UNITED STATES
SECURITIES AND EXCHANGE COMMISSION
Washington, D.C. 20549
FORM N-CSR
CERTIFIED SHAREHOLDER REPORT OF REGISTERED
MANAGEMENT INVESTMENT COMPANIES
Investment Company Act file number 811-04642
Virtus Variable Insurance Trust
(Exact name of registrant as specified in charter)
100 Pearl Street
Hartford, CT 06103-4506
(Address of principal executive offices) (Zip code)
Kevin J. Carr, Esq.
Vice President, Chief Legal Officer, Counsel and Secretary for Registrant
100 Pearl Street
Hartford, CT 06103-4506
(Name and address of agent for service)
Registrant’s telephone number, including area code: (800) 248-7971
Date of fiscal year end: December 31
Date of reporting period: December 31, 2011
Form N-CSR is to be used by management investment companies to file reports with the Commission not later than 10 days after the transmission to stockholders of any report that is required to be transmitted to stockholders under Rule 30e-1 under the Investment Company Act of 1940 (17 CFR 270.30e-1). The Commission may use the information provided on Form N-CSR in its regulatory, disclosure review, inspection, and policymaking roles.
A registrant is required to disclose the information specified by Form N-CSR, and the Commission will make this information public. A registrant is not required to respond to the collection of information contained in Form N-CSR unless the Form displays a currently valid Office of Management and Budget (“OMB”) control number. Please direct comments concerning the accuracy of the information collection burden estimate and any suggestions for reducing the burden to Secretary, Securities and Exchange Commission, 100 F Street, NE, Washington, DC 20549. The OMB has reviewed this collection of information under the clearance requirements of 44 U.S.C. § 3507.
Item 1. Reports to Stockholders.
The Report to Shareholders is attached herewith.

VIRTUS VARIABLE INSURANCE TRUST
ANNUAL REPORT
Virtus Capital Growth Series*
Virtus Growth & Income Series*
Virtus International Series
Virtus Multi-Sector Fixed Income Series
Virtus Premium AlphaSectorTM Series*
Virtus Real Estate Securities Series
Virtus Small-Cap Growth Series
Virtus Small-Cap Value Series
Virtus Strategic Allocation Series*
| | | | | | |
| * Prospectus supplements applicable to these Series appear at the back of this annual report. | | | | | December 31, 2011 | |
| The Annual Report describes one or more Series available for underlying investment through your variable contract. For information about your variable contract, including information about insurance-related expenses, see the prospectus for your variable contract. | | | | | Not FDIC Insured No Bank Guarantee May Lose Value | |
Table of Contents
* Prospectus supplements applicable to these Series appear at the back of this annual report
Proxy Voting Procedures and Voting Record (Form N-PX)
The adviser and subadvisers vote proxies relating to portfolio securities in accordance with procedures that have been approved by the Trustees of the Trust (“Trustees,” or the “Board”). You may obtain a description of these procedures, along with information regarding how the Series voted proxies during the most recent 12-month period ended June 30, free of charge, by calling toll-free 800-367-5877. This information is also available through the Securities and Exchange Commission’s (the “SEC”) website at http://www.sec.gov.
Form N-Q Information
The Fund files a complete schedule of portfolio holdings for each Series with the SEC for the first and third quarters of each fiscal year on Form N-Q. Form N-Q is available on the SEC’s website at http://www.sec.gov. Form N-Q may be reviewed and copied at the SEC’s Public Reference Room. Information on the operation of the SEC’s Public Reference Room can be obtained by calling toll-free 1-800-SEC-0330.
MESSAGE TO SHAREHOLDERS
Dear Virtus Variable Product Investors:

| Investors will likely recall 2011 as a highly volatile year for the global financial markets, which were tested by a number of geopolitical and economic events, including social unrest in the Middle East, the European sovereign debt crisis, the impact of Japan’s earthquake, and persistent U.S. political gridlock. |
| | Global equity markets suffered heavy losses, with developed markets, as measured by the MSCI EAFE Index, declining 11.7%, and emerging markets, as measured by the MSCI Emerging Markets Index, falling even further, 18.2%. By comparison, U.S. stocks managed to pull ahead of other markets. Dividend-paying blue-chip stocks were rewarded the most, as indicated by the Dow Jones Industrial Average’s 8.4% return for the year. By comparison, the S&P 500® Total Return Index, a broad benchmark of U.S. stocks, gained 2.1%. |
Fixed-income markets were among the strongest performers in 2011. The Barclays Capital U.S. Aggregate Bond Index, a metric of taxable bond returns, rose 7.8%. Investor skittishness fueled demand for the relative safety of U.S. government bonds, pushing the yield on the 10-year Treasury below 2% for the first time ever.
As we turn the corner into 2012, the U.S. economy is starting to show encouraging signs of growth. The manufacturing sector is recovering, consumer spending is rising and the labor market is moving in the right direction, with unemployment dropping four straight months, to 8.5% in December.
Last year’s volatility is an important reminder of the importance of diversification. While diversification cannot guarantee a profit or prevent loss, owning a variety of asset classes may cushion your portfolio against market fluctuations. In fact, this is an excellent time of year to check with your advisor to make sure your variable product portfolio is adequately diversified.
Thank you for entrusting Virtus with your assets. We appreciate your business and remain committed to your long-term financial success.
Sincerely,

George R. Aylward
President, Virtus Variable Insurance Trust
February 2012
Variable insurance products are sold by prospectus. You should carefully consider investment objectives, charges, expenses and risks before you invest. The contract prospectuses and underlying Series prospectuses contain this and other important information about the variable insurance product. You may obtain contract prospectuses from your registered representative. You may obtain Series prospectuses by contacting us at 1-800-367-5877 or Virtus.com. Please read the prospectuses carefully before you invest.
1
KEY INVESTMENT TERMS
ADR (American Depositary Receipt)
Represents shares of foreign companies traded in U.S. dollars on U.S. exchanges that are held by a U.S. bank or trust. Foreign companies use ADRs in order to make it easier for Americans to buy their shares. An ADR is likely to be traded over the counter.
Barclays Capital U.S. Aggregate Bond Index
The Barclays Capital U.S. Aggregate Bond Index measures the U.S. investment grade fixed rate bond market. The index is calculated on a total return basis.
Composite Index for Strategic Allocation Series
A composite index made up of 60% of the S&P 500® Index, which measures stock market total return performance, and 40% of the Barclays Capital U.S. Aggregate Bond Index, which measures bond market total return performance.
ETF (Exchange-Traded Fund)
A Fund that tracks an index, but can be traded like a stock.
Federal Reserve (the “Fed”)
The central bank of the United States, responsible for controlling the money supply, interest rates and credit with the goal of keeping the U.S. economy and currency stable. Governed by a seven-member board, the system includes 12 regional Federal Reserve Banks, 25 branches and all national and state banks that are part of the system.
FTSE NAREIT Equity REITs Index
The FTSE NAREIT Equity REITs Index is a free-float market capitalization-weighted index measuring equity tax-qualified real estate investment trusts, which meet minimum size and liquidity criteria, that are listed on the New York Stock Exchange, the American Stock Exchange and the NASDAQ National Market System. The index is calculated on a total return basis with dividends reinvested.
MSCI EAFE® Index
The MSCI EAFE® Index is a free float-adjusted market capitalization index that measures developed foreign market equity performance, excluding the U.S. and Canada. The index is calculated on a total return basis with gross dividends reinvested.
PIK (Payment-in-Kind)
A bond which pays interest in the form of additional bonds, or preferred stock which pays dividends in the form of additional preferred stock.
REIT (Real Estate Investment Trust)
A publicly traded company that owns, develops and operates income-producing real estate such as apartments, office buildings, hotels, shopping centers and other commercial properties.
Russell 1000® Growth Index
The Russell 1000® Growth Index is a market capitalization-weighted index of growth-oriented stocks of the 1,000 largest companies in the Russell Universe, which comprises the 3,000 largest U.S. companies. The index is calculated on a total return basis with dividends reinvested.
Russell 2000® Growth Index
The Russell 2000® Growth Index is a market capitalization-weighted index of growth-oriented stocks of the 2,000 smallest companies in the Russell Universe, which comprises the 3,000 largest U.S. companies. The index is calculated on a total return basis with dividends reinvested.
Russell 2000® Value Index
The Russell 2000® Value Index is a market capitalization-weighted index of value-oriented stocks of the 2,000 smallest companies in the Russell Universe, which comprises the 3,000 largest U.S. companies. The index is calculated on a total return basis with dividends reinvested.
S&P 500® Index
The S&P 500® Index is a free-float market capitalization-weighted index of 500 of the largest U.S. companies. The index is calculated on a total return basis with dividends reinvested.
Sponsored ADR (American Depositary Receipt)
An ADR which is issued with the cooperation of the company whose stock will underlie the ADR. Sponsored ADRs generally carry the same rights normally given to stockholders, such as voting rights. ADRs must be sponsored to be able to trade on a major U.S. exchange such as the NYSE.
The indexes are unmanaged and not available for direct investment; therefore, their performance does not reflect the expenses associated with active management of an actual portfolio.
2
VIRTUS VARIABLE INSURANCE TRUST
Disclosure of Fund Expenses (Unaudited)
For the six-month period of July 1, 2011 to December 31, 2011
We believe it is important for you to understand the impact of costs on your investment. All mutual funds have operating expenses. As a shareholder of Virtus Variable Insurance Trust Series (each a “Series”), you incur ongoing costs including investment advisory fees and other expenses. These examples are intended to help you understand your ongoing costs (in dollars) of investing in a Series and to compare these costs with the ongoing costs of investing in other mutual funds. These examples are based on an investment of $1,000 invested at the beginning of the period and held for the entire six-month period. The following Expense Table illustrates your Series’ costs in two ways.
Actual Expenses
This section of the accompanying table provides information about actual account values and actual expenses. You may use the information in this line, together with the amount you invested, to estimate the expenses that you paid over the period. Simply divide your account value by $1,000 (for example, an $8,600 account value divided by $1,000 = 8.6), then multiply the result by the number in the first line under the heading entitled “Expenses Paid During Period” to estimate the expenses you paid on your account during this period. The expense estimate does not include the fees or expenses associated with the separate insurance accounts, and if such charges were included, your costs would have been higher.
Hypothetical Example for Comparison Purposes
This section of the accompanying table provides information about hypothetical account values and hypothetical expenses based on the Series’ actual expense ratio and an assumed rate of return of 5% per year before expenses, which is not your Series’ actual return. The hypothetical account values and expenses may not be used to estimate the actual ending account balance or expenses you paid for the period. You may use this information to compare the ongoing costs of investing in your Series and other funds. To do so, compare these 5% hypothetical examples with the 5% hypothetical examples that appear in the shareholder reports of the other funds.
Please note that the expenses shown in the accompanying table are meant to highlight your ongoing costs only and do not reflect additional fees and expenses associated with the annuity or life insurance policy through which you invest. Therefore, this section of the accompanying table is useful in comparing ongoing costs only, and will not help you determine the relative total costs of owning different funds. In addition, if the annuity or life insurance policy costs were included, your costs would have been higher. The calculations assume no shares were bought or sold during the period. Your actual costs may have been higher or lower, depending on the amount of your investment and the timing of any purchases or redemptions.
| | | | | | | | | | | | | | | | |
| Expense Table | |
| | | Beginning
Account Value
July 1, 2011 | | | Ending
Account Value
December 31, 2011 | | | Annualized
Expense
Ratio | | | Expenses Paid
During
Period* | |
Capital Growth Series | | | | | |
Actual | | $ | 1,000.00 | | | $ | 899.60 | | | | 0.95 | % | | $ | 4.55 | |
|
Hypothetical (5% return before expenses) | |
| | | | 1,000.00 | | | | 1,020.36 | | | | 0.95 | | | | 4.85 | |
Growth & Income Series | |
Actual | | $ | 1,000.00 | | | $ | 923.00 | | | | 0.90 | % | | $ | 4.36 | |
|
Hypothetical (5% return before expenses) | |
| | | | 1,000.00 | | | | 1,020.61 | | | | 0.90 | | | | 4.59 | |
International Series | |
Actual | | $ | 1,000.00 | | | $ | 910.90 | | | | 1.03 | % | | $ | 4.96 | |
|
Hypothetical (5% return before expenses) | |
| | | | 1,000.00 | | | | 1,019.95 | | | | 1.03 | | | | 5.26 | |
Multi-Sector Fixed Income Series | |
Actual | | $ | 1,000.00 | | | $ | 983.50 | | | | 0.75 | % | | $ | 3.75 | |
|
Hypothetical (5% return before expenses) | |
| | | | 1,000.00 | | | | 1,021.38 | | | | 0.75 | | | | 3.83 | |
Premium AlphaSector Series | |
Actual | | $ | 1,000.00 | | | $ | 949.60 | | | | 1.70 | % | | $ | 8.35 | |
|
Hypothetical (5% return before expenses) | |
| | | | 1,000.00 | | | | 1,016.53 | | | | 1.70 | | | | 8.68 | |
Real Estate Securities Series | |
Actual | | $ | 1,000.00 | | | $ | 987.50 | | | | 1.10 | % | | $ | 5.56 | |
|
Hypothetical (5% return before expenses) | |
| | | | 1,000.00 | | | | 1,019.54 | | | | 1.10 | | | | 5.67 | |
Small-Cap Growth Series | |
Actual | | $ | 1,000.00 | | | $ | 984.50 | | | | 1.05 | % | | $ | 5.25 | |
|
Hypothetical (5% return before expenses) | |
| | | | 1,000.00 | | | | 1,019.85 | | | | 1.05 | | | | 5.36 | |
Small-Cap Value Series | |
Actual | | $ | 1,000.00 | | | $ | 929.90 | | | | 1.30 | % | | $ | 6.32 | |
|
Hypothetical (5% return before expenses) | |
| | | | 1,000.00 | | | | 1,018.57 | | | | 1.30 | | | | 6.64 | |
Strategic Allocation Series | |
Actual | | $ | 1,000.00 | | | $ | 964.40 | | | | 0.85 | % | | $ | 4.21 | |
|
Hypothetical (5% return before expenses) | |
| | | | 1,000.00 | | | | 1,020.87 | | | | 0.85 | | | | 4.34 | |
| * | Expenses are equal to the relevant Series’ annualized expense ratio which includes waived fees and reimbursed expenses, if applicable, multiplied by the average account value over the period, multiplied by the number of days (184) expenses were accrued in the most recent fiscal half-year, then divided by 365 days to reflect the one-half year period. Exceptions noted below. |
| | The Series may invest in other funds, and the annualized expense ratios noted above do not reflect fees and expenses associated with the underlying funds. If such fees and expenses had been included, the expenses would have been higher. |
| | You can find more information about the Series’ expenses in the Financial Statements section that follows. For additional information on operating expenses and other shareholder costs, including contractual charges associated with the separate account, refer to the Series prospectus and the contract prospectus. |
3
Portfolio Manager Commentary
| ¢ | | Virtus Capital Growth Series (the “Series”) is diversified and has an investment objective of long-term growth of capital. There is no guarantee that the Series will meet its objective. |
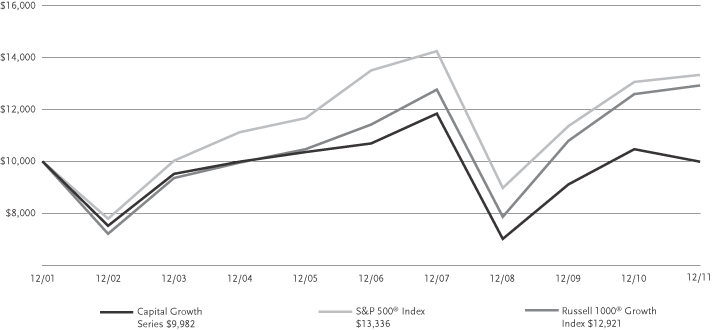
| ¢ | | For the fiscal year ended December 31, 2011, the Series returned -4.60%. For the same period, the S&P 500® Index, a broad-based equity index, returned 2.11% and the Russell 1000® Growth Index, the Series’ style-specific benchmark, returned 2.64%. |
All performance figures assume the reinvestment of distributions and exclude the effect of fees and expenses associated with the variable life insurance or annuity product through which you invest. Past performance is no guarantee of future results and current performance may be higher or lower than the performance shown above.
How did the market in which the Series invests perform during the Series’ fiscal year?
| ¢ | | U.S. markets ended the year mixed after a tumultuous global geo-political and macro-economic environment. Strong first and fourth quarters were offset by weak second and third quarters which were influenced by Euro-zone collapse fears, the U.S. credit rating downgrade, and inklings of a double-dip recession within our borders. The fourth quarter alone was equally volatile, as initial hopes of a resolution in Europe led to a solid October after four straight down quarters, only to be met by a flat November and December as talks among European countries seemed to be going nowhere. |
| ¢ | | The top performing sectors for the reporting period were the more defensive sectors of utilities, consumer staples, and health care while the materials, telecommunications-services, and industrials sectors did not perform as strongly. |
| ¢ | | High-quality stocks, as measured by S&P Quality Rankings, outperformed low-quality stocks for the year. Additionally, less risky stocks, as measured by beta, had superior returns relative to more risky stocks. |
What factors affected the Series’ performance during its fiscal year?
| ¢ | | The Series underperformed the Russell 1000® Growth Index for the reporting period. Performance of the Series was helped by stock selection in the health care sector. However, performance was hurt by negative stock selection and an underweight in financials, negative stock selection in information technology, and negative stock selection and an overweight in energy. |
The preceding information is the opinion of portfolio management only through the end of the period of the report as stated on the cover. Any such opinions are subject to change at any time based upon market or other conditions and should not be relied upon as investment advice.
Because the Series is heavily weighted in the technology sector, it will be impacted by that Sector’s performance more than a series with broader sector diversification.
| | | | |
| |
| Asset Allocation | |
| |
The following table presents asset allocations within certain sectors and as a percentage of total investments as of December 31, 2011. | |
Information Technology | | | 25 | % |
Industrials | | | 16 | |
Consumer Discretionary | | | 16 | |
Consumer Staples | | | 14 | |
Energy | | | 11 | |
Health Care | | | 8 | |
Materials | | | 6 | |
Other (includes short-term investments) | | | 4 | |
| | | | | |
Total | | | 100 | % |
| | | | | |
For information regarding the indexes and key investment terms, see the Key Investment Terms starting on page 2.
4
| | |
| Capital Growth Series (Continued) | | |
| | | | | | | | | | | | |
| Average Annual Total Return1 for periods ended 12/31/11 | | | | | | | | | |
| | | |
| | | 1 year | | | 5 years | | | 10 years | |
| Capital Growth Series | | | –4.60 | % | | | –1.36 | % | | | –0.02 | % |
| S&P 500® Index | | | 2.11 | | | | –0.25 | | | | 2.92 | |
| Russell 1000® Growth Index | | | 2.64 | | | | 2.50 | | | | 2.60 | |
| Series expense ratios2: Gross: 1.18%; Net: 0.95%. | | | | | | | | | | | | |
Returns represent past performance, which is no guarantee of future results. The investment return and principal value will fluctuate so that an investor’s shares, when redeemed, may be worth more or less than the original cost. Total return does not reflect expenses associated with the separate account such as the administrative fees, account charges and surrender charges, which if reflected, would reduce total return. Performance figures may reflect fee waivers and/or expense reimbursements. In the absence of fee waivers and/or expense reimbursements, the total return would have been lower. Please visit Virtus.com for performance data current to the most recent month-end.
| 1 | Total returns are historical and include changes in share price and the reinvestment of both dividends and capital gains distributions. |
| 2 | The expense ratios of the Series are set forth according to the prospectus for the Series effective May 1, 2011, as supplemented and revised, and may differ from the expense ratios disclosed in the Financial Highlights tables in this report. Net Expenses: Expenses reduced by a contractual waiver in effect through November 5, 2012. Gross Expenses: Does not reflect the effect of a contractual waiver. See the financial highlights for more current information. |
Growth of $10,000 For periods ended 12/31
This chart assumes an initial investment of $10,000 made on December 31, 2001. Returns shown include the reinvestment of all distributions at net asset value, and the change in share price for the stated period.
The indexes are unmanaged and not available for direct investment; therefore, their performance does not reflect the expenses associated with active management of an actual portfolio.
For information regarding the indexes and key investment terms, see the Key Investment Terms starting on page 2.
5
Portfolio Manager Commentary
| ¢ | | Virtus Growth & Income Series (the “Series”) is diversified and has an investment objective of capital appreciation and current income. There is no guarantee that the Series will meet its objective. |
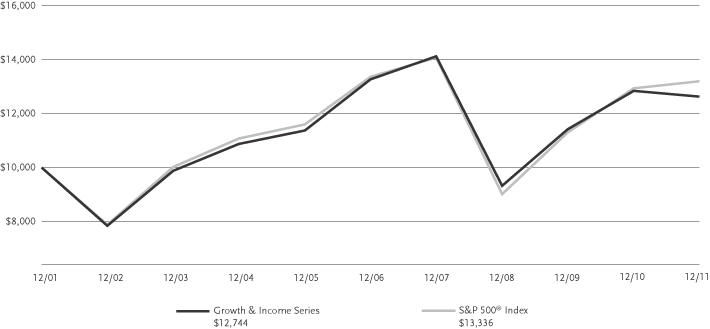
| ¢ | | For the fiscal year ended December 31, 2011, the Series returned -1.66%. For the same period, the S&P 500® Index, a broad-based equity index, returned 2.11%. |
All performance figures assume the reinvest- ment of distributions and exclude the effect of fees and expenses associated with the variable life insurance or annuity product through which you invest. Past performance is no guarantee of future results and current performance may be higher or lower than the performance shown above.
How did the market in which the Series invests perform during the Series’ fiscal year?
| ¢ | | The S&P 500® Index ended the year with a slight gain of 2.11%, although that hides the extreme volatility experienced by the market. The year 2011 can be divided almost in half with the first two quarters being highlighted by higher stock prices, investors willing to buy cyclically sensitive stocks, and a general rise in asset prices. Beginning in mid-July things got much more difficult as the market started a massive correction over concerns about the European debt crisis. While in the first six months stocks that had economically sensitive earnings did well, the second half of the year was marked by the much better performance of late-cycle equities such as utilities, consumer staple names, and other high dividend paying stocks. Volatility was also extreme, with so-called “headline risk” associated with both global economic growth data and news regarding Greece, and the European debt crisis, dominating price action, even in our own markets. In the end, the market managed a marginal gain, but it was a difficult market for most investors. |
What factors affected the Series’ performance during its fiscal year?
| ¢ | | For most of the year, the Series had a greater weighting in more economically sensitive stocks such as energy stocks, material and mining names and industrial stocks, which generally did very well in the first half of the year. While the Series managers did reduce holdings of many of these names early in the summer, it was not enough to offset the negative effects of the sell-off. Furthermore, the under-weighting in utilities and staple stocks created a head-wind for the Series as much of the back half of the year was dominated by a move to yield-oriented stocks. While on balance the Series did keep up with peers, the stretch between late July and early October was difficult and the Series slightly under-performed the S&P 500® Index on the year. |
The preceding information is the opinion of portfolio management only through the end of the period of the report as stated on the cover. Any such opinions are subject to change at any time based upon market or other conditions and should not be relied upon as investment advice, and there is no guarantee that market forecasts will be realized.
Investing internationally involves risks not associated with investing solely in the U.S., such as currency fluctuation, political risk, differences in accounting and the limited availability of information.
| | | | |
| |
| Asset Allocation | |
| |
The following table presents asset allocations within certain sectors and as a percentage of total investments as of December 31, 2011. | |
Energy | | | 17 | % |
Information Technology | | | 15 | |
Industrials | | | 14 | |
Materials | | | 14 | |
Consumer Discretionary | | | 13 | |
Health Care | | | 10 | |
Financials | | | 7 | |
Other (includes short-term investments) | | | 10 | |
| | | | | |
Total | | | 100 | % |
| | | | | |
For information regarding the indexes and key investment terms, see the Key Investment Terms starting on page 2.
6
| | |
| Growth & Income Series (Continued) | | |
| | | | | | | | | | | | |
| Average Annual Total Return1 for periods ended 12/31/11 | | | | | | | | | |
| | | |
| | | 1 year | | | 5 years | | | 10 years | |
| Growth & Income Series | | | –1.66 | % | | | –1.00 | % | | | 2.45 | % |
| S&P 500® Index | | | 2.11 | | | | –0.25 | | | | 2.92 | |
| Series expense ratios2: Gross: 1.19%; Net: 0.90%. | | | | | | | | | | | | |
Returns represent past performance, which is no guarantee of future results. The investment return and principal value will fluctuate so that an investor’s shares, when redeemed, may be worth more or less than their original cost. Total return does not reflect expenses associated with the separate account such as the administrative fees, account charges and surrender charges, which if reflected, would reduce total return. Performance figures may reflect fee waivers and/or expense reimbursements. In the absence of fee waivers and/or expense reimbursements, the total return would have been lower. Please visit Virtus.com for performance data current to the most recent month-end.
| 1 | Total returns are historical and include changes in share price and the reinvestment of both dividends and capital gains distributions. |
| 2 | The expense ratios of the Series, both net and gross are set forth according to the prospectus for the Series effective May 1, 2011, as supplemented and revised, and may differ from the expense ratios disclosed in the Financial Highlights tables in this report. Net Expenses: Expenses reduced by a contractual waiver in effect through November 5, 2012. Gross Expenses: Does not reflect the effect of the contractual waiver. See the financial highlights for more current information. |
Growth of $10,000 For periods ended 12/31
This chart assumes an initial investment of $10,000 made on December 31, 2001. Returns shown include the reinvestment of all distributions at net asset value, and the change in share price for the stated period.
The index is unmanaged and not available for direct investment; therefore, its performance does not reflect the expenses associated with active management of an actual portfolio.
For information regarding the indexes and key investment terms, see the Key Investment Terms starting on page 2.
7
Portfolio Manager Commentary
| ¢ | | Virtus International Series (the “Series”) is diversified and has an investment objective of high total return consistent with reasonable risk. There is no guarantee that the Series will meet its objective. |
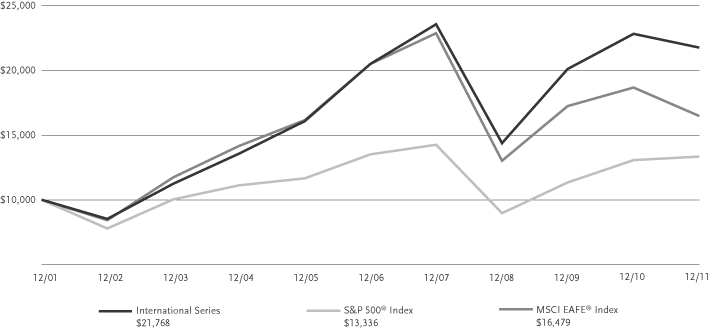
| ¢ | | For the fiscal year ended December 31, 2011, the Series returned -4.57%. For the same period, the S&P 500® Index, a broad-based equity index, returned 2.11% and the MSCI EAFE® Index, the Series’ style-specific benchmark, returned -11.73%. |
All performance figures assume the reinvestment of distributions and exclude the effect of fees and expenses associated with the variable life insurance or annuity product through which you invest. Past performance is no guarantee of future results and current performance may be higher or lower than the performance shown above.
How did the market in which the Series invests perform during the Series’ fiscal year?
| ¢ | | It was a volatile twelve months in global equity markets. Initially, in January there was renewed optimism over global growth prospects on the back of improving economic data. However, by June we saw global equities fall on the back of worries over the Greek debt crisis and the Federal Reserve’s downgrade of the nation’s growth outlook. Euro-zone worries together with worries over a general slowdown in global growth continued through 2011, which resulted in equity stock markets being down significantly, and the MSCI EAFE® Index in particular fell 11.73% over the year. |
What factors affected the Series’ performance during its fiscal year?
| ¢ | | In 2011, the Series outperformed the MSCI EAFE® Index benchmark as a result of both asset allocation and stock selection. We invest in what we believe are quality stocks with strong balance sheets, experienced management and sustainable business models as these are the types of stocks that can survive these challenging times and come out the other side in a strong position. It was these types of stocks that held up relatively well in 2011 and resulted in our relative outperformance. With regards to stock selection, the main contributors to our relative outperformance came from our holdings in Switzerland, Japan, the United Kingdom and Italy as well as our non-benchmark holdings in China, Korea, Taiwan, Mexico and Canada. |
| ¢ | | At the sector level, the largest contribution to relative outperformance came from financials where not holding any diversified financials benefited the Series. In addition, stock selection within our banks, insurance and real estate holdings was relatively strong. We also gained from stock selection in the information technology and telecommunication sectors and benefited from being underweight in materials and industrials as these sectors had struggled last year on the back of worries over a general slowdown in global growth. We also gained from our overweight to consumer staples and pharmaceuticals, with the more defensive stocks such as tobacco and healthcare stocks holding up relatively well over the year. |
The preceding information is the opinion of portfolio management only through the end of the period of the report as stated on the cover. Any such opinions are subject to change at any time based upon market or other conditions and should not be relied upon as investment advice.
Investing internationally involves risks not associated with investing solely in the U.S., such as currency fluctuation, political risk, differences in accounting and the limited availability of information. The economies of developing countries may be adversely affected by trade barriers, exchange controls, managed adjustments in relative currency values and other protagonist measures imposed or negotiated by the countries with which they trade.
Because the Series is heavily weighted in the financial sector, it will be impacted by that Sector’s performance more than a series with broader sector diversification.
| | | | |
| |
| Asset Allocation | |
| |
The following table presents asset allocations within certain sectors and as a percentage of total investments as of December 31, 2011. | |
Financials | | | 26 | % |
Energy | | | 13 | |
Consumer Staples | | | 12 | |
Information Technology | | | 12 | |
Telecommunication Services | | | 11 | |
Health Care | | | 10 | |
Industrials | | | 8 | |
Other (includes short-term investments) | | | 8 | |
| | | | | |
Total | | | 100 | % |
| | | | | |
For information regarding the indexes and key investment terms, see the Key Investment Terms starting on page 2.
8
| | |
| International Series (Continued) | | |
| | | | | | | | | | | | |
| Average Annual Total Return1 for periods ended 12/31/11 | | | | | | | | | |
| | | |
| | | 1 year | | | 5 years | | | 10 years | |
| International Series | | | –4.57 | % | | | 1.21 | % | | | 8.09 | % |
| S&P 500® Index | | | 2.11 | | | | –0.25 | | | | 2.92 | |
| MSCI EAFE® Index | | | –11.73 | | | | –4.26 | | | | 5.12 | |
| Series expense ratios2: Gross: 1.21%; Net: 1.03%. | |
Returns represent past performance, which is no guarantee of future results. The investment return and principal value will fluctuate so that an investor’s shares, when redeemed, may be worth more or less than the original cost. Total return does not reflect expenses associated with the separate account such as the administrative fees, account charges and surrender charges, which if reflected, would reduce total return. Performance figures may reflect fee waivers and/or expense reimbursements. In the absence of fee waivers and/or expense reimbursements, the total return would have been lower. Please visit Virtus.com for performance data current to the most recent month-end.
| 1 | Total returns are historical and include changes in share price and the reinvestment of both dividends and capital gains distributions. |
| 2 | The expense ratios of the Series, both net and gross are set forth according to the prospectus for the Series effective May 1, 2011, as supplemented and revised, and may differ from the expense ratios disclosed in the Financial Highlights tables in this report. Net Expenses: Expenses reduced by a contractual waiver in effect through November 5, 2012. Gross Expenses: Does not reflect the effect of the contractual waiver. See the financial highlights for more current information. |
Growth of $10,000 For periods ended 12/31
This chart assumes an initial investment of $10,000 made on December 31, 2001. Returns shown include the reinvestment of all distributions at net asset value, and the change in share price for the stated period.
The indexes are unmanaged and not available for direct investment; therefore, their performance does not reflect the expenses associated with active management of an actual portfolio.
For information regarding the indexes and key investment terms, see the Key Investment Terms starting on page 2.
9
| | |
| Multi-Sector Fixed Income Series | | |
Portfolio Manager Commentary
| ¢ | | Virtus Multi-Sector Fixed Income Series (the “Series”) is diversified and has an investment objective of long-term total return. There is no guarantee that the Series will meet its objective. |
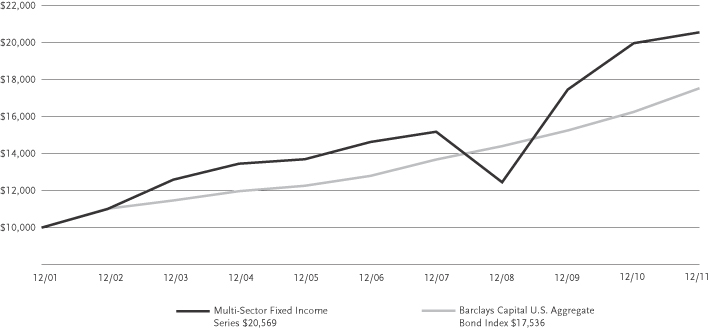
| ¢ | | For the fiscal year ended December 31, 2011, the Series returned 2.99%. For the same period, the Barclays Capital U.S. Aggregate Bond Index, a broad-based fixed income index, returned 7.84%. |
All performance figures assume the reinvestment of distributions and exclude the effect of fees and expenses associated with the variable life insurance or annuity product through which you invest. Past performance is no guarantee of future results and current performance may be higher or lower than the performance shown above.
How did the fixed income market perform during the Series’ fiscal year?
| ¢ | | During the last 12 months the economy showed signs of improvement and the likelihood of the U.S. entering another recession diminished. This has been positive for spread sectors. However, during the year there have been periods of volatility and subsequent spread widening stemming from growing concerns over the sovereign debt crisis in Europe, the U.S. debt ceiling debate and subsequent loss of its AAA long-term rating by Standard & Poor’s, and global growth concerns. Overall U.S. Treasuries outperformed most spread sectors during the Series’ fiscal year. |
| ¢ | | Over the last 12 months yields declined across the U.S. Treasury curve and the curve flattened. |
What factors affected the Series’ performance during its fiscal year?
| ¢ | | The underperformance of most spread sectors relative to U.S. Treasuries was a key factor that detracted from Series’ performance for the year. |
| ¢ | | Among fixed income sectors, the Series’ overweight to emerging markets, non-U.S. Dollar securities, and corporate high yield securities detracted from the Series’ performance. |
| ¢ | | Strong issue selection within the commercial mortgage backed security sector benefited performance. |
The preceding information is the opinion of portfolio management only through the end of the period of the report as stated on the cover. Any such opinions are subject to change at any time based upon market or other conditions and should not be relied upon as investment advice.
Investing internationally involves risks not associated with investing solely in the U.S., such as currency fluctuation, political risk, differences in accounting and the limited availability of information.
Portfolios that invest in high-yield securities are subject to greater credit risk and price fluctuation than portfolios that invest in higher quality securities.
The value of mortgage-backed and other asset-backed securities, including pass-through type securities and collateralized mortgage obligations (CMOs) may fluctuate to a greater degree than other debt securities in response to interest rate changes.
��
| | | | | | | | |
| |
| Asset Allocation | |
| |
The following table presents asset allocations within certain sectors and as a percentage of total investments as of December 31, 2011. | |
Corporate Bonds | | | | | | | 52 | % |
Financials | | | 21 | % | | | | |
Energy | | | 9 | | | | | |
Consumer Discretionary | | | 7 | | | | | |
Total of all others | | | 15 | | | | | |
Mortgage-Backed Securities | | | | | | | 15 | |
Loan Agreements | | | | | | | 15 | |
Foreign Government Securities | | | | | | | 12 | |
Asset-Backed Securities | | | | | | | 3 | |
Other (includes short-term investments) | | | | | | | 3 | |
| | | | | | | | | |
Total | | | | | | | 100 | % |
| | | | | | | | | |
For information regarding the indexes and key investment terms, see the Key Investment Terms starting on page 2.
10
| | |
| Multi-Sector Fixed Income Series (Continued) | | |
| | | | | | | | | | | | |
| Average Annual Total Return1 for periods ended 12/31/11 | | | | | | | | | |
| | | |
| | | 1 year | | | 5 years | | | 10 years | |
| Multi-Sector Fixed Income Series | | | 2.99 | % | | | 7.03 | % | | | 7.48 | % |
| Barclays Capital U.S. Aggregate Bond Index | | | 7.84 | | | | 6.50 | | | | 5.78 | |
| Series expense ratios2: Gross: 0.99%; Net: 0.75%. | | | | | | | | | | | | |
Returns represent past performance, which is no guarantee of future results. The investment return and principal value will fluctuate so that an investor’s shares, when redeemed, may be worth more or less than the original cost. Total return does not reflect expenses associated with the separate account such as the administrative fees, account charges and surrender charges, which if reflected, would reduce total return. Performance figures may reflect fee waivers and/or expense reimbursements. In the absence of fee waivers and/or expense reimbursements, the total return would have been lower. Please visit Virtus.com for performance data current to the most recent month-end.
| 1 | Total returns are historical and include changes in share price and the reinvestment of both dividends and capital gains distributions. |
| 2 | The expense ratios of the Series is set forth according to the prospectus for the Series effective May 1, 2011, as supplemented and revised, and may differ from the expense ratios disclosed in the Financial Highlights tables in this report. Net Expenses: Expenses reduced by a contractual waiver in effect through November 5, 2012. Gross Expenses: Does not reflect the effect of the contractual waiver. See the financial highlights for more current information. |
Growth of $10,000 For periods ended 12/31
This chart assumes an initial investment of $10,000 made on December 31, 2001. Returns shown include the reinvestment of all distributions at net asset value, and the change in share price for the stated period.
The index is unmanaged and not available for direct investment; therefore, its performance does not reflect the expenses associated with active management of an actual portfolio.
For information regarding the indexes and key investment terms, see the Key Investment Terms starting on page 2.
11
| | |
| Premium AlphaSector™ Series | | |
Portfolio Manager Commentary
| ¢ | | Premium AlphaSectorTM Series (the “Series”) is diversified and has an investment objective of long-term capital appreciation. There is no guarantee that the Series will achieve its objective. |
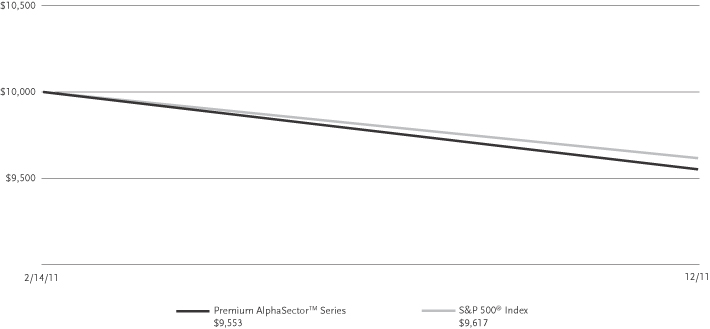
| ¢ | | For the fiscal period ended December 31, 2011, the Series returned -4.47%*. For the same period, the S&P 500® Index, a broad-based equity index, returned -3.83%*. |
| * | Returns less than 1 year are not annualized |
All performance figures assume reinvestment of distributions and exclude the effect of fees and expenses associated with the variable life insurance or annuity product through which you invest. Past performance is no guarantee of future results and current performance may be higher or lower than the performance shown above.
How did the market perform during the Series’ fiscal period?
| ¢ | | Sustained market volatility was the major challenge in 2011. The series invests in the U.S. equity market. On a full-year 2011 basis, the S&P 500® Index returned a modest 2.1%. But to reach that destination, investors experienced a turbulent up-and-down ride. Volatility rattled the markets, especially in the second half of the year. |
| ¢ | | Three examples of the market volatility are as follows: (1) The first quarter of 2011 was the best Q1 since 1998 for the S&P 500® Total Return Index, but the third quarter was the worst Q3 since 2008. (2) The Chicago Board Options Exchange Market Volatility Index (a common measure of volatility) reached a high of 30 or more during twenty weeks in 2011, a level of volatility exceeded in only two periods since 1989 — the 2002 and 2008-2009 market crashes. (3) Between August 1 and December 1, the S&P 500® Index saw eight declines of 5% or more and eight advances of 5% or more; the total of sixteen such movements means that, on average, big swings were a weekly occurrence. |
| ¢ | | The headlines echoed the market swings and added to investor uncertainty. Stories on the sluggish economy at home and abroad, U.S. government deficits, and the Euro credit crisis added to investor uncertainty. Altogether, the period was an unsettled time in the US equity markets. |
What factors affected the Series’ performance during its fiscal period?
| ¢ | | The Series is designed to “de-risk the portfolio” in volatile and negative markets. In an extended bear market, as in 2008-2009, the goal is to reduce capital loss. In periods of up-and-down swings such as 2011, the dual objectives are to 1) position the portfolio defensively to move quickly to cash if the markets deteriorate significantly, and 2) to reduce volatility and its negative impact on clients. |
| ¢ | | When volatility spiked in late July and August, the Series reduced exposure to the most volatile sectors and assumed a defensive part-cash position. Cash remained in the portfolio, at 25% or 50% weighting, into early December. The result was meaningful lowering of day-to-day volatility. |
The preceding information is the opinion of portfolio management only through the end of the period of the report as stated on the cover. Any such opinions are subject to change at any time based upon market or other conditions and should not be relied upon as investment advice. Past performance is no guarantee of future results, and there is no guarantee that market forecasts will be realized.
Lack of liquidity in an ETF could result in its value being more volatile than the underlying portfolio of securities. Sector ETFs are subject to sector risks and non-diversification risks, which may result in greater price fluctuations than the overall market. Because the Fund invests in ETFs, it indirectly bears its proportionate share of the operating expenses of the underlying funds. Indirectly, the Fund is subject to all risks associated with the underlying ETFs.
The guarantee on U.S. government securities applies only to the underlying securities of the portfolio, and not to the value of the portfolio’s shares.
A portfolio that holds a limited number of securities will be impacted by each security’s performance more than a portfolio with a larger number of holdings.
| | | | |
| |
| Asset Allocation | |
| |
The following table presents asset allocations within certain sectors and as a percentage of total investments as of December 31, 2011. | |
Exchange-Traded Funds | | | 99 | % |
Other (includes short-term investments) | | | 1 | |
| | | | | |
Total | | | 100 | % |
| | | | | |
For information regarding the indexes and key investment terms, see the Key Investment Terms starting on page 2.
12
| | |
| Premium AlphaSector™ Series (Continued) | | |
| | | | | | | | |
| Average Annual Total Return1 for periods ended 12/31/11 | | | | | | |
| | |
| | | Since
Inception | | | Inception
Date | |
| Premium AlphaSector™ Series | | | –4.47 | % | | | 2/14/11 | |
| S&P 500® Index | | | –3.83 | | | | —3 | |
| Series expense ratios2: Gross: 4.78%; Net: 1.70%. | |
Returns represent past performance, which is no guarantee of future results. The investment return and principal value will fluctuate so that an investor’s shares, when redeemed, may be worth more or less than their original cost. Total return does not reflect expenses associated with the separate account such as the administrative fees, account charges and surrender charges, which if reflected, would reduce total return. Performance figures may reflect fee waivers and/or expense reimbursements. In the absence of fee waivers and/or expense reimbursements, the total return would have been lower. Please visit Virtus.com for performance data current to the most recent month-end.
| 1 | Total returns are historical and include changes in share price and the reinvestment of both dividends and capital gains distributions. |
| 2 | The expense ratio of the Series is set forth according to the prospectus for the Series effective May 1, 2011, as supplemented and revised, and may differ from the expense ratios disclosed in the Financial Highlights tables in this report. Net Expenses: Expenses reduced by a contractual waiver in effect through April 30, 2012. Gross Expenses: Does not reflect the effect of the contractual waiver. See the financial highlights for more current information. |
| 3 | The since inception index returns are from the Series’ inception date. |
Growth of $10,000 For periods ended 12/31
This chart assumes an initial investment of $10,000 made on February 14, 2011 (inception date of the Series). Returns shown include the reinvestment of all distributions at net asset value and the change in share price for the stated period.
The index is unmanaged and not available for direct investment; therefore, its performance does not reflect the expenses associated with active management of an actual portfolio.
For information regarding the indexes and key investment terms, see the Key Investment Terms starting on page 2.
13
| | |
| Real Estate Securities Series | | |
Portfolio Manager Commentary
| ¢ | | Virtus Real Estate Securities Series (the “Series”) is non-diversified and has an investment objective of capital appreciation and income with approximately equal emphasis. There is no guarantee that the Series will meet its objective. |
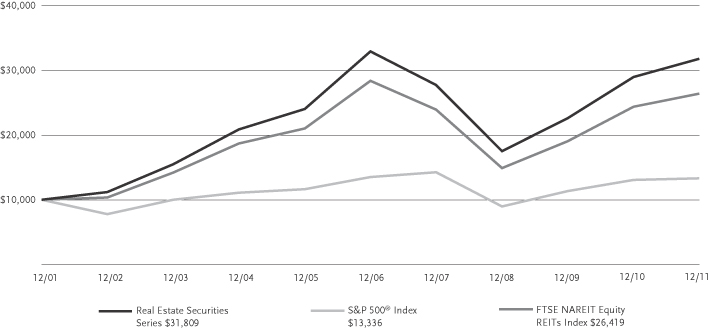
| ¢ | | For the fiscal year ended December 31, 2011, the Series returned 9.87%. For the same period, the S&P 500® Index, a broad-based equity index, returned 2.11% and the FTSE NAREIT Equity REITs Index, the Series’ style-specific benchmark, returned 8.29%. |
All performance figures assume the reinvestment of distributions and exclude the effect of fees and expenses associated with the variable life insurance or annuity product through which you invest. Past performance is no guarantee of future results and current performance may be higher or lower than the performance shown above.
How did the market in which the Series invests perform during the Series’ fiscal year?
| ¢ | | Total returns in 2011 were driven by a more meaningful increase in cash flow growth as a result of better than expected internal and external growth across a number of the large property sectors (i.e. regional malls, apartments and health care) and a couple of the niche property sectors (i.e. self storage and manufactured homes). |
| ¢ | | The market was influenced in both directions by macro forces and events throughout the year while supported by an accelerating U.S. economy, limited new supply, and low interest rates, ultimately ending on another positive note. |
| ¢ | | De-leveraging and debt refinancing via competitive advantages of access to and cost of capital over private real estate players were visible through 2011. |
| ¢ | | More than $30.9 billion in secondary equity, $2.3 billion in IPOs and $12.5 billion in unsecured debt was raised in 2011 by U.S. REITs (NAREIT). |
What factors affected the Series’ performance during its fiscal year?
| ¢ | | The Series performed well in 2011 as did its Benchmark vs. the S&P 500® Index. |
| ¢ | | Attribution results highlight positive contributions from both property sector allocation and stock selection in the year. |
| ¢ | | Results were broad based with the majority of the sectors contributing to positive results. The largest contributions came from the Office, Self Storage and Regional Mall sectors. |
The preceding information is the opinion of portfolio management only through the end of the period of the report as stated on the cover. Any such opinions are subject to change at any time based upon market or other conditions and should not be relied upon as investment advice. Past performance is no guarantee of future results, and there is no guarantee that market forecasts will be realized.
Investing in REITs involves certain risks such as refinancing, changes in the value of properties REITs own, dependency on management skills, economic impact on the industry and risks similar to those linked to small-company investing.
Investing in sector funds or non-diversified funds may be more volatile than investing in broadly diversified funds, and may be more susceptible to adverse economic, political or regulatory developments affecting a single issuer than would be the case if the Series were more broadly diversified.
| | | | |
| |
| Asset Allocation | |
| |
The following table presents asset allocations within certain sectors and as a percentage of total investments as of December 31, 2011. | |
Apartments | | | 21 | % |
Regional Malls | | | 18 | |
Office | | | 12 | |
Health Care | | | 12 | |
Self Storage | | | 10 | |
Shopping Centers | | | 7 | |
Lodging/Resorts | | | 6 | |
Other (includes short-term investments) | | | 14 | |
| | | | | |
Total | | | 100 | % |
| | | | | |
For information regarding the indexes and key investment terms, see the Key Investment Terms starting on page 2.
14
| | |
| Real Estate Securities Series (Continued) | | |
| | | | | | | | | | | | |
| Average Annual Total Return1 for periods ended 12/31/11 | | | | | | | | | |
| | | |
| | | 1 year | | | 5 years | | | 10 years | |
| Real Estate Securities Series | | | 9.87 | % | | | –0.69 | % | | | 12.27 | % |
| S&P 500® Index | | | 2.11 | | | | –0.25 | | | | 2.92 | |
| FTSE NAREIT Equity REITs Index | | | 8.29 | | | | –1.42 | | | | 10.20 | |
| Series expense ratios2: Gross: 1.25%; Net: 1.10%. | |
Returns represent past performance, which is no guarantee of future results. The investment return and principal value will fluctuate so that an investor’s shares, when redeemed, may be worth more or less than their original cost. Total return does not reflect expenses associated with the separate account such as the administrative fees, account charges and surrender charges, which if reflected, would reduce total return. Performance figures may reflect fee waivers and/or expense reimbursements. In the absence of fee waivers and/or expense reimbursements, the total return would have been lower. Please visit Virtus.com for performance data current to the most recent month-end.
| 1 | Total returns are historical and include changes in share price and the reinvestment of both dividends and capital gains distributions. |
| 2 | The expense ratio of the Series is set forth according to the prospectus for the Series effective May 1, 2011, as supplemented and revised, and may differ from the expense ratios disclosed in the Financial Highlights tables in this report. Net Expenses: Expenses reduced by a contractual waiver in effect through November 5, 2012. Gross Expenses: Does not reflect the effect of the contractual waiver. See the financial highlights for more current information. |
Growth of $10,000 For periods ended 12/31
This chart assumes an initial investment of $10,000 made on December 31, 2001. Returns shown include the reinvestment of all distributions at net asset value, and the change in share price for the stated period.
The indexes are unmanaged and not available for direct investment; therefore, their performance does not reflect the expenses associated with active management of an actual portfolio.
For information regarding the indexes and key investment terms, see the Key Investment Terms starting on page 2.
15
Portfolio Manager Commentary
| ¢ | | Virtus Small-Cap Growth Series (the “Series”) is diversified and has an investment objective of long-term capital growth. There is no guarantee that the Series will meet its objective. |
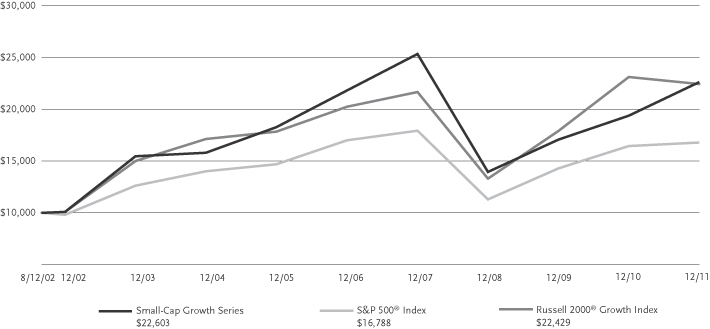
| ¢ | | For the fiscal year ended December 31, 2011, the Series returned 16.59%. For the same period, the S&P 500® Index, a broad-based equity index, returned 2.11% and the Russell 2000® Growth Index, the Series’ style-specific benchmark, returned –2.91%. |
All performance figures assume the reinvestment of distributions and exclude the effect of fees and expenses associated with the variable life insurance or annuity product through which you invest. Past performance is no guarantee of future results and current performance may be higher or lower than the performance shown above.
How did the market in which the Series invests perform during the Series’ fiscal year?
| ¢ | | U.S. markets ended the year mixed after a tumultuous global geo-political and macro-economic environment. Strong first and fourth quarters were offset by weak second and third quarters, which were influenced by Euro-zone collapse fears, the U.S. credit rating downgrade, and inklings of a double-dip recession within our borders. The fourth quarter alone was equally volatile, as initial hopes of a resolution in Europe led to a solid October after four straight down quarters, only to be met by a flat November and December as talks among European countries seemed to be going nowhere. |
| ¢ | | The top performing sectors for the reporting period were consumer staples, financial services, and health care while the materials and processing, technology, and consumer-discretionary sectors did not perform as strongly. |
| ¢ | | High-quality stocks, as measured by S&P Quality Rankings, outperformed low-quality stocks for the year. Additionally, less risky stocks, as measured by beta, had superior returns relative to more risky stocks. |
What factors affected the Series’ performance during its fiscal year?
| ¢ | | Given the high-quality tailwind, the Series outperformed the Russell 2000® Growth Index for the reporting period. |
| ¢ | | Performance of the Series was helped by strong stock selection and an underweight in the consumer-discretionary and consumer-staples sectors, as well as strong stock selection in the producer-durables sector. An underweight in utilities was the lowest contributor to performance during the period. |
The preceding information is the opinion of portfolio management only through the end of the period of the report as stated on the cover. Any such opinions are subject to change at any time based upon market or other conditions and should not be relied upon as investment advice.
Investing in the securities of small companies involves risks, such as relatively low trading volumes, more price volatility and less liquidity than securities from larger, more established companies.
Because the Series is heavily weighted in the information technology sector, it will be impacted by that Sector’s performance more than a series with a broader sector diversification.
| | | | |
| |
| Asset Allocation | |
| |
The following table presents asset allocations within certain sectors and as a percentage of total investments as of December 31, 2011. | |
Information Technology | | | 35 | % |
Health Care | | | 20 | |
Consumer Discretionary | | | 15 | |
Industrials | | | 15 | |
Financials | | | 10 | |
Consumer Staples | | | 3 | |
Other (includes short-term investments) | | | 2 | |
| | | | | |
Total | | | 100 | % |
| | | | | |
For information regarding the indexes and key investment terms, see the Key Investment Terms starting on page 2.
16
| | |
| Small-Cap Growth Series (Continued) | | |
| | | | | | | | | | | | | | | | |
| Average Annual Total Return1 for periods ended 12/31/11 | | | | | | | | | | |
| | | | |
| | | 1 year | | | 5 years | | | Inception
to 12/31/11 | | | Inception
Date | |
| Small-Cap Growth Series | | | 16.59 | % | | | 0.71 | % | | | 9.07 | % | | | 8/12/02 | |
| S&P 500® Index | | | 2.11 | | | | –0.25 | | | | 5.67 | | | | —3 | |
| Russell 2000® Growth Index | | | –2.91 | | | | 2.09 | | | | 8.98 | | | | —3 | |
| Series expense ratios2: Gross: 1.44%; Net: 1.05%. | | | | | | | | | | | | | | | | |
Returns represent past performance, which is no guarantee of future results. The investment return and principal value will fluctuate so that an investor’s shares, when redeemed, may be worth more or less than their original cost. Total return does not reflect expenses associated with the separate account such as the administrative fees, account charges and surrender charges, which if reflected, would reduce total return. Performance figures may reflect fee waivers and/or expense reimbursements. In the absence of fee waivers and/or expense reimbursements, the total return would have been lower. Please visit Virtus.com for performance data current to the most recent month-end.
| 1 | Total returns are historical and include changes in share price and the reinvestment of both dividends and capital gains distributions. |
| 2 | The expense ratios of the Series, both net and gross are set forth according to the prospectus for the Series effective May 1, 2011, as supplemented and revised, may differ from the expense ratios disclosed in the Financial Highlights tables in this report. Net Expenses: Expenses reduced by a contractual waiver in effect through November 5, 2012. Gross Expenses: Does not reflect the effect of the contractual waiver. See the financial highlights for more current information. |
| 3 | The since inception index returns are from the Series inception date. |
Growth of $10,000 For periods ended 12/31
This chart assumes an initial investment of $10,000 made on August 12, 2002 (inception of the Series). Returns shown include the reinvestment of all distributions at net asset value, and the change in share price for the stated period.
The indexes are unmanaged and not available for direct investment; therefore, their performance does not reflect the expenses associated with active management of an actual portfolio.
For information regarding the indexes and key investment terms, see the Key Investment Terms starting on page 2.
17
Portfolio Manager Commentary
| ¢ | | Virtus Small-Cap Value Series (the “Series”) is diversified and has an investment objective of long-term capital appreciation. There is no guarantee that the Series will meet its objective. |
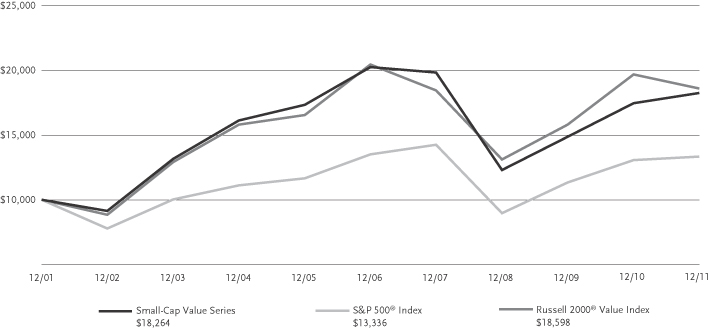
| ¢ | | For the fiscal year ended December 31, 2011, the Series returned 4.54%. For the same period, the S&P 500® Index, a broad-based equity index, returned 2.11% and the Russell 2000® Value Index, the Series’ style-specific benchmark, returned -5.50%. |
All performance figures assume the reinvestment of distributions and exclude the effect of fees and expenses associated with the variable life insurance or annuity product through which you invest. Past performance is no guarantee of future results and current performance may be higher or lower than the performance shown above.
How did the market in which the Series invests perform during the Series’ fiscal year?
| ¢ | | U.S. markets ended the year mixed after a tumultuous global geo-political and macro-economic environment. Strong first and fourth quarters were offset by weak second and third quarters, which were influenced by Euro-zone collapse fears, the U.S. credit rating downgrade, and inklings of a double-dip recession within our borders. The fourth quarter alone was equally volatile, as initial hopes of a resolution in Europe led to a solid October after four straight down quarters, only to be met by a flat November and December as talks among European countries seemed to be going nowhere. |
| ¢ | | The top performing sectors for the reporting period were the more defensive sectors of utilities, health care, and consumer staples while the technology, producer-durables, and consumer-discretionary sectors did not perform as strongly. |
| ¢ | | High-quality stocks, as measured by S&P Quality Rankings, outperformed low-quality stocks for the year. Additionally, less risky stocks, as measured by beta, had superior returns relative to more risky stocks. |
What factors affected the Series’ performance during its fiscal year?
| ¢ | | Given the high-quality tailwind, the Series outperformed the Russell 2000® Value Index for the reporting period. |
| ¢ | | Performance of the Series was helped by strong stock selection in the consumer-discretionary, producer-durables, and energy sectors. An underweight in utilities was the largest detractor from performance, given that the Series had a zero percent weight and this was the strongest performing sector for the period. Also, negative stock selection in health care detracted from performance. |
The preceding information is the opinion of portfolio management only through the end of the period of the report as stated on the cover. Any such opinions are subject to change at any time based upon market or other conditions and should not be relied upon as investment advice.
Investing in the securities of small companies involves risks, such as relatively low trading volumes, more price volatility and less liquidity than securities from larger, more established companies.
| | | | |
| |
| Asset Allocation | |
| |
The following table presents asset allocations within certain sectors and as a percentage of total investments as of December 31, 2011. | |
Industrials | | | 23 | % |
Financials | | | 19 | |
Information Technology | | | 19 | |
Consumer Discretionary | | | 14 | |
Energy | | | 9 | |
Health Care | | | 7 | |
Consumer Staples | | | 6 | |
Other (includes short-term investments) | | | 3 | |
| | | | | |
Total | | | 100 | % |
| | | | | |
For information regarding the indexes and key investment terms, see the Key Investment Terms starting on page 2.
18
| | |
| Small-Cap Value Series (Continued) | | |
| | | | | | | | | | | | |
| Average Annual Total Return1 for periods ended 12/31/11 | | | | | | | | | |
| | | |
| | | 1 year | | | 5 years | | | 10 years | |
| Small-Cap Value Series | | | 4.54 | % | | | –2.04 | % | | | 6.21 | % |
| S&P 500® Index | | | 2.11 | | | | –0.25 | | | | 2.92 | |
| Russell 2000® Value Index | | | –5.50 | | | | –1.87 | | | | 6.40 | |
| Series expense ratios2: Gross: 1.41%; Net: 1.30%. | | | | | | | | | | | | |
Returns represent past performance, which is no guarantee of future results. The investment return and principal value will fluctuate so that an investor’s shares, when redeemed, may be worth more or less than their original cost. Total return does not reflect expenses associated with the separate account such as the administrative fees, account charges and surrender charges, which if reflected, would reduce total return. Performance figures may reflect fee waivers and/or expense reimbursements. In the absence of fee waivers and/or expense reimbursements, the total return would have been lower. Please visit Virtus.com for performance data current to the most recent month-end.
| 1 | Total returns are historical and include changes in share price and the reinvestment of both dividends and capital gains distributions. |
| 2 | The expense ratios of the Series, both net and gross are set forth according to the prospectus for the Series effective May 1, 2011, as supplemented and revised, and may differ from the expense ratios disclosed in the Financial Highlights tables in this report. Net Expenses: Expenses reduced by a contractual waiver in effect through November 5, 2012. Gross Expenses: Does not reflect the effect of the contractual waiver. See the financial highlights for more current information. |
Growth of $10,000 For periods ended 12/31
This chart assumes an initial investment of $10,000 made on December 31, 2001. Returns shown include the reinvestment of all distributions at net asset value, and the change in share price for the stated period.
The indexes are unmanaged and not available for direct investment; therefore, their performance does not reflect the expenses associated with active management of an actual portfolio.
For information regarding the indexes and key investment terms, see the Key Investment Terms starting on page 2.
19
| | |
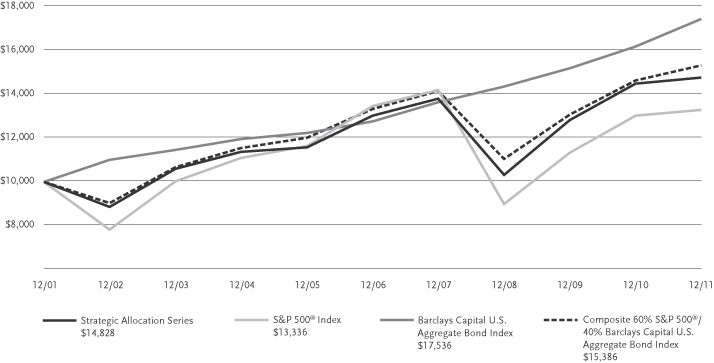
| Strategic Allocation Series | | |
Portfolio Manager Commentary
| ¢ | | Virtus Strategic Allocation Series (the “Series”) is diversified and has an investment objective of high total return over an extended period of time consistent with prudent investment risk. There is no guarantee that the Series will meet its objective. |
| ¢ | | For the fiscal year ended December 31, 2011, the Series returned 1.91%. For the same period, the S&P 500® Index, a broad-based equity index, returned 2.11% and the Barclays Capital U.S. Aggregate Bond Index, a broad-based fixed income index, returned 7.84%. The Composite Index for the Series, the Series’ style-specific benchmark, returned 4.69%. |
All performance figures assume the reinvestment of distributions and exclude the effect of fees and expenses associated with the variable life insurance or annuity product through which you invest. Past performance is no guarantee of future results and current performance may be higher or lower than the performance shown above.
How did the markets perform during the Series’ fiscal year?
Equities:
| ¢ | | The S&P 500® Index ended the year with a slight gain of 2.11%, although that hides the extreme volatility experienced by the market. The year 2011 can be divided almost in half, with the first two quarters being highlighted by higher stock prices, investors willing to buy cyclically sensitive stocks, and a general rise in asset prices. Beginning in mid-July things got much more difficult, as the market started a massive correction over concerns about the European debt crisis. While in the first six months stocks that had economically sensitive earnings did well, the second half of the year was marked by the much better performance of late-cycle equities such as utilities, consumer staple names, and other high dividend paying stocks. Volatility was also extreme, with so-called “headline risk” associated with both global economic growth data and news regarding Greece, and the European debt crisis, dominating price action, even in our own markets. In the end, the market managed a marginal gain, but it was a difficult market for most investors. |
Fixed Income:
| ¢ | | During the last 12 months the economy showed signs of improvement and the likelihood of the U.S. entering another recession diminished. This has been positive for spread sectors. However, during the year there have been periods of volatility and subsequent spread widening stemming from growing concerns over the sovereign debt crisis in Europe, the U.S. debt ceiling debate and subsequent loss of its AAA long-term rating by Standard & Poor’s, and global growth concerns. Overall U.S. Treasuries outperformed most spread sectors during the Series’ fiscal year. |
| ¢ | | Over the last 12 months yields declined across the U.S. Treasury curve and the curve flattened. |
What factors affected the Series’ performance during its fiscal year?
Equities:
| ¢ | | For most of the year the Series had a greater weighting in more economically sensitive stocks such as energy stocks, material and mining names and industrial stocks, which generally did very well in the first half of the year. While the Series managers did reduce holdings of many of these names early in the summer, it was not enough to offset the negative effects of the sell-off. Furthermore, the under-weighting in utilities and staple stocks created a head-wind for the Series as much of the back half of the year was dominated by a move to yield-oriented stocks. While on balance the Series did keep up with peers, the stretch between late July and early October was difficult and the Series slightly under-performed the S&P 500® Index on the year. |
Fixed Income:
| ¢ | | The underperformance of most spread sectors relative to U.S. Treasuries was a key factor that detracted from Series’ performance for the year. |
| ¢ | | Among fixed income sectors, the Series’ overweight to emerging markets, non-U.S. Dollar securities, corporate high yield, and corporate high quality securities detracted from the Series’ performance. |
| ¢ | | Strong issue selection within the commercial mortgage backed security sector benefited performance. |
The preceding information is the opinion of portfolio management only through the end of the period of the report as stated on the cover. Any such opinions are subject to change at any time based upon market or other conditions and should not be relied upon as investment advice, and there is no guarantee that market forecasts will be realized.
Portfolios that invest in high yield securities are subject to greater credit risk and price fluctuation than portfolios that invest in higher quality securities.
Investing internationally involves risks not associated with investing solely in the U.S., such as currency fluctuation, political risk, differences in accounting and the limited availability of information.
The value of mortgage-backed and other asset-backed securities, including pass-through type securities and collateralized mortgage obligations (CMOs) may fluctuate to a greater degree than other debt securities in response to interest rate changes.
| | | | | | | | |
| |
| Asset Allocation | |
| |
The following table presents asset allocations within certain sectors and as a percentage of total investments as of December 31, 2011. | |
Equities | | | | | | | | |
Common Stocks | | | | | | | 58 | % |
Energy | | | 11 | % | | | | |
Information Technology | | | 9 | % | | | | |
Industrials | | | 8 | % | | | | |
Total of all other common stock sectors | | | 30 | % | | | | |
Corporate Bonds | | | | | | | 20 | % |
Financials | | | 10 | % | | | | |
Industrials | | | 3 | % | | | | |
Energy | | | 2 | % | | | | |
Total of all other corporate bond sectors | | | 5 | % | | | | |
Mortgage-Backed Securities | | | | | | | 11 | % |
Municipal Bonds | | | | | | | 3 | % |
Exchange-Traded Funds | | | | | | | 3 | % |
Asset-Backed Securities | | | | | | | 2 | % |
Foreign Government Securities | | | | | | | 1 | % |
Loan Agreements | | | | | | | 1 | % |
Other | | | | | | | 1 | % |
| | | | | | | | | |
Total | | | | | | | 100 | % |
| | | | | | | | | |
For information regarding the indexes and key investment terms, see the Key Investment Terms starting on page 2.
20
| | |
| Strategic Allocation Series (Continued) | | |
| | | | | | | | | | | | |
| Average Annual Total Return1 for periods ended 12/31/11 | | | | | | | | | |
| | | |
| | | 1 year | | | 5 years | | | 10 years | |
| Strategic Allocation Series | | | 1.91 | % | | | 2.56 | % | | | 4.02 | % |
| S&P 500® Index | | | 2.11 | | | | –0.25 | | | | 2.92 | |
| Barclays Capital U.S. Aggregate Bond Index | | | 7.84 | | | | 6.50 | | | | 5.70 | |
| Composite Index for Strategic Allocation Series | | | 4.69 | | | | 2.84 | | | | 4.40 | |
| Series expense ratios2: Gross: 1.09%; Net: 0.85%. | | | | | | | | | | | | |
Returns represent past performance, which is no guarantee of future results. The investment return and principal value will fluctuate so that an investor’s shares, when redeemed, may be worth more or less than the original cost. Total return does not reflect expenses associated with the separate account such as the administrative fees, account charges and surrender charges, which if reflected, would reduce total return. Performance figures may reflect fee waivers and/or expense reimbursements. In the absence of fee waivers and/or expense reimbursements, the total return would have been lower. Please visit Virtus.com for performance data current to the most recent month-end.
| 1 | Total returns are historical and include changes in share price and the reinvestment of both dividends and capital gains distributions. |
| 2 | The expense ratios of the Series are set forth according to the prospectus for the Series effective May 1, 2011, as supplemented and revised, and may differ from the expense ratios disclosed in the Financial Highlights tables in this report. Net Expenses: Expenses reduced by a contractual waiver in effect through November 5, 2012. Gross Expenses: Does not reflect the effect of the contractual waiver. See the financial highlights for more current information. |
Growth of $10,000 For periods ended 12/31
This chart assumes an initial investment of $10,000 made on December 31, 2001. Returns shown include the reinvestment of all distributions at net asset value, and the change in share price for the stated period.
The indexes are unmanaged and not available for direct investment; therefore, their performance does not reflect the expenses associated with active management of an actual portfolio.
For information regarding the indexes and key investment terms, see the Key Investment Terms starting on page 2.
21
VIRTUS CAPITAL GROWTH SERIES
SCHEDULE OF INVESTMENTS
DECEMBER 31, 2011
($ reported in thousands)
| | | | | | | | |
| | | SHARES | | | VALUE | |
| COMMON STOCKS—98.9% | |
|
| Consumer Discretionary—15.8% | |
Bed Bath & Beyond, Inc.(2) | | | 61,300 | | | $ | 3,554 | |
Coach, Inc. | | | 88,100 | | | | 5,378 | |
McDonald’s Corp. | | | 58,400 | | | | 5,859 | |
NIKE, Inc. Class B | | | 57,700 | | | | 5,561 | |
priceline.com, Inc.(2) | | | 7,700 | | | | 3,601 | |
Ross Stores, Inc. | | | 125,000 | | | | 5,941 | |
| | | | | | | | |
| | | | | | | 29,894 | |
| | | | | | | | |
|
| Consumer Staples—13.6% | |
Coca-Cola Co. (The) | | | 84,000 | | | | 5,877 | |
Colgate-Palmolive Co. | | | 62,000 | | | | 5,728 | |
Costco Wholesale Corp. | | | 66,600 | | | | 5,549 | |
Kellogg Co. | | | 75,000 | | | | 3,793 | |
Lorillard, Inc. | | | 41,700 | | | | 4,754 | |
| | | | | | | | |
| | | | | | | 25,701 | |
| | | | | | | | |
|
| Energy—11.1% | |
Core Laboratories N.V. | | | 33,400 | | | | 3,806 | |
Exxon Mobil Corp. | | | 72,200 | | | | 6,120 | |
National Oilwell Varco, Inc. | | | 83,200 | | | | 5,657 | |
Schlumberger Ltd. | | | 79,100 | | | | 5,403 | |
| | | | | | | | |
| | | | | | | 20,986 | |
| | | | | | | | |
|
| Financials—3.0% | |
T. Rowe Price Group, Inc. | | | 103,600 | | | | 5,900 | |
| | | | | | | | |
|
| Health Care—8.0% | |
Intuitive Surgical, Inc.(2) | | | 12,900 | | | | 5,973 | |
Laboratory Corp. of America Holdings(2) | | | 55,000 | | | | 4,728 | |
Waters Corp.(2) | | | 60,700 | | | | 4,495 | |
| | | | | | | | |
| | | | | | | 15,196 | |
| | | | | | | | |
|
| Industrials—15.9% | |
Danaher Corp. | | | 78,900 | | | | 3,711 | |
Emerson Electric Co. | | | 111,400 | | | | 5,190 | |
Expeditors International of Washington, Inc. | | | 66,600 | | | | 2,728 | |
Fastenal Co. | | | 91,600 | | | | 3,995 | |
MSC Industrial Direct Co., Inc. Class A | | | 57,000 | | | | 4,078 | |
Precision Castparts Corp. | | | 23,000 | | | | 3,790 | |
Robinson (C.H.) Worldwide, Inc. | | | 41,500 | | | | 2,896 | |
Roper Industries, Inc. | | | 44,200 | | | | 3,840 | |
| | | | | | | | |
| | | | | | | 30,228 | |
| | | | | | | | |
|
| Information Technology—25.4% | |
Accenture plc Class A | | | 99,000 | | | | 5,270 | |
Amphenol Corp. Class A | | | 127,600 | | | | 5,792 | |
ANSYS, Inc.(2) | | | 93,800 | | | | 5,373 | |
Apple, Inc.(2) | | | 24,300 | | | | 9,841 | |
Oracle Corp. | | | 183,200 | | | | 4,699 | |
QUALCOMM, Inc. | | | 101,500 | | | | 5,552 | |
Visa, Inc. Class A | | | 58,600 | | | | 5,949 | |
Xilinx, Inc. | | | 178,000 | | | | 5,707 | |
| | | | | | | | |
| | | | | | | 48,183 | |
| | | | | | | | |
| | | | | | | | |
| | | SHARES | | | VALUE | |
| Materials—6.1% | |
Praxair, Inc. | | | 56,300 | | | $ | 6,018 | |
Sigma-Aldrich Corp. | | | 89,800 | | | | 5,609 | |
| | | | | | | | |
| | | | | | | | 11,627 | |
| TOTAL COMMON STOCKS | | | | | |
| (Identified Cost $173,071) | | | | 187,715 | |
| TOTAL LONG TERM INVESTMENTS—98.9% | |
| (Identified Cost $173,071) | | | | 187,715 | |
|
| SHORT-TERM INVESTMENTS—1.2% | |
|
| Money Market Mutual Funds—1.2% | |
Dreyfus Cash Management Fund – Institutional Shares (seven-day effective yield 0.050%) | | | 2,181,738 | | | | 2,182 | |
| TOTAL SHORT-TERM INVESTMENTS | | | | | |
| (Identified Cost $2,182) | | | | 2,182 | |
| TOTAL INVESTMENTS—100.1% | |
| (Identified Cost $175,253) | | | | 189,897 | (1) |
Other assets and liabilities, net—(0.1)% | | | | (208 | ) |
| | | | | | | | |
| NET ASSETS—100.0% | | | $ | 189,689 | |
| | | | | | | | |
Abbreviations:
Footnote Legend:
| (1) | Federal Income Tax Information: For tax information at December 31, 2011, see Note 11 Federal Income Tax Information in the Notes to Financial Statements. |
| (2) | Non-income producing. |
The following table provides a summary of inputs used to value the Fund’s investments as of December 31, 2011 (See Security Valuation Note 2A in the Notes to Financial Statements):
| | | | | | | | |
| | | Total
Value at
December 31, 2011 | | | Level 1 –
Quoted
Prices | |
Equity Securities: | | | | | | | | |
Common Stocks | | $ | 187,715 | | | $ | 187,715 | |
Short-term Investments | | | 2,182 | | | | 2,182 | |
| | | | | | | | |
Total Investments | | $ | 189,897 | | | $ | 189,897 | |
| | | | | | | | |
There are no Level 2 (significant observable inputs) or Level 3 (significant unobservable inputs) priced securities.
See Notes to Financial Statements
22
VIRTUS GROWTH & INCOME SERIES
SCHEDULE OF INVESTMENTS
DECEMBER 31, 2011
($ reported in thousands)
| | | | | | | | |
| | | SHARES | | | VALUE | |
| COMMON STOCKS—95.0% | |
|
| Consumer Discretionary—12.8% | |
Amazon.com, Inc.(2) | | | 22,700 | | | $ | 3,930 | |
AutoZone, Inc.(2) | | | 9,100 | | | | 2,957 | |
Comcast Corp. Class A | | | 127,000 | | | | 3,011 | |
Darden Restaurants, Inc. | | | 66,000 | | | | 3,008 | |
Lululemon Athletica, Inc.(2) | | | 60,000 | | | | 2,800 | |
McDonald’s Corp. | | | 33,000 | | | | 3,311 | |
| | | | | | | | |
| | | | | | | 19,017 | |
| | | | | | | | |
|
| Consumer Staples—4.2% | |
Altria Group, Inc. | | | 109,000 | | | | 3,232 | |
PepsiCo, Inc. | | | 46,000 | | | | 3,052 | |
| | | | | | | | |
| | | | | | | 6,284 | |
| | | | | | | | |
|
| Energy—17.3% | |
Chesapeake Energy Corp. | | | 115,000 | | | | 2,563 | |
Chevron Corp. | | | 33,000 | | | | 3,511 | |
ConocoPhillips | | | 47,000 | | | | 3,425 | |
Continental Resources, Inc.(2) | | | 22,000 | | | | 1,468 | |
Halliburton Co. | | | 73,000 | | | | 2,519 | |
Occidental Petroleum Corp. | | | 32,000 | | | | 2,998 | |
Petroleo Brasileiro S.A. ADR | | | 70,000 | | | | 1,740 | |
Schlumberger Ltd. | | | 40,000 | | | | 2,732 | |
Whiting Petroleum Corp.(2) | | | 33,000 | | | | 1,541 | |
Williams Cos., Inc. (The) | | | 97,000 | | | | 3,203 | |
| | | | | | | | |
| | | | | | | 25,700 | |
| | | | | | | | |
|
| Financials—6.7% | |
Bank of America Corp. | | | 375,000 | | | | 2,085 | |
Citigroup, Inc. | | | 88,000 | | | | 2,315 | |
Goldman Sachs Group, Inc. (The) | | | 27,000 | | | | 2,442 | |
Lincoln National Corp. | | | 157,000 | | | | 3,049 | |
| | | | | | | | |
| | | | | | | 9,891 | |
| | | | | | | | |
|
| Health Care—9.9% | |
Abbott Laboratories | | | 53,000 | | | | 2,980 | |
Biogen Idec, Inc.(2) | | | 28,000 | | | | 3,081 | |
Express Scripts, Inc.(2) | | | 51,000 | | | | 2,279 | |
Gilead Sciences, Inc.(2) | | | 75,000 | | | | 3,070 | |
UnitedHealth Group, Inc. | | | 63,000 | | | | 3,193 | |
| | | | | | | | |
| | | | | | | 14,603 | |
| | | | | | | | |
|
| Industrials—13.7% | |
Alaska Air Group, Inc.(2) | | | 43,000 | | | | 3,229 | |
Caterpillar, Inc. | | | 30,000 | | | | 2,718 | |
Cummins, Inc. | | | 33,000 | | | | 2,905 | |
Deere & Co. | | | 39,000 | | | | 3,017 | |
Foster Wheeler AG(2) | | | 118,000 | | | | 2,258 | |
Union Pacific Corp. | | | 32,000 | | | | 3,390 | |
United Continental Holdings, Inc.(2) | | | 150,000 | | | | 2,830 | |
| | | | | | | | |
| | | | | | | 20,347 | |
| | | | | | | | |
|
| Information Technology—14.8% | |
Apple, Inc.(2) | | | 14,600 | | | | 5,913 | |
Intel Corp. | | | 123,000 | | | | 2,983 | |
International Business Machines Corp. | | | 16,000 | | | | 2,942 | |
QUALCOMM, Inc. | | | 65,000 | | | | 3,555 | |
| | | | | | | | |
| | | SHARES | | | VALUE | |
| Information Technology—continued | |
SanDisk Corp.(2) | | | 62,000 | | | $ | 3,051 | |
Visa, Inc. Class A | | | 34,000 | | | | 3,452 | |
| | | | | | | | |
| | | | | | | 21,896 | |
| | | | | | | | |
|
| Materials—13.5% | |
CF Industries Holdings, Inc. | | | 18,000 | | | | 2,610 | |
Cliffs Natural Resources, Inc. | | | 46,000 | | | | 2,868 | |
Du Pont (E.I.) de Nemours & Co. | | | 71,000 | | | | 3,250 | |
Freeport-McMoRan Copper & Gold, Inc. | | | 83,000 | | | | 3,054 | |
Monsanto Co. | | | 47,000 | | | | 3,293 | |
Nucor Corp. | | | 68,000 | | | | 2,691 | |
Potash Corp. of Saskatchewan, Inc. | | | 54,000 | | | | 2,229 | |
| | | | | | | | |
| | | | | | | 19,995 | |
| | | | | | | | |
|
| Telecommunication Services—2.1% | |
Verizon Communications, Inc. | | | 79,000 | | | | 3,170 | |
TOTAL COMMON STOCKS
(Identified Cost $116,579) | | | | 140,903 | |
|
| EXCHANGE-TRADED FUNDS—4.4% | |
Consumer Staples Select Sector SPDR Fund | | | 73,000 | | | | 2,372 | |
Health Care Select Sector SPDR Fund | | | 69,000 | | | | 2,393 | |
Utilities Select Sector SPDR Fund | | | 46,000 | | | | 1,656 | |
TOTAL EXCHANGE-TRADED FUNDS
(Identified Cost $6,284) | | | | 6,421 | |
| TOTAL LONG TERM INVESTMENTS—99.4% | |
| (Identified Cost $122,863) | | | | | | | 147,324 | |
| TOTAL INVESTMENTS—99.4% (Identified Cost $122,863) | | | | 147,324 | (1) |
Other assets and liabilities, net—0.6% | | | | 959 | |
| | | | | | | | |
| NET ASSETS—100.0% | | | | | | $ | 148,283 | |
| | | | | | | | |
Abbreviations:
| ADR | American Depositary Receipt |
| AG | Aktiengesellschaft a corporation that is limited by shares, i.e., owned by shareholders (Germany). |
| SPDR | S&P Depositary Receipt |
Footnote Legend:
| (1) | Federal Income Tax Information: For tax information at December 31, 2011, see Note 11 Federal Income Tax Information in the Notes to Financial Statements. |
| (2) | Non-income producing. |
| | | | |
| Country Weightings† (unaudited) | | | |
United States | | | 94 | % |
Canada | | | 3 | |
Switzerland | | | 2 | |
Brazil | | | 1 | |
Total | | | 100 | % |
† % of total investments as of December 31, 2011 | |
The following table provides a summary of inputs used to value the Fund’s investments as of December 31, 2011 (See Security Valuation Note 2A in the Notes to Financial Statements):
| | | | | | | | |
| | | Total
Value at
December 31, 2011 | | | Level 1 –
Quoted
Prices | |
Equity Securities: | |
Common Stocks | | $ | 140,903 | | | $ | 140,903 | |
Exchange-traded Funds | | | 6,421 | | | | 6,421 | |
| | | | | | | | |
Total Investments | | $ | 147,324 | | | $ | 147,324 | |
| | | | | | | | |
There are no Level 2 (significant observable inputs) or Level 3 (significant unobservable inputs) priced securities.
See Notes to Financial Statements
23
VIRTUS INTERNATIONAL SERIES
SCHEDULE OF INVESTMENTS
DECEMBER 31, 2011
($ reported in thousands)
| | | | | | | | |
| | | SHARES | | | VALUE | |
| PREFERRED STOCK—3.8% | |
|
| Information Technology—3.6% | |
Samsung Electronics Co., Ltd. 1.470% | | | 22,300 | | | $ | 12,911 | |
| TOTAL PREFERRED STOCK | |
| (Identified Cost $3,924) | | | | 12,911 | |
|
| COMMON STOCKS—95.1% | |
|
| Consumer Staples—12.4% | |
British American Tobacco plc (United Kingdom) | | | 337,200 | | | | 16,001 | |
Casino Guichard Perrachon S.A. (France) | | | 78,700 | | | | 6,629 | |
Fomento Economico Mexicano S.A.B. de C.V. Sponsored ADR (Mexico) | | | 101,200 | | | | 7,055 | |
Nestle S.A. Registered Shares (Switzerland) | | | 206,600 | | | | 11,877 | |
| | | | | | | | |
| | | | | | | 41,562 | |
| | | | | | | | |
|
| Energy—12.6% | |
ENI S.p.A. (Italy) | | | 473,000 | | | | 9,801 | |
PetroChina Co., Ltd. Class H (China) | | | 5,280,000 | | | | 6,574 | |
Petroleo Brasileiro SA Sponsored ADR (Brazil) | | | 339,500 | | | | 7,975 | |
Royal Dutch Shell plc B Shares (United Kingdom) | | | 219,100 | | | | 8,350 | |
Tenaris S.A. Sponsored ADR (Italy) | | | 259,657 | | | | 9,654 | |
| | | | | | | | |
| | | | | | | 42,354 | |
| | | | | | | | |
|
| Financials—25.4% | |
Banco Bradesco S.A. Sponsored ADR (Brazil) | | | 628,400 | | | | 10,482 | |
City Developments Ltd. (Singapore) | | | 791,000 | | | | 5,428 | |
Daito Trust Construction Co., Ltd. (Japan) | | | 60,200 | | | | 5,162 | |
HSBC Holdings plc (United Kingdom) | | | 782,800 | | | | 5,970 | |
Mapfre SA (Spain) | | | 1,045,000 | | | | 3,320 | |
Nordea Bank AB (Sweden) | | | 797,900 | | | | 6,174 | |
Oversea-Chinese Banking Corp., Ltd. (Singapore) | | | 1,034,330 | | | | 6,244 | |
QBE Insurance Group Ltd. (Australia) | | | 981,400 | | | | 12,999 | |
Standard Chartered plc (United Kingdom) | | | 474,800 | | | | 10,389 | |
Swire Pacific Ltd. Class B (Hong Kong) | | | 2,220,000 | | | | 5,219 | |
Zurich Financial Services AG (Switzerland) | | | 60,700 | | | | 13,732 | |
| | | | | | | | |
| | | | | | | 85,119 | |
| | | | | | | | |
|
| Health Care—9.8% | |
Novartis AG Registered Shares (Switzerland) | | | 231,000 | | | | 13,206 | |
Roche Holding AG (Switzerland) | | | 86,000 | | | | 14,576 | |
| | | | | | | | |
| | | SHARES | | | VALUE | |
| Health Care—continued | |
Takeda Pharmaceutical Co., Ltd. (Japan) | | | 117,500 | | | $ | 5,160 | |
| | | | | | | | |
| | | | | | | 32,942 | |
| | | | | | | | |
|
| Industrials—7.8% | |
Atlas Copco AB Class A (Sweden) | | | 172,900 | | | | 3,718 | |
Canadian National Railway Co. (Canada) | | | 86,800 | | | | 6,829 | |
FANUC Ltd. (Japan) | | | 30,600 | | | | 4,683 | |
Schindler Holding AG (Switzerland) | | | 30,700 | | | | 3,576 | |
Schneider Electric SA (France) | | | 70,200 | | | | 3,696 | |
Weir Group plc (The) (United Kingdom) | | | 116,200 | | | | 3,667 | |
| | | | | | | | |
| | | | | | | 26,169 | |
| | | | | | | | |
|
| Information Technology—8.6% | |
Canon, Inc. (Japan) | | | 183,650 | | | | 8,136 | |
Taiwan Semiconductor Manufacturing Co., Ltd., Sponsored ADR (Taiwan) | | | 1,110,100 | | | | 14,332 | |
Telefonaktiebolaget LM Ericsson Class B (Sweden) | | | 623,200 | | | | 6,375 | |
| | | | | | | | |
| | | | | | | 28,843 | |
| | | | | | | | |
|
| Materials—4.0% | |
BHP Billiton plc (United Kingdom) | | | 111,300 | | | | 3,245 | |
Rio Tinto plc (United Kingdom) | | | 81,100 | | | | 3,936 | |
Shin-Etsu Chemical Co., Ltd. (Japan) | | | 128,100 | | | | 6,308 | |
| | | | | | | | |
| | | | | | | 13,489 | |
| | | | | | | | |
|
| Telecommunication Services—10.6% | |
China Mobile Ltd. (China) | | | 853,500 | | | | 8,341 | |
Singapore Telecommunications Ltd. (Singapore) | | | 3,109,000 | | | | 7,407 | |
TELUS Corp. (Canada) | | | 71,000 | | | | 4,017 | |
Vodafone Group plc (United Kingdom) | | | 5,743,300 | | | | 15,956 | |
| | | | | | | | |
| | | | | | | 35,721 | |
| | | | | | | | |
|
| Utilities—3.9% | |
Centrica plc (United Kingdom) | | | 1,725,700 | | | | 7,753 | |
GDF Suez (France) | | | 184,500 | | | | 5,043 | |
| | | | | | | | |
| | | | | | | | 12,796 | |
| TOTAL COMMON STOCKS | |
| (Identified Cost $248,601) | | | | 318,995 | |
| TOTAL LONG TERM INVESTMENTS—93.3% | |
| (Identified Cost $252,525) | | | | 331,906 | |
| | | | | | | | |
| | | SHARES | | | VALUE | |
| SHORT-TERM INVESTMENTS—0.3% | |
|
| Money Market Mutual Funds—0.3% | |
Dreyfus Cash Management Fund – Institutional Shares (seven-day effective yield 0.050%) | | | 916,785 | | | $ | 917 | |
| TOTAL SHORT-TERM INVESTMENTS | | | | | |
| (Identified Cost $917) | | | | 917 | |
| TOTAL INVESTMENTS—99.2% | |
| (Identified Cost $253,442) | | | | 332,823 | (1) |
Other assets and liabilities, net—0.8% | | | | 2,706 | |
| | | | | | | | |
| NET ASSETS—100.0% | | | $ | 335,529 | |
| | | | | | | | |
| ADR | American Depositary Receipt |
| AG | Aktiengesellschaft a corporation that is limited by shares, i.e., owned by shareholders (Germany). |
Footnote Legend:
| (1) | Federal Income Tax Information: For tax information at December 31, 2011, see Note 11 Federal Income Tax Information in the Notes to Financial Statements. |
| | | | |
| Country Weightings† (unaudited) | | | |
United Kingdom | | | 23 | % |
Switzerland | | | 17 | |
Japan | | | 9 | |
Italy | | | 6 | |
Singapore | | | 6 | |
Brazil | | | 5 | |
Sweden | | | 5 | |
Other | | | 29 | |
Total | | | 100 | % |
† % of total investments as of December 31, 2011 | |
The following table provides a summary of inputs used to value the Fund’s investments as of December 31, 2011 (See Security Valuation Note 2A in the Notes to Financial Statements):
| | | | | | | | |
| | | Total
Value at
December 31, 2011 | | | Level 1 –
Quoted
Prices | |
Debt Securities: | | | | | | | | |
Equity Securities: | | | | | | | | |
Common Stocks | | $ | 318,995 | | | $ | 318,995 | |
Preferred Stock | | | 12,911 | | | | 12,911 | |
Short-term Investments | | | 917 | | |
| 917
|
|
| | | | | | | | |
Total Investments | | $ | 332,823 | | | $ | 332,823 | |
| | | | | | | | |
There are no Level 2 (significant observable inputs) or Level 3 (significant unobservable inputs) priced securities.
See Notes to Financial Statements
24
VIRTUS MULTI-SECTOR FIXED INCOME SERIES
SCHEDULE OF INVESTMENTS
DECEMBER 31, 2011
($ reported in thousands)
| | | | | | | | |
| | | PAR
VALUE | | | VALUE | |
| MUNICIPAL BONDS—1.9% | |
|
| California—0.9% | |
Alameda Corridor Transportation Authority Taxable Series 99-C,
(NATL Insured)
6.600%, 10/1/29 | | $ | 1,750 | | | $ | 1,772 | |
| | | | | | | | |
|
| Connecticut—0.3% | |
Mashantucket Western Pequot
Tribe Taxable Series A, 144A
(NATL Insured)
6.910%, 9/1/12(4) | | | 100 | | | | 97 | |
State of Connecticut
5.000%, 5/15/22 | | | 400 | | | | 495 | |
| | | | | | | | |
| | | | | | | 592 | |
| | | | | | | | |
|
| Kentucky—0.3% | |
Commonwealth of Kentucky Taxable
3.165%, 4/1/18 | | | 530 | | | | 544 | |
| | | | | | | | |
|
| Massachusetts—0.1% | |
Commonwealth School Building Authority, Sr. Series B
5.000%, 10/15/41 | | | 300 | | | | 325 | |
| | | | | | | | |
|
| Michigan—0.1% | |
Tobacco Settlement Finance Authority Taxable Series 06-A,
7.309%, 6/1/34 | | | 215 | | | | 157 | |
| | | | | | | | |
|
| Virginia—0.2% | |
Tobacco Settlement Financing Corp. Taxable Series 07-A1,
6.706%, 6/1/46 | | | 685 | | | | 430 | |
TOTAL MUNICIPAL BONDS
(Identified Cost $4,007) | | | | 3,820 | |
|
| FOREIGN GOVERNMENT SECURITIES—10.3% | |
Bolivarian Republic of Venezuela | | | | | |
8.500%, 10/8/14 | | | 235 | | | | 220 | |
RegS 5.750%, 2/26/16(5) | | | 675 | | | | 532 | |
RegS 7.000%, 12/1/18(5) | | | 70 | | | | 50 | |
7.650%, 4/21/25 | | | 1,000 | | | | 625 | |
9.250%, 9/15/27 | | | 945 | | | | 687 | |
9.375%, 1/13/34 | | | 850 | | | | 591 | |
Commonwealth of Australia
Series 123,
5.750%, 4/15/12 | | | 1,035 | AUD | | | 1,064 | |
Series 118,
6.500%, 5/15/13 | | | 275 | AUD | | | 293 | |
Commonwealth of Canada
2.000%, 9/1/12 | | | 2,676 | CAD | | | 2,644 | |
Commonwealth of New Zealand Series 413,
6.500%, 4/15/13 | | | 970 | NZD | | | 793 | |
Series 415,
6.000%, 4/15/15 | | | 265 | NZD | | | 227 | |
Federative Republic of Brazil
12.500%, 1/5/16 | | | 295 | BRL | | | 187 | |
10.250%, 1/10/28 | | | 2,235 | BRL | | | 1,366 | |
| | | | | | | | |
| | | PAR
VALUE | | | VALUE | |
| FOREIGN GOVERNMENT SECURITIES—continued | |
Kingdom of Norway Series 470 6.500%, 5/15/13 | | $ | 6,336 | NOK | | $ | 1,132 | |
Kingdom of Sweden
Series 1046,
5.500%, 10/8/12 | | | 6,550 | SEK | | | 984 | |
Republic of Argentina | | | | | | | | |
Provincia de Bueno Aires Series GDP, 144A
10.875%, 1/26/21(4) | | | 500 | | | | 376 | |
Provincia de Neuquen 144A
7.875%, 4/26/21(4) | | | 478 | | | | 480 | |
PIK Interest Capitalization
8.280%, 12/31/33 | | | 3,495 | | | | 2,569 | |
Series GDP
0.044%, 12/15/35(3) | | | 3,670 | | | | 477 | |
Republic of Colombia
12.000%, 10/22/15 | | | 1,180,000 | COP | | | 784 | |
Republic of Indonesia Series FR-23, 11.000%, 12/15/12 | | | 2,790,000 | IDR | | | 326 | |
Republic of Lithuania 144A
7.375%, 2/11/20(4) | | | 350 | | | | 378 | |
Republic of Poland Series 0414,
5.750%, 4/25/14 | | | 3,435 | PLZ | | | 1,013 | |
Republic of South Africa Series R206 7.500%, 1/15/14 | | | 3,800 | ZAR | | | 484 | |
Republic of Turkey
0.000%, 4/25/12 | | | 930 | TRY | | | 475 | |
6.750%, 5/30/40 | | | 500 | | | | 518 | |
State of Qatar 144A
4.500%, 1/20/22(4) | | | 450 | | | | 464 | |
United Mexican States
Series M,
6.000%, 6/18/15 | | | 8,000 | MXN | | | 587 | |
| TOTAL FOREIGN GOVERNMENT SECURITIES | |
| (Identified Cost $19,085) | | | | 20,326 | |
|
| MORTGAGE-BACKED SECURITIES—15.0% | |
|
| Non-Agency—15.0% | |
American Tower Trust
07-1A, C 144A
5.615%, 4/15/37(4) | | | 500 | | | | 527 | |
Americold LLC Trust
10-ARTA, B 144A
6.031%, 1/14/29(4) | | | 900 | | | | 895 | |
Banc of America Alternative Loan Trust 03-10, 2A1
6.000%, 12/25/33 | | | 95 | | | | 99 | |
Banc of America Commercial Mortgage, Inc.
05-6, AM
5.366%, 9/10/47(3) | | | 40 | | | | 43 | |
07-1, AMFX
5.482%, 1/15/49(3) | | | 445 | | | | 415 | |
Banc of America Funding Corp. 06-5, 4A4
6.000%, 9/25/36 | | | 13 | | | | 13 | |
Banc of America Mortgage Securities, Inc.
05-1, 1A22
5.250%, 2/25/35 | | | 25 | | | | 25 | |
| | | | | | | | |
| | | PAR
VALUE | | | VALUE | |
| Non-Agency—continued | |
Bear Stearns Commercial Mortgage Securities, Inc. | | | | | | | | |
06-PW12, AM
5.759%, 9/11/38(3) | | $ | 750 | | | $ | 784 | |
06-PW14, A4
5.201%, 12/11/38 | | | 750 | | | | 823 | |
05-PW10, A4
5.405%, 12/11/40(3) | | | 1,130 | | | | 1,244 | |
05-PW10, AM
5.449%, 12/11/40(3) | | | 725 | | | | 688 | |
07-T28, A4
5.742%, 9/11/42(3) | | | 780 | | | | 897 | |
07-PW18, A4
5.700%, 6/11/50 | | | 75 | | | | 83 | |
07-PW18, AM
6.084%, 6/11/50(3) | | | 1,475 | | | | 1,438 | |
Citicorp Mortgage Securities, Inc. 03-11, 2A10
5.500%, 12/25/33 | | | 111 | | | | 111 | |
Citigroup/Deutsche Bank Commercial Mortgage Trust
05-CD1, AM
5.225%, 7/15/44(3) | | | 90 | | | | 94 | |
07-CD4, A4
5.322%, 12/11/49 | | | 820 | | | | 870 | |
Credit Suisse First Boston Mortgage Securities Corp.
03-8, 3A24,
5.500%, 4/25/33 | | | 175 | | | | 169 | |
03-CPN1, C
4.763%, 3/15/35 | | | 100 | | | | 92 | |
Credit Suisse Mortgage Capital Certificates 06-C1, A3
5.419%, 2/15/39(3) | | | 948 | | | | 1,003 | |
Entertainment Properties Trust 03-EPR, A2, 144A
5.244%, 2/15/18(4) | | | 74 | | | | 76 | |
Extended Stay America Trust 10-ESHA, D, 144A
5.498%, 11/5/27(4) | | | 235 | | | | 236 | |
GE Capital Commercial Mortgage Corp. 03-C1, C
4.975%, 1/10/38(3) | | | 555 | | | | 558 | |
Goldman Sachs Mortgage Securities Corp. II 07-EOP, G, 144A
3.018%, 3/6/20(3)(4) | | | 130 | | | | 125 | |
07-EOP, H, 144A
3.585%, 3/6/20(3)(4) | | | 110 | | | | 107 | |
07-GG10, A4
5.984%, 8/10/45(3) | | | 400 | | | | 434 | |
GSR Mortgage Loan Trust
05-5F, 2A8
5.500%, 6/25/35 | | | 180 | | | | 183 | |
JPMorgan Chase Commercial Mortgage Securities Corp.
09-IWST, A1, 144A
4.314%, 12/5/27(4) | | | 73 | | | | 78 | |
06-CB17, AM
5.464%, 12/12/43 | | | 575 | | | | 564 | |
06-LDP7, AM
6.065%, 4/15/45(3) | | | 780 | | | | 803 | |
06-LDP9, A3
5.336%, 5/15/47 | | | 850 | | | | 902 | |
Refer to Footnote Legend on page 32.
See Notes to Financial Statements
25
VIRTUS MULTI-SECTOR FIXED INCOME SERIES
SCHEDULE OF INVESTMENTS (Continued)
DECEMBER 31, 2011
($ reported in thousands)
| | | | | | | | |
| | | PAR
VALUE | | | VALUE | |
| Non-Agency—continued | |
07-LD12, A4
5.882%, 2/15/51(3) | | $ | 1,100 | | | $ | 1,195 | |
JPMorgan Mortgage Trust
05-A1, 4A1
4.775%, 2/25/35(3) | | | 74 | | | | 70 | |
05-A4, 3A1
5.096%, 7/25/35(3) | | | 76 | | | | 68 | |
06-A1, B1
3.919%, 2/25/36(3) | | | 64 | | | | 1 | |
Lehman Brothers - UBS Commercial Mortgage Trust
06-C3, AM
5.712%, 3/15/39(3) | | | 25 | | | | 25 | |
06-C6, A4
5.372%, 9/15/39 | | | 670 | | | | 743 | |
07-C2, A3
5.430%, 2/15/40 | | | 115 | | | | 123 | |
05-C3, AM
4.794%, 7/15/40 | | | 670 | | | | 702 | |
07-C6, A2
5.845%, 7/15/40 | | | 144 | | | | 146 | |
07-C6, A4
5.858%, 7/15/40(3) | | | 350 | | | | 383 | |
07-C7, A3
5.866%, 9/15/45(3) | | | 600 | | | | 658 | |
Lehman Brothers Commercial Conduit Mortgage Trust 07-C3, A4
5.941%, 7/15/44(3) | | | 400 | | | | 435 | |
Merrill Lynch Floating Trust 08-LAQA, A1 144A
0.814%, 7/9/21(3)(4) | | | 100 | | | | 93 | |
Merrill Lynch Mortgage Investors, Inc. 98-C1, C
6.750%, 11/15/26(3) | | | 465 | | | | 485 | |
Merrill Lynch Mortgage Trust 06-C1, AM
5.666%, 5/12/39(3) | | | 110 | | | | 114 | |
Merrill Lynch-Countrywide Commercial Mortgage Trust
06-3, A4
5.414%, 7/12/46(3) | | | 100 | | | | 110 | |
06-4, A3
5.172%, 12/12/49(3) | | | 1,350 | | | | 1,454 | |
Morgan Stanley Capital I
06-T23, A4
5.814%, 8/12/41(3) | | | 135 | | | | 154 | |
06-IQ12, A4
5.332%, 12/15/43 | | | 1,600 | | | | 1,789 | |
07-IQ14, A4
5.692%, 4/15/49(3) | | | 1,020 | | | | 1,080 | |
Prudential Commercial Mortgage Trust 03-PWR1, D, 144A
4.775%, 2/11/36(4) | | | 50 | | | | 48 | |
RAAC 05-SP1, 2A2
5.250%, 9/25/34 | | | 12 | | | | 12 | |
Residential Accredit Loans, Inc. 03-QS6, A4
4.250%, 3/25/33 | | | 109 | | | | 111 | |
Residential Asset Mortgage Products, Inc. 04-SL1, A8
6.500%, 11/25/31 | | | 77 | | | | 78 | |
Residential Asset Securitization Trust 04-A4, A5
5.500%, 8/25/34 | | | 25 | | | | 25 | |
| | | | | | | | |
| | | PAR
VALUE | | | VALUE | |
| Non-Agency—continued | |
Residential Funding Mortgage Securities I, Inc. 06-S4, A2
6.000%, 4/25/36 | | $ | 59 | | | $ | 53 | |
Structured Asset Securities Corp. 03-21, 2A2
5.250%, 8/25/33 | | | 80 | | | | 83 | |
Timberstar Trust 06-1A, A, 144A
5.668%, 10/15/36(4) | | | 1,275 | | | | 1,424 | |
Wachovia Bank Commercial Mortgage Trust 05-C20, AMFX
5.179%, 7/15/42(3) | | | 100 | | | | 105 | |
07-C30, A5
5.342%, 12/15/43 | | | 970 | | | | 1,023 | |
05-C21, D
5.204%, 10/15/44(3) | | | 600 | | | | 448 | |
05-C22, AM
5.319%, 12/15/44(3) | | | 140 | | | | 143 | |
07-C33, A4
5.899%, 2/15/51(3) | | | 1,160 | | | | 1,256 | |
Washington Mutual Mortgage Pass Through Certificates
04-CB1, 5A
5.000%, 6/25/19 | | | 54 | | | | 56 | |
Wells Fargo Mortgage Backed Securities Trust
| | | | | | | | |
06-17, A1
5.500%, 11/25/21 | | | 22 | | | | 22 | |
06-9, 1A15
6.000%, 8/25/36 | | | 19 | | | | 19 | |
07-16, 1A7
6.000%, 12/28/37 | | | 404 | | | | 374 | |
| TOTAL MORTGAGE-BACKED SECURITIES | |
| (Identified Cost $25,775) | | | | 29,487 | |
|
| ASSET-BACKED SECURITIES—2.5% | |
American General Mortgage Loan Trust
09-1, A6, 144A
5.750%, 9/25/48(3)(4) | | | 150 | | | | 151 | |
10-1A, A1, 144A
5.150%, 3/25/58(3)(4) | | | 91 | | | | 93 | |
Ameriquest Mortgage Securities, Inc. 03-10, AF6
4.710%, 11/25/33(3) | | | 66 | | | | 65 | |
Bombardier Capital Mortgage Securitization Corp. 99-A, A3
5.980%, 1/15/18(3) | | | 696 | | | | 681 | |
CIT Group, Inc. 10-VT1A, B 144A
3.880%, 9/16/13(4) | | | 100 | | | | 102 | |
Conseco Finance Securitizations Corp. 01-3, A4
6.910%, 5/1/33(3) | | | 906 | | | | 965 | |
Conseco Financial Corp. 94-1, A5
7.650%, 4/15/19 | | | 100 | | | | 105 | |
Daimler Chrysler Auto Trust 08-B, A4A,
5.320%, 11/10/14 | | | 47 | | | | 47 | |
DT Auto Owner Trust 11-2A, C 144A
3.050%, 2/16/16(4) | | | 175 | | | | 174 | |
Ford Credit Auto Owner Trust 09-E, D 144A
5.530%, 5/15/16(4) | | | 250 | | | | 267 | |
| | | | | | | | |
| | | PAR
VALUE | | | VALUE | |
| ASSET-BACKED SECURITIES—continued | |
GMAC Mortgage Corp. Loan Trust
06-HE2, A3 6.320%, 5/25/36(3) | | $ | 246 | | | $ | 159 | |
06-HE3, A2 5.750%, 10/25/36(3) | | | 141 | | | | 92 | |
Harley-Davidson Motorcycle Trust
07-2, C 5.410%, 8/15/15 | | | 640 | | | | 645 | |
JPMorgan Chase Funding Mortgage Loan Asset-Backed Certificates 04-1,1A4
4.111%, 8/25/30 | | | 14 | | | | 13 | |
JPMorgan Mortgage Acquisition Corp. 06-CW2, AF3
5.777%, 8/25/36(3) | | | 225 | | | | 99 | |
Popular ABS Mortgage Pass-Through-Trust 05-5, AF3
5.086%, 11/25/35(3) | | | 429 | | | | 418 | |
Santander Drive Auto Receivables Trust 11-2, C
3.280%, 6/15/16 | | | 220 | | | | 221 | |
Saxon Asset Securities Trust 06-3 A2 0.404%, 10/25/46(3) | | | 34 | | | | 32 | |
SVO MOI Mortgage Corp. 10-AA, A ,144A 3.650%, 7/20/27(4) | | | 85 | | | | 86 | |
Tidewater Auto Receivables Trust 10-A, A 144A
5.920%, 5/15/17(4) | | | 38 | | | | 38 | |
U-Haul S Fleet LLC 10-BT1A, 1 144A
4.899%, 10/25/23(4) | | | 428 | | | | 444 | |
TOTAL ASSET-BACKED SECURITIES
(Identified Cost $4,999) | | | | 4,897 | |
|
| CORPORATE BONDS AND NOTES—51.6% | |
|
| Consumer Discretionary—6.4% | |
American Axle & Manufacturing Holdings, Inc. 144A
9.250%, 1/15/17(4) | | | 260 | | | | 283 | |
Boyd Gaming Corp.
9.125%, 12/1/18 | | | 210 | | | | 200 | |
Caesar’s Entertainment Operating Co., Inc.
12.750%, 4/15/18 | | | 80 | | | | 64 | |
Cengage Learning Acquisitions, Inc. 144A
10.500%, 1/15/15(4) | | | 350 | | | | 253 | |
Chrysler Group LLC/Chrysler Group Co-Issuer, Inc. 144A
8.000%, 6/15/19(4) | | | 500 | | | | 460 | |
CityCenter Holdings LLC/CityCenter Finance Corp. 144A
7.625%, 1/15/16(4) | | | 189 | | | | 195 | |
Clear Channel Communications, Inc.
9.000%, 3/1/21 | | | 500 | | | | 424 | |
CSC Holdings LLC 144A
6.750%, 11/15/21(4) | | | 450 | | | | 476 | |
Dana Holding Corp.
6.500%, 2/15/19 | | | 65 | | | | 66 | |
DISH DBS Corp.
7.125%, 2/1/16 | | | 315 | | | | 341 | |
Gap, Inc. (The)
5.950%, 4/12/21 | | | 300 | | | | 286 | |
Gateway Casinos & Entertainment Ltd. 144A
8.875%, 11/15/17(4) | | | 160 | CAD | | | 159 | |
Refer to Footnote Legend on page 32.
See Notes to Financial Statements
26
VIRTUS MULTI-SECTOR FIXED INCOME SERIES
SCHEDULE OF INVESTMENTS (Continued)
DECEMBER 31, 2011
($ reported in thousands)
| | | | | | | | |
| | | PAR
VALUE | | | VALUE | |
| Consumer Discretionary—continued | |
HOA Restaurant Group LLC / HOA Finance Corp. 144A
11.250%, 4/1/17(4) | | $ | 250 | | | $ | 234 | |
Host Hotels & Resorts LP 144A
6.000%, 10/1/21(4) | | | 750 | | | | 771 | |
Hyatt Hotels Corp.
5.375%, 8/15/21 | | | 400 | | | | 409 | |
International Game Technology | | | | | | | | |
7.500%, 6/15/19 | | | 160 | | | | 184 | |
5.500%, 6/15/20 | | | 125 | | | | 130 | |
inVentiv Health, Inc. 144A
10.000%, 8/15/18(4) | | | 330 | | | | 304 | |
Isle of Capri Casinos, Inc.
7.000%, 3/1/14 | | | 350 | | | | 329 | |
Landry’s Acquisition Co. 144A
11.625%, 12/1/15(4) | | | 40 | | | | 42 | |
Landry’s Holdings, Inc. 144A
11.500%, 6/1/14(4) | | | 275 | | | | 271 | |
Landry’s Restaurants, Inc.
11.625%, 12/1/15 | | | 140 | | | | 148 | |
Marina District Finance Co., Inc.
9.500%, 10/15/15 | | | 325 | | | | 305 | |
Mediacom LLC/Mediacom Capital Corp.
9.125%, 8/15/19 | | | 250 | | | | 267 | |
MGM Resorts International, Inc. | | | | | | | | |
7.500%, 6/1/16 | | | 375 | | | | 361 | |
7.625%, 1/15/17 | | | 350 | | | | 335 | |
Mobile Mini, Inc.
6.875%, 5/1/15 | | | 270 | | | | 273 | |
Needle Merger Sub Corp. 144A
8.125%, 3/15/19(4) | | | 500 | | | | 479 | |
Ono Finance II plc 144A
10.875%, 7/15/19(4) | | | 150 | | | | 134 | |
Penn National Gaming, Inc.
8.750%, 8/15/19 | | | 550 | | | | 601 | |
Pittsburgh Glass Works LLC 144A
8.500%, 4/15/16(4) | | | 200 | | | | 193 | |
Polymer Group, Inc. 144A
7.750%, 2/1/19(4) | | | 92 | | | | 96 | |
Production Resource Group, Inc. 144A
8.875%, 5/1/19(4) | | | 250 | | | | 230 | |
QVC, Inc. | | | | | | | | |
144A 7.125%, 4/15/17(4) | | | 50 | | | | 53 | |
144A 7.500%, 10/1/19(4) | | | 770 | | | | 830 | |
Royal Caribbean Cruises Ltd.
7.000%, 6/15/13 | | | 50 | | | | 53 | |
Scientific Games International, Inc.
9.250%, 6/15/19 | | | 260 | | | | 277 | |
Seminole Hard Rock Entertainment, Inc. / Seminole Hard Rock International LLC 144A
3.046%, 3/15/14(3)(4) | | | 150 | | | | 141 | |
Seneca Gaming Corp. 144A
8.250%, 12/1/18(4) | | | 55 | | | | 54 | |
Toys “R” Us Property Co., LLC
8.500%, 12/1/17 | | | 400 | | | | 416 | |
TRW Automotive, Inc. 144A
8.875%, 12/1/17(4) | | | 80 | | | | 87 | |
United Rentals North America, Inc.
10.875%, 6/15/16 | | | 280 | | | | 312 | |
| | | | | | | | |
| | | PAR
VALUE | | | VALUE | |
| Consumer Discretionary—continued | |
Univision Communications, Inc.
144A 7.875%, 11/1/20(4) | | $ | 100 | | | $ | 102 | |
Videotron Ltee
9.125%, 4/15/18 | | | 83 | | | | 92 | |
Wyndham Worldwide Corp. | | | | | | | | |
5.750%, 2/1/18 | | | 15 | | | | 16 | |
7.375%, 3/1/20 | | | 395 | | | | 451 | |
Wynn Las Vegas LLC / Wynn Las Vegas Capital Corp.
7.875%, 11/1/17 | | | 450 | | | | 496 | |
| | | | | | | | |
| | | | | | | 12,683 | |
| | | | | | | | |
|
| Consumer Staples—1.1% | |
American Achievement Corp. 144A
10.875%, 4/15/16(4) | | | 335 | | | | 260 | |
Bumble Bee Acquisition Corp. 144A
9.000%, 12/15/17(4) | | | 69 | | | | 70 | |
Bunge Ltd. Finance Corp.
8.500%, 6/15/19 | | | 250 | | | | 304 | |
Cencosud SA 144A
5.500%, 1/20/21(4) | | | 450 | | | | 461 | |
Constellation Brands, Inc.
8.375%, 12/15/14 | | | 280 | | | | 316 | |
Dean Holding Co.
6.900%, 10/15/17 | | | 50 | | | | 48 | |
Michael Foods, Inc.
9.750%, 7/15/18 | | | 225 | | | | 238 | |
Reynolds Group Issuer, Inc./ Reynolds Group Issuer LLC/ Reynolds Group Issuer 144A
9.000%, 4/15/19(4) | | | 135 | | | | 129 | |
Rite Aid Corp.
8.000%, 8/15/20 | | | 110 | | | | 122 | |
SABMiller plc 144A
6.625%, 8/15/33(4) | | | 75 | | | | 95 | |
Tyson Foods, Inc.
10.500%, 3/1/14 | | | 60 | | | | 70 | |
| | | | | | | | |
| | | | | | | 2,113 | |
| | | | | | | | |
|
| Energy—8.8% | |
Afren plc 144A
11.500%, 2/1/16(4) | | | 475 | | | | 470 | |
Anadarko Petroleum Corp.
8.700%, 3/15/19 | | | 75 | | | | 96 | |
Antero Resources Finance Corp.
9.375%, 12/1/17 | | | 250 | | | | 271 | |
Bill Barrett Corp.
7.625%, 10/1/19 | | | 500 | | | | 525 | |
Calumet Specialty Products Partners LP / Calumet Finance Corp. 144A
9.375%, 5/1/19(4) | | | 213 | | | | 208 | |
Carrizo Oil & Gas, Inc.
8.625%, 10/15/18 | | | 215 | | | | 218 | |
Cloud Peak Energy Resources LLC/ Cloud Peak Energy Finance Corp.
8.250%, 12/15/17 | | | 80 | | | | 86 | |
Coffeyville Resources Inc. LLC/ Coffeyville Finance, Inc., 144A
10.875%, 4/1/17(4) | | | 500 | | | | 562 | |
Compagnie Generale de Geophysique-Veritas
7.750%, 5/15/17 | | | 85 | | | | 86 | |
| | | | | | | | |
| | | PAR
VALUE | | | VALUE | |
| Energy—continued | |
Energy Partners Ltd.
8.250%, 2/15/18 | | $ | 500 | | | $ | 477 | |
Energy XXI Gulf Coast, Inc.
9.250%, 12/15/17 | | | 500 | | | | 545 | |
Expro Finance Luxembourg SCA 144A
8.500%, 12/15/16(4) | | | 730 | | | | 646 | |
Frontier Oil Corp.
6.875%, 11/15/18 | | | 195 | | | | 201 | |
Gazprom International SA 144A
7.201%, 2/1/20(4) | | | 454 | | | | 480 | |
Gazprom OAO (Gaz Capital SA) | | | | | | | | |
144A 6.212%, 11/22/16(4) | | | 1,890 | | | | 1,956 | |
144A 8.146%, 4/11/18(4) | | | 145 | | | | 163 | |
144A 6.510%, 3/7/22(4) | | | 520 | | | | 528 | |
Helix Energy Solutions Group, Inc. 144A
9.500%, 1/15/16(4) | | | 413 | | | | 432 | |
Hercules Offshore, Inc. 144A
10.500%, 10/15/17(4) | | | 375 | | | | 367 | |
KazMunaiGaz Finance Sub BV 144A
8.375%, 7/2/13(4) | | | 100 | | | | 105 | |
Linn Energy LLC / Linn Energy Finance Corp. 144A
6.500%, 5/15/19(4) | | | 112 | | | | 112 | |
Lukoil International Finance BV | | | | | | | | |
144A 6.375%, 11/5/14(4) | | | 100 | | | | 105 | |
144A 7.250%, 11/5/19(4) | | | 300 | | | | 310 | |
MIE Holdings Corp. 144A
9.750%, 5/12/16(4) | | | 285 | | | | 257 | |
NAK Naftogaz Ukraine
9.500%, 9/30/14 | | | 100 | | | | 94 | |
Petrohawk Energy Corp.
10.500%, 8/1/14 | | | 1,000 | | | | 1,117 | |
Petroleos de Venezuela SA
5.250%, 4/12/17 | | | 2,000 | | | | 1,290 | |
Petroleos Mexicanos
5.500%, 1/21/21 | | | 350 | | | | 380 | |
Petroplus Finance Ltd. 144A
6.750%, 5/1/14(4) | | | 500 | | | | 305 | |
Pioneer Drilling Co.
9.875%, 3/15/18 | | | 125 | | | | 131 | |
144A 9.875%, 3/15/18(4) | | | 95 | | | | 100 | |
Pride International, Inc.
8.500%, 6/15/19 | | | 605 | | | | 749 | |
Rowan Cos., Inc.
5.000%, 9/1/17 | | | 65 | | | | 68 | |
SEACOR Holdings, Inc.
7.375%, 10/1/19 | | | 50 | | | | 53 | |
SESI LLC
6.375%, 5/1/19 | | | 126 | | | | 129 | |
Swift Energy Co.
8.875%, 1/15/20 | | | 500 | | | | 527 | |
TNK-BP Finance SA RegS
6.125%, 3/20/12(5) | | | 115 | | | | 117 | |
144A 7.500%, 3/13/13(4) | | | 425 | | | | 444 | |
Transocean, Inc.
6.375%, 12/15/21 | | | 190 | | | | 202 | |
Venoco, Inc. | | | | | | | | |
11.500%, 10/1/17 | | | 400 | | | | 406 | |
8.875%, 2/15/19 | | | 225 | | | | 204 | |
Weatherford International Ltd.
9.625%, 3/1/19 | | | 567 | | | | 733 | |
Refer to Footnote Legend on page 32.
See Notes to Financial Statements
27
VIRTUS MULTI-SECTOR FIXED INCOME SERIES
SCHEDULE OF INVESTMENTS (Continued)
DECEMBER 31, 2011
($ reported in thousands)
| | | | | | | | |
| | | PAR
VALUE | | | VALUE | |
| Energy—continued | |
Western Refining, Inc. 144A
11.250%, 6/15/17(4) | | $ | 935 | | | $ | 1,068 | |
| | | | | | | | |
| | | | | | | 17,323 | |
| | | | | | | | |
|
| Financials—20.3% | |
ABH Financial Ltd.
(Alfa Markets Ltd.) 144A
8.200%, 6/25/12(4) | | | 250 | | | | 253 | |
Agile Property Holdings Ltd. 144A
10.000%, 11/14/16(4) | | | 100 | | | | 90 | |
Alfa Invest Ltd. 144A
9.250%, 6/24/13(4) | | | 575 | | | | 602 | |
Allstate Corp.
6.125%, 5/15/37(3) | | | 1,390 | | | | 1,263 | |
Ally Financial, Inc.
8.000%, 3/15/20 | | | 350 | | | | 360 | |
Alta Mesa Holdings / Alta Mesa Finance Services Corp.
9.625%, 10/15/18 | | | 500 | | | | 488 | |
American General (Springleaf) Finance Corp.
5.400%, 12/1/15 | | | 650 | | | | 476 | |
American International Group, Inc.
8.175%, 5/15/58(3) | | | 650 | | | | 578 | |
AmSouth Bank N.A.
4.850%, 4/1/13 | | | 700 | | | | 677 | |
Assurant, Inc. | | | | | | | | |
5.625%, 2/15/14 | | | 75 | | | | 78 | |
6.750%, 2/15/34 | | | 75 | | | | 78 | |
Banco Bilbao Vizcaya Argentaria Bancomer SA 144A
6.500%, 3/10/21(4) | | | 425 | | | | 410 | |
Banco Bradesco SA 144A
5.900%, 1/16/21(4) | | | 600 | | | | 615 | |
Banco de Credito del Peru 144A
4.750%, 3/16/16(4) | | | 400 | | | | 399 | |
Banco Santander Brasil SA 144A
4.500%, 4/6/15(4) | | | 300 | | | | 291 | |
Banco Santander Chile SA 144A
3.750%, 9/22/15(4) | | | 100 | | | | 100 | |
Banco Votorantim SA 144A
7.375%, 1/21/20(4) | | | 450 | | | | 479 | |
Bank of America Corp. | | | | | | | | |
5.420%, 3/15/17 | | | 600 | | | | 541 | |
Bank of America
Capital Trust XI
6.625%, 5/23/36(7) | | | 525 | | | | 464 | |
Barclays Bank plc | | | | | | | | |
144A 6.050%, 12/4/17(4) | | | 435 | | | | 393 | |
144A 5.926%(3)(4)(6)(7) | | | 600 | | | | 498 | |
Brandywine Operating Partnership LP
7.500%, 5/15/15 | | | 70 | | | | 77 | |
Capital One Capital IV
8.875%, 5/15/40(7) | | | 400 | | | | 415 | |
Chubb Corp.
6.375%, 3/29/67(3) | | | 1,390 | | | | 1,373 | |
CIT Group, Inc. | | | | | | | | |
7.000%, 5/1/15 | | | 22 | | | | 22 | |
Series A 7.000%, 5/1/16 | | | 37 | | | | 37 | |
144A 7.000%, 5/2/16(4) | | | 300 | | | | 300 | |
Citigroup, Inc. | | | | | | | | |
4.875%, 5/7/15 | | | 750 | | | | 741 | |
| | | | | | | | |
| | | PAR
VALUE | | | VALUE | |
| Financials—continued | |
5.500%, 2/15/17 | | $ | 525 | | | $ | 529 | |
City National Corp.
5.250%, 9/15/20 | | | 425 | | | | 422 | |
Discover Bank
7.000%, 4/15/20 | | | 550 | | | | 575 | |
DuPont Fabros Technology LP
8.500%, 12/15/17 | | | 625 | | | | 672 | |
Equity One, Inc.
6.250%, 12/15/14 | | | 40 | | | | 42 | |
Fidelity National Financial Sevices, Inc.
6.600%, 5/15/17 | | | 600 | | | | 636 | |
Fifth Third Bancorp
4.500%, 6/1/18 | | | 305 | | | | 306 | |
Fifth Third Capital Trust IV
6.500%, 4/15/37(3) | | | 500 | | | | 490 | |
First Horizon National Corp.
5.375%, 12/15/15 | | | 50 | | | | 51 | |
First Niagara Financial Group, Inc.
6.750%, 3/19/20 | | | 375 | | | | 395 | |
First Tennessee Bank N.A.
5.050%, 1/15/15(7) | | | 750 | | | | 751 | |
Ford Motor Credit Co., LLC | | | | | | | | |
8.000%, 6/1/14 | | | 735 | | | | 801 | |
8.700%, 10/1/14 | | | 300 | | | | 336 | |
Genworth Financial, Inc. | | | | | | | | |
5.750%, 6/15/14 | | | 485 | | | | 480 | |
6.515%, 5/22/18 | | | 440 | | | | 404 | |
Glen Meadow Pass-Through-Trust 144A
6.505%, 2/12/67(3)(4) | | | 950 | | | | 677 | |
Hana Bank 144A
4.500%, 10/30/15(4) | | | 200 | | | | 205 | |
HBOS plc 144A
6.750%, 5/21/18(4) | | | 200 | | | | 160 | |
Hudson United Bank
7.000%, 5/15/12 | | | 80 | | | | 82 | |
Huntington Bancshares, Inc.
7.000%, 12/15/20 | | | 280 | | | | 317 | |
Huntington National Bank (The)
6.600%, 6/15/18 | | | 250 | | | | 270 | |
Hyundai Capital Services, Inc.
144A 6.000%, 5/5/15(4) | | | 100 | | | | 107 | |
ICICI Bank Ltd. | | | | | | | | |
144A 5.750%, 11/16/20(4) | | | 325 | | | | 299 | |
144A 6.375%, 4/30/22(3)(4) | | | 625 | | | | 544 | |
ING Bank NV 144A
5.000%, 6/9/21(4) | | | 400 | | | | 387 | |
International Lease Finance Corp. | | | | | | | | |
5.650%, 6/1/14 | | | 350 | | | | 336 | |
6.250%, 5/15/19 | | | 605 | | | | 560 | |
Kazkommerts Bank International BV | | | | | | | | |
RegS 8.500%, 4/16/13(5) | | | 500 | | | | 493 | |
RegS 8.000%, 11/3/15(5) | | | 1,000 | | | | 900 | |
Kingsway America, Inc.
7.500%, 2/1/14 | | | 125 | | | | 116 | |
Korea Finance Corp.
4.625%, 11/16/21(4) | | | 400 | | | | 397 | |
Liberty Mutual Group, Inc. 144A
7.000%, 3/15/34(4) | | | 150 | | | | 159 | |
Liberty Mutual Insurance Co. 144A
8.500%, 5/15/25(4) | | | 25 | | | | 30 | |
| | | | | | | | |
| | | PAR
VALUE | | | VALUE | |
| Financials—continued | |
Lincoln National Corp.
6.050%, 4/20/67(3) | | $ | 365 | | | $ | 304 | |
Lloyds Banking Group Capital No.1 plc 144A
7.875%, 11/1/20(4) | | | 400 | | | | 303 | |
Lloyds TSB Bank plc | | | | | | | | |
144A 4.375%, 1/12/15 | | | 100 | | | | 96 | |
144A 6.500%, 9/14/20(4) | | | 600 | | | | 502 | |
Macquarie Bank Ltd. 144A
6.625%, 4/7/21(4) | | | 750 | | | | 692 | |
Morgan Stanley 144A
10.090%, 5/3/17(4) | | | 1,250 | BRL | | | 606 | |
National Retail Properties, Inc.
5.500%, 7/15/21 | | | 400 | | | | 401 | |
NYMAGIC, Inc.
6.500%, 3/15/14 | | | 150 | | | | 139 | |
OJSC AK Transneft (TransCapitalInvest Ltd.) 144A
5.670%, 3/5/14(4) | | | 880 | | | | 913 | |
ORIX Corp.
5.000%, 1/12/16 | | | 343 | | | | 360 | |
ProLogis LP
7.625%, 8/15/14 | | | 75 | | | | 82 | |
Prudential Financial, Inc.
8.875%, 6/15/38(3)(7) | | | 550 | | | | 630 | |
Realogy Corp. 144A
7.875%, 2/15/19(4) | | | 500 | | | | 438 | |
Regions Financial Corp. | | | | | | | | |
7.750%, 11/10/14 | | | 225 | | | | 226 | |
5.750%, 6/15/15 | | | 200 | | | | 191 | |
Resona Bank Ltd. 144A
5.850%, 9/29/49(3)(4)(6)(7) | | | 1,250 | | | | 1,242 | |
Royal Bank of Scotland Group plc (The)
7.648%, 8/29/49(3)(6)(7) | | | 450 | | | | 309 | |
Royal Bank of Scotland plc (The) | | | | | | | | |
4.875%, 3/16/15 | | | 385 | | | | 368 | |
3.950%, 9/21/15 | | | 35 | | | | 33 | |
5.625%, 8/24/20 | | | 750 | | | | 719 | |
Russian Agricultural Bank OJSC (RSHB Capital SA) | | | | | | | | |
144A 9.000%, 6/11/14(4) | | | 120 | | | | 130 | |
144A 6.299%, 5/15/17(4) | | | 715 | | | | 714 | |
Santander U.S. Debt S.A.U. 144A
3.724%, 1/20/15(4) | | | 100 | | | | 91 | |
SLM Corp. | | | | | | | | |
5.645%, 1/31/14(3) | | | 50 | | | | 47 | |
6.250%, 1/25/16 | | | 650 | | | | 632 | |
8.450%, 6/15/18 | | | 950 | | | | 978 | |
Societe Generale 144A
5.922%, 4/29/49(3)(4)(6)(7)(8) | | | 550 | | | | 335 | |
Sovereign Bank
8.750%, 5/30/18 | | | 600 | | | | 669 | |
Spansion LLC
7.875%, 11/15/17 | | | 300 | | | | 275 | |
SunTrust Bank
5.400%, 4/1/20 | | | 250 | | | | 255 | |
Vanguard Health Holding Co. II, LLC/ Vanguard Holding Co. II, Inc.
7.750%, 2/1/19 | | | 466 | | | | 450 | |
Vnesheconombank Via (VEB Finance Ltd.) 144A
6.902%, 7/9/20(4) | | | 500 | | | | 512 | |
Refer to Footnote Legend on page 32.
See Notes to Financial Statements
28
VIRTUS MULTI-SECTOR FIXED INCOME SERIES
SCHEDULE OF INVESTMENTS (Continued)
DECEMBER 31, 2011
($ reported in thousands)
| | | | | | | | |
| | | PAR
VALUE | | | VALUE | |
| Financials—continued | |
Webster Financial Corp.
5.125%, 4/15/14 | | $ | 230 | | | $ | 226 | |
XL Capital Ltd.
5.250%, 9/15/14 | | | 85 | | | | 90 | |
XL Group Ltd.
5.750%, 10/1/21 | | | 405 | | | | 427 | |
Yankee Candle Co. Holdings LLC/ Yankee Finance, Inc. PIK Interest Capitalization
10.250%, 2/15/16 | | | 455 | | | | 400 | |
Zions Bancorp | | | | | | | | |
7.750%, 9/23/14 | | | 145 | | | | 154 | |
6.000%, 9/15/15 | | | 125 | | | | 125 | |
| | | | | | | | |
| | | | | | | 40,091 | |
| | | | | | | | |
| | |
| Health Care—0.5% | | | | | | | | |
Mylan, Inc. 144A
7.625%, 7/15/17(4) | | | 113 | | | | 124 | |
Omnicare, Inc.
7.750%, 6/1/20 | | | 185 | | | | 200 | |
Patheon, Inc. 144A
8.625%, 4/15/17(4) | | | 10 | | | | 8 | |
Rotech Healthcare, Inc. | | | | | | | | |
10.750%, 10/15/15 | | | 75 | | | | 74 | |
10.500%, 3/15/18 | | | 350 | | | | 271 | |
Symbion, Inc.
8.000%, 6/15/16 | | | 189 | | | | 175 | |
U.S. Oncology, Inc.
0.000%, 2/16/49(10) | | | 437 | | | | — | |
Universal Health Services, Inc.
7.000%, 10/1/18 | | | 135 | | | | 141 | |
| | | | | | | | |
| | | | | | | 993 | |
| | | | | | | | |
| | |
| Industrials—4.6% | | | | | | | | |
ADS Tactical, Inc. 144A
11.000%, 4/1/18(4) | | | 600 | | | | 597 | |
America West Airlines 00-1G
8.057%, 7/2/20 | | | 49 | | | | 48 | |
AWAS Aviation Capital Ltd. 144A
7.000%, 10/17/16(4) | | | 221 | | | | 222 | |
CHC Helicopter S,A. 144A
9.250%, 10/15/20(4) | | | 325 | | | | 294 | |
Continental Airlines, Inc. Pass-Through-Trust 98-1, A,
6.648%, 9/15/17 | | | 656 | | | | 670 | |
Deluxe Corp. 144A
7.000%, 3/15/19(4) | | | 510 | | | | 498 | |
Dematic SA 144A
8.750%, 5/1/16(4) | | | 525 | | | | 521 | |
GATX Corp.
4.750%, 5/15/15 | | | 60 | | | | 64 | |
General Cable Corp.
7.125%, 4/1/17 | | | 500 | | | | 501 | |
Iron Mountain, Inc.
7.750%, 10/1/19 | | | 500 | | | | 531 | |
Kennametal, Inc.
7.200%, 6/15/12 | | | 225 | | | | 231 | |
Kratos Defense & Security Solutions, Inc.
10.000%, 6/1/17 | | | 500 | | | | 515 | |
Liberty Tire Recycling 144A
11.000%, 10/1/16(4) | | | 165 | | | | 165 | |
| | | | | | | | |
| | | PAR
VALUE | | | VALUE | |
| Industrials—continued | |
Marquette Transportation Co./ Marquette Transportation Finance Corp.
10.875%, 1/15/17 | | $ | 125 | | | $ | 127 | |
McJunkin Red Man Corp.
9.500%, 12/15/16 | | | 35 | | | | 36 | |
Owens Corning, Inc.
6.500%, 12/1/16 | | | 745 | | | | 813 | |
Reynolds Group Issuer, Inc./ Reynolds Group Issuer LLC 144A
8.750%, 10/15/16(4) | | | 750 | | | | 793 | |
Steelcase, Inc.
6.375%, 2/15/21 | | | 675 | | | | 717 | |
Teekay Corp.
8.500%, 1/15/20 | | | 225 | | | | 218 | |
Thermadyne Holdings Corp.
9.000%, 12/15/17 | | | 500 | | | | 520 | |
UAL Pass-Through-Trust 09-2A
9.750%, 1/15/17 | | | 267 | | | | 288 | |
Voto-Votorantim Ltd. 144A
6.750%, 4/5/21(4) | | | 600 | | | | 640 | |
| | | | | | | | |
| | | | | | | 9,009 | |
| | | | | | | | |
| | |
| Information Technology—1.9% | | | | | | | | |
Audatex North America, Inc. 144A
6.750%, 6/15/18(4) | | | 275 | | | | 279 | |
Broadridge Financial Solutions, Inc.
6.125%, 6/1/17 | | | 555 | | | | 582 | |
CDW LLC / CDW Finance Corp. | | | | | | | | |
PIK Interest Capitalization
11.500%, 10/12/15 | | | 6 | | | | 7 | |
8.500%, 4/1/19 | | | 575 | | | | 582 | |
CommScope, Inc. 144A
8.250%, 1/15/19(4) | | | 520 | | | | 523 | |
Crown Castle Holdings GS V LLC/ Crown Castle GS III Corp. 144A
7.750%, 5/1/17(4) | | | 75 | | | | 81 | |
Earthlink, Inc.
8.875%, 5/15/19 | | | 200 | | | | 185 | |
Equinix, Inc.
7.000%, 7/15/21 | | | 200 | | | | 211 | |
Freescale Semiconductor, Inc.
10.125%, 12/15/16 | | | 300 | | | | 317 | |
iGate Corp. 144A
9.000%, 5/1/16(4) | | | 600 | | | | 622 | |
Jabil Circuit, Inc.
7.750%, 7/15/16 | | | 48 | | | | 54 | |
Sorenson Communications, Inc. 144A
10.500%, 2/1/15(4) | | | 350 | | | | 243 | |
SunGard Data Systems, Inc.
7.375%, 11/15/18 | | | 100 | | | | 103 | |
| | | | | | | | |
| | | | | | | 3,789 | |
| | | | | | | | |
| | |
| Materials—4.0% | | | | | | | | |
AbitibiBowater, Inc. 144A
10.250%, 10/15/18(4) | | | 340 | | | | 377 | |
APERAM 144A
7.375%, 4/1/16(4) | | | 250 | | | | 215 | |
Berry Plastics Corp.
9.500%, 5/15/18 | | | 185 | | | | 187 | |
| | | | | | | | |
| | | PAR
VALUE | | | VALUE | |
| Materials—continued | | | | | | | | |
Building Materials Corp. of America 144A
6.750%, 5/1/21(4) | | $ | 44 | | | $ | 46 | |
Carpenter Technology Corp.
5.200%, 7/15/21 | | | 425 | | | | 413 | |
Catalyst Paper Corp.
7.375%, 3/1/14(10) | | | 905 | | | | 47 | |
Commercial Metals Co.
7.350%, 8/15/18 | | | 140 | | | | 132 | |
Edgen Murray Corp.
12.250%, 1/15/15 | | | 350 | | | | 317 | |
Fosun International Ltd. 144A
7.500%, 5/12/16(4) | | | 530 | | | | 466 | |
Gerdau Holdings, Inc. 144A
7.000%, 1/20/20(4) | | | 200 | | | | 211 | |
Hanson Australia Funding Ltd.
5.250%, 3/15/13 | | | 125 | | | | 126 | |
Huntsman International LLC
8.625%, 3/15/21 | | | 125 | | | | 133 | |
Ineos Group Holdings plc 144A
8.500%, 2/15/16(4) | | | 1,450 | | | | 1,160 | |
JMC Steel Group, Inc. 144A
8.250%, 3/15/18(4) | | | 195 | | | | 191 | |
Nortek, Inc. 144A
8.500%, 4/15/21(4) | | | 500 | | | | 425 | |
Nova Chemicals Corp.
3.784%, 11/15/13(3) | | | 818 | | | | 810 | |
Oxea Finance / Cy SCA 144A
9.500%, 7/15/17(4) | | | 355 | | | | 357 | |
Plastipak Holdings, Inc. 144A
8.500%, 12/15/15(4) | | | 500 | | | | 512 | |
Sealed Air Corp. 144A
8.375%, 9/15/21(4) | | | 180 | | | | 200 | |
Severstal OAO Via Steel Capital SA 144A
6.700%, 10/25/17(4) | | | 500 | | | | 471 | |
Vedanta Resources plc | | | | | | | | |
144A 8.750%, 1/15/14(4) | | | 100 | | | | 98 | |
144A 9.500%, 7/18/18(4) | | | 625 | | | | 544 | |
Verso Paper Holdings LLC / Verso Paper, Inc. | | | | | | | | |
11.500%, 7/1/14 | | | 46 | | | | 47 | |
Series B, 4.179%, 8/1/14(3) | | | 85 | | | | 54 | |
Series B, 11.375%, 8/1/16 | | | 850 | | | | 353 | |
| | | | | | | | |
| | | | | | | 7,892 | |
| | | | | | | | |
| |
| Telecommunication Services—2.9% | | | | | |
Axtel SAB de C.V. 144A
9.000%, 9/22/19(4) | | | 12 | | | | 9 | |
Clearwire Communications LLC/ Clearwire Finance, Inc. | | | | | | | | |
144A 12.000%, 12/1/15(4) | | | 85 | | | | 82 | |
144A 12.000%, 12/1/15(4) | | | 100 | | | | 96 | |
Cricket Communications, Inc.
7.750%, 10/15/20 | | | 238 | | | | 209 | |
Crown Castle Towers LLC | | | | | | | | |
144A 4.523%, 1/15/15(4) | | | 75 | | | | 78 | |
144A 3.214%, 8/15/15(4) | | | 50 | | | | 51 | |
144A 5.495%, 1/15/17(4) | | | 85 | | | | 93 | |
144A 4.883%, 8/15/20(4) | | | 500 | | | | 511 | |
Embarq Corp.
6.738%, 6/1/13 | | | 50 | | | | 52 | |
Refer to Footnote Legend on page 32.
See Notes to Financial Statements
29
VIRTUS MULTI-SECTOR FIXED INCOME SERIES
SCHEDULE OF INVESTMENTS (Continued)
DECEMBER 31, 2011
($ reported in thousands)
| | | | | | | | |
| | | PAR
VALUE | | | VALUE | |
| Telecommunication Services—continued | |
Frontier Communications Corp. | | | | | | | | |
7.875%, 4/15/15 | | $ | 295 | | | $ | 301 | |
8.250%, 4/15/17 | | | 200 | | | | 205 | |
8.125%, 10/1/18 | | | 150 | | | | 152 | |
ITC DeltaCom, Inc.
10.500%, 4/1/16 | | | 400 | | | | 411 | |
Nextel Communications, Inc. | | | | | | | | |
Series E 6.875%, 10/31/13 | | | 235 | | | | 235 | |
Series D 7.375%, 8/1/15 | | | 1,075 | | | | 989 | |
OJSC Vimpel Communications (VIP Finance Ireland Ltd.) | | | | | | | | |
144A 8.375%, 4/30/13(4) | | | 100 | | | | 105 | |
144A 9.125%, 4/30/18(4) | | | 250 | | | | 246 | |
Qwest Corp. | | | | | | | | |
8.375%, 5/1/16 | | | 300 | | | | 344 | |
6.500%, 6/1/17 | | | 307 | | | | 335 | |
SBA Tower Trust 144A
4.254%, 4/15/15(4) | | | 115 | | | | 118 | |
Telecom Italia Capital SA
6.175%, 6/18/14 | | | 100 | | | | 96 | |
Telemar Norte Leste SA 144A
5.500%, 10/23/20(4) | | | 245 | | | | 241 | |
West Corp.
7.875%, 1/15/19 | | | 420 | | | | 419 | |
Wind Acquisition Finance S.A. 144A
11.750%, 7/15/17(4) | | | 350 | | | | 315 | |
| | | | | | | | |
| | | | | | | 5,693 | |
| | | | | | | | |
| |
| Utilities—1.1% | | | | | |
Allegheny Energy Supply Co. LLC 144A
8.250%, 4/15/12(4) | | | 290 | | | | 295 | |
Calpine Corp. 144A
7.875%, 1/15/23(4) | | | 250 | | | | 270 | |
Centrais Eletricas Brasileiras SA 144A
6.875%, 7/30/19(4) | | | 135 | | | | 152 | |
Israel Electric Corp., Ltd. 144A
7.250%, 1/15/19(4) | | | 345 | | | | 356 | |
Mega Advance Investments Ltd. 144A
5.000%, 5/12/21(4) | | | 500 | | | | 508 | |
Midwest Generation LLC Series B
8.560%, 1/2/16 | | | 141 | | | | 143 | |
NRG Energy, Inc.
7.625%, 1/15/18 | | | 95 | | | | 95 | |
Suburban Propane Partners LP/ Suburban Energy Finance Corp.
7.375%, 3/15/20 | | | 150 | | | | 157 | |
Texas Competitive Electric Holdings Co. LLC Series A
10.250%, 11/1/15 | | | 396 | | | | 143 | |
| | | | | | | | |
| | | | | | | | 2,119 | |
TOTAL CORPORATE BONDS AND NOTES
(Identified Cost $102,447) | | | | 101,705 | |
| | | | | | | | |
| | | PAR
VALUE | | | VALUE | |
| CONVERTIBLE BONDS—0.2% | |
Transocean, Inc. Series C,
1.500%, 12/15/37 | | $ | 500 | | | $ | 491 | |
TOTAL CONVERTIBLE BONDS
(Identified Cost $477) | | | | | | | 491 | |
|
| LOAN AGREEMENTS(3)—14.6% | |
|
| Consumer Discretionary—5.0% | |
Affinity Gaming LLC (Herbest Gaming LLC)
10.000%, 12/31/15 | | | 749 | | | | 753 | |
AMF Bowling Worldwide, Inc. Tranche B,
2.796%, 6/7/13 | | | 826 | | | | 700 | |
Bourland & Leverich Supply Co. LLC
11.000%, 8/19/15 | | | 279 | | | | 271 | |
Brickman Group Holdings, Inc. Tranche B,
7.250%, 10/14/16 | | | 496 | | | | 498 | |
Caesars Entertainment Operating Co., Inc. (Harrah’s Operating Company, Inc.) | | | | | | | | |
Tranche B-2,
3.356%, 1/28/15 | | | 562 | | | | 490 | |
Tranche B-4,
9.500%, 10/31/16 | | | 29 | | | | 29 | |
Caesars Linq LLC/Caesars Octavius LLC Tranche B,
9.500%, 4/25/17 | | | 300 | | | | 287 | |
Cengage Learning Acquisitions, Inc.
2.550%, 7/3/14 | | | 792 | | | | 677 | |
Chrysler Group LLC / Chrysler Group Co-Issuer, Inc. Tranche B,
6.000%, 5/24/17 | | | 249 | | | | 236 | |
CityCenter Holdings LLC
7.500%, 1/21/15 | | | 53 | | | | 52 | |
Entercom Radio LLC
6.750%, 11/23/18 | | | 360 | | | | 360 | |
Focus Brands, Inc.
5.583%, 11/5/16 | | | 93 | | | | 92 | |
Gateway Casinos & Entertainment Ltd. Tranche B,
6.000%, 5/12/16 | | | 434 | CAD | | | 413 | |
Getty Images, Inc.
5.250%, 11/7/16 | | | 255 | | | | 256 | |
Guitar Center, Inc. –Extended Term Loan
5.830%, 4/9/17 | | | 225 | | | | 198 | |
HHI Holdings LLC
7.375%, 3/21/17 | | | 248 | | | | 246 | |
Hubbard Radio LLC
8.750%, 4/30/18 | | | 200 | | | | 199 | |
Intelsat Jackson Holding SA (Intelsat Jackson Holding Ltd.)
3.391%, 2/1/14 | | | 90 | | | | 86 | |
Kalispel Tribal Economic Authority
7.500%, 2/25/17 | | | 487 | | | | 453 | |
Landry’s Restaurants, Inc. | | | | | | | | |
6.250%, 12/1/14 | | | 117 | | | | 116 | |
6.250%, 12/1/14 | | | 302 | | | | 301 | |
Mediacom Illinois LLC (Mediacom Communications LLC) Tranche D,
5.500%, 3/31/17 | | | 86 | | | | 86 | |
| | | | | | | | |
| | | PAR
VALUE | | | VALUE | |
| Consumer Discretionary—continued | |
Nielsen Finance LLC Tranche B,
4.026%, 5/2/16 | | $ | 421 | | | $ | 415 | |
Ozburn-Hessey Holding Co., LLC
8.250%, 4/8/16 | | | 284 | | | | 251 | |
Radio One, Inc.
7.500%, 3/31/16 | | | 223 | | | | 208 | |
Revel AC, Inc. Tranche B,
9.000%, 2/17/17 | | | 258 | | | | 237 | |
Sports Authority, Inc. (The) Tranche B,
7.500%, 11/16/17 | | | 272 | | | | 263 | |
SRAM LLC
8.500%, 12/7/18 | | | 200 | | | | 202 | |
Toys “R” Us, Inc.
6.000%, 9/1/16 | | | 49 | | | | 49 | |
Transtar Industries, Inc. Tranche 2,
10.250%, 12/21/17 | | | 275 | | | | 275 | |
Visant Corp. (Jostens) Tranche B,
5.750%, 12/22/16 | | | 706 | | | | 664 | |
Vision Solutions, Inc.
6.000%, 7/23/16 | | | 448 | | | | 443 | |
| | | | | | | | |
| | | | | | | 9,806 | |
| | | | | | | | |
| | |
| Consumer Staples—0.7% | | | | | | | | |
Del Monte Foods Co.
4.500%, 3/8/18 | | | 113 | | | | 108 | |
Revlon Consumer Products Corp. Tranche B,
4.750%, 11/19/17 | | | 410 | | | | 407 | |
Spectrum Brands Holdings, Inc.
5.417%, 6/17/16 | | | 541 | | | | 541 | |
U.S. Foodservice, Inc.
5.750%, 3/31/17 | | | 248 | | | | 239 | |
| | | | | | | | |
| | | | | | | 1,295 | |
| | | | | | | | |
| | |
| Financials—0.8% | | | | | | | | |
Asurion LLC (Asurion Corp.)
9.000%, 5/24/19 | | | 350 | | | | 346 | |
Fortress Invest Group LLC (FIG)
5.750%, 10/7/15 | | | 33 | | | | 33 | |
International Lease Finance Corp. (Delos Aircraft, Inc.)
7.500%, 3/17/16 | | | 70 | | | | 70 | |
iStar Financial, Inc. Tranche A-2
7.000%, 6/30/14 | | | 465 | | | | 451 | |
Ocwen Financial Corp.
7.000%, 9/1/16 | | | 238 | | | | 234 | |
Pinnacle Foods Finance LLC
2.822%, 4/2/14 | | | 44 | | | | 43 | |
Springleaf Financial Funding Co. (American General Finance Corp.)
5.500%, 5/10/17 | | | 45 | | | | 39 | |
Walter Investments, Inc.
7.750%, 6/30/16 | | | 301 | | | | 301 | |
| | | | | | | | |
| | | | | | | 1,517 | |
| | | | | | | | |
| | |
| Health Care—1.4% | | | | | | | | |
Aptalis Pharma, Inc.
(Axcan Intermediate Holdings, Inc.)
5.500%, 2/10/17 | | | 411 | | | | 394 | |
Refer to Footnote Legend on page 32.
See Notes to Financial Statements
30
VIRTUS MULTI-SECTOR FIXED INCOME SERIES
SCHEDULE OF INVESTMENTS (Continued)
DECEMBER 31, 2011
($ reported in thousands)
| | | | | | | | |
| | | PAR
VALUE | | | VALUE | |
| Health Care—continued | | | | | | | | |
Ardent Health Services LLC
6.500%, 9/15/15 | | $ | 491 | | | $ | 488 | |
InVentiv Health, Inc.
(Ventive Health, Inc)
6.500%, 8/4/16 | | | 246 | | | | 236 | |
Kinetic Concepts, Inc.
7.000%, 5/4/18 | | | 280 | | | | 283 | |
Medical Card Systems, Inc.
12.000%, 9/17/15(9) | | | 352 | | | | 293 | |
NBTY, Inc. Tranche B-1
4.250%, 10/1/17 | | | 22 | | | | 21 | |
Res-Care, Inc. Tranche B,
7.250%, 12/22/16 | | | 495 | | | | 473 | |
Sheridan Healthcare, Inc. Tranche B,
4.046%, 6/15/14 | | | 99 | | | | 95 | |
Smile Brands, Inc. Tranche B,
7.250%, 12/21/17 | | | 371 | | | | 371 | |
Surgery Center Holdings, Inc.
6.500%, 2/6/17 | | | 128 | | | | 119 | |
Vanguard Health Holding Co., LLC (Vanguard Health System, Inc.)
5.000%, 1/29/16 | | | 44 | | | | 44 | |
| | | | | | | | |
| | | | | | | 2,817 | |
| | | | | | | | |
| | |
| Industrials—1.2% | | | | | | | | |
Alliance Laundry Holdings LLC
6.255%, 9/30/16 | | | 512 | | | | 512 | |
ARAMARK Corp. | | | | | | | | |
Letter of Credit 2,
0.145%, 7/26/16 | | | 2 | | | | 2 | |
Tranche B,
3.829%, 7/26/16 | | | 26 | | | | 25 | |
Brock Holdings Ill, Inc.
10.000%, 3/16/18 | | | 265 | | | | 244 | |
Building Materials Holdings Corp.
5.000%, 1/5/15(10) | | | 52 | | | | 46 | |
Goodman Global, Inc.
9.000%, 10/30/17 | | | 101 | | | | 101 | |
Harland Clarke Holdings Corp. (Clarke American Corp.) Tranche B,
2.843%, 6/30/14 | | | 757 | | | | 643 | |
Holdings Gaming Borrower LP Tranche B-1,
12.000%, 6/30/15 | | | 323 | | | | 336 | |
Intelligrated, Inc.
7.500%, 2/17/17 | | | 475 | | | | 473 | |
Vertrue LLC
5.810%, 8/16/14(10) | | | 169 | | | | 54 | |
| | | | | | | | |
| | | | | | | 2,436 | |
| | | | | | | | |
| | |
| Information Technology—3.7% | | | | | | | | |
Applied Systems, Inc.
9.250%, 6/8/17 | | | 333 | | | | 324 | |
Avaya, Inc. | | | | | | | | |
Tranche B-1 3.256%, 10/24/14 | | | 270 | | | | 259 | |
Tranche B-3 5.006%, 10/26/17 | | | 543 | | | | 496 | |
AVG Technologies N.V.
7.500%, 3/15/16 | | | 425 | | | | 400 | |
DataTel, Inc.
0.000%, 12/13/18 | | | 300 | | | | 300 | |
DynCorp International LLC
6.500%, 7/7/16 | | | 293 | | | | 288 | |
| | | | | | | | |
| | | PAR
VALUE | | | VALUE | |
| Information Technology—continued | |
Fibertech Networks LLC (Firefox Merger Sub LLC)
6.750%, 11/30/16 | | $ | 141 | | | $ | 141 | |
First Data Corp. | | | | | | | | |
Tranche B-1, 3.044%, 9/24/14 | | | 510 | | | | 464 | |
Tranche B-3, 3.044%, 9/24/14 | | | 730 | | | | 665 | |
Freescale Semiconductor, Inc.
4.520%, 12/1/16 | | | 472 | | | | 452 | |
Infor Enterprise Solutions Holdings, Inc. (Magellan Holdings, Inc.) | | | | | | | | |
Tranche DD, 6.546%, 3/2/14 | | | 174 | | | | 142 | |
6.546%, 3/2/14 | | | 301 | | | | 245 | |
Instant Web, Inc. | | | | | | | | |
3.671%, 8/7/14 | | | 403 | | | | 381 | |
Tranche DD 3.671%, 8/7/14 | | | 42 | | | | 40 | |
Lawson Software, Inc. (SoftBrands, Inc.)
6.750%, 7/5/17 | | | 299 | | | | 292 | |
Novell, Inc. (Attachmate Corp.)
6.500%, 4/27/17 | | | 543 | | | | 533 | |
Smart Modular Technologies (Global), Inc.
8.250%, 8/26/17 | | | 249 | | | | 227 | |
SonicWALL, Inc.
8.375%, 1/23/16 | | | 241 | | | | 242 | |
Sorenson Communications, Inc. Tranche C
6.000%, 8/16/13 | | | 221 | | | | 214 | |
Spansion LLC
4.750%, 2/9/15 | | | 298 | | | | 295 | |
SRA International, Inc.
6.500%, 7/20/18 | | | 386 | | | | 366 | |
Transaction Network Services, Inc.
6.000%, 11/18/15 | | | 259 | | | | 258 | |
Wall Street Systems, Inc.
9.000%, 6/20/18 | | | 335 | | | | 322 | |
| | | | | | | | |
| | | | | | | 7,346 | |
| | | | | | | | |
| | |
| Materials—0.6% | | | | | | | | |
Anchor Glass Container Corp. | | | | | | | | |
Second Lien
6.000%, 3/2/16 | | | 48 | | | | 48 | |
10.000%, 9/2/16 | | | 50 | | | | 50 | |
AZ Chem US. Inc.
0.000%, 12/22/17 | | | 285 | | | | 284 | |
Berry Plastics Group, Inc. Tranche C,
2.278%, 4/3/15 | | | 141 | | | | 135 | |
CPG International, Inc. Tranche B,
6.000%, 2/18/17 | | | 263 | | | | 246 | |
Huntsman International LLC | | | | | | | | |
Tranche B, 1.925%, 4/19/14 | | | 4 | | | | 4 | |
Extended Tranche B
2.886%, 4/19/17 | | | 10 | | | | 10 | |
New Sunward Holding BV Tranche B,
4.778%, 2/14/14 | | | 396 | | | | 327 | |
| | | | | | | | |
| | | | | | | 1,104 | |
| | | | | | | | |
|
| Telecommunication Services—1.0% | |
Presidio, Inc.
7.250%, 3/31/17 | | | 231 | | | | 230 | |
| | | | | | | | |
| | | PAR
VALUE | | | VALUE | |
| Telecommunication Services—continued | |
Securus Technologies Holdings, Inc. (Securus Technologies, Inc.)
5.250%, 5/31/17 | | $ | 358 | | | $ | 353 | |
U.S. TelePacific Corp.
5.750%, 2/23/17 | | | 271 | | | | 252 | |
Univision Communications, Inc.
5.546%, 3/31/17 | | | 1,342 | | | | 1,199 | |
| | | | | | | | |
| | | | | | | 2,034 | |
| | | | | | | | |
| | |
| Utilities—0.2% | | | | | | | | |
Texas Competitive Electric Holdings Co., LLC Tranche 2014,
3.776%, 10/10/14 | | | 467 | | | | 327 | |
TOTAL LOAN AGREEMENTS
(Identified Cost $29,729) | | | | | | | 28,682 | |
| | |
| | | SHARES | | | | |
| PREFERRED STOCK—2.3% | |
| | |
| Financials—2.0% | | | | | | | | |
Ally Financial, Inc.
Series A, 8.50% | | | 20,000 | | | | 368 | |
Ally Financial, Inc.
Series G, 144A 7.00%(4) | | | 439 | | | | 315 | |
Banco Bilbao Vizcaya Argentaria S.A. International Preferred S.A. Unipersonal 5.92%(3) | | | 380 | | | | 251 | |
Banco do Brasil S.A. 144A
8.50%(3)(4) | | | 200 | | | | 232 | |
Bank of America Corp.
Series K, 8.00%(3) | | | 625 | | | | 559 | |
Citigroup Capital XIII 7.875%, | | | 9,350 | | | | 244 | |
FNMA Series S, 8.250% | | | 63 | | | | 83 | |
JPMorgan Chase & Co.
Series 1 7.90%(3) | | | 525 | | | | 559 | |
PNC Financial Services Group, Inc.
Series K, 8.25%(3) | | | 650 | | | | 665 | |
Saul Centers, Inc.
Series A 8.000% | | | 425 | | | | 11 | |
UOB Cayman Ltd. 144A 5.80%(3)(4) | | | 700 | | | | 699 | |
| | | | | | | | |
| | | | | | | 3,986 | |
| | | | | | | | |
| | |
| Industrials—0.3% | | | | | | | | |
Seaspan Corp.
Series C, 9.50% | | | 20 | | | | 546 | |
TOTAL PREFERRED STOCK
(Identified Cost $5,422) | | | | 4,532 | |
| | |
| COMMON STOCKS—0.0% | | | | | | | | |
|
| Consumer Discretionary—0.0% | |
Mark IV Industries(10) | | | 217 | | | | 9 | |
| | | | | | | | |
| | |
| Financials—0.0% | | | | | | | | |
CIT Group, Inc.(2) | | | 1,257 | | | | 44 | |
| | | | | | | | |
Refer to Footnote Legend on page 32.
See Notes to Financial Statements
31
VIRTUS MULTI-SECTOR FIXED INCOME SERIES
SCHEDULE OF INVESTMENTS (Continued)
DECEMBER 31, 2011
($ reported in thousands)
| | | | | | | | |
| | | SHARES | | | VALUE | |
| Industrials—0.0% | | | | | | | | |
Building Materials Holding Corp.(2)(9) | | | 27,113 | | | $ | 27 | |
TOTAL COMMON STOCKS
(Identified Cost $88) | | | | 80 | |
TOTAL LONG TERM INVESTMENTS—98.4%
(Identified cost $192,029) | | | | 194,020 | |
|
| SHORT-TERM INVESTMENTS—0.2% | |
| |
| Money Market Mutual Funds—0.2% | | | | | |
Dreyfus Cash Management Fund – Institutional Shares (seven-day effective yield 0.050%) | | | 319,736 | | | | 320 | |
TOTAL SHORT-TERM INVESTMENTS
(Identified Cost $320) | | | | 320 | |
TOTAL INVESTMENTS—98.6%
(Identified Cost $192,349) | | | | 194,340 | (1) |
Other assets and liabilities, net—1.4% | | | | 2,676 | |
| | | | | | | | |
| NET ASSETS—100.0% | | | | | | $ | 197,016 | |
| | | | | | | | |
Abbreviations:
| FNMA | Federal National Mortgage Association (“Fannie Mae”). |
| NATL | National Public Finance Guarantee Corp. |
| OJSC | Open Joint Stock Company (Russia) |
| PIK | Payment-in-Kind Security |
Footnote Legend:
| (1) | Federal Income Tax Information: For tax information at December 31, 2011, see Note 11 Federal Income Tax Information in the Notes to Financial Statements. |
| (2) | Non-income producing. |
| (3) | Variable or step coupon security; interest rate shown reflects the rate in effect at December 31, 2011. |
| (4) | Security exempt from registration under Rule 144A of the Securities Act of 1933. These securities may be resold in transactions exempt from registration, normally to qualified institutional buyers. At December 31, 2011, these securities amounted to a value of $51,767 or 26.3% of net assets. |
| (5) | Regulation S security. Security is offered and sold outside of the United States, therefore, it is exempt from registration with the SEC under rules 903 and 904 of the Securities Act of 1933. |
| (6) | No contractual maturity date |
| (7) | Interest payments may be deferred. |
| (8) | Issuer may elect not to pay interest causing the payment to be forfeited and no longer due. The issuer has not invoked this election since the fund purchased this security. |
| (10) | Security valued at fair value as determined in good faith by or under the direction of the Trustees. This security is disclosed as a Level 3 security in the disclosure table located after the Schedule of Investments. |
Foreign Currencies:
| | | | |
| Country Weightings† (unaudited) | | | |
United States | | | 72 | % |
Russia | | | 3 | |
United Kingdom | | | 3 | |
Argentina | | | 2 | |
Brazil | | | 2 | |
Canada | | | 2 | |
Venezuela | | | 2 | |
Other | | | 14 | |
Total | | | 100 | % |
† % of total investments as of December 31, 2011 | |
The following table provides a summary of inputs used to value the Fund’s investments as of December 31, 2011 (See Security Valuation Note 2A in the Notes to Financial Statements):
| | | | | | | | | | | | | | | | |
| | | Total
Value at
December 31, 2011 | | | Level 1 –
Quoted
Prices | | | Level 2 –
Significant
Observable
Inputs | | | Level 3 –
Significant
Unobservable
Inputs | |
Debt Securities: | |
Asset-Backed Securities | | $ | 4,897 | | | $ | — | | | $ | 4,897 | | | $ | — | |
Convertible Bonds | | | 491 | | | | — | | | | 491 | | | | — | |
Corporate Bonds And Notes | | | 101,705 | | | | — | | | | 101,658 | | | | 47 | |
Foreign Government Securities | | | 20,326 | | | | — | | | | 20,326 | | | | — | |
Loan Agreements | | | 28,682 | | | | — | | | | 28,628 | | | | 54 | |
Mortgage-Backed Securities | | | 29,487 | | | | — | | | | 29,487 | | | | — | |
Municipal Bonds | | | 3,820 | | | | — | | | | 3,820 | | | | — | |
Equity Securities: | | | | | | | | | | | | | | | | |
Common Stocks | | | 80 | | | | 44 | | | | — | | | | 36 | |
Preferred Stock | | | 4,532 | | | | 11 | | | | 4,521 | | | | — | |
Short-term Investments | | | 320 | | | | 320 | | | | — | | | | — | |
| | | | | | | | | | | | | | | | |
Total Investments | | $ | 194,340 | | | $ | 375 | | | $ | 193,828 | | | $ | 137 | |
| | | | | | | | | | | | | | | | |
See Notes to Financial Statements
32
VIRTUS MULTI-SECTOR FIXED INCOME SERIES
SCHEDULE OF INVESTMENTS (Continued)
DECEMBER 31, 2011
($ reported in thousands)
The following is a reconciliation of assets of the Fund for Level 3 investments for which significant unobservable inputs were used to determine fair value.
| | | | | | | | | | | | | | | | | | | | |
| | | Investment in
Securities | | | Asset-Backed
Securities | | | Corporate Bonds
and Notes | | | Loan
Agreements | | | Common
Stocks | |
Beginning Balance 12/31/10: | | $ | 652 | | | $ | 112 | | | $ | — | | | $ | 510 | | | $ | 30 | |
Accrued discount/(premium) | | | 5 | | | | — | | | | — | | | | 5 | | | | | |
Realized gain (loss) | | | 26 | | | | — | | | | — | | | | 26 | | | | — | |
Change in unrealized appreciation (depreciation) | | | (1 | ) | | | (26 | ) | | | — | | | | 19 | | | | 6 | |
Purchases | | | — | | | | — | | | | — | | | | — | | | | — | |
(Sales)(b) | | | (560 | ) | | | — | | | | — | | | | (560 | ) | | | — | |
Transfers into Level 3(a) | | | 101 | | | | — | | | | 47 | | | | 54 | | | | — | |
Transfers from Level 3(a) | | | (86 | ) | | | (86 | ) | | | — | | | | — | | | | — | |
| | | | | | | | | | | | | | | | | | | | |
Ending Balance 12/31/11 | | $ | 137 | | | $ | — | | | $ | 47 | | | $ | 54 | | | $ | 36 | |
| | | | | | | | | | | | | | | | | | | | |
| (a) | “Transfers in and/or out” represent the ending value as of December 31, 2011, for any investment security where a change in the pricing level occurred from the beginning to the end of the period. |
| (b) | Includes paydowns on securities. |
| (c) | Amount is less than $500. |
See Notes to Financial Statements
33
VIRTUS PREMIUM ALPHASECTOR™ SERIES
SCHEDULE OF INVESTMENTS
DECEMBER 31, 2011
($ reported in thousands)
| | | | | | | | |
| | | SHARES | | | VALUE | |
| EXCHANGE-TRADED FUNDS—99.0% | |
Consumer Discretionary Select Sector SPDR Fund | | | 7,800 | | | $ | 304 | |
Consumer Staples Select Sector SPDR Fund | | | 9,660 | | | | 314 | |
iShares Dow Jones U.S. Technology Sector Index Fund | | | 2,365 | | | | 151 | |
Technology Select Sector SPDR Fund | | | 5,930 | | | | 151 | |
Utilities Select Sector SPDR Fund | | | 8,810 | | | | 318 | |
| TOTAL EXCHANGE-TRADED FUNDS (Identified Cost $1,185) | | | | 1,238 | |
| TOTAL LONG TERM INVESTMENTS—99.0% | |
| (Identified Cost $1,185) | | | | 1,238 | |
|
| SHORT-TERM INVESTMENTS—3.0% | |
|
| Money Market Mutual Funds—3.0% | |
Dreyfus Cash Management
Fund – Institutional Shares
(seven-day effective yield 0.050%) | | | 38,029 | | | | 38 | |
| TOTAL SHORT-TERM INVESTMENTS (Identified Cost $38) | | | | 38 | |
TOTAL INVESTMENTS—102.0%
(Identified Cost $1,223) | | | | 1,276 | (1) |
Other assets and liabilities, net—(2.0)% | | | | (26 | ) |
| | | | | |
| NET ASSETS—100.0% | | | | | | $ | 1,250 | |
| | | | | | | | |
Abbreviations:
| SPDR | S&P Depositary Receipt |
Footnote Legend:
| (1) | Federal Income Tax Information: For tax information at December 31, 2011, see Note 11 Federal Income Tax Information in the Notes to Financial Statements. |
The following table provides a summary of inputs used to value the Fund’s investments as of December 31, 2011 (See Security Valuation Note 2A in the Notes to Financial Statements):
| | | | | | | | |
| | | Total
Value at
December 31,
2011 | | | Level 1 –
Quoted
Prices | |
Equity Securities: | | | | | | | | |
Exchange-traded Funds | | $ | 1,238 | | | $ | 1,238 | |
Short-term Investments | | | 38 | | | | 38 | |
| | | | | | | | |
Total Investments | | $ | 1,276 | | | $ | 1,276 | |
| | | | | | | | |
There are no Level 2 (significant observable inputs) or Level 3 (significant unobservable inputs) priced securities.
See Notes to Financial Statements
34
VIRTUS REAL ESTATE SECURITIES SERIES
SCHEDULE OF INVESTMENTS
DECEMBER 31, 2011
($ reported in thousands)
| | | | | | | | |
| | | SHARES | | | VALUE | |
| COMMON STOCKS—98.3% | |
|
| Real Estate Investment Trusts—98.3% | |
|
| Diversified—5.2% | |
Digital Realty Trust, Inc. | | | 22,154 | | | $ | 1,477 | |
Vornado Realty Trust | | | 49,836 | | | | 3,830 | |
| | | | | | | | |
| | | | | | | 5,307 | |
| | | | | | | | |
| | |
| Health Care—12.2% | | | | | | | | |
HCP, Inc. | | | 78,946 | | | | 3,271 | |
Health Care REIT, Inc. | | | 55,267 | | | | 3,014 | |
Ventas, Inc. | | | 113,866 | | | | 6,277 | |
| | | | | | | | |
| | | | | | | 12,562 | |
| | | | | | | | |
| | |
| Industrial/Office—18.2% | | | | | | | | |
| | |
| Industrial—3.6% | | | | | | | | |
Prologis, Inc. | | | 129,337 | | | | 3,698 | |
| | | | | | | | |
| | |
| Mixed—2.2% | | | | | | | | |
Duke Realty Corp. | | | 189,530 | | | | 2,284 | |
| | | | | | | | |
| | |
| Office—12.4% | | | | | | | | |
Alexandria Real Estate Equities, Inc. | | | 11,311 | | | | 780 | |
BioMed Realty Trust, Inc. | | | 91,027 | | | | 1,646 | |
Boston Properties, Inc. | | | 49,114 | | | | 4,891 | |
Kilroy Realty Corp. | | | 88,175 | | | | 3,357 | |
SL Green Realty Corp. | | | 32,321 | | | | 2,154 | |
| | | | | | | | |
| | | | | | | 12,828 | |
| | | | | | | | |
| | | | | | | 18,810 | |
| | | | | | | | |
| | |
| Lodging/Resorts—5.7% | | | | | | | | |
Host Hotels & Resorts, Inc. | | | 264,674 | | | | 3,909 | |
LaSalle Hotel Properties | | | 77,013 | | | | 1,865 | |
Starwood Hotels & Resorts Worldwide, Inc. | | | 3,080 | | | | 148 | |
| | | | | | | | |
| | | | | | | 5,922 | |
| | | | | | | | |
| | |
| Residential—23.0% | | | | | | | | |
| | |
| Apartments—20.6% | | | | | | | | |
Apartment Investment & Management Co. Class A | | | 91,899 | | | | 2,105 | |
AvalonBay Communities, Inc. | | | 31,008 | | | | 4,050 | |
BRE Properties, Inc. | | | 33,406 | | | | 1,686 | |
Camden Property Trust | | | 41,800 | | | | 2,602 | |
Campus Crest Communities, Inc. | | | 15,443 | | | | 155 | |
Equity Residential | | | 98,959 | | | | 5,643 | |
Essex Property Trust, Inc. | | | 20,161 | | | | 2,833 | |
UDR, Inc. | | | 87,277 | | | | 2,191 | |
| | | | | | | | |
| | | | | | | 21,265 | |
| | | | | | | | |
| | |
| Manufactured Homes—2.4% | | | | | | | | |
Equity Lifestyle Properties, Inc. | | | 36,616 | | | | 2,442 | |
| | | | | | | | |
| | | | | | | 23,707 | |
| | | | | | | | |
| | | | | | | | |
| | | SHARES | | | VALUE | |
| Retail—24.3% | | | | | | | | |
| | |
| Regional Malls—17.7% | | | | | | | | |
General Growth Properties, Inc. | | | 133,521 | | | $ | 2,006 | |
Macerich Co. (The) | | | 23,997 | | | | 1,214 | |
Simon Property Group, Inc. | | | 93,506 | | | | 12,057 | |
Taubman Centers, Inc. | | | 48,678 | | | | 3,023 | |
| | | | | | | | |
| | | | | | | 18,300 | |
| | | | | | | | |
| | |
| Shopping Centers—6.6% | | | | | | | | |
DDR Corp. | | | 154,250 | | | | 1,877 | |
Kimco Realty Corp. | | | 136,084 | | | | 2,210 | |
Regency Centers Corp. | | | 34,700 | | | | 1,305 | |
Weingarten Realty Investors | | | 63,270 | | | | 1,381 | |
| | | | | | | | |
| | | | | | | 6,773 | |
| | | | | | | | |
| | | | | | | 25,073 | |
| | | | | | | | |
| | |
| Self Storage—9.7% | | | | | | | | |
CubeSmart, Inc. | | | 79,862 | | | | 850 | |
Extra Space Storage, Inc. | | | 126,030 | | | | 3,054 | |
Public Storage | | | 45,467 | | | | 6,113 | |
| | | | | | | | |
| | | | | | | | 10,017 | |
TOTAL COMMON STOCKS
(Identified Cost $56,644) | | | | 101,398 | |
| TOTAL LONG TERM INVESTMENTS—98.3% | |
| (Identified Cost $56,644) | | | | 101,398 | |
|
| SHORT-TERM INVESTMENTS—1.1% | |
|
| Money Market Mutual Funds—1.1% | |
Dreyfus Cash Management Fund – Institutional Shares (seven-day effective yield 0.050%) | | | 1,069,345 | | | | 1,069 | |
| TOTAL SHORT-TERM INVESTMENTS (Identified Cost $1,069) | | | | 1,069 | |
TOTAL INVESTMENTS—99.4%
(Identified Cost $57,713) | | | | 102,467 | (1) |
Other assets and liabilities, net—0.6% | | | | 647 | |
| | | | | |
| NET ASSETS—100.0% | | | | | | $ | 103,114 | |
| | | | | | | | |
Abbreviation Legend:
| REIT | Real Estate Investment Trust |
Footnote Legend
| (1) | Federal Income Tax Information: For tax information at December 31, 2011, see Note 11 Federal Income Tax Information in the Notes to Financial Statements. |
The following table provides a summary of inputs used to value the Fund’s investments as of December 31, 2011 (See Security Valuation Note 2A in the Notes to Financial Statements):
| | | | | | | | |
| | | Total
Value at
December 31, 2011 | | | Level 1 –
Quoted
Prices | |
Common Stocks: | | | | | | | | |
Real Estate Investment Trusts | | $ | 101,398 | | | $ | 101,398 | |
Short-term Investments | | | 1,069 | | | | 1,069 | |
| | | | | | | | |
Total Investments | | $ | 102,467 | | | $ | 102,467 | |
| | | | | | | | |
There are no Level 2 (significant observable inputs) or Level 3 (significant unobservable inputs) priced securities.
See Notes to Financial Statements
35
VIRTUS SMALL-CAP GROWTH SERIES
SCHEDULE OF INVESTMENTS
DECEMBER 31, 2011
($ reported in thousands)
| | | | | | | | |
| | | SHARES | | | VALUE | |
| COMMON STOCKS—98.8% | |
|
| Consumer Discretionary—14.6% | |
Aaron’s, Inc.(2) | | | 67,200 | | | $ | 1,793 | |
Hibbett Sports, Inc.(2) | | | 47,300 | | | | 2,137 | |
Morningstar, Inc. | | | 33,300 | | | | 1,979 | |
Pool Corp. | | | 118,800 | | | | 3,576 | |
| | | | | | | | |
| | | | | | | 9,485 | |
| | | | | | | | |
|
| Consumer Staples—3.4% | |
PriceSmart, Inc. | | | 32,000 | | | | 2,228 | |
| | | | | | | | |
| | |
| Financials—9.7% | | | | | | | | |
Cohen & Steers, Inc. | | | 109,300 | | | | 3,159 | |
Financial Engines, Inc.(2) | | | 140,700 | | | | 3,142 | |
| | | | | | | | |
| | | | | | | 6,301 | |
| | | | | | | | |
|
| Health Care—20.7% | |
Abaxis, Inc.(2) | | | 82,200 | | | | 2,275 | |
National Research Corp. | | | 95,668 | | | | 3,713 | |
Quality Systems, Inc. | | | 32,200 | | | | 1,191 | |
Sirona Dental Systems, Inc.(2) | | | 72,300 | | | | 3,184 | |
Techne Corp. | | | 44,600 | | | | 3,044 | |
| | | | | | | | |
| | | | | | | 13,407 | |
| | | | | | | | |
|
| Industrials—14.9% | |
Aaon, Inc. | | | 109,500 | | | | 2,244 | |
Copart, Inc.(2) | | | 73,100 | | | | 3,501 | |
Heartland Express, Inc. | | | 102,000 | | | | 1,457 | |
HEICO Corp. Class A | | | 37,550 | | | | 1,477 | |
Omega Flex, Inc.(2) | | | 71,100 | | | | 1,005 | |
| | | | | | | | |
| | | | | | | 9,684 | |
| | | | | | | | |
|
| Information Technology—35.5% | |
ANSYS, Inc.(2) | | | 65,600 | | | | 3,757 | |
Blackbaud, Inc. | | | 88,400 | | | | 2,449 | |
Clicksoftware Technologies Ltd | | | 205,000 | | | | 1,966 | |
FactSet Research Systems, Inc. | | | 7,200 | | | | 628 | |
FLIR Systems, Inc. | | | 100,300 | | | | 2,514 | |
Hittite Microwave Corp.(2) | | | 60,500 | | | | 2,987 | |
MercadoLibre, Inc. | | | 31,000 | | | | 2,466 | |
Mesa Laboratories, Inc. | | | 6,586 | | | | 266 | |
NVE Corp.(2) | | | 38,000 | | | | 2,110 | |
ScanSource, Inc.(2) | | | 106,800 | | | | 3,845 | |
| | | | | | | | |
| | | | | | | | 22,988 | |
TOTAL COMMON STOCKS
(Identified Cost $57,130) | | | | 64,093 | |
TOTAL LONG TERM INVESTMENTS—98.8%
(Identified Cost $57,130) | | | | 64,093 | |
|
| SHORT-TERM INVESTMENTS—2.2% | |
|
| Money Market Mutual Funds—2.2% | |
Dreyfus Cash Management Fund – Institutional Shares (seven-day effective yield 0.050%) | | | 1,406,171 | | | | 1,406 | |
| TOTAL SHORT-TERM INVESTMENTS (Identified Cost $1,406) | | | | 1,406 | |
| TOTAL INVESTMENTS—101.0% (Identified Cost $58,536) | | | | 65,499 | (1) |
Other assets and liabilities, net—(1.0)% | | | | (631 | ) |
| | | | | | | | |
| NET ASSETS—100.0% | | | $ | 64,868 | |
| | | | | | | | |
Footnote Legend:
| (1) | Federal Income Tax Information: For tax information at December 31, 2011, see Note 11 Federal Income Tax Information in the Notes to Financial Statements. |
| (2) | Non-income producing. |
| | | | |
| Country Weightings† (unaudited) | | | |
United States | | | 93 | % |
Argentina | | | 4 | |
Israel | | | 3 | |
Total | | | 100 | % |
† % of total investments as of December 31, 2011 | |
The following table provides a summary of inputs used to value the Fund’s investments as of December 31, 2011 (See Security Valuation Note 2A in the Notes to Financial Statements):
| | | | | | | | |
| | | Total
Value at
December 31, 2011 | | | Level 1 –
Quoted
Prices | |
Equity Securities: | | | | | | | | |
Common Stocks | | $ | 64,093 | | | $ | 64,093 | |
Short-term Investments | | | 1,406 | | | | 1,406 | |
| | | | | | | | |
Total Investments | | $ | 65,499 | | | $ | 65,499 | |
| | | | | | | | |
There are no Level 2 (significant observable inputs) or Level 3 (significant unobservable inputs) priced securities.
See Notes to Financial Statements
36
VIRTUS SMALL-CAP VALUE SERIES
SCHEDULE OF INVESTMENTS
DECEMBER 31, 2011
($ reported in thousands)
| | | | | | | | |
| | | SHARES | | | VALUE | |
| COMMON STOCKS—97.9% | |
|
| Consumer Discretionary—14.0% | |
Hillenbrand, Inc. | | | 306,000 | | | $ | 6,830 | |
John Wiley & Sons, Inc. Class A | | | 140,000 | | | | 6,216 | |
Tempur-Pedic International, Inc.(2) | | | 96,700 | | | | 5,080 | |
| | | | | | | | |
| | | | | | | 18,126 | |
| | | | | | | | |
| | |
| Consumer Staples—6.2% | | | | | | | | |
National Beverage Corp.(2) | | | 80,700 | | | | 1,297 | |
WD-40 Co. | | | 168,700 | | | | 6,817 | |
| | | | | | | | |
| | | | | | | 8,114 | |
| | | | | | | | |
| | |
| Energy—8.7% | | | | | | | | |
CARBO Ceramics, Inc. | | | 28,500 | | | | 3,515 | |
World Fuel Services Corp. | | | 185,500 | | | | 7,787 | |
| | | | | | | | |
| | | | | | | 11,302 | |
| | | | | | | | |
| | |
| Financials—19.0% | | | | | | | | |
Ares Capital Corp. | | | 410,600 | | | | 6,344 | |
Entertainment Properties Trust | | | 75,500 | | | | 3,300 | |
Federated Investors, Inc. Class B | | | 211,900 | | | | 3,210 | |
First Cash Financial Services, Inc.(2) | | | 140,600 | | | | 4,934 | |
Golub Capital BDC, Inc. | | | 82,000 | | | | 1,271 | |
RLI Corp. | | | 77,800 | | | | 5,668 | |
| | | | | | | | |
| | | | | | | 24,727 | |
| | | | | | | | |
| | |
| Health Care—6.5% | | | | | | | | |
Owens & Minor, Inc. | | | 227,800 | | | | 6,330 | |
Young Innovations, Inc. | | | 72,323 | | | | 2,143 | |
| | | | | | | | |
| | | | | | | 8,473 | |
| | | | | | | | |
| | |
| Industrials—22.4% | | | | | | | | |
Badger Meter, Inc. | | | 75,000 | | | | 2,207 | |
CLARCOR, Inc. | | | 91,200 | | | | 4,559 | |
Corporate Executive Board Co. (The) | | | 70,000 | | | | 2,667 | |
Graco, Inc. | | | 125,600 | | | | 5,136 | |
Landstar System, Inc. | | | 154,900 | | | | 7,423 | |
Lincoln Electric Holdings, Inc. | | | 180,800 | | | | 7,073 | |
| | | | | | | | |
| | | | | | | 29,065 | |
| | | | | | | | |
|
| Information Technology—19.0% | |
ADTRAN, Inc. | | | 145,000 | | | | 4,373 | |
Cabot Microelectronics Corp. | | | 62,000 | | | | 2,930 | |
Cass Information Systems, Inc. | | | 102,269 | | | | 3,722 | |
Computer Services, Inc. | | | 90,500 | | | | 2,579 | |
Jack Henry & Associates, Inc. | | | 171,100 | | | | 5,751 | |
Syntel, Inc. | | | 113,800 | | | | 5,322 | |
| | | | | | | | |
| | | | | | | 24,677 | |
| | | | | | | | |
| | | | | | | | |
| | | SHARES | | | VALUE | |
| Materials—2.1% | |
Balchem Corp. | | | 66,000 | | | $ | 2,676 | |
TOTAL COMMON STOCKS
(Identified Cost $118,533) | | | | 127,160 | |
| TOTAL LONG TERM INVESTMENTS—97.9% | |
| (Identified Cost $118,533) | | | | 127,160 | |
| |
| SHORT-TERM INVESTMENTS—1.3% | | | | | |
| |
| Money Market Mutual Funds—1.3% | | | | | |
Dreyfus Cash Management Fund – Institutional Shares (seven-day effective yield 0.050%) | | | 1,679,086 | | | | 1,679 | |
TOTAL SHORT-TERM INVESTMENTS
(Identified Cost $1,679) | | | | 1,679 | |
TOTAL INVESTMENTS—99.2%
(Identified Cost $120,212) | | | | 128,839 | (1) |
Other assets and liabilities, net—0.8% | | | | 1,068 | |
| | | | | | | | |
| NET ASSETS—100.0% | | | | | | $ | 129,907 | |
| | | | | | | | |
| (1) | Federal Income Tax Information: For tax information at December 31, 2011, see Note 11 Federal Income Tax Information in the Notes to Financial Statements. |
| (2) | Non-income producing. |
The following table provides a summary of inputs used to value the Fund’s investments as of December 31, 2011 (See Security Valuation Note 2A in the Notes to Financial Statements):
| | | | | | | | |
| | | Total
Value at
December 31, 2011 | | | Level 1 –
Quoted
Prices | |
Equity Securities: | | | | | | | | |
Common Stocks | | $ | 127,160 | | | $ | 127,160 | |
Short-term Investments | | | 1,679 | | | | 1,679 | |
| | | | | | | | |
Total Investments | | $ | 128,839 | | | $ | 128,839 | |
| | | | | | | | |
There are no Level 2 (significant observable inputs) or Level 3 (significant unobservable inputs) priced securities.
See Notes to Financial Statements
37
VIRTUS STRATEGIC ALLOCATION SERIES
SCHEDULE OF INVESTMENTS
DECEMBER 31, 2011
($ reported in thousands)
| | | | | | | | |
| | | PAR
VALUE | | | VALUE | |
| U.S. GOVERNMENT SECURITIES—0.7% | |
U.S. Treasury Bond | | | | | | | | |
4.250%, 11/15/40 | | $ | 450 | | | $ | 573 | |
3.750%, 8/15/41 | | | 400 | | | | 469 | |
| TOTAL U.S. GOVERNMENT SECURITIES | |
| (Identified Cost $916) | | | | | | | 1,042 | |
|
| MUNICIPAL BONDS—3.5% | |
|
| California—1.3% | |
Alameda Corridor Transportation Authority
Taxable Series 99 – C,
(NATL Insured)
6.600%, 10/1/29 | | | 1,000 | | | | 1,012 | |
Kern County Pension Obligation
Taxable (NATL-RE Insured)
7.260%, 8/15/14 | | | 335 | | | | 357 | |
Sonoma County Pension Obligation
Taxable (FSA Insured)
6.625%, 6/1/13 | | | 430 | | | | 446 | |
| | | | | | | | |
| | | | | | | 1,815 | |
| | | | | | | | |
| | |
| Florida—0.1% | | | | | | | | |
Miami-Dade County Educational Facilities
Authority Taxable Series C
5.480%, 4/1/16 | | | 105 | | | | 115 | |
| | | | | | | | |
| | |
| Kentucky—0.1% | | | | | | | | |
Commonwealth of Kentucky Taxable
3.165%, 4/1/18 | | | 140 | | | | 144 | |
| | | | | | | | |
| | |
| Massachusetts—0.4% | | | | | | | | |
Commionwealth School Building Authority,
Sr. Series B
5.000%, 10/15/41 | | | 500 | | | | 542 | |
| | | | | | | | |
| | |
| Pennsylvania—1.0% | | | | | | | | |
City of Pittsburgh Pension Obligation Taxable Series C (NATL- RE, FGIC Insured) 6.500%, 3/1/17 | | | 1,250 | | | | 1,390 | |
| | | | | | | | |
| | |
| Virginia—0.1% | | | | | | | | |
Tobacco Settlement Financing Corp. Taxable
Series 07-A1,
6.706%, 6/1/46 | | | 220 | | | | 138 | |
| | | | | | | | |
| | |
| Washington—0.5% | | | | | | | | |
King County Sewer Revenue
5.000%, 1/1/45 | | | 600 | | | | 642 | |
| TOTAL MUNICIPAL BONDS | |
| (Identified Cost $4,560) | | | | | | | 4,786 | |
| | | | | | | | |
| | | PAR
VALUE | | | VALUE | |
| FOREIGN GOVERNMENT SECURITIES—1.0% | |
Bolivarian Republic of Venezuela | |
RegS 5.750%, 2/26/16(5) | | $ | 160 | | | $ | 126 | |
9.250%, 9/15/27 | | | 95 | | | | 69 | |
Commonwealth of Australia | | | | | | | | |
Series 123,
5.750%, 4/15/12 | | | 146 | AUD | | | 150 | |
Series 118,
6.500%, 5/15/13 | | | 50 | AUD | | | 53 | |
Commonwealth of Canada
2.000%, 9/1/12 | | | 322 | CAD | | | 318 | |
Commonwealth of New Zealand Series 413,
6.500%, 4/15/13 | | | 197 | NZD | | | 161 | |
Kingdom of Norway Series 470
6.500%, 5/15/13 | | | 719 | NOK | | | 129 | |
Kingdom of Sweden Series 1046, 5.500%, 10/8/12 | | | 595 | SEK | | | 89 | |
Republic of Lithuania 144A
7.380%, 2/11/20(4) | | | 150 | | | | 162 | |
Republic of Turkey
6.750%, 5/30/40 | | | 100 | | | | 104 | |
United Mexican States Series M,
6.000%, 6/18/15 | | | 775 | MXN | | | 57 | |
| TOTAL FOREIGN GOVERNMENT SECURITIES | |
| (Identified Cost $1,410) | | | | 1,418 | |
|
| MORTGAGE-BACKED SECURITIES—10.6% | |
| | |
| Agency—3.6% | | | | | | | | |
FNMA | | | | | | | | |
4.000%, 6/1/20 | | | 193 | | | | 206 | |
4.500%, 7/1/20 | | | 21 | | | | 23 | |
6.500%, 10/1/31 | | | 13 | | | | 15 | |
6.000%, 9/1/32 | | | 44 | | | | 49 | |
5.000%, 10/1/35 | | | 198 | | | | 214 | |
6.000%, 9/1/36 | | | 91 | | | | 100 | |
5.500%, 4/1/37 | | | 89 | | | | 96 | |
6.000%, 10/1/37 | | | 120 | | | | 132 | |
5.000%, 5/1/38 | | | 429 | | | | 463 | |
5.000%, 6/1/38 | | | 210 | | | | 227 | |
5.500%, 6/1/38 | | | 65 | | | | 71 | |
5.500%, 6/1/38 | | | 75 | | | | 81 | |
5.500%, 11/1/38 | | | 150 | | | | 163 | |
4.000%, 1/1/39 | | | 203 | | | | 214 | |
5.000%, 1/1/39 | | | 111 | | | | 120 | |
6.000%, 1/1/39 | | | 158 | | | | 174 | |
4.500%, 3/1/39 | | | 215 | | | | 229 | |
5.000%, 3/1/39 | | | 160 | | | | 173 | |
6.000%, 3/1/39 | | | 137 | | | | 151 | |
4.500%, 4/1/39 | | | 330 | | | | 358 | |
4.000%, 5/1/39 | | | 489 | | | | 514 | |
4.500%, 2/1/40 | | | 194 | | | | 209 | |
4.000%, 7/1/41 | | | 374 | | | | 393 | |
4.000%, 7/1/41 | | | 194 | | | | 204 | |
GNMA | | | | | | | | |
6.500%, 11/15/23 | | | 52 | | | | 59 | |
6.500%, 12/15/23 | | | 7 | | | | 8 | |
6.500%, 2/15/24 | | | 62 | | | | 70 | |
6.500%, 6/15/28 | | | 91 | | | | 106 | |
6.500%, 7/15/31 | | | 50 | | | | 57 | |
6.500%, 11/15/31 | | | 46 | | | | 54 | |
| | | | | | | | |
| | | PAR
VALUE | | | VALUE | |
| Agency—continued | | | | | | | | |
6.500%, 2/15/32 | | $ | 52 | | | $ | 60 | |
6.500%, 4/15/32 | | | 58 | | | | 67 | |
| | | | | | | | |
| | | | | | | 5,060 | |
| | | | | | | | |
| | |
| Non-Agency—7.0% | | | | | | | | |
Americold LLC Trust 10-ARTA, B 144A 6.031%, 1/14/29(4) | | | 200 | | | | 199 | |
Bear Stearns Commercial Mortgage Securities, Inc. | | | | | | | | |
06-PW12, A4
5.902%, 9/11/38(3) | | | 440 | | | | 491 | |
07-PW18, AM
6.084%, 6/11/50(3) | | | 550 | | | | 536 | |
Citigroup/Deutsche Bank Commercial Mortgage Trust
06-CD2, A4
5.505%, 1/15/46(3) | | | 590 | | | | 638 | |
Credit Suisse Mortgage Capital Certificates 06-C1, A4
5.594%, 2/15/39(3) | | | 1,210 | | | | 1,339 | |
Extended Stay America Trust 10-ESHA, D, 144A
5.498%, 11/5/27(4) | | | 100 | | | | 100 | |
GE Capital Commercial Mortgage Corp. 03-C1, C
4.975%, 1/10/38(3) | | | 175 | | | | 176 | |
Goldman Sachs Mortgage Securities Corp. II
07-GG10, A4
5.984%, 8/10/45(3) | | | 140 | | | | 152 | |
JPMorgan Chase Commercial Mortgage Securities Corp. | | | | | | | | |
10-CNTR, A1, 144A
3.300%, 8/5/32(4) | | | 290 | | | | 294 | |
10-CNTR, A2, 144A
4.311%, 8/5/32(4) | | | 300 | | | | 313 | |
06-LDP7, AM
6.065%, 4/15/45(3) | | | 125 | | | | 129 | |
07-LD12, A4
5.882%, 2/15/51(3) | | | 425 | | | | 462 | |
Lehman Brothers—UBS Commercial Mortgage Trust | | | | | | | | |
06-C6, A4 5.372%, 9/15/39 | | | 325 | | | | 360 | |
07-C6, A2 5.845%, 7/15/40 | | | 480 | | | | 485 | |
07-C7, A3 5.866%, 9/15/45(3) | | | 700 | | | | 768 | |
Merrill Lynch Mortgage Investors, Inc. 98-C1, C
6.750%, 11/15/26(3) | | | 125 | | | | 130 | |
Morgan Stanley Capital I | | | | | | | | |
06-T23, A4 5.814%, 8/12/41(3) | | | 790 | | | | 903 | |
06-IQ12, A4
5.332%, 12/15/43 | | | 525 | | | | 587 | |
Timberstar Trust 06-1A, A, 144A 5.668%, 10/15/36(4) | | | 675 | | | | 754 | |
Wachovia Bank Commercial Mortgage Trust | | | | | | | | |
07-C30, A5 5.342%, 12/15/43 | | | 285 | | | | 301 | |
05-C21, D
5.204%, 10/15/44(3) | | | 100 | | | | 75 | |
07-C33, A4
6.096%, 2/15/51(3) | | | 425 | | | | 460 | |
| | | | | | | | |
| | | | | | | | 9,652 | |
| TOTAL MORTGAGE-BACKED SECURITIES | |
| (Identified Cost $13,114) | | | | | | | 14,712 | |
Refer to Footnote Legend on page 43.
See Notes to Financial Statements
38
VIRTUS STRATEGIC ALLOCATION SERIES
SCHEDULE OF INVESTMENTS (Continued)
DECEMBER 31, 2011
($ reported in thousands)
| | | | | | | | |
| | | PAR
VALUE | | | VALUE | |
| ASSET-BACKED SECURITIES—1.8% | |
Bayview Financial Acquisition Trust 06-A, 1A2
5.483%, 2/28/41(3) | | $ | 182 | | | $ | 181 | |
Chrysler Financial Auto Securitization Trust 10-A, C
2.000%, 1/8/14 | | | 300 | | | | 300 | |
JPMorgan Mortgage Acquisition Corp. | | | | | | | | |
06-CW2, AF3
5.777%, 8/25/36(3) | | | 470 | | | | 206 | |
06-CW2, AF4 6.080%, 8/25/36(3) | | | 530 | | | | 221 | |
Lehman XS Trust 05-6, 3A2B
5.420%, 11/25/35(3) | | | 276 | | | | 256 | |
Popular ABS Mortgage Pass-Through-Trust 05-5, AF3
5.086%, 11/25/35(3) | | | 94 | | | | 91 | |
Residential Funding Mortgage Securities II, Inc. 06-HSA1, A3 5.230%, 2/25/36(3) | | | 835 | | | | 509 | |
Santander Drive Auto Receivables Trust | | | | | | | | |
11-2, B 2.660%, 1/15/16 | | | 240 | | | | 240 | |
11-2, C 3.280%, 6/15/16 | | | 100 | | | | 100 | |
10-B, C 144A
3.020%, 10/17/16(4) | | | 250 | | | | 248 | |
Trip Rail Master Funding LLC 11-1A, A1A, 144A
4.370%, 7/15/41(4) | | | 105 | | | | 105 | |
| TOTAL ASSET-BACKED SECURITIES | |
| (Identified Cost $3,375) | | | | | | | 2,457 | |
|
| CORPORATE BONDS AND NOTES—18.7% | |
|
| Consumer Discretionary—1.6% | |
Arcos Dorados B.V. 144A
7.500%, 10/1/19(4) | | | 125 | | | | 138 | |
Cequel Communications Holdings I LLC / Cequel Capital Corp.
144A 8.625%, 11/15/17(4) | | | 90 | | | | 96 | |
CityCenter Holdings LLC / CityCenter Finance Corp. 144A
7.625%, 1/15/16(4) | | | 42 | | | | 43 | |
CSC Holdings LLC 144A
6.750%, 11/15/21(4) | | | 100 | | | | 106 | |
Dana Holding Corp.
6.500%, 2/15/19 | | | 10 | | | | 10 | |
DISH DBS Corp.
7.125%, 2/1/16 | | | 60 | | | | 65 | |
Gap, Inc. (The)
5.950%, 4/12/21 | | | 75 | | | | 72 | |
Hasbro, Inc. 6.300%, 9/15/17 | | | 200 | | | | 230 | |
Host Hotels & Resorts LP 144A 6.000%, 10/1/21(4) | | | 150 | | | | 154 | |
Hyatt Hotels Corp.
5.375%, 8/15/21 | | | 100 | | | | 102 | |
International Game Technology
7.500%, 6/15/19 | | | 150 | | | | 173 | |
Korea Expressway Corp. 144A
4.500%, 3/23/15(4) | | | 100 | | | | 104 | |
| | | | | | | | |
| | | PAR
VALUE | | | VALUE | |
| Consumer Discretionary—continued | |
Landry’s Acquisition Co. 144A
11.625%, 12/1/15(4) | | $ | 25 | | | $ | 26 | |
Landry’s Restaurants, Inc.
11.625%, 12/1/15 | | | 83 | | | | 88 | |
Limited Brands, Inc.
6.900%, 7/15/17 | | | 25 | | | | 27 | |
Nissan Motor Acceptance Corp. 144A 4.500%, 1/30/15(4) | | | 160 | | | | 166 | |
Penn National Gaming, Inc.
8.750%, 8/15/19 | | | 85 | | | | 93 | |
Pittsburgh Glass Works LLC 144A 8.500%, 4/15/16(4) | | | 40 | | | | 39 | |
Polymer Group, Inc. 144A 7.750%, 2/1/19(4) | | | 16 | | | | 17 | |
Seneca Gaming Corp. 144A 8.250%, 12/1/18(4) | | | 15 | | | | 15 | |
Starwood Hotels & Resorts Worldwide, Inc.
7.150%, 12/1/19 | | | 85 | | | | 98 | |
Time Warner Cable, Inc. 5.850%, 5/1/17 | | | 130 | | | | 148 | |
Univision Communications, Inc. 144A 7.875%, 11/1/20(4) | | | 25 | | | | 25 | |
Wyndham Worldwide Corp. | | | | | | | | |
6.000%, 12/1/16 | | | 60 | | | | 65 | |
5.750%, 2/1/18 | | | 25 | | | | 26 | |
Wynn Las Vegas LLC / Wynn Las Vegas Capital Corp.
7.875%, 11/1/17 | | | 100 | | | | 110 | |
| | | | | | | | |
| | | | | | | 2,236 | |
| | | | | | | | |
| | |
| Consumer Staples—0.5% | | | | | | | | |
Cencosud SA 144A
5.500%, 1/20/21(4) | | | 150 | | | | 154 | |
Rite Aid Corp.
8.000%, 8/15/20 | | | 20 | | | | 22 | |
Sigma Alimentos SA de CV 144A 5.625%, 4/14/18(4) | | | 150 | | | | 153 | |
Tate & Lyle International Finance plc 144A
6.625%, 6/15/16(4) | | | 275 | | | | 313 | |
| | | | | | | | |
| | | | | | | 642 | |
| | | | | | | | |
| | |
| Energy—1.4% | | | | | | | | |
Anadarko Petroleum Corp. 6.375%, 9/15/17 | | | 160 | | | | 186 | |
Bill Barrett Corp.
7.625%, 10/1/19 | | | 100 | | | | 105 | |
Breitburn Energy Partners LP/Breitburn Finance Corp.
8.625%, 10/15/20 | | | 60 | | | | 63 | |
Calumet Specialty Products Partners LP/Calumet Finance Corp. 144A 9.375%, 5/1/19(4) | | | 30 | | | | 29 | |
Coffeyville Resources Inc./Coffeyville Finance, Inc.,
144A 10.875%, 4/1/17(4) | | | 125 | | | | 141 | |
Expro Finance Luxembourg SCA 144A
8.500%, 12/15/16(4) | | | 125 | | | | 111 | |
Frontier Oil Corp.
6.875%, 11/15/18 | | | 45 | | | | 46 | |
| | | | | | | | |
| | | PAR
VALUE | | | VALUE | |
| Energy—continued | | | | | | | | |
Helix Energy Solutions Group, Inc. 144A 9.500%, 1/15/16(4) | | $ | 50 | | | $ | 52 | |
HollyFrontier Corp.
9.875%, 6/15/17 | | | 12 | | | | 13 | |
Linn Energy LLC / Linn Energy Finance Corp. 144A
6.500%, 5/15/19(4) | | | 20 | | | | 20 | |
Lukoil International Finance BV 144A 7.250%, 11/5/19(4) | | | 175 | | | | 181 | |
Petroleos de Venezuela SA
5.250%, 4/12/17 | | | 65 | | | | 42 | |
Petroplus Finance Ltd. 144A
6.750%, 5/1/14(4) | | | 150 | | | | 92 | |
Petropower I Funding Trust 144A 7.360%, 2/15/14(4)(8) | | | 176 | | | | 177 | |
Pioneer Drilling Co. | | | | | | | | |
9.875%, 3/15/18 | | | 20 | | | | 21 | |
144A 9.875%, 3/15/18(4) | | | 20 | | | | 21 | |
QEP Resources, Inc.
6.875%, 3/1/21 | | | 100 | | | | 108 | |
SEACOR Holdings, Inc.
7.375%, 10/1/19 | | | 150 | | | | 158 | |
SESI LLC 6.375%, 5/1/19 | | | 80 | | | | 82 | |
Swift Energy Co.
7.125%, 6/1/17 | | | 175 | | | | 175 | |
Transocean, Inc.
6.375%, 12/15/21 | | | 30 | | | | 32 | |
Weatherford International Ltd.
9.625%, 3/1/19 | | | 45 | | | | 58 | |
| | | | | | | | |
| | | | | | | 1,913 | |
| | | | | | | | |
| | |
| Financials—9.6% | | | | | | | | |
ADCB Finance Cayman Ltd. 144A 4.750%, 10/8/14(4) | | | 150 | | | | 156 | |
AFLAC, Inc.
8.500%, 5/15/19 | | | 100 | | | | 123 | |
Ally Financial, Inc. Series 8,
6.750%, 12/1/14 | | | 49 | | | | 49 | |
Alta Mesa Holdings / Alta Mesa Finance Services Corp.
9.625%, 10/15/18 | | | 75 | | | | 73 | |
American General (Springleaf) Finance Corp.
5.400%, 12/1/15 | | | 100 | | | | 73 | |
American International Group, Inc. 4.875%, 9/15/16 | | | 100 | | | | 95 | |
AmSouth Bank N.A.
4.850%, 4/1/13 | | | 200 | | | | 193 | |
Associated Banc Corp.
5.125%, 3/28/16 | | | 55 | | | | 57 | |
Assurant, Inc.
5.625%, 2/15/14 | | | 250 | | | | 261 | |
Banco Bilbao Vizcaya Argentaria Bancomer SA 144A 6.500%, 3/10/21(4) | | | 150 | | | | 145 | |
Banco Bradesco SA 144A
5.900%, 1/16/21(4) | | | 150 | | | | 154 | |
Banco de Credito del Peru 144A 4.750%, 3/16/16(4) | | | 150 | | | | 150 | |
Banco do Brasil SA 144A 5.375%, 1/15/21(4) | | | 150 | | | | 150 | |
Refer to Footnote Legend on page 43.
See Notes to Financial Statements
39
VIRTUS STRATEGIC ALLOCATION SERIES
SCHEDULE OF INVESTMENTS (Continued)
DECEMBER 31, 2011
($ reported in thousands)
| | | | | | | | |
| | | PAR
VALUE | | | VALUE | |
| Financials—continued | | | | | | | | |
Banco Santander Brasil SA 144A 4.500%, 4/6/15(4) | | $ | 100 | | | $ | 97 | |
Banco Santander Chile SA 144A 3.750%, 9/22/15(4) | | | 100 | | | | 100 | |
Bank of America Corp.
5.650%, 5/1/18 | | | 400 | | | | 381 | |
Capital Trust XI
6.625%, 5/23/36 | | | 325 | | | | 287 | |
Barclays Bank plc | | | | | | | | |
5.200%, 7/10/14 | | | 140 | | | | 144 | |
144A 5.926%(3)(4)(6)(7) | | | 100 | | | | 83 | |
Bear Stearns Cos., Inc. LLC (The) 7.250%, 2/1/18 | | | 250 | | | | 293 | |
Blackstone Holdings Finance Co., LLC 144A
6.625%, 8/15/19(4) | | | 135 | | | | 143 | |
Brandywine Operating Partnership LP
7.500%, 5/15/15 | | | 125 | | | | 137 | |
Capital One Capital IV
8.875%, 5/15/40(6) | | | 100 | | | | 104 | |
Capital One Financial Corp.
6.150%, 9/1/16 | | | 125 | | | | 130 | |
CIT Group, Inc. Series A
7.000%, 5/1/16 | | | 75 | | | | 75 | |
Citigroup, Inc. | | | | | | | | |
5.000%, 9/15/14 | | | 40 | | | | 40 | |
4.875%, 5/7/15 | | | 150 | | | | 148 | |
5.500%, 2/15/17 | | | 45 | | | | 45 | |
City National Corp.
5.250%, 9/15/20 | | | 100 | | | | 99 | |
CommonWealth REIT
5.750%, 11/1/15 | | | 275 | | | | 287 | |
Credit Suisse 6.000%, 2/15/18 | | | 125 | | | | 123 | |
Deutsche Bank Financial LLC
5.375%, 3/2/15 | | | 131 | | | | 129 | |
Discover Bank
7.000%, 4/15/20 | | | 250 | | | | 261 | |
DuPont Fabros Technology LP
8.500%, 12/15/17 | | | 125 | | | | 134 | |
Equity One, Inc.
6.250%, 12/15/14 | | | 100 | | | | 105 | |
Export-Import Bank of Korea
5.875%, 1/14/15 | | | 100 | | | | 107 | |
Fidelity National Financial Sevices, Inc. 6.600%, 5/15/17 | | | 175 | | | | 186 | |
Fifth Third Bancorp
4.500%, 6/1/18 | | | 150 | | | | 150 | |
First Niagara Financial Group, Inc. 6.750%, 3/19/20 | | | 125 | | | | 132 | |
Ford Motor Credit Co., LLC
8.700%, 10/1/14 | | | 100 | | | | 112 | |
General Electric Capital Corp. 5.375%, 10/20/16 | | | 200 | | | | 224 | |
Genworth Financial, Inc. | | | | | | | | |
5.750%, 6/15/14 | | | 125 | | | | 124 | |
6.515%, 5/22/18 | | | 85 | | | | 78 | |
Glen Meadow Pass-Through-Trust 144A
6.505%, 2/12/67(3)(4) | | | 135 | | | | 96 | |
Goldman Sachs Group, Inc. (The) 5.950%, 1/18/18 | | | 165 | | | | 169 | |
| | | | | | | | |
| | | PAR
VALUE | | | VALUE | |
| Financials—continued | | | | | | | | |
Hana Bank 144A
4.500%, 10/30/15(4) | | $ | 150 | | | $ | 154 | |
HCP, Inc. 5.375%, 2/1/21 | | | 60 | | | | 63 | |
Health Care REIT, Inc.
4.700%, 9/15/17 | | | 150 | | | | 149 | |
HSBC Bank plc 144A
3.100%, 5/24/16(4) | | | 150 | | | | 150 | |
Huntington Bancshares, Inc. 7.000%, 12/15/20 | | | 80 | | | | 91 | |
Hyundai Capital Services, Inc. 144A 6.000%, 5/5/15(4) | | | 100 | | | | 107 | |
ICICI Bank Ltd. 144A
5.750%, 11/16/20(4) | | | 125 | | | | 115 | |
International Lease Finance Corp. 6.250%, 5/15/19 | | | 96 | | | | 89 | |
Jefferies Group, Inc.
5.125%, 4/13/18 | | | 109 | | | | 96 | |
JPMorgan Chase & Co. 5.250%, 5/1/15 | | | 250 | | | | 265 | |
KeyBank NA 4.950%, 9/15/15 | | | 170 | | | | 179 | |
Kimco Realty Corp.
6.875%, 10/1/19 | | | 150 | | | | 173 | |
Korea Development Bank 4.375%, 8/10/15 | | | 100 | | | | 103 | |
Korea Finance Corp.
4.625%, 11/16/21 | | | 200 | | | | 198 | |
Lincoln National Corp.
6.050%, 4/20/67(3) | | | 50 | | | | 42 | |
Lloyds Banking Group Capital No.1 plc 144A
7.875%, 11/1/20(4) | | | 500 | | | | 379 | |
Lloyds TSB Bank plc 144A 6.500%, 9/14/20(4) | | | 150 | | | | 125 | |
Macquarie Bank Ltd. 144A 6.625%, 4/7/21(4) | | | 100 | | | | 92 | |
Morgan Stanley | | | | | | | | |
3.800%, 4/29/16 | | | 150 | | | | 138 | |
5.750%, 10/18/16 | | | 100 | | | | 97 | |
National Capital Trust II 144A 5.486%, 12/29/49(3)(4) | | | 950 | | | | 865 | |
National Retail Properties, Inc. 5.500%, 7/15/21 | | | 150 | | | | 150 | |
Nordea Bank AB 144A
4.875%, 1/14/21(4) | | | 200 | | | | 204 | |
ORIX Corp. 5.000%, 1/12/16 | | | 86 | | | | 90 | |
ProLogis LP | | | | | | | | |
7.625%, 8/15/14 | | | 150 | | | | 164 | |
6.625%, 5/15/18 | | | 120 | | | | 130 | |
Prudential Financial, Inc. 8.875%, 6/15/38(3) | | | 50 | | | | 57 | |
Regions Financial Corp. | | | | | | | | |
7.750%, 11/10/14 | | | 50 | | | | 50 | |
5.750%, 6/15/15 | | | 55 | | | | 53 | |
Royal Bank of Scotland plc (The) | | | | | | | | |
4.875%, 3/16/15 | | | 100 | | | | 96 | |
3.950%, 9/21/15 | | | 50 | | | | 47 | |
5.625%, 8/24/20 | | | 150 | | | | 144 | |
Senior Housing Properties Trust 4.300%, 1/15/16 | | | 125 | | | | 123 | |
Simon Property Group LP 5.650%, 2/1/20 | | | 50 | | | | 57 | |
SLM Corp. 6.250%, 1/25/16 | | | 200 | | | | 195 | |
| | | | | | | | |
| | | PAR
VALUE | | | VALUE | |
| Financials—continued | | | | | | | | |
Societe Generale 144A
3.500%, 1/15/16(4) | | $ | 105 | | | $ | 93 | |
Spansion LLC
7.875%, 11/15/17 | | | 100 | | | | 92 | |
Unum Group 7.125%, 9/30/16 | | | 125 | | | | 143 | |
Vanguard Health Holding Co. II, LLC / Vanguard Holding Co. II, Inc. 7.750%, 2/1/19 | | | 56 | | | | 54 | |
Vnesheconombank Via (VEB Finance Ltd.) 144A
6.902%, 7/9/20(4) | | | 155 | | | | 159 | |
Webster Financial Corp.
5.125%, 4/15/14 | | | 65 | | | | 64 | |
Westfield Capital Corp., Ltd./ Westfield Finance Authority 144A 5.125%, 11/15/14(4) | | | 355 | | | | 372 | |
XL Group Ltd. 5.750%, 10/1/21 | | | 95 | | | | 100 | |
Zions Bancorporation Series C 9.500%, 12/29/49 | | | 20 | | | | 505 | |
| | | | | | | | |
| | | | | | | 13,214 | |
| | | | | | | | |
| | |
| Health Care—0.5% | | | | | | | | |
Healthsouth Corp.
7.250%, 10/1/18 | | | 90 | | | | 90 | |
Mylan, Inc. 144A
6.000%, 11/15/18(4) | | | 100 | | | | 104 | |
Patheon, Inc. 144A
8.625%, 4/15/17(4) | | | 20 | | | | 16 | |
Quest Diagnostics, Inc. 6.400%, 7/1/17 | | | 280 | | | | 331 | |
Universal Health Services, Inc. | | | | | | | | |
7.125%, 6/30/16 | | | 24 | | | | 26 | |
7.000%, 10/1/18 | | | 25 | | | | 26 | |
Valeant Pharmaceuticals International, Inc. 144A
6.500%, 7/15/16(4) | | | 100 | | | | 100 | |
| | | | | | | | |
| | | | | | | 693 | |
| | | | | | | | |
| | |
| Industrials—1.5% | | | | | | | | |
ADS Tactical, Inc. 144A 11.000%, 4/1/18(4) | | | 75 | | | | 75 | |
AWAS Aviation Capital Ltd. 144A 7.000%, 10/17/16(4) | | | 136 | | | | 136 | |
CHC Helicopter S,A. 144A 9.250%, 10/15/20(4) | | | 100 | | | | 91 | |
Continental Airlines, Inc. Pass-Through-Trust | | | | | | | | |
98-1, A, 6.648%, 9/15/17 | | | 302 | | | | 308 | |
01-1, A1, 6.703%, 6/15/21 | | | 63 | | | | 64 | |
Delta Air Lines, Inc. Pass-Through-Trust 11-1, A 5.300%, 4/15/19 | | | 325 | | | | 328 | |
Deluxe Corp. 144A
7.000%, 3/15/19(4) | | | 60 | | | | 59 | |
Equifax, Inc. 6.300%, 7/1/17 | | | 240 | | | | 271 | |
Griffon Corp. 7.125%, 4/1/18 | | | 100 | | | | 99 | |
Iron Mountain, Inc.
7.750%, 10/1/19 | | | 100 | | | | 106 | |
Kratos Defense & Security Solutions, Inc.
10.000%, 6/1/17 | | | 130 | | | | 134 | |
Refer to Footnote Legend on page 43.
See Notes to Financial Statements
40
VIRTUS STRATEGIC ALLOCATION SERIES
SCHEDULE OF INVESTMENTS (Continued)
DECEMBER 31, 2011
($ reported in thousands)
| | | | | | | | |
| | | PAR
VALUE | | | VALUE | |
| Industrials—continued | | | | | | | | |
Owens Corning, Inc.
6.500%, 12/1/16 | | $ | 60 | | | $ | 65 | |
Steelcase, Inc.
6.375%, 2/15/21 | | | 150 | | | | 159 | |
Teekay Corp. 8.500%, 1/15/20 | | | 75 | | | | 73 | |
Voto-Votorantim Ltd. 144A
6.750%, 4/5/21(4) | | | 150 | | | | 160 | |
| | | | | | | | |
| | | | | | | 2,128 | |
| | | | | | | | |
|
| Information Technology—0.7% | |
Amkor Technology, Inc.
6.625%, 6/1/21 | | | 100 | | | | 97 | |
Audatex North America, Inc. 144A
6.750%, 6/15/18(4) | | | 50 | | | | 51 | |
Broadridge Financial Solutions, Inc. 6.125%, 6/1/17 | | | 250 | | | | 262 | |
CommScope, Inc. 144A
8.250%, 1/15/19(4) | | | 65 | | | | 65 | |
Crown Castle Holdings GS V LLC / Crown Castle GS III Corp. 144A 7.750%, 5/1/17(4) | | | 150 | | | | 161 | |
Earthlink, Inc. 8.875%, 5/15/19 | | | 100 | | | | 92 | |
Equinix, Inc. 7.000%, 7/15/21 | | | 40 | | | | 42 | |
iGate Corp. 144A
9.000%, 5/1/16(4) | | | 75 | | | | 78 | |
Intuit, Inc. 5.750%, 3/15/17 | | | 71 | | | | 80 | |
SunGard Data Systems, Inc. 7.375%, 11/15/18 | | | 30 | | | | 31 | |
| | | | | | | | |
| | | | | | | 959 | |
| | | | | | | | |
| | |
| Materials—1.3% | | | | | | | | |
AbitibiBowater, Inc. 144A 10.250%, 10/15/18(4) | | | 62 | | | | 69 | |
Alcoa, Inc. 5.400%, 4/15/21 | | | 150 | | | | 150 | |
Building Materials Corp. of America 144A
6.750%, 5/1/21(4) | | | 10 | | | | 11 | |
Carpenter Technology Corp. 5.200%, 7/15/21 | | | 150 | | | | 146 | |
Catalyst Paper Corp.
7.375%, 3/1/14 | | | 135 | | | | 7 | |
Celulosa Arauco
7.250%, 7/29/19 | | | 150 | | | | 177 | |
Cemex SAB de CV 144A
5.579%, 9/30/15(3)(4) | | | 150 | | | | 113 | |
Commercial Metals Co.
7.350%, 8/15/18 | | | 170 | | | | 161 | |
CRH America, Inc. | | | | | | | | |
6.000%, 9/30/16 | | | 255 | | | | 272 | |
8.125%, 7/15/18 | | | 150 | | | | 171 | |
Gerdau Holdings, Inc. 144A 7.000%, 1/20/20(4) | | | 100 | | | | 105 | |
Sealed Air Corp. 144A
8.375%, 9/15/21(4) | | | 50 | | | | 56 | |
Severstal OAO Via Steel Capital SA 144A 6.700%, 10/25/17(4) | | | 100 | | | | 94 | |
Verso Paper Holdings LLC / Verso Paper, Inc. Series B,
4.179%, 8/1/14(3) | | | 93 | | | | 59 | |
Xstrata Canada Corp.
5.500%, 6/15/17 | | | 260 | | | | 282 | |
| | | | | | | | |
| | | | | | | 1,873 | |
| | | | | | | | |
| | | | | | | | |
| | | PAR
VALUE | | | VALUE | |
| Telecommunication Services—0.9% | |
Axtel SAB de C.V. 144A
9.000%, 9/22/19(4) | | $ | 38 | | | $ | 29 | |
Cincinnati Bell, Inc.
8.250%, 10/15/17 | | | 60 | | | | 61 | |
Clearwire Communications LLC /Clearwire Finance, Inc. 144A
12.000%, 12/1/15(4) | | | 20 | | | | 19 | |
France Telecom S.A.
4.125%, 9/14/21 | | | 125 | | | | 126 | |
Frontier Communications Corp. | | | | | | | | |
7.875%, 4/15/15 | | | 55 | | | | 56 | |
8.125%, 10/1/18 | | | 75 | | | | 76 | |
OJSC Vimpel Communications (VIP Finance Ireland Ltd.) 144A
9.125%, 4/30/18(4) | | | 125 | | | | 123 | |
Qwest Corp. 6.500%, 6/1/17 | | | 143 | | | | 156 | |
SBA Tower Trust 144A
4.254%, 4/15/15(4) | | | 225 | | | | 231 | |
Telecom Italia Capital SA
5.250%, 10/1/15 | | | 200 | | | | 183 | |
Telemar Norte Leste SA 144A
5.500%, 10/23/20(4) | | | 100 | | | | 99 | |
West Corp. 7.875%, 1/15/19 | | | 100 | | | | 100 | |
| | | | | | | | |
| | | | | | | 1,259 | |
| | | | | | | | |
|
| Utilities—0.7% | |
AmeriGas Partners LP/ AmeriGas Finance Corp.
6.250%, 8/20/19 | | | 90 | | | | 90 | |
Centrais Eletricas Brasileiras SA 144A 6.875%, 7/30/19(4) | | | 100 | | | | 113 | |
Midwest Generation LLC Series B 8.560%, 1/2/16 | | | 105 | | | | 106 | |
NRG Energy, Inc. 144A 7.625%, 5/15/19(4) | | | 100 | | | | 98 | |
Suburban Propane Partners LP/Suburban Energy Finance Corp. 7.375%, 3/15/20 | | | 45 | | | | 47 | |
United Energy Distribution Holdings Property Ltd. 144A 5.450%, 4/15/16(4)(8) | | | 500 | | | | 533 | |
| | | | | | | | |
| | | | | | | | 987 | |
| TOTAL CORPORATE BONDS AND NOTES | |
| (Identified Cost $25,478) | | | | | | | 25,904 | |
|
| LOAN AGREEMENTS(3)—0.9% | |
|
| Consumer Discretionary—0.2% | |
Advantage Sales & Marketing, Inc. 5.250%, 12/18/17 | | | 17 | | | | 17 | |
Brickman Group Holdings, Inc. Tranche B, 7.250%, 10/14/16 | | | 99 | | | | 100 | |
Chrysler Group LLC / Chrysler Group Co-Issuer, Inc. Tranche B, 6.000%, 5/24/17 | | | 100 | | | | 94 | |
SRAM LLC 5.250%, 6/7/18 | | | 31 | | | | 31 | |
Visant Corp. (Jostens) Tranche B, 5.750%, 12/22/16 | | | 71 | | | | 66 | |
| | | | | | | | |
| | | | | | | 308 | |
| | | | | | | | |
| | | | | | | | |
| | | PAR
VALUE | | | VALUE | |
| Consumer Staples—0.1% | | | | | | | | |
Del Monte Foods Co.
4.500%, 3/8/18 | | $ | 22 | | | $ | 21 | |
Revlon Consumer Products Corp. Tranche B,
4.750%, 11/19/17 | | | 63 | | | | 62 | |
Reynolds Group Holdings, Inc. Tranche B, 6.500%, 2/9/18 | | | 98 | | | | 98 | |
| | | | | | | | |
| | | | | | | 181 | |
| | | | | | | | |
|
| Financials—0.1% | |
International Lease Finance Corp. (Delos Aircraft, Inc.) 7.000%, 3/17/16 | | | 8 | | | | 9 | |
iStar Financial, Inc. Tranche A-1 5.000%, 6/28/13 | | | 64 | | | | 64 | |
MoneyGram International, Inc. 4.500%, 11/17/17 | | | 7 | | | | 7 | |
Springleaf Financial Funding Co. (American General Finance Corp.)
5.500%, 5/10/17 | | | 60 | | | | 52 | |
Walter Investments, Inc. 7.750%, 6/30/16 | | | 40 | | | | 40 | |
| | | | | | | | |
| | | | | | | 172 | |
| | | | | | | | |
|
| Health Care—0.1% | |
Surgery Center Holdings, Inc. 6.500%, 2/6/17 | | | 66 | | | | 61 | |
| | | | | | | | |
|
| Industrials—0.0% | |
Brock Holdings Ill, Inc. 6.000%, 3/16/17 | | | 20 | | | | 19 | |
| | | | | | | | |
|
| Information Technology—0.2% | |
Lawson Software, Inc. (SoftBrands, Inc.)
6.750%, 7/5/17 | | | 60 | | | | 59 | |
Mood Media Corp.
7.000%, 5/6/18 | | | 65 | | | | 60 | |
Novell, Inc. (Attachmate Corp.)
6.500%, 4/27/17 | | | 99 | | | | 97 | |
| | | | | | | | |
| | | | | | | 216 | |
| | | | | | | | |
| | |
| Materials—0.2% | | | | | | | | |
Anchor Glass Container Corp. Second Lien 6.000%, 3/2/16 | | | 66 | | | | 66 | |
CPG International, Inc. Tranche B,
6.000%, 2/18/17 | | | 44 | | | | 41 | |
General Chemical Corp. Tranche B,
5.000%, 10/6/15 | | | 46 | | | | 46 | |
JMC Steel Group
4.750%, 4/1/17 | | | 20 | | | | 20 | |
Norit Holding B.V.
6.750%, 7/10/17 | | | 30 | | | | 30 | |
| | | | | | | | |
| | | | | | | 203 | |
| | | | | | | | |
Refer to Footnote Legend on page 43.
See Notes to Financial Statements
41
VIRTUS STRATEGIC ALLOCATION SERIES
SCHEDULE OF INVESTMENTS (Continued)
DECEMBER 31, 2011
($ reported in thousands)
| | | | | | | | |
| | | PAR
VALUE | | | VALUE | |
| Utilities—0.0% | | | | | | | | |
Texas Competitive Electric Holdings Co., LLC Tranche 2014,
3.780%, 10/10/14 | | $ | 68 | | | $ | 48 | |
TOTAL LOAN AGREEMENTS
(Identified Cost $1,258) | | | | 1,208 | |
| | |
SHARES | | | | |
| PREFERRED STOCK—0.2% | |
| |
| Financials—0.2% | | | | | |
Ally Financial, Inc. Series G, 144A 7.00%(4) | | | 84 | | | | 60 | |
Banco Bilbao Vizcaya Argentaria S.A. International Preferred S.A. Unipersonal 5.92%(3) | | | 110 | | | | 73 | |
JPMorgan Chase & Co. Series 1 7.90%(3) | | | 89 | | | | 95 | |
TOTAL PREFERRED STOCK
(Identified Cost $200) | | | | 228 | |
|
| COMMON STOCKS—57.3% | |
|
| Consumer Discretionary—7.7% | |
Amazon.com, Inc.(2) | | | 12,600 | | | | 2,181 | |
AutoZone, Inc.(2) | | | 5,000 | | | | 1,625 | |
Comcast Corp. Class A | | | 71,000 | | | | 1,683 | |
Darden Restaurants, Inc. | | | 37,000 | | | | 1,686 | |
Lululemon Athletica, Inc.(2) | | | 30,000 | | | | 1,400 | |
McDonald’s Corp. | | | 20,000 | | | | 2,007 | |
| | | | | | | | |
| | | | | | | 10,582 | |
| | | | | | | | |
|
| Consumer Staples—2.6% | |
Altria Group, Inc. | | | 61,000 | | | | 1,809 | |
PepsiCo, Inc. | | | 27,000 | | | | 1,791 | |
| | | | | | | | |
| | | | | | | 3,600 | |
| | | | | | | | |
| | |
| Energy—10.5% | | | | | | | | |
Chesapeake Energy Corp. | | | 59,000 | | | | 1,315 | |
Chevron Corp. | | | 18,000 | | | | 1,915 | |
ConocoPhillips | | | 25,000 | | | | 1,822 | |
Continental Resources, Inc.(2) | | | 12,000 | | | | 801 | |
Halliburton Co. | | | 43,000 | | | | 1,484 | |
Occidental Petroleum Corp. | | | 18,000 | | | | 1,687 | |
Petroleo Brasileiro S.A. ADR | | | 39,000 | | | | 969 | |
Schlumberger Ltd. | | | 27,000 | | | | 1,844 | |
Whiting Petroleum Corp.(2) | | | 19,000 | | | | 887 | |
Williams Cos., Inc. (The) | | | 54,000 | | | | 1,783 | |
| | | | | | | | |
| | | | | | | 14,507 | |
| | | | | | | | |
| | |
| Financials—4.0% | | | | | | | | |
Bank of America Corp. | | | 208,000 | | | | 1,156 | |
Citigroup, Inc. | | | 42,000 | | | | 1,105 | |
Goldman Sachs Group, Inc. (The) | | | 18,000 | | | | 1,628 | |
Lincoln National Corp. | | | 88,000 | | | | 1,709 | |
| | | | | | | | |
| | | | | | | 5,598 | |
| | | | | | | | |
| | | | | | | | |
| | |
SHARES | | | VALUE | |
| Health Care—6.0% | | | | | | | | |
Abbott Laboratories | | | 30,000 | | | $ | 1,687 | |
Biogen Idec, Inc.(2) | | | 17,000 | | | | 1,871 | |
Express Scripts, Inc.(2) | | | 29,000 | | | | 1,296 | |
Gilead Sciences, Inc.(2) | | | 42,000 | | | | 1,719 | |
UnitedHealth Group, Inc. | | | 34,000 | | | | 1,723 | |
| | | | | | | | |
| | | | | | | 8,296 | |
| | | | | | | | |
| | |
| Industrials—8.2% | | | | | | | | |
Alaska Air Group, Inc.(2) | | | 24,000 | | | | 1,802 | |
Caterpillar, Inc. | | | 18,000 | | | | 1,631 | |
Cummins, Inc. | | | 19,000 | | | | 1,672 | |
Deere & Co. | | | 22,000 | | | | 1,702 | |
Foster Wheeler AG(2) | | | 69,000 | | | | 1,321 | |
Union Pacific Corp. | | | 16,000 | | | | 1,695 | |
United Continental Holdings, Inc.(2) | | | 82,000 | | | | 1,547 | |
| | | | | | | | |
| | | | | | | 11,370 | |
| | | | | | | | |
| |
| Information Technology—8.7% | | | | | |
Apple, Inc.(2) | | | 8,300 | | | | 3,362 | |
Intel Corp. | | | 69,000 | | | | 1,673 | |
International Business Machines Corp. | | | 9,000 | | | | 1,655 | |
QUALCOMM, Inc. | | | 31,000 | | | | 1,696 | |
SanDisk Corp.(2) | | | 34,000 | | | | 1,673 | |
Visa, Inc. Class A | | | 19,000 | | | | 1,929 | |
| | | | | | | | |
| | | | | | | 11,988 | |
| | | | | | | | |
| | |
| Materials—8.2% | | | | | | | | |
CF Industries Holdings, Inc. | | | 10,000 | | | | 1,450 | |
Cliffs Natural Resources, Inc. | | | 26,000 | | | | 1,621 | |
Du Pont (E.I.) de Nemours & Co. | | | 36,000 | | | | 1,648 | |
Freeport-McMoRan Copper & Gold, Inc. | | | 46,000 | | | | 1,692 | |
Monsanto Co. | | | 26,000 | | | | 1,822 | |
Nucor Corp. | | | 38,000 | | | | 1,504 | |
Potash Corp. of Saskatchewan, Inc. | | | 38,000 | | | | 1,568 | |
| | | | | | | | |
| | | | | | | 11,305 | |
| | | | | | | | |
| |
| Telecommunication Services—1.4% | | | | | |
Verizon Communications, Inc. | | | 47,000 | | | | 1,886 | |
TOTAL COMMON STOCKS
(Identified Cost $63,367) | | | | | | | 79,132 | |
| |
| EXCHANGE-TRADED FUNDS—2.6% | | | | | |
Consumer Staples Select Sector SPDR Fund | | | 41,000 | | | | 1,332 | |
Health Care Select Sector SPDR Fund | | | 38,000 | | | | 1,318 | |
Utilities Select Sector SPDR Fund | | | 26,000 | | | | 935 | |
TOTAL EXCHANGE-TRADED FUNDS
(Identified Cost $3,499) | | | | 3,585 | |
| TOTAL LONG TERM INVESTMENTS—97.4% | |
| (Identified Cost $117,177) | | | | 134,472 | |
| | | | | | | | |
| | |
SHARES | | | VALUE | |
| SHORT-TERM INVESTMENTS—0.5% | | | | | |
| |
| Money Market Mutual Funds—0.5% | | | | | |
Dreyfus Cash Management Fund – Institutional Shares (seven-day effective yield 0.050%) | | | 638,905 | | | $ | 639 | |
| TOTAL SHORT-TERM INVESTMENTS (Identified Cost $639) | | | | 639 | |
| TOTAL INVESTMENTS—97.9% (Identified Cost $117,816) | | | | 135,111 | (1) |
Other assets and liabilities, net—2.1% | | | | 3,013 | |
| | | | | | | | |
| NET ASSETS—100.0% | | | | | | $ | 138,124 | |
| | | | | | | | |
Abbreviations:
| ADR | American Depositary Receipt |
| AG | Aktiengesellschaft a corporation that is limited by shares, i.e., owned by shareholders (Germany). |
| FGIC | Financial Guaranty Insurance Company |
| FNMA | Federal National Mortgage Association (“Fannie Mae”). |
| FSA | Financial Security Assurance, Inc. |
| GNMA | Government National Mortgage Association (“Ginnie Mae”) |
| NATL | National Public Finance Guarantee Corp. |
| OJSC | Open Joint Stock Company (Russia) |
| REIT | Real Estate Investment Trust |
| de CV | A variable capital company. |
| SPDR | S&P Depositary Receipt |
See Notes to Financial Statements
42
VIRTUS STRATEGIC ALLOCATION SERIES
SCHEDULE OF INVESTMENTS (Continued)
DECEMBER 31, 2011
($ reported in thousands)
Footnote Legend:
| (1) | Federal Income Tax Information: For tax information at December 31, 2011, see Note 11 Federal Income Tax Information in the Notes to Financial Statements. |
| (2) | Non-income producing. |
| (3) | Variable or step coupon security; interest rate shown reflects the rate in effect at December 31, 2011. |
| (4) | Security exempt from registration under Rule 144A of the Securities Act of 1933. These securities may be resold in transactions exempt from registration, normally to qualified institutional buyers. At December 31, 2011, these securities amounted to a value of $13,486 or 9.8% of net assets. |
| (5) | Regulation S security. Security is offered and sold outside of the United States, therefore, it is exempt from registration with the SEC under rules 903 and 904 of the Securities Act of 1933. |
| (6) | Interest payments may be deferred. |
| (7) | No contractual maturity date. |
Foreign Currencies:
| | | | |
| Country Weightings† (Unaudited) | | | |
United States | | | 89 | % |
Canada | | | 3 | |
Australia | | | 1 | |
Brazil | | | 1 | |
South Korea | | | 1 | |
Switzerland | | | 1 | |
United Kingdom | | | 1 | |
Other | | | 3 | |
Total | | | 100 | % |
† % of total investments as of December 31, 2011 | |
The following table provides a summary of inputs used to value the Fund’s investments as of December 31, 2011 (See Security Valuation Note 2A in the Notes to Financial Statements):
| | | | | | | | | | | | | | | | |
| | | Total
Value at
December 31, 2011 | | | Level 1 –
Quoted
Prices | | | Level 2 –
Significant
Observable
Inputs | | | Level 3 –
Significant
Unobservable
Inputs | |
Debt Securities: | | | | | | | | | | | | | | | | |
Asset-Backed Securities | | $ | 2,457 | | | $ | — | | | $ | 2,457 | | | $ | — | |
Corporate Bonds And Notes | | | 25,904 | | | | — | | | | 25,897 | | | | 7 | |
Foreign Government Securities | | | 1,418 | | | | — | | | | 1,418 | | | | — | |
Loan Agreements | | | 1,208 | | | | — | | | | 1,208 | | | | — | |
Mortgage-Backed Securities | | | 14,712 | | | | — | | | | 14,712 | | | | — | |
Municipal Bonds | | | 4,786 | | | | — | | | | 4,786 | | | | — | |
U.S. Government Securities | | | 1,042 | | | | — | | | | 1,042 | | | | — | |
Equity Securities: | | | | | | | | | | | | | | | | |
Common Stocks | | | 79,132 | | | | 79,132 | | | | — | | | | — | |
Exchange-Traded Funds | | | 3,585 | | | | 3,585 | | | | — | | | | — | |
Preferred Stock | | | 228 | | | | — | | | | 228 | | | | — | |
Short-term Investments | | | 639 | | | | 639 | | | | — | | | | — | |
| | | | | | | | | | | | | | | | |
Total Investments | | $ | 135,111 | | | $ | 83,356 | | | $ | 51,748 | | | $ | 7 | |
| | | | | | | | | | | | | | | | |
The following is a reconciliation of assets of the Fund for Level 3 investments for which significant unobservable inputs were used to determine fair value.
| | | | |
| | | Corporate Bonds
and Notes | |
Beginning Balance December 31, 2010: | | $ | — | |
Accrued discount/(premium) | | | — | |
Realized gain (loss) | | | — | |
Change in unrealized appreciation (depreciation) | | | — | |
Purchases | | | — | |
Sales(b) | | | — | |
Transfers into Level 3(a) | | | 7 | |
Transfers from Level 3(a) | | | — | |
| | | | |
Ending Balance December 31, 2011 | | $ | 7 | |
| | | | |
| (a) | “Transfers in and/or out” represent the ending value as of December 31, 2011, for any investment security where a change in the pricing level occurred from the beginning to the end of the period. |
| (b) | Includes paydowns on securities. |
See Notes to Financial Statements
43
VIRTUS VARIABLE INSURANCE TRUST
STATEMENTS OF ASSETS AND LIABILITIES
DECEMBER 31, 2011
(Reported in thousands except shares and per share amounts)
| | | | | | | | | | | | | | | | |
| | | Capital Growth
Series | | | Growth & Income
Series | | | International
Series | | | Multi-Sector
Fixed Income
Series | |
| | | | | | | | | | | | | | | | |
Assets | | | | | | | | | | | | | | | | |
Investment in securities at value(1) | | $ | 189,897 | | | $ | 147,324 | | | $ | 332,823 | | | $ | 194,340 | |
Foreign currency at value(2) | | | — | | | | — | | | | 874 | | | | 2 | |
Cash | | | — | | | | — | | | | — | | | | 320 | |
Receivables | | | | | | | | | | | | | | | | |
Investment securities sold | | | — | | | | 2,020 | | | | — | | | | 588 | |
Fund shares sold | | | — | | | | — | | | | 7 | | | | — | |
Dividends and interest | | | 59 | | | | 170 | | | | 1,218 | | | | 2,731 | |
Tax reclaims | | | 4 | | | | — | | | | 1,067 | | | | — | |
Prepaid expenses | | | 17 | | | | 13 | | | | 29 | | | | 16 | |
Other assets | | | 93 | | | | 75 | | | | 162 | | | | 94 | |
| | | | | | | | | | | | | | | | |
Total assets | | | 190,070 | | | | 149,602 | | | | 336,180 | | | | 198,091 | |
| | | | | | | | | | | | | | | | |
Liabilities | | | | | | | | | | | | | | | | |
Cash overdraft | | | — | | | | 75 | | | | — | | | | — | |
Payables | | | | | | | | | | | | | | | | |
Fund shares repurchased | | | 77 | | | | 211 | | | | 99 | | | | 99 | |
Investment securities purchased | | | — | | | | 794 | | | | — | | | | 693 | |
Investment advisory fee | | | 99 | | | | 66 | | | | 178 | | | | 64 | |
Administration fee | | | 13 | | | | 10 | | | | 23 | | | | 14 | |
Transfer agent fees and expenses | | | 2 | | | | 2 | | | | 2 | | | | 2 | |
Trustees’ fee and expenses | | | 6 | | | | 8 | | | | 11 | | | | 7 | |
Professional fee | | | 29 | | | | 28 | | | | 39 | | | | 32 | |
Distribution and service fees | | | 40 | | | | 32 | | | | 71 | | | | 42 | |
Trustee deferred compensation plan | | | 93 | | | | 75 | | | | 162 | | | | 94 | |
Other accrued expenses | | | 22 | | | | 18 | | | | 66 | | | | 28 | |
| | | | | | | | | | | | | | | | |
Total liabilities | | | 381 | | | | 1,319 | | | | 651 | | | | 1,075 | |
| | | | | | | | | | | | | | | | |
Net Assets | | $ | 189,689 | | | $ | 148,283 | | | $ | 335,529 | | | $ | 197,016 | |
| | | | | | | | | | | | | | | | |
Net Assets Consist of: | | | | | | | | | | | | | | | | |
Capital paid in on shares of beneficial interest | | $ | 253,128 | | | $ | 146,538 | | | $ | 300,727 | | | $ | 207,293 | |
Accumulated undistributed net investment income (loss) | | | — | (3) | | | 81 | | | | 1,648 | | | | 1,444 | |
Accumulated undistributed net realized gain (loss) | | | (78,083 | ) | | | (22,797 | ) | | | (46,233 | ) | | | (13,696 | ) |
Net unrealized appreciation (depreciation) | | | 14,644 | | | | 24,461 | | | | 79,387 | | | | 1,975 | |
| | | | | | | | | | | | | | | | |
Net Assets | | $ | 189,689 | | | $ | 148,283 | | | $ | 335,529 | | | $ | 197,016 | |
| | | | | | | | | | | | | | | | |
Net asset value and offering price per share | | $ | 13.99 | | | $ | 12.51 | | | $ | 15.28 | | | $ | 9.18 | |
| | | | | | | | | | | | | | | | |
Shares of beneficial interest outstanding, $1 par value, unlimited authorization | | | 13,559,173 | | | | 11,851,651 | | | | 21,962,454 | | | | 21,472,512 | |
| | | | | | | | | | | | | | | | |
(1) Investments in securities at cost | | $ | 175,253 | | | $ | 122,863 | | | $ | 253,442 | | | $ | 192,349 | |
(2) Foreign currency at cost | | $ | — | | | $ | — | | | $ | 881 | | | $ | 2 | |
(3) Amount less than $500. | | | | | | | | | | | | | | | | |
See Notes to Financial Statements
44
VIRTUS VARIABLE INSURANCE TRUST
STATEMENTS OF ASSETS AND LIABILITIES (Continued)
DECEMBER 31, 2011
(Reported in thousands except shares and per share amounts)
| | | | | | | | | | | | | | | | | | | | |
| | | Premium
AlphaSector
Series | | | Real Estate
Securities Series | | | Small-Cap Growth
Series | | | Small-Cap
Value Series | | | Strategic
Allocation Series | |
| | | | | | | | | | | | | | | | | | | | |
Assets | | | | | | | | | | | | | | | | | | | | |
Investment in securities at value(1) | | $ | 1,276 | | | $ | 102,467 | | | $ | 65,499 | | | $ | 128,839 | | | $ | 135,111 | |
Cash | | | — | | | | — | | | | — | | | | — | | | | 8 | |
Receivables | | | | | | | | | | | | | | | | | | | | |
Investment securities sold | | | 152 | | | | 533 | | | | 595 | | | | 1,265 | | | | 2,913 | |
Fund shares sold | | | — | | | | 1 | | | | — | | | | — | | | | — | |
Receivable from adviser | | | 6 | | | | — | | | | — | | | | — | | | | — | |
Dividends and interest | | | — | (2) | | | 319 | | | | 9 | | | | 137 | | | | 729 | |
Prepaid expenses | | | — | (2) | | | 8 | | | | 6 | | | | 11 | | | | 12 | |
Other assets | | | — | (2) | | | 47 | | | | 30 | | | | 63 | | | | 65 | |
| | | | | | | | | | | | | | | | | | | | |
Total assets | | | 1,434 | | | | 103,375 | | | | 66,139 | | | | 130,315 | | | | 138,838 | |
| | | | | | | | | | | | | | | | | | | | |
Liabilities | | | | | | | | | | | | | | | | | | | | |
Payables | | | | | | | | | | | | | | | | | | | | |
Fund shares repurchased | | | — | (2) | | | 78 | | | | 54 | | | | 65 | | | | 57 | |
Investment securities purchased | | | 152 | | | | — | | | | 1,095 | | | | — | | | | 443 | |
Investment advisory fee | | | — | | | | 64 | | | | 35 | | | | 195 | | | | 54 | |
Administration fee | | | — | (2) | | | 7 | | | | 5 | | | | 9 | | | | 9 | |
Transfer agent fees and expenses | | | 2 | | | | 2 | | | | 2 | | | | 2 | | | | 2 | |
Trustees’ fee and expenses | | | — | (2) | | | 3 | | | | 2 | | | | 4 | | | | 5 | |
Professional fee | | | 25 | | | | 27 | | | | 26 | | | | 27 | | | | 32 | |
Distribution and service fees | | | — | (2) | | | 21 | | | | 14 | | | | 28 | | | | 29 | |
Trustee deferred compensation plan | | | — | (2) | | | 47 | | | | 30 | | | | 63 | | | | 65 | |
Other accrued expenses | | | 5 | | | | 12 | | | | 8 | | | | 15 | | | | 18 | |
| | | | | | | | | | | | | | | | | | | | |
Total liabilities | | | 184 | | | | 261 | | | | 1,271 | | | | 408 | | | | 714 | |
| | | | | | | | | | | | | | | | | | | | |
Net Assets | | $ | 1,250 | | | $ | 103,114 | | | $ | 64,868 | | | $ | 129,907 | | | $ | 138,124 | |
| | | | | | | | | | | | | | | | | | | | |
Net Assets Consist of: | | | | | | | | | | | | | | | | | | | | |
Capital paid in on shares of beneficial interest | | $ | 1,295 | | | $ | 58,311 | | | $ | 69,512 | | | $ | 141,161 | | | $ | 134,006 | |
Accumulated undistributed net investment income (loss) | | | — | (2) | | | 312 | | | | (32 | ) | | | 348 | | | | 492 | |
Accumulated undistributed net realized gain (loss) | | | (98 | ) | | | (263 | ) | | | (11,575 | ) | | | (20,229 | ) | | | (13,669 | ) |
Net unrealized appreciation (depreciation) | | | 53 | | | | 44,754 | | | | 6,963 | | | | 8,627 | | | | 17,295 | |
| | | | | | | | | | | | | | | | | | | | |
Net Assets | | $ | 1,250 | | | $ | 103,114 | | | $ | 64,868 | | | $ | 129,907 | | | $ | 138,124 | |
| | | | | | | | | | | | | | | | | | | | |
Net asset value and offering price per share | | $ | 9.49 | | | $ | 26.18 | | | $ | 14.03 | | | $ | 11.99 | | | $ | 12.17 | |
| | | | | | | | | | | | | | | | | | | | |
Shares of beneficial interest outstanding, $1 par value, unlimited authorization | | | 131,693 | | | | 3,938,023 | | | | 4,622,432 | | | | 10,838,459 | | | | 11,351,294 | |
| | | | | | | | | | | | | | | | | | | | |
(1) Investments in securities at cost | | $ | 1,223 | | | $ | 57,713 | | | $ | 58,536 | | | $ | 120,212 | | | $ | 117,816 | |
(2) Amount is less than $500. | | | | | | | | | | | | | | | | | | | | |
See Notes to Financial Statements
45
VIRTUS VARIABLE INSURANCE TRUST
STATEMENTS OF OPERATIONS
YEAR ENDED DECEMBER 31, 2011
(Reported in thousands)
| | | | | | | | | | | | | | | | |
| | | Capital Growth
Series | | | Growth & Income
Series | | | International
Series | | | Multi-Sector
Fixed Income
Series | |
| | | | | | | | | | | | | | | | |
Investment Income | | | | | | | | | | | | | | | | |
Dividends | | $ | 2,085 | | | $ | 2,755 | | | $ | 15,834 | | | $ | 92 | |
Interest | | | 48 | | | | 2 | | | | 2 | | | | 15,509 | |
Security lending | | | 3 | | | | 2 | | | | 17 | | | | — | |
Foreign taxes withheld | | | (17 | ) | | | (14 | ) | | | (1,130 | ) | | | (19 | ) |
| | | | | | | | | | | | | | | | |
Total investment income | | | 2,119 | | | | 2,745 | | | | 14,723 | | | | 15,582 | |
| | | | | | | | | | | | | | | | |
Expenses | | | | | | | | | | | | | | | | |
Investment advisory fee | | | 1,497 | | | | 1,207 | | | | 2,738 | | | | 1,076 | |
Administration fee | | | 177 | | | | 143 | | | | 307 | | | | 177 | |
Distribution and service fees | | | 535 | | | | 431 | | | | 933 | | | | 538 | |
Transfer agent fee and expenses | | | 13 | | | | 13 | | | | 14 | | | | 13 | |
Custodian fees | | | 2 | | | | 10 | | | | 83 | | | | 23 | |
Printing fees and expenses | | | 44 | | | | 36 | | | | 69 | | | | 43 | |
Professional fees | | | 50 | | | | 45 | | | | 74 | | | | 59 | |
Trustees’ fee and expenses | | | 68 | | | | 58 | | | | 119 | | | | 68 | |
Miscellaneous | | | 68 | | | | 58 | | | | 121 | | | | 83 | |
| | | | | | | | | | | | | | | | |
Total expenses | | | 2,454 | | | | 2,001 | | | | 4,458 | | | | 2,080 | |
Less expenses reimbursed by investment advisor | | | (423 | ) | | | (449 | ) | | | (613 | ) | | | (466 | ) |
| | | | | | | | | | | | | | | | |
Net expenses | | | 2,031 | | | | 1,552 | | | | 3,845 | | | | 1,614 | |
| | | | | | | | | | | | | | | | |
Net investment income (loss) | | | 88 | | | | 1,193 | | | | 10,878 | | | | 13,968 | |
| | | | | | | | | | | | | | | | |
Net Realized and Unrealized Gain (Loss) on Investments | | | | | | | | | | | | | | | | |
Net realized gain (loss) on securities | | | 3,163 | | | | 6,338 | | | | 16,928 | | | | 4,103 | |
Net realized gain (loss) on foreign currency transactions | | | — | | | | — | | | | 20 | | | | 29 | |
Net change in unrealized appreciation (depreciation) on investments | | | (12,086 | ) | | | (9,300 | ) | | | (43,724 | ) | | | (11,314 | ) |
Net change in unrealized appreciation (depreciation) on foreign currency translations | | | — | | | | — | | | | (85 | ) | | | (26 | ) |
| | | | | | | | | | | | | | | | |
| | | | |
Net gain (loss) on investments | | | (8,923 | ) | | | (2,962 | ) | | | (26,861 | ) | | | (7,208 | ) |
| | | | | | | | | | | | | | | | |
Net increase (decrease) in net assets resulting from operations | | $ | (8,835 | ) | | $ | (1,769 | ) | | $ | (15,983 | ) | | $ | 6,760 | |
| | | | | | | | | | | | | | | | |
See Notes to Financial Statements
46
VIRTUS VARIABLE INSURANCE TRUST
STATEMENTS OF OPERATIONS (Continued)
YEAR ENDED DECEMBER 31, 2011
(Reported in thousands)
| | | | | | | | | | | | | | | | | | | | |
| | | Premium
AlphaSector
Series(2) | | | Real Estate
Securities
Series | | | Small-Cap Growth
Series | | | Small-Cap Value
Series | | | Strategic
Allocation Series | |
| | | | | | | | | | | | | | | | | | | | |
Investment Income | | | | | | | | | | | | | | | | | | | | |
Dividends | | $ | 23 | | | $ | 2,157 | | | $ | 613 | | | $ | 3,227 | | | $ | 1,469 | |
Interest | | | — | | | | — | | | | — | | | | — | | | | 3,410 | |
Security lending | | | — | | | | — | (1) | | | 3 | | | | 20 | | | | — | |
Foreign taxes withheld | | | — | | | | — | | | | — | | | | — | | | | (9 | ) |
| | | | | | | | | | | | | | | | | | | | |
Total investment income | | | 23 | | | | 2,157 | | | | 616 | | | | 3,247 | | | | 4,870 | |
| | | | | | | | | | | | | | | | | | | | |
Expenses | | | | | | | | | | | | | | | | | | | | |
Investment advisory fee | | | 10 | | | | 807 | | | | 582 | | | | 1,297 | | | | 903 | |
Administration fee | | | 1 | | | | 88 | | | | 56 | | | | 119 | | | | 131 | |
Distribution and service fees | | | 2 | | | | 269 | | | | 171 | | | | 360 | | | | 376 | |
Transfer agent fee and expenses | | | 11 | | | | 14 | | | | 14 | | | | 13 | | | | 13 | |
Custodian fees | | | 3 | | | | 5 | | | | 6 | | | | 7 | | | | 9 | |
Printing fees and expenses | | | 5 | | | | 25 | | | | 16 | | | | 33 | | | | 30 | |
Professional fees | | | 31 | | | | 39 | | | | 34 | | | | 42 | | | | 52 | |
Trustees’ fee and expenses | | | — | (1) | | | 34 | | | | 21 | | | | 45 | | | | 48 | |
Miscellaneous | | | — | (1) | | | 36 | | | | 23 | | | | 48 | | | | 47 | |
| | | | | | | | | | | | | | | | | | | | |
Total expenses | | | 63 | | | | 1,317 | | | | 923 | | | | 1,964 | | | | 1,609 | |
Less expenses reimbursed by investment advisor | | | (49 | ) | | | (134 | ) | | | (205 | ) | | | (91 | ) | | | (330 | ) |
| | | | | | | | | | | | | | | | | | | | |
Net expenses | | | 14 | | | | 1,183 | | | | 718 | | | | 1,873 | | | | 1,279 | |
| | | | | | | | | | | | | | | | | | | | |
Net investment income (loss) | | | 9 | | | | 974 | | | | (102 | ) | | | 1,374 | | | | 3,591 | |
| | | | | | | | | | | | | | | | | | | | |
Net Realized and Unrealized Gain (Loss) on Investments | | | | | | | | | | | | | | | | | | | | |
Net realized gain (loss) on securities | | | (98 | ) | | | 10,746 | | | | 6,450 | | | | 2,408 | | | | 8,769 | |
Net realized gain (loss) on foreign currency transactions | | | — | | | | — | | | | — | | | | — | | | | (3 | ) |
Net change in unrealized appreciation (depreciation) on investments | | | 53 | | | | (1,562 | ) | | | 4,284 | | | | 3,222 | | | | (9,188 | ) |
Net change in unrealized appreciation (depreciation) on foreign currency translations | | | — | | | | — | | | | — | | | | — | | | | (1 | ) |
| | | | | | | | | | | | | | | | | | | | |
Net gain (loss) on investments | | | (45 | ) | | | 9,184 | | | | 10,734 | | | | 5,630 | | | | (423 | ) |
| | | | | | | | | | | | | | | | | | | | |
Net increase (decrease) in net assets resulting from operations | | $ | (36 | ) | | $ | 10,158 | | | $ | 10,632 | | | $ | 7,004 | | | $ | 3,168 | |
| | | | | | | | | | | | | | | | | | | | |
| (1) | Amount is less than $500. |
| (2) | Inception date February 14, 2011. |
See Notes to Financial Statements
47
VIRTUS VARIABLE INSURANCE TRUST
STATEMENTS OF CHANGES IN NET ASSETS
(Reported in thousands)
| | | | | | | | | | | | | | | | |
| | | Capital Growth Series | | | Growth & Income Series | |
| | | Year Ended
December 31, 2011 | | | Year Ended
December 31, 2010 | | |
Year Ended
December 31, 2011 | | | Year Ended
December 31, 2010 | |
| | | | | | | | | | | | | | | | |
INCREASE/(DECREASE) IN NET ASSETS | | | | | | | | | | | | | | | | |
From Operations | | | | | | | | | | | | | | | | |
Net investment income (loss) | | $ | 88 | | | $ | 793 | | | $ | 1,193 | | | $ | 969 | |
Net realized gain (loss) | | | 3,163 | | | | 48,702 | | | | 6,338 | | | | 23,957 | |
Net change in unrealized appreciation (depreciation) | | | (12,086 | ) | | | (19,546 | ) | | | (9,300 | ) | | | (9,877 | ) |
| | | | | | | | | | | | | | | | |
Increase (decrease) in net assets resulting from operations | | | (8,835 | ) | | | 29,949 | | | | (1,769 | ) | | | 15,049 | |
| | | | | | | | | | | | | | | | |
From Distributions to Shareholders | | | | | | | | | | | | | | | | |
Net investment income | | | (116 | ) | | | (916 | ) | | | (1,187 | ) | | | (1,098 | ) |
Net realized short-term gains | | | — | | | | — | | | | — | | | | — | |
Net realized long-term gains | | | — | | | | — | | | | — | | | | — | |
| | | | | | | | | | | | | | | | |
Decrease in net assets from distributions to shareholders | | | (116 | ) | | | (916 | ) | | | (1,187 | ) | | | (1,098 | ) |
| | | | | | | | | | | | | | | | |
From Share Transactions | | | | | | | | | | | | | | | | |
Sale of shares | | | 5,485 | | | | 6,280 | | | | 2,681 | | | | 3,548 | |
Plan of reorganization | | | — | | | | — | | | | — | | | | 101,390 | |
Reinvestment of distributions | | | 116 | | | | 916 | | | | 1,187 | | | | 1,098 | |
Shares repurchased | | | (35,070 | ) | | | (44,529 | ) | | | (41,990 | ) | | | (20,926 | ) |
| | | | | | | | | | | | | | | | |
Increase (decrease) in net assets from share transactions | | | (29,469 | ) | | | (37,333 | ) | | | (38,122 | ) | | | 85,110 | |
| | | | | | | | | | | | | | | | |
Net increase (decrease) in net assets | | | (38,420 | ) | | | (8,300 | ) | | | (41,078 | ) | | | 99,061 | |
| | | | |
Net Assets | | | | | | | | | | | | | | | | |
Beginning of period | | | 228,109 | | | | 236,409 | | | | 189,361 | | | | 90,300 | |
| | | | | | | | | | | | | | | | |
End of period | | $ | 189,689 | | | $ | 228,109 | | | $ | 148,283 | | | $ | 189,361 | |
| | | | | | | | | | | | | | | | |
Accumulated undistributed net investment income (loss) at end of period | | | — | (1) | | | 37 | | | | 81 | | | | 76 | |
| | | | | | | | |
Shares | | | | | | | | | | | | | | | | |
Sales of shares | | | 372 | | | | 485 | | | | 206 | | | | 308 | |
Plan of reorganization | | | — | | | | — | | | | — | | | | 8,303 | |
Reinvestment of distributions | | | 8 | | | | 70 | | | | 92 | | | | 98 | |
Shares repurchased | | | (2,368 | ) | | | (3,440 | ) | | | (3,221 | ) | | | (1,797 | ) |
| | | | | | | | | | | | | | | | |
Net Increase/(Decrease) | | | (1,988 | ) | | | (2,885 | ) | | | (2,923 | ) | | | 6,912 | |
| | | | | | | | | | | | | | | | |
| (1) | Amount is less than $500. |
See Notes to Financial Statements
48
| | | | | | | | | | | | | | | | | | | | | | | | | | |
| International Series | | | Multi-Sector Fixed Income Series | | | Premium AlphaSector Series | | | Real Estate Securities Series | |
Year Ended
December 31, 2011 | | | Year Ended
December 31, 2010 | | | Year Ended
December 31, 2011 | | | Year Ended
December 31, 2010 | | | From Inception
February 14, 2011 to
December 31, 2011 | | | Year Ended
December 31, 2011 | | | Year Ended
December 31, 2010 | |
| | | | | | | | | | | | | | | | | | | | | | | | | | |
| | | | | | | | | | | | | | | | | | | | | | | | | | |
| $ | 10,878 | | | $ | 9,267 | | | $ | 13,968 | | | $ | 13,400 | | | $ | 9 | | | $ | 974 | | | $ | 1,386 | |
| | 16,948 | | | | 8,845 | | | | 4,132 | | | | 9,933 | | | | (98 | ) | | | 10,746 | | | | 12,204 | |
| | (43,809 | ) | | | 31,719 | | | | (11,340 | ) | | | 3,481 | | | | 53 | | | | (1,562 | ) | | | 14,258 | |
| | | | | | | | | | | | | | | | | | | | | | | | | | |
| | (15,983 | ) | | | 49,831 | | | | 6,760 | | | | 26,814 | | | | (36 | ) | | | 10,158 | | | | 27,848 | |
| | | | | | | | | | | | | | | | | | | | | | | | | | |
| | | | | | | | | | | | | | | | | | | | | | | | | | |
| | (9,551 | ) | | | (9,454 | ) | | | (14,102 | ) | | | (15,159 | ) | | | (9 | ) | | | (749 | ) | | | (2,116 | ) |
| | — | | | | — | | | | — | | | | — | | | | — | | | | — | | | | — | |
| | — | | | | — | | | | — | | | | — | | | | — | | | | (5,753 | ) | | | — | |
| | | | | | | | | | | | | | | | | | | | | | | | | | |
| | (9,551 | ) | | | (9,454 | ) | | | (14,102 | ) | | | (15,159 | ) | | | (9 | ) | | | (6,502 | ) | | | (2,116 | ) |
| | | | | | | | | | | | | | | | | | | | | | | | | | |
| | | | | | | | | | | | | | | | | | | | | | | | | | |
| | 3,858 | | | | 9,316 | | | | 3,958 | | | | 3,805 | | | | 1,286 | | | | 2,276 | | | | 4,975 | |
| | — | | | | — | | | | — | | | | 33,044 | | | | — | | | | — | | | | — | |
| | 9,551 | | | | 9,454 | | | | 14,102 | | | | 15,159 | | | | 9 | | | | 6,502 | | | | 2,116 | |
| | (55,953 | ) | | | (77,246 | ) | | | (41,562 | ) | | | (41,910 | ) | | | — | (1) | | | (20,089 | ) | | | (34,804 | ) |
| | | | | | | | | | | | | | | | | | | | | | | | | | |
| | (42,544 | ) | | | (58,476 | ) | | | (23,502 | ) | | | 10,098 | | | | 1,295 | | | | (11,311 | ) | | | (27,713 | ) |
| | | | | | | | | | | | | | | | | | | | | | | | | | |
| | (68,078 | ) | | | (18,099 | ) | | | (30,844 | ) | | | 21,753 | | | | 1,250 | | | | (7,655 | ) | | | (1,981 | ) |
| | | | | | |
| | | | | | | | | | | | | | | | | | | | | | | | | | |
| | 403,607 | | | | 421,706 | | | | 227,860 | | | | 206,107 | | | | — | | | | 110,769 | | | | 112,750 | |
| | | | | | | | | | | | | | | | | | | | | | | | | | |
| $ | 335,529 | | | $ | 403,607 | | | $ | 197,016 | | | $ | 227,860 | | | $ | 1,250 | | | $ | 103,114 | | | $ | 110,769 | |
| | | | | | | | | | | | | | | | | | | | | | | | | | |
| | 1,648 | | | | 302 | | | | 1,444 | | | | 1,191 | | | | — | (1) | | | 312 | | | | 28 | |
| | | | | | | | | | | | | | |
| | | | | | | | | | | | | | | | | | | | | | | | | | |
| | 240 | | | | 636 | | | | 414 | | | | 405 | | | | 131 | | | | 84 | | | | 214 | |
| | — | | | | — | | | | — | | | | 3,326 | | | | — | | | | — | | | | — | |
| | 605 | | | | 644 | | | | 1,502 | | | | 1,635 | | | | 1 | | | | 249 | | | | 91 | |
| | (3,419 | ) | | | (5,122 | ) | | | (4,311 | ) | | | (4,437 | ) | | | — | | | | (751 | ) | | | (1,517 | ) |
| | | | | | | | | | | | | | | | | | | | | | | | | | |
| | (2,574 | ) | | | (3,842 | ) | | | (2,395 | ) | | | 929 | | | | 132 | | | | (418 | ) | | | (1,212 | ) |
| | | | | | | | | | | | | | | | | | | | | | | | | | |
See Notes to Financial Statements
49
VIRTUS VARIABLE INSURANCE TRUST
STATEMENTS OF CHANGES IN NET ASSETS (Continued)
(Reported in thousands)
| | | | | | | | | | | | | | | | | | | | | | | | |
| | | Small-Cap Growth Series | | | Small-Cap Value Series | | | Strategic Allocation Series | |
| | | Year Ended
December 31, 2011 | | | Year Ended
December 31, 2010 | | | Year Ended
December 31, 2011 | | | Year Ended
December 31, 2010 | | | Year Ended
December 31, 2011 | | | Year Ended
December 31, 2010 | |
INCREASE/(DECREASE) IN NET ASSETS | | | | | | | | | | | | | | | | | | | | | | | | |
From Operations | | | | | | | | | | | | | | | | | | | | | | | | |
Net investment income (loss) | | $ | (102 | ) | | $ | (172 | ) | | $ | 1,374 | | | $ | 729 | | | $ | 3,591 | | | $ | 4,135 | |
Net realized gain (loss) | | | 6,450 | | | | 22,293 | | | | 2,408 | | | | 36,932 | | | | 8,766 | | | | 9,856 | |
Net change in unrealized appreciation (depreciation) | | | 4,284 | | | | (17,709 | ) | | | 3,222 | | | | (28,018 | ) | | | (9,189 | ) | | | 5,208 | |
| | | | | | | | | | | | | | | | | | | | | | | | |
Increase (decrease) in net assets resulting from operations | | | 10,632 | | | | 4,412 | | | | 7,004 | | | | 9,643 | | | | 3,168 | | | | 19,199 | |
| | | | | | | | | | | | | | | | | | | | | | | | |
From Distributions to Shareholders | | | | | | | | | | | | | | | | | | | | | | | | |
Net investment income | | | — | | | | — | | | | (1,146 | ) | | | (631 | ) | | | (3,332 | ) | | | (4,426 | ) |
Net realized short-term gains | | | — | | | | — | | | | — | | | | — | | | | — | | | | — | |
Net realized long-term gains | | | (6,550 | ) | | | — | | | | (9,362 | ) | | | — | | | | — | | | | — | |
| | | | | | | | | | | | | | | | | | | | | | | | |
Decrease in net assets from distributions to shareholders | | | (6,550 | ) | | | — | | | | (10,508 | ) | | | (631 | ) | | | (3,332 | ) | | | (4,426 | ) |
| | | | | | | | | | | | | | | | | | | | | | | | |
From Share Transactions | | | | | | | | | | | | | | | | | | | | | | | | |
Sale of shares | | | 3,085 | | | | 823 | | | | 1,672 | | | | 1,124 | | | | 2,267 | | | | 2,703 | |
Plan of reorganization | | | — | | | | 46,116 | | | | — | | | | 114,619 | | | | — | | | | — | |
Reinvestment of distributions | | | 6,550 | | | | — | | | | 10,508 | | | | 631 | | | | 3,332 | | | | 4,426 | |
Shares repurchased | | | (17,312 | ) | | | (9,198 | ) | | | (30,050 | ) | | | (12,525 | ) | | | (25,633 | ) | | | (33,827 | ) |
| | | | | | | | | | | | | | | | | | | | | | | | |
Increase (decrease) in net assets from share transactions | | | (7,677 | ) | | | 37,741 | | | | (17,870 | ) | | | 103,849 | | | | (20,034 | ) | | | (26,698 | ) |
| | | | | | | | | | | | | | | | | | | | | | | | |
Net increase (decrease) in net assets | | | (3,595 | ) | | | 42,153 | | | | (21,374 | ) | | | 112,861 | | | | (20,198 | ) | | | (11,925 | ) |
| | | | | | |
Net Assets | | | | | | | | | | | | | | | | | | | | | | | | |
Beginning of period | | | 68,463 | | | | 26,310 | | | | 151,281 | | | | 38,420 | | | | 158,322 | | | | 170,247 | |
| | | | | | | | | | | | | | | | | | | | | | | | |
End of period | | $ | 64,868 | | | $ | 68,463 | | | $ | 129,907 | | | $ | 151,281 | | | $ | 138,124 | | | $ | 158,322 | |
| | | | | | | | | | | | | | | | | | | | | | | | |
Accumulated undistributed net investment income (loss) at end of period | | | (32 | ) | | | (28 | ) | | | 348 | | | | 121 | | | | 492 | | | | 220 | |
| | | | | | | | | | | | |
Shares | | | | | | | | | | | | | | | | | | | | | | | | |
Sales of shares | | | 220 | | | | 68 | | | | 133 | | | | 100 | | | | 182 | | | | 238 | |
Plan of reorganization | | | — | | | | 3,597 | | | | — | | | | 9,565 | | | | — | | | | — | |
Reinvestment of distributions | | | 463 | | | | — | | | | 827 | | | | 51 | | | | 269 | | | | 396 | |
Shares repurchased | | | (1,231 | ) | | | (751 | ) | | | (2,394 | ) | | | (1,086 | ) | | | (2,059 | ) | | | (2,994 | ) |
| | | | | | | | | | | | | | | | | | | | | | | | |
Net Increase/(Decrease) | | | (548 | ) | | | 2,914 | | | | (1,434 | ) | | | 8,630 | | | | (1,608 | ) | | | (2,360 | ) |
| | | | | | | | | | | | | | | | | | | | | | | | |
See Notes to Financial Statements
50
VIRTUS VARIABLE INSURANCE TRUST
FINANCIAL HIGHLIGHTS
SELECTED PER SHARE DATA AND RATIOS FOR A SHARE OUTSTANDING
THROUGHOUT EACH PERIOD
| | | | | | | | | | | | | | | | | | | | | | | | | | | | | | | | | | | | | | | | | | | | | | | | | | | | | | | | | | | | | | | | | | | | | | | | | | | |
| | | Net Asset Value, Beginning of Period | | Net Investment Income (Loss)(1) | | Net Realized and Unrealized Gain (Loss) | | Total from Investment Operations | | Dividends from Net Investment Income | | Distributions from Net Realized Gains | | Total Distributions | | Change in Net Asset Value | | Net Asset Value, End of Period | | Total Return(3) | | Net Assets, End of Period (in thousands) | | Ratio of Net Operating Expenses to Average Net Assets(4) | | Ratio of Gross Operating Expenses to Average Net Assets (before waivers and reimbursements)(4) | | Ratio of Net Investment Income to Average Net Assets | | Portfolio Turnover Rate |
Capital Growth Series | | | | | | | | | | | | | | | | | | | | | | | | | | | | | | | | | | | | | | | | | | | | | | �� | | | | | | | | | | | | | | | | | | | | | | | | | | | | | |
1/1/11 to 12/31/11 | | | $ | 14.67 | | | | | 0.01 | | | | | (0.68 | ) | | | | (0.67 | ) | | | | (0.01 | ) | | | | — | | | | | (0.01 | ) | | | | (0.68 | ) | | | $ | 13.99 | | | | | (4.60 | )% | | | $ | 189,689 | | | | | 0.95 | % | | | | 1.15 | % | | | | 0.04 | % | | | | 127 | % |
1/1/10 to 12/31/10 | | | | 12.83 | | | | | 0.05 | | | | | 1.85 | | | | | 1.90 | | | | | (0.06 | ) | | | | — | | | | | (0.06 | ) | | | | 1.84 | | | | | 14.67 | | | | | 14.88 | | | | | 228,109 | | | | | 0.95 | | | | | 1.05 | | | | | 0.36 | | | | | 166 | |
1/1/09 to 12/31/09 | | | | 9.95 | | | | | 0.09 | | | | | 2.89 | | | | | 2.98 | | | | | (0.10 | ) | | | | — | | | | | (0.10 | ) | | | | 2.88 | | | | | 12.83 | | | | | 29.93 | | | | | 236,409 | | | | | 0.95 | | | | | 1.07 | | | | | 0.85 | | | | | 107 | |
1/1/08 to 12/31/08 | | | | 16.81 | | | | | 0.01 | | | | | (6.87 | ) | | | | (6.86 | ) | | | | — | (2) | | | | — | | | | | — | (2) | | | | (6.86 | ) | | | | 9.95 | | | | | (40.78 | ) | | | | 203,188 | | | | | 0.94 | | | | | 0.94 | | | | | 0.08 | | | | | 164 | |
| 1/1/07 to 12/31/07 | | | | 15.21 | | | | | 0.04 | | | | | 1.60 | | | | | 1.64 | | | | | (0.04 | ) | | | | — | | | | | (0.04 | ) | | | | 1.60 | | | | | 16.81 | | | | | 10.75 | | | | | 400,612 | | | | | 0.91 | | | | | 0.91 | | | | | 0.22 | | | | | 88 | |
Growth & Income Series | | | | | | | | | | | | | | | | | | | | | | | | | | | | | | | | | | | | | | | | | | | | | | | | | | | | | | | | | | | | | | | | | | | | | | | | | | | |
1/1/11 to 12/31/11 | | | $ | 12.82 | | | | | 0.09 | | | | | (0.30 | ) | | | | (0.21 | ) | | | | (0.10 | ) | | | | — | | | | | (0.10 | ) | | | | (0.31 | ) | | | $ | 12.51 | | | | | (1.66 | )% | | | $ | 148,283 | | | | | 0.90 | % | | | | 1.16 | % | | | | 0.69 | % | | | | 36 | % |
1/1/10 to 12/31/10 | | | | 11.49 | | | | | 0.11 | | | | | 1.34 | | | | | 1.45 | | | | | (0.12 | ) | | | | — | | | | | (0.12 | ) | | | | 1.33 | | | | | 12.82 | | | | | 12.83 | | | | | 189,361 | | | | | 0.90 | | | | | 1.07 | | | | | 0.98 | | | | | 39 | |
1/1/09 to 12/31/09 | | | | 9.45 | | | | | 0.13 | | | | | 2.07 | | | | | 2.20 | | | | | (0.16 | ) | | | | — | | | | | (0.16 | ) | | | | 2.04 | | | | | 11.49 | | | | | 23.50 | | | | | 90,300 | | | | | 0.94 | | | | | 1.11 | | | | | 1.35 | | | | | 109 | |
1/1/08 to 12/31/08 | | | | 14.94 | | | | | 0.19 | | | | | (5.35 | ) | | | | (5.16 | ) | | | | (0.17 | ) | | | | (0.16 | ) | | | | (0.33 | ) | | | | (5.49 | ) | | | | 9.45 | | | | | (34.93 | ) | | | | 85,111 | | | | | 0.85 | | | | | 0.99 | | | | | 1.51 | | | | | 56 | |
| 1/1/07 to 12/31/07 | | | | 14.51 | | | | | 0.16 | | | | | 0.81 | | | | | 0.97 | | | | | (0.15 | ) | | | | (0.39 | ) | | | | (0.54 | ) | | | | 0.43 | | | | | 14.94 | | | | | 6.66 | | | | | 159,074 | | | | | 0.85 | | | | | 0.95 | | | | | 1.03 | | | | | 44 | |
International Series | | | | | | | | | | | | | | | | | | | | | | | | | | | | | | | | | | | | | | | | | | | | | | | | | | | | | | | | | | | | | | | | | | | | | | | | | | | |
1/1/11 to 12/31/11 | | | $ | 16.45 | | | | | 0.47 | | | | | (1.21 | ) | | | | (0.74 | ) | | | | (0.43 | ) | | | | — | | | | | (0.43 | ) | | | | (1.17 | ) | | | $ | 15.28 | | | | | (4.57 | )% | | | $ | 335,529 | | | | | 1.03 | % | | | | 1.19 | % | | | | 2.91 | % | | | | 17 | % |
1/1/10 to 12/31/10 | | | | 14.86 | | | | | 0.35 | | | | | 1.61 | | | | | 1.96 | | | | | (0.37 | ) | | | | — | | | | | (0.37 | ) | | | | 1.59 | | | | | 16.45 | | | | | 13.47 | | | | | 403,607 | | | | | 1.03 | | | | | 1.08 | | | | | 2.36 | | | | | 24 | |
1/1/09 to 12/31/09 | | | | 10.95 | | | | | 0.31 | | | | | 4.01 | | | | | 4.32 | | | | | (0.41 | ) | | | | — | | | | | (0.41 | ) | | | | 3.91 | | | | | 14.86 | | | | | 39.87 | | | | | 421,706 | | | | | 1.03 | | | | | 1.08 | | | | | 2.55 | | | | | 26 | |
1/1/08 to 12/31/08 | | | | 19.14 | | | | | 0.40 | | | | | (7.57 | ) | | | | (7.17 | ) | | | | (0.31 | ) | | | | (0.71 | ) | | | | (1.02 | ) | | | | (8.19 | ) | | | | 10.95 | | | | | (38.98 | ) | | | | 319,937 | | | | | 1.00 | | | | | 1.00 | | | | | 2.56 | | | | | 33 | |
| 1/1/07 to 12/31/07 | | | | 17.80 | | | | | 0.40 | | | | | 2.25 | | | | | 2.65 | | | | | (0.30 | ) | | | | (1.01 | ) | | | | (1.31 | ) | | | | 1.34 | | | | | 19.14 | | | | | 14.94 | | | | | 501,913 | | | | | 0.98 | | | | | 0.98 | | | | | 2.10 | | | | | 34 | |
Multi-Sector Fixed Income Series | | | | | | | | | | | | | | | | | | | | | | | | | | | | | | | | | | | | | | | | | | | | | | | | | | | | | | | | | | | | | | | | | | | | | | | | | | | |
1/1/11 to 12/31/11 | | | $ | 9.55 | | | | | 0.63 | | | | | (0.34 | ) | | | | 0.29 | | | | | (0.66 | ) | | | | — | | | | | (0.66 | ) | | | | (0.37 | ) | | | $ | 9.18 | | | | | 2.99 | % | | | $ | 197,016 | | | | | 0.75 | % | | | | 0.97 | % | | | | 6.50 | % | | | | 39 | % |
1/1/10 to 12/31/10 | | | | 8.98 | | | | | 0.61 | | | | | 0.65 | | | | | 1.26 | | | | | (0.69 | ) | | | | — | | | | | (0.69 | ) | | | | 0.57 | | | | | 9.55 | | | | | 14.36 | | | | | 227,860 | | | | | 0.75 | | | | | 0.85 | | | | | 6.48 | | | | | 56 | |
1/1/09 to 12/31/09 | | | | 6.86 | | | | | 0.57 | | | | | 2.15 | | | | | 2.72 | | | | | (0.60 | ) | | | | — | | | | | (0.60 | ) | | | | 2.12 | | | | | 8.98 | | | | | 40.13 | | | | | 206,107 | | | | | 0.75 | | | | | 0.84 | | | | | 7.06 | | | | | 72 | |
1/1/08 to 12/31/08 | | | | 9.09 | | | | | 0.57 | | | | | (2.15 | ) | | | | (1.58 | ) | | | | (0.65 | ) | | | | — | | | | | (0.65 | ) | | | | (2.23 | ) | | | | 6.86 | | | | | (17.93 | ) | | | | 172,901 | | | | | 0.75 | | | | | 0.76 | | | | | 6.69 | | | | | 72 | |
| 1/1/07 to 12/31/07 | | | | 9.25 | | | | | 0.53 | | | | | (0.19 | ) | | | | 0.34 | | | | | (0.50 | ) | | | | — | | | | | (0.50 | ) | | | | (0.16 | ) | | | | 9.09 | | | | | 3.71 | | | | | 250,867 | | | | | 0.74 | | | | | 0.74 | | | | | 5.65 | | | | | 94 | |
Premium AlphaSectorTM Series | | | | | | | | | | | | | | | | | | | | | | | | | | | | | | | | | | | | | | | | | | | | | | | | | | | | | | | | | | | | | | | | | | | | | | | | | | | |
2/14/11(5) to 12/31/11 | | | $ | 10.00 | | | | | 0.08 | | | | | (0.52 | ) | | | | (0.44 | ) | | | | (0.07 | ) | | | | — | | | | | (0.07 | ) | | | | (0.51 | ) | | | $ | 9.49 | | | | | (4.47 | )%(7) | | | $ | 1,250 | | | | | 1.70 | %(6) | | | | 7.31 | %(6) | | | | 0.98 | %(6) | | | | 249 | %(7) |
The footnote legend is at the end of the financial highlights.
See Notes to Financial Statements
51
VIRTUS VARIABLE INSURANCE TRUST
FINANCIAL HIGHLIGHTS
SELECTED PER SHARE DATA AND RATIOS FOR A SHARE OUTSTANDING
THROUGHOUT EACH PERIOD
| | | | | | | | | | | | | | | | | | | | | | | | | | | | | | | | | | | | | | | | | | | | | | | | | | | | | | | | | | | | | | | | | | | | | | | | | | | |
| | | Net Asset Value, Beginning of Period | | Net Investment Income (Loss)(1) | | Net Realized and Unrealized Gain (Loss) | | Total from Investment Operations | | Dividends from Net Investment Income | | Distributions from Net Realized Gains | | Total Distributions | | Change in Net Asset Value | | Net Asset Value, End of Period | | Total Return(3) | | Net Assets, End of Period (in thousands) | | Ratio of Net Operating Expenses to Average Net Assets(4) | | Ratio of Gross Operating Expenses to Average Net Assets (before waivers and reimbursements)(4) | | Ratio of Net Investment Income to Average Net Assets | | Portfolio Turnover Rate |
Real Estate Securities Series | | | | | | | | | | | | | | | | | | | | | | | | | | | | | | | | | | | | | | | | | | | | | | | | | | | | | | | | | | | | | | | | | | | | | | | | | | | |
1/1/11 to 12/31/11 | | | $ | 25.43 | | | | | 0.24 | | | | | 2.25 | | | | | 2.49 | | | | | (0.19 | ) | | | | (1.55 | ) | | | | (1.74 | ) | | | | 0.75 | | | | $ | 26.18 | | | | | 9.87 | % | | | $ | 103,114 | | | | | 1.10 | % | | | | 1.22 | % | | | | 0.90 | % | | | | 22 | % |
1/1/10 to 12/31/10 | | | | 20.25 | | | | | 0.28 | | | | | 5.35 | | | | | 5.63 | | | | | (0.45 | ) | | | | — | | | | | (0.45 | ) | | | | 5.18 | | | | | 25.43 | | | | | 28.00 | | | | | 110,769 | | | | | 1.10 | | | | | 1.11 | | | | | 1.23 | | | | | 36 | |
1/1/09 to 12/31/09 | | | | 16.26 | | | | | 0.44 | | | | | 4.12 | | | | | 4.56 | | | | | (0.57 | ) | | | | — | | | | | (0.57 | ) | | | | 3.99 | | | | | 20.25 | | | | | 29.11 | | | | | 112,750 | | | | | 1.10 | | | | | 1.11 | | | | | 2.80 | | | | | 43 | |
1/1/08 to 12/31/08 | | | | 26.82 | | | | | 0.56 | | | | | (10.17 | ) | | | | (9.61 | ) | | | | (0.37 | ) | | | | (0.58 | ) | | | | (0.95 | ) | | | | (10.56 | ) | | | | 16.26 | | | | | (36.88 | ) | | | | 86,199 | | | | | 1.01 | | | | | 1.01 | | | | | 2.33 | | | | | 42 | |
| 1/1/07 to 12/31/07 | | | | 35.60 | | | | | 0.51 | | | | | (6.00 | ) | | | | (5.49 | ) | | | | (0.44 | ) | | | | (2.85 | ) | | | | (3.29 | ) | | | | (8.78 | ) | | | | 26.82 | | | | | (15.71 | ) | | | | 135,140 | | | | | 0.98 | | | | | 0.98 | | | | | 1.50 | | | | | 23 | |
Small-Cap Growth Series | | | | | | | | | | | | | | | | | | | | | | | | | | | | | | | | | | | | | | | | | | | | | | | | | | | | | | | | | | | | | | | | | | | | | | | | | | | |
1/1/11 to 12/31/11 | | | $ | 13.24 | | | | | (0.02 | ) | | | | 2.23 | | | | | 2.21 | | | | | — | | | | | (1.42 | ) | | | | (1.42 | ) | | | | 0.79 | | | | $ | 14.03 | | | | | 16.59 | % | | | $ | 64,868 | | | | | 1.05 | % | | | | 1.35 | % | | | | (0.15 | )% | | | | 35 | % |
1/1/10 to 12/31/10 | | | | 11.66 | | | | | (0.07 | ) | | | | 1.65 | | | | | 1.58 | | | | | — | | | | | — | | | | | — | | | | | 1.58 | | | | | 13.24 | | | | | 13.53 | | | | | 68,463 | | | | | 1.05 | | | | | 1.33 | | | | | (0.55 | ) | | | | 179 | |
1/1/09 to 12/31/09 | | | | 9.53 | | | | | (0.08 | ) | | | | 2.21 | | | | | 2.13 | | | | | — | | | | | — | | | | | — | | | | | 2.13 | | | | | 11.66 | | | | | 22.39 | | | | | 26,310 | | | | | 1.05 | | | | | 1.41 | | | | | (0.83 | ) | | | | 262 | |
1/1/08 to 12/31/08 | | | | 17.85 | | | | | (0.10 | ) | | | | (7.76 | ) | | | | (7.86 | ) | | | | — | | | | | (0.46 | ) | | | | (0.46 | ) | | | | (8.32 | ) | | | | 9.53 | | | | | (44.92 | ) | | | | 25,716 | | | | | 1.00 | | | | | 1.20 | | | | | (0.75 | ) | | | | 177 | |
| 1/1/07 to 12/31/07 | | | | 18.65 | | | | | (0.12 | ) | | | | 3.07 | | | | | 2.95 | | | | | — | | | | | (3.75 | ) | | | | (3.75 | ) | | | | (0.80 | ) | | | | 17.85 | | | | | 16.10 | | | | | 55,768 | | | | | 1.00 | | | | | 1.12 | | | | | (0.62 | ) | | | | 59 | |
Small-Cap Value Series | | | | | | | | | | | | | | | | | | | | | | | | | | | | | | | | | | | | | | | | | | | | | | | | | | | | | | | | | | | | | | | | | | | | | | | | | | | |
1/1/11 to 12/31/11 | | | $ | 12.33 | | | | | 0.12 | | | | | 0.48 | | | | | 0.60 | | | | | (0.10 | ) | | | | (0.84 | ) | | | | (0.94 | ) | | | | (0.34 | ) | | | $ | 11.99 | | | | | 4.54 | % | | | $ | 129,907 | | | | | 1.30 | % | | | | 1.36 | % | | | | 0.95 | % | | | | 22 | % |
1/1/10 to 12/31/10 | | | | 10.55 | | | | | 0.15 | | | | | 1.69 | | | | | 1.84 | | | | | (0.06 | ) | | | | — | | | | | (0.06 | ) | | | | 1.78 | | | | | 12.33 | | | | | 17.40 | | | | | 151,281 | | | | | 1.30 | | | | | 1.41 | | | | | 1.34 | | | | | 69 | |
1/1/09 to 12/31/09 | | | | 8.77 | | | | | 0.01 | | | | | 1.81 | | | | | 1.82 | | | | | (0.04 | ) | | | | — | | | | | (0.04 | ) | | | | 1.78 | | | | | 10.55 | | | | | 20.90 | | | | | 38,421 | | | | | 1.30 | | | | | 1.51 | | | | | 0.14 | | | | | 153 | |
1/1/08 to 12/31/08 | | | | 14.46 | | | | | 0.04 | | | | | (5.42 | ) | | | | (5.38 | ) | | | | (0.01 | ) | | | | (0.30 | ) | | | | (0.31 | ) | | | | (5.69 | ) | | | | 8.77 | | | | | (37.91 | ) | | | | 38,012 | | | | | 1.30 | | | | | 1.38 | | | | | 0.33 | | | | | 50 | |
| 1/1/07 to 12/31/07 | | | | 17.03 | | | | | — | (2) | | | | (0.30 | ) | | | | (0.30 | ) | | | | — | | | | | (2.27 | ) | | | | (2.27 | ) | | | | (2.57 | ) | | | | 14.46 | | | | | (2.10 | ) | | | | 73,242 | | | | | 1.30 | | | | | 1.31 | | | | | (0.03 | ) | | | | 32 | |
Strategic Allocation Series | | | | | | | | | | | | | | | | | | | | | | | | | | | | | | | | | | | | | | | | | | | | | | | | | | | | | | | | | | | | | | | | | | | | | | | | | | | |
1/1/11 to 12/31/11 | | | $ | 12.22 | | | | | 0.30 | | | | | (0.06 | ) | | | | 0.24 | | | | | (0.29 | ) | | | | — | | | | | (0.29 | ) | | | | (0.05 | ) | | | $ | 12.17 | | | | | 1.91 | % | | | $ | 138,124 | | | | | 0.85 | % | | | | 1.07 | % | | | | 2.39 | % | | | | 43 | % |
1/1/10 to 12/31/10 | | | | 11.11 | | | | | 0.30 | | | | | 1.14 | | | | | 1.44 | | | | | (0.33 | ) | | | | — | | | | | (0.33 | ) | | | | 1.11 | | | | | 12.22 | | | | | 13.20 | | | | | 158,322 | | | | | 0.85 | | | | | 0.96 | | | | | 2.61 | | | | | 42 | |
1/1/09 to 12/31/09 | | | | 9.25 | | | | | 0.29 | | | | | 1.94 | | | | | 2.23 | | | | | (0.37 | ) | | | | — | | | | | (0.37 | ) | | | | 1.86 | | | | | 11.11 | | | | | 24.51 | | | | | 170,247 | | | | | 0.85 | | | | | 0.95 | | | | | 2.98 | | | | | 89 | |
1/1/08 to 12/31/08 | | | | 12.95 | | | | | 0.37 | | | | | (3.60 | ) | | | | (3.23 | ) | | | | (0.35 | ) | | | | (0.12 | ) | | | | (0.47 | ) | | | | (3.70 | ) | | | | 9.25 | | | | | (25.45 | ) | | | | 163,271 | | | | | 0.85 | | | | | 0.87 | | | | | 3.19 | | | | | 50 | |
1/1/07 to 12/31/07 | | | | 13.30 | | | | | 0.36 | | | | | 0.43 | | | | | 0.79 | | | | | (0.37 | ) | | | | (0.77 | ) | | | | (1.14 | ) | | | | (0.35 | ) | | | | 12.95 | | | | | 5.98 | | | | | 270,653 | | | | | 0.84 | | | | | 0.84 | | | | | 2.62 | | | | | 52 | |
Footnote Legend:
| (1) | Computed using average shares outstanding. |
| (2) | Amount is less than $0.005. |
| (3) | The total return does not include the expenses associated with the annuity or life insurance policy through which you invest. |
| (4) | The Series will also indirectly bear their prorated share of expenses of the underlying funds in which they invest. Such expenses are not included in the calculation of this ratio. |
See Notes to Financial Statements
52
VIRTUS VARIABLE INSURANCE TRUST
NOTES TO FINANCIAL STATEMENTS
DECEMBER 31, 2011
Note 1—Organization
The Virtus Variable Insurance Trust (the “Trust” or “VVIT”) is organized as a Delaware statutory trust and is registered under the Investment Company Act of 1940, as amended (“1940 Act”), as an open-end management investment company. It was formed on February 18, 1986 as a Massachusetts business trust, commenced operations on December 5, 1986 and was reorganized as a Delaware statutory trust on February 14, 2011.
The Trust is organized with series, which are currently available only to separate accounts of participating insurance companies to fund variable accumulation annuity contracts and variable universal life insurance policies. As of the date of this report the Trust is comprised of nine series (each a “Series”), reported in this annual report. Each Series’ investment objective is outlined in the respective Series Summary page.
Note 2—Significant Accounting Policies
The following is a summary of significant accounting policies consistently followed by the Trust in the preparation of its financial statements. The preparation of financial statements in conformity with accounting principles generally accepted in the United States of America requires management to make estimates and assumptions that affect the reported amounts of assets and liabilities, and disclosure of contingent assets and liabilities at the date of the financial statements and the reported amounts of increases and decreases in net assets from operations during the reporting period. Actual results could differ from those estimates and those differences could be significant.
Security valuation procedures for the Series have been approved by the Board. All internally fair valued securities, referred to below, are approved by a valuation committee appointed under the direction of the Board.
| | Ÿ | | The Series utilize a fair value hierarchy, which prioritizes the inputs to valuation techniques used to measure fair value into three broad levels. |
| | Ÿ | | Level 1 – quoted prices in active markets for identical securities |
| | Ÿ | | Level 2 – prices determined using other significant observable inputs (including quoted prices for similar securities, interest rates, prepayment speeds, credit risk, etc.) |
| | Ÿ | | Level 3 – prices determined using significant unobservable inputs (including the valuation committee’s own assumptions in determining the fair value of investments) |
A description of the valuation techniques applied to the Series’ major categories of assets and liabilities measured at fair value on a recurring basis is as follows:
Equity securities are valued at the official closing price (typically last sale) on the exchange on which the securities are primarily traded, or if no closing price is available, at the last bid price and are categorized as Level 1 in the hierarchy. Restricted Equity Securities and Private Placements that are not widely traded, are illiquid or are internally fair valued by the valuation committee, are generally categorized as Level 3 in the hierarchy.
Certain foreign securities may be fair valued in cases where closing prices are not readily available or are deemed not reflective of readily available market prices. For example, significant events (such as movement in the U.S. securities market, or other regional and local developments) may occur between the time that foreign markets close (where the security is principally traded) and the time that the Series calculates its net asset value (generally, the close of the New York Stock Exchange (“NYSE”)) that may impact the value of securities traded in these foreign markets. In such cases the Series fair value foreign securities using an external pricing service which considers the correlation of the trading patterns of the foreign security to the intraday trading in the U.S. markets for investments such as ADRs, financial futures, ETFs, and certain indexes as well as prices for similar securities. Such fair valuations are categorized as Level 2 in the hierarchy. Because the frequency of significant events is not predictable, fair valuation of certain foreign common stocks may occur on a frequent basis.
Debt securities, including restricted securities, are valued based on evaluated quotations received from independent pricing services or from dealers who make markets in such securities. For most bond types, the pricing service utilizes matrix pricing which considers one or more of the following factors: yield or price of bonds of comparable quality, coupon, maturity, current cash flows, type, and current day trade information, as well as dealer supplied prices. These valuations are generally categorized as Level 2 in the hierarchy. Structured debt instruments such as mortgage-backed and asset-backed securities may also incorporate collateral analysis and utilize cash flow models for valuation and are generally categorized as Level 2 in the hierarchy. Pricing services do not provide pricing for all securities and therefore indicative bids from dealers are utilized based on pricing models used by market makers in the security and are generally categorized as Level 2 in the hierarchy. Debt securities that are not widely traded, are illiquid, or are internally fair valued by the valuation committee are generally categorized as Level 3 in the hierarchy.
Listed derivatives that are actively traded are valued based on quoted prices from the exchange and are categorized as Level 1 in the hierarchy. Over the counter (OTC) derivative contracts, which include Forward Currency Contracts and Equity Linked Instruments, do not require material subjectivity as pricing inputs are observed from actively quoted markets and are categorized as Level 2 in the hierarchy.
Investments in open-end mutual funds are valued at their closing net asset value determined as of the close of regular trading on the NYSE (generally 4:00 p.m. Eastern time) each business day and are categorized as Level 1 in the hierarchy.
Short-term Notes having a remaining maturity of 60 days or less are valued at amortized cost, which approximates market and are generally categorized as Level 2 in the hierarchy.
A summary of the inputs used to value the Series’ major categories of assets and liabilities, which primarily include investments of the Series, by each major security type is disclosed at the end of the Schedule of Investments for each Series. The inputs or methodology used for valuing securities is not necessarily an indication of the risk associated with investing in those securities.
53
VIRTUS VARIABLE INSURANCE TRUST
NOTES TO FINANCIAL STATEMENTS (Continued)
DECEMBER 31, 2011
| | B. | | Security transactions and related income |
Security transactions are recorded on the trade date. Dividend income is recorded on the ex-dividend date, or in the case of certain foreign securities, as soon as the Series is notified. Interest income is recorded on the accrual basis. Each Series amortizes premiums and accretes discounts using the effective interest method. Realized gains and losses are determined on the identified cost basis.
Dividend income is recorded using Management’s estimate of the income included in distributions received from the REIT investments.
Distributions received in excess of this estimated amount are recorded as a reduction of the cost of investments or reclassified to capital gains.
The actual amounts of income, return of capital, and capital gains are only determined by each REIT after its fiscal year-end, and may differ from the estimated amounts.
Each Series is treated as a separate taxable entity. It is the policy of each Series in the Trust to comply with the requirements of Subchapter M of the Internal Revenue Code and to distribute substantially all of its taxable income to its shareholders. Therefore, no provision for federal income taxes or excise taxes has been made.
Certain Series may be subject to foreign taxes on income, gains on investments or currency repatriation, a portion of which may be recoverable. Each Series will accrue such taxes and recoveries as applicable based upon current interpretations of the tax rules and regulations that exist in the markets in which they invest.
Management of the Trust has concluded that there are no significant uncertain tax positions that would require recognition in the financial statements.
As of December 31, 2011, the tax years that remain subject to examination by the major tax jurisdictions under the statute of limitations are from the year 2008 forward (with limited exceptions).
| | D. | | Distributions to shareholders |
Distributions are recorded by each Series on the ex-dividend date. Income and capital gain distributions are determined in accordance with income tax regulations which may differ from accounting principles generally accepted in the United States of America. These differences may include the treatment of non-taxable dividends, market premium and discount, non-deductible expenses, expiring capital loss carryovers, foreign currency gain or loss, gain or loss on futures contracts, partnerships, operating losses and losses deferred due to wash sales. Permanent book and tax basis differences relating to shareholder distributions will result in reclassifications to capital paid in on shares of beneficial interest.
Expenses incurred by the Trust with respect to more than one Series are allocated in proportion to the net assets of each Series, except where allocation of direct expense to each Series or an alternative allocation method can be more appropriately used. In addition to the net operating expenses that the Series bear directly, the contract owners, as investors in the Series, indirectly bear the Series’ pro-rata expenses of any underlying funds in which each Series invests.
| | F. | | Foreign currency translation |
Foreign securities and other assets and liabilities are valued using the foreign currency exchange rate effective at the end of the reporting period. Cost of investments is translated at the currency exchange rate effective at the trade date. The gain or loss resulting from a change in currency exchange rates between the trade and settlement date of a portfolio transaction is treated as a gain or loss on foreign currency. Likewise, the gain or loss resulting from a change in currency exchange rates between the date income is accrued and the date it is paid is treated as a gain or loss on foreign currency. The Series does not isolate that portion of the results of operations arising from changes in exchange rates or from fluctuations, which arise due to changes in the market prices of securities.
Each Series may loan securities to qualified brokers through an agreement with Bank of New York Mellon (“BNY Mellon”), the Series’ custodian. Under the terms of agreement, the Series is required to maintain collateral with a market value not less than 100% of the market value of loaned securities. Collateral is adjusted daily in connection with changes in the market value of securities on loan. Collateral may consist of cash and securities issued by the U.S. Government or its agencies. Cash collateral is invested in a short-term money market fund. Dividends earned on the collateral and premiums paid by the borrower are recorded as income by the Series net of fees and rebates charged by BNY Mellon for its services as securities lending agent and in connection with this securities lending program. Lending portfolio securities involves a risk of delay in the recovery of the loaned securities or in the foreclosure on collateral.
As of the close of business on October 31, 2011, MF Global Holding Inc. was in default of the security lending agreement with the Capital Growth Series and the Small-Cap Value Series (the “Series”). As a result, BNY Mellon as Securities Lending Agent took possession of the collateral and repurchased the securities in the Series through open market purchases. The Financial Accounting Standards Board, Accounting Standards Codification No. 860, Transfers and Servicing (“ASC 860”), the criteria for sales accounting have been met. As a result of recording the sale of the original securities out on loan at market value and the repurchase of the identical securities into the Series’ at replacement value, the Series’ had realized gains (losses) of $19 and $(1) respectively ($ reported in thousands), which did not have an impact on the net asset value of the Series. The transactions are being treated as nontaxable events.
Effective November 7, 2011, securities lending was suspended on all Virtus Series.
Certain Series may invest in direct debt instruments, which are interests in amounts owed by a corporate, governmental, or other borrower to lenders or lending syndicates. The Series’ investments in loans may be in the form of participations in loans or assignments of all or a portion of
54
VIRTUS VARIABLE INSURANCE TRUST
NOTES TO FINANCIAL STATEMENTS (Continued)
DECEMBER 31, 2011
loans from third parties. A bank or other financial institution (the lender) that acts as agent for all holders often administers a loan. The agent administers the terms of the loan, as specified in the loan agreement. When investing in loan participation, the Series has the right to receive payments of principal, interest and any fees to which it is entitled only from the lender selling the loan agreement and only upon receipt by the lender of payments from the borrower. The Series generally has no right to enforce compliance with the terms of the loan agreement with the borrower. As a result, the Series may be subject to the credit risk of both the borrower and the lender that is selling the loan agreement. When the Series purchases assignments from lenders, it acquires direct rights against the borrower on the loan. Direct indebtedness of emerging countries involves a risk that the government entities responsible for the repayment of the debt may be unable, or unwilling, to pay the principal and interest when due.
| | I. | | When-issued and delayed delivery transactions |
Certain Series may engage in when-issued or delayed delivery transactions. Each Series records when-issued and delayed delivery securities on the trade date. Each Series maintains collateral for the securities purchased. Securities purchased on a when-issued or delayed delivery basis begin earning interest on the settlement date.
Note 3—Investment Advisory Fees and Related Party Transactions
($ reported in thousands except as noted)
Virtus Investment Advisers, Inc. (“VIA,” the “Adviser”), an indirect wholly-owned subsidiary of Virtus Investment Partners, Inc. (“Virtus”), is the Adviser to the Trust.
As compensation for its service to the Trust, the Adviser is entitled to a fee based upon the following annual rates as a percentage of the average daily net assets of each separate Series listed below:
| | | | | | | | | | | | |
Series | | Rate for First
$250,000,000 | | | Rate for Next
$250,000,000 | | | Rate for Excess Over
$500,000,000 | |
Capital Growth Series | | | 0.70 | % | | | 0.65 | % | | | 0.60 | % |
Growth & Income Series | | | 0.70 | | | | 0.65 | | | | 0.60 | |
International Series | | | 0.75 | | | | 0.70 | | | | 0.65 | |
Multi-Sector Fixed Income Series | | | 0.50 | | | | 0.45 | | | | 0.40 | |
Strategic Allocation Series | | | 0.60 | | | | 0.55 | | | | 0.50 | |
| | | |
| | | Rate for First
$1 Billion | | | Rate for Next
$1 Billion | | | Rate Over
$2 Billion | |
Real Estate Securities Series | | | 0.75 | % | | | 0.70 | % | | | 0.65 | % |
| | | |
| | | | | | Rate | | | | |
Premium AlphaSector™ Series | | | | | | | 1.10 | % | | | | |
Small-Cap Growth Series | | | | | | | 0.85 | | | | | |
Small-Cap Value Series | | | | | | | 0.90 | | | | | |
The Adviser manages the Series’ investment programs and general operations of the Series, including oversight of the Series’ subadvisers.
The Adviser employs subadvisers to furnish portfolio management services to certain of the Series, subject to Investment Subadvisory Agreements. VIA delegates certain investment decisions and/or research functions with respect to the following Series to the subadviser indicated, for which each is paid a fee by the Adviser.
| | | | | | |
Series | | Subadviser | | Series | | Subadviser |
| Capital Growth Series | | Kayne Anderson Rudnick Investment Management LLC (“Kayne”)†* | | Real Estate Securities Series | | Duff & Phelps Investment Management Co.* |
| Growth & Income Series | | Euclid Advisors LLC (“Euclid”)¿* | | Small-Cap Growth Series Small-Cap Value Series | | Kayne* Kayne* |
| International Series | | Aberdeen Asset Management, Inc. | | Strategic Allocation Series
(equity portfolio) | | Euclid¿* |
| Multi-Sector Fixed Income Series | | Newfleet Asset Management, LLC††* | | (fixed income portfolio) | | Newfleet††* |
Premium AlphaSector™ Series | | F-Squared Institutional Advisors, LLC/Euclid¿* | | | | |
| | † | Effective June 2, 2011, SCM Advisors LLC changed its name to Newfleet Asset Management LLC. Effective September 30, 2011, Kayne became the subadvisor to the Series. For more information regarding this change, please see the supplement at the back of this report. |
| | †† | Effective June 2, 2011, Goodwin Capital Advisers, Inc. was no longer the subadviser to the Series. Effective June 17, 2011, Newfleet became the subadviser to the series. |
| | * | Affiliate of the Adviser. |
| | ¿ | Effective September 30, 2011, Euclid became a subadviser to the Series. For more information regarding this change, please see the supplement at the back of this report. |
55
VIRTUS VARIABLE INSURANCE TRUST
NOTES TO FINANCIAL STATEMENTS (Continued)
DECEMBER 31, 2011
VIA has contractually agreed to reimburse expenses of certain series of the Trust until at least November 5, 2012††, to the extent that total operating expenses (excluding interest, taxes, extraordinary expenses and acquired fund fees and expenses, if any) exceed the total operating expenses of the Series’ average net assets (the “expense caps”) as listed in the chart below.
| | | | | | | | | | |
| | | Maximum Total
Operating
Expense | | | | | Maximum Total
Operating
Expense | |
| | | | | | | | | |
| Capital Growth Series | | | 0.95 | % | | Real Estate Securities Series | | | 1.10 | % |
| Growth & Income Series | | | 0.90 | | | Small-Cap Growth Series | | | 1.05 | |
| International Series | | | 1.03 | | | Small-Cap Value Series | | | 1.30 | |
| Multi-Sector Fixed Income Series | | | 0.75 | | | Strategic Allocation Series | | | 0.85 | |
| Premium AlphaSector™ Series | | | 1.70 | | | | | | | |
| | †† | For the Premium AlphaSector™ Series, the contractual expiration date is April 30, 2012. |
Effective November 5, 2010, the Adviser may recapture operating expenses waived or reimbursed under this arrangement, within three fiscal years following the end of the fiscal year in which such waiver or reimbursement occurred. Each Series must pay its ordinary operating expenses before the Adviser is entitled to any reimbursement and must remain in compliance with applicable expense limitations. All or a portion of the following Adviser reimbursed expenses may be recaptured by the fiscal year ending ($ reported in thousands):
| | | | | | | | | | | | |
| | | Expiration Date | |
| | | 2013 | | | 2014 | | | Total | |
| Capital Growth Series | | | $52 | | | | $423 | | | | $475 | |
| Growth & Income Series | | | 61 | | | | 449 | | | | 510 | |
| International Series | | | 73 | | | | 613 | | | | 686 | |
| Multi-Sector Fixed Income Series | | | 50 | | | | 466 | | | | 516 | |
| Premium AlphaSectorTM Series | | | 0 | | | | 49 | | | | 49 | |
| Real Estate Securities Series | | | 9 | | | | 133 | | | | 142 | |
| Small-Cap Value Series | | | 5 | | | | 91 | | | | 96 | |
| Small-Cap Growth Series | | | 27 | | | | 205 | | | | 232 | |
| Strategic Allocation Series | | | 37 | | | | 330 | | | | 367 | |
| | D. | | Administration, Distribution and Service Fees |
VP Distributors, LLC. (“VP Distributors”), an indirect wholly-owned subsidiary of Virtus, serves as the Administrator to the Trust. For the fiscal year ended December 31, 2011 (the “period”), the Trust incurred administration fees totaling $1,199. A portion of these fees is paid to an outside entity that also provides services to the Trust.
VP Distributors is the distributor for all the Series’ shares. Pursuant to an Underwriting Agreement, VP Distributors receives a service fee for providing certain distribution services for each series. For the period ended December 31, 2011, VP Distributors received $3,615, which is included in the Statement of Operations.
At December 31, 2011, Virtus and its affiliates, and the retirement plans of Virtus and its affiliates held 100,682 shares, of Premium AlphaSector® Series which may be redeemed at any time, with a value of $955 (reported in thousands).
The Trust provides a deferred compensation plan for its Trustees who receive compensation from the Trust. Under the deferred compensation plan, Trustees may elect to defer all or a portion of their compensation. Amounts deferred are retained by the Trust, and then, to the extent permitted by the 1940 Act, in turn, may be invested in the shares of unaffiliated mutual funds or variable annuities selected by the Trustees. Investments in such unaffiliated mutual funds are included in “Other Assets” on the Statement of Assets and Liabilities at December 31, 2011.
Note 4—Purchases and Sales of Securities
($ reported in thousands except as noted)
Purchases and sales of securities (excluding U.S. Government and agency securities and short-term securities) during the period ended December 31, 2011, were as follows:
| | | | | | | | |
| | | Purchases | | | Sales | |
| | | | | | | |
Capital Growth Series | | $ | 272,471 | | | $ | 302,407 | |
Growth and Income Series | | | 61,878 | | | | 103,489 | |
International Series | | | 63,163 | | | | 105,742 | |
Multi-Sector Fixed Income Series | | | 75,160 | | | | 98,892 | |
Premium AlphaSector™ Series | | | 3,696 | | | | 2,413 | |
Real Estate Securities Series | | | 23,680 | | | | 40,344 | |
Small-Cap Growth Series | | | 23,714 | | | | 37,654 | |
Small-Cap Value Series | | | 31,843 | | | | 58,010 | |
Strategic Allocation Series | | | 56,330 | | | | 76,308 | |
56
VIRTUS VARIABLE INSURANCE TRUST
NOTES TO FINANCIAL STATEMENTS (Continued)
DECEMBER 31, 2011
Purchases and sales of long-term U.S. Government and agency securities during the period ended December 31, 2011, were as follows:
| | | | | | | | |
Government | | Purchases | | | Sales | |
| | | | | | | |
Multi-Sector Fixed Income Series | | $ | 6,918 | | | $ | 6,908 | |
Strategic Allocation Series | | | 7,254 | | | | 9,340 | |
Note 5—Credit Risk and Asset Concentrations
In countries with limited or developing markets, investments may present greater risks than in more developed markets, and the prices of such investments may be volatile. The consequences of political, social or economic changes in these markets may have disruptive effects on the market prices of these investments and the income they generate, as well as a Series’ ability to repatriate such amounts.
High-yield/high-risk securities typically entail greater price volatility and/or principal and interest rate risk. There is a greater chance that an issuer will not be able to make principal and interest payments on time. Analysis of the creditworthiness of issuers of high-yield securities may be complex, and as a result, it may be more difficult for the Adviser and/or subadvisers to accurately predict risk.
Certain Series may invest in exchange traded funds (“ETF”), which may expose the Series to the risk that the value of an ETF will be more volatile than the underlying portfolio of securities the ETF is designed to track, or that the costs to the Series of owning shares of the ETF will exceed those the Series would incur by investing in such securities directly.
Investing in sector funds or non-diversified funds may be more volatile than investing in broadly diversified funds, and may be more susceptible to adverse economic, political or regulatory developments affecting a single issuer than would be the case if it were more broadly diversified.
Certain Series may invest a high percentage of their assets in specific sectors of the market in their pursuit of a greater investment return. Fluctuations in these sectors of concentration may have a greater impact on a Series, positive or negative, than if a Series did not concentrate its investments in such sectors.
At December 31, 2011, the Series held securities in specific sectors as detailed below:
| | | | | | |
Series | | Sector | | Percentage of
Total Investments | |
Capital Growth Series | | Information Technology | | | 25 | % |
International Series | | Financial | | | 26 | |
Small-Cap Growth Series | | Information Technology | | | 35 | |
Note 6—Illiquid and Restricted Securities
Investments are generally considered illiquid if they cannot be disposed of in seven days in the ordinary course of business at the approximate amount at which such securities have been valued by the Series. Additionally, the following information is also considered in determining illiquidity: the frequency of trades and quotes for the investment; whether the investment is listed for trading on a recognized domestic exchange and/or whether two or more brokers are willing to purchase or sell the security at a comparable price; the extent of market making activity in the investment; and the nature of the market for investment. Illiquid securities are noted as such within each Series’ Schedule of Investments where applicable.
Restricted securities are not registered under the Securities Act of 1933. Generally, 144A securities are excluded from this category, except where defined as illiquid.
At December 31, 2011, the Trust did not hold restricted securities.
Each Series will bear any costs, including those involved in registration under the Securities Act of 1933, in connection with the disposition of such securities.
Note 7—Indemnifications
Under the Trust’s organizational documents and in a separate agreement between each Disinterested Trustee and the Trust, its trustees and officers are indemnified against certain liabilities arising out of the performance of their duties to the Trust. In addition, the Series enter into contracts that contain a variety of indemnifications. The Series’ maximum exposure under these arrangements is unknown. However, the Trust has not had prior claims or losses pursuant to these arrangements.
Note 8—Manager of Managers
The Trust and VIA have each received an exemptive order from the Securities and Exchange Commission (“SEC”) granting exemptions from certain provisions of the 1940 Act, as amended, pursuant to which VIA will, subject to review and approval of the Trust’s Board of Trustees, be permitted to enter into and materially amend subadvisory agreements without such agreements being approved by the shareholders of the applicable Series of the Fund. VIA will continue to have the ultimate responsibility to oversee the subadvisers and recommend their hiring, termination and replacement.
57
VIRTUS VARIABLE INSURANCE TRUST
NOTES TO FINANCIAL STATEMENTS (Continued)
DECEMBER 31, 2011
Note 9—Plans of Reorganization
(All amounts except for the per share amounts are reported in thousands)
At special meetings held on July 1, 2010 and July 26, 2010, all of the Trustees of the Trust on behalf of Phoenix Comstock Series (“Comstock,” the “Merging Series”), including the Trustees who are not interested persons as defined in Section 2(a)(19) of the 1940 Act (the “Disinterested Trustees”) considered and approved the Agreement and Plan of Reorganization (the “Plan”) as set forth. The Plan was submitted to shareholders of Comstock Series at a Special Meeting of Shareholders held on October 29, 2010. The assets of the Merging Series were exchanged for shares of Virtus Growth & Income Series (formerly known as Phoenix Growth and Income Series) (the “Acquiring Series”) and the assumption of the liabilities of the Merging Series. The purpose of the transaction was to eliminate the offering of overlapping Series with similar investment objectives and similar investment strategies within the Trust, while simultaneously creating economies of scale for the surviving Series that were intended to lower Series expenses. For financial reporting purposes, assets received and shares issued by the Acquiring Series were recorded at fair value; however, the cost basis of the investments received from the Merging Series was carried forward to align ongoing reporting of the Acquiring Series’ realized and unrealized gains and losses with amounts distributable to shareholders for tax purposes. The acquisitions were accomplished by a tax-free exchange of shares on November 5, 2010.
| | | | | | | | | | | | | | |
Merging Series | | 11/5/10
Shares
Outstanding | | | Acquiring
Series | | 11/5/10
Shares
Converted | | | Merging Series
Net Asset
Value | |
| Comstock Series | | | 3,977 | | | Growth & Income Series | | | 3,519 | | | $ | 42,967 | |
The net assets and net unrealized appreciation (depreciation) immediately before the acquisition were as follows:
| | | | | | | | | | | | |
Merging Series | | Net
Assets | | | Unrealized
Appreciation
(Depreciation) | | Acquiring
Series | | Net
Assets | |
| Comstock Series | | $ | 42,967 | | | $7,651 | | Growth & Income Series | | $ | 84,444 | |
Assuming the acquisition had been completed on January 1, 2010, the Virtus Growth & Income Series’ results of operations for the year ended December 31, 2010, would have been as follows:
| | | | |
| Net investment income (loss) | | $ | 1,454 | (a) |
| Net realized and unrealized gain (loss) on investments | | | 21,518 | (b) |
| | | | |
| Net increase (decrease) in assets from operations | | $ | 22,972 | |
| | (a) | $969, as reported in the Statement of Operations, plus $485 Net Investment Income from the Comstock Series pre-merger. |
| | (b) | $14,080, as reported in the Statement of Operations, plus $7,438 Net Realized and Unrealized Gain (Loss) on Investments from the Comstock Series pre-merger. |
At special meetings held on July 1, 2010 and July 26, 2010, all of the Trustees of the Trust on behalf of Phoenix Equity Index 500 Series (“Equity Index 500,” the “Merging Series”), including the Disinterested Trustees, considered and approved the Agreement and Plan of Reorganization (the “Plan”) as set forth. The Plan was submitted to shareholders of Equity Index 500 Series at a Special Meeting of Shareholders held on October 29, 2010. The assets of the Merging Series were exchanged for shares of Virtus Growth & Income Series (formerly known as Phoenix Growth and Income Series) (the “Acquiring Series”) and the assumption of the liabilities of the Merging Series. The purpose of the transaction was to eliminate the offering of overlapping Series with similar investment objectives and similar investment strategies within the Trust, while simultaneously creating economies of scale for the surviving Series that were intended to lower Series expenses. For financial reporting purposes, assets received and shares issued by the Acquiring Series were recorded at fair value; however, the cost basis of the investments received from the Merging Series was carried forward to align ongoing reporting of the Acquiring Series’ realized and unrealized gains and losses with amounts distributable to shareholders for tax purposes. The acquisitions were accomplished by a tax-free exchange of shares on November 5, 2010.
| | | | | | | | | | | | | | |
Merging Series | | 11/5/10
Shares
Outstanding | | | Acquiring
Series | | 11/5/10
Shares
Converted | | | Merging Series
Net Asset
Value | |
| Equity 500 Index Series | | | 5,314 | | | Growth & Income Series | | | 4,784 | | | $ | 58,423 | |
The net assets and net unrealized appreciation (depreciation) immediately before the acquisition were as follows:
| | | | | | | | | | | | | | |
Merging Series | | Net
Assets | | | Unrealized
Appreciation
(Depreciation) | | | Acquiring
Series | | Net
Assets | |
| Equity Index 500 Series | | $ | 58,423 | | | $ | 14,559 | | | Growth & income Series | | $ | 84,444 | |
Assuming the acquisition had been completed on January 1, 2010, the Virtus Growth & Income Series’ results of operations for the year ended December 31, 2010, would have been as follows:
| | | | |
| Net investment income (loss) | | $ | 1,721 | (a) |
| Net realized and unrealized gain (loss) on investments | | | 27,814 | (b) |
| | | | |
| Net increase (decrease) in assets from operations | | $ | 29,535 | |
| | (a) | $969, as reported in the Statement of Operations, plus $752 Net Investment Income from the Equity Index 500 Series pre-merger. |
| | (b) | $14,080, as reported in the Statement of Operations, plus $13,734 Net Realized and Unrealized Gain (Loss) on Investments from the Equity Index 500 Series pre-merger. |
58
VIRTUS VARIABLE INSURANCE TRUST
NOTES TO FINANCIAL STATEMENTS (Continued)
DECEMBER 31, 2011
At special meetings held on July 1, 2010 and July 26, 2010, all of the Trustees of the Trust on behalf of Phoenix Mid-Cap Growth Series (“Mid-Cap Growth,” the “Merging Series”), including the Disinterested Trustees, considered and approved the Agreement and Plan of Reorganization (the “Plan”) as set forth. The Plan was submitted to shareholders of Mid-Cap Growth Series at a Special Meeting of Shareholders held on October 29, 2010. The assets of the Merging Series were exchanged for shares of Virtus Small-Cap Growth Series (formerly known as Phoenix Small-Cap Growth Series) (the “Acquiring Series”) and the assumption of the liabilities of the Merging Series. The purpose of the transaction was to eliminate the offering of overlapping Series with similar investment objectives and similar investment strategies within the Trust, while simultaneously creating economies of scale for the surviving Series that were intended to lower Series expenses. For financial reporting purposes, assets received and shares issued by the Acquiring Series were recorded at fair value; however, the cost basis of the investments received from the Merging Series was carried forward to align ongoing reporting of the Acquiring Series’ realized and unrealized gains and losses with amounts distributable to shareholders for tax purposes. The acquisitions were accomplished by a tax-free exchange of shares on November 5, 2010.
| | | | | | | | | | | | | | | | |
Merging Series | | 11/5/10
Shares
Outstanding | | | Acquiring
Series | | | 11/5/10
Shares
Converted | | | Merging Series
Net Asset
Value | |
| Mid-Cap Growth Series | | | 3,197 | | | | Small-Cap Growth Series | | | | 3,597 | | | $ | 46,116 | |
The net assets and net unrealized appreciation (depreciation) immediately before the acquisition were as follows:
| | | | | | | | | | | | | | | | |
Merging Series | | Net
Assets | | | Unrealized
Appreciation
(Depreciation) | | | Acquiring
Series | | | Net
Assets | |
| Mid-Cap Growth Series | | $ | 46,116 | | | $ | 13,969 | | | | Small-Cap Growth Series | | | $ | 22,775 | |
Assuming the acquisition had been completed on January 1, 2010, the Virtus Small-Cap Growth Series’ results of operations for the year ended December 31, 2010, would have been as follows:
| | | | |
| Net investment income (loss) | | $ | (429 | )(a) |
| Net realized and unrealized gain (loss) on investments | | | 22,037 | (b) |
| | | | |
| Net increase (decrease) in assets from operations | | $ | 21,608 | |
| | (a) | $(172), as reported in the Statement of Operations, plus $(257) Net Investment Income from the Mid-Cap Growth Series pre-merger. |
| | (b) | $4,584, as reported in the Statement of Operations, plus $17,453 Net Realized and Unrealized Gain (Loss) on Investments from the Mid-Cap Growth Series pre-merger. |
At special meetings held on July 1, 2010 and July 26, 2010, all of the Trustees of the Trust on behalf of Phoenix Mid-Cap Value Series (“Mid-Cap Value,” the “Merging Series”), including the Disinterested Trustees, considered and approved the Agreement and Plan of Reorganization (the “Plan”) as set forth. The Plan was submitted to shareholders of Mid-Cap Value at a Special Meeting of Shareholders held on October 29, 2010. The assets of the Merging Series were exchanged for shares of Virtus Small-Cap Value Series (formerly known as Phoenix Small-Cap Value Series) (the “Acquiring Series”) and the assumption of the liabilities of the Merging Series. The purpose of the transaction was to eliminate the offering of overlapping Series with similar investment objectives and similar investment strategies within the Trust, while simultaneously creating economies of scale for the surviving Series that were intended to lower Series expenses. For financial reporting purposes, assets received and shares issued by the Acquiring Series were recorded at fair value; however, the cost basis of the investments received from the Merging Series was carried forward to align ongoing reporting of the Acquiring Series’ realized and unrealized gains and losses with amounts distributable to shareholders for tax purposes. The acquisitions were accomplished by a tax-free exchange of shares on November 5, 2010.
| | | | | | | | | | | | | | | | |
Merging Series | | 11/5/10
Shares
Outstanding | | | Acquiring
Series | | | 11/5/10
Shares
Converted | | | Merging Series
Net Asset
Value | |
| Mid-Cap Value Series | | | 9,791 | | | | Small-Cap Value Series | | | | 9,565 | | | $ | 114,619 | |
The net assets and net unrealized appreciation (depreciation) immediately before the acquisition were as follows:
| | | | | | | | | | | | | | | | |
Merging Series | | Net
Assets | | | Unrealized
Appreciation
(Depreciation) | | | Acquiring
Series | | | Net
Assets | |
| Mid-Cap Value Series | | $ | 114,619 | | | $ | 28,302 | | | | Small-Cap Value Series | | | $ | 37,725 | |
Assuming the acquisition had been completed on January 1, 2010, the Virtus Small-Cap Value Series’ results of operations for the year ended December 31, 2010, would have been as follows:
| | | | |
| Net investment income (loss) | | $ | 758 | (a) |
| Net realized and unrealized gain (loss) on investments | | | 52,205 | (b) |
| | | | |
| Net increase (decrease) in assets from operations | | $ | 52,963 | |
| | (a) | $729, as reported in the Statement of Operations, plus $29 Net Investment Income from the Mid-Cap Value Series pre-merger. |
| | (b) | $8,914, as reported in the Statement of Operations, plus $43,291 Net Realized and Unrealized Gain (Loss) on Investments from the Mid-Cap Value Series pre-merger. |
At special meetings held on July 1, 2010 and July 26, 2010, all of the Trustees of the Trust on behalf of Phoenix Multi-Sector Short Term Bond Series (“Multi-Sector Short Term Bond,” the “Merging Series”), including the Disinterested Trustees, considered and approved the Agreement and Plan of Reorganization (the “Plan”) as set forth. The Plan was submitted to shareholders of Multi-Sector Short Term Bond at a Special Meeting of Shareholders
59
VIRTUS VARIABLE INSURANCE TRUST
NOTES TO FINANCIAL STATEMENTS (Continued)
DECEMBER 31, 2011
held on October 29, 2010. The assets of the Merging Series were exchanged for shares of Virtus Multi-Sector Fixed Income Series (formerly known as Phoenix Multi-Sector Fixed Income Series) (the “Acquiring Series”) and the assumption of the liabilities of the Merging Series. The purpose of the transaction was to eliminate the offering of overlapping Series with similar investment objectives and similar investment strategies within the Trust, while simultaneously creating economies of scale for the surviving Series that were intended to lower Series expenses. For financial reporting purposes, assets received and shares issued by the Acquiring Series were recorded at fair value; however, the cost basis of the investments received from the Merging Series was carried forward to align ongoing reporting of the Acquiring Series’ realized and unrealized gains and losses with amounts distributable to shareholders for tax purposes. The acquisitions were accomplished by a tax-free exchange of shares on November 5, 2010.
| | | | | | | | | | | | | | |
Merging Series | | 11/5/10
Shares
Outstanding | | | Acquiring Series | | 11/5/10
Shares
Converted | | | Merging Series
Net Asset
Value | |
| Multi-Sector Short Term Bond Series | | | 3,112 | | | Multi-Sector Fixed Income Series | | | 3,326 | | | $ | 33,044 | |
The net assets and net unrealized appreciation (depreciation) immediately before the acquisition were as follows:
| | | | | | | | | | | | | | |
Merging Series | | Net
Assets | | | Unrealized
Appreciation
(Depreciation) | | | Acquiring Series | | Net
Assets | |
| Multi-Sector Short Term Bond Series | | $ | 33,044 | | | $ | 1,972 | | | Multi-Sector Fixed Income Series | | $ | 204,176 | |
Assuming the acquisition had been completed on January 1, 2010, the Virtus Multi-Sector Fixed Income Series’ results of operations for the year ended December 31, 2010, would have been as follows:
| | | | |
| Net investment income (loss) | | $ | 15,000 | (a) |
| Net realized and unrealized gain (loss) on investments | | | 16,036 | (b) |
| | | | |
| Net increase (decrease) in assets from operations | | $ | 31,036 | |
| | (a) | $13,400, as reported in the Statement of Operations, plus $1,600 Net Investment Income from the Virtus Multi-Sector Short Term Bond Series pre-merger. |
| | (b) | $13,414, as reported in the Statement of Operations, plus $2,622 Net Realized and Unrealized Gain (Loss) on Investments from the Multi-Sector Short Term Bond Series pre-merger. |
Note 10—Mixed and Shared Funding
Shares of the Trust are not directly offered to the public. Shares of the Trust are currently offered through separate accounts to fund variable accumulation annuity contracts and variable universal life insurance policies issued by participating insurance companies.
The interests of variable annuity contract owners and variable life policy owners could diverge based on differences in federal and state regulatory requirements, tax laws, investment management or other unanticipated developments. The Trust’s Trustees do not foresee any such differences or disadvantages at this time. However, the Trust’s Trustees intend to monitor for any material conflicts and will determine what action, if any, should be taken in response to such conflicts. If such a conflict should occur, one or more separate accounts may be required to withdraw its investment in the Trust, or shares of another fund may be substituted.
Note 11—Federal Income Tax Information
($ reported in thousands except as noted)
At December 31, 2011, federal tax cost and aggregate gross unrealized appreciation (depreciation) of securities held by each Series were as follows:
| | | | | | | | | | | | | | | | |
Series | | Federal
Tax Cost | | | Unrealized
Appreciation | | | Unrealized
(Depreciation) | | | Net Unrealized
Appreciation
(Depreciation) | |
Capital Growth Series | | $ | 175,269 | | | $ | 15,494 | | | $ | (866 | ) | | $ | 14,628 | |
Growth & Income Series | | | 125,254 | | | | 29,671 | | | | (7,601 | ) | | | 22,070 | |
International Series | | | 254,750 | | | | 86,573 | | | | (8,500 | ) | | | 78,073 | |
Multi-Sector Fixed Income Series | | | 192,889 | | | | 10,662 | | | | (9,211 | ) | | | 1,451 | |
Premium AlphaSector™ Series | | | 1,229 | | | | 48 | | | | (1 | ) | | | 47 | |
Real Estate Securities Series | | | 60,017 | | | | 42,550 | | | | (101 | ) | | | 42,449 | |
Small-Cap Growth Series | | | 58,536 | | | | 8,268 | | | | (1,304 | ) | | | 6,964 | |
Small-Cap Value Series | | | 120,213 | | | | 13,845 | | | | (5,219 | ) | | | 8,626 | |
Strategic Allocation Series | | | 118,384 | | | | 21,870 | | | | (5,143 | ) | | | 16,727 | |
60
VIRTUS VARIABLE INSURANCE TRUST
NOTES TO FINANCIAL STATEMENTS (Continued)
DECEMBER 31, 2011
The following Series have capital loss carryovers, which may be used to offset future capital gains, as follows:
| | | | | | | | | | | | | | | | | | | | | | | | |
| | | Expiration Year | |
Series | | 2012 | | | 2015 | | | 2016 | | | 2017 | | | No
Expiration | | | Total | |
Capital Growth Series | | $ | 2,334 | | | $ | — | | | $ | 45,875 | | | $ | 26,333 | | | $ | — | | | $ | 74,542 | |
Growth & Income Series | | | — | | | | 2,415 | | | | 14,070 | | | | 3,865 | | | | — | | | | 20,350 | |
International Series | | | — | | | | — | | | | — | | | | 44,925 | | | | — | | | | 44,925 | |
Multi-Sector Fixed Income Series | | | — | | | | — | | | | 470 | | | | 11,514 | | | | — | | | | 11,984 | |
Premium AlphaSector™ Series | | | — | | | | — | | | | — | | | | — | | | | 91 | | | | 91 | |
Real Estate Securities Series | | | — | | | | — | | | | — | | | | — | | | | — | | | | — | |
Small-Cap Growth Series | | | — | | | | 43 | | | | 10,422 | | | | — | | | | — | | | | 10,465 | |
Small-Cap Value Series | | | — | | | | — | | | | 19,507 | | | | — | | | | — | | | | 19,507 | |
Strategic Allocation Series | | | — | | | | — | | | | — | | | | 13,101 | | | | — | | | | 13,101 | |
The Trust may not realize the benefit of these losses to the extent each Series does not realize gains on investments prior to the expiration of the capital loss carryovers. The Growth & Income Series, Multi-Sector Fixed Income Series, the Small-Cap Growth Series and the Small-Cap Value Series amounts include losses acquired in connection with mergers. Utilization of this capital loss carryover is subject to annual limits.
Under the Regulated Investment Company Modernization Act of 2010 (the “Act”), net capital losses recognized for tax years beginning after December 22, 2010 may be carried forward indefinitely, and their character is retained as short-term and/or long-term losses. Previously, net capital losses were carried forward for eight years and treated as short-term losses. As a transition rule, the Act requires that post-enactment net capital losses be used before pre-enactment net capital losses.
For the Period ended December 31, 2011, the following Series utilized losses deferred in prior years against current year capital gains.
| | | | |
| Capital Growth Series | | $ | 6,459 | |
| Growth & Income Series | | | 6,167 | |
| International Series | | | 16,146 | |
| Multi-Sector Fixed Income Series | | | 4,923 | |
| Real Estate Securities Series | | | 2,179 | |
| Small-Cap Growth Series | | | 7,544 | |
| Small-Cap Value Series | | | 3,104 | |
| Strategic Allocation Series | | | 8,788 | |
Capital losses realized after October 31 and certain late year losses (e.g. foreign currency) may be deferred and treated as occurring on the first day of the following fiscal year. For the fiscal period ended December 31, 2011, the Series deferred and recognized losses as follows:
| | | | | | | | | | | | |
| | | Ordinary
Loss
Deferred | | | Capital
Loss
Deferred | | | Capital
Loss
Recognized | |
Capital Growth Series | | $ | — | | | $ | 3,527 | | | $ | — | |
Growth & Income Series | | | — | | | | 56 | | | | — | |
International Series | | | 15 | | | | — | | | | — | |
Multi-Sector Fixed Income Series | | | — | | | | 1,177 | | | | — | |
Premium AlphaSector™ Series | | | — | | | | — | | | | — | |
Real Estate Securities Series | | | — | | | | 21 | | | | — | |
Small-Cap Growth Series | | | — | | | | 1,110 | | | | — | |
Small-Cap Value Series | | | — | | | | 722 | | | | — | |
Strategic Allocation Series | | | — | (1) | | | — | | | | — | |
The components of distributable earnings on a tax basis (excluding unrealized appreciation (depreciation) which are disclosed in the Schedules of Investments) consist of the following:
| | | | | | | | |
| | | Undistributed
Ordinary Income | | | Undistributed
Long-Term Capital Gains | |
Capital Growth Series | | $ | 81 | | | $ | — | |
Growth & Income Series | | | 158 | | | | — | |
International Series | | | 1,779 | | | | — | |
Multi-Sector Fixed Income Series | | | 1,523 | | | | — | |
Premium AlphaSector™ Series | | | — | (1) | | | — | |
Real Estate Securities Series | | | 348 | | | | 2,062 | |
Small-Cap Growth Series | | | — | | | | — | |
Small-Cap Value Series | | | 400 | | | | — | |
Strategic Allocation Series | | | 550 | | | | — | |
| | (1) | Amount less than $500. |
The differences between the book and tax basis components of distributable earnings relate principally to the timing of recognition of income and gains for federal tax purposes. Short-term gains distributions reported in the Statements of Changes in Net Assets, if any, are reported as ordinary income for federal tax purposes. Distributions are determined on a tax basis and may differ from net investment income and realized capital gains for financial reporting purposes.
61
VIRTUS VARIABLE INSURANCE TRUST
NOTES TO FINANCIAL STATEMENTS (Continued)
DECEMBER 31, 2011
Note 12—Reclassification of Capital Accounts
($ reported in thousands)
For financial reporting purposes, book basis capital accounts are adjusted to reflect the tax character of permanent book/tax differences. Permanent reclassifications can arise from differing treatment of certain income and gain transactions, nondeductible current year net operating losses, expiring capital loss carryovers and investments in passive foreign investment companies. The reclassifications have no impact on the net assets or net asset value of the Series. As of December 31, 2011, the Series recorded reclassifications to increase (decrease) the accounts as listed below:
| | | | | | | | | | | | |
| | | Capital Paid In
on Shares of
Beneficial Interest | | | Accumulated
Net Realized
Gain (Loss) | | | Undistributed
Net Investment
Income (Loss) | |
Capital Growth Series | | $ | 1 | | | $ | 8 | | | $ | (9 | ) |
Growth & Income Series | | | 2 | | | | (1 | ) | | | (1 | ) |
International Series | | | — | | | | (19 | ) | | | 19 | |
Multi-Sector Fixed Income Series | | | — | | | | (387 | ) | | | 387 | |
Real Estate Securities Series | | | (63 | ) | | | 4 | | | | 59 | |
Small-Cap Growth Series | | | (120 | ) | | | 22 | | | | 98 | |
Small-Cap Value Series | | | — | | | | 1 | | | | (1 | ) |
Strategic Allocation Series | | | 1 | | | | (14 | ) | | | 13 | |
Note 13—Recent Accounting Pronouncement
In May 2011, the Financial Accounting Standards Board issued Accounting Standards Update (“ASU”) No. 2011-04, “Amendments to Achieve Common Fair Value Measurement and Disclosure Requirements in U.S. GAAP and IFRSs.” ASU No. 2011-04 includes common requirements for measurement of and disclosure about fair value between U.S. GAAP and IFRS. ASU No. 2011-04 will require reporting entities to disclose quantitative information about the unobservable inputs used in the fair value measurements categorized within Level 3 of the fair value hierarchy. In addition, ASU No. 2011-04 will require reporting entities to make disclosures about amounts and reasons for all transfers in and out of Level 1 and Level 2 fair value measurements. The new and revised disclosures are effective for interim and annual reporting periods beginning after December 15, 2011. At this time, management is evaluating the implications of ASU No. 2011-04 and its impact on the financial statements has not been determined.
Note 14—Subsequent Events
Management has evaluated the impact of all subsequent events on the Series through the date the financial statements were available for issuance, and has determined that there are no subsequent events requiring recognition or disclosure in these financial statements.
62

REPORT OF INDEPENDENT REGISTERED PUBLIC ACCOUNTING FIRM
To the Board of Trustees and Shareholders of the
Virtus Variable Insurance Trust:
In our opinion, the accompanying statements of assets and liabilities, including the schedules of investments, the related statements of operations and of changes in net assets and the financial highlights present fairly, in all material respects, the financial position of Virtus Capital Growth Series, Virtus Growth & Income Series, Virtus International Series, Virtus Multi-Sector Fixed Income Series, Virtus Premium AlphaSector Series, Virtus Real Estate Securities Series, Virtus Small-Cap Growth Series, Virtus Small-Cap Value Series and Virtus Strategic Allocation Series (constituting Virtus Variable Insurance Trust, hereafter referred to as the “Trust”) at December 31, 2011, the results of each of their operations, the changes in each of their net assets and the financial highlights for each of the periods indicated, in conformity with accounting principles generally accepted in the United States of America. These financial statements and financial highlights (hereafter referred to as “financial statements”) are the responsibility of the Trust’s management; our responsibility is to express an opinion on these financial statements based on our audits. We conducted our audits of these financial statements in accordance with the standards of the Public Company Accounting Oversight Board (United States). Those standards require that we plan and perform the audit to obtain reasonable assurance about whether the financial statements are free of material misstatement. An audit includes examining, on a test basis, evidence supporting the amounts and disclosures in the financial statements, assessing the accounting principles used and significant estimates made by management, and evaluating the overall financial statement presentation. We believe that our audits, which included confirmation of securities at December 31, 2011 by correspondence with the custodian and brokers, provide a reasonable basis for our opinion.

Philadelphia, Pennsylvania
February 24, 2012
63
VIRTUS VARIABLE INSURANCE TRUST
TAX INFORMATION NOTICE (UNAUDITED)
DECEMBER 31, 2011
For the fiscal year ended December 31, 2011, the Series make the following disclosures for federal income tax purposes: the percentages of ordinary income dividends earned by the Series which qualify for the dividends received deduction (“DRD”) for corporate shareholders; the actual percentage of DRD for the calendar year will be designated in year-end tax statements. The Series designate the amounts below, or if subsequently different, as long-term capital gains dividends (“LTCG”) (reported in thousands).
| | | | | | | | |
| | | DRD | | | LTCG | |
| Capital Growth Series | | | 100 | % | | $ | — | |
| Growth & Income Series | | | 100 | | | | — | |
| International Series | | | — | | | | — | |
| Multi-Sector Fixed Income Series | | | — | | | | — | |
| Premium AlphaSectorTM Series | | | 100 | | | | — | |
| Real Estate Securities Series | | | — | | | | 7,816 | |
| Small-Cap Growth Series | | | — | | | | 16 | |
| Small-Cap Value Series | | | 100 | | | | 23 | |
| Strategic Allocation Series | | | 39 | | | | — | |
64
CONSIDERATION OF ADVISORY AND SUB-ADVISORY AGREEMENTS
BY THE BOARD OF TRUSTEES
The Board of Trustees (the “Board”) of the Virtus Variable Insurance Trust (the “Trust”) is responsible for determining whether to approve the continuation of the investment advisory agreement (the “Advisory Agreement”) between the Trust and Virtus Investment Advisers, Inc. (“VIA”) and of each sub-advisory agreement (each, a “Sub-Advisory Agreement” and collectively, the “Sub-Advisory Agreements”) (together with the Advisory Agreement, the “Agreements”) with respect to the series (individually and collectively, the “Series”) of the Trust. At an in-person meeting held on November 14, 2011, the Board, including a majority of the Trustees who are not interested persons of the Trust as defined in Section 2(a)(19) of the Investment Company Act of 1940, as amended, (the “Independent Trustees”), considered and approved the continuation of each Agreement due for renewal,1 as further discussed below.
In connection with the approval of the Agreements, the Board requested and evaluated information provided by VIA and each subadviser (each, a “Subadviser” and collectively, the “Subadvisers”) which, in the Board’s view, constituted information necessary for the Board to form a judgment as to whether the renewal of each of the Agreements would be in the best interests of each applicable Series and its respective shareholders. The Board also considered information furnished throughout the year at regular Board meetings with respect to the services provided by VIA and the Subadvisers, including quarterly performance reports prepared by management containing reviews of investment results and periodic presentations from the Subadvisers with respect to the Series they manage. The Board noted the affiliation of certain of the Subadvisers with VIA and any potential conflicts of interest.
The Board was separately advised by independent legal counsel throughout the process. For each Agreement, the Board considered all the criteria separately with respect to the applicable Series and its shareholders. In their deliberations, the Board considered various factors, including those discussed below, none of which were controlling, and each Trustee may have attributed different weights to the various factors. The Board also discussed the proposed approval of the Agreements in private sessions with their independent legal counsel at which no representatives of management were present.
In considering whether to approve the renewal of the Agreements with respect to each Series, the Board reviewed and analyzed the factors it deemed relevant, including: (1) the nature, extent and quality of the services to be provided to the Series by VIA and each of the Subadvisers; (2) the performance of the Series as compared to an appropriate peer group and an appropriate index; (3) the level and method of computing each Series’ advisory and subadvisory fees, and comparisons of the Series’ advisory fee rates with those of a group of funds with similar investment objectives; (4) the profitability of VIA under the Advisory Agreement; (5) any “fall-out” benefits to VIA, the Subadvisers and their affiliates (i.e., ancillary benefits realized by VIA, the Subadvisers or their affiliates from VIA’s or the Subadvisers’ relationship with the Trust); (6) the anticipated effect of growth in size on each Series’ performance and expenses; (7) fees paid to VIA and the Subadvisers by comparable accounts, as applicable; (8) possible conflicts of interest; and (9) the terms of the Agreements.
Nature, Extent and Quality of Services. The Trustees received in advance of the meeting information in the form of questionnaires completed by VIA and each Subadviser, each concerning a number of topics, including such company’s investment philosophy, resources, operations and compliance structure. The Trustees also received a presentation by VIA’s senior management personnel, during which among other items, VIA’s history, investment process, investment strategies, personnel, compliance procedures and the firm’s overall performance were reviewed and discussed. The Trustees noted that the Series are managed using a “manager of managers” structure that generally involves the use of one or more subadvisers to manage some or all of a Series’ portfolio. Under this structure, VIA is responsible for evaluating and selecting subadvisers on an ongoing basis and making any recommendations to the Board regarding hiring, retaining or replacing subadvisers. In considering the Agreement with VIA, the Board considered VIA’s process for supervising and managing the Series’ subadvisers, including (a) VIA’s ability to select and monitor the subadvisers; (b) VIA’s ability to provide the services necessary to monitor the subadvisers’ compliance with the Series’ respective investment objectives, policies and restrictions as well as provide other oversight activities; and (c) VIA’s ability and willingness to identify instances in which a subadviser should be replaced and to carry out the required changes. The Trustees also considered: (a) the experience and capability of VIA’s management and other personnel; (b) the financial condition of VIA, and whether it had the financial wherewithal to provide a high level and quality of services to the Series; (c) the quality of VIA’s own regulatory and legal compliance policies, procedures and systems; (d) the nature, extent and quality of administrative and other services provided by VIA and its affiliates to the Series; (e) VIA’s supervision of the Series’ other service providers; and (f) VIA’s risk management processes. It was noted that VP Distributors, LLC, an affiliate of VIA, serves as administrator and distributor to the Series. The Board also took into account its knowledge of VIA’s management and the quality of the performance of its duties through Board meetings, discussions and reports during the preceding year, as well as information from the Trust’s Chief Compliance Officer (“CCO”) regarding the Series’ compliance policies and procedures established pursuant to Rule 38a-1 under the 1940 Act.
With respect to the services provided by each of the Subadvisers, the Board considered information provided to the Board by each Subadviser, including each Subadviser’s Form ADV, as well as information provided throughout the past year. With respect to the Sub-Advisory Agreements, the Board noted that each Subadviser provided portfolio management, compliance with the respective Series’ investment policies and procedures, compliance with applicable securities laws and assurances thereof. In considering the renewal of the Sub-Advisory Agreements, the Board also considered each Subadviser’s investment management process, including (a) the experience and capability of the Subadviser’s management and other personnel committed by the Subadviser to the respective Series; (b) the financial condition of the Subadviser; (c) the quality of the Subadviser’s regulatory and legal compliance policies, procedures and systems; and (d) the Subadviser’s brokerage and trading practices, including with respect to best execution and soft dollars. The Board also took into account the Subadviser’s risk assessment and monitoring process. The Board noted each Subadviser’s regulatory history, including whether it was currently involved in any regulatory actions or investigations as well as material litigation, and any settlements and amelioratory actions undertaken, as appropriate.
| 1 | The advisory and subadvisory Agreements were not due for renewal with respect to Virtus Premium AlphaSector Series because they were initially approved in November 2010 for a 2-year period. |
65
CONSIDERATION OF ADVISORY AND SUB-ADVISORY AGREEMENTS
BY THE BOARD OF TRUSTEES (Continued)
After considering all of the information provided to them, the Trustees concluded that the nature, extent and quality of the services provided by VIA and each Subadviser were satisfactory and that there was a reasonable basis on which to conclude that each would continue to provide a high quality of investment services to the applicable Series.
Investment Performance. The Board considered performance reports and discussions at Board meetings throughout the year, as well as a report (the “Lipper Report”) for the Series prepared by Lipper Inc. (“Lipper”), an independent third party provider of investment company data, furnished in connection with the contract renewal process. The Lipper Report presented each Series’ performance relative to a peer group of other mutual funds (the “Performance Universe”) and relevant indexes, as selected by Lipper. The Board also considered performance information presented by management and took into account management’s discussion of the same, including the effect of market conditions on each Series’ performance. The Board evaluated each Series’ performance in the context of the special considerations that a “manager of managers” structure requires. The Board noted that it also reviews on a quarterly basis detailed information about both the Series’ performance results and portfolio composition, as well as each Subadviser’s investment strategy. The Board noted VIA’s expertise and resources in monitoring the performance, investment style and risk-adjusted performance of each Subadviser. The Board also noted each Subadviser’s performance record with respect to the Series. The Board was mindful of VIA’s focus on each Subadviser’s performance and noted VIA’s performance in monitoring and responding to any performance issues with respect to the Series. The Board also took into account its discussions with management regarding factors that contributed to the performance of each Series.
The Board considered, among other performance data, the information set forth below with respect to the performance of each Series for the periods ended September 30, 2011:
Virtus International Series. The Board noted that the Series outperformed the median of its Performance Universe and its benchmark for the 1-, 3-, 5- and 10- year periods.
Virtus Real Estate Securities Series. The Board noted that the Series outperformed the median of its Performance Universe and its benchmark for the 1-, 3-, 5- and 10- year periods.
Virtus Growth & Income Series. The Board noted that the Series outperformed the median of its Performance Universe for the 1- and 5- year periods and underperformed the median of its Performance Universe for the 3- and 10- year periods. The Board also noted that the Series underperformed its benchmark for the 1-, 3-, 5- and 10- year periods. The Board took into account management’s discussion of the Series’ performance. The Board concluded that it will continue to monitor the Series’ performance and any actions taken by VIA and the Subadviser to continue to improve performance.
Virtus Strategic Allocation Series. The Board noted that the Series outperformed the median of its Performance Universe for the 1-, 3- and 5- year periods and underperformed the median of its Performance Universe for the 10- year period. The Board also noted that the Series underperformed its benchmark for the 1-, 3-, 5- and 10- year periods. The Board took into account management’s discussion of the Series’ performance relative to its benchmark.
Virtus Capital Growth Series. The Board noted that the Series underperformed the median of its Performance Universe for the 1-, 3-, 5- and 10- year periods. The Board also noted that the Series outperformed its benchmark for the 3- and 5- year periods and underperformed its benchmark for the 1- and 10- year periods. The Board took into account management’s discussion of the Series’ performance and any actions taken to address the Series’ performance, including the replacement of the Series’ Subadviser in November 2010. The Board noted that the Series’ longer-term performance reflects the performance of the Series’ previous Subadviser. The Board also took into account management’s change in the Series’ portfolio manager effective September 30, 2011. The Board concluded that it will continue to monitor the Series’ performance and any actions taken by VIA and the Subadviser to improve performance.
Virtus Small-Cap Growth Series. The Board noted that the Series outperformed the median of its Performance Universe and benchmark for the 1- and 3- year periods, and underperformed the median of its Performance Universe and benchmark for the 5- year period. The Board took into account management’s discussion of the Series’ performance over the longer-term period.
Virtus Small-Cap Value Series. The Board noted that the Series outperformed the median of its Performance Universe for the 1- and 10- year periods and underperformed the median of its Performance Universe for the 3- and 5- year periods. The Board also noted that the Series outperformed its benchmark for the 1-, 3-, 5- and 10- year periods. The Board took into account management’s discussion of the Series’ performance.
Virtus Multi-Sector Fixed Income Series. The Board noted that the Series underperformed the median of its Performance Universe and benchmark for the 1- year period and outperformed the median of its Performance Universe and benchmark for the 3-, 5- and 10- year periods. The Board took into account management’s discussion of the Series’ performance over the short-term period.
After reviewing these and related factors, the Board concluded that each Series’ overall performance was satisfactory, or where noted above, action was being taken to address performance.
Management Fees and Total Expenses. The Board considered the fees charged to the Series for advisory services as well as the total expense levels of the Series. This information included comparisons of each Series’ net management fee and total expense level to those of its peer group (the “Expense Group”). In comparing each Series’ net management fee to that of comparable funds, the Board noted that such fee includes both advisory and administrative fees. The Board also noted that all of the Series had fee waivers and/or expense caps in place to limit the total expenses incurred by the Series and its shareholders. The Board also noted that the subadvisory fees were paid by VIA out of its management fees rather than paid separately by the Series. In this regard, the Board took into account management’s discussion with respect to the advisory/subadvisory fee structure, including the amount of the advisory fee retained by VIA after payment of the subadvisory fee. The Board also took into account the size of each of the Series and the impact on expenses. The Subadvisers provided, and the Board considered, expense information of comparable accounts managed by the Subadvisers, as applicable.
66
CONSIDERATION OF ADVISORY AND SUB-ADVISORY AGREEMENTS
BY THE BOARD OF TRUSTEES (Continued)
In addition to the foregoing, the Board considered, among other data, the information set forth below with respect to each Series’ fees and expenses:
Virtus International Series. The Board considered that the Series’ net management fee and net total expenses after waivers were below the median of the Expense Group.
Virtus Real Estate Securities Series. The Board considered that the Series’ net management fee and net total expenses after waivers were below the median of the Expense Group.
Virtus Growth & Income Series. The Board considered that the Series’ net management fee and net total expenses after waivers were below the median of the Expense Group.
Virtus Strategic Allocation Series. The Board considered that the Series’ net management fee and net total expenses after waivers were below the median of the Expense Group.
Virtus Capital Growth Series. The Board considered that the Series’ net management fee and net total expenses after waivers were below the median of the Expense Group.
Virtus Small-Cap Growth Series. The Board considered that the Series’ net management fee and net total expenses after waivers were below the median of the Expense Group.
Virtus Small-Cap Value Series. The Board considered that the Series’ net management fee and net total expenses after waivers were above the median of the Expense Group. The Board took into account management’s discussion of the Series’ expenses, including the type of fund.
Virtus Multi-Sector Fixed Income Series. The Board considered that the Series’ net management fee and net total expenses after waivers were below the median of the Expense Group.
The Board concluded that the advisory and sub-advisory fees for each Series were fair and reasonable in light of the usual and customary charges made for services of the same nature and quality and the other factors considered.
Profitability. The Board also considered certain information relating to profitability that had been provided by VIA. In this regard, the Board considered information regarding the overall profitability, as well as on a Series-by-Series basis, of VIA for its management of the Trust, as well as its profits and those of its affiliates for managing and providing other services to each Series, such as distribution and administrative services provided to the Series by a VIA affiliate. In addition to the fees paid to VIA and its affiliates, including the applicable Subadvisers, the Board considered any other benefits derived by VIA or its affiliates from their relationship with the Series. Attention was paid to the methodology used to allocate costs to each Series, in recognition of the fact that allocation methodologies are inherently subjective and various allocation methodologies may each be reasonable while producing different results. The Board concluded that the profitability to VIA and its affiliates from each Series was reasonable in light of the quality of the services rendered to the Series by VIA and its affiliates.
In considering the profitability to the Subadvisers in connection with their relationship to the Series, the Board noted that the fees under the Sub-Advisory Agreements are paid by VIA out of the fees that VIA receives under the Advisory Agreement, so that Series shareholders are not directly impacted by those fees. In considering the reasonableness of the fees payable by VIA to the affiliated Subadvisers, the Board noted that, because such Subadvisers are affiliates of VIA, such profitability might be directly or indirectly shared by VIA. In addition, with respect to Aberdeen Asset Management, Inc., the unaffiliated Subadviser, the Board relied on the ability of VIA to negotiate the Sub-Advisory Agreement and the fees thereunder at arm’s length. For each of the above reasons, the Board concluded that the profitability to the Subadvisers and their affiliates from their relationship with the Series was not a material factor in approval of the Sub-Advisory Agreements.
Economies of Scale. The Board received and discussed information concerning whether VIA realizes economies of scale as the Series’ assets grow. The Board noted that the management fees for several of the Series included breakpoints based on assets under management, and that fee waivers and/or expense caps were also in place for all of the Series. The Board also took into account management’s discussion of the Series’ management fee and sub-advisory fee structure, including with respect to the Series that do not currently have breakpoints. The Board also took into account the current size of the Series. The Board concluded that no changes to the advisory fee structure of the Series were necessary at this time. The Board noted that VIA and the Series may realize certain economies of scale if the assets of the Series were to increase, particularly in relationship to certain fixed costs, and that shareholders of the Series would have an opportunity to benefit from these economies of scale.
For similar reasons as stated above with respect to the Subadvisers’ profitability, and based upon the current size of the Series managed by each Subadviser, the Board concluded that the potential for economies of scale in the Subadvisers’ management of the Series was not a material factor in the approval of the Sub-Advisory Agreements at this time.
Other Factors. The Board considered other benefits that may be realized by VIA and the Subadviser and their respective affiliates from their relationships with the applicable Series. Among them, the Board recognized that VP Distributors, LLC, an affiliate of VIA, serves as the Distributor for the Trust, and, as such, receives payments pursuant to Rule 12b-1 from the Series to compensate it for providing shareholder services and selling activities, which could lead to growth in the Trust’s assets and corresponding benefits from such growth, including economies of scale. The Board also noted that VP Distributors, LLC also provides administrative services to the Trust. The Board noted management’s discussion of the fact that, while certain of the Subadvisers are affiliates of VIA, there are no other direct benefits to the Subadvisers or VIA in providing investment advisory services to the Series, other than the fee to be earned under the Sub-Advisory Agreement. There may be certain indirect benefits gained, including to the extent that serving the Series could provide the opportunity to provide advisory services to additional portfolios of the Trust or certain reputational benefits.
67
CONSIDERATION OF ADVISORY AND SUB-ADVISORY AGREEMENTS
BY THE BOARD OF TRUSTEES (Continued)
Based on all of the foregoing considerations, the Board, comprised wholly of Independent Trustees, determined that approval of each Agreement was in the best interests of each of the applicable Series and its respective shareholders. Accordingly, the Board, and the Independent Trustees voting separately, approved the Agreements with respect to each Series.
68
CONSIDERATION OF SUBADVISORY AGREEMENT FOR
VIRTUS CAPITAL GROWTH SERIES
BY THE BOARD OF TRUSTEES
The Board of Trustees (the “Board”) of the Virtus Variable Insurance Trust (the “Trust”) is responsible for determining whether to approve the investment advisory agreement (the “Advisory Agreement”) between the Trust and Virtus Investment Advisers, Inc. (“VIA”) and of each sub-advisory agreement (each, a “Sub-Advisory Agreement” and collectively, the “Sub-Advisory Agreements”) (together with the Advisory Agreement, the “Agreements”) with respect to the series (individually and collectively, the “Series”) of the Trust. At an in-person meeting held on August 22, 2011, the Board, including a majority of the Trustees who are not interested persons of the Trust as defined in Section 2(a)(19) of the Investment Company Act of 1940, as amended (the “Independent Trustees”), considered and approved the Sub-Advisory Agreement between VIA and Kayne Anderson Rudnick Investment Management, LLC (the “Subadviser”) with respect to the Virtus Capital Growth Series. The Board noted that the replacement of Newfleet Asset Management, LLC (“Newfleet”), the Series’ current subadviser, was being proposed in connection with the anticipated transition of the Series’ portfolio manager from Newfleet to the Subadviser. In connection with the approval of the Sub-Advisory Agreement with the Subadviser, the Board terminated the Sub-Advisory Agreement with the Series’ current subadviser effective September 30, 2011.
In connection with the approval of the Sub-Advisory Agreement, the Board requested and evaluated information provided by VIA and the Subadviser which, in the Board’s view, constituted information necessary for the Board to form a judgment as to whether the approval of the Sub-Advisory Agreement would be in the best interests of the Series and its shareholders. The Board took into account that the Series would be managed by the same portfolio manager and that the portfolio management and advisory services currently being provided to the Series would not materially change as a result of the replacement of Newfleet. The Board also took into account discussions with management and information provided to the Board in its meetings throughout the year with respect to the services provided by Newfleet with respect to the portfolio management team, as well as the services provided by the Subadviser with respect to other funds in the Trust. This information included quarterly performance reports prepared by management containing reviews of investment results and periodic presentations from the Newfleet with respect to the Series. The Board noted the affiliation of the Subadviser with VIA and any potential conflicts of interest.
The Board was separately advised by independent legal counsel throughout the process. In their deliberations, the Board considered various factors, including those discussed below, none of which were controlling, and each Trustee may have attributed different weights to the various factors. The Board also discussed the proposed approval of the Sub-Advisory Agreement in private sessions with their independent legal counsel at which no representatives of management were present.
In making its determination with respect to the Sub-Advisory Agreement, the Trustees considered various factors, including:
Nature, Extent and Quality of Services. The Trustees received in advance of the meeting information in the form of a questionnaire completed by the Subadviser concerning a number of topics, including its investment philosophy, resources, operations and compliance structure. The Board considered that the portfolio management services provided to the Series would not materially change as a result of the replacement of Newfleet and that the Series would be managed by the same portfolio manager. In this regard, the Board also considered information provided throughout the past year. The Board noted that the Subadviser would provide portfolio management, compliance with the Series’ investment policies and procedures, compliance with applicable securities laws and assurances thereof. In considering the approval of the Sub-Advisory Agreement, the Board also considered the Subadviser’s investment management process, including (a) the experience and capability of the Subadviser’s management and other personnel committed by the Subadviser to the Series; (b) the financial condition of the Subadviser; (c) the quality of the Subadviser’s regulatory and legal compliance policies, procedures and systems; and (d) the Subadviser’s brokerage and trading practices, including with respect to best execution and soft dollars. The Board also took into account the Subadviser’s risk assessment and monitoring process. The Board also took into account its knowledge of the Subadviser’s management and the quality of the performance of it duties in connection with the Subadviser’s provision of services to other series of the Trust. The Board noted the Subadviser’s regulatory history, including whether it was currently involved in any regulatory actions or investigations as well as material litigation, and any settlements and amelioratory actions undertaken, as appropriate.
After considering all of the information provided to them, the Trustees concluded that the nature, extent and quality of the services to be provided by the Subadviser to the Series were reasonable.
Investment Performance. The Board considered performance reports and discussions at Board meetings throughout the year regarding the Series. The Board took into account management’s discussion of the Series’ performance, including the effect of market conditions on the Series’ performance. The Board noted that it also reviewed on a quarterly basis detailed information about the Series’ performance results and portfolio composition. The Board also noted that the Subadviser would utilize the same investment strategy with respect to the Series and that the Series would be managed by the same portfolio manager. The Board took into account its discussions with management regarding the factors that contributed to the performance of the Series.
The Board considered, among other performance data, that the Series’ performance ranking was in the top 35%, 79% and 89%, respectively, of its Lipper peer group for the 1-, 3- and 5- year periods ended June 30, 2011, and had underperformed its benchmark for the same periods. The Board took into account management’s discussion of the Series’ performance and any actions taken to address the Series’ performance, including the replacement of the Series’ previous subadviser in November 2010. The Board noted that the Series’ longer-term performance reflects the performance of the Series’ previous subadviser. The Board concluded that it would continue to monitor the Series’ performance and any actions taken by VIA and the Subadviser to improve performance. After reviewing these and related factors, the Board concluded that action was being taken to address the Series’ performance.
Subadvisory Fee. The Board took into account that the rate of the investment subadvisory fee that would be paid by VIA (and not the Series) under the Sub-Advisory Agreement would remain substantially unchanged from the fee rate paid under the current Sub-Advisory Agreement. In addition, the fees paid by the Series to VIA under the Advisory Agreement would not change. The Board also noted that the Series’ subadvisory fees are paid by VIA out of its management fee rather than paid separately by the Series. In this regard, the Board took into account management’s discussion with respect to the advisory/sub-advisory fee structure, including the amount of the
69
CONSIDERATION OF SUBADVISORY AGREEMENT FOR VIRTUS CAPITAL GROWTH SERIES
BY THE BOARD OF TRUSTEES (Continued)
advisory fee retained by VIA after payment of the subadvisory fee. The Subadviser provided and the Board considered expense information of comparable accounts managed by the Subadviser, as applicable. The Board concluded that the proposed subadvisory fee for the Series was fair and reasonable in light of the usual and customary charges made for services of the same nature and quality and the other factors considered.
Profitability and Economies of Scale. In considering the anticipated profitability to the Subadviser in connection with its relationship with the Series, the Board noted that the fees under the Sub-Advisory Agreement are paid by VIA out of the advisory fees that it receives under the Advisory Agreement, so that Series shareholders are not directly impacted by those fees. In considering the reasonableness of the fee payable by VIA to the Subadviser, the Board noted that because the Subadviser is an affiliate of VIA, such profitability might be directly or indirectly shared by VIA. However, for the reason stated above, the Board concluded that the anticipated profitability to the Subadviser and its affiliates from their relationship with the Series was not a material factor in the approval of the Sub-Advisory Agreement.
For similar reasons as stated above with respect to the Subadviser’s profitability, and based upon the current size of the Series, the Board concluded that the potential for economies of scale in the Subadviser’s management of the Series was not a material factor in the approval of the Sub-Advisory Agreement at this time.
Other Factors. The Board considered other benefits that may be realized by the Subadviser and its affiliates from their relationship with the Series. Among them, the Board recognized that VP Distributors, LLC, an affiliate of VIA, serves as the Distributor of the Trust, and, as such, receives payments pursuant to Rule 12b-1 from the Series to compensate it for providing shareholder services and selling activities, which could lead to growth in the Trust’s assets and corresponding benefits from such growth, including economies of scale. The Board also noted that VP Distributors, LLC also provides administrative services to the Trust. The Board noted management’s discussion of the fact that, while the Subadviser is an affiliate of VIA, there are no other direct benefits to the Subadviser in providing investment advisory services to the Series, other than the fee to be earned under the Sub-Advisory Agreement. The Board noted that there may be certain indirect benefits gained, including to the extent that serving the Series could provide the opportunity to provide advisory services to additional portfolios of the Trust or certain reputational benefits.
Based on all of the foregoing considerations, the Board, comprised wholly of Independent Trustees, determined that approval of the Sub-Advisory Agreement was in the best interests of the Series and its shareholders. Accordingly, the Board, and the Independent Trustees voting separately, approved the Sub-Advisory Agreement with respect to the Series.
70
CONSIDERATION OF SUBADVISORY AGREEMENT FOR VIRTUS GROWTH & INCOME SERIES, VIRTUS STRATEGIC ALLOCATION SERIES
AND VIRTUS PREMIUM ALPHASECTOR SERIES
BY THE BOARD OF TRUSTEES
The Board of Trustees (the “Board”) of the Virtus Variable Insurance Trust (the “Trust”) is responsible for determining whether to approve the investment advisory agreement (the “Advisory Agreement”) between the Trust and Virtus Investment Advisers, Inc. (“VIA”) and of each sub-advisory agreement (each, a “Sub-Advisory Agreement” and collectively, the “Sub-Advisory Agreements”) (together with the Advisory Agreement, the “Agreements”) with respect to the series (individually and collectively, the “Series”) of the Trust. At an in-person meeting held on August 22, 2011, the Board, including a majority of the Trustees who are not interested persons of the Trust as defined in Section 2(a)(19) of the Investment Company Act of 1940, as amended (the “Independent Trustees”), considered and approved the Sub-Advisory Agreement between VIA and Euclid Advisors LLC (the “Subadviser”) with respect to Virtus Growth & Income Series, Virtus Strategic Allocation Series, and Virtus Premium AlphaSector Series. The Board noted that VIA was currently responsible for the day-to-day investment management of the Series’ assets, and that it was proposed that the Subadviser assume responsibility for the day-to-day investment management of the Series’ assets, consistent with the “manager-of-managers” structure in place with respect to the Trust’s other Series.
In connection with the approval of the Sub-Advisory Agreement, the Board requested and evaluated information provided by VIA and the Subadviser which, in the Board’s view, constituted information necessary for the Board to form a judgment as to whether the approval of the Sub-Advisory Agreement would be in the best interests of each applicable Series and its respective shareholders. The Board took into account that the Series would be managed by the same portfolio management teams and that the portfolio management and advisory services currently being provided to the Series would not materially change as a result of the appointment of the Subadviser. The Board also took into account discussions with management and information provided to the Board in its meetings throughout the year with respect to the services provided by VIA with respect to the portfolio management teams, and noted that such information was relevant to its consideration of the Sub-Advisory Agreement because the team at VIA currently responsible for providing portfolio management services to the Series would continue to do so at the Sub-Adviser. This information included quarterly performance reports prepared by management containing reviews of investment results and periodic presentations from VIA with respect to the Series. The Board noted the affiliation of the Subadviser with VIA and any potential conflicts of interest.
The Board was separately advised by independent legal counsel throughout the process. The Board considered all the criteria separately with respect to the applicable Series and its shareholders. In their deliberations, the Board considered various factors, including those discussed below, none of which were controlling, and each Trustee may have attributed different weights to the various factors. The Board also discussed the proposed approval of the Sub-Advisory Agreement in private sessions with their independent legal counsel at which no representatives of management were present.
In making its determination with respect to the Sub-Advisory Agreement, the Trustees considered various factors, including:
Nature, Extent and Quality of Services. The Trustees received in advance of the meeting information in the form of a questionnaire completed by the Subadviser concerning a number of topics, including its investment philosophy, resources, operations and compliance structure. The Board considered that the portfolio management services provided to the Series would not materially change as a result of the appointment of the Subadviser and that the Series would be managed by the same portfolio management teams. In this regard, the Board also considered information provided throughout the past year with respect to the Series’ portfolio management teams. The Board noted that the Subadviser would provide portfolio management, compliance with the respective Series’ investment policies and procedures, compliance with applicable securities laws and assurances thereof. In considering the approval of the Sub-Advisory Agreement, the Board also considered the Subadviser’s investment management process, including (a) the experience and capability of the Subadviser’s management and other personnel to be committed by the Subadviser to the respective Series; (b) the financial condition of the Subadviser; (c) the quality of the Subadviser’s regulatory and legal compliance policies, procedures and systems; and (d) the Subadviser’s brokerage and trading practices, including with respect to best execution and soft dollars. The Board also took into account the Subadviser’s risk assessment and monitoring process. The Board also noted that the Sub-Adviser had recently commenced operations and took into account VIA’s ability to provide the services necessary to monitor the Sub-Adviser’s compliance with the Series’ investment objective, policies and restrictions as well as provide other oversight activities.
After considering all of the information provided to them, the Trustees concluded that the nature, extent and quality of the services to be provided by the Subadviser to each Series under the Sub-Advisory Agreement were reasonable.
Investment Performance. The Board considered performance reports and discussions at Board meetings throughout the year regarding the Series. The Board took into account management’s discussion of the Series’ performance, including the effect of market conditions on the Series’ performance. The Board noted that it also reviewed on a quarterly basis detailed information about the Series’ performance results and portfolio composition. The Board also noted that the Subadviser would utilize the same investment strategies with respect to the Series and that the Series would be managed by the same portfolio management teams. The Board took into account its discussions with management regarding the factors that contributed to the performance of the Series.
The Board considered, among other performance data, the information set forth below with respect to the performance of each Series for the periods ended June 30, 2011:
Virtus Growth & Income Series. The Board noted that the Series’ performance ranking was in the top 3%, 34% and 29%, respectively, of its Lipper peer group for the 1-, 3- and 5- year periods, and had outperformed its benchmark for the 1- and 5- year periods and underperformed its benchmark for the 3- year period.
Virtus Strategic Allocation Series. The Board noted that the Series’ performance ranking was in the top 2%, 8% and 27%, respectively, of its Lipper peer group for the 1-, 3- and 5- year periods, and had outperformed its benchmark for the same periods.
Virtus Premium AlphaSector Series. The Board noted that the Series’ performance ranking was in the top 24% of its Lipper peer group for the quarter ended June 30, 2011, and had outperformed its benchmark for the same period. The Board also noted that the Series recently commenced operations in February 2011, and therefore has a limited performance history.
71
CONSIDERATION OF SUBADVISORY AGREEMENT FOR VIRTUS GROWTH & INCOME SERIES, VIRTUS STRATEGIC ALLOCATION SERIES
AND VIRTUS PREMIUM ALPHASECTOR SERIES
BY THE BOARD OF TRUSTEES (Continued)
After reviewing these and related factors, the Board concluded that each Series’ overall performance was satisfactory.
Subadvisory Fees. The Board took into account that the fees paid by the Series to VIA under the Advisory Agreement would not change. The Board also noted that the Series’ subadvisory fees are paid by VIA out of its management fees rather than paid separately by the Series. In this regard, the Board took into account management’s discussion with respect to the advisory/sub-advisory fee structure, including the amount of the advisory fee retained by VIA after payment of the subadvisory fee. The Subadviser provided and the Board considered expense information of comparable funds managed by the Subadviser, as applicable. The Board concluded that the proposed subadvisory fee for each Series was fair and reasonable in light of the usual and customary charges made for services of the same nature and quality and the other factors considered.
Profitability and Economies of Scale. In considering the anticipated profitability to the Subadviser in connection with its relationship with the Series, the Board noted that the fees under the Sub-Advisory Agreement are paid by VIA out of the advisory fees that it receives under the Advisory Agreement, so that Series shareholders are not directly impacted by those fees. In considering the reasonableness of the fee payable by VIA to the Subadviser, the Board noted that because the Subadviser is an affiliate of VIA, such profitability might be directly or indirectly shared by VIA. However, for the reason stated above, the Board concluded that the anticipated profitability to the Subadviser and its affiliates from their relationship with the Series was not a material factor in the approval of the Sub-Advisory Agreement.
For similar reasons as stated above with respect to the Subadviser’s profitability, and based upon the current size of the Series, the Board concluded that the potential for economies of scale in the Subadviser’s management of the Series was not a material factor in the approval of the Sub-Advisory Agreement at this time.
Other Factors. The Board considered other benefits that may be realized by the Subadviser and its affiliates from their relationship with the Series. Among them, the Board recognized that VP Distributors, LLC, an affiliate of VIA, serves as the Distributor of the Trust, and, as such, receives payments pursuant to Rule 12b-1 from the Series to compensate it for providing shareholder services and selling activities, which could lead to growth in the Trust’s assets and corresponding benefits from such growth, including economies of scale. The Board also noted that VP Distributors, LLC also provides administrative services to the Trust. The Board noted management’s discussion of the fact that, while the Subadviser is an affiliate of VIA, there are no other direct benefits to the Subadviser in providing investment advisory services to the Series, other than the fee to be earned under the Sub-Advisory Agreement. The Board noted that there may be certain indirect benefits gained, including to the extent that serving the Series could provide the opportunity to provide advisory services to additional portfolios of the Trust or certain reputational benefits.
In addition, the Board reviewed the sub-advisory fee to be paid to the Sub-Adviser for the Virtus Premium AlphaSector Series and concluded that the sub-advisory fee to be paid to the Sub-Adviser with respect to the Series is based on services to be provided that are in addition to, rather than duplicative of, the services provided pursuant to the advisory agreements and the sub-advisory agreements for the underlying funds in which the Series invests and that the additional services are necessary because of the differences between the investment policies, strategies and techniques of the Series and those of the underlying funds.
Based on all of the foregoing considerations, the Board, comprised wholly of Independent Trustees, determined that approval of the Sub-Advisory Agreement was in the best interests of each of the applicable Series and its respective shareholders. Accordingly, the Board, and the Independent Trustees voting separately, approved the Sub-Advisory Agreement with respect to the Series.
72
FUND MANAGEMENT TABLES
Information pertaining to the Trustees and officers of the Trust as of December 31, 2011, is set forth below. The statement of additional information (SAI) includes additional information about the Trustees and is available without charge, upon request, by calling (800) 367-5877.
The address of each individual, unless otherwise noted, is c/o Virtus Variable Insurance Trust, 100 Pearl Street, Hartford, CT 06103.
Disinterested Trustees
| | |
| | |
Name
Year of Birth
Year Elected
# of Portfolios in Fund Complex
Overseen by Trustee | | Principal Occupation(s)
During Past 5 Years and Other Directorships Held by Trustee |
Thomas J. Brown YOB: 1945 Elected: 2011 9 Portfolios | | Retired. Director, VALIC Company I, and VALIC Company II (collectively, 48 funds) (since 2005). Director, D’Youville Senior Care Center (since 2010). |
Roger A. Gelfenbien YOB: 1943 Elected: 2000 9 Portfolios | | Retired. Director, Webster Bank (2003 to 2009). Director, USAllianz Variable Insurance Product Trust (36 funds) (since 1999). |
Eunice S. Groark YOB: 1938 Elected: 1999 9 Portfolios | | Director, Peoples’ United Financial Inc. & Peoples United Bank-Board Committees at Peoples: Treasury & Finance, Member; Trust & Wealth Management-Chair, Risk management, Member (since 2007). Rideshare Corp-Director (1999-present), Ct Humanities Council Director (1999-present) |
John R. Mallin YOB: 1950 Elected: 1999 9 Portfolios | | Attorney/Partner, and Chair Real Property Practice Group, McCarter & English, LLP (law firm) (since 2003). |
Hassell H. McClellan YOB: 1945 Elected: 2008 9 Portfolios | | Professor, Wallace E. Carroll School of Management, Boston College (since 1984). Independent Trustee, John Hancock Variable Insurance Trust (since 2000) and John Hancock Funds II (collectively, 210 portfolios) (since 2005). Board of Overseers, Tufts University School of Dental Medicine (2000 to 2008). Director, Barnes Group, Inc. (diversified global components manufacturer and logistical services company) (since 2010). |
Philip R. McLoughlin YOB: 1946 Elected: 2003 Chairman 9 Portfolios | | Partner, Cross Pond Partners, LLC (since 2006). Director (since 1991) and Chairman (since 2010), World Trust Fund. Chairman and Trustee, Virtus Mutual Funds (since 1989). Director, DTF Tax-Free Income Fund, Inc. (since 1996); Duff & Phelps Utility and Corporate Bond Trust, Inc. (since 1996); DNP Select Income Fund Inc. (since 2009); and Duff & Phelps Global Utility Income Fund Inc. (since 2011). Director, Argo Group International Holdings Inc. and its predecessor, PXRE Corporation (insurance) (1986 to 2009). Trustee, Virtus Global Multi-Sector Fixed Income Fund (since 2011). |
73
FUND MANAGEMENT TABLES
Officers of the Trust Who Are Not Trustees
| | | | |
| | | |
Name, Address and
Year of Birth | | Position(s) Held with
Trust and Length of
Time Served | | Principal Occupation(s)
During Past 5 Years |
George R. Aylward YOB: 1964 | | President since 2010. | | Director, President and Chief Executive Officer (since 2008), Virtus Investment Partners, Inc. and/or certain of its subsidiaries; various senior officer positions with Virtus affiliates (since 2005); Chairman, President and Chief Executive Officer, The Zweig Fund Inc. and The Zweig Total Return Fund Inc. (since 2006); President and Trustee, Virtus Global Multi-Sector Fixed Income Fund (since 2011). |
Francis G. Waltman YOB: 1962 | | Senior Vice President since 2010. | | Executive Vice President, Product Development (since 2009), Virtus Investment Partners, Inc. and/or certain of its subsidiaries; various senior officer positions with Virtus affiliates (since 2006). |
Nancy J. Engberg YOB: 1956 | | Vice President and Chief Compliance Officer since 2011. | | Vice President (since 2008) and Chief Compliance Officer (2008 to 2011), Virtus Investment Partners, Inc. and/or certain of its subsidiaries; various officer positions with Virtus affiliates (since 2008); Vice President and Chief Compliance Officer, The Zweig Fund Inc. and Zweig Total Return Fund, Inc. (since 2012); Vice President and Chief Compliance Officer, Virtus Variable Insurance Trust (since 2011); Vice President and Counsel, The Phoenix Cos., Inc. (2003 to 2008). |
W. Patrick Bradley YOB: 1972 | | Vice President since 2011, Chief Financial Officer and Treasurer since 2006. | | Senior Vice President, Fund Services (since 2010), Virtus Investment Partners, Inc. and/or certain of its subsidiaries; various officer positions with Virtus affiliates (since 2006); Vice President, Chief Financial Officer, Treasurer and Principal Accounting Officer, Virtus Mutual Funds (since 2006); Vice President (since 2012), Chief Financial Officer and Treasurer (since 2007), The Zweig Fund, Inc. and Zweig Total Return Fund, Inc. |
Kevin J. Carr YOB: 1954 | | Vice President, Chief Legal Officer, Counsel and Secretary since 2010. | | Senior Vice President, Legal (since 2009), Virtus Investment Partners, Inc. and/or certain of its subsidiaries; various senior officer positions with Virtus affiliates (since 2008); Vice President, Chief Legal Officer, Counsel and Secretary, Virtus Mutual Funds (since 2005).; Vice President (since 2012), Secretary and Chief Legal Officer (since 2005), The Zweig Fund, Inc. and Zweig Total Return Fund, Inc.; Vice President and Counsel, Phoenix Life Insurance Company (2005 to 2008). |
74
VIRTUS VARIABLE INSURANCE TRUST
100 Pearl Street
Hartford, CT 06103-4506
Trustees
Thomas J. Brown
Roger A. Gelfenbien
Eunice S. Groark
John R. Mallin
Hassell H. McClellan
Philip R. McLoughlin
Officers
George R. Aylward, President
Francis G. Waltman, Senior Vice President
Mark S. Flynn, Anti-Money Laundering Compliance Officer and Assistant Secretary
Nancy J. Engberg, Vice President and Chief Compliance Officer
W. Patrick Bradley, Vice President, Chief Financial Officer and Treasurer
Kevin J. Carr, Vice President, Chief Legal Officer, Counsel and Secretary
Investment Adviser
Virtus Investment Advisers, Inc.
100 Pearl Street
Hartford, CT 06103-4506
Principal Underwriter
VP Distributors, LLC
100 Pearl Street
Hartford, CT 06103-4506
Transfer Agent
Bank of New York Mellon
4400 Computer Drive
Westborough, MA 01581-1722
Custodian
The Bank of New York Mellon
One Wall Street
New York, NY 10005-2588
Independent Registered Public Accounting Firm
PricewaterhouseCoopers LLC
2001 Market Street
Philadelphia, PA 19103-7042
How to Contact Us
Mutual Fund Services1-800-367-5877
Text Telephone1-800-243-1926
Web siteVirtus.com
Important Notice to Shareholders
The Securities and Exchange Commission has modified mailing regulations for semiannual and annual shareholder fund reports to allow mutual fund companies to send a single copy of these reports to shareholders who share the same mailing address. If you would like additional copies, please call Mutual Fund Services at 1-800-367-5877.
Virtus Capital Growth Series
a series of Virtus Variable Insurance Trust
Supplement dated September 30, 2011 to the
Prospectuses dated May 1, 2011
IMPORTANT NOTICETO INVESTORS
As approved by the Board of Trustees of Virtus Variable Insurance Trust, effective September 30, 2011, Kayne Anderson Rudnick Investment Management, LLC (“Kayne”) became the investment subadviser for the Virtus Capital Growth Series, which was previously subadvised by Newfleet Asset Management, LLC (formerly SCM Advisors, LLC) (“Newfleet”). The portfolio manager at Newfleet responsible for the Series will continue to manage the Series on behalf of Kayne.
VIA will continue to be the Series’ investment adviser. No changes to the Series’ principal investment strategies are being made. Also, the fees and expenses paid by the Series remain unchanged.
The Series’ summary and statutory prospectuses are hereby revised as described below.
| | • | | The description of the subadviser under “Management” in the Series’ summary prospectus and in the summary section of the Series’ statutory prospectus is revised to read: “Kayne Anderson Rudnick Investment Management, LLC (“Kayne”), an affiliate of VIA, is the subadviser to the Series (since September 2011).” |
| | • | | The description of Mr. Couden under “Portfolio Manager” in the Series’ summary prospectus and in the summary section of the Series’ statutory prospectus is replaced with the following: “Douglas Couden, CFA, Portfolio Manager and Senior Analyst at Kayne, is the manager of the Series. Mr. Couden has been Portfolio Manager since November 2010.” |
| | • | | The disclosure under “The Subadviser” on page 6 of the Series’ statutory prospectus is replaced with the following: |
Kayne Anderson Rudnick Investment Management, LLC (“Kayne”) has served as subadviser to the Series since September 2011. Kayne, an affiliate of VIA, is located at 1800 Avenue of the Stars, 2nd Floor, Los Angeles, CA 90067. Kayne acts as subadviser to mutual funds and as investment adviser to institutions and individuals. As of June 30, 2011, Kayne had approximately $5.1 billion in assets under management.
| | • | | The following replaces the disclosure under “Board of Trustees Approval of the Investment Advisory and Subadvisory Agreements” on page 6 of the Series’ statutory prospectus: |
The Trust’s annual report to shareholders for the year ended December 31, 2010 contains a discussion regarding the basis for the Trust’s Board of Trustees’ approval of the investment advisory agreement with VIA. The Trust’s annual report to shareholders for the year ended December 31, 2011 is expected to contain a discussion regarding the basis for the Trust’s Board of Trustees’ approval of the investment subadvisory agreement with Kayne.
| | • | | The following information about Mr. Couden replaces the disclosure under “Portfolio Management” on page 6 of the Series’ statutory prospectus: |
Douglas Couden, CFA, manages the Capital Growth Series (since November 2010) and is primarily responsible for the day-to-day management of the Series’ portfolio. Mr. Couden is Portfolio Manager and Senior Analyst at Kayne (since September 2011). Previously, he was Senior Portfolio Manager and Director of Equities at Newfleet, an affiliate of Kayne. Prior to joining Newfleet in 1996, he was a business analyst with PaineWebber, Inc. Mr. Couden has 17 years of investment experience.
Investors should retain this supplement with the Prospectuses for future reference.
VVIT 8501/CapGr-KayneChanges (9/2011)
Virtus Capital Growth Series,
a Series of Virtus Variable Insurance Trust
Supplement dated November 29, 2011 to the Summary and
Statutory Prospectuses dated May 1, 2011, as supplemented and revised
IMPORTANT NOTICETO INVESTORS
This supplement describes a number of modifications affecting the Virtus Capital Growth Series (the “Series”). These changes are described more fully below.
The Series’ portfolio management strategies have been modified. Accordingly, the disclosure under Principal Investment Strategies on page 2 of the Series’ summary prospectus and page 1 of the Series’ statutory prospectus is hereby replaced in its entirety with the following:
The Series invests in a select group of large-cap growth companies believed to be undervalued relative to their future growth potential. The investment strategy emphasizes companies the subadviser believes to have a sustainable competitive advantage, strong management and low financial risk, and to be able to grow over market cycles.
Under normal conditions, the Series invests at least 80% of its assets in equity securities of large capitalization companies that, at the time of initial purchase, have market capitalizations within the range of the Russell 1000® Growth Index. Generally, the Series invests in approximately 30 – 40 securities at any given time.
Additionally, the first five paragraphs of disclosure under More About Principal Investment Strategies on page 4 of the Series’ statutory prospectus are hereby replaced with the following:
Under normal circumstances, the Series invests at least 80% of its assets in equity securities of large capitalization companies that, at the time of initial purchase, have market capitalizations within the range of companies included in the Russell 1000® Growth Index. Because large capitalization companies are defined by reference to an index, the market capitalization of companies in which the Series may invest may vary with market conditions. As of September 30, 2011, the market capitalization range of companies included in the Russell 1000® Growth Index was $579 million to $353.5 billion. The Series’ policy of investing 80% of its assets in large capitalization companies may be changed only upon 60 days written notice to shareholders.
The subadviser uses a strategy emphasizing consistently growing, highly profitable, low-debt companies with rising cash flows, which the subadviser deems to be of high quality. If a company meets these criteria, the subadviser researches and analyzes that company’s strength of management, relative competitive position in the industry, and its financial structure. A proprietary model is used to determine relative value. Generally, the Series invests in approximately 30 – 40 securities at any given time.
The subadviser’s sell discipline seeks to dispose of holdings that, among other things, achieve a target price, or are the subject of negative developments individually or as an industry, or as necessary to provide funding to upgrade and improve portfolio holdings or meet diversification requirements.
The disclosure under “Portfolio Manager” on page 3 of the Series’ summary prospectus is hereby renamed “Portfolio Managers” and replaced in its entirety with the following:
| | • | | Doug Foreman, CFA, Director of Equities at Kayne, is a co-manager of the Series. Mr. Foreman has been Portfolio Manager since November 2011. |
| | • | | Gregory Toppe, CFA, is a co-manager of the Series. Mr. Toppe has been Portfolio Manager since November 2011. |
The disclosure under “Portfolio Management” on page 6 of the Series’ statutory prospectus is hereby replaced in its entirety with the following:
Doug Foreman, CFA, is a Co-Portfolio Manager of the Capital Growth Series (since November 2011) and is jointly responsible for the day-to-day management of the Series’ portfolio. Mr. Foreman is Director of Equities, playing a leadership role in Kayne’s equity investment operations. Before joining Kayne in 2011, he was director of equities at HighMark Capital Management (2009 to 2011). Prior to HighMark, Mr. Foreman was retired for two years (2007 to 2008) and was group managing director and chief investment officer of U.S. equities at Trust Company of the West (TCW) (1994 – 2006).
Gregory Toppe, CFA, is a Co-Portfolio Manager of the Capital Growth Series (since November 2011) and is jointly responsible for the day-to-day management of the Series’ portfolio. Mr. Toppe is a Portfolio Manager and Senior Research Analyst at Kayne, with primary research responsibilities for the small and mid-capitalization materials and processing, producer durables, and technology sectors. Before joining Kayne in 2008, he was an equity analyst at Mt. Eden Investment Advisors (2006 to 2008). Prior to that, he was a research analyst and portfolio specialist at Fisher Investments (2000 to 2004) and earned an MBA from the University of Wisconsin (2004 to 2006).
All other disclosure concerning the Series, including fees and expenses, remains unchanged from its prospectuses dated May 1, 2011, as supplemented and revised.
Investors should retain this supplement with the Prospectuses for future reference.
VVIT CapGrowth Strat&PMChanges (11/2011)
Virtus Growth & Income Series
a series of Virtus Variable Insurance Trust
Supplement dated September 30, 2011 to the
Prospectuses dated May 1, 2011
IMPORTANT NOTICETO INVESTORS
As approved by the Board of Trustees of Virtus Variable Insurance Trust, effective September 30, 2011, Euclid Advisors LLC (“Euclid”) became the investment subadviser for the Virtus Growth & Income Series, which was previously managed directly by Virtus Investment Advisers, Inc. (“VIA”), the Series’ investment adviser. The portfolio managers at VIA responsible for the Series will continue to manage the Series on behalf of Euclid.
VIA will continue to be the Series’ investment adviser. No changes to the Series’ principal investment strategies are being made. Also, the fees and expenses paid by the Series remain unchanged.
The Series’ summary and statutory prospectuses are hereby revised as described below.
| | • | | The disclosure under “Management” in the Series’ summary prospectus and in the summary section of the Series’ statutory prospectus is revised to read: |
The Adviser and Subadviser
Virtus Investment Advisers, Inc. (“VIA”) is the investment adviser to the Series.
Euclid Advisors LLC (“Euclid”), an affiliate of VIA, is the subadviser to the Series.
Portfolio Managers
David Dickerson, Managing Director at Euclid, has managed the Series since 2009.
Carlton Neel, Senior Managing Director at Euclid, has managed the Series since 2009.
| | • | | The following disclosure is inserted immediately after the last paragraph under “The Adviser” on page 5 of the Series’ statutory prospectus: |
The Subadviser
Euclid, an affiliate of VIA, is located at 900 Third Avenue, New York, NY 10022. As of September 30, 2011 Euclid had approximately $3.7 billion in assets under management.
| | • | | The following replaces the disclosure under “Board of Trustees Approval of the Investment Advisory and Subadvisory Agreements” on page 6 of the Series’ statutory prospectus: |
The Trust’s annual report to shareholders for the year ended December 31, 2010 contains a discussion regarding the basis for the Trust’s Board of Trustees’ approval of the investment advisory agreement with VIA. The Trust’s annual report to shareholders for the year ended December 31, 2011 is expected to contain a discussion regarding the basis for the Trust’s Board of Trustees’ approval of the investment subadvisory agreement with Euclid.
| | • | | The following information replaces the disclosure under “Portfolio Management” on page 5 of the Series’ statutory prospectus: |
David Dickerson and Carlton Neel have managed the investments of the Series since March 2009, and are jointly and primarily responsible for the day-to-day management of the Series’ investments.
| | • | | Mr. Dickerson is Managing Director of Euclid. He also serves as portfolio manager for the Virtus Strategic Allocation Series, Virtus Alternatives Diversifier Fund, Virtus Balanced Fund, Virtus Growth & Income Fund and Virtus Tactical Allocation Fund, as well as The Zweig Fund, Inc. and The Zweig Total Return Fund, Inc., two closed-end funds managed by Zweig Advisers, LLC (“Zweig”), an affiliate of VIA and Euclid. Mr. Dickerson has been with Zweig since April 2003 and was previously employed by Zweig from 1993 until July 2002. |
| | • | | Mr. Neel is Senior Managing Director of Euclid. He also serves as portfolio manager of the Virtus Strategic Allocation Series, Virtus Alternatives Diversifier Fund, Virtus Balanced Fund, Virtus Growth & Income Fund and Virtus Tactical Allocation Fund, as well as The Zweig Fund, Inc. and The Zweig Total Return Fund, Inc., two closed-end funds managed by Zweig, an affiliate of VIA and Euclid. Mr. Neel has been with Zweig since April 2003 and was previously employed by Zweig from 1995 until July 2002. |
Investors should retain this supplement with the Prospectuses for future reference.
VVIT 8503/G&I-EuclidChanges (9/2011)
Virtus Premium AlphaSector Series
a series of Virtus Variable Insurance Trust
Supplement dated September 30, 2011 to the
Prospectuses dated May 1, 2011
IMPORTANT NOTICETO INVESTORS
As approved by the Board of Trustees of Virtus Variable Insurance Trust, effective September 30, 2011, Euclid Advisors LLC (“Euclid”) became an investment subadviser for the Virtus Premium AlphaSector Series. Amy Robinson, the Series’ portfolio manager who managed the Series in her role with Virtus Investment Advisers, Inc. (“VIA”), will continue to manage the Series on behalf of Euclid.
VIA will continue to be the Series’ investment adviser. No changes to the Series’ principal investment strategies are being made. Also, the fees and expenses paid by the Series remain unchanged.
The Series’ summary and statutory prospectuses are hereby revised as described below.
| | • | | The disclosure under “Management” in the Series’ summary prospectus and in the summary section of the Series’ statutory prospectus is revised to read: |
The Adviser and Subadvisers
Virtus Investment Advisers, Inc. (“VIA”) is the investment adviser to the Series.
Euclid Advisors LLC (“Euclid”), an affiliate of VIA, and F-Squared Institutional Advisors, LLC (“F-Squared”) are the subadvisers to the Series.
The description of Ms. Robinson under “Portfolio Managers” is replaced with the following: “Amy Robinson, Managing Director at Euclid, is a manager of the Series. Ms Robinson has been Portfolio Manager since inception in February 2011.”
| | • | | The subheading “The Subadviser” on page 6 of the Series’ statutory prospectus is hereby changed to “The Subadvisers” and the following is inserted: |
Euclid, an affiliate of VIA, is located at 100 Pearl Street, Hartford, CT 06103. As of September 30, 2011 Euclid had approximately $3.7 billion in assets under management. As subadviser to the Series, Euclid is responsible for determining final allocations and trading decisions following receipt of F-Squared’s investment recommendations.
| | • | | The following replaces the disclosure under “Board of Trustees Approval of the Investment Advisory and Subadvisory Agreements” on page 6 of the Series’ statutory prospectus: |
The Trust’s semiannual report to shareholders for the period ended June 30, 2011 contains a discussion regarding the basis for the Trust’s Board of Trustees’ approval of the investment advisory agreement with VIA and the investment subadvisory agreement with F-Squared. The Trust’s annual report to shareholders for the year ended December 31, 2011 is expected to contain a discussion regarding the basis for the Trust’s Board of Trustees’ approval of the investment subadvisory agreement with Euclid.
| | • | | The following information replaces the description of Ms. Robinson under “Portfolio Management” on page 7 of the Series’ statutory prospectus: |
| | • | | Amy Robinson is Managing Director of Euclid (since September 2011) and of VIA (since 1992) and leads VIA’s equity trading function. Ms. Robinson is responsible for all trading activities of investment portfolios and mutual funds; she also manages strategic operational initiatives for the firm. As Portfolio Manager of the Series, she is responsible for determining final allocations and trading decisions following receipt of F-Squared’s investment recommendations. Ms. Robinson has 31 years of investment experience and is a former president of the Security Traders Association of Connecticut. |
Investors should retain this supplement with the Prospectuses for future reference.
VVIT 8510/PAS-EuclidChanges (9/2011)
Virtus Premium AlphaSector Series,
each a series of Virtus Variable Insurance Trust
Supplement dated December 15, 2011 to the Prospectuses
dated May 1, 2011, as supplemented
IMPORTANT NOTICETO INVESTORS
THE PURPOSE OF THIS SUPPLEMENT IS TO CLARIFY THE MANNER IN WHICH THE FUND WILL IMPLEMENT CERTAIN OF ITS INVESTMENT STRATEGIES.
Virtus Premium AlphaSector Series
The following disclosure hereby replaces the disclosure under “Principal Investment Strategies” in the series’ Summary Prospectus and the summary section of its Statutory Prospectus:
The series seeks to track the Premium AlphaSectorSM Index (ASRP), a public index published by NASDAQ. The series may be invested in exchange traded funds (“ETFs”) representing the primary sectors of the S&P 500® Index and high-quality short-term securities. The primary sectors of the S&P 500® Index: consumer discretionary, consumer staples, energy, financials, healthcare, industrials, materials, technology, and utilities. Allocations are based on a proprietary quantitative model that seeks to evaluate “true” trends within each sector by adjusting for market noise and changing levels of volatility in the market. The series has the flexibility to be invested in any combination of the sector ETFs, a combination of sector ETFs and high-quality short-term securities, or 100% in high-quality short-term securities. The series may also invest in stocks of primarily large-cap issuers. The series may invest in a basket of securities to represent a sector if it determines that investment in the ETF for that sector is not feasible or otherwise not in the best interest of the series.
The following disclosure hereby replaces the disclosure in the first two paragraphs and the fifth paragraph under “Principal Investment Strategies” in the series’ Statutory Prospectus:
The series seeks to track the Premium AlphaSectorSM Index (ASRP), a public index published by NASDAQ. The series may invest in ETFs representing the primary sectors of the S&P 500® Index and high-quality short-term securities. ETFs are funds that are traded on securities exchanges that generally hold a portfolio of common stocks or bonds designed to track the performance of a securities index or sector of an index. Allocations are based on a proprietary quantitative model that seeks to evaluate “true” trends within each sector by adjusting for market noise and changing levels of volatility in the market. The model allocates to the sectors using a model that results in sectors either being included in the portfolio or entirely excluded. The analytical model does not attempt to determine relative weights versus the S&P 500® Index weights or relative to other sector weights; it simply seeks to determine whether or not each sector is positioned to produce positive absolute returns. Sectors that are included are equally weighted, with a maximum allocation per sector of 25% at time of rebalancing. When three or fewer sectors are represented, the remainder is allocated to high-quality short-term securities, up to 100%. The series may also invest in stocks of primarily large-cap issuers. The series may invest in a basket of securities to represent a sector if it determines that investment in the ETF for that sector is not feasible or otherwise not in the best interest of the series. In times of extreme market weakness, the series has the ability to move partially or fully to high-quality short-term securities.
Investors should retain this supplement with the Prospectuses for future reference.
VVIT 8510/PASFStrategies (12/11)
Virtus Strategic Allocation Series
a series of Virtus Variable Insurance Trust
Supplement dated September 30, 2011 to the
Prospectuses dated May 1, 2011
IMPORTANT NOTICETO INVESTORS
As approved by the Board of Trustees of Virtus Variable Insurance Trust, effective September 30, 2011, Euclid Advisors LLC (“Euclid”) became an investment subadviser for the Virtus Strategic Allocation Series, the equity portion of which was previously managed directly by Virtus Investment Advisers, Inc. (“VIA”), the Series’ investment adviser. The portfolio managers at VIA responsible for the equity portion of the Series will continue to manage the Series on behalf of Euclid.
VIA will continue to be the Series’ investment adviser. No changes to the Series’ principal investment strategies are being made. Also, the fees and expenses paid by the Series remain unchanged.
The Series’ summary and statutory prospectuses are hereby revised as described below.
| | • | | The disclosure under “Management” in the Series’ summary prospectus and in the summary section of the Series’ statutory prospectus is revised to read: |
The Adviser and Subadvisers
Virtus Investment Advisers, Inc. (“VIA”) is the investment adviser to the Series.
Euclid Advisors LLC (“Euclid”), an affiliate of VIA, is the subadviser for the equity portion of the Series and Newfleet Asset Management, LLC (“Newfleet”) is the subadviser for the fixed income portion of the Series.
The description of Mr. Dickerson is revised to read: “David Dickerson, Managing Director at Euclid, has served as a portfolio manager of the Series since March 2009.” The description of Mr. Neel is revised to read: “Carlton Neel, Senior Managing Director at Euclid, has served as a portfolio manager of the Series since March 2009.”
| | • | | The subheading “The Subadviser” on page 7 of the Series’ statutory prospectus is hereby changed to “The Subadvisers” and the following is inserted: |
Euclid, an affiliate of VIA, is located at 900 Third Avenue, New York, NY 10022. As of September 30, 2011 Euclid had approximately $3.7 billion in assets under management.
| | • | | The following replaces the disclosure under “Board of Trustees Approval of the Investment Advisory and Subadvisory Agreements” on page 7 of the Series’ statutory prospectus: |
The Trust’s annual report to shareholders for the year ended December 31, 2010 contains a discussion regarding the basis for the Trust’s Board of Trustees’ approval of the investment advisory agreement with VIA. The Trust’s annual report to shareholders for the year ended December 31, 2011 is expected to contain a discussion regarding the basis for the Trust’s Board of Trustees’ approval of the investment subadvisory agreements with Euclid and Newfleet.
| | • | | The following information replaces the description of Mr. Dickerson and Mr. Neel under “Portfolio Management” on page 8 of the Series’ statutory prospectus: |
David Dickerson and Carlton Neel of Euclid managed the equity investments of the Series (since March 2009), and they are jointly and primarily responsible for the day-to-day management of the Series’ equity investments.
| | • | | Mr. Dickerson is Managing Director of Euclid (since September 2011). He also serves as portfolio manager for the Virtus Growth & Income Series, Virtus Alternatives Diversifier Fund, Virtus Balanced Fund, Virtus Growth & Income Fund and Virtus Tactical Allocation Fund, as well as The Zweig Fund, Inc. and The Zweig Total Return Fund, Inc., two closed-end funds managed by Zweig Advisers, LLC (“Zweig”), an affiliate of VIA and Euclid. Mr. Dickerson has been with Zweig since April 2003 and was previously employed by Zweig from 1993 until July 2002. |
| | • | | Mr. Neel is Senior Managing Director of Euclid (since September 2011). He also serves as portfolio manager of the Virtus Growth & Income Series, Virtus Alternatives Diversifier Fund, Virtus Balanced Fund, Virtus Growth & Income Fund and Virtus Tactical Allocation Fund, as well as The Zweig Fund, Inc. and The Zweig Total Return Fund, Inc., two closed-end funds managed by Zweig, an affiliate of VIA and Euclid. Mr. Neel has been with Zweig since April 2003 and was previously employed by Zweig from 1995 until July 2002. |
Investors should retain this supplement with the Prospectuses for future reference.
VVIT 8507/StratAlloc-EuclidChanges (9/2011)

100 Pearl Street
Hartford, CT 06103
For more information about the Virtus Variable Insurance Trust, please contact us at 1-800-367-5877 or Virtus.com.
Item 2. Code of Ethics.
| | (a) | The registrant, as of the end of the period covered by this report, has adopted a code of ethics that applies to the registrant’s principal executive officer, principal financial officer, principal accounting officer or controller, or persons performing similar functions, regardless of whether these individuals are employed by the registrant or a third party. |
| | (c) | There have been no amendments, during the period covered by this report, to a provision of the code of ethics that applies to the registrant’s principal executive officer, principal financial officer, principal accounting officer or controller, or persons performing similar functions, regardless of whether these individuals are employed by the registrant or a third party, and that relates to any element of the code of ethics described in Item 2(b) of the instructions for completion of Form N-CSR. |
| | (d) | The registrant has not granted any waivers, during the period covered by this report, including an implicit waiver, from a provision of the code of ethics that applies to the registrant’s principal executive officer, principal financial officer, principal accounting officer or controller, or persons performing similar functions, regardless of whether these individuals are employed by the registrant or a third party, that relates to one or more of the items set forth in paragraph (b) of the instructions for completion of this Item. |
Item 3. Audit Committee Financial Expert.
| (a)(1) | The Registrant’s Board of Trustees has determined that the Registrant has an “audit committee financial expert” serving on its Audit Committee. |
| (a)(2) | Thomas Brown has been determined by the Registrant to possess the technical attributes identified in Instruction 2(b) of Item 3 to Form N-CSR to qualify as an “audit committee financial expert.” Mr. Brown is an “independent” trustee pursuant to paragraph (a)(2) of Item 3 to Form N-CSR. Mr. Brown began serving in this capacity as of March 1, 2011. Prior to such time, Roger A. Gelfenbien was the Registrant’s “audit committee financial expert” serving on its Audit Committee. |
Item 4. Principal Accountant Fees and Services.
Audit Fees
| | (a) | The aggregate fees billed for each of the last two fiscal years for professional services rendered by the principal accountant for the audit of the registrant’s annual financial statements or services that are normally provided by the accountant in connection with statutory and regulatory filings or engagements for those fiscal years are $163,170 for 2011 and $353,920 for 2010. |
Audit-Related Fees
| | (b) | The aggregate fees billed in each of the last two fiscal years for assurance and related services by the principal accountant that are reasonably related to the performance of the audit of the registrant’s financial statements and are not reported under paragraph (a) of this Item are $49,769 for 2011 and $35,251 for 2010. This represents the review of the semi-annual financial statements, a 485 B Filing and out of pocket expenses. |
Tax Fees
| | (c) | The aggregate fees billed in each of the last two fiscal years for professional services rendered by the principal accountant for tax compliance, tax advice, and tax planning are $41,300 for 2011 and $48,300 for 2010. |
“Tax Fees” are those primarily associated with review of the Trust’s tax provision and qualification as a regulated investment company (RIC) in connection with audits of the Trust’s financial statement, review of year-end distributions by the Fund to avoid excise tax for the Trust, periodic discussion with management on tax issues affecting the Trust, and reviewing and signing the Fund’s federal income tax returns.
All Other Fees
| | (d) | The aggregate fees billed in each of the last two fiscal years for products and services provided by the principal accountant, other than the services reported in paragraphs (a) through (c) of this Item are $0 for 2011 and $0 for 2010. |
| | (e)(1) | Disclose the audit committee’s pre-approval policies and procedures described in paragraph (c)(7) of Rule 2-01 of Regulation S-X. |
The Virtus Variable Insurance Trust (the “Fund”) Board has adopted policies and procedures with regard to the pre-approval of services provided by PwC. Audit, audit-related and tax compliance services provided to the Fund on an annual basis require specific pre-approval by the Board. As noted above, the Board must also approve other non-audit services provided to the Fund and those non-audit services provided to the Fund’s Affiliated Service Providers that relate directly to the operations and financial reporting of the Fund. Certain of these non-audit services that the Board believes are a) consistent with the SEC’s auditor independence rules and b) routine and recurring services that will not impair the independence of the independent auditors may be approved by the Board without consideration on a specific case-by-case basis (“general pre-approval”).
The Audit Committee has determined that Mr. Brown, Chair of the Audit Committee, may provide pre-approval for such services that meet the above requirements in the event such approval is sought between regularly scheduled meetings. (Prior to Mr. Brown’s appointment as Chair of the Audit Committee, pre-approvals were provided by Mr. Gelfenbien as the prior Chair of the Audit Committee.) In any event, the Board is informed of each service approved subject to general pre-approval at the next regularly scheduled in-person board meeting.
| | (e)(2) | The percentage of services described in each of paragraphs (b) through (d) of this Item that were approved by the audit committee pursuant to paragraph (c)(7)(i)(C) of Rule 2-01 of Regulation S-X are as follows: |
(b) 0% for 2011 and 2010
(c) 0% for 2011 and 2010
(d) Not applicable
| | (f) | The percentage of hours expended on the principal accountant’s engagement to audit the registrant’s financial statements for the most recent fiscal year that were attributed to work performed by persons other than the principal accountant’s full-time, permanent employees was less than fifty percent. |
| | (g) | The aggregate non-audit fees billed by the registrant’s accountant for services rendered to the registrant, and rendered to the registrant’s investment adviser (not including any sub-adviser whose role is primarily portfolio management and is subcontracted with or overseen by another investment adviser), and any entity controlling, controlled by, or under common control with the adviser that provides ongoing services to the registrant for each of the last two fiscal years of the registrant was $327,554 for 2011 and $398,818 for 2010. |
| | (h) | The registrant’s audit committee of the board of directors has considered whether the provision of non-audit services that were rendered to the registrant’s investment adviser (not including any sub-adviser whose role is primarily portfolio management and is subcontracted with or overseen by another investment adviser), and any entity controlling, controlled by, or under common control with the investment adviser that provides ongoing services to the registrant that were not pre-approved pursuant to paragraph (c)(7)(ii) of Rule 2-01 of Regulation S-X is compatible with maintaining the principal accountant’s independence. |
Item 5. Audit Committee of Listed registrants.
Not applicable.
Item 6. Investments.
| (a) | Schedule of Investments in securities of unaffiliated issuers as of the close of the reporting period is included as part of the report to shareholders filed under Item 1 of this form. |
Item 7. Disclosure of Proxy Voting Policies and Procedures for Closed-End Management Investment Companies.
Not applicable.
Item 8. Portfolio Managers of Closed-End Management Investment Companies.
Not applicable.
Item 9. Purchases of Equity Securities by Closed-End Management Investment Company and Affiliated Purchasers.
Not applicable.
Item 10. Submission of Matters to a Vote of Security Holders.
There have been no material changes to the procedures by which the shareholders may recommend nominees to the registrant’s board of trustees, where those changes were implemented after the registrant last provided disclosure in response to the requirements of Item 407(c)(2)(iv) of Regulation S-K (17 CFR 229.407) (as required by Item 22(b)(15) of Schedule 14A (17 CFR 240.14a-101)), or this Item.
Item 11. Controls and Procedures.
| | (a) | The registrant’s principal executive and principal financial officers, or persons performing similar functions, have concluded that the registrant’s disclosure controls and procedures (as defined in Rule 30a-3(c) under the Investment Company Act of 1940, as amended (the “1940 Act”) (17 CFR 270.30a-3(c))) are effective, as of a date within 90 days of the filing date of the report that includes the disclosure required by this paragraph, based on their evaluation of these controls and procedures required by Rule 30a-3(b) under the 1940 Act (17 CFR 270.30a-3(b)) and Rules 13a-15(b) or 15d-15(b) under the Securities Exchange Act of 1934, as amended (17 CFR 240.13a-15(b) or 240.15d-15(b)). |
| | (b) | There were no changes in the registrant’s internal control over financial reporting (as defined in Rule 30a-3(d) under the 1940 Act (17 CFR 270.30a-3(d)) that occurred during the registrant’s second fiscal quarter of the period covered by this report that has materially affected, or is reasonably likely to materially affect, the registrant’s internal control over financial reporting. |
Item 12. Exhibits.
| | (a)(1) | Code of ethics, or any amendment thereto, that is the subject of disclosure required by Item 2 is attached hereto. |
| | (a)(2) | Certifications pursuant to Rule 30a-2(a) under the 1940 Act and Section 302 of the Sarbanes-Oxley Act of 2002 are attached hereto. |
| | (b) | Certifications pursuant to Rule 30a-2(b) under the 1940 Act and Section 906 of the Sarbanes-Oxley Act of 2002 are attached hereto. |
SIGNATURES
Pursuant to the requirements of the Securities Exchange Act of 1934 and the Investment Company Act of 1940, the registrant has duly caused this report to be signed on its behalf by the undersigned, thereunto duly authorized.
| | |
| (Registrant) Virtus Variable Insurance Trust |
| |
| By (Signature and Title)* | | /s/ George R. Aylward |
| | George R. Aylward, President |
| | (principal executive officer) |
|
| Date March 8, 2012 |
Pursuant to the requirements of the Securities Exchange Act of 1934 and the Investment Company Act of 1940, this report has been signed below by the following persons on behalf of the registrant and in the capacities and on the dates indicated.
| | |
| |
| By (Signature and Title)* | | /s/ George R. Aylward |
| | George R. Aylward, President |
| | (principal executive officer) |
|
| Date March 8, 2012 |
| | |
| |
| By (Signature and Title)* | | /s/ W. Patrick Bradley |
| | W. Patrick Bradley, Vice President, Chief Financial Officer and Treasurer |
| | (principal financial officer) |
|
| Date March 8, 2012 |
| * | Print the name and title of each signing officer under his or her signature. |