UNITED STATES
SECURITIES AND EXCHANGE COMMISSION
Washington, D.C. 20549
FORM N-CSR
CERTIFIED SHAREHOLDER REPORT OF REGISTERED MANAGEMENT
INVESTMENT COMPANIES
Investment Company Act file number 811-04642
Virtus Variable Insurance Trust
(Exact name of registrant as specified in charter)
100 Pearl Street
Hartford, CT 06103-4506
(Address of principal executive offices) (Zip code)
Jennifer S. Fromm, Esq.
Vice President, Chief Legal Officer, Counsel and Secretary for Registrant
100 Pearl Street
Hartford, CT 06103-4506
(Name and address of agent for service)
Registrant’s telephone number, including area code: (800) 367-5877
Date of fiscal year end: December 31
Date of reporting period: December 31, 2014
Form N-CSR is to be used by management investment companies to file reports with the Commission not later than 10 days after the transmission to stockholders of any report that is required to be transmitted to stockholders under Rule 30e-1 under the Investment Company Act of 1940 (17 CFR 270.30e-1). The Commission may use the information provided on Form N-CSR in its regulatory, disclosure review, inspection, and policymaking roles.
A registrant is required to disclose the information specified by Form N-CSR, and the Commission will make this information public. A registrant is not required to respond to the collection of information contained in Form N-CSR unless the Form displays a currently valid Office of Management and Budget (“OMB”) control number. Please direct comments concerning the accuracy of the information collection burden estimate and any suggestions for reducing the burden to Secretary, Securities and Exchange Commission, 100 F Street, NE, Washington, DC 20549. The OMB has reviewed this collection of information under the clearance requirements of 44 U.S.C. § 3507.
Item 1. Reports to Stockholders.
The Report to Shareholders is attached herewith.

VIRTUS VARIABLE INSURANCE TRUST
ANNUAL REPORT
Virtus Capital Growth Series
Virtus Growth & Income Series
Virtus International Series
Virtus Multi-Sector Fixed Income Series
Virtus Premium AlphaSector® Series*
Virtus Real Estate Securities Series
Virtus Small-Cap Growth Series
Virtus Small-Cap Value Series
Virtus Strategic Allocation Series
| | | | | | |
| * Prospectus supplement applicable to the Series appears at the back of this annual report. | | | | | December 31, 2014 | |
| | |
| The Annual Report describes one or more Series available for underlying investment through your variable contract. For information about your variable contract, including information about insurance-related expenses, see the prospectus for your variable contract. | | | |
| Not FDIC Insured
No Bank Guarantee May Lose Value |
|
Table of Contents
Proxy Voting Procedures and Voting Record (Form N-PX)
The adviser and subadvisers vote proxies relating to portfolio securities in accordance with procedures that have been approved by the Trustees of the Trust (“Trustees,” or the “Board”). You may obtain a description of these procedures, along with information regarding how the Series voted proxies during the most recent 12-month period ended June 30, free of charge, by calling toll-free 1-800-367-5877. This information is also available through the Securities and Exchange Commission’s (the “SEC”) website at http://www.sec.gov.
Form N-Q Information
The Trust files a complete schedule of portfolio holdings for each Series with the SEC for the first and third quarters of each fiscal year on Form N-Q. Form N-Q is available on the SEC’s website at http://www.sec.gov. Form N-Q may be reviewed and copied at the SEC’s Public Reference Room. Information on the operation of the SEC’s Public Reference Room can be obtained by calling toll-free 1-800-SEC-0330.
MESSAGE TO SHAREHOLDERS
Dear Virtus Variable Insurance Trust Investors:
| | |

| | I am pleased to present this annual report which reviews the performance of your Series for the 12 months ended December 31, 2014, and includes comments from the Series manager. Last year was generally strong for U.S. equities, although market volatility increased over the fourth quarter, driven by falling oil prices, geopolitical risks, and a slowdown in growth outside the U.S. While the leading economies of Europe, Japan, and China weakened, the U.S. economy accelerated and the dollar rallied strongly. Broad U.S. equity indexes registered solid gains for the 12 months ended December 31, 2014. The S&P 500® Index returned 13.69%, the Dow Jones Industrial AverageTM rose 10.04%, and the NASDAQ Composite Index® was up 14.75%. By comparison, international equities generally underperformed, for both developed markets and emerging markets. |
Even though the U.S. economy continues to expand, the Federal Reserve has promised to maintain low interest rates, at least until the middle of 2015. Against this backdrop, U.S. Treasuries are an attractive “safe haven” among global investors. Steady demand throughout last year pushed the yield on the bellwether 10-year U.S. Treasury to 2.17% on December 31, 2014 from 3.04% a year earlier. The low interest rate environment was generally favorable for the fixed income market, and as measured by the Barclays U.S. Aggregate Bond Index, which concentrates on investment-grade debt securities, rose 5.97% for the 12 months ended December 31, 2014. By comparison, non-investment grade debt was negatively impacted by the ongoing stock market volatility and declining oil prices. The uncertain state of the global economy is likely to remain a concern for the markets in the months ahead, and the interventions of central banks will be watched with great interest. However, the health of the U.S. economy – including improving hiring, manufacturing, and housing data – gives investors reason for optimism. Future market direction will be determined largely by the ability of corporations to continue to produce robust earnings. Market volatility is an ever-present reminder of the importance of portfolio diversification. While diversification cannot guarantee a profit or prevent loss, owning a variety of asset classes may cushion your portfolio against inevitable market fluctuations. Your financial advisor can help you ensure that your variable investment portfolio is adequately diversified across asset classes and investment strategies. Thank you for entrusting your assets to Virtus. Should you have questions or require assistance, our customer service team is here to help at 1-866-270-7788. We appreciate your business and remain committed to your long-term financial success. Sincerely, 
George R. Aylward President, Virtus Variable Insurance Trust February 2015 |
Variable insurance products are sold by prospectus. You should carefully consider investment objectives, charges, expenses and risks before you invest. The contract prospectuses and underlying Series prospectuses contain this and other important information about the variable insurance product. You may obtain contract prospectuses from your registered representative. You may obtain Series prospectuses by contacting us at 1-800-367-5877 or Virtus.com. Please read the prospectuses carefully before you invest.
1
KEY INVESTMENT TERMS
American Depositary Receipt (ADR)
Represents shares of foreign companies traded in U.S. dollars on U.S. exchanges that are held by a U.S. bank or a trust. Foreign companies use ADRs in order to make it easier for Americans to buy their shares.
Barclays U.S. Aggregate Bond Index
The Barclays U.S. Aggregate Bond Index measures the U.S. investment-grade fixed-rate bond market. The index is calculated on a total return basis. The index is unmanaged, its returns do not reflect any fees, expenses, or sales charges, and it is not available for direct investment.
Basel III
A comprehensive series of reform measures intended to strengthen the regulation, supervision, and risk management of the global banking sector.
Composite Index for Strategic Allocation
The composite index consists of 60% S&P 500® Index and 40% Barclays U.S. Aggregate Bond Index. The S&P 500® Index is a free-float market capitalization-weighted index of 500 of the largest U.S. companies. The Barclays U.S. Aggregate Bond Index measures the U.S. investment-grade fixed-rate bond market. Each index is calculated on a total return basis. Each index is unmanaged, its returns do not reflect any fees, expenses, or sales charges, and it is not available for direct investment.
Consumer Price Index (CPI)
A measure that examines the weighted average of prices of a basket of consumer goods and services, such as transportation, food and medical care. The CPI is calculated by taking price changes for each item in the predetermined basket of goods and averaging them; the goods are weighted according to their importance.
Dow Jones Industrial AverageTM
A price weighted average of 30 blue chip stocks. The index is calculated on total return basis with dividends reinvested. The index is unmanaged, its returns do not reflect any fees, expenses or sales charges, and it is not available for direct investment.
Exchange-Traded Fund (ETF)
A fund that is traded on a stock exchange. Most ETFs have a portfolio of stocks or bonds that track a specific market index.
European Central Bank (ECB)
The European Central Bank (ECB) is responsible for conducting monetary policy for the Euro area. The ECB was established as the core of the Eurosystem and the European System of Central Banks (ESCB). The ESCB comprises the ECB and the National Central Banks (NCBs) of all 17 EU Member States whether they have adopted the Euro or not.
Federal Reserve (the “Fed”)
The Central Bank of the United States, responsible for controlling the money supply, interest rates and credit with the goal of keeping the U.S. economy and currency stable. Governed by a seven-member board, the system includes 12 regional Federal Reserve Banks, 25 branches and all national and state banks that are part of the system.
FTSE NAREIT Equity REITs Index
The FTSE NAREIT Equity REITs Index is a free-float market capitalization-weighted index measuring equity tax-qualified real estate investment trusts, which meet minimum size and liquidity criteria, that are listed on the New York Stock Exchange, the American Stock Exchange and the NASDAQ National Market System. The index is calculated on a total return basis with dividends reinvested. The index is unmanaged, its returns do not reflect any fees, expenses, or sales charges, and it is not available for direct investment.
MSCI EAFE® Index (net)
The MSCI EAFE® (Europe, Australasia, Far East) Index (net) is a free float-adjusted market capitalization-weighted index that measures developed foreign market equity performance, excluding the U.S. and Canada. The index is calculated on a total return basis with net dividends reinvested. The index is unmanaged, its returns do not reflect any fees, expenses, or sales charges, and it is not available for direct investment.
NASDAQ Composite Index®
A market-capitalization weighted index of the more than 3,000 common equities listed on the Nasdaq stock exchange. Unlike other market indexes, the NASDAQ composite is not limited to companies that have U.S. headquarters. The index is unmanaged, its returns do not reflect any fees, expenses or sales charges and it is not available for direct investment.
2
KEY INVESTMENT TERMS (Continued)
Organization of the Petroleum Exporting Countries (OPEC)
The Organization of the Petroleum Exporting Countries is an intergovernmental organization that currently has 12 member countries. The organization’s objective is to co-ordinate and unify petroleum policies among member countries, in order to secure fair and stable prices for petroleum producers; an efficient, economic and regular supply of petroleum to consuming nations; and a fair return on capital to those investing in the industry.
Payment-in-Kind Security (PIK)
A bond which pays interest in the form of additional bonds, or preferred stock which pays dividends in the form of additional preferred stock.
Premium AlphaSector® Index
The Premium AlphaSector® Index is composed of the nine Select Sector SPDR® exchange traded funds (“ETFs”) which represent the primary sectors of the S&P 500® Index plus an ETF representing short-term U.S. Treasuries. The relative weights of the sectors within the index are based upon a model that evaluates sector trends while adjusting for market noise and for changing levels of volatility in the market. The index is calculated on a total return basis with dividends reinvested, its returns do not reflect any fees, expenses, or sales charges, and it is not available for direct investment.
Quantitative Easing
A government monetary policy occasionally used to increase the money supply by buying government securities or other securities from the market. Quantitative easing increases the money supply by flooding financial institutions with capital in an effort to promote increased lending and liquidity.
Real Estate Investment Trust (REIT)
A publicly traded company that owns, develops and operates income-producing real estate such as apartments, office buildings, hotels, shopping centers and other commercial properties.
Russell 1000® Growth Index
The Russell 1000® Growth Index is a market capitalization-weighted index of growth-oriented stocks of the 1,000 largest companies in the Russell Universe, which comprises the 3,000 largest U.S. companies. The index is calculated on a total return basis with dividends reinvested. The index is unmanaged, its returns do not reflect any fees, expenses, or sales charges, and it is not available for direct investment.
Russell 2000® Growth Index
The Russell 2000® Growth Index is a market capitalization-weighted index of growth-oriented stocks of the smallest 2,000 companies in the Russell Universe, which comprises the 3,000 largest U.S. companies. The index is calculated on a total return basis with dividends reinvested. The index is unmanaged, its returns do not reflect any fees, expenses, or sales charges, and it is not available for direct investment.
Russell 2000® Index
The Russell 2000® Index is a market capitalization-weighted index that measures the performance of the smallest 2,000 companies in the Russell Universe which comprises the 3,000 largest U.S. companies. The index is calculated on a total return basis with dividends reinvested. The index is unmanaged, its returns do not reflect any fees, expenses or sales charges and it is not available for direct investment.
Russell 2000® Value Index
The Russell 2000® Value Index is a market capitalization-weighted index of value-oriented stocks of the smallest 2,000 companies in the Russell Universe, which comprises the 3,000 largest U.S. companies. The index is calculated on a total return basis with dividends reinvested. The index is unmanaged, its returns do not reflect any fees, expenses, or sales charges, and it is not available for direct investment.
S&P 500® Index
The S&P 500® Index is a free-float market capitalization-weighted index of 500 of the largest U.S. companies. The index is calculated on a total return basis with dividends reinvested. The index is unmanaged, its returns do not reflect any fees, expenses, or sales charges, and it is not available for direct investment.
Sponsored ADR (American Depositary Receipt)
An ADR which is issued with the cooperation of the company whose stock will underlie the ADR. Sponsored ADRs generally carry the same rights normally given to stockholders, such as voting rights. ADRs must be sponsored to be able to trade on a major U.S. exchange such as the New York Stock Exchange (“NYSE”).
The indexes are unmanaged and not available for direct investment; therefore, their performance does not reflect the expenses associated with active management of an actual portfolio.
3
VIRTUS VARIABLE INSURANCE TRUST
Disclosure of Series Expenses (Unaudited)
For the six-month period of July 1, 2014 to December 31, 2014
We believe it is important for you to understand the impact of costs on your investment. All mutual funds have operating expenses. As a shareholder of a Series (each a “Series”) of Virtus Variable Insurance Trust (the “Trust”), you incur ongoing costs including investment advisory fees and other expenses. These expense examples are intended to help you understand your ongoing costs (in dollars) of investing in a Series and to compare these costs with the ongoing costs of investing in other mutual funds. These expense examples are based on an investment of $1,000 invested at the beginning of the period and held for the entire six-month period. The following Expense Table illustrates a Series’ costs in two ways.
Actual Expenses
This section of the accompanying table provides information about actual account values and actual expenses. You may use the information in this section, together with the amount you invested, to estimate the expenses that you paid over the period. Simply divide your account value by $1,000 (for example, an $8,600 account value divided by $1,000 = 8.6), then multiply the result by the number in the first line under the heading entitled “Expenses Paid During Period” to estimate the expenses you paid on your account during this period. The expense estimate does not include the fees or expenses associated with the separate insurance accounts, and if such charges were included, your costs would have been higher.
Hypothetical Example for Comparison Purposes
This section of the accompanying table provides information about hypothetical account values and hypothetical expenses based on a Series’ actual expense ratio and an assumed rate of return of 5% per year before expenses, which is not your Series’ actual return. The hypothetical account values and expenses may not be used to estimate the actual ending account balance or expenses you paid for the period. You may use this information to compare the ongoing costs of investing in your Series and other mutual funds. To do so, compare these 5% hypothetical examples with the 5% hypothetical examples that appear in the shareholder reports of the other mutual funds.
Please note that the expenses shown in the accompanying table are meant to highlight your ongoing costs only and do not reflect additional fees and expenses associated with the annuity or life insurance policy through which you invest. Therefore, this section of the accompanying table is useful in comparing ongoing costs only, and will not help you determine the relative total costs of owning different funds. In addition, if the annuity or life insurance policy costs were included, your costs would have been higher. The calculations assume no shares were bought or sold during the period. Your actual costs may have been higher or lower, depending on the amount of your investment and the timing of any purchases or redemptions.
| | | | | | | | | | | | | | | | |
| Expense Table | |
| | | Beginning
Account Value
July 1, 2014 | | | Ending
Account Value
December 31, 2014 | | | Annualized
Expense
Ratio | | | Expenses Paid
During the
Period* | |
Capital Growth Series | |
Actual | |
Class A | | $ | 1,000.00 | | | $ | 1,081.60 | | | | 1.03 | % | | $ | 5.40 | |
|
Hypothetical (5% return before expenses) | |
Class A | | | 1,000.00 | | | | 1,019.95 | | | | 1.03 | | | | 5.26 | |
Growth & Income Series | |
Actual | |
Class A | | $ | 1,000.00 | | | $ | 1,018.90 | | | | 0.98 | % | | $ | 4.99 | |
|
Hypothetical (5% return before expenses) | |
Class A | | | 1,000.00 | | | | 1,020.20 | | | | 0.98 | | | | 5.00 | |
International Series | |
Actual | |
Class A | | $ | 1,000.00 | | | $ | 888.30 | | | | 1.18 | % | | $ | 5.62 | |
Class I | | | 1,000.00 | | | | 889.40 | | | | 0.93 | | | | 4.43 | |
|
Hypothetical (5% return before expenses) | |
Class A | | | 1,000.00 | | | | 1,019.18 | | | | 1.18 | | | | 6.02 | |
Class I | | | 1,000.00 | | | | 1,020.46 | | | | 0.93 | | | | 4.75 | |
Multi-Sector Fixed Income Series | |
Actual | |
Class A | | $ | 1,000.00 | | | $ | 964.40 | | | | 0.94 | % | | $ | 4.65 | |
Class I | | | 1,000.00 | | | | 965.70 | | | | 0.69 | | | | 3.42 | |
|
Hypothetical (5% return before expenses) | |
Class A | | | 1,000.00 | | | | 1,020.41 | | | | 0.94 | | | | 4.80 | |
Class I | | | 1,000.00 | | | | 1,021.68 | | | | 0.69 | | | | 3.52 | |
Premium AlphaSector® Series | |
Actual | |
Class A | | $ | 1,000.00 | | | $ | 959.40 | | | | 1.70 | % | | $ | 8.40 | |
Class I | | | 1,000.00 | | | | 960.00 | | | | 1.45 | | | | 7.16 | |
|
Hypothetical (5% return before expenses) | |
Class A | | | 1,000.00 | | | | 1,016.53 | | | | 1.70 | | | | 8.68 | |
Class I | | | 1,000.00 | | | | 1,017.80 | | | | 1.45 | | | | 7.40 | |
Real Estate Securities Series | |
Actual | |
Class A | | $ | 1,000.00 | | | $ | 1,114.70 | | | | 1.16 | % | | $ | 6.18 | |
Class I | | | 1,000.00 | | | | 1,116.10 | | | | 0.91 | | | | 4.85 | |
|
Hypothetical (5% return before expenses) | |
Class A | | | 1,000.00 | | | | 1,019.28 | | | | 1.16 | | | | 5.92 | |
Class I | | | 1,000.00 | | | | 1,020.56 | | | | 0.91 | | | | 4.65 | |
Small-Cap Growth Series | |
Actual | |
Class A | | $ | 1,000.00 | | | $ | 1,092.80 | | | | 1.19 | % | | $ | 6.28 | |
Class I | | | 1,000.00 | | | | 1,094.00 | | | | 0.94 | | | | 4.96 | |
|
Hypothetical (5% return before expenses) | |
Class A | | | 1,000.00 | | | | 1,019.13 | | | | 1.19 | | | | 6.07 | |
Class I | | | 1,000.00 | | | | 1,020.41 | | | | 0.94 | | | | 4.80 | |
4
VIRTUS VARIABLE INSURANCE TRUST
Disclosure of Series Expenses (Unaudited) (Continued)
For the six-month period of July 1, 2014 to December 31, 2014
| | | | | | | | | | | | | | | | |
| Expense Table—continued | |
| | | Beginning
Account Value
July 1, 2014 | | | Ending
Account Value
December 31, 2014 | | | Annualized
Expense
Ratio | | | Expenses Paid
During the
Period* | |
Small-Cap Value Series | |
Actual | |
Class A | | $ | 1,000.00 | | | $ | 1,053.20 | | | | 1.20 | % | | $ | 6.21 | |
|
Hypothetical (5% return before expenses) | |
Class A | | | 1,000.00 | | | | 1,019.08 | | | | 1.20 | | | | 6.13 | |
Strategic Allocation Series | |
Actual | |
Class A | | $ | 1,000.00 | | | $ | 1,011.70 | | | | 0.98 | % | | $ | 4.97 | |
|
Hypothetical (5% return before expenses) | |
Class A | | | 1,000.00 | | | | 1,020.20 | | | | 0.98 | | | | 5.00 | |
| * | Expenses are equal to the relevant Series’ annualized expense ratio, which is net of waived fees and reimbursed expenses, if applicable, multiplied by the average account value over the period, multiplied by the number of days (184) expenses were accrued in the most recent fiscal half-year, then divided by 365 to reflect the one-half year period. Exceptions noted below. |
| | A Series may invest in other funds, and the annualized expense ratios noted above do not reflect fees and expenses associated with the underlying funds. If such fees and expenses had been included, the expenses would have been higher. |
| | You can find more information about a Series’ expenses in the Financial Statements section that follows. For additional information on operating expenses and other shareholder costs, including contractual charges associated with the separate account, refer to the Series prospectus and the contract prospectus. |
5
Series Summary December 31, 2014 (Unaudited)
Portfolio Manager Commentary by
Kayne Anderson Rudnick Investment Management, LLC
| ¢ | | The Series is diversified and has an investment objective of long-term growth of capital. There is no guarantee that the Series will meet its objective. |
| ¢ | | For the fiscal year ended December 31, 2014, the Series’ Class A shares at NAV returned 11.73%. For the same period, the S&P 500® Index, a broad-based equity index, returned 13.69% and the Russell 1000® Growth Index, the Series’ style-specific benchmark appropriate for comparison, returned 13.05%. |
All performance figures assume reinvestment of distributions and exclude the effect of fees and expenses associated with the variable life insurance or annuity product through which you invest. Past performance is no guarantee of future results, and current performance may be higher or lower than the performance shown above.
How did the market in which the Series invests perform during the Series’ fiscal year?
| ¢ | | The S&P 500® Index delivered double-digit returns in 2014, appreciating 13.69% for the year. This is the fifth time in the last six years that the benchmark has produced double-digit returns, and it is up over 200% since its March 9, 2009 bottom. Unlike the unusual years of 2008 and 2009, when almost all asset classes moved down or up together, 2014 was a more typical year where there was fairly wide dispersion among asset class returns. Small-capitalization stocks, as measured by the Russell 2000® Index, experienced positive returns of 4.89% but lagged larger company returns for the year after significant outperformance in 2013. The Russell 1000® Growth Index rose 13.05% for the year. |
| ¢ | | While we did not have the technical definition of a correction (10% or more off peak) in the S&P 500® Index during 2014, we did have several sharp, albeit brief, pullbacks. Further, many individual industries and sectors had very meaningful corrections during the year. In particular, biotechnology and technology stocks were hit hard in the spring, and retail stocks suffered greatly during the first quarter due to a brutal winter throughout most of the U.S. Energy stocks fell dramatically with the decline in the price of oil in the second half of the year. |
| ¢ | | The equity markets experienced positive returns in the fourth quarter. Within the large-cap market, higher-quality stocks with lower betas |
| | | outperformed the Russell 1000® Growth Index. In this type of environment, our high quality-focused strategy will typically experience stronger performance than the benchmark, and the Series slightly outperformed the Russell 1000® Growth Index during the quarter. |
What factors affected the Series’ performance during its fiscal year?
| ¢ | | From a sector perspective, performance was helped by strong stock selection in the information technology and consumer staples sectors, as well as an underweight in the energy sector. Negative stock selection in the industrials and energy sectors detracted from performance during the quarter. |
| ¢ | | From an individual stock perspective, the companies that contributed the most to performance were Apple and Facebook. Apple shares rebounded over the last 12 months as investors’ excitement for the stock increased due to the launch of the iPhone 6. Additionally, the company’s profitability improved with gross margins increasing from 36% to 38% over the last four quarters. Facebook’s shares rallied during the second half of the year following their decline in the first half. Investors returned to the stock after revenues exceeded the first quarter’s earnings estimates, growing 121% year-over-year. These results came on the heels of Facebook’s strong results last year when revenues grew over 60%. The company has continued to generate significant revenue from mobile advertising and improve its ability to monetize its user base. |
| ¢ | | The companies that contributed the least to performance were Bed, Bath & Beyond and Core Laboratories. The lone survivor of the big box home furnishing retailers, Bed, Bath & Beyond has struggled recently as online competition has disrupted its long-standing formula of using couponing to drive traffic and provide an expertly created, variable assortment to continually increase average transaction size. Investments in omni-channel initiatives and attempts to enhance the in-store experience have pressured margins and have yet to reinvigorate growth. With questions about the brand’s long-term relevance, we exited our position. Core Laboratories is one of the world’s leading providers of proprietary and patented reservoir description, production enhancement, and reservoir management services to the oil and gas industry. Shares lagged along with energy sector peers due to a dramatic drop in crude oil prices that is expected to curtail future global drilling |
| | | activity and, therefore, reduce industry demand for Core’s products and services. |
The preceding information is the opinion of portfolio management only through the end of the period of the report as stated on the cover. Any such opinions are subject to change at any time based upon market or other conditions and should not be relied upon as investment advice.
The market prices of equity securities may be affected by financial market, industry, or issuer-specific events. Focus on a particular style or on small or medium-sized companies may enhance that risk.
Because the Series has a limited number of securities, it may be more susceptible to factors adversely affecting its securities than a less concentrated portfolio.
Because the Series is presently heavily weighted in the technology sector, it will be impacted by that sector’s performance more than a portfolio with broader sector diversification.
| | | | |
| |
| Asset Allocation | |
| |
The following table presents asset allocations within certain sectors and as a percentage of total investments as of December 31, 2014. | |
Information Technology | | | 36 | % |
Consumer Discretionary | | | 19 | |
Health Care | | | 16 | |
Consumer Staples | | | 11 | |
Industrials | | | 8 | |
Materials | | | 4 | |
Financials | | | 3 | |
Other (includes short-term investments) | | | 3 | |
| | | | | |
Total | | | 100 | % |
| | | | | |
For information regarding the indexes and certain investment terms, see the Key Investment Terms starting on page 2.
6
| | |
| Capital Growth Series (Continued) | | |
| | | | | | | | | | | | |
| Average Annual Total Returns1 for periods ended 12/31/14 | | | | | | | | | |
| | | |
| | | 1 year | | | 5 years | | | 10 years | |
| Class A at NAV2 | | | 11.73 | % | | | 12.51 | % | | | 5.10 | % |
| S&P 500® Index | | | 13.69 | | | | 15.45 | | | | 7.67 | |
| Russell 1000® Growth Index | | | 13.05 | | | | 15.81 | | | | 8.49 | |
| Series Expense Ratios3: Class A Gross: 1.19%, Net: 1.03%. | | | | | | | | | | | | |
Returns represent past performance which is no guarantee of future results. The investment return and principal value will fluctuate so that an investor’s shares, when redeemed, may be worth more or less than their original cost. Total return does not reflect expenses associated with the separate account such as the administrative fees, account charges and surrender charges, which if reflected, would reduce total return. Performance figures may reflect fee waivers and/or expense reimbursements. In the absence of fee waivers and/or expense reimbursements, the total return would have been lower. Please visit Virtus.com for performance data current to the most recent month-end.
| 1 | Total returns are historical and include changes in share price and the reinvestment of both dividends and capital gains distributions. |
| 2 | “NAV” (Net Asset Value) total returns do not reflect any fees or expenses associated with the separate insurance accounts. |
| 3 | The expense ratios of the Series, both net and gross, are set forth according to the prospectus for the Series effective April 30, 2014, as supplemented and revised, and may differ from the expense ratios disclosed in the Financial Highlights tables in this report. See the Financial Highlights for more current information. Net Expenses: Expenses reduced by a contractual waiver in effect through April 30, 2016. Gross Expenses: Do not reflect the effect of the contractual waiver. |
Growth of $10,000 For periods ended 12/31
This chart assumes an initial investment of $10,000 made on December 31, 2004 for Class A shares. Returns shown include the reinvestment of all distributions at net asset value, and the change in share price for the stated period.
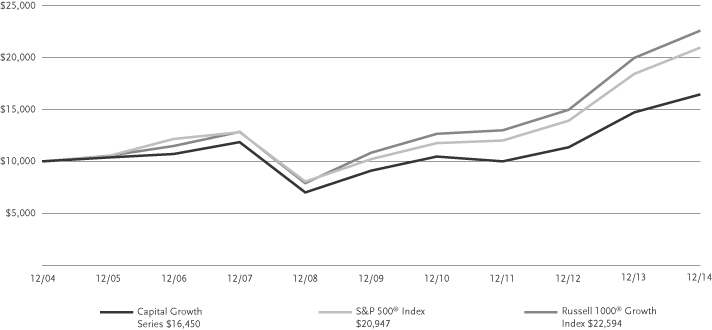
The indexes are unmanaged and not available for direct investment; therefore, their performance does not reflect the expenses associated with active management of an actual portfolio.
For information regarding the indexes and certain investment terms, see the Key Investment Terms starting on page 2.
7
Series Summary December 31, 2014 (Unaudited)
Portfolio Manager Commentary by
Euclid Advisors LLC
| ¢ | | The Series is diversified and has investment objectives of capital appreciation and current income. There is no guarantee that the Series will meet its objectives. |
| ¢ | | For the fiscal year ended December 31, 2014, the Series’ Class A shares at NAV returned 9.64%. For the same period, the S&P 500® Index, which serves as the broad-based and style-specific benchmark index appropriate for comparison, returned 13.69%. |
All performance figures assume reinvestment of distributions and exclude the effect of fees and expenses associated with the variable life insurance or annuity product through which you invest. Past performance is no guarantee of future results, and current performance may be higher or lower than the performance shown above.
How did the market in which the Series invests perform during the Series’ fiscal year?
| ¢ | | U.S. equity markets had another strong year, with the S&P 500® Index recording its sixth up year in a row. The Index gained 13.69% (including reinvested dividends) for the year, hitting multiple new all-time highs along the way. Despite several short-lived price drops, the Index closed higher in value in every quarter of 2014, making for eight positive quarters in a row. A violent sell-off in October and brief decline in December were quickly erased, and the Index ended the year just shy of its record close. |
| ¢ | | There were a few other brief pauses in the equity rally during the year, often related to global growth concerns or debate around Federal Reserve policy. Ultimately, the October announcement that the Fed was ending quantitative easing came as little surprise, and U.S. economic data showed accelerating strength. Corporate earnings also continued to grow solidly, and with a stronger dollar and falling energy prices, domestic equities performed well. With low interest rates, non-existent inflation, and an improving jobs picture, stocks had a favorable backdrop to end the year in a strong position. |
What factors affected the Series’ performance during its fiscal year?
| ¢ | | During 2014, the Series was invested in many non-commodity cyclical segments, such as industrials (specifically transports), consumer discretionary, and financials. The Series started the year with many energy stocks, which worked well for the first half of the year, but as oil prices declined, returns were hurt. The Series ended the year with a less than market weight in energy-related stocks, which helped mitigate extended losses, but the energy exposure was a drag on performance for the year. |
| ¢ | | At year-end, the Series continues to be weighted toward more economically sensitive areas of the market, although with the recent exit from several energy names, the weighting was reduced. Declining growth outside the U.S. has hurt cyclical stocks relative to defensive names. Cyclical companies, and industrials in particular, tend to rely more heavily on foreign sales than defensive companies. In addition, many defensive names tend to pay higher dividends, and stubbornly low global yields have pushed many investors toward areas such as utilities and consumer staples. While the market continues to stretch for new highs and recent growth implies improvement in economically sensitive sectors, the performance of cyclical stocks since late July has been dramatically outstripped by more defensive segments. Recent purchases have focused more on companies that derive a greater percentage of their earnings from the U.S., but the overall positioning is for the eventual reversal in price action from defensive stocks back to cyclical. |
| ¢ | | Energy was the worst-performing sector in 2014 and continues to be since the market lows in October. This is not surprising with the price of crude oil bumping at new four-year lows virtually every day. Although it is impossible to predict where oil prices will stabilize, it appears the combination of weak non-U.S. economic growth, increased supply in North America, and Saudi Arabia’s desire to squeeze high-cost producers in the short run by pushing prices lower, could limit upside in the energy group. The incredibly negative sentiment towards the sector will likely be opportunity for investment, but crude oil prices need to stabilize for a broad-based rally in energy issuers. |
| ¢ | | The Series remains significantly exposed to consumer discretionary stocks while very light in consumer staples offerings. With the fourth quarter volatility in equities and the turmoil in other markets, this stance proved to be challenging. As noted above, consumer staples stocks are considered more defensive, and tend to outperform consumer discretionary stocks during periods of volatility. With the plunge in oil prices and commensurate price relief at the pump, there are reasons to be optimistic about consumer spending and retail earnings for the fourth quarter and beyond. The Series increased holdings within travel and leisure in the fourth quarter, anticipating that lower energy costs could lead to a busy winter travel season for consumers. This worked well into year-end for the returns. |
| ¢ | | The Series is also favorably positioned in the industrials sector. The holdings have shifted to a somewhat more domestically focused bias, although most companies within this space do |
| | | have some exposure to non-U.S. sales. However, our holdings in airlines and rails are less exposed to non-U.S. sales than most industrial conglomerates, and these have been good holdings for the Series. |
| ¢ | | The Series remains well diversified across both the technology and health care sectors. Information technology is once again the largest sector within the S&P 500® Index, representing nearly 20% of the market capitalization of the Index, and was among the Series’ largest sector weightings throughout the year. The combination of strong balance sheets and innovation propelled the tech sector to 20% returns in the year, and the semiconductor holdings were particularly strong for the Series. Health care stocks were pushed higher during 2014 by strong drug pipelines and merger activity in the sector. Biotechnology led the way, but several other themes such as hospitals and device makers also made solid contributions. An improving jobs picture and the Affordable Care Act mean more people have insurance, which is a benefit to all of these health care sub-groups. Given the Series’ modest holdings in defensive areas, such as utilities and consumer staples stocks, both tech and health care have provided the Series with holdings that are less dependent on global economic growth and also offer a compelling growth-to-valuation trade-off. |
The preceding information is the opinion of portfolio management only through the end of the period of the report as stated on the cover. Any such opinions are subject to change at any time based upon market or other conditions and should not be relied upon as investment advice, and there is no guarantee that market forecasts will be realized.
The market prices of equity securities may be affected by financial market, industry, or issuer-specific events. Focus on a particular style or on small or medium-sized companies may enhance that risk.
| | | | |
| |
| Asset Allocation | |
| |
The following table presents asset allocations within certain sectors and as a percentage of total investments as of December 31, 2014. | |
Consumer Discretionary | | | 20 | % |
Information Technology | | | 19 | |
Industrials | | | 16 | |
Financials | | | 16 | |
Health Care | | | 12 | |
Energy | | | 7 | |
Consumer Staples | | | 4 | |
Other (includes short-term investments) | | | 6 | |
| | | | | |
Total | | | 100 | % |
| | | | | |
For information regarding the indexes and certain investment terms, see the Key Investment Terms starting on page 2.
8
| | |
| Growth & Income Series (Continued) | | |
| | | | | | | | | | | | |
| Average Annual Total Returns1 for periods ended 12/31/14 | | | | | | | | | |
| | | |
| | | 1 year | | | 5 years | | | 10 years | |
| Class A at NAV2 | | | 9.64 | % | | | 12.97 | % | | | 6.84 | % |
| S&P 500® Index | | | 13.69 | | | | 15.45 | | | | 7.67 | |
| Series Expense Ratios3: Class A Gross: 1.19%, Net: 0.98%. | | | | | | | | | | | | |
Returns represent past performance which is no guarantee of future results. The investment return and principal value will fluctuate so that an investor’s shares, when redeemed, may be worth more or less than their original cost. Total return does not reflect expenses associated with the separate account such as the administrative fees, account charges and surrender charges, which if reflected, would reduce total return. Performance figures may reflect fee waivers and/or expense reimbursements. In the absence of fee waivers and/or expense reimbursements, the total return would have been lower. Please visit Virtus.com for performance data current to the most recent month-end.
| 1 | Total returns are historical and include changes in share price and the reinvestment of both dividends and capital gains distributions. |
| 2 | “NAV” (Net Asset Value) total returns do not reflect any fees or expenses associated with the separate insurance accounts. |
| 3 | The expense ratios of the Series, both net and gross, are set forth according to the prospectus for the Series effective April 30, 2014, as supplemented and revised, and may differ from the expense ratios disclosed in the Financial Highlights tables in this report. See the Financial Highlights for more current information. Net Expenses: Expenses reduced by a contractual waiver in effect through April 30, 2016. Gross Expenses: Do not reflect the effect of the contractual waiver. |
Growth of $10,000 For periods ended 12/31
This chart assumes an initial investment of $10,000 made on December 31, 2004 for Class A shares. Returns shown include the reinvestment of all distributions at net asset value, and the change in share price for the stated period.
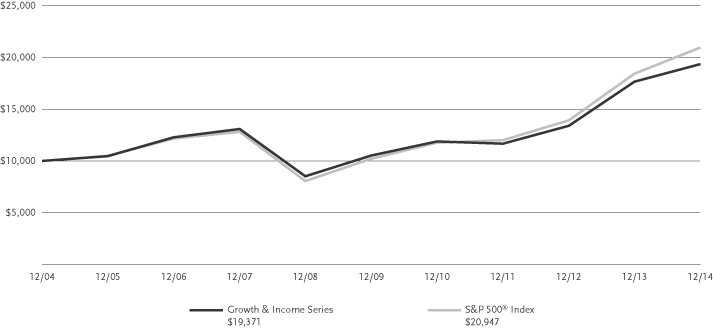
The index is unmanaged and not available for direct investment; therefore, its performance does not reflect the expenses associated with active management of an actual portfolio.
For information regarding the indexes and certain investment terms, see the Key Investment Terms starting on page 2.
9
Series Summary December 31, 2014 (Unaudited)
Portfolio Manager Commentary by
Aberdeen Asset Management Inc.
| ¢ | | The Series is diversified and has an investment objective of high total return consistent with reasonable risk. There is no guarantee that the Series will meet its objective. |
| ¢ | | For the fiscal year ended December 31, 2014, the Series’ Class A shares at NAV returned -3.90% and Class I shares at NAV returned -3.71%. For the same period, the S&P 500® Index, a broad-based equity index, returned 13.69% and the MSCI EAFE® Index (net), the Series’ style-specific benchmark appropriate for comparison, returned -4.90%. |
All performance figures assume reinvestment of distributions and exclude the effect of fees and expenses associated with the variable life insurance or annuity product through which you invest. Past performance is no guarantee of future results, and current performance may be higher or lower than the performance shown above.
How did the market in which the Series invests perform during the Series’ fiscal year?
| ¢ | | Despite heightened volatility, global equity markets recorded gains in 2014. Initially, markets were affected by risk aversion, fueled by renewed turmoil in emerging economies, mixed Chinese data, and the start of the Federal Reserve’s continued tapering of its asset purchases. In particular, emerging markets currencies suffered a sharp sell-off. However, confidence returned following improving U.S. economic data and assurances of continued loose monetary policy. In particular, the European Central Bank cut interest rates to a record low and introduced fresh stimulus measures, such as purchasing private sector credit. Although the U.S. officially ended its bond-buying program, the Bank of Japan’s stimulus measures helped to boost confidence in the global economy. Toward the end of the period, the sustained drop in oil prices caused turmoil in Russia’s financial markets and the ruble’s collapse, which reverberated worldwide and pared gains. Emerging markets were also depressed by the resurgent U.S. dollar amid expectations that the Federal Reserve could raise interest rates soon as the economy improves. |
What factors affected the Series’ performance during its fiscal year?
| ¢ | | The Series’ outperformance of its benchmark was driven by the positive currency impact, which |
| | | offset negative stock selection. In asset allocation, the overweight to the Asia ex-Japan region contributed the most to the relative return. The underweight to Europe ex-U.K. also benefited the Series, as the region suffered from sluggish economic data and corporate earnings. |
| ¢ | | The Series’ non-benchmark exposure to Taiwan added value as well, where Taiwan Semiconductor Manufacturing Company (TSMC) was the top contributor to relative return. TSMC’s shares rallied after it upgraded its earnings forecast on the back of robust demand, as well as inventory restocking by customers. This underscores the company’s leadership in advanced semiconductor technology where capacity remains tight and its manufacturing expertise is uncontested. Further, it posted record net profits in the third quarter that exceeded market expectations, driven by robust orders from Apple for its latest smartphone models. |
| ¢ | | Holdings in Switzerland and Japan also benefited the Series. In Switzerland, Novartis’s share price climbed following the effectiveness of its psoriatic arthritis drug. In Japan, Shin-Etsu Chemical benefited from good demand for silicon wafers, while Daito Trust was boosted by a share buyback of up to 1.71 million shares, which brought overall shareholder returns to around 80% of net profits. The company declared a commemorative dividend of 20 yen per share in the fiscal year ending March 2015. Within North America, Canadian National Railway was consistently strong throughout the period, posting positive results and the continuation of the company’s goal to drive operational efficiencies. |
| ¢ | | On the other hand, our commodity holdings, including Vale, BHP Billiton, Tenaris, Petrobras, and Eni, cost the Series. Vale and BHP Billiton were hurt by lower iron ore prices, while the decline in oil prices affected Tenaris, Petrobras, and Eni. Tenaris also posted weaker-than-expected quarterly results because of lower sales of premium pipes. Despite current headwinds, management has a good track record of managing oil price fluctuations and the company’s net cash balance sheet is encouraging. Vale and Petrobras also suffered amid the escalating political scandal in Brazil and the weak real currency. We have since sold out of our position in Petrobras, due to concerns over its deteriorating business quality and ability to pay its debt. |
The preceding information is the opinion of portfolio management only through the end of the period of the report as stated on the cover. Any such opinions
are subject to change at any time based upon market or other conditions and should not be relied upon as investment advice.
Investing internationally, especially in emerging markets, involves risks such as currency, political, accounting, economic, and market risk.
The market prices of equity securities may be affected by financial market, industry, or issuer-specific events. Focus on a particular style or on small or medium-sized companies may enhance that risk.
| | | | |
| |
| Asset Allocation | |
| |
The following table presents asset allocations within certain sectors and as a percentage of total investments as of December 31, 2014. | |
Financials | | | 22 | % |
Consumer Staples | | | 14 | |
Industrials | | | 14 | |
Materials | | | 12 | |
Information Technology | | | 9 | |
Health Care | | | 9 | |
Energy | | | 9 | |
Other (includes short-term investments) | | | 11 | |
| | | | | |
Total | | | 100 | % |
| | | | | |
For information regarding the indexes and certain investment terms, see the Key Investment Terms starting on page 2.
10
| | |
| International Series (Continued) | | |
| | | | | | | | | | | | | | | | | | | | |
| Average Annual Total Returns1 for periods ended 12/31/14 | | | | | | | |
| | | | | |
| | | 1 year | | | 5 years | | | 10 years | | | Since
Inception | | | Inception
Date | |
| Class A at NAV2 | | | –3.90 | % | | | 5.50 | % | | | 6.83 | % | | | — | | | | — | |
| Class I at NAV2 | | | –3.71 | | | | — | | | | — | | | | –1.56 | % | | | 4/30/13 | |
| S&P 500® Index | | | 13.69 | | | | 15.45 | | | | 7.67 | | | | 18.88 | 4 | | | — | |
| MSCI EAFE® Index (net) | | | –4.90 | | | | 5.33 | | | | 4.43 | | | | 3.29 | 4 | | | — | |
| Series Expense Ratios3: Class A Gross: 1.23%, Net: 1.18%; Class I Gross: 0.98%, Net: 0.93%. | | | | | | | | | |
Returns represent past performance which is no guarantee of future results. The investment return and principal value will fluctuate so that an investor’s shares, when redeemed, may be worth more or less than their original cost. Total return does not reflect expenses associated with the separate account such as the administrative fees, account charges and surrender charges, which if reflected, would reduce total return. Performance figures may reflect fee waivers and/or expense reimbursements. In the absence of fee waivers and/or expense reimbursements, the total return would have been lower. Please visit Virtus.com for performance data current to the most recent month-end.
| 1 | Total returns are historical and include changes in share price and the reinvestment of both dividends and capital gains distributions. |
| 2 | “NAV” (Net Asset Value) total returns do not reflect any fees or expenses associated with the separate insurance accounts. |
| 3 | The expense ratios of the Series, both net and gross, are set forth according to the prospectus for the Series effective April 30, 2014, as supplemented and revised, and may differ from the expense ratios disclosed in the Financial Highlights tables in this report. See the Financial Highlights for more current information. The Advisor contractually agreed to limit the Series’ expenses through April 30, 2016. Gross Expenses: Do not reflect the effect of the contractual waiver. |
| 4 | The since inception index returns are from the inception date of Class I shares. |
Growth of $10,000 For periods ended 12/31
This chart assumes an initial investment of $10,000 made on December 31, 2004 for Class A shares. Returns shown include the reinvestment of all distributions at net asset value, and the change in share price for the stated period.
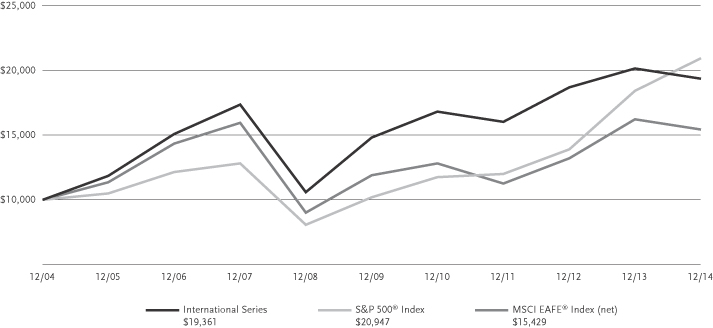
The indexes are unmanaged and not available for direct investment; therefore, their performance does not reflect the expenses associated with active management of an actual portfolio.
For information regarding the indexes and certain investment terms, see the Key Investment Terms starting on page 2.
11
| | |
| Multi-Sector Fixed Income Series | | |
Series Summary December 31, 2014 (Unaudited)
Portfolio Manager Commentary by
Newfleet Asset Management, LLC
| ¢ | | The Series is diversified and has an investment objective of long-term total return. There is no guarantee that the Series will meet its objective. |
| ¢ | | For the fiscal year ended December 31, 2014, the Series’ Class A shares at NAV returned 1.90% and Class I shares at NAV returned 2.16%. For the same period, the Barclays U.S. Aggregate Bond Index, which serves as the broad-based and style-specific benchmark index appropriate for comparison, returned 5.97%. |
All performance figures assume reinvestment of distributions and exclude the effect of fees and expenses associated with the variable life insurance or annuity product through which you invest. Past performance is no guarantee of future results, and current performance may be higher or lower than the performance shown above.
How did the fixed income market perform during the Series’ fiscal year?
| ¢ | | Higher beta and foreign-related spread sectors, such as emerging markets debt and non-U.S. dollar underperformed U.S. Treasuries during the fiscal year. Plummeting oil prices dominated market volatility and investor concerns in the second half of the fiscal year, especially during the fourth quarter of 2014. Brent crude, the international oil benchmark, fell almost 50% since June to end the year at roughly $57 a barrel. Rising output of U.S. shale producers and OPEC’s persistence in maintaining production quotas caused a supply glut, exacerbated by slowing global demand. Lower oil prices contributed to the U.S. dollar’s continued ascent against other major currencies, as did the greenback’s safe haven status amidst heightened geopolitical risk, anticipation of Federal Reserve tightening, and weaker global growth. |
| ¢ | | The collapse in oil prices has contributed to the divergence theme that has been playing out between the U.S. and much of the rest of the world. While lower crude prices are viewed as a net stimulus to the U.S. economy via increased consumer spending, the deflationary effects within the stagnating eurozone economies increase the probability that the European Central Bank will expand its bond purchase program in early 2015. Other central banks (e.g., in Japan and China) already have eased credit conditions in response to slow global growth. |
| ¢ | | Economic growth in the U.S. continued to gain momentum, toward the end of the fiscal year the Fed ended the third round of quantitative easing, and in December it tempered the “considerable time” language in its policy statement to “patience” in reference to the anticipated timing of the first interest rate increase since 2006. The tightening effects of slowing global growth, an appreciating dollar, and low oil prices may delay the Fed’s decision to raise rates until the second half of 2015. Inflation remains below the Fed’s 2% target. |
| ¢ | | Over the 12 months, yields increased on the short end of the U.S. Treasury curve and decreased on the long end, and overall the curve flattened. |
What factors affected the Series’ performance during its fiscal year?
| ¢ | | The underperformance of higher beta and foreign-related fixed income spread sectors relative to U.S. Treasuries was the key driver of the Series’ underperformance for the fiscal year. |
| ¢ | | During the fiscal year the Series’ allocations to the non-U.S. dollar and emerging markets debt sectors detracted from performance. |
| ¢ | | The Series’ allocations to the structured product (commercial mortgage-backed securities, residential mortgage-backed securities, and asset-backed securities) and corporate high quality sectors, in addition to issue selection within the corporate high yield sector, were positive contributors to performance for the fiscal year. |
The preceding information is the opinion of portfolio management only through the end of the period of the report as stated on the cover. Any such opinions are subject to change at any time based upon market or other conditions and should not be relied upon as investment advice.
Debt securities are subject to various risks, the most prominent of which are credit and interest rate risk. The issuer of a security may fail to make payments in a timely manner. Values of debt securities may rise and fall in response to changes in interest rates. This risk may be enhanced with longer-term maturities.
There is a greater level of credit risk and price volatility involved with high-yield securities than investment grade securities.
Changes in interest rates can cause both extension and prepayment risks for asset and mortgage-backed
securities. These securities are also subject to risks associated with the repayment of underlying collateral.
There may be no ready market for loan participation interests. The Series may have to sell the interests at a substantial discount. Such interests are subject to the credit risk of the underlying corporate borrower.
Investing internationally, especially in emerging markets, involves additional risks such as currency, political, accounting, economic, and market risk.
| | | | | | | | |
| |
| Asset Allocation | |
| |
The following table presents asset allocations within certain sectors and as a percentage of total investments as of December 31, 2014. | |
Corporate Bonds | | | | | | | 59 | % |
Financials | | | 23 | % | | | | |
Energy | | | 8 | | | | | |
Industrials | | | 7 | | | | | |
Total of all others | | | 21 | | | | | |
Mortgage-Backed Securities | | | | | | | 13 | |
Loan Agreements | | | | | | | 11 | |
Foreign Government Securities | | | | | | | 7 | |
Preferred Stock | | | | | | | 4 | |
Asset-Backed Securities | | | | | | | 4 | |
Other (includes short-term investments) | | | | | | | 2 | |
| | | | | | | | | |
Total | | | | | | | 100 | % |
| | | | | | | | | |
For information regarding the indexes and certain investment terms, see the Key Investment Terms starting on page 2.
12
| | |
| Multi-Sector Fixed Income Series (Continued) | | |
| | | | | | | | | | | | | | | | | | | | |
| Average Annual Total Returns1 for periods ended 12/31/14 | | | | | | | | | | |
| | | | | |
| | | 1 year | | | 5 years | | | 10 years | | | Since
Inception | | | Inception
Date | |
| Class A at NAV2 | | | 1.90 | % | | | 7.08 | % | | | 6.20 | % | | | — | | | | — | |
| Class I at NAV2 | | | 2.16 | | | | — | | | | — | | | | 0.75 | % | | | 4/30/13 | |
| Barclays U.S. Aggregate Bond Index | | | 5.97 | | | | 4.45 | | | | 4.71 | | | | 1.73 | 4 | | | — | |
| Series Expense Ratios3: Class A Gross: 1.01%, Net: 0.94%; Class I Gross: 0.76%, Net: 0.69%. | | | | | | | | | |
Returns represent past performance which is no guarantee of future results. The investment return and principal value will fluctuate so that an investor’s shares, when redeemed, may be worth more or less than their original cost. Total return does not reflect expenses associated with the separate account such as the administrative fees, account charges and surrender charges, which if reflected, would reduce total return. Performance figures may reflect fee waivers and/or expense reimbursements. In the absence of fee waivers and/or expense reimbursements, the total return would have been lower. Please visit Virtus.com for performance data current to the most recent month-end.
| 1 | Total returns are historical and include changes in share price and the reinvestment of both dividends and capital gains distributions. |
| 2 | “NAV” (Net Asset Value) total returns do not reflect any fees or expenses associated with the separate insurance products. |
| 3 | The expense ratios of the Series, both net and gross, are set forth according to the prospectus for the Series effective April 30, 2014, as supplemented and revised, and may differ from the expense ratios disclosed in the Financial Highlights tables in this report. See the Financial Highlights for more current information. The Advisor contractually agreed to limit the Series’ expenses through April 30, 2016. Gross Expenses: Do not reflect the effect of the contractual waiver. |
| 4 | The since inception index returns are from the inception date of Class I shares. |
Growth of $10,000 For periods ended 12/31
This chart assumes an initial investment of $10,000 made on December 31, 2004 for Class A shares. Returns shown include the reinvestment of all distributions at net asset value, and the change in share price for the stated period.
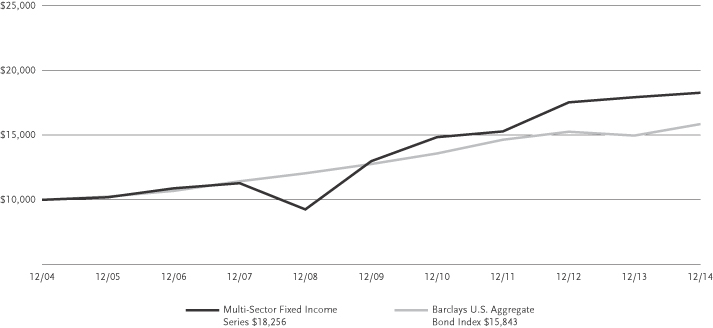
The index is unmanaged and not available for direct investment; therefore, its performance does not reflect the expenses associated with active management of an actual portfolio.
For information regarding the indexes and certain investment terms, see the Key Investment Terms starting on page 2.
13
| | |
| Premium AlphaSector® Series | | |
Series Summary December 31, 2014 (Unaudited)
Portfolio Managers Commentary by
Euclid Advisors LLC and
F-Squared Institutional Advisors, LLC
| ¢ | | The Series is diversified and has an investment objective of long-term capital appreciation. There is no guarantee that the Series will meet its objective. |
| ¢ | | For the fiscal year ended December 31, 2014, the Series’ Class A shares at NAV returned 2.23% and Class I shares at NAV returned 2.39%. For the same period, the S&P 500® Index, which serves as the broad-based equity index and style-specific benchmark index appropriate for comparison, returned 13.69%. |
All performance figures assume reinvestment of distributions and exclude the effect of fees and expenses associated with the variable life insurance or annuity product through which you invest. Past performance is no guarantee of future results, and current performance may be higher or lower than the performance shown above.
How did the market perform during the Series’ fiscal year?
| ¢ | | During the Series’ fiscal year ended December 31, 2014, the U.S. equity markets performed well, with the S&P 500® Index gaining 13.69%. |
| ¢ | | During the 2014 fiscal year, the second and fourth quarters provided the majority of the total gains for the period, as each quarter produced a return of approximately 5% for the S&P 500® Index. Performance was more modest during the first and third quarters of 2014, at 1.81% and 1.13%, respectively. |
| ¢ | | Viewing the U.S. equity market by sector, the overall picture was strong for the year. The energy sector was down in both the third and fourth quarters, resulting in a negative return for the period, while the consumer staples, consumer discretionary, financials, healthcare, industrials, materials, technology, and utilities sectors all had positive performance. During the fiscal period, the consumer staples, financials, healthcare, technology, and utilities sectors outperformed the broader S&P 500® Index, while the others underperformed. |
What factors affected the Series’ performance during its fiscal year?
| ¢ | | The Series is designed to track the Premium AlphaSector Index. The Index’s objective is to provide risk controls for declining markets and participation in rising markets. |
| ¢ | | In bear market conditions, the Series’ risk controls are intended to help it outperform its benchmark, the S&P 500® Index. In strong bull markets, the Series may be expected to lag the benchmark to a moderate degree. |
| ¢ | | During the 2014 fiscal year, the Series’ Class A shares returned 2.23%, lagging its benchmark. While both the Series and the U.S. equity market were positive for the year, allocations to cash alternatives during the fourth quarter caused a drag on performance. By design, the Series exits sectors when its Subadviser’s models used with respect to the Series detect high levels of volatility during which the risk of suffering significant losses appears to outweigh the probability of enjoying gains. This was evident during the fourth quarter as the Subadviser’s models detected elevated volatility levels. |
| ¢ | | The quantitative model that drives the Series does an independent assessment of each of the nine S&P 500® Index equity sectors discussed above. During the first three quarters of the fiscal year, individual sectors in the portfolio were turned “on” or “off,” but the Series as a whole remained 100% invested in U.S. equities. During the fourth quarter, however, the Series held a position in cash equivalents for the first time in three years as volatility increased significantly during the period. |
The preceding information is the opinion of portfolio management only through the end of the period of the report as stated on the cover. Any such opinions are subject to change at any time based upon market or other conditions and should not be relied upon as investment advice. Past performance is no guarantee of future results, and there is no guarantee that market forecasts will be realized.
The market prices of equity securities may be affected by financial market, industry, or issuer-specific events. Focus on a particular style or on small or medium-sized companies may enhance that risk.
A fund that focuses its investments in a particular industry or sector will be more sensitive to conditions that affect that industry or sector than a non-concentrated fund.
The value of an ETF may be more volatile than the underlying portfolio of securities the ETF is designed to track. The costs of owning the ETF may exceed the cost of investing directly in the underlying securities.
The risk that investments selected using quantitative models may perform differently from the market as a whole or from their expected performance. There can be no assurance that use of a quantitative model will enable the Series to achieve positive returns or outperform.
U.S. government securities may be subject to price fluctuations. An agency may default on an obligation not backed by the United States. Any guarantee on U.S. government securities does not apply to the value of the Series’ shares.
The Series’ exposure to different asset classes may not be optimal for market conditions at a given time. Asset allocation does not guarantee a profit or protect against a loss in declining markets.
| | | | |
| |
| Asset Allocation | |
| |
The following table presents asset allocations within certain sectors and as a percentage of total investments as of December 31, 2014. | |
Consumer Discretionary | | | 20 | % |
Financials | | | 20 | |
Consumer Staples | | | 20 | |
Information Technology | | | 20 | |
Utilities | | | 19 | |
Other (includes short-term investments) | | | 1 | |
| | | | | |
Total | | | 100 | % |
| | | | | |
For information regarding the indexes and certain investment terms, see the Key Investment Terms starting on page 2.
14
| | |
| Premium AlphaSector® Series (Continued) | | |
| | | | | | | | | | | | |
| Average Annual Total Returns1 for periods ended 12/31/14 | | | | | | | | | |
| | | |
| | | 1 year | | | Since
Inception | | | Inception
Date | |
| Class A at NAV2 | | | 2.23 | % | | | 8.88 | % | | | 2/14/11 | |
| Class I at NAV2 | | | 2.39 | | | | 10.06 | | | | 4/30/13 | |
| S&P 500® Index | | | 13.69 | | | | — | 4 | | | — | |
| Series Expense Ratios3: Class A Gross 2.01%, Net 1.87%; Class I Gross 1.76%, Net 1.62%. | |
Returns represent past performance which is no guarantee of future results. The investment return and principal value will fluctuate so that an investor’s shares, when redeemed, may be worth more or less than their original cost. Total return does not reflect expenses associated with the separate account such as the administrative fees, account charges and surrender charges, which if reflected, would reduce total return. Performance figures may reflect fee waivers and/or expense reimbursements. In the absence of fee waivers and/or expense reimbursements, the total return would have been lower. Please visit Virtus.com for performance data current to the most recent month-end.
| 1 | Total returns are historical and include changes in share price and the reinvestment of both dividends and capital gains distributions. |
| 2 | “NAV” (Net Asset Value) total returns do not reflect any fees or expenses associated with the separate insurance products. |
| 3 | The expense ratios of the Series, both net and gross, are set forth according to the prospectus for the Series effective April 30, 2014, as supplemented and revised, and may differ from the expense ratios disclosed in the Financial Highlights tables in this report. See the Financial Highlights for more current information. Net Expenses: Expenses reduced by a contractual waiver in effect through April 30, 2016. Gross Expenses: Do not reflect the effect of the contractual waiver. Expense ratios reflect fees and expenses associated with the underlying funds. |
| 4 | The index returned 14.29% for Class A shares and 18.88% for Class I shares since the inception date of the respective share classes. |
Growth of $10,000 For periods ended 12/31
This chart assumes an initial investment of $10,000 made on February 14, 2011 (inception date of the Class A shares). Returns shown include the reinvestment of all distributions at net asset value, and the change in share price for the stated period.
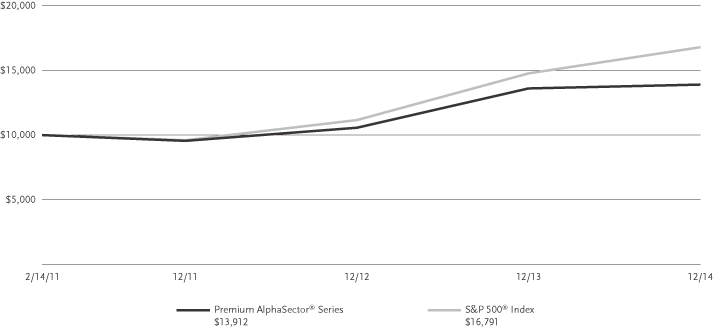
The index is unmanaged and not available for direct investment; therefore, its performance does not reflect the expenses associated with active management of an actual portfolio.
For information regarding the indexes and certain investment terms, see the Key Investment Terms starting on page 2.
15
| | |
| Real Estate Securities Series | | |
Series Summary December 31, 2014 (Unaudited)
Portfolio Manager Commentary by
Duff & Phelps Investment Management Co.
| ¢ | | The Series is diversified and has investment objectives of capital appreciation and income with approximately equal emphasis. There is no guarantee that the Series will meet its objectives. |
| ¢ | | For the fiscal year ended December 31, 2014, the Series’ Class A shares at NAV returned 31.62% and Class I shares at NAV returned 31.98%. For the same period, the S&P 500® Index, a broad-based equity index, returned 13.69% and the FTSE NAREIT Equity REITs Index, the Series’ style-specific benchmark appropriate for comparison, returned 30.14%. |
All performance figures assume reinvestment of distributions and exclude the effect of fees and expenses associated with the variable life insurance or annuity product through which you invest. Past performance is no guarantee of future results, and current performance may be higher or lower than the performance shown above.
How did the market in which the Series invests perform during the Series’ fiscal year?
| ¢ | | Last year was another solid year for the broad equity market following a strong year in 2013. The U.S. economy accelerated and job growth was robust. Bonds defied the consensus projections and rallied on a global basis. |
| ¢ | | Demand for private commercial real estate continued to grow, leading to further price increases for the buildings. The buildings owned by the companies, or Real Estate Investment Trusts (REITs), in which the Series invests, have become more valuable. Pension plans, private groups of investors, and sovereign wealth funds are chasing the opportunity to own more healthy commercial real estate, so the value of the buildings owned by the REITs in which the Series invests grew over the fiscal year. |
| ¢ | | Demand by the tenants continued to grow too, leading to tighter conditions and greater pricing power for owners of the buildings. This allowed them to raise rents further in buildings and markets where occupancy was already at high levels, and begin raising rents in other markets where occupancy had lifted enough to give the owners of the buildings pricing power. |
| ¢ | | The growth in demand by tenants to occupy more space, and the increased appetite for ownership in the private commercial real estate market, are part of a healthy commercial real estate cycle. Geographic strength is most evident where the |
| | | underlying demand drivers are the greatest, such as job growth, and new supply is quite contained. |
| ¢ | | We highlight the pricing power, in the form of higher rents, since it is a key driver of cash flow for earnings, and because pricing power, or inflation, is a rare attribute these days. In fact, one can look around the world today and ask, what companies can I invest in today that can raise prices to their customers, and in turn, cash flow and dividends? The Series is benefiting from this higher pricing power. |
| ¢ | | As further support for the growing pricing power in buildings and markets where occupancy has grown, we are witnessing less new competition for the owners of commercial real estate. Since there is less new development of buildings underway than there usually is at this point in a real estate cycle, it is easier to keep tenants than it would be if there was more new development. We expect continued low levels of new development/supply as a multi-year tailwind. Constraints to construction financing are a key driver. New banking regulations introduced after the last recession named Basel III have added constraints to construction lending. |
| ¢ | | For the securities in which we invest, which we often refer to as listed real estate, valuations lifted just as they did in the broader market last year. The broader market benefited from another year of multiple expansion (a valuation reference towards price/earnings for the broader market). The real estate securities recovered lost valuation in 2013 when it was absorbing a record amount of equity issuance, or new stock being issued into the marketplace. Cash flow growth per share and dividend growth per share were solid again in listed real estate. |
| ¢ | | Mergers and acquisitions returned to real estate securities and are likely to increase given the aforementioned robust private bid and access to capital. |
| ¢ | | Balance sheets for the listed real estate securities we invest in finished the year stronger given solid cash flow growth, on-going equity issuance, asset pruning and well placed long-term fixed-rate debt. |
| ¢ | | And as we wrapped up the year, the lower gas prices began to grow and began to feel a bit like a tax cut for consumers. For the country as a whole, where close to two-thirds of our GDP, or gross domestic product, is driven by consumers, that is a good thing. |
What factors affected the Series’ performance during its fiscal year?
| ¢ | | The Series outperformed both its style-specific benchmark and the S&P 500® Index in 2014. As mentioned above, relative to the markets, there were a number of positive drivers behind the Series’ performance. |
| ¢ | | The Series invests in a number of listed real estate securities in a universe of a dozen property sectors, such as apartments, office buildings, regional malls, self storage, industrial or warehouses, health care, lodging or hotels, etc. In 2014, the Series benefited from stock selection and property sector allocation. It was rewarded for what the portfolio owned as well as what it didn’t, with nine of twelve sectors contributing on a security selection basis, and six of twelve sectors as a result of the property allocations within each sector. Given the time the investment team spends on property tours each year, we are pleased when our security selection is a key and consistent contributor. |
| ¢ | | The largest combined property sector contributors to performance were the free standing sector because of a zero weight allocation as it underperformed, the office sector due to security selection, and the regional malls sector based on security selection and an overweight property sector allocation as it outperformed. |
| ¢ | | The largest combined property sector detractors from performance were the shopping centers sector based on security selection, the health care sector based on security selection and an underweight property sector allocation as it outperformed, and the industrial sector based on an overweight property sector allocation as it underperformed, partially offset by security selection. |
The preceding information is the opinion of portfolio management only through the end of the period of the report as stated on the cover. Any such opinions are subject to change at any time based upon market or other conditions and should not be relied upon as investment advice.
The market prices of equity securities may be affected by financial market, industry, or issuer-specific events. Focus on a particular style or on small or medium-sized companies may enhance that risk.
The Series may be negatively affected by factors specific to the real estate market, including interest rate, leverage, property, and management.
For information regarding the indexes and certain investment terms, see the Key Investment Terms starting on page 2.
16
| | |
| Real Estate Securities Series (Continued) | | |
Series Summary December 31, 2014 (Unaudited)
Portfolio Manager Commentary by
Duff & Phelps Investment Management Co.
A fund that focuses its investments in a particular industry or sector will be more sensitive to conditions that affect that industry or sector than a non-concentrated fund.
Because the Series’ portfolio has a limited number of securities, it may be more susceptible to factors adversely affecting its securities than a less concentrated portfolio.
| | | | |
| |
| Asset Allocation | |
| |
The following table presents asset allocations within certain sectors and as a percentage of total investments as of December 31, 2014. | |
Apartments | | | 17 | % |
Regional Malls | | | 16 | |
Office | | | 13 | |
Lodging/Resorts | | | 12 | |
Self Storage | | | 11 | |
Industrials | | | 9 | |
Shopping Centers | | | 8 | |
Other (includes short-term investments) | | | 14 | |
| | | | | |
Total | | | 100 | % |
| | | | | |
For information regarding the indexes and certain investment terms, see the Key Investment Terms starting on page 2.
17
| | |
| Real Estate Securities Series (Continued) | | |
| | | | | | | | | | | | | | | | | | | | |
| Average Annual Total Returns1 for periods ended 12/31/14 | | | | | | | | | | |
| | | | | |
| | | 1 year | | | 5 years | | | 10 years | | | Since
Inception | | | Inception
Date | |
| Class A at NAV2 | | | 31.62 | % | | | 16.92 | % | | | 9.00 | % | | | — | | | | — | |
| Class I at NAV2 | | | 31.98 | | | | — | | | | — | | | | 10.51 | % | | | 4/30/13 | |
| S&P 500® Index | | | 13.69 | | | | 15.45 | | | | 7.67 | | | | 18.88 | 4 | | | — | |
| FTSE NAREIT Equity REITs Index | | | 30.14 | | | | 16.88 | | | | 8.30 | | | | 9.02 | 4 | | | — | |
| Series Expense Ratios3: Class A Gross: 1.27%, Net: 1.16%; Class I Gross: 1.02%, Net 0.91%. | | | | | |
Returns represent past performance which is no guarantee of future results. The investment return and principal value will fluctuate so that an investor’s shares, when redeemed, may be worth more or less than their original cost. Total return does not reflect expenses associated with the separate account such as the administrative fees, account charges and surrender charges, which if reflected, would reduce total return. Performance figures may reflect fee waivers and/or expense reimbursements. In the absence of fee waivers and/or expense reimbursements, the total return would have been lower. Please visit Virtus.com for performance data current to the most recent month-end.
| 1 | Total returns are historical and include changes in share price and the reinvestment of both dividends and capital gains distributions. |
| 2 | “NAV” (Net Asset Value) total returns do not reflect any fees or expenses associated with the separate insurance products. |
| 3 | The expense ratios of the Series, both net and gross, are set forth according to the prospectus for the Series effective April 30, 2014, as supplemented and revised, and may differ from the expense ratios disclosed in the Financial Highlights tables in this report. See the Financial Highlights for more current information. Net Expenses: Expenses reduced by a contractual waiver in effect through April 30, 2016. Gross Expenses: Do not reflect the effect of the contractual waiver. |
| 4 | The since inception index returns are from the inception date of Class I shares. |
Growth of $10,000 For periods ended 12/31
This chart assumes an initial investment of $10,000 made on December 31, 2004 for Class A shares. Returns shown include the reinvestment of all distributions at net asset value, and the change in share price for the stated period.
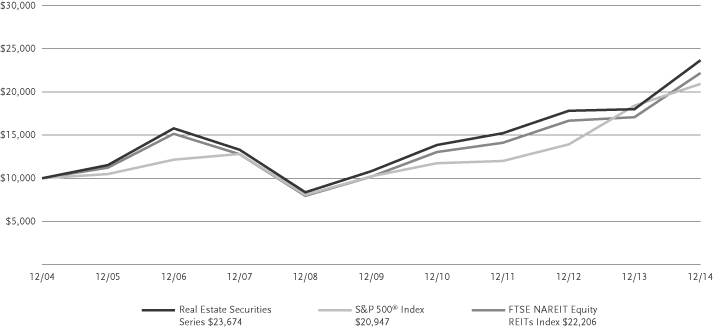
The indexes are unmanaged and not available for direct investment; therefore, their performance does not reflect the expenses associated with active management of an actual portfolio.
For information regarding the indexes and certain investment terms, see the Key Investment Terms starting on page 2.
18
Series Summary December 31, 2014 (Unaudited)
Portfolio Manager Commentary by
Kayne Anderson Rudnick Investment Management, LLC
| ¢ | | The Series is diversified and has an investment objective of long-term capital growth. There is no guarantee that the Series will meet its objective. |
| ¢ | | For the fiscal year ended December 31, 2014, the Series’ Class A shares at NAV returned 5.50% and Class I shares at NAV returned 5.78%. For the same period, the S&P 500® Index, a broad-based equity index, returned 13.69% and the Russell 2000® Growth Index, the Series’ style-specific benchmark appropriate for comparison, returned 5.60%. |
All performance figures assume reinvestment of distributions and exclude the effect of fees and expenses associated with the variable life insurance or annuity product through which you invest. Past performance is no guarantee of future results, and current performance may be higher or lower than the performance shown above.
How did the market in which the Series invests perform during the Series’ fiscal year?
| ¢ | | The S&P 500® Index delivered double-digit returns in 2014, appreciating 13.69% for the year. This is the fifth time in the last six years that the benchmark has produced double-digit returns, and it is up over 200% since its March 9, 2009 bottom. Unlike the unusual years of 2008 and 2009, when almost all asset classes moved down or up together, 2014 was a more typical year where there was fairly wide dispersion among asset class returns. Small-capitalization stocks, as measured by the Russell 2000® Index, experienced positive returns of 4.89%, but lagged larger company returns for the year after significant outperformance in 2013. The Russell 2000® Growth Index rose 5.60% for the year. |
| ¢ | | While we did not have the technical definition of a correction (10% or more off peak) in the S&P 500® Index during 2014, we did have several sharp, albeit brief, pullbacks. Further, many individual industries and sectors had very meaningful corrections during the year. In particular, biotechnology and technology stocks were hit hard in the spring, and retail stocks suffered greatly during the first quarter due to a brutal winter throughout most of the U.S. Energy stocks fell dramatically with the decline in the price of oil in the second half of the year. |
| ¢ | | Riskier, lower-quality stocks performed better than the overall market in 2014. Specifically, stocks with price-to-earnings ratios greater than 30-times and long-term debt-to-capital ratios greater than 70% performed better than the Russell 2000® Growth Index. |
What factors affected the Series’ performance during its fiscal year?
| ¢ | | From a sector perspective, performance was helped by strong stock selection in the technology, producer durables, and materials & processing sectors, as well as having no exposure to the energy sector. This more than offset some poor stock selection in the consumer staples and consumer discretionary sectors. |
| ¢ | | From an individual stock perspective, the companies that contributed the most to performance were Abaxis and Ellie Mae. Abaxis, a manufacturer of blood diagnostic devices sold through both medical and veterinarian channels, saw its shares drive higher in the past year as the company’s new third-party distributors improved sales after a year of inventory disconnect that led to weaker top-line results. Abaxis’ systems are being adopted in vet clinics and labs, as well as in the human medical market, with retail opportunities such as drug stores being another leg of potential growth. Ellie Mae provides automation software for the mortgage industry in the U.S. The company’s technology solutions help streamline and automate the process of originating and funding new mortgage loans, increasing efficiency, facilitating regulatory compliance, and reducing documentation errors. This past year, the company demonstrated strong revenue growth despite facing 40% year-over-year declines in mortgage volumes. Ellie Mae dramatically grew its user base in the face of a challenging mortgage market by creating meaningful efficiencies and by helping mortgage providers meet increasingly challenging regulatory conditions. The company has also been able to penetrate some of the largest mortgage lenders in the industry, demonstrating the strength of its platform. |
| ¢ | | The companies that contributed the least to performance were Chefs’ Warehouse and Hibbett Sports. Chefs’ Warehouse distributes specialty food products in the U.S. and Canada, focusing on serving the specific needs of chefs who own and operate independent restaurants, fine dining establishments, country clubs, hotels, caterers, culinary schools, and specialty food stores. Sales growth has been robust over the past year, but profit margins have been under pressure due to high beef prices and investments in infrastructure to support future growth opportunities. Hibbett Sports operates sporting goods stores in small to |
| | | mid-sized markets predominantly in the Southeast, Southwest, Mid-Atlantic, and the Midwest. The company’s stores offer a broad assortment of quality athletic equipment, footwear, and apparel. In 2014, Hibbett’s operating results were challenged by sluggish traffic and sales growth in addition to higher investment spending. The company is laying the early foundation for omni-channel expansion, beginning first with being able to save a sale in store when a customer’s size is not available. Management has not yet stated if it will be a full omni-channel retailer, but the incremental investments should improve productivity in stores while making inventory management more efficient. |
The preceding information is the opinion of portfolio management only through the end of the period of the report as stated on the cover. Any such opinions are subject to change at any time based upon market or other conditions and should not be relied upon as investment advice.
The market prices of equity securities may be affected by financial market, industry, or issuer-specific events. Focus on a particular style or on small or medium-sized companies may enhance that risk.
Because the Series’ portfolio has a limited number of securities, it may be more susceptible to factors adversely affecting its securities than a less concentrated portfolio.
Because the Series is presently heavily weighted in the technology sector, it will be impacted by that sector’s performance more than a portfolio with broader sector diversification.
| | | | |
| |
| Asset Allocation | |
| |
The following table presents asset allocations within certain sectors and as a percentage of total investments as of December 31, 2014. | |
Information Technology | | | 31 | % |
Industrials | | | 16 | |
Health Care | | | 13 | |
Financials | | | 12 | |
Consumer Discretionary | | | 12 | |
Consumer Staples | | | 11 | |
Materials | | | 3 | |
Other (includes short-term investments) | | | 2 | |
| | | | | |
Total | | | 100 | % |
| | | | | |
For information regarding the indexes and certain investment terms, see the Key Investment Terms starting on page 2.
19
| | |
| Small-Cap Growth Series (Continued) | | |
| | | | | | | | | | | | | | | | | | | | |
| Average Annual Total Returns1 for periods ended 12/31/14 | | | | | | | | | | |
| | | | | |
| | | 1 year | | | 5 years | | | 10 years | | | Since
Inception | | | Inception
Date | |
| Class A at NAV2 | | | 5.50 | % | | | 16.97 | % | | | 9.00 | % | | | — | | | | — | |
| Class I at NAV2 | | | 5.78 | | | | — | | | | — | | | | 18.91 | % | | | 4/30/13 | |
| S&P 500® Index | | | 13.69 | | | | 15.45 | | | | 7.67 | | | | 18.88 | 4 | | | — | |
| Russell 2000® Growth Index | | | 5.60 | | | | 16.80 | | | | 8.54 | | | | 19.43 | 4 | | | — | |
| Series Expense Ratios3: Class A Gross: 1.38%, Net: 1.19%; Class I Gross: 1.13%, Net: 0.94%. | |
Returns represent past performance which is no guarantee of future results. The investment return and principal value will fluctuate so that an investor’s shares, when redeemed, may be worth more or less than their original cost. Total return does not reflect expenses associated with the separate account such as the administrative fees, account charges and surrender charges, which if reflected, would reduce total return. Performance figures may reflect fee waivers and/or expense reimbursements. In the absence of fee waivers and/or expense reimbursements, the total return would have been lower. Please visit Virtus.com for performance data current to the most recent month-end.
| 1 | Total returns are historical and include changes in share price and the reinvestment of both dividends and capital gains distributions. |
| 2 | “NAV”(Net Asset Value) total returns do not reflect any fees or expenses associated with the separate insurance products. |
| 3 | The expense ratios of the Series, both net and gross, are set forth according to the prospectus for the Series effective April 30, 2014, as supplemented and revised, and may differ from the expense ratios disclosed in the Financial Highlights tables in this report. See the Financial Highlights for more current information. Net Expenses: Expenses reduced by a contractual waiver in effect through April 30, 2016. Gross Expenses: Do not reflect the effect of the contractual waiver. |
| 4 | The since inception index returns are from the inception date of Class I shares. |
Growth of $10,000 For periods ended 12/31
This chart assumes an initial investment of $10,000 made on December 31, 2004 for Class A shares. Returns shown include the reinvestment of all distributions at net asset value, and the change in share price for the stated period.
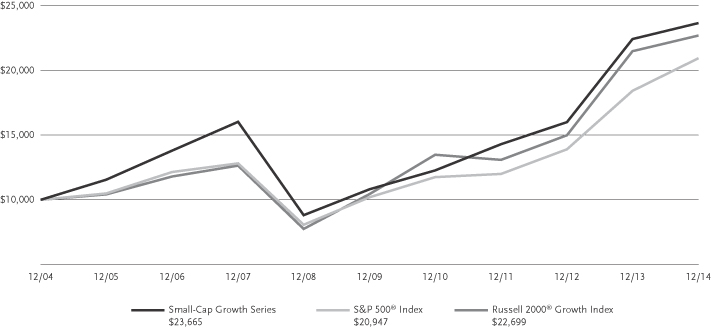
The indexes are unmanaged and not available for direct investment; therefore, their performance does not reflect the expenses associated with active management of an actual portfolio.
For information regarding the indexes and certain investment terms, see the Key Investment Terms starting on page 2.
20
Series Summary December 31, 2014 (Unaudited)
Portfolio Manager Commentary by
Kayne Anderson Rudnick Investment Management, LLC
| ¢ | | The Series is diversified and has an investment objective of long-term capital appreciation. There is no guarantee that the Series will meet its objective. |
| ¢ | | For the fiscal year ended December 31, 2014, the Series’ Class A shares at NAV returned 1.83%. For the same period, the S&P 500® Index, a broad-based equity index, returned 13.69% and the Russell 2000® Value Index, the Series’ style-specific benchmark appropriate for comparison, returned 4.22%. |
All performance figures assume reinvestment of distributions and exclude the effect of fees and expenses associated with the variable life insurance or annuity product through which you invest. Past performance is no guarantee of future results, and current performance may be higher or lower than the performance shown above.
How did the market in which the Series invests perform during the Series’ fiscal year?
| ¢ | | The S&P 500® Index delivered double-digit returns in 2014, appreciating 13.69% for the year. This is the fifth time in the last six years that the benchmark has produced double-digit returns, and it is up over 200% since its March 9, 2009 bottom. Unlike the unusual years of 2008 and 2009, when almost all asset classes went down or up together, 2014 was a more typical year where there was fairly wide dispersion among asset class returns. Small-capitalization stocks, as measured by the Russell 2000® Index, experienced positive returns of 4.89% but lagged larger company returns for the year after significant outperformance in 2013. The Russell 2000® Value Index rose 4.22% for the year. |
| ¢ | | While we did not have the technical definition of a correction (10% or more off peak) in the S&P 500® Index during 2014, we did have several sharp, albeit brief, pullbacks. Further, many individual industries and sectors had very meaningful corrections during the year. In particular, biotechnology and technology stocks were hit hard in the spring, and retail stocks suffered greatly during the first quarter due to a brutal winter throughout most of the U.S. Energy stocks fell dramatically with the decline in the price of oil in the second half of the year. |
| ¢ | | Riskier, lower-quality stocks performed better than the overall market in 2014. Specifically, stocks with price-to-earnings ratios greater than 16-times performed better than the Russell 2000® Value Index. |
What factors affected the Series’ performance during its fiscal year?
| ¢ | | For the year, the Series underperformed the return of the Russell 2000® Value Index. From a sector |
| | | perspective, performance was hurt by poor stock selection in the financial services and consumer discretionary sectors, despite some strong stock selection in the producer durables and materials & processing sectors, and having no exposure to the troubled energy sector. |
| ¢ | | From an individual stock perspective, the companies that contributed the most to performance were Landstar System and WD-40. Truck transportation capacity has steadily declined over the past few years after an extended period of sluggish demand following the 2009 recession and increased regulatory requirements. Landstar, a leading truck brokerage, is now experiencing accelerating revenue and earnings growth as customer demand has strengthened and rail service is challenged, leading to improved freight volume and pricing. WD-40 produces and sells multi-purpose maintenance products around the world under the WD-40 brand name and several other lines of maintenance and cleaning products under different brand names. WD-40 dominates its maintenance product category, has a conservative balance sheet, and consistently generates free cash-flow. Shares of the company increased during the year following strong revenue growth and margin expansion due to operational leverage and reduced input costs. |
| ¢ | | The companies that contributed the least to performance were Interval Leisure Group and Cass Information Systems. Interval Leisure provides members a platform to exchange their timeshare weeks with other members. The company also has a property management business that serves vacation condo owners and developers. In the second quarter of 2014, Interval reported a decline in revenue and margins in its core exchange business due to unfavorable contract renewal terms with several key customers. Interval also announced it was entering the property development business via its acquisition of Hyatt’s vacation ownership business. Following these announcements, the stock sold-off, but the price recovered slightly after strong third quarter results. The expansion of Interval’s business model into timeshare development increases execution risk, and we opted to use the recent recovery in the share price as an opportunity to exit our position. Cass Information Systems is the nation’s oldest and largest provider of freight invoice payment and bill-processing services. Through its wholly-owned bank subsidiary, CCB (Cass Commercial Bank), Cass also provides specialized banking services to privately held companies in St. Louis and to churches throughout the United States. Shares of Cass weakened in early 2014, and declined further driven by a moderating interest rate outlook as well as the |
| | | company’s reports of “mixed” operating results with solid growth in payment and processing fees offset by increased headcount costs. Cass continues to deliver solid transaction volume growth in a challenging economic environment, and CCB’s asset quality remains stellar. The company remains a solid free-cash-flow generator returning excess cash to shareholders in the form of regular cash dividends, opportunistic stock dividends, and share repurchases. With the interest rate environment outlook once again improving, the shares posted solid performance in the fourth quarter of 2014. |
The preceding information is the opinion of portfolio management only through the end of the period of the report as stated on the cover. Any such opinions are subject to change at any time based upon market or other conditions and should not be relied upon as investment advice.
The market prices of equity securities may be affected by financial market, industry, or issuer-specific events. Focus on a particular style or on small or medium-sized companies may enhance that risk.
Because the Series’ portfolio has a limited number of securities, it may be more susceptible to factors adversely affecting its securities than a less concentrated portfolio.
Because the Series is presently heavily weighted in the technology sector, it will be impacted by that sector’s performance more than a portfolio with broader sector diversification.
| | | | |
| |
| Asset Allocation | |
| |
The following table presents asset allocations within certain sectors and as a percentage of total investments as of December 31, 2014. | |
Information Technology | | | 30 | % |
Industrials | | | 21 | |
Financials | | | 20 | |
Consumer Discretionary | | | 10 | |
Consumer Staples | | | 9 | |
Utilities | | | 4 | |
Health Care | | | 3 | |
Other (includes short-term investments) | | | 3 | |
| | | | | |
Total | | | 100 | % |
| | | | | |
For information regarding the indexes and certain investment terms, see the Key Investment Terms starting on page 2.
21
| | |
| Small-Cap Value Series (Continued) | | |
| | | | | | | | | | | | |
| Average Annual Total Returns1 for periods ended 12/31/14 | | | | | | | | | |
| | | |
| | | 1 year | | | 5 years | | | 10 years | |
| Class A at NAV2 | | | 1.83 | % | | | 13.73 | % | | | 5.78 | % |
| S&P 500® Index | | | 13.69 | | | | 15.45 | | | | 7.67 | |
| Russell 2000® Value Index | | | 4.22 | | | | 14.26 | | | | 6.89 | |
| Series Expense Ratios3: Class A Gross: 1.40%, Net: 1.20%. | | | | | | | | | | | | |
Returns represent past performance which is no guarantee of future results. The investment return and principal value will fluctuate so that an investor’s shares, when redeemed, may be worth more or less than their original cost. Total return does not reflect expenses associated with the separate account such as the administrative fees, account charges and surrender charges, which if reflected, would reduce total return. Performance figures may reflect fee waivers and/or expense reimbursements. In the absence of fee waivers and/or expense reimbursements, the total return would have been lower. Please visit Virtus.com for performance data current to the most recent month-end.
| 1 | Total returns are historical and include changes in share price and the reinvestment of both dividends and capital gains distributions. |
| 2 | “NAV” (Net Asset Value) total returns do not reflect any fees or expenses associated with the separate insurance accounts. |
| 3 | The expense ratios of the Series, both net and gross, are set forth according to the prospectus for the Series effective April 30, 2014, as supplemented and revised, and may differ from the expense ratios disclosed in the Financial Highlights tables in this report. See the Financial Highlights for more current information. Net Expenses: Expenses reduced by a contractual waiver in effect through April 30, 2016. Gross Expenses: Do not reflect the effect of the contractual waiver. |
Growth of $10,000 For periods ended 12/31
This chart assumes an initial investment of $10,000 made on December 31, 2004 for Class A shares. Returns shown include the reinvestment of all distributions at net asset value, and the change in share price for the stated period.
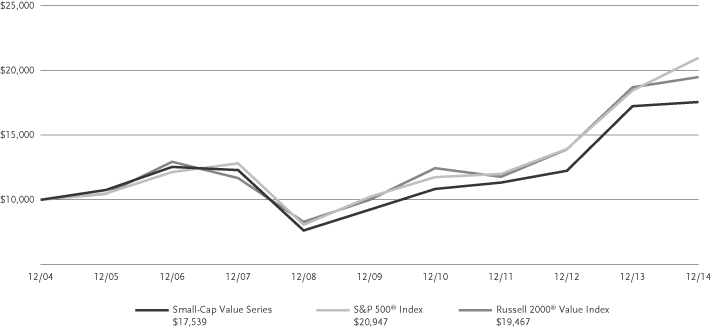
The indexes are unmanaged and not available for direct investment; therefore, their performance does not reflect the expenses associated with active management of an actual portfolio.
For information regarding the indexes and certain investment terms, see the Key Investment Terms starting on page 2.
22
| | |
| Strategic Allocation Series | | |
Series Summary December 31, 2014 (Unaudited)
Portfolio Managers Commentaries by
Euclid Advisors LLC (equity portfolio) and
Newfleet Asset Management, LLC (fixed income portfolio)
| ¢ | | The Series is diversified and has an investment objective of high total return over an extended period of time consistent with prudent investment risk. There is no guarantee that the Series will meet its objective. |
| ¢ | | For the fiscal year ended December 31, 2014, the Series’ Class A shares at NAV returned 7.51%. For the same period, the S&P 500® Index, a broad-based equity index, returned 13.69% and the Barclays U.S. Aggregate Bond Index, a broad-based fixed income index, returned 5.97%. The Composite Index for the Series, the Series’ style-specific benchmark appropriate for comparison, returned 10.62%. |
All performance figures assume reinvestment of distributions and exclude the effect of fees and expenses associated with the variable life insurance or annuity product through which you invest. Past performance is no guarantee of future results, and current performance may be higher or lower than the performance shown above.
How did the markets perform during the Series’ fiscal year?
Equities:
| ¢ | | U.S. equity markets had another strong year, with the S&P 500® Index recording its sixth up year in a row. The Index gained 13.69% (including reinvested dividends) for the year, hitting multiple new all-time highs along the way. Despite several short-lived price drops, the Index closed higher in value in every quarter of 2014, making for eight positive quarters in a row. A violent sell-off in October and brief decline in December were quickly erased, and the Index ended the year just shy of its record close. |
| ¢ | | There were a few other brief pauses in the equity rally during the year, often related to global growth concerns or debate around Federal Reserve policy. Ultimately, the October announcement that the Fed was ending quantitative easing came as little surprise, and U.S. economic data showed accelerating strength. Corporate earnings also continued to grow solidly, and with a stronger dollar and falling energy prices, domestic equities performed well. With low interest rates, non-existent inflation, and an improving jobs picture, stocks had a favorable backdrop to end the year in a strong position. |
Fixed Income:
| ¢ | | Higher beta and foreign-related fixed income spread sectors, such as emerging markets and non-U.S. dollar denominated securities, underperformed U.S. Treasuries during the fiscal year. Plummeting oil prices dominated market volatility and investor concerns in the second half of the fiscal year, especially during the fourth quarter of 2014. Brent crude, the international oil benchmark, fell almost 50% since June to end the year at roughly $57 a barrel. Rising output of U.S. shale producers and OPEC’s persistence in maintaining production quotas caused a supply glut, exacerbated by slowing global demand. Lower oil prices contributed to the U.S. dollar’s continued ascent against other major currencies, as did the safe haven status of U.S. Treasuries, which continued to attract investor assets amidst heightened geopolitical risk, anticipation of Federal Reserve tightening, and weaker global growth. |
| ¢ | | The collapse in oil prices has contributed to the divergence theme that has been playing out between the U.S. and much of the rest of the world. While lower crude prices are viewed as a net stimulus to the U.S. economy via increased consumer spending, the deflationary effects within the stagnating eurozone economies increase the probability that the European Central Bank will expand its bond purchase program in early 2015. Other central banks (e.g., in Japan and China) already have eased credit conditions in response to slow global growth. |
| ¢ | | Economic growth in the U.S. continued to gain momentum. Toward the end of the fiscal year, the Fed ended the third round of quantitative easing, and in December it tempered the “considerable time” language in its policy statement to “patience” in reference to the anticipated timing of the first interest rate increase since 2006. |
| ¢ | | Over the 12 months, yields increased on the short end of the U.S. Treasury curve and decreased on the long end, and overall the curve flattened. |
What factors affected the Series’ performance during its fiscal year?
Equities:
| ¢ | | During 2014, the Series was invested in many non-commodity cyclical segments, such as industrials (specifically transports), consumer discretionary, |
| | | and financials. The Series started the year with many energy stocks, which worked well for the first half of the year, but as oil prices declined, returns were hurt. The Series ended the year with a less than market weight in energy-related stocks, which helped mitigate extended losses, but the energy exposure was a drag on performance for the year. |
| ¢ | | At year-end, the Series’ equity allocation continues to be weighted toward more economically sensitive areas of the market, although with the recent exit from several energy names, the weighting was reduced. Declining growth outside the U.S. has hurt cyclical stocks relative to defensive names. Cyclical companies, and industrials in particular, tend to rely more heavily on foreign sales than defensive companies. In addition, many defensive names tend to pay higher dividends, and stubbornly low global yields have pushed many investors toward areas such as utilities and consumer staples. While the market continues to stretch for new highs and recent growth implies improvement in economically sensitive sectors, the performance of cyclical stocks since late July has been dramatically outstripped by more defensive segments. Recent purchases have focused more on companies that derive a greater percentage of their earnings from the U.S., but the overall positioning is for the eventual reversal in price action from defensive stocks back to cyclical. |
| ¢ | | Energy was the worst-performing sector in 2014 and continues to be since the market lows in October. This is not surprising with the price of crude oil bumping at new four-year lows virtually every day. Although it is impossible to predict where oil prices will stabilize, it appears the combination of weak non-U.S. economic growth, increased supply in North America, and Saudi Arabia’s desire to squeeze high-cost producers in the short run by pushing prices lower, could limit upside in the energy group. The incredibly negative sentiment towards the sector will likely be opportunity for investment, but crude oil prices need to stabilize for a broad-based rally in energy issuers. |
| ¢ | | The Series’ equity allocation remains significantly exposed to consumer discretionary stocks while very light in consumer staples offerings. With the fourth quarter volatility in equities and the turmoil in other markets, this stance proved to be challenging. As noted above, consumer staples stocks are considered more defensive, and tend to |
For information regarding the indexes and certain investment terms, see the Key Investment Terms starting on page 2.
23
| | |
| Strategic Allocation Series (Continued) | | |
Series Summary December 31, 2014 (Unaudited)
Portfolio Managers Commentaries by
Euclid Advisors LLC (equity portfolio) and
Newfleet Asset Management, LLC (fixed income portfolio)
| | | outperform consumer discretionary stocks during periods of volatility. With the plunge in oil prices and commensurate price relief at the pump, there are reasons to be optimistic about consumer spending and retail earnings for the fourth quarter and beyond. The Series increased holdings within travel and leisure in the fourth quarter, anticipating that lower energy costs could lead to a busy winter travel season for consumers. This worked well into year-end for the returns. |
| ¢ | | The Series is also favorably positioned in the industrials sector. The holdings have shifted to a somewhat more domestically focused bias, although most companies within this space do have some exposure to non-U.S. sales. However, our holdings in airlines and rails are less exposed to non-U.S. sales than most industrial conglomerates, and these have been good holdings for the Series. |
| ¢ | | The Series’ equity allocation remains well diversified across both the technology and health care sectors. Information technology is once again the largest sector within the S&P 500® Index, representing nearly 20% of the market capitalization of the Index, and was among the portfolio’s largest sector weightings throughout the year. The combination of strong balance sheets and innovation propelled the tech sector to 20% returns in the year, and the semiconductor holdings were particularly strong for the Series. Health care stocks were pushed higher during 2014 by strong drug pipelines and merger activity in the sector. Biotechnology led the way, but several other themes such as hospitals and device makers also made solid contributions. An improving jobs picture and the Affordable Care Act mean more people have insurance, which is a benefit to all of these health care sub-groups. Given the Series’ modest holdings in defensive areas, such as utilities and consumer staples stocks, both tech and health care have provided the portfolio with holdings that are less dependent on global economic growth and also offer a compelling growth-to-valuation trade-off. |
Fixed Income:
| ¢ | | The underperformance of higher beta and foreign-related fixed income spread sectors relative to U.S. Treasuries was the key driver of the Series’ fixed income allocation’s underperformance for the fiscal year. |
| ¢ | | During the fiscal year the Series’ allocations to the non-U.S. dollar and emerging markets sectors detracted from performance. |
| ¢ | | The Series’ allocations to the agency mortgage-backed securities, corporate high quality, and taxable municipal bond sectors were positive contributors to performance for the year. Issue selection within the asset-backed securities sector also positively contributed to performance. |
The preceding information is the opinion of portfolio management only through the end of the period of the report as stated on the cover. Any such opinions are subject to change at any time based upon market or other conditions and should not be relied upon as investment advice, and there is no guarantee that market forecasts will be realized.
The market prices of equity securities may be affected by financial market, industry, or issuer-specific events. Focus on a particular style or on small or medium-sized companies may enhance that risk.
Debt securities are subject to various risks, the most prominent of which are credit and interest rate risk. The issuer of a security may fail to make payments in a timely manner. Values of debt securities may rise and fall in response to changes in interest rates. This risk may be enhanced with longer-term maturities. Changes in interest rates can cause both extension and prepayment risks for asset and mortgage-backed securities. These securities are also subject to risks associated with the repayment of underlying collateral. There is a greater level of credit risk and price volatility involved with high-yield securities than investment grade securities.
Investing internationally, especially in emerging markets, involves additional risks such as currency, political, accounting, economic, and market risk.
There may be no ready market for loan participation interests. The Series may have to sell the interests at a substantial discount. Such interests are subject to the credit risk of the underlying corporate borrower.
| | | | | | | | |
| |
| Asset Allocation | |
| |
The following table presents asset allocations within certain sectors and as a percentage of total investments as of December 31, 2014. | |
Common Stocks | | | | | | | 59 | % |
Consumer Discretionary | | | 12 | % | | | | |
Information Technology | | | 11 | | | | | |
Financials | | | 10 | | | | | |
Total of all other common stock sectors | | | 26 | | | | | |
Corporate Bonds | | | | | | | 19 | |
Financials | | | 10 | | | | | |
Industrials | | | 2 | | | | | |
Energy | | | 2 | | | | | |
Total of all other corporate bond sectors | | | 5 | | | | | |
Mortgage-Backed Securities | | | | | | | 13 | |
Asset-Backed Securities | | | | | | | 2 | |
Municipal Bonds | | | | | | | 2 | |
U.S. Government Securities | | | | | | | 1 | |
Foreign Government Securities | | | | | | | 1 | |
Loan Agreements | | | | | | | 1 | |
Other (includes short-term investments) | | | | | | | 2 | |
| | | | | | | | | |
Total | | | | | | | 100 | % |
| | | | | | | | | |
For information regarding the indexes and certain investment terms, see the Key Investment Terms starting on page 2.
24
| | |
| Strategic Allocation Series (Continued) | | |
| | | | | | | | | | | | |
| Average Annual Total Returns1 for periods ended 12/31/14 | | | | | | | | | |
| | | |
| | | 1 year | | | 5 years | | | 10 years | |
| Class A at NAV2 | | | 7.51 | % | | | 10.67 | % | | | 6.48 | % |
| S&P 500® Index | | | 13.69 | | | | 15.45 | | | | 7.67 | |
| Barclays U.S. Aggregate Bond Index | | | 5.97 | | | | 4.45 | | | | 4.71 | |
| Composite Index for Strategic Allocation Series | | | 10.62 | | | | 11.18 | | | | 6.77 | |
| Series Expense Ratios3: Class A Gross: 1.11%, Net: 0.98%. | | | | | | | | | | | | |
Returns represent past performance which is no guarantee of future results. The investment return and principal value will fluctuate so that an investor’s shares, when redeemed, may be worth more or less than their original cost. Total return does not reflect expenses associated with the separate account such as the administrative fees, account charges and surrender charges, which if reflected, would reduce total return. Performance figures may reflect fee waivers and/or expense reimbursements. In the absence of fee waivers and/or expense reimbursements, the total return would have been lower. Please visit Virtus.com for performance data current to the most recent month-end.
| 1 | Total returns are historical and include changes in share price and the reinvestment of both dividends and capital gains distributions. |
| 2 | “NAV” (Net Asset Value) total returns do not reflect any fees or expenses associated with separate insurance accounts. |
| 3 | The expense ratios of the Series, both net and gross, are set forth according to the prospectus for the Series effective April 30, 2014, as supplemented and revised, and may differ from the expense ratios disclosed in the Financial Highlights tables in this report. See the Financial Highlights for more current information. Net Expenses: Expenses reduced by a contractual waiver in effect through April 30, 2016. Gross Expenses: Do not reflect the effect of the contractual waiver. |
Growth of $10,000 For periods ended 12/31
This chart assumes an initial investment of $10,000 made on December 31, 2004 for Class A shares. Returns shown include the reinvestment of all distributions at net asset value, and the change in share price for the stated period.
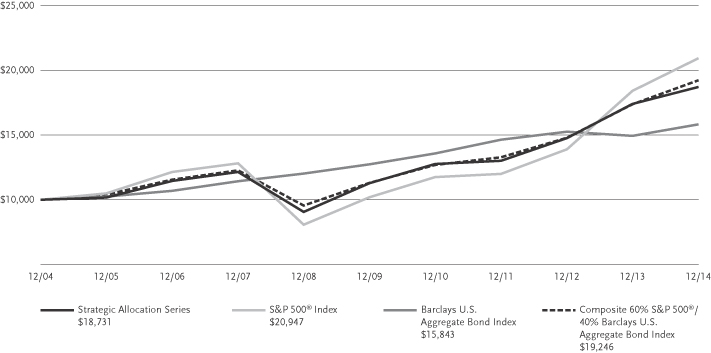
The indexes are unmanaged and not available for direct investment; therefore, their performance does not reflect the expenses associated with active management of an actual portfolio.
For information regarding the indexes and certain investment terms, see the Key Investment Terms starting on page 2.
25
VIRTUS CAPITAL GROWTH SERIES
SCHEDULE OF INVESTMENTS
DECEMBER 31, 2014
($ reported in thousands)
| | | | | | | | |
| | | SHARES | | | VALUE | |
| | | | | | | | |
| COMMON STOCKS—99.5% | |
|
| Consumer Discretionary—19.0% | |
Home Depot, Inc. (The) | | | 53,620 | | | $ | 5,629 | |
Las Vegas Sands Corp. | | | 63,740 | | | | 3,707 | |
NIKE, Inc. Class B | | | 91,660 | | | | 8,813 | |
Priceline Group, Inc. (The)(2) | | | 4,280 | | | | 4,880 | |
Ross Stores, Inc. | | | 58,870 | | | | 5,549 | |
Starbucks Corp. | | | 77,330 | | | | 6,345 | |
Time Warner, Inc. | | | 37,180 | | | | 3,176 | |
TripAdvisor, Inc.(2) | | | 43,100 | | | | 3,218 | |
| | | | | | | | |
| | | | | | | 41,317 | |
| | | | | | | | |
|
| Consumer Staples—10.8% | |
Colgate-Palmolive Co. | | | 64,230 | | | | 4,444 | |
Costco Wholesale Corp. | | | 31,597 | | | | 4,479 | |
Estee Lauder Cos., Inc. (The) Class A | | | 34,150 | | | | 2,602 | |
Mead Johnson Nutrition Co. | | | 42,200 | | | | 4,243 | |
Monster Beverage Corp.(2) | | | 69,771 | | | | 7,560 | |
| | | | | | | | |
| | | | | | | 23,328 | |
| | | | | | | | |
|
| Energy—2.5% | |
Core Laboratories N.V. | | | 14,620 | | | | 1,759 | |
Schlumberger Ltd. | | | 42,150 | | | | 3,600 | |
| | | | | | | | |
| | | | | | | 5,359 | |
| | | | | | | | |
|
| Financials—2.9% | |
Charles Schwab Corp. (The) | | | 98,880 | | | | 2,985 | |
T. Rowe Price Group, Inc. | | | 39,200 | | | | 3,366 | |
| | | | | | | | |
| | | | | | | 6,351 | |
| | | | | | | | |
|
| Health Care—16.0% | |
Amgen, Inc. | | | 13,090 | | | | 2,085 | |
Bristol-Myers Squibb Co. | | | 35,720 | | | | 2,109 | |
Celgene Corp.(2) | | | 40,830 | | | | 4,567 | |
Cerner Corp.(2) | | | 74,174 | | | | 4,796 | |
Gilead Sciences, Inc.(2) | | | 68,390 | | | | 6,446 | |
Intuitive Surgical, Inc.(2) | | | 6,480 | | | | 3,428 | |
Medidata Solutions, Inc.(2) | | | 67,080 | | | | 3,203 | |
Perrigo Co. plc | | | 24,770 | | | | 4,141 | |
Zoetis, Inc. | | | 92,960 | | | | 4,000 | |
| | | | | | | | |
| | | | | | | 34,775 | |
| | | | | | | | |
|
| Industrials—8.3% | |
Canadian Pacific Railway Ltd. | | | 9,770 | | | | 1,883 | |
Danaher Corp. | | | 51,490 | | | | 4,413 | |
Fastenal Co. | | | 39,084 | | | | 1,859 | |
Roper Industries, Inc. | | | 29,650 | | | | 4,636 | |
Towers Watson & Co. Class A | | | 46,180 | | | | 5,226 | |
| | | | | | | | |
| | | | | | | 18,017 | |
| | | | | | | | |
|
| Information Technology—36.4% | |
Accenture plc Class A | | | 36,500 | | | | 3,260 | |
Amphenol Corp. Class A | | | 109,480 | | | | 5,891 | |
ANSYS, Inc.(2) | | | 57,330 | | | | 4,701 | |
Apple, Inc. | | | 147,620 | | | | 16,294 | |
Applied Materials, Inc. | | | 258,760 | | | | 6,448 | |
Baidu, Inc. Sponsored ADR(2) | | | 27,440 | | | | 6,255 | |
CoStar Group, Inc.(2) | | | 20,803 | | | | 3,820 | |
Facebook, Inc. Class A(2) | | | 178,570 | | | | 13,932 | |
| | | | | | | | |
| | | SHARES | | | VALUE | |
| | | | | | | | |
| Information Technology—continued | |
Fleetmatics Group plc(2) | | | 106,990 | | | $ | 3,797 | |
Tableau Software, Inc. Class A(2) | | | 43,530 | | | | 3,690 | |
Visa, Inc. Class A | | | 26,990 | | | | 7,077 | |
Workday, Inc.(2) | | | 48,030 | | | | 3,920 | |
| | | | | | | | |
| | | | | | | 79,085 | |
| | | | | | | | |
|
| Materials—3.6% | |
Ecolab, Inc. | | | 37,890 | | | | 3,960 | |
Praxair, Inc. | | | 29,780 | | | | 3,858 | |
| | | | | | | | |
| | | | | | | | 7,818 | |
TOTAL COMMON STOCKS
(Identified Cost $140,818) | | | | 216,050 | |
| TOTAL LONG TERM INVESTMENTS—99.5% | |
| (Identified Cost $140,818) | | | | | | | 216,050 | |
|
| SHORT-TERM INVESTMENTS—0.6% | |
|
| Money Market Mutual Fund—0.6% | |
Fidelity Money Market Portfolio – Institutional
Shares (seven-day effective yield 0.110%) | | | 1,312,499 | | | | 1,312 | |
TOTAL SHORT-TERM INVESTMENTS
(Identified Cost $1,312) | | | | 1,312 | |
TOTAL INVESTMENTS—100.1%
(Identified Cost $142,130) | | | | 217,362 | (1) |
Other assets and liabilities, net—(0.1)% | | | | (324 | ) |
| | | | | | | | |
| NET ASSETS—100.0% | | | | | | $ | 217,038 | |
| | | | | | | | |
Abbreviation:
| ADR | American Depositary Receipt |
Footnote Legend:
| (1) | Federal Income Tax Information: For tax information at December 31, 2014, see Note 10 Federal Income Tax Information in the Notes to Financial Statements. |
| | | | |
| Country Weightings (unaudited)† | | | |
United States | | | 96 | % |
China | | | 3 | |
Canada | | | 1 | |
Total | | | 100 | % |
† % of total investments as of December 31, 2014 | |
The following table provides a summary of inputs used to value the Series’ investments as of December 31, 2014 (See Security Valuation Note 2A in the Notes to Financial Statements):
| | | | | | | | |
| | | Total
Value at
December 31,
2014 | | | Level 1
Quoted
Prices | |
Equity Securities: | | | | | | | | |
Common Stocks | | $ | 216,050 | | | $ | 216,050 | |
Short-Term Investments | | | 1,312 | | | | 1,312 | |
| | | | | | | | |
Total Investments | | $ | 217,362 | | | $ | 217,362 | |
| | | | | | | | |
There are no Level 2 (significant observable inputs) or Level 3 (significant unobservable inputs) priced securities.
There were no transfers between Level 1 and Level 2 related to securities held at December 31, 2014.
See Notes to Financial Statements
26
VIRTUS GROWTH & INCOME SERIES
SCHEDULE OF INVESTMENTS
DECEMBER 31, 2014
($ reported in thousands)
| | | | | | | | |
| | | SHARES | | | VALUE | |
| COMMON STOCKS—98.4% | |
|
| Consumer Discretionary—20.1% | |
American Eagle Outfitters, Inc. | | | 199,000 | | | $ | 2,762 | |
Best Buy Co., Inc. | | | 72,000 | | | | 2,806 | |
Ford Motor Co. | | | 190,000 | | | | 2,945 | |
Goodyear Tire & Rubber
Co. (The) | | | 98,000 | | | | 2,800 | |
Lear Corp. | | | 29,000 | | | | 2,844 | |
Macy’s, Inc. | | | 43,000 | | | | 2,827 | |
Michael Kors Holdings Ltd.(2) | | | 35,000 | | | | 2,628 | |
Royal Caribbean Cruises Ltd. | | | 34,000 | | | | 2,803 | |
Time Warner, Inc. | | | 33,000 | | | | 2,819 | |
Viacom, Inc. Class B | | | 36,000 | | | | 2,709 | |
| | | | | | | | |
| | | | | | | 27,943 | |
| | | | | | | | |
|
| Consumer Staples—4.1% | |
Archer-Daniels-Midland
Co. (The) | | | 54,000 | | | | 2,808 | |
PepsiCo, Inc. | | | 31,000 | | | | 2,931 | |
| | | | | | | | |
| | | | | | | 5,739 | |
| | | | | | | | |
|
| Energy—6.9% | |
Continental Resources, Inc.(2) | | | 74,000 | | | | 2,839 | |
Helmerich & Payne, Inc. | | | 32,000 | | | | 2,158 | |
Schlumberger Ltd. | | | 23,000 | | | | 1,964 | |
Valero Energy Corp. | | | 54,000 | | | | 2,673 | |
| | | | | | | | |
| | | | | | | 9,634 | |
| | | | | | | | |
|
| Financials—16.2% | |
Aflac, Inc. | | | 35,000 | | | | 2,138 | |
BB&T Corp. | | | 72,000 | | | | 2,800 | |
BlackRock, Inc. | | | 7,900 | | | | 2,825 | |
Blackstone Group LP (The) | | | 84,000 | | | | 2,842 | |
Goldman Sachs Group, Inc. (The) | | | 16,000 | | | | 3,101 | |
JPMorgan Chase & Co. | | | 48,000 | | | | 3,004 | |
Lincoln National Corp. | | | 53,000 | | | | 3,056 | |
T. Rowe Price Group, Inc. | | | 32,000 | | | | 2,748 | |
| | | | | | | | |
| | | | | | | 22,514 | |
| | | | | | | | |
|
| Health Care—12.1% | |
Abbott Laboratories | | | 61,000 | | | | 2,746 | |
Biogen Idec, Inc.(2) | | | 8,300 | | | | 2,817 | |
HCA Holdings, Inc.(2) | | | 38,000 | | | | 2,789 | |
St. Jude Medical, Inc. | | | 41,000 | | | | 2,666 | |
UnitedHealth Group, Inc. | | | 30,000 | | | | 3,033 | |
Zimmer Holdings, Inc. | | | 25,000 | | | | 2,836 | |
| | | | | | | | |
| | | | | | | 16,887 | |
| | | | | | | | |
|
| Industrials—16.4% | |
Alaska Air Group, Inc. | | | 50,000 | | | | 2,988 | |
Cummins, Inc. | | | 19,000 | | | | 2,739 | |
FedEx Corp. | | | 16,000 | | | | 2,779 | |
L-3 Communications Holdings, Inc. | | | 22,000 | | | | 2,777 | |
Parker Hannifin Corp. | | | 22,000 | | | | 2,837 | |
Southwest Airlines Co. | | | 70,000 | | | | 2,962 | |
Trinity Industries, Inc. | | | 100,000 | | | | 2,801 | |
Union Pacific Corp. | | | 24,000 | | | | 2,859 | |
| | | | | | | | |
| | | | | | | 22,742 | |
| | | | | | | | |
| | | | | | | | |
| | | SHARES | | | VALUE | |
| Information Technology—18.7% | |
Apple, Inc. | | | 25,000 | | | $ | 2,759 | |
EMC Corp. | | | 97,000 | | | | 2,885 | |
Facebook, Inc. Class A(2) | | | 39,000 | | | | 3,043 | |
Google, Inc. Class A(2) | | | 2,000 | | | | 1,061 | |
Google, Inc. Class C(2) | | | 3,400 | | | | 1,790 | |
Intel Corp. | | | 77,000 | | | | 2,794 | |
MasterCard, Inc. Class A | | | 33,000 | | | | 2,843 | |
NetApp, Inc. | | | 68,000 | | | | 2,819 | |
QUALCOMM, Inc. | | | 40,000 | | | | 2,973 | |
Western Digital Corp. | | | 27,000 | | | | 2,989 | |
| | | | | | | | |
| | | | | | | 25,956 | |
| | | | | | | | |
|
| Materials—2.0% | |
CF Industries Holdings, Inc. | | | 10,300 | | | | 2,807 | |
| | | | | | | | |
|
| Telecommunication Services—1.9% | |
Verizon Communications, Inc. | | | 57,000 | | | | 2,667 | |
TOTAL COMMON STOCKS
(Identified Cost $94,723) | | | | 136,889 | |
|
| EXCHANGE-TRADED FUND—1.5% | |
iShares Nasdaq Biotechnology Index Fund | | | 6,900 | | | | 2,093 | |
TOTAL EXCHANGE-TRADED FUND
(Identified Cost $1,863) | | | | 2,093 | |
| TOTAL LONG TERM INVESTMENTS—99.9% | |
| (Identified Cost $96,586) | | | | 138,982 | |
|
| SHORT-TERM INVESTMENTS—0.2% | |
|
| Money Market Mutual Fund—0.2% | |
Fidelity Money Market Portfolio – Institutional Shares (seven-day effective yield 0.110%) | | | 303,838 | | | | 304 | |
| TOTAL SHORT-TERM INVESTMENTS | | | | | |
| (Identified Cost $304) | | | | 304 | |
| TOTAL INVESTMENTS—100.1% | |
| (Identified Cost $96,890) | | | | 139,286 | (1) |
Other assets and liabilities, net—(0.1)% | | | | (164 | ) |
| | | | | | | | |
| NET ASSETS—100.0% | | | $ | 139,122 | |
| | | | | | | | |
Footnote Legend:
| (1) | Federal Income Tax Information: For tax information at December 31, 2014, see Note 10 Federal Income Tax Information in the Notes to Financial Statements. |
The following table provides a summary of inputs used to value the Series’ investments as of December 31, 2014 (See Security Valuation Note 2A in the Notes to Financial Statements):
| | | | | | | | |
| | | Total
Value at
December 31, 2014 | | | Level 1
Quoted
Prices | |
Equity Securities: | | | | | | | | |
Common Stocks | | $ | 136,889 | | | $ | 136,889 | |
Exchange-Traded Fund | | | 2,093 | | | | 2,093 | |
Short-Term Investments | | | 304 | | | | 304 | |
| | | | | | | | |
Total Investments | | $ | 139,286 | | | $ | 139,286 | |
| | | | | | | | |
There are no Level 2 (significant observable inputs) or Level 3 (significant unobservable inputs) priced securities.
There were no transfers between Level 1 and Level 2 related to securities held at December 31, 2014.
See Notes to Financial Statements
27
VIRTUS INTERNATIONAL SERIES
SCHEDULE OF INVESTMENTS
DECEMBER 31, 2014
($ reported in thousands)
| | | | | | | | |
| | | SHARES | | | VALUE | |
| PREFERRED STOCKS—9.3% | |
|
| Financials—2.9% | |
Banco Bradesco S.A. Sponsored ADR 0.69% (Brazil) | | | 576,732 | | | $ | 7,711 | |
| | | | | | | | |
|
| Information Technology—3.6% | |
Samsung Electronics Co., Ltd. 1.66% (South Korea) | | | 10,000 | | | | 9,406 | |
| | | | | | | | |
|
| Materials—2.8% | |
Vale S.A. ADR 3.0% (Brazil) | | | 1,008,940 | | | | 7,325 | |
TOTAL PREFERRED STOCKS
(Identified Cost $23,316) | | | | 24,442 | |
|
| COMMON STOCKS—88.6% | |
|
| Consumer Staples—14.4% | |
British American Tobacco plc (United Kingdom) | | | 181,300 | | | | 9,825 | |
Casino Guichard Perrachon S.A. (France) | | | 57,400 | | | | 5,279 | |
Fomento Economico Mexicano S.A.B. de C.V. Sponsored ADR (Mexico)(2) | | | 74,200 | | | | 6,532 | |
Japan Tobacco, Inc. (Japan) | | | 226,400 | | | | 6,231 | |
Nestle S.A. Registered Shares (Switzerland) | | | 135,000 | | | | 9,841 | |
| | | | | | | | |
| | | | | | | 37,708 | |
| | | | | | | | |
|
| Energy—8.6% | |
ENI SpA (Italy) | | | 294,337 | | | | 5,156 | |
John Wood Group plc (United Kingdom) | | | 355,800 | | | | 3,291 | |
Royal Dutch Shell plc
B Shares (United Kingdom) | | | 234,900 | | | | 8,116 | |
Tenaris S.A. Sponsored ADR (Italy) | | | 193,800 | | | | 5,855 | |
| | | | | | | | |
| | | | | | | 22,418 | |
| | | | | | | | |
|
| Financials—18.9% | |
AIA Group Ltd. (Hong Kong) | | | 1,126,400 | | | | 6,213 | |
City Developments Ltd. (Singapore) | | | 485,000 | | | | 3,742 | |
Daito Trust Construction Co., Ltd. (Japan) | | | 24,900 | | | | 2,825 | |
Experian plc
(United Kingdom) | | | 269,000 | | | | 4,534 | |
HSBC Holdings plc (United Kingdom) | | | 622,900 | | | | 5,886 | |
Nordea Bank AB (Sweden) | | | 323,700 | | | | 3,747 | |
Oversea-Chinese Banking Corp., Ltd. (Singapore) | | | 634,871 | | | | 4,995 | |
Standard Chartered plc (United Kingdom) | | | 358,559 | | | | 5,363 | |
Swire Pacific Ltd. Class B (Hong Kong) | | | 1,405,000 | | | | 3,343 | |
Zurich Financial Services AG (Switzerland) | | | 28,000 | | | | 8,750 | |
| | | | | | | | |
| | | | | | | 49,398 | |
| | | | | | | | |
|
| Health Care—8.8% | |
Novartis AG Registered Shares (Switzerland) | | | 125,900 | | | | 11,676 | |
| | | | | | | | |
| | | SHARES | | | VALUE | |
| Health Care—continued | |
Roche Holding AG (Switzerland) | | | 42,300 | | | $ | 11,461 | |
| | | | | | | | |
| | | | | | | 23,137 | |
| | | | | | | | |
|
| Industrials—14.1% | |
Atlas Copco AB Class A (Sweden) | | | 204,260 | | | | 5,684 | |
Canadian National Railway Co. (Canada) | | | 81,400 | | | | 5,607 | |
FANUC Corp. (Japan) | | | 38,700 | | | | 6,381 | |
Jardine Matheson Holdings Ltd. (Hong Kong) | | | 80,000 | | | | 4,876 | |
Rolls-Royce Holdings plc C Shares (United Kingdom)(2) | | | 15,993,000 | | | | 25 | |
Rolls-Royce Holdings plc (United Kingdom) | | | 302,022 | | | | 4,057 | |
Schindler Holding AG (Switzerland) | | | 23,600 | | | | 3,407 | |
Schneider Electric SE (France) | | | 37,400 | | | | 2,724 | |
Weir Group plc (The) (United Kingdom) | | | 141,600 | | | | 4,060 | |
| | | | | | | | |
| | | | | | | 36,821 | |
| | | | | | | | |
|
| Information Technology—5.5% | |
Taiwan Semiconductors Manufacturing Co., Ltd. Sponsored ADR (Taiwan) | | | 449,500 | | | | 10,060 | |
Telefonaktiebolaget LM Ericsson Class B (Sweden) | | | 361,200 | | | | 4,374 | |
| | | | | | | | |
| | | | | | | 14,434 | |
| | | | | | | | |
|
| Materials—9.3% | |
BHP Billiton plc (United Kingdom) | | | 248,700 | | | | 5,330 | |
Linde AG (Germany) | | | 23,500 | | | | 4,329 | |
Potash Corp. of Saskatchewan, Inc. (Canada) | | | 176,500 | | | | 6,239 | |
Shin-Etsu Chemical Co., Ltd. (Japan) | | | 128,400 | | | | 8,359 | |
| | | | | | | | |
| | | | | | | 24,257 | |
| | | | | | | | |
|
| Telecommunication Services—6.3% | |
MTN Group Ltd. (South Africa) | | | 241,600 | | | | 4,596 | |
Singapore Telecommunications Ltd. (Singapore) | | | 1,964,000 | | | | 5,765 | |
TELUS Corp. (Canada) | | | 82,700 | | | | 2,982 | |
Vodafone Group plc (United Kingdom) | | | 908,161 | | | | 3,113 | |
| | | | | | | | |
| | | | | | | 16,456 | |
| | | | | | | | |
|
| Utilities—2.7% | |
Centrica plc (United Kingdom) | | | 837,100 | | | | 3,626 | |
GDF Suez (France) | | | 142,800 | | | | 3,330 | |
| | | | | | | | |
| | | | | | | | 6,956 | |
TOTAL COMMON STOCKS
(Identified Cost $162,260) | | | | 231,585 | |
| TOTAL LONG TERM INVESTMENTS—97.9% | |
| (Identified Cost $185,576) | | | | 256,027 | |
| | | | | | | | |
| | | SHARES | | | VALUE | |
| SHORT-TERM INVESTMENTS—1.7% | |
|
| Money Market Mutual Fund—1.7% | |
Fidelity Money Market Portfolio – Institutional Shares (seven-day effective yield 0.110%) | | | 4,366,493 | | | $ | 4,366 | |
| TOTAL SHORT-TERM INVESTMENTS (Identified Cost $4,366) | | | | 4,366 | |
| TOTAL INVESTMENTS—99.6% (Identified Cost $189,942) | | | | 260,393 | (1) |
Other assets and liabilities, net—0.4% | | | | 985 | |
| | | | | | | | |
| NET ASSETS—100.0% | | | | | | $ | 261,378 | |
| | | | | | | | |
Abbreviation:
| ADR | American Depositary Receipt |
Footnote Legend:
| (1) | Federal Income Tax Information: For tax information at December 31, 2014, see Note 10 Federal Income Tax Information in the Notes to Financial Statements. |
| (2) | Non-income producing. |
| | | | |
| Country Weightings (unaudited)† | |
United Kingdom | | | 22 | % |
Switzerland | | | 17 | |
Japan | | | 9 | |
Brazil | | | 6 | |
Canada | | | 6 | |
Singapore | | | 6 | |
Hong Kong | | | 5 | |
Other | | | 29 | |
Total | | | 100 | % |
† % of total investments as of December 31, 2014 | |
See Notes to Financial Statements
28
VIRTUS INTERNATIONAL SERIES
SCHEDULE OF INVESTMENTS (Continued)
DECEMBER 31, 2014
($ reported in thousands)
The following table provides a summary of inputs used to value the Series’ investments as of December 31, 2014 (See Security Valuation Note 2A in the Notes to Financial Statements):
| | | | | | | | | | | | |
| | | Total
Value at
December 31, 2014 | | | Level 1
Quoted
Prices | | | Level 2
Significant
Observable
Inputs | |
Equity Securities: | | | | | | | | | | | | |
Common Stocks | | $ | 231,585 | | | $ | 42,150 | | | $ | 189,435 | |
Preferred Stocks | | | 24,442 | | | | 24,442 | | | | — | |
Short-Term Investments | | | 4,366 | | | | 4,366 | | |
| —
|
|
| | | | | | | | | | | | |
Total Investments | | $ | 260,393 | | | $ | 70,958 | | | $ | 189,435 | |
| | | | | | | | | | | | |
Securities held by the Series with an end of period value of $177,704 were transferred from Level 1 to Level 2 based on our valuation procedures for non-US securities (See Note 2A in the Notes to Financial Statements).
There are no Level 3 (significant unobservable inputs) priced securities.
See Notes to Financial Statements
29
VIRTUS MULTI-SECTOR FIXED INCOME SERIES
SCHEDULE OF INVESTMENTS
DECEMBER 31, 2014
($ reported in thousands)
| | | | | | | | |
| | | PAR
VALUE | | | VALUE | |
| MUNICIPAL BONDS—1.2% | |
|
| California—0.7% | |
Alameda Corridor Transportation Authority
Series 99 – C, Taxable (NATL Insured)
6.600%, 10/1/29 | | $ | 875 | | | $ | 1,036 | |
| | | | | | | | |
|
| Michigan—0.1% | |
Tobacco Settlement Finance Authority Taxable
Series 06-A,
7.309%, 6/1/34 | | | 200 | | | | 173 | |
| | | | | | | | |
|
| Texas—0.1% | |
City of Houston Airport System Revenue United Airlines, Inc., Terminal E Project
4.750%, 7/1/24 | | | 100 | | | | 108 | |
| | | | | | | | |
|
| Virginia—0.3% | |
Tobacco Settlement Financing Corp.
Series A-1, Taxable
6.706%, 6/1/46 | | | 655 | | | | 492 | |
TOTAL MUNICIPAL BONDS
(Identified Cost $1,786) | | | | 1,809 | |
|
| FOREIGN GOVERNMENT SECURITIES—7.3% | |
Argentine Republic | | | | | |
Series X,
7.000%, 4/17/17 | | | 280 | | | | 270 | |
8.750%, 5/7/24 | | | 100 | | | | 98 | |
Series NY,
8.280%, 12/31/33(12) | | | 562 | | | | 504 | |
Bolivarian Republic of Venezuela | | | | | | | | |
RegS 7.000%, 12/1/18(4) | | | 220 | | | | 101 | |
7.650%, 4/21/25 | | | 825 | | | | 354 | |
9.250%, 9/15/27 | | | 470 | | | | 219 | |
9.375%, 1/13/34 | | | 750 | | | | 329 | |
Federative Republic of Brazil
8.500%, 1/5/24 | | | 2,770 | BRL | | | 956 | |
Kingdom of Morocco 144A
4.250%, 12/11/22(3) | | | 505 | | | | 511 | |
Mongolia 144A
5.125%, 12/5/22(3) | | | 340 | | | | 296 | |
Provincia de Neuquen, Argentina 144A
7.875%, 4/26/21(3) | | | 378 | | | | 374 | |
Republic of Chile
5.500%, 8/5/20 | | | 231,500 | CLP | | | 401 | |
Republic of Colombia 12.000%, 10/22/15 | | | 309,000 | COP | | | 137 | |
Treasury Note,
Series B,
11.250%, 10/24/18 | | | 422,000 | COP | | | 210 | |
4.375%, 3/21/23 | | | 994,000 | COP | | | 367 | |
Republic of El Salvador 144A
6.375%, 1/18/27(3) | | | 340 | | | | 343 | |
| | | | | | | | |
| | | PAR
VALUE | | | VALUE | |
| FOREIGN GOVERNMENT SECURITIES—continued | |
Republic of Indonesia | | | | | | | | |
Series FR30,
10.750%, 5/15/16 | | | 8,333,000 | IDR | | $ | 702 | |
Series FR55,
7.375%, 9/15/16 | | | 4,457,000 | IDR | | | 358 | |
Series FR63,
5.625%, 5/15/23 | | | 2,221,000 | IDR | | | 155 | |
Republic of Iraq
RegS 5.800%, 1/15/28(4) | | $ | 250 | | | | 211 | |
Republic of Kazakhstan 144A 4.875%, 10/14/44(3) | | | 335 | | | | 307 | |
Republic of Philippines
4.950%, 1/15/21 | | | 11,000 | PHP | | | 256 | |
Republic of South Africa | | | | | | | | |
Series R203,
8.250%, 9/15/17 | | | 2,375 | ZAR | | | 212 | |
Series R208,
6.750%, 3/31/21 | | | 1,310 | ZAR | | | 108 | |
Republic of Uruguay
4.375%, 12/15/28 | | | 10,638 | UYU(9) | | | 436 | |
Russian Federation | | | | | | | | |
144A 7.850%, 3/10/18(3) | | | 30,000 | RUB | | | 402 | |
144A 4.875%, 9/16/23(3) | | | 800 | | | | 713 | |
United Mexican States | | | | | | | | |
Series M,
6.000%, 6/18/15 | | | 12,065 | MXN | | | 829 | |
Series M,
6.500%, 6/9/22 | | | 15,755 | MXN | | | 1,120 | |
| TOTAL FOREIGN GOVERNMENT SECURITIES | |
(Identified Cost $14,017) | | | | 11,279 | |
|
| MORTGAGE-BACKED SECURITIES—12.8% | |
| | |
| Agency—1.0% | | | | | | | | |
FHLMC 14-DN2, M2
1.820%, 4/25/24(2) | | | 350 | | | | 339 | |
FNMA | | | | | | | | |
3.000%, 5/1/43 | | | 658 | | | | 667 | |
3.000%, 6/1/43 | | | 461 | | | | 466 | |
| | | | | | | | |
| | | | | | | 1,472 | |
| | | | | | | | |
|
| Non-Agency—11.8% | |
Aventura Mall Trust
13-AVM, C 144A
3.743%, 12/5/32(2)(3) | | | 400 | | | | 412 | |
Banc of America Alternative Loan Trust 03-10, 2A1
6.000%, 12/25/33 | | | 56 | | | | 61 | |
Banc of America Funding Trust 05-1, 1A1
5.500%, 2/25/35 | | | 196 | | | | 199 | |
Bank of America (Merrill Lynch—Countrywide) Alternative Loan Trust
04-22CB, 1A1
6.000%, 10/25/34 | | | 292 | | | | 310 | |
Bank of America (Merrill Lynch—Countrywide) Mortgage Trust 06-C1, AM
5.677%, 5/12/39(2) | | | 350 | | | | 367 | |
| | | | | | | | |
| | | PAR
VALUE | | | VALUE | |
| Non-Agency—continued | |
Bank of America (Merrill Lynch) Mortgage Investors Trust 98-C1, CTL
6.750%, 11/15/26(2) | | $ | 465 | | | $ | 520 | |
Barclays (Lehman Brothers)—UBS Commercial Mortgage Trust 07-C7, A3
5.866%, 9/15/45(2) | | | 451 | | | | 495 | |
Citigroup Mortgage Loan Trust, Inc. 05-5, 2A3
5.000%, 8/25/35 | | | 204 | | | | 196 | |
Commercial Mortgage Trust 07-GG11, AM
5.867%, 12/10/49(2) | | | 771 | | | | 836 | |
Credit Suisse Commercial Mortgage Trust | | | | | | | | |
07-C1, A1A
5.361%, 2/15/40 | | | 291 | | | | 307 | |
07-C2, A3
5.542%, 1/15/49(2) | | | 740 | | | | 793 | |
Credit Suisse First Boston Mortgage Securities Corp. 04-AR8, 6A1
2.387%, 9/25/34(2) | | | 470 | | | | 468 | |
Goldman Sachs Mortgage Securities Trust II
07-GG10, A4
5.796%, 8/10/45(2) | | | 573 | | | | 621 | |
JPMorgan Chase (Bear Stearns) Adjustable Rate Mortgage Trust | | | | | | | | |
04-1, 21A1
2.314%, 4/25/34(2) | | | 409 | | | | 406 | |
04-10, 12A3
2.657%, 1/25/35(2) | | | 470 | | | | 467 | |
JPMorgan Chase (Bear Stearns) Commercial Mortgage Securities, Inc. | | | | | | | | |
06-PW12, AM
5.743%, 9/11/38(2) | | | 750 | | | | 789 | |
05-PW10, AM
5.449%, 12/11/40(2) | | | 725 | | | | 748 | |
07-PW18, AM
6.084%, 6/11/50(2) | | | 1,475 | | | | 1,622 | |
JPMorgan Chase (Washington Mutual) Mortgage Pass-Through Certificates Trust
04-CB1, 5A
5.000%, 6/25/19 | | | 20 | | | | 20 | |
JPMorgan Chase Commercial Mortgage Securities Trust | | | | | | | | |
09-IWST, A2 144A
5.633%, 12/5/27(3) | | | 100 | | | | 114 | |
06-LDP7, AM
5.865%, 4/15/45(2) | | | 780 | | | | 828 | |
06-LDP9, A3
5.336%, 5/15/47 | | | 344 | | | | 366 | |
07-LDPX, AM
5.464%, 1/15/49(2) | | | 450 | | | | 467 | |
Refer to Footnote Legend on page 36.
See Notes to Financial Statements
30
VIRTUS MULTI-SECTOR FIXED INCOME SERIES
SCHEDULE OF INVESTMENTS (Continued)
DECEMBER 31, 2014
($ reported in thousands)
| | | | | | | | |
| | | PAR
VALUE | | | VALUE | |
| Non-Agency—continued | |
JPMorgan Chase Mortgage Trust | | | | | | | | |
05-A1, 4A1
2.565%, 2/25/35(2) | | $ | 25 | | | $ | 25 | |
05-A4, 3A1
2.227%, 7/25/35(2) | | | 39 | | | | 39 | |
14-1, 1A1 144A
4.000%, 1/25/44(2)(3) | | | 619 | | | | 649 | |
Lehman Brothers Commercial Mortgage Trust 07-C3, A4
5.904%, 7/15/44(2) | | | 400 | | | | 433 | |
MASTR Reperforming Loan Trust 05-1, 1A2 144A
6.500%, 8/25/34(3) | | | 381 | | | | 389 | |
Morgan Stanley Capital I Trust 07-IQ14, AM
5.684%, 4/15/49(2) | | | 325 | | | | 338 | |
Motel 6 Trust 12-MTL6 D
144A 3.781%, 10/5/25(3) | | | 550 | | | | 544 | |
New Residential Mortgage Loan Trust 14-1A, A 144A 3.750%, 1/25/54(2)(3) | | | 251 | | | | 258 | |
Nomura Asset Acceptance Corp. 04-R3, A1 144A 6.500%, 2/25/35(3) | | | 358 | | | | 368 | |
Residential Accredit Loans, Inc. 03-QS6, A4
4.250%, 3/25/33 | | | 31 | | | | 31 | |
Residential Asset Mortgage Products, Inc. | | | | | | | | |
04-SL1, A8
6.500%, 11/25/31 | | | 41 | | | | 42 | |
05-SL2, A4
7.500%, 2/25/32 | | | 268 | | | | 282 | |
Sequoia Mortgage Trust
14-2, A1 144A
4.000%, 7/25/44(2)(3) | | | 287 | | | | 296 | |
Structured Adjustable Rate Mortgage Loan
Trust 04-4, 3A1
2.467%, 4/25/34(2) | | | 358 | | | | 355 | |
Wells Fargo (Wachovia Bank) Commercial Mortgage Trust | | | | | | | | |
06-C25, AM
5.723%, 5/15/43(2) | | | 670 | | | | 705 | |
07-C30, A5
5.342%, 12/15/43 | | | 970 | | | | 1,035 | |
07-C32, A3
5.716%, 6/15/49(2) | | | 775 | | | | 832 | |
Wells Fargo Mortgage Backed Securities Trust 06-17, A1
5.500%, 11/25/21 | | | 7 | | | | 7 | |
WinWater Mortgage Loan Trust 14-1, A1 144A 4.000%, 6/20/44(2)(3) | | | 323 | | | | 334 | |
| | | | | | | | |
| | | | | | | | 18,374 | |
TOTAL MORTGAGE-BACKED SECURITIES
(Identified Cost $18,796) | | | | 19,846 | |
| | | | | | | | |
| | | PAR
VALUE | | | VALUE | |
| ASSET-BACKED SECURITIES—3.9% | |
American Homes 4 Rent
14-SFR2, C 144A
4.705%, 10/17/36(3) | | $ | 435 | | | $ | 444 | |
Ameriquest Mortgage Securities, Inc. 03-10, AF6
5.210%, 11/25/33(2) | | | 18 | | | | 18 | |
Bank of America (Merrill Lynch—Countrywide) Asset-Backed Certificates | | | | | | | | |
05-1 AF5A
5.332%, 7/25/35(2) | | | 588 | | | | 585 | |
05-12, 2A4
5.575%, 2/25/36(2) | | | 340 | | | | 329 | |
Cheesecake Restaurant Holdings, Inc. 13-1A, A2
144A 4.474%, 3/20/43(3) | | | 390 | | | | 395 | |
CIT Group Home Equity Loan Trust 03-1, A5
4.980%, 7/20/34(2) | | | 300 | | | | 302 | |
Conseco Financial Corp. | | | | | | | | |
94-1, A5 7.650%, 4/15/19 | | | 12 | | | | 13 | |
01-3, A4 6.910%, 5/1/33(2) | | | 619 | | | | 685 | |
Drug Royalty LP II 14-1, A2
144A 3.484%, 7/15/23(3) | | | 499 | | | | 501 | |
Exeter Automobile Receivables Trust 14-1A, C
144A 3.570%, 7/15/19(3) | | | 340 | | | | 337 | |
Fairway Outdoor Funding LLC 12-1A, A2 144A
4.212%, 10/15/42(3) | | | 611 | | | | 613 | |
GSAA Home Equity Trust
05-12, AF3W
4.999%, 9/25/35(2) | | | 302 | | | | 307 | |
LEAF Receivables Funding 9 LLC 13-1, E1 144A
6.000%, 9/15/21(3) | | | 398 | | | | 406 | |
MASTR Specialized Loan Trust 05-3, A2 144A 5.704%, 11/25/35(2)(3) | | | 358 | | | | 366 | |
Origen Manufactured Housing Contract Trust
04-B, M1
5.730%, 11/15/35(2) | | | 271 | | | | 283 | |
Residential Funding Mortgage Securities II Home Loan Trust
07-HI1, A3
5.720%, 3/25/37 | | | 163 | | | | 166 | |
SVO VOI Mortgage Corp.
10-AA, A 144A
3.650%, 7/20/27(3) | | | 32 | | | | 33 | |
U-Haul S Fleet LLC
10-BT1A, 1 144A
4.899%, 10/25/23(3) | | | 253 | | | | 261 | |
TOTAL ASSET-BACKED SECURITIES
(Identified Cost $5,895) | | | | 6,044 | |
|
| CORPORATE BONDS AND NOTES—57.9% | |
|
| Consumer Discretionary—6.7% | |
Anna Merger Sub, Inc.
144A 7.750%, 10/1/22(3) | | | 250 | | | | 254 | |
| | | | | | | | |
| | | PAR
VALUE | | | VALUE | |
| Consumer Discretionary—continued | |
Ashton Woods USA LLC (Ashton Woods Finance Co.) 144A
6.875%, 2/15/21(3) | | $ | 405 | | | $ | 387 | |
Boyd Gaming Corp.
9.000%, 7/1/20 | | | 260 | | | | 267 | |
Caesars Entertainment Operating Co., Inc.
9.000%, 2/15/20 | | | 270 | | | | 201 | |
Caesars Entertainment Resort Properties LLC 144A 8.000%, 10/1/20(3) | | | 105 | | | | 103 | |
Caesars Growth Properties Holdings LLC 144A 9.375%, 5/1/22(3) | | | 230 | | | | 204 | |
CCO Holdings LLC | | | | | | | | |
5.250%, 3/15/21 | | | 165 | | | | 167 | |
5.250%, 9/30/22 | | | 180 | | | | 180 | |
Cequel Communications Holdings I LLC (Cequel Capital Corp.) | | | | | | | | |
144A 5.125%, 12/15/21(3) | | | 100 | | | | 98 | |
144A 5.125%, 12/15/21(3) | | | 240 | | | | 234 | |
Churchill Downs Inc. 5.375%, 12/15/21 | | | 335 | | | | 337 | |
Clear Channel Worldwide Holdings, Inc. | | | | | | | | |
Series A 7.625%, 3/15/20 | | | 250 | | | | 261 | |
Series B 7.625%, 3/15/20 | | | 440 | | | | 465 | |
iHeartCommunications, Inc.
10.000%, 1/15/18 | | | 275 | | | | 239 | |
Intelsat Jackson Holdings SA
5.500%, 8/1/23 | | | 285 | | | | 284 | |
International Game Technology | | | | | | | | |
7.500%, 6/15/19 | | | 160 | | | | 173 | |
5.500%, 6/15/20 | | | 125 | | | | 130 | |
Isle of Capri Casinos, Inc.
5.875%, 3/15/21 | | | 400 | | | | 408 | |
Landry’s, Inc. 144A
9.375%, 5/1/20(3) | | | 300 | | | | 320 | |
Meritor, Inc.
6.750%, 6/15/21 | | | 325 | | | | 341 | |
MGM Resorts International
6.000%, 3/15/23 | | | 330 | | | | 333 | |
MHGE Parent LLC 144A 8.500%, 8/1/19(3) | | | 265 | | | | 259 | |
MPG Holdco I, Inc. 144A 7.375%, 10/15/22(3) | | | 35 | | | | 36 | |
Norwegian Cruise Lines Corp. Ltd. 144A
5.250%, 11/15/19(3) | | | 30 | | | | 30 | |
Numericable Group SA 144A 6.000%, 5/15/22(3) | | | 200 | | | | 201 | |
Penn National Gaming, Inc.
5.875%, 11/1/21 | | | 220 | | | | 206 | |
Pinnacle Entertainment, Inc.
6.375%, 8/1/21 | | | 355 | | | | 367 | |
Scientific Games International, Inc. 144A 7.000%, 1/1/22(3) | | | 255 | | | | 259 | |
Seminole Hard Rock Entertainment, Inc. 144A 5.875%, 5/15/21(3) | | | 405 | | | | 403 | |
Refer to Footnote Legend on page 36.
See Notes to Financial Statements
31
VIRTUS MULTI-SECTOR FIXED INCOME SERIES
SCHEDULE OF INVESTMENTS (Continued)
DECEMBER 31, 2014
($ reported in thousands)
| | | | | | | | |
| | | PAR
VALUE | | | VALUE | |
| Consumer Discretionary—continued | |
Signet UK Finance plc
4.700%, 6/15/24 | | $ | 460 | | | $ | 445 | |
Six Flags Entertainment Corp. 144A
5.250%, 1/15/21(3) | | | 440 | | | | 442 | |
Standard Pacific Corp.
5.875%, 11/15/24 | | | 140 | | | | 141 | |
Station Casinos LLC
7.500%, 3/1/21 | | | 320 | | | | 330 | |
Taylor Morrison Communities, Inc. (Monarch Communities, Inc.) 144A
5.250%, 4/15/21(3) | | | 490 | | | | 485 | |
Toll Brothers Finance Corp.
6.750%, 11/1/19 | | | 350 | | | | 394 | |
Viking Cruises Ltd. 144A 8.500%, 10/15/22(3) | | | 350 | | | | 381 | |
VTR Finance B.V. 144A 6.875%, 1/15/24(3) | | | 345 | | | | 353 | |
Wynn Macau Ltd. 144A 5.250%, 10/15/21(3) | | | 345 | | | | 326 | |
| | | | | | | | |
| | | | | | | 10,444 | |
| | | | | | | | |
|
| Consumer Staples—0.3% | |
Dole Food Co., Inc. 144A 7.250%,
5/1/19(3) | | | 155 | | | | 155 | |
Ingles Markets, Inc.
5.750%, 6/15/23 | | | 295 | | | | 297 | |
| | | | | | | | |
| | | | | | | 452 | |
| | | | | | | | |
| | |
| Energy—8.5% | | | | | | | | |
Atlas Energy Holdings Operating Co. LLC
7.750%, 1/15/21 | | | 130 | | | | 95 | |
California Resources Corp.
144A 6.000%, 11/15/24(3) | | | 455 | | | | 387 | |
Calumet Specialty Products Partners LP 144A
6.500%, 4/15/21(3) | | | 390 | | | | 350 | |
Carrizo Oil & Gas, Inc.
144A 7.500%,
9/15/20(3) | | | 235 | | | | 227 | |
7.500%, 9/15/20 | | | 140 | | | | 135 | |
CHC Helicopter SA
9.250%, 10/15/20 | | | 293 | | | | 288 | |
Compagnie Generale de Geophysique-Veritas
6.500%, 6/1/21 | | | 375 | | | | 287 | |
CONSOL Energy, Inc. 144A 5.875%,
4/15/22(3) | | | 225 | | | | 210 | |
Denbury Resources, Inc.
5.500%, 5/1/22 | | | 345 | | | | 317 | |
Empresa Nacional del Petroleo 144A
4.375%, 10/30/24(3) | | | 350 | | | | 342 | |
Endeavor Energy Resources LP 144A 7.000%, 8/15/21(3) | | | 245 | | | | 218 | |
Energy XXI Gulf Coast, Inc.
144A 6.875%,
3/15/24(3) | | | 455 | | | | 247 | |
EnQuest plc 144A
7.000%, 4/15/22(3) | | | 345 | | | | 217 | |
| | | | | | | | |
| | | PAR
VALUE | | | VALUE | |
| Energy—continued | | | | | | | | |
EPL Oil & Gas, Inc.
8.250%, 2/15/18 | | $ | 500 | | | $ | 383 | |
FTS International, Inc. 144A 6.250%, 5/1/22(3) | | | 175 | | | | 130 | |
Gazprom Neft OAO (GPN Capital SA) 144A
6.000%, 11/27/23(3)(7) | | | 335 | | | | 266 | |
Gazprom OAO (Gaz Capital SA) 144A
8.146%, 4/11/18(3) | | | 205 | | | | 203 | |
Gulfport Energy Corp. 144A 7.750%,
11/1/20(3) | | | 300 | | | | 295 | |
Halcon Resources Corp.
8.875%, 5/15/21 | | | 260 | | | | 197 | |
Laredo Petroleum, Inc.
7.375%, 5/1/22 | | | 245 | | | | 230 | |
Linn Energy LLC
6.500%, 9/15/21 | | | 160 | | | | 130 | |
Lukoil OAO International Finance BV
144A 7.250%,
11/5/19(3) | | | 300 | | | | 284 | |
MarkWest Energy Partners LP (MarkWest Energy Finance Corp.)
4.875%, 12/1/24 | | | 330 | | | | 324 | |
MEG Energy Corp. 144A 7.000%, 3/31/24(3) | | | 180 | | | | 164 | |
NGL Energy Partners LP (NGL Energy Finance Corp.)
144A 5.125%,
7/15/19(3) | | | 335 | | | | 322 | |
Novatek OAO (Novatek Finance Ltd.) 144A
4.422%, 12/13/22(3)(7) | | | 540 | | | | 400 | |
Odebrecht Offshore Drilling Finance Ltd. 144A
6.750%, 10/1/22(3) | | | 561 | | | | 513 | |
Pacific Rubiales Energy Corp.
144A 5.375%,
1/26/19(3) | | | 340 | | | | 294 | |
Parker Drilling Co. (The)
7.500%, 8/1/20 | | | 365 | | | | 296 | |
Petrobras Global Finance BV
6.250%, 3/17/24 | | | 155 | | | | 148 | |
Petrobras International Finance Co.
5.375%, 1/27/21 | | | 355 | | | | 329 | |
Petroleos de Venezuela SA | | | | | | | | |
Series 2015,
5.000%, 10/28/15 | | | 185 | | | | 140 | |
RegS 8.500%,
11/2/17(4) | | | 140 | | | | 80 | |
144A 6.000%,
5/16/24(3) | | | 1,040 | | | | 398 | |
RegS 6.000%,
11/15/26(4) | | | 360 | | | | 133 | |
Petroleos Mexicanos | | | | | | | | |
5.500%, 1/21/21 | | | 350 | | | | 379 | |
4.875%, 1/18/24 | | | 145 | | | | 151 | |
5.500%, 6/27/44 | | | 200 | | | | 204 | |
QEP Resources, Inc.
6.875%, 3/1/21 | | | 390 | | | | 402 | |
QGOG Constellation SA 144A 6.250%,
11/9/19(3) | | | 400 | | | | 253 | |
Regency Energy Partners LP
4.500%, 11/1/23 | | | 385 | | | | 355 | |
Rosetta Resources, Inc.
5.875%, 6/1/22 | | | 355 | | | | 323 | |
| | | | | | | | |
| | | PAR
VALUE | | | VALUE | |
| Energy—continued | | | | | | | | |
Sabine Pass Liquefaction LLC
5.625%, 2/1/21 | | $ | 315 | | | $ | 311 | |
SM Energy Co. 144A
6.125%, 11/15/22(3) | | | 410 | | | | 386 | |
Transocean, Inc.
3.800%, 10/15/22 | | | 470 | | | | 381 | |
Tullow Oil plc 144A
6.000%, 11/1/20(3) | | | 350 | | | | 294 | |
Williams Cos., Inc. (The) | | | | | | | | |
3.700%,
1/15/23 | | | 375 | | | | 337 | |
4.550%, 6/24/24 | | | 450 | | | | 419 | |
| | | | | | | | |
| | | | | | | 13,174 | |
| | | | | | | | |
| | |
| Financials—22.4% | | | | | | | | |
Aircastle Ltd.
5.125%, 3/15/21 | | | 510 | | | | 511 | |
Akbank TAS 144A
7.500%, 2/5/18(3) | | | 530 | TRY | | | 208 | |
Allstate Corp. (The)
5.750%, 8/15/53(2)(6) | | | 625 | | | | 659 | |
ALROSA Finance S.A. 144A 7.750%, 11/3/20(3) | | | 455 | | | | 432 | |
Apollo Management Holdings LP 144A 4.000%, 5/30/24(3) | | | 440 | | | | 448 | |
Ares Capital Corp.
3.875%, 1/15/20 | | | 330 | | | | 329 | |
Banco ABC Brasil S.A. 144A 7.875%, 4/8/20(3) | | | 425 | | | | 440 | |
Banco Bilbao Vizcaya Argentaria Bancomer S.A.
144A 6.500%, 3/10/21(3) | | | 425 | | | | 460 | |
Banco Bradesco S.A. 144A 5.900%, 1/16/21(3) | | | 600 | | | | 627 | |
Banco de Credito del Peru
144A 6.125%, 4/24/27(2)(3) | | | 520 | | | | 549 | |
Banco de Credito e Inversiones 144A
4.000%, 2/11/23(3) | | | 390 | | | | 383 | |
Banco Inbursa SA Institucion de Banca Multiple 144A 4.125%, 6/6/24(3) | | | 200 | | | | 196 | |
Banco Internacional del Peru SAA 144A
6.625%, 3/19/29(2)(3) | | | 155 | | | | 164 | |
Banco Santander Brasil SA
144A 8.000%, 3/18/16(3) | | | 600 | BRL | | | 216 | |
Banco Santander Chile | | | | | | | | |
144A 3.750%, 9/22/15(3) | | | 100 | | | | 102 | |
144A 3.875%, 9/20/22(3) | | | 505 | | | | 500 | |
Banco Votorantim S.A.
144A 7.375%, 1/21/20(3) | | | 450 | | | | 476 | |
Bancolombia S.A.
5.125%, 9/11/22 | | | 545 | | | | 540 | |
Bank of America Corp.
4.200%, 8/26/24 | | | 130 | | | | 132 | |
Bank of China Ltd. 144A 5.000%, 11/13/24(3) | | | 390 | | | | 401 | |
Bank of Georgia JSC 144A 7.750%, 7/5/17(3) | | | 290 | | | | 300 | |
Barclays Bank plc | | | | | | | | |
144A 6.050%, 12/4/17(3) | | | 435 | | | | 479 | |
144A
5.926%(2)(3)(5)(6) | | | 600 | | | | 628 | |
Refer to Footnote Legend on page 36.
See Notes to Financial Statements
32
VIRTUS MULTI-SECTOR FIXED INCOME SERIES
SCHEDULE OF INVESTMENTS (Continued)
DECEMBER 31, 2014
($ reported in thousands)
| | | | | | | | |
| | | PAR
VALUE | | | VALUE | |
| Financials—continued | | | | | | | | |
Braskem America Finance Co.
RegS 7.125%,
7/22/41(4) | | $ | 495 | | | $ | 490 | |
Brazil Loan Trust 1
144A 5.477%,
7/24/23(3) | | | 460 | | | | 467 | |
Caixa Economica Federal
144A 7.250%,
7/23/24(2)(3) | | | 350 | | | | 334 | |
Chubb Corp. (The)
6.375%, 3/29/67(2) | | | 1,390 | | | | 1,490 | |
City National Corp.
5.250%, 9/15/20 | | | 425 | | | | 473 | |
CorpGroup Banking S.A.
144A 6.750%,
3/15/23(3) | | | 425 | | | | 421 | |
Credit Bank of Moscow
144A 7.700%,
2/1/18(3)(7) | | | 200 | | | | 150 | |
CTR Partnership LP (Caretrust Capital Corp.)
5.875%, 6/1/21 | | | 285 | | | | 290 | |
Development Bank of Kazakhstan OJSC
144A 4.125%, 12/10/22(3) | | | 535 | | | | 449 | |
Drawbridge Special Opportunities Fund LP
144A 5.000%, 8/1/21(3) | | | 440 | | | | 439 | |
E*Trade Financial Corp.
5.375%, 11/15/22 | | | 340 | | | | 349 | |
Eurasian Development Bank
144A 4.767%,
9/20/22(3) | | | 475 | | | | 401 | |
Evergrande Real Estate Group Ltd. 144A
8.750%, 10/30/18(3) | | | 345 | | | | 318 | |
Excel Trust LP
4.625%, 5/15/24 | | | 175 | | | | 182 | |
Fidelity National Financial, Inc.
5.500%, 9/1/22 | | | 130 | | | | 142 | |
First Cash Financial Services, Inc.
6.750%, 4/1/21 | | | 200 | | | | 209 | |
First Niagara Financial Group, Inc.
7.250%, 12/15/21 | | | 610 | | | | 692 | |
General Motors Financial Co., Inc.
4.750%, 8/15/17 | | | 735 | | | | 777 | |
Genworth Holdings, Inc. 4.900%, 8/15/23 | | | 620 | | | | 503 | |
GLP Capital LP (GLP Financing II, Inc.) | | | | | | | | |
4.875%, 11/1/20 | | | 300 | | | | 304 | |
5.375%, 11/1/23 | | | 10 | | | | 10 | |
HBOS plc 144A
6.750%, 5/21/18(3) | | | 200 | | | | 223 | |
Huntington National Bank (The) 6.600%, 6/15/18 | | | 250 | | | | 277 | |
Hutchison Whampoa International Ltd.
Series 12, 144A
6.000%(2)(3)(5)(6) | | | 610 | | | | 650 | |
ICAHN Enterprises LP (ICAHN Enterprises Finance Corp.) | | | | | | | | |
4.875%, 3/15/19 | | | 30 | | | | 30 | |
6.000%, 8/1/20 | | | 175 | | | | 180 | |
5.875%, 2/1/22 | | | 355 | | | | 357 | |
| | | | | | | | |
| | | PAR
VALUE | | | VALUE | |
| Financials—continued | |
iStar Financial, Inc. | | | | | | | | |
4.875%, 7/1/18 | | $ | 125 | | | $ | 123 | |
5.000%, 7/1/19 | | | 195 | | | | 190 | |
Itau Unibanco Holding S.A.
144A 5.125%, 5/13/23(3) | | | 560 | | | | 559 | |
Kazakhstan Temir Zholy Finance BV 144A
6.950%, 7/10/42(3) | | | 410 | | | | 396 | |
Korea Finance Corp.
4.625%, 11/16/21 | | | 400 | | | | 443 | |
Leucadia National Corp.
5.500%, 10/18/23 | | | 250 | | | | 256 | |
Liberty Mutual Insurance Co.
144A 8.500%, 5/15/25(3) | | | 25 | | | | 32 | |
Lincoln National Corp.
6.050%, 4/20/67(2)(6) | | | 365 | | | | 365 | |
Lloyds TSB Bank plc
144A 6.500%, 9/14/20(3) | | | 600 | | | | 695 | |
Macquarie Bank Ltd.
144A 6.625%,
4/7/21(3) | | | 330 | | | | 381 | |
Morgan Stanley
144A 10.090%, 5/3/17(3) | | | 1,250 | BRL | | | 458 | |
Series H,
5.450%, 12/29/49(2) | | | 350 | | | | 351 | |
MPT Operating Partnership LP 5.500%, 5/1/24 | | | 115 | | | | 120 | |
Nationstar Mortgage LLC | | | | | | | | |
6.500%, 8/1/18 | | | 170 | | | | 163 | |
6.500%, 7/1/21 | | | 275 | | | | 252 | |
Navient LLC 5.500%, 1/25/23 | | | 420 | | | | 402 | |
Nordea Bank AB 144A 4.250%, 9/21/22(3) | | | 600 | | | | 623 | |
PennantPark Investment Corp. 4.500%, 10/1/19 | | | 365 | | | | 366 | |
Phosagro OAO (Phosagro Bond Funding Ltd.) 144A 4.204%, 2/13/18(3)(7) | | | 360 | | | | 310 | |
PKO Finance AB 144A 4.630%, 9/26/22(3)(7) | | | 610 | | | | 639 | |
Progressive Corp. (The)
6.700%, 6/15/37(2) | | | 750 | | | | 811 | |
Prudential Financial, Inc. | | | | | | | | |
5.875%, 9/15/42(2) | | | 1,100 | | | | 1,160 | |
5.625%, 6/15/43(2)(6) | | | 190 | | | | 194 | |
Royal Bank of Scotland Group plc (The) | | | | | | | | |
5.625%, 8/24/20 | | | 375 | | | | 427 | |
7.648%(2)(5)(6) | | | 450 | | | | 527 | |
Russian Agricultural Bank OJSC (RSHB Capital SA)
144A 5.298%, 12/27/17(3) | | | 130 | | | | 110 | |
Santander Bank NA
8.750%, 5/30/18 | | | 200 | | | | 238 | |
Springleaf Finance Corp.
5.250%, 12/15/19 | | | 325 | | | | 319 | |
SunTrust Bank, Inc.
5.400%, 4/1/20 | | | 250 | | | | 275 | |
Teachers Insurance & Annuity Association of America 144A
4.375%, 9/15/54(2)(3) | | | 360 | | | | 362 | |
TIAA Asset Management Finance Co. LLC 144A 4.125%, 11/1/24(3) | | | 350 | | | | 359 | |
| | | | | | | | |
| | | PAR
VALUE | | | VALUE | |
| Financials—continued | | | | | | | | |
Turkiye Garanti Bankasi AS
144A 5.250%,
9/13/22(3) | | $ | 705 | | | $ | 723 | |
Ukreximbank Via Biz Finance plc RegS
8.375%, 4/27/15(4)(7) | | | 180 | | | | 137 | |
Voya Financial, Inc. (ING (U.S.), Inc.)
5.650%, 5/15/53(2) | | | 395 | | | | 393 | |
VTB Bank OJSC (VTB Capital SA) 144A
6.000%, 4/12/17(3)(7) | | | 700 | | | | 604 | |
Walter Investment Management Corp.
7.875%, 12/15/21 | | | 435 | | | | 390 | |
WP Carey, Inc.
4.600%, 4/1/24 | | | 345 | | | | 362 | |
Yapi ve Kredi Bankasi AS
144A 4.000%,
1/22/20(3) | | | 510 | | | | 494 | |
| | | | | | | | |
| | | | | | | 34,796 | |
| | | | | | | | |
| | |
| Health Care—1.8% | | | | | | | | |
Acadia Healthcare Co., Inc.
5.125%, 7/1/22 | | | 115 | | | | 114 | |
Capsugel SA PIK Interest Capitalization 144A
7.000%, 5/15/19(3)(11) | | | 75 | | | | 76 | |
Catamaran Corp.
4.750%, 3/15/21 | | | 235 | | | | 236 | |
Community Health Systems, Inc. 6.875%, 2/1/22 | | | 70 | | | | 75 | |
Crimson Merger Sub, Inc.
144A 6.625%,
5/15/22(3) | | | 265 | | | | 238 | |
IASIS Healthcare LLC
8.375%, 5/15/19 | | | 165 | | | | 174 | |
inVentiv Health, Inc. 144A 9.000%,
1/15/18(3) | | | 165 | | | | 169 | |
Mallinckrodt International Finance S.A. 144A
5.750%, 8/1/22(3) | | | 135 | | | | 139 | |
MPH Acquisition Holdings LLC 144A 6.625%, 4/1/22(3) | | | 245 | | | | 251 | |
Omnicare, Inc.
4.750%, 12/1/22 | | | 10 | | | | 10 | |
Owens & Minor, Inc.
3.875%, 9/15/21 | | | 75 | | | | 76 | |
Salix Pharmaceuticals Ltd. 144A 6.000%, 1/15/21(3) | | | 60 | | | | 61 | |
Select Medical Corp.
6.375%, 6/1/21 | | | 115 | | | | 117 | |
Tenet Healthcare Corp. | | | | | | | | |
144A 5.500%, 3/1/19(3) | | | 245 | | | | 252 | |
4.500%, 4/1/21 | | | 330 | | | | 332 | |
8.125%, 4/1/22 | | | 345 | | | | 386 | |
Valeant Pharmaceuticals International, Inc. 144A 7.500%,
7/15/21(3) | | | 50 | | | | 54 | |
| | | | | | | | |
| | | | | | | 2,760 | |
| | | | | | | | |
| | |
| Industrials—6.6% | | | | | | | | |
AAR Corp. 7.250%, 1/15/22 | | | 365 | | | | 396 | |
ADT Corp. (The)
6.250%, 10/15/21 | | | 435 | | | | 448 | |
Refer to Footnote Legend on page 36.
See Notes to Financial Statements
33
VIRTUS MULTI-SECTOR FIXED INCOME SERIES
SCHEDULE OF INVESTMENTS (Continued)
DECEMBER 31, 2014
($ reported in thousands)
| | | | | | | | |
| | | PAR
VALUE | | | VALUE | |
| Industrials—continued | |
Ahern Rentals, Inc. 144A 9.500%, 6/15/18(3) | | $ | 290 | | | $ | 302 | |
Air Canada 144A
6.750%, 10/1/19(3) | | | 425 | | | | 443 | |
Pass-Through-
Trust, 13-1, B 144A 5.375%, 5/15/21(3) | | | 210 | | | | 214 | |
American Airlines Pass-Through-Trust 14-1, B
4.375%, 10/1/22 | | | 600 | | | | 615 | |
Atlas Air Pass-Through-
Trust 00-1, A
8.707%, 1/2/19 | | | 347 | | | | 357 | |
Avis Budget Car Rental LLC
5.500%, 4/1/23 | | | 250 | | | | 256 | |
Bombardier, Inc. | | | | | | | | |
144A 4.750%, 4/15/19(3) | | | 170 | | | | 171 | |
144A 6.125%, 1/15/23(3) | | | 420 | | | | 429 | |
Builders FirstSource, Inc.
144A 7.625%, 6/1/21(3) | | | 320 | | | | 329 | |
Building Materials Corp. of America 144A
5.375%, 11/15/24(3) | | | 160 | | | | 160 | |
Carpenter Technology Corp.
5.200%, 7/15/21 | | | 425 | | | | 451 | |
Continental Airlines Pass-Through-Trust | | | | | | | | |
99-1, A 6.545%, 2/2/19 | | | 729 | | | | 800 | |
00-1, A1 8.048%, 11/1/20 | | | 386 | | | | 437 | |
CPG Merger Sub LLC 144A 8.000%, 10/1/21(3) | | | 105 | | | | 108 | |
Delta Air Lines Pass-Through-Trust 12-1, A
4.750%, 5/7/20 | | | 432 | | | | 460 | |
DP World Ltd. 144A
6.850%, 7/2/37(3) | | | 200 | | | | 226 | |
Harland Clarke Holdings Corp. 144A
6.875%, 3/1/20(3) | | | 245 | | | | 240 | |
Huntington Ingalls Industries, Inc. 144A
5.000%, 12/15/21(3) | | | 150 | | | | 153 | |
KLX, Inc. 144A
5.875%, 12/1/22(3) | | | 400 | | | | 405 | |
Masco Corp.
5.950%, 3/15/22 | | | 390 | | | | 433 | |
Northwest Airlines Pass-Through-Trust 02-1, G2
6.264%, 11/20/21 | | | 367 | | | | 395 | |
Odebrecht Finance Ltd. 144A 8.250%, 4/25/18(3) | | | 400 | BRL | | | 127 | |
Rexel SA 144A
5.250%, 6/15/20(3) | | | 395 | | | | 400 | |
Spirit AeroSystems, Inc.
5.250%, 3/15/22 | | | 100 | | | | 102 | |
TransDigm, Inc.
6.000%, 7/15/22 | | | 355 | | | | 356 | |
UAL Pass-Through-Trust | | | | | | | | |
09-2A 9.750%, 1/15/17 | | | 162 | | | | 180 | |
07-01, A 6.636%, 7/2/22 | | | 879 | | | | 950 | |
| | | | | | | | |
| | | | | | | 10,343 | |
| | | | | | | | |
| | | | | | | | |
| | | PAR
VALUE | | | VALUE | |
| Information Technology—2.2% | |
Avaya, Inc. 144A
7.000%, 4/1/19(3) | | $ | 735 | | | $ | 720 | |
First Data Corp.
144A 8.250%,
1/15/21(3) | | | 230 | | | | 247 | |
11.750%, 8/15/21 | | | 752 | | | | 867 | |
PIK Interest Capitalization,
144A 8.750%,
1/15/22(3)(11) | | | 260 | | | | 281 | |
Infinity Acquisition LLC (Infinity Acquisition Finance Corp.) 144A
7.250%, 8/1/22(3) | | | 265 | | | | 241 | |
Infor Software Parent LLC PIK Interest Capitalization,
144A 7.125%,
5/1/21(3)(11) | | | 130 | | | | 128 | |
Interactive Data Corp.
144A 5.875%,
4/15/19(3) | | | 265 | | | | 264 | |
QualityTech LP (QTS Finance Corp.) 144A
5.875%, 8/1/22(3) | | | 35 | | | | 35 | |
Sanmina Corp.
144A 4.375%, 6/1/19(3) | | | 55 | | | | 55 | |
Sophia Holding Finance LP PIK Interest Capitalization,
144A 9.625%,
12/1/18(3)(11) | | | 170 | | | | 171 | |
Sungard Availability Services Capital, Inc. 144A
8.750%, 4/1/22(3) | | | 100 | | | | 60 | |
VeriSign, Inc. 4.625%, 5/1/23 | | | 290 | | | | 286 | |
| | | | | | | | |
| | | | | | | 3,355 | |
| | | | | | | | |
| | |
| Materials—5.3% | | | | | | | | |
Alpek SA de C.V. 144A 5.375%, 8/8/23(3) | | | 625 | | | | 655 | |
Ardagh Packaging Finance plc
144A 6.250%,
1/31/19(3) | | | 200 | | | | 196 | |
144A 6.750%,
1/31/21(3) | | | 260 | | | | 259 | |
Cemex SAB de CV | | | | | | | | |
144A 9.500%,
6/15/18(3) | | | 395 | | | | 433 | |
144A 7.250%,
1/15/21(3) | | | 275 | | | | 289 | |
Eldorado Gold Corp.
144A 6.125%,
12/15/20(3) | | | 180 | | | | 175 | |
EuroChem Mineral & Chemical Co. OJSC
144A 5.125%,
12/12/17(3)(7) | | | 270 | | | | 232 | |
Fortescue Metals Group (FMG) 144A
8.250%, 11/1/19(3) | | | 325 | | | | 297 | |
Gerdau Holdings, Inc.
144A 7.000%,
1/20/20(3) | | | 375 | | | | 405 | |
Gerdau Trade, Inc.
144A 4.750%,
4/15/23(3) | | | 200 | | | | 187 | |
Hexion U.S. Finance Corp. | | | | | | | | |
8.875%, 2/1/18 | | | 230 | | | | 205 | |
6.625%, 4/15/20 | | | 225 | | | | 222 | |
Inversiones CMPC S.A.
144A 4.375%,
5/15/23(3) | | | 600 | | | | 590 | |
Nufarm Australia Ltd.
144A 6.375%,
10/15/19(3) | | | 220 | | | | 222 | |
Rayonier AM Products, Inc.
144A 5.500%,
6/1/24(3) | | | 220 | | | | 182 | |
Samarco Mineracao SA
144A 5.375%,
9/26/24(3) | | | 255 | | | | 236 | |
| | | | | | | | |
| | | PAR
VALUE | | | VALUE | |
| Materials—continued | |
Sappi Papier Holding GmbH
144A 8.375%, 6/15/19(3) | | $ | 200 | | | $ | 215 | |
144A 6.625%, 4/15/21(3) | | | 780 | | | | 803 | |
Severstal OAO (Steel Capital SA) 144A
6.700%,
10/25/17(3)(7) | | | 500 | | | | 464 | |
Tronox Finance LLC
6.375%, 8/15/20 | | | 345 | | | | 348 | |
United States Steel Corp.
6.875%, 4/1/21 | | | 490 | | | | 502 | |
Vale Overseas Ltd.
4.375%, 1/11/22 | | | 525 | | | | 506 | |
Vedanta Resources plc | | | | | | | | |
144A 9.500%, 7/18/18(3) | | | 345 | | | | 373 | |
144A 6.000%, 1/31/19(3) | | | 200 | | | | 196 | |
| | | | | | | | |
| | | | | | | 8,192 | |
| | | | | | | | |
|
| Telecommunication Services—2.9% | |
America Movil SAB de C.V.
Series 12
6.450%, 12/5/22 | | | 2,000 | MXN | | | 133 | |
Bharti Airtel International Netherlands BV 144A 5.125%, 3/11/23(3) | | | 400 | | | | 429 | |
CenturyLink, Inc.
Series T 5.800%, 3/15/22 | | | 350 | | | | 365 | |
Cincinnati Bell, Inc.
8.375%, 10/15/20 | | | 375 | | | | 396 | |
Crown Castle Towers LLC | | | | | | | | |
144A 3.214%, 8/15/15(3) | | | 50 | | | | 51 | |
144A 5.495%, 1/15/17(3) | | | 85 | | | | 90 | |
Digicel Group Ltd.
144A 8.250%, 9/30/20(3) | | | 345 | | | | 336 | |
Frontier Communications Corp. 6.250%, 9/15/21 | | | 195 | | | | 196 | |
Koninklijke KPN NV 144A 7.000%(2)(3)(6) | | | 385 | | | | 406 | |
Level 3 Financing, Inc.
7.000%, 6/1/20 | | | 400 | | | | 423 | |
Sprint Corp.
7.250%, 9/15/21 | | | 340 | | | | 339 | |
T-Mobile USA, Inc. | | | | | | | | |
6.125%, 1/15/22 | | | 190 | | | | 194 | |
6.731%, 4/28/22 | | | 60 | | | | 62 | |
6.500%, 1/15/24 | | | 140 | | | | 144 | |
Wind Acquisition Finance S.A. 144A
4.750%, 7/15/20(3) | | | 220 | | | | 206 | |
Windstream Corp.
7.750%, 10/15/20 | | | 650 | | | | 671 | |
| | | | | | | | |
| | | | | | | 4,441 | |
| | | | | | | | |
|
| Utilities—1.2% | |
Calpine Corp.
144A 6.000%, 1/15/22(3) | | | 20 | | | | 21 | |
Dynegy Finance I, Inc. | | | | | | | | |
144A 7.375%, 11/1/22(3) | | | 185 | | | | 188 | |
144A 7.625%, 11/1/24(3) | | | 70 | | | | 72 | |
Electricite de France SA
144A
5.250%(2)(3)(5)(6) | | | 635 | | | | 651 | |
Israel Electric Corp. Ltd.
144A 5.625%, 6/21/18(3) | | | 275 | | | | 292 | |
Majapahit Holding BV
144A 7.750%, 1/20/20(3) | | | 300 | | | | 349 | |
Refer to Footnote Legend on page 36.
See Notes to Financial Statements
34
VIRTUS MULTI-SECTOR FIXED INCOME SERIES
SCHEDULE OF INVESTMENTS (Continued)
DECEMBER 31, 2014
($ reported in thousands)
| | | | | | | | |
| | | PAR
VALUE | | | VALUE | |
| Utilities—continued | |
RJS Power Holdings LLC
144A 5.125%,
7/15/19(3) | | $ | 250 | | | $ | 248 | |
Texas Competitive Electric Holdings Co. LLC
Series A
10.250%, 11/1/15(12) | | | 396 | | | | 40 | |
| | | | | | | | |
| | | | | | | | 1,861 | |
TOTAL CORPORATE BONDS AND NOTES
(Identified Cost $91,729) | | | | 89,818 | |
|
| LOAN AGREEMENTS(2)—11.0% | |
|
| Consumer Discretionary—2.8% | |
Advantage Sales & Marketing, Inc. Second Lien, 7.500%, 7/25/22 | | | 260 | | | | 258 | |
Affinity Gaming LLC
5.250%, 11/9/17 | | | 377 | | | | 373 | |
Brickman Group Ltd. LLC (The) Second Lien,
7.500%, 12/17/21 | | | 166 | | | | 163 | |
Caesars Entertainment Operating Co., Inc.
Tranche B-6,
6.985%, 3/1/17 | | | 257 | | | | 226 | |
Tranche B-7,
9.750%, 1/28/18 | | | 19 | | | | 16 | |
Caesars Growth Properties Holdings LLC Tranche B, First Lien, 6.250%, 5/8/21 | | | 128 | | | | 118 | |
CBAC Borrower LLC
Tranche B, 8.250%, 7/2/20 | | | 202 | | | | 200 | |
Charter Communications Operating LLC Tranche G,
4.250%, 9/10/21 | | | 80 | | | | 81 | |
Clear Channel Communications, Inc. Tranche D,
6.919%, 1/30/19 | | | 514 | | | | 486 | |
Cumulus Media Holdings, Inc. 4.250%, 12/23/20 | | | 112 | | | | 109 | |
Delta 2 (Lux) S.A.R.L. Second Lien,
0.000%, 7/29/22(8) | | | 146 | | | | 143 | |
Granite Broadcasting Corp. Tranche B, First Lien,
6.750%, 5/23/18 | | | 127 | | | | 126 | |
Key Safety Systems, Inc.
4.750%, 8/29/21 | | | 170 | | | | 169 | |
Landry’s Restaurant, Inc. Tranche B, 4.000%, 4/24/18 | | | 616 | | | | 613 | |
Marina District Finance Co., Inc. 6.750%, 8/15/18 | | | 180 | | | | 180 | |
Peppermill Casinos, Inc. Tranche B, 7.250%, 11/9/18 | | | 397 | | | | 398 | |
Shingle Springs Tribal Gaming Authority
6.250%, 8/29/19 | | | 222 | | | | 223 | |
Transtar Holding Co. Second Lien, 10.000%, 10/9/19 | | | 197 | | | | 195 | |
TWCC Holding Corp. Second Lien, 7.000%, 6/26/20 | | | 349 | | | | 336 | |
| | | | | | | | |
| | | | | | | 4,413 | |
| | | | | | | | |
| | | | | | | | |
| | | PAR
VALUE | | | VALUE | |
| Consumer Staples—0.3% | |
Albertson’s LLC | | | | | | | | |
Tranche B-4-1,
4.500%, 8/25/21 | | $ | 24 | | | $ | 24 | |
Tranche B-4,
4.500%, 8/25/21 | | | 227 | | | | 227 | |
New Hostess Brand Acquisition LLC Tranche B,
6.750%, 4/9/20 | | | 264 | | | | 269 | |
| | | | | | | | |
| | | | | | | 520 | |
| | | | | | | | |
| | |
| Energy—1.3% | | | | | | | | |
Arch Coal, Inc.
6.250%, 5/16/18 | | | 443 | | | | 368 | |
Chief Exploration & Development LLC Second Lien, 7.500%, 5/16/21 | | | 257 | | | | 233 | |
Drillships Ocean Ventures, Inc. 5.500%, 7/25/21 | | | 273 | | | | 221 | |
Expro Finservices S.A.R.L. 5.750%, 9/2/21 | | | 176 | | | | 145 | |
Fieldwood Energy LLC Closing Date Loan, Second Lien, 8.375%, 9/30/20 | | | 341 | | | | 251 | |
Jonah Energy LLC Second Lien, 7.500%, 5/12/21 | | | 206 | | | | 178 | |
Paragon Offshore Finance Co.
3.750%, 7/16/21 | | | 247 | | | | 200 | |
Seadrill Operating LP
4.000%, 2/21/21 | | | 248 | | | | 194 | |
Templar Energy LLC Second Lien, 8.500%, 11/25/20 | | | 345 | | | | 250 | |
| | | | | | | | |
| | | | | | | 2,040 | |
| | | | | | | | |
| | |
| Financials—0.6% | | | | | | | | |
Altisource Solutions S.A.R.L. Tranche B, 4.500%, 12/9/20 | | | 455 | | | | 355 | |
Asurion LLC Second Lien,
8.500%, 3/3/21 | | | 275 | | | | 274 | |
Capital Automotive LP Second Lien,
6.000%, 4/30/20 | | | 189 | | | | 189 | |
Walter Investment Management Corp.
Tranche B,
4.750%, 12/18/20 | | | 169 | | | | 153 | |
| | | | | | | | |
| | | | | | | 971 | |
| | | | | | | | |
| | |
| Health Care—1.4% | | | | | | | | |
AMAG Pharmaceuticals, Inc.
7.250%, 11/12/20 | | | 120 | | | | 120 | |
American Renal Holdings, Inc. 8.500%, 3/20/20 | | | 307 | | | | 304 | |
Ardent Medical Services, Inc. | | | | | | | | |
First Lien, 6.750%, 7/2/18 | | | 118 | | | | 119 | |
Second Lien,
11.000%, 1/2/19 | | | 101 | | | | 101 | |
Gentiva Health Services, Inc. Tranche B,
6.500%, 10/18/19 | | | 340 | | | | 339 | |
InVentiv Health, Inc.
Tranche B-4,
7.750%, 5/15/18 | | | 262 | | | | 262 | |
| | | | | | | | |
| | | PAR
VALUE | | | VALUE | |
| Health Care—continued | | | | | | | | |
MMM Holdings, Inc.
9.750%, 12/12/17 | | $ | 123 | | | $ | 120 | |
MSO of Puerto Rico, Inc.
9.750%, 12/12/17 | | | 90 | | | | 87 | |
NVA Holdings, Inc. Second Lien 8.000%, 8/14/22 | | | 158 | | | | 156 | |
PharMEDium Healthcare Corp. Second Lien,
7.750%, 1/28/22 | | | 67 | | | | 66 | |
Regional Care, Inc. (RCHP, Inc.) First Lien,
0.000%, 4/23/19(8) | | | 277 | | | | 276 | |
Surgery Center Holdings, Inc. First Lien, 5.250%, 11/3/20 | | | 36 | | | | 35 | |
Second Lien,
8.500%, 11/3/21 | | | 138 | | | | 134 | |
| | | | | | | | |
| | | | | | | 2,119 | |
| | | | | | | | |
| | |
| Industrials—1.8% | | | | | | | | |
Alliance Laundry Systems LLC Second Lien,
9.500%, 12/10/19 | | | 37 | | | | 37 | |
American Airlines, Inc. Tranche B, 3.750%, 6/27/19 | | | 414 | | | | 410 | |
CHG Healthcare Services, Inc. Second Lien,
9.000%, 11/19/20 | | | 321 | | | | 322 | |
Commercial Barge Line Co. First Lien, 7.500%, 9/22/19 | | | 290 | | | | 290 | |
DynCorp International, Inc.
6.250%, 7/7/16 | | | 137 | | | | 137 | |
Filtration Group Corp. Second Lien, 8.250%, 11/22/21 | | | 260 | | | | 260 | |
Genpact Ltd. 3.500%, 8/30/19 | | | 348 | | | | 345 | |
International Equipment Solutions Global B.V.
6.750%, 8/16/19 | | | 176 | | | | 175 | |
Landmark U.S. Member LLC (and LM U.S. Corp. Acquisition, Inc.)
8.250%, 1/25/21 | | | 265 | | | | 261 | |
Navistar, Inc. Tranche B,
5.750%, 8/17/17 | | | 281 | | | | 281 | |
Sedgwick, Inc. 6.750%, 2/28/22 | | | 340 | | | | 322 | |
| | | | | | | | |
| | | | | | | 2,840 | |
| | | | | | | | |
|
| Information Technology—1.9% | |
Allflex Holdings III, Inc. Second Lien,
8.000%, 7/19/21 | | | 200 | | | | 196 | |
Applied Systems, Inc.
Second Lien,
7.500%, 1/24/22 | | | 182 | | | | 179 | |
Avago Technologies Cayman Ltd. 3.750%, 5/6/21 | | | 335 | | | | 335 | |
Blue Coat Systems, Inc. Second Lien,
9.500%, 6/26/20 | | | 339 | | | | 334 | |
Deltek, Inc. Second Lien,
10.000%, 10/10/19 | | | 236 | | | | 238 | |
Refer to Footnote Legend on page 36.
See Notes to Financial Statements
35
VIRTUS MULTI-SECTOR FIXED INCOME SERIES
SCHEDULE OF INVESTMENTS (Continued)
DECEMBER 31, 2014
($ reported in thousands)
| | | | | | | | |
| | | PAR
VALUE | | | VALUE | |
| Information Technology—continued | |
Evergreen Skills Lux S.A.R.L. Second Lien,
9.250%, 4/28/22 | | $ | 189 | | | $ | 179 | |
First Data Corp.
3.667%, 3/23/18 | | | 375 | | | | 368 | |
Infinity Acquisition Ltd.
4.250%, 8/6/21 | | | 171 | | | | 168 | |
IPC Systems, Inc.
6.000%, 11/8/20 | | | 238 | | | | 237 | |
Kronos, Inc. Second Lien,
9.750%, 4/30/20 | | | 458 | | | | 467 | |
Lanyon Solutions, Inc.
First Lien,
5.500%, 11/13/20 | | | 226 | | | | 222 | |
Sungard Availability Services Capital, Inc. Tranche B,
6.000%, 3/29/19 | | | 96 | | | | 86 | |
| | | | | | | | |
| | | | | | | 3,009 | |
| | | | | | | | |
| | |
| Materials—0.6% | | | | | | | | |
Crown Americas LLC
Tranche B,
0.000%, 10/22/21(8) | | | 138 | | | | 138 | |
Fortescue Metals Group (FMG) Resources Property Ltd. 3.750%, 6/30/19 | | | 446 | | | | 407 | |
Houghton International, Inc. Holding Corp. Second Lien,
9.500%, 12/21/20 | | | 310 | | | | 310 | |
| | | | | | | | |
| | | | | | | 855 | |
| | | | | | | | |
| | |
| Utilities—0.3% | | | | | | | | |
Atlantic Power LP
4.750%, 2/24/21 | | | 73 | | | | 72 | |
Texas Competitive Electric Holdings Co. LLC 2017 Extended,
4.648%,
10/10/17(13) | | | 465 | | | | 303 | |
| | | | | | | | |
| | | | | | | | 375 | |
TOTAL LOAN AGREEMENTS
(Identified Cost $17,925) | | | | 17,142 | |
| | |
| | | SHARES | | | | |
| |
| PREFERRED STOCKS—3.9% | | | | | |
|
| Energy—0.3% | |
PTT Exploration & Production PCL 144A,
4.875%(2)(3) | | | 440 | (10) | | | 433 | |
| | | | | | | | |
|
| Financials—3.3% | |
Ally Financial, Inc.
Series A, 8.500% | | | 20,000 | | | | 538 | |
Ally Financial, Inc.
Series G, 144A, 7.000%(3) | | | 439 | | | | 439 | |
Banco Bilbao Vizcaya Argentaria S.A. International S.A. Unipersonal 5.919%(2) | | | 150 | (10) | | | 153 | |
Citigroup, Inc.
5.800%, 11/29/49(2) | | | 420 | (10) | | | 421 | |
Series J, 7.125% | | | 15,800 | | | | 428 | |
General Electric Capital Corp.
Series B 6.25%(2) | | | 300 | (10) | | | 327 | |
| | | | | | | | |
| | |
SHARES | | | VALUE | |
| Financials—continued | |
General Electric Capital Corp.
Series C, 5.25%(2) | | | 400 | (10) | | $ | 400 | |
Goldman Sachs Group, Inc. (The) Series L, 5.700%(2) | | | 315 | (10) | | | 319 | |
JPMorgan Chase & Co.
Series V, 5.000%(2) | | | 595 | (10) | | | 582 | |
PNC Financial Services Group, Inc. (The) Series R, 4.850%(2) | | | 405 | (10) | | | 382 | |
SunTrust Banks, Inc.
5.625%, 12/29/49(2) | | | 120 | (10) | | | 121 | |
Wells Fargo & Co.
Series K, 7.980%(2) | | | 440 | (10) | | | 486 | |
Zions Bancorp
Series A, 6.950% | | | 17,215 | | | | 471 | |
| | | | | | | | |
| | | | | | | 5,067 | |
| | | | | | | | |
| | |
| Industrials—0.3% | | | | | | | | |
Seaspan Corp.
Series C, 9.500% | | | 20,000 | | | | 535 | |
TOTAL PREFERRED STOCKS
(Identified Cost $5,596) | | | | 6,035 | |
| | |
| COMMON STOCK—0.0% | | | | | | | | |
|
| Consumer Discretionary—0.0% | |
Mark IV Industries | | | 828 | | | | 31 | |
TOTAL COMMON STOCK
(Identified Cost $7) | | | | | | | 31 | |
TOTAL LONG TERM
INVESTMENTS—98.0% (Identified
Cost $155,751) | | | | 152,004 | (14) |
|
| SHORT-TERM INVESTMENTS—1.0% | |
|
| Money Market Mutual Fund—1.0% | |
Fidelity Money Market Portfolio – Institutional Shares (seven-day effective yield 0.110%) | | | 1,605,171 | | | | 1,605 | |
TOTAL SHORT-TERM INVESTMENTS
(Identified Cost $1,605) | | | | 1,605 | |
TOTAL INVESTMENTS—99.0%
(Identified Cost $157,356) | | | | 153,609 | (1) |
Other assets and liabilities, net—1.0% | | | | 1,529 | |
| | | | | | | | |
| NET ASSETS—100.0% | | | $ | 155,138 | |
| | | | | | | | |
Abbreviations:
| FHLMC | Federal Home Loan Mortgage Corporation (“Freddie Mac”). |
| FNMA | Federal National Mortgage Association (“Fannie Mae”). |
| NATL | National Public Finance Guarantee Corp. |
| PIK | Payment-in-Kind Security |
Footnote Legend:
| (1) | Federal Income Tax Information: For tax information at December 31, 2014, see Note 10 Federal Income Tax Information in the Notes to Financial Statements. |
| (2) | Variable or step coupon security; interest rate shown reflects the rate in effect at December 31, 2014. |
| (3) | Security exempt from registration under Rule 144A of the Securities Act of 1933. These securities may be resold in transactions exempt from registration, normally to qualified institutional buyers. At December 31, 2014, these securities amounted to a value of $56,371 or 36.3% of net assets. |
| (4) | Regulation S security. Security is offered and sold outside of the United States, therefore, it is exempt from registration with the SEC under rules 903 and 904 of the Securities Act of 1933. |
| (5) | No contractual maturity date. |
| (6) | Interest payments may be deferred. |
| (7) | This Note was issued for the sole purpose of funding a loan agreement between the issuer and the borrower. As the credit risk for this security lies solely with the borrower, the name represented here is that of the borrower. |
| (8) | This loan will settle after December 31, 2014, at which time the interest rate, based on the London Interbank Offered Rate (“LIBOR”) and the agreed upon spread on trade date, will be reflected. |
| (9) | Principal amount is adjusted daily pursuant to the change in the Consumer Price Index. |
| (10) | Value shown as par value. |
| (11) | 100% of the income received was in cash. |
| (12) | Security in default. |
| (13) | Security in default, interest payments are being received during the bankruptcy proceedings. |
| (14) | A portion of the Fund’s assets have been segregated for delayed delivery settlements. |
Foreign Currencies:
| | | | |
| Country Weightings (unaudited)† | | | |
United States | | | 67 | % |
Brazil | | | 3 | |
Luxembourg | | | 3 | |
Mexico | | | 3 | |
United Kingdom | | | 3 | |
Chile | | | 2 | |
Canada | | | 1 | |
Other | | | 18 | |
Total | | | 100 | % |
† % of total investments as of December 31, 2014 | |
See Notes to Financial Statements
36
VIRTUS MULTI-SECTOR FIXED INCOME SERIES
SCHEDULE OF INVESTMENTS (Continued)
DECEMBER 31, 2014
($ reported in thousands)
The following table provides a summary of inputs used to value the Series’ investments as of December 31, 2014 (See Security Valuation Note 2A in the Notes to Financial Statements):
| | | | | | | | | | | | | | | | |
| | | Total
Value at
December 31, 2014 | | | Level 1
Quoted
Prices | | | Level 2
Significant
Observable
Inputs | | | Level 3
Significant
Unobservable
Inputs | |
Debt Securities: | | | | | | | | | | | | | | | | |
Asset-Backed Securities | | $ | 6,044 | | | $ | — | | | $ | 6,044 | | | $ | — | |
Corporate Bonds and Notes | | | 89,818 | | | | — | | | | 89,818 | | | | — | |
Foreign Government Securities | | | 11,279 | | | | — | | | | 11,279 | | | | — | |
Loan Agreements | | | 17,142 | | | | — | | | | 16,964 | | | | 178 | |
Mortgage-Backed Securities | | | 19,846 | | | | — | | | | 19,846 | | | | — | |
Municipal Bonds | | | 1,809 | | | | — | | | | 1,809 | | | | — | |
Equity Securities: | | | | | | | | | | | | | | | | |
Common Stock | | | 31 | | | | — | | | | — | | | | 31 | |
Preferred Stocks | | | 6,035 | | | | 1,972 | | | | 4,063 | | | | — | |
Short-Term Investments | | | 1,605 | | | | 1,605 | | | | — | | | | — | |
| | | | | | | | | | | | | | | | |
Total Investments | | $ | 153,609 | | | $ | 3,577 | | | $ | 149,823 | | | $ | 209 | |
| | | | | | | | | | | | | | | | |
There were no transfers between Level 1 and Level 2 related to securities held at December 31, 2014.
The following is a reconciliation of assets of the Series for Level 3 investments for which significant unobservable inputs were used to determine fair value.
| | | | | | | | | | | | | | | | |
| | | Investments in
Securities | | | Asset-Backed
Securities | | | Common
Stocks | | | Loan
Agreements | |
Beginning Balance December 31, 2013: | | $ | 505 | | | $ | 474 | | | $ | 31 | | | $ | — | |
Accrued Discount/(Premium) | | | — | (a) | | | — | (a) | | | — | | | | — | (a) |
Realized Gain (Loss) | | | 9 | | | | 9 | | | | — | | | | — | |
Change in Unrealized Appreciation (Depreciation)(b) | | | (25 | ) | | | 2 | | | | — | (a) | | | (27 | ) |
Purchases | | | 205 | | | | — | | | | — | | | | 205 | |
(Sales)(c) | | | (485 | ) | | | (485 | ) | | | — | | | | — | |
Transfers into Level 3(d) | | | — | | | | — | | | | — | | | | — | |
Transfers from Level 3(d) | | | — | | | | — | | | | — | | | | — | |
| | | | | | | | | | | | | | | | |
Ending Balance December 31, 2014 | | $ | 209 | | | $ | — | | | $ | 31 | (e) | | $ | 178 | (e) |
| | | | | | | | | | | | | | | | |
None of the securities in this table are internally fair valued.
| (a) | Amount is less than $500. |
| (b) | Included in the related net change in unrealized appreciation (depreciation) in the Statement of Operations. The change in unrealized appreciation (depreciation) on investments still held as of December 31, 2014 was $(25). |
| (c) | Includes paydowns on securities. |
| (d) | “Transfers into and/or from” represent the ending value as of December 31, 2014, for any investment security where a change in the pricing level occurred from the beginning to the end of the period. |
| (e) | The Fund’s investments that are categorized as Level 3 were valued utilizing third party pricing information without adjustment. Such valuations are based on unobservable inputs. A significant change in third party information inputs could result in a significantly lower or higher value of Level 3 investments. |
See Notes to Financial Statements
37
VIRTUS PREMIUM ALPHASECTOR® SERIES
SCHEDULE OF INVESTMENTS
DECEMBER 31, 2014
($ reported in thousands)
| | | | | | | | |
| | | SHARES | | | VALUE | |
| EXCHANGE-TRADED FUNDS—99.7% | |
Consumer Discretionary Select Sector SPDR Fund | | | 103,610 | | | $ | 7,476 | |
Consumer Staples Select Sector SPDR Fund | | | 151,500 | | | | 7,346 | |
Financial Select Sector SPDR Fund | | | 300,190 | | | | 7,424 | |
Technology Select Sector SPDR Fund | | | 176,980 | | | | 7,318 | |
Utilities Select Sector SPDR Fund | | | 154,340 | | | | 7,288 | |
| TOTAL EXCHANGE-TRADED FUNDS | | | | | |
| (Identified Cost $36,484) | | | | | | | 36,852 | |
| TOTAL LONG TERM INVESTMENTS—99.7% | |
| (Identified Cost $36,484) | | | | | | | 36,852 | |
|
| SHORT-TERM INVESTMENTS—1.2% | |
|
| Money Market Mutual Funds—1.2% | |
Fidelity Money Market Portfolio – Institutional Shares (seven-day effective yield 0.110%) | | | 145,091 | | | | 145 | |
JPMorgan Prime Money Market Fund (seven-day effective yield 0.080%) | | | 145,091 | | | | 145 | |
JPMorgan U.S. Government Money Market Fund (seven-day effective yield 0.010%) | | | 149,488 | | | | 149 | |
| TOTAL SHORT-TERM INVESTMENTS | |
| (Identified Cost $439) | | | | | | | 439 | |
| TOTAL INVESTMENTS—100.9% | |
| (Identified Cost $36,923) | | | | 37,291 | (1) |
Other assets and liabilities, net—(0.9)% | | | | (334 | ) |
| | | | | |
| NET ASSETS—100.0% | | | $ | 36,957 | |
| | | | | | | | |
Abbreviation:
| SPDR | S&P Depositary Receipt |
Footnote Legend:
| (1) | Federal Income Tax Information: For tax information at December 31, 2014, see Note 10 Federal Income Tax Information in the Notes to Financial Statements. |
The following table provides a summary of inputs used to value the Series’ investments as of December 31, 2014 (See Security Valuation Note 2A in the Notes to Financial Statements):
| | | | | | | | |
| | | Total
Value at
December 31, 2014 | | | Level 1
Quoted
Prices | |
Equity Securities: | | | | | | | | |
Exchange-Traded Funds | | $ | 36,852 | | | $ | 36,852 | |
Short-Term Investments | | | 439 | | | | 439 | |
| | | | | | | | |
Total Investments | | $ | 37,291 | | | $ | 37,291 | |
| | | | | | | | |
There are no Level 2 (significant observable inputs) or Level 3 (significant unobservable inputs) priced securities.
There were no transfers between Level 1 and Level 2 related to securities held at December 31, 2014.
See Notes to Financial Statements
38
VIRTUS REAL ESTATE SECURITIES SERIES
SCHEDULE OF INVESTMENTS
DECEMBER 31, 2014
($ reported in thousands)
| | | | | | | | |
| | | SHARES | | | VALUE | |
| COMMON STOCKS—97.0% | |
|
| Real Estate Investment Trusts—97.0% | |
|
| Health Care—5.2% | |
HCP, Inc. | | | 49,274 | | | $ | 2,169 | |
Ventas, Inc. | | | 45,366 | | | | 3,253 | |
| | | | | | | | |
| | | | | | | 5,422 | |
| | | | | | | | |
|
| Industrial/Office—27.5% | |
|
| Industrial—9.3% | |
DCT Industrial Trust, Inc. | | | 109,157 | | | | 3,893 | |
Eastgroup Properties, Inc. | | | 521 | | | | 33 | |
Prologis, Inc. | | | 137,171 | | | | 5,902 | |
| | | | | | | | |
| | | | | | | 9,828 | |
| | | | | | | | |
|
| Mixed—4.8% | |
Duke Realty Corp. | | | 95,800 | | | | 1,935 | |
Liberty Property Trust | | | 83,501 | | | | 3,142 | |
| | | | | | | | |
| | | | | | | 5,077 | |
| | | | | | | | |
|
| Office—13.4% | |
Boston Properties, Inc. | | | 23,214 | | | | 2,988 | |
Cousins Properties, Inc. | | | 25,588 | | | | 292 | |
Douglas Emmett, Inc. | | | 94,473 | | | | 2,683 | |
Highwoods Properties, Inc. | | | 48,297 | | | | 2,139 | |
Kilroy Realty Corp. | | | 54,180 | | | | 3,742 | |
Paramount Group, Inc.(2) | | | 53,684 | | | | 998 | |
SL Green Realty Corp. | | | 11,125 | | | | 1,324 | |
| | | | | | | | |
| | | | | | | 14,166 | |
| | | | | | | | |
Total Industrial/Office | | | | | | | 29,071 | |
| | | | | | | | |
|
| Lodging/Resorts—11.9% | |
Host Hotels & Resorts, Inc. | | | 187,861 | | | | 4,466 | |
LaSalle Hotel Properties | | | 70,878 | | | | 2,868 | |
Pebblebrook Hotel Trust | | | 63,665 | | | | 2,905 | |
RLJ Lodging Trust | | | 69,900 | | | | 2,344 | |
| | | | | | | | |
| | | | | | | 12,583 | |
| | | | | | | | |
|
| Residential—18.2% | |
|
| Apartments—17.3% | |
American Campus Communities, Inc. | | | 49,987 | | | | 2,067 | |
AvalonBay Communities, Inc. | | | 13,004 | | | | 2,125 | |
Camden Property Trust | | | 53,300 | | | | 3,936 | |
Equity Residential | | | 72,354 | | | | 5,198 | |
Essex Property Trust, Inc. | | | 24,071 | | | | 4,973 | |
| | | | | | | | |
| | | | | | | 18,299 | |
| | | | | | | | |
|
| Manufactured Homes—0.9% | |
Equity Lifestyle Properties, Inc. | | | 18,067 | | | | 931 | |
| | | | | | | | |
Total Residential | | | | | | | 19,230 | |
| | | | | | | | |
| | | | | | | | |
| | | SHARES | | | VALUE | |
| Retail—23.1% | |
|
| Regional Malls—15.1% | |
General Growth Properties, Inc. | | | 153,121 | | | $ | 4,307 | |
Macerich Co. (The) | | | 20,047 | | | | 1,672 | |
Simon Property Group, Inc. | | | 49,926 | | | | 9,092 | |
Washington Prime Group, Inc. | | | 53,338 | | | | 919 | |
| | | | | | | | |
| | | | | | | 15,990 | |
| | | | | | | | |
| | |
| Shopping Centers—8.0% | | | | | | | | |
Brixmor Property Group, Inc. | | | 100,302 | | | | 2,491 | |
DDR Corp. | | | 39,957 | | | | 734 | |
Kimco Realty Corp. | | | 65,084 | | | | 1,636 | |
Tanger Factory Outlet Centers | | | 96,400 | | | | 3,563 | |
| | | | | | | | |
| | | | | | | 8,424 | |
| | | | | | | | |
Total Retail | | | | | | | 24,414 | |
| | | | | | | | |
|
| Self Storage—11.1% | |
CubeSmart | | | 45,100 | | | | 995 | |
Extra Space Storage, Inc. | | | 67,707 | | | | 3,970 | |
Public Storage | | | 36,627 | | | | 6,771 | |
| | | | | | | | |
| | | | | | | | 11,736 | |
| TOTAL COMMON STOCKS | |
| (Identified Cost $53,519) | | | | 102,456 | |
| TOTAL LONG TERM INVESTMENTS—97.0% | |
| (Identified Cost $53,519) | | | | 102,456 | |
|
| SHORT-TERM INVESTMENTS—3.5% | |
|
| Money Market Mutual Fund—3.5% | |
Fidelity Money Market Portfolio – Institutional Shares (Seven-day effective yield 0.110%) | | | 3,687,000 | | | | 3,687 | |
TOTAL SHORT-TERM INVESTMENTS
(Identified Cost $3,687) | | | | 3,687 | |
TOTAL INVESTMENTS—100.5%
(Identified Cost $57,206) | | | | 106,143 | (1) |
Other assets and liabilities, net—(0.5)% | | | | (501 | ) |
| | | | | | | | |
| NET ASSETS—100.0% | | | $ | 105,642 | |
| | | | | | | | |
Footnote Legend
| (1) | Federal Income Tax Information: For tax information at December 31, 2014, see Note 10 Federal Income Tax Information in the Notes to Financial Statements. |
| (2) | Non-income producing. |
The following table provides a summary of inputs used to value the Series’ investments as of December 31, 2014 (See Security Valuation Note 2A in the Notes to Financial Statements):
| | | | | | | | |
| | | Total
Value at
December 31, 2014 | | | Level 1
Quoted
Prices | |
Equity Securities: | | | | | | | | |
Common Stocks | | $ | 102,456 | | | $ | 102,456 | |
Short-Term Investments | | | 3,687 | | | | 3,687 | |
| | | | | | | | |
Total Investments | | $ | 106,143 | | | $ | 106,143 | |
| | | | | | | | |
There are no Level 2 (significant observable inputs) or Level 3 (significant unobservable inputs) priced securities.
There were no transfers between Level 1 and Level 2 related to securities held at December 31, 2014.
See Notes to Financial Statements
39
VIRTUS SMALL-CAP GROWTH SERIES
SCHEDULE OF INVESTMENTS
DECEMBER 31, 2014
($ reported in thousands)
| | | | | | | | |
| | | SHARES | | | VALUE | |
| COMMON STOCKS—98.2% | |
|
| Consumer Discretionary—11.9% | |
Hibbett Sports, Inc.(2) | | | 50,800 | | | $ | 2,460 | |
Monro Muffler Brake, Inc. | | | 27,000 | | | | 1,561 | |
Morningstar, Inc. | | | 31,700 | | | | 2,051 | |
Pool Corp. | | | 23,900 | | | | 1,516 | |
| | | | | | | | |
| | | | | | | 7,588 | |
| | | | | | | | |
|
| Consumer Staples—10.8% | |
Chefs’ Warehouse, Inc. (The)(2) | | | 192,000 | | | | 4,424 | |
PriceSmart, Inc. | | | 27,200 | | | | 2,481 | |
| | | | | | | | |
| | | | | | | 6,905 | |
| | | | | | | | |
|
| Financials—12.2% | |
Cohen & Steers, Inc. | | | 27,900 | | | | 1,174 | |
Financial Engines, Inc. | | | 80,100 | | | | 2,928 | |
MarketAxess Holdings, Inc. | | | 51,000 | | | | 3,657 | |
| | | | | | | | |
| | | | | | | 7,759 | |
| | | | | | | | |
|
| Health Care—13.2% | |
Abaxis, Inc. | | | 56,700 | | | | 3,223 | |
National Research Corp. Class A | | | 149,115 | | | | 2,086 | |
Sirona Dental Systems, Inc.(2) | | | 35,700 | | | | 3,119 | |
| | | | | | | | |
| | | | | | | 8,428 | |
| | | | | | | | |
|
| Industrials—15.7% | |
AAON, Inc. | | | 65,850 | | | | 1,474 | |
Copart, Inc.(2) | | | 64,200 | | | | 2,343 | |
Heartland Express, Inc. | | | 26,000 | | | | 702 | |
HEICO Corp. Class A | | | 43,405 | | | | 2,056 | |
HUB Group, Inc. Class A(2) | | | 36,200 | | | | 1,378 | |
Omega Flex, Inc. | | | 54,159 | | | | 2,048 | |
| | | | | | | | |
| | | | | | | 10,001 | |
| | | | | | | | |
|
| Information Technology—31.3% | |
ANSYS, Inc.(2) | | | 25,400 | | | | 2,083 | |
Ellie Mae, Inc.(2) | | | 72,000 | | | | 2,903 | |
FactSet Research Systems, Inc. | | | 18,500 | | | | 2,604 | |
Forrester Research, Inc. | | | 58,800 | | | | 2,314 | |
HomeAway, Inc.(2) | | | 83,200 | | | | 2,478 | |
MercadoLibre, Inc. | | | 13,650 | | | | 1,742 | |
Mesa Laboratories, Inc. | | | 7,035 | | | | 544 | |
NVE Corp.(2) | | | 49,400 | | | | 3,497 | |
Shutterstock, Inc.(2) | | | 25,600 | | | | 1,769 | |
| | | | | | | | |
| | | | | | | 19,934 | |
| | | | | | | | |
|
| Materials—3.1% | |
UFP Technologies, Inc.(2) | | | 80,200 | | | | 1,972 | |
| TOTAL COMMON STOCKS | |
| (Identified Cost $42,609) | | | | | | | 62,587 | |
| TOTAL LONG TERM INVESTMENTS—98.2% | |
| (Identified Cost $42,609) | | | | | | | 62,587 | |
| | | | | | | | |
| | | SHARES | | | VALUE | |
| SHORT-TERM INVESTMENTS—2.2% | |
|
| Money Market Mutual Fund—2.2% | |
Fidelity Money Market
Portfolio – Institutional Shares (seven-day effective yield 0.110%) | | | 1,418,236 | | | $ | 1,418 | |
| TOTAL SHORT-TERM INVESTMENTS | |
| (Identified Cost $1,418) | | | | | | | 1,418 | |
| TOTAL INVESTMENTS—100.4% | |
| (Identified Cost $44,027) | | | | | | | 64,005 | (1) |
Other assets and liabilities, net—(0.4)% | | | | (247 | ) |
| | | | | | | | |
| NET ASSETS—100.0% | | | $ | 63,758 | |
| | | | | | | | |
Footnote Legend:
| (1) | Federal Income Tax Information: For tax information at December 31, 2014, see Note 10 Federal Income Tax Information in the Notes to Financial Statements. |
| (2) | Non-income producing. |
The following table provides a summary of inputs used to value the Series’ investments as of December 31, 2014 (See Security Valuation Note 2A in the Notes to Financial Statements):
| | | | | | | | |
| | | Total
Value at
December 31, 2014 | | | Level 1
Quoted
Prices | |
Equity Securities: | | | | | | | | |
Common Stocks | | $ | 62,587 | | | $ | 62,587 | |
Short-Term Investments | | | 1,418 | | | | 1,418 | |
| | | | | | | | |
Total Investments | | $ | 64,005 | | | $ | 64,005 | |
| | | | | | | | |
There are no Level 2 (significant observable inputs) or Level 3 (significant unobservable inputs) priced securities.
There were no transfers between Level 1 and Level 2 related to securities held at December 31, 2014.
See Notes to Financial Statements
40
VIRTUS SMALL-CAP VALUE SERIES
SCHEDULE OF INVESTMENTS
DECEMBER 31, 2014
($ reported in thousands)
| | | | | | | | |
| | | SHARES | | | VALUE | |
| COMMON STOCKS—99.5% | |
|
| Consumer Discretionary—10.1% | |
Cheesecake Factory, Inc. (The) | | | 66,400 | | | $ | 3,340 | |
Cinemark Holdings, Inc. | | | 110,500 | | | | 3,932 | |
Wolverine World Wide, Inc. | | | 139,600 | | | | 4,114 | |
| | | | | | | | |
| | | | | | | 11,386 | |
| | | | | | | | |
|
| Consumer Staples—9.2% | |
National Beverage Corp.(2) | | | 145,500 | | | | 3,291 | |
Village Super Market, Inc. Class A | | | 47,000 | | | | 1,287 | |
WD-40 Co. | | | 68,100 | | | | 5,794 | |
| | | | | | | | |
| | | | | | | 10,372 | |
| | | | | | | | |
|
| Financials—19.6% | |
Artisan Partners Asset Management, Inc. Class A | | | 58,000 | | | | 2,931 | |
Bank of Hawaii Corp. | | | 48,500 | | | | 2,877 | |
First Cash Financial Services, Inc.(2) | | | 76,920 | | | | 4,282 | |
Primerica, Inc. | | | 73,700 | | | | 3,999 | |
RLI Corp. | | | 105,700 | | | | 5,222 | |
Westamerica Bancorp | | | 57,700 | | | | 2,828 | |
| | | | | | | | |
| | | | | | | 22,139 | |
| | | | | | | | |
|
| Health Care—3.4% | |
Patterson Cos., Inc. | | | 81,000 | | | | 3,896 | |
| | | | | | | | |
|
| Industrials—21.4% | |
CLARCOR, Inc. | | | 60,200 | | | | 4,012 | |
Corporate Executive Board Co. (The) | | | 69,700 | | | | 5,055 | |
G&K Services, Inc. Class A | | | 23,017 | | | | 1,631 | |
Graco, Inc. | | | 66,200 | | | | 5,308 | |
Landstar System, Inc. | | | 66,800 | | | | 4,845 | |
RBC Bearings, Inc. | | | 27,000 | | | | 1,742 | |
Sun Hydraulics Corp. | | | 40,000 | | | | 1,575 | |
| | | | | | | | |
| | | | | | | 24,168 | |
| | | | | | | | |
|
| Information Technology—29.7% | |
American Software, Inc. Class A | | | 204,000 | | | | 1,858 | |
Badger Meter, Inc. | | | 66,483 | | | | 3,946 | |
Cabot Microelectronics Corp.(2) | | | 74,200 | | | | 3,511 | |
Cass Information Systems, Inc. | | | 91,895 | | | | 4,893 | |
Cognex Corp.(2) | | | 59,300 | | | | 2,451 | |
Computer Services, Inc. | | | 58,700 | | | | 2,350 | |
Heartland Payment Systems, Inc. | | | 47,000 | | | | 2,536 | |
Jack Henry & Associates, Inc. | | | 80,900 | | | | 5,027 | |
Monotype Imaging Holdings, Inc. | | | 82,733 | | | | 2,385 | |
Syntel Co.(2) | | | 104,000 | | | | 4,678 | |
| | | | | | | | |
| | | | | | | 33,635 | |
| | | | | | | | |
|
| Materials—2.2% | |
Balchem Corp. | | | 37,400 | | | | 2,492 | |
| | | | | | | | |
| | | | | | | | |
| | | SHARES | | | VALUE | |
| Utilities—3.9% | |
Questar Corp. | | | 175,000 | | | $ | 4,424 | |
| TOTAL COMMON STOCKS | | | | | |
| (Identified Cost $79,226) | | | | | | | 112,512 | |
| TOTAL LONG TERM INVESTMENTS—99.5% | |
| (Identified Cost $79,226) | | | | | | | 112,512 | |
|
| SHORT-TERM INVESTMENTS—0.7% | |
|
| Money Market Mutual Fund—0.7% | |
Fidelity Money Market
Portfolio – Institutional Shares (seven-day effective yield 0.110%) | | | 736,395 | | | | 736 | |
| TOTAL SHORT-TERM INVESTMENTS | | | | | |
| (Identified Cost $736) | | | | | | | 736 | |
| TOTAL INVESTMENTS—100.2% | | | | | |
| (Identified Cost $79,962) | | | | | | | 113,248 | (1) |
Other assets and liabilities, net—(0.2)% | | | | (218 | ) |
| | | | | | | | |
| NET ASSETS—100.0% | | | $ | 113,030 | |
| | | | | | | | |
Footnote Legend:
| (1) | Federal Income Tax Information: For tax information at December 31, 2014, see Note 10 Federal Income Tax Information in the Notes to Financial Statements. |
| (2) | Non-income producing. |
The following table provides a summary of inputs used to value the Series’ investments as of December 31, 2014 (See Security Valuation Note 2A in the Notes to Financial Statements):
| | | | | | | | |
| | | Total
Value at
December 31, 2014 | | | Level 1
Quoted
Prices | |
Equity Securities: | | | | | | | | |
Common Stocks | | $ | 112,512 | | | $ | 112,512 | |
Short-Term Investments | | | 736 | | | | 736 | |
| | | | | | | | |
Total Investments | | $ | 113,248 | | | $ | 113,248 | |
| | | | | | | | |
There are no Level 2 (significant observable inputs) or Level 3 (significant unobservable inputs) priced securities.
There were no transfers between Level 1 and Level 2 related to securities held at December 31, 2014.
See Notes to Financial Statements
41
VIRTUS STRATEGIC ALLOCATION SERIES
SCHEDULE OF INVESTMENTS
DECEMBER 31, 2014
($ reported in thousands)
| | | | | | | | |
| | | PAR
VALUE | | | VALUE | |
| U.S. GOVERNMENT SECURITIES—1.0% | |
U.S. Treasury Bond
3.125%, 11/15/41 | | $ | 145 | | | $ | 157 | |
U.S. Treasury Note | | | | | | | | |
0.625%, 11/30/17 | | | 180 | | | | 177 | |
2.375%, 8/15/24 | | | 435 | | | | 443 | |
3.125%, 8/15/44 | | | 475 | | | | 511 | |
TOTAL U.S. GOVERNMENT SECURITIES
(Identified Cost $1,229) | | | | 1,288 | |
|
| MUNICIPAL BONDS—1.8% | |
| | |
| California—0.4% | | | | | | | | |
Alameda Corridor Transportation Authority Series 99 – C, Taxable (NATL Insured) 6.600%, 10/1/29 | | | 250 | | | | 296 | |
San Diego County Regional Airport Authority Rental Car Center Project Series B – Taxable 5.594%, 7/1/43 | | | 275 | | | | 308 | |
| | | | | | | | |
| | | | | | | 604 | |
| | | | | | | | |
| | |
| Florida—0.1% | | | | | | | | |
Miami-Dade County Educational Facilities Authority Series C, Taxable 5.480%, 4/1/16 | | | 105 | | | | 109 | |
| | | | | | | | |
| | |
| Kentucky—0.1% | | | | | | | | |
Commonwealth of Kentucky Taxable 3.165%, 4/1/18 | | | 91 | | | | 93 | |
| | | | | | | | |
| | |
| Pennsylvania—1.1% | | | | | | | | |
City of Pittsburgh Pension Obligation Series C, Taxable (NATL- RE, FGIC Insured) 6.500%, 3/1/17 | | | 1,250 | | | | 1,381 | |
| | | | | | | | |
| | |
| Virginia—0.1% | | | | | | | | |
Tobacco Settlement Financing Corp. Series A-1, Taxable 6.706%, 6/1/46 | | | 210 | | | | 158 | |
TOTAL MUNICIPAL BONDS
(Identified Cost $2,154) | | | | | | | 2,345 | |
|
| FOREIGN GOVERNMENT SECURITIES—1.0% | |
Bolivarian Republic of Venezuela | | | | | | | | |
9.250%, 9/15/27 | | | 45 | | | | 21 | |
9.375%, 1/13/34 | | | 65 | | | | 29 | |
Republic of Chile
5.500%, 8/5/20 | | | 52,000 | CLP | | | 90 | |
Republic of El Salvador 144A 6.375%, 1/18/27(4) | | | 75 | | | | 76 | |
Republic of Iceland 144A 5.875%, 5/11/22(4) | | | 135 | | | | 151 | |
Republic of Indonesia | | | | | | | | |
Series FR30, 10.750%, 5/15/16 | | | 1,127,000 | IDR | | | 95 | |
| | | | | | | | |
| | | PAR
VALUE | | | VALUE | |
| FOREIGN GOVERNMENT SECURITIES—continued | |
Series FR55, 7.375%, 9/15/16 | | | 300,000 | IDR | | $ | 24 | |
Republic of Kazakhstan 144A 4.875%, 10/14/44(4) | | $ | 200 | | | | 184 | |
Republic of Latvia RegS 2.750%, 1/12/20(5) | | | 200 | | | | 198 | |
Republic of Poland 4.000%, 1/22/24 | | | 90 | | | | 96 | |
Russian Federation | | | | | | | | |
144A 7.850%, 3/10/18(4) | | | 5,000 | RUB | | | 67 | |
144A 4.875%, 9/16/23(4) | | | 200 | | | | 178 | |
United Mexican States | | | | | | | | |
Series M,
6.000%, 6/18/15 | | | 575 | MXN | | | 39 | |
Series M,
6.500%, 6/9/22 | | | 890 | MXN | | | 63 | |
| TOTAL FOREIGN GOVERNMENT SECURITIES | |
| (Identified Cost $1,500) | | | | 1,311 | |
|
| MORTGAGE-BACKED SECURITIES—13.0% | |
| | |
| Agency—4.3% | | | | | | | | |
FHLMC 14-DN2, M2
1.820%, 4/25/24(3) | | | 250 | | | | 242 | |
FNMA | | | | | | | | |
4.000%, 6/1/20 | | | 29 | | | | 31 | |
4.500%, 7/1/20 | | | 4 | | | | 4 | |
3.000%, 2/1/27 | | | 191 | | | | 199 | |
2.500%, 5/1/28 | | | 372 | | | | 379 | |
6.500%, 10/1/31 | | | 5 | | | | 6 | |
6.000%, 9/1/32 | | | 13 | | | | 15 | |
5.000%, 10/1/35 | | | 61 | | | | 68 | |
6.000%, 9/1/36 | | | 10 | | | | 12 | |
5.500%, 4/1/37 | | | 19 | | | | 21 | |
5.500%, 7/1/37 | | | 52 | | | | 58 | |
6.000%, 10/1/37 | | | 22 | | | | 25 | |
5.000%, 6/1/38 | | | 43 | | | | 48 | |
5.500%, 6/1/38 | | | 11 | | | | 13 | |
5.500%, 6/1/38 | | | 11 | | | | 12 | |
5.500%, 11/1/38 | | | 36 | | | | 40 | |
4.000%, 1/1/39 | | | 78 | | | | 83 | |
5.000%, 1/1/39 | | | 18 | | | | 19 | |
6.000%, 1/1/39 | | | 28 | | | | 32 | |
4.500%, 3/1/39 | | | 32 | | | | 34 | |
5.000%, 3/1/39 | | | 26 | | | | 29 | |
6.000%, 3/1/39 | | | 21 | | | | 24 | |
4.500%, 4/1/39 | | | 151 | | | | 166 | |
4.000%, 5/1/39 | | | 164 | | | | 175 | |
4.500%, 2/1/40 | | | 103 | | | | 113 | |
4.000%, 10/1/40 | | | 222 | | | | 237 | |
4.500%, 4/1/41 | | | 532 | | | | 578 | |
4.000%, 7/1/41 | | | 126 | | | | 135 | |
3.500%, 1/1/42 | | | 173 | | | | 181 | |
3.500%, 4/1/42 | | | 412 | | | | 431 | |
3.000%, 11/1/42 | | | 214 | | | | 216 | |
3.500%, 12/1/42 | | | 225 | | | | 234 | |
3.000%, 3/1/43 | | | 359 | | | | 363 | |
3.000%, 5/1/43 | | | 110 | | | | 111 | |
3.000%, 7/1/43 | | | 250 | | | | 253 | |
4.000%, 10/1/44 | | | 417 | | | | 446 | |
GNMA | | | | | | | | |
6.500%, 11/15/23 | | | 42 | | | | 48 | |
6.500%, 12/15/23 | | | 1 | | | | 1 | |
| | | | | | | | |
| | | PAR
VALUE | | | VALUE | |
| Agency—continued | | | | | | | | |
6.500%, 2/15/24 | | $ | 25 | | | $ | 28 | |
6.500%, 6/15/28 | | | 78 | | | | 89 | |
6.500%, 7/15/31 | | | 23 | | | | 27 | |
6.500%, 11/15/31 | | | 21 | | | | 24 | |
6.500%, 2/15/32 | | | 48 | | | | 54 | |
6.500%, 4/15/32 | | | 34 | | | | 40 | |
12-147, AK 2.587%, 4/16/54 | | | 260 | | | | 266 | |
| | | | | | | | |
| | | | | | | 5,610 | |
| | | | | | | | |
| | |
| Non-Agency—8.7% | | | | | | | | |
Aventura Mall Trust
13-AVM, C 144A
3.743%, 12/5/32(3)(4) | | | 300 | | | | 309 | |
Banc of America Alternative Loan Trust 03-2, CB3
5.750%, 4/25/33 | | | 109 | | | | 113 | |
Banc of America Commercial Mortgage Trust 07-2, A4
5.612%, 4/10/49(3) | | | 120 | | | | 128 | |
Bank of America (Merrill Lynch—Countrywide) Mortgage Trust 06-C1, AM
5.677%, 5/12/39(3) | | | 195 | | | | 205 | |
Bank of America (Merrill Lynch) Mortgage Investors Trust 98-C1, CTL 6.750%, 11/15/26(3) | | | 125 | | | | 140 | |
Barclays (Lehman Brothers)—UBS Commercial Mortgage Trust | | | | | | | | |
06-C3, AM 5.712%, 3/15/39(3) | | | 130 | | | | 136 | |
06-C6, A4
5.372%, 9/15/39 | | | 325 | | | | 343 | |
07-C6, A4
5.858%, 7/15/40(3) | | | 230 | | | | 242 | |
Citigroup—Deutsche Bank Commercial Mortgage Trust 06-CD2, A4
5.299%, 1/15/46(3) | | | 590 | | | | 607 | |
Citigroup Commercial Mortgage Trust | | | | | | | | |
07-C6, A1A 5.710%, 12/10/49(3) | | | 267 | | | | 288 | |
07-6, A4 5.710%, 12/10/49(3) | | | 120 | | | | 130 | |
08-C7, AM 6.142%, 12/10/49(3) | | | 95 | | | | 104 | |
Citigroup Mortgage Loan Trust, Inc. | | | | | | | | |
04-UST1, A3 2.133%, 8/25/34(3) | | | 125 | | | | 125 | |
04-NCM2, 2CB2 6.750%, 8/25/34 | | | 93 | | | | 99 | |
14-A, A 144A 4.000%, 1/25/35(3)(4) | | | 137 | | | | 142 | |
Colony Multifamily Commercial Mortgage-Backed Securities 14-1, A 144A 2.543%, 4/20/50(4) | | | 246 | | | | 245 | |
Credit Suisse Commercial Mortgage Trust 07-C1, A1A
5.361%, 2/15/40 | | | 109 | | | | 116 | |
Refer to Footnote Legend on page 47.
See Notes to Financial Statements
42
VIRTUS STRATEGIC ALLOCATION SERIES
SCHEDULE OF INVESTMENTS (Continued)
DECEMBER 31, 2014
($ reported in thousands)
| | | | | | | | |
| | | PAR
VALUE | | | VALUE | |
| Non-Agency—continued | | | | | | | | |
Credit Suisse First Boston Mortgage Securities Corp. 04-AR8, 6A1
2.387%, 9/25/34(3) | | $ | 76 | | | $ | 76 | |
Extended Stay America Trust 13-ESH7, A27 144A
2.958%, 12/5/31(4) | | | 300 | | | | 304 | |
GMAC Mortgage Corp. Loan Trust 04-AR1, 12A
2.989%, 6/25/34(3) | | | 84 | | | | 85 | |
Goldman Sachs Mortgage Securities Trust II
07-GG10, A4
5.796%, 8/10/45(3) | | | 330 | | | | 357 | |
JPMorgan Chase (Bear Stearns) Adjustable Rate Mortgage Trust | | | | | | | | |
04-1, 21A1 2.314%, 4/25/34(3) | | | 118 | | | | 117 | |
04-10, 12A3 2.657%, 1/25/35(3) | | | 131 | | | | 130 | |
JPMorgan Chase (Bear Stearns) Commercial Mortgage Securities, Inc. | | | | | | | | |
06-T22, AM 5.575%, 4/12/38(3) | | | 80 | | | | 84 | |
07- PW17, A4 5.694%, 6/11/50(3) | | | 425 | | | | 461 | |
07-PW18, AM 6.084%, 6/11/50(3) | | | 550 | | | | 605 | |
JPMorgan Chase (Washington Mutual) Mortgage Pass-Through Certificates Trust | | | | | | | | |
03-AR6, A1 2.438%, 6/25/33(3) | | | 101 | | | | 102 | |
03-AR4, 2A1 2.254%, 8/25/33(3) | | | 148 | | | | 147 | |
JPMorgan Chase Commercial Mortgage Securities Trust | | | | | | | | |
10-CNTR, A1 144A 3.300%, 8/5/32(4) | | | 207 | | | | 214 | |
10-CNTR, A2 144A 4.311%, 8/5/32(4) | | | 300 | | | | 328 | |
06-LDP9, A3 5.336%, 5/15/47 | | | 233 | | | | 248 | |
07-LD12, A4 5.882%, 2/15/51(3) | | | 575 | | | | 623 | |
JPMorgan Chase Mortgage Trust 14-1, 1A1 144A
4.000%, 1/25/44(3)(4) | | | 226 | | | | 237 | |
JPMorgan Mortgage Trust 14-2, 2A2 144A
3.500%, 6/25/29(3)(4) | | | 108 | | | | 111 | |
JPMorgan Mortgage Trust 14-IVR3, 2A1
3.000%, 10/25/29(3)(4) | | | 94 | | | | 95 | |
Leaf II Receivables Funding LLC 13-1, C 144A
3.460%, 9/15/21(4) | | | 150 | | | | 150 | |
MASTR Alternative Loan Trust 03-8, 2A1
5.750%, 11/25/33 | | | 204 | | | | 214 | |
| | | | | | | | |
| | | PAR
VALUE | | | VALUE | |
| Non-Agency—continued | | | | | | | | |
MASTR Asset Securitization Trust 04-6, 4A1
5.000%, 7/25/19 | | $ | 105 | | | $ | 106 | |
Morgan Stanley Capital I Trust | | | | | | | | |
06-IQ12, A4
5.332%, 12/15/43 | | | 492 | | | | 519 | |
07-IQ14, AM
5.684%, 4/15/49(3) | | | 130 | | | | 135 | |
07-IQ14, A4
5.692%, 4/15/49(3) | | | 240 | | | | 258 | |
Motel 6 Trust 12-MTL6 D 144A 3.781%, 10/5/25(4) | | | 155 | | | | 153 | |
New Residential Mortgage Loan Trust 14-1A, A 144A 3.750%, 1/25/54(3)(4) | | | 92 | | | | 95 | |
Nomura Asset Acceptance Corp. 04-R3, A1 144A
6.500%, 2/25/35(4) | | | 127 | | | | 130 | |
Residential Asset Mortgage Products, Inc. 05-SL2, A4
7.500%, 2/25/32 | | | 80 | | | | 84 | |
Sequoia Mortgage Trust 14-2, A1 144A 4.000%, 7/25/44(3)(4) | | | 185 | | | | 191 | |
Springleaf Mortgage Loan Trust 12-3A, A 144A
1.570%, 12/25/59(3)(4) | | | 215 | | | | 215 | |
Structured Adjustable Rate Mortgage Loan Trust
04-1, 6A 2.433%, 2/25/34(3) | | | 159 | | | | 156 | |
Wells Fargo (Wachovia Bank Commercial Mortgage Trust) | | | | | | | | |
07-C30, A5
5.342%, 12/15/43 | | | 285 | | | | 304 | |
07-C30, AM
5.383%, 12/15/43 | | | 160 | | | | 170 | |
07-C31, A4
5.509%, 4/15/47 | | | 250 | | | | 263 | |
07-C33, A5
5.941%, 2/15/51(3) | | | 140 | | | | 153 | |
WinWater Mortgage Loan Trust 14-1, A1 144A 4.000%, 6/20/44(3)(4) | | | 101 | | | | 104 | |
| | | | | | | | |
| | | | | | | | 11,196 | |
TOTAL MORTGAGE-BACKED SECURITIES
(Identified Cost $16,039) | | | | 16,806 | |
|
| ASSET-BACKED SECURITIES—2.0% | |
AmeriCredit Automobile Receivables Trust | | | | | | | | |
12-4, D 2.680%, 10/9/18 | | | 140 | | | | 141 | |
13-2, D 2.420%, 5/8/19 | | | 275 | | | | 274 | |
Bayview Financial Mortgage-Pass-Through
Trust 06-A, 1A2
5.483%, 2/28/41(3) | | | 58 | | | | 59 | |
Beacon Container Finance LLC 12-1A, A 144A 3.720%, 9/20/27(4) | | | 213 | | | | 216 | |
| | | | | | | | |
| | | PAR
VALUE | | | VALUE | |
| ASSET-BACKED SECURITIES—continued | |
BXG Receivables Note Trust 12-A, A 144A
2.660%, 12/2/27(4) | | $ | 83 | | | $ | 83 | |
CIT Group Home Equity Loan Trust 03-1, A5
4.980%, 7/20/34(3) | | | 250 | | | | 252 | |
Domino’s Pizza Master Issuer LLC 12-1A, A2 144A
5.216%, 1/25/42(4) | | | 217 | | | | 228 | |
Exeter Automobile Receivables Trust 14-1A, B 144A 2.420%, 1/15/19(4) | | | 135 | | | | 135 | |
Fairway Outdoor Funding LLC 12-1A, A2 144A
4.212%, 10/15/42(4) | | | 80 | | | | 80 | |
GSAA Home Equity Trust
05-12, AF3W
4.999%, 9/25/35(3) | | | 82 | | | | 83 | |
IMC Home Equity Loan Trust 97-5, A9 7.310%, 11/20/28 | | | 119 | | | | 120 | |
MASTR Specialized Loan Trust 05-3, A2 144A 5.704%, 11/25/35(3)(4) | | | 113 | | | | 116 | |
Origen Manufactured Housing Contract Trust
04-B, M1
5.730%, 11/15/35(3) | | | 74 | | | | 77 | |
SolarCity LMC Series III LLC 14-2, A 144A
4.020%, 7/20/44(4) | | | 165 | | | | 166 | |
Structured Asset Securities Corp. 01-SB1, A2
3.375%, 8/25/31 | | | 105 | | | | 103 | |
TAL Advantage V LLC 3.270%, 11/21/39(4) | | | 149 | | | | 150 | |
TCF Auto Receivables Owner Trust 14-1A, C 144A 3.120%,
4/15/21(4) | | | 165 | | | | 165 | |
Trip Rail Master Funding LLC 11-1A, A1A 144A
4.370%, 7/15/41(4) | | | 153 | | | | 159 | |
TOTAL ASSET-BACKED SECURITIES
(Identified Cost $2,578) | | | | 2,607 | |
|
| CORPORATE BONDS AND NOTES—19.2% | |
|
| Consumer Discretionary—1.5% | |
CCO Holdings LLC | | | | | | | | |
5.250%, 3/15/21 | | | 40 | | | | 40 | |
5.250%, 9/30/22 | | | 40 | | | | 40 | |
Hyatt Hotels Corp.
3.375%, 7/15/23 | | | 115 | | | | 113 | |
International Game Technology
7.500%, 6/15/19 | | | 150 | | | | 162 | |
Lear Corp. 5.250%, 1/15/25 | | | 100 | | | | 102 | |
Marriott International, Inc. 3.125%, 10/15/21 | | | 105 | | | | 106 | |
MGM Resorts International 6.000%, 3/15/23 | | | 80 | | | | 81 | |
Norwegian Cruise Lines Corp. Ltd. 144A
5.250%, 11/15/19(4) | | | 10 | | | | 10 | |
Refer to Footnote Legend on page 47.
See Notes to Financial Statements
43
VIRTUS STRATEGIC ALLOCATION SERIES
SCHEDULE OF INVESTMENTS (Continued)
DECEMBER 31, 2014
($ reported in thousands)
| | | | | | | | |
| | | PAR
VALUE | | | VALUE | |
| Consumer Discretionary—continued | |
Numericable Group SA 144A
6.000%, 5/15/22(4) | | $ | 200 | | | $ | 201 | |
Penn National Gaming, Inc.
5.875%, 11/1/21 | | | 50 | | | | 47 | |
Pinnacle Entertainment, Inc.
6.375%, 8/1/21 | | | 80 | | | | 83 | |
QVC, Inc. 5.125%, 7/2/22 | | | 135 | | | | 142 | |
Seminole Hard Rock Entertainment, Inc. 144A
5.875%, 5/15/21(4) | | | 90 | | | | 90 | |
Sinclair Television Group, Inc. 5.375%, 4/1/21 | | | 110 | | | | 110 | |
Starwood Hotels & Resorts Worldwide, Inc.
3.125%, 2/15/23 | | | 200 | | | | 194 | |
Taylor Morrison Communities, Inc. (Monarch Communities, Inc.) 144A
5.250%, 4/15/21(4) | | | 110 | | | | 109 | |
Time Warner Cable, Inc.
6.750%, 7/1/18 | | | 185 | | | | 212 | |
Wyndham Worldwide Corp.
5.625%, 3/1/21 | | | 125 | | | | 140 | |
| | | | | | | | |
| | | | | | | 1,982 | |
| | | | | | | | |
|
| Consumer Staples—0.6% | |
Altria Group, Inc.
2.950%, 5/2/23 | | | 140 | | | | 135 | |
Flowers Foods, Inc.
4.375%, 4/1/22 | | | 120 | | | | 127 | |
Reynolds American, Inc.
3.250%, 11/1/22 | | | 150 | | | | 146 | |
Smithfield Foods, Inc. 144A
5.875%, 8/1/21(4) | | | 50 | | | | 51 | |
Tate & Lyle International Finance plc 144A
6.625%, 6/15/16(4) | | | 275 | | | | 296 | |
| | | | | | | | |
| | | | | | | 755 | |
| | | | | | | | |
|
| Energy—2.1% | |
California Resources Corp. 144A 6.000%, 11/15/24(4) | | | 105 | | | | 89 | |
Calumet Specialty Products Partners LP 144A
6.500%, 4/15/21(4) | | | 95 | | | | 85 | |
CHC Helicopter SA
9.250%, 10/15/20 | | | 90 | | | | 89 | |
Denbury Resources, Inc.
5.500%, 5/1/22 | | | 80 | | | | 74 | |
Ecopetrol SA
4.125%, 1/16/25 | | | 135 | | | | 128 | |
Energy Transfer Partners LP
4.150%, 10/1/20 | | | 130 | | | | 133 | |
Frontier Oil Corp.
6.875%, 11/15/18 | | | 45 | | | | 46 | |
Gazprom Neft OAO (GPN Capital SA) 144A
6.000%, 11/27/23(4)(12) | | | 200 | | | | 159 | |
Kinder Morgan, Inc.
4.300%, 6/1/25 | | | 150 | | | | 151 | |
| | | | | | | | |
| | | PAR
VALUE | | | VALUE | |
| Energy—continued | |
Linn Energy LLC
6.500%, 9/15/21 | | $ | 50 | | | $ | 41 | |
Lukoil OAO International Finance BV 144A
7.250%, 11/5/19(4) | | | 175 | | | | 166 | |
MarkWest Energy Partners LP (MarkWest Energy Finance Corp.)
4.875%, 12/1/24 | | | 160 | | | | 157 | |
NGL Energy Partners LP (NGL Energy Finance Corp.) 144A 5.125%, 7/15/19(4) | | | 45 | | | | 43 | |
Pacific Rubiales Energy Corp. 144A 5.375%, 1/26/19(4) | | | 100 | | | | 86 | |
Petrobras Global Finance BV
6.250%, 3/17/24 | | | 135 | | | | 128 | |
Petrobras International Finance Co.
5.375%, 1/27/21 | | | 100 | | | | 93 | |
Petroleos de Venezuela SA RegS 6.000%, 11/15/26(5) | | | 35 | | | | 13 | |
Petroleos Mexicanos | | | | | | | | |
4.875%, 1/18/24 | | | 45 | | | | 47 | |
5.500%, 6/27/44 | | | 150 | | | | 153 | |
PHI, Inc. 5.250%, 3/15/19 | | | 35 | | | | 30 | |
QEP Resources, Inc.
6.875%, 3/1/21 | | | 105 | | | | 108 | |
QGOG Constellation SA 144A
6.250%, 11/9/19(4) | | | 200 | | | | 127 | |
Rowan Cos., Inc.
4.875%, 6/1/22 | | | 140 | | | | 136 | |
SM Energy Co. 144A
6.125%, 11/15/22(4) | | | 105 | | | | 99 | |
Transocean, Inc.
3.800%, 10/15/22 | | | 120 | | | | 97 | |
Weatherford International Ltd.
9.625%, 3/1/19 | | | 45 | | | | 53 | |
Williams Cos., Inc. (The)
3.700%, 1/15/23 | | | 100 | | | | 90 | |
Williams Partners LP
3.900%, 1/15/25 | | | 145 | | | | 139 | |
| | | | | | | | |
| | | | | | | 2,760 | |
| | | | | | | | |
|
| Financials—9.7% | |
Aircastle Ltd.
5.125%, 3/15/21 | | | 55 | | | | 55 | |
Allstate Corp. (The)
5.750%, 8/15/53(3)(6) | | | 135 | | | | 142 | |
American International Group, Inc. | | | | | | | | |
2.375%, 8/24/15 | | | 85 | | | | 86 | |
3.375%, 8/15/20 | | | 55 | | | | 57 | |
Apollo Management Holdings LP 144A 4.000%, 5/30/24(4) | | | 135 | | | | 137 | |
Ares Capital Corp.
3.875%, 1/15/20 | | | 105 | | | | 105 | |
Ares Finance Co., LLC 144A
4.000%, 10/8/24(4) | | | 140 | | | | 138 | |
Associated Banc Corp.
5.125%, 3/28/16 | | | 85 | | | | 89 | |
| | | | | | | | |
| | | PAR
VALUE | | | VALUE | |
| Financials—continued | |
Banco Bilbao Vizcaya Argentaria Bancomer S.A. 144A 6.500%, 3/10/21(4) | | $ | 150 | | | $ | 162 | |
Banco Bradesco S.A. 144A
5.900%, 1/16/21(4) | | | 150 | | | | 157 | |
Banco de Credito del Peru 144A 4.250%, 4/1/23(4) | | | 164 | | | | 162 | |
Banco de Credito e Inversiones 144A
4.000%, 2/11/23(4) | | | 200 | | | | 196 | |
Banco do Brasil S.A. 144A
5.375%, 1/15/21(4) | | | 150 | | | | 149 | |
Banco Internacional del Peru SAA 144A
6.625%, 3/19/29(3)(4) | | | 115 | | | | 122 | |
Banco Santander Brasil SA 144A 4.500%, 4/6/15(4) | | | 100 | | | | 101 | |
Banco Santander Chile 144A
3.750%, 9/22/15(4) | | | 100 | | | | 102 | |
Banco Votorantim S.A. 144A
7.375%, 1/21/20(4) | | | 130 | | | | 137 | |
Bancolombia S.A.
5.125%, 9/11/22 | | | 150 | | | | 149 | |
Bank of America Corp. | | | | | | | | |
5.650%, 5/1/18 | | | 400 | | | | 444 | |
4.200%, 8/26/24 | | | 155 | | | | 158 | |
Bank of New York Mellon Corp. (The)
2.200%, 3/4/19 | | | 100 | | | | 100 | |
Barclays Bank plc 144A 5.926%(3)(4)(6)(7) | | | 100 | | | | 105 | |
Brazil Loan Trust 1 144A 5.477%, 7/24/23(4) | | | 150 | | | | 152 | |
Capital One Financial Corp. 6.150%, 9/1/16 | | | 125 | | | | 134 | |
City National Corp.
5.250%, 9/15/20 | | | 100 | | | | 111 | |
CNOOC Finance 2013 Ltd.
3.000%, 5/9/23 | | | 200 | | | | 189 | |
Cooperatieve Centrale Raiffeisen-Boerenleenbank BA NY 2.250%, 1/14/19 | | | 250 | | | | 252 | |
Corporate Office Properties LP | | | | | | | | |
3.700%, 6/15/21 | | | 90 | | | | 90 | |
3.600%, 5/15/23 | | | 150 | | | | 144 | |
Education Realty Operating Partnership LP
4.600%, 12/1/24 | | | 135 | | | | 138 | |
Excel Trust LP
4.625%, 5/15/24 | | | 55 | | | | 57 | |
Fidelity National Financial,
Inc.
6.600%, 5/15/17 | | | 175 | | | | 192 | |
5.500%, 9/1/22 | | | 40 | | | | 44 | |
Fifth Third Bancorp
4.500%, 6/1/18 | | | 150 | | | | 162 | |
First Niagara Financial Group, Inc. 7.250%, 12/15/21 | | | 125 | | | | 142 | |
Ford Motor Credit Co. LLC
5.750%, 2/1/21 | | | 75 | | | | 86 | |
General Motors Financial Co., Inc. 3.500%, 7/10/19 | | | 120 | | | | 123 | |
Genworth Holdings, Inc.
4.900%, 8/15/23 | | | 135 | | | | 109 | |
Refer to Footnote Legend on page 47.
See Notes to Financial Statements
44
VIRTUS STRATEGIC ALLOCATION SERIES
SCHEDULE OF INVESTMENTS (Continued)
DECEMBER 31, 2014
($ reported in thousands)
| | | | | | | | |
| | | PAR
VALUE | | | VALUE | |
| Financials—continued | |
GLP Capital LP (GLP Financing II, Inc.) | | | | | | | | |
4.875%, 11/1/20 | | $ | 95 | | | $ | 96 | |
5.375%, 11/1/23 | | | 5 | | | | 5 | |
Goldman Sachs Group, Inc. (The) 5.950%, 1/18/18 | | | 165 | | | | 183 | |
HCP, Inc. | | | | | | | | |
3.750%, 2/1/19 | | | 60 | | | | 63 | |
5.375%, 2/1/21 | | | 60 | | | | 67 | |
Healthcare Trust of America Holdings LP
3.375%, 7/15/21 | | | 50 | | | | 50 | |
Highwoods Realty LP
3.625%, 1/15/23 | | | 135 | | | | 135 | |
Hospitality Properties Trust
4.500%, 3/15/25 | | | 130 | | | | 131 | |
HSBC USA, Inc.
1.625%, 1/16/18 | | | 135 | | | | 134 | |
Huntington Bancshares, Inc.
7.000%, 12/15/20 | | | 95 | | | | 114 | |
Hutchison Whampoa International Ltd.
Series 12, 144A 6.000%(3)(4)(6)(7) | | | 160 | | | | 171 | |
ICAHN Enterprises LP (ICAHN Enterprises Finance Corp.) | | | | | | | | |
4.875%, 3/15/19 | | | 10 | | | | 10 | |
6.000%, 8/1/20 | | | 55 | | | | 57 | |
5.875%, 2/1/22 | | | 115 | | | | 115 | |
iStar Financial, Inc.
5.000%, 7/1/19 | | | 45 | | | | 44 | |
Jefferies Group LLC
6.875%, 4/15/21 | | | 150 | | | | 171 | |
JPMorgan Chase & Co. | | | | | | | | |
5.250%, 5/1/15 | | | 250 | | | | 254 | |
6.125%, 6/27/17 | | | 270 | | | | 298 | |
KeyCorp
5.100%, 3/24/21 | | | 165 | | | | 186 | |
Kimco Realty Corp.
6.875%, 10/1/19 | | | 150 | | | | 178 | |
Korea Finance Corp.
4.625%, 11/16/21 | | | 200 | | | | 222 | |
Lazard Group LLC
4.250%, 11/14/20 | | | 135 | | | | 142 | |
Liberty Mutual Group, Inc. 144A 4.250%, 6/15/23(4) | | | 135 | | | | 139 | |
Lincoln National Corp.
6.050%, 4/20/67(3)(6) | | | 50 | | | | 50 | |
Lloyds TSB Bank plc 144A
6.500%, 9/14/20(4) | | | 150 | | | | 174 | |
Macquarie Bank Ltd. 144A
6.625%, 4/7/21(4) | | | 100 | | | | 116 | |
Morgan Stanley | | | | | | | | |
5.550%, 4/27/17 | | | 120 | | | | 130 | |
4.100%, 5/22/23 | | | 80 | | | | 81 | |
Series H,
5.450%, 12/29/49(3) | | | 85 | | | | 85 | |
National Retail Properties, Inc. 5.500%, 7/15/21 | | | 150 | | | | 170 | |
Nationstar Mortgage LLC
6.500%, 7/1/21 | | | 135 | | | | 124 | |
Navient LLC 5.500%, 1/25/23 | | | 130 | | | | 124 | |
| | | | | | | | |
| | | PAR
VALUE | | | VALUE | |
| Financials—continued | |
Nordea Bank AB 144A
4.250%, 9/21/22(4) | | $ | 200 | | | $ | 208 | |
ORIX Corp. 5.000%, 1/12/16 | | | 86 | | | | 89 | |
PennantPark Investment Corp. 4.500%, 10/1/19 | | | 115 | | | | 115 | |
PKO Finance AB 144A
4.630%, 9/26/22(4)(12) | | | 200 | | | | 209 | |
Progressive Corp. (The)
6.700%, 6/15/37(3) | | | 160 | | | | 173 | |
Prudential Financial, Inc. | | | | | | | | |
5.875%, 9/15/42(3) | | | 90 | | | | 95 | |
5.625%, 6/15/43(3)(6) | | | 60 | | | | 61 | |
Retail Opportunity Investments Partnership LP
4.000%, 12/15/24 | | | 105 | | | | 105 | |
Royal Bank of Scotland Group plc (The)
5.625%, 8/24/20 | | | 150 | | | | 171 | |
Sabra Health Care LP
5.500%, 2/1/21 | | | 60 | | | | 63 | |
Santander U.S. Debt S.A.U. 144A 3.724%, 1/20/15(4) | | | 145 | | | | 145 | |
Senior Housing Properties Trust 4.300%, 1/15/16 | | | 125 | | | | 128 | |
Springleaf Finance Corp.
5.250%, 12/15/19 | | | 80 | | | | 79 | |
SunTrust Banks, Inc. | | | | | | | | |
2.750%, 5/1/23 | | | 200 | | | | 195 | |
Swedbank AB 144A
1.750%, 3/12/18(4) | | | 200 | | | | 200 | |
Teachers Insurance & Annuity Association of America 144A
4.375%, 9/15/54(3)(4) | | | 110 | | | | 111 | |
TIAA Asset Management Finance Co. LLC 144A
4.125%, 11/1/24(4) | | | 125 | | | | 128 | |
Unum Group
7.125%, 9/30/16 | | | 125 | | | | 137 | |
Ventas Realty LP (Ventas Capital Corp.)
3.250%, 8/15/22 | | | 155 | | | | 153 | |
Voya Financial, Inc. | | | | | | | | |
(ING (U.S.), Inc.)
5.500%, 7/15/22 | | | 110 | | | | 124 | |
(ING (U.S.), Inc.)
5.650%, 5/15/53(3) | | | 110 | | | | 109 | |
Wells Fargo & Co.
3.450%, 2/13/23 | | | 115 | | | | 117 | |
Willis Group Holdings plc 5.750%, 3/15/21 | | | 125 | | | | 140 | |
WP Carey, Inc.
4.600%, 4/1/24 | | | 105 | | | | 110 | |
XL Group plc
Series E, 6.500%(3) | | | 100 | | | | 95 | |
Zions Bancorporation
4.500%, 6/13/23 | | | 40 | | | | 42 | |
| | | | | | | | |
| | | | | | | 12,499 | |
| | | | | | | | |
| | |
| Health Care—0.8% | | | | | | | | |
Cardinal Health, Inc.
3.200%, 3/15/23 | | | 70 | | | | 70 | |
| | | | | | | | |
| | | PAR
VALUE | | | VALUE | |
| Health Care—continued | | | | | | | | |
Carefusion Corp.
3.300%, 3/1/23 | | $ | 135 | | | $ | 132 | |
Catamaran Corp.
4.750%, 3/15/21 | | | 70 | | | | 70 | |
Community Health Systems, Inc. 6.875%, 2/1/22 | | | 15 | | | | 16 | |
Endo Finance LLC 144A
5.375%, 1/15/23(4) | | | 85 | | | | 83 | |
Express Scripts Holding Co.
3.900%, 2/15/22 | | | 140 | | | | 146 | |
Forest Laboratories, Inc. 144A 4.875%,
2/15/21(4) | | | 80 | | | | 86 | |
Mylan, Inc. 144A
3.125%, 1/15/23(4) | | | 150 | | | | 145 | |
Tenet Healthcare Corp. | | | | | | | | |
144A 5.500%, 3/1/19(4) | | | 60 | | | | 62 | |
4.500%, 4/1/21 | | | 105 | | | | 106 | |
Valeant Pharmaceuticals International, Inc. | | | | | | | | |
144A 6.750%,
8/15/18(4) | | | 45 | | | | 48 | |
144A 7.500%,
7/15/21(4) | | | 15 | | | | 16 | |
144A 5.625%,
12/1/21(4) | | | 25 | | | | 25 | |
Zoetis, Inc. 3.250%, 2/1/23 | | | 70 | | | | 69 | |
| | | | | | | | |
| | | | | | | 1,074 | |
| | | | | | | | |
| | |
| Industrials—1.6% | | | | | | | | |
AAR Corp. 7.250%, 1/15/22 | | | 80 | | | | 87 | |
ADT Corp. (The)
6.250%, 10/15/21 | | | 110 | | | | 113 | |
Atlas Air Pass-Through-Trust 00-1, A 8.707%, 1/2/19 | | | 60 | | | | 62 | |
Avis Budget Car Rental LLC
5.500%, 4/1/23 | | | 105 | | | | 108 | |
Bombardier, Inc. 144A
6.125%, 1/15/23(4) | | | 155 | | | | 159 | |
British Airways Pass-Through-Trust 13-1, B 144A 5.625%,
6/20/20(4) | | | 57 | | | | 60 | |
Building Materials Corp. of America 144A
5.375%, 11/15/24(4) | | | 50 | | | | 50 | |
Carpenter Technology Corp.
5.200%, 7/15/21 | | | 150 | | | | 159 | |
Continental Airlines Pass-Through-Trust | | | | | | | | |
99-1, A 6.545%, 2/2/19 | | | 171 | | | | 188 | |
01-1, A1 6.703%, 6/15/21 | | | 169 | | | | 183 | |
Deluxe Corp. | | | | | | | | |
7.000%, 3/15/19 | | | 60 | | | | 63 | |
6.000%, 11/15/20 | | | 40 | | | | 41 | |
Huntington Ingalls Industries, Inc. 144A
5.000%, 12/15/21(4) | | | 50 | | | | 51 | |
KLX, Inc. 144A
5.875%, 12/1/22(4) | | | 100 | | | | 101 | |
Norfolk Southern Corp.
2.903%, 2/15/23 | | | 140 | | | | 138 | |
Northwest Airlines Pass-Through-Trust 02-1, G2
6.264%, 11/20/21 | | | 117 | | | | 126 | |
Spirit AeroSystems, Inc.
5.250%, 3/15/22 | | | 25 | | | | 26 | |
Refer to Footnote Legend on page 47.
See Notes to Financial Statements
45
VIRTUS STRATEGIC ALLOCATION SERIES
SCHEDULE OF INVESTMENTS (Continued)
DECEMBER 31, 2014
($ reported in thousands)
| | | | | | | | |
| | | PAR
VALUE | | | VALUE | |
| Industrials—continued | | | | | | | | |
UAL Pass-Through-Trust
07-01, A 6.636%, 7/2/22 | | $ | 230 | | | $ | 248 | |
Virgin Australia Trust 13-1A 144A 5.000%, 10/23/23(4) | | | 120 | | | | 124 | |
| | | | | | | | |
| | | | | | | 2,087 | |
| | | | | | | | |
|
| Information Technology—0.1% | |
Dun & Bradstreet Corp. (The)
4.375%, 12/1/22 | | | 135 | | | | 138 | |
Infor Software Parent LLC PIK Interest Capitalization, 144A 7.125%, 5/1/21(4)(14) | | | 30 | | | | 30 | |
QualityTech LP (QTS Finance Corp.) 144A
5.875%, 8/1/22(4) | | | 10 | | | | 10 | |
Sanmina Corp. 144A
4.375%, 6/1/19(4) | | | 15 | | | | 15 | |
| | | | | | | | |
| | | | | | | 193 | |
| | | | | | | | |
|
| Materials—1.6% | |
Corp Nacional del Cobre de Chile 144A
3.750%, 11/4/20(4) | | | 100 | | | | 102 | |
CRH America, Inc. | | | | | | | | |
6.000%, 9/30/16 | | | 255 | | | | 275 | |
8.125%, 7/15/18 | | | 150 | | | | 180 | |
Gerdau Holdings, Inc. 144A
7.000%, 1/20/20(4) | | | 100 | | | | 108 | |
Hexion U.S. Finance Corp. | | | | | | | | |
8.875%, 2/1/18 | | | 65 | | | | 58 | |
6.625%, 4/15/20 | | | 80 | | | | 79 | |
Methanex Corp.
4.250%, 12/1/24 | | | 130 | | | | 129 | |
NewMarket Corp.
4.100%, 12/15/22 | | | 142 | | | | 145 | |
Nufarm Australia Ltd. 144A
6.375%, 10/15/19(4) | | | 70 | | | | 71 | |
PTT Global Chemical plc 144A 4.250%,
9/19/22(4) | | | 200 | | | | 205 | |
Rayonier AM Products, Inc. 144A 5.500%, 6/1/24(4) | | | 70 | | | | 58 | |
Sappi Papier Holding GmbH 144A 6.625%, 4/15/21(4) | | | 230 | | | | 237 | |
Severstal OAO (Steel Capital SA) 144A
6.700%, 10/25/17(4)(12) | | | 100 | | | | 93 | |
Tronox Finance LLC
6.375%, 8/15/20 | | | 55 | | | | 55 | |
Vale Overseas Ltd.
4.375%, 1/11/22 | | | 130 | | | | 125 | |
Vedanta Resources plc 144A
9.500%, 7/18/18(4) | | | 100 | | | | 108 | |
| | | | | | | | |
| | | | | | | 2,028 | |
| | | | | | | | |
|
| Telecommunication Services—0.4% | |
CenturyLink, Inc. Series V 5.625%, 4/1/20 | | | 65 | | | | 68 | |
Crown Castle Towers LLC 144A 4.883%, 8/15/20(4) | | | 250 | | | | 275 | |
| | | | | | | | |
| | | PAR
VALUE | | | VALUE | |
| Telecommunication Services—continued | |
T-Mobile USA, Inc.
6.731%, 4/28/22 | | $ | 30 | | | $ | 31 | |
Verizon Communications, Inc. 2.550%, 6/17/19 | | | 100 | | | | 101 | |
Windstream Corp.
7.750%, 10/15/20 | | | 80 | | | | 82 | |
| | | | | | | | |
| | | | | | | 557 | |
| | | | | | | | |
|
| Utilities—0.8% | |
Electricite de France SA
144A 5.250%(3)(4)(6)(7) | | | 170 | | | | 174 | |
Entergy Mississippi, Inc.
3.100%, 7/1/23 | | | 175 | | | | 173 | |
Kansas City Power & Light Co. 3.150%, 3/15/23 | | | 110 | | | | 111 | |
United Energy Distribution Holdings Property Ltd. 144A 5.450%, 4/15/16(4)(8) | | | 500 | | | | 519 | |
| | | | | | | | |
| | | | | | | | 977 | |
| TOTAL CORPORATE BONDS AND NOTES | |
| (Identified Cost $24,551) | | | | 24,912 | |
|
| LOAN AGREEMENTS(3)—1.0% | |
|
| Consumer Discretionary—0.2% | |
Charter Communications Operating LLC Tranche G,
4.250%, 9/10/21 | | | 26 | | | | 26 | |
Landry’s Restaurant, Inc. Tranche B, 4.000%, 4/24/18 | | | 97 | | | | 97 | |
Seminole Hard Rock Entertainment, Inc.
Tranche B,
3.500%, 5/14/20 | | | 44 | | | | 43 | |
SRAM LLC First Lien,
4.000%, 4/10/20 | | | 24 | | | | 23 | |
TWCC Holding Corp.
Second Lien,
7.000%, 6/26/20 | | | 52 | | | | 50 | |
| | | | | | | | |
| | | | | | | 239 | |
| | | | | | | | |
|
| Consumer Staples—0.0% | |
Prestige Brands Tranche B-2,
4.500%, 9/3/21 | | | 7 | | | | 7 | |
| | | | | | | | |
|
| Energy—0.1% | |
Paragon Offshore
Finance Co.
3.750%, 7/16/21 | | | 43 | | | | 35 | |
Seadrill Operating LP
4.000%, 2/21/21 | | | 52 | | | | 40 | |
| | | | | | | | |
| | | | | | | 75 | |
| | | | | | | | |
|
| Financials—0.2% | |
Altisource Solutions S.A.R.L. Tranche B, 4.500%, 12/9/20 | | | 104 | | | | 81 | |
Delos Finance S.A.R.L.
3.500%, 3/6/21 | | | 80 | | | | 80 | |
| | | | | | | | |
| | | PAR
VALUE | | | VALUE | |
| Financials—continued | |
Walter Investment Management Corp.
Tranche B,
4.750%, 12/18/20 | | $ | 119 | | | $ | 107 | |
| | | | | | | | |
| | | | | | | 268 | |
| | | | | | | | |
|
| Health Care—0.0% | |
ConvaTec, Inc.
0.000%, 12/22/16(10) | | | 12 | | | | 12 | |
PharMEDium Healthcare Corp. Second Lien,
7.750%, 1/28/22 | | | 28 | | | | 28 | |
| | | | | | | | |
| | | | | | | 40 | |
| | | | | | | | |
|
| Industrials—0.2% | |
American Airlines, Inc.
Tranche B,
3.750%, 6/27/19 | | | 103 | | | | 102 | |
AWAS Finance
Luxembourg SA
3.500%, 7/16/18 | | | 35 | | | | 35 | |
Brock Holdings Ill, Inc.
First Lien,
6.000%, 3/16/17 | | | 18 | | | | 17 | |
Ceridian HCM Holding, Inc.
4.500%, 9/15/20 | | | 49 | | | | 48 | |
| | | | | | | | |
| | | | | | | 202 | |
| | | | | | | | |
|
| Information Technology—0.2% | |
Applied Systems, Inc.
Second Lien,
7.500%, 1/24/22 | | | 14 | | | | 14 | |
CCC Information Services 4.000%, 12/20/19 | | | 33 | | | | 33 | |
First Data Corp.
3.667%, 3/23/18 | | | 94 | | | | 92 | |
Infinity Acquisition Ltd.
4.250%, 8/6/21 | | | 55 | | | | 54 | |
IPC Systems, Inc.
0.000%, 11/8/20(10) | | | 50 | | | | 50 | |
Mitchell International, Inc.
4.500%, 10/13/20 | | | 27 | | | | 26 | |
Sungard Availability Services Capital, Inc. Tranche B,
6.000%, 3/29/19 | | | 38 | | | | 34 | |
| | | | | | | | |
| | | | | | | 303 | |
| | | | | | | | |
|
| Materials—0.1% | |
Fortescue Metals Group (FMG) Resources Property Ltd. 3.750%, 6/30/19 | | | 102 | | | | 93 | |
| | | | | | | | |
|
| Utilities—0.0% | |
Texas Competitive Electric Holdings Co. LLC 2017 Extended,
4.648%, 10/10/17(11) | | | 65 | | | | 42 | |
TOTAL LOAN AGREEMENTS
(Identified Cost $1,348) | | | | 1,269 | |
Refer to Footnote Legend on page 47.
See Notes to Financial Statements
46
VIRTUS STRATEGIC ALLOCATION SERIES
SCHEDULE OF INVESTMENTS (Continued)
DECEMBER 31, 2014
($ reported in thousands)
| | | | | | | | |
| | |
SHARES | | | VALUE | |
| PREFERRED STOCKS—0.6% | |
|
| Financials—0.6% | |
Ally Financial, Inc.
Series G, 144A,
7.000%(4) | | | 84 | | | $ | 84 | |
Banco Bilbao Vizcaya Argentaria S.A. International S.A. Unipersonal 5.919%(3) | | | 40 | (9) | | | 41 | |
Citigroup, Inc.
5.800%, 11/29/49(3) | | | 100 | (9) | | | 100 | |
Goldman Sachs Group, Inc. (The) Series L, 5.700%(3) | | | 55 | (9) | | | 55 | |
JPMorgan Chase & Co.
Series Q, 5.150%(3) | | | 105 | (9) | | | 99 | |
JPMorgan Chase & Co.
Series V, 5.000%(3) | | | 100 | (9) | | | 98 | |
PNC Financial Services Group, Inc. (The)
Series R, 4.850%(3) | | | 95 | (9) | | | 90 | |
SunTrust Banks, Inc. | | | | | | | | |
5.625%, 12/29/49(3) | | | 20 | (9) | | | 20 | |
Wells Fargo & Co.
Series K, 7.980%(3) | | | 95 | (9) | | | 105 | |
Zions Bancorp, 6.950%(3) | | | 4,250 | | | | 116 | |
TOTAL PREFERRED STOCKS
(Identified Cost $740) | | | | 808 | |
|
| COMMON STOCKS—58.6% | |
|
| Consumer Discretionary—12.0% | |
American Eagle Outfitters, Inc. | | | 111,000 | | | | 1,541 | |
Best Buy Co., Inc. | | | 40,000 | | | | 1,559 | |
Ford Motor Co. | | | 110,000 | | | | 1,705 | |
Goodyear Tire & Rubber Co. (The) | | | 54,000 | | | | 1,543 | |
Lear Corp. | | | 16,000 | | | | 1,569 | |
Macy’s, Inc. | | | 24,000 | | | | 1,578 | |
Michael Kors Holdings Ltd.(2) | | | 19,000 | | | | 1,427 | |
Royal Caribbean Cruises Ltd. | | | 19,000 | | | | 1,566 | |
Time Warner, Inc. | | | 18,000 | | | | 1,538 | |
Viacom, Inc. Class B | | | 20,000 | | | | 1,505 | |
| | | | | | | | |
| | | | | | | 15,531 | |
| | | | | | | | |
| |
| Consumer Staples—2.5% | | | | | |
Archer-Daniels-Midland Co. (The) | | | 31,000 | | | | 1,612 | |
PepsiCo, Inc. | | | 17,000 | | | | 1,607 | |
| | | | | | | | |
| | | | | | | 3,219 | |
| | | | | | | | |
| | |
| Energy—4.2% | | | | | | | | |
Continental Resources, Inc.(2) | | | 41,000 | | | | 1,573 | |
Helmerich & Payne, Inc. | | | 19,000 | | | | 1,281 | |
Schlumberger Ltd. | | | 13,000 | | | | 1,110 | |
Valero Energy Corp. | | | 30,000 | | | | 1,485 | |
| | | | | | | | |
| | | | | | | 5,449 | |
| | | | | | | | |
| | |
| Financials—9.6% | | | | | | | | |
Aflac, Inc. | | | 20,000 | | | | 1,222 | |
BB&T Corp. | | | 40,000 | | | | 1,555 | |
BlackRock, Inc. | | | 4,400 | | | | 1,573 | |
Blackstone Group LP (The) | | | 47,000 | | | | 1,590 | |
Goldman Sachs Group, Inc. (The) | | | 8,000 | | | | 1,551 | |
| | | | | | | | |
| | |
SHARES | | | VALUE | |
| Financials—continued | | | | | | | | |
JPMorgan Chase & Co. | | | 27,000 | | | $ | 1,690 | |
Lincoln National Corp. | | | 28,000 | | | | 1,615 | |
T. Rowe Price Group, Inc. | | | 19,000 | | | | 1,631 | |
| | | | | | | | |
| | | | | | | 12,427 | |
| | | | | | | | |
| Health Care—7.2% | | | | | | | | |
Abbott Laboratories | | | 34,000 | | | | 1,531 | |
Biogen Idec, Inc.(2) | | | 4,600 | | | | 1,561 | |
HCA Holdings, Inc.(2) | | | 21,000 | | | | 1,541 | |
St. Jude Medical, Inc. | | | 23,000 | | | | 1,496 | |
UnitedHealth Group, Inc. | | | 16,000 | | | | 1,617 | |
Zimmer Holdings, Inc. | | | 14,000 | | | | 1,588 | |
| | | | | | | | |
| | | | | | | 9,334 | |
| | | | | | | | |
| | |
| Industrials—9.8% | | | | | | | | |
Alaska Air Group, Inc. | | | 28,000 | | | | 1,673 | |
Cummins, Inc. | | | 11,000 | | | | 1,586 | |
FedEx Corp. | | | 9,000 | | | | 1,563 | |
L-3 Communications Holdings, Inc. | | | 12,000 | | | | 1,515 | |
Parker Hannifin Corp. | | | 12,000 | | | | 1,547 | |
Southwest Airlines Co. | | | 39,000 | | | | 1,650 | |
Trinity Industries, Inc. | | | 56,000 | | | | 1,569 | |
Union Pacific Corp. | | | 13,000 | | | | 1,549 | |
| | | | | | | | |
| | | | | | | 12,652 | |
| | | | | | | | |
|
| Information Technology—11.0% | |
Apple, Inc. | | | 14,000 | | | | 1,545 | |
EMC Corp. | | | 54,000 | | | | 1,606 | |
Facebook, Inc. Class A(2) | | | 20,000 | | | | 1,560 | |
Google, Inc. Class A(2) | | | 1,100 | | | | 584 | |
Google, Inc. Class C(2) | | | 1,900 | | | | 1,000 | |
Intel Corp. | | | 43,000 | | | | 1,561 | |
MasterCard, Inc. Class A | | | 18,000 | | | | 1,551 | |
NetApp, Inc. | | | 38,000 | | | | 1,575 | |
QUALCOMM, Inc. | | | 22,000 | | | | 1,635 | |
Western Digital Corp. | | | 15,000 | | | | 1,661 | |
| | | | | | | | |
| | | | | | | 14,278 | |
| | | | | | | | |
| | |
| Materials—1.2% | | | | | | | | |
CF Industries Holdings, Inc. | | | 5,600 | | | | 1,526 | |
| | | | | | | | |
|
| Telecommunication Services—1.1% | |
Verizon Communications, Inc. | | | 32,000 | | | | 1,497 | |
TOTAL COMMON STOCKS
(Identified Cost $52,777) | | | | 75,913 | |
|
| EXCHANGE-TRADED FUND—0.9% | |
iShares Nasdaq Biotechnology Index Fund | | | 3,800 | | | | 1,153 | |
TOTAL EXCHANGE-TRADED FUND
(Identified Cost $1,026) | | | | 1,153 | |
| TOTAL LONG TERM INVESTMENTS—99.1% | |
| (Identified Cost $103,942) | | | | | | | 128,412 | (13) |
| | | | | | | | |
| | |
SHARES | | | VALUE | |
| SHORT-TERM INVESTMENTS—0.5% | |
|
| Money Market Mutual Fund—0.5% | |
Fidelity Money Market Portfolio – Institutional Shares (seven-day effective yield 0.110%) | | | 597,186 | | | $ | 597 | |
TOTAL SHORT-TERM INVESTMENTS
(Identified Cost $597) | | | | 597 | |
| TOTAL INVESTMENTS—99.6% | |
| (Identified Cost $104,539) | | | | | | | 129,009 | (1) |
Other assets and liabilities, net—0.4% | | | | 464 | |
| | | | | | | | |
| NET ASSETS—100.0% | | | | | | $ | 129,473 | |
| | | | | | | | |
Abbreviations:
| FGIC | Financial Guaranty Insurance Company |
| FHLMC | Federal Home Loan Mortgage Corporation (“Freddie Mac”). |
| FNMA | Federal National Mortgage Association (“Fannie Mae”). |
| GNMA | Government National Mortgage Association (“Ginnie Mae”) |
| NATL | National Public Finance Guarantee Corp. |
| PIK | Payment-in-Kind Security |
Footnote Legend:
| (1) | Federal Income Tax Information: For tax information at December 31, 2014, see Note 10 Federal Income Tax Information in the Notes to Financial Statements. |
| (2) | Non-income producing. |
| (3) | Variable or step coupon security; interest rate shown reflects the rate in effect at December 31, 2014. |
| (4) | Security exempt from registration under Rule 144A of the Securities Act of 1933. These securities may be resold in transactions exempt from registration, normally to qualified institutional buyers. At December 31, 2014, these securities amounted to a value of $13,308 or 10.3% of net assets. |
| (5) | Regulation S security. Security is offered and sold outside of the United States, therefore, it is exempt from registration with the SEC under rules 903 and 904 of the Securities Act of 1933. |
| (6) | Interest payments may be deferred. |
| (7) | No contractual maturity date. |
| (9) | Value shown as par value. |
| (10) | This loan will settle after December 31, 2014, at which time the interest rate, based on the London Interbank Offered Rate (“LIBOR”) and the agreed upon spread on trade date, will be reflected. |
| (11) | Security in default, interest payments are being received during the bankruptcy proceedings. |
| (12) | This Note was issued for the sole purpose of funding a loan agreement between the issuer and the borrower. As the credit risk for this security |
See Notes to Financial Statements
47
VIRTUS STRATEGIC ALLOCATION SERIES
SCHEDULE OF INVESTMENTS (Continued)
DECEMBER 31, 2014
($ reported in thousands)
| | lies solely with the borrower, the name represented here is that of the borrower. |
| (13) | All or a portion segregated as collateral for unsettled loan transactions. |
| (14) | 100% of the income received was in cash. |
Foreign Currencies:
| | | | |
| Country Weightings (unaudited)† | | | |
United States | | | 90 | % |
United Kingdom | | | 2 | |
Australia | | | 1 | |
Brazil | | | 1 | |
Liberia | | | 1 | |
Luxembourg | | | 1 | |
Other | | | 4 | |
Total | | | 100 | % |
† % of total investments as of December 31, 2014 | |
The following table provides a summary of inputs used to value the Series’ investments as of December 31, 2014 (See Security Valuation Note 2A in the Notes to Financial Statements):
| | | | | | | | | | | | |
| | | Total
Value at
December 31, 2014 | | | Level 1
Quoted
Prices | | | Level 2
Significant
Observable
Inputs | |
Debt Securities: | | | | | | | | | | | | |
Asset-Backed Securities | | $ | 2,607 | | | $ | — | | | $ | 2,607 | |
Corporate Bonds and Notes | | | 24,912 | | | | — | | | | 24,912 | |
Foreign Government Securities | | | 1,311 | | | | — | | | | 1,311 | |
Loan Agreements | | | 1,269 | | | | — | | | | 1,269 | |
Mortgage-Backed Securities | | | 16,806 | | | | — | | | | 16,806 | |
Municipal Bonds | | | 2,345 | | | | — | | | | 2,345 | |
U.S. Government Securities | | | 1,288 | | | | — | | | | 1,288 | |
Equity Securities: | | | | | | | | | | | | |
Common Stocks | | | 75,913 | | | | 75,913 | | | | — | |
Preferred Stocks | | | 808 | | | | 116 | | | | 692 | |
Exchange-Traded Fund | | | 1,153 | | | | 1,153 | | | | — | |
Short-Term Investments | | | 597 | | | | 597 | | | | — | |
| | | | | | | | | | | | |
Total Investments | | $ | 129,009 | | | $ | 77,779 | | | $ | 51,230 | |
| | | | | | | | | | | | |
There are no Level 3 (significant unobservable inputs) priced securities.
There were no transfers between Level 1 and Level 2 related to securities held at December 31, 2014.
See Notes to Financial Statements
48
VIRTUS VARIABLE INSURANCE TRUST SERIES
STATEMENTS OF ASSETS AND LIABILITIES
DECEMBER 31, 2014
(Reported in thousands except shares and per share amounts)
| | | | | | | | | | | | |
| | | Capital Growth
Series | | | Growth & Income
Series | | | International
Series | |
Assets | | | | | | | | | | | | |
Investment in securities at value(1) | | $ | 217,362 | | | $ | 139,286 | | | $ | 260,393 | |
Cash | | | — | | | | — | | | | 15 | |
Receivables | | | | | | | | | | | | |
Series shares sold | | | — | | | | — | | | | 733 | |
Dividends and interest | | | 114 | | | | 124 | | | | 374 | |
Tax reclaims | | | — | (2) | | | — | | | | 687 | |
Prepaid expenses | | | 15 | | | | 11 | | | | 23 | |
Other assets | | | 249 | | | | 169 | | | | 355 | |
| | | | | | | | | | | | |
Total assets | | | 217,740 | | | | 139,590 | | | | 262,580 | |
| | | | | | | | | | | | |
Liabilities | | | | | | | | | | | | |
Payables | | | | | | | | | | | | |
Series shares repurchased | | | 206 | | | | 144 | | | | 70 | |
Investment securities purchased | | | — | | | | — | | | | 467 | |
Investment advisory fee | | | 94 | | | | 50 | | | | 119 | |
Administration fees | | | 26 | | | | 16 | | | | 30 | |
Transfer agent fees and expenses | | | — | (2) | | | — | (2) | | | 1 | |
Trustees’ fees and expenses | | | 2 | | | | 1 | | | | 3 | |
Professional fees | | | 38 | | | | 34 | | | | 47 | |
Distribution and service fees | | | 48 | | | | 30 | | | | 56 | |
Trustee deferred compensation plan | | | 249 | | | | 169 | | | | 355 | |
Other accrued expenses | | | 39 | | | | 24 | | | | 54 | |
| | | | | | | | | | | | |
Total liabilities | | | 702 | | | | 468 | | | | 1,202 | |
| | | | | | | | | | | | |
Net Assets | | $ | 217,038 | | | $ | 139,122 | | | $ | 261,378 | |
| | | | | | | | | | | | |
Net Assets Consist of: | | | | | | | | | | | | |
Capital paid in on shares of beneficial interest | | $ | 180,291 | | | $ | 92,236 | | | $ | 188,989 | |
Accumulated undistributed net investment income (loss) | | | (234 | ) | | | (2 | ) | | | 237 | |
Accumulated undistributed net realized gain (loss) | | | (38,251 | ) | | | 4,492 | | | | 1,776 | |
Net unrealized appreciation (depreciation) | | | 75,232 | | | | 42,396 | | | | 70,376 | |
| | | | | | | | | | | | |
Net Assets | | $ | 217,038 | | | $ | 139,122 | | | $ | 261,378 | |
| | | | | | | | | | | | |
Class A | | | | | | | | | | | | |
Net asset value and offering price per share | | $ | 22.79 | | | $ | 16.91 | | | $ | 16.67 | |
| | | | | | | | | | | | |
Shares of beneficial interest outstanding, $1 par value, unlimited authorization | | | 9,523,284 | | | | 8,225,021 | | | | 15,676,607 | |
| | | | | | | | | | | | |
Net assets | | $ | 217,038 | | | $ | 139,122 | | | $ | 261,281 | |
| | | | | | | | | | | | |
Class I | | | | | | | | | | | | |
Net asset value per share | | $ | — | | | $ | — | | | $ | 16.65 | |
| | | | | | | | | | | | |
Shares of beneficial interest outstanding, $1 par value, unlimited authorization | | | — | | | | — | | | | 5,852 | |
| | | | | | | | | | | | |
Net assets | | $ | — | | | $ | — | | | $ | 97 | |
| | | | | | | | | | | | |
(1) Investments in securities at cost | | $ | 142,130 | | | $ | 96,890 | | | $ | 189,942 | |
(2) Amount is less than $500. | | | | | | | | | | | | |
See Notes to Financial Statements
49
VIRTUS VARIABLE INSURANCE TRUST SERIES
STATEMENTS OF ASSETS AND LIABILITIES (Continued)
DECEMBER 31, 2014
(Reported in thousands except shares and per share amounts)
| | | | | | | | | | | | |
| | | Multi-Sector
Fixed Income
Series | | | Premium
AlphaSector®
Series | | | Real Estate
Securities
Series | |
Assets | | | | | | | | | | | | |
Investment in securities at value(1) | | $ | 153,609 | | | $ | 37,291 | | | $ | 106,143 | |
Cash | | | 495 | | | | — | | | | — | |
Receivables | | | | | | | | | | | | |
Investment securities sold | | | 742 | | | | 7,111 | | | | 210 | |
Series shares sold | | | — | | | | 128 | | | | 4 | |
Dividends and interest | | | 1,989 | | | | 1 | | | | 524 | |
Tax reclaims | | | 1 | | | | — | | | | — | |
Prepaid expenses | | | 12 | | | | 2 | | | | 8 | |
Other assets | | | 201 | | | | 36 | | | | 118 | |
| | | | | | | | | | | | |
Total assets | | | 157,049 | | | | 44,569 | | | | 107,007 | |
| | | | | | | | | | | | |
Liabilities | | | | | | | | | | | | |
Payables | | | | | | | | | | | | |
Series shares repurchased | | | 38 | | | | — | (2) | | | 434 | |
Investment securities purchased | | | 1,487 | | | | 7,521 | | | | 663 | |
Investment advisory fee | | | 47 | | | | 31 | | | | 52 | |
Administration fees | | | 18 | | | | 4 | | | | 12 | |
Transfer agent fees and expenses | | | 1 | | | | — | (2) | | | 1 | |
Trustees’ fees and expenses | | | 2 | | | | — | (2) | | | 1 | |
Professional fees | | | 41 | | | | 10 | | | | 31 | |
Distribution and service fees | | | 33 | | | | 8 | | | | 22 | |
Trustee deferred compensation plan | | | 201 | | | | 36 | | | | 118 | |
Other accrued expenses | | | 43 | | | | 2 | | | | 31 | |
| | | | | | | | | | | | |
Total liabilities | | | 1,911 | | | | 7,612 | | | | 1,365 | |
| | | | | | | | | | | | |
Net Assets | | $ | 155,138 | | | $ | 36,957 | | | $ | 105,642 | |
| | | | | | | | | | | | |
Net Assets Consist of: | | | | | | | | | | | | |
Capital paid in on shares of beneficial interest | | $ | 160,559 | | | $ | 37,174 | | | $ | 54,521 | |
Accumulated undistributed net investment income (loss) | | | 28 | | | | (10 | ) | | | 84 | |
Accumulated undistributed net realized gain (loss) | | | (1,689 | ) | | | (575 | ) | | | 2,100 | |
Net unrealized appreciation (depreciation) | | | (3,760 | ) | | | 368 | | | | 48,937 | |
| | | | | | | | | | | | |
Net Assets | | $ | 155,138 | | | $ | 36,957 | | | $ | 105,642 | |
| | | | | | | | | | | | |
Class A | | | | | | | | | | | | |
Net asset value and offering price per share | | $ | 9.25 | | | $ | 12.55 | | | $ | 27.05 | |
| | | | | | | | | | | | |
Shares of beneficial interest outstanding, $1 par value, unlimited authorization | | | 16,741,926 | | | | 2,923,110 | | | | 3,900,349 | |
| | | | | | | | | | | | |
Net assets | | $ | 154,915 | | | $ | 36,680 | | | $ | 105,508 | |
| | | | | | | | | | | | |
Class I | | | | | | | | | | | | |
Net asset value per share | | $ | 9.24 | | | $ | 12.57 | | | $ | 27.02 | |
| | | | | | | | | | | | |
Shares of beneficial interest outstanding, $1 par value, unlimited authorization | | | 24,129 | | | | 22,058 | | | | 4,975 | |
| | | | | | | | | | | | |
Net assets | | $ | 223 | | | $ | 277 | | | $ | 134 | |
| | | | | | | | | | | | |
(1) Investments in securities at cost | | $ | 157,356 | | | $ | 36,923 | | | $ | 57,206 | |
(2) Amount is less than $500. | | | | | | | | | | | | |
See Notes to Financial Statements
50
VIRTUS VARIABLE INSURANCE TRUST SERIES
STATEMENTS OF ASSETS AND LIABILITIES (Continued)
DECEMBER 31, 2014
(Reported in thousands except shares and per share amounts)
| | | | | | | | | | | | |
| | | Small-Cap Growth
Series | | | Small-Cap
Value Series | | | Strategic
Allocation Series | |
Assets | | | | | | | | | | | | |
Investment in securities at value(1) | | $ | 64,005 | | | $ | 113,248 | | | $ | 129,009 | |
Cash | | | — | | | | — | | | | 11 | |
Receivables | | | | | | | | | | | | |
Investment securities sold | | | — | | | | — | | | | 78 | |
Dividends and interest | | | 46 | | | | 80 | | | | 558 | |
Prepaid expenses | | | 3 | | | | 9 | | | | 10 | |
Other assets | | | 74 | | | | 137 | | | | 158 | |
| | | | | | | | | | | | |
Total assets | | | 64,128 | | | | 113,474 | | | | 129,824 | |
| | | | | | | | | | | | |
Liabilities | | | | | | | | | | | | |
Payables | | | | | | | | | | | | |
Series shares repurchased | | | 198 | | | | 140 | | | | 43 | |
Investment advisory fee | | | 32 | | | | 62 | | | | 45 | |
Administration fees | | | 7 | | | | 13 | | | | 8 | |
Transfer agent fees and expenses | | | — | (2) | | | — | (2) | | | — | (2) |
Trustees’ fees and expenses | | | 1 | | | | 1 | | | | 1 | |
Professional fees | | | 29 | | | | 33 | | | | 39 | |
Distribution and service fees | | | 13 | | | | 24 | | | | 28 | |
Trustee deferred compensation plan | | | 74 | | | | 137 | | | | 158 | |
Other accrued expenses | | | 16 | | | | 34 | | | | 29 | |
| | | | | | | | | | | | |
Total liabilities | | | 370 | | | | 444 | | | | 351 | |
| | | | | | | | | | | | |
Net Assets | | $ | 63,758 | | | $ | 113,030 | | | $ | 129,473 | |
| | | | | | | | | | | | |
Net Assets Consist of: | | | | | | | | | | | | |
Capital paid in on shares of beneficial interest | | $ | 43,156 | | | $ | 79,627 | | | $ | 101,925 | |
Accumulated undistributed net investment income (loss) | | | (74 | ) | | | 32 | | | | (70 | ) |
Accumulated undistributed net realized gain (loss) | | | 698 | | | | 85 | | | | 3,149 | |
Net unrealized appreciation (depreciation) | | | 19,978 | | | | 33,286 | | | | 24,469 | |
| | | | | | | | | | | | |
Net Assets | | $ | 63,758 | | | $ | 113,030 | | | $ | 129,473 | |
| | | | | | | | | | | | |
Class A | | | | | | | | | | | | |
Net asset value and offering price per share | | $ | 20.73 | | | $ | 17.03 | | | $ | 14.30 | |
| | | | | | | | | | | | |
Shares of beneficial interest outstanding, $1 par value, unlimited authorization | | | 3,062,505 | | | | 6,635,952 | | | | 9,054,842 | |
| | | | | | | | | | | | |
Net assets | | $ | 63,483 | | | $ | 113,030 | | | $ | 129,473 | |
| | | | | | | | | | | | |
Class I | | | | | | | | | | | | |
Net asset value per share | | $ | 20.82 | | | $ | — | | | $ | — | |
| | | | | | | | | | | | |
Shares of beneficial interest outstanding, $1 par value, unlimited authorization | | | 13,227 | | | | — | | | | — | |
| | | | | | | | | | | | |
Net assets | | $ | 275 | | | $ | — | | | $ | — | |
| | | | | | | | | | | | |
(1) Investments in securities at cost | | $ | 44,027 | | | $ | 79,962 | | | $ | 104,539 | |
(2) Amount is less than $500. | | | | | | | | | | | | |
See Notes to Financial Statements
51
VIRTUS VARIABLE INSURANCE TRUST SERIES
STATEMENTS OF OPERATIONS
YEAR ENDED DECEMBER 31, 2014
($ reported in thousands)
| | | | | | | | | | | | |
| | | Capital Growth
Series | | | Growth & Income
Series | | | International
Series | |
Investment Income | | | | | | | | | | | | |
Dividends | | $ | 2,168 | | | $ | 2,720 | | | $ | 15,263 | |
Security lending | | | — | (1) | | | 4 | | | | 27 | |
Interest | | | — | (1) | | | 1 | | | | — | |
Foreign taxes withheld | | | (5 | ) | | | (3 | ) | | | (874 | ) |
| | | | | | | | | | | | |
Total investment income | | | 2,163 | | | | 2,722 | | | | 14,416 | |
| | | | | | | | | | | | |
Expenses | | | | | | | | | | | | |
Investment advisory fee | | | 1,484 | | | | 1,006 | | | | 2,236 | |
Administration fee | | | 263 | | | | 178 | | | | 372 | |
Distribution and service fees | | | 530 | | | | 359 | | | | 754 | |
Transfer agent fees and expenses | | | 1 | | | | 1 | | | | 3 | |
Custodian fees | | | 3 | | | | 3 | | | | 71 | |
Printing fees and expenses | | | 32 | | | | 21 | | | | 51 | |
Professional fees | | | 66 | | | | 55 | | | | 107 | |
Trustees’ fees and expenses | | | 95 | | | | 65 | | | | 139 | |
Miscellaneous expenses | | | 47 | | | | 33 | | | | 77 | |
| | | | | | | | | | | | |
Total expenses | | | 2,521 | | | | 1,721 | | | | 3,810 | |
Less expenses reimbursed by investment advisor | | | (336 | ) | | | (312 | ) | | | (252 | ) |
| | | | | | | | | | | | |
Net expenses | | | 2,185 | | | | 1,409 | | | | 3,558 | |
| | | | | | | | | | | | |
Net investment income (loss) | | | (22 | ) | | | 1,313 | | | | 10,858 | |
| | | | | | | | | | | | |
Net Realized and Unrealized Gain (Loss) on Investments | | | | | | | | | | | | |
Net realized gain (loss) on investments | | | 17,985 | | | | 15,723 | | | | 20,250 | |
Net realized gain (loss) on foreign currency transactions | | | — | | | | — | | | | (29 | ) |
Net change in unrealized appreciation (depreciation) on investments | | | 5,404 | | | | (3,833 | ) | | | (40,153 | ) |
Net change in unrealized appreciation (depreciation) on foreign currency translations | | | — | | | | — | | | | (96 | ) |
| | | | | | | | | | | | |
Net gain (loss) on investments | | | 23,389 | | | | 11,890 | | | | (20,028 | ) |
| | | | | | | | | | | | |
Net increase (decrease) in net assets resulting from operations | | $ | 23,367 | | | $ | 13,203 | | | $ | (9,170 | ) |
| | | | | | | | | | | | |
| (1) | Amount is less than $500. |
See Notes to Financial Statements
52
VIRTUS VARIABLE INSURANCE TRUST SERIES
STATEMENTS OF OPERATIONS (Continued)
YEAR ENDED DECEMBER 31, 2014
($ reported in thousands)
| | | | | | | | | | | | |
| | | Multi-Sector
Fixed Income
Series | | | Premium
AlphaSector®
Series | | | Real Estate
Securities
Series | |
Investment Income | | | | | | | | | | | | |
Interest | | $ | 9,800 | | | $ | — | | | $ | — | |
Dividends | | | 217 | | | | 609 | | | | 2,275 | |
Foreign taxes withheld | | | (9 | ) | | | — | | | | — | |
| | | | | | | | | | | | |
Total investment income | | | 10,008 | | | | 609 | | | | 2,275 | |
| | | | | | | | | | | | |
Expenses | | | | | | | | | | | | |
Investment advisory fee | | | 853 | | | | 332 | | | | 753 | |
Administration fee | | | 211 | | | | 37 | | | | 124 | |
Distribution and service fees | | | 426 | | | | 75 | | | | 251 | |
Transfer agent fees and expenses | | | 3 | | | | 2 | | | | 4 | |
Custodian fees | | | 9 | | | | 2 | | | | 2 | |
Printing fees and expenses | | | 32 | | | | 3 | | | | 24 | |
Professional fees | | | 65 | | | | 27 | | | | 47 | |
Trustees’ fees and expenses | | | 78 | | | | 12 | | | | 45 | |
Miscellaneous expenses | | | 42 | | | | 5 | | | | 24 | |
| | | | | | | | | | | | |
Total expenses | | | 1,719 | | | | 495 | | | | 1,274 | |
Less expenses reimbursed by investment advisor | | | (115 | ) | | | — | | | | (109 | ) |
Plus expenses recaptured by investment advisor | | | — | | | | 16 | (2) | | | — | |
| | | | | | | | | | | | |
Net expenses | | | 1,604 | | | | 511 | | | | 1,165 | |
| | | | | | | | | | | | |
Net investment income | | | 8,404 | | | | 98 | | | | 1,110 | |
| | | | | | | | | | | | |
Net Realized and Unrealized Gain (Loss) on Investments | | | | | | | | | | | | |
Net realized gain (loss) on investments | | | 1,059 | | | | 2,211 | | | | 12,433 | |
Net realized gain (loss) on foreign currency transactions | | | (30 | ) | | | — | | | | — | |
Net change in unrealized appreciation (depreciation) on investments | | | (5,786 | ) | | | (2,226 | ) | | | 13,589 | |
Net change in unrealized appreciation (depreciation) on foreign currency translations | | | (9 | ) | | | — | | | | — | |
| | | | | | | | | | | | |
Net gain (loss) on investments | | | (4,766 | ) | | | (15 | ) | | | 26,022 | |
| | | | | | | | | | | | |
Net increase (decrease) in net assets resulting from operations | | $ | 3,638 | | | $ | 83 | | | $ | 27,132 | |
| | | | | | | | | | | | |
| (1) | Amount is less than $500. |
| (2) | See Note 3D in the Notes to Financial Statements. |
See Notes to Financial Statements
53
VIRTUS VARIABLE INSURANCE TRUST SERIES
STATEMENTS OF OPERATIONS (Continued)
YEAR ENDED DECEMBER 31, 2014
($ reported in thousands)
| | | | | | | | | | | | |
| | | Small-Cap Growth
Series | | | Small-Cap Value
Series | | | Strategic
Allocation Series | |
Investment Income | | | | | | | | | | | | |
Dividends | | $ | 362 | | | $ | 2,085 | | | $ | 1,532 | |
Interest | | | — | | | | — | (1) | | | 2,315 | |
Security lending | | | — | | | | — | | | | 2 | |
Foreign taxes withheld | | | — | | | | — | | | | (3 | ) |
| | | | | | | | | | | | |
Total investment income | | | 362 | | | | 2,085 | | | | 3,846 | |
| | | | | | | | | | | | |
Expenses | | | | | | | | | | | | |
Investment advisory fee | | | 535 | | | | 1,048 | | | | 803 | |
Administration fee | | | 78 | | | | 144 | | | | 166 | |
Distribution and service fees | | | 157 | | | | 291 | | | | 335 | |
Transfer agent fees and expenses | | | 2 | | | | 1 | | | | 1 | |
Custodian fees | | | 2 | | | | 2 | | | | 5 | |
Printing fees and expenses | | | 13 | | | | 25 | | | | 22 | |
Professional fees | | | 40 | | | | 49 | | | | 58 | |
Trustees’ fees and expenses | | | 28 | | | | 53 | | | | 60 | |
Miscellaneous expenses | | | 15 | | | | 28 | | | | 31 | |
| | | | | | | | | | | | |
Total expenses | | | 870 | | | | 1,641 | | | | 1,481 | |
Less expenses reimbursed by investment advisor | | | (121 | ) | | | (245 | ) | | | (171 | ) |
| | | | | | | | | | | | |
Net expenses | | | 749 | | | | 1,396 | | | | 1,310 | |
| | | | | | | | | | | | |
Net investment income (loss) | | | (387 | ) | | | 689 | | | | 2,536 | |
| | | | | | | | | | | | |
Net Realized and Unrealized Gain (Loss) on Investments | | | | | | | | | | | | |
Net realized gain (loss) on investments | | | 5,697 | | | | 12,882 | | | | 9,000 | |
Net realized gain (loss) on foreign currency transactions | | | — | | | | — | | | | (3 | ) |
Net change in unrealized appreciation (depreciation) on investments | | | (2,457 | ) | | | (12,636 | ) | | | (1,825 | ) |
Net change in unrealized appreciation (depreciation) on foreign currency translations | | | — | | | | — | | | | (1 | ) |
| | | | | | | | | | | | |
Net gain (loss) on investments | | | 3,240 | | | | 246 | | | | 7,171 | |
| | | | | | | | | | | | |
Net increase in net assets resulting from operations | | $ | 2,853 | | | $ | 935 | | | $ | 9,707 | |
| | | | | | | | | | | | |
| (1) | Amount is less than $500. |
See Notes to Financial Statements
54
VIRTUS VARIABLE INSURANCE TRUST SERIES
STATEMENTS OF CHANGES IN NET ASSETS
($ reported in thousands)
| | | | | | | | | | | | | | | | | | | | | | | | |
| | | Capital Growth Series | | | Growth & Income Series | | | International Series | |
| | | Year Ended
December 31, 2014 | | | Year Ended
December 31, 2013 | | | Year Ended
December 31, 2014 | | | Year Ended
December 31, 2013 | | | Year Ended
December 31, 2014 | | | Year Ended
December 31, 2013 | |
INCREASE/(DECREASE) IN NET ASSETS | | | | | | | | | | | | | | | | | | | | | | | | |
From Operations | | | | | | | | | | | | | | | | | | | | | | | | |
Net investment income (loss) | | $ | (22 | ) | | $ | 380 | | | $ | 1,313 | | | $ | 1,199 | | | $ | 10,858 | | | $ | 6,493 | |
Net realized gain (loss) | | | 17,985 | | | | 15,987 | | | | 15,723 | | | | 23,083 | | | | 20,221 | | | | 21,510 | |
Net change in unrealized appreciation (depreciation) | | | 5,404 | | | | 35,890 | | | | (3,833 | ) | | | 15,419 | | | | (40,249 | ) | | | (3,040 | ) |
| | | | | | | | | | | | | | | | | | | | | | | | |
Increase (decrease) in net assets resulting from operations | | | 23,367 | | | | 52,257 | | | | 13,203 | | | | 39,701 | | | | (9,170 | ) | | | 24,963 | |
| | | | | | | | | | | | | | | | | | | | | | | | |
From Distributions to Shareholders | | | | | | | | | | | | | | | | | | | | | | | | |
Net investment income, Class A | | | (131 | ) | | | (655 | ) | | | (1,320 | ) | | | (1,206 | ) | | | (11,031 | ) | | | (7,001 | ) |
Net investment income, Class I | | | — | | | | — | | | | — | | | | — | | | | (5 | ) | | | (2 | ) |
Net realized short-term gains, Class A | | | — | | | | — | | | | (227 | ) | | | — | | | | — | | | | — | |
Net realized short-term gains, Class I | | | — | | | | — | | | | — | | | | — | | | | — | | | | — | |
Net realized long-term gains, Class A | | | — | | | | — | | | | (13,694 | ) | | | (11,002 | ) | | | (2,690 | ) | | | — | |
Net realized long-term gains, Class I | | | — | | | | — | | | | — | | | | — | | | | (1 | ) | | | — | |
| | | | | | | | | | | | | | | | | | | | | | | | |
Decrease in net assets from distributions to shareholders | | | (131 | ) | | | (655 | ) | | | (15,241 | ) | | | (12,208 | ) | | | (13,727 | ) | | | (7,003 | ) |
| | | | | | | | | | | | | | | | | | | | | | | | |
From Share Transactions | | | | | | | | | | | | | | | | | | | | | | | | |
Sale of shares | | | | | | | | | | | | | | | | | | | | | | | | |
Class A | | | 3,467 | | | | 3,923 | | | | 1,764 | | | | 1,555 | | | | 5,432 | | | | 4,543 | |
Class I | | | — | | | | — | | | | — | | | | — | | | | 3 | | | | 103 | |
Reinvestment of distributions | | | | | | | | | | | | | | | | | | | | | | | | |
Class A | | | 131 | | | | 655 | | | | 15,241 | | | | 12,208 | | | | 13,722 | | | | 7,001 | |
Class I | | | — | | | | — | | | | — | | | | — | | | | 5 | | | | 2 | |
Shares repurchased | | | | | | | | | | | | | | | | | | | | | | | | |
Class A | | | (28,060 | ) | | | (27,891 | ) | | | (26,228 | ) | | | (28,258 | ) | | | (52,712 | ) | | | (53,496 | ) |
Class I | | | — | | | | — | | | | — | | | | — | | | | (5 | ) | | | — | |
| | | | | | | | | | | | | | | | | | | | | | | | |
Increase (decrease) in net assets from share transactions | | | (24,462 | ) | | | (23,313 | ) | | | (9,223 | ) | | | (14,495 | ) | | | (33,555 | ) | | | (41,847 | ) |
| | | | | | | | | | | | | | | | | | | | | | | | |
Net increase (decrease) in net assets | | | (1,226 | ) | | | 28,289 | | | | (11,261 | ) | | | 12,998 | | | | (56,452 | ) | | | (23,887 | ) |
| | | | | | |
Net Assets | | | | | | | | | | | | | | | | | | | | | | | | |
Beginning of period | | | 218,264 | | | | 189,975 | | | | 150,383 | | | | 137,385 | | | | 317,830 | | | | 341,717 | |
| | | | | | | | | | | | | | | | | | | | | | | | |
End of period | | $ | 217,038 | | | $ | 218,264 | | | $ | 139,122 | | | $ | 150,383 | | | $ | 261,378 | | | $ | 317,830 | |
| | | | | | | | | | | | | | | | | | | | | | | | |
Accumulated undistributed net investment income (loss) at end of period | | $ | (234 | ) | | $ | (84 | ) | | $ | (2 | ) | | $ | 45 | | | $ | 237 | | | $ | 443 | |
| | | | | | | | | | | | |
Shares | | | | | | | | | | | | | | | | | | | | | | | | |
Sales of shares | | | | | | | | | | | | | | | | | | | | | | | | |
Class A | | | 166 | | | | 222 | | | | 99 | | | | 95 | | | | 294 | | | | 255 | |
Class I | | | — | | | | — | | | | — | | | | — | | | | — | | | | 6 | |
Reinvestment of distributions | | | | | | | | | | | | | | | | | | | | | | | | |
Class A | | | 6 | | | | 36 | | | | 880 | | | | 716 | | | | 777 | | | | 408 | |
Class I | | | — | | | | — | | | | — | | | | — | | | | — | | | | — | |
Shares repurchased | | | | | | | | | | | | | | | | | | | | | | | | |
Class A | | | (1,341 | ) | | | (1,571 | ) | | | (1,480 | ) | | | (1,738 | ) | | | (2,821 | ) | | | (2,993 | ) |
Class I | | | — | | | | — | | | | — | | | | — | | | | — | | | | — | |
| | | | | | | | | | | | | | | | | | | | | | | | |
Net Increase/(Decrease) | | | (1,169 | ) | | | (1,313 | ) | | | (501 | ) | | | (927 | ) | | | (1,750 | ) | | | (2,324 | ) |
| | | | | | | | | | | | | | | | | | | | | | | | |
See Notes to Financial Statements
55
VIRTUS VARIABLE INSURANCE TRUST SERIES
STATEMENTS OF CHANGES IN NET ASSETS (Continued)
($ reported in thousands)
| | | | | | | | | | | | | | | | | | | | | | | | |
| | | Multi-Sector Fixed Income Series | | | Premium AlphaSector® Series | | | Real Estate Securities Series | |
| | | Year Ended
December 31, 2014 | | | Year Ended
December 31, 2013 | | | Year Ended
December 31, 2014 | | | Year Ended
December 31, 2013 | | | Year Ended
December 31, 2014 | | | Year Ended
December 31, 2013 | |
INCREASE/(DECREASE) IN NET ASSETS | | | | | | | | | | | | | | | | | | | | | | | | |
From Operations | | | | | | | | | | | | | | | | | | | | | | | | |
Net investment income (loss) | | $ | 8,404 | | | $ | 9,716 | | | $ | 98 | | | $ | 55 | | | $ | 1,110 | | | $ | 1,204 | |
Net realized gain (loss) | | | 1,029 | | | | 4,676 | | | | 2,211 | | | | 123 | | | | 12,433 | | | | 14,501 | |
Net change in unrealized appreciation (depreciation) | | | (5,795 | ) | | | (10,289 | ) | | | (2,226 | ) | | | 2,416 | | | | 13,589 | | | | (14,293 | ) |
| | | | | | | | | | | | | | | | | | | | | | | | |
Increase (decrease) in net assets resulting from operations | | | 3,638 | | | | 4,103 | | | | 83 | | | | 2,594 | | | | 27,132 | | | | 1,412 | |
| | | | | | | | | | | | | | | | | | | | | | | | |
From Distributions to Shareholders | | | | | | | | | | | | | | | | | | | | | | | | |
Net investment income, Class A | | | (8,108 | ) | | | (9,966 | ) | | | (103 | ) | | | (57 | ) | | | (1,131 | ) | | | (1,464 | ) |
Net investment income, Class I | | | (9 | ) | | | (6 | ) | | | (1 | ) | | | (1 | ) | | | (2 | ) | | | (2 | ) |
Net realized short-term gains, Class A | | | — | | | | — | | | | (551 | ) | | | — | (1) | | | (445 | ) | | | (354 | ) |
Net realized short-term gains, Class I | | | — | | | | — | | | | (4 | ) | | | — | | | | (1 | ) | | | — | (1) |
Net realized long-term gains, Class A | | | — | | | | — | | | | (2,182 | ) | | | (55 | ) | | | (11,391 | ) | | | (14,262 | ) |
Net realized long-term gains, Class I | | | — | | | | — | | | | (16 | ) | | | — | (1) | | | (14 | ) | | | (16 | ) |
| | | | | | | | | | | | | | | | | | | | | | | | |
Decrease in net assets from distributions to shareholders | | | (8,117 | ) | | | (9,972 | ) | | | (2,857 | ) | | | (113 | ) | | | (12,984 | ) | | | (16,098 | ) |
| | | | | | | | | | | | | | | | | | | | | | | | |
From Share Transactions | | | | | | | | | | | | | | | | | | | | | | | | |
Sale of shares | | | | | | | | | | | | | | | | | | | | | | | | |
Class A | | | 11,880 | | | | 15,854 | | | | 30,572 | | | | 15,954 | | | | 11,894 | | | | 4,467 | |
Class I | | | 100 | | | | 128 | | | | 147 | | | | 125 | | | | — | | | | 113 | |
Reinvestment of distributions | | | | | | | | | | | | | | | | | | | | | | | | |
Class A | | | 8,107 | | | | 9,966 | | | | 2,836 | | | | 112 | | | | 12,967 | | | | 16,080 | |
Class I | | | 10 | | | | 6 | | | | 21 | | | | 1 | | | | 17 | | | | 18 | |
Shares repurchased | | | | | | | | | | | | | | | | | | | | | | | | |
Class A | | | (32,596 | ) | | | (51,738 | ) | | | (12,684 | ) | | | (4,778 | ) | | | (24,280 | ) | | | (17,495 | ) |
Class I | | | (3 | ) | | | (3 | ) | | | (11 | ) | | | (3 | ) | | | — | | | | — | |
| | | | | | | | | | | | | | | | | | | | | | | | |
Increase (decrease) in net assets from share transactions | | | (12,502 | ) | | | (25,787 | ) | | | 20,881 | | | | 11,411 | | | | 598 | | | | 3,183 | |
| | | | | | | | | | | | | | | | | | | | | | | | |
Net increase (decrease) in net assets | | | (16,981 | ) | | | (31,656 | ) | | | 18,107 | | | | 13,892 | | | | 14,746 | | | | (11,503 | ) |
| | | | | | |
Net Assets | | | | | | | | | | | | | | | | | | | | | | | | |
Beginning of period | | | 172,119 | | | | 203,775 | | | | 18,850 | | | | 4,958 | | | | 90,896 | | | | 102,399 | |
| | | | | | | | | | | | | | | | | | | | | | | | |
End of period | | $ | 155,138 | | | $ | 172,119 | | | $ | 36,957 | | | $ | 18,850 | | | $ | 105,642 | | | $ | 90,896 | |
| | | | | | | | | | | | | | | | | | | | | | | | |
Accumulated undistributed net investment income (loss) at end of period | | $ | 28 | | | $ | 625 | | | $ | (10 | ) | | $ | (4 | ) | | $ | 84 | | | $ | 107 | |
| | | | | | | | | | | | |
Shares | | | | | | | | | | | | | | | | | | | | | | | | |
Sales of shares | | | | | | | | | | | | | | | | | | | | | | | | |
Class A | | | 1,213 | | | | 1,613 | | | | 2,224 | | | | 1,313 | | | | 439 | | | | 158 | |
Class I | | | 10 | | | | 13 | | | | 11 | | | | 11 | | | | — | | | | 4 | |
Reinvestment of distributions | | | | | | | | | | | | | | | | | | | | | | | | |
Class A | | | 849 | | | | 1,054 | | | | 222 | | | | 9 | | | | 477 | | | | 660 | |
Class I | | | 1 | | | | 1 | | | | 2 | | | | — | | | | 1 | | | | 1 | |
Shares repurchased | | | | | | | | | | | | | | | | | | | | | | | | |
Class A | | | (3,345 | ) | | | (5,259 | ) | | | (930 | ) | | | (392 | ) | | | (908 | ) | | | (612 | ) |
Class I | | | — | | | | (1 | ) | | | (1 | ) | | | — | | | | — | | | | — | |
| | | | | | | | | | | | | | | | | | | | | | | | |
Net Increase/(Decrease) | | | (1,272 | ) | | | (2,579 | ) | | | 1,528 | | | | 941 | | | | 9 | | | | 211 | |
| | | | | | | | | | | | | | | | | | | | | | | | |
| (1) | Amount is less than $500. |
| (2) | Amount is less than 500 shares. |
See Notes to Financial Statements
56
VIRTUS VARIABLE INSURANCE TRUST
STATEMENTS OF CHANGES IN NET ASSETS
($ reported in thousands)
| | | | | | | | | | | | | | | | | | | | | | | | |
| | | Small-Cap Growth Series | | | Small-Cap Value Series | | | Strategic Allocation Series | |
| | | Year Ended
December 31, 2014 | | | Year Ended
December 31, 2013 | | | Year Ended
December 31, 2014 | | | Year Ended
December 31, 2013 | | | Year Ended
December 31, 2014 | | | Year Ended
December 31, 2013 | |
INCREASE/(DECREASE) IN NET ASSETS | | | | | | | | | | | | | | | | | | | | | | | | |
From Operations | | | | | | | | | | | | | | | | | | | | | | | | |
Net investment income (loss) | | $ | (387 | ) | | $ | (415 | ) | | $ | 689 | | | $ | 313 | | | $ | 2,536 | | | $ | 2,552 | |
Net realized gain (loss) | | | 5,697 | | | | 8,789 | | | | 12,882 | | | | 9,947 | | | | 8,997 | | | | 14,428 | |
Net change in unrealized appreciation (depreciation) | | | (2,457 | ) | | | 13,726 | | | | (12,636 | ) | | | 33,453 | | | | (1,826 | ) | | | 5,528 | |
| | | | | | | | | | | | | | | | | | | | | | | | |
Increase (decrease) in net assets resulting from operations | | | 2,853 | | | | 22,100 | | | | 935 | | | | 43,713 | | | | 9,707 | | | | 22,508 | |
| | | | | | | | | | | | | | | | | | | | | | | | |
From Distributions to Shareholders | | | | | | | | | | | | | | | | | | | | | | | | |
Net investment income, Class A | | | — | | | | (177 | ) | | | (686 | ) | | | (725 | ) | | | (2,822 | ) | | | (2,599 | ) |
Net investment income, Class I | | | — | | | | — | (1) | | | — | | | | — | | | | — | | | | — | |
Net realized short-term gains, Class A | | | — | | | | — | | | | — | | | | — | | | | (172 | ) | | | — | |
Net realized short-term gains, Class I | | | — | | | | — | | | | — | | | | — | | | | — | | | | — | |
Net realized long-term gains, Class A | | | (6,216 | ) | | | (567 | ) | | | (5,790 | ) | | | — | | | | (7,372 | ) | | | (10,364 | ) |
Net realized long-term gains, Class I | | | (26 | ) | | | (1 | ) | | | — | | | | — | | | | — | | | | — | |
| | | | | | | | | | | | | | | | | | | | | | | | |
Decrease in net assets from distributions to shareholders | | | (6,242 | ) | | | (745 | ) | | | (6,476 | ) | | | (725 | ) | | | (10,366 | ) | | | (12,963 | ) |
| | | | | | | | | | | | | | | | | | | | | | | | |
From Share Transactions | | | | | | | | | | | | | | | | | | | | | | | | |
Sale of shares | | | | | | | | | | | | | | | | | | | | | | | | |
Class A | | | 961 | | | | 1,187 | | | | 807 | | | | 932 | | | | 533 | | | | 1,106 | |
Class I | | | 131 | | | | 110 | | | | — | | | | — | | | | — | | | | — | |
Reinvestment of distributions | | | | | | | | | | | | | | | | | | | | | | | | |
Class A | | | 6,216 | | | | 744 | | | | 6,476 | | | | 725 | | | | 10,366 | | | | 12,963 | |
Class I | | | 26 | | | | 1 | | | | — | | | | — | | | | — | | | | — | |
Shares repurchased | | | | | | | | | | | | | | | | | | | | | | | | |
Class A | | | (11,262 | ) | | | (12,210 | ) | | | (24,064 | ) | | | (28,034 | ) | | | (18,220 | ) | | | (21,207 | ) |
Class I | | | (10 | ) | | | — | | | | — | | | | — | | | | — | | | | — | |
| | | | | | | | | | | | | | | | | | | | | | | | |
Increase (decrease) in net assets from share transactions | | | (3,938 | ) | | | (10,168 | ) | | | (16,781 | ) | | | (26,377 | ) | | | (7,321 | ) | | | (7,138 | ) |
| | | | | | | | | | | | | | | | | | | | | | | | |
Net increase (decrease) in net assets | | | (7,327 | ) | | | 11,187 | | | | (22,322 | ) | | | 16,611 | | | | (7,980 | ) | | | 2,407 | |
| | | | | | |
Net Assets | | | | | | | | | �� | | | | | | | | | | | | | | | |
Beginning of period | | | 71,085 | | | | 59,898 | | | | 135,352 | | | | 118,741 | | | | 137,453 | | | | 135,046 | |
| | | | | | | | | | | | | | | | | | | | | | | | |
End of period | | $ | 63,758 | | | $ | 71,085 | | | $ | 113,030 | | | $ | 135,352 | | | $ | 129,473 | | | $ | 137,453 | |
| | | | | | | | | | | | | | | | | | | | | | | | |
Accumulated undistributed net investment income (loss) at end of period | | $ | (74 | ) | | $ | (59 | ) | | $ | 32 | | | $ | 37 | | | $ | (70 | ) | | $ | 321 | |
| | | | | | | | | | | | |
Shares | | | | | | | | | | | | | | | | | | | | | | | | |
Sales of shares | | | | | | | | | | | | | | | | | | | | | | | | |
Class A | | | 47 | | | | 63 | | | | 48 | | | | 63 | | | | 36 | | | | 77 | |
Class I | | | 6 | | | | 6 | | | | — | | | | — | | | | — | | | | — | |
Reinvestment of distributions | | | | | | | | | | | | | | | | | | | | | | | | |
Class A | | | 300 | | | | 36 | | | | 375 | | | | 47 | | | | 712 | | | | 906 | |
Class I | | | 1 | | | | — | | | | — | | | | — | | | | — | | | | — | |
Shares repurchased | | | | | | | | | | | | | | | | | | | | | | | | |
Class A | | | (551 | ) | | | (657 | ) | | | (1,425 | ) | | | (1,855 | ) | | | (1,234 | ) | | | (1,464 | ) |
Class I | | | (1 | ) | | | — | | | | — | | | | — | | | | — | | | | — | |
| | | | | | | | | | | | | | | | | | | | | | | | |
Net Increase/(Decrease) | | | (198 | ) | | | (552 | ) | | | (1,002 | ) | | | (1,745 | ) | | | (486 | ) | | | (481 | ) |
| | | | | | | | | | | | | | | | | | | | | | | | |
| (1) | Amount is less than $500. |
See Notes to Financial Statements
57
VIRTUS VARIABLE INSURANCE TRUST
FINANCIAL HIGHLIGHTS
SELECTED PER SHARE DATA AND RATIOS FOR A SHARE OUTSTANDING
THROUGHOUT EACH PERIOD
| | | | | | | | | | | | | | | | | | | | | | | | | | | | | | | | | | | | | | | | | | | | | | | | | | | | | | | | | | | | | | | | | | | | | | | | | | | |
| | | Net Asset Value,
Beginning of Period | | Net Investment Income (Loss)(1) | | Net Realized and
Unrealized Gain (Loss) | | Total from Investment Operations
| | Dividends from
Net Investment Income | | Distributions from
Net Realized Gains | | Total Distributions | | Change in Net Asset Value | | Net Asset Value, End of Period | | Total Return(2) | | Net Assets, End of Period
(in thousands) | | Ratio
of Net
Expenses to
Average
Net Assets(3) | | Ratio
of Gross
Expenses to
Average
Net Assets
(before
waivers
and
reimbursements)(3) | | Ratio of Net Investment Income
to Average Net Assets | | Portfolio Turnover Rate |
Capital Growth Series | | | | | | | | | | | | | | | | | | | | | | | | | | | | | | | | | | | | | | | | | | | | | | | | | | | | | | | | | | | | | | | | | | | | | | | | | | | |
Class A | | | | | | | | | | | | | | | | | | | | | | | | | | | | | | | | | | | | | | | | | | | | | | | | | | | | | | | | | | | | | | | | | | | | | | | | | | | |
1/1/14 to 12/31/14 | | | $ | 20.41 | | | | | (0.00 | ) | | | | 2.39 | | | | | 2.39 | | | | | (0.01 | ) | | | | — | | | | | (0.01 | ) | | | | 2.38 | | | | $ | 22.79 | | | | | 11.73 | % | | | $ | 217,038 | | | | | 1.03 | % | | | | 1.19 | % | | | | (0.01 | )% | | | | 29 | % |
1/1/13 to 12/31/13 | | | | 15.82 | | | | | 0.04 | | | | | 4.61 | | | | | 4.65 | | | | | (0.06 | ) | | | | — | | | | | (0.06 | ) | | | | 4.59 | | | | | 20.41 | | | | | 29.44 | | | | | 218,264 | | | | | 1.03 | | | | | 1.14 | | | | | 0.19 | | | | | 30 | |
1/1/12 to 12/31/12 | | | | 13.99 | | | | | 0.11 | | | | | 1.81 | | | | | 1.92 | | | | | (0.09 | ) | | | | — | | | | | (0.09 | ) | | | | 1.83 | | | | | 15.82 | | | | | 13.76 | | | | | 189,975 | | | | | 0.96 | (7) | | | | 1.13 | | | | | 0.68 | | | | | 16 | |
1/1/11 to 12/31/11 | | | | 14.67 | | | | | 0.01 | | | | | (0.68 | ) | | | | (0.67 | ) | | | | (0.01 | ) | | | | — | | | | | (0.01 | ) | | | | (0.68 | ) | | | | 13.99 | | | | | (4.60 | ) | | | | 189,689 | | | | | 0.95 | | | | | 1.15 | | | | | 0.04 | | | | | 127 | |
| 1/1/10 to 12/31/10 | | | | 12.83 | | | | | 0.05 | | | | | 1.85 | | | | | 1.90 | | | | | (0.06 | ) | | | | — | | | | | (0.06 | ) | | | | 1.84 | | | | | 14.67 | | | | | 14.88 | | | | | 228,109 | | | | | 0.95 | | | | | 1.05 | | | | | 0.36 | | | | | 166 | |
Growth & Income Series | | | | | | | | | | | | | | | | | | | | | | | | | | | | | | | | | | | | | | | | | | | | | | | | | | | | | | | | | | | | | | | | | | | | | | | | | | | |
Class A | | | | | | | | | | | | | | | | | | | | | | | | | | | | | | | | | | | | | | | | | | | | | | | | | | | | | | | | | | | | | | | | | | | | | | | | | | | |
1/1/14 to 12/31/14 | | | $ | 17.23 | | | | | 0.16 | | | | | 1.51 | | | | | 1.67 | | | | | (0.17 | ) | | | | (1.82 | ) | | | | (1.99 | ) | | | | (0.32 | ) | | | $ | 16.91 | | | | | 9.64 | % | | | $ | 139,122 | | | | | 0.98 | % | | | | 1.20 | % | | | | 0.91 | % | | | | 53 | % |
1/1/13 to 12/31/13 | | | | 14.23 | | | | | 0.11 | | | | | 4.39 | | | | | 4.50 | | | | | (0.14 | ) | | | | (1.36 | ) | | | | (1.50 | ) | | | | 3.00 | | | | | 17.23 | | | | | 31.81 | | | | | 150,383 | | | | | 0.98 | | | | | 1.14 | | | | | 0.84 | | | | | 54 | |
1/1/12 to 12/31/12 | | | | 12.51 | | | | | 0.12 | | | | | 1.73 | | | | | 1.85 | | | | | (0.13 | ) | | | | — | | | | | (0.13 | ) | | | | 1.72 | | | | | 14.23 | | | | | 14.77 | | | | | 137,385 | | | | | 0.91 | (7) | | | | 1.14 | | | | | 0.83 | | | | | 73 | |
1/1/11 to 12/31/11 | | | | 12.82 | | | | | 0.09 | | | | | (0.30 | ) | | | | (0.21 | ) | | | | (0.10 | ) | | | | — | | | | | (0.10 | ) | | | | (0.31 | ) | | | | 12.51 | | | | | (1.66 | ) | | | | 148,283 | | | | | 0.90 | | | | | 1.16 | | | | | 0.69 | | | | | 36 | |
| 1/1/10 to 12/31/10 | | | | 11.49 | | | | | 0.11 | | | | | 1.34 | | | | | 1.45 | | | | | (0.12 | ) | | | | — | | | | | (0.12 | ) | | | | 1.33 | | | | | 12.82 | | | | | 12.83 | | | | | 189,361 | | | | | 0.90 | | | | | 1.07 | | | | | 0.98 | | | | | 39 | |
International Series | | | | | | | | | | | | | | | | | | | | | | | | | | | | | | | | | | | | | | | | | | | | | | | | | | | | | | | | | | | | | | | | | | | | | | | | | | | |
Class A | | | | | | | | | | | | | | | | | | | | | | | | | | | | | | | | | | | | | | | | | | | | | | | | | | | | | | | | | | | | | | | | | | | | | | | | | | | |
1/1/14 to 12/31/14 | | | $ | 18.23 | | | | | 0.67 | | | | | (1.34 | ) | | | | (0.67 | ) | | | | (0.71 | ) | | | | (0.18 | ) | | | | (0.89 | ) | | | | (1.56 | ) | | | $ | 16.67 | | | | | (3.90 | )% | | | $ | 261,281 | | | | | 1.18 | % | | | | 1.26 | % | | | | 3.60 | % | | | | 9 | % |
1/1/13 to 12/31/13 | | | | 17.30 | | | | | 0.35 | | | | | 0.97 | | | | | 1.32 | | | | | (0.39 | ) | | | | — | | | | | (0.39 | ) | | | | 0.93 | | | | | 18.23 | | | | | 7.78 | | | | | 317,726 | | | | | 1.18 | | | | | 1.18 | | | | | 1.97 | | | | | 11 | |
1/1/12 to 12/31/12 | | | | 15.28 | | | | | 0.41 | | | | | 2.06 | | | | | 2.47 | | | | | (0.45 | ) | | | | — | | | | | (0.45 | ) | | | | 2.02 | | | | | 17.30 | | | | | 16.52 | | | | | 341,717 | | | | | 1.06 | (7) | | | | 1.18 | | | | | 2.53 | | | | | 13 | |
1/1/11 to 12/31/11 | | | | 16.45 | | | | | 0.47 | | | | | (1.21 | ) | | | | (0.74 | ) | | | | (0.43 | ) | | | | — | | | | | (0.43 | ) | | | | (1.17 | ) | | | | 15.28 | | | | | (4.57 | ) | | | | 335,529 | | | | | 1.03 | | | | | 1.19 | | | | | 2.91 | | | | | 17 | |
1/1/10 to 12/31/10 | | | | 14.86 | | | | | 0.35 | | | | | 1.61 | | | | | 1.96 | | | | | (0.37 | ) | | | | — | | | | | (0.37 | ) | | | | 1.59 | | | | | 16.45 | | | | | 13.47 | | | | | 403,607 | | | | | 1.03 | | | | | 1.08 | | | | | 2.36 | | | | | 24 | |
| | | | | | | | | | | | | | | |
Class I | | | | | | | | | | | | | | | | | | | | | | | | | | | | | | | | | | | | | | | | | | | | | | | | | | | | | | | | | | | | | | | | | | | | | | | | | | | |
1/1/14 to 12/31/14 | | | $ | 18.22 | | | | | 0.69 | | | | | (1.32 | ) | | | | (0.63 | ) | | | | (0.76 | ) | | | | (0.18 | ) | | | | (0.94 | ) | | | | (1.57 | ) | | | $ | 16.65 | | | | | (3.71 | )% | | | $ | 97 | | | | | 0.93 | % | | | | 1.01 | % | | | | 3.71 | % | | | | 9 | % |
| 4/30/13(4) to 12/31/13 | | | | 18.40 | | | | | 0.18 | | | | | 0.08 | | | | | 0.26 | | | | | (0.44 | ) | | | | — | | | | | (0.44 | ) | | | | (0.18 | ) | | | | 18.22 | | | | | 1.17 | (6) | | | | 104 | | | | | 0.93 | (5) | | | | 0.93 | (5) | | | | 1.54 | (5) | | | | 11 | |
Multi-Sector Fixed Income Series | | | | | | | | | | | | | | | | | | | | | | | | | | | | | | | | | | | | | | | | | | | | | | | | | | | | | | | | | | | | | | | | | | | | | | | | | | | |
Class A | | | | | | | | | | | | | | | | | | | | | | | | | | | | | | | | | | | | | | | | | | | | | | | | | | | | | | | | | | | | | | | | | | | | | | | | | | | |
1/1/14 to 12/31/14 | | | $ | 9.54 | | | | | 0.48 | | | | | (0.29 | ) | | | | 0.19 | | | | | (0.48 | ) | | | | — | | | | | (0.48 | ) | | | | (0.29 | ) | | | $ | 9.25 | | | | | 1.90 | % | | | $ | 154,915 | | | | | 0.94 | % | | | | 1.01 | % | | | | 4.93 | % | | | | 48 | % |
1/1/13 to 12/31/13 | | | | 9.88 | | | | | 0.51 | | | | | (0.30 | ) | | | | 0.21 | | | | | (0.55 | ) | | | | — | | | | | (0.55 | ) | | | | (0.34 | ) | | | | 9.54 | | | | | 2.25 | | | | | 171,995 | | | | | 0.94 | | | | | 0.96 | | | | | 5.23 | | | | | 56 | |
1/1/12 to 12/31/12 | | | | 9.18 | | | | | 0.58 | | | | | 0.74 | | | | | 1.32 | | | | | (0.62 | ) | | | | — | | | | | (0.62 | ) | | | | 0.70 | | | | | 9.88 | | | | | 14.69 | | | | | 203,775 | | | | | 0.78 | (7) | | | | 0.94 | | | | | 5.94 | | | | | 85 | |
1/1/11 to 12/31/11 | | | | 9.55 | | | | | 0.63 | | | | | (0.34 | ) | | | | 0.29 | | | | | (0.66 | ) | | | | — | | | | | (0.66 | ) | | | | (0.37 | ) | | | | 9.18 | | | | | 2.99 | | | | | 197,016 | | | | | 0.75 | | | | | 0.97 | | | | | 6.50 | | | | | 39 | |
1/1/10 to 12/31/10 | | | | 8.98 | | | | | 0.61 | | | | | 0.65 | | | | | 1.26 | | | | | (0.69 | ) | | | | — | | | | | (0.69 | ) | | | | 0.57 | | | | | 9.55 | | | | | 14.36 | | | | | 227,860 | | | | | 0.75 | | | | | 0.85 | | | | | 6.48 | | | | | 56 | |
| | | | | | | | | | | | | | | |
Class I | | | | | | | | | | | | | | | | | | | | | | | | | | | | | | | | | | | | | | | | | | | | | | | | | | | | | | | | | | | | | | | | | | | | | | | | | | | |
1/1/14 to 12/31/14 | | | $ | 9.53 | | | | | 0.51 | | | | | (0.29 | ) | | | | 0.22 | | | | | (0.51 | ) | | | | — | | | | | (0.51 | ) | | | | (0.29 | ) | | | $ | 9.24 | | | | | 2.16 | % | | | $ | 223 | | | | | 0.69 | % | | | | 0.76 | % | | | | 5.19 | % | | | | 48 | % |
| 4/30/13(4) to 12/31/13 | | | | 10.19 | | | | | 0.36 | | | | | (0.44 | ) | | | | (0.08 | ) | | | | (0.58 | ) | | | | — | | | | | (0.58 | ) | | | | (0.66 | ) | | | | 9.53 | | | | | (0.89 | )(6) | | | | 124 | | | | | 0.69 | (5) | | | | 0.71 | (5) | | | | 5.54 | (5) | | | | 56 | |
The footnote legend is at the end of the Financial Highlights.
See Notes to Financial Statements
58
VIRTUS VARIABLE INSURANCE TRUST
FINANCIAL HIGHLIGHTS
SELECTED PER SHARE DATA AND RATIOS FOR A SHARE OUTSTANDING
THROUGHOUT EACH PERIOD
| | | | | | | | | | | | | | | | | | | | | | | | | | | | | | | | | | | | | | | | | | | | | | | | | | | | | | | | | | | | | | | | | | | | | | | | | | | |
| | | Net Asset Value,
Beginning of Period | | Net Investment Income (Loss)(1) | | Net Realized and
Unrealized Gain (Loss) | | Total from Investment Operations
| | Dividends from
Net Investment Income | | Distributions from
Net Realized Gains | | Total Distributions | | Change in Net Asset Value | | Net Asset Value, End of Period | | Total Return(2) | | Net Assets, End of Period
(in thousands) | | Ratio of Net Expenses to
Average Net Assets(3) | | Ratio of Gross Expenses to
Average Net Assets (before
waivers and reimbursements)(3) | | Ratio of Net Investment Income
to Average Net Assets | | Portfolio Turnover Rate |
Premium AlphaSector® Series | | | | | | | | | | | | | | | | | | | | | | | | | | | | | | | | | | | | | | | | | | | | | | | | | | | | | | | | | | | | | | | | | | | | | | | | | | | |
Class A | | | | | | | | | | | | | | | | | | | | | | | | | | | | | | | | | | | | | | | | | | | | | | | | | | | | | | | | | | | | | | | | | | | | | | | | | | | |
1/1/14 to 12/31/14 | | | $ | 13.30 | | | | | 0.04 | | | | | 0.27 | | | | | 0.31 | | | | | (0.05 | ) | | | | (1.01 | ) | | | | (1.06 | ) | | | | (0.75 | ) | | | $ | 12.55 | | | | | 2.23 | % | | | $ | 36,680 | | | | | 1.70 | %(8) | | | | 1.65 | % | | | | 0.32 | % | | | | 473 | % |
1/1/13 to 12/31/13 | | | | 10.41 | | | | | 0.06 | | | | | 2.92 | | | | | 2.98 | | | | | (0.05 | ) | | | | (0.04 | ) | | | | (0.09 | ) | | | | 2.89 | | | | | 13.30 | | | | | 28.71 | | | | | 18,710 | | | | | 1.70 | | | | | 1.79 | | | | | 0.52 | | | | | 108 | |
1/1/12 to 12/31/12 | | | | 9.49 | | | | | 0.15 | | | | | 0.86 | | | | | 1.01 | | | | | (0.09 | ) | | | | — | | | | | (0.09 | ) | | | | 0.92 | | | | | 10.41 | | | | | 10.69 | | | | | 4,958 | | | | | 1.70 | | | | | 2.07 | | | | | 1.50 | | | | | 272 | |
2/14/11(4) to 12/31/11 | | | | 10.00 | | | | | 0.08 | | | | | (0.52 | ) | | | | (0.44 | ) | | | | (0.07 | ) | | | | — | | | | | (0.07 | ) | | | | (0.51 | ) | | | | 9.49 | | | | | (4.47 | )(6) | | | | 1,250 | | | | | 1.70 | (5) | | | | 7.31 | (5) | | | | 0.98 | (5) | | | | 249 | (6) |
| | | | | | | | | | | | | | | |
Class I | | | | | | | | | | | | | | | | | | | | | | | | | | | | | | | | | | | | | | | | | | | | | | | | | | | | | | | | | | | | | | | | | | | | | | | | | | | |
1/1/14 to 12/31/14 | | | $ | 13.30 | | | | | 0.05 | | | | | 0.29 | | | | | 0.34 | | | | | (0.06 | ) | | | | (1.01 | ) | | | | (1.07 | ) | | | | (0.73 | ) | | | $ | 12.57 | | | | | 2.39 | % | | | $ | 277 | | | | | 1.45 | %(8) | | | | 1.41 | % | | | | 0.40 | % | | | | 473 | % |
| 4/30/13(4) to 12/31/13 | | | | 11.69 | | | | | 0.07 | | | | | 1.66 | | | | | 1.73 | | | | | (0.08 | ) | | | | (0.04 | ) | | | | (0.12 | ) | | | | 1.61 | | | | | 13.30 | | | | | 14.64 | (6) | | | | 140 | | | | | 1.45 | (5) | | | | 1.50 | (5) | | | | 0.89 | (5) | | | | 108 | |
Real Estate Securities Series | | | | | | | | | | | | | | | | | | | | | | | | | | | | | | | | | | | | | | | | | | | | | | | | | | | | | | | | | | | | | | | | | | | | | | | | | | | |
Class A | | | | | | | | | | | | | | | | | | | | | | | | | | | | | | | | | | | | | | | | | | | | | | | | | | | | | | | | | | | | | | | | | | | | | | | | | | | |
1/1/14 to 12/31/14 | | | $ | 23.33 | | | | | 0.29 | | | | | 7.00 | | | | | 7.29 | | | | | (0.31 | ) | | | | (3.26 | ) | | | | (3.57 | ) | | | | 3.72 | | | | $ | 27.05 | | | | | 31.62 | % | | | $ | 105,508 | | | | | 1.16 | % | | | | 1.27 | % | | | | 1.10 | % | | | | 22 | % |
1/1/13 to 12/31/13 | | | | 27.78 | | | | | 0.34 | | | | | (0.05 | ) | | | | 0.29 | | | | | (0.43 | ) | | | | (4.31 | ) | | | | (4.74 | ) | | | | (4.45 | ) | | | | 23.33 | | | | | 0.90 | | | | | 90,794 | | | | | 1.16 | | | | | 1.22 | | | | | 1.20 | | | | | 26 | |
1/1/12 to 12/31/12 | | | | 26.18 | | | | | 0.30 | | | | | 4.10 | | | | | 4.40 | | | | | (0.29 | ) | | | | (2.51 | ) | | | | (2.80 | ) | | | | 1.60 | | | | | 27.78 | | | | | 16.98 | | | | | 102,399 | | | | | 1.11 | (7) | | | | 1.20 | | | | | 1.03 | | | | | 18 | |
1/1/11 to 12/31/11 | | | | 25.43 | | | | | 0.24 | | | | | 2.25 | | | | | 2.49 | | | | | (0.19 | ) | | | | (1.55 | ) | | | | (1.74 | ) | | | | 0.75 | | | | | 26.18 | | | | | 9.87 | | | | | 103,114 | | | | | 1.10 | | | | | 1.22 | | | | | 0.90 | | | | | 22 | |
1/1/10 to 12/31/10 | | | | 20.25 | | | | | 0.28 | | | | | 5.35 | | | | | 5.63 | | | | | (0.45 | ) | | | | — | | | | | (0.45 | ) | | | | 5.18 | | | | | 25.43 | | | | | 28.00 | | | | | 110,769 | | | | | 1.10 | | | | | 1.11 | | | | | 1.23 | | | | | 36 | |
| | | | | | | | | | | | | | | |
Class I | | | | | | | | | | | | | | | | | | | | | | | | | | | | | | | | | | | | | | | | | | | | | | | | | | | | | | | | | | | | | | | | | | | | | | | | | | | |
1/1/14 to 12/31/14 | | | $ | 23.30 | | | | | 0.34 | | | | | 7.02 | | | | | 7.36 | | | | | (0.38 | ) | | | | (3.26 | ) | | | | (3.64 | ) | | | | 3.72 | | | | $ | 27.02 | | | | | 31.98 | % | | | $ | 134 | | | | | 0.91 | % | | | | 1.02 | % | | | | 1.30 | % | | | | 22 | % |
| 4/30/13(4) to 12/31/13 | | | | 30.96 | | | | | 0.23 | | | | | (3.08 | ) | | | | (2.85 | ) | | | | (0.50 | ) | | | | (4.31 | ) | | | | (4.81 | ) | | | | (7.66 | ) | | | | 23.30 | | | | | (10.45 | )(6) | | | | 102 | | | | | 0.91 | (5) | | | | 0.98 | (5) | | | | 1.23 | (5) | | | | 26 | |
Small-Cap Growth Series | | | | | | | | | | | | | | | | | | | | | | | | | | | | | | | | | | | | | | | | | | | | | | | | | | | | | | | | | | | | | | | | | | | | | | | | | | | |
Class A | | | | | | | | | | | | | | | | | | | | | | | | | | | | | | | | | | | | | | | | | | | | | | | | | | | | | | | | | | | | | | | | | | | | | | | | | | | |
1/1/14 to 12/31/14 | | | $ | 21.72 | | | | | (0.13 | ) | | | | 1.29 | | | | | 1.16 | | | | | — | | | | | (2.15 | ) | | | | (2.15 | ) | | | | (0.99 | ) | | | $ | 20.73 | | | | | 5.50 | % | | | $ | 63,483 | | | | | 1.19 | % | | | | 1.38 | % | | | | (0.62 | )% | | | | 20 | % |
1/1/13 to 12/31/13 | | | | 15.66 | | | | | (0.12 | ) | | | | 6.39 | | | | | 6.27 | | | | | (0.05 | ) | | | | (0.16 | ) | | | | (0.21 | ) | | | | 6.06 | | | | | 21.72 | | | | | 40.20 | | | | | 70,948 | | | | | 1.19 | | | | | 1.33 | | | | | (0.63 | ) | | | | 28 | |
1/1/12 to 12/31/12 | | | | 14.03 | | | | | 0.07 | | | | | 1.59 | | | | | 1.66 | | | | | (0.03 | ) | | | | — | | | | | (0.03 | ) | | | | 1.63 | | | | | 15.66 | | | | | 11.81 | | | | | 59,898 | | | | | 1.07 | (7) | | | | 1.32 | | | | | 0.44 | | | | | 16 | |
1/1/11 to 12/31/11 | | | | 13.24 | | | | | (0.02 | ) | | | | 2.23 | | | | | 2.21 | | | | | — | | | | | (1.42 | ) | | | | (1.42 | ) | | | | 0.79 | | | | | 14.03 | | | | | 16.59 | | | | | 64,868 | | | | | 1.05 | | | | | 1.35 | | | | | (0.15 | ) | | | | 35 | |
1/1/10 to 12/31/10 | | | | 11.66 | | | | | (0.07 | ) | | | | 1.65 | | | | | 1.58 | | | | | — | | | | | — | | | | | — | | | | | 1.58 | | | | | 13.24 | | | | | 13.53 | | | | | 68,463 | | | | | 1.05 | | | | | 1.33 | | | | | (0.55 | ) | | | | 179 | |
| | | | | | | | | | | | | | | |
Class I | | | | | | | | | | | | | | | | | | | | | | | | | | | | | | | | | | | | | | | | | | | | | | | | | | | | | | | | | | | | | | | | | | | | | | | | | | | |
1/1/14 to 12/31/14 | | | $ | 21.75 | | | | | (0.07 | ) | | | | 1.29 | | | | | 1.22 | | | | | — | | | | | (2.15 | ) | | | | (2.15 | ) | | | | (0.93 | ) | | | $ | 20.82 | | | | | 5.78 | % | | | $ | 275 | | | | | 0.94 | % | | | | 1.14 | % | | | | (0.34 | )% | | | | 20 | % |
| 4/30/13(4) to 12/31/13 | | | | 17.29 | | | | | (0.03 | ) | | | | 4.70 | | | | | 4.67 | | | | | (0.05 | ) | | | | (0.16 | ) | | | | (0.21 | ) | | | | 4.46 | | | | | 21.75 | | | | | 26.28 | (6) | | | | 137 | | | | | 0.94 | (5) | | | | 1.07 | (5) | | | | (0.23 | )(5) | | | | 28 | |
Small-Cap Value Series | | | | | | | | | | | | | | | | | | | | | | | | | | | | | | | | | | | | | | | | | | | | | | | | | | | | | | | | | | | | | | | | | | | | | | | | | | | |
Class A | | | | | | | | | | | | | | | | | | | | | | | | | | | | | | | | | | | | | | | | | | | | | | | | | | | | | | | | | | | | | | | | | | | | | | | | | | | |
1/1/14 to 12/31/14 | | | $ | 17.72 | | | | | 0.10 | | | | | 0.24 | | | | | 0.34 | | | | | (0.11 | ) | | | | (0.92 | ) | | | | (1.03 | ) | | | | (0.69 | ) | | | $ | 17.03 | | | | | 1.83 | % | | | $ | 113,030 | | | | | 1.20 | % | | | | 1.41 | % | | | | 0.61 | % | | | | 26 | % |
1/1/13 to 12/31/13 | | | | 12.66 | | | | | 0.04 | | | | | 5.11 | | | | | 5.15 | | | | | (0.09 | ) | | | | — | | | | | (0.09 | ) | | | | 5.06 | | | | | 17.72 | | | | | 40.77 | | | | | 135,352 | | | | | 1.20 | | | | | 1.35 | | | | | 0.25 | | | | | 14 | |
1/1/12 to 12/31/12 | | | | 11.99 | | | | | 0.29 | | | | | 0.67 | | | | | 0.96 | | | | | (0.29 | ) | | | | — | | | | | (0.29 | ) | | | | 0.67 | | | | | 12.66 | | | | | 8.13 | | | | | 118,741 | | | | | 1.29 | (7) | | | | 1.34 | | | | | 2.29 | | | | | 17 | |
1/1/11 to 12/31/11 | | | | 12.33 | | | | | 0.12 | | | | | 0.48 | | | | | 0.60 | | | | | (0.10 | ) | | | | (0.84 | ) | | | | (0.94 | ) | | | | (0.34 | ) | | | | 11.99 | | | | | 4.54 | | | | | 129,907 | | | | | 1.30 | | | | | 1.36 | | | | | 0.95 | | | | | 22 | |
1/1/10 to 12/31/10 | | | | 10.55 | | | | | 0.15 | | | | | 1.69 | | | | | 1.84 | | | | | (0.06 | ) | | | | — | | | | | (0.06 | ) | | | | 1.78 | | | | | 12.33 | | | | | 17.40 | | | | | 151,281 | | | | | 1.30 | | | | | 1.41 | | | | | 1.34 | | | | | 69 | |
The footnote legend is at the end of the Financial Highlights.
See Notes to Financial Statements
59
VIRTUS VARIABLE INSURANCE TRUST
FINANCIAL HIGHLIGHTS
SELECTED PER SHARE DATA AND RATIOS FOR A SHARE OUTSTANDING
THROUGHOUT EACH PERIOD
| | | | | | | | | | | | | | | | | | | | | | | | | | | | | | | | | | | | | | | | | | | | | | | | | | | | | | | | | | | | | | | | | | | | | | | | | | | |
| | | Net Asset Value,
Beginning of Period | | Net Investment Income (Loss)(1) | | Net Realized and
Unrealized Gain (Loss) | | Total from Investment Operations
| | Dividends from
Net Investment Income | | Distributions from
Net Realized Gains | | Total Distributions | | Change in Net Asset Value | | Net Asset Value, End of Period | | Total Return(2) | | Net Assets, End of Period
(in thousands) | | Ratio of Net Expenses to
Average Net Assets(3) | | Ratio of Gross Expenses to
Average Net Assets (before
waivers and reimbursements)(3) | | Ratio of Net Investment Income
to Average Net Assets | | Portfolio Turnover Rate |
Strategic Allocation Series | | | | | | | | | | | | | | | | | | | | | | | | | | | | | | | | | | | | | | | | | | | | | | | | | | | | | | | | | | | | | | | | | | | | | | | | | | | |
Class A | | | | | | | | | | | | | | | | | | | | | | | | | | | | | | | | | | | | | | | | | | | | | | | | | | | | | | | | | | | | | | | | | | | | | | | | | | | |
1/1/14 to 12/31/14 | | | $ | 14.41 | | | | | 0.28 | | | | | 0.80 | | | | | 1.08 | | | | | (0.32 | ) | | | | (0.87 | ) | | | | (1.19 | ) | | | | (0.11 | ) | | | $ | 14.30 | | | | | 7.51 | % | | | $ | 129,473 | | | | | 0.98 | % | | | | 1.11 | % | | | | 1.89 | % | | | | 47 | % |
1/1/13 to 12/31/13 | | | | 13.48 | | | | | 0.27 | | | | | 2.13 | | | | | 2.40 | | | | | (0.29 | ) | | | | (1.18 | ) | | | | (1.47 | ) | | | | 0.93 | | | | | 14.41 | | | | | 17.99 | | | | | 137,453 | | | | | 0.98 | | | | | 1.06 | | | | | 1.88 | | | | | 49 | |
1/1/12 to 12/31/12 | | | | 12.17 | | | | | 0.29 | | | | | 1.33 | | | | | 1.62 | | | | | (0.31 | ) | | | | — | | | | | (0.31 | ) | | | | 1.31 | | | | | 13.48 | | | | | 13.42 | | | | | 135,046 | | | | | 0.87 | (7) | | | | 1.05 | | | | | 2.18 | | | | | 72 | |
1/1/11 to 12/31/11 | | | | 12.22 | | | | | 0.30 | | | | | (0.06 | ) | | | | 0.24 | | | | | (0.29 | ) | | | | — | | | | | (0.29 | ) | | | | (0.05 | ) | | | | 12.17 | | | | | 1.91 | | | | | 138,124 | | | | | 0.85 | | | | | 1.07 | | | | | 2.39 | | | | | 43 | |
1/1/10 to 12/31/10 | | | | 11.11 | | | | | 0.30 | | | | | 1.14 | | | | | 1.44 | | | | | (0.33 | ) | | | | — | | | | | (0.33 | ) | | | | 1.11 | | | | | 12.22 | | | | | 13.20 | | | | | 158,322 | | | | | 0.85 | | | | | 0.96 | | | | | 2.61 | | | | | 42 | |
Footnote Legend:
| (1) | Computed using average shares outstanding. |
| (2) | The total return does not include the expenses associated with the annuity or life insurance policy through which you invest. |
| (3) | Each Series will also indirectly bear its prorated share of expenses of any underlying funds in which it invests. Such expenses are not included in the calculation of this ratio. |
| (7) | Blended net expense ratio due to a change in expense limitation agreements during the fiscal year. |
| (8) | See Note 3D in the Notes to Financial Statements for information on recapture of expense previously waived. |
See Notes to Financial Statements
60
VIRTUS VARIABLE INSURANCE TRUST
NOTES TO FINANCIAL STATEMENTS
DECEMBER 31, 2014
Note 1—Organization
Virtus Variable Insurance Trust (the “Trust”) is organized as a Delaware statutory trust and is registered under the Investment Company Act of 1940, as amended (“1940 Act”), as an open-end management investment company. It was formed on February 18, 1986 as a Massachusetts business trust, commenced operations on December 5, 1986 and was reorganized as a Delaware statutory trust on February 14, 2011.
The Trust is organized with series, which are currently available only to separate accounts of participating insurance companies to fund variable accumulation annuity contracts and variable universal life insurance policies. As of the date of this report the Trust is comprised of nine series (each a “Series”), each reported in this annual report. Each Series’ investment objective is outlined in the respective Series Summary page.
Each Series offers Class A shares. The International Series, Multi-Sector Fixed Income Series, Premium AlphaSector® Series, Real Estate Securities Series and Small-Cap Growth Series also offer Class I shares.
Note 2—Significant Accounting Policies
The following is a summary of significant accounting policies consistently followed by the Trust in the preparation of its financial statements. The preparation of financial statements in conformity with accounting principles generally accepted in the United States of America requires management to make estimates and assumptions that affect the reported amounts of assets and liabilities, and disclosure of contingent assets and liabilities at the date of the financial statements and the reported amounts of increases and decreases in net assets from operations during the reporting period. Actual results could differ from those estimates and those differences could be significant.
Security valuation procedures for each Series, which include nightly price variance as well as back-testing such as bi-weekly unchanged price, monthly secondary source and transaction analysis, have been approved by the Board of Trustees (the “Board” or the “Trustees”). All internally fair valued securities are approved by a valuation committee (the “Valuation Committee”) appointed by the Board. The Valuation Committee is comprised of certain members of management as identified to the Board and convenes independently from portfolio management. All internally fair valued securities are updated daily and reviewed in detail by the Valuation Committee monthly unless changes occur within the period. The Valuation Committee reviews the validity of the model inputs and any changes to the model. Fair valuations are reviewed by the Board at least quarterly.
Each Series utilizes a fair value hierarchy which prioritizes the inputs to valuation techniques used to measure fair value into three broad levels.
| | |
Ÿ Level 1 – | | quoted prices in active markets for identical securities (security types generally include listed equities). |
| |
Ÿ Level 2 – | | prices determined using other significant observable inputs (including quoted prices for similar securities, interest rates, prepayment speeds, credit risk, etc.). |
| |
Ÿ Level 3 – | | prices determined using significant unobservable inputs (including the Valuation Committee’s own assumptions in determining the fair value of investments). |
A description of the valuation techniques applied to a Series’ major categories of assets and liabilities measured at fair value on a recurring basis is as follows:
Equity securities are valued at the official closing price (typically last sale) on the exchange on which the securities are primarily traded, or if no closing price is available, at the last bid price and are categorized as Level 1 in the hierarchy. Restricted equity securities and private placements that are not widely traded, are illiquid or are internally fair valued by the Valuation Committee, are generally categorized as Level 3 in the hierarchy.
Certain non-U.S. securities may be fair valued in cases where closing prices are not readily available or are deemed not reflective of readily available market prices. For example, significant events (such as movement in the U.S. securities market, or other regional and local developments) may occur between the time that non-U.S. markets close (where the security is principally traded) and the time that a Series calculates its net asset value (“NAV”) (at the close of regular trading on the New York Stock Exchange (“NYSE”), generally 4 p.m. Eastern time) that may impact the value of securities traded in these non-U.S. markets. In such cases a Series fair values non-U.S. securities using an external pricing service which considers the correlation of the trading patterns of the non-U.S. security to the intraday trading in the U.S. markets for investments such as ADRs, financial futures, ETFs, and certain indexes as well as prices for similar securities. Such fair valuations are categorized as Level 2 in the hierarchy. Because the frequency of significant events is not predictable, fair valuation of certain non-U.S. common stocks may occur on a frequent basis.
Debt securities, including restricted securities, are valued based on evaluated quotations received from independent pricing services or from dealers who make markets in such securities. For most bond types, the pricing service utilizes matrix pricing that considers one or more of the following factors: yield or price of bonds of comparable quality, coupon, maturity, current cash flows, type, and current day trade information, as well as dealer supplied prices. These valuations are generally categorized as Level 2 in the hierarchy. Structured debt instruments such as mortgage-backed and asset-backed securities may also incorporate collateral analysis and utilize cash flow models for valuation and are generally categorized as Level 2 in the hierarchy. Pricing services do not provide pricing for all securities, and therefore indicative bids from dealers are utilized which are based on pricing models used by market makers in the security and are generally categorized as Level 2 in the hierarchy. Debt securities that are not widely traded, are illiquid, or are internally fair valued by the Valuation Committee are generally categorized as Level 3 in the hierarchy.
Listed derivatives, such as options, that are actively traded are valued based on quoted prices from the exchange and are categorized as Level 1 in the hierarchy. Over-the-counter derivative contracts, which include forward currency contracts and equity-linked Instruments, do not require material subjectivity, as pricing inputs are observed from actively quoted markets and are categorized as Level 2 in the hierarchy.
Investments in open-end mutual funds are valued at NAV. Investments in closed-end funds are valued as of the close of regular trading on the NYSE each business day. Both are categorized as Level 1 in the hierarchy.
61
VIRTUS VARIABLE INSURANCE TRUST
NOTES TO FINANCIAL STATEMENTS (Continued)
DECEMBER 31, 2014
A summary of the inputs used to value a Series’ net assets by each major security type is disclosed at the end of the Schedule of Investments for each Series. The inputs or methodologies used for valuing securities are not necessarily an indication of the risk associated with investing in those securities.
| | B. | | Security Transactions and Investment Income |
Security transactions are recorded on the trade date. Realized gains and losses from sales of securities are determined on the identified cost basis. Dividend income is recognized on the ex-dividend date, or in the case of certain non-U.S. securities, as soon as the Series is notified. Interest income is recorded on the accrual basis. Each Series amortizes premiums and accretes discounts using the effective interest method.
Dividend income from investments in real estate investment trusts (“REITs”) is recorded using management’s estimate of the income included in distributions received from such investments. Distributions received in excess of this estimated amount are recorded as a reduction of the cost of investments or reclassified to capital gains. The actual amounts of income, return of capital, and capital gains are only determined by each REIT after its fiscal year-end, and may differ from the estimated amounts.
Each Series is treated as a separate taxable entity. Each Series intends to comply with the requirements of Subchapter M of the Internal Revenue Code and to distribute substantially all of its taxable income to its shareholders. Therefore, no provision for federal income taxes or excise taxes has been made.
Certain Series may be subject to non-U.S. taxes on income, gains on investments or currency repatriation, a portion of which may be recoverable. Each Series will accrue such taxes and recoveries as applicable based upon current interpretations of the tax rules and regulations that exist in the markets in which it invests.
Management of the Trust has concluded that there are no significant uncertain tax positions that would require recognition in the financial statements.
As of December 31, 2014, the tax years that remain subject to examination by the major tax jurisdictions under the statute of limitations are from the year 2011 forward (with limited exceptions).
| | D. | | Distributions to Shareholders |
Distributions are recorded by each Series on the ex-dividend date. Income and capital gain distributions are determined in accordance with income tax regulations that may differ from accounting principles generally accepted in the United States of America. These differences may include the treatment of non-taxable dividends, market premium and discount, non-deductible expenses, expiring capital loss carryovers, non-U.S. currency gain or loss, gain or loss on futures contracts, partnerships, operating losses and losses deferred due to wash sales. Permanent book and tax basis differences relating to shareholder distributions will result in reclassifications to capital paid in on shares of beneficial interest.
Expenses incurred together by a Series and other affiliated mutual funds are allocated in proportion to the net assets of each such Series/fund, except where allocation of direct expense to each Series/fund or an alternative allocation method can be more appropriately used.
In addition to the net annual operating expenses that a Series bears directly, the contract owners, as investors in the Series, indirectly bear the Series’ pro-rata expenses of any underlying mutual funds in which the Series invests.
| | F. | | Foreign Currency Translation |
Non-U.S. investment securities and other assets and liabilities denominated in foreign currencies are translated into U.S. dollar amounts at the foreign currency exchange rate effective at the end of the reporting period. Cost of investments is translated at the currency exchange rate effective at the trade date. The gain or loss resulting from a change in currency exchange rates between the trade and settlement date of a portfolio transaction is treated as a gain or loss on foreign currency. Likewise, the gain or loss resulting from a change in currency exchange rates between the date income is accrued and the date it is paid is treated as a gain or loss on foreign currency. The Series do not isolate that portion of the results of operations arising from changes in foreign exchange rates on investments from the fluctuations arising from changes in the market prices of securities held. Such fluctuations are included with the net realized and unrealized gain or loss on investments.
Certain Series may invest in direct debt instruments which are interests in amounts owed by a corporate, governmental, or other borrower to lenders or lending syndicates. Loan agreements are generally non-investment grade and often involve borrowers that are highly leveraged. The Series may invest in obligations of borrowers who are in bankruptcy proceedings. Loan agreements are typically senior in the corporate capital structure of the borrower. A loan is often administered by a bank or other financial institution (the “lender”) that acts as agent for all holders. The agent administers the terms of the loan, as specified in the loan agreement. A Series’ investments in loans may be in the form of participations in loans or assignments of all or a portion of loans from third parties. When investing in loan participations, a Series has the right to receive payments of principal, interest and any fees to which it is entitled only from the lender selling the loan participation and only upon receipt by the lender of payments from the borrower. The Series generally has no right to enforce compliance with the terms of the loan agreement with the borrower. As a result, the Series may be subject to the credit risk of both the borrower and the lender that is selling the loan agreement. When the Series purchases assignments from lenders it acquires direct rights against the borrower on the loan.
62
VIRTUS VARIABLE INSURANCE TRUST
NOTES TO FINANCIAL STATEMENTS (Continued)
DECEMBER 31, 2014
A Series may invest in multiple series or tranches of a loan, which may have varying terms and carry different associated risks. Loan agreements may involve foreign borrowers and investments may be denominated in foreign currencies. Direct indebtedness of emerging countries involves a risk that the government entities responsible for the repayment of the debt may be unable, or unwilling, to pay the principal and interest when due.
The loan agreements have floating rate loan interests which generally pay interest at rates that are periodically determined by reference to a base lending rate plus a premium. The base lending rates are generally LIBOR (London Interbank Offered Rate), the prime rate offered by one or more U.S. banks or the certificate of deposit rate. When a loan agreement is purchased the Series may pay an assignment fee. On an ongoing basis, the Series may receive a commitment fee based on the undrawn portion of the underlying line of credit portion of a loan agreement. Prepayment penalty fees are received upon the prepayment of a loan agreement by a borrower. Prepayment penalty, facility, commitment, consent and amendment fees are recorded to income as earned or paid.
At December 31, 2014, all loan agreements held by the Series are assignment loans.
| | H. | | When-issued Purchases and Forward Commitments (Delayed Delivery) |
Certain Series may engage in when-issued or forward commitment transactions. Securities purchased on a when-issued or forward commitment basis are also known as delayed delivery transactions. Delayed delivery transactions involve a commitment by a Series to purchase or sell a security at a future date (ordinarily up to 90 days later). When-issued or forward commitments enable a Series to lock in what is believed to be an attractive price or yield on a particular security for a period of time, regardless of future changes in interest rates. Each Series records when-issued and delayed delivery securities on the trade date. Each Series maintains collateral for the securities purchased. Securities purchased on a when-issued or delayed delivery basis begin earning interest on the settlement date.
Certain Series may loan securities to qualified brokers through an agreement with Brown Brothers Harriman (“BBH”), as a third party lending agent. Under the terms of the agreement, a Series is required to maintain collateral with a market value not less than 100% of the market value of loaned securities. Collateral is adjusted daily in connection with changes in the market value of securities on loan. Collateral may consist of cash and securities issued by the U.S. Government or its agencies. Cash collateral is invested in a short-term money market fund. Dividends earned on the collateral and premiums paid by the broker are recorded as income by the Series net of fees and rebates charged by BBH for its services as securities lending agent and in connection with this securities lending program. Lending portfolio securities involves a risk of delay in the recovery of the loaned securities or in the declining value of the collateral.
Securities lending for all Series was suspended effective June 23, 2014.
Note 3—Investment Advisory Fees and Related Party Transactions
($ reported in thousands except as noted)
Virtus Investment Advisers, Inc. (the “Adviser”), an indirect wholly-owned subsidiary of Virtus Investment Partners, Inc. (“Virtus”), is the adviser to the Trust. The Adviser manages the Series’ investment programs and general operations of the Series, including oversight of the Series’ subadvisers.
As compensation for its services to the Series, the Adviser is entitled to a fee based upon the following annual rates as a percentage of the average daily net assets of each Series:
| | | | | | | | | | | | |
Series | | First
$250 Million | | | Next
$250 Million | | | Over
$500 Million | |
Capital Growth Series | | | 0.70 | % | | | 0.65 | % | | | 0.60 | % |
Growth & Income Series | | | 0.70 | | | | 0.65 | | | | 0.60 | |
International Series | | | 0.75 | | | | 0.70 | | | | 0.65 | |
Multi-Sector Fixed Income Series | | | 0.50 | | | | 0.45 | | | | 0.40 | |
Strategic Allocation Series | | | 0.60 | | | | 0.55 | | | | 0.50 | |
| | | |
| | | First
$1 Billion | | | Next
$1 Billion | | | Over
$2 Billion | |
Real Estate Securities Series | | | 0.75 | % | | | 0.70 | % | | | 0.65 | % |
| | | |
| | | First
$1 Billion | | | $1+ Billion | | | | |
Small-Cap Growth Series | | | 0.85 | % | | | 0.80 | % | | | | |
| | | |
| | | First
$400 Million | | | $400 Million
to $1 Billion | | | Over
$1 Billion | |
Small-Cap Value Series | | | 0.90 | % | | | 0.85 | % | | | 0.80 | % |
| | | |
| | | | | | Rate | | | | |
Premium AlphaSector® Series | | | | | | | 1.10 | % | | | | |
63
VIRTUS VARIABLE INSURANCE TRUST
NOTES TO FINANCIAL STATEMENTS (Continued)
DECEMBER 31, 2014
The subadvisers manage the investments of each Series for which they are paid a fee by the Adviser. A list of the subadvisers and the Series they serve is as follows:
| | |
Series | | Subadviser |
| Capital Growth Series | | Kayne Anderson Rudnick Investment Management, LLC (“KAR”)* |
| Growth & Income Series | | Euclid Advisors LLC (“Euclid”)* |
| International Series | | Aberdeen Asset Management Inc. |
| Multi-Sector Fixed Income Series | | Newfleet Asset Management, LLC (“NF”)* |
| | |
Series | | Subadviser |
Premium AlphaSector® Series | | F-Squared Institutional Advisors, LLC1 and Euclid* |
| Real Estate Securities Series | | Duff & Phelps Investment Management Co.* |
| Small-Cap Growth Series | | KAR* |
| Small-Cap Value Series | | KAR* |
| Strategic Allocation Series: | | |
Equity Portfolio | | Euclid* |
Fixed Income Portfolio | | NF* |
| | * | An indirect wholly-owned subsidiary of Virtus. |
| | 1 | On December 22, 2014, a settlement between F-squared and the Securities Exchange Commission, related to a number of regulatory matters, was announced. Management has reviewed the settlement and has concluded that there is no impact to these financial statements. |
The Adviser has extended the contractual agreement to limit total operating expenses of certain Series of the Trust through April 30, 2016 (excluding interest, taxes, extraordinary expenses and acquired fund fees and expenses, if any), so that such expenses do not exceed the following percentages of average net assets:
| | | | | | | | |
| | | Maximum Total Operating Expenses | |
| | | Class A | | | Class I | |
Capital Growth Series | | | 1.03 | % | | | — | |
Growth & Income Series | | | 0.98 | | | | — | |
International Series | | | 1.18 | | | | 0.93 | % |
Multi-Sector Fixed Income Series | | | 0.94 | | | | 0.69 | |
Premium AlphaSector® Series | | | 1.70 | | | | 1.45 | |
Real Estate Securities Series | | | 1.16 | | | | 0.91 | |
Small-Cap Growth Series | | | 1.19 | | | | 0.94 | |
Small-Cap Value Series | | | 1.20 | | | | — | |
Strategic Allocation Series | | | 0.98 | | | | — | |
The Adviser may recapture operating expenses waived or reimbursed under this arrangement, within three fiscal years following the end of the fiscal year in which such waiver or reimbursement occurred. Each Series must pay its ordinary operating expenses before the Adviser is entitled to any reimbursement and must remain in compliance with applicable expense limitations. All or a portion of the following Adviser reimbursed expenses may be recaptured by the fiscal year ending:
| | | | | | | | | | | | | | | | |
| | | Expiration Date | |
| | | 2015 | | | 2016 | | | 2017 | | | Total | |
Capital Growth Series | | $ | 334 | | | $ | 211 | | | $ | 336 | | | $ | 881 | |
Growth & Income Series | | | 335 | | | | 231 | | | | 312 | | | | 878 | |
International Series | | | 407 | | | | — | | | | 252 | | | | 659 | |
Multi-Sector Fixed Income Series | | | 327 | | | | 34 | | | | 115 | | | | 476 | |
Premium AlphaSector® Series | | | 8 | | | | 9 | | | | — | | | | 17 | |
Real Estate Securities Series | | | 95 | | | | 57 | | | | 109 | | | | 261 | |
Small-Cap Growth Series | | | 155 | | | | 88 | | | | 121 | | | | 364 | |
Small-Cap Value Series | | | 69 | | | | 194 | | | | 245 | | | | 508 | |
Strategic Allocation Series | | | 253 | | | | 112 | | | | 171 | | | | 536 | |
| | E. | | Administrator and Distributor |
Virtus Fund Services, LLC, an indirect wholly-owned subsidiary of Virtus, serves as administrator to the Series.
For the year ended December 31, 2014 (the “period”), the Series incurred administration fees, totaling $1,270, which are included in the Statement of Operations. A portion of these fees was paid to an outside entity that also provides services to the Series.
VP Distributors, LLC (“VP Distributors”), an indirect wholly-owned subsidiary of Virtus, serves as the distributor for all the Series’ shares. Each Series pays VP Distributors distribution and/or service fees under a Board approved Rule 12b-1 plan, at the annual rate of 0.25% of the average daily net assets of such Series’ Class A shares. Class I shares are not subject to a Rule 12b-1 plan. For the year ended December 31, 2014, the Series incurred distribution fees totaling $3,177, which are included in the Statement of Operations. A portion of these fees was paid to certain insurance companies for marketing and/or shareholder services provided to contract owners.
64
VIRTUS VARIABLE INSURANCE TRUST
NOTES TO FINANCIAL STATEMENTS (Continued)
DECEMBER 31, 2014
At December 31, 2014, Virtus and its affiliates, and the retirement plans of Virtus and its affiliates, held shares of certain Series which may be redeemed at any time that aggregated to the following:
| | | | | | | | |
| | | Shares | | | Aggregate
Net Asset
Value | |
International Series | | | | | | | | |
Class I | | | 5,851 | | | $ | 97 | |
Multi-Sector Fixed Income Series | | | | | | | | |
Class I | | | 10,959 | | | | 101 | |
Premium AlphaSector® Series | | | | | | | | |
Class I | | | 9,345 | | | | 117 | |
Real Estate Securities Series | | | | | | | | |
Class I | | | 4,374 | | | | 118 | |
Small-Cap Growth Series | | | | | | | | |
Class I | | | 6,416 | | | | 134 | |
The Trust provides a deferred compensation plan for its Trustees who receive compensation from the Trust. Under the deferred compensation plan, Trustees may elect to defer all or a portion of their compensation. Amounts deferred are retained by the Trust, and then, to the extent permitted by the 1940 Act, in turn, may be invested in the shares of affiliated or unaffiliated mutual funds or variable annuities selected by the Trustees. Investments in such instruments are included in “Other Assets” on the Statement of Assets and Liabilities at December 31, 2014.
Note 4—Purchases and Sales of Securities
($ reported in thousands except as noted)
Purchases and sales of securities (excluding U.S. Government and agency securities and short-term investments) during the year ended December 31, 2014, were as follows:
| | | | | | | | |
| | | Purchases | | | Sales | |
Capital Growth Series | | $ | 61,355 | | | $ | 84,734 | |
Growth and Income Series | | | 75,716 | | | | 98,094 | |
International Series | | | 27,307 | | | | 68,096 | |
Multi-Sector Fixed Income Series | | | 77,406 | | | | 90,317 | |
Premium AlphaSector® Series | | | 143,291 | | | | 125,060 | |
Real Estate Securities Series | | | 22,057 | | | | 33,910 | |
Small-Cap Growth Series | | | 12,347 | | | | 23,025 | |
Small-Cap Value Series | | | 29,431 | | | | 51,563 | |
Strategic Allocation Series | | | 57,081 | | | | 69,198 | |
Purchases and sales of long-term U.S. Government and agency securities during the year ended December 31, 2014, were as follows:
| | | | | | | | |
| | | Purchases | | | Sales | |
Multi-Sector Fixed Income Series | | $ | 2,920 | | | $ | 2,935 | |
Strategic Allocation Series | | | 4,813 | | | | 6,892 | |
Note 5—Credit Risk and Asset Concentrations
In countries with limited or developing markets, investments may present greater risks than in more developed markets and the prices of such investments may be volatile. The consequences of political, social or economic changes in these markets may have disruptive effects on the market prices of these investments and the income they generate, as well as a Series’ ability to repatriate such amounts.
High-yield/high-risk securities typically entail greater price volatility and/or principal and interest rate risk. There is a greater chance that an issuer will not be able to make principal and interest payments on time. Analysis of the creditworthiness of issuers of high-yield/high-risk securities may be complex, and as a result, it may be more difficult for the Adviser and/or subadvisers to accurately predict risk.
Certain Series may invest in ETFs, which may expose the Series to the risk that the value of an ETF will be more volatile than the underlying portfolio of securities the ETF is designed to track, or that the costs to the Series of owning shares of the ETF will exceed those the Series would incur by investing in such securities directly.
Investing in sector funds or non-diversified funds may be more volatile than investing in broadly diversified funds, and may be more susceptible to adverse economic, political or regulatory developments affecting a single issuer than would be the case if it were more broadly diversified.
Certain Series may invest a high percentage of their assets in specific sectors of the market in the pursuit of their investment objectives. Fluctuations in these sectors of concentration may have a greater impact on a Series, positive or negative, than if the Series did not concentrate its investments in such sectors.
65
VIRTUS VARIABLE INSURANCE TRUST
NOTES TO FINANCIAL STATEMENTS (Continued)
DECEMBER 31, 2014
At December 31, 2014, the Series below held securities in specific sectors as detailed below:
| | | | | | |
Series | | Sector | | Percentage of
Total Investments | |
Capital Growth Series | | Information Technology | | | 36 | % |
Small-Cap Growth Series | | Information Technology | | | 31 | |
Small-Cap Value Series | | Information Technology | | | 30 | |
Note 6—Illiquid and Restricted Securities
Investments are generally considered illiquid if they cannot be disposed of within seven days in the ordinary course of business at the approximate amount at which such securities have been valued by the Series. Additionally, the following information is also considered in determining illiquidity: the frequency of trades and quotes for the investment; whether the investment is listed for trading on a recognized domestic exchange and/or whether two or more brokers are willing to purchase or sell the security at a comparable price; the extent of market making activity in the investment; and the nature of the market for investment. Illiquid securities are noted as such within each Series’ Schedule of Investments where applicable. However, a portion of such footnoted securities could be liquid where it’s determined that some, though not all, of the position could be disposed of within seven days in the ordinary course of business at the approximate amount at which such securities have been valued by the Series.
Restricted securities are illiquid securities as defined above, not registered under the Securities Act of 1933, as amended (the “1933 Act”). Generally, 144A securities are excluded from this category, except where defined as illiquid.
Each Series will bear any costs, including those involved in registration under the 1933 Act in connection with the disposition of such securities.
At December 31, 2014, the Series did not hold any securities that were both illiquid and restricted.
Note 7—Indemnifications
Under the Trust’s organizational documents and in separate agreements between each Trustee and the Trust, the Trustees and officers are indemnified against certain liabilities arising out of the performance of their duties to the Trust and its Series. In addition, in the normal course of business, the Series enter into contracts that provide a variety of indemnifications to other parties. The Series’ maximum exposure under these arrangements is unknown as this would involve future claims that may be made against the Series and that have not occurred. However, the Series have not had prior claims or losses pursuant to these arrangements and expect the risk of loss to be remote.
Note 8—Manager of Managers
The Trust and the Adviser have each received an exemptive order from the SEC that permits the Adviser, subject to certain conditions and without the approval of shareholders, to: (a) employ a new unaffiliated subadviser for a Series pursuant to the terms of a new subadvisory agreement, in each case either as a replacement for an existing subadviser or as an additional subadviser; (b) change the terms of any subadvisory agreement; and (c) continue the employment of an existing subadviser on the same subadvisory agreement terms where an agreement has been assigned because of a change in control of the subadviser. In such circumstances, shareholders would receive notice of such action, including the information concerning the new subadviser that normally is provided in a proxy statement.
Note 9—Mixed and Shared Funding
Shares of the Series are not directly offered to the public. Shares of the Series are currently offered through separate accounts to fund variable accumulation annuity contracts and variable universal life insurance policies issued by participating insurance companies.
The interests of variable annuity contract owners and variable life policy owners could diverge based on differences in U.S. federal and state regulatory requirements, tax laws, investment management or other unanticipated developments. The Trust’s Trustees do not foresee any such differences or disadvantages at this time. However, the Trust’s Trustees intend to monitor for any material conflicts and will determine what action, if any, should be taken in response to such conflicts. If such a conflict should occur, one or more separate accounts may be required to withdraw its investment in the Series, or shares of another Series may be substituted.
Note 10—Federal Income Tax Information
($ reported in thousands except as noted)
At December 31, 2014, federal tax cost and aggregate gross unrealized appreciation (depreciation) of securities held by each Series were as follows:
| | | | | | | | | | | | | | | | |
Series | | Federal
Tax Cost | | | Unrealized
Appreciation | | | Unrealized
(Depreciation) | | | Net Unrealized
Appreciation
(Depreciation) | |
Capital Growth Series | | $ | 142,264 | | | $ | 76,593 | | | $ | (1,495 | ) | | $ | 75,098 | |
Growth & Income Series | | | 97,136 | | | | 42,376 | | | | (226 | ) | | | 42,150 | |
International Series | | | 190,528 | | | | 85,053 | | | | (15,188 | ) | | | 69,865 | |
Multi-Sector Fixed Income Series | | | 157,613 | | | | 5,075 | | | | (9,079 | ) | | | (4,004 | ) |
Premium AlphaSector® Series | | | 37,051 | | | | 521 | | | | (281 | ) | | | 240 | |
Real Estate Securities Series | | | 58,712 | | | | 47,517 | | | | (86 | ) | | | 47,431 | |
Small-Cap Growth Series | | | 44,027 | | | | 20,451 | | | | (473 | ) | | | 19,978 | |
Small-Cap Value Series | | | 79,962 | | | | 33,658 | | | | (372 | ) | | | 33,286 | |
Strategic Allocation Series | | | 104,707 | | | | 25,407 | | | | (1,105 | ) | | | 24,302 | |
The differences between book basis cost and tax basis cost were primarily attributable to the tax deferral of losses on wash sales.
66
VIRTUS VARIABLE INSURANCE TRUST
NOTES TO FINANCIAL STATEMENTS (Continued)
DECEMBER 31, 2014
The following Series have capital loss carryovers, which may be used to offset future capital gains, as follows:
| | | | | | | | | | | | |
| | | Expiration Year | |
Series | | 2016 | | | 2017 | | | Total | |
Capital Growth Series | | $ | 11,783 | | | $ | 26,333 | | | $ | 38,116 | |
Multi-Sector Fixed Income Series | | | — | | | | 1,395 | | | | 1,395 | |
The Trust may not realize the benefit of these losses to the extent each Series does not realize gains on investments prior to the expiration of the capital loss carryovers. Utilization of this capital loss carryover is subject to annual limits.
Under the Regulated Investment Company Modernization Act of 2010 (the “Act”), net capital losses recognized for tax years beginning after December 22, 2010, may be carried forward indefinitely, and their character is retained as short-term and/or long-term losses. Previously, net capital losses were carried forward for eight years and treated as short-term losses. As a transition rule, the Act requires that post-enactment net capital losses be used before pre-enactment net capital losses.
For the year ended December 31, 2014, the following Series utilized losses deferred in prior years against current year capital gains:
| | | | |
| Capital Growth Series | | $ | 18,084 | |
| International Series | | | 15,194 | |
| Multi-Sector Fixed Income Series | | | 1,996 | |
| Small-Cap Value Series | | | 7,014 | |
Capital losses realized after October 31 and certain late year losses may be deferred and treated as occurring on the first day of the following fiscal year. For the fiscal year ended December 31, 2014, the Series deferred and recognized qualified late year losses as follows:
| | | | | | | | | | | | | | | | |
| | | Late Year
Ordinary
Losses
Deferred | | | Late Year
Ordinary
Losses
Recognized | | | Capital
Loss
Deferred | | | Capital
Loss
Recognized | |
International Series | | $ | — | | | $ | — | | | $ | — | | | $ | 3 | |
Multi-Sector Fixed Income Series | | | — | | | | — | | | | 83 | | | | — | |
Premium AlphaSector® Series | | | — | | | | — | | | | 448 | | | | — | |
The components of distributable earnings on a tax basis (excluding unrealized appreciation (depreciation) which are disclosed in the beginning of this note) consist of the following:
| | | | | | | | |
| | | Undistributed
Ordinary Income | | | Undistributed
Long-Term Capital Gains | |
Growth & Income Series | | $ | 308 | | | $ | 4,607 | |
International Series | | | 599 | | | | 2,362 | |
Multi-Sector Fixed Income Series | | | 288 | | | | — | |
Real Estate Securities Series | | | 314 | | | | 3,484 | |
Small-Cap Growth Series | | | 226 | | | | 472 | |
Small-Cap Value Series | | | 165 | | | | 87 | |
Strategic Allocation Series | | | 319 | | | | 3,091 | |
The differences between the book and tax basis components of distributable earnings relate principally to the timing of recognition of income and gains for federal income tax purposes. Short-term gains distributions reported in the Statements of Changes in Net Assets, if any, are reported as ordinary income for federal tax purposes. Distributions are determined on a tax basis and may differ from net investment income and realized capital gains for financial reporting purposes.
The tax character of dividends and distributions paid during the years ended December 31, 2014 and 2013 was as follows:
| | | | | | | | | | | | | | | | |
| | | | | | Ordinary
Income | | | Long-Term
Capital Gains | | | Total | |
Capital Growth Series | | | 2014 | | | $ | 131 | | | $ | — | | | $ | 131 | |
| | | 2013 | | | | 655 | | | | — | | | | 655 | |
Growth & Income Series | | | 2014 | | | | 1,547 | | | | 13,694 | | | | 15,241 | |
| | | 2013 | | | | 1,206 | | | | 11,002 | | | | 12,208 | |
International Series | | | 2014 | | | | 11,036 | | | | 2,691 | | | | 13,727 | |
| | | 2013 | | | | 7,003 | | | | — | | | | 7,003 | |
Multi-Sector Fixed Income Series | | | 2014 | | | | 8,117 | | | | — | | | | 8,117 | |
| | | 2013 | | | | 9,972 | | | | — | | | | 9,972 | |
Premium AlphaSector® Series | | | 2014 | | | | 659 | | | | 2,198 | | | | 2,857 | |
| | | 2013 | | | | 58 | | | | 55 | | | | 113 | |
Real Estate Securities Series | | | 2014 | | | | 1,580 | | | | 11,405 | | | | 12,985 | |
| | | 2013 | | | | 1,820 | | | | 14,278 | | | | 16,098 | |
Small-Cap Growth Series | | | 2014 | | | | — | | | | 6,242 | | | | 6,242 | |
| | | 2013 | | | | 177 | | | | 568 | | | | 745 | |
67
VIRTUS VARIABLE INSURANCE TRUST
NOTES TO FINANCIAL STATEMENTS (Continued)
DECEMBER 31, 2014
| | | | | | | | | | | | | | | | |
| | | | | | Ordinary
Income | | | Long-Term
Capital Gains | | | Total | |
Small-Cap Value Series | | | 2014 | | | $ | 686 | | | $ | 5,790 | | | $ | 6,476 | |
| | | 2013 | | | | 725 | | | | — | | | | 725 | |
Strategic Allocation Series | | | 2014 | | | | 2,994 | | | | 7,372 | | | | 10,366 | |
| | | 2013 | | | | 2,599 | | | | 10,364 | | | | 12,963 | |
Note 11—Reclassifications of Capital Accounts
($ reported in thousands)
For financial reporting purposes, book basis capital accounts are adjusted to reflect the tax character of permanent book/tax differences. Permanent reclassifications can arise from differing treatment of certain income and gain transactions, nondeductible current year net operating losses, expiring capital loss carryovers and investments in passive foreign investment companies. The reclassifications have no impact on the net assets or net asset value of the Series. As of December 31, 2014, the Series recorded reclassifications to increase (decrease) the accounts as listed below:
| | | | | | | | | | | | |
| | | Capital Paid In
on Shares of
Beneficial Interest | | | Accumulated
Net Realized
Gain (Loss) | | | Undistributed
Net Investment
Income (Loss) | |
Capital Growth Series | | $ | (9 | ) | | $ | 6 | | | $ | 3 | |
Growth & Income Series | | | — | (1) | | | 40 | | | | (40 | ) |
International Series | | | — | (1) | | | 29 | | | | (29 | ) |
Multi-Sector Fixed Income Series | | | — | (1) | | | 884 | | | | (884 | ) |
Premium AlphaSector® Series | | | — | (1) | | | — | (1) | | | — | |
Real Estate Securities Series | | | — | (1) | | | — | | | | — | (1) |
Small-Cap Growth Series | | | — | | | | (371 | ) | | | 371 | |
Small-Cap Value Series | | | — | (1) | | | 8 | | | | (8 | ) |
Strategic Allocation Series | | | — | | | | 105 | | | | (105 | ) |
| | (1) | Amount less than $500. |
As of December 31, 2014, each Series had individual shareholder account(s) (comprised of participating insurance companies to fund variable accumulation annuity contracts and variable universal life insurance policies), which individually amounted to more than 10% of the total shares outstanding of each such Series as detailed below:
| | | | | | | | |
| | | % of Shares
Outstanding | | | Number of
Accounts | |
Capital Growth Series | | | 100 | % | | | 2 | |
Growth & Income Series | | | 100 | | | | 2 | |
International Series | | | 99 | | | | 2 | |
Multi-Sector Fixed Income Series | | | 95 | | | | 2 | |
Premium AlphaSector® Series | | | 93 | | | | 2 | |
Real Estate Securities Series | | | 94 | | | | 2 | |
Small-Cap Growth Series | | | 100 | | | | 2 | |
Small-Cap Value Series | | | 100 | | | | 2 | |
Strategic Allocation Series | | | 100 | | | | 2 | |
Note 13—Regulatory Exams
From time to time, the Series’ investment adviser and/or its affiliates may be involved in litigation and arbitration as well as examinations and investigations by various regulatory bodies, including the SEC, involving compliance with, among other things, securities laws, client investment guidelines, laws governing the activities of broker-dealers and other laws and regulations affecting their products and other activities. At this time, the Series’ investment adviser believes that the outcomes of such matters are not likely, either individually or in the aggregate, to be material to these financial statements.
Note 14—Subsequent Events
Management has evaluated the impact of all subsequent events on the Series through the date the financial statements were issued and has determined that there are no subsequent events requiring recognition or disclosure in these financial statements.
68

REPORT OF INDEPENDENT REGISTERED PUBLIC ACCOUNTING FIRM
To the Board of Trustees and Shareholders of
Virtus Variable Insurance Trust:
In our opinion, the accompanying statements of assets and liabilities, including the schedules of investments, and the related statements of operations and of changes in net assets and the financial highlights present fairly, in all material respects, the financial position of Virtus Capital Growth Series, Virtus Growth & Income Series, Virtus International Series, Virtus Multi-Sector Fixed Income Series, Virtus Premium AlphaSector Series, Virtus Real Estate Securities Series, Virtus Small-Cap Growth Series, Virtus Small-Cap Value Series and Virtus Strategic Allocation Series (constituting Virtus Variable Insurance Trust, hereafter referred to as the “Trust”) at December 31, 2014, the results of each of their operations for the year then ended, the changes in each of their net assets for each of the two years in the period then ended and the financial highlights for each of the periods indicated, in conformity with accounting principles generally accepted in the United States of America. These financial statements and financial highlights (hereafter referred to as “financial statements”) are the responsibility of the Trust’s management. Our responsibility is to express an opinion on these financial statements based on our audits. We conducted our audits of these financial statements in accordance with the standards of the Public Company Accounting Oversight Board (United States). Those standards require that we plan and perform the audit to obtain reasonable assurance about whether the financial statements are free of material misstatement. An audit includes examining, on a test basis, evidence supporting the amounts and disclosures in the financial statements, assessing the accounting principles used and significant estimates made by management, and evaluating the overall financial statement presentation. We believe that our audits, which included confirmation of securities at December 31, 2014 by correspondence with the custodian and brokers, provide a reasonable basis for our opinion.
PricewaterhouseCoopers LLP
Philadelphia, Pennsylvania
March 2, 2015
69
VIRTUS VARIABLE INSURANCE TRUST
TAX INFORMATION NOTICE (UNAUDITED)
DECEMBER 31, 2014
For the fiscal year ended December 31, 2014, the Series make the following disclosures for federal income tax purposes: the percentages of ordinary income dividends earned by the Series which qualify for the dividends received deduction (“DRD”) for corporate shareholders; the actual percentage of DRD for the calendar year will be designated in year-end tax statements. The Series designate the amounts below, or if subsequently different, as long-term capital gains dividends (“LTCG”) (reported in thousands) subject to the 15% rate gains category.
| | | | | | | | |
| | | DRD | | | LTCG | |
| Capital Growth Series | | | 100 | % | | $ | — | |
| Growth & Income Series | | | 100 | | | | 15,417 | |
| International Series | | | — | | | | 5,053 | |
| Multi-Sector Fixed Income Series | | | — | | | | — | |
| Premium AlphaSector® Series | | | 85 | | | | 2,194 | |
| Real Estate Securities Series | | | — | | | | 11,730 | |
| Small-Cap Growth Series | | | 100 | | | | 5,100 | |
| Small-Cap Value Series | | | 100 | | | | 5,877 | |
| Strategic Allocation Series | | | 46 | | | | 8,711 | |
70
CONSIDERATION OF ADVISORY AND SUB-ADVISORY AGREEMENTS
BY THE BOARD OF TRUSTEES
The Board of Trustees (the “Board”) of Virtus Variable Insurance Trust (the “Trust”) is responsible for determining whether to approve the continuation of the investment advisory agreement (the “Advisory Agreement”) between the Trust and Virtus Investment Advisers, Inc. (“VIA”) and of each sub-advisory agreement (each, a “Subadvisory Agreement” and collectively, the “Subadvisory Agreements”)(together with the Advisory Agreement, the “Agreements”) with respect to the series (individually and collectively, the “Series”) of the Trust. At an in-person meeting held on November 18, 2014 (the “Meeting”), the Board, including a majority of the Trustees who are not interested persons of the Trust as defined in Section 2(a)(19) of the Investment Company Act of 1940, as amended (the “Independent Trustees”), considered and approved the continuation of each Agreement as further discussed below. In addition, prior to the meeting, the Independent Trustees met with their independent legal counsel to discuss and consider the information provided by management and submitted questions to management, and they considered the responses provided.
In connection with the approval of the Agreements, the Board requested and evaluated information provided by VIA and each subadviser (each, a “Subadviser” and collectively, the “Subadvisers”) which, in the Board’s view, constituted information necessary for the Board to form a judgment as to whether the renewal of each of the Agreements would be in the best interests of each applicable Series and its respective shareholders. The Board also considered information furnished throughout the year at regular Board meetings with respect to the services provided by VIA and the Subadvisers, including quarterly performance reports prepared by management containing reviews of investment results and periodic presentations from the Subadvisers with respect to the Series they manage. The Board noted the affiliation of certain of the Subadvisers with VIA and any potential conflicts of interest.
The Board was separately advised by independent legal counsel throughout the process. For each Agreement, the Board considered all the criteria separately with respect to the applicable Series and its shareholders. In their deliberations, the Board considered various factors, including those discussed below, none of which were controlling, and each Trustee may have attributed different weights to the various factors. The Board also discussed the proposed approval of the Agreements in private sessions with their independent legal counsel at which no representatives of management were present.
In considering whether to approve the renewal of the Agreements with respect to each Series, the Board reviewed and analyzed the factors it deemed relevant, including: (1) the nature, extent and quality of the services to be provided to the Series by VIA and each of the Subadvisers; (2) the performance of the Series as compared to an appropriate peer group and an appropriate index; (3) the level and method of computing each Series’ advisory and subadvisory fees, and comparisons of the Series’ advisory fee rates with those of a group of funds with similar investment objectives; (4) the profitability of VIA under the Advisory Agreement; (5) any “fall-out” benefits to VIA, the Subadvisers and their affiliates (i.e., ancillary benefits realized by VIA, the Subadvisers or their affiliates from VIA’s or the applicable Subadviser’s relationship with the Trust); (6) the anticipated effect of growth in size on each Series’ performance and expenses; (7) fees paid to VIA and the Subadvisers by comparable accounts, as applicable; (8) possible conflicts of interest; and (9) the terms of the Agreements.
Nature, Extent and Quality of Services. The Trustees received in advance of the meeting information from VIA and each Subadviser, including completed questionnaires concerning a number of topics, including such company’s investment philosophy, resources, operations and compliance structure. The Trustees also received a presentation by VIA’s senior management personnel, during which among other items, VIA’s history, investment process, investment strategies, personnel, compliance procedures and the firm’s overall performance were reviewed and discussed. The Trustees noted that the Series are managed using a “manager of managers” structure that generally involves the use of one or more subadvisers to manage some or all of a Series’ portfolio. Under this structure, VIA is responsible for the management of the Series’ investment programs and for evaluating and selecting subadvisers on an ongoing basis and making any recommendations to the Board regarding hiring, retaining or replacing subadvisers. In considering the Agreement with VIA, the Board considered VIA’s process for supervising and managing the Series’ subadvisers, including (a) VIA’s ability to select and monitor the subadvisers; (b) VIA’s ability to provide the services necessary to monitor the subadvisers’ compliance with the Series’ respective investment objectives, policies and restrictions as well as provide other oversight activities; and (c) VIA’s ability and willingness to identify instances in which a subadviser should be replaced and to carry out the required changes. The Trustees also considered: (a) the experience and capability of VIA’s management and other personnel; (b) the financial condition of VIA, and whether it had the financial wherewithal to provide a high level and quality of services to the Series; (c) the quality of VIA’s own regulatory and legal compliance policies, procedures and systems; (d) the nature, extent and quality of administrative and other services provided by VIA and its affiliates to the Series; (e) VIA’s supervision of the Series’ other service providers; and (f) VIA’s risk management processes. The Board noted that affiliates of VIA serve as administrator and distributor to the Series. The Board also took into account its knowledge of VIA’s management and the quality of the performance of VIA’s duties through Board meetings, discussions and reports during the preceding year, as well as information from the Trust’s Chief Compliance Officer (“CCO”) regarding the Series’ compliance policies and procedures established pursuant to Rule 38a-1 under the 1940 Act.
With respect to the services provided by each of the Subadvisers, the Board considered information provided to the Board by each Subadviser, including each Subadviser’s Form ADV, as well as information provided throughout the past year. With respect to the Subadvisory Agreements, the Board noted that each Subadviser provided portfolio management, or in the case of F-Squared Institutional Advisors, LLC, a proprietary quantitative model that supports allocation of Virtus Premium AlphaSector® Series’ assets. The Board also noted that VIA’s and the Subadvisers’ management of the Series is subject to the oversight of the Board and must be carried out in accordance with the investment objectives, policies and restrictions set forth in the Series’ prospectuses and statement of additional information. In considering the renewal of the Subadvisory Agreements, the Board also considered each Subadviser’s investment management process, including (a) the experience and capability of the Subadviser’s management and other personnel committed by the Subadviser to the respective Series; (b) the financial condition of the Subadviser; (c) the quality of the Subadviser’s regulatory and legal compliance policies, procedures and systems; and (d) the Subadviser’s brokerage and trading practices, if applicable, including with respect to best execution and soft dollars. The Board also took into account the Subadviser’s risk assessment and monitoring process. The Board noted each Subadviser’s regulatory history, including whether it was currently involved in any regulatory actions or investigations as well as material litigation, and any settlements and amelioratory actions undertaken, as appropriate.
71
CONSIDERATION OF ADVISORY AND SUB-ADVISORY AGREEMENTS
BY THE BOARD OF TRUSTEES (Continued)
After considering all of the information provided to them, the Trustees concluded that the nature, extent and quality of the services provided by VIA and each Subadviser were satisfactory and that there was a reasonable basis on which to conclude that each would continue to provide a high quality of investment services to the applicable Series.
Investment Performance. The Board considered performance reports and discussions at Board meetings throughout the year, as well as a report (the “Lipper Report”) for the Series prepared by Lipper Inc. (“Lipper”), an independent third party provider of investment company data, furnished in connection with the contract renewal process. The Lipper Report presented each Series’ performance relative to a peer group of other mutual funds (the “Performance Universe”) and relevant indexes, as selected by Lipper. The Board also considered performance information presented by management and took into account management’s discussion of the same, including the effect of market conditions on each Series’ performance. The Board evaluated each Series’ performance in the context of the considerations that a “manager of managers” structure requires. The Board noted that it also reviews on a quarterly basis detailed information about the Series’ performance results and portfolio composition, as well as each Subadviser’s investment strategy. The Board noted VIA’s expertise and resources in monitoring the performance, investment style and risk-adjusted performance of each Subadviser. The Board also noted each Subadviser’s performance record with respect to the Series. The Board was mindful of VIA’s focus on each Subadviser’s performance and noted VIA’s performance in monitoring and responding to any performance issues with respect to the Series. The Board also took into account its discussions with management regarding factors that contributed to the performance of each Series.
The Board considered, among other performance data, the information set forth below with respect to the performance of each Series for the periods ended September 30, 2014:
Virtus International Series. The Board noted that the Series outperformed the median of its Performance Universe and its benchmark for the 1-, 5- and 10-year periods, and underperformed the median of its Performance Universe and its benchmark for the 3-year period. The Board took into account management’s discussion of the factors that contributed to the Series’ performance for the three-year period, including the impact of market conditions. The Board also noted the Series’ strong performance over the long-term and management’s continued monitoring of the Series’ performance.
Virtus Real Estate Securities Series. The Board noted that the Series outperformed the median of its Performance Universe for the 3-, 5- and 10-year periods, and underperformed the median of its Performance Universe for the 1-year period. The Board also noted that the Series equaled its benchmark for the 1-year period, underperformed its benchmark for the 3- and 5-year periods and outperformed its benchmark for the 10-year period. The Board took into account management’s discussion of the factors that contributed to the Series’ performance over the relevant periods. The Board also noted the Series’ strong performance over the long term.
Virtus Growth & Income Series. The Board noted that the Series underperformed the median of its Performance Universe and its benchmark for the 1-, 3-, 5- and 10-year periods. The Board took into account management’s discussion of the factors that contributed to the Series’ performance, including the impact of market conditions on the Series’ performance. The Board also noted that management continues to closely monitor the Series’ performance.
Virtus Strategic Allocation Series. The Board noted that the Series outperformed the median of its Performance Universe for the 1-, 3-, 5- and 10-year periods. The Board also noted that the Series underperformed its benchmark for the 1-, 5- and 10-year periods and outperformed its benchmark for the 3-year period. The Board took into account management’s discussion of the factors that contributed to the Series’ underperformance relative to its benchmark for the relevant periods.
Virtus Premium AlphaSector® Series. The Board noted that the Series underperformed the median of its Performance Universe and benchmark for the 1- and 3-year periods. The Board took into account management’s discussion of the Series’ performance, including the type of fund and the Series’ peer group, as well as the impact of market conditions on the Series’ performance and the fact that management continues to closely monitor the Series’ performance.
Virtus Capital Growth Series. The Board noted that the Series underperformed the median of its Performance Universe and its benchmark for the 1-, 3-, 5- and 10-year periods. The Board took into account management’s discussion of the Series’ performance, including the Subadviser’s investment style in the current market environment and any actions taken to address the Series’ performance, including the replacement of the Series’ Subadviser in November 2010 and change in the Series’ portfolio manager in 2011. The Board also noted that because the Series’ Subadviser changed in November 2010, 5- and 10-year performance data in part reflects the performance of a prior subadviser.
Virtus Small-Cap Growth Series. The Board noted that the Series underperformed the median of its Performance Universe and its benchmark for the 1-, 3-, 5- and 10-year periods. The Board took into account management’s discussion of the Series’ performance, including the impact of market conditions on the Series’ performance and the Subadviser’s investment style in the current market environment, as well as the type of fund. The Board also noted that because the Series’ Subadviser changed in November 2010, 5- and 10-year performance data in part reflects the performance of a prior subadviser.
Virtus Small-Cap Value Series. The Board noted that the Series underperformed the median of its Performance Universe and its benchmark for the 1-, 3-, 5- and 10-year periods. The Board took into account management’s discussion of the Series’ performance, including the impact of market conditions on the Series’ performance and the Subadviser’s investment style in the current market environment, as well as the type of fund. The Board also noted that because the Series’ Subadviser changed in November 2010, 5- and 10-year performance data in part reflects the performance of a prior subadviser.
Virtus Multi-Sector Fixed Income Series. The Board noted that the Series outperformed the median of its Performance Universe and benchmark for the 1-, 3-, 5- and 10-year periods.
After reviewing these and related factors, the Board concluded that each Series’ overall performance was satisfactory, or where noted above, action was being taken to address performance.
72
CONSIDERATION OF ADVISORY AND SUB-ADVISORY AGREEMENTS
BY THE BOARD OF TRUSTEES (Continued)
Management Fees and Total Expenses. The Board considered the fees charged to the Series for advisory services as well as the total expense levels of the Series. This information included comparisons of each Series’ net management fee and total expense level to those of its peer group (the “Expense Group”). In comparing each Series’ net management fee to that of comparable funds, the Board noted that in the materials presented such fee included both advisory and administrative fees. The Board also noted that all of the Series had fee waivers and/or expense caps in place to limit the total expenses incurred by the Series and its shareholders. The Board also noted that the subadvisory fees were paid by VIA out of its management fees rather than paid separately by the Series. In this regard, the Board took into account management’s discussion with respect to the advisory/subadvisory fee structure, including the amount of the advisory fee retained by VIA after payment of the subadvisory fee. The Board also took into account the size of each of the Series and the impact on expenses. The Subadvisers provided, and the Board considered, expense information of comparable accounts managed by the Subadvisers, as applicable.
In addition to the foregoing, the Board considered, among other data, the information set forth below with respect to each Series’ fees and expenses:
Virtus International Series. The Board considered that the Series’ net management fee and net total expenses after waivers were below the median of the Expense Group.
Virtus Real Estate Securities Series. The Board considered that the Series’ net management fee equaled the median of the Expense Group and net total expenses after waivers were above the median of the Expense Group. The Board took into account management’s discussion of the Series’ expenses, including that VIA had waived a portion of its management fee and that the Series’ net total expenses after waivers were close to the average of the Expense Group.
Virtus Growth & Income Series. The Board considered that the Series’ net management fee and net total expenses after waivers were below the median of the Expense Group.
Virtus Strategic Allocation Series. The Board considered that the Series’ net management fee was above the median of the Expense Group while the Series’ net total expenses after waivers were below the median of the Expense Group. The Board took into account management’s discussion of the Series’ expenses, including that VIA had waived a portion of its management fee.
Virtus Premium AlphaSector® Series. The Board considered that the Series’ net management fee was above the median of the Expense Group while the Series’ net total expenses after waivers equaled the median of the Expense Group. The Board took into account management’s discussion of the Series’ expenses, including the type and size of fund. The Board also noted that VIA had waived a portion of its management fee.
Virtus Capital Growth Series. The Board considered that the Series’ net management fee and net total expenses after waivers were below the median of the Expense Group.
Virtus Small-Cap Growth Series. The Board considered that the Series’ net management fee and net total expenses after waivers were above the median of the Expense Group. The Board took into account management’s discussion of the Series’ expenses, including that VIA had waived a portion of its management fee.
Virtus Small-Cap Value Series. The Board considered that the Series’ net management fee was below the median of the Expense Group while net total expenses after waivers were above the median of the Expense Group. The Board took into account management’s discussion of the Series’ expenses, including that VIA had waived a portion of its management fee.
Virtus Multi-Sector Fixed Income Series. The Board considered that the Series’ net management fee was below the median of the Expense Group while net total expenses after waivers were above the median of the Expense Group. The Board took into account management’s discussion of the Series’ expenses, including that VIA had waived a portion of its management fee.
The Board approved the amendment of the sub-advisory fees payable to Kayne Anderson Rudnick Investment Management, LLC for Virtus Small-Cap Growth Series and Virtus Small-Cap Value Series, to 50% of the net advisory fee paid to VIA. The Board noted that this change would have no effect on the advisory fees paid by the Series. The Board concluded that the advisory and sub-advisory fees for each Series, including with the proposed amendments, were fair and reasonable in light of the usual and customary charges made for services of the same nature and quality and the other factors considered.
Profitability. The Board also considered certain information relating to profitability that had been provided by VIA. In this regard, the Board considered information regarding the overall profitability, as well as on a Series-by-Series basis, of VIA for its management of the Trust, as well as its profits and those of its affiliates for managing and providing other services to the Trust, such as distribution and administrative services provided to the Series by a VIA affiliate. In addition to the fees paid to VIA and its affiliates, including the applicable Subadvisers, the Board considered any other benefits derived by VIA or its affiliates from their relationships with the Series. The Board reviewed the methodology used to allocate costs to each Series, taking into account the fact that allocation methodologies are inherently subjective and various allocation methodologies may each be reasonable while producing different results. The Board concluded that the profitability to VIA and its affiliates from each Series was reasonable in light of the quality of the services rendered to the Series by VIA and its affiliates.
In considering the profitability to the Subadvisers in connection with their relationship to the Series, the Board noted that the fees under the Subadvisory Agreements are paid by VIA out of the fees that VIA receives under the Advisory Agreement, so that Series shareholders are not directly impacted by those fees. In considering the reasonableness of the fees payable by VIA to the affiliated Subadvisers, the Board noted that, because such Subadvisers are affiliates of VIA, such profitability might be directly or indirectly shared by VIA. In addition, with respect to Aberdeen Asset Management, Inc. and F-Squared Institutional Advisors, LLC, the unaffiliated Subadvisers, the Board relied on the ability of VIA to negotiate the Subadvisory Agreement and the fees thereunder at arm’s length. For each of the above reasons, the Board concluded that the profitability to the Subadvisers and their affiliates from their relationships with the Series was not a material factor in approval of the Subadvisory Agreements.
73
CONSIDERATION OF ADVISORY AND SUB-ADVISORY AGREEMENTS
BY THE BOARD OF TRUSTEES (Continued)
Economies of Scale. The Board received and discussed information concerning whether VIA realizes economies of scale as the Series’ assets grow. The Board noted that the management fees for most of the Series included breakpoints based on assets under management, and that fee waivers and/or expense caps were also in place for all of the Series. The Board also took into account management’s discussion of the Series’ management fee and sub-advisory fee structure, including with respect to the Series that does not currently have breakpoints. The Board also took into account the current size of each Series. The Board also noted that VIA had agreed to implement an extension of each Series’ expense cap through April 30, 2016. The Board then concluded that no additional changes to the advisory fee structure of the Series were necessary at this time. The Board noted that VIA and the Series may realize certain economies of scale if the assets of the Series were to increase, particularly in relationship to certain fixed costs, and that shareholders of the Series would have an opportunity to benefit from these economies of scale.
For similar reasons as stated above with respect to the Subadvisers’ profitability, and based upon the current size of the Series managed by each Subadviser, the Board concluded that the potential for economies of scale in the Subadvisers’ management of the Series was not a material factor in the approval of the Subadvisory Agreements at this time.
Other Factors. The Board considered other benefits that may be realized by VIA and each Subadviser and their respective affiliates from their relationships with the applicable Series. Among them, the Board recognized that VP Distributors, LLC, an affiliate of VIA, serves as the Distributor for the Trust, and, as such, receives payments pursuant to Rule 12b-1 from the Series to compensate it for providing shareholder services and selling activities, which could lead to growth in the Trust’s assets and corresponding benefits from such growth, including economies of scale. The Board noted that an affiliate of VIA also provides administrative services to the Trust. The Board noted management’s discussion of the fact that, while certain of the Subadvisers are affiliates of VIA, there are no other direct benefits to the Subadvisers or VIA in providing investment advisory services to the Series, other than the fee to be earned under the Subadvisory Agreement. There may be certain indirect benefits gained, including to the extent that serving the Series could provide the opportunity to provide advisory services to additional portfolios of the Trust or certain reputational benefits.
Based on all of the foregoing considerations, the Board, including a majority of the Independent Trustees, determined that approval of each Agreement, as amended, was in the best interests of each of the applicable Series and its respective shareholders. Accordingly, the Board, and the Independent Trustees voting separately, approved the Agreements, as amended, with respect to each Series.
74
FUND MANAGEMENT TABLES
Information pertaining to the Trustees and officers of the Trust as of December 31, 2014, is set forth below. The statement of additional information (SAI) includes additional information about the Trustees and is available without charge, upon request, by calling (800) 367-5877.
The address of each individual, unless otherwise noted, is c/o Virtus Variable Insurance Trust, 100 Pearl Street, Hartford, CT 06103.
Disinterested Trustees
| | |
| | |
Name
Year of Birth
Year Elected
# of Portfolios in Fund Complex
Overseen by Trustee | | Principal Occupation(s)
During Past 5 Years and
Other Directorships Held by Trustee During Past 5 Years |
Thomas J. Brown YOB: 1945 Elected: 2011 9 Portfolios | | Director (since 2005), VALIC Company Funds (49 portfolios); and Director (since 2010), D’Youville Senior Care Center. |
Roger A. Gelfenbien YOB: 1943 Elected: 2000 9 Portfolios | | Director (since 1999), USAllianz Variable Insurance Product Trust (42 portfolios). |
Eunice S. Groark* YOB: 1938 Elected: 1999 9 Portfolios | | Director (since 2007), People’s United Financial Inc. and Director (1995 to 2007), People’s United Bank. |
John R. Mallin YOB: 1950 Elected: 1999 9 Portfolios | | Director (since 2013), Horizon, Inc.; Director and Past President (1996 to 2008), Connecticut River Council, BSA, Inc.; Partner/Attorney (since 2003), McCarter & English LLP (law firm), Real Property Practice Group. |
Hassell H. McClellan YOB: 1945 Elected: 2008 55 Portfolios | | Trustee, (since 2005), John Hancock Fund Complex (collectively, 228 portfolios); Director (since 2010), Barnes Group, Inc. (diversified global components manufacturer and logistical services company); Professor (1984 to 2013), Wallace E. Carroll School of Management, Boston College; and Trustee (since 2015), Virtus Mutual Fund Complex (46 portfolios). |
Philip R. McLoughlin YOB: 1946 Elected: 2003 66 Portfolios | | Director (since 1991) and Chairman (since 2010), World Trust Fund (closed-end investment firm in Luxembourg); Director (since 1995), closed-end funds managed by Duff & Phelps Investment Management Co. (4 portfolios); Chairman (since 2002) and Trustee (since 1999), Virtus Mutual Fund Complex (46 portfolios); Trustee/Director and Chairman (since 2011), Virtus Closed-End Funds (3 portfolios); Trustee and Chairman (since 2013), Virtus Alternative Solutions Trust (4 portfolios); Partner (2006 to 2010), Cross Pond Partners, LLC (investment management consultant); and Partner (2008 to 2010), SeaCap Partners, LLC (strategic advisory firm). |
| * | Retired, effective December 31, 2014 |
Interested Trustee
| | |
| | |
Name Year of Birth
Year Elected
# of Portfolios in Fund Complex
Overseen by Trustee | | Principal Occupation(s)
During Past 5 Years and
Other Directorships Held by Trustee During Past 5 Years |
George R. Aylward** Trustee and President YOB: 1964 Elected: 2012 64 Portfolios | | Director, President and Chief Executive Officer (since 2008), Virtus Investment Partners, Inc. and/or certain of its subsidiaries; various senior officer positions with Virtus affiliates (since 2005); Trustee (since 2006), Virtus Mutual Funds (46 portfolios); Chairman, President and Chief Executive Officer (since 2006), The Zweig Closed-End Funds (2 portfolios); Trustee and President (since 2011), Virtus Closed-End Funds (3 portfolios); Director (since 2013), Virtus Global Funds, PLC (2 portfolios); and Trustee (since 2013), Virtus Alternative Solutions Trust (4 portfolios). |
| ** | Mr. Aylward is an “interested person,” as defined in the 1940 Act, by reason of his position as President and Chief Executive Officer of Virtus Investment Partners, Inc. (“Virtus”), the ultimate parent company of the Adviser, and various positions with its affiliates, including the Adviser. |
75
FUND MANAGEMENT TABLES
Officers of the Trust Who Are Not Trustees
| | | | |
| | | |
Name, Address and
Year of Birth | | Position(s) Held with
Trust and Length of
Time Served | | Principal Occupation(s)
During Past 5 Years |
W. Patrick Bradley YOB: 1972 | | Senior Vice President (since 2013), Vice President (2011-2013); Chief Financial Officer and Treasurer, since 2004 | | Senior Vice President, Fund Services (since 2010), Virtus Investment Partners, Inc. and/or certain of its subsidiaries; various officer positions (since 2006) with Virtus affiliates; Senior Vice President (since 2013), Vice President (2011 to 2013), Chief Financial Officer and Treasurer (since 2006), Virtus Mutual Fund Complex; Senior Vice President (since 2013), Vice President (2011 to 2013), Chief Financial Officer and Treasurer (since 2011), Virtus Closed-End Funds; Senior Vice President (since 2013), Vice President (2012 to 2013) and Treasurer (Chief Financial Officer) (since 2007), The Zweig Closed-End Funds; Vice President and Assistant Treasurer (since 2011), Duff & Phelps Global Utility Income Fund Inc.; Director (since 2013), Virtus Global Funds, PLC; and Senior Vice President, Chief Financial Officer and Treasurer (since 2013), Virtus Alternative Solutions Funds. |
Jennifer S. Fromm YOB: 1973 | | Vice President, Chief Legal Officer and Secretary, since 2013 | | Assistant Secretary of various Virtus-affiliated open-end funds (since 2008); and Senior Counsel, Legal, Virtus Investment Partners, Inc. and/or certain of its subsidiaries (since 2007); and Vice President, Chief Legal Officer, and Secretary (since 2013), Virtus Alternative Solutions Funds. |
Nancy J. Engberg YOB: 1956 | | Vice President, since 2010; Chief Compliance Officer, since 2011 | | Vice President (since 2008) and Chief Compliance Officer (2008 to 2011), Virtus Investment Partners, Inc. and/or certain of its subsidiaries; various officer positions (since 2003) with Virtus affiliates; Vice President and Chief Compliance Officer (since 2011), Virtus Mutual Fund Complex; Vice President and Chief Compliance Officer (since 2011), Virtus Closed-End Funds; Vice President and Chief Compliance Officer (since 2012), The Zweig Closed-End Funds; and Vice President and Chief Compliance Officer (since 2013), Virtus Alternative Solutions Funds. |
Francis G. Waltman YOB: 1962 | | Executive Vice President (since 2013), Senior Vice President (2010 to 2013) | | Executive Vice President, Product Development (since 2009), Virtus Investment Partners, Inc. and/or certain of its subsidiaries; various senior officer positions (since 2006) with Virtus affiliates; Executive Vice President (since 2013), Senior Vice President (2008 to 2013), Virtus Mutual Fund Complex; Executive Vice President (since 2013), Senior Vice President (2011 to 2013), Virtus Closed-End Funds; Director (since 2013), Virtus Global Funds PLC; and Executive Vice President (since 2013) Virtus Alternative Solutions Funds. |
76
Virtus Premium AlphaSector® Series,
a series of Virtus Variable Insurance Trust
Supplement dated November 14, 2014 to the Summary and
Statutory Prospectuses and Statement of Additional Information (“SAI”) dated April 30, 2014, as supplemented
THIS SUPPLEMENT SUPERCEDES THE SUPPLEMENT DATED NOVEMBER 12, 2014 TO THE ABOVE-REFERENCED PROSPECTUS AND SAI. DUE TO MORE RECENT DEVELOPMENTS, THIS SUPPLEMENT PROVIDES REVISED INFORMATION ABOUT PORTFOLIO MANAGEMENT.
IMPORTANT NOTICETO INVESTORS
The disclosure under “Principal Investment Strategies” in the summary prospectus of Virtus Premium AlphaSector® Series, and in the summary section of the series’ statutory prospectus, is hereby amended to remove the reference to the index the series seeks to track being published by NASDAQ. This is due to the fact that although the performance of the index continues to be calculated by NASDAQ, the returns are no longer widely disseminated.
The disclosure under “Portfolio Managers” in the summary prospectus and in the summary section of the statutory prospectus, is hereby replaced with the following:
| | Ø | | Alexey Panchekha, CFA, PhD, Senior Vice President, Research at F-Squared Institutional, is a manager of the Series. Mr. Panchekha has served as a Portfolio Manager of the Series since November 2014. |
| | Ø | | Amy Robinson, Managing Director at Euclid. Ms. Robinson has served as a Portfolio Manager of the Series since inception in February 2011. |
The disclosure under Portfolio Management on page 8 of the series’ statutory prospectus is hereby replaced with the following:
Alexey Panchekha, CFA, PhD. Mr. Panchekha is Senior Vice President of F-Squared Institutional (“F-Squared”). As Portfolio Manager of the Series, he is responsible for providing the model portfolios to Euclid. Prior to F-Squared, he was Senior Vice President of Markov Processes International (2010 to 2012), a provider of investment research and technology within the financial services industry. Prior thereto, he was a Quant Researcher (2009 to 2010), Head of Portfolio Risk Analytics (2006 to 2009) and Senior Software Engineer (2004 to 2006) at Bloomberg. Mr. Panchekha has over 15 years of investment management industry experience.
Amy Robinson. Ms. Robinson is Managing Director of Euclid (since September 2011) and leads Euclid’s equity trading function. She also served in this role for VIA from 1992 to 2011. In this role Ms. Robinson is responsible for all trading activities of investment portfolios and mutual funds; she also manages strategic operational initiatives for the firm. As Co-Portfolio Manager of the Series, she is responsible for determining final allocations and trading decisions following receipt of F-Squared’s investment recommendations. Ms. Robinson has 35 years of investment experience and is a former president of the Security Traders Association of Connecticut.
The information for the fund in the “Portfolio Managers” section of the series’ SAI is hereby replaced with the following:
| | |
Fund | | Portfolio Managers |
| Virtus Premium AlphaSector Fund | | Alexey Panchekha |
| | Amy Robinson |
All other disclosure concerning the series, including fees and expenses, remains unchanged from its prospectuses and SAI dated April 30, 2014.
Investors should retain this supplement with the
Prospectuses and SAI for future reference.
VVIT PASS SAStrat&PMChanges2 (11/2014)
77
VIRTUS VARIABLE INSURANCE TRUST
100 Pearl Street
Hartford, CT 06103-4506
Trustees
George R. Aylward
Thomas J. Brown
Roger A. Gelfenbien
Eunice S. Groark*
John R. Mallin
Hassell H. McClellan
Philip R. McLoughlin
Officers
George R. Aylward, President
Francis G. Waltman, Executive Vice President
Yvonne Pytlik, Anti-Money Laundering Compliance Officer
W. Patrick Bradley, Senior Vice President, Chief Financial Officer and Treasurer
Nancy J. Engberg, Vice President and Chief Compliance Officer
Jennifer Fromm, Vice President, Chief Legal Officer, Counsel and Secretary
Investment Adviser
Virtus Investment Advisers, Inc.
100 Pearl Street
Hartford, CT 06103-4506
Principal Underwriter
VP Distributors, LLC
100 Pearl Street
Hartford, CT 06103-4506
Transfer Agent
Bank of New York Mellon
4400 Computer Drive
Westborough, MA 01581-1722
Custodian
JPMorgan Chase Bank, NA
1 Chase Manhattan Plaza
New York, NY 10005-1401
Independent Registered Public Accounting Firm
PricewaterhouseCoopers LLP
2001 Market Street
Philadelphia, PA 19103-7042
How to Contact Us
Mutual Fund Services1-800-367-5877
Web siteVirtus.com
* Retired, effective December 31, 2014
Important Notice to Shareholders
The Securities and Exchange Commission has modified mailing regulations for semiannual and annual shareholder fund reports to allow mutual fund companies to send a single copy of these reports to shareholders who share the same mailing address. If you would like additional copies, please call Mutual Fund Services at 1-800-367-5877.

For more information about the Virtus Variable Insurance Trust, please contact us at 1-800-367-5877 or Virtus.com.
Item 2. Code of Ethics.
| | (a) | The registrant, as of the end of the period covered by this report, has adopted a code of ethics that applies to the registrant’s principal executive officer, principal financial officer, principal accounting officer or controller, or persons performing similar functions, regardless of whether these individuals are employed by the registrant or a third party. |
| | (c) | There have been no amendments, during the period covered by this report, to a provision of the code of ethics that applies to the registrant’s principal executive officer, principal financial officer, principal accounting officer or controller, or persons performing similar functions, regardless of whether these individuals are employed by the registrant or a third party, and that relates to any element of the code of ethics described in Item 2(b) of the instructions for completion of Form N-CSR. |
| | (d) | The registrant has not granted any waivers, during the period covered by this report, including an implicit waiver, from a provision of the code of ethics that applies to the registrant’s principal executive officer, principal financial officer, principal accounting officer or controller, or persons performing similar functions, regardless of whether these individuals are employed by the registrant or a third party, that relates to one or more of the items set forth in paragraph (b) of the instructions for completion of this Item. |
Item 3. Audit Committee Financial Expert.
| (a)(1) | The Registrant’s Board of Trustees has determined that the Registrant has an “audit committee financial expert” serving on its Audit Committee. |
| (a)(2) | The Registrant’s Board of Trustees has determined that Thomas J. Brown possesses the technical attributes identified in Instruction 2(b) of Item 3 to Form N-CSR to qualify as an “audit committee financial expert.” Mr. Brown is an “independent” trustee pursuant to paragraph (a)(2) of Item 3 to Form N-CSR. |
Item 4. Principal Accountant Fees and Services.
Audit Fees
| | (a) | The aggregate fees billed for each of the last two fiscal years for professional services rendered by the principal accountant for the audit of the registrant’s annual financial statements or services that are normally provided by the accountant in connection with statutory and regulatory filings or engagements for those fiscal years are $209,510 for 2014 and $209,510 for 2013. |
Audit-Related Fees
| | (b) | The aggregate fees billed in each of the last two fiscal years for assurance and related services by the principal accountant that are reasonably related to the performance of the audit of the registrant’s financial statements and are not reported under paragraph (a) of this Item are $41,344 for 2014 and $26,395 for 2013. Such audit-related fees include out of pocket expenses and cross fund fees. |
Tax Fees
| | (c) | The aggregate fees billed in each of the last two fiscal years for professional services rendered by the principal accountant for tax compliance, tax advice, and tax planning are $30,375 for 2014 and $31,375 for 2013. |
“Tax Fees” are those primarily associated with review of the Trust’s tax provision and qualification as a regulated investment company (RIC) in connection with audits of the Trust’s financial statement, review of year-end distributions by the Fund to avoid excise tax for the Trust, periodic discussion with management on tax issues affecting the Trust, and reviewing and signing the Fund’s federal income tax returns.
All Other Fees
| | (d) | The aggregate fees billed in each of the last two fiscal years for products and services provided by the principal accountant, other than the services reported in paragraphs (a) through (c) of this Item are $0 for 2014 and $0 for 2013. |
| (e)(1) | Disclose the audit committee’s pre-approval policies and procedures described in paragraph (c)(7) of Rule 2-01 of Regulation S-X. |
The Virtus Variable Insurance Trust (the “Fund”) Board has adopted policies and procedures with regard to the pre-approval of services provided by PwC. Audit, audit-related and tax compliance services provided to the Fund on an annual basis require specific pre-approval by the Audit Committee. The Audit Committee also must approve other non-audit services provided to the Fund and those non-audit services provided to the Fund’s Affiliated Service Providers that relate directly to the operations and financial reporting of the Fund. Certain of these non-audit services that the Audit Committee believes are a) consistent with the SEC’s auditor independence rules and b) routine and recurring services that will not impair the independence of the independent auditors may be approved by the Audit Committee without consideration on a specific case-by-case basis (“general pre-approval”).
The Audit Committee has determined that Mr. Brown, Chair of the Audit Committee, may provide pre-approval for such services that meet the above requirements in the event such approval is sought between regularly scheduled meetings. In any event, the Audit Committee is informed of each service approved subject to general pre-approval at the next regularly scheduled in-person Audit-Committee meeting.
| (e)(2) | The percentage of services described in each of paragraphs (b) through (d) of this Item that were approved by the audit committee pursuant to paragraph (c)(7)(i)(C) of Rule 2-01 of Regulation S-X are as follows: |
| | (f) | The percentage of hours expended on the principal accountant’s engagement to audit the registrant’s financial statements for the most recent fiscal year that were attributed to work performed by persons other than the principal accountant’s full-time, permanent employees was less than fifty percent. |
| | (g) | The aggregate non-audit fees billed by the registrant’s accountant for services rendered to the registrant, and rendered to the registrant’s investment adviser (not including any sub-adviser whose role is primarily portfolio management and is subcontracted with or overseen by another investment adviser), and any entity controlling, controlled by, or under common control with the adviser that provides ongoing services to the registrant for each of the last two fiscal years of the registrant was $430,462 for 2014 and $434,669 for 2013. |
| | (h) | The registrant’s audit committee of the board of directors has considered whether the provision of non-audit services that were rendered to the registrant’s investment adviser (not including any sub-adviser whose role is primarily portfolio management and is subcontracted with or overseen by another investment adviser), and any entity controlling, controlled by, or under common control with the investment adviser that provides ongoing services to the registrant that were not pre-approved pursuant to paragraph (c)(7)(ii) of Rule 2-01 of Regulation S-X is compatible with maintaining the principal accountant’s independence. |
Item 5. Audit Committee of Listed Registrants.
Not applicable.
Item 6. Investments.
| (a) | Schedule of Investments in securities of unaffiliated issuers as of the close of the reporting period is included as part of the report to shareholders filed under Item 1 of this form. |
| Item 7. | Disclosure of Proxy Voting Policies and Procedures for Closed-End Management Investment Companies. |
Not applicable.
Item 8. Portfolio Managers of Closed-End Management Investment Companies.
Not applicable.
| Item 9. | Purchases of Equity Securities by Closed-End Management Investment Company and Affiliated Purchasers. |
Not applicable.
Item 10. Submission of Matters to a Vote of Security Holders.
There have been no material changes to the procedures by which the shareholders may recommend nominees to the registrant’s board of trustees, where those changes were implemented after the registrant last provided disclosure in response to the requirements of Item 407(c)(2)(iv) of Regulation S-K (17 CFR 229.407) (as required by Item 22(b)(15) of Schedule 14A (17 CFR 240.14a-101)), or this Item.
Item 11. Controls and Procedures.
| | (a) | The registrant’s principal executive and principal financial officers, or persons performing similar functions, have concluded that the registrant’s disclosure controls and procedures (as defined in Rule 30a-3(c) under the Investment Company Act of 1940, as amended (the “1940 Act”) (17 CFR 270.30a-3(c))) are effective, as of a date within 90 days of the filing date of the report that includes the disclosure required by this paragraph, based on their evaluation of these controls and procedures required by Rule 30a-3(b) under the 1940 Act (17 CFR 270.30a-3(b)) and Rules 13a-15(b) or 15d-15(b) under the Securities Exchange Act of 1934, as amended (17 CFR 240.13a-15(b) or 240.15d-15(b)). |
| | (b) | There were no changes in the registrant’s internal control over financial reporting (as defined in Rule 30a-3(d) under the 1940 Act (17 CFR 270.30a-3(d)) that occurred during the registrant’s second fiscal quarter of the period covered by this report that has materially affected, or is reasonably likely to materially affect, the registrant’s internal control over financial reporting. |
Item 12. Exhibits.
| | (a)(1) | Code of ethics, or any amendment thereto, that is the subject of disclosure required by Item 2 is attached hereto. |
| | (a)(2) | Certifications pursuant to Rule 30a-2(a) under the 1940 Act and Section 302 of the Sarbanes-Oxley Act of 2002 are attached hereto. |
| | (b) | Certifications pursuant to Rule 30a-2(b) under the 1940 Act and Section 906 of the Sarbanes-Oxley Act of 2002 are attached hereto. |
(12.other) Not applicable.
SIGNATURES
Pursuant to the requirements of the Securities Exchange Act of 1934 and the Investment Company Act of 1940, the registrant has duly caused this report to be signed on its behalf by the undersigned, thereunto duly authorized.
| | |
(Registrant) | | Virtus Variable Insurance Trust |
| | |
By (Signature and Title)* | | /s/ George R. Aylward |
| | George R. Aylward, President |
| | (principal executive officer) |
Pursuant to the requirements of the Securities Exchange Act of 1934 and the Investment Company Act of 1940, this report has been signed below by the following persons on behalf of the registrant and in the capacities and on the dates indicated.
| | |
By (Signature and Title)* | | /s/ George R. Aylward |
| | George R. Aylward, President |
| | (principal executive officer) |
| | | | |
By (Signature and Title)* | | /s/ W. Patrick Bradley | | |
| | W. Patrick Bradley, Senior Vice President, Chief Financial Officer and Treasurer |
| | (principal financial officer) |
* Print the name and title of each signing officer under his or her signature.