UNITED STATES
SECURITIES AND EXCHANGE COMMISSION
Washington, D.C. 20549
FORM N-CSR
CERTIFIED SHAREHOLDER REPORT OF REGISTERED
MANAGEMENT INVESTMENT COMPANIES
Investment Company Act file number 811-04642
Virtus Variable Insurance Trust
(Exact name of registrant as specified in charter)
100 Pearl Street
Hartford, CT 06103-4506
(Address of principal executive offices) (Zip code)
Jennifer S. Fromm, Esq.
Vice President, Chief Legal Officer, Counsel and Secretary for Registrant
100 Pearl Street
Hartford, CT 06103-4506
(Name and address of agent for service)
Registrant’s telephone number, including area code: (800) 367-5877
Date of fiscal year end: December 31
Date of reporting period: December 31, 2017
Form N-CSR is to be used by management investment companies to file reports with the Commission not later than 10 days after the transmission to stockholders of any report that is required to be transmitted to stockholders under Rule 30e-1 under the Investment Company Act of 1940 (17 CFR 270.30e-1). The Commission may use the information provided on Form N-CSR in its regulatory, disclosure review, inspection, and policymaking roles.
A registrant is required to disclose the information specified by Form N-CSR, and the Commission will make this information public. A registrant is not required to respond to the collection of information contained in Form N-CSR unless the Form displays a currently valid Office of Management and Budget (“OMB”) control number. Please direct comments concerning the accuracy of the information collection burden estimate and any suggestions for reducing the burden to Secretary, Securities and Exchange Commission, 450 Fifth Street, NW, Washington, DC 20549-0609. The OMB has reviewed this collection of information under the clearance requirements of 44 U.S.C. § 3507.
| Item 1. | Reports to Stockholders. |
The Report to Shareholders is attached herewith.
| | | | |
| ANNUAL REPORT | | |  | |
| VIRTUS VARIABLE INSURANCE TRUST | |
December 31, 2017
|
Virtus Duff & Phelps International Series |
Virtus Duff & Phelps Real Estate Securities Series |
Virtus KAR Capital Growth Series |
Virtus KAR Small-Cap Growth Series |
Virtus KAR Small-Cap Value Series |
Virtus Newfleet Multi-Sector Intermediate Bond Series |
Virtus Rampart Enhanced Core Equity Series |
Virtus Rampart Equity Trend Series |
Virtus Strategic Allocation Series |
|
The Annual Report describes one or more Series available for underlying investment through your variable contract. For information about your variable contract, including information about insurance-related expenses, see the prospectus for your variable contract. |
Not FDIC Insured
No Bank Guarantee
May Lose Value
Table of Contents
Proxy Voting Procedures and Voting Record (Form N-PX)
The adviser and subadvisers vote proxies relating to portfolio securities in accordance with procedures that have been approved by the Board of Trustees of the Trust (“Trustees,” or the “Board”). You may obtain a description of these procedures, along with information regarding how the Series voted proxies during the most recent 12-month period ended June 30, free of charge, by calling toll-free 1-800-367-5877. This information is also available through the Securities and Exchange Commission’s (the “SEC”) website at http://www.sec.gov.
Form N-Q Information
The Trust files a complete schedule of portfolio holdings for each Series with the SEC for the first and third quarters of each fiscal year on Form N-Q. Form N-Q is available on the SEC’s website at http://www.sec.gov. Form N-Q may be reviewed and copied at the SEC’s Public Reference Room. Information on the operation of the SEC’s Public Reference Room can be obtained by calling toll-free 1-800-SEC-0330.
MESSAGE TO SHAREHOLDERS
To Virtus Variable Insurance Trust Investors:
| | |
 | | I am pleased to present this annual report that reviews the performance of your Series for the 12-month period ended December 31, 2017. Economic growth and strong corporate earnings were driving forces in the U.S. in 2017, capped off by the sweeping tax overhaul signed into law at year-end, which fueled optimism further. The Federal Reserve, buoyed by a steadily strengthening economy, raised interest rates three times over the course of the year, and began the process of unwinding its balance sheet debt accumulated since the Financial Crisis of 2008 – a clear signal that it believes the U.S. has resumed a growth path. Outside the U.S., global growth also strengthened, with other major central banks preparing to taper their own stimulus policies. |
The favorable investment backdrop lifted major U.S. equity markets to new all-time highs with near-record low volatility. Large-cap stocks, as measured by the S&P 500® Index, returned 21.83% for the year, outpacing small-cap stocks, which returned 14.65%, as measured by the Russell 2000® Index. Within international equities, emerging markets led their developed peers, with the MSCI Emerging Markets Index (net) up 37.28%, compared with the MSCI EAFE® Index (net), which returned 25.03%. Demand for U.S. Treasuries remained strong, driven by foreign investors who favored their yield advantage and credit quality over many foreign government bonds. On December 31, 2017, the benchmark 10-year U.S. Treasury yielded 2.40%, compared with 2.45% one year earlier. The broader U.S. fixed income market, as represented by the Bloomberg Barclays U.S. Aggregate Bond Index, which tracks Treasuries and other investment-grade debt securities, increased 3.54% for the 12 months, while non-investment grade bonds gained 7.50%, as measured by the Bloomberg Barclays U.S. Corporate High Yield Bond Index. Market uncertainty is an ever-present reminder of the importance of portfolio diversification, including exposure to traditional and alternative asset classes. While diversification cannot guarantee a profit or prevent a loss, owning a variety of asset classes may cushion your portfolio against inevitable market fluctuations. Your financial advisor can help you ensure that your variable investment portfolio is adequately diversified across asset classes and investment strategies. On behalf of our investment affiliates, thank you for entrusting assets to the Virtus Variable Insurance Trust. Should you have questions about your account or require assistance, please visit Virtus.com, or call our customer service team at
1-800-367-5877. We appreciate your business and remain committed to your long-term financial success. |
Sincerely,

George R. Aylward
President, Virtus Variable Insurance Trust
February 2018
Performance data quoted represents past results. Past performance is no guarantee of future results, and current performance may be higher or lower than the performance shown above.
1
KEY INVESTMENT TERMS
American Depositary Receipt (“ADR”)
Represents shares of foreign companies traded in U.S. dollars on U.S. exchanges that are held by a U.S. bank or a trust. Foreign companies use ADRs in order to make it easier for Americans to buy their shares.
Bloomberg Barclays U.S. Aggregate Bond Index
The Bloomberg Barclays U.S. Aggregate Bond Index measures the U.S. investment-grade fixed-rate bond market. The index is calculated on a total return basis. The index is unmanaged, its returns do not reflect any fees, expenses, or sales charges, and it is not available for direct investment.
Bloomberg Barclays U.S. Corporate High Yield Bond Index
The Bloomberg Barclays U.S. Corporate High Yield Bond Index measures the U.S. dollar-denominated, high yield, fixed-rate corporate bond market. The index is calculated on a total return basis. The index is unmanaged, its returns do not reflect any fees, expenses, or sales charges, and it is not available for direct investment.
Chicago Board Options Exchange Volatility Index® (“CBOE VIX®”)
The CBOE VIX® shows the market’s expectation of 30-day volatility. It is constructed using the implied volatilities of a wide range of S&P 500® Index options. This volatility is meant to be forward looking and is calculated from both calls and puts. The CBOE VIX® is a widely used measure of market risk and is often referred to as the “investor fear gauge.” The index is unmanaged, its returns do not reflect any fees, expenses, or sales charges, and it is not available for direct investment.
Composite Index for Strategic Allocation Series
The Composite Index for Strategic Allocation Series consists of 45% Russell 1000® Growth Index (a market capitalization-weighted index of growth-oriented stocks of the 1,000 largest companies in the Russell Universe, which comprises the 3,000 largest U.S. companies, calculated on a total return basis with dividends reinvested), 15% MSCI EAFE® Index (net) (a free floatadjusted market capitalization-weighted index that measures developed foreign market equity performance, excluding the U.S. and Canada, calculated on a total return basis with net dividends reinvested) and 40% Bloomberg Barclays U.S. Aggregate Bond Index (an index that measures the U.S. investment grade fixed rate bond market, calculated on a total return basis). The index is unmanaged, its returns do not reflect any fees, expenses, or sales charges, and is not available for direct investment. Performance of the Composite Index for Strategic Allocation Series prior to 9/7/2016 represents an allocation consisting of 60% S&P 500® Index and 40% Bloomberg Barclays U.S. Aggregate Bond Index.
European Central Bank (“ECB”)
The European Central Bank (ECB) is responsible for conducting monetary policy for the Euro area. The ECB was established as the core of the Eurosystem and the European System of Central Banks (ESCB). The ESCB comprises the ECB and the National Central Banks (NCBs) of all 17 EU Member States whether they have adopted the Euro or not.
European Union (“EU”)
The European Union (EU) is a unique economic and political union of 28 European countries. The EU was created in the aftermath of the Second World War that has become a single market for goods and services and it created the single currency the Euro.
Exchange-Traded Fund (“ETF”)
An open-end fund that is traded on a stock exchange. Most ETFs have a portfolio of stocks or bonds that track a specific market index.
Federal Funds Rate
The interest rate at which a depository institution lends funds maintained at the Federal Reserve to another depository institution overnight. The Federal Funds rate is generally only applicable to the most creditworthy institutions when they borrow and lend overnight funds to each other. The Federal Funds rate is one of the most influential interest rates in the U.S. economy, since it affects monetary and financial conditions, which in turn have a bearing on key aspects of the broad economy including employment, growth and inflation.
Federal Reserve (the “Fed”)
The Central Bank of the U.S., responsible for controlling the money supply, interest rates, and credit with the goal of keeping the U.S. economy and currency stable. Governed by a seven-member board, the system includes 12 regional Federal Reserve Banks, 25 branches, and all national and state banks that are part of the system.
2
KEY INVESTMENT TERMS (Continued)
Financial Crisis of 2008
The Financial Crisis of 2008, also known as the Global Financial Crisis or Financial Crisis of 2007-2008, is considered by many economists to have been the worst financial and economic crisis since the Great Depression that lasted from 1929 to 1941. The Crisis began in 2007 with a crisis in the subprime mortgage market in the U.S., and it developed into an international banking crisis with the collapse of the investment bank Lehman Brothers in September of 2008. Although bail-outs of financial institutions as well as monetary and fiscal policies were put into place throughout the world to mitigate its impact, the Crisis led to the global economic downturn commonly referred to as the Great Recession. During the Crisis and through the Great Recession that followed, housing prices fell drastically and unemployment rose, leading to legislation designed to promote financial stability such as the Dodd-Frank Act in the U.S. and efforts by various central banks to stimulate their countries’ economies.
FTSE NAREIT Equity REITs Index
The FTSE NAREIT Equity REITs Index is a free-float market capitalization-weighted index measuring equity tax-qualified real estate investment trusts, which meet minimum size and liquidity criteria, that are listed on the New York Stock Exchange, the American Stock Exchange and the NASDAQ National Market System. The index is calculated on a total return basis with dividends reinvested. The index is unmanaged, its returns do not reflect any fees, expenses, or sales charges, and it is not available for direct investment.
Gross Domestic Product (“GDP”)
The GDP represents the market value of all goods and services produced by the economy during the period measured, including personal consumption, government purchases, private inventories, paid-in construction costs, and the foreign trade balance.
MSCI EAFE® Index (net)
The MSCI EAFE® (Europe, Australasia, Far East) Index (net) is a free float-adjusted market capitalization-weighted index that measures developed foreign market equity performance, excluding the U.S. and Canada. The index is calculated on a total return basis with net dividends reinvested. The index is unmanaged, its returns do not reflect any fees, expenses, or sales charges, and it is not available for direct investment.
MSCI Emerging Markets Index (net)
The MSCI Emerging Markets Index (net) is a free float-adjusted market capitalization-weighted index designed to measure equity market performance in the global emerging markets. The index is calculated on a total return basis with net dividends reinvested. The index is unmanaged, its returns do not reflect any fees, expenses, or sales charges, and it is not available for direct investment.
Payment-in-Kind Security (“PIK”)
A bond which pays interest in the form of additional bonds, or preferred stock which pays dividends in the form of additional preferred stock.
Real Estate Investment Trust (“REIT”)
A publicly traded company that owns, develops, and operates income-producing real estate such as apartments, office buildings, hotels, shopping centers, and other commercial properties.
Russell 1000® Growth Index
The Russell 1000® Growth Index is a market capitalization-weighted index of growth-oriented stocks of the 1,000 largest companies in the Russell Universe, which comprises the 3,000 largest U.S. companies. The index is calculated on a total return basis with dividends reinvested. The index is unmanaged, its returns do not reflect any fees, expenses, or sales charges, and it is not available for direct investment.
Russell 2000® Growth Index
The Russell 2000® Growth Index is a market capitalization-weighted index of growth-oriented stocks of the smallest 2,000 companies in the Russell Universe, which comprises the 3,000 largest U.S. companies. The index is calculated on a total return basis with dividends reinvested. The index is unmanaged, its returns do not reflect any fees, expenses, or sales charges, and it is not available for direct investment.
3
KEY INVESTMENT TERMS (Continued)
Russell 2000® Index
The Russell 2000® Index is a market capitalization-weighted index of the 2,000 smallest companies in the Russell Universe, which comprises the 3,000 largest U.S. companies. The index is calculated on a total return basis with dividends reinvested. The index is unmanaged, its returns do not reflect any fees, expenses, or sales charges, and it is not available for direct investment.
Russell 2000® Value Index
The Russell 2000® Value Index is a market capitalization-weighted index of value-oriented stocks of the smallest 2,000 companies in the Russell Universe, which comprises the 3,000 largest U.S. companies. The index is calculated on a total return basis with dividends reinvested. The index is unmanaged, its returns do not reflect any fees, expenses, or sales charges, and it is not available for direct investment.
S&P 500® Index
The S&P 500® Index is a free-float market capitalization-weighted index of 500 of the largest U.S. companies. The index is calculated on a total return basis with dividends reinvested. The index is unmanaged, its returns do not reflect any fees, expenses, or sales charges, and it is not available for direct investment.
Sponsored ADR (American Depositary Receipt)
An ADR which is issued with the cooperation of the company whose stock will underlie the ADR. Sponsored ADRs generally carry the same rights normally given to stockholders, such as voting rights. ADRs must be sponsored to be able to trade on a major U.S. exchange such as the New York Stock Exchange (“NYSE”).
Tax Cuts and Jobs Act (TCJA)
The Tax Cuts and Jobs Act, which became law in December 2017, provides the first major overhaul of the U.S. federal tax code since 1986. The TCJA modifies tax rates, policies, credits, and deductions for individuals and businesses.
Treasury Yield
The return on investment, expressed as a percentage, on the U.S. government’s debt obligations (bonds, notes and bills). The Treasury yield is considered a bellwether of the U.S. economy; the higher the yields on 10-, 20- and 30-year Treasuries, the better the economic outlook.
U.S. Dollar Index®
The U.S. Dollar Index® is a geometrically-averaged calculation of the following six currencies weighted against the U.S. dollar: the euro, Japanese yen, British pound, Canadian dollar, Swedish krona and Swiss franc. The index is compiled by ICE Futures U.S., Inc. The index is unmanaged, its returns do not reflect any fees, expenses, or sales charges, and it is not available for direct investment.
Yankee bonds
Yankee bonds are dollar-denominated instruments issued in the U.S. market by foreign branches of U.S. banks and U.S. branches of foreign banks.
4
VIRTUS VARIABLE INSURANCE TRUST
Disclosure of Series Expenses (Unaudited)
For the six-month period of July 1, 2017 to December 31, 2017
We believe it is important for you to understand the impact of costs on your investment. All mutual funds have operating expenses. As a shareholder of a Series (each a “Series”) of Virtus Variable Insurance Trust (the “Trust”), you incur ongoing costs including investment advisory fees and other expenses. These examples are intended to help you understand your ongoing costs (in dollars) of investing in a Series and to compare these costs with the ongoing costs of investing in other mutual funds. These examples are based on an investment of $1,000 invested at the beginning of the period and held for the entire six-month period.
Actual Expenses
The following Expense Table illustrates a Series’ information about actual account values and actual expenses. You may use the information in this section, together with the amount you invested, to estimate the expenses that you paid over the period. Simply divide your account value by $1,000 (for example, an $8,600 account value divided by $1,000 = 8.6), then multiply the result by the number in the first table under the heading “Expenses Paid During Period” to estimate the expenses you paid on your account during this period. The Annualized Expense Ratios may be different from the expense ratios in the Financial Highlights which is for the fiscal year ended December 31, 2017. The expense estimate does not include the fees or expenses associated with the separate insurance accounts, and if such charges were included, your costs would have been higher.
| | | | | | | | | | | | | | | | | | |
| | | | | Beginning
Account Value
July 1,
2017 | | | Ending
Account Value
December 31,
2017 | | | Annualized
Expense
Ratio | | | Expenses
Paid
During
Period* | |
Duff & Phelps International Series | | Class A | | $ | 1,000.00 | | | $ | 1,088.00 | | | | 1.18 | % | | $ | 6.21 | |
| | Class I | | | 1,000.00 | | | | 1,089.60 | | | | 0.93 | | | | 4.90 | |
Duff & Phelps Real Estate Securities Series | | Class A | | | 1,000.00 | | | | 1,043.20 | | | | 1.16 | | | | 5.97 | |
| | Class I | | | 1,000.00 | | | | 1,044.60 | | | | 0.91 | | | | 4.69 | |
KAR Capital Growth Series | | Class A | | | 1,000.00 | | | | 1,126.40 | | | | 1.03 | | | | 5.52 | |
KAR Small-Cap Growth Series | | Class A | | | 1,000.00 | | | | 1,194.80 | | | | 1.19 | | | | 6.58 | |
| | Class I | | | 1,000.00 | | | | 1,196.20 | | | | 0.94 | | | | 5.20 | |
KAR Small-Cap Value Series | | Class A | | | 1,000.00 | | | | 1,123.70 | | | | 1.20 | | | | 6.42 | |
Newfleet Multi-Sector Intermediate Bond Series | | Class A | | | 1,000.00 | | | | 1,024.70 | | | | 0.93 | | | | 4.75 | |
| | Class I | | | 1,000.00 | | | | 1,026.00 | | | | 0.68 | | | | 3.47 | |
Rampart Enhanced Core Equity Series | | Class A | | | 1,000.00 | | | | 1,126.70 | | | | 0.98 | | | | 5.25 | |
Rampart Equity Trend Series | | Class A | | | 1,000.00 | | | | 1,108.00 | | | | 1.70 | | | | 9.03 | |
| | Class I | | | 1,000.00 | | | | 1,109.60 | | | | 1.45 | | | | 7.71 | |
Strategic Allocation Series | | Class A | | | 1,000.00 | | | | 1,077.00 | | | | 0.98 | | | | 5.13 | |
| * | Expenses are equal to the relevant Series’ annualized expense ratio, which is net of waived fees and reimbursed expenses, if applicable, multiplied by the average account value over the period, multiplied by the number of days (184) expenses were accrued in the most recent fiscal half-year, then divided by 365 to reflect the one-half year period. Exceptions noted below. |
A Series may invest in other funds, and the annualized expense ratios noted above do not reflect fees and expenses associated with the underlying funds. If such fees and expenses had been included, the expenses would have been higher.
You can find more information about a Series’ expenses in the Financial Statements section that follows. For additional information on operating expenses and other shareholder costs, including contractual charges associated with the separate account, refer to the Series prospectus and the contract prospectus.
5
VIRTUS VARIABLE INSURANCE TRUST
Disclosure of Series Expenses (Unaudited) (Continued)
For the six-month period of July 1, 2017 to December 31, 2017
Hypothetical Example for Comparison Purposes
The accompanying table provides information about hypothetical account values and hypothetical expenses based on a Series’ actual expense ratio and an assumed rate of return of 5% per year before expenses, which is not your Series’ actual return. The hypothetical account values and expenses may not be used to estimate the actual ending account balance or expenses you paid for the period. You may use this information to compare the ongoing costs of investing in your Series and other funds. To do so, compare these 5% hypothetical examples with the 5% hypothetical examples that appear in the shareholder reports of the other funds.
Please note that the expenses shown in the accompanying table are meant to highlight your ongoing costs only and do not reflect additional fees and expenses associated with the annuity or life insurance policy through which you invest. Therefore, the accompanying table is useful in comparing ongoing costs only, and will not help you determine the relative total costs of owning different funds. In addition, if the annuity or life insurance policy costs were included, your costs would have been higher. The calculations assume no shares were bought or sold during the period. Your actual costs may have been higher or lower, depending on the amount of your investment and the timing of any purchases or redemptions.
| | | | | | | | | | | | | | | | | | |
| | | | | Beginning
Account Value
July 1,
2017 | | | Ending
Account Value
December 31,
2017 | | | Annualized
Expense
Ratio | | | Expenses
Paid
During
Period* | |
Duff & Phelps International Series | | Class A | | $ | 1,000.00 | | | $ | 1,019.26 | | | | 1.18 | % | | $ | 6.01 | |
| | Class I | | | 1,000.00 | | | | 1,020.52 | | | | 0.93 | | | | 4.74 | |
Duff & Phelps Real Estate Securities Series | | Class A | | | 1,000.00 | | | | 1,019.36 | | | | 1.16 | | | | 5.90 | |
| | Class I | | | 1,000.00 | | | | 1,020.62 | | | | 0.91 | | | | 4.63 | |
KAR Capital Growth Series | | Class A | | | 1,000.00 | | | | 1,020.01 | | | | 1.03 | | | | 5.24 | |
KAR Small-Cap Growth Series | | Class A | | | 1,000.00 | | | | 1,019.21 | | | | 1.19 | | | | 6.06 | |
| | Class I | | | 1,000.00 | | | | 1,020.47 | | | | 0.94 | | | | 4.79 | |
KAR Small-Cap Value Series | | Class A | | | 1,000.00 | | | | 1,019.16 | | | | 1.20 | | | | 6.11 | |
Newfleet Multi-Sector Intermediate Bond Series | | Class A | | | 1,000.00 | | | | 1,020.52 | | | | 0.93 | | | | 4.74 | |
| | Class I | | | 1,000.00 | | | | 1,021.78 | | | | 0.68 | | | | 3.47 | |
Rampart Enhanced Core Equity Series | | Class A | | | 1,000.00 | | | | 1,020.27 | | | | 0.98 | | | | 4.99 | |
Rampart Equity Trend Series | | Class A | | | 1,000.00 | | | | 1,016.64 | | | | 1.70 | | | | 8.64 | |
| | Class I | | | 1,000.00 | | | | 1,017.90 | | | | 1.45 | | | | 7.37 | |
Strategic Allocation Series | | Class A | | | 1,000.00 | | | | 1,020.27 | | | | 0.98 | | | | 4.99 | |
| * | Expenses are equal to the relevant Series’ annualized expense ratio, which is net of waived fees and reimbursed expenses, if applicable, multiplied by the average account value over the period, multiplied by the number of days (184) expenses were accrued in the most recent fiscal half-year, then divided by 365 to reflect the one-half year period. Exceptions noted below. |
A Series may invest in other funds, and the annualized expense ratios noted above do not reflect fees and expenses associated with the underlying funds. If such fees and expenses had been included, the expenses would have been higher.
You can find more information about a Series’ expenses in the Financial Statements section that follows. For additional information on operating expenses and other shareholder costs, including contractual charges associated with the separate account, refer to the Series prospectus and the contract prospectus.
6
| | |
| Duff & Phelps International Series | | |
Series Summary (Unaudited)
Portfolio Manager Commentary by
Duff & Phelps Investment Management Co. (“Duff & Phelps”)
| ⬛ | | The Series is diversified and has an investment objective of high total return consistent with reasonable risk. There is no guarantee that the Series will meet its objective. |
| ⬛ | | For the fiscal year ended December 31, 2017, the Series’ Class A shares at NAV returned 15.95% and Class I shares at NAV returned 16.17%. For the same period, the MSCI EAFE® Index (net), which serves as the Series’ broad-based and style-specific benchmark index appropriate for comparison, returned 25.03%. |
All performance figures assume reinvestment of distributions and exclude the effect of fees and expenses associated with the variable life insurance or annuity product through which you invest. Past performance is no guarantee of future results, and current performance may be higher or lower than the performance shown above. Investment return and principal value will fluctuate so your shares, when redeemed, may be worth more or less than their original cost. Please visit Virtus.com for performance data current to the most recent month-end.
How did the international equity markets perform during the fiscal year ended December 31, 2017?
| ⬛ | | International equity markets posted strong returns during each quarter of 2017, with the MSCI EAFE® Index (net) delivering a 25.03% return for the 12-month period. Equity markets worldwide displayed ongoing resilience on the back of continued global economic momentum. |
| ⬛ | | Geopolitical tensions, natural disasters, and political divisions within many countries were relegated to background noise in 2017 as economic momentum fueled persistent optimism across most major developed markets. |
What factors affected the Series’ performance during the fiscal year?
| ⬛ | | Both sector allocation and security selection detracted from the Series’ performance for the fiscal year ended December 31, 2017, with security selection having the greater impact. On a sector performance basis, all of the 11 market sectors posted positive returns, exemplifying the one-directional nature of international equity markets during the period. |
| ⬛ | | The Series’ consumer discretionary holdings had a challenging year, detracting 2.67% on a relative basis for the period primarily due to unfavorable security selection (particularly IMAX and Ctrip.com). The second largest detractor at the sector level was energy, due to both security selection (especially Technip) and the adverse effect of being overweight the sector as it lagged the index. The third largest detractor was consumer staples, due to security selection, although an underweight position in the sector was accretive as it and other defensive sectors lagged the market for the most part. |
| ⬛ | | On the positive side, the Series’ industrial sector investments contributed 1.02% to relative performance for the year, primarily due to favorable security selection (particularly Nidec and Airbus). The second largest contributor at the sector level was utilities, due to security selection (especially Veolia). The third largest contributor was information technology, due to being overweight the sector as it and other cyclical sectors led the market for the most part. |
| ⬛ | | While the Series’ positioning in the health care sector overall was not among the most impactful, it was notable in that the Series’ strongest relative contributor (ICON plc) and second biggest detractor (Allergan plc) were health care names. We reaped some benefit from being underweight the sector as a whole, as it underperformed, and the net overall detraction was fairly minimal compared to the impact of other sectors. |
| ⬛ | | Derivatives made a negative contribution to the Series’ performance. Specifically, a Japanese yen short forward currency contract detracted -0.83% from relative total return as the U.S. dollar weakened relative to the yen during the year. |
The preceding information is the opinion of portfolio management only through the end of the period of the report as stated on the cover. Any such opinions are subject to change at any time based upon market or other conditions and should not be relied upon as investment advice.
Equity Securities: The market price of equity securities may be adversely affected by financial market, industry, or issuer-specific events. Focus on a particular style or on small or medium-sized companies may enhance that risk.
Foreign & Emerging Markets: Investing internationally, especially in emerging markets, involves additional risks such as currency, political, accounting, economic, and market risk.
Derivatives: Investments in derivatives such as futures, options, forwards, and swaps may increase volatility or cause a loss greater than the principal investment.
For information regarding the indexes and certain investment terms, see the Key Investment Terms starting on page 2.
7
| | |
| Duff & Phelps International Series (Continued) | | |
Prospectus: For additional information on risks, please see the Series’ prospectus.
| | | | |
| |
| Asset Allocation | |
| |
The following table presents asset allocations within certain sectors as a percentage of total investments as of December 31, 2017. | |
Financials | | | 29 | % |
Industrials | | | 16 | |
Materials | | | 13 | |
Information Technology | | | 9 | |
Consumer Discretionary | | | 8 | |
Energy | | | 7 | |
Consumer Staples | | | 5 | |
Other (includes short-term investments) | | | 13 | |
| | | | | |
Total | | | 100 | % |
| | | | | |
For information regarding the indexes and certain investment terms, see the Key Investment Terms starting on page 2.
8
| | |
| Duff & Phelps International Series (Continued) | | |
| | | | | | | | | | | | | | | | | | | | |
| Average Annual Total Returns1 for periods ended 12/31/17 | | | | | | | |
| | | | | |
| | | 1 year | | | 5 years | | | 10 years | | | Since
Inception | | | Inception
Date | |
| Class A shares at NAV2 | | | 15.95 | % | | | 1.13 | % | | | 1.31 | % | | | — | | | | — | |
| Class I shares at NAV2 | | | 16.17 | | | | — | | | | — | | | | 0.05 | % | | | 4/30/13 | |
| S&P 500® Index* | | | 21.83 | | | | 15.79 | | | | 8.50 | | | | 14.04 | 4 | | | — | |
| MSCI EAFE® Index (net)* | | | 25.03 | | | | 7.90 | | | | 1.94 | | | | 6.16 | 4 | | | — | |
| Series Expense Ratios3: Class A shares: Gross 1.26%, Net 1.19%; Class I shares: Gross 1.01%, Net 0.94%. | | | | | |
Returns represent past performance which is no guarantee of future results. The investment return and principal value will fluctuate so that an investor’s shares, when redeemed, may be worth more or less than their original cost. Total return does not reflect expenses associated with the separate account such as the administrative fees, account charges and surrender charges, which if reflected, would reduce total return. Performance figures may reflect fee waivers and/or expense reimbursements. In the absence of fee waivers and/or expense reimbursements, the total return would have been lower. Please visit Virtus.com for performance data current to the most recent month-end.
| 1 | Total returns are historical and include changes in share price and the reinvestment of both dividends and capital gains distributions. |
| 2 | “NAV” (Net Asset Value) total returns do not reflect any fees or expenses associated with the separate insurance accounts. |
| 3 | The expense ratios of the Series, both net and gross, are set forth according to the prospectus for the Series effective May 1, 2017, as supplemented and revised, and may differ from the expense ratios disclosed in the Financial Highlights tables in this report. See the Financial Highlights for more current information. Net Expenses: Expenses reduced by a contractual waiver in effect through April 30, 2018. Gross Expenses: Do not reflect the effect of the contractual waiver. Expense ratios include fees and expenses associated with underlying funds. |
| 4 | The since inception index returns are from the inception date of Class I shares. |
| * | The MSCI EAFE® Index (net) is an appropriate broad-based index. The Series is no longer using the S&P 500® Index. |
Growth of $10,000 For periods ended 12/31
This chart assumes an initial investment of $10,000 made on December 31, 2007 for Class A shares. Returns shown include the reinvestment of all distributions at net asset value, and the change in share price for the stated period.
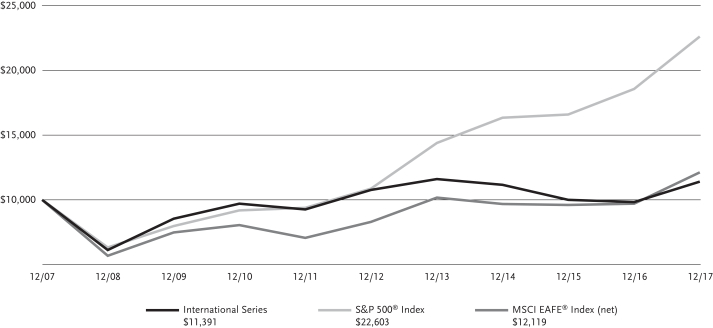
The indexes are unmanaged and not available for direct investment; therefore, their performance does not reflect the expenses associated with active management of an actual portfolio.
For information regarding the indexes and certain investment terms, see the Key Investment Terms starting on page 2.
9
| | |
| Duff & Phelps Real Estate Securities Series | | |
Series Summary (Unaudited)
Portfolio Manager Commentary by
Duff & Phelps Investment Management Co.
| ⬛ | | The Series is diversified and has investment objectives of capital appreciation and income with approximately equal emphasis. There is no guarantee that the Series will meet its objectives. |
| ⬛ | | For the fiscal year ended December 31, 2017, the Series’ Class A shares at NAV returned 5.97% and Class I shares at NAV returned 6.25%. For the same period, the FTSE NAREIT Equity REITs Index, which serves as the Series’ broad-based and style-specific benchmark index appropriate for comparison, returned 5.23%. |
All performance figures assume reinvestment of distributions and exclude the effect of fees and expenses associated with the variable life insurance or annuity product through which you invest. Past performance is no guarantee of future results, and current performance may be higher or lower than the performance shown above. Investment return and principal value will fluctuate so your shares, when redeemed, may be worth more or less than their original cost. Please visit Virtus.com for performance data current to the most recent month-end.
How did the markets perform during the fiscal year ended December 31, 2017?
| ⬛ | | Equity markets, as measured by the S&P 500® Index, were quite strong during the Series’ fiscal year. |
| ⬛ | | U.S. REITs put up solid performance within real assets of 5.23%, as measured by the Series’ benchmark, the FTSE NAREIT Equity REITs Index. Cash flow and dividend growth were supportive, as were mergers and acquisitions (M&A) announcements within listed real estate, both in the U.S. and overseas, through the end of 2017. Private real estate funds had raised a significant amount of capital, which remained largely unspent, and were looking to purchase real estate from listed REITs, in part or in whole. Overall new supply remained contained, while there were some property sectors and markets in stronger positions on supply/demand dynamics than others. Certain sectors benefited from secular trends, such as industrial warehouses from e-commerce, as well as data centers, which provided an opportunity for security selection. |
| ⬛ | | Interest rate volatility picked up into the end of the fiscal year, and expectations grew of additional increases by the Federal Reserve (the Fed) in 2018 following three increases of 0.25% each in 2017 to normalize rates. |
| ⬛ | | At the end of the fiscal year, Congress was effective in passing tax reform, a material event and a notable fiscal stimulus. It is interesting to note that, following the global Financial Crisis of 2008, former Fed Chair Ben Bernanke called for a fiscal stimulus on top of a monetary one, but it was never implemented. The economic environment remained positive based on a number of macro factors, employment levels, and market returns. |
| ⬛ | | The S&P 500® Index had a good year. Corporate earnings lifted notably through the year and benefited from a weaker U.S. dollar, which declined roughly 10% as measured by the U.S. Dollar Index (DXY). The dollar’s weakness helped non-U.S. listed real estate outperform U.S. listed real estate in 2017. |
| ⬛ | | Central banks around the globe modified their quantitative easing programs during the fiscal year, and in some cases began to reduce the size of their balance sheets. The U.S. Fed is well ahead of the European Central Bank (ECB) in raising rates, tightening once in 2015, once in 2016, and three times in 2017. Equity REITs had positive returns in each of those years. M&A appeared to be picking up as the Fed hiked in 2017, just as it did from June ’04 to ’06, when the Fed hiked 17 times for 0.25% each. During that time period, equity REITs put up positive returns. |
What factors affected the Series’ performance during the fiscal year?
| ⬛ | | For the fiscal year ended December 31, 2017, the Series benefited from security selection and property sector allocation, outperforming its benchmark. |
| ⬛ | | Within the U.S., the data centers, manufactured homes, and industrial property sectors delivered the best total returns over the last 12 months. Retail, namely shopping centers and regional malls, as well as diversified property were the most significant laggards. |
| ⬛ | | The most significant individual positive contributor to relative performance during the Series’ fiscal year was an underweight allocation to and security selection within healthcare, which lagged. Other contributors included security selection within office, which performed in line; an overweight allocation and security selection within industrial, which outperformed; and an overweight allocation and security selection within data centers, which also outperformed. |
| ⬛ | | The most significant detractor from relative performance during the Series’ fiscal year was an overweight allocation to and security selection within apartments, which lagged. This was followed by an overweight allocation to shopping centers, which lagged and was partially offset by security selection; a zero-weight to specialty, which outperformed; and security selection within single family home rentals, which outperformed and was partially offset by an overweight allocation. |
The preceding information is the opinion of portfolio management only through the end of the period of the report as stated on the cover. Any such opinions are subject to change at any time based upon market or other conditions and should not be relied upon as investment advice.
Equity Securities: The market price of equity securities may be adversely affected by financial market, industry, or issuer-specific events. Focus on a particular style or on small or medium-sized companies may enhance that risk.
Industry/Sector Concentration: A fund that focuses its investments in a particular industry or sector will be more sensitive to conditions that affect that industry or sector than a non-concentrated fund.
Real Estate: The Series may be negatively affected by factors specific to the real estate market, including interest rates, leverage, property, and management.
For information regarding the indexes and certain investment terms, see the Key Investment Terms starting on page 2.
10
| | |
| Duff & Phelps Real Estate Securities Series (Continued) | | |
Prospectus: For additional information on risks, please see the Series’ prospectus.
| | | | |
| |
| Asset Allocation | |
| |
The following table presents asset allocations within certain sectors as a percentage of total investments as of December 31, 2017. | |
Apartments | | | 17 | % |
Office | | | 16 | |
Industrials | | | 14 | |
Data Centers | | | 13 | |
Shopping Centers | | | 8 | |
Regional Malls | | | 7 | |
Self Storage | | | 6 | |
Other (includes short-term investments) | | | 19 | |
| | | | | |
Total | | | 100 | % |
| | | | | |
For information regarding the indexes and certain investment terms, see the Key Investment Terms starting on page 2.
11
| | |
| Duff & Phelps Real Estate Securities Series (Continued) |
| | | | | | | | | | | | | | | | | | | | |
| Average Annual Total Returns1 for periods ended 12/31/17 | | | | | | | | | | |
| | | | | |
| | | 1 year | | | 5 years | | | 10 years | | | Since
Inception | | | Inception
Date | |
| Class A shares at NAV2 | | | 5.97 | % | | | 9.00 | % | | | 7.51 | % | | | — | | | | — | |
| Class I shares at NAV2 | | | 6.25 | | | | — | | | | — | | | | 7.14 | % | | | 4/30/13 | |
| S&P 500® Index* | | | 21.83 | | | | 15.79 | | | | 8.50 | | | | 14.04 | 4 | | | — | |
| FTSE NAREIT Equity REITs Index* | | | 5.23 | | | | 9.46 | | | | 7.44 | | | | 6.83 | 4 | | | — | |
| Series Expense Ratios3: Class A shares: Gross 1.24%, Net 1.16%; Class I shares: Gross 0.99%, Net 0.91%. | | | | | |
Returns represent past performance which is no guarantee of future results. The investment return and principal value will fluctuate so that an investor’s shares, when redeemed, may be worth more or less than their original cost. Total return does not reflect expenses associated with the separate account such as the administrative fees, account charges and surrender charges, which if reflected, would reduce total return. Performance figures may reflect fee waivers and/or expense reimbursements. In the absence of fee waivers and/or expense reimbursements, the total return would have been lower. Please visit Virtus.com for performance data current to the most recent month-end.
| 1 | Total returns are historical and include changes in share price and the reinvestment of both dividends and capital gains distributions. |
| 2 | “NAV” (Net Asset Value) total returns do not reflect any fees or expenses associated with the separate insurance products. |
| 3 | The expense ratios of the Series, both net and gross, are set forth according to the prospectus for the Series effective May 1, 2017, as supplemented and revised, and may differ from the expense ratios disclosed in the Financial Highlights tables in this report. See the Financial Highlights for more current information. Net Expenses: Expenses reduced by a contractual waiver in effect through April 30, 2018. Gross Expenses: Do not reflect the effect of the contractual waiver. Expense ratios include fees and expenses associated with underlying funds. |
| 4 | The since inception index returns are from the inception date of Class I shares. |
| * | The FTSE NAREIT Equity REITs Index is an appropriate broad-based index. The Series is no longer using the S&P 500® Index. |
Growth of $10,000 For periods ended 12/31
This chart assumes an initial investment of $10,000 made on December 31, 2007 for Class A shares. Returns shown include the reinvestment of all distributions at net asset value, and the change in share price for the stated period.
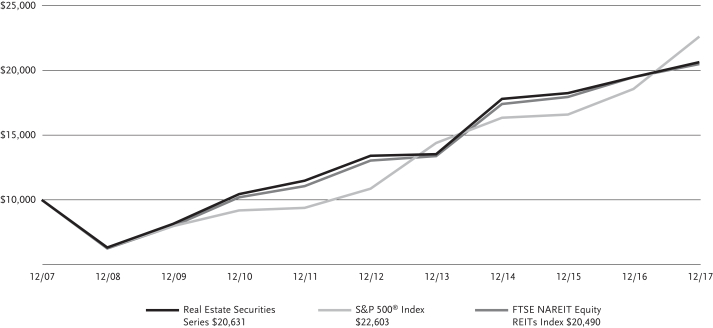
The indexes are unmanaged and not available for direct investment; therefore, their performance does not reflect the expenses associated with active management of an actual portfolio.
For information regarding the indexes and certain investment terms, see the Key Investment Terms starting on page 2.
12
| | |
| KAR Capital Growth Series | | |
Series Summary (Unaudited)
Portfolio Manager Commentary by
Kayne Anderson Rudnick Investment Management, LLC
| ⬛ | | The Series is diversified and has an investment objective of long-term growth of capital. There is no guarantee that the Series will meet its objective. |
| ⬛ | | For the fiscal year ended December 31, 2017, the Series’ Class A shares at NAV returned 36.07%. For the same period, the Russell 1000® Growth Index, which serves as the Series’ broad-based and style-specific benchmark index appropriate for comparison, returned 30.21%. |
All performance figures assume reinvestment of distributions and exclude the effect of fees and expenses associated with the variable life insurance or annuity product through which you invest. Past performance is no guarantee of future results, and current performance may be higher or lower than the performance shown above. Investment return and principal value will fluctuate so your shares, when redeemed, may be worth more or less than their original cost. Please visit Virtus.com for performance data current to the most recent month-end.
How did the market perform during the fiscal year ended December 31, 2017?
| ⬛ | | The year 2017 was a banner one for global equities: The S&P 500® Index returned 21.83%; foreign markets, as measured by the MSCI EAFE® Index (net), gained 25.03%; and emerging markets stocks, as measured by the MSCI Emerging Markets Index (net), climbed 37.28%. Growth stocks across the market-cap spectrum outperformed value stocks for the year, the opposite of what occurred in 2016. |
| ⬛ | | The Russell 1000® Growth Index rose 30.21% in 2017. The utilities sector was by far the best performer, with a gain of 70.80%. Other contributing sectors included information technology (+41.55%), financials (+31.63%) and industrials (+31.42%). Energy was the only negative sector in the index for the year, down 6.70%. |
What factors affected the Series’ performance during the fiscal year?
| ⬛ | | The Series outperformed the Russell 1000® Growth Index for the year. The Series benefited from positive stock selection in the information technology and consumer staples sectors. Negative stock selection in health care and an overweight in energy detracted from performance. |
| ⬛ | | Stocks that contributed the most to the year’s gains were Facebook and Alibaba Group Holding. |
| ⬛ | | Facebook continued to grow advertising revenue and take share in the online digital marketing space. The company delivered an unprecedented global reach of about 30% of the earth’s population to advertisers in a measurable way. Facebook’s user growth remained stunning despite its scale, and Instagram’s Stories format had resounding success in fighting off competitors like Snapchat. |
| ⬛ | | Alibaba’s two marketplaces, Taobao and Tmall.com, combine to form the largest online commerce company in the world. Management has committed to a number of social initiatives to further improve mobile monetization over time. Alibaba’s marketplaces have huge network effects, and the company made efforts to foster the ecosystem with investments in payments and logistics partnerships. Taobao, in particular, has become a destination for consumers, merchants, and key opinion leaders to interact and engage in what Alibaba calls social commerce. E-commerce penetration, mobile usage, and growth in Chinese consumer spending power were all durable long-term tailwinds benefitting the company during the fiscal period. Alibaba has attempted to seize the opportunity by using data to improve targeting and increasingly consummating transactions through Alipay, its leading mobile payment offering. |
| ⬛ | | Positions that detracted the most from performance were Bristol-Myers Squibb and Schlumberger. |
| ⬛ | | Bristol-Myers dominated the initial immuno-oncology (I/O) market, securing a market share over 80%. The company is working on combination therapies with a broad set of checkpoint inhibitors to treat cancer. However, a failed trial in first-line lung cancer and positive results from competitors led analysts to adjust assumptions for Bristol’s ultimate market share and pricing power. When Bristol’s back-up plan also fell through and left the company potentially years behind competitors, we exited our position. |
| ⬛ | | Schlumberger has historically traded at a premium due to its technological prowess, scale, and efficiency. However, its shares underperformed peers during the fiscal year due to its exposure to late-cycle offshore and international customers rather than the faster-growing North American shale basins. Schlumberger’s business also became more capital intensive as it took ownership stakes in many of the fields alongside its operating customers. After trimming our position in April, we exited the name in July of 2017. |
The preceding information is the opinion of portfolio management only through the end of the period of the report as stated on the cover. Any such opinions are subject to change at any time based upon market or other conditions and should not be relied upon as investment advice.
Equity Securities: The market price of equity securities may be adversely affected by financial market, industry, or issuer-specific events. Focus on a particular style or on small or medium-sized companies may enhance that risk.
Limited Number of Investments: Because the Series has a limited number of securities, it may be more susceptible to factors adversely affecting its securities than a less concentrated fund.
For information regarding the indexes and certain investment terms, see the Key Investment Terms starting on page 2.
13
| | |
| KAR Capital Growth Series (Continued) | | |
Industry/Sector Concentration: A fund that focuses its investments in a particular industry or sector will be more sensitive to conditions that affect that industry or sector than a non-concentrated fund.
Prospectus: For additional information on risks, please see the Series’ prospectus.
| | | | |
| |
| Asset Allocation | |
| |
The following table presents asset allocations within certain sectors as a percentage of total investments as of December 31, 2017. | |
Information Technology | | | 42 | % |
Consumer Discretionary | | | 24 | |
Health Care | | | 8 | |
Industrials | | | 7 | |
Financials | | | 6 | |
Consumer Staples | | | 6 | |
Energy | | | 5 | |
Other (includes short-term investment) | | | 2 | |
| | | | | |
Total | | | 100 | % |
| | | | | |
For information regarding the indexes and certain investment terms, see the Key Investment Terms starting on page 2.
14
| | |
| KAR Capital Growth Series (Continued) | | |
| | | | | | | | | | | | |
| Average Annual Total Returns1 for periods ended 12/31/17 | |
| | | |
| | | 1 year | | | 5 years | | | 10 years | |
| Class A shares at NAV2 | | | 36.07 | % | | | 16.34 | % | | | 7.42 | % |
| S&P 500® Index* | | | 21.83 | | | | 15.79 | | | | 8.50 | |
| Russell 1000® Growth Index* | | | 30.21 | | | | 17.33 | | | | 10.00 | |
| Series Expense Ratios3: Class A shares: Gross 1.17%, Net 1.03%. | |
Returns represent past performance which is no guarantee of future results. The investment return and principal value will fluctuate so that an investor’s shares, when redeemed, may be worth more or less than their original cost. Total return does not reflect expenses associated with the separate account such as the administrative fees, account charges and surrender charges, which if reflected, would reduce total return. Performance figures may reflect fee waivers and/or expense reimbursements. In the absence of fee waivers and/or expense reimbursements, the total return would have been lower. Please visit Virtus.com for performance data current to the most recent month-end.
| 1 | Total returns are historical and include changes in share price and the reinvestment of both dividends and capital gains distributions. |
| 2 | “NAV” (Net Asset Value) total returns do not reflect any fees or expenses associated with the separate insurance accounts. |
| 3 | The expense ratios of the Series, both net and gross, are set forth according to the prospectus for the Series effective May 1, 2017, as supplemented and revised, and may differ from the expense ratios disclosed in the Financial Highlights tables in this report. See the Financial Highlights for more current information. Net Expenses: Expenses reduced by a contractual waiver in effect through April 30, 2018. Gross Expenses: Do not reflect the effect of the contractual waiver. Expense ratios include fees and expenses associated with underlying funds. |
| * | The Russell 1000® Growth Index is an appropriate broad-based index. The Series is no longer using the S&P 500® Index. |
Growth of $10,000 For periods ended 12/31
This chart assumes an initial investment of $10,000 made on December 31, 2007 for Class A shares. Returns shown include the reinvestment of all distributions at net asset value, and the change in share price for the stated period.
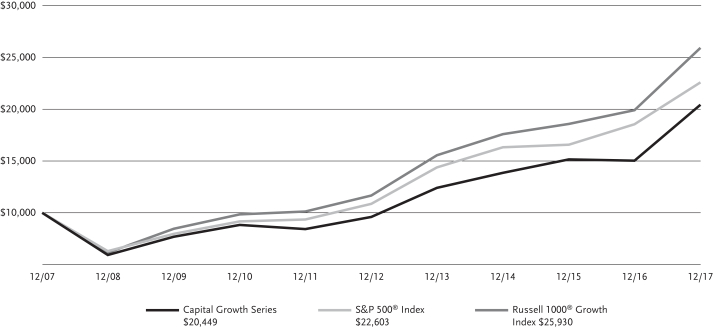
The indexes are unmanaged and not available for direct investment; therefore, their performance does not reflect the expenses associated with active management of an actual portfolio.
For information regarding the indexes and certain investment terms, see the Key Investment Terms starting on page 2.
15
| | |
| KAR Small-Cap Growth Series | | |
Series Summary (Unaudited)
Portfolio Manager Commentary by
Kayne Anderson Rudnick Investment Management, LLC
| ⬛ | | The Series is diversified and has an investment objective of long-term capital growth. There is no guarantee that the Series will meet its objective. |
| ⬛ | | For the fiscal year ended December 31, 2017, the Series’ Class A shares at NAV returned 40.85% and Class I shares at NAV returned 41.16%. For the same period, the Russell 2000® Growth Index, which serves as the Series’ broad-based and style-specific benchmark index appropriate for comparison, returned 22.17%. |
All performance figures assume reinvestment of distributions and exclude the effect of fees and expenses associated with the variable life insurance or annuity product through which you invest. Past performance is no guarantee of future results, and current performance may be higher or lower than the performance shown above. Investment return and principal value will fluctuate so your shares, when redeemed, may be worth more or less than their original cost. Please visit Virtus.com for performance data current to the most recent month-end.
How did the market perform during the fiscal year ended December 31, 2017?
| ⬛ | | The year 2017 was a banner one for global equities: The S&P 500® Index returned 21.83%; foreign markets, as measured by the MSCI EAFE® Index (net), gained 25.03%; and emerging markets stocks, as measured by the MSCI Emerging Markets Index (net), climbed 37.28%. Growth stocks across the market-cap spectrum outperformed value stocks for the year, the opposite of what occurred in 2016. |
| ⬛ | | The Russell 2000® Growth Index rose 22.17% in 2017. Health care was the best performing sector, gaining 37.34% following a down year in 2016. Other sectors that posted solid performance in 2017 included technology (+21.87%), materials and processing (+19.92%), and consumer discretionary (+19.80%). Energy was the only negative sector in the index for the year, down 15.30%. |
What factors affected the Series’ performance during the fiscal year?
| ⬛ | | The Series outperformed the Russell 2000® Growth Index for the year. From a sector perspective, returns were largely driven by positive stock selection in the technology and consumer discretionary sectors. Performance was hurt by an underweight in health care. |
| ⬛ | | From an individual stock perspective, names that contributed the most to performance were Autohome and Ollie’s Bargain Outlet Holdings. |
| ⬛ | | Autohome’s share price increased meaningfully during 2017 as the company refined its strategy and exited a money-losing new car transaction business. This allowed the strong profitability of its core business to re-emerge, and translated into double-digit growth in revenue and earnings per share for the trailing 12 months. Autohome’s financial results also benefited from the ongoing secular shift of advertising budgets from traditional to online media. Given Autohome’s strong competitive positioning, improved capital allocation, and the expected long-term growth of the Chinese car market, the Fund remained invested in the business as of the end of the period. |
| ⬛ | | Throughout 2017, Ollie’s continued to defy the doom and gloom in retail and deliver healthy same-store sales growth and margins. The company focused on delivering best-in-class closeout deals, and as it grew, it continued to be the first choice for vendors looking to unload merchandise. The company slowly tilted inventory toward consumables, which helped to increase repeat purchases, as customers saw Ollie’s as more than just a once-a-year, deal-hunting adventure. |
| ⬛ | | Names that detracted the most from performance were Shutterstock and Abaxis. |
| ⬛ | | Shutterstock’s stock price had rebounded in the first half of 2016 as concerns regarding the competitive threat from Adobe’s new stock photo offering abated. However, a meaningful slowdown in revenue growth over the next two quarters sent the share price lower. Our original investment thesis was based on the network effects of Shutterstock’s core stock photo marketplace business. Even at lower growth rates, that marketplace business was profitable and valuable. Unfortunately, management sought growth by investing capital in other parts of the company where Shutterstock’s competitive advantage was less clear. Thus, we sold the Series’ position in early 2017. |
| ⬛ | | Abaxis saw its shares fall after experiencing a weak sales quarter as its veterinary business grew only slightly while the medical business declined due to distributor de-stocking. The company ramped up its research and development (R&D) efforts in an effort to drive the top line, but those efforts did not bear fruit in 2017. The company’s solid balance sheet and high consumables mix kept the Series as a shareholder through the end of the period. |
The preceding information is the opinion of portfolio management only through the end of the period of the report as stated on the cover. Any such opinions are subject to change at any time based upon market or other conditions and should not be relied upon as investment advice.
Equity Securities: The market price of equity securities may be adversely affected by financial market, industry, or issuer-specific events. Focus on a particular style or on small or medium-sized companies may enhance that risk.
Limited Number of Investments: Because the Series has a limited number of securities, it may be more susceptible to factors adversely affecting its securities than a less concentrated fund.
Industry/Sector Concentration: A fund that focuses its investments in a particular industry or sector will be more sensitive to conditions that affect that industry or sector than a non-concentrated fund.
For information regarding the indexes and certain investment terms, see the Key Investment Terms starting on page 2.
16
| | |
| KAR Small-Cap Growth Series (Continued) | | |
Prospectus: For additional information on risks, please see the Series’ prospectus.
| | | | |
| |
| Asset Allocation | |
| |
The following table presents asset allocations within certain sectors as a percentage of total investments as of December 31, 2017. | |
Information Technology | | | 28 | % |
Industrials | | | 19 | |
Consumer Discretionary | | | 18 | |
Financials | | | 17 | |
Health Care | | | 8 | |
Consumer Staples | | | 6 | |
Short-Term Investments | | | 4 | |
| | | | | |
Total | | | 100 | % |
| | | | | |
For information regarding the indexes and certain investment terms, see the Key Investment Terms starting on page 2.
17
| | |
| KAR Small-Cap Growth Series (Continued) | | |
| | | | | | | | | | | | | | | | | | | | |
| Average Annual Total Returns1 for periods ended 12/31/17 | | | | | | | | | | |
| | | | | |
| | | 1 year | | | 5 years | | | 10 years | | | Since
Inception | | | Inception
Date | |
| Class A shares at NAV2 | | | 40.85 | % | | | 21.45 | % | | | 10.18 | % | | | — | | | | — | |
| Class I shares at NAV2 | | | 41.16 | | | | — | | | | — | | | | 20.68 | % | | | 4/30/13 | |
| S&P 500® Index* | | | 21.83 | | | | 15.79 | | | | 8.50 | | | | 14.04 | 4 | | | — | |
| Russell 2000® Growth Index* | | | 22.17 | | | | 15.21 | | | | 9.19 | | | | 13.48 | 4 | | | — | |
| Series Expense Ratios3: Class A shares: Gross 1.36%, Net 1.19%; Class I shares: Gross 1.11%, Net 0.94%. | |
Returns represent past performance which is no guarantee of future results. The investment return and principal value will fluctuate so that an investor’s shares, when redeemed, may be worth more or less than their original cost. Total return does not reflect expenses associated with the separate account such as the administrative fees, account charges and surrender charges, which if reflected, would reduce total return. Performance figures may reflect fee waivers and/or expense reimbursements. In the absence of fee waivers and/or expense reimbursements, the total return would have been lower. Please visit Virtus.com for performance data current to the most recent month-end.
| 1 | Total returns are historical and include changes in share price and the reinvestment of both dividends and capital gains distributions. |
| 2 | “NAV” (Net Asset Value) total returns do not reflect any fees or expenses associated with the separate insurance products. |
| 3 | The expense ratios of the Series, both net and gross, are set forth according to the prospectus for the Series effective May 1, 2017, as supplemented and revised, and may differ from the expense ratios disclosed in the Financial Highlights tables in this report. See the Financial Highlights for more current information. Net Expenses: Expenses reduced by a contractual waiver in effect through April 30, 2018. Gross Expenses: Do not reflect the effect of the contractual waiver. Expense ratios include fees and expenses associated with underlying funds. |
| 4 | The since inception index returns are from the inception date of Class I shares. |
| * | The Russell 2000® Growth Index is an appropriate broad-based index. The Series is no longer using the S&P 500® Index. |
Growth of $10,000 For periods ended 12/31
This chart assumes an initial investment of $10,000 made on December 31, 2007 for Class A shares. Returns shown include the reinvestment of all distributions at net asset value, and the change in share price for the stated period.
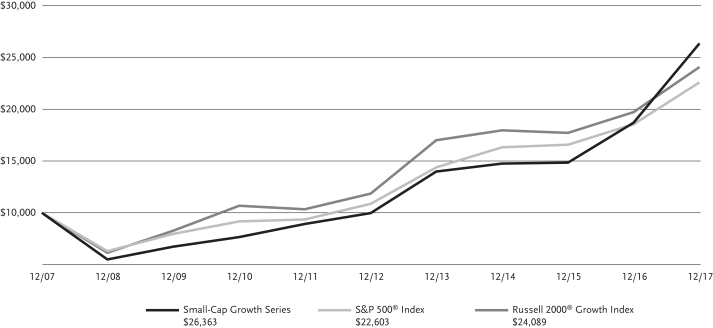
The indexes are unmanaged and not available for direct investment; therefore, their performance does not reflect the expenses associated with active management of an actual portfolio.
For information regarding the indexes and certain investment terms, see the Key Investment Terms starting on page 2.
18
| | |
| KAR Small-Cap Value Series | | |
Series Summary (Unaudited)
Portfolio Manager Commentary by
Kayne Anderson Rudnick Investment Management, LLC
| ⬛ | | The Series is diversified and has an investment objective of long-term capital appreciation. There is no guarantee that the Series will meet its objective. |
| ⬛ | | For the fiscal year ended December 31, 2017, the Series’ Class A shares at NAV returned 20.16%. For the same period, the Russell 2000® Value Index, which serves as the Series’ broad-based and style-specific benchmark index appropriate for comparison, returned 7.84%. |
All performance figures assume reinvestment of distributions and exclude the effect of fees and expenses associated with the variable life insurance or annuity product through which you invest. Past performance is no guarantee of future results, and current performance may be higher or lower than the performance shown above. Investment return and principal value will fluctuate so your shares, when redeemed, may be worth more or less than their original cost. Please visit Virtus.com for performance data current to the most recent month-end.
How did the market perform during the fiscal year ended December 31, 2017?
| ⬛ | | The year 2017 was a banner one for global equities: The S&P 500® Index returned 21.83%; foreign markets, as measured by the MSCI EAFE® Index (net), gained 25.03%; and emerging markets stocks, as measured by the MSCI Emerging Markets Index (net), climbed 37.28%. Growth stocks across the market-cap spectrum outperformed value stocks for the year, the opposite of what occurred in 2016. |
| ⬛ | | The Russell 2000® Value Index rose 7.84% in 2017. Health care and producer durables were the best performing sectors, returning 30.75% and 18.79%, respectively. Energy was the worst performing sector, down 17.46%, followed by consumer staples, which was down 5.33%. |
What factors affected the Series’ performance during the fiscal year?
| ⬛ | | The Series outperformed the Russell 2000® Value Index for the year. By sector, performance was driven by positive stock selection in the consumer staples, financial services, and producer durables sectors. Gains were offset by the effects of negative stock selection in health care. |
| ⬛ | | Companies that contributed the most to performance were SiteOne Landscape Supply and National Beverage Corp. |
| ⬛ | | SiteOne continued to consolidate the industry and saw accelerating organic daily sales growth. With the company’s increased scale and initiatives such as improving its supply chain, SiteOne was able to expand gross margins during the year. |
| ⬛ | | While National Beverage’s carbonated soft drink brands were weak like the rest of the industry, these declines were more than offset by growth in the company’s sparkling water portfolio, particularly the LaCroix brand. LaCroix’s sales grew at a rapid clip over the past several years as the brand gained additional points of distribution. As a result, National Beverage grew its consolidated revenue and profits by double digits over the past 12 months. The company recently launched a new Shasta-branded line of flavored sparkling water. |
| ⬛ | | Stocks that detracted the most from performance were Sally Beauty Holdings and Cass Information Systems, Inc. |
| ⬛ | | Throughout the year, Sally Beauty Supply, one of the two core segments of Sally Beauty Holdings, struggled to drive positive traffic into stores. The core business underwent a major transformation in terms of look, branding, service, and assortment. Sally also tinkered with its loyalty program, with plans to launch chain-wide in 2018. The company took price cuts on certain products in an effort to drive more traffic to its stores and maintain a more consistent value image. The professional segment had better results, with some execution missteps when it came to promotions. |
| ⬛ | | Although Cass’s shares lagged, driven by the persistently low interest rate environment, the company was a solid generator of free cash flow, returning excess cash to shareholders in the form of regular cash dividends (paid continuously since 1934), opportunistic stock dividends, and sizeable share repurchases. |
The preceding information is the opinion of portfolio management only through the end of the period of the report as stated on the cover. Any such opinions are subject to change at any time based upon market or other conditions and should not be relied upon as investment advice.
Equity Securities: The market price of equity securities may be adversely affected by financial market, industry, or issuer-specific events. Focus on a particular style or on small or medium-sized companies may enhance that risk.
Limited Number of Investments: Because the Series has a limited number of securities, it may be more susceptible to factors adversely affecting its securities than a less concentrated fund.
Industry/Sector Concentration: A fund that focuses its investments in a particular industry or sector will be more sensitive to conditions that affect that industry or sector than a non-concentrated fund.
For information regarding the indexes and certain investment terms, see the Key Investment Terms starting on page 2.
19
| | |
| KAR Small-Cap Value Series (Continued) | | |
Prospectus: For additional information on risks, please see the Series’ prospectus.
| | | | |
| |
| Asset Allocation | |
| |
The following table presents asset allocations within certain sectors as a percentage of total investments as of December 31, 2017. | |
Industrials | | | 21 | % |
Financials | | | 16 | |
Information Technology | | | 16 | |
Consumer Discretionary | | | 15 | |
Real Estate | | | 11 | |
Consumer Staples | | | 6 | |
Health Care | | | 6 | |
Other (includes short-term investments) | | | 9 | |
| | | | | |
Total | | | 100 | % |
| | | | | |
For information regarding the indexes and certain investment terms, see the Key Investment Terms starting on page 2.
20
| | |
| KAR Small-Cap Value Series (Continued) | | |
| | | | | | | | | | | | |
| Average Annual Total Returns1 for periods ended 12/31/17 | |
| | | |
| | | 1 year | | | 5 years | | | 10 years | |
| Class A shares at NAV2 | | | 20.16 | % | | | 16.54 | % | | | 7.91 | % |
| S&P 500® Index* | | | 21.83 | | | | 15.79 | | | | 8.50 | |
| Russell 2000® Value Index* | | | 7.84 | | | | 13.01 | | | | 8.17 | |
| Series Expense Ratios3: Class A shares: Gross 1.39%, Net 1.20%. | |
Returns represent past performance which is no guarantee of future results. The investment return and principal value will fluctuate so that an investor’s shares, when redeemed, may be worth more or less than their original cost. Total return does not reflect expenses associated with the separate account such as the administrative fees, account charges and surrender charges, which if reflected, would reduce total return. Performance figures may reflect fee waivers and/or expense reimbursements. In the absence of fee waivers and/or expense reimbursements, the total return would have been lower. Please visit Virtus.com for performance data current to the most recent month-end.
| 1 | Total returns are historical and include changes in share price and the reinvestment of both dividends and capital gains distributions. |
| 2 | “NAV” (Net Asset Value) total returns do not reflect any fees or expenses associated with the separate insurance accounts. |
| 3 | The expense ratios of the Series, both net and gross, are set forth according to the prospectus for the Series effective May 1, 2017, as supplemented and revised, and may differ from the expense ratios disclosed in the Financial Highlights tables in this report. See the Financial Highlights for more current information. Net Expenses: Expenses reduced by a contractual waiver in effect through April 30, 2018. Gross Expenses: Do not reflect the effect of the contractual waiver. Expense ratios include fees and expenses associated with underlying funds. |
| * | The Russell 2000® Value Index is an appropriate broad-based index. The Series is no longer using the S&P 500® Index. |
Growth of $10,000 For periods ended 12/31
This chart assumes an initial investment of $10,000 made on December 31, 2007 for Class A shares. Returns shown include the reinvestment of all distributions at net asset value, and the change in share price for the stated period.
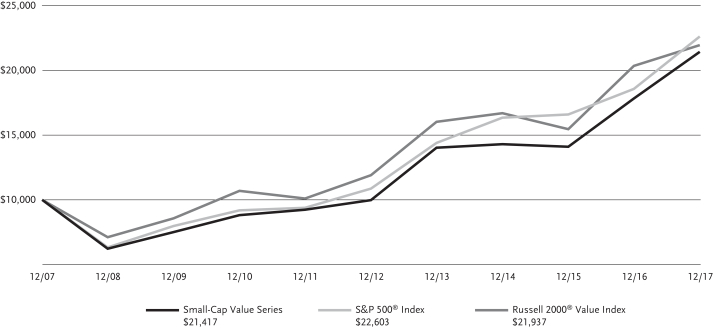
The indexes are unmanaged and not available for direct investment; therefore, their performance does not reflect the expenses associated with active management of an actual portfolio.
For information regarding the indexes and certain investment terms, see the Key Investment Terms starting on page 2.
21
|
| Newfleet Multi-Sector Intermediate Bond Series |
Series Summary (Unaudited)
Portfolio Manager Commentary by
Newfleet Asset Management, LLC
| ⬛ | | The Series is diversified and has an investment objective of long-term total return. There is no guarantee that the Series will meet its objective. |
| ⬛ | | For the fiscal year ended December 31, 2017, the Series’ Class A shares at NAV returned 6.72% and Class I shares at NAV returned 7.00%. For the same period, the Bloomberg Barclays U.S. Aggregate Bond Index, which serves as the broad-based and style-specific benchmark index appropriate for comparison, returned 3.54%. |
All performance figures assume reinvestment of distributions and exclude the effect of fees and expenses associated with the variable life insurance or annuity product through which you invest. Past performance is no guarantee of future results, and current performance may be higher or lower than the performance shown above. Investment return and principal value will fluctuate so your shares, when redeemed, may be worth more or less than their original cost. Please visit Virtus.com for performance data current to the most recent month-end.
How did the markets perform during the fiscal year ended December 31, 2017?
Most spread sectors outperformed U.S. Treasuries during the fiscal year ended December 31, 2017. The global growth outlook remained favorable and the search for yield persisted through the end of the fiscal year. Within most fixed income sectors, longer duration and lower quality assets were key drivers of performance.
The positive tone of the market that continued after the surprise outcome of the U.S. presidential election faced numerous challenges over the fiscal year. Geopolitical tensions with North Korea, continued gridlock in Washington, moderate volatility in oil prices, and major weather events such as Hurricane Harvey caused periods of weakness within spread sectors. However, these periods were short-lived as investors bought into any meaningful dip in prices, quickly pushing prices higher.
As anticipated, the Federal Reserve (the Fed) raised its target rate 0.25% on three separate occasions during the last 12 months to a range of 1.25% to 1.50%. During its September 2017 meeting, the Fed announced the start of its balance sheet reduction plan.
Over the 12 months ended December 31, 2017, short-term interest rates increased while longer-term rates decreased. This was due to the Fed rate hikes and U.S. inflation data that was generally below expectations.
What factors affected the Fund’s performance during the fiscal year?
The underperformance of U.S. Treasuries relative to most fixed income spread sectors was the key driver of the Fund’s outperformance for the fiscal year ended December 31, 2017. Among fixed income sectors, the Fund’s allocations to corporate high yield, emerging markets high yield, and high quality Yankee bonds were the largest positive contributors to performance for the fiscal year.
During the fiscal year, the Fund’s allocation to high yield bank loans was the largest detractor from performance. Valuations in the sector remained attractive on a risk-adjusted relative basis, and warranted strategic allocation, especially given the short duration nature of the asset class in a rising rate environment.
The preceding information is the opinion of portfolio management only through the end of the period of the report as stated on the cover. Any such opinions are subject to change at any time based upon market or other conditions and should not be relied upon as investment advice.
Credit & Interest: Debt securities are subject to various risks, the most prominent of which are credit and interest rate risk. The issuer of a debt security may fail to make interest and/or principal payments. Values of debt securities may rise or fall in response to changes in interest rates, and this risk may be enhanced with longer-term maturities.
Foreign & Emerging Markets: Investing internationally, especially in emerging markets, involves additional risks such as currency, political, accounting, economic, and market risk.
High Yield-High Risk Fixed Income Securities: There is a greater level of credit risk and price volatility involved with high yield securities than investment grade securities.
ABS/MBS: Changes in interest rates can cause both extension and prepayment risks for asset- and mortgage-backed securities. These securities are also subject to risks associated with the repayment of underlying collateral.
Bank Loans: Loans may be unsecured or not fully collateralized, may be subject to restrictions on resale and/or trade infrequently on the secondary market. Loans can carry significant credit and call risk, can be difficult to value and have longer settlement times than other investments, which can make loans relatively illiquid at times.
For information regarding the indexes and certain investment terms, see the Key Investment Terms starting on page 2.
22
|
| Newfleet Multi-Sector Intermediate Bond Series (Continued) |
Prospectus: For additional information on risks, please see the Series’ prospectus.
| | | | | | | | |
| |
| Asset Allocation | |
| |
The following table presents asset allocations within certain sectors as a percentage of total investments as of December 31, 2017. | |
Corporate Bonds and Notes | | | | | | | 54 | % |
Financials | | | 15 | % | | | | |
Energy | | | 11 | | | | | |
Materials | | | 6 | | | | | |
All other corporate bond and note sectors | | | 22 | | | | | |
Mortgage Backed Securities | | | | | | | 15 | |
Foreign Government Securities | | | | | | | 10 | |
Loan Agreements | | | | | | | 7 | |
Asset-Backed Securities | | | | | | | 5 | |
U.S. Government Securities | | | | | | | 3 | |
Preferred Stocks | | | | | | | 2 | |
Other (includes short-term investments) | | | | | | | 4 | |
| | | | | | | | | |
Total | | | | | | | 100 | % |
| | | | | | | | | |
For information regarding the indexes and certain investment terms, see the Key Investment Terms starting on page 2.
23
| | |
| Newfleet Multi-Sector Intermediate Bond Series (Continued) |
| | | | | | | | | | | | | | | | | | | | |
| Average Annual Total Returns1 for periods ended 12/31/17 | | | | | | | | | | |
| | | | | |
| | | 1 year | | | 5 years | | | 10 years | | | Since
Inception | | | Inception
Date | |
| Class A shares at NAV2 | | | 6.72 | % | | | 3.71 | % | | | 6.43 | % | | | — | | | | — | |
| Class I shares at NAV2 | | | 7.00 | | | | — | | | | — | | | | 3.52 | % | | | 4/30/13 | |
| Bloomberg Barclays U.S. Aggregate Bond Index | | | 3.54 | | | | 2.10 | | | | 4.01 | | | | 2.06 | 4 | | | — | |
| Series Expense Ratios3: Class A shares: Gross 1.02%, Net 0.97%; Class I shares: Gross 0.77%, Net 0.72%. | | | | | | | | | |
Returns represent past performance which is no guarantee of future results. The investment return and principal value will fluctuate so that an investor’s shares, when redeemed, may be worth more or less than their original cost. Total return does not reflect expenses associated with the separate account such as the administrative fees, account charges and surrender charges, which if reflected, would reduce total return. Performance figures may reflect fee waivers and/or expense reimbursements. In the absence of fee waivers and/or expense reimbursements, the total return would have been lower. Please visit Virtus.com for performance data current to the most recent month-end.
| 1 | Total returns are historical and include changes in share price and the reinvestment of both dividends and capital gains distributions. |
| 2 | “NAV” (Net Asset Value) total returns do not reflect any fees or expenses associated with the separate insurance products. |
| 3 | The expense ratios of the Series, both net and gross, are set forth according to the prospectus for the Series effective May 1, 2017, as supplemented and revised, and may differ from the expense ratios disclosed in the Financial Highlights tables in this report. See the Financial Highlights for more current information. Net Expenses: Expenses reduced by a contractual waiver in effect through April 30, 2018. Gross Expenses: Do not reflect the effect of the contractual waiver. Expense ratios include fees and expenses associated with underlying funds. |
| 4 | The since inception index returns are from the inception date of Class I shares. |
Growth of $10,000 For periods ended 12/31
This chart assumes an initial investment of $10,000 made on December 31, 2007 for Class A shares. Returns shown include the reinvestment of all distributions at net asset value, and the change in share price for the stated period.
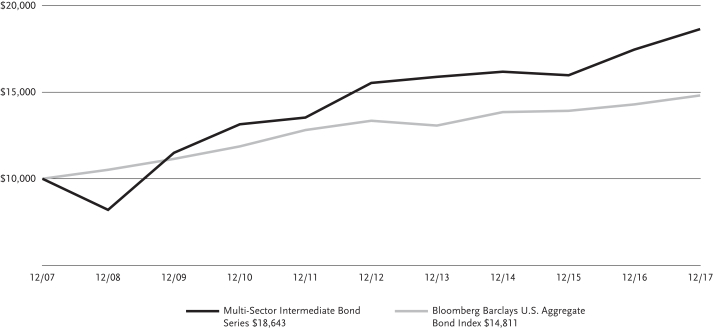
The index is unmanaged and not available for direct investment; therefore, its performance does not reflect the expenses associated with active management of an actual portfolio.
For information regarding the indexes and certain investment terms, see the Key Investment Terms starting on page 2.
24
| | |
| Rampart Enhanced Core Equity Series | | |
Series Summary (Unaudited)
Portfolio Manager Commentary by
Rampart Investment Management Company, LLC (“Rampart”)
| ⬛ | | The Series is diversified and has investment objectives of capital appreciation and current income. There is no guarantee that the Series will meet its objectives. |
| ⬛ | | For the fiscal year ended December 31, 2017, the Series’ Class A shares at NAV returned 22.96%. For the same period, the S&P 500® Index, which serves as the broad-based and style-specific benchmark index appropriate for comparison, returned 21.83%. |
All performance figures assume reinvestment of distributions and exclude the effect of fees and expenses associated with the variable life insurance or annuity product through which you invest. Past performance is no guarantee of future results, and current performance may be higher or lower than the performance shown above. Investment return and principal value will fluctuate so your shares, when redeemed, may be worth more or less than their original cost. Please visit Virtus.com for performance data current to the most recent month-end.
How did the markets perform during the fiscal year ended December 31, 2017?
The year ended December 31, 2017, was a remarkable one, with a near-constant series of significant political, economic, cultural, and environmental events. Amid this tumult, the U.S. stock market kept its eye on the prize: corporate tax cuts. As year-end approached, it appeared that nearly every index move could be attributed to the progress that the Tax Cuts and Jobs Act was making through Washington. This single-minded approach produced a series of all-time high price levels with record-low volatility.
To put the year into perspective, some data analysis is in order:
| ⬛ | | The Chicago Board Options Exchange Volatility Index® (CBOE VIX®) reached both its lowest-ever intraday level (8.56) and its lowest-ever closing level (9.14) in November 2017. |
| ⬛ | | The average CBOE VIX® level during 2017 was the lowest of any year since the index was launched in 1990. |
| ⬛ | | The highest intraday CBOE VIX® level reached during the year (17.28) was lower than the long-term average CBOE VIX® level (19.36). |
| ⬛ | | One-month realized S&P 500® Index volatility in 2017 was the third-lowest ever at 6.67%, less than half the historical average. |
| ⬛ | | The S&P 500® Index had 62 new all-time high closes in 2017, the second most in a single year (1995 had 77). |
| ⬛ | | One quarter (25%) of all trading days in 2017 closed at an all-time high, and 33% of all trading days in the fourth quarter closed at an all-time high. |
| ⬛ | | Since the market lows of 2009, U.S. stocks have nearly quadrupled in value, with the aggregate S&P 500® Index market capitalization going from $6 trillion to $23 trillion. |
| ⬛ | | The market cap of the S&P 500® Index exceeds the estimated 2017 gross domestic product (GDP) of the U.S., and exceeds the combined GDPs of China, Japan, Germany, and the U.K. |
The year 2017 will go down in history as a definitive example of a low-volatility bull market. Such an environment can be challenging for volatility trading strategies, particularly those with a goal of income generation. Low volatility tends to produce lower option prices, which tends to lead to tighter spreads between strike price levels.
What factors affected the Series’ performance during the fiscal year?
Even with challenging market dynamics, the options overlay strategy that drives performance in the Series performed well. This was partly because performance is more closely linked to the spread between implied volatility (as measured by the CBOE VIX® Index) and realized volatility, than it is to the absolute level of volatility itself. Through this lens, 2017 had rather favorable characteristics. For example, the average volatility spread during 2017 of 4.1% was nearly spot-on the historical average of 4.2%. For the first time since the CBOE VIX® Index was first launched in 1990, this spread was positive throughout the year, without a single negative day.
In this context, the Series performed well during the fiscal year, outperforming the S&P 500® Index by 1.13%. The year was not without its share of drama, though. The combination of extremely low volatility and relentlessly upward moving stock prices put pressure on the options trading strategy near the end of November 2017. In such an environment, the Series’ short call options can occasionally expire in-the-money, requiring the Series to make a payment to settle the positions.
The portfolio management team made efforts during the year to control the risk associated with upside index moves, as our research and experience have highlighted this as a feature of low volatility bull markets. But at the same time, we are always aware that large gap moves – the more serious risk to options strategy performance – are typically experienced to the downside. By balancing these two risks – the greater probability of smaller losses to the upside versus the smaller probability of larger losses to the downside – the Series was able to successfully navigate the fourth quarter and the year.
The preceding information is the opinion of portfolio management only through the end of the period of the report as stated on the cover. Any such opinions are subject to change at any time based upon market or other conditions and should not be relied upon as investment advice, and there is no guarantee that market forecasts will be realized.
For information regarding the indexes and certain investment terms, see the Key Investment Terms starting on page 2.
25
| | |
| Rampart Enhanced Core Equity Series (Continued) | | |
Equity Securities: The market price of equity securities may be adversely affected by financial market, industry, or issuer-specific events. Focus on a particular style or on small or medium-sized companies may enhance that risk.
Call/Put Spreads: Buying and selling call and put option spreads on the SPX Index risks the loss of the premium when buying, can limit upside participation and increase downside losses.
Portfolio Turnover: The Series’ principal investments strategies will result in a consistently high portfolio turnover rate. A higher portfolio turnover rate may indicate higher transaction costs and may result in higher taxes when fund shares are held in a taxable account.
Fund of Funds: Because the Series can invest in other funds, it indirectly bears its proportionate share of the operating expenses and management fees of the underlying fund(s).
Industry/Sector Concentration: A fund that focuses its investments in a particular industry or sector will be more sensitive to conditions that affect that industry or sector than a non-concentrated fund.
Prospectus: For additional information on risks, please see the Series’ prospectus.
| | | | |
| |
| Asset Allocation | |
| |
The following table presents asset allocations within certain sectors as a percentage of total investments net of written options as of December 31, 2017. | |
Information Technology | | | 24 | % |
Financials | | | 15 | |
Health Care | | | 13 | |
Consumer Discretionary | | | 12 | |
Industrials | | | 10 | |
Consumer Staples | | | 8 | |
Energy | | | 6 | |
Other (includes purchased and written options and short-term investment) | | | 12 | |
| | | | | |
Total | | | 100 | % |
| | | | | |
For information regarding the indexes and certain investment terms, see the Key Investment Terms starting on page 2.
26
| | |
| Rampart Enhanced Core Equity Series (Continued) | | |
| | | | | | | | | | | | |
| Average Annual Total Returns1 for periods ended 12/31/17 | |
| | | |
| | | 1 year | | | 5 years | | | 10 years | |
| Class A shares at NAV2 | | | 22.96 | % | | | 12.11 | % | | | 6.13 | % |
| S&P 500® Index | | | 21.83 | | | | 15.79 | | | | 8.50 | |
| Series Expense Ratios3: Class A shares: Gross 1.21%, Net 1.00%. | |
Returns represent past performance which is no guarantee of future results. The investment return and principal value will fluctuate so that an investor’s shares, when redeemed, may be worth more or less than their original cost. Total return does not reflect expenses associated with the separate account such as the administrative fees, account charges and surrender charges, which if reflected, would reduce total return. Performance figures may reflect fee waivers and/or expense reimbursements. In the absence of fee waivers and/or expense reimbursements, the total return would have been lower. Please visit Virtus.com for performance data current to the most recent month-end.
| 1 | Total returns are historical and include changes in share price and the reinvestment of both dividends and capital gains distributions. |
| 2 | “NAV” (Net Asset Value) total returns do not reflect any fees or expenses associated with the separate insurance accounts. |
| 3 | The expense ratios of the Series, both net and gross, are set forth according to the prospectus for the Series effective May 1, 2017, as supplemented and revised, and may differ from the expense ratios disclosed in the Financial Highlights tables in this report. See the Financial Highlights for more current information. Net Expenses: Expenses reduced by a contractual waiver in effect through April 30, 2018. Gross Expenses: Do not reflect the effect of the contractual waiver. Expense ratios include fees and expenses associated with underlying funds. |
Growth of $10,000 For periods ended 12/31
This chart assumes an initial investment of $10,000 made on December 31, 2007 for Class A shares. Returns shown include the reinvestment of all distributions at net asset value, and the change in share price for the stated period.
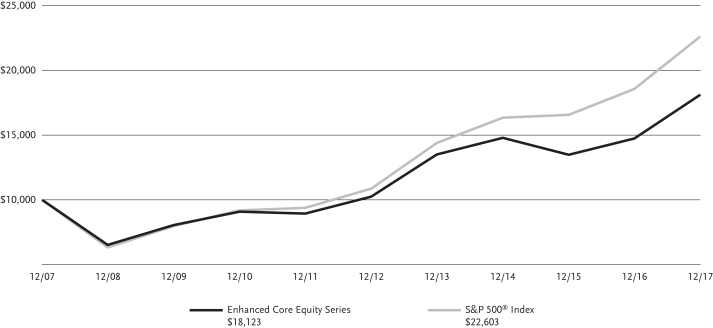
The index is unmanaged and not available for direct investment; therefore, its performance does not reflect the expenses associated with active management of an actual portfolio.
For information regarding the indexes and certain investment terms, see the Key Investment Terms starting on page 2.
27
| | |
| Rampart Equity Trend Series | | |
Series Summary (Unaudited)
Portfolio Manager Commentary by
Rampart Investment Management Company, LLC (“Rampart”)
| ⬛ | | The Series is diversified and has an investment objective of long-term capital appreciation. There is no guarantee that the Series will meet its objective. |
| ⬛ | | For the fiscal year ended December 31, 2017, the Series’ Class A shares at NAV returned 20.44% and Class I shares at NAV returned 20.73%. For the same period, the S&P 500® Index, which serves as the broad-based equity index and style-specific benchmark index appropriate for comparison, returned 21.83%. |
All performance figures assume reinvestment of distributions and exclude the effect of fees and expenses associated with the variable life insurance or annuity product through which you invest. Past performance is no guarantee of future results, and current performance may be higher or lower than the performance shown above. Investment return and principal value will fluctuate so your shares, when redeemed, may be worth more or less than their original cost. Please visit Virtus.com for performance data current to the most recent month-end.
How did the markets perform during the fiscal year ended December 31, 2017?
The year ended December 31, 2017, was a remarkable one, with a near-constant series of significant political, economic, cultural, and environmental events. Amid this tumult, the U.S. stock market kept its eye on the prize: corporate tax cuts. As year-end approached, it appeared that nearly every index move could be attributed to the progress that the Tax Cuts and Jobs Act was making through Washington. This single-minded approach produced a series of all-time high price levels with record-low volatility.
To put the year into perspective, some data analysis is in order:
| ⬛ | | The Chicago Board Options Exchange Volatility Index® (CBOE VIX®) reached both its lowest-ever intraday level (8.56) and its lowest-ever closing level (9.14) in November 2017. |
| ⬛ | | The average CBOE VIX® level during 2017 was the lowest of any year since the index was launched in 1990. |
| ⬛ | | The highest intraday CBOE VIX® level reached during the year (17.28) was lower than the long-term average CBOE VIX® level (19.36). |
| ⬛ | | One-month realized S&P 500® Index volatility in 2017 was the third-lowest ever at 6.67%, less than half the historical average. |
| ⬛ | | The S&P 500® Index had 62 new all-time high closes in 2017, the second most in a single year (1995 had 77). |
| ⬛ | | One quarter (25%) of all trading days in 2017 closed at an all-time high, and 33% of all trading days in the fourth quarter closed at an all-time high. |
| ⬛ | | Since the market lows of 2009, U.S. stocks have nearly quadrupled in value, with the aggregate S&P 500® Index market capitalization going from $6 trillion to $23 trillion. |
| ⬛ | | The market cap of the S&P 500® Index exceeds the estimated 2017 gross domestic product (GDP) of the U.S., and exceeds the combined GDPs of China, Japan, Germany, and the U.K. |
Thus, 2017 will go down in history as a definitive example of a low-volatility bull market. While the upward move was led by the technology sector, the rally was broad. Only one sector, energy, was down for the year, and seven out of 10 sectors were up 10% or more. The story during the fourth quarter of 2017 was similar, with only one sector (utilities) slightly down during the period. Without a doubt, 2017 saw the continuation of a remarkably broad and strong bull market in U.S. large cap stocks.
What factors affected the Series’ performance during the fiscal year?
The Equity Trend Series underperformed the S&P 500® Index during the fiscal year ended December 31, 2017, gaining 20.73% compared to 21.83% for the index. The majority of this underperformance occurred during the third quarter, when the Series underperformed the index by nearly 2%. This was driven by two main factors: difficulty in identifying strong and weak market components, and allocation limitations emerging from the Series’ diversified investment technique.
Significant outperformance during the fourth quarter of 2017 gained back much of this loss, and represented the improved environment for momentum and trend-based investment strategies, such as the relative strength technique that drives allocations in the Series. Examples of this increased recent effectiveness can be found in the Series’ sub-industry allocations during the fourth quarter. While the top-performing sub-industries for the quarter were well-represented in the Series (in many cases with weightings in excess of the index), none of the 10 worst-performing sub-industries were held in the Series’ portfolio. This ability to identify and appropriately allocate to those market components which are exhibiting strength or weakness is one of the goals of the Series’ investment strategy.
The preceding information is the opinion of portfolio management only through the end of the period of the report as stated on the cover. Any such opinions are subject to change at any time based upon market or other conditions and should not be relied upon as investment advice. Past performance is no guarantee of future results, and there is no guarantee that market forecasts will be realized.
For information regarding the indexes and certain investment terms, see the Key Investment Terms starting on page 2.
28
| | |
| Rampart Equity Trend Series (Continued) | | |
Equity Securities: The market price of equity securities may be adversely affected by financial market, industry, or issuer-specific events. Focus on a particular style or on small or medium-sized companies may enhance that risk.
Industry/Sector Concentration: A fund that focuses its investments in a particular industry or sector will be more sensitive to conditions that affect that industry or sector than a non-concentrated fund.
Allocation: The Series’ exposure to different asset classes may not be optimal for market conditions at a given time. Asset allocation does not guarantee a profit or protect against a loss in declining markets.
Prospectus: For additional information on risks, please see the Series’ prospectus.
| | | | |
| |
| Asset Allocation | |
| |
The following table presents asset allocations within certain sectors as a percentage of total investments as of December 31, 2017. | |
Consumer Discretionary | | | 19 | % |
Information Technology | | | 17 | |
Industrials | | | 16 | |
Financials | | | 13 | |
Materials | | | 10 | |
Real Estate | | | 6 | |
Health Care | | | 6 | |
Other (includes short-term investments) | | | 13 | |
| | | | | |
Total | | | 100 | % |
| | | | | |
For information regarding the indexes and certain investment terms, see the Key Investment Terms starting on page 2.
29
| | |
| Rampart Equity Trend Series (Continued) | | |
| | | | | | | | | | | | | | | | |
| Average Annual Total Returns1 for periods ended 12/31/17 | | | | | | | | | | |
| | | | |
| | | 1 year | | | 5 years | | | Since
Inception | | | Inception
Date | |
| Class A shares at NAV2 | | | 20.44 | % | | | 7.31 | % | | | 6.12 | % | | | 2/14/11 | |
| Class I shares at NAV2 | | | 20.73 | | | | — | | | | 5.44 | | | | 4/30/13 | |
| S&P 500® Index | | | 21.83 | | | | 15.79 | | | | —4 | | | | — | |
| Series Expense Ratios3: Class A shares: Gross 1.93%, Net 1.72%; Class I shares: Gross 1.68%, Net 1.47%. | |
Returns represent past performance which is no guarantee of future results. The investment return and principal value will fluctuate so that an investor’s shares, when redeemed, may be worth more or less than their original cost. Total return does not reflect expenses associated with the separate account such as the administrative fees, account charges and surrender charges, which if reflected, would reduce total return. Performance figures may reflect fee waivers and/or expense reimbursements. In the absence of fee waivers and/or expense reimbursements, the total return would have been lower. Please visit Virtus.com for performance data current to the most recent month-end.
| 1 | Total returns are historical and include changes in share price and the reinvestment of both dividends and capital gains distributions. |
| 2 | “NAV” (Net Asset Value) total returns do not reflect any fees or expenses associated with the separate insurance products. |
| 3 | The expense ratios of the Series, both net and gross, are set forth according to the prospectus for the Series effective May 1, 2017, as supplemented and revised, and may differ from the expense ratios disclosed in the Financial Highlights tables in this report. See the Financial Highlights for more current information. Net Expenses: Expenses reduced by a contractual waiver in effect through April 30, 2018. Gross Expenses: Do not reflect the effect of the contractual waiver. Expense ratios include fees and expenses associated with underlying funds. |
| 4 | The index returned 13.03% for Class A shares and 14.04% for Class I shares since the inception date of the respective share classes. |
Growth of $10,000 For periods ended 12/31
This chart assumes an initial investment of $10,000 made on February 14, 2011 (inception date of the Class A shares). Returns shown include the reinvestment of all distributions at net asset value, and the change in share price for the stated period.
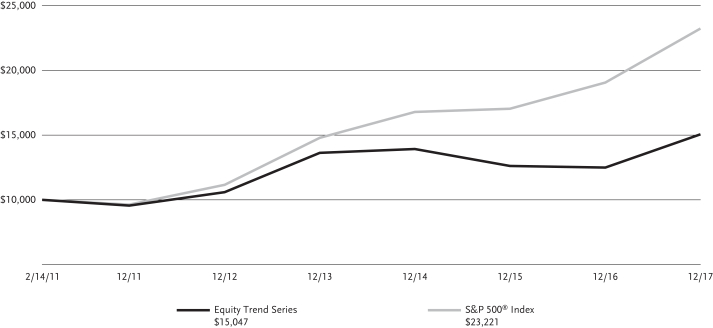
The index is unmanaged and not available for direct investment; therefore, its performance does not reflect the expenses associated with active management of an actual portfolio.
For information regarding the indexes and certain investment terms, see the Key Investment Terms starting on page 2.
30
| | |
| Strategic Allocation Series | | |
Series Summary (Unaudited)
Portfolio Managers Commentaries by
Kayne Anderson Rudnick Investment Management, LLC (domestic equity portfolio), Duff & Phelps Investment Management Co. (international equity portfolio), and Newfleet Asset Management, LLC (fixed income portfolio)
| ⬛ | | The Series is diversified and has an investment objective of high total return over an extended period of time consistent with prudent investment risk. There is no guarantee that the Series will meet its objective. |
| ⬛ | | For the fiscal year ended December 31, 2017, the Series’ Class A shares at NAV returned 18.97%. For the same period, the Bloomberg Barclays U.S. Aggregate Bond Index, a broad-based fixed income index, returned 3.54%. The Russell 1000® Growth Index, a broad-based U.S. equity index, returned 30.21%. The MSCI EAFE® Index (net), a broad-based international equity index, returned 25.03%. The Composite Index for the Series, the Series’ style-specific benchmark appropriate for comparison, returned 18.18%. |
All performance figures assume reinvestment of distributions and exclude the effect of fees and expenses associated with the variable life insurance or annuity product through which you invest. Past performance is no guarantee of future results, and current performance may be higher or lower than the performance shown above. Investment return and principal value will fluctuate so your shares, when redeemed, may be worth more or less than their original cost. Please visit Virtus.com for performance data current to the most recent month-end.
How did the markets perform during the fiscal year ended December 31, 2017?
U.S. Equities
| ⬛ | | The year 2017 was a banner one for global equities: The S&P 500® Index returned 21.83%; foreign markets, as measured by the MSCI EAFE® Index (net), gained 25.03%; and emerging markets stocks, as measured by the MSCI Emerging Markets Index (net), climbed 37.28%. Growth stocks across the market-cap spectrum outperformed value stocks for the year, the opposite of what occurred in 2016. |
| ⬛ | | The Russell 1000® Growth Index rose 30.22% in 2017. The utilities sector was by far the best performer, with a gain of 70.80%. Other contributing sectors included information technology (+41.55%), financials (+31.63%) and industrials (+31.42%). Energy was the only negative sector in the index for the year, down 6.70%. |
International Equities
| ⬛ | | International equity markets posted strong returns during each quarter of 2017, with the MSCI EAFE® Index (net) delivering a 25.03% return for the 12-month period. Equity markets worldwide displayed ongoing resilience on the back of continued global economic momentum. |
| ⬛ | | Geopolitical tensions, natural disasters, and political divisions within many countries were relegated to background noise in 2017 as economic momentum fueled persistent optimism across most major developed markets. |
Fixed Income
| ⬛ | | Most spread sectors outperformed U.S. Treasuries during the fiscal year ended December 31, 2017. The global growth outlook remained favorable and the search for yield persisted through the end of the fiscal year. Within most fixed income sectors, longer duration and lower quality assets were key drivers of performance. |
| ⬛ | | The positive tone of the market that continued after the surprise outcome of the U.S. presidential election faced numerous challenges over the fiscal year. Geopolitical tensions with North Korea, continued gridlock in Washington, moderate volatility in oil prices, and major weather events such as Hurricane Harvey caused periods of weakness within spread sectors. However, these periods were short-lived as investors bought into any meaningful dip in prices, quickly pushing prices higher. |
| ⬛ | | As anticipated, the Federal Reserve (the Fed) raised its target rate 0.25% on three separate occasions during the last 12 months to a range of 1.25% to 1.50%. During its September 2017 meeting, the Fed announced the start of its balance sheet reduction plan. |
| ⬛ | | Over the 12 months ended December 31, 2017, short-term interest rates increased while longer-term rates decreased. This was due to the Fed rate hikes and U.S. inflation data that was generally below expectations. |
What factors affected the Series’ performance during the fiscal year?
U.S. Equities
| ⬛ | | The Series’ U.S. equity sleeve outperformed the Russell 1000® Growth Index for the year. The sleeve benefited from positive stock selection in the information technology and consumer staples sectors. Negative stock selection in health care and an overweight in energy detracted from performance. |
| ⬛ | | Stocks that contributed the most to the year’s gains were Facebook and Alibaba Group Holding. |
| ⬛ | | Facebook continued to grow advertising revenue and take share in the online digital marketing space. The company delivered an unprecedented global reach of about 30% of the earth’s population to advertisers in a measurable way. Facebook’s user growth remained stunning despite its scale, and Instagram’s Stories format had resounding success in fighting off competitors like Snapchat. |
For information regarding the indexes and certain investment terms, see the Key Investment Terms starting on page 2.
31
| | |
| Strategic Allocation Series (Continued) | | |
| ⬛ | | Alibaba’s two marketplaces, Taobao and Tmall.com, combine to form the largest online commerce company in the world. Management has committed to a number of social initiatives to further improve mobile monetization over time. Alibaba’s marketplaces have huge network effects, and the company made efforts to foster the ecosystem with investments in payments and logistics partnerships. Taobao, in particular, has become a destination for consumers, merchants, and key opinion leaders to interact and engage in what Alibaba calls social commerce. E-commerce penetration, mobile usage, and growth in Chinese consumer spending power were all durable long-term tailwinds benefitting the company during the fiscal period. Alibaba has attempted to seize the opportunity by using data to improve targeting and increasingly consummating transactions through Alipay, its leading mobile payment offering. |
| ⬛ | | Positions that detracted the most from performance were Bristol-Myers Squibb and Schlumberger. |
| ⬛ | | Bristol-Myers dominated the initial immuno-oncology (I/O) market, securing a market share over 80%. The company is working on combination therapies with a broad set of checkpoint inhibitors to treat cancer. However, a failed trial in first-line lung cancer and positive results from competitors led analysts to adjust assumptions for Bristol’s ultimate market share and pricing power. When Bristol’s back-up plan also fell through and left the company potentially years behind competitors, we exited our position. |
| ⬛ | | Schlumberger has historically traded at a premium due to its technological prowess, scale, and efficiency. However, its shares underperformed peers during the fiscal year due to its exposure to late-cycle offshore and international customers rather than the faster-growing North American shale basins. Schlumberger’s business also became more capital intensive as it took ownership stakes in many of the fields alongside its operating customers. After trimming our position in April, we exited the name in July of 2017. |
International Equities
| ⬛ | | Security selection detracted from the international equity sleeve’s performance for the fiscal year ended December 31, 2017, partially offset by a positive impact from sector allocations. On a sector performance basis, all of the 11 market sectors posted positive returns, exemplifying the one-directional nature of international equity markets during the period. |
| ⬛ | | The Series’ consumer discretionary holdings had a challenging year, detracting 2.55% on a relative basis for the period primarily due to unfavorable security selection (particularly IMAX and Subaru). The second largest detractor at the sector level was energy, due to both security selection (especially Technip) and the adverse effect of being overweight the sector as it lagged the index. The third largest detractor was materials, due to security selection, although an overweight position in the sector was accretive as it and other cyclical sectors led the market for the most part. |
| ⬛ | | On the positive side, the Series’ industrial sector investments contributed 1.03% to relative performance for the year, primarily due to favorable security selection (particularly Nidec and Airbus). The second largest contributor at the sector level was information technology, primarily due to being overweight the sector as it too enjoyed a cyclical upswing. The third largest contributor was utilities, driven by security selection (especially Veolia). |
| ⬛ | | While the Series’ positioning in the health care sector overall was not among the most impactful, it was notable in that the Series’ strongest relative contributor (ICON plc) and second biggest detractor (Allergan plc) were health care names. We reaped some benefit from being underweight the sector as a whole, as it underperformed, and the net overall detraction was fairly minimal compared to the impact of other sectors. |
Fixed Income
| ⬛ | | The underperformance of U.S. Treasuries relative to most fixed income spread sectors was the key driver of the fixed income portfolio’s outperformance versus the Bloomberg Barclays U.S. Aggregate Bond Index for the fiscal year ended December 31, 2017. Among fixed income sectors, the portfolio’s allocations to corporate high yield, emerging markets high yield, and corporate high quality securities were the largest positive contributors to performance for the fiscal year. |
| ⬛ | | During the fiscal year, the portfolio’s allocation to high yield bank loans was the largest detractor from performance. Valuations in the sector remained attractive on a risk-adjusted relative basis, and warranted strategic allocation, especially given the short duration nature of the asset class in a rising rate environment. |
The preceding information is the opinion of portfolio management only through the end of the period of the report as stated on the cover. Any such opinions are subject to change at any time based upon market or other conditions and should not be relied upon as investment advice, and there is no guarantee that market forecasts will be realized.
Equity Securities: The market price of equity securities may be adversely affected by financial market, industry, or issuer-specific events. Focus on a particular style or on small or medium-sized companies may enhance that risk.
Credit & Interest: Debt securities are subject to various risks, the most prominent of which are credit and interest rate risk. The issuer of a debt security may fail to make interest and/or principal payments. Values of debt securities may rise or fall in response to changes in interest rates, and this risk may be enhanced with longer-term maturities.
Foreign & Emerging Markets: Investing internationally, especially in emerging markets, involves additional risks such as currency, political, accounting, economic, and market risk.
Allocation: The Series’ exposure to different asset classes may not be optimal for market conditions at a given time. Asset allocation does not guarantee a profit or protect against a loss in declining markets.
For information regarding the indexes and certain investment terms, see the Key Investment Terms starting on page 2.
32
| | |
| Strategic Allocation Series (Continued) | | |
High Yield-High Risk Fixed Income Securities: There is a greater level of credit risk and price volatility involved with high yield securities than investment grade securities.
Prospectus: For additional information on risks, please see the Series’ prospectus.
| | | | | | | | |
| |
| Asset Allocation | |
| |
The following table presents asset allocations within certain sectors as a percentage of total investments as of December 31, 2017. | |
Common Stocks | | | | | | | 63 | % |
Information Technology | | | 22 | % | | | | |
Consumer Discretionary | | | 13 | | | | | |
Financials | | | 7 | | | | | |
All other common stock sectors | | | 21 | | | | | |
Corporate Bonds and Notes | | | | | | | 18 | |
Financials | | | 7 | | | | | |
Energy | | | 2 | | | | | |
All other corporate bond and note sectors | | | 9 | | | | | |
Mortgage Backed Securities | | | | | | | 9 | |
Asset-Backed Securities | | | | | | | 3 | |
U.S. Government Securities | | | | | | | 2 | |
Municipal Bonds | | | | | | | 2 | |
Other (includes short-term investments) | | | | | | | 3 | |
| | | | | | | | | |
Total | | | | | | | 100 | % |
| | | | | | | | | |
For information regarding the indexes and certain investment terms, see the Key Investment Terms starting on page 2.
33
| | |
| Strategic Allocation Series (Continued) | | |
| | | | | | | | | | | | |
| Average Annual Total Returns1 for periods ended 12/31/17 | |
| | | |
| | | 1 year | | | 5 years | | | 10 years | |
| Class A shares at NAV2 | | | 18.97 | % | | | 7.56 | % | | | 5.75 | % |
| S&P 500® Index* | | | 21.83 | | | | 15.79 | | | | 8.50 | |
| Russell 1000® Growth Index | | | 30.21 | | | | 17.33 | | | | 10.00 | |
| MSCI EAFE® Index (net) | | | 25.03 | | | | 7.90 | | | | 1.94 | |
| Bloomberg Barclays U.S. Aggregate Bond Index | | | 3.54 | | | | 2.10 | | | | 4.01 | |
| Composite Index for Strategic Allocation Series* | | | 18.18 | | | | 10.58 | | | | 7.14 | |
| Series Expense Ratios3: Class A shares: Gross 1.06%, Net 0.99%. | |
Returns represent past performance which is no guarantee of future results. The investment return and principal value will fluctuate so that an investor’s shares, when redeemed, may be worth more or less than their original cost. Total return does not reflect expenses associated with the separate account such as the administrative fees, account charges and surrender charges, which if reflected, would reduce total return. Performance figures may reflect fee waivers and/or expense reimbursements. In the absence of fee waivers and/or expense reimbursements, the total return would have been lower. Please visit Virtus.com for performance data current to the most recent month-end.
| 1 | Total returns are historical and include changes in share price and the reinvestment of both dividends and capital gains distributions. |
| 2 | “NAV” (Net Asset Value) total returns do not reflect any fees or expenses associated with separate insurance accounts. |
| 3 | The expense ratios of the Series, both net and gross, are set forth according to the prospectus for the Series effective May 1, 2017, as supplemented and revised, and may differ from the expense ratios disclosed in the Financial Highlights tables in this report. See the Financial Highlights for more current information. Net Expenses: Expenses reduced by a contractual waiver in effect through April 30, 2018. Gross Expenses: Do not reflect the effect of the contractual waiver. Expense ratios include fees and expenses associated with underlying funds. |
| * | The Composite Index for the Series no longer includes the S&P 500® Index. |
Growth of $10,000 For periods ended 12/31
This chart assumes an initial investment of $10,000 made on December 31, 2007 for Class A shares. Returns shown include the reinvestment of all distributions at net asset value, and the change in share price for the stated period.
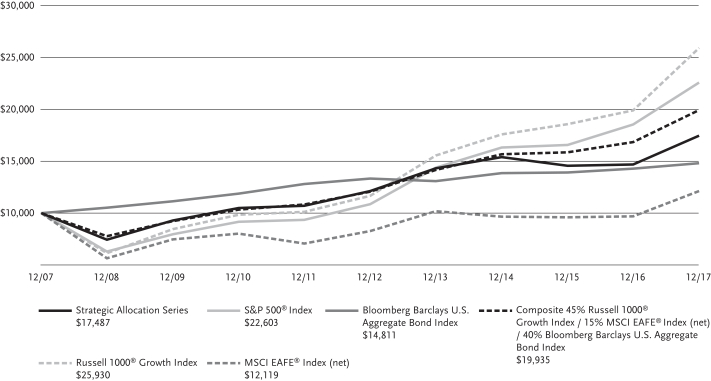
The indexes are unmanaged and not available for direct investment; therefore, their performance does not reflect the expenses associated with active management of an actual portfolio.
For information regarding the indexes and certain investment terms, see the Key Investment Terms starting on page 2.
34
VIRTUS DUFF & PHELPS INTERNATIONAL SERIES
SCHEDULE OF INVESTMENTS
DECEMBER 31, 2017
($ reported in thousands)
| | | | | | | | |
| | | SHARES | | | VALUE | |
| COMMON STOCKS—98.7% | |
|
| Consumer Discretionary—8.2% | |
Ctrip.com International Ltd. ADR (China)(1) | | | 103,727 | | | $ | 4,574 | |
IMAX Corp. (Canada)(1) | | | 200,346 | | | | 4,638 | |
Sony Corp. (Japan) | | | 131,220 | | | | 5,920 | |
| | | | | | | | |
| | | | 15,132 | |
| | | | | | | | |
|
| Consumer Staples—5.2% | |
Fomento Economico Mexicano SAB de C.V. ADR (Mexico) | | | 56,147 | | | | 5,272 | |
Marine Harvest ASA (Norway)(1) | | | 252,707 | | | | 4,278 | |
| | | | | | | | |
| | | | 9,550 | |
| | | | | | | | |
|
| Energy—6.7% | |
Statoil ASA (Norway) | | | 296,279 | | | | 6,322 | |
TechnipFMC plc (France) | | | 194,536 | | | | 6,034 | |
| | | | | | | | |
| | | | 12,356 | |
| | | | | | | | |
|
| Financials—28.9% | |
BOC Hong Kong Holdings Ltd. (Hong Kong) | | | 1,061,500 | | | | 5,380 | |
CaixaBank SA (Spain) | | | 1,179,110 | | | | 5,502 | |
China Construction Bank Corp. Class H (China) | | | 6,175,000 | | | | 5,691 | |
Credit Agricole SA (France) | | | 331,910 | | | | 5,496 | |
DBS Group Holdings Ltd. (Singapore) | | | 380,510 | | | | 7,070 | |
ING Groep NV (Netherlands) | | | 331,208 | | | | 6,090 | |
Nomura Holdings, Inc. (Japan) | | | 941,800 | | | | 5,559 | |
ORIX Corp. (Japan) | | | 356,290 | | | | 6,022 | |
UBS Group AG Registered Shares (Switzerland)(1) | | | 333,663 | | | | 6,143 | |
| | | | | | | | |
| | | | 52,953 | |
| | | | | | | | |
|
| Health Care—4.9% | |
Allergan plc (Ireland) | | | 32,351 | | | | 5,292 | |
ICON plc (Ireland)(1) | | | 32,328 | | | | 3,626 | |
| | | | | | | | |
| | | | 8,918 | |
| | | | | | | | |
|
| Industrials—16.2% | |
Airbus SE (France) | | | 61,027 | | | | 6,078 | |
Ashtead Group plc (United Kingdom) | | | 248,896 | | | | 6,694 | |
Hitachi Ltd. (Japan) | | | 890,215 | | | | 6,936 | |
Nidec Corp. (Japan) | | | 44,935 | | | | 6,305 | |
RELX plc (United Kingdom) | | | 157,863 | | | | 3,706 | |
| | | | | | | | |
| | | | 29,719 | |
| | | | | | | | |
|
| Information Technology—8.5% | |
Broadcom Ltd. (Singapore) | | | 21,517 | | | | 5,528 | |
Check Point Software Technologies Ltd. (Israel)(1) | | | 45,130 | | | | 4,676 | |
SAP SE (Germany) | | | 48,490 | | | | 5,437 | |
| | | | | | | | |
| | | | 15,641 | |
| | | | | | | | |
|
| Materials—13.0% | |
Anhui Conch Cement Co., Ltd. Class H (China) | | | 1,367,500 | | | | 6,432 | |
Glencore plc (Jersey)(1) | | | 1,203,337 | | | | 6,336 | |
HeidelbergCement AG (Germany) | | | 51,909 | | | | 5,621 | |
Toray Industries, Inc. (Japan) | | | 569,750 | | | | 5,373 | |
| | | | | | | | |
| | | | 23,762 | |
| | | | | | | | |
| | | | | | | | |
| | | SHARES | | | VALUE | |
| Real Estate—2.1% | |
LendLease Group (Australia) | | | 303,952 | | | $ | 3,877 | |
| | | | | | | | |
|
| Telecommunication Services—2.0% | |
BT Group plc (United Kingdom) | | | 982,641 | | | | 3,605 | |
| | | | | | | | |
|
| Utilities—3.0% | |
Veolia Environnement SA (France) | | | 217,727 | | | | 5,558 | |
TOTAL COMMON STOCKS
(Identified Cost $153,986) | | | | | | | 181,071 | |
| TOTAL LONG TERM INVESTMENTS—98.7% | |
| (Identified Cost $153,986) | | | | | | | 181,071 | |
|
| SHORT-TERM INVESTMENT—1.4% | |
|
| Money Market Mutual Fund—1.4% | |
Dreyfus Government Cash Management Fund – Institutional Shares (seven-day effective yield 1.190%)(2) | | | 2,575,780 | | | | 2,576 | |
| TOTAL SHORT-TERM INVESTMENT | |
| (Identified Cost $2,576) | | | | | | | 2,576 | |
| TOTAL INVESTMENTS—100.1% | |
| (Identified Cost $156,562) | | | | | | | 183,647 | |
Other assets and liabilities, net—(0.1)% | | | | (144 | ) |
| | | | | | | | |
| NET ASSETS—100.0% | | | $ | 183,503 | |
| | | | | | | | |
Abbreviation:
| ADR | American Depositary Receipt |
Footnote Legend:
| (1) | Non-income producing. |
| (2) | Shares of this fund are publicly offered, and its prospectus and annual report are publicly available. |
| | | | |
| Country Weightings† (unaudited) | | | |
Japan | | | 20 | % |
France | | | 12 | |
China | | | 9 | |
United Kingdom | | | 8 | |
Singapore | | | 7 | |
Germany | | | 6 | |
Norway | | | 6 | |
Other | | | 32 | |
Total | | | 100 | % |
† % of total investments as of December 31, 2017 | |
See Notes to Financial Statements
35
VIRTUS DUFF & PHELPS INTERNATIONAL SERIES
SCHEDULE OF INVESTMENTS (Continued)
DECEMBER 31, 2017
($ reported in thousands)
The following table provides a summary of inputs used to value the Series’ investments as of December 31, 2017 (See Security Valuation Note 2A in the Notes to Financial Statements):
| | | | | | | | |
| | | Total
Value at
December 31, 2017 | | | Level 1
Quoted
Prices | |
Equity Securities: | | | | | | | | |
Common Stocks | | $ | 181,071 | | | $ | 181,071 | |
Short-Term Investment | | | 2,576 | | | | 2,576 | |
| | | | | | | | |
Total Investments | | $ | 183,647 | | | $ | 183,647 | |
| | | | | | | | |
There were no securities valued using significant observable inputs (Level 2) or significant unobservable inputs (Level 3) at December 31, 2017.
There were no transfers between Level 1, Level 2, or Level 3 related to securities held at December 31, 2017.
See Notes to Financial Statements
36
VIRTUS DUFF & PHELPS REAL ESTATE SECURITIES SERIES
SCHEDULE OF INVESTMENTS
DECEMBER 31, 2017
($ reported in thousands)
| | | | | | | | |
| | | SHARES | | | VALUE | |
| COMMON STOCKS—98.8% | |
|
| Real Estate Investment Trusts—98.8% | |
|
| Data Centers—13.2% | |
CoreSite Realty Corp. | | | 9,400 | | | $ | 1,071 | |
CyrusOne, Inc. | | | 32,000 | | | | 1,905 | |
Digital Realty Trust, Inc. | | | 32,150 | | | | 3,662 | |
Equinix, Inc. | | | 7,975 | | | | 3,614 | |
| | | | | | | | |
| | | | | | | 10,252 | |
| | | | | | | | |
| | |
| Diversified—3.0% | | | | | | | | |
Vornado Realty Trust | | | 29,700 | | | | 2,322 | |
| | | | | | | | |
| | |
| Health Care—4.3% | | | | | | | | |
Healthcare Realty Trust, Inc. | | | 33,291 | | | | 1,069 | |
Healthcare Trust of America, Inc. Class A | | | 76,400 | | | | 2,295 | |
| | | | | | | | |
| | | | | | | 3,364 | |
| | | | | | | | |
|
| Industrial/Office—29.7% | |
|
| Industrial—13.7% | |
DCT Industrial Trust, Inc. | | | 48,057 | | | | 2,825 | |
Duke Realty Corp. | | | 103,398 | | | | 2,813 | |
Prologis, Inc. | | | 78,264 | | | | 5,049 | |
| | | | | | | | |
| | | | 10,687 | |
| | | | | | | | |
| | |
| Office—16.0% | | | | | | | | |
Alexandria Real Estate Equities, Inc. | | | 19,050 | | | | 2,488 | |
Boston Properties, Inc. | | | 7,014 | | | | 912 | |
Cousins Properties, Inc. | | | 167,180 | | | | 1,546 | |
Douglas Emmett, Inc. | | | 49,414 | | | | 2,029 | |
Highwoods Properties, Inc. | | | 32,667 | | | | 1,663 | |
Kilroy Realty Corp. | | | 24,164 | | | | 1,804 | |
Paramount Group, Inc. | | | 123,860 | | | | 1,963 | |
| | | | | | | | |
| | | | | | | 12,405 | |
| | | | | | | | |
Total Industrial/Office | | | | 23,092 | |
| | | | | | | | |
| | |
| Lodging/Resorts—2.8% | | | | | | | | |
Host Hotels & Resorts, Inc. | | | 36,904 | | | | 733 | |
RLJ Lodging Trust | | | 66,553 | | | | 1,462 | |
| | | | | | | | |
| | | | | | | 2,195 | |
| | | | | | | | |
| | |
| Residential—25.3% | | | | | | | | |
| | |
| Apartments—17.2% | | | | | | | | |
American Campus Communities, Inc. | | | 17,787 | | | | 730 | |
Apartment Investment & Management Co. Class A | | | 59,700 | | | | 2,609 | |
AvalonBay Communities, Inc. | | | 20,704 | | | | 3,694 | |
Equity Residential | | | 41,731 | | | | 2,661 | |
Essex Property Trust, Inc. | | | 6,955 | | | | 1,679 | |
Mid-America Apartment Communities, Inc. | | | 19,800 | | | | 1,991 | |
| | | | | | | | |
| | | | | | | 13,364 | |
| | | | | | | | |
| | |
| Manufactured Homes—4.8% | | | | | | | | |
Equity LifeStyle Properties, Inc. | | | 12,042 | | | | 1,072 | |
Sun Communities, Inc. | | | 28,150 | | | | 2,612 | |
| | | | | | | | |
| | | | 3,684 | |
| | | | | | | | |
| | | | | | | | |
| | | SHARES | | | VALUE | |
| Single Family Homes—3.3% | | | | | | | | |
American Homes 4 Rent Class A | | | 118,800 | | | $ | 2,595 | |
| | | | | | | | |
Total Residential | | | | 19,643 | |
| | | | | | | | |
| | |
| Retail—14.1% | | | | | | | | |
| | |
| Regional Malls—6.4% | | | | | | | | |
Simon Property Group, Inc. | | | 29,201 | | | | 5,015 | |
| | | | | | | | |
| | |
| Shopping Centers—7.7% | | | | | | | | |
Brixmor Property Group, Inc. | | | 85,602 | | | | 1,597 | |
Federal Realty Investment Trust | | | 11,000 | | | | 1,461 | |
Regency Centers Corp. | | | 38,750 | | | | 2,681 | |
Tanger Factory Outlet Centers, Inc. | | | 8,686 | | | | 230 | |
| | | | | | | | |
| | | | 5,969 | |
| | | | | | | | |
Total Retail | | | | 10,984 | |
| | | | | | | | |
| | |
| Self Storage—6.4% | | | | | | | | |
CubeSmart | | | 79,600 | | | | 2,302 | |
Extra Space Storage, Inc. | | | 23,948 | | | | 2,094 | |
Public Storage | | | 2,761 | | | | 577 | |
| | | | | | | | |
| | | | | 4,973 | |
TOTAL COMMON STOCKS
(Identified Cost $53,285) | | | | 76,825 | |
TOTAL LONG TERM INVESTMENTS—98.8%
(Identified Cost $53,285) | | | | 76,825 | |
|
| SHORT-TERM INVESTMENT—1.0% | |
|
| Money Market Mutual Fund—1.0% | |
Dreyfus Government Cash Management Fund – Institutional Shares (seven-day effective yield 1.190%)(1) | | | 755,000 | | | | 755 | |
Total SHORT-TERM INVESTMENT
(Identified Cost $755) | | | | 755 | |
TOTAL INVESTMENTS—99.8%
(Identified cost $54,050) | | | | 77,580 | |
Other assets and liabilities, net—0.2% | | | | 191 | |
| | | | | | | | |
| NET ASSETS—100.0% | | | | | | $ | 77,771 | |
| | | | | | | | |
Footnote Legend
| (1) | Shares of this fund are publicly offered, and its prospectus and annual report are publicly available. |
The following table provides a summary of inputs used to value the Series’ investments as of December 31, 2017 (See Security Valuation Note 2A in the Notes to Financial Statements):
| | | | | | | | |
| | | Total
Value at
December 31, 2017 | | | Level 1
Quoted
Prices | |
Equity Securities: | | | | | | | | |
Common Stocks | | $ | 76,825 | | | $ | 76,825 | |
Short-Term Investment | | | 755 | | | | 755 | |
| | | | | | | | |
Total Investments | | $ | 77,580 | | | $ | 77,580 | |
| | | | | | | | |
There were no securities valued using significant observable inputs (Level 2) or significant unobservable inputs (Level 3) at December 31, 2017.
There were no transfers between Level 1, Level 2, or Level 3 related to securities held at December 31, 2017.
See Notes to Financial Statements
37
VIRTUS KAR CAPITAL GROWTH SERIES
SCHEDULE OF INVESTMENTS
DECEMBER 31, 2017
($ reported in thousands)
| | | | | | | | |
| | | SHARES | | | VALUE | |
| COMMON STOCKS—99.9% | |
|
| Consumer Discretionary—23.8% | |
Amazon.com, Inc.(1) | | | 9,130 | | | $ | 10,677 | |
Ctrip.com International Ltd. ADR(1) | | | 80,600 | | | | 3,555 | |
Home Depot, Inc. (The) | | | 26,778 | | | | 5,075 | |
Las Vegas Sands Corp. | | | 99,222 | | | | 6,895 | |
McDonald’s Corp. | | | 20,390 | | | | 3,510 | |
MercadoLibre, Inc. | | | 4,020 | | | | 1,265 | |
Netflix, Inc.(1) | | | 31,880 | | | | 6,120 | |
NIKE, Inc. Class B | | | 68,635 | | | | 4,293 | |
Priceline Group, Inc. (The)(1) | | | 1,769 | | | | 3,074 | |
Ross Stores, Inc. | | | 55,367 | | | | 4,443 | |
Starbucks Corp. | | | 76,338 | | | | 4,384 | |
| | | | | | | | |
| | | | 53,291 | |
| | | | | | | | |
|
| Consumer Staples—6.2% | |
Monster Beverage Corp.(1) | | | 137,165 | | | | 8,681 | |
Philip Morris International, Inc. | | | 49,701 | | | | 5,251 | |
| | | | | | | | |
| | | | 13,932 | |
| | | | | | | | |
|
| Energy—4.6% | |
Cabot Oil & Gas Corp. | | | 146,873 | | | | 4,200 | |
Core Laboratories N.V. | | | 23,246 | | | | 2,547 | |
Pioneer Natural Resources Co. | | | 20,580 | | | | 3,557 | |
| | | | | | | | |
| | | | 10,304 | |
| | | | | | | | |
|
| Financials—6.4% | |
Bank of America Corp. | | | 269,070 | | | | 7,943 | |
Charles Schwab Corp. (The) | | | 67,757 | | | | 3,481 | |
MarketAxess Holdings, Inc. | | | 14,990 | | | | 3,024 | |
| | | | | | | | |
| | | | 14,448 | |
| | | | | | | | |
|
| Health Care—7.7% | |
BioMarin Pharmaceutical, Inc.(1) | | | 35,786 | | | | 3,191 | |
Danaher Corp. | | | 37,207 | | | | 3,454 | |
HealthEquity, Inc.(1) | | | 45,700 | | | | 2,132 | |
Illumina, Inc.(1) | | | 16,760 | | | | 3,662 | |
Zoetis, Inc. | | | 66,394 | | | | 4,783 | |
| | | | | | | | |
| | | | 17,222 | |
| | | | | | | | |
|
| Industrials—6.6% | |
Caterpillar, Inc. | | | 30,570 | | | | 4,817 | |
Kansas City Southern | | | 30,790 | | | | 3,240 | |
Rockwell Automation, Inc. | | | 11,820 | | | | 2,321 | |
Roper Technologies, Inc. | | | 17,142 | | | | 4,440 | |
| | | | | | | | |
| | | | 14,818 | |
| | | | | | | | |
|
| Information Technology—42.5% | |
Accenture plc Class A | | | 24,791 | | | | 3,795 | |
Activision Blizzard, Inc. | | | 61,350 | | | | 3,885 | |
Alibaba Group Holding Ltd. Sponsored ADR(1) | | | 79,458 | | | | 13,701 | |
Alphabet, Inc. Class A(1) | | | 3,589 | | | | 3,781 | |
Amphenol Corp. Class A | | | 76,964 | | | | 6,757 | |
CoStar Group, Inc.(1) | | | 10,800 | | | | 3,207 | |
Facebook, Inc. Class A(1) | | | 121,182 | | | | 21,384 | |
Gartner, Inc.(1) | | | 19,630 | | | | 2,417 | |
NVIDIA Corp. | | | 39,110 | | | | 7,568 | |
Paycom Software, Inc.(1) | | | 48,702 | | | | 3,912 | |
Tencent Holdings Ltd. ADR | | | 118,930 | | | | 6,175 | |
Visa, Inc. Class A | | | 77,118 | | | | 8,793 | |
| | | | | | | | |
| | | SHARES | | | VALUE | |
| Information Technology—continued | |
Workday, Inc. Class A(1) | | | 44,820 | | | $ | 4,560 | |
Yandex N.V. Class A(1) | | | 163,345 | | | | 5,350 | |
| | | | | | | | |
| | | | 95,285 | |
| | | | | | | | |
|
| Materials—2.1% | |
Ecolab, Inc. | | | 34,754 | | | | 4,663 | |
| TOTAL COMMON STOCKS | | | | | | | | |
| (Identified Cost $119,419) | | | | | | | 223,963 | |
| TOTAL LONG TERM INVESTMENTS—99.9% | |
| (Identified Cost $119,419) | | | | | | | 223,963 | |
|
| SHORT-TERM INVESTMENT—0.2% | |
|
| Money Market Mutual Fund—0.2% | |
Dreyfus Government Cash Management Fund – Institutional Shares (seven-day effective yield 1.190%)(2) | | | 483,256 | | | | 483 | |
| TOTAL SHORT-TERM INVESTMENT | |
| (Identified Cost $483) | | | | 483 | |
| TOTAL INVESTMENTS—100.1% | |
| (Identified Cost $119,902) | | | | 224,446 | |
Other assets and liabilities, net—(0.1)% | | | | (193 | ) |
| | | | | | | | |
| NET ASSETS—100.0% | | | $ | 224,253 | |
| | | | | | | | |
Abbreviation:
| ADR | American Depositary Receipt |
Footnote Legend:
| (1) | Non-income producing. |
| (2) | Shares of this fund are publicly offered, and its prospectus and annual report are publicly available. |
| | | | |
| Country Weightings† (unaudited) | |
United States | | | 87 | % |
China | | | 11 | |
Russia | | | 2 | |
Total | | | 100 | % |
† % of total investments as of December 31, 2017 | |
The following table provides a summary of inputs used to value the Series’ investments as of December 31, 2017 (See Security Valuation Note 2A in the Notes to Financial Statements):
| | | | | | | | |
| | | Total
Value at
December 31, 2017 | | | Level 1
Quoted
Prices | |
Equity Securities: | | | | | | | | |
Common Stocks | | $ | 223,963 | | | $ | 223,963 | |
Short-Term Investment | | | 483 | | | | 483 | |
| | | | | | | | |
Total Investments | | $ | 224,446 | | | $ | 224,446 | |
| | | | | | | | |
There were no securities valued using significant observable inputs (Level 2) or significant unobservable inputs (Level 3) at December 31, 2017.
There were no transfers between Level 1, Level 2, or Level 3 related to securities held at December 31, 2017.
See Notes to Financial Statements
38
VIRTUS KAR SMALL-CAP GROWTH SERIES
SCHEDULE OF INVESTMENTS
DECEMBER 31, 2017
($ reported in thousands)
| | | | | | | | |
| | | SHARES | | | VALUE | |
| COMMON STOCKS—95.5% | |
|
| Consumer Discretionary—17.6% | |
Emerald Expositions Events, Inc. | | | 87,850 | | | $ | 1,787 | |
Fox Factory Holding Corp.(1) | | | 127,925 | | | | 4,970 | |
MercadoLibre, Inc. | | | 11,350 | | | | 3,571 | |
Ollie’s Bargain Outlet Holdings, Inc.(1) | | | 75,140 | | | | 4,001 | |
| | | | | | | | |
| | | | 14,329 | |
| | | | | | | | |
|
| Consumer Staples—5.6% | |
Chefs’ Warehouse, Inc. (The)(1) | | | 124,350 | | | | 2,549 | |
PriceSmart, Inc. | | | 23,000 | | | | 1,981 | |
| | | | | | | | |
| | | | 4,530 | |
| | | | | | | | |
|
| Financials—16.8% | |
FactSet Research Systems, Inc. | | | 12,200 | | | | 2,352 | |
Financial Engines, Inc. | | | 11,350 | | | | 344 | |
Interactive Brokers Group, Inc. Class A | | | 89,530 | | | | 5,301 | |
MarketAxess Holdings, Inc. | | | 10,150 | | | | 2,048 | |
Moelis & Co. Class A | | | 13,885 | | | | 673 | |
Morningstar, Inc. | | | 30,740 | | | | 2,981 | |
| | | | | | | | |
| | | | 13,699 | |
| | | | | | | | |
|
| Health Care—8.0% | |
Abaxis, Inc. | | | 34,100 | | | | 1,688 | |
National Research Corp. Class A | | | 83,240 | | | | 3,105 | |
U.S. Physical Therapy, Inc. | | | 24,000 | | | | 1,733 | |
| | | | | | | | |
| | | | 6,526 | |
| | | | | | | | |
|
| Industrials—19.5% | |
AAON, Inc. | | | 45,600 | | | | 1,673 | |
Copart, Inc.(1) | | | 79,500 | | | | 3,434 | |
HEICO Corp. Class A | | | 45,811 | | | | 3,621 | |
Old Dominion Freight Line, Inc. | | | 32,000 | | | | 4,210 | |
Omega Flex, Inc. | | | 41,699 | | | | 2,978 | |
| | | | | | | | |
| | | | 15,916 | |
| | | | | | | | |
|
| Information Technology—28.0% | |
ANSYS, Inc.(1) | | | 14,820 | | | | 2,187 | |
Aspen Technology, Inc.(1) | | | 45,420 | | | | 3,007 | |
Autohome, Inc. ADR(1) | | | 103,700 | | | | 6,706 | |
Ellie Mae, Inc.(1) | | | 20,000 | | | | 1,788 | |
Mesa Laboratories, Inc. | | | 7,035 | | | | 875 | |
NVE Corp. | | | 39,200 | | | | 3,371 | |
Paycom Software, Inc.(1) | | | 14,700 | | | | 1,181 | |
Rightmove plc | | | 60,000 | | | | 3,645 | |
| | | | | | | | |
| | | | | 22,760 | |
TOTAL COMMON STOCKS
(Identified Cost $37,099) | | | | | | | 77,760 | |
| TOTAL LONG TERM INVESTMENTS—95.5% | |
| (Identified Cost $37,099) | | | | | | | 77,760 | |
| | | | | | | | |
| | | SHARES | | | VALUE | |
| SHORT-TERM INVESTMENT—4.8% | |
|
| Money Market Mutual Fund—4.8% | |
Dreyfus Government Cash Management Fund – Institutional Shares (seven-day effective yield 1.190%)(2) | | | 3,928,117 | | | $ | 3,928 | |
| TOTAL SHORT-TERM INVESTMENT | |
| (Identified Cost $3,928) | | | | | | | 3,928 | |
| TOTAL INVESTMENTS—100.3% | |
| (Identified Cost $41,027) | | | | | | | 81,688 | |
Other assets and liabilities, net—(0.3)% | | | | | | | (233 | ) |
| | | | | | | | |
| NET ASSETS—100.0% | | | | | | $ | 81,455 | |
| | | | | | | | |
Abbreviation:
| ADR | American Depositary Receipt |
Footnote Legend:
| (1) | Non-income producing. |
| (2) | Shares of this fund are publicly offered, and its prospectus and annual report are publicly available. |
| | | | |
| Country Weightings† (unaudited) | |
United States | | | 87 | % |
China | | | 8 | |
United Kingdom | | | 5 | |
Total | | | 100 | % |
† % of total investments as of December 31, 2017 | |
The following table provides a summary of inputs used to value the Series’ investments as of December 31, 2017 (See Security Valuation Note 2A in the Notes to Financial Statements):
| | | | | | | | |
| | | Total
Value at
December 31, 2017 | | | Level 1
Quoted
Prices | |
Equity Securities: | | | | | | | | |
Common Stocks | | $ | 77,760 | | | $ | 77,760 | |
Short-Term Investment | | | 3,928 | | | | 3,928 | |
| | | | | | | | |
Total Investments | | $ | 81,688 | | | $ | 81,688 | |
| | | | | | | | |
There were no securities valued using significant observable inputs (Level 2) or significant unobservable inputs (Level 3) at December 31, 2017.
There were no transfers between Level 1, Level 2, or Level 3 related to securities held at December 31, 2017.
See Notes to Financial Statements
39
VIRTUS KAR SMALL-CAP VALUE SERIES
SCHEDULE OF INVESTMENTS
DECEMBER 31, 2017
($ reported in thousands)
| | | | | | | | |
| | | SHARES | | | VALUE | |
| COMMON STOCKS—99.3% | |
|
| Consumer Discretionary—15.1% | |
Cheesecake Factory, Inc. (The) | | | 86,200 | | | $ | 4,153 | |
Cinemark Holdings, Inc. | | | 84,900 | | | | 2,956 | |
Sally Beauty Holdings, Inc.(1) | | | 124,000 | | | | 2,327 | |
Thor Industries, Inc. | | | 32,100 | | | | 4,838 | |
| | | | | | | | |
| | | | 14,274 | |
| | | | | | | | |
|
| Consumer Staples—6.0% | |
National Beverage Corp. | | | 38,650 | | | | 3,766 | |
WD-40 Co. | | | 15,900 | | | | 1,876 | |
| | | | | | | | |
| | | | 5,642 | |
| | | | | | | | |
|
| Energy—3.7% | |
Core Laboratories N.V. | | | 31,800 | | | | 3,484 | |
| | | | | | | | |
|
| Financials—16.0% | |
Artisan Partners Asset Management, Inc. Class A | | | 73,200 | | | | 2,891 | |
Bank of Hawaii Corp. | | | 45,070 | | | | 3,863 | |
First Financial Bankshares, Inc. | | | 54,870 | | | | 2,472 | |
Primerica, Inc. | | | 33,828 | | | | 3,435 | |
RLI Corp. | | | 40,450 | | | | 2,454 | |
| | | | | | | | |
| | | | 15,115 | |
| | | | | | | | |
|
| Health Care—5.8% | |
Anika Therapeutics, Inc.(1) | | | 62,830 | | | | 3,387 | |
Patterson Cos., Inc. | | | 59,500 | | | | 2,150 | |
| | | | | | | | |
| | | | 5,537 | |
| | | | | | | | |
|
| Industrials—21.5% | |
Graco, Inc. | | | 70,110 | | | | 3,170 | |
Landstar System, Inc. | | | 28,100 | | | | 2,925 | |
Lincoln Electric Holdings, Inc. | | | 22,010 | | | | 2,016 | |
RBC Bearings, Inc.(1) | | | 31,050 | | | | 3,925 | |
SiteOne Landscape Supply, Inc.(1) | | | 67,850 | | | | 5,204 | |
Watsco, Inc. | | | 18,050 | | | | 3,069 | |
| | | | | | | | |
| | | | 20,309 | |
| | | | | | | | |
|
| Information Technology—15.7% | |
American Software, Inc. Class A | | | 102,600 | | | | 1,193 | |
Badger Meter, Inc. | | | 71,466 | | | | 3,416 | |
Cass Information Systems, Inc. | | | 53,454 | | | | 3,112 | |
Cognex Corp. | | | 38,980 | | | | 2,384 | |
Jack Henry & Associates, Inc. | | | 24,640 | | | | 2,882 | |
Manhattan Associates, Inc.(1) | | | 37,750 | | | | 1,870 | |
| | | | | | | | |
| | | | 14,857 | |
| | | | | | | | |
|
| Materials—4.2% | |
Scotts Miracle-Gro Co. (The) | | | 37,592 | | | | 4,022 | |
| | | | | | | | |
|
| Real Estate—11.3% | |
HFF, Inc. Class A | | | 71,500 | | | | 3,478 | |
MGM Growth Properties LLC Class A | | | 134,040 | | | | 3,907 | |
| | | | | | | | |
| | | SHARES | | | VALUE | |
| Real Estate—continued | |
RE/MAX Holdings, Inc. Class A | | | 67,700 | | | $ | 3,283 | |
| | | | | | | | |
| | | | | 10,668 | |
| TOTAL COMMON STOCKS | | | | | |
| (Identified Cost $60,251) | | | | | | | 93,908 | |
| TOTAL LONG TERM INVESTMENTS—99.3% | | | | | |
| (Identified Cost $60,251) | | | | | | | 93,908 | |
|
| SHORT-TERM INVESTMENT—0.8% | |
|
| Money Market Mutual Fund—0.8% | |
Dreyfus Government Cash Management Fund – Institutional Shares (seven-day effective yield 1.190%)(2) | | | 796,967 | | | | 797 | |
| TOTAL SHORT-TERM INVESTMENT | | | | | |
| (Identified Cost $797) | | | | | | | 797 | |
| TOTAL INVESTMENTS—100.1% | | | | | |
| (Identified Cost $61,048) | | | | | | | 94,705 | |
Other assets and liabilities, net—(0.1)% | | | | (67 | ) |
| | | | | | | | |
| NET ASSETS—100.0% | | | $ | 94,638 | |
| | | | | | | | |
Footnote Legend:
| (1) | Non-income producing. |
| (2) | Shares of this fund are publicly offered, and its prospectus and annual report are publicly available. |
The following table provides a summary of inputs used to value the Series’ investments as of December 31, 2017 (See Security Valuation Note 2A in the Notes to Financial Statements):
| | | | | | | | |
| | | Total
Value at
December 31, 2017 | | | Level 1
Quoted
Prices | |
Equity Securities: | | | | | | | | |
Common Stocks | | $ | 93,908 | | | $ | 93,908 | |
Short-Term Investment | | | 797 | | | | 797 | |
| | | | | | | | |
Total Investments | | $ | 94,705 | | | $ | 94,705 | |
| | | | | | | | |
There were no securities valued using significant observable inputs (Level 2) or significant unobservable inputs (Level 3) at December 31, 2017.
There were no transfers between Level 1, Level 2, or Level 3 related to securities held at December 31, 2017.
See Notes to Financial Statements
40
VIRTUS NEWFLEET MULTI-SECTOR INTERMEDIATE BOND SERIES
SCHEDULE OF INVESTMENTS
DECEMBER 31, 2017
($ reported in thousands)
| | | | | | | | |
| | | PAR
VALUE | | | VALUE | |
| U.S. GOVERNMENT SECURITIES—2.7% | |
U.S. Treasury Note | | | | | | | | |
2.000%, 12/31/21 | | $ | 1,185 | | | $ | 1,179 | |
1.875%, 1/31/22 | | | 600 | | | | 594 | |
1.875%, 2/28/22 | | | 1,845 | | | | 1,825 | |
| TOTAL U.S. GOVERNMENT SECURITIES | | | | | | | | |
| (Identified Cost $3,614) | | | | | | | 3,598 | |
|
| MUNICIPAL BONDS—0.6% | |
|
| Michigan—0.1% | |
Tobacco Settlement Finance Authority Taxable Series A,
7.309%, 6/1/34 | | | 185 | | | | 184 | |
| | | | | | | | |
|
| Virginia—0.5% | |
Tobacco Settlement Financing Corp. Series A-1, Taxable
6.706%, 6/1/46 | | | 655 | | | | 591 | |
| TOTAL MUNICIPAL BONDS | | | | | | | | |
| (Identified Cost $830) | | | | | | | 775 | |
|
| FOREIGN GOVERNMENT SECURITIES—10.3% | |
Argentine Republic
5.625%, 1/26/22 | | | 130 | | | | 137 | |
7.500%, 4/22/26 | | | 540 | | | | 611 | |
Series NY,
8.280%, 12/31/33 | | | 562 | | | | 663 | |
7.125%, 7/6/36 | | | 265 | | | | 287 | |
7.625%, 4/22/46 | | | 150 | | | | 169 | |
Bolivarian Republic of Venezuela
7.650%, 4/21/25(18) | | | 825 | | | | 169 | |
9.375%, 1/13/34(18) | | | 295 | | | | 60 | |
Federative Republic of Brazil
12.500%, 1/5/22 | | | 930 | BRL | | | 316 | |
Treasury Note Series F,
10.000%, 1/1/23 | | | 870 | BRL | | | 266 | |
Treasury Note Series F,
10.000%, 1/1/25 | | | 1,030 | BRL | | | 310 | |
10.250%, 1/10/28 | | | 1,200 | BRL | | | 388 | |
5.625%, 1/7/41 | | | 310 | | | | 317 | |
Kingdom of Bahrain 144A
7.000%, 10/12/28(3) | | | 340 | | | | 345 | |
Kingdom of Morocco 144A
5.500%, 12/11/42(3) | | | 300 | | | | 340 | |
Pakistan Government International Bond 144A
6.875%, 12/5/27(3) | | | 285 | | | | 286 | |
Provincia de Buenos Aires
144A, 9.125%, 3/16/24(3) | | | 280 | | | | 328 | |
144A, 7.875%, 6/15/27(3) | | | 465 | | | | 517 | |
Republic of Chile
5.500%, 8/5/20 | | | 231,500 | CLP | | | 394 | |
Republic of Colombia
4.375%, 3/21/23 | | | 1,823,000 | COP | | | 577 | |
9.850%, 6/28/27 | | | 283,000 | COP | | | 118 | |
Republic of Costa Rica 144A
7.000%, 4/4/44(3) | | | 315 | | | | 325 | |
Republic of Ghana 144A
10.750%, 10/14/30(3) | | | 225 | | | | 310 | |
Republic of Indonesia | |
Series FR70,
8.375%, 3/15/24 | | | 4,196,000 | IDR | | | 344 | |
Series FR56,
8.375%, 9/15/26 | | | 6,228,000 | IDR | | | 520 | |
144A, 4.350%, 1/8/27(3) | | | 270 | | | | 286 | |
| | | | | | | | |
| | | PAR
VALUE | | | VALUE | |
| FOREIGN GOVERNMENT SECURITIES—continued | |
Republic of Iraq RegS
5.800%, 1/15/28(4) | | $ | 250 | | | $ | 242 | |
Republic of South Africa | |
Series R208,
6.750%, 3/31/21 | | | 3,680 | ZAR | | | 291 | |
4.875%, 4/14/26 | | | 200 | | | | 204 | |
4.300%, 10/12/28 | | | 785 | | | | 757 | |
Republic of Turkey
4.875%, 10/9/26 | | | 570 | | | | 562 | |
4.875%, 4/16/43 | | | 420 | | | | 368 | |
Russian Federation
144A, 7.850%, 3/10/18(3) | | | 30,000 | RUB | | | 521 | |
Series 6216,
6.700%, 5/15/19 | | | 20,000 | RUB | | | 347 | |
Series 6215,
7.000%, 8/16/23 | | | 11,865 | RUB | | | 206 | |
Sultanate of Oman 144A
4.750%, 6/15/26(3) | | | 470 | | | | 456 | |
Ukraine
144A, 7.750%, 9/1/22(3) | | | 275 | | | | 292 | |
144A, 7.750%, 9/1/26(3) | | | 400 | | | | 413 | |
United Mexican States Series M,
6.500%, 6/9/22 | | | 6,713 | MXN | | | 327 | |
4.150%, 3/28/27 | | | 275 | | | | 285 | |
4.750%, 3/8/44 | | | 164 | | | | 166 | |
| TOTAL FOREIGN GOVERNMENT SECURITIES | | | | | | | | |
| (Identified Cost $14,374) | | | | | | | 13,820 | |
|
| MORTGAGE-BACKED SECURITIES—14.5% | |
|
| Agency—4.9% | |
FNMA
3.000%, 4/1/43 | | | 424 | | | | 426 | |
3.000%, 5/1/43 | | | 791 | | | | 795 | |
3.500%, 1/1/45 | | | 170 | | | | 174 | |
3.500%, 5/1/45 | | | 258 | | | | 266 | |
3.500%, 8/1/45 | | | 1,244 | | | | 1,278 | |
3.000%, 12/1/45 | | | 654 | | | | 654 | |
3.500%, 1/1/46 | | | 639 | | | | 657 | |
3.500%, 1/1/46 | | | 515 | | | | 530 | |
3.500%, 1/1/47 | | | 375 | | | | 385 | |
4.000%, 4/1/47 | | | 147 | | | | 154 | |
4.000%, 7/1/47 | | | 109 | | | | 115 | |
4.000%, 8/1/47 | | | 866 | | | | 907 | |
4.000%, 9/1/47 | | | 318 | | | | 333 | |
| | | | | | | | |
| | | | | | | 6,674 | |
| | | | | | | | |
|
| Non-Agency—9.6% | |
American Homes 4 Rent Trust
2014-SFR2, C 144A, 4.705%, 10/17/36(3) | | | 435 | | | | 462 | |
2015-SFR2, C 144A, 4.691%, 10/17/45(3) | | | 340 | | | | 363 | |
2015-SFR1, A 144A, 3.467%, 4/17/52(3) | | | 323 | | | | 331 | |
Ameriquest Mortgage Securities, Inc.
2003-AR3, M4, (5.850% minus 1 month LIBOR)
4.593%, 6/25/33(2) | | | 310 | | | | 308 | |
2003-10, AF6, 5.210%, 11/25/33(2) | | | 5 | | | | 5 | |
AMSR Trust
2016-SFR1, D 144A, (1 month LIBOR + 2.400%)
3.891%, 11/17/33(2)(3) | | | 335 | | | | 338 | |
Banc of America Funding Trust
2005-1, 1A1 5.500%, 2/25/35 | | | 94 | | | | 94 | |
Bank of America (Countrywide) Asset-Backed Certificates
2005-1, AF5A 5.042%, 7/25/35(2) | | | 368 | | | | 379 | |
Refer to Footnote Legend on page 50.
See Notes to Financial Statements
41
VIRTUS NEWFLEET MULTI-SECTOR INTERMEDIATE BOND SERIES
SCHEDULE OF INVESTMENTS (Continued)
DECEMBER 31, 2017
($ reported in thousands)
| | | | | | | | |
| | | PAR
VALUE | | | VALUE | |
| Non-Agency—continued | |
Bank of America (Merrill Lynch - Countrywide) Alternative Loan Trust 2004-22CB, 1A1
6.000%, 10/25/34 | | $ | 159 | | | $ | 164 | |
Bank of America (Merrill Lynch) Commercial Mortgage Securities Trust 2015-200P, A 144A
3.218%, 4/14/33(3) | | | 295 | | | | 298 | |
Bayview Opportunity Master Fund IVa Trust
2016-SPL1, B1 144A, 4.250%, 4/28/55(3) | | | 275 | | | | 284 | |
2017-SPL1, B1 144A, 4.250%, 10/28/64(2)(3) | | | 203 | | | | 208 | |
Bayview Opportunity Master Fund IVb Trust
2016-SPL2, B1 144A, 4.250%, 6/28/53(2)(3) | | | 130 | | | | 134 | |
2017-SPL3, B1 144A, 4.250%, 11/28/53(2)(3) | | | 300 | | | | 314 | |
Caesars Palace Las Vegas Trust 2017-VICI, C 144A
4.138%, 10/15/34(3) | | | 215 | | | | 221 | |
CIT Home Equity Loan Trust 2003-1, A5
5.480%, 7/20/34(2) | | | 205 | | | | 208 | |
Citigroup Mortgage Loan Trust, Inc. 2015-A, A1 144A 3.500%, 6/25/58(2)(3) | | | 201 | | | | 203 | |
Colony American Finance Ltd. 2015-1, A 144A
2.896%, 10/15/47(3) | | | 214 | | | | 214 | |
Colony Starwood Homes Trust 2016-2A, C 144A, (1 month LIBOR + 2.150%)
3.627%, 12/17/33(2)(3) | | | 335 | | | | 335 | |
COLT Mortgage Loan Trust Funding LLC 2017-1, A3 144A 3.074%, 5/27/47(2)(3) | | | 220 | | | | 220 | |
Credit Suisse Commercial Mortgage Trust 2014-IVR2, A2 144A
3.807%, 4/25/44(2)(3) | | | 123 | | | | 126 | |
Credit Suisse Commercial Mortgage-Backed Trust
2006-8, 3A1
6.000%, 10/25/21 | | | 104 | | | | 98 | |
Deephaven Residential Mortgage Trust 2017-1A, A2 144A 2.928%, 12/26/46(2)(3) | | | 65 | | | | 64 | |
GAHR Commercial Mortgage Trust 2015-NRF, CFX 144A 3.382%, 12/15/34(2)(3) | | | 290 | | | | 292 | |
Galton Funding Mortgage Trust 2017-1, A21 144A
3.500%, 7/25/56(2)(3) | | | 199 | | | | 200 | |
GSAA Home Equity Trust 2005-12, AF3W
4.999%, 9/25/35(2) | | | 109 | | | | 110 | |
JPMorgan Chase (Bear Stearns) Adjustable Rate Mortgage Trust 2004-1, 21A1
3.396%, 4/25/34(2) | | | 137 | | | | 137 | |
JPMorgan Chase (Washington Mutual) Mortgage Pass-Through Certificates Trust 2004-CB1, 5A
5.000%, 6/25/19 | | | 4 | | | | 4 | |
JPMorgan Chase Commercial Mortgage Securities Trust
2007-LDPX, AM
5.464%, 1/15/49(2) | | | 99 | | | | 99 | |
JPMorgan Chase Mortgage Trust
2005-A1, 4A1, 3.829%, 2/25/35(2) | | | 13 | | | | 13 | |
2005-A4, 3A1, 3.408%, 7/25/35(2) | | | 15 | | | | 15 | |
2016-1, M2 144A, 3.750%, 4/25/45(2)(3) | | | 301 | | | | 304 | |
2016-2, M2 144A, 3.750%, 12/25/45(2)(3) | | | 373 | | | | 377 | |
JPMorgan Mortgage Trust
2017-5, A1 144A, 3.188%, 10/26/48(2)(3) | | | 483 | | | | 487 | |
2017-4, A3 144A, 3.500%, 11/25/48(2)(3) | | | 311 | | | | 315 | |
MASTR Alternative Loan Trust 2005-5, 2A3
5.500%, 7/25/25 | | | 140 | | | | 132 | |
MASTR Specialized Loan Trust 2005-3, A2 144A
5.704%, 11/25/35(2)(3) | | | 175 | | | | 180 | |
MetLife Securitization Trust 2017-1A, M1 144A
3.601%, 4/25/55(2)(3) | | | 150 | | | | 155 | |
Morgan Stanley - Bank of America (Merrill Lynch) Trust
2013-C13, AS
4.266%, 11/15/46 | | | 125 | | | | 132 | |
| | | | | | | | |
| | | PAR
VALUE | | | VALUE | |
| Non-Agency—continued | |
New Residential Mortgage Loan Trust
2014-1A, A 144A, 3.750%, 1/25/54(2)(3) | | $ | 297 | | | $ | 303 | |
2015-2A, A1 144A, 3.750%, 8/25/55(2)(3) | | | 240 | | | | 245 | |
2016-1A, A1 144A, 3.750%, 3/25/56(2)(3) | | | 207 | | | | 211 | |
2016-4A, B1A 144A, 4.500%, 11/25/56(2)(3) | | | 297 | | | | 315 | |
One Market Plaza Trust 2017-1MKT, A 144A
3.614%, 2/10/32(3) | | | 260 | | | | 268 | |
Pretium Mortgage Credit Partners I LLC 2017-NPL2, A1 144A
3.250%, 3/28/57(2)(3) | | | 213 | | | | 213 | |
Pretium Mortgage Credit Partners LLC 2017-NPL5, A1 144A 3.327%, 12/30/32(2)(3) | | | 131 | | | | 131 | |
Residential Asset Mortgage Products Trust
2004-SL1, A8, 6.500%, 11/25/31 | | | 20 | | | | 21 | |
2005-SL2, A4, 7.500%, 2/25/32 | | | 157 | | | | 147 | |
Residential Asset Securitization Trust 2005-A1, A3
5.500%, 4/25/35 | | | 229 | | | | 235 | |
Sequoia Mortgage Trust 2013-8, B1
3.534%, 6/25/43(2) | | | 192 | | | | 191 | |
Structured Adjustable Rate Mortgage Loan Trust
2004-4, 3A1
3.542%, 4/25/34(2) | | | 154 | | | | 155 | |
Sutherland Commercial Mortgage Loans 2017-SBC6, A 144A
3.192%, 5/25/37(2)(3) | | | 94 | | | | 94 | |
Towd Point Mortgage Trust
2015-1, A2 144A, 3.250%, 10/25/53(2)(3) | | | 255 | | | | 257 | |
2015-6, M1 144A, 3.750%, 4/25/55(2)(3) | | | 130 | | | | 135 | |
2015-5, A2 144A, 3.500%, 5/25/55(2)(3) | | | 315 | | | | 324 | |
2017-1, M1 144A, 3.750%, 10/25/56(2)(3) | | | 135 | | | | 137 | |
2015-2, 1M1 144A, 3.250%, 11/25/60(2)(3) | | | 855 | | | | 869 | |
Vericrest Opportunity Loan Trust LLC 2017-NPL3, A1 144A 3.500%, 3/25/47(2)(3) | | | 215 | | | | 216 | |
Wells Fargo Commercial Mortgage Trust 2015-LC20, B 3.719%, 4/15/50 | | | 150 | | | | 150 | |
| | | | | | | | |
| | | | | | | | 12,940 | |
TOTAL MORTGAGE-BACKED SECURITIES
| | | | | | | | |
| (Identified Cost $19,470) | | | | | | | 19,614 | |
|
| ASSET-BACKED SECURITIES—4.8% | |
|
| Automobiles—3.1% | |
AmeriCredit Automobile Receivables Trust 2017-3, D 3.180%, 7/18/23 | | | 405 | | | | 406 | |
Capital Auto Receivables Asset Trust 2017-1, D 144A 3.150%, 2/20/25(3) | | | 340 | | | | 338 | |
Carnow Auto Receivables Trust 2016-1A, D 144A
7.340%, 11/15/21(3) | | | 325 | | | | 327 | |
Drive Auto Receivables Trust 2017-2, C
2.750%, 9/15/23 | | | 405 | | | | 405 | |
Exeter Automobile Receivables Trust
2014-1A, C 144A, 3.570%, 7/15/19(3) | | | 67 | | | | 67 | |
2015-2A, C 144A, 3.900%, 3/15/21(3) | | | 380 | | | | 385 | |
2014-3A, D 144A, 5.690%, 4/15/21(3) | | | 410 | | | | 420 | |
First Investors Auto Owner Trust 2015-2A, E 144A
5.590%, 11/15/22(3) | | | 400 | | | | 401 | |
Flagship Credit Auto Trust
2014-1, E 144A, 5.710%, 8/16/21(3) | | | 305 | | | | 311 | |
2016-3, D 144A, 3.890%, 11/15/22(3) | | | 400 | | | | 404 | |
Foursight Capital Automobile Receivables Trust 2017-1, B 144A
3.050%, 12/15/22(3) | | | 320 | | | | 318 | |
GLS Auto Receivables Trust 2017-1A, B 144A
2.980%, 12/15/21(3) | | | 405 | | | | 404 | |
| | | | | | | | |
| | | | | | | 4,186 | |
| | | | | | | | |
Refer to Footnote Legend on page 50.
See Notes to Financial Statements
42
VIRTUS NEWFLEET MULTI-SECTOR INTERMEDIATE BOND SERIES
SCHEDULE OF INVESTMENTS (Continued)
DECEMBER 31, 2017
($ reported in thousands)
| | | | | | | | |
| | | PAR
VALUE | | | VALUE | |
| Other—1.6% | |
CKE Restaurant Holdings, Inc. 2013-1A, A2 144A
4.474%, 3/20/43(3) | | $ | 354 | | | $ | 355 | |
Diamond Resorts Owner Trust 2017-1A, A 144A
3.270%, 10/22/29(3) | | | 313 | | | | 311 | |
Drug Royalty II LP 2 2014-1, A2 144A
3.484%, 7/15/23(3) | | | 203 | | | | 202 | |
HOA Funding LLC 2014-1A, A2 144A
4.846%, 8/20/44(3) | | | 379 | | | | 368 | |
Mariner Finance Issuance Trust 2017-AA, A 144A
3.620%, 2/20/29(3) | | | 325 | | | | 327 | |
Prosper Marketplace Issuance Trust 2017-2A, B 144A 3.480%, 9/15/23(3) | | | 340 | | | | 341 | |
TGIF Funding LLC 2017-1A, A2 144A
6.202%, 4/30/47(3) | | | 262 | | | | 267 | |
| | | | | | | | |
| | | | | | | 2,171 | |
| | | | | | | | |
| Student Loans—0.1% | |
Sofi Professional Loan Program LLC 2016-A, A2 144A 2.760%, 12/26/36(3) | | | 160 | | | | 160 | |
| TOTAL ASSET-BACKED SECURITIES | | | | | | | | |
| (Identified Cost $6,489) | | | | | | | 6,517 | |
|
| CORPORATE BONDS AND NOTES—53.7% | |
|
| Consumer Discretionary—5.0% | |
Beacon Escrow Corp. 144A
4.875%, 11/1/25(3) | | | 170 | | | | 171 | |
Beazer Homes USA, Inc. 144A
5.875%, 10/15/27(3) | | | 215 | | | | 217 | |
Cablevision Systems Corp.
5.875%, 9/15/22 | | | 290 | | | | 286 | |
CalAtlantic Group, Inc.
5.000%, 6/15/27 | | | 215 | | | | 223 | |
Charter Communications Operating LLC
4.908%, 7/23/25 | | | 340 | | | | 361 | |
Clear Channel Worldwide Holdings, Inc. Series A
7.625%, 3/15/20 | | | 250 | | | | 245 | |
CRC Escrow Issuer LLC 144A
5.250%, 10/15/25(3) | | | 255 | | | | 258 | |
Discovery Communications LLC
3.950%, 3/20/28 | | | 325 | | | | 323 | |
DISH DBS Corp.
7.750%, 7/1/26 | | | 135 | | | | 142 | |
Eldorado Resorts, Inc.
6.000%, 4/1/25 | | | 145 | | | | 152 | |
Gateway Casinos & Entertainment Ltd. 144A
8.250%, 3/1/24(3) | | | 250 | | | | 267 | |
Goodyear Tire & Rubber Co. (The)
4.875%, 3/15/27 | | | 110 | | | | 113 | |
Horton (D.R.), Inc.
4.750%, 2/15/23 | | | 260 | | | | 278 | |
L Brands, Inc.
6.875%, 11/1/35 | | | 162 | | | | 164 | |
Laureate Education, Inc. 144A
8.250%, 5/1/25(3) | | | 55 | | | | 58 | |
Lear Corp.
3.800%, 9/15/27 | | | 405 | | | | 405 | |
Lennar Corp. 144A
4.750%, 11/29/27(3) | | | 335 | | | | 345 | |
M/I Homes, Inc.
5.625%, 8/1/25 | | | 220 | | | | 223 | |
McGraw-Hill Global Education Holdings LLC 144A
7.875%, 5/15/24(3) | | | 210 | | | | 207 | |
| | | | | | | | |
| | | PAR
VALUE | | | VALUE | |
| Consumer Discretionary—continued | |
MDC Holdings, Inc.
5.500%, 1/15/24 | | $ | 295 | | | $ | 311 | |
PetSmart, Inc. 144A
8.875%, 6/1/25(3) | | | 150 | | | | 90 | |
Scientific Games International, Inc. 144A
5.000%, 10/15/25(3) | | | 205 | | | | 205 | |
SFR Group S.A. 144A
7.375%, 5/1/26(3) | | | 200 | | | | 206 | |
Station Casinos LLC 144A
5.000%, 10/1/25(3) | | | 70 | | | | 70 | |
TRI Pointe Group, Inc.
5.875%, 6/15/24 | | | 270 | | | | 288 | |
Viking Cruises Ltd. 144A
5.875%, 9/15/27(3) | | | 270 | | | | 275 | |
Vista Outdoor, Inc.
5.875%, 10/1/23 | | | 275 | | | | 264 | |
Weekley Homes LLC 144A
6.625%, 8/15/25(3) | | | 270 | | | | 269 | |
Wyndham Worldwide Corp.
4.500%, 4/1/27 | | | 325 | | | | 330 | |
| | | | | | | | |
| | | | | | | 6,746 | |
| | | | | | | | |
|
| Consumer Staples—1.2% | |
Albertsons’s Cos LLC
5.750%, 3/15/25 | | | 155 | | | | 140 | |
Anheuser-Busch InBev Finance, Inc.
3.650%, 2/1/26 | | | 210 | | | | 217 | |
BAT Capital Corp. 144A
3.557%, 8/15/27(3) | | | 275 | | | | 275 | |
Cumberland Farms, Inc. 144A
6.750%, 5/1/25(3) | | | 125 | | | | 133 | |
Kronos Acquisition Holdings, Inc. 144A
9.000%, 8/15/23(3) | | | 140 | | | | 131 | |
MARB BondCo plc 144A
7.000%, 3/15/24(3) | | | 260 | | | | 261 | |
Post Holdings, Inc. 144A
5.625%, 1/15/28(3) | | | 40 | | | | 40 | |
Rite Aid Corp. 144A
6.125%, 4/1/23(3) | | | 245 | | | | 221 | |
Tops Holding LLC 144A
8.000%, 6/15/22(3) | | | 250 | | | | 135 | |
| | | | | | | | |
| | | | | | | 1,553 | |
| | | | | | | | |
|
| Energy—11.1% | |
Alliance Resource Operating Partners LP 144A
7.500%, 5/1/25(3) | | | 193 | | | | 205 | |
Alta Mesa Holdings LP
7.875%, 12/15/24 | | | 160 | | | | 175 | |
American Midstream Partners LP 144A
8.500%, 12/15/21(3) | | | 130 | | | | 134 | |
Anadarko Finance Co. Series B
7.500%, 5/1/31 | | | 160 | | | | 205 | |
Anadarko Petroleum Corp.
6.600%, 3/15/46 | | | 200 | | | | 257 | |
Antero Resources Corp.
5.625%, 6/1/23 | | | 125 | | | | 130 | |
Blue Racer Midstream LLC 144A
6.125%, 11/15/22(3) | | | 125 | | | | 130 | |
Callon Petroleum Co.
6.125%, 10/1/24 | | | 235 | | | | 242 | |
Cheniere Corpus Christi Holdings LLC
7.000%, 6/30/24 | | | 260 | | | | 296 | |
Refer to Footnote Legend on page 50.
See Notes to Financial Statements
43
VIRTUS NEWFLEET MULTI-SECTOR INTERMEDIATE BOND SERIES
SCHEDULE OF INVESTMENTS (Continued)
DECEMBER 31, 2017
($ reported in thousands)
| | | | | | | | |
| | | PAR
VALUE | | | VALUE | |
| Energy—continued | |
Chesapeake Energy Corp. 144A
8.000%, 6/15/27(3) | | $ | 270 | | | $ | 259 | |
Compagnie Generale de Geophysique-Veritas SA
6.500%, 6/1/21(10) | | | 375 | | | | 172 | |
Continental Resources, Inc.
4.500%, 4/15/23 | | | 145 | | | | 148 | |
Crownrock LP 144A
5.625%, 10/15/25(3) | | | 285 | | | | 286 | |
Denbury Resources, Inc.
5.500%, 5/1/22 | | | 150 | | | | 103 | |
Ecopetrol S.A.
5.875%, 9/18/23 | | | 285 | | | | 315 | |
5.375%, 6/26/26 | | | 725 | | | | 783 | |
Encana Corp.
8.125%, 9/15/30 | | | 155 | | | | 209 | |
Energy Transfer Equity LP | |
5.000%, 10/1/22 | | | 425 | | | | 453 | |
4.250%, 3/15/23 | | | 150 | | | | 149 | |
EP Energy LLC
6.375%, 6/15/23 | | | 155 | | | | 84 | |
144A, 8.000%, 11/29/24(3) | | | 180 | | | | 186 | |
FTS International, Inc.
6.250%, 5/1/22 | | | 175 | | | | 169 | |
Gazprom OAO 144A
4.950%, 2/6/28(3)(7) | | | 205 | | | | 213 | |
Geopark Ltd. 144A
6.500%, 9/21/24(3) | | | 270 | | | | 277 | |
Helmerich & Payne International Drilling Co.
4.650%, 3/15/25 | | | 220 | | | | 232 | |
HollyFrontier Corp.
5.875%, 4/1/26 | | | 360 | | | | 400 | |
KazMunayGas National Co JSC 144A
4.750%, 4/19/27(3) | | | 395 | | | | 416 | |
Kinder Morgan, Inc.
7.750%, 1/15/32 | | | 400 | | | | 516 | |
MEG Energy Corp. 144A
6.500%, 1/15/25(3) | | | 190 | | | | 188 | |
Nabors Industries, Inc.
5.500%, 1/15/23 | | | 135 | | | | 131 | |
NGL Energy Partners LP
5.125%, 7/15/19 | | | 335 | | | | 341 | |
NuStar Logistics LP
5.625%, 4/28/27 | | | 115 | | | | 117 | |
Oasis Petroleum, Inc.
6.875%, 1/15/23 | | | 265 | | | | 271 | |
Odebrecht Offshore Drilling Finance Ltd.
6.720%, 12/1/22 | | | 132 | | | | 126 | |
7.720%, 12/1/26 | | | 363 | | | | 73 | |
Odebrecht Oil & Gas Finance Ltd.
0.000%(5) | | | 60 | | | | 2 | |
Parker Drilling Co.
7.500%, 8/1/20 | | | 365 | | | | 332 | |
Peabody Energy Corp. 144A
6.375%, 3/31/25(3) | | | 195 | | | | 203 | |
Pertamina Persero PT 144A
5.625%, 5/20/43(3) | | | 370 | | | | 402 | |
Petrobras Global Finance BV
144A, 5.299%, 1/27/25(3) | | | 364 | | | | 365 | |
7.375%, 1/17/27 | | | 660 | | | | 727 | |
144A, 5.999%, 1/27/28(3) | | | 180 | | | | 180 | |
Petroleos de Venezuela S.A. 144A
6.000%, 5/16/24(3)(18) | | | 650 | | | | 146 | |
Petroleos Mexicanos
6.875%, 8/4/26 | | | 755 | | | | 856 | |
6.500%, 6/2/41 | | | 220 | | | | 226 | |
5.500%, 6/27/44 | | | 200 | | | | 184 | |
| | | | | | | | |
| | | PAR
VALUE | | | VALUE | |
| Energy—continued | |
QEP Resources, Inc.
5.625%, 3/1/26 | | $ | 35 | | | $ | 35 | |
RSP Permian, Inc.
5.250%, 1/15/25 | | | 275 | | | | 282 | |
SESI LLC 144A
7.750%, 9/15/24(3) | | | 210 | | | | 223 | |
Seven Generations Energy Ltd. 144A
5.375%, 9/30/25(3) | | | 270 | | | | 273 | |
Southern Gas Corridor CJSC 144A
6.875%, 3/24/26(3) | | | 265 | | | | 301 | |
SRC Energy, Inc. 144A
6.250%, 12/1/25(3) | | | 155 | | | | 158 | |
State Oil Co. of the Azerbaijan Republic
6.950%, 3/18/30 | | | 320 | | | | 355 | |
TerraForm Power Operating LLC 144A
5.000%, 1/31/28(3) | | | 230 | | | | 228 | |
Transocean, Inc.
144A, 9.000%, 7/15/23(3) | | | 95 | | | | 103 | |
6.800%, 3/15/38 | | | 85 | | | | 68 | |
Ultra Resources, Inc.
144A, 6.875%, 4/15/22(3) | | | 16 | | | | 16 | |
144A, 7.125%, 4/15/25(3) | | | 51 | | | | 51 | |
Vine Oil & Gas LP 144A
8.750%, 4/15/23(3) | | | 205 | | | | 199 | |
Weatherford International Ltd.
9.875%, 2/15/24 | | | 80 | | | | 85 | |
Whiting Petroleum Corp. 144A
6.625%, 1/15/26(3) | | | 110 | | | | 112 | |
YPF S.A.
144A, 8.500%, 3/23/21(3) | | | 138 | | | | 156 | |
144A, 8.750%, 4/4/24(3) | | | 45 | | | | 52 | |
144A, 6.950%, 7/21/27(3) | | | 295 | | | | 313 | |
| | | | | | | | |
| | | | | | | 15,024 | |
| | | | | | | | |
|
| Financials—14.6% | |
Acrisure LLC 144A
7.000%, 11/15/25(3) | | | 325 | | | | 313 | |
AerCap Ireland Capital Ltd.
3.950%, 2/1/22 | | | 150 | | | | 155 | |
3.650%, 7/21/27 | | | 310 | | | | 307 | |
Akbank TAS 144A
7.500%, 2/5/18(3) | | | 935 | TRY | | | 245 | |
Allstate Corp. (The)
5.750%, 8/15/53(6) | | | 365 | | | | 398 | |
Apollo Management Holdings LP 144A
4.000%, 5/30/24(3) | | | 440 | | | | 450 | |
Ares Capital Corp.
3.625%, 1/19/22 | | | 210 | | | | 211 | |
3.500%, 2/10/23 | | | 205 | | | | 202 | |
Australia & New Zealand Banking Group Ltd. 144A
4.400%, 5/19/26(3) | | | 335 | | | | 348 | |
Aviation Capital Group LLC 144A
3.500%, 11/1/27(3) | | | 155 | | | | 152 | |
Banco Bilbao Vizcaya Argentaria Bancomer S.A. 144A
6.500%, 3/10/21(3) | | | 425 | | | | 463 | |
Banco de Bogota S.A. 144A
6.250%, 5/12/26(3) | | | 330 | | | | 356 | |
Banco de Credito del Peru 144A
6.125%, 4/24/27(3) | | | 520 | | | | 571 | |
Banco de Credito e Inversiones 144A
3.500%, 10/12/27(3) | | | 415 | | | | 405 | |
Banco Internacional del Peru SAA Interbank 144A
6.625%, 3/19/29(3) | | | 155 | | | | 175 | |
Refer to Footnote Legend on page 50.
See Notes to Financial Statements
44
VIRTUS NEWFLEET MULTI-SECTOR INTERMEDIATE BOND SERIES
SCHEDULE OF INVESTMENTS (Continued)
DECEMBER 31, 2017
($ reported in thousands)
| | | | | | | | |
| | | PAR
VALUE | | | VALUE | |
| Financials—continued | |
Banco Santander Chile 144A
3.875%, 9/20/22(3) | | $ | 505 | | | $ | 525 | |
Bancolombia S.A.
5.125%, 9/11/22 | | | 545 | | | | 570 | |
Bank of America Corp.
4.200%, 8/26/24 | | | 458 | | | | 482 | |
Bank of China Ltd. 144A
5.000%, 11/13/24(3) | | | 390 | | | | 416 | |
Bank of Montreal
3.803%, 12/15/32 | | | 71 | | | | 70 | |
Bonos del Banco Central de Chile En Pesos
4.500%, 6/1/20 | | | 70,000 | CLP | | | 117 | |
Brighthouse Financial, Inc. 144A
3.700%, 6/22/27(3) | | | 215 | | | | 211 | |
Capital One Financial Corp.
3.750%, 7/28/26 | | | 405 | | | | 403 | |
Compass Bank
3.875%, 4/10/25 | | | 380 | | | | 381 | |
Development Bank of Kazakhstan JSC 144A
4.125%, 12/10/22(3) | | | 535 | | | | 550 | |
Drawbridge Special Opportunities Fund LP 144A
5.000%, 8/1/21(3) | | | 440 | | | | 454 | |
Eurasian Development Bank 144A
4.767%, 9/20/22(3) | | | 475 | | | | 503 | |
FS Investment Corp.
4.250%, 1/15/20 | | | 230 | | | | 234 | |
4.750%, 5/15/22 | | | 50 | | | | 51 | |
GrupoSura Finance S.A. 144A
5.500%, 4/29/26(3) | | | 335 | | | | 363 | |
HBOS plc 144A
6.750%, 5/21/18(3) | | | 200 | | | | 203 | |
Huntington National Bank (The)
6.600%, 6/15/18 | | | 250 | | | | 253 | |
ICAHN Enterprises LP 144A
6.375%, 12/15/25(3) | | | 335 | | | | 335 | |
ING Groep N.V.
6.000%(5)(6) | | | 275 | | | | 285 | |
iStar, Inc.
6.000%, 4/1/22 | | | 110 | | | | 114 | |
5.250%, 9/15/22 | | | 155 | | | | 156 | |
Jefferies Group LLC
5.125%, 1/20/23 | | | 165 | | | | 179 | |
4.850%, 1/15/27 | | | 60 | | | | 64 | |
JPMorgan Chase & Co.
2.950%, 10/1/26 | | | 475 | | | | 466 | |
Kazakhstan Temir Zholy Finance BV 144A
6.950%, 7/10/42(3) | | | 410 | | | | 480 | |
Kazakhstan Temir Zholy National Co. JSC 144A
4.850%, 11/17/27(3) | | | 435 | | | | 453 | |
Leucadia National Corp.
5.500%, 10/18/23 | | | 250 | | | | 269 | |
Liberty Mutual Insurance Co. 144A
8.500%, 5/15/25(3) | | | 25 | | | | 32 | |
Lincoln National Corp., (3 month LIBOR + 2.040%)
3.403%, 4/20/67(2)(6) | | | 365 | | | | 334 | |
Lloyds Bank plc 144A
6.500%, 9/14/20(3) | | | 600 | | | | 656 | |
Navient Corp.
6.750%, 6/25/25 | | | 215 | | | | 221 | |
Nuveen Finance LLC 144A
4.125%, 11/1/24(3) | | | 350 | | | | 369 | |
OM Asset Management plc
4.800%, 7/27/26 | | | 270 | | | | 280 | |
| | | | | | | | |
| | | PAR
VALUE | | | VALUE | |
| Financials—continued | |
Powszechna Kasa Oszczednosci Bank Polski S.A. 144A
4.630%, 9/26/22(3)(7) | | $ | 610 | | | $ | 652 | |
Prudential Financial, Inc.
5.875%, 9/15/42 | | | 405 | | | | 442 | |
Santander Holdings USA, Inc.
144A, 3.700%, 3/28/22(3) | | | 195 | | | | 197 | |
144A, 4.400%, 7/13/27(3) | | | 200 | | | | 205 | |
Sberbank of Russia 144A
5.500%, 2/26/24(3)(7) | | | 315 | | | | 320 | |
Springleaf Finance Corp.
6.125%, 5/15/22 | | | 265 | | | | 275 | |
Synchrony Financial
3.950%, 12/1/27 | | | 295 | | | | 294 | |
TC Ziraat Bankasi AS 144A
5.125%, 5/3/22(3) | | | 335 | | | | 332 | |
Teachers Insurance & Annuity Association of America 144A
4.375%, 9/15/54(3) | | | 360 | | | | 365 | |
Toronto-Dominion Bank (The)
3.625%, 9/15/31 | | | 135 | | | | 135 | |
Turkiye Vakiflar Bankasi TAO 144A
5.625%, 5/30/22(3) | | | 405 | | | | 404 | |
VICI Properties 1 LLC, (3 month LIBOR + 3.500%)
4.847%, 10/15/22(2) | | | 2 | | | | 2 | |
Voya Financial, Inc.
5.650%, 5/15/53 | | | 290 | | | | 309 | |
Wells Fargo & Co. Series S
5.900%, 8/15/27 | | | 475 | | | | 508 | |
| | | | | | | | |
| | | | | | | 19,670 | |
| | | | | | | | |
|
| Health Care—3.4% | |
Abbott Laboratories
3.750%, 11/30/26 | | | 405 | | | | 416 | |
Anthem, Inc.
3.650%, 12/1/27 | | | 90 | | | | 92 | |
Avantor, Inc. 144A
6.000%, 10/1/24(3) | | | 125 | | | | 125 | |
Becton Dickinson & Co.
3.700%, 6/6/27 | | | 420 | | | | 423 | |
Catalent Pharma Solutions, Inc. 144A
4.875%, 1/15/26(3) | | | 25 | | | | 25 | |
Community Health Systems, Inc.
6.250%, 3/31/23 | | | 80 | | | | 72 | |
Concordia International Corp. 144A
9.000%, 4/1/22(3) | | | 65 | | | | 56 | |
DJO Finco, Inc. 144A
8.125%, 6/15/21(3) | | | 135 | | | | 126 | |
Eagle Holding Co. II, LLC PIK Interest Capitalization, 144A
7.625%, 5/15/22(3)(15) | | | 150 | | | | 153 | |
Endo Dac
144A, 6.000%, 7/15/23(3) | | | 100 | | | | 79 | |
144A, 6.000%, 2/1/25(3) | | | 190 | | | | 147 | |
Envision Healthcare Corp. 144A
6.250%, 12/1/24(3) | | | 60 | | | | 62 | |
HCA, Inc.
5.250%, 6/15/26 | | | 130 | | | | 138 | |
MPH Acquisition Holdings LLC 144A
7.125%, 6/1/24(3) | | | 205 | | | | 218 | |
Mylan NV
3.950%, 6/15/26 | | | 335 | | | | 338 | |
Owens & Minor, Inc.
3.875%, 9/15/21 | | | 75 | | | | 76 | |
Polaris Intermediate Corp. PIK Interest Capitalization, 144A
8.500%, 12/1/22(3)(15) | | | 30 | | | | 31 | |
Refer to Footnote Legend on page 50.
See Notes to Financial Statements
45
VIRTUS NEWFLEET MULTI-SECTOR INTERMEDIATE BOND SERIES
SCHEDULE OF INVESTMENTS (Continued)
DECEMBER 31, 2017
($ reported in thousands)
| | | | | | | | |
| | | PAR
VALUE | | | VALUE | |
| Health Care—continued | |
SP Finco LLC 144A
6.750%, 7/1/25(3) | | $ | 50 | | | $ | 47 | |
Surgery Center Holdings, Inc. 144A
8.875%, 4/15/21(3) | | | 265 | | | | 274 | |
Teleflex Inc.
4.625%, 11/15/27 | | | 120 | | | | 121 | |
Tenet Healthcare Corp.
8.125%, 4/1/22 | | | 60 | | | | 61 | |
144A, 4.625%, 7/15/24(3) | | | 70 | | | | 68 | |
144A, 5.125%, 5/1/25(3) | | | 65 | | | | 63 | |
144A, 7.000%, 8/1/25(3) | | | 220 | | | | 207 | |
Valeant Pharmaceuticals International, Inc.
144A, 7.500%, 7/15/21(3) | | | 50 | | | | 51 | |
144A, 6.500%, 3/15/22(3) | | | 20 | | | | 21 | |
144A, 5.875%, 5/15/23(3) | | | 300 | | | | 278 | |
144A, 7.000%, 3/15/24(3) | | | 30 | | | | 32 | |
144A, 5.500%, 11/1/25(3) | | | 200 | | | | 203 | |
144A, 9.000%, 12/15/25(3) | | | 35 | | | | 36 | |
West Street Merger Sub, Inc. 144A
6.375%, 9/1/25(3) | | | 165 | | | | 165 | |
Zimmer Biomet Holdings, Inc.
3.550%, 4/1/25 | | | 405 | | | | 405 | |
| | | | | | | | |
| | | | | | | 4,609 | |
| | | | | | | | |
|
| Industrials—3.6% | |
Alfa SAB de CV 144A
5.250%, 3/25/24(3) | | | 320 | | | | 338 | |
Ashtead Capital, Inc. 144A
4.375%, 8/15/27(3) | | | 340 | | | | 345 | |
Bombardier, Inc. 144A
6.125%, 1/15/23(3) | | | 280 | | | | 274 | |
CNH Industrial N.V.
4.500%, 8/15/23 | | | 280 | | | | 291 | |
3.850%, 11/15/27 | | | 180 | | | | 180 | |
DP World Ltd. 144A
6.850%, 7/2/37(3) | | | 200 | | | | 246 | |
Embraer Netherlands Finance BV
5.400%, 2/1/27 | | | 150 | | | | 162 | |
GrafTech International Ltd.
6.375%, 11/15/20 | | | 280 | | | | 279 | |
JBS Investments GmbH 144A
7.250%, 4/3/24(3) | | | 285 | | | | 280 | |
JSL Europe S.A. 144A
7.750%, 7/26/24(3) | | | 285 | | | | 302 | |
Masco Corp.
5.950%, 3/15/22 | | | 296 | | | | 328 | |
Navistar International Corp. 144A
6.625%, 11/1/25(3) | | | 270 | | | | 282 | |
New Enterprise Stone & Lime Co., Inc. 144A
10.125%, 4/1/22(3) | | | 20 | | | | 22 | |
Owens Corning
3.400%, 8/15/26 | | | 330 | | | | 324 | |
Pitney Bowes, Inc.
4.125%, 5/15/22 | | | 391 | | | | 359 | |
Prime Security Services Borrower LLC 144A
9.250%, 5/15/23(3) | | | 130 | | | | 144 | |
Standard Industries, Inc.
144A, 5.500%, 2/15/23(3) | | | 65 | | | | 68 | |
144A, 4.750%, 1/15/28(3) | | | 130 | | | | 130 | |
TransDigm, Inc.
6.500%, 7/15/24 | | | 145 | | | | 149 | |
6.500%, 5/15/25 | | | 90 | | | | 92 | |
| | | | | | | | |
| | | PAR
VALUE | | | VALUE | |
| Industrials—continued | |
Wrangler Buyer Corp. 144A
6.000%, 10/1/25(3) | | $ | 208 | | | $ | 214 | |
| | | | | | | | |
| | | | | | | 4,809 | |
| | | | | | | | |
|
| Information Technology—2.4% | |
Arrow Electronics, Inc.
3.875%, 1/12/28 | | | 340 | | | | 339 | |
Blackboard, Inc. 144A
9.750%, 10/15/21(3) | | | 155 | | | | 141 | |
Broadcom Corp.
144A, 3.000%, 1/15/22(3) | | | 105 | | | | 104 | |
144A, 3.625%, 1/15/24(3) | | | 260 | | | | 259 | |
Citrix Systems, Inc.
4.500%, 12/1/27 | | | 320 | | | | 325 | |
Dell International LLC
144A, 5.450%, 6/15/23(3) | | | 70 | | | | 76 | |
144A, 8.100%, 7/15/36(3) | | | 140 | | | | 177 | |
Everi Payments, Inc. 144A
7.500%, 12/15/25(3) | | | 65 | | | | 64 | |
Flex Ltd.
4.750%, 6/15/25 | | | 375 | | | | 401 | |
Match Group, Inc. 144A
5.000%, 12/15/27(3) | | | 160 | | | | 162 | |
Rackspace Hosting, Inc. 144A
8.625%, 11/15/24(3) | | | 265 | | | | 283 | |
Radiate Holdco LLC 144A
6.625%, 2/15/25(3) | | | 260 | | | | 246 | |
ViaSat, Inc. 144A
5.625%, 9/15/25(3) | | | 270 | | | | 272 | |
VMware, Inc.
2.950%, 8/21/22 | | | 217 | | | | 216 | |
3.900%, 8/21/27 | | | 230 | | | | 232 | |
| | | | | | | | |
| | | | | | | 3,297 | |
| | | | | | | | |
| Materials—5.8% | |
AK Steel Corp.
7.500%, 7/15/23 | | | 130 | | | | 141 | |
7.000%, 3/15/27 | | | 195 | | | | 198 | |
Alpek SAB de C.V. 144A
5.375%, 8/8/23(3) | | | 425 | | | | 449 | |
Anglo American Capital plc 144A
4.000%, 9/11/27(3) | | | 435 | | | | 432 | |
BHP Billiton Finance USA Ltd. 144A
6.750%, 10/19/75(3)(6) | | | 225 | | | | 263 | |
BlueScope Steel Finance Ltd. 144A
6.500%, 5/15/21(3) | | | 150 | | | | 156 | |
CRH America Finance, Inc. 144A
3.400%, 5/9/27(3) | | | 300 | | | | 300 | |
Equate Petrochemical BV 144A
4.250%, 11/3/26(3) | | | 340 | | | | 346 | |
Fibria Overseas Finance Ltd.
4.000%, 1/14/25 | | | 350 | | | | 347 | |
FMG Resources August 2006 Pty Ltd. 144A
9.750%, 3/1/22(3) | | | 130 | | | | 144 | |
Gerdau Holdings, Inc. 144A
7.000%, 1/20/20(3) | | | 210 | | | | 225 | |
Glencore Funding LLC 144A
4.000%, 3/27/27(3) | | | 390 | | | | 391 | |
INEOS Group Holdings S.A. 144A
5.625%, 8/1/24(3) | | | 345 | | | | 360 | |
Inversiones CMPC S.A. 144A
4.375%, 5/15/23(3) | | | 300 | | | | 314 | |
Refer to Footnote Legend on page 50.
See Notes to Financial Statements
46
VIRTUS NEWFLEET MULTI-SECTOR INTERMEDIATE BOND SERIES
SCHEDULE OF INVESTMENTS (Continued)
DECEMBER 31, 2017
($ reported in thousands)
| | | | | | | | |
| | | PAR
VALUE | | | VALUE | |
| Materials—continued | |
James Hardie International Finance DAC 144A
5.000%, 1/15/28(3) | | $ | 265 | | | $ | 267 | |
Kraton Polymers LLC 144A
7.000%, 4/15/25(3) | | | 390 | | | | 417 | |
Mercer International, Inc. 144A
5.500%, 1/15/26(3) | | | 65 | | | | 66 | |
NOVA Chemicals Corp.
144A, 4.875%, 6/1/24(3) | | | 130 | | | | 130 | |
144A, 5.000%, 5/1/25(3) | | | 300 | | | | 299 | |
OCP SA 144A
5.625%, 4/25/24(3) | | | 320 | | | | 343 | |
Platform Specialty Products Corp. 144A
5.875%, 12/1/25(3) | | | 220 | | | | 218 | |
PQ Corp. 144A
5.750%, 12/15/25(3) | | | 90 | | | | 92 | |
Reynolds Group Issuer, Inc. 144A
7.000%, 7/15/24(3) | | | 185 | | | | 198 | |
Rusal Capital DAC 144A
5.125%, 2/2/22(3) | | | 325 | | | | 332 | |
Severstal OAO 144A
5.900%, 10/17/22(3)(7) | | | 260 | | | | 288 | |
Standard Industries, Inc. 144A
6.000%, 10/15/25(3) | | | 175 | | | | 187 | |
Vale Overseas Ltd.
5.875%, 6/10/21 | | | 205 | | | | 223 | |
6.250%, 8/10/26 | | | 135 | | | | 156 | |
Vedanta Resources plc 144A
6.125%, 8/9/24(3) | | | 215 | | | | 219 | |
Yamana Gold, Inc. 144A
4.625%, 12/15/27(3) | | | 350 | | | | 352 | |
| | | | | | | | |
| | | | | | | 7,853 | |
| | | | | | | | |
|
| Real Estate—2.0% | |
EPR Properties
4.750%, 12/15/26 | | | 130 | | | | 133 | |
4.500%, 6/1/27 | | | 205 | | | | 206 | |
Greystar Real Estate Partners LLC 144A
5.750%, 12/1/25(3) | | | 140 | | | | 144 | |
Healthcare Trust of America Holdings LP
3.750%, 7/1/27 | | | 180 | | | | 179 | |
Hospitality Properties Trust
4.950%, 2/15/27 | | | 195 | | | | 206 | |
LifeStorage LP
3.875%, 12/15/27 | | | 135 | | | | 135 | |
MPT Operating Partnership LP
5.500%, 5/1/24 | | | 165 | | | | 171 | |
5.000%, 10/15/27 | | | 155 | | | | 158 | |
Physicians Realty LP
4.300%, 3/15/27 | | | 330 | | | | 336 | |
Select Income REIT
4.500%, 2/1/25 | | | 385 | | | | 388 | |
Uniti Group, Inc. 144A
7.125%, 12/15/24(3) | | | 325 | | | | 296 | |
WP Carey, Inc.
4.600%, 4/1/24 | | | 345 | | | | 360 | |
| | | | | | | | |
| | | | | | | 2,712 | |
| | | | | | | | |
|
| Telecommunication Services—3.0% | |
America Movil SAB de C.V. Series 12
6.450%, 12/5/22 | | | 2,000 | MXN | | | 94 | |
AT&T, Inc.
3.400%, 8/14/24 | | | 213 | | | | 214 | |
| | | | | | | | |
| | | PAR
VALUE | | | VALUE | |
| Telecommunication Services—continued | |
4.250%, 3/1/27 | | $ | 195 | | | $ | 199 | |
3.900%, 8/14/27 | | | 295 | | | | 297 | |
5.250%, 3/1/37 | | | 65 | | | | 69 | |
4.800%, 6/15/44 | | | 265 | | | | 262 | |
5.650%, 2/15/47 | | | 135 | | | | 147 | |
Axtel SAB de C.V. 144A
6.375%, 11/14/24(3) | | | 270 | | | | 278 | |
Crown Castle Towers LLC 144A
6.113%, 1/15/20(3) | | | 100 | | | | 105 | |
Digicel Group Ltd. 144A
8.250%, 9/30/20(3) | | | 345 | | | | 339 | |
Frontier Communications Corp.
6.250%, 9/15/21 | | | 135 | | | | 96 | |
10.500%, 9/15/22 | | | 135 | | | | 102 | |
GTH Finance BV 144A
7.250%, 4/26/23(3) | | | 300 | | | | 337 | |
Level 3 Financing, Inc.
5.375%, 1/15/24 | | | 265 | | | | 265 | |
Qwest Corp.
7.250%, 9/15/25 | | | 185 | | | | 198 | |
Sprint Spectrum Co., LLC 144A
3.360%, 9/20/21(3) | | | 188 | | | | 189 | |
Telenet Finance Luxembourg Notes S.a.r.l. 144A
5.500%, 3/1/28(3) | | | 200 | | | | 200 | |
Verizon Communications, Inc.
4.125%, 3/16/27 | | | 395 | | | | 412 | |
West Corp. 144A
8.500%, 10/15/25(3) | | | 80 | | | | 79 | |
Windstream Services LLC 144A
8.625%, 10/31/25(3) | | | 140 | | | | 135 | |
| | | | | | | | |
| | | | | | | 4,017 | |
| | | | | | | | |
|
| Utilities—1.6% | |
AmeriGas Partners LP
5.500%, 5/20/25 | | | 110 | | | | 111 | |
Dynegy, Inc.
7.375%, 11/1/22 | | | 225 | | | | 238 | |
Eskom Holdings SOC Ltd. 144A
7.125%, 2/11/25(3) | | | 250 | | | | 255 | |
Exelon Corp.
3.497%, 6/1/22 | | | 540 | | | | 550 | |
Ferrellgas Partners LP
8.625%, 6/15/20 | | | 50 | | | | 43 | |
6.750%, 6/15/23 | | | 270 | | | | 248 | |
Lamar Funding Ltd. 144A
3.958%, 5/7/25(3) | | | 375 | | | | 346 | |
Majapahit Holding BV 144A
7.750%, 1/20/20(3) | | | 300 | | | | 328 | |
Texas Competitive Electric Escrow Series A
10.250%, 11/1/36(10)(16) | | | 396 | | | | — | (14) |
Vistra Operations Co. LLC 144A
11.500%, 10/1/20(3)(10)(16) | | | 465 | | | | — | (14) |
| | | | | | | | |
| | | | | | | | 2,119 | |
| TOTAL CORPORATE BONDS AND NOTES | | | | | | | | |
| (Identified Cost $71,908) | | | | | | | 72,409 | |
|
| LOAN AGREEMENTS(2)—6.8% | |
|
| Consumer Discretionary—1.6% | |
Advantage Sales & Marketing, Inc. | |
Tranche B-2, First Lien, (3 month LIBOR + 3.250%)
4.630%, 7/23/21 | | | 139 | | | | 136 | |
Refer to Footnote Legend on page 50.
See Notes to Financial Statements
47
VIRTUS NEWFLEET MULTI-SECTOR INTERMEDIATE BOND SERIES
SCHEDULE OF INVESTMENTS (Continued)
DECEMBER 31, 2017
($ reported in thousands)
| | | | | | | | |
| | | PAR
VALUE | | | VALUE | |
| Consumer Discretionary—continued | |
Second Lien, (3 month LIBOR + 6.500%)
7.878%, 7/25/22 | | $ | 280 | | | $ | 259 | |
Affinity Gaming, (3 month LIBOR + 3.500%)
5.193%, 7/1/23 | | | 362 | | | | 363 | |
Gateway Casinos & Entertainment Ltd. Tranche B-1, (3 month LIBOR + 3.750%)
5.443%, 2/22/23 | | | 45 | | | | 45 | |
Global Appliance, Inc. Tranche B, (1 month
LIBOR + 4.000%)
5.570%, 9/29/24 | | | 190 | | | | 192 | |
Hoya Midco LLC First Lien, (1 month LIBOR + 4.000%)
5.569%, 6/30/24 | | | 85 | | | | 85 | |
Laureate Education, Inc. 2024, (1 month LIBOR + 4.500%) 6.069%, 4/26/24 | | | 151 | | | | 152 | |
Neiman Marcus Group Inc. (The), (1 month
LIBOR + 3.250%)
0.000%, 10/25/20(8) | | | 165 | | | | 134 | |
Playa Resorts Holding B.V., (3 month LIBOR + 3.000%)
4.620%, 4/29/24 | | | 229 | | | | 230 | |
Seminole Tribe of Florida Tranche B, (1 month
LIBOR + 2.000%)
3.569%, 7/8/24 | | | 219 | | | | 220 | |
U.S. Farathane LLC Tranche B-4, (3 month
LIBOR + 3.500%)
5.193%, 12/23/21 | | | 166 | | | | 167 | |
UFC Holdings LLC First Lien, (1 month LIBOR + 3.250%)
4.810%, 8/18/23 | | | 175 | | | | 176 | |
| | | | | | | | |
| | | | | | | 2,159 | |
| | | | | | | | |
|
| Consumer Staples—0.6% | |
Albertson’s LLC 2017-1, Tranche B-4, (1 month
LIBOR + 2.750%)
4.319%, 8/25/21 | | | 227 | | | | 222 | |
Chobani LLC First Lien, (1 month LIBOR + 3.500%)
5.069%, 10/10/23 | | | 118 | | | | 119 | |
Galleria Co. Tranche B, (1 month LIBOR + 3.000%)
4.375%, 9/29/23 | | | 100 | | | | 100 | |
JBS USA Lux S.A., (3 month LIBOR + 2.500%)
4.100%, 10/30/22 | | | 89 | | | | 88 | |
Parfums Holdings Co., Inc. First Lien, (3 month
LIBOR + 4.750%)
6.443%, 6/30/24 | | | 144 | | | | 145 | |
TKC Holdings, Inc. First Lien, (2 month LIBOR + 4.250%)
5.673%, 2/1/23 | | | 174 | | | | 175 | |
| | | | | | | | |
| | | | | | | 849 | |
| | | | | | | | |
|
| Energy—0.8% | |
California Resources Corp., (1 month LIBOR + 10.375%)
11.876%, 12/31/21 | | | 190 | | | | 208 | |
Chesapeake Energy Corp. Tranche A, (3 month
LIBOR + 7.500%)
8.954%, 8/23/21 | | | 44 | | | | 47 | |
Contura Energy, Inc., (2 month LIBOR + 5.000%)
6.630%, 3/18/24 | | | 131 | | | | 129 | |
Medallion Midland Acquisition LLC, (1 month
LIBOR + 3.250%)
4.819%, 10/30/24 | | | 190 | | | | 190 | |
Paragon Offshore Finance Co., (3 month LIBOR + 2.750%)
0.000%, 7/16/21(8)(10)(16) | | | 2 | | | | — | |
Seadrill Operating LP, (3 month LIBOR + 3.000%)
4.693%, 2/21/21 | | | 241 | | | | 194 | |
| | | | | | | | |
| | | PAR
VALUE | | | VALUE | |
| Energy—continued | |
Traverse Midstream Partners LLC, (3 month
LIBOR + 4.000%)
5.850%, 9/27/24 | | $ | 110 | | | $ | 111 | |
Ultra Resources, Inc., (3 month LIBOR + 3.000%)
4.413%, 4/12/24 | | | 175 | | | | 175 | |
| | | | | | | | |
| | | | | | | 1,054 | |
| | | | | | | | |
|
| Financials—0.3% | |
Asurion LLC Tranche B-2, Second Lien, (1 month
LIBOR + 6.000%)
7.569%, 8/4/25 | | | 30 | | | | 31 | |
FinCo I LLC, (1 month LIBOR + 2.750%)
4.319%, 12/27/22 | | | 80 | | | | 81 | |
Walter Investment Management Corp. Tranche B, (1 month LIBOR + 3.750%)
5.319%, 12/18/20(18) | | | 260 | | | | 248 | |
| | | | | | | | |
| | | | | | | 360 | |
| | | | | | | | |
|
| Health Care—0.4% | |
21st Century Oncology Holdings, Inc. Tranche B, (3 month LIBOR + 6.125%)
7.825%, 4/30/22(11) | | | 42 | | | | 39 | |
Envision Healthcare Corp., (1 month LIBOR + 3.000%)
4.570%, 12/1/23 | | | 37 | | | | 38 | |
HLF Financing S.a.r.l. Senior Lien, (1 month
LIBOR + 5.500%)
7.069%, 2/15/23 | | | 61 | | | | 61 | |
MMM Holdings, Inc., (3 month LIBOR + 8.750%)
10.324%, 6/30/19 | | | 91 | | | | 87 | |
MSO of Puerto Rico, Inc., (3 month LIBOR + 8.750%)
10.324%, 6/30/19 | | | 66 | | | | 63 | |
NVA Holdings, Inc. Second Lien, (3 month
LIBOR + 7.000%)
8.693%, 8/14/22 | | | 183 | | | | 184 | |
PharMerica Corp. Second Lien, (3 month LIBOR + 7.750%)
9.153%, 9/26/25 | | | 20 | | | | 20 | |
U.S. Renal Care, Inc. First Lien, (3 month LIBOR + 4.250%)
5.943%, 12/30/22 | | | 68 | | | | 67 | |
Wink Holdco, Inc. (Superior Vision Holdings, Inc.) First Lien, (3 month LIBOR + 3.000%)
4.490%, 12/2/24 | | | 10 | | | | 10 | |
| | | | | | | | |
| | | | | | | 569 | |
| | | | | | | | |
|
| Industrials—0.9% | |
84 Lumber Co. Tranche B-1, (1 month LIBOR + 5.250%)
6.802%, 10/25/23 | | | 126 | | | | 127 | |
Accudyne Industries LLC, (1 month LIBOR + 3.750%)
5.319%, 8/18/24 | | | 35 | | | | 35 | |
Navistar, Inc. Tranche B, (1 month LIBOR + 3.500%)
4.900%, 11/6/24 | | | 215 | | | | 215 | |
PAE Holding Corp. First Lien, (2 month LIBOR + 5.500%)
7.124%, 10/20/22 | | | 117 | | | | 118 | |
Red Ventures LLC First Lien, (1 month LIBOR + 4.000%)
5.569%, 11/8/24 | | | 204 | | | | 204 | |
Sedgwick Claims Management Services, Inc. Second Lien, (3 month LIBOR + 5.750%)
7.229%, 2/28/22 | | | 340 | | | | 342 | |
TransDigm, Inc. Tranche F, (3 month LIBOR + 2.750%)
4.381%, 6/9/23 | | | 203 | | | | 204 | |
Refer to Footnote Legend on page 50.
See Notes to Financial Statements
48
VIRTUS NEWFLEET MULTI-SECTOR INTERMEDIATE BOND SERIES
SCHEDULE OF INVESTMENTS (Continued)
DECEMBER 31, 2017
($ reported in thousands)
| | | | | | | | |
| | | PAR
VALUE | | | VALUE | |
| Industrials—continued | |
TransDigm, Inc. Tranche G, (3 month LIBOR + 3.000%)
4.652%, 8/22/24 | | $ | 30 | | | $ | 30 | |
| | | | | | | | |
| | | | | | | 1,275 | |
| | | | | | | | |
|
| Information Technology—0.4% | |
Applied Systems, Inc. Second Lien, (3 month
LIBOR + 7.000%)
8.693%, 9/19/25 | | | 25 | | | | 26 | |
Blackboard, Inc. Tranche B-4, First Lien, (3 month
LIBOR + 5.000%)
6.354%, 6/30/21 | | | 68 | | | | 67 | |
Everi Payments, Inc. Tranche B, (3 month LIBOR + 3.500%)
4.979%, 5/9/24 | | | 65 | | | | 65 | |
Kronos, Inc. Second Lien, (3 month LIBOR + 8.250%)
9.627%, 11/1/24 | | | 84 | | | | 87 | |
NAB Holdings LLC, (1 month LIBOR + 3.250%)
4.819%, 7/1/24 | | | 100 | | | | 100 | |
Presidio LLC Tranche B, (3 month PRIME + 2.250%)
5.668%, 2/2/22 | | | 159 | | | | 159 | |
Veritas US, Inc. Tranche B, (3 month LIBOR + 4.500%)
6.193%, 1/27/23 | | | 54 | | | | 54 | |
| | | | | | | | |
| | | | | | | 558 | |
| | | | | | | | |
|
| Materials—0.7% | |
Anchor Glass Container Corp. Second Lien, (1 month
LIBOR + 7.750%)
9.182%, 12/7/24 | | | 58 | | | | 59 | |
CPG International LLC, (3 month LIBOR + 3.750%)
5.593%, 5/5/24 | | | 194 | | | | 194 | |
CPI Acquisition, Inc. First Lien, (3 month LIBOR + 4.500%)
5.962%, 8/17/22 | | | 358 | | | | 258 | |
IPS Acquisition LLC First Lien, (1 month LIBOR + 3.250%)
4.819%, 11/7/24 | | | 35 | | | | 35 | |
KMG Chemicals, Inc., (1 month LIBOR + 2.750%)
4.319%, 6/15/24 | | | 29 | | | | 29 | |
New Arclin U.S. Holding Corp. First Lien, (3 month
LIBOR + 4.250%)
5.943%, 2/14/24 | | | 129 | | | | 130 | |
Omnova Solutions, Inc. Tranche B-2, (1 month
LIBOR + 4.250%)
5.819%, 8/25/23 | | | 173 | | | | 174 | |
| | | | | | | | |
| | | | | | | 879 | |
| | | | | | | | |
|
| Real Estate—0.1% | |
Capital Automotive LP Tranche B, Second Lien, (1 month LIBOR + 6.000%)
7.570%, 3/24/25 | | | 64 | | | | 65 | |
| | | | | | | | |
|
| Telecommunication Services—0.4% | |
CenturyLink, Inc. Tranche B, (3 month PRIME + 1.750%)
0.000%, 1/31/25(8) | | | 140 | | | | 135 | |
Digicel International Finance Ltd. Tranche-B, First Lien, (1 month LIBOR + 3.750%)
5.310%, 5/27/24 | | | 20 | | | | 20 | |
Securus Technologies Holdings, Inc. | |
First Lien, (2 month LIBOR + 4.500%)
6.124%, 11/1/24 | | | 180 | | | | 182 | |
Second Lien, (2 month LIBOR + 8.250%)
9.874%, 11/1/25 | | | 150 | | | | 151 | |
West Corp. Tranche B, (1 month LIBOR + 4.000%)
5.350%, 10/10/24 | | | 84 | | | | 84 | |
| | | | | | | | |
| | | | | | | 572 | |
| | | | | | | | |
| | | | | | | | |
| | | PAR
VALUE | | | VALUE | |
| Utilities—0.6% | |
APLP Holdings LP, (1 month LIBOR + 3.500%)
5.069%, 4/13/23 | | $ | 258 | | | $ | 262 | |
Energy Future Intermediate Holding Co. LLC, (1 month LIBOR + 3.000%)
4.546%, 6/30/18 | | | 240 | | | | 240 | |
Talen Energy Supply LLC, (1 month LIBOR + 4.000%)
5.569%, 4/15/24 | | | 124 | | | | 125 | |
Vistra Operations Co. LLC | |
Tranche C, (1 month LIBOR + 2.500%)
3.834%, 8/4/23 | | | 26 | | | | 26 | |
(1 month LIBOR + 2.750%)
3.951%, 8/4/23 | | | 149 | | | | 149 | |
| | | | | | | | |
| | | | | | | | 802 | |
| TOTAL LOAN AGREEMENTS | | | | | | | | |
| (Identified Cost $9,215) | | | | | | | 9,142 | |
| | |
| | | SHARES | | | | |
| PREFERRED STOCKS—2.5% | |
|
| Financials—1.9% | |
Bank of New York Mellon Corp. (The)
Series E, 4.950% | | | 290 | (9) | | | 300 | |
Citigroup, Inc.
Series J, 7.125% | | | 15,800 | | | | 456 | |
JPMorgan Chase & Co.
Series Z, 5.300% | | | 70 | (9) | | | 73 | |
KeyCorp
Series D, 5.000% | | | 640 | (9) | | | 659 | |
M&T Bank Corp.
Series F, 5.125% | | | 160 | (9) | | | 171 | |
PNC Financial Services Group, Inc. (The)
Series R, 4.850% | | | 405 | (9) | | | 413 | |
PNC Financial Services Group, Inc. (The)
Series S, 5.000% | | | 405 | (9) | | | 428 | |
| | | | | | | | |
| | | | 2,500 | |
| | | | | | | | |
|
| Industrials—0.6% | |
General Electric Co.
Series D, 5.000% | | | 792 | (9) | | | 816 | |
| TOTAL PREFERRED STOCKS | | | | | | | | |
| (Identified Cost $3,113) | | | | | | | 3,316 | |
|
| COMMON STOCKS—0.2% | |
|
| Consumer Discretionary—0.0% | |
Mark IV Industries(1)(17) | | | 828 | | | | 26 | |
| | | | | | | | |
|
| Energy—0.0% | |
Frontera Energy Corp.(1) | | | 1,339 | | | | 42 | |
| | | | | | | | |
|
| Financials—0.1% | |
VICI Properties, Inc.(1) | | | 4,879 | | | | 100 | |
| | | | | | | | |
|
| Utilities—0.1% | |
Vistra Energy Corp.(1) | | | 7,753 | | | | 142 | |
| TOTAL COMMON STOCKS | | | | | | | | |
| (Identified Cost $267) | | | | | | | 310 | |
Refer to Footnote Legend on page 50.
See Notes to Financial Statements
49
VIRTUS NEWFLEET MULTI-SECTOR INTERMEDIATE BOND SERIES
SCHEDULE OF INVESTMENTS (Continued)
DECEMBER 31, 2017
($ reported in thousands)
| | | | | | | | |
| | | SHARES | | | VALUE | |
| AFFILIATED MUTUAL FUND(13)—2.2% | |
Virtus Newfleet Credit Opportunities Fund Class R6 | | | 310,156 | | | $ | 3,002 | |
| TOTAL AFFILIATED MUTUAL FUND | | | | | | | | |
| (Identified Cost $3,100) | | | | | | | 3,002 | |
| |
| RIGHTS—0.0% | | | | | |
|
| Utilities—0.0% | |
Vistra Energy Corp.(17) | | | 7,753 | | | | 7 | |
TOTAL RIGHTS
(Identified Cost $7) | | | | 7 | |
| TOTAL LONG TERM INVESTMENTS—98.3% | |
| (Identified Cost $132,387) | | | | 132,510 | (12) |
|
| SHORT-TERM INVESTMENT(13)—0.7% | |
|
| Money Market Mutual Fund—0.7% | |
Dreyfus Government Cash Management Fund – Institutional Shares (seven-day effective yield 1.190%) | | | 963,170 | | | | 963 | |
TOTAL SHORT-TERM INVESTMENT
(Identified Cost $963) | | | | | | | 963 | |
TOTAL INVESTMENTS—99.0%
(Identified Cost $133,350) | | | | 133,473 | |
Other assets and liabilities, net—1.0% | | | | 1,335 | |
| | | | | | | | |
| NET ASSETS—100.0% | | | $ | 134,808 | |
| | | | | | | | |
Abbreviations:
| FNMA | Federal National Mortgage Association (“Fannie Mae”) |
| LIBOR | London Interbank Offered Rate |
| PIK | Payment-in-Kind Security |
| REIT | Real Estate Investment Trust |
Footnote Legend:
| (1) | Non-income producing. |
| (2) | Variable rate security. Rate disclosed is as of December 31, 2017. For loan agreements, the rate shown may represent a weighted average interest rate. Information in parenthesis represents benchmark and reference rate for each security. Certain variable rate securities are not based on a published reference rate and spread but are determined by the issuer or agent and are based on current market conditions, or, for mortgage-backed securities, are impacted by the individual mortgages which are paying off over time. These securities do not indicate a reference rate and spread in their descriptions. |
| (3) | Security exempt from registration under Rule 144A of the Securities Act of 1933. These securities may be resold in transactions exempt from registration, normally to qualified institutional buyers. At December 31, 2017, these securities amounted to a value of $58,095 or 43.1% of net assets. |
| (4) | Regulation S security. Security is offered and sold outside of the United States, therefore, it is exempt from registration with the SEC under Rules 903 and 904 of the Securities Act of 1933. |
| (5) | No contractual maturity date. |
| (6) | Interest payments may be deferred. |
| (7) | This Note was issued for the sole purpose of funding a loan agreement between the issuer and the borrower. As the credit risk for this security lies solely with the borrower, the name represented here is that of the borrower. |
| (8) | This loan will settle after December 31, 2017, at which time the interest rate, based on the LIBOR and the agreed upon spread on trade date, will be reflected. |
| (9) | Value shown as par value. |
| (10) | Security in default, no interest payments are being received during the bankruptcy proceedings. |
| (11) | Security in default, a portion of the interest payments are being received during the bankruptcy proceedings. |
| (12) | All or a portion of the Fund’s assets have been segregated for delayed delivery security. |
| (13) | Shares of these funds are publicly offered, and the prospectus and annual reports of each are publicly available. |
| (14) | Amount is less than $500. |
| (15) | 100% of the income received was in cash. |
| (16) | Security valued at fair value as determined in good faith by or under the direction of the Trustees. This security is disclosed as a Level 3 security in the Fair Value Hierarchy table located after the Schedule of Investments. |
| (17) | The value of this security was determined using significant unobservable inputs and is reported as a Level 3 security in the Fair Value Hierarchy table located at the end of the Schedule of Investments. |
| (18) | Security in default. Interest payments are being received during the bankruptcy proceedings. |
Foreign Currencies:
| | | | |
| Country Weightings† (unaudited) | | | |
United States | | | 66 | % |
Mexico | | | 3 | |
Canada | | | 3 | |
Netherlands | | | 3 | |
Argentina | | | 2 | |
Colombia | | | 2 | |
Brazil | | | 2 | |
Other | | | 19 | |
Total | | | 100 | % |
† % of total investments as of December 31, 2017 | |
See Notes to Financial Statements
50
VIRTUS NEWFLEET MULTI-SECTOR INTERMEDIATE BOND SERIES
SCHEDULE OF INVESTMENTS (Continued)
DECEMBER 31, 2017
($ reported in thousands)
The following table provides a summary of inputs used to value the Series’ investments as of December 31, 2017 (See Security Valuation Note 2A in the Notes to Financial Statements):
| | | | | | | | | | | | | | | | |
| | | Total
Value at
December 31, 2017 | | | Level 1
Quoted
Prices | | | Level 2
Significant
Observable
Inputs | | | Level 3
Significant
Unobservable
Inputs | |
Debt Securities: | | | | | | | | | | | | | | | | |
Asset-Backed Securities | | $ | 6,517 | | | $ | — | | | $ | 6,517 | | | $ | — | |
Corporate Bonds and Notes | | | 72,409 | | | | — | | | | 72,409 | | | | — | |
Foreign Government Securities | | | 13,820 | | | | — | | | | 13,820 | | | | — | |
Loan Agreements | | | 9,142 | | | | — | | | | 9,142 | | | | — | |
Mortgage-Backed Securities | | | 19,614 | | | | — | | | | 19,614 | | | | — | |
Municipal Bonds | | | 775 | | | | — | | | | 775 | | | | — | |
U.S. Government Securities | | | 3,598 | | | | — | | | | 3,598 | | | | — | |
Equity Securities: | | | | | | | | | | | | | | | | |
Common Stocks | | | 310 | | | | 184 | | | | 100 | | | | 26 | |
Preferred Stocks | | | 3,316 | | | | 456 | | | | 2,860 | | | | — | |
Rights | | | 7 | | | | — | | | | — | | | | 7 | |
Affiliated Mutual Fund | | | 3,002 | | | | 3,002 | | | | — | | | | — | |
Short-Term Investment | | | 963 | | | | 963 | | | | — | | | | — | |
| | | | | | | | | | | | | | | | |
Total Investments | | $ | 133,473 | | | $ | 4,605 | | | $ | 128,835 | | | $ | 33 | |
| | | | | | | | | | | | | | | | |
Security held by the series with an end of period value of $0 was transferred from Level 2 to Level 3 due to a decrease in trading activities at period end.
There were no other transfers between Level 1, Level 2, or Level 3 related to securities held at December 31, 2017.
Management has determined that the amount of Level 3 securities compared to total net assets is de minimis; therefore, the rollforward of Level 3 securities and assumptions are not shown for the period ended December 31, 2017.
See Notes to Financial Statements
51
VIRTUS RAMPART ENHANCED CORE EQUITY SERIES
SCHEDULE OF INVESTMENTS
DECEMBER 31, 2017
($ reported in thousands)
| | | | | | | | |
| | | SHARES | | | VALUE | |
| COMMON STOCKS—97.1% | |
|
| Consumer Discretionary—12.4% | |
Advance Auto Parts, Inc. | | | 346 | | | $ | 35 | |
Amazon.com, Inc.(1)(3) | | | 1,973 | | | | 2,307 | |
Aptiv plc | | | 1,205 | | | | 102 | |
AutoZone, Inc.(1) | | | 139 | | | | 99 | |
Best Buy Co., Inc. | | | 1,324 | | | | 91 | |
BorgWarner, Inc. | | | 935 | | | | 48 | |
CarMax, Inc.(1) | | | 906 | | | | 58 | |
Carnival Corp. | | | 2,019 | | | | 134 | |
CBS Corp. Class B | | | 1,801 | | | | 106 | |
Charter Communications, Inc. Class A(1) | | | 995 | | | | 334 | |
Chipotle Mexican Grill, Inc.(1) | | | 129 | | | | 37 | |
Comcast Corp. Class A(3) | | | 23,277 | | | | 932 | |
Darden Restaurants, Inc. | | | 641 | | | | 62 | |
Discovery Communications, Inc. Class A(1) | | | 721 | | | | 16 | |
Discovery Communications, Inc. Class C(1) | | | 988 | | | | 21 | |
DISH Network Corp. Class A(1) | | | 1,170 | | | | 56 | |
Dollar General Corp. | | | 1,289 | | | | 120 | |
Dollar Tree, Inc.(1) | | | 1,173 | | | | 126 | |
Expedia, Inc. | | | 617 | | | | 74 | |
Foot Locker, Inc. | | | 615 | | | | 29 | |
Ford Motor Co.(3) | | | 19,352 | | | | 242 | |
Gap, Inc. (The) | | | 1,031 | | | | 35 | |
Garmin Ltd. | | | 538 | | | | 32 | |
General Motors Co.(3) | | | 6,491 | | | | 266 | |
Genuine Parts Co. | | | 726 | | | | 69 | |
Goodyear Tire & Rubber Co. (The) | | | 1,180 | | | | 38 | |
H&R Block, Inc. | | | 971 | | | | 25 | |
Hanesbrands, Inc. | | | 1,706 | | | | 36 | |
Harley-Davidson, Inc. | | | 819 | | | | 42 | |
Hasbro, Inc. | | | 580 | | | | 53 | |
Hilton Worldwide Holdings, Inc. | | | 1,023 | | | | 82 | |
Home Depot, Inc. (The)(3) | | | 5,833 | | | | 1,106 | |
Horton (D.R.), Inc. | | | 1,686 | | | | 86 | |
Interpublic Group of Cos., Inc. (The) | | | 1,851 | | | | 37 | |
Kohl’s Corp. | | | 799 | | | | 43 | |
L Brands, Inc. | | | 1,235 | | | | 74 | |
Leggett & Platt, Inc. | | | 620 | | | | 30 | |
Lennar Corp. Class A | | | 1,034 | | | | 65 | |
LKQ Corp.(1) | | | 1,573 | | | | 64 | |
Lowe’s Cos., Inc.(3) | | | 4,178 | | | | 388 | |
Macy’s, Inc. | | | 1,427 | | | | 36 | |
Marriott International, Inc. Class A | | | 1,548 | | | | 210 | |
Mattel, Inc. | | | 1,605 | | | | 25 | |
McDonald’s Corp.(3) | | | 4,008 | | | | 690 | |
MGM Resorts International | | | 2,568 | | | | 86 | |
Michael Kors Holdings Ltd.(1) | | | 730 | | | | 46 | |
Mohawk Industries, Inc.(1) | | | 314 | | | | 87 | |
Netflix, Inc.(1) | | | 2,136 | | | | 410 | |
Newell Brands, Inc. | | | 2,423 | | | | 75 | |
News Corp. Class A | | | 1,791 | | | | 29 | |
News Corp. Class B | | | 561 | | | | 9 | |
NIKE, Inc. Class B(3) | | | 6,502 | | | | 407 | |
Nordstrom, Inc. | | | 521 | | | | 25 | |
Norwegian Cruise Line Holdings Ltd.(1) | | | 904 | | | | 48 | |
O’Reilly Automotive, Inc.(1) | | | 436 | | | | 105 | |
Omnicom Group, Inc. | | | 1,141 | | | | 83 | |
Priceline Group, Inc. (The)(1)(3) | | | 243 | | | | 422 | |
PulteGroup, Inc. | | | 1,331 | | | | 44 | |
PVH Corp. | | | 366 | | | | 50 | |
Ralph Lauren Corp. | | | 258 | | | | 27 | |
Ross Stores, Inc. | | | 1,925 | | | | 154 | |
Royal Caribbean Cruises Ltd. | | | 851 | | | | 102 | |
| | | | | | | | |
| | | SHARES | | | VALUE | |
| Consumer Discretionary—continued | |
Scripps Networks Interactive, Inc. Class A | | | 449 | | | $ | 38 | |
Signet Jewelers Ltd. | | | 308 | | | | 17 | |
Starbucks Corp.(3) | | | 7,145 | | | | 410 | |
Tapestry, Inc. | | | 1,434 | | | | 63 | |
Target Corp.(3) | | | 2,703 | | | | 176 | |
Tiffany & Co. | | | 505 | | | | 53 | |
Time Warner, Inc.(3) | | | 3,849 | | | | 352 | |
TJX Cos., Inc. (The) | | | 3,149 | | | | 241 | |
Tractor Supply Co. | | | 602 | | | | 45 | |
TripAdvisor, Inc.(1) | | | 517 | | | | 18 | |
Twenty-First Century Fox, Inc. Class A(3) | | | 5,207 | | | | 180 | |
Twenty-First Century Fox, Inc. Class B(3) | | | 2,173 | | | | 74 | |
Ulta Beauty, Inc.(1) | | | 297 | | | | 66 | |
Under Armour, Inc. Class A(1) | | | 865 | | | | 12 | |
Under Armour, Inc. Class C(1) | | | 864 | | | | 12 | |
VF Corp. | | | 1,617 | | | | 120 | |
Viacom, Inc. Class B | | | 1,820 | | | | 56 | |
Walt Disney Co. (The)(3) | | | 7,638 | | | | 821 | |
Whirlpool Corp. | | | 361 | | | | 61 | |
Wyndham Worldwide Corp. | | | 490 | | | | 57 | |
Wynn Resorts Ltd. | | | 405 | | | | 68 | |
Yum! Brands, Inc. | | | 1,706 | | | | 139 | |
| | | | | | | | |
| | | | 13,849 | |
| | | | | | | | |
|
| Consumer Staples—7.5% | |
Altria Group, Inc.(3) | | | 8,592 | | | | 614 | |
Archer-Daniels-Midland Co. | | | 2,559 | | | | 103 | |
Brown-Forman Corp. Class B | | | 844 | | | | 58 | |
Campbell Soup Co. | | | 899 | | | | 43 | |
Church & Dwight Co., Inc. | | | 1,168 | | | | 59 | |
Clorox Co. (The) | | | 569 | | | | 85 | |
Coca-Cola Co. (The)(3) | | | 17,191 | | | | 789 | |
Colgate-Palmolive Co.(3) | | | 3,935 | | | | 297 | |
Conagra Brands, Inc. | | | 1,894 | | | | 71 | |
Constellation Brands, Inc. Class A | | | 776 | | | | 177 | |
Costco Wholesale Corp.(3) | | | 1,964 | | | | 365 | |
Coty, Inc. Class A | | | 2,207 | | | | 44 | |
CVS Health Corp.(3) | | | 4,549 | | | | 330 | |
Dr. Pepper Snapple Group, Inc. | | | 806 | | | | 78 | |
Estee Lauder Cos., Inc. (The) Class A | | | 1,003 | | | | 128 | |
General Mills, Inc. | | | 2,610 | | | | 155 | |
Hershey Co. (The) | | | 611 | | | | 69 | |
Hormel Foods Corp. | | | 1,264 | | | | 46 | |
J.M. Smucker Co. (The) | | | 498 | | | | 62 | |
Kellogg Co. | | | 1,108 | | | | 75 | |
Kimberly-Clark Corp. | | | 1,563 | | | | 189 | |
Kraft Heinz Co.(The)(3) | | | 2,649 | | | | 206 | |
Kroger Co. (The) | | | 4,044 | | | | 111 | |
McCormick & Co., Inc. | | | 531 | | | | 54 | |
Molson Coors Brewing Co. Class B | | | 805 | | | | 66 | |
Mondelez International, Inc. Class A(3) | | | 6,752 | | | | 289 | |
Monster Beverage Corp.(1) | | | 1,890 | | | | 120 | |
PepsiCo, Inc.(3) | | | 6,397 | | | | 767 | |
Philip Morris International, Inc.(3) | | | 6,955 | | | | 735 | |
Procter & Gamble Co. (The)(3) | | | 11,420 | | | | 1,049 | |
Sysco Corp. | | | 2,213 | | | | 134 | |
Tyson Foods, Inc. Class A | | | 1,279 | | | | 104 | |
Wal-Mart Stores, Inc.(3) | | | 6,555 | | | | 647 | |
Walgreens Boots Alliance, Inc.(3) | | | 3,888 | | | | 282 | |
| | | | | | | | |
| | | | 8,401 | |
| | | | | | | | |
|
| Energy—5.6% | |
Anadarko Petroleum Corp. | | | 2,509 | | | | 135 | |
Refer to Footnote Legend on page 56.
See Notes to Financial Statements
52
VIRTUS RAMPART ENHANCED CORE EQUITY SERIES
SCHEDULE OF INVESTMENTS (Continued)
DECEMBER 31, 2017
($ reported in thousands)
| | | | | | | | |
| | | SHARES | | | VALUE | |
| Energy—continued | |
Andeavor | | | 646 | | | $ | 74 | |
Apache Corp. | | | 1,706 | | | | 72 | |
Baker Hughes a GE Co. | | | 1,917 | | | | 61 | |
Cabot Oil & Gas Corp. | | | 2,071 | | | | 59 | |
Chesapeake Energy Corp.(1) | | | 3,499 | | | | 14 | |
Chevron Corp.(3) | | | 8,486 | | | | 1,062 | |
Cimarex Energy Co. | | | 427 | | | | 52 | |
Concho Resources, Inc.(1)(3) | | | 666 | | | | 100 | |
ConocoPhillips | | | 5,450 | | | | 299 | |
Devon Energy Corp. | | | 2,354 | | | | 97 | |
EOG Resources, Inc. | | | 2,586 | | | | 279 | |
EQT Corp. | | | 1,070 | | | | 61 | |
Exxon Mobil Corp.(3) | | | 18,976 | | | | 1,587 | |
Halliburton Co.(3) | | | 3,887 | | | | 190 | |
Helmerich & Payne, Inc. | | | 486 | | | | 31 | |
Hess Corp. | | | 1,210 | | | | 57 | |
Kinder Morgan, Inc.(3) | | | 8,598 | | | | 155 | |
Marathon Oil Corp. | | | 3,807 | | | | 64 | |
Marathon Petroleum Corp. | | | 2,267 | | | | 150 | |
National Oilwell Varco, Inc. | | | 1,702 | | | | 61 | |
Newfield Exploration Co.(1) | | | 892 | | | | 28 | |
Noble Energy, Inc. | | | 2,179 | | | | 64 | |
Occidental Petroleum Corp.(3) | | | 3,424 | | | | 252 | |
ONEOK, Inc. | | | 1,701 | | | | 91 | |
Phillips 66 | | | 1,924 | | | | 195 | |
Pioneer Natural Resources Co. | | | 762 | | | | 132 | |
Range Resources Corp. | | | 1,157 | | | | 20 | |
Schlumberger Ltd.(3) | | | 6,222 | | | | 419 | |
TechnipFMC plc | | | 1,967 | | | | 62 | |
Valero Energy Corp. | | | 1,978 | | | | 182 | |
Williams Cos., Inc. (The) | | | 3,702 | | | | 113 | |
| | | | | | | | |
| | | | 6,218 | |
| | | | | | | | |
|
| Financials—15.2% | |
Affiliated Managers Group, Inc. | | | 282 | | | | 58 | |
Aflac, Inc. | | | 1,967 | | | | 173 | |
Allstate Corp. (The)(3) | | | 1,798 | | | | 188 | |
American Express Co.(3) | | | 3,637 | | | | 361 | |
American International Group, Inc.(3) | | | 4,479 | | | | 267 | |
Ameriprise Financial, Inc. | | | 746 | | | | 126 | |
AON plc | | | 1,266 | | | | 170 | |
Assurant, Inc. | | | 284 | | | | 29 | |
Bank of America Corp.(3) | | | 48,644 | | | | 1,436 | |
Bank of New York Mellon Corp. (The) | | | 5,122 | | | | 276 | |
BB&T Corp. | | | 4,022 | | | | 200 | |
Berkshire Hathaway, Inc. Class B(1)(3) | | | 9,539 | | | | 1,891 | |
BlackRock, Inc.(3) | | | 615 | | | | 316 | |
Brighthouse Financial, Inc.(1)(3) | | | 489 | | | | 29 | |
Capital One Financial Corp.(3) | | | 2,407 | | | | 240 | |
Cboe Global Markets, Inc. | | | 561 | | | | 70 | |
Charles Schwab Corp. (The) | | | 5,909 | | | | 303 | |
Chubb Ltd. | | | 2,307 | | | | 337 | |
Cincinnati Financial Corp. | | | 743 | | | | 56 | |
Citigroup, Inc.(3) | | | 13,507 | | | | 1,005 | |
Citizens Financial Group, Inc. | | | 2,492 | | | | 104 | |
CME Group, Inc. | | | 1,692 | | | | 247 | |
Comerica, Inc. | | | 875 | | | | 76 | |
Discover Financial Services | | | 1,853 | | | | 142 | |
E*TRADE Financial Corp.(1) | | | 1,369 | | | | 68 | |
Everest Re Group Ltd. | | | 209 | | | | 46 | |
Fifth Third Bancorp | | | 3,667 | | | | 111 | |
Franklin Resources, Inc. | | | 1,659 | | | | 72 | |
Gallagher (Arthur J.) & Co. | | | 897 | | | | 57 | |
| | | | | | | | |
| | | SHARES | | | VALUE | |
| Financials—continued | |
Goldman Sachs Group, Inc. (The)(3) | | | 1,784 | | | $ | 454 | |
Hartford Financial Services Group, Inc. (The) | | | 1,813 | | | | 102 | |
Huntington Bancshares, Inc. | | | 5,425 | | | | 79 | |
Intercontinental Exchange, Inc. | | | 2,929 | | | | 207 | |
Invesco Ltd. | | | 2,025 | | | | 74 | |
JPMorgan Chase & Co.(3) | | | 17,446 | | | | 1,866 | |
KeyCorp | | | 5,413 | | | | 109 | |
Leucadia National Corp. | | | 1,658 | | | | 44 | |
Lincoln National Corp. | | | 1,103 | | | | 85 | |
Loews Corp. | | | 1,374 | | | | 69 | |
M&T Bank Corp. | | | 756 | | | | 129 | |
Marsh & McLennan Cos., Inc. | | | 2,551 | | | | 208 | |
MetLife, Inc.(3) | | | 5,269 | | | | 266 | |
Moody’s Corp. | | | 827 | | | | 122 | |
Morgan Stanley(3) | | | 7,011 | | | | 368 | |
Nasdaq, Inc. | | | 583 | | | | 45 | |
Navient Corp. | | | 1,545 | | | | 20 | |
Northern Trust Corp. | | | 1,069 | | | | 107 | |
People’s United Financial, Inc. | | | 1,763 | | | | 33 | |
PNC Financial Services Group, Inc. (The) | | | 2,376 | | | | 343 | |
Principal Financial Group, Inc. | | | 1,337 | | | | 94 | |
Progressive Corp. (The) | | | 2,896 | | | | 163 | |
Prudential Financial, Inc. | | | 2,125 | | | | 244 | |
Raymond James Financial, Inc. | | | 639 | | | | 57 | |
Regions Financial Corp. | | | 5,948 | | | | 103 | |
S&P Global, Inc. | | | 1,279 | | | | 217 | |
State Street Corp. | | | 1,861 | | | | 182 | |
SunTrust Banks, Inc. | | | 2,389 | | | | 154 | |
Synchrony Financial | | | 3,721 | | | | 144 | |
T. Rowe Price Group, Inc. | | | 1,196 | | | | 125 | |
Torchmark Corp. | | | 554 | | | | 50 | |
Travelers Cos., Inc. (The) | | | 1,373 | | | | 186 | |
U.S. Bancorp(3) | | | 7,878 | | | | 422 | |
Unum Group | | | 1,129 | | | | 62 | |
Wells Fargo & Co.(3) | | | 22,148 | | | | 1,344 | |
Willis Towers Watson plc | | | 668 | | | | 101 | |
XL Group Ltd. | | | 1,302 | | | | 46 | |
Zions Bancorporation | | | 1,027 | | | | 52 | |
| | | | | | | | |
| | | | 16,930 | |
| | | | | | | | |
|
| Health Care—12.7% | |
Abbott Laboratories(3) | | | 7,781 | | | | 444 | |
AbbVie, Inc.(3) | | | 7,139 | | | | 690 | |
Aetna, Inc. | | | 1,479 | | | | 267 | |
Agilent Technologies, Inc. | | | 1,461 | | | | 98 | |
Alexion Pharmaceuticals, Inc.(1) | | | 1,014 | | | | 121 | |
Align Technology, Inc.(1) | | | 328 | | | | 73 | |
Allergan plc(3) | | | 1,489 | | | | 244 | |
AmerisourceBergen Corp. | | | 733 | | | | 67 | |
Amgen, Inc.(3) | | | 3,268 | | | | 568 | |
Anthem, Inc. | | | 1,170 | | | | 263 | |
Baxter International, Inc. | | | 2,278 | | | | 147 | |
Becton, Dickinson & Co. | | | 1,179 | | | | 252 | |
Biogen, Inc.(1)(3) | | | 945 | | | | 301 | |
Boston Scientific Corp.(1) | | | 6,237 | | | | 155 | |
Bristol-Myers Squibb Co.(3) | | | 7,344 | | | | 450 | |
Cardinal Health, Inc. | | | 1,438 | | | | 88 | |
Celgene Corp.(1)(3) | | | 3,504 | | | | 366 | |
Centene Corp.(1) | | | 784 | | | | 79 | |
Cerner Corp.(1) | | | 1,432 | | | | 97 | |
Cigna Corp. | | | 1,119 | | | | 227 | |
Cooper Cos., Inc. (The) | | | 222 | | | | 48 | |
Danaher Corp.(3) | | | 2,725 | | | | 253 | |
Refer to Footnote Legend on page 56.
See Notes to Financial Statements
53
VIRTUS RAMPART ENHANCED CORE EQUITY SERIES
SCHEDULE OF INVESTMENTS (Continued)
DECEMBER 31, 2017
($ reported in thousands)
| | | | | | | | |
| | | SHARES | | | VALUE | |
| Health Care—continued | |
DaVita, Inc.(1) | | | 695 | | | $ | 50 | |
DENTSPLY SIRONA, Inc. | | | 1,024 | | | | 67 | |
Edwards Lifesciences Corp.(1) | | | 960 | | | | 108 | |
Eli Lilly & Co.(3) | | | 4,339 | | | | 366 | |
Envision Healthcare Corp.(1) | | | 612 | | | | 21 | |
Express Scripts Holding Co.(1) | | | 2,552 | | | | 191 | |
Gilead Sciences, Inc.(3) | | | 5,848 | | | | 419 | |
HCA Healthcare, Inc.(1) | | | 1,314 | | | | 115 | |
Henry Schein, Inc.(1) | | | 684 | | | | 48 | |
Hologic, Inc.(1) | | | 1,275 | | | | 55 | |
Humana, Inc. | | | 637 | | | | 158 | |
IDEXX Laboratories, Inc.(1) | | | 395 | | | | 62 | |
Illumina, Inc.(1) | | | 664 | | | | 145 | |
Incyte Corp.(1) | | | 776 | | | | 74 | |
Intuitive Surgical, Inc.(1) | | | 494 | | | | 180 | |
IQVIA Holdings, Inc.(1) | | | 679 | | | | 66 | |
Johnson & Johnson(3) | | | 12,020 | | | | 1,679 | |
Laboratory Corp. of America Holdings(1) | | | 463 | | | | 74 | |
McKesson Corp. | | | 956 | | | | 149 | |
Medtronic plc(3) | | | 6,066 | | | | 490 | |
Merck & Co., Inc.(3) | | | 12,249 | | | | 689 | |
Mettler-Toledo International, Inc.(1) | | | 117 | | | | 73 | |
Mylan NV(1) | | | 2,437 | | | | 103 | |
Patterson Cos., Inc. | | | 422 | | | | 15 | |
PerkinElmer, Inc. | | | 500 | | | | 37 | |
Perrigo Co., plc | | | 603 | | | | 53 | |
Pfizer, Inc.(3) | | | 26,726 | | | | 968 | |
Quest Diagnostics, Inc. | | | 601 | | | | 59 | |
Regeneron Pharmaceuticals, Inc.(1) | | | 349 | | | | 131 | |
ResMed, Inc. | | | 646 | | | | 55 | |
Stryker Corp. | | | 1,428 | | | | 221 | |
Thermo Fisher Scientific, Inc. | | | 1,792 | | | | 340 | |
UnitedHealth Group, Inc.(3) | | | 4,330 | | | | 955 | |
Universal Health Services, Inc. Class B | | | 402 | | | | 46 | |
Varian Medical Systems, Inc.(1) | | | 417 | | | | 46 | |
Vertex Pharmaceuticals, Inc.(1) | | | 1,146 | | | | 172 | |
Waters Corp.(1) | | | 361 | | | | 70 | |
Zimmer Biomet Holdings, Inc. | | | 919 | | | | 111 | |
Zoetis, Inc. | | | 2,231 | | | | 161 | |
| | | | | | | | |
| | | | 14,120 | |
| | | | | | | | |
|
| Industrials—9.5% | |
3M Co.(3) | | | 2,673 | | | | 629 | |
A.O. Smith Corp. | | | 690 | | | | 42 | |
Acuity Brands, Inc. | | | 176 | | | | 31 | |
Alaska Air Group, Inc. | | | 560 | | | | 41 | |
Allegion plc | | | 446 | | | | 35 | |
American Airlines Group, Inc. | | | 1,970 | | | | 102 | |
AMETEK, Inc. | | | 1,049 | | | | 76 | |
Arconic, Inc. | | | 1,883 | | | | 51 | |
Boeing Co. (The)(3) | | | 2,488 | | | | 734 | |
Caterpillar, Inc.(3) | | | 2,647 | | | | 417 | |
Cintas Corp. | | | 388 | | | | 60 | |
CSX Corp. | | | 4,063 | | | | 224 | |
Cummins, Inc. | | | 716 | | | | 126 | |
Deere & Co. | | | 1,420 | | | | 222 | |
Delta Air Lines, Inc. | | | 3,028 | | | | 170 | |
Dover Corp. | | | 708 | | | | 72 | |
Eaton Corp. plc | | | 2,022 | | | | 160 | |
Emerson Electric Co.(3) | | | 2,833 | | | | 197 | |
Equifax, Inc. | | | 547 | | | | 65 | |
Expeditors International of Washington, Inc. | | | 821 | | | | 53 | |
Fastenal Co. | | | 1,309 | | | | 72 | |
| | | | | | | | |
| | | SHARES | | | VALUE | |
| Industrials—continued | |
FedEx Corp.(3) | | | 1,101 | | | $ | 275 | |
Flowserve Corp. | | | 612 | | | | 26 | |
Fluor Corp. | | | 636 | | | | 33 | |
Fortive Corp. | | | 1,386 | | | | 100 | |
Fortune Brands Home & Security, Inc. | | | 700 | | | | 48 | |
General Dynamics Corp.(3) | | | 1,240 | | | | 252 | |
General Electric Co.(3) | | | 38,773 | | | | 677 | |
Harris Corp. | | | 592 | | | | 84 | |
Honeywell International, Inc.(3) | | | 3,414 | | | | 524 | |
Hunt (JB) Transport Services, Inc. | | | 402 | | | | 46 | |
IHS Markit Ltd.(1) | | | 1,651 | | | | 75 | |
Illinois Tool Works, Inc. | | | 1,377 | | | | 230 | |
Ingersoll-Rand plc | | | 1,153 | | | | 103 | |
Jacobs Engineering Group, Inc. | | | 564 | | | | 37 | |
Johnson Controls International plc | | | 4,238 | | | | 162 | |
Kansas City Southern | | | 479 | | | | 50 | |
L3 Technologies, Inc. | | | 356 | | | | 70 | |
Lockheed Martin Corp.(3) | | | 1,122 | | | | 360 | |
Masco Corp. | | | 1,448 | | | | 64 | |
Nielsen Holdings plc | | | 1,527 | | | | 56 | |
Norfolk Southern Corp. | | | 1,274 | | | | 185 | |
Northrop Grumman Corp. | | | 775 | | | | 238 | |
PACCAR, Inc. | | | 1,597 | | | | 114 | |
Parker-Hannifin Corp. | | | 605 | | | | 121 | |
Pentair plc | | | 713 | | | | 50 | |
Quanta Services, Inc.(1) | | | 694 | | | | 27 | |
Raytheon Co.(3) | | | 1,292 | | | | 243 | |
Republic Services, Inc. | | | 1,041 | | | | 70 | |
Robert Half International, Inc. | | | 574 | | | | 32 | |
Robinson (C.H.) Worldwide, Inc. | | | 638 | | | | 57 | |
Rockwell Automation, Inc. | | | 583 | | | | 114 | |
Rockwell Collins, Inc. | | | 738 | | | | 100 | |
Roper Technologies, Inc. | | | 465 | | | | 120 | |
Snap-on, Inc. | | | 272 | | | | 47 | |
Southwest Airlines Co. | | | 2,503 | | | | 164 | |
Stanley Black & Decker, Inc. | | | 696 | | | | 118 | |
Stericycle, Inc.(1) | | | 400 | | | | 27 | |
Textron, Inc. | | | 1,203 | | | | 68 | |
TransDigm Group, Inc. | | | 219 | | | | 60 | |
Union Pacific Corp.(3) | | | 3,584 | | | | 481 | |
United Continental Holdings, Inc.(1) | | | 1,175 | | | | 79 | |
United Parcel Service, Inc. Class B(3) | | | 3,085 | | | | 368 | |
United Rentals, Inc.(1) | | | 384 | | | | 66 | |
United Technologies Corp.(3) | | | 3,327 | | | | 424 | |
Verisk Analytics, Inc.(1) | | | 706 | | | | 68 | |
W.W. Grainger, Inc. | | | 239 | | | | 56 | |
Waste Management, Inc. | | | 1,840 | | | | 159 | |
Xylem, Inc. | | | 816 | | | | 56 | |
| | | | | | | | |
| | | | 10,563 | |
| | | | | | | | |
|
| Information Technology—24.0% | |
Accenture plc Class A(3) | | | 3,042 | | | | 466 | |
Activision Blizzard, Inc. | | | 3,724 | | | | 236 | |
Adobe Systems, Inc.(1) | | | 2,430 | | | | 426 | |
Advanced Micro Devices, Inc.(1) | | | 4,028 | | | | 41 | |
Akamai Technologies, Inc.(1) | | | 804 | | | | 52 | |
Alliance Data Systems Corp. | | | 239 | | | | 61 | |
Alphabet, Inc. Class A(1)(3) | | | 1,466 | | | | 1,544 | |
Alphabet, Inc. Class C(1)(3) | | | 1,485 | | | | 1,554 | |
Amphenol Corp. Class A | | | 1,513 | | | | 133 | |
Analog Devices, Inc. | | | 1,809 | | | | 161 | |
ANSYS, Inc.(1) | | | 434 | | | | 64 | |
Apple, Inc.(3) | | | 25,409 | | | | 4,300 | |
Refer to Footnote Legend on page 56.
See Notes to Financial Statements
54
VIRTUS RAMPART ENHANCED CORE EQUITY SERIES
SCHEDULE OF INVESTMENTS (Continued)
DECEMBER 31, 2017
($ reported in thousands)
| | | | | | | | |
| | | SHARES | | | VALUE | |
| Information Technology—continued | |
Applied Materials, Inc. | | | 5,257 | | | $ | 269 | |
Autodesk, Inc.(1) | | | 1,087 | | | | 114 | |
Automatic Data Processing, Inc. | | | 2,187 | | | | 256 | |
Broadcom Ltd. | | | 2,002 | | | | 514 | |
CA, Inc. | | | 1,618 | | | | 54 | |
Cadence Design Systems, Inc.(1) | | | 1,383 | | | | 58 | |
Cisco Systems, Inc.(3) | | | 24,606 | | | | 942 | |
Citrix Systems, Inc.(1) | | | 714 | | | | 63 | |
Cognizant Technology Solutions Corp. Class A | | | 2,933 | | | | 208 | |
Corning, Inc. | | | 4,399 | | | | 141 | |
CSRA, Inc. | | | 759 | | | | 23 | |
DXC Technology Co. | | | 1,395 | | | | 132 | |
eBay, Inc.(1) | | | 4,907 | | | | 185 | |
Electronic Arts, Inc.(1) | | | 1,544 | | | | 162 | |
F5 Networks, Inc.(1) | | | 296 | | | | 39 | |
Facebook, Inc. Class A(1)(3) | | | 11,660 | | | | 2,058 | |
Fidelity National Information Services, Inc. | | | 1,647 | | | | 155 | |
Fiserv, Inc.(1) | | | 1,052 | | | | 138 | |
FLIR Systems, Inc. | | | 710 | | | | 33 | |
Gartner, Inc.(1) | | | 464 | | | | 57 | |
Global Payments, Inc. | | | 734 | | | | 74 | |
Hewlett Packard Enterprise Co. | | | 8,195 | | | | 118 | |
HP, Inc. | | | 8,150 | | | | 171 | |
Intel Corp.(3) | | | 23,124 | | | | 1,067 | |
International Business Machines Corp.(3) | | | 4,265 | | | | 654 | |
Intuit, Inc. | | | 1,215 | | | | 192 | |
Juniper Networks, Inc. | | | 1,801 | | | | 51 | |
KLA-Tencor Corp. | | | 759 | | | | 80 | |
Lam Research Corp. | | | 798 | | | | 147 | |
Mastercard, Inc. Class A(3) | | | 4,596 | | | | 696 | |
Microchip Technology, Inc. | | | 1,124 | | | | 99 | |
Micron Technology, Inc.(1) | | | 5,502 | | | | 226 | |
Microsoft Corp.(3) | | | 37,890 | | | | 3,241 | |
Motorola Solutions, Inc. | | | 788 | | | | 71 | |
NetApp, Inc. | | | 1,308 | | | | 72 | |
NVIDIA Corp. | | | 2,958 | | | | 572 | |
Oracle Corp.(3) | | | 14,862 | | | | 703 | |
Paychex, Inc. | | | 1,563 | | | | 106 | |
PayPal Holdings, Inc.(1)(3) | | | 5,568 | | | | 410 | |
Qorvo, Inc.(1) | | | 658 | | | | 44 | |
QUALCOMM, Inc.(3) | | | 7,273 | | | | 466 | |
Red Hat, Inc.(1) | | | 870 | | | | 104 | |
salesforce.com, Inc.(1) | | | 3,362 | | | | 344 | |
Seagate Technology plc | | | 1,388 | | | | 58 | |
Skyworks Solutions, Inc. | | | 906 | | | | 86 | |
Symantec Corp. | | | 2,990 | | | | 84 | |
Synopsys, Inc.(1) | | | 712 | | | | 61 | |
TE Connectivity Ltd. | | | 1,767 | | | | 168 | |
Texas Instruments, Inc.(3) | | | 4,875 | | | | 509 | |
Total System Services, Inc. | | | 856 | | | | 68 | |
VeriSign, Inc.(1) | | | 410 | | | | 47 | |
Visa, Inc. Class A(3) | | | 9,003 | | | | 1,027 | |
Western Digital Corp. | | | 1,439 | | | | 114 | |
Western Union Co. (The) | | | 2,176 | | | | 41 | |
Xerox Corp. | | | 1,103 | | | | 32 | |
Xilinx, Inc. | | | 1,203 | | | | 81 | |
| | | | | | | | |
| | | | 26,723 | |
| | | | | | | | |
|
| Materials—2.7% | |
Air Products & Chemicals, Inc. | | | 976 | | | | 160 | |
Albemarle Corp. | | | 495 | | | | 63 | |
Avery Dennison Corp. | | | 396 | | | | 46 | |
Ball Corp. | | | 1,575 | | | | 60 | |
CF Industries Holdings, Inc. | | | 1,045 | | | | 45 | |
| | | | | | | | |
| | | SHARES | | | VALUE | |
| Materials—continued | |
DowDuPont, Inc.(3) | | | 10,449 | | | $ | 744 | |
Eastman Chemical Co. | | | 649 | | | | 60 | |
Ecolab, Inc. | | | 1,166 | | | | 156 | |
FMC Corp. | | | 601 | | | | 57 | |
Freeport-McMoRan, Inc.(1) | | | 6,026 | | | | 114 | |
International Flavors & Fragrances, Inc. | | | 354 | | | | 54 | |
International Paper Co. | | | 1,849 | | | | 107 | |
LyondellBasell Industries N.V. Class A | | | 1,453 | | | | 160 | |
Martin Marietta Materials, Inc. | | | 281 | | | | 62 | |
Monsanto Co.(3) | | | 1,967 | | | | 230 | |
Mosaic Co. (The) | | | 1,572 | | | | 40 | |
Newmont Mining Corp. | | | 2,388 | | | | 90 | |
Nucor Corp. | | | 1,430 | | | | 91 | |
Packaging Corp. of America | | | 423 | | | | 51 | |
PPG Industries, Inc. | | | 1,149 | | | | 134 | |
Praxair, Inc. | | | 1,281 | | | | 198 | |
Sealed Air Corp. | | | 808 | | | | 40 | |
Sherwin-Williams Co. (The) | | | 368 | | | | 151 | |
Vulcan Materials Co. | | | 592 | | | | 76 | |
WestRock Co. | | | 1,137 | | | | 72 | |
| | | | | | | | |
| | | | 3,061 | |
| | | | | | | | |
|
| Real Estate—2.7% | |
Alexandria Real Estate Equities, Inc. | | | 420 | | | | 55 | |
American Tower Corp. | | | 1,922 | | | | 274 | |
Apartment Investment & Management Co. Class A | | | 704 | | | | 31 | |
AvalonBay Communities, Inc. | | | 620 | | | | 111 | |
Boston Properties, Inc. | | | 692 | | | | 90 | |
CBRE Group, Inc. Class A(1) | | | 1,349 | | | | 58 | |
Crown Castle International Corp. | | | 1,819 | | | | 202 | |
Digital Realty Trust, Inc. | | | 918 | | | | 105 | |
Duke Realty Corp. | | | 1,596 | | | | 43 | |
Equinix, Inc. | | | 350 | | | | 159 | |
Equity Residential | | | 1,648 | | | | 105 | |
Essex Property Trust, Inc. | | | 296 | | | | 71 | |
Extra Space Storage, Inc. | | | 565 | | | | 49 | |
Federal Realty Investment Trust | | | 324 | | | | 43 | |
GGP, Inc. | | | 2,721 | | | | 64 | |
HCP, Inc. | | | 2,104 | | | | 55 | |
Host Hotels & Resorts, Inc. | | | 3,320 | | | | 66 | |
Iron Mountain, Inc. | | | 1,152 | | | | 43 | |
Kimco Realty Corp. | | | 1,910 | | | | 35 | |
Macerich Co. (The) | | | 471 | | | | 31 | |
Mid-America Apartment Communities, Inc. | | | 510 | | | | 51 | |
Prologis, Inc. | | | 2,386 | | | | 154 | |
Public Storage | | | 671 | | | | 140 | |
Realty Income Corp. | | | 1,230 | | | | 70 | |
Regency Centers Corp. | | | 664 | | | | 46 | |
SBA Communications, Corp.(1) | | | 540 | | | | 88 | |
Simon Property Group, Inc.(3) | | | 1,392 | | | | 239 | |
SL Green Realty Corp. | | | 444 | | | | 45 | |
UDR, Inc. | | | 1,200 | | | | 46 | |
Ventas, Inc. | | | 1,598 | | | | 96 | |
Vornado Realty Trust | | | 774 | | | | 61 | |
Welltower, Inc. | | | 1,655 | | | | 106 | |
Weyerhaeuser Co. | | | 3,378 | | | | 119 | |
| | | | | | | | |
| | | | 2,951 | |
| | | | | | | | |
|
| Telecommunication Services—2.1% | |
AT&T, Inc.(3) | | | 30,205 | | | | 1,174 | |
CenturyLink, Inc. | | | 4,853 | | | | 81 | |
Verizon Communications, Inc.(3) | | | 19,757 | | | | 1,046 | |
| | | | | | | | |
| | | | 2,301 | |
| | | | | | | | |
Refer to Footnote Legend on page 56.
See Notes to Financial Statements
55
VIRTUS RAMPART ENHANCED CORE EQUITY SERIES
SCHEDULE OF INVESTMENTS (Continued)
DECEMBER 31, 2017
($ reported in thousands)
| | | | | | | | |
| | | SHARES | | | VALUE | |
| Utilities—2.7% | |
AES Corp. | | | 3,093 | | | $ | 33 | |
Alliant Energy Corp. | | | 1,037 | | | | 44 | |
Ameren Corp. | | | 1,089 | | | | 64 | |
American Electric Power Co., Inc. | | | 2,207 | | | | 162 | |
American Water Works Co., Inc. | | | 800 | | | | 73 | |
CenterPoint Energy, Inc. | | | 1,934 | | | | 55 | |
CMS Energy Corp. | | | 1,265 | | | | 60 | |
Consolidated Edison, Inc. | | | 1,390 | | | | 118 | |
Dominion Energy, Inc. | | | 2,878 | | | | 233 | |
DTE Energy Co. | | | 805 | | | | 88 | |
Duke Energy Corp.(3) | | | 3,134 | | | | 264 | |
Edison International | | | 1,462 | | | | 92 | |
Entergy Corp. | | | 805 | | | | 66 | |
Eversource Energy | | | 1,422 | | | | 90 | |
Exelon Corp.(3) | | | 4,308 | | | | 170 | |
FirstEnergy Corp. | | | 1,993 | | | | 61 | |
NextEra Energy, Inc.(3) | | | 2,097 | | | | 328 | |
NiSource, Inc. | | | 1,462 | | | | 38 | |
NRG Energy, Inc. | | | 1,286 | | | | 37 | |
PG&E Corp. | | | 2,301 | | | | 103 | |
Pinnacle West Capital Corp. | | | 501 | | | | 43 | |
PPL Corp. | | | 3,065 | | | | 95 | |
Public Service Enterprise Group, Inc. | | | 2,270 | | | | 117 | |
SCANA Corp. | | | 641 | | | | 25 | |
Sempra Energy | | | 1,126 | | | | 120 | |
Southern Co. (The)(3) | | | 4,476 | | | | 215 | |
WEC Energy Group, Inc. | | | 1,416 | | | | 94 | |
Xcel Energy, Inc. | | | 2,278 | | | | 110 | |
| | | | | | | | |
| | | | | 2,998 | |
| TOTAL COMMON STOCKS | |
| (Identified Cost $96,474) | | | | 108,115 | |
|
| EXCHANGE-TRADED FUND(2)—1.5% | |
Powershares S&P 500 High Beta Port ETF | | | 40,511 | | | | 1,721 | |
| TOTAL EXCHANGE-TRADED FUND | | | | | |
| (Identified Cost $1,641) | | | | 1,721 | |
| TOTAL LONG TERM INVESTMENTS—98.6% | |
| (Identified Cost $98,115) | | | | | | | 109,836 | |
| | | | | | | | |
| | | SHARES | | | VALUE | |
| SHORT-TERM INVESTMENTS—1.1% | |
| | |
| PURCHASED OPTIONS—0.1% | | | | | | | | |
|
| (see open purchased options schedule) | |
| TOTAL PURCHASED OPTIONS—0.1% | |
| (Premiums Paid $126) | | | $ | 88 | |
|
| Money Market Mutual Fund(2)—1.0% | |
Dreyfus Government Cash Management Fund – Institutional Shares (seven-day effective yield 1.190%) | | | 1,074,908 | | | | 1,075 | |
| TOTAL SHORT-TERM INVESTMENTS | |
| (Identified Cost $1,201) | | | | 1,163 | |
| TOTAL INVESTMENTS, BEFORE WRITTEN OPTIONS—99.7% | |
| (Identified Cost $99,316) | | | | 110,999 | |
|
| WRITTEN OPTIONS—(0.2)% | |
|
| (see open written options schedule) | |
| TOTAL WRITTEN OPTIONS—(0.2)% | |
| (Premiums Received $237) | | | | (161 | ) |
| TOTAL INVESTMENTS NET OF WRITTEN OPTIONS—99.5% | |
| (Identified Cost $99,079) | | | | 110,838 | |
Other assets and liabilities, net—0.5% | | | | | | | 548 | |
| | | | | | | | |
| NET ASSETS—100.0% | | | | | | $ | 111,386 | |
| | | | | | | | |
Abbreviation:
Footnote Legend:
| (1) | Non-income producing. |
| (2) | Shares of these funds are publicly offered, and the prospectus and annual reports of each are publicly available. |
| (3) | All or a portion of the security is segregated as collateral for written options. |
| | | | | | | | | | | | | | | | | | | | |
Open Purchased Options contracts as of December 31, 2017, were as follows: | |
| | | | | |
Description of Options | | Number of
Contracts | | | Contract
Notional
Amount | | | Strike Price(1) | | | Expiration Date | | | Value | |
Call Options | | | | | | | | | | | | | | | | | | | | |
S&P 500® Index | | | 219 | | | $ | 61,320 | | | $ | 2,800 | | | | 1/2/2018 | | | $ | — | |
S&P 500® Index | | | 110 | | | | 30,690 | | | | 2,790 | | | | 1/3/2018 | | | | — | |
S&P 500® Index | | | 147 | | | | 40,866 | | | | 2,780 | | | | 1/5/2018 | | | | 1 | |
S&P 500® Index | | | 110 | | | | 30,580 | | | | 2,780 | | | | 1/8/2018 | | | | 1 | |
S&P 500® Index | | | 110 | | | | 30,580 | | | | 2,780 | | | | 1/10/2018 | | | | — | |
S&P 500® Index | | | 110 | | | | 30,635 | | | | 2,785 | | | | 1/12/2018 | | | | 1 | |
| | | | | |
Put Options | | | | | | | | | | | | | | | | | | | | |
S&P 500® Index | | | 219 | | | | 56,393 | | | | 2,575 | | | | 1/2/2018 | | | | 7 | |
S&P 500® Index | | | 110 | | | | 28,215 | | | | 2,565 | | | | 1/3/2018 | | | | 7 | |
S&P 500® Index | | | 147 | | | | 37,706 | | | | 2,565 | | | | 1/5/2018 | | | | 11 | |
S&P 500® Index | | | 110 | | | | 28,270 | | | | 2,570 | | | | 1/8/2018 | | | | 12 | |
S&P 500® Index | | | 110 | | | | 28,215 | | | | 2,565 | | | | 1/10/2018 | | | | 21 | |
S&P 500® Index | | | 110 | | | | 28,160 | | | | 2,560 | | | | 1/12/2018 | | | | 27 | |
| | | | | | | | | | | | | | | | | | | | |
Total Purchased Options | | | | | | | | | | | | | | | $ | 88 | |
| | | | | | | | | | | | | | | | | | | | |
See Notes to Financial Statements
56
VIRTUS RAMPART ENHANCED CORE EQUITY SERIES
SCHEDULE OF INVESTMENTS (Continued)
DECEMBER 31, 2017
($ reported in thousands)
| | | | | | | | | | | | | | | | | | | | |
Open Written Options contracts as of December 31, 2017, were as follows: | |
| | | | | |
Description of Options | | Number of
Contracts | | | Contract
Notional
Amount | | | Strike Price(1) | | | Expiration Date | | | Value | |
Call Options | | | | | | | | | | | | | | | | | | | | |
S&P 500® Index | | | 219 | | | $ | 60,335 | | | $ | 2,755 | | | | 1/2/2018 | | | $ | — | |
S&P 500® Index | | | 110 | | | | 30,140 | | | | 2,740 | | | | 1/3/2018 | | | | — | |
S&P 500® Index | | | 147 | | | | 40,131 | | | | 2,730 | | | | 1/5/2018 | | | | (2 | ) |
S&P 500® Index | | | 110 | | | | 30,030 | | | | 2,730 | | | | 1/8/2018 | | | | (3 | ) |
S&P 500® Index | | | 110 | | | | 30,030 | | | | 2,730 | | | | 1/10/2018 | | | | (5 | ) |
S&P 500® Index | | | 110 | | | | 30,085 | | | | 2,735 | | | | 1/12/2018 | | | | (3 | ) |
| | | | | |
Put Options | | | | | | | | | | | | | | | | | | | | |
S&P 500® Index | | | 219 | | | | 57,488 | | | | 2,625 | | | | 1/2/2018 | | | | (13 | ) |
S&P 500® Index | | | 110 | | | | 28,765 | | | | 2,615 | | | | 1/3/2018 | | | | (9 | ) |
S&P 500® Index | | | 147 | | | | 38,441 | | | | 2,615 | | | | 1/5/2018 | | | | (24 | ) |
S&P 500® Index | | | 110 | | | | 28,820 | | | | 2,620 | | | | 1/8/2018 | | | | (24 | ) |
S&P 500® Index | | | 110 | | | | 28,765 | | | | 2,615 | | | | 1/10/2018 | | | | (30 | ) |
S&P 500® Index | | | 110 | | | | 28,710 | | | | 2,610 | | | | 1/12/2018 | | | | (48 | ) |
| | | | | | | | | | | | | | | | | | | | |
Total Written Options | | | | | | | | | | | | | | | $ | (161 | ) |
| | | | | | | | | | | | | | | | | | | | |
Footnote Legend:
| (1) | Strike price not reported in thousands. |
The following table provides a summary of inputs used to value the Series’ investments as of December 31, 2017 (See Security Valuation Note 2A in the Notes to Financial Statements):
| | | | | | | | | | | | |
| | | Total
Value at
December 31, 2017 | | | Level 1
Quoted
Prices | | | Level 2
Significant
Observable
Inputs | |
Equity Securities: | | | | | | | | | | | | |
Common Stocks | | $ | 108,115 | | | $ | 108,115 | | | $ | — | |
Exchange-Traded Fund | | | 1,721 | | | | 1,721 | | | | — | |
Purchased Options | | | 88 | | | | 88 | | | | — | (a) |
Short-Term Investment | | | 1,075 | | | | 1,075 | | | | — | |
| | | | | | | | | | | | |
Total Investments before Written Options | | $ | 110,999 | | | $ | 110,999 | | | $ | — | (a) |
| | | | | | | | | | | | |
Written Options | | | (161 | ) | | | (161 | ) | | | — | (a) |
| | | | | | | | | | | | |
Total Investments Net of Written Options | | $ | 110,838 | | | $ | 110,838 | | | $ | — | (a) |
| | | | | | | | | | | | |
There were no securities valued using significant unobservable inputs (Level 3) at December 31, 2017.
There were no transfers between Level 1, Level 2, or Level 3 related to securities held at December 31, 2017.
| (a) | Purchased and written options valued at zero above are considered to be Level 2 investments in this table. |
See Notes to Financial Statements
57
VIRTUS RAMPART EQUITY TREND SERIES
SCHEDULE OF INVESTMENTS
DECEMBER 31, 2017
($ reported in thousands)
| | | | | | | | |
| | | SHARES | | | VALUE | |
| COMMON STOCKS—98.1% | |
|
| Consumer Discretionary—19.4% | |
Amazon.com, Inc.(1) | | | 36 | | | $ | 42 | |
Aptiv plc | | | 403 | | | | 34 | |
Best Buy Co., Inc. | | | 987 | | | | 68 | |
BorgWarner, Inc. | | | 299 | | | | 15 | |
Carnival Corp. | | | 192 | | | | 13 | |
Charter Communications, Inc. Class A(1) | | | 47 | | | | 16 | |
Chipotle Mexican Grill, Inc.(1) | | | 5 | | | | 1 | |
Comcast Corp. Class A | | | 1,090 | | | | 44 | |
Darden Restaurants, Inc. | | | 27 | | | | 3 | |
Delphi Technologies plc(1) | | | 134 | | | | 7 | |
DISH Network Corp. Class A(1) | | | 53 | | | | 3 | |
Expedia, Inc. | | | 11 | | | | 1 | |
Garmin Ltd. | | | 947 | | | | 56 | |
H&R Block, Inc. | | | 2,246 | | | | 59 | |
Hilton Worldwide Holdings, Inc. | | | 96 | | | | 8 | |
Home Depot, Inc. (The) | | | 246 | | | | 47 | |
Horton (D.R.), Inc. | | | 506 | | | | 26 | |
Leggett & Platt, Inc. | | | 321 | | | | 15 | |
Lennar Corp. Class A | | | 302 | | | | 19 | |
Lowe’s Cos., Inc. | | | 176 | | | | 16 | |
Marriott International, Inc. Class A | | | 147 | | | | 20 | |
McDonald’s Corp. | | | 177 | | | | 30 | |
MGM Resorts International | | | 1,004 | | | | 34 | |
Mohawk Industries, Inc.(1) | | | 153 | | | | 42 | |
Netflix, Inc.(1) | | | 39 | | | | 7 | |
Norwegian Cruise Line Holdings Ltd.(1) | | | 84 | | | | 4 | |
Priceline Group, Inc. (The)(1) | | | 4 | | | | 7 | |
PulteGroup, Inc. | | | 412 | | | | 14 | |
Royal Caribbean Cruises Ltd. | | | 81 | | | | 10 | |
Starbucks Corp. | | | 315 | | | | 18 | |
TripAdvisor, Inc.(1) | | | 10 | | | | — | (2) |
Wyndham Worldwide Corp. | | | 48 | | | | 6 | |
Wynn Resorts Ltd. | | | 155 | | | | 26 | |
Yum! Brands, Inc. | | | 75 | | | | 6 | |
| | | | | | | | |
| | | | 717 | |
| | | | | | | | |
|
| Consumer Staples—5.0% | |
Altria Group, Inc. | | | 389 | | | | 28 | |
Brown-Forman Corp. Class B | | | 234 | | | | 16 | |
Constellation Brands, Inc. Class A | | | 206 | | | | 47 | |
Philip Morris International, Inc. | | | 315 | | | | 33 | |
Sysco Corp. | | | 1,019 | | | | 62 | |
| | | | | | | | |
| | | | 186 | |
| | | | | | | | |
|
| Energy—1.7% | |
Andeavor | | | 67 | | | | 8 | |
Marathon Petroleum Corp. | | | 235 | | | | 15 | |
Phillips 66 | | | 199 | | | | 20 | |
Valero Energy Corp. | | | 205 | | | | 19 | |
| | | | | | | | |
| | | | 62 | |
| | | | | | | | |
|
| Financials—12.8% | |
Affiliated Managers Group, Inc. | | | 12 | | | | 3 | |
Aflac, Inc. | | | 113 | | | | 10 | |
Allstate Corp. (The) | | | 108 | | | | 11 | |
Ameriprise Financial, Inc. | | | 33 | | | | 6 | |
AON plc | | | 133 | | | | 18 | |
Bank of America Corp. | | | 485 | | | | 14 | |
Bank of New York Mellon Corp. (The) | | | 230 | | | | 12 | |
BB&T Corp. | | | 162 | | | | 8 | |
| | | | | | | | |
| | | SHARES | | | VALUE | |
| Financials—continued | |
Berkshire Hathaway, Inc. Class B(1) | | | 298 | | | $ | 59 | |
BlackRock, Inc. | | | 28 | | | | 14 | |
Brighthouse Financial, Inc.(1) | | | 27 | | | | 2 | |
Charles Schwab Corp. (The) | | | 286 | | | | 15 | |
Chubb Ltd. | | | 139 | | | | 20 | |
Cincinnati Financial Corp. | | | 44 | | | | 3 | |
Citigroup, Inc. | | | 135 | | | | 10 | |
Citizens Financial Group, Inc. | | | 101 | | | | 4 | |
Comerica, Inc. | | | 35 | | | | 3 | |
E*Trade Financial Corp.(1) | | | 66 | | | | 3 | |
Fifth Third Bancorp | | | 148 | | | | 5 | |
Franklin Resources, Inc. | | | 73 | | | | 3 | |
Gallagher (Arthur J.) & Co. | | | 94 | | | | 6 | |
Goldman Sachs Group, Inc. (The) | | | 86 | | | | 22 | |
Huntington Bancshares, Inc. | | | 219 | | | | 3 | |
Invesco Ltd. | | | 90 | | | | 3 | |
JPMorgan Chase & Co. | | | 174 | | | | 19 | |
KeyCorp | | | 218 | | | | 4 | |
Leucadia National Corp. | | | 49 | | | | 1 | |
Lincoln National Corp. | | | 63 | | | | 5 | |
M&T Bank Corp. | | | 31 | | | | 5 | |
Marsh & McLennan Cos., Inc. | | | 269 | | | | 22 | |
MetLife, Inc. | | | 305 | | | | 15 | |
Morgan Stanley | | | 340 | | | | 18 | |
Northern Trust Corp. | | | 48 | | | | 5 | |
People’s United Financial, Inc. | | | 69 | | | | 1 | |
PNC Financial Services Group, Inc. (The) | | | 96 | | | | 14 | |
Principal Financial Group, Inc. | | | 77 | | | | 6 | |
Progressive Corp. (The) | | | 173 | | | | 10 | |
Prudential Financial, Inc. | | | 122 | | | | 14 | |
Raymond James Financial, Inc. | | | 31 | | | | 3 | |
Regions Financial Corp. | | | 240 | | | | 4 | |
State Street Corp. | | | 83 | | | | 8 | |
SunTrust Banks, Inc. | | | 96 | | | | 6 | |
T. Rowe Price Group, Inc. | | | 53 | | | | 6 | |
Torchmark Corp. | | | 31 | | | | 3 | |
Travelers Cos., Inc. (The) | | | 82 | | | | 11 | |
U.S. Bancorp | | | 79 | | | | 4 | |
Unum Group | | | 65 | | | | 4 | |
Wells Fargo & Co. | | | 221 | | | | 13 | |
Willis Towers Watson plc | | | 70 | | | | 11 | |
XL Group Ltd. | | | 77 | | | | 3 | |
Zions Bancorporation | | | 41 | | | | 2 | |
| | | | | | | | |
| | | | 474 | |
| | | | | | | | |
|
| Health Care—6.1% | |
Abbott Laboratories | | | 169 | | | | 10 | |
Aetna, Inc. | | | 43 | | | | 8 | |
Agilent Technologies, Inc. | | | 100 | | | | 7 | |
Align Technology, Inc.(1) | | | 92 | | | | 20 | |
Anthem, Inc. | | | 34 | | | | 8 | |
Baxter International, Inc. | | | 49 | | | | 3 | |
Becton, Dickinson & Co. | | | 26 | | | | 5 | |
Boston Scientific Corp.(1) | | | 134 | | | | 3 | |
Centene Corp.(1) | | | 23 | | | | 2 | |
Cigna Corp. | | | 33 | | | | 7 | |
Cooper Cos., Inc. (The) | | | 62 | | | | 14 | |
Danaher Corp. | | | 60 | | | | 6 | |
DENTSPLY SIRONA, Inc. | | | 293 | | | | 19 | |
Edwards Lifesciences Corp.(1) | | | 21 | | | | 2 | |
Hologic, Inc.(1) | | | 27 | | | | 1 | |
Humana, Inc. | | | 19 | | | | 5 | |
IDEXX Laboratories, Inc.(1) | | | 9 | | | | 1 | |
Refer to Footnote Legend on page 60.
See Notes to Financial Statements
58
VIRTUS RAMPART EQUITY TREND SERIES
SCHEDULE OF INVESTMENTS (Continued)
DECEMBER 31, 2017
($ reported in thousands)
| | | | | | | | |
| | | SHARES | | | VALUE | |
| Health Care—continued | |
Illumina, Inc.(1) | | | 46 | | | $ | 10 | |
Intuitive Surgical, Inc.(1) | | | 11 | | | | 4 | |
Iqvia Holdings, Inc.(1) | | | 47 | | | | 5 | |
Medtronic plc | | | 132 | | | | 11 | |
Mettler-Toledo International, Inc.(1) | | | 8 | | | | 5 | |
PerkinElmer, Inc. | | | 34 | | | | 2 | |
ResMed, Inc. | | | 14 | | | | 1 | |
Stryker Corp. | | | 31 | | | | 5 | |
Thermo Fisher Scientific, Inc. | | | 125 | | | | 24 | |
UnitedHealth Group, Inc. | | | 126 | | | | 28 | |
Varian Medical Systems, Inc.(1) | | | 9 | | | | 1 | |
Waters Corp.(1) | | | 25 | | | | 5 | |
Zimmer Biomet Holdings, Inc. | | | 20 | | | | 2 | |
| | | | | | | | |
| | | | 224 | |
| | | | | | | | |
|
| Industrials—16.3% | |
A.O. Smith Corp. | | | 112 | | | | 7 | |
Allegion plc | | | 73 | | | | 6 | |
Arconic, Inc. | | | 44 | | | | 1 | |
Boeing Co. (The) | | | 58 | | | | 17 | |
Caterpillar, Inc. | | | 258 | | | | 41 | |
Cintas Corp. | | | 373 | | | | 58 | |
CSX Corp. | | | 263 | | | | 14 | |
Cummins, Inc. | | | 69 | | | | 12 | |
Deere & Co. | | | 392 | | | | 61 | |
Dover Corp. | | | 45 | | | | 5 | |
Expeditors International of Washington, Inc. | | | 65 | | | | 4 | |
FedEx Corp. | | | 88 | | | | 22 | |
Flowserve Corp. | | | 38 | | | | 2 | |
Fortive Corp. | | | 88 | | | | 6 | |
Fortune Brands Home & Security, Inc. | | | 118 | | | | 8 | |
General Dynamics Corp. | | | 29 | | | | 6 | |
Hunt (JB) Transport Services, Inc. | | | 529 | | | | 61 | |
Illinois Tool Works, Inc. | | | 90 | | | | 15 | |
Ingersoll-Rand plc | | | 73 | | | | 7 | |
Johnson Controls International plc | | | 716 | | | | 27 | |
Kansas City Southern | | | 30 | | | | 3 | |
L3 Technologies, Inc. | | | 8 | | | | 2 | |
Lockheed Martin Corp. | | | 26 | | | | 8 | |
Masco Corp. | | | 245 | | | | 11 | |
Norfolk Southern Corp. | | | 83 | | | | 12 | |
Northrop Grumman Corp. | | | 18 | | | | 6 | |
PACCAR, Inc. | | | 154 | | | | 11 | |
Parker-Hannifin Corp. | | | 39 | | | | 8 | |
Pentair plc | | | 48 | | | | 3 | |
Raytheon Co. | | | 30 | | | | 6 | |
Republic Services, Inc. | | | 250 | | | | 17 | |
Robinson (C.H.) Worldwide, Inc. | | | 50 | | | | 4 | |
Rockwell Collins, Inc. | | | 17 | | | | 2 | |
Snap-on, Inc. | | | 17 | | | | 3 | |
Stanley Black & Decker, Inc. | | | 44 | | | | 7 | |
Stericycle, Inc.(1) | | | 93 | | | | 6 | |
Textron, Inc. | | | 27 | | | | 2 | |
TransDigm Group, Inc. | | | 5 | | | | 1 | |
Union Pacific Corp. | | | 231 | | | | 31 | |
United Parcel Service, Inc. Class B | | | 246 | | | | 29 | |
United Technologies Corp. | | | 77 | | | | 10 | |
Waste Management, Inc. | | | 442 | | | | 38 | |
Xylem, Inc. | | | 52 | | | | 4 | |
| | | | | | | | |
| | | | 604 | |
| | | | | | | | |
|
| Information Technology—17.4% | |
Activision Blizzard, Inc. | | | 555 | | | | 35 | |
| | | | | | | | |
| | | SHARES | | | VALUE | |
| Information Technology—continued | |
Adobe Systems, Inc.(1) | | | 106 | | | $ | 18 | |
Advanced Micro Devices, Inc.(1) | | | 60 | | | | 1 | |
Akamai Technologies, Inc.(1) | | | 9 | | | | 1 | |
Alliance Data Systems Corp. | | | 5 | | | | 1 | |
Alphabet, Inc. Class A(1) | | | 16 | | | | 17 | |
Alphabet, Inc. Class C(1) | | | 16 | | | | 17 | |
Amphenol Corp. Class A | | | 316 | | | | 28 | |
Analog Devices, Inc. | | | 27 | | | | 2 | |
ANSYS, Inc.(1) | | | 18 | | | | 3 | |
Apple, Inc. | | | 303 | | | | 51 | |
Applied Materials, Inc. | | | 606 | | | | 31 | |
Autodesk, Inc.(1) | | | 47 | | | | 5 | |
Automatic Data Processing, Inc. | | | 43 | | | | 5 | |
Broadcom Ltd. | | | 30 | | | | 8 | |
CA, Inc. | | | 22 | | | | 1 | |
Cadence Design Systems, Inc.(1) | | | 60 | | | | 2 | |
Citrix Systems, Inc.(1) | | | 31 | | | | 3 | |
Corning, Inc. | | | 933 | | | | 30 | |
eBay, Inc.(1) | | | 54 | | | | 2 | |
Electronic Arts, Inc.(1) | | | 227 | | | | 24 | |
Facebook, Inc. Class A(1) | | | 128 | | | | 23 | |
Fidelity National Information Services, Inc. | | | 32 | | | | 3 | |
Fiserv, Inc.(1) | | | 20 | | | | 3 | |
FLIR Systems, Inc. | | | 1,262 | | | | 59 | |
Global Payments, Inc. | | | 15 | | | | 1 | |
Hewlett Packard Enterprise Co. | | | 96 | | | | 1 | |
HP, Inc. | | | 98 | | | | 2 | |
Intel Corp. | | | 349 | | | | 16 | |
Intuit, Inc. | | | 52 | | | | 8 | |
KLA-Tencor Corp. | | | 89 | | | | 9 | |
Lam Research Corp. | | | 92 | | | | 17 | |
Mastercard, Inc. Class A | | | 90 | | | | 14 | |
Microchip Technology, Inc. | | | 17 | | | | 1 | |
Micron Technology, Inc.(1) | | | 83 | | | | 3 | |
Microsoft Corp. | | | 535 | | | | 46 | |
NetApp, Inc. | | | 16 | | | | 1 | |
NVIDIA Corp. | | | 45 | | | | 9 | |
Oracle Corp. | | | 210 | | | | 10 | |
Paychex, Inc. | | | 31 | | | | 2 | |
PayPal Holdings, Inc.(1) | | | 109 | | | | 8 | |
Qorvo, Inc.(1) | | | 9 | | | | 1 | |
QUALCOMM, Inc. | | | 110 | | | | 7 | |
Red Hat, Inc.(1) | | | 12 | | | | 1 | |
salesforce.com, Inc.(1) | | | 146 | | | | 15 | |
Seagate Technology plc | | | 17 | | | | 1 | |
Skyworks Solutions, Inc. | | | 14 | | | | 1 | |
Symantec Corp. | | | 43 | | | | 1 | |
Synopsys, Inc.(1) | | | 32 | | | | 3 | |
TE Connectivity Ltd. | | | 623 | | | | 59 | |
Texas Instruments, Inc. | | | 73 | | | | 8 | |
Total System Services, Inc. | | | 16 | | | | 1 | |
VeriSign, Inc.(1) | | | 5 | | | | 1 | |
Visa, Inc. Class A | | | 176 | | | | 20 | |
Western Digital Corp. | | | 17 | | | | 1 | |
Western Union Co. (The) | | | 45 | | | | 1 | |
Xerox Corp. | | | 13 | | | | — | (2) |
Xilinx, Inc. | | | 18 | | | | 1 | |
| | | | | | | | |
| | | | 643 | |
| | | | | | | | |
|
| Materials—9.9% | |
Albemarle Corp. | | | 52 | | | | 7 | |
Avery Dennison Corp. | | | 75 | | | | 9 | |
DowDuPont, Inc. | | | 757 | | | | 54 | |
Refer to Footnote Legend on page 60.
See Notes to Financial Statements
59
VIRTUS RAMPART EQUITY TREND SERIES
SCHEDULE OF INVESTMENTS (Continued)
DECEMBER 31, 2017
($ reported in thousands)
| | | | | | | | |
| | | SHARES | | | VALUE | |
| Materials—continued | |
Eastman Chemical Co. | | | 47 | | | $ | 4 | |
Ecolab, Inc. | | | 122 | | | | 16 | |
International Flavors & Fragrances, Inc. | | | 37 | | | | 6 | |
International Paper Co. | | | 351 | | | | 20 | |
LyondellBasell Industries N.V. Class A | | | 562 | | | | 62 | |
Martin Marietta Materials, Inc. | | | 124 | | | | 27 | |
Nucor Corp. | | | 1,023 | | | | 65 | |
Packaging Corp. of America | | | 80 | | | | 10 | |
PPG Industries, Inc. | | | 120 | | | | 14 | |
Sealed Air Corp. | | | 153 | | | | 7 | |
Sherwin-Williams Co. (The) | | | 39 | | | | 16 | |
Vulcan Materials Co. | | | 262 | | | | 34 | |
WestRock Co. | | | 216 | | | | 14 | |
| | | | | | | | |
| | | | 365 | |
| | | | | | | | |
|
| Real Estate—6.3% | |
American Tower Corp. | | | 94 | | | | 13 | |
CBRE Group, Inc. Class A(1) | | | 1,356 | | | | 59 | |
Crown Castle International Corp. | | | 89 | | | | 10 | |
Digital Realty Trust, Inc. | | | 45 | | | | 5 | |
Duke Realty Corp. | | | 462 | | | | 13 | |
Equinix, Inc. | | | 17 | | | | 8 | |
Extra Space Storage, Inc. | | | 28 | | | | 2 | |
Host Hotels & Resorts, Inc. | | | 2,971 | | | | 59 | |
Iron Mountain, Inc. | | | 58 | | | | 2 | |
Prologis, Inc. | | | 691 | | | | 45 | |
Public Storage | | | 33 | | | | 7 | |
SBA Communications, Corp.(1) | | | 26 | | | | 4 | |
Weyerhaeuser Co. | | | 165 | | | | 6 | |
| | | | | | | | |
| | | | 233 | |
| | | | | | | | |
|
| Utilities—3.2% | |
AES Corp. | | | 2,538 | | | | 27 | |
American Water Works Co., Inc. | | | 641 | | | | 59 | |
NRG Energy, Inc. | | | 1,156 | | | | 33 | |
| | | | | | | | |
| | | | | 119 | |
| TOTAL COMMON STOCKS | | | | | |
| (Identified Cost $2,776) | | | | | | | 3,627 | |
| TOTAL LONG TERM INVESTMENTS—98.1% | | | | | |
| (Identified Cost $2,776) | | | | | | | 3,627 | |
|
| SHORT-TERM INVESTMENT—2.2% | |
|
| Money Market Mutual Fund—2.2% | |
Dreyfus Government Cash Management Fund – Institutional Shares (seven-day effective yield 1.190%)(3) | | | 83,198 | | | | 83 | |
| TOTAL SHORT-TERM INVESTMENT | | | | | |
| (Identified Cost $83) | | | | | | | 83 | |
| TOTAL INVESTMENTS—100.3% | | | | | |
| (Identified Cost $2,859) | | | | | | | 3,710 | |
Other assets and liabilities, net—(0.3)% | | | | (12 | ) |
| | | | | | | | |
| NET ASSETS—100.0% | | | $ | 3,698 | |
| | | | | | | | |
Footnote Legend:
| (1) | Non-income producing. |
| (2) | Amount is less than $500. |
| (3) | Shares of this fund are publicly offered, and its prospectus and annual report are publicly available. |
| | | | |
| Country Weightings† (unaudited) | | | |
United States | | | 94 | % |
Switzerland | | | 2 | |
United Kingdom | | | 2 | |
Ireland | | | 2 | |
Total | | | 100 | % |
† % of total investments as of December 31, 2017 | |
The following table provides a summary of inputs used to value the Series’ investments as of December 31, 2017 (See Security Valuation Note 2A in the Notes to Financial Statements):
| | | | | | | | |
| | | Total
Value at
December 31, 2017 | | | Level 1
Quoted
Prices | |
Equity Securities: | | | | | | | | |
Common Stocks | | $ | 3,627 | | | $ | 3,627 | |
Short-Term Investment | | | 83 | | | | 83 | |
| | | | | | | | |
Total Investments | | $ | 3,710 | | | $ | 3,710 | |
| | | | | | | | |
There were no securities valued using significant observable inputs (Level 2) or significant unobservable inputs (Level 3) at December 31, 2017.
There were no transfers between Level 1, Level 2, or Level 3 related to securities held at December 31, 2017.
See Notes to Financial Statements
60
VIRTUS STRATEGIC ALLOCATION SERIES
SCHEDULE OF INVESTMENTS
DECEMBER 31, 2017
($ reported in thousands)
| | | | | | | | |
| | | PAR
VALUE | | | VALUE | |
| U.S. GOVERNMENT SECURITIES—2.1% | |
U.S. Treasury Bond
2.500%, 2/15/46 | | $ | 1,837 | | | $ | 1,746 | |
U.S. Treasury Note
1.125%, 2/28/19 | | | 182 | | | | 180 | |
1.375%, 4/30/20 | | | 75 | | | | 74 | |
1.625%, 2/15/26 | | | 38 | | | | 36 | |
| TOTAL U.S. GOVERNMENT SECURITIES | |
| (Identified Cost $2,043) | | | | | | | 2,036 | |
|
| MUNICIPAL BONDS—1.6% | |
|
| California—0.8% | |
San Diego County Regional Airport Authority Rental Car Center Project Series B – Taxable
5.594%, 7/1/43 | | | 275 | | | | 307 | |
State of California, Build America Bonds Taxable
7.600%, 11/1/40 | | | 265 | | | | 423 | |
| | | | | | | | |
| | | | | | | 730 | |
| | | | | | | | |
| | |
| New York—0.4% | | | | | | | | |
Port Authority of New York & New Jersey, Consolidated Bonds Revenue
5.000%, 4/15/57 | | | 335 | | | | 392 | |
| | | | | | | | |
| | |
| Texas—0.2% | | | | | | | | |
State of Texas
3.011%, 10/1/26 | | | 200 | | | | 203 | |
| | | | | | | | |
| | |
| Virginia—0.2% | | | | | | | | |
Tobacco Settlement Financing Corp. Series A-1, Taxable
6.706%, 6/1/46 | | | 210 | | | | 189 | |
| TOTAL MUNICIPAL BONDS | | | | | | | | |
| (Identified Cost $1,486) | | | | | | | 1,514 | |
|
| FOREIGN GOVERNMENT SECURITIES—0.7% | |
Argentine Republic
7.625%, 4/22/46 | | | 150 | | | | 169 | |
Bolivarian Republic of Venezuela
9.375%, 1/13/34(8) | | | 65 | | | | 13 | |
Kingdom of Abu Dhabi 144A
2.500%, 10/11/22(3) | | | 200 | | | | 196 | |
Republic of Chile
5.500%, 8/5/20 | | | 52,000 | CLP | | | 88 | |
Russian Federation 144A
7.850%, 3/10/18(3) | | | 5,000 | RUB | | | 87 | |
United Mexican States | | | | | | | | |
Series M, 6.500%, 6/9/22 | | | 925 | MXN | | | 45 | |
4.750%, 3/8/44 | | | 54 | | | | 55 | |
| TOTAL FOREIGN GOVERNMENT SECURITIES | | | | | | | | |
| (Identified Cost $772) | | | | | | | 653 | |
|
| MORTGAGE-BACKED SECURITIES—8.9% | |
| | |
| Agency—3.5% | | | | | | | | |
FHLMC
3.500%, 4/1/46 | | | 140 | | | | 144 | |
FNMA
4.000%, 6/1/20 | | | 7 | | | | 7 | |
4.500%, 7/1/20 | | | 1 | | | | 1 | |
6.500%, 10/1/31 | | | 3 | | | | 3 | |
6.000%, 9/1/32 | | | 8 | | | | 9 | |
| | | | | | | | |
| | | PAR
VALUE | | | VALUE | |
| Agency—continued | | | | | | | | |
5.000%, 10/1/35 | | $ | 26 | | | $ | 29 | |
6.000%, 9/1/36 | | | 1 | | | | 1 | |
5.500%, 4/1/37 | | | 7 | | | | 8 | |
5.500%, 7/1/37 | | | 23 | | | | 25 | |
6.000%, 10/1/37 | | | 7 | | | | 8 | |
5.000%, 6/1/38 | | | 19 | | | | 21 | |
5.500%, 6/1/38 | | | 3 | | | | 3 | |
5.500%, 6/1/38 | | | 4 | | | | 4 | |
5.500%, 11/1/38 | | | 14 | | | | 15 | |
4.000%, 1/1/39 | | | 43 | | | | 45 | |
5.000%, 1/1/39 | | | 6 | | | | 6 | |
6.000%, 1/1/39 | | | 10 | | | | 11 | |
4.500%, 3/1/39 | | | 11 | | | | 12 | |
5.000%, 3/1/39 | | | 10 | | | | 11 | |
6.000%, 3/1/39 | | | 5 | | | | 6 | |
4.500%, 4/1/39 | | | 81 | | | | 88 | |
4.000%, 5/1/39 | | | 75 | | | | 79 | |
4.500%, 2/1/40 | | | 59 | | | | 63 | |
4.000%, 10/1/40 | | | 120 | | | | 126 | |
4.500%, 4/1/41 | | | 126 | | | | 135 | |
4.000%, 7/1/41 | | | 88 | | | | 92 | |
3.500%, 1/1/42 | | | 62 | | | | 64 | |
3.500%, 4/1/42 | | | 252 | | | | 260 | |
3.500%, 12/1/42 | | | 154 | | | | 159 | |
3.000%, 7/1/43 | | | 177 | | | | 178 | |
4.000%, 10/1/44 | | | 247 | | | | 258 | |
3.500%, 9/1/45 | | | 154 | | | | 158 | |
3.500%, 1/1/46 | | | 77 | | | | 79 | |
4.000%, 1/1/46 | | | 216 | | | | 226 | |
3.000%, 6/1/46 | | | 145 | | | | 146 | |
3.000%, 7/1/46 | | | 81 | | | | 81 | |
3.500%, 1/1/47 | | | 79 | | | | 81 | |
4.000%, 4/1/47 | | | 46 | | | | 48 | |
3.500%, 7/1/47 | | | 176 | | | | 181 | |
3.500%, 7/1/47 | | | 135 | | | | 139 | |
4.000%, 7/1/47 | | | 157 | | | | 164 | |
4.000%, 8/1/47 | | | 169 | | | | 177 | |
GNMA
6.500%, 11/15/23 | | | 21 | | | | 23 | |
6.500%, 12/15/23 | | | 1 | | | | 1 | |
6.500%, 2/15/24 | | | 15 | | | | 17 | |
6.500%, 11/15/31 | | | 18 | | | | 20 | |
6.500%, 2/15/32 | | | 21 | | | | 23 | |
| | | | | | | | |
| | | | | | | 3,435 | |
| | | | | | | | |
| | |
| Non-Agency—5.4% | | | | | | | | |
American Homes 4 Rent Trust
2015-SFR2, C 144A, 4.691%, 10/17/45(3) | | | 110 | | | | 117 | |
2015-SFR1, A 144A, 3.467%, 4/17/52(3) | | | 105 | | | | 107 | |
Ameriquest Mortgage Securities, Inc. 2003-AR3, M4, (5.850% minus 1 month LIBOR)
4.593%, 6/25/33(2) | | | 148 | | | | 147 | |
AMSR Trust 2016-SFR1, C 144A, (1 month LIBOR + 2.250%)
3.741%, 11/17/33(2)(3) | | | 100 | | | | 101 | |
Aventura Mall Trust 2013-AVM, C 144A
3.743%, 12/5/32(2)(3) | | | 300 | | | | 305 | |
Bank of America (Merrill Lynch) Commercial Mortgage Securities Trust 2015-200P, A 144A
3.218%, 4/14/33(3) | | | 100 | | | | 101 | |
Bayview Opportunity Master Fund IVa Trust
2016-SPL1, B1 144A, 4.250%, 4/28/55(3) | | | 100 | | | | 103 | |
2017-SPL1, B1 144A, 4.250%, 10/28/64(2)(3) | | | 100 | | | | 102 | |
Refer to Footnote Legend on page 68.
See Notes to Financial Statements
61
VIRTUS STRATEGIC ALLOCATION SERIES
SCHEDULE OF INVESTMENTS (Continued)
DECEMBER 31, 2017
($ reported in thousands)
| | | | | | | | |
| | | PAR
VALUE | | | VALUE | |
| Non-Agency—continued | | | | | | | | |
Bayview Opportunity Master Fund IVb Trust 2016-SPL2, B1 144A
4.250%, 6/28/53(2)(3) | | $ | 100 | | | $ | 103 | |
CIT Home Equity Loan Trust 2003-1, A5
5.480%, 7/20/34(2) | | | 171 | | | | 174 | |
Citigroup Commercial Mortgage Trust 2016-SMPL, A 144A
2.228%, 9/10/31(3) | | | 100 | | | | 98 | |
Citigroup Mortgage Loan Trust, Inc.
2004-NCM2, 2CB2, 6.750%, 8/25/34 | | | 61 | | | | 65 | |
2014-A, A 144A, 4.000%, 1/25/35(2)(3) | | | 45 | | | | 47 | |
2015-A, A1 144A, 3.500%, 6/25/58(2)(3) | | | 69 | | | | 70 | |
Cold Storage Trust 2017-ICE3, A 144A, (1 month
LIBOR + 1.000%)
2.477%, 4/15/36(2)(3) | | | 115 | | | | 115 | |
Colony Multi-Family Mortgage Trust 2014-1, A 144A
2.543%, 4/20/50(3) | | | 28 | | | | 28 | |
Colony Starwood Homes Trust 2016-2A, C 144A, (1 month LIBOR + 2.150%)
3.627%, 12/17/33(2)(3) | | | 100 | | | | 100 | |
Credit Suisse Mortgage Capital Trust 2013-HYB1, A16 144A
3.006%, 4/25/43(2)(3) | | | 37 | | | | 37 | |
GAHR Commercial Mortgage Trust 2015-NRF, CFX 144A
3.382%, 12/15/34(2)(3) | | | 100 | | | | 101 | |
Galton Funding Mortgage Trust 2017-1, A21 144A
3.500%, 7/25/56(2)(3) | | | 75 | | | | 76 | |
GMAC Mortgage Corp. Loan Trust 2004-AR1, 12A
3.979%, 6/25/34(2) | | | 30 | | | | 31 | |
Goldman Sachs Mortgage Securities Trust 2012-ALOH, A 144A
3.551%, 4/10/34(3) | | | 100 | | | | 103 | |
GSAA Home Equity Trust 2005-12, AF3W
4.999%, 9/25/35(2) | | | 29 | | | | 30 | |
IMC Home Equity Loan Trust 1997-5, A9
7.310%, 11/20/28 | | | 67 | | | | 67 | |
JPMorgan Chase (Bear Stearns) Adjustable Rate Mortgage Trust 2004-1, 21A1
3.396%, 4/25/34(2) | | | 39 | | | | 40 | |
JPMorgan Chase (Washington Mutual) Mortgage Pass-Through Certificates Trust
2003-AR6, A1, 3.227%, 6/25/33(2) | | | 44 | | | | 45 | |
2003-AR4, 2A1, 3.045%, 8/25/33(2) | | | 62 | | | | 62 | |
JPMorgan Chase Commercial Mortgage Securities Trust
2014-C22, A4, 3.801%, 9/15/47 | | | 150 | | | | 157 | |
2007-LDPX, AM, 5.464%, 1/15/49(2) | | | 28 | | | | 28 | |
JPMorgan Chase Mortgage Trust
2014-2, 2A2 144A, 3.500%, 6/25/29(2)(3) | | | 50 | | | | 51 | |
2016-1, M2 144A, 3.750%, 4/25/45(2)(3) | | | 73 | | | | 74 | |
2016-2, M2 144A, 3.750%, 12/25/45(2)(3) | | | 80 | | | | 81 | |
2011-C4, A4 144A, 4.388%, 7/15/46(3) | | | 225 | | | | 236 | |
JPMorgan Mortgage Trust
2017-5, A1 144A, 3.188%, 10/26/48(2)(3) | | | 175 | | | | 177 | |
2017-4, A3 144A, 3.500%, 11/25/48(2)(3) | | | 97 | | | | 98 | |
MASTR Alternative Loan Trust 2003-8, 2A1
5.750%, 11/25/33 | | | 101 | | | | 104 | |
MASTR Specialized Loan Trust 2005-3, A2 144A
5.704%, 11/25/35(2)(3) | | | 55 | | | | 57 | |
MetLife Securitization Trust 2017-1A, M1 144A
3.601%, 4/25/55(2)(3) | | | 100 | | | | 103 | |
Morgan Stanley – Bank of America (Merrill Lynch) Trust 2015-C22, AS
3.561%, 4/15/48 | | | 225 | | | | 226 | |
New Residential Mortgage Loan Trust
2014-1A, A 144A, 3.750%, 1/25/54(2)(3) | | | 78 | | | | 80 | |
2015-2A, A1 144A, 3.750%, 8/25/55(2)(3) | | | 66 | | | | 67 | |
| | | | | | | | |
| | | PAR
VALUE | | | VALUE | |
| Non-Agency—continued | | | | | | | | |
2016-1A, A1 144A, 3.750%, 3/25/56(2)(3) | | $ | 62 | | | $ | 63 | |
2016-3A, A1 144A, 3.750%, 9/25/56(2)(3) | | | 76 | | | | 78 | |
2016-4A, B1A 144A, 4.500%, 11/25/56(2)(3) | | | 96 | | | | 102 | |
NovaStar Mortgage Funding Trust Series 2004-4, M5, (1 month LIBOR + 1.725%)
3.277%, 3/25/35(2) | | | 116 | | | | 116 | |
One Market Plaza Trust 2017-1MKT, A 144A
3.614%, 2/10/32(3) | | | 100 | | | | 103 | |
Residential Asset Mortgage Products Trust 2005-SL2, A4
7.500%, 2/25/32 | | | 47 | | | | 44 | |
Structured Adjustable Rate Mortgage Loan Trust 2004-1, 6A
3.579%, 2/25/34(2) | | | 89 | | | | 87 | |
Towd Point Mortgage Trust
2015-1, A2 144A, 3.250%, 10/25/53(2)(3) | | | 100 | | | | 101 | |
2015-6, M1 144A, 3.750%, 4/25/55(2)(3) | | | 100 | | | | 104 | |
2015-5, A2 144A, 3.500%, 5/25/55(2)(3) | | | 100 | | | | 103 | |
2016-4, A1 144A, 2.250%, 7/25/56(2)(3) | | | 74 | | | | 73 | |
2015-2, 1M1 144A, 3.250%, 11/25/60(2)(3) | | | 145 | | | | 147 | |
Wells Fargo Commercial Mortgage Trust 2015-LC20, B
3.719%, 4/15/50 | | | 50 | | | | 50 | |
| | | | | | | | |
| | | | | | | | 5,185 | |
| TOTAL MORTGAGE-BACKED SECURITIES | | | | | | | | |
| (Identified Cost $8,510) | | | | | | | 8,620 | |
|
| ASSET-BACKED SECURITIES—2.5% | |
| | |
| Auto Floor Plan—0.1% | | | | | | | | |
Navistar Financial Dealer Note Master Owner Trust II 2016-1, B 144A, (1 month LIBOR + 1.750%)
3.302%, 9/27/21(2)(3) | | | 165 | | | | 166 | |
| | | | | | | | |
| | | | | | | 166 | |
| | | | | | | | |
| Automobiles—1.3% | | | | | | | | |
American Credit Acceptance Receivables Trust 2017-2, C 144A
2.860%, 6/12/23(3) | | | 95 | | | | 95 | |
Avis Budget Rental Car Funding LLC 2015-2A, A 144A
2.630%, 12/20/21(3) | | | 180 | | | | 180 | |
Capital Auto Receivables Asset Trust 2017-1, C 144A
2.700%, 9/20/22(3) | | | 90 | | | | 90 | |
Centre Point Funding LLC 2012-2A, 1 144A
2.610%, 8/20/21(3) | | | 57 | | | | 56 | |
DT Auto Owner Trust 2016-4A, C 144A
2.740%, 10/17/22(3) | | | 125 | | | | 125 | |
Exeter Automobile Receivables Trust
2015-1A, C 144A, 4.100%, 12/15/20(3) | | | 135 | | | | 137 | |
2014-3A, D 144A, 5.690%, 4/15/21(3) | | | 115 | | | | 118 | |
Flagship Credit Auto Trust 2016-1, A 144A
2.770%, 12/15/20(3) | | | 47 | | | | 47 | |
GLS Auto Receivables Trust 2017-1A, B 144A
2.980%, 12/15/21(3) | | | 115 | | | | 115 | |
TCF Auto Receivables Owner Trust 2014-1A, C 144A
3.120%, 4/15/21(3) | | | 165 | | | | 165 | |
Westlake Automobile Receivables Trust 2017-2A, C 144A
2.590%, 12/15/22(3) | | | 110 | | | | 109 | |
| | | | | | | | |
| | | | | | | 1,237 | |
| | | | | | | | |
| Home Equity Loans—0.0% | | | | | | | | |
Structured Asset Securities Corp. Mortgage Pass-Through Certificates 2001-SB1, A2
3.375%, 8/25/31 | | | 46 | | | | 45 | |
| | | | | | | | |
| | | | | | | 45 | |
| | | | | | | | |
Refer to Footnote Legend on page 68.
See Notes to Financial Statements
62
VIRTUS STRATEGIC ALLOCATION SERIES
SCHEDULE OF INVESTMENTS (Continued)
DECEMBER 31, 2017
($ reported in thousands)
| | | | | | | | |
| | | PAR
VALUE | | | VALUE | |
| Other—0.7% | | | | | | | | |
BXG Receivables Note Trust 2012-A, A 144A
2.660%, 12/2/27(3) | | $ | 33 | | | $ | 32 | |
Dell Equipment Finance Trust 2017-2, A3 144A
2.190%, 10/24/22(3) | | | 100 | | | | 100 | |
Diamond Resorts Owner Trust 2017-1A, A 144A
3.270%, 10/22/29(3) | | | 92 | | | | 91 | |
Mariner Finance Issuance Trust 2017-AA, A 144A
3.620%, 2/20/29(3) | | | 100 | | | | 101 | |
MVW Owner Trust 2017-1A, A 144A
2.420%, 12/20/34(3) | | | 106 | | | | 105 | |
OneMain Financial Issuance Trust 2015-1A, A 144A
3.190%, 3/18/26(3) | | | 125 | | | | 126 | |
Prosper Marketplace Issuance Trust 2017-2A, B 144A
3.480%, 9/15/23(3) | | | 100 | | | | 100 | |
| | | | | | | | |
| | | | | | | 655 | |
| | | | | | | | |
| Student Loans—0.4% | | | | | | | | |
Earnest Student Loan Program LLC 2017-A, A2 144A
2.650%, 1/25/41(3) | | | 85 | | | | 84 | |
Laurel Road Prime Student Loan Trust 2017-B, A2FX 144A
2.770%, 8/25/42(3) | | | 110 | | | | 109 | |
Sofi Professional Loan Program LLC 2017-E, A2B 144A
2.720%, 11/26/40(3) | | | 110 | | | | 110 | |
Sofi Professional Loan Program LLC 2016-A, A2 144A
2.760%, 12/26/36(3) | | | 60 | | | | 60 | |
| | | | | | | | |
| | | | | | | | 363 | |
| TOTAL ASSET-BACKED SECURITIES | | | | | | | | |
| (Identified Cost $2,467) | | | | | | | 2,466 | |
|
| CORPORATE BONDS AND NOTES—18.3% | |
|
| Consumer Discretionary—1.9% | |
Aptiv plc
3.150%, 11/19/20 | | | 90 | | | | 91 | |
Cooper-Standard Automotive, Inc. 144A
5.625%, 11/15/26(3) | | | 80 | | | | 83 | |
Discovery Communications LLC
3.950%, 3/20/28 | | | 90 | | | | 90 | |
Ford Motor Credit Co., LLC
5.750%, 2/1/21 | | | 275 | | | | 299 | |
General Motors Financial Co., Inc.
3.500%, 7/10/19 | | | 120 | | | | 122 | |
4.200%, 3/1/21 | | | 40 | | | | 42 | |
Horton (D.R.), Inc.
4.750%, 2/15/23 | | | 115 | | | | 123 | |
L Brands, Inc.
6.875%, 11/1/35 | | | 42 | | | | 42 | |
Lear Corp.
3.800%, 9/15/27 | | | 110 | | | | 110 | |
Lennar Corp. 144A
4.750%, 11/29/27(3) | | | 70 | | | | 72 | |
Marriott International, Inc.
3.125%, 2/15/23 | | | 160 | | | | 160 | |
QVC, Inc.
5.125%, 7/2/22 | | | 135 | | | | 143 | |
Scientific Games International, Inc. 144A
5.000%, 10/15/25(3) | | | 35 | | | | 35 | |
SFR Group S.A. 144A
7.375%, 5/1/26(3) | | | 200 | | | | 206 | |
Sirius XM Radio, Inc. 144A
5.000%, 8/1/27(3) | | | 75 | | | | 75 | |
TRI Pointe Group, Inc.
5.875%, 6/15/24 | | | 35 | | | | 37 | |
| | | | | | | | |
| | | PAR
VALUE | | | VALUE | |
| Consumer Discretionary—continued | |
Wyndham Worldwide Corp.
5.100%, 10/1/25 | | $ | 130 | | | $ | 136 | |
| | | | | | | | |
| | | | | | | 1,866 | |
| | | | | | | | |
| Consumer Staples—0.4% | | | | | | | | |
CVS Health Corp.
2.875%, 6/1/26 | | | 110 | | | | 105 | |
Flowers Foods, Inc.
4.375%, 4/1/22 | | | 120 | | | | 127 | |
Kraft Heinz Foods Co. (The)
3.500%, 7/15/22 | | | 48 | | | | 49 | |
Safeway, Inc.
7.250%, 2/1/31 | | | 70 | | | | 59 | |
| | | | | | | | |
| | | | | | | 340 | |
| | | | | | | | |
| | |
| Energy—2.2% | | | | | | | | |
Anadarko Petroleum Corp.
5.550%, 3/15/26 | | | 20 | | | | 22 | |
Ecopetrol S.A.
5.375%, 6/26/26 | | | 125 | | | | 135 | |
Enbridge Energy Partners LP
5.875%, 10/15/25 | | | 95 | | | | 108 | |
Energy Transfer Equity LP
5.000%, 10/1/22 | | | 135 | | | | 144 | |
4.250%, 3/15/23 | | | 90 | | | | 89 | |
EP Energy LLC 144A
8.000%, 11/29/24(3) | | | 35 | | | | 36 | |
Helmerich & Payne International Drilling Co.
4.650%, 3/15/25 | | | 70 | | | | 74 | |
HollyFrontier Corp.
5.875%, 4/1/26 | | | 100 | | | | 111 | |
Kinder Morgan, Inc.
4.300%, 6/1/25 | | | 150 | | | | 156 | |
7.750%, 1/15/32 | | | 60 | | | | 77 | |
Lukoil International Finance BV 144A
4.563%, 4/24/23(3) | | | 200 | | | | 208 | |
MPLX LP
4.875%, 12/1/24 | | | 110 | | | | 119 | |
NGL Energy Partners LP
5.125%, 7/15/19 | | | 95 | | | | 97 | |
NuStar Logistics LP
5.625%, 4/28/27 | | | 80 | | | | 81 | |
Occidental Petroleum Corp.
4.400%, 4/15/46 | | | 80 | | | | 89 | |
Parsley Energy LLC 144A
5.625%, 10/15/27(3) | | | 80 | | | | 82 | |
Petrobras Global Finance BV 144A,
5.299%, 1/27/25(3) | | | 58 | | | | 58 | |
7.375%, 1/17/27 | | | 105 | | | | 116 | |
Petroleos Mexicanos
6.875%, 8/4/26 | | | 35 | | | | 40 | |
6.500%, 6/2/41 | | | 90 | | | | 93 | |
5.500%, 6/27/44 | | | 60 | | | | 55 | |
QEP Resources, Inc.
5.625%, 3/1/26 | | | 10 | | | | 10 | |
Range Resources Corp.
4.875%, 5/15/25 | | | 75 | | | | 72 | |
TerraForm Power Operating LLC 144A
5.000%, 1/31/28(3) | | | 65 | | | | 64 | |
| | | | | | | | |
| | | | | | | 2,136 | |
| | | | | | | | |
Refer to Footnote Legend on page 68.
See Notes to Financial Statements
63
VIRTUS STRATEGIC ALLOCATION SERIES
SCHEDULE OF INVESTMENTS (Continued)
DECEMBER 31, 2017
($ reported in thousands)
| | | | | | | | |
| | | PAR
VALUE | | | VALUE | |
| Financials—6.6% | | | | | | | | |
Allstate Corp. (The)
5.750%, 8/15/53(4) | | $ | 135 | | | $ | 147 | |
Apollo Management Holdings LP 144A
4.000%, 5/30/24(3) | | | 135 | | | | 138 | |
Ares Capital Corp.
4.875%, 11/30/18 | | | 18 | | | | 18 | |
3.875%, 1/15/20 | | | 49 | | | | 50 | |
3.500%, 2/10/23 | | | 40 | | | | 39 | |
Ares Finance Co., LLC 144A
4.000%, 10/8/24(3) | | | 140 | | | | 135 | |
Aviation Capital Group LLC 144A
3.500%, 11/1/27(3) | | | 40 | | | | 39 | |
Banco Bilbao Vizcaya Argentaria Bancomer S.A. 144A
6.500%, 3/10/21(3) | | | 150 | | | | 163 | |
Banco de Credito del Peru 144A
4.250%, 4/1/23(3) | | | 164 | | | | 172 | |
Banco de Credito e Inversiones 144A
3.500%, 10/12/27(3) | | | 215 | | | | 210 | |
Banco Internacional del Peru SAA Interbank 144A
6.625%, 3/19/29(3) | | | 115 | | | | 130 | |
Bank of America Corp.
5.650%, 5/1/18 | | | 345 | | | | 349 | |
4.200%, 8/26/24 | | | 155 | | | | 163 | |
Bank of Montreal
3.803%, 12/15/32 | | | 26 | | | | 26 | |
Brookfield Finance LLC
4.000%, 4/1/24 | | | 82 | | | | 85 | |
Capital One Financial Corp.
3.750%, 7/28/26 | | | 105 | | | | 105 | |
Citigroup, Inc.
3.200%, 10/21/26 | | | 150 | | | | 149 | |
CNOOC Finance 2013 Ltd.
3.000%, 5/9/23 | | | 200 | | | | 198 | |
Fifth Third Bancorp
4.500%, 6/1/18 | | | 150 | | | | 152 | |
First Horizon National Corp.
3.500%, 12/15/20 | | | 110 | | | | 112 | |
FS Investment Corp.
4.250%, 1/15/20 | | | 115 | | | | 117 | |
4.750%, 5/15/22 | | | 35 | | | | 36 | |
Goldman Sachs Group, Inc. (The)
4.250%, 10/21/25 | | | 180 | | | | 188 | |
Huntington Bancshares, Inc.
7.000%, 12/15/20 | | | 95 | | | | 106 | |
ICAHN Enterprises LP 144A
6.375%, 12/15/25(3) | | | 20 | | | | 20 | |
iStar, Inc.
6.000%, 4/1/22 | | | 30 | | | | 31 | |
5.250%, 9/15/22 | | | 25 | | | | 25 | |
Jefferies Group LLC
5.125%, 1/20/23 | | | 150 | | | | 163 | |
JPMorgan Chase & Co.
3.300%, 4/1/26 | | | 150 | | | | 151 | |
KeyCorp
5.100%, 3/24/21 | | | 165 | | | | 178 | |
Kimco Realty Corp.
3.300%, 2/1/25 | | | 115 | | | | 114 | |
Liberty Mutual Group, Inc. 144A
4.250%, 6/15/23(3) | | | 135 | | | | 142 | |
Lincoln National Corp., (3 month LIBOR + 2.040%)
3.403%, 4/20/67(2)(4) | | | 50 | | | | 46 | |
Lloyds Bank plc 144A
6.500%, 9/14/20(3) | | | 150 | | | | 164 | |
| | | | | | | | |
| | | PAR
VALUE | | | VALUE | |
| Financials—continued | | | | | | | | |
Manulife Financial Corp.
4.150%, 3/4/26 | | $ | 100 | | | $ | 106 | |
Morgan Stanley
4.100%, 5/22/23 | | | 80 | | | | 83 | |
3.125%, 7/27/26 | | | 115 | | | | 113 | |
Navient Corp.
7.250%, 9/25/23 | | | 20 | | | | 21 | |
Nordea Bank AB 144A
2.125%, 5/29/20(3) | | | 200 | | | | 199 | |
Nuveen Finance LLC 144A
4.125%, 11/1/24(3) | | | 125 | | | | 132 | |
OM Asset Management plc
4.800%, 7/27/26 | | | 60 | | | | 62 | |
Powszechna Kasa Oszczednosci Bank Polski S.A. 144A
4.630%, 9/26/22(3)(6) | | | 200 | | | | 214 | |
Prudential Financial, Inc.
5.875%, 9/15/42 | | | 90 | | | | 98 | |
5.625%, 6/15/43(4) | | | 60 | | | | 65 | |
S&P Global, Inc.
4.000%, 6/15/25 | | | 125 | | | | 131 | |
Santander Holdings USA, Inc. 144A
3.700%, 3/28/22(3) | | | 115 | | | | 116 | |
SBA Tower Trust 144A
2.877%, 7/9/21(3) | | | 100 | | | | 99 | |
Teachers Insurance & Annuity Association of America 144A
4.375%, 9/15/54(3) | | | 110 | | | | 112 | |
Toronto-Dominion Bank (The)
2.125%, 4/7/21 | | | 65 | | | | 64 | |
3.625%, 9/15/31 | | | 25 | | | | 25 | |
Trinity Acquisition plc
4.400%, 3/15/26 | | | 80 | | | | 85 | |
Turkiye Vakiflar Bankasi TAO 144A
5.625%, 5/30/22(3) | | | 200 | | | | 199 | |
Wells Fargo & Co.
3.069%, 1/24/23 | | | 40 | | | | 40 | |
Series M, 3.450%, 2/13/23 | | | 115 | | | | 117 | |
Series S, 5.900%, 12/29/49 | | | 130 | | | | 139 | |
Willis Towers Watson plc
5.750%, 3/15/21 | | | 125 | | | | 136 | |
Zions Bancorporation
4.500%, 6/13/23 | | | 40 | | | | 42 | |
| | | | | | | | |
| | | | | | | 6,459 | |
| | | | | | | | |
| | |
| Health Care—1.5% | | | | | | | | |
Abbott Laboratories
3.400%, 11/30/23 | | | 25 | | | | 25 | |
3.750%, 11/30/26 | | | 105 | | | | 108 | |
AbbVie, Inc.
3.600%, 5/14/25 | | | 45 | | | | 46 | |
3.200%, 5/14/26 | | | 65 | | | | 65 | |
AmerisourceBergen Corp.
3.450%, 12/15/27 | | | 75 | | | | 74 | |
Anthem, Inc.
3.650%, 12/1/27 | | | 24 | | | | 24 | |
Becton Dickinson and Co.
3.300%, 3/1/23 | | | 135 | | | | 136 | |
Cardinal Health, Inc.
3.200%, 3/15/23 | | | 70 | | | | 70 | |
3.079%, 6/15/24 | | | 5 | | | | 5 | |
3.410%, 6/15/27 | | | 40 | | | | 39 | |
Catalent Pharma Solutions, Inc. 144A
4.875%, 1/15/26(3) | | | 5 | | | | 5 | |
Refer to Footnote Legend on page 68.
See Notes to Financial Statements
64
VIRTUS STRATEGIC ALLOCATION SERIES
SCHEDULE OF INVESTMENTS (Continued)
DECEMBER 31, 2017
($ reported in thousands)
| | | | | | | | |
| | | PAR
VALUE | | | VALUE | |
| Health Care—continued | | | | | | | | |
Endo Finance LLC 144A
5.375%, 1/15/23(3) | | $ | 50 | | | $ | 39 | |
Express Scripts Holding Co.
3.900%, 2/15/22 | | | 140 | | | | 145 | |
Forest Laboratories LLC 144A
4.875%, 2/15/21(3) | | | 38 | | | | 40 | |
Fresenius U.S. Finance II, Inc. 144A
4.500%, 1/15/23(3) | | | 15 | | | | 16 | |
HCA, Inc.
5.375%, 2/1/25 | | | 20 | | | | 21 | |
Mylan NV
3.150%, 6/15/21 | | | 20 | | | | 20 | |
3.950%, 6/15/26 | | | 75 | | | | 76 | |
Shire Acquisitions Investments Ireland DAC
2.400%, 9/23/21 | | | 120 | | | | 118 | |
Tenet Healthcare Corp. 144A
4.625%, 7/15/24(3) | | | 95 | | | | 93 | |
Valeant Pharmaceuticals International, Inc. 144A,
7.500%, 7/15/21(3) | | | 15 | | | | 15 | |
144A, 5.625%, 12/1/21(3) | | | 25 | | | | 24 | |
144A, 5.875%, 5/15/23(3) | | | 10 | | | | 9 | |
144A, 7.000%, 3/15/24(3) | | | 15 | | | | 16 | |
144A, 5.500%, 11/1/25(3) | | | 35 | | | | 36 | |
Zimmer Biomet Holdings, Inc.
3.550%, 4/1/25 | | | 130 | | | | 130 | |
Zoetis, Inc.
3.250%, 2/1/23 | | | 70 | | | | 71 | |
| | | | | | | | |
| | | | | | | 1,466 | |
| | | | | | | | |
|
| Industrials—0.5% | |
Bombardier, Inc. 144A
6.125%, 1/15/23(3) | | | 55 | | | | 54 | |
British Airways Pass-Through-Trust 2013-1, B 144A
5.625%, 6/20/20(3) | | | 26 | | | | 27 | |
CNH Industrial N.V.
4.500%, 8/15/23 | | | 79 | | | | 82 | |
3.850%, 11/15/27 | | | 49 | | | | 49 | |
Embraer Netherlands Finance BV
5.400%, 2/1/27 | | | 45 | | | | 49 | |
Owens Corning
3.400%, 8/15/26 | | | 80 | | | | 78 | |
Penske Truck Leasing Co., LP 144A
3.375%, 2/1/22(3) | | | 50 | | | | 51 | |
Pitney Bowes, Inc.
4.125%, 5/15/22 | | | 91 | | | | 84 | |
| | | | | | | | |
| | | | | | | 474 | |
| | | | | | | | |
|
| Information Technology—1.0% | |
Apple, Inc.
2.400%, 1/13/23 | | | 65 | | | | 64 | |
3.250%, 2/23/26 | | | 80 | | | | 82 | |
3.350%, 2/9/27 | | | 80 | | | | 82 | |
Applied Materials, Inc.
3.300%, 4/1/27 | | | 95 | | | | 97 | |
Arrow Electronics, Inc.
3.875%, 1/12/28 | | | 95 | | | | 95 | |
Broadcom Corp. | | | | | | | | |
144A, 3.000%, 1/15/22(3) | �� | | 45 | | | | 45 | |
144A, 3.625%, 1/15/24(3) | | | 80 | | | | 79 | |
Citrix Systems, Inc.
4.500%, 12/1/27 | | | 90 | | | | 91 | |
Dell International LLC 144A
6.020%, 6/15/26(3) | | | 10 | | | | 11 | |
| | | | | | | | |
| | | PAR
VALUE | | | VALUE | |
| Information Technology—continued | |
Hewlett Packard Enterprise Co.
4.900%, 10/15/25 | | $ | 60 | | | $ | 63 | |
Match Group, Inc. 144A
5.000%, 12/15/27(3) | | | 40 | | | | 41 | |
Microsoft Corp.
3.300%, 2/6/27 | | | 115 | | | | 119 | |
Verisk Analytics, Inc.
4.000%, 6/15/25 | | | 125 | | | | 129 | |
| | | | | | | | |
| | | | | | | 998 | |
| | | | | | | | |
|
| Materials—0.7% | |
Anglo American Capital plc 144A
4.000%, 9/11/27(3) | | | 200 | | | | 199 | |
Glencore Funding LLC 144A
4.125%, 5/30/23(3) | | | 95 | | | | 98 | |
NewMarket Corp.
4.100%, 12/15/22 | | | 142 | | | | 148 | |
NOVA Chemicals Corp. 144A,
4.875%, 6/1/24(3) | | | 35 | | | | 35 | |
144A, 5.000%, 5/1/25(3) | | | 60 | | | | 60 | |
Vulcan Materials Co.
3.900%, 4/1/27 | | | 95 | | | | 97 | |
| | | | | | | | |
| | | | | | | 637 | |
| | | | | | | | |
|
| Real Estate—2.2% | |
Alexandria Real Estate Equities, Inc.
3.950%, 1/15/27 | | | 60 | | | | 61 | |
American Tower Corp.
3.000%, 6/15/23 | | | 41 | | | | 41 | |
Brixmor Operating Partnership LP
3.875%, 8/15/22 | | | 35 | | | | 36 | |
Corporate Office Properties LP
3.700%, 6/15/21 | | | 90 | | | | 92 | |
3.600%, 5/15/23 | | | 150 | | | | 150 | |
Education Realty Operating Partnership LP
4.600%, 12/1/24 | | | 150 | | | | 156 | |
EPR Properties
4.750%, 12/15/26 | | | 110 | | | | 113 | |
Healthcare Realty Trust, Inc.
3.875%, 5/1/25 | | | 80 | | | | 81 | |
Healthcare Trust of America Holdings LP
3.375%, 7/15/21 | | | 50 | | | | 51 | |
3.750%, 7/1/27 | | | 100 | | | | 99 | |
Highwoods Realty LP
3.625%, 1/15/23 | | | 135 | | | | 136 | |
Hospitality Properties Trust
4.500%, 3/15/25 | | | 130 | | | | 135 | |
Kilroy Realty LP
4.375%, 10/1/25 | | | 110 | | | | 115 | |
LifeStorage LP
3.500%, 7/1/26 | | | 50 | | | | 49 | |
3.875%, 12/15/27 | | | 35 | | | | 35 | |
MPT Operating Partnership LP
5.000%, 10/15/27 | | | 40 | | | | 41 | |
National Retail Properties, Inc.
5.500%, 7/15/21 | | | 150 | | | | 163 | |
Physicians Realty LP
4.300%, 3/15/27 | | | 95 | | | | 97 | |
Retail Opportunity Investments Partnership LP
4.000%, 12/15/24 | | | 105 | | | | 103 | |
Select Income REIT
4.500%, 2/1/25 | | | 125 | | | | 126 | |
Refer to Footnote Legend on page 68.
See Notes to Financial Statements
65
VIRTUS STRATEGIC ALLOCATION SERIES
SCHEDULE OF INVESTMENTS (Continued)
DECEMBER 31, 2017
($ reported in thousands)
| | | | | | | | |
| | | PAR
VALUE | | | VALUE | |
| Real Estate—continued | |
Welltower, Inc.
4.000%, 6/1/25 | | $ | 135 | | | $ | 139 | |
WP Carey, Inc.
4.600%, 4/1/24 | | | 105 | | | | 110 | |
| | | | | | | | |
| | | | | | | 2,129 | |
| | | | | | | | |
|
| Telecommunication Services—0.6% | |
AT&T, Inc.
3.400%, 8/14/24 | | | 77 | | | | 77 | |
4.250%, 3/1/27 | | | 60 | | | | 61 | |
5.250%, 3/1/37 | | | 20 | | | | 21 | |
4.800%, 6/15/44 | | | 80 | | | | 79 | |
Level 3 Financing, Inc.
5.375%, 1/15/24 | | | 70 | | | | 70 | |
Qwest Corp.
7.250%, 9/15/25 | | | 55 | | | | 59 | |
Verizon Communications, Inc.
2.946%, 3/15/22 | | | 110 | | | | 111 | |
4.125%, 3/16/27 | | | 95 | | | | 99 | |
| | | | | | | | |
| | | | | | | 577 | |
| | | | | | | | |
|
| Utilities—0.7% | |
American Electric Power Co., Inc.
3.200%, 11/13/27 | | | 85 | | | | 84 | |
Entergy Mississippi, Inc.
3.100%, 7/1/23 | | | 175 | | | | 177 | |
Exelon Corp.
3.497%, 6/1/22 | | | 135 | | | | 138 | |
Kansas City Power & Light Co.
3.150%, 3/15/23 | | | 110 | | | | 110 | |
Southern Power Co.
4.150%, 12/1/25 | | | 145 | | | | 153 | |
Vistra Operations Co. LLC 144A
11.500%, 10/1/20(3)(11)(12) | | | 65 | | | | — | (9) |
| | | | | | | | |
| | | | | | | | 662 | |
| TOTAL CORPORATE BONDS AND NOTES | |
| (Identified Cost $17,403) | | | | | | | 17,744 | |
|
| LOAN AGREEMENTS(2)—0.9% | |
|
| Consumer Discretionary—0.3% | |
Advantage Sales & Marketing, Inc. Tranche B-2, First Lien, (3 month LIBOR + 3.250%)
4.630%, 7/23/21 | | | 35 | | | | 34 | |
Global Appliance, Inc. Tranche B, (1 month LIBOR + 4.000%)
5.570%, 9/29/24 | | | 30 | | | | 30 | |
PetSmart, Inc. Tranche B-2, (1 month LIBOR + 3.000%)
4.570%, 3/11/22 | | | 62 | | | | 49 | |
Seminole Tribe of Florida Tranche B, (1 month
LIBOR + 2.000%)
3.569%, 7/8/24 | | | 60 | | | | 60 | |
Sinclair Television Group, Inc. Tranche B, (3 month
LIBOR + 2.500%)
0.000%, 12/12/24(10) | | | 45 | | | | 45 | |
UFC Holdings LLC First Lien, (1 month LIBOR + 3.250%)
4.810%, 8/18/23 | | | 47 | | | | 48 | |
| | | | | | | | |
| | | | | | | 266 | |
| | | | | | | | |
|
| Consumer Staples—0.0% | |
Aramark Intermediate HoldCo Corp. Tranche B-1, (1 month LIBOR + 2.000%)
3.569%, 3/11/25 | | | 35 | | | | 35 | |
| | | | | | | | |
| | | | | | | | |
| | | PAR
VALUE | | | VALUE | |
| Energy—0.0% | |
Paragon Offshore Finance Co., (3 month LIBOR + 2.750%)
0.000%, 7/16/21(10)(11)(12) | | $ | — | (9) | | $ | — | |
Seadrill Operating LP, (3 month LIBOR + 3.000%)
4.693%, 2/21/21 | | | 50 | | | | 40 | |
| | | | | | | | |
| | | | | | | 40 | |
| | | | | | | | |
|
| Financials—0.1% | |
Delos Finance S.a.r.l., (3 month LIBOR + 2.000%)
3.693%, 10/6/23 | | | 80 | | | | 81 | |
| | | | | | | | |
|
| Health Care—0.0% | |
Envision Healthcare Corp., (1 month LIBOR + 3.000%)
4.570%, 12/1/23 | | | 10 | | | | 11 | |
HLF Financing S.a.r.l. Senior Lien, (1 month LIBOR + 5.500%)
7.069%, 2/15/23 | | | 14 | | | | 14 | |
| | | | | | | | |
| | | | | | | 25 | |
| | | | | | | | |
|
| Industrials—0.1% | |
Accudyne Industries LLC, (1 month LIBOR + 3.750%)
5.319%, 8/18/24 | | | 5 | | | | 5 | |
Beacon Roofing Supply, Inc. Tranche B, (3 month
LIBOR + 2.250%)
0.000%, 1/2/25(10) | | | 60 | | | | 60 | |
Red Ventures LLC First Lien, (1 month LIBOR + 4.000%)
5.569%, 11/8/24 | | | 35 | | | | 35 | |
| | | | | | | | |
| | | | | | | 100 | |
| | | | | | | | |
| Information Technology—0.1% | |
Rackspace Hosting, Inc. Tranche B, First Lien, (3 month LIBOR + 3.000%)
4.385%, 11/3/23 | | | 107 | | | | 107 | |
| | | | | | | | |
|
| Materials—0.1% | |
CPI Acquisition, Inc. First Lien, (3 month LIBOR + 4.500%)
5.962%, 8/17/22 | | | 36 | | | | 26 | |
Tronox Ltd. | | | | | | | | |
First Lien, (3 month LIBOR + 3.000%)
4.693%, 9/23/24 | | | 10 | | | | 10 | |
First Lien, (3 month LIBOR + 3.000%)
4.693%, 9/23/24 | | | 5 | | | | 5 | |
| | | | | | | | |
| | | | | | | 41 | |
| | | | | | | | |
|
| Telecommunication Services—0.1% | |
CenturyLink, Inc. Tranche B, (3 month PRIME + 1.750%)
0.000%, 1/31/25(10) | | | 55 | | | | 53 | |
Digicel International Finance Ltd. Tranche-B, First Lien, (1 month LIBOR + 3.750%)
5.310%, 5/27/24 | | | 10 | | | | 10 | |
| | | | | | | | |
| | | | | | | 63 | |
| | | | | | | | |
|
| Utilities—0.1% | |
Energy Future Intermediate Holding Co. LLC, (1 month LIBOR + 3.000%)
4.546%, 6/30/18 | | | 60 | | | | 60 | |
Vistra Operations Co. LLC | | | | | | | | |
Tranche C, (1 month LIBOR + 2.500%)
3.833%, 8/4/23 | | | 5 | | | | 5 | |
(1 month LIBOR + 2.750%)
3.951%, 8/4/23 | | | 24 | | | | 24 | |
| | | | | | | | |
| | | | | | | | 89 | |
| TOTAL LOAN AGREEMENTS | |
| (Identified Cost $877) | | | | | | | 847 | |
Refer to Footnote Legend on page 68.
See Notes to Financial Statements
66
VIRTUS STRATEGIC ALLOCATION SERIES
SCHEDULE OF INVESTMENTS (Continued)
DECEMBER 31, 2017
($ reported in thousands)
| | | | | | | | |
| | | SHARES | | | VALUE | |
| PREFERRED STOCKS—0.8% | |
| | |
| Financials—0.6% | | | | | | | | |
Bank of New York Mellon Corp. (The)
Series E, 4.950% | | | 40 | (5) | | $ | 41 | |
Citigroup, Inc.
Series T, 6.250% | | | 125 | (5) | | | 138 | |
JPMorgan Chase & Co.
Series V, 5.000% | | | 50 | (5) | | | 51 | |
JPMorgan Chase & Co.
Series Z, 5.300% | | | 95 | (5) | | | 98 | |
KeyCorp
Series D, 5.000% | | | 100 | (5) | | | 103 | |
PNC Financial Services Group, Inc. (The)
Series R, 4.850% | | | 95 | (5) | | | 97 | |
PNC Financial Services Group, Inc. (The)
Series S, 5.000% | | | 100 | (5) | | | 106 | |
| | | | | | | | |
| | | | | | | 634 | |
| | | | | | | | |
|
| Industrials—0.2% | |
General Electric Co.
Series D, 5.000% | | | 150 | (5) | | | 155 | |
| TOTAL PREFERRED STOCKS | |
| (Identified Cost $770) | | | | | | | 789 | |
|
| COMMON STOCKS—62.9% | |
|
| Consumer Discretionary—12.6% | |
Amazon.com, Inc.(1) | | | 1,870 | | | | 2,187 | |
Ctrip.com International Ltd. ADR(1) | | | 25,185 | | | | 1,111 | |
Home Depot, Inc. (The) | | | 5,560 | | | | 1,054 | |
IMAX Corp.(1) | | | 15,986 | | | | 370 | |
Las Vegas Sands Corp. | | | 20,400 | | | | 1,418 | |
McDonald’s Corp. | | | 4,170 | | | | 718 | |
MercadoLibre, Inc. | | | 840 | | | | 264 | |
Netflix, Inc.(1) | | | 6,590 | | | | 1,265 | |
NIKE, Inc. Class B | | | 14,200 | | | | 888 | |
Priceline Group, Inc. (The)(1) | | | 365 | | | | 634 | |
Ross Stores, Inc. | | | 11,320 | | | | 908 | |
Sony Corp. Sponsored ADR | | | 10,428 | | | | 469 | |
Starbucks Corp. | | | 16,020 | | | | 920 | |
| | | | | | | | |
| | | | | | | 12,206 | |
| | | | | | | | |
|
| Consumer Staples—3.8% | |
Fomento Economico Mexicano SAB de C.V. ADR | | | 4,485 | | | | 421 | |
Marine Harvest ASA Sponsored ADR(1) | | | 20,009 | | | | 339 | |
Monster Beverage Corp.(1) | | | 28,490 | | | | 1,803 | |
Philip Morris International, Inc. | | | 10,260 | | | | 1,084 | |
| | | | | | | | |
| | | | | | | 3,647 | |
| | | | | | | | |
|
| Energy—3.2% | |
Cabot Oil & Gas Corp. | | | 30,420 | | | | 870 | |
Core Laboratories N.V. | | | 4,730 | | | | 518 | |
Frontera Energy Corp.(1) | | | 557 | | | | 17 | |
Pioneer Natural Resources Co. | | | 4,270 | | | | 738 | |
Statoil ASA Sponsored ADR | | | 23,786 | | | | 510 | |
TechnipFMC plc | | | 15,605 | | | | 489 | |
| | | | | | | | |
| | | | | | | 3,142 | |
| | | | | | | | |
| Financials—7.5% | |
Bank of America Corp. | | | 55,330 | | | | 1,633 | |
BOC Hong Kong Holdings Ltd. Sponsored ADR | | | 4,283 | | | | 435 | |
CaixaBank S.A. ADR | | | 277,495 | | | | 430 | |
| | | | | | | | |
| | | SHARES | | | VALUE | |
| Financials—continued | |
Charles Schwab Corp. (The) | | | 14,200 | | | $ | 730 | |
China Construction Bank Corp. ADR | | | 24,747 | | | | 457 | |
Credit Agricole S.A. ADR | | | 53,533 | | | | 440 | |
DBS Group Holdings Ltd. Sponsored ADR | | | 7,626 | | | | 569 | |
ING Groep N.V. Sponsored ADR | | | 26,676 | | | | 492 | |
MarketAxess Holdings, Inc. | | | 3,150 | | | | 636 | |
Nomura Holdings, Inc. Sponsored ADR | | | 78,420 | | | | 456 | |
ORIX Corp. Sponsored ADR | | | 5,757 | | | | 488 | |
UBS Group AG Registered Shares | | | 26,826 | | | | 493 | |
| | | | | | | | |
| | | | | | | 7,259 | |
| | | | | | | | |
|
| Health Care—4.4% | |
Allergan plc | | | 2,606 | | | | 426 | |
BioMarin Pharmaceutical, Inc.(1) | | | 7,510 | | | | 670 | |
Danaher Corp. | | | 7,700 | | | | 715 | |
HealthEquity, Inc.(1) | | | 9,580 | | | | 447 | |
ICON plc(1) | | | 2,610 | | | | 293 | |
Illumina, Inc.(1) | | | 3,550 | | | | 775 | |
Zoetis, Inc. | | | 13,780 | | | | 993 | |
| | | | | | | | |
| | | | | | | 4,319 | |
| | | | | | | | |
|
| Industrials—5.0% | |
Airbus SE ADR | | | 19,587 | | | | 485 | |
Ashtead Group plc ADR | | | 4,917 | | | | 535 | |
Caterpillar, Inc. | | | 6,270 | | | | 988 | |
Kansas City Southern | | | 6,470 | | | | 681 | |
Nidec Corp. Sponsored ADR | | | 14,311 | | | | 503 | |
RELX plc Sponsored ADR | | | 12,478 | | | | 296 | |
Rockwell Automation, Inc. | | | 2,430 | | | | 477 | |
Roper Technologies, Inc. | | | 3,560 | | | | 922 | |
| | | | | | | | |
| | | | | | | 4,887 | |
| | | | | | | | |
|
| Information Technology—22.3% | |
Accenture plc Class A | | | 5,200 | | | | 796 | |
Activision Blizzard, Inc. | | | 12,660 | | | | 802 | |
Alibaba Group Holding Ltd. Sponsored ADR(1) | | | 16,530 | | | | 2,850 | |
Alphabet, Inc. Class A(1) | | | 750 | | | | 790 | |
Amphenol Corp. Class A | | | 15,950 | | | | 1,400 | |
Broadcom Ltd. | | | 1,739 | | | | 447 | |
Check Point Software Technologies Ltd.(1) | | | 3,735 | | | | 387 | |
CoStar Group, Inc.(1) | | | 2,220 | | | | 659 | |
Facebook, Inc. Class A(1) | | | 25,060 | | | | 4,422 | |
Gartner, Inc.(1) | | | 4,080 | | | | 502 | |
Hitachi Ltd. ADR | | | 7,119 | | | | 556 | |
NVIDIA Corp. | | | 8,200 | | | | 1,587 | |
Paycom Software, Inc.(1) | | | 10,120 | | | | 813 | |
SAP SE Sponsored ADR | | | 3,914 | | | | 440 | |
Tencent Holdings Ltd. ADR | | | 24,750 | | | | 1,285 | |
Visa, Inc. Class A | | | 16,050 | | | | 1,830 | |
Workday, Inc. Class A(1) | | | 9,050 | | | | 921 | |
Yandex N.V. Class A(1) | | | 34,100 | | | | 1,117 | |
| | | | | | | | |
| | | | | | | 21,604 | |
| | | | | | | | |
|
| Materials—3.0% | |
Anhui Conch Cement Co., Ltd. ADR | | | 22,362 | | | | 525 | |
Ecolab, Inc. | | | 7,200 | | | | 966 | |
Glencore plc ADR(1) | | | 48,684 | | | | 507 | |
HeidelbergCement AG ADR | | | 20,934 | | | | 452 | |
Toray Industries, Inc. ADR | | | 22,835 | | | | 430 | |
| | | | | | | | |
| | | | | | | 2,880 | |
| | | | | | | | |
Refer to Footnote Legend on page 68.
See Notes to Financial Statements
67
VIRTUS STRATEGIC ALLOCATION SERIES
SCHEDULE OF INVESTMENTS (Continued)
DECEMBER 31, 2017
($ reported in thousands)
| | | | | | | | |
| | | SHARES | | | VALUE | |
| Real Estate—0.3% | |
Lendlease Group Sponsored ADR | | | 24,486 | | | $ | 313 | |
| | | | | | | | |
|
| Telecommunication Services—0.3% | |
BT Group plc Sponsored ADR | | | 15,719 | | | | 286 | |
| | | | | | | | |
|
| Utilities—0.5% | |
Veolia Environnement S.A. ADR | | | 17,495 | | | | 446 | |
Vistra Energy Corp.(1) | | | 1,084 | | | | 20 | |
| | | | | | | | |
| | | | | | | | 466 | |
TOTAL COMMON STOCKS
(Identified Cost $47,453) | | | | 61,009 | |
|
| AFFILIATED MUTUAL FUND(7)—0.3% | |
Virtus Newfleet Credit Opportunities Fund Class R6 | | | 33,447 | | | | 324 | |
TOTAL AFFILIATED MUTUAL FUND
(Identified Cost $334) | | | | 324 | |
|
| RIGHTS—0.0% | |
Vistra Energy Corp.(13) | | | 1,084 | | | | 1 | |
TOTAL RIGHTS
(Identified Cost $1) | | | | 1 | |
TOTAL LONG TERM INVESTMENTS—99.0%
(Identified Cost $82,116) | | | | 96,003 | |
|
| SHORT-TERM INVESTMENT—1.0% | |
|
| Money Market Mutual Fund(7)—1.0% | |
Dreyfus Government Cash Management Fund – Institutional Shares (seven-day effective yield 1.190%) | | | 988,019 | | | | 988 | |
TOTAL SHORT-TERM INVESTMENT
(Identified Cost $988) | | | | 988 | |
TOTAL INVESTMENTS—100.0%
(Identified Cost $83,104) | | | | 96,991 | |
Other assets and liabilities, net—0.0% | | | | 37 | |
| | | | | | | | |
| NET ASSETS—100.0% | | | | | | $ | 97,028 | |
| | | | | | | | |
Abbreviations:
| ADR | American Depositary Receipt |
| FHLMC | Federal Home Loan Mortgage Corporation (“Freddie Mac”) |
| FNMA | Federal National Mortgage Association (“Fannie Mae”) |
| GNMA | Government National Mortgage Association (“Ginnie Mae”) |
| LIBOR | London Interbank Offered Rate |
| REIT | Real Estate Investment Trust |
Footnote Legend:
| (1) | Non-income producing. |
| (2) | Variable rate security. Rate disclosed is as of December 31, 2017. For loan agreements, the rate shown may represent a weighted average interest rate. Information in parenthesis represents benchmark and reference rate for each security. Certain variable rate securities are not based on a published reference rate and spread but are determined by the issuer or agent and are based on current market conditions, or, for mortgage-backed securities, are impacted by the individual mortgages which are paying off over time. These securities do not indicate a reference rate and spread in their descriptions. |
| (3) | Security exempt from registration under Rule 144A of the Securities Act of 1933. These securities may be resold in transactions exempt from registration, normally to qualified institutional buyers. At December 31, 2017, these securities amounted to a value of $10,712 or 11.0% of net assets. |
| (4) | Interest payments may be deferred. |
| (5) | Value shown as par value. |
| (6) | This Note was issued for the sole purpose of funding a loan agreement between the issuer and the borrower. As the credit risk for this security lies solely with the borrower, the name represented here is that of the borrower. |
| (7) | Shares of these funds are publicly offered, and the prospectus and annual reports of each are publicly available. |
| (8) | Security in default, interest payments are being received during the bankruptcy proceedings. |
| (9) | Amount is less than $500. |
| (10) | This loan will settle after December 31, 2017, at which time the interest rate, based on the LIBOR and the agreed upon spread on trade date, will be reflected. |
| (11) | Security valued at fair value as determined in good faith by or under the direction of the Trustees. This security is disclosed as a Level 3 security in the Fair Value Hierarchy table located after the Schedule of Investments. |
| (12) | Security in default, no interest payments are being received during the bankruptcy proceedings. |
| (13) | The value of this security was determined using significant unobservable inputs and is reported as a Level 3 security in the Fair Value Hierarchy table located at the end of the Schedule of Investments. |
Foreign Currencies:
| | | | |
| Country Weightings† (unaudited) | | | |
United States | | | 74 | % |
China | | | 6 | |
Japan | | | 3 | |
France | | | 2 | |
Russia | | | 2 | |
United Kingdom | | | 2 | |
Singapore | | | 1 | |
Other | | | 10 | |
Total | | | 100 | % |
† % of total investments as of December 31, 2017 | |
See Notes to Financial Statements
68
VIRTUS STRATEGIC ALLOCATION SERIES
SCHEDULE OF INVESTMENTS (Continued)
DECEMBER 31, 2017
($ reported in thousands)
The following table provides a summary of inputs used to value the Series’ investments as of December 31, 2017 (See Security Valuation Note 2A in the Notes to Financial Statements):
| | | | | | | | | | | | | | | | |
| | | Total
Value at
December 31, 2017 | | | Level 1
Quoted
Prices | | | Level 2
Significant
Observable
Inputs | | | Level 3
Significant
Unobservable
Inputs | |
Debt Securities: | | | | | | | | | | | | | | | | |
Asset-Backed Securities | | $ | 2,466 | | | $ | — | | | $ | 2,466 | | | $ | — | |
Corporate Bonds and Notes | | | 17,744 | | | | — | | | | 17,744 | | | | — | |
Foreign Government Securities | | | 653 | | | | — | | | | 653 | | | | — | |
Loan Agreements | | | 847 | | | | — | | | | 847 | | | | — | |
Mortgage-Backed Securities | | | 8,620 | | | | — | | | | 8,620 | | | | — | |
Municipal Bonds | | | 1,514 | | | | — | | | | 1,514 | | | | — | |
U.S. Government Securities | | | 2,036 | | | | — | | | | 2,036 | | | | — | |
Equity Securities: | | | | | | | | | | | | | | | | |
Common Stocks | | | 61,009 | | | | 61,009 | | | | — | | | | — | |
Preferred Stocks | | | 789 | | | | — | | | | 789 | | | | — | |
Rights | | | 1 | | | | — | | | | — | | | | 1 | |
Affiliated Mutual Fund | | | 324 | | | | 324 | | | | — | | | | — | |
Short-Term Investment | | | 988 | | | | 988 | | | | — | | | | — | |
| | | | | | | | | | | | | | | | |
Total Investments | | $ | 96,991 | | | $ | 62,321 | | | $ | 34,669 | | | $ | 1 | |
| | | | | | | | | | | | | | | | |
Security held by the series with an end of period value of $0 was transferred from Level 2 to Level 3 due to a decrease in trading activities at period end.
There were no other transfers between Level 1, Level 2, or Level 3 related to securities held at December 31, 2017.
Management has determined that the amount of Level 3 securities compared to total net assets is de minimis; therefore, the rollforward of Level 3 securities and assumptions are not shown for the period ended December 31, 2017.
See Notes to Financial Statements
69
VIRTUS VARIABLE INSURANCE TRUST
STATEMENTS OF ASSETS AND LIABILITIES
DECEMBER 31, 2017
(Reported in thousands except shares and per share amounts)
| | | | | | | | | | | | |
| | | Duff & Phelps
International
Series | | | Duff & Phelps
Real Estate
Securities Series | | | KAR
Capital Growth
Series | |
| Assets | | | | | | | | | | | | |
Investment in securities at value(1) | | $ | 183,647 | | | $ | 77,580 | | | $ | 224,446 | |
Cash | | | 38 | | | | — | (2) | | | — | |
Investment securities sold | | | — | | | | 326 | | | | — | |
Series shares sold | | | — | | | | 2 | | | | — | |
Receivables | | | | | | | | | | | | |
Dividends and interest | | | 66 | | | | 321 | | | | 114 | |
Tax reclaims | | | 44 | | | | — | | | | — | |
Other assets | | | 467 | | | | 198 | | | | 572 | |
| | | | | | | | | | | | |
Total assets | | | 184,262 | | | | 78,427 | | | | 225,132 | |
| | | | | | | | | | | | |
Liabilities | | | | | | | | | | | | |
Payables | | | | | | | | | | | | |
Series shares repurchased | | | 18 | | | | 31 | | | | 34 | |
Investment securities purchased | | | — | | | | 302 | | | | — | |
Investment advisory fees | | | 120 | | | | 52 | | | | 119 | |
Administration fees | | | 13 | | | | 6 | | | | 17 | |
Transfer and sub-transfer agent fees and expenses | | | 1 | | | | 1 | | | | — | (2) |
Professional fees | | | 23 | | | | 22 | | | | 19 | |
Distribution and service fees | | | 39 | | | | 16 | | | | 49 | |
Trustee deferred compensation plan | | | 467 | | | | 198 | | | | 572 | |
Other accrued expenses | | | 78 | | | | 28 | | | | 69 | |
| | | | | | | | | | | | |
Total liabilities | | | 759 | | | | 656 | | | | 879 | |
| | | | | | | | | | | | |
Net Assets | | $ | 183,503 | | | $ | 77,771 | | | $ | 224,253 | |
| | | | | | | | | | | | |
Net Assets Consist of: | | | | | | | | | | | | |
Capital paid in on shares of beneficial interest | | $ | 167,523 | | | $ | 53,532 | | | $ | 116,112 | |
Accumulated undistributed net investment income (loss) | | | (433 | ) | | | (25 | ) | | | (455 | ) |
Accumulated undistributed net realized gain (loss) | | | (10,677 | ) | | | 734 | | | | 4,052 | |
Net unrealized appreciation (depreciation) | | | 27,090 | | | | 23,530 | | | | 104,544 | |
| | | | | | | | | | | | |
Net Assets | | $ | 183,503 | | | $ | 77,771 | | | $ | 224,253 | |
| | | | | | | | | | | | |
| Net Assets: | | | | | | | | | | | | |
Class A | | $ | 183,403 | | | $ | 77,564 | | | $ | 224,253 | |
Class I | | $ | 100 | | | $ | 207 | | | $ | — | |
| Shares of Beneficial Interest Outstanding, $1 par value, unlimited authorization: | | | | | | | | | | | | |
Class A | | | 14,671,584 | | | | 4,033,027 | | | | 7,140,910 | |
Class I | | | 8,033 | | | | 10,776 | | | | — | |
| Net Asset Value Per Share: | | | | | | | | | | | | |
Class A | | $ | 12.50 | | | $ | 19.23 | | | $ | 31.40 | |
Class I | | $ | 12.48 | | | $ | 19.19 | | | $ | — | |
| | | |
(1) Investments in securities at cost | | $ | 156,562 | | | $ | 54,050 | | | $ | 119,902 | |
| (2) Amount is less than $500. | | | | | | | | | | | | |
See Notes to Financial Statements
70
VIRTUS VARIABLE INSURANCE TRUST
STATEMENTS OF ASSETS AND LIABILITIES (Continued)
DECEMBER 31, 2017
(Reported in thousands except shares and per share amounts)
| | | | | | | | | | | | |
| | | KAR
Small-Cap
Growth Series | | | KAR
Small-Cap
Value Series | | | Newfleet
Multi-Sector
Intermediate Bond
Series | |
Assets | | | | | | | | | | | | |
Investment in unaffiliated securities at value(1) | | $ | 81,688 | | | $ | 94,705 | | | $ | 130,471 | |
Investment in affiliated funds at value(2) | | | — | | | | — | | | | 3,002 | |
Cash | | | — | | | | — | (3) | | | 68 | |
Receivables | | | | | | | | | | | | |
Investment securities sold | | | — | | | | — | | | | 46 | |
Series shares sold | | | — | | | | — | | | | 217 | |
Dividends and interest | | | 23 | | | | 88 | | | | 1,463 | |
Other assets | | | 205 | | | | 241 | | | | 343 | |
| | | | | | | | | | | | |
Total assets | | | 81,916 | | | | 95,034 | | | | 135,610 | |
| | | | | | | | | | | | |
Liabilities | | | | | | | | | | | | |
Cash overdraft | | | — | (3) | | | — | | | | — | |
Payables | | | | | | | | | | | | |
Series shares repurchased | | | 115 | | | | 11 | | | | 9 | |
Investment securities purchased | | | 20 | | | | — | | | | 280 | |
Investment advisory fees | | | 54 | | | | 66 | | | | 59 | |
Administration fees | | | 6 | | | | 7 | | | | 11 | |
Transfer and sub-transfer agent fees and expenses | | | 1 | | | | — | (3) | | | 1 | |
Professional fees | | | 20 | | | | 20 | | | | 24 | |
Distribution and service fees | | | 17 | | | | 20 | | | | 28 | |
Trustee deferred compensation plan | | | 205 | | | | 241 | | | | 343 | |
Other accrued expenses | | | 23 | | | | 31 | | | | 47 | |
| | | | | | | | | | | | |
Total liabilities | | | 461 | | | | 396 | | | | 802 | |
| | | | | | | | | | | | |
Net Assets | | $ | 81,455 | | | $ | 94,638 | | | $ | 134,808 | |
| | | | | | | | | | | | |
Net Assets Consist of: | | | | | | | | | | | | |
Capital paid in on shares of beneficial interest | | $ | 38,250 | | | $ | 58,918 | | | $ | 137,627 | |
Accumulated undistributed net investment income (loss) | | | (145 | ) | | | (155 | ) | | | (139 | ) |
Accumulated undistributed net realized gain (loss) | | | 2,689 | | | | 2,218 | | | | (2,803 | ) |
Net unrealized appreciation (depreciation) | | | 40,661 | | | | 33,657 | | | | 123 | |
| | | | | | | | | | | | |
Net Assets | | $ | 81,455 | | | $ | 94,638 | | | $ | 134,808 | |
| | | | | | | | | | | | |
| Net Assets: | | | | | | | | | | | | |
Class A | | $ | 79,597 | | | $ | 94,638 | | | $ | 133,430 | |
Class I | | $ | 1,858 | | | $ | — | | | $ | 1,378 | |
| Shares of Beneficial Interest Outstanding, $1 par value, unlimited authorization: | | | | | | | | | | | | |
Class A | | | 2,777,206 | | | | 5,450,099 | | | | 14,293,193 | |
Class I | | | 63,910 | | | | — | | | | 147,760 | |
| Net Asset Value Per Share: | | | | | | | | | | | | |
Class A | | $ | 28.66 | | | $ | 17.36 | | | $ | 9.34 | |
Class I | | $ | 29.08 | | | $ | — | | | $ | 9.32 | |
| | | |
(1) Investments in unaffiliated securities at cost | | $ | 41,027 | | | $ | 61,048 | | | $ | 130,250 | |
(2) Investments in affiliated funds at cost | | $ | — | | | $ | — | | | $ | 3,100 | |
| (3) Amount is less than $500. | | | | | | | | | | | | |
See Notes to Financial Statements
71
VIRTUS VARIABLE INSURANCE TRUST
STATEMENTS OF ASSETS AND LIABILITIES (Continued)
DECEMBER 31, 2017
(Reported in thousands except shares and per share amounts)
| | | | | | | | | | | | |
| | | Rampart
Enhanced
Core Equity
Series | | | Rampart
Equity Trend
Series | | | Strategic
Allocation Series | |
Assets | | | | | | | | | | | | |
Investment in unaffiliated securities at value(1) | | $ | 110,999 | | | $ | 3,710 | | | $ | 96,667 | |
Investment in affiliated funds at value(2) | | | — | | | | — | | | | 324 | |
Cash | | | 4 | | | | 2 | | | | 5 | |
Deposits with broker for written options | | | 583 | | | | — | | | | — | |
Receivables | | | | | | | | | | | | |
Investment securities sold | | | 111 | | | | — | | | | 15 | |
Series shares sold | | | — | | | | — | | | | — | (4) |
Dividends and interest | | | 108 | | | | 4 | | | | 305 | |
Tax reclaims | | | — | | | | — | | | | 1 | |
Other assets | | | 283 | | | | 9 | | | | 248 | |
| | | | | | | | | | | | |
Total assets | | | 112,088 | | | | 3,725 | | | | 97,565 | |
| | | | | | | | | | | | |
Liabilities | | | | | | | | | | | | |
Written call options at value(3) | | | 161 | | | | — | | | | — | |
Payables | | | | | | | | | | | | |
Series shares repurchased | | | 97 | | | | — | (4) | | | 12 | |
Investment securities purchased | | | 23 | | | | — | | | | 158 | |
Investment advisory fees | | | 51 | | | | 2 | | | | 43 | |
Administration fees | | | 9 | | | | — | (4) | | | — | (4) |
Transfer and sub-transfer agent fees and expenses | | | — | (4) | | | 1 | | | | — | (4) |
Professional fees | | | 19 | | | | 13 | | | | 24 | |
Distribution and service fees | | | 24 | | | | 1 | | | | 21 | |
Trustee deferred compensation plan | | | 283 | | | | 9 | | | | 248 | |
Other accrued expenses | | | 35 | | | | 1 | | | | 31 | |
| | | | | | | | | | | | |
Total liabilities | | | 702 | | | | 27 | | | | 537 | |
| | | | | | | | | | | | |
Net Assets | | $ | 111,386 | | | $ | 3,698 | | | $ | 97,028 | |
| | | | | | | | | | | | |
Net Assets Consist of: | | | | | | | | | | | | |
Capital paid in on shares of beneficial interest | | $ | 100,253 | | | $ | 5,535 | | | $ | 82,831 | |
Accumulated undistributed net investment income (loss) | | | (298 | ) | | | (50 | ) | | | (246 | ) |
Accumulated undistributed net realized gain (loss) | | | (328 | ) | | | (2,638 | ) | | | 556 | |
Net unrealized appreciation (depreciation) on investments | | | 11,683 | | | | 851 | | | | 13,887 | |
Net unrealized appreciation (depreciation) on written options | | | 76 | | | | — | | | | — | |
| | | | | | | | | | | | |
Net Assets | | $ | 111,386 | | | $ | 3,698 | | | $ | 97,028 | |
| | | | | | | | | | | | |
| Net Assets: | | | | | | | | | | | | |
Class A | | $ | 111,386 | | | $ | 3,554 | | | $ | 97,028 | |
Class I | | $ | — | | | $ | 144 | | | $ | — | |
| Shares of Beneficial Interest Outstanding, $1 par value, unlimited authorization: | | | | | | | | | | | | |
Class A | | | 9,283,721 | | | | 268,252 | | | | 7,686,332 | |
Class I | | | — | | | | 10,743 | | | | — | |
| Net Asset Value Per Share: | | | | | | | | | | | | |
Class A | | $ | 12.00 | | | $ | 13.25 | | | $ | 12.62 | |
Class I | | $ | — | | | $ | 13.38 | | | $ | — | |
| | | |
(1) Investments in unaffiliated securities at cost | | $ | 99,316 | | | $ | 2,859 | | | $ | 82,770 | |
(2) Investments in affiliated funds at cost | | $ | — | | | $ | — | | | $ | 334 | |
(3) Premiums received | | $ | 237 | | | $ | — | | | $ | — | |
| (4) Amount is less than $500. | | | | | | | | | | | | |
See Notes to Financial Statements
72
VIRTUS VARIABLE INSURANCE TRUST
STATEMENTS OF OPERATIONS
YEAR ENDED DECEMBER 31, 2017
($ reported in thousands)
| | | | | | | | | | | | |
| | | Duff & Phelps
International
Series | | | Duff & Phelps
Real Estate
Securities Series | | | KAR
Capital Growth
Series | |
Investment Income | | | | | | | | | | | | |
Dividends | | $ | 4,707 | | | $ | 1,903 | | | $ | 1,814 | |
Interest | | | 5 | | | | 2 | | | | 8 | |
Foreign taxes withheld | | | (335 | ) | | | — | | | | (8 | ) |
| | | | | | | | | | | | |
Total investment income | | | 4,377 | | | | 1,905 | | | | 1,814 | |
| | | | | | | | | | | | |
Expenses | | | | | | | | | | | | |
Investment advisory fees | | | 1,363 | | | | 597 | | | | 1,464 | |
Administration fees | | | 227 | | | | 100 | | | | 261 | |
Distribution and service fees | | | 454 | | | | 198 | | | | 523 | |
Transfer agent fees and expenses | | | 2 | | | | 3 | | | | 1 | |
Sub-transfer agent fees—Class A | | | — | (1) | | | — | (1) | | | — | (1) |
Sub-transfer agent fees—Class I | | | — | | | | — | | | | — | |
Custodian fees | | | 47 | | | | 3 | | | | 7 | |
Printing fees and expenses | | | 40 | | | | 19 | | | | 45 | |
Professional fees | | | 27 | | | | 22 | | | | 24 | |
Trustees’ fees and expenses | | | 21 | | | | 9 | | | | 23 | |
Miscellaneous expenses | | | 17 | | | | 8 | | | | 18 | |
| | | | | | | | | | | | |
Total expenses | | | 2,198 | | | | 959 | | | | 2,366 | |
Less expenses reimbursed and/or waived by investment advisor | | | (54 | ) | | | (37 | ) | | | (212 | ) |
Custody fees reimbursed (Note 14) | | | — | (1) | | | — | (1) | | | — | (1) |
Earnings credit from custodian | | | (17 | ) | | | (2 | ) | | | — | |
| | | | | | | | | | | | |
Net expenses | | | 2,127 | | | | 920 | | | | 2,154 | |
| | | | | | | | | | | | |
Net investment income (loss) | | | 2,250 | | | | 985 | | | | (340 | ) |
| | | | | | | | | | | | |
| Net Realized and Unrealized Gain (Loss) on Investments and Foreign Currency | | | | | | | | | | | | |
Net Realized Gain (Loss) from: | | | | | | | | | | | | |
Investments | | | 5,747 | | | | 5,909 | | | | 19,080 | |
Foreign currency transactions | | | 10 | | | | — | | | | — | |
Forward currency transactions | | | (1,143 | ) | | | — | | | | — | |
Net Change in Unrealized Appreciation (Depreciation) on Investments and Foreign Currency: | | | | | | | | | | | | |
Investments | | | 20,453 | | | | (2,287 | ) | | | 44,560 | |
Foreign currency transactions | | | 6 | | | | — | | | | — | |
Forward currency transactions | | | (496 | ) | | | — | | | | — | |
| | | | | | | | | | | | |
Net Realized and Unrealized Gain (Loss) on Investments and Foreign Currency | | | 24,577 | | | | 3,622 | | | | 63,640 | |
| | | | | | | | | | | | |
Net increase (decrease) in net assets resulting from operations | | $ | 26,827 | | | $ | 4,607 | | | $ | 63,300 | |
| | | | | | | | | | | | |
| (1) | Amount is less than $500. |
See Notes to Financial Statements
73
VIRTUS VARIABLE INSURANCE TRUST
STATEMENTS OF OPERATIONS (Continued)
YEAR ENDED DECEMBER 31, 2017
($ reported in thousands)
| | | | | | | | | | | | |
| | | KAR
Small-Cap
Growth Series | | | KAR
Small-Cap
Value Series | | | Newfleet
Multi-Sector
Intermediate Bond
Series | |
Investment Income | | | | | | | | | | | | |
Interest | | $ | 3 | | | $ | 8 | | | $ | 6,840 | |
Dividends | | | 501 | | | | 1,359 | | | | 40 | |
Dividends from affiliated funds | | | — | | | | — | | | | 188 | |
Foreign taxes withheld | | | — | | | | (10 | ) | | | (9 | ) |
| | | | | | | | | | | | |
Total investment income | | | 504 | | | | 1,357 | | | | 7,059 | |
| | | | | | | | | | | | |
Expenses | | | | | | | | | | | | |
Investment advisory fees | | | 610 | | | | 835 | | | | 669 | |
Administration fees | | | 89 | | | | 116 | | | | 168 | |
Distribution and service fees | | | 176 | | | | 232 | | | | 332 | |
Transfer agent fees and expenses | | | 2 | | | | 1 | | | | 3 | |
Sub-transfer agent fees—Class A | | | — | (1) | | | — | (1) | | | — | (1) |
Sub-transfer agent fees—Class I | | | — | (1) | | | — | | | | — | (1) |
Custodian fees | | | 5 | | | | 3 | | | | 14 | |
Printing fees and expenses | | | 17 | | | | 21 | | | | 28 | |
Professional fees | | | 20 | | | | 21 | | | | 30 | |
Trustees’ fees and expenses | | | 8 | | | | 10 | | | | 15 | |
Miscellaneous expenses | | | 7 | | | | 8 | | | | 16 | |
| | | | | | | | | | | | |
Total expenses | | | 934 | | | | 1,247 | | | | 1,275 | |
Less expenses reimbursed and/or waived by investment advisor | | | (82 | ) | | | (134 | ) | | | (36 | ) |
Custody fees reimbursed (Note 14) | | | — | (1) | | | — | (1) | | | — | (1) |
Earnings credit from custodian | | | (2 | ) | | | — | | | | (2 | ) |
| | | | | | | | | | | | |
Net expenses | | | 850 | | | | 1,113 | | | | 1,237 | |
| | | | | | | | | | | | |
Net investment income (loss) | | | (346 | ) | | | 244 | | | | 5,822 | |
| | | | | | | | | | | | |
Net Realized and Unrealized Gain (Loss) on Investments and Foreign Currency | | | | | | | | | | | | |
Net Realized Gain (Loss) from: | | | | | | | | | | | | |
Unaffiliated investments | | | 7,399 | | | | 11,084 | | | | 539 | |
Foreign currency transactions | | | (3 | ) | | | — | | | | (9 | ) |
Net Change in Unrealized Appreciation (Depreciation) on Investments and Foreign Currency: | | | | | | | | | | | | |
Unaffiliated investments | | | 17,596 | | | | 5,753 | | | | 2,346 | |
Affiliated funds | | | — | | | | — | | | | (72 | ) |
Foreign currency transactions | | | — | | | | — | | | | 1 | |
| | | | | | | | | | | | |
| | | |
Net Realized and Unrealized Gain (Loss) on Investments and Foreign Currency | | | 24,992 | | | | 16,837 | | | | 2,805 | |
| | | | | | | | | | | | |
Net increase (decrease) in net assets resulting from operations | | $ | 24,646 | | | $ | 17,081 | | | $ | 8,627 | |
| | | | | | | | | | | | |
| (1) | Amount is less than $500. |
See Notes to Financial Statements
74
VIRTUS VARIABLE INSURANCE TRUST
STATEMENTS OF OPERATIONS (Continued)
YEAR ENDED DECEMBER 31, 2017
($ reported in thousands)
| | | | | | | | | | | | |
| | | Rampart
Enhanced
Core Equity
Series | | | Rampart
Equity Trend
Series | | | Strategic
Allocation Series | |
Investment Income | | | | | | | | | | | | |
Dividends | | $ | 2,064 | | | $ | 65 | | | $ | 767 | |
Dividends on affiliated funds | | | — | | | | — | | | | 20 | |
Interest | | | 5 | | | | — | (1) | | | 1,446 | |
Foreign taxes withheld | | | — | | | | — | | | | (32 | ) |
| | | | | | | | | | | | |
Total investment income | | | 2,069 | | | | 65 | | | | 2,201 | |
| | | | | | | | | | | | |
Expenses | | | | | | | | | | | | |
Investment advisory fees | | | 748 | | | | 40 | | | | 530 | |
Administration fees | | | 134 | | | | 5 | | | | 155 | |
Distribution and service fees | | | 267 | | | | 10 | | | | 241 | |
Transfer agent fees and expenses | | | 1 | | | | 2 | | | | 1 | |
Sub-transfer agent fees—Class A | | | — | (1) | | | — | (1) | | | — | (1) |
Sub-transfer agent fees—Class I | | | — | | | | — | (1) | | | — | |
Custodian fees | | | 25 | | | | 1 | | | | 28 | |
Printing fees and expenses | | | 24 | | | | 2 | | | | 20 | |
Professional fees | | | 23 | | | | 21 | | | | 26 | |
Trustees’ fees and expenses | | | 12 | | | | 1 | | | | 11 | |
Miscellaneous expenses | | | 9 | | | | 1 | | | | 8 | |
| | | | | | | | | | | | |
Total expenses | | | 1,243 | | | | 83 | | | | 1,020 | |
Less expenses reimbursed and/or waived by investment advisor | | | (196 | ) | | | (15 | ) | | | (77 | ) |
Custody fees reimbursed (Note 14) | | | — | (1) | | | — | | | | — | (1) |
Earnings credit from custodian | | | (2 | ) | | | — | (1) | | | (1 | ) |
| | | | | | | | | | | | |
Net expenses | | | 1,045 | | | | 68 | | | | 942 | |
| | | | | | | | | | | | |
Net investment income (loss) | | | 1,024 | | | | (3 | ) | | | 1,259 | |
| | | | | | | | | | | | |
Net Realized and Unrealized Gain (Loss) on Investments, Foreign Currency, and Written Options | | | | | | | | | | | | |
Net Realized Gain (Loss) from: | | | | | | | | | | | | |
Unaffiliated investments | | | 7,951 | | | | 299 | | | | 998 | |
Foreign currency transactions | | | — | | | | — | | | | — | (1) |
Written options | | | 8,254 | | | | — | | | | — | |
Net Change in Unrealized Appreciation (Depreciation) on Investments, Foreign Currency, and Written Options: | | | | | | | | | | | | |
Unaffiliated investments | | | 4,741 | | | | 451 | | | | 14,487 | |
Affiliated funds | | | — | | | | — | | | | (8 | ) |
Foreign currency transactions | | | — | | | | — | | | | — | (1) |
Written options | | | 114 | | | | — | | | | — | |
| | | | | | | | | | | | |
Net Realized and Unrealized Gain (Loss) on Investments, Foreign Currency, and Written Options | | | 21,060 | | | | 750 | | | | 15,477 | |
| | | | | | | | | | | | |
Net increase (decrease) in net assets resulting from operations | | $ | 22,084 | | | $ | 747 | | | $ | 16,736 | |
| | | | | | | | | | | | |
| (1) | Amount is less than $500. |
See Notes to Financial Statements
75
VIRTUS VARIABLE INSURANCE TRUST
STATEMENTS OF CHANGES IN NET ASSETS
($ reported in thousands)
| | | | | | | | | | | | | | | | | | | | | | | | |
| | | Duff & Phelps International Series | | | Duff & Phelps Real Estate
Securities Series | | | KAR Capital Growth Series | |
| | | Year Ended
December 31, 2017 | | | Year Ended
December 31, 2016 | | | Year Ended
December 31, 2017 | | | Year Ended
December 31, 2016 | | | Year Ended
December 31, 2017 | | | Year Ended
December 31, 2016 | |
INCREASE/(DECREASE) IN NET ASSETS | | | | | | | | | | | | | | | | | | | | | | | | |
From Operations | | | | | | | | | | | | | | | | | | | | | | | | |
Net investment income (loss) | | $ | 2,250 | | | $ | 1,253 | | | $ | 985 | | | $ | 1,237 | | | $ | (340 | ) | | $ | (7 | ) |
Net realized gain (loss) | | | 4,614 | | | | (14,918 | ) | | | 5,909 | | | | 13,447 | | | | 19,080 | | | | 18,654 | |
Net change in unrealized appreciation (depreciation) | | | 19,963 | | | | 9,833 | | | | (2,287 | ) | | | (9,047 | ) | | | 44,560 | | | | (20,728 | ) |
| | | | | | | | | | | | | | | | | | | | | | | | |
Increase (decrease) in net assets resulting from operations | | | 26,827 | | | | (3,832 | ) | | | 4,607 | | | | 5,637 | | | | 63,300 | | | | (2,081 | ) |
| | | | | | | | | | | | | | | | | | | | | | | | |
Dividends and Distributions to Shareholders: | | | | | | | | | | | | | | | | | | | | | | | | |
Net Investment Income: | | | | | | | | | | | | | | | | | | | | | | | | |
Class A | | | (2,824 | ) | | | (1,466 | ) | | | (1,113 | ) | | | (1,520 | ) | | | — | | | | (4,514 | ) |
Class I | | | (2 | ) | | | (1 | ) | | | (3 | ) | | | (4 | ) | | | — | | | | — | |
Net Realized Gains: | | | | | | | | | | | | | | | | | | | | | | | | |
Class A | | | — | | | | (36,139 | ) | | | (7,444 | ) | | | (12,698 | ) | | | (9,483 | ) | | | — | |
Class I | | | — | | | | (16 | ) | | | (19 | ) | | | (29 | ) | | | — | | | | — | |
| | | | | | | | | | | | | | | | | | | | | | | | |
Total Dividends and Distributions | | | (2,826 | ) | | | (37,622 | ) | | | (8,579 | ) | | | (14,251 | ) | | | (9,483 | ) | | | (4,514 | ) |
| | | | | | | | | | | | | | | | | | | | | | | | |
From Share Transactions | | | | | | | | | | | | | | | | | | | | | | | | |
Sale of shares | | | | | | | | | | | | | | | | | | | | | | | | |
Class A | | | 2,956 | | | | 2,480 | | | | 4,023 | | | | 8,088 | | | | 3,454 | | | | 3,451 | |
Class I | | | — | | | | — | | | | 53 | | | | 89 | | | | — | | | | — | |
Reinvestment of distributions | | | | | | | | | | | | | | | | | | | | | | | | |
Class A | | | 2,824 | | | | 37,605 | | | | 8,557 | | | | 14,218 | | | | 9,483 | | | | 4,514 | |
Class I | | | 2 | | | | 17 | | | | 22 | | | | 33 | | | | — | | | | — | |
Shares repurchased | | | | | | | | | | | | | | | | | | | | | | | | |
Class A | | | (24,234 | ) | | | (30,771 | ) | | | (12,298 | ) | | | (20,375 | ) | | | (28,020 | ) | | | (25,945 | ) |
Class I | | | — | | | | — | | | | (56 | ) | | | (54 | ) | | | — | | | | — | |
| | | | | | | | | | | | | | | | | | | | | | | | |
Increase (decrease) in net assets from share transactions | | | (18,452 | ) | | | 9,331 | | | | 301 | | | | 1,999 | | | | (15,083 | ) | | | (17,980 | ) |
| | | | | | | | | | | | | | | | | | | | | | | | |
Net increase (decrease) in net assets | | | 5,549 | | | | (32,123 | ) | | | (3,671 | ) | | | (6,615 | ) | | | 38,734 | | | | (24,575 | ) |
| | | | | | |
Net Assets | | | | | | | | | | | | | | | | | | | | | | | | |
Beginning of period | | | 177,954 | | | | 210,077 | | | | 81,442 | | | | 88,057 | | | | 185,519 | | | | 210,094 | |
| | | | | | | | | | | | | | | | | | | | | | | | |
End of period | | $ | 183,503 | | | $ | 177,954 | | | $ | 77,771 | | | $ | 81,442 | | | $ | 224,253 | | | $ | 185,519 | |
| | | | | | | | | | | | | | | | | | | | | | | | |
Accumulated undistributed net investment income (loss) at end of period | | $ | (433 | ) | | $ | (207 | ) | | $ | (25 | ) | | $ | 106 | | | $ | (455 | ) | | $ | (364 | ) |
| | | | | | | | | | | | | | | | |
Shares | | | | | | | | | | | | | | | | | | | | | | | | |
Sales of shares | | | | | | | | | | | | | | | | | | | | | | | | |
Class A | | | 251 | | | | 209 | | | | 197 | | | | 340 | | | | 116 | | | | 141 | |
Class I | | | — | | | | — | | | | 3 | | | | 4 | | | | — | | | | — | |
Reinvestment of distributions | | | | | | | | | | | | | | | | | | | | | | | | |
Class A | | | 233 | | | | 3,585 | | | | 440 | | | | 683 | | | | 301 | | | | 186 | |
Class I | | | — | (1) | | | 2 | | | | 1 | | | | 1 | | | | — | | | | — | |
Shares repurchased | | | | | | | | | | | | | | | | | | | | | | | | |
Class A | | | (2,051 | ) | | | (2,543 | ) | | | (604 | ) | | | (870 | ) | | | (976 | ) | | | (1,062 | ) |
Class I | | | — | | | | — | | | | (3 | ) | | | (2 | ) | | | — | | | | — | |
| | | | | | | | | | | | | | | | | | | | | | | | |
Net Increase/(Decrease) | | | (1,567 | ) | | | 1,253 | | | | 34 | | | | 156 | | | | (559 | ) | | | (735 | ) |
| | | | | | | | | | | | | | | | | | | | | | | | |
| (1) | Amount is less than 500 shares. |
See Notes to Financial Statements
76
VIRTUS VARIABLE INSURANCE TRUST
STATEMENTS OF CHANGES IN NET ASSETS (Continued)
($ reported in thousands)
| | | | | | | | | | | | | | | | | | | | | | | | |
| | | KAR Small-Cap Growth Series | | | KAR Small-Cap Value Series | | | Newfleet Multi-Sector Intermediate
Bond Series | |
| | | Year Ended
December 31, 2017 | | | Year Ended
December 31, 2016 | | | Year Ended
December 31, 2017 | | | Year Ended
December 31, 2016 | | | Year Ended
December 31, 2017 | | | Year Ended
December 31, 2016 | |
INCREASE/(DECREASE) IN NET ASSETS | | | | | | | | | | | | | | | | | | | | | | | | |
From Operations | | | | | | | | | | | | | | | | | | | | | | | | |
Net investment income (loss) | | $ | (346 | ) | | $ | (163 | ) | | $ | 244 | | | $ | 1,764 | | | $ | 5,822 | | | $ | 6,486 | |
Net realized gain (loss) | | | 7,396 | | | | 4,817 | | | | 11,084 | | | | 13,250 | | | | 530 | | | | (1,865 | ) |
Net change in unrealized appreciation (depreciation) | | | 17,596 | | | | 8,834 | | | | 5,753 | | | | 6,544 | | | | 2,275 | | | | 7,154 | |
| | | | | | | | | | | | | | | | | | | | | | | | |
Increase (decrease) in net assets resulting from operations | | | 24,646 | | | | 13,488 | | | | 17,081 | | | | 21,558 | | | | 8,627 | | | | 11,775 | |
| | | | | | | | | | | | | | | | | | | | | | | | |
Dividends and Distributions to Shareholders: | | | | | | | | | | | | | | | | | | | | | | | | |
Net Investment Income: | | | | | | | | | | | | | | | | | | | | | | | | |
Class A | | | — | | | | — | | | | (600 | ) | | | (1,727 | ) | | | (5,734 | ) | | | (5,840 | ) |
Class I | | | — | | | | — | | | | — | | | | — | | | | (59 | ) | | | (11 | ) |
Net Realized Gains: | | | | | | | | | | | | | | | | | | | | | | | | |
Class A | | | (4,641 | ) | | | (5,282 | ) | | | (12,415 | ) | | | (10,774 | ) | | | — | | | | — | |
Class I | | | (106 | ) | | | (28 | ) | | | — | | | | — | | | | — | | | | — | |
| | | | | | | | | | | | | | | | | | | | | | | | |
Total Dividends and Distributions | | | (4,747 | ) | | | (5,310 | ) | | | (13,015 | ) | | | (12,501 | ) | | | (5,793 | ) | | | (5,851 | ) |
| | | | | | | | | | | | | | | | | | | | | | | | |
From Share Transactions | | | | | | | | | | | | | | | | | | | | | | | | |
Sale of shares | | | | | | | | | | | | | | | | | | | | | | | | |
Class A | | | 1,300 | | | | 2,658 | | | | 1,167 | | | | 1,445 | | | | 17,075 | | | | 12,757 | |
Class I | | | 1,671 | | | | 247 | | | | — | | | | — | | | | 1,404 | | | | 9 | |
Reinvestment of distributions | | | | | | | | | | | | | | | | | | | | | | | | |
Class A | | | 4,642 | | | | 5,282 | | | | 13,015 | | | | 12,501 | | | | 5,734 | | | | 5,840 | |
Class I | | | 105 | | | | 28 | | | | — | | | | — | | | | 59 | | | | 11 | |
Shares repurchased | | | | | | | | | | | | | | | | | | | | | | | | |
Class A | | | (8,897 | ) | | | (8,957 | ) | | | (18,576 | ) | | | (20,871 | ) | | | (21,187 | ) | | | (30,100 | ) |
Class I | | | (626 | ) | | | (126 | ) | | | — | | | | — | | | | (322 | ) | | | (1 | ) |
| | | | | | | | | | | | | | | | | | | | | | | | |
Increase (decrease) in net assets from share transactions | | | (1,805 | ) | | | (868 | ) | | | (4,394 | ) | | | (6,925 | ) | | | 2,763 | | | | (11,484 | ) |
| | | | | | | | | | | | | | | | | | | | | | | | |
Net increase (decrease) in net assets | | | 18,094 | | | | 7,310 | | | | (328 | ) | | | 2,132 | | | | 5,597 | | | | (5,560 | ) |
| | | | | | |
Net Assets | | | | | | | | | | | | | | | | | | | | | | | | |
Beginning of period | | | 63,361 | | | | 56,051 | | | | 94,966 | | | | 92,834 | | | | 129,211 | | | | 134,771 | |
| | | | | | | | | | | | | | | | | | | | | | | | |
End of period | | $ | 81,455 | | | $ | 63,361 | | | $ | 94,638 | | | $ | 94,966 | | | $ | 134,808 | | | $ | 129,211 | |
| | | | | | | | | | | | | | | | | | | | | | | | |
Accumulated undistributed net investment income (loss) at end of period | | $ | (145 | ) | | $ | (113 | ) | | $ | (155 | ) | | $ | 112 | | | $ | (139 | ) | | $ | 80 | |
| | | | | | | | | | | | |
Shares | | | | | | | | | | | | | | | | | | | | | | | | |
Sales of shares | | | | | | | | | | | | | | | | | | | | | | | | |
Class A | | | 51 | | | | 128 | | | | 66 | | | | 85 | | | | 1,809 | | | | 1,391 | |
Class I | | | 69 | | | | 12 | | | | — | | | | — | | | | 149 | | | | 1 | |
Reinvestment of distributions | | | | | | | | | | | | | | | | | | | | | | | | |
Class A | | | 163 | | | | 250 | | | | 751 | | | | 754 | | | | 614 | | | | 642 | |
Class I | | | 4 | | | | 1 | | | | — | | | | — | | | | 6 | | | | 1 | |
Shares repurchased | | | | | | | | | | | | | | | | | | | | | | | | |
Class A | | | (352 | ) | | | (443 | ) | | | (1,057 | ) | | | (1,270 | ) | | | (2,246 | ) | | | (3,292 | ) |
Class I | | | (25 | ) | | | (6 | ) | | | — | | | | — | | | | (34 | ) | | | — | (1) |
| | | | | | | | | | | | | | | | | | | | | | | | |
Net Increase/(Decrease) | | | (90 | ) | | | (58 | ) | | | (240 | ) | | | (431 | ) | | | 298 | | | | (1,257 | ) |
| | | | | | | | | | | | | | | | | | | | | | | | |
| (1) | Amount is less than 500 shares. |
See Notes to Financial Statements
77
VIRTUS VARIABLE INSURANCE TRUST
STATEMENTS OF CHANGES IN NET ASSETS (Continued)
($ reported in thousands)
| | | | | | | | | | | | | | | | | | | | | | | | |
| | | Rampart Enhanced Core Equity Series | | | Rampart Equity Trend Series | | | Strategic Allocation Series | |
| | | Year Ended
December 31, 2017 | | | Year Ended
December 31, 2016 | | | Year Ended
December 31, 2017 | | | Year Ended
December 31, 2016 | | | Year Ended
December 31, 2017 | | | Year Ended
December 31, 2016 | |
INCREASE/(DECREASE) IN NET ASSETS | | | | | | | | | | | | | | | | | | | | | | | | |
From Operations | | | | | | | | | | | | | | | | | | | | | | | | |
Net investment income (loss) | | $ | 1,024 | | | $ | 1,903 | | | $ | (3 | ) | | $ | (11 | ) | | $ | 1,259 | | | $ | 1,989 | |
Net realized gain (loss) | | | 16,205 | | | | 20,692 | | | | 299 | | | | (518 | ) | | | 998 | | | | 10,276 | |
Net change in unrealized appreciation (depreciation) | | | 4,855 | | | | (13,640 | ) | | | 451 | | | | 147 | | | | 14,479 | | | | (11,468 | ) |
| | | | | | | | | | | | | | | | | | | | | | | | |
Increase (decrease) in net assets resulting from operations | | | 22,084 | | | | 8,955 | | | | 747 | | | | (382 | ) | | | 16,736 | | | | 797 | |
| | | | | | | | | | | | | | | | | | | | | | | | |
Dividends and Distributions to Shareholders: | | | | | | | | | | | | | | | | | | | | | | | | |
Net Investment Income: | | | | | | | | | | | | | | | | | | | | | | | | |
Class A | | | (1,783 | ) | | | (1,308 | ) | | | — | | | | — | | | | (1,796 | ) | | | (1,648 | ) |
Class I | | | — | | | | — | | | | — | | | | — | | | | — | | | | — | |
Net Realized Gains: | | | | | | | | | | | | | | | | | | | | | | | | |
Class A | | | (18,760 | ) | | | (19,999 | ) | | | (85 | ) | | | — | | | | (646 | ) | | | (10,307 | ) |
Class I | | | — | | | | — | | | | (3 | ) | | | — | | | | — | | | | — | |
Return of Capital: | | | | | | | | | | | | | | | | | | | | | | | | |
Class A | | | (531 | ) | | | — | | | | — | | | | — | | | | — | | | | — | |
| | | | | | | | | | | | | | | | | | | | | | | | |
Total Dividends and Distributions | | | (21,074 | ) | | | (21,307 | ) | | | (88 | ) | | | — | | | | (2,442 | ) | | | (11,955 | ) |
| | | | | | | | | | | | | | | | | | | | | | | | |
From Share Transactions | | | | | | | | | | | | | | | | | | | | | | | | |
Sale of shares | | | | | | | | | | | | | | | | | | | | | | | | |
Class A | | | 907 | | | | 1,665 | | | | 185 | | | | 178 | | | | 531 | | | | 1,292 | |
Class I | | | — | | | | — | | | | — | (1) | | | — | | | | — | | | | — | |
Reinvestment of distributions | | | | | | | | | | | | | | | | | | | | | | | | |
Class A | | | 21,074 | | | | 21,307 | | | | 85 | | | | — | | | | 2,442 | | | | 11,955 | |
Class I | | | — | | | | — | | | �� | 3 | | | | — | | | | — | | | | — | |
Shares repurchased | | | | | | | | | | | | | | | | | | | | | | | | |
Class A | | | (16,192 | ) | | | (15,946 | ) | | | (1,797 | ) | | | (6,285 | ) | | | (13,515 | ) | | | (15,638 | ) |
Class I | | | — | | | | — | | | | — | (1) | | | (3 | ) | | | — | | | | — | |
| | | | | | | | | | | | | | | | | | | | | | | | |
Increase (decrease) in net assets from share transactions | | | 5,789 | | | | 7,026 | | | | (1,524 | ) | | | (6,110 | ) | | | (10,542 | ) | | | (2,391 | ) |
| | | | | | | | | | | | | | | | | | | | | | | | |
Net increase (decrease) in net assets | | | 6,799 | | | | (5,326 | ) | | | (865 | ) | | | (6,492 | ) | | | 3,752 | | | | (13,549 | ) |
| | | | | | |
Net Assets | | | | | | | | | | | | | | | | | | | | | | | | |
Beginning of period | | | 104,587 | | | | 109,913 | | | | 4,563 | | | | 11,055 | | | | 93,276 | | | | 106,825 | |
| | | | | | | | | | | | | | | | | | | | | | | | |
End of period | | $ | 111,386 | | | $ | 104,587 | | | $ | 3,698 | | | $ | 4,563 | | | $ | 97,028 | | | $ | 93,276 | |
| | | | | | | | | | | | | | | | | | | | | | | | |
Accumulated undistributed net investment income (loss) at end of period | | $ | (298 | ) | | $ | 396 | | | $ | (50 | ) | | $ | (50 | ) | | $ | (246 | ) | | $ | 224 | |
| | | | | | | | | | | | |
Shares | | | | | | | | | | | | | | | | | | | | | | | | |
Sales of shares | | | | | | | | | | | | | | | | | | | | | | | | |
Class A | | | 70 | | | | 123 | | | | 15 | | | | 16 | | | | 43 | | | | 104 | |
Class I | | | — | | | | — | | | | — | | | | — | | | | — | | | | — | |
Reinvestment of distributions | | | | | | | | | | | | | | | | | | | | | | | | |
Class A | | | 1,735 | | | | 1,759 | | | | 6 | | | | — | | | | 199 | | | | 1,085 | |
Class I | | | — | | | | — | | | | — | (2) | | | — | | | | — | | | | — | |
Shares repurchased | | | | | | | | | | | | | | | | | | | | | | | | |
Class A | | | (1,255 | ) | | | (1,190 | ) | | | (147 | ) | | | (582 | ) | | | (1,131 | ) | | | (1,271 | ) |
Class I | | | — | | | | — | | | | — | (2) | | | — | (2) | | | — | | | | — | |
| | | | | | | | | | | | | | | | | | | | | | | | |
Net Increase/(Decrease) | | | 550 | | | | 692 | | | | (126 | ) | | | (566 | ) | | | (889 | ) | | | (82 | ) |
| | | | | | | | | | | | | | | | | | | | | | | | |
| (1) | Amount is less than $500. |
| (2) | Amount is less than 500 shares. |
See Notes to Financial Statements
78
VIRTUS VARIABLE INSURANCE TRUST
FINANCIAL HIGHLIGHTS
SELECTED PER SHARE DATA AND RATIOS FOR A SHARE OUTSTANDING
THROUGHOUT EACH PERIOD
| | | | | | | | | | | | | | | | | | | | | | | | | | | | | | | | | | | | | | | | | | | | | | | | | | | | | | | | | | | | | | | | | | | | | | | | | | | |
| | | Net Asset Value,
Beginning of Period | | Net Investment Income (Loss)(1) | | Net Realized and
Unrealized Gain (Loss) | | Total from Investment Operations
| | Dividends from
Net Investment Income | | Distributions from
Net Realized Gains | | Total Distributions | | Change in Net Asset Value | | Net Asset Value, End of Period | | Total Return(2) | | Net Assets, End of Period
(in thousands) | | Ratio
of Net
Expenses to
Average
Net Assets(3) | | Ratio
of Gross
Expenses to
Average
Net Assets
(before
waivers
and
reimbursements)(3) | | Ratio of Net Investment Income (Loss)
to Average Net Assets | | Portfolio Turnover Rate |
Duff & Phelps International Series | | | | | | | | | | | | | | | | | | | | | | | | | | | | | | | | | | | | | | | | | | | | | | | | | | | | | | | | | | | | | | | | | | | | | | | | | | | |
Class A | | | | | | | | | | | | | | | | | | | | | | | | | | | | | | | | | | | | | | | | | | | | | | | | | | | | | | | | | | | | | | | | | | | | | | | | | | | |
1/1/17 to 12/31/17 | | | $ | 10.95 | | | | | 0.15 | | | | | 1.59 | | | | | 1.74 | | | | | (0.19 | ) | | | | — | | | | | (0.19 | ) | | | | 1.55 | | | | $ | 12.50 | | | | | 15.95 | % | | | $ | 183,403 | | | | | 1.18 | % | | | | 1.21 | % | | | | 1.24 | % | | | | 81 | % |
1/1/16 to 12/31/16 | | | | 14.01 | | | | | 0.08 | | | | | (0.44 | ) | | | | (0.36 | ) | | | | (0.09 | ) | | | | (2.61 | ) | | | | (2.70 | ) | | | | (3.06 | ) | | | | 10.95 | | | | | (1.61 | )(13) | | | | 177,868 | | | | | 1.18 | (11)(13) | | | | 1.26 | | | | | 0.62 | (13) | | | | 83 | |
1/1/15 to 12/31/15 | | | | 16.67 | | | | | 0.35 | | | | | (2.04 | ) | | | | (1.69 | ) | | | | (0.37 | ) | | | | (0.60 | ) | | | | (0.97 | ) | | | | (2.66 | ) | | | | 14.01 | | | | | (10.48 | ) | | | | 209,990 | | | | | 1.19 | (11) | | | | 1.30 | | | | | 2.16 | | | | | 104 | |
1/1/14 to 12/31/14 | | | | 18.23 | | | | | 0.67 | | | | | (1.34 | ) | | | | (0.67 | ) | | | | (0.71 | ) | | | | (0.18 | ) | | | | (0.89 | ) | | | | (1.56 | ) | | | | 16.67 | | | | | (3.90 | ) | | | | 261,281 | | | | | 1.18 | | | | | 1.26 | | | | | 3.60 | | | | | 9 | |
1/1/13 to 12/31/13 | | | | 17.30 | | | | | 0.35 | | | | | 0.97 | | | | | 1.32 | | | | | (0.39 | ) | | | | — | | | | | (0.39 | ) | | | | 0.93 | | | | | 18.23 | | | | | 7.78 | | | | | 317,726 | | | | | 1.18 | | | | | 1.18 | | | | | 1.97 | | | | | 11 | |
| | | | | | | | | | | | | | | |
Class I | | | | | | | | | | | | | | | | | | | | | | | | | | | | | | | | | | | | | | | | | | | | | | | | | | | | | | | | | | | | | | | | | | | | | | | | | | | |
1/1/17 to 12/31/17 | | | $ | 10.94 | | | | | 0.17 | | | | | 1.59 | | | | | 1.76 | | | | | (0.22 | ) | | | | — | | | | | (0.22 | ) | | | | 1.54 | | | | $ | 12.48 | | | | | 16.17 | % | | | $ | 100 | | | | | 0.93 | % | | | | 0.96 | % | | | | 1.48 | % | | | | 81 | % |
1/1/16 to 12/31/16 | | | | 13.99 | | | | | 0.11 | | | | | (0.42 | ) | | | | (0.31 | ) | | | | (0.13 | ) | | | | (2.61 | ) | | | | (2.74 | ) | | | | (3.05 | ) | | | | 10.94 | | | | | (1.28 | )(13) | | | | 86 | | | | | 0.93 | (11)(13) | | | | 1.01 | | | | | 0.88 | (13) | | | | 83 | |
1/1/15 to 12/31/15 | | | | 16.65 | | | | | 0.38 | | | | | (2.03 | ) | | | | (1.65 | ) | | | | (0.41 | ) | | | | (0.60 | ) | | | | (1.01 | ) | | | | (2.66 | ) | | | | 13.99 | | | | | (10.26 | ) | | | | 87 | | | | | 0.94 | (11) | | | | 1.05 | | | | | 2.39 | | | | | 104 | |
1/1/14 to 12/31/14 | | | | 18.22 | | | | | 0.69 | | | | | (1.32 | ) | | | | (0.63 | ) | | | | (0.76 | ) | | | | (0.18 | ) | | | | (0.94 | ) | | | | (1.57 | ) | | | | 16.65 | | | | | (3.71 | ) | | | | 97 | | | | | 0.93 | | | | | 1.01 | | | | | 3.71 | | | | | 9 | |
| 4/30/13(4) to 12/31/13 | | | | 18.40 | | | | | 0.18 | | | | | 0.08 | | | | | 0.26 | | | | | (0.44 | ) | | | | — | | | | | (0.44 | ) | | | | (0.18 | ) | | | | 18.22 | | | | | 1.17 | (6) | | | | 104 | | | | | 0.93 | (5) | | | | 0.93 | (5) | | | | 1.54 | (5) | | | | 11 | (9) |
Duff & Phelps Real Estate Securities Series | | | | | | | | | | | | | | | | | | | | | | | | | | | | | | | | | | | | | | | | | | | | | | | | | | | | | | | | | | | | | | | | | | | | | | | | | | | |
Class A | | | | | | | | | | | | | | | | | | | | | | | | | | | | | | | | | | | | | | | | | | | | | | | | | | | | | | | | | | | | | | | | | | | | | | | | | | | |
1/1/17 to 12/31/17 | | | $ | 20.31 | | | | | 0.25 | | | | | 0.92 | | | | | 1.17 | | | | | (0.29 | ) | | | | (1.96 | ) | | | | (2.25 | ) | | | | (1.08 | ) | | | $ | 19.23 | | | | | 5.97 | % | | | $ | 77,564 | | | | | 1.16 | % | | | | 1.21 | % | | | | 1.24 | % | | | | 24 | % |
1/1/16 to 12/31/16 | | | | 22.85 | | | | | 0.34 | | | | | 1.17 | | | | | 1.51 | | | | | (0.43 | ) | | | | (3.62 | ) | | | | (4.05 | ) | | | | (2.54 | ) | | | | 20.31 | | | | | 6.82 | (13) | | | | 81,243 | | | | | 1.17 | (11)(13) | | | | 1.25 | | | | | 1.42 | (13) | | | | 35 | |
1/1/15 to 12/31/15 | | | | 27.05 | | | | | 0.44 | | | | | 0.17 | | | | | 0.61 | | | | | (0.37 | ) | | | | (4.44 | ) | | | | (4.81 | ) | | | | (4.20 | ) | | | | 22.85 | | | | | 2.38 | | | | | 87,899 | | | | | 1.18 | (11) | | | | 1.29 | | | | | 1.64 | | | | | 18 | |
1/1/14 to 12/31/14 | | | | 23.33 | | | | | 0.29 | | | | | 7.00 | | | | | 7.29 | | | | | (0.31 | ) | | | | (3.26 | ) | | | | (3.57 | ) | | | | 3.72 | | | | | 27.05 | | | | | 31.62 | | | | | 105,508 | | | | | 1.16 | | | | | 1.27 | | | | | 1.10 | | | | | 22 | |
1/1/13 to 12/31/13 | | | | 27.78 | | | | | 0.34 | | | | | (0.05 | ) | | | | 0.29 | | | | | (0.43 | ) | | | | (4.31 | ) | | | | (4.74 | ) | | | | (4.45 | ) | | | | 23.33 | | | | | 0.90 | | | | | 90,794 | | | | | 1.16 | | | | | 1.22 | | | | | 1.20 | | | | | 26 | |
| | | | | | | | | | | | | | | |
Class I | | | | | | | | | | | | | | | | | | | | | | | | | | | | | | | | | | | | | | | | | | | | | | | | | | | | | | | | | | | | | | | | | | | | | | | | | | | |
1/1/17 to 12/31/17 | | | $ | 20.27 | | | | | 0.30 | | | | | 0.93 | | | | | 1.23 | | | | | (0.35 | ) | | | | (1.96 | ) | | | | (2.31 | ) | | | | (1.08 | ) | | | $ | 19.19 | | | | | 6.25 | % | | | $ | 207 | | | | | 0.91 | % | | | | 0.96 | % | | | | 1.49 | % | | | | 24 | % |
1/1/16 to 12/31/16 | | | | 22.81 | | | | | 0.35 | | | | | 1.22 | | | | | 1.57 | | | | | (0.49 | ) | | | | (3.62 | ) | | | | (4.11 | ) | | | | (2.54 | ) | | | | 20.27 | | | | | 7.10 | (13) | | | | 199 | | | | | 0.92 | (11)(13) | | | | 1.00 | | | | | 1.46 | (13) | | | | 35 | |
1/1/15 to 12/31/15 | | | | 27.02 | | | | | 0.48 | | | | | 0.19 | | | | | 0.67 | | | | | (0.44 | ) | | | | (4.44 | ) | | | | (4.88 | ) | | | | (4.21 | ) | | | | 22.81 | | | | | 2.62 | | | | | 158 | | | | | 0.94 | (11) | | | | 1.05 | | | | | 1.79 | | | | | 18 | |
1/1/14 to 12/31/14 | | | | 23.30 | | | | | 0.34 | | | | | 7.02 | | | | | 7.36 | | | | | (0.38 | ) | | | | (3.26 | ) | | | | (3.64 | ) | | | | 3.72 | | | | | 27.02 | | | | | 31.98 | | | | | 134 | | | | | 0.91 | | | | | 1.02 | | | | | 1.30 | | | | | 22 | |
| 4/30/13(4) to 12/31/13 | | | | 30.96 | | | | | 0.23 | | | | | (3.08 | ) | | | | (2.85 | ) | | | | (0.50 | ) | | | | (4.31 | ) | | | | (4.81 | ) | | | | (7.66 | ) | | | | 23.30 | | | | | (10.45 | )(6) | | | | 102 | | | | | 0.91 | (5) | | | | 0.98 | (5) | | | | 1.23 | (5) | | | | 26 | (9) |
KAR Capital Growth Series | | | | | | | | | | | | | | | | | | | | | | | | | | | | | | | | | | | | | | | | | | | | | | | | | | | | | | | | | | | | | | | | | | | | | | | | | | | |
Class A | | | | | | | | | | | | | | | | | | | | | | | | | | | | | | | | | | | | | | | | | | | | | | | | | | | | | | | | | | | | | | | | | | | | | | | | | | | |
1/1/17 to 12/31/17 | | | $ | 24.09 | | | | | (0.05 | ) | | | | 8.75 | | | | | 8.70 | | | | | — | | | | | (1.39 | ) | | | | (1.39 | ) | | | | 7.31 | | | | $ | 31.40 | | | | | 36.07 | % | | | $ | 224,253 | | | | | 1.03 | % | | | | 1.13 | % | | | | (0.16 | )% | | | | 21 | % |
1/1/16 to 12/31/16 | | | | 24.91 | | | | | — | (12) | | | | (0.22 | ) | | | | (0.22 | ) | | | | (0.60 | ) | | | | — | | | | | (0.60 | ) | | | | (0.82 | ) | | | | 24.09 | | | | | (0.86 | )(13) | | | | 185,519 | | | | | 1.04 | (11)(13) | | | | 1.18 | | | | | (0.10 | )(13) | | | | 23 | |
1/1/15 to 12/31/15 | | | | 22.79 | | | | | (0.01 | ) | | | | 2.13 | | | | | 2.12 | | | | | — | | | | | — | | | | | — | | | | | 2.12 | | | | | 24.91 | | | | | 9.26 | | | | | 210,094 | | | | | 1.04 | (11) | | | | 1.21 | | | | | (0.04 | ) | | | | 19 | |
1/1/14 to 12/31/14 | | | | 20.41 | | | | | (0.00 | ) | | | | 2.39 | | | | | 2.39 | | | | | (0.01 | ) | | | | — | | | | | (0.01 | ) | | | | 2.38 | | | | | 22.79 | | | | | 11.73 | | | | | 217,038 | | | | | 1.03 | | | | | 1.19 | | | | | (0.01 | ) | | | | 29 | |
1/1/13 to 12/31/13 | | | | 15.82 | | | | | 0.04 | | | | | 4.61 | | | | | 4.65 | | | | | (0.06 | ) | | | | — | | | | | (0.06 | ) | | | | 4.59 | | | | | 20.41 | | | | | 29.44 | | | | | 218,264 | | | | | 1.03 | | | | | 1.14 | | | | | 0.19 | | | | | 30 | |
The footnote legend is at the end of the Financial Highlights.
See Notes to Financial Statements
79
VIRTUS VARIABLE INSURANCE TRUST
FINANCIAL HIGHLIGHTS
SELECTED PER SHARE DATA AND RATIOS FOR A SHARE OUTSTANDING
THROUGHOUT EACH PERIOD
| | | | | | | | | | | | | | | | | | | | | | | | | | | | | | | | | | | | | | | | | | | | | | | | | | | | | | | | | | | | | | | | | | | | | | | | | | | | | | | | |
| | | Net Asset Value,
Beginning of Period | | Net Investment Income (Loss)(1) | | Net Realized and
Unrealized Gain (Loss) | | Total from Investment Operations
| | Dividends from
Net Investment Income | | Distributions from
Net Realized Gains | | Total Distributions | | Payment from Affiliate | | Change in Net Asset Value | | Net Asset Value, End of Period | | Total Return(2) | | Net Assets, End of Period
(in thousands) | | Ratio
of Net
Expenses to
Average
Net Assets(3) | | Ratio
of Gross
Expenses to
Average
Net Assets
(before
waivers
and
reimbursements)(3) | | Ratio of Net Investment Income (Loss)
to Average Net Assets | | Portfolio Turnover Rate |
KAR Small-Cap Growth Series | | | | | | | | | | | | | | | | | | | | | | | | | | | | | | | | | | | | | | | | | | | | | | | | | | | | | | | | | | | | | | | | | | | | | | | | | | | | | | | | |
Class A | | | | | | | | | | | | | | | | | | | | | | | | | | | | | | | | | | | | | | | | | | | | | | | | | | | | | | | | | | | | | | | | | | | | | | | | | | | | | | | | |
1/1/17 to 12/31/17 | | | $ | 21.61 | | | | | (0.12 | ) | | | | 8.93 | | | | | 8.81 | | | | | — | | | | | (1.76 | ) | | | | (1.76 | ) | | | | — | | | | | 7.05 | | | | $ | 28.66 | | | | | 40.85 | % | | | $ | 79,597 | | | | | 1.19 | % | | | | 1.30 | % | | | | (0.49 | )% | | | | 18 | % |
1/1/16 to 12/31/16 | | | | 18.75 | | | | | (0.06 | ) | | | | 4.85 | | | | | 4.79 | | | | | — | | | | | (1.93 | ) | | | | (1.93 | ) | | | | — | | | | | 2.86 | | | | | 21.61 | | | | | 25.92 | (13) | | | | 63,008 | | | | | 1.20 | (11)(13) | | | | 1.37 | | | | | (0.37 | )(13) | | | | 18 | |
1/1/15 to 12/31/15 | | | | 20.73 | | | | | (0.04 | ) | | | | 0.23 | | | | | 0.19 | | | | | — | | | | | (2.17 | ) | | | | (2.17 | ) | | | | — | | | | | (1.98 | ) | | | | 18.75 | | | | | 0.73 | | | | | 55,872 | | | | | 1.20 | (11) | | | | 1.41 | | | | | (0.17 | ) | | | | 18 | |
1/1/14 to 12/31/14 | | | | 21.72 | | | | | (0.13 | ) | | | | 1.29 | | | | | 1.16 | | | | | — | | | | | (2.15 | ) | | | | (2.15 | ) | | | | — | | | | | (0.99 | ) | | | | 20.73 | | | | | 5.50 | | | | | 63,483 | | | | | 1.19 | | | | | 1.38 | | | | | (0.62 | ) | | | | 20 | |
1/1/13 to 12/31/13 | | | | 15.66 | | | | | (0.12 | ) | | | | 6.39 | | | | | 6.27 | | | | | (0.05 | ) | | | | (0.16 | ) | | | | (0.21 | ) | | | | — | | | | | 6.06 | | | | | 21.72 | | | | | 40.20 | | | | | 70,948 | | | | | 1.19 | | | | | 1.33 | | | | | (0.63 | ) | | | | 28 | |
| | | | | | | | | | | | | | | | |
Class I | | | | | | | | | | | | | | | | | | | | | | | | | | | | | | | | | | | | | | | | | | | | | | | | | | | | | | | | | | | | | | | | | | | | | | | | | | | | | | | | |
1/1/17 to 12/31/17 | | | $ | 21.86 | | | | | (0.06 | ) | | | | 9.04 | | | | | 8.98 | | | | | — | | | | | (1.76 | ) | | | | (1.76 | ) | | | | — | | | | | 7.22 | | | | $ | 29.08 | | | | | 41.16 | % | | | $ | 1,858 | | | | | 0.94 | % | | | | 1.05 | % | | | | (0.24 | )% | | | | 18 | % |
1/1/16 to 12/31/16 | | | | 18.90 | | | | | 0.01 | | | | | 4.88 | | | | | 4.89 | | | | | — | | | | | (1.93 | ) | | | | (1.93 | ) | | | | — | | | | | 2.96 | | | | | 21.86 | | | | | 26.25 | (13) | | | | 353 | | | | | 0.95 | (11)(13) | | | | 1.12 | | | | | (0.10 | )(13) | | | | 18 | |
1/1/15 to 12/31/15 | | | | 20.82 | | | | | — | (12) | | | | 0.25 | | | | | 0.25 | | | | | — | | | | | (2.17 | ) | | | | (2.17 | ) | | | | — | | | | | (1.92 | ) | | | | 18.90 | | | | | 1.01 | | | | | 179 | | | | | 0.96 | (11) | | | | 1.17 | | | | | (0.02 | ) | | | | 18 | |
1/1/14 to 12/31/14 | | | | 21.75 | | | | | (0.07 | ) | | | | 1.29 | | | | | 1.22 | | | | | — | | | | | (2.15 | ) | | | | (2.15 | ) | | | | — | | | | | (0.93 | ) | | | | 20.82 | | | | | 5.78 | | | | | 275 | | | | | 0.94 | | | | | 1.14 | | | | | (0.34 | ) | | | | 20 | |
| 4/30/13(4) to 12/31/13 | | | | 17.29 | | | | | (0.03 | ) | | | | 4.70 | | | | | 4.67 | | | | | (0.05 | ) | | | | (0.16 | ) | | | | (0.21 | ) | | | | — | | | | | 4.46 | | | | | 21.75 | | | | | 26.28 | (6) | | | | 137 | | | | | 0.94 | (5) | | | | 1.07 | (5) | | | | (0.23 | )(5) | | | | 28 | (9) |
KAR Small-Cap Value Series | | | | | | | | | | | | | | | | | | | | | | | | | | | | | | | | | | | | | | | | | | | | | | | | | | | | | | | | | | | | | | | | | | | | | | | | | | | | | | | | |
Class A | | | | | | | | | | | | | | | | | | | | | | | | | | | | | | | | | | | | | | | | | | | | | | | | | | | | | | | | | | | | | | | | | | | | | | | | | | | | | | | | |
1/1/17 to 12/31/17 | | | $ | 16.69 | | | | | 0.05 | | | | | 3.23 | | | | | 3.28 | | | | | (0.12 | ) | | | | (2.49 | ) | | | | (2.61 | ) | | | | — | | | | | 0.67 | | | | $ | 17.36 | | | | | 20.16 | % | | | $ | 94,638 | | | | | 1.20 | % | | | | 1.34 | % | | | | 0.26 | % | | | | 20 | % |
1/1/16 to 12/31/16 | | | | 15.17 | | | | | 0.32 | | | | | 3.66 | | | | | 3.98 | | | | | (0.34 | ) | | | | (2.12 | ) | | | | (2.46 | ) | | | | — | | | | | 1.52 | | | | | 16.69 | | | | | 26.54 | (13) | | | | 94,966 | | | | | 1.21 | (11)(13) | | | | 1.40 | | | | | 1.85 | (13) | | | | 22 | |
1/1/15 to 12/31/15 | | | | 17.03 | | | | | 0.09 | | | | | (0.29 | ) | | | | (0.20 | ) | | | | (0.09 | ) | | | | (1.57 | ) | | | | (1.66 | ) | | | | — | | | | | (1.86 | ) | | | | 15.17 | | | | | (1.37 | ) | | | | 92,834 | | | | | 1.22 | (11) | | | | 1.43 | | | | | 0.56 | | | | | 16 | |
1/1/14 to 12/31/14 | | | | 17.72 | | | | | 0.10 | | | | | 0.24 | | | | | 0.34 | | | | | (0.11 | ) | | | | (0.92 | ) | | | | (1.03 | ) | | | | — | | | | | (0.69 | ) | | | | 17.03 | | | | | 1.83 | | | | | 113,030 | | | | | 1.20 | | | | | 1.41 | | | | | 0.61 | | | | | 26 | |
| 1/1/13 to 12/31/13 | | | | 12.66 | | | | | 0.04 | | | | | 5.11 | | | | | 5.15 | | | | | (0.09 | ) | | | | — | | | | | (0.09 | ) | | | | — | | | | | 5.06 | | | | | 17.72 | | | | | 40.77 | | | | | 135,352 | | | | | 1.20 | | | | | 1.35 | | | | | 0.25 | | | | | 14 | |
Newfleet Multi-Sector
Intermediate Bond Series | | | | | | | | | | | | | | | | | | | | | | | | | | | | | | | | | | | | | | | | | | | | | | | | | | | | | | | | | | | | | | | | | | | | | | | | | | | | | | | | |
Class A | | | | | | | | | | | | | | | | | | | | | | | | | | | | | | | | | | | | | | | | | | | | | | | | | | | | | | | | | | | | | | | | | | | | | | | | | | | | | | | | |
1/1/17 to 12/31/17 | | | $ | 9.14 | | | | | 0.41 | | | | | 0.20 | | | | | 0.61 | | | | | (0.41 | ) | | | | — | | | | | (0.41 | ) | | | | — | | | | | 0.20 | | | | $ | 9.34 | | | | | 6.72 | % | | | $ | 133,430 | | | | | 0.93 | % | | | | 0.96 | % | | | | 4.35 | % | | | | 62 | % |
1/1/16 to 12/31/16 | | | | 8.75 | | | | | 0.44 | | | | | 0.37 | | | | | 0.81 | | | | | (0.42 | ) | | | | — | | | | | (0.42 | ) | | | | — | | | | | 0.39 | | | | | 9.14 | | | | | 9.29 | (13) | | | | 128,969 | | | | | 0.94 | (11)(13) | | | | 1.00 | | | | | 4.82 | (13) | | | | 68 | |
1/1/15 to 12/31/15 | | | | 9.25 | | | | | 0.45 | | | | | (0.56 | ) | | | | (0.11 | ) | | | | (0.39 | ) | | | | — | | | | | (0.39 | ) | | | | — | (10) | | | | (0.50 | ) | | | | 8.75 | | | | | (1.26 | ) | | | | 134,558 | | | | | 0.95 | (11) | | | | 1.03 | | | | | 4.89 | | | | | 55 | |
1/1/14 to 12/31/14 | | | | 9.54 | | | | | 0.48 | | | | | (0.29 | ) | | | | 0.19 | | | | | (0.48 | ) | | | | — | | | | | (0.48 | ) | | | | — | | | | | (0.29 | ) | | | | 9.25 | | | | | 1.90 | | | | | 154,915 | | | | | 0.94 | | | | | 1.01 | | | | | 4.93 | | | | | 48 | |
1/1/13 to 12/31/13 | | | | 9.88 | | | | | 0.51 | | | | | (0.30 | ) | | | | 0.21 | | | | | (0.55 | ) | | | | — | | | | | (0.55 | ) | | | | — | | | | | (0.34 | ) | | | | 9.54 | | | | | 2.25 | | | | | 171,995 | | | | | 0.94 | | | | | 0.96 | | | | | 5.23 | | | | | 56 | |
| | | | | | | | | | | | | | | | |
Class I | | | | | | | | | | | | | | | | | | | | | | | | | | | | | | | | | | | | | | | | | | | | | | | | | | | | | | | | | | | | | | | | | | | | | | | | | | | | | | | | |
1/1/17 to 12/31/17 | | | $ | 9.12 | | | | | 0.43 | | | | | 0.20 | | | | | 0.63 | | | | | (0.43 | ) | | | | — | | | | | (0.43 | ) | | | | — | | | | | 0.20 | | | | $ | 9.32 | | | | | 7.00 | % | | | $ | 1,378 | | | | | 0.68 | % | | | | 0.70 | % | | | | 4.54 | % | | | | 62 | % |
1/1/16 to 12/31/16 | | | | 8.74 | | | | | 0.47 | | | | | 0.35 | | | | | 0.82 | | | | | (0.44 | ) | | | | — | | | | | (0.44 | ) | | | | — | | | | | 0.38 | | | | | 9.12 | | | | | 9.46 | (13) | | | | 242 | | | | | 0.69 | (11)(13) | | | | 0.75 | | | | | 5.08 | (13) | | | | 68 | |
1/1/15 to 12/31/15 | | | | 9.24 | | | | | 0.47 | | | | | (0.56 | ) | | | | (0.09 | ) | | | | (0.41 | ) | | | | — | | | | | (0.41 | ) | | | | — | (10) | | | | (0.50 | ) | | | | 8.74 | | | | | (1.00 | ) | | | | 213 | | | | | 0.70 | (11) | | | | 0.78 | | | | | 5.11 | | | | | 55 | |
1/1/14 to 12/31/14 | | | | 9.53 | | | | | 0.51 | | | | | (0.29 | ) | | | | 0.22 | | | | | (0.51 | ) | | | | — | | | | | (0.51 | ) | | | | — | | | | | (0.29 | ) | | | | 9.24 | | | | | 2.16 | | | | | 223 | | | | | 0.69 | | | | | 0.76 | | | | | 5.19 | | | | | 48 | |
| 4/30/13(4) to 12/31/13 | | | | 10.19 | | | | | 0.36 | | | | | (0.44 | ) | | | | (0.08 | ) | | | | (0.58 | ) | | | | — | | | | | (0.58 | ) | | | | — | | | | | (0.66 | ) | | | | 9.53 | | | | | (0.89 | )(6) | | | | 124 | | | | | 0.69 | (5) | | | | 0.71 | (5) | | | | 5.54 | (5) | | | | 56 | (9) |
The footnote legend is at the end of the Financial Highlights.
See Notes to Financial Statements
80
VIRTUS VARIABLE INSURANCE TRUST
FINANCIAL HIGHLIGHTS
SELECTED PER SHARE DATA AND RATIOS FOR A SHARE OUTSTANDING
THROUGHOUT EACH PERIOD
| | | | | | | | | | | | | | | | | | | | | | | | | | | | | | | | | | | | | | | | | | | | | | | | | | | | | | | | | | | | | | | | | | | | | | | | | | | | | | | | |
| | | Net Asset Value,
Beginning of Period | | Net Investment Income (Loss)(1) | | Net Realized and
Unrealized Gain (Loss) | | Total from Investment Operations
| | Dividends from
Net Investment Income | | Distributions from
Net Realized Gains | | Return of Capital | | Total Distributions | | Change in Net Asset Value | | Net Asset Value, End of Period | | Total Return(2) | | Net Assets, End of Period
(in thousands) | | Ratio
of Net
Expenses to
Average
Net Assets(3) | | Ratio
of Gross
Expenses to
Average
Net Assets
(before
waivers
and
reimbursements)(3) | | Ratio of Net Investment Income (Loss)
to Average Net Assets | | Portfolio Turnover Rate |
Rampart Enhanced Core Equity Series | | | | | | | | | | | | | | | | | | | | | | | | | | | | | | | | | | | | | | | | | | | | | | | | | | | | | | | | | | | | | | | | | | | | | | | | | | | | | | | | |
Class A | | | | | | | | | | | | | | | | | | | | | | | | | | | | | | | | | | | | | | | | | | | | | | | | | | | | | | | | | | | | | | | | | | | | | | | | | | | | | | | | |
1/1/17 to 12/31/17 | | | $ | 11.97 | | | | | 0.12 | | | | | 2.58 | | | | | 2.70 | | | | | (0.21 | ) | | | | (2.39 | ) | | | | (.07 | ) | | | | (2.67 | ) | | | | 0.03 | | | | $ | 12.00 | | | | | 22.96 | % | | | $ | 111,386 | | | | | 0.98 | % | | | | 1.16 | % | | | | 0.96 | % | | | | 241 | % |
1/1/16 to 12/31/16 | | | | 13.67 | | | | | 0.25 | | | | | 1.01 | | | | | 1.26 | | | | | (0.18 | ) | | | | (2.78 | ) | | | | — | | | | | (2.96 | ) | | | | (1.70 | ) | | | | 11.97 | | | | | 9.41 | (13) | | | | 104,587 | | | | | 0.99 | (11)(13) | | | | 1.20 | | | | | 1.41 | (13) | | | | 241 | (7) |
1/1/15 to 12/31/15 | | | | 16.91 | | | | | 0.13 | | | | | (1.55 | ) | | | | (1.42 | ) | | | | (0.14 | ) | | | | (1.68 | ) | | | | — | | | | | (1.82 | ) | | | | (3.24 | ) | | | | 13.67 | | | | | (8.91 | ) | | | | 109,913 | | | | | 0.99 | (11) | | | | 1.23 | | | | | 0.83 | | | | | 94 | |
1/1/14 to 12/31/14 | | | | 17.23 | | | | | 0.16 | | | | | 1.51 | | | | | 1.67 | | | | | (0.17 | ) | | | | (1.82 | ) | | | | — | | | | | (1.99 | ) | | | | (0.32 | ) | | | | 16.91 | | | | | 9.64 | | | | | 139,122 | | | | | 0.98 | | | | | 1.20 | | | | | 0.91 | | | | | 53 | |
1/1/13 to 12/31/13 | | | | 14.23 | | | | | 0.11 | | | | | 4.39 | | | | | 4.50 | | | | | (0.14 | ) | | | | (1.36 | ) | | | | — | | | | | (1.50 | ) | | | | 3.00 | | | | | 17.23 | | | | | 31.81 | | | | | 150,383 | | | | | 0.98 | | | | | 1.14 | | | | | 0.84 | | | | | 54 | |
Rampart Equity Trend Series | | | | | | | | | | | | | | | | | | | | | | | | | | | | | | | | | | | | | | | | | | | | | | | | | | | | | | | | | | | | | | | | | | | | | | | | | | | | | | | | |
Class A | | | | | | | | | | | | | | | | | | | | | | | | | | | | | | | | | | | | | | | | | | | | | | | | | | | | | | | | | | | | | | | | | | | | | | | | | | | | | | | | |
1/1/17 to 12/31/17 | | | $ | 11.27 | | | | | (0.01 | ) | | | | 2.31 | | | | | 2.30 | | | | | — | | | | | (0.32 | ) | | | | — | | | | | (0.32 | ) | | | | 1.98 | | | | $ | 13.25 | | | | | 20.44 | % | | | $ | 3,554 | | | | | 1.70 | % | | | | 2.08 | % | | | | (0.08 | )% | | | | 80 | % |
1/1/16 to 12/31/16 | | | | 11.38 | | | | | (0.02 | ) | | | | (0.09 | ) | | | | (0.11 | ) | | | | — | | | | | — | | | | | — | | | | | — | | | | | (0.11 | ) | | | | 11.27 | | | | | (0.97 | ) | | | | 4,444 | | | | | 1.70 | (11) | | | | 1.92 | | | | | (0.19 | ) | | | | 187 | |
1/1/15 to 12/31/15 | | | | 12.55 | | | | | (0.11 | ) | | | | (1.06 | ) | | | | (1.17 | ) | | | | — | | | | | — | | | | | — | | | | | — | | | | | (1.17 | ) | | | | 11.38 | | | | | (9.32 | ) | | | | 10,932 | | | | | 1.71 | (11) | | | | 2.23 | | | | | (0.92 | ) | | | | 366 | |
1/1/14 to 12/31/14 | | | | 13.30 | | | | | 0.04 | | | | | 0.27 | | | | | 0.31 | | | | | (0.05 | ) | | | | (1.01 | ) | | | | — | | | | | (1.06 | ) | | | | (0.75 | ) | | | | 12.55 | | | | | 2.23 | | | | | 36,680 | | | | | 1.70 | (8) | | | | 1.65 | | | | | 0.32 | | | | | 473 | |
1/1/13 to 12/31/13 | | | | 10.41 | | | | | 0.06 | | | | | 2.92 | | | | | 2.98 | | | | | (0.05 | ) | | | | (0.04 | ) | | | | — | | | | | (0.09 | ) | | | | 2.89 | | | | | 13.30 | | | | | 28.71 | | | | | 18,710 | | | | | 1.70 | | | | | 1.79 | | | | | 0.52 | | | | | 108 | |
| | | | | | | | | | | | | | | | |
Class I | | | | | | | | | | | | | | | | | | | | | | | | | | | | | | | | | | | | | | | | | | | | | | | | | | | | | | | | | | | | | | | | | | | | | | | | | | | | | | | | |
1/1/17 to 12/31/17 | | | $ | 11.35 | | | | | 0.02 | | | | | 2.33 | | | | | 2.35 | | | | | — | | | | | (0.32 | ) | | | | — | | | | | (0.32 | ) | | | | 2.03 | | | | $ | 13.38 | | | | | 20.73 | % | | | $ | 144 | | | | | 1.45 | % | | | | 1.85 | % | | | | 0.18 | % | | | | 80 | % |
1/1/16 to 12/31/16 | | | | 11.43 | | | | | 0.02 | | | | | (0.10 | ) | | | | (0.08 | ) | | | | — | | | | | — | | | | | — | | | | | — | | | | | (0.08 | ) | | | | 11.35 | | | | | (0.70 | ) | | | | 119 | | | | | 1.46 | (11) | | | | 1.65 | | | | | 0.20 | | | | | 187 | |
1/1/15 to 12/31/15 | | | | 12.57 | | | | | (0.08 | ) | | | | (1.06 | ) | | | | (1.14 | ) | | | | — | | | | | — | | | | | — | | | | | — | | | | | (1.14 | ) | | | | 11.43 | | | | | (9.00 | ) | | | | 123 | | | | | 1.46 | (11) | | | | 2.06 | | | | | (0.57 | ) | | | | 366 | |
1/1/14 to 12/31/14 | | | | 13.30 | | | | | 0.05 | | | | | 0.29 | | | | | 0.34 | | | | | (0.06 | ) | | | | (1.01 | ) | | | | — | | | | | (1.07 | ) | | | | (0.73 | ) | | | | 12.57 | | | | | 2.39 | | | | | 277 | | | | | 1.45 | (8) | | | | 1.41 | | | | | 0.40 | | | | | 473 | |
4/30/13(4) to 12/31/13 | | | | 11.69 | | | | | 0.07 | | | | | 1.66 | | | | | 1.73 | | | | | (0.08 | ) | | | | (0.04 | ) | | | | — | | | | | (0.12 | ) | | | | 1.61 | | | | | 13.30 | | | | | 14.64 | (6) | | | | 140 | | | | | 1.45 | (5) | | | | 1.50 | (5) | | | | 0.89 | (5) | | | | 108 | (9) |
Strategic
Allocation Series | | | | | | | | | | | | | | | | | | | | | | | | | | | | | | | | | | | | | | | | | | | | | | | | | | | | | | | | | | | | | | | | | | | | | | | | | | | | | | | | |
Class A | | | | | | | | | | | | | | | | | | | | | | | | | | | | | | | | | | | | | | | | | | | | | | | | | | | | | | | | | | | | | | | | | | | | | | | | | | | | | | | | |
1/1/17 to 12/31/17 | | | $ | 10.88 | | | | | 0.16 | | | | | 1.89 | | | | | 2.05 | | | | | (0.23 | ) | | | | (0.08 | ) | | | | — | | | | | (0.31 | ) | | | | 1.74 | | | | $ | 12.62 | | | | | 18.97 | % | | | $ | 97,028 | | | | | 0.98 | % | | | | 1.06 | % | | | | 1.31 | % | | | | 38 | % |
1/1/16 to 12/31/16 | | | | 12.34 | | | | | 0.24 | | | | | (0.14 | ) | | | | 0.10 | | | | | (0.21 | ) | | | | (1.35 | ) | | | | — | | | | | (1.56 | ) | | | | (1.46 | ) | | | | 10.88 | | | | | 0.82 | (13) | | | | 93,276 | | | | | 0.99 | (11)(13) | | | | 1.09 | | | | | 1.96 | (13) | | | | 114 | |
1/1/15 to 12/31/15 | | | | 14.30 | | | | | 0.25 | | | | | (0.98 | ) | | | | (0.73 | ) | | | | (0.24 | ) | | | | (0.99 | ) | | | | — | | | | | (1.23 | ) | | | | (1.96 | ) | | | | 12.34 | | | | | (5.38 | ) | | | | 106,825 | | | | | 0.99 | (11) | | | | 1.13 | | | | | 1.79 | | | | | 75 | |
1/1/14 to 12/31/14 | | | | 14.41 | | | | | 0.28 | | | | | 0.80 | | | | | 1.08 | | | | | (0.32 | ) | | | | (0.87 | ) | | | | — | | | | | (1.19 | ) | | | | (0.11 | ) | | | | 14.30 | | | | | 7.51 | | | | | 129,473 | | | | | 0.98 | | | | | 1.11 | | | | | 1.89 | | | | | 47 | |
1/1/13 to 12/31/13 | | | | 13.48 | | | | | 0.27 | | | | | 2.13 | | | | | 2.40 | | | | | (0.29 | ) | | | | (1.18 | ) | | | | — | | | | | (1.47 | ) | | | | 0.93 | | | | | 14.41 | | | | | 17.99 | | | | | 137,453 | | | | | 0.98 | | | | | 1.06 | | | | | 1.88 | | | | | 49 | |
The footnote legend is at the end of the Financial Highlights.
See Notes to Financial Statements
81
VIRTUS VARIABLE INSURANCE TRUST
FINANCIAL HIGHLIGHTS
SELECTED PER SHARE DATA AND RATIOS FOR A SHARE OUTSTANDING
THROUGHOUT EACH PERIOD
Footnote Legend:
| (1) | Computed using average shares outstanding. |
| (2) | The total return does not include the expenses associated with the annuity or life insurance policy through which you invest. |
| (3) | Each Series will also indirectly bear its prorated share of expenses of any underlying funds in which it invests. Such expenses are not included in the calculation of this ratio. |
| (7) | The increase in the portfolio turnover rate is due to a change in the subadviser associated with a strategy change on the Series. |
| (8) | See Note 3D in the Notes to Financial Statements for information on recapture of expense previously waived. |
| (9) | Portfolio turnover is representative of the Series for the entire period. |
| (10) | Amount is less than $.005 per share and payment from affiliate had no impact on total performance. |
| (11) | Net expense ratios include proxy expenses. |
| (12) | Amount is less than $.005 per share. |
| (13) | Custody fees reimbursed were excluded from the Ratio of Net Expenses to Average Net Assets and Ratio of Net Investment Income (Loss) to Average Net Assets. If included the impact would have been to lower the Ratio of Net Expenses and increase the Ratio of Net Investment Income (Loss) as follows: |
| | Duff & Phelps International Series 0.04%, |
| | Duff & Phelps Real Estate Securities Series 0.02% (Class A) and 0.03% (Class I), |
| | KAR Capital Growth Series 0.10%, |
| | KAR Small-Cap Growth Series 0.09% (Class A) and 0.14% (Class I), |
| | KAR Small-Cap Value Series 0.08%, |
| | Newfleet Multi-Sector Intermediate Bond Series 0.04% (Class A) and 0.05% (Class I), |
| | Rampart Enhanced Core Equity Series 0.46%, |
| | Strategic Allocation Series 0.03%. |
| | Custody fees reimbursed were included in Total Return. If excluded the impact would have been to lower the Total Return as follows: |
| | Duff & Phelps International Series 0.04%, |
| | Duff & Phelps Real Estate Securities Series 0.03%, |
| | KAR Capital Growth Series 0.10%, |
| | KAR Small-Cap Growth Series 0.08%, |
| | KAR Small-Cap Value Series 0.08%, |
| | Newfleet Multi-Sector Intermediate Bond Series 0.04%, |
| | Rampart Enhanced Core Equity Series 0.44%, |
| | Strategic Allocation Series 0.03%. |
| | The amounts reflected in the Statements of Operations for 2017 were immaterial and do not impact the financial highlights. |
| | Please refer to Note 14 in the Notes to Financial Statements for a further explanation on the custody fees reimbursed. |
See Notes to Financial Statements
82
VIRTUS VARIABLE INSURANCE TRUST
NOTES TO FINANCIAL STATEMENTS
DECEMBER 31, 2017
Note 1—Organization
Virtus Variable Insurance Trust (the “Trust”) is organized as a Delaware statutory trust and is registered under the Investment Company Act of 1940, as amended (the “1940 Act”), as an open-end management investment company. It was formed on February 18, 1986, as a Massachusetts business trust, commenced operations on December 5, 1986, and was reorganized as a Delaware statutory trust on February 14, 2011.
The Trust is organized with series, which are currently available only to separate accounts of participating insurance companies to fund variable accumulation annuity contracts and variable universal life insurance policies. As of the date of this report the Trust is comprised of nine series (each a “Series”), each reported in this annual report. Each Series’ investment objective is outlined in the respective Series Summary page.
Each Series offers Class A shares. The Duff & Phelps International Series, Duff & Phelps Real Estate Securities Series, KAR Small-Cap Growth Series, Newfleet Multi-Sector Intermediate Bond Series, and Rampart Equity Trend Series also offer Class I shares.
Note 2—Significant Accounting Policies
The Trust is an investment company that follows the accounting and reporting guidance of Accounting Standards Codification Topic 946 applicable to Investment Companies. The following is a summary of the significant accounting policies consistently followed by the Funds in the preparation of their financial statements, and for derivatives, included in Note 6 below. The preparation of financial statements in conformity with U.S. generally accepted accounting principles (“U.S. GAAP”) requires management to make estimates and assumptions that affect the reported amounts of assets and liabilities, and disclosure of contingent assets and liabilities at the date of the financial statements and the reported amounts of increases and decreases in net assets from operations during the reporting period. Actual results could differ from those estimates, and those differences could be significant.
Security valuation procedures for each Series, which include nightly price variance, as well as back-testing items such as bi-weekly unchanged price, monthly secondary source and transaction analysis, have been approved by the Board. All internally fair valued securities are approved by a valuation committee appointed by the Board (the “Valuation Committee”). The Valuation Committee is comprised of certain members of management as identified to the Board and convenes independently from portfolio management. All internally fair valued securities are updated daily and reviewed in detail by the Valuation Committee monthly unless changes occur within the period. The Valuation Committee reviews the validity of any model inputs and any changes to the model. Fair valuations are reviewed by the Board at least quarterly.
Each Series utilizes a fair value hierarchy which prioritizes the inputs to valuation techniques used to measure fair value into three broad levels. The Series’ policy is to recognize transfers between levels at the end of the reporting period.
| | |
• Level 1 – | | quoted prices in active markets for identical securities (security types generally include listed equities). |
| |
• Level 2 – | | prices determined using other significant observable inputs (including quoted prices for similar securities, interest rates, prepayment speeds, credit risk, etc.). |
| |
• Level 3 – | | prices determined using significant unobservable inputs (including the Valuation Committee’s own assumptions in determining the fair value of investments). |
A description of the valuation techniques applied to a Series’ major categories of assets and liabilities measured at fair value on a recurring basis is as follows:
Equity securities are valued at the official closing price (typically last sale) on the exchange on which the securities are primarily traded or, if no closing price is available, at the last bid price and are categorized as Level 1 in the hierarchy. Restricted equity securities and private placements that are not widely traded, are illiquid, or are internally fair valued by the Valuation Committee, are generally categorized as Level 3 in the hierarchy.
Certain non-U.S. securities may be fair valued in cases where closing prices are not readily available or are deemed not reflective of readily available market prices. For example, significant events (such as movement in the U.S. securities market, or other regional and local developments) may occur between the time that non-U.S. markets close (where the security is principally traded) and the time that a Series calculates its net asset value (“NAV”) (at the close of regular trading on the New York Stock Exchange (“NYSE”), generally 4 p.m. Eastern time) that may impact the value of securities traded in these non-U.S. markets. In such cases the Series fair value non-U.S. securities using an independent pricing service which considers the correlation of the trading patterns of the non-U.S. security to the intraday trading in the U.S. markets for investments such as ADRs, financial futures, exchange-traded funds (“ETFs”), and certain indexes, as well as prices for similar securities. Such fair valuations are categorized as Level 2 in the hierarchy. Because the frequency of significant events is not predictable, fair valuation of certain non-U.S. common stocks may occur on a frequent basis.
Debt securities, including restricted securities, are valued based on evaluated quotations received from independent pricing services or from dealers who make markets in such securities. For most bond types, the pricing service utilizes matrix pricing that considers one or more of the following factors: yield or price of bonds of comparable quality, coupon, maturity, current cash flows, type, and current day trade information, as well as dealer supplied prices. These valuations are generally categorized as Level 2 in the hierarchy. Structured debt instruments, such as mortgage-backed and asset-backed securities, may also incorporate collateral analysis and utilize cash flow models for valuation and are generally categorized as Level 2 in the hierarchy. Pricing services do not provide pricing for all securities and therefore indicative bids from dealers are utilized which are based on pricing models used by market makers in the security and are generally categorized as Level 2 in the hierarchy. Debt securities that are not widely traded or are internally fair valued by the Valuation Committee, are generally categorized as Level 3 in the hierarchy.
Listed derivatives that are actively traded are valued based on quoted prices from the exchange and are categorized as Level 1 in the hierarchy. Over-the-counter derivative contracts, which include forward currency contracts and equity-linked instruments, do not require material subjectivity as pricing inputs are observed from actively quoted markets and are categorized as Level 2 in the hierarchy.
83
VIRTUS VARIABLE INSURANCE TRUST
NOTES TO FINANCIAL STATEMENTS (Continued)
DECEMBER 31, 2017
Investments in open-end mutual funds are valued at NAV. Investments in closed-end funds are valued as of the close of regular trading on the NYSE each business day. Both are categorized as Level 1 in the hierarchy.
A summary of the inputs used to value the Series’ net assets by each major security type is disclosed at the end of the Schedule of Investments for each Series. The inputs or methodologies used for valuing securities are not necessarily an indication of the risk associated with investing in those securities.
| | B. | | Security Transactions and Investment Income |
Security transactions are recorded on the trade date. Realized gains and losses from the sales of securities are determined on the identified cost basis. Dividend income is recognized on the ex-dividend date or, in the case of certain foreign securities, as soon as a Series is notified. Interest income is recorded on the accrual basis. Each Series amortizes premiums and accretes discounts using the effective interest method.
Any distributions from underlying funds are recorded in accordance with the character of the distributions as designated by the underlying funds. Dividend income from REIT investments is recorded using management’s estimate of the percentage of income included in distributions received from the REIT investments based on historical information and other industry sources. Distributions received in excess of this estimated amount are recorded as a reduction of the cost of investments or reclassified to capital gains. The actual amounts of income, return of capital, and capital gains are only determined by each REIT after its fiscal year-end, and may differ from the estimated amounts.
Each Series is treated as a separate taxable entity. It is the intention of each Series to comply with the requirements of Subchapter M of the Internal Revenue Code and to distribute substantially all of its taxable income to its shareholders. Therefore, no provision for federal income taxes or excise taxes has been made.
Certain Series may be subject to foreign taxes on income, gains on investments or currency repatriation, a portion of which may be recoverable. Each Series will accrue such taxes and recoveries as applicable based upon current interpretations of the tax rules and regulations that exist in the markets in which it invests.
Management of the Trust has concluded that there are no significant uncertain tax positions that would require recognition in the financial statements. As of December 31, 2017, the tax years that remain subject to examination by the major tax jurisdictions under the statute of limitations are from the year 2014 forward (with limited exceptions).
| | D. | | Distributions to Shareholders |
Distributions are recorded by each Series on the ex-dividend date. Income and capital gain distributions are determined in accordance with income tax regulations that may differ from U.S. GAAP.
Expenses incurred together by a Series and other affiliated open- and closed-end funds are allocated in proportion to the net assets of each such Series/fund, except where allocation of direct expenses to each Series/fund or an alternative allocation method can be more appropriately used.
In addition to the net annual operating expenses that a Series bears directly, the contract owners, as investors in the Series, indirectly bear the Series’ pro rata expenses of any underlying open- and closed-end funds in which the Series invests.
| | F. | | Foreign Currency Transactions |
Non-U.S. investment securities and other assets and liabilities denominated in foreign currencies are translated into U.S. dollar amounts at the foreign currency exchange rate effective at the end of the reporting period. Cost of investments is translated at the currency exchange rate effective at the trade date. The gain or loss resulting from a change in currency exchange rates between the trade and settlement date of a portfolio transaction is treated as a gain or loss on foreign currency. Likewise, the gain or loss resulting from a change in currency exchange rates between the date income is accrued and the date it is paid is treated as a gain or loss on foreign currency. The Series do not isolate that portion of the results of operations arising from changes in foreign exchange rates on investments from the fluctuations arising from changes in the market prices of securities held. Such fluctuations are included with the net realized and unrealized gain or loss on investments.
Certain Series may invest in direct debt instruments which are interests in amounts owed by a corporate, governmental, or other borrower to lenders or lending syndicates. Loan agreements are generally non-investment grade and often involve borrowers that are highly leveraged. The Series may invest in obligations of borrowers who are in bankruptcy proceedings. Loan agreements are typically senior in the corporate capital structure of the borrower. A loan is often administered by a bank or other financial institution (the “lender”) that acts as agent for all holders. The agent administers the terms of the loan, as specified in the loan agreement. A Series’ investments in loans may be in the form of participations in loans or assignments of all or a portion of loans from third parties. When investing in loan participations, a Series has the right to receive payments of principal, interest and any fees to which it is entitled only from the lender selling the loan participation and only upon receipt by the lender of payments from the borrower. A Series generally has no right to enforce compliance with the terms of the loan agreement with the borrower. As a result, a Series may be subject to the credit risk of both the borrower and the lender that is selling the loan agreement. When a Series purchases assignments from lenders it acquires direct rights against the borrower on the loan.
A Series may invest in multiple series or tranches of a loan, which may have varying terms and carry different associated risks. Loan agreements may involve foreign borrowers and investments may be denominated in foreign currencies. Direct indebtedness of emerging countries involves a risk that the government entities responsible for the repayment of the debt may be unable, or unwilling, to pay the principal and interest when due.
The loan agreements have floating rate loan interests which generally pay interest at rates that are periodically determined by reference to a base lending rate plus a premium. The base lending rates are generally LIBOR (London Interbank Offered Rate), the prime rate offered by one or more
84
VIRTUS VARIABLE INSURANCE TRUST
NOTES TO FINANCIAL STATEMENTS (Continued)
DECEMBER 31, 2017
U.S. banks or the certificate of deposit rate. When a loan agreement is purchased a Series may pay an assignment fee. On an ongoing basis, a Series may receive a commitment fee based on the undrawn portion of the underlying line of credit portion of a loan agreement. Prepayment penalty fees are received upon the prepayment of a loan agreement by a borrower. Prepayment penalty, facility, commitment, consent and amendment fees are recorded to income as earned or paid.
| | H. | | When-issued Purchases and Forward Commitments (Delayed Delivery) |
Certain Series may engage in when-issued or forward commitment transactions. Securities purchased on a when-issued or forward commitment basis are also known as delayed delivery transactions. Delayed delivery transactions involve a commitment by a Series to purchase or sell a security at a future date (ordinarily up to 90 days later). When-issued or forward commitments enable a Series to lock in what is believed to be an attractive price or yield on a particular security for a period of time, regardless of future changes in interest rates. Each Series records when-issued and delayed delivery securities on the trade date. Each Series maintains collateral for the securities purchased. Securities purchased on a when-issued or delayed delivery basis begin earning interest on the settlement date.
| | I. | | Earnings Credit and Interest |
Through arrangements with the Series’ previous custodian which ended on various dates in September 2017, most Series received either an earnings credit or interest on agreed upon target un-invested cash balances to reduce each Series’ custody expenses. The credits are reflected as “Earnings credit from custodian” and the interest is reflected under “Interest income” in the Series’ Statements of Operations for the period, as applicable.
| | J. | | Interest-Only and Principal-Only Securities |
Certain Funds may invest in stripped mortgage-backed securities. Stripped mortgage-backed securities represent a participation in, or are secured by, or payable from, mortgage loans on real property, and may be structured in classes with rights to receive varying proportions of principal and interest. Stripped mortgage-backed securities include interest-only securities (IOs) which receive all of the interest, and principal-only securities (POs) which receive all of the principal. The market value of these securities is highly sensitive to changes in interest rates and a rapid (slow) rate of principal payments may have an adverse (positive) effect on yield to maturity. Payments received for IOs are included in interest income.
Because principal will not be received at the maturity of an IO, adjustments are made to the book value of the security on a daily basis until maturity and these adjustments are also included in interest income. Payments received for POs are treated as reductions to the cost and par value of the securities. Any pay down gains or losses associated with the payments received are included in interest income. If the underlying mortgage assets are greater than anticipated payments of principal, a Fund may fail to recoup some or all of its initial investment in these securities.
Note 3—Investment Advisory Fees and Related Party Transactions
($ reported in thousands except as noted)
Virtus Investment Advisers, Inc. (the “Adviser”), an indirect wholly owned subsidiary of Virtus Investment Partners, Inc. (“Virtus”), is the investment adviser to the Series. The Adviser manages the Series’ investment programs and general operations of the Series, including oversight of the Series’ subadvisers.
As compensation for its services to the Series, the Adviser is entitled to a fee based upon the following annual rates as a percentage of the average daily net assets of each Series:
| | | | | | | | | | | | |
Series | | First
$250 Million | | | Next
$250 Million | | | Over
$500 Million | |
Duff & Phelps International Series | | | 0.75 | % | | | 0.70 | % | | | 0.65 | % |
KAR Capital Growth Series | | | 0.70 | | | | 0.65 | | | | 0.60 | |
Newfleet Multi-Sector Intermediate Bond Series | | | 0.50 | | | | 0.45 | | | | 0.40 | |
Rampart Enhanced Core Equity Series | | | 0.70 | | | | 0.65 | | | | 0.60 | |
Strategic Allocation Series | | | 0.55 | | | | 0.50 | | | | 0.45 | |
| | | |
| | | First
$1 Billion | | | Next
$1 Billion | | | Over
$2 Billion | |
Duff & Phelps Real Estate Securities Series | | | 0.75 | % | | | 0.70 | % | | | 0.65 | % |
| | | |
| | | First
$1 Billion | | | $1+ Billion | | | | |
KAR Small-Cap Growth Series | | | 0.85 | % | | | 0.80 | % | | | | |
| | | |
| | | First
$400 Million | | | $400 Million
to $1 Billion | | | Over
$1 Billion | |
KAR Small-Cap Value Series | | | 0.90 | % | | | 0.85 | % | | | 0.80 | % |
| | | |
| | | | | | Rate | | | | |
Rampart Equity Trend Series | | | | | | | 1.00 | % | | | | |
During the period covered by these financial statements, each of Newfleet Multi-Sector Intermediate Bond Series and Strategic Allocation Series invested a portion of its assets in Virtus Newfleet Credit Opportunities Fund, an affiliated mutual fund. In order to avoid any duplication of advisory
85
VIRTUS VARIABLE INSURANCE TRUST
NOTES TO FINANCIAL STATEMENTS (Continued)
DECEMBER 31, 2017
fees, the Adviser has voluntarily waived its advisory fees in an amount equal to that which would otherwise be paid by the Series on the assets invested in the Virtus Newfleet Credit Opportunities Fund. For the period covered by these financial statements, the waivers amounted to $15 and $2, respectively. These waivers are in addition to the expense limitation and/or fee waiver covered elsewhere in these financial statements and are included in the Statements of Operations in “expenses reimbursed and/or waived by investment adviser.”
The subadvisers manage the investments of each Series for which they are paid a fee by the Adviser. A list of the subadvisers and the Series they serve is as follows:
| | |
Series | | Subadviser |
| Duff & Phelps International Series | | Duff & Phelps Investment Management Co. (“DPIM”)* |
| Duff & Phelps Real Estate Securities Series | | DPIM* |
| KAR Capital Growth Series | | Kayne Anderson Rudnick Investment Management, LLC (“KAR”)* |
| KAR Small-Cap Growth Series | | KAR* |
| KAR Small-Cap Value Series | | KAR* |
| Newfleet Multi-Sector Intermediate Bond Series | | Newfleet Asset Management, LLC (“NF”)* |
| | |
Series | | Subadviser |
| Rampart Enhanced Core Equity Series | | Rampart Investment Management Company, LLC* (“RIMCO”) |
| Rampart Equity Trend Series | | RIMCO* |
| Strategic Allocation Series: | | |
Equity Portfolio (domestic) | | KAR* |
Equity Portfolio (international) | | DPIM* |
Fixed Income Portfolio | | NF* |
| | * | An indirect wholly owned subsidiary of Virtus. |
The Adviser has contractually agreed to limit the total operating expenses (excluding front-end or contingent deferred loads, taxes, leverage expenses, interest, brokerage commissions, expenses incurred in connection with any merger or reorganization, unusual or infrequently occurring expenses (such as litigation), acquired fund fees and expenses, and dividend expenses, if any) of each Series, so that such expenses do not exceed, on an annualized basis, the following percentages of average net assets, through April 30, 2018:
| | | | | | | | |
| | | Maximum Total Operating Expenses | |
| | | Class A | | | Class I | |
Duff & Phelps International Series | | | 1.18 | % | | | 0.93 | % |
Duff & Phelps Real Estate Securities Series | | | 1.16 | | | | 0.91 | |
KAR Capital Growth Series | | | 1.03 | | | | — | |
KAR Small-Cap Growth Series | | | 1.19 | | | | 0.94 | |
KAR Small-Cap Value Series | | | 1.20 | | | | — | |
Newfleet Multi-Sector Intermediate Bond Series | | | 0.94 | | | | 0.69 | |
Rampart Enhanced Core Equity Series | | | 0.98 | | | | — | |
Rampart Equity Trend Series | | | 1.70 | | | | 1.45 | |
Strategic Allocation Series | | | 0.98 | | | | — | |
Under certain conditions, the Adviser may recapture operating expenses reimbursed or fees waived under these arrangements within three years after the date on which such amounts were incurred or waived. A Series must pay its ordinary operating expenses before the Adviser is entitled to any reimbursement and must remain in compliance with applicable expense limitations or, if none, the expense limitation in effect at the time of the waiver or reimbursement. All or a portion of the following Adviser reimbursed expenses may be recaptured by the fiscal year ending:
| | | | | | | | | | | | | | | | |
| | | Expiration Date | |
| | | 2018 | | | 2019 | | | 2020 | | | Total | |
Duff & Phelps International Series | | $ | 265 | | | $ | 126 | | | $ | 63 | | | $ | 454 | |
Duff & Phelps Real Estate Securities Series | | | 105 | | | | 72 | | | | 40 | | | | 217 | |
KAR Capital Growth Series | | | 375 | | | | 275 | | | | 212 | | | | 862 | |
KAR Small-Cap Growth Series | | | 126 | | | | 100 | | | | 82 | | | | 308 | |
KAR Small-Cap Value Series | | | 219 | | | | 172 | | | | 134 | | | | 525 | |
Newfleet Multi-Sector Intermediate Bond Series | | | 118 | | | | 71 | | | | 26 | | | | 215 | |
Rampart Enhanced Core Equity Series | | | 300 | | | | 209 | | | | 196 | | | | 705 | |
Rampart Equity Trend Series | | | 103 | | | | 13 | | | | 16 | | | | 132 | |
Strategic Allocation Series | | | 168 | | | | 102 | | | | 75 | | | | 345 | |
| | E. | | Administrator and Distributor |
Virtus Fund Services, LLC, an indirect wholly owned subsidiary of Virtus, serves as administrator to the Series.
For the year ended December 31, 2017 (the “period”), the Series incurred administration fees totaling $920 which are included in the Statements of Operations within the line item “Administration fees.” A portion of these fees was paid to an outside entity that also provides services to the Series.
VP Distributors, LLC (“VP Distributors”), an indirect wholly owned subsidiary of Virtus, serves as the distributor of each Series’ shares. Each Series pays VP Distributors distribution and/or service fees under a Board-approved Rule 12b-1 plan, at the annual rate of 0.25% of the average daily net
86
VIRTUS VARIABLE INSURANCE TRUST
NOTES TO FINANCIAL STATEMENTS (Continued)
DECEMBER 31, 2017
assets of such Series’ Class A shares. Class I shares are not subject to a Rule 12b-1 plan. For the period ended December 31, 2017, the Series incurred distribution fees totaling $2,433 which are included in the Statements of Operations within the line item “Distribution and service fees.” A portion of these fees was paid to certain insurance companies for marketing and/or shareholder services provided to contract owners.
At December 31, 2017, Virtus and its affiliates, and the retirement plans of Virtus and its affiliates, held shares of certain Series which may be redeemed at any time, that aggregated to the following:
| | | | | | | | |
| | | Shares | | | Aggregate
Net Asset
Value | |
Duff & Phelps International Series | | | | | | | | |
Class I | | | 8,033 | | | $ | 100 | |
Duff & Phelps Real Estate Securities Series | | | | | | | | |
Class I | | | 7,192 | | | | 138 | |
KAR Small-Cap Growth Series | | | | | | | | |
Class I | | | 8,270 | | | | 240 | |
Newfleet Multi-Sector Intermediate Bond Series | | | | | | | | |
Class I | | | 12,598 | | | | 118 | |
Rampart Equity Trend Series | | | | | | | | |
Class I | | | 9,571 | | | | 128 | |
| | G. | | Investments in Affiliates |
A summary of the total long-term and short-term purchases and sales of an affiliated fund, Virtus Newfleet Credit Opportunities Fund, during the period ended December 31, 2017, is as follows:
| | | | | | | | | | | | | | | | | | | | | | | | | | | | | | | | |
| | | Value,
beginning of
period | | | Purchases | | | Sales
Proceeds | | | Net realized
gain (loss)
on affiliated
fund | | | Net change in
unrealized
appreciation
(depreciation)
on affiliated
fund | | | Value, end
of period | | | Dividend
Income | | | Distributions
of Realized
Gains | |
Newfleet Multi-Sector Intermediate Bond Series | | $ | 3,074 | | | $ | — | | | $ | — | | | $ | — | | | $ | (72 | ) | | $ | 3,002 | | | $ | 188 | | | $ | — | |
Strategic Allocation Series | | | 332 | | | | — | | | | — | | | | — | | | | (8 | ) | | | 324 | | | | 20 | | | | — | |
The Trust provides a deferred compensation plan for its Trustees who receive compensation from the Trust. Under the deferred compensation plan, Trustees may elect to defer all or a portion of their compensation. Amounts deferred are retained by the Trust, and then, to the extent permitted by the 1940 Act, in turn, may be invested in the shares of affiliated or unaffiliated mutual funds selected by the participating Trustees. Investments in such instruments are included in “Other Assets” on the Statement of Assets and Liabilities at December 31, 2017.
Note 4—Purchases and Sales of Securities
($ reported in thousands)
Purchases and sales of securities (excluding U.S. Government and agency securities, forward currency contracts, written options, and short-term investments) during the period ended December 31, 2017, were as follows:
| | | | | | | | |
| | | Purchases | | | Sales | |
Duff & Phelps International Series | | $ | 143,826 | | | $ | 154,480 | |
Duff & Phelps Real Estate Securities Series | | | 18,954 | | | | 24,397 | |
KAR Capital Growth Series | | | 44,129 | | | | 62,944 | |
KAR Small-Cap Growth Series | | | 12,053 | | | | 21,020 | |
KAR Small-Cap Value Series | | | 18,004 | | | | 30,851 | |
Newfleet Multi-Sector Intermediate Bond Series | | | 71,735 | | | | 72,622 | |
Rampart Enhanced Core Equity Series | | | 252,138 | | | | 263,635 | |
Rampart Equity Trend Series | | | 3,198 | | | | 4,800 | |
Strategic Allocation Series | | | 33,338 | | | | 43,553 | |
Purchases and sales of long-term U.S. Government and agency securities during the period ended December 31, 2017, were as follows:
| | | | | | | | |
| | | Purchases | | | Sales | |
Newfleet Multi-Sector Intermediate Bond Series | | $ | 11,688 | | | $ | 9,379 | |
Strategic Allocation Series | | | 2,975 | | | | 3,833 | |
Note 5—Credit Risk and Asset Concentration
In countries with limited or developing markets, investments may present greater risks than in more developed markets and the prices of such investments may be volatile. The consequences of political, social or economic changes in these markets may have disruptive effects on the market prices of these investments and the income they generate, as well as a Series’ ability to repatriate such amounts.
87
VIRTUS VARIABLE INSURANCE TRUST
NOTES TO FINANCIAL STATEMENTS (Continued)
DECEMBER 31, 2017
High-yield/high-risk securities typically entail greater price volatility and/or principal and interest rate risk. There is a greater chance that an issuer will not be able to make principal and interest payments on time. Analysis of the creditworthiness of issuers of high-yield/high-risk securities may be complex, and as a result, it may be more difficult for the Adviser and/or subadvisers to accurately predict risk.
Certain Series may invest in ETFs, which may expose the Series to the risk that the value of an ETF will be more volatile than the underlying portfolio of securities the ETF is designed to track, or that the costs to the Series of owning shares of the ETF will exceed those the Series would incur by investing in such securities directly.
Investing in sector funds or non-diversified funds may be more volatile than investing in broadly diversified funds, and may be more susceptible to adverse economic, political or regulatory developments affecting a single issuer than would be the case if it were more broadly diversified.
Certain Series may invest a high percentage of their assets in specific sectors of the market in the pursuit of their investment objectives. Fluctuations in these sectors of concentration may have a greater impact on a Series, positive or negative, than if the Series did not concentrate its investments in such sectors.
At December 31, 2017, the Series below held securities in specific sectors as detailed below:
| | | | | | | | |
Series | | Sector | | | Percentage of
Total Investments | |
Duff & Phelps International Series | | | Financials | | | | 29 | % |
KAR Capital Growth Series | | | Information Technology | | | | 42 | |
KAR Small-Cap Growth Series | | | Information Technology | | | | 28 | |
Note 6—Derivative Financial Instruments and Transactions
($ reported in thousands)
Disclosures about derivative instruments and hedging activities are intended to enable investors to understand how and why a Series uses derivatives, how derivatives are accounted for, and how derivative instruments affect a Series’ results of operations and financial position. Summarized below are such disclosures and accounting policies for each specific type of derivative instrument used by certain Series.
Forward Currency Contracts: A forward foreign currency exchange contract is an agreement between two parties to buy and sell a currency at a set exchange rate on a future date. Forward foreign currency exchange contracts, when used by a Series, help to manage the overall exposure to the currencies in which some of the investments held by the Series are denominated. The contract is marked-to-market daily and the change in market value is recorded by the Series as an unrealized appreciation or depreciation. When the contract is closed, the Series records a realized gain or loss equal to the difference between the value at the time it was opened and the value at the time it was closed. The use of forward foreign currency exchange contracts involves the risk that the value of the contract changes unfavorably due to movements in the value of the referenced foreign currencies. Non-deliverable forward foreign currency exchange contracts are settled with the counterparty in U.S. dollars without the delivery of foreign currency.
During the fiscal period, the Duff & Phelps International Series entered into forward foreign currency exchange contracts as an economic hedge against either specific transactions or portfolio instruments or to obtain exposure to, or hedge exposure away from, foreign currencies (foreign currency exchange rate risk). Forward foreign currency contracts outstanding at period end, if any, are listed after each Series’ Schedule of Investments.
These foreign currency contracts were executed under the ISDA 2002 Master Agreement without any Schedule thereto and without the requirement of posting any collateral to the counterparty.
The following is a summary of the Series’ foreign currency exchange contracts which have a primary risk exposure as of December 31, 2017:
| | | | |
Statements of Assets and Liabilities | |
| Assets | | | | |
Unrealized appreciation on forward foreign currency exchange contracts | | $ | — | |
| Liabilities | | | | |
Unrealized depreciation on forward foreign currency exchange contracts | | | — | |
| | | | |
| | $ | — | |
| | | | |
| | | | |
Statements of Operations | |
Net realized gain (loss) on forward foreign currency exchange contracts | | $ | (1,143 | ) |
Net Change in Unrealized Appreciation / (Depreciation) on forward foreign currency exchange contracts | | | (496 | ) |
| | | | |
| | $ | (1,639 | ) |
| | | | |
For the period ended December 31, 2017, the average daily cost of foreign currency exchange contracts purchased were $18,197 and the average daily cost of foreign currency exchange contracts sold were $21,293.
Options Contracts: An options contract provides the purchaser with the right, but not the obligation, to buy (call option) or sell (put option) a financial instrument at an agreed-upon price. Certain Series may purchase or write both put and call options on portfolio securities for hedging purposes or to facilitate the rapid implementation of investment strategies if the Series anticipates a significant market or sector advance. A Series doing so is subject to equity price risk in the normal course of pursuing its investment objective(s).
When a Series purchases an option, it pays a premium and an amount equal to that premium is recorded as an asset. When a Series writes an option, it receives a premium and an amount equal to that premium is recorded as a liability. The asset or liability is adjusted daily to reflect the current market value of the option. Holdings of the Series designated to cover outstanding written options are noted in the Schedules of Investments. Purchased options are reported as an asset within “Investment in unaffiliated securities at value” on the Statements of Assets and Liabilities. Options written are reported as a liability within “Written options at value.” Changes in value of the purchased option are included in “Net change in unrealized appreciation (depreciation) on investments” in the Statements of Operations. Changes in value of written options are included in “Net change in unrealized appreciation (depreciation) on written options” in the Statements of Operations.
88
VIRTUS VARIABLE INSURANCE TRUST
NOTES TO FINANCIAL STATEMENTS (Continued)
DECEMBER 31, 2017
If an option expires unexercised, the Series realizes a gain or loss to the extent of the premium received or paid. If an option is exercised, the premium received or paid is recorded as an adjustment to the proceeds from the sale or the cost basis of the purchase. The difference between the premium and the amount received or paid on effecting a closing purchase or sale transaction is also treated as a realized gain or loss. Gain or loss on purchased options is included in “Net realized gain (loss) on investments” in the Statements of Operations. Gain or loss on written options is presented separately as “Net realized gain (loss) on written options” in the Statements of Operations.
The risk in writing call options is that the Series gives up the opportunity for profit if the market price of the security increases and the option is exercised. The risk in writing put options is that the Series may incur a loss if the market price of the security decreases and the option is exercised. The risk in buying options is that the Series pays a premium whether or not the option is exercised. The use of such instruments may involve certain additional risks as a result of unanticipated movements in the market. Writers (sellers) of options are subject to unlimited risk of loss, as the seller will be obligated to deliver or take delivery of the security at a predetermined price which may, upon exercise of the option, be significantly different from the then-market value.
The Rampart Enhanced Core Equity Series invests in written covered call options contracts in an attempt to manage equity price risk and with the purpose of generating realized gains.
The following is a summary of the Rampart Enhanced Core Equity Series’ derivative instrument holdings categorized by primary risk exposure (equity contracts) in the financial statements as of December 31, 2017:
| | | | |
Statements of Assets and Liabilities | |
| | | Rampart
Enhanced
Core Equity | |
Assets: Purchased options at value | | $ | 88 | (1) |
Liabilities: Written options at value | | | (161 | ) |
| | | | |
Net asset (liability) balance | | $ | (73 | ) |
| | | | |
| | | | |
Statements of Operations | |
| | | Rampart
Enhanced
Core Equity | |
Net realized gain (loss) on purchased options | | $ | (4,640 | )(2) |
Net realized gain (loss) on written options | | | 8,254 | |
Net change in unrealized appreciation (depreciation) on purchased options | | | (56 | )(3) |
Net change in unrealized appreciation (depreciation) on written options | | | 114 | |
| | | | |
Total net realized and unrealized gain (loss) | | $ | 3,672 | |
| | | | |
| | (1) | Amount included in Investment in unaffiliated securities at value. |
| | (2) | Amount included in Net realized gain (loss) on unaffiliated investments. |
| | (3) | Amount included in Net change in unrealized appreciation (depreciation) on unaffiliated investments. |
For the period ended December 31, 2017, Rampart Enhanced Core Equity Series’ average daily premiums paid by the Series for purchased options were $152 and the average daily premiums received for written options by the Series were $315.
Note 7—Indemnifications
Under the Trust’s organizational documents and in separate agreements between each Trustee and the Trust, its Trustees and officers are indemnified against certain liabilities arising out of the performance of their duties to the Trust and its Series. In addition, in the normal course of business, the Trust and the Series enter into contracts that provide a variety of indemnifications to other parties. The Trust’s and/or the Series’ maximum exposure under these arrangements is unknown as this would involve future claims that may be made against the Trust or the Series and that have not occurred. However, neither the Trust nor the Series has had prior claims or losses pursuant to these arrangements and they each expect the risk of loss to be remote.
Note 8—Manager of Managers
The Trust and the Adviser have received an exemptive order from the SEC that permits the Adviser, subject to certain conditions and without the approval of shareholders to: (a) select both unaffiliated subadvisers and certain wholly-owned affiliated subadvisers to manage all or a portion of the assets of a Series, and enter into subadvisory agreements with such subadvisers, and (b) materially amend subadvisory agreements with such subadvisers. In such circumstances, shareholders would receive notice of such action.
Note 9—Mixed and Shared Funding
Shares of the Series are not directly offered to the public. Shares of the Series are currently offered through separate accounts to fund variable accumulation annuity contracts and variable universal life insurance policies issued by participating insurance companies.
The interests of variable annuity contract owners and variable life policy owners could diverge based on differences in U.S. federal and state regulatory requirements, tax laws, investment management or other unanticipated developments. The Trust’s Trustees do not foresee any such differences or disadvantages at this time. However, the Trust’s Trustees intend to monitor for any material conflicts and will determine what action, if any, should be taken in response to such conflicts. If such a conflict should occur, one or more separate accounts may be required to withdraw its investment in the Series, or shares of another Series may be substituted.
89
VIRTUS VARIABLE INSURANCE TRUST
NOTES TO FINANCIAL STATEMENTS (Continued)
DECEMBER 31, 2017
Note 10—Federal Income Tax Information
($ reported in thousands)
At December 31, 2017, federal tax cost and aggregate gross unrealized appreciation (depreciation) of securities held by each Series were as follows:
| | | | | | | | | | | | | | | | |
| Series | | Federal
Tax Cost | | | Unrealized
Appreciation | | | Unrealized
(Depreciation) | | | Net Unrealized
Appreciation
(Depreciation) | |
Duff & Phelps International Series | | $ | 159,387 | | | $ | 29,032 | | | $ | (4,772 | ) | | $ | 24,260 | |
Duff & Phelps Real Estate Securities Series | | | 54,564 | | | | 24,001 | | | | (985 | ) | | | 23,016 | |
KAR Capital Growth Series | | | 120,365 | | | | 104,814 | | | | (733 | ) | | | 104,081 | |
KAR Small-Cap Growth Series | | | 41,027 | | | | 40,826 | | | | (165 | ) | | | 40,661 | |
KAR Small-Cap Value Series | | | 61,048 | | | | 35,162 | | | | (1,505 | ) | | | 33,657 | |
Newfleet Multi-Sector Intermediate Bond Series | | | 133,417 | | | | 3,615 | | | | (3,559 | ) | | | 56 | |
Rampart Enhanced Core Equity Series (Including Purchased Options) | | | 99,568 | | | | 13,258 | | | | (1,827 | ) | | | 11,431 | |
Rampart Enhanced Core Equity Series (Written Options) | | | (161 | ) | | | — | | | | — | | | | — | |
Rampart Equity Trend Series | | | 2,886 | | | | 842 | | | | (18 | ) | | | 824 | |
Strategic Allocation Series | | | 83,281 | | | | 14,680 | | | | (970 | ) | | | 13,710 | |
Certain Series have capital loss carryovers available to offset future realized capital gains, through the indicated expiration dates shown below:
| | | | | | | | | | | | |
| | | No Expiration | | | Total | |
Series | | Short-Term | | | Long-Term | | | | |
Duff & Phelps International Series | | $ | 9,367 | | | $ | — | | | $ | 9,367 | |
Newfleet Multi-Sector Intermediate Bond Series | | | 101 | | | | 2,619 | | | | 2,720 | |
Rampart Equity Trend Series | | | 2,636 | | | | — | | | | 2,636 | |
Under the Regulated Investment Company Modernization Act of 2010 (the “Act”), net capital losses recognized for tax years beginning after December 22, 2010, may be carried forward indefinitely, and their character is retained as short-term and/or long-term losses. Previously, net capital losses were carried forward for eight years and treated as short-term losses. As a transition rule, the Act requires that post-enactment net capital losses be used before pre-enactment net capital losses. Capital loss carryover may be subject to limits on use of losses.
For the year ended December 31, 2017, the following Series utilized losses deferred in prior years against current year capital gains:
| | | | |
| Duff & Phelps International Series | | $ | 3,706 | |
| KAR Capital Growth Series | | | 5,033 | |
| Newfleet Multi-Sector Intermediate Bond Series | | | 314 | |
| Rampart Equity Trend Series | | | 143 | |
For the year ended December 31, 2017, the following Series had capital loss carryovers which expired:
| | | | |
| Newfleet Multi-Sector Intermediate Bond Series | | $ | 1,228 | |
Capital losses realized after October 31 and certain late year losses may be deferred and treated as occurring on the first day of the following fiscal year. For the fiscal year ended December 31, 2017, the following Series deferred and recognized qualified late year losses as follows:
| | | | | | | | | | | | | | | | |
| | | Late Year
Ordinary
Losses
Deferred | | | Late Year
Ordinary
Losses
Recognized | | | Capital
Loss
Deferred | | | Capital
Loss
Recognized | |
Newfleet Multi-Sector Intermediate Bond Series | | $ | — | | | $ | — | | | $ | 27 | | | $ | 718 | |
Rampart Equity Trend Series | | | — | | | | — | | | | — | | | | 18 | |
The components of distributable earnings on a tax basis (excluding unrealized appreciation (depreciation) which are disclosed in the beginning of this note) consist of the following:
| | | | | | | | |
| | | Undistributed
Ordinary Income | | | Undistributed
Long-Term Capital Gains | |
Duff & Phelps International Series | | $ | 1,674 | | | $ | — | |
Duff & Phelps Real Estate Securities Series | | | 309 | | | | 1,108 | |
KAR Capital Growth Series | | | — | | | | 4,516 | |
KAR Small-Cap Growth Series | | | 93 | | | | 2,596 | |
KAR Small-Cap Value Series | | | 212 | | | | 2,088 | |
Newfleet Multi-Sector Intermediate Bond Series | | | 233 | | | | — | |
Rampart Enhanced Core Equity Series | | | — | | | | — | |
Rampart Equity Trend Series | | | 1 | | | | 26 | |
Strategic Allocation Series | | | 298 | | | | 462 | |
The differences between the book and tax basis components of distributable earnings relate principally to the timing of recognition of income and gains for federal income tax purposes. Short-term gain distributions reported in the Statements of Changes in Net Assets, if any, are reported as ordinary income for federal tax purposes. Distributions are determined on a tax basis and may differ from net investment income and realized capital gains for financial reporting purposes. Permanent book and tax basis differences relating to shareholder distributions will result in reclassifications to capital paid in on shares of beneficial interest.
90
VIRTUS VARIABLE INSURANCE TRUST
NOTES TO FINANCIAL STATEMENTS (Continued)
DECEMBER 31, 2017
The tax character of dividends and distributions paid during the years ended December 31, 2017, and 2016 was as follows:
| | | | | | | | | | | | | | | | | | | | |
| | | | | | Ordinary
Income | | | Long-Term
Capital Gains | | | Return of
Capital | | | Total | |
Duff & Phelps International Series | | | 2017 | | | $ | 2,826 | | | $ | — | | | $ | — | | | $ | 2,826 | |
| | | 2016 | | | | 1,467 | | | | 36,155 | | | | — | | | | 37,622 | |
Duff & Phelps Real Estate Securities Series | | | 2017 | | | | 1,692 | | | | 6,887 | | | | — | | | | 8,579 | |
| | | 2016 | | | | 2,001 | | | | 12,250 | | | | — | | | | 14,251 | |
KAR Capital Growth Series | | | 2017 | | | | — | | | | 9,483 | | | | — | | | | 9,483 | |
| | | 2016 | | | | 4,514 | | | | — | | | | — | | | | 4,514 | |
KAR Small-Cap Growth Series | | | 2017 | | | | 445 | | | | 4,302 | | | | — | | | | 4,747 | |
| | | 2016 | | | | 677 | | | | 4,633 | | | | — | | | | 5,310 | |
KAR Small-Cap Value Series | | | 2017 | | | | 1,924 | | | | 11,091 | | | | — | | | | 13,015 | |
| | | 2016 | | | | 2,427 | | | | 10,074 | | | | — | | | | 12,501 | |
Newfleet Multi-Sector Intermediate Bond Series | | | 2017 | | | | 5,793 | | | | — | | | | — | | | | 5,793 | |
| | | 2016 | | | | 5,851 | | | | — | | | | — | | | | 5,851 | |
Rampart Enhanced Core Equity Series | | | 2017 | | | | 15,209 | | | | 5,334 | | | | 531 | | | | 21,074 | |
| | | 2016 | | | | 1,666 | | | | 19,641 | | | | — | | | | 21,307 | |
Rampart Equity Trend Series | | | 2017 | | | | — | | | | 88 | | | | — | | | | 88 | |
| | | 2016 | | | | — | | | | — | | | | — | | | | — | |
Strategic Allocation Series | | | 2017 | | | | 1,796 | | | | 646 | | | | — | | | | 2,442 | |
| | | 2016 | | | | 1,648 | | | | 10,307 | | | | — | | | | 11,955 | |
For financial reporting purposes, book basis capital accounts are adjusted to reflect the tax character of permanent book/tax differences. Permanent reclassifications can arise from differing treatment of certain income and gain transactions, nondeductible current year net operating losses, expiring capital loss carryovers and investments in passive foreign investment companies. The reclassifications have no impact on the net assets or net asset value of the Series. As of December 31, 2017, the Series recorded reclassifications to increase (decrease) the accounts as listed below:
| | | | | | | | | | | | |
| | | Capital Paid In
on Shares of
Beneficial Interest | | | Accumulated
Net Realized
Gain (Loss) | | | Undistributed
Net Investment
Income (Loss) | |
Duff & Phelps International Series | | $ | — | | | $ | (349 | ) | | $ | 349 | |
Duff & Phelps Real Estate Securities Series | | | — | | | | — | | | | — | |
KAR Capital Growth Series | | | (304 | ) | | | 55 | | | | 249 | |
KAR Small-Cap Growth Series | | | (1 | ) | | | (313 | ) | | | 314 | |
KAR Small-Cap Value Series | | | — | | | | (89 | ) | | | 89 | |
Newfleet Multi-Sector Intermediate Bond Series | | | (1,216 | ) | | | 1,464 | | | | (248 | ) |
Rampart Enhanced Core Equity Series | | | — | (1) | | | (65 | ) | | | 65 | |
Rampart Equity Trend Series | | | (3 | ) | | | — | | | | 3 | |
Strategic Allocation Series | | | — | (1) | | | (67 | ) | | | 67 | |
| | (1) | Amount is less than $500. |
Note 11—Illiquid and Restricted Securities
Investments are generally considered illiquid if they cannot be disposed of within seven days in the ordinary course of business at the approximate amount at which such securities have been valued by the Series. Additionally, the following information is also considered in determining liquidity: the frequency of trades and quotes for the investment, whether the investment is listed for trading on a recognized domestic exchange and/or whether two or more brokers are willing to purchase or sell the security at a comparable price, the extent of market making activity in the investment and the nature of the market for investment.
Restricted securities are illiquid securities, as defined above, not registered under the Securities Act of 1933, as amended (the “1933 Act”). Generally, 144A securities are excluded from this category, except where defined as illiquid.
Each Series will bear any costs, including those involved in registration under the 1933 Act, in connection with the disposition of such securities.
The following Series held securities considered to be illiquid at December 31, 2017:
($ reported in thousands)
| | | | | | | | |
Series | | Aggregate Value | | | % of Series’
Net Assets | |
Newfleet Multi-Sector Intermediate Bond Series | | $ | 157 | | | | 0.1 | % |
Strategic Allocation Series | | | 1 | | | | 0.0 | |
At December 31, 2017, the Series did not hold any securities that were illiquid and restricted except as noted in the table above.
91
VIRTUS VARIABLE INSURANCE TRUST
NOTES TO FINANCIAL STATEMENTS (Continued)
DECEMBER 31, 2017
As of December 31, 2017, each Series had individual shareholder account(s) (comprised of participating insurance companies to fund variable accumulation annuity contracts and variable universal life insurance policies), which individually amounted to more than 10% of the total shares outstanding of each such Series as detailed below:
| | | | | | | | |
| | | % of Total Shares
Outstanding | | | Number of
Accounts | |
Duff & Phelps International Series | | | 98 | % | | | 2 | |
Duff & Phelps Real Estate Securities Series | | | 87 | | | | 2 | |
KAR Capital Growth Series | | | 100 | | | | 2 | |
KAR Small-Cap Growth Series | | | 99 | | | | 2 | |
KAR Small-Cap Value Series | | | 100 | | | | 2 | |
Newfleet Multi-Sector Intermediate Bond Series | | | 97 | | | | 4 | |
Rampart Enhanced Core Equity Series | | | 99 | | | | 2 | |
Rampart Equity Trend Series | | | 96 | | | | 3 | |
Strategic Allocation Series | | | 100 | | | | 2 | |
Note 13—Borrowings
($ reported in thousands)
On September 18, 2017, the Series and other affiliated funds entered into a $150,000 unsecured line of credit. This Credit Agreement is with a commercial bank that allows the Series to borrow cash from the bank to manage large unexpected redemptions and trade fails, up to a limit of one-third or one-fifth of each Series’ total net assets in accordance with the terms of the agreement. This Credit Agreement has a term of 364 days. Interest is charged at the higher of the LIBOR or the Federal Funds rate plus an additional percentage rate on the amount borrowed. Commitment fees are charged on the undrawn balance. The Series and other affiliated funds that are parties are individually, and not jointly, liable for their particular advances, if any, under the line of credit. The lending bank has the ability to require repayment of outstanding borrowings under this Credit Agreement upon certain circumstances such as an event of default.
On June 29, 2016, the Series and other affiliated funds renewed a $50,000 secured line of credit. This Credit Agreement was with a commercial bank that allowed the Series to borrow cash from the bank to manage large unexpected redemptions and trade fails, up to a limit of one-third of each Series’ total net assets in accordance with the terms of the agreement. This Credit Agreement had a term of 364 days and was renewable by the Series with the bank’s consent and approval of the Board. Interest was charged at the higher of the LIBOR or the Federal Funds rate plus an additional percentage rate on the amount borrowed. Commitment fees were charged on the undrawn balance. The Series and other affiliated funds that were parties were individually, and not jointly, liable for their particular advances, if any, under the line of credit. The lending bank had the ability to require repayment of outstanding borrowings under this Credit Agreement upon certain circumstances such as an event of default. On June 14, 2017, the term of this Credit Agreement was extended for an additional 90 days. Effective September 18, 2017, this Credit Agreement was terminated and replaced by a new credit facility.
The Series had no outstanding borrowings at any time during the period ended December 31, 2017.
Note 14—Custody Fees Reimbursed
State Street Bank & Trust, custodian for some of the Series through January 29, 2010, reimbursed the Series for out-of-pocket custody expenses overbilled for the period 1998 through January 29, 2010. Amounts were reimbursed during both fiscal years ended 2016 and 2017. The amounts reimbursed, including interest, are shown in the Statement of Operations under “Custody fees reimbursed.”
Note 15—Regulatory Matters and Litigation
From time to time, the Trust, the Series, the Series’ Adviser and/or subadvisers and/or their affiliates may be involved in litigation and arbitration as well as examinations and investigations by various regulatory bodies, including the SEC, involving compliance with, among other things, securities laws, client investment guidelines, laws governing the activities of broker-dealers and other laws and regulations affecting their products and other activities. At this time, the Series’ Adviser believes that the outcomes of such matters are not likely, either individually or in aggregate, to be material to these financial statements.
Note 16—Recent Accounting Pronouncements
In October 2016, the SEC released its Final Rule on Investment Company Reporting Modernization (the “Rule”). The Rule contains amendments to Regulation S-X which impact financial statement presentation, particularly the presentation of derivative investments. The financial statements presented are in compliance with the most recent Regulation S-X amendments.
In March 2017, the Financial Accounting Standards Board issued an Accounting Standards Update, ASU 2017-08, Receivables – Nonrefundable Fees and Other Costs (Subtopic 310-20), Premium Amortization on Purchased Callable Debt Securities (the “ASU”) which amends the amortization period for certain purchased callable debt securities held at a premium, shortening such period to the earliest call date. The ASU does not require any accounting change for debt securities held at a discount; the discount continues to be amortized to maturity. The ASU is effective for fiscal years, and interim periods within those fiscal years, beginning after December 15, 2018. At this time, management is evaluating the implications of these changes on the financial statements.
Note 17—Subsequent Events
Management has evaluated the impact of all subsequent events on the Series through the date the financial statements were available for issuance and has determined that there are no subsequent events requiring recognition or disclosure in these financial statements.
92

REPORT OF INDEPENDENT REGISTERED PUBLIC ACCOUNTING FIRM
To the Board of Trustees of Virtus Variable Insurance Trust and Shareholders of Virtus Duff & Phelps International Series, Virtus Duff & Phelps Real Estate Securities Series, Virtus KAR Capital Growth Series, Virtus KAR Small-Cap Growth Series, Virtus KAR Small-Cap Value Series, Virtus Newfleet Multi-Sector Intermediate Bond Series, Virtus Rampart Enhanced Core Equity Series, Virtus Rampart Equity Trend Series and Virtus Strategic Allocation Series
Opinions on the Financial Statements
We have audited the accompanying statements of assets and liabilities, including the schedules of investments, of Virtus Duff & Phelps International Series, Virtus Duff & Phelps Real Estate Securities Series, Virtus KAR Capital Growth Series, Virtus KAR Small-Cap Growth Series, Virtus KAR Small-Cap Value Series, Virtus Newfleet Multi-Sector Intermediate Bond Series, Virtus Rampart Enhanced Core Equity Series, Virtus Rampart Equity Trend Series and Virtus Strategic Allocation Series (constituting Virtus Variable Insurance Trust, hereafter collectively referred to as the “Funds”) as of December 31, 2017, the related statements of operations for the year ended December 31, 2017, the statements of changes in net assets for each of the two years in the period ended December 31, 2017, including the related notes, and the financial highlights for each of the periods indicated therein (collectively referred to as the “financial statements”). In our opinion, the financial statements present fairly, in all material respects, the financial position of each of the Funds as of December 31, 2017, the results of each of their operations for the year then ended, the changes in each of their net assets for each of the two years in the period ended December 31, 2017 and each of the financial highlights for each of the periods indicated therein in conformity with accounting principles generally accepted in the United States of America.
Basis for Opinions
These financial statements are the responsibility of the Funds’ management. Our responsibility is to express an opinion on the Funds’ financial statements based on our audits. We are a public accounting firm registered with the Public Company Accounting Oversight Board (United States) (“PCAOB”) and are required to be independent with respect to the Funds in accordance with the U.S. federal securities laws and the applicable rules and regulations of the Securities and Exchange Commission and the PCAOB.
We conducted our audits of these financial statements in accordance with the standards of the PCAOB. Those standards require that we plan and perform the audit to obtain reasonable assurance about whether the financial statements are free of material misstatement, whether due to error or fraud.
Our audits included performing procedures to assess the risks of material misstatement of the financial statements, whether due to error or fraud, and performing procedures that respond to those risks. Such procedures included examining, on a test basis, evidence regarding the amounts and disclosures in the financial statements. Our audits also included evaluating the accounting principles used and significant estimates made by management, as well as evaluating the overall presentation of the financial statements. Our procedures included confirmation of securities owned as of December 31, 2017 by correspondence with the custodians, transfer agent and brokers; when replies were not received from brokers, we performed other auditing procedures. We believe that our audits provide a reasonable basis for our opinions.
PricewaterhouseCoopers LLP
Philadelphia, Pennsylvania
February 23, 2018
We have served as the auditor of one or more investment companies in Virtus Variable Insurance Trust since 1982.
93
VIRTUS VARIABLE INSURANCE TRUST
TAX INFORMATION NOTICE (UNAUDITED)
DECEMBER 31, 2017
For the fiscal year ended December 31, 2017, the Series make the following disclosures for federal income tax purposes: the percentages of ordinary income dividends earned by the Series which qualify for the dividends received deduction (“DRD”) for corporate shareholders; the actual percentage of DRD for the calendar year will be designated in year-end tax statements. The Series designate the amounts below as long-term capital gains dividends (“LTCG”) taxable at a 20% rate, or lower depending on the shareholder’s income ($ reported in thousands). LTCG amounts, if subsequently different, will be designated in the next annual report.
| | | | | | | | |
| | | DRD | | | LTCG | |
Duff & Phelps International Series | | | 1 | % | | $ | — | |
Duff & Phelps Real Estate Securities Series | | | — | | | | 5,426 | |
KAR Capital Growth Series | | | — | | | | 13,999 | |
KAR Small-Cap Growth Series | | | 100 | | | | 6,642 | |
KAR Small-Cap Value Series | | | 100 | | | | 10,228 | |
Newfleet Multi-Sector Intermediate Bond Series | | | — | | | | — | |
Rampart Enhanced Core Equity Series | | | 12 | | | | 2,793 | |
Rampart Equity Trend Series | | | 100 | | | | 114 | |
Strategic Allocation Series | | | 22 | | | | 806 | |
94
CONSIDERATION OF ADVISORY AND SUBADVISORY AGREEMENTS
BY THE BOARD OF TRUSTEES
The Board of Trustees (the “Board”) of Virtus Variable Insurance Trust (the “Trust”) is responsible for determining whether to approve the continuation of the investment advisory agreement (the “Advisory Agreement”) between the Trust and Virtus Investment Advisers, Inc. (“VIA”) and of each subadvisory agreement (each, a “Subadvisory Agreement” and collectively, the “Subadvisory Agreements”) (together with the Advisory Agreement, the “Agreements”) with respect to the series (individually and collectively, the “Series”) of the Trust. At in-person meetings held on November 3, 2017 and November 15-16, 2017 (the “Meetings”), the Board, including a majority of the Trustees who are not interested persons of the Trust as defined in Section 2(a)(19) of the Investment Company Act of 1940, as amended (such Act, the “1940 Act” and such Trustees, the “Independent Trustees”), considered and approved the continuation of each Agreement due for renewal as further discussed below. In addition, prior to the Meetings, the Independent Trustees met with their independent legal counsel to discuss and consider the information provided by management and submitted questions to management, and they considered the responses provided.
In connection with the approval of the Agreements, the Board requested and evaluated information provided by VIA and each subadviser (each, a “Subadviser” and collectively, the “Subadvisers”) which, in the Board’s view, constituted information necessary for the Board to form a judgment as to whether the renewal of each of the Agreements would be in the best interests of each applicable Series and its respective shareholders. The Board also considered information furnished throughout the year at regular Board meetings with respect to the services provided by VIA and the Subadvisers, including quarterly performance reports prepared by management containing reviews of investment results and periodic presentations from the Subadvisers with respect to the Series they manage. The Board noted the affiliation of the Subadvisers with VIA and any potential conflicts of interest.
The Board was separately advised by independent legal counsel throughout the process. For each Agreement, the Board considered all the criteria separately with respect to the applicable Series and its shareholders. In their deliberations, the Board considered various factors, including those discussed below, none of which were controlling, and each Trustee may have attributed different weights to the various factors. The Independent Trustees also discussed the proposed approval of the Agreements in private sessions with their independent legal counsel at which no representatives of management were present.
In considering whether to approve the renewal of the Agreements with respect to each Series, the Board reviewed and analyzed the factors it deemed relevant, including: (1) the nature, extent and quality of the services to be provided to the Series by VIA and each of the Subadvisers; (2) the performance of the Series as compared to an appropriate peer group and an appropriate index; (3) the level and method of computing each Series’ advisory and subadvisory fees, and comparisons of the Series’ advisory fee rates with those of a group of funds with similar investment objective(s); (4) the profitability of VIA under the Advisory Agreement; (5) any “fall-out” benefits to VIA, the Subadvisers and their affiliates (i.e., ancillary benefits realized by VIA, the Subadvisers or their affiliates from VIA’s or the applicable Subadviser’s relationship with the Trust); (6) the anticipated effect of growth in size on each Series’ performance and expenses; (7) fees paid to VIA and the Subadvisers by comparable accounts, as applicable; (8) possible conflicts of interest; and (9) the terms of the Agreements.
Nature, Extent and Quality of Services. The Trustees received in advance of the Meetings information provided by VIA and each Subadviser, including completed questionnaires concerning a number of topics, including such company’s investment philosophy, resources, operations and compliance structure. The Trustees also received a presentation by VIA’s senior management personnel, during which among other items, VIA’s history, investment process, investment strategies, personnel, compliance procedures and the firm’s overall performance were reviewed and discussed. The Trustees noted that the Series are managed using a “manager of managers” structure that generally involves the use of one or more subadvisers to manage some or all of a Series’ portfolio. Under this structure, VIA is responsible for oversight of the Series’ investment programs and day-to-day operations and for evaluating and selecting subadvisers on an ongoing basis and making any recommendations to the Board regarding hiring, retaining or replacing subadvisers. In considering the Advisory Agreement with VIA, the Board considered VIA’s process for supervising and managing subadvisers, including (a) VIA’s ability to select and monitor the subadvisers; (b) VIA’s ability to provide the services necessary to monitor the subadvisers’ compliance with the Series’ respective investment objective(s), policies and restrictions as well as provide other oversight activities; and (c) VIA’s ability and willingness to identify instances in which a subadviser should be replaced and to carry out the required changes. The Trustees also considered: (a) the experience and capability of VIA’s management and other personnel; (b) the financial condition of VIA, and whether it had the financial wherewithal to provide a high level and quality of services to the Series; (c) the quality of VIA’s own regulatory and legal compliance policies, procedures and systems; (d) the nature, extent and quality of administrative and other services provided by VIA and its affiliates to the Series; (e) VIA’s supervision of the Series’ other service providers; and (f) VIA’s risk management processes. It was noted that affiliates of VIA serve as administrator and distributor to the Series. The Board also took into account its knowledge of VIA’s management and the quality of the performance of VIA’s duties through Board meetings, discussions and reports during the preceding year, as well as information from the Trust’s Chief Compliance Officer regarding the Series’ compliance policies and procedures established pursuant to Rule 38a-1 under the 1940 Act.
With respect to the services provided by each of the Subadvisers, the Board considered information provided to the Board by each Subadviser, including each Subadviser’s Form ADV, as well as information provided throughout the past year. With respect to the Subadvisory Agreements, the Board noted that each Subadviser provided portfolio management, compliance with the respective Series’ investment policies and procedures, compliance with applicable securities laws and assurances thereof. The Board also noted that VIA’s and the Subadvisers’ management of the Series is subject to the oversight of the Board and must be carried out in accordance with the investment objectives, policies and restrictions set forth in the Series’ prospectuses and statement of additional information. In considering the renewal of the Subadvisory Agreements, the Board also considered each Subadviser’s investment management process, including (a) the experience and capability of the Subadviser’s management and other personnel committed by the Subadviser to the respective Series; (b) the financial condition of the Subadviser; (c) the quality of the Subadviser’s regulatory and legal compliance policies, procedures and systems; and (d) the Subadviser’s brokerage and trading practices, including with respect to best execution and soft dollars. The Board also took into account each Subadviser’s risk assessment and monitoring process. The Board noted each Subadviser’s regulatory history, including whether it was currently involved in any regulatory actions or investigations as well as material litigation, and any settlements and amelioratory actions undertaken, as appropriate.
95
CONSIDERATION OF ADVISORY AND SUBADVISORY AGREEMENTS
BY THE BOARD OF TRUSTEES (Continued)
After considering all of the information provided to them, the Trustees concluded that the nature, extent and quality of the services provided by VIA and each Subadviser were satisfactory and that there was a reasonable basis on which to conclude that each would continue to provide a high quality of investment services to the applicable Series.
Investment Performance. The Board considered performance reports and discussions at Board meetings throughout the year, as well as a report (the “Lipper Report”) for the Series prepared by Broadridge, an independent third party provider of investment company data, furnished in connection with the contract renewal process. The Lipper Report presented each Series’ performance relative to a peer group of other mutual funds (the “Performance Universe”) and relevant indexes, as selected by Broadridge. The Board also considered performance information presented by management and took into account management’s discussion of the same, including the effect of market conditions on each Series’ performance. The Board evaluated each Series’ performance in the context of the considerations that a “manager of managers” structure requires. The Board noted that it also reviews on a quarterly basis detailed information about the Series’ performance results and portfolio composition, as well as each Subadviser’s investment strategy. The Board noted VIA’s expertise and resources in monitoring the performance, investment style and risk-adjusted performance of each Subadviser. The Board also noted each Subadviser’s performance record with respect to the Series it subadvises. The Board was mindful of VIA’s focus on each Subadviser’s performance and noted VIA’s performance in monitoring and responding to any performance issues with respect to the Series. The Board also took into account its discussions with management regarding factors that contributed to the performance of each Series.
The Board considered, among other performance data, the information set forth below with respect to the performance of each Series for the period ended June 30, 2017:
Virtus Duff & Phelps International Series. The Board noted that the Series underperformed the median of its Performance Universe and underperformed its benchmark for the 1-, 3-, 5- and 10-year periods. The Board took into account management’s discussion of the Series’ performance, including the Subadviser’s investment style in the current market environment and actions taken to address the Series’ performance, including the replacement of the Series’ subadviser in November 2015 before the Series’ portfolio manager moved from one affiliated subadviser to another in September 2016. The Board also noted that because the Series’ subadviser changed in November 2015, all of the performance data shown for the period prior to that date reflected the performance of a prior subadviser.
Virtus Duff & Phelps Real Estate Securities Series. The Board noted that the Series outperformed the median of its Performance Universe for the 10-year period, underperformed the median of its Performance Universe for the 1- and 5-year periods, and performed at the median of its Performance Universe for the 3-year period. The Board also noted that the Series underperformed its benchmark for the 1-, 3- and 5-year periods and outperformed its benchmark for the 10-year period. The Board took into account management’s discussion of the factors that contributed to the Series’ performance over the relevant periods.
Virtus KAR Capital Growth Series. The Board noted that the Series underperformed the median of its Performance Universe for the 10-year period and outperformed the median of its Performance Universe for the 1-, 3- and 5- year periods. The Board also noted that the Series underperformed its benchmark for the 5- and 10-year periods and outperformed its benchmark for the 1- and 3-year periods. The Board took into account management’s discussion of the Series’ performance, including the Subadviser’s investment style in the current market environment and any actions taken to address the Series’ performance, including the replacement of the Series’ subadviser in November 2010 and September 2011 and change in the Series’ portfolio manager in November 2011. The Board also noted that because the Series’ subadviser changed in November 2010 and September 2011, 10-year performance data in part reflects the performance of prior subadvisers.
Virtus KAR Small-Cap Growth Series. The Board noted that the Series outperformed the median of its Performance Universe and its benchmark for the 1-, 3-, 5- and 10-year periods.
Virtus KAR Small-Cap Value Series. The Board noted that the Series outperformed the median of its Performance Universe and its benchmark for the 3- and 5-year periods and underperformed the median of its Performance Universe and its benchmark for the 1- and 10-year periods. The Board took into account management’s discussion of the Series’ performance, including the impact of market conditions on the Series’ performance and the Subadviser’s investment style in the current market environment as well as the type of fund. The Board noted that because the Series’ subadviser changed in November 2010, 10-year performance data in part reflects the performance of a prior subadviser.
Virtus Newfleet Multi-Sector Intermediate Bond Series (formerly Virtus Multi-Sector Fixed Income Series). The Board noted that the Series outperformed the median of its Performance Universe and its benchmark for the 1-, 3-, 5- and 10-year periods.
Virtus Rampart Enhanced Core Equity Series. The Board noted that the Series underperformed the median of its Performance Universe and underperformed its benchmark for the 3-, 5- and 10-year periods. The Board also noted that the Series outperformed the median of its Performance Universe and outperformed its benchmark for the 1-year period. The Board took into account management’s discussion of the Series’ performance and any actions taken to address the Series’ performance, including the replacement of the Series’ subadviser in September 2016. The Board noted that because the Series’ subadviser changed in September 2016, performance data prior to that date reflects the performance of a prior subadviser.
Virtus Rampart Equity Trend Series. The Board noted that the Series underperformed the median of its Performance Universe and underperformed its benchmark for the 1-, 3- and 5-year periods. The Board took into account management’s discussion of the Series’ performance, including the type of fund and the Series’ peer group, and any actions taken to address the Series’ performance, including the removal of the Series’ prior subadviser in May 2015. The Board noted that because the Series’ prior subadviser was removed in May 2015, performance data prior to that date reflects the performance of the prior subadviser.
Virtus Strategic Allocation Series. The Board noted that the Series underperformed the median of its Performance Universe for the 3- and 5-year periods and outperformed its Performance Universe for the 1- and 10-year periods. The Board also noted that the Series underperformed its benchmark for the 1-, 3-, 5- and 10-year periods. The Board took into account management’s discussion of the factors
96
CONSIDERATION OF ADVISORY AND SUBADVISORY AGREEMENTS
BY THE BOARD OF TRUSTEES (Continued)
that contributed to the Series’ performance over the relevant periods and any actions taken to address the Series’ performance, including the replacement of one of the Series’ Subadvisers in September 2016. The Board noted that because one of the Series’ subadvisers was replaced in September 2016, performance data prior to that date in part reflects the performance of that prior subadviser.
After reviewing these and related factors, the Board concluded that each Series’ overall performance was satisfactory, or where noted above, action was being taken to address performance.
Management Fees and Total Expenses. The Board considered the fees charged to the Series for advisory services as well as the total expense levels of the Series. This information included comparisons of each Series’ net management fee and total expense level to those of its peer group (the “Expense Group”). In comparing each Series’ net management fee to that of comparable funds, the Board noted that in the materials presented such fee included both advisory and administrative fees. The Board also noted that all of the Series had fee waivers and/or expense caps in place to limit the total expenses incurred by the Series and their shareholders. The Board also noted that the subadvisory fees were paid by VIA out of its management fees rather than paid separately by the Series. In this regard, the Board took into account management’s discussion with respect to the advisory/subadvisory fee structure, including the amount of the advisory fee retained by VIA after payment of the subadvisory fee. The Board also took into account the size of each of the Series and the impact on expenses. The Subadvisers provided, and the Board considered, fee information of comparable accounts managed by the Subadvisers, as applicable.
In addition to the foregoing, the Board considered, among other data, the information set forth below with respect to each Series’ fees and expenses. In each case, the Board took into account management’s discussion of the Series’ expenses, including the type and size of the Series relative to the other series in its Expense Group.
Virtus Duff & Phelps International Series. The Board considered that the Series’ net management fee after waivers was equal to the median of the Expense Group and net total expenses after waivers were above the median of the Expense Group. The Board took into account management’s discussion of the Series’ expenses, including that VIA had waived a portion of its management fee and/or reimbursed expenses for the Series.
Virtus Duff & Phelps Real Estate Securities Series. The Board considered that the Series’ net management fee after waivers and net total expenses after waivers were above the median of the Expense Group. The Board took into account management’s discussion of the Series’ expenses, including that VIA had waived a portion of its management fee and/or reimbursed expenses for the Series.
Virtus KAR Capital Growth Series. The Board considered that the Series’ net management fee after waivers and net total expenses after waivers were above the median of the Expense Group. The Board took into account management’s discussion of the Series’ expenses, including that VIA had waived a portion of its management fee and/or reimbursed expenses for the Series.
Virtus KAR Small-Cap Growth Series. The Board considered that the Series’ net management fee after waivers and net total expenses were above the median of the Expense Group. The Board took into account management’s discussion of the Series’ expenses, including that VIA had waived a portion of its management fee and/or reimbursed expenses for the Series.
Virtus KAR Small-Cap Value Series. The Board considered that the Series’ net management fee and net total expenses after waivers were both equal to the median of the Expense Group.
Virtus Newfleet Multi-Sector Intermediate Bond Series (formerly Virtus Multi-Sector Fixed Income Series). The Board considered that the Series’ net management fee after waivers and net total expenses after waivers were above the median of the Expense Group. The Board took into account management’s discussion of the Series’ expenses, including that VIA had waived a portion of its management fee and/or reimbursed expenses for the Series.
Virtus Rampart Enhanced Core Equity Series (fka Growth & Income Series). The Board considered that the Series’ net management fee and net total expenses after waivers were both below the median of the Expense Group.
Virtus Rampart Equity Trend Series. The Board considered that the Series’ net management fee after waivers and the Series’ net total expenses after waivers were above the median of the Expense Group. The Board took into account management’s discussion of the Series’ expenses, including that VIA had waived a portion of its management fee and/or reimbursed expenses for the Series.
Virtus Strategic Allocation Series. The Board considered that the Series’ net management fee after waivers and net total expenses after waivers were below the median of the Expense Group.
The Board concluded that the advisory and subadvisory fees for each Series, including with any proposed amendments, were fair and reasonable in light of the usual and customary charges made for services of the same nature and quality and the other factors considered.
Profitability. The Board also considered certain information relating to profitability that had been provided by VIA. In this regard, the Board considered information regarding the overall profitability, as well as on a Series-by-Series basis, of VIA for its management of the Trust, as well as its profits and those of its affiliates for managing and providing other services to the Trust, such as distribution and administrative services provided to the Series by a VIA affiliate. In addition to the fees paid to VIA and its affiliates, including the applicable Subadvisers, the Board considered any other benefits derived by VIA or its affiliates from their relationships with the Series. The Board reviewed the methodology used to allocate costs to each Series, taking into account the fact that allocation methodologies are inherently subjective and various allocation methodologies may each be reasonable while producing different results. The Board concluded that the profitability to VIA and its affiliates from each Series was reasonable in light of the quality of the services rendered to the Series by VIA and its affiliates.
In considering the profitability to the Subadvisers in connection with their relationship to the Series, the Board noted that the fees under the Subadvisory Agreements are paid by VIA out of the fees that VIA receives under the Advisory Agreement, so that Series
97
CONSIDERATION OF ADVISORY AND SUBADVISORY AGREEMENTS
BY THE BOARD OF TRUSTEES (Continued)
shareholders are not directly impacted by those fees. In considering the reasonableness of the fees payable by VIA to the affiliated Subadvisers, the Board noted that, because such Subadvisers are affiliates of VIA, such profitability might be directly or indirectly shared by VIA. For each of the above reasons, the Board concluded that the profitability to the Subadvisers and their affiliates from their relationships with the Series was not a material factor in approval of the Subadvisory Agreements.
Economies of Scale. The Board received and discussed information concerning whether VIA realizes economies of scale as the Series’ assets grow. The Board noted that the management fees for most of the Series included breakpoints based on assets under management, and that fee waivers and/or expense caps were also in place for all of the Series. The Board also took into account management’s discussion of the Series’ management fee and subadvisory fee structure, including with respect to the Series that does not currently have breakpoints. The Board also took into account the current size of each Series. The Board also noted that VIA had agreed to implement an extension of each Series’ expense cap through April 30, 2019. The Board then concluded that no additional changes to the advisory fee structure of the Series were necessary at this time. The Board noted that VIA and the Series may realize certain economies of scale if the assets of the Series were to increase, particularly in relationship to certain fixed costs, and that shareholders of the Series would have an opportunity to benefit from these economies of scale.
For similar reasons as stated above with respect to the Subadvisers’ profitability, and based upon the current size of the Series managed by each Subadviser, the Board concluded that the potential for economies of scale in the Subadvisers’ management of the Series was not a material factor in the approval of the Subadvisory Agreements at this time.
Other Factors. The Board considered other benefits that may be realized by VIA and each Subadviser and their affiliates from their relationships with the applicable Series. Among them, the Board recognized that VP Distributors, LLC, an affiliate of VIA, serves as the distributor for the Trust, and, as such, receives payments pursuant to Rule 12b-1 from the Series to compensate it for providing selling activities, which could lead to growth in the Trust’s assets and corresponding benefits from such growth, including economies of scale. The Board noted that an affiliate of VIA also provides administrative services to the Trust. The Board noted management’s discussion of the fact that, while the Subadvisers are affiliates of VIA, there are no other direct benefits to the Subadvisers or VIA in providing investment advisory services to the Series, other than the fee to be earned under the Subadvisory Agreement. There may be certain indirect benefits gained, including to the extent that serving the Series could provide the opportunity to provide advisory services to additional portfolios of the Trust or certain reputational benefits.
Conclusion. Based on all of the foregoing considerations, the Board, including a majority of the Independent Trustees, determined that approval of each Agreement, as amended, was in the best interests of each of the applicable Series and its respective shareholders. Accordingly, the Board, and the Independent Trustees voting separately, approved the Agreements, as amended, with respect to each Series.
98
FUND MANAGEMENT TABLES
Information pertaining to the Trustees and officers of the Trust as of the date the financial statements were available for issuance, is set forth below. The statement of additional information (SAI) includes additional information about the Trustees and is available without charge, upon request, by calling (800) 243-4361.
The address of each individual, unless otherwise noted, is c/o Virtus Variable Insurance Trust, 100 Pearl Street, Hartford, CT 06103. There is no stated term of office for Trustees or officers of the Trust.
Independent Trustees
| | |
| | |
Name,
Year of Birth,
Length of Time Served and
Number of Portfolios in Complex | | Principal Occupation(s)
During Past 5 Years and
Other Directorships Held by Trustee |
Brown, Thomas J. YOB: 1945 Served Since: 2011 86 Portfolios | | Retired. Trustee (since 2016), Virtus Mutual Fund Family (74 portfolios) and Virtus Alternative Solutions Trust (3 portfolios); Trustee (since 2011), Virtus Variable Insurance Trust (9 portfolios); Director (since 2010), D’Youville Senior Care Center; and Director (since 2005), VALIC Company Funds (49 portfolios). |
Burke, Donald C. YOB: 1960 Served Since: 2016 90 Portfolios | | Retired. Trustee (since 2016), Virtus Mutual Fund Family (74 portfolios), Virtus Variable Insurance Trust (9 portfolios) and Virtus Alternative Solutions Trust (3 portfolios); Director (since 2014) closed-end funds managed by Duff & Phelps Investment Management Co. (4 funds); Director, Avista Corp. (energy company) (since 2011); Trustee, Goldman Sachs Fund Complex (2010 to 2014); and Director, BlackRock Luxembourg and Cayman Funds (2006 to 2010). |
Gelfenbien, Roger A. YOB: 1943 Served Since: 2000 86 Portfolios | | Retired. Trustee (since 2016), Virtus Mutual Fund Family (74 portfolios) and Virtus Alternative Solutions Trust (3 portfolios); Trustee (since 2000), Virtus Variable Insurance Trust (9 portfolios); and Director (1999 to 2017), USAllianz Variable Insurance Product Trust (42 portfolios). |
Harris, Sidney E. YOB: 1949 Served Since: 2017 86 Portfolios | | Professor and Dean Emeritus (since April 2015), Professor (1997 to 2014), Dean (1997 to 2004), J. Mack Robinson College of Business, Georgia State University; Trustee (since 2017), Virtus Mutual Fund Family (74 portfolios), Virtus Variable Insurance Trust (9 portfolios), and Virtus Alternative Solutions Trust (3 portfolios); Trustee (since 2013), KIPP Metro Atlanta; Trustee (since 1999) Total System Services, Inc.; Trustee (2004 to 2017), RidgeWorth Funds; Trustee (2012 to 2017), International University of the Grand Bassam; and Trustee (2011 to 2015), Genspring Family Offices, LLC. |
Mallin, John R. YOB: 1950 Served Since: 1999 86 Portfolios | | Partner/Attorney (since 2003), McCarter & English LLP (law firm), Real Property Practice Group; and Member (since 2014), Counselors of Real Estate. Trustee (since 2016), Virtus Mutual Fund Family (74 portfolios) and Virtus Alternative Solutions Trust (3 portfolios); Director (since 2013), Horizons, Inc. (non-profit); and Trustee (since 1999), Virtus Variable Insurance Trust (9 portfolios). |
McClellan, Hassell H. YOB: 1945 Served Since: 2008 86 Portfolios | | Retired (since 2013); and Professor (1984 to 2013), Wallace E. Carroll School of Management, Boston College. Chairperson of the Board (since 2017) and Trustee (since 2000), John Hancock Fund Complex (collectively, 227 portfolios); Trustee (since 2016), Virtus Alternative Solutions Trust (3 portfolios); Trustee (since 2015), Virtus Mutual Fund Family (74 portfolios); Director (since 2010), Barnes Group, Inc. (diversified global components manufacturer and logistical services company); and Trustee (since 2008), Virtus Variable Insurance Trust (9 portfolios). |
McDaniel, Connie D. YOB: 1958 Served Since: 2017 86 Portfolios | | Retired. Vice President, Chief of Internal Audit, Corporate Audit Department (2009 to 2013); Vice President Global Finance Transformation (2007 to 2009); Vice President and Controller (1999 to 2007), The Coca-Cola Company. Trustee (since 2017), Virtus Mutual Fund Family (74 portfolios), Virtus Variable Insurance Trust (9 portfolios), and Virtus Alternative Solutions Trust (3 portfolios); Trustee (since 2014), Total System Services, Inc.; and Trustee (2005 to 2017), RidgeWorth Funds. |
McLoughlin, Philip YOB: 1946 Served Since: 2003 94 Portfolios | | Retired. Director and Chairman (since 2016), Virtus Total Return Fund Inc. and Virtus Global Dividend & Income Fund Inc.; Director and Chairman (since 2014) Duff & Phelps Select Energy MLP Fund Inc.; Trustee and Chairman (since 2013), Virtus Alternative Solutions Trust (3 portfolios); Trustee and Chairman (since 2011), Virtus Global Multi-Sector Income Fund; Chairman and Trustee (since 2003), Virtus Variable Insurance Trust (9 portfolios); Director (since 1995), closed-end funds managed by Duff & Phelps Investment Management Co. (4 funds); Director (since 1991) and Chairman (since 2010), Lazard World Trust Fund (closed-end investment firm in Luxembourg); and Trustee (since 1989) and Chairman (since 2002), Virtus Mutual Fund Family (74 portfolios). |
McNamara, Geraldine M. YOB: 1951 Served Since: 2015 90 Portfolios | | Retired. Trustee (since 2016), Virtus Alternative Solutions Trust (3 portfolios); Trustee (since 2015), Virtus Variable Insurance Trust (9 portfolios); Director (since 2003), closed-end funds managed by Duff & Phelps Investment Management Co. (4 funds); and Trustee (since 2001), Virtus Mutual Fund Family (74 portfolios). |
Oates, James M. YOB: 1946 Served Since: 2016 90 Portfolios | | Managing Director (since 1994), Wydown Group (consulting firm). Director (since 2016), Virtus Total Return Fund Inc. and Virtus Global Dividend & Income Fund Inc.; Trustee (since 2016), Virtus Variable Insurance Trust (9 portfolios); Director (since 2014), Duff & Phelps Select Energy MLP Fund Inc.; Trustee (since 2013), Virtus Alternative Solutions Trust (3 portfolios); Trustee (since 2011), Virtus Global Multi-Sector Income Fund; Trustee (since 2005) and Chairman (2005 to 2017), John Hancock Fund Complex (227 portfolios); Director (2002 to 2014), New Hampshire Trust Company; Chairman (2000 to 2016), Emerson Investment Management, Inc.; Non-Executive Chairman (2000 to 2014), Hudson Castle Group, Inc. (formerly IBEX Capital Markets, Inc.) (financial services); Chairman and Director (1999 to 2014), Connecticut River Bank; Director (since 1996), Stifel Financial; and Trustee (since 1987), Virtus Mutual Fund Family (74 portfolios). |
Segerson, Richard E. YOB: 1946 Served Since: 2016 86 Portfolios | | Retired; and Managing Director (1998 to 2013), Northway Management Company. Trustee (since 2016), Virtus Alternative Solutions Trust (3 portfolios) and Virtus Variable Insurance Trust (9 portfolios); and Trustee (since 1983), Virtus Mutual Fund Family (74 portfolios). |
99
FUND MANAGEMENT TABLES (Continued)
Interested Trustee
| | |
| | |
Name,
Year of Birth,
Year Elected
and Number of Funds Overseen | | Principal Occupation(s) During Past 5 Years and
Other Directorships Held by Trustee |
Aylward, George R.* Trustee and President YOB: 1964 Elected: 2012 92 Portfolios | | Director, President and Chief Executive Officer (since 2008), Virtus Investment Partners, Inc. and/or certain of its subsidiaries; various senior officer positions with Virtus affiliates (since 2005). Chairman and Trustee (since 2015), Virtus ETF Trust II (2 funds); Director, President and Chief Executive Officer (since 2014), Duff & Phelps Select Energy MLP Fund Inc.; Trustee and President (since 2013), Virtus Alternative Solutions Trust (3 portfolios); Director (since 2013), Virtus Global Funds, PLC (3 portfolios); Trustee (since 2012) and President (since 2010), Virtus Variable Insurance Trust (9 portfolios); Trustee, President and Chief Executive Officer (since 2011), Virtus Global Multi-Sector Income Fund; Trustee and President (since 2006) and Executive Vice President (2004 to 2006), Virtus Mutual Fund Family (74 portfolios); and Director, President and Chief Executive Officer (since 2006), Virtus Global Dividend & Income Fund Inc. and Virtus Total Return Fund Inc. |
| * | Mr. Aylward is an “interested person,” as defined in the 1940 Act, by reason of his position as President and Chief Executive Officer of Virtus Investment Partners, Inc. (“Virtus”), the ultimate parent company of the Adviser, and various positions with its affiliates, including the Adviser. |
100
FUND MANAGEMENT TABLES (Continued)
Officers of the Trust Who Are Not Trustees
| | | | |
| | | |
Name, Address and Year of Birth | | Position(s) Held with
Trust and Length of Time Served | | Principal Occupation(s)
During Past 5 Years |
Bradley, W. Patrick YOB: 1972 | | Executive Vice President (since 2016), Senior Vice President (2013 to 2016), Vice President (2011 to 2013), Chief Financial Officer and Treasurer (since 2006). | | Executive Vice President, Fund Services (since 2016), Senior Vice President, Fund Services (2010 to 2016), Virtus Investment Partners, Inc. and/or certain of its subsidiaries; various officer positions (since 2006) with Virtus affiliates; Executive Vice President (since 2016), Senior Vice President (2013 to 2016), Vice President (2011 to 2013), Chief Financial Officer and Treasurer (since 2004), Virtus Variable Insurance Trust; Executive Vice President (since 2016), Senior Vice President (2013 to 2016), Vice President (2011 to 2013), Chief Financial Officer and Treasurer (since 2006), Virtus Mutual Fund Family; Executive Vice President (since 2016), Senior Vice President (2013 to 2016), Vice President (2012 to 2013) and Treasurer and Chief Financial Officer (since 2010), Virtus Total Return Fund Inc. and Virtus Global Dividend & Income Fund Inc.; Executive Vice President (since 2016), Senior Vice President (2013 to 2016), Vice President (2011 to 2013), Chief Financial Officer and Treasurer (since 2011), Virtus Global Multi-Sector Income Fund; Executive Vice President (since 2016), Senior Vice President (2014 to 2016), Chief Financial Officer and Treasurer (since 2014), Duff & Phelps Select Energy MLP Fund Inc.; Vice President and Assistant Treasurer (since 2011), Duff & Phelps Global Utility Income Fund Inc.; Director (since 2013), Virtus Global Funds, PLC; and Executive Vice President (since 2016), Senior Vice President (2013 to 2016), and Chief Financial Officer and Treasurer (since 2013), Virtus Alternative Solutions Trust. |
Engberg, Nancy J. YOB: 1956 | | Senior Vice President (since 2017), Vice President and Chief Compliance Officer (2011 to 2017), and Chief Compliance Officer (since 2011). | | Senior Vice President (since 2017), Vice President (2008 to 2017) and Chief Compliance Officer (2008 to 2011 and since 2016), Virtus Investment Partners, Inc. and/or certain of its subsidiaries; various officer positions (since 2003) with Virtus affiliates; Senior Vice President (since 2017), Vice President (2011 to 2017) and Chief Compliance Officer (since 2011), Virtus Mutual Fund Family; Senior Vice President (since 2017), Vice President (2010 to 2017) and Chief Compliance Officer (since 2011), Virtus Variable Insurance Trust; Senior Vice President (since 2017), Vice President (2011 to 2017) and Chief Compliance Officer (since 2011), Virtus Global Multi-Sector Income Fund; Senior Vice President (since 2017), Vice President (2012 to 2017) and Chief Compliance Officer (since 2012), Virtus Total Return Fund Inc. and Virtus Global Dividend & Income Fund Inc.; Senior Vice President (since 2017), Vice President (2013 to 2017) and Chief Compliance Officer (since 2013), Virtus Alternative Solutions Trust; Senior Vice President (since 2017), Vice President (2014 to 2017) and Chief Compliance Officer (since 2014), Duff & Phelps Select Energy MLP Fund Inc.; Chief Compliance Officer (since 2015), ETFis Series Trust I; and Chief Compliance Officer (since 2015), Virtus ETF Trust II. |
Fromm, Jennifer S. YOB: 1973 | | Vice President, Chief Legal Officer and Secretary (since 2013). | | Vice President (since 2016) and Senior Counsel (since 2007), Virtus Investment Partners, Inc. and/or certain of its subsidiaries; Vice President (since 2017) and Assistant Secretary (since 2008), various Virtus-affiliated open-end funds; Vice President, Chief Legal Officer, and Secretary (since 2013), Virtus Variable Insurance Trust; and Vice President, Chief Legal Officer, and Secretary (since 2013), Virtus Alternative Solutions Trust. |
Short, Julia R. YOB: 1972 | | Senior Vice President (since 2017). | | Senior Vice President, Product Development (since 2017), Virtus Investment Partners, Inc. and/or certain of its subsidiaries; Senior Vice President (since 2017), Virtus Mutual Fund Family; President and Chief Executive Officer, RidgeWorth Funds (2007 to 2017); and Managing Director, Product Manager, RidgeWorth Investments (2004 to 2017). |
Waltman, Francis G. YOB: 1962 | | Executive Vice President (since 2013), Senior Vice President (2008 to 2013). | | Executive Vice President, Product Development (since 2009), Virtus Investment Partners, Inc. and/or certain of its subsidiaries; various senior officer positions (since 2006) with Virtus affiliates; Executive Vice President (since 2013), Senior Vice President (2008 to 2013), Virtus Mutual Fund Family; Executive Vice President (since 2013), Senior Vice President (2010 to 2013), Virtus Variable Insurance Trust; Executive Vice President (since 2013), Senior Vice President (2011 to 2013), Virtus Global Multi-Sector Income Fund; Executive Vice President (since 2014), Duff & Phelps Select Energy MLP Fund Inc.; Director (since 2013), Virtus Global Funds PLC; and Executive Vice President (since 2013), Virtus Alternative Solutions Trust. |
101
VIRTUS VARIABLE INSURANCE TRUST
100 Pearl Street
Hartford, CT 06103-4506
Trustees
George R. Aylward
Thomas J. Brown
Donald C. Burke
Roger A. Gelfenbien
Sidney E. Harris
John R. Mallin
Hassell H. McClellan
Connie D. McDaniel
Philip R. McLoughlin, Chairman
Geraldine M. McNamara
James M. Oates
Richard E. Segerson
Officers
George R. Aylward, President
Francis G. Waltman, Executive Vice President
W. Patrick Bradley, Executive Vice President, Chief Financial Officer and Treasurer
Nancy J. Engberg, Senior Vice President and Chief Compliance Officer
Jennifer Fromm, Vice President, Chief Legal Officer, Counsel and Secretary
Julia Short, Senior Vice President
Investment Adviser
Virtus Investment Advisers, Inc.
100 Pearl Street
Hartford, CT 06103-4506
Principal Underwriter
VP Distributors, LLC
100 Pearl Street
Hartford, CT 06103-4506
Transfer Agent
Bank of New York Mellon
4400 Computer Drive
Westborough, MA 01581-1722
Custodian
The Bank of New York Mellon
225 Liberty Street
New York, NY 10286-1048
Independent Registered Public
Accounting Firm
PricewaterhouseCoopers LLP
2001 Market Street
Philadelphia, PA 19103-7042
How to Contact Us
Mutual Fund Services1-800-367-5877
WebsiteVirtus.com
Important Notice to Shareholders
The Securities and Exchange Commission has modified mailing regulations for semiannual and annual shareholder fund reports to allow mutual fund companies to send a single copy of these reports to shareholders who share the same mailing address. If you would like additional copies, please call Mutual Fund Services at 1-800-367-5877.

For more information about the Virtus Variable Insurance Trust, please contact us at 1-800-367-5877 or Virtus.com.
| | (a) | The registrant, as of the end of the period covered by this report, has adopted a code of ethics that applies to the registrant’s principal executive officer, principal financial officer, principal accounting officer or controller, or persons performing similar functions, regardless of whether these individuals are employed by the registrant or a third party. |
| | (c) | Other than certain non-substantive changes, there have been no amendments, during the period covered by this report, to a provision of the code of ethics that applies to the registrant’s principal executive officer, principal financial officer, principal accounting officer or controller, or persons performing similar functions, regardless of whether these individuals are employed by the registrant or a third party, and that relates to any element of the code of ethics described in Item 2(b) of the instructions for completion of Form N-CSR. |
| | (d) | The registrant has not granted any waivers, during the period covered by this report, including an implicit waiver, from a provision of the code of ethics that applies to the registrant’s principal executive officer, principal financial officer, principal accounting officer or controller, or persons performing similar functions, regardless of whether these individuals are employed by the registrant or a third party, that relates to one or more of the items set forth in paragraph (b) of the instructions for completion of this Item. |
| Item 3. | Audit Committee Financial Expert. |
| (a)(1) | The Registrant’s Board of Trustees has determined that the Registrant has an “audit committee financial expert” serving on its Audit Committee. |
| (a)(2) | The Registrant’s Board of Trustees has determined that each of Thomas J. Brown, Donald C. Burke and Richard E. Segerson possesses the technical attributes identified in Instruction 2(b) of Item 3 to Form N-CSR to qualify as an “audit committee financial expert.” Each of Messrs. Brown, Burke and Segerson is an “independent” trustee pursuant to paragraph (a)(2) of Item 3 to Form N-CSR. |
| Item 4. | Principal Accountant Fees and Services. |
Audit Fees
| | (a) | The aggregate fees billed for each of the last two fiscal years for professional services rendered by the principal accountant for the audit of the registrant’s annual financial statements or services that are normally provided by the accountant in connection with statutory and regulatory filings or engagements for those fiscal years are $207,494 for 2017 and $215,702 for 2016. |
Audit-Related Fees
| | (b) | The aggregate fees billed in each of the last two fiscal years for assurance and related services by the principal accountant that are reasonably related to the performance of the audit of the registrant’s financial statements and are not reported under paragraph (a) of this Item are $9,729 for 2017 and $36,002 for 2016. Such audit-related fees include out of pocket expenses and other fees. |
Tax Fees
| | (c) | The aggregate fees billed in each of the last two fiscal years for professional services rendered by the principal accountant for tax compliance, tax advice, and tax planning are $0 for 2017 and $28,375 for 2016. |
“Tax Fees” are those primarily associated with review of the Trust’s tax provision and qualification as a regulated investment company (RIC) in connection with audits of the Trust’s financial statement, review of year-end distributions by the Fund to avoid excise tax for the Trust, periodic discussion with management on tax issues affecting the Trust, and reviewing and signing the Fund’s federal income tax returns.
All Other Fees
| | (d) | The aggregate fees billed in each of the last two fiscal years for products and services provided by the principal accountant, other than the services reported in paragraphs (a) through (c) of this Item are $0 for 2017 and $0 for 2016. |
| | (e)(1) | Disclose the audit committee’s pre-approval policies and procedures described in paragraph (c)(7) of Rule 2-01 of Regulation S-X. |
The Virtus Variable Insurance Trust (the “Fund”) Board has adopted policies and procedures with regard to the pre-approval of services provided by PwC. Audit, audit-related and tax compliance services provided to the Fund on an annual basis require specific pre-approval by the Audit Committee. The Audit Committee must also approve other non-audit services provided to the Fund and those non-audit services provided to the Fund’s Affiliated Service Providers that relate directly to the operations and financial reporting of the Fund. Certain of these non-audit services that the Audit Committee believes are a) consistent with the SEC’s auditor independence rules and b) routine and recurring services that will not impair the independence of the independent auditors may be approved by the Audit Committee without consideration on a specific case-by-case basis (“general pre-approval”).
The Audit Committee has determined that Mr. Thomas J. Brown, Chair of the Audit Committee, may provide pre-approval for such services that meet the above requirements in the event such approval is sought between regularly scheduled meetings. In any event, the Audit Committee is informed of each service approved subject to general pre-approval at the next regularly scheduled in-person Audit Committee meeting.
| | (e)(2) | The percentage of services described in each of paragraphs (b) through (d) of this Item that were approved by the audit committee pursuant to paragraph (c)(7)(i)(C) of Rule 2-01 of Regulation S-X are as follows: |
| | (f) | The percentage of hours expended on the principal accountant’s engagement to audit the registrant’s financial statements for the most recent fiscal year that were attributed to work performed by persons other than the principal accountant’s full-time, permanent employees was less than fifty percent. |
| | (g) | The aggregate non-audit fees billed by the registrant’s accountant for services rendered to the registrant, and rendered to the registrant’s investment adviser (not including any sub-adviser whose role is primarily portfolio management and is subcontracted with or overseen by another investment adviser), and any entity controlling, controlled by, or under common control with the adviser that provides ongoing services to the registrant for each of the last two fiscal years of the registrant was $566,627 for 2017 and $686,723 for 2016. |
| | (h) | The registrant’s audit committee of the board of directors has considered whether the provision of non-audit services that were rendered to the registrant’s investment adviser (not including any sub-adviser whose role is primarily portfolio management and is subcontracted with or overseen by another investment adviser), and any entity controlling, controlled by, or under common control with the investment adviser that provides ongoing services to the registrant that were not pre-approved pursuant to paragraph (c)(7)(ii) of Rule 2-01 of Regulation S-X is compatible with maintaining the principal accountant’s independence. |
| Item 5. | Audit Committee of Listed Registrants. |
Not applicable.
| (a) | Schedule of Investments in securities of unaffiliated issuers as of the close of the reporting period is included as part of the report to shareholders filed under Item 1 of this form. |
| Item 7. | Disclosure of Proxy Voting Policies and Procedures for Closed-End Management Investment Companies. |
Not applicable.
| Item 8. | Portfolio Managers of Closed-End Management Investment Companies. |
Not applicable.
| Item 9. | Purchases of Equity Securities by Closed-End Management Investment Company and Affiliated Purchasers. |
Not applicable.
| Item 10. | Submission of Matters to a Vote of Security Holders. |
There have been no material changes to the procedures by which the shareholders may recommend nominees to the registrant’s board of trustees, where those changes were implemented after the registrant last provided disclosure in response to the requirements of Item 407(c)(2)(iv) of Regulation S-K (17 CFR 229.407) (as required by Item 22(b)(15) of Schedule 14A (17 CFR 240.14a-101)), or this Item.
| Item 11. | Controls and Procedures. |
| | (a) | The registrant’s principal executive and principal financial officers, or persons performing similar functions, have concluded that the registrant’s disclosure controls and procedures (as defined in Rule 30a-3(c) under the Investment Company Act of 1940, as amended (the “1940 Act”) (17 CFR 270.30a-3(c))) are effective, as of a date within 90 days of the filing date of the report that includes the disclosure required by this paragraph, based on their evaluation of these controls and procedures required by Rule 30a-3(b) under the 1940 Act (17 CFR 270.30a-3(b)) and Rules 13a-15(b) or 15d-15(b) under the Securities Exchange Act of 1934, as amended (17 CFR 240.13a-15(b) or 240.15d-15(b)). |
| | (b) | There were no changes in the registrant’s internal control over financial reporting (as defined in Rule 30a-3(d) under the 1940 Act (17 CFR 270.30a-3(d))) that occurred during the registrant’s last fiscal quarter that has materially affected, or is reasonably likely to materially affect, the registrant’s internal control over financial reporting. |
| Item 12. | Disclosure of Securities Lending Activities for Closed-End Management Investment Companies. |
Not applicable.
| | (a)(1) | Code of ethics, or any amendment thereto, that is the subject of disclosure required by Item 2 is attached hereto. |
| | (a)(2) | Certifications pursuant to Rule 30a-2(a) under the 1940 Act and Section 302 of the Sarbanes-Oxley Act of 2002 are attached hereto. |
| | (b) | Certifications pursuant to Rule 30a-2(b) under the 1940 Act and Section 906 of the Sarbanes-Oxley Act of 2002 are attached hereto. |
SIGNATURES
Pursuant to the requirements of the Securities Exchange Act of 1934 and the Investment Company Act of 1940, the registrant has duly caused this report to be signed on its behalf by the undersigned, thereunto duly authorized.
| | | | |
| | |
| (Registrant) | | Virtus Variable Insurance Trust | | |
| | | | |
| | |
| By (Signature and Title)* | | /s/ George R. Aylward | | |
| | George R. Aylward, President (principal executive officer) | | |
Pursuant to the requirements of the Securities Exchange Act of 1934 and the Investment Company Act of 1940, this report has been signed below by the following persons on behalf of the registrant and in the capacities and on the dates indicated.
| | | | |
| | |
| By (Signature and Title)* | | /s/ George R. Aylward | | |
| | George R. Aylward, President (principal executive officer) | | |
| | | | |
| | |
| By (Signature and Title)* | | /s/ W. Patrick Bradley | | |
| | W. Patrick Bradley, Executive Vice President, Chief Financial Officer and Treasurer (principal financial officer) | | |
| * | Print the name and title of each signing officer under his or her signature. |