American Depositary Receipt (“ADR”)
Represents shares of foreign companies traded in U.S. dollars on U.S. exchanges that are held by a U.S. bank or a trust. Foreign companies use ADRs in order to make it easier for Americans to buy their shares.
Asset-Backed Securities (“ABS”)
Asset-backed securities represent interests in pools of underlying assets such as motor vehicle installment sales or installment loan contracts, leases of various types of real and personal property, and receivables from credit card arrangements.
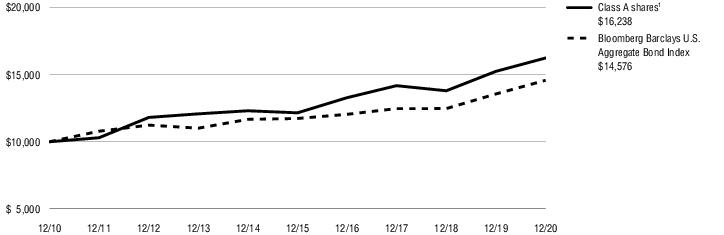
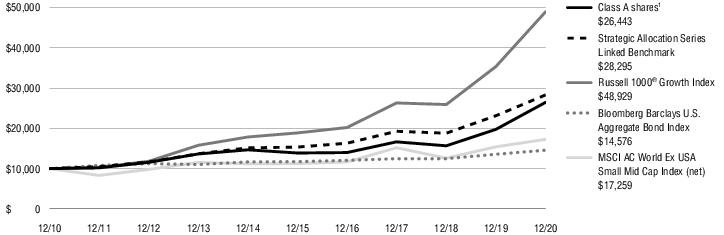
Bloomberg Barclays U.S. Aggregate Bond Index
The Bloomberg Barclays U.S. Aggregate Bond Index measures the U.S. investment-grade fixed-rate bond market. The index is calculated on a total return basis. The index is unmanaged, its returns do not reflect any fees, expenses, or sales charges, and it is not available for direct investment.
Bloomberg Barclays U.S. Corporate High Yield Bond Index
The Bloomberg Barclays U.S. Corporate High Yield Bond Index measures the U.S. dollar-denominated, high yield, fixed-rate corporate bond market. The index is calculated on a total return basis. The index is unmanaged, its returns do not reflect any fees, expenses, or sales charges, and it is not available for direct investment.
Brexit
A combination of the words “Britain” and “exit” which refers to Britain’s withdrawal from the European Union.
Exchange-Traded Fund (“ETF”)
An open-end fund that is traded on a stock exchange. Most ETFs have a portfolio of stocks or bonds that track a specific market index.
Federal Reserve (the “Fed”)
The Central Bank of the U.S., the Fed is responsible for controlling the money supply, interest rates, and credit with the goal of keeping the U.S. economy and currency stable. Governed by a seven-member board, the system includes 12 regional Federal Reserve Banks, 25 branches, and all national and state banks that are part of the system.
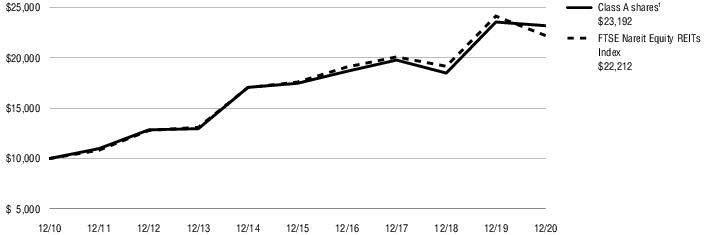
FTSE Nareit Equity REITs Index
The FTSE Nareit Equity REITs Index is a free-float market capitalization-weighted index measuring equity tax-qualified real estate investment trusts, which meet minimum size and liquidity criteria, that are listed on the New York Stock Exchange (“NYSE”), the American Stock Exchange and the NASDAQ National Market System. The index is calculated on a total return basis with dividends reinvested. The index is unmanaged, its returns do not reflect any fees, expenses, or sales charges, and it is not available for direct investment.
Gross Domestic Product (“GDP”)
The GDP represents the market value of all goods and services produced by the economy during the period measured, including personal consumption, government purchases, private inventories, paid-in construction costs, and the foreign trade balance.
London Interbank Offered Rate (“LIBOR”)
A benchmark rate that some of the world’s leading banks charge each other for short-term loans and that serves as the first step to calculating interest rates on various loans throughout the world.
MSCI ACWI ex USA SMID Cap Index (net)
The MSCI ACWI ex USA SMID Cap Index (net) is a free float-adjusted market capitalization-weighted index that measures mid- and small-cap performance across 22 of 23 Developed Market countries (excluding the U.S.) and 24 Emerging Markets countries. The index is calculated on a total return basis with net dividends reinvested. The index is unmanaged, its returns do not reflect any fees, expenses, or sales charges, and is not available for direct investment.
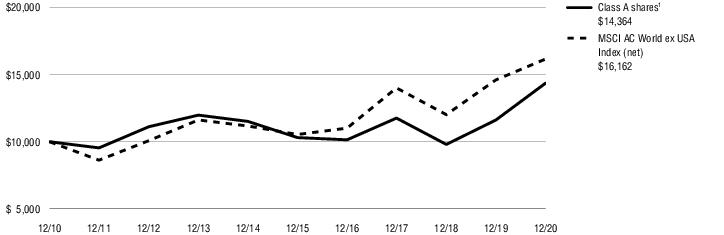
MSCI All Country World ex USA Index (net)
The MSCI All Country World ex USA Index (net) is a free float-adjusted market capitalization-weighted index that measures equity performance of developed and emerging markets, excluding the United States. The index is calculated on a total return basis with net dividends reinvested. The index is unmanaged, its returns do not reflect any fees, expenses, or sales charges, and is not available for direct investment.