UNITED STATES
SECURITIES AND EXCHANGE COMMISSION
Washington, D.C. 20549
FORMN-CSR
CERTIFIED SHAREHOLDER REPORT OF REGISTERED
MANAGEMENT INVESTMENT COMPANIES
Investment Company Act file number811-04642
Virtus Variable Insurance Trust
(Exact name of registrant as specified in charter)
One Financial Plaza
Hartford, CT 06103-4506
(Address of principal executive offices) (Zip code)
Jennifer S. Fromm, Esq.
Vice President, Chief Legal Officer, Counsel and Secretary for Registrant
One Financial Plaza
Hartford, CT 06103-4506
(Name and address of agent for service)
Registrant’s telephone number, including area code: (800)367-5877
Date of fiscal year end: December 31
Date of reporting period: December 31, 2019
FormN-CSR is to be used by management investment companies to file reports with the Commission not later than 10 days after the transmission to stockholders of any report that is required to be transmitted to stockholders under Rule30e-1 under the Investment Company Act of 1940 (17 CFR270.30e-1). The Commission may use the information provided on FormN-CSR in its regulatory, disclosure review, inspection, and policymaking roles.
A registrant is required to disclose the information specified by FormN-CSR, and the Commission will make this information public. A registrant is not required to respond to the collection of information contained in FormN-CSR unless the Form displays a currently valid Office of Management and Budget (“OMB”) control number. Please direct comments concerning the accuracy of the information collection burden estimate and any suggestions for reducing the burden to Secretary, Securities and Exchange Commission, 450 Fifth Street, NW, Washington, DC 20549-0609. The OMB has reviewed this collection of information under the clearance requirements of 44 U.S.C. § 3507.
| Item 1. | Reports to Stockholders. |
The Report to Shareholders is attached herewith.
ANNUAL REPORT
VIRTUS VARIABLE INSURANCE TRUST
| Virtus Duff & Phelps Real Estate Securities Series* |
| Virtus KAR Capital Growth Series* |
| Virtus KAR Small-Cap Growth Series* |
| Virtus KAR Small-Cap Value Series |
| Virtus Newfleet Multi-Sector Intermediate Bond Series |
| Virtus Rampart Enhanced Core Equity Series |
| Virtus SGA International Growth Series* |
| Virtus Strategic Allocation Series |
*Prospectus supplement applicable to this series appears at the back of this annual report.
Beginning on January 1, 2021, as permitted by regulations adopted by the Securities and Exchange Commission, you may no longer receive paper copies of the Series’ shareholder reports from your insurance company unless you specifically request paper copies from the insurance company. If your insurance company elects to use this method of delivery, the shareholder reports will be made available on a website, and the insurance company will notify you by mail each time a report is posted and provide you with a website link to access the report. Instructions for requesting paper copies will be provided by your insurance company.
If you already elected to receive shareholder reports electronically, you will not be affected by this change and you need not take any action. You may elect to receive shareholder reports and other communications from the insurance company electronically by following the instructions provided by the insurance company.
You may elect to receive paper copies of all future shareholder reports free of charge from the insurance company. You can do so by contacting the insurance company. Your election to receive reports in paper likely will apply to all of the funds available in your insurance product, but you should ask your insurance company whether this is the case.
Not FDIC Insured • No Bank Guarantee • May Lose Value
Table of Contents
| 1 |
| 2 |
| 4 |
| Series | Series
Summary | Schedule
of
Investments |
| 7 | 30 |
| 9 | 32 |
| 12 | 34 |
| 15 | 35 |
| 18 | 36 |
| 21 | 48 |
| 24 | 55 |
| 26 | 57 |
| | 67 |
| | 69 |
| | 71 |
| | 75 |
| | 79 |
| | 92 |
| | 93 |
| | 94 |
| | 95 |
| | 99 |
The subadvisers vote proxies, if any, relating to portfolio securities in accordance with procedures that have been approved by the Board of Trustees of the Trust (“Trustees”, or the “Board”). You may obtain a description of these procedures, along with information regarding how the Series voted proxies during the most recent 12-month period ended June 30, free of charge, by calling toll-free 1-800-367-5877. This information is also available through the Securities and Exchange Commission’s (the “SEC”) website athttps://www.sec.gov.
For periods prior to the quarter ended March 31, 2019, the Trust has filed a complete schedule of portfolio holdings for each Series with the SEC for the first and third quarters of each fiscal year on Form N-Q. Each Series’ Form N-Qs are available on the SEC’s website athttps://www.sec.gov.
Effective September 30, 2019, the Trust files a complete schedule of portfolio holdings for each Series with the SEC for the first and third quarters of each fiscal year as an exhibit to its reports on Form N-PORT-P. Form N-PORT-P is available on the SEC’s website athttps://www.sec.gov.
To Virtus Variable Insurance Trust Investors:
I am pleased to present this annual report that reviews the performance of your Series for the 12 months ended December 31, 2019.
Global financial markets rallied strongly during most of 2019 after a sharp downturn in the fourth quarter of 2018. While global growth was slower, interest rate cuts by the U.S. Federal Reserve and the European Central Bank helped restore confidence in the markets. The easing of monetary policy boosted the returns of both equities and fixed income during the year, but uncertainty about trade, tariffs, and other geopolitical issues led to several reversals in the direction of the markets.
Many asset classes posted double-digit returns for the 12 months ended December 31, 2019. U.S. large-capitalization stocks led the way, rising 31.49% as measured by the S&P 500® Index. Small-cap stocks, as measured by the Russell 2000® Index, returned 25.52% for the year. Within international equities, developed markets, as measured by the MSCI EAFE® Index (net), returned 22.01% for the full year, while emerging markets gained 18.42%, as measured by the MSCI Emerging Markets Index (net).
In fixed income markets, the yield on the 10-year Treasury was 1.92% at December 31, 2019, down from 2.69% at December 31, 2018. The broader U.S. fixed income market, as represented by the Bloomberg Barclays U.S. Aggregate Bond Index, which tracks Treasuries and other investment-grade debt securities, rallied during the 12 months to post a return of 8.72%. Non-investment grade bonds were up 14.32% for the period, as measured by the Bloomberg Barclays U.S. Corporate High Yield Bond Index.
After such a strong year in 2019, many investors are wondering what 2020 will bring. While no one can predict the short-term direction of the markets, a broadly diversified portfolio can position you for long-term success. While diversification cannot guarantee a profit or prevent a loss, owning a variety of equity and fixed income asset classes has been shown to dampen the effect of market volatility. Your financial advisor can help you determine whether your variable investment portfolio is appropriately diversified.
On behalf of our investment affiliates, thank you for entrusting the Virtus Funds with your assets. Please visit us at Virtus.com or call our customer service team at 800-367-5877 if you have questions about your Series. We appreciate your business and remain committed to your long-term financial success.
Sincerely,
George R. Aylward
President, Virtus Variable Insurance Trust
February 2020
Performance data quoted represents past results. Past performance is no guarantee of future results, and current performance may be higher or lower than the performance shown above.
VIRTUS VARIABLE INSURANCE TRUST
DISCLOSURE OF SERIES EXPENSES (Unaudited)
FOR THE SIX-MONTH PERIOD OFJuly 1, 2019 TODecember 31, 2019
We believe it is important for you to understand the impact of costs on your investment. All mutual funds have operating expenses. As a shareholder of a Virtus Variable Insurance Trust series (each, a “Series”), you incur ongoing costs, including investment advisory fees and other expenses. These examples are intended to help you understand your ongoing costs (in dollars) of investing in a Series and to compare these costs with the ongoing costs of investing in other mutual funds. These examples are based on an investment of $1,000 invested at the beginning of the period and held for the entire six-month period. The Annualized Expense Ratios may be different from the expense ratios in the Financial Highlights which are for the fiscal year ended December 31, 2019.
Please note that the expenses shown in the accompanying tables are meant to highlight your ongoing costs only and do not reflect additional fees and expenses associated with the annuity or life insurance policy through which you invest. Therefore, the accompanying tables are useful in comparing ongoing costs only, and will not help you determine the relative total costs of owning different funds. In addition, if the annuity or life insurance policy costs were included, your costs would have been higher. The calculations assume no shares were bought or sold during the period. Your actual costs may have been higher or lower, depending on the amount of your investment and the timing of any purchases or redemptions.
Actual Expenses
The table below provides information about actual account values and actual expenses. You may use the information below, together with the amount you invested, to estimate the expenses that you paid over the period. Simply divide your account value by $1,000 (for example, an $8,600 account value divided by $1,000 = 8.6), then multiply the result by the number in the table under the heading entitled “Expenses Paid During Period” to estimate the expenses you paid on your account during this period.
| | | Beginning
Account Value
July 1, 2019 | | Ending
Account Value
December 31, 2019 | | Annualized
Expense
Ratio | | Expenses
Paid
During
Period* |
Duff & Phelps Real Estate Securities Series
| | | | | | | | |
| | Class A | $ 1,000.00 | | $ 1,080.00 | | 1.16 % | | $ 6.08 |
| | Class I | 1,000.00 | | 1,081.40 | | 0.91 | | 4.77 |
KAR Capital Growth Series
| | | | | | | | |
| | Class A | 1,000.00 | | 1,074.20 | | 1.03 | | 5.38 |
KAR Small-Cap Growth Series
| | | | | | | | |
| | Class A | 1,000.00 | | 1,055.20 | | 1.19 | | 6.16 |
| | Class I | 1,000.00 | | 1,056.30 | | 0.94 | | 4.87 |
KAR Small-Cap Value Series
| | | | | | | | |
| | Class A | 1,000.00 | | 1,089.90 | | 1.10 | | 5.79 |
Newfleet Multi-Sector Intermediate Bond Series
| | | | | | | | |
| | Class A | 1,000.00 | | 1,028.10 | | 0.94 | | 4.81 |
| | Class I | 1,000.00 | | 1,030.70 | | 0.69 | | 3.53 |
Rampart Enhanced Core Equity Series
| | | | | | | | |
| | Class A | 1,000.00 | | 1,111.30 | | 0.98 | | 5.22 |
SGA International Growth Series
| | | | | | | | |
| | Class A | 1,000.00 | | 1,040.00 | | 1.21 | | 6.22 |
| | Class I | 1,000.00 | | 1,040.90 | | 0.96 | | 4.94 |
Strategic Allocation Series
| | | | | | | | |
| | Class A | 1,000.00 | | 1,064.10 | | 0.98 | | 5.10 |
| * | Expenses are equal to the relevant Series’ annualized expense ratio, which is net of waived fees and reimbursed expenses, if applicable, multiplied by the average account value over the period, multiplied by the number of days (184) expenses were accrued in the most recent fiscal half-year, then divided by 365 to reflect the one-half year period. |
For Series which may invest in other funds, the annualized expense ratios noted above do not reflect fees and expenses associated with any underlying funds. If such fees and expenses had been included, the expenses would have been higher.
You can find more information about a Series’ expenses in the Financial Statements section that follows. For additional information on operating expenses and other shareholder costs, refer to that Series’ prospectus.
VIRTUS VARIABLE INSURANCE TRUST
DISCLOSURE OF SERIES EXPENSES (Unaudited) (Continued)
FOR THE SIX-MONTH PERIOD OFJuly 1, 2019 TODecember 31, 2019
Hypothetical Example for Comparison Purposes
The table below provides information about hypothetical account values and hypothetical expenses based on a Series’ actual expense ratio and an assumed rate of return of 5% per year before expenses, which is not your Series’ actual return. The hypothetical account values and expenses may not be used to estimate the actual ending account balance or expenses you paid for the period. You may use this information to compare the ongoing costs of investing in your Series and other funds. To do so, compare these 5% hypothetical examples with the 5% hypothetical examples that appear in the shareholder reports of other mutual funds.
| | | Beginning
Account Value
July 1, 2019 | | Ending
Account Value
December 31, 2019 | | Annualized
Expense
Ratio | | Expenses
Paid
During
Period* |
Duff & Phelps Real Estate Securities Series
| | | | | | | | |
| | Class A | $ 1,000.00 | | $ 1,019.36 | | 1.16 % | | $ 5.90 |
| | Class I | 1,000.00 | | 1,020.62 | | 0.91 | | 4.63 |
KAR Capital Growth Series
| | | | | | | | |
| | Class A | 1,000.00 | | 1,020.01 | | 1.03 | | 5.24 |
KAR Small-Cap Growth Series
| | | | | | | | |
| | Class A | 1,000.00 | | 1,019.21 | | 1.19 | | 6.06 |
| | Class I | 1,000.00 | | 1,020.47 | | 0.94 | | 4.79 |
KAR Small-Cap Value Series
| | | | | | | | |
| | Class A | 1,000.00 | | 1,019.66 | | 1.10 | | 5.60 |
Newfleet Multi-Sector Intermediate Bond Series
| | | | | | | | |
| | Class A | 1,000.00 | | 1,020.47 | | 0.94 | | 4.79 |
| | Class I | 1,000.00 | | 1,021.73 | | 0.69 | | 3.52 |
Rampart Enhanced Core Equity Series
| | | | | | | | |
| | Class A | 1,000.00 | | 1,020.27 | | 0.98 | | 4.99 |
SGA International Growth Series
| | | | | | | | |
| | Class A | 1,000.00 | | 1,019.11 | | 1.21 | | 6.16 |
| | Class I | 1,000.00 | | 1,020.37 | | 0.96 | | 4.89 |
Strategic Allocation Series
| | | | | | | | |
| | Class A | 1,000.00 | | 1,020.27 | | 0.98 | | 4.99 |
| * | Expenses are equal to the relevant Series’ annualized expense ratio, which is net of waived fees and reimbursed expenses, if applicable, multiplied by the average account value over the period, multiplied by the number of days (184) expenses were accrued in the most recent fiscal half-year, then divided by 365 to reflect the one-half year period. |
For Series which may invest in other funds, the annualized expense ratios noted above do not reflect fees and expenses associated with any underlying funds. If such fees and expenses had been included, the expenses would have been higher.
You can find more information about a Series’ expenses in the Financial Statements section that follows. For additional information on operating expenses and other shareholder costs, refer to that Series’ prospectus.
VIRTUS VARIABLE INSURANCE TRUST
KEY INVESTMENT TERMS (Unaudited)
December 31, 2019
American Depositary Receipt (“ADR”)
Represents shares of foreign companies traded in U.S. dollars on U.S. exchanges that are held by a U.S. bank or a trust. Foreign companies use ADRs in order to make it easier for Americans to buy their shares.
Bloomberg Barclays U.S. Aggregate Bond Index
The Bloomberg Barclays U.S. Aggregate Bond Index measures the U.S. investment-grade fixed-rate bond market. The index is calculated on a total return basis. The index is unmanaged, its returns do not reflect any fees, expenses, or sales charges, and it is not available for direct investment.
Bloomberg Barclays U.S. Corporate High Yield Bond Index
The Bloomberg Barclays U.S. Corporate High Yield Bond Index measures the U.S. dollar-denominated, high yield, fixed-rate corporate bond market. The index is calculated on a total return basis. The index is unmanaged, its returns do not reflect any fees, expenses, or sales charges, and it is not available for direct investment.
Chicago Board Options Exchange Volatility Index® (“CBOE VIX®”)
The CBOE VIX® shows the market’s expectation of 30-day volatility. It is constructed using the implied volatilities of a wide range of S&P 500® Index options. This volatility is meant to be forward looking and is calculated from both calls and puts. The CBOE VIX® is a widely used measure of market risk and is often referred to as the “investor fear gauge.” The index is unmanaged, its returns do not reflect any fees, expenses, or sales charges, and it is not available for direct investment.
European Central Bank (“ECB”)
The ECB is responsible for conducting monetary policy for the Euro zone. The ECB was established as the core of the Euro-system and the European System of Central Banks (“ESCB”). The ESCB comprises the ECB and the National Central Banks (“NCBs”) of all European Union Member States whether or not they have adopted the Euro.
Exchange-Traded Fund (“ETF”)
An open-end fund that is traded on a stock exchange. Most ETFs have a portfolio of stocks or bonds that track a specific market index.
Federal Reserve (the “Fed”)
The Central Bank of the U.S., the Fed is responsible for controlling the money supply, interest rates, and credit with the goal of keeping the U.S. economy and currency stable. Governed by a seven-member board, the system includes 12 regional Federal Reserve Banks, 25 branches, and all national and state banks that are part of the system.
FTSE Nareit Equity REITs Index
The FTSE Nareit Equity REITs Index is a free-float market capitalization-weighted index measuring equity tax-qualified real estate investment trusts, which meet minimum size and liquidity criteria, that are listed on the New York Stock Exchange (“NYSE”), the American Stock Exchange and the NASDAQ National Market System. The index is calculated on a total return basis with dividends reinvested. The index is unmanaged, its returns do not reflect any fees, expenses, or sales charges, and it is not available for direct investment.
London Interbank Offered Rate (“LIBOR”)
A benchmark rate that some of the world’s leading banks charge each other for short-term loans and that serves as the first step to calculating interest rates on various loans throughout the world.
MSCI ACWI ex USA SMID Cap Index (net)
The MSCI ACWI ex USA SMID Cap Index (net) is a free float-adjusted market capitalization-weighted index that measures mid- and small-cap performance across 22 of 23 Developed Market countries (excluding the U.S.) and 24 Emerging Markets countries. The index is calculated on a total return basis with net dividends reinvested. The index is unmanaged, its returns do not reflect any fees, expenses, or sales charges, and is not available for direct investment.
MSCI All Country World ex USA Index (net)
The MSCI All Country World ex USA Index (net) is a free float-adjusted market capitalization-weighted index that measures equity performance of developed and emerging markets, excluding the United States. The index is calculated on a total return basis with net dividends reinvested. The index is unmanaged, its returns do not reflect any fees, expenses, or sales charges, and is not available for direct investment.
VIRTUS VARIABLE INSURANCE TRUST
KEY INVESTMENT TERMS (Unaudited) (Continued)
December 31, 2019
MSCI EAFE® Index (net)
The MSCI EAFE® (Europe, Australasia, Far East) Index (net) is a free float-adjusted market capitalization-weighted index that measures developed foreign market equity performance, excluding the U.S. and Canada. The index is calculated on a total return basis with net dividends reinvested. The index is unmanaged, its returns do not reflect any fees, expenses, or sales charges, and it is not available for direct investment.
MSCI Emerging Markets Index (net)
The MSCI Emerging Markets Index (net) is a free float-adjusted market capitalization-weighted index designed to measure equity market performance in the global emerging markets. The index is calculated on a total return basis with net dividends reinvested. The index is unmanaged, its returns do not reflect any fees, expenses, or sales charges, and it is not available for direct investment.
Payment-in-Kind Security (“PIK”)
A bond which pays interest in the form of additional bonds, or preferred stock which pays dividends in the form of additional preferred stock.
Risk Assets
Risk assets are those that tend to demonstrate price volatility, such as equities, high yield bonds, currencies, and commodities.
Real Estate Investment Trust (“REIT”)
A publicly traded company that owns, develops, and operates income-producing real estate such as apartments, office buildings, hotels, shopping centers, and other commercial properties.
Russell 1000® Growth Index
The Russell 1000® Growth Index is a market capitalization-weighted index of growth-oriented stocks of the 1,000 largest companies in the Russell Universe, which comprises the 3,000 largest U.S. companies. The index is calculated on a total return basis with dividends reinvested. The index is unmanaged, its returns do not reflect any fees, expenses, or sales charges, and it is not available for direct investment.
Russell 2000® Growth Index
The Russell 2000® Growth Index is a market capitalization-weighted index of growth-oriented stocks of the smallest 2,000 companies in the Russell Universe, which comprises the 3,000 largest U.S. companies. The index is calculated on a total return basis with dividends reinvested. The index is unmanaged, its returns do not reflect any fees, expenses, or sales charges, and it is not available for direct investment.
Russell 2000®Index
The Russell 2000® Index is a market capitalization-weighted index of the 2,000 smallest companies in the Russell Universe, which comprises the 3,000 largest U.S. companies. The index is calculated on a total return basis with dividends reinvested. The index is unmanaged, its returns do not reflect any fees, expenses, or sales charges, and it is not available for direct investment.
Russell 2000® Value Index
The Russell 2000® Value Index is a market capitalization-weighted index of value-oriented stocks of the smallest 2,000 companies in the Russell Universe, which comprises the 3,000 largest U.S. companies. The index is calculated on a total return basis with dividends reinvested. The index is unmanaged, its returns do not reflect any fees, expenses, or sales charges, and it is not available for direct investment.
S&P 500® Index
The S&P 500® Index is a free-float market capitalization-weighted index of 500 of the largest U.S. companies. The index is calculated on a total return basis with dividends reinvested. The index is unmanaged, its returns do not reflect any fees, expenses, or sales charges, and it is not available for direct investment.
Sponsored ADR
An ADR which is issued with the cooperation of the company whose stock will underlie the ADR. Sponsored ADRs generally carry the same rights normally given to stockholders, such as voting rights. ADRs must be sponsored to be able to trade on a major U.S. exchange such as the NYSE.
VIRTUS VARIABLE INSURANCE TRUST
KEY INVESTMENT TERMS (Unaudited) (Continued)
December 31, 2019
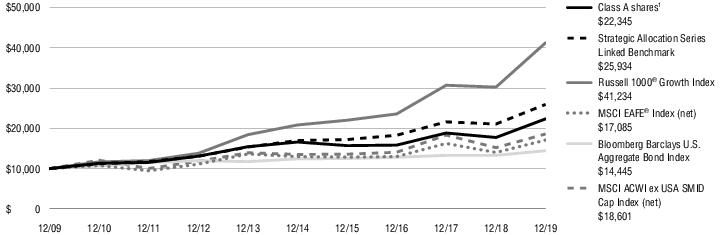
Strategic Allocation Series Linked Benchmark
The Strategic Allocation Linked Benchmark consists of 45% Russell1000®Growth Index, 15% MSCI ACWI ex USA SMID Cap Index, and 40% Bloomberg Barclays U.S. Aggregate Bond Index. Performance of the Strategic Allocation Linked Benchmark from September 7, 2016 to June 3, 2019 represents an allocation consisting of 45% Russell 1000® Growth Index, 15% MSCI EAFE® Index, and 40% Bloomberg Barclays U.S. Aggregate Bond Index; and performance of the Strategic Allocation Linked Benchmark prior to September 7, 2016 represents an allocation consisting of 60% S&P 500®Index and 40% Bloomberg Barclays U.S. Aggregate Bond Index.
Yankee Bond
A yankee bond is a bond that is issued by a foreign entity, such as a bank or company, but issued and traded in the United States and denominated in U.S. dollars.
Yield Curve
A line that plots the interest rates, at a set point in time, of bonds having equal credit quality, but differing maturity dates. The most frequently reported yield curve compares the three-month, two-year, five-year and 30-year U.S. Treasury debt. This yield curve is used as a benchmark for other debt in the market, such as mortgage rates or bank lending rates. The curve is also used to predict changes in economic output and growth.
Duff & Phelps Real Estate Securities Series
Series Summary (Unaudited)
Portfolio Manager Commentary by
Duff & Phelps Investment Management Co.
| ■ | The Series is diversified and has investment objectives of capital appreciation and income with approximately equal emphasis.There is no guarantee that the Series will meet its objectives. |
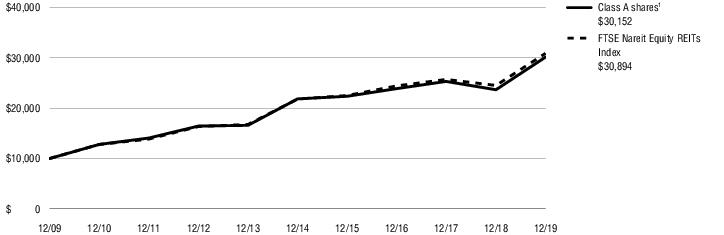
| ■ | For the fiscal year ended December 31, 2019, the Series’ Class A shares at NAV returned 27.42% and Class I shares at NAV returned 27.78%. For the same period, the FTSE Nareit Equity REITs Index, which serves as the Series’ broad-based and style-specific benchmark appropriate for comparison, returned 26.00%. |
All performance figures assume reinvestment of distributions and exclude the effect of fees and expenses associated with the variable life insurance or annuity product through which you invest. Performance data quoted represents past results. Past performance is no guarantee of future results, and current performance may be higher or lower than the performance shown above. Investment return and principal value will fluctuate so your shares, when redeemed, may be worth more or less than their original cost. Please visit Virtus.com for performance data current to the most recent month-end.
How did the markets perform during the Series’ fiscal year ended December 31, 2019?
Real Estate Investment Trusts (REITs) performed well in 2019. For the year, REITs’ total return performance benefited from solid contractual cash flows, operating results in excess of Wall Street’s expectations, and a supportive private real estate market. The environment was supportive of cash flow and dividend growth from REITs in most property sectors and markets. Additionally, the relentless search for yield, combined with the significant pool of capital raised by private real estate
investment firms, drove bids and supported real estate valuations in the public and private markets.
Relative to the broader market, as measured by the S&P 500® Index, REITs outperformed in both the fourth quarter 2018 market decline and the first quarter 2019 rebound. For the full year 2019, the S&P 500® Index edged out REITs, boosted by the strong finish to the year, which was due to the Phase 1 trade accord between the U.S. and China.
What factors affected the Series’ performance during its fiscal year?
For the fiscal year ended December 31, 2019, the Series benefited from both property sector allocation and security selection, which helped the Series outperform its style-specific benchmark.
Manufactured homes, industrial, and single family homes delivered the best total returns over the 12-month period. The bottom performing property sectors in the year included regional malls, self storage, and lodging.
The three best performing sectors demonstrated strong drivers of organic, or internal, growth. Strength in both occupancy levels and pricing power in the form of higher rents was driven by solid demand.
Relative to the Series’ performance, the most significant individual positive contributors were security selection and overweight in the office sector, security selection and underweight in free standing, and security selection and underweight in specialty. The most significant detractors were security selection in data centers, single family homes, and diversified, all three of which were partially offset by property sector allocation benefits.
The preceding information is the opinion of portfolio management only through the end of the period stated on the cover. Any such opinions are subject to
change at any time based upon market or other conditions and should not be relied upon as investment advice. Past performance is no guarantee of future results, and there is no guarantee that market forecasts will be realized.
Equity Securities: The market price of equity securities may be adversely affected by financial market, industry, or issuer-specific events. Focus on a particular style or on small or medium-sized companies may enhance that risk.
Real Estate: The Series may be negatively affected by factors specific to the real estate market, including interest rates, leverage, property, and management.
Industry/Sector Concentration: A series that focuses its investments in a particular industry or sector will be more sensitive to conditions that affect that industry or sector than a non-concentrated series.
Prospectus: For additional information on risks, please see the Series’ prospectus.
Asset Allocations
The following table presents asset allocations within certain sectors as a percentage of total investments as of December 31, 2019.
| Residential | 26% |
| Industrial/Office | 24 |
| Retail | 16 |
| Health Care | 10 |
| Data Centers | 8 |
| Specialty | 7 |
| Lodging/Resorts | 4 |
| Other (includes short-term investment) | 5 |
| Total | 100% |
For information regarding the indexes and certain investment terms, see the Key Investment Terms starting on page 4.
Duff & Phelps Real Estate Securities Series (Continued)
Average Annual Total Returns1for periods ended 12/31/19
| | | 1 Year | 5 Years | 10 Years | Since
inception | Inception
date |
| Class A shares at NAV2 | | 27.42 % | 6.66 % | 11.67 % | — % | — |
| Class I shares at NAV2 | | 27.78 | 6.92 | — | 7.80 | 4/30/13 |
| FTSE Nareit Equity REITs Index | | 26.00 | 7.21 | 11.94 | 7.663 | — |
| Series Expense Ratios4: Class A shares: Gross 1.19%, Net 1.14%; Class I shares: Gross 0.94%, Net 0.89%. | | | | | | |
| All returns represent past performance which is no guarantee of future results. Current performance may be higher or lower than the performance shown. The investment return and principal value of an investment will fluctuate so that an investor’s shares, when redeemed, may be worth more or less than their original cost. The above table and graph below do not reflect the deduction of taxes that a shareholder would pay on fund distributions or the redemption of shares. Please visit Virtus.com for performance data current to the most recent month-end. |
| |
| |
| |
| |
Growth of $10,000for periods ended 12/31
This chart assumes an initial investment of $10,000 made on December 31, 2009 for Class A shares. The performance of the other share class may be greater or less than that shown based on differences in inception dates, fees, and sales charges. Returns shown include the reinvestment of all distributions at net asset value, and the change in share price for the stated period.
| 1 | Total returns are historical and include changes in share price and the reinvestment of both dividends and capital gain distributions. |
| 2 | “NAV” (Net Asset Value) total returns do not reflect any fees or expenses associated with the separate insurance products. |
| 3 | The since inception index return is from the inception date of Class I shares. |
| 4 | The expense ratios of the Series are set forth according to the prospectus for the Series effective April 30, 2019, as supplemented and revised, and may differ from the expense ratios disclosed in the Financial Highlights tables in this report. See the Financial Highlights for more current expense ratios. Net Expense: Expenses reduced by a contractual expense limitation in effect through April 30, 2021. Gross Expense: Does not reflect the effect of the contractual expense limitation. Expense ratios include fees and expenses associated with any underlying funds. |
The index is unmanaged and not available for direct investment; therefore, its performance does not reflect the expenses associated with active management of an actual portfolio.
For information regarding the indexes and certain investment terms, see the Key Investment Terms starting on page 4.
KAR Capital Growth Series
Series Summary (Unaudited)
Portfolio Manager Commentary by
Kayne Anderson Rudnick Investment Management, LLC
| ■ | The Series is diversified and has an investment objective of long-term growth of capital.There is no guarantee that the Series will meet its objective. |
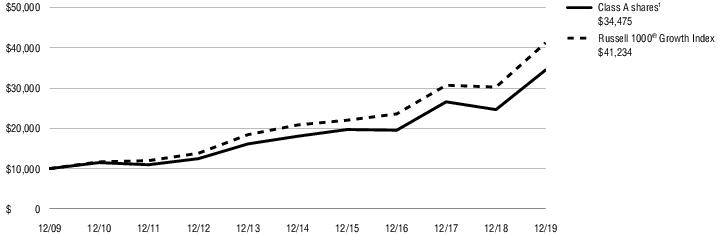
| ■ | For the fiscal year ended December 31, 2019, the Series’ Class A shares at NAV returned 39.87%. For the same period, the Russell 1000® Growth Index, which serves as the Series’ broad- based and style-specific benchmark appropriate for comparison, returned 36.39%. |
All performance figures assume reinvestment of distributions and exclude the effect of fees and expenses associated with the variable life insurance or annuity product through which you invest. Performance data quoted represents past results. Past performance is no guarantee of future results, and current performance may be higher or lower than the performance shown above. Investment return and principal value will fluctuate so your shares, when redeemed, may be worth more or less than their original cost. Please visit Virtus.com for performance data current to the most recent month-end.
How did the markets perform during the Series’ fiscal year ended December 31, 2019?
Equity investors enjoyed extraordinary returns in 2019. After a very weak fourth quarter of 2018, stocks recovered all those losses and more in 2019. U.S. large-capitalization stocks returned 31.49%, as measured by the S&P 500® Index, and small-capitalization stocks, as measured by the Russell 2000® Index, returned 25.52%.
Coming into 2019, the stock market was pricing in a potential recession during the year. Global growth had been slowing and the Federal Reserve (the Fed) had made the mistake of raising interest rates in December of 2018. When no recession appeared in the first half of 2019 and the trade dispute with China looked like it was going to be resolved, stocks recovered strongly in the first six months of the year.
However, by the summer of 2019 it became clear that global industrial activity was continuing to slow dramatically, with industrials within most major countries (Germany, China and Japan) reaching recessionary levels. In addition, the U.S.-China trade dispute remained unresolved and appeared to be
escalating, increasing the odds of a full-blown recession.
The Fed finally began to reverse course, lowering interest rates at its July meeting in response to slowing conditions. The yield curve inverted briefly in August, with short-term bonds paying higher interest rates than longer-term bonds, reflecting fears about the future outlook for growth. Fortunately, the Fed lowered rates twice more in 2019, which helped restore the yield curve to its usual shape by year end.
Despite all the volatile trade discussions that occurred with China throughout the year, a limited Phase 1 deal was announced at year-end. While this did not resolve trade tensions, it helped to de-escalate them.
And despite slowing growth all year long, especially in industrial activity, the consumer continued to show strength, the Fed and other central banks lowered interest rates, trade discussions appeared headed in the right direction, and companies’ profits continued to grow in the U.S.
What factors affected the Series’ performance during its fiscal year?
The Series outperformed the Russell 1000® Growth Index for the year ended December 31, 2019. Performance was driven by strong stock selection in the information technology sector, and strong stock selection and an underweight in the health care sector. Negative stock selection and an underweight in energy, as well as negative stock selection in materials, detracted from performance.
From an individual stock perspective, the holdings that contributed the most to performance were Paycom Software and Facebook.
• Paycom’s cloud-based human capital management (HCM) and payroll software have carved out a niche as a nimble software as a service (SaaS) offering that serves small to medium-sized businesses. Its out-of-the-box solution, low cost research and development, and sales office strategy combined to give the company some of the best profit margins among its SaaS peers. Paycom’s revenue continued to meaningfully exceed expectations during the year, as its efforts to sell to larger employers (2,000 to 5,000 employees) proved highly successful. The company saw improved retention and upsell opportunities as a result of its
differentiated mobile offering. Paycom has boosted platform engagement with additional products to inform employers on employee usage of the software, which has led to better client retention over time. Paycom’s shares performed well in the fourth quarter of 2019 after the market digested the company’s plan to boost marketing spend to better address larger customers.
• Regulators around the world have made social media titan Facebook public enemy #1 for the past 18 months. Facebook stumbled a few times but, to its credit, took an honest look at its product and adapted it in ways that reengaged users and affirmed its value to advertising customers. Even with new regulations on ad targeting, headwinds in its ability to get and/or use user data, and the self-imposed demonetization from ad format changes, revenue continued to grow. The cost of these changes has been hotly debated, and Facebook acknowledged that costs would rise approximately 35% in 2020, but claimed that costs were expected to more closely mirror revenue growth soon.
• Other top contributors included Alibaba Group, Bill.com, and Visa.
The stocks that detracted the most from performance were Uber Technologies and Cabot Oil & Gas.
• Uber Technologies has revolutionized personal mobility through ridesharing, and has leveraged its platform to expand the breadth of services to meal deliveries and logistics. Uber has captured greater than 65% market share in all but one of its major ridesharing markets (India). The company enjoyed cross-platform synergies, as 16% of Uber customers have ordered a meal through the Eats service just three years after its launch. In the past, Uber had said it would aggressively spend to compete in all markets, but recently the company pivoted to focus only on markets where it could be first or second. To that end, the company recently disclosed it is in talks to sell its business in India.
• Cabot Oil & Gas has been fenced in for years by lack of take-away capacity for its Marcellus Shale production acreage. However, while that capacity has come online, Cabot has discovered new challenges as it ramps up production. One of these challenges has been reduced operational efficiencies as it moves to larger drilling pads and operates a larger production base. With many other strong stock ideas
For information regarding the indexes and certain investment terms, see the Key Investment Terms starting on page 4.
KAR Capital Growth Series (Continued)
and the specter of an economic slowdown hurting demand for the ample supply of domestic natural gas, we sold our position in the third quarter of 2019.
• Other top detractors included bluebird bio, Lyft, and Equifax.
The preceding information is the opinion of portfolio management only through the end of the period stated on the cover. Any such opinions are subject to change at any time based upon market or other conditions and should not be relied upon as investment advice. Past performance is no guarantee of future results, and there is no guarantee that market forecasts will be realized.
Equity Securities: The market price of equity securities may be adversely affected by financial market, industry, or issuer-specific events. Focus on
a particular style or on small or medium-sized companies may enhance that risk.
Prospectus: For additional information on risks, please see the Series’ prospectus.
Asset Allocations
The following table presents asset allocations within certain sectors as a percentage of total investments as of December 31, 2019.
| Information Technology | 27% |
| Consumer Discretionary | 26 |
| Communication Services | 14 |
| Industrials | 10 |
| Financials | 8 |
| Health Care | 7 |
| Consumer Staples | 6 |
| Other | 2 |
| Total | 100% |
For information regarding the indexes and certain investment terms, see the Key Investment Terms starting on page 4.
KAR Capital Growth Series (Continued)
Average Annual Total Returns1for periods ended 12/31/19
| | | 1 Year | 5 Years | 10 Years |
| Class A shares at NAV2 | 39.87% | 13.84% | 13.18% |
| Russell 1000® Growth Index | 36.39 | 14.63 | 15.22 |
| Series Expense Ratios3: Class A shares: Gross 1.11%, Net 1.03%. | | | | |
| All returns represent past performance which is no guarantee of future results. Current performance may be higher or lower than the performance shown. The investment return and principal value of an investment will fluctuate so that an investor’s shares, when redeemed, may be worth more or less than their original cost. The above table and graph below do not reflect the deduction of taxes that a shareholder would pay on fund distributions or the redemption of shares. Please visit Virtus.com for performance data current to the most recent month-end. |
| |
| |
| |
Growth of $10,000for periods ended 12/31
This chart assumes an initial investment of $10,000 made on December 31, 2009 for Class A shares. Returns shown include the reinvestment of all distributions at net asset value, and the change in share price for the stated period.
| 1 | Total returns are historical and include changes in share price and the reinvestment of both dividends and capital gain distributions. |
| 2 | “NAV” (Net Asset Value) total returns do not reflect any fees or expenses associated with the separate insurance products. |
| 3 | The expense ratios of the Series are set forth according to the prospectus for the Series effective April 30, 2019, as supplemented and revised, and may differ from the expense ratios disclosed in the Financial Highlights tables in this report. See the Financial Highlights for more current expense ratios. Net Expense: Expenses reduced by a contractual expense limitation in effect through April 30, 2020. Gross Expense: Does not reflect the effect of the contractual expense limitation. Expense ratios include fees and expenses associated with any underlying funds. |
The index is unmanaged and not available for direct investment; therefore, its performance does not reflect the expenses associated with active management of an actual portfolio.
For information regarding the indexes and certain investment terms, see the Key Investment Terms starting on page 4.
KAR Small-Cap Growth Series
Series Summary (Unaudited)
Portfolio Manager Commentary by
Kayne Anderson Rudnick Investment Management, LLC
| ■ | The Series is diversified and has an investment objective of long-term capital growth.There is no guarantee that the Series will meet its objective. |
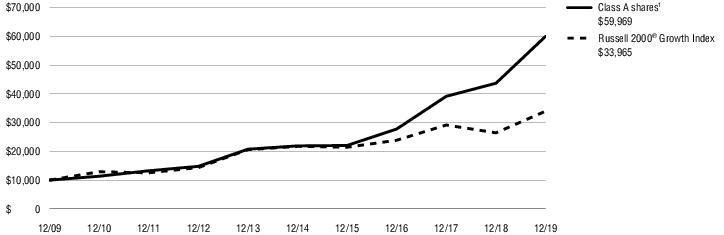
| ■ | For the fiscal year ended December 31, 2019, the Series’ Class A shares at NAV returned 37.31% and Class I shares at NAV returned 37.66%. For the same period, the Russell 2000® Growth Index, which serves as the Series’ broad-based and style-specific benchmark appropriate for comparison, returned 28.48%. |
All performance figures assume reinvestment of distributions and exclude the effect of fees and expenses associated with the variable life insurance or annuity product through which you invest. Performance data quoted represents past results. Past performance is no guarantee of future results, and current performance may be higher or lower than the performance shown above. Investment return and principal value will fluctuate so your shares, when redeemed, may be worth more or less than their original cost. Please visit Virtus.com for performance data current to the most recent month-end.
How did the markets perform during the Series’ fiscal year ended December 31, 2019?
Equity investors enjoyed extraordinary returns in 2019. After a very weak fourth quarter of 2018, stocks recovered all those losses and more in 2019. U.S. large-capitalization stocks returned 31.49%, as measured by the S&P 500® Index, and small-capitalization stocks, as measured by the Russell 2000® Index, returned 25.52%.
Coming into 2019, the stock market was pricing in a potential recession during the year. Global growth had been slowing and the Federal Reserve (the Fed) had made the mistake of raising interest rates in December of 2018. When no recession appeared in the first half of 2019 and the trade dispute with China looked like it was going to be resolved, stocks recovered strongly in the first six months of the year.
However, by the summer of 2019 it became clear that global industrial activity was continuing to slow dramatically, with industrials within most major countries (Germany, China and Japan) reaching recessionary levels. In addition, the U.S.-China trade
dispute remained unresolved and appeared to be escalating, increasing the odds of a full-blown recession.
The Fed finally began to reverse course, lowering interest rates at its July meeting in response to slowing conditions. The yield curve inverted briefly in August, with short-term bonds paying higher interest rates than longer-term bonds, reflecting fears about the future outlook for growth. Fortunately, the Fed lowered rates twice more in 2019, which helped restore the yield curve to its usual shape by year end.
Despite all the volatile trade discussions that occurred with China throughout the year, a limited Phase 1 deal was announced at year-end. While this did not resolve trade tensions, it helped to de-escalate them.
And despite slowing growth all year long, especially in industrial activity, the consumer continued to show strength, the Fed and other central banks lowered interest rates, trade discussions appeared headed in the right direction, and companies’ profits continued to grow in the U.S.
What factors affected the Series’ performance during its fiscal year?
The Series outperformed the Russell 2000® Growth Index for the year. Performance was driven by strong stock selection in the technology and producer durables sectors. Negative stock selection in consumer discretionary, and negative stock selection and an overweight in consumer staples, detracted from performance.
From an individual stock perspective, the holdings that contributed the most to performance were Paycom Software and Copart.
• The 12-month period ended December 31, 2019, marked another very strong year for Paycom’s execution. The company’s focus on driving strong usage among its customers is leading clients to have high returns on the product, which has resulted in stickiness as well as excellent referrals. Despite increased spending on product innovation, the company still drove meaningful growth in profitability.
• Through the trailing 12 months, Copart delivered strong growth in both salvage car volumes and average selling price. The company increased its business selling increasingly higher value cars to
international rebuilders. We believe this success was due to Copart’s large and growing network of both domestic and international buyers and sellers.
• Other top contributors included DocuSign, Rightmove, and Omega Flex.
The stocks that detracted the most from performance were Interactive Brokers Group and NVE.
• At the beginning of October 2019, a competing large electronic broker, Charles Schwab, lowered its commissions for U.S. equity trades to zero, following Interactive Brokers’ creation of a zero-commission Lite account offering in late September. Competitors TD-Ameritrade, Fidelity, and E*TRADE, all followed suit, cutting U.S. equity trade commissions to zero. Market participants reacted negatively to the commission cuts and sold off public electronic brokers’ stocks as a group. The move to zero commissions is revenue-neutral to Interactive Brokers. We view the company’s core competitive cost advantage, achieved through a high level of automation, as intact, and we continued to hold the stock through year-end.
• NVE had some difficulties in 2019, as its largest customer had challenges selling its pacemakers. We believe in the technology’s differentiation, and expect the company’s strong financial position to enable it to weather lumpy order flows. Demographics favor pacemaker adoption long-term. We also expect new avenues, such as automotive, food safety, and the internet of things, to help the company diversify its revenue. Core profitability remained industry-leading, and we continued to hold the stock.
• Other top detractors included Goosehead Insurance, Grocery Outlet, and PriceSmart.
The preceding information is the opinion of portfolio management only through the end of the period stated on the cover. Any such opinions are subject to change at any time based upon market or other conditions and should not be relied upon as investment advice. Past performance is no guarantee of future results, and there is no guarantee that market forecasts will be realized.
Equity Securities: The market price of equity securities may be adversely affected by financial market, industry, or issuer-specific events. Focus on a particular style or on small or medium-sized companies may enhance that risk.
For information regarding the indexes and certain investment terms, see the Key Investment Terms starting on page 4.
KAR Small-Cap Growth Series (Continued)
Foreign & Emerging Markets: Investing internationally, especially in emerging markets, involves additional risks such as currency, political, accounting, economic, and markets risk.
Limited Number of Investments: Because the Series has a limited number of securities, it may be more susceptible to factors adversely affecting its securities than a less concentrated series.
Industry/Sector Concentration: A series that focuses its investments in a particular industry or sector will be more sensitive to conditions that affect that industry or sector than a non-concentrated series.
Prospectus: For additional information on risks, please see the Series’ prospectus.
Asset Allocations
The following table presents asset allocations within certain sectors as a percentage of total investments as of December 31, 2019.
| Information Technology | 25% |
| Communication Services | 18 |
| Financials | 15 |
| Industrials | 14 |
| Consumer Discretionary | 10 |
| Consumer Staples | 7 |
| Health Care | 7 |
| Other (includes short-term investment and securities lending collateral) | 4 |
| Total | 100% |
For information regarding the indexes and certain investment terms, see the Key Investment Terms starting on page 4.
KAR Small-Cap Growth Series (Continued)
Average Annual Total Returns1for periods ended 12/31/19
| | | 1 Year | 5 Years | 10 Years | Since
inception | Inception
date |
| Class A shares at NAV2 | | 37.31 % | 22.33 % | 19.62 % | — % | — |
| Class I shares at NAV2 | | 37.66 | 22.64 | — | 21.69 | 4/30/13 |
| Russell 2000® Growth Index | | 28.48 | 9.34 | 13.01 | 11.783 | — |
| Series Expense Ratios4: Class A shares: Gross 1.27%, Net 1.16%; Class I shares: Gross 1.03%, Net 0.91%. | | | | | | |
| All returns represent past performance which is no guarantee of future results. Current performance may be higher or lower than the performance shown. The investment return and principal value of an investment will fluctuate so that an investor’s shares, when redeemed, may be worth more or less than their original cost. The above table and graph below do not reflect the deduction of taxes that a shareholder would pay on fund distributions or the redemption of shares. Please visit Virtus.com for performance data current to the most recent month-end. |
| |
| |
| |
| |
Growth of $10,000for periods ended 12/31
This chart assumes an initial investment of $10,000 made on December 31, 2009 for Class A shares. The performance of the other share class may be greater or less than that shown based on differences in inception dates, fees, and sales charges. Returns shown include the reinvestment of all distributions at net asset value, and the change in share price for the stated period.
| 1 | Total returns are historical and include changes in share price and the reinvestment of both dividends and capital gain distributions. |
| 2 | “NAV” (Net Asset Value) total returns do not reflect any fees or expenses associated with the separate insurance products. |
| 3 | The since inception index return is from the inception date of Class I shares. |
| 4 | The expense ratios of the Series are set forth according to the prospectus for the Series effective April 30, 2019, as supplemented and revised, and may differ from the expense ratios disclosed in the Financial Highlights tables in this report. See the Financial Highlights for more current expense ratios. Net Expense: Expenses reduced by a contractual expense limitation in effect through April 30, 2021. Gross Expense: Does not reflect the effect of the contractual expense limitation. Expense ratios include fees and expenses associated with any underlying funds. |
The index is unmanaged and not available for direct investment; therefore, its performance does not reflect the expenses associated with active management of an actual portfolio.
For information regarding the indexes and certain investment terms, see the Key Investment Terms starting on page 4.
KAR Small-Cap Value Series
Series Summary (Unaudited)
Portfolio Manager Commentary by
Kayne Anderson Rudnick Investment Management, LLC
| ■ | The Series is diversified and has an investment objective of long-term capital appreciation.There is no guarantee that the Series will meet its objective. |
| ■ | For the fiscal year ended December 31, 2019, the Series’ Class A shares at NAV returned 24.63%. For the same period, the Russell 2000® Value Index, which serves as the Series’ broad-based and style-specific benchmark appropriate for comparison, returned 22.39%. |
All performance figures assume reinvestment of distributions and exclude the effect of fees and expenses associated with the variable life insurance or annuity product through which you invest. Performance data quoted represents past results. Past performance is no guarantee of future results, and current performance may be higher or lower than the performance shown above. Investment return and principal value will fluctuate so your shares, when redeemed, may be worth more or less than their original cost. Please visit Virtus.com for performance data current to the most recent month-end.
How did the markets perform during the Series’ fiscal year ended December 31, 2019?
Equity investors enjoyed extraordinary returns in 2019. After a very weak fourth quarter of 2018, stocks recovered all those losses and more in 2019. U.S. large-capitalization stocks returned 31.49%, as measured by the S&P 500® Index, and small-capitalization stocks, as measured by the Russell 2000® Index, returned 25.52%.
Coming into 2019, the stock market was pricing in a potential recession during the year. Global growth had been slowing and the Federal Reserve (the Fed) had made the mistake of raising interest rates in December of 2018. When no recession appeared in the first half of 2019 and the trade dispute with China looked like it was going to be resolved, stocks recovered strongly in the first six months of the year.
However, by the summer of 2019 it became clear that global industrial activity was continuing to slow dramatically, with industrials within most major countries (Germany, China and Japan) reaching recessionary levels. In addition, the U.S.-China trade
dispute remained unresolved and appeared to be escalating, increasing the odds of a full-blown recession.
The Fed finally began to reverse course, lowering interest rates at its July meeting in response to slowing conditions. The yield curve inverted briefly in August, with short-term bonds paying higher interest rates than longer-term bonds, reflecting fears about the future outlook for growth. Fortunately, the Fed lowered rates twice more in 2019, which helped restore the yield curve to its usual shape by year end.
Despite all the volatile trade discussions that occurred with China throughout the year, a limited Phase 1 deal was announced at year-end. While this did not resolve trade tensions, it helped to de-escalate them.
And despite slowing growth all year long, especially in industrial activity, the consumer continued to show strength, the Fed and other central banks lowered interest rates, trade discussions appeared headed in the right direction, and companies’ profits continued to grow in the U.S.
What factors affected the Series’ performance during its fiscal year?
The Series outperformed the Russell 2000® Value Index for the year ended December 31, 2019. Performance was driven by strong stock selection and an overweight in the materials and processing sector, as well as by strong stock selection in the financial services sector. Negative stock selection and an overweight in the consumer staples sector, as well as an underweight in technology, detracted from performance.
From an individual stock perspective, the holdings that contributed the most to performance were Scotts Miracle-Gro and SiteOne Landscape Supply.
• Scotts Miracle Gro serves cannabis growers through its hydroponic segment. These customers were adversely affected in 2018 by California’s cannabis licensing law, which caused many growers to exit the market during that year. We took advantage of this stock weakness to add to our position. In 2019, hydroponic sales ceased their decline and then returned to double-digit year-over-year organic growth in the second quarter. This gave market participants increased confidence
that the grower disruption had been mostly worked through, and caused the stock to rebound strongly.
• After disappointing weather results in the beginning of 2019, SiteOne saw better growth in the latter half of the year, which propelled it to its expected full-year results. Additionally, industry consolidation by SiteOne continued, which led to tangible improvements in profit margins, and helped reinforce the company’s business model of leveraging its scale and network. With only 12% of total industry market share, we believe SiteOne still has plenty of runway for further consolidation.
• Other top contributors included Brooks Automation, Thor Industries, and Bank of Hawaii.
The stocks that detracted the most from performance were Sally Beauty Holdings and Core Laboratories.
• Sally Beauty’s shares lagged following reports of continued negative same-store sales growth at the company’s professional Beauty Systems Group segment. The stock price declined sharply in late June 2019 on the news of Amazon launching its own e-commerce portal for salon professionals. We believe the entrance of Amazon into the professional channel is likely to challenge the competitive position of the Sally Beauty business and, as a result, we exited the position during the reporting period.
• Core Laboratories’ business has suffered over the past five years amid a severe cyclical downturn in the energy industry. More recently, a drop in U.S. onshore drilling activity and ongoing delays with international projects kept pressure on Core’s business and caused management to reduce the company’s dividend.
• Other top detractors included National Beverage, Cheesecake Factory, and UniFirst.
The preceding information is the opinion of portfolio management only through the end of the period stated on the cover. Any such opinions are subject to change at any time based upon market or other conditions and should not be relied upon as investment advice. Past performance is no guarantee of future results, and there is no guarantee that market forecasts will be realized.
Equity Securities: The market price of equity securities may be adversely affected by financial market, industry, or issuer-specific events. Focus on
For information regarding the indexes and certain investment terms, see the Key Investment Terms starting on page 4.
KAR Small-Cap Value Series (Continued)
a particular style or on small or medium-sized companies may enhance that risk.
Limited Number of Investments: Because the Series has a limited number of securities, it may be more susceptible to factors adversely affecting its securities than a less concentrated series.
Prospectus: Prospectus: For additional information on risks, please see the Series’ prospectus.
Asset Allocations
The following table presents asset allocations within certain sectors as a percentage of total investments as of December 31, 2019.
| Industrials | 27% |
| Financials | 19 |
| Information Technology | 18 |
| Consumer Discretionary | 9 |
| Real Estate | 7 |
| Consumer Staples | 7 |
| Materials | 6 |
| Other | 7 |
| Total | 100% |
For information regarding the indexes and certain investment terms, see the Key Investment Terms starting on page 4.
KAR Small-Cap Value Series (Continued)
Average Annual Total Returns1for periods ended 12/31/19
| | | 1 Year | 5 Years | 10 Years |
| Class A shares at NAV2 | 24.63% | 9.47% | 11.58% |
| Russell 2000® Value Index | 22.39 | 6.99 | 10.56 |
| Series Expense Ratios3: Class A shares: Gross 1.33%, Net 1.10%. | | | | |
| All returns represent past performance which is no guarantee of future results. Current performance may be higher or lower than the performance shown. The investment return and principal value of an investment will fluctuate so that an investor’s shares, when redeemed, may be worth more or less than their original cost. The above table and graph below do not reflect the deduction of taxes that a shareholder would pay on fund distributions or the redemption of shares. Please visit Virtus.com for performance data current to the most recent month-end. |
| |
| |
| |
Growth of $10,000for periods ended 12/31
This chart assumes an initial investment of $10,000 made on December 31, 2009 for Class A shares. Returns shown include the reinvestment of all distributions at net asset value, and the change in share price for the stated period.

| 1 | Total returns are historical and include changes in share price and the reinvestment of both dividends and capital gain distributions. |
| 2 | “NAV” (Net Asset Value) total returns do not reflect any fees or expenses associated with the separate insurance products. |
| 3 | The expense ratios of the Series are set forth according to the prospectus for the Series effective April 30, 2019, as supplemented and revised, and may differ from the expense ratios disclosed in the Financial Highlights tables in this report. See the Financial Highlights for more current expense ratios. Net Expense: Expenses reduced by a contractual expense limitation in effect through April 30, 2020. Gross Expense: Does not reflect the effect of the contractual expense limitation. Expense ratios include fees and expenses associated with any underlying funds. |
The index is unmanaged and not available for direct investment; therefore, its performance does not reflect the expenses associated with active management of an actual portfolio.
For information regarding the indexes and certain investment terms, see the Key Investment Terms starting on page 4.
Newfleet Multi-Sector Intermediate Bond Series
Series Summary (Unaudited)
Portfolio Manager Commentary by
Newfleet Asset Management, LLC
| ■ | The Series is diversified and has an investment objective of long-term total return.There is no guarantee that the Series will meet its objective. |
| ■ | For the fiscal year ended December 31, 2019, the Series’ Class A shares at NAV returned 10.47% and Class I shares at NAV returned 10.89%. For the same period, the Bloomberg Barclays U.S. Aggregate Bond Index, which serves as the broad-based and style-specific benchmark index appropriate for comparison, returned 8.72%. |
All performance figures assume reinvestment of distributions and exclude the effect of fees and expenses associated with the variable life insurance or annuity product through which you invest. Performance data quoted represents past results. Past performance is no guarantee of future results, and current performance may be higher or lower than the performance shown above. Investment return and principal value will fluctuate so your shares, when redeemed, may be worth more or less than their original cost. Please visit Virtus.com for performance data current to the most recent month-end.
How did the markets perform during the Series’ fiscal year ended December 31, 2019?
The year 2019 began in stark contrast to how 2018 ended. While many of the same concerns loomed, major global central banks, including the Federal Reserve (the Fed) and the European Central Bank (ECB), reacted to slowing economic activity and tame inflation by pivoting their tone and policy toward easing. This significant development, combined with improved valuations, led to a return to favor of risk assets. Fixed income markets responded favorably during the year to the global central banks’ pivot toward easing, positive developments on the trade front, and signs of stability in economic data. Geopolitical developments, including trade, Middle East tensions, and European politics, as well as central bank headlines, all continued to be significant market movers. Recession fears eased, but remained topical given the age of the business cycle.
Most spread sectors outperformed for the 12-month period, led by investment grade corporates, corporate high yield, emerging markets, and yankee high quality. Generally speaking, lower quality within investment grade spread sectors and higher quality
within below investment grade sectors outperformed in 2019. Given the change in U.S. interest rates, longer duration within most asset classes outperformed on a total return basis. Securitized sectors (asset-backed securities and residential mortgage-backed securities), while still positive, lagged other sectors.
The Fed, indicating a pivot toward easing of monetary policy early in 2019, signaled that rates were likely on hold for the balance of 2019. The Fed also announced changes to the management of its balance sheet. However, in early June the Chairman of the Fed indicated they were monitoring the impact of the tariff issues on the U.S. economic outlook, which was interpreted by the market as an indicator that the Fed had opened the door to the rate cut discussion. The Fed subsequently lowered its target rate at the July, September, and October meetings to a range of 1.50% to 1.75%. At its December meeting, the Fed left rates unchanged, reinforcing its view that current policy was appropriate to support a continued economic expansion, and that rates would remain on hold unless/until a significant change to the Fed’s outlook occurred.
The Treasury yield curve steepened and shifted broadly lower, more so on the front end, during the 12 months ended December 31, 2019.
What factors affected the Series’ performance during its fiscal year?
The outperformance of most spread sectors relative to U.S. Treasuries and agency mortgage-backed securities was the key driver of the Series’ performance for the fiscal year ended December 31, 2019. Among fixed income sectors, the Series’ allocation to and issue selection within corporate high yield, along with issue selection within the corporate high quality and yankee high quality sectors, had the largest positive impact on performance during the period.
Among fixed income sectors, the Series’ allocations to asset-backed securities and high yield bank loans were the largest detractors from performance during the fiscal year.
The preceding information is the opinion of portfolio management only through the end of the period stated on the cover. Any such opinions are subject to change at any time based upon market or other conditions and should not be relied upon as
investment advice. Past performance is no guarantee of future results, and there is no guarantee that market forecasts will be realized.
Credit & Interest: Debt securities are subject to various risks, the most prominent of which are credit and interest rate risk. The issuer of a bebt security may fail to make interest and /or principal payments. Values of debt securities may rise in response to changes in interest rates, and this risk may be enhanced with longer-term maturities.
High Yield-high Risk Fixed Income Securities: There is a greater level of credit risk and price volatility involved with high yield securities than investment grade securities.
Bank Loans: Loans may be unsecured or not fully collateralized, may be subject to restrictions on resale and/or infrequently on the secondary market. Loans can carry significant credit and call risks, can be difficult to value, and have longer settlement times than other investments, which can make loans relatively illiquid at times.
Foreign & Emerging Markets: Investing internationally, especially in emerging markets, involves additional risks such as currency, political, accounting, economic, and markets risk.
ABS/MBS: Changes in interest rates can cause both extension and prepayment risks for asset- and mortgage- backed securities. These securities are also subject to risks associated with the repayment of underlying collateral.
Prospectus: For additional information on risks, please see the Series’ prospectus.
For information regarding the indexes and certain investment terms, see the Key Investment Terms starting on page 4.
Newfleet Multi-Sector Intermediate Bond Series (Continued)
Asset Allocations
The following table presents asset allocations within certain sectors as a percentage of total investments as of December 31, 2019.
| Corporate Bonds and Notes | | 46% |
| Financials | 11% | |
| Energy | 8 | |
| Materials | 5 | |
| All other Corporate Bonds and Notes | 22 | |
| Mortgage-Backed Securities | | 22 |
| Asset-Backed Securities | | 10 |
| Foreign Government Securities | | 8 |
| Leveraged Loans | | 8 |
| Municipal Bonds | | 2 |
| Preferred Stocks | | 2 |
| Other (includes securitites lending collateral) | | 2 |
| Total | | 100% |
For information regarding the indexes and certain investment terms, see the Key Investment Terms starting on page 4.
Newfleet Multi-Sector Intermediate Bond Series (Continued)
Average Annual Total Returns1for periods ended 12/31/19
| | | 1 Year | 5 Years | 10 Years | Since
inception | Inception
date |
| Class A shares at NAV2 | | 10.47 % | 4.37 % | 5.71 % | — % | — |
| Class I shares at NAV2 | | 10.89 | 4.65 | — | 3.65 | 4/30/13 |
| Bloomberg Barclays U.S. Aggregate Bond Index | | 8.72 | 3.05 | 3.75 | 2.713 | — |
| Series Expense Ratios4: Class A shares: Gross 0.93%, Net 0.94%; Class I shares: Gross 0.68%, Net 0.69%. | | | | | | |
| All returns represent past performance which is no guarantee of future results. Current performance may be higher or lower than the performance shown. The investment return and principal value of an investment will fluctuate so that an investor’s shares, when redeemed, may be worth more or less than their original cost. The above table and graph below do not reflect the deduction of taxes that a shareholder would pay on fund distributions or the redemption of shares. Please visit Virtus.com for performance data current to the most recent month-end. |
| |
| |
| |
| |
Growth of $10,000for periods ended 12/31
This chart assumes an initial investment of $10,000 made on December 31, 2009 for Class A shares. The performance of the other share class may be greater or less than that shown based on differences in inception dates, fees, and sales charges. Returns shown include the reinvestment of all distributions at net asset value, and the change in share price for the stated period.

| 1 | Total returns are historical and include changes in share price and the reinvestment of both dividends and capital gain distributions. |
| 2 | “NAV” (Net Asset Value) total returns do not reflect any fees or expenses associated with the separate insurance products. |
| 3 | The since inception index return is from the inception date of Class I shares. |
| 4 | The expense ratios of the Series are set forth according to the prospectus for the Series effective April 30, 2019, as supplemented and revised, and may differ from the expense ratios disclosed in the Financial Highlights tables in this report. See the Financial Highlights for more current expense ratios. Net Expense: Expenses reduced by a contractual expense limitation in effect through April 30, 2020. Gross Expense: Does not reflect the effect of the contractual expense limitation. Gross Expenses were below the contractual expense limitation before recapture of expenses previously reimbursed and/or fees waived, which is why the net expense ratio is higher than the gross expense ratio. See Note 4D for additional information on Expense Recapture. Expense ratios include fees and expenses associated with any underlying funds. |
The index is unmanaged and not available for direct investment; therefore, its performance does not reflect the expenses associated with active management of an actual portfolio.
For information regarding the indexes and certain investment terms, see the Key Investment Terms starting on page 4.
Rampart Enhanced Core Equity Series
Series Summary (Unaudited)
Portfolio Manager Commentary by
Rampart Investment Management Company, LLC (“Rampart”)
| ■ | The Series is diversified and has investment objectives of capital appreciation and current income.There is no guarantee that the Series will meet its objectives. |
| ■ | For the fiscal year ended December 31, 2019, the Series’ Class A shares at NAV returned 28.67%. For the same period, the S&P 500® Index, which serves as the broad-based and style-specific benchmark appropriate for comparison, returned 31.49%. |
All performance figures assume reinvestment of distributions and exclude the effect of fees and expenses associated with the variable life insurance or annuity product through which you invest. Performance data quoted represents past results. Past performance is no guarantee of future results, and current performance may be higher or lower than the performance shown above. Investment return and principal value will fluctuate so your shares, when redeemed, may be worth more or less than their original cost. Please visit Virtus.com for performance data current to the most recent month-end.
How did the markets perform during the Series’ fiscal year ended December 31, 2019?
The U.S. stock market was extremely strong in 2019, as the post-financial-crisis bull market kept chugging along. The total return of the S&P 500® Index was 31.49% for the year. To achieve these levels, investors had to contend with a host of market stressors – a constantly evolving trade war, a relatively active Federal Reserve (Fed), presidential impeachment, and an array of military provocations by a number of state and non-state actors. Even with all this, investors saw what they wanted. Corporate profits looked good, earnings guidance was generally optimistic, and there were few appealing alternatives for investor money aside from U.S. large-cap stocks.
Volatility during the year was generally normal, meaning there were few flareups of risk, trading was not overly reactionary, and the overall sentiment of the market was calm skepticism. In quantitative terms, the Chicago Board Options Exchange Volatility Index® (CBOE VIX®) typically traded in the mid-teens, and the minimum (11.5) and maximum (25.5) price levels it reached during 2019 were not
especially notable. We have seen much lower levels, as recently as 2017, and we have certainly seen much higher levels, when the CBOE VIX® traded above 80 in 2008.
The volatility spread – defined as the difference between the future volatility estimates baked into options prices, and the actual realized volatility in the market – was positive for most of the year, and the size of the spread was in line with historical levels going back to 1990. This meant that, for the most part, the options market was pricing in a slightly higher level of market risk than actually occurred. This is considered normal and healthy.
There were two “inversions” during 2019. These are events in which the realized market volatility spikes, exceeding the volatility estimated by the options market. The first event, in May, was short and well contained, and associated with a trade war and tariff news. At that point, the market had gained 25% since its December 2018 lows, so a pullback seemed justified. The second event occurred in late July, at the end of an otherwise slow month. The catalyst event began when the Fed cut interest rates for the first time since 2008. While this was widely expected, subsequent comments by Chairman Powell put investors and traders in a sour mood, leading to some highly volatile trading. In the last two hours of the last trading day in July, the S&P 500® Index dropped nearly 2% (that drop happened within just 20 minutes), then recovered nearly all of its loss, and then sold off to finish down about 1% for the day. The frenetic trading persisted into August, as this relatively minor one-day event was exacerbated by renewed trade war rhetoric. By the end of August, calmness once again prevailed in the market, and investors appeared determined to set new record highs. They got their wish, closing out the year with a low-volatility bull market and the S&P 500® Index at record highs.
What factors affected the Series’ performance during its fiscal year?
The Series trailed the benchmark S&P 500® Index for the year, gaining 28.6% (including dividends). Performance was in line with the benchmark for much of the year, as the investment team deployed the options overlay program in a conservative manner. The team deemed this to be prudent, given the volatility that had occurred during 2018.
One element of this conservative positioning was to impose tight loss limits on option trades. During June and July, these tight loss limits caused the team to close out a handful of trades with relatively small losses in an effort to avoid larger potential losses. In hindsight, these trades would have been profitable if they had continued for longer. But, in a market which had behaved so erratically in 2018, the team put a priority on containing risk, even if that meant realizing the occasional loss.
The preceding information is the opinion of portfolio management only through the end of the period stated on the cover. Any such opinions are subject to change at any time based upon market or other conditions and should not be relied upon as investment advice. Past performance is no guarantee of future results, and there is no guarantee that market forecasts will be realized.
Equity Securities: The market price of equity securities may be adversely affected by financial market, industry, or issuer-specific events. Focus on a particular style or on small or medium-sized companies may enhance that risk.
Portfolio Turnover: The Series’ principal investments strategies will result in a consistently high portfolio turnover rate. A higher portfolio turnover rate may indicate higher transaction cost and may result in higher taxes when fund shares are held in a taxable account.
Options Overlay: The options overlay strategy may not be successful in achieving its objective of increasing distributable income while limiting the risk of loss and, in periods of significant moves in the S&P 500(R) Index, has resulted and, in the future, may result in losses for investors.
Call/Put Spreads: Buying and selling call and put option spreads on the SPX Index risks the loss of the premium when buying, can limit upside participation and increase downside losses.
Fund of Funds:Because the Series can invest in other funds, it indirectly bears its proportionate share of the operating expenses and management fees of the underlying fund(s).
Prospectus: For additional information on risks, please see the Series’ prospectus.
For information regarding the indexes and certain investment terms, see the Key Investment Terms starting on page 4.
Rampart Enhanced Core Equity Series (Continued)
Asset Allocations
The following table presents asset allocations within certain sectors as a percentage of total investments as of December 31, 2019.
| Information Technology | 23% |
| Health Care | 14 |
| Financials | 13 |
| Communication Services | 10 |
| Industrials | 9 |
| Consumer Discretionary | 9 |
| Consumer Staples | 7 |
| Other | 15 |
| Total | 100% |
For information regarding the indexes and certain investment terms, see the Key Investment Terms starting on page 4.
Rampart Enhanced Core Equity Series (Continued)
Average Annual Total Returns1for periods ended 12/31/19
| | | 1 Year | 5 Years | 10 Years |
| Class A shares at NAV2 | 28.67% | 6.56% | 9.72% |
| S&P 500® Index | 31.49 | 11.70 | 13.56 |
| Series Expense Ratios3: Class A shares: Gross 1.14%, Net 0.98%. | | | | |
| All returns represent past performance which is no guarantee of future results. Current performance may be higher or lower than the performance shown. The investment return and principal value of an investment will fluctuate so that an investor’s shares, when redeemed, may be worth more or less than their original cost. The above table and graph below do not reflect the deduction of taxes that a shareholder would pay on fund distributions or the redemption of shares. Please visit Virtus.com for performance data current to the most recent month-end. |
| |
| |
| |
Growth of $10,000for periods ended 12/31
This chart assumes an initial investment of $10,000 made on December 31, 2009 for Class A shares. Returns shown include the reinvestment of all distributions at net asset value, and the change in share price for the stated period.

| 1 | Total returns are historical and include changes in share price and the reinvestment of both dividends and capital gain distributions. |
| 2 | “NAV” (Net Asset Value) total returns do not reflect any fees or expenses associated with the separate insurance products. |
| 3 | The expense ratios of the Series are set forth according to the prospectus for the Series effective April 30, 2019, as supplemented and revised, and may differ from the expense ratios disclosed in the Financial Highlights tables in this report. See the Financial Highlights for more current expense ratios. Net Expense: Expenses reduced by a contractual expense limitation in effect through April 30, 2020. Gross Expense: Does not reflect the effect of the contractual expense limitation. Expense ratios include fees and expenses associated with any underlying funds. |
The index is unmanaged and not available for direct investment; therefore, its performance does not reflect the expenses associated with active management of an actual portfolio.
For information regarding the indexes and certain investment terms, see the Key Investment Terms starting on page 4.
SGA International Growth Series
Series Summary (Unaudited)
Portfolio Manager Commentary by
Sustainable Growth Advisers, LP
| ■ | The Series is diversified and has an investment objective of high total return consistent with reasonable risk.There is no guarantee that the Series will meet its objective. |
| ■ | For the fiscal year ended December 31, 2019, the Series’ Class A shares at NAV returned 18.54% and Class I shares at NAV returned 18.77%. For the same period, the MSCI All Country World ex USA Index (net), which serves as the Series’ broad-based and style-specific benchmark appropriate for comparison, returned 21.51%. |
All performance figures assume reinvestment of distributions and exclude the effect of fees and expenses associated with the variable life insurance or annuity product through which you invest. Performance data quoted represents past results. Past performance is no guarantee of future results, and current performance may be higher or lower than the performance shown above. Investment return and principal value will fluctuate so your shares, when redeemed, may be worth more or less than their original cost. Please visit Virtus.com for performance data current to the most recent month-end.
How did the markets perform during the Series’ fiscal year ended December 31, 2019?
International equity markets generated attractive returns for the year, with the MSCI All Country World ex USA (ACWI ex USA) Index (net) returning 21.5%, led primarily by strength in the information technology, health care, and consumer discretionary sectors. Developed markets outperformed emerging markets, which were impacted by weaker returns from India, South Africa, Hong Kong, and Mexico. The year saw periods of increased volatility as investors reacted to varying signs of economic resilience and weakness, continued slowing in China, concern over the impact of the U.S.-China trade war, an impasse on Brexit, and myriad geopolitical challenges. These fears were mitigated by rising optimism later in the year over a Phase 1 trade agreement between the U.S. and China, better than expected economic data, a seeming resolution to Brexit, and support from world monetary authorities to maintain accommodative policies. This rising optimism fueled significant increases in stock prices, despite remaining uncertainties over what happens
next with trade, how the Brexit implementation will impact the U.K. and continental Europe, and rising tensions in the Middle East and their impact on oil prices.
Earnings estimates for full year 2019 were ratcheted down dramatically over the course of the year. At December 31, 2018, the estimated 2019 earnings per share (EPS) growth for the ACWI ex USA Index was 6.9%. At December 31, 2019, the estimate had declined to -9.7%. With earnings growth estimates falling, multiple expansion was the primary driver of market appreciation. While the forecast earnings for the Series’ portfolio and the market declined over the course of the year, at the end of 2019, the Series’ forecast earnings growth exceeded that of the ACWI ex USA Index by a wide margin.
What factors affected the Series’ performance during its fiscal year?
Sustainable Growth Advisers (“SGA”) became the subadviser of the Series effective June 4, 2019. Performance of the Series prior thereto is that of a different manager.
Slowing global economic growth, declining earnings expectations, the U.S.-China trade war, and myriad other geopolitical issues led to increased volatility in the markets during the fiscal year ended December 31, 2019. Rising volatility is generally helpful to an investment strategy focused on businesses with above average, more predictable, and more sustainable revenue and earnings growth. Wide swings in investor risk preferences and market leadership over the course of the year, as well as stock-specific drivers, affected the performance of the Series.
The Series outperformed its benchmark due to strong stock selection in the industrials, consumer discretionary, financials, and health care sectors. Stock selection in the information technology sector was the primary detractor from performance. All other sectors, with the exception of energy, contributed positively to results. Sector allocations, which are purely a result of our stock selection process, contributed positively to the Series’ outperformance. This was due largely to an overweight in the strongly performing information technology sector and marginal exposure to the weakly performing energy sector. The Series’ overweight in the more defensive consumer staples sector detracted from relative performance.
The top contributors to the Series’ performance for the period were Shopify, adidas, Alibaba, IHS Markit, and AIA Group. The largest detractors for the period were Novozymes, Ubisoft Entertainment, Trip.com, Chr Hansen, and EssilorLuxottica. Of these, Shopify, Ubisoft Entertainment, and EssilorLuxottica were purchased by the Series’ prior manager, but sold upon the transition of the portfolio to SGA.
The preceding information is the opinion of portfolio management only through the end of the period stated on the cover. Any such opinions are subject to change at any time based upon market or other conditions and should not be relied upon as investment advice. Past performance is no guarantee of future results, and there is no guarantee that market forecasts will be realized.
Equity Securities: The market price of equity securities may be adversely affected by financial market, industry, or issuer-specific events. Focus on a particular style or on small or medium-sized companies may enhance that risk.
Foreign & Emerging Markets: Investing internationally, especially in emerging markets, involves additional risks such as currency, political, accounting, economic, and markets risk.
Geographic Concentration: A Series that focuses its investments in a particular geographic location will be highly sensitive to financial, economic, political, and other developments affecting the fiscal stability of that location.
Prospectus: For additional information on risks, please see the Series’ prospectus.
Asset Allocations
The following table presents asset allocations within certain sectors as a percentage of total investments as of December 31, 2019.
| Consumer Staples | 25% |
| Financials | 19 |
| Consumer Discretionary | 16 |
| Health Care | 12 |
| Information Technology | 11 |
| Materials | 6 |
| Industrials | 6 |
| Other (includes short-term investment) | 5 |
| Total | 100% |
For information regarding the indexes and certain investment terms, see the Key Investment Terms starting on page 4.
SGA International Growth Series (Continued)
Average Annual Total Returns1for periods ended 12/31/19
| | | 1 Year | 5 Years | 10 Years | Since
inception | Inception
date |
| Class A shares at NAV2 | | 18.54 % | 0.18 % | 2.80 % | — % | — |
| Class I shares at NAV2 | | 18.77 | 0.42 | — | -0.08 | 4/30/13 |
| MSCI All Country World ex USA Index (net) | | 21.51 | 5.51 | 4.97 | 4.653 | — |
| MSCI EAFE® Index (net)* | | 22.01 | 5.67 | 5.50 | 5.073 | — |
| Series Expense Ratios4: Class A shares: Gross 1.17%, Net 1.16%; Class I shares: Gross 0.92%, Net 0.91%. | | | | | | |
| All returns represent past performance which is no guarantee of future results. Current performance may be higher or lower than the performance shown. The investment return and principal value of an investment will fluctuate so that an investor’s shares, when redeemed, may be worth more or less than their original cost. The above table and graph below do not reflect the deduction of taxes that a shareholder would pay on fund distributions or the redemption of shares. Please visit Virtus.com for performance data current to the most recent month-end. |
| |
| |
| |
| |
Growth of $10,000for periods ended 12/31
This chart assumes an initial investment of $10,000 made on December 31, 2009 for Class A shares. The performance of the other share class may be greater or less than that shown based on differences in inception dates, fees, and sales charges. Returns shown include the reinvestment of all distributions at net asset value, and the change in share price for the stated period.
* The Series changed its primary benchmark during the year to MSCI All Country World ex USA Index (net). The Series’ new subadviser believes the MSCI All Country World ex USA Index (net) better reflects the markets and securities in which the Series’ portfolio is invested than the Series’ previous primary benchmark, the MSCI EAFE® Index (net).
| 1 | Total returns are historical and include changes in share price and the reinvestment of both dividends and capital gain distributions. |
| 2 | “NAV” (Net Asset Value) total returns do not reflect any fees or expenses associated with the separate insurance products. |
| 3 | The since inception index return is from the inception date of Class I shares. |
| 4 | The expense ratios of the Series are set forth according to the prospectus for the Series effective April 30, 2019, as supplemented and revised, and may differ from the expense ratios disclosed in the Financial Highlights tables in this report. See the Financial Highlights for more current expense ratios. Net Expense: Expenses reduced by a contractual expense limitation in effect through April 30, 2021. Gross Expense: Does not reflect the effect of the contractual expense limitation. Expense ratios include fees and expenses associated with any underlying funds. |
The indexes are unmanaged and not available for direct investment; therefore, their performance does not reflect the expenses associated with active management of an actual portfolio.
For information regarding the indexes and certain investment terms, see the Key Investment Terms starting on page 4.
Strategic Allocation Series
Series Summary (Unaudited)
Portfolio Manager Commentary by
Kayne Anderson Rudnick Investment Management, LLC (Domestic and International Equity Portfolio) and Newfleet Asset Management, LLC (Fixed Income Portfolio)
| ■ | The Series is diversified and has an investment objective of high total return over an extended period of time consistent with prudent investment risk.There is no guarantee that the Series will meet its objective. |
| ■ | For the fiscal year ended December 31, 2019, the Series’ Class A shares at NAV returned 26.05%. For the same period, the Bloomberg Barclays U.S. Aggregate Bond Index, a broad-based fixed income index, returned 8.72%; the MSCI ACWI ex USA SMID Cap Index (net), a broad-based international index, returned 22.36%; and Russell 1000® Growth Index, a broad-based U.S. equity index, returned 36.39%. The Strategic Allocation Series Linked Benchmark, the Series’ style-specific benchmark, returned 23.10%. |
All performance figures assume reinvestment of distributions and exclude the effect of fees and expenses associated with the variable life insurance or annuity product through which you invest. Performance data quoted represents past results. Past performance is no guarantee of future results, and current performance may be higher or lower than the performance shown above. Investment return and principal value will fluctuate so your shares, when redeemed, may be worth more or less than their original cost. Please visit Virtus.com for performance data current to the most recent month-end.
How did the markets perform during the Series’ fiscal year ended December 31, 2019?
U.S. Equities
Equity investors enjoyed extraordinary returns in 2019. After a very weak fourth quarter of 2018, stocks recovered all those losses and more in 2019. U.S. large-capitalization stocks returned 31.49%, as measured by the S&P 500® Index, and small-capitalization stocks, as measured by the Russell 2000® Index, returned 25.52%.
Coming into 2019, the stock market was pricing in a potential recession during the year. Global growth
had been slowing and the Federal Reserve (the Fed) had made the mistake of raising interest rates in December of 2018. When no recession appeared in the first half of 2019 and the trade dispute with China looked like it was going to be resolved, stocks recovered strongly in the first six months of the year.
However, by the summer of 2019 it became clear that global industrial activity was continuing to slow dramatically, with industrials within most major countries (Germany, China and Japan) reaching recessionary levels. In addition, the U.S.-China trade dispute remained unresolved and appeared to be escalating, increasing the odds of a full-blown recession.
The Fed finally began to reverse course, lowering interest rates at its July meeting in response to slowing conditions. The yield curve inverted briefly in August, with short-term bonds paying higher interest rates than longer-term bonds, reflecting fears about the future outlook for growth. Fortunately, the Fed lowered rates twice more in 2019, which helped restore the yield curve to its usual shape by year end.
Despite all the volatile trade discussions that occurred with China throughout the year, a limited Phase 1 deal was announced at year-end. While this did not resolve trade tensions, it helped to de-escalate them.
And despite slowing growth all year long, especially in industrial activity, the consumer continued to show strength, the Fed and other central banks lowered interest rates, trade discussions appeared headed in the right direction, and companies’ profits continued to grow in the U.S.
International Equities
The MSCI ACWI ex USA SMID Cap Index (net) increased 22.36% in a strong year for global equity markets. In 2018, equity markets around the world declined on economic growth fears, increasing trade tensions, and tightening monetary conditions. In 2019, however, global economic growth appeared to be stabilizing, trade sentiment improved, and global central banks were increasingly accommodative. In addition, the results of the December election in the U.K. appeared to offer clarity on an ultimate resolution to the Brexit saga that had dragged on for over three years. As a result, equity markets moved sharply higher.
Information technology was the best performing sector for the year, while the less economically sensitive consumer staples sector gained the least. Small-cap stocks in developed markets significantly outperformed during the year, led by gains in the U.K. Emerging markets underperformed, dragged down by negative returns in India and South Korea.
Fixed Income
The year 2019 began in stark contrast to how 2018 ended. While many of the same concerns loomed, major global central banks, including the Fed and the European Central Bank (ECB), reacted to slowing economic activity and tame inflation by pivoting their tone and policy toward easing. This significant development, combined with improved valuations, led to a return to favor of risk assets. Fixed income markets responded favorably during the year to the global central banks’ pivot toward easing, positive developments on the trade front, and signs of stability in economic data. Geopolitical developments, including trade, Middle East tensions, and European politics, as well as central bank headlines, all continued to be significant market movers. Recession fears eased, but remained topical given the age of the business cycle.
Most spread sectors outperformed for the 12-month period, led by investment grade corporates, corporate high yield, emerging markets, and yankee high quality. Generally speaking, lower quality within investment grade spread sectors and higher quality within below investment grade sectors outperformed in 2019. Given the change in U.S. interest rates, longer duration within most asset classes outperformed on a total return basis. Securitized sectors (asset-backed securities and residential mortgage-backed securities), while still positive, lagged other sectors.
The Fed, indicating a pivot toward easing of monetary policy early in 2019, signaled that rates were likely on hold for the balance of 2019. The Fed also announced changes to the management of its balance sheet. However, in early June the Chairman of the Fed indicated they were monitoring the impact of the tariff issues on the U.S. economic outlook, which was interpreted by the market as an indicator that the Fed had opened the door to the rate cut discussion. The Fed subsequently lowered its target rate at the July, September, and October meetings to a range of 1.50% to 1.75%. At its December meeting, the Fed
For information regarding the indexes and certain investment terms, see the Key Investment Terms starting on page 4.
Strategic Allocation Series (Continued)
left rates unchanged, reinforcing its view that current policy was appropriate to support a continued economic expansion, and that rates would remain on hold unless/until a significant change to the Fed’s outlook occurred.
The Treasury yield curve steepened and shifted broadly lower, more so on the front end, during the 12 months ended December 31, 2019.
What factors affected the Series’ performance during its fiscal year?
U.S. Equities
The U.S. equity sleeve of the Series outperformed the Russell 1000® Growth Index for the year ended December 31, 2019. Performance was driven by strong stock selection in the information technology sector, as well as strong stock selection and an underweight in the health care sector. Negative stock selection and an underweight in energy, as well as negative stock selection in materials, detracted from performance.
From an individual stock perspective, the holdings that contributed the most to performance were Paycom Software and Facebook.
• Paycom’s cloud-based human capital management (HCM) and payroll software have carved out a niche as a nimble software as a service (SaaS) offering that serves small to medium-sized businesses. Its out-of-the-box solution, low cost research and development, and sales office strategy combined to give the company some of the best profit margins among its SaaS peers. Paycom’s revenue continued to meaningfully exceed expectations during the year, as its efforts to sell to larger employers (2,000 to 5,000 employees) proved highly successful. The company saw improved retention and upsell opportunities as a result of its differentiated mobile offering. Paycom has boosted platform engagement with additional products to inform employers on employee usage of the software, which has led to better client retention over time. Paycom’s shares performed well in the fourth quarter of 2019 after the market digested the company’s plan to boost marketing spend to better address larger customers.
• Regulators around the world have made social media titan Facebook public enemy #1 for the past 18 months. Facebook stumbled a few times but, to its
credit, took an honest look at its product and adapted it in ways that reengaged users and affirmed its value to advertising customers. Even with new regulations on ad targeting, headwinds in its ability to get and/or use user data, and the self-imposed demonetization from ad format changes, revenue continued to grow. The cost of these changes has been hotly debated, and Facebook acknowledged that costs would rise approximately 35% in 2020, but claimed that costs were expected to more closely mirror revenue growth soon.
• Other top contributors included Alibaba Group, Bill.com, and Visa.
The stocks that detracted the most from performance were Uber Technologies and Cabot Oil & Gas.
• Uber Technologies has revolutionized personal mobility through ridesharing, and has leveraged its platform to expand the breadth of services to meal deliveries and logistics. Uber has captured greater than 65% market share in all but one of its major ridesharing markets (India). The company enjoyed cross-platform synergies, as 16% of Uber customers have ordered a meal through the Eats service just three years after its launch. In the past, Uber had said it would aggressively spend to compete in all markets, but recently the company pivoted to focus only on markets where it could be first or second. To that end, the company recently disclosed it is in talks to sell its business in India.
• Cabot Oil & Gas has been fenced in for years by lack of take-away capacity for its Marcellus Shale production acreage. However, while that capacity has come online, Cabot has discovered new challenges as it ramps up production. One of these challenges has been reduced operational efficiencies as it moves to larger drilling pads and operates a larger production base. With many other strong stock ideas and the specter of an economic slowdown hurting demand for the ample supply of domestic natural gas, we sold our position in the third quarter of 2019.
• Other top detractors included bluebird bio, Lyft, and Equifax.
International Equities
Kayne Anderson Rudnick Investment Management, LLC (“KAR”) became the subadviser of the Series’ International Equity Portfolio effective June 4, 2019.
Performance of the Series’ International Equity Portfolio prior thereto is that of a different manager.
The international equity sleeve of the Series outperformed the MSCI ACWI ex USA SMID Cap Index (net) for the year. Performance was driven by strong stock selection in the industrials and information technology sectors. Negative stock selection and an underweight in health care, as well as negative stock selection in consumer discretionary, detracted from performance.
From an individual stock perspective, the holdings that contributed the most to performance were HeadHunter Group and Mortgage Advice Bureau.
• HeadHunter is the leading online job portal in Russia. The company recently completed an initial public offering. The company reported extremely strong revenue and profit growth since this time, and the shares reacted favorably.
• Mortgage Advice Bureau is one of the leading networks for mortgage brokers in the U.K. Uncertainty related to Brexit had been hampering real estate for some time, acting as a headwind on underlying fundamentals and sentiment on the stock. The stock rallied sharply following the U.K. election results, as investors viewed this as a clear mandate for the Conservative party to move forward with an orderly Brexit.
• Other top contributors included Airbus, Freee, and Hitachi (holdings from the previous manager).
The stocks that detracted the most from performance were Autohome and easyJet.
• Autohome is the largest online destination for automotive research in China. Automotive sales over the last year have been weak, negatively impacting Autohome’s customers. This affected Autohome’s ability to pass on historical levels of price increases for advertising on its platform. We are comfortable owning stocks through negative cyclical issues, but in the case of Autohome, we had increasing concerns about management veering outside of the company’s core business. Most notably, we were skeptical about their decision to enter overseas markets, where there are already strong, established competitors. As a result, we exited our position during the reporting period.
• easyJet was held by the previous manager.
For information regarding the indexes and certain investment terms, see the Key Investment Terms starting on page 4.
Strategic Allocation Series (Continued)
• Other top detractors included BT Group (held by the previous manager), Cia Cervecerias Unidas, and Lloyds Banking Group (held by the previous manager).
Fixed Income
The outperformance of most spread sectors relative to U.S. Treasuries and agency mortgage-backed securities was the key driver of performance for the Series’ fixed income sleeve for the 12 months ended December 31, 2019. Among fixed income sectors, the portfolio’s allocation to and issue selection within corporate high yield, along with issue selection within the corporate high quality and yankee high quality sectors, had the largest positive impact on performance during the period.
Among fixed income sectors, the portfolio’s allocations to asset-backed securities and non-agency residential mortgage-backed securities were the largest detractors from performance during the fiscal year.
The preceding information is the opinion of portfolio management only through the end of the period stated on the cover. Any such opinions are subject to change at any time based upon market or other conditions and should not be relied upon as
investment advice. Past performance is no guarantee of future results, and there is no guarantee that market forecasts will be realized.
Equity Securities: The market price of equity securities may be adversely affected by financial market, industry, or issuer-specific events. Focus on a particular style or on small or medium-sized companies may enhance that risk.
Foreign & Emerging Markets: Investing internationally, especially in emerging markets, involves additional risks such as currency, political, accounting, economic, and markets risk.
Credit & Interest: Debt securities are subject to various risks, the most prominent of which are credit and interest rate risk. The issuer of a debt security may fail to make interest and /or principal payments. Values of debt securities may rise in response to changes in interest rates, and this risk may be enhanced with longer-term maturities.
High Yield-high Risk Fixed Income Securities: There is a greater level of credit risk and price volatility involved with high yield securities than investment grade securities.
ABS/MBS: Changes in interestrates can cause both extension and prepayment risks for asset- and
mortgage- backed securities. These securities are also subject to risks associated with the repayment of underlying collateral.
Prospectus: For additional information on risks, please see the Series’ prospectus.
Asset Allocations
The following table presents asset allocations within certain sectors as a percentage of total investments as of December 31, 2019.
| Common Stocks | | 63% |
| Information Technology | 16% | |
| Consumer Discretionary | 14 | |
| Communication Services | 10 | |
| All other Common Stocks | 23 | |
| Corporate Bonds and Notes | | 13 |
| Financials | 6 | |
| All Other Corporate Bonds and Notes | 7 | |
| Mortgage-Backed Securities | | 11 |
| U.S. Government Securities | | 5 |
| Asset-Backed Securities | | 4 |
| Municipal Bonds | | 2 |
| Leveraged Loans | | 1 |
| Other (includes securities lending collateral) | | 1 |
| Total | | 100% |
For information regarding the indexes and certain investment terms, see the Key Investment Terms starting on page 4.
Strategic Allocation Series (Continued)
Average Annual Total Returns1for periods ended 12/31/19
| | | 1 Year | 5 Years | 10 Years |
| Class A shares at NAV2 | 26.05% | 6.13% | 8.37% |
| Bloomberg Barclay U.S. Aggregate Bond Index | 8.72 | 3.05 | 3.75 |
| MSCI ACWI ex USA SMID Cap Index (net) | 22.36 | 6.59 | 6.40 |
| MSCI EAFE® Index (net)* | 22.01 | 5.67 | 5.50 |
| Russell 1000® Growth Index | 36.39 | 14.63 | 15.22 |
| Strategic Allocation Series Linked Benchmark | 23.10 | 8.83 | 10.00 |
| Series Expense Ratios3: Class A shares: Gross 1.02%, Net 0.98%. | | | | |
| All returns represent past performance which is no guarantee of future results. Current performance may be higher or lower than the performance shown. The investment return and principal value of an investment will fluctuate so that an investor’s shares, when redeemed, may be worth more or less than their original cost. The above table and graph below do not reflect the deduction of taxes that a shareholder would pay on fund distributions or the redemption of shares. Please visit Virtus.com for performance data current to the most recent month-end. |
| |
| |
| |
Growth of $10,000for periods ended 12/31
This chart assumes an initial investment of $10,000 made on December 31, 2009 for Class A shares. Returns shown include the reinvestment of all distributions at net asset value, and the change in share price for the stated period.
* The Series changed its broad based International index during the year to the MSCI ACWI ex USA SMID Cap Index (net), The Series’ new international equity subadviser believes the MSCI ACWI ex USA SMID Cap Index better reflects the markets and securities in which the Series’ non-U.S. portfolio is invested than the Series’ previous non-U.S. benchmark, the MSCI EAFE® Index (net).
| 1 | Total returns are historical and include changes in share price and the reinvestment of both dividends and capital gain distributions. |
| 2 | “NAV” (Net Asset Value) total returns do not reflect any fees or expenses associated with the separate insurance products. |
| 3 | The expense ratios of the Series are set forth according to the prospectus for the Series effective April 30, 2019, as supplemented and revised, and may differ from the expense ratios disclosed in the Financial Highlights tables in this report. See the Financial Highlights for more current expense ratios. Net Expense: Expenses reduced by a contractual expense limitation in effect through April 30, 2020. Gross Expense: Does not reflect the effect of the contractual expense limitation. Expense ratios include fees and expenses associated with any underlying funds. |
The indexes are unmanaged and not available for direct investment; therefore, their performance does not reflect the expenses associated with active management of an actual portfolio.
For information regarding the indexes and certain investment terms, see the Key Investment Terms starting on page 4.
Duff & Phelps Real Estate Securities Series
SCHEDULE OF INVESTMENTS
December 31, 2019
($ reported in thousands)
| | Shares | | Value |
| Common Stocks—96.2% |
| Real Estate Investment Trusts—96.2% | | |
| Data Centers—8.2% | | |
| CyrusOne, Inc. | 22,067 | | $1,444 |
| Equinix, Inc. | 8,677 | | 5,065 |
| | | | 6,509 |
| | | | |
| |
| Diversified—0.4% | | |
| Vornado Realty Trust | 4,900 | | 326 |
| Health Care—9.8% | | |
| Healthcare Trust of America, Inc. Class A | 84,500 | | 2,559 |
| Healthpeak Properties, Inc. | 114,450 | | 3,945 |
| Welltower, Inc. | 14,900 | | 1,218 |
| | | | 7,722 |
| | | | |
| |
| Industrial/Office—23.1% | | |
| Industrial—11.9% | | |
| Americold Realty Trust | 50,317 | | 1,764 |
| Duke Realty Corp. | 93,346 | | 3,236 |
| Prologis, Inc. | 49,052 | | 4,373 |
| | | | 9,373 |
| | | | |
| |
| Office—11.2% | | |
| Alexandria Real Estate Equities, Inc. | 22,617 | | 3,654 |
| Cousins Properties, Inc. | 69,512 | | 2,864 |
| Douglas Emmett, Inc. | 35,890 | | 1,576 |
| Paramount Group, Inc. | 57,560 | | 801 |
| | | | 8,895 |
| | | | |
| |
| Total Industrial/Office | | 18,268 |
| | | | |
| |
| Lodging/Resorts—3.8% | | |
| Host Hotels & Resorts, Inc. | 28,064 | | 520 |
| RLJ Lodging Trust | 46,535 | | 825 |
| Ryman Hospitality Properties, Inc. | 17,447 | | 1,512 |
| Summit Hotel Properties, Inc. | 14,343 | | 177 |
| | | | 3,034 |
| | | | |
| |
| Residential—25.1% | | |
| Apartments—16.2% | | |
| Apartment Investment & Management Co. Class A | 51,755 | | 2,673 |
| AvalonBay Communities, Inc. | 19,679 | | 4,127 |
| Equity Residential | 45,520 | | 3,684 |
| Essex Property Trust, Inc. | 3,205 | | 964 |
| Mid-America Apartment Communities, Inc. | 10,400 | | 1,371 |
| | | | 12,819 |
| | | | |
| |
| Manufactured Homes—4.1% | | |
| Sun Communities, Inc. | 21,451 | | 3,220 |
| Single Family Homes—4.8% | | |
| American Homes 4 Rent Class A | 101,300 | | 2,655 |
| Invitation Homes, Inc. | 39,950 | | 1,197 |
| | | | 3,852 |
| | | | |
| |
| Total Residential | | 19,891 |
| | | | |
| |
| | Shares | | Value |
| | | | |
| Retail—15.9% | | |
| Free Standing—5.3% | | |
| Spirit Realty Capital, Inc. | 38,354 | | $1,886 |
| STORE Capital Corp. | 61,500 | | 2,291 |
| | | | 4,177 |
| | | | |
| |
| Regional Malls—5.2% | | |
| Simon Property Group, Inc. | 22,401 | | 3,337 |
| Taubman Centers, Inc. | 26,910 | | 836 |
| | | | 4,173 |
| | | | |
| |
| Shopping Centers—5.4% | | |
| Brixmor Property Group, Inc. | 94,802 | | 2,049 |
| Regency Centers Corp. | 35,250 | | 2,224 |
| | | | 4,273 |
| | | | |
| |
| Total Retail | | | 12,623 |
| | | | |
| |
| Self Storage—3.4% | | |
| CubeSmart | 43,300 | | 1,363 |
| Extra Space Storage, Inc. | 12,366 | | 1,306 |
| | | | 2,669 |
| | | | |
| |
| Specialty—6.5% | | |
| Crown Castle International Corp. | 14,150 | | 2,011 |
| VICI Properties, Inc. | 123,000 | | 3,143 |
| | | | 5,154 |
| | | | |
| |
Total Common Stocks
(Identified Cost $54,967) | | 76,196 |
| | | | |
| |
| | | | |
| |
Total Long-Term Investments—96.2%
(Identified Cost $54,967) | | 76,196 |
| | | | |
| |
| | | | |
| |
| Short-Term Investment—1.9% |
| Money Market Mutual Fund—1.9% |
| Dreyfus Government Cash Management Fund - Institutional Shares (seven-day effective yield 1.512%)(1) | 1,546,696 | | 1,547 |
Total Short-Term Investment
(Identified Cost $1,547) | | 1,547 |
| | | | |
| |
| | | | |
| |
TOTAL INVESTMENTS—98.1%
(Identified Cost $56,514) | | $77,743 |
| Other assets and liabilities, net—1.9% | | 1,474 |
| NET ASSETS—100.0% | | $79,217 |
| Footnote Legend: |
| (1) | Shares of this fund are publicly offered, and its prospectus and annual report are publicly available. |
See Notes to Financial Statements
Duff & Phelps Real Estate Securities Series
SCHEDULE OF INVESTMENTS (Continued)
December 31, 2019
($ reported in thousands)
The following table summarizes the market value of the Series’ investments as of December 31, 2019, based on the inputs used to value them (See Security Valuation Note 2A in the Notes to Financial Statements):
| | Total
Value at
December 31, 2019 | | Level 1
Quoted Prices |
| Assets: | | | |
| Equity Securities: | | | |
| Common Stocks | $76,196 | | $76,196 |
| Money Market Mutual Fund | 1,547 | | 1,547 |
| Total Investments | $77,743 | | $77,743 |
There were no securities valued using significant observable inputs (Level 2) or significant unobservable inputs (Level 3) at December 31, 2019.
There were no transfers into or out of Level 3 related to securities held at December 31, 2019.
See Notes to Financial Statements
KAR Capital Growth Series
SCHEDULE OF INVESTMENTS
December 31, 2019
($ reported in thousands)
| | Shares | | Value |
| Common Stocks—99.3% | |
| Communication Services—13.6% | | |
| Activision Blizzard, Inc. | 49,350 | | $2,932 |
| Facebook, Inc. Class A(1) | 66,382 | | 13,625 |
| Netflix, Inc.(1) | 25,440 | | 8,232 |
| Tencent Holdings Ltd. ADR | 141,670 | | 6,801 |
| | | | 31,590 |
| | | | |
| |
| Consumer Discretionary—25.9% | | |
| Alibaba Group Holding Ltd. Sponsored ADR(1) | 64,278 | | 13,633 |
| Amazon.com, Inc.(1) | 9,220 | | 17,037 |
| Home Depot, Inc. (The) | 15,738 | | 3,437 |
| Las Vegas Sands Corp. | 80,072 | | 5,528 |
| McDonald’s Corp. | 16,040 | | 3,170 |
| MercadoLibre, Inc.(1) | 5,990 | | 3,426 |
| NIKE, Inc. Class B | 67,935 | | 6,883 |
| Ross Stores, Inc. | 43,927 | | 5,114 |
| Trip.com Group Ltd. ADR(1) | 64,310 | | 2,157 |
| | | | 60,385 |
| | | | |
| |
| Consumer Staples—6.0% | | |
| McCormick & Co., Inc. | 17,520 | | 2,974 |
| Monster Beverage Corp.(1) | 34,435 | | 2,188 |
| Philip Morris International, Inc. | 50,681 | | 4,312 |
| Procter & Gamble Co. (The) | 36,540 | | 4,564 |
| | | | 14,038 |
| | | | |
| |
| Financials—7.5% | | |
| Bank of America Corp. | 216,970 | | 7,642 |
| Charles Schwab Corp. (The) | 74,467 | | 3,541 |
| MarketAxess Holdings, Inc. | 11,970 | | 4,538 |
| Progressive Corp. (The) | 23,250 | | 1,683 |
| | | | 17,404 |
| | | | |
| |
| Health Care—7.1% | | |
| Danaher Corp. | 29,527 | | 4,532 |
| HealthEquity, Inc.(1) | 33,650 | | 2,492 |
| Illumina, Inc.(1) | 7,240 | | 2,402 |
| Zoetis, Inc. | 53,984 | | 7,145 |
| | | | 16,571 |
| | | | |
| |
| Industrials—9.8% | | |
| CoStar Group, Inc.(1) | 8,500 | | 5,085 |
| Equifax, Inc. | 15,820 | | 2,217 |
| Fair Isaac Corp.(1) | 8,930 | | 3,346 |
| | Shares | | Value |
| | | | |
| Industrials—continued | | |
| Kansas City Southern | 25,750 | | $3,944 |
| Roper Technologies, Inc. | 13,852 | | 4,907 |
| Uber Technologies, Inc.(1) | 108,420 | | 3,224 |
| | | | 22,723 |
| | | | |
| |
| Information Technology—27.1% | | |
| Accenture plc Class A | 20,011 | | 4,214 |
| Amphenol Corp. Class A | 61,894 | | 6,699 |
| Avalara, Inc.(1) | 71,480 | | 5,236 |
| Bill.com Holdings, Inc.(1)(2) | 145,467 | | 5,535 |
| NVIDIA Corp. | 32,330 | | 7,607 |
| Paycom Software, Inc.(1) | 38,962 | | 10,315 |
| Trade Desk, Inc. (The) Class A(1) | 22,600 | | 5,871 |
| Visa, Inc. Class A | 62,638 | | 11,770 |
| Workday, Inc. Class A(1) | 35,480 | | 5,835 |
| | | | 63,082 |
| | | | |
| |
| Materials—2.3% | | |
| Ecolab, Inc. | 27,494 | | 5,306 |
Total Common Stocks
(Identified Cost $98,529) | | 231,099 |
| | | | |
| |
| | | | |
| |
Total Long-Term Investments—99.3%
(Identified Cost $98,529) | | 231,099 |
| | | | |
| |
| | | | |
| |
TOTAL INVESTMENTS—99.3%
(Identified Cost $98,529) | | $231,099 |
| Other assets and liabilities, net—0.7% | | 1,735 |
| NET ASSETS—100.0% | | $232,834 |
| Abbreviation: |
| ADR | American Depositary Receipt |
| Footnote Legend: |
| (1) | Non-income producing. |
| (2) | Restricted security. |
| Country Weightings (Unaudited)† |
| United States | 90% |
| China | 10 |
| Total | 100% |
| † % of total investments as of December 31, 2019. |
For information regarding the abbreviations, see the Key Investment Terms starting on page 4.
See Notes to Financial Statements
KAR Capital Growth Series
SCHEDULE OF INVESTMENTS (Continued)
December 31, 2019
($ reported in thousands)
The following table summarizes the market value of the Series’ investments as of December 31, 2019, based on the inputs used to value them (See Security Valuation Note 2A in the Notes to Financial Statements):
| | Total
Value at
December 31, 2019 | | Level 1
Quoted Prices |
| Assets: | | | |
| Equity Securities: | | | |
| Common Stocks | $231,099 | | $231,099 |
| Total Investments | $231,099 | | $231,099 |
Securities held by the Series with an end of period value of $5,535 were transferred from Level 3 to Level 1 due to a market listing.
There were no securities valued using significant observable inputs (Level 2) or significant unobservable inputs (Level 3) at December 31, 2019.
See Notes to Financial Statements
KAR Small-Cap Growth Series
SCHEDULE OF INVESTMENTS
December 31, 2019
($ reported in thousands)
| | Shares | | Value |
| Common Stocks—94.7% | |
| Communication Services—18.2% | | |
| Auto Trader Group plc | 800,000 | | $6,301 |
| Autohome, Inc. ADR(1) | 83,670 | | 6,694 |
| Rightmove plc | 699,000 | | 5,867 |
| | | | 18,862 |
| | | | |
| |
| Consumer Discretionary—10.1% | | |
| Fox Factory Holding Corp.(1) | 90,355 | | 6,286 |
| Ollie’s Bargain Outlet Holdings, Inc.(1) | 64,710 | | 4,226 |
| | | | 10,512 |
| | | | |
| |
| Consumer Staples—6.6% | | |
| Chefs’ Warehouse, Inc. (The)(1) | 85,290 | | 3,251 |
| Grocery Outlet Holding Corp.(1) | 71,780 | | 2,329 |
| PriceSmart, Inc. | 18,500 | | 1,314 |
| | | | 6,894 |
| | | | |
| |
| Financials—14.7% | | |
| FactSet Research Systems, Inc. | 9,600 | | 2,576 |
| Goosehead Insurance, Inc. Class A | 23,760 | | 1,007 |
| Interactive Brokers Group, Inc. Class A | 77,630 | | 3,619 |
| MarketAxess Holdings, Inc. | 8,150 | | 3,090 |
| Morningstar, Inc. | 24,140 | | 3,653 |
| Oportun Financial Corp.(1)(2) | 53,880 | | 1,282 |
| | | | 15,227 |
| | | | |
| |
| Health Care—6.6% | | |
| Mesa Laboratories, Inc. | 5,435 | | 1,355 |
| National Research Corp. | 46,960 | | 3,097 |
| U.S. Physical Therapy, Inc. | 20,900 | | 2,390 |
| | | | 6,842 |
| | | | |
| |
| Industrials—14.0% | | |
| AAON, Inc. | 81,000 | | 4,002 |
| HEICO Corp. Class A | 35,938 | | 3,217 |
| Old Dominion Freight Line, Inc. | 27,000 | | 5,124 |
| Omega Flex, Inc. | 19,859 | | 2,131 |
| | | | 14,474 |
| | | | |
| |
| Information Technology—24.5% | | |
| ANSYS, Inc.(1) | 12,070 | | 3,107 |
| Aspen Technology, Inc.(1) | 36,980 | | 4,472 |
| Avalara, Inc.(1) | 36,540 | | 2,677 |
| Blackline, Inc.(1) | 61,190 | | 3,155 |
| DocuSign, Inc.(1) | 63,075 | | 4,674 |
| NVE Corp. | 8,850 | | 632 |
| Paycom Software, Inc.(1) | 25,050 | | 6,632 |
| | | | 25,349 |
| | | | |
| |
Total Common Stocks
(Identified Cost $44,337) | | 98,160 |
| | | | |
| |
| | | | |
| |
Total Long-Term Investments—94.7%
(Identified Cost $44,337) | | 98,160 |
| | | | |
| |
| | | | |
| |
| | Shares | | Value |
| | | | |
| | | | |
| Short-Term Investment—2.6% | |
| Money Market Mutual Fund—2.6% | |
| Dreyfus Government Cash Management Fund - Institutional Shares (seven-day effective yield 1.512%)(3) | 2,679,224 | | $2,679 |
Total Short-Term Investment
(Identified Cost $2,679) | | 2,679 |
| | | | |
| |
| | | | |
| |
| Securities Lending Collateral—1.2% | |
| Dreyfus Government Cash Management Fund - Institutional Shares (seven-day effective yield 1.512%)(3)(4) | 1,225,049 | | 1,225 |
Total Securities Lending Collateral
(Identified Cost $1,225) | | 1,225 |
| | | | |
| |
| | | | |
| |
TOTAL INVESTMENTS—98.5%
(Identified Cost $48,241) | | $102,064 |
| Other assets and liabilities, net—1.5% | | 1,551 |
| NET ASSETS—100.0% | | $103,615 |
| Abbreviation: |
| ADR | American Depositary Receipt |
| Footnote Legend: |
| (1) | Non-income producing. |
| (2) | All or a portion of security is on loan. |
| (3) | Shares of this fund are publicly offered, and its prospectus and annual report are publicly available. |
| (4) | Represents security purchased with cash collateral received for securities on loan. |
| Country Weightings (Unaudited)† |
| United States | 81% |
| United Kingdom | 12 |
| China | 7 |
| Total | 100% |
| † % of total investments as of December 31, 2019. |
The following table summarizes the market value of the Series’ investments as of December 31, 2019, based on the inputs used to value them (See Security Valuation Note 2A in the Notes to Financial Statements):
| | Total
Value at
December 31, 2019 | | Level 1
Quoted Prices |
| Assets: | | | |
| Equity Securities: | | | |
| Common Stocks | $98,160 | | $98,160 |
| Securities Lending Collateral | 1,225 | | 1,225 |
| Money Market Mutual Fund | 2,679 | | 2,679 |
| Total Investments | $102,064 | | $102,064 |
There were no securities valued using significant observable inputs (Level 2) or significant unobservable inputs (Level 3) at December 31, 2019.
There were no transfers into or out of Level 3 related to securities held at December 31, 2019.
For information regarding the abbreviations, see the Key Investment Terms starting on page 4.
See Notes to Financial Statements
KAR Small-Cap Value Series
SCHEDULE OF INVESTMENTS
December 31, 2019
($ reported in thousands)
| | Shares | | Value |
| Common Stocks—98.9% | |
| Communication Services—3.0% | | |
| Cinemark Holdings, Inc. | 69,000 | | $2,336 |
| Consumer Discretionary—8.8% | | |
| Cheesecake Factory, Inc. (The) | 72,650 | | 2,823 |
| Thor Industries, Inc. | 53,280 | | 3,958 |
| | | | 6,781 |
| | | | |
| |
| Consumer Staples—6.6% | | |
| National Beverage Corp. | 53,490 | | 2,729 |
| WD-40 Co. | 12,400 | | 2,407 |
| | | | 5,136 |
| | | | |
| |
| Energy—1.5% | | |
| Core Laboratories N.V. | 30,000 | | 1,130 |
| Financials—19.2% | | |
| Bank of Hawaii Corp. | 33,970 | | 3,232 |
| First Financial Bankshares, Inc. | 74,840 | | 2,627 |
| Houlihan Lokey, Inc. | 63,490 | | 3,103 |
| Primerica, Inc. | 25,628 | | 3,346 |
| RLI Corp. | 28,150 | | 2,534 |
| | | | 14,842 |
| | | | |
| |
| Health Care—2.5% | | |
| Anika Therapeutics, Inc.(1) | 37,150 | | 1,926 |
| Industrials—26.6% | | |
| Graco, Inc. | 53,210 | | 2,767 |
| Landstar System, Inc. | 22,530 | | 2,566 |
| Lincoln Electric Holdings, Inc. | 18,560 | | 1,795 |
| RBC Bearings, Inc.(1) | 25,300 | | 4,006 |
| SiteOne Landscape Supply, Inc.(1) | 54,554 | | 4,945 |
| UniFirst Corp. | 6,040 | | 1,220 |
| Watsco, Inc. | 18,050 | | 3,252 |
| | | | 20,551 |
| | | | |
| |
| Information Technology—17.7% | | |
| American Software, Inc. Class A | 83,100 | | 1,236 |
| Badger Meter, Inc. | 29,856 | | 1,939 |
| Brooks Automation, Inc. | 90,420 | | 3,794 |
| Cass Information Systems, Inc. | 39,864 | | 2,302 |
| CoreLogic, Inc.(1) | 64,050 | | 2,800 |
| Jack Henry & Associates, Inc. | 11,090 | | 1,615 |
| | | | 13,686 |
| | | | |
| |
| | Shares | | Value |
| | | | |
| Materials—6.4% | | |
| Scotts Miracle-Gro Co. (The) | 46,242 | | $4,910 |
| Real Estate—6.6% | | |
| Jones Lang LaSalle, Inc. | 6,396 | | 1,114 |
| MGM Growth Properties LLC Class A | 130,040 | | 4,027 |
| | | | 5,141 |
| | | | |
| |
Total Common Stocks
(Identified Cost $49,040) | | 76,439 |
| | | | |
| |
| | | | |
| |
Total Long-Term Investments—98.9%
(Identified Cost $49,040) | | 76,439 |
| | | | |
| |
| | | | |
| |
TOTAL INVESTMENTS—98.9%
(Identified Cost $49,040) | | $76,439 |
| Other assets and liabilities, net—1.1% | | 832 |
| NET ASSETS—100.0% | | $77,271 |
| Abbreviation: |
| LLC | Limited Liability Company |
| Footnote Legend: |
| (1) | Non-income producing. |
The following table summarizes the market value of the Series’ investments as of December 31, 2019, based on the inputs used to value them (See Security Valuation Note 2A in the Notes to Financial Statements):
| | Total
Value at
December 31, 2019 | | Level 1
Quoted Prices |
| Assets: | | | |
| Equity Securities: | | | |
| Common Stocks | $76,439 | | $76,439 |
| Total Investments | $76,439 | | $76,439 |
There were no securities valued using significant observable inputs (Level 2) or significant unobservable inputs (Level 3) at December 31, 2019.
There were no transfers into or out of Level 3 related to securities held at December 31, 2019.
For information regarding the abbreviations, see the Key Investment Terms starting on page 4.
See Notes to Financial Statements
Newfleet Multi-Sector Intermediate Bond Series
SCHEDULE OF INVESTMENTS
December 31, 2019
($ reported in thousands)
| | Par Value | | Value |
| U.S. Government Securities—0.7% |
| U.S. Treasury Note | | | |
| 1.250%, 8/31/24 | $360 | | $353 |
| 2.625%, 2/15/29 | 420 | | 445 |
Total U.S. Government Securities
(Identified Cost $810) | | 798 |
| | | | |
| |
| | | | |
| |
| Municipal Bonds—1.7% |
| California—1.0% | | |
State of California, Build America Bonds Taxable
7.600%, 11/1/40 | 725 | | 1,196 |
| Michigan—0.2% | | |
Tobacco Settlement Finance Authority Revenue Taxable Series A
7.309%, 6/1/34 | 170 | | 176 |
| Virginia—0.5% | | |
Tobacco Settlement Financing Corp. Revenue Taxable Series A-1, Taxable
6.706%, 6/1/46 | 630 | | 607 |
Total Municipal Bonds
(Identified Cost $2,001) | | 1,979 |
| | | | |
| |
| | | | |
| |
| Foreign Government Securities—8.2% |
| Bolivarian Republic of Venezuela | | | |
| 9.375%, 1/13/34(1) | 295 | | 34 |
RegS
7.650%, 4/21/25(1)(2) | 825 | | 95 |
Dominican Republic 144A
6.000%, 7/19/28(3) | 250 | | 278 |
Federal Republic of Nigeria 144A
7.875%, 2/16/32(3) | 495 | | 513 |
Kingdom of Abu Dhabi 144A
3.125%, 9/30/49(3) | 200 | | 195 |
Kingdom of Jordan 144A
5.750%, 1/31/27(3) | 200 | | 211 |
Kingdom of Morocco 144A
5.500%, 12/11/42(3) | 300 | | 367 |
| Kingdom of Saudi Arabia | | | |
144A
3.625%, 3/4/28(3) | 470 | | 496 |
144A
4.500%, 10/26/46(3) | 300 | | 332 |
| Republic of Angola | | | |
144A
8.250%, 5/9/28(3) | 200 | | 216 |
144A
8.000%, 11/26/29(3) | 200 | | 213 |
Republic of Costa Rica 144A
6.125%, 2/19/31(3) | 235 | | 250 |
Republic of Ecuador 144A
8.875%, 10/23/27(3) | 285 | | 261 |
| Republic of Egypt | | | |
144A
7.600%, 3/1/29(3) | 200 | | 219 |
144A
8.500%, 1/31/47(3) | 200 | | 222 |
| Republic of Ghana | | | |
144A
7.625%, 5/16/29(3) | 200 | | 204 |
| | Par Value | | Value |
| | | | |
| Foreign Government Securities—continued |
144A
8.125%, 3/26/32(3) | $200 | | $203 |
Republic of Indonesia 144A
4.350%, 1/8/27(3) | 440 | | 480 |
Republic of Kenya 144A
8.000%, 5/22/32(3) | 315 | | 343 |
Republic of Mongolia 144A
8.750%, 3/9/24(3) | 200 | | 227 |
Republic of Panama
4.300%, 4/29/53 | 355 | | 413 |
Republic of South Africa
5.650%, 9/27/47 | 390 | | 379 |
| Republic of Turkey | | | |
| 4.875%, 10/9/26 | 275 | | 262 |
| 6.000%, 3/25/27 | 505 | | 512 |
| 7.625%, 4/26/29 | 400 | | 442 |
Russian Federation 144A
5.625%, 4/4/42(3) | 600 | | 784 |
Ukraine 144A
7.375%, 9/25/32(3) | 555 | | 592 |
| United Mexican States | | | |
| 4.150%, 3/28/27 | 275 | | 295 |
| 4.500%, 4/22/29 | 260 | | 285 |
Series M
6.500%, 6/9/22 | 6,713MXN | | 353 |
Total Foreign Government Securities
(Identified Cost $10,100) | | 9,676 |
| | | | |
| |
| | | | |
| |
| Mortgage-Backed Securities—22.4% |
| Agency—1.7% | | |
| Federal National Mortgage Association | | | |
Pool #AT2016
3.000%, 4/1/43 | 329 | | 339 |
Pool #AS4992
3.500%, 5/1/45 | 195 | | 204 |
Pool #AS5696
3.500%, 8/1/45 | 410 | | 428 |
Pool #AS9393
4.000%, 4/1/47 | 98 | | 104 |
Pool #MA3058
4.000%, 7/1/47 | 77 | | 81 |
Pool #MA3088
4.000%, 8/1/47 | 618 | | 649 |
Pool #MA3121
4.000%, 9/1/47 | 229 | | 240 |
| | | | 2,045 |
| | | | |
| |
| Non-Agency—20.7% | | |
Agate Bay Mortgage Trust 2016-3, A5 144A
3.500%, 8/25/46(3)(4) | 186 | | 190 |
| American Homes 4 Rent Trust | | | |
2014-SFR2, C 144A
4.705%, 10/17/36(3) | 435 | | 461 |
2015-SFR1, A 144A
3.467%, 4/17/52(3) | 311 | | 320 |
2015-SFR2, C 144A
4.691%, 10/17/52(3) | 340 | | 363 |
Angel Oak Mortgage Trust I LLC 2019-1, A1 144A
3.920%, 11/25/48(3)(4) | 320 | | 325 |
See Notes to Financial Statements
Newfleet Multi-Sector Intermediate Bond Series
SCHEDULE OF INVESTMENTS (Continued)
December 31, 2019
($ reported in thousands)
| | Par Value | | Value |
| | | | |
| Non-Agency—continued | | |
Angel Oak Mortgage Trust LLC 2019-3, A1 144A
2.930%, 5/25/59(3)(4) | $293 | | $294 |
| Arroyo Mortgage Trust | | | |
2018-1, A1 144A
3.763%, 4/25/48(3)(4) | 89 | | 90 |
2019-1, A1 144A
3.805%, 1/25/49(3)(4) | 144 | | 147 |
2019-2, A1 144A
3.347%, 4/25/49(3)(4) | 182 | | 184 |
Banc of America Funding Trust 2005-1, 1A1
5.500%, 2/25/35 | 74 | | 76 |
Bank of America (Merrill Lynch - Countrywide) Alternative Loan Trust 2004-22CB, 1A1
6.000%, 10/25/34 | 113 | | 115 |
Bayview Opportunity Master Fund IVa Trust 2016-SPL1, B1 144A
4.250%, 4/28/55(3) | 275 | | 285 |
Bayview Opportunity Master Fund IVb Trust 2016-SPL2, B1 144A
4.250%, 6/28/53(3)(4) | 130 | | 135 |
BSPRT Issuer Ltd. 2019-FL5, A (1 month LIBOR + 1.150%) 144A
2.915%, 5/15/29(3)(4) | 235 | | 235 |
Bunker Hill Loan Depositary Trust 2019-1, A1 144A
3.613%, 10/26/48(3)(4) | 602 | | 608 |
BX Trust 2019-OC11, D 144A
4.075%, 12/9/41(3) | 295 | | 300 |
Chase Home Lending Mortgage Trust 2019-ATR1, A4 144A
4.000%, 4/25/49(3)(4) | 171 | | 172 |
CHC Commercial Mortgage Trust 2019-CHC, A (1 month LIBOR + 1.120%) 144A
2.860%, 6/15/34(3)(4) | 205 | | 205 |
CIT Home Equity Loan Trust 2003-1, A5
5.480%, 7/20/34(4) | 70 | | 70 |
| Citigroup Mortgage Loan Trust, Inc. | | | |
2019-IMC1, A1 144A
2.720%, 7/25/49(3)(4) | 260 | | 260 |
2015-A, A1 144A
3.500%, 6/25/58(3)(4) | 76 | | 77 |
2019-RP1, A1 144A
3.500%, 1/25/66(3)(4) | 262 | | 267 |
| COLT Mortgage Loan Trust Funding LLC | | | |
2018-1, A1 144A
2.930%, 2/25/48(3)(4) | 64 | | 64 |
2019-1, A1 144A
3.705%, 3/25/49(3)(4) | 93 | | 94 |
2019-3, A1 144A
2.764%, 8/25/49(3)(4) | 412 | | 411 |
Credit Suisse Mortgage Capital Trust 2014-IVR2, A2 144A
3.750%, 4/25/44(3)(4) | 89 | | 90 |
Deephaven Residential Mortgage Trust 2017-1A, A2 144A
2.928%, 12/26/46(3)(4) | 15 | | 15 |
| Ellington Financial Mortgage Trust | | | |
2018-1, A1FX 144A
4.140%, 10/25/58(3)(4) | 118 | | 120 |
2019-1, A1 144A
2.934%, 6/25/59(3)(4) | 199 | | 200 |
2019-2, A3 144A
3.046%, 11/25/59(3)(4) | 117 | | 117 |
| | Par Value | | Value |
| | | | |
| Non-Agency—continued | | |
| Galton Funding Mortgage Trust | | | |
2017-1, A21 144A
3.500%, 7/25/56(3)(4) | $103 | | $104 |
2018-1, A23 144A
3.500%, 11/25/57(3)(4) | 185 | | 185 |
2018-2, A41 144A
4.500%, 10/25/58(3)(4) | 257 | | 262 |
2019-H1,A1 144A
2.657%, 10/25/59(3)(4) | 118 | | 118 |
GCAT LLC 2019-NQM1, A1 144A
2.985%, 2/25/59(3)(4) | 110 | | 111 |
GSAA Home Equity Trust 2005-12, AF3W
4.999%, 9/25/35(4) | 84 | | 87 |
Homeward Opportunities Fund I Trust 2019-1, A1 144A
3.454%, 1/25/59(3)(4) | 221 | | 222 |
JPMorgan Chase Commercial Mortgage Securities Trust 2015-C31, AS
4.106%, 8/15/48 | 295 | | 314 |
| JPMorgan Chase Mortgage Trust | | | |
2014-2, 2A2 144A
3.500%, 6/25/29(3)(4) | 97 | | 98 |
2014-1, 2A12 144A
3.500%, 1/25/44(3)(4) | 153 | | 156 |
2016-SH1, M2 144A
3.750%, 4/25/45(3)(4) | 227 | | 232 |
2016-SH2, M2 144A
3.750%, 12/25/45(3)(4) | 288 | | 294 |
2017-5, A1 144A
3.155%, 10/26/48(3)(4) | 325 | | 329 |
2017-4, A3 144A
3.500%, 11/25/48(3)(4) | 212 | | 216 |
2018-8, A3 144A
4.000%, 1/25/49(3)(4) | 322 | | 327 |
LHOME Mortgage Trust 2019-RTL1, A1 144A
4.580%, 10/25/23(3)(4) | 355 | | 358 |
MASTR Alternative Loan Trust 2005-5, 2A3
5.500%, 7/25/25 | 82 | | 82 |
MASTR Specialized Loan Trust 2005-3, A2 144A
5.704%, 11/25/35(3)(4) | 76 | | 76 |
Mello Warehouse Securitization Trust 2019-1, C (1 month LIBOR + 1.200%) 144A
2.992%, 6/25/52(3)(4)(5) | 175 | | 175 |
| MetLife Securitization Trust | | | |
2017-1A, M1 144A
3.621%, 4/25/55(3)(4) | 150 | | 154 |
2019-1A, A1A 144A
3.750%, 4/25/58(3)(4) | 313 | | 322 |
| Mill City Mortgage Loan Trust | | | |
2017-1, A1 144A
2.750%, 11/25/58(3)(4) | 84 | | 84 |
2018-4, A1B 144A
3.500%, 4/25/66(3)(4) | 770 | | 786 |
Morgan Stanley - Bank of America (Merrill Lynch) Trust 2013-C13, AS
4.266%, 11/15/46 | 125 | | 132 |
| New Residential Mortgage Loan Trust | | | |
2018-4A, A1S (1 month LIBOR + 0.750%) 144A
2.542%, 1/25/48(3)(4) | 263 | | 263 |
2014-1A, A 144A
3.750%, 1/25/54(3)(4) | 184 | | 190 |
2015-2A, A1 144A
3.750%, 8/25/55(3)(4) | 155 | | 160 |
See Notes to Financial Statements
Newfleet Multi-Sector Intermediate Bond Series
SCHEDULE OF INVESTMENTS (Continued)
December 31, 2019
($ reported in thousands)
| | Par Value | | Value |
| | | | |
| Non-Agency—continued | | |
2016-1A, A1 144A
3.750%, 3/25/56(3)(4) | $133 | | $137 |
2016-4A, B1A 144A
4.500%, 11/25/56(3)(4) | 274 | | 292 |
2017-2A, A3 144A
4.000%, 3/25/57(3)(4) | 122 | | 128 |
2018-1A, A1A 144A
4.000%, 12/25/57(3)(4) | 244 | | 253 |
2019-NQM4, A1 144A
2.492%, 9/25/59(3)(4) | 363 | | 361 |
| OBX Trust | | | |
2018-EXP2, 1A1 144A
4.000%, 11/25/48(3)(4) | 343 | | 345 |
2019-INV1, A3 144A
4.500%, 11/25/48(3)(4) | 220 | | 226 |
One Market Plaza Trust 2017-1MKT, A 144A
3.614%, 2/10/32(3) | 260 | | 266 |
| Pretium Mortgage Credit Partners I LLC | | | |
2019-NPL3, A1 144A
3.105%, 7/27/59(3)(4) | 391 | | 391 |
2019-NPL1, A1 144A
4.213%, 7/25/60(3)(4) | 208 | | 208 |
| Progress Residential Trust | | | |
2018-SFR1, B 144A
3.484%, 3/17/35(3) | 270 | | 271 |
2018-SFR2, B 144A
3.841%, 8/17/35(3) | 545 | | 551 |
Provident Funding Mortgage Trust 2019-1, A2 144A
3.000%, 12/25/49(3)(4) | 589 | | 592 |
| PRPM LLC | | | |
2019-1A, A1 144A
4.500%, 1/25/24(3)(4) | 328 | | 329 |
2019-2A, A1 144A
3.967%, 4/25/24(3)(4) | 421 | | 422 |
2019-GS1, A1 144A
3.500%, 10/25/24(3)(4) | 228 | | 228 |
| RCO V Mortgage LLC | | | |
2019-1, A1 144A
3.721%, 5/24/24(3)(4) | 379 | | 380 |
2019-2, A1 144A
3.475%, 11/25/24(3)(4) | 230 | | 230 |
Residential Asset Mortgage Products Trust 2004-SL1, A8
6.500%, 11/25/31 | 16 | | 17 |
Residential Asset Securitization Trust 2005-A1, A3
5.500%, 4/25/35 | 182 | | 186 |
Residential Mortgage Loan Trust 2019-2, A1 144A
2.913%, 5/25/59(3)(4) | 365 | | 366 |
RMF Proprietary Issuance Trust 2019-1, A 144A
2.750%, 10/25/63(3)(4) | 292 | | 289 |
| Sequoia Mortgage Trust | | | |
2013-8, B1
3.523%, 6/25/43(4) | 170 | | 172 |
2018-CH2, A12 144A
4.000%, 6/25/48(3)(4) | 105 | | 105 |
Starwood Mortgage Residential Trust 2019-IMC1, A1 144A
3.468%, 2/25/49(3)(4) | 358 | | 360 |
Structured Adjustable Rate Mortgage Loan Trust 2004-4, 3A1
4.373%, 4/25/34(4) | 88 | | 91 |
| | Par Value | | Value |
| | | | |
| Non-Agency—continued | | |
Sutherland Commercial Mortgage Loans 2017-SBC6, A 144A
3.192%, 5/25/37(3)(4) | $29 | | $29 |
| Towd Point Mortgage Trust | | | |
2019-HE1, A1 (1 month LIBOR + 0.900%) 144A
2.692%, 4/25/48(3)(4) | 127 | | 127 |
2015-1, A2 144A
3.250%, 10/25/53(3)(4) | 255 | | 255 |
2016-1, M1 144A
3.500%, 2/25/55(3)(4) | 135 | | 139 |
2015-6, M1 144A
3.750%, 4/25/55(3)(4) | 130 | | 137 |
2015-5, A2 144A
3.500%, 5/25/55(3)(4) | 315 | | 320 |
2017-1, M1 144A
3.750%, 10/25/56(3)(4) | 135 | | 140 |
2018-6, A2 144A
3.750%, 3/25/58(3)(4) | 125 | | 130 |
2019-1, A1 144A
3.750%, 3/25/58(3)(4) | 153 | | 159 |
2018-4, A1 144A
3.000%, 6/25/58(3)(4) | 168 | | 170 |
2018-SJ1, A1 144A
4.000%, 10/25/58(3)(4) | 106 | | 107 |
2015-2, 1M1 144A
3.250%, 11/25/60(3)(4) | 315 | | 319 |
Tricon American Homes Trust 2019-SFR1, C 144A
3.149%, 3/17/38(3) | 235 | | 233 |
VCAT LLC 2019-NPL2, A1 144A
3.573%, 11/25/49(3)(4) | 119 | | 119 |
Vericrest Opportunity Loan Trust 2019-NPL2, A1 144A
3.967%, 2/25/49(3)(4) | 214 | | 215 |
Vericrest Opportunity Loan Trust LXIV LLC 2017-NP11, A1 144A
3.375%, 10/25/47(3)(4) | 134 | | 134 |
Vericrest Opportunity Loan Trust LXXV LLC 2019-NPL1, A1A 144A
4.336%, 1/25/49(3)(4) | 276 | | 277 |
| Verus Securitization Trust | | | |
2018-1, A1 144A
2.929%, 2/25/48(3)(4) | 98 | | 98 |
2018-2, B1 144A
4.426%, 6/1/58(3)(4) | 415 | | 419 |
2018-3, A1 144A
4.108%, 10/25/58(3)(4) | 186 | | 188 |
2019-1, A1 144A
3.836%, 2/25/59(3)(4) | 287 | | 290 |
2019-INV1, A1 144A
3.402%, 12/25/59(3)(4) | 253 | | 254 |
| Wells Fargo Commercial Mortgage Trust | | | |
2014-C24, AS
3.931%, 11/15/47 | 295 | | 310 |
2015-LC20, A5
3.184%, 4/15/50 | 295 | | 306 |
2015-LC20, B
3.719%, 4/15/50 | 150 | | 155 |
| | | | 24,353 |
| | | | |
| |
Total Mortgage-Backed Securities
(Identified Cost $26,080) | | 26,398 |
| | | | |
| |
| | | | |
| |
See Notes to Financial Statements
Newfleet Multi-Sector Intermediate Bond Series
SCHEDULE OF INVESTMENTS (Continued)
December 31, 2019
($ reported in thousands)
| | Par Value | | Value |
| | | | |
| | | | |
| Asset-Backed Securities—10.2% |
| Automobiles—6.7% | | |
ACC Trust 2018-1, B 144A
4.820%, 5/20/21(3) | $295 | | $296 |
| American Credit Acceptance Receivables Trust | | | |
2018-1, C
144A 3.550%, 4/10/24(3) | 322 | | 324 |
2018-4, C
144A 3.970%, 1/13/25(3) | 355 | | 360 |
AmeriCredit Automobile Receivables Trust 2018-1, D
3.820%, 3/18/24 | 295 | | 305 |
Avid Automobile Receivables Trust 2019-1, C 144A
3.140%, 7/15/26(3) | 355 | | 354 |
Capital Auto Receivables Asset Trust 2017-1, D 144A
3.150%, 2/20/25(3) | 340 | | 344 |
CPS Auto Receivables Trust 2018-C, D 144A
4.400%, 6/17/24(3) | 310 | | 319 |
DT Auto Owner Trust 2018-1A, C 144A
3.470%, 12/15/23(3) | 334 | | 335 |
| Exeter Automobile Receivables Trust | | | |
2018-1A, C
144A 3.030%, 1/17/23(3) | 410 | | 411 |
2018-4A, D
144A 4.350%, 9/16/24(3) | 365 | | 376 |
2019-1A, D
144A 4.130%, 12/16/24(3) | 355 | | 366 |
2019-3A, C
144A 2.790%, 5/15/24(3) | 295 | | 297 |
| Flagship Credit Auto Trust | | | |
2016-3, D
144A 3.890%, 11/15/22(3) | 400 | | 407 |
2019-1, C
144A 3.600%, 2/18/25(3) | 235 | | 241 |
Foursight Capital Automobile Receivables Trust 2017-1, B 144A
3.050%, 12/15/22(3) | 320 | | 321 |
| GLS Auto Receivables Trust | | | |
2018-1A, B
144A 3.520%, 8/15/23(3) | 410 | | 412 |
2018-3A, C
144A 4.180%, 7/15/24(3) | 455 | | 468 |
Hertz Vehicle Financing II LP 2016-4A, A 144A
2.650%, 7/25/22(3) | 405 | | 407 |
Prestige Auto Receivables Trust 2019-1A, D 144A
3.010%, 8/15/25(3) | 295 | | 297 |
Tesla Auto Lease Trust 2018-A, D 144A
3.300%, 5/20/20(3) | 340 | | 340 |
Tricolor Auto Securitization Trust 2018-2A, B 144A
4.760%, 2/15/22(3) | 289 | | 293 |
United Auto Credit Securitization Trust 2019-1, E 144A
4.290%, 8/12/24(3) | 295 | | 298 |
Veros Automobile Receivables Trust 2018-1, B 144A
4.050%, 2/15/24(3) | 300 | | 303 |
| | | | 7,874 |
| | | | |
| |
| Consumer Loans—0.3% | | |
Marlette Funding Trust 2019-4A, A 144A
2.390%, 12/17/29(3) | 331 | | 331 |
| Other—3.1% | | |
Amur Equipment Finance Receivables V LLC 2018-1A, A2 144A
3.240%, 12/20/23(3) | 194 | | 196 |
| | Par Value | | Value |
| | | | |
| Other—continued | | |
Aqua Finance Trust 2019-A, C 144A
4.010%, 7/16/40(3) | $355 | | $354 |
Arby’s Funding LLC 2015-1A, A2 144A
4.969%, 10/30/45(3) | 355 | | 364 |
Business Jet Securities LLC 2019-1, A 144A
4.212%, 7/15/34(3) | 329 | | 337 |
DB Master Finance LLC 2017-1A, A2I 144A
3.629%, 11/20/47(3) | 216 | | 219 |
Diamond Resorts Owner Trust 2017-1A, A 144A
3.270%, 10/22/29(3) | 113 | | 114 |
Drug Royalty II LP 2 2014-1, A2 144A
3.484%, 7/15/23(3) | 16 | | 16 |
ExteNet LLC 2019-1A, A2 144A
3.204%, 7/26/49(3) | 175 | | 176 |
Jersey Mike’s Funding 2019-1A, A2 144A
4.433%, 2/15/50(3) | 295 | | 295 |
Lendmark Funding Trust 2018-2A, A 144A
4.230%, 4/20/27(3) | 360 | | 370 |
OneMain Financial Issuance Trust 2018-1A, A 144A
3.300%, 3/14/29(3) | 335 | | 340 |
Oportun Funding VIII LLC 2018-A, A 144A
3.610%, 3/8/24(3) | 335 | | 338 |
Prosper Marketplace Issuance Trust 2018-2A, B 144A
3.960%, 10/15/24(3) | 305 | | 307 |
Regional Management Issuance Trust 2018-2, A 144A
4.560%, 1/18/28(3) | 295 | | 300 |
| | | | 3,726 |
| | | | |
| |
| Student Loan—0.1% | | |
SoFi Professional Loan Program LLC 2016-A, A2 144A
2.760%, 12/26/36(3) | 78 | | 78 |
Total Asset-Backed Securities
(Identified Cost $11,864) | | 12,009 |
| | | | |
| |
| | | | |
| |
| Corporate Bonds and Notes—45.4% |
| Communication Services—4.0% | | |
America Movil SAB de C.V.
6.450%, 12/5/22 | 20MXN | | 103 |
AT&T, Inc.
4.250%, 3/1/27 | 265 | | 291 |
Cable Onda S.A. 144A
4.500%, 1/30/30(3) | 240 | | 253 |
CCO Holdings LLC 144A
4.750%, 3/1/30(3) | 115 | | 117 |
Cincinnati Bell, Inc. 144A
7.000%, 7/15/24(3) | 245 | | 257 |
| Clear Channel Worldwide Holdings, Inc. | | | |
| 144A 9.250%, 2/15/24(3) | 62 | | 69 |
| 144A 5.125%, 8/15/27(3) | 80 | | 83 |
Consolidated Communications, Inc.
6.500%, 10/1/22(6) | 250 | | 226 |
| Diamond Sports Group LLC | | | |
| 144A 5.375%, 8/15/26(3) | 105 | | 106 |
| 144A 6.625%, 8/15/27(3)(6) | 180 | | 175 |
| DISH DBS Corp. | | | |
| 5.875%, 7/15/22 | 125 | | 133 |
| 7.750%, 7/1/26 | 60 | | 64 |
| Frontier Communications Corp. | | | |
| 8.500%, 4/15/20(6) | 110 | | 65 |
| 11.000%, 9/15/25 | 175 | | 85 |
See Notes to Financial Statements
Newfleet Multi-Sector Intermediate Bond Series
SCHEDULE OF INVESTMENTS (Continued)
December 31, 2019
($ reported in thousands)
| | Par Value | | Value |
| | | | |
| Communication Services—continued | | |
| 144A 8.500%, 4/1/26(3) | $110 | | $111 |
| iHeartCommunications, Inc. | | | |
| 8.375%, 5/1/27 | 106 | | 117 |
| Escrow 144A(3)(5) | 55 | | — |
IHS Netherlands Holdco B.V. 144A
8.000%, 9/18/27(3) | 260 | | 276 |
LCPR Senior Secured Financing DAC 144A
6.750%, 10/15/27(3) | 260 | | 276 |
Live Nation Entertainment, Inc. 144A
4.750%, 10/15/27(3) | 60 | | 62 |
McGraw-Hill Global Education Holdings LLC Senior Unsecured Notes 144A
7.875%, 5/15/24(3)(6) | 170 | | 146 |
Meredith Corp.
6.875%, 2/1/26 | 145 | | 151 |
Sirius XM Radio, Inc. 144A
5.500%, 7/1/29(3) | 105 | | 114 |
Sprint Corp.
7.875%, 9/15/23 | 160 | | 177 |
| Sprint Spectrum Co. LLC | | | |
| 144A 3.360%, 9/20/21(3) | 87 | | 88 |
| 144A 5.152%, 3/20/28(3) | 200 | | 218 |
| Telesat Canada | | | |
| 144A 4.875%, 6/1/27(3) | 80 | | 81 |
| 144A 6.500%, 10/15/27(3) | 220 | | 229 |
Tencent Holdings Ltd. 144A
3.975%, 4/11/29(3) | 400 | | 431 |
Twitter, Inc. 144A
3.875%, 12/15/27(3) | 175 | | 175 |
| | | | 4,679 |
| | | | |
| |
| Consumer Discretionary—3.3% | | |
American Axle & Manufacturing, Inc.
6.500%, 4/1/27 | 180 | | 187 |
Boyd Gaming Corp.
6.000%, 8/15/26 | 65 | | 70 |
Brookfield Residential Properties, Inc. 144A
6.250%, 9/15/27(3) | 355 | | 375 |
Bunge Ltd. Finance Corp.
4.350%, 3/15/24 | 70 | | 73 |
Caesars Resort Collection LLC 144A
5.250%, 10/15/25(3) | 120 | | 124 |
Dana, Inc.
5.375%, 11/15/27 | 110 | | 113 |
Downstream Development Authority of the Quapaw Tribe of Oklahoma 144A
10.500%, 2/15/23(3) | 130 | | 136 |
Eldorado Resorts, Inc.
6.000%, 9/15/26 | 75 | | 83 |
Gateway Casinos & Entertainment Ltd. 144A
8.250%, 3/1/24(3) | 285 | | 291 |
| GLP Capital LP | | | |
| 5.250%, 6/1/25 | 185 | | 203 |
| 5.750%, 6/1/28 | 64 | | 73 |
Golden Nugget, Inc. 144A
8.750%, 10/1/25(3) | 130 | | 139 |
Lear Corp.
3.800%, 9/15/27 | 290 | | 293 |
Lithia Motors, Inc. 144A
4.625%, 12/15/27(3) | 125 | | 128 |
| | Par Value | | Value |
| | | | |
| Consumer Discretionary—continued | | |
MGM Growth Properties Operating Partnership LP 144A
5.750%, 2/1/27(3) | $135 | | $151 |
Michaels Stores, Inc. 144A
8.000%, 7/15/27(3)(6) | 120 | | 115 |
Panther BF Aggregator 2 LP 144A
8.500%, 5/15/27(3) | 200 | | 212 |
PulteGroup, Inc.
7.875%, 6/15/32 | 180 | | 231 |
| Scientific Games International, Inc. | | | |
| 144A 8.250%, 3/15/26(3) | 80 | | 88 |
| 144A 7.000%, 5/15/28(3) | 40 | | 43 |
Tenneco, Inc.
5.000%, 7/15/26 | 125 | | 115 |
Under Armour, Inc.
3.250%, 6/15/26 | 170 | | 165 |
Vista Outdoor, Inc.
5.875%, 10/1/23 | 235 | | 225 |
Weekley Homes LLC
6.625%, 8/15/25 | 215 | | 223 |
| | | | 3,856 |
| | | | |
| |
| Consumer Staples—1.5% | | |
Albertsons Cos., Inc. 144A
4.625%, 1/15/27(3) | 235 | | 235 |
Altria Group, Inc.
4.800%, 2/14/29 | 450 | | 501 |
Bacardi Ltd. 144A
4.700%, 5/15/28(3) | 320 | | 348 |
Chobani LLC 144A
7.500%, 4/15/25(3) | 180 | | 181 |
Kronos Acquisition Holdings, Inc. 144A
9.000%, 8/15/23(3) | 140 | | 134 |
Sigma Finance Netherlands BV 144A
4.875%, 3/27/28(3) | 295 | | 318 |
| | | | 1,717 |
| | | | |
| |
| Energy—8.0% | | |
Alliance Resource Operating Partners LP 144A
7.500%, 5/1/25(3) | 225 | | 205 |
Blue Racer Midstream LLC 144A
6.625%, 7/15/26(3) | 260 | | 235 |
Callon Petroleum Co.
6.125%, 10/1/24 | 101 | | 102 |
| Cheniere Energy Partners LP | | | |
| 5.625%, 10/1/26 | 125 | | 132 |
| 144A 4.500%, 10/1/29(3) | 105 | | 108 |
CITGO Holding, Inc. 144A
9.250%, 8/1/24(3) | 110 | | 118 |
CrownRock LP 144A
5.625%, 10/15/25(3) | 240 | | 245 |
| Denbury Resources, Inc. | | | |
| 144A 9.250%, 3/31/22(3) | 94 | | 89 |
| 144A 7.750%, 2/15/24(3) | 125 | | 111 |
Encana Corp.
8.125%, 9/15/30 | 155 | | 200 |
Energy Transfer Partners LP
5.000%, 10/1/22 | 314 | | 333 |
Geopark Ltd. 144A
6.500%, 9/21/24(3) | 270 | | 281 |
HollyFrontier Corp.
5.875%, 4/1/26 | 360 | | 405 |
See Notes to Financial Statements
Newfleet Multi-Sector Intermediate Bond Series
SCHEDULE OF INVESTMENTS (Continued)
December 31, 2019
($ reported in thousands)
| | Par Value | | Value |
| | | | |
| Energy—continued | | |
| KazMunayGas National Co. JSC | | | |
| 144A 4.750%, 4/19/27(3) | $595 | | $653 |
| 144A 5.750%, 4/19/47(3) | 320 | | 382 |
Kinder Morgan, Inc.
7.750%, 1/15/32 | 320 | | 440 |
MPLX LP
4.000%, 3/15/28 | 283 | | 293 |
Nabors Industries, Inc.
5.500%, 1/15/23 | 110 | | 106 |
Odebrecht Offshore Drilling Finance Ltd. PIK Interest Capitalization, 144A
7.720%, 12/1/26(3)(7) | 427 | | 105 |
Odebrecht Oil & Gas Finance Ltd. 144A
0.000%(3)(8) | 60 | | —(9) |
Patterson-UTI Energy, Inc.
5.150%, 11/15/29 | 180 | | 184 |
Pertamina Persero PT 144A
6.450%, 5/30/44(3) | 760 | | 976 |
| Petrobras Global Finance B.V. | | | |
| 7.375%, 1/17/27 | 270 | | 329 |
| 5.999%, 1/27/28 | 180 | | 205 |
| 5.750%, 2/1/29 | 210 | | 237 |
| 6.900%, 3/19/49 | 265 | | 311 |
Petroleos de Venezuela S.A. 144A
6.000%, 5/16/24(1)(3) | 650 | | 50 |
| Petroleos Mexicanos | | | |
| 6.500%, 3/13/27 | 230 | | 244 |
| 5.350%, 2/12/28 | 260 | | 259 |
| 6.500%, 6/2/41 | 220 | | 218 |
| 6.375%, 1/23/45 | 185 | | 178 |
| 144A 6.840%, 1/23/30(3) | 355 | | 378 |
Sabine Pass Liquefaction LLC
4.200%, 3/15/28 | 280 | | 296 |
Sanchez Energy Corp. 144A
7.250%, 2/15/23(1)(3)(6) | 120 | | 78 |
State Oil Co. of the Azerbaijan Republic RegS
6.950%, 3/18/30(2) | 320 | | 393 |
Targa Resources Partners LP
5.875%, 4/15/26 | 170 | | 181 |
Transocean, Inc. 144A
9.000%, 7/15/23(3) | 85 | | 90 |
| USA Compression Partners LP | | | |
| 6.875%, 4/1/26 | 215 | | 226 |
| 6.875%, 9/1/27 | 30 | | 31 |
Vine Oil & Gas LP 144A
8.750%, 4/15/23(3) | 165 | | 81 |
| | | | 9,488 |
| | | | |
| |
| Financials—10.9% | | |
| Acrisure LLC | | | |
| 144A 8.125%, 2/15/24(3) | 80 | | 87 |
| 144A 7.000%, 11/15/25(3) | 270 | | 261 |
AerCap Ireland Capital DAC
3.650%, 7/21/27 | 310 | | 319 |
Allstate Corp. (The) Series B
5.750%, 8/15/53(10) | 365 | | 392 |
Athene Holding Ltd.
4.125%, 1/12/28 | 325 | | 336 |
Australia & New Zealand Banking Group Ltd. 144A
4.400%, 5/19/26(3) | 335 | | 357 |
Aviation Capital Group LLC 144A
3.500%, 11/1/27(3) | 355 | | 357 |
| | Par Value | | Value |
| | | | |
| Financials—continued | | |
Banco Bilbao Vizcaya Argentaria Bancomer S.A. 144A
5.125%, 1/18/33(3) | $275 | | $277 |
Banco de Credito e Inversiones 144A
3.500%, 10/12/27(3) | 215 | | 220 |
Bank of America Corp.
4.200%, 8/26/24 | 223 | | 239 |
Bank of China Ltd. 144A
5.000%, 11/13/24(3) | 390 | | 425 |
Bank of Montreal
3.803%, 12/15/32 | 326 | | 340 |
Brighthouse Financial, Inc.
3.700%, 6/22/27 | 350 | | 349 |
Brightsphere Investment Group, Inc.
4.800%, 7/27/26 | 270 | | 281 |
Capital One Financial Corp.
3.750%, 7/28/26 | 405 | | 426 |
Citadel LP 144A
4.875%, 1/15/27(3) | 235 | | 247 |
Development Bank of Kazakhstan JSC 144A
8.950%, 5/4/23(3) | 85,000KZT | | 208 |
Discover Bank
4.682%, 8/9/28 | 340 | | 355 |
Drawbridge Special Opportunities Fund LP 144A
5.000%, 8/1/21(3) | 440 | | 447 |
Fairfax Financial Holdings Ltd.
4.850%, 4/17/28 | 365 | | 397 |
Fairstone Financial, Inc. 144A
7.875%, 7/15/24(3) | 35 | | 38 |
Goldman Sachs Group, Inc. (The)
3.850%, 1/26/27 | 385 | | 409 |
Grupo de Inversiones Suramericana S.A. 144A
5.500%, 4/29/26(3) | 335 | | 374 |
ICAHN Enterprises LP
6.250%, 5/15/26 | 255 | | 272 |
Intercorp Peru Ltd. 144A
3.875%, 8/15/29(3)(6) | 235 | | 233 |
Jefferies Financial Group, Inc.
5.500%, 10/18/23 | 100 | | 109 |
Jefferies Group LLC
4.850%, 1/15/27 | 60 | | 66 |
JPMorgan Chase & Co.
2.950%, 10/1/26 | 475 | | 489 |
Liberty Mutual Insurance Co. 144A
8.500%, 5/15/25(3) | 25 | | 31 |
Lincoln National Corp. (3 month LIBOR + 2.040%)
4.006%, 4/20/67(4)(10) | 365 | | 308 |
Lloyds Bank plc 144A
6.500%, 9/14/20(3) | 600 | | 617 |
MSCI, Inc. 144A
4.000%, 11/15/29(3) | 175 | | 177 |
Navient Corp.
6.750%, 6/25/25 | 290 | | 320 |
Prudential Financial, Inc. (3 month LIBOR + 4.175%)
5.875%, 9/15/42 | 280 | | 301 |
| Santander Holdings USA, Inc. | | | |
| 3.500%, 6/7/24 | 175 | | 180 |
| 4.400%, 7/13/27 | 200 | | 216 |
| Springleaf Finance Corp. | | | |
| 7.125%, 3/15/26 | 110 | | 127 |
| 5.375%, 11/15/29 | 20 | | 21 |
Synchrony Financial
3.950%, 12/1/27 | 410 | | 430 |
See Notes to Financial Statements
Newfleet Multi-Sector Intermediate Bond Series
SCHEDULE OF INVESTMENTS (Continued)
December 31, 2019
($ reported in thousands)
| | Par Value | | Value |
| | | | |
| Financials—continued | | |
Synovus Financial Corp.
5.900%, 2/7/29 | $164 | | $174 |
Teachers Insurance & Annuity Association of America (3 month LIBOR + 2.661%) 144A
4.375%, 9/15/54(3) | 360 | | 375 |
Toronto-Dominion Bank (The)
3.625%, 9/15/31 | 380 | | 397 |
Voya Financial, Inc. (3 month LIBOR + 3.580%)
5.650%, 5/15/53 | 240 | | 255 |
Wells Fargo & Co. Series S
5.900%(10) | 300 | | 327 |
Zions Bancorp NA
3.250%, 10/29/29 | 350 | | 343 |
| | | | 12,909 |
| | | | |
| |
| Health Care—2.9% | | |
Advanz Pharma Corp.
8.000%, 9/6/24 | 41 | | 39 |
| Avantor, Inc. | | | |
| 144A 6.000%, 10/1/24(3) | 100 | | 107 |
| 144A 9.000%, 10/1/25(3) | 145 | | 162 |
| Bausch Health Americas, Inc. | | | |
| 144A 9.250%, 4/1/26(3) | 90 | | 103 |
| 144A 8.500%, 1/31/27(3) | 100 | | 114 |
Bausch Health Cos., Inc. 144A
7.000%, 1/15/28(3) | 140 | | 154 |
Catalent Pharma Solutions, Inc. 144A
5.000%, 7/15/27(3) | 50 | | 52 |
| Centene Corp. | | | |
| 144A 5.375%, 6/1/26(3) | 75 | | 80 |
| 144A 4.625%, 12/15/29(3) | 100 | | 105 |
Charles River Laboratories International, Inc. 144A
4.250%, 5/1/28(3) | 60 | | 61 |
| Eagle Holding Co. II LLC | | | |
PIK Interest Capitalization,
144A 7.625%, 5/15/22(3)(11) | 125 | | 127 |
PIK Interest Capitalization,
144A 7.750%, 5/15/22(3)(11) | 120 | | 122 |
Endo Dac 144A
6.000%, 7/15/23(3) | 100 | | 72 |
| HCA, Inc. | | | |
| 5.625%, 9/1/28 | 185 | | 211 |
| 5.875%, 2/1/29 | 25 | | 29 |
| 4.125%, 6/15/29 | 305 | | 323 |
Mylan NV
3.950%, 6/15/26 | 325 | | 338 |
Par Pharmaceutical, Inc. 144A
7.500%, 4/1/27(3) | 75 | | 75 |
Perrigo Finance Unlimited Co.
4.375%, 3/15/26 | 300 | | 309 |
Select Medical Corp. 144A
6.250%, 8/15/26(3) | 190 | | 206 |
| Surgery Center Holdings, Inc. | | | |
| 144A 6.750%, 7/1/25(3) | 35 | | 35 |
| 144A 10.000%, 4/15/27(3) | 100 | | 110 |
| Tenet Healthcare Corp. | | | |
| 8.125%, 4/1/22 | 60 | | 66 |
| 4.625%, 7/15/24 | 70 | | 72 |
| 144A 5.125%, 11/1/27(3) | 80 | | 84 |
Teva Pharmaceutical Finance Netherlands III BV
3.150%, 10/1/26 | 210 | | 175 |
| | Par Value | | Value |
| | | | |
| Health Care—continued | | |
West Street Merger Sub, Inc. 144A
6.375%, 9/1/25(3) | $140 | | $140 |
| | | | 3,471 |
| | | | |
| |
| Industrials—3.8% | | |
Allied Universal Holdco LLC 144A
6.625%, 7/15/26(3) | 235 | | 253 |
ASGN, Inc. 144A
4.625%, 5/15/28(3) | 122 | | 125 |
Ashtead Capital, Inc. 144A
4.375%, 8/15/27(3) | 360 | | 373 |
Avolon Holdings Funding Ltd. 144A
4.375%, 5/1/26(3) | 358 | | 378 |
| Bombardier, Inc. | | | |
| 144A 5.750%, 3/15/22(3) | 115 | | 119 |
| 144A 7.500%, 3/15/25(3) | 120 | | 124 |
DP World plc 144A
6.850%, 7/2/37(3) | 300 | | 394 |
GFL Environmental, Inc. 144A
8.500%, 5/1/27(3) | 120 | | 132 |
Granite Holdings US Acquisition Co. 144A
11.000%, 10/1/27(3) | 180 | | 182 |
Hillenbrand, Inc.
4.500%, 9/15/26 | 305 | | 319 |
Hillman Group, Inc. (The) 144A
6.375%, 7/15/22(3) | 120 | | 112 |
Norwegian Air Shuttle ASA Pass-Through-Trust 2016-1, A 144A
4.875%, 5/10/28(3) | 287 | | 281 |
Oshkosh Corp.
4.600%, 5/15/28 | 424 | | 452 |
| Owens Corning | | | |
| 3.400%, 8/15/26 | 330 | | 335 |
| 3.950%, 8/15/29 | 211 | | 219 |
Patrick Industries, Inc. 144A
7.500%, 10/15/27(3) | 165 | | 176 |
Pentair Finance S.a.r.l
4.500%, 7/1/29 | 345 | | 363 |
Vertiv Intermediate Holding Corp. PIK Interest Capitalization, 144A
12.000%, 2/15/22(3)(11) | 175 | | 182 |
| | | | 4,519 |
| | | | |
| |
| Information Technology—2.3% | | |
Alibaba Group Holding Ltd.
3.400%, 12/6/27 | 235 | | 245 |
Banff Merger Sub, Inc. 144A
9.750%, 9/1/26(3) | 35 | | 35 |
Broadcom Corp.
3.625%, 1/15/24 | 192 | | 199 |
Broadcom, Inc. 144A
3.625%, 10/15/24(3) | 200 | | 208 |
Citrix Systems, Inc.
4.500%, 12/1/27 | 285 | | 308 |
Dell International LLC 144A
8.100%, 7/15/36(3) | 140 | | 184 |
Everi Payments, Inc. 144A
7.500%, 12/15/25(3) | 50 | | 54 |
Exela Intermediate LLC 144A
10.000%, 7/15/23(3) | 90 | | 36 |
Juniper Networks, Inc.
3.750%, 8/15/29 | 260 | | 270 |
See Notes to Financial Statements
Newfleet Multi-Sector Intermediate Bond Series
SCHEDULE OF INVESTMENTS (Continued)
December 31, 2019
($ reported in thousands)
| | Par Value | | Value |
| | | | |
| Information Technology—continued | | |
| Motorola Solutions, Inc. | | | |
| 4.600%, 2/23/28 | $228 | | $247 |
| 4.600%, 5/23/29 | 120 | | 131 |
Radiate Holdco LLC 144A
6.625%, 2/15/25(3) | 235 | | 237 |
ViaSat, Inc. 144A
5.625%, 9/15/25(3) | 305 | | 314 |
VMware, Inc.
3.900%, 8/21/27 | 230 | | 240 |
| | | | 2,708 |
| | | | |
| |
| Materials—4.6% | | |
Alpek SAB de C.V. 144A
5.375%, 8/8/23(3) | 425 | | 459 |
ARD Finance S.A. PIK Interest Capitalization, 144A
6.500%, 6/30/27(3)(12) | 235 | | 243 |
BHP Billiton Finance USA Ltd. 144A
6.750%, 10/19/75(3)(10) | 225 | | 264 |
CPG Merger Sub LLC 144A
8.000%, 10/1/21(3) | 115 | | 115 |
Equate Petrochemical BV 144A
4.250%, 11/3/26(3) | 340 | | 363 |
Glencore Funding LLC 144A
4.000%, 3/27/27(3) | 390 | | 405 |
Greif, Inc. 144A
6.500%, 3/1/27(3) | 155 | | 167 |
GUSAP III LP 144A
4.250%, 1/21/30(3) | 245 | | 249 |
Inversiones CMPC S.A. 144A
4.375%, 5/15/23(3) | 300 | | 310 |
Kaiser Aluminum Corp. 144A
4.625%, 3/1/28(3) | 120 | | 123 |
Kraton Polymers LLC 144A
7.000%, 4/15/25(3) | 250 | | 258 |
LSB Industries, Inc. 144A
9.625%, 5/1/23(3) | 110 | | 113 |
Mauser Packaging Solutions Holding Co. 144A
7.250%, 4/15/25(3) | 115 | | 114 |
Olin Corp.
5.625%, 8/1/29 | 230 | | 243 |
SABIC Capital II BV 144A
4.500%, 10/10/28(3) | 305 | | 340 |
Schweitzer-Mauduit International, Inc. 144A
6.875%, 10/1/26(3) | 175 | | 189 |
Scotts Miracle-Gro Co. (The) 144A
4.500%, 10/15/29(3) | 120 | | 123 |
Severstal OAO Via Steel Capital S.A. 144A
5.900%, 10/17/22(3)(13) | 260 | | 281 |
Syngenta Finance N.V. 144A
4.441%, 4/24/23(3) | 400 | | 418 |
Teck Resources Ltd.
6.125%, 10/1/35 | 260 | | 305 |
TPC Group, Inc. 144A
10.500%, 8/1/24(3) | 55 | | 55 |
| Trident TPI Holdings, Inc. | | | |
| 144A 9.250%, 8/1/24(3) | 115 | | 116 |
| 144A 6.625%, 11/1/25(3) | 130 | | 117 |
| | | | 5,370 |
| | | | |
| |
| Real Estate—2.0% | | |
| EPR Properties | | | |
| 4.750%, 12/15/26 | 130 | | 142 |
| | Par Value | | Value |
| | | | |
| Real Estate—continued | | |
| 4.500%, 6/1/27 | $205 | | $220 |
ESH Hospitality, Inc. 144A
4.625%, 10/1/27(3) | 175 | | 177 |
Healthcare Trust of America Holdings LP
3.750%, 7/1/27 | 180 | | 190 |
Iron Mountain, Inc. 144A
4.875%, 9/15/29(3) | 245 | | 249 |
iStar, Inc.
4.250%, 8/1/25 | 115 | | 116 |
| Life Storage LP | | | |
| 3.875%, 12/15/27 | 135 | | 142 |
| 4.000%, 6/15/29 | 200 | | 214 |
| MPT Operating Partnership LP | | | |
| 5.000%, 10/15/27 | 125 | | 133 |
| 4.625%, 8/1/29 | 45 | | 47 |
Office Properties Income Trust
4.500%, 2/1/25 | 385 | | 402 |
| Service Properties Trust | | | |
| 4.950%, 2/15/27 | 195 | | 202 |
| 4.375%, 2/15/30 | 135 | | 132 |
| | | | 2,366 |
| | | | |
| |
| Utilities—2.1% | | |
CenterPoint Energy, Inc.
4.250%, 11/1/28 | 295 | | 320 |
DPL, Inc. 144A
4.350%, 4/15/29(3) | 294 | | 283 |
Exelon Corp.
3.497%, 6/1/22 | 255 | | 262 |
Ferrellgas Partners LP
8.625%, 6/15/20(14) | 50 | | 30 |
Perusahaan Listrik Negara PT 144A
4.125%, 5/15/27(3) | 390 | | 411 |
| Talen Energy Supply LLC | | | |
| 144A 7.250%, 5/15/27(3) | 55 | | 58 |
| 144A 6.625%, 1/15/28(3) | 205 | | 209 |
TerraForm Power Operating LLC 144A
5.000%, 1/31/28(3) | 190 | | 201 |
Texas Competitive Electric
Escrow(5) | 396 | | — |
Texas Competitive Electric Holdings Co. 144A
0.000%, 10/1/20(3)(5) | 465 | | 1 |
Transportadora de Gas Internacional SA ESP 144A
5.550%, 11/1/28(3) | 305 | | 349 |
Vistra Operations Co. LLC 144A
4.300%, 7/15/29(3) | 300 | | 306 |
| | | | 2,430 |
| | | | |
| |
Total Corporate Bonds and Notes
(Identified Cost $51,759) | | 53,513 |
| | | | |
| |
| | | | |
| |
| Leveraged Loans(4)—8.2% |
| Aerospace—0.4% | | |
Atlantic Aviation FBO, Inc. (1 month LIBOR + 3.750%)
5.550%, 12/6/25 | 55 | | 55 |
| Dynasty Acquisition Co., Inc. | | | |
Tranche B-1 (3 month LIBOR + 4.000%)
5.945%, 4/6/26 | 71 | | 72 |
Tranche B-2 (3 month LIBOR + 4.000%)
5.945%, 4/6/26 | 38 | | 39 |
See Notes to Financial Statements
Newfleet Multi-Sector Intermediate Bond Series
SCHEDULE OF INVESTMENTS (Continued)
December 31, 2019
($ reported in thousands)
| | Par Value | | Value |
| | | | |
| Aerospace—continued | | |
DynCorp International, Inc. Tranche B, First Lien (1 month LIBOR + 6.000%)
7.740%, 8/15/25 | $133 | | $132 |
| TransDigm, Inc. | | | |
2018, Tranche E (1 month LIBOR + 2.500%)
4.299%, 5/30/25 | 54 | | 54 |
2018, Tranche F (1 month LIBOR + 2.500%)
4.299%, 6/9/23 | 46 | | 45 |
Tranche G (1 month LIBOR + 2.500%)
4.299%, 8/22/24 | 29 | | 29 |
| | | | 426 |
| | | | |
| |
| Consumer Durables—0.1% | | |
Global Appliance, Inc. Tranche B (1 month LIBOR + 4.000%)
5.800%, 9/29/24 | 96 | | 95 |
| Consumer Non-Durables—0.5% | | |
American Greetings Corp. (1 month LIBOR + 4.500%)
6.299%, 4/6/24 | 239 | | 235 |
Kronos Acquisition Holdings, Inc. Tranche B-3 (3 month LIBOR + 4.000%)
5.792%, 5/15/23 | 136 | | 133 |
Parfums Holding Co., Inc. First Lien (3 month LIBOR + 4.250%)
6.159%, 6/30/24 | 141 | | 139 |
Rodan & Fields LLC (1 month LIBOR + 4.000%)
5.740%, 6/16/25 | 153 | | 89 |
| | | | 596 |
| | | | |
| |
| Energy—0.4% | | |
California Resources Corp. 2016 (1 month LIBOR + 10.375%)
12.180%, 12/31/21 | 190 | | 141 |
CITGO Petroleum Corp. 2019, Tranche B (3 month LIBOR + 5.000%)
6.945%, 3/27/24 | 154 | | 154 |
Fieldwood Energy LLC First Lien (3 month LIBOR + 5.250%)
7.177%, 4/11/22 | 270 | | 225 |
Paragon Offshore Finance Co. (1 month PRIME + 0.000%)
5.250%, 7/16/21(1)(5) | 1 | | — |
| | | | 520 |
| | | | |
| |
| Financial—0.5% | | |
Asurion LLC Tranche B-2, Second Lien (1 month LIBOR + 6.500%)
8.299%, 8/4/25 | 110 | | 111 |
Blackhawk Network Holdings, Inc. First Lien (1 month LIBOR + 3.000%)
4.799%, 6/16/25 | 222 | | 222 |
FinCo I LLC 2018 (1 month LIBOR + 2.000%)
3.799%, 12/27/22 | 58 | | 58 |
iStar, Inc. Tranche B (1 month LIBOR + 2.750%)
5.068%, 6/28/23 | 166 | | 168 |
| | | | 559 |
| | | | |
| |
| Food / Tobacco—0.5% | | |
Chobani LLC Tranche B (3 month LIBOR + 3.500%)
0.000%, 10/10/23(15) | 120 | | 120 |
| | Par Value | | Value |
| | | | |
| Food / Tobacco—continued | | |
Dole Food Co., Inc. Tranche B (1 month LIBOR + 2.750%)
4.526%, 4/6/24 | $119 | | $119 |
H-Food Holdings LLC (1 month LIBOR + 3.688%)
5.487%, 5/23/25 | 124 | | 123 |
Milk Specialties Co. (1 month LIBOR + 4.000%)
5.799%, 8/16/23 | 107 | | 101 |
Shearer’s Foods LLC Second Lien (1 month LIBOR + 6.750%)
8.549%, 6/30/22 | 150 | | 148 |
| | | | 611 |
| | | | |
| |
| Food and Drug—0.0% | | |
Albertsons LLC 2019-1, Tranche B-7 (1 month LIBOR + 2.750%)
4.549%, 11/17/25 | 23 | | 23 |
| Forest Prod / Containers—0.1% | | |
Spectrum Holdings III Corp. First Lien (1 month LIBOR + 3.250%)
5.049%, 1/31/25 | 80 | | 74 |
| Gaming / Leisure—0.7% | | |
Affinity Gaming LLC (1 month LIBOR + 3.250%)
5.049%, 7/3/23 | 350 | | 335 |
Playa Resorts Holding B.V. (1 month LIBOR + 2.750%)
4.550%, 4/29/24 | 111 | | 110 |
Scientific Games International, Inc. Tranche B-5 (1 month LIBOR + 2.750%)
4.471%, 8/14/24 | 128 | | 128 |
Stars Group Holdings B.V. (3 month LIBOR + 3.500%)
5.446%, 7/10/25 | 155 | | 157 |
UFC Holdings LLC Tranche B (1 month LIBOR + 3.250%)
5.050%, 4/29/26 | 97 | | 97 |
| | | | 827 |
| | | | |
| |
| Healthcare—1.1% | | |
21st Century Oncology, Inc. Tranche B (3 month LIBOR + 6.125%)
8.135%, 1/16/23 | 41 | | 41 |
Accelerated Health Systems LLC (1 month LIBOR + 3.500%)
5.236%, 10/31/25 | 124 | | 124 |
Agiliti Health, Inc. (1 month LIBOR + 3.000%)
4.750%, 1/4/26 | 25 | | 25 |
AHP Health Partners, Inc. (1 month LIBOR + 4.500%)
6.299%, 6/30/25 | 187 | | 188 |
Bausch Health Cos., Inc. (1 month LIBOR + 2.750%)
4.490%, 11/27/25 | 55 | | 55 |
CHG Healthcare Services, Inc. (1 month LIBOR + 3.000%)
4.799%, 6/7/23 | 54 | | 55 |
Envision Healthcare Corp. (1 month LIBOR + 3.750%)
5.549%, 10/10/25 | 105 | | 90 |
LifePoint Health, Inc. Tranche B, First Lien (1 month LIBOR + 4.500%)
6.304%, 11/16/25 | 189 | | 190 |
Navicure, Inc. (1 month LIBOR + 4.000%)
5.799%, 10/22/26 | 85 | | 85 |
One Call Corp. First Lien (3 month LIBOR + 5.250%)
7.160%, 11/27/22 | 140 | | 128 |
See Notes to Financial Statements
Newfleet Multi-Sector Intermediate Bond Series
SCHEDULE OF INVESTMENTS (Continued)
December 31, 2019
($ reported in thousands)
| | Par Value | | Value |
| | | | |
| Healthcare—continued | | |
Ortho-Clinical Diagnostics, Inc. (3 month LIBOR + 3.250%)
5.306%, 6/30/25 | $129 | | $128 |
Phoenix Guarantor, Inc. First Lien (1 month LIBOR + 4.500%)
6.210%, 3/5/26 | 45 | | 45 |
Sotera Health Holdings LLC First Lien (3 month LIBOR + 4.500%)
6.289%, 12/11/26 | 120 | | 120 |
Viant Medical Holdings, Inc. First Lien (3 month LIBOR + 3.750%)
0.000%, 7/2/25(15) | 60 | | 59 |
| | | | 1,333 |
| | | | |
| |
| Housing—0.4% | | |
Capital Automotive LP Tranche B, Second Lien (1 month LIBOR + 6.000%)
7.800%, 3/24/25 | 46 | | 47 |
CPG International LLC (3 month LIBOR + 3.750%)
5.933%, 5/6/24 | 190 | | 189 |
Summit Materials LLC Tranche B (1 month LIBOR + 2.000%)
3.799%, 11/21/24 | 257 | | 258 |
| | | | 494 |
| | | | |
| |
| Information Technology—0.8% | | |
Applied Systems, Inc. Second Lien (3 month LIBOR + 7.000%)
8.945%, 9/19/25 | 112 | | 114 |
Aston Finco S.a.r.l. First Lien (3 month LIBOR + 4.250%)
6.262%, 10/9/26 | 85 | | 84 |
Boxer Parent Co., Inc. (1 month LIBOR + 4.250%)
6.049%, 10/2/25 | 49 | | 48 |
Dell International LLC Tranche B-1 (1 month LIBOR + 2.000%)
3.800%, 9/19/25 | 95 | | 96 |
| Kronos, Inc. | | | |
2018 (3 month LIBOR + 3.000%)
4.909%, 11/1/23 | 314 | | 316 |
Second Lien (3 month LIBOR + 8.250%)
10.159%, 11/1/24 | 99 | | 101 |
| SS&C Technologies, Inc. | | | |
Tranche B-3 (1 month LIBOR + 2.250%)
4.049%, 4/16/25 | 65 | | 65 |
Tranche B-4 (1 month LIBOR + 2.250%)
4.049%, 4/16/25 | 45 | | 45 |
Vertafore, Inc. First Lien (1 month LIBOR + 3.250%)
5.049%, 7/2/25 | 123 | | 121 |
| | | | 990 |
| | | | |
| |
| Manufacturing—0.3% | | |
CPI Acquisition, Inc. First Lien (3 month LIBOR + 4.500%)
6.710%, 8/17/22 | 233 | | 186 |
Filtration Group Corp. (1 month LIBOR + 3.000%)
4.799%, 3/29/25 | 113 | | 113 |
Hillman Group, Inc. (The) (1 month LIBOR + 4.000%)
5.799%, 5/31/25 | 98 | | 97 |
| | | | 396 |
| | | | |
| |
| | Par Value | | Value |
| | | | |
| Media / Telecom - Broadcasting—0.2% | | |
Diamond Sports Group LLC (1 month LIBOR + 3.250%)
5.030%, 8/24/26 | $90 | | $90 |
Nexstar Broadcasting, Inc. Tranche B-4 (3 month LIBOR + 2.750%)
4.452%, 9/18/26 | 95 | | 95 |
| | | | 185 |
| | | | |
| |
| Media / Telecom - Cable/Wireless Video—0.1% | | |
CSC Holdings LLC 2018 (1 month LIBOR + 2.250%)
3.990%, 1/15/26 | 99 | | 99 |
| Media / Telecom - Telecommunications—0.2% | | |
CenturyLink, Inc. Tranche B (1 month LIBOR + 2.750%)
4.549%, 1/31/25 | 190 | | 191 |
| Securus Technologies Holdings, Inc. | | | |
First Lien (3 month LIBOR + 4.500%)
6.299%, 11/1/24 | 36 | | 27 |
Second Lien (1 month LIBOR + 8.250%)
10.049%, 11/1/25 | 150 | | 68 |
| | | | 286 |
| | | | |
| |
| Media / Telecom - Wireless Communications—0.1% | | |
CommScope, Inc. (1 month LIBOR + 3.250%)
5.049%, 4/4/26 | 100 | | 100 |
Iridium Satellite LLC (1 month LIBOR + 3.750%)
5.549%, 11/4/26 | 25 | | 26 |
| | | | 126 |
| | | | |
| |
| Retail—0.1% | | |
Neiman Marcus Group Ltd. LLC (1 month LIBOR + 6.000%)
7.713%, 10/25/23 | 130 | | 107 |
| Service—1.1% | | |
Carlisle Food Service Products, Inc. First Lien (3 month LIBOR + 3.000%)
4.799%, 3/20/25 | 45 | | 44 |
Dun & Bradstreet Corp. (The) (1 month LIBOR + 5.000%)
6.792%, 2/6/26 | 120 | | 121 |
GFL Environmental, Inc. 2018 (1 month LIBOR + 3.000%)
4.799%, 5/30/25 | 188 | | 188 |
Hoya Midco LLC First Lien (1 month LIBOR + 3.500%)
5.299%, 6/30/24 | 69 | | 69 |
Pearl Intermediate Parent LLC First Lien (1 month LIBOR + 2.750%)
4.549%, 2/14/25 | 182 | | 179 |
Pi US Mergerco, Inc. Tranche B-1 (1 month LIBOR + 3.250%)
5.049%, 1/3/25 | 225 | | 226 |
Sedgwick Claims Management Services, Inc. 2019 (1 month LIBOR + 4.000%)
5.799%, 9/3/26 | 189 | | 190 |
Terra Bidco BC Ltd. First Lien (3 month LIBOR + 5.000%)
0.000%, 11/25/26(15) | 115 | | 115 |
See Notes to Financial Statements
Newfleet Multi-Sector Intermediate Bond Series
SCHEDULE OF INVESTMENTS (Continued)
December 31, 2019
($ reported in thousands)
| | Par Value | | Value |
| | | | |
| Service—continued | | |
TKC Holdings, Inc. First Lien (1 month LIBOR + 3.750%)
5.550%, 2/1/23 | $108 | | $100 |
| | | | 1,232 |
| | | | |
| |
| Utility—0.6% | | |
APLP Holdings LP (1 month LIBOR + 2.750%)
4.549%, 4/13/23 | 182 | | 182 |
Brookfield WEC Holdings, Inc. First Lien (1 month LIBOR + 3.500%)
5.299%, 8/1/25 | 228 | | 229 |
Calpine Corp. 2019 (3 month LIBOR + 2.250%)
4.200%, 4/1/26 | 119 | | 120 |
| Pacific Gas and Electric Co. | | | |
(1 month LIBOR + 2.250%)
3.970%, 12/31/20 | 105 | | 105 |
(4 month LIBOR + 2.250%)
2.250%, 12/31/20(16) | 35 | | 35 |
| | | | 671 |
| | | | |
| |
Total Leveraged Loans
(Identified Cost $9,924) | | 9,650 |
| | | | |
| |
| | | | |
| |
| | Shares | |
| Preferred Stocks—1.6% |
| Financials—1.3% | |
| Bank of New York Mellon Corp. (The) Series E, 4.950% | 290(17) | 293 |
| Huntington Bancshares, Inc. Series E, 5.700% | 96(17) | 100 |
| KeyCorp Series D, 5.000%(18) | 300(17) | 319 |
| M&T Bank Corp. Series F, 5.125%(18) | 229(17) | 248 |
| MetLife, Inc. Series D, 5.875%(8) | 173(17) | 192 |
| PNC Financial Services Group, Inc. (The) Series S, 5.000% | 405(17) | 433 |
| | | 1,585 |
| | | |
| |
| Industrials—0.3% | |
| General Electric Co. Series D, 5.000% | 332(17) | 325 |
Total Preferred Stocks
(Identified Cost $1,788) | 1,910 |
| | | |
| |
| | | |
| |
| Common Stocks—0.0% |
| Communication Services—0.0% | |
| Clear Channel Outdoor Holdings, Inc.(19) | 1,381 | 4 |
| Consumer Discretionary—0.0% | |
| Mark IV Industries(5) | 828 | 2 |
| Energy—0.0% | |
| Contra CB Downey(5) | 130,000 | — |
| Frontera Energy Corp. | 2,618 | 20 |
| | | 20 |
| | | |
| |
Total Common Stocks
(Identified Cost $59) | 26 |
| | | |
| |
| | | |
| |
| | Shares | | Value |
| | | | |
| | | | |
| Rights—0.0% | |
| Utilities—0.0% | | |
| Vistra Energy Corp.(19) | 7,753 | | $8 |
Total Rights
(Identified Cost $7) | | 8 |
| | | | |
| |
| | | | |
| |
| Warrant—0.0% | |
| Communication Services—0.0% | | |
| iHeartMedia, Inc.(5)(19) | 587 | | 9 |
Total Warrant
(Identified Cost $10) | | 9 |
| | | | |
| |
| | | | |
| |
Total Long-Term Investments—98.4%
(Identified Cost $114,402) | | 115,976 |
| | | | |
| |
| | | | |
| |
| Securities Lending Collateral—0.9% | |
| Dreyfus Government Cash Management Fund - Institutional Shares (seven-day effective yield 1.512%)(20)(21) | 1,068,347 | | 1,068 |
Total Securities Lending Collateral
(Identified Cost $1,068) | | 1,068 |
| | | | |
| |
| | | | |
| |
TOTAL INVESTMENTS—99.3%
(Identified Cost $115,470) | | $117,044 |
| Other assets and liabilities, net—0.7% | | 811 |
| NET ASSETS—100.0% | | $117,855 |
| Abbreviations: |
| LIBOR | London Interbank Offered Rate |
| LLC | Limited Liability Company |
| LP | Limited Partnership |
| PIK | Payment-in-Kind Security |
| Foreign Currencies: |
| KZT | Kazakhstani Tenge |
| MXN | Mexican Peso |
| Footnote Legend: |
| (1) | Security in default; no interest payments are being received during the bankruptcy proceedings. |
| (2) | Regulation S security. Security is offered and sold outside of the United States, therefore, it is exempt from registration with the SEC under Rules 903 and 904 of the Securities Act of 1933. |
| (3) | Security exempt from registration under Rule 144A of the Securities Act of 1933. These securities may be resold in transactions exempt from registration, normally to qualified institutional buyers. At December 31, 2019, these securities amounted to a value of $68,625 or 58.2% of net assets. |
| (4) | Variable rate security. Rate disclosed is as of December 31, 2019. For leveraged loans, the rate shown may represent a weighted average interest rate. Information in parenthesis represents benchmark and reference rate for each security. Certain variable rate securities are not based on a published reference rate and spread but are determined by the issuer or agent and are based on current market conditions, or, for mortgage-backed securities, are impacted by the individual mortgages which are paying off over time. These securities do not indicate a reference rate and spread in their descriptions. |
For information regarding the abbreviations, see the Key Investment Terms starting on page 4.
See Notes to Financial Statements
Newfleet Multi-Sector Intermediate Bond Series
SCHEDULE OF INVESTMENTS (Continued)
December 31, 2019
($ reported in thousands)
| (5) | The value of this security was determined using significant unobservable inputs and is reported as a Level 3 security in the Fair Value Hierarchy table located after the Schedule of Investments. |
| (6) | All or a portion of security is on loan. |
| (7) | 14% of the income received was in cash and 86% was in PIK. |
| (8) | No contractual maturity date. |
| (9) | Amount is less than $500. |
| (10) | Interest payments may be deferred. |
| (11) | 100% of the income received was in cash. |
| (12) | No pay date announced. |
| (13) | This Note was issued for the sole purpose of funding a loan agreement between the issuer and the borrower. As the credit risk for this security lies solely with the borrower, the name represented here is that of the borrower. |
| (14) | Security in default, interest payments are being received during the bankruptcy proceedings. |
| (15) | This loan will settle after December 31, 2019, at which time the interest rate, based on the LIBOR and the agreed upon spread on trade date, will be reflected. |
| (16) | Represents unfunded portion of security and commitment fee earned on this portion. |
| (17) | Value shown as par value. |
| (18) | Interest may be forfeited. |
| (19) | Non-income producing. |
| (20) | Shares of this fund are publicly offered, and its prospectus and annual report are publicly available. |
| (21) | Represents security purchased with cash collateral received for securities on loan. |
| Country Weightings (Unaudited)† |
| United States | 74% |
| Canada | 3 |
| Netherlands | 3 |
| Mexico | 3 |
| Indonesia | 2 |
| Cayman Islands | 1 |
| Kazakhstan | 1 |
| Other | 13 |
| Total | 100% |
| † % of total investments as of December 31, 2019. |
The following table summarizes the market value of the Series’ investments as of December 31, 2019, based on the inputs used to value them (See Security Valuation Note 2A in the Notes to Financial Statements):
| | Total
Value at
December 31, 2019 | | Level 1
Quoted Prices | | Level 2
Significant
Observable
Inputs | | Level 3
Significant
Unobservable
Inputs |
| Assets: | | | | | | | |
| Debt Securities: | | | | | | | |
| Asset-Backed Securities | $12,009 | | $— | | $12,009 | | $— |
| Corporate Bonds and Notes | 53,513 | | — | | 53,512 | | 1(1) |
| Foreign Government Securities | 9,676 | | — | | 9,676 | | — |
| Leveraged Loans | 9,650 | | — | | 9,650 | | —(1) |
| Mortgage-Backed Securities | 26,398 | | — | | 26,223 | | 175 |
| Municipal Bonds | 1,979 | | — | | 1,979 | | — |
| U.S. Government Securities | 798 | | — | | 798 | | — |
| Equity Securities: | | | | | | | |
| Preferred Stocks | 1,910 | | — | | 1,910 | | — |
| Common Stocks | 26 | | 24 | | — | | 2(1) |
| Rights | 8 | | — | | 8 | | — |
| Warrant | 9 | | — | | — | | 9 |
| Securities Lending Collateral | 1,068 | | 1,068 | | — | | — |
| Total Investments | $117,044 | | $1,092 | | $115,765 | | $187 |
| (1) | Security held by the Series with an end of period value of $0 was categorized as Level 3 in this table. |
Securities held by the Series with an end value of $8 were transferred from Level 3 to Level 2 due to an increase in trading activities at period end. Securities held by the Series with an end of period value of $2 were transferred from Level 2 to Level 3 due to a decrease in trading activities at period end.
Some of the Series’ investments that were categorized as Level 3 were valued utilizing third party pricing information without adjustment. Such valuations are based on unobservable inputs. A significant change in third party information could result in a significant lower or higher value of Level 3 investments.
Management has determined that the amount of Level 3 securities compared to total net assets is not material; therefore, the rollforward of Level 3 securities and assumptions are not shown for the period ended December 31, 2019.
See Notes to Financial Statements
Rampart Enhanced Core Equity Series
SCHEDULE OF INVESTMENTS
December 31, 2019
($ reported in thousands)
| | Shares | | Value |
| Common Stocks—96.3% | |
| Communication Services—9.4% | | |
| Activision Blizzard, Inc. | 2,523 | | $150 |
| Alphabet, Inc. Class A(1)(2) | 985 | | 1,319 |
| Alphabet, Inc. Class C(1)(2) | 994 | | 1,329 |
| AT&T, Inc.(2) | 24,001 | | 938 |
| CenturyLink, Inc. | 3,226 | | 43 |
| Charter Communications, Inc. Class A(1) | 534 | | 259 |
| Comcast Corp. Class A(2) | 14,831 | | 667 |
| Discovery, Inc. Class A(1) | 520 | | 17 |
| Discovery, Inc. Class C(1) | 1,143 | | 35 |
| DISH Network Corp. Class A(1) | 797 | | 28 |
| Electronic Arts, Inc.(1) | 963 | | 104 |
| Facebook, Inc. Class A(1)(2) | 7,849 | | 1,611 |
| Fox Corp. Class A(2) | 1,161 | | 43 |
| Fox Corp. Class B(2) | 531 | | 19 |
| Interpublic Group of Cos., Inc. (The) | 1,278 | | 29 |
| Netflix, Inc.(1) | 1,441 | | 466 |
| News Corp. Class A | 1,262 | | 18 |
| News Corp. Class B | 399 | | 6 |
| Omnicom Group, Inc. | 718 | | 58 |
| Take-Two Interactive Software, Inc.(1) | 372 | | 46 |
| T-Mobile US, Inc.(1) | 1,036 | | 81 |
| TripAdvisor, Inc. | 341 | | 10 |
| Twitter, Inc.(1) | 2,548 | | 82 |
| Verizon Communications, Inc.(2) | 13,631 | | 837 |
| ViacomCBS, Inc. Class B | 1,761 | | 74 |
| Walt Disney Co. (The)(2) | 5,906 | | 854 |
| | | | 9,123 |
| | | | |
| |
| Consumer Discretionary—8.9% | | |
| Advance Auto Parts, Inc. | 232 | | 37 |
| Amazon.com, Inc.(1)(2) | 1,372 | | 2,535 |
| Aptiv plc | 838 | | 80 |
| AutoZone, Inc.(1) | 81 | | 97 |
| Best Buy Co., Inc. | 754 | | 66 |
| Booking Holdings, Inc.(1)(2) | 139 | | 286 |
| BorgWarner, Inc. | 674 | | 29 |
| Capri Holdings Ltd.(1) | 494 | | 19 |
| CarMax, Inc.(1) | 541 | | 47 |
| Carnival Corp. | 1,310 | | 67 |
| Chipotle Mexican Grill, Inc.(1) | 84 | | 70 |
| Darden Restaurants, Inc. | 406 | | 44 |
| Dollar General Corp. | 853 | | 133 |
| Dollar Tree, Inc.(1) | 780 | | 73 |
| eBay, Inc. | 2,570 | | 93 |
| Expedia Group, Inc. | 459 | | 50 |
| Ford Motor Co.(2) | 12,859 | | 120 |
| Gap, Inc. (The) | 698 | | 12 |
| Garmin Ltd. | 475 | | 46 |
| General Motors Co.(2) | 4,141 | | 152 |
| Genuine Parts Co. | 480 | | 51 |
| H&R Block, Inc. | 661 | | 16 |
| Hanesbrands, Inc. | 1,163 | | 17 |
| Harley-Davidson, Inc. | 515 | | 19 |
| Hasbro, Inc. | 413 | | 44 |
| Hilton Worldwide Holdings, Inc. | 941 | | 104 |
| Home Depot, Inc. (The)(2) | 3,603 | | 787 |
| Horton (D.R.), Inc. | 1,118 | | 59 |
| Kohl’s Corp. | 521 | | 27 |
| L Brands, Inc. | 749 | | 14 |
| Las Vegas Sands Corp. | 1,122 | | 78 |
| Leggett & Platt, Inc. | 433 | | 22 |
| | Shares | | Value |
| | | | |
| Consumer Discretionary—continued | | |
| Lennar Corp. Class A | 941 | | $53 |
| LKQ Corp.(1) | 1,018 | | 36 |
| Lowe’s Cos., Inc.(2) | 2,518 | | 302 |
| Macy’s, Inc. | 1,004 | | 17 |
| Marriott International, Inc. Class A | 893 | | 135 |
| McDonald’s Corp.(2) | 2,514 | | 497 |
| MGM Resorts International | 1,713 | | 57 |
| Mohawk Industries, Inc.(1) | 197 | | 27 |
| Newell Brands, Inc. | 1,261 | | 24 |
| NIKE, Inc. Class B(2) | 4,100 | | 415 |
| Nordstrom, Inc. | 352 | | 14 |
| Norwegian Cruise Line Holdings Ltd.(1) | 709 | | 41 |
| NVR, Inc.(1) | 11 | | 42 |
| O’Reilly Automotive, Inc.(1) | 252 | | 110 |
| PulteGroup, Inc. | 857 | | 33 |
| PVH Corp. | 243 | | 26 |
| Ralph Lauren Corp. | 170 | | 20 |
| Ross Stores, Inc. | 1,200 | | 140 |
| Royal Caribbean Cruises Ltd. | 561 | | 75 |
| Starbucks Corp.(2) | 3,952 | | 347 |
| Tapestry, Inc. | 938 | | 25 |
| Target Corp.(2) | 1,683 | | 216 |
| Tiffany & Co. | 359 | | 48 |
| TJX Cos., Inc. (The) | 3,983 | | 243 |
| Tractor Supply Co. | 392 | | 37 |
| Ulta Beauty, Inc.(1) | 195 | | 49 |
| Under Armour, Inc. Class A(1) | 614 | | 13 |
| Under Armour, Inc. Class C(1) | 636 | | 12 |
| VF Corp. | 1,074 | | 107 |
| Whirlpool Corp. | 212 | | 31 |
| Wynn Resorts Ltd. | 316 | | 44 |
| Yum! Brands, Inc. | 1,005 | | 101 |
| | | | 8,631 |
| | | | |
| |
| Consumer Staples—6.5% | | |
| Altria Group, Inc.(2) | 6,118 | | 305 |
| Archer-Daniels-Midland Co. | 1,829 | | 85 |
| Brown-Forman Corp. Class B | 599 | | 40 |
| Campbell Soup Co. | 558 | | 28 |
| Church & Dwight Co., Inc. | 817 | | 57 |
| Clorox Co. (The) | 414 | | 64 |
| Coca-Cola Co. (The)(2) | 12,657 | | 701 |
| Colgate-Palmolive Co.(2) | 2,832 | | 195 |
| Conagra Brands, Inc. | 1,600 | | 55 |
| Constellation Brands, Inc. Class A | 558 | | 106 |
| Costco Wholesale Corp.(2) | 1,446 | | 425 |
| Coty, Inc. Class A | 975 | | 11 |
| Estee Lauder Cos., Inc. (The) Class A | 728 | | 150 |
| General Mills, Inc. | 1,976 | | 106 |
| Hershey Co. (The) | 492 | | 72 |
| Hormel Foods Corp. | 917 | | 41 |
| J.M. Smucker Co. (The) | 374 | | 39 |
| Kellogg Co. | 821 | | 57 |
| Kimberly-Clark Corp. | 1,134 | | 156 |
| Kraft Heinz Co.(The)(2) | 2,037 | | 65 |
| Kroger Co. (The) | 2,642 | | 77 |
| Lamb Weston Holdings, Inc. | 481 | | 41 |
| McCormick & Co., Inc. | 407 | | 69 |
| Molson Coors Brewing Co. Class B | 616 | | 33 |
| Mondelez International, Inc. Class A(2) | 4,745 | | 261 |
| Monster Beverage Corp.(1) | 1,275 | | 81 |
| PepsiCo, Inc.(2) | 4,629 | | 633 |
See Notes to Financial Statements
Rampart Enhanced Core Equity Series
SCHEDULE OF INVESTMENTS (Continued)
December 31, 2019
($ reported in thousands)
| | Shares | | Value |
| | | | |
| Consumer Staples—continued | | |
| Philip Morris International, Inc.(2) | 5,085 | | $433 |
| Procter & Gamble Co. (The)(2) | 8,230 | | 1,028 |
| Sysco Corp. | 1,690 | | 145 |
| Tyson Foods, Inc. Class A | 963 | | 88 |
| Walgreens Boots Alliance, Inc.(2) | 2,484 | | 146 |
| Walmart, Inc.(2) | 4,668 | | 555 |
| | | | 6,348 |
| | | | |
| |
| Energy—3.9% | | |
| Apache Corp. | 1,207 | | 31 |
| Baker Hughes Co. | 2,062 | | 53 |
| Cabot Oil & Gas Corp. | 1,362 | | 24 |
| Chevron Corp.(2) | 6,222 | | 750 |
| Cimarex Energy Co. | 325 | | 17 |
| Concho Resources, Inc. | 656 | | 57 |
| ConocoPhillips(2) | 3,625 | | 236 |
| Devon Energy Corp. | 1,295 | | 34 |
| Diamondback Energy, Inc. | 532 | | 49 |
| EOG Resources, Inc. | 1,889 | | 158 |
| Exxon Mobil Corp.(2) | 13,858 | | 967 |
| Halliburton Co.(2) | 2,840 | | 69 |
| Helmerich & Payne, Inc. | 348 | | 16 |
| Hess Corp. | 844 | | 56 |
| HollyFrontier Corp. | 500 | | 25 |
| Kinder Morgan, Inc.(2) | 6,390 | | 135 |
| Marathon Oil Corp. | 2,597 | | 35 |
| Marathon Petroleum Corp. | 2,151 | | 130 |
| National Oilwell Varco, Inc. | 1,260 | | 32 |
| Noble Energy, Inc. | 1,560 | | 39 |
| Occidental Petroleum Corp.(2) | 2,867 | | 118 |
| ONEOK, Inc. | 1,357 | | 103 |
| Phillips 66 | 1,481 | | 165 |
| Pioneer Natural Resources Co. | 545 | | 83 |
| Schlumberger Ltd.(2) | 4,467 | | 180 |
| TechnipFMC plc | 1,363 | | 29 |
| Valero Energy Corp. | 1,369 | | 128 |
| Williams Cos., Inc. (The) | 3,965 | | 94 |
| | | | 3,813 |
| | | | |
| |
| Financials—13.1% | | |
| Affiliated Managers Group, Inc. | 179 | | 15 |
| Aflac, Inc. | 2,715 | | 144 |
| Allstate Corp. (The)(2) | 1,206 | | 136 |
| American Express Co.(2) | 2,468 | | 307 |
| American International Group, Inc.(2) | 3,171 | | 163 |
| Ameriprise Financial, Inc. | 474 | | 79 |
| Aon plc | 868 | | 181 |
| Assurant, Inc. | 224 | | 29 |
| Bank of America Corp.(2) | 30,231 | | 1,065 |
| Bank of New York Mellon Corp. (The)(2) | 3,115 | | 157 |
| Berkshire Hathaway, Inc. Class B(1)(2) | 7,153 | | 1,620 |
| BlackRock, Inc.(2) | 426 | | 214 |
| Capital One Financial Corp.(2) | 1,703 | | 175 |
| Cboe Global Markets, Inc. | 407 | | 49 |
| Charles Schwab Corp. (The) | 4,219 | | 201 |
| Chubb Ltd. | 1,663 | | 259 |
| Cincinnati Financial Corp. | 557 | | 59 |
| Citigroup, Inc.(2) | 8,190 | | 654 |
| Citizens Financial Group, Inc. | 1,618 | | 66 |
| CME Group, Inc. | 1,305 | | 262 |
| Comerica, Inc. | 541 | | 39 |
| Discover Financial Services | 1,159 | | 98 |
| | Shares | | Value |
| | | | |
| Financials—continued | | |
| E*TRADE Financial Corp. | 821 | | $37 |
| Everest Re Group Ltd. | 149 | | 41 |
| Fifth Third Bancorp | 2,651 | | 81 |
| First Republic Bank | 611 | | 72 |
| Franklin Resources, Inc. | 1,015 | | 26 |
| Gallagher (Arthur J.) & Co. | 682 | | 65 |
| Globe Life, Inc. | 365 | | 38 |
| Goldman Sachs Group, Inc. (The)(2) | 1,162 | | 267 |
| Hartford Financial Services Group, Inc. (The) | 1,323 | | 80 |
| Huntington Bancshares, Inc. | 3,764 | | 57 |
| Intercontinental Exchange, Inc. | 2,052 | | 190 |
| Invesco Ltd. | 1,387 | | 25 |
| JPMorgan Chase & Co.(2) | 11,590 | | 1,616 |
| KeyCorp | 3,646 | | 74 |
| Lincoln National Corp. | 725 | | 43 |
| Loews Corp. | 948 | | 50 |
| M&T Bank Corp. | 484 | | 82 |
| MarketAxess Holdings, Inc. | 138 | | 52 |
| Marsh & McLennan Cos., Inc. | 1,853 | | 206 |
| MetLife, Inc.(2) | 2,897 | | 148 |
| Moody’s Corp. | 589 | | 140 |
| Morgan Stanley(2) | 4,532 | | 232 |
| MSCI, Inc. | 306 | | 79 |
| Nasdaq, Inc. | 416 | | 45 |
| Northern Trust Corp. | 774 | | 82 |
| People’s United Financial, Inc. | 1,608 | | 27 |
| PNC Financial Services Group, Inc. (The) | 1,612 | | 257 |
| Principal Financial Group, Inc. | 942 | | 52 |
| Progressive Corp. (The) | 2,152 | | 156 |
| Prudential Financial, Inc. | 1,460 | | 137 |
| Raymond James Financial, Inc. | 449 | | 40 |
| Regions Financial Corp. | 3,610 | | 62 |
| S&P Global, Inc. | 898 | | 245 |
| State Street Corp. | 1,347 | | 107 |
| SVB Financial Group(1) | 186 | | 47 |
| Synchrony Financial | 2,218 | | 80 |
| T. Rowe Price Group, Inc. | 857 | | 104 |
| Travelers Cos., Inc. (The) | 952 | | 130 |
| Truist Financial Corp. | 4,886 | | 275 |
| U.S. Bancorp(2) | 5,217 | | 309 |
| Unum Group | 756 | | 22 |
| Wells Fargo & Co.(2) | 14,523 | | 781 |
| Willis Towers Watson plc | 473 | | 96 |
| Zions Bancorp NA | 641 | | 33 |
| | | | 12,760 |
| | | | |
| |
| Health Care—14.2% | | |
| Abbott Laboratories(2) | 6,443 | | 560 |
| AbbVie, Inc.(2) | 5,306 | | 470 |
| ABIOMED, Inc.(1) | 165 | | 28 |
| Agilent Technologies, Inc. | 1,127 | | 96 |
| Alexion Pharmaceuticals, Inc.(1) | 812 | | 88 |
| Align Technology, Inc.(1) | 263 | | 73 |
| Allergan plc(2) | 1,192 | | 228 |
| AmerisourceBergen Corp. | 555 | | 47 |
| Amgen, Inc.(2) | 2,153 | | 519 |
| Anthem, Inc. | 930 | | 281 |
| Baxter International, Inc. | 1,868 | | 156 |
| Becton, Dickinson & Co. | 990 | | 269 |
| Biogen, Inc.(1)(2) | 667 | | 198 |
| Boston Scientific Corp.(1) | 5,068 | | 229 |
| Bristol-Myers Squibb Co.(2) | 8,606 | | 552 |
See Notes to Financial Statements
Rampart Enhanced Core Equity Series
SCHEDULE OF INVESTMENTS (Continued)
December 31, 2019
($ reported in thousands)
| | Shares | | Value |
| | | | |
| Health Care—continued | | |
| Cardinal Health, Inc. | 1,084 | | $55 |
| Centene Corp.(1) | 1,512 | | 95 |
| Cerner Corp. | 1,163 | | 85 |
| Cigna Corp. | 1,374 | | 281 |
| Cooper Cos., Inc. (The) | 180 | | 58 |
| CVS Health Corp.(2) | 4,736 | | 352 |
| Danaher Corp.(2) | 2,257 | | 346 |
| DaVita, Inc.(1) | 333 | | 25 |
| DENTSPLY SIRONA, Inc. | 811 | | 46 |
| Edwards Lifesciences Corp.(1) | 758 | | 177 |
| Eli Lilly & Co.(2) | 3,079 | | 405 |
| Gilead Sciences, Inc.(2) | 4,573 | | 297 |
| HCA Healthcare, Inc. | 973 | | 144 |
| Henry Schein, Inc.(1) | 542 | | 36 |
| Hologic, Inc.(1) | 975 | | 51 |
| Humana, Inc. | 494 | | 181 |
| IDEXX Laboratories, Inc.(1) | 314 | | 82 |
| Illumina, Inc.(1) | 534 | | 177 |
| Incyte Corp.(1) | 648 | | 57 |
| Intuitive Surgical, Inc.(1) | 418 | | 247 |
| IQVIA Holdings, Inc.(1) | 665 | | 103 |
| Johnson & Johnson(2) | 9,629 | | 1,405 |
| Laboratory Corporation of America Holdings(1) | 357 | | 60 |
| McKesson Corp. | 678 | | 94 |
| Medtronic plc(2) | 4,879 | | 553 |
| Merck & Co., Inc.(2) | 9,356 | | 851 |
| Mettler-Toledo International, Inc.(1) | 89 | | 71 |
| Mylan NV(1) | 1,872 | | 38 |
| PerkinElmer, Inc. | 404 | | 39 |
| Perrigo Co. plc | 495 | | 26 |
| Pfizer, Inc.(2) | 19,951 | | 782 |
| Quest Diagnostics, Inc. | 491 | | 52 |
| Regeneron Pharmaceuticals, Inc.(1) | 288 | | 108 |
| ResMed, Inc. | 524 | | 81 |
| Stryker Corp. | 1,170 | | 246 |
| Teleflex, Inc. | 169 | | 64 |
| Thermo Fisher Scientific, Inc. | 1,453 | | 472 |
| UnitedHealth Group, Inc.(2) | 3,429 | | 1,008 |
| Universal Health Services, Inc. Class B | 298 | | 43 |
| Varian Medical Systems, Inc.(1) | 333 | | 47 |
| Vertex Pharmaceuticals, Inc.(1) | 937 | | 205 |
| Waters Corp.(1) | 243 | | 57 |
| WellCare Health Plans, Inc.(1) | 184 | | 61 |
| Zimmer Biomet Holdings, Inc. | 750 | | 112 |
| Zoetis, Inc. | 1,748 | | 231 |
| | | | 13,800 |
| | | | |
| |
| Industrials—9.1% | | |
| 3M Co.(2) | 2,108 | | 372 |
| A.O. Smith Corp. | 503 | | 24 |
| Alaska Air Group, Inc. | 444 | | 30 |
| Allegion plc | 339 | | 42 |
| American Airlines Group, Inc. | 1,430 | | 41 |
| AMETEK, Inc. | 830 | | 83 |
| Arconic, Inc. | 1,415 | | 44 |
| Boeing Co. (The)(2) | 1,940 | | 632 |
| Caterpillar, Inc.(2) | 2,040 | | 301 |
| Cintas Corp. | 301 | | 81 |
| Copart, Inc.(1) | 729 | | 66 |
| CSX Corp. | 2,902 | | 210 |
| Cummins, Inc. | 576 | | 103 |
| Deere & Co. | 1,147 | | 199 |
| | Shares | | Value |
| | | | |
| Industrials—continued | | |
| Delta Air Lines, Inc. | 2,094 | | $122 |
| Dover Corp. | 528 | | 61 |
| Eaton Corp. plc | 1,528 | | 145 |
| Emerson Electric Co.(2) | 2,233 | | 170 |
| Equifax, Inc. | 441 | | 62 |
| Expeditors International of Washington, Inc. | 622 | | 49 |
| Fastenal Co. | 2,090 | | 77 |
| FedEx Corp.(2) | 871 | | 132 |
| Flowserve Corp. | 476 | | 24 |
| Fortive Corp. | 1,070 | | 82 |
| Fortune Brands Home & Security, Inc. | 507 | | 33 |
| General Dynamics Corp.(2) | 856 | | 151 |
| General Electric Co.(2) | 31,858 | | 356 |
| Honeywell International, Inc.(2) | 2,625 | | 465 |
| Hunt (JB) Transport Services, Inc. | 312 | | 36 |
| Huntington Ingalls Industries, Inc. | 151 | | 38 |
| IDEX Corp. | 276 | | 47 |
| IHS Markit Ltd.(1) | 1,461 | | 110 |
| Illinois Tool Works, Inc. | 1,075 | | 193 |
| Ingersoll-Rand plc | 885 | | 118 |
| Jacobs Engineering Group, Inc. | 497 | | 45 |
| Johnson Controls International plc | 2,901 | | 118 |
| Kansas City Southern | 365 | | 56 |
| L3Harris Technologies, Inc. | 814 | | 161 |
| Lockheed Martin Corp.(2) | 910 | | 354 |
| Masco Corp. | 1,044 | | 50 |
| Nielsen Holdings plc | 1,295 | | 26 |
| Norfolk Southern Corp. | 949 | | 184 |
| Northrop Grumman Corp. | 575 | | 198 |
| PACCAR, Inc. | 1,254 | | 99 |
| Parker-Hannifin Corp. | 465 | | 96 |
| Pentair plc | 612 | | 28 |
| Quanta Services, Inc. | 516 | | 21 |
| Raytheon Co.(2) | 1,014 | | 223 |
| Republic Services, Inc. | 777 | | 70 |
| Robert Half International, Inc. | 429 | | 27 |
| Robinson (C.H.) Worldwide, Inc. | 494 | | 39 |
| Rockwell Automation, Inc. | 426 | | 86 |
| Rollins, Inc. | 510 | | 17 |
| Roper Technologies, Inc. | 378 | | 134 |
| Snap-on, Inc. | 202 | | 34 |
| Southwest Airlines Co. | 1,758 | | 95 |
| Stanley Black & Decker, Inc. | 551 | | 91 |
| Textron, Inc. | 831 | | 37 |
| TransDigm Group, Inc. | 181 | | 101 |
| Union Pacific Corp.(2) | 2,545 | | 460 |
| United Airlines Holdings, Inc.(1) | 802 | | 71 |
| United Parcel Service, Inc. Class B(2) | 2,541 | | 297 |
| United Rentals, Inc.(1) | 279 | | 47 |
| United Technologies Corp.(2) | 2,964 | | 444 |
| Verisk Analytics, Inc. | 596 | | 89 |
| W.W. Grainger, Inc. | 161 | | 54 |
| Waste Management, Inc. | 1,434 | | 163 |
| Westinghouse Air Brake Technologies Corp.(2) | 660 | | 51 |
| Xylem, Inc. | 651 | | 51 |
| | | | 8,816 |
| | | | |
| |
| Information Technology—23.1% | | |
| Accenture plc Class A(2) | 2,323 | | 489 |
| Adobe, Inc.(1) | 1,749 | | 577 |
| Advanced Micro Devices, Inc.(1) | 3,890 | | 178 |
| Akamai Technologies, Inc.(1) | 600 | | 52 |
See Notes to Financial Statements
Rampart Enhanced Core Equity Series
SCHEDULE OF INVESTMENTS (Continued)
December 31, 2019
($ reported in thousands)
| | Shares | | Value |
| | | | |
| Information Technology—continued | | |
| Alliance Data Systems Corp. | 149 | | $17 |
| Amphenol Corp. Class A | 1,081 | | 117 |
| Analog Devices, Inc. | 1,339 | | 159 |
| ANSYS, Inc.(1) | 304 | | 78 |
| Apple, Inc.(2) | 15,421 | | 4,528 |
| Applied Materials, Inc. | 3,162 | | 193 |
| Arista Networks, Inc.(1) | 196 | | 40 |
| Autodesk, Inc.(1) | 798 | | 146 |
| Automatic Data Processing, Inc. | 1,585 | | 270 |
| Broadcom, Inc. | 1,446 | | 457 |
| Broadridge Financial Solutions, Inc. | 415 | | 51 |
| Cadence Design Systems, Inc.(1) | 1,004 | | 70 |
| CDW Corp. | 523 | | 75 |
| Cisco Systems, Inc.(2) | 15,297 | | 734 |
| Citrix Systems, Inc. | 448 | | 50 |
| Cognizant Technology Solutions Corp. Class A | 1,997 | | 124 |
| Corning, Inc. | 2,846 | | 83 |
| DXC Technology Co. | 933 | | 35 |
| F5 Networks, Inc.(1) | 219 | | 30 |
| Fidelity National Information Services, Inc. | 2,237 | | 311 |
| Fiserv, Inc.(1) | 2,077 | | 240 |
| FleetCor Technologies, Inc.(1) | 312 | | 90 |
| FLIR Systems, Inc. | 495 | | 26 |
| Fortinet, Inc.(1) | 514 | | 55 |
| Gartner, Inc.(1) | 329 | | 51 |
| Global Payments, Inc. | 1,092 | | 199 |
| Hewlett Packard Enterprise Co. | 4,729 | | 75 |
| HP, Inc. | 5,405 | | 111 |
| Intel Corp.(2) | 16,051 | | 961 |
| International Business Machines Corp.(2) | 3,229 | | 433 |
| Intuit, Inc. | 939 | | 246 |
| IPG Photonics Corp.(1) | 128 | | 18 |
| Jack Henry & Associates, Inc. | 279 | | 41 |
| Juniper Networks, Inc. | 1,256 | | 31 |
| Keysight Technologies, Inc.(1) | 685 | | 70 |
| KLA Corp. | 574 | | 102 |
| Lam Research Corp. | 519 | | 152 |
| Leidos Holdings, Inc. | 496 | | 48 |
| Mastercard, Inc. Class A(2) | 3,240 | | 967 |
| Maxim Integrated Products, Inc. | 978 | | 60 |
| Microchip Technology, Inc. | 852 | | 89 |
| Micron Technology, Inc.(1) | 3,917 | | 211 |
| Microsoft Corp.(2) | 27,812 | | 4,386 |
| Motorola Solutions, Inc. | 602 | | 97 |
| NetApp, Inc. | 864 | | 54 |
| NortonLifeLock, Inc. | 2,079 | | 53 |
| NVIDIA Corp. | 2,213 | | 521 |
| Oracle Corp.(2) | 8,018 | | 425 |
| Paychex, Inc. | 1,165 | | 99 |
| PayPal Holdings, Inc.(1)(2) | 4,272 | | 462 |
| Qorvo, Inc.(1) | 423 | | 49 |
| QUALCOMM, Inc.(2) | 4,116 | | 363 |
| salesforce.com, Inc.(1) | 3,198 | | 520 |
| Seagate Technology plc | 861 | | 51 |
| Skyworks Solutions, Inc. | 618 | | 75 |
| Synopsys, Inc.(1) | 545 | | 76 |
| TE Connectivity Ltd. | 1,217 | | 117 |
| Texas Instruments, Inc.(2) | 3,382 | | 434 |
| VeriSign, Inc.(1) | 378 | | 73 |
| Visa, Inc. Class A(2) | 6,278 | | 1,180 |
| Western Digital Corp. | 1,044 | | 66 |
| Western Union Co. (The) | 1,553 | | 42 |
| Xerox Holdings Corp. | 693 | | 25 |
| | Shares | | Value |
| | | | |
| Information Technology—continued | | |
| Xilinx, Inc. | 910 | | $89 |
| | | | 22,397 |
| | | | |
| |
| Materials—2.4% | | |
| Air Products & Chemicals, Inc. | 722 | | 170 |
| Albemarle Corp. | 344 | | 25 |
| Amcor plc | 5,288 | | 57 |
| Avery Dennison Corp. | 276 | | 36 |
| Ball Corp. | 1,090 | | 70 |
| Celanese Corp. | 405 | | 50 |
| CF Industries Holdings, Inc. | 711 | | 34 |
| Corteva, Inc.(2) | 2,422 | | 72 |
| Dow, Inc.(2) | 2,420 | | 132 |
| DuPont de Nemours, Inc.(2) | 2,438 | | 156 |
| Eastman Chemical Co. | 448 | | 35 |
| Ecolab, Inc. | 822 | | 159 |
| FMC Corp. | 427 | | 43 |
| Freeport-McMoRan, Inc. | 4,694 | | 62 |
| International Flavors & Fragrances, Inc. | 351 | | 45 |
| International Paper Co. | 1,287 | | 59 |
| Linde plc | 1,774 | | 378 |
| LyondellBasell Industries NV Class A | 842 | | 79 |
| Martin Marietta Materials, Inc. | 206 | | 58 |
| Mosaic Co. (The) | 1,152 | | 25 |
| Newmont Goldcorp Corp. | 2,713 | | 118 |
| Nucor Corp. | 991 | | 56 |
| Packaging Corporation of America | 310 | | 35 |
| PPG Industries, Inc. | 775 | | 103 |
| Sealed Air Corp. | 507 | | 20 |
| Sherwin-Williams Co. (The) | 270 | | 158 |
| Vulcan Materials Co. | 435 | | 63 |
| Westrock Co. | 842 | | 36 |
| | | | 2,334 |
| | | | |
| |
| Real Estate—2.7% | | |
| Alexandria Real Estate Equities, Inc. | 375 | | 61 |
| American Tower Corp. | 1,458 | | 335 |
| Apartment Investment & Management Co. Class A | 493 | | 26 |
| AvalonBay Communities, Inc. | 462 | | 97 |
| Boston Properties, Inc. | 474 | | 65 |
| CBRE Group, Inc. Class A(1) | 1,106 | | 68 |
| Crown Castle International Corp. | 1,367 | | 194 |
| Digital Realty Trust, Inc. | 688 | | 82 |
| Duke Realty Corp. | 1,196 | | 42 |
| Equinix, Inc. | 280 | | 163 |
| Equity Residential | 1,154 | | 93 |
| Essex Property Trust, Inc. | 217 | | 65 |
| Extra Space Storage, Inc. | 426 | | 45 |
| Federal Realty Investment Trust | 230 | | 30 |
| Healthpeak Properties, Inc. | 1,626 | | 56 |
| Host Hotels & Resorts, Inc. | 2,400 | | 45 |
| Iron Mountain, Inc. | 946 | | 30 |
| Kimco Realty Corp. | 1,397 | | 29 |
| Macerich Co. (The) | 358 | | 10 |
| Mid-America Apartment Communities, Inc. | 377 | | 50 |
| Prologis, Inc. | 2,085 | | 186 |
| Public Storage | 498 | | 106 |
| Realty Income Corp. | 1,050 | | 77 |
| Regency Centers Corp. | 555 | | 35 |
| SBA Communications, Corp. | 373 | | 90 |
| Simon Property Group, Inc.(2) | 1,016 | | 151 |
| SL Green Realty Corp. | 272 | | 25 |
See Notes to Financial Statements
Rampart Enhanced Core Equity Series
SCHEDULE OF INVESTMENTS (Continued)
December 31, 2019
($ reported in thousands)
| | Shares | | Value |
| | | | |
| Real Estate—continued | | |
| UDR, Inc. | 970 | | $45 |
| Ventas, Inc. | 1,234 | | 71 |
| Vornado Realty Trust | 523 | | 35 |
| Welltower, Inc. | 1,344 | | 110 |
| Weyerhaeuser Co. | 2,465 | | 74 |
| | | | 2,591 |
| | | | |
| |
| Utilities—3.0% | | |
| AES Corp. | 2,181 | | 43 |
| Alliant Energy Corp. | 784 | | 43 |
| Ameren Corp. | 812 | | 62 |
| American Electric Power Co., Inc. | 1,633 | | 154 |
| American Water Works Co., Inc. | 595 | | 73 |
| Atmos Energy Corp. | 390 | | 44 |
| CenterPoint Energy, Inc. | 1,647 | | 45 |
| CMS Energy Corp. | 936 | | 59 |
| Consolidated Edison, Inc. | 1,093 | | 99 |
| Dominion Energy, Inc. | 2,711 | | 225 |
| DTE Energy Co. | 600 | | 78 |
| Duke Energy Corp.(2) | 2,401 | | 219 |
| Edison International | 1,181 | | 89 |
| Entergy Corp. | 659 | | 79 |
| Evergy, Inc. | 777 | | 51 |
| Eversource Energy | 1,068 | | 91 |
| Exelon Corp.(2) | 3,197 | | 146 |
| FirstEnergy Corp. | 1,779 | | 86 |
| NextEra Energy, Inc.(2) | 1,616 | | 391 |
| NiSource, Inc. | 1,229 | | 34 |
| NRG Energy, Inc. | 835 | | 33 |
| Pinnacle West Capital Corp. | 371 | | 33 |
| PPL Corp. | 2,388 | | 86 |
| Public Service Enterprise Group, Inc. | 1,664 | | 98 |
| Sempra Energy | 904 | | 137 |
| Southern Co. (The)(2) | 3,434 | | 219 |
| WEC Energy Group, Inc. | 1,042 | | 96 |
| Xcel Energy, Inc. | 1,730 | | 110 |
| | | | 2,923 |
| | | | |
| |
Total Common Stocks
(Identified Cost $66,902) | | 93,536 |
| | | | |
| |
| | | | |
| |
| Exchange-Traded Fund—2.5% | |
| Invesco S&P 500 High Beta ETF(3) | 52,651 | | 2,456 |
Total Exchange-Traded Fund
(Identified Cost $2,320) | | 2,456 |
| | | | |
| |
| | | | |
| |
| | Shares | | Value |
| | | | |
| | | | |
| Rights—0.0% | |
| Health Care—0.0% | | |
| Bristol-Myers Squibb Co.(1)(2) | 2,606 | | $8 |
Total Rights
(Identified Cost $6) | | 8 |
| | | | |
| |
| | | | |
| |
Total Long-Term Investments—98.8%
(Identified Cost $69,228) | | 96,000 |
| | | | |
| |
| | | | |
| |
| Short-Term Investments—0.1% | |
| Purchased Options—0.1% | |
| (See open purchased options schedule) | | | |
Total Purchased Options
(Premiums paid $59) | | 43 |
| | | | |
| |
| | | | |
| |
Total Short-Term Investments
(Identified Cost $59) | | 43 |
| | | | |
| |
| | | | |
| |
TOTAL INVESTMENTS, BEFORE WRITTEN OPTIONS—98.9%
(Identified Cost $69,287) | | 96,043 |
| | | | |
| |
| | | | |
| |
| Written Options—(0.1)% | |
| (See open written options schedule) | | | |
Total Written Options
(Premiums received $99) | | (69) |
| | | | |
| |
| | | | |
| |
TOTAL INVESTMENTS, NET OF WRITTEN OPTIONS—98.8%
(Identified Cost $69,188) | | $95,974 |
| Other assets and liabilities, net—1.2% | | 1,211 |
| NET ASSETS—100.0% | | $97,185 |
| Abbreviation: |
| ETF | Exchange-Traded Fund |
| Footnote Legend: |
| (1) | Non-income producing. |
| (2) | All or a portion of the security is segregated as collateral for written options. |
| (3) | Shares of this fund are publicly offered, and its prospectus and annual report are publicly available. |
For information regarding the abbreviations, see the Key Investment Terms starting on page 4.
See Notes to Financial Statements
Rampart Enhanced Core Equity Series
SCHEDULE OF INVESTMENTS (Continued)
December 31, 2019
($ reported in thousands)
| Open Purchased Options Contracts as of December 31, 2019 were as follows: |
| Description of Options | Number of
Contracts | Contract
Notional
Amount | Strike
Price(1) | Expiration
Date | Value |
| Call Options | | | | | |
| S&P 500® Index | 32 | $10,736 | $3,355.00 | 01/03/20 | $—(2) |
| S&P 500® Index | 32 | 10,720 | 3,350.00 | 01/06/20 | —(2) |
| S&P 500® Index | 32 | 10,752 | 3,360.00 | 01/08/20 | —(2) |
| S&P 500® Index | 32 | 10,832 | 3,385.00 | 01/10/20 | —(2) |
| S&P 500® Index | 29 | 9,816 | 3,385.00 | 01/13/20 | —(2) |
| S&P 500® Index | 32 | 10,832 | 3,385.00 | 01/15/20 | 1 |
| | | | | | 1 |
| Put Options | | | | | |
| S&P 500® Index | 32 | 9,840 | 3,075.00 | 01/03/20 | 3 |
| S&P 500® Index | 32 | 9,840 | 3,075.00 | 01/06/20 | 4 |
| S&P 500® Index | 32 | 9,792 | 3,060.00 | 01/08/20 | 5 |
| S&P 500® Index | 32 | 9,808 | 3,065.00 | 01/10/20 | 12 |
| S&P 500® Index | 29 | 8,802 | 3,035.00 | 01/13/20 | 7 |
| S&P 500® Index | 32 | 9,600 | 3,000.00 | 01/15/20 | 11 |
| | | | | | 42 |
| Total Purchased Options | | $43 |
| Open Written Options Contracts as of December 31, 2019 were as follows: |
| Description of Options | Number of
Contracts | Contract
Notional
Amount | Strike
Price(1) | Expiration
Date | Value |
| Call Options | | | | | |
| S&P 500® Index | 32 | $10,576 | $3,305.00 | 01/03/20 | $—(2) |
| S&P 500® Index | 32 | 10,560 | 3,300.00 | 01/06/20 | (1) |
| S&P 500® Index | 32 | 10,592 | 3,310.00 | 01/08/20 | (1) |
| S&P 500® Index | 32 | 10,672 | 3,335.00 | 01/10/20 | (1) |
| S&P 500® Index | 29 | 9,657 | 3,330.00 | 01/13/20 | (1) |
| S&P 500® Index | 32 | 10,672 | 3,335.00 | 01/15/20 | (2) |
| | | | | | (6) |
| Put Options | | | | | |
| S&P 500® Index | 32 | 10,000 | 3,125.00 | 01/03/20 | (3) |
| S&P 500® Index | 32 | 10,000 | 3,125.00 | 01/06/20 | (5) |
| S&P 500® Index | 32 | 9,952 | 3,110.00 | 01/08/20 | (9) |
| S&P 500® Index | 32 | 9,968 | 3,115.00 | 01/10/20 | (15) |
| S&P 500® Index | 29 | 8,961 | 3,090.00 | 01/13/20 | (14) |
| S&P 500® Index | 32 | 9,760 | 3,050.00 | 01/15/20 | (17) |
| | | | | | (63) |
| Total Written Options | | $(69) |
| Footnote Legend: |
| (1) | Strike price not reported in thousands. |
| (2) | Amount is less than $500. |
See Notes to Financial Statements
Rampart Enhanced Core Equity Series
SCHEDULE OF INVESTMENTS (Continued)
December 31, 2019
($ reported in thousands)
The following table summarizes the market value of the Series’ investments as of December 31, 2019, based on the inputs used to value them (See Security Valuation Note 2A in the Notes to Financial Statements):
| | Total
Value at
December 31, 2019 | | Level 1
Quoted Prices | | Level 2
Significant
Observable
Inputs |
| Assets: | | | | | |
| Equity Securities: | | | | | |
| Common Stocks | $93,536 | | $93,536 | | $— |
| Exchange-Traded Fund | 2,456 | | 2,456 | | — |
| Rights | 8 | | 8 | | — |
| Other Financial Instruments: | | | | | |
| Purchased Options | 43 | | 36 | | 7 |
| Total Assets | 96,043 | | 96,036 | | 7 |
| Liabilities: | | | | | |
| Other Financial Instruments: | | | | | |
| Written Options | (69) | | (68) | | (1) |
| Total Investments | $95,974 | | $95,968 | | $6 |
There were no securities valued using significant unobservable inputs (Level 3) at December 31, 2019.
There were no transfers into or out of Level 3 related to securities held at December 31, 2019.
See Notes to Financial Statements
SGA International Growth Series
SCHEDULE OF INVESTMENTS
December 31, 2019
($ reported in thousands)
| | Shares | | Value |
| Common Stocks—98.0% |
| Communication Services—3.4% | | |
| Tencent Holdings Ltd. (China) | 102,962 | | $4,963 |
| Consumer Discretionary—16.3% | | |
| adidas AG (Germany) | 19,133 | | 6,220 |
| Alibaba Group Holding Ltd. Sponsored ADR (China)(1) | 31,108 | | 6,598 |
| Fast Retailing Co. Ltd. (Japan) | 5,862 | | 3,507 |
| MercadoLibre, Inc. (Argentina)(1) | 6,442 | | 3,684 |
| TAL Education Group ADR (China)(1) | 84,612 | | 4,078 |
| | | | 24,087 |
| | | | |
| |
| Consumer Staples—25.0% | | |
| Diageo plc (United Kingdom) | 139,207 | | 5,901 |
| Fomento Economico Mexicano SAB de C.V. Sponsored ADR (Mexico) | 44,400 | | 4,196 |
| Heineken NV (Netherlands) | 68,474 | | 7,291 |
| L’Oreal SA (France) | 25,394 | | 7,520 |
| Nestle S.A. Registered Shares (Switzerland) | 64,754 | | 7,011 |
| Wal-Mart de Mexico SAB de C.V. (Mexico) | 1,781,083 | | 5,113 |
| | | | 37,032 |
| | | | |
| |
| Financials—18.5% | | |
| AIA Group Ltd. (Hong Kong) | 802,951 | | 8,429 |
| Aon plc (United Kingdom) | 34,693 | | 7,226 |
| HDFC Bank Ltd. ADR (India) | 126,738 | | 8,032 |
| Sanlam Ltd. (South Africa) | 668,951 | | 3,778 |
| | | | 27,465 |
| | | | |
| |
| Health Care—12.4% | | |
| Alcon, Inc. (Switzerland)(1) | 74,527 | | 4,216 |
| Novo Nordisk A/S Sponsored ADR (Denmark) | 109,272 | | 6,325 |
| Shandong Weigao Group Medical Polymer Co. Ltd. Class H (China) | 3,664,646 | | 4,392 |
| Sysmex Corp. (Japan) | 49,376 | | 3,385 |
| | | | 18,318 |
| | | | |
| |
| Industrials—5.4% | | |
| IHS Markit Ltd. (United Kingdom)(1) | 106,285 | | 8,009 |
| Information Technology—11.3% | | |
| Adyen NV (Netherlands)(1) | 4,906 | | 4,023 |
| Dassault Systemes SE (France) | 23,233 | | 3,819 |
| SAP SE Sponsored ADR (Germany) | 44,413 | | 5,951 |
| Temenos AG Registered Shares (Switzerland)(1) | 19,013 | | 3,009 |
| | | | 16,802 |
| | | | |
| |
| | Shares | | Value |
| | | | |
| Materials—5.7% | | |
| Chr. Hansen Holding A/S (Denmark) | 49,406 | | $3,926 |
| Linde plc (United Kingdom) | 21,052 | | 4,482 |
| | | | 8,408 |
| | | | |
| |
Total Common Stocks
(Identified Cost $134,286) | | 145,084 |
| | | | |
| |
| | | | |
| |
Total Long-Term Investments—98.0%
(Identified Cost $134,286) | | 145,084 |
| | | | |
| |
| | | | |
| |
| Short-Term Investment—2.4% |
| Money Market Mutual Fund—2.4% |
| Dreyfus Government Cash Management Fund - Institutional Shares (seven-day effective yield 1.512%)(2) | 3,596,847 | | 3,597 |
Total Short-Term Investment
(Identified Cost $3,597) | | 3,597 |
| | | | |
| |
| | | | |
| |
TOTAL INVESTMENTS—100.4%
(Identified Cost $137,883) | | $148,681 |
| Other assets and liabilities, net—(0.4)% | | (581) |
| NET ASSETS—100.0% | | $148,100 |
| Abbreviation: |
| ADR | American Depositary Receipt |
| Footnote Legend: |
| (1) | Non-income producing. |
| (2) | Shares of this fund are publicly offered, and its prospectus and annual report are publicly available. |
| Country Weightings (Unaudited)† |
| United Kingdom | 17% |
| China | 13 |
| Switzerland | 10 |
| Germany | 8 |
| France | 8 |
| Netherlands | 8 |
| Denmark | 7 |
| Other | 29 |
| Total | 100% |
| † % of total investments as of December 31, 2019. |
For information regarding the abbreviations, see the Key Investment Terms starting on page 4.
See Notes to Financial Statements
SGA International Growth Series
SCHEDULE OF INVESTMENTS (Continued)
December 31, 2019
($ reported in thousands)
The following table summarizes the market value of the Series’ investments as of December 31, 2019, based on the inputs used to value them (See Security Valuation Note 2A in the Notes to Financial Statements):
| | Total
Value at
December 31, 2019 | | Level 1
Quoted Prices |
| Assets: | | | |
| Equity Securities: | | | |
| Common Stocks | $145,084 | | $145,084 |
| Money Market Mutual Fund | 3,597 | | 3,597 |
| Total Investments | $148,681 | | $148,681 |
There were no securities valued using significant observable inputs (Level 2) or significant unobservable inputs (Level 3) at December 31, 2019.
There were no transfers into or out of Level 3 related to securities held at December 31, 2019.
See Notes to Financial Statements
Strategic Allocation Series
SCHEDULE OF INVESTMENTS
December 31, 2019
($ reported in thousands)
| | Par Value | | Value |
| U.S. Government Securities—4.7% |
| U.S. Treasury Bonds | | | |
| 2.500%, 2/15/46 | $2,179 | | $2,222 |
| 3.000%, 8/15/48 | 560 | | 630 |
U.S. Treasury Note
1.625%, 2/15/26 | 80 | | 79 |
U.S. Treasury Notes
2.875%, 8/15/28 | 1,145 | | 1,233 |
Total U.S. Government Securities
(Identified Cost $3,883) | | 4,164 |
| | | | |
| |
| | | | |
| |
| Municipal Bonds—1.7% |
| California—0.9% | | |
San Diego County Regional Airport Authority Rental Car Center Project Series B - Taxable
5.594%, 7/1/43 | 275 | | 311 |
State of California, Build America Bonds Taxable
7.600%, 11/1/40 | 265 | | 438 |
University of California, Series B-A, Taxable
4.428%, 5/15/48 | 75 | | 81 |
| | | | 830 |
| | | | |
| |
| Idaho—0.1% | | |
Idaho Health Facilities Authority Saint Luke’s Health System Revenue Taxable
5.020%, 3/1/48 | 90 | | 109 |
| Texas—0.3% | | |
State of Texas
3.011%, 10/1/26 | 200 | | 210 |
State of Texas, General Obligation Taxable
3.211%, 4/1/44 | 25 | | 25 |
| | | | 235 |
| | | | |
| |
| Virginia—0.4% | | |
City of Bristol, General Obligation Taxable
4.210%, 1/1/42 | 135 | | 140 |
Tobacco Settlement Financing Corp. Revenue Taxable Series A-1, Taxable
6.706%, 6/1/46 | 200 | | 193 |
| | | | 333 |
| | | | |
| |
Total Municipal Bonds
(Identified Cost $1,415) | | 1,507 |
| | | | |
| |
| | | | |
| |
| Foreign Government Securities—0.1% |
Bolivarian Republic of Venezuela
9.375%, 1/13/34(1) | 65 | | 7 |
| United Mexican States | | | |
| 4.750%, 3/8/44 | 54 | | 60 |
Series M
6.500%, 6/9/22 | 925MXN | | 49 |
Total Foreign Government Securities
(Identified Cost $160) | | 116 |
| | | | |
| |
| | | | |
| |
| | Par Value | | Value |
| | | | |
| | | | |
| Mortgage-Backed Securities—10.5% |
| Agency—0.7% | | |
| Federal National Mortgage Association | | | |
Pool #813881
4.000%, 6/1/20 | $1 | | $1 |
Pool #825985
4.500%, 7/1/20 | —(2) | | —(2) |
Pool #254007
6.500%, 10/1/31 | 2 | | 2 |
Pool #656288
6.000%, 9/1/32 | 6 | | 6 |
Pool #835144
5.000%, 10/1/35 | 19 | | 21 |
Pool #882224
6.000%, 9/1/36 | 1 | | 1 |
Pool #914724
5.500%, 4/1/37 | 4 | | 5 |
Pool #940524
5.500%, 7/1/37 | 14 | | 15 |
Pool #949301
6.000%, 10/1/37 | 4 | | 4 |
Pool #975097
5.000%, 6/1/38 | 14 | | 16 |
Pool #929637
5.500%, 6/1/38 | 2 | | 3 |
Pool #986012
5.500%, 6/1/38 | 2 | | 2 |
Pool #994383
5.500%, 11/1/38 | 10 | | 12 |
Pool #991124
5.000%, 1/1/39 | 4 | | 4 |
Pool #994322
6.000%, 1/1/39 | 3 | | 4 |
Pool #AA4418
4.500%, 3/1/39 | 8 | | 8 |
Pool #AA4434
5.000%, 3/1/39 | 7 | | 7 |
Pool #AA4436
6.000%, 3/1/39 | 4 | | 5 |
Pool #CA4128
3.000%, 9/1/49 | 113 | | 114 |
Pool#MA3803
3.500%, 10/1/49 | 310 | | 319 |
| Government National Mortgage Association | | | |
Pool #368053
6.500%, 11/15/23 | 8 | | 9 |
Pool #351336
6.500%, 12/15/23 | 1 | | 1 |
Pool #385198
6.500%, 2/15/24 | 10 | | 11 |
Pool #563381
6.500%, 11/15/31 | 15 | | 17 |
Pool #581072
6.500%, 2/15/32 | 4 | | 4 |
| | | | 591 |
| | | | |
| |
| Non-Agency—9.8% | | |
Access Point Funding I LLC 2017-A, A 144A
3.060%, 4/15/29(3) | 4 | | 4 |
Agate Bay Mortgage Trust 2016-3, A5 144A
3.500%, 8/25/46(3)(4) | 53 | | 54 |
See Notes to Financial Statements
Strategic Allocation Series
SCHEDULE OF INVESTMENTS (Continued)
December 31, 2019
($ reported in thousands)
| | Par Value | | Value |
| | | | |
| Non-Agency—continued | | |
Ajax Mortgage Loan Trust 2019-D, A1 144A
2.956%, 9/25/65(3)(4) | $93 | | $92 |
| American Homes 4 Rent Trust | | | |
2015-SFR1, A 144A
3.467%, 4/17/52(3) | 101 | | 104 |
2015-SFR2, C 144A
4.691%, 10/17/52(3) | 110 | | 117 |
| Angel Oak Mortgage Trust I LLC | | | |
2018-1, A1 144A
3.258%, 4/27/48(3)(4) | 66 | | 66 |
2018-2, A1 144A
3.674%, 7/27/48(3)(4) | 96 | | 97 |
2019-1, A1 144A
3.920%, 11/25/48(3)(4) | 90 | | 92 |
Angel Oak Mortgage Trust LLC 2019-3, A1 144A
2.930%, 5/25/59(3)(4) | 84 | | 84 |
| Arroyo Mortgage Trust | | | |
2018-1, A1 144A
3.763%, 4/25/48(3)(4) | 66 | | 67 |
2019-1, A1 144A
3.805%, 1/25/49(3)(4) | 82 | | 84 |
Aventura Mall Trust 2013-AVM, C 144A
3.743%, 12/5/32(3)(4) | 300 | | 302 |
Bayview Opportunity Master Fund IVa Trust 2016-SPL1, B1 144A
4.250%, 4/28/55(3) | 100 | | 104 |
Bayview Opportunity Master Fund IVb Trust 2016-SPL2, B1 144A
4.250%, 6/28/53(3)(4) | 100 | | 104 |
Bunker Hill Loan Depositary Trust 2019-1, A1 144A
3.613%, 10/26/48(3)(4) | 158 | | 160 |
| BX Trust | | | |
2018-GW, B (1 month LIBOR + 1.020%) 144A
2.760%, 5/15/35(3)(4) | 125 | | 125 |
2019-OC11, D 144A
4.075%, 12/9/41(3) | 80 | | 81 |
CIT Home Equity Loan Trust 2003-1, A5
5.480%, 7/20/34(4) | 58 | | 59 |
| Citigroup Commercial Mortgage Trust | | | |
2013-375P, B 144A
3.518%, 5/10/35(3)(4) | 100 | | 103 |
2019-SST2, A (1 month LIBOR + 0.920%) 144A
2.660%, 12/15/36(3)(4) | 100 | | 100 |
2015-GC27, A4
2.878%, 2/10/48 | 80 | | 82 |
| Citigroup Mortgage Loan Trust, Inc. | | | |
2004-NCM2, 2CB2
6.750%, 8/25/34 | 47 | | 51 |
2014-A, A 144A
4.000%, 1/25/35(3)(4) | 26 | | 27 |
2019-IMC1, A1 144A
2.720%, 7/25/49(3)(4) | 88 | | 88 |
2015-A, A1 144A
3.500%, 6/25/58(3)(4) | 26 | | 27 |
2019-RP1, A1 144A
3.500%, 1/25/66(3)(4) | 102 | | 104 |
| COLT Mortgage Loan Trust Funding LLC | | | |
2018-1, A1 144A
2.930%, 2/25/48(3)(4) | 23 | | 23 |
2018-2, A1 144A
3.470%, 7/27/48(3)(4) | 35 | | 35 |
2019-1, A1 144A
3.705%, 3/25/49(3)(4) | 67 | | 67 |
| | Par Value | | Value |
| | | | |
| Non-Agency—continued | | |
Credit Suisse Mortgage Capital Certificates 2019-ICE4, A (1 month LIBOR + 0.980%) 144A
2.720%, 5/15/36(3)(4) | $100 | | $100 |
Credit Suisse Mortgage Capital Trust 2013-HYB1, A16 144A
3.041%, 4/25/43(3)(4) | 15 | | 15 |
Ellington Financial Mortgage Trust 2018-1, A1FX 144A
4.140%, 10/25/58(3)(4) | 66 | | 67 |
| Galton Funding Mortgage Trust | | | |
2017-1, A21 144A
3.500%, 7/25/56(3)(4) | 39 | | 39 |
2018-2, A41 144A
4.500%, 10/25/58(3)(4) | 55 | | 56 |
GCAT LLC 2019-NQM1, A1 144A
2.985%, 2/25/59(3)(4) | 85 | | 85 |
Goldman Sachs Mortgage Securities Trust 2012-ALOH, A 144A
3.551%, 4/10/34(3) | 100 | | 102 |
GSAA Home Equity Trust 2005-12, AF3W
4.999%, 9/25/35(4) | 23 | | 24 |
Homeward Opportunities Fund I Trust 2019-1, A1 144A
3.454%, 1/25/59(3)(4) | 75 | | 75 |
IMC Home Equity Loan Trust 1997-5, A9
7.310%, 11/20/28 | 49 | | 49 |
JP Morgan Chase Mortgage Trust 2005-A5, 1A2
4.107%, 8/25/35(4) | 34 | | 35 |
| JPMorgan Chase (Washington Mutual) Mortgage Pass-Through Certificates Trust | | | |
2003-AR6, A1
4.699%, 6/25/33(4) | 26 | | 27 |
2003-AR4, 2A1
4.074%, 8/25/33(4) | 28 | | 28 |
| JPMorgan Chase Commercial Mortgage Securities Trust | | | |
2011-C4, A4 144A
4.388%, 7/15/46(3) | 203 | | 207 |
2014-C22, A4
3.801%, 9/15/47 | 150 | | 159 |
2015-C31, AS
4.106%, 8/15/48 | 85 | | 91 |
2015-C28, B
3.986%, 10/15/48 | 90 | | 94 |
| JPMorgan Chase Mortgage Trust | | | |
2014-2, 2A2 144A
3.500%, 6/25/29(3)(4) | 63 | | 64 |
2016-SH1, M2 144A
3.750%, 4/25/45(3)(4) | 55 | | 57 |
2016-SH2, M2 144A
3.750%, 12/25/45(3)(4) | 62 | | 63 |
2017-5, A1 144A
3.155%, 10/26/48(3)(4) | 185 | | 187 |
2018-8, A3 144A
4.000%, 1/25/49(3)(4) | 33 | | 33 |
KNDL Mortgage Trust 2019-KNSQ, A (1 month LIBOR + 0.800%) 144A
2.540%, 5/15/36(3)(4) | 100 | | 100 |
LHOME Mortgage Trust 2019-RTL1, A1 144A
4.580%, 10/25/23(3)(4) | 100 | | 101 |
MASTR Alternative Loan Trust 2003-8, 2A1
5.750%, 11/25/33 | 69 | | 71 |
MASTR Specialized Loan Trust 2005-3, A2 144A
5.704%, 11/25/35(3)(4) | 24 | | 24 |
See Notes to Financial Statements
Strategic Allocation Series
SCHEDULE OF INVESTMENTS (Continued)
December 31, 2019
($ reported in thousands)
| | Par Value | | Value |
| | | | |
| Non-Agency—continued | | |
Mello Warehouse Securitization Trust 2019-1, C (1 month LIBOR + 1.200%) 144A
2.992%, 6/25/52(3)(4)(5) | $50 | | $50 |
| MetLife Securitization Trust | | | |
2017-1A, M1 144A
3.621%, 4/25/55(3)(4) | 100 | | 103 |
2019-1A, A1A 144A
3.750%, 4/25/58(3)(4) | 88 | | 91 |
Morgan Stanley - Bank of America (Merrill Lynch) Trust 2015-C22, AS
3.561%, 4/15/48 | 225 | | 232 |
Morgan Stanley Capital I Trust 2017-CLS, A (1 month LIBOR + 0.700%) 144A
2.440%, 11/15/34(3)(4) | 108 | | 108 |
Motel 6 Trust 2017-MTL6, A (1 month LIBOR + 0.920%) 144A
2.660%, 8/15/34(3)(4) | 89 | | 89 |
| New Residential Mortgage Loan Trust | | | |
2016-2A, A1 144A
3.750%, 11/26/35(3)(4) | 115 | | 118 |
2014-1A, A 144A
3.750%, 1/25/54(3)(4) | 48 | | 50 |
2015-2A, A1 144A
3.750%, 8/25/55(3)(4) | 93 | | 96 |
2016-1A, A1 144A
3.750%, 3/25/56(3)(4) | 40 | | 41 |
2016-3A, A1 144A
3.750%, 9/25/56(3)(4) | 49 | | 51 |
2016-4A, A1 144A
3.750%, 11/25/56(3)(4) | 131 | | 135 |
2016-4A, B1A 144A
4.500%, 11/25/56(3)(4) | 88 | | 94 |
2018-1A, A1A 144A
4.000%, 12/25/57(3)(4) | 112 | | 116 |
NovaStar Mortgage Funding Trust 2004-4, M5 (1 month LIBOR + 1.725%)
3.517%, 3/25/35(4) | 56 | | 56 |
| OBX Trust | | | |
2018-EXP2, 1A1 144A
4.000%, 11/25/48(3)(4) | 134 | | 135 |
2019-INV1, A3 144A
4.500%, 11/25/48(3)(4) | 75 | | 77 |
One Market Plaza Trust 2017-1MKT, A 144A
3.614%, 2/10/32(3) | 100 | | 102 |
Progress Residential Trust 2018-SFR1, B 144A
3.484%, 3/17/35(3) | 110 | | 110 |
| PRPM LLC | | | |
2019-1A, A1 144A
4.500%, 1/25/24(3)(4) | 82 | | 82 |
2019-2A, A1 144A
3.967%, 4/25/24(3)(4) | 102 | | 102 |
RCO V Mortgage LLC 2019-1, A1 144A
3.721%, 5/24/24(3)(4) | 93 | | 93 |
Residential Mortgage Loan Trust 2019-2, A1 144A
2.913%, 5/25/59(3)(4) | 84 | | 84 |
Sequoia Mortgage Trust 2018-CH2, A12 144A
4.000%, 6/25/48(3)(4) | 67 | | 68 |
Starwood Mortgage Residential Trust 2019-IMC1, A1 144A
3.468%, 2/25/49(3)(4) | 79 | | 79 |
Structured Adjustable Rate Mortgage Loan Trust 2004-1, 6A
4.256%, 2/25/34(4) | 64 | | 65 |
| | Par Value | | Value |
| | | | |
| Non-Agency—continued | | |
| Towd Point Mortgage Trust | | | |
2015-1, A2 144A
3.250%, 10/25/53(3)(4) | $100 | | $100 |
2015-6, M1 144A
3.750%, 4/25/55(3)(4) | 100 | | 105 |
2015-5, A1B 144A
2.750%, 5/25/55(3)(4) | 42 | | 42 |
2015-5, A2 144A
3.500%, 5/25/55(3)(4) | 100 | | 101 |
2016-4, A1 144A
2.250%, 7/25/56(3)(4) | 44 | | 43 |
2018-6, A2 144A
3.750%, 3/25/58(3)(4) | 110 | | 114 |
2018-4, A1 144A
3.000%, 6/25/58(3)(4) | 90 | | 92 |
2018-SJ1, A1 144A
4.000%, 10/25/58(3)(4) | 56 | | 56 |
| Tricon American Homes Trust | | | |
2017-SFR1, A 144A
2.716%, 9/17/34(3) | 99 | | 99 |
2019-SFR1, C 144A
3.149%, 3/17/38(3) | 100 | | 99 |
Vericrest Opportunity Loan Trust 2019-NPL2, A1 144A
3.967%, 2/25/49(3)(4) | 84 | | 84 |
Vericrest Opportunity Loan Trust LXIV LLC 2017-NP11, A1 144A
3.375%, 10/25/47(3)(4) | 49 | | 49 |
Vericrest Opportunity Loan Trust LXXV LLC 2019-NPL1, A1A 144A
4.336%, 1/25/49(3)(4) | 89 | | 90 |
| Verus Securitization Trust | | | |
2018-1, A1 144A
2.929%, 2/25/48(3)(4) | 65 | | 65 |
2018-2, B1 144A
4.426%, 6/1/58(3)(4) | 100 | | 101 |
2018-3, A1 144A
4.108%, 10/25/58(3)(4) | 62 | | 63 |
2019-1, A1 144A
3.836%, 2/25/59(3)(4) | 72 | | 72 |
2019-INV1, A1 144A
3.402%, 12/25/59(3)(4) | 86 | | 86 |
| Wells Fargo Commercial Mortgage Trust | | | |
2014-C24, AS
3.931%, 11/15/47 | 85 | | 89 |
2015-LC20, A5
3.184%, 4/15/50 | 85 | | 88 |
2015-LC20, B
3.719%, 4/15/50 | 140 | | 145 |
| | | | 8,666 |
| | | | |
| |
Total Mortgage-Backed Securities
(Identified Cost $9,144) | | 9,257 |
| | | | |
| |
| | | | |
| |
| Asset-Backed Securities—3.8% |
| Automobiles—2.3% | | |
ACC Trust 2019-1, A 144A
3.750%, 5/20/22(3) | 70 | | 70 |
| American Credit Acceptance Receivables Trust | | | |
2018-3, C
144A 3.750%, 10/15/24(3) | 105 | | 106 |
See Notes to Financial Statements
Strategic Allocation Series
SCHEDULE OF INVESTMENTS (Continued)
December 31, 2019
($ reported in thousands)
| | Par Value | | Value |
| | | | |
| Automobiles—continued | | |
2018-4, C
144A 3.970%, 1/13/25(3) | $100 | | $101 |
2019-2, C
144A 3.170%, 6/12/25(3) | 85 | | 86 |
Capital Auto Receivables Asset Trust 2017-1, C 144A
2.700%, 9/20/22(3) | 90 | | 91 |
Centre Point Funding LLC 2012-2A, 1 144A
2.610%, 8/20/21(3) | 10 | | 10 |
| Drive Auto Receivables Trust | | | |
2018-4, D
4.090%, 1/15/26 | 105 | | 108 |
2019-4, C
2.510%, 11/17/25 | 85 | | 85 |
DT Auto Owner Trust 2018-3A, C 144A
3.790%, 7/15/24(3) | 75 | | 76 |
| Exeter Automobile Receivables Trust | | | |
2018-3A, C
144A 3.710%, 6/15/23(3) | 105 | | 106 |
2018-4A, D
144A 4.350%, 9/16/24(3) | 100 | | 103 |
2019-2A, C
144A 3.300%, 3/15/24(3) | 85 | | 86 |
2019-3A, C
144A 2.790%, 5/15/24(3) | 85 | | 85 |
Flagship Credit Auto Trust 2019-1, C 144A
3.600%, 2/18/25(3) | 55 | | 56 |
GLS Auto Receivables Issuer Trust 2019-2A, B 144A
3.320%, 3/15/24(3) | 100 | | 102 |
GLS Auto Receivables Trust 2018-3A, C 144A
4.180%, 7/15/24(3) | 130 | | 134 |
Hertz Vehicle Financing II LP 2015-1A, A 144A
2.730%, 3/25/21(3) | 110 | | 110 |
Prestige Auto Receivables Trust 2019-1A, D 144A
3.010%, 8/15/25(3) | 85 | | 85 |
Skopos Auto Receivables Trust 2019-1A, C 144A
3.630%, 9/16/24(3) | 100 | | 100 |
Tesla Auto Lease Trust 2018-B, B 144A
4.120%, 10/20/21(3) | 85 | | 87 |
Tricolor Auto Securitization Trust 2018-2A, B 144A
4.760%, 2/15/22(3) | 96 | | 98 |
Veros Automobile Receivables Trust 2018-1, B 144A
4.050%, 2/15/24(3) | 85 | | 86 |
| | | | 1,971 |
| | | | |
| |
| Other—1.4% | | |
Amur Equipment Finance Receivables VI LLC 2018-2A, A2 144A
3.890%, 7/20/22(3) | 88 | | 89 |
Arby’s Funding LLC 2015-1A, A2 144A
4.969%, 10/30/45(3) | 67 | | 69 |
BXG Receivables Note Trust 2012-A, A 144A
2.660%, 12/2/27(3) | 12 | | 12 |
Diamond Resorts Owner Trust 2017-1A, A 144A
3.270%, 10/22/29(3) | 33 | | 34 |
Jersey Mike’s Funding 2019-1A, A2 144A
4.433%, 2/15/50(3) | 80 | | 80 |
Lendmark Funding Trust 2019-1A, A 144A
3.000%, 12/20/27(3) | 100 | | 100 |
Mariner Finance Issuance Trust 2019-AA, A 144A
2.960%, 7/20/32(3) | 100 | | 100 |
MVW LLC 2019-2A, A 144A
2.220%, 10/20/38(3) | 96 | | 95 |
| | Par Value | | Value |
| | | | |
| Other—continued | | |
MVW Owner Trust 2017-1A, A 144A
2.420%, 12/20/34(3) | $49 | | $49 |
Orange Lake Timeshare Trust 2019-A, B 144A
3.360%, 4/9/38(3) | 81 | | 82 |
Primose Funding LLC 2019-1A, A2 144A
4.475%, 7/30/49(3) | 85 | | 86 |
| Prosper Marketplace Issuance Trust | | | |
2018-2A, B
144A 3.960%, 10/15/24(3) | 100 | | 101 |
2019-3A, A
144A 3.190%, 7/15/25(3) | 68 | | 69 |
| SoFi Consumer Loan Program LLC | | | |
2016-3, A
144A 3.050%, 12/26/25(3) | 23 | | 23 |
2017-1, A
144A 3.280%, 1/26/26(3) | 17 | | 17 |
SoFi Consumer Loan Program Trust 2019-3, A 144A
2.900%, 5/25/28(3) | 73 | | 73 |
Stack Infrastructure Issuer LLC 2019-1A, A2 144A
4.540%, 2/25/44(3) | 94 | | 99 |
Taco Bell Funding LLC 2016-1A, A23 144A
4.970%, 5/25/46(3) | 78 | | 83 |
| | | | 1,261 |
| | | | |
| |
| Student Loan—0.1% | | |
Earnest Student Loan Program LLC 2017-A, A2 144A
2.650%, 1/25/41(3) | 36 | | 36 |
SoFi Professional Loan Program LLC 2016-A, A2 144A
2.760%, 12/26/36(3) | 29 | | 29 |
| | | | 65 |
| | | | |
| |
Total Asset-Backed Securities
(Identified Cost $3,263) | | 3,297 |
| | | | |
| |
| | | | |
| |
| Corporate Bonds and Notes—13.5% |
| Communication Services—0.7% | | |
| AT&T, Inc. | | | |
| 4.250%, 3/1/27 | 20 | | 22 |
| 4.100%, 2/15/28 | 55 | | 60 |
Diamond Sports Group LLC 144A
5.375%, 8/15/26(3) | 40 | | 40 |
Discovery Communications LLC
3.950%, 3/20/28 | 100 | | 107 |
Meredith Corp.
6.875%, 2/1/26 | 40 | | 42 |
Sprint Spectrum Co. LLC 144A
4.738%, 3/20/25(3) | 200 | | 212 |
Telesat Canada 144A
4.875%, 6/1/27(3) | 30 | | 30 |
| Verizon Communications, Inc. | | | |
| 4.125%, 3/16/27 | 60 | | 66 |
(3 month LIBOR + 1.100%)
3.010%, 5/15/25(4) | 35 | | 36 |
| | | | 615 |
| | | | |
| |
| Consumer Discretionary—0.8% | | |
Aptiv Corp.
4.150%, 3/15/24 | 90 | | 95 |
Brookfield Residential Properties, Inc. 144A
6.250%, 9/15/27(3) | 65 | | 69 |
See Notes to Financial Statements
Strategic Allocation Series
SCHEDULE OF INVESTMENTS (Continued)
December 31, 2019
($ reported in thousands)
| | Par Value | | Value |
| | | | |
| Consumer Discretionary—continued | | |
Bunge Ltd. Finance Corp.
4.350%, 3/15/24 | $70 | | $73 |
Dollar Tree, Inc.
4.000%, 5/15/25 | 90 | | 96 |
| General Motors Financial Co., Inc. | | | |
| 4.200%, 3/1/21 | 45 | | 46 |
| 3.550%, 4/9/21 | 17 | | 17 |
GLP Capital LP
5.750%, 6/1/28 | 100 | | 114 |
Lear Corp.
3.800%, 9/15/27 | 120 | | 121 |
MGM Growth Properties Operating Partnership LP 144A
5.750%, 2/1/27(3) | 35 | | 39 |
TRI Pointe Group, Inc.
5.875%, 6/15/24 | 55 | | 60 |
| | | | 730 |
| | | | |
| |
| Consumer Staples—0.1% | | |
Conagra Brands, Inc.
4.300%, 5/1/24 | 85 | | 92 |
| Energy—1.3% | | |
Boardwalk Pipelines LP
4.950%, 12/15/24 | 65 | | 70 |
| Cheniere Energy Partners LP | | | |
| 5.625%, 10/1/26 | 35 | | 37 |
| 144A 4.500%, 10/1/29(3) | 30 | | 31 |
CNOOC Finance 2013 Ltd.
3.000%, 5/9/23 | 200 | | 203 |
HollyFrontier Corp.
5.875%, 4/1/26 | 100 | | 113 |
| Kinder Morgan, Inc. | | | |
| 4.300%, 6/1/25 | 165 | | 179 |
| 7.750%, 1/15/32 | 65 | | 89 |
MPLX LP
4.875%, 12/1/24 | 120 | | 130 |
Patterson-UTI Energy, Inc.
5.150%, 11/15/29 | 50 | | 51 |
Sabine Pass Liquefaction LLC
4.200%, 3/15/28 | 60 | | 64 |
Targa Resources Partners LP
5.875%, 4/15/26 | 60 | | 64 |
Valero Energy Partners LP
4.500%, 3/15/28 | 90 | | 99 |
| | | | 1,130 |
| | | | |
| |
| Financials—5.6% | | |
Allstate Corp. (The) Series B
5.750%, 8/15/53(6) | 145 | | 156 |
Apollo Management Holdings LP 144A
4.000%, 5/30/24(3) | 75 | | 79 |
Ares Finance Co. LLC 144A
4.000%, 10/8/24(3) | 140 | | 140 |
Athene Holding Ltd.
4.125%, 1/12/28 | 110 | | 114 |
| Aviation Capital Group LLC | | | |
| 144A 3.875%, 5/1/23(3) | 108 | | 112 |
| 144A 3.500%, 11/1/27(3) | 100 | | 101 |
| Bank of America Corp. | | | |
| 4.200%, 8/26/24 | 235 | | 252 |
| | Par Value | | Value |
| | | | |
| Financials—continued | | |
(3 month LIBOR + 0.790%)
3.004%, 12/20/23 | $90 | | $92 |
Bank of Montreal
3.803%, 12/15/32 | 156 | | 163 |
Brighthouse Financial, Inc.
3.700%, 6/22/27 | 100 | | 100 |
Brightsphere Investment Group, Inc.
4.800%, 7/27/26 | 65 | | 68 |
Brookfield Finance, Inc.
4.000%, 4/1/24 | 92 | | 99 |
Capital One Financial Corp.
3.750%, 7/28/26 | 130 | | 137 |
Citadel LP 144A
4.875%, 1/15/27(3) | 65 | | 68 |
| Citigroup, Inc. | | | |
| 3.200%, 10/21/26 | 171 | | 177 |
(3 month LIBOR + 1.250%)
3.159%, 7/1/26(4) | 160 | | 164 |
Fairfax Financial Holdings Ltd.
4.850%, 4/17/28 | 105 | | 114 |
Goldman Sachs Group, Inc. (The)
4.250%, 10/21/25 | 195 | | 212 |
Guanay Finance Ltd. 144A
6.000%, 12/15/20(3) | 56 | | 57 |
Huntington Bancshares, Inc.
7.000%, 12/15/20 | 95 | | 99 |
ICAHN Enterprises LP
6.250%, 5/15/26 | 85 | | 91 |
JPMorgan Chase & Co.
3.875%, 9/10/24 | 50 | | 53 |
| Liberty Mutual Group, Inc. | | | |
| 144A 4.250%, 6/15/23(3) | 34 | | 36 |
| 144A 4.569%, 2/1/29(3) | 116 | | 129 |
Lincoln National Corp. (3 month LIBOR + 2.040%)
4.006%, 4/20/67(4)(6) | 55 | | 46 |
Lloyds Bank plc 144A
6.500%, 9/14/20(3) | 150 | | 154 |
| Morgan Stanley | | | |
| 3.125%, 7/27/26 | 125 | | 129 |
| 6.375%, 7/24/42 | 100 | | 147 |
MSCI, Inc. 144A
4.000%, 11/15/29(3) | 46 | | 47 |
Navient Corp.
6.750%, 6/25/25(7) | 60 | | 66 |
Nuveen Finance LLC 144A
4.125%, 11/1/24(3) | 135 | | 147 |
| Prudential Financial, Inc. | | | |
| 5.625%, 6/15/43(6) | 65 | | 70 |
(3 month LIBOR + 4.175%)
5.875%, 9/15/42 | 100 | | 107 |
| Santander Holdings USA, Inc. | | | |
| 3.700%, 3/28/22 | 93 | | 96 |
| 3.500%, 6/7/24 | 65 | | 67 |
SBA Tower Trust 144A
2.877%, 7/9/21(3) | 100 | | 100 |
Springleaf Finance Corp.
7.125%, 3/15/26 | 40 | | 46 |
Synchrony Financial
3.950%, 12/1/27 | 90 | | 94 |
Teachers Insurance & Annuity Association of America (3 month LIBOR + 2.661%) 144A
4.375%, 9/15/54(3) | 120 | | 125 |
See Notes to Financial Statements
Strategic Allocation Series
SCHEDULE OF INVESTMENTS (Continued)
December 31, 2019
($ reported in thousands)
| | Par Value | | Value |
| | | | |
| Financials—continued | | |
Toronto-Dominion Bank (The)
3.625%, 9/15/31 | $155 | | $162 |
Trinity Acquisition plc
4.400%, 3/15/26 | 90 | | 98 |
Voya Financial, Inc. (3 month LIBOR + 3.580%)
5.650%, 5/15/53 | 65 | | 69 |
| Wells Fargo & Co. | | | |
Series M
3.450%, 2/13/23 | 125 | | 129 |
Series S
5.900%(6) | 75 | | 82 |
Willis Towers Watson plc
5.750%, 3/15/21 | 135 | | 141 |
| | | | 4,935 |
| | | | |
| |
| Health Care—0.5% | | |
AbbVie, Inc.
3.200%, 5/14/26 | 40 | | 41 |
Anthem, Inc.
2.875%, 9/15/29 | 65 | | 65 |
Centene Corp. 144A
4.625%, 12/15/29(3) | 25 | | 26 |
Charles River Laboratories International, Inc. 144A
4.250%, 5/1/28(3) | 15 | | 15 |
CVS Health Corp.
2.875%, 6/1/26 | 120 | | 122 |
| HCA, Inc. | | | |
| 5.625%, 9/1/28 | 35 | | 40 |
| 5.125%, 6/15/39 | 35 | | 39 |
| 5.250%, 6/15/49 | 50 | | 56 |
| | | | 404 |
| | | | |
| |
| Industrials—0.8% | | |
Avolon Holdings Funding Ltd. 144A
4.375%, 5/1/26(3) | 85 | | 90 |
DP World plc 144A
6.850%, 7/2/37(3) | 100 | | 131 |
Hillenbrand, Inc.
4.500%, 9/15/26 | 85 | | 89 |
Oshkosh Corp.
4.600%, 5/15/28 | 117 | | 125 |
Owens Corning
3.950%, 8/15/29 | 109 | | 113 |
Penske Truck Leasing Co., LP 144A
4.125%, 8/1/23(3) | 90 | | 95 |
SRS Distribution, Inc. 144A
8.250%, 7/1/26(3) | 45 | | 46 |
TransDigm, Inc. 144A
6.250%, 3/15/26(3) | 35 | | 38 |
| | | | 727 |
| | | | |
| |
| Information Technology—0.8% | | |
Apple, Inc.
3.350%, 2/9/27 | 90 | | 96 |
Broadcom Corp.
3.000%, 1/15/22 | 45 | | 46 |
Citrix Systems, Inc.
4.500%, 12/1/27 | 75 | | 81 |
Dell International LLC 144A
6.020%, 6/15/26(3) | 100 | | 115 |
Hewlett Packard Enterprise Co.
4.900%, 10/15/25 | 65 | | 72 |
| | Par Value | | Value |
| | | | |
| Information Technology—continued | | |
Motorola Solutions, Inc.
4.600%, 5/23/29 | $100 | | $109 |
Verisk Analytics, Inc.
4.000%, 6/15/25 | 135 | | 145 |
| | | | 664 |
| | | | |
| |
| Materials—0.5% | | |
DuPont de Nemours, Inc.
4.493%, 11/15/25 | 97 | | 107 |
Glencore Funding LLC 144A
4.125%, 5/30/23(3) | 105 | | 109 |
Kaiser Aluminum Corp. 144A
4.625%, 3/1/28(3) | 30 | | 31 |
Olin Corp.
5.625%, 8/1/29 | 80 | | 84 |
Vulcan Materials Co.
3.900%, 4/1/27 | 105 | | 111 |
| | | | 442 |
| | | | |
| |
| Real Estate—1.2% | | |
Corporate Office Properties LP
3.600%, 5/15/23 | 165 | | 170 |
EPR Properties
4.750%, 12/15/26 | 120 | | 131 |
ESH Hospitality, Inc. 144A
4.625%, 10/1/27(3) | 55 | | 56 |
Healthcare Realty Trust, Inc.
3.875%, 5/1/25 | 90 | | 95 |
Healthcare Trust of America Holdings LP
3.750%, 7/1/27 | 110 | | 116 |
Hospitality Properties Trust
4.500%, 3/15/25 | 105 | | 108 |
iStar, Inc.
4.250%, 8/1/25 | 65 | | 66 |
Life Storage LP
3.500%, 7/1/26 | 55 | | 56 |
| MPT Operating Partnership LP | | | |
| 5.000%, 10/15/27 | 35 | | 37 |
| 4.625%, 8/1/29 | 15 | | 15 |
Office Properties Income Trust
4.500%, 2/1/25 | 135 | | 141 |
Retail Opportunity Investments Partnership LP
4.000%, 12/15/24 | 105 | | 107 |
| | | | 1,098 |
| | | | |
| |
| Utilities—1.2% | | |
CenterPoint Energy, Inc.
4.250%, 11/1/28 | 85 | | 92 |
DPL, Inc. 144A
4.350%, 4/15/29(3) | 102 | | 98 |
Energy Metro, Inc.
3.150%, 3/15/23 | 120 | | 124 |
Exelon Corp.
3.497%, 6/1/22 | 100 | | 103 |
Pennsylvania Electric Co. 144A
3.600%, 6/1/29(3) | 90 | | 95 |
PNM Resources, Inc.
3.250%, 3/9/21 | 85 | | 86 |
PSEG Power LLC
3.850%, 6/1/23 | 65 | | 68 |
Southern Power Co.
4.150%, 12/1/25 | 160 | | 173 |
See Notes to Financial Statements
Strategic Allocation Series
SCHEDULE OF INVESTMENTS (Continued)
December 31, 2019
($ reported in thousands)
| | Par Value | | Value |
| | | | |
| Utilities—continued | | |
Talen Energy Supply LLC 144A
6.625%, 1/15/28(3) | $40 | | $41 |
TerraForm Power Operating LLC 144A
5.000%, 1/31/28(3) | 55 | | 58 |
Texas Competitive Electric Holdings Co. 144A
0.000%, 10/1/20(3)(5) | 65 | | —(2) |
Vistra Operations Co. LLC 144A
4.300%, 7/15/29(3) | 85 | | 87 |
| | | | 1,025 |
| | | | |
| |
Total Corporate Bonds and Notes
(Identified Cost $11,236) | | 11,862 |
| | | | |
| |
| | | | |
| |
| Leveraged Loans(4)—1.0% |
| Aerospace—0.1% | | |
American Airlines, Inc. 2018 (3 month LIBOR + 1.750%)
0.000%, 6/27/25(8) | 65 | | 65 |
TransDigm, Inc. 2018, Tranche E (1 month LIBOR + 2.500%)
4.299%, 5/30/25 | 34 | | 34 |
| | | | 99 |
| | | | |
| |
| Energy—0.0% | | |
Paragon Offshore Finance Co. (1 month PRIME + 0.000%)
5.250%, 7/16/21(1)(5) | —(2) | | — |
| Financial—0.1% | | |
Delos Finance S.a.r.l. 2018 (3 month LIBOR + 1.750%)
3.695%, 10/6/23 | 56 | | 56 |
| Food / Tobacco—0.0% | | |
Aramark Services, Inc. Tranche B-4 (3 month LIBOR + 1.750%)
0.000%, 1/27/27(8) | 15 | | 15 |
| Forest Prod / Containers—0.0% | | |
Berry Global, Inc. Tranche U (3 month LIBOR + 2.500%)
4.215%, 7/1/26 | 35 | | 35 |
| Gaming / Leisure—0.1% | | |
Seminole Tribe of Florida (1 month LIBOR + 1.750%)
3.549%, 7/8/24 | 62 | | 63 |
| Healthcare—0.2% | | |
Bausch Health Cos., Inc. (1 month LIBOR + 3.000%)
4.740%, 6/2/25 | 4 | | 4 |
IQVIA, Inc. Tranche B-3 (3 month LIBOR + 1.750%)
3.695%, 6/11/25 | 69 | | 69 |
LifePoint Health, Inc. Tranche B, First Lien (1 month LIBOR + 4.500%)
6.304%, 11/16/25 | 70 | | 70 |
Select Medical Corp. Tranche B (6 month LIBOR + 2.500%)
0.000%, 3/6/25(8) | 10 | | 10 |
| | | | 153 |
| | | | |
| |
| Housing—0.1% | | |
American Builders & Contractors Supply Co., Inc. (1 month LIBOR + 2.000%)
3.799%, 1/15/27 | 65 | | 65 |
| | Par Value | | Value |
| | | | |
| Housing—continued | | |
Summit Materials LLC Tranche B (1 month LIBOR + 2.000%)
3.799%, 11/21/24 | $69 | | $70 |
| | | | 135 |
| | | | |
| |
| Media / Telecom - Broadcasting—0.1% | | |
Nexstar Broadcasting, Inc. Tranche B-4 (3 month LIBOR + 2.750%)
4.452%, 9/18/26 | 50 | | 50 |
| Media / Telecom - Cable/Wireless Video—0.1% | | |
CSC Holdings LLC 2018 (1 month LIBOR + 2.250%)
3.990%, 1/15/26 | 65 | | 64 |
| Media / Telecom - Telecommunications—0.1% | | |
CenturyLink, Inc. Tranche B (1 month LIBOR + 2.750%)
4.549%, 1/31/25 | 73 | | 74 |
| Media / Telecom - Wireless Communications—0.1% | | |
CommScope, Inc. (1 month LIBOR + 3.250%)
5.049%, 4/4/26 | 25 | | 25 |
SBA Senior Finance II LLC Tranche B (1 month LIBOR + 1.750%)
3.550%, 4/11/25 | 39 | | 40 |
| | | | 65 |
| | | | |
| |
| Utility—0.0% | | |
| Pacific Gas and Electric Co. | | | |
(1 month LIBOR + 2.250%)
3.970%, 12/31/20 | 30 | | 30 |
(4 month LIBOR + 2.250%)
2.250%, 12/31/20(9) | 10 | | 10 |
| | | | 40 |
| | | | |
| |
Total Leveraged Loans
(Identified Cost $843) | | 849 |
| | | | |
| |
| | | | |
| |
| | Shares | |
| Preferred Stocks—0.4% |
| Financials—0.3% | |
| M&T Bank Corp. Series F, 5.125%(10) | 58(11) | 63 |
| MetLife, Inc. Series D, 5.875% | 40(11) | 44 |
| PNC Financial Services Group, Inc. (The) Series S, 5.000% | 110(11) | 118 |
| | | 225 |
| | | |
| |
| Industrials—0.1% | |
| General Electric Co. Series D, 5.000% | 90(11) | 88 |
Total Preferred Stocks
(Identified Cost $300) | 313 |
| | | |
| |
| | | |
| |
| Common Stocks—62.8% |
| Communication Services—10.4% | |
| 58.com, Inc. ADR(12) | 5,800 | 376 |
| Activision Blizzard, Inc. | 9,240 | 549 |
| Adevinta ASA(12) | 15,049 | 178 |
| Ascential plc | 69,011 | 358 |
| Auto Trader Group plc | 60,982 | 480 |
| carsales.com Ltd. | 23,485 | 274 |
See Notes to Financial Statements
Strategic Allocation Series
SCHEDULE OF INVESTMENTS (Continued)
December 31, 2019
($ reported in thousands)
| | Shares | | Value |
| | | | |
| Communication Services—continued | | |
| CTS Eventim AG & Co. KGaA | 3,815 | | $240 |
| Facebook, Inc. Class A(12) | 12,600 | | 2,586 |
| Karnov Group AB(12) | 57,784 | | 327 |
| Netflix, Inc.(12) | 4,770 | | 1,543 |
| Rightmove plc | 77,751 | | 653 |
| Scout24 AG | 4,401 | | 291 |
| Tencent Holdings Ltd. ADR | 27,070 | | 1,300 |
| | | | 9,155 |
| | | | |
| |
| Consumer Discretionary—13.5% | | |
| Alibaba Group Holding Ltd. Sponsored ADR(12) | 12,140 | | 2,575 |
| Amazon.com, Inc.(12) | 1,760 | | 3,252 |
| Home Depot, Inc. (The) | 2,980 | | 651 |
| Las Vegas Sands Corp. | 15,250 | | 1,053 |
| McDonald’s Corp. | 3,020 | | 597 |
| MercadoLibre, Inc.(12) | 1,140 | | 652 |
| NIKE, Inc. Class B | 12,880 | | 1,305 |
| Ross Stores, Inc. | 8,360 | | 973 |
| Trip.com Group Ltd. ADR(12) | 21,425 | | 719 |
| Union Auction PCL | 453,500 | | 107 |
| | | | 11,884 |
| | | | |
| |
| Consumer Staples—3.1% | | |
| Compania Cervecerias Unidas SA Sponsored ADR | 4,000 | | 76 |
| McCormick & Co., Inc. | 3,350 | | 569 |
| Monster Beverage Corp.(12) | 6,580 | | 418 |
| Philip Morris International, Inc. | 9,720 | | 827 |
| Procter & Gamble Co. (The) | 6,910 | | 863 |
| | | | 2,753 |
| | | | |
| |
| Energy—0.4% | | |
| Computer Modelling Group Ltd. | 36,581 | | 232 |
| Frontera Energy Corp. | 1,088 | | 8 |
| Pason Systems, Inc. | 7,600 | | 77 |
| | | | 317 |
| | | | |
| |
| Financials—5.4% | | |
| Bank of America Corp. | 41,120 | | 1,448 |
| Charles Schwab Corp. (The) | 14,130 | | 672 |
| Gruppo Mutuionline SpA | 16,024 | | 360 |
| MarketAxess Holdings, Inc. | 2,310 | | 876 |
| Mortgage Advice Bureau Holdings Ltd. | 37,261 | | 382 |
| Progressive Corp. (The) | 4,400 | | 319 |
| Sabre Insurance Group plc | 98,842 | | 403 |
| Vostok New Ventures Ltd. SDR(12) | 50,368 | | 338 |
| | | | 4,798 |
| | | | |
| |
| Health Care—3.8% | | |
| Danaher Corp. | 5,570 | | 855 |
| Haw Par Corp., Ltd. | 21,300 | | 203 |
| HealthEquity, Inc.(12) | 6,360 | | 471 |
| Illumina, Inc.(12) | 1,390 | | 461 |
| Zoetis, Inc. | 10,120 | | 1,339 |
| | | | 3,329 |
| | | | |
| |
| Industrials—9.0% | | |
| 51job, Inc. ADR(12) | 3,100 | | 263 |
| Asiakastieto Group Oyj | 3,386 | | 120 |
| CoStar Group, Inc.(12) | 1,590 | | 951 |
| DSV PANALPINA A/S | 3,750 | | 432 |
| en-japan, Inc. | 9,700 | | 426 |
| | Shares | | Value |
| | | | |
| Industrials—continued | | |
| Equifax, Inc. | 2,990 | | $419 |
| Fair Isaac Corp.(12) | 1,690 | | 633 |
| Haitian International Holdings Ltd. | 151,000 | | 366 |
| HeadHunter Group plc ADR | 32,400 | | 695 |
| JOST Werke AG | 5,145 | | 215 |
| Kansas City Southern | 4,860 | | 744 |
| Knorr-Bremse AG | 3,027 | | 308 |
| Marel HF | 23,715 | | 121 |
| Roper Technologies, Inc. | 2,630 | | 932 |
| Rotork plc | 42,500 | | 189 |
| Uber Technologies, Inc.(12) | 20,495 | | 610 |
| VAT Group AG(12) | 1,119 | | 189 |
| Voltronic Power Technology Corp. | 11,600 | | 277 |
| | | | 7,890 |
| | | | |
| |
| Information Technology—15.6% | | |
| Accenture plc Class A | 3,810 | | 802 |
| Admicom Oyj | 2,087 | | 151 |
| Alten SA | 3,440 | | 434 |
| Amphenol Corp. Class A | 11,790 | | 1,276 |
| Avalara, Inc.(12) | 13,610 | | 997 |
| Bill.com Holdings, Inc.(12)(13) | 27,685 | | 1,053 |
| Bouvet ASA | 3,124 | | 138 |
| Douzone Bizon Co., Ltd. | 2,582 | | 181 |
| FDM Group Holdings plc | 10,187 | | 139 |
| Fortnox AB | 5,607 | | 101 |
| Freee KK(12) | 10,300 | | 306 |
| NVIDIA Corp. | 6,130 | | 1,442 |
| Paycom Software, Inc.(12) | 7,430 | | 1,967 |
| SimCorp A/S | 1,240 | | 141 |
| Trade Desk, Inc. (The) Class A(12) | 4,290 | | 1,114 |
| Visa, Inc. Class A | 11,850 | | 2,227 |
| Webstep AS | 43,373 | | 120 |
| Workday, Inc. Class A(12) | 6,750 | | 1,110 |
| | | | 13,699 |
| | | | |
| |
| Materials—1.6% | | |
| Chr. Hansen Holding A/S | 2,185 | | 174 |
| Corp. Moctezuma SAB de C.V. | 68,907 | | 201 |
| Ecolab, Inc. | 5,350 | | 1,032 |
| | | | 1,407 |
| | | | |
| |
Total Common Stocks
(Identified Cost $34,159) | | 55,232 |
| | | | |
| |
| | | | |
| |
| Exchange-Traded Fund—0.1% | |
| Invesco Senior Loan ETF(14) | 2,861 | | 65 |
Total Exchange-Traded Fund
(Identified Cost $65) | | 65 |
| | | | |
| |
| | | | |
| |
| Rights—0.0% | |
| Utilities—0.0% | | |
| Vistra Energy Corp.(12) | 1,084 | | 1 |
Total Rights
(Identified Cost $1) | | 1 |
| | | | |
| |
See Notes to Financial Statements
Strategic Allocation Series
SCHEDULE OF INVESTMENTS (Continued)
December 31, 2019
($ reported in thousands)
| | Shares | | Value |
| | | | |
| | | | |
| |
Total Long-Term Investments—98.6%
(Identified Cost $64,469) | | $86,663 |
| | | | |
| |
| | | | |
| |
| Short-Term Investment—0.6% | |
| Money Market Mutual Fund—0.6% | |
| Dreyfus Government Cash Management Fund - Institutional Shares (seven-day effective yield 1.512%)(14) | 532,549 | | 533 |
Total Short-Term Investment
(Identified Cost $533) | | 533 |
| | | | |
| |
| | | | |
| |
| Securities Lending Collateral—0.1% | |
| Dreyfus Government Cash Management Fund - Institutional Shares (seven-day effective yield 1.512%)(14)(15) | 66,444 | | 66 |
Total Securities Lending Collateral
(Identified Cost $66) | | 66 |
| | | | |
| |
| | | | |
| |
TOTAL INVESTMENTS—99.3%
(Identified Cost $65,068) | | $87,262 |
| Other assets and liabilities, net—0.7% | | 640 |
| NET ASSETS—100.0% | | $87,902 |
| Abbreviations: |
| ADR | American Depositary Receipt |
| ETF | Exchange-Traded Fund |
| LIBOR | London Interbank Offered Rate |
| LLC | Limited Liability Company |
| LP | Limited Partnership |
| Foreign Currencies: |
| MXN | Mexican Peso |
| Footnote Legend: |
| (1) | Security in default; no interest payments are being received during the bankruptcy proceedings. |
| (2) | Amount is less than $500. |
| (3) | Security exempt from registration under Rule 144A of the Securities Act of 1933. These securities may be resold in transactions exempt from registration, normally to qualified institutional buyers. At December 31, 2019, these securities amounted to a value of $13,172 or 15.0% of net assets. |
| (4) | Variable rate security. Rate disclosed is as of December 31, 2019. For leveraged loans, the rate shown may represent a weighted average interest rate. Information in parenthesis represents benchmark and reference rate for each security. Certain variable rate securities are not based on a published reference rate and spread but are determined by the issuer or agent and are based on current market conditions, or, for mortgage-backed securities, are impacted by the individual mortgages which are paying off over time. These securities do not indicate a reference rate and spread in their descriptions. |
| (5) | The value of this security was determined using significant unobservable inputs and is reported as a Level 3 security in the Fair Value Hierarchy table located after the Schedule of Investments. |
| (6) | Interest payments may be deferred. |
| (7) | All or a portion of security is on loan. |
| (8) | This loan will settle after December 31, 2019, at which time the interest rate, based on the London Interbank Offered Rate (“LIBOR”) and the agreed upon spread on trade date, will be reflected. |
| (9) | Represents unfunded portion of security and commitment fee earned on this portion. |
| (10) | Interest may be forfeited. |
| (11) | Value shown as par value. |
| (12) | Non-income producing. |
| (13) | Restricted security. |
| (14) | Shares of this fund are publicly offered, and its prospectus and annual report are publicly available. |
| (15) | Represents security purchased with cash collateral received for securities on loan. |
| Country Weightings (Unaudited)† |
| United States | 81% |
| China | 6 |
| United Kingdom | 3 |
| Germany | 1 |
| Canada | 1 |
| Sweden | 1 |
| Denmark | 1 |
| Other | 6 |
| Total | 100% |
| † % of total investments as of December 31, 2019. |
For information regarding the abbreviations, see the Key Investment Terms starting on page 4.
See Notes to Financial Statements
Strategic Allocation Series
SCHEDULE OF INVESTMENTS (Continued)
December 31, 2019
($ reported in thousands)
The following table summarizes the market value of the Series’ investments as of December 31, 2019, based on the inputs used to value them (See Security Valuation Note 2A in the Notes to Financial Statements):
| | Total
Value at
December 31, 2019 | | Level 1
Quoted Prices | | Level 2
Significant
Observable
Inputs | | Level 3
Significant
Unobservable
Inputs |
| Assets: | | | | | | | |
| Debt Securities: | | | | | | | |
| Asset-Backed Securities | $3,297 | | $— | | $3,297 | | $— |
| Corporate Bonds and Notes | 11,862 | | — | | 11,862 | | —(1) |
| Foreign Government Securities | 116 | | — | | 116 | | — |
| Leveraged Loans | 849 | | — | | 849 | | —(2) |
| Mortgage-Backed Securities | 9,257 | | — | | 9,207 | | 50 |
| Municipal Bonds | 1,507 | | — | | 1,507 | | — |
| U.S. Government Securities | 4,164 | | — | | 4,164 | | — |
| Equity Securities: | | | | | | | |
| Common Stocks | 55,232 | | 55,232 | | — | | — |
| Preferred Stocks | 313 | | — | | 313 | | — |
| Exchange-Traded Fund | 65 | | 65 | | — | | — |
| Rights | 1 | | — | | 1 | | — |
| Securities Lending Collateral | 66 | | 66 | | — | | — |
| Money Market Mutual Fund | 533 | | 533 | | — | | — |
| Total Investments | $87,262 | | $55,896 | | $31,316 | | $50 |
| (1) | Amount is less than $500. |
| (2) | Includes internally fair valued securities currently priced at $0. |
Securities held by the Series with an end of period value of $1 were transferred from Level 3 to Level 2 due to a increase in trading activities at period end. Securities held by the Series with an end of period value of $1,053 were transferred from Level 3 to Level 1 due to a market listing.
Some of the Series’ investments that were categorized as Level 3 were valued utilizing third party pricing information without adjustment. Such valuations are based on unobservable inputs. A significant change in third party information could result in a significantly lower or higher value of Level 3 investments.
Management has determined that the amount of Level 3 securities compared to total net assets is not material; therefore, the rollforward of Level 3 securities and assumptions are not shown for the period ended December 31, 2019.
See Notes to Financial Statements
VIRTUS VARIABLE INSURANCE TRUST
STATEMENTS OF ASSETS AND LIABILITIES
December 31, 2019
(Reported in thousands except shares and per share amounts)
| | Duff & Phelps Real Estate Securities Series | | KAR Capital Growth Series | | KAR Small-Cap Growth Series | | KAR Small-Cap Value Series |
| Assets | | | | | | | |
Investment in securities at value(1)(2)
| $77,743 | | $231,099 | | $102,064 | | $76,439 |
Foreign currency at value(3)
| — | | — | | —(a) | | — |
Cash
| 287 | | 1,905 | | 2,995 | | 830 |
| Receivables | | | | | | | |
Investment securities sold
| 31 | | — | | — | | — |
Series shares sold
| 1,370 | | — | | — | | 3 |
Dividends
| 313 | | 131 | | 20 | | 102 |
Securities lending income
| — | | 4 | | —(a) | | — |
Receivable from affiliate(b)
| — | | 36 | | — | | — |
Other assets
| 229 | | 680 | | 305 | | 230 |
Total assets
| 79,973 | | 233,855 | | 105,384 | | 77,604 |
| Liabilities | | | | | | | |
| Payables | | | | | | | |
Series shares repurchased
| 6 | | 97 | | 110 | | 5 |
Investment securities purchased
| 419 | | — | | — | | — |
Collateral on securities loaned
| — | | — | | 1,225 | | — |
Investment advisory fees
| 44 | | 124 | | 65 | | 43 |
Distribution and service fees
| 16 | | 49 | | 20 | | 16 |
Administration and accounting fees
| 7 | | 21 | | 10 | | 8 |
Transfer agent fees and expenses
| —(a) | | —(a) | | —(a) | | —(a) |
Professional fees
| 22 | | 19 | | 20 | | 19 |
Trustee deferred compensation plan
| 229 | | 680 | | 305 | | 230 |
Interest expense and/or commitment fees
| —(a) | | —(a) | | —(a) | | —(a) |
Other accrued expenses
| 13 | | 31 | | 14 | | 12 |
Total liabilities
| 756 | | 1,021 | | 1,769 | | 333 |
Net Assets
| $79,217 | | $232,834 | | $103,615 | | $77,271 |
| Net Assets Consist of: | | | | | | | |
Capital paid in on shares of beneficial interest
| $57,768 | | $99,147 | | $49,830 | | $49,070 |
Accumulated earnings (loss)
| 21,449 | | 133,687 | | 53,785 | | 28,201 |
Net Assets
| $79,217 | | $232,834 | | $103,615 | | $77,271 |
| Net Assets: | | | | | | | |
Class A
| $77,044 | | $232,834 | | $96,996 | | $77,271 |
Class I
| $2,173 | | $— | | $6,619 | | $— |
| Shares of Beneficial Interest Outstanding $1 par value, unlimited authorization: | | | | | | | |
Class A
| 4,156,398 | | 6,760,554 | | 3,081,271 | | 4,896,459 |
Class I
| 117,435 | | — | | 204,747 | | — |
| Net Asset Value Per Share: | | | | | | | |
Class A
| $18.54 | | $34.44 | | $31.48 | | $15.78 |
Class I
| $18.51 | | $— | | $32.33 | | $— |
| | | | | | | | |
(1)Investment in securities at cost
| $56,514 | | $98,529 | | $48,241 | | $49,040 |
(2) Market value of securities on loan
| $— | | $— | | $1,190 | | $— |
(3) Foreign currency at cost
| $— | | $— | | $—(a) | | $— |
| | | | | | | | |
| (a) | Amount is less than $500. |
| (b) | See Note 4G in the Notes to Financial Statements. |
See Notes to Financial Statements
VIRTUS VARIABLE INSURANCE TRUST
STATEMENTS OF ASSETS AND LIABILITIES (Continued)
December 31, 2019
(Reported in thousands except shares and per share amounts)
| | Newfleet Multi-Sector Intermediate Bond Series | | Rampart Enhanced Core Equity Series | | SGA International Growth Series | | Strategic Allocation Series |
| Assets | | | | | | | |
Investment in securities at value(1)(2)
| $117,044 | | $96,043 | | $148,681 | | $87,262 |
Foreign currency at value(3)
| — | | — | | —(a) | | — |
Cash
| 1,053 | | 1,290 | | — | | 979 |
| Receivables | | | | | | | |
Investment securities sold
| 354 | | 19 | | — | | 2 |
Series shares sold
| 59 | | — | | 31 | | 13 |
Dividends and interest
| 1,037 | | 94 | | 4 | | 233 |
Tax reclaims
| — | | — | | 119 | | 5 |
Securities lending income
| 2 | | — | | — | | 1 |
Receivable from affiliate(b)
| — | | — | | — | | 5 |
Other assets
| 350 | | 285 | | 434 | | 258 |
Total assets
| 119,899 | | 97,731 | | 149,269 | | 88,758 |
| Liabilities | | | | | | | |
Due to custodian
| — | | — | | — | | —(a) |
Written options at value(4)
| — | | 69 | | — | | — |
| Payables | | | | | | | |
Series shares repurchased
| —(a) | | 70 | | —(a) | | 17 |
Investment securities purchased
| 494 | | 12 | | 579 | | 414 |
Collateral on securities loaned
| 1,068 | | — | | — | | 66 |
Investment advisory fees
| 52 | | 45 | | 87 | | 40 |
Distribution and service fees
| 25 | | 21 | | 31 | | 19 |
Administration and accounting fees
| 11 | | 9 | | 14 | | 8 |
Transfer agent fees and expenses
| —(a) | | —(a) | | —(a) | | —(a) |
Professional fees
| 24 | | 19 | | 22 | | 24 |
Trustee deferred compensation plan
| 350 | | 285 | | 434 | | 258 |
Interest expense and/or commitment fees
| —(a) | | —(a) | | —(a) | | 1 |
Other accrued expenses
| 20 | | 16 | | 2 | | 9 |
Total liabilities
| 2,044 | | 546 | | 1,169 | | 856 |
Net Assets
| $117,855 | | $97,185 | | $148,100 | | $87,902 |
| Net Assets Consist of: | | | | | | | |
Capital paid in on shares of beneficial interest
| $121,437 | | $77,794 | | $141,006 | | $65,563 |
Accumulated earnings (loss)
| (3,582) | | 19,391 | | 7,094 | | 22,339 |
Net Assets
| $117,855 | | $97,185 | | $148,100 | | $87,902 |
| Net Assets: | | | | | | | |
Class A
| $116,901 | | $97,185 | | $148,000 | | $87,902 |
Class I
| $954 | | $— | | $100 | | $— |
| Shares of Beneficial Interest Outstanding $1 par value, unlimited authorization: | | | | | | | |
Class A
| 12,592,527 | | 7,392,212 | | 12,481,737 | | 6,379,744 |
Class I
| 102,977 | | — | | 8,410 | | — |
| Net Asset Value Per Share: | | | | | | | |
Class A
| $9.28 | | $13.15 | | $11.86 | | $13.78 |
Class I
| $9.27 | | $— | | $11.83 | | $— |
| | | | | | | | |
(1)Investment in securities at cost
| $115,470 | | $69,287 | | $137,883 | | $65,068 |
(2) Market value of securities on loan
| $1,017 | | $— | | $— | | $65 |
(3) Foreign currency at cost
| $— | | $— | | $—(a) | | $— |
(4) Written options premiums received
| $— | | $99 | | $— | | $— |
| | | | | | | | |
| (a) | Amount is less than $500. |
| (b) | See Note 4G in the Notes to Financial Statements. |
See Notes to Financial Statements
VIRTUS VARIABLE INSURANCE TRUST
STATEMENTS OF OPERATIONS
YEAR ENDEDDecember 31, 2019
($ reported in thousands)
| | Duff & Phelps Real Estate Securities Series | | KAR Capital Growth Series | | KAR Small-Cap Growth Series | | KAR Small-Cap Value Series |
| Investment Income | | | | | | | |
Dividends
| $2,024 | | $1,721 | | $696 | | $1,399 |
Security lending, net of fees
| — | | 25 | | 1 | | — |
Foreign taxes withheld
| — | | — | | — | | (10) |
Total investment income
| 2,024 | | 1,746 | | 697 | | 1,389 |
| Expenses | | | | | | | |
Investment advisory fees
| 556 | | 1,552 | | 852 | | 682 |
Distribution and service fees, Class A
| 183 | | 554 | | 237 | | 190 |
Administration and accounting fees
| 85 | | 239 | | 112 | | 86 |
Transfer agent fees and expenses
| —(1) | | —(1) | | —(1) | | —(1) |
Custodian fees
| —(1) | | —(1) | | —(1) | | —(1) |
Printing fees and expenses
| 22 | | 53 | | 26 | | 22 |
Professional fees
| 26 | | 32 | | 25 | | 24 |
Interest expense and/or commitment fees
| —(1) | | 1 | | —(1) | | —(1) |
Trustees’ fees and expenses
| 6 | | 17 | | 8 | | 6 |
Miscellaneous expenses
| 7 | | 18 | | 8 | | 5 |
Total expenses
| 885 | | 2,466 | | 1,268 | | 1,015 |
Less net expenses reimbursed and/or waived by investment adviser(2)
| (29) | | (183) | | (91) | | (181) |
Net expenses
| 856 | | 2,283 | | 1,177 | | 834 |
Net investment income (loss)
| 1,168 | | (537) | | (480) | | 555 |
| Net Realized and Unrealized Gain (Loss) on Investments | | | | | | | |
| Net realized gain (loss) from: | | | | | | | |
investments
| 8,025 | | 8,697 | | 13,425 | | 2,648 |
Foreign currency transactions
| — | | — | | 1 | | — |
| Net change in unrealized appreciation (depreciation) on: | | | | | | | |
investments
| 8,132 | | 63,554 | | 17,540 | | 13,275 |
Net realized and unrealized gain (loss) on investments
| 16,157 | | 72,251 | | 30,966 | | 15,923 |
Net increase (decrease) in net assets resulting from operations
| $17,325 | | $71,714 | | $30,486 | | $16,478 |
| (1) | Amount is less than $500. |
| (2) | See Note 4D in the Notes to Financial Statements. |
See Notes to Financial Statements
VIRTUS VARIABLE INSURANCE TRUST
STATEMENTS OF OPERATIONS (Continued)
YEAR ENDEDDecember 31, 2019
($ reported in thousands)
| | Newfleet Multi-Sector Intermediate Bond Series | | Rampart Enhanced Core Equity Series | | SGA International Growth Series | | Strategic Allocation Series |
| Investment Income | | | | | | | |
Dividends
| $20 | | $1,845 | | $3,610 | | $652 |
Dividends from affiliated fund
| 31 | | — | | — | | 4 |
Interest
| 5,721 | | — | | — | | 1,246 |
Security lending, net of fees
| 18 | | — | | 10 | | 22 |
Foreign taxes withheld
| (3) | | —(1) | | (297) | | (27) |
Total investment income
| 5,787 | | 1,845 | | 3,323 | | 1,897 |
| Expenses | | | | | | | |
Investment advisory fees
| 589 | | 652 | | 1,095 | | 474 |
Distribution and service fees, Class A
| 292 | | 233 | | 365 | | 215 |
Administration and accounting fees
| 130 | | 105 | | 160 | | 97 |
Transfer agent fees and expenses
| —(1) | | —(1) | | —(1) | | —(1) |
Custodian fees
| 2 | | 1 | | 3 | | 1 |
Printing fees and expenses
| 30 | | 24 | | 38 | | 23 |
Professional fees
| 31 | | 26 | | 61 | | 33 |
Interest expense and/or commitment fees
| —(1) | | —(1) | | —(1) | | 1 |
Trustees’ fees and expenses
| 10 | | 7 | | 12 | | 7 |
Miscellaneous expenses
| 12 | | 6 | | 29 | | 19 |
Total expenses
| 1,096 | | 1,054 | | 1,763 | | 870 |
Less net expenses reimbursed and/or waived by investment adviser(2)
| — | | (141) | | (18) | | (25) |
Plus net expenses recaptured(2)
| 6 | | — | | — | | — |
Net expenses
| 1,102 | | 913 | | 1,745 | | 845 |
Net investment income (loss)
| 4,685 | | 932 | | 1,578 | | 1,052 |
| Net Realized and Unrealized Gain (Loss) on Investments | | | | | | | |
| Net realized gain (loss) from: | | | | | | | |
Unaffiliated investments
| (454) | | 137 | | 6,933 | | 1,779 |
Affiliated fund
| (120) | | — | | — | | (16) |
Foreign currency transactions
| (357) | | — | | 92 | | (5) |
Written options
| — | | 289 | | — | | — |
Net increase from payment by affiliate(3)
| 2 | | — | | — | | — |
| Net change in unrealized appreciation (depreciation) on: | | | | | | | |
Unaffiliated investments
| 7,844 | | 21,939 | | 16,046 | | 16,816 |
Affiliated fund
| 186 | | — | | — | | 25 |
Foreign currency transactions
| 2 | | — | | (2) | | —(1) |
Written options
| — | | (80) | | — | | — |
Net realized and unrealized gain (loss) on investments
| 7,103 | | 22,285 | | 23,069 | | 18,599 |
Net increase (decrease) in net assets resulting from operations
| $11,788 | | $23,217 | | $24,647 | | $19,651 |
| | |
| (1) | Amount is less than $500. |
| (2) | See Note 4D in the Notes to Financial Statements. |
| (3) | See Note 4G in the Notes to Financial Statements. |
See Notes to Financial Statements
VIRTUS VARIABLE INSURANCE TRUST
STATEMENTS OF CHANGES IN NET ASSETS
($ reported in thousands)
| | Duff & Phelps Real Estate Securities Series | | KAR Capital Growth Series |
| | Year Ended
December 31,
2019 | | Year Ended
December 31,
2018 | | Year Ended
December 31,
2019 | | Year Ended
December 31,
2018 |
Increase (Decrease) in Net Assets
From Operations | | | | | | | |
Net investment income (loss)
| $1,168 | | $1,114 | | $(537) | | $(631) |
Net realized gain (loss)
| 8,025 | | 4,587 | | 8,697 | | 23,183 |
Net change in unrealized appreciation (depreciation)
| 8,132 | | (10,433) | | 63,554 | | (35,528) |
Increase (decrease) in net assets resulting from operations
| 17,325 | | (4,732) | | 71,714 | | (12,976) |
| Dividends and Distributions to Shareholders | | | | | | | |
| Net Investment Income and Net Realized Gains: | | | | | | | |
Class A
| (8,680) | | (6,458) | | (8,813) | | (24,960) |
Class I
| (224) | | (21) | | — | | — |
Total Dividends and Distributions to Shareholders
| (8,904) | | (6,479) | | (8,813) | | (24,960) |
| Change in Net Assets from Capital Transactions (See Note 6): | | | | | | | |
Class A
| 3,175 | | (1,031) | | (17,227) | | 843 |
Class I
| 2,049 | | 43 | | — | | — |
Increase (decrease) in net assets from capital transactions
| 5,224 | | (988) | | (17,227) | | 843 |
Net increase (decrease) in net assets
| 13,645 | | (12,199) | | 45,674 | | (37,093) |
| Net Assets | | | | | | | |
Beginning of period
| 65,572 | | 77,771 | | 187,160 | | 224,253 |
End of Period
| $79,217 | | $65,572 | | $232,834 | | $187,160 |
See Notes to Financial Statements
VIRTUS VARIABLE INSURANCE TRUST
STATEMENTS OF CHANGES IN NET ASSETS (Continued)
($ reported in thousands)
| | KAR Small-Cap Growth Series | | KAR Small-Cap Value Series |
| | Year Ended
December 31,
2019 | | Year Ended
December 31,
2018 | | Year Ended
December 31,
2019 | | Year Ended
December 31,
2018 |
Increase (Decrease) in Net Assets
From Operations | | | | | | | |
Net investment income (loss)
| $(480) | | $(86) | | $555 | | $638 |
Net realized gain (loss)
| 13,426 | | 14,308 | | 2,648 | | 5,575 |
Net change in unrealized appreciation (depreciation)
| 17,540 | | (4,378) | | 13,275 | | (19,533) |
Increase (decrease) in net assets resulting from operations
| 30,486 | | 9,844 | | 16,478 | | (13,320) |
| Dividends and Distributions to Shareholders | | | | | | | |
| Net Investment Income and Net Realized Gains: | | | | | | | |
Class A
| (13,810) | | (14,632) | | (1,794) | | (8,965) |
Class I
| (892) | | (617) | | — | | — |
Total Dividends and Distributions to Shareholders
| (14,702) | | (15,249) | | (1,794) | | (8,965) |
| Change in Net Assets from Capital Transactions (See Note 6): | | | | | | | |
Class A
| 1,572 | | 5,710 | | (7,274) | | (2,492) |
Class I
| 2,285 | | 2,214 | | — | | — |
Increase (decrease) in net assets from capital transactions
| 3,857 | | 7,924 | | (7,274) | | (2,492) |
Net increase (decrease) in net assets
| 19,641 | | 2,519 | | 7,410 | | (24,777) |
| Net Assets | | | | | | | |
Beginning of period
| 83,974 | | 81,455 | | 69,861 | | 94,638 |
End of Period
| $103,615 | | $83,974 | | $77,271 | | $69,861 |
See Notes to Financial Statements
VIRTUS VARIABLE INSURANCE TRUST
STATEMENTS OF CHANGES IN NET ASSETS (Continued)
($ reported in thousands)
| | Newfleet Multi-Sector Intermediate Bond Series | | Rampart Enhanced Core Equity Series |
| | Year Ended
December 31,
2019 | | Year Ended
December 31,
2018 | | Year Ended
December 31,
2019 | | Year Ended
December 31,
2018 |
Increase (Decrease) in Net Assets
From Operations | | | | | | | |
Net investment income (loss)
| $4,685 | | $5,361 | | $932 | | $984 |
Net realized gain (loss)
| (931) | | (2,166) | | 426 | | (7,069) |
Net increase from payment by affiliate(1)
| 2 | | — | | — | | — |
Net change in unrealized appreciation (depreciation)
| 8,032 | | (6,587) | | 21,859 | | (6,832) |
Increase (decrease) in net assets resulting from operations
| 11,788 | | (3,392) | | 23,217 | | (12,917) |
| Dividends and Distributions to Shareholders | | | | | | | |
| Net Investment Income and Net Realized Gains: | | | | | | | |
Class A
| (4,273) | | (4,818) | | (1,109) | | (1,020) |
Class I
| (37) | | (31) | | — | | — |
Total Dividends and Distributions to Shareholders
| (4,310) | | (4,849) | | (1,109) | | (1,020) |
| Change in Net Assets from Capital Transactions (See Note 6): | | | | | | | |
Class A
| (5,909) | | (9,868) | | (10,768) | | (11,604) |
Class I
| 201 | | (614) | | — | | — |
Increase (decrease) in net assets from capital transactions
| (5,708) | | (10,482) | | (10,768) | | (11,604) |
Net increase (decrease) in net assets
| 1,770 | | (18,723) | | 11,340 | | (25,541) |
| Net Assets | | | | | | | |
Beginning of period
| 116,085 | | 134,808 | | 85,845 | | 111,386 |
End of Period
| $117,855 | | $116,085 | | $97,185 | | $85,845 |
| (1) | See Note 4G in the Notes to Financial Statements. |
See Notes to Financial Statements
VIRTUS VARIABLE INSURANCE TRUST
STATEMENTS OF CHANGES IN NET ASSETS (Continued)
($ reported in thousands)
| | SGA International Growth Series | | Strategic Allocation Series |
| | Year Ended
December 31,
2019 | | Year Ended
December 31,
2018 | | Year Ended
December 31,
2019 | | Year Ended
December 31,
2018 |
Increase (Decrease) in Net Assets
From Operations | | | | | | | |
Net investment income (loss)
| $1,578 | | $3,376 | | $1,052 | | $1,227 |
Net realized gain (loss)
| 7,025 | | 1,497 | | 1,758 | | 2,695 |
Net change in unrealized appreciation (depreciation)
| 16,044 | | (32,337) | | 16,841 | | (8,544) |
Increase (decrease) in net assets resulting from operations
| 24,647 | | (27,464) | | 19,651 | | (4,622) |
| Dividends and Distributions to Shareholders | | | | | | | |
| Net Investment Income and Net Realized Gains: | | | | | | | |
Class A
| (1,216) | | (4,849) | | (2,202) | | (4,685) |
Class I
| (1) | | (3) | | — | | — |
Total Dividends and Distributions to Shareholders
| (1,217) | | (4,852) | | (2,202) | | (4,685) |
| Change in Net Assets from Capital Transactions (See Note 6): | | | | | | | |
Class A
| (12,977) | | (13,544) | | (9,083) | | (8,185) |
Class I
| 1 | | 3 | | — | | — |
Increase (decrease) in net assets from capital transactions
| (12,976) | | (13,541) | | (9,083) | | (8,185) |
Net increase (decrease) in net assets
| 10,454 | | (45,857) | | 8,366 | | (17,492) |
| Net Assets | | | | | | | |
Beginning of period
| 137,646 | | 183,503 | | 79,536 | | 97,028 |
End of Period
| $148,100 | | $137,646 | | $87,902 | | $79,536 |
See Notes to Financial Statements
VIRTUS VARIABLE INSURANCE TRUST
FINANCIAL HIGHLIGHTS
SELECTED PER SHARE DATA AND RATIOS FOR A SHARE OUTSTANDING
THROUGHOUT EACH PERIOD
| | | Net Asset Value,
Beginning of Period | Net Investment Income (Loss)(1) | Net Realized and
Unrealized Gain (Loss) | Total from Investment Operations | Dividends from
Net Investment Income | Distributions from
Net Realized Gains | Total Distributions | Change in Net Asset Value | Net Asset Value, End of Period | Total Return(2) | Net Assets, End of Period
(in thousands) | Ratio of Net Expenses to
Average Net Assets(3) | Ratio of Gross Expenses
to Average Net Assets(3) | Ratio of Net Investment Income (Loss)
to Average Net Assets | Portfolio Turnover Rate |
| | | | | | | | | | | | | | | | | |
| Duff & Phelps Real Estate Securities Series | | | | | | | | | | | | | | | | |
| Class A | | | | | | | | | | | | | | | | |
| 1/1/19 to 12/31/19 | | $16.40 | 0.30 | 4.20 | 4.50 | (0.34) | (2.02) | (2.36) | 2.14 | $18.54 | 27.42 % | $77,044 | 1.16 % (4) | 1.20 % | 1.57 % | 44 % |
| 1/1/18 to 12/31/18 | | 19.23 | 0.28 | (1.41) | (1.13) | (0.30) | (1.40) | (1.70) | (2.83) | 16.40 | (6.53) | 65,357 | 1.16 | 1.19 | 1.54 | 20 |
| 1/1/17 to 12/31/17 | | 20.31 | 0.25 | 0.92 | 1.17 | (0.29) | (1.96) | (2.25) | (1.08) | 19.23 | 5.97 | 77,564 | 1.16 | 1.21 | 1.24 | 24 |
| 1/1/16 to 12/31/16 | | 22.85 | 0.34 | 1.17 | 1.51 | (0.43) | (3.62) | (4.05) | (2.54) | 20.31 | 6.82 (5) | 81,243 | 1.17 (5)(6) | 1.25 | 1.42 (5) | 35 |
| 1/1/15 to 12/31/15 | | 27.05 | 0.44 | 0.17 | 0.61 | (0.37) | (4.44) | (4.81) | (4.20) | 22.85 | 2.38 | 87,899 | 1.18 (6) | 1.29 | 1.64 | 18 |
| Class I | | | | | | | | | | | | | | | | |
| 1/1/19 to 12/31/19 | | $16.35 | 0.40 | 4.14 | 4.54 | (0.36) | (2.02) | (2.38) | 2.16 | $18.51 | 27.78 % | $2,173 | 0.91 % (4) | 0.95 % | 2.04 % | 44 % |
| 1/1/18 to 12/31/18 | | 19.19 | 0.34 | (1.43) | (1.09) | (0.35) | (1.40) | (1.75) | (2.84) | 16.35 | (6.36) | 215 | 0.91 | 0.94 | 1.85 | 20 |
| 1/1/17 to 12/31/17 | | 20.27 | 0.30 | 0.93 | 1.23 | (0.35) | (1.96) | (2.31) | (1.08) | 19.19 | 6.25 | 207 | 0.91 | 0.96 | 1.49 | 24 |
| 1/1/16 to 12/31/16 | | 22.81 | 0.35 | 1.22 | 1.57 | (0.49) | (3.62) | (4.11) | (2.54) | 20.27 | 7.10 (5) | 199 | 0.92 (5)(6) | 1.00 | 1.46 (5) | 35 |
| 1/1/15 to 12/31/15 | | 27.02 | 0.48 | 0.19 | 0.67 | (0.44) | (4.44) | (4.88) | (4.21) | 22.81 | 2.62 | 158 | 0.94 (6) | 1.05 | 1.79 | 18 |
| | | | | | | | | | | | | | | | | |
| KAR Capital Growth Series | | | | | | | | | | | | | | | | |
| Class A | | | | | | | | | | | | | | | | |
| 1/1/19 to 12/31/19 | | $25.62 | (0.08) | 10.22 | 10.14 | — | (1.32) | (1.32) | 8.82 | $34.44 | 39.87 % | $232,834 | 1.03 % | 1.11 % | (0.24) % | 9 % |
| 1/1/18 to 12/31/18 | | 31.40 | (0.09) | (1.92) | (2.01) | — | (3.77) | (3.77) | (5.78) | 25.62 | (7.25) | 187,160 | 1.03 | 1.11 | (0.28) | 15 |
| 1/1/17 to 12/31/17 | | 24.09 | (0.05) | 8.75 | 8.70 | — | (1.39) | (1.39) | 7.31 | 31.40 | 36.07 | 224,253 | 1.03 | 1.13 | (0.16) | 21 |
| 1/1/16 to 12/31/16 | | 24.91 | — (7) | (0.22) | (0.22) | (0.60) | — | (0.60) | (0.82) | 24.09 | (0.86) (5) | 185,519 | 1.04 (5)(6) | 1.18 | (0.10) (5) | 23 |
| 1/1/15 to 12/31/15 | | 22.79 | (0.01) | 2.13 | 2.12 | — | — | — | 2.12 | 24.91 | 9.26 | 210,094 | 1.04 (6) | 1.21 | (0.04) | 19 |
| | | | | | | | | | | | | | | | | |
| KAR Small-Cap Growth Series | | | | | | | | | | | | | | | | |
| Class A | | | | | | | | | | | | | | | | |
| 1/1/19 to 12/31/19 | | $26.70 | (0.16) | 10.00 | 9.84 | — | (5.06) | (5.06) | 4.78 | $31.48 | 37.31 % | $96,996 | 1.19 % (4) | 1.28 % | (0.49) % | 11 % |
| 1/1/18 to 12/31/18 | | 28.66 | (0.03) | 3.66 | 3.63 | — | (5.59) | (5.59) | (1.96) | 26.70 | 11.66 | 80,309 | 1.19 | 1.27 | (0.10) | 20 |
| 1/1/17 to 12/31/17 | | 21.61 | (0.12) | 8.93 | 8.81 | — | (1.76) | (1.76) | 7.05 | 28.66 | 40.85 | 79,597 | 1.19 | 1.30 | (0.49) | 18 |
| 1/1/16 to 12/31/16 | | 18.75 | (0.06) | 4.85 | 4.79 | — | (1.93) | (1.93) | 2.86 | 21.61 | 25.92 (5) | 63,008 | 1.20 (5)(6) | 1.37 | (0.37) (5) | 18 |
| 1/1/15 to 12/31/15 | | 20.73 | (0.04) | 0.23 | 0.19 | — | (2.17) | (2.17) | (1.98) | 18.75 | 0.73 | 55,872 | 1.20 (6) | 1.41 | (0.17) | 18 |
| Class I | | | | | | | | | | | | | | | | |
| 1/1/19 to 12/31/19 | | $27.25 | (0.08) | 10.22 | 10.14 | — | (5.06) | (5.06) | 5.08 | $32.33 | 37.66 % | $6,619 | 0.94 % (4) | 1.03 % | (0.25) % | 11 % |
| 1/1/18 to 12/31/18 | | 29.08 | 0.04 | 3.72 | 3.76 | — | (5.59) | (5.59) | (1.83) | 27.25 | 11.95 | 3,665 | 0.94 | 1.03 | 0.12 | 20 |
| 1/1/17 to 12/31/17 | | 21.86 | (0.06) | 9.04 | 8.98 | — | (1.76) | (1.76) | 7.22 | 29.08 | 41.16 | 1,858 | 0.94 | 1.05 | (0.24) | 18 |
| 1/1/16 to 12/31/16 | | 18.90 | 0.01 | 4.88 | 4.89 | — | (1.93) | (1.93) | 2.96 | 21.86 | 26.25 (5) | 353 | 0.95 (5)(6) | 1.12 | (0.10) (5) | 18 |
| 1/1/15 to 12/31/15 | | 20.82 | — (7) | 0.25 | 0.25 | — | (2.17) | (2.17) | (1.92) | 18.90 | 1.01 | 179 | 0.96 (6) | 1.17 | (0.02) | 18 |
The footnote legend is at the end of the financial highlights.
See Notes to Financial Statements
VIRTUS VARIABLE INSURANCE TRUST
FINANCIAL HIGHLIGHTS (Continued)
SELECTED PER SHARE DATA AND RATIOS FOR A SHARE OUTSTANDING
THROUGHOUT EACH PERIOD
| | | Net Asset Value,
Beginning of Period | Net Investment Income (Loss)(1) | Net Realized and
Unrealized Gain (Loss) | Total from Investment Operations | Dividends from
Net Investment Income | Return of Capital | Distributions from
Net Realized Gains | Total Distributions | Payment from Affiliate | Change in Net Asset Value | Net Asset Value, End of Period | Total Return(2) | Net Assets, End of Period
(in thousands) | Ratio of Net Expenses to
Average Net Assets(3) | Ratio of Gross Expenses
to Average Net Assets(3) | Ratio of Net Investment Income (Loss)
to Average Net Assets | Portfolio Turnover Rate |
| | | | | | | | | | | | | | | | | | | |
| KAR Small-Cap Value Series | | | | | | | | | | | | | | | | | | |
| Class A | | | | | | | | | | | | | | | | | | |
| 1/1/19 to 12/31/19 | | $12.96 | 0.11 | 3.08 | 3.19 | (0.15) | — | (0.22) | (0.37) | — | 2.82 | $15.78 | 24.63 % | $77,271 | 1.10 % | 1.34 % | 0.73 % | 8 % |
| 1/1/18 to 12/31/18 | | 17.36 | 0.12 | (2.72) | (2.60) | (0.15) | — | (1.65) | (1.80) | — | (4.40) | 12.96 | (15.88) | 69,861 | 1.19 (4) | 1.33 | 0.74 | 11 |
| 1/1/17 to 12/31/17 | | 16.69 | 0.05 | 3.23 | 3.28 | (0.12) | — | (2.49) | (2.61) | — | 0.67 | 17.36 | 20.16 | 94,638 | 1.20 | 1.34 | 0.26 | 20 |
| 1/1/16 to 12/31/16 | | 15.17 | 0.32 | 3.66 | 3.98 | (0.34) | — | (2.12) | (2.46) | — | 1.52 | 16.69 | 26.54 (5) | 94,966 | 1.21 (5)(6) | 1.40 | 1.85 (5) | 22 |
| 1/1/15 to 12/31/15 | | 17.03 | 0.09 | (0.29) | (0.20) | (0.09) | — | (1.57) | (1.66) | — | (1.86) | 15.17 | (1.37) | 92,834 | 1.22 (6) | 1.43 | 0.56 | 16 |
| | | | | | | | | | | | | | | | | | | |
| Newfleet Multi-Sector Intermediate Bond Series | | | | | | | | | | | | | | | | | | |
| Class A | | | | | | | | | | | | | | | | | | |
| 1/1/19 to 12/31/19 | | $8.72 | 0.37 | 0.54 | 0.91 | (0.35) | — | — | (0.35) | — (7) | 0.56 | $9.28 | 10.47 % (8) | $116,901 | 0.94 % (9)(10) | 0.93 % | 3.98 % | 66 % |
| 1/1/18 to 12/31/18 | | 9.34 | 0.39 | (0.64) | (0.25) | (0.37) | — | — | (0.37) | — | (0.62) | 8.72 | (2.66) | 115,379 | 0.93 | 0.93 | 4.23 | 64 |
| 1/1/17 to 12/31/17 | | 9.14 | 0.41 | 0.20 | 0.61 | (0.41) | — | — | (0.41) | — | 0.20 | 9.34 | 6.72 | 133,430 | 0.93 | 0.96 | 4.35 | 62 |
| 1/1/16 to 12/31/16 | | 8.75 | 0.44 | 0.37 | 0.81 | (0.42) | — | — | (0.42) | — | 0.39 | 9.14 | 9.29 (5) | 128,969 | 0.94 (5)(6) | 1.00 | 4.82 (5) | 68 |
| 1/1/15 to 12/31/15 | | 9.25 | 0.45 | (0.56) | (0.11) | (0.39) | — | — | (0.39) | — (7) | (0.50) | 8.75 | (1.26) (8) | 134,558 | 0.95 (6) | 1.03 | 4.89 | 55 |
| Class I | | | | | | | | | | | | | | | | | | |
| 1/1/19 to 12/31/19 | | $8.70 | 0.39 | 0.55 | 0.94 | (0.37) | — | — | (0.37) | — (7) | 0.57 | $9.27 | 10.89 % (8) | $954 | 0.69 % (9)(10) | 0.68 % | 4.22 % | 66 % |
| 1/1/18 to 12/31/18 | | 9.32 | 0.41 | (0.63) | (0.22) | (0.40) | — | — | (0.40) | — | (0.62) | 8.70 | (2.41) | 706 | 0.68 | 0.68 | 4.46 | 64 |
| 1/1/17 to 12/31/17 | | 9.12 | 0.43 | 0.20 | 0.63 | (0.43) | — | — | (0.43) | — | 0.20 | 9.32 | 7.00 | 1,378 | 0.68 | 0.70 | 4.54 | 62 |
| 1/1/16 to 12/31/16 | | 8.74 | 0.47 | 0.35 | 0.82 | (0.44) | — | — | (0.44) | — | 0.38 | 9.12 | 9.46 (5) | 242 | 0.69 (5)(6) | 0.75 | 5.08 (5) | 68 |
| 1/1/15 to 12/31/15 | | 9.24 | 0.47 | (0.56) | (0.09) | (0.41) | — | — | (0.41) | — (7) | (0.50) | 8.74 | (1.00) (8) | 213 | 0.70 (6) | 0.78 | 5.11 | 55 |
| | | | | | | | | | | | | | | | | | | |
| Rampart Enhanced Core Equity Series | | | | | | | | | | | | | | | | | | |
| Class A | | | | | | | | | | | | | | | | | | |
| 1/1/19 to 12/31/19 | | $10.34 | 0.12 | 2.84 | 2.96 | (0.15) | — | — | (0.15) | — | 2.81 | $13.15 | 28.67 % | $97,185 | 0.98 % | 1.13 % | 1.00 % | 27 % |
| 1/1/18 to 12/31/18 | | 12.00 | 0.11 | (1.65) | (1.54) | (0.12) | — | — | (0.12) | — | (1.66) | 10.34 | (12.86) | 85,845 | 0.98 | 1.14 | 0.97 | 26 |
| 1/1/17 to 12/31/17 | | 11.97 | 0.12 | 2.58 | 2.70 | (0.21) | (0.07) | (2.39) | (2.67) | — | 0.03 | 12.00 | 22.96 | 111,386 | 0.98 | 1.16 | 0.96 | 241 |
| 1/1/16 to 12/31/16 | | 13.67 | 0.25 | 1.01 | 1.26 | (0.18) | — | (2.78) | (2.96) | — | (1.70) | 11.97 | 9.41 (5) | 104,587 | 0.99 (5)(6) | 1.20 | 1.41 (5) | 241 (11) |
| 1/1/15 to 12/31/15 | | 16.91 | 0.13 | (1.55) | (1.42) | (0.14) | — | (1.68) | (1.82) | — | (3.24) | 13.67 | (8.91) | 109,913�� | 0.99 (6) | 1.23 | 0.83 | 94 |
The footnote legend is at the end of the financial highlights.
See Notes to Financial Statements
VIRTUS VARIABLE INSURANCE TRUST
FINANCIAL HIGHLIGHTS (Continued)
SELECTED PER SHARE DATA AND RATIOS FOR A SHARE OUTSTANDING
THROUGHOUT EACH PERIOD
| | | Net Asset Value,
Beginning of Period | Net Investment Income (Loss)(1) | Net Realized and
Unrealized Gain (Loss) | Total from Investment Operations | Dividends from
Net Investment Income | Distributions from
Net Realized Gains | Total Distributions | Change in Net Asset Value | Net Asset Value, End of Period | Total Return(2) | Net Assets, End of Period
(in thousands) | Ratio of Net Expenses to
Average Net Assets(3) | Ratio of Gross Expenses
to Average Net Assets(3) | Ratio of Net Investment Income (Loss)
to Average Net Assets | Portfolio Turnover Rate |
| | | | | | | | | | | | | | | | | |
| SGA International Growth Series | | | | | | | | | | | | | | | | |
| Class A | | | | | | | | | | | | | | | | |
| 1/1/19 to 12/31/19 | | $10.09 | 0.12 | 1.75 | 1.87 | (0.10) | — | (0.10) | 1.77 | $11.86 | 18.54 % | $148,000 | 1.20 % (4)(6) | 1.21 % | 1.08 % | 140 % (11) |
| 1/1/18 to 12/31/18 | | 12.50 | 0.24 | (2.29) | (2.05) | (0.36) | — | (0.36) | (2.41) | 10.09 | (16.67) | 137,562 | 1.18 (10) | 1.17 | 1.97 | 40 |
| 1/1/17 to 12/31/17 | | 10.95 | 0.15 | 1.59 | 1.74 | (0.19) | — | (0.19) | 1.55 | 12.50 | 15.95 | 183,403 | 1.18 | 1.21 | 1.24 | 81 |
| 1/1/16 to 12/31/16 | | 14.01 | 0.08 | (0.44) | (0.36) | (0.09) | (2.61) | (2.70) | (3.06) | 10.95 | (1.61) (5) | 177,868 | 1.18 (5)(6) | 1.26 | 0.62 (5) | 83 |
| 1/1/15 to 12/31/15 | | 16.67 | 0.35 | (2.04) | (1.69) | (0.37) | (0.60) | (0.97) | (2.66) | 14.01 | (10.48) | 209,990 | 1.19 (6) | 1.30 | 2.16 | 104 |
| Class I | | | | | | | | | | | | | | | | |
| 1/1/19 to 12/31/19 | | $10.07 | 0.15 | 1.74 | 1.89 | (0.13) | — | (0.13) | 1.76 | $11.83 | 18.77 % | $100 | 0.95 % (4)(6) | 0.96 % | 1.30 % | 140 % (11) |
| 1/1/18 to 12/31/18 | | 12.48 | 0.27 | (2.29) | (2.02) | (0.39) | — | (0.39) | (2.41) | 10.07 | (16.44) | 84 | 0.93 (10) | 0.92 | 2.23 | 40 |
| 1/1/17 to 12/31/17 | | 10.94 | 0.17 | 1.59 | 1.76 | (0.22) | — | (0.22) | 1.54 | 12.48 | 16.17 | 100 | 0.93 | 0.96 | 1.48 | 81 |
| 1/1/16 to 12/31/16 | | 13.99 | 0.11 | (0.42) | (0.31) | (0.13) | (2.61) | (2.74) | (3.05) | 10.94 | (1.28) (5) | 86 | 0.93 (5)(6) | 1.01 | 0.88 (5) | 83 |
| 1/1/15 to 12/31/15 | | 16.65 | 0.38 | (2.03) | (1.65) | (0.41) | (0.60) | (1.01) | (2.66) | 13.99 | (10.26) | 87 | 0.94 (6) | 1.05 | 2.39 | 104 |
| | | | | | | | | | | | | | | | | |
| Strategic Allocation Series | | | | | | | | | | | | | | | | |
| Class A | | | | | | | | | | | | | | | | |
| 1/1/19 to 12/31/19 | | $11.22 | 0.16 | 2.75 | 2.91 | (0.17) | (0.18) | (0.35) | 2.56 | $13.78 | 26.05 % | $87,902 | 0.98 % | 1.01 % | 1.22 % | 40 % |
| 1/1/18 to 12/31/18 | | 12.62 | 0.17 | (0.89) | (0.72) | (0.18) | (0.50) | (0.68) | (1.40) | 11.22 | (5.89) | 79,536 | 0.98 | 1.02 | 1.32 | 33 |
| 1/1/17 to 12/31/17 | | 10.88 | 0.16 | 1.89 | 2.05 | (0.23) | (0.08) | (0.31) | 1.74 | 12.62 | 18.97 | 97,028 | 0.98 | 1.06 | 1.31 | 38 |
| 1/1/16 to 12/31/16 | | 12.34 | 0.24 | (0.14) | 0.10 | (0.21) | (1.35) | (1.56) | (1.46) | 10.88 | 0.82 (5) | 93,276 | 0.99 (5)(6) | 1.09 | 1.96 (5) | 114 |
| 1/1/15 to 12/31/15 | | 14.30 | 0.25 | (0.98) | (0.73) | (0.24) | (0.99) | (1.23) | (1.96) | 12.34 | (5.38) | 106,825 | 0.99 (6) | 1.13 | 1.79 | 75 |
| Footnote Legend: |
| (1) | Calculated using average shares outstanding. |
| (2) | The total return does not include the expenses associated with the annuity or life insurance policy through which you invest. |
| (3) | The Series will also indirectly bear their prorated shares of expenses of any underlying funds in which they invest. Such expenses are not included in the calculation of this ratio. |
| (4) | Due to a change in expense cap, the ratio shown is a blended expense ratio. |
The footnote legend is at the end of the financial highlights.
See Notes to Financial Statements
VIRTUS VARIABLE INSURANCE TRUST
FINANCIAL HIGHLIGHTS (Continued)
SELECTED PER SHARE DATA AND RATIOS FOR A SHARE OUTSTANDING
THROUGHOUT EACH PERIOD
| (5) | State Street Bank & Trust, custodian for some of the Series through January 29, 2010, reimbursed the Series for out-of-pocket custody expenses overbilled for the period 1998 through January 29, 2010. Custody fees reimbursed were excluded from the Ratio of Net Expenses to Average Net Assets and Ratio of Net Investment Income (Loss) to Average Net Assets. If included, the impact would have been to lower the Ratio of Net Expenses to Average Net Assets and increase the Ratio of Net Investment Income (Loss) to Average Net Assets as follows:
Duff & Phelps Real Estate Securities Series 0.02% (Class A) and 0.03% (Class I),
KAR Capital Growth Series 0.10%,
KAR Small-Cap Growth Series 0.09% (Class A) and 0.14% (Class I),
KAR Small-Cap Value Series 0.08%,
Newfleet Multi-Sector Intermediate Bond Series 0.04% (Class A) and 0.05% (Class I),
Rampart Enhanced Core Equity Series 0.46%,
SGA International Growth Series 0.04%,
Strategic Allocation Series 0.03%.
Custody fees reimbursed were included in Total Return. If excluded, the impact would have been to lower the Total Return as follows:
Duff & Phelps Real Estate Securities Series 0.03%,
KAR Capital Growth Series 0.10%,
KAR Small-Cap Growth Series 0.08%,
KAR Small-Cap Value Series 0.08%,
Newfleet Multi-Sector Intermediate Bond Series 0.04%,
Rampart Enhanced Core Equity Series 0.44%,
SGA International Growth Series 0.04%,
Strategic Allocation Series 0.03%. |
| (6) | Net expense ratio includes extraordinary proxy expenses. |
| (7) | Amount is less than $0.005 per share. |
| (8) | Payment from affiliate had no impact on total return. |
| (9) | The share class is currently below its expense cap. |
| (10) | See Note 4D in the Notes to Financial Statements for information on recapture of expenses previously reimbursed. |
| (11) | The Series’ portfolio turnover rate increased substantially during the year ended December 31, 2019 due to a change in the Series’ subadviser and associated repositioning. |
The footnote legend is at the end of the financial highlights.
See Notes to Financial Statements
VIRTUS VARIABLE INSURANCE TRUST
NOTES TO FINANCIAL STATEMENTS
December 31, 2019
Note 1. Organization
Virtus Variable Insurance Trust (the “Trust”) is organized as a Delaware statutory trust and is registered under the Investment Company Act of 1940, as amended (the “1940 Act”), as an open-end management investment company. It was formed on February 18, 1986, as a Massachusetts business trust, commenced operations on December 5, 1986, and was reorganized as a Delaware statutory trust on February 14, 2011.
The Trust is organized with series, which are currently available only to separate accounts of participating insurance companies to fund variable accumulation annuity contracts and variable universal life insurance policies. As of the date of this report, the Trust is comprised of eight series (each a “Series”), each reported in this annual report. Each Series’ investment objective is outlined in the respective Series Summary page.There is no guarantee that a Series will achieve its objective(s).
Each Series offers Class A shares. The Duff & Phelps Real Estate Securities Series, KAR Small-Cap Growth Series, Newfleet Multi-Sector Intermediate Bond Series, and SGA International Growth Series also offer Class I shares.
Note 2. Significant Accounting Policies
($ reported in thousands)
The Trust is an investment company that follows the accounting and reporting guidance of Accounting Standards Codification Topic 946 applicable to Investment Companies. The following is a summary of the significant accounting policies consistently followed by the Series in the preparation of their financial statements, and for derivatives, included in Note 3 below. The preparation of financial statements in conformity with U.S. generally accepted accounting principles (“U.S. GAAP”) requires management to make estimates and assumptions that affect the reported amounts of assets and liabilities, and disclosure of contingent assets and liabilities at the date of the financial statements and the reported amounts of increases and decreases in net assets from operations during the reporting period. Actual results could differ from those estimates, and those differences could be significant.
| A. | Security Valuation |
| | Each Series utilizes a fair value hierarchy which prioritizes the inputs to valuation techniques used to measure fair value into three broad levels. The Series’ policy is to recognize transfers into or out of Level 3 at the end of the reporting period. |
| • | Level 1 – quoted prices in active markets for identical securities (security types generally include listed equities). |
| • | Level 2 – prices determined using other significant observable inputs (including quoted prices for similar securities, interest rates, prepayment speeds, credit risk, etc.). |
| • | Level 3 – prices determined using significant unobservable inputs (including the Valuation Committee’s own assumptions in determining the fair value of investments). |
A description of the valuation techniques applied to a Series’ major categories of assets and liabilities measured at fair value on a recurring basis is as follows:
Equity securities are valued at the official closing price (typically last sale) on the exchange on which the securities are primarily traded or, if no closing price is available, at the last bid price and are categorized as Level 1 in the hierarchy. Restricted equity securities and private placements that are illiquid, or are internally fair valued by the Valuation Committee, are generally categorized as Level 3 in the hierarchy.
Certain non-U.S. securities may be fair valued in cases where closing prices are not readily available or are deemed not reflective of readily available market prices. For example, significant events (such as movement in the U.S. securities market, or other regional and local developments) may occur between the time that non-U.S. markets close (where the security is principally traded) and the time that a Series calculates its net asset value (“NAV”) at the close of regular trading on the NYSE (generally 4 p.m. Eastern time) that may impact the value of securities traded in these non-U.S. markets. In such cases, the Series fair value non-U.S. securities using an independent pricing service which considers the correlation of the trading patterns of the non-U.S. security to the intraday trading in the U.S. markets for investments such as ADRs, financial futures, ETFs, and certain indexes, as well as prices for similar securities. Such fair valuations are categorized as Level 2 in the hierarchy. Because the frequency of significant events is not predictable, fair valuation of certain non-U.S. common stocks may occur on a frequent basis.
Debt securities, including restricted securities, are valued based on evaluated quotations received from independent pricing services or from dealers who make markets in such securities. For most bond types, the pricing service utilizes matrix pricing that considers one or more of the following factors: yield or price of bonds of comparable quality, coupon, maturity, current cash flows, type, and current day trade information, as well as dealer-supplied prices. These valuations are generally categorized as Level 2 in the hierarchy. Structured debt instruments, such as mortgage-backed and asset-backed securities, may also incorporate collateral analysis and utilize cash flow models for valuation and are generally categorized as Level 2 in the hierarchy. Pricing services do not provide pricing for all securities and therefore indicative bids from dealers are utilized which are based on pricing models used by market makers in the security and are generally categorized as Level 2 in the hierarchy. Debt securities that are internally fair valued by the Valuation Committee, are generally categorized as Level 3 in the hierarchy.
Listed derivatives, such as options, that are actively traded are valued based on quoted prices from the exchange and are categorized as Level 1 in the hierarchy. Over-the-counter derivative contracts, which include forward currency contracts and equity-linked instruments, do not require material subjectivity as pricing inputs are observed from actively quoted markets and are categorized as Level 2 in the hierarchy.
Investments in open-end mutual funds are valued at NAV. Investments in closed-end funds and ETFs are valued as of the close of regular trading on the NYSE each business day. Each is categorized as Level 1 in the hierarchy.
VIRTUS VARIABLE INSURANCE TRUST
NOTES TO FINANCIAL STATEMENTS (Continued)
December 31, 2019
A summary of the inputs used to value a Series’ net assets by each major security type is disclosed at the end of the Schedule of Investments for each Series. The inputs or methodologies used for valuing securities are not necessarily an indication of the risk associated with investing in those securities.
| B. | Security Transactions and Investment Income |
| | Security transactions are recorded on the trade date. Realized gains and losses from the sale of securities are determined on the identified cost basis. Dividend income is recognized on the ex-dividend date or, in the case of certain foreign securities, as soon as a Series is notified. Interest income is recorded on the accrual basis. Each Series amortizes premiums and accretes discounts using the effective interest method. Premiums on callable debt securities are amortized to interest income to the earliest call date using the effective interest method. Any distributions from underlying funds are recorded in accordance with the character of the distributions as designated by the underlying funds. |
| | Dividend income from REITs is recorded using management’s estimate of the percentage of income included in distributions received from such investments based on historical information and other industry sources. The return of capital portion of the estimate is a reduction to investment income and a reduction in the cost basis of each investment which increases net realized gain (loss) and net change in unrealized appreciation (depreciation). If the return of capital distributions exceed its cost basis, the distributions are treated as realized gains. The actual amounts of income, return of capital, and capital gains are only determined by each REIT after its fiscal year-end, and may differ from the estimated amounts. |
| C. | Income Taxes |
| | Each Series is treated as a separate taxable entity. It is the intention of each Series to comply with the requirements of Subchapter M of the Internal Revenue Code and to distribute substantially all of its taxable income to its shareholders. Therefore, no provision for federal income taxes or excise taxes has been made. |
| | Certain Series may be subject to foreign taxes on income, gains on investments or currency repatriation, a portion of which may be recoverable. Each Series will accrue such taxes and recoveries as applicable based upon current interpretations of the tax rules and regulations that exist in the markets in which it invests. |
| | Management of the Series has concluded that there are no significant uncertain tax positions that would require recognition in the financial statements. As of December 31, 2019, the tax years that remain subject to examination by the major tax jurisdictions under the statute of limitations are from the year 2016 forward (with limited exceptions). |
| D. | Distributions to Shareholders |
| | Distributions are recorded by each Series on the ex-dividend date. Income and capital gain distributions are determined in accordance with income tax regulations that may differ from U.S. GAAP. |
| E. | Expenses |
| | Expenses incurred together by a Series and other affiliated mutual funds are allocated in proportion to the net assets of each such Series, except where allocation of direct expense to each Series or an alternative allocation method can be more appropriately used. |
| | In addition to the net annual operating expenses that a Series bears directly, the contract owners, as investors in the Series, indirectly bear the Series’ pro-rata expenses of any underlying mutual funds in which the Series invests. |
| F. | Foreign Currency Transactions |
| | Non-U.S. investment securities and other assets and liabilities denominated in foreign currencies are translated into U.S. dollar amounts at the foreign currency exchange rate effective at the end of the reporting period. Cost of investments is translated at the currency exchange rate effective at the trade date. The gain or loss resulting from a change in currency exchange rates between the trade and settlement date of a portfolio transaction is treated as a gain or loss on foreign currency. Likewise, the gain or loss resulting from a change in currency exchange rates between the date income is accrued and the date it is paid is treated as a gain or loss on foreign currency. The Series do not isolate that portion of the results of operations arising from changes in foreign exchange rates on investments from the fluctuations arising from changes in the market prices of securities held. Such fluctuations are included with the net realized and unrealized gain or loss on investments. |
| G. | When-issued Purchases and Forward Commitments (Delayed Delivery) |
| | Certain Series may engage in when-issued or forward commitment transactions. Securities purchased on a when-issued or forward commitment basis are also known as delayed delivery transactions. Delayed delivery transactions involve a commitment by a Series to purchase or sell a security at a future date (ordinarily up to 90 days later). When-issued or forward commitments enable the Series to lock in what is believed to be an attractive price or yield on a particular security for a period of time, regardless of future changes in interest rates. Each Series records when-issued and forward commitment securities on the trade date. Each Series maintains collateral for the securities purchased. Securities purchased on a when-issued or forward commitment basis begin earning interest on the settlement date. |
VIRTUS VARIABLE INSURANCE TRUST
NOTES TO FINANCIAL STATEMENTS (Continued)
December 31, 2019
| H. | Interest-Only and Principal-Only Securities |
| | Certain Series may invest in stripped mortgage-backed securities. Stripped mortgage-backed securities represent a participation in, or are secured by, or payable from, mortgage loans on real property, and may be structured in classes with rights to receive varying proportions of principal and interest. Stripped mortgage-backed securities include interest-only securities (IOs) which receive all of the interest, and principal-only securities (POs) which receive all of the principal. The market value of these securities is highly sensitive to changes in interest rates and a rapid (slow) rate of principal payments may have an adverse (positive) effect on yield to maturity. Payments received for IOs are included in interest income. Because principal will not be received at the maturity of an IO, adjustments are made to the book value of the security on a daily basis until maturity and these adjustments are also included in interest income. Payments received for POs are treated as reductions to the cost and par value of the securities. Any paydown gains or losses associated with the payments received are included in interest income. If the underlying mortgage assets are greater than anticipated payments of principal, a Series may fail to recoup some or all of its initial investment in these securities. |
| I. | Leveraged Loans |
| | Certain Series may invest in direct debt instruments which are interests in amounts owed by a corporate, governmental, or other borrower to lenders or lending syndicates. Leveraged loans are generally non-investment grade and often involve borrowers that are highly leveraged. The Series may invest in obligations of borrowers who are in bankruptcy proceedings. Leveraged loans are typically senior in the corporate capital structure of the borrower. A loan is often administered by a bank or other financial institution (the “lender”) that acts as agent for all holders. The agent administers the terms of the loan, as specified in the leveraged loan. A Series’ investments in loans may be in the form of participations in loans or assignments of all or a portion of loans from third parties. When investing in loan participations, a Series has the right to receive payments of principal, interest and any fees to which it is entitled only from the lender selling the loan participation and only upon receipt by the lender of payments from the borrower. A Series generally has no right to enforce compliance with the terms of the leveraged loan with the borrower. As a result, a Series may be subject to the credit risk of both the borrower and the lender that is selling the leveraged loan. When a Series purchases assignments from lenders it acquires direct rights against the borrower on the loan. |
| | A Series may invest in multiple series or tranches of a loan, which may have varying terms and carry different associated risks. Leveraged loans may involve foreign borrowers and investments may be denominated in foreign currencies. Direct indebtedness of emerging countries involves a risk that the government entities responsible for the repayment of the debt may be unable, or unwilling, to pay the principal and interest when due. |
| | The leveraged loans have floating rate loan interests which generally pay interest at rates that are periodically determined by reference to a base lending rate plus a premium. The base lending rates are generally LIBOR, the prime rate offered by one or more U.S. banks or the certificate of deposit rate. When a leveraged loan is purchased a Series may pay an assignment fee. On an ongoing basis, a Series may receive a commitment fee based on the undrawn portion of the underlying line of credit portion of a leveraged loan. Prepayment penalty fees are received upon the prepayment of a leveraged loan by a borrower. Prepayment penalty, facility, commitment, consent and amendment fees are recorded to income as earned or paid. |
| | As of December 31, 2019, the following Series had unfunded loan commitments as follows: |
| | | Unfunded Loan Commitment |
| | | Newfleet Multi-Sector | | Strategic |
| | | Intermediate | | Allocation |
| Borrower | | Bond Series | | Series |
| Pacific Gas and Electric Co. | | $35 | | $10 |
| J. | Securities Lending |
| | The Series may loan securities to qualified brokers through a securities lending agency agreement with The Bank of New York Mellon (“BNYM”). Under the securities lending policy, when lending securities, a Series is required to maintain collateral with a market value not less than 100% of the market value of loaned securities. Collateral is adjusted daily in connection with changes in the market value of securities on loan. Collateral may consist of cash and securities issued by the U.S. Government or its agencies. Cash collateral is invested in a short-term money market fund. Dividends earned on the collateral and premiums paid by the broker are recorded as income by the Series net of fees and rebates charged/paid by BNYM for its services as securities lending agent and in connection with this securities lending program. Lending portfolio securities involves a risk of delay in the recovery of the loaned securities or in the declining value of the collateral. |
| | Securities lending transactions are entered into by each Series under Master Securities Lending Agreements (“MSLA”) which permit the Series, under certain circumstances including an event of default (such as bankruptcy or insolvency), to offset amounts payable by the Series to the same counterparty against amounts to be received and create one single net payment due to or from the Series. |
| | At December 31, 2019, the securities loaned were subject to a MSLA on a net payment basis as follows: |
| Series | | Counterparty | | Value of
Securities
on Loan | | Cash
Collateral
Received(1) | | Net
Amount(2) |
| KAR Small-Cap Growth Series | | BNYM | | $1,190 | | $1,190 | | $— |
| Newfleet Multi-Sector Intermediate Bond Series | | BNYM | | 1,017 | | 1,017 | | — |
| Strategic Allocation Series | | BNYM | | 65 | | 65 | | — |
(1) Collateral received in excess of the market value of securities on loan is not presented in this table. The cash collateral received
in connection with securities lending transactions has been used for the purchase of securities as disclosed in the Series’ Schedule of
Investments.
(2) Net amount represents the net amount receivable due from the counterparty in the event of default.
VIRTUS VARIABLE INSURANCE TRUST
NOTES TO FINANCIAL STATEMENTS (Continued)
December 31, 2019
Note 3. Derivative Financial Instruments and Transactions
($ reported in thousands)
Disclosures about derivative instruments and hedging activities are intended to enable investors to understand how and why a Series uses derivatives, how derivatives are accounted for, and how derivative instruments affect a Series’ results of operations and financial position. Summarized below are such disclosures and accounting policies for each specific type of derivative instrument used by certain Series.
| A. | Options Contracts |
| | An options contract provides the purchaser with the right, but not the obligation, to buy (call option) or sell (put option) a financial instrument at an agreed-upon price. Certain Series may purchase or write both put and call options on portfolio securities for hedging purposes or to facilitate the rapid implementation of investment strategies if the Series anticipates a significant market or sector advance. A Series doing so is subject to equity price risk in the normal course of pursuing its investment objective(s). |
| | When a Series purchases an option, it pays a premium and an amount equal to that premium is recorded as an asset. When a Series writes an option, it receives a premium and an amount equal to that premium is recorded as a liability. The asset or liability is adjusted daily to reflect the current market value of the option. Holdings of the Series designated to cover outstanding written options are noted in the Schedule of Investments. Purchased options are reported as an asset within “Investment in securities at value” in the Statements of Assets and Liabilities. Written options are reported as a liability within “Written options at value.” Changes in value of the purchased option are included in “Net change in unrealized appreciation (depreciation) on unaffiliated investments” in the Statements of Operations. Changes in value of written options are included in “Net change in unrealized appreciation (depreciation) on written options” in the Statements of Operations. |
| | If an option expires unexercised, the Series realizes a gain or loss to the extent of the premium received or paid. If an option is exercised, the premium received or paid is recorded as an adjustment to the proceeds from the sale or the cost basis of the purchase. The difference between the premium and the amount received or paid on effecting a closing purchase or sale transaction is also treated as a realized gain or loss. Gain or loss on purchased options is included in “Net realized gain (loss) from unaffiliated investments” in the Statements of Operations. Gain or loss on written options is presented separately as “Net realized gain (loss) from written options” in the Statements of Operations. |
| | The risk in writing call options is that the Series gives up the opportunity for profit if the market price of the referenced security increases and the option is exercised. The risk in writing put options is that the Series may incur a loss if the market price of the referenced security decreases and the option is exercised. The risk in buying options is that the Series pays a premium whether or not the option is exercised. The use of such instruments may involve certain additional risks as a result of unanticipated movements in the market. Writers (sellers) of options are subject to unlimited risk of loss, as the seller will be obligated to deliver or take delivery of the security at a predetermined price which may, upon exercise of the option, be significantly different from the then-market value. |
| | The Rampart Enhanced Core Equity Series invests in written covered call options contracts in an attempt to manage equity price risk and with the purpose of generating realized gains. |
| | The following is a summary of the Rampart Enhanced Core Equity Series’ derivative instrument holdings categorized by primary risk exposure (equity contracts) in the financial statements as of December 31, 2019: |
| Statements of Assets and Liabilities | |
| | Rampart
Enhanced
Core Equity
Series |
Assets:
Purchased options at value
| $43(1) |
Liabilities:
Written Options at value
| (69) |
Net asset (liability) balance
| $(26) |
| Statement of Operations | |
| | Rampart
Enhanced
Core Equity
Series |
Net realized gain (loss) from purchased options
| $(1,137) (2) |
Net realized gain (loss) from written options
| 289 |
Net change in unrealized appreciation (depreciation) on purchased options
| 59(3) |
Net change in unrealized appreciation (depreciation) on written options
| (80) |
Total net realized and unrealized gain (loss) on purchased and written options
| $(869) |
(1) Amount included in Investment in securities at value.
(2) Amount included in Net realized gain (loss) from unaffiliated investments.
(3) Amount included in Net change in unrealized appreciation (depreciation) on unaffiliated investments.
For the period ended December 31, 2019, the average daily premiums paid by the Rampart Enhanced Core Equity Series for purchased options were $310 and the average daily premiums received for written options by the Rampart Enhanced Core Equity Series were $572.
VIRTUS VARIABLE INSURANCE TRUST
NOTES TO FINANCIAL STATEMENTS (Continued)
December 31, 2019
Note 4. Investment Advisory Fees and Related Party Transactions
($ reported in thousands)
| A. | Investment Adviser |
| | Virtus Investment Advisers, Inc. (the “Adviser”), an indirect, wholly-owned subsidiary of Virtus Investment Partners, Inc. (“Virtus”), is the investment adviser to the Series. The Adviser manages the Series’ investment programs and general operations of the Series, including oversight of the Series’ subadviser(s). |
| | As compensation for its services to the Series, the Adviser is entitled to a fee, which is calculated daily and paid monthly based upon the following annual rates as a percentage of the average daily net assets of each Series: |
| Series | | First
$250 Million | | Next
$250 Million | | Over
$500 Million |
KAR Capital Growth Series
| | 0.70% | | 0.65% | | 0.60% |
Newfleet Multi-Sector Intermediate Bond Series
| | 0.50 | | 0.45 | | 0.40 |
Rampart Enhanced Core Equity Series
| | 0.70 | | 0.65 | | 0.60 |
SGA International Growth Series
| | 0.75 | | 0.70 | | 0.65 |
Strategic Allocation Series
| | 0.55 | | 0.50 | | 0.45 |
| | | First
$1 Billion | | Next
$1 Billion | | Over
$2 Billion |
Duff & Phelps Real Estate Securities Series
| | 0.75% | | 0.70% | | 0.65% |
| | | First
$1 Billion | | $1+ Billion | | |
KAR Small-Cap Growth Series
| | 0.85% | | 0.80% | | |
| | | First
$400 Million | | $400 Million
to $1 Billion | | Over
$1 Billion |
KAR Small-Cap Value Series
| | 0.90% | | 0.85% | | 0.80% |
During the period covered by these financial statements, the Newfleet Multi-Sector Intermediate Bond Series and Strategic Allocation Series invested a portion of its assets in Virtus Newfleet Credit Opportunities Fund, an affiliated mutual fund. In order to avoid any duplication of advisory fees, the Adviser has voluntarily waived its advisory fees in an amount equal to that which would otherwise be paid by the Series on the assets invested in the Virtus Newfleet Credit Opportunities Fund. For the period covered by these financial statements, the waivers amounted to $3 and $— *, respectively. These waivers are in addition to the expense limitation and/or fee waiver covered elsewhere in these financial statements and are included in the Statements of Operations in “expense recaptured and expenses reimbursed and/or waived by investment adviser, respectively.”
* Amount is less than $500.
| B. | Subadvisers |
| | The subadvisers manage the investments of each Series for which they are paid a fee by the Adviser. A list of the subadvisers and the Series they serve is as follows: |
| Series | | Subadviser |
| Duff & Phelps Real Estate Securities Series | | DPIM(1) |
| KAR Capital Growth Series | | KAR(2) |
| KAR Small-Cap Growth Series | | KAR(2) |
| KAR Small-Cap Value Series | | KAR(2) |
| Newfleet Multi-Sector Intermediate Bond Series | | Newfleet(3) |
| Rampart Enhanced Core Equity Series | | Rampart(4) |
| | | |
| Series | | Subadviser |
| SGA International Growth Series | | SGA(5) |
| Strategic Allocation Series | | |
| (Equity Portfolio) | | KAR(2)(6) |
| (Fixed Income Portfolio) | | Newfleet(3) |
| | | |
| (1) | Duff & Phelps Investment Management Co. (“DPIM”), an indirect, wholly-owned subsidiary of Virtus. |
| (2) | Kayne Anderson Rudnick Investment Management, LLC (“KAR”), an indirect, wholly-owned subsidiary of Virtus. |
| (3) | Newfleet Asset Management, LLC (“Newfleet”), an indirect, wholly-owned subsidiary of Virtus. |
| (4) | Rampart Investment Management Company, LLC (“Rampart”), an indirect, wholly-owned subsidiary of Virtus. |
| (5) | Sustainable Growth Advisers LP (“SGA”), an indirect, majority-owned subsidiary of Virtus. Prior to June 4, 2019, the subadviser was DPIM. |
| (6) | Prior to June 4, 2019, the subadviser was DPIM for the international equity portfolio. |
VIRTUS VARIABLE INSURANCE TRUST
NOTES TO FINANCIAL STATEMENTS (Continued)
December 31, 2019
| C. | Expense Limits |
| | The Adviser has contractually agreed to limit each Series’ total operating expenses, subject to the exceptions listed below, so that such expenses do not exceed, on an annualized basis, the following percentages of average net assets, through April 30, 2020 (except as noted). Following the contractual period, the Adviser may discontinue these expense reimbursement arrangements at any time. The waivers and reimbursements are accrued daily and received monthly. |
| Series | | Class A | | Class I |
Duff & Phelps Real Estate Securities Series(1)
| | 1.14 % | | 0.89 % |
KAR Capital Growth Series
| | 1.03 | | N/A |
KAR Small-Cap Growth Series(2)
| | 1.16 | | 0.91 |
KAR Small-Cap Value Series
| | 1.10 | | N/A |
Newfleet Multi-Sector Intermediate Bond Series
| | 0.94 ‡ | | 0.69 ‡ |
Rampart Enhanced Core Equity Series
| | 0.98 | | N/A |
SGA International Growth Series(3)
| | 1.16 | | 0.91 |
Strategic Allocation Series
| | 0.98 | | N/A |
| (1) | Effective December 1, 2019 through April 30, 2021. For the period January 1, 2019 through November 30, 2019, the expense cap for Class A and Class I were as follows: 1.16% and 0.91%, respectively. |
| (2) | Effective December 1, 2019 through April 30, 2021. For the period January 1, 2019 through November 30, 2019, the expense cap for Class A and Class I were as follows: 1.19% and 0.94%, respectively. |
| (3) | Effective December 1, 2019 through April 30, 2021. For the period January 1, 2019 through November 30, 2019, the expense cap for Class A and Class I were as follows: 1.18% and 0.93%, respectively. |
| ‡ | Each share class is currently below its expense cap. |
From January 1, 2019 through September 24, 2019, the exclusions included front-end or contingent deferred loads, taxes, leverage expenses, interest, brokerage commissions, expenses incurred in connection with any merger or reorganization, unusual or infrequently occurring expenses (such as litigation), acquired fund fees and expenses, and dividend expenses, if any. As of September 25, 2019, the exclusions include front-end or contingent deferred loads, taxes, leverage and borrowing expenses (such as commitment, amendment and renewal expenses on credit or redemption facilities), interest, brokerage commissions, expenses incurred in connection with any merger or reorganization, unusual or infrequently occurring expenses (such as litigation), acquired fund fees and expenses, and dividend expenses, if any.
| D. | Expense Recapture |
| | Under certain conditions, the Adviser may recapture operating expenses reimbursed or fees waived under these arrangements within three years after the date on which such amounts were incurred or waived. A Series must pay its ordinary operating expenses before the Adviser is entitled to any reimbursement and must remain in compliance with any applicable expense limitations or, if none, the expense limitation in effect at the time of the waiver or reimbursement. All or a portion of the following Adviser reimbursed expenses may be recaptured by the fiscal year ending: |
| | | Expiration | |
| Series | | 2020 | | 2021 | | 2022 | | Total |
| Duff & Phelps Real Estate Securities Series | | | | | | | | |
Class A
| | $ 40 | | $ 24 | | $29 | | $93 |
Class I
| | —(1) | | —(1) | | —(1) | | —(1) |
| KAR Capital Growth Series | | | | | | | | |
Class A
| | 212 | | 172 | | 183 | | 567 |
| KAR Small-Cap Growth Series | | | | | | | | |
Class A
| | 80 | | 75 | | 86 | | 241 |
Class I
| | 2 | | 3 | | 5 | | 10 |
| KAR Small-Cap Value Series | | | | | | | | |
Class A
| | 134 | | 117 | | 181 | | 432 |
| Newfleet Multi-Sector Intermediate Bond Series | | | | | | | | |
Class A
| | 26 | | 3 | | — | | 29 |
Class I
| | —(1) | | —(1) | | — | | —(1) |
| Rampart Enhanced Core Equity Series | | | | | | | | |
Class A
| | 196 | | 163 | | 141 | | 500 |
| SGA International Growth Series | | | | | | | | |
Class A
| | 63 | | 1 | | 22 | | 86 |
Class I
| | —(1) | | —(1) | | —(1) | | —(1) |
| Strategic Allocation Series | | | | | | | | |
Class A
| | 75 | | 42 | | 25 | | 142 |
| | | | | | | | | |
VIRTUS VARIABLE INSURANCE TRUST
NOTES TO FINANCIAL STATEMENTS (Continued)
December 31, 2019
During the year ended December 31, 2019, the Adviser recaptured expenses previously waived for the following Series:
| | | | | |
| Series | | Class A | | Class I | | Total |
| Newfleet Multi-Sector Intermediate Bond Series | | $9 | | —(1) | | $9 |
| SGA International Growth Series | | 4 | | —(1) | | 4 |
| | | | | | | |
| (1) | Amount is less than $500. |
| E. | Administrator and Distributor |
| | Virtus Fund Services, LLC, an indirect, wholly-owned subsidiary of Virtus, serves as the administrator to the Series. |
| | For the period ended December 31, 2019 (the “period”), the Series incurred administration fees totaling $873 which are included in the Statements of Operations within the line item “Administration and accounting fees.” The fees are calculated daily and paid monthly. |
| | VP Distributors, LLC (“VP Distributors”), an indirect, wholly-owned subsidiary of Virtus, serves as the distributor of each Series’ shares. Each Series pays VP Distributors distribution and/or service fees under a Board-approved Rule 12b-1 plan, at the annual rate of 0.25% of the average daily net assets of such Series’ Class A shares. Class I shares are not subject to a Rule 12b-1 plan. For the period ended December 31, 2019, the Series incurred distribution fees totaling $2,268 which are included in the Statements of Operations within the line item “Distribution and service fees.” A portion of these fees was paid to certain insurance companies for marketing and/or shareholder services provided to contract owners. The fees are calculated daily and paid monthly. |
| F. | Investments in Affiliates |
| | A summary of the total long-term and short-term purchases and sales of an affiliated fund, Virtus Newfleet Credit Opportunities Fund, during the period ended December 31, 2019, is as follows: |
| | Value,
beginning
of period | | Purchases | | Sales
Proceeds | | Net
realized
gain (loss)
on
affiliated
fund | | Net change in
unrealized
appreciation
(depreciation)
on affiliated fund | | Value,
end of
period | | Shares | | Dividend
Income | | Distributions
of Realized
Gains |
| Newfleet Multi-Sector Intermediate Bond Series | | | | | | | | | | | | |
| Affiliated Mutual Fund—0.0% | | | | | | | | | | | | |
Virtus Newfleet Credit Opportunities Fund Class R6*
| $1,647 | | $— | | $1,713 | | $(120) | | $186 | | $— | | — | | $31 | | $— |
| | Value,
beginning
of period | | Purchases | | Sales
Proceeds | | Net
realized
gain (loss)
on
affiliated
fund | | Net change in
unrealized
appreciation
(depreciation)
on affiliated fund | | Value,
end of
period | | Shares | | Dividend
Income | | Distributions
of Realized
Gains |
| Strategic Allocation Series | | | | | | | | | | | | |
| Affiliated Mutual Fund—0.0% | | | | | | | | | | | | |
Virtus Newfleet Credit Opportunities Fund Class R6*
| $219 | | $— | | $228 | | $(16) | | $25 | | $— | | — | | $4 | | $— |
* The Virtus Newfleet Credit Opportunities Fund liquidated on April 26, 2019.
During the period ended December 31, 2019, the Newfleet Multi-Sector Intermediate Bond Series received shares at a market value of $827 by means of a distribution in kind.
| G. | Payment from Affiliate |
| | During the period December 31, 2019, the Adviser reimbursed Newfleet Multi-Sector Intermediate Bond for losses. These amounts are included in “Net increase from payment by affiliates” in the Statements of Operations. There was no impact on the total return. |
| | The KAR Capital Growth Series and the Strategic Allocation Series will be reimbursed by the Subadviser for costs incurred due to an error in the processing of a corporate action of an investment during the period ended December 31, 2019. The reimbursement amount for each affected Series is disclosed in the Series’ “Statements of Assets and Liabilities” as a “Receivable from affiliate”. |
VIRTUS VARIABLE INSURANCE TRUST
NOTES TO FINANCIAL STATEMENTS (Continued)
December 31, 2019
| H. | Trustee Compensation |
| | The Trust provides a deferred compensation plan for its Trustees who receive compensation from the Trust. Under the deferred compensation plan, Trustees may elect to defer all or a portion of their compensation. Amounts deferred are retained by the Trust, and then, to the extent permitted by the 1940 Act, in turn, may be invested in the shares of affiliated or unaffiliated mutual funds selected by the participating Trustees. Investments in such instruments are included in “Other assets” in the Statements of Assets and Liabilities at December 31, 2019. |
| I. | Cross Trades |
| | Cross trades for the period ended December 31, 2019, were executed by certain Series pursuant to procedures adopted by the Board designed to ensure compliance with Rule 17a-7 under the 1940 Act. Cross trading is the buying or selling of portfolio securities between funds of investment companies, or between a fund of an investment company and another entity, that are or could be considered affiliates by virtue of having a common investment adviser (or affiliated investment advisers), common directors/ trustees and/or common officers. At regularly scheduled meetings, the Series’ CCO provides written representation that certain transactions effected pursuant to Rule 17a-7 complied with procedures adopted by the Board. Pursuant to these procedures, for the period ended December 31, 2019, the KAR Small-Cap Growth Series engaged in Rule 17a-7 securities sales of $206, which resulted in a net realized loss of $(91). |
Note 5. Purchases and Sales of Securities
($ reported in thousands)
Purchases and sales of securities (excluding U.S. Government and agency securities, forward currency contracts, written options, and short-term investments) during the period ended December 31, 2019, were as follows:
| | Purchases | | Sales |
Duff & Phelps Real Estate Securities Series
| $31,880 | | $36,099 |
KAR Capital Growth Series
| 18,603 | | 43,808 |
KAR Small-Cap Growth Series
| 10,521 | | 25,455 |
KAR Small-Cap Value Series
| 6,003 | | 13,513 |
Newfleet Multi-Sector Intermediate Bond Series
| 72,092 | | 69,805 |
Rampart Enhanced Core Equity Series
| 24,430 | | 36,194 |
SGA International Growth Series
| 198,200 | | 210,617 |
Strategic Allocation Series
| 30,640 | | 41,306 |
Purchases and sales of U.S. Government and agency securities during the period ended December 31, 2019, were as follows:
| | Purchases | | Sales |
Newfleet Multi-Sector Intermediate Bond Series
| $5,159 | | $12,084 |
Strategic Allocation Series
| 2,905 | | 2,504 |
Note 6. Capital Share Transactions
($ reported in thousands)
Transactions in shares of capital stock, during the periods ended as indicated below, were as follows:
| | Duff & Phelps Real Estate Securities Series | | KAR Capital Growth Series |
| | Year Ended
December 31, 2019 | | Year Ended
December 31, 2018 | | Year Ended
December 31, 2019 | | Year Ended
December 31, 2018 |
| | SHARES | | AMOUNT | | SHARES | | AMOUNT | | SHARES | | AMOUNT | | SHARES | | AMOUNT |
| Class A | | | | | | | | | | | | | | | |
| Shares sold | 473 | | $9,341 | | 178 | | $3,243 | | 61 | | $1,930 | | 73 | | $2,380 |
| Reinvestment of distributions | 464 | | 8,680 | | 358 | | 6,458 | | 269 | | 8,813 | | 889 | | 24,960 |
| Shares repurchased | (767) | | (14,846) | | (582) | | (10,732) | | (875) | | (27,970) | | (797) | | (26,497) |
| Net Increase / (Decrease) | 170 | | $3,175 | | (46) | | $(1,031) | | (545) | | $(17,227) | | 165 | | $843 |
| Class I | | | | | | | | | | | | | | | |
| Shares sold | 128 | | $2,538 | | 3 | | $50 | | — | | $— | | — | | $— |
| Reinvestment of distributions | 12 | | 224 | | 1 | | 21 | | — | | — | | — | | — |
| Shares repurchased | (35) | | (713) | | (2) | | (28) | | — | | — | | — | | — |
| Net Increase / (Decrease) | 105 | | $2,049 | | 2 | | $43 | | — | | $— | | — | | $— |
VIRTUS VARIABLE INSURANCE TRUST
NOTES TO FINANCIAL STATEMENTS (Continued)
December 31, 2019
| | KAR Small-Cap Growth Series | | KAR Small-Cap Value Series |
| | Year Ended
December 31, 2019 | | Year Ended
December 31, 2018 | | Year Ended
December 31, 2019 | | Year Ended
December 31, 2018 |
| | SHARES | | AMOUNT | | SHARES | | AMOUNT | | SHARES | | AMOUNT | | SHARES | | AMOUNT |
| Class A | | | | | | | | | | | | | | | |
| Shares sold | 61 | | $1,905 | | 119 | | $4,029 | | 41 | | $607 | | 79 | | $1,272 |
| Reinvestment of distributions | 443 | | 13,810 | | 508 | | 14,632 | | 114 | | 1,794 | | 618 | | 8,965 |
| Shares repurchased | (430) | | (14,143) | | (396) | | (12,951) | | (648) | | (9,675) | | (757) | | (12,729) |
| Net Increase / (Decrease) | 74 | | $1,572 | | 231 | | $5,710 | | (493) | | $(7,274) | | (60) | | $(2,492) |
| Class I | | | | | | | | | | | | | | | |
| Shares sold | 84 | | $2,760 | | 79 | | $2,529 | | — | | $— | | — | | $— |
| Reinvestment of distributions | 28 | | 892 | | 21 | | 617 | | — | | — | | — | | — |
| Shares repurchased | (42) | | (1,367) | | (29) | | (932) | | — | | — | | — | | — |
| Net Increase / (Decrease) | 70 | | $2,285 | | 71 | | $2,214 | | — | | $— | | — | | $— |
| | Newfleet Multi-Sector Intermediate Bond Series | | Rampart Enhanced Core Equity Series |
| | Year Ended
December 31, 2019 | | Year Ended
December 31, 2018 | | Year Ended
December 31, 2019 | | Year Ended
December 31, 2018 |
| | SHARES | | AMOUNT | | SHARES | | AMOUNT | | SHARES | | AMOUNT | | SHARES | | AMOUNT |
| Class A | | | | | | | | | | | | | | | |
| Shares sold | 809 | | $7,540 | | 832 | | $7,717 | | 76 | | $903 | | 110 | | $1,268 |
| Reinvestment of distributions | 464 | | 4,273 | | 549 | | 4,818 | | 87 | | 1,109 | | 93 | | 1,020 |
| Shares repurchased | (1,917) | | (17,722) | | (2,440) | | (22,403) | | (1,069) | | (12,780) | | (1,188) | | (13,892) |
| Net Increase / (Decrease) | (644) | | $(5,909) | | (1,059) | | $(9,868) | | (906) | | $(10,768) | | (985) | | $(11,604) |
| Class I | | | | | | | | | | | | | | | |
| Shares sold | 24 | | $221 | | 5 | | $45 | | — | | $— | | — | | $— |
| Reinvestment of distributions | 4 | | 37 | | 4 | | 31 | | — | | — | | — | | — |
| Shares repurchased | (6) | | (57) | | (75) | | (690) | | — | | — | | — | | — |
| Net Increase / (Decrease) | 22 | | $201 | | (66) | | $(614) | | — | | $— | | — | | $— |
| | SGA International Growth Series | | Strategic Allocation Series |
| | Year Ended
December 31, 2019 | | Year Ended
December 31, 2018 | | Year Ended
December 31, 2019 | | Year Ended
December 31, 2018 |
| | SHARES | | AMOUNT | | SHARES | | AMOUNT | | SHARES | | AMOUNT | | SHARES | | AMOUNT |
| Class A | | | | | | | | | | | | | | | |
| Shares sold | 233 | | $2,616 | | 335 | | $4,004 | | 28 | | $355 | | 44 | | $575 |
| Reinvestment of distributions | 105 | | 1,216 | | 435 | | 4,848 | | 164 | | 2,202 | | 398 | | 4,684 |
| Shares repurchased | (1,493) | | (16,809) | | (1,806) | | (22,396) | | (900) | | (11,640) | | (1,040) | | (13,444) |
| Net Increase / (Decrease) | (1,155) | | $(12,977) | | (1,036) | | $(13,544) | | (708) | | $(9,083) | | (598) | | $(8,185) |
| Class I | | | | | | | | | | | | | | | |
| Reinvestment of distributions | —(1) | | $1 | | —(1) | | $3 | | — | | $— | | — | | $— |
| Net Increase / (Decrease) | —(1) | | $1 | | —(1) | | $3 | | — | | $— | | — | | $— |
| | |
| (1) | Amount is less than 500 shares. |
VIRTUS VARIABLE INSURANCE TRUST
NOTES TO FINANCIAL STATEMENTS (Continued)
December 31, 2019
Note 7. 10% Shareholders
As of December 31, 2019, certain Series had individual shareholder account(s) and/or omnibus shareholder account(s) (comprised of a group of individual shareholders), which individually amounted to more than 10% of the total shares outstanding of each such Series as detailed below:
| | % of Shares
Outstanding | | Number of
Accounts* |
Duff & Phelps Real Estate Securities Series
| 76% | | 2 |
KAR Capital Growth Series
| 100 | | 2 |
KAR Small-Cap Growth Series
| 92 | | 2 |
KAR Small-Cap Value Series
| 100 | | 2 |
Newfleet Multi-Sector Intermediate Bond Series
| 88 | | 3 |
Rampart Enhanced Core Equity Series
| 99 | | 2 |
SGA International Growth Series
| 98 | | 2 |
Strategic Allocation Series
| 100 | | 2 |
| * | None of the accounts are affiliated. |
Note 8. Credit Risk and Asset Concentration
In countries with limited or developing markets, investments may present greater risks than in more developed markets and the prices of such investments may be volatile. The consequences of political, social or economic changes in these markets may have disruptive effects on the market prices of these investments and the income they generate, as well as a Series’ ability to repatriate such amounts.
High-yield/high-risk securities typically entail greater price volatility and/or principal and interest rate risk. There is a greater chance that an issuer will not be able to make principal and interest payments on time. Analysis of the creditworthiness of issuers of high-yield/high-risk securities may be complex, and as a result, it may be more difficult for the Adviser and/or subadvisers to accurately predict risk.
Certain Series may invest in ETFs, which may expose the Series to the risk that the value of an ETF will be more volatile than the underlying portfolio of securities the ETF is designed to track, or that the costs to the Series of owning shares of the ETF will exceed those the Series would incur by investing in such securities directly.
Certain Series may invest a high percentage of their assets in specific sectors of the market in the pursuit of their investment objectives. Fluctuations in these sectors of concentration may have a greater impact on a Series, positive or negative, than if the Series did not concentrate its investments in such sectors.
At December 31, 2019, the Series below held securities issued by various companies in specific sectors as detailed below:
| Series | | Sector | | Percentage of
Total Investments |
Duff & Phelps Real Estate Securities Series
| | Residential | | 26% |
KAR Capital Growth Series
| | Information Technology | | 27 |
KAR Capital Growth Series
| | Consumer Discretionary | | 26 |
KAR Small-Cap Growth Series
| | Information Technology | | 25 |
KAR Small-Cap Value Series
| | Industrials | | 27 |
SGA International Growth Series
| | Consumer Staples | | 25 |
Note 9. Indemnifications
Under the Trust’s organizational documents and in separate agreements between each Trustee and the Trust, its Trustees and officers are indemnified against certain liabilities arising out of the performance of their duties to the Trust and its funds. In addition, in the normal course of business, the Trust and the Series enter into contracts that provide a variety of indemnifications to other parties. The Trust’s and/or the Series’ maximum exposure under these arrangements is unknown, as this would involve future claims that may be made against the Trust or the Series and that have not occurred. However, neither the Trust nor the Series have had prior claims or losses pursuant to these arrangements, and they expect the risk of loss to be remote.
Note 10. Restricted Securities
Restricted securities are not registered under the Securities Act of 1933, as amended (the “1933 Act”). Generally, 144A securities are excluded from this category. Each Series will bear any costs, including those involved in registration under the 1933 Act, in connection with the disposition of such securities. The following Series held securities considered to be restricted at December 31, 2019:
| Series | | Investment | | Date of
Acquisition | | Cost | | Value | | Percentage of
Net Assets |
KAR Capital Growth Series
| | Bill.com Holdings, Inc. | | 12/21/18 | | $2,417 | | $5,535 | | 2.4% |
Strategic Allocation Series
| | Bill.com Holdings, Inc. | | 12/21/18 | | 460 | | 1,053 | | 1.2 |
VIRTUS VARIABLE INSURANCE TRUST
NOTES TO FINANCIAL STATEMENTS (Continued)
December 31, 2019
Note 11. Redemption Facility
($ reported in thousands)
On September 18, 2017, the Series and certain other affiliated funds entered into a $150,000 unsecured line of credit (“Credit Agreement”). This Credit Agreement, as amended, is with a commercial bank that allows the Series to borrow cash from the bank to manage large unexpected redemptions and trade fails, up to a limit of one-third of total net assets for KAR Capital Growth Series, KAR Small-Cap Growth Series, KAR Small-Cap Value Series, Newfleet Multi-Sector Intermediate Bond Series, Rampart Enhanced Core Equity Series, SGA International Growth Series, and Strategic Allocation Series or one-fifth of total net assets for Duff & Phelps Real Estate Securities Series in accordance with the terms of the agreement. This Credit Agreement has a term of 364 days and has been renewed for a period up to March 12, 2020. Interest is charged at the higher of the LIBOR or the Federal Funds rate plus an additional percentage rate on the amount borrowed. Commitment fees are charged on the undrawn balance. The Series and other affiliated funds that are parties are individually, and not jointly, liable for their particular advances, if any, under the Credit Agreement. The lending bank has the ability to require repayment of outstanding borrowings under this Credit Agreement upon certain circumstances such as an event of default.
The Series had no outstanding borrowings at any time during the period ended December 31, 2019.
Note 12. Federal Income Tax Information
($ reported in thousands)
At December 31, 2019, federal tax cost and aggregate gross unrealized appreciation (depreciation) of securities held by the Series were as follows:
| Series | | Federal
Tax Cost | | Unrealized
Appreciation | | Unrealized
(Depreciation) | | Net Unrealized
Appreciation
(Depreciation) |
Duff & Phelps Real Estate Securities Series
| | $56,972 | | $21,669 | | $(898) | | $20,771 |
KAR Capital Growth Series
| | 98,780 | | 134,067 | | (1,748) | | 132,319 |
KAR Small-Cap Growth Series
| | 48,240 | | 54,187 | | (363) | | 53,824 |
KAR Small-Cap Value Series
| | 49,071 | | 29,531 | | (2,163) | | 27,368 |
Newfleet Multi-Sector Intermediate Bond Series
| | 115,535 | | 3,857 | | (2,348) | | 1,509 |
Rampart Enhanced Core Equity Series (Including Purchased Options)
| | 70,091 | | 27,779 | | (1,827) | | 25,952 |
Rampart Enhanced Core Equity Series (Written Options)
| | (69) | | — | | — | | — |
SGA International Growth Series
| | 137,883 | | 13,350 | | (2,552) | | 10,798 |
Strategic Allocation Series
| | 65,168 | | 22,852 | | (758) | | 22,094 |
Certain Series had capital loss carryforwards available to offset future realized capital gains, through the indicated expiration dates shown below:
| | | No Expiration | | Total |
| Series | | Short-Term | | Long-Term | | Short-Term | | Long-Term |
Newfleet Multi-Sector Intermediate Bond Series
| | $525 | | $4,203 | | $525 | | $4,203 |
Rampart Enhanced Core Equity Series
| | 2,402 | | 3,869 | | 2,402 | | 3,869 |
SGA International Growth Series
| | 3,079 | | — | | 3,079 | | — |
For the year ended December 31, 2019, the following Series utilized losses deferred in prior years against current year capital gains:
| Series | |
Rampart Enhanced Core Equity Series
| $ 156 |
SGA International Growth Series
| 3,406 |
VIRTUS VARIABLE INSURANCE TRUST
NOTES TO FINANCIAL STATEMENTS (Continued)
December 31, 2019
Capital losses realized after October 31 and certain late year ordinary losses may be deferred and treated as occurring on the first day of the following fiscal year. For the fiscal period ended December 31, 2019, the following Series deferred qualified late year losses as follows:
| Series | | Late Year
Ordinary
Losses
Deferred | | Late Year
Ordinary
Losses
Recognized | | Capital
Loss
Deferred | | Capital
Loss
Recognized |
Duff & Phelps Real Estate Securities Series
| | $ — | | $ — | | $ 48 | | $ — |
KAR Capital Growth Series
| | — | | — | | — | | (53) |
KAR Small-Cap Value Series
| | — | | — | | — | | (359) |
Newfleet Multi-Sector Intermediate Bond Series
| | — | | (40) | | — | | (265) |
Rampart Enhanced Core Equity Series
| | — | | — | | — | | (561) |
SGA International Growth Series
| | 2 | | (471) | | — | | (3,287) |
Strategic Allocation Series
| | — | | (18) | | — | | (119) |
The components of distributable earnings on a tax basis (excluding unrealized appreciation (depreciation) which is disclosed in the beginning of this note) consist of the following:
| | Undistributed
Ordinary
Income | | Undistributed
Long-Term
Capital Gains |
Duff & Phelps Real Estate Securities Series
| $39 | | $899 |
KAR Capital Growth Series
| — | | 1,870 |
KAR Small-Cap Growth Series
| 79 | | 49 |
KAR Small-Cap Value Series
| 8 | | 1,078 |
Newfleet Multi-Sector Intermediate Bond Series
| 23 | | — |
Rampart Enhanced Core Equity Series
| 29 | | — |
Strategic Allocation Series
| 152 | | 385 |
The tax character of dividends and distributions paid during the fiscal periods ended December 31, 2019 and December 31, 2018, was as follows:
| | Ordinary
Income | | Long-Term
Capital Gains | | Total |
Duff & Phelps Real Estate Securities Series
| | | | | |
12/31/19
| $ 1,576 | | $ 7,328 | | $8,904 |
12/31/18
| 1,320 | | 5,159 | | 6,479 |
KAR Capital Growth Series
| | | | | |
12/31/19
| — | | 8,813 | | 8,813 |
12/31/18
| — | | 24,960 | | 24,960 |
KAR Small-Cap Growth Series
| | | | | |
12/31/19
| 407 | | 14,295 | | 14,702 |
12/31/18
| 93 | | 15,156 | | 15,249 |
KAR Small-Cap Value Series
| | | | | |
12/31/19
| 716 | | 1,078 | | 1,794 |
12/31/18
| 797 | | 8,168 | | 8,965 |
Newfleet Multi-Sector Intermediate Bond Series
| | | | | |
12/31/19
| 4,310 | | — | | 4,310 |
12/31/18
| 4,849 | | — | | 4,849 |
Rampart Enhanced Core Equity Series
| | | | | |
12/31/19
| 1,109 | | — | | 1,109 |
12/31/18
| 1,020 | | — | | 1,020 |
SGA International Growth Series
| | | | | |
12/31/19
| 1,217 | | — | | 1,217 |
12/31/18
| 4,852 | | — | | 4,852 |
Strategic Allocation Series
| | | | | |
12/31/19
| 1,065 | | 1,137 | | 2,202 |
12/31/18
| 1,424 | | 3,261 | | 4,685 |
VIRTUS VARIABLE INSURANCE TRUST
NOTES TO FINANCIAL STATEMENTS (Continued)
December 31, 2019
For financial reporting purposes, book basis capital accounts are adjusted to reflect the tax character of permanent book/tax differences. Permanent reclassifications can arise from differing treatment of certain income and gain transactions and nondeductible current year net operating losses. The reclassifications have no impact on the net assets or net asset value of the Series. As of December 31, 2019, the Series recorded reclassifications to increase (decrease) the accounts as listed below:
| | Capital Paid in on
Shares of
Beneficial Interest | | Total Distributable
Earnings
(Accumulated Losses) |
KAR Capital Growth Series
| $ (445) | | $ 445 |
KAR Small-Cap Growth Series
| (183) | | 183 |
KAR Small-Cap Value Series
| (82) | | 82 |
Rampart Enhanced Core Equity Series
| (83) | | 83 |
Note 13. Regulatory Matters and Litigation
From time to time, the Trust, the Series, the Adviser and/or the Subadvisers and/or their affiliates may be involved in litigation and arbitration as well as examinations and investigations by various regulatory bodies, including the SEC, involving compliance with, among other things, securities laws, client investment guidelines, laws governing the activities of broker-dealers and other laws and regulations affecting their products and other activities. At this time, the Adviser believes that the outcomes of such matters are not likely, either individually or in aggregate, to be material to these financial statements.
Note 14. Recent Accounting Pronouncement
In March 2017, the Financial Accounting Standards Board (“FASB”) issued Accounting Standards Update (“ASU”), ASU 2017-08, Receivables – Nonrefundable Fees and Other Costs (Subtopic 310-20), Premium Amortization on Purchased Callable Debt Securities which amends the amortization period for certain callable debt securities purchased at a premium, shortening such period to the earliest call date. The ASU 2017-08 does not require any accounting change for debt securities held at a discount; the discount continues to be amortized to maturity. The ASU 2017-08 is effective for fiscal years, and interim periods within those fiscal years, beginning after December 15, 2018. Management has implemented the ASU 2017-08 and determined the impact of this guidance to the Series’ net assets at the end of the year is not material.
In August 2018, the FASB issued ASU No. 2018-13, which changes certain fair value measurement disclosure requirements. This ASU, in addition to other modifications and additions, removes the requirement to disclose the amount and reasons for transfers between Level 1 and Level 2 of the fair value hierarchy, the policy for the timing of transfers between levels and the valuation process for Level 3 fair value measurements. For public companies, the amendments are effective for financial statements issued for fiscal years beginning after December 15, 2019, and interim periods within those fiscal years. Management has evaluated the implications of certain provisions of ASU No. 2018-13 and has determined to early adopt all aspects related to the removal and modification of certain fair value measurement disclosures under the ASU effective immediately.
Note 15. Mixed and Shared Funding
Shares of the Series are not directly offered to the public. Shares of the Series are currently offered through separate accounts to fund variable accumulation annuity contracts and variable universal life insurance policies issued by participating insurance companies. The interests of variable annuity contract owners and variable life policy owners could diverge based on differences in U.S. federal and state regulatory requirements, tax laws, investment management or other unanticipated developments. The Trust’s Trustees do not foresee any such differences or disadvantages at this time. However, the Trust’s Trustees intend to monitor for any material conflicts and will determine what action, if any, should be taken in response to such conflicts. If such a conflict should occur, one or more separate accounts may be required to withdraw its investment in the Series, or shares of another Series may be substituted.
Note 16. Subsequent Events
Management has evaluated the impact of all subsequent events on the Series through the date the financial statements were available for issuance, and has determined that there are no subsequent events requiring recognition or disclosure in these financial statements.
Report of Independent Registered Public Accounting Firm
To the Board of Trustees of Virtus Variable Insurance Trust and Shareholders of Virtus Duff & Phelps Real Estate Securities Series, Virtus KAR Capital Growth Series, Virtus KAR Small-Cap Growth Series, Virtus KAR Small-Cap Value Series, Virtus Newfleet Multi-Sector Intermediate Bond Series, Virtus Rampart Enhanced Core Equity Series, Virtus SGA International Growth Series and Virtus Strategic Allocation Series
Opinions on the Financial Statements
We have audited the accompanying statements of assets and liabilities, including the schedules of investments, of Virtus Duff & Phelps Real Estate Securities Series, Virtus KAR Capital Growth Series, Virtus KAR Small-Cap Growth Series, Virtus KAR Small-Cap Value Series, Virtus Newfleet Multi-Sector Intermediate Bond Series, Virtus Rampart Enhanced Core Equity Series, Virtus SGA International Growth Series and Virtus Strategic Allocation Series (constituting Virtus Variable Insurance Trust, hereafter collectively referred to as the “Funds”) as of December 31, 2019, the related statements of operations for the year ended December 31, 2019, the statements of changes in net assets for each of the two years in the period ended December 31, 2019, including the related notes, and the financial highlights for each of the five years in the period ended December 31, 2019 (collectively referred to as the “financial statements”). In our opinion, the financial statements present fairly, in all material respects, the financial position of each of the Funds as of December 31, 2019, the results of each of their operations for the year then ended, the changes in each of their net assets for each of the two years in the period ended December 31, 2019 and each of the financial highlights for each of the five years in the period ended December 31, 2019 in conformity with accounting principles generally accepted in the United States of America.
Basis for Opinions
These financial statements are the responsibility of the Funds’ management. Our responsibility is to express an opinion on the Funds’ financial statements based on our audits. We are a public accounting firm registered with the Public Company Accounting Oversight Board (United States) (“PCAOB”) and are required to be independent with respect to the Funds in accordance with the U.S. federal securities laws and the applicable rules and regulations of the Securities and Exchange Commission and the PCAOB.
We conducted our audits of these financial statements in accordance with the standards of the PCAOB. Those standards require that we plan and perform the audit to obtain reasonable assurance about whether the financial statements are free of material misstatement, whether due to error or fraud.
Our audits included performing procedures to assess the risks of material misstatement of the financial statements, whether due to error or fraud, and performing procedures that respond to those risks. Such procedures included examining, on a test basis, evidence regarding the amounts and disclosures in the financial statements. Our audits also included evaluating the accounting principles used and significant estimates made by management, as well as evaluating the overall presentation of the financial statements. Our procedures included confirmation of securities owned as of December 31, 2019 by correspondence with the custodians, transfer agent and brokers; when replies were not received from brokers, we performed other auditing procedures. We believe that our audits provide a reasonable basis for our opinions.
/s/ PricewaterhouseCoopers LLP
Philadelphia, Pennsylvania
February 21, 2020
We have served as the Virtus Mutual Funds’ auditor since at least 1977. We have not been able to determine the specific year we began serving as auditor.
VIRTUS VARIABLE INSURANCE TRUST
TAX INFORMATION NOTICE (Unaudited)
December 31, 2019
For the fiscal year ended December 31, 2019, the Series make the following disclosures for federal income tax purposes: the percentages of ordinary income dividends earned by the Series which qualifies for the dividends received deduction (“DRD”) for corporate shareholders; the actual percentage of DRD for the calendar year will be designated in year-end tax statements. The Series designate the amounts below as long term capital gains dividends (“LTCG”) taxable at a 20% rate, or lower depending on the shareholder’s income ($ reported in thousands). LTCG amounts, if subsequently different, will be designated in the next annual report.
| | DRD | | LTCG |
| Duff & Phelps Real Estate Securities Series | —% | | $ 7,786 |
| KAR Capital Growth Series | — | | 8,581 |
| KAR Small-Cap Growth Series | 100.00 | | 12,684 |
| KAR Small-Cap Value Series | 100.00 | | 2,173 |
| Rampart Enhanced Core Equity Series | 100.00 | | — |
| SGA International Growth Series | 4.99 | | — |
| Strategic Allocation Series | 29.13 | | 1,522 |
RESULTS OF SHAREHOLDER MEETING (Unaudited)
VIRTUS VARIABLE INSURANCE TRUST
JULY 30, 2019
At a special meeting of shareholders of Virtus SGA International Growth Series (the “Series”), a series of Virtus Variable Insurance Trust, held on July 30, 2019, shareholders voted on the following proposal:
| Number of Eligible Votes: | | FOR | | AGAINST | | ABSTAIN |
| To approve a Subadvisory Agreement by and among the Virtus Variable Insurance Trust, Virtus Investment Advisers, Inc. and Sustainable Growth Advisers, LP | | 126,069,392.27 | | 4,363,662.01 | | 15,652,780.74 |
Shareholders of the Series voted to approve the above proposal.
CONSIDERATION OF ADVISORY AND SUBADVISORY
AGREEMENTS BY THE BOARD OF TRUSTEES (Unaudited)
The Board of Trustees (the “Board”) of Virtus Variable Insurance Trust (the “Trust”) is responsible for determining whether to approve the establishment and continuation of the investment advisory agreement (the “Advisory Agreement”) between the Trust and Virtus Investment Advisers, Inc. (“VIA”) and of each subadvisory agreement (each, a “Subadvisory Agreement” and collectively, the “Subadvisory Agreements”) (together with the Advisory Agreement, the “Agreements”) with respect to the series of the Trust (individually and collectively, the “Series”). At in-person meetings held on October 30, 2019 and November 20-21, 2019 (the “Meetings”), the Board, including a majority of the Trustees who are not interested persons of the Trust as defined in Section 2(a)(19) of the Investment Company Act of 1940, as amended (such Act, the “1940 Act” and such Trustees, the “Independent Trustees”), considered and approved the continuation of each Agreement due for renewal, as further discussed below. (The Advisory Agreement was due for renewal, and all of the Subadvisory Agreements were due for renewal other than the Subadvisory Agreement with Kayne Anderson Rudnick Investment Management, LLC, with respect to Virtus Strategic Allocation Series, and the Subadvisory Agreement with Sustainable Growth Advisers, LP, with respect to Virtus SGA International Growth Series.) In addition, prior to the Meetings, the Independent Trustees met with their independent legal counsel to discuss and consider the information provided by management and submitted questions to management, and they considered the responses provided.
In connection with the approval of the Agreements, the Board requested and evaluated information provided by VIA and each subadviser (each, a “Subadviser” and collectively, the “Subadvisers”) which, in the Board’s view, constituted information necessary for the Board to form a judgment as to whether the renewal of each of the Agreements would be in the best interests of each applicable Series and its respective shareholders. The Board also considered information furnished throughout the year at regular Board meetings with respect to the services provided by VIA and the Subadvisers, including quarterly performance reports prepared by management containing reviews of investment results and periodic presentations from the Subadvisers with respect to the Series they manage. The Board noted the affiliation of the Subadvisers with VIA and any potential conflicts of interest.
The Board was separately advised by independent legal counsel throughout the process. For each Agreement, the Board considered all the criteria separately with respect to the applicable Series and its shareholders. In its deliberations, the Board considered various factors, including those discussed below, none of which were controlling, and each Trustee may have attributed different weights to the various factors. The Independent Trustees also discussed the proposed approval of the Agreements in private sessions with their independent legal counsel at which no representatives of management were present.
In considering whether to approve the renewal of the Agreements with respect to each Series, the Board reviewed and analyzed the factors it deemed relevant, including: (1) the nature, extent and quality of the services provided to the Series by VIA and each of the Subadvisers; (2) the performance of the Series as compared to an appropriate peer group and an appropriate index; (3) the level and method of computing each Series’ advisory and subadvisory fees, and comparisons of the Series’ advisory fee rates and total expenses with those of a group of funds with similar investment objective(s); (4) the profitability of VIA under the Advisory Agreement; (5) any “fall-out” benefits to VIA, the Subadvisers and their affiliates (i.e., ancillary benefits realized by VIA, the Subadvisers or their affiliates from VIA’s or the applicable Subadviser’s relationship with the Trust); (6) the anticipated effect of growth in size on each Series’ performance and expenses; (7) fees paid to VIA and the Subadvisers by comparable accounts, as applicable; (8) possible conflicts of interest; and (9) the terms of the Agreements.
Nature, Extent and Quality of Services
The Trustees received in advance of the Meetings information provided by VIA and each Subadviser, including completed questionnaires each concerning a number of topics, including such company’s investment philosophy, resources, operations and compliance structure. The Trustees noted that the Series are managed using a “manager of managers” structure that generally involves the use of one or more subadvisers to manage some or all of a Series’ portfolio. Under this structure, VIA is responsible for the management of the Series’ investment programs and for evaluating and selecting subadvisers on an ongoing basis and making any recommendations to the Board regarding hiring, retaining or replacing subadvisers. In considering the Advisory Agreement with VIA, the Board considered VIA’s process for supervising and managing the Series’ subadvisers, including (a) VIA’s ability to select and monitor subadvisers; (b) VIA’s ability to provide the services necessary to monitor the subadvisers’ compliance with the Series’ respective investment objective(s), policies and restrictions as well as provide other oversight activities; and (c) VIA’s ability and willingness to identify instances in which a subadviser should be replaced and to carry out the required changes. The Trustees also considered: (a) the experience and capability of VIA’s management and other personnel; (b) the financial condition of VIA, and whether it had the financial wherewithal to provide a high level and quality of services to the Series; (c) the quality of VIA’s own regulatory and legal compliance policies, procedures and systems; (d) the nature, extent and quality of administrative and other services provided by VIA and its affiliates to the Series; (e) VIA’s supervision of the Series’ other service providers; and (f) VIA’s risk management processes. It was noted that affiliates of VIA serve as administrator and distributor of the Series. The Board also took into account its knowledge of VIA’s management and the quality of the performance of VIA’s duties through Board meetings, discussions and reports during the preceding year, as well as information from the Trust’s Chief Compliance Officer regarding the Series’ compliance policies and procedures established pursuant to Rule 38a-1 under the 1940 Act.
With respect to the services provided by each of the Subadvisers, the Board considered information provided to the Board by each Subadviser, including each Subadviser’s Form ADV, as well as information provided throughout the past year. With respect to the Subadvisory Agreements, the Board noted that each Subadviser provided portfolio management, compliance with the respective Series’ investment policies and procedures, compliance with applicable securities laws and assurances thereof. The Board also noted that VIA’s and each Subadviser’s management of the respective Series is subject to the oversight of the Board and must be carried out in accordance with the investment objective(s), policies and restrictions set forth in the Series’ prospectuses and statement of additional information. In considering the renewal of the Subadvisory Agreements, the Board also considered each Subadviser’s investment management process, including (a) the experience and capability of the Subadviser’s management and other personnel committed by the Subadviser to the respective Series; (b) the financial condition of the Subadviser; (c) the quality of the Subadviser’s regulatory and legal compliance policies, procedures and systems; and (d) the Subadviser’s brokerage and trading practices, including with respect to best execution and soft dollars. The Board also
CONSIDERATION OF ADVISORY AND SUBADVISORY
AGREEMENTS BY THE BOARD OF TRUSTEES (Unaudited) (Continued)
took into account each Subadviser’s risk assessment and monitoring process. The Board noted each Subadviser’s regulatory history, including whether it was currently involved in any regulatory actions or investigations as well as material litigation, and any settlements and amelioratory actions undertaken, as appropriate.
After considering all of the information provided to them, the Trustees concluded that the nature, extent and quality of the services provided by VIA and each Subadviser were satisfactory and that there was a reasonable basis on which to conclude that each would continue to provide a high quality of investment services to the applicable Series.
Investment Performance
The Board considered performance reports and discussions at Board meetings throughout the year, as well as a report (the “Broadridge Report”) for the Series prepared by Broadridge, an independent third party provider of investment company data, furnished in connection with the contract renewal process. The Broadridge Report presented each Series’ performance relative to a peer group of other mutual funds (the “Performance Universe”) and relevant indexes, as selected by Broadridge. The Board also considered performance information presented by management and took into account management’s discussion of the same, including the effect of market conditions on each Series’ performance. The Board evaluated each Series’ performance in the context of the considerations that a “manager of managers” structure requires. The Board noted that it also reviews on a quarterly basis detailed information about both the Series’ performance results and portfolio composition, as well as each Subadviser’s investment strategy. The Board noted VIA’s expertise and resources in monitoring the performance, investment style and risk-adjusted performance of each Subadviser. The Board also noted each Subadviser’s performance record with respect to each applicable Series. The Board was mindful of VIA’s focus on each Subadviser’s performance and noted VIA’s performance in monitoring and responding to any performance issues with respect to the Series. The Board also took into account its discussions with management regarding factors that contributed to the performance of each Series.
The Board considered, among other performance data, the information set forth below with respect to the performance of each Series for the period ended June 30, 2019:
Virtus Duff & Phelps Real Estate Securities Series. The Board noted that the Series outperformed the median of its Performance Universe for the 5- and 10-year periods and underperformed the median of its Performance Universe for the 1- and 3-year periods. The Board also noted that the Series underperformed its benchmark for the 1-, 3-, 5- and 10-year periods.
Virtus KAR Capital Growth Series. The Board noted that the Series underperformed the median of its Performance Universe for the 1- and 10-year periods and outperformed the median of its Performance Universe for the 3- and 5-year periods. The Board also noted that the Series underperformed its benchmark for the 1- and 10-year periods and outperformed its benchmark for the 3- and 5-year periods.
Virtus KAR Small-Cap Growth Series. The Board noted that the Series outperformed the median of its Performance Universe and its benchmark for the 1-, 3-, 5- and 10-year periods.
Virtus KAR Small-Cap Value Series. The Board noted that the Series underperformed the median of its Performance Universe for the 1-, 3-, 5- and 10-year periods. The Board also noted that the Series underperformed its benchmark for the 3- year period and outperformed its benchmark for the 1-, 5- and 10-year periods. The Board noted that because the Series’ subadviser changed in November 2010, 10-year performance data in part reflects the performance of a prior subadviser.
Virtus Newfleet Multi-Sector Intermediate Bond Series. The Board noted that the Series’ performance was equal to the median of its Performance Universe for the 1- and 3- year periods and that the Series underperformed the median of its Performance Universe for the 5- year period and outperformed the median of its Performance Universe for the 10- year period. The Board also noted that the Series underperformed its benchmark for the 1- year period and outperformed its benchmark for the 3-, 5- and 10-year periods.
Virtus Rampart Enhanced Core Equity Series. The Board noted that the Series underperformed the median of its Performance Universe and underperformed its benchmark for the 1-, 3-, 5- and 10-year periods. The Board noted that because the Series’ subadviser changed in September 2016, performance data prior to that date reflects the performance of a prior subadviser.
Virtus SGA International Growth Series (fka Virtus Duff & Phelps International Growth Series). The Board noted that the Series underperformed the median of its Performance Universe and underperformed its benchmark for the 1-, 3-, 5- and 10-year periods. The Board took into account actions taken to address the Series’ performance, including the replacement of the Series’ subadviser in June 2019. The Board also noted that because the Series’ subadviser changed in June 2019, all of the performance data shown reflected the performance of a prior subadviser.
Virtus Strategic Allocation Series. The Board noted that the Series underperformed the median of its Performance Universe for the 5-year period and outperformed the median of its Performance Universe for the 1-, 3- and 10-year periods. The Board also noted that the Series underperformed its benchmark for the 1-, 3-, 5- and 10-year periods. The Board took into account actions taken to address the Series’ performance, including the replacement of one of the Series’ Subadvisers in June 2019. The Board noted that because the subadviser to the Series’ international equity portfolio was replaced in June 2019, all of the performance data shown in part reflects the performance of that prior subadviser. The Board also noted that because another of the Series’ subadvisers was replaced in September 2016, performance data prior to that date in part reflects the performance of that prior subadviser.
CONSIDERATION OF ADVISORY AND SUBADVISORY
AGREEMENTS BY THE BOARD OF TRUSTEES (Unaudited) (Continued)
After reviewing these and related factors, the Board concluded that each Series’ overall performance, reasons discussed for certain Series’ underperformance, and/or actions taken to address certain Series’ underperformance, was satisfactory.
Management Fees and Total Expenses
The Board considered the fees charged to the Series for advisory services as well as the total expense levels of the Series. This information included comparisons of each Series’ contractual and net management fee and net total expense level to those of its peer universe (the “Expense Universe”) and ranked according to quintile (the first quintile being lowest and, therefore, best in these expense component rankings, and fifth being highest and, therefore, worst in these expense component rankings). The Board also noted that all of the Series had expense caps in place to limit the total expenses incurred by the Series and their shareholders. The Board also noted that the subadvisory fees were paid by VIA out of its management fees rather than paid separately by the Series. In this regard, the Board took into account management’s discussion with respect to the advisory/subadvisory fee structure, including the amount of the advisory fee retained by VIA after payment of the subadvisory fee. The Board also took into account the size of each of the Series and the impact on expenses and economies of scale. The Subadvisers provided, and the Board considered, fee information of comparable accounts managed by the Subadvisers, as applicable.
In addition to the foregoing, the Board considered, among other data, the information set forth below with respect to each Series’ fees and expenses. In each case, the Board took into account management’s discussion of the Series’ expenses, including the type and size of the Series relative to the other funds in its Expense Universe.
Virtus Duff & Phelps Real Estate Securities Series. The Board considered that the Series’ net management fee was in the third quintile of the Expense Universe and net total expenses after waivers were in the fifth quintile of the Expense Universe.
Virtus KAR Capital Growth Series. The Board considered that the Series’ net management fee was in the second quintile of the Expense Universe and net total expenses after waivers were in the fourth quintile of the Expense Universe.
Virtus KAR Small-Cap Growth Series. The Board considered that the Series’ net management fee was in the third quintile of the Expense Universe and net total expenses after waivers were in the fifth quintile of the Expense Universe.
Virtus KAR Small-Cap Value Series. The Board considered that the Series’ net management fee was in the second quintile of the Expense Universe and net total expenses after waivers were in the third quintile of the Expense Universe.
Virtus Newfleet Multi-Sector Intermediate Bond Series. The Board considered that the Series’ net management fee was in the second quintile of the Expense Universe and net total expenses were in the fourth quintile of the Expense Universe.
Virtus Rampart Enhanced Core Equity Series. The Board considered that the Series’ net management fee was in the third quintile of the Expense Universe and net total expenses after waivers were in the fourth quintile of the Expense Universe.
Virtus SGA International Growth Series (fka Virtus Duff & Phelps International Growth Series). The Board considered that the Series’ net management fee was in the third quintile of the Expense Universe and net total expenses after waivers were in the fifth quintile of the Expense Universe.
Virtus Strategic Allocation Series. The Board considered that the Series’ net management fee was in the second quintile of the Expense Universe and net total expenses after waivers were in the fourth quintile of the Expense Universe.
The Board concluded that the advisory and subadvisory fees for each Series, including with any proposed amendments, were fair and reasonable in light of the usual and customary charges made for services of the same nature and quality and the other factors considered.
Profitability
The Board also considered certain information relating to profitability that had been provided by VIA. In this regard, the Board considered information regarding the overall profitability, as well as on a Series-by-Series basis, of VIA for its management of the Series, as well as its profits and those of its affiliates for managing and providing other services to the Trust, such as distribution and administrative services provided to the Series by VIA affiliates. In addition to the fees paid to VIA and its affiliates, including the applicable Subadvisers, the Board considered any other benefits derived by VIA or its affiliates from their relationships with the Series. The Board reviewed the methodology used to allocate costs to each Series, taking into account the fact that allocation methodologies are inherently subjective and various allocation methodologies may each be reasonable while producing different results. The Board concluded that the profitability to VIA and its affiliates from each Series was reasonable in light of the quality of the services rendered to the Series by VIA and its affiliates as well as other factors.
In considering the profitability to the Subadvisers in connection with their relationships to the Series, the Board noted that the fees under the Subadvisory Agreements are paid by VIA out of the fees that VIA receives under the Advisory Agreement, so that Series shareholders are not directly impacted by those fees. In considering the reasonableness of the fees payable by VIA to the Subadvisers, the Board noted that, because the Subadvisers are affiliates of VIA,
CONSIDERATION OF ADVISORY AND SUBADVISORY
AGREEMENTS BY THE BOARD OF TRUSTEES (Unaudited) (Continued)
such profitability might be directly or indirectly shared by VIA. For each of the above reasons, the Board concluded that the profitability to the Subadvisers and their affiliates from their relationships with the Series was not a material factor in approval of the Subadvisory Agreements.
Economies of Scale
The Board received and discussed information concerning whether VIA realizes economies of scale as the Series’ assets grow. The Board noted that the management fees for all of the Series included breakpoints based on assets under management, and that expense caps were also in place for all of the Series. The Board also took into account management’s discussion of the Series’ management fee and subadvisory fee structure. The Board also took into account the current sizes of the Series. The Board also noted that VIA had agreed to implement an extension of each Series’ expense cap through April 30, 2021. The Board then concluded that no changes to the advisory fee structure of the Series with respect to economies of scale were necessary at this time. The Board noted that VIA and the Series may realize certain economies of scale if the assets of the Series were to increase, particularly in relationship to certain fixed costs, and that shareholders of the Series would have an opportunity to benefit from these economies of scale.
For similar reasons as stated above with respect to the Subadvisers’ profitability, and based upon the current sizes of the Series managed by each Subadviser, the Board concluded that the potential for economies of scale in the Subadvisers’ management of the Series was not a material factor in the approval of the Subadvisory Agreements at this time.
Other Factors
The Board considered other benefits that may be realized by VIA and each Subadviser and their affiliates from their relationships with the applicable Series. Among them, the Board recognized that VP Distributors, LLC, an affiliate of VIA and the Subadvisers, serves as the distributor for the Trust, and, as such, receives payments pursuant to Rule 12b-1 from the Series to compensate it for providing selling activities, which could lead to growth in the Trust’s assets and corresponding benefits from such growth, including economies of scale. The Board noted that an affiliate of VIA and the Subadvisers also provides administrative services to the Trust. The Board noted management’s discussion of the fact that, while the Subadvisers are affiliates of VIA, there are no other direct benefits to the Subadvisers or VIA in providing investment advisory services to the Series, other than the fee to be earned under the applicable Agreement(s). There may be certain indirect benefits gained, including to the extent that serving the Series could provide the opportunity to provide advisory services to additional portfolios of the Trust or certain reputational benefits.
Conclusion
Based on all of the foregoing considerations, the Board, including a majority of the Independent Trustees, determined that approval of each Agreement, as amended, was in the best interests of each applicable Series and its respective shareholders. Accordingly, the Board, and the Independent Trustees voting separately, approved the Agreements, as amended, with respect to each Series.
FUND MANAGEMENT TABLES (Unaudited)
Information pertaining to the Trustees and officers of the Trust as of the date of issuance of this report is set forth below. The statement of additional information (SAI) includes additional information about the Trustees and is available without charge, upon request, by calling (800) 367-5877.
The address of each individual, unless otherwise noted, is c/o Virtus Variable Insurance Trust, One Financial Plaza, Hartford, CT 06103. There is no stated term of office for Trustees or officers of the Trust.
Independent Trustees
Name, Year of Birth,
Length of Time Served
and Number of
Portfolios in Fund
Complex Overseen | Principal Occupation(s) During Past 5 Years | Other Directorships Held by Trustee During Past 5 Years |
Brown, Thomas J.
YOB: 1945
Served Since: 2011
70 Portfolios | Retired. | Honorary Board Member (since 2020), Duff & Phelps Select MLP and Midstream Energy Fund Inc., Virtus Total Return Fund Inc. and Virtus Global Multi-Sector Income Fund; Trustee (since 2016), Virtus Mutual Fund Family (56 portfolios) and Virtus Alternative Solutions Trust (3 portfolios); Trustee (since 2011), Virtus Variable Insurance Trust (8 portfolios); Director (since 2010), D’Youville Senior Care Center; and Director (since 2005), VALIC Company Funds (49 portfolios). |
Burke, Donald C.
YOB: 1960
Served Since: 2016
74 Portfolios | Retired. | Director (since 2020), Duff & Phelps Select MLP and Midstream Energy Fund Inc. and Virtus Total Return Fund Inc.; and Trustee (since 2020), Virtus Global Multi-Sector Income Fund; Trustee (since 2016), Virtus Mutual Fund Family (56 portfolios), Virtus Variable Insurance Trust (8 portfolios) and Virtus Alternative Solutions Trust (3 portfolios); Director (since 2014) closed-end funds managed by Duff & Phelps Investment Management Co. (4 funds); Director, Avista Corp. (energy company) (since 2011); Trustee, Goldman Sachs Fund Complex (2010 to 2014); and Director, BlackRock Luxembourg and Cayman Funds (2006 to 2010). |
Harris, Sidney E.
YOB: 1949
Served Since: 2017
70 Portfolios | Professor and Dean Emeritus (since April 2015), Professor (1997 to 2014), Dean (1997 to 2004), J. Mack Robinson College of Business, Georgia State University. | Director (since 2020), Duff & Phelps Select MLP and Midstream Energy Fund Inc. and Virtus Total Return Fund Inc.; and Trustee (since 2020), Virtus Global Multi-Sector Income Fund; Trustee (since 2019), Mutual Fund Directors Forum; Trustee (since 2017), Virtus Mutual Fund Family (56 portfolios), Virtus Variable Insurance Trust (8 portfolios), and Virtus Alternative Solutions Trust (3 portfolios); Trustee (since 2013), KIPP Metro Atlanta; Trustee (1999 to 2019) Total System Services, Inc.; Trustee (2004 to 2017), RidgeWorth Funds; Trustee (since 2012), International University of the Grand Bassam Foundation; and Trustee (2011 to 2015), Genspring Family Offices, LLC. |
Mallin, John R.
YOB: 1950
Served Since: 1999
70 Portfolios | Partner/Attorney (since 2003), McCarter & English LLP (law firm), Real Property Practice Group; and Member (since 2014), Counselors of Real Estate. | Director (since 2020), Duff & Phelps Select MLP and Midstream Energy Fund Inc. and Virtus Total Return Fund Inc.; Trustee (since 2020), Virtus Global Multi-Sector Income Fund; Trustee (since 2016), Virtus Mutual Fund Family (56 portfolios) and Virtus Alternative Solutions Trust (3 portfolios); Director (since 2013), Horizons, Inc. (non-profit); and Trustee (since 1999), Virtus Variable Insurance Trust (8 portfolios). |
McClellan, Hassell H.
YOB: 1945
Served Since: 2008
70 Portfolios | Retired (since 2013); and Professor (1984 to 2013), Wallace E. Carroll School of Management, Boston College. | Honorary Board Member (since 2020), Duff & Phelps Select MLP and Midstream Energy Fund Inc., Virtus Total Return Fund Inc. and Virtus Global Multi-Sector Income Fund; Chairperson of the Board (since 2017) and Trustee (since 2000), John Hancock Fund Complex (collectively, 227 portfolios); Trustee (since 2016), Virtus Alternative Solutions Trust (3 portfolios); Trustee (since 2015), Virtus Mutual Fund Family (56 portfolios); Director (since 2010), Barnes Group, Inc. (diversified global components manufacturer and logistical services company); and Trustee (since 2008), Virtus Variable Insurance Trust (8 portfolios). |
McDaniel, Connie D.
YOB: 1958
Served Since: 2017
70 Portfolios | Retired (since 2013); and Vice President, Chief of Internal Audit, Corporate Audit Department (2009 to 2013); Vice President Global Finance Transformation (2007 to 2009); and Vice President and Controller (1999 to 2007), The Coca-Cola Company. | Director (since 2020), Duff & Phelps Select MLP and Midstream Energy Fund Inc. and Virtus Total Return Fund Inc.; Trustee (since 2020), Virtus Global Multi-Sector Income Fund; Director (since 2019), Global Payments Inc.; Trustee (since 2017), Virtus Mutual Fund Family (56 portfolios), Virtus Variable Insurance Trust (8 portfolios), and Virtus Alternative Solutions Trust (3 portfolios); Director (2014 to 2019), Total System Services, Inc.; and Trustee (2005 to 2017), RidgeWorth Funds. |
FUND MANAGEMENT TABLES (Unaudited) (Continued)
Independent Trustees (continued)
Name, Year of Birth,
Length of Time Served
and Number of
Portfolios in Fund
Complex Overseen | Principal Occupation(s) During Past 5 Years | Other Directorships Held by Trustee During Past 5 Years |
McLoughlin, Philip
YOB: 1946
Served Since: 2003
74 Portfolios | Retired. | Director and Chairman (since 2016), Virtus Total Return Fund Inc.; Director and Chairman (2016 to 2019), the former Virtus Total Return Fund Inc.; Director and Chairman (since 2014), Duff & Phelps Select MLP and Midstream Energy Fund Inc.; Trustee and Chairman (since 2013), Virtus Alternative Solutions Trust (3 portfolios); Trustee and Chairman (since 2011), Virtus Global Multi-Sector Income Fund; Chairman and Trustee (since 2003), Virtus Variable Insurance Trust (8 portfolios); Director (since 1995), closed-end funds managed by Duff & Phelps Investment Management Co. (4 funds); Director (1991 to 2019) and Chairman (2010 to 2019), Lazard World Trust Fund (closed-end investment firm in Luxembourg); and Trustee (since 1989) and Chairman (since 2002), Virtus Mutual Fund Family (56 portfolios). |
McNamara, Geraldine M.
YOB: 1951
Served Since: 2015
74 Portfolios | Retired. | Director (since 2020), Duff & Phelps Select MLP and Midstream Energy Fund Inc. and Virtus Total Return Fund Inc.; Trustee (since 2020), Virtus Global Multi-Sector Income Fund; Trustee (since 2016), Virtus Alternative Solutions Trust (3 portfolios); Trustee (since 2015), Virtus Variable Insurance Trust (8 portfolios); Director (since 2003), closed-end funds managed by Duff & Phelps Investment Management Co. (4 funds); and Trustee (since 2001), Virtus Mutual Fund Family (56 portfolios). |
Oates, James M.
YOB: 1946
Served Since: 2016
70 Portfolios | Managing Director (since 1994), Wydown Group (consulting firm). | Director (since 2016), Virtus Total Return Fund Inc.; Director (2016 to 2019), the former Virtus Total Return Fund Inc.; Trustee (since 2016), Virtus Variable Insurance Trust (8 portfolios); Director (since 2014), Duff & Phelps Select MLP and Midstream Energy Fund Inc.; Trustee (since 2013), Virtus Alternative Solutions Trust (3 portfolios); Trustee (since 2013), Virtus Global Multi-Sector Income Fund; Trustee (since 2005) and Chairman (2005 to 2017), John Hancock Fund Complex (227 portfolios); Director (2002 to 2014), New Hampshire Trust Company; Chairman (2000 to 2016), Emerson Investment Management, Inc.; Non-Executive Chairman (2000 to 2014), Hudson Castle Group, Inc. (formerly IBEX Capital Markets, Inc.) (financial services); Chairman and Director (1999 to 2014), Connecticut River Bank; Director (since 1996), Stifel Financial; and Trustee (since 1987), Virtus Mutual Fund Family (56 portfolios). |
Segerson, Richard E.
YOB: 1946
Served Since:2016
70 Portfolios | Retired; and Managing Director (1998 to 2013), Northway Management Company. | Honorary Board Member (since 2020), Duff & Phelps Select MLP and Midstream Energy Fund Inc., Virtus Total Return Fund Inc. and Virtus Global Multi-Sector Income Fund; Trustee (since 2016), Virtus Alternative Solutions Trust (3 portfolios) and Virtus Variable Insurance Trust (8 portfolios); and Trustee (since 1983), Virtus Mutual Fund Family (56 portfolios). |
Walton, R. Keith
YOB: 1964
Served Since: 2020
70 Portfolios | Senior Adviser (2018 to 2019), Vatic Labs, LLC; Venture Partner (since 2019) and Senior Advisor (2018 to 2019), Plexo, LLC; Executive Vice President, Strategy (2017 to 2019), Zero Mass Water, LLC; Vice President, Strategy (2013 to 2017), Arizona State University; Partner (since 2006), Global Infrastructure Partners. | Trustee (since 2020) Virtus Alternative Solutions Trust (3 portfolios), Virtus Variable Insurance Trust (8 portfolios) and Virtus Mutual Fund Family (56 portfolios); Director (since 2017), certain funds advised by Bessemer Investment Management LLC; Director (since 2016), Duff & Phelps Select MLP and Midstream Energy Fund Inc.; Trustee (since 2016), Virtus Global Multi-Sector Income Fund; Director (2006 to 2019), Systematica Investments Limited Funds; Director (2006 to 2017), BlueCrest Capital Management Limited Funds; Trustee (2014 to 2017), AZ Service; Director (since 2016), Duff & Phelps Select MLP and Midstream Energy Fund Inc.; Trustee (since 2016), Virtus Global Multi-Sector Income Fund; Director (since 2004), Virtus Total Return Fund Inc.; Director (since 2004), Virtus Total Return Fund Inc.; Director (2004 to 2019), the former Virtus Total Return Fund Inc.; and Director (since 2006), Blue Crest Capital Management Funds. |
Zino, Brian T.
YOB: 1952
Served Since: 2020
70 Portfolios | Retired; and various roles (1982 to 2008), J. & W. Seligman & Co. Incorporated, including President (1994 to 2008). | Trustee (since 2020) Virtus Alternative Solutions Trust (3 portfolios), Virtus Variable Insurance Trust (8 portfolios) and Virtus Mutual Fund Family (56 portfolios); Director (since 2016), Duff & Phelps Select MLP and Midstream Energy Fund Inc.; Trustee (since 2016), Virtus Global Multi-Sector Income Fund; Director (since 2014), Virtus Total Return Fund Inc.; Director (2014 to 2019), the former Virtus Total Return Fund Inc.; Trustee (since 2011), Bentley University; Director (1986 to 2008) and President (1994 to 2008), J&W Seligman Co. Inc.; Director (1998 to 2009), Chairman (2002 to 2004) and Vice Chairman (2000 to 2002), ICI Mutual Insurance Company; Member, Board of Governors of ICI (1998 to 2008). |
FUND MANAGEMENT TABLES (Unaudited) (Continued)
Independent Trustees (continued)
Interested Trustee
Name, Year of Birth,
Length of Time Served
and Number of
Portfolios in Fund Complex Overseen | Principal Occupation(s) During Past 5 Years | Other Directorships Held by Trustee During Past 5 Years |
Aylward, George R.*
Director and President
YOB: 1964
Served Since: 2012
72 Portfolios | Director, President and Chief Executive Officer (since 2008), Virtus Investment Partners, Inc. and/or certain of its subsidiaries; various senior officer positions with Virtus affiliates (since 2005). | Chairman and Trustee (since 2015), Virtus ETF Trust II (2 portfolios); Director, President and Chief Executive Officer (since 2014), Duff & Phelps Select MLP and Midstream Energy Fund Inc.; Trustee and President (since 2013), Virtus Alternative Solutions Trust (3 portfolios); Director (since 2013), Virtus Global Funds, PLC (4 portfolios); Trustee (since 2012) and President (since 2010), Virtus Variable Insurance Trust (8 portfolios); Trustee, President and Chief Executive Officer (since 2011), Virtus Global Multi-Sector Income Fund; Trustee and President (since 2006) and Executive Vice President (2004 to 2006), Virtus Mutual Fund Family (56 portfolios); Director, President and Chief Executive Officer (since 2006), Virtus Total Return Fund Inc.; and Director, President and Chief Executive Officer (2006 to 2019), the former Virtus Total Return Fund Inc. |
* Mr. Aylward is an “interested person” as defined in the Investment Company Act of 1940, by reason of his position as President and Chief Executive Officer of Virtus, the ultimate parent company of the Adviser, and various positions with its affiliates including the Adviser.
Advisory Board Member
Name, Year of Birth,
Length of Time
Served, and Number
of Portfolios in Fund
Complex Overseen | Principal Occupation(s) During Past 5 Years | Other Directorships Held by Trustees During Past 5 Years |
Moyer, William R.
YOB: 1944
Served Since: 2020
70 Portfolios | Private investor (since 2004); Financial and Operations Principal (2006 to 2017), Newcastle Distributors LLC (broker dealer). | Advisory Board Member (since 2020), Virtus Variable Insurance Trust (8 portfolios) and Virtus Mutual Fund Family (56 portfolios); Advisory Board Member (since 2020) and Director (2016 to 2019), Virtus Total Return Fund Inc.; Director (2016 to 2019), the former Virtus Total Return Fund Inc.; Advisory Board Member (since 2020) and Director (2014 to 2019), Duff & Phelps Select MLP and Midstream Energy Fund Inc.; Advisory Board Member (2020) and Trustee (2011 to 2019), Virtus Global Multi-Sector Income Fund; Trustee (2013 to 2016), Virtus Alternative Solutions Trust (4 portfolios). |
Officers of the Trust Who Are Not Trustees
Name and
Year of Birth | Position(s) Held
with Trust and
Length of
Time Served | Principal Occupation(s) During Past 5 Years |
Batchelar, Peter
YOB: 1970 | Senior Vice President (since 2017), Vice President (2008 to 2016). | Senior Vice President, Product Development (since 2017), Vice President, Product Development (2008 to 2016), and various officer positions (since 2008), Virtus Investment Partners, Inc. and/or certain of its subsidiaries; Senior Vice President (since 2017), Vice President (2008 to 2016), Virtus Mutual Fund Family; Senior Vice President (since 2017), Vice President (2010 to 2016), Virtus Variable Insurance Trust; Senior Vice President (since 2017), Vice President (2013 to 2016), Virtus Alternative Solutions Trust; and Senior Vice President (since 2017) and Vice President (2016 to 2017), Duff & Phelps Select MLP and Midstream Energy Fund Inc., Virtus Total Return Fund Inc. and Virtus Global Multi-Sector Income Fund. |
FUND MANAGEMENT TABLES (Unaudited) (Continued)
Officers of the Trust Who Are Not Trustees (continued)
Name and
Year of Birth | Position(s) Held
with Trust and
Length of
Time Served | Principal Occupation(s) During Past 5 Years |
Bradley, W. Patrick
YOB: 1972 | Executive Vice President (since 2016); Senior Vice President (2013 to 2016); Vice President (2011 to 2013); Chief Financial Officer and Treasurer (since 2006). | Executive Vice President, Fund Services (since 2016), Senior Vice President, Fund Services (2010 to 2016), and various officer positons (since 2006), Virtus Investment Partners, Inc. and/or certain of its subsidiaries; Executive Vice President (since 2016), Senior Vice President (2013 to 2016), Vice President (2011 to 2013), Chief Financial Officer and Treasurer (since 2004), Virtus Variable Insurance Trust; Executive Vice President (since 2016), Senior Vice President (2013 to 2016), Vice President (2011 to 2013), Chief Financial Officer and Treasurer (since 2006), Virtus Mutual Fund Family; Executive Vice President (since 2016), Senior Vice President (2013 to 2016), Vice President (2012 to 2013) and Treasurer and Chief Financial Officer (since 2010), Virtus Total Return Fund Inc.; Executive Vice President (since 2016), Senior Vice President (2013 to 2016), Vice President (2011 to 2013), Chief Financial Officer and Treasurer (since 2011), Virtus Global Multi-Sector Income Fund; Executive Vice President (since 2016), Senior Vice President (2014 to 2016), Chief Financial Officer and Treasurer (since 2014), Duff & Phelps Select MLP and Midstream Energy Fund Inc.; Vice President and Assistant Treasurer (since 2011), Duff & Phelps Utility and Infrastructure Fund Inc.; Director (since 2013), Virtus Global Funds, PLC; and Executive Vice President (since 2016), Senior Vice President (2013 to 2016), and Chief Financial Officer and Treasurer (since 2013), Virtus Alternative Solutions Trust. |
Carr, Kevin J.
YOB: 1954 | Senior Vice President (since 2017), Assistant Secretary (since 2013), Vice President, Chief Legal Officer, Counsel and Secretary (2010 to 2013). | Vice President and Senior Counsel (2017 to Present), Senior Vice President (2009 to 2017), Vice President, Counsel and Secretary (2008 to 2009), and various officer positions (since 2005), Virtus Investment Partners, Inc. and/or certain of its subsidiaries; Senior Vice President (since 2013), Vice President (2005 to 2013), Chief Legal Officer, Counsel and Secretary (since 2005), Virtus Mutual Fund Family; Senior Vice President (2013 to 2014), Vice President (2012 to 2013), Secretary and Chief Legal Officer (2005 to 2013), and Assistant Secretary (2013 to 2014 and since 2017), Virtus Total Return Fund Inc.; Senior Vice President (since 2017), Assistant Secretary (since 2013), Vice President, Chief Legal Officer, Counsel and Secretary (2010 to 2013), Virtus Variable Insurance Trust; Senior Vice President (2013 to 2014), Vice President (2011 to 2013), and Assistant Secretary (since 2011), Virtus Global Multi-Sector Income Fund; Assistant Secretary (since 2015), Duff & Phelps Select MLP and Midstream Energy Fund Inc.; Senior Vice President (since 2017) and Assistant Secretary (since 2013), Virtus Alternative Solutions Trust; Secretary (since 2015), ETFis Series Trust I; and Secretary (since 2015), Virtus ETF Trust II. |
Engberg, Nancy J.
YOB: 1956 | Senior Vice President (since 2017); Vice President (2011 to 2017); and Chief Compliance Officer (since 2011). | Senior Vice President (since 2017), Vice President (2008 to 2017) and Chief Compliance Officer (2008 to 2011 and since 2016), and various officer positions (since 2003), Virtus Investment Partners, Inc. and/or certain of its subsidiaries; Senior Vice President (since 2017), Vice President (2011 to 2017) and Chief Compliance Officer (since 2011), Virtus Mutual Fund Family; Senior Vice President (since 2017), Vice President (2010 to 2017) and Chief Compliance Officer (since 2011), Virtus Variable Insurance Trust; Senior Vice President (since 2017), Vice President (2011 to 2016) and Chief Compliance Officer (since 2011), Virtus Global Multi-Sector Income Fund; Senior Vice President (since 2017), Vice President (2012 to 2017) and Chief Compliance Officer (since 2012), Virtus Total Return Fund Inc.; Senior Vice President (since 2017), Vice President (2013 to 2016) and Chief Compliance Officer (since 2013), Virtus Alternative Solutions Trust; Senior Vice President (since 2017), Vice President (2014 to 2017) and Chief Compliance Officer (since 2014), Duff & Phelps Select MLP and Midstream Energy Fund Inc.; Chief Compliance Officer (since 2015), ETFis Series Trust I; and Chief Compliance Officer (since 2015), Virtus ETF Trust II. |
Fromm, Jennifer S.
YOB: 1973 | Vice President, Chief Legal Officer, Counsel and Secretary (since 2013). | Vice President, Chief Legal Officer, Counsel and Secretary (since 2020), Duff & Phelps Select MLP and Midstream Energy Fund Inc., Virtus Total Return Fund Inc. and Virtus Global Multi-Sector Income Fund; Vice President (since 2016) and Senior Counsel (since 2007), and various officer positions (since 2008), Virtus Investment Partners, Inc. and/or certain of its subsidiaries; Vice President (since 2017) and Assistant Secretary (since 2008), Virtus Mutual Fund Family; Vice President, Chief Legal Officer, and Secretary (since 2013), Virtus Variable Insurance Trust; and Vice President, Chief Legal Officer, and Secretary (since 2013), Virtus Alternative Solutions Trust. |
FUND MANAGEMENT TABLES (Unaudited) (Continued)
Officers of the Trust Who Are Not Trustees (continued)
Name and
Year of Birth | Position(s) Held
with Trust and
Length of
Time Served | Principal Occupation(s) During Past 5 Years |
Short, Julia R.
YOB: 1972 | Senior Vice President (since 2017). | Senior Vice President (since 2018), Duff & Phelps Select MLP and Midstream Energy Fund Inc., Virtus Total Return Fund Inc. and Virtus Global Multi-Sector Income Fund; Senior Vice President (2018 to 2019), the former Virtus Total Return Fund Inc.; Senior Vice President, Product Development (since 2017), Virtus Investment Partners, Inc. and/or certain of its subsidiaries; Senior Vice President (since 2017), Virtus Mutual Fund Family; President and Chief Executive Officer, RidgeWorth Funds (2007 to 2017); and Managing Director, Product Manager, RidgeWorth Investments (2004 to 2017). |
Waltman, Francis G.
YOB: 1962 | Executive Vice President (since 2013); Senior Vice President (2008 to 2013). | Executive Vice President, Product Development (since 2009), and various senior officer positions (since 2006), Virtus Investment Partners, Inc. and/or certain of its subsidiaries; Executive Vice President (since 2013), Senior Vice President (2008 to 2013), Virtus Mutual Fund Family; Executive Vice President (since 2013), Senior Vice President (2010 to 2013), Virtus Variable Insurance Trust; Executive Vice President (since 2013), Senior Vice President (2011 to 2013), Virtus Global Multi-Sector Income Fund; Executive Vice President (since 2014), Duff & Phelps Select MLP and Midstream Energy Fund Inc.; Director (since 2013), Virtus Global Funds PLC; Executive Vice President (since 2013), Virtus Alternative Solutions Trust; and Executive Vice President (since 2017), Virtus Total Return Fund Inc. |
Virtus Duff & Phelps Real Estate Securities Series (the “Series”),
a series of Virtus Variable Insurance Trust (Unaudited)
Supplement dated November 22, 2019, to the Summary Prospectuses
and Statutory Prospectus, each dated April 30, 2019, each as supplemented
IMPORTANT NOTICE TO INVESTORS
Effective December 1, 2019, the Series’ investment adviser, Virtus Investment Advisers, Inc., will implement more favorable expense limitation arrangements. These changes are described in more detail below.
Under “Fees and Expenses” in the Series’ summary prospectuses and the summary section of the Series’ statutory prospectus, the information in the “Annual Series Operating Expenses” tables and associated footnotes will be replaced with the following, as applicable:
Annual Series Operating Expenses (expenses that you pay each year
as a percentage of the value of your investment) | Class A | Class I |
| Management Fees | 0.75% | 0.75% |
| Distribution and Shareholder Servicing (12b-1) Fees | 0.25% | None |
| Other Expenses | 0.19% | 0.19% |
| Total Annual Series Operating Expenses | 1.19% | 0.94% |
| Less: Expense Reimbursement(a) | (0.05%) | (0.05%) |
| Total Annual Series Operating Expenses After Expense Reimbursement(a) | 1.14% | 0.89% |
(a) The Series’ investment adviser has contractually agreed to limit the Series’ total operating expenses (excluding certain expenses, such as front-end or contingent deferred sales charges, taxes, leverage and borrowing expenses (such as commitment, amendment and renewal expenses on credit or redemption facilities), interest, brokerage commissions, expenses incurred in connection with any merger or reorganization, unusual or infrequently occurring expenses (such as litigation), acquired fund fees and expenses, and dividend expenses, if any) so that such expenses do not exceed 1.14% for Class A Shares and 0.89% for Class I Shares through April 30, 2021. Following the contractual period, the adviser may discontinue these expense reimbursement arrangements at any time. Under certain conditions, the adviser may recapture operating expenses reimbursed and/or fees waived under these arrangements for a period of three years following the date such waiver or reimbursement occurred, provided that the recapture does not cause the Series to exceed its expense limit in effect at the time of the waiver or reimbursement, or at the time of recapture.
Under “Fees and Expenses,” the information in the “Example” table will be replaced with the following, as applicable:
| | 1 Year | 3 Years | 5 Years | 10 Years |
| Class A | $116 | $373 | $650 | $1,439 |
In the section “Management of the Series” under the heading “The Adviser” beginning on page 7 of the statutory prospectus, the second paragraph under the table will be replaced with the following:
The Trust has entered into an expense limitation agreement with VIA whereby VIA has agreed to reimburse the Series for expenses necessary or appropriate for the operation of the Series (excluding certain expenses, such as front-end or contingent deferred sales charges, taxes, leverage and borrowing expenses (such as commitment, amendment and renewal expenses on credit or redemption facilities), interest, brokerage commissions, expenses incurred in connection with any merger or reorganization, unusual or infrequently occurring expenses (such as litigation), acquired fund fees and expenses, and dividend expenses, if any) to the extent that such expenses exceed 1.14% of the Series’ Class A Shares and 0.89% of the Series’ Class I Shares average net assets. This expense limitation agreement is in place through April 30, 2021. After April 30, 2021, VIA may discontinue this expense reimbursement arrangement at any time. Under certain conditions, VIA may recapture operating expenses reimbursed and/or fees waived under these arrangements for a period of three years following the date such waiver or reimbursement occurred, provided that the recapture does not cause the Series to exceed its expense limit in effect at the time of the waiver or reimbursement, or at the time of recapture.
Investors should retain this supplement with the Prospectuses for future reference.
VVIT 8502 DPRES NewExpCaps (11/19)
Virtus KAR Capital Growth Series,
a series of Virtus Variable Insurance Trust (Unaudited)
Supplement dated January 28, 2020, to the Summary Prospectus
and Statutory Prospectus, each dated April 30, 2019, as supplemented
IMPORTANT NOTICE TO INVESTORS
Effective January 28, 2020, Chris Armbruster, CFA will be added as a portfolio manager of Virtus KAR Capital Growth Series (the “Series”).
The following disclosure will be added under “Portfolio Management” in the summary prospectus for the Series, and in the summary section of the Series’ statutory prospectus:
> Chris Armbruster, CFA, research analyst at KAR. Mr. Armbruster has served as a Portfolio Manager of the Series since January 2020.
The following disclosure will be added under “Portfolio Management” on pages 6 and 7 of the statutory prospectus:
Chris Armbruster, CFA. Mr. Armbruster is a Portfolio Manager and Research Analyst at KAR with primary research responsibilities for the large-capitalization consumer discretionary, health care, and information technology sectors. Before joining Kayne Anderson Rudnick in 2013, Mr. Armbruster worked at B. Riley & Co. as an associate analyst covering special situations, and at Al Frank Asset Management as a vice president in equity research. He has approximately 15 years of investment industry experience.
All other disclosure concerning the Series, including fees, expenses, investment objective, strategies and risks will remain unchanged.
Investors should retain this supplement for future reference.
VVIT 8500/KARCG-PMChanges (1/2020)
Virtus KAR Small-Cap Growth Series (the “Series”),
a series of Virtus Variable Insurance Trust (Unaudited)
Supplement dated November 22, 2019, to the Summary Prospectuses
and Statutory Prospectus, each dated April 30, 2019, each as supplemented
IMPORTANT NOTICE TO INVESTORS
Effective December 1, 2019, the Series’ investment adviser, Virtus Investment Advisers, Inc., will implement more favorable expense limitation arrangements. These changes are described in more detail below.
Under “Fees and Expenses” in the Series’ summary prospectuses and the summary section of the Series’ statutory prospectus, the information in the “Annual Series Operating Expenses” tables and associated footnotes will be replaced with the following, as applicable:
Annual Series Operating Expenses (expenses that you pay each year
as a percentage of the value of your investment) | Class A | Class I |
| Management Fees | 0.85% | 0.85% |
| Distribution and Shareholder Servicing (12b-1) Fees | 0.25% | None |
| Other Expenses | 0.17% | 0.18% |
| Total Annual Series Operating Expenses | 1.27% | 1.03% |
| Less: Expense Reimbursement(a) | (0.11%) | (0.12%) |
| Total Annual Series Operating Expenses After Expense Reimbursement(a) | 1.16% | 0.91% |
(a) The Series’ investment adviser has contractually agreed to limit the Series’ total operating expenses (excluding certain expenses, such as front-end or contingent deferred sales charges, taxes, leverage and borrowing expenses (such as commitment, amendment and renewal expenses on credit or redemption facilities), interest, brokerage commissions, expenses incurred in connection with any merger or reorganization, unusual or infrequently occurring expenses (such as litigation), acquired fund fees and expenses, and dividend expenses, if any) so that such expenses do not exceed 1.16% for Class A Shares and 0.91% for Class I Shares through April 30, 2021. Following the contractual period, the adviser may discontinue these expense reimbursement arrangements at any time. Under certain conditions, the adviser may recapture operating expenses reimbursed and/or fees waived under these arrangements for a period of three years following the date such waiver or reimbursement occurred, provided that the recapture does not cause the Series to exceed its expense limit in effect at the time of the waiver or reimbursement, or at the time of recapture.
Under “Fees and Expenses,” the information in the “Example” table will be replaced with the following, as applicable:
| | 1 Year | 3 Years | 5 Years | 10 Years |
| Class A | $118 | $392 | $686 | $1,524 |
| Class I | $93 | $316 | $557 | $1,249 |
In the section “Management of the Series” under the heading “The Adviser” beginning on page 6 of the statutory prospectus, the second paragraph under the table will be replaced with the following:
The Trust has entered into an expense limitation agreement with VIA whereby VIA has agreed to reimburse the Series for expenses necessary or appropriate for the operation of the Series (excluding certain expenses, such as front-end or contingent deferred sales charges, taxes, leverage and borrowing expenses (such as commitment, amendment and renewal expenses on credit or redemption facilities), interest, brokerage commissions, expenses incurred in connection with any merger or reorganization, unusual or infrequently occurring expenses (such as litigation), acquired fund fees and expenses, and dividend expenses, if any) to the extent that such expenses exceed 1.16% of the Series’ Class A Shares and 0.91% of the Series’ Class I Shares average net assets. This expense limitation agreement is in place through April 30, 2021. After April 30, 2021, VIA may discontinue this expense reimbursement arrangement at any time. Under certain conditions, VIA may recapture operating expenses reimbursed and/or fees waived under these arrangements for a period of three years following the date such waiver or reimbursement occurred, provided that the recapture does not cause the Series to exceed its expense limit in effect at the time of the waiver or reimbursement, or at the time of recapture.
Investors should retain this supplement with the Prospectuses for future reference.
VVIT 8505 KARSCG NewExpCaps (11/19)
Virtus SGA International Growth Series (the “Series”),
a series of Virtus Variable Insurance Trust (Unaudited)
Supplement dated November 22, 2019, to the Summary Prospectuses
and Statutory Prospectus, each dated April 30, 2019, as supplemented
IMPORTANT NOTICE TO INVESTORS
Effective December 1, 2019, the Series’ investment adviser, Virtus Investment Advisers, Inc., will implement more favorable expense limitation arrangements. These changes are described in more detail below.
Under “Fees and Expenses” in the Series’ summary prospectuses and the summary section of the Series’ statutory prospectus, the information in the “Annual Series Operating Expenses” tables and associated footnotes will be replaced with the following, as applicable:
Annual Series Operating Expenses (expenses that you pay each year
as a percentage of the value of your investment) | Class A | Class I |
| Management Fees | 0.75% | 0.75% |
| Distribution and Shareholder Servicing (12b-1) Fees | 0.25% | None |
| Other Expenses | 0.17% | 0.17% |
| Total Annual Series Operating Expenses | 1.17% | 0.92% |
| Less: Expense Reimbursement(a) | (0.01%) | (0.01%) |
| Total Annual Series Operating Expenses After Expense Reimbursement(a) | 1.16% | 0.91% |
(a) The Series’ investment adviser has contractually agreed to limit the Series’ total operating expenses (excluding certain expenses, such as front-end or contingent deferred sales charges, taxes, leverage and borrowing expenses (such as commitment, amendment and renewal expenses on credit or redemption facilities), interest, brokerage commissions, expenses incurred in connection with any merger or reorganization, unusual or infrequently occurring expenses (such as litigation), acquired fund fees and expenses, and dividend expenses, if any) so that such expenses do not exceed 1.16% for Class A Shares and 0.91% for Class I Shares through April 30, 2021. Following the contractual period, the adviser may discontinue these expense reimbursement arrangements at any time. Under certain conditions, the adviser may recapture operating expenses reimbursed and/or fees waived under these arrangements for a period of three years following the date such waiver or reimbursement occurred, provided that the recapture does not cause the Series to exceed its expense limit in effect at the time of the waiver or reimbursement, or at the time of recapture.
Under “Fees and Expenses,” the information in the “Example” table will be replaced with the following, as applicable:
| | 1 Year | 3 Years | 5 Years | 10 Years |
| Class A | $118 | $371 | $643 | $1,419 |
| Class I | $93 | $292 | $508 | $1,130 |
In the section “Management of the Series” under the heading “The Adviser” beginning on page 7 of the statutory prospectus, the second paragraph under the table will be replaced with the following:
The Trust has entered into an expense limitation agreement with VIA whereby VIA has agreed to reimburse the Series for expenses necessary or appropriate for the operation of the Series (excluding certain expenses, such as front-end or contingent deferred sales charges, taxes, leverage and borrowing expenses (such as commitment, amendment and renewal expenses on credit or redemption facilities), interest, brokerage commissions, expenses incurred in connection with any merger or reorganization, unusual or infrequently occurring expenses (such as litigation), acquired fund fees and expenses, and dividend expenses, if any) to the extent that such expenses exceed 1.16% of the Series’ Class A Shares and 0.91% of the Series Class I Shares average net assets. This expense limitation agreement is in place through April 30, 2021. After April 30, 2021, VIA may discontinue this expense reimbursement arrangement at any time. Under certain conditions, VIA may recapture operating expenses reimbursed and/or fees waived under these arrangements for a period of three years following the date such waiver or reimbursement occurred, provided that the recapture does not cause the Series to exceed its expense limit in effect at the time of the waiver or reimbursement, or at the time of recapture.
Investors should retain this supplement with the Prospectuses for future reference.
VVIT 8500 SGAInt’lGr NewExpCaps (11/19)
THIS PAGE INTENTIONALLY BLANK.
VIRTUS VARIABLE INSURANCE TRUST
One Financial Plaza
Hartford, CT 06103-2608
Trustees
Philip R. McLoughlin, Chairman
George R. Aylward
Thomas J. Brown
Donald C. Burke
Sidney E. Harris
John R. Mallin
Hassell H. McClellan
Connie D. McDaniel
Geraldine M. McNamara
James M. Oates
Richard E. Segerson
R. Keith Walton
Brian T. Zino
Advisory Board Member
William R. Moyer
Officers
George R. Aylward, President
Peter Batchelar, Senior Vice President
W. Patrick Bradley, Executive Vice President, Chief Financial Officer and Treasurer
Kevin J. Carr, Senior Vice President and Assistant Secretary
Nancy J. Engberg, Senior Vice President and Chief Compliance Officer
Jennifer Fromm, Vice President, Chief Legal Officer, Counsel and Secretary
Julia R. Short, Senior Vice President
Francis G. Waltman, Executive Vice President
Investment Adviser
Virtus Investment Advisers, Inc.
One Financial Plaza
Hartford, CT 06103-2608
Principal Underwriter
VP Distributors, LLC
One Financial Plaza
Hartford, CT 06103-2608
Administrator and Transfer Agent
Virtus Fund Services, LLC
One Financial Plaza
Hartford, CT 06103-2608
Custodian
The Bank of New York Mellon
240 Greenwich Street
New York, NY 10286-1048
Independent Registered Public
Accounting Firm
PricewaterhouseCoopers LLP
2001 Market Street
Philadelphia, PA 19103-7042
How to Contact Us
| Mutual Fund Services | 1-800-367-5877 |
Important Notice to Shareholders
The Securities and Exchange Commission has modified mailing regulations for semiannual and annual shareholder fund reports to allow mutual fund companies to send a single copy of these reports to shareholders who share the same mailing address. If you would like additional copies, please call Mutual Fund Services at 1-800-367-5877.
P.O. Box 9874
Providence, RI 02940-8074
For more information about Virtus Variable Insurance Trust,
please contact us at1-800-367-5877, orVirtus.com.
| (a) | The registrant, as of the end of the period covered by this report, has adopted a code of ethics that applies to the registrant’s principal executive officer, principal financial officer, principal accounting officer or controller, or persons performing similar functions, regardless of whether these individuals are employed by the registrant or a third party. |
| (c) | Other than certainnon-substantive changes, there have been no amendments, during the period covered by this report, to a provision of the code of ethics that applies to the registrant’s principal executive officer, principal financial officer, principal accounting officer or controller, or persons performing similar functions, regardless of whether these individuals are employed by the registrant or a third party, and that relates to any element of the code of ethics described in Item 2(b) of the instructions for completion of FormN-CSR. |
| (d) | The registrant has not granted any waivers, during the period covered by this report, including an implicit waiver, from a provision of the code of ethics that applies to the registrant’s principal executive officer, principal financial officer, principal accounting officer or controller, or persons performing similar functions, regardless of whether these individuals are employed by the registrant or a third party, that relates to one or more of the items set forth in paragraph (b) of the instructions for completion of this Item. |
| Item 3. | Audit Committee Financial Expert. |
| (a)(1) | The Registrant’s Board of Trustees has determined that the Registrant has an “audit committee financial expert” serving on its Audit Committee. |
| (a)(2) | As of the end of the period covered by the report, the Registrant’s Board of Trustees has determined that each of Thomas J. Brown, Donald C. Burke and Richard E. Segerson possesses the technical attributes identified in Instruction 2(b) of Item 3 to FormN-CSR to qualify as an “audit committee financial expert.” On January 14, 2020, the members of the audit committed changed and as a result the Registrant’s Board of Trustees reviewed the new membership to determine whether the members possess the technical attributes identified in Instruction 2(b) of Item 3 to FormN-CSR to qualify as an “audit committee financial expert” and determined that each of Thomas J. Brown, Donald C. Burke, Connie D. McDaniel and Brian T. Zino possesses such attributes. Each of Messrs. Brown, Burke, Segerson and Zino, and Ms. McDaniel, is an “independent” trustee pursuant to paragraph (a)(2) of Item 3 to FormN-CSR. |
| Item 4. | Principal Accountant Fees and Services. |
| | • | | Registrant may incorporate the following information by reference, if this information has been disclosed in the registrant’s definitive proxy statement or definitive information statement. The proxy statement or information statementmust be filed no later than 120 days after the end of the fiscal year covered by the Annual Report. |
Audit Fees
| (a) | The aggregate fees billed for each of the last two fiscal years for professional services rendered by the principal accountant for the audit of the registrant’s annual financial statements or services that are normally provided by the accountant in connection with statutory and regulatory filings or engagements for those fiscal years are $138,632 for 2019 and $141,920 for 2018. |
Audit-Related Fees
| (b) | The aggregate fees billed in each of the last two fiscal years for assurance and related services by the principal accountant that are reasonably related to the performance of the audit of the registrant’s financial statements and are not reported under paragraph (a) of this Item are $10,717 for 2019 and $22,377 for 2018. Such audit-related fees include out of pocket expenses and system conversion fees. |
Tax Fees
| (c) | The aggregate fees billed in each of the last two fiscal years for professional services rendered by the principal accountant for tax compliance, tax advice, and tax planning are $27,375 for 2019 and $61,941 for 2018. |
| | “Tax Fees” are those primarily associated with review of the Trust’s tax provision and qualification as a regulated investment company (RIC) in connection with audits of the Trust’s financial statement, review ofyear-end distributions by the Fund to avoid excise tax for the Trust, periodic discussion with management on tax issues affecting the Trust, and reviewing and signing the Fund’s federal income tax returns. |
All Other Fees
| (d) | The aggregate fees billed in each of the last two fiscal years for products and services provided by the principal accountant, other than the services reported in paragraphs (a) through (c) of this Item are $0 for 2019 and $0 for 2018. |
| (e)(1) | Disclose the audit committee’spre-approval policies and procedures described in paragraph (c)(7) of Rule2-01 of RegulationS-X. |
The Virtus Variable Insurance Trust (the “Fund”) Board has adopted policies and procedures with regard to thepre-approval of services provided by PwC. Audit, audit-related and tax compliance services provided to the Fund on an annual basis require specificpre-approval by the Audit Committee. The Audit Committee must also approve othernon-audit services provided to the Fund and thosenon-audit services provided to the Fund’s Affiliated Service Providers that relate directly to the operations and financial
reporting of the Fund. Certain of thesenon-audit services that the Audit Committee believes are a) consistent with the SEC’s auditor independence rules and b) routine and recurring services that will not impair the independence of the independent auditors may be approved by the Audit Committee without consideration on a specificcase-by-case basis (“generalpre-approval”).
The Audit Committee has determined that Mr. Thomas J. Brown, Chair of the Audit Committee, may providepre-approval for such services that meet the above requirements in the event such approval is sought between regularly scheduled meetings. In any event, the Audit Committee is informed of each service approved subject to generalpre-approval at the next regularly scheduledin-person Audit Committee meeting.
| (e)(2) | The percentage of services described in each of paragraphs (b) through (d) of this Item that were approved by the audit committee pursuant to paragraph (c)(7)(i)(C) of Rule2-01 of RegulationS-X are as follows: |
| (f) | The percentage of hours expended on the principal accountant’s engagement to audit the registrant’s financial statements for the most recent fiscal year that were attributed to work performed by persons other than the principal accountant’s full-time, permanent employees was less than fifty percent. |
| (g) | The aggregatenon-audit fees billed by the registrant’s accountant for services rendered to the registrant, and rendered to the registrant’s investment adviser (not including anysub-adviser whose role is primarily portfolio management and is subcontracted with or overseen by another investment adviser), and any entity controlling, controlled by, or under common control with the adviser that provides ongoing services to the registrant for each of the last two fiscal years of the registrant was $38,092 for 2019 and $84,318 for 2018. |
| (h) | The registrant’s audit committee of the board of directors has considered whether the provision ofnon-audit services that were rendered to the registrant’s investment adviser (not including anysub-adviser whose role is primarily portfolio management and is subcontracted with or overseen by another investment adviser), and any entity controlling, controlled by, or under common control with the investment adviser that provides ongoing services to the registrant that were notpre-approved pursuant to paragraph (c)(7)(ii) of Rule2-01 of RegulationS-X is compatible with maintaining the principal accountant’s independence. |
| Item 5. | Audit Committee of Listed Registrants. |
Not applicable.
| (a) | Schedule of Investments in securities of unaffiliated issuers as of the close of the reporting period is included as part of the report to shareholders filed under Item 1 of this form. |
| Item 7. | Disclosure of Proxy Voting Policies and Procedures forClosed-End Management Investment Companies. |
Not applicable.
| Item 8. | Portfolio Managers ofClosed-End Management Investment Companies. |
Not applicable.
| Item 9. | Purchases of Equity Securities byClosed-End Management Investment Company and Affiliated Purchasers. |
Not applicable.
| Item 10. | Submission of Matters to a Vote of Security Holders. |
There have been no material changes to the procedures by which the shareholders may recommend nominees to the registrant’s board of trustees, where those changes were implemented after the registrant last provided disclosure in response to the requirements of Item 407(c)(2)(iv) of Regulation S-K (17 CFR 229.407) (as required by Item 22(b)(15) of Schedule 14A (17 CFR240.14a-101)), or this Item.
| Item 11. | Controls and Procedures. |
| (a) | The registrant’s principal executive and principal financial officers, or persons performing similar functions, have concluded that the registrant’s disclosure controls and procedures (as defined in Rule30a-3(c) under the Investment Company Act of 1940, as amended (the “1940 Act”) (17 CFR270.30a-3(c))) are effective, as of a date within 90 days of the filing date of the report that includes the disclosure required by this paragraph, based on their evaluation of these controls and procedures required by Rule30a-3(b) under the 1940 Act (17 CFR270.30a-3(b)) and Rules13a-15(b) or15d-15(b) under the Securities Exchange Act of 1934, as amended (17 CFR240.13a-15(b) or240.15d-15(b)). |
| (b) | There were no changes in the registrant’s internal control over financial reporting (as defined in Rule30a-3(d) under the 1940 Act (17 CFR270.30a-3(d))) that occurred during the period covered by this report that has materially affected, or is reasonably likely to materially affect, the registrant’s internal control over financial reporting. |
| Item 12. | Disclosure of Securities Lending Activities forClosed-End Management Investment Companies. |
Not applicable.
| (a)(1) | Code of ethics, or any amendment thereto, that is the subject of disclosure required by Item 2 is attached hereto. |
| (a)(2) | Certifications pursuant to Rule30a-2(a) under the 1940 Act and Section 302 of the Sarbanes-Oxley Act of 2002 are attached hereto. |
| (b) | Certifications pursuant to Rule30a-2(b) under the 1940 Act and Section 906 of the Sarbanes-Oxley Act of 2002 are attached hereto. |
SIGNATURES
Pursuant to the requirements of the Securities Exchange Act of 1934 and the Investment Company Act of 1940, the registrant has duly caused this report to be signed on its behalf by the undersigned, thereunto duly authorized.
| | |
| (Registrant) | | Virtus Variable Insurance Trust |
| | |
| |
| By (Signature and Title)* | | /s/ George R. Aylward |
| | George R. Aylward, President (principal executive officer) |
Pursuant to the requirements of the Securities Exchange Act of 1934 and the Investment Company Act of 1940, this report has been signed below by the following persons on behalf of the registrant and in the capacities and on the dates indicated.
| | |
| By (Signature and Title)* | | /s/ George R. Aylward |
| | George R. Aylward, President (principal executive officer) |
| | |
| |
| By (Signature and Title)* | | /s/ W. Patrick Bradley |
| | W. Patrick Bradley, Executive Vice President, Chief Financial Officer and Treasurer (principal financial officer) |
| * | Print the name and title of each signing officer under his or her signature. |