UNITED STATES
SECURITIES AND EXCHANGE COMMISSION
Washington, D.C. 20549
FORM N-CSR
CERTIFIED SHAREHOLDER REPORT OF REGISTERED
MANAGEMENT INVESTMENT COMPANIES
Investment Company Act file number 811-04642
Virtus Variable Insurance Trust
(Exact name of registrant as specified in charter)
100 Pearl Street
Hartford, CT 06103-4506
(Address of principal executive offices) (Zip code)
Jennifer S. Fromm, Esq.
Vice President, Chief Legal Officer, Counsel and Secretary for Registrant
100 Pearl Street
Hartford, CT 06103-4506
(Name and address of agent for service)
Registrant’s telephone number, including area code: (800) 367-5877
Date of fiscal year end: December 31
Date of reporting period: December 31, 2016
Form N-CSR is to be used by management investment companies to file reports with the Commission not later than 10 days after the transmission to stockholders of any report that is required to be transmitted to stockholders under Rule 30e-1 under the Investment Company Act of 1940 (17 CFR 270.30e-1). The Commission may use the information provided on Form N-CSR in its regulatory, disclosure review, inspection, and policymaking roles.
A registrant is required to disclose the information specified by Form N-CSR, and the Commission will make this information public. A registrant is not required to respond to the collection of information contained in Form N-CSR unless the Form displays a currently valid Office of Management and Budget (“OMB”) control number. Please direct comments concerning the accuracy of the information collection burden estimate and any suggestions for reducing the burden to Secretary, Securities and Exchange Commission, 450 Fifth Street, NW, Washington, DC 20549-0609. The OMB has reviewed this collection of information under the clearance requirements of 44 U.S.C. § 3507.
| Item 1. | Reports to Stockholders. |
The Report to Shareholders is attached herewith.


VIRTUS VARIABLE INSURANCE TRUST
ANNUAL REPORT
Virtus Capital Growth Series
Virtus Enhanced Core Equity Series
(FKA: Virtus Growth & Income Series)
Virtus Equity Trend Series
Virtus International Series
Virtus Multi-Sector Fixed Income Series
Virtus Real Estate Securities Series
Virtus Small-Cap Growth Series
Virtus Small-Cap Value Series
Virtus Strategic Allocation Series
| | | | | | | | |
| | | | | | | December 31, 2016 | |
| | |
| The Annual Report describes one or more Series available for underlying investment through your variable contract. For information about your variable contract, including information about insurance-related expenses, see the prospectus for your variable contract. | | | | | |
| Not FDIC Insured
No Bank Guarantee May Lose Value |
|
Table of Contents
Proxy Voting Procedures and Voting Record (Form N-PX)
The adviser and subadvisers vote proxies relating to portfolio securities in accordance with procedures that have been approved by the Board of Trustees of the Trust (“Trustees,” or the “Board”). You may obtain a description of these procedures, along with information regarding how the Series voted proxies during the most recent 12-month period ended June 30, free of charge, by calling toll-free 1-800-367-5877. This information is also available through the Securities and Exchange Commission’s (the “SEC”) website at http://www.sec.gov.
Form N-Q Information
The Trust files a complete schedule of portfolio holdings for each Series with the SEC for the first and third quarters of each fiscal year on Form N-Q. Form N-Q is available on the SEC’s website at http://www.sec.gov. Form N-Q may be reviewed and copied at the SEC’s Public Reference Room. Information on the operation of the SEC’s Public Reference Room can be obtained by calling toll-free 1-800-SEC-0330.
MESSAGE TO SHAREHOLDERS
Dear Virtus Variable Insurance Trust Investors:
| | |
 | | I am pleased to present this report that reviews the performance of your Series for the 12 months ended December 31, 2016. At the start of 2016, global markets were challenged by falling oil prices, China’s economic slowdown, and concerns over the Federal Reserve’s (“the Fed”) December 2015 rate hike, its first in nine years. Equities plummeted in the first six weeks of the year, but stabilizing oil prices and the Fed’s softened stance on further rate hikes sparked a market rally that lasted from mid-February until June. The outcomes of the U.K.’s “Brexit” decision and the U.S. presidential election triggered short-lived selloffs |
later in the year, but calm was restored by better-than-expected corporate earnings and an improving global economic picture. Even though the Fed raised rates at its year-end meeting, other major central banks remained committed to monetary stimulus and provided reassurance to global markets. For the year, U.S. large- and small-cap stocks generated positive performance, as measured by the 11.96% and 21.31% returns of the S&P 500® Index and Russell 2000® Index, respectively. Within international equities, emerging markets significantly outperformed their developed peers, with the MSCI Emerging Markets Index (net) up 11.19%, compared with the MSCI EAFE® Index (net), which returned 1.00%. Demand for U.S. Treasuries remained strong, driven by foreign investors seeking safe havens and yield in light of the negative interest rate environment in many international economies. On December 31, 2016, the benchmark 10-year U.S. Treasury yielded 2.45% compared with 2.27% one year earlier. The broader U.S. fixed income market, as represented by the Bloomberg Barclays U.S. Aggregate Bond Index, which tracks Treasuries and other investment-grade debt securities, gained 2.65% for the year, while non-investment grade bonds rose 17.13%, as measured by the Bloomberg Barclays U.S. Corporate High Yield Bond Index. The U.S. economy’s growth, as evidenced by strong jobs, housing, and consumer spending data, gives investors reason for optimism. In addition, the proposed pro-growth policies of the new administration, if implemented, could have a positive impact on corporate earnings and the markets. Market uncertainty is an ever-present reminder of the importance of portfolio diversification, including exposure to both traditional and alternative asset classes. While diversification cannot guarantee a profit or prevent a loss, owning a variety of asset classes may cushion your portfolio against inevitable market fluctuations. Your financial advisor can help you ensure that your variable investment portfolio is adequately diversified across asset classes and investment strategies. On behalf of our investment affiliates, thank you for entrusting Virtus with your assets. Should you have questions about your account or require assistance, please visit our website at Virtus.com, or call our customer service team at 1-800-367-5877. We appreciate your business and remain committed to your long-term financial success. Sincerely, 
George R. Aylward President, Virtus Variable Insurance Trust February 2017 |
Performance data quoted represents past results. Past performance is no guarantee of future results, and current performance may be higher or lower than the performance shown above.
1
KEY INVESTMENT TERMS
American Depositary Receipt (ADR)
Represents shares of foreign companies traded in U.S. dollars on U.S. exchanges that are held by a U.S. bank or a trust. Foreign companies use ADRs in order to make it easier for Americans to buy their shares.
Bank of Japan (BOJ)
One of the world’s major central banks, the Bank of Japan is responsible for issuing the country’s currency, managing monetary policy, and maintaining financial system stability.
Bloomberg Barclays U.S. Aggregate Bond Index
The Bloomberg Barclays U.S. Aggregate Bond Index measures the U.S. investment-grade fixed-rate bond market. The index is calculated on a total return basis. The index is unmanaged, its returns do not reflect any fees, expenses, or sales charges, and it is not available for direct investment.
Bloomberg Barclays U.S. Corporate High Yield Bond Index
The Bloomberg Barclays U.S. Corporate High Yield Bond Index measures the U.S. dollar-denominated, high yield, fixed-rate corporate bond market. The index is calculated on a total return basis. The index is unmanaged, its returns do not reflect any fees, expenses, or sales charges, and it is not available for direct investment.
Brexit
A combination of the words “Britain” and “exit” which refers to Britain’s withdrawal from the European Union.
Department of Labor’s (DOL) Fiduciary Standard Rule
The Department of Labor (DOL) Fiduciary Rule, scheduled to be phased in beginning April 10, 2017, expands the “investment advice fiduciary” definition under the Employee Retirement Income Security Act (“ERISA”). The rule covers all financial professionals offering investment advice for retirement accounts and seeks to put their clients’ best interests ahead of their own profits. On February 3, 2017, President Trump called for a review of the new rule, and the DOL announced that it is considering its legal options to delay the applicability date as it seeks to comply with the President’s memorandum.
European Central Bank (ECB)
The European Central Bank (ECB) is responsible for conducting monetary policy for the euro area. The ECB was established as the core of the Eurosystem and the European System of Central Banks (ESCB). The ESCB comprises the ECB and the National Central Banks (NCBs) of all 17 EU Member States whether they have adopted the Euro or not.
European Union (EU)
The European Union (EU) is a unique economic and political union of 28 European countries. The EU was created in the aftermath of the Second World War that has become a single market for goods and services and it created the single currency the euro.
Exchange-Traded Fund (ETF)
An open-end fund that is traded on a stock exchange. Most ETFs have a portfolio of stocks or bonds that track a specific market index.
Federal Open Market Committee (FOMC)
The Federal Open Market Committee (FOMC) is the branch of the Federal Reserve Board that determines the direction of monetary policy.
Federal Reserve (the Fed)
The Central Bank of the United States, responsible for controlling the money supply, interest rates and credit with the goal of keeping the U.S. economy and currency stable. Governed by a seven-member board, the system includes 12 regional Federal Reserve Banks, 25 branches and all national and state banks that are part of the system.
Foreign Investment in Real Property Tax Act of 1980 (FIRPTA)
Foreign Investment in Real Property Tax Act of 1980 (FIRPTA) is a federal law that requires a foreign person to pay tax on the gain realized upon the sale of U.S. real property owned by that person.
2
KEY INVESTMENT TERMS (Continued)
FTSE NAREIT Equity REITs Index
The FTSE NAREIT Equity REITs Index is a free-float market capitalization-weighted index measuring equity tax-qualified real estate investment trusts, which meet minimum size and liquidity criteria, that are listed on the New York Stock Exchange, the American Stock Exchange and the NASDAQ National Market System. The index is calculated on a total return basis with dividends reinvested. The index is unmanaged, its returns do not reflect any fees, expenses, or sales charges, and it is not available for direct investment.
Global Industry Classification Standard (GICS)
The Global Industry Classification Standard (GICS) is a standardized classification system for equities that was developed by, and is the exclusive property and a service mark of, MSCI Inc. (MSCI) and Standard & Poor’s, a division of the McGraw-Hill Companies, Inc. (S&P). As of September 1, 2016, the GICS structure comprises 11 sectors, 24 industry groups, 68 industries, and 157 subindustries.
Gross Domestic Product (GDP)
The market value of all officially recognized final goods and services produced within a country in a given period.
MSCI EAFE® Index (net)
The MSCI EAFE® (Europe, Australasia, Far East) Index (net) is a free float-adjusted market capitalization-weighted index that measures developed foreign market equity performance, excluding the U.S. and Canada. The index is calculated on a total return basis with net dividends reinvested. The index is unmanaged, its returns do not reflect any fees, expenses, or sales charges, and it is not available for direct investment.
MSCI Emerging Markets Index (net)
The MSCI Emerging Markets Index (net) is a free float-adjusted market capitalization-weighted index designed to measure equity market performance in the global emerging markets. The index is calculated on a total return basis with net dividends reinvested. The index is unmanaged, its returns do not reflect any fees, expenses, or sales charges, and it is not available for direct investment.
Organization of the Petroleum Exporting Countries (OPEC)
The Organization of the Petroleum Exporting Countries is an intergovernmental organization that currently has 12 member countries. The organization’s objective is to coordinate and unify petroleum policies among member countries, in order to secure fair and stable prices for petroleum producers; an efficient, economic and regular supply of petroleum to consuming nations; and a fair return on capital to those investing in the industry.
Quantitative Easing (QE)
An unconventional monetary policy in which a central bank purchases government securities or other securities from the market in order to lower interest rates and increase the money supply. Quantitative easing increases the money supply by flooding financial institutions with capital in an effort to promote increased lending and liquidity. Quantitative easing is considered when short-term interest rates are at or approaching zero, and does not involve the printing of new banknotes.
Real Estate Investment Trust (REIT)
A publicly traded company that owns, develops and operates income-producing real estate such as apartments, office buildings, hotels, shopping centers, and other commercial properties.
Russell 1000® Growth Index
The Russell 1000® Growth Index is a market capitalization-weighted index of growth-oriented stocks of the 1,000 largest companies in the Russell Universe, which comprises the 3,000 largest U.S. companies. The index is calculated on a total return basis with dividends reinvested. The index is unmanaged, its returns do not reflect any fees, expenses, or sales charges, and it is not available for direct investment.
Russell 2000® Growth Index
The Russell 2000® Growth Index is a market capitalization-weighted index of growth-oriented stocks of the smallest 2,000 companies in the Russell Universe, which comprises the 3,000 largest U.S. companies. The index is calculated on a total return basis with dividends reinvested. The index is unmanaged, its returns do not reflect any fees, expenses, or sales charges, and it is not available for direct investment.
3
KEY INVESTMENT TERMS (Continued)
Russell 2000® Index
The Russell 2000® Index is a market capitalization-weighted index of the 2,000 smallest companies in the Russell Universe, which comprises the 3,000 largest U.S. companies. The index is calculated on a total return basis with dividends reinvested. The index is unmanaged, its returns do not reflect any fees, expenses, or sales charges, and it is not available for direct investment.
Russell 2000® Value Index
The Russell 2000® Value Index is a market capitalization-weighted index of value-oriented stocks of the smallest 2,000 companies in the Russell Universe, which comprises the 3,000 largest U.S. companies. The index is calculated on a total return basis with dividends reinvested. The index is unmanaged, its returns do not reflect any fees, expenses, or sales charges, and it is not available for direct investment.
S&P 500® Index
The S&P 500® Index is a free-float market capitalization-weighted index of 500 of the largest U.S. companies. The index is calculated on a total return basis with dividends reinvested. The index is unmanaged, its returns do not reflect any fees, expenses, or sales charges, and it is not available for direct investment.
Sponsored ADR (American Depositary Receipt)
An ADR which is issued with the cooperation of the company whose stock will underlie the ADR. Sponsored ADRs generally carry the same rights normally given to stockholders, such as voting rights. ADRs must be sponsored to be able to trade on a major U.S. exchange such as the New York Stock Exchange (“NYSE”).
Strategic Allocation Series Linked Benchmark
The Strategic Allocation Series Linked Benchmark consists of 45% Russell 1000® Growth Index (a market capitalization-weighted index of growth-oriented stocks of the 1,000 largest companies in the Russell Universe, which comprises the 3,000 largest U.S. companies, calculated on a total return basis with dividends reinvested), 15% MSCI EAFE® Index (a free floatadjusted market capitalization-weighted index that measures developed foreign market equity performance, excluding the U.S. and Canada, calculated on a total return basis with net dividends reinvested) and 40% Bloomberg Barclays U.S. Aggregate Bond Index (an index that measures the U.S. investment grade fixed rate bond market, calculated on a total return basis). The index is unmanaged, its returns do not reflect any fees, expenses, or sales charges, and is not available for direct investment. Performance of the Strategic Allocation Series Linked Benchmark prior to 9/7/2016 represents an allocation consisting of 60% S&P 500® Index and 40% Bloomberg Barclays U.S. Aggregate Bond Index.
Treasury Yield
The return on investment, expressed as a percentage, on the U.S. government’s debt obligations (bonds, notes and bills). The Treasury yield is considered a bellwether of the U.S. economy; the higher the yields on 10-, 20- and 30-year Treasuries, the better the economic outlook.
U.S. Treasury Federal Funds Target Rate
The interest rate at which a depository institution lends funds maintained at the Federal Reserve to another depository institution overnight. The federal funds rate is generally only applicable to the most creditworthy institutions when they borrow and lend overnight funds to each other. The federal funds rate is one of the most influential interest rates in the U.S. economy, since it affects monetary and financial conditions, which in turn have a bearing on key aspects of the broad economy including employment, growth and inflation.
4
VIRTUS VARIABLE INSURANCE TRUST
Disclosure of Series Expenses (Unaudited)
For the six-month period of July 1, 2016 to December 31, 2016
We believe it is important for you to understand the impact of costs on your investment. All mutual funds have operating expenses. As a shareholder of a Series (each a “Series”) of Virtus Variable Insurance Trust (the “Trust”), you incur ongoing costs including investment advisory fees and other expenses. These examples are intended to help you understand your ongoing costs (in dollars) of investing in a Series and to compare these costs with the ongoing costs of investing in other mutual funds. These examples are based on an investment of $1,000 invested at the beginning of the period and held for the entire six-month period. The following Expense Table illustrates a Series’ costs in two ways.
Actual Expenses
The first section of the accompanying table provides information about actual account values and actual expenses. You may use the information in this section, together with the amount you invested, to estimate the expenses that you paid over the period. Simply divide your account value by $1,000 (for example, an $8,600 account value divided by $1,000 = 8.6), then multiply the result by the number in the first section under the heading “Expenses Paid During Period” to estimate the expenses you paid on your account during this period. The expense estimate does not include the fees or expenses associated with the separate insurance accounts, and if such charges were included, your costs would have been higher.
Hypothetical Example for Comparison Purposes
The second section of the accompanying table provides information about hypothetical account values and hypothetical expenses based on a Series’ actual expense ratio and an assumed rate of return of 5% per year before expenses, which is not your Series’ actual return. The hypothetical account values and expenses may not be used to estimate the actual ending account balance or expenses you paid for the period. You may use this information to compare the ongoing costs of investing in your Series and other funds. To do so, compare these 5% hypothetical examples with the 5% hypothetical examples that appear in the shareholder reports of the other funds.
Please note that the expenses shown in the accompanying table are meant to highlight your ongoing costs only and do not reflect additional fees and expenses associated with the annuity or life insurance policy through which you invest. Therefore, the second section of the accompanying table is useful in comparing ongoing costs only, and will not help you determine the relative total costs of owning different funds. In addition, if the annuity or life insurance policy costs were included, your costs would have been higher. The calculations assume no shares were bought or sold during the period. Your actual costs may have been higher or lower, depending on the amount of your investment and the timing of any purchases or redemptions.
| | | | | | | | | | | | | | | | |
Expense Table | |
| | | Beginning
Account Value
July 1, 2016 | | | Ending
Account Value
December 31, 2016 | | | Annualized
Expense
Ratio | | | Expenses Paid
During
Period* | |
Capital Growth Series | |
Actual | |
Class A | | $ | 1,000.00 | | | $ | 1,019.60 | | | | 1.04 | % | | $ | 5.28 | |
|
Hypothetical (5% return before expenses) | |
Class A | | | 1,000.00 | | | | 1,019.91 | | | | 1.04 | | | | 5.28 | |
Enhanced Core Equity Series | |
Actual | |
Class A | | $ | 1,000.00 | | | $ | 1,117.40 | | | | 0.99 | % | | $ | 5.27 | |
|
Hypothetical (5% return before expenses) | |
Class A | | | 1,000.00 | | | | 1,020.16 | | | | 0.99 | | | | 5.03 | |
Equity Trend Series | |
Actual | |
Class A | | $ | 1,000.00 | | | $ | 1,010.80 | | | | 1.71 | % | | $ | 8.64 | |
Class I | | | 1,000.00 | | | | 1,012.50 | | | | 1.46 | | | | 7.39 | |
|
Hypothetical (5% return before expenses) | |
Class A | | | 1,000.00 | | | | 1,016.54 | | | | 1.71 | | | | 8.67 | |
Class I | | | 1,000.00 | | | | 1,017.80 | | | | 1.46 | | | | 7.41 | |
International Series | |
Actual | |
Class A | | $ | 1,000.00 | | | $ | 1,020.00 | | | | 1.18 | % | | $ | 5.99 | |
Class I | | | 1,000.00 | | | | 1,022.30 | | | | 0.93 | | | | 4.73 | |
|
Hypothetical (5% return before expenses) | |
Class A | | | 1,000.00 | | | | 1,019.20 | | | | 1.18 | | | | 5.99 | |
Class I | | | 1,000.00 | | | | 1,020.46 | | | | 0.93 | | | | 4.72 | |
Multi-Sector Fixed Income Series | |
Actual | |
Class A | | $ | 1,000.00 | | | $ | 1,025.20 | | | | 0.94 | % | | $ | 4.79 | |
Class I | | | 1,000.00 | | | | 1,026.60 | | | | 0.69 | | | | 3.51 | |
|
Hypothetical (5% return before expenses) | |
Class A | | | 1,000.00 | | | | 1,020.41 | | | | 0.94 | | | | 4.77 | |
Class I | | | 1,000.00 | | | | 1,021.67 | | | | 0.69 | | | | 3.51 | |
Real Estate Securities Series | |
Actual | |
Class A | | $ | 1,000.00 | | | $ | 951.30 | | | | 1.17 | % | | $ | 5.74 | |
Class I | | | 1,000.00 | | | | 952.50 | | | | 0.92 | | | | 4.52 | |
|
Hypothetical (5% return before expenses) | |
Class A | | | 1,000.00 | | | | 1,019.25 | | | | 1.17 | | | | 5.94 | |
Class I | | | 1,000.00 | | | | 1,020.51 | | | | 0.92 | | | | 4.67 | |
Small-Cap Growth Series | |
Actual | |
Class A | | $ | 1,000.00 | | | $ | 1,149.80 | | | | 1.20 | % | | $ | 6.48 | |
Class I | | | 1,000.00 | | | | 1,151.30 | | | | 0.95 | | | | 5.14 | |
|
Hypothetical (5% return before expenses) | |
Class A | | | 1,000.00 | | | | 1,019.10 | | | | 1.20 | | | | 6.09 | |
Class I | | | 1,000.00 | | | | 1,020.36 | | | | 0.95 | | | | 4.82 | |
5
VIRTUS VARIABLE INSURANCE TRUST
Disclosure of Series Expenses (Unaudited) (Continued)
For the six-month period of July 1, 2016 to December 31, 2016
| | | | | | | | | | | | | | | | |
Expense Table | |
| | | Beginning
Account Value
July 1, 2016 | | | Ending
Account Value
December 31, 2016 | | | Annualized
Expense
Ratio | | | Expenses Paid
During
Period* | |
Small-Cap Value Series | |
Actual | |
Class A | | $ | 1,000.00 | | | $ | 1,138.90 | | | | 1.21 | % | | $ | 6.51 | |
|
Hypothetical (5% return before expenses) | |
Class A | | | 1,000.00 | | | | 1,019.05 | | | | 1.21 | | | | 6.14 | |
Strategic Allocation Series | |
Actual | |
Class A | | $ | 1,000.00 | | | $ | 1,000.60 | | | | 0.99 | % | | $ | 4.98 | |
|
Hypothetical (5% return before expenses) | |
Class A | | | 1,000.00 | | | | 1,020.16 | | | | 0.99 | | | | 5.03 | |
| * | Expenses are equal to the relevant Series’ annualized expense ratio, which is net of waived fees and reimbursed expenses, if applicable, multiplied by the average account value over the period, multiplied by the number of days (184) expenses were accrued in the most recent fiscal half-year, then divided by 366 to reflect the one-half year period. Exceptions noted below. |
| | A Series may invest in other funds, and the annualized expense ratios noted above do not reflect fees and expenses associated with the underlying funds. If such fees and expenses had been included, the expenses would have been higher. |
| | You can find more information about a Series’ expenses in the Financial Statements section that follows. For additional information on operating expenses and other shareholder costs, including contractual charges associated with the separate account, refer to the Series prospectus and the contract prospectus. |
6
Series Summary December 31, 2016 (Unaudited)
Portfolio Manager Commentary by
Kayne Anderson Rudnick Investment Management, LLC
| ⬛ | | The Series is diversified and has an investment objective of long-term growth of capital. There is no guarantee that the Series will meet its objective. |
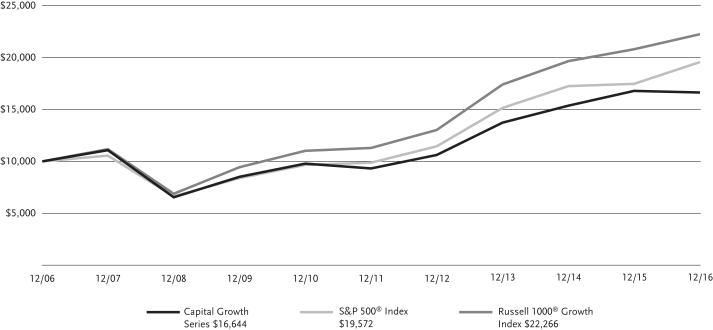
| ⬛ | | For the fiscal year ended December 31, 2016, the Series’ Class A shares at NAV returned -0.86%. For the same period, the S&P 500® Index, a broad-based equity index, returned 11.96% and the Russell 1000® Growth Index, the Series’ style-specific benchmark appropriate for comparison, returned 7.08%. |
All performance figures assume reinvestment of distributions and exclude the effect of fees and expenses associated with the variable life insurance or annuity product through which you invest. Past performance is no guarantee of future results, and current performance may be higher or lower than the performance shown above.
How did the equity markets perform during the Series’ fiscal year?
| ⬛ | | The S&P 500® Index, a broad measure of large-cap stocks, rose nearly 12% in 2016, and small-cap stocks registered an even more impressive gain, advancing slightly more than 21%, as measured by the Russell 2000® Index. The Russell 1000® Growth Index, which measures large-cap growth stocks, gained 1.01% during the fourth quarter and 7.08% for all of 2016. |
| ⬛ | | The U.S. presidential election in November was one of the most significant economic events of 2016, as it turned some market sector losers into winners, and vice versa. In the Russell 1000® Growth Index, industrials (+6.86%), financials (+6.56%), telecommunications services (+4.55%), and utilities (+3.70%) all increased during the fourth quarter. Other sectors, including real estate (-5.08%), health care (-3.53%), and energy (-0.89%) lagged in the quarter. In addition, deep value strategies strongly outperformed growth and core strategies. |
| ⬛ | | Investors’ risk appetite changed dramatically over the course of 2016. For example, the first half of the year was marked by disappointing economic growth, falling bond yields, and defensive fixed income and equity positioning on the part of investors. After two years of dramatic declines, many commodities – particularly crude oil (up 45% for the year) – finally found a bottom, and investors adopted a much more aggressive risk appetite as the economy started to stabilize over the summer and improve into the fall. In |
| | | November, then President-elect Trump’s pro-business, tax-cutting, and fewer regulatory burdens agenda accentuated the outlook that economic growth would continue to accelerate in 2017. |
What factors affected the Series’ performance during the fiscal year?
| ⬛ | | The Series underperformed the Russell 1000® Growth Index for the year. From a sector perspective, performance was hurt by negative stock selection in the information technology and consumer discretionary sectors. Performance was helped by positive stock selection in the financials sector and an overweight in the energy sector. |
| ⬛ | | From an individual stock perspective, the companies that contributed the most to performance were Facebook and Amphenol, an electronics manufacturer of interconnect products. |
| ⬛ | | Facebook continued to grow advertising revenue and take share in the online digital marketing space. The company has delivered an unprecedented global reach of 20% of the earth’s population to advertisers in a very measureable way. Monetization of this audience has barely scratched the surface of its long-term potential. Despite reaching a revenue run rate greater than $25 billion, the company’s second-quarter growth rate accelerated again to 59%. Ad revenue soared as mobile monetization continued to rapidly improve and user engagement remained incredibly robust. Future growth levers include untapped monetization of Messenger, WhatsApp, and video advertising, along with Virtual Reality. |
| ⬛ | | Amphenol serves a highly fragmented customer base and is diversified with none of its eight segments accounting for more than 20% of revenue. While mobile sales have been weak, other parts of the business have contributed to growth, and margins continued to expand rapidly helped by its acquisition of FCI. |
| ⬛ | | The companies that detracted the most from performance were Tableau Software and online travel site TripAdvisor. |
| ⬛ | | Tableau reported highly disappointing earnings for the third quarter of 2016. Revenue and billings decelerated sharply and the company missed expectations for the first time since the company went public. New customer growth exceeded license growth for the first time as well, indicating the “expand” part of the company’s “land and expand” mantra was running into resistance. |
| ⬛ | | While user engagement decelerated, TripAdvisor remained robust and we believe recent partnerships for its Instant Book feature, including both Expedia and Priceline, bode well for the product’s ultimate success. Driving the stock lower, however, revenue growth decelerated meaningfully due to shifting the business model twice, and margins contracted as expenses ballooned. |
The preceding information is the opinion of portfolio management only through the end of the period of the report as stated on the cover. Any such opinions are subject to change at any time based upon market or other conditions and should not be relied upon as investment advice.
Equity Securities: The market price of equity securities may be adversely affected by financial market, industry, or issuer-specific events. Focus on a particular style or on small or medium-sized companies may enhance that risk.
Limited Number of Investments: Because the Series has a limited number of securities, it may be more susceptible to factors adversely affecting its securities than a less concentrated fund.
Industry/Sector Concentration: A fund that focuses its investments in a particular industry or sector will be more sensitive to conditions that affect that industry or sector than a non-concentrated fund.
Prospectus: For additional information on risks, please see the Series’ prospectus.
| | | | |
| |
| Asset Allocation | |
| |
The following table presents asset allocations within certain sectors and as a percentage of total investments as of December 31, 2016. | |
Information Technology | | | 34 | % |
Consumer Discretionary | | | 27 | |
Health Care | | | 12 | |
Consumer Staples | | | 10 | |
Energy | | | 6 | |
Financials | | | 5 | |
Industrials | | | 4 | |
Materials | | | 2 | |
| | | | | |
Total | | | 100 | % |
| | | | | |
For information regarding the indexes and certain investment terms, see the Key Investment Terms starting on page 2.
7
| | |
| Capital Growth Series (Continued) | | |
| | | | | | | | | | | | |
| Average Annual Total Returns1 for periods ended 12/31/16 | |
| | | |
| | | 1 year | | | 5 years | | | 10 years | |
| Class A at NAV2 | | | –0.86 | % | | | 12.25 | % | | | 5.23 | % |
| S&P 500® Index | | | 11.96 | | | | 14.66 | | | | 6.95 | |
| Russell 1000® Growth Index | | | 7.08 | | | | 14.50 | | | | 8.33 | |
| Series Expense Ratios3: Class A Gross: 1.20%, Net: 1.03%. | |
Returns represent past performance which is no guarantee of future results. The investment return and principal value will fluctuate so that an investor’s shares, when redeemed, may be worth more or less than their original cost. Total return does not reflect expenses associated with the separate account such as the administrative fees, account charges and surrender charges, which if reflected, would reduce total return. Performance figures may reflect fee waivers and/or expense reimbursements. In the absence of fee waivers and/or expense reimbursements, the total return would have been lower. Please visit Virtus.com for performance data current to the most recent month-end.
| 1 | Total returns are historical and include changes in share price and the reinvestment of both dividends and capital gains distributions. |
| 2 | “NAV” (Net Asset Value) total returns do not reflect any fees or expenses associated with the separate insurance accounts. |
| 3 | The expense ratios of the Series, both net and gross, are set forth according to the prospectus for the Series effective April 29, 2016, as supplemented and revised, and may differ from the expense ratios disclosed in the Financial Highlights tables in this report. See the Financial Highlights for more current information. Net Expenses: Expenses reduced by a contractual waiver in effect through April 30, 2017. Gross Expenses: Do not reflect the effect of the contractual waiver. Expense ratios include fees and expenses associated with underlying funds. |
Growth of $10,000 For periods ended 12/31
This chart assumes an initial investment of $10,000 made on December 31, 2006 for Class A shares. Returns shown include the reinvestment of all distributions at net asset value, and the change in share price for the stated period.
The indexes are unmanaged and not available for direct investment; therefore, their performance does not reflect the expenses associated with active management of an actual portfolio.
For information regarding the indexes and certain investment terms, see the Key Investment Terms starting on page 2.
8
| | |
| Enhanced Core Equity Series | | |
Series Summary December 31, 2016 (Unaudited)
Portfolio Manager Commentary by
Rampart Investment Management Company, LLC (“Rampart”)
| ⬛ | | The Series is diversified and has investment objectives of capital appreciation and current income. There is no guarantee that the Series will meet its objectives. |
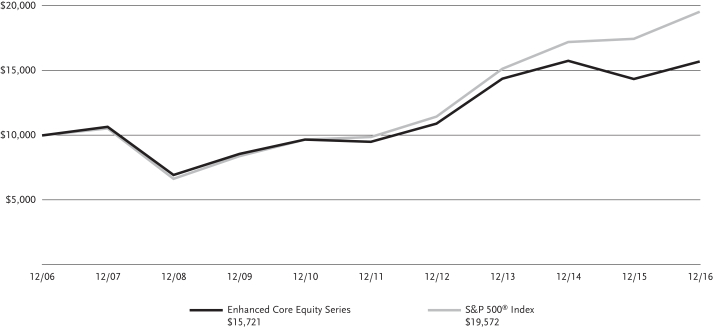
| ⬛ | | For the fiscal year ended December 31, 2016, the Series’ Class A shares at NAV returned 9.41%. For the same period, the S&P 500® Index, which serves as the broad-based and style-specific benchmark index appropriate for comparison, returned 11.96%. |
All performance figures assume reinvestment of distributions and exclude the effect of fees and expenses associated with the variable life insurance or annuity product through which you invest. Past performance is no guarantee of future results, and current performance may be higher or lower than the performance shown above.
Effective September 7, 2016, Rampart Investment Management Company, LLC (“Rampart”) became subadviser of the Series (then named Virtus Growth & Income Series). Effective October 11, 2016, the name of the Series was changed to Virtus Enhanced Core Equity Series. The following commentary includes the views of the previous subadviser, Euclid Advisors LLC, and the current subadviser, Rampart, for the respective periods they managed the Series’ portfolio.
How did the equity markets perform during the Series’ fiscal year?
| ⬛ | | U.S. equity markets enjoyed a relatively low volatility, steady climb higher during 2016. Volatility levels were below long-term historical averages, and the nearly 12% return of the S&P 500® Index was slightly higher than usual. |
| ⬛ | | There were, aside from this relative tranquility, a handful of notable market events during the year. The year started off in historically bad fashion, with the S&P 500® Index down nearly 9% by the middle of January before recovering and then dropping again in the middle of February. Fortunately for investors, the recovery was as intense as the drawdown, and by the middle of March, previous highs had been regained. |
| ⬛ | | The rest of the spring season was relatively uneventful, but by the time early summer arrived, the United Kingdom’s “Brexit” vote to leave the European Union (EU) was impacting markets around the globe. For U.S. investors, the overnight futures market was positively alarming, as S&P 500® Index futures dropped more than 5% over |
| | | the course of just six hours. By the time markets opened in the morning, this damage had been significantly mitigated, and the day after the vote, the market opened less than 3% below its prior close. |
| ⬛ | | While there was additional market damage to come, by the end of the first full week of July, previous market levels were regained. At that point, the U.S. market found a new obsession, the U.S. presidential election. A choppy, sideways market gave way to significant weakness in early November. A pre-election risk flare quickly resolved, leading to a strong, low-volatility, post-election bull market through the end of the year. |
| ⬛ | | Taking a step back, market dynamics over the period, while positive overall, indicated general uncertainty. This sentiment may have been related to lingering central bank intervention, and the relative non-competitiveness of fixed income assets, or perhaps observations of U.S. and global economic strength. In any case, the story for the year was certainly a preference for risk over protection. |
What factors affected the performance of the Series during the fiscal year?
| ⬛ | | During the first quarter of the fiscal year, the Series posted a negative return and underperformed the positive return of the benchmark S&P 500® Index. Security selection was the largest drag on performance, with stock picking particularly weak in the industrials, consumer staples, and financials sectors. Health care and consumer discretionary stocks had a mildly positive affect on performance. During the second quarter, the Series also underperformed. Detracting from performance were the Series’ underweight allocations to the materials, consumer staples, utilities, and energy sectors, and poor stock selection within each of these sectors. In addition, the portfolio’s exposure to industrials was detrimental to performance, both in terms of the sector overweight as well as negative stock selection. Stock selection was weakest in industrials, health care, and consumer discretionary, while the technology stocks provided modest benefit. |
| ⬛ | | During the third quarter, the Series was appointed a new subadviser and began transitioning to a new strategy. Effective September 7, 2016, the Series’ strategy has two main drivers of performance: a trend-based equity component and an income-focused option overlay component. The equity component is intended to capture the momentum |
| | | risk premium, whereby those stocks and sectors that have shown strong near-term performance have a tendency to exhibit continued strength. This performance driver tends to do well when there is clear sector leadership in the market, and the market as a whole has a strong upward or downward trend established. While overall market performance in 2016 was positive, there were few strong trends established, a handful of outsized risk flare-ups, and strong sector leadership was lacking. Given these headwinds, the trend-based equity component of the portfolio detracted 2.44% from performance. |
| ⬛ | | The option overlay component is intended to capture the volatility risk premium. This is a more nuanced technique which seeks to extract value from the difference between the volatility levels at which options are sold and the volatility level that actually occurs in market performance. The Series added the option overlay late in the third quarter, and during that period, the strategy was consistently additive to returns. For the period that the option overlay strategy was active, it added just over 0.50% to the Series’ performance. |
The preceding information is the opinion of portfolio management only through the end of the period of the report as stated on the cover. Any such opinions are subject to change at any time based upon market or other conditions and should not be relied upon as investment advice, and there is no guarantee that market forecasts will be realized.
Equity Securities: The market price of equity securities may be adversely affected by financial market, industry, or issuer-specific events. Focus on a particular style or on small or medium-sized companies may enhance that risk.
Call/Put Spreads: Buying and selling call and put option spreads on the SPX Index risks the loss of the premium when buying, can limit upside participation and increase downside losses.
Portfolio Turnover: The Series’ principal investments strategies will result in a consistently high portfolio turnover rate. A higher portfolio turnover rate may indicate higher transaction costs and may result in higher taxes when fund shares are held in a taxable account.
Fund of Funds: Because the Series can invest in other funds, it indirectly bears its proportionate share of the operating expenses and management fees of the underlying fund(s).
For information regarding the indexes and certain investment terms, see the Key Investment Terms starting on page 2.
9
| | |
| Enhanced Core Equity Series (Continued) | | |
Industry/Sector Concentration: A fund that focuses its investments in a particular industry or sector will be more sensitive to conditions that affect that industry or sector than a non-concentrated fund.
Prospectus: For additional information on risks, please see the Series’ prospectus.
| | | | |
| |
| Asset Allocation | |
| |
The following table presents asset allocations within certain sectors and as a percentage of total investments net of written options as of December 31, 2016. | |
Financials | | | 58 | % |
Energy | | | 16 | |
Materials | | | 10 | |
Industrials | | | 9 | |
Information Technology | | | 3 | |
Consumer Discretionary | | | 2 | |
Health Care | | | 1 | |
Other (includes purchased and written options) | | | 1 | |
| | | | | |
Total | | | 100 | % |
| | | | | |
For information regarding the indexes and certain investment terms, see the Key Investment Terms starting on page 2.
10
| | |
| Enhanced Core Equity Series (Continued) | | |
| | | | | | | | | | | | |
| Average Annual Total Returns1 for periods ended 12/31/16 | |
| | | |
| | | 1 year | | | 5 years | | | 10 years | |
| Class A at NAV2 | | | 9.41 | % | | | 10.58 | % | | | 4.63 | % |
| S&P 500® Index | | | 11.96 | | | | 14.66 | | | | 6.95 | |
| Series Expense Ratios3: Class A Gross: 1.22%, Net: 0.98%. | |
Returns represent past performance which is no guarantee of future results. The investment return and principal value will fluctuate so that an investor’s shares, when redeemed, may be worth more or less than their original cost. Total return does not reflect expenses associated with the separate account such as the administrative fees, account charges and surrender charges, which if reflected, would reduce total return. Performance figures may reflect fee waivers and/or expense reimbursements. In the absence of fee waivers and/or expense reimbursements, the total return would have been lower. Please visit Virtus.com for performance data current to the most recent month-end.
| 1 | Total returns are historical and include changes in share price and the reinvestment of both dividends and capital gains distributions. |
| 2 | “NAV” (Net Asset Value) total returns do not reflect any fees or expenses associated with the separate insurance accounts. |
| 3 | The expense ratios of the Series, both net and gross, are set forth according to the prospectus for the Series effective April 29, 2016, as supplemented and revised, and may differ from the expense ratios disclosed in the Financial Highlights tables in this report. See the Financial Highlights for more current information. Net Expenses: Expenses reduced by a contractual waiver in effect through April 30, 2017. Gross Expenses: Do not reflect the effect of the contractual waiver. Expense ratios include fees and expenses associated with underlying funds. |
Growth of $10,000 For periods ended 12/31
This chart assumes an initial investment of $10,000 made on December 31, 2006 for Class A shares. Returns shown include the reinvestment of all distributions at net asset value, and the change in share price for the stated period.
The index is unmanaged and not available for direct investment; therefore, its performance does not reflect the expenses associated with active management of an actual portfolio.
For information regarding the indexes and certain investment terms, see the Key Investment Terms starting on page 2.
11
Series Summary December 31, 2016 (Unaudited)
Portfolio Manager Commentary by
Virtus Investment Advisers, Inc.
| ⬛ | | The Series is diversified and has an investment objective of long-term capital appreciation. There is no guarantee that the Series will meet its objective. |
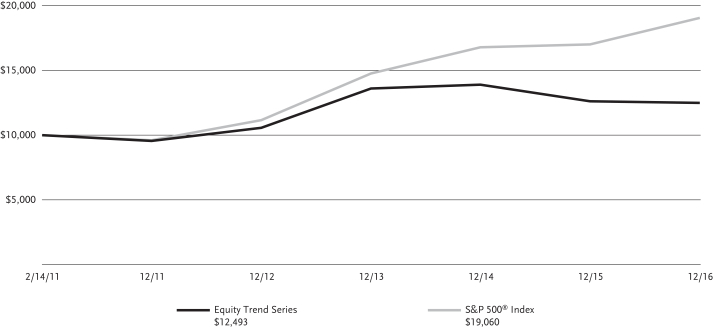
| ⬛ | | For the fiscal year ended December 31, 2016, the Series’ Class A shares at NAV returned -0.97% and Class I shares at NAV returned -0.70%. For the same period, the S&P 500® Index, which serves as the broad-based equity index and style-specific benchmark index appropriate for comparison, returned 11.96%. |
All performance figures assume reinvestment of distributions and exclude the effect of fees and expenses associated with the variable life insurance or annuity product through which you invest. Past performance is no guarantee of future results, and current performance may be higher or lower than the performance shown above.
How did the equity markets perform during the Series’ fiscal year?
| ⬛ | | During 2016, U.S. equity markets enjoyed volatility levels that were below long-term historical averages, and the nearly 12% return of the S&P 500® Index for the year was slightly higher than usual. Aside from this relative tranquility, there were a handful of notable market events. The year started off in historically bad fashion, with the S&P 500® Index down nearly 9% by the middle of January before recovering and then dropping again in the middle of February. Fortunately, for investors, the recovery was as intense as the drawdown, and by the middle of March, previous market highs had been regained. |
| ⬛ | | The rest of the spring season was relatively uneventful, but by the time early summer arrived, the United Kingdom’s “Brexit” vote to leave the European Union (EU) was impacting markets around the globe. For U.S. investors, the overnight futures market was positively alarming, as S&P 500® Index futures dropped more than 5% over the course of just six hours. By the time markets opened in the morning, this damage had been significantly mitigated, and the day after the vote, the market opened less than 3% below its prior close. |
| ⬛ | | While there was additional market damage to come, by the end of the first full week of July, previous market levels were regained. At that point, the U.S. market found a new obsession, the U.S. presidential election. A choppy, sideways market |
| | | gave way to significant weakness in early November. A pre-election risk flare quickly resolved, leading to a strong, low-volatility, post-election bull market through the end of the year. |
| ⬛ | | Taking a step back, market dynamics over the period, while positive overall, indicated general uncertainty. This sentiment may have been related to lingering central bank intervention, and the relative non-competitiveness of fixed income assets, or perhaps observations of U.S. and global economic strength. In any case, a preference for risk over protection was a central market theme for the year. |
What factors affected the Series’ performance during the fiscal year?
| ⬛ | | The Series’ strategy has two main drivers of performance: a trend-based equity component, and a risk-control mechanism that adjusts the cash level in times of market stress. In 2016, each of these components experienced challenges. |
| ⬛ | | The equity component is intended to capture the momentum (or trend) risk premium, whereby those stocks and sectors that have shown strong near-term performance have a tendency to exhibit continued strength. This performance driver tends to do well when there is clear sector leadership in the market and the market as a whole has a strong upward or downward trend established. While overall market performance for 2016 was strong, there were few strong trends established, and there were a handful of outsized risk flare-ups. Sector leadership, in particular, was extremely weak. Given the lack of clear sector trends in the market to follow, the trend-based equity component of the portfolio struggled during the year, causing the bulk of the Series’ underperformance. |
| ⬛ | | The Series’ risk-control mechanism is a unique feature that enables the portfolio to add cash (up to 100%) as a defensive measure in times of market stress, and thus can lead to outperformance when markets deteriorate. In January 2016, the severe market drop led the Series to adopt a large cash allocation, with the portfolio moving to nearly two-thirds of risk-free assets as the market fell. Unfortunately, while the subsequent rebound was a relief for fully-invested long investors, the portfolio’s low equity levels served to lock in the downside losses. As a result, the severity of both the market decline (the worst early January in stock market history) and the sharp recovery caused the risk-control mechanism to detract from the Series’ performance in the early part of the year. |
The preceding information is the opinion of portfolio management only through the end of the period of the report as stated on the cover. Any such opinions are subject to change at any time based upon market or other conditions and should not be relied upon as investment advice. Past performance is no guarantee of future results, and there is no guarantee that market forecasts will be realized.
Equity Securities: The market price of equity securities may be adversely affected by financial market, industry, or issuer-specific events. Focus on a particular style or on small or medium-sized companies may enhance that risk.
Industry/Sector Concentration: A fund that focuses its investments in a particular industry or sector will be more sensitive to conditions that affect that industry or sector than a non-concentrated fund.
Allocation: The Series’ exposure to different asset classes may not be optimal for market conditions at a given time. Asset allocation does not guarantee a profit or protect against a loss in declining markets.
Prospectus: For additional information on risks, please see the Series’ prospectus.
| | | | |
| |
| Asset Allocation | |
| |
The following table presents asset allocations within certain sectors and as a percentage of total investments as of December 31, 2016. | |
Consumer Discretionary | | | 28 | % |
Industrials | | | 16 | |
Information Technology | | | 15 | |
Financials | | | 10 | |
Materials | | | 10 | |
Consumer Staples | | | 8 | |
Health Care | | | 5 | |
Other | | | 8 | |
| | | | | |
Total | | | 100 | % |
| | | | | |
For information regarding the indexes and certain investment terms, see the Key Investment Terms starting on page 2.
12
| | |
| Equity Trend Series (Continued) | | |
| | | | | | | | | | | | | | | | |
| Average Annual Total Returns1 for periods ended 12/31/16 | | | | | | | | | | |
| | | | |
| | | 1 year | | | 5 years | | | Since
Inception | | | Inception
Date | |
| Class A at NAV2 | | | –0.97 | % | | | 5.51 | % | | | 3.86 | % | | | 2/14/11 | |
| Class I at NAV2 | | | –0.70 | | | | — | | | | 1.62 | | | | 4/30/13 | |
| S&P 500® Index | | | 11.96 | | | | 14.66 | | | | —4 | | | | — | |
| Series Expense Ratios3: Class A 1.73%; Class I 1.48%. | |
Returns represent past performance which is no guarantee of future results. The investment return and principal value will fluctuate so that an investor’s shares, when redeemed, may be worth more or less than their original cost. Total return does not reflect expenses associated with the separate account such as the administrative fees, account charges and surrender charges, which if reflected, would reduce total return. Performance figures may reflect fee waivers and/or expense reimbursements. In the absence of fee waivers and/or expense reimbursements, the total return would have been lower. Please visit Virtus.com for performance data current to the most recent month-end.
| 1 | Total returns are historical and include changes in share price and the reinvestment of both dividends and capital gains distributions. |
| 2 | “NAV” (Net Asset Value) total returns do not reflect any fees or expenses associated with the separate insurance products. |
| 3 | The expense ratios of the Series are set forth according to the prospectus for the Series effective April 29, 2016, as supplemented and revised, and may differ from the expense ratios disclosed in the Financial Highlights tables in this report. See the Financial Highlights for more current information. Expense ratios include fees and expenses associated with underlying funds. |
| 4 | The index returned 11.59% for Class A shares and 11.99% for Class I shares since the inception date of the respective share classes. |
Growth of $10,000 For periods ended 12/31
This chart assumes an initial investment of $10,000 made on February 14, 2011 (inception date of the Class A shares). Returns shown include the reinvestment of all distributions at net asset value, and the change in share price for the stated period.
The index is unmanaged and not available for direct investment; therefore, its performance does not reflect the expenses associated with active management of an actual portfolio.
For information regarding the indexes and certain investment terms, see the Key Investment Terms starting on page 2.
13
Series Summary December 31, 2016 (Unaudited)
Portfolio Manager Commentary by
Duff & Phelps Investment Management Co. (“Duff & Phelps”)
| ⬛ | | The Series is diversified and has an investment objective of high total return consistent with reasonable risk. There is no guarantee that the Series will meet its objective. |
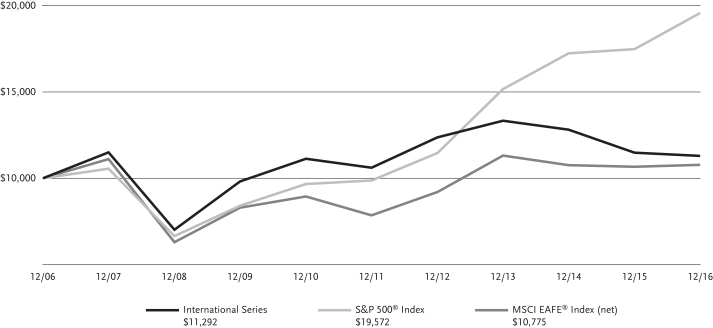
| ⬛ | | For the fiscal year ended December 31, 2016, the Series’ Class A shares at NAV returned -1.61% and Class I shares at NAV returned -1.28%. For the same period, the S&P 500® Index, a broad-based equity index, returned 11.96% and the MSCI EAFE® Index (net), the Series’ style-specific benchmark appropriate for comparison, returned 1.00%. |
All performance figures assume reinvestment of distributions and exclude the effect of fees and expenses associated with the variable life insurance or annuity product through which you invest. Past performance is no guarantee of future results, and current performance may be higher or lower than the performance shown above.
How did the international equity markets perform during the Series’ fiscal year?
| ⬛ | | International equity markets proved to be resilient, as represented by the 1.00% return of the MSCI EAFE® Index (net) for the 12 months. Markets weathered not only a rocky start to the year that was sparked by China growth fears and dramatic oil price declines, but also a steady stream of global electoral surprises (most notably the United Kingdom’s (UK) Brexit vote to leave the European Union (EU), and the U.S. presidential election results), populist movements, geopolitical events, and positive but not particularly robust GDP growth trends. This result stands in contrast to the previous year, where most markets suffered losses of varying degrees. |
| ⬛ | | Over the year, the winds of change clearly shifted the focus of economic policy in the U.S. from monetary toward fiscal. It remains to be seen whether the EU, U.K., and Japan have the ability and desire to pivot in this fashion. A global decoupling of policy of this kind has not been seen since pre-2008. Policy decoupling, combined with global growth, led to a major shift toward cyclical stocks and a selloff in U.S. Treasuries, pushing the yield on the 10-year Treasury note to 2.45% by year-end from 1.8% on November 7, 2016, the day before the U.S. election. |
What factors affected the Series’ performance during the fiscal year?
| ⬛ | | Both sector selection and security selection detracted from the Series’ performance for the fiscal year, with security selection having the greater impact. On a sector performance basis, seven of the eleven sectors posted positive returns, however, poor performance of the four remaining sectors pulled the Series into negative territory for the year. |
| ⬛ | | The Series’ health care holdings had a challenging year (particularly Valeant Pharmaceuticals and Allergan), detracting 5.43% for the year. Utilities started their decline in the second quarter and after a particularly difficult fourth quarter, posted a -25.2% return, detracting 0.68% from the Series’ performance for the year. Investments in the real estate sector detracted 0.54%, due mostly to a poor fourth quarter showing. Even though financials experienced a mid-year turnaround, the sector still detracted from results and was down 1.77% for the year. |
| ⬛ | | On the positive side, the Series’ energy investments posted a gain of 1.38%, and an impressive 24.5% return for the year for the sector. The allocation to consumer staples contributed 1.65% after giving back some gains in the fourth quarter. Technology and industrials were positive contributors, up a little over 1.00%, and consumer discretionary positively contributed 0.28% for the year. Finally, materials and telecommunication both ended the year with modest absolute returns of 4.50% and 1.20%, adding less than 1.00% to the portfolio, respectively. |
| ⬛ | | Derivatives made a positive contribution to the Series’ performance. Specifically, a Japanese yen short forward put on at the beginning of December added 0.28% to total return as the U.S. dollar continued to strengthen. |
The preceding information is the opinion of portfolio management only through the end of the period of the report as stated on the cover. Any such opinions are subject to change at any time based upon market or other conditions and should not be relied upon as investment advice.
Equity Securities: The market price of equity securities may be adversely affected by financial market, industry, or issuer-specific events. Focus on a particular style or on small or medium-sized companies may enhance that risk.
Foreign & Emerging Markets: Investing internationally, especially in emerging markets, involves additional risks such as currency, political, accounting, economic, and market risk.
Derivatives: Investments in derivatives such as futures, options, forwards, and swaps may increase volatility or cause a loss greater than the principal investment.
Prospectus: For additional information on risks, please see the Series’ prospectus.
| | | | |
| |
| Asset Allocation | |
| |
The following table presents asset allocations within certain sectors and as a percentage of total investments as of December 31, 2016. | |
Consumer Discretionary | | | 17 | % |
Financials | | | 16 | |
Industrials | | | 16 | |
Energy | | | 9 | |
Information Technology | | | 8 | |
Health Care | | | 8 | |
Consumer Staples | | | 8 | |
Other (includes short-term investments) | | | 18 | |
| | | | | |
Total | | | 100 | % |
| | | | | |
For information regarding the indexes and certain investment terms, see the Key Investment Terms starting on page 2.
14
| | |
| International Series (Continued) | | |
| | | | | | | | | | | | | | | | | | | | |
| Average Annual Total Returns1 for periods ended 12/31/16 | | | | | | | |
| | | | | |
| | | 1 year | | | 5 years | | | 10 years | | | Since
Inception | | | Inception
Date | |
| Class A at NAV2 | | | –1.61 | % | | | 1.23 | % | | | 1.22 | % | | | — | | | | — | |
| Class I at NAV2 | | | –1.28 | | | | — | | | | — | | | | –3.94 | % | | | 4/30/13 | |
| S&P 500® Index | | | 11.96 | | | | 14.66 | | | | 6.95 | | | | 11.99 | 4 | | | — | |
| MSCI EAFE® Index (net) | | | 1.00 | | | | 6.53 | | | | 0.75 | | | | 1.53 | 4 | | | — | |
| Series Expense Ratios3: Class A Gross: 1.29%, Net: 1.18%; Class I Gross: 1.04%, Net: 0.93%. | | | | | | | | | |
Returns represent past performance which is no guarantee of future results. The investment return and principal value will fluctuate so that an investor’s shares, when redeemed, may be worth more or less than their original cost. Total return does not reflect expenses associated with the separate account such as the administrative fees, account charges and surrender charges, which if reflected, would reduce total return. Performance figures may reflect fee waivers and/or expense reimbursements. In the absence of fee waivers and/or expense reimbursements, the total return would have been lower. Please visit Virtus.com for performance data current to the most recent month-end.
| 1 | Total returns are historical and include changes in share price and the reinvestment of both dividends and capital gains distributions. |
| 2 | “NAV” (Net Asset Value) total returns do not reflect any fees or expenses associated with the separate insurance accounts. |
| 3 | The expense ratios of the Series, both net and gross, are set forth according to the prospectus for the Series effective April 29, 2016, as supplemented and revised, and may differ from the expense ratios disclosed in the Financial Highlights tables in this report. See the Financial Highlights for more current information. The Advisor contractually agreed to limit the Series’ expenses through April 30, 2017. Gross Expenses: Do not reflect the effect of the contractual waiver. Expense ratios include fees and expenses associated with underlying funds. |
| 4 | The since inception index returns are from the inception date of Class I shares. |
Growth of $10,000 For periods ended 12/31
This chart assumes an initial investment of $10,000 made on December 31, 2006 for Class A shares. Returns shown include the reinvestment of all distributions at net asset value, and the change in share price for the stated period.
The indexes are unmanaged and not available for direct investment; therefore, their performance does not reflect the expenses associated with active management of an actual portfolio.
For information regarding the indexes and certain investment terms, see the Key Investment Terms starting on page 2.
15
| | |
| Multi-Sector Fixed Income Series | | |
Series Summary December 31, 2016 (Unaudited)
Portfolio Manager Commentary by
Newfleet Asset Management, LLC
| ⬛ | | The Series is diversified and has an investment objective of long-term total return. There is no guarantee that the Series will meet its objective. |
| ⬛ | | For the fiscal year ended December 31, 2016, the Series’ Class A shares at NAV returned 9.29% and Class I shares at NAV returned 9.58%*. For the same period, the Bloomberg Barclays U.S. Aggregate Bond Index, which serves as the broad-based and style-specific benchmark index appropriate for comparison, returned 2.65%. |
* See Footnote 5 on page 17.
All performance figures assume reinvestment of distributions and exclude the effect of fees and expenses associated with the variable life insurance or annuity product through which you invest. Past performance is no guarantee of future results, and current performance may be higher or lower than the performance shown above.
How did the markets perform during the Series’ fiscal year?
| ⬛ | | Most fixed income spread sectors outperformed U.S. Treasuries during the fiscal year. The Federal Reserve’s (“the Fed”) dovish stance in mid-February sparked a rally that turned around a volatile time period that began with fresh concerns over China, plummeting oil prices, and fears that the Fed had raised interest rates too soon. |
| ⬛ | | Late in June volatility returned briefly with fallout from the United Kingdom’s decision to leave the European Union (“Brexit”). Bond yields in the U.S., Japan, and across Europe fell to historic lows in early July as investors fled to the safety of bonds on global growth concerns fueled by the U.K.’s June 23 decision. Markets recovered rather quickly however from the initial shock. Easing by major central banks and a weaker U.S. dollar helped to improve global risk sentiment and stabilize markets. |
| ⬛ | | September brought heightened concerns over the ability and willingness of central banks to fight chronic low inflation and weak growth as the decision by the European Central Bank (ECB) to leave interest rates and its stimulus program unchanged was a precipitating factor in a widespread market sell-off, reinforced by fears that the Bank of Japan (BOJ) had run out of quantitative easing tools. Hawkish signals from the Fed added to the volatility. The BOJ subsequently decided not to change rates but to shift its focus to stabilizing rates for longer maturity government bonds. This bolstered market sentiment, as did the Fed’s eventual |
| | | decision to stand pat at its September meeting and not raise rates. |
| ⬛ | | The unexpected election of Donald Trump as the 45th U.S. president sparked another bout of volatility in early November. President-elect Trump’s campaign, which focused on immigration, trade, tax cuts, and infrastructure spending, was largely perceived by the market as supportive of faster growth. Inflation expectations increased, causing the yield on the 10-year Treasury to rise 0.52% by the end of November. Also in late November, oil prices benefited from OPEC’s decision to cut oil production for the first time in eight years. In December, in a largely anticipated move, the Federal Reserve raised its target rate 25 basis points to a range of 0.5% to 0.75% at its final meeting of 2016. |
| ⬛ | | Over the fiscal year, yields increased for U.S. Treasuries across maturities, more so for shorter term Treasuries. |
What factors affected the Series’ performance during the fiscal year?
| ⬛ | | The underperformance of U.S. Treasuries relative to most fixed income spread sectors was the key driver of the Series outperformance for the fiscal year. |
| ⬛ | | The Series’ allocation to high yield corporate bonds, and issue selection within emerging markets high yield bonds and corporate high quality bonds were the largest positive contributors to performance for the fiscal year. |
| ⬛ | | While exposure to high yield corporate bonds contributed to the Series’ overall performance, our bias toward higher quality securities within the sector detracted from returns during a period in which lower quality outperformed. |
The preceding information is the opinion of portfolio management only through the end of the period of the report as stated on the cover. Any such opinions are subject to change at any time based upon market or other conditions and should not be relied upon as investment advice.
Credit & Interest: Debt securities are subject to various risks, the most prominent of which are credit and interest rate risk. The issuer of a debt security may fail to make interest and/or principal payments. Values of debt securities may rise or fall in response to changes in interest rates, and this risk may be enhanced with longer-term maturities.
Foreign & Emerging Markets: Investing internationally, especially in emerging markets, involves additional risks such as currency, political, accounting, economic, and market risk.
High Yield-High Risk Fixed Income Securities: There is a greater level of credit risk and price volatility involved with high yield securities than investment grade securities.
ABS/MBS: Changes in interest rates can cause both extension and prepayment risks for asset- and mortgage-backed securities. These securities are also subject to risks associated with the repayment of underlying collateral.
Bank Loans: Loans may be unsecured or not fully collateralized, may be subject to restrictions on resale and/or trade infrequently on the secondary market. Loans can carry significant credit and call risk, can be difficult to value and have longer settlement times than other investments, which can make loans relatively illiquid at times.
Prospectus: For additional information on risks, please see the Series’ prospectus.
| | | | | | | | |
| |
| Asset Allocation | |
| |
The following table presents asset allocations within certain sectors and as a percentage of total investments as of December 31, 2016. | |
Corporate Bonds and Notes | | | | | | | 52 | % |
Financials | | | 15 | % | | | | |
Energy | | | 13 | | | | | |
Consumer Discretionary | | | 5 | | | | | |
Total of all others | | | 19 | | | | | |
Mortgage-Backed Securities | | | | | | | 19 | |
Foreign Government Securities | | | | | | | 10 | |
Loan Agreements | | | | | | | 8 | |
Asset-Backed Securities | | | | | | | 4 | |
Preferred Stocks | | | | | | | 4 | |
Other | | | | | | | 3 | |
| | | | | | | | | |
Total | | | | | | | 100 | % |
| | | | | | | | | |
For information regarding the indexes and certain investment terms, see the Key Investment Terms starting on page 2.
16
| | |
| Multi-Sector Fixed Income Series (Continued) | | |
| | | | | | | | | | | | | | | | | | | | |
| Average Annual Total Returns1 for periods ended 12/31/16 | | | | | | | | | | |
| | | | | |
| | | 1 year | | | 5 years | | | 10 years | | | Since
Inception | | | Inception
Date | |
| Class A at NAV2 | | | 9.29 | % | | | 5.22 | % | | | 6.12 | % | | | — | | | | — | |
| Class I at NAV2,5 | | | 9.58 | | | | — | | | | — | | | | 2.59 | % | | | 4/30/13 | |
| Bloomberg Barclays U.S. Aggregate Bond Index | | | 2.65 | | | | 2.23 | | | | 4.35 | | | | 1.66 | 4 | | | — | |
| Series Expense Ratios3: Class A Gross: 1.03%, Net: 0.95%; Class I Gross: 0.78%, Net: 0.70%. | | | | | | | | | |
Returns represent past performance which is no guarantee of future results. The investment return and principal value will fluctuate so that an investor’s shares, when redeemed, may be worth more or less than their original cost. Total return does not reflect expenses associated with the separate account such as the administrative fees, account charges and surrender charges, which if reflected, would reduce total return. Performance figures may reflect fee waivers and/or expense reimbursements. In the absence of fee waivers and/or expense reimbursements, the total return would have been lower. Please visit Virtus.com for performance data current to the most recent month-end.
| 1 | Total returns are historical and include changes in share price and the reinvestment of both dividends and capital gains distributions. |
| 2 | “NAV” (Net Asset Value) total returns do not reflect any fees or expenses associated with the separate insurance products. |
| 3 | The expense ratios of the Series, both net and gross, are set forth according to the prospectus for the Series effective April 29, 2016, as supplemented and revised, and may differ from the expense ratios disclosed in the Financial Highlights tables in this report. See the Financial Highlights for more current information. The Advisor contractually agreed to limit the Series’ expenses through April 30, 2017. Gross Expenses: Do not reflect the effect of the contractual waiver. Expense ratios include fees and expenses associated with underlying funds. |
| 4 | The since inception index returns are from the inception date of Class I shares. |
| 5 | Total Return for the report period presented in the table differs from the return in the Financial Highlights. The total return presented in the above table is calculated based on the NAV at which shareholder transactions were processed. The total return presented in the Financial Highlights section of the report is calculated in the same manner, but also takes into account certain adjustments that are necessary under generally accepted accounting principals required in the annual report and semiannual report. |
Growth of $10,000 For periods ended 12/31
This chart assumes an initial investment of $10,000 made on December 31, 2006 for Class A shares. Returns shown include the reinvestment of all distributions at net asset value, and the change in share price for the stated period.
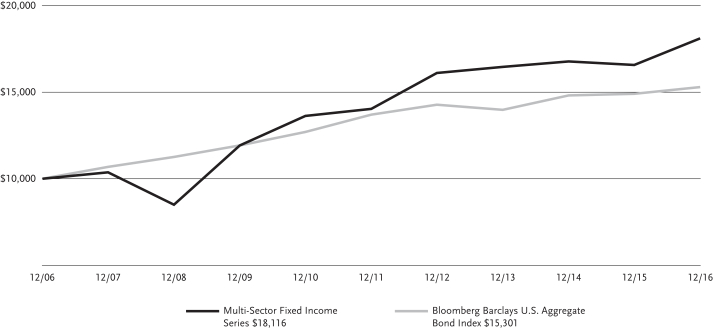
The index is unmanaged and not available for direct investment; therefore, its performance does not reflect the expenses associated with active management of an actual portfolio.
For information regarding the indexes and certain investment terms, see the Key Investment Terms starting on page 2.
17
| | |
| Real Estate Securities Series | | |
Series Summary December 31, 2016 (Unaudited)
Portfolio Manager Commentary by
Duff & Phelps Investment Management Co.
| ⬛ | | The Series is diversified and has investment objectives of capital appreciation and income with approximately equal emphasis. There is no guarantee that the Series will meet its objectives. |
| ⬛ | | For the fiscal year ended December 31, 2016, the Series’ Class A shares at NAV returned 6.82% and Class I shares at NAV returned 7.10%. For the same period, the S&P 500® Index, a broad-based equity index, returned 11.96% and the FTSE NAREIT Equity REITs Index, the Series’ style-specific benchmark appropriate for comparison, returned 8.52%. |
All performance figures assume reinvestment of distributions and exclude the effect of fees and expenses associated with the variable life insurance or annuity product through which you invest. Past performance is no guarantee of future results, and current performance may be higher or lower than the performance shown above.
How did the equity markets perform during the Series’ fiscal year?
| ⬛ | | Equity markets, as measured by the S&P 500® Index, were up 11.96% during the Series’ fiscal year, rebounding from a post-Brexit dip and a later fade into the U.S. Presidential election. |
| ⬛ | | U.S. REITs put up solid performance of 8.52% as measured by the Series’ benchmark, the FTSE NAREIT Equity REITs Index. Cash flow and dividend growth were supportive as were modifications to FIRPTA (Foreign Investment in Real Property Tax Act), and listed real estate being elevated to a standalone sector in the Global Classification System Standard (GICS®) from its previous sub-sector status within the financials sector. Interest rate volatility and a shift to elevated growth expectations post the U.S. Presidential election impacted intra-year returns and improved valuations. |
| ⬛ | | The results of the U.S. Presidential and Congressional elections were clearly the defining events of the year. Defying the odds and most political prognosticators and market strategists, Donald Trump was elected President of the United States and global equity markets rallied. Much like with the Brexit vote in the United Kingdom, prominent forecasters and news outlets missed the outcome as none seemed to call for the House, Senate, and White House to end up in control of the Republican Party under President Trump. The Republican Party’s strong results surprised the market and drove a global equity rally as the potential for more market-friendly policies and higher economic |
| | | growth were taken into account. Some of candidate Trump’s less market-friendly policy prescriptions were dismissed for the time being. |
| ⬛ | | As market expectations for global growth and inflation increased, interest rates leapt higher. This had a knock-on effect on the U.S. dollar and financial-oriented equities, which were turbo-charged into year-end. Financials led the post-election rally in the S&P 500® Index, as the possibilities of a friendlier regulatory environment and rising net interest margins were embraced. Oil prices also resumed their rally following production agreements between OPEC and non-OPEC members. |
| ⬛ | | On the global monetary policy front, the U.S. FOMC increased the federal funds target rate by 25 basis points (in this context, a 100 basis point increase would raise the rate by 1.00%) as was widely expected and signaled that several more rate increases are likely in 2017. The European Central Bank (ECB) extended its quantitative easing program of repurchasing government bonds past its previous March 2017 expiration until the end of 2017. However, the ECB also expressed its intention beginning in April 2017 to reduce the targeted asset purchase amount by 20 billion euros to 60 billion euros per month. |
| ⬛ | | Interestingly enough and supportive of how REITs can generate positive returns in environments when interest rates rise, REITs put up a 6.9% return from the day the 10-year U.S. Treasury hit an intra-month low yield of 1.78% on November 4, just days before the election, through the end of the year. During the same window the 10-year Treasury yield rose to 2.44%. In comparison to the 6.9% return of REITs in this intra-quarter window, the S&P 500® Index put up a 7.8% return. (Source of REIT returns: FTSE NAREIT Equity REITs Index.) |
What factors affected the Series’ performance during the fiscal year?
| ⬛ | | For the fiscal year, the Series benefited from security selection, yet was negatively impacted by property sector allocation. Over the year the Series lagged its style-specific benchmark. |
| ⬛ | | Within the U.S., the industrial, data centers, single family homes, and lodging property sectors demonstrated the best total returns over the last twelve months. Self-storage, regional malls, shopping centers, and apartments were the most significant property sector laggards. |
| ⬛ | | During the fiscal year, the most significant individual positive contributor to the Series’ relative performance was our overweight allocation to |
| | | the industrial sector, followed by our underweight allocation and security selection within regional malls, and our security selection and underweight to the diversified property sector. |
| ⬛ | | The most significant detractor from relative performance during the Series’ fiscal year was our underweight allocation and security selection within the lodging sector, our allocation and security selection within apartments, our underweight allocation and security selection to freestanding retail, and our zero weight to the specialty property sector. Lodging lagged into the election and then had very strong performance afterwards, as did prison REITs within the specialty sector. The opposite was the case for freestanding retail, whose post-election underperformance was modest compared to its outperformance into the election. |
The preceding information is the opinion of portfolio management only through the end of the period of the report as stated on the cover. Any such opinions are subject to change at any time based upon market or other conditions and should not be relied upon as investment advice.
Equity Securities: The market price of equity securities may be adversely affected by financial market, industry, or issuer-specific events. Focus on a particular style or on small or medium-sized companies may enhance that risk.
Industry/Sector Concentration: A fund that focuses its investments in a particular industry or sector will be more sensitive to conditions that affect that industry or sector than a non-concentrated fund.
Real Estate: The Series may be negatively affected by factors specific to the real estate market, including interest rates, leverage, property, and management.
Prospectus: For additional information on risks, please see the Series’ prospectus.
| | | | |
| |
| Asset Allocation | |
| |
The following table presents asset allocations within certain sectors and as a percentage of total investments as of December 31, 2016. | |
Office | | | 15 | % |
Apartments | | | 13 | |
Data Centers | | | 11 | |
Shopping Centers | | | 11 | |
Industrials | | | 11 | |
Self Storage | | | 9 | |
Regional Malls | | | 8 | |
Healthcare | | | 6 | |
Other (includes short-term investments) | | | 16 | |
| | | | | |
Total | | | 100 | % |
| | | | | |
For information regarding the indexes and certain investment terms, see the Key Investment Terms starting on page 2.
18
| | |
| Real Estate Securities Series (Continued) | | |
| | | | | | | | | | | | | | | | | | | | |
| Average Annual Total Returns1 for periods ended 12/31/16 | | | | | | | | | | |
| | | | | |
| | | 1 year | | | 5 years | | | 10 years | | | Since
Inception | | | Inception
Date | |
| Class A at NAV2 | | | 6.82 | % | | | 11.18 | % | | | 5.08 | % | | | — | | | | — | |
| Class I at NAV2 | | | 7.10 | | | | — | | | | — | | | | 7.38 | % | | | 4/30/13 | |
| S&P 500® Index | | | 11.96 | | | | 14.66 | | | | 6.95 | | | | 11.99 | 4 | | | — | |
| FTSE NAREIT Equity REITs Index | | | 8.52 | | | | 12.01 | | | | 5.08 | | | | 7.27 | 4 | | | — | |
| Series Expense Ratios3: Class A Gross: 1.27%, Net: 1.16%; Class I Gross: 1.02%, Net 0.91%. | | | | | |
Returns represent past performance which is no guarantee of future results. The investment return and principal value will fluctuate so that an investor’s shares, when redeemed, may be worth more or less than their original cost. Total return does not reflect expenses associated with the separate account such as the administrative fees, account charges and surrender charges, which if reflected, would reduce total return. Performance figures may reflect fee waivers and/or expense reimbursements. In the absence of fee waivers and/or expense reimbursements, the total return would have been lower. Please visit Virtus.com for performance data current to the most recent month-end.
| 1 | Total returns are historical and include changes in share price and the reinvestment of both dividends and capital gains distributions. |
| 2 | “NAV” (Net Asset Value) total returns do not reflect any fees or expenses associated with the separate insurance products. |
| 3 | The expense ratios of the Series, both net and gross, are set forth according to the prospectus for the Series effective April 29, 2016, as supplemented and revised, and may differ from the expense ratios disclosed in the Financial Highlights tables in this report. See the Financial Highlights for more current information. Net Expenses: Expenses reduced by a contractual waiver in effect through April 30, 2017. Gross Expenses: Do not reflect the effect of the contractual waiver. Expense ratios include fees and expenses associated with underlying funds. |
| 4 | The since inception index returns are from the inception date of Class I shares. |
Growth of $10,000 For periods ended 12/31
This chart assumes an initial investment of $10,000 made on December 31, 2006 for Class A shares. Returns shown include the reinvestment of all distributions at net asset value, and the change in share price for the stated period.
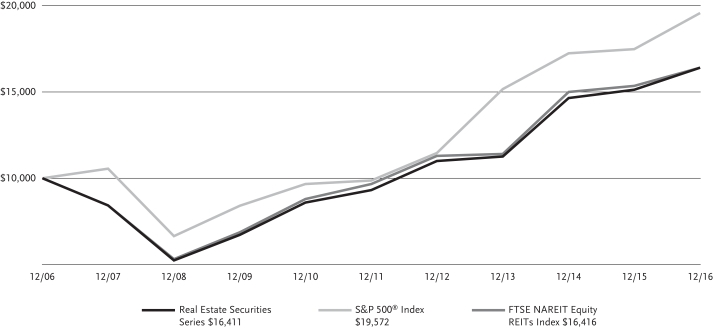
The indexes are unmanaged and not available for direct investment; therefore, their performance does not reflect the expenses associated with active management of an actual portfolio.
For information regarding the indexes and certain investment terms, see the Key Investment Terms starting on page 2.
19
Series Summary December 31, 2016 (Unaudited)
Portfolio Manager Commentary by
Kayne Anderson Rudnick Investment Management, LLC
| ⬛ | | The Series is diversified and has an investment objective of long-term capital growth. There is no guarantee that the Series will meet its objective. |
| ⬛ | | For the fiscal year ended December 31, 2016, the Series’ Class A shares at NAV returned 25.92% and Class I shares at NAV returned 26.25%. For the same period, the S&P 500® Index, a broad-based equity index, returned 11.96% and the Russell 2000® Growth Index, the Series’ style-specific benchmark appropriate for comparison, returned 11.32%. |
All performance figures assume reinvestment of distributions and exclude the effect of fees and expenses associated with the variable life insurance or annuity product through which you invest. Past performance is no guarantee of future results, and current performance may be higher or lower than the performance shown above.
How did the markets perform during the Series’ fiscal year?
| ⬛ | | The S&P 500® Index, a broad measure of large-cap stocks, rose nearly 12% in 2016, and small-cap stocks registered an even more impressive gain, advancing slightly more than 21%, as measured by the Russell 2000® Index. The Russell 2000® Growth Index, which measures small-cap growth stocks, gained 3.57% during the fourth quarter of 2016, bringing its return for the year to 11.32%. |
| ⬛ | | The U.S. presidential election in November was one of the most significant economic events of 2016, as it turned some market sector losers into winners, and vice versa. In the Russell 2000® Growth Index, utilities (+10.50%), financial services (+10.42%), and producer durables (+9.94%) all increased sharply during the fourth quarter. Other sectors, including health care (-6.66%) and energy (-1.21%), lagged in the quarter. In addition, deep value strategies strongly outperformed growth and core strategies. |
| ⬛ | | Investors’ risk appetite changed dramatically over the course of 2016. For example, the first half of the year was marked by disappointing economic growth, falling bond yields, and defensive fixed income and equity positioning on the part of investors. After two years of dramatic declines, many commodities – particularly crude oil (up 45% for the year) – finally found a bottom, and investors adopted a much more aggressive risk appetite as the economy started to stabilize over |
| | | the summer and improve into the fall. In November, then President-elect Trump’s pro-business, tax-cutting, and fewer regulatory burdens agenda accentuated the outlook that economic growth would continue to accelerate in 2017. |
What factors affected the Series’ performance during the fiscal year?
| ⬛ | | The Series outperformed the Russell 2000® Growth Index for the year. From a sector perspective, performance was primarily driven by positive stock selection in the consumer discretionary sector and an underweight and positive stock selection in the health care sector. Performance was hurt by negative stock selection in the consumer staples sector. |
| ⬛ | | From an individual stock perspective, the companies that contributed the most to performance were retail chain store Ollie’s Bargain Outlet Holdings and software and service provider Aspen Technology. |
| ⬛ | | Over the last year, Ollie’s continued to deliver healthy compensation, revenue, and profit growth despite a challenging retail environment. The company opened stores at a measured pace, with initial productivity running ahead of expectations, and its competitive position, vis-à-vis its ability to secure merchandise at compelling pricing, strengthened. |
| ⬛ | | Aspen Technology’s revenue declined just 0.4% year-over-year in its worst quarter. This speaks to the mission-critical nature of the software, helped by long-term contracts. As oil stabilized, business conditions improved for Aspen. |
| ⬛ | | The companies that detracted the most from performance were Autohome, an automobile website for consumers in China, and Abaxis, which manufactures portable blood analysis systems used in a broad range of medical specialties in human and veterinary patient care. |
| ⬛ | | Autohome’s shares were under pressure for the past year due to investments in a new car transaction business at the expense of near-term margins and management upheaval. |
| ⬛ | | Abaxis reported flat overall revenues versus the previous year, with the medical side providing most of the disappointment. Veterinary revenues grew 6%, while the medical market fell 21%. |
The preceding information is the opinion of portfolio management only through the end of the period of the report as stated on the cover. Any such opinions are subject to change at any time based upon market or other conditions and should not be relied upon as investment advice.
Equity Securities: The market price of equity securities may be adversely affected by financial market, industry, or issuer-specific events. Focus on a particular style or on small or medium-sized companies may enhance that risk.
Limited Number of Investments: Because the Series has a limited number of securities, it may be more susceptible to factors adversely affecting its securities than a less concentrated fund.
Industry/Sector Concentration: A fund that focuses its investments in a particular industry or sector will be more sensitive to conditions that affect that industry or sector than a non-concentrated fund.
Prospectus: For additional information on risks, please see the Series’ prospectus.
| | | | |
| |
| Asset Allocation | |
| |
The following table presents asset allocations within certain sectors and as a percentage of total investments as of December 31, 2016. | |
Information Technology | | | 32 | % |
Industrials | | | 22 | |
Consumer Discretionary | | | 15 | |
Financials | | | 10 | |
Health Care | | | 10 | |
Consumer Staples | | | 8 | |
Materials | | | 2 | |
Short-Term Investments | | | 1 | |
| | | | | |
Total | | | 100 | % |
| | | | | |
For information regarding the indexes and certain investment terms, see the Key Investment Terms starting on page 2.
20
| | |
| Small-Cap Growth Series (Continued) | | |
| | | | | | | | | | | | | | | | | | | | |
| Average Annual Total Returns1 for periods ended 12/31/16 | | | | | | | | | | |
| | | | | |
| | | 1 year | | | 5 years | | | 10 years | | | Since
Inception | | | Inception
Date | |
| Class A at NAV2 | | | 25.92 | % | | | 15.97 | % | | | 8.07 | % | | | — | | | | — | |
| Class I at NAV2 | | | 26.25 | | | | — | | | | — | | | | 15.62 | % | | | 4/30/13 | |
| S&P 500® Index | | | 11.96 | | | | 14.66 | | | | 6.95 | | | | 11.99 | 4 | | | — | |
| Russell 2000® Growth Index | | | 11.32 | | | | 13.74 | | | | 7.76 | | | | 11.21 | 4 | | | — | |
| Series Expense Ratios3: Class A Gross: 1.40%, Net: 1.19%; Class I Gross: 1.15%, Net: 0.94%. | |
Returns represent past performance which is no guarantee of future results. The investment return and principal value will fluctuate so that an investor’s shares, when redeemed, may be worth more or less than their original cost. Total return does not reflect expenses associated with the separate account such as the administrative fees, account charges and surrender charges, which if reflected, would reduce total return. Performance figures may reflect fee waivers and/or expense reimbursements. In the absence of fee waivers and/or expense reimbursements, the total return would have been lower. Please visit Virtus.com for performance data current to the most recent month-end.
| 1 | Total returns are historical and include changes in share price and the reinvestment of both dividends and capital gains distributions. |
| 2 | “NAV”(Net Asset Value) total returns do not reflect any fees or expenses associated with the separate insurance products. |
| 3 | The expense ratios of the Series, both net and gross, are set forth according to the prospectus for the Series effective April 29, 2016, as supplemented and revised, and may differ from the expense ratios disclosed in the Financial Highlights tables in this report. See the Financial Highlights for more current information. Net Expenses: Expenses reduced by a contractual waiver in effect through April 30, 2017. Gross Expenses: Do not reflect the effect of the contractual waiver. Expense ratios include fees and expenses associated with underlying funds. |
| 4 | The since inception index returns are from the inception date of Class I shares. |
Growth of $10,000 For periods ended 12/31
This chart assumes an initial investment of $10,000 made on December 31, 2006 for Class A shares. Returns shown include the reinvestment of all distributions at net asset value, and the change in share price for the stated period.
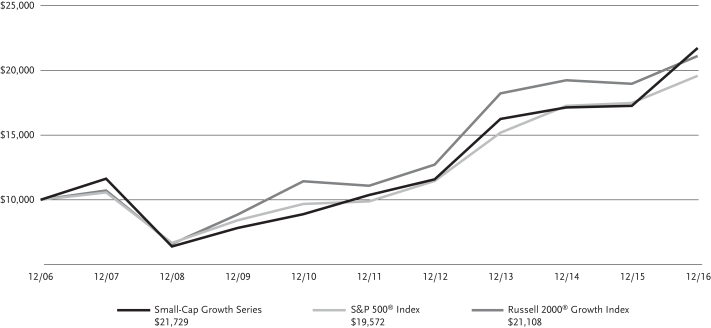
The indexes are unmanaged and not available for direct investment; therefore, their performance does not reflect the expenses associated with active management of an actual portfolio.
For information regarding the indexes and certain investment terms, see the Key Investment Terms starting on page 2.
21
Series Summary December 31, 2016 (Unaudited)
Portfolio Manager Commentary by
Kayne Anderson Rudnick Investment Management, LLC
| ⬛ | | The Series is diversified and has an investment objective of long-term capital appreciation. There is no guarantee that the Series will meet its objective. |
| ⬛ | | For the fiscal year ended December 31, 2016, the Series’ Class A shares at NAV returned 26.54%. For the same period, the S&P 500® Index, a broad-based equity index, returned 11.96% and the Russell 2000® Value Index, the Series’ style-specific benchmark appropriate for comparison, returned 31.74%. |
All performance figures assume reinvestment of distributions and exclude the effect of fees and expenses associated with the variable life insurance or annuity product through which you invest. Past performance is no guarantee of future results, and current performance may be higher or lower than the performance shown above.
How did the markets perform during the Series’ fiscal year?
| ⬛ | | The S&P 500® Index, a broad measure of large-cap stocks, rose nearly 12% in 2016, and small-cap stocks registered an even more impressive gain, advancing slightly more than 21%, as measured by the Russell 2000® Index. Small-cap value stocks significantly outperformed small-cap growth stocks in 2016, as the Russell 2000® Value Index increased 31.74% for the year while the Russell 2000® Growth Index rose 11.32%. From a small-cap value perspective, the top-performing sectors for the year were materials and processing (+62.67%), energy (+43.15%), and technology (+42.24%). The health care sector was the worst-performing sector, returning 4.91%. |
| ⬛ | | The U.S. presidential election in November was one of the most significant economic events of 2016, as it turned some market sector losers into winners, and vice versa. In the Russell 2000® Growth Index, utilities (+10.50%), financial services (+10.42%), and producer durables (+9.94%) all increased sharply during the fourth quarter. Other sectors, including health care (-6.66%) and energy (-1.21%), lagged in the quarter. In addition, deep value strategies strongly outperformed growth and core strategies. |
| ⬛ | | Investors’ risk appetite changed dramatically over the course of 2016. For example, the first half of the year was marked by disappointing economic growth, falling bond yields, and defensive fixed income and equity positioning on the part of |
| | | investors. After two years of dramatic declines, many commodities – particularly crude oil (up 45% for the year) – finally found a bottom, and investors adopted a much more aggressive risk appetite as the economy started to stabilize over the summer and improve into the fall. In November, then President-elect Trump’s pro-business, tax-cutting, and fewer regulatory burdens agenda accentuated the outlook that economic growth would continue to accelerate in 2017. |
What factors affected the Series’ performance during the fiscal year?
| ⬛ | | The Series slightly underperformed the Russell 2000® Value Index for the year. From a sector perspective, performance was primarily driven by positive stock selection and an underweight in the utilities sector and positive stock selection in the consumer discretionary and producer durables sectors. Performance was hurt by negative stock selection in the technology and energy sectors. |
| ⬛ | | From an individual stock perspective, the companies that contributed the most to performance were real estate company RE/MAX Holdings and insurance and financial services company Primerica. |
| ⬛ | | The stock of RE/MAX increased over the past year due to strong agent growth and the purchase of independent RE/MAX agencies. |
| ⬛ | | Primerica’s shares were under pressure during the first half of 2016 due to concern about how the Department of Labor’s Fiduciary Standard Rule would impact the retirement investment account industry. While the final language of the rule was less onerous than feared, questions remained over the ultimate cost of implementation. With the new Trump administration expected to drastically reduce federal regulation, those fears were then pushed aside, allowing investors to focus on the fundamentals of the business. |
| ⬛ | | The companies that detracted the most from performance were IT consulting business Syntel and digital typesetter Monotype Image Holdings. |
| ⬛ | | Syntel again reported weak results, with sluggish end-market demand. Management commented that decision cycles continue to lengthen with persistent contract delays. Customer concentration has been an ongoing issue for the company and remained a concern from the standpoint of long-term prospects and profitability. |
| ⬛ | | The larger driver of stock underperformance for Monotype Imaging Holdings was the acquisition of Olapic, a user-generated content specialist. This was a sizable acquisition outside the scope of Monotype’s core business, and was expected to have a negative impact on overall margins. |
The preceding information is the opinion of portfolio management only through the end of the period of the report as stated on the cover. Any such opinions are subject to change at any time based upon market or other conditions and should not be relied upon as investment advice.
Equity Securities: The market price of equity securities may be adversely affected by financial market, industry, or issuer-specific events. Focus on a particular style or on small or medium-sized companies may enhance that risk.
Limited Number of Investments: Because the Series has a limited number of securities, it may be more susceptible to factors adversely affecting its securities than a less concentrated fund.
Industry/Sector Concentration: A fund that focuses its investments in a particular industry or sector will be more sensitive to conditions that affect that industry or sector than a non-concentrated fund.
Prospectus: For additional information on risks, please see the Series’ prospectus.
| | | | |
| |
| Asset Allocation | |
| |
The following table presents asset allocations within certain sectors and as a percentage of total investments as of December 31, 2016. | |
Information Technology | | | 23 | % |
Industrials | | | 18 | |
Financials | | | 16 | |
Consumer Discretionary | | | 16 | |
Real Estate | | | 9 | |
Health Care | | | 6 | |
Consumer Staples | | | 5 | |
Other (includes short-term investments) | | | 7 | |
| | | | | |
Total | | | 100 | % |
| | | | | |
For information regarding the indexes and certain investment terms, see the Key Investment Terms starting on page 2.
22
| | |
| Small-Cap Value Series (Continued) | | |
| | | | | | | | | | | | |
| Average Annual Total Returns1 for periods ended 12/31/16 | |
| | | |
| | | 1 year | | | 5 years | | | 10 years | |
| Class A at NAV2 | | | 26.54 | % | | | 14.11 | % | | | 5.72 | % |
| S&P 500® Index | | | 11.96 | | | | 14.66 | | | | 6.95 | |
| Russell 2000® Value Index | | | 31.74 | | | | 15.07 | | | | 6.26 | |
| Series Expense Ratios3: Class A Gross: 1.41%, Net: 1.20%. | |
Returns represent past performance which is no guarantee of future results. The investment return and principal value will fluctuate so that an investor’s shares, when redeemed, may be worth more or less than their original cost. Total return does not reflect expenses associated with the separate account such as the administrative fees, account charges and surrender charges, which if reflected, would reduce total return. Performance figures may reflect fee waivers and/or expense reimbursements. In the absence of fee waivers and/or expense reimbursements, the total return would have been lower. Please visit Virtus.com for performance data current to the most recent month-end.
| 1 | Total returns are historical and include changes in share price and the reinvestment of both dividends and capital gains distributions. |
| 2 | “NAV” (Net Asset Value) total returns do not reflect any fees or expenses associated with the separate insurance accounts. |
| 3 | The expense ratios of the Series, both net and gross, are set forth according to the prospectus for the Series effective April 29, 2016, as supplemented and revised, and may differ from the expense ratios disclosed in the Financial Highlights tables in this report. See the Financial Highlights for more current information. Net Expenses: Expenses reduced by a contractual waiver in effect through April 30, 2017. Gross Expenses: Do not reflect the effect of the contractual waiver. Expense ratios include fees and expenses associated with underlying funds. |
Growth of $10,000 For periods ended 12/31
This chart assumes an initial investment of $10,000 made on December 31, 2006 for Class A shares. Returns shown include the reinvestment of all distributions at net asset value, and the change in share price for the stated period.
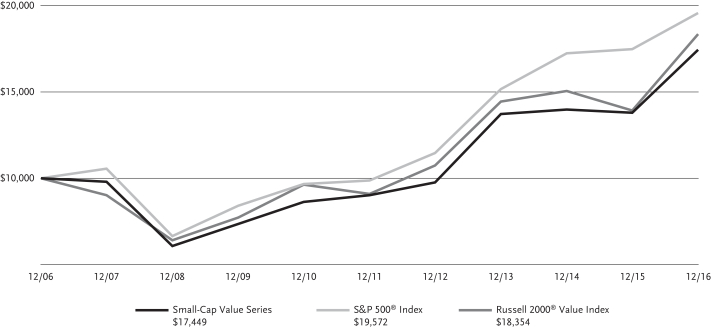
The indexes are unmanaged and not available for direct investment; therefore, their performance does not reflect the expenses associated with active management of an actual portfolio.
For information regarding the indexes and certain investment terms, see the Key Investment Terms starting on page 2.
23
| | |
| Strategic Allocation Series | | |
Series Summary December 31, 2016 (Unaudited)
Portfolio Managers Commentaries by
Kayne Anderson Rudnick Investment Management, LLC (domestic equity portfolio), Duff & Phelps Investment Management Co. (international equity portfolio), and Newfleet Asset Management, LLC (fixed income portfolio)
| ⬛ | | The Series is diversified and has an investment objective of high total return over an extended period of time consistent with prudent investment risk. There is no guarantee that the Series will meet its objective. |
| ⬛ | | For the fiscal year ended December 31, 2016, the Series’ Class A shares at NAV returned 0.82%. For the same period, the S&P 500® Index, a broad-based equity index, returned 11.96% and the Bloomberg Barclays U.S. Aggregate Bond Index, a broad-based fixed income index, returned 2.65%. The Composite Index for the Series, the Series’ style-specific benchmark appropriate for comparison, returned 7.13%. |
All performance figures assume reinvestment of distributions and exclude the effect of fees and expenses associated with the variable life insurance or annuity product through which you invest. Past performance is no guarantee of future results, and current performance may be higher or lower than the performance shown above.
Effective September 7, 2016, Kayne Anderson Rudnick Investment Management, LLC (“KAR”) became subadviser to the domestic equity sleeve of the Series and Duff & Phelps Investment Management Co. (“DPIM”) became subadviser to the international equity sleeve. The following commentary includes the views of the previous subadviser to the equity sleeve, Euclid Advisors LLC, and the current subadvisers, KAR and DPIM, for the periods they managed their respective equity sleeves. There was no change to the subadviser of the fixed income sleeve of the portfolio, which continues to be managed by Newfleet Asset Management, LLC (“Newfleet”).
How did the markets perform during the Series’ fiscal year?
U.S. Equities
| ⬛ | | Large-cap stocks, as measured by the S&P 500® Index, rose nearly 12% in 2016, and small-cap stocks registered an even more impressive gain, advancing slightly more than 21%, as measured by the Russell 2000® Index. The Russell 1000® Growth Index gained 1.01% during the fourth quarter and 7.08% for all of 2016. In the Russell 1000® Growth Index, the telecommunications services (+23.47%), energy (+22.74%), utilities (+17.97%), and industrials (+15.59%) sectors all increased in the year, while the health care (-6.80%) sector lagged for the year. |
| ⬛ | | Investors’ appetite for risk changed dramatically over the course of 2016. For example, the first half of the year was marked by disappointing economic growth, falling bond yields, and defensive fixed income and equity positioning within portfolios. After two years of dramatic declines, many commodities – particularly crude oil (up 45% for the year) – finally found a bottom, and investors adopted a much more aggressive risk appetite as the economy started to stabilize over the summer and improve into the fall. In November, then President-elect Trump’s pro-business agenda of tax-cutting and fewer regulatory burdens further accentuated the outlook that economic growth would accelerate further in 2017. |
International Equities
| ⬛ | | International equity markets proved resilient in 2016, as measured by the 1.00% return of the MSCI EAFE® Index (net) for the year. Markets weathered not only a rocky start to the year that was sparked by China growth fears and dramatic oil price declines, but also a steady stream of global electoral surprises (most notably the United Kingdom’s (UK) Brexit vote to leave the European Union (EU), and the U.S. presidential election results), populist movements, geopolitical events, and positive but not particularly robust GDP growth trends. This result stands in contrast to the previous year, where most markets suffered losses of varying degrees. |
| ⬛ | | Over the year, the winds of change clearly shifted the focus of economic policy in the U.S. from monetary toward fiscal. It remains to be seen whether the EU, U.K., and Japan have the ability and desire to pivot in this fashion. A global decoupling of policy of this kind has not been seen since pre-2008. Policy decoupling, combined with global growth, led to a major shift toward cyclical stocks and a selloff in U.S. Treasuries, pushing the yield on the 10-year Treasury note to 2.45% by year-end from 1.8% on November 7, 2016, the day before the U.S. election. |
Fixed Income
| ⬛ | | Most fixed income spread sectors outperformed U.S. Treasuries during the fiscal year. The Federal Reserve’s (“the Fed”) dovish stance in mid-February sparked a rally that turned around a volatile time period that began with fresh concerns over China, plummeting oil prices, and fears that the Fed had raised interest rates too soon. |
| ⬛ | | Late in June volatility returned briefly with fallout from the United Kingdom’s decision to leave the European Union (“Brexit”). Bond yields in the U.S., Japan, and across Europe fell to historic lows in early July as investors fled to the safety of bonds on global growth concerns fueled by the U.K.’s June 23 decision. Markets recovered rather quickly however from the initial shock. Easing by major central banks and a weaker U.S. dollar helped to improve global risk sentiment and stabilize markets. |
| ⬛ | | September brought heightened concerns over the ability and willingness of central banks to fight chronic low inflation and weak growth as the decision by the European Central Bank (ECB) to leave interest rates and its stimulus program unchanged was a precipitating factor in a widespread market sell-off, reinforced by fears that the Bank of Japan (BOJ) had run out of quantitative easing tools. Hawkish signals from the Fed added to the volatility. The BOJ subsequently decided not to change rates but to shift its focus to stabilizing rates for longer maturity government bonds. This bolstered market sentiment, as did the Fed’s eventual decision to stand pat at its September meeting and not raise rates. |
| ⬛ | | The unexpected election of Donald Trump as the 45th U.S. president sparked another bout of volatility in early November. President-elect Trump’s campaign, which focused on immigration, trade, tax cuts, and infrastructure spending, was largely perceived by the market as supportive of faster growth. Inflation expectations increased, causing the yield on the 10-year U.S. Treasury to rise 0.52% by the end of November. Also in late November, oil prices benefited from OPEC’s decision to cut oil production for the first time in eight years. In December, in a largely anticipated move, the Fed raised its target rate 25 basis points to a range of 0.5% to 0.75% at its final meeting of 2016. |
| ⬛ | | Over the fiscal year, yields of U.S. Treasuries increased across maturities, particularly for shorter term Treasury bonds. |
What factors affected the Series’ performance during the fiscal year?
U.S. Equities
| ⬛ | | During the third quarter, the domestic equity sleeve and international equity sleeve of the portfolio were each appointed a new subadviser, effective September 7, 2016. |
For information regarding the indexes and certain investment terms, see the Key Investment Terms starting on page 2.
24
| | |
| Strategic Allocation Series (Continued) | | |
| ⬛ | | Under the new subadviser, the U.S. equity sleeve underperformed the Russell 1000® Growth Index from September 13 (the date the transition was completed) through December 31, 2016. From a sector perspective, performance was primarily driven by positive stock selection in the health care and financials sector, while performance as hurt by negative stock selection in the information technology and consumer discretionary sectors. |
| ⬛ | | From an individual stock perspective, the companies that contributed the most to performance were Netflix and Bank of America. |
| ⬛ | | Netflix embarked on two bold growth initiatives in recent years with the build-out of international infrastructure and a massive investment in original content. The company’s unmatched scale gives it the data and financial firepower to deliver better content and led to another better-than-expected third quarter earnings report. |
| ⬛ | | Bank of America also beat earnings expectations in the third quarter. The company has the opportunity to reduce its bloated expense base and allow its legacy loan portfolio to run off. With the prospect for higher interest rates (helping net interest margins) from the new administration, reduced regulation (allowing banks to refocus on growth), and lower corporate taxes, Bank of America is one of many financial institutions that now, for the first time in years, has the opportunity to grow and return capital to shareholders. |
| ⬛ | | The companies that detracted the most from performance were Facebook and Alibaba Group, the Chinese e-commerce company. |
| ⬛ | | Facebook continued to grow advertising revenue and take share in the online digital marketing space. The company has delivered an unprecedented global reach of 20% of the earth’s population to advertisers in a very measureable way. Monetization of this audience has barely scratched the surface of its long-term potential. Future growth levers include untapped monetization of Messenger, WhatsApp, and video advertising, along with Virtual Reality. Facebook’s stock was perceived as a relative loser following the U.S. election, and was thus used by investors as a source of funds for share purchases of more Trump-sensitive companies in the quarter. |
| ⬛ | | Alibaba’s marketplaces have huge network effects and Alibaba is fostering the ecosystem with investments in payments and logistics partnerships. Alibaba can leverage its computing architecture for Alicloud, a cloud computing offering that should turn profitable in the next two years. Like Facebook, Alibaba was also a perceived relative loser post the U.S. election, and also used by investors as a source of funds for purchases of more Trump-sensitive names in the quarter. |
International Equities
| ⬛ | | Under the new subadviser, the Series’ international equity sleeve underperformed the MSCI EAFE® Index from September 13 (the date the transition was completed) through December 31, 2016. Both sector selection and security selection detracted from the performance of the international equity sleeve for the period, with security selection having the greater impact. |
| ⬛ | | On a sector performance basis, five of the eleven sectors represented in the Series’ international equity sleeve contributed positively to returns; however, the six remaining sectors in the sleeve posted negative returns and pulled the sleeve into negative territory for the period. The materials and health care holdings in the sleeve were particularly challenged, detracting more than 1% each from the sleeve’s performance for the period. Telecommunications and utilities, after a particularly difficult fourth quarter, detracted about 0.75% each within the sleeve for the period. The sleeve’s investments in the real estate sector detracted 0.37% from the sleeve’s performance, due mostly to a poor fourth quarter showing. |
| ⬛ | | On the positive side, financials contributed 1.37% to the Series’ international equity results for the period, while the energy sector investments contributed 1.11%. Finally, sleeve allocations to industrials and consumer staples sectors ended the period with modest positive contributions to the Series’ international equity returns of less than 1% each. |
Fixed Income
| ⬛ | | The underperformance of U.S. Treasuries relative to most fixed income spread sectors was the key driver of the outperformance of the Series’ fixed income sleeve relative to the benchmark. |
| ⬛ | | The Series’ allocation to high yield corporate bonds, high quality corporate bonds, and issue selection within emerging market high yield bonds were the largest positive contributors to performance for the fiscal year. |
| ⬛ | | During the fiscal year, the Series’ exposure to a long-dated U.S. Treasury position detracted from performance. While exposure to high yield corporate bonds contributed to the Series’ overall performance, our bias toward higher quality securities within the sector detracted from returns during a period in which lower quality outperformed. |
The preceding information is the opinion of portfolio management only through the end of the period of the report as stated on the cover. Any such opinions are subject to change at any time based upon market or other conditions and should not be relied upon as investment advice, and there is no guarantee that market forecasts will be realized.
Equity Securities: The market price of equity securities may be adversely affected by financial market, industry, or issuer-specific events. Focus on a particular style or on small or medium-sized companies may enhance that risk.
Credit & Interest: Debt securities are subject to various risks, the most prominent of which are credit and interest rate risk. The issuer of a debt security may fail to make interest and/or principal payments. Values of debt securities may rise or fall in response to changes in interest rates, and this risk may be enhanced with longer-term maturities.
Foreign & Emerging Markets: Investing internationally, especially in emerging markets, involves additional risks such as currency, political, accounting, economic, and market risk.
Allocation: The Series’ exposure to different asset classes may not be optimal for market conditions at a given time. Asset allocation does not guarantee a profit or protect against a loss in declining markets.
High Yield-High Risk Fixed Income Securities: There is a greater level of credit risk and price volatility involved with high yield securities than investment grade securities.
Prospectus: For additional information on risks, please see the Series’ prospectus.
| | | | | | | | |
| |
| Asset Allocation | |
| |
The following table presents asset allocations within certain sectors and as a percentage of total investments as of December 31, 2016. | |
Common Stocks | | | | | | | 58 | % |
Information Technology | | | 16 | % | | | | |
Consumer Discretionary | | | 14 | | | | | |
Health Care | | | 6 | | | | | |
Total of all other common stock sectors | | | 22 | | | | | |
Corporate Bonds and Notes | | | | | | | 19 | |
Financials | | | 7 | | | | | |
Energy | | | 3 | | | | | |
Total of all other corporate bond sectors | | | 9 | | | | | |
Mortgage-Backed Securities | | | | | | | 13 | |
Asset-Backed Securities | | | | | | | 3 | |
U.S. Government Securities | | | | | | | 2 | |
Municipal Bonds | | | | | | | 1 | |
Foreign Government Securities | | | | | | | 1 | |
Other (includes short-term investments) | | | | | | | 3 | |
| | | | | | | | | |
Total | | | | | | | 100 | % |
| | | | | | | | | |
For information regarding the indexes and certain investment terms, see the Key Investment Terms starting on page 2.
25
| | |
| Strategic Allocation Series (Continued) | | |
| | | | | | | | | | | | |
| Average Annual Total Returns1 for periods ended 12/31/16 | |
| | | |
| | | 1 year | | | 5 years | | | 10 years | |
| Class A at NAV2 | | | 0.82 | % | | | 6.54 | % | | | 4.53 | % |
| S&P 500® Index | | | 11.96 | | | | 14.66 | | | | 6.95 | |
| Bloomberg Barclays U.S. Aggregate Bond Index | | | 2.65 | | | | 2.23 | | | | 4.35 | |
| Composite Index for Strategic Allocation Series | | | 7.13 | | | | 9.45 | | | | 6.10 | |
| Series Expense Ratios3: Class A Gross: 1.07%, Net: 0.98%. | |
Returns represent past performance which is no guarantee of future results. The investment return and principal value will fluctuate so that an investor’s shares, when redeemed, may be worth more or less than their original cost. Total return does not reflect expenses associated with the separate account such as the administrative fees, account charges and surrender charges, which if reflected, would reduce total return. Performance figures may reflect fee waivers and/or expense reimbursements. In the absence of fee waivers and/or expense reimbursements, the total return would have been lower. Please visit Virtus.com for performance data current to the most recent month-end.
| 1 | Total returns are historical and include changes in share price and the reinvestment of both dividends and capital gains distributions. |
| 2 | “NAV” (Net Asset Value) total returns do not reflect any fees or expenses associated with separate insurance accounts. |
| 3 | The expense ratios of the Series, both net and gross, are set forth according to the prospectus for the Series effective April 29, 2016, as supplemented and revised, and may differ from the expense ratios disclosed in the Financial Highlights tables in this report. See the Financial Highlights for more current information. Net Expenses: Expenses reduced by a contractual waiver in effect through April 30, 2017. Gross Expenses: Do not reflect the effect of the contractual waiver. Expense ratios include fees and expenses associated with underlying funds. |
Growth of $10,000 For periods ended 12/31
This chart assumes an initial investment of $10,000 made on December 31, 2006 for Class A shares. Returns shown include the reinvestment of all distributions at net asset value, and the change in share price for the stated period.
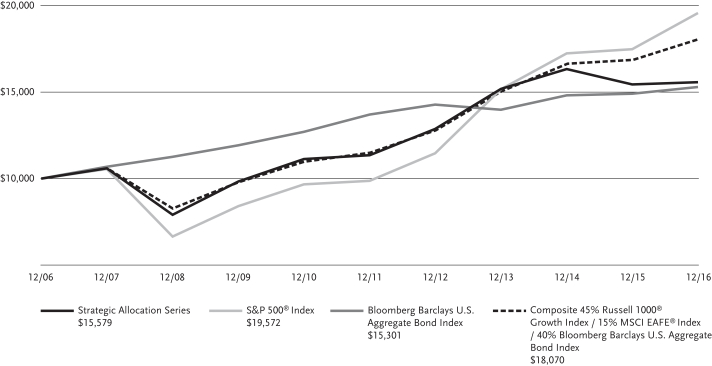
The indexes are unmanaged and not available for direct investment; therefore, their performance does not reflect the expenses associated with active management of an actual portfolio.
For information regarding the indexes and certain investment terms, see the Key Investment Terms starting on page 2.
26
VIRTUS CAPITAL GROWTH SERIES
SCHEDULE OF INVESTMENTS
DECEMBER 31, 2016
($ reported in thousands)
| | | | | | | | |
| | | SHARES | | | VALUE | |
| COMMON STOCKS—99.1% | |
|
| Consumer Discretionary—27.1% | |
Amazon.com, Inc.(2) | | | 10,060 | | | $ | 7,544 | |
Ctrip.Com International Ltd. ADR(2) | | | 64,830 | | | | 2,593 | |
Home Depot, Inc. (The) | | | 29,558 | | | | 3,963 | |
Las Vegas Sands Corp. | | | 109,992 | | | | 5,875 | |
Netflix, Inc.(2) | | | 35,010 | | | | 4,334 | |
NIKE, Inc. Class B | | | 98,815 | | | | 5,023 | |
Priceline Group, Inc. (The)(2) | | | 4,169 | | | | 6,112 | |
Ross Stores, Inc. | | | 76,667 | | | | 5,029 | |
Starbucks Corp. | | | 128,718 | | | | 7,146 | |
TripAdvisor, Inc.(2) | | | 58,632 | | | | 2,719 | |
| | | | | | | | |
| | | | | | | 50,338 | |
| | | | | | | | |
|
| Consumer Staples—10.2% | |
Colgate-Palmolive Co. | | | 36,097 | | | | 2,362 | |
Costco Wholesale Corp. | | | 25,081 | | | | 4,016 | |
Mead Johnson Nutrition Co. | | | 25,581 | | | | 1,810 | |
Monster Beverage Corp.(2) | | | 131,925 | | | | 5,849 | |
Philip Morris International, Inc. | | | 54,221 | | | | 4,961 | |
| | | | | | | | |
| | | | | | | 18,998 | |
| | | | | | | | |
|
| Energy—6.0% | |
Cabot Oil & Gas Corp. | | | 73,623 | | | | 1,720 | |
Core Laboratories N.V. | | | 26,436 | | | | 3,174 | |
Pioneer Natural Resources Co. | | | 16,600 | | | | 2,989 | |
Schlumberger Ltd. | | | 37,809 | | | | 3,174 | |
| | | | | | | | |
| | | | | | | 11,057 | |
| | | | | | | | |
|
| Financials—4.5% | |
Bank of America Corp. | | | 250,030 | | | | 5,526 | |
Charles Schwab Corp. (The) | | | 69,237 | | | | 2,733 | |
| | | | | | | | |
| | | | | | | 8,259 | |
| | | | | | | | |
|
| Health Care—11.8% | |
BioMarin Pharmaceutical, Inc.(2) | | | 40,346 | | | | 3,342 | |
Bristol-Myers Squibb Co. | | | 83,713 | | | | 4,892 | |
Celgene Corp.(2) | | | 58,059 | | | | 6,720 | |
Danaher Corp. | | | 40,667 | | | | 3,166 | |
Zoetis, Inc. | | | 71,264 | | | | 3,815 | |
| | | | | | | | |
| | | | | | | 21,935 | |
| | | | | | | | |
|
| Industrials—4.2% | |
Roper Technologies, Inc. | | | 19,172 | | | | 3,510 | |
Union Pacific Corp. | | | 22,990 | | | | 2,384 | |
Wabtec Corp. | | | 23,940 | | | | 1,987 | |
| | | | | | | | |
| | | | | | | 7,881 | |
| | | | | | | | |
|
| Information Technology—33.4% | |
Accenture plc Class A | | | 27,201 | | | | 3,186 | |
Activision Blizzard, Inc. | | | 67,670 | | | | 2,443 | |
Alibaba Group Holding Ltd. Sponsored ADR(2) | | | 87,098 | | | | 7,648 | |
Alphabet, Inc. Class A(2) | | | 6,699 | | | | 5,309 | |
Amphenol Corp. Class A | | | 88,224 | | | | 5,929 | |
CoStar Group, Inc.(2) | | | 15,850 | | | | 2,987 | |
Facebook, Inc. Class A(2) | | | 148,612 | | | | 17,098 | |
Gartner, Inc.(2) | | | 12,770 | | | | 1,291 | |
Paycom Software, Inc.(2) | | | 53,982 | | | | 2,456 | |
| | | | | | | | |
| | | SHARES | | | VALUE | |
| Information Technology—continued | |
Visa, Inc. Class A | | | 85,998 | | | $ | 6,709 | |
Workday, Inc. Class A(2) | | | 48,160 | | | | 3,183 | |
Yandex N.V. Class A(2) | | | 181,555 | | | | 3,655 | |
| | | | | | | | |
| | | | | | | 61,894 | |
| | | | | | | | |
|
| Materials—1.9% | |
Ecolab, Inc. | | | 29,374 | | | | 3,443 | |
TOTAL COMMON STOCKS
(Identified Cost $123,821) | | | | 183,805 | |
| TOTAL LONG TERM INVESTMENTS—99.1% | |
| (Identified Cost $123,821) | | | | 183,805 | |
TOTAL INVESTMENTS—99.1%
(Identified Cost $123,821) | | | | 183,805 | (1) |
Other assets and liabilities, net—0.9% | | | | 1,714 | |
| | | | | | | | |
| NET ASSETS—100.0% | | | $ | 185,519 | |
| | | | | | | | |
Abbreviation:
| ADR | American Depositary Receipt |
Footnote Legend:
| (1) | Federal Income Tax Information: For tax information at December 31, 2016, see Note 10 Federal Income Tax Information in the Notes to Financial Statements. |
| (2) | Non-income producing. |
| | | | |
| Country Weightings (unaudited)† | |
United States | | | 92 | % |
China | | | 6 | |
Russia | | | 2 | |
Total | | | 100 | % |
† % of total investments as of December 31, 2016 | |
The following table provides a summary of inputs used to value the Series’ investments as of December 31, 2016 (See Security Valuation Note 2A in the Notes to Financial Statements):
| | | | | | | | |
| | | Total
Value at
December 31, 2016 | | | Level 1
Quoted
Prices | |
Equity Securities: | | | | | | | | |
Common Stocks | | $ | 183,805 | | | $ | 183,805 | |
| | | | | | | | |
Total Investments | | $ | 183,805 | | | $ | 183,805 | |
| | | | | | | | |
There are no Level 2 (significant observable inputs) or Level 3 (significant unobservable inputs) priced securities.
There were no transfers between Level 1 and Level 2 related to securities held at December 31, 2016.
See Notes to Financial Statements
27
VIRTUS ENHANCED CORE EQUITY SERIES
SCHEDULE OF INVESTMENTS
DECEMBER 31, 2016
($ reported in thousands)
| | | | | | | | |
| | | SHARES | | | VALUE | |
| COMMON STOCKS—28.0% | |
|
| Consumer Discretionary—2.3% | |
BorgWarner, Inc. | | | 6,790 | | | $ | 268 | |
Delphi Automotive plc | | | 3,717 | | | | 250 | |
Harman International Industries, Inc. | | | 3,217 | | | | 358 | |
Horton (D.R.), Inc. | | | 7,005 | | | | 191 | |
Lennar Corp. Class A | | | 4,574 | | | | 196 | |
Netflix, Inc.(2) | | | 2,359 | | | | 292 | |
News Corp. Class A | | | 16,368 | | | | 188 | |
Royal Caribbean Cruises Ltd. | | | 3,288 | | | | 270 | |
Under Armour, Inc. Class A(2) | | | 5,146 | | | | 149 | |
Wynn Resorts Ltd. | | | 2,717 | | | | 235 | |
| | | | | | | | |
| | | | | | | 2,397 | |
| | | | | | | | |
| | |
| Energy—7.9% | | | | | | | | |
Anadarko Petroleum Corp. | | | 5,575 | | | | 389 | |
Apache Corp. | | | 5,718 | | | | 363 | |
Baker Hughes, Inc. | | | 4,789 | | | | 311 | |
Chesapeake Energy Corp.(2) | | | 72,044 | | | | 506 | |
Cimarex Energy Co. | | | 2,002 | | | | 272 | |
Concho Resources, Inc.(2) | | | 2,145 | | | | 284 | |
ConocoPhillips | | | 6,004 | | | | 301 | |
Devon Energy Corp. | | | 8,077 | | | | 369 | |
Diamond Offshore Drilling, Inc. | | | 11,937 | | | | 211 | |
EOG Resources, Inc. | | | 2,574 | | | | 260 | |
FMC Technologies, Inc.(2) | | | 9,434 | | | | 335 | |
Halliburton Co. | | | 5,361 | | | | 290 | |
Helmerich & Payne, Inc. | | | 4,003 | | | | 310 | |
Hess Corp. | | | 5,146 | | | | 320 | |
Kinder Morgan, Inc. | | | 11,579 | | | | 240 | |
Marathon Oil Corp. | | | 23,300 | | | | 403 | |
Marathon Petroleum Corp. | | | 6,576 | | | | 331 | |
Murphy Oil Corp. | | | 11,365 | | | | 354 | |
Newfield Exploration Co.(2) | | | 6,290 | | | | 255 | |
Noble Energy, Inc. | | | 7,219 | | | | 275 | |
ONEOK, Inc. | | | 5,504 | | | | 316 | |
Pioneer Natural Resources Co. | | | 1,287 | | | | 232 | |
Southwestern Energy Co.(2) | | | 15,653 | | | | 169 | |
Tesoro Corp. | | | 3,003 | | | | 263 | |
Transocean Ltd.(2) | | | 29,161 | | | | 430 | |
Williams Cos., Inc. (The) | | | 15,867 | | | | 494 | |
| | | | | | | | |
| | | | | | | 8,283 | |
| | | | | | | | |
| | |
| Financials—9.8% | | | | | | | | |
Affiliated Managers Group, Inc.(2) | | | 2,073 | | | | 301 | |
Ameriprise Financial, Inc. | | | 2,574 | | | | 286 | |
Bank of America Corp. | | | 17,226 | | | | 381 | |
Bank of New York Mellon Corp. (The) | | | 5,718 | | | | 271 | |
BlackRock, Inc. | | | 643 | | | | 245 | |
Capital One Financial Corp. | | | 3,288 | | | | 287 | |
Charles Schwab Corp. (The) | | | 9,434 | | | | 372 | |
Citigroup, Inc. | | | 5,861 | | | | 348 | |
Citizens Financial Group, Inc. | | | 9,291 | | | | 331 | |
Comerica, Inc. | | | 5,575 | | | | 380 | |
E*TRADE Financial Corp.(2) | | | 11,222 | | | | 389 | |
Fifth Third Bancorp. | | | 12,866 | | | | 347 | |
Franklin Resources, Inc. | | | 6,290 | | | | 249 | |
Goldman Sachs Group, Inc. (The) | | | 1,358 | | | | 325 | |
Huntington Bancshares, Inc. | | | 22,800 | | | | 301 | |
Invesco Ltd. | | | 9,363 | | | | 284 | |
| | | | | | | | |
| | | SHARES | | | VALUE | |
| Financials—continued | | | | | | | | |
JPMorgan Chase & Co. | | | 3,503 | | | $ | 302 | |
KeyCorp. | | | 20,013 | | | | 366 | |
Legg Mason, Inc. | | | 7,291 | | | | 218 | |
Lincoln National Corp. | | | 6,361 | | | | 422 | |
MetLife, Inc. | | | 6,147 | | | | 331 | |
Moody’s Corp. | | | 2,145 | | | | 202 | |
Morgan Stanley | | | 9,291 | | | | 393 | |
Navient Corp. | | | 17,440 | | | | 286 | |
Northern Trust Corp. | | | 3,503 | | | | 312 | |
Principal Financial Group, Inc. | | | 5,575 | | | | 323 | |
Prudential Financial, Inc. | | | 3,431 | | | | 357 | |
Regions Financial Corp. | | | 27,803 | | | | 399 | |
State Street Corp. | | | 3,646 | | | | 283 | |
SunTrust Banks, Inc. | | | 5,647 | | | | 310 | |
Unum Group | | | 6,647 | | | | 292 | |
Zions Bancorporation | | | 8,721 | | | | 375 | |
| | | | | | | | |
| | | | | | | 10,268 | |
| | | | | | | | |
| | |
| Health Care—1.3% | | | | | | | | |
Alexion Pharmaceuticals, Inc.(2) | | | 1,716 | | | | 210 | |
Celgene Corp.(2) | | | 2,073 | | | | 240 | |
Endo International plc(2) | | | 11,794 | | | | 194 | |
Illumina, Inc.(2) | | | 1,287 | | | | 165 | |
Mallinckrodt plc(2) | | | 3,217 | | | | 160 | |
Regeneron Pharmaceuticals, Inc.(2) | | | 572 | | | | 210 | |
Vertex Pharmaceuticals, Inc.(2) | | | 2,574 | | | | 190 | |
| | | | | | | | |
| | | | | | | 1,369 | |
| | | | | | | | |
|
| Industrials—1.0% | |
American Airlines Group, Inc. | | | 6,004 | | | | 281 | |
Arconic, Inc. | | | 7,726 | | | | 143 | |
Ryder System, Inc. | | | 3,789 | | | | 282 | |
United Rentals, Inc.(2) | | | 3,503 | | | | 370 | |
| | | | | | | | |
| | | | | | | 1,076 | |
| | | | | | | | |
|
| Information Technology—3.3% | |
Autodesk, Inc.(2) | | | 3,503 | | | | 259 | |
Broadcom Ltd. | | | 1,358 | | | | 240 | |
Citrix Systems, Inc.(2) | | | 2,645 | | | | 236 | |
Cognizant Technology Solutions Corp. Class A(2) | | | 3,860 | | | | 216 | |
First Solar, Inc.(2) | | | 6,433 | | | | 207 | |
Hewlett Packard Enterprise Co. | | | 9,792 | | | | 227 | |
HP, Inc. | | | 15,152 | | | | 225 | |
Micron Technology, Inc.(2) | | | 18,940 | | | | 415 | |
Qorvo, Inc.(2) | | | 5,075 | | | | 268 | |
salesforce.com, Inc.(2) | | | 2,860 | | | | 196 | |
Seagate Technology plc | | | 7,648 | | | | 292 | |
Skyworks Solutions, Inc. | | | 3,860 | | | | 288 | |
Western Digital Corp. | | | 6,290 | | | | 427 | |
| | | | | | | | |
| | | | | | | 3,496 | |
| | | | | | | | |
|
| Materials—1.5% | |
Alcoa Corp. | | | 2,575 | | | | 72 | |
FMC Corp. | | | 4,717 | | | | 267 | |
Freeport-McMoRan, Inc.(2) | | | 34,951 | | | | 461 | |
LyondellBasell Industries N.V. Class A | | | 2,788 | | | | 239 | |
Owens-Illinois, Inc.(2) | | | 12,723 | | | | 222 | |
WestRock Co. | | | 5,146 | | | | 261 | |
| | | | | | | | |
| | | | | | | 1,522 | |
| | | | | | | | |
| | | | | | | | |
| | | SHARES | | | VALUE | |
| Real Estate—0.6% | |
CBRE Group, Inc. Class A(2) | | | 9,220 | | | $ | 290 | |
Host Hotels & Resorts, Inc. | | | 16,978 | | | | 320 | |
| | | | | | | | |
| | | | | | | 610 | |
| | | | | | | | |
|
| Telecommunication Services—0.3% | |
Level 3 Communications, Inc.(2) | | | 4,646 | | | | 262 | |
TOTAL COMMON STOCKS
(Identified Cost $25,806) | | | | 29,283 | |
|
| EXCHANGE-TRADED FUNDS(3)—71.5% | |
Energy Select Sector SPDR Fund | | | 113,478 | | | | 8,547 | |
Financial Select Sector SPDR Fund | | | 403,758 | | | | 9,387 | |
Industrial Select Sector SPDR Fund | | | 132,502 | | | | 8,244 | |
Materials Select Sector SPDR Fund | | | 166,876 | | | | 8,294 | |
SPDR S&P 500® ETF Trust | | | 73,764 | | | | 16,489 | |
Vanguard S&P 500 Index Fund (4) | | | 116,076 | | | | 23,832 | |
TOTAL EXCHANGE-TRADED FUNDS
(Identified Cost $71,345) | | | | 74,793 | |
| | |
| | | CONTRACTS | | | | |
|
| PURCHASED OPTIONS—0.1% | |
| | |
| Call Options—0.0% | | | | | | | | |
S&P 500® Index expiration 01/04/17 strike price $2,375 | | | 148 | | | | 1 | |
S&P 500® Index expiration 01/06/17 strike price $2,370 | | | 274 | | | | 3 | |
S&P 500® Index expiration 01/11/17 strike price $2,375 | | | 148 | | | | 3 | |
S&P 500® Index expiration 01/13/17 strike price $2,375 | | | 271 | | | | 7 | |
| | | | | | | | |
| | | | | | | 14 | |
| | | | | | | | |
| | |
| Put Options—0.1% | | | | | | | | |
S&P 500® Index expiration 01/04/17 strike price $2,160 | | | 148 | | | | 14 | |
S&P 500® Index expiration 01/06/17 strike price $2,145 | | | 274 | | | | 26 | |
S&P 500® Index expiration 01/11/17 strike price $2,135 | | | 148 | | | | 27 | |
S&P 500® Index expiration 01/13/17 strike price $2,100 | | | 271 | | | | 46 | |
| | | | | | | | |
| | | | | | | | 113 | |
TOTAL PURCHASED OPTIONS
(Premiums Paid $109) | | | | 127 | |
TOTAL INVESTMENTS, BEFORE WRITTEN OPTIONS—99.6%
(Identified Cost $97,260) | | | | 104,203 | (1) |
Refer to Footnote Legend on page 29.
See Notes to Financial Statements
28
VIRTUS ENHANCED CORE EQUITY SERIES
SCHEDULE OF INVESTMENTS (Continued)
DECEMBER 31, 2016
($ reported in thousands)
| | | | | | | | |
| | | CONTRACTS | | | VALUE | |
| WRITTEN OPTIONS—(0.3)% | |
| | |
| Call Options—(0.0)% | | | | | | | | |
S&P 500® Index expiration 01/04/17 strike price $2,325 | | | 148 | | | $ | (2 | ) |
S&P 500® Index expiration 01/06/17 strike price $2,320 | | | 274 | | | | (7 | ) |
S&P 500® Index expiration 01/11/17 strike price $2,325 | | | 148 | | | | (7 | ) |
S&P 500® Index expiration 01/13/17 strike price $2,325 | | | 271 | | | | (14 | ) |
| | | | | | | | |
| | | | | | | (30 | ) |
| | | | | | | | |
| | |
| Put Options—(0.3)% | | | | | | | | |
S&P 500® Index expiration 01/04/17 strike price $2,210 | | | 148 | | | | (31 | ) |
S&P 500® Index expiration 01/06/17 strike price $2,195 | | | 274 | | | | (80 | ) |
| | | | | | | | |
| | | CONTRACTS | | | VALUE | |
| Put Options—continued | |
S&P 500® Index expiration 01/11/17 strike price $2,185 | | | 148 | | | $ | (80 | ) |
S&P 500® Index expiration 01/13/17 strike price $2,150 | | | 271 | | | | (89 | ) |
| | | | | | | | |
| | | | | | | | (280 | ) |
TOTAL WRITTEN OPTIONS—(0.3)%
(Premiums Received $271) | | | | (310 | )(1) |
TOTAL INVESTMENTS NET OF
WRITTEN OPTIONS—99.3%
(Identified Cost $96,989) | | | | 103,893 | |
Other assets and liabilities, net—0.7% | | | | 694 | |
| | | | | | | | |
| NET ASSETS—100.0% | | | | | | $ | 104,587 | |
| | | | | | | | |
Abbreviations:
| SPDR | S&P Depositary Receipt |
Footnote Legend:
| (1) | Federal Income Tax Information: For tax information at December 31, 2016, see Note 10 Federal Income Tax Information in the Notes to Financial Statements. |
| (2) | Non-income producing. |
| (3) | Shares of these funds are publicly offered and the prospectus and annual reports of each are publicly available. |
| (4) | All or a portion segregated as collateral for written options. |
The following table provides a summary of inputs used to value the Series’ investments as of December 31, 2016 (See Security Valuation Note 2A in the Notes to Financial Statements):
| | | | | | | | | | | | |
| | | Total
Value at
December 31, 2016 | | | Level 1
Quoted
Prices | | | Level 2
Significant
Observable
Inputs | |
Equity Securities: | | | | | | | | | | | | |
Common Stocks | | $ | 29,283 | | | $ | 29,283 | | | $ | — | |
Exchange-Traded Funds | | | 74,793 | | | | 74,793 | | | | — | |
Purchased Options | | | 127 | | | | 100 | | | | 27 | |
| | | | | | | | | | | | |
Total Investments before Written Options | | $ | 104,203 | | | $ | 104,176 | | | $ | 27 | |
| | | | | | | | | | | | |
Written Options | | | (310 | ) | | | (310 | ) | | | — | |
| | | | | | | | | | | | |
Total Investments Net of Written Options | | $ | 103,893 | | | $ | 103,866 | | | $ | 27 | |
| | | | | | | | | | | | |
There are no Level 3 (significant unobservable inputs) priced securities.
There were no transfers between Level 1 and Level 2 related to securities held at December 31, 2016.
See Notes to Financial Statements
29
VIRTUS EQUITY TREND SERIES
SCHEDULE OF INVESTMENTS
DECEMBER 31, 2016
($ reported in thousands)
| | | | | | | | |
| | | SHARES | | | VALUE | |
| COMMON STOCKS—98.3% | |
|
| Consumer Discretionary—27.4% | |
Advance Auto Parts, Inc. | | | 69 | | | $ | 12 | |
Amazon.com, Inc.(2) | | | 63 | | | | 47 | |
AutoNation, Inc.(2) | | | 78 | | | | 4 | |
AutoZone, Inc.(2) | | | 29 | | | | 23 | |
Best Buy Co., Inc. | | | 1,545 | | | | 66 | |
CarMax, Inc.(2) | | | 184 | | | | 12 | |
Carnival Corp. | | | 444 | | | | 23 | |
CBS Corp. Class B | | | 623 | | | | 40 | |
Charter Communications, Inc. Class A(2) | | | 69 | | | | 20 | |
Chipotle Mexican Grill, Inc.(2) | | | 14 | | | | 5 | |
Comcast Corp. Class A | | | 780 | | | | 54 | |
Darden Restaurants, Inc. | | | 37 | | | | 3 | |
Discovery Communications, Inc. Class A(2) | | | 231 | | | | 6 | |
Discovery Communications, Inc. Class C(2) | | | 343 | | | | 9 | |
Expedia, Inc. | | | 30 | | | | 3 | |
Foot Locker, Inc. | | | 92 | | | | 6 | |
Gap, Inc. (The) | | | 172 | | | | 4 | |
Garmin Ltd. | | | 597 | | | | 29 | |
Genuine Parts Co. | | | 431 | | | | 41 | |
Harley-Davidson, Inc. | | | 1,206 | | | | 70 | |
Harman International Industries, Inc. | | | 370 | | | | 41 | |
Hasbro, Inc. | | | 373 | | | | 29 | |
Home Depot, Inc. (The) | | | 394 | | | | 53 | |
Interpublic Group of Cos., Inc. (The) | | | 950 | | | | 22 | |
L Brands, Inc. | | | 166 | | | | 11 | |
Leggett & Platt, Inc. | | | 505 | | | | 25 | |
LKQ Corp.(2) | | | 870 | | | | 27 | |
Lowe’s Cos., Inc. | | | 278 | | | | 20 | |
Marriott International, Inc. Class A | | | 328 | | | | 27 | |
Mattel, Inc. | | | 1,124 | | | | 31 | |
McDonald’s Corp. | | | 263 | | | | 32 | |
Mohawk Industries, Inc.(2) | | | 238 | | | | 47 | |
Netflix, Inc.(2) | | | 60 | | | | 7 | |
Newell Brands, Inc. | | | 1,502 | | | | 67 | |
NIKE, Inc. Class B | | | 1,409 | | | | 72 | |
O’Reilly Automotive, Inc.(2) | | | 85 | | | | 24 | |
Omnicom Group, Inc. | | | 560 | | | | 48 | |
Priceline Group, Inc. (The)(2) | | | 7 | | | | 10 | |
Ross Stores, Inc. | | | 236 | | | | 15 | |
Royal Caribbean Cruises Ltd. | | | 172 | | | | 14 | |
Scripps Networks Interactive, Inc. Class A | | | 146 | | | | 10 | |
Starbucks Corp. | | | 452 | | | | 25 | |
TEGNA, Inc. | | | 328 | | | | 7 | |
TJX Cos., Inc. (The) | | | 388 | | | | 29 | |
TripAdvisor, Inc.(2) | | | 21 | | | | 1 | |
Urban Outfitters, Inc.(2) | | | 69 | | | | 2 | |
Wyndham Worldwide Corp. | | | 112 | | | | 9 | |
Wynn Resorts Ltd. | | | 692 | | | | 60 | |
Yum China Holdings, Inc.(2) | | | 110 | | | | 3 | |
Yum! Brands, Inc. | | | 106 | | | | 7 | |
| | | | | | | | |
| | | | | | | 1,252 | |
| | | | | | | | |
|
| Consumer Staples—8.0% | |
Altria Group, Inc. | | | 449 | | | | 30 | |
Brown-Forman Corp. Class B | | | 358 | | | | 16 | |
Campbell Soup Co. | | | 49 | | | | 3 | |
ConAgra Brands, Inc. | | | 118 | | | | 5 | |
| | | | | | | | |
| | | SHARES | | | VALUE | |
| Consumer Staples—continued | |
Constellation Brands, Inc. Class A | | | 357 | | | $ | 55 | |
General Mills, Inc. | | | 149 | | | | 9 | |
Hershey Co. (The) | | | 37 | | | | 4 | |
Hormel Foods Corp. | | | 83 | | | | 3 | |
J.M. Smucker Co. (The) | | | 36 | | | | 5 | |
Kellogg Co. | | | 76 | | | | 6 | |
Kraft Heinz Co.(The) | | | 144 | | | | 13 | |
Lamb Weston Holdings, Inc.(2) | | | 40 | | | | 1 | |
McCormick & Co., Inc. | | | 27 | | | | 2 | |
Mead Johnson Nutrition Co. | | | 59 | | | | 4 | |
Molson Coors Brewing Co. Class B | | | 720 | | | | 70 | |
Mondelez International, Inc. Class A | | | 404 | | | | 18 | |
Philip Morris International, Inc. | | | 357 | | | | 33 | |
Reynolds American, Inc. | | | 179 | | | | 10 | |
Sysco Corp. | | | 1,363 | | | | 75 | |
Tyson Foods, Inc. Class A | | | 78 | | | | 5 | |
| | | | | | | | |
| | | | | | | 367 | |
| | | | | | | | |
|
| Energy—3.3% | |
Helmerich & Payne, Inc. | | | 578 | | | | 45 | |
Marathon Petroleum Corp. | | | 379 | | | | 19 | |
Phillips 66 | | | 305 | | | | 26 | |
Tesoro Corp. | | | 91 | | | | 8 | |
Transocean Ltd.(2) | | | 2,078 | | | | 31 | |
Valero Energy Corp. | | | 339 | | | | 23 | |
| | | | | | | | |
| | | | | | | 152 | |
| | | | | | | | |
|
| Financials—9.8% | |
Aflac, Inc. | | | 159 | | | | 11 | |
Allstate Corp. (The) | | | 174 | | | | 13 | |
AON plc | | | 203 | | | | 23 | |
Bank of America Corp. | | | 720 | | | | 16 | |
BB&T Corp. | | | 262 | | | | 12 | |
Charles Schwab Corp. (The) | | | 426 | | | | 17 | |
CHUBB Ltd. | | | 209 | | | | 28 | |
Cincinnati Financial Corp. | | | 80 | | | | 6 | |
Citigroup, Inc. | | | 206 | | | | 12 | |
Citizens Financial Group, Inc. | | | 168 | | | | 6 | |
Comerica, Inc. | | | 11 | | | | 1 | |
E*TRADE Financial Corp.(2) | | | 96 | | | | 3 | |
Fifth Third Bancorp. | | | 247 | | | | 7 | |
Gallagher (Arthur J.) & Co. | | | 135 | | | | 7 | |
Goldman Sachs Group, Inc. (The) | | | 134 | | | | 32 | |
Huntington Bancshares, Inc. | | | 349 | | | | 5 | |
JPMorgan Chase & Co. | | | 255 | | | | 22 | |
KeyCorp. | | | 348 | | | | 6 | |
Lincoln National Corp. | | | 90 | | | | 6 | |
M&T Bank Corp. | | | 51 | | | | 8 | |
Marsh & McLennan Cos., Inc. | | | 413 | | | | 28 | |
MetLife, Inc. | | | 427 | | | | 23 | |
Morgan Stanley | | | 521 | | | | 22 | |
People’s United Financial, Inc. | | | 46 | | | | 1 | |
PNC Financial Services Group, Inc. (The) | | | 158 | | | | 18 | |
Principal Financial Group, Inc. | | | 103 | | | | 6 | |
Progressive Corp. (The) | | | 246 | | | | 9 | |
Prudential Financial, Inc. | | | 170 | | | | 18 | |
Regions Financial Corp. | | | 405 | | | | 6 | |
SunTrust Banks, Inc. | | | 161 | | | | 9 | |
Torchmark Corp. | | | 44 | | | | 3 | |
Travelers Cos., Inc. (The) | | | 126 | | | | 15 | |
U.S. Bancorp. | | | 113 | | | | 6 | |
Unum Group | | | 91 | | | | 4 | |
| | | | | | | | |
| | | SHARES | | | VALUE | |
| Financials—continued | |
Wells Fargo & Co. | | | 321 | | | $ | 18 | |
Willis Towers Watson plc | | | 98 | | | | 12 | |
XL Group Ltd. | | | 144 | | | | 5 | |
Zions Bancorporation | | | 104 | | | | 4 | |
| | | | | | | | |
| | | | | | | 448 | |
| | | | | | | | |
|
| Health Care—5.0% | |
Abbott Laboratories | | | 245 | | | | 9 | |
Aetna, Inc. | | | 91 | | | | 11 | |
Agilent Technologies, Inc. | | | 201 | | | | 9 | |
Anthem, Inc. | | | 74 | | | | 11 | |
Bard (C.R.), Inc. | | | 10 | | | | 2 | |
Baxter International, Inc. | | | 109 | | | | 5 | |
Becton, Dickinson & Co. | | | 40 | | | | 7 | |
Boston Scientific Corp.(2) | | | 240 | | | | 5 | |
Centene Corp.(2) | | | 42 | | | | 2 | |
Cigna Corp. | | | 74 | | | | 10 | |
Danaher Corp. | | | 96 | | | | 8 | |
Edwards Lifesciences Corp.(2) | | | 43 | | | | 4 | |
Hologic, Inc.(2) | | | 38 | | | | 2 | |
Humana, Inc. | | | 41 | | | | 8 | |
Illumina, Inc.(2) | | | 90 | | | | 12 | |
Intuitive Surgical, Inc.(2) | | | 6 | | | | 4 | |
Medtronic plc | | | 196 | | | | 14 | |
Mettler-Toledo International, Inc.(2) | | | 16 | | | | 7 | |
PerkinElmer, Inc. | | | 80 | | | | 4 | |
St. Jude Medical, Inc. | | | 62 | | | | 5 | |
Stryker Corp. | | | 44 | | | | 5 | |
Thermo Fisher Scientific, Inc. | | | 239 | | | | 34 | |
UnitedHealth Group, Inc. | | | 225 | | | | 36 | |
Varian Medical Systems, Inc.(2) | | | 15 | | | | 1 | |
Waters Corp.(2) | | | 57 | | | | 8 | |
Zimmer Biomet Holdings, Inc. | | | 33 | | | | 3 | |
| | | | | | | | |
| | | | | | | 226 | |
| | | | | | | | |
|
| Industrials—15.8% | |
3M Co. | | | 85 | | | | 15 | |
Allegion plc | | | 117 | | | | 8 | |
Arconic, Inc. | | | 74 | | | | 1 | |
Boeing Co. (The) | | | 98 | | | | 15 | |
Cintas Corp. | | | 627 | | | | 72 | |
Deere & Co. | | | 723 | | | | 75 | |
Dover Corp. | | | 94 | | | | 7 | |
Dun & Bradstreet Corp. (The) | | | 60 | | | | 7 | |
Equifax, Inc. | | | 185 | | | | 22 | |
Expeditors International of Washington, Inc. | | | 89 | | | | 5 | |
FedEx Corp. | | | 118 | | | | 22 | |
Flowserve Corp. | | | 88 | | | | 4 | |
Fortive Corp. | | | 137 | | | | 7 | |
Fortune Brands Home & Security, Inc. | | | 160 | | | | 9 | |
General Dynamics Corp. | | | 58 | | | | 10 | |
General Electric Co. | | | 1,281 | | | | 41 | |
Honeywell International, Inc. | | | 118 | | | | 14 | |
Hunt (JB) Transport Services, Inc. | | | 494 | | | | 48 | |
Illinois Tool Works, Inc. | | | 145 | | | | 18 | |
Ingersoll-Rand plc | | | 118 | | | | 9 | |
Johnson Controls International plc | | | 980 | | | | 40 | |
L-3 Communications Holdings, Inc. | | | 18 | | | | 3 | |
Lockheed Martin Corp. | | | 41 | | | | 10 | |
Masco Corp. | | | 400 | | | | 13 | |
Nielsen Holdings plc | | | 520 | | | | 22 | |
Refer to Footnote Legend on page 31.
See Notes to Financial Statements
30
VIRTUS EQUITY TREND SERIES
SCHEDULE OF INVESTMENTS (Continued)
DECEMBER 31, 2016
($ reported in thousands)
| | | | | | | | |
| | | SHARES | | | VALUE | |
| Industrials—continued | |
Northrop Grumman Corp. | | | 27 | | | $ | 6 | |
Parker Hannifin Corp. | | | 60 | | | | 8 | |
Pentair plc | | | 77 | | | | 4 | |
Raytheon Co. | | | 58 | | | | 8 | |
Republic Services, Inc. | | | 342 | | | | 20 | |
Robinson (C.H.) Worldwide, Inc. | | | 69 | | | | 5 | |
Rockwell Collins, Inc. | | | 20 | | | | 2 | |
Roper Technologies, Inc. | | | 19 | | | | 3 | |
Ryder System, Inc. | | | 300 | | | | 22 | |
Snap-On, Inc. | | | 36 | | | | 6 | |
Stanley Black & Decker, Inc. | | | 68 | | | | 8 | |
Stericycle, Inc.(2) | | | 121 | | | | 9 | |
Textron, Inc. | | | 40 | | | | 2 | |
TransDigm Group, Inc. | | | 10 | | | | 3 | |
United Parcel Service, Inc. Class B | | | 335 | | | | 38 | |
United Technologies Corp. | | | 115 | | | | 13 | |
Verisk Analytics, Inc.(2) | | | 244 | | | | 20 | |
Waste Management, Inc. | | | 598 | | | | 42 | |
Xylem, Inc. | | | 107 | | | | 5 | |
| | | | | | | | |
| | | | | | | 721 | |
| | | | | | | | |
|
| Information Technology—14.4% | |
Activision Blizzard, Inc. | | | 986 | | | | 36 | |
Adobe Systems, Inc.(2) | | | 221 | | | | 23 | |
Akamai Technologies, Inc.(2) | | | 17 | | | | 1 | |
Alliance Data Systems Corp. | | | 9 | | | | 2 | |
Alphabet, Inc. Class A(2) | | | 25 | | | | 20 | |
Alphabet, Inc. Class C(2) | | | 26 | | | | 20 | |
Amphenol Corp. Class A | | | 496 | | | | 33 | |
Analog Devices, Inc. | | | 66 | | | | 5 | |
Apple, Inc. | | | 542 | | | | 63 | |
Applied Materials, Inc. | | | 1,217 | | | | 39 | |
Autodesk, Inc.(2) | | | 84 | | | | 6 | |
Automatic Data Processing, Inc. | | | 79 | | | | 8 | |
Broadcom Ltd. | | | 48 | | | | 8 | |
CA, Inc. | | | 36 | | | | 1 | |
Citrix Systems, Inc.(2) | | | 80 | | | | 7 | |
Corning, Inc. | | | 1,551 | | | | 38 | |
eBay, Inc.(2) | | | 111 | | | | 3 | |
Electronic Arts, Inc.(2) | | | 436 | | | | 34 | |
Facebook, Inc. Class A(2) | | | 203 | | | | 23 | |
Fidelity National Information Services, Inc. | | | 58 | | | | 4 | |
First Solar, Inc.(2) | | | 15 | | | | — | (3) |
Fiserv, Inc.(2) | | | 40 | | | | 4 | |
Global Payments, Inc. | | | 24 | | | | 2 | |
Hewlett Packard Enterprise Co. | | | 179 | | | | 4 | |
HP, Inc. | | | 175 | | | | 3 | |
Intel Corp. | | | 574 | | | | 21 | |
Intuit, Inc. | | | 122 | | | | 14 | |
KLA-Tencor Corp. | | | 175 | | | | 14 | |
Lam Research Corp. | | | 180 | | | | 19 | |
Linear Technology Corp. | | | 59 | | | | 4 | |
MasterCard, Inc. Class A | | | 144 | | | | 15 | |
Microchip Technology, Inc. | | | 31 | | | | 2 | |
Micron Technology, Inc.(2) | | | 198 | | | | 4 | |
Microsoft Corp. | | | 872 | | | | 54 | |
NetApp, Inc. | | | 23 | | | | 1 | |
NVIDIA Corp. | | | 91 | | | | 10 | |
Oracle Corp. | | | 327 | | | | 13 | |
Paychex, Inc. | | | 67 | | | | 4 | |
PayPal Holdings, Inc.(2) | | | 186 | | | | 7 | |
Qorvo, Inc.(2) | | | 20 | | | | 1 | |
| | | | | | | | |
| | | SHARES | | | VALUE | |
| Information Technology—continued | |
QUALCOMM, Inc. | | | 178 | | | $ | 12 | |
Red Hat, Inc.(2) | | | 22 | | | | 2 | |
salesforce.com, Inc.(2) | | | 296 | | | | 20 | |
Seagate Technology plc | | | 32 | | | | 1 | |
Skyworks Solutions, Inc. | | | 36 | | | | 3 | |
Symantec Corp. | | | 75 | | | | 2 | |
Texas Instruments, Inc. | | | 122 | | | | 9 | |
Total System Services, Inc. | | | 27 | | | | 1 | |
VeriSign, Inc.(2) | | | 9 | | | | 1 | |
Visa, Inc. Class A | | | 296 | | | | 23 | |
Western Digital Corp. | | | 28 | | | | 2 | |
Western Union Co. (The) | | | 80 | | | | 2 | |
Xerox Corp. | | | 144 | | | | 1 | |
Xilinx, Inc. | | | 46 | | | | 3 | |
Yahoo!, Inc.(2) | | | 85 | | | | 3 | |
| | | | | | | | |
| | | | | | | 655 | |
| | | | | | | | |
|
| Materials—9.8% | |
AdvanSix, Inc.(2) | | | 5 | | | | — | (3) |
Albemarle Corp. | | | 79 | | | | 7 | |
Alcoa Corp. | | | 667 | | | | 19 | |
Avery Dennison Corp. | | | 147 | | | | 10 | |
Dow Chemical Co. (The) | | | 549 | | | | 31 | |
Du Pont (E.I.) de Nemours & Co. | | | 446 | | | | 33 | |
Eastman Chemical Co. | | | 90 | | | | 7 | |
Ecolab, Inc. | | | 182 | | | | 21 | |
International Flavors & Fragrances, Inc. | | | 67 | | | | 8 | |
International Paper Co. | | | 601 | | | | 32 | |
Martin Marietta Materials, Inc. | | | 150 | | | | 33 | |
Newmont Mining Corp. | | | 2,177 | | | | 74 | |
Nucor Corp. | | | 1,135 | | | | 68 | |
PPG Industries, Inc. | | | 185 | | | | 18 | |
Sealed Air Corp. | | | 269 | | | | 12 | |
Sherwin-Williams Co. (The) | | | 57 | | | | 15 | |
Vulcan Materials Co. | | | 328 | | | | 41 | |
WestRock Co. | | | 345 | | | | 18 | |
| | | | | | | | |
| | | | | | | 447 | |
| | | | | | | | |
|
| Real Estate—3.2% | |
American Tower Corp. | | | 149 | | | | 16 | |
Crown Castle International Corp. | | | 132 | | | | 11 | |
Digital Realty Trust, Inc. | | | 54 | | | | 5 | |
Equinix, Inc. | | | 28 | | | | 10 | |
Extra Space Storage, Inc. | | | 59 | | | | 5 | |
Iron Mountain, Inc. | | | 86 | | | | 3 | |
Prologis, Inc. | | | 1,387 | | | | 73 | |
Public Storage | | | 52 | | | | 12 | |
Quality Care Properties,
Inc.(2) | | | 89 | | | | 1 | |
Weyerhaeuser Co. | | | 273 | | | | 8 | |
| | | | | | | | |
| | | | | | | 144 | |
| | | | | | | | |
|
| Utilities—1.6% | |
Ameren Corp. | | | 87 | | | | 5 | |
CenterPoint Energy, Inc. | | | 159 | | | | 4 | |
CMS Energy Corp. | | | 98 | | | | 4 | |
Consolidated Edison, Inc. | | | 100 | | | | 7 | |
Dominion Resources, Inc. | | | 197 | | | | 15 | |
DTE Energy Co. | | | 76 | | | | 8 | |
NiSource, Inc. | | | 111 | | | | 2 | |
Public Service Enterprise Group, Inc. | | | 171 | | | | 8 | |
| | | | | | | | |
| | | SHARES | | | VALUE | |
| Utilities—continued | |
SCANA Corp. | | | 61 | | | $ | 4 | |
Sempra Energy | | | 83 | | | | 8 | |
WEC Energy Group, Inc. | | | 116 | | | | 7 | |
| | | | | | | | |
| | | | | | | | 72 | |
TOTAL COMMON STOCKS
(Identified Cost $4,084) | | | | 4,484 | |
TOTAL LONG TERM INVESTMENTS—98.3%
(Identified Cost $4,084) | | | | 4,484 | |
TOTAL INVESTMENTS—98.3%
(Identified Cost $4,084) | | | | 4,484 | (1) |
Other assets and liabilities, net—1.7% | | | | 79 | |
| | | | | | | | |
| NET ASSETS—100.0% | | | $ | 4,563 | |
| | | | | | | | |
Footnote Legend:
| (1) | Federal Income Tax Information: For tax information at December 31, 2016, see Note 10 Federal Income Tax Information in the Notes to Financial Statements. |
| (2) | Non-income producing. |
| (3) | Amount is less than $500. |
The following table provides a summary of inputs used to value the Series’ investments as of December 31, 2016 (See Security Valuation Note 2A in the Notes to Financial Statements):
| | | | | | | | |
| | | Total
Value at
December 31, 2016 | | | Level 1
Quoted
Prices | |
Equity Securities: | | | | | | | | |
Common Stocks | | $ | 4,484 | | | $ | 4,484 | |
| | | | | | | | |
Total Investments | | $ | 4,484 | | | $ | 4,484 | |
| | | | | | | | |
There are no Level 2 (significant observable inputs) or Level 3 (significant unobservable inputs) priced securities.
There were no transfers between Level 1 and Level 2 related to securities held at December 31, 2016.
See Notes to Financial Statements
31
VIRTUS INTERNATIONAL SERIES
SCHEDULE OF INVESTMENTS
DECEMBER 31, 2016
($ reported in thousands)
| | | | | | | | |
| | | SHARES | | | VALUE | |
| PREFERRED STOCK—2.5% | |
|
| Consumer Staples—2.5% | |
Companhia Brasileira de Distribuicao Grupo Pao de Acucar 0.03% (Brazil) | | | 265,345 | | | $ | 4,463 | |
| TOTAL PREFERRED STOCK (Identified Cost $4,372) | | | | | | | 4,463 | |
|
| COMMON STOCKS—90.6% | |
|
| Consumer Discretionary—16.0% | |
Bayerische Motoren Werke AG (Germany) | | | 53,720 | | | | 5,019 | |
Bridgestone Corp. (Japan) | | | 117,725 | | | | 4,245 | |
Fuji Heavy Industries Ltd. (Japan) | | | 134,170 | | | | 5,478 | |
IMAX Corp. (Canada)(2) | | | 171,675 | | | | 5,390 | |
Sony Corp. (Japan) | | | 165,475 | | | | 4,637 | |
WPP plc (United Kingdom) | | | 162,013 | | | | 3,626 | |
| | | | | | | | |
| | | | | | | 28,395 | |
| | | | | | | | |
|
| Consumer Staples—5.3% | |
British American Tobacco plc (United Kingdom) | | | 74,295 | | | | 4,231 | |
Marine Harvest ASA (Norway) | | | 290,888 | | | | 5,245 | |
| | | | | | | | |
| | | | | | | 9,476 | |
| | | | | | | | |
| | |
| Energy—8.3% | | | | | | | | |
Petroleo Brasileiro S.A. ADR (Brazil)(2) | | | 435,720 | | | | 4,405 | |
Statoil ASA (Norway) | | | 281,430 | | | | 5,162 | |
Technip SA (France) | | | 72,985 | | | | 5,210 | |
| | | | | | | | |
| | | | | | | 14,777 | |
| | | | | | | | |
| Financials—14.9% | | | | | | | | |
American International Group, Inc. (United States) | | | 87,120 | | | | 5,690 | |
DBS Group Holdings Ltd. (Singapore) | | | 480,900 | | | | 5,758 | |
Mizuho Financial Group, Inc. (Japan) | | | 2,714,520 | | | | 4,873 | |
ORIX Corp. (Japan) | | | 319,605 | | | | 4,988 | |
Societe Generale SA (France) | | | 106,675 | | | | 5,249 | |
| | | | | | | | |
| | | | | | | 26,558 | |
| | | | | | | | |
| | | | | | | | |
| | | SHARES | | | VALUE | |
| Health Care—8.0% | | | | | | | | |
Allergan plc (Ireland)(2) | | | 26,685 | | | $ | 5,604 | |
Icon plc (Ireland)(2) | | | 56,215 | | | | 4,227 | |
Shire plc (United Kingdom) | | | 75,351 | | | | 4,350 | |
| | | | | | | | |
| | | | | | | 14,181 | |
| | | | | | | | |
| | |
| Industrials—14.8% | | | | | | | | |
Airbus Group SE (France) | | | 75,935 | | | | 5,023 | |
Ashtead Group plc (United Kingdom) | | | 324,590 | | | | 6,320 | |
Nidec Corp. (Japan) | | | 60,430 | | | | 5,215 | |
RELX plc (United Kingdom) | | | 251,994 | | | | 4,500 | |
Safran SA (France) | | | 73,935 | | | | 5,325 | |
| | | | | | | | |
| | | | | | | 26,383 | |
| | | | | | | | |
| Information Technology—8.3% | |
Broadcom Ltd. (Singapore) | | | 30,460 | | | | 5,385 | |
Check Point Software Technologies Ltd. (Israel)(2) | | | 47,075 | | | | 3,976 | |
SAP SE (Germany) | | | 60,721 | | | | 5,293 | |
| | | | | | | | |
| | | | | | | 14,654 | |
| | | | | | | | |
| Materials—4.2% | | | | | | | | |
Fortescue Metals Group Ltd. (Australia) | | | 365,435 | | | | 1,553 | |
Toray Industries, Inc. (Japan) | | | 718,370 | | | | 5,816 | |
| | | | | | | | |
| | | | | | | 7,369 | |
| | | | | | | | |
| Real Estate—2.5% | | | | | | | | |
LendLease Group (Australia) | | | 416,870 | | | | 4,398 | |
| | | | | | | | |
|
| Telecommunication Services—6.6% | |
KDDI Corp. (Japan) | | | 166,005 | | | | 4,204 | |
Nippon Telegraph & Telephone Corp. (Japan) | | | 99,925 | | | | 4,200 | |
Spark New Zealand Ltd. (New Zealand) | | | 1,432,933 | | | | 3,394 | |
| | | | | | | | |
| | | | | | | 11,798 | |
| | | | | | | | |
| | |
| Utilities—1.7% | | | | | | | | |
Korea Electric Power Corp. (South Korea) | | | 84,345 | | | | 3,076 | |
TOTAL COMMON STOCKS
(Identified Cost $154,523) | | | | 161,065 | |
| TOTAL LONG TERM INVESTMENTS—93.1% | |
| (Identified Cost $158,895) | | | | 165,528 | |
| | | | | | | | |
| | | SHARES | | | VALUE | |
| SHORT-TERM INVESTMENT—2.3% | |
|
| Money Market Mutual Fund—2.3% | |
JPMorgan U.S. Government Money Market Fund – Institutional Shares (seven-day effective yield 0.440%)(3) | | | 4,171,514 | | | $ | 4,172 | |
| TOTAL SHORT-TERM INVESTMENT (Identified Cost $4,172) | | | | 4,172 | |
| TOTAL INVESTMENTS—95.4% (Identified Cost $163,067) | | | | 169,700 | (1) |
Other assets and liabilities, net—4.6% | | | | 8,254 | |
| | | | | | | | |
| NET ASSETS—100.0% | | | | | | $ | 177,954 | |
| | | | | | | | |
Abbreviation:
| ADR | American Depositary Receipt |
Footnote Legend:
| (1) | Federal Income Tax Information: For tax information at December 31, 2016, see Note 10 Federal Income Tax Information in the Notes to Financial Statements. |
| (2) | Non-income producing. |
| (3) | Shares of this fund are publicly offered and its prospectus and annual report are publicly available. |
Foreign Currency:
| | | | |
| Country Weightings (unaudited)† | |
Japan | | | 26 | % |
United Kingdom | | | 14 | |
France | | | 12 | |
Singapore | | | 6 | |
Norway | | | 6 | |
Germany | | | 6 | |
United States | | | 6 | |
Other | | | 24 | |
Total | | | 100 | % |
† % of total investments as of December 31, 2016 | |
At December 31, 2016, the Series had entered into forward currency contracts as follows (reported in 000’s):
| | | | | | | | |
Contracts to Sell | | In Exchange for | | Counterparty | | Settlement Date | | Unrealized
Appreciation
(Depreciation) |
JPY 2,599,743 | | USD 22,922 | | JPMorgan | | 6/5/2017 | | $496 |
| | | | | | | | |
See Notes to Financial Statements
32
VIRTUS INTERNATIONAL SERIES
SCHEDULE OF INVESTMENTS (Continued)
DECEMBER 31, 2016
($ reported in thousands)
The following table provides a summary of inputs used to value the Series’ investments as of December 31, 2016 (See Security Valuation Note 2A in the Notes to Financial Statements):
| | | | | | | | | | | | |
| | | Total
Value at
December 31, 2016 | | | Level 1
Quoted
Prices | | | Level 2
Significant
Observable
Inputs | |
Equity Securities: | | | | | | | | | | | | |
Common Stocks | | $ | 161,065 | | | $ | 161,065 | | | $ | — | |
Preferred Stock | | | 4,463 | | | | 4,463 | | | | — | |
Short-Term Investment | | | 4,172 | | | $ | 4,172 | | | | — | |
| | | | | | | | | | | | |
Total Investments | | $ | 169,700 | | | $ | 169,700 | | | $ | — | |
| | | | | | | | | | | | |
Other Financial Instruments:
| | | | | | | | | | | | |
Forward Currency Contracts* | | $ | 496 | | | $ | — | | | $ | 496 | |
| | | | | | | | | | | | |
There are no Level 3 (significant unobservable inputs) priced securities.
| * | Valued at the unrealized appreciation (depreciation) on the investment. |
Securities held by the Series with an end of period value of $32,160 were transferred from Level 2 to Level 1 based on our valuation procedures for non-US securities (See Note 2A in the Notes to Financial Statements).
See Notes to Financial Statements
33
VIRTUS MULTI-SECTOR FIXED INCOME SERIES
SCHEDULE OF INVESTMENTS
DECEMBER 31, 2016
($ reported in thousands)
| | | | | | | | |
| | | PAR
VALUE | | | VALUE | |
| MUNICIPAL BONDS—0.5% | |
|
| Michigan—0.1% | |
Tobacco Settlement Finance Authority Taxable Series A,
7.309%, 6/1/34 | | $ | 190 | | | $ | 175 | |
| | | | | | | | |
|
| Virginia—0.4% | |
Tobacco Settlement Financing Corp. Series A-1, Taxable
6.706%, 6/1/46 | | | 655 | | | | 522 | |
TOTAL MUNICIPAL BONDS
(Identified Cost $828) | | | | 697 | |
|
| FOREIGN GOVERNMENT SECURITIES—9.9% | |
Argentine Republic | | | | | | | | |
144A 7.500%, 4/22/26(3) | | | 440 | | | | 462 | |
7.875%, 6/15/27 | | | 465 | | | | 460 | |
8.280%, 12/31/33 | | | 562 | | | | 603 | |
144A 7.125%, 7/6/36(3) | | | 265 | | | | 253 | |
144A 7.625%, 4/22/46(3) | | | 150 | | | | 150 | |
Bolivarian Republic of Venezuela | | | | | | | | |
RegS 7.000%, 12/1/18(4) | | | 93 | | | | 60 | |
RegS 7.750%, 10/13/19(4) | | | 87 | | | | 49 | |
RegS 7.650%, 4/21/25(4) | | | 825 | | | | 380 | |
9.375%, 1/13/34 | | | 750 | | | | 351 | |
Federative Republic of Brazil | | | | | | | | |
Treasury Note Series F, 10.000%, 1/1/23 | | | 870 | BRL | | | 252 | |
8.500%, 1/5/24 | | | 350 | BRL | | | 94 | |
Treasury Note Series F, 10.000%, 1/1/25 | | | 860 | BRL | | | 246 | |
10.250%, 1/10/28 | | | 250 | BRL | | | 71 | |
5.625%, 1/7/41 | | | 310 | | | | 277 | |
Kingdom of Bahrain 144A
7.000%, 10/12/28(3) | | | 340 | | | | 348 | |
Kingdom of Jordan 144A 5.750%, 1/31/27(3) | | | 420 | | | | 399 | |
Kingdom of Morocco 144A 5.500%, 12/11/42(3) | | | 300 | | | | 305 | |
Kingdom of Saudi Arabia 144A 3.250%, 10/26/26(3) | | | 355 | | | | 337 | |
Provincia de Buenos Aires 144A 9.125%, 3/16/24(3) | | | 280 | | | | 305 | |
Republic of Chile
5.500%, 8/5/20 | | | 231,500 | CLP | | | 364 | |
Republic of Colombia | | | | | | | | |
4.375%, 3/21/23 | | | 994,000 | COP | | | 288 | |
9.850%, 6/28/27 | | | 283,000 | COP | | | 111 | |
Republic of Costa Rica 144A 7.000%, 4/4/44(3) | | | 315 | | | | 289 | |
Republic of Cote d’Ivoire 144A 6.375%, 3/3/28(3) | | | 305 | | | | 297 | |
Republic of El Salvador 144A 6.375%, 1/18/27(3) | | | 475 | | | | 439 | |
Republic of Indonesia Series FR56, 8.375%, 9/15/26 | | | 6,228,000 | IDR | | | 476 | |
Republic of Iraq RegS 5.800%, 1/15/28(4) | | | 250 | | | | 208 | |
Republic of Panama
3.750%, 3/16/25 | | | 380 | | | | 377 | |
| | | | | | | | |
| | | PAR
VALUE | | | VALUE | |
| FOREIGN GOVERNMENT SECURITIES—continued | |
Republic of Romania 144A 6.750%, 2/7/22(3) | | $ | 170 | | | $ | 194 | |
Republic of South Africa | | | | | | | | |
Series R203,
8.250%, 9/15/17 | | | 2,375 | ZAR | | | 174 | |
Series R208,
6.750%, 3/31/21 | | | 1,410 | ZAR | | | 97 | |
4.300%, 10/12/28 | | | 270 | | | | 250 | |
Republic of Sri Lanka 144A 6.850%, 11/3/25(3) | | | 300 | | | | 296 | |
Republic of Turkey | | | | | | | | |
9.000%, 3/8/17 | | | 570 | TRY | | | 162 | |
4.875%, 10/9/26 | | | 1,110 | | | | 1,030 | |
4.875%, 4/16/43 | | | 420 | | | | 338 | |
Russian Federation 144A
7.850%, 3/10/18(3) | | | 30,000 | RUB | | | 484 | |
State of Qatar 144A
3.250%, 6/2/26(3) | | | 225 | | | | 217 | |
Sultanate of Oman 144A
4.750%, 6/15/26(3) | | | 470 | | | | 454 | |
Ukraine 144A
7.750%, 9/1/26(3) | | | 400 | | | | 374 | |
United Mexican States | | | | | | | | |
Series M, 6.500%, 6/9/22 | | | 6,713 | MXN | | | 313 | |
4.750%, 3/8/44 | | | 164 | | | | 149 | |
TOTAL FOREIGN GOVERNMENT SECURITIES
(Identified Cost $14,196) | | | | 12,783 | |
|
| MORTGAGE-BACKED SECURITIES—19.0% | |
| | |
| Agency—6.2% | | | | | | | | |
FHLMC 3.500%, 4/1/46 | | | 569 | | | | 583 | |
FNMA | | | | | | | | |
3.000%, 4/1/43 | | | 1,172 | | | | 1,171 | |
3.000%, 5/1/43 | | | 519 | | | | 518 | |
3.000%, 5/1/43 | | | 905 | | | | 904 | |
3.500%, 1/1/45 | | | 201 | | | | 206 | |
3.500%, 5/1/45 | | | 300 | | | | 308 | |
3.500%, 8/1/45 | | | 1,907 | | | | 1,955 | |
3.000%, 12/1/45 | | | 712 | | | | 708 | |
3.500%, 1/1/46 | | | 718 | | | | 736 | |
3.500%, 1/1/46 | | | 574 | | | | 588 | |
3.000%, 7/1/46 | | | 296 | | | | 294 | |
| | | | | | | | |
| | | | | | | 7,971 | |
| | | | | | | | |
| | |
| Non-Agency—12.8% | | | | | | | | |
American Homes 4 Rent | | | | | | | | |
14-SFR2, C 144A
4.705%, 10/17/36(3) | | | 435 | | | | 450 | |
15-SFR2, C 144A
4.691%, 10/17/45(3) | | | 340 | | | | 350 | |
15-SFR1, A 144A
3.467%, 4/17/52(3) | | | 330 | | | | 331 | |
Ameriquest Mortgage Securities, Inc. | | | | | | | | |
03-AR3, M4
4.274%, 6/25/33(2) | | | 325 | | | | 314 | |
03-10, AF6
5.210%, 11/25/33(2) | | | 7 | | | | 8 | |
AMSR Trust 16-SFR1, D 144A
3.136%, 11/17/33(2)(3) | | | 335 | | | | 334 | |
| | | | | | | | |
| | | PAR
VALUE | | | VALUE | |
| Non-Agency—continued | |
Banc of America Funding Trust 05-1, 1A1
5.500%, 2/25/35 | | $ | 112 | | | $ | 112 | |
Bank of America (Countrywide) Asset-Backed Certificates | | | | | | | | |
05-1, AF5A 5.137%, 7/25/35(2) | | | 467 | | | | 486 | |
05-12, 2A4 5.575%, 2/25/36(2) | | | 319 | | | | 318 | |
Bank of America (Merrill Lynch – Countrywide) Alternative Loan Trust 04-22CB, 1A1
6.000%, 10/25/34 | | | 190 | | | | 203 | |
Barclays (Lehman Brothers) – UBS Commercial Mortgage Trust 07-C7, A3
5.866%, 9/15/45(2) | | | 425 | | | | 436 | |
Bayview Opportunity Master Fund IVa Trust 16-SPL1, B1 144A
4.250%, 4/28/55(3) | | | 275 | | | | 280 | |
Bayview Opportunity Master Fund IVb Trust 16-SPL2, B1 144A
4.250%, 6/28/53(2)(3) | | | 130 | | | | 131 | |
CIT Group Home Equity Loan Trust 03-1,
A5 5.480%, 7/20/34(2) | | | 299 | | | | 300 | |
Citigroup Mortgage Loan Trust, Inc. | | | | | | | | |
05-5, 2A3 5.000%, 8/25/35 | | | 108 | | | | 107 | |
15-A, A1 144A 3.500%, 6/25/58(2)(3) | | | 273 | | | | 277 | |
Colony American Finance Ltd. 15-1 144A
2.896%, 10/15/47(3) | | | 270 | | | | 269 | |
Colony Starwood Homes Trust 16-2A, C
144A 2.886%, 12/17/33(2)(3) | | | 335 | | | | 336 | |
Credit Suisse Commercial Mortgage-Backed Trust 07-C1, A1A
5.361%, 2/15/40 | | | 49 | | | | 49 | |
Credit Suisse Mortgage-Backed Trust 06-08, 3A1
6.000%, 10/25/21 | | | 158 | | | | 150 | |
Deutsche Bank-UBS Mortgage Trust 11-LC3A, D 144A
5.345%, 8/10/44(2)(3) | | | 350 | | | | 362 | |
GAHR Commercial Mortgage Trust 15-NRF, CFX 144A
3.382%, 12/15/34(2)(3) | | | 290 | | | | 291 | |
GSAA Home Equity Trust 05-12, AF3W
4.999%, 9/25/35(2) | | | 132 | | | | 133 | |
JPMorgan Chase (Bear Stearns) Adjustable Rate Mortgage Trust 04-1, 21A1
2.938%, 4/25/34(2) | | | 220 | | | | 218 | |
JPMorgan Chase (Bear Stearns) Commercial Mortgage Securities Trust 07-PW18, AM,
6.084%, 6/11/50(2) | | | 825 | | | | 851 | |
Refer to Footnote Legend on page 41.
See Notes to Financial Statements
34
VIRTUS MULTI-SECTOR FIXED INCOME SERIES
SCHEDULE OF INVESTMENTS (Continued)
DECEMBER 31, 2016
($ reported in thousands)
| | | | | | | | |
| | | PAR
VALUE | | | VALUE | |
| Non-Agency—continued | |
JPMorgan Chase (Washington Mutual) Mortgage Pass-Through Certificates Trust 04-CB1, 5A
5.000%, 6/25/19 | | $ | 8 | | | $ | 8 | |
JPMorgan Chase Commercial Mortgage Securities Trust | | | | | | | | |
06-LDP7, AM
5.925%, 4/17/45(2) | | | 63 | | | | 63 | |
07-LDPX, AM
5.464%, 1/15/49(2) | | | 323 | | | | 320 | |
JPMorgan Chase Mortgage Trust | | | | | | | | |
05-A1, 4A1
3.308%, 2/25/35(2) | | | 18 | | | | 18 | |
05-A4, 3A1
3.016%, 7/25/35(2) | | | 21 | | | | 21 | |
14-1, 1A1 144A
4.000%, 1/25/44(2)(3) | | | 365 | | | | 377 | |
16-1, M2 144A
3.750%, 4/25/45(2)(3) | | | 263 | | | | 261 | |
15-4, 1A4 144A
3.500%, 6/25/45(2)(3) | | | 199 | | | | 201 | |
16-2, M2 144A
3.750%, 12/25/45(2)(3) | | | 422 | | | | 418 | |
16-1, A3 144A
3.500%, 5/25/46(3) | | | 234 | | | | 235 | |
MASTR Adjustable Rate Mortgages Trust 05-1, 3A1
4.373%, 2/25/35(2) | | | 255 | | | | 233 | |
MASTR Alternative Loan Trust 04-6, 7A1 6.000%, 7/25/34 | | | 302 | | | | 297 | |
MASTR Specialized Loan Trust 05-3, A2 144A
5.704%, 11/25/35(2)(3) | | | 242 | | | | 244 | |
Mill City Mortgage Loan Trust 16-1, M1 144A
3.150%, 4/25/57(2)(3) | | | 245 | | | | 238 | |
Morgan Stanley – Bank of America (Merrill Lynch) Trust | | | | | | | | |
13-C13, AS
4.266%, 11/15/46 | | | 125 | | | | 132 | |
15-C26, C
4.411%, 10/15/48(2) | | | 355 | | | | 349 | |
Morgan Stanley Capital I Trust 07-IQ14, AM
5.690%, 4/15/49(2) | | | 325 | | | | 318 | |
New Residential Mortgage Loan Trust | | | | | | | | |
14-1A, A 144A
3.750%, 1/25/54(2)(3) | | | 259 | | | | 266 | |
15-2A, A1 144A
3.750%, 8/25/55(2)(3) | | | 307 | | | | 317 | |
16-1A, A1 144A 3.750%, 3/25/56(2)(3) | | | 273 | | | | 277 | |
16-4A, B1A 144A
4.500%, 11/25/56(3) | | | 309 | | | | 321 | |
Nomura Asset Acceptance Corp. 04-R3, A1 144A 6.500%, 2/25/35(3) | | | 294 | | | | 287 | |
| | | | | | | | |
| | | PAR
VALUE | | | VALUE | |
| Non-Agency—continued | |
Residential Asset Mortgage Products, Inc. | | | | | | | | |
04-SL1, A8
6.500%, 11/25/31 | | $ | 26 | | | $ | 26 | |
05-SL2, A4
7.500%, 2/25/32 | | | 184 | | | | 185 | |
Residential Asset Securitization Trust 05-A1, A3
5.500%, 4/25/35 | | | 266 | | | | 265 | |
Sequoia Mortgage Trust | | | | | | | | |
14-2, A1 144A
4.000%, 7/25/44(2)(3) | | | 134 | | | | 136 | |
14-4, A6 144A
3.500%, 11/25/44(2)(3) | | | 282 | | | | 282 | |
15-1, A1 144A
3.500%, 1/25/45(2)(3) | | | 286 | | | | 287 | |
Structured Adjustable Rate Mortgage Loan Trust 04-4, 3A1
3.112%, 4/25/34(2) | | | 214 | | | | 210 | |
Towd Point Mortgage Trust | | | | | | | | |
15-1, A2 144A
3.250%, 10/25/53(2)(3) | | | 255 | | | | 249 | |
15-6, M1 144A
3.750%, 4/25/55(2)(3) | | | 130 | | | | 127 | |
15-5, A2 144A
3.500%, 5/25/55(2)(3) | | | 315 | | | | 316 | |
15-2, 1M1 144A
3.250%, 11/25/60(2)(3) | | | 855 | | | | 848 | |
Vericrest Opportunity Loan Trust | | | | | | | | |
15-NP11, A1 144A
3.625%, 7/25/45(2)(3) | | | 172 | | | | 172 | |
16-NPL9, A1 144A
3.500%, 9/25/46(2)(3) | | | 160 | | | | 160 | |
15-NPL2, A1 144A
3.375%, 2/25/55(2)(3) | | | 81 | | | | 81 | |
15-NPL3, A1 144A
3.375%, 10/25/58(2)(3) | | | 150 | | | | 150 | |
Wells Fargo (Wachovia Bank) Commercial Mortgage Trust | | | | | | | | |
07-C30, A5
5.342%, 12/15/43 | | | 255 | | | | 254 | |
15-LC20, B
3.719%, 4/15/50 | | | 150 | | | | 150 | |
Wells Fargo – Royal Bank of Scotland plc Commercial Mortgage Trust 11-C5, C 144A
5.673%, 11/15/44(2)(3) | | | 330 | | | | 353 | |
Wells Fargo Mortgage Backed Securities Trust 06-17, A1
5.500%, 11/25/21 | | | 3 | | | | 3 | |
| | | | | | | | |
| | | | | | | | 16,551 | |
TOTAL MORTGAGE-BACKED SECURITIES
(Identified Cost $24,466) | | | | 24,522 | |
|
| ASSET-BACKED SECURITIES—4.4% | |
CarFinance Capital Auto Trust 15-1A, C 144A
3.580%, 6/15/21(3) | | | 895 | | | | 894 | |
| | | | | | | | |
| | | PAR
VALUE | | | VALUE | |
| ASSET-BACKED SECURITIES—continued | |
Carnow Auto Receivables Trust 2016-1 144A
7.340%, 11/15/21(3) | | $ | 325 | | | $ | 323 | |
Cheesecake Restaurant Holdings, Inc. 13-1A, A2 144A
4.474%, 3/20/43(3) | | | 378 | | | | 373 | |
Citi Held For Asset Issuance 15-PM3, B 144A
4.310%, 5/16/22(3) | | | 335 | | | | 336 | |
DB Master Finance LLC 15-A1, A2II 144A
3.980%, 2/20/45(3) | | | 157 | | | | 157 | |
Drug Royalty II LP 1 14-1, A2 144A
3.484%, 7/15/23(3) | | | 312 | | | | 310 | |
Exeter Automobile Receivables Trust | | | | | | | | |
14-1A, C 144A
3.570%, 7/15/19(3) | | | 340 | | | | 342 | |
15-2A, C 144A
3.900%, 3/15/21(3) | | | 380 | | | | 385 | |
Fairway Outdoor Funding LLC 12-1A, A2 144A
4.212%, 10/15/42(3) | | | 573 | | | | 575 | |
Flagship Credit Auto Trust | | | | | | | | |
14-1, E 144A
5.710%, 8/16/21(3) | | | 305 | | | | 309 | |
16-3, D 144A
3.890%, 11/15/22(3) | | | 400 | | | | 392 | |
Foursight Capital Automobile Receivables Trust 15-1, B 144A
4.120%, 9/15/22(3) | | | 455 | | | | 454 | |
Greater Capital Association of Realtors 15-1A, C
9.790%, 10/15/25 | | | 250 | | | | 258 | |
SoFi Professional Loan Program LLC 16-A, A2 144A
2.760%, 12/26/36(3) | | | 216 | | | | 217 | |
U-Haul S Fleet LLC 10-BT1A, 1 144A
4.899%, 10/25/23(3) | | | 382 | | | | 386 | |
TOTAL ASSET-BACKED SECURITIES
(Identified Cost $5,703) | | | | 5,711 | |
|
| CORPORATE BONDS AND NOTES—51.1% | |
|
| Consumer Discretionary—5.4% | |
AMC Entertainment Holdings, Inc. 144A
5.875%, 11/15/26(3) | | | 55 | | | | 56 | |
Boyd Gaming Corp.
6.875%, 5/15/23 | | | 145 | | | | 156 | |
Cablevision Systems Corp.
5.875%, 9/15/22 | | | 290 | | | | 284 | |
Caesars Entertainment Operating Co., Inc.
9.000%, 2/15/20(11) | | | 59 | | | | 61 | |
Caesars Entertainment Resort Properties LLC
8.000%, 10/1/20 | | | 105 | | | | 111 | |
Refer to Footnote Legend on page 41.
See Notes to Financial Statements
35
VIRTUS MULTI-SECTOR FIXED INCOME SERIES
SCHEDULE OF INVESTMENTS (Continued)
DECEMBER 31, 2016
($ reported in thousands)
| | | | | | | | |
| | | PAR
VALUE | | | VALUE | |
| Consumer Discretionary—continued | |
Caesars Growth Properties Holdings LLC
9.375%, 5/1/22 | | $ | 295 | | | $ | 319 | |
CBS Radio, Inc. 144A
7.250%, 11/1/24(3) | | | 20 | | | | 21 | |
Clear Channel Worldwide Holdings, Inc. | | | | | | | | |
Series B
7.625%, 3/15/20 | | | 160 | | | | 161 | |
Series A
7.625%, 3/15/20 | | | 250 | | | | 241 | |
Columbus Cable Barbados Ltd. 144A
7.375%, 3/30/21(3) | | | 340 | | | | 363 | |
Cooper-Standard Automotive, Inc. 144A
5.625%, 11/15/26(3) | | | 200 | | | | 198 | |
Dana Financing Luxembourg S.a.r.l. 144A
6.500%, 6/1/26(3) | | | 105 | | | | 110 | |
Diamond Resorts International, Inc. 144A
7.750%, 9/1/23(3) | | | 20 | | | | 20 | |
Grupo Televisa SAB
4.625%, 1/30/26 | | | 350 | | | | 354 | |
Landry’s, Inc. 144A
6.750%, 10/15/24(3) | | | 80 | | | | 81 | |
Live Nation Entertainment, Inc. 144A
4.875%, 11/1/24(3) | | | 120 | | | | 121 | |
M/I Homes, Inc.
6.750%, 1/15/21 | | | 180 | | | | 189 | |
MDC Holdings, Inc.
5.500%, 1/15/24 | | | 355 | | | | 368 | |
MPG Holdco I, Inc.
7.375%, 10/15/22 | | | 285 | | | | 299 | |
NCL Corp., Ltd. 144A
4.750%, 12/15/21(3) | | | 240 | | | | 240 | |
New York University
4.142%, 7/1/48 | | | 225 | | | | 212 | |
Pinnacle Entertainment, Inc. 144A
5.625%, 5/1/24(3) | | | 125 | | | | 126 | |
RCN Telecom Services LLC (RCN Capital Corp.) 144A
8.500%, 8/15/20(3) | | | 145 | | | | 154 | |
Scientific Games International, Inc. 144A
7.000%, 1/1/22(3) | | | 255 | | | | 275 | |
SFR (Numericable) Group S.A. | | | | | | | | |
144A 6.000%, 5/15/22(3) | | | 200 | | | | 206 | |
144A 7.375%, 5/1/26(3) | | | 200 | | | | 205 | |
Signet UK Finance plc
4.700%, 6/15/24 | | | 460 | | | | 440 | |
TI Group Automotive Systems LLC 144A
8.750%, 7/15/23(3) | | | 150 | | | | 158 | |
Toll Brothers Finance Corp.
4.875%, 11/15/25 | | | 400 | | | | 394 | |
TRI Pointe Group, Inc.
5.875%, 6/15/24 | | | 305 | | | | 316 | |
VTR Finance BV 144A
6.875%, 1/15/24(3) | | | 345 | | | | 357 | |
| | | | | | | | |
| | | PAR
VALUE | | | VALUE | |
| Consumer Discretionary—continued | |
Ziggo Secured Finance BV 144A
5.500%, 1/15/27(3) | | $ | 335 | | | $ | 327 | |
| | | | | | | | |
| | | | | | | 6,923 | |
| | | | | | | | |
|
| Consumer Staples—0.7% | |
AdvancePierre Foods Holdings, Inc. 144A
5.500%, 12/15/24(3) | | | 180 | | | | 182 | |
Dole Food Co., Inc. 144A
7.250%, 5/1/19(3) | | | 155 | | | | 158 | |
Pilgrim’s Pride Corp. 144A
5.750%, 3/15/25(3) | | | 115 | | | | 116 | |
Post Holdings, Inc. 144A
5.000%, 8/15/26(3) | | | 235 | | | | 226 | |
Tops Holding LLC (Tops Markets II Corp.) 144A
8.000%, 6/15/22(3) | | | 300 | | | | 259 | |
| | | | | | | | |
| | | | | | | 941 | |
| | | | | | | | |
| | |
| Energy—12.7% | | | | | | | | |
Alberta Energy Co., Ltd.
8.125%, 9/15/30 | | | 155 | | | | 187 | |
Alta Mesa Holdings LP (Alta Mesa Finance Services Corp.) 144A
7.875%, 12/15/24(3) | | | 160 | | | | 166 | |
American Midstream Partners LP 144A
8.500%, 12/15/21(3) | | | 130 | | | | 129 | |
Anadarko Petroleum Corp. | | | | | | | | |
4.850%, 3/15/21 | | | 70 | | | | 75 | |
5.550%, 3/15/26 | | | 100 | | | | 112 | |
6.600%, 3/15/46 | | | 200 | | | | 247 | |
Antero Midstream Partners LP 144A
5.375%, 9/15/24(3) | | | 105 | | | | 107 | |
Antero Resources Corp.
5.625%, 6/1/23 | | | 165 | | | | 170 | |
Blue Racer Midstream LLC 144A
6.125%, 11/15/22(3) | | | 105 | | | | 106 | |
Callon Petroleum Co. 144A
6.125%, 10/1/24(3) | | | 100 | | | | 104 | |
Carrizo Oil & Gas, Inc.
6.250%, 4/15/23 | | | 280 | | | | 288 | |
Cheniere Corpus Christi Holdings LLC 144A
7.000%, 6/30/24(3) | | | 260 | | | | 283 | |
Cimarex Energy Co.
4.375%, 6/1/24 | | | 210 | | | | 218 | |
Compagnie Generale de Geophysique-Veritas
6.500%, 6/1/21 | | | 375 | | | | 174 | |
Concho Resources, Inc.
4.375%, 1/15/25 | | | 195 | | | | 196 | |
CONSOL Energy, Inc.
5.875%, 4/15/22 | | | 110 | | | | 108 | |
Continental Resources, Inc. | | | | | | | | |
5.000%, 9/15/22 | | | 235 | | | | 238 | |
4.500%, 4/15/23 | | | 145 | | | | 143 | |
| | | | | | | | |
| | | PAR
VALUE | | | VALUE | |
| Energy—continued | |
Diamondback Energy, Inc. | | | | | | | | |
144A 4.750%, 11/1/24(3) | | $ | 50 | | | $ | 49 | |
144A 5.375%, 5/31/25(3) | | | 215 | | | | 217 | |
Ecopetrol S.A. | | | | | | | | |
5.875%, 9/18/23 | | | 285 | | | | 302 | |
5.375%, 6/26/26 | | | 375 | | | | 373 | |
Enbridge Energy Partners LP
4.375%, 10/15/20 | | | 70 | | | | 73 | |
Encana Corp.
3.900%, 11/15/21 | | | 150 | | | | 151 | |
EnLink Midstream Partners LP
4.850%, 7/15/26 | | | 35 | | | | 35 | |
EnQuest plc
7.000%, 4/15/22 | | | 360 | | | | 263 | |
EP Energy LLC 144A
8.000%, 11/29/24(3) | | | 15 | | | | 16 | |
EP Energy LLC (Everest Acquisition Finance, Inc.)
6.375%, 6/15/23 | | | 155 | | | | 123 | |
FTS International, Inc.
6.250%, 5/1/22 | | | 175 | | | | 146 | |
Gazprom OAO (Gaz Capital S.A.) | | | | | | | | |
144A 6.000%, 11/27/23(3)(7) | | | 335 | | | | 357 | |
144A 4.950%, 2/6/28(3)(7) | | | 205 | | | | 202 | |
Helmerich & Payne International Drilling Co. 4.650%, 3/15/25 | | | 220 | | | | 227 | |
Holly Energy Partners LP 144A 6.000%, 8/1/24(3) | | | 25 | | | | 26 | |
HollyFrontier Corp.
5.875%, 4/1/26 | | | 395 | | | | 403 | |
KazMunayGas National Co. 144A 6.375%, 4/9/21(3) | | | 260 | | | | 283 | |
Kinder Morgan, Inc.
7.750%, 1/15/32 | | | 305 | | | | 373 | |
Laredo Petroleum, Inc. 7.375%, 5/1/22 | | | 180 | | | | 187 | |
Linn Energy LLC
6.500%, 9/15/21(10) | | | 160 | | | | 68 | |
Matador Resources Co. 144A 6.875%, 4/15/23(3) | | | 330 | | | | 348 | |
MPLX LP 4.875%, 12/1/24 | | | 405 | | | | 417 | |
Newfield Exploration Co. 5.375%, 1/1/26 | | | 305 | | | | 311 | |
NGL Energy Partners LP 5.125%, 7/15/19 | | | 335 | | | | 334 | |
Noble Holding International Ltd. 7.750%, 1/15/24 | | | 80 | | | | 76 | |
Occidental Petroleum Corp. | | | | | | | | |
3.400%, 4/15/26 | | | 15 | | | | 15 | |
4.400%, 4/15/46 | | | 320 | | | | 325 | |
Odebrecht Offshore Drilling Finance Ltd. 144A
6.750%, 10/1/22(3) | | | 501 | | | | 133 | |
Parker Drilling Co.
7.500%, 8/1/20 | | | 365 | | | | 330 | |
Parsley Energy LLC 144A 6.250%, 6/1/24(3) | | | 375 | | | | 397 | |
Pertamina Persero PT 144A 5.625%, 5/20/43(3) | | | 370 | | | | 342 | |
Petrobras Global Finance BV | | | | | | | | |
5.375%, 1/27/21 | | | 155 | | | | 152 | |
Refer to Footnote Legend on page 41.
See Notes to Financial Statements
36
VIRTUS MULTI-SECTOR FIXED INCOME SERIES
SCHEDULE OF INVESTMENTS (Continued)
DECEMBER 31, 2016
($ reported in thousands)
| | | | | | | | |
| | | PAR
VALUE | | | VALUE | |
| Energy—continued | |
8.375%, 5/23/21 | | $ | 155 | | | $ | 167 | |
8.750%, 5/23/26 | | | 500 | | | | 541 | |
Petroleos de Venezuela S.A. | | | | | | | | |
RegS 8.500%, 11/2/17(4) | | | 47 | | | | 37 | |
144A 6.000%, 5/16/24(3) | | | 650 | | | | 252 | |
Petroleos Mexicanos | | | | | | | | |
144A 6.875%, 8/4/26(3) | | | 480 | | | | 506 | |
6.500%, 6/2/41 | | | 220 | | | | 206 | |
5.500%, 6/27/44 | | | 200 | | | | 166 | |
QEP Resources, Inc.
5.250%, 5/1/23 | | | 277 | | | | 279 | |
Range Resources Corp. 144A 5.000%, 3/15/23(3) | | | 380 | | | | 377 | |
Regency Energy Partners LP 5.000%, 10/1/22 | | | 425 | | | | 450 | |
RSP Permian, Inc. 144A 5.250%, 1/15/25(3) | | | 175 | | | | 176 | |
Sabine Pass Liquefaction LLC 5.625%, 2/1/21 | | | 315 | | | | 337 | |
SM Energy Co. | | | | | | | | |
6.125%, 11/15/22 | | | 160 | | | | 163 | |
6.500%, 1/1/23 | | | 150 | | | | 153 | |
Southern Gas Corridor CJSC 144A 6.875%, 3/24/26(3) | | | 265 | | | | 286 | |
State Oil Co. (Republic of Azerbaijan) 6.950%, 3/18/30 | | | 320 | | | | 335 | |
Sunoco LP 6.375%, 4/1/23 | | | 570 | | | | 580 | |
Tesoro Logistics LP
5.250%, 1/15/25 | | | 50 | | | | 51 | |
Transocean, Inc. | | | | | | | | |
144A 9.000%, 7/15/23(3) | | | 95 | | | | 98 | |
6.800%, 3/15/38 | | | 85 | | | | 66 | |
Weatherford International Ltd. 144A 9.875%, 2/15/24(3) | | | 80 | | | | 86 | |
Williams Cos., Inc. (The) | | | | | | | | |
3.700%, 1/15/23 | | | 375 | | | | 362 | |
4.550%, 6/24/24 | | | 450 | | | | 449 | |
YPF S.A. 144A
8.500%, 3/23/21(3) | | | 180 | | | | 194 | |
| | | | | | | | |
| | | | | | | 16,422 | |
| | | | | | | | |
|
| Financials—14.4% | |
AerCap Ireland Capital Ltd. (Aercap Global Aviation Trust) 3.950%, 2/1/22 | | | 150 | | | | 151 | |
Akbank TAS 144A
7.500%, 2/5/18(3) | | | 935TRY | | | | 254 | |
Allstate Corp. (The)
5.750%, 8/15/53(2)(6) | | | 365 | | | | 377 | |
Ally Financial, Inc.
5.750%, 11/20/25 | | | 200 | | | | 200 | |
Apollo Management Holdings LP 144A 4.000%, 5/30/24(3) | | | 440 | | | | 436 | |
Ares Capital Corp.
3.625%, 1/19/22 | | | 210 | | | | 203 | |
Australia & New Zealand Banking Group Ltd. 144A 4.400%, 5/19/26(3) | | | 335 | | | | 339 | |
Banco Bilbao Vizcaya Argentaria Bancomer S.A. 144A 6.500%, 3/10/21(3) | | | 425 | | | | 458 | |
Banco de Bogota SA 144A 6.250%, 5/12/26(3) | | | 330 | | | | 337 | |
| | | | | | | | |
| | | PAR
VALUE | | | VALUE | |
| Financials—continued | |
Banco de Credito del Peru 144A 6.125%, 4/24/27(2)(3) | | $ | 520 | | | $ | 561 | |
Banco de Credito e Inversiones 144A
4.000%, 2/11/23(3) | | | 390 | | | | 397 | |
Banco Inbursa S.A. Institucion de Banca Multiple 144A 4.125%, 6/6/24(3) | | | 200 | | | | 196 | |
Banco Internacional del Peru SAA Interbank 144A
6.625%, 3/19/29(2)(3) | | | 155 | | | | 164 | |
Banco Santander Chile 144A 3.875%, 9/20/22(3) | | | 505 | | | | 519 | |
Bancolombia S.A.
5.125%, 9/11/22 | | | 545 | | | | 554 | |
Bank of America Corp. | | | | | | | | |
4.200%, 8/26/24 | | | 405 | | | | 412 | |
4.450%, 3/3/26 | | | 55 | | | | 57 | |
Bank of China Ltd. 144A 5.000%, 11/13/24(3) | | | 390 | | | | 404 | |
Barclays Bank plc 144A 6.050%, 12/4/17(3) | | | 435 | | | | 449 | |
Bonos del Banco Central de Chile En Pesos
4.500%, 6/1/20 | | | 70,000CLP | | | | 108 | |
Citigroup, Inc. 4.600%, 3/9/26 | | | 300 | | | | 310 | |
Citizens Financial Group, Inc. 5.500%, 12/29/49(2) | | | 300 | | | | 297 | |
Compass Bank
3.875%, 4/10/25 | | | 380 | | | | 361 | |
Development Bank of Kazakhstan OJSC 144A 4.125%, 12/10/22(3) | | | 535 | | | | 515 | |
Drawbridge Special Opportunities Fund LP 144A 5.000%, 8/1/21(3) | | | 440 | | | | 423 | |
Eurasian Development Bank 144A 4.767%, 9/20/22(3) | | | 475 | | | | 489 | |
Fidelity National Financial, Inc. 5.500%, 9/1/22 | | | 130 | | | | 137 | |
FS Investment Corp. | | | | | | | | |
4.250%, 1/15/20 | | | 230 | | | | 231 | |
4.750%, 5/15/22 | | | 50 | | | | 50 | |
Genworth Holdings, Inc. 4.900%, 8/15/23 | | | 230 | | | | 191 | |
GrupoSura Finance S.A. 144A 5.500%, 4/29/26(3) | | | 335 | | | | 343 | |
HBOS plc 144A
6.750%, 5/21/18(3) | | | 200 | | | | 211 | |
Huntington National Bank (The) 6.600%, 6/15/18 | | | 250 | | | | 264 | |
ICAHN Enterprises LP | | | | | | | | |
6.000%, 8/1/20 | | | 175 | | | | 180 | |
5.875%, 2/1/22 | | | 200 | | | | 199 | |
ING Groep NV 6.000%(2)(5)(6) | | | 275 | | | | 269 | |
iStar Financial, Inc. | | | | | | | | |
4.875%, 7/1/18 | | | 125 | | | | 125 | |
5.000%, 7/1/19 | | | 195 | | | | 196 | |
Jefferies Group LLC
6.875%, 4/15/21 | | | 165 | | | | 188 | |
Kazakhstan Temir Zholy Finance BV 144A
6.950%, 7/10/42(3) | | | 410 | | | | 398 | |
| | | | | | | | |
| | | PAR
VALUE | | | VALUE | |
| Financials—continued | |
Korea Finance Corp.
4.625%, 11/16/21 | | $ | 400 | | | $ | 433 | |
Leucadia National Corp. 5.500%, 10/18/23 | | | 250 | | | | 264 | |
Liberty Mutual Insurance Co. 144A 8.500%, 5/15/25(3) | | | 25 | | | | 31 | |
Lincoln National Corp.
6.050%, 4/20/67(2)(6) | | | 365 | | | | 281 | |
Lloyds TSB Bank plc 144A 6.500%, 9/14/20(3) | | | 600 | | | | 663 | |
Morgan Stanley | | | | | | | | |
144A 10.090%, 5/3/17(3) | | | 1,250 | BRL | | | 380 | |
4.350%, 9/8/26 | | | 195 | | | | 199 | |
Navient Corp. 7.250%, 9/25/23 | | | 85 | | | | 88 | |
OM Asset Management plc 4.800%, 7/27/26 | | | 270 | | | | 255 | |
Phosagro OAO (Phosagro Bond Funding Ltd.) 144A
4.204%, 2/13/18(3)(7) | | | 360 | | | | 365 | |
PKO Finance AB 144A
4.630%, 9/26/22(3)(7) | | | 610 | | | | 630 | |
Prudential Financial, Inc. 5.875%, 9/15/42(2) | | | 405 | | | | 425 | |
Santander Bank NA
8.750%, 5/30/18 | | | 200 | | | | 215 | |
Sberbank of Russia Via SB Capital S.A. 144A
5.500%, 2/26/24(2)(3)(7) | | | 315 | | | | 320 | |
Springleaf Finance Corp. 5.250%, 12/15/19 | | | 155 | | | | 157 | |
Starwood Property Trust, Inc. 144A 5.000%, 12/15/21(3) | | | 50 | | | | 51 | |
Teachers Insurance & Annuity Association Asset Management Finance Co., LLC 144A 4.125%, 11/1/24(3) | | | 350 | | | | 353 | |
Teachers Insurance & Annuity Association of America 144A 4.375%, 9/15/54(2)(3) | | | 360 | | | | 353 | |
Tervita Escrow Corp. 144A 7.625%, 12/1/21(3) | | | 45 | | | | 46 | |
Toronto-Dominion Bank (The) 3.625%, 9/15/31(2) | | | 135 | | | | 133 | |
Turkiye Garanti Bankasi AS 144A 5.250%, 9/13/22(3) | | | 705 | | | | 683 | |
Voya Financial, Inc.
5.650%, 5/15/53(2) | | | 355 | | | | 350 | |
| | | | | | | | |
| | | | | | | 18,628 | |
| | | | | | | | |
| | |
| Health Care—2.6% | | | | | | | | |
Abbott Laboratories | | | | | | | | |
3.400%, 11/30/23 | | | 75 | | | | 75 | |
3.750%, 11/30/26 | | | 255 | | | | 253 | |
Centene Corp. 4.750%, 1/15/25 | | | 330 | | | | 323 | |
Concordia Healthcare Corp. 144A 7.000%, 4/15/23(3) | | | 55 | | | | 18 | |
Concordia International Corp. 144A 9.000%, 4/1/22(3) | | | 65 | | | | 55 | |
Endo Finance LLC | | | | | | | | |
144A 6.000%, 7/15/23(3) | | | 100 | | | | 88 | |
(Endo Finco, Inc.) 144A 6.500%, 2/1/25(3) | | | 190 | | | | 159 | |
Refer to Footnote Legend on page 41.
See Notes to Financial Statements
37
VIRTUS MULTI-SECTOR FIXED INCOME SERIES
SCHEDULE OF INVESTMENTS (Continued)
DECEMBER 31, 2016
($ reported in thousands)
| | | | | | | | |
| | | PAR
VALUE | | | VALUE | |
| Health Care—continued | | | | | | | | |
Envision Healthcare Corp. 144A 6.250%, 12/1/24(3) | | $ | 60 | | | $ | 64 | |
HCA, Inc. | | | | | | | | |
5.375%, 2/1/25 | | | 125 | | | | 126 | |
5.250%, 6/15/26 | | | 130 | | | | 134 | |
IASIS Healthcare LLC
8.375%, 5/15/19 | | | 165 | | | | 144 | |
Inventiv Group Holdings, Inc. 144A
7.500%, 10/1/24(3) | | | 110 | | | | 116 | |
inVentiv Health, Inc. 144A
9.000%, 1/15/18(3) | | | 165 | | | | 165 | |
MEDNAX, Inc. 144A
5.250%, 12/1/23(3) | | | 170 | | | | 175 | |
MPH Acquisition Holdings LLC 144A
7.125%, 6/1/24(3) | | | 205 | | | | 216 | |
Ortho-Clinical Diagnostics, Inc. 144A
6.625%, 5/15/22(3) | | | 265 | | | | 236 | |
Owens & Minor, Inc.
3.875%, 9/15/21 | | | 75 | | | | 75 | |
Surgery Center Holdings, Inc. 144A
8.875%, 4/15/21(3) | | | 265 | | | | 283 | |
Surgical Care Affiliates, Inc. 144A
6.000%, 4/1/23(3) | | | 41 | | | | 43 | |
Team Health, Inc. 144A
7.250%, 12/15/23(3) | | | 15 | | | | 17 | |
Tenet Healthcare Corp. | | | | | | | | |
4.463%, 6/15/20(2) | | | 70 | | | | 71 | |
144A 7.500%, 1/1/22(3) | | | 10 | | | | 10 | |
8.125%, 4/1/22 | | | 190 | | | | 180 | |
Valeant Pharmaceuticals International, Inc. | | | | | | | | |
144A 6.375%, 10/15/20(3) | | | 145 | | | | 125 | |
144A 7.500%, 7/15/21(3) | | | 50 | | | | 43 | |
144A 5.875%, 5/15/23(3) | | | 205 | | | | 156 | |
| | | | | | | | |
| | | | | | | 3,350 | |
| | | | | | | | |
|
| Industrials—4.4% | |
Advanced Disposal Services, Inc. 144A
5.625%, 11/15/24(3) | | | 45 | | | | 45 | |
Air Canada Pass-Through-Trust 13-1, B 144A
5.375%, 5/15/21(3) | | | 175 | | | | 180 | |
Allegiant Travel Co.
5.500%, 7/15/19 | | | 55 | | | | 57 | |
Bombardier, Inc. | | | | | | | | |
144A 4.750%, 4/15/19(3) | | | 80 | | | | 81 | |
144A 6.125%, 1/15/23(3) | | | 205 | | | | 197 | |
Carpenter Technology Corp.
5.200%, 7/15/21 | | | 425 | | | | 429 | |
CEB, Inc. 144A
5.625%, 6/15/23(3) | | | 275 | | | | 268 | |
Cemex Finance LLC 144A
6.000%, 4/1/24(3) | | | 270 | | | | 278 | |
Continental Airlines Pass-Through-Trust 99-1, A
6.545%, 2/2/19 | | | 584 | | | | 608 | |
| | | | | | | | |
| | | PAR
VALUE | | | VALUE | |
| Industrials—continued | |
DP World Ltd. 144A
6.850%, 7/2/37(3) | | $ | 200 | | | $ | 213 | |
GATX Corp.
3.250%, 9/15/26 | | | 60 | | | | 57 | |
Harland Clarke Holdings Corp. 144A
6.875%, 3/1/20(3) | | | 205 | | | | 199 | |
JBS Investments GmbH 144A
7.250%, 4/3/24(3) | | | 285 | | | | 299 | |
Masco Corp.
5.950%, 3/15/22 | | | 390 | | | | 431 | |
Navistar International Corp.
8.250%, 11/1/21 | | | 135 | | | | 137 | |
Owens Corning
3.400%, 8/15/26 | | | 330 | | | | 313 | |
Pelabuhan Indonesia II PT 144A
4.250%, 5/5/25(3) | | | 305 | | | | 290 | |
Prime Security Services Borrower LLC 144A
9.250%, 5/15/23(3) | | | 130 | | | | 142 | |
Standard Industries, Inc. 144A
5.500%, 2/15/23(3) | | | 65 | | | | 67 | |
TransDigm, Inc. | | | | | | | | |
6.000%, 7/15/22 | | | 265 | | | | 277 | |
6.500%, 5/15/25 | | | 90 | | | | 95 | |
UAL Pass-Through-Trust 07-01, A
6.636%, 7/2/22 | | | 759 | | | | 817 | |
United Airlines Pass-Through Trust 14-1, B
4.750%, 4/11/22 | | | 271 | | | | 271 | |
| | | | | | | | |
| | | | | | | 5,751 | |
| | | | | | | | |
|
| Information Technology—1.3% | |
Blackboard, Inc. 144A
9.750%, 10/15/21(3) | | | 155 | | | | 160 | |
Diamond 1 Finance Corp. (Diamond 2 Finance Corp.) | | | | | | | | |
144A 5.450%, 6/15/23(3) | | | 70 | | | | 74 | |
144A 6.020%, 6/15/26(3) | | | 65 | | | | 70 | |
144A 8.100%, 7/15/36(3) | | | 140 | | | | 166 | |
Flex Ltd.
4.750%, 6/15/25 | | | 375 | | | | 396 | |
Inception Merger Sub, Inc. (Rackspace Hosting, Inc.) 144A
8.625%, 11/15/24(3) | | | 405 | | | | 430 | |
NXP BV 144A
4.625%, 6/1/23(3) | | | 275 | | | | 289 | |
WESCO Distribution, Inc. 144A
5.375%, 6/15/24(3) | | | 90 | | | | 91 | |
| | | | | | | | |
| | | | | | | 1,676 | |
| | | | | | | | |
| | |
| Materials—5.2% | | | | | | | | |
AK Steel Corp.
7.500%, 7/15/23 | | | 130 | | | | 145 | |
Aleris International, Inc. 144A
9.500%, 4/1/21(3) | | | 200 | | | | 215 | |
Alpek SAB de C.V. 144A
5.375%, 8/8/23(3) | | | 625 | | | | 645 | |
| | | | | | | | |
| | | PAR
VALUE | | | VALUE | |
| Materials—continued | |
ArcelorMittal
6.125%, 6/1/25 | | $ | 300 | | | $ | 330 | |
Ardagh Packaging Finance plc 144A
6.750%, 1/31/21(3) | | | 260 | | | | 269 | |
Berry Plastics Corp.
5.125%, 7/15/23 | | | 215 | | | | 220 | |
BHP Billiton Finance USA Ltd. 144A
6.750%, 10/19/75(2)(3)(6) | | | 225 | | | | 253 | |
BlueScope Steel Finance Ltd. 144A
6.500%, 5/15/21(3) | | | 185 | | | | 196 | |
Eldorado Gold Corp. 144A
6.125%, 12/15/20(3) | | | 180 | | | | 184 | |
Equate Petrochemical BV 144A
4.250%, 11/3/26(3) | | | 340 | | | | 324 | |
Fibria Overseas Finance Ltd.
5.250%, 5/12/24 | | | 185 | | | | 185 | |
Fortescue Metals Group (FMG) Resources August 2006 Pty Ltd. 144A
9.750%, 3/1/22(3) | | | 130 | | | | 151 | |
Freeport-McMoRan Copper & Gold, Inc. | | | | | | | | |
3.550%, 3/1/22 | | | 120 | | | | 112 | |
3.875%, 3/15/23 | | | 145 | | | | 134 | |
Gerdau Holdings, Inc. 144A
7.000%, 1/20/20(3) | | | 230 | | | | 246 | |
Graphic Packaging International, Inc.
4.125%, 8/15/24 | | | 305 | | | | 292 | |
INEOS Group Holdings S.A. 144A
5.625%, 8/1/24(3) | | | 345 | | | | 343 | |
Inversiones CMPC S.A. 144A
4.375%, 5/15/23(3) | | | 600 | | | | 603 | |
Novelis Corp. | | | | | | | | |
144A 6.250%, 8/15/24(3) | | | 25 | | | | 27 | |
144A 5.875%, 9/30/26(3) | | | 250 | | | | 253 | |
Office Cherifien des Phosphates S.A. (OCP) 144A
5.625%, 4/25/24(3) | | | 320 | | | | 331 | |
Reynolds Group Issuer, Inc. | | | | | | | | |
144A 5.125%, 7/15/23(3) | | | 55 | | | | 56 | |
144A 7.000%, 7/15/24(3) | | | 10 | | | | 11 | |
Scotts Miracle-Gro Co. (The) 144A
5.250%, 12/15/26(3) | | | 30 | | | | 30 | |
Severstal OAO Via Steel Capital SA 144A
5.900%, 10/17/22(3)(7) | | | 260 | | | | 279 | |
Standard Industries, Inc. 144A
6.000%, 10/15/25(3) | | | 175 | | | | 184 | |
Teck Resources Ltd. | | | | | | | | |
144A 8.000%, 6/1/21(3) | | | 25 | | | | 28 | |
144A 8.500%, 6/1/24(3) | | | 70 | | | | 81 | |
Vale Overseas Ltd.
5.875%, 6/10/21 | | | 205 | | | | 215 | |
Vedanta Resources plc | | | | | | | | |
144A 9.500%, 7/18/18(3) | | | 115 | | | | 122 | |
144A 6.000%, 1/31/19(3) | | | 200 | | | | 203 | |
| | | | | | | | |
| | | | | | | 6,667 | |
| | | | | | | | |
Refer to Footnote Legend on page 41.
See Notes to Financial Statements
38
VIRTUS MULTI-SECTOR FIXED INCOME SERIES
SCHEDULE OF INVESTMENTS (Continued)
DECEMBER 31, 2016
($ reported in thousands)
| | | | | | | | |
| | | PAR
VALUE | | | VALUE | |
| Real Estate—1.2% | | | | | | | | |
Communications Sales & Leasing, Inc. (CSL Capital LLC) 144A
7.125%, 12/15/24(3) | | $ | 325 | | | $ | 329 | |
EPR Properties
4.750%, 12/15/26 | | | 130 | | | | 128 | |
ESH Hospitality, Inc. 144A
5.250%, 5/1/25(3) | | | 200 | | | | 199 | |
MPT Operating Partnership LP | | | | | | | | |
6.375%, 3/1/24 | | | 50 | | | | 53 | |
5.500%, 5/1/24 | | | 165 | | | | 167 | |
5.250%, 8/1/26 | | | 15 | | | | 15 | |
Select Income REIT
4.500%, 2/1/25 | | | 385 | | | | 372 | |
WP Carey, Inc.
4.600%, 4/1/24 | | | 345 | | | | 349 | |
| | | | | | | | |
| | | | | | | 1,612 | |
| | | | | | | | |
|
| Telecommunication Services—2.0% | |
America Movil SAB de C.V. Series 12
6.450%, 12/5/22 | | | 2,000 | MXN | | | 87 | |
AT&T, Inc. | | | | | | | | |
4.800%, 6/15/44 | | | 265 | | | | 250 | |
5.650%, 2/15/47 | | | 135 | | | | 145 | |
Cincinnati Bell Inc 144A
7.000%, 7/15/24(3) | | | 60 | | | | 64 | |
Crown Castle International Corp.
3.700%, 6/15/26 | | | 20 | | | | 20 | |
Crown Castle Towers LLC 144A
6.113%, 1/15/20(3) | | | 100 | | | | 108 | |
Digicel Group Ltd. 144A
8.250%, 9/30/20(3) | | | 345 | | | | 298 | |
Frontier Communications Corp. | | | | | | | | |
6.250%, 9/15/21 | | | 135 | | | | 129 | |
10.500%, 9/15/22 | | | 135 | | | | 142 | |
GTH Finance BV 144A
7.250%, 4/26/23(3) | | | 300 | | | | 323 | |
Qwest Corp.
7.250%, 9/15/25 | | | 185 | | | | 198 | |
Sprint Communications, Inc.
6.000%, 11/15/22 | | | 90 | | | | 91 | |
Sprint Corp.
7.250%, 9/15/21 | | | 200 | | | | 213 | |
Sprint Spectrum Co. LLC (Sprint Spectrum Co. II LLC/Sprint Spectrum Co. III LLC) 144A
3.360%, 9/20/23(3) | | | 200 | | | | 200 | |
T-Mobile USA, Inc.
6.375%, 3/1/25 | | | 125 | | | | 134 | |
Zayo Group LLC
6.375%, 5/15/25 | | | 130 | | | | 136 | |
| | | | | | | | |
| | | | | | | 2,538 | |
| | | | | | | | |
|
| Utilities—1.2% | |
AmeriGas Partners LP
5.500%, 5/20/25 | | | 110 | | | | 112 | |
Dynegy, Inc.
7.375%, 11/1/22 | | | 225 | | | | 216 | |
| | | | | | | | |
| | | PAR
VALUE | | | VALUE | |
| Utilities—continued | | | | | | | | |
Lamar Funding Ltd. 144A
3.958%, 5/7/25(3) | | $ | 375 | | | $ | 345 | |
Majapahit Holding BV 144A
7.750%, 1/20/20(3) | | | 300 | | | | 337 | |
Talen Energy Supply LLC 144A
4.625%, 7/15/19(3) | | | 250 | | | | 238 | |
TerraForm Power Operating LLC 144A
6.375%, 2/1/23(2)(3) | | | 285 | | | | 290 | |
| | | | | | | | |
| | | | | | | | 1,538 | |
TOTAL CORPORATE BONDS AND NOTES
(Identified Cost $66,653) | | | | 66,046 | |
|
| LOAN AGREEMENTS(2)—8.4% | |
|
| Consumer Discretionary—2.1% | |
Advantage Sales & Marketing, Inc. Second Lien,
7.500%, 7/25/22 | | | 130 | | | | 127 | |
Affinity Gaming LLC
5.000%, 7/1/23 | | | 375 | | | | 379 | |
Bass Pro Group LLC
5.970%, 12/15/23 | | | 400 | | | | 397 | |
Caesars Entertainment Operating Co., Inc. Tranche B-6,
1.500%, 3/1/17(11) | | | 243 | | | | 270 | |
Caesars Entertainment Resort Properties LLC Tranche B,
7.000%, 10/11/20 | | | 269 | | | | 272 | |
Caesars Growth Properties Holdings LLC Tranche B, First Lien,
6.250%, 5/8/21 | | | 126 | | | | 127 | |
CDS U.S. Intermediate Holdings, Inc. First Lien,
5.000%, 7/8/22 | | | 77 | | | | 78 | |
Cengage Learning, Inc. 2016 Refinance,
5.250%, 6/7/23 | | | 110 | | | | 108 | |
Floor & Decor Outlets of America, Inc.
5.250%, 9/30/23 | | | 180 | | | | 180 | |
Graton Resort & Casino Tranche B,
5.510%, 9/1/22 | | | 78 | | | | 79 | |
Harbor Freight Tools USA, Inc.
3.919%, 8/18/23 | | | 151 | | | | 153 | |
Laureare Education, Inc. 2021 Extended,
8.868%, 3/17/21 | | | 126 | | | | 127 | |
Leslie’s Poolmart, Inc. Tranche B 5.250%, 8/16/23 | | | 108 | | | | 109 | |
Transtar Holding Co. Second Lien,
13.500%, 10/9/19(10) | | | 197 | | | | 3 | |
U.S. Farathane LLC Tranche B-2, 5.750%, 12/23/21 | | | 173 | | | | 173 | |
UFC Holdings LLC First Lien
5.000%, 8/18/23 | | | 167 | | | | 169 | |
| | | | | | | | |
| | | | | | | 2,751 | |
| | | | | | | | |
| | | | | | | | |
| | | PAR
VALUE | | | VALUE | |
| Consumer Staples—0.6% | |
Albertson’s Companies LLC TRanche B-4,
3.750%, 8/25/21 | | $ | 248 | | | $ | 251 | |
ASP MSG Acquisitions, Co., Inc.
6.000%, 8/16/23 | | | 199 | | | | 202 | |
Chobani LLC First Lien,
5.250%, 10/9/23 | | | 64 | | | | 65 | |
Coty, Inc.
3.092%, 10/27/22 | | | 50 | | | | 50 | |
Galleria Co. Tranche B,
3.750%, 1/26/23 | | | 100 | | | | 100 | |
Kronos, Inc. Second Lien,
9.250%, 11/1/24 | | | 84 | | | | 87 | |
| | | | | | | | |
| | | | | | | 755 | |
| | | | | | | | |
|
| Energy—0.7% | |
California Resources Corp.
11.375%, 12/31/21 | | | 190 | | | | 211 | |
Chesapeake Energy Corp. Trance A,
8.500%, 8/23/21 | | | 44 | | | | 48 | |
EP Energy LLC
9.750%, 6/30/21 | | | 205 | | | | 215 | |
Jonah Energy LLC Second Lien,
7.500%, 5/12/21 | | | 206 | | | | 196 | |
Paragon Offshore Finance Co.
5.500%, 7/16/21(14) | | | 187 | | | | 71 | |
Seadrill Operating LP
4.000%, 2/21/21 | | | 243 | | | | 169 | |
| | | | | | | | |
| | | | | | | 910 | |
| | | | | | | | |
|
| Financials—0.4% | |
Lonestar Intermediate Super Holdings LLC
10.000%, 8/31/21 | | | 200 | | | | 207 | |
Walter Investment Management Corp. Tranche B,
4.750%, 12/18/20 | | | 300 | | | | 287 | |
| | | | | | | | |
| | | | | | | 494 | |
| | | | | | | | |
| | |
| Health Care—0.9% | | | | | | | | |
21st Century Oncology Holdings, Inc. Tranche B,
7.125%, 4/30/22(14) | | | 42 | | | | 39 | |
American Renal Holdings, Inc. Tranche B, First Lien,
4.750%, 8/20/19 | | | 78 | | | | 78 | |
Concordia Pharmaceuticals, Inc.
5.250%, 10/21/21 | | | 80 | | | | 63 | |
InVentiv Health, Inc.
4.750%, 11/9/23 | | | 80 | | | | 81 | |
MMM Holdings, Inc.
9.750%, 6/30/19 | | | 92 | | | | 90 | |
MPH Acquisition Holdings LLC
5.000%, 6/7/23 | | | 74 | | | | 76 | |
MSO of Puerto Rico, Inc.
9.750%, 6/30/19 | | | 67 | | | | 66 | |
Refer to Footnote Legend on page 41.
See Notes to Financial Statements
39
VIRTUS MULTI-SECTOR FIXED INCOME SERIES
SCHEDULE OF INVESTMENTS (Continued)
DECEMBER 31, 2016
($ reported in thousands)
| | | | | | | | |
| | | PAR
VALUE | | | VALUE | |
| Health Care—continued | |
NVA Holdings, Inc. Second Lien,
8.000%, 8/14/22 | | $ | 158 | | | $ | 159 | |
Quorum Health Corp.
6.750%, 4/29/22 | | | 114 | | | | 112 | |
Surgery Center Holdings, Inc. First Lien,
4.750%, 11/3/20 | | | 183 | | | | 184 | |
U.S. Renal Care, Inc. First Lien,
0.000%, 12/30/22(8) | | | 205 | | | | 193 | |
| | | | | | | | |
| | | | | | | 1,141 | |
| | | | | | | | |
|
| Industrials—1.0% | |
84 Lumber Co.
6.750%, 10/25/23 | | | 270 | | | | 271 | |
Aspen Merger Sub (Coinstar), Inc. Tranche B, First Lien
6.125%, 9/27/23 | | | 126 | | | | 128 | |
McGraw-Hill Global Education Holdings LLC Tranche B, First Lien,
5.000%, 5/4/22 | | | 164 | | | | 165 | |
Navistar, Inc. Tranche B,
6.500%, 8/7/20 | | | 140 | | | | 142 | |
PAE Holding Corp. First Lien,
6.500%, 10/20/22 | | | 108 | | | | 109 | |
Quikrete International, Inc.
0.000%, 11/15/23(8) | | | 30 | | | | 30 | |
Sedgwick Claims Management Services, Inc. Second Lien,
6.750%, 2/28/22 | | | 340 | | | | 340 | |
Zodiac Pool Solutions LLC
5.500%, 12/20/23 | | | 75 | | | | 76 | |
| | | | | | | | |
| | | | | | | 1,261 | |
| | | | | | | | |
|
| Information Technology—1.3% | |
Applied Systems, Inc. Second Lien,
7.500%, 1/24/22 | | | 77 | | | | 78 | |
Avaya, Inc.
0.000%, 5/29/20(8) | | | 165 | | | | 144 | |
Blackboard, Inc. Tranche B-4 First Lien,
6.000%, 6/30/21 | | | 259 | | | | 262 | |
Donnelley Financial Solutions 5.000%, 9/29/23 | | | 61 | | | | 62 | |
First Data Corp.
3.756%, 7/8/22 | | | 334 | | | | 338 | |
Information Resources
0.000%, 12/20/23(8) | | | 25 | | | | 25 | |
Masergy Communications, Inc. Tranche B, First Lien,
5.500%, 12/15/23 | | | 55 | | | | 55 | |
NXP B.V. (NXP Funding LLC) Tranche F
3.297%, 12/7/20 | | | 122 | | | | 123 | |
On Semiconductor Corp. 2016 New Replacement Term Loan
4.020%, 3/31/23 | | | 86 | | | | 87 | |
Presidio, Inc. Refinancing Term,
5.250%, 2/2/22 | | | 194 | | | | 197 | |
| | | | | | | | |
| | | PAR
VALUE | | | VALUE | |
| Information Technology—continued | |
Rackspace Hosting, Inc. Tranche B, First Lien,
4.500%, 11/3/23 | | $ | 108 | | | $ | 110 | |
Veritas US, Inc.
0.000%, 1/27/23(8) | | | 215 | | | | 199 | |
Western Digital Corp. Tranche B-1,
4.520%, 4/29/23 | | | 24 | | | | 24 | |
| | | | | | | | |
| | | | | | | 1,704 | |
| | | | | | | | |
| | |
| Materials—0.6% | | | | | | | | |
Anchor Glass Container Corp. | | | | | | | | |
First Lien,
4.250%, 12/7/23 | | | 75 | | | | 76 | |
Second Lien,
8.750%, 12/7/24 | | | 58 | | | | 59 | |
CPI Acquisition, Inc. First Lien,
5.500%, 8/17/22 | | | 248 | | | | 227 | |
Omnova Solutions, Inc. Tranche B-2,
5.250%, 8/25/23 | | | 198 | | | | 201 | |
Platform Specialty Services
4.500%, 6/7/20 | | | 155 | | | | 157 | |
PQ Corp. Tranche B-1,
5.250%, 11/4/22 | | | 43 | | | | 44 | |
| | | | | | | | |
| | | | | | | 764 | |
| | | | | | | | |
| | |
| Real Estate—0.1% | | | | | | | | |
Capital Automotive LP Second Lien,
6.000%, 4/30/20 | | | 189 | | | | 192 | |
| | | | | | | | |
| | |
| Utilities—0.7% | | | | | | | | |
Atlantic Power LP
6.000%, 4/13/23 | | | 306 | | | | 311 | |
NRG Energy, Inc.
3.520%, 6/30/23 | | | 387 | | | | 392 | |
Vistra Operations Company LLC (Tex Operations Co., LLC) | | | | | | | | |
5.000%, 8/4/23 | | | 150 | | | | 152 | |
Tranche C, 5.000%, 8/4/23 | | | 34 | | | | 34 | |
| | | | | | | | |
| | | | | | | | 889 | |
| TOTAL LOAN AGREEMENTS (Identified Cost $11,064) | | | | | | | 10,861 | |
| | |
| | | SHARES | | | | |
|
| PREFERRED STOCKS—3.8% | |
| | |
| Energy—0.3% | | | | | | | | |
PTT Exploration & Production PCL 144A, 4.875%(2)(3) | | | 440 | (9) | | | 444 | |
| | | | | | | | |
| | |
| Financials—2.9% | | | | | | | | |
Banco Bilbao Vizcaya Argentaria S.A. International S.A. Unipersonal 5.919%(2) | | | 150 | (9) | | | 148 | |
Bank of New York Mellon Corp. (The) Series E, 4.950%(2) | | | 290 | (9) | | | 291 | |
| | | | | | | | |
| | |
SHARES | | | VALUE | |
| Financials—continued | |
Citigroup, Inc.
Series J, 7.125%(2) | | | 15,800 | | | $ | 442 | |
Citigroup, Inc.
Series T, 6.250%(2) | | | 400 | (9) | | | 412 | |
JPMorgan Chase & Co.
Series Z, 5.300%(2) | | | 70 | (9) | | | 72 | |
KeyCorp. Series D, 5.000%(2) | | | 340 | (9) | | | 314 | |
M&T Bank Corp.
Series F, 5.125%(2) | | | 160 | (9) | | | 155 | |
PNC Financial Services Group, Inc. (The)
Series R, 4.850%(2) | | | 405 | (9) | | | 389 | |
PNC Financial Services Group, Inc. (The) Series S,
5.000%(2) | | | 405 | (9) | | | 391 | |
SunTrust Bank, Inc. 5.625%(2) | | | 120 | (9) | | | 123 | |
Wells Fargo & Co.
Series K, 7.980%(2) | | | 440 | (9) | | | 460 | |
Zions Bancorp 6.950%(2) | | | 17,215 | | | | 482 | |
| | | | | | | | |
| | | | | | | 3,679 | |
| | | | | | | | |
| | |
| Industrials—0.6% | | | | | | | | |
General Electric Co. Series D, 5.000%(2) | | | 792 | (9) | | | 822 | |
TOTAL PREFERRED STOCKS
(Identified Cost $4,805) | | | | 4,945 | |
|
| COMMON STOCKS—0.2% | |
|
| Consumer Discretionary—0.0% | |
Mark IV Industries(15) | | | 828 | | | | 21 | |
| | | | | | | | |
| |
| Energy—0.1% | | | | | |
Pacific Exploration and Production Corp.(15) | | | 1,339 | | | | 54 | |
| | | | | | | | |
|
| Utilities—0.1% | |
Vistra Energy Corp.(15) | | | 7,753 | | | | 120 | |
| TOTAL COMMON STOCKS | | | | | |
| (Identified Cost $176) | | | | 195 | |
|
| AFFILIATED MUTUAL FUND(13)—2.4% | |
Virtus Credit Opportunities Fund Class R6 | | | 310,156 | | | | 3,074 | |
| TOTAL AFFILIATED MUTUAL FUND (Identified Cost $3,100) | | | | 3,074 | |
| |
| RIGHTS—0.0% | | | | | |
Texas Competitive TRA | | | 7,753 | | | | 13 | |
TOTAL RIGHTS
(Identified Cost $6) | | | | 13 | |
TOTAL LONG TERM INVESTMENTS—99.7% (Identified Cost $130,997) | | | | 128,847 | (12) |
TOTAL INVESTMENTS—99.7%
(Identified Cost $130,997) | | | | 128,847 | (1) |
Other assets and liabilities, net—0.3% | | | | 364 | |
| | | | | | | | |
| NET ASSETS—100.0% | | | $ | 129,211 | |
| | | | | | | | |
Refer to Footnote Legend on page 41.
See Notes to Financial Statements
40
VIRTUS MULTI-SECTOR FIXED INCOME SERIES
SCHEDULE OF INVESTMENTS (Continued)
DECEMBER 31, 2016
($ reported in thousands)
Abbreviations:
| FHLMC | Federal Home Loan Mortgage Corporation (“Freddie Mac”). |
| FNMA | Federal National Mortgage Association (“Fannie Mae”). |
| REIT | Real Estate Investment Trust |
Footnote Legend:
| (1) | Federal Income Tax Information: For tax information at December 31, 2016, see Note 10 Federal Income Tax Information in the Notes to Financial Statements. |
| (2) | Variable or step coupon security; interest rate shown reflects the rate in effect at December 31, 2016. |
| (3) | Security exempt from registration under Rule 144A of the Securities Act of 1933. These securities may be resold in transactions exempt from registration, normally to qualified institutional buyers. At December 31, 2016, these securities amounted to a value of $54,754 or 42.4% of net assets. |
| (4) | Regulation S security. Security is offered and sold outside of the United States, therefore, it is exempt from registration with the SEC under Rules 903 and 904 of the Securities Act of 1933. |
| (5) | No contractual maturity date. |
| (6) | Interest payments may be deferred. |
| (7) | This Note was issued for the sole purpose of funding a loan agreement between the issuer and the borrower. As the credit risk for this security lies solely with the borrower, the name represented here is that of the borrower. |
| (8) | This loan will settle after December 31, 2016, at which time the interest rate, based on the London Interbank Offered Rate (“LIBOR”) and the agreed upon spread on trade date, will be reflected. |
| (9) | Value shown as par value. |
| (10) | Security in default, no interest payments are being received during the bankruptcy proceedings. |
| (11) | Security in default, a portion of the interest payments are being received during the bankruptcy proceedings. |
| (12) | All or a portion of the Series’ assets have been segregated for delayed delivery security. |
| (13) | Shares of this fund are publicly offered and its prospectus and annual report are publicly available. |
| (14) | Security in default, interest payments are being received during the bankruptcy proceedings. |
| (15) | Non-income producing. |
Foreign Currencies:
| | | | |
| Country Weightings (unaudited)† | | | |
United States | | | 67 | % |
Argentina | | | 2 | |
Brazil | | | 2 | |
Chile | | | 2 | |
Mexico | | | 2 | |
Turkey | | | 2 | |
United Kingdom | | | 2 | |
Other | | | 21 | |
Total | | | 100 | % |
† % of total investments as of December 31, 2016 | |
The following table provides a summary of inputs used to value the Series’ investments as of December 31, 2016 (See Security Valuation Note 2A in the Notes to Financial Statements):
| | | | | | | | | | | | | | | | |
| | | Total
Value at
December 31, 2016 | | | Level 1
Quoted
Prices | | | Level 2
Significant
Observable
Inputs | | | Level 3
Significant
Unobservable
Inputs | |
Debt Securities: | | | | | | | | | | | | | | | | |
Asset-Backed Securities | | $ | 5,711 | | | $ | — | | | $ | 5,453 | | | $ | 258 | |
Corporate Bonds and Notes | | | 66,046 | | | | — | | | | 66,046 | | | | — | |
Foreign Government Securities | | | 12,783 | | | | — | | | | 12,783 | | | | — | |
Loan Agreements | | | 10,861 | | | | — | | | | 10,858 | | | | 3 | |
Mortgage-Backed Securities | | | 24,522 | | | | — | | | | 24,522 | | | | — | |
Municipal Bonds | | | 697 | | | | — | | | | 697 | | | | — | |
U.S. Government Securities | | | | | | | — | | | | | | | | — | |
Equity Securities: | | | | | | | | | | | | | | | | |
Common Stocks | | | 195 | | | | 174 | | | | — | | | | 21 | |
Preferred Stocks | | | 4,945 | | | | 924 | | | | 4,021 | | | | — | |
Rights | | | 13 | | | | — | | | | — | | | | 13 | |
Affiliated Mutual Fund | | | 3,074 | | | | 3,074 | | | | — | | | | — | |
| | | | | | | | | | | | | | | | |
Total Investments | | $ | 128,847 | | | $ | 4,172 | | | $ | 124,380 | | | $ | 295 | |
| | | | | | | | | | | | | | | | |
There were no transfers between Level 1 and Level 2 related to securities held at December 31, 2016.
See Notes to Financial Statements
41
VIRTUS MULTI-SECTOR FIXED INCOME SERIES
SCHEDULE OF INVESTMENTS (Continued)
DECEMBER 31, 2016
($ reported in thousands)
The following is a reconciliation of assets of the Series for Level 3 investments for which significant unobservable inputs were used to determine fair value.
| | | | | | | | | | | | | | | | | | | | |
| | | Investments in
Securities | | | Common
Stocks | | | Loan
Agreements | | | Asset-Backed
Securities | | | Rights | |
Beginning Balance December 31, 2015: | | $ | 647 | | | $ | 31 | | | $ | 368 | | | $ | 248 | | | $ | — | |
Accrued Discount/(Premium) | | | 1 | | | | — | | | | 1 | | | | — | | | | — | |
Realized Gain (Loss) | | | — | (a) | | | — | | | | — | (a) | | | — | | | | — | |
Change in Unrealized Appreciation (Depreciation)(b) | | | (85 | ) | | | (10 | ) | | | (91 | ) | | | 10 | | | | 6 | |
Purchases | | | 7 | | | | — | | | | — | | | | — | | | | 7 | |
(Sales)(c) | | | (42 | ) | | | — | | | | (42 | ) | | | — | | | | — | |
Transfers into Level 3(d) | | | — | | | | — | | | | — | | | | — | | | | — | |
Transfers from Level 3(d) | | | (233 | ) | | | — | | | | (233 | ) | | | — | | | | — | |
| | | | | | | | | | | | | | | | | | | | |
Ending Balance December 31, 2016 | | $ | 295 | | | $ | 21 | | | $ | 3 | | | $ | 258 | | | $ | 13 | |
| | | | | | | | | | | | | | | | | | | | |
None of the securities in this table are internally fair valued. The Series’ investments that are categorized as Level 3 were valued utilizing third party pricing information without adjustment. Such valuations are based on unobservable inputs. A significant change in third party information inputs could result in a significantly lower or higher value of Level 3 investments.
| (a) | Amount is less than $500. |
| (b) | Included in the related net change in unrealized appreciation (depreciation) in the Statement of Operations. The change in unrealized appreciation (depreciation) on investments still held as of December 31, 2016 was $(155). |
| (c) | Includes paydowns on securities. |
| (d) | “Transfers into and/or from” Level 3 represent the ending value as of December 31, 2016, for any investment security where a change in the pricing level occurred from the beginning to the end of the period. The transfers from Level 3 are due to an increase in trading activities at period end. |
See Notes to Financial Statements
42
VIRTUS REAL ESTATE SECURITIES SERIES
SCHEDULE OF INVESTMENTS
DECEMBER 31, 2016
($ reported in thousands)
| | | | | | | | |
| | | SHARES | | | VALUE | |
| COMMON STOCKS—97.5% | |
|
| Real Estate Investment Trusts—97.5% | |
|
| Data Centers—11.1% | |
Coresite Realty Corp. | | | 19,100 | | | $ | 1,516 | |
CyrusOne, Inc. | | | 13,800 | | | | 617 | |
Digital Realty Trust, Inc. | | | 35,750 | | | | 3,513 | |
Equinix, Inc. | | | 9,450 | | | | 3,378 | |
| | | | | | | | |
| | | | | | | 9,024 | |
| | | | | | | | |
|
| Diversified—4.4% | |
Vornado Realty Trust | | | 34,200 | | | | 3,570 | |
| | | | | | | | |
|
| Health Care—6.3% | |
Healthcare Realty Trust, Inc. | | | 44,191 | | | | 1,340 | |
Healthcare Trust of America, Inc. Class A | | | 64,400 | | | | 1,875 | |
Ventas, Inc. | | | 24,066 | | | | 1,504 | |
Welltower, Inc. | | | 5,510 | | | | 369 | |
| | | | | | | | |
| | | | | | | 5,088 | |
| | | | | | | | |
|
| Industrial/Office—24.7% | |
|
| Industrial—10.4% | |
DCT Industrial Trust, Inc. | | | 55,457 | | | | 2,655 | |
Duke Realty Corp. | | | 94,098 | | | | 2,499 | |
Prologis, Inc. | | | 62,864 | | | | 3,319 | |
| | | | | | | | |
| | | | | | | 8,473 | |
| | | | | | | | |
|
| Office—14.3% | |
Boston Properties, Inc. | | | 15,914 | | | | 2,002 | |
Cousins Properties, Inc. | | | 86,780 | | | | 738 | |
Douglas Emmett, Inc. | | | 57,614 | | | | 2,106 | |
Highwoods Properties, Inc. | | | 40,067 | | | | 2,044 | |
Kilroy Realty Corp. | | | 36,680 | | | | 2,686 | |
Paramount Group, Inc. | | | 122,684 | | | | 1,962 | |
Parkway, Inc.(2) | | | 5,447 | | | | 121 | |
| | | | | | | | |
| | | | | | | 11,659 | |
| | | | | | | | |
Total Industrial / Office | | | | | | | 20,132 | |
| | | | | | | | |
|
| Lodging/Resorts—3.8% | |
Host Hotels & Resorts, Inc. | | | 38,604 | | | | 727 | |
Pebblebrook Hotel Trust | | | 39,165 | | | | 1,165 | |
RLJ Lodging Trust | | | 50,653 | | | | 1,241 | |
| | | | | | | | |
| | | | | | | 3,133 | |
| | | | | | | | |
|
| Residential—16.9% | |
|
| Apartments—12.6% | |
American Campus Communities, Inc. | | | 31,187 | | | | 1,552 | |
Apartment Investment & Management Co. Class A | | | 35,600 | | | | 1,618 | |
AvalonBay Communities, Inc. | | | 11,904 | | | | 2,109 | |
Equity Residential | | | 27,731 | | | | 1,785 | |
Essex Property Trust, Inc. | | | 13,647 | | | | 3,173 | |
| | | | | | | | |
| | | | | | | 10,237 | |
| | | | | | | | |
|
| Manufactured Homes—2.8% | |
Equity LifeStyle Properties, Inc. | | | 14,142 | | | | 1,020 | |
Sun Communities, Inc. | | | 16,950 | | | | 1,298 | |
| | | | | | | | |
| | | | | | | 2,318 | |
| | | | | | | | |
| | | | | | | | |
| | | SHARES | | | VALUE | |
| Single Family Homes—1.5% | |
American Homes 4 Rent Class A | | | 57,700 | | | $ | 1,210 | |
| | | | | | | | |
Total Residential | | | | | | | 13,765 | |
| | | | | | | | |
|
| Retail—21.3% | |
|
| Free Standing—2.4% | |
STORE Capital Corp. | | | 79,477 | | | | 1,964 | |
| | | | | | | | |
|
| Regional Malls—8.2% | |
General Growth Properties, Inc. | | | 45,021 | | | | 1,125 | |
Simon Property Group, Inc. | | | 31,201 | | | | 5,543 | |
| | | | | | | | |
| | | | | | | 6,668 | |
| | | | | | | | |
|
| Shopping Centers—10.7% | |
Brixmor Property Group, Inc. | | | 80,602 | | | | 1,968 | |
Federal Realty Investment Trust | | | 13,500 | | | | 1,919 | |
Regency Centers Corp. | | | 35,950 | | | | 2,479 | |
Tanger Factory Outlet Centers, Inc. | | | 64,853 | | | | 2,320 | |
| | | | | | | | |
| | | | | | | 8,686 | |
| | | | | | | | |
Total Retail | | | | | | | 17,318 | |
| | | | | | | | |
|
| Self Storage—9.0% | |
CubeSmart | | | 97,400 | | | | 2,607 | |
Extra Space Storage, Inc. | | | 26,878 | | | | 2,076 | |
Public Storage | | | 11,861 | | | | 2,651 | |
| | | | | | | | |
| | | | | | | | 7,334 | |
TOTAL COMMON STOCKS
(Identified Cost $53,547) | | | | 79,364 | |
| TOTAL LONG TERM INVESTMENTS—97.5% | |
| (Identified Cost $53,547) | | | | 79,364 | |
|
| SHORT-TERM INVESTMENTS—1.1% | |
|
| Money Market Mutual Fund—1.1% | |
JPMorgan U.S. Government Money Market Fund – Institutional Shares (seven-day effective yield 0.440%)(3) | | | 930,223 | | | | 930 | |
TOTAL SHORT-TERM INVESTMENTS
(Identified Cost $930) | | | | 930 | |
Total Investments—98.6%
(Identified cost $54,477) | | | | 80,294 | (1) |
Other assets and liabilities, net—1.4% | | | | 1,148 | |
| | | | | | | | |
| NET ASSETS—100.0% | | | $ | 81,442 | |
| | | | | | | | |
Footnote Legend
| (1) | Federal Income Tax Information: For tax information at December 31, 2016, see Note 10 Federal Income Tax Information in the Notes to Financial Statements. |
| (2) | Non-income producing. |
| (3) | Shares of this fund are publicly offered and its prospectus and annual report are publicly available. |
The following table provides a summary of inputs used to value the Series’ investments as of December 31, 2016 (See Security Valuation Note 2A in the Notes to Financial Statements):
| | | | | | | | |
| | | Total
Value at
December 31, 2016 | | | Level 1
Quoted
Prices | |
Equity Securities: | | | | | | | | |
Common Stocks | | $ | 79,364 | | | $ | 79,364 | |
Short-Term Investments | | | 930 | | | | 930 | |
| | | | | | | | |
Total Investments | | $ | 80,294 | | | $ | 80,294 | |
| | | | | | | | |
There are no Level 2 (significant observable inputs) or Level 3 (significant unobservable inputs) priced securities.
There were no transfers between Level 1 and Level 2 related to securities held at December 31, 2016.
See Notes to Financial Statements
43
VIRTUS SMALL-CAP GROWTH SERIES
SCHEDULE OF INVESTMENTS
DECEMBER 31, 2016
($ reported in thousands)
| | | | | | | | |
| | | SHARES | | | VALUE | |
| COMMON STOCKS—97.5% | |
| Consumer Discretionary—14.3% | |
Fox Factory Holding Corp.(2) | | | 150,925 | | | $ | 4,188 | |
Monro Muffler Brake, Inc. | | | 19,200 | | | | 1,098 | |
Ollie’s Bargain Outlet Holdings, Inc.(2) | | | 133,500 | | | | 3,798 | |
| | | | | | | | |
| | | | | | | 9,084 | |
| | | | | | | | |
| | |
| Consumer Staples—8.0% | | | | | | | | |
Chefs’ Warehouse, Inc. (The)(2) | | | 163,500 | | | | 2,583 | |
PriceSmart, Inc. | | | 29,600 | | | | 2,472 | |
| | | | | | | | |
| | | | | | | 5,055 | |
| | | | | | | | |
| | |
| Financials—10.1% | | | | | | | | |
FactSet Research Systems, Inc. | | | 13,000 | | | | 2,125 | |
Financial Engines, Inc. | | | 17,450 | | | | 641 | |
MarketAxess Holdings, Inc. | | | 12,150 | | | | 1,785 | |
Morningstar, Inc. | | | 25,570 | | | | 1,881 | |
| | | | | | | | |
| | | | | | | 6,432 | |
| | | | | | | | |
| | |
| Health Care—9.9% | | | | | | | | |
Abaxis, Inc. | | | 59,300 | | | | 3,129 | |
National Research Corp. Class A | | | 164,815 | | | | 3,132 | |
| | | | | | | | |
| | | | | | | 6,261 | |
| | | | | | | | |
| | |
| Industrials—21.5% | | | | | | | | |
AAON, Inc. | | | 52,600 | | | | 1,738 | |
Copart, Inc.(2) | | | 44,350 | | | | 2,457 | |
HEICO Corp. Class A | | | 49,905 | | | | 3,389 | |
Old Dominion Freight Line, Inc.(2) | | | 33,000 | | | | 2,831 | |
Omega Flex, Inc. | | | 57,399 | | | | 3,201 | |
| | | | | | | | |
| | | | | | | 13,616 | |
| | | | | | | | |
|
| Information Technology—31.8% | |
ANSYS, Inc.(2) | | | 16,900 | | | | 1,563 | |
Aspen Technology, Inc.(2) | | | 64,000 | | | | 3,499 | |
Autohome, Inc. ADR(2) | | | 107,500 | | | | 2,718 | |
Ellie Mae, Inc.(2) | | | 20,000 | | | | 1,674 | |
MercadoLibre, Inc. | | | 12,650 | | | | 1,975 | |
Mesa Laboratories, Inc. | | | 7,035 | | | | 863 | |
NVE Corp. | | | 48,400 | | | | 3,457 | |
Paycom Software, Inc.(2) | | | 16,500 | | | | 751 | |
Shutterstock, Inc.(2) | | | 76,500 | | | | 3,635 | |
| | | | | | | | |
| | | | | | | 20,135 | |
| | | | | | | | |
| | |
| Materials—1.9% | | | | | | | | |
UFP Technologies, Inc.(2) | | | 48,200 | | | | 1,227 | |
TOTAL COMMON STOCKS
(Identified Cost $38,745) | | | | | | | 61,810 | |
| TOTAL LONG TERM INVESTMENTS—97.5% | |
| (Identified Cost $38,745) | | | | 61,810 | |
| | | | | | | | |
| | | SHARES | | | VALUE | |
| SHORT-TERM INVESTMENT—1.3% | |
|
| Money Market Mutual Fund—1.3% | |
JPMorgan U.S. Government Money Market Fund – Institutional Shares (seven-day effective yield
0.440%)(3) | | | 798,684 | | | $ | 799 | |
TOTAL SHORT-TERM INVESTMENT
(Identified Cost $799) | | | | 799 | |
TOTAL INVESTMENTS—98.8%
(Identified Cost $39,544) | | | | | | | 62,609 | (1) |
Other assets and liabilities, net—1.2% | | | | 752 | |
| | | | | | | | |
| NET ASSETS—100.0% | | | | | | $ | 63,361 | |
| | | | | | | | |
Abbreviation:
| ADR | American Depositary Receipt |
Footnote Legend:
| (1) | Federal Income Tax Information: For tax information at December 31, 2016, see Note 10 Federal Income Tax Information in the Notes to Financial Statements. |
| (2) | Non-income producing. |
| (3) | Shares of this fund are publicly offered and its prospectus and annual report are publicly available. |
The following table provides a summary of inputs used to value the Series’ investments as of December 31, 2016 (See Security Valuation Note 2A in the Notes to Financial Statements):
| | | | | | | | |
| | | Total
Value at
December 31, 2016 | | | Level 1
Quoted
Prices | |
Equity Securities: | | | | | | | | |
Common Stocks | | $ | 61,810 | | | $ | 61,810 | |
Short-Term Investments | | | 799 | | | | 799 | |
| | | | | | | | |
Total Investments | | $ | 62,609 | | | $ | 62,609 | |
| | | | | | | | |
There are no Level 2 (significant observable inputs) or Level 3 (significant unobservable inputs) priced securities.
There were no transfers between Level 1 and Level 2 related to securities held at December 31, 2016.
See Notes to Financial Statements
44
VIRTUS SMALL-CAP VALUE SERIES
SCHEDULE OF INVESTMENTS
DECEMBER 31, 2016
($ reported in thousands)
| | | | | | | | |
| | | SHARES | | | VALUE | |
| COMMON STOCKS—95.1% | | | | | | | | |
|
| Consumer Discretionary—15.2% | |
Cheesecake Factory, Inc. (The) | | | 62,000 | | | $ | 3,712 | |
Cinemark Holdings, Inc. | | | 107,400 | | | | 4,120 | |
Sally Beauty Holdings, Inc.(2) | | | 104,000 | | | | 2,748 | |
Thor Industries, Inc. | | | 38,200 | | | | 3,822 | |
| | | | | | | | |
| | | | | | | 14,402 | |
| | | | | | | | |
| | |
| Consumer Staples—5.1% | | | | | | | | |
National Beverage Corp.(2) | | | 51,550 | | | | 2,633 | |
WD-40 Co. | | | 18,900 | | | | 2,209 | |
| | | | | | | | |
| | | | | | | 4,842 | |
| | | | | | | | |
| | |
| Energy—3.9% | | | | | | | | |
Core Laboratories N.V. | | | 30,900 | | | | 3,709 | |
| | | | | | | | |
| | |
| Financials—15.3% | | | | | | | | |
Artisan Partners Asset Management, Inc. Class A | | | 97,400 | | | | 2,898 | |
Bank of Hawaii Corp. | | | 47,200 | | | | 4,186 | |
First Financial Bancshares, Inc. | | | 41,500 | | | | 1,876 | |
Primerica, Inc. | | | 39,528 | | | | 2,733 | |
RLI Corp. | | | 45,350 | | | | 2,863 | |
| | | | | | | | |
| | | | | | | 14,556 | |
| | | | | | | | |
| | |
| Health Care—6.2% | | | | | | | | |
Anika Therapeutics, Inc.(2) | | | 62,140 | | | | 3,042 | |
Patterson Cos., Inc. | | | 69,700 | | | | 2,860 | |
| | | | | | | | |
| | | | | | | 5,902 | |
| | | | | | | | |
| | |
| Industrials—17.2% | | | | | | | | |
CEB, Inc. | | | 50,300 | | | | 3,048 | |
CLARCOR, Inc. | | | 22,900 | | | | 1,889 | |
Graco, Inc. | | | 41,950 | | | | 3,486 | |
Landstar System, Inc. | | | 34,400 | | | | 2,934 | |
RBC Bearings, Inc.(2) | | | 37,100 | | | | 3,443 | |
Sun Hydraulics Corp. | | | 37,200 | | | | 1,487 | |
| | | | | | | | |
| | | | | | | 16,287 | |
| | | | | | | | |
| | |
| Information Technology—21.5% | | | | | | | | |
American Software, Inc. Class A | | | 139,600 | | | | 1,442 | |
Badger Meter, Inc. | | | 85,666 | | | | 3,165 | |
Cabot Microelectronics Corp. | | | 48,800 | | | | 3,083 | |
Cass Information Systems, Inc. | | | 54,895 | | | | 4,039 | |
Cognex Corp. | | | 37,600 | | | | 2,392 | |
Jack Henry & Associates, Inc. | | | 38,200 | | | | 3,391 | |
Monotype Imaging Holdings, Inc. | | | 146,733 | | | | 2,913 | |
| | | | | | | | |
| | | | | | | 20,425 | |
| | | | | | | | |
| | |
| Materials—2.5% | | | | | | | | |
Scotts Miracle-Gro Co. (The) Class A | | | 25,000 | | | | 2,389 | |
| | | | | | | | |
| | | | | | | | |
| | | SHARES | | | VALUE | |
| Real Estate—8.2% | | | | | | | | |
HFF, Inc. Class A | | | 102,500 | | | $ | 3,101 | |
RE/MAX Holdings, Inc. Class A | | | 84,000 | | | | 4,704 | |
| | | | | | | | |
| | | | | | | | 7,805 | |
| TOTAL COMMON STOCKS (Identified Cost $62,413) | | | | | | | 90,317 | |
| TOTAL LONG TERM INVESTMENTS—95.1% | |
| (Identified Cost $62,413) | | | | | | | 90,317 | |
|
| SHORT-TERM INVESTMENT—0.7% | |
|
| Money Market Mutual Fund—0.7% | |
JPMorgan U.S. Government Money Market Fund – Institutional Shares (seven-day effective yield 0.440%)(3) | | | 628,659 | | | | 629 | |
TOTAL SHORT-TERM INVESTMENT
(Identified Cost $629) | | | | 629 | |
TOTAL INVESTMENTS—95.8%
(Identified Cost $63,042) | | | | 90,946 | (1) |
Other assets and liabilities, net—4.2% | | | | 4,020 | |
| | | | | | | | |
| NET ASSETS—100.0% | | | | | | $ | 94,966 | |
| | | | | | | | |
Footnote Legend:
| (1) | Federal Income Tax Information: For tax information at December 31, 2016, see Note 10 Federal Income Tax Information in the Notes to Financial Statements. |
| (2) | Non-income producing. |
| (3) | Shares of this fund are publicly offered and its prospectus and annual report are publicly available. |
The following table provides a summary of inputs used to value the Series’ investments as of December 31, 2016 (See Security Valuation Note 2A in the Notes to Financial Statements):
| | | | | | | | |
| | | Total
Value at
December 31, 2016 | | | Level 1
Quoted
Prices | |
Equity Securities: | | | | | | | | |
Common Stocks | | $ | 90,317 | | | $ | 90,317 | |
Short-Term Investments | | | 629 | | | | 629 | |
| | | | | | | | |
Total Investments | | $ | 90,946 | | | $ | 90,946 | |
| | | | | | | | |
There are no Level 2 (significant observable inputs) or Level 3 (significant unobservable inputs) priced securities.
There were no transfers between Level 1 and Level 2 related to securities held at December 31, 2016.
See Notes to Financial Statements
45
VIRTUS STRATEGIC ALLOCATION SERIES
SCHEDULE OF INVESTMENTS
DECEMBER 31, 2016
($ reported in thousands)
| | | | | | | | |
| | | PAR
VALUE | | | VALUE | |
| U.S. GOVERNMENT SECURITIES—2.1% | |
U.S. Treasury Bond
2.500%, 2/15/46 | | $ | 1,230 | | | $ | 1,090 | |
U.S. Treasury Note
1.625%, 2/15/26 | | | 950 | | | | 887 | |
| TOTAL U.S. GOVERNMENT SECURITIES | |
| (Identified Cost $2,160) | | | | | | | 1,977 | |
| | |
| MUNICIPAL BONDS—1.6% | | | | | | | | |
| | |
| California—0.8% | | | | | | | | |
San Diego County Regional Airport Authority Rental Car Center Project Series B – Taxable 5.594%, 7/1/43 | | | 275 | | | | 302 | |
State of California, Build America Bonds Taxable
7.600%, 11/1/40 | | | 265 | | | | 399 | |
| | | | | | | | |
| | | | | | | 701 | |
| | | | | | | | |
| | |
| New York—0.4% | | | | | | | | |
New York City Transitional Finance Authority Taxable
5.000%, 5/1/40 | | | 345 | | | | 393 | |
| | | | | | | | |
| | |
| Texas—0.2% | | | | | | | | |
State of Texas
3.011%, 10/1/26 | | | 200 | | | | 199 | |
| | | | | | | | |
| | |
| Virginia—0.2% | | | | | | | | |
Tobacco Settlement Financing Corp. Series A-1, Taxable 6.706%, 6/1/46 | | | 210 | | | | 167 | |
| TOTAL MUNICIPAL BONDS (Identified Cost $1,515) | | | | | | | 1,460 | |
|
| FOREIGN GOVERNMENT SECURITIES—0.7% | |
Argentine Republic 144A
7.625%, 4/22/46(4) | | | 150 | | | | 150 | |
Bolivarian Republic of Venezuela 9.375%, 1/13/34 | | | 65 | | | | 30 | |
Republic of Chile
5.500%, 8/5/20 | | | 52,000 | CLP | | | 82 | |
Republic of El Salvador 144A 6.375%, 1/18/27(4) | | | 75 | | | | 69 | |
Republic of Romania 144A 6.750%, 2/7/22(4) | | | 50 | | | | 57 | |
Republic of Turkey
7.375%, 2/5/25 | | | 100 | | | | 110 | |
Russian Federation 144A
7.850%, 3/10/18(4) | | | 5,000 | RUB | | | 81 | |
United Mexican States | | | | | | | | |
Series M, 6.500%, 6/9/22 | | | 925 | MXN | | | 43 | |
4.750%, 3/8/44 | | | 54 | | | | 49 | |
| TOTAL FOREIGN GOVERNMENT SECURITIES | |
| (Identified Cost $830) | | | | 671 | |
| | | | | | | | |
| | | PAR
VALUE | | | VALUE | |
| MORTGAGE-BACKED SECURITIES—13.5% | |
| | |
| Agency—4.6% | | | | | | | | |
FHLMC | | | | | | | | |
3.500%, 3/1/45 | | $ | 290 | | | $ | 298 | |
3.000%, 5/1/45 | | | 86 | | | | 85 | |
3.500%, 4/1/46 | | | 159 | | | | 163 | |
FNMA | | | | | | | | |
4.000%, 6/1/20 | | | 13 | | | | 13 | |
4.500%, 7/1/20 | | | 1 | | | | 1 | |
3.000%, 2/1/27 | | | 130 | | | | 133 | |
2.500%, 5/1/28 | | | 181 | | | | 182 | |
6.500%, 10/1/31 | | | 3 | | | | 4 | |
6.000%, 9/1/32 | | | 12 | | | | 14 | |
5.000%, 10/1/35 | | | 33 | | | | 36 | |
6.000%, 9/1/36 | | | 1 | | | | 1 | |
5.500%, 4/1/37 | | | 10 | | | | 11 | |
5.500%, 7/1/37 | | | 29 | | | | 32 | |
6.000%, 10/1/37 | | | 9 | | | | 11 | |
5.000%, 6/1/38 | | | 25 | | | | 27 | |
5.500%, 6/1/38 | | | 6 | | | | 6 | |
5.500%, 6/1/38 | | | 5 | | | | 6 | |
5.500%, 11/1/38 | | | 18 | | | | 20 | |
4.000%, 1/1/39 | | | 50 | | | | 53 | |
5.000%, 1/1/39 | | | 6 | | | | 7 | |
6.000%, 1/1/39 | | | 15 | | | | 18 | |
4.500%, 3/1/39 | | | 14 | | | | 15 | |
5.000%, 3/1/39 | | | 13 | | | | 14 | |
6.000%, 3/1/39 | | | 13 | | | | 15 | |
4.500%, 4/1/39 | | | 97 | | | | 105 | |
4.000%, 5/1/39 | | | 92 | | | | 97 | |
4.500%, 2/1/40 | | | 69 | | | | 74 | |
4.000%, 10/1/40 | | | 133 | | | | 140 | |
4.500%, 4/1/41 | | | 150 | | | | 162 | |
4.000%, 7/1/41 | | | 101 | | | | 106 | |
3.500%, 1/1/42 | | | 82 | | | | 84 | |
3.500%, 4/1/42 | | | 325 | | | | 335 | |
3.500%, 12/1/42 | | | 174 | | | | 180 | |
3.000%, 3/1/43 | | | 304 | | | | 302 | |
3.000%, 5/1/43 | | | 86 | | | | 86 | |
3.000%, 7/1/43 | | | 200 | | | | 200 | |
4.000%, 10/1/44 | | | 297 | | | | 312 | |
3.500%, 9/1/45 | | | 175 | | | | 180 | |
3.500%, 1/1/46 | | | 86 | | | | 88 | |
4.000%, 1/1/46 | | | 259 | | | | 272 | |
3.000%, 6/1/46 | | | 159 | | | | 158 | |
3.000%, 7/1/46 | | | 89 | | | | 88 | |
GNMA | | | | | | | | |
6.500%, 11/15/23 | | | 34 | | | | 39 | |
6.500%, 12/15/23 | | | 1 | | | | 1 | |
6.500%, 2/15/24 | | | 18 | | | | 21 | |
6.500%, 11/15/31 | | | 19 | | | | 22 | |
6.500%, 2/15/32 | | | 42 | | | | 48 | |
| | | | | | | | |
| | | | | | | 4,265 | |
| | | | | | | | |
| | |
| Non-Agency—8.9% | | | | | | | | |
Agate Bay Mortgage Trust
13-1, A1 144A
3.500%, 7/25/43(3)(4) | | | 151 | | | | 152 | |
American Homes 4 Rent | | | | | | | | |
15-SFR2, C 144A
4.691%, 10/17/45(4) | | | 110 | | | | 113 | |
15-SFR1, A 144A
3.467%, 4/17/52(4) | | | 107 | | | | 107 | |
| | | | | | | | |
| | | PAR
VALUE | | | VALUE | |
| Non-Agency—continued | | | | | | | | |
Ameriquest Mortgage Securities, Inc. 03-AR3, M4
4.274%, 6/25/33(3) | | $ | 155 | | | $ | 150 | |
AMSR Trust 16-SFR1, C
144A
2.986%, 11/17/33(3)(4) | | | 100 | | | | 100 | |
Aventura Mall Trust
13-AVM, C 144A
3.743%, 12/5/32(3)(4) | | | 300 | | | | 310 | |
Banc of America Commercial Mortgage Trust 07-2, A4
5.638%, 4/10/49(3) | | | 19 | | | | 19 | |
Barclays (Lehman Brothers) – UBS Commercial Mortgage Trust 07-C6, A4
5.858%, 7/15/40(3) | | | 114 | | | | 115 | |
Bayview Opportunity Master Fund IVa Trust 16-SPL1, B1 144A
4.250%, 4/28/55(4) | | | 100 | | | | 102 | |
Bayview Opportunity Master Fund IVb Trust 16-SPL2, B1 144A
4.250%, 6/28/53(3)(4) | | | 100 | | | | 101 | |
CIT Group Home Equity Loan Trust 03-1, A5
5.480%, 7/20/34(3) | | | 249 | | | | 250 | |
Citigroup Commercial Mortgage Trust | | | | | | | | |
16-SMPL, A 144A
2.228%, 9/10/31(4) | | | 100 | | | | 97 | |
07-C6, A4
5.711%, 12/10/49(3) | | | 120 | | | | 121 | |
08-C7, AM
6.136%, 12/10/49(3) | | | 95 | | | | 98 | |
Citigroup Mortgage Loan Trust, Inc. | | | | | | | | |
04-UST1, A3
2.914%, 8/25/34(3) | | | 79 | | | | 79 | |
04-NCM2, 2CB2
6.750%, 8/25/34 | | | 69 | | | | 72 | |
14-A, A 144A
4.000%, 1/25/35(3)(4) | | | 65 | | | | 67 | |
15-A, A1 144A
3.500%, 6/25/58(3)(4) | | | 94 | | | | 96 | |
Colony Multi-Family Mortgage Trust 14-1, A 144A
2.543%, 4/20/50(4) | | | 109 | | | | 108 | |
Colony Starwood Homes Trust 16-2A, C 144A
2.886%, 12/17/33(3)(4) | | | 100 | | | | 100 | |
Credit Suisse Commercial Mortgage-Backed Trust 07-C1, A1A
5.361%, 2/15/40 | | | 18 | | | | 18 | |
Credit Suisse First Boston Mortgage Securities Corp. 13-HYB1, A16,144A
3.023%, 4/25/43(3)(4) | | | 49 | | | | 49 | |
Deutsche Bank-UBS Mortgage Trust 11-LC3A, D 144A
5.345%, 8/10/44(3)(4) | | | 120 | | | | 124 | |
GAHR Commercial Mortgage Trust 15-NRF, CFX 144A
3.382%, 12/15/34(3)(4) | | | 100 | | | | 100 | |
Refer to Footnote Legend on page 51.
See Notes to Financial Statements
46
VIRTUS STRATEGIC ALLOCATION SERIES
SCHEDULE OF INVESTMENTS (Continued)
DECEMBER 31, 2016
($ reported in thousands)
| | | | | | | | |
| | | PAR
VALUE | | | VALUE | |
| Non-Agency—continued | | | | | | | | |
GMAC Mortgage Corp. Loan Trust 04-AR1, 12A
3.489%, 6/25/34(3) | | $ | 45 | | | $ | 45 | |
GSAA Home Equity Trust
05-12, AF3W
4.999%, 9/25/35(3) | | | 36 | | | | 36 | |
IMC Home Equity Loan Trust 97-5, A9
7.310%, 11/20/28 | | | 82 | | | | 83 | |
JPMorgan Chase (Bear Stearns) Adjustable Rate Mortgage Trust 04-1, 21A1
2.938%, 4/25/34(3) | | | 63 | | | | 63 | |
JPMorgan Chase (Bear Stearns) Commercial Mortgage Securities Trust 07-PW18, AM,
6.084%, 6/11/50(3) | | | 450 | | | | 464 | |
JPMorgan Chase (Washington Mutual) Mortgage Pass-Through Certificates Trust | | | | | | | | |
03-AR6, A1
2.898%, 6/25/33(3) | | | 64 | | | | 63 | |
03-AR4, 2A1
2.622%, 8/25/33(3) | | | 98 | | | | 96 | |
JPMorgan Chase Commercial Mortgage Securities Trust | | | | | | | | |
14-C22, A4
3.801%, 9/15/47 | | | 150 | | | | 156 | |
07-LD12, A4
5.882%, 2/15/51(3) | | | 478 | | | | 485 | |
JPMorgan Chase Mortgage Trust | | | | | | | | |
14-2, 2A2 144A
3.500%, 6/25/29(3)(4) | | | 64 | | | | 65 | |
14-1, 1A1 144A
3.937%, 1/25/44(3)(4) | | | 133 | | | | 138 | |
16-1, M2 144A
3.750%, 4/25/45(3)(4) | | | 85 | | | | 84 | |
16-2, M2 144A
3.750%, 12/25/45(3)(4) | | | 91 | | | | 90 | |
16-1, A3 144A
3.500%, 5/25/46(4) | | | 87 | | | | 87 | |
11-C4, A4, 144A
4.388%, 7/15/46(4) | | | 225 | | | | 241 | |
16-3, A3 144A
3.500%, 10/25/46(3)(4) | | | 75 | | | | 76 | |
MASTR Alternative Loan Trust 03-8, 2A1
5.750%, 11/25/33 | | | 122 | | | | 126 | |
MASTR Specialized Loan Trust 05-3, A2 144A
5.704%, 11/25/35(3)(4) | | | 76 | | | | 77 | |
Morgan Stanley – Bank of America (Merrill Lynch) Trust | | | | | | | | |
15-C22, AS
3.561%, 4/15/48 | | | 225 | | | | 225 | |
15-C26, C
4.411%, 10/15/48(3) | | | 115 | | | | 113 | |
Morgan Stanley Capital Barclays Bank Trust 16-MART, A 144A 2.200%, 9/13/31(4) | | | 155 | | | | 152 | |
Morgan Stanley Capital I Trust | | | | | | | | |
07-IQ14, AM
5.690%, 4/15/49(3) | | | 130 | | | | 127 | |
07-IQ14, A4
5.692%, 4/15/49(3) | | | 178 | | | | 178 | |
| | | | | | | | |
| | | PAR
VALUE | | | VALUE | |
| Non-Agency—continued | | | | | | | | |
Motel 6 Trust 15-MTL6, D 144A 4.532%, 2/5/30(4) | | $ | 155 | | | $ | 156 | |
New Residential Mortgage Loan Trust | | | | | | | | |
14-1A, A 144A
3.750%, 1/25/54(3)(4) | | | 102 | | | | 105 | |
15-2A, A1 144A
3.750%, 8/25/55(3)(4) | | | 84 | | | | 87 | |
16-1A, A1 144A
3.750%, 3/25/56(3)(4) | | | 82 | | | | 83 | |
16-3A, A1 144A
3.750%, 9/25/56(3)(4) | | | 94 | | | | 96 | |
16-4A, B1A 144A
4.500%, 11/25/56(4) | | | 100 | | | | 104 | |
Nomura Asset Acceptance Corp. 04-R3, A1 144A
6.500%, 2/25/35(4) | | | 104 | | | | 102 | |
Novastar Mortgage Funding Trust Series 04-4, M5
2.481%, 3/25/35(3) | | | 120 | | | | 117 | |
Residential Asset Mortgage Products, Inc. 05-SL2, A4
7.500%, 2/25/32 | | | 55 | | | | 55 | |
Sequoia Mortgage Trust | | | | | | | | |
14-2, A1 144A
4.000%, 7/25/44(3)(4) | | | 86 | | | | 88 | |
14-4, A6 144A
3.500%, 11/25/44(3)(4) | | | 86 | | | | 86 | |
Structured Adjustable Rate Mortgage Loan Trust 04-1, 6A 3.247%, 2/25/34(3) | | | 111 | | | | 107 | |
Towd Point Mortgage Trust | | | | | | | | |
15-1, A2 144A
3.250%, 10/25/53(3)(4) | | | 100 | | | | 98 | |
15-6, M1 144A
3.750%, 4/25/55(3)(4) | | | 100 | | | | 98 | |
15-5, A2 144A
3.500%, 5/25/55(3)(4) | | | 100 | | | | 100 | |
16-4, A1 144A
2.250%, 7/25/56(3)(4) | | | 93 | | | | 92 | |
15-2, 1M1 144A
3.250%, 11/25/60(3)(4) | | | 145 | | | | 144 | |
Wells Fargo (Wachovia Bank) Commercial Mortgage Trust | | | | | | | | |
07-C30, A5
5.342%, 12/15/43 | | | 75 | | | | 75 | |
07-C30, AM
5.383%, 12/15/43 | | | 160 | | | | 160 | |
07-C31, A4
5.509%, 4/15/47 | | | 169 | | | | 169 | |
15-LC20, B
3.719%, 4/15/50 | | | 50 | | | | 50 | |
07-C33, A5
5.969%, 2/15/51(3) | | | 140 | | | | 142 | |
Wells Fargo – Royal Bank of Scotland plc Commercial Mortgage Trust 11-C5, C 144A 5.673%, 11/15/44(3)(4) | | | 110 | | | | 118 | |
| | | | | | | | |
| | | | | | | | 8,350 | |
TOTAL MORTGAGE-BACKED SECURITIES
(Identified Cost $12,461) | | | | 12,615 | |
| | | | | | | | |
| | | PAR
VALUE | | | VALUE | |
| ASSET-BACKED SECURITIES—2.5% | |
AmeriCredit Automobile Receivables Trust | | | | | | | | |
12-4, D
2.680%, 10/9/18 | | $ | 140 | | | $ | 140 | |
13-2, D
2.420%, 5/8/19 | | | 275 | | | | 277 | |
BXG Receivables Note Trust 12-A, A 144A 2.660%, 12/2/27(4) | | | 46 | | | | 46 | |
Centre Point Funding LLC 12-2A,1 144A 2.610%, 8/20/21(4) | | | 72 | | | | 71 | |
Conn Funding II LP 16-B, A 144A 3.730%, 10/15/18(4) | | | 78 | | | | 78 | |
DB Master Finance LLC 15-A1, A2II 144A 3.980%, 2/20/45(4) | | | 49 | | | | 49 | |
Drive Auto Receivables Trust 15-AA, C 144A
3.060%, 5/17/21(4) | | | 150 | | | | 151 | |
DT Auto Owner Trust 16-4A C,144A 2.740%, 10/17/22(4) | | | 125 | | | | 124 | |
Exeter Automobile Receivables Trust | | | | | | | | |
14-1A, B 144A
2.420%, 1/15/19(4) | | | 36 | | | | 36 | |
15-A1, C 144A 4.
100%, 12/15/20(4) | | | 135 | | | | 137 | |
Fairway Outdoor Funding LLC 12-1A, A2 144A
4.212%, 10/15/42(4) | | | 75 | | | | 75 | |
Flagship Credit Auto Trust 16-1, A 144A
2.770%, 12/15/20(4) | | | 96 | | | | 97 | |
Leaf Receivables Funding 9 LLC 13-1,E2 C 144A
3.460%, 9/15/21(4) | | | 150 | | | | 150 | |
Navistar Financial Dealer Note Master Owner Trust II 16-1, B 144A
2.506%, 9/27/21(3)(4) | | | 165 | | | | 166 | |
OneMain Financial Issuance Trust 15-A, A 144A
3.190%, 3/18/26(4) | | | 125 | | | | 126 | |
SoFi Professional Loan Program LLC 16-A, A2 144A
2.760%, 12/26/36(4) | | | 82 | | | | 82 | |
SolarCity LMC Series III LLC 14-2, A 144A
4.020%, 7/20/44(4) | | | 152 | | | | 143 | |
Structured Asset Securities Corp. Mortgage Pass-Through Certificates 01-SB1, A2
3.375%, 8/25/31 | | | 61 | | | | 60 | |
TCF Auto Receivables Owner Trust 14-1A, C 144A
3.120%, 4/15/21(4) | | | 165 | | | | 165 | |
Trip Rail Master Funding LLC 11-1A, A1A 144A
4.370%, 7/15/41(4) | | | 103 | | | | 104 | |
U-Haul S Fleet LLC 10-BT1A, 1 144A
4.899%, 10/25/23(4) | | | 90 | | | | 91 | |
TOTAL ASSET-BACKED SECURITIES
(Identified Cost $2,369) | | | | 2,368 | |
Refer to Footnote Legend on page 51.
See Notes to Financial Statements
47
VIRTUS STRATEGIC ALLOCATION SERIES
SCHEDULE OF INVESTMENTS (Continued)
DECEMBER 31, 2016
($ reported in thousands)
| | | | | | | | |
| | | PAR
VALUE | | | VALUE | |
| CORPORATE BONDS AND NOTES—18.3% | |
|
| Consumer Discretionary—1.7% | |
Cooper-Standard Automotive, Inc. 144A
5.625%, 11/15/26(4) | | $ | 80 | | | $ | 79 | |
Delphi Automotive plc
3.150%, 11/19/20 | | | 90 | | | | 91 | |
Hyatt Hotels Corp.
3.375%, 7/15/23 | | | 115 | | | | 113 | |
International Game Technology plc
7.500%, 6/15/19 | | | 75 | | | | 83 | |
Marriott International
3.125%, 2/15/23 | | | 200 | | | | 195 | |
Marriott International, Inc. Series N,
3.125%, 10/15/21 | | | 105 | | | | 106 | |
NCL Corp., Ltd. 144A
4.750%, 12/15/21(4) | | | 60 | | | | 60 | |
New York University
4.142%, 7/1/48 | | | 70 | | | | 66 | |
Priceline Group, Inc. (The) 3.650%, 3/15/25 | | | 130 | | | | 130 | |
QVC, Inc.
5.125%, 7/2/22 | | | 135 | | | | 140 | |
SFR (Numericable) Group S.A. 144A
6.000%, 5/15/22(4) | | | 200 | | | | 206 | |
Wyndham Worldwide Corp. 5.100%, 10/1/25 | | | 130 | | | | 137 | |
Ziggo Secured Finance BV 144A
5.500%, 1/15/27(4) | | | 200 | | | | 195 | |
| | | | | | | | |
| | | | | | | 1,601 | |
| | | | | | | | |
| | |
| Consumer Staples—0.5% | | | | | | | | |
CVS Health Corp.
2.875%, 6/1/26 | | | 110 | | | | 105 | |
Flowers Foods, Inc.
4.375%, 4/1/22 | | | 120 | | | | 126 | |
Kraft Heinz Foods Co. (The) | | | | | | | | |
2.800%, 7/2/20 | | | 20 | | | | 20 | |
3.500%, 7/15/22 | | | 25 | | | | 25 | |
Safeway, Inc.
7.250%, 2/1/31 | | | 70 | | | | 69 | |
Whole Foods Market, Inc.
5.200%, 12/3/25 | | | 70 | | | | 74 | |
| | | | | | | | |
| | | | | | | 419 | |
| | | | | | | | |
| | |
| Energy—2.5% | | | | | | | | |
Anadarko Petroleum Corp. 5.550%, 3/15/26 | | | 20 | | | | 22 | |
Blue Racer Midstream LLC 144A
6.125%, 11/15/22(4) | | | 20 | | | | 20 | |
Diamondback Energy, Inc. 144A 4.750%, 11/1/24(4) | | | 10 | | | | 10 | |
Ecopetrol S.A.
4.125%, 1/16/25 | | | 135 | | | | 126 | |
Enbridge Energy Partners LP 4.375%, 10/15/20 | | | 25 | | | | 26 | |
Gazprom OAO (Gaz Capital S.A.) 144A
6.000%, 11/27/23(4)(8) | | | 200 | | | | 213 | |
| | | | | | | | |
| | | PAR
VALUE | | | VALUE | |
| Energy—continued | | | | | | | | |
Helmerich & Payne International Drilling Co.
4.650%, 3/15/25 | | $ | 70 | | | $ | 72 | |
Holly Energy Partners LP 144A 6.000%, 8/1/24(4) | | | 5 | | | | 5 | |
HollyFrontier Corp.
5.875%, 4/1/26 | | | 100 | | | | 102 | |
Kinder Morgan, Inc. | | | | | | | | |
4.300%, 6/1/25 | | | 150 | | | | 154 | |
7.750%, 1/15/32 | | | 60 | | | | 74 | |
Linn Energy LLC
6.500%, 9/15/21(9) | | | 50 | | | | 21 | |
Lukoil International Finance BV 144A
4.563%, 4/24/23(4) | | | 200 | | | | 202 | |
MPLX LP
4.875%, 12/1/24 | | | 170 | | | | 175 | |
NGL Energy Partners LP
5.125%, 7/15/19 | | | 95 | | | | 95 | |
Occidental Petroleum Corp. | | | | | | | | |
3.400%, 4/15/26 | | | 5 | | | | 5 | |
4.400%, 4/15/46 | | | 80 | | | | 81 | |
Petrobras Global Finance BV 5.375%, 1/27/21 | | | 55 | | | | 54 | |
Petroleos Mexicanos 144A
6.875%, 8/4/26(4) | | | 35 | | | | 37 | |
6.500%, 6/2/41 | | | 90 | | | | 84 | |
5.500%, 6/27/44 | | | 60 | | | | 50 | |
PHI, Inc.
5.250%, 3/15/19 | | | 35 | | | | 33 | |
Regency Energy Partners LP
5.000%, 10/1/22 | | | 135 | | | | 143 | |
Rowan Cos., Inc.
4.875%, 6/1/22 | | | 140 | | | | 133 | |
SM Energy Co.
6.125%, 11/15/22 | | | 45 | | | | 46 | |
Sunoco LP
6.375%, 4/1/23 | | | 140 | | | | 143 | |
Williams Cos., Inc. (The)
3.700%, 1/15/23 | | | 100 | | | | 97 | |
Williams Partners LP
3.900%, 1/15/25 | | | 145 | | | | 142 | |
| | | | | | | | |
| | | | | | | 2,365 | |
| | | | | | | | |
| | |
| Financials—7.2% | | | | | | | | |
Allstate Corp. (The)
5.750%, 8/15/53(3)(5) | | | 135 | | | | 140 | |
Ally Financial, Inc.
5.750%, 11/20/25 | | | 60 | | | | 60 | |
Apollo Management Holdings LP 144A
4.000%, 5/30/24(4) | | | 135 | | | | 134 | |
Ares Capital Corp. | | | | | | | | |
4.875%, 11/30/18 | | | 18 | | | | 19 | |
3.875%, 1/15/20 | | | 49 | | | | 50 | |
Ares Finance Co., LLC 144A
4.000%, 10/8/24(4) | | | 140 | | | | 129 | |
Aviation Capital Group Corp. 144A
2.875%, 9/17/18(4) | | | 25 | | | | 25 | |
Banco Bilbao Vizcaya Argentaria Bancomer S.A. 144A
6.500%, 3/10/21(4) | | | 150 | | | | 162 | |
| | | | | | | | |
| | | PAR
VALUE | | | VALUE | |
| Financials—continued | | | | | | | | |
Banco de Credito del Peru 144A
4.250%, 4/1/23(4) | | $ | 164 | | | $ | 168 | |
Banco de Credito e Inversiones 144A
4.000%, 2/11/23(4) | | | 200 | | | | 204 | |
Banco Internacional del Peru SAA Interbank 144A
6.625%, 3/19/29(3)(4) | | | 115 | | | | 122 | |
Bank of America Corp. | | | | | | | | |
5.650%, 5/1/18 | | | 400 | | | | 419 | |
4.200%, 8/26/24 | | | 155 | | | | 158 | |
Berkshire Hathaway, Inc.
3.125%, 3/15/26 | | | 25 | | | | 25 | |
Capital One Financial Corp.
3.750%, 7/28/26 | | | 105 | | | | 102 | |
Citigroup, Inc.
4.600%, 3/9/26 | | | 140 | | | | 144 | |
CNOOC Finance 2013 Ltd.
3.000%, 5/9/23 | | | 200 | | | | 193 | |
Fidelity National Financial, Inc. | | | | | | | | |
6.600%, 5/15/17 | | | 175 | | | | 178 | |
5.500%, 9/1/22 | | | 40 | | | | 42 | |
Fifth Third Bancorp
4.500%, 6/1/18 | | | 150 | | | | 155 | |
First Horizon National Corp.
3.500%, 12/15/20 | | | 110 | | | | 111 | |
Ford Motor Credit Co., LLC
5.750%, 2/1/21 | | | 75 | | | | 82 | |
FS Investment Corp. | | | | | | | | |
4.250%, 1/15/20 | | | 115 | | | | 116 | |
4.750%, 5/15/22 | | | 35 | | | | 35 | |
General Motors Financial Co., Inc. | | | | | | | | |
3.500%, 7/10/19 | | | 120 | | | | 122 | |
4.200%, 3/1/21 | | | 40 | | | | 41 | |
Genworth Holdings, Inc.
4.900%, 8/15/23 | | | 68 | | | | 56 | |
Goldman Sachs Group, Inc. (The)
4.250%, 10/21/25 | | | 180 | | | | 183 | |
HSBC USA, Inc.
1.700%, 3/5/18 | | | 135 | | | | 135 | |
Huntington Bancshares, Inc.
7.000%, 12/15/20 | | | 95 | | | | 107 | |
Hutchison Whampoa International Ltd. Series 12 144A
6.000%(3)(4)(5)(6) | | | 160 | | | | 162 | |
ICAHN Enterprises LP | | | | | | | | |
6.000%, 8/1/20 | | | 55 | | | | 56 | |
5.875%, 2/1/22 | | | 45 | | | | 45 | |
iStar Financial, Inc.
5.000%, 7/1/19 | | | 45 | | | | 45 | |
Jefferies Group LLC
6.875%, 4/15/21 | | | 150 | | | | 171 | |
KeyCorp.
5.100%, 3/24/21 | | | 165 | | | | 180 | |
Korea Finance Corp.
4.625%, 11/16/21 | | | 200 | | | | 217 | |
Liberty Mutual Group, Inc. 144A 4.250%, 6/15/23(4) | | | 135 | | | | 141 | |
Lincoln National Corp. 6.050%, 4/20/67(3)(5) | | | 50 | | | | 38 | |
Lloyds TSB Bank plc 144A 6.500%, 9/14/20(4) | | | 150 | | | | 166 | |
Manulife Financial Corp.
4.150%, 3/4/26 | | | 100 | | | | 104 | |
Refer to Footnote Legend on page 51.
See Notes to Financial Statements
48
VIRTUS STRATEGIC ALLOCATION SERIES
SCHEDULE OF INVESTMENTS (Continued)
DECEMBER 31, 2016
($ reported in thousands)
| | | | | | | | |
| | | PAR
VALUE | | | VALUE | |
| Financials—continued | | | | | | | | |
Morgan Stanley | | | | | | | | |
4.100%, 5/22/23 | | $ | 80 | | | $ | 82 | |
4.350%, 9/8/26 | | | 100 | | | | 102 | |
Navient Corp.
7.250%, 9/25/23 | | | 20 | | | | 21 | |
OM Asset Management plc
4.800%, 7/27/26 | | | 60 | | | | 57 | |
PKO Finance AB 144A
4.630%, 9/26/22(4)(8) | | | 200 | | | | 207 | |
Prudential Financial, Inc. | | | | | | | | |
5.875%, 9/15/42(3) | | | 90 | | | | 94 | |
5.625%, 6/15/43(3)(5) | | | 60 | | | | 62 | |
S&P Global, Inc.
4.000%, 6/15/25 | | | 125 | | | | 128 | |
Santander Holdings USA, Inc.
2.650%, 4/17/20 | | | 130 | | | | 129 | |
SBA Tower Trust 144A
2.877%, 7/15/21(4) | | | 100 | | | | 99 | |
Springleaf Finance Corp.
5.250%, 12/15/19 | | | 45 | | | | 45 | |
Starwood Property Trust, Inc. 144A
5.000%, 12/15/21(4) | | | 15 | | | | 15 | |
Teachers Insurance & Annuity Association Asset Management Finance Co., LLC 144A
4.125%, 11/1/24(4) | | | 125 | | | | 126 | |
Teachers Insurance & Annuity Association of America 144A
4.375%, 9/15/54(3)(4) | | | 110 | | | | 108 | |
Toronto-Dominion Bank (The) | | | | | | | | |
2.125%, 4/7/21 | | | 65 | | | | 64 | |
3.625%, 9/15/31(3) | | | 25 | | | | 25 | |
Trinity Acquisition plc
4.400%, 3/15/26 | | | 80 | | | | 81 | |
Wells Fargo & Co. Series M,
3.450%, 2/13/23 | | | 115 | | | | 115 | |
Willis Group Holdings plc
5.750%, 3/15/21 | | | 125 | | | | 136 | |
Woodside Finance Ltd. 144A
3.700%, 9/15/26(4) | | | 20 | | | | 20 | |
Zions Bancorporation
4.500%, 6/13/23 | | | 40 | | | | 40 | |
| | | | | | | | |
| | | | | | | 6,698 | |
| | | | | | | | |
| | |
| Health Care—1.5% | | | | | | | | |
Abbott Laboratories | | | | | | | | |
3.400%, 11/30/23 | | | 25 | | | | 25 | |
3.750%, 11/30/26 | | | 80 | | | | 79 | |
AbbVie, Inc. | | | | | | | | |
3.600%, 5/14/25 | | | 45 | | | | 45 | |
3.200%, 5/14/26 | | | 65 | | | | 62 | |
Becton Dickinson and Co.
3.300%, 3/1/23 | | | 135 | | | | 135 | |
Cardinal Health, Inc. | | | | | | | | |
3.200%, 3/15/23 | | | 70 | | | | 71 | |
3.750%, 9/15/25 | | | 105 | | | | 108 | |
Centene Corp.
4.750%, 1/15/25 | | | 80 | | | | 78 | |
Endo Finance LLC 144A
5.375%, 1/15/23(4) | | | 50 | | | | 43 | |
| | | | | | | | |
| | | PAR
VALUE | | | VALUE | |
| Health Care—continued | | | | | | | | |
Express Scripts Holding Co.
3.900%, 2/15/22 | | $ | 140 | | | $ | 145 | |
Forest Laboratories LLC 144A
4.875%, 2/15/21(4) | | | 80 | | | | 86 | |
Fresenius U.S. Finance II, Inc.
144A 4.500%, 1/15/23(4) | | | 15 | | | | 16 | |
HCA, Inc. | | | | | | | | |
5.375%, 2/1/25 | | | 20 | | | | 20 | |
5.250%, 6/15/26 | | | 40 | | | | 41 | |
MEDNAX, Inc. 144A
5.250%, 12/1/23(4) | | | 55 | | | | 57 | |
Mylan NV | | | | | | | | |
144A 3.000%, 12/15/18(4) | | | 35 | | | | 35 | |
144A 3.150%, 6/15/21(4) | | | 20 | | | | 20 | |
Shire Acquisitions Investments
2.400%, 9/23/21 | | | 120 | | | | 116 | |
Tenet Healthcare Corp.
4.463%, 6/15/20(3) | | | 35 | | | | 35 | |
Teva Pharmaceutical Finance BV
4.100%, 10/1/46 | | | 60 | | | | 51 | |
Teva Pharmaceutical Finance III BV
3.150%, 10/1/26 | | | 60 | | | | 55 | |
Valeant Pharmaceuticals International, Inc. | | | | | | | | |
144A 7.500%, 7/15/21(4) | | | 15 | | | | 13 | |
144A 5.625%, 12/1/21(4) | | | 25 | | | | 19 | |
144A 5.875%, 5/15/23(4) | | | 10 | | | | 8 | |
Zoetis, Inc. 3.250%, 2/1/23 | | | 70 | | | | 70 | |
| | | | | | | | |
| | | | | | | 1,433 | |
| | | | | | | | |
| | |
| Industrials—1.0% | | | | | | | | |
Bombardier, Inc. 144A
6.125%, 1/15/23(4) | | | 70 | | | | 67 | |
British Airways Pass-Through-Trust 13-1, B 144A
5.625%, 6/20/20(4) | | | 37 | | | | 39 | |
Carpenter Technology Corp.
5.200%, 7/15/21 | | | 150 | | | | 151 | |
Continental Airlines Pass-Through-Trust 99-1, A
6.545%, 2/2/19 | | | 137 | | | | 143 | |
01-1, A1 6.703%, 6/15/21 | | | 40 | | | | 43 | |
GATX Corp.
3.250%, 9/15/26 | | | 15 | | | | 14 | |
Lockheed Martin Corp.
3.100%, 1/15/23 | | | 100 | | | | 101 | |
Owens Corning
3.400%, 8/15/26 | | | 80 | | | | 76 | |
Penske Truck Leasing Co., LP 144A 3.375%, 2/1/22(4) | | | 50 | | | | 50 | |
UAL Pass-Through-Trust 07-01, A 6.636%, 7/2/22 | | | 198 | | | | 214 | |
| | | | | | | | |
| | | | | | | 898 | |
| | | | | | | | |
| |
| Information Technology—0.5% | | | | | |
Apple, Inc.
3.250%, 2/23/26 | | | 80 | | | | 80 | |
Diamond 1 Finance Corp. (Diamond 2 Finance Corp.) | | | | | | | | |
144A 5.450%, 6/15/23(4) | | | 15 | | | | 16 | |
144A 6.020%, 6/15/26(4) | | | 10 | | | | 11 | |
| | | | | | | | |
| | | PAR
VALUE | | | VALUE | |
| Information Technology—continued | |
Dun & Bradstreet Corp. (The)
4.375%, 12/1/22 | | $ | 135 | | | $ | 136 | |
Hewlett Packard Enterprise Co.
4.900%, 10/15/25 | | | 60 | | | | 62 | |
Verisk Analytics, Inc.
4.000%, 6/15/25 | | | 125 | | | | 126 | |
| | | | | | | | |
| | | | | | | 431 | |
| | | | | | | | |
| | |
| Materials—0.6% | | | | | | | | |
Airgas, Inc.
3.050%, 8/1/20 | | | 7 | | | | 7 | |
ArcelorMittal
6.125%, 6/1/25 | | | 100 | | | | 110 | |
Freeport-McMoRan Copper & Gold, Inc.
3.875%, 3/15/23 | | | 55 | | | | 51 | |
Gerdau Holdings, Inc.
144A 7.000%, 1/20/20(4) | | | 100 | | | | 107 | |
NewMarket Corp.
4.100%, 12/15/22 | | | 142 | | | | 144 | |
Reynolds Group Issuer, Inc.
144A 5.125%, 7/15/23(4) | | | 35 | | | | 36 | |
Vedanta Resources plc 144A
9.500%, 7/18/18(4) | | | 100 | | | | 106 | |
| | | | | | | | |
| | | | | | | 561 | |
| | | | | | | | |
| | |
| Real Estate—2.1% | | | | | | | | |
Alexandria Real Estate Equities, Inc. 3.950%, 1/15/27 | | | 60 | | | | 60 | |
Brixmor Operating Partnership LP
3.875%, 8/15/22 | | | 35 | | | | 36 | |
Corporate Office Properties LP | | | | | | | | |
3.700%, 6/15/21 | | | 90 | | | | 92 | |
3.600%, 5/15/23 | | | 150 | | | | 144 | |
Developers Diversified Realty Corp. | | | | | | | | |
3.400%, 10/1/20 | | | 50 | | | | 51 | |
3.950%, 7/1/22 | | | 65 | | | | 67 | |
Education Realty Operating Partnership LP 4.600%, 12/1/24 | | | 150 | | | | 149 | |
EPR Properties
4.750%, 12/15/26 | | | 40 | | | | 39 | |
HCP, Inc.
3.750%, 2/1/19 | | | 50 | | | | 51 | |
Healthcare Realty Trust, Inc.
3.875%, 5/1/25 | | | 80 | | | | 79 | |
Healthcare Trust of America Holdings LP
3.375%, 7/15/21 | | | 50 | | | | 50 | |
Highwoods Realty LP
3.625%, 1/15/23 | | | 135 | | | | 133 | |
Hospitality Properties Trust
4.500%, 3/15/25 | | | 130 | | | | 126 | |
Kilroy Realty LP
4.375%, 10/1/25 | | | 110 | | | | 113 | |
Kimco Realty Corp.
3.400%, 11/1/22 | | | 115 | | | | 117 | |
National Retail Properties, Inc.
5.500%, 7/15/21 | | | 150 | | | | 166 | |
Retail Opportunity Investments Partnership LP
4.000%, 12/15/24 | | | 105 | | | | 100 | |
Refer to Footnote Legend on page 51.
See Notes to Financial Statements
49
VIRTUS STRATEGIC ALLOCATION SERIES
SCHEDULE OF INVESTMENTS (Continued)
DECEMBER 31, 2016
($ reported in thousands)
| | | | | | | | |
| | | PAR
VALUE | | | VALUE | |
| Real Estate—continued | | | | | | | | |
Select Income REIT
4.500%, 2/1/25 | | $ | 125 | | | $ | 121 | |
Sovran Acquisition LP
3.500%, 7/1/26 | | | 50 | | | | 48 | |
Welltower, Inc.
4.000%, 6/1/25 | | | 135 | | | | 138 | |
WP Carey, Inc.
4.600%, 4/1/24 | | | 105 | | | | 106 | |
| | | | | | | | |
| | | | | | | 1,986 | |
| | | | | | | | |
|
| Telecommunication Services—0.2% | |
AT&T, Inc. | | | | | | | | |
3.000%, 6/30/22 | | | 50 | | | | 49 | |
4.800%, 6/15/44 | | | 80 | | | | 75 | |
Qwest Corp.
7.250%, 9/15/25 | | | 55 | | | | 59 | |
T-Mobile USA, Inc.
6.375%, 3/1/25 | | | 40 | | | | 43 | |
| | | | | | | | |
| | | | | | | 226 | |
| | | | | | | | |
|
| Utilities—0.5% | |
Dominion Resources, Inc.
2.962%, 7/1/19(3) | | | 10 | | | | 10 | |
Entergy Mississippi, Inc.
3.100%, 7/1/23 | | | 175 | | | | 172 | |
Kansas City Power & Light Co.
3.150%, 3/15/23 | | | 110 | | | | 109 | |
Southern Power Co.
4.150%, 12/1/25 | | | 145 | | | | 150 | |
| | | | | | | | |
| | | | | | | | 441 | |
| TOTAL CORPORATE BONDS AND NOTES | |
| (Identified Cost $16,917) | | | | 17,059 | |
|
| LOAN AGREEMENTS(3)—1.0% | |
|
| Consumer Discretionary—0.3% | |
Boyd Gaming Corp. Tranche B-2
3.756%, 9/15/23 | | | 24 | | | | 24 | |
Harbor Freight Tools USA, Inc.
3.887%, 8/18/23 | | | 105 | | | | 106 | |
PetSmart, Inc.
4.000%, 3/11/22 | | | 62 | | | | 63 | |
UFC Holdings LLC First Lien
5.000%, 8/18/23 | | | 45 | | | | 46 | |
| | | | | | | | |
| | | | | | | 239 | |
| | | | | | | | |
|
| Consumer Staples—0.0% | |
Coty, Inc.
3.092%, 10/27/22 | | | 14 | | | | 14 | |
Galleria Co. Tranche B,
3.750%, 1/26/23 | | | 27 | | | | 27 | |
| | | | | | | | |
| | | | | | | 41 | |
| | | | | | | | |
|
| Energy—0.1% | |
Paragon Offshore Finance Co.
5.500%, 7/16/21(13) | | | 33 | | | | 12 | |
Seadrill Operating LP
4.000%, 2/21/21 | | | 51 | | | | 35 | |
| | | | | | | | |
| | | | | | | 47 | |
| | | | | | | | |
| | | | | | | | |
| | | PAR
VALUE | | | VALUE | |
| Financials—0.1% | |
Delos Finance S.a.r.l.
3.748%, 3/6/21 | | $ | 80 | | | $ | 81 | |
| | | | | | | | |
|
| Industrials—0.1% | |
AWAS Finance Luxembourg S.A.
3.630%, 7/16/18 | | | 28 | | | | 28 | |
McGraw-Hill Global Education Holdings LLC Tranche B, First Lien,
5.000%, 5/4/22 | | | 52 | | | | 52 | |
| | | | | | | | |
| | | | | | | 80 | |
| | | | | | | | |
|
| Information Technology—0.3% | |
First Data Corp.
3.756%, 7/8/22 | | | 21 | | | | 22 | |
First Data Corp. Tranche 2021C,
3.756%, 3/24/21 | | | 68 | | | | 69 | |
Mitchell International, Inc.
4.500%, 10/13/20 | | | 32 | | | | 32 | |
NXP B.V. (NXP Funding LLC) Tranche F
3.270%, 12/7/20 | | | 37 | | | | 37 | |
Rackspace Hosting, Inc. Tranche B, First Lien,
4.500%, 11/3/23 | | | 38 | | | | 39 | |
SS&C European Holdings S.a.r.l. | | | | | | | | |
Tranche B-1, 4.010%, 7/8/22 | | | 22 | | | | 22 | |
Tranche B-2, 4.010%, 7/8/22 | | | 2 | | | | 2 | |
Western Digital Corp. Tranche B-1, 4.520%, 4/29/23 | | | 26 | | | | 26 | |
| | | | | | | | |
| | | | | | | 249 | |
| | | | | | | | |
|
| Materials—0.1% | |
Anchor Glass Container Corp. First Lien,
4.250%, 12/7/23 | | | 14 | | | | 14 | |
CPI Acquisition, Inc. First Lien,
5.500%, 8/17/22 | | | 36 | | | | 33 | |
Huntsman International LLC
3.873%, 4/1/23 | | | 22 | | | | 22 | |
PolyOne Corp. Tranche B-1,
3.500%, 11/11/22 | | | 41 | | | | 41 | |
| | | | | | | | |
| | | | | | | 110 | |
| | | | | | | | |
|
| Real Estate—0.0% | |
ESH Hospitality, Inc.
3.770%, 8/30/23 | | | 11 | | | | 11 | |
| | | | | | | | |
|
| Utilities—0.0% | |
Vistra Operations Company LLC (Tex Operations Co., LLC) | | | | | | | | |
5.000%, 8/4/23 | | | 24 | | | | 25 | |
Tranche C, 5.000%, 8/4/23 | | | 6 | | | | 6 | |
| | | | | | | | |
| | | | | | | | 31 | |
TOTAL LOAN AGREEMENTS
(Identified Cost $918) | | | | 889 | |
| | | | | | | | |
| | |
SHARES | | | VALUE | |
| PREFERRED STOCKS—0.9% | |
|
| Financials—0.9% | |
Banco Bilbao Vizcaya Argentaria S.A. International S.A. Unipersonal
5.919%(3) | | | 40 | (7) | | $ | 40 | |
Bank of New York Mellon Corp. (The) Series E,
4.950%(3) | | | 40 | (7) | | | 40 | |
Citigroup, Inc. Series T,
6.250%(3) | | | 125 | (7) | | | 129 | |
JPMorgan Chase & Co. Series V,
5.000%(3) | | | 50 | (7) | | | 50 | |
KeyCorp. Series D,
5.000%(3) | | | 100 | (7) | | | 92 | |
PNC Financial Services Group, Inc. (The) Series R,
4.850%(3) | | | 95 | (7) | | | 91 | |
PNC Financial Services Group, Inc. (The) Series S,
5.000%(3) | | | 100 | (7) | | | 96 | |
Wells Fargo & Co. Series K,
7.980%(3) | | | 95 | (7) | | | 99 | |
XLIT Ltd. Series E,
6.50%(3) | | | 100 | (7) | | | 78 | |
Zions Bancorp
6.950% | | | 4,250 | | | | 119 | |
TOTAL PREFERRED STOCKS
(Identified Cost $855) | | | | 834 | |
|
| COMMON STOCKS—57.4% | |
|
| Consumer Discretionary—13.7% | |
Amazon.com, Inc.(2) | | | 2,190 | | | | 1,642 | |
Bayerische Motoren Werke AG(2) | | | 13,510 | | | | 419 | |
Bridgestone Corp. ADR | | | 19,320 | | | | 349 | |
Ctrip.Com International Ltd. ADR(2) | | | 13,970 | | | | 559 | |
Fuji Heavy Industries Ltd. ADR | | | 21,990 | | | | 446 | |
Home Depot, Inc. (The) | | | 6,370 | | | | 854 | |
Las Vegas Sands Corp. | | | 23,580 | | | | 1,260 | |
Netflix, Inc.(2) | | | 7,600 | | | | 941 | |
NIKE, Inc. Class B | | | 21,290 | | | | 1,082 | |
Priceline Group, Inc. (The)(2) | | | 880 | | | | 1,290 | |
Ross Stores, Inc. | | | 17,020 | | | | 1,117 | |
Sony Corp. Sponsored ADR | | | 13,710 | | | | 384 | |
Starbucks Corp. | | | 27,380 | | | | 1,520 | |
TripAdvisor, Inc.(2) | | | 12,450 | | | | 577 | |
WPP plc Sponsored ADR | | | 2,685 | | | | 297 | |
| | | | | | | | |
| | | | | | | 12,737 | |
| | | | | | | | |
|
| Consumer Staples—5.6% | |
British American Tobacco plc Sponsored ADR | | | 3,050 | | | | 344 | |
Colgate-Palmolive Co. | | | 7,990 | | | | 523 | |
Companhia Brasileira de Distribuicao Grupo Pao de Acucar ADR | | | 22,000 | | | | 364 | |
Costco Wholesale Corp. | | �� | 5,410 | | | | 866 | |
Marine Harvest ASA Sponsored ADR | | | 24,140 | | | | 438 | |
Mead Johnson Nutrition Co. | | | 5,510 | | | | 390 | |
Monster Beverage Corp.(2) | | | 28,260 | | | | 1,253 | |
Philip Morris International, Inc. | | | 11,600 | | | | 1,061 | |
| | | | | | | | |
| | | | | | | 5,239 | |
| | | | | | | | |
Refer to Footnote Legend on page 51.
See Notes to Financial Statements
50
VIRTUS STRATEGIC ALLOCATION SERIES
SCHEDULE OF INVESTMENTS (Continued)
DECEMBER 31, 2016
($ reported in thousands)
| | | | | | | | |
| | | SHARES | | | VALUE | |
| Energy—3.9% | |
Cabot Oil & Gas Corp. | | | 16,630 | | | $ | 389 | |
Core Laboratories N.V. | | | 5,710 | | | | 685 | |
Pacific Exploration and Production Corp. | | | 557 | | | | 23 | |
Petroleo Brasileiro S.A. Sponsored ADR(2) | | | 35,310 | | | | 357 | |
Pioneer Natural Resources Co. | | | 3,520 | | | | 634 | |
Schlumberger Ltd. | | | 8,280 | | | | 695 | |
Statoil ASA Sponsored ADR | | | 22,760 | | | | 415 | |
Technip S.A. ADR | | | 24,025 | | | | 428 | |
| | | | | | | | |
| | | | | | | 3,626 | |
| | | | | | | | |
|
| Financials—4.3% | |
American International Group, Inc. | | | 7,190 | | | | 470 | |
Bank of America Corp. | | | 53,870 | | | | 1,190 | |
Charles Schwab Corp. (The) | | | 16,170 | | | | 638 | |
DBS Group Holdings Ltd. Sponsored ADR | | | 9,955 | | | | 475 | |
Mizuho Financial Group, Inc. | | | 113,940 | | | | 409 | |
ORIX Corp. Sponsored ADR | | | 5,305 | | | | 413 | |
Societe Generale SA Sponsored ADR | | | 46,210 | | | | 454 | |
| | | | | | | | |
| | | | | | | 4,049 | |
| | | | | | | | |
|
| Health Care—6.3% | |
Allergan plc(2) | | | 2,215 | | | | 465 | |
BioMarin Pharmaceutical, Inc.(2) | | | 8,550 | | | | 708 | |
Bristol-Myers Squibb Co. | | | 18,070 | | | | 1,056 | |
Celgene Corp.(2) | | | 12,550 | | | | 1,453 | |
Danaher Corp. | | | 8,740 | | | | 680 | |
Icon plc(2) | | | 4,610 | | | | 347 | |
Shire plc ADR | | | 2,115 | | | | 361 | |
Zoetis, Inc. | | | 15,680 | | | | 839 | |
| | | | | | | | |
| | | | | | | 5,909 | |
| | | | | | | | |
|
| Industrials—4.7% | |
Airbus Group Se ADR | | | 25,665 | | | | 421 | |
Ashtead Group plc ADR | | | 6,590 | | | | 523 | |
IMAX Corp.(2) | | | 14,295 | | | | 449 | |
Nidec Corp. Sponsored ADR | | | 20,110 | | | | 431 | |
RELX plc Sponsored ADR | | | 20,535 | | | | 369 | |
Roper Technologies, Inc. | | | 4,170 | | | | 764 | |
Safran SA | | | 25,220 | | | | 453 | |
Union Pacific Corp. | | | 4,980 | | | | 516 | |
Wabtec Corp. | | | 5,269 | | | | 438 | |
| | | | | | | | |
| | | | | | | 4,364 | |
| | | | | | | | |
|
| Information Technology—15.7% | |
Accenture plc Class A | | | 6,170 | | | | 723 | |
Activision Blizzard, Inc. | | | 14,640 | | | | 529 | |
Alibaba Group Holding Ltd. Sponsored ADR(2) | | | 18,630 | | | | 1,636 | |
Alphabet, Inc. Class A(2) | | | 1,430 | | | | 1,133 | |
Amphenol Corp. Class A | | | 18,630 | | | | 1,252 | |
Broadcom Ltd. | | | 2,515 | | | | 445 | |
Check Point Software Technologies Ltd.(2) | | | 3,975 | | | | 336 | |
CoStar Group, Inc.(2) | | | 3,520 | | | | 663 | |
Facebook, Inc. Class A(2) | | | 32,230 | | | | 3,708 | |
Gartner, Inc.(2) | | | 2,750 | | | | 278 | |
| | | | | | | | |
| | | SHARES | | | VALUE | |
| Information Technology—continued | |
Paycom Software, Inc.(2) | | | 11,890 | | | $ | 541 | |
SAP SE Sponsored ADR | | | 5,255 | | | | 454 | |
Visa, Inc. Class A | | | 18,730 | | | | 1,461 | |
Workday, Inc. Class A(2) | | | 10,650 | | | | 704 | |
Yandex N.V. Class A(2) | | | 39,270 | | | | 790 | |
| | | | | | | | |
| | | | | | | 14,653 | |
| | | | | | | | |
|
| Materials—1.4% | |
Ecolab, Inc. | | | 6,360 | | | | 745 | |
Fortescue Metals Group Ltd. | | | 15,360 | | | | 129 | |
Toray Industries, Inc. | | | 29,735 | | | | 479 | |
| | | | | | | | |
| | | | | | | 1,353 | |
| | | | | | | | |
|
| Real Estate—0.4% | |
Lendlease Group ADR | | | 35,135 | | | | 370 | |
| | | | | | | | |
|
| Telecommunication Services—1.1% | |
KDDI Corp. ADR | | | 27,440 | | | | 347 | |
Nippon Telegraph & Telephone Corp. ADR | | | 8,620 | | | | 362 | |
Spark New Zealand Ltd. Sponsored ADR | | | 23,640 | | | | 277 | |
| | | | | | | | |
| | | | | | | 986 | |
| | | | | | | | |
|
| Utilities—0.3% | |
Korea Electric Power Corp. Sponsored ADR(2) | | | 13,785 | | | | 254 | |
Vistra Energy Corp.(2) | | | 1,084 | | | | 17 | |
| | | | | | | | |
| | | | | | | | 271 | |
TOTAL COMMON STOCKS
(Identified Cost $53,996) | | | | 53,557 | |
|
| AFFILIATED MUTUAL FUND(11)—0.4% | |
Virtus Credit Opportunities Fund Class R6 | | | 33,447 | | | | 332 | |
TOTAL AFFILIATED MUTUAL FUND
(Identified Cost $334) | | | | 332 | |
|
| RIGHTS—0.0% | |
Texas Competitive TRA | | | 1,084 | | | | 2 | |
TOTAL RIGHTS
(Identified Cost $1) | | | | 2 | |
| TOTAL LONG TERM INVESTMENTS—98.4% | |
| (Identified Cost $92,356) | | | | 91,764 | (12) |
| | | | | | | | |
| | | SHARES | | | VALUE | |
| SHORT-TERM INVESTMENT—0.6% | |
|
| Money Market Mutual Fund(11)—0.6% | |
JPMorgan U.S. Government Money Market Fund – Institutional Shares (seven-day effective yield 0.440%) | | | 560,299 | | | $ | 560 | |
TOTAL SHORT-TERM INVESTMENT
(Identified Cost $560) | | | | 560 | |
TOTAL INVESTMENTS—99.0%
(Identified Cost $92,916) | | | | 92,324 | (1) |
Other assets and liabilities, net—1.0% | | | | 952 | |
| | | | | | | | |
| NET ASSETS—100.0% | | | $ | 93,276 | |
| | | | | | | | |
Abbreviations:
| ADR | American Depositary Receipt |
| FHLMC | Federal Home Loan Mortgage Corporation (“Freddie Mac”). |
| FNMA | Federal National Mortgage Association (���Fannie Mae”). |
| GNMA | Government National Mortgage Association (“Ginnie Mae”) |
| REIT | Real Estate Investment Trust |
Footnote Legend:
| (1) | Federal Income Tax Information: For tax information at December 31, 2016, see Note 10 Federal Income Tax Information in the Notes to Financial Statements. |
| (2) | Non-income producing. |
| (3) | Variable or step coupon security; interest rate shown reflects the rate in effect at December 31, 2016. |
| (4) | Security exempt from registration under Rule 144A of the Securities Act of 1933. These securities may be resold in transactions exempt from registration, normally to qualified institutional buyers. At December 31, 2016, these securities amounted to a value of $10,285 or 11.0% of net assets. |
| (5) | Interest payments may be deferred. |
| (6) | No contractual maturity date. |
| (7) | Value shown as par value. |
| (8) | This Note was issued for the sole purpose of funding a loan agreement between the issuer and the borrower. As the credit risk for this security lies solely with the borrower, the name represented here is that of the borrower. |
| (9) | Security in default, no interest payments are being received during the bankruptcy proceedings. |
| (10) | Security in default, a portion of the interest payments are being received during the bankruptcy proceedings. |
| (11) | Shares of this fund are publicly offered and its prospectus and annual report are publicly available. |
| (12) | All or a portion of the Series’ assets have been segregated for delayed delivery securities. |
| (13) | Security in default, interest payments are being received during the bankruptcy proceedings. |
See Notes to Financial Statements
51
VIRTUS STRATEGIC ALLOCATION SERIES
SCHEDULE OF INVESTMENTS (Continued)
DECEMBER 31, 2016
($ reported in thousands)
| | | | |
| Country Weightings (Unaudited)† | | | |
United States | | | 77 | % |
Japan | | | 4 | |
United Kingdom | | | 3 | |
China | | | 2 | |
France | | | 2 | |
Russia | | | 2 | |
Ireland | | | 1 | |
Other | | | 9 | |
Total | | | 100 | % |
† % of total investments as of December 31, 2016 | |
The following table provides a summary of inputs used to value the Series’ investments as of December 31, 2016 (See Security Valuation Note 2A in the Notes to Financial Statements):
| | | | | | | | | | | | | | | | |
| | | Total
Value at
December 31, 2016 | | | Level 1
Quoted
Prices | | | Level 2
Significant
Observable
Inputs | | | Level 3
Significant
Unobservable
Inputs | |
Debt Securities: | | | | | | | | | | | | | | | | |
Asset-Backed Securities | | $ | 2,368 | | | $ | — | | | $ | 2,368 | | | $ | — | |
Corporate Bonds and Notes | | | 17,059 | | | | — | | | | 17,059 | | | | — | |
Foreign Government Securities | | | 671 | | | | — | | | | 671 | | | | — | |
Loan Agreements | | | 889 | | | | — | | | | 889 | | | | — | |
Mortgage-Backed Securities | | | 12,615 | | | | — | | | | 12,615 | | | | — | |
Municipal Bonds | | | 1,460 | | | | — | | | | 1,460 | | | | — | |
U.S. Government Securities | | | 1,977 | | | | — | | | | 1,977 | | | | — | |
Equity Securities: | | | | | | | | | | | | | | | | |
Common Stocks | | | 53,557 | | | | 53,557 | | | | — | | | | — | |
Preferred Stocks | | | 834 | | | | 119 | | | | 715 | | | | — | |
Rights | | | 2 | | | | — | | | | — | | | | 2 | |
Affiliated Mutual Fund | | | 332 | | | | 332 | | | | — | | | | — | |
Short-Term Investment | | | 560 | | | | 560 | | | | — | | | | — | |
| | | | | | | | | | | | | | | | |
Total Investments | | $ | 92,324 | | | $ | 54,568 | | | $ | 37,754 | | | $ | 2 | |
| | | | | | | | | | | | | | | | |
There were no transfers between Level 1 and Level 2 related to securities held at December 31, 2016.
See Notes to Financial Statements
52
VIRTUS STRATEGIC ALLOCATION SERIES
SCHEDULE OF INVESTMENTS (Continued)
DECEMBER 31, 2016
($ reported in thousands)
The following is a reconciliation of assets of the Series for Level 3 investments for which significant unobservable inputs were used to determine fair value.
| | | | | | | | |
| | | Investments in
Securities | | | Rights | |
Beginning Balance December 31, 2015: | | $ | — | | | $ | — | |
Accrued Discount/(Premium) | | | — | | | | — | |
Realized Gain (Loss) | | | — | | | | — | |
Change in Unrealized Appreciation (Depreciation)(b) | | | 1 | | | | 1 | |
Purchases | | | 1 | | | | 1 | |
(Sales)(c) | | | — | | | | — | |
Transfers into Level 3(d) | | | — | | | | — | |
Transfers from Level 3(d) | | | — | | | | — | |
| | | | | | | | |
Ending Balance December 31, 2016 | | $ | 2 | | | $ | 2 | |
| | | | | | | | |
None of the securities in this table are internally fair valued. The Series’ investments that are categorized as Level 3 were valued utilizing third party pricing information without adjustment. Such valuations are based on unobservable inputs. A significant change in third party information inputs could result in a significantly lower or higher value of Level 3 investments.
| (a) | Amount is less than $500. |
| (b) | Included in the related net change in unrealized appreciation (depreciation) in the Statement of Operations. The change in unrealized appreciation (depreciation) on investments still held as of December 31, 2016 was $1. |
| (c) | Includes paydowns on securities. |
| (d) | “Transfers into and/or from” Level 3 represent the ending value as of December 31, 2016, for any investment security where a change in the pricing level occurred from the beginning to the end of the period. |
See Notes to Financial Statements
53
VIRTUS VARIABLE INSURANCE TRUST
STATEMENTS OF ASSETS AND LIABILITIES
DECEMBER 31, 2016
(Reported in thousands except shares and per share amounts)
| | | | | | | | | | | | |
| | | Capital Growth
Series | | | Enhanced
Core Equity
Series | | | Equity Trend
Series | |
Assets | | | | | | | | | | | | |
Investment in securities at value(1) | | $ | 183,805 | | | $ | 104,203 | | | $ | 4,484 | |
Cash | | | 1,703 | | | | 7 | | | | 98 | |
Deposits with broker | | | — | | | | 230 | | | | — | |
Receivables | | | | | | | | | | | | |
Investment securities sold | | | — | | | | 8,434 | | | | — | |
Custody fees reimbursement (Note 14) | | | 185 | | | | 468 | | | | — | |
Dividends and interest | | | 136 | | | | 78 | | | | 6 | |
Prepaid expenses | | | 2 | | | | 1 | | | | — | (3) |
Other assets | | | 434 | | | | 242 | | | | 11 | |
| | | | | | | | | | | | |
Total assets | | | 186,265 | | | | 113,663 | | | | 4,599 | |
| | | | | | | | | | | | |
Liabilities | | | | | | | | | | | | |
Written options at value(2) | | | — | | | | 310 | | | | — | |
Payables | | | | | | | | | | | | |
Series shares repurchased | | | 93 | | | | 64 | | | | — | |
Investment securities purchased | | | — | | | | 8,332 | | | | — | |
Investment advisory fees | | | 92 | | | | 49 | | | | 5 | |
Administration fees | | | 10 | | | | 6 | | | | — | |
Transfer agent fees and expenses | | | — | (3) | | | — | (3) | | | 1 | |
Trustees’ fees and expenses | | | — | (3) | | | — | (3) | | | — | (3) |
Professional fees | | | 26 | | | | 25 | | | | 17 | |
Distribution and service fees | | | 41 | | | | 22 | | | | 1 | |
Trustee deferred compensation plan | | | 434 | | | | 242 | | | | 11 | |
Other accrued expenses | | | 50 | | | | 26 | | | | 1 | |
| | | | | | | | | | | | |
Total liabilities | | | 746 | | | | 9,076 | | | | 36 | |
| | | | | | | | | | | | |
Net Assets | | $ | 185,519 | | | $ | 104,587 | | | $ | 4,563 | |
| | | | | | | | | | | | |
Net Assets Consist of: | | | | | | | | | | | | |
Capital paid in on shares of beneficial interest | | $ | 131,499 | | | $ | 94,995 | | | $ | 7,062 | |
Accumulated undistributed net investment income (loss) | | | (364 | ) | | | 396 | | | | (50 | ) |
Accumulated undistributed net realized gain (loss) | | | (5,600 | ) | | | 2,292 | | | | (2,849 | ) |
Net unrealized appreciation (depreciation) on investments | | | 59,984 | | | | 6,943 | | | | 400 | |
Net unrealized appreciation (depreciation) on written options | | | — | | | | (39 | ) | | | — | |
| | | | | | | | | | | | |
Net Assets | | $ | 185,519 | | | $ | 104,587 | | | $ | 4,563 | |
| | | | | | | | | | | | |
Class A | | | | | | | | | | | | |
Net asset value and offering price per share | | $ | 24.09 | | | $ | 11.97 | | | $ | 11.27 | |
| | | | | | | | | | | | |
Shares of beneficial interest outstanding, $1 par value, unlimited authorization | | | 7,700,066 | | | | 8,733,800 | | | | 394,342 | |
| | | | | | | | | | | | |
Net assets | | $ | 185,519 | | | $ | 104,587 | | | $ | 4,444 | |
| | | | | | | | | | | | |
Class I | | | | | | | | | | | | |
Net asset value per share | | $ | — | | | $ | — | | | $ | 11.35 | |
| | | | | | | | | | | | |
Shares of beneficial interest outstanding, $1 par value, unlimited authorization | | | — | | | | — | | | | 10,492 | |
| | | | | | | | | | | | |
Net assets | | $ | — | | | $ | — | | | $ | 119 | |
| | | | | | | | | | | | |
(1) Investments in securities at cost | | $ | 123,821 | | | $ | 97,260 | | | $ | 4,084 | |
(2) Written options at cost | | $ | — | | | $ | 271 | | | $ | — | |
(3) Amount is less than $500. | | | | | | | | | | | | |
See Notes to Financial Statements
54
VIRTUS VARIABLE INSURANCE TRUST
STATEMENTS OF ASSETS AND LIABILITIES (Continued)
DECEMBER 31, 2016
(Reported in thousands except shares and per share amounts)
| | | | | | | | | | | | |
| | | International
Series | | | Multi-Sector
Fixed Income
Series | | | Real Estate
Securities Series | |
Assets | | | | | | | | | | | | |
Investment in unaffiliated securities at value(1) | | $ | 169,700 | | | $ | 125,773 | | | $ | 80,294 | |
Investment in affiliated funds at value(2) | | | — | | | | 3,074 | | | | — | |
Cash | | | 7,697 | | | | — | | | | 750 | |
Receivables | | | | | | | | | | | | |
Investment securities sold | | | — | | | | 460 | | | | 128 | |
Series shares sold | | | 8 | | | | 53 | | | | 17 | |
Custody fees reimbursement (Note 14) | | | 77 | | | | 56 | | | | 20 | |
Dividends and interest | | | 233 | | | | 1,403 | | | | 436 | |
Tax reclaims | | | 41 | | | | — | | | | — | |
Unrealized appreciation on forward currency contracts | | | 496 | | | | — | | | | — | |
Prepaid expenses | | | 2 | | | | 2 | | | | 1 | |
Other assets | | | 410 | | | | 297 | | | | 183 | |
| | | | | | | | | | | | |
Total assets | | | 178,664 | | | | 131,118 | | | | 81,829 | |
| | | | | | | | | | | | |
Liabilities | | | | | | | | | | | | |
Cash overdraft | | | — | | | | 809 | | | | — | |
Payables | | | | | | | | | | | | |
Series shares repurchased | | | 63 | | | | 17 | | | | 10 | |
Investment securities purchased | | | — | | | | 636 | | | | 75 | |
Investment advisory fees | | | 106 | | | | 44 | | | | 47 | |
Administration fees | | | 9 | | | | 7 | | | | 4 | |
Transfer agent fees and expenses | | | 1 | | | | 2 | | | | 2 | |
Trustees’ fees and expenses | | | — | (3) | | | — | (3) | | | — | (3) |
Professional fees | | | 30 | | | | 31 | | | | 26 | |
Distribution and service fees | | | 38 | | | | 27 | | | | 17 | |
Trustee deferred compensation plan | | | 410 | | | | 297 | | | | 183 | |
Other accrued expenses | | | 53 | | | | 37 | | | | 23 | |
| | | | | | | | | | | | |
Total liabilities | | | 710 | | | | 1,907 | | | | 387 | |
| | | | | | | | | | | | |
Net Assets | | $ | 177,954 | | | $ | 129,211 | | | $ | 81,442 | |
| | | | | | | | | | | | |
Net Assets Consist of: | | | | | | | | | | | | |
Capital paid in on shares of beneficial interest | | $ | 185,975 | | | $ | 136,080 | | | $ | 53,231 | |
Accumulated undistributed net investment income (loss) | | | (206 | ) | | | 80 | | | | 106 | |
Accumulated undistributed net realized gain (loss) | | | (14,942 | ) | | | (4,797 | ) | | | 2,288 | |
Net unrealized appreciation (depreciation) | | | 7,127 | | | | (2,152 | ) | | | 25,817 | |
| | | | | | | | | | | | |
Net Assets | | $ | 177,954 | | | $ | 129,211 | | | $ | 81,442 | |
| | | | | | | | | | | | |
Class A | | | | | | | | | | | | |
Net asset value and offering price per share | | $ | 10.95 | | | $ | 9.14 | | | $ | 20.31 | |
| | | | | | | | | | | | |
Shares of beneficial interest outstanding, $1 par value, unlimited authorization | | | 16,238,589 | | | | 14,116,228 | | | | 3,999,756 | |
| | | | | | | | | | | | |
Net assets | | $ | 177,868 | | | $ | 128,969 | | | $ | 81,243 | |
| | | | | | | | | | | | |
Class I | | | | | | | | | | | | |
Net asset value per share | | $ | 10.94 | | | $ | 9.12 | | | $ | 20.27 | |
| | | | | | | | | | | | |
Shares of beneficial interest outstanding, $1 par value, unlimited authorization | | | 7,888 | | | | 26,462 | | | | 9,810 | |
| | | | | | | | | | | | |
Net assets | | $ | 86 | | | $ | 242 | | | $ | 199 | |
| | | | | | | | | | | | |
(1) Investments in unaffiliated securities at cost | | $ | 163,067 | | | $ | 127,897 | | | $ | 54,477 | |
(2) Investment in affiliated funds at cost | | $ | — | | | $ | 3,100 | | | $ | — | |
(3) Amount is less than $500. | | | | | | | | | | | | |
See Notes to Financial Statements
55
VIRTUS VARIABLE INSURANCE TRUST
STATEMENTS OF ASSETS AND LIABILITIES (Continued)
DECEMBER 31, 2016
(Reported in thousands except shares and per share amounts)
| | | | | | | | | | | | |
| | | Small-Cap
Growth Series | | | Small-Cap
Value Series | | | Strategic
Allocation Series | |
Assets | | | | | | | | | | | | |
Investment in unaffiliated securities at value(1) | | $ | 62,609 | | | $ | 90,946 | | | $ | 91,992 | |
Investment in affiliated funds at value(2) | | | — | | | | — | | | | 332 | |
Cash | | | 750 | | | | 2,000 | | | | 777 | |
Receivables | | | | | | | | | | | | |
Investment securities sold | | | — | | | | 2,094 | | | | — | |
Custody fees reimbursement (Note 14) | | | 53 | | | | 72 | | | | 33 | |
Dividends and interest | | | 74 | | | | 128 | | | | 350 | |
Prepaid expenses | | | — | (3) | | | 1 | | | | 1 | |
Other assets | | | 145 | | | | 220 | | | | 217 | |
| | | | | | | | | | | | |
Total assets | | | 63,631 | | | | 95,461 | | | | 93,702 | |
| | | | | | | | | | | | |
Liabilities | | | | | | | | | | | | |
Payables | | | | | | | | | | | | |
Series shares repurchased | | | 29 | | | | 76 | | | | 110 | |
Investment securities purchased | | | — | | | | 61 | | | | 5 | |
Investment advisory fees | | | 38 | | | | 62 | | | | 38 | |
Administration fees | | | 3 | | | | 5 | | | | — | (3) |
Transfer agent fees and expenses | | | 1 | | | | — | (3) | | | 1 | |
Trustees’ fees and expenses | | | — | (3) | | | — | (3) | | | — | (3) |
Professional fees | | | 26 | | | | 26 | | | | 31 | |
Distribution and service fees | | | 13 | | | | 20 | | | | 20 | |
Trustee deferred compensation plan | | | 145 | | | | 220 | | | | 217 | |
Other accrued expenses | | | 15 | | | | 25 | | | | 4 | |
| | | | | | | | | | | | |
Total liabilities | | | 270 | | | | 495 | | | | 426 | |
| | | | | | | | | | | | |
Net Assets | | $ | 63,361 | | | $ | 94,966 | | | $ | 93,276 | |
| | | | | | | | | | | | |
Net Assets Consist of: | | | | | | | | | | | | |
Capital paid in on shares of beneficial interest | | $ | 40,056 | | | $ | 63,312 | | | $ | 93,374 | |
Accumulated undistributed net investment income (loss) | | | (113 | ) | | | 112 | | | | 224 | |
Accumulated undistributed net realized gain (loss) | | | 353 | | | | 3,638 | | | | 271 | |
Net unrealized appreciation (depreciation) | | | 23,065 | | | | 27,904 | | | | (593 | ) |
| | | | | | | | | | | | |
Net Assets | | $ | 63,361 | | | $ | 94,966 | | | $ | 93,276 | |
| | | | | | | | | | | | |
Class A | | | | | | | | | | | | |
Net asset value and offering price per share | | $ | 21.61 | | | $ | 16.69 | | | $ | 10.88 | |
| | | | | | | | | | | | |
Shares of beneficial interest outstanding, $1 par value, unlimited authorization | | | 2,914,888 | | | | 5,689,765 | | | | 8,575,383 | |
| | | | | | | | | | | | |
Net assets | | $ | 63,008 | | | $ | 94,966 | | | $ | 93,276 | |
| | | | | | | | | | | | |
Class I | | | | | | | | | | | | |
Net asset value per share | | $ | 21.86 | | | $ | — | | | $ | — | |
| | | | | | | | | | | | |
Shares of beneficial interest outstanding, $1 par value, unlimited authorization | | | 16,162 | | | | — | | | | — | |
| | | | | | | | | | | | |
Net assets | | $ | 353 | | | $ | — | | | $ | — | |
| | | | | | | | | | | | |
(1) Investments in unaffiliated securities at cost | | $ | 39,544 | | | $ | 63,042 | | | $ | 92,582 | |
(2) Investment in affiliated funds at cost | | $ | — | | | $ | — | | | $ | 334 | |
(3) Amount is less than $500. | | | | | | | | | | | | |
See Notes to Financial Statements
56
VIRTUS VARIABLE INSURANCE TRUST
STATEMENTS OF OPERATIONS
YEAR ENDED DECEMBER 31, 2016
($ reported in thousands)
| | | | | | | | | | | | |
| | | Capital Growth
Series | | | Enhanced
Core Equity
Series | | | Equity Trend
Series | |
Investment Income | | | | | | | | | | | | |
Dividends | | $ | 1,839 | | | $ | 2,441 | | | $ | 91 | |
Foreign taxes withheld | | | (12 | ) | | | — | | | | — | |
| | | | | | | | | | | | |
Total investment income | | | 1,827 | | | | 2,441 | | | | 91 | |
| | | | | | | | | | | | |
Expenses | | | | | | | | | | | | |
Investment advisory fees | | | 1,360 | | | | 713 | | | | 60 | |
Administration fees | | | 240 | | | | 126 | | | | 7 | |
Distribution and service fees | | | 486 | | | | 254 | | | | 15 | |
Transfer agent fees and expenses | | | 1 | | | | 1 | | | | 2 | |
Custodian fees | | | 5 | | | | 3 | | | | 1 | |
Printing fees and expenses | | | 55 | | | | 32 | | | | 4 | |
Professional fees | | | 36 | | | | 30 | | | | 20 | |
Trustees’ fees and expenses | | | 70 | | | | 36 | | | | 3 | |
Miscellaneous expenses | | | 42 | | | | 23 | | | | 3 | |
| | | | | | | | | | | | |
Total expenses | | | 2,295 | | | | 1,218 | | | | 115 | |
Less expenses reimbursed and/or waived by investment advisor | | | (275 | ) | | | (210 | ) | | | (13 | ) |
Custody fees reimbursed (Note 14) | | | (185 | ) | | | (468 | ) | | | — | |
Earnings credit from custodian | | | (1 | ) | | | (2 | ) | | | — | (1) |
| | | | | | | | | | | | |
Net expenses | | | 1,834 | | | | 538 | | | | 102 | |
| | | | | | | | | | | | |
Net investment income (loss) | | | (7 | ) | | | 1,903 | | | | (11 | ) |
| | | | | | | | | | | | |
Net Realized and Unrealized Gain (Loss) on Investments | | | | | | | | | | | | |
Net realized gain (loss) on investments | | | 18,654 | | | | 19,611 | | | | (518 | ) |
Net realized gain (loss) on written options | | | — | | | | 1,081 | | | | — | |
Net change in unrealized appreciation (depreciation) on investments | | | (20,728 | ) | | | (13,601 | ) | | | 147 | |
Net change in unrealized appreciation (depreciation) on written options | | | — | | | | (39 | ) | | | — | |
| | | | | | | | | | | | |
Net gain (loss) on investments | | | (2,074 | ) | | | 7,052 | | | | (371 | ) |
| | | | | | | | | | | | |
Net increase (decrease) in net assets resulting from operations | | $ | (2,081 | ) | | $ | 8,955 | | | $ | (382 | ) |
| | | | | | | | | | | | |
| (1) | Amount is less than $500. |
See Notes to Financial Statements
57
VIRTUS VARIABLE INSURANCE TRUST
STATEMENTS OF OPERATIONS (Continued)
YEAR ENDED DECEMBER 31, 2016
($ reported in thousands)
| | | | | | | | | | | | |
| | | International
Series | | | Multi-Sector
Fixed Income
Series | | | Real Estate
Securities Series | |
Investment Income | | | | | | | | | | | | |
Interest | | $ | — | | | $ | 7,452 | | | $ | — | |
Dividends | | | 3,922 | | | | 110 | | | | 2,214 | |
Dividends from affiliated funds | | | — | | | | 125 | | | | — | |
Foreign taxes withheld | | | (521 | ) | | | (6 | ) | | | — | |
| | | | | | | | | | | | |
Total investment income | | | 3,401 | | | | 7,681 | | | | 2,214 | |
| | | | | | | | | | | | |
Expenses | | | | | | | | | | | | |
Investment advisory fees | | | 1,416 | | | | 667 | | | | 641 | |
Administration fees | | | 234 | | | | 165 | | | | 106 | |
Distribution and service fees | | | 472 | | | | 333 | | | | 213 | |
Transfer agent fees and expenses | | | 2 | | | | 4 | | | | 4 | |
Custodian fees | | | 23 | | | | 8 | | | | 2 | |
Printing fees and expenses | | | 59 | | | | 42 | | | | 27 | |
Professional fees | | | 55 | | | | 38 | | | | 31 | |
Trustees’ fees and expenses | | | 69 | | | | 48 | | | | 30 | |
Miscellaneous expenses | | | 42 | | | | 33 | | | | 17 | |
| | | | | | | | | | | | |
Total expenses | | | 2,372 | | | | 1,338 | | | | 1,071 | |
Less expenses reimbursed and/or waived by investment advisor | | | (126 | ) | | | (85 | ) | | | (72 | ) |
Custody fees reimbursed (Note 14) | | | (77 | ) | | | (56 | ) | | | (20 | ) |
Earnings credit from custodian | | | (21 | ) | | | (2 | ) | | | (2 | ) |
| | | | | | | | | | | | |
Net expenses | | | 2,148 | | | | 1,195 | | | | 977 | |
| | | | | | | | | | | | |
Net investment income (loss) | | | 1,253 | | | | 6,486 | | | | 1,237 | |
| | | | | | | | | | | | |
Net Realized and Unrealized Gain (Loss) on Investments | | | | | | | | | | | | |
Net realized gain (loss) on unaffiliated investments | | | (14,821 | ) | | | (1,856 | ) | | | 13,447 | |
Net realized gain (loss) on foreign currency transactions | | | (97 | ) | | | (9 | ) | | | — | |
Net change in unrealized appreciation (depreciation) on unaffiliated investments | | | 9,234 | | | | 7,077 | | | | (9,047 | ) |
Net change in unrealized appreciation (depreciation) on affiliated investments | | | — | | | | 74 | | | | — | |
Net change in unrealized appreciation (depreciation) on foreign currency translations | | | 103 | | | | 3 | | | | — | |
Net change in unrealized appreciation (depreciation) on forward currency transactions | | | 496 | | | | — | | | | — | |
| | | | | | | | | | | | |
Net gain (loss) on investments | | | (5,085 | ) | | | 5,289 | | | | 4,400 | |
| | | | | | | | | | | | |
Net increase (decrease) in net assets resulting from operations | | $ | (3,832 | ) | | $ | 11,775 | | | $ | 5,637 | |
| | | | | | | | | | | | |
See Notes to Financial Statements
58
VIRTUS VARIABLE INSURANCE TRUST
STATEMENTS OF OPERATIONS (Continued)
YEAR ENDED DECEMBER 31, 2016
($ reported in thousands)
| | | | | | | | | | | | |
| | | Small-Cap Growth
Series | | | Small-Cap
Value Series | | | Strategic
Allocation Series | |
Investment Income | | | | | | | | | | | | |
Dividends | | $ | 476 | | | $ | 2,804 | | | $ | 1,121 | |
Dividends from affiliated funds | | | — | | | | — | | | | 13 | |
Interest | | | — | | | | — | | | | 1,816 | |
Foreign taxes withheld | | | — | | | | (9 | ) | | | (7 | ) |
| | | | | | | | | | | | |
Total investment income | | | 476 | | | | 2,795 | | | | 2,943 | |
| | | | | | | | | | | | |
Expenses | | | | | | | | | | | | |
Investment advisory fees | | | 492 | | | | 821 | | | | 584 | |
Administration fees | | | 72 | | | | 113 | | | | 124 | |
Distribution and service fees | | | 144 | | | | 228 | | | | 250 | |
Transfer agent fees and expenses | | | 2 | | | | 1 | | | | 1 | |
Custodian fees | | | 3 | | | | 2 | | | | 8 | |
Printing fees and expenses | | | 19 | | | | 28 | | | | 30 | |
Professional fees | | | 30 | | | | 31 | | | | 35 | |
Trustees’ fees and expenses | | | 20 | | | | 33 | | | | 36 | |
Miscellaneous expenses | | | 12 | | | | 19 | | | | 23 | |
| | | | | | | | | | | | |
Total expenses | | | 794 | | | | 1,276 | | | | 1,091 | |
Less expenses reimbursed and/or waived by investment advisor | | | (100 | ) | | | (172 | ) | | | (104 | ) |
Custody fees reimbursed (Note 14) | | | (53 | ) | | | (72 | ) | | | (33 | ) |
Earnings credit from custodian | | | (2 | ) | | | (1 | ) | | | — | (1) |
| | | | | | | | | | | | |
Net expenses | | | 639 | | | | 1,031 | | | | 954 | |
| | | | | | | | | | | | |
Net investment income (loss) | | | (163 | ) | | | 1,764 | | | | 1,989 | |
| | | | | | | | | | | | |
Net Realized and Unrealized Gain (Loss) on Investments | | | | | | | | | | | | |
Net realized gain (loss) on unaffiliated investments | | | 4,817 | | | | 13,250 | | | | 10,276 | |
Net realized gain (loss) on foreign currency transactions | | | — | | | | — | | | | — | (1) |
Net change in unrealized appreciation (depreciation) on unaffiliated investments | | | 8,834 | | | | 6,544 | | | | (11,476 | ) |
Net change in unrealized appreciation (depreciation) on affiliated investments | | | — | | | | — | | | | 8 | |
Net change in unrealized appreciation (depreciation) on foreign currency translations | | | — | | | | — | | | | — | (1) |
| | | | | | | | | | | | |
Net gain (loss) on investments | | | 13,651 | | | | 19,794 | | | | (1,192 | ) |
| | | | | | | | | | | | |
Net increase in net assets resulting from operations | | $ | 13,488 | | | $ | 21,558 | | | $ | 797 | |
| | | | | | | | | | | | |
| (1) | Amount is less than $500. |
See Notes to Financial Statements
59
VIRTUS VARIABLE INSURANCE TRUST
STATEMENTS OF CHANGES IN NET ASSETS
($ reported in thousands)
| | | | | | | | | | | | | | | | | | | | | | | | |
| | | Capital Growth Series | | | Enhanced Core Equity Series | | | Equity Trend Series | |
| | | Year Ended
December 31, 2016 | | | Year Ended
December 31, 2015 | | | Year Ended
December 31, 2016 | | | Year Ended
December 31, 2015 | | | Year Ended
December 31, 2016 | | | Year Ended
December 31, 2015 | |
INCREASE/(DECREASE) IN NET ASSETS | | | | | | | | | | | | | | | | | | | | | | | | |
From Operations | | | | | | | | | | | | | | | | | | | | | | | | |
Net investment income (loss) | | $ | (7 | ) | | $ | (92 | ) | | $ | 1,903 | | | $ | 1,055 | | | $ | (11 | ) | | $ | (178 | ) |
Net realized gain (loss) | | | 18,654 | | | | 13,988 | | | | 20,692 | | | | 9,588 | | | | (518 | ) | | | (1,753 | ) |
Net change in unrealized appreciation (depreciation) | | | (20,728 | ) | | | 5,479 | | | | (13,640 | ) | | | (21,853 | ) | | | 147 | | | | (115 | ) |
| | | | | | | | | | | | | | | | | | | | | | | | |
Increase (decrease) in net assets resulting from operations | | | (2,081 | ) | | | 19,375 | | | | 8,955 | | | | (11,210 | ) | | | (382 | ) | | | (2,046 | ) |
| | | | | | | | | | | | | | | | | | | | | | | | |
From Distributions to Shareholders | | | | | | | | | | | | | | | | | | | | | | | | |
Net investment income, Class A | | | (4,514 | ) | | | — | | | | (1,308 | ) | | | (981 | ) | | | — | | | | — | |
Net investment income, Class I | | | — | | | | — | | | | — | | | | — | | | | — | | | | — | |
Net realized short-term gains, Class A | | | — | | | | — | | | | (358 | ) | | | (134 | ) | | | — | | | | — | |
Net realized short-term gains, Class I | | | — | | | | — | | | | — | | | | — | | | | — | | | | — | |
Net realized long-term gains, Class A | | | — | | | | — | | | | (19,641 | ) | | | (12,618 | ) | | | — | | | | — | |
Net realized long-term gains, Class I | | | — | | | | — | | | | — | | | | — | | | | — | | | | — | |
| | | | | | | | | | | | | | | | | | | | | | | | |
Decrease in net assets from distributions to shareholders | | | (4,514 | ) | | | — | | | | (21,307 | ) | | | (13,733 | ) | | | — | | | | — | |
| | | | | | | | | | | | | | | | | | | | | | | | |
From Share Transactions | | | | | | | | | | | | | | | | | | | | | | | | |
Sale of shares | | | | | | | | | | | | | | | | | | | | | | | | |
Class A | | | 3,451 | | | | 3,115 | | | | 1,665 | | | | 1,441 | | | | 178 | | | | 5,160 | |
Class I | | | — | | | | — | | | | — | | | | — | | | | — | | | | — | (1) |
Reinvestment of distributions | | | | | | | | | | | | | | | | | | | | | | | | |
Class A | | | 4,514 | | | | — | | | | 21,307 | | | | 13,733 | | | | — | | | | — | |
Class I | | | — | | | | — | | | | — | | | | — | | | | — | | | | — | |
Shares repurchased | | | | | | | | | | | | | | | | | | | | | | | | |
Class A | | | (25,945 | ) | | | (29,434 | ) | | | (15,946 | ) | | | (19,440 | ) | | | (6,285 | ) | | | (28,877 | ) |
Class I | | | — | | | | — | | | | — | | | | — | | | | (3 | ) | | | (139 | ) |
| | | | | | | | | | | | | | | | | | | | | | | | |
Increase (decrease) in net assets from share transactions | | | (17,980 | ) | | | (26,319 | ) | | | 7,026 | | | | (4,266 | ) | | | (6,110 | ) | | | (23,856 | ) |
| | | | | | | | | | | | | | | | | | | | | | | | |
Net increase (decrease) in net assets | | | (24,575 | ) | | | (6,944 | ) | | | (5,326 | ) | | | (29,209 | ) | | | (6,492 | ) | | | (25,902 | ) |
| | | | | | |
Net Assets | | | | | | | | | | | | | | | | | | | | | | | | |
Beginning of period | | | 210,094 | | | | 217,038 | | | | 109,913 | | | | 139,122 | | | | 11,055 | | | | 36,957 | |
| | | | | | | | | | | | | | | | | | | | | | | | |
End of period | | $ | 185,519 | | | $ | 210,094 | | | $ | 104,587 | | | $ | 109,913 | | | $ | 4,563 | | | $ | 11,055 | |
| | | | | | | | | | | | | | | | | | | | | | | | |
Accumulated undistributed net investment income (loss) at end of period | | $ | (364 | ) | | $ | (283 | ) | | $ | 396 | | | $ | (209 | ) | | $ | (50 | ) | | $ | (48 | ) |
| | | | | | | | | | | | |
Shares | | | | | | | | | | | | | | | | | | | | | | | | |
Sales of shares | | | | | | | | | | | | | | | | | | | | | | | | |
Class A | | | 141 | | | | 129 | | | | 123 | | | | 90 | | | | 16 | | | | 429 | |
Class I | | | — | | | | — | | | | — | | | | — | | | | — | | | | — | |
Reinvestment of distributions | | | | | | | | | | | | | | | | | | | | | | | | |
Class A | | | 186 | | | | — | | | | 1,759 | | | | 928 | | | | — | | | | — | |
Class I | | | — | | | | — | | | | — | | | | — | | | | — | | | | — | |
Shares repurchased | | | | | | | | | | | | | | | | | | | | | | | | |
Class A | | | (1,062 | ) | | | (1,217 | ) | | | (1,190 | ) | | | (1,202 | ) | | | (582 | ) | | | (2,392 | ) |
Class I | | | — | | | | — | | | | — | | | | — | | | | — | (2) | | | (11 | ) |
| | | | | | | | | | | | | | | | | | | | | | | | |
Net Increase/(Decrease) | | | (735 | ) | | | (1,088 | ) | | | 692 | | | | (184 | ) | | | (566 | ) | | | (1,974 | ) |
| | | | | | | | | | | | | | | | | | | | | | | | |
| (1) | Amount is less than $500. |
| (2) | Amount is less than 500 shares. |
See Notes to Financial Statements
60
VIRTUS VARIABLE INSURANCE TRUST
STATEMENTS OF CHANGES IN NET ASSETS (Continued)
($ reported in thousands)
| | | | | | | | | | | | | | | | | | | | | | | | |
| | | International Series | | | Multi-Sector Fixed Income Series | | | Real Estate Securities Series | |
| | | Year Ended
December 31, 2016 | | | Year Ended
December 31, 2015 | | | Year Ended
December 31,2016 | | | Year Ended
December 31, 2015 | | | Year Ended
December 31,2016 | | | Year Ended
December 31, 2015 | |
INCREASE/(DECREASE) IN NET ASSETS | | | | | | | | | | | | | | | | | | | | | | | | |
From Operations | | | | | | | | | | | | | | | | | | | | | | | | |
Net investment income (loss) | | $ | 1,253 | | | $ | 5,227 | | | $ | 6,486 | | | $ | 7,165 | | | $ | 1,237 | | | $ | 1,583 | |
Net realized gain (loss) | | | (14,918 | ) | | | 42,856 | | | | (1,865 | ) | | | (3,170 | ) | | | 13,447 | | | | 14,506 | |
Net change in unrealized appreciation (depreciation) | | | 9,833 | | | | (73,082 | ) | | | 7,154 | | | | (5,544 | ) | | | (9,047 | ) | | | (14,073 | ) |
| | | | | | | | | | | | | | | | | | | | | | | | |
Increase (decrease) in net assets resulting from operations | | | (3,832 | ) | | | (24,999 | ) | | | 11,775 | | | | (1,549 | ) | | | 5,637 | | | | 2,016 | |
| | | | | | | | | | | | | | | | | | | | | | | | |
From Distributions to Shareholders | | | | | | | | | | | | | | | | | | | | | | | | |
Net investment income, Class A | | | (1,466 | ) | | | (5,313 | ) | | | (5,840 | ) | | | (5,991 | ) | | | (1,520 | ) | | | (1,272 | ) |
Net investment income, Class I | | | (1 | ) | | | (2 | ) | | | (11 | ) | | | (10 | ) | | | (4 | ) | | | (3 | ) |
Net realized short-term gains, Class A | | | — | | | | — | | | | — | | | | — | | | | (476 | ) | | | (127 | ) |
Net realized short-term gains, Class I | | | — | | | | — | | | | — | | | | — | | | | (1 | ) | | | — | (1) |
Net realized long-term gains, Class A | | | (36,139 | ) | | | (8,638 | ) | | | — | | | | — | | | | (12,222 | ) | | | (14,884 | ) |
Net realized long-term gains, Class I | | | (16 | ) | | | (4 | ) | | | — | | | | — | | | | (28 | ) | | | (26 | ) |
| | | | | | | | | | | | | | | | | | | | | | | | |
Decrease in net assets from distributions to shareholders | | | (37,622 | ) | | | (13,957 | ) | | | (5,851 | ) | | | (6,001 | ) | | | (14,251 | ) | | | (16,312 | ) |
| | | | | | | | | | | | | | | | | | | | | | | | |
From Share Transactions | | | | | | | | | | | | | | | | | | | | | | | | |
Sale of shares | | | | | | | | | | | | | | | | | | | | | | | | |
Class A | | | 2,480 | | | | 4,403 | | | | 12,757 | | | | 9,998 | | | | 8,088 | | | | 9,419 | |
Class I | | | — | | | | 1 | | | | 9 | | | | 179 | | | | 89 | | | | 40 | |
Reinvestment of distributions | | | | | | | | | | | | | | | | | | | | | | | | |
Class A | | | 37,605 | | | | 13,951 | | | | 5,840 | | | | 5,991 | | | | 14,218 | | | | 16,283 | |
Class I | | | 17 | | | | 6 | | | | 11 | | | | 10 | | | | 33 | | | | 29 | |
Shares repurchased | | | | | | | | | | | | | | | | | | | | | | | | |
Class A | | | (30,771 | ) | | | (30,705 | ) | | | (30,100 | ) | | | (28,808 | ) | | | (20,375 | ) | | | (29,041 | ) |
Class I | | | — | | | | (1 | ) | | | (1 | ) | | | (187 | ) | | | (54 | ) | | | (19 | ) |
| | | | | | | | | | | | | | | | | | | | | | | | |
Increase (decrease) in net assets from share transactions | | | 9,331 | | | | (12,345 | ) | | | (11,484 | ) | | | (12,817 | ) | | | 1,999 | | | | (3,289 | ) |
| | | | | | | | | | | | | | | | | | | | | | | | |
Net increase (decrease) in net assets | | | (32,123 | ) | | | (51,301 | ) | | | (5,560 | ) | | | (20,367 | ) | | | | ) | | | (17,585 | ) |
| | | | | | |
Net Assets | | | | | | | | | | | | | | | | | | | | | | | | |
Beginning of period | | | 210,077 | | | | 261,378 | | | | 134,771 | | | | 155,138 | | | | 88,057 | | | | 105,642 | |
| | | | | | | | | | | | | | | | | | | | | | | | |
End of period | | $ | 177,954 | | | $ | 210,077 | | | $ | 129,211 | | | $ | 134,771 | | | $ | 81,442 | | | $ | 88,057 | |
| | | | | | | | | | | | | | | | | | | | | | | | |
Accumulated undistributed net investment income (loss) at end of period | | $ | (207 | ) | | $ | (16 | ) | | $ | 80 | | | $ | (85 | ) | | | | | | $ | 392 | |
| | | | | | | | | | | | |
Shares | | | | | | | | | | | | | | | | | | | | | | | | |
Sales of shares | | | | | | | | | | | | | | | | | | | | | | | | |
Class A | | | 209 | | | | 278 | | | | 1,391 | | | | 1,078 | | | | 340 | | | | 341 | |
Class I | | | — | | | | — | (2) | | | 1 | | | | 20 | | | | 4 | | | | 2 | |
Reinvestment of distributions | | | | | | | | | | | | | | | | | | | | | | | | |
Class A | | | 3,585 | | | | 931 | | | | 642 | | | | 666 | | | | 683 | | | | 691 | |
Class I | | | 2 | | | | — | (2) | | | 1 | | | | 1 | | | | 1 | | | | 1 | |
Shares repurchased | | | | | | | | | | | | | | | | | | | | | | | | |
Class A | | | (2,543 | ) | | | (1,898 | ) | | | (3,292 | ) | | | (3,111 | ) | | | (870 | ) | | | (1,086 | ) |
Class I | | | — | | | | — | (2) | | | — | (2) | | | (20 | ) | | | (2 | ) | | | (1 | ) |
| | | | | | | | | | | | | | | | | | | | | | | | |
Net Increase/(Decrease) | | | 1,253 | | | | (689 | ) | | | (1,257 | ) | | | (1,366 | ) | | | 156 | | | | (52 | ) |
| | | | | | | | | | | | | | | | | | | | | | | | |
| (1) | Amount is less than $500. |
| (2) | Amount is less than 500 shares. |
See Notes to Financial Statements
61
VIRTUS VARIABLE INSURANCE TRUST
STATEMENTS OF CHANGES IN NET ASSETS (Continued)
($ reported in thousands)
| | | | | | | | | | | | | | | | | | | | | | | | |
| | | Small-Cap Growth Series | | | Small-Cap Value Series | | | Strategic Allocation Series | |
| | | Year Ended
December 31, 2016 | | | Year Ended
December 31, 2015 | | | Year Ended
December 31, 2016 | | | Year Ended
December 31, 2015 | | | Year Ended
December 31, 2016 | | | Year Ended
December 31, 2015 | |
INCREASE/(DECREASE) IN NET ASSETS | | | | | | | | | | | | | | | | | | | | | | | | |
From Operations | | | | | | | | | | | | | | | | | | | | | | | | |
Net investment income (loss) | | $ | (163 | ) | | $ | (101 | ) | | $ | 1,764 | | | $ | 574 | | | $ | 1,989 | | | $ | 2,143 | |
Net realized gain (loss) | | | 4,817 | | | | 6,320 | | | | 13,250 | | | | 9,824 | | | | 10,276 | | | | 5,194 | |
Net change in unrealized appreciation (depreciation) | | | 8,834 | | | | (5,747 | ) | | | 6,544 | | | | (11,926 | ) | | | (11,468 | ) | | | (13,593 | ) |
| | | | | | | | | | | | | | | | | | | | | | | | |
Increase (decrease) in net assets resulting from operations | | | 13,488 | | | | 472 | | | | 21,558 | | | | (1,528 | ) | | | 797 | | | | (6,256 | ) |
| | | | | | | | | | | | | | | | | | | | | | | | |
From Distributions to Shareholders | | | | | | | | | | | | | | | | | | | | | | | | |
Net investment income, Class A | | | — | | | | — | | | | (1,727 | ) | | | (528 | ) | | | (1,648 | ) | | | (2,012 | ) |
Net investment income, Class I | | | — | | | | — | | | | — | | | | — | | | | — | | | | — | |
Net realized short-term gains, Class A | | | (673 | ) | | | (229 | ) | | | (700 | ) | | | (206 | ) | | | — | | | | (226 | ) |
Net realized short-term gains, Class I | | | (4 | ) | | | (1 | ) | | | — | | | | — | | | | — | | | | — | |
Net realized long-term gains, Class A | | | (4,609 | ) | | | (5,697 | ) | | | (10,074 | ) | | | (8,544 | ) | | | (10,307 | ) | | | (7,994 | ) |
Net realized long-term gains, Class I | | | (24 | ) | | | (19 | ) | | | — | | | | — | | | | — | | | | — | |
| | | | | | | | | | | | | | | | | | | | | | | | |
Decrease in net assets from distributions to shareholders | | | (5,310 | ) | | | (5,946 | ) | | | (12,501 | ) | | | (9,278 | ) | | | (11,955 | ) | | | (10,232 | ) |
| | | | | | | | | | | | | | | | | | | | | | | | |
From Share Transactions | | | | | | | | | | | | | | | | | | | | | | | | |
Sale of shares | | | | | | | | | | | | | | | | | | | | | | | | |
Class A | | | 2,658 | | | | 1,107 | | | | 1,445 | | | | 669 | | | | 1,292 | | | | 1,191 | |
Class I | | | 247 | | | | 183 | | | | — | | | | — | | | | — | | | | — | |
Reinvestment of distributions | | | | | | | | | | | | | | | | | | | | | | | | |
Class A | | | 5,282 | | | | 5,925 | | | | 12,501 | | | | 9,278 | | | | 11,955 | | | | 10,232 | |
Class I | | | 28 | | | | 21 | | | | — | | | | — | | | | — | | | | — | |
Shares repurchased | | | | | | | | | | | | | | | | | | | | | | | | |
Class A | | | (8,957 | ) | | | (9,191 | ) | | | (20,871 | ) | | | (19,337 | ) | | | (15,638 | ) | | | (17,583 | ) |
Class I | | | (126 | ) | | | (278 | ) | | | — | | | | — | | | | — | | | | — | |
| | | | | | | | | | | | | | | | | | | | | | | | |
Increase (decrease) in net assets from share transactions | | | (868 | ) | | | (2,233 | ) | | | (6,925 | ) | | | (9,390 | ) | | | (2,391 | ) | | | (6,160 | ) |
| | | | | | | | | | | | | | | | | | | | | | | | |
Net increase (decrease) in net assets | | | 7,310 | | | | (7,707 | ) | | | 2,132 | | | | (20,196 | ) | | | (13,549 | ) | | | (22,648 | ) |
| | | | | | |
Net Assets | | | | | | | | | | | | | | | | | | | | | | | | |
Beginning of period | | | 56,051 | | | | 63,758 | | | | 92,834 | | | | 113,030 | | | | 106,825 | | | | 129,473 | |
| | | | | | | | | | | | | | | | | | | | | | | | |
End of period | | $ | 63,361 | | | $ | 56,051 | | | $ | 94,966 | | | $ | 92,834 | | | $ | 93,276 | | | $ | 106,825 | |
| | | | | | | | | | | | | | | | | | | | | | | | |
Accumulated undistributed net investment income (loss) at end of period | | $ | (113 | ) | | $ | (88 | ) | | $ | 112 | | | $ | 75 | | | $ | 224 | | | $ | (127 | ) |
| | | | | | | | | | | | |
Shares | | | | | | | | | | | | | | | | | | | | | | | | |
Sales of shares | | | | | | | | | | | | | | | | | | | | | | | | |
Class A | | | 128 | | | | 53 | | | | 85 | | | | 40 | | | | 104 | | | | 84 | |
Class I | | | 12 | | | | 9 | | | | — | | | | — | | | | — | | | | — | |
Reinvestment of distributions | | | | | | | | | | | | | | | | | | | | | | | | |
Class A | | | 250 | | | | 306 | | | | 754 | | | | 596 | | | | 1,085 | | | | 784 | |
Class I | | | 1 | | | | 1 | | | | — | | | | — | | | | — | | | | — | |
Shares repurchased | | | | | | | | | | | | | | | | | | | | | | | | |
Class A | | | (443 | ) | | | (443 | ) | | | (1,270 | ) | | | (1,151 | ) | | | (1,271 | ) | | | (1,266 | ) |
Class I | | | (6 | ) | | | (13 | ) | | | — | | | | — | | | | — | | | | — | |
| | | | | | | | | | | | | | | | | | | | | | | | |
Net Increase/(Decrease) | | | (58 | ) | | | (87 | ) | | | (431 | ) | | | (515 | ) | | | (82 | ) | | | (398 | ) |
| | | | | | | | | | | | | | | | | | | | | | | | |
See Notes to Financial Statements
62
VIRTUS VARIABLE INSURANCE TRUST
FINANCIAL HIGHLIGHTS
SELECTED PER SHARE DATA AND RATIOS FOR A SHARE OUTSTANDING
THROUGHOUT EACH PERIOD
| | | | | | | | | | | | | | | | | | | | | | | | | | | | | | | | | | | | | | | | | | | | | | | | | | | | | | | | | | | | | | | | | | | | | | | | | | | |
| | | Net Asset Value,
Beginning of Period | | Net Investment Income (Loss)(1) | | Net Realized and
Unrealized Gain (Loss) | | Total from Investment Operations
| | Dividends from
Net Investment Income | | Distributions from
Net Realized Gains | | Total Distributions | | Change in Net Asset Value | | Net Asset Value, End of Period | | Total Return(2) | | Net Assets, End of Period
(in thousands) | | Ratio
of Net
Expenses to
Average
Net Assets(3) | | Ratio
of Gross
Expenses to
Average
Net Assets
(before
waivers
and
reimbursements)(3) | | Ratio of Net Investment Income (Loss)
to Average Net Assets | | Portfolio Turnover Rate |
Capital Growth Series | | | | | | | | | | | | | | | | | | | | | | | | | | | | | | | | | | | | | | | | | | | | | | | | | | | | | | | | | | | | | | | | | | | | | | | | | | | |
Class A | | | | | | | | | | | | | | | | | | | | | | | | | | | | | | | | | | | | | | | | | | | | | | | | | | | | | | | | | | | | | | | | | | | | | | | | | | | |
1/1/16 to 12/31/16 | | | $ | 24.91 | | | | | — | (12) | | | | (0.22 | ) | | | | (0.22 | ) | | | | (0.60 | ) | | | | — | | | | | (0.60 | ) | | | | (0.82 | ) | | | $ | 24.09 | | | | | (0.86 | )%(13) | | | $ | 185,519 | | | | | 1.04 | %(9)(11)(13) | | | | 1.18 | % | | | | (0.10 | )%(13) | | | | 23 | % |
1/1/15 to 12/31/15 | | | | 22.79 | | | | | (0.01 | ) | | | | 2.13 | | | | | 2.12 | | | | | — | | | | | — | | | | | — | | | | | 2.12 | | | | | 24.91 | | | | | 9.26 | | | | | 210,094 | | | | | 1.04 | (9)(11) | | | | 1.21 | | | | | (0.04 | ) | | | | 19 | |
1/1/14 to 12/31/14 | | | | 20.41 | | | | | (0.00 | ) | | | | 2.39 | | | | | 2.39 | | | | | (0.01 | ) | | | | — | | | | | (0.01 | ) | | | | 2.38 | | | | | 22.79 | | | | | 11.73 | | | | | 217,038 | | | | | 1.03 | | | | | 1.19 | | | | | (0.01 | ) | | | | 29 | |
1/1/13 to 12/31/13 | | | | 15.82 | | | | | 0.04 | | | | | 4.61 | | | | | 4.65 | | | | | (0.06 | ) | | | | — | | | | | (0.06 | ) | | | | 4.59 | | | | | 20.41 | | | | | 29.44 | | | | | 218,264 | | | | | 1.03 | | | | | 1.14 | | | | | 0.19 | | | | | 30 | |
1/1/12 to 12/31/12 | | | | 13.99 | | | | | 0.11 | | | | | 1.81 | | | | | 1.92 | | | | | (0.09 | ) | | | | — | | | | | (0.09 | ) | | | | 1.83 | | | | | 15.82 | | | | | 13.76 | | | | | 189,975 | | | | | 0.96 | (7) | | | | 1.13 | | | | | 0.68 | | | | | 16 | |
Enhanced Core Equity Series | | | | | | | | | | | | | | | | | | | | | | | | | | | | | | | | | | | | | | | | | | | | | | | | | | | | | | | | | | | | | | | | | | | | | | | | | | | |
Class A | | | | | | | | | | | | | | | | | | | | | | | | | | | | | | | | | | | | | | | | | | | | | | | | | | | | | | | | | | | | | | | | | | | | | | | | | | | |
1/1/16 to 12/31/16 | | | $ | 13.67 | | | | | 0.25 | | | | | 1.01 | | | | | 1.26 | | | | | (0.18 | ) | | | | (2.78 | ) | | | | (2.96 | ) | | | | (1.70 | ) | | | $ | 11.97 | | | | | 9.41 | %(13) | | | $ | 104,587 | | | | | 0.99 | %(9)(11)(13) | | | | 1.20 | % | | | | 1.41 | %(13) | | | | 241 | %(14) |
1/1/15 to 12/31/15 | | | | 16.91 | | | | | 0.13 | | | | | (1.55 | ) | | | | (1.42 | ) | | | | (0.14 | ) | | | | (1.68 | ) | | | | (1.82 | ) | | | | (3.24 | ) | | | | 13.67 | | | | | (8.91 | ) | | | | 109,913 | | | | | 0.99 | (9)(11) | | | | 1.23 | | | | | 0.83 | | | | | 94 | |
1/1/14 to 12/31/14 | | | | 17.23 | | | | | 0.16 | | | | | 1.51 | | | | | 1.67 | | | | | (0.17 | ) | | | | (1.82 | ) | | | | (1.99 | ) | | | | (0.32 | ) | | | | 16.91 | | | | | 9.64 | | | | | 139,122 | | | | | 0.98 | | | | | 1.20 | | | | | 0.91 | | | | | 53 | |
1/1/13 to 12/31/13 | | | | 14.23 | | | | | 0.11 | | | | | 4.39 | | | | | 4.50 | | | | | (0.14 | ) | | | | (1.36 | ) | | | | (1.50 | ) | | | | 3.00 | | | | | 17.23 | | | | | 31.81 | | | | | 150,383 | | | | | 0.98 | | | | | 1.14 | | | | | 0.84 | | | | | 54 | |
1/1/12 to 12/31/12 | | | | 12.51 | | | | | 0.12 | | | | | 1.73 | | | | | 1.85 | | | | | (0.13 | ) | | | | — | | | | | (0.13 | ) | | | | 1.72 | | | | | 14.23 | | | | | 14.77 | | | | | 137,385 | | | | | 0.91 | (7) | | | | 1.14 | | | | | 0.83 | | | | | 73 | |
Equity Trend Series | | | | | | | | | | | | | | | | | | | | | | | | | | | | | | | | | | | | | | | | | | | | | | | | | | | | | | | | | | | | | | | | | | | | | | | | | | | |
Class A | | | | | | | | | | | | | | | | | | | | | | | | | | | | | | | | | | | | | | | | | | | | | | | | | | | | | | | | | | | | | | | | | | | | | | | | | | | |
1/1/16 to 12/31/16 | | | $ | 11.38 | | | | | (0.02 | ) | | | | (0.09 | ) | | | | (0.11 | ) | | | | — | | | | | — | | | | | — | | | | | (0.11 | ) | | | $ | 11.27 | | | | | (0.97 | )% | | | $ | 4,444 | | | | | 1.70 | %(9)(11) | | | | 1.92 | % | | | | (0.19 | )% | | | | 187 | % |
1/1/15 to 12/31/15 | | | | 12.55 | | | | | (0.11 | ) | | | | (1.06 | ) | | | | (1.17 | ) | | | | — | | | | | — | | | | | — | | | | | (1.17 | ) | | | | 11.38 | | | | | (9.32 | ) | | | | 10,932 | | | | | 1.71 | (9)(11) | | | | 2.23 | | | | | (0.92 | ) | | | | 366 | |
1/1/14 to 12/31/14 | | | | 13.30 | | | | | 0.04 | | | | | 0.27 | | | | | 0.31 | | | | | (0.05 | ) | | | | (1.01 | ) | | | | (1.06 | ) | | | | (0.75 | ) | | | | 12.55 | | | | | 2.23 | | | | | 36,680 | | | | | 1.70 | (8) | | | | 1.65 | | | | | 0.32 | | | | | 473 | |
1/1/13 to 12/31/13 | | | | 10.41 | | | | | 0.06 | | | | | 2.92 | | | | | 2.98 | | | | | (0.05 | ) | | | | (0.04 | ) | | | | (0.09 | ) | | | | 2.89 | | | | | 13.30 | | | | | 28.71 | | | | | 18,710 | | | | | 1.70 | | | | | 1.79 | | | | | 0.52 | | | | | 108 | |
1/1/12 to 12/31/12 | | | | 9.49 | | | | | 0.15 | | | | | 0.86 | | | | | 1.01 | | | | | (0.09 | ) | | | | — | | | | | (0.09 | ) | | | | 0.92 | | | | | 10.41 | | | | | 10.69 | | | | | 4,958 | | | | | 1.70 | | | | | 2.07 | | | | | 1.50 | | | | | 272 | |
| | | | | | | | | | | | | | | |
Class I | | | | | | | | | | | | | | | | | | | | | | | | | | | | | | | | | | | | | | | | | | | | | | | | | | | | | | | | | | | | | | | | | | | | | | | | | | | |
1/1/16 to 12/31/16 | | | $ | 11.43 | | | | | 0.02 | | | | | (0.10 | ) | | | | (0.08 | ) | | | | — | | | | | — | | | | | — | | | | | (0.08 | ) | | | $ | 11.35 | | | | | (0.70 | )% | | | $ | 119 | | | | | 1.46 | %(9)(11) | | | | 1.65 | % | | | | 0.20 | % | | | | 187 | % |
1/1/15 to 12/31/15 | | | | 12.57 | | | | | (0.08 | ) | | | | (1.06 | ) | | | | (1.14 | ) | | | | — | | | | | — | | | | | — | | | | | (1.14 | ) | | | | 11.43 | | | | | (9.00 | ) | | | | 123 | | | | | 1.46 | (9)(11) | | | | 2.06 | | | | | (0.57 | ) | | | | 366 | |
1/1/14 to 12/31/14 | | | | 13.30 | | | | | 0.05 | | | | | 0.29 | | | | | 0.34 | | | | | (0.06 | ) | | | | (1.01 | ) | | | | (1.07 | ) | | | | (0.73 | ) | | | | 12.57 | | | | | 2.39 | | | | | 277 | | | | | 1.45 | (8) | | | | 1.41 | | | | | 0.40 | | | | | 473 | |
| 4/30/13(4) to 12/31/13 | | | | 11.69 | | | | | 0.07 | | | | | 1.66 | | | | | 1.73 | | | | | (0.08 | ) | | | | (0.04 | ) | | | | (0.12 | ) | | | | 1.61 | | | | | 13.30 | | | | | 14.64 | (6) | | | | 140 | | | | | 1.45 | (5) | | | | 1.50 | (5) | | | | 0.89 | (5) | | | | 108 | |
International Series | | | | | | | | | | | | | | | | | | | | | | | | | | | | | | | | | | | | | | | | | | | | | | | | | | | | | | | | | | | | | | | | | | | | | | | | | | | |
Class A | | | | | | | | | | | | | | | | | | | | | | | | | | | | | | | | | | | | | | | | | | | | | | | | | | | | | | | | | | | | | | | | | | | | | | | | | | | |
1/1/16 to 12/31/16 | | | $ | 14.01 | | | | | 0.08 | | | | | (0.44 | ) | | | | (0.36 | ) | | | | (0.09 | ) | | | | (2.61 | ) | | | | (2.70 | ) | | | | (3.06 | ) | | | $ | 10.95 | | | | | (1.61 | )%(13) | | | $ | 177,868 | | | | | 1.18 | %(9)(11)(13) | | | | 1.26 | % | | | | 0.62 | %(13) | | | | 83 | % |
1/1/15 to 12/31/15 | | | | 16.67 | | | | | 0.35 | | | | | (2.04 | ) | | | | (1.69 | ) | | | | (0.37 | ) | | | | (0.60 | ) | | | | (0.97 | ) | | | | (2.66 | ) | | | | 14.01 | | | | | (10.48 | ) | | | | 209,990 | | | | | 1.19 | (9)(11) | | | | 1.30 | | | | | 2.16 | | | | | 104 | |
1/1/14 to 12/31/14 | | | | 18.23 | | | | | 0.67 | | | | | (1.34 | ) | | | | (0.67 | ) | | | | (0.71 | ) | | | | (0.18 | ) | | | | (0.89 | ) | | | | (1.56 | ) | | | | 16.67 | | | | | (3.90 | ) | | | | 261,281 | | | | | 1.18 | | | | | 1.26 | | | | | 3.60 | | | | | 9 | |
1/1/13 to 12/31/13 | | | | 17.30 | | | | | 0.35 | | | | | 0.97 | | | | | 1.32 | | | | | (0.39 | ) | | | | — | | | | | (0.39 | ) | | | | 0.93 | | | | | 18.23 | | | | | 7.78 | | | | | 317,726 | | | | | 1.18 | | | | | 1.18 | | | | | 1.97 | | | | | 11 | |
1/1/12 to 12/31/12 | | | | 15.28 | | | | | 0.41 | | | | | 2.06 | | | | | 2.47 | | | | | (0.45 | ) | | | | — | | | | | (0.45 | ) | | | | 2.02 | | | | | 17.30 | | | | | 16.52 | | | | | 341,717 | | | | | 1.06 | (7) | | | | 1.18 | | | | | 2.53 | | | | | 13 | |
| | | | | | | | | | | | | | | |
Class I | | | | | | | | | | | | | | | | | | | | | | | | | | | | | | | | | | | | | | | | | | | | | | | | | | | | | | | | | | | | | | | | | | | | | | | | | | | |
1/1/16 to 12/31/16 | | | $ | 13.99 | | | | | 0.11 | | | | | (0.42 | ) | | | | (0.31 | ) | | | | (0.13 | ) | | | | (2.61 | ) | | | | (2.74 | ) | | | | (3.05 | ) | | | $ | 10.94 | | | | | (1.28 | )%(13) | | | $ | 86 | | | | | 0.93 | %(9)(11)(13) | | | | 1.01 | % | | | | 0.88 | %(13) | | | | 83 | % |
1/1/15 to 12/31/15 | | | | 16.65 | | | | | 0.38 | | | | | (2.03 | ) | | | | (1.65 | ) | | | | (0.41 | ) | | | | (0.60 | ) | | | | (1.01 | ) | | | | (2.66 | ) | | | | 13.99 | | | | | (10.26 | ) | | | | 87 | | | | | 0.94 | (9)(11) | | | | 1.05 | | | | | 2.39 | | | | | 104 | |
1/1/14 to 12/31/14 | | | | 18.22 | | | | | 0.69 | | | | | (1.32 | ) | | | | (0.63 | ) | | | | (0.76 | ) | | | | (0.18 | ) | | | | (0.94 | ) | | | | (1.57 | ) | | | | 16.65 | | | | | (3.71 | ) | | | | 97 | | | | | 0.93 | | | | | 1.01 | | | | | 3.71 | | | | | 9 | |
| 4/30/13(4) to 12/31/13 | | | | 18.40 | | | | | 0.18 | | | | | 0.08 | | | | | 0.26 | | | | | (0.44 | ) | | | | — | | | | | (0.44 | ) | | | | (0.18 | ) | | | | 18.22 | | | | | 1.17 | (6) | | | | 104 | | | | | 0.93 | (5) | | | | 0.93 | (5) | | | | 1.54 | (5) | | | | 11 | |
The footnote legend is at the end of the Financial Highlights.
See Notes to Financial Statements
63
VIRTUS VARIABLE INSURANCE TRUST
FINANCIAL HIGHLIGHTS
SELECTED PER SHARE DATA AND RATIOS FOR A SHARE OUTSTANDING
THROUGHOUT EACH PERIOD
| | | | | | | | | | | | | | | | | | | | | | | | | | | | | | | | | | | | | | | | | | | | | | | | | | | | | | | | | | | | | | | | | | | | | | | | | | | | | | | | |
| | | Net Asset Value,
Beginning of Period | | Net Investment Income (Loss)(1) | | Net Realized and
Unrealized Gain (Loss) | | Total from Investment Operations
| | Dividends from
Net Investment Income | | Distributions from
Net Realized Gains | | Total Distributions | | Payment from Affiliate | | Change in Net Asset Value | | Net Asset Value, End of Period | | Total Return(2) | | Net Assets, End of Period
(in thousands) | | Ratio of
Net
Expenses to
Average Net Assets(3) | | Ratio of Gross
Expenses to
Average Net
Assets (before
waivers and
reimbursements)(3) | | Ratio of Net
Investment
Income (Loss)
to Average Net Assets | | Portfolio Turnover Rate |
Multi-Sector Fixed Income
Series | | | | | | | | | | | | | | | | | | | | | | | | | | | | | | | | | | | | | | | | | | | | | | | | | | | | | | | | | | | | | | | | | | | | | | | | | | | | | | | | |
Class A | | | | | | | | | | | | | | | | | | | | | | | | | | | | | | | | | | | | | | | | | | | | | | | | | | | | | | | | | | | | | | | | | | | | | | | | | | | | | | | | |
1/1/16 to 12/31/16 | | | $ | 8.75 | | | | | 0.44 | | | | | 0.37 | | | | | 0.81 | | | | | (0.42 | ) | | | | — | | | | | (0.42 | ) | | | | — | | | | | 0.39 | | | | $ | 9.14 | | | | | 9.29 | %(13) | | | $ | 128,969 | | | | | 0.94 | %(9)(11)(13) | | | | 1.00 | % | | | | 4.82 | %(13) | | | | 68 | % |
1/1/15 to 12/31/15 | | | | 9.25 | | | | | 0.45 | | | | | (0.56 | ) | | | | (0.11 | ) | | | | (0.39 | ) | | | | — | | | | | (0.39 | ) | | | | — | (10) | | | | (0.50 | ) | | | | 8.75 | | | | | (1.26 | ) | | | | 134,558 | | | | | 0.95 | (9)(11) | | | | 1.03 | | | | | 4.89 | | | | | 55 | |
1/1/14 to 12/31/14 | | | | 9.54 | | | | | 0.48 | | | | | (0.29 | ) | | | | 0.19 | | | | | (0.48 | ) | | | | — | | | | | (0.48 | ) | | | | — | | | | | (0.29 | ) | | | | 9.25 | | | | | 1.90 | | | | | 154,915 | | | | | 0.94 | | | | | 1.01 | | | | | 4.93 | | | | | 48 | |
1/1/13 to 12/31/13 | | | | 9.88 | | | | | 0.51 | | | | | (0.30 | ) | | | | 0.21 | | | | | (0.55 | ) | | | | — | | | | | (0.55 | ) | | | | — | | | | | (0.34 | ) | | | | 9.54 | | | | | 2.25 | | | | | 171,995 | | | | | 0.94 | | | | | 0.96 | | | | | 5.23 | | | | | 56 | |
1/1/12 to 12/31/12 | | | | 9.18 | | | | | 0.58 | | | | | 0.74 | | | | | 1.32 | | | | | (0.62 | ) | | | | — | | | | | (0.62 | ) | | | | — | | | | | 0.70 | | | | | 9.88 | | | | | 14.69 | | | | | 203,775 | | | | | 0.78 | (7) | | | | 0.94 | | | | | 5.94 | | | | | 85 | |
| | | | | | | | | | | | | | | | |
Class I | | | | | | | | | | | | | | | | | | | | | | | | | | | | | | | | | | | | | | | | | | | | | | | | | | | | | | | | | | | | | | | | | | | | | | | | | | | | | | | | |
1/1/16 to 12/31/16 | | | $ | 8.74 | | | | | 0.47 | | | | | 0.35 | | | | | 0.82 | | | | | (0.44 | ) | | | | — | | | | | (0.44 | ) | | | | — | | | | | 0.38 | | | | $ | 9.12 | | | | | 9.46 | %(13) | | | $ | 242 | | | | | 0.69 | %(9)(11)(13) | | | | 0.75 | % | | | | 5.08 | %(13) | | | | 68 | % |
1/1/15 to 12/31/15 | | | | 9.24 | | | | | 0.47 | | | | | (0.56 | ) | | | | (0.09 | ) | | | | (0.41 | ) | | | | — | | | | | (0.41 | ) | | | | — | (10) | | | | (0.50 | ) | | | | 8.74 | | | | | (1.00 | ) | | | | 213 | | | | | 0.70 | (9)(11) | | | | 0.78 | | | | | 5.11 | | | | | 55 | |
1/1/14 to 12/31/14 | | | | 9.53 | | | | | 0.51 | | | | | (0.29 | ) | | | | 0.22 | | | | | (0.51 | ) | | | | — | | | | | (0.51 | ) | | | | — | | | | | (0.29 | ) | | | | 9.24 | | | | | 2.16 | | | | | 223 | | | | | 0.69 | | | | | 0.76 | | | | | 5.19 | | | | | 48 | |
| 4/30/13(4) to 12/31/13 | | | | 10.19 | | | | | 0.36 | | | | | (0.44 | ) | | | | (0.08 | ) | | | | (0.58 | ) | | | | — | | | | | (0.58 | ) | | | | — | | | | | (0.66 | ) | | | | 9.53 | | | | | (0.89 | )(6) | | | | 124 | | | | | 0.69 | (5) | | | | 0.71 | (5) | | | | 5.54 | (5) | | | | 56 | |
Real Estate Securities Series | | | | | | | | | | | | | | | | | | | | | | | | | | | | | | | | | | | | | | | | | | | | | | | | | | | | | | | | | | | | | | | | | | | | | | | | | | | | | | | | |
Class A | | | | | | | | | | | | | | | | | | | | | | | | | | | | | | | | | | | | | | | | | | | | | | | | | | | | | | | | | | | | | | | | | | | | | | | | | | | | | | | | |
1/1/16 to 12/31/16 | | | $ | 22.85 | | | | | 0.34 | | | | | 1.17 | | | | | 1.51 | | | | | (0.43 | ) | | | | (3.62 | ) | | | | (4.05 | ) | | | | — | | | | | (2.54 | ) | | | $ | 20.31 | | | | | 6.82 | %(13) | | | $ | 81,243 | | | | | 1.17 | %(9)(11)(13) | | | | 1.25 | % | | | | 1.42 | %(13) | | | | 35 | % |
1/1/15 to 12/31/15 | | | | 27.05 | | | | | 0.44 | | | | | 0.17 | | | | | 0.61 | | | | | (0.37 | ) | | | | (4.44 | ) | | | | (4.81 | ) | | | | — | | | | | (4.20 | ) | | | | 22.85 | | | | | 2.38 | | | | | 87,899 | | | | | 1.18 | (9)(11) | | | | 1.29 | | | | | 1.64 | | | | | 18 | |
1/1/14 to 12/31/14 | | | | 23.33 | | | | | 0.29 | | | | | 7.00 | | | | | 7.29 | | | | | (0.31 | ) | | | | (3.26 | ) | | | | (3.57 | ) | | | | — | | | | | 3.72 | | | | | 27.05 | | | | | 31.62 | | | | | 105,508 | | | | | 1.16 | | | | | 1.27 | | | | | 1.10 | | | | | 22 | |
1/1/13 to 12/31/13 | | | | 27.78 | | | | | 0.34 | | | | | (0.05 | ) | | | | 0.29 | | | | | (0.43 | ) | | | | (4.31 | ) | | | | (4.74 | ) | | | | — | | | | | (4.45 | ) | | | | 23.33 | | | | | 0.90 | | | | | 90,794 | | | | | 1.16 | | | | | 1.22 | | | | | 1.20 | | | | | 26 | |
1/1/12 to 12/31/12 | | | | 26.18 | | | | | 0.30 | | | | | 4.10 | | | | | 4.40 | | | | | (0.29 | ) | | | | (2.51 | ) | | | | (2.80 | ) | | | | — | | | | | 1.60 | | | | | 27.78 | | | | | 16.98 | | | | | 102,399 | | | | | 1.11 | (7) | | | | 1.20 | | | | | 1.03 | | | | | 18 | |
| | | | | | | | | | | | | | | | |
Class I | | | | | | | | | | | | | | | | | | | | | | | | | | | | | | | | | | | | | | | | | | | | | | | | | | | | | | | | | | | | | | | | | | | | | | | | | | | | | | | | |
1/1/16 to 12/31/16 | | | $ | 22.81 | | | | | 0.35 | | | | | 1.22 | | | | | 1.57 | | | | | (0.49 | ) | | | | (3.62 | ) | | | | (4.11 | ) | | | | — | | | | | (2.54 | ) | | | $ | 20.27 | | | | | 7.10 | %(13) | | | $ | 199 | | | | | 0.92 | %(9)(11)(13) | | | | 1.00 | % | | | | 1.46 | %(13) | | | | 35 | % |
1/1/15 to 12/31/15 | | | | 27.02 | | | | | 0.48 | | | | | 0.19 | | | | | 0.67 | | | | | (0.44 | ) | | | | (4.44 | ) | | | | (4.88 | ) | | | | — | | | | | (4.21 | ) | | | | 22.81 | | | | | 2.62 | | | | | 158 | | | | | 0.94 | (9)(11) | | | | 1.05 | | | | | 1.79 | | | | | 18 | |
1/1/14 to 12/31/14 | | | | 23.30 | | | | | 0.34 | | | | | 7.02 | | | | | 7.36 | | | | | (0.38 | ) | | | | (3.26 | ) | | | | (3.64 | ) | | | | — | | | | | 3.72 | | | | | 27.02 | | | | | 31.98 | | | | | 134 | | | | | 0.91 | | | | | 1.02 | | | | | 1.30 | | | | | 22 | |
| 4/30/13(4) to 12/31/13 | | | | 30.96 | | | | | 0.23 | | | | | (3.08 | ) | | | | (2.85 | ) | | | | (0.50 | ) | | | | (4.31 | ) | | | | (4.81 | ) | | | | — | | | | | (7.66 | ) | | | | 23.30 | | | | | (10.45 | )(6) | | | | 102 | | | | | 0.91 | (5) | | | | 0.98 | (5) | | | | 1.23 | (5) | | | | 26 | |
Small-Cap Growth Series | | | | | | | | | | | | | | | | | | | | | | | | | | | | | | | | | | | | | | | | | | | | | | | | | | | | | | | | | | | | | | | | | | | | | | | | | | | | | | | | |
Class A | | | | | | | | | | | | | | | | | | | | | | | | | | | | | | | | | | | | | | | | | | | | | | | | | | | | | | | | | | | | | | | | | | | | | | | | | | | | | | | | |
1/1/16 to 12/31/16 | | | $ | 18.75 | | | | | (0.06 | ) | | | | 4.85 | | | | | 4.79 | | | | | — | | | | | (1.93 | ) | | | | (1.93 | ) | | | | — | | | | | 2.86 | | | | $ | 21.61 | | | | | 25.92 | %(13) | | | $ | 63,008 | | | | | 1.20 | %(9)(11)(13) | | | | 1.37 | % | | | | (0.37 | )%(13) | | | | 18 | % |
1/1/15 to 12/31/15 | | | | 20.73 | | | | | (0.04 | ) | | | | 0.23 | | | | | 0.19 | | | | | — | | | | | (2.17 | ) | | | | (2.17 | ) | | | | — | | | | | (1.98 | ) | | | | 18.75 | | | | | 0.73 | | | | | 55,872 | | | | | 1.20 | (9)(11) | | | | 1.41 | | | | | (0.17 | ) | | | | 18 | |
1/1/14 to 12/31/14 | | | | 21.72 | | | | | (0.13 | ) | | | | 1.29 | | | | | 1.16 | | | | | — | | | | | (2.15 | ) | | | | (2.15 | ) | | | | — | | | | | (0.99 | ) | | | | 20.73 | | | | | 5.50 | | | | | 63,483 | | | | | 1.19 | | | | | 1.38 | | | | | (0.62 | ) | | | | 20 | |
1/1/13 to 12/31/13 | | | | 15.66 | | | | | (0.12 | ) | | | | 6.39 | | | | | 6.27 | | | | | (0.05 | ) | | | | (0.16 | ) | | | | (0.21 | ) | | | | — | | | | | 6.06 | | | | | 21.72 | | | | | 40.20 | | | | | 70,948 | | | | | 1.19 | | | | | 1.33 | | | | | (0.63 | ) | | | | 28 | |
1/1/12 to 12/31/12 | | | | 14.03 | | | | | 0.07 | | | | | 1.59 | | | | | 1.66 | | | | | (0.03 | ) | | | | — | | | | | (0.03 | ) | | | | — | | | | | 1.63 | | | | | 15.66 | | | | | 11.81 | | | | | 59,898 | | | | | 1.07 | (7) | | | | 1.32 | | | | | 0.44 | | | | | 16 | |
| | | | | | | | | | | | | | | | |
Class I | | | | | | | | | | | | | | | | | | | | | | | | | | | | | | | | | | | | | | | | | | | | | | | | | | | | | | | | | | | | | | | | | | | | | | | | | | | | | | | | |
1/1/16 to 12/31/16 | | | $ | 18.90 | | | | | 0.01 | | | | | 4.88 | | | | | 4.89 | | | | | — | | | | | (1.93 | ) | | | | (1.93 | ) | | | | — | | | | | 2.96 | | | | $ | 21.86 | | | | | 26.25 | %(13) | | | $ | 353 | | | | | 0.95 | %(9)(11)(13) | | | | 1.12 | % | | | | (0.10 | )%(13) | | | | 18 | % |
1/1/15 to 12/31/15 | | | | 20.82 | | | | | — | | | | | 0.25 | | | | | 0.25 | | | | | — | | | | | (2.17 | ) | | | | (2.17 | ) | | | | — | | | | | (1.92 | ) | | | | 18.90 | | | | | 1.01 | | | | | 179 | | | | | 0.96 | (9)(11) | | | | 1.17 | | | | | (0.02 | ) | | | | 18 | |
1/1/14 to 12/31/14 | | | | 21.75 | | | | | (0.07 | ) | | | | 1.29 | | | | | 1.22 | | | | | — | | | | | (2.15 | ) | | | | (2.15 | ) | | | | — | | | | | (0.93 | ) | | | | 20.82 | | | | | 5.78 | | | | | 275 | | | | | 0.94 | | | | | 1.14 | | | | | (0.34 | ) | | | | 20 | |
| 4/30/13(4) to 12/31/13 | | | | 17.29 | | | | | (0.03 | ) | | | | 4.70 | | | | | 4.67 | | | | | (0.05 | ) | | | | (0.16 | ) | | | | (0.21 | ) | | | | — | | | | | 4.46 | | | | | 21.75 | | | | | 26.28 | (6) | | | | 137 | | | | | 0.94 | (5) | | | | 1.07 | (5) | | | | (0.23 | )(5) | | | | 28 | |
The footnote legend is at the end of the Financial Highlights.
See Notes to Financial Statements
64
VIRTUS VARIABLE INSURANCE TRUST
FINANCIAL HIGHLIGHTS
SELECTED PER SHARE DATA AND RATIOS FOR A SHARE OUTSTANDING
THROUGHOUT EACH PERIOD
| | | | | | | | | | | | | | | | | | | | | | | | | | | | | | | | | | | | | | | | | | | | | | | | | | | | | | | | | | | | | | | | | | | | | | | | | | | |
| | | Net Asset Value,
Beginning of Period | | Net Investment Income (Loss)(1) | | Net Realized and
Unrealized Gain (Loss) | | Total from Investment Operations
| | Dividends from
Net Investment Income | | Distributions from
Net Realized Gains | | Total Distributions | | Change in Net Asset Value | | Net Asset Value, End of Period | | Total Return(2) | | Net Assets, End of Period
(in thousands) | | Ratio of Net Expenses to
Average Net Assets(3) | | Ratio of Gross Expenses to
Average Net Assets (before
waivers and reimbursements)(3) | | Ratio of Net Investment Income
to Average Net Assets | | Portfolio Turnover Rate |
Small-Cap Value Series | | | | | | | | | | | | | | | | | | | | | | | | | | | | | | | | | | | | | | | | | | | | | | | | | | | | | | | | | | | | | | | | | | | | | | | | | | | |
Class A | | | | | | | | | | | | | | | | | | | | | | | | | | | | | | | | | | | | | | | | | | | | | | | | | | | | | | | | | | | | | | | | | | | | | | | | | | | |
1/1/16 to 12/31/16 | | | $ | 15.17 | | | | | 0.32 | | | | | 3.66 | | | | | 3.98 | | | | | (0.34 | ) | | | | (2.12 | ) | | | | (2.46 | ) | | | | 1.52 | | | | $ | 16.69 | | | | | 26.54 | %(13) | | | $ | 94,966 | | | | | 1.21 | %(9)(11)(13) | | | | 1.40 | % | | | | 1.85 | %(13) | | | | 22 | % |
1/1/15 to 12/31/15 | | | | 17.03 | | | | | 0.09 | | | | | (0.29 | ) | | | | (0.20 | ) | | | | (0.09 | ) | | | | (1.57 | ) | | | | (1.66 | ) | | | | (1.86 | ) | | | | 15.17 | | | | | (1.37 | ) | | | | 92,834 | | | | | 1.22 | (9)(11) | | | | 1.43 | | | | | 0.56 | | | | | 16 | |
1/1/14 to 12/31/14 | | | | 17.72 | | | | | 0.10 | | | | | 0.24 | | | | | 0.34 | | | | | (0.11 | ) | | | | (0.92 | ) | | | | (1.03 | ) | | | | (0.69 | ) | | | | 17.03 | | | | | 1.83 | | | | | 113,030 | | | | | 1.20 | | | | | 1.41 | | | | | 0.61 | | | | | 26 | |
1/1/13 to 12/31/13 | | | | 12.66 | | | | | 0.04 | | | | | 5.11 | | | | | 5.15 | | | | | (0.09 | ) | | | | — | | | | | (0.09 | ) | | | | 5.06 | | | | | 17.72 | | | | | 40.77 | | | | | 135,352 | | | | | 1.20 | | | | | 1.35 | | | | | 0.25 | | | | | 14 | |
1/1/12 to 12/31/12 | | | | 11.99 | | | | | 0.29 | | | | | 0.67 | | | | | 0.96 | | | | | (0.29 | ) | | | | — | | | | | (0.29 | ) | | | | 0.67 | | | | | 12.66 | | | | | 8.13 | | | | | 118,741 | | | | | 1.29 | (7) | | | | 1.34 | | | | | 2.29 | | | | | 17 | |
Strategic Allocation Series | | | | | | | | | | | | | | | | | | | | | | | | | | | | | | | | | | | | | | | | | | | | | | | | | | | | | | | | | | | | | | | | | | | | | | | | | | | |
Class A | | | | | | | | | | | | | | | | | | | | | | | | | | | | | | | | | | | | | | | | | | | | | | | | | | | | | | | | | | | | | | | | | | | | | | | | | | | |
1/1/16 to 12/31/16 | | | $ | 12.34 | | | | | 0.24 | | | | | (0.14 | ) | | | | 0.10 | | | | | (0.21 | ) | | | | (1.35 | ) | | | | (1.56 | ) | | | | (1.46 | ) | | | $ | 10.88 | | | | | 0.82 | %(13) | | | $ | 93,276 | | | | | 0.99 | %(9)(11)(13) | | | | 1.09 | % | | | | 1.96 | %(13) | | | | 114 | % |
1/1/15 to 12/31/15 | | | | 14.30 | | | | | 0.25 | | | | | (0.98 | ) | | | | (0.73 | ) | | | | (0.24 | ) | | | | (0.99 | ) | | | | (1.23 | ) | | | | (1.96 | ) | | | | 12.34 | | | | | (5.38 | ) | | | | 106,825 | | | | | 0.99 | (9)(11) | | | | 1.13 | | | | | 1.79 | | | | | 75 | |
1/1/14 to 12/31/14 | | | | 14.41 | | | | | 0.28 | | | | | 0.80 | | | | | 1.08 | | | | | (0.32 | ) | | | | (0.87 | ) | | | | (1.19 | ) | | | | (0.11 | ) | | | | 14.30 | | | | | 7.51 | | | | | 129,473 | | | | | 0.98 | | | | | 1.11 | | | | | 1.89 | | | | | 47 | |
1/1/13 to 12/31/13 | | | | 13.48 | | | | | 0.27 | | | | | 2.13 | | | | | 2.40 | | | | | (0.29 | ) | | | | (1.18 | ) | | | | (1.47 | ) | | | | 0.93 | | | | | 14.41 | | | | | 17.99 | | | | | 137,453 | | | | | 0.98 | | | | | 1.06 | | | | | 1.88 | | | | | 49 | |
1/1/12 to 12/31/12 | | | | 12.17 | | | | | 0.29 | | | | | 1.33 | | | | | 1.62 | | | | | (0.31 | ) | | | | — | | | | | (0.31 | ) | | | | 1.31 | | | | | 13.48 | | | | | 13.42 | | | | | 135,046 | | | | | 0.87 | (7) | | | | 1.05 | | | | | 2.18 | | | | | 72 | |
Footnote Legend:
| (1) | Computed using average shares outstanding. |
| (2) | The total return does not include the expenses associated with the annuity or life insurance policy through which you invest. |
| (3) | Each Series will also indirectly bear its prorated share of expenses of any underlying funds in which it invests. Such expenses are not included in the calculation of this ratio. |
| (7) | Blended net expense ratio due to a change in expense limitation agreements during the fiscal year. |
| (8) | See Note 3D in the Notes to Financial Statements for information on recapture of expense previously waived. |
| (9) | Earnings credits from Custodian were not material, as reflected in the Statements of Operations, and had no impact on Financial Highlights. |
| (10) | Amount is less than $.005 per share and payment from affiliate had no impact on total performance. |
| (11) | Net expense ratios include proxy expenses. |
| (12) | Amount is less than $.005 per share. |
| (13) | Custody fees reimbursed were excluded from the Ratio of Net Expenses to Average Net Assets and Ratio of Net Investment Income (Loss) to Average Net Assets. If included the impact would have been to lower the Ratio of Net Expenses and increase the Ratio of Net Investment Income (Loss) as follows: |
| | Capital Growth Series 0.10%, |
| | Enhanced Core Equity Series 0.46%, |
| | International Series 0.04%, |
| | Multi-Sector Fixed Income Series 0.04% (Class A) and 0.05% (Class I), |
| | Real Estate Securities Series 0.02% (Class A) and 0.03% (Class I), |
| | Small-Cap Growth Series 0.09% (Class A) and 0.14% (Class I), |
| | Small-Cap Value Series 0.08%, |
| | Strategic Allocation Series 0.03%. |
| | Custody fees reimbursed were included in Total Return. If excluded the impact would have been to lower the Total Return as follows: |
| | Capital Growth Series 0.10%, |
| | Enhanced Core Equity Series 0.44%, |
| | International Series 0.04%, |
| | Multi-Sector Fixed Income Series 0.04%, |
| | Real Estate Securities Series 0.03%, |
| | Small-Cap Growth Series 0.08%, |
| | Small-Cap Value Series 0.08%, |
| | Strategic Allocation Series 0.03%. |
| | Please refer Note 14 in the Notes to Financial Statements for a further explanation on the custody fees reimbursed. |
| (14) | The increase in the portfolio turnover rate is due to a change in the subadviser associated with a strategy change on the Series. |
See Notes to Financial Statements
65
VIRTUS VARIABLE INSURANCE TRUST
NOTES TO FINANCIAL STATEMENTS
DECEMBER 31, 2016
Note 1—Organization
Virtus Variable Insurance Trust (the “Trust”) is organized as a Delaware statutory trust and is registered under the Investment Company Act of 1940, as amended (the “1940 Act”), as an open-end management investment company. It was formed on February 18, 1986, as a Massachusetts business trust, commenced operations on December 5, 1986, and was reorganized as a Delaware statutory trust on February 14, 2011.
The Trust is organized with series, which are currently available only to separate accounts of participating insurance companies to fund variable accumulation annuity contracts and variable universal life insurance policies. As of the date of this report the Trust is comprised of nine series (each a “Series”), each reported in this annual report. Each Series’ investment objective is outlined in the respective Series summary page.
Each Series offers Class A shares. The Equity Trend Series, International Series, Multi-Sector Fixed Income Series, Real Estate Securities Series, and Small-Cap Growth Series also offer Class I shares.
Note 2—Significant Accounting Policies
The significant accounting policies consistently followed by the Trust in the preparation of its financial statements are summarized below. The preparation of financial statements in conformity with accounting principles generally accepted in the United States of America requires management to make estimates and assumptions that affect the reported amounts of assets and liabilities, and disclosure of contingent assets and liabilities at the date of the financial statements and the reported amounts of increases and decreases in net assets from operations during the reporting period. Actual results could differ from those estimates, and those differences could be significant.
Security valuation procedures for each Series, which include nightly price variance, as well as back-testing items such as bi-weekly unchanged price, monthly secondary source and transaction analysis, have been approved by the Board of Trustees of the Series (the “Board”, or the “Trustees”). All internally fair valued securities are approved by a valuation committee (the “Valuation Committee”) appointed by the Board. The Valuation Committee is comprised of certain members of management as identified to the Board and convenes independently from portfolio management. All internally fair valued securities are updated daily and reviewed in detail by the Valuation Committee monthly unless changes occur within the period. The Valuation Committee reviews the validity of the model inputs and any changes to the model. Fair valuations are reviewed quarterly by the Board.
Each Series utilizes a fair value hierarchy which prioritizes the inputs to valuation techniques used to measure fair value into three broad levels. The Series’ policy is to recognize transfers between levels at the end of the reporting period.
| | |
•Level 1 – | | quoted prices in active markets for identical securities (security types generally include listed equities). |
| |
•Level 2 – | | prices determined using other significant observable inputs (including quoted prices for similar securities, interest rates, prepayment speeds, credit risk, etc.). |
| |
•Level 3 – | | prices determined using significant unobservable inputs (including the Valuation Committee’s own assumptions in determining the fair value of investments). |
A description of the valuation techniques applied to a Series’ major categories of assets and liabilities measured at fair value on a recurring basis is as follows:
Equity securities are valued at the official closing price (typically last sale) on the exchange on which the securities are primarily traded or, if no closing price is available, at the last bid price and are categorized as Level 1 in the hierarchy. Restricted equity securities and private placements that are not widely traded, are illiquid, or are internally fair valued by the Valuation Committee, are generally categorized as Level 3 in the hierarchy.
Certain non-U.S. securities may be fair valued in cases where closing prices are not readily available or are deemed not reflective of readily available market prices. For example, significant events (such as movement in the U.S. securities market, or other regional and local developments) may occur between the time that non-U.S. markets close (where the security is principally traded) and the time that a Series calculates its net asset value (“NAV”) (at the close of regular trading on the New York Stock Exchange (“NYSE”), generally 4 p.m. Eastern time) that may impact the value of securities traded in these non-U.S. markets. In such cases the Series fair values non-U.S. securities using an independent pricing service which considers the correlation of the trading patterns of the non-U.S. security to the intraday trading in the U.S. markets for investments such as ADRs, financial futures, ETFs, and certain indexes, as well as prices for similar securities. Such fair valuations are categorized as Level 2 in the hierarchy. Because the frequency of significant events is not predictable, fair valuation of certain non-U.S. common stocks may occur on a frequent basis.
Debt securities, including restricted securities, are valued based on evaluated quotations received from independent pricing services or from dealers who make markets in such securities. For most bond types, the pricing service utilizes matrix pricing that considers one or more of the following factors: yield or price of bonds of comparable quality, coupon, maturity, current cash flows, type, and current day trade information, as well as dealer supplied prices. These valuations are generally categorized as Level 2 in the hierarchy. Structured debt instruments, such as mortgage-backed and asset-backed securities, may also incorporate collateral analysis and utilize cash flow models for valuation and are generally categorized as Level 2 in the hierarchy. Pricing services do not provide pricing for all securities and therefore indicative bids from dealers are utilized which are based on pricing models used by market makers in the security and are generally categorized as Level 2 in the hierarchy. Debt securities that are not widely traded, are illiquid, or are internally fair valued by the Valuation Committee, are generally categorized as Level 3 in the hierarchy.
Listed derivatives that are actively traded are valued based on quoted prices from the exchange and are categorized as Level 1 in the hierarchy. Over-the-counter derivative contracts, which include forward currency contracts and equity-linked instruments, do not require material subjectivity as pricing inputs are observed from actively quoted markets and are categorized as Level 2 in the hierarchy.
Investments in open-end mutual funds are valued at NAV. Investments in closed-end funds are valued as of the close of regular trading on the NYSE each business day. Both are categorized as Level 1 in the hierarchy.
66
VIRTUS VARIABLE INSURANCE TRUST
NOTES TO FINANCIAL STATEMENTS (Continued)
DECEMBER 31, 2016
A summary of the inputs used to value a Series’ net assets by each major security type is disclosed at the end of the Schedule of Investments for each Series. The inputs or methodologies used for valuing securities are not necessarily an indication of the risk associated with investing in those securities.
| | B. | | Security Transactions and Investment Income |
Security transactions are recorded on the trade date. Realized gains and losses from sales of securities are determined on the identified cost basis. Dividend income is recognized on the ex-dividend date or, in the case of certain foreign securities, as soon as the Series is notified. Interest income is recorded on the accrual basis. Each Series amortizes premiums and accretes discounts using the effective interest method.
Any distributions from underlying funds are recorded in accordance with the character of the distributions as designated by the underlying funds. Dividend income from REIT investments is recorded using management’s estimate of the income included in distributions received from the REIT investments. Distributions received in excess of this estimated amount are recorded as a reduction of the cost of investments or reclassified to capital gains. The actual amounts of income, return of capital, and capital gains are only determined by each REIT after its fiscal year-end, and may differ from the estimated amounts.
Each Series is treated as a separate taxable entity. It is the intention of each Series to comply with the requirements of Subchapter M of the Internal Revenue Code and to distribute substantially all of its taxable income to its shareholders. Therefore, no provision for federal income taxes or excise taxes has been made.
Certain Series may be subject to foreign taxes on income, gains on investments or currency repatriation, a portion of which may be recoverable. Each Series will accrue such taxes and recoveries as applicable based upon current interpretations of the tax rules and regulations that exist in the markets in which it invests.
Management of the Trust has concluded that there are no significant uncertain tax positions that would require recognition in the financial statements. As of December 31, 2016, the tax years that remain subject to examination by the major tax jurisdictions under the statute of limitations are from the year 2013 forward (with limited exceptions).
| | D. | | Distributions to Shareholders |
Distributions are recorded by each Series on the ex-dividend date. Income and capital gain distributions are determined in accordance with income tax regulations that may differ from accounting principles generally accepted in the United States of America. These differences may include the treatment of non-taxable dividends, market premium and discount, non-deductible expenses, expiring capital loss carryovers, foreign currency gain or loss, gain or loss on futures contracts, partnerships, operating losses and losses deferred due to wash sales.
Expenses incurred together by a Series and other affiliated open- and closed-end funds are allocated in proportion to the net assets of each such Series/fund, except where allocation of direct expense to each Series/fund or an alternative allocation method can be more appropriately used.
In addition to the net annual operating expenses that a Series bears directly, the contract owners, as investors in the Series, indirectly bear the Series’ pro rata expenses of any underlying open- and closed-end funds in which the Series invests.
| | F. | | Foreign Currency Translation |
Non-U.S. investment securities and other assets and liabilities denominated in foreign currencies are translated into U.S. dollar amounts at the foreign currency exchange rate effective at the end of the reporting period. Cost of investments is translated at the currency exchange rate effective at the trade date. The gain or loss resulting from a change in currency exchange rates between the trade and settlement date of a portfolio transaction is treated as a gain or loss on foreign currency. Likewise, the gain or loss resulting from a change in currency exchange rates between the date income is accrued and the date it is paid is treated as a gain or loss on foreign currency. The Series do not isolate that portion of the results of operations arising from changes in foreign exchange rates on investments from the fluctuations arising from changes in the market prices of securities held. Such fluctuations are included with the net realized and unrealized gain or loss on investments.
Certain Series may invest in direct debt instruments which are interests in amounts owed by a corporate, governmental, or other borrower to lenders or lending syndicates. Loan agreements are generally non-investment grade and often involve borrowers that are highly leveraged. The Series may invest in obligations of borrowers who are in bankruptcy proceedings. Loan agreements are typically senior in the corporate capital structure of the borrower. A loan is often administered by a bank or other financial institution (the “lender”) that acts as agent for all holders. The agent administers the terms of the loan, as specified in the loan agreement. A Series’ investments in loans may be in the form of participations in loans or assignments of all or a portion of loans from third parties. When investing in loan participations, a Series has the right to receive payments of principal, interest and any fees to which it is entitled only from the lender selling the loan participation and only upon receipt by the lender of payments from the borrower. A Series generally has no right to enforce compliance with the terms of the loan agreement with the borrower. As a result, a Series may be subject to the credit risk of both the borrower and the lender that is selling the loan agreement. When a Series purchases assignments from lenders it acquires direct rights against the borrower on the loan.
A Series may invest in multiple series or tranches of a loan, which may have varying terms and carry different associated risks. Loan agreements may involve foreign borrowers and investments may be denominated in foreign currencies. Direct indebtedness of emerging countries involves a risk that the government entities responsible for the repayment of the debt may be unable, or unwilling, to pay the principal and interest when due.
67
VIRTUS VARIABLE INSURANCE TRUST
NOTES TO FINANCIAL STATEMENTS (Continued)
DECEMBER 31, 2016
The loan agreements have floating rate loan interests which generally pay interest at rates that are periodically determined by reference to a base lending rate plus a premium. The base lending rates are generally LIBOR (London Interbank Offered Rate), the prime rate offered by one or more U.S. banks or the certificate of deposit rate. When a loan agreement is purchased a Series may pay an assignment fee. On an ongoing basis, a Series may receive a commitment fee based on the undrawn portion of the underlying line of credit portion of a loan agreement. Prepayment penalty fees are received upon the prepayment of a loan agreement by a borrower. Prepayment penalty, facility, commitment, consent and amendment fees are recorded to income as earned or paid.
At December 31, 2016, all loan agreements held by the Series were assignment loans.
| | H. | | When-issued Purchases and Forward Commitments (Delayed Delivery) |
Certain Series may engage in when-issued or forward commitment transactions. Securities purchased on a when-issued or forward commitment basis are also known as delayed delivery transactions. Delayed delivery transactions involve a commitment by a Series to purchase or sell a security at a future date (ordinarily up to 90 days later). When-issued or forward commitments enable a Series to lock in what is believed to be an attractive price or yield on a particular security for a period of time, regardless of future changes in interest rates. Each Series records when-issued and delayed delivery securities on the trade date. Each Series maintains collateral for the securities purchased. Securities purchased on a when-issued or delayed delivery basis begin earning interest on the settlement date.
| | I. | | Earnings Credit and Interest |
Through arrangements with the Series’ custodian, most Series either receive an earnings credit or interest on agreed upon target un-invested cash balances to reduce each Series’ custody expenses. The credits are reflected as “Earnings credit from custodian” and the interest is reflected under “Interest income” in the Series’ Statements of Operations for the period, as applicable.
Note 3—Investment Advisory Fees and Related Party Transactions
($ reported in thousands except as noted)
Virtus Investment Advisers, Inc. (the “Adviser”), an indirect wholly owned subsidiary of Virtus Investment Partners, Inc. (“Virtus”), is the investment adviser of the Series. The Adviser manages the Series’ investment programs and general operations of the Series, including oversight of the Series’ subadvisers.
As compensation for its services to the Series, the Adviser is entitled to a fee based upon the following annual rates as a percentage of the average daily net assets of each Series:
| | | | | | | | | | | | |
Series | | First
$250 Million | | | Next
$250 Million | | | Over
$500 Million | |
Capital Growth Series | | | 0.70 | % | | | 0.65 | % | | | 0.60 | % |
Enhanced Core Equity Series | | | 0.70 | | | | 0.65 | | | | 0.60 | |
International Series | | | 0.75 | | | | 0.70 | | | | 0.65 | |
Multi-Sector Fixed Income Series | | | 0.50 | | | | 0.45 | | | | 0.40 | |
Strategic Allocation Series | | | 0.55 | | | | 0.50 | | | | 0.45 | |
| | | |
| | | First
$1 Billion | | | Next
$1 Billion | | | Over
$2 Billion | |
Real Estate Securities Series | | | 0.75 | % | | | 0.70 | % | | | 0.65 | % |
| | | |
| | | First
$1 Billion | | | $1+ Billion | | | | |
Small-Cap Growth Series | | | 0.85 | % | | | 0.80 | % | | | | |
| | | |
| | | First
$400 Million | | | $400 Million
to $1 Billion | | | Over
$1 Billion | |
Small-Cap Value Series | | | 0.90 | % | | | 0.85 | % | | | 0.80 | % |
| | | |
| | | | | | Rate | | | | |
Equity Trend Series | | | | | | | 1.00 | % | | | | |
During the period covered by these financial statements, each of Multi-Sector Fixed Income Series and Strategic Allocation Series invested a portion of its assets in Virtus Credit Opportunities Fund, an affiliated mutual fund. In order to avoid any duplication of advisory fees, the Adviser has voluntarily waived its advisory fees in an amount equal to that which would otherwise be paid by the Series on the assets invested in the Credit Opportunities Fund. For the period covered by these financial statements, the waiver amounted to $15 and $2, respectively. These waivers are in addition to the expense limitation and/or fee waiver covered elsewhere in these financial statements and are included in the Statements of Operations in “expenses reimbursed and/or waived by investment adviser.”
68
VIRTUS VARIABLE INSURANCE TRUST
NOTES TO FINANCIAL STATEMENTS (Continued)
DECEMBER 31, 2016
The subadvisers manage the investments of each Series for which they are paid a fee by the Adviser. A list of the subadvisers and the Series they serve is as follows:
| | |
Series | | Subadviser |
| Capital Growth Series | | Kayne Anderson Rudnick Investment Management, LLC (“KAR”)* |
| Enhanced Core Equity Series | | Rampart Investment Management Company, LLC*† |
| International Series | | Duff & Phelps Investment Management Co. (“DPIM”)*† |
| | |
Series | | Subadviser |
| Multi-Sector Fixed Income Series | | Newfleet Asset Management, LLC (“NF”)* |
| Real Estate Securities Series | | DPIM* |
| Small-Cap Growth Series | | KAR* |
| Small-Cap Value Series | | KAR* |
| Strategic Allocation Series: | | |
Equity Portfolio (domestic) | | KAR*† |
Equity Portfolio (international) | | DPIM* |
Fixed Income Portfolio | | NF* |
| | * | An indirect wholly owned subsidiary of Virtus. |
| | † | Prior to September 7, 2016, subadviser was Euclid Advisors LLC. |
Prior to September 7, 2016, Euclid Advisors LLC served as the subadviser to the Equity Trend Series. Since that date, the Series does not have a subadviser.
The Adviser has extended the contractual agreement to limit total operating expenses of each Series of the Trust through April 30, 2017 (excluding front-end or contingent deferred loads, interest, taxes, leverage expenses, brokerage commissions, expenses incurred in connection with any merger or reorganization, unusual or infrequently occuring expenses (such as litigation) and acquired fund fees and expenses, if any), so that such expenses do not exceed the following percentages of average net assets:
| | | | | | | | |
| | | Maximum Total Operating Expenses | |
| | | Class A | | | Class I | |
Capital Growth Series | | | 1.03 | % | | | — | |
Enhanced Core Equity Series | | | 0.98 | | | | — | |
Equity Trend Series | | | 1.70 | | | | 1.45 | % |
International Series | | | 1.18 | | | | 0.93 | |
Multi-Sector Fixed Income Series | | | 0.94 | | | | 0.69 | |
Real Estate Securities Series | | | 1.16 | | | | 0.91 | |
Small-Cap Growth Series | | | 1.19 | | | | 0.94 | |
Small-Cap Value Series | | | 1.20 | | | | — | |
Strategic Allocation Series | | | 0.98 | | | | — | |
The Adviser may recapture operating expenses waived or reimbursed under this arrangement within three years after the date on which such waiver or reimbursement occurred. A Series must pay its ordinary operating expenses before the Adviser is entitled to any reimbursement and must remain in compliance with applicable expense limitations or, if none, the expense limitation in effect at the time of the waiver. All or a portion of the following Adviser reimbursed expenses may be recaptured by the fiscal year ending:
| | | | | | | | | | | | | | | | |
| | | Expiration Date | |
| | | 2017 | | | 2018 | | | 2019 | | | Total | |
Capital Growth Series | | $ | 336 | | | $ | 375 | | | $ | 275 | | | $ | 986 | |
Enhanced Core Equity Series | | | 312 | | | | 300 | | | | 210 | | | | 822 | |
Equity Trend Series | | | 4 | | | | 103 | | | | 13 | | | | 120 | |
International Series | | | 252 | | | | 265 | | | | 126 | | | | 643 | |
Multi-Sector Fixed Income Series | | | 115 | | | | 118 | | | | 71 | | | | 304 | |
Real Estate Securities Series | | | 109 | | | | 105 | | | | 72 | | | | 286 | |
Small-Cap Growth Series | | | 121 | | | | 126 | | | | 100 | | | | 347 | |
Small-Cap Value Series | | | 245 | | | | 219 | | | | 172 | | | | 636 | |
Strategic Allocation Series | | | 171 | | | | 168 | | | | 102 | | | | 441 | |
| | E. | | Administrator and Distributor |
Virtus Fund Services, LLC, an indirect wholly owned subsidiary of Virtus, serves as administrator to the Series.
For the year ended December 31, 2016 (the “period”), the Series incurred administration fees totaling $958 which are included in the Statements of Operations. A portion of these fees was paid to an outside entity that also provides services to the Series.
VP Distributors, LLC (“VP Distributors” or the “Distributor”), an indirect wholly owned subsidiary of Virtus, serves as the distributor for all the Series’ shares. Each Series pays VP Distributors distribution and/or service fees under a Board approved Rule 12b-1 plan, at the annual rate of 0.25% of the average daily net assets of such Series’ Class A shares. Class I shares are not subject to a Rule 12b-1 plan. For the period ended December 31, 2016, the Series incurred distribution fees totaling $2,394 which are included in the Statements of Operations. A portion of these fees was paid to certain insurance companies for marketing and/or shareholder services provided to contract owners.
69
VIRTUS VARIABLE INSURANCE TRUST
NOTES TO FINANCIAL STATEMENTS (Continued)
DECEMBER 31, 2016
At December 31, 2016, Virtus and its affiliates, and the retirement plans of Virtus and its affiliates, held shares of certain Series which may be redeemed at any time, that aggregated to the following:
| | | | | | | | |
| | | Shares | | | Aggregate
Net Asset
Value | |
Equity Trend Series | | | | | | | | |
Class I | | | 9,345 | | | $ | 106 | |
International Series | | | | | | | | |
Class I | | | 7,888 | | | | 86 | |
Multi-Sector Fixed Income Series | | | | | | | | |
Class I | | | 12,032 | | | | 110 | |
Real Estate Securities Series | | | | | | | | |
Class I | | | 6,408 | | | | 130 | |
Small-Cap Growth Series | | | | | | | | |
Class I | | | 7,793 | | | | 170 | |
| | G. | | Investments in Affiliates |
A summary of the total long-term and short-term purchases and sales of an affiliated fund, Virtus Credit Opportunities Fund, during the period ended December 31, 2016, is as follows:
| | | | | | | | | | | | | | | | | | | | | | | | |
| | | Value,
beginning of
period | | | Purchases | | | Sales
Proceeds | | | Value, end
of period | | | Dividend
Income | | | Distributions
of Realized
Gains | |
Multi-Sector Fixed Income Series | | $ | 2,999 | | | $ | — | | | $ | — | | | | 3,074 | | | | 125 | | | $ | — | |
Strategic Allocation Series | | | 324 | | | | — | | | | — | | | | 332 | | | | 13 | | | | — | |
The Trust provides a deferred compensation plan for its Trustees who receive compensation from the Trust. Under the deferred compensation plan, Trustees may elect to defer all or a portion of their compensation. Amounts deferred are retained by the Trust, and then, to the extent permitted by the 1940 Act, in turn, may be invested in the shares of affiliated or unaffiliated mutual funds selected by the participating Trustees. Investments in such instruments are included in “Other Assets” on the Statement of Assets and Liabilities at December 31, 2016.
Note 4—Purchases and Sales of Securities
($ reported in thousands)
Purchases and sales of securities (excluding U.S. Government and agency securities, forward currency contracts, written options, and short-term investments) during the period ended December 31, 2016, were as follows:
| | | | | | | | |
| | | Purchases | | | Sales | |
Capital Growth Series | | $ | 43,877 | | | $ | 69,167 | |
Enhanced Core Equity Series | | | 243,668 | | | | 254,898 | |
Equity Trend Series | | | 9,830 | | | | 15,666 | |
International Series | | | 145,848 | | | | 180,852 | |
Multi-Sector Fixed Income Series | | | 78,612 | | | | 88,685 | |
Real Estate Securities Series | | | 29,273 | | | | 39,186 | |
Small-Cap Growth Series | | | 10,235 | | | | 14,524 | |
Small-Cap Value Series | | | 19,495 | | | | 40,990 | |
Strategic Allocation Series | | | 107,208 | | | | 121,750 | |
Purchases and sales of long-term U.S. Government and agency securities during the period ended December 31, 2016, were as follows:
| | | | | | | | |
| | | Purchases | | | Sales | |
Multi-Sector Fixed Income Series | | $ | 11,146 | | | $ | 12,167 | |
Strategic Allocation Series | | | 5,272 | | | | 3,697 | |
Note 5—Credit Risk and Asset Concentration
In countries with limited or developing markets, investments may present greater risks than in more developed markets and the prices of such investments may be volatile. The consequences of political, social or economic changes in these markets may have disruptive effects on the market prices of these investments and the income they generate, as well as a Series’ ability to repatriate such amounts.
High-yield/high-risk securities typically entail greater price volatility and/or principal and interest rate risk. There is a greater chance that an issuer will not be able to make principal and interest payments on time. Analysis of the creditworthiness of issuers of high-yield/high-risk securities may be complex, and as a result, it may be more difficult for the Adviser and/or subadvisers to accurately predict risk.
Certain Series may invest in ETFs, which may expose the Series to the risk that the value of an ETF will be more volatile than the underlying portfolio of securities the ETF is designed to track, or that the costs to the Series of owning shares of the ETF will exceed those the Series would incur by investing in such securities directly.
70
VIRTUS VARIABLE INSURANCE TRUST
NOTES TO FINANCIAL STATEMENTS (Continued)
DECEMBER 31, 2016
Investing in sector funds or non-diversified funds may be more volatile than investing in broadly diversified funds, and may be more susceptible to adverse economic, political or regulatory developments affecting a single issuer than would be the case if it were more broadly diversified.
Certain Series may invest a high percentage of their assets in specific sectors of the market in the pursuit of their investment objectives. Fluctuations in these sectors of concentration may have a greater impact on a Series, positive or negative, than if the Series did not concentrate its investments in such sectors.
At December 31, 2016, the Series below held securities in specific sectors as detailed below:
| | | | | | |
Series | | Sector | | Percentage of
Total Investments | |
Capital Growth Series | | Information Technology | | | 34 | % |
Capital Growth Series | | Consumer Discretionary | | | 27 | |
Enhanced Core Equity Series | | Financials | | | 58 | |
Equity Trend Series | | Consumer Discretionary | | | 28 | |
Small-Cap Growth Series | | Information Technology | | | 32 | |
Note 6—Derivative Financial Instruments and Transactions
($ reported in thousands)
Disclosures about derivative instruments and hedging activities are intended to enable investors to understand how and why a Series uses derivatives, how derivatives are accounted for, and how derivative instruments affect a Series’ results of operations and financial position. Summarized below are such disclosures and accounting policies for each specific type of derivative instrument used by certain Series.
Forward Currency Contracts: A forward currency contract involves an obligation to purchase or sell a specific currency at a future date, which may be any number of days from the date of the contract agreed upon by the parties, at a price set at the time of the contract. These contracts are traded directly between currency traders and their customers. The contract is marked-to-market daily and the change in market value is recorded by the Series as an unrealized gain or loss in the Statements of Operations. When the contract is closed or offset with the same counterparty, on settlement date, the Series record a realized gain or loss equal to the change in the value of the contract when it was opened and the value at the time it was closed or offset. This is presented in the Statements of Operations as net realized gain (loss) from foreign currency transactions.
Series enter into forward currency contracts in conjunction with the planned purchase or sale of foreign denominated securities in order to hedge the U.S. dollar cost or proceeds. The Series also, from time to time, hedge the currency exposure of foreign denominated securities, held in the portfolio, back to U.S. dollars during perceived times of U.S. dollar strength. This is done in order to protect the U.S. dollar value of the portfolio. Forward currency contracts involve, to varying degrees, elements of market risk in excess of the amount recognized in the Statement of Assets and Liabilities. Risks arise from the possible movements in foreign exchange rates or if the counterparty does not perform under the contract.
The International Series invested in a derivative instrument during the reporting period in the form of a forward currency contract. The primary type of risk associated with forward currency contracts is the risk associated with the conversion of foreign currency to U.S. dollars. The Series may invest in forward currency contracts in an attempt to manage such risk and protect the U.S. dollar value of the portfolio.
As of December 31, 2016, the International Series has an amount of $496 disclosed as “unrealized appreciation on forward currency contracts” in the Statements of Assets and Liabilities. This forward currency contract was executed under the ISDA 2002 Master Agreement without any Schedule thereto and without the requirement of posting any collateral to the counterparty.
Options Contracts: An options contract provides the purchaser with the right, but not the obligation, to buy (call option) or sell (put option) a financial instrument at an agreed-upon price. Certain Series may purchase or write both put and call options on portfolio securities for hedging purposes or to facilitate the rapid implementation of investment strategies if the Series anticipates a significant market or sector advance. The Series are subject to equity price risk in the normal course of pursuing their investment objectives. The Series may use options contracts to hedge against changes in the values of equities.
When a Series purchases an option, it pays a premium and an amount equal to that premium is recorded as an asset. When a Series writes an option, it receives a premium and an amount equal to that premium is recorded as a liability. The asset or liability is adjusted daily to reflect the current market value of the option. Holdings of the Series designated to cover outstanding written options are noted in the Schedules of Investments. Purchased options are reported as an asset within “Investment in unaffiliated securities at value” on the Statements of Assets and Liabilities. Options written are reported as a liability within “Written options at value.” Changes in value of the purchased option are included in “Net change in unrealized appreciation (depreciation) on investments” in the Statements of Operations. Changes in value of written options are included in “Net change in unrealized appreciation (depreciation) on written options” in the Statements of Operations.
If an option expires unexercised, the Series realizes a gain or loss to the extent of the premium received or paid. If an option is exercised, the premium received or paid is recorded as an adjustment to the proceeds from the sale or the cost basis of the purchase. The difference between the premium and the amount received or paid on effecting a closing purchase or sale transaction is also treated as a realized gain or loss. Gain or loss on purchased options is included in “Net realized gain (loss) on investments” in the Statements of Operations. Gain or loss on written options is presented separately as “Net realized gain (loss) on written options” in the Statements of Operations.
The risk in writing call options is that the Series gives up the opportunity for profit if the market price of the security increases and the option is exercised. The risk in writing put options is that the Series may incur a loss if the market price of the security decreases and the option is exercised. The risk in buying options is that the Series pays a premium whether or not the option is exercised. The use of such instruments may involve certain additional risks as a result of unanticipated movements in the market. Writers (sellers) of options are subject to unlimited risk of loss, as the seller will be obligated to deliver or take delivery of the security at a predetermined price which may, upon exercise of the option, be significantly different from the then-market value.
71
VIRTUS VARIABLE INSURANCE TRUST
NOTES TO FINANCIAL STATEMENTS (Continued)
DECEMBER 31, 2016
The Enhanced Core Equity Series invests in written covered call options contracts in an attempt to manage equity price risk and with the purpose of generating realized gains.
Written options transactions held by Enhanced Core Equity Series, during the period ended December 31, 2016, were as follows:
| | | | | | | | | | | | | | | | |
| | | Calls | | | Puts | |
| | | Number of
Contracts | | | Premiums
received | | | Number of
Contracts | | | Premiums
received | |
Written Options outstanding at December 31, 2015 | | | — | | | $ | — | | | | — | | | $ | — | |
Options written | | | 3,891 | | | | 277 | | | | 3,891 | | | | 1,197 | |
Options closed | | | (2,842 | ) | | | (205 | ) | | | (2,573 | ) | | | (791 | ) |
Options expired | | | (208 | ) | | | (5 | ) | | | (477 | ) | | | (202 | ) |
Options exercised | | | — | | | | — | | | | — | | | | — | |
| | | | | | | | | | | | | | | | |
Written Options outstanding at December 31, 2016 | | | 841 | | | $ | 67 | | | | 841 | | | $ | 204 | |
| | | | | | | | | | | | | | | | |
The following is a summary of the Enhanced Core Equity Series’ derivative instrument holdings categorized by primary risk exposure (equity contracts) in the financial statements as of December 31, 2016:
| | | | |
Statements of Assets and Liabilities | |
| | | Enhanced
Core Equity | |
Assets: Purchased options at value | | $ | 127 | (1) |
Liabilities: Written options at value | | | (310 | ) |
| | | | |
Net asset (liability) balance | | $ | (183 | ) |
| | | | |
| | | | |
Statements of Operations | |
| | | Enhanced
Core Equity | |
Net realized gain (loss) on purchased options | | $ | (543 | )(2) |
Net realized gain (loss) on written options | | | 1,081 | |
Net change in unrealized appreciation (depreciation) on purchased options | | | 18 | (3) |
Net change in unrealized appreciation (depreciation) on written options | | | (39 | ) |
| | | | |
Total net realized and unrealized gain (loss) | | $ | 517 | |
| | | | |
| | (1) | Amount included in Investment in securities at value. |
| | (2) | Amount included in Net realized gain (loss) on investments. |
| | (3) | Amount included in Net change in unrealized appreciation (depreciation) on investments. |
For the period ended December 31, 2016, Enhanced Core Equity Series’ average daily premiums paid by the Series for purchased options were $17 and the average daily premiums received for written call options by the Series were $38.
Note 7—Indemnifications
Under the Trust’s organizational documents and in separate agreements between each Trustee and the Trust, its Trustees and officers are indemnified against certain liabilities arising out of the performance of their duties to the Trust and its Series. In addition, in the normal course of business, the Series enter into contracts that provide a variety of indemnifications to other parties. The Series’ maximum exposure under these arrangements is unknown as this would involve future claims that may be made against the Series and that have not occurred. However, the Series have not had prior claims or losses pursuant to these arrangements and expect the risk of loss to be remote.
Note 8—Manager of Managers
The Trust and the Adviser have received an exemptive order from the SEC that permits the Adviser, subject to certain conditions and without the approval of shareholders to: (a) select both unaffiliated subadvisers and certain wholly-owned affiliated subadvisers to manage all or a portion of the assets of a Series, and enter into subadvisory agreements with such subadvisers, and (b) materially amend subadvisory agreements with such subadvisers. In such circumstances, shareholders would receive notice of such action.
Note 9—Mixed and Shared Funding
Shares of the Series are not directly offered to the public. Shares of the Series are currently offered through separate accounts to fund variable accumulation annuity contracts and variable universal life insurance policies issued by participating insurance companies.
The interests of variable annuity contract owners and variable life policy owners could diverge based on differences in U.S. federal and state regulatory requirements, tax laws, investment management or other unanticipated developments. The Trust’s Trustees do not foresee any such differences or disadvantages at this time. However, the Trust’s Trustees intend to monitor for any material conflicts and will determine what action, if any, should be taken in response to such conflicts. If such a conflict should occur, one or more separate accounts may be required to withdraw its investment in the Series, or shares of another Series may be substituted.
72
VIRTUS VARIABLE INSURANCE TRUST
NOTES TO FINANCIAL STATEMENTS (Continued)
DECEMBER 31, 2016
Note 10—Federal Income Tax Information
($ reported in thousands)
At December 31, 2016, federal tax cost and aggregate gross unrealized appreciation (depreciation) of securities held by each Series were as follows:
| | | | | | | | | | | | | | | | |
Series | | Federal
Tax Cost | | | Unrealized
Appreciation | | | Unrealized
(Depreciation) | | | Net Unrealized
Appreciation
(Depreciation) | |
Capital Growth Series | | $ | 124,388 | | | $ | 64,571 | | | $ | (5,154 | ) | | $ | 59,417 | |
Enhanced Core Equity Series (Including Purchased Options) | | | 97,896 | | | | 7,030 | | | | (723 | ) | | | 6,307 | |
Enhanced Core Equity Series—Written Options | | | (310 | ) | | | — | | | | — | | | | — | |
Equity Trend Series | | | 4,134 | | | | 398 | | | | (48 | ) | | | 350 | |
International Series | | | 164,796 | | | | 10,124 | | | | (5,220 | ) | | | 4,904 | |
Multi-Sector Fixed Income Series | | | 131,217 | | | | 2,895 | | | | (5,265 | ) | | | (2,370 | ) |
Real Estate Securities Series | | | 55,041 | | | | 26,125 | | | | (872 | ) | | | 25,253 | |
Small-Cap Growth Series | | | 39,544 | | | | 24,751 | | | | (1,686 | ) | | | 23,065 | |
Small-Cap Value Series | | | 63,042 | | | | 30,171 | | | | (2,267 | ) | | | 27,904 | |
Strategic Allocation Series | | | 92,990 | | | | 2,577 | | | | (3,243 | ) | | | (666 | ) |
Certain Series have capital loss carryovers available to offset future realized capital gains, through the indicated expiration dates shown below:
| | | | | | | | | | | | | | | | |
| | | 2017 | | | No Expiration | | | Total | |
Series | | Short-Term | | | Short-Term | | | Long-Term | | | | |
Capital Growth Series | | | 5,033 | | | $ | — | | | $ | — | | | $ | 5,033 | |
Equity Trend Series | | | — | | | | 2,780 | | | | — | | | | 2,780 | |
International Series | | | — | | | | 13,074 | | | | — | | | | 13,074 | |
Multi-Sector Fixed Income Series | | | 1,216 | | | | 415 | | | | 2,292 | | | | 3,923 | |
The Trust may not realize the benefit of these losses to the extent each Series does not realize gains on investments prior to the expiration of the capital loss carryovers. Utilization of this capital loss carryover is subject to annual limits.
Under the Regulated Investment Company Modernization Act of 2010 (the “Act”), net capital losses recognized for tax years beginning after December 22, 2010, may be carried forward indefinitely, and their character is retained as short-term and/or long-term losses. Previously, net capital losses were carried forward for eight years and treated as short-term losses. As a transition rule, the Act requires that post-enactment net capital losses be used before pre-enactment net capital losses. Capital loss carryover may be subject to limits on use of losses.
For the year ended December 31, 2016, the following Series utilized losses deferred in prior years against current year capital gains:
| | | | |
| Capital Growth Series | | $ | 18,965 | |
| Multi-Sector Fixed Income Series | | | 603 | |
For the year ended December 31, 2016, the following Series wrote off losses deferred in prior years:
| | | | |
| Multi-Sector Fixed Income Series | | $ | 179 | |
Capital losses realized after October 31 and certain late year losses may be deferred and treated as occurring on the first day of the following fiscal year. For the fiscal year ended December 31, 2016, the following Series deferred and recognized qualified late year losses as follows:
| | | | | | | | | | | | | | | | |
| | | Late Year
Ordinary
Losses
Deferred | | | Late Year
Ordinary
Losses
Recognized | | | Capital
Loss
Deferred | | | Capital
Loss
Recognized | |
Capital Growth Series | | $ | — | | | $ | — | | | $ | — | | | $ | 68 | |
Equity Trend Series | | | — | | | | — | | | | 18 | | | | 62 | |
Multi-Sector Fixed Income Series | | | — | | | | — | | | | 718 | | | | 2 | |
The components of distributable earnings on a tax basis (excluding unrealized appreciation (depreciation) which are disclosed in the beginning of this note) consist of the following:
| | | | | | | | |
| | | Undistributed
Ordinary Income | | | Undistributed
Long-Term Capital Gains | |
Enhanced Core Equity Series | | $ | 996 | | | $ | 2,541 | |
International Series | | | 666 | | | | — | |
Multi-Sector Fixed Income Series | | | 449 | | | | — | |
Real Estate Securities Series | | | 563 | | | | 2,558 | |
Small-Cap Growth Series | | | 97 | | | | 256 | |
Small-Cap Value Series | | | 998 | | | | 2,951 | |
Strategic Allocation Series | | | 481 | | | | 320 | |
The differences between the book and tax basis components of distributable earnings relate principally to the timing of recognition of income and gains for federal income tax purposes. Short-term gain distributions reported in the Statements of Changes in Net Assets, if any, are reported as ordinary income for federal tax purposes. Distributions are determined on a tax basis and may differ from net investment income and realized capital gains for financial reporting purposes. Permanent book and tax basis differences relating to shareholder distributions will result in reclassifications to capital paid in on shares of beneficial interest.
73
VIRTUS VARIABLE INSURANCE TRUST
NOTES TO FINANCIAL STATEMENTS (Continued)
DECEMBER 31, 2016
The tax character of dividends and distributions paid during the years ended December 31, 2016, and 2015 was as follows:
| | | | | | | | | | | | | | | | |
| | | | | | Ordinary
Income | | | Long-Term
Capital Gains | | | Total | |
Capital Growth Series | | | 2016 | | | $ | 4,514 | | | $ | — | | | $ | 4,514 | |
| | | 2015 | | | | — | | | | — | | | | — | |
Enhanced Core Equity Series | | | 2016 | | | | 1,666 | | | | 19,641 | | | | 21,307 | |
| | | 2015 | | | | 1,115 | | | | 12,618 | | | | 13,733 | |
Equity Trend Series | | | 2016 | | | | — | | | | — | | | | — | |
| | | 2015 | | | | — | | | | — | | | | — | |
International Series | | | 2016 | | | | 1,467 | | | | 36,155 | | | | 37,622 | |
| | | 2015 | | | | 5,315 | | | | 8,642 | | | | 13,957 | |
Multi-Sector Fixed Income Series | | | 2016 | | | | 5,851 | | | | — | | | | 5,851 | |
| | | 2015 | | | | 6,001 | | | | — | | | | 6,001 | |
Real Estate Securities Series | | | 2016 | | | | 2,001 | | | | 12,250 | | | | 14,251 | |
| | | 2015 | | | | 1,402 | | | | 14,910 | | | | 16,312 | |
Small-Cap Growth Series | | | 2016 | | | | 677 | | | | 4,633 | | | | 5,310 | |
| | | 2015 | | | | 230 | | | | 5,716 | | | | 5,946 | |
Small-Cap Value Series | | | 2016 | | | | 2,427 | | | | 10,074 | | | | 12,501 | |
| | | 2015 | | | | 734 | | | | 8,544 | | | | 9,278 | |
Strategic Allocation Series | | | 2016 | | | | 1,648 | | | | 10,307 | | | | 11,955 | |
| | | 2015 | | | | 2,238 | | | | 7,994 | | | | 10,232 | |
For financial reporting purposes, book basis capital accounts are adjusted to reflect the tax character of permanent book/tax differences. Permanent reclassifications can arise from differing treatment of certain income and gain transactions, nondeductible current year net operating losses, expiring capital loss carryovers and investments in passive foreign investment companies. The reclassifications have no impact on the net assets or net asset value of the Series. As of December 31, 2016, the Series recorded reclassifications to increase (decrease) the accounts as listed below:
| | | | | | | | | | | | |
| | | Capital Paid In
on Shares of
Beneficial Interest | | | Accumulated
Net Realized
Gain (Loss) | | | Undistributed
Net Investment
Income (Loss) | |
Capital Growth Series | | $ | (4,449 | ) | | $ | 9 | | | | 4,440 | |
Enhanced Core Equity Series | | | — | (1) | | | (10 | ) | | | 10 | |
Equity Trend Series | | | (9 | ) | | | — | (1) | | | 9 | |
International Series | | | — | | | | (24 | ) | | | 24 | |
Multi-Sector Fixed Income Series | | | (179 | ) | | | 649 | | | | (470 | ) |
Real Estate Securities Series | | | — | (1) | | | — | (1) | | | — | (1) |
Small-Cap Growth Series | | | — | | | | (139 | ) | | | 139 | |
Small-Cap Value Series | | | — | | | | — | (1) | | | — | (1) |
Strategic Allocation Series | | | — | (1) | | | (10 | ) | | | 10 | |
| | (1) | Amount is less than $500. |
Note 11—Illiquid and Restricted Securities
Investments are generally considered illiquid if they cannot be disposed of within seven days in the ordinary course of business at the approximate amount at which such securities have been valued by the Series. Additionally, the following information is also considered in determining liquidity: the frequency of trades and quotes for the investment, whether the investment is listed for trading on a recognized domestic exchange and/or whether two or more brokers are willing to purchase or sell the security at a comparable price, the extent of market making activity in the investment and the nature of the market for investment. Illiquid securities are footnoted as such at the end of each Series’ Schedule of Investments, where applicable. However, a portion of such footnoted securities could be liquid where it is determined that some, though not all, of the position could be disposed of within seven days in the ordinary course of business at the approximate amount at which such securities have been valued by the applicable Series.
Restricted securities are illiquid securities, as defined above, not registered under the Securities Act of 1933, as amended (the “1933 Act”). Generally, 144A securities are excluded from this category, except where defined as illiquid.
Each Series will bear any costs, including those involved in registration under the 1933 Act, in connection with the disposition of such securities.
None of the Series held securities considered to be illiquid at December 31, 2016.
At December 31, 2016, the Series did not hold any securities that were both illiquid and restricted.
74
VIRTUS VARIABLE INSURANCE TRUST
NOTES TO FINANCIAL STATEMENTS (Continued)
DECEMBER 31, 2016
As of December 31, 2016, each Series had individual shareholder account(s) (comprised of participating insurance companies to fund variable accumulation annuity contracts and variable universal life insurance policies), which individually amounted to more than 10% of the total shares outstanding of each such Series as detailed below:
| | | | | | | | |
| | | % of Total Shares
Outstanding | | | Number of
Accounts | |
Capital Growth Series | | | 100 | % | | | 2 | |
Enhanced Core Equity Series | | | 100 | | | | 2 | |
Equity Trend Series | | | 96 | | | | 3 | |
International Series | | | 99 | | | | 2 | |
Multi-Sector Fixed Income Series | | | 86 | | | | 2 | |
Real Estate Securities Series | | | 89 | | | | 2 | |
Small-Cap Growth Series | | | 99 | | | | 2 | |
Small-Cap Value Series | | | 100 | | | | 2 | |
Strategic Allocation Series | | | 100 | | | | 2 | |
Note 13—Borrowings
($ reported in thousands)
On June 29, 2016, the Series and other affiliated funds renewed a $50,000 secured line of credit. The Credit Agreement (the “Agreement”) is with a commercial bank (the “Bank”) that allows the Series to borrow cash from the Bank to manage large unexpected redemptions and trade fails, up to a limit of one-third of each Series’ total net assets in accordance with the Agreement. The Agreement has a term of 364 days and is renewable by the Series with the Bank’s consent and approval of the Board. Interest is charged at the higher of the LIBOR (London Interbank Offered Rate) or the Federal Funds rate plus an additional percentage rate on the amount borrowed. Commitment fees are charged on the undrawn balance. The Series and other affiliated funds that are parties are individually, and not jointly, liable for their particular advances, if any, under the line of credit. The Bank has the ability to require repayment of outstanding borrowings under the Agreement upon certain circumstances such as an event of default.
The Series had no outstanding borrowings at any time during the period ended December 31, 2016.
Note 14—Custody Fees Reimbursed
State Street Bank & Trust, custodian for some of the Series through January 29, 2010, reimbursed the Series for out-of-pocket custody expenses overbilled for the period 1998 through January 29, 2010. The amounts reimbursed, including interest, are shown in the Statement of Operations under “Custody Fees reimbursed.”
Note 15—Regulatory Matters and Litigation
From time to time, the Trust, the Series’ Adviser and/or Subadvisers and/or their affiliates may be involved in litigation and arbitration as well as examinations and investigations by various regulatory bodies, including the SEC, involving compliance with, among other things, securities laws, client investment guidelines, laws governing the activities of broker-dealers and other laws and regulations affecting their products and other activities. At this time, the Series’ Adviser believes that the outcomes of such matters are not likely, either individually or in the aggregate, to be material to these financial statements.
Note 16—New Accounting Pronouncements
On October 13, 2016, the SEC amended existing rules intended to modernize reporting and disclosure of information. Certain of these amendments relate to Regulation S-X which sets forth the requisite form and content of financial statements. At this time, management is evaluating the implications of adopting these amendments and their impact on the financial statements and accompanying notes.
Note 17—Subsequent Events
Management has evaluated the impact of all subsequent events on the Series through the date the financial statements were issued and has determined that there are no subsequent events requiring recognition or disclosure in these financial statements.
75

REPORT OF INDEPENDENT REGISTERED PUBLIC ACCOUNTING FIRM
To the Board of Trustees and Shareholders of
Virtus Variable Insurance Trust:
In our opinion, the accompanying statements of assets and liabilities, including the schedules of investments, and the related statements of operations and of changes in net assets and the financial highlights present fairly, in all material respects, the financial position of the Virtus Capital Growth Series, Virtus Enhanced Core Equity Series, Virtus Equity Trend Series, Virtus International Series, Virtus Multi-Sector Fixed Income Series, Virtus Real Estate Securities Series, Virtus Small-Cap Growth Series, Virtus Small-Cap Value Series and Virtus Strategic Allocation Series (constituting funds within Virtus Variable Insurance Trust, hereafter referred to as the “Trust”) at December 31, 2016, the results of each of their operations for the year then ended, the changes in each of their net assets for each of the two years in the period then ended and the financial highlights for each of the periods indicated, in conformity with accounting principles generally accepted in the United States of America. These financial statements and financial highlights (hereafter referred to as “financial statements”) are the responsibility of the Trust’s management. Our responsibility is to express an opinion on these financial statements based on our audits. We conducted our audits of these financial statements in accordance with the standards of the Public Company Accounting Oversight Board (United States). Those standards require that we plan and perform the audit to obtain reasonable assurance about whether the financial statements are free of material misstatement. An audit includes examining, on a test basis, evidence supporting the amounts and disclosures in the financial statements, assessing the accounting principles used and significant estimates made by management, and evaluating the overall financial statement presentation. We believe that our audits, which included confirmation of securities at December 31, 2016 by correspondence with the custodian, brokers, and the transfer agent of the investee funds, provide a reasonable basis for our opinion.
PricewaterhouseCoopers LLP
Philadelphia, Pennsylvania
February 23, 2017
76
VIRTUS VARIABLE INSURANCE TRUST
TAX INFORMATION NOTICE (UNAUDITED)
DECEMBER 31, 2016
For the fiscal year ended December 31, 2016, the Series make the following disclosures for federal income tax purposes: the percentages of ordinary income dividends earned by the Series which qualify for the dividends received deduction (“DRD”) for corporate shareholders; the actual percentage of DRD for the calendar year will be designated in year-end tax statements. The Series designate the amounts below as long-term capital gains dividends (“LTCG”) taxable at a 20% rate, or lower depending on the shareholder’s income ($ reported in thousands). LTCG amounts, if subsequently different, will be designated in the next annual report.
| | | | | | | | |
| | | DRD | | | LTCG | |
| Capital Growth Series | | | 37 | % | | $ | — | |
| Enhanced Core Equity Series | | | 73 | | | | 20,466 | |
| Equity Trend Series | | | — | | | | — | |
| International Series | | | 5 | | | | — | |
| Multi-Sector Fixed Income Series | | | — | | | | — | |
| Real Estate Securities Series | | | — | | | | 12,120 | |
| Small-Cap Growth Series | | | 65 | | | | 3,953 | |
| Small-Cap Value Series | | | 83 | | | | 11,901 | |
| Strategic Allocation Series | | | 47 | | | | 10,231 | |
77
CONSIDERATION OF ADVISORY AND SUBADVISORY AGREEMENTS
BY THE BOARD OF TRUSTEES
The Board of Trustees (the “Board”) of Virtus Variable Insurance Trust (the “Trust”) is responsible for determining whether to approve the continuation of the investment advisory agreement (the “Advisory Agreement”) between the Trust and Virtus Investment Advisers, Inc. (“VIA”) and of each subadvisory agreement (each, a “Subadvisory Agreement” and collectively, the “Subadvisory Agreements”) (together with the Advisory Agreement, the “Agreements”) with respect to the series (individually and collectively, the “Series”) of the Trust. At in-person meetings held on November 3, 2016 and November 16, 2016 (the “Meetings”), the Board, including a majority of the Trustees who are not interested persons of the Trust as defined in Section 2(a)(19) of the Investment Company Act of 1940, as amended (such Act, the “1940 Act” and such Trustees, the “Independent Trustees”), considered and approved the continuation of each Agreement due for renewal as further discussed below. In addition, prior to the Meetings, the Independent Trustees met with their independent legal counsel to discuss and consider the information provided by management and submitted questions to management, and they considered the responses provided.
In connection with the approval of the Agreements, the Board requested and evaluated information provided by VIA and each subadviser (each, a “Subadviser” and collectively, the “Subadvisers”) which, in the Board’s view, constituted information necessary for the Board to form a judgment as to whether the renewal of each of the Agreements would be in the best interests of each applicable Series and its respective shareholders. The Board also considered information furnished throughout the year at regular Board meetings with respect to the services provided by VIA and the Subadvisers, including quarterly performance reports prepared by management containing reviews of investment results and periodic presentations from the Subadvisers with respect to the Series they manage. The Board noted the affiliation of the Subadvisers with VIA and any potential conflicts of interest.
The Board was separately advised by independent legal counsel throughout the process. For each Agreement, the Board considered all the criteria separately with respect to the applicable Series and its shareholders. In their deliberations, the Board considered various factors, including those discussed below, none of which were controlling, and each Trustee may have attributed different weights to the various factors. The Independent Trustees also discussed the proposed approval of the Agreements in private sessions with their independent legal counsel at which no representatives of management were present.
In considering whether to approve the renewal of the Agreements with respect to each Series, the Board reviewed and analyzed the factors it deemed relevant, including: (1) the nature, extent and quality of the services to be provided to the Series by VIA and each of the Subadvisers; (2) the performance of the Series as compared to an appropriate peer group and an appropriate index; (3) the level and method of computing each Series’ advisory and subadvisory fees, and comparisons of the Series’ advisory fee rates with those of a group of funds with similar investment objective(s); (4) the profitability of VIA under the Advisory Agreement; (5) any “fall-out” benefits to VIA, the Subadvisers and their affiliates (i.e., ancillary benefits realized by VIA, the Subadvisers or their affiliates from VIA’s or the applicable Subadviser’s relationship with the Trust); (6) the anticipated effect of growth in size on each Series’ performance and expenses; (7) fees paid to VIA and the Subadvisers by comparable accounts, as applicable; (8) possible conflicts of interest; and (9) the terms of the Agreements.
Nature, Extent and Quality of Services. The Trustees received in advance of the Meetings information from VIA and each Subadviser, including completed questionnaires concerning a number of topics, including such company’s investment philosophy, resources, operations and compliance structure. The Trustees also received a presentation by VIA’s senior management personnel, during which among other items, VIA’s history, investment process, investment strategies, personnel, compliance procedures and the firm’s overall performance were reviewed and discussed. The Trustees noted that the Series are managed using a “manager of managers” structure that generally involves the use of one or more subadvisers to manage some or all of a Series’ portfolio. Under this structure, VIA is responsible for the management of the Series’ investment programs and for evaluating and selecting subadvisers on an ongoing basis and making any recommendations to the Board regarding hiring, retaining or replacing subadvisers. In considering the Agreement with VIA, the Board considered VIA’s process for supervising and managing the Series’ subadvisers, including (a) VIA’s ability to select and monitor the subadvisers; (b) VIA’s ability to provide the services necessary to monitor the subadvisers’ compliance with the Series’ respective investment objective(s), policies and restrictions as well as provide other oversight activities; and (c) VIA’s ability and willingness to identify instances in which a subadviser should be replaced and to carry out the required changes. The Trustees also considered: (a) the experience and capability of VIA’s management and other personnel; (b) the financial condition of VIA, and whether it had the financial wherewithal to provide a high level and quality of services to the Series; (c) the quality of VIA’s own regulatory and legal compliance policies, procedures and systems; (d) the nature, extent and quality of administrative and other services provided by VIA and its affiliates to the Series; (e) VIA’s supervision of the Series’ other service providers; and (f) VIA’s risk management processes. It was noted that affiliates of VIA serve as administrator and distributor to the Series. The Board also took into account its knowledge of VIA’s management and the quality of the performance of VIA’s duties through Board meetings, discussions and reports during the preceding year, as well as information from the Trust’s Chief Compliance Officer regarding the Series’ compliance policies and procedures established pursuant to Rule 38a-1 under the 1940 Act.
With respect to the services provided by each of the Subadvisers, the Board considered information provided to the Board by each Subadviser, including each Subadviser’s Form ADV, as well as information provided throughout the past year. With respect to the Subadvisory Agreements, the Board noted that each Subadviser provided portfolio management, compliance with each Series’ investment policies and procedures, compliance with applicable securities laws and assurances thereof. The Board also noted that VIA’s and the Subadvisers’ management of the Series is subject to the oversight of the Board and must be carried out in accordance with the investment objectives, policies and restrictions set forth in the Series’ prospectuses and statement of additional information. In considering the renewal of the Subadvisory Agreements, the Board also considered each Subadviser’s investment management process, including (a) the experience and capability of the Subadviser’s management and other personnel committed by the Subadviser to the respective Series; (b) the financial condition of the Subadviser; (c) the quality of the Subadviser’s regulatory and legal compliance policies, procedures and systems; and (d) the Subadviser’s brokerage and trading practices, including with respect to best execution and soft dollars. The Board
78
CONSIDERATION OF ADVISORY AND SUBADVISORY AGREEMENTS
BY THE BOARD OF TRUSTEES (Continued)
also took into account the Subadviser’s risk assessment and monitoring process. The Board noted each Subadviser’s regulatory history, including whether it was currently involved in any regulatory actions or investigations as well as material litigation, and any settlements and amelioratory actions undertaken, as appropriate.
After considering all of the information provided to them, the Trustees concluded that the nature, extent and quality of the services provided by VIA and each Subadviser were satisfactory and that there was a reasonable basis on which to conclude that each would continue to provide a high quality of investment services to the applicable Series.
Investment Performance. The Board considered performance reports and discussions at Board meetings throughout the year, as well as a report (the “Lipper Report”) for the Series prepared by Broadridge, an independent third party provider of investment company data, furnished in connection with the contract renewal process. The Lipper Report presented each Series’ performance relative to a peer group of other mutual funds (the “Performance Universe”) and relevant indexes, as selected by Broadridge. The Board also considered performance information presented by management and took into account management’s discussion of the same, including the effect of market conditions on each Series’ performance. The Board evaluated each Series’ performance in the context of the considerations that a “manager of managers” structure requires. The Board noted that it also reviews on a quarterly basis detailed information about the Series’ performance results and portfolio composition, as well as each Subadviser’s investment strategy. The Board noted VIA’s expertise and resources in monitoring the performance, investment style and risk-adjusted performance of each Subadviser. The Board also noted each Subadviser’s performance record with respect to the Series. The Board was mindful of VIA’s focus on each Subadviser’s performance and noted VIA’s performance in monitoring and responding to any performance issues with respect to the Series. The Board also took into account its discussions with management regarding factors that contributed to the performance of each Series.
The Board considered, among other performance data, the information set forth below with respect to the performance of each Series for the periods ended June 30, 2016:
Virtus International Series. The Board noted that the Series underperformed the median of its Performance Universe for the 1-, 3-, 5- and 10-year periods, and underperformed its benchmark for the 1-, 3-and 5- year periods. The Board also noted that the Series outperformed its benchmark for the 10 year period. The Board took into account management’s discussion of the Series’ performance, including the Subadviser’s investment style in the current market environment and actions taken to address the Series’ performance, including the replacement of the Series’ Subadviser in September 2016. The Board also noted that because the Series’ Subadviser changed in September 2016, all of the performance data shown reflected the performance of a prior subadviser.
Virtus Real Estate Securities Series. The Board noted that the Series outperformed the median of its Performance Universe for the 3-, 5- and 10-year periods, and underperformed the median of its Performance Universe for the 1-year period. The Board also noted that the Series underperformed its benchmark for the 1-, 3- and 5-year periods and outperformed its benchmark for the 10-year period. The Board took into account management’s discussion of the factors that contributed to the Series’ performance over the relevant periods. The Board also noted the Series’ strong performance over the long term.
Virtus Capital Growth Series. The Board noted that the Series underperformed the median of its Performance Universe for the 5- and 10-year periods and outperformed the median of its Performance Universe for the 1- and 3- year periods. The Board also noted that the Series underperformed its benchmark for the 1-, 3-, 5- and 10-year periods The Board took into account management’s discussion of the Series’ performance, including the Subadviser’s investment style in the current market environment and any actions taken to address the Series’ performance, including the replacement of the Series’ Subadviser in November 2010 and change in the Series’ portfolio manager in 2011. The Board also noted that because the Series’ Subadviser changed in November 2010, 10-year performance data in part reflects the performance of a prior subadviser.
Virtus Small-Cap Growth Series. The Board noted that the Series outperformed the median of its Performance Universe and its benchmark for the 1-, 3-, 5- and 10-year periods.
Virtus Small-Cap Value Series. The Board noted that the Series outperformed the median of its Performance Universe and its benchmark for the 1-, 3-, and 5-year periods and underperformed the median of its Performance Universe and its benchmark for the 10-year period. The Board took into account management’s discussion of the Series’ performance, including the impact of market conditions on the Series’ performance and the Subadviser’s investment style in the current market environment as well as the type of fund. The Board noted that because the Series’ Subadviser changed in November 2010, 10-year performance data in part reflects the performance of a prior subadviser.
Virtus Multi-Sector Fixed Income Series. The Board noted that the Series outperformed the median of its Performance Universe for the 3-, 5- and 10-year periods and outperformed its benchmark for the 5- and 10-year periods. The Board also noted that the Series underperformed the median of its Performance Universe for the 1-year period and underperformed its benchmark for the 1- and 3-year periods. The Board took into account management’s discussion of the factors that contributed to the Series’ performance over the relevant periods. The Board also noted the Series’ strong performance over the long term.
Virtus Strategic Allocation Series. The Board noted that the Series underperformed the median of its Performance Universe for the 1-, 3-, and 10-year periods and outperformed its Performance Universe for the 5-year period. The Board also noted that the Series underperformed its benchmark for the 1-, 3-, 5- and 10-year periods. The Board took into account management’s discussion of the factors that contributed to the Series’ performance over the relevant periods and any actions taken to address the Series’ performance, including the replacement of one of the Series’ Subadvisers in September 2016.
Virtus Enhanced Core Equity Series (fka Growth & Income Series). The Board noted that the Series underperformed the median of its Performance Universe and its benchmark for the 1-, 3-, 5- and 10-year periods. The Board took into account management’s discussion of the Series’ performance and any actions taken to address the Series’ performance, including the replacement of the Series’ Subadviser in September 2016.
79
CONSIDERATION OF ADVISORY AND SUBADVISORY AGREEMENTS
BY THE BOARD OF TRUSTEES (Continued)
Virtus Equity Trend Series. The Board noted that the Series underperformed the median of its Performance Universe and benchmark for the 1-, 3- and 5 year periods. The Board took into account management’s discussion of the Series’ performance, including the type of fund and the Series’ peer group, and any actions taken to address the Series’ performance, including the removal of the Series’ prior subadviser in May 2015.
After reviewing these and related factors, the Board concluded that each Series’ overall performance was satisfactory, or where noted above, action was being taken to address performance.
Management Fees and Total Expenses. The Board considered the fees charged to the Series for advisory services as well as the total expense levels of the Series. This information included comparisons of each Series’ net management fee and total expense level to those of its peer group (the “Expense Group”). In comparing each Series’ net management fee to that of comparable funds, the Board noted that in the materials presented such fee included both advisory and administrative fees. The Board also noted that all of the Series had fee waivers and/or expense caps in place to limit the total expenses incurred by the Series and its shareholders. The Board also noted that the subadvisory fees were paid by VIA out of its management fees rather than paid separately by the Series. In this regard, the Board took into account management’s discussion with respect to the advisory/subadvisory fee structure, including the amount of the advisory fee retained by VIA after payment of the subadvisory fee. The Board also took into account the size of each of the Series and the impact on expenses. The Subadvisers provided, and the Board considered, expense information of comparable accounts managed by the Subadvisers, as applicable.
In addition to the foregoing, the Board considered, among other data, the information set forth below with respect to each Series’ fees and expenses:
Virtus International Series. The Board considered that the Series’ net management fee after waivers was below the median of the Expense Group and net total expenses after waivers were the same as the median of the Expense Group.
Virtus Real Estate Securities Series. The Board considered that the Series’ net management fee after waivers and net total expenses after waivers were below the median of the Expense Group.
Virtus Capital Growth Series. The Board considered that the Series’ net management fee after waivers was below the median of the Expense Group while the Series’ net total expenses after waivers equaled the median of the Expense Group.
Virtus Small-Cap Growth Series. The Board considered that the Series’ net management fee after waivers was below the median of the Expense Group while the Series’ net total expenses after waivers were above the median of the Expense Group. The Board took into account management’s discussion of the Series’ expenses, including that VIA had waived a portion of its management fee.
Virtus Small-Cap Value Series. The Board considered that the Series’ net management fee and net total expenses after waivers were above the median of the Expense Group. The Board took into account management’s discussion of the Series’ expenses, including that VIA had waived a portion of its management fee.
Virtus Multi-Sector Fixed Income Series. The Board considered that the Series’ net management fee after waivers was below the median of the Expense Group while net total expenses after waivers were above the median of the Expense Group. The Board took into account management’s discussion of the Series’ expenses, including that VIA had waived a portion of its management fee.
Virtus Strategic Allocation Series. The Board considered that the Series’ net management fee after waivers was below the median of the Expense Group while the Series’ net total expenses after waivers were equal to the median of the Expense Group.
Virtus Enhanced Core Equity Series (fka Growth & Income Series). The Board considered that the Series’ net management fee and net total expenses after waivers were below the median of the Expense Group.
Virtus Equity Trend Series. The Board considered that the Series’ net management fee after waivers and the Series’ net total expenses after waivers each equaled the median of the Expense Group.
The Board concluded that the advisory and subadvisory fees for each Series, including with any proposed amendments, were fair and reasonable in light of the usual and customary charges made for services of the same nature and quality and the other factors considered.
Profitability. The Board also considered certain information relating to profitability that had been provided by VIA. In this regard, the Board considered information regarding the overall profitability, as well as on a Series-by-Series basis, of VIA for its management of the Trust, as well as its profits and those of its affiliates for managing and providing other services to the Trust, such as distribution and administrative services provided to the Series by a VIA affiliate. In addition to the fees paid to VIA and its affiliates, including the applicable Subadvisers, the Board considered any other benefits derived by VIA or its affiliates from their relationships with the Series. The Board reviewed the methodology used to allocate costs to each Series, taking into account the fact that allocation methodologies are inherently subjective and various allocation methodologies may each be reasonable while producing different results. The Board concluded that the profitability to VIA and its affiliates from each Series was reasonable in light of the quality of the services rendered to the Series by VIA and its affiliates.
In considering the profitability to the Subadvisers in connection with their relationship to the Series, the Board noted that the fees under the Subadvisory Agreements are paid by VIA out of the fees that VIA receives under the Advisory Agreement, so that Series shareholders are not directly impacted by those fees. In considering the reasonableness of the fees payable by VIA to the affiliated Subadvisers, the Board noted that, because such Subadvisers are affiliates of VIA, such profitability might be directly or indirectly shared by VIA. For each of the above reasons, the Board concluded that the profitability to the Subadvisers and their affiliates from their relationships with the Series was not a material factor in approval of the Subadvisory Agreements.
80
CONSIDERATION OF ADVISORY AND SUBADVISORY AGREEMENTS
BY THE BOARD OF TRUSTEES (Continued)
Economies of Scale. The Board received and discussed information concerning whether VIA realizes economies of scale as the Series’ assets grow. The Board noted that the management fees for most of the Series included breakpoints based on assets under management, and that fee waivers and/or expense caps were also in place for all of the Series. The Board also took into account management’s discussion of the Series’ management fee and subadvisory fee structure, including with respect to the Series that does not currently have breakpoints. The Board also took into account the current size of each Series. The Board also noted that VIA had agreed to implement an extension of each Series’ expense cap through April 30, 2018. The Board then concluded that no additional changes to the advisory fee structure of the Series were necessary at this time. The Board noted that VIA and the Series may realize certain economies of scale if the assets of the Series were to increase, particularly in relationship to certain fixed costs, and that shareholders of the Series would have an opportunity to benefit from these economies of scale.
For similar reasons as stated above with respect to the Subadvisers’ profitability, and based upon the current size of the Series managed by each Subadviser, the Board concluded that the potential for economies of scale in the Subadvisers’ management of the Series was not a material factor in the approval of the Subadvisory Agreements at this time.
Other Factors. The Board considered other benefits that may be realized by VIA and each Subadviser and their affiliates from their relationships with the applicable Series. Among them, the Board recognized that VP Distributors, LLC, an affiliate of VIA, serves as the Distributor for the Trust, and, as such, receives payments pursuant to Rule 12b-1 from the Series to compensate it for providing selling activities, which could lead to growth in the Trust’s assets and corresponding benefits from such growth, including economies of scale. The Board noted that an affiliate of VIA also provides administrative services to the Trust. The Board noted management’s discussion of the fact that, while the Subadvisers are affiliates of VIA, there are no other direct benefits to the Subadvisers or VIA in providing investment advisory services to the Series, other than the fee to be earned under the Subadvisory Agreement. There may be certain indirect benefits gained, including to the extent that serving the Series could provide the opportunity to provide advisory services to additional portfolios of the Trust or certain reputational benefits.
Based on all of the foregoing considerations, the Board, including a majority of the Independent Trustees, determined that approval of each Agreement, as amended, was in the best interests of each of the applicable Series and its respective shareholders. Accordingly, the Board, and the Independent Trustees voting separately, approved the Agreements, as amended, with respect to each Series.
81
FUND MANAGEMENT TABLES
Information pertaining to the Trustees and officers of the Trust as of December 31, 2016, is set forth below. The statement of additional information (SAI) includes additional information about the Trustees and is available without charge, upon request, by calling (800) 367-5877.
The address of each individual, unless otherwise noted, is c/o Virtus Variable Insurance Trust, 100 Pearl Street, Hartford, CT 06103. There is no stated term of office for Trustees or officers of the Trust.
Independent Trustees
| | |
| | |
Name,
Year of Birth,
Length of Time Served and
Number of Portfolios in Complex
Overseen | | Principal Occupation(s)
During Past 5 Years and
Other Directorships Held by Trustee |
Brown, Thomas J. YOB: 1945 Served Since: 2011 65 Portfolios | | Retired. Trustee (since 2016), Virtus Mutual Fund Complex (52 portfolios) and Virtus Alternative Solutions Trust (4 portfolios); Trustee (since 2011), Virtus Variable Insurance Trust (9 portfolios); Director (since 2010), D’Youville Senior Care Center; and Director (since 2005), VALIC Company Funds (49 portfolios). |
Burke, Donald C. YOB: 1960 Served Since: 2016 69 Portfolios | | Retired. Trustee (since 2016), Virtus Mutual Fund Complex (52 portfolios), Virtus Variable Insurance Trust (9 portfolios) and Virtus Alternative Solutions Trust (4 portfolios); Director (since 2014) closed-end funds managed by Duff & Phelps Investment Management Co. (4 funds); Director, Avista Corp. (energy company) (since 2011); Trustee, Goldman Sachs Fund Complex (2010 to 2014); and Director, BlackRock Luxembourg and Cayman Funds (2006 to 2010). |
Gelfenbien, Roger A. YOB: 1943 Served Since: 2000 65 Portfolios | | Retired. Trustee (since 2016), Virtus Mutual Fund Complex (52 portfolios) and Virtus Alternative Solutions Trust (4 portfolios); Trustee (since 2000), Virtus Variable Insurance Trust (9 portfolios); and Director (since 1999), USAllianz Variable Insurance Product Trust (42 portfolios). |
Mallin, John R. YOB: 1950 Served Since: 1999 65 Portfolios | | Partner/Attorney (since 2003), McCarter & English LLP (law firm), Real Property Practice Group; and Member (since 2014), Counselors of Real Estate. Trustee (since 2016), Virtus Mutual Fund Complex (52 portfolios) and Virtus Alternative Solutions Trust (4 portfolios); Director (since 2013), Horizons, Inc. (non-profit); and Trustee (since 1999), Virtus Variable Insurance Trust (9 portfolios). |
McClellan, Hassell H. YOB: 1945 Served Since: 2008 65 Portfolios | | Retired (since 2013); and Professor (1984 to 2013), Wallace E. Carroll School of Management, Boston College. Trustee (since 2016), Virtus Alternative Solutions Trust (4 portfolios); Trustee (since 2015), Virtus Mutual Fund Complex (52 portfolios); and Director (since 2010), Barnes Group, Inc. (diversified global components manufacturer and logistical services company); Trustee, Virtus Variable Insurance Trust (9 portfolios) (since 2008); and Trustee, John Hancock Fund Complex (since 2000) (collectively, 228 portfolios). |
McLoughlin, Philip YOB: 1946 Served Since: 2003 74 Portfolios | | Retired. Director and Chairman (since 2016), The Zweig Fund, Inc. and Virtus Global Dividend & Income Fund Inc.; Trustee and Chairman (since 2013), Virtus Alternative Solutions Trust (4 portfolios); Trustee/Director and Chairman (since 2011), Virtus Closed-End Funds (3 funds); Chairman and Trustee (since 2003), Virtus Variable Insurance Trust (9 portfolios); Director (since 1995), closed-end funds managed by Duff & Phelps Investment Management Co. (4 funds); Director (since 1991) and Chairman (since 2010), Lazard World Trust Fund (closed-end investment firm in Luxembourg); and Trustee (since 1989) and Chairman (since 2002), Virtus Mutual Fund Complex (52 portfolios). |
McNamara, Geraldine M. YOB: 1951 Served Since: 2015 69 Portfolios | | Retired. Trustee (since 2016) Virtus Alternative Solutions Trust (4 portfolios); Trustee (since 2015), Virtus Variable Insurance Trust (9 portfolios); Director (since 2003), closed-end funds managed by Duff & Phelps Investment Management Co. (4 funds); and Trustee (since 2001), Virtus Mutual Fund Complex (52 portfolios). |
Oates, James M. YOB: 1946 Served Since: 2016 70 Portfolios | | Managing Director (since 1994), Wydown Group (consulting firm). Director (since 2016), The Zweig Fund, Inc. and Virtus Global Dividend & Income Fund Inc.; Trustee (since 2016) Virtus Variable Insurance Trust (9 portfolios); Trustee/Director (since 2013), Virtus Closed-End Funds (3 funds); Trustee (since 2013), Virtus Alternative Solutions Trust (4 portfolios); Chairman and Trustee (since 2005), John Hancock Fund Complex (228 portfolios); Director (2002 to 2014), New Hampshire Trust Company; Chairman (since 2000), Emerson Investment Management, Inc.; Non-Executive Chairman (2000 to 2014), Hudson Castle Group, Inc. (formerly IBEX Capital Markets, Inc.) (financial services); Chairman and Director (1999 to 2014), Connecticut River Bank; Director (since 1996), Stifel Financial; and Trustee (since 1987), Virtus Mutual Fund Complex (52 portfolios). |
Segerson, Richard E. YOB: 1948 Served Since: 2016 65 Portfolios | | Retired; and Managing Director (1998 to 2013), Northway Management Company. Trustee (since 2016) Virtus Alternative Solutions Trust (4 portfolios) and Virtus Variable Insurance Trust (9 portfolios); and Trustee (since 1983), Virtus Mutual Fund Complex (52 portfolios). |
Verdonck, Ferdinand L.J. YOB: 1942 Served Since: 2016 65 Portfolios | | Vice Chairman (since 2014), Affirmed Therapeutics (biotechnology); Director (1998 to 2015), The J.P. Morgan Continental European Investment Trust; Director (2005 to 2013), Galapagos N.V. (biotechnology); Director (1998 to 2015) Groupe SNEF; and Mr. Verdonck is also a director of several non-U.S. companies. Trustee (since 2016) Virtus Variable Insurance Trust (9 portfolios) and Virtus Alternative Solutions Trust (4 portfolios); and Trustee (since 2002), Virtus Mutual Fund Complex (52 portfolios). |
82
FUND MANAGEMENT TABLES (Continued)
Interested Trustee
| | |
| | |
Name,
Year of Birth,
Year Elected and
Number of Funds
Overseen | | Principal Occupation(s)
During Past 5 Years and
Other Directorships Held by Trustee |
Aylward, George R.* Trustee and President YOB: 1964 Elected: 2012 70 Portfolios | | Director, President and Chief Executive Officer (since 2008), Virtus Investment Partners, Inc. and/or certain of its subsidiaries; various senior officer positions with Virtus affiliates (since 2005). Chairman and Trustee (since 2015), Virtus ETF Trust II (1 fund); Trustee and President (since 2013), Virtus Alternative Solutions Trust (4 portfolios); Director (since 2013), Virtus Global Funds, PLC (2 portfolios); Trustee (since 2012) and President (since 2010), Virtus Variable Insurance Trust (9 portfolios); Trustee and President (since 2011), Virtus Closed-End Funds (3 funds); Trustee (since 2006), Virtus Mutual Funds (52 portfolios); and Director, President and Chief Executive Officer (since 2006), The Zweig Fund, Inc. and Virtus Global Dividend & Income Fund Inc. |
| * | Mr. Aylward is an “interested person,” as defined in the 1940 Act, by reason of his position as President and Chief Executive Officer of Virtus Investment Partners, Inc. (“Virtus”), the ultimate parent company of the Adviser, and various positions with its affiliates, including the Adviser. |
83
FUND MANAGEMENT TABLES (Continued)
Officers
| | | | |
| | | |
Name, Address and
Year of Birth | | Position(s) Held with
Trust and Length of
Time Served | | Principal Occupation(s)
During Past 5 Years |
Bradley, W. Patrick YOB: 1972 | | Executive Vice President (since 2016); Senior Vice President (2013 to 2016); Vice President (2011 to 2013); Chief Financial Officer and Treasurer (since 2006). | | Executive Vice President, Fund Services (since 2016), Senior Vice President, Fund Services (2010 to 2016), Virtus Investment Partners, Inc. and/or certain of its subsidiaries; various officer positions (since 2006) with Virtus affiliates; Executive Vice President (since 2016), Senior Vice President (2013 to 2016), Vice President (2011 to 2013), Chief Financial Officer and Treasurer (since 2004), Virtus Variable Insurance Trust; Executive Vice President (since 2016), Senior Vice President (2013 to 2016), Vice President (2011 to 2013), Chief Financial Officer and Treasurer (since 2006), Virtus Mutual Fund Complex; Executive Vice President (since 2016), Senior Vice President (2013 to 2016), Vice President (2012 to 2013) and Treasurer (Chief Financial Officer) (since 2007), The Zweig Fund, Inc. and Virtus Global Dividend & Income Fund Inc.; Executive Vice President (since 2016), Senior Vice President (2013 to 2016), Vice President (2011 to 2013), Chief Financial Officer and Treasurer (since 2011), Virtus Closed-End Funds; Vice President and Assistant Treasurer (since 2011), Duff & Phelps Global Utility Income Fund Inc.; Director (since 2013), Virtus Global Funds, PLC; and Executive Vice President (since 2016), Senior Vice President, Chief Financial Officer and Treasurer (2013 to 2016), Virtus Alternative Solutions Trust. |
Engberg, Nancy J. YOB: 1956 | | Vice President and Chief Compliance Officer since 2011. | | Vice President (since 2008) and Chief Compliance Officer (2008 to 2011 and since 2016), Virtus Investment Partners, Inc. and/or certain of its subsidiaries; various officer positions (since 2003) with Virtus affiliates; Vice President and Chief Compliance Officer (since 2011), Virtus Mutual Fund Complex; Vice President (since 2010) and Chief Compliance Officer (since 2011), Virtus Variable Insurance Trust; Vice President and Chief Compliance Officer (since 2011), Virtus Closed-End Funds; Vice President and Chief Compliance Officer (since 2012), The Zweig Fund, Inc. and Virtus Global Dividend & Income Fund Inc.; Vice President and Chief Compliance Officer (since 2013), Virtus Alternative Solutions Trust; Chief Compliance Officer (since 2015), ETFis Series Trust I; and Chief Compliance Officer (since 2015), Virtus ETF Trust II. |
Jennifer S. Fromm YOB: 1973 | | Vice President, Chief Legal Officer and Secretary, since 2013 | | Assistant Secretary of various Virtus-affiliated open-end funds (since 2008); and Vice President (since 2016) and Senior Counsel (since 2007), Virtus Investment Partners, Inc. and/or certain of its subsidiaries; and Vice President, Chief Legal Officer, and Secretary (since 2013), Virtus Alternative Solutions Trust. |
Waltman, Francis G. YOB: 1962 | | Executive Vice President (since 2013); Senior Vice President (2008-2013). | | Executive Vice President, Product Development (since 2009), Virtus Investment Partners, Inc. and/or certain of its subsidiaries; various senior officer positions (since 2006) with Virtus affiliates; Executive Vice President (since 2013), Senior Vice President (2008 to 2013), Virtus Mutual Fund Complex; Executive Vice President (since 2013), Senior Vice President (2010 to 2013), Virtus Variable Insurance Trust; Executive Vice President (since 2013), Senior Vice President (2011 to 2013), Virtus Closed-End Funds; Director (since 2013), Virtus Global Funds PLC; and Executive Vice President (since 2013), Virtus Alternative Solutions Trust. |
84
VIRTUS VARIABLE INSURANCE TRUST
100 Pearl Street
Hartford, CT 06103-4506
Trustees
George R. Aylward
Thomas J. Brown
Donald C. Burke
Roger A. Gelfenbien
John R. Mallin
Hassell H. McClellan
Philip R. McLoughlin, Chairman
Geraldine M. McNamara
James M. Oates
Richard E. Segerson
Ferdinand L. J. Verdonck
Officers
George R. Aylward, President
Francis G. Waltman, Executive Vice President
W. Patrick Bradley, Executive Vice President, Chief Financial Officer and Treasurer
Nancy J. Engberg, Vice President and Chief Compliance Officer
Jennifer Fromm, Vice President, Chief Legal Officer, Counsel and Secretary
Investment Adviser
Virtus Investment Advisers, Inc.
100 Pearl Street
Hartford, CT 06103-4506
Principal Underwriter
VP Distributors, LLC
100 Pearl Street
Hartford, CT 06103-4506
Transfer Agent
Bank of New York Mellon
4400 Computer Drive
Westborough, MA 01581-1722
Custodian
JPMorgan Chase Bank, NA
1 Chase Manhattan Plaza
New York, NY 10005-1401
Independent Registered Public
Accounting Firm
PricewaterhouseCoopers LLP
2001 Market Street
Philadelphia, PA 19103-7042
How to Contact Us
Mutual Fund Services1-800-367-5877
WebsiteVirtus.com
Important Notice to Shareholders
The Securities and Exchange Commission has modified mailing regulations for semiannual and annual shareholder fund reports to allow mutual fund companies to send a single copy of these reports to shareholders who share the same mailing address. If you would like additional copies, please call Mutual Fund Services at 1-800-367-5877.

For more information about the Virtus Variable Insurance Trust, please contact us at 1-800-367-5877 or Virtus.com.
| (a) | The registrant, as of the end of the period covered by this report, has adopted a code of ethics that applies to the registrant’s principal executive officer, principal financial officer, principal accounting officer or controller, or persons performing similar functions, regardless of whether these individuals are employed by the registrant or a third party. |
| (c) | There have been no amendments, during the period covered by this report, to a provision of the code of ethics that applies to the registrant’s principal executive officer, principal financial officer, principal accounting officer or controller, or persons performing similar functions, regardless of whether these individuals are employed by the registrant or a third party, and that relates to any element of the code of ethics described in Item 2(b) of the instructions for completion of Form N-CSR. |
| (d) | The registrant has not granted any waivers, during the period covered by this report, including an implicit waiver, from a provision of the code of ethics that applies to the registrant’s principal executive officer, principal financial officer, principal accounting officer or controller, or persons performing similar functions, regardless of whether these individuals are employed by the registrant or a third party, that relates to one or more of the items set forth in paragraph (b) of the instructions for completion of this Item. |
| Item 3. | Audit Committee Financial Expert. |
| (a)(1) | The Registrant’s Board of Trustees has determined that the Registrant has an “audit committee financial expert” serving on its Audit Committee. |
| (a)(2) | The Registrant’s Board of Trustees has determined that each of Thomas J. Brown, Donald C. Burke and Richard E. Segerson possesses the technical attributes identified in Instruction 2(b) of Item 3 to Form N-CSR to qualify as an “audit committee financial expert.” Each of Messrs. Brown, Burke and Segerson is an “independent” trustee pursuant to paragraph (a)(2) of Item 3 to Form N-CSR. |
| Item 4. | Principal Accountant Fees and Services. |
Audit Fees
| (a) | The aggregate fees billed for each of the last two fiscal years for professional services rendered by the principal accountant for the audit of the registrant’s annual financial statements or services that are normally provided by the accountant in connection with statutory and regulatory filings or engagements for those fiscal years are $215,702 for 2016 and $209,510 for 2015. |
Audit-Related Fees
| (b) | The aggregate fees billed in each of the last two fiscal years for assurance and related services by the principal accountant that are reasonably related to the performance of the audit of the registrant’s financial statements and are not reported under paragraph (a) of this Item are $36,002 for 2016 and $44,907 for 2015. Such audit-related fees include out of pocket expenses and cross fund fees. |
Tax Fees
| (c) | The aggregate fees billed in each of the last two fiscal years for professional services rendered by the principal accountant for tax compliance, tax advice, and tax planning are $28,375 for 2016 and $31,000 for 2015. |
“Tax Fees” are those primarily associated with review of the Trust’s tax provision and qualification as a regulated investment company (RIC) in connection with audits of the Trust’s financial statement, review of year-end distributions by the Fund to avoid excise tax for the Trust, periodic discussion with management on tax issues affecting the Trust, and reviewing and signing the Fund’s federal income tax returns.
All Other Fees
| (d) | The aggregate fees billed in each of the last two fiscal years for products and services provided by the principal accountant, other than the services reported in paragraphs (a) through (c) of this Item are $0 for 2016 and $0 for 2015. |
| (e)(1) | Disclose the audit committee’s pre-approval policies and procedures described in paragraph (c)(7) of Rule 2-01 of Regulation S-X. |
The Virtus Variable Insurance Trust (the “Fund”) Board has adopted policies and procedures with regard to the pre-approval of services provided by PwC. Audit, audit-related and tax compliance services provided to the Fund on an annual basis require specific pre-approval by the Board. The Audit Committee must approve other non-audit services provided to the Fund and those non-audit services provided to the Fund’s Affiliated Service Providers that relate directly to the operations and financial reporting of the Fund. Certain of these non-audit services that the Audit Committee believes are a) consistent with the SEC’s auditor independence rules and b) routine and recurring services that will not impair the independence of the independent auditors may be approved by the Audit Committee without consideration on a specific case-by-case basis (“general pre-approval”).
The Audit Committee has determined that Mr. Thomas J. Brown, Chair of the Audit Committee, may provide pre-approval for such services that meet the above requirements in the event such approval is sought between regularly scheduled meetings. In any event, the Audit Committee is informed of each service approved subject to general pre-approval at the next regularly scheduled in-person Audit Committee meeting.
| (e)(2) | The percentage of services described in each of paragraphs (b) through (d) of this Item that were approved by the audit committee pursuant to paragraph (c)(7)(i)(C) of Rule 2-01 of Regulation S-X are as follows: |
(b) 0%
(c) 0%
(d) N/A
| (f) | The percentage of hours expended on the principal accountant’s engagement to audit the registrant’s financial statements for the most recent fiscal year that were attributed to work performed by persons other than the principal accountant’s full-time, permanent employees was less than fifty percent. |
| (g) | The aggregate non-audit fees billed by the registrant’s accountant for services rendered to the registrant, and rendered to the registrant’s investment adviser (not including any sub-adviser whose role is primarily portfolio management and is subcontracted with or overseen by another investment adviser), and any entity controlling, controlled by, or under common control with the adviser that provides ongoing services to the registrant for each of the last two fiscal years of the registrant was $686,723 for 2016 and $550,983 for 2015. |
| (h) | The registrant’s audit committee of the board of directors has considered whether the provision of non-audit services that were rendered to the registrant’s investment adviser (not including any sub-adviser whose role is primarily portfolio management and is subcontracted with or overseen by another investment adviser), and any entity controlling, controlled by, or under common control with the investment adviser that provides ongoing services to the registrant that were not pre-approved pursuant to paragraph (c)(7)(ii) of Rule 2-01 of Regulation S-X is compatible with maintaining the principal accountant’s independence. |
| Item 5. | Audit Committee of Listed Registrants. |
Not applicable.
| (a) | Schedule of Investments in securities of unaffiliated issuers as of the close of the reporting period is included as part of the report to shareholders filed under Item 1 of this form. |
| Item 7. | Disclosure of Proxy Voting Policies and Procedures for Closed-End Management Investment Companies. |
Not applicable.
| Item 8. | Portfolio Managers of Closed-End Management Investment Companies. |
Not applicable.
| Item 9. | Purchases of Equity Securities by Closed-End Management Investment Company and Affiliated Purchasers. |
Not applicable.
| Item 10. | Submission of Matters to a Vote of Security Holders. |
There have been no material changes to the procedures by which the shareholders may recommend nominees to the registrant’s board of trustees, where those changes were implemented after the registrant last provided disclosure in response to the requirements of Item 407(c)(2)(iv) of Regulation S-K (17 CFR 229.407) (as required by Item 22(b)(15) of Schedule 14A (17 CFR 240.14a-101)), or this Item.
| Item 11. | Controls and Procedures. |
| (a) | The registrant’s principal executive and principal financial officers, or persons performing similar functions, have concluded that the registrant’s disclosure controls and procedures (as defined in Rule 30a-3(c) under the Investment Company Act of 1940, as amended (the “1940 Act”) (17 CFR 270.30a-3(c))) are effective, as of a date within 90 days of the filing date of the report that includes the disclosure required by this paragraph, based on their evaluation of these controls and procedures required by Rule 30a-3(b) under the 1940 Act (17 CFR 270.30a-3(b)) and Rules 13a-15(b) or 15d-15(b) under the Securities Exchange Act of 1934, as amended (17 CFR 240.13a-15(b) or 240.15d-15(b)). |
| (b) | There were no changes in the registrant’s internal control over financial reporting (as defined in Rule 30a-3(d) under the 1940 Act (17 CFR 270.30a-3(d))) that occurred during the registrant’s second fiscal quarter of the period covered by this report that has materially affected, or is reasonably likely to materially affect, the registrant’s internal control over financial reporting. |
| | (a)(1) | Code of ethics, or any amendment thereto, that is the subject of disclosure required by Item 2 is attached hereto. |
| | (a)(2) | Certifications pursuant to Rule 30a-2(a) under the 1940 Act and Section 302 of the Sarbanes-Oxley Act of 2002 are attached hereto. |
| | (b) | Certifications pursuant to Rule 30a-2(b) under the 1940 Act and Section 906 of the Sarbanes-Oxley Act of 2002 are attached hereto. |
| (12.other) | Not applicable. |
SIGNATURES
Pursuant to the requirements of the Securities Exchange Act of 1934 and the Investment Company Act of 1940, the registrant has duly caused this report to be signed on its behalf by the undersigned, thereunto duly authorized.
| | | | |
| (Registrant) | | Virtus Variable Insurance Trust | | |
| | | | |
| | |
| By (Signature and Title)* | | /s/ George R. Aylward | | |
| | George R. Aylward, President | | |
| | (principal executive officer) | | |
Pursuant to the requirements of the Securities Exchange Act of 1934 and the Investment Company Act of 1940, this report has been signed below by the following persons on behalf of the registrant and in the capacities and on the dates indicated.
| | | | |
| By (Signature and Title)* | | /s/ George R. Aylward | | |
| | George R. Aylward, President | | |
| | (principal executive officer) | | |
| | | | |
| By (Signature and Title)* | | /s/ W. Patrick Bradley | | |
| | W. Patrick Bradley, Executive Vice President, Chief Financial Officer and Treasurer | | |
| | (principal financial officer) | | |
| * | Print the name and title of each signing officer under his or her signature. |