UNITED STATES
SECURITIES AND EXCHANGE COMMISSION
Washington, D.C. 20549
FORM N-CSR
CERTIFIED SHAREHOLDER REPORT OF REGISTERED MANAGEMENT INVESTMENT COMPANIES
Investment Company Act file number 811-04642
Virtus Variable Insurance Trust
(Exact name of registrant as specified in charter)
100 Pearl Street
Hartford, CT 06103-4506
(Address of principal executive offices) (Zip code)
Jennifer S. Fromm, Esq.
Vice President, Chief Legal Officer, Counsel and Secretary for Registrant
100 Pearl Street
Hartford, CT 06103-4506
(Name and address of agent for service)
Registrant’s telephone number, including area code: (800) 367-5877
Date of fiscal year end: December 31
Date of reporting period: December 31, 2013
Form N-CSR is to be used by management investment companies to file reports with the Commission not later than 10 days after the transmission to stockholders of any report that is required to be transmitted to stockholders under Rule 30e-1 under the Investment Company Act of 1940 (17 CFR 270.30e-1). The Commission may use the information provided on Form N-CSR in its regulatory, disclosure review, inspection, and policymaking roles.
A registrant is required to disclose the information specified by Form N-CSR, and the Commission will make this information public. A registrant is not required to respond to the collection of information contained in Form N-CSR unless the Form displays a currently valid Office of Management and Budget (“OMB”) control number. Please direct comments concerning the accuracy of the information collection burden estimate and any suggestions for reducing the burden to Secretary, Securities and Exchange Commission, 100 F Street, NE, Washington, DC 20549. The OMB has reviewed this collection of information under the clearance requirements of 44 U.S.C. § 3507.
Item 1. Reports to Stockholders.
The Report to Shareholders is attached herewith.

VIRTUS VARIABLE INSURANCE TRUST
ANNUAL REPORT
Virtus Capital Growth Series*
Virtus Growth & Income Series*
Virtus International Series*
Virtus Multi-Sector Fixed Income Series*
Virtus Premium AlphaSector® Series*
Virtus Real Estate Securities Series*
Virtus Small-Cap Growth Series*
Virtus Small-Cap Value Series*
Virtus Strategic Allocation Series*
| | | | | | |
* Prospectus supplements applicable to the Series appear at the back of this annual report. | | | | | December 31, 2013 | |
| | |
| The Annual Report describes one or more Series available for underlying investment through your variable contract. For information about your variable contract, including information about insurance-related expenses, see the prospectus for your variable contract. | | | |
| Not FDIC Insured
No Bank Guarantee May Lose Value |
|
Table of Contents
Proxy Voting Procedures and Voting Record (Form N-PX)
The adviser and subadvisers vote proxies relating to portfolio securities in accordance with procedures that have been approved by the Trustees of the Trust (“Trustees,” or the “Board”). You may obtain a description of these procedures, along with information regarding how the Series voted proxies during the most recent 12-month period ended June 30, free of charge, by calling toll-free 800-367-5877. This information is also available through the Securities and Exchange Commission’s (the “SEC”) website at http://www.sec.gov.
Form N-Q Information
The Trust files a complete schedule of portfolio holdings for each Series with the SEC for the first and third quarters of each fiscal year on Form N-Q. Form N-Q is available on the SEC’s website at http://www.sec.gov. Form N-Q may be reviewed and copied at the SEC’s Public Reference Room. Information on the operation of the SEC’s Public Reference Room can be obtained by calling toll-free 1-800-SEC-0330.
MESSAGE TO SHAREHOLDERS
Dear Virtus Variable Insurance Trust Investors:
| | |
 | | There were many positive signs for the economy in 2013. It was an exceptionally strong year for equities. Fueled by easy money from the Federal Reserve (the “Fed”) and a growing economy, the U.S. stock market soared to new highs as major indices delivered double-digit returns. The S&P 500® Index gained 32.4%, achieving its best year since 1997. International equities had mixed performance, as developed markets including Japan and Europe, generally posted strong returns, while emerging markets underperformed after several years of strong asset inflows. Worries about rising interest rates triggered volatility across fixed income markets for much of the second half of the year in response to the Fed’s decision to taper its aggressive bond buying program, an idea raised in late May and enacted in mid-December. The 10-year Treasury yield rose above 3.00% for the |
| | |
| first time since the summer of 2011, ending the year at 3.04% versus 1.78% at year-end 2012. The broad fixed income market, as measured by the Barclays U.S. Aggregate Bond Index, was down 2%, only the third negative annual return since 1976. |
|
Looking to the year ahead, there is good reason for investors to be optimistic. The U.S. economy continues to show signs of growth in hiring, consumer spending, and housing. While China’s recovery is still tenuous, Europe continues to recover and gain strength. The onus remains on the U.S. government to keep the country on strong fiscal footing and on corporations to produce robust earnings, which will play a pivotal role in determining future market direction. Market uncertainty is a timely reminder of the importance of portfolio diversification. While diversification cannot guarantee a profit or prevent loss, owning a variety of asset classes may cushion your portfolio against inevitable market fluctuations. Your financial advisor can help you ensure that your variable product portfolio is adequately diversified. Thank you for choosing Virtus investments. We appreciate your business and remain committed to your long-term financial success. Sincerely, 
George R. Aylward President, Virtus Variable Insurance Trust February 2014 |
Variable insurance products are sold by prospectus. You should carefully consider investment objectives, charges, expenses and risks before you invest. The contract prospectuses and underlying Series prospectuses contain this and other important information about the variable insurance product. You may obtain contract prospectuses from your registered representative. You may obtain Series prospectuses by contacting us at 1-800-367-5877 or Virtus.com. Please read the prospectuses carefully before you invest.
1
KEY INVESTMENT TERMS
ADR (American Depositary Receipt)
Represents shares of non-U.S. companies traded in U.S. dollars on U.S. exchanges that are held by a U.S. bank or trust. Non-U.S. companies use ADRs in order to make it easier for Americans to buy their shares. An ADR is likely to be traded over the counter.
Barclays U.S. Aggregate Bond Index
The Barclays U.S. Aggregate Bond Index measures the U.S. investment grade fixed rate bond market. The index is calculated on a total return basis. The index is unmanaged, its returns do not reflect any fees, expenses, or sales charges, and it is not available for direct investment.
Composite Index for Strategic Allocation
The composite index consists of 60% S&P 500® Index and 40% Barclays U.S. Aggregate Bond Index. The S&P 500® Index is a free-float market capitalization-weighted index of 500 of the largest U.S. companies. The index is calculated on a total return basis with dividends reinvested. The Barclays U.S. Aggregate Bond Index measures the U.S. investment grade fixed rate bond market. The index is calculated on a total return basis. The index is unmanaged, its returns do not reflect any fees, expenses, or sales charges, and it is not available for direct investment.
Consumer Price Index (CPI)
A measure that examines the weighted average of prices of a basket of consumer goods and services, such as transportation, food and medical care. The CPI is calculated by taking price changes for each item in the predetermined basket of goods and averaging them; the goods are weighted according to their importance.
ETF (Exchange-Traded Fund)
An open-end investment company that is traded like a stock.
European Central Bank (“ECB”)
The European Central Bank (ECB) is responsible for conducting monetary policy for the eurozone. The ECB was established as the core of the Eurosystem and the European System of Central Banks (ESCB). The ESCB comprises the ECB and the national central banks (NCBs) of all 17 European Union Member States whether they have adopted the Euro or not.
Federal Reserve (the “Fed”)
The central bank of the United States, responsible for controlling the money supply, interest rates and credit with the goal of keeping the U.S. economy and currency stable. Governed by a seven-member board, the system includes 12 regional Federal Reserve Banks, 25 branches and all national and state banks that are part of the system.
FTSE NAREIT Equity REITs Index
The FTSE NAREIT Equity REITs Index is a free-float market capitalization-weighted index measuring equity tax-qualified real estate investment trusts, which meet minimum size and liquidity criteria, that are listed on the New York Stock Exchange, the American Stock Exchange and the NASDAQ National Market System. The index is calculated on a total return basis with dividends reinvested. The index is unmanaged, its returns do not reflect any fees, expenses, or sales charges, and it is not available for direct investment.
MSCI EAFE® Index (net)
The MSCI EAFE® Index (net) is a free float-adjusted market capitalization-weighted index that measures developed foreign market equity performance, excluding the U.S. and Canada. The index is calculated on a total return basis with net dividends reinvested. The index is unmanaged, its returns do not reflect any fees, expenses, or sales charges, and it is not available for direct investment.
PIK (Payment-in-Kind)
A bond which pays interest in the form of additional bonds, or preferred stock that pays dividends in the form of additional preferred stock.
Quantitative Easing
A government monetary policy occasionally used to increase the money supply by buying government securities or other securities from the market. Quantitative easing increases the money supply by flooding financial institutions with capital in an effort to promote increased lending and liquidity.
2
KEY INVESTMENT TERMS (Continued)
REIT (Real Estate Investment Trust)
A publicly traded company that owns, develops and operates income-producing real estate such as apartments, office buildings, hotels, shopping centers and other commercial properties.
Russell 1000® Growth Index
The Russell 1000® Growth Index is a market capitalization-weighted index of growth-oriented stocks of the 1,000 largest companies in the Russell Universe, which comprises the 3,000 largest U.S. companies. The index is calculated on a total return basis with dividends reinvested. The index is unmanaged, its returns do not reflect any fees, expenses, or sales charges, and it is not available for direct investment.
Russell 2000® Growth Index
The Russell 2000® Growth Index is a market capitalization-weighted index of growth-oriented stocks of the smallest 2,000 companies in the Russell Universe, which comprises the 3,000 largest U.S. companies. The index is calculated on a total return basis with dividends reinvested. The index is unmanaged, its returns do not reflect any fees, expenses, or sales charges, and it is not available for direct investment.
Russell 2000® Value Index
The Russell 2000® Value Index is a market capitalization-weighted index of value-oriented stocks of the smallest 2,000 companies in the Russell Universe, which comprises the 3,000 largest U.S. companies. The index is calculated on a total return basis with dividends reinvested. The index is unmanaged, its returns do not reflect any fees, expenses, or sales charges, and it is not available for direct investment.
S&P 500® Index
The S&P 500® Index is a free-float market capitalization-weighted index of 500 of the largest U.S. companies. The index is calculated on a total return basis with dividends reinvested. The index is unmanaged, its returns do not reflect any fees, expenses, or sales charges, and it is not available for direct investment.
Sponsored ADR (American Depositary Receipt)
An ADR that is issued with the cooperation of the company whose stock will underlie the ADR. Sponsored ADRs generally carry the same rights normally given to stockholders, such as voting rights. ADRs must be sponsored to be able to trade on a major U.S. exchange such as the NYSE.
The indexes are unmanaged and not available for direct investment; therefore, their performance does not reflect the expenses associated with active management of an actual portfolio.
3
VIRTUS VARIABLE INSURANCE TRUST
Disclosure of Series Expenses (Unaudited)
For the six-month period of July 1, 2013 to December 31, 2013
We believe it is important for you to understand the impact of costs on your investment. All mutual funds have operating expenses. As a shareholder of a Series (each a “Series”) of Virtus Variable Insurance Trust (the “Trust”), you incur ongoing costs including investment advisory fees and other expenses. These expense examples are intended to help you understand your ongoing costs (in dollars) of investing in a Series and to compare these costs with the ongoing costs of investing in other mutual funds. These expense examples are based on an investment of $1,000 invested at the beginning of the period and held for the entire six-month period. The following Expense Table illustrates a Series’ costs in two ways.
Actual Expenses
This section of the accompanying table provides information about actual account values and actual expenses. You may use the information in this section, together with the amount you invested, to estimate the expenses that you paid over the period. Simply divide your account value by $1,000 (for example, an $8,600 account value divided by $1,000 = 8.6), then multiply the result by the number in the first line under the heading entitled “Expenses Paid During Period” to estimate the expenses you paid on your account during this period. The expense estimate does not include the fees or expenses associated with the separate insurance accounts, and if such charges were included, your costs would have been higher.
Hypothetical Example for Comparison Purposes
This section of the accompanying table provides information about hypothetical account values and hypothetical expenses based on a Series’ actual expense ratio and an assumed rate of return of 5% per year before expenses, which is not your Series’ actual return. The hypothetical account values and expenses may not be used to estimate the actual ending account balance or expenses you paid for the period. You may use this information to compare the ongoing costs of investing in your Series and other mutual funds. To do so, compare these 5% hypothetical examples with the 5% hypothetical examples that appear in the shareholder reports of the other mutual funds.
Please note that the expenses shown in the accompanying table are meant to highlight your ongoing costs only and do not reflect additional fees and expenses associated with the annuity or life insurance policy through which you invest. Therefore, this section of the accompanying table is useful in comparing ongoing costs only, and will not help you determine the relative total costs of owning different funds. In addition, if the annuity or life insurance policy costs were included, your costs would have been higher. The calculations assume no shares were bought or sold during the period. Your actual costs may have been higher or lower, depending on the amount of your investment and the timing of any purchases or redemptions.
| | | | | | | | | | | | | | | | |
| Expense Table | |
| | | Beginning
Account Value
July 1, 2013 | | | Ending
Account Value
December 31, 2013 | | | Annualized
Expense
Ratio | | | Expenses Paid
During
Period* | |
Capital Growth Series | |
Actual | |
Class A | | $ | 1,000.00 | | | $ | 1,198.20 | | | | 1.03 | % | | $ | 5.71 | |
|
Hypothetical (5% return before expenses) | |
Class A | | | 1,000.00 | | | | 1,019.95 | | | | 1.03 | | | | 5.26 | |
Growth & Income Series | |
Actual | |
Class A | | $ | 1,000.00 | | | $ | 1,203.80 | | | | 0.98 | % | | $ | 5.44 | |
|
Hypothetical (5% return before expenses) | |
Class A | | | 1,000.00 | | | | 1,020.20 | | | | 0.98 | | | | 5.00 | |
International Series | |
Actual | |
Class A | | $ | 1,000.00 | | | $ | 1,088.90 | | | | 1.18 | % | | $ | 6.21 | |
Class I | | | 1,000.00 | | | | 1,090.40 | | | | 0.93 | | | | 4.90 | |
|
Hypothetical (5% return before expenses) | |
Class A | | | 1,000.00 | | | | 1,019.18 | | | | 1.18 | | | | 6.02 | |
Class I | | | 1,000.00 | | | | 1,020.46 | | | | 0.93 | | | | 4.75 | |
Multi-Sector Fixed Income Series | |
Actual | |
Class A | | $ | 1,000.00 | | | $ | 1,033.80 | | | | 0.94 | % | | $ | 4.82 | |
Class I | | | 1,000.00 | | | | 1,035.20 | | | | 0.69 | | | | 3.54 | |
|
Hypothetical (5% return before expenses) | |
Class A | | | 1,000.00 | | | | 1,020.41 | | | | 0.94 | | | | 4.80 | |
Class I | | | 1,000.00 | | | | 1,021.68 | | | | 0.69 | | | | 3.52 | |
Premium AlphaSector® Series | |
Actual | |
Class A | | $ | 1,000.00 | | | $ | 1,148.30 | | | | 1.70 | % | | $ | 9.21 | |
Class I | | | 1,000.00 | | | | 1,149.30 | | | | 1.45 | | | | 7.86 | |
|
Hypothetical (5% return before expenses) | |
Class A | | | 1,000.00 | | | | 1,016.53 | | | | 1.70 | | | | 8.68 | |
Class I | | | 1,000.00 | | | | 1,017.80 | | | | 1.45 | | | | 7.40 | |
Real Estate Securities Series | |
Actual | |
Class A | | $ | 1,000.00 | | | $ | 962.55 | | | | 1.16 | % | | $ | 5.74 | |
Class I | | | 1,000.00 | | | | 963.50 | | | | 0.91 | | | | 4.50 | |
|
Hypothetical (5% return before expenses) | |
Class A | | | 1,000.00 | | | | 1,019.28 | | | | 1.16 | | | | 5.92 | |
Class I | | | 1,000.00 | | | | 1,020.56 | | | | 0.91 | | | | 4.65 | |
Small-Cap Growth Series | |
Actual | |
Class A | | $ | 1,000.00 | | | $ | 1,195.00 | | | | 1.19 | % | | $ | 6.58 | |
Class I | | | 1,000.00 | | | | 1,196.00 | | | | 0.94 | | | | 5.20 | |
|
Hypothetical (5% return before expenses) | |
Class A | | | 1,000.00 | | | | 1,019.13 | | | | 1.19 | | | | 6.07 | |
Class I | | | 1,000.00 | | | | 1,020.41 | | | | 0.94 | | | | 4.80 | |
Small-Cap Value Series | |
Actual | |
Class A | | $ | 1,000.00 | | | $ | 1,264.40 | | | | 1.20 | % | | $ | 6.85 | |
|
Hypothetical (5% return before expenses) | |
Class A | | | 1,000.00 | | | | 1,019.08 | | | | 1.20 | | | | 6.13 | |
4
VIRTUS VARIABLE INSURANCE TRUST
Disclosure of Series Expenses (Unaudited) (Continued)
For the six-month period of July 1, 2013 to December 31, 2013
| | | | | | | | | | | | | | | | |
| Expense Table—continued | |
| | | Beginning
Account Value
July 1, 2013 | | | Ending
Account Value
December 31, 2013 | | | Annualized
Expense
Ratio | | | Expenses Paid
During
Period* | |
Strategic Allocation Series | |
Actual | | | | | | | | | | | | | | | | |
Class A | | $ | 1,000.00 | | | $ | 1,124.80 | | | | 0.98 | % | | $ | 5.25 | |
|
Hypothetical (5% return before expenses) | |
Class A | | | 1,000.00 | | | | 1,020.20 | | | | 0.98 | | | | 5.00 | |
| * | Expenses are equal to the relevant Series’ annualized expense ratio which is net of waived fees and reimbursed expenses, if applicable, multiplied by the average account value over the period, multiplied by the number of days (184) expenses were accrued in the most recent fiscal half-year, then divided by 365 days to reflect the one-half year period. Exceptions noted below. |
| | A Series may invest in other funds, and the annualized expense ratios noted above do not reflect fees and expenses associated with the underlying funds. If such fees and expenses had been included, the expenses would have been higher. |
| | You can find more information about a Series’ expenses in the Financial Statements section that follows. For additional information on operating expenses and other shareholder costs, including contractual charges associated with the separate account, refer to the Series prospectus and the contract prospectus. |
5
Series Summary December 31, 2013 (Unaudited)
Portfolio Manager Commentary by
Kayne Anderson Rudnick Investment Management LLC
| ¢ | | The Series is diversified and has an investment objective of long-term growth of capital. There is no guarantee that the Series will meet its objective. |
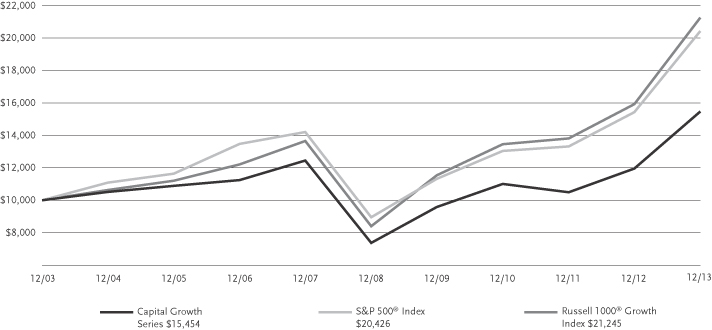
| ¢ | | For the fiscal year ended December 31, 2013, the Series’ Class A shares at NAV returned 29.44%. For the same period, the S&P 500® Index, a broad-based equity index, returned 32.39% and the Russell 1000® Growth Index, the Series’ style-specific benchmark appropriate for comparison, returned 33.48%. |
All performance figures assume the reinvestment of distributions and exclude the effect of fees and expenses associated with the variable life insurance or annuity product through which you invest. Past performance is no guarantee of future results and current performance may be higher or lower than the performance shown above.
How did the market in which the Series invests perform during the Series’ fiscal year?
| ¢ | | The stock market had an extraordinary year in 2013, moving to record highs despite fear of Federal Reserve stimulus tapering coupled with political debates surrounding a government shutdown and the possible threat of a U.S. debt default. For the year, the S&P 500® Index increased 32.39%, and the Russell 1000® Growth Index rose 33.48%. Notably, the S&P 500 Index produced its highest annual return since 1997. |
| ¢ | | There are a number of key reasons why stocks did so well in 2013. First, the Federal Reserve continued to provide supportive monetary policy through its quantitative easing (QE) program and did not confirm its plans for modest tapering until December. Central bankers in Europe and Japan also used monetary policy to stimulate domestic business activity. |
| ¢ | | Second, corporate profitability held up very well, with companies generating excess capital, sustaining healthy margins, and allocating capital more wisely than they have in the past. Corporate buybacks and dividend increases continued at a robust pace, while 2013 proved to be the strongest IPO market since 2000, thanks to the impressive pace of innovation in industries such as technology, energy, and health care. |
| ¢ | | Third, improvement in the housing market and the employment situation was significant in 2013. Despite some slowdown in the second half of the year as a result of slightly higher mortgage rates, housing prices continued to improve due to low levels of inventory. Meanwhile, the U.S. employ- |
| | | ment situation experienced slow but material improvement, and after hitting a post-recession low during the third quarter, the unemployment rate decreased even further, falling to 7% by year end. In addition, initial jobless claims decreased consistently, reaching levels not experienced since 2007. |
| ¢ | | Riskier, lower quality stocks tend to perform better than the overall market in this type of environment. Specifically, stocks with higher betas, long-term debt-to-capital ratios greater than 100%, and price-to-earnings ratios greater than 45 times earnings performed better than the Russell 1000 Growth Index. |
What factors affected the Series’ performance during its fiscal year?
| ¢ | | For the year, the Virtus Capital Growth Series trailed the return of the Russell 1000 Growth Index. In a market where riskier, lower quality stocks have strong performance, our portfolio of less risky, higher quality names will typically underperform. |
| ¢ | | From a sector perspective, performance was helped by strong stock selection in the information technology and financials sectors, but this was more than offset by negative stock selection in the health care and industrials sectors. |
| ¢ | | From a stock perspective, the companies that contributed the most to performance were Facebook and priceline.com. Facebook’s stock rallied when the company reported strong results from its mobile advertising platform. Investors had been worried that the company might not be able to duplicate its success at generating revenues on desktop computers. Shares of priceline.com outperformed after reporting strong revenue and earnings growth despite increased advertising spending and continued headwinds in Europe. Despite Europe’s near-term macro headwinds, the company has significant long-term growth prospects in a highly fragmented European lodging market. Over the long term, in our opinion we expect revenue and earnings growth to be robust driven by international bookings in Europe as well as Asia. |
| ¢ | | The companies that contributed the least to performance were Intuitive Surgical and Zoetis. After years of rapid expansion in its installed base of robotic surgery machines, Intuitive Surgical is suffering from customer uncertainty surrounding new health care legislation and transitory factors pressuring demand which have resulted in excess capacity for the company’s da Vinci robots. As a result, Intuitive missed second quarter expectations and lowered its 2013 guidance, which sent the stock down in the quarter. We continue to like |
| | | the stock as the company’s technology and competitive position in our view could create long-term sustainable growth and robust profitability. Shares of animal health leader Zoetis finished the year at nearly the same price at which it started trading in February when it was spun off from drug giant Pfizer. As a result, it underperformed the market despite underlying improvements in the business. The company’s large direct sales force offers the industry’s widest portfolio of products and services, but struggled to meaningfully grow revenue due to lower demand from North America’s drought-affected areas. Over the next few quarters, in our view declining commodity costs should improve livestock producer profitability and reignite growth in that segment, Zoetis’ largest. It is anticipated that the company will augment that improvement with a product pipeline full of novel technologies that could reach the market in the next 18 months, emerging market growth, and proliferation of complementary service offerings. |
The preceding information is the opinion of portfolio management only through the end of the period of the report as stated on the cover. Any such opinions are subject to change at any time based upon market or other conditions and should not be relied upon as investment advice.
The market price of equity securities may be affected by financial market, industry, or issuer-specific events. Focus on a particular style or on small or medium sized companies may enhance that risk.
Because the Series has a limited number of securities, it may be more susceptible to factors adversely affecting its securities than a less concentrated portfolio.
Because the Series is presently heavily weighted in the technology sector, it will be impacted by that sector’s performance more than a portfolio with broader sector diversification.
| | | | |
| |
| Asset Allocation | |
| |
The following table presents asset allocations within certain sectors and as a percentage of total investments as of December 31, 2013. | |
Information Technology | | | 35 | % |
Consumer Discretionary | | | 18 | |
Industrials | | | 12 | |
Consumer Staples | | | 10 | |
Health Care | | | 8 | |
Financials | | | 6 | |
Energy | | | 5 | |
Other (includes short-term investments) | | | 6 | |
| | | | | |
Total | | | 100 | % |
| | | | | |
For information regarding the indexes and key investment terms, see the Key Investment Terms starting on page 2.
6
| | |
| Capital Growth Series (Continued) | | |
| | | | | | | | | | | | |
| Average Annual Total Return1 for periods ended 12/31/13 | | | | | | | | | |
| | | |
| | | 1 year | | | 5 years | | | 10 years | |
| Class A at NAV2 | | | 29.44 | % | | | 15.96 | % | | | 4.45 | % |
| S&P 500® Index | | | 32.39 | | | | 17.94 | | | | 7.40 | |
| Russell 1000® Growth Index | | | 33.48 | | | | 20.39 | | | | 7.83 | |
| Series expense ratios3: Class A Gross: 1.13%; Net: 1.03%. | | | | | | | | | | | | |
Returns represent past performance, which is no guarantee of future results. The investment return and principal value will fluctuate so that an investor’s shares, when redeemed, may be worth more or less than the original cost. Total return does not reflect expenses associated with the separate account such as the administrative fees, account charges and surrender charges, which if reflected, would reduce total return. Performance figures may reflect fee waivers and/or expense reimbursements. In the absence of fee waivers and/or expense reimbursements, the total return would have been lower. Please visit Virtus.com for performance data current to the most recent month-end.
| 1 | Total returns are historical and include changes in share price and the reinvestment of both dividends and capital gains distributions. |
| 2 | “NAV” (Net Asset Value) total returns do not reflect any fees or expenses associated with the separate insurance accounts. |
| 3 | The expense ratios of the Series, both net and gross, are set forth according to the prospectus for the Series effective May 1, 2013, as supplemented and revised, and may differ from the expense ratios disclosed in the Financial Highlights tables in this report. See the Financial Highlights for more current information. Net Expenses: Expenses reduced by a contractual waiver in effect through April 30, 2014. Gross Expenses: Do not reflect the effect of a contractual waiver. |
Growth of $10,000 For periods ended 12/31
This chart assumes an initial investment of $10,000 made on December 31, 2003 for Class A shares. Returns shown include the reinvestment of all distributions at net asset value, and the change in share price for the stated period.
The indexes are unmanaged and not available for direct investment; therefore, their performance does not reflect the expenses associated with active management of an actual portfolio.
For information regarding the indexes and key investment terms, see the Key Investment Terms starting on page 2.
7
Series Summary December 31, 2013 (Unaudited)
Portfolio Manager Commentary by
Euclid Advisors LLC
| ¢ | | The Series is diversified and has investment objectives of capital appreciation and current income. There is no guarantee that the Series will meet its objectives. |
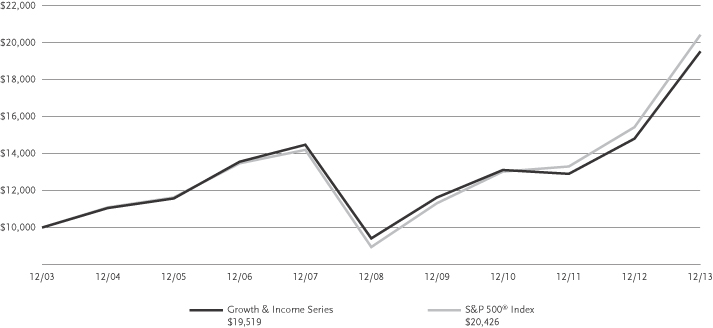
| ¢ | | For the fiscal year ended December 31, 2013, the Series Class A shares at NAV returned 31.81%. For the same period, the S&P 500® Index, which serves as the broad-based and style-specific benchmark index appropriate for comparison, returned 32.39%. |
All performance figures assume the reinvestment of distributions and exclude the effect of fees and expenses associated with the variable life insurance or annuity product through which you invest. Past performance is no guarantee of future results and current performance may be higher or lower than the performance shown above.
How did the market in which the Series invests perform during the Series’ fiscal year?
| ¢ | | Overall, 2013 was a very good year to be in the stock market. U.S. equity markets traded higher throughout the year with very few dips, stocks were propelled to record highs, and notably the S&P 500 Index produced its highest annual return since 1997. |
| ¢ | | Drastically different investment themes drove the market in the first and second halves of the year. Early in the year, more defensive, higher yielding stocks led the market as investors were still reaching for yield. During this period, the sectors that performed best included consumer staples, health care, telecom, and utilities. Investors who had been on the sidelines since the 2008-2009 financial crisis seemingly felt more comfortable investing in these ostensibly more conservative stocks. |
| ¢ | | However, as the year progressed, equity investors started focusing on better-than-expected global growth, and recognized that more cyclical sectors of the market were worthy of investment. In the second half of the year, the best performing areas were industrials, technology, consumer discretionary, basic materials, and financials, all of which are considered more economically sensitive and cyclical. |
What factors affected the Series’ performance during its fiscal year?
| ¢ | | We are generally pleased with the Series’ performance, despite being slightly behind the benchmark S&P 500® Index net of all fees and expenses. Our belief early in 2013 was that a combination of easy money, loose central bank policy globally, low inflation, marginally better economic growth, and attractive valuations would lead to higher stock prices. Indeed, the market did move sharply higher, largely because of the factors mentioned above. |
| ¢ | | However, as noted above, the year was very much bifurcated where at first defensive stocks rallied, and then cyclical names played catch-up in the second half. In the first part of the year, the Series was positioned in the more economically sensitive areas of the market, which hurt returns in the first two quarters. However, as market sentiment shifted in favor of the more cyclical holdings of the portfolio, performance was strong in the third and fourth quarters and the Series finished out the year virtually in line with the benchmark. |
| ¢ | | The Series was well positioned by having a greater-than-market weight in both financial stocks and energy issues. Both sectors helped relative performance on the year, as did being underweight in telecom and consumer staples. However, stock selection was challenged in both technology and consumer discretionary, which hurt performance on the year. |
The preceding information is the opinion of portfolio management only through the end of the period of the report as stated on the cover. Any such opinions are subject to change at any time based upon market or other conditions and should not be relied upon as investment advice, and there is no guarantee that market forecasts will be realized.
The market price of equity securities may be affected by financial market, industry, or issuer-specific events. Focus on a particular style or on small or medium sized companies may enhance that risk.
| | | | |
| |
| Asset Allocation | |
| |
The following table presents asset allocations within certain sectors and as a percentage of total investments as of December 31, 2013. | |
Financials | | | 19 | % |
Consumer Discretionary | | | 17 | |
Information Technology | | | 16 | |
Industrials | | | 14 | |
Energy | | | 11 | |
Health Care | | | 10 | |
Materials | | | 4 | |
Other (includes short-term investments and securities lending collateral) | | | 9 | |
| | | | | |
Total | | | 100 | % |
| | | | | |
For information regarding the indexes and key investment terms, see the Key Investment Terms starting on page 2.
8
| | |
| Growth & Income Series (Continued) | | |
| | | | | | | | | | | | |
| Average Annual Total Return1 for periods ended 12/31/13 | | | | | | | | | |
| | | |
| | | 1 year | | | 5 years | | | 10 years | |
| Class A at NAV2 | | | 31.81 | % | | | 15.70 | % | | | 6.92 | % |
| S&P 500® Index | | | 32.39 | | | | 17.94 | | | | 7.40 | |
| Series expense ratios3: Class A Gross: 1.14%; Net: 0.98%. | | | | | | | | | | | | |
Returns represent past performance, which is no guarantee of future results. The investment return and principal value will fluctuate so that an investor’s shares, when redeemed, may be worth more or less than their original cost. Total return does not reflect expenses associated with the separate account such as the administrative fees, account charges and surrender charges, which if reflected, would reduce total return. Performance figures may reflect fee waivers and/or expense reimbursements. In the absence of fee waivers and/or expense reimbursements, the total return would have been lower. Please visit Virtus.com for performance data current to the most recent month-end.
| 1 | Total returns are historical and include changes in share price and the reinvestment of both dividends and capital gains distributions. |
| 2 | “NAV” (Net Asset Value) total returns do not reflect any fees or expenses associated with the separate insurance accounts. |
| 3 | The expense ratios of the Series, both net and gross, are set forth according to the prospectus for the Series effective May 1, 2013, as supplemented and revised, and may differ from the expense ratios disclosed in the Financial Highlights tables in this report. See the Financial Highlights for more current information. Net Expenses: Expenses reduced by a contractual waiver in effect through April 30, 2014. Gross Expenses: Do not reflect the effect of the contractual waiver. |
Growth of $10,000 For periods ended 12/31
This chart assumes an initial investment of $10,000 made on December 31, 2003 for Class A shares. Returns shown include the reinvestment of all distributions at net asset value, and the change in share price for the stated period.
The index is unmanaged and not available for direct investment; therefore, its performance does not reflect the expenses associated with active management of an actual portfolio.
For information regarding the indexes and key investment terms, see the Key Investment Terms starting on page 2.
9
Series Summary December 31, 2013 (Unaudited)
Portfolio Manager Commentary by
Aberdeen Asset Management, Inc.
| ¢ | | The Series is diversified and has an investment objective of high total return consistent with reasonable risk. There is no guarantee that the Series will meet its objective. |
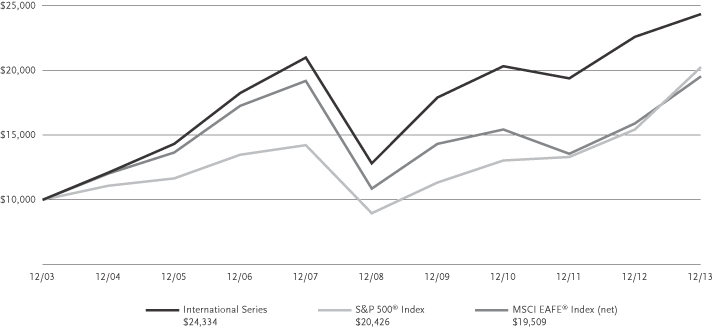
| ¢ | | For the fiscal year ended December 31, 2013, the Series’ Class A shares at NAV returned 7.78% and Class I shares at NAV from April 30, 2013 (inception date) through December 31, 2013 returned 1.17%*. For the year ended December 31, 2013, the S&P 500® Index, a broad-based equity index, returned 32.39% and the MSCI EAFE® Index (net), the Series’ style-specific benchmark appropriate for comparison, returned 22.78%. |
| * | Returns less than 1 year are not annualized. |
All performance figures assume the reinvestment of distributions and exclude the effect of fees and expenses associated with the variable life insurance or annuity product through which you invest. Past performance is no guarantee of future results and current performance may be higher or lower than the performance shown above.
How did the market in which the Series invests perform during the Series’ fiscal year?
| ¢ | | International equity markets generated considerable absolute returns for investors during 2013, with developed markets in Japan, Continental Europe, and the U.K. leading the charge higher; leaving many Asian and emerging markets firmly in their wake. The level of returns was impressive, particularly in light of continued anemic global earnings growth. Much of the rise in developed markets has therefore resulted in an expansion in stock valuations. In Europe, aggregate earnings growth was negative last year, with all of the market movement reflecting a rerating in earnings multiples. |
| ¢ | | The continued coordinated effort by global central banks to add liquidity to the financial markets and maintain low interest rates helped spur increased investor risk appetite. However, the Federal Reserve’s guidance in May 2013 that it would start tapering, combined with concerns over China’s slowing growth rates, weighed on many emerging markets and sent currencies tumbling. As a result, central banks in those countries sought to raise interest rates to support their currencies. The impact was a cyclical slowing of growth in 2013, which resulted in a flow of capital out of the developing world. |
| ¢ | | In contrast, economic news across developed markets, while still weak, reflected a gradual incremental improvement. Improving employment data in the U.S., along with rising business and |
| | | consumer confidence in core European markets, raised expectations that growth would improve heading into 2014. However, evidence of deflationary pressures from continued debt delevering remained, with Consumer Price Index (CPI) levels continuing to fall in many regions. While Japan bucked this trend somewhat, much of the heralded rise in inflation resulted from the depreciation of the yen currency and higher energy prices. |
What factors affected the Series’ performance during its fiscal year?
| ¢ | | Against the backdrop of rapidly rising developed equity markets, the investments within the Virtus International Series struggled to keep pace with returns generated by the wider market. The portfolio’s underweight position to Japanese equities weighed heavily on relative returns, as “Abenomics,” Japan’s economic policies, and quantitative easing driven by the Bank of Japan provided a catalyst for the market’s dramatic rise. The portfolio’s exposure to this market is ultimately driven by our view that on a case-by-case basis, we have been able to find more attractive long-term investment opportunities elsewhere in the world compared to those in Japan. This has also led us to favor more export-oriented Japanese businesses over domestic companies. Clearly, as the market has risen dramatically, this exposure weighed on performance as Fanuc, Canon (sold during the year), and Shin-Etsu Chemical failed to keep pace with the rebound in financial and domestic asset-oriented businesses. |
| ¢ | | Indeed, this underweight to financials not only weighed on relative performance in Japan, but across the eurozone and the U.K., as our lack of exposure to banks and diversified financial businesses had a negative impact as stocks within these regions rose sharply over the year. The impact of this was compounded on a relative basis as our holdings in more Asian and emerging market-focused operators (HSBC, Standard Chartered, and Banco Bradesco) lagged over this period. While this has been painful from a relative perspective in the short term, we remain comfortable with this position given the remaining uncertainty over many eurozone banks’ balance sheets, sovereign bond exposure, and the slow grind of the regulatory process which warrants caution. |
| ¢ | | In addition to our exposure within the financial sector, our exposure to Asia and the emerging markets was one of the main drags on relative performance. Emerging markets have clearly suffered as concerns over the Fed’s tapering plans and China’s slowing economic growth have sparked a flow of capital from these markets. The resulting currency weakness in the short term has |
| | | also played a part. In particular, our Brazilian exposure has suffered from this, with Petrobras, Vale, and Banco Bradesco weighed down. However, focusing on the underlying businesses and valuations, we used this weakness in their share prices to add to these positions at the margin. Indeed, stocks within the energy and materials sectors have been among the weakest in the market and an area where we have been finding individual cases of opportunity, such as BHP Billiton and Royal Dutch Shell. |
| ¢ | | The consumer discretionary sector has clearly been the favored area within the market over the last year, led by resurgent auto manufacturers and media. Our underweight position to this sector has weighed on relative performance as we have favored investment opportunities in other areas, typically on valuation grounds. On the flip side, health care exposure has been a relative positive with investments in Novartis and Roche very much to the forefront and outperforming the rapid rise in the market. This contrasts with the portfolio’s consumer staples exposure, where British American Tobacco and Mexican beverage company FEMSA paused for breath following a strong performance over the previous two years. |
The preceding information is the opinion of portfolio management only through the end of the period of the report as stated on the cover. Any such opinions are subject to change at any time based upon market or other conditions and should not be relied upon as investment advice.
Investing internationally, especially in emerging markets, involves risks such as currency, political, accounting, economic, and market risk.
The market price of equity securities may be affected by financial market, industry, or issuer-specific events. Focus on a particular style or on small or medium sized companies may enhance that risk.
| | | | |
| |
| Asset Allocation | |
| |
The following table presents asset allocations within certain sectors and as a percentage of total investments as of December 31, 2013. | |
Financials | | | 21 | % |
Consumer Staples | | | 14 | |
Energy | | | 14 | |
Materials | | | 11 | |
Industrials | | | 10 | |
Health Care | | | 9 | |
Information Technology | | | 9 | |
Other (includes short-term investments) | | | 12 | |
| | | | | |
Total | | | 100 | % |
| | | | | |
For information regarding the indexes and key investment terms, see the Key Investment Terms starting on page 2.
10
| | |
| International Series (Continued) | | |
| | | | | | | | | | | | | | | | | | | | |
| Average Annual Total Return1 for periods ended 12/31/13 | | | | | | | |
| | | | | |
| | | 1 year | | | 5 years | | | 10 years | | | Since
Inception | | | Inception
Date | |
| Class A at NAV2 | | | 7.78 | % | | | 13.72 | % | | | 9.30 | % | | | — | | | | — | |
| Class I at NAV2 | | | — | | | | — | | | | — | | | | 1.17 | % | | | 4/30/13 | |
| S&P 500® Index | | | 32.39 | | | | 17.94 | | | | 7.40 | | | | 17.43 | 4 | | | | |
| MSCI EAFE® Index (net) | | | 22.78 | | | | 12.44 | | | | 6.91 | | | | 11.00 | 4 | | | | |
| Series expense ratio3: Class A: 1.17%; Class I: 0.92%. | | | | | | | | | |
Returns represent past performance, which is no guarantee of future results. The investment return and principal value will fluctuate so that an investor’s shares, when redeemed, may be worth more or less than the original cost. Total return does not reflect expenses associated with the separate account such as the administrative fees, account charges and surrender charges, which if reflected, would reduce total return. Performance figures may reflect fee waivers and/or expense reimbursements. In the absence of fee waivers and/or expense reimbursements, the total return would have been lower. Please visit Virtus.com for performance data current to the most recent month-end.
| 1 | Total returns are historical and include changes in share price and the reinvestment of both dividends and capital gains distributions. |
| 2 | “NAV” (Net Asset Value) total returns do not reflect any fees or expenses associated with the separate insurance accounts. |
| 3 | The expense ratios of the Series, both net and gross, are set forth according to the prospectus for the Series effective May 1, 2013, as supplemented and revised, and may differ from the expense ratios disclosed in the Financial Highlights tables in this report. See the Financial Highlights for more current information. The Advisor contractually agreed to limit the Series’ expenses through April 30, 2014. Gross Expenses: Do not reflect the effect of a contractual waiver. |
| 4 | The since inception index returns are from the inception date of Class I. |
Growth of $10,000 For periods ended 12/31
This chart assumes an initial investment of $10,000 made on December 31, 2003 for Class A. Returns shown include the reinvestment of all distributions at net asset value, and the change in share price for the stated period.
The indexes are unmanaged and not available for direct investment; therefore, their performance does not reflect the expenses associated with active management of an actual portfolio.
For information regarding the indexes and key investment terms, see the Key Investment Terms starting on page 2.
11
| | |
| Multi-Sector Fixed Income Series | | |
Series Summary December 31, 2013 (Unaudited)
Portfolio Manager Commentary by
Newfleet Asset Management, LLC
| ¢ | | The Series is diversified and has an investment objective of long-term total return. There is no guarantee that the Series will meet its objective. |
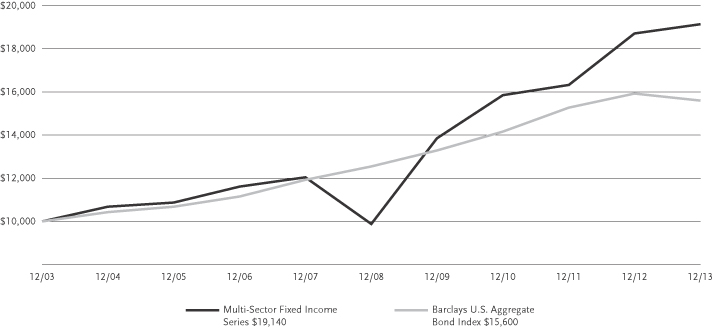
| ¢ | | For the fiscal year ended December 31, 2013, the Series’ Class A shares at NAV returned 2.25% and Class I shares at NAV from April 30, 2013 (inception date) through December 31, 2013 returned -0.89%*. For the year ended December 31, 2013, the Barclays U.S. Aggregate Bond Index, which serves as the broad-based and the style-specific benchmark index appropriate for comparison, returned -2.02%. |
| * | Returns less than 1 year are not annualized. |
All performance figures assume the reinvestment of distributions and exclude the effect of fees and expenses associated with the variable life insurance or annuity product through which you invest. Past performance is no guarantee of future results and current performance may be higher or lower than the performance shown above.
How did the fixed income market perform during the Series’ fiscal year?
| ¢ | | Most spread sectors (the non-governmental sectors of the fixed income markets) outperformed U.S. Treasuries during the fiscal year. The overall economic picture was supportive of spread sectors as expectations for economic growth remained positive, but subdued enough, to likely keep inflation at low levels and the Federal Reserve from raising short-term interest rates in the immediate future. Spread sectors were also supported by an overall improvement in the U.S. macroeconomic environment, positive credit fundamentals, and continued demand for spread product. |
| ¢ | | Still, there were spells of volatility for fixed income markets as headwinds still exist. Various factors contributed to periods of weakness, such as the uncertainty surrounding the impact of the fiscal cliff, the effects of subsequent tax increases, and sequestration budget cuts. Despite resolution of these issues, uncertainty remains over the impact of the Federal Reserve’s tapering of bond purchases (the beginning of the end of quantitative easing), which was announced at the end of the fiscal year; the looming U.S. debt ceiling debate; the effect that higher interest rates could have on the housing recovery; and overall global growth concerns. |
| ¢ | | Yields were higher across the U.S. Treasury curve in 2013, with the curve steepening between 2- and 10-year Treasuries, and flattening between 10- and 30-year Treasuries. The largest rise in yields was in the 7- to 10-year section of the curve. |
What factors affected the Series’ performance during its fiscal year?
| ¢ | | The outperformance of most fixed income spread sectors relative to U.S. Treasuries was the key driver of the strong performance of the Virtus Multi-Sector Fixed Income Series for the fiscal year. |
| ¢ | | Among fixed income sectors, the Series’ allocation to corporate high yield securities, high yield bank loans, high quality corporate bonds, asset-backed securities, and non-agency commercial mortgage-backed securities were all significant positive contributors to performance. |
| ¢ | | During the year, the Series’ allocation to the non-U.S. dollar sector detracted from performance. In addition, our higher quality bias in the corporate high yield bond sector was a detractor as lower quality securities outperformed. |
The preceding information is the opinion of portfolio management only through the end of the period of the report as stated on the cover. Any such opinions are subject to change at any time based upon market or other conditions and should not be relied upon as investment advice.
Debt securities are subject to various risks, the most prominent of which are credit and interest rate risk. The issuer of a security may fail to make payments in a timely manner. Values of debt securities may rise and fall in response to changes in interest rates. This risk may be enhanced with longer-term maturities.
There is a greater level of credit risk and price volatility involved with high yield securities than investment grade securities.
Changes in interest rates can cause both extension and prepayment risks for asset and mortgage-backed securities. These securities are also subject to risks associated with the repayment of underlying collateral.
There may be no ready market for loan participation interests. The fund may have to sell the interests at a substantial discount. Such interests are subject to the credit risk of the underlying corporate borrower.
Investing internationally, especially in emerging markets, involves additional risks such as currency, political, accounting, economic, and market risk.
| | | | | | | | |
| |
| Asset Allocation | |
| |
The following table presents asset allocations within certain sectors and as a percentage of total investments as of December 31, 2013. | |
Corporate Bonds | | | | | | | 57 | % |
Financials | | | 24 | % | | | | |
Industrials | | | 8 | | | | | |
Energy | | | 7 | | | | | |
Total of all others | | | 18 | | | | | |
Loan Agreements | | | | | | | 12 | |
Foreign Government Securities | | | | | | | 10 | |
Mortgage-Backed Securities | | | | | | | 10 | |
Preferred Stock | | | | | | | 4 | |
Asset-Backed Securities | | | | | | | 3 | |
Other (includes short-term investments) | | | | | | | 4 | |
| | | | | | | | | |
Total | | | | | | | 100 | % |
| | | | | | | | | |
For information regarding the indexes and key investment terms, see the Key Investment Terms starting on page 2.
12
| | |
| Multi-Sector Fixed Income Series (Continued) | | |
| | | | | | | | | | | | | | | | | | | | |
| Average Annual Total Return1 for periods ended 12/31/13 | | | | | | | | | | |
| | | | | |
| | | 1 year | | | 5 years | | | 10 years | | | Since
Inception | | | Inception
Date | |
| Class A at NAV2 | | | 2.25 | % | | | 14.12 | % | | | 6.71 | % | | | — | | | | — | |
| Class I at NAV2 | | | — | | | | — | | | | — | | | | –0.89 | % | | | 4/30/13 | |
| Barclays U.S. Aggregate Bond Index | | | –2.02 | | | | 4.44 | | | | 4.55 | | | | –2.89 | 4 | | | | |
| Series expense ratios3: Class A: 0.94%; Class I: 0.69%. | | | | | | | | | | | | | | | | | | | | |
Returns represent past performance, which is no guarantee of future results. The investment return and principal value will fluctuate so that an investor’s shares, when redeemed, may be worth more or less than the original cost. Total return does not reflect expenses associated with the separate account such as the administrative fees, account charges and surrender charges, which if reflected, would reduce total return. Performance figures may reflect fee waivers and/or expense reimbursements. In the absence of fee waivers and/or expense reimbursements, the total return would have been lower. Please visit Virtus.com for performance data current to the most recent month-end.
| 1 | Total returns are historical and include changes in share price and the reinvestment of both dividends and capital gains distributions. |
| 2 | “NAV” (Net Asset Value) total returns do not reflect any fees or expenses associated with the separate insurance products. |
| 3 | The expense ratios of the Series, both net and gross, are set forth according to the prospectus for the Series effective May 1, 2013, as supplemented and revised, and may differ from the expense ratios disclosed in the Financial Highlights tables in this report. See the Financial Highlights for more current information. The Advisor has contractually agreed to limit the Series’ expenses through April 30, 2014. Gross Expenses: Do not reflect the effect of the contractual waiver. |
| 4 | The since inception index returns are from the inception date of Class I shares. |
Growth of $10,000 For periods ended 12/31
This chart assumes an initial investment of $10,000 made on December 31, 2003 for Class A. Returns shown include the reinvestment of all distributions at net asset value, and the change in share price for the stated period.
The index is unmanaged and not available for direct investment; therefore, its performance does not reflect the expenses associated with active management of an actual portfolio.
For information regarding the indexes and key investment terms, see the Key Investment Terms starting on page 2.
13
| | |
| Premium AlphaSector® Series | | |
Series Summary December 31, 2013 (Unaudited)
Portfolio Managers Commentary by
Euclid Advisors LLC and
F-Squared Institutional Advisors, LLC
| ¢ | | The Series is diversified and has an investment objective of long-term capital appreciation. There is no guarantee that the Series will achieve its objective. |
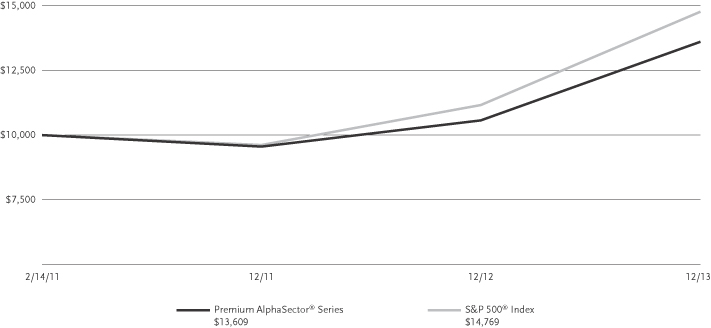
| ¢ | | For the fiscal period ended December 31, 2013, the Series’ Class A shares at NAV returned 28.71% and Class I shares at NAV from April 30, 2013 (inception date) through December 31, 2013 returned 14.64%*. For the year end December 31, 2013, the S&P 500® Index, which serves as the broad-based equity index and style-specific benchmark index appropriate for comparison, returned 32.39%. |
| * | Returns less than 1 year are not annualized. |
All performance figures assume reinvestment of distributions and exclude the effect of fees and expenses associated with the variable life insurance or annuity product through which you invest. Past performance is no guarantee of future results and current performance may be higher or lower than the performance shown above.
How did the market perform during the Series’ fiscal year?
| ¢ | | In the Series’ fiscal year ended December 31, 2013, the U.S. equity markets performed strongly. The S&P 500® Index finished up 32.39% on a total return basis, its best annual performance in 16 years, and the third best since 1980. Volatility was relatively muted during the year. |
| ¢ | | The strong full-year performance of the S&P 500® Index was not distributed evenly through the year. The first quarter and fourth quarter of 2013 were very positive, with gains of 10.6% and 10.5%, respectively. The second and third quarters were more subdued for the Index, with the second quarter adding 2.9% and the third quarter contributing 5.2%. |
What factors affected the Series’ performance during its fiscal year?
| ¢ | | The Virtus Premium AlphaSector Series tracks the Premium AlphaSector® Index, an actively-managed index that seeks to participate in normal, rising markets and to provide downside risk management in severe down markets. All investment decision-making is driven by a quantitative model. |
| ¢ | | The Series has a defined investment universe comprising nine major sectors of the U.S. economy, and has the flexibility to move partly or wholly to a cash equivalent when needed for defensive positioning. Each of the nine sectors may be included or excluded from the portfolio, depending on a quantitative projection of its potential to deliver positive value or to present the risk of loss. |
| ¢ | | Given the strong market performance of 2013, the goal of the Series was to participate in the market, and the Series delivered on this expectation. |
| ¢ | | The most important factor affecting performance is that the Series was allocated to U.S. equities throughout 2013; there was no use of a cash equivalent. This fully-allocated posture allowed the Series to participate in the positive market environment. |
| ¢ | | A secondary factor in performance is that at the time of rebalancing, all sector allocations are equally weighted, resulting in a sector weighting that is different from the S&P 500 benchmark. The performance lag versus the benchmark reflects this weighting discrepancy. |
| ¢ | | In line with its goal of managing risk during down markets while also participating on the upside, the Series performed well relative to the S&P 500 benchmark during the fiscal year, producing a strong return, while maintaining its focus on minimizing exposure to market declines and volatility. |
The preceding information is the opinion of portfolio management only through the end of the period of the report as stated on the cover. Any such opinions are subject to change at any time based upon market or other conditions and should not be relied upon as investment advice. Past performance is no guarantee of future results, and there is no guarantee that market forecasts will be realized.
The market price of equity securities may be affected by financial market, industry, or issuer-specific events. Focus on a particular style or on small or medium-sized companies may enhance that risk.
A fund that focuses its investments in a particular industry or sector will be more sensitive to conditions that affect that industry or sector than a non-concentrated fund.
The value of an ETF may be more volatile than the underlying portfolio of securities the ETF is designed to track. The costs of owning the ETF may exceed the cost of investing directly in the underlying securities.
U.S. government securities may be subject to price fluctuations. An agency may default on an obligation not backed by the United States. Any guarantee on U.S. government securities does not apply to the value of the fund’s shares.
The fund’s exposure to different asset classes may not be optimal for market conditions at a given time. Asset allocation does not guarantee a profit or protect against a loss in declining markets.
| | | | |
| |
| Asset Allocation | |
| |
The following table presents asset allocations within certain sectors and as a percentage of total investments as of December 31, 2013. | |
Consumer Discretionary | | | 13 | % |
Industrials | | | 13 | |
Materials | | | 13 | |
Energy | | | 12 | |
Financials | | | 12 | |
Health Care | | | 12 | |
Information Technology | | | 12 | |
Other (includes short-term investments) | | | 13 | |
| | | | | |
Total | | | 100 | % |
| | | | | |
For information regarding the indexes and key investment terms, see the Key Investment Terms starting on page 2.
14
| | |
| Premium AlphaSector® Series (Continued) | | |
| | | | | | | | | | | | |
| Average Annual Total Return1 for periods ended 12/31/13 | | | | | | | | | |
| | | |
| | | 1 year | | | Since
Inception | | | Inception
Date | |
| Class A at NAV2 | | | 28.71 | % | | | 11.30 | % | | | 2/14/11 | |
| Class I at NAV2 | | | — | | | | 14.64 | | | | 4/30/13 | |
| S&P 500® Index | | | 32.39 | | | | — | 4 | | | — | |
| Series expense ratios3: Class A Gross 2.25%; Net 1.88%; Class I Gross 2.00; Net 1.63%. | |
Returns represent past performance, which is no guarantee of future results. The investment return and principal value will fluctuate so that an investor’s shares, when redeemed, may be worth more or less than their original cost. Total return does not reflect expenses associated with the separate account such as the administrative fees, account charges and surrender charges, which if reflected, would reduce total return. Performance figures may reflect fee waivers and/or expense reimbursements. In the absence of fee waivers and/or expense reimbursements, the total return would have been lower. Please visit Virtus.com for performance data current to the most recent month-end.
| 1 | Total returns are historical and include changes in share price and the reinvestment of both dividends and capital gains distributions. |
| 2 | “NAV” (Net Asset Value) total returns do not reflect any fees or expenses associated with the separate insurance products. |
| 3 | The expense ratios of the Series, both net and gross, are set forth according to the prospectus for the Series effective May 1, 2013, as supplemented and revised, and may differ from the expense ratios disclosed in the Financial Highlights tables in this report. See the Financial Highlights for more current information. Net Expenses: Expenses reduced by a contractual waiver in effect through April 30, 2014. Gross Expenses: Do not reflect the effect of the contractual waiver. Expense ratios reflect fees and expenses associated with the underlying funds. |
| 4 | The index returned 14.50% for Class A shares and 17.43% for Class I shares since the inception date of the respective share classes. |
Growth of $10,000 For periods ended 12/31
This chart assumes an initial investment of $10,000 made on February 14, 2011 (inception date of the Class A). Returns shown include the reinvestment of all distributions at net asset value and the change in share price for the stated period.
The index is unmanaged and not available for direct investment; therefore, its performance does not reflect the expenses associated with active management of an actual portfolio.
For information regarding the indexes and key investment terms, see the Key Investment Terms starting on page 2.
15
| | |
| Real Estate Securities Series | | |
Series Summary December 31, 2013 (Unaudited)
Portfolio Manager Commentary by
Duff & Phelps Investment Management Co.
| ¢ | | The Series is diversified and has investment objectives of capital appreciation and income with approximately equal emphasis. There is no guarantee that the Series will meet its objectives. |
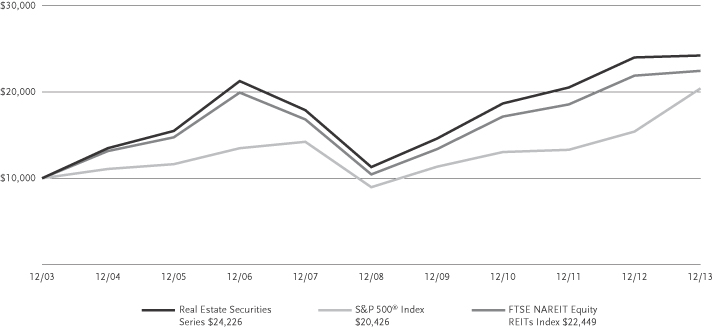
| ¢ | | For the fiscal year ended December 31, 2013, the Series’ Class A shares at NAV returned 0.90% and Class I shares at NAV from April 30, 2013 (inception date) through December 31, 2013 returned -10.45%*. For the year ended December 31, 2013, the S&P 500® Index, a broad-based equity index, returned 32.39% and the FTSE NAREIT Equity REITs Index, the Series’ style-specific benchmark appropriate for comparison, returned 2.47%. |
| * | Returns less than 1 year are not annualized. |
All performance figures assume the reinvestment of distributions and exclude the effect of fees and expenses associated with the variable life insurance or annuity product through which you invest. Past performance is no guarantee of future results and current performance may be higher or lower than the performance shown above.
How did the market in which the Series invests perform during the Series’ fiscal year?
| ¢ | | It was a strong-performing year for the broader equity market, as the U.S. economy accelerated. |
| ¢ | | For real estate securities, in many respects, the year operated with one set of characteristics at the tail end of what was one of the greatest bull markets in bonds until the Fed’s tapering comments on May 22, 2013, and then it exhibited another set of characteristics as interest rates began to rise until the year end. |
| ¢ | | Investors’ misplaced fears surrounding the effects of rising interest rates on REITs weighed on performance, as opposed to recognizing their ability to benefit from higher cash flows and replacement costs, as well as a historically high supply of new equity offerings. |
| ¢ | | REITs wrapped up the year with attractive valuations and balance sheets, given that the fourth quarter was the third consecutive quarter of negative REIT returns, and 2013 saw the highest amount of equity issuance in the modern REIT era. |
| ¢ | | As we begin 2014, additional tailwinds include low new supply, as well as strong cash flow and dividend growth. |
What factors affected the Series’ performance during its fiscal year?
| ¢ | | Both the Series and the style benchmark lagged the S&P 500® Index in 2013, for the first time in five years. |
| ¢ | | For the year, the Series modestly lagged the benchmark due to stock selection. On a quarter-by-quarter basis, the Series lagged the benchmark in the first quarter, and made up ground by outperforming the benchmark for the remaining three quarters. |
| ¢ | | In the first quarter of 2013, lower quality REITs, which lack rental rate pricing power, as well as high yield stocks and longer-lease duration sectors, which lack organic growth but offer external spread investing, were the strongest performers in the benchmark. |
| ¢ | | The first quarter was an environment where one would expect the Series to underperform given the investment philosophy and process followed, which emphasizes higher quality. |
| ¢ | | Our concern towards, and positioning away from, lower quality and sectors with long leases lacking pricing power and those companies dependent on external spread investing to drive growth, given their inherent lack of protection against potential higher interest rates, paid dividends as we moved past the Fed’s tapering comments in the second quarter. |
| ¢ | | Following the Fed’s taper talk, we saw a change in leadership from lower quality and those property sectors with long lease duration and minimal ability to push rents, to those property sectors which could benefit from repricing power in the form of higher rents and greater repricing frequency, à la shorter leases. |
The preceding information is the opinion of portfolio management only through the end of the period of the report as stated on the cover. Any such opinions are subject to change at any time based upon market or other conditions and should not be relied upon as investment advice. Past performance is no guarantee of future results, and there is no guarantee that market forecasts will be realized.
The market price of equity securities may be affected by financial market, industry, or issuer-specific events. Focus on a particular style or on small or medium sized companies may enhance that risk.
The fund may be negatively affected by factors specific to the real estate market, including interest rate, leverage, property, and management.
A fund that focuses its investments in a particular industry or sector will be more sensitive to conditions that affect that industry or sector than a non-concentrated fund.
Because the Series has a limited number of securities, it may be more susceptible to factors adversely affecting its securities than a less concentrated portfolio.
| | | | |
| |
| Asset Allocation | |
| |
The following table presents asset allocations within certain sectors and as a percentage of total investments as of December 31, 2013. | |
Regional Malls | | | 20 | % |
Apartments | | | 17 | |
Office | | | 11 | |
Industrials | | | 10 | |
Self Storage | | | 10 | |
Health Care | | | 8 | |
Shopping Centers | | | 8 | |
Other (includes short-term investments) | | | 16 | |
| | | | | |
Total | | | 100 | % |
| | | | | |
For information regarding the indexes and key investment terms, see the Key Investment Terms starting on page 2.
16
| | |
| Real Estate Securities Series (Continued) | | |
| | | | | | | | | | | | | | | | | | | | |
| Average Annual Total Return1 for periods ended 12/31/13 | | | | | | | | | | |
| | | | | |
| | | 1 year | | | 5 years | | | 10 years | | | Since
Inception | | | Inception
Date | |
| Class A at NAV2 | | | 0.90 | % | | | 16.47 | % | | | 9.25 | % | | | — | | | | — | |
| Class I at NAV2 | | | — | | | | — | | | | — | | | | –10.45 | % | | | 4/30/13 | |
| S&P 500® Index | | | 32.39 | | | | 17.94 | | | | 7.40 | | | | 17.43 | 4 | | | | |
| FTSE NAREIT Equity REITs Index | | | 2.47 | | | | 16.50 | | | | 8.42 | | | | –11.22 | 4 | | | | |
| Series expense ratios3: Class A Gross: 1.20%; Net: 1.16%; Class I Gross: 0.95%; Net 0.91%. | | | | | |
Returns represent past performance, which is no guarantee of future results. The investment return and principal value will fluctuate so that an investor’s shares, when redeemed, may be worth more or less than their original cost. Total return does not reflect expenses associated with the separate account such as the administrative fees, account charges and surrender charges, which if reflected, would reduce total return. Performance figures may reflect fee waivers and/or expense reimbursements. In the absence of fee waivers and/or expense reimbursements, the total return would have been lower. Please visit Virtus.com for performance data current to the most recent month-end.
| 1 | Total returns are historical and include changes in share price and the reinvestment of both dividends and capital gains distributions. |
| 2 | “NAV” (Net Asset Value) total returns do not reflect any fees or expenses associated with the separate insurance products. |
| 3 | The expense ratios of the Series, both net and gross, are set forth according to the prospectus for the Series effective May 1, 2013, as supplemented and revised, and may differ from the expense ratios disclosed in the Financial Highlights tables in this report. See the Financial Highlights for more current information. Net Expenses: Expenses reduced by a contractual waiver in effect through April 30, 2014. Gross Expenses: Do not reflect the effect of the contractual waiver. |
| 4 | The since inception index returns are from the inception date of Class I shares. |
Growth of $10,000 For periods ended 12/31
This chart assumes an initial investment of $10,000 made on December 31, 2003 for Class A shares. Returns shown include the reinvestment of all distributions at net asset value, and the change in share price for the stated period.
The indexes are unmanaged and not available for direct investment; therefore, their performance does not reflect the expenses associated with active management of an actual portfolio.
For information regarding the indexes and key investment terms, see the Key Investment Terms starting on page 2.
17
Series Summary December 31, 2013 (Unaudited)
Portfolio Manager Commentary by
Kayne Anderson Rudnick Investment Management, LLC
| ¢ | | The Series is diversified and has an investment objective of long-term capital growth. There is no guarantee that the Series will meet its objective. |
| ¢ | | For the fiscal year ended December 31, 2013, the Series’ Class A shares at NAV returned 40.20% and Class I shares at NAV from April 30, 2013 (inception date) through December 31, 2013 returned 26.28%*. For the year ended December 31, 2013, the S&P 500® Index, a broad-based equity index, returned 32.39% and the Russell 2000® Growth Index, the Series’ style-specific benchmark appropriate for comparison, returned 43.30%. |
| * | Returns less than 1 year are not annualized. |
All performance figures assume the reinvestment of distributions and exclude the effect of fees and expenses associated with the variable life insurance or annuity product through which you invest. Past performance is no guarantee of future results and current performance may be higher or lower than the performance shown above.
How did the market in which the Series invests perform during the Series’ fiscal year?
| ¢ | | The stock market had an extraordinary year in 2013, moving to record highs despite fear of Federal Reserve stimulus tapering coupled with political debates surrounding a government shutdown and the possible threat of a U.S. debt default. For the year, the S&P 500® Index increased 32.39%, and the Russell 2000® Growth Index rose 43.30%. Notably, the S&P 500 Index produced its highest annual return since 1997. |
| ¢ | | There are a number of key reasons why stocks did so well in 2013. First, the Federal Reserve continued to provide supportive monetary policy through its quantitative easing (QE) program and did not confirm its plans for modest tapering until December. Central bankers in Europe and Japan also used monetary policy to stimulate domestic business activity. |
| ¢ | | Second, corporate profitability held up very well, with companies generating excess capital, sustaining healthy margins, and allocating capital more wisely than they have in the past. Corporate buybacks and dividend increases continued at a robust pace, while 2013 proved to be the strongest IPO market since 2000, thanks to the impressive pace of innovation in industries such as technology, energy, and health care. |
| ¢ | | Third, improvement in the housing market and the employment situation was significant in 2013. Despite some slowdown in the second half of the year as a result of slightly higher mortgage rates, housing prices have continued to improve due to low levels of inventory. Meanwhile, the U.S. employment situation experienced slow but material improvement, and after hitting a post-recession low during the third quarter, the unemployment rate decreased even further, falling to 7% by year end. In addition, initial jobless claims decreased consistently, reaching levels not experienced since 2007. |
| ¢ | | Riskier stocks performed better than the overall market in this environment. Specifically, stocks with higher price-to-earnings ratios greater than 30 times earnings outperformed the Russell 2000 Growth Index. |
What factors affected the Series’ performance during its fiscal year?
| ¢ | | For the year, the Virtus Small-Cap Growth Series trailed the return of the Russell 2000 Growth Index. In a market where riskier stocks have strong performance, our portfolio of less risky, higher quality names will typically underperform the benchmark. |
| ¢ | | From a sector perspective, performance was helped by strong stock selection in the materials and processing, financial services, and consumer staples sectors, despite poor stock selection in the health care and technology sectors. |
| ¢ | | From a stock perspective, the companies that contributed the most to performance included The Chefs’ Warehouse and Financial Engines. The Chefs’ Warehouse shares have outperformed driven by strong organic sales and earnings growth as the company continues to build out scale and distribution advantages in the niche markets it serves. Financial Engines continues to penetrate the large corporate 401K market with unbiased, conflict-free advice, and scalable platform. New products such as Income Plus have allowed increased differentiation from the company’s principal competition, target date funds. Financial Engines has the potential to become the corporate standard for the retirement market. |
| ¢ | | The companies that contributed the least to performance included National Research and ClickSoftware Technologies. Shares of National |
| | | Research fell after a recapitalization by the company that led to some temporary weakness in the stock that we believe does not reflect the underlying fundamentals of the business. ClickSoftware underperformed as revenue growth, although healthy by absolute standards, has been below management’s expectations. This has occurred despite higher spending on sales, marketing, and research and development for the purpose of accelerating growth, and this combination of weak revenue growth and higher operating expenses is causing the business to be unprofitable. The inability to grow profitably is an indication to us that the company lacks a strong competitive advantage and thus the ability to generate attractive economics even on a “normalized” basis. We therefore sold the Series’ position during the third quarter of 2013. |
The preceding information is the opinion of portfolio management only through the end of the period of the report as stated on the cover. Any such opinions are subject to change at any time based upon market or other conditions and should not be relied upon as investment advice.
The market price of equity securities may be affected by financial market, industry, or issuer-specific events. Focus on a particular style or on small or medium sized companies may enhance that risk. Because the Series’ portfolio has a limited number of securities, it may be more susceptible to factors adversely affecting its securities than a less concentrated portfolio.
Because the Series is presently heavily weighted in the technology sector, it will be impacted by that sector’s performance more than a portfolio with broader sector diversification.
| | | | |
| |
| Asset Allocation | |
| |
The following table presents asset allocations within certain sectors and as a percentage of total investments as of December 31, 2013. | |
Information Technology | | | 34 | % |
Consumer Discretionary | | | 16 | |
Health Care | | | 15 | |
Industrials | | | 15 | |
Consumer Staples | | | 11 | |
Financials | | | 5 | |
Materials | | | 3 | |
Other (includes short-term investments) | | | 1 | |
| | | | | |
Total | | | 100 | % |
| | | | | |
For information regarding the indexes and key investment terms, see the Key Investment Terms starting on page 2.
18
| | |
| Small-Cap Growth Series (Continued) | | |
| | | | | | | | | | | | | | | | | | | | |
| Average Annual Total Return1 for periods ended 12/31/13 | | | | | | | | | | |
| | | | | |
| | | 1 year | | | 5 years | | | 10 years | | | Since
Inception | | | Inception
Date | |
| Class A at NAV2 | | | 40.20 | % | | | 20.49 | % | | | 8.64 | % | | | — | | | | — | |
| Class I at NAV2 | | | — | | | | — | | | | — | | | | 26.28 | % | | | 4/30/13 | |
| S&P 500® Index | | | 32.39 | | | | 17.94 | | | | 7.40 | | | | 17.43 | 4 | | | | |
| Russell 2000® Growth Index | | | 43.30 | | | | 22.58 | | | | 9.41 | | | | 27.41 | %4 | | | | |
| Series expense ratios3: Class A Gross: 1.32%; Net: 1.19%; Class I Gross: 1.07%; Net: 0.94%. | |
Returns represent past performance, which is no guarantee of future results. The investment return and principal value will fluctuate so that an investor’s shares, when redeemed, may be worth more or less than their original cost. Total return does not reflect expenses associated with the separate account such as the administrative fees, account charges and surrender charges, which if reflected, would reduce total return. Performance figures may reflect fee waivers and/or expense reimbursements. In the absence of fee waivers and/or expense reimbursements, the total return would have been lower. Please visit Virtus.com for performance data current to the most recent month-end.
| 1 | Total returns are historical and include changes in share price and the reinvestment of both dividends and capital gains distributions. |
| 2 | “NAV”(Net Asset Value) total returns do not reflect any fees or expenses associated with the separate insurance products. |
| 3 | The expense ratios of the Series, both net and gross, are set forth according to the prospectus for the Series effective May 1, 2013, as supplemented and revised, may differ from the expense ratios disclosed in the Financial Highlights tables in this report. See the Financial Highlights for more current information. Net Expenses: Expenses reduced by a contractual waiver in effect through April 30, 2014. Gross Expenses: Do not reflect the effect of the contractual waiver. |
| 4 | The since inception index returns are from the inception date of Class I shares. |
Growth of $10,000 For periods ended 12/31
This chart assumes an initial investment of $10,000 made on December 31, 2003 for Class A shares. Returns shown include the reinvestment of all distributions at net asset value, and the change in share price for the stated period.
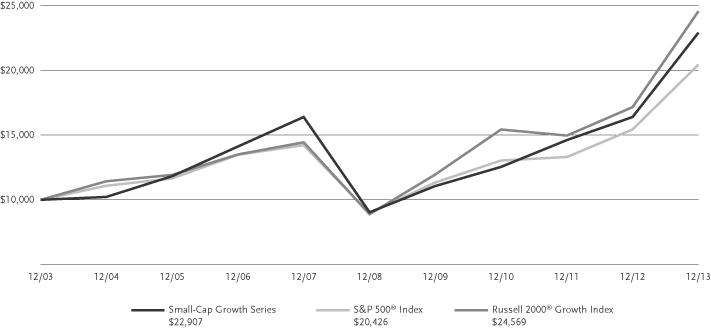
The indexes are unmanaged and not available for direct investment; therefore, their performance does not reflect the expenses associated with active management of an actual portfolio.
For information regarding the indexes and key investment terms, see the Key Investment Terms starting on page 2.
19
Series Summary December 31, 2013 (Unaudited)
Portfolio Manager Commentary by
Kayne Anderson Rudnick Investment Management, LLC
| ¢ | | The Series is diversified and has an investment objective of long-term capital appreciation. There is no guarantee that the Series will meet its objective. |
| ¢ | | For the fiscal year ended December 31, 2013, the Series Class A shares at NAV returned 40.77%. For the same period, the S&P 500® Index, a broad-based equity index, returned 32.39% and the Russell 2000® Value Index, the Series’ style-specific benchmark, appropriate for comparison returned 34.52%. |
All performance figures assume the reinvestment of distributions and exclude the effect of fees and expenses associated with the variable life insurance or annuity product through which you invest. Past performance is no guarantee of future results and current performance may be higher or lower than the performance shown above.
How did the market in which the Series invests perform during the Series’ fiscal year?
| ¢ | | The stock market had an extraordinary year in 2013, moving to record highs despite fear of Federal Reserve stimulus tapering coupled with political debates surrounding a government shutdown and the possible threat of a U.S. debt default. For the year, the S&P 500® Index increased 32.39%, and the Russell 2000® Value Index rose 34.52%. Notably, the S&P 500 Index produced its highest annual return since 1997. |
| ¢ | | There are a number of key reasons why stocks did so well in 2013. First, the Federal Reserve continued to provide supportive monetary policy through its quantitative easing (QE) program and did not confirm its plans for modest tapering until December. Central bankers in Europe and Japan also used monetary policy to stimulate domestic business activity. |
| ¢ | | Second, corporate profitability held up very well, with companies generating excess capital, sustaining healthy margins, and allocating capital more wisely than they have in the past. Corporate buybacks and dividend increases continued at a robust pace, while 2013 proved to be the strongest IPO market since 2000, thanks to the impressive pace of innovation in industries such as technology, energy, and health care. |
| ¢ | | Third, improvement in the housing market and the employment situation was significant in 2013. Despite some slowdown in the second half of the year as a result of slightly higher mortgage rates, housing prices have continued to improve due to low levels of inventory. Meanwhile, the U.S. employment situation experienced slow but material improvement, and after hitting a |
| | | post-recession low during the third quarter, the unemployment rate decreased even further, falling to 7% by year end. In addition, initial jobless claims decreased consistently, reaching levels not experienced since 2007. |
| ¢ | | Riskier, lower quality stocks tend to post stronger performance than the overall market in this type of environment. Specifically, stocks with higher betas, long-term debt-to-capital ratios greater than 70%, and price-to-earnings ratios greater than 30 times earnings performed better than the Russell 2000 Value Index. |
What factors affected the Series’ performance during its fiscal year?
| ¢ | | For the year, the Virtus Small-Cap Value Series outperformed the Russell 2000 Value Index. Typically in a market where riskier, lower quality companies outperform, our portfolio of less risky, higher quality names will lag the benchmark. However, our strategy outperformed the index due to strong stock selection. |
| ¢ | | From a sector perspective, performance was primarily driven by positive stock selection in the financial services and technology sectors, despite some negative stock selection in the health care and energy sectors. |
| ¢ | | From a stock perspective, the companies that contributed the most to performance included Syntel and WD-40. Syntel generated strong revenue and earnings growth driven by strengthening demand for discretionary spending in its core verticals. As financial services and insurance companies have recovered, demand for project work has improved. Syntel has also benefited from increasing regulatory compliance in its core industry verticals, including health care. Even Europe is beginning to see improving demand, particularly as companies recognize the need for efficiency and become more open to outsourcing. Syntel’s margins are likely near highs as it has strongly benefited from a depreciating Indian rupee. WD-40 reported strong results for its 2013 fiscal year end (in August) with 8% revenue growth. With higher pricing, cost efficiencies, and mix, the company was able to translate the high single-digit top-line growth into 18% earnings growth. While margin expansion in fiscal 2014 is not likely to occur at the same pace as 2013, management did provide top-line revenue growth guidance of around 5%. We trimmed the Series’ position slightly in October due to the recent strong performance. In our longer term view, the new product and geographic extension should continue to sustain the company’s growth. |
| ¢ | | The companies that contributed the least to performance included Village Super Market and |
| | | Questar. Village Super Market’s shares were under pressure due to concerns about the current competitive environment and management’s modest near-term outlook for same-store sales growth. Longer term, we continue to believe that the ShopRite brand name, local market knowledge, and Wakefern cooperative business model provide Village Super Market with a solid sustainable competitive advantage in its core market. Added to the Series late in the third quarter of 2013, Questar’s shares have underperformed the benchmark while providing a positive return for the period. With its fully-integrated structure and advantageous geographic and market positioning, Questar represents a unique play in the highly-regulated, highly capital-intensive utilities segment. Questar’s low-cost advantage due to its ownership of Wexpro allows for superior returns on capital. Importantly, Questar maintains a healthy balance sheet and has a history of disciplined capital allocation, generally having returned excess cash to shareholders in the form of regular cash dividends and opportunistic share repurchases. |
The preceding information is the opinion of portfolio management only through the end of the period of the report as stated on the cover. Any such opinions are subject to change at any time based upon market or other conditions and should not be relied upon as investment advice.
The market price of equity securities may be affected by financial market, industry, or issuer-specific events. Focus on a particular style or on small or medium sized companies may enhance that risk. Because the Series’ portfolio has a limited number of securities, it may be more susceptible to factors adversely affecting its securities than a less concentrated portfolio.
Because the Series is presently heavily weighted in the technology sector, it will be impacted by that sector’s performance more than a portfolio with broader sector diversification.
| | | | |
| |
| Asset Allocation | |
| |
The following table presents asset allocations within certain sectors and as a percentage of total investments as of December 31, 2013. | |
Information Technology | | | 29 | % |
Financials | | | 19 | |
Industrials | | | 19 | |
Consumer Staples | | | 9 | |
Health Care | | | 7 | |
Consumer Discretionary | | | 6 | |
Energy | | | 6 | |
Other (includes short-term investments) | | | 5 | |
| | | | | |
Total | | | 100 | % |
| | | | | |
For information regarding the indexes and key investment terms, see the Key Investment Terms starting on page 2.
20
| | |
| Small-Cap Value Series (Continued) | | |
| | | | | | | | | | | | |
| Average Annual Total Return1 for periods ended 12/31/13 | | | | | | | | | |
| | | |
| | | 1 year | | | 5 years | | | 10 years | |
| Class A at NAV2 | | | 40.77 | % | | | 17.70 | % | | | 7.77 | % |
| S&P 500® Index | | | 32.39 | | | | 17.94 | | | | 7.40 | |
| Russell 2000® Value Index | | | 34.52 | | | | 17.64 | | | | 8.61 | |
| Series expense ratios3: Class A Gross: 1.34%; Net: 1.20%. | | | | | | | | | | | | |
Returns represent past performance, which is no guarantee of future results. The investment return and principal value will fluctuate so that an investor’s shares, when redeemed, may be worth more or less than their original cost. Total return does not reflect expenses associated with the separate account such as the administrative fees, account charges and surrender charges, which if reflected, would reduce total return. Performance figures may reflect fee waivers and/or expense reimbursements. In the absence of fee waivers and/or expense reimbursements, the total return would have been lower. Please visit Virtus.com for performance data current to the most recent month-end.
| 1 | Total returns are historical and include changes in share price and the reinvestment of both dividends and capital gains distributions. |
| 2 | “NAV” (Net Asset Value) total returns do not reflect any fees or expenses associated with the separate insurance accounts. |
| 3 | The expense ratios of the Series, both net and gross, are set forth according to the prospectus for the Series effective May 1, 2013, as supplemented and revised, and may differ from the expense ratios disclosed in the Financial Highlights tables in this report. See the Financial Highlights for more current information. Net Expenses: Expenses reduced by a contractual waiver in effect through April 30, 2014. Gross Expenses: Do not reflect the effect of the contractual waiver. |
Growth of $10,000 For periods ended 12/31
This chart assumes an initial investment of $10,000 made on December 31, 2003. Returns shown include the reinvestment of all distributions at net asset value, and the change in share price for the stated period.
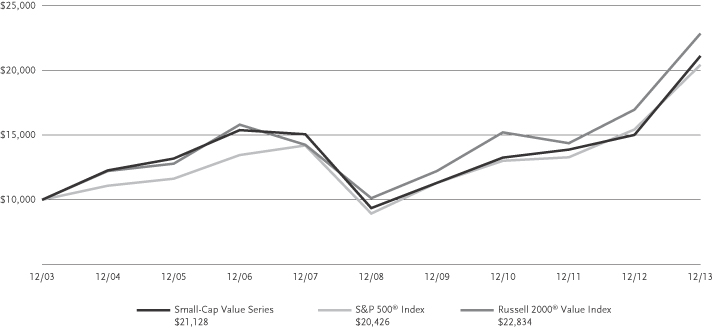
The indexes are unmanaged and not available for direct investment; therefore, their performance does not reflect the expenses associated with active management of an actual portfolio.
For information regarding the indexes and key investment terms, see the Key Investment Terms starting on page 2.
21
| | |
| Strategic Allocation Series | | |
Series Summary December 31, 2013 (Unaudited)
Portfolio Managers Commentaries by
Euclid Advisors LLC (equity portfolio) and
Newfleet Asset Management, LLC (fixed income portfolio)
| ¢ | | The Series is diversified and has an investment objective of high total return over an extended period of time consistent with prudent investment risk. There is no guarantee that the Series will meet its objective. |
| ¢ | | For the fiscal year ended December 31, 2013, the Series’ Class A shares at NAV returned 17.99%. For the same period, the S&P 500® Index, a broad-based equity index, returned 32.39% and the Barclays U.S. Aggregate Bond Index, a broad-based fixed income index, returned -2.02%. The Composite Index for the Series, the Series’ style-specific benchmark, appropriate for comparison returned 17.56%. |
All performance figures assume the reinvestment of distributions and exclude the effect of fees and expenses associated with the variable life insurance or annuity product through which you invest. Past performance is no guarantee of future results and current performance may be higher or lower than the performance shown above.
How did the markets perform during the Series’ fiscal year?
Equities:
| ¢ | | Overall, 2013 was a very good year to be in the stock market. U.S. equity markets traded higher throughout the year with very few dips, stocks were propelled to record highs, and notably, the S&P 500® Index produced its highest annual return since 1997. |
| ¢ | | Drastically different investment themes drove the market in the first and second halves of the year. Early in the year, more defensive, higher yielding stocks led the market as investors were still reaching for yield. During this period, the sectors that performed best included consumer staples, health care, telecom, and utilities. Investors who had been on the sidelines since the 2008-2009 financial crisis seemingly felt more comfortable investing in these ostensibly more conservative stocks. |
| ¢ | | However, as the year progressed, equity investors started focusing on better-than-expected global growth, and recognized that more cyclical sectors of the market were worthy of investment. In the second half of the year, the best performing areas were industrials, technology, consumer discretionary, basic materials, and financials, all of which are considered more economically sensitive and cyclical. |
Fixed Income:
| ¢ | | Most spread sectors (the non-governmental sectors of the fixed income markets) outperformed U.S. Treasuries during the fiscal year. The overall economic picture was supportive of spread sectors as expectations for economic growth remained positive, but subdued enough, to likely keep inflation at low levels and the Federal Reserve from raising short-term interest rates in the immediate future. Spread sectors were also supported by an overall improvement in the U.S. macroeconomic environment, positive credit fundamentals, and continued demand for spread product. |
| ¢ | | Still, there were spells of volatility for fixed income markets as headwinds still exist. Various factors contributed to periods of weakness, such as the uncertainty surrounding the impact of the fiscal cliff, the effects of subsequent tax increases, and sequestration budget cuts. Despite resolution of these issues, uncertainty remains over the impact of the Federal Reserve’s tapering of bond purchases (the beginning of the end of quantitative easing), which was announced at the end of the fiscal year; the looming U.S. debt ceiling debate; the effect that higher interest rates could have on the housing recovery; and overall global growth concerns. |
| ¢ | | Yields were higher across the U.S. Treasury curve in 2013, with the curve steepening between 2- and 10-year Treasuries, and flattening between 10- and 30-year Treasuries. The largest rise in yields was in the 7- to 10-year section of the curve. |
What factors affected the Series’ performance during its fiscal year?
Equities:
| ¢ | | We are generally pleased with the Series performance, especially in the returns of the equity allocation. Our belief early in 2013 was that a combination of easy money, loose central bank policy globally, low inflation, marginally better economic growth, and attractive valuations would lead to higher stock prices. Indeed, the market did move sharply higher, largely because of the factors mentioned above. |
| ¢ | | However, as noted above, the year was very much bifurcated where at first defensive stocks rallied, and then cyclical names played catch-up in the second half. In the first part of the year, the Series was positioned in the more economically sensitive |
| | | areas of the market, which hurt returns in the first two quarters. However, as market sentiment shifted in favor of the more cyclical holdings in the portfolio, the Series had very strong performance in the third and fourth quarters, eventually finishing above the benchmark. |
| ¢ | | The equity allocation was well positioned by its greater-than-market weight in both financial stocks and energy issues. Both sectors helped relative performance on the year, as did being underweight in telecom and consumer staples. However, stock selection was challenged in both technology and consumer discretionary, which hurt performance on the year. |
Fixed Income:
| ¢ | | The outperformance of most fixed income spread sectors relative to U.S. Treasuries was the key driver of the strong performance of the fixed income allocation of the Virtus Strategic Allocation Series for the fiscal year. |
| ¢ | | Among fixed income sectors, the Series’ allocations to corporate high yield securities, high yield bank loans, high quality corporate bonds, and asset-backed securities were all significant positive contributors to performance during the year. |
| ¢ | | At the same time, our allocation to the non-U.S. dollar sector detracted from performance. In addition, our higher quality bias in the corporate high yield bond sector was a detractor as lower quality securities outperformed. |
The preceding information is the opinion of portfolio management only through the end of the period of the report as stated on the cover. Any such opinions are subject to change at any time based upon market or other conditions and should not be relied upon as investment advice, and there is no guarantee that market forecasts will be realized.
For information regarding the indexes and key investment terms, see the Key Investment Terms starting on page 2.
22
| | |
| Strategic Allocation Series (Continued) | | |
Series Summary December 31, 2013 (Unaudited)
Portfolio Managers Commentaries by
Euclid Advisors LLC (equity portfolio) and
Newfleet Asset Management, LLC (fixed income portfolio)
The market price of equity securities may be affected by financial market, industry, or issuer-specific events. Focus on a particular style or on small or medium sized companies may enhance that risk.
Debt securities are subject to various risks, the most prominent of which are credit and interest rate risk. The issuer of a security may fail to make payments in a timely manner. Values of debt securities may rise and fall in response to changes in interest rates. This risk may be enhanced with longer-term maturities. Changes in interest rates can cause both extension and prepayment risks for asset and mortgage-backed securities. These securities are also subject to risks associated with the repayment of underlying collateral. There is a greater level of credit risk and price volatility involved with high yield securities than investment grade securities.
Investing internationally, especially in emerging markets, involves additional risks such as currency, political, accounting, economic, and market risk.
There may be no ready market for loan participation interests. The Series may have to sell the interests at a substantial discount. Such interests are subject to the credit risk of the underlying corporate borrower.
| | | | | | | | |
| |
| Asset Allocation | |
| |
The following table presents asset allocations within certain sectors and as a percentage of total investments as of December 31, 2013. | |
Common Stocks | | | | | | | 60 | % |
Financials | | | 12 | % | | | | |
Consumer Discretionary | | | 11 | | | | | |
Information Technology | | | 10 | | | | | |
Total of all other common stock sectors | | | 27 | | | | | |
Corporate Bonds | | | | | | | 17 | |
Financials | | | 8 | | | | | |
Industrials | | | 2 | | | | | |
Energy | | | 1 | | | | | |
Total of all other corporate bond sectors | | | 6 | | | | | |
Mortgage-Backed Securities | | | | | | | 13 | |
Asset-Backed Securities | | | | | | | 2 | |
Municipal Bonds | | | | | | | 2 | |
U.S. Government Securities | | | | | | | 1 | |
Foreign Government Securities | | | | | | | 1 | |
Loan Agreements | | | | | | | 1 | |
Other (includes short-term investments and securities lending collateral) | | | | | | | 3 | |
| | | | | | | | | |
Total | | | | | | | 100 | % |
| | | | | | | | | |
For information regarding the indexes and certain investment terms, see the Key Investment Terms starting on page 2.
23
| | |
| Strategic Allocation Series (Continued) | | |
| | | | | | | | | | | | |
| Average Annual Total Return1 for periods ended 12/31/13 | | | | | | | | | |
| | | |
| | | 1 year | | | 5 years | | | 10 years | |
Class A at NAV2 | | | 17.99 | % | | | 13.96 | % | | | 6.47 | % |
| S&P 500® Index | | | 32.39 | | | | 17.94 | | | | 7.40 | |
| Barclays U.S. Aggregate Bond Index | | | –2.02 | | | | 4.44 | | | | 4.55 | |
| Composite Index for Strategic Allocation Series | | | 17.56 | | | | 12.71 | | | | 6.54 | |
| Series expense ratios3: Class A Gross: 1.04%; Net: 0.98%. | | | | | | | | | | | | |
Returns represent past performance, which is no guarantee of future results. The investment return and principal value will fluctuate so that an investor’s shares, when redeemed, may be worth more or less than the original cost. Total return does not reflect expenses associated with the separate account such as the administrative fees, account charges and surrender charges, which if reflected, would reduce total return. Performance figures may reflect fee waivers and/or expense reimbursements. In the absence of fee waivers and/or expense reimbursements, the total return would have been lower. Please visit Virtus.com for performance data current to the most recent month-end.
| 1 | Total returns are historical and include changes in share price and the reinvestment of both dividends and capital gains distributions. |
| 2 | “NAV” (Net Asset Value) total returns do not reflect any fees or expenses associated with separate insurance accounts. |
| 3 | The expense ratios of the Series, both net and gross, are set forth according to the prospectus for the Series effective May 1, 2013, as supplemented and revised, and may differ from the expense ratios disclosed in the Financial Highlights tables in this report. See the Financial Highlights for more current information. Net Expenses: Expenses reduced by a contractual waiver in effect through April 30, 2014. Gross Expenses: Do not reflect the effect of the contractual waiver. |
Growth of $10,000 For periods ended 12/31
This chart assumes an initial investment of $10,000 made on December 31, 2003 of Class A. Returns shown include the reinvestment of all distributions at net asset value, and the change in share price for the stated period.
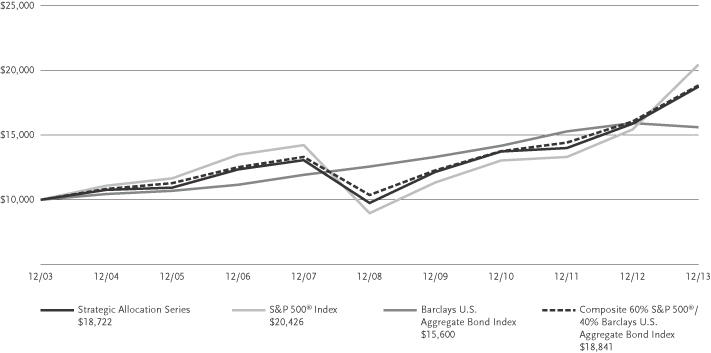
The indexes are unmanaged and not available for direct investment; therefore, their performance does not reflect the expenses associated with active management of an actual portfolio.
For information regarding the indexes and key investment terms, see the Key Investment Terms starting on page 2.
24
VIRTUS CAPITAL GROWTH SERIES
SCHEDULE OF INVESTMENTS
DECEMBER 31, 2013
($ reported in thousands)
| | | | | | | | |
| | | SHARES | | | VALUE | |
| COMMON STOCKS—99.1% | |
|
| Consumer Discretionary—18.5% | |
Bed Bath & Beyond, Inc.(2) | | | 64,810 | | | $ | 5,204 | |
Home Depot, Inc. (The) | | | 60,270 | | | | 4,962 | |
NIKE, Inc. Class B | | | 72,410 | | | | 5,694 | |
PetSmart, Inc. | | | 39,670 | | | | 2,886 | |
priceline.com, Inc.(2) | | | 4,850 | | | | 5,638 | |
Ross Stores, Inc. | | | 81,520 | | | | 6,108 | |
Starbucks Corp. | | | 84,790 | | | | 6,647 | |
Time Warner, Inc. | | | 45,090 | | | | 3,144 | |
| | | | | | | | |
| | | | | | | 40,283 | |
| | | | | | | | |
|
| Consumer Staples—10.1% | |
Coca-Cola Co. (The) | | | 135,100 | | | | 5,581 | |
Colgate-Palmolive Co. | | | 105,130 | | | | 6,856 | |
Costco Wholesale Corp. | | | 27,480 | | | | 3,270 | |
Estee Lauder Cos., Inc. (The) Class A | | | 41,920 | | | | 3,157 | |
Monster Beverage Corp.(2) | | | 46,080 | | | | 3,123 | |
| | | | | | | | |
| | | | | | | 21,987 | |
| | | | | | | | |
|
| Energy—5.0% | |
Core Laboratories N.V. | | | 18,180 | | | | 3,472 | |
National Oilwell Varco, Inc. | | | 38,490 | | | | 3,061 | |
Schlumberger Ltd. | | | 47,900 | | | | 4,316 | |
| | | | | | | | |
| | | | | | | 10,849 | |
| | | | | | | | |
|
| Financials—5.6% | |
Charles Schwab Corp. (The) | | | 161,770 | | | | 4,206 | |
Fifth Third Bancorp | | | 95,030 | | | | 1,999 | |
T. Rowe Price Group, Inc. | | | 72,580 | | | | 6,080 | |
| | | | | | | | |
| | | | | | | 12,285 | |
| | | | | | | | |
|
| Health Care—7.5% | |
Cerner Corp.(2) | | | 35,940 | | | | 2,003 | |
Gilead Sciences, Inc.(2) | | | 46,290 | | | | 3,479 | |
HealthSouth Corp. | | | 1,533 | | | | 51 | |
Intuitive Surgical, Inc.(2) | | | 7,770 | | | | 2,984 | |
Perrigo Co. plc | | | 28,520 | | | | 4,377 | |
Zoetis, Inc. | | | 109,920 | | | | 3,593 | |
| | | | | | | | |
| | | | | | | 16,487 | |
| | | | | | | | |
|
| Industrials—12.1% | |
Danaher Corp. | | | 58,820 | | | | 4,541 | |
Expeditors International of Washington, Inc. | | | 128,280 | | | | 5,676 | |
Fastenal Co. | | | 78,780 | | | | 3,743 | |
MSC Industrial Direct Co., Inc. Class A | | | 41,770 | | | | 3,378 | |
Precision Castparts Corp. | | | 16,640 | | | | 4,481 | |
Roper Industries, Inc. | | | 33,570 | | | | 4,656 | |
| | | | | | | | |
| | | | | | | 26,475 | |
| | | | | | | | |
|
| Information Technology—35.5% | |
Accenture plc Class A | | | 56,270 | | | | 4,627 | |
Amphenol Corp. Class A | | | 94,050 | | | | 8,387 | |
ANSYS, Inc.(2) | | | 77,380 | | | | 6,748 | |
Apple, Inc. | | | 21,970 | | | | 12,328 | |
Applied Materials, Inc. | | | 286,040 | | | | 5,060 | |
Baidu, Inc. SPON ADR(2) | | | 30,440 | | | | 5,415 | |
| | | | | | | | |
| | | SHARES | | | VALUE | |
| Information Technology—continued | |
Facebook, Inc. Class A(2) | | | 186,910 | | | $ | 10,216 | |
Fleetmatics Group plc | | | 56,150 | | | | 2,428 | |
MICROS Systems, Inc.(2) | | | 82,170 | | | | 4,714 | |
QUALCOMM, Inc. | | | 56,610 | | | | 4,203 | |
Visa, Inc. Class A | | | 29,550 | | | | 6,580 | |
Xilinx, Inc. | | | 146,180 | | | | 6,713 | |
| | | | | | | | |
| | | | | | | 77,419 | |
| | | | | | | | |
|
| Materials—4.8% | |
Ecolab, Inc. | | | 43,120 | | | | 4,496 | |
Praxair, Inc. | | | 45,820 | | | | 5,958 | |
| | | | | | | | |
| | | | | | | | 10,454 | |
TOTAL COMMON STOCKS
(Identified Cost $146,411) | | | | | | | 216,239 | |
| TOTAL LONG TERM INVESTMENTS—99.1% | |
| (Identified Cost $146,411) | | | | 216,239 | |
|
| SHORT-TERM INVESTMENTS—1.0% | |
|
| Money Market Mutual Funds—1.0% | |
Fidelity Money Market Portfolio – Institutional Shares (Seven-day effective yield 0.090%) | | | 2,224,557 | | | | 2,225 | |
| TOTAL SHORT-TERM INVESTMENTS | |
| (Identified Cost $2,225) | | | | 2,225 | |
| TOTAL INVESTMENTS—100.1% | |
| (Identified Cost $148,636) | | | | 218,464 | (1) |
Other assets and liabilities, net—(0.1)% | | | | (200 | ) |
| | | | | | | | |
| NET ASSETS—100.0% | | | $ | 218,264 | |
| | | | | | | | |
Abbreviations:
| ADR | American Depositary Receipt |
Footnote Legend:
| (1) | Federal Income Tax Information: For tax information at December 31, 2013, see Note 11 Federal Income Tax Information in the Notes to Financial Statements. |
| (2) | Non-income producing. |
| | | | |
| Country Weightings (unaudited)† | | | |
United States | | | 91 | % |
Ireland | | | 5 | |
Cayman Islands | | | 2 | |
Netherlands | | | 2 | |
Total | | | 100 | % |
† % of total investments as of December 31, 2013 | |
The following table provides a summary of inputs used to value the Series’ investments as of December 31, 2013 (See Security Valuation Note 2A in the Notes to Financial Statements):
| | | | | | | | |
| | | Total
Value at
December 31, 2013 | | | Level 1 –
Quoted
Prices | |
Equity Securities: | | | | | | | | |
Common Stocks | | $ | 216,239 | | | $ | 216,239 | |
Short-term Investments | | | 2,225 | | | | 2,225 | |
| | | | | | | | |
Total Investments | | $ | 218,464 | | | $ | 218,464 | |
| | | | | | | | |
There are no Level 2 (significant observable inputs) or Level 3 (significant unobservable inputs) priced securities.
There were no transfers between Level 1 and Level 2 for the period.
See Notes to Financial Statements
25
VIRTUS GROWTH & INCOME SERIES
SCHEDULE OF INVESTMENTS
DECEMBER 31, 2013
($ reported in thousands)
| | | | | | | | |
| | | SHARES | | | VALUE | |
| COMMON STOCKS—99.4% | |
|
| Consumer Discretionary—17.7% | |
Amazon.com, Inc.(2) | | | 7,900 | | | $ | 3,150 | |
Coach, Inc. | | | 52,000 | | | | 2,919 | |
Comcast Corp. Class A | | | 63,000 | | | | 3,274 | |
Express, Inc.(2) | | | 152,000 | | | | 2,838 | |
Ford Motor Co. | | | 165,000 | | | | 2,546 | |
Goodyear Tire & Rubber Co. (The) | | | 131,000 | | | | 3,124 | |
Lear Corp. | | | 36,000 | | | | 2,915 | |
Macy’s, Inc. | | | 56,000 | | | | 2,990 | |
Michael Kors Holdings Ltd. | | | 36,000 | | | | 2,923 | |
| | | | | | | | |
| | | | | | | 26,679 | |
| | | | | | | | |
|
| Consumer Staples—3.6% | |
PepsiCo, Inc. | | | 31,000 | | | | 2,571 | |
Safeway, Inc. | | | 88,000 | | | | 2,866 | |
| | | | | | | | |
| | | | | | | 5,437 | |
| | | | | | | | |
|
| Energy—11.6% | |
Chevron Corp. | | | 21,000 | | | | 2,623 | |
Continental Resources, Inc.(2)(3) | | | 26,000 | | | | 2,926 | |
Helmerich & Payne, Inc. | | | 35,000 | | | | 2,943 | |
Noble Corp plc | | | 78,000 | | | | 2,923 | |
Schlumberger Ltd. | | | 30,000 | | | | 2,703 | |
Valero Energy Corp. | | | 66,000 | | | | 3,326 | |
| | | | | | | | |
| | | | | | | 17,444 | |
| | | | | | | | |
|
| Financials—19.9% | |
Aflac, Inc. | | | 44,000 | | | | 2,939 | |
BB&T Corp. | | | 82,000 | | | | 3,060 | |
BlackRock, Inc. | | | 9,200 | | | | 2,912 | |
Blackstone Group LP (The)(3) | | | 104,000 | | | | 3,276 | |
Fifth Third Bancorp | | | 154,000 | | | | 3,239 | |
Goldman Sachs Group, Inc. (The) | | | 15,000 | | | | 2,659 | |
JPMorgan Chase & Co. | | | 48,000 | | | | 2,807 | |
Lincoln National Corp. | | | 58,000 | | | | 2,994 | |
T. Rowe Price Group, Inc. | | | 38,000 | | | | 3,183 | |
U.S. Bancorp | | | 70,000 | | | | 2,828 | |
| | | | | | | | |
| | | | | | | 29,897 | |
| | | | | | | | |
|
| Health Care—10.1% | |
Abbott Laboratories | | | 85,000 | | | | 3,258 | |
Biogen Idec, Inc.(2) | | | 10,100 | | | | 2,825 | |
Gilead Sciences, Inc.(2) | | | 40,000 | | | | 3,006 | |
UnitedHealth Group, Inc. | | | 42,000 | | | | 3,163 | |
Zimmer Holdings, Inc. | | | 32,000 | | | | 2,982 | |
| | | | | | | | |
| | | | | | | 15,234 | |
| | | | | | | | |
|
| Industrials—14.1% | |
Alaska Air Group, Inc. | | | 43,000 | | | | 3,155 | |
Cummins, Inc. | | | 23,000 | | | | 3,242 | |
Deere & Co. | | | 31,000 | | | | 2,831 | |
Dover Corp. | | | 32,000 | | | | 3,089 | |
Parker Hannifin Corp. | | | 24,000 | | | | 3,088 | |
Trinity Industries, Inc. | | | 53,000 | | | | 2,890 | |
Union Pacific Corp. | | | 17,000 | | | | 2,856 | |
| | | | | | | | |
| | | | | | | 21,151 | |
| | | | | | | | |
| | | | | | | | |
| | | SHARES | | | VALUE | |
| Information Technology—16.6% | |
Apple, Inc. | | | 7,800 | | | $ | 4,377 | |
Cisco Systems, Inc. | | | 137,000 | | | | 3,075 | |
EMC Corp. | | | 123,000 | | | | 3,093 | |
Google, Inc. Class A(2) | | | 2,600 | | | | 2,914 | |
Jabil Circuit, Inc. | | | 147,000 | | | | 2,564 | |
MasterCard, Inc. Class A | | | 3,600 | | | | 3,008 | |
NetApp, Inc. | | | 68,000 | | | | 2,797 | |
QUALCOMM, Inc. | | | 43,000 | | | | 3,193 | |
| | | | | | | | |
| | | | | | | 25,021 | |
| | | | | | | | |
|
| Materials—3.9% | |
CF Industries Holdings, Inc. | | | 12,400 | | | | 2,890 | |
Freeport-McMoRan Copper & Gold, Inc. | | | 79,000 | | | | 2,981 | |
| | | | | | | | |
| | | | | | | 5,871 | |
| | | | | | | | |
|
| Telecommunication Services—1.9% | |
Verizon Communications, Inc. | | | 57,000 | | | | 2,802 | |
| TOTAL COMMON STOCKS | | | | | |
| (Identified Cost $103,307) | | | | 149,536 | |
| TOTAL LONG TERM INVESTMENTS—99.4% | |
| (Identified Cost $103,307) | | | | 149,536 | |
|
| SHORT-TERM INVESTMENTS—0.3% | |
|
| Money Market Mutual Funds—0.3% | |
Fidelity Money Market Portfolio – Institutional Shares (Seven-day effective yield 0.090%) | | | 428,405 | | | | 428 | |
| TOTAL SHORT-TERM INVESTMENTS | | | | | |
| (Identified Cost $428) | | | | 428 | |
|
| SECURITIES LENDING COLLATERAL—4.1% | |
INVESCO Trust Short-Term Investments Liquid Assets Portfolio (The) Institutional Shares (seven-day effective yield 0.070%)(4) | | | 6,204,627 | | | | 6,205 | |
| TOTAL SECURITIES LENDING COLLATERAL | |
| (Identified Cost $6,205) | | | | | | | 6,205 | |
| TOTAL INVESTMENTS—103.8% | |
| (Identified Cost $109,940) | | | | 156,169 | (1) |
Other assets and liabilities, net—(3.8)% | | | | (5,786 | ) |
| | | | | | | | |
| NET ASSETS—100.0% | | | $ | 150,383 | |
| | | | | | | | |
Footnote Legend:
| (1) | Federal Income Tax Information: For tax information at December 31, 2013, see Note 11 Federal Income Tax Information in the Notes to Financial Statements. |
| (2) | Non-income producing. |
| (3) | All or a portion of security is on loan. |
| (4) | Represents security purchased with cash collateral received for securities on loan. |
The following table provides a summary of inputs used to value the Series’ investments as of December 31, 2013 (See Security Valuation Note 2A in the Notes to Financial Statements):
| | | | | | | | |
| | | Total
Value at
December 31, 2013 | | | Level 1 –
Quoted
Prices | |
Equity Securities: | |
Common Stocks | | $ | 149,536 | | | $ | 149,536 | |
Securities Lending Collateral | | | 6,205 | | | | 6,205 | |
Short-Term Investments | | | 428 | | | | 428 | |
| | | | | | | | |
Total Investments | | $ | 156,169 | | | $ | 156,169 | |
| | | | | | | | |
There are no level 2 (significant observable inputs) or level 3 (significant unobservable inputs) priced securities.
There were no transfers between Level 1 and Level 2 for the period.
See Notes to Financial Statements
26
VIRTUS INTERNATIONAL SERIES
SCHEDULE OF INVESTMENTS
DECEMBER 31, 2013
($ reported in thousands)
| | | | | | | | |
| | | SHARES | | | VALUE | |
| PREFERRED STOCK—9.3% | |
|
| Financials—2.6% | |
Banco Bradesco S.A. Sponsored ADR 8.66% (Brazil) | | | 674,000 | | | $ | 8,445 | |
| | | | | | | | |
|
| Information Technology—4.1% | |
Samsung Electronics Co., Ltd.4.55% (South Korea) | | | 13,500 | | | | 12,958 | |
| | | | | | | | |
|
| Materials—2.6% | |
Vale S.A. ADR 5.58% (Brazil) | | | 584,700 | | | | 8,192 | |
TOTAL PREFERRED STOCK
(Identified Cost $21,896) | | | | 29,595 | |
|
| COMMON STOCKS—89.2% | |
|
| Consumer Staples—13.9% | |
British American Tobacco plc (United Kingdom) | | | 240,000 | | | | 12,868 | |
Casino Guichard Perrachon S.A. (France) | | | 57,400 | | | | 6,615 | |
Fomento Economico Mexicano S.A.B. de C.V. Sponsored ADR (Mexico) | | | 91,100 | | | | 8,916 | |
Japan Tobacco, Inc. (Japan) | | | 136,500 | | | | 4,433 | |
Nestle S.A. Registered Shares (Switzerland) | | | 153,600 | | | | 11,244 | |
| | | | | | | | |
| | | | | | | 44,076 | |
| | | | | | | | |
| | |
| Energy—13.5% | | | | | | | | |
ENI SpA (Italy) | | | 395,300 | | | | 9,511 | |
John Wood Group plc (United Kingdom) | | | 355,800 | | | | 4,042 | |
PetroChina Co., Ltd. Class H (China) | | | 4,194,000 | | | | 4,597 | |
Petroleo Brasileiro S.A. ADR (Brazil) | | | 340,200 | | | | 4,998 | |
Royal Dutch Shell plc B Shares (United Kingdom) | | | 274,200 | | | | 10,353 | |
Tenaris S.A. Sponsored ADR (Italy) | | | 212,600 | | | | 9,288 | |
| | | | | | | | |
| | | | | | | 42,789 | |
| | | | | | | | |
| | |
| Financials—18.5% | | | | | | | | |
AIA Group Ltd. (Hong Kong) | | | 1,340,000 | | | | 6,722 | |
City Developments Ltd. (Singapore) | | | 485,000 | | | | 3,690 | |
Daito Trust Construction Co., Ltd. (Japan) | | | 34,800 | | | | 3,248 | |
HSBC Holdings plc (United Kingdom) | | | 574,000 | | | | 6,296 | |
Nordea Bank AB (Sweden) | | | 500,700 | | | | 6,746 | |
Oversea-Chinese Banking Corp., Ltd. (Singapore) | | | 757,330 | | | | 6,121 | |
QBE Insurance Group Ltd. (Australia) | | | 349,200 | | | | 3,589 | |
Standard Chartered plc (United Kingdom) | | | 405,500 | | | | 9,132 | |
Swire Pacific Ltd. Class B (Hong Kong) | | | 1,405,000 | | | | 3,171 | |
| | | | | | | | |
| | | SHARES | | | VALUE | |
| Financials—continued | | | | | | | | |
Zurich Financial Services AG (Switzerland) | | | 34,400 | | | $ | 9,969 | |
| | | | | | | | |
| | | | | | | 58,684 | |
| | | | | | | | |
| Health Care—8.6% | | | | | | | | |
Novartis AG Registered Shares (Switzerland) | | | 162,500 | | | | 12,970 | |
Roche Holding AG (Switzerland) | | | 51,700 | | | | 14,443 | |
| | | | | | | | |
| | | | | | | 27,413 | |
| | | | | | | | |
|
| Industrials—10.0% | |
Atlas Copco AB Class A (Sweden) | | | 166,500 | | | | 4,616 | |
Canadian National Railway Co. (Canada) | | | 128,000 | | | | 7,297 | |
FANUC Corp. (Japan) | | | 38,700 | | | | 7,074 | |
Schindler Holding AG (Switzerland) | | | 23,600 | | | | 3,474 | |
Schneider Electric SA (France) | | | 37,400 | | | | 3,262 | |
Weir Group plc (The) (United Kingdom) | | | 176,100 | | | | 6,217 | |
| | | | | | | | |
| | | | | | | 31,940 | |
| | | | | | | | |
|
| Information Technology—4.6% | |
Taiwan Semiconductor Manufacturing Co., Ltd. Sponsored ADR (Taiwan) | | | 660,700 | | | | 11,523 | |
Telefonaktiebolaget LM Ericsson Class B (Sweden) | | | 266,400 | | | | 3,251 | |
| | | | | | | | |
| | | | | | | 14,774 | |
| | | | | | | | |
|
| Materials—8.8% | |
BHP Billiton plc (United Kingdom) | | | 291,700 | | | | 9,028 | |
Linde AG (Germany) | | | 16,300 | | | | 3,410 | |
Potash Corp. of Saskatchewan, Inc. (Canada) | | | 216,700 | | | | 7,144 | |
Shin-Etsu Chemical Co., Ltd. (Japan) | | | 142,500 | | | | 8,308 | |
| | | | | | | | |
| | | | | | | 27,890 | |
| | | | | | | | |
|
| Telecommunication Services—8.2% | |
MTN Group Ltd. (South Africa) | | | 193,300 | | | | 3,999 | |
Singapore Telecommunications Ltd. (Singapore) | | | 2,245,000 | | | | 6,511 | |
TELUS Corp. (Canada) | | | 108,200 | | | | 3,724 | |
Vodafone Group plc (United Kingdom) | | | 3,002,100 | | | | 11,782 | |
| | | | | | | | |
| | | | | | | 26,016 | |
| | | | | | | | |
|
| Utilities—3.1% | |
Centrica plc (United Kingdom) | | | 1,133,000 | | | | 6,524 | |
GDF Suez (France) | | | 142,800 | | | | 3,357 | |
| | | | | | | | |
| | | | | | | | 9,881 | |
TOTAL COMMON STOCKS
(Identified Cost $180,558) | | | | 283,463 | |
| TOTAL LONG TERM INVESTMENTS—98.5% | |
| (Identified Cost $202,454) | | | | 313,058 | |
| | | | | | | | |
| | | SHARES | | | VALUE | |
| SHORT-TERM INVESTMENTS—1.0% | |
|
| Money Market Mutual Funds—1.0% | |
Fidelity Money Market Portfolio – Institutional Shares (Seven-day effective yield 0.090%) | | | 3,078,633 | | | $ | 3,079 | |
TOTAL SHORT-TERM INVESTMENTS
(Identified Cost $3,079) | | | | 3,079 | |
| TOTAL INVESTMENTS—99.5% | |
| (Identified Cost $205,533) | | | | 316,137 | (1) |
Other assets and liabilities, net—0.5% | | | | 1,693 | |
| | | | | | | | |
| NET ASSETS—100.0% | | | $ | 317,830 | |
| | | | | | | | |
Footnote Legend:
| (1) | Federal Income Tax Information: For tax information at December 31, 2013, see Note 11 Federal Income Tax Information in the Notes to Financial Statements. |
| | | | |
| Country Weightings (unaudited)† | |
United Kingdom | | | 24 | % |
Switzerland | | | 17 | |
Brazil | | | 7 | |
Japan | | | 7 | |
Canada | | | 6 | |
Italy | | | 6 | |
Singapore | | | 5 | |
Other | | | 28 | |
Total | | | 100 | % |
† % of total investments as of December 31, 2013 | |
The following table provides a summary of inputs used to value the Series’ investments as of December 31, 2013 (See Security Valuation Note 2A in the Notes to Financial Statements):
| | | | | | | | |
| | | Total
Value at
December 31, 2013 | | | Level 1 –
Quoted
Prices | |
Equity Securities: | | | | | | | | |
Common Stocks | | $ | 283,463 | | | $ | 283,463 | |
Preferred Stock | | | 29,595 | | | | 29,595 | |
Short-Term Investments | | | 3,079 | | | | 3,079 | |
| | | | | | | | |
Total Investments | | $ | 316,137 | | | $ | 316,137 | |
| | | | | | | | |
There are no level 2 (significant observable inputs) or level 3 (significant unobservable inputs) priced securities.
Securities held by the Series with an end of period value of $222,142 were transferred from level 2 into level 1 based on our valuation procedures for non-U.S. securities.
See Notes to Financial Statements
27
VIRTUS MULTI-SECTOR FIXED INCOME SERIES
SCHEDULE OF INVESTMENTS
DECEMBER 31, 2013
($ reported in thousands)
| | | | | | | | |
| | | PAR
VALUE | | | VALUE | |
| U.S. GOVERNMENT SECURITIES—0.6% | |
U.S. Treasury Note | | | | | | | | |
1.750%, 5/15/23 | | $ | 400 | | | $ | 360 | |
2.500%, 8/15/23 | | | 750 | | | | 719 | |
| TOTAL U.S. GOVERNMENT SECURITIES | |
| (Identified Cost $1,119) | | | | 1,079 | |
|
| MUNICIPAL BONDS—0.9% | |
|
| California—0.5% | |
Alameda Corridor Transportation Authority Taxable Series 99-C, (NATL Insured) 6.600%, 10/1/29 | | | 875 | | | | 915 | |
| | | | | | | | |
|
| Michigan—0.1% | |
Tobacco Settlement Finance Authority Taxable
Series 06-A,
7.309%, 6/1/34 | | | 205 | | | | 160 | |
| | | | | | | | |
|
| Virginia—0.3% | |
Tobacco Settlement Financing Corp. Taxable Series 07-A1,
6.706%, 6/1/46 | | | 665 | | | | 449 | |
| TOTAL MUNICIPAL BONDS | |
| (Identified Cost $1,694) | | | | 1,524 | |
|
| FOREIGN GOVERNMENT SECURITIES—9.7% | |
Argentine Republic,
8.280%, 12/31/33 | | | 562 | | | | 427 | |
Bolivarian Republic of Venezuela | | | | | | | | |
RegS 7.000%, 12/1/18(4) | | | 220 | | | | 168 | |
RegS 12.750%, 8/23/22(4) | | | 90 | | | | 84 | |
9.250%, 9/15/27 | | | 470 | | | | 366 | |
9.375%, 1/13/34 | | | 750 | | | | 560 | |
Commonwealth of Australia Series 125
6.250%, 6/15/14 | | | 555 | AUD | | | 504 | |
Commonwealth of Canada
2.000%, 3/1/14 | | | 1,760 | CAD | | | 1,660 | |
Commonwealth of New Zealand Series 415,
6.000%, 4/15/15 | | | 805 | NZD | | | 685 | |
Federative Republic of Brazil
8.500%, 1/5/24 | | | 2,770 | BRL | | | 1,027 | |
Hungary
5.750%, 11/22/23 | | | 168 | | | | 170 | |
Kingdom of Morocco 144A
4.250%, 12/11/22(3) | | | 505 | | | | 467 | |
Mongolia 144A
5.125%, 12/5/22(3) | | | 340 | | | | 287 | |
Provincia de Neuquen 144A
7.875%, 4/26/21(3) | | | 435 | | | | 439 | |
Republic of Colombia | | | | | | | | |
12.000%, 10/22/15 | | | 309,000 | COP | | | 180 | |
4.375%, 3/21/23 | | | 994,000 | COP | | | 456 | |
Republic of Costa Rica 144A
4.375%, 4/30/25(3) | | | 540 | | | | 479 | |
Republic of Croatia 144A
6.375%, 3/24/21(3) | | | 565 | | | | 591 | |
Republic of Iceland 144A
5.875%, 5/11/22(3) | | | 570 | | | | 581 | |
| | | | | | | | |
| | | PAR
VALUE | | | VALUE | |
| FOREIGN GOVERNMENT SECURITIES—continued | |
Republic of Indonesia | | | | | | | | |
Series FR30,
10.750%, 5/15/16 | | | 2,620,000 | IDR | | $ | 229 | |
Series FR63,
5.625%, 5/15/23 | | | 2,221,000 | IDR | | | 150 | |
Republic of Peru | | | | | | | | |
GDN, 144A
7.840%, 8/12/20(3) | | | 530 | PEN | | | 216 | |
RegS 6.900%, 8/12/37(4) | | | 870 | PEN | | | 304 | |
Republic of Philippines
4.950%, 1/15/21 | | | 11,000 | PHP | | | 263 | |
Republic of Slovak 144A
4.375%, 5/21/22(3) | | $ | 515 | | | | 531 | |
Republic of South Africa | | | | | | | | |
Series R206,
7.500%, 1/15/14 | | | 6,785 | ZAR | | | 647 | |
Series R208,
6.750%, 3/31/21 | | | 1,310 | ZAR | | | 119 | |
Republic of Turkey
9.000%, 3/5/14 | | | 1,000 | TRY | | | 466 | |
Republic of Uruguay
4.375%, 12/15/28 | | | 9,844 | UYU(9) | | | 469 | |
Russian Federation | | | | | | | | |
144A 7.850%, 3/10/18(3) | | | 30,000 | RUB | | | 940 | |
144A 4.875%, 9/16/23(3) | | | 800 | | | | 808 | |
Series 6207
8.150%, 2/3/27 | | | 17,815 | RUB | | | 559 | |
United Mexican States | | | | | | | | |
Series M, 6.000%, 6/18/15 | | | 12,065 | MXN | | | 954 | |
Series M, 6.500%, 6/9/22 | | | 12,430 | MXN | | | 962 | |
| TOTAL FOREIGN GOVERNMENT SECURITIES | |
| (Identified Cost $18,307) | | | | 16,748 | |
|
| MORTGAGE-BACKED SECURITIES—10.3% | |
|
| Non-Agency—10.3% | |
Aventura Mall Trust 13-AVM, C, 144A
3.743%, 12/5/32(2)(3) | | | 150 | | | | 148 | |
Banc of America Alternative Loan Trust 03-10, 2A1
6.000%, 12/25/33 | | | 68 | | | | 73 | |
Bear Stearns Adjustable Rate Mortgage Trust | | | | | | | | |
04-1, 21A1
2.398%, 4/25/34(2) | | | 498 | | | | 487 | |
04-10, 12A3
2.695%, 1/25/35(2) | | | 541 | | | | 536 | |
Bear Stearns Commercial Mortgage Securities, Inc. | | | | | | | | |
06-PW12, AM
5.751%, 9/11/38(2) | | | 750 | | | | 813 | |
05-PW10, AM
5.449%, 12/11/40(2) | | | 725 | | | | 774 | |
07-PW18, AM
6.084%, 6/11/50(2) | | | 1,475 | | | | 1,673 | |
Countrywide Home Loan Mortgage Pass-Through-Trust 03-4, 1A15
5.500%, 4/25/33 | | | 282 | | | | 294 | |
Credit Suisse Commercial Mortgage Trust 07-C2, A3
5.542%, 1/15/49(2) | | | 740 | | | | 814 | |
| | | | | | | | |
| | | PAR
VALUE | | | VALUE | |
| Non-Agency—continued | |
Extended Stay America Trust 13-ESHM, M 144A 7.625%, 12/5/19(3) | | $ | 521 | | | $ | 521 | |
Goldman Sachs Mortgage Securities Corp. II
05-5F, 2A8
5.500%, 6/25/35 | | | 42 | | | | 42 | |
07-GG10, A4
5.804%, 8/10/45(2) | | | 135 | | | | 148 | |
Greenwich Capital Commercial Funding Corp. Commercial Mortgage Trust 07-GG11, A4
5.736%, 12/10/49 | | | 780 | | | | 871 | |
JPMorgan Chase Commercial Mortgage Securities Trust
09-IWST, A2, 144A
5.633%, 12/5/27(3) | | | 100 | | | | 113 | |
06-LDP7, AM
5.863%, 4/15/45(2) | | | 780 | | | | 859 | |
06-LDP9, A3
5.336%, 5/15/47 | | | 350 | | | | 383 | |
07-LDPX, AM
5.464%, 1/15/49(2) | | | 450 | | | | 465 | |
JPMorgan Chase Mortgage Finance Corp. 07-A1, 10A1
2.794%, 2/25/37(2) | | | 370 | | | | 348 | |
JPMorgan Chase Mortgage Trust
05-A1, 4A1
3.275%, 2/25/35(2) | | | 32 | | | | 32 | |
05-A4, 3A1
2.256%, 7/25/35(2) | | | 52 | | | | 52 | |
JPMorgan Chase (WaMu) Mortgage Pass-Through-Certificates 04-CB1, 5A
5.000%, 6/25/19 | | | 29 | | | | 30 | |
Lehman Brothers – UBS Commercial Mortgage Trust 07-C7, A3
5.866%, 9/15/45(2) | | | 455 | | | | 504 | |
Lehman Brothers Commercial Mortgage Trust 07-C3, A4
5.884%, 7/15/44(2) | | | 400 | | | | 448 | |
MASTR Reperforming Loan Trust 05-1, 1A2, 144A
6.500%, 8/25/34(3) | | | 421 | | | | 434 | |
Merrill Lynch Mortgage Investors Trust 98-C1, CTL 6.750%, 11/15/26(2) | | | 465 | | | | 500 | |
Merrill Lynch Mortgage Trust 06-C1, AM
5.676%, 5/12/39(2) | | | 110 | | | | 119 | |
Morgan Stanley Capital I Trust 07-IQ14, AM 5.689%, 4/15/49(2) | | | 360 | | | | 372 | |
Motel 6 Trust 12-MTLB, D, 144A 3.781%, 10/5/25(3) | | | 550 | | | | 545 | |
Refer to Footnote Legend on page 34.
See Notes to Financial Statements
28
VIRTUS MULTI-SECTOR FIXED INCOME SERIES
SCHEDULE OF INVESTMENTS (Continued)
DECEMBER 31, 2013
($ reported in thousands)
| | | | | | | | |
| | | PAR
VALUE | | | VALUE | |
| Non-Agency—continued | |
Nomura Asset Acceptance Corp.
04-R1, A1, 144A
6.500%, 3/25/34(3) | | $ | 659 | | | $ | 694 | |
04-R3, A1, 144A 6.500%, 2/25/35(3) | | | 394 | | | | 410 | |
Residential Accredit Loans, Inc. 03-QS6, A4
4.250%, 3/25/33 | | | 45 | | | | 45 | |
Residential Asset Mortgage Products, Inc. 04-SL1, A8
6.500%, 11/25/31 | | | 49 | | | | 50 | |
Residential Funding Mortgage Securities I, Inc. 06-S4, A2
6.000%, 4/25/36 | | | 36 | | | | 33 | |
S2 Hospitality LLC 12-LV1, A, 144A
4.500%, 4/15/25(3) | | | 3 | | | | 3 | |
SBA Tower Trust 144A 4.254%, 4/15/15(3) | | | 115 | | | | 116 | |
Sequoia Mortgage Trust
12-3, A1
3.500%, 7/25/42(2) | | | 423 | | | | 412 | |
12-3, A1, 144A
4.000%, 12/25/43(2)(3) | | | 347 | | | | 348 | |
Springleaf Mortgage Loan Trust 09-1, A6, 144A
5.750%, 9/25/48(2)(3) | | | 24 | | | | 24 | |
Structured Asset Securities Corp. Mortgage Pass-Through Certificates 03-21, 2A2
5.250%, 8/25/33 | | | 115 | | | | 117 | |
SunTrust Adjustable Rate Mortgage Loan Trust 07-S1, 5A1
4.295%, 1/25/37(2) | | | 439 | | | | 430 | |
Wells Fargo (Wachovia Bank Commercial Mortgage Trust) | | | | | | | | |
06-C25, AM
5.724%, 5/15/43(2) | | | 670 | | | | 725 | |
07-C30, A5
5.342%, 12/15/43 | | | 970 | | | | 1,067 | |
07-C32, A3
5.733%, 6/15/49(2) | | | 775 | | | | 858 | |
Wells Fargo Mortgage Backed Securities Trust 06-17, A1
5.500%, 11/25/21 | | | 9 | | | | 9 | |
| TOTAL MORTGAGE-BACKED SECURITIES | |
| (Identified Cost $16,378) | | | | 17,739 | |
|
| ASSET-BACKED SECURITIES—3.6% | |
AABS Ltd. 13-1, A
4.875%, 1/15/38(2) | | | 471 | | | | 474 | |
Ameriquest Mortgage Securities, Inc. 03-10, AF6
5.210%, 11/25/33(2) | | | 26 | | | | 27 | |
CIT Group Home Equity Loan Trust 03-1, A5
4.980%, 7/20/34(2) | | | 300 | | | | 301 | |
| | | | | | | | |
| | | PAR
VALUE | | | VALUE | |
| ASSET-BACKED SECURITIES—continued | |
Conseco Financial Corp.
94-1, A5
7.650%, 4/15/19 | | $ | 26 | | | $ | 27 | |
01-3, A4
6.910%, 5/1/33(2) | | | 707 | | | | 794 | |
Countrywide Asset-Backed Certificates 05-1, AF5A
5.497%, 7/25/35(2) | | | 588 | | | | 567 | |
Drug Royalty LP II 12-1, A2, 144A 4.474%, 1/15/25(3) | | | 228 | | | | 232 | |
Fairway Outdoor Funding LLC 12-1A, A2, 144A
4.212%, 10/15/42(3) | | | 291 | | | | 291 | |
Ford Credit Auto Owner Trust 09-E, D 144A
5.530%, 5/15/16(3) | | | 250 | | | | 252 | |
GSAA Home Equity Trust
05-12, AF3W
4.999%, 9/25/35(2) | | | 495 | | | | 492 | |
MASTR Specialized Loan Trust 05-3, A2, 144A
5.704%, 11/25/35(2)(3) | | | 405 | | | | 411 | |
Origen Manufactured Housing Contract Trust 04-B, M1
5.730%, 11/15/35(2) | | | 321 | | | | 337 | |
Popular ABS Mortgage Pass-Through-Trust 05-5, AF3 4.807%, 11/25/35(2) | | | 297 | | | | 292 | |
Residential Funding Mortgage Securities II Home Loan Trust
07-HI1, A3
5.720%, 3/25/37 | | | 369 | | | | 371 | |
Santander Drive Auto Receivables Trust 11-2, C
3.280%, 6/15/16 | | | 220 | | | | 224 | |
Security National Mortgage Loan Trust 04-1A, AF3, 144A 6.420%, 6/25/32(2)(3) | | | 548 | | | | 443 | |
SVO VOI Mortgage Corp.
10-AA, A 144A
3.650%, 7/20/27(3) | | | 45 | | | | 46 | |
Terwin Mortgage Trust
04-15AL, A1 144A
5.796%, 7/25/34(2)(3) | | | 258 | | | | 246 | |
U-Haul S Fleet LLC
10-BT1A, 1 144A
4.899%, 10/25/23(3) | | | 302 | | | | 317 | |
| TOTAL ASSET-BACKED SECURITIES | |
| (Identified Cost $6,004) | | | | 6,144 | |
|
| CORPORATE BONDS—56.7% | |
|
| Consumer Discretionary—5.7% | |
American Axle & Manufacturing, Inc.
6.250%, 3/15/21 | | | 300 | | | | 320 | |
Arcelik AS 144A
5.000%, 4/3/23(3) | | | 200 | | | | 174 | |
Bon-Ton Department Stores, Inc. (The)
8.000%, 6/15/21 | | | 265 | | | | 268 | |
| | | | | | | | |
| | | PAR
VALUE | | | VALUE | |
| Consumer Discretionary—continued | |
Boyd Gaming Corp.
9.000%, 7/1/20 | | $ | 260 | | | $ | 286 | |
Brookfield Residential Properties, Inc. 144A 6.500%, 12/15/20(3) | | | 410 | | | | 427 | |
Caesars Entertainment Resort Properties LLC 144A 8.000%, 10/1/20(3) | | | 105 | | | | 110 | |
Cencosud S.A. 144A
4.875%, 1/20/23(3) | | | 270 | | | | 252 | |
Churchill Downs, Inc. 144A
5.375%, 12/15/21(3) | | | 335 | | | | 342 | |
Clear Channel Worldwide Holdings, Inc. | | | | | | | | |
Series A 7.625%, 3/15/20 | | | 250 | | | | 261 | |
Series B 7.625%, 3/15/20 | | | 280 | | | | 296 | |
Dana Holding Corp.
5.375%, 9/15/21 | | | 360 | | | | 363 | |
Hot Topic, Inc. 144A
9.250%, 6/15/21(3) | | | 190 | | | | 200 | |
International Game Technology | | | | | | | | |
7.500%, 6/15/19 | | | 160 | | | | 186 | |
5.500%, 6/15/20 | | | 125 | | | | 133 | |
Isle of Capri Casinos, Inc.
5.875%, 3/15/21 | | | 400 | | | | 395 | |
Jaguar Land Rover Automotive plc 144A
4.125%, 12/15/18(3) | | | 120 | | | | 121 | |
KOC Holding AS 144A
3.500%, 4/24/20(3) | | | 305 | | | | 260 | |
Kohl’s Corp.
4.750%, 12/15/23 | | | 480 | | | | 486 | |
Landry’s, Inc. 144A
9.375%, 5/1/20(3) | | | 300 | | | | 329 | |
Meritor, Inc.
6.750%, 6/15/21 | | | 325 | | | | 333 | |
MGM Resorts International
6.750%, 10/1/20 | | | 425 | | | | 456 | |
Mohegan Tribal Gaming Authority 144A
9.750%, 9/1/21(3) | | | 325 | | | | 352 | |
Nara Cable Funding Ltd. 144A 8.875%, 12/1/18(3) | | | 200 | | | | 216 | |
ONO Finance II plc 144A
10.875%, 7/15/19(3) | | | 150 | | | | 165 | |
Penn National Gaming, Inc. 144A 5.875%, 11/1/21(3) | | | 220 | | | | 218 | |
PNK Finance Corp. 144A
6.375%, 8/1/21(3) | | | 355 | | | | 365 | |
Rent-A-Center, Inc.
4.750%, 5/1/21 | | | 125 | | | | 118 | |
Seminole Hard Rock Entertainment, Inc. (Seminole Hard Rock International LLC) 144A
5.875%, 5/15/21(3) | | | 405 | | | | 400 | |
Sirius XM Radio, Inc. 144A
4.250%, 5/15/20(3) | | | 400 | | | | 379 | |
Six Flags Entertainment Corp. 144A
5.250%, 1/15/21(3) | | | 440 | | | | 431 | |
Refer to Footnote Legend on page 34.
See Notes to Financial Statements
29
VIRTUS MULTI-SECTOR FIXED INCOME SERIES
SCHEDULE OF INVESTMENTS (Continued)
DECEMBER 31, 2013
($ reported in thousands)
| | | | | | | | |
| | | PAR
VALUE | | | VALUE | |
| Consumer Discretionary—continued | |
Station Casinos LLC
7.500%, 3/1/21 | | $ | 320 | | | $ | 342 | |
Taylor Morrison Communities, Inc. 144A
5.250%, 4/15/21(3) | | | 490 | | | | 478 | |
Toll Brothers Finance Corp.
6.750%, 11/1/19 | | | 350 | | | | 402 | |
| | | | | | | | |
| | | | | | | 9,864 | |
| | | | | | | | |
|
| Consumer Staples—0.8% | |
Alphabet Holding Co., Inc. PIK Interest Capitalization, 144A 7.750%, 11/1/17(3)(11) | | | 35 | | | | 36 | |
Chiquita Brands International, Inc. 144A
7.875%, 2/1/21(3) | | | 215 | | | | 233 | |
Darling Escrow Corp. 144A
5.375%, 1/15/22(3) | | | 345 | | | | 348 | |
Flowers Foods, Inc.
4.375%, 4/1/22 | | | 430 | | | | 423 | |
Ingles Markets, Inc.
5.750%, 6/15/23 | | | 295 | | | | 291 | |
| | | | | | | | |
| | | | | | | 1,331 | |
| | | | | | | | |
| | |
| Energy—6.8% | | | | | | | | |
BreitBurn Energy Partners (BreitBurn Finance Corp.)
7.875%, 4/15/22 | | | 200 | | | | 209 | |
Calumet Specialty Products Partners LP (Calumet Finance Corp.)
9.625%, 8/1/20 | | | 245 | | | | 276 | |
CHC Helicopter SA
9.250%, 10/15/20 | | | 325 | | | | 352 | |
Chesapeake Energy Corp.
5.375%, 6/15/21 | | | 420 | | | | 437 | |
Compagnie Generale de Geophysique-Veritas
6.500%, 6/1/21 | | | 375 | | | | 386 | |
Ecopetrol S.A.
5.875%, 9/18/23 | | | 260 | | | | 274 | |
EPL Oil & Gas, Inc.
8.250%, 2/15/18 | | | 500 | | | | 540 | |
Gazprom Neft OAO (GPN Capital SA) 144A
6.000%, 11/27/23(3) | | | 335 | | | | 340 | |
Gazprom OAO (Gaz Capital SA)
144A 8.146%, 4/11/18(3) | | | 505 | | | | 595 | |
144A 6.510%, 3/7/22(3)(7) | | | 520 | | | | 558 | |
Lukoil OAO International Finance BV 144A
7.250%, 11/5/19(3) | | | 300 | | | | 347 | |
MEG Energy Corp. 144A
7.000%, 3/31/24(3) | | | 180 | | | | 183 | |
Memorial Production Partners LP
7.625%, 5/1/21 | | | 325 | | | | 336 | |
Novatek OAO (Novatek Finance Ltd.) 144A
4.422%, 12/13/22(3)(7) | | | 540 | | | | 497 | |
| | | | | | | | |
| | | PAR
VALUE | | | VALUE | |
| Energy—continued | |
Pacific Rubiales Energy Corp. 144A
5.375%, 1/26/19(3) | | $ | 340 | | | $ | 343 | |
Parker Drilling Co. 144A
7.500%, 8/1/20(3) | | | 365 | | | | 385 | |
Petrobras International Finance Co.
5.375%, 1/27/21 | | | 355 | | | | 352 | |
Petroleos de Venezuela SA
Series 2014
4.900%, 10/28/14 | | | 550 | | | | 503 | |
RegS 8.500%, 11/2/17(4) | | | 2,040 | | | | 1,703 | |
Petroleos Mexicanos
5.500%, 1/21/21 | | | 350 | | | | 376 | |
5.500%, 6/27/44 | | | 200 | | | | 183 | |
QGOG Constellation SA 144A 6.250%, 11/9/19(3) | | | 400 | | | | 383 | |
Rosetta Resources, Inc.
5.875%, 6/1/22 | | | 355 | | | | 353 | |
Sabine Pass Liquefaction LLC 144A
5.625%, 2/1/21(3) | | | 315 | | | | 309 | |
Targa Resources Partners LP 6.375%, 8/1/22 | | | 375 | | | | 398 | |
Teekay Corp.
8.500%, 1/15/20 | | | 225 | | | | 244 | |
Tullow Oil plc 144A
6.000%, 11/1/20(3) | | | 350 | | | | 357 | |
Venoco, Inc.
8.875%, 2/15/19 | | | 225 | | | | 223 | |
Williams Cos., Inc. (The)
3.700%, 1/15/23 | | | 375 | | | | 327 | |
| | | | | | | | |
| | | | | | | 11,769 | |
| | | | | | | | |
| | |
| Financials—23.4% | | | | | | | | |
Air Lease Corp.
4.750%, 3/1/20 | | | 405 | | | | 421 | |
Aircastle Ltd.
7.625%, 4/15/20 | | | 420 | | | | 474 | |
Akbank TAS 144A
7.500%, 2/5/18(3) | | | 530 | TRY | | | 211 | |
Alfa Bank OJSC (Alfa Bond Issuance plc) RegS
7.875%, 9/25/17(4)(7) | | | 485 | | | | 541 | |
Allstate Corp. (The)
5.750%, 8/15/53(2)(6) | | | 625 | | | | 630 | |
ALROSA Finance S.A. 144A
7.750%, 11/3/20(3) | | | 455 | | | | 507 | |
Avis Budget Car Rental LLC
5.500%, 4/1/23 | | | 480 | | | | 467 | |
Banco ABC Brasil S.A. 144A
7.875%, 4/8/20(3) | | | 425 | | | | 423 | |
Banco Bilbao Vizcaya Argentaria Bancomer S.A. 144A
6.500%, 3/10/21(3) | | | 425 | | | | 448 | |
Banco Bradesco S.A. 144A
5.900%, 1/16/21(3) | | | 600 | | | | 599 | |
Banco de Credito e Inversiones 144A
4.000%, 2/11/23(3) | | | 390 | | | | 360 | |
Banco Internacional del Peru SAA 144A
5.750%, 10/7/20(3) | | | 500 | | | | 508 | |
| | | | | | | | |
| | | PAR
VALUE | | | VALUE | |
| Financials—continued | |
Banco Santander Brasil SA
144A 8.000%, 3/18/16(3) | | | 600 | BRL | | $ | 235 | |
Banco Santander Chile
144A 3.750%, 9/22/15(3) | | | 100 | | | | 103 | |
144A 3.875%, 9/20/22(3) | | | 505 | | | | 476 | |
Banco Votorantim S.A. 144A
7.375%, 1/21/20(3) | | | 450 | | | | 466 | |
Bancolombia S.A.
5.125%, 9/11/22 | | | 545 | | | | 512 | |
Bank of Georgia JSC 144A
7.750%, 7/5/17(3) | | | 290 | | | | 302 | |
Bank of India
144A 3.250%, 4/18/18(3) | | | 500 | | | | 484 | |
144A 3.625%, 9/21/18(3) | | | 495 | | | | 472 | |
Barclays Bank plc
144A 6.050%, 12/4/17(3) | | | 435 | | | | 486 | |
144A 5.926%(2)(3)(5)(6) | | | 600 | | | | 633 | |
Braskem Finance Ltd. 144A
5.750%, 4/15/21(3) | | | 490 | | | | 480 | |
Brazil Loan Trust 1 144A
5.477%, 7/24/23(3) | | | 460 | | | | 463 | |
Chubb Corp. (The)
6.375%, 3/29/67(2) | | | 1,390 | | | | 1,505 | |
City National Corp.
5.250%, 9/15/20 | | | 425 | | | | 455 | |
CorpGroup Banking S.A. 144A 6.750%, 3/15/23(3) | | | 425 | | | | 412 | |
CPG Merger Sub LLC 144A
8.000%, 10/1/21(3) | | | 105 | | | | 110 | |
Credit Bank of Moscow 144A 7.700%, 2/1/18(3)(7) | | | 200 | | | | 200 | |
Denali Borrower LLC (Denali Finance Corp.) 144A
5.625%, 10/15/20(3) | | | 320 | | | | 318 | |
Development Bank of Kazakhstan JSC 144A
4.125%, 12/10/22(3) | | | 535 | | | | 478 | |
Dupont Fabros Technology LP 5.875%, 9/15/21 | | | 250 | | | | 259 | |
ESAL GmbH 144A
6.250%, 2/5/23(3) | | | 410 | | | | 370 | |
Eurasian Development Bank 144A 4.767%, 9/20/22(3) | | | 475 | | | | 458 | |
Evergrande Real Estate Group Ltd. 144A
8.750%, 10/30/18(3) | | | 345 | | | | 348 | |
Fidelity National Financial, Inc. 5.500%, 9/1/22 | | | 130 | | | | 135 | |
First Niagara Financial Group, Inc.
6.750%, 3/19/20 | | | 610 | | | | 700 | |
General Motors Financial Co., Inc. 144A
4.750%, 8/15/17(3) | | | 735 | | | | 784 | |
Genworth Holdings, Inc.
4.900%, 8/15/23 | | | 620 | | | | 619 | |
Glen Meadow Pass-Through Trust 144A
6.505%, 2/12/67(2)(3) | | | 950 | | | | 926 | |
GLP Capital LP (GLP Financing II, Inc.)
144A 4.375%, 11/1/18(3) | | | 15 | | | | 15 | |
144A 4.875%, 11/1/20(3) | | | 135 | | | | 135 | |
144A 5.375%, 11/1/23(3) | | | 10 | | | | 10 | |
Refer to Footnote Legend on page 34.
See Notes to Financial Statements
30
VIRTUS MULTI-SECTOR FIXED INCOME SERIES
SCHEDULE OF INVESTMENTS (Continued)
DECEMBER 31, 2013
($ reported in thousands)
| | | | | | | | |
| | | PAR
VALUE | | | VALUE | |
| Financials—continued | |
GRD Holdings III Corp. 144A
10.750%, 6/1/19(3) | | $ | 320 | | | $ | 350 | |
HBOS plc 144A
6.750%, 5/21/18(3) | | | 200 | | | | 226 | |
Huntington National Bank (The)
6.600%, 6/15/18 | | | 250 | | | | 276 | |
Hutchison Whampoa International Ltd.
Series 12, 144A
6.000%(2)(3)(5)(6) | | | 610 | | | | 649 | |
ICICI Bank Ltd. 144A
4.800%, 5/22/19(3) | | | 435 | | | | 438 | |
ING (U.S.), Inc.
5.650%, 5/15/53(2)(6) | | | 395 | | | | 384 | |
International Lease Finance Corp.
6.250%, 5/15/19 | | | 305 | | | | 332 | |
Intesa San Paolo SpA
3.125%, 1/15/16 | | | 410 | | | | 418 | |
Itau Unibanco Holding S.A. 144A
5.125%, 5/13/23(3) | | | 560 | | | | 518 | |
Jefferies Group LLC
6.875%, 4/15/21 | | | 135 | | | | 154 | |
Kazakhstan Temir Zholy Finance BV 144A
6.950%, 7/10/42(3) | | | 410 | | | | 408 | |
Kingsway America, Inc.
7.500%, 2/1/14 | | | 68 | | | | 67 | |
Korea Finance Corp.
4.625%, 11/16/21 | | | 400 | | | | 422 | |
Lazard Group LLC
4.250%, 11/14/20 | | | 50 | | | | 50 | |
Level 3 Financing, Inc.
7.000%, 6/1/20 | | | 400 | | | | 426 | |
Liberty Mutual Insurance Co. 144A
8.500% , 5/15/25(3) | | | 25 | | | | 31 | |
Lincoln National Corp.
6.050%, 4/20/67(2)(6) | | | 365 | | | | 362 | |
Lloyds TSB Bank plc 144A
6.500% , 9/14/20(3) | | | 600 | | | | 681 | |
Macquarie Bank Ltd. 144A
6.625%, 4/7/21(3) | | | 330 | | | | 365 | |
Magyar Fejlesztesi Bank Zrt. 144A
6.250%, 10/21/20(3) | | | 300 | | | | 310 | |
Michaels FinCo Holdings LLC (Michaels FinCo, Inc.) PIK Interest Capitalization, 144A 7.500%, 8/1/18(3)(11) | | | 295 | | | | 308 | |
Morgan Stanley 144A
10.090%, 5/3/17(3) | | | 1,250 | BRL | | | 501 | |
Nationstar Mortgage LLC
6.500%, 7/1/21 | | | 275 | | | | 263 | |
Nordea Bank AB 144A
4.250%, 9/21/22(3) | | | 600 | | | | 592 | |
Phosagro OAO (Phosagro Bond Funding Ltd.) 144A
4.204%, 2/13/18(3)(7) | | | 360 | | | | 357 | |
PKO Finance AB 144A
4.630%, 9/26/22(3)(7) | | | 610 | | | | 607 | |
| | | | | | | | |
| | | PAR
VALUE | | | VALUE | |
| Financials—continued | |
Progressive Corp. (The)
6.700%, 6/15/37(2) | | $ | 750 | | | $ | 810 | |
Prudential Financial, Inc.
5.875%, 9/15/42(2) | | | 1,100 | | | | 1,118 | |
5.200%, 3/15/44(2)(6) | | | 95 | | | | 92 | |
Regency Energy Partners LP (Regency Energy Finance Corp.)
4.500%, 11/1/23 | | | 385 | | | | 352 | |
Resona Bank Ltd. 144A
5.850%(2)(3)(5)(6) | | | 600 | | | | 642 | |
Royal Bank of Scotland Group plc (The)
5.625%, 8/24/20 | | | 750 | | | | 839 | |
7.648%(2)(5)(6) | | | 450 | | | | 475 | |
Russian Agricultural Bank OJSC (RSHB Capital SA) 144A 6.299%, 5/15/17(3) | | | 715 | | | | 762 | |
144A 5.298%, 12/27/17(3) | | | 130 | | | | 134 | |
Santander U.S. Debt S.A.U. 144A 3.724%, 1/20/15(3) | | | 100 | | | | 102 | |
Sberbank of Russia (Sberbank CapItal SA) 144A 5.125%, 10/29/22(3)(7) | | | 580 | | | | 554 | |
Shinhan Bank 144A
4.375% , 7/27/17(3) | | | 450 | | | | 481 | |
SLM Corp.
5.500%, 1/25/23 | | | 665 | | | | 627 | |
Sovereign Bank
8.750%, 5/30/18 | | | 200 | | | | 240 | |
Spansion LLC
7.875%, 11/15/17 | | | 300 | | | | 313 | |
Sun Merger Sub, Inc. 144A
5.875%, 8/1/21(3) | | | 175 | | | | 180 | |
SunTrust Bank, Inc.
5.400%, 4/1/20 | | | 250 | | | | 270 | |
Telecom Italia Capital SA
6.175%, 6/18/14 | | | 65 | | | | 66 | |
7.175%, 6/18/19 | | | 200 | | | | 225 | |
TMK OAO Via (TMK Capital) SA 144A 6.750%, 4/3/20(3)(7) | | | 395 | | | | 380 | |
Turkiye Garanti Bankasi AS 144A 5.250%, 9/13/22(3) | | | 505 | | | | 451 | |
UPCB Finance Ltd. Series VI 144A 6.875%, 1/15/22(3) | | | 260 | | | | 278 | |
VTB Bank OJSC (VTB Capital SA) 144A
6.000%, 4/12/17(3)(7) | | | 700 | | | | 744 | |
Walter Investment Management Corp 144A 7.875%, 12/15/21(3) | | | 345 | | | | 351 | |
Webster Financial Corp.
5.125%, 4/15/14 | | | 230 | | | | 232 | |
Willis Group Holdings plc
5.750%, 3/15/21 | | | 440 | | | | 473 | |
Yapi ve Kredi Bankasi AS 144A 4.000%, 1/22/20(3) | | | 510 | | | | 456 | |
Zions Bancorporation
4.500%, 6/13/23 | | | 170 | | | | 165 | |
| | | | | | | | |
| | | | | | | 40,245 | |
| | | | | | | | |
| | | | | | | | |
| | | PAR
VALUE | | | VALUE | |
| Health Care—1.7% | |
HCA, Inc.
6.500%, 2/15/20 | | $ | 330 | | | $ | 363 | |
IASIS Healthcare LLC (IASIS Capital Corp.)
8.375%, 5/15/19 | | | 165 | | | | 176 | |
Lifepoint Hospitals, Inc. 144A 5.500%, 12/1/21(3) | | | 310 | | | | 312 | |
MPH Intermediate Holding Co. 2 PIK Interest Capitalization, 144A
8.375%, 8/1/18(3)(11) | | | 170 | | | | 177 | |
Salix Pharmaceuticals Ltd. 144A
6.000%, 1/15/21(3) | | | 60 | | | | 62 | |
Symbion, Inc.
8.000%, 6/15/16 | | | 405 | | | | 431 | |
Tenet Healthcare Corp.
144A 6.000%, 10/1/20(3) | | | 80 | | | | 84 | |
4.500%, 4/1/21 | | | 580 | | | | 552 | |
8.125%, 4/1/22 | | | 345 | | | | 373 | |
Valeant Pharmaceuticals International, Inc. Escrow Corp. | | | | | | | | |
144A 6.750%, 8/15/18(3) | | | 255 | | | | 281 | |
144A 7.500%, 7/15/21(3) | | | 50 | | | | 55 | |
144A 5.625%, 12/1/21(3) | | | 20 | | | | 20 | |
| | | | | | | | |
| | | | | | | 2,886 | |
| | | | | | | | |
|
| Industrials—7.8% | |
AAR Corp. 144A
7.250%, 1/15/22(3) | | | 365 | | | | 392 | |
ADT Corp. (The) 144A
6.250%, 10/15/21(3) | | | 435 | | | | 457 | |
Ahern Rentals, Inc. 144A
9.500%, 6/15/18(3) | | | 290 | | | | 315 | |
Air Canada 144A
6.750%, 10/1/19(3) | | | 425 | | | | 449 | |
Air Canada Pass-Through-Trust 13-1, B 144A
5.375%, 5/15/21(3) | | | 228 | | | | 222 | |
America West Airlines Pass-Through-Trust 00-1, G
8.057%, 7/2/20 | | | 412 | | | | 441 | |
American Airlines Pass-Through-Trust 13-1, A 144A
4.000%, 7/15/25(3) | | | 980 | | | | 948 | |
Ashton Woods USA LLC (Ashton Woods Finance Co.) 144A
6.875%, 2/15/21(3) | | | 405 | | | | 401 | |
Atlas Air Pass-Through-Trust 00-1, A
8.707% , 1/2/19 | | | 514 | | | | 534 | |
Automotores Gildemeister S.A. 144A
6.750%, 1/15/23(3) | | | 150 | | | | 101 | |
Bharti Airtel International Netherlands BV 144A
5.125%, 3/11/23(3) | | | 400 | | | | 371 | |
Bombardier, Inc. 144A
6.125%, 1/15/23(3) | | | 520 | | | | 519 | |
Refer to Footnote Legend on page 34.
See Notes to Financial Statements
31
VIRTUS MULTI-SECTOR FIXED INCOME SERIES
SCHEDULE OF INVESTMENTS (Continued)
DECEMBER 31, 2013
($ reported in thousands)
| | | | | | | | |
| | | PAR
VALUE | | | VALUE | |
| Industrials—continued | |
Builders FirstSource, Inc. 144A
7.625%, 6/1/21(3) | | $ | 285 | | | $ | 299 | |
Carpenter Technology Corp.
5.200%, 7/15/21 | | | 425 | | | | 435 | |
Ceridian HCM Holding, Inc. 144A
11.000%, 3/15/21(3) | | | 15 | | | | 17 | |
Continental Airlines Pass-Through-Trust | | | | | | | | |
98-1, A 6.648%, 9/15/17 | | | 425 | | | | 447 | |
99-1, A 6.545%, 2/2/19 | | | 814 | | | | 888 | |
00-1, A1 8.048%, 11/1/20 | | | 421 | | | | 481 | |
Delta Air Lines Pass-Through-Trust 12-1A, 1A
4.750%, 5/7/20 | | | 465 | | | | 498 | |
DP World Ltd. 144A
6.850%, 7/2/37(3) | | | 200 | | | | 197 | |
Embraer S.A.
5.150%, 6/15/22 | | | 600 | | | | 600 | |
Hellenic Railways
5.460%, 1/30/14 | | | 490 | EUR | | | 657 | |
Kratos Defense & Security Solutions, Inc.
10.000%, 6/1/17 | | | 325 | | | | 352 | |
Northwest Airlines Pass-Through-Trust 02-1, G2
6.264%, 11/20/21 | | | 437 | | | | 470 | |
Odebrecht Finance Ltd. 144A
8.250%, 4/25/18(3) | | | 400 | BRL | | | 140 | |
Rexel SA 144A
5.250%, 6/15/20(3) | | | 395 | | | | 399 | |
Sappi Papier Holding GmbH 144A
8.375%, 6/15/19(3) | | | 200 | | | | 220 | |
TransDigm, Inc. 144A
7.500%, 7/15/21 | | | 270 | | | | 292 | |
UAL Pass-Through-Trust | | | | | | | | |
09-2 9.750%, 1/15/17 | | | 198 | | | | 227 | |
07-01, A 6.636%, 7/2/22 | | | 960 | | | | 1,017 | |
Voto-Votorantim Ltd. 144A
6.750%, 4/5/21(3) | | | 600 | | | | 654 | |
| | | | | | | | |
| | | | | | | 13,440 | |
| | | | | | | | |
|
| Information Technology—2.1% | |
Equinix, Inc.
4.875%, 4/1/20 | | | 180 | | | | 180 | |
Fidelity National Financial, Inc.
6.600%, 5/15/17 | | | 600 | | | | 670 | |
First Data Corp. | | | | | | | | |
144A 8.250%, 1/15/21(3) | | | 400 | | | | 428 | |
144A 11.750%, 8/15/21(3) | | | 935 | | | | 991 | |
Freescale Semiconductor, Inc. | | | | | | | | |
144A 5.000%, 5/15/21(3) | | | 285 | | | | 278 | |
144A 6.000%, 1/15/22(3) | | | 210 | | | | 213 | |
NCR Corp.
4.625%, 2/15/21 | | | 415 | | | | 399 | |
Sophia Holding Finance LP PIK Inerest Capitalization, 144A 9.625%, 12/1/18(3)(11) | | | 115 | | | | 119 | |
| | | | | | | | |
| | | PAR
VALUE | | | VALUE | |
| Information Technology—continued | |
VeriSign, Inc.
4.625%, 5/1/23(12) | | $ | 290 | | | $ | 278 | |
| | | | | | | | |
| | | | | | | 3,556 | |
| | | | | | | | |
|
| Materials—5.0% | |
Alpek SA de C.V. 144A
5.375%, 8/8/23(3) | | | 625 | | | | 621 | |
Beverage Packaging Holdings Luxembourg II SA 144A
6.000%, 6/15/17(3) | | | 625 | | | | 634 | |
Calumet Specialty Products Partners LP
9.375%, 5/1/19 | | | 213 | | | | 238 | |
Cemex SAB de CV | | | | | | | | |
144A 9.500%, 6/15/18(3) | | | 395 | | | | 450 | |
144A 5.875%, 3/25/19(3) | | | 275 | | | | 276 | |
Eldorado Gold Corp. 144A
6.125%, 12/15/20(3) | | | 180 | | | | 174 | |
EuroChem Mineral & Chemical Co. OJSC 144A
5.125%, 12/12/17(3)(7) | | | 270 | | | | 272 | |
Gerdau Holdings, Inc. | | | | | | | | |
144A 7.000%, 1/20/20(3) | | | 375 | | | | 409 | |
144A 4.750%, 4/15/23(3) | | | 200 | | | | 184 | |
Hexion U.S. Finance Corp. | | | | | | | | |
8.875%, 2/1/18 | | | 230 | | | | 240 | |
6.625%, 4/15/20 | | | 225 | | | | 232 | |
Inversiones CMPC S.A. 144A 4.375%, 5/15/23(3) | | | 600 | | | | 558 | |
NewMarket Corp.
4.100%, 12/15/22 | | | 543 | | | | 517 | |
Nufarm Australia Ltd. 144A
6.375%, 10/15/19(3) | | | 365 | | | | 380 | |
Sappi Papier Holding GmbH 144A 6.625%, 4/15/21(3) | | | 780 | | | | 772 | |
Severstal OAO (Steel Capital SA) 144A
6.700%, 10/25/17(3)(7) | | | 500 | | | | 541 | |
Tronox Finance LLC
6.375%, 8/15/20 | | | 305 | | | | 313 | |
Turkiye Sise Ve Cam Fabrikalari AS 144A
4.250%, 5/9/20(3) | | | 400 | | | | 354 | |
United States Steel Corp.
6.875%, 4/1/21 | | | 490 | | | | 521 | |
Vale Overseas Ltd.
4.375%, 1/11/22 | | | 525 | | | | 509 | |
Vedanta Resources plc 144A 9.500%, 7/18/18(3) | | | 345 | | | | 385 | |
| | | | | | | | |
| | | | | | | 8,580 | |
| | | | | | | | |
|
| Telecommunication Services—2.7% | |
America Movil SAB de C.V. Series 12
6.450%, 12/5/22 | | | 2,000 | MXN | | | 141 | |
CenturyLink, Inc. | | | | | | | | |
Series V 5.625%, 4/1/20 | | | 355 | | | | 363 | |
Series T 5.800%, 3/15/22 | | | 350 | | | | 347 | |
Cincinnati Bell, Inc.
8.375%, 10/15/20 | | | 375 | | | | 409 | |
| | | | | | | | |
| | | PAR
VALUE | | | VALUE | |
| Telecommunication Services—continued | |
Crown Castle Towers LLC | | | | | | | | |
144A 4.523%, 1/15/15(3) | | $ | 75 | | | $ | 77 | |
144A 3.214%, 8/15/15(3) | | | 50 | | | | 51 | |
144A 5.495%, 1/15/17(3) | | | 85 | | | | 92 | |
Digicel Group Ltd. 144A
8.250%, 9/30/20(3) | | | 345 | | | | 359 | |
Earthlink, Inc.
7.375%, 6/1/20 | | | 270 | | | | 271 | |
Intelsat Luxembourg SA 144A 7.750%, 6/1/21(3) | | | 245 | | | | 264 | |
Koninklijke KPN NV 144A
7.000%, 3/28/73(2)(3)(6) | | | 385 | | | | 390 | |
Sprint Corp. 144A
7.250%, 9/15/21(3) | | | 340 | | | | 366 | |
T-Mobile USA, Inc. | | | | | | | | |
6.633%, 4/28/21 | | | 50 | | | | 53 | |
6.125%, 1/15/22 | | | 190 | | | | 194 | |
6.731%, 4/28/22 | | | 60 | | | | 63 | |
6.500%, 1/15/24 | | | 140 | | | | 142 | |
Telefonica Emisiones, S.A.U. 5.462%, 2/16/21 | | | 325 | | | | 343 | |
Windstream Corp.
7.750%, 10/15/20 | | | 650 | | | | 693 | |
| | | | | | | | |
| | | | | | | 4,618 | |
| | | | | | | | |
|
| Utilities—0.7% | |
Calpine Corp. | | | | | | | | |
144A 7.500%, 2/15/21(3) | | | 214 | | | | 234 | |
144A 6.000%, 1/15/22(3) | | | 20 | | | | 21 | |
Electricite de France SA 144A 5.250% (2)(3)(5)(6) | | | 635 | | | | 631 | |
Israel Electric Corp. Ltd. 144A
5.625%, 6/21/18(3) | | | 275 | | | | 291 | |
NRG Energy, Inc.
6.625%, 3/15/23 | | | 55 | | | | 56 | |
Texas Competitive Electric Holdings Co., LLC Series A
10.250%, 11/1/15 | | | 396 | | | | 27 | |
| | | | | | | | |
| | | | | | | | 1,260 | |
| TOTAL CORPORATE BONDS (Identified Cost $96,015) | | | | | | | 97,549 | |
|
| LOAN AGREEMENTS(2)—12.4% | |
|
| Consumer Discretionary—2.6% | |
Affinity Gaming LLC (Herbst Gaming LLC).
4.250%, 11/9/17 | | | 395 | | | | 397 | |
Brickman Group Holdings, Inc. Second Lien,
0.000%, 12/17/21(8) | | | 96 | | | | 98 | |
Caesars Entertainment Operating Co., Inc.
(Harrah’s Operating Company, Inc.)
Tranche B-6,
5.488%, 1/28/18 | | | 545 | | | | 522 | |
CBAC Borrower LLC
Tranche B,
8.250%, 7/2/20 | | | 202 | | | | 209 | |
Refer to Footnote Legend on page 34.
See Notes to Financial Statements
32
VIRTUS MULTI-SECTOR FIXED INCOME SERIES
SCHEDULE OF INVESTMENTS (Continued)
DECEMBER 31, 2013
($ reported in thousands)
| | | | | | | | |
| | | PAR
VALUE | | | VALUE | |
| Consumer Discretionary—continued | |
Clear Channel Communications, Inc.
Tranche B,
3.814%, 1/29/16 | | $ | 226 | | | $ | 219 | |
Tranche D,
6.919%, 1/30/19 | | | 409 | | | | 392 | |
Cumulus Media Holdings, Inc. 0.000%, 12/18/20(8) | | | 119 | | | | 120 | |
EB Sports Corp.
11.500%, 12/31/15 | | | 310 | | | | 309 | |
Granite Broadcasting Corp.
Tranche B First Lien
6.750%, 5/23/18 | | | 328 | | | | 331 | |
Landry’s, Inc. (Landry’s Restaurant, Inc.)
Tranche B,
4.000%, 4/24/18 | | | 669 | | | | 675 | |
Marina District Finance Co., Inc. 6.750%, 8/15/18 | | | 197 | | | | 198 | |
Peppermill Casinos, Inc.
Tranche B,
7.250%, 11/9/18 | | | 401 | | | | 411 | |
Shingle Springs Tribal Gaming Authority
6.250%, 8/29/19 | | | 229 | | | | 231 | |
Transtar Holding Co. Second Lien,
9.750%, 10/9/19 | | | 197 | | | | 189 | |
TWCC Holding Corp. Second Lien,
7.000%, 6/26/20 | | | 184 | | | | 190 | |
| | | | | | | | |
| | | | | | | 4,491 | |
| | | | | | | | |
|
| Consumer Staples—0.4% | |
AdvancePierre Foods, Inc.
First Lien,
5.750%, 7/10/17 | | | 46 | | | | 45 | |
Second Lien,
9.500%, 10/10/17 | | | 330 | | | | 320 | |
Hostess Brands Acquisition LLC Tranche B,
6.750%, 4/9/20 | | | 266 | | | | 276 | |
| | | | | | | | |
| | | | | | | 641 | |
| | | | | | | | |
|
| Energy—1.0% | |
Fieldwood Energy LLC
8.375%, 9/30/20 | | | 219 | | | | 224 | |
FTS International, Inc. (Frac Tech International LLC)
8.500%, 5/6/16 | | | 458 | | | | 461 | |
NGPL Pipeco LLC
6.750%, 9/15/17 | | | 309 | | | | 289 | |
SES International Holdings Ltd. (Saxon)
5.500%, 2/15/19 | | | 331 | | | | 334 | |
Templar Energy LLC
Second Lien,
8.000%, 11/25/20 | | | 345 | | | | 347 | |
| | | | | | | | |
| | | | | | | 1,655 | |
| | | | | | | | |
| | | | | | | | |
| | | PAR
VALUE | | | VALUE | |
| Financials—0.7% | | | | | | | | |
Altisource Solutions S.A.R.L Tranche B,
4.500%, 12/9/20 | | $ | 223 | | | $ | 225 | |
Capital Automotive LP
Second Lien,
6.000%, 4/30/20 | | | 35 | | | | 36 | |
iPayment, Inc.
6.750%, 5/8/17 | | | 296 | | | | 288 | |
iStar Financial, Inc.
4.500%, 10/15/17 | | | 303 | | | | 306 | |
Nuveen Investments, Inc.
Tranche B, Second Lien
6.500%, 2/28/19 | | | 395 | | | | 392 | |
| | | | | | | | |
| | | | | | | 1,247 | |
| | | | | | | | |
| | |
| Health Care—1.2% | | | | | | | | |
American Renal Holdings, Inc. Second Lien,
8.500%, 3/20/20 | | | 307 | | | | 308 | |
Ardent Medical Services, Inc.
First Lien,
6.750%, 7/2/18 | | | 129 | | | | 130 | |
Second Lien,
11.000%, 1/2/19 | | | 142 | | | | 144 | |
Gentiva Health Services, Inc. Tranche B,
6.500%, 10/18/19 | | | 288 | | | | 285 | |
INC Research LLC
6.000%, 7/12/18 | | | 111 | | | | 111 | |
InVentiv Health, Inc.
(Ventive Health, Inc.)
7.500%, 8/4/16 | | | 262 | | | | 260 | |
MMM Holdings, Inc.
9.750%, 12/12/17 | | | 138 | | | | 140 | |
MSO of Puerto Rico, Inc.
9.750%, 12/12/17 | | | 101 | | | | 101 | |
Rural/Metro Operating Co. LLC First Lien,
5.750%, 6/30/18 | | | 169 | | | | 163 | |
Sheridan Healthcare, Inc.
Second Lien
9.000%, 12/13/21 | | | 238 | | | | 240 | |
Surgery Center Holdings, Inc. First Lien
6.000%, 4/11/19 | | | 104 | | | | 105 | |
| | | | | | | | |
| | | | | | | 1,987 | |
| | | | | | | | |
|
| Industrials—2.0% | |
Alliance Laundry Systems LLC Second Lien,
9.500%, 12/10/19 | | | 37 | | | | 37 | |
American Airlines, Inc.
Tranche B,
3.750%, 6/27/19 | | | 418 | | | | 421 | |
AWAS Finance Luxemborg SA Tranche 2012,
3.500%, 7/16/18 | | | 451 | | | | 454 | |
Brock Holdings Ill, Inc.
Second Lien,
10.000%, 3/16/18 | | | 265 | | | | 270 | |
| | | | | | | | |
| | | PAR
VALUE | | | VALUE | |
| Industrials—continued | |
Ceridian Corp. Tranche 2013,
4.415%, 5/9/17 | | $ | 568 | | | $ | 571 | |
CHG Healthcare Services, Inc. Second Lien,
9.000%, 11/19/20 | | | 107 | | | | 109 | |
Commercial Barge Line Co.
First Lien
7.500%, 9/22/19 | | | 293 | | | | 293 | |
Filtration Group, Inc.
Second Lien,
8.250%, 11/22/21 | | | 260 | | | | 266 | |
Hawker Beechcraft Acquisition Company LLC
5.750%, 2/14/20 | | | 400 | | | | 404 | |
International Equipment Solutions (IES Global B.V.)
6.750%, 8/16/19 | | | 188 | | | | 187 | |
Navistar, Inc. Tranche B,
5.750%, 8/17/17 | | | 281 | | | | 286 | |
SESAC Holding Co. II LLC
First Lien,
5.000%, 2/7/19 | | | 151 | | | | 153 | |
| | | | | | | | |
| | | | | | | 3,451 | |
| | | | | | | | |
|
| Information Technology—3.5% | |
Active Network, Inc.
5.500%, 11/13/20 | | | 178 | | | | 179 | |
Alcatel-Lucent USA, Inc. | | | | | | | | |
0.000%, 1/30/19(8) | | | 260 | | | | 262 | |
5.750%, 1/30/19 | | | 363 | | | | 366 | |
Allflex Holdings III, Inc.
Second Lien,
8.000%, 7/19/21 | | | 200 | | | | 203 | |
Applied Systems, Inc.
8.250%, 6/8/17 | | | 333 | | | | 335 | |
Avaya, Inc. Tranche B-3,
4.736%, 10/26/17 | | | 680 | | | | 668 | |
Blue Coat Systems, Inc.
Second Lien
9.500%, 6/26/20 | | | 339 | | | | 346 | |
Deltek, Inc. | | | | | | | | |
First Lien,
5.000%, 10/10/18 | | | 396 | | | | 398 | |
Second Lien,
10.000%, 10/10/19 | | | 236 | | | | 241 | |
Excelitas Technologies Corp. Term B Loan
6.000%, 11/2/20 | | | 262 | | | | 264 | |
IPC Systems, Inc.
Tranche C, First Lien,
7.750%, 7/31/17 | | | 420 | | | | 418 | |
Kronos, Inc. | | | | | | | | |
First Lien,
4.500%, 10/30/19 | | | 3 | | | | 3 | |
Second Lien,
9.750%, 4/30/20 | | | 267 | | | | 277 | |
Novell, Inc. (Attachmate Corp.) First Lien,
7.250%, 11/22/17 | | | 205 | | | | 209 | |
RP Crown Parent LLC
6.000%, 12/21/18 | | | 280 | | | | 282 | |
Refer to Footnote Legend on page 34.
See Notes to Financial Statements
33
VIRTUS MULTI-SECTOR FIXED INCOME SERIES
SCHEDULE OF INVESTMENTS (Continued)
DECEMBER 31, 2013
($ reported in thousands)
| | | | | | | | |
| | | PAR
VALUE | | | VALUE | |
| Information Technology—continued | |
SCS Holdings I, Inc. (Sirius Computer Solutions, Inc.)
7.000%, 12/7/18 | | $ | 184 | | | $ | 187 | |
Sorenson Communications, Inc. 9.500%, 10/31/14 | | | 298 | | | | 302 | |
Spansion LLC
3.750%, 12/18/19 | | | 152 | | | | 153 | |
SRA International, Inc.
6.500%, 7/20/18 | | | 327 | | | | 327 | |
Vision Solutions, Inc.
6.000%, 7/23/16 | | | 370 | | | | 372 | |
Wall Street Systems Holdings, Inc. First Lien,
5.750%, 10/25/19 | | | 198 | | | | 199 | |
| | | | | | | | |
| | | | | | | 5,991 | |
| | | | | | | | |
|
| Materials—0.6% | |
AZ Chem US, Inc.
6.250%, 12/22/17 | | | 350 | | | | 353 | |
Cyanco Intermediate Corp.
5.500%, 5/1/20 | | | 53 | | | | 53 | |
Fortescue Metals Group Ltd. (FMG Resources Ltd.)
4.250%, 6/28/19 | | | 275 | | | | 278 | |
Houghton International, Inc. Holding Corp. (HII Holding Corp.) Second Lien,
9.500%, 12/21/20 | | | 310 | | | | 314 | |
Tronox Pigments B.V.
4.500%, 3/19/20 | | | 100 | | | | 101 | |
| | | | | | | | |
| | | | | | | 1,099 | |
| | | | | | | | |
|
| Telecommunication Services—0.2% | |
Integra Telecom Holdings, Inc. Tranche B,
5.250%, 2/22/19 | | | 219 | | | | 223 | |
Securus Technologies Holdings, Inc. (Securus Technologies, Inc.) Second Lien
9.000%, 4/30/21 | | | 200 | | | | 199 | |
| | | | | | | | |
| | | | | | | 422 | |
| | | | | | | | |
|
| Utilities—0.2% | |
Texas Compeptitive Electric Holdings Co. LLC 2017 Extended,
4.739%, 10/10/17 | | | 465 | | | | 323 | |
| TOTAL LOAN AGREEMENTS | | | | | |
| (Identified Cost $21,055) | | | | 21,307 | |
| | |
SHARES | | | | |
| | |
| PREFERRED STOCK—3.8% | | | | | | | | |
| | |
| Financials—3.5% | | | | | | | | |
Ally Financial, Inc.
Series A, 8.500%(2) | | | 20,000 | | | | 537 | |
Ally Financial, Inc.
Series G, 144A, 7.000%(3) | | | 439 | | | | 419 | |
| | | | | | | | |
| | |
SHARES | | | VALUE | |
| Financials—continued | | | | | | | | |
Banco Bilbao Vizcaya Argentaria S.A. International S.A. Unipersonal 5.919%(2) | | | 380 | (10) | | $ | 366 | |
Banco do Brasil S.A. 144A
8.500%(2)(3) | | | 200 | (10) | | | 215 | |
Bank of America Corp.
Series K, 8.000%(2) | | | 625 | (10) | | | 692 | |
Citigroup Capital XVII
Series E 6.350% | | | 16,000 | | | | 401 | |
Citigroup, Inc.
Series D 5.350%(2) | | | 410 | (10) | | | 361 | |
General Electric Capital Corp.
Series B 6.250%(2) | | | 300 | (10) | | | 310 | |
Series C, 5.250%(2) | | | 400 | (10) | | | 376 | |
JPMorgan Chase & Co.
Series 1, 7.900%(2) | | | 525 | (10) | | | 579 | |
PNC Financial Services Group, Inc. (The) Series R,
4.850%(2) | | | 405 | (10) | | | 363 | |
Saul Centers, Inc.
Series A 8.000% | | | 171 | | | | 4 | |
U.S. Bancorp
Series G 6.000%(2) | | | 14,600 | | | | 400 | |
Wells Fargo & Co.
Series K, 7.980%(2) | | | 440 | (10) | | | 491 | |
Zions Bancorp, 6.950%(2) | | | 17,215 | | | | 458 | |
| | | | | | | | |
| | | | | | | 5,972 | |
| | | | | | | | |
| | |
| Industrials—0.3% | | | | | | | | |
Seaspan Corp. 9.500% | | | 20,000 | | | | 529 | |
TOTAL PREFERRED STOCK
(Identified Cost $6,004) | | | | 6,501 | |
|
| COMMON STOCKS—0.0% | |
|
| Consumer Discretionary—0.0% | |
Mark IV Industries | | | 828 | | | | 31 | |
| TOTAL COMMON STOCKS | |
| (Identified Cost $7) | | | | 31 | |
| TOTAL LONG TERM INVESTMENTS—98.0% | |
| (Identified Cost $166,583) | | | | 168,622 | (12) |
|
| SHORT-TERM INVESTMENTS—1.4% | |
|
| Money Market Mutual Funds—1.4% | |
Fidelity Money Market Portfolio – Institutional Shares (Seven-day effective yield 0.090%) | | | 2,490,267 | | | | 2,490 | |
| TOTAL SHORT-TERM INVESTMENTS | |
| (Identified Cost $2,490) | | | | 2,490 | |
| TOTAL INVESTMENTS—99.4% | |
| (Identified Cost $169,073) | | | | 171,112 | (1) |
Other assets and liabilities, net—0.6% | | | | 1,007 | |
| | | | | | | | |
| NET ASSETS—100.0% | | | $ | 172,119 | |
| | | | | | | | |
Abbreviations:
| GDN | Global Depositary Note |
| NATL | National Public Finance Guarantee Corp. |
| PIK | Payment-in-Kind Security |
Refer to Footnote Legend on page 34.
See Notes to Financial Statements
34
VIRTUS MULTI-SECTOR FIXED INCOME SERIES
SCHEDULE OF INVESTMENTS (Continued)
DECEMBER 31, 2013
($ reported in thousands)
Footnote Legend:
| (1) | Federal Income Tax Information: For tax information at December 31, 2013, see Note 11 Federal Income Tax Information in the Notes to Financial Statements. |
| (2) | Variable or step coupon security; interest rate shown reflects the rate in effect at December 31, 2013. |
| (3) | Security exempt from registration under Rule 144A of the Securities Act of 1933. These securities may be resold in transactions exempt from registration, normally to qualified institutional buyers. At December 31, 2013, these securities amounted to a value of $63,683 or 37.0% of net assets. |
| (4) | Regulation S security. Security is offered and sold outside of the United States, therefore, it is exempt from registration with the SEC under rules 903 and 904 of the Securities Act of 1933. |
| (5) | No contractual maturity date |
| (6) | Interest payments may be deferred. |
| (7) | This note was issued for the sole purpose of funding a loan agreement between the issuer and the borrower. As the credit risk for this security lies solely with the borrower, the name represented here is that of the borrower. |
| (8) | This loan will settle after December 31, 2013, at which time the interest rate based on the London Interbank Offered Rate (“LIBOR”) and the agreed upon spread on trade date, will be known. |
| (9) | Principal amount is adjusted daily pursuant to the change in the Consumer Price Index. |
| (10) | Value shown as par value. |
| (11) | 100% of the income received was in cash. |
| (12) | All or a portion segregated as collateral for unsettled loan transactions. |
Foreign Currencies:
| EUR | European Currency Unit |
| | | | |
| Country Weightings (unaudited)† | |
United States | | | 61 | % |
Luxembourg | | | 4 | |
Brazil | | | 3 | |
Canada | | | 3 | |
Mexico | | | 3 | |
United Kingdom | | | 2 | |
Venezuela | | | 2 | |
Other | | | 22 | |
Total | | | 100 | % |
† % of total investments as of December 31, 2013 | |
The following table provides a summary of inputs used to value the Series’ investments as of December 31, 2013 (See Security Valuation Note 2A in the Notes to Financial Statements):
| | | | | | | | | | | | | | | | |
| | | Total
Value at
December 31, 2013 | | | Level 1 –
Quoted
Prices | | | Level 2 –
Significant
Observable
Inputs | | | Level 3 –
Significant
Unobservable
Inputs | |
Debt Securities: | | | | | | | | | | | | | | | | |
Asset-Backed Securities | | $ | 6,144 | | | $ | — | | | $ | 5,670 | | | $ | 474 | |
Corporate Bonds and Notes | | | 97,549 | | | | — | | | | 97,549 | | | | — | |
Foreign Government Securities | | | 16,748 | | | | — | | | | 16,748 | | | | — | |
Loan Agreements | | | 21,307 | | | | — | | | | 21,307 | | | | — | |
Mortgage-Backed Securities | | | 17,739 | | | | — | | | | 17,739 | | | | — | |
Municipal Bonds | | | 1,524 | | | | — | | | | 1,524 | | | | — | |
U.S. Government Securities | | | 1,079 | | | | — | | | | 1,079 | | | | — | |
Equity Securities: | | | | | | | | | | | | | | | | |
Preferred Stock | | | 6,501 | | | | 2,329 | | | | 4,172 | | | | — | |
Common Stocks | | | 31 | | | | — | | | | — | | | | 31 | |
Short-term Investments | | | 2,490 | | | | 2,490 | | | | — | | | | — | |
| | | | | | | | | | | | | | | | |
Total Investments | | $ | 171,112 | | | $ | 4,819 | | | $ | 165,788 | | | $ | 505 | |
| | | | | | | | | | | | | | | | |
Securities held by the series with an end of period value of $938 were transferred from Level 2 to Level 1 since starting to use an exchange price.
See Notes to Financial Statements
35
VIRTUS MULTI-SECTOR FIXED INCOME SERIES
SCHEDULE OF INVESTMENTS (Continued)
DECEMBER 31, 2013
($ reported in thousands)
The following is a reconciliation of assets of the Series for Level 3 investments for which significant unobservable inputs were used to determine fair value.
| | | | | | | | | | | | | | | | | | | | |
| | | Investments in
Securities | | | Asset-Backed
Securities | | | Corporate Bonds
and Notes | | | Loan
Agreements | | | Common
Stocks | |
Beginning Balance December 31, 2012: | | $ | 63 | | | $ | — | | | $ | 0 | (d) | | $ | 41 | | | $ | 22 | |
Accrued Discount/(Premium) | | | — | (c) | | | — | (c) | | | — | (c) | | | — | (c) | | | — | |
Realized Gain (Loss) | | | (1 | ) | | | — | (c) | | | — | | | | (2 | ) | | | 1 | |
Change in Unrealized Appreciation (Depreciation) | | | 8 | | | | (2 | ) | | | — | | | | (1 | ) | | | 11 | |
Purchases | | | 502 | | | | 502 | | | | — | | | | — | | | | — | |
(Sales)(b) | | | (67 | ) | | | (26 | ) | | | — | | | | (38 | ) | | | (3 | ) |
Transfers into Level 3(a) | | | — | | | | — | | | | — | | | | — | | | | — | |
Transfers from Level 3(a) | | | — | | | | — | | | | — | | | | — | | | | — | |
| | | | | | | | | | | | | | | | | | | | |
Ending Balance December 31, 2013 | | $ | 505 | | | $ | 474 | | | $ | 0 | | | $ | — | | | $ | 31 | |
| | | | | | | | | | | | | | | | | | | | |
| (a) | “Transfers into and/or from” represent the ending value as of December 31, 2013, for any investment security where a change in the pricing level occurred from the beginning to the end of the period. |
| (b) | Includes paydowns on securities. |
| (c) | Amount is less than $500. |
| (d) | Includes internally fair valued security priced at $0. |
See Notes to Financial Statements
36
VIRTUS PREMIUM ALPHASECTOR® SERIES
SCHEDULE OF INVESTMENTS
DECEMBER 31, 2013
($ reported in thousands)
| | | | | | | | |
| | | SHARES | | | VALUE | |
| EXCHANGE-TRADED FUNDS—98.8% | |
Consumer Discretionary Select Sector SPDR Fund | | | 34,980 | | | $ | 2,338 | |
Consumer Staples Select Sector
SPDR Fund | | | 52,890 | | | | 2,273 | |
Energy Select Sector SPDR Fund | | | 26,350 | | | | 2,332 | |
Financial Select Sector SPDR Fund | | | 106,450 | | | | 2,327 | |
Health Care Select Sector SPDR Fund | | | 41,230 | | | | 2,286 | |
Industrial Select Sector SPDR Fund | | | 45,240 | | | | 2,364 | |
Materials Select Sector SPDR Fund | | | 51,450 | | | | 2,378 | |
Technology Select Sector SPDR Fund | | | 65,380 | | | | 2,337 | |
| TOTAL EXCHANGE-TRADED FUNDS | | | | | |
| (Identified Cost $16,041) | | | | | | | 18,635 | |
| TOTAL LONG TERM INVESTMENTS—98.8% | |
| (Identified Cost $16,041) | | | | 18,635 | |
|
| SHORT-TERM INVESTMENTS—1.3% | |
|
| Money Market Mutual Funds—1.3% | |
Fidelity Money Market Portfolio – Institutional Shares (Seven-day effective yield 0.090%) | | | 243,013 | | | | 243 | |
| TOTAL SHORT-TERM INVESTMENTS | |
| (Identified Cost $243) | | | | 243 | |
| TOTAL INVESTMENTS—100.1% | |
| (Identified Cost $16,284) | | | | 18,878 | (1) |
Other assets and liabilities, net—(0.1)% | | | | (28 | ) |
| | | | | | | | |
| NET ASSETS—100.0% | | | $ | 18,850 | |
| | | | | | | | |
Abbreviations:
| SPDR | S&P Depositary Receipt |
Footnote Legend:
| (1) | Federal Income Tax Information: For tax information at December 31, 2013, see Note 11 Federal Income Tax Information in the Notes to Financial Statements. |
The following table provides a summary of inputs used to value the Series’ investments as of December 31, 2013 (See Security Valuation Note 2A in the Notes to Financial Statements):
| | | | | | | | |
| | | Total
Value at
December 31,
2013 | | | Level 1 –
Quoted
Prices | |
Equity Securities: | | | | | | | | |
Exchange-Traded Funds | | $ | 18,635 | | | $ | 18,635 | |
Short-Term Investments | | | 243 | | | | 243 | |
| | | | | | | | |
Total Investments | | $ | 18,878 | | | $ | 18,878 | |
| | | | | | | | |
There are no level 2 (significant observable inputs) or level 3 (significant unobservable inputs) priced securities.
There were no transfers between Level 1 and Level 2 for the period.
See Notes to Financial Statements
37
VIRTUS REAL ESTATE SECURITIES SERIES
SCHEDULE OF INVESTMENTS
DECEMBER 31, 2013
($ reported in thousands)
| | | | | | | | |
| | | SHARES | | | VALUE | |
| COMMON STOCKS—98.4% | |
| |
| Real Estate Investment Trusts—98.4% | | | | | |
| | |
| Diversified—1.3% | | | | | | | | |
Digital Realty Trust, Inc. | | | 16,911 | | | $ | 830 | |
Vornado Realty Trust | | | 3,636 | | | | 323 | |
| | | | | | | | |
| | | | | | | 1,153 | |
| | | | | | | | |
| | |
| Health Care—8.1% | | | | | | | | |
HCP, Inc. | | | 82,946 | | | | 3,013 | |
Health Care REIT, Inc. | | | 29,477 | | | | 1,579 | |
Ventas, Inc. | | | 48,166 | | | | 2,759 | |
| | | | | | | | |
| | | | | | | 7,351 | |
| | | | | | | | |
| | |
| Industrial/Office—24.1% | | | | | | | | |
| | |
| Industrial—10.0% | | | | | | | | |
DCT Industrial Trust, Inc. | | | 442,819 | | | | 3,157 | |
Eastgroup Properties, Inc. | | | 8,021 | | | | 465 | |
Prologis, Inc. | | | 147,371 | | | | 5,445 | |
| | | | | | | | |
| | | | | | | 9,067 | |
| | | | | | | | |
| | |
| Mixed—3.6% | | | | | | | | |
Duke Realty Corp. | | | 50,800 | | | | 764 | |
Liberty Property Trust | | | 75,001 | | | | 2,540 | |
| | | | | | | | |
| | | | | | | 3,304 | |
| | | | | | | | |
| | |
| Office—10.5% | | | | | | | | |
Boston Properties, Inc. | | | 35,514 | | | | 3,565 | |
Douglas Emmett, Inc. | | | 28,000 | | | | 652 | |
Kilroy Realty Corp. | | | 72,918 | | | | 3,659 | |
SL Green Realty Corp. | | | 18,325 | | | | 1,693 | |
| | | | | | | | |
| | | | | | | 9,569 | |
| | | | | | | | |
| | | | | | | 21,940 | |
| | | | | | | | |
| | |
| Lodging/Resorts—7.7% | | | | | | | | |
Host Hotels & Resorts, Inc. | | | 175,661 | | | | 3,415 | |
LaSalle Hotel Properties | | | 62,341 | | | | 1,924 | |
Pebblebrook Hotel Trust | | | 53,676 | | | | 1,651 | |
| | | | | | | | |
| | | | | | | 6,990 | |
| | | | | | | | |
| | |
| Residential—18.6% | | | | | | | | |
| | |
| Apartments—16.9% | | | | | | | | |
American Campus Communities, Inc. | | | 58,187 | | | | 1,874 | |
AvalonBay Communities, Inc. | | | 29,008 | | | | 3,430 | |
Camden Property Trust | | | 40,800 | | | | 2,321 | |
Equity Residential | | | 83,679 | | | | 4,340 | |
Essex Property Trust, Inc. | | | 23,621 | | | | 3,390 | |
| | | | | | | | |
| | | | | | | 15,355 | |
| | | | | | | | |
|
| Manufactured Homes—1.7% | |
Equity Lifestyle Properties, Inc. | | | 42,032 | | | | 1,523 | |
| | | | | | | | |
| | | | | | | 16,878 | |
| | | | | | | | |
| | | | | | | | |
| | | SHARES | | | VALUE | |
| Retail—28.9% | | | | | | | | |
| | |
| Regional Malls—20.1% | | | | | | | | |
General Growth Properties, Inc. | | | 216,121 | | | $ | 4,337 | |
Macerich Co. (The) | | | 69,097 | | | | 4,069 | |
Simon Property Group, Inc. | | | 64,976 | | | | 9,887 | |
| | | | | | | | |
| | | | | | | 18,293 | |
| | | | | | | | |
| | |
| Shopping Centers—8.8% | | | | | | | | |
Brixmor Property Group, Inc. | | | 37,352 | | | | 760 | |
DDR Corp. | | | 154,254 | | | | 2,371 | |
Kimco Realty Corp. | | | 94,384 | | | | 1,864 | |
Tanger Factory Outlet Centers | | | 94,600 | | | | 3,029 | |
| | | | | | | | |
| | | | | | | 8,024 | |
| | | | | | | | |
| | | | | | | 26,317 | |
| | | | | | | | |
| | |
| Self Storage—9.7% | | | | | | | | |
Extra Space Storage, Inc. | | | 68,718 | | | | 2,895 | |
Public Storage | | | 39,360 | | | | 5,924 | |
| | | | | | | | |
| | | | | | | | 8,819 | |
TOTAL COMMON STOCKS
(Identified Cost $54,100) | | | | 89,448 | |
| TOTAL LONG TERM INVESTMENTS—98.4% | |
| (Identified Cost $54,100) | | | | 89,448 | |
|
| SHORT-TERM INVESTMENTS—0.7% | |
|
| Money Market Mutual Funds—0.7% | |
Fidelity Money Market Portfolio – Institutional Shares (Seven-day effective yield 0.090%) | | | 642,231 | | | | 642 | |
TOTAL SHORT-TERM INVESTMENTS
(Identified Cost $642) | | | | 642 | |
TOTAL INVESTMENTS—99.1%
(Identified Cost $54,742) | | | | 90,090 | (1) |
Other assets and liabilities, net—0.9% | | | | 806 | |
| | | | | |
| NET ASSETS—100.0% | | | | | | $ | 90,896 | |
| | | | | | | | |
Abbreviation Legend:
| REIT | Real Estate Investment Trust |
Footnote Legend
| (1) | Federal Income Tax Information : For tax information at December 31, 2013, see Note 11 Federal Income Tax Information in the Notes to Financial Statements. |
The following table provides a summary of inputs used to value the Series’ investments as of December 31, 2013 (See Security Valuation Note 2A in the Notes to Financial Statements):
| | | | | | | | |
| | | Total
Value at
December 31,
2013 | | | Level 1 –
Quoted
Prices | |
Equity Securities: | | | | | | | | |
Common Stocks | | $ | 89,448 | | | $ | 89,448 | |
Short-term Investments | | | 642 | | | | 642 | |
| | | | | | | | |
Total Investments | | $ | 90,090 | | | $ | 90,090 | |
| | | | | | | | |
There are no Level 2 (significant observable inputs) or Level 3 (significant unobservable inputs) priced securities.
There were no transfers between Level 1 and Level 2 for the period.
See Notes to Financial Statements
38
VIRTUS SMALL-CAP GROWTH SERIES
SCHEDULE OF INVESTMENTS
DECEMBER 31, 2013
($ reported in thousands)
| | | | | | | | |
| | | SHARES | | | VALUE | |
| COMMON STOCKS—98.5% | |
|
| Consumer Discretionary—16.1% | |
Aaron’s, Inc.(2) | | | 81,800 | | | $ | 2,405 | |
Hibbett Sports, Inc.(2) | | | 50,800 | | | | 3,414 | |
Monro Muffler Brake, Inc. | | | 32,800 | | | | 1,849 | |
Morningstar, Inc. | | | 30,200 | | | | 2,358 | |
Pool Corp. | | | 23,900 | | | | 1,389 | |
| | | | | | | | |
| | | | | | | 11,415 | |
| | | | | | | | |
|
| Consumer Staples—10.8% | |
Chefs’ Warehouse, Inc. (The)(2) | | | 192,000 | | | | 5,599 | |
PriceSmart, Inc. | | | 18,100 | | | | 2,091 | |
| | | | | | | | |
| | | | | | | 7,690 | |
| | | | | | | | |
|
| Financials—4.5% | |
Cohen & Steers, Inc. | | | 27,900 | | | | 1,118 | |
Financial Engines, Inc. | | | 30,400 | | | | 2,112 | |
| | | | | | | | |
| | | | | | | 3,230 | |
| | | | | | | | |
|
| Health Care—15.1% | |
Abaxis, Inc.(2) | | | 66,200 | | | | 2,649 | |
National Research Corp.(2)(3) | | | 132,504 | | | | 2,494 | |
Sirona Dental Systems, Inc.(2) | | | 44,300 | | | | 3,110 | |
Techne Corp. | | | 26,600 | | | | 2,518 | |
| | | | | | | | |
| | | | | | | 10,771 | |
| | | | | | | | |
|
| Industrials—15.4% | |
AAON, Inc. | | | 55,300 | | | | 1,767 | |
Copart, Inc.(2) | | | 72,200 | | | | 2,646 | |
Heartland Express, Inc. | | | 78,400 | | | | 1,538 | |
HEICO Corp. Class A | | | 39,905 | | | | 1,681 | |
HUB Group, Inc. Class A(2) | | | 55,000 | | | | 2,193 | |
Omega Flex, Inc.(2)(3) | | | 53,300 | | | | 1,091 | |
| | | | | | | | |
| | | | | | | 10,916 | |
| | | | | | | | |
|
| Information Technology—33.4% | |
ANSYS, Inc.(2) | | | 27,000 | | | | 2,354 | |
Ellie Mae, Inc.(2) | | | 72,000 | | | | 1,935 | |
FactSet Research Systems, Inc. | | | 19,400 | | | | 2,106 | |
FLIR Systems, Inc. | | | 79,800 | | | | 2,402 | |
Forrester Research, Inc. | | | 58,800 | | | | 2,250 | |
Hittite Microwave Corp.(2) | | | 53,900 | | | | 3,327 | |
MercadoLibre, Inc. | | | 26,250 | | | | 2,830 | |
Mesa Laboratories, Inc. | | | 21,635 | | | | 1,700 | |
NVE Corp.(2) | | | 53,900 | | | | 3,141 | |
VistaPrint NV | | | 30,000 | | | | 1,706 | |
| | | | | | | | |
| | | | | | | 23,751 | |
| | | | | | | | |
|
| Materials—3.2% | |
UFP Technologies, Inc.(2) | | | 90,800 | | | | 2,290 | |
| TOTAL COMMON STOCKS | |
| (Identified Cost $47,628) | | | | | | | 70,063 | |
| TOTAL LONG TERM INVESTMENTS—98.5% | |
| (Identified Cost $47,628) | | | | | | | 70,063 | |
| | | | | | | | |
| | | SHARES | | | VALUE | |
| SHORT-TERM INVESTMENTS—1.0% | |
|
| Money Market Mutual Funds—1.0% | |
Fidelity Money Market Portfolio – Institutional Shares (Seven-day effective yield 0.090%) | | | 690,855 | | | $ | 691 | |
| TOTAL SHORT-TERM INVESTMENTS | |
| (Identified Cost $691) | | | | | | | 691 | |
| TOTAL INVESTMENTS—99.5% | |
| (Identified Cost $48,319) | | | | | | | 70,754 | (1) |
Other assets and liabilities, net—0.5% | | | | 331 | |
| | | | | | | | |
| NET ASSETS—100.0% | | | $ | 71,085 | |
| | | | | | | | |
Footnote Legend:
| (1) | Federal Income Tax Information: For tax information at December 31, 2013, see Note 11 Federal Income Tax Information in the Notes to Financial Statements. |
| (2) | Non-income producing. |
The following table provides a summary of inputs used to value the Series’ investments as of December 31, 2013 (See Security Valuation Note 2A in the Notes to Financial Statements):
| | | | | | | | |
| | | Total
Value at
December 31,
2013 | | | Level 1 –
Quoted
Prices | |
Equity Securities: | | | | | | | | |
Common Stocks | | $ | 70,063 | | | $ | 70,063 | |
Short-Term Investments | | | 691 | | | | 691 | |
| | | | | | | | |
Total Investments | | $ | 70,754 | | | $ | 70,754 | |
| | | | | | | | |
There are no level 2 (significant observable inputs) or level 3 (significant unobservable inputs) priced securities.
There were no transfers between Level 1 and Level 2 for the period.
See Notes to Financial Statements
39
VIRTUS SMALL-CAP VALUE SERIES
SCHEDULE OF INVESTMENTS
DECEMBER 31, 2013
($ reported in thousands)
| | | | | | | | |
| | | SHARES | | | VALUE | |
| COMMON STOCKS—99.4% | | | | | | | | |
|
| Consumer Discretionary—6.3% | |
Interval Leisure Group, Inc. | | | 191,000 | | | $ | 5,902 | |
Thor Industries, Inc. | | | 48,100 | | | | 2,656 | |
| | | | | | | | |
| | | | | | | 8,558 | |
| | | | | | | | |
| | |
| Consumer Staples—8.7% | | | | | | | | |
National Beverage Corp.(2)(3) | | | 223,700 | | | | 4,510 | |
Village Super Market, Inc. | | | 36,000 | | | | 1,116 | |
WD-40 Co. | | | 81,300 | | | | 6,072 | |
| | | | | | | | |
| | | | | | | 11,698 | |
| | | | | | | | |
| | |
| Energy—6.2% | | | | | | | | |
CARBO Ceramics, Inc. | | | 47,500 | | | | 5,535 | |
World Fuel Services Corp. | | | 67,500 | | | | 2,914 | |
| | | | | | | | |
| | | | | | | 8,449 | |
| | | | | | | | |
| | |
| Financials—18.9% | | | | | | | | |
Eaton Vance Corp. | | | 141,600 | | | | 6,059 | |
EPR Properties | | | 57,500 | | | | 2,827 | |
First Cash Financial Services, Inc.(2) | | | 86,520 | | | | 5,350 | |
RLI Corp. | | | 63,600 | | | | 6,193 | |
Westamerica Bancorp | | | 91,000 | | | | 5,138 | |
| | | | | | | | |
| | | | | | | 25,567 | |
| | | | | | | | |
| | |
| Health Care—6.8% | | | | | | | | |
Owens & Minor, Inc. | | | 145,800 | | | | 5,330 | |
Patterson Cos., Inc. | | | 95,000 | | | | 3,914 | |
| | | | | | | | |
| | | | | | | 9,244 | |
| | | | | | | | |
| | |
| Industrials—19.0% | | | | | | | | |
CLARCOR, Inc. | | | 79,100 | | | | 5,090 | |
Corporate Executive Board Co. (The) | | | 86,200 | | | | 6,674 | |
Graco, Inc. | | | 79,300 | | | | 6,195 | |
Landstar System, Inc. | | | 106,600 | | | | 6,124 | |
Sun Hydraulics Corp. | | | 40,000 | | | | 1,633 | |
| | | | | | | | |
| | | | | | | 25,716 | |
| | | | | | | | |
|
| Information Technology—29.2% | |
Badger Meter, Inc. | | | 94,083 | | | | 5,128 | |
Cabot Microelectronics Corp.(2) | | | 101,500 | | | | 4,639 | |
Cass Information Systems, Inc. | | | 114,495 | | | | 7,711 | |
Cognex Corp.(2) | | | 107,500 | | | | 4,104 | |
Computer Services, Inc.(3) | | | 90,500 | | | | 3,005 | |
Jack Henry & Associates, Inc. | | | 113,500 | | | | 6,720 | |
Monotype Imaging Holdings, Inc. | | | 45,000 | | | | 1,432 | |
Syntel Co.(2) | | | 74,500 | | | | 6,776 | |
| | | | | | | | |
| | | | | | | 39,515 | |
| | | | | | | | |
| | |
| Materials—2.2% | | | | | | | | |
Balchem Corp. | | | 49,500 | | | | 2,906 | |
| | | | | | | | |
| | | | | | | | |
| | | SHARES | | | VALUE | |
| Utilities—2.1% | | | | | | | | |
Questar Corp. | | | 125,000 | | | $ | 2,874 | |
| TOTAL COMMON STOCKS | | | | | |
| (Identified Cost $88,605) | | | | | | | 134,527 | |
| TOTAL LONG TERM INVESTMENTS—99.4% | |
| (Identified Cost $88,605) | | | | | | | 134,527 | |
|
| SHORT-TERM INVESTMENTS—1.0% | |
|
| Money Market Mutual Funds—1.0% | |
Fidelity Money Market Portfolio – Institutional Shares (Seven-day effective yield 0.090%) | | | 1,363,984 | | | | 1,364 | |
| TOTAL SHORT-TERM INVESTMENTS | |
| (Identified Cost $1,364) | | | | 1,364 | |
| TOTAL INVESTMENTS—100.4% | |
| (Identified Cost $89,969) | | | | 135,891 | (1) |
Other assets and liabilities, net—(0.4)% | | | | (539 | ) |
| | | | | | | | |
| NET ASSETS—100.0% | | | $ | 135,352 | |
| | | | | | | | |
Footnote Legend:
| (1) | Federal Income Tax Information: For tax information at December 31, 2013, see Note 11 Federal Income Tax Information in the Notes to Financial Statements. |
| (2) | Non-income producing. |
The following table provides a summary of inputs used to value the Series’ investments as of December 31, 2013 (See Security Valuation Note 2A in the Notes to Financial Statements):
| | | | | | | | |
| | | Total
Value at
December 31,
2013 | | | Level 1 –
Quoted
Prices | |
Equity Securities: | | | | | | | | |
Common Stocks | | $ | 134,527 | | | $ | 134,527 | |
Short-Term Investments | | | 1,364 | | | | 1,364 | |
| | | | | | | | |
Total Investments | | $ | 135,891 | | | $ | 135,891 | |
| | | | | | | | |
There are no level 2 (significant observable inputs) or level 3 (significant unobservable inputs) priced securities.
There were no transfers between Level 1 and Level 2 for the period.
See Notes to Financial Statements
40
VIRTUS STRATEGIC ALLOCATION SERIES
SCHEDULE OF INVESTMENTS
DECEMBER 31, 2013
($ reported in thousands)
| | | | | | | | |
| | | PAR
VALUE | | | VALUE | |
| U.S. GOVERNMENT SECURITIES—1.5% | |
U.S. Treasury Bond
3.125%, 11/15/41 | | $ | 665 | | | $ | 572 | |
U.S. Treasury Note | | | | | | | | |
0.625%, 11/30/17 | | | 215 | | | | 210 | |
1.000%, 5/31/18 | | | 525 | | | | 513 | |
1.625%, 8/15/22 | | | 300 | | | | 272 | |
1.625%, 11/15/22 | | | 380 | | | | 342 | |
1.750%, 5/15/23 | | | 200 | | | | 180 | |
| TOTAL U.S. GOVERNMENT SECURITIES | | | | | |
| (Identified Cost $2,287) | | | | | | | 2,089 | |
| |
| MUNICIPAL BONDS—1.9% | | | | | |
| |
| California—0.3% | | | | | |
Alameda Corridor Transportation Authority Taxable Series 99-C,
(NATL Insured)
6.600%, 10/1/29 | | | 250 | | | | 262 | |
Kern County Pension
Obligation Taxable
(NATL-RE Insured)
7.260%, 8/15/14 | | | 125 | | | | 125 | |
| | | | | | | | |
| | | | | | | 387 | |
| | | | | | | | |
|
| Florida—0.1% | |
Miami-Dade County
Educational Facilities Authority Taxable Series C
5.480%, 4/1/16 | | | 105 | | | | 111 | |
| | | | | | | | |
|
| Kentucky—0.1% | |
Commonwealth of Kentucky Taxable
3.165%, 4/1/18 | | | 116 | | | | 119 | |
| | | | | | | | |
|
| New York—0.3% | |
New York City Water & Sewer System Taxable Series FF 5.000%, 6/15/45 | | | 500 | | | | 509 | |
| | | | | | | | |
|
| Pennsylvania—1.0% | |
City of Pittsburgh Pension Obligation Taxable Series C (NATL- RE, FGIC Insured)
6.500%, 3/1/17 | | | 1,250 | | | | 1,347 | |
| | | | | | | | |
|
| Virginia—0.1% | |
Tobacco Settlement Financing Corp. Taxable Series 07-A1,
6.706%, 6/1/46 | | | 215 | | | | 145 | |
| TOTAL MUNICIPAL BONDS | | | | | | | | |
| (Identified Cost $2,566) | | | | | | | 2,618 | |
|
| FOREIGN GOVERNMENT SECURITIES—1.1% | |
Bolivarian Republic of Venezuela | | | | | | | | |
9.250%, 9/15/27 | | | 45 | | | | 35 | |
9.375%, 1/13/34 | | | 65 | | | | 49 | |
| | | | | | | | |
| | | PAR
VALUE | | | VALUE | |
| FOREIGN GOVERNMENT SECURITIES—continued | |
Commonwealth of Australia Series 125
6.250%, 6/15/14 | | | 55 | AUD | | $ | 50 | |
Commonwealth of Canada
2.000%, 3/1/14 | | | 275 | CAD | | | 259 | |
Commonwealth of New Zealand Series 415,
6.000%, 4/15/15 | | | 120 | NZD | | | 102 | |
Hungary
5.750%, 11/22/23 | | $ | 42 | | | | 42 | |
Republic of Iceland 144A
5.875%, 5/11/22(4) | | | 135 | | | | 138 | |
Republic of Indonesia
Series FR30,
10.750%, 5/15/16 | | | 540,000 | IDR | | | 47 | |
Republic of Peru RegS
6.900 %, 8/12/37(5) | | | 120 | PEN | | | 42 | |
Republic of Slovak 144A
4.375%, 5/21/22(4) | | | 200 | | | | 206 | |
Russian Federation | | | | | | | | |
144A 7.850%, 3/10/18(4) | | | 5,000 | RUB | | | 157 | |
144A 4.875%, 9/16/23(4) | | | 200 | | | | 202 | |
Series 6207
8.150%, 2/3/27 | | | 2,950 | RUB | | | 93 | |
United Mexican States | | | | | | | | |
Series M,
6.000%, 6/18/15 | | | 575 | MXN | | | 45 | |
Series M,
6.500%, 6/9/22 | | | 890 | MXN | | | 69 | |
| TOTAL FOREIGN GOVERNMENT SECURITIES | |
| (Identified Cost $1,609) | | | | 1,536 | |
|
| MORTGAGE-BACKED SECURITIES—12.9% | |
| | |
| Agency—4.6% | | | | | | | | |
FNMA | | | | | | | | |
4.000%, 6/1/20 | | | 50 | | | | 53 | |
4.500%, 7/1/20 | | | 9 | | | | 10 | |
3.000%, 2/1/27 | | | 228 | | | | 233 | |
2.500%, 5/1/28 | | | 982 | | | | 973 | |
6.500%, 10/1/31 | | | 7 | | | | 8 | |
6.000%, 9/1/32 | | | 17 | | | | 18 | |
5.000%, 10/1/35 | | | 79 | | | | 85 | |
6.000%, 9/1/36 | | | 11 | | | | 12 | |
5.500%, 4/1/37 | | | 28 | | | | 31 | |
5.500%, 7/1/37 | | | 74 | | | | 82 | |
6.000%, 10/1/37 | | | 35 | | | | 39 | |
5.000%, 6/1/38 | | | 61 | | | | 66 | |
5.500%, 6/1/38 | | | 16 | | | | 17 | |
5.500%, 6/1/38 | | | 19 | | | | 21 | |
5.500%, 11/1/38 | | | 44 | | | | 49 | |
4.000%, 1/1/39 | | | 93 | | | | 96 | |
5.000%, 1/1/39 | | | 26 | | | | 29 | |
6.000%, 1/1/39 | | | 39 | | | | 43 | |
4.500%, 3/1/39 | | | 42 | | | | 44 | |
5.000%, 3/1/39 | | | 36 | | | | 39 | |
6.000%, 3/1/39 | | | 28 | | | | 31 | |
4.500%, 4/1/39 | | | 175 | | | | 186 | |
4.000%, 5/1/39 | | | 191 | | | | 196 | |
4.500%, 2/1/40 | | | 119 | | | | 126 | |
4.000%, 10/1/40 | | | 271 | | | | 279 | |
3.500%, 2/1/41 | | | 598 | | | | 595 | |
| | | | | | | | |
| | | PAR
VALUE | | | VALUE | |
| Agency—continued | | | | | | | | |
4.500%, 4/1/41 | | $ | 641 | | | $ | 679 | |
4.000%, 7/1/41 | | | 151 | | | | 156 | |
3.500%, 1/1/42 | | | 177 | | | | 176 | |
3.500%, 4/1/42 | | | 452 | | | | 449 | |
3.000%, 11/1/42 | | | 229 | | | | 218 | |
3.000%, 6/1/43 | | | 395 | | | | 376 | |
3.000%, 7/1/43 | | | 266 | | | | 252 | |
GNMA | | | | | | | | |
6.500%, 11/15/23 | | | 45 | | | | 50 | |
6.500%, 12/15/23 | | | 1 | | | | 1 | |
6.500%, 2/15/24 | | | 41 | | | | 45 | |
6.500%, 6/15/28 | | | 83 | | | | 92 | |
6.500%, 7/15/31 | | | 27 | | | | 31 | |
6.500%, 11/15/31 | | | 25 | | | | 28 | |
6.500%, 2/15/32 | | | 49 | | | | 55 | |
6.500%, 4/15/32 | | | 36 | | | | 40 | |
2.586%, 4/16/54 | | | 265 | | | | 274 | |
| | | | | | | | |
| | | | | | | 6,283 | |
| | | | | | | | |
|
| Non-Agency—8.3% | |
Aventura Mall Trust 13-AVM, C, 144A
3.743%, 12/5/32(3)(4) | | | 100 | | | | 99 | |
Banc of America Alternative Loan Trust 03-2, CB3
5.750%, 4/25/33 | | | 130 | | | | 139 | |
Bear Stearns Adjustable Rate Mortgage Trust | | | | | | | | |
04-1, 21A1
2.398%, 4/25/34(3) | | | 143 | | | | 140 | |
04-10, 12A3
2.695%, 1/25/35(3) | | | 150 | | | | 149 | |
Bear Stearns Commercial Mortgage Securities 06-PW12, A4
5.712%, 9/11/38(3) | | | 670 | | | | 732 | |
Bear Stearns Commercial Mortgage Securities, Inc. | | | | | | | | |
06-T22, AM
5.579%, 4/12/38(3) | | | 80 | | | | 87 | |
07- PW17, A4
5.694%, 6/11/50(3) | | | 425 | | | | 476 | |
07-PW18, AM
6.084%, 6/11/50(3) | | | 550 | | | | 624 | |
Citigroup—Deutsche Bank Commercial Mortgage Trust | | | | | | | | |
06-CD2, A4
5.304%, 1/15/46(3) | | | 590 | | | | 630 | |
07-C6, A1A
5.705%, 12/10/49(3) | | | 284 | | | | 316 | |
Countrywide Home Loan Mortgage Pass-Through-Trust 03-4, 1A15
5.500%, 4/25/33 | | | 89 | | | | 93 | |
Credit Suisse Commercial Mortgage Trust | | | | | | | | |
07-C1, A1A
5.361%, 2/15/40 | | | 124 | | | | 132 | |
13-IVR3, A2, 144A
3.000%, 5/25/43(3)(4) | | | 133 | | | | 123 | |
Extended Stay America Trust 13-ESH7, A27, 144A
2.958%, 12/5/31(4) | | | 300 | | | | 291 | |
Refer to Footnote Legend on page 44.
See Notes to Financial Statements
41
VIRTUS STRATEGIC ALLOCATION SERIES
SCHEDULE OF INVESTMENTS (Continued)
DECEMBER 31, 2013
($ reported in thousands)
| | | | | | | | |
| | | PAR
VALUE | | | VALUE | |
| Non-Agency—continued | |
GMAC Mortgage Corp. Loan Trust 04-AR1, 12A
3.173%, 6/25/34(3) | | $ | 95 | | | $ | 97 | |
Goldman Sachs Mortgage Securities Corp. II
07-GG10, A4
5.804%, 8/10/45(3) | | | 365 | | | | 401 | |
Greenwich Capital Commercial Funding Corp. Commercial Mortgage Trust 07-GG11, A4
5.736%, 12/10/49 | | | 240 | | | | 268 | |
JPMorgan Chase Commercial Mortgage Securities Trust | | | | | | | | |
10-CNTR, A1, 144A
3.300%, 8/5/32(4) | | | 236 | | | | 247 | |
10-CNTR, A2, 144A
4.311%, 8/5/32(4) | | | 300 | | | | 315 | |
06-LDP7, AM
5.863%, 4/15/45(3) | | | 125 | | | | 138 | |
06-LDP9, A3
5.336%, 5/15/47 | | | 237 | | | | 259 | |
07-LD12, A4
5.882%, 2/15/51(3) | | | 425 | | | | 476 | |
JPMorgan Chase Mortgage Finance Corp. 07-A1, 10A1
2.794%, 2/25/37(3) | | | 106 | | | | 100 | |
JPMorgan Chase (WAMU) Mortgage Pass-Through Certificates Trust | | | | | | | | |
03-AR6, A1
2.440%, 6/25/33(3) | | | 121 | | | | 123 | |
03-AR4, 2A1
2.221%, 8/25/33(3) | | | 177 | | | | 177 | |
Leaf II Receivables Funding LLC 13-1, C, 144A
3.460%, 9/15/21(4) | | | 150 | | | | 150 | |
Lehman Brothers—UBS Commercial Mortgage Trust | | | | | | | | |
06-C3, AM
5.712%, 3/15/39(3) | | | 130 | | | | 140 | |
06-C6, A4
5.372%, 9/15/39 | | | 325 | | | | 355 | |
07-C6, A4
5.858%, 7/15/40(3) | | | 244 | | | | 265 | |
MASTR Alternative Loan Trust 03-8, 2A1
5.750%, 11/25/33 | | | 250 | | | | 258 | |
MASTR Asset Securitization Trust 04-6, 4A1
5.000%, 7/25/19 | | | 150 | | | | 155 | |
Merrill Lynch Mortgage Investors Trust 98-C1, CTL
6.750%, 11/15/26(3) | | | 125 | | | | 134 | |
Merrill Lynch Mortgage Trust
06-C1, AM
5.676%, 5/12/39(3) | | | 75 | | | | 81 | |
Morgan Stanley Capital I Trust
06-IQ12, A4
5.332%, 12/15/43 | | | 521 | | | | 569 | |
| | | | | | | | |
| | | PAR
VALUE | | | VALUE | |
| Non-Agency—continued | |
07-IQ14, AM
5.689%, 4/15/49(3) | | $ | 130 | | | $ | 134 | |
07-IQ14, A4
5.692%, 4/15/49(3) | | | 240 | | | | 266 | |
Motel 6 Trust 12-MTLB, D, 144A
3.781%, 10/5/25(4) | | | 155 | | | | 154 | |
Nomura Asset Acceptance Corp. 04-R3, A1, 144A
6.500%, 2/25/35(4) | | | 140 | | | | 145 | |
Residential Asset Securitization Trust 13-LT2, A, 144A
2.833%, 5/22/28(4) | | | 92 | | | | 93 | |
SBA Tower Trust 144A
4.254% , 4/15/15(4) | | | 225 | | | | 228 | |
Sequoia Mortgage Trust
12-3, A1
3.500%, 7/25/42(3) | | | 179 | | | | 174 | |
12-3, A1, 144A
4.000%, 12/25/43(3)(4) | | | 99 | | | | 100 | |
Springleaf Mortgage Loan Trust 12-3A, A, 144A
1.570%, 12/25/59(3)(4) | | | 323 | | | | 322 | |
Structured Asset Securities Corp. Mortgage Pass-Through Certificates
03-21, 2A2
5.250%, 8/25/33 | | | 30 | | | | 30 | |
SunTrust Adjustable Rate Mortgage Loan Trust
07-S1, 5A1
4.295%, 1/25/37(3) | | | 112 | | | | 110 | |
Wells Fargo (Wachovia Bank Commercial Mortgage Trust)
07-C30, A5
5.342%, 12/15/43 | | | 285 | | | | 313 | |
07-C30, AM
5.383%, 12/15/43 | | | 160 | | | | 172 | |
07-C31, A4
5.509%, 4/15/47 | | | 250 | | | | 273 | |
07-C33, A5
5.925%, 2/15/51(3) | | | 140 | | | | 157 | |
| | | | | | | | |
| | | | | | | | 11,410 | |
| TOTAL MORTGAGE-BACKED SECURITIES | |
| (Identified Cost $16,837) | | | | | | | 17,693 | |
|
| ASSET-BACKED SECURITIES—2.1% | |
AmeriCredit Automobile Receivables Trust | | | | | | | | |
12-4, D 2.680%, 10/9/18 | | | 140 | | | | 141 | |
13-2, D 2.420%, 5/8/19 | | | 275 | | | | 273 | |
Bayview Financial Mortgage-Pass-Through Trust
06-A, 1A2
5.483% , 2/28/41(3) | | | 101 | | | | 102 | |
Beacon Container Finance LLC
12-1A, A, 144A
3.720%, 9/20/27(4) | | | 241 | | | | 242 | |
| | | | | | | | |
| | | PAR
VALUE | | | VALUE | |
| ASSET-BACKED SECURITIES—continued | |
BXG Receivables Note Trust
12-A, A, 144A
2.660%, 12/2/27(4) | | $ | 107 | | | $ | 105 | |
CIT Group Home Equity Loan Trust 03-1, A5
4.980%, 7/20/34(3) | | | 250 | | | | 251 | |
Dominos Pizza Master Issuer LLC 12-1A, A2, 144A
5.216%, 1/25/42(4) | | | 219 | | | | 232 | |
Fairway Outdoor Funding LLC
12-1A, A2, 144A
4.212%, 10/15/42(4) | | | 82 | | | | 82 | |
GSAA Home Equity Trust
05-12, AF3W
4.999%, 9/25/35(3) | | | 134 | | | | 133 | |
Imc Home Equity Loan Trust
97-5, A9
7.310%, 11/20/28 | | | 148 | | | | 149 | |
JPMorgan Chase Funding Trust
02-2, 1A5
6.333%, 4/25/32(3) | | | 148 | | | | 151 | |
MASTR Specialized Loan Trust
05-3, A2, 144A
5.704%, 11/25/35(3)(4) | | | 128 | | | | 130 | |
Orange Lake Timeshare Trust
12-AA, B 144A
4.870%, 3/10/27(4) | | | 87 | | | | 89 | |
Origen Manufactured Housing Contract Trust 04-B, M1
5.730%, 11/15/35(3) | | | 87 | | | | 92 | |
Popular ABS Mortgage Pass-Through-Trust 05-5, AF3
4.807%, 11/25/35(3) | | | 65 | | | | 64 | |
Santander Drive Auto Receivables Trust | | | | | | | | |
11-2, C 3.280%, 6/15/16 | | | 100 | | | | 102 | |
10-B, C 144A
3.020%, 10/17/16(4) | | | 131 | | | | 132 | |
Structured Asset Securities Corp. 01-SB1, A2
3.375%, 8/25/31 | | | 128 | | | | 126 | |
Terwin Mortgage Trust
04-15AL, A1 144A
5.796%, 7/25/34(3)(4) | | | 65 | | | | 62 | |
Trip Rail Master Funding LLC
11-1A, A1A, 144A
4.370%, 7/15/41(4) | | | 185 | | | | 194 | |
| TOTAL ASSET-BACKED SECURITIES | |
| (Identified Cost $2,818) | | | | 2,852 | |
|
| CORPORATE BONDS—17.8% | |
|
| Consumer Discretionary—1.3% | |
Hertz Corp. (The) 144A
4.250%, 4/1/18(4) | | | 35 | | | | 36 | |
Hyatt Hotels Corp.
3.375%, 7/15/23 | | | 115 | | | | 105 | |
International Game Technology
7.500%, 6/15/19 | | | 150 | | | | 175 | |
Refer to Footnote Legend on page 44.
See Notes to Financial Statements
42
VIRTUS STRATEGIC ALLOCATION SERIES
SCHEDULE OF INVESTMENTS (Continued)
DECEMBER 31, 2013
($ reported in thousands)
| | | | | | | | |
| | | PAR
VALUE | | | VALUE | |
| Consumer Discretionary—continued | |
KOC Holding AS 144A
3.500%, 4/24/20(4) | | $ | 200 | | | $ | 171 | |
Kohl’s Corp.
4.750%, 12/15/23 | | | 160 | | | | 162 | |
Penn National Gaming, Inc. 144A
5.875%, 11/1/21(4) | | | 50 | | | | 50 | |
PNK Finance Corp. 144A
6.375%, 8/1/21(4) | | | 80 | | | | 82 | |
Rent-A-Center, Inc.
4.750%, 5/1/21 | | | 35 | | | | 33 | |
Seminole Hard Rock Entertainment, Inc. (Seminole Hard Rock International LLC) 144A 5.875%, 5/15/21(4) | | | 90 | | | | 89 | |
Sinclair Television Group, Inc. 144A 5.375%, 4/1/21(4) | | | 110 | | | | 109 | |
Sirius XM Radio, Inc. 144A
4.250%, 5/15/20(4) | | | 115 | | | | 109 | |
Starwood Hotels & Resorts Worldwide, Inc.
3.125%, 2/15/23 | | | 200 | | | | 181 | |
Taylor Morrison Communities, Inc. 144A 5.250%, 4/15/21(4) | | | 110 | | | | 107 | |
Time Warner Cable, Inc.
6.750%, 7/1/18 | | | 185 | | | | 207 | |
Wyndham Worldwide Corp.
5.625%, 3/1/21 | | | 125 | | | | 133 | |
| | | | | | | | |
| | | | | | | 1,749 | |
| | | | | | | | |
| | |
| Consumer Staples—0.5% | | | | | | | | |
Altria Group, Inc.
2.950%, 5/2/23 | | | 140 | | | | 127 | |
Flowers Foods, Inc.
4.375%, 4/1/22 | | | 120 | | | | 118 | |
Reynolds American, Inc.
3.250%, 11/1/22 | | | 150 | | | | 138 | |
Tate & Lyle International
Finance plc 144A
6.625%, 6/15/16(4) | | | 275 | | | | 309 | |
| | | | | | | | |
| | | | | | | 692 | |
| | | | | | | | |
| | |
| Energy—1.5% | | | | | | | | |
Calumet Specialty Products Partners LP (Calumet Finance Corp.) 9.625%, 8/1/20 | | | 55 | | | | 62 | |
CHC Helicopter SA
9.250%, 10/15/20 | | | 100 | | | | 108 | |
CNOOC Finance 2013 Ltd.
3.000%, 5/9/23 | | | 200 | | | | 178 | |
Ecopetrol S.A.
5.875%, 9/18/23 | | | 65 | | | | 69 | |
Frontier Oil Corp.
6.875%, 11/15/18 | | | 45 | | | | 49 | |
Gazprom Neft OAO
(GPN Capital SA) 144A
6.000%, 11/27/23(4)(9) | | | 200 | | | | 203 | |
| | | | | | | | |
| | | PAR
VALUE | | | VALUE | |
| Energy—continued | |
Lukoil OAO International Finance BV 144A 7.250%, 11/5/19(4) | | $ | 175 | | | $ | 202 | |
Pacific Rubiales Energy Corp.
144A 5.375%, 1/26/19(4) | | | 100 | | | | 101 | |
Petrobras International Finance Co.
5.375%, 1/27/21 | | | 100 | | | | 99 | |
Petroleos de Venezuela SA
RegS 8.500%, 11/2/17(5) | | | 95 | | | | 79 | |
Petroleos Mexicanos
5.500%, 6/27/44 | | | 150 | | | | 137 | |
Petropower I Funding Trust
144A 7.360%, 2/15/14(4)(8) | | | 38 | | | | 37 | |
QEP Resources, Inc.
6.875%, 3/1/21 | | | 105 | | | | 113 | |
QGOG Constellation SA 144A
6.250%, 11/9/19(4) | | | 200 | | | | 192 | |
Rowan Cos., Inc.
4.875%, 6/1/22 | | | 140 | | | | 142 | |
Targa Resources Partners LP
6.375%, 8/1/22 | | | 98 | | | | 104 | |
Teekay Corp.
8.500%, 1/15/20 | | | 75 | | | | 82 | |
Weatherford International Ltd.
9.625%, 3/1/19 | | | 45 | | | | 58 | |
Williams Cos., Inc. (The)
3.700%, 1/15/23 | | | 100 | | | | 87 | |
| | | | | | | | |
| | | | | | | 2,102 | |
| | | | | | | | |
| | |
| Financials—8.6% | | | | | | | | |
ADCB Finance Cayman Ltd.
144A 4.750%, 10/8/14(4) | | | 150 | | | | 154 | |
Air Lease Corp.
4.750%, 3/1/20 | | | 80 | | | | 83 | |
Aircastle Ltd.
7.625%, 4/15/20 | | | 55 | | | | 62 | |
Allstate Corp. (The)
5.750%, 8/15/53(3)(6) | | | 135 | | | | 136 | |
American International Group, Inc.
2.375%, 8/24/15 | | | 85 | | | | 87 | |
3.375%, 8/15/20 | | | 55 | | | | 55 | |
Associated Banc Corp.
5.125%, 3/28/16 | | | 85 | | | | 91 | |
Assurant, Inc.
5.625%, 2/15/14 | | | 250 | | | | 251 | |
Avis Budget Car Rental LLC
5.500%, 4/1/23 | | | 105 | | | | 102 | |
Banco Bilbao Vizcaya
Argentaria Bancomer S.A.
144A 6.500%, 3/10/21(4) | | | 150 | | | | 158 | |
Banco Bradesco S.A.
144A 5.900%, 1/16/21(4) | | | 150 | | | | 150 | |
Banco de Credito del Peru
144A 4.250%, 4/1/23(4) | | | 164 | | | | 151 | |
Banco de Credito e Inversiones
144A 4.000%, 2/11/23(4) | | | 200 | | | | 185 | |
Banco do Brasil S.A.
144A 5.375%, 1/15/21(4) | | | 150 | | | | 145 | |
Banco Santander Brasil SA
144A 4.500%, 4/6/15(4) | | | 100 | | | | 103 | |
| | | | | | | | |
| | | PAR
VALUE | | | VALUE | |
| Financials—continued | | | | | | | | |
Banco Santander Chile
144A 3.750%, 9/22/15(4) | | $ | 100 | | | $ | 103 | |
Banco Votorantim S.A.
144A 7.375%, 1/21/20(4) | | | 130 | | | | 135 | |
Bancolombia S.A.
5.125%, 9/11/22 | | | 150 | | | | 141 | |
Bank of America Corp.
5.650%, 5/1/18 | | | 400 | | | | 455 | |
Barclays Bank plc 144A
5.926% (3)(4)(6)(7) | | | 100 | | | | 106 | |
Brazil Loan Trust 1 144A
5.477%, 7/24/23(4) | | | 150 | | | | 151 | |
Capital One Financial Corp.
6.150%, 9/1/16 | | | 125 | | | | 140 | |
Carlyle Holdings Finance LLC
144A 3.875%, 2/1/23(4) | | | 135 | | | | 129 | |
City National Corp.
5.250%, 9/15/20 | | | 100 | | | | 107 | |
Corporate Office Properties LP 3.600%, 5/15/23 | | | 150 | | | | 136 | |
Denali Borrower LLC
(Denali Finance Corp.)
144A 5.625%, 10/15/20(4) | | | 70 | | | | 70 | |
Fidelity National Financial, Inc. 5.500%, 9/1/22 | | | 40 | | | | 41 | |
Fifth Third Bancorp
4.500%, 6/1/18 | | | 150 | | | | 160 | |
First Niagara Financial Group, Inc. 6.750%, 3/19/20 | | | 125 | | | | 144 | |
Ford Motor Credit Co. LLC
5.750%, 2/1/21 | | | 75 | | | | 84 | |
General Electric Capital Corp.
5.625%, 5/1/18 | | | 235 | | | | 270 | |
Genworth Holdings, Inc.
4.900%, 8/15/23 | | | 135 | | | | 135 | |
Glen Meadow Pass-Through Trust 144A
6.505%, 2/12/67(3)(4) | | | 135 | | | | 132 | |
GLP Capital LP (GLP Financing II, Inc.) | | | | | | | | |
144A 4.375%, 11/1/18(4) | | | 5 | | | | 5 | |
144A 4.875%, 11/1/20(4) | | | 30 | | | | 30 | |
144A 5.375%, 11/1/23(4) | | | 5 | | | | 5 | |
Goldman Sachs Group, Inc. (The) 5.950%, 1/18/18 | | | 165 | | | | 188 | |
HCP, Inc. | | | | | | | | |
3.750%, 2/1/19 | | | 60 | | | | 62 | |
5.375%, 2/1/21 | | | 60 | | | | 65 | |
Health Care REIT, Inc.
4.700%, 9/15/17 | | | 150 | | | | 163 | |
Highwoods Realty LP
3.625%, 1/15/23 | | | 135 | | | | 123 | |
HSBC USA, Inc.
1.625%, 1/16/18 | | | 135 | | | | 133 | |
Huntington Bancshares, Inc.
7.000%, 12/15/20 | | | 95 | | | | 110 | |
Hutchison Whampoa International Ltd. Series 12, 144A 6.000%(3)(4)(6)(7) | | | 160 | | | | 170 | |
ING (U.S.), Inc. | | | | | | | | |
5.500%, 7/15/22 | | | 110 | | | | 119 | |
5.650%, 5/15/53(3) | | | 110 | | | | 107 | |
Refer to Footnote Legend on page 44.
See Notes to Financial Statements
43
VIRTUS STRATEGIC ALLOCATION SERIES
SCHEDULE OF INVESTMENTS (Continued)
DECEMBER 31, 2013
($ reported in thousands)
| | | | | | | | |
| | | PAR
VALUE | | | VALUE | |
| Financials—continued | | | | | | | | |
International Lease Finance Corp.
6.250%, 5/15/19 | | $ | 96 | | | $ | 104 | |
Jefferies Group LLC
6.875%, 4/15/21 | | | 150 | | | | 171 | |
JPMorgan Chase & Co. | | | | | | | | |
5.250%, 5/1/15 | | | 250 | | | | 264 | |
6.125%, 6/27/17 | | | 270 | | | | 307 | |
KeyCorp
5.100%, 3/24/21 | | | 165 | | | | 180 | |
Kimco Realty Corp.
6.875%, 10/1/19 | | | 150 | | | | 179 | |
Korea Development Bank
4.375%, 8/10/15 | | | 100 | | | | 105 | |
Korea Finance Corp.
4.625%, 11/16/21 | | | 200 | | | | 211 | |
Lazard Group LLC
4.250%, 11/14/20 | | | 135 | | | | 135 | |
Legg Mason, Inc.
5.500%, 5/21/19 | | | 130 | | | | 142 | |
Liberty Mutual Group, Inc. 144A 4.250%, 6/15/23(4) | | | 135 | | | | 130 | |
Lincoln National Corp.
6.050%, 4/20/67(3)(6) | | | 50 | | | | 50 | |
Lloyds TSB Bank plc 144A
6.500%, 9/14/20(4) | | | 150 | | | | 170 | |
Macquarie Bank Ltd. 144A
6.625%, 4/7/21(4) | | | 100 | | | | 111 | |
Morgan Stanley | | | | | | | | |
5.550%, 4/27/17 | | | 120 | | | | 134 | |
4.100%, 5/22/23 | | | 80 | | | | 77 | |
National Retail Properties, Inc.
5.500%, 7/15/21 | | | 150 | | | | 163 | |
Nationstar Mortgage LLC
6.500%, 7/1/21 | | | 135 | | | | 129 | |
Nordea Bank AB 144A
4.250%, 9/21/22(4) | | | 200 | | | | 197 | |
ORIX Corp.
5.000%, 1/12/16 | | | 86 | | | | 92 | |
Penske Truck Leasing Co. LP (PTL Finance Corp.) 144A
2.875%, 7/17/18(4) | | | 65 | | | | 65 | |
PKO Finance AB 144A
4.630%, 9/26/22(4)(9) | | | 200 | | | | 199 | |
Progressive Corp. (The)
6.700%, 6/15/37 | | | 160 | | | | 173 | |
Prudential Financial, Inc. | | | | | | | | |
5.875%, 9/15/42(3) | | | 140 | | | | 142 | |
5.200%, 3/15/44(3)(6) | | | 15 | | | | 15 | |
Retail Opportunity Investments Partnership LP
5.000%, 12/15/23 | | | 135 | | | | 134 | |
Royal Bank of Scotland Group plc (The)
5.625%, 8/24/20 | | | 150 | | | | 168 | |
Santander U.S. Debt S.A.U. 144A 3.724%, 1/20/15(4) | | | 145 | | | | 148 | |
Sberbank of Russia (Sberbank CapItal SA) 144A
5.125%, 10/29/22(4)(9) | | | 200 | | | | 191 | |
Senior Housing Properties Trust
4.300%, 1/15/16 | | | 125 | | | | 130 | |
| | | | | | | | |
| | | PAR
VALUE | | | VALUE | |
| Financials—continued | | | | | | | | |
SLM Corp.
5.500%, 1/25/23 | | $ | 235 | | | $ | 222 | |
Societe Generale S.A. 144A
3.500%, 1/15/16(4) | | | 105 | | | | 110 | |
Spansion LLC
7.875%, 11/15/17 | | | 100 | | | | 104 | |
Sun Merger Sub, Inc. 144A
5.875%, 8/1/21(4) | | | 50 | | | | 51 | |
SunTrust Bank Atlanta GA
2.750%, 5/1/23 | | | 200 | | | | 181 | |
Swedbank AB 144A
1.750%, 3/12/18(4) | | | 200 | | | | 196 | |
Unum Group
7.125%, 9/30/16 | | | 125 | | | | 142 | |
Ventas Realty LP (Ventas Capital Corp.)
3.250%, 8/15/22 | | | 155 | | | | 143 | |
Webster Financial Corp.
5.125%, 4/15/14 | | | 65 | | | | 65 | |
Wells Fargo & Co.
3.450%, 2/13/23 | | | 115 | | | | 109 | |
Willis Group Holdings plc
5.750%, 3/15/21 | | | 125 | | | | 134 | |
Zions Bancorporation
4.500%, 6/13/23 | | | 40 | | | | 39 | |
| | | | | | | | |
| | | | | | | 11,744 | |
| | | | | | | | |
|
| Health Care—0.6% | |
Cardinal Health, Inc.
3.200%, 3/15/23 | | | 70 | | | | 65 | |
CareFusion Corp. 144A
3.300%, 3/1/23(4) | | | 135 | | | | 123 | |
Express Scripts Holding Co.
3.900%, 2/15/22 | | | 140 | | | | 140 | |
HCA, Inc.
6.500%, 2/15/20 | | | 105 | | | | 116 | |
Mylan, Inc. 144A
3.125%, 1/15/23(4) | | | 150 | | | | 136 | |
Tenet Healthcare Corp.
4.500%, 4/1/21 | | | 105 | | | | 100 | |
Valeant Pharmaceuticals International, Inc. Escrow Corp. | | | | | | | | |
144A 6.750%, 8/15/18(4) | | | 65 | | | | 72 | |
144A 7.500%, 7/15/21(4) | | | 15 | | | | 17 | |
144A 5.625%, 12/1/21(4) | | | 5 | | | | 5 | |
Zoetis, Inc.
3.250%, 2/1/23 | | | 70 | | | | 65 | |
| | | | | | | | |
| | | | | | | 839 | |
| | | | | | | | |
|
| Industrials—2.3% | |
AAR Corp. 144A
7.250%, 1/15/22(4) | | | 80 | | | | 86 | |
ADT Corp. (The) 144A
6.250%, 10/15/21(4) | | | 110 | | | | 116 | |
America West Airlines Pass-Through-Trust 00-1, G
8.057%, 7/2/20 | | | 112 | | | | 120 | |
American Airlines Pass-Through-Trust 13-1, A 144A
4.000%, 7/15/25(4) | | | 200 | | | | 193 | |
| | | | | | | | |
| | | PAR
VALUE | | | VALUE | |
| Industrials—continued | | | | | | | | |
Atlas Air Pass-Through-Trust 00-1, A
8.707%, 1/2/19 | | $ | 89 | | | $ | 93 | |
Bombardier, Inc. 144A
6.125%, 1/15/23(4) | | | 135 | | | | 135 | |
British Airways plc 144A
5.625%, 6/20/20(4) | | | 60 | | | | 63 | |
Carpenter Technology Corp.
5.200%, 7/15/21 | | | 150 | | | | 153 | |
Continental Airlines Pass-Through-Trust | | | | | | | | |
98-1, A 6.648%, 9/15/17 | | | 195 | | | | 205 | |
99-1, A 6.545%, 2/2/19 | | | 192 | | | | 209 | |
01-1, A1 6.703%, 6/15/21 | | | 171 | | | | 184 | |
Delta Air Lines Pass-Through-Trust 11-1, A
5.300%, 4/15/19 | | | 248 | | | | 270 | |
Deluxe Corp. | | | | | | | | |
7.000%, 3/15/19 | | | 60 | | | | 65 | |
6.000%, 11/15/20 | | | 40 | | | | 42 | |
Embraer S.A.
5.150%, 6/15/22 | | | 145 | | | | 145 | |
Kratos Defense & Security Solutions, Inc.
10.000%, 6/1/17 | | | 130 | | | | 141 | |
Norfolk Southern Corp.
2.903%, 2/15/23 | | | 140 | | | | 129 | |
Northwest Airlines Pass-Through-Trust 02-1, G2
6.264%, 11/20/21 | | | 140 | | | | 150 | |
Spirit Aerosystems, Inc.
6.750%, 12/15/20 | | | 80 | | | | 87 | |
UAL Pass-Through-Trust
07-01, A
6.636%, 7/2/22 | | | 251 | | | | 266 | |
Virgin Australia Trust 13-1A, 144A 5.000%, 10/23/23(4) | | | 134 | | | | 138 | |
Voto-Votorantim Ltd. 144A
6.750%, 4/5/21(4) | | | 150 | | | | 163 | |
| | | | | | | | |
| | | | | | | 3,153 | |
| | | | | | | | |
|
| Information Technology—0.3% | |
Dun & Bradstreet Corp. (The)
4.375%, 12/1/22 | | | 135 | | | | 130 | |
Fidelity National Financial, Inc. 6.600%, 5/15/17 | | | 175 | | | | 195 | |
QVC, Inc.
5.125%, 7/2/22 | | | 135 | | | | 134 | |
| | | | | | | | |
| | | | | | | 459 | |
| | | | | | | | |
|
| Materials—1.4% | |
Calumet Specialty Products Partners LP
9.375%, 5/1/19 | | | 30 | | | | 33 | |
Corp Nacional del Cobre de Chile 144A
3.750%, 11/4/20(4) | | | 100 | | | | 100 | |
CRH America, Inc. | | | | | | | | |
6.000%, 9/30/16 | | | 255 | | | | 285 | |
8.125%, 7/15/18 | | | 150 | | | | 184 | |
Gerdau Holdings, Inc. 144A
7.000%, 1/20/20(4) | | | 100 | | | | 109 | |
Refer to Footnote Legend on page 44.
See Notes to Financial Statements
44
VIRTUS STRATEGIC ALLOCATION SERIES
SCHEDULE OF INVESTMENTS (Continued)
DECEMBER 31, 2013
($ reported in thousands)
| | | | | | | | |
| | | PAR
VALUE | | | VALUE | |
| Materials—continued | | | | | | | | |
Hexion U.S. Finance Corp. | | | | | | | | |
8.875%, 2/1/18 | | $ | 65 | | | $ | 68 | |
6.625%, 4/15/20 | | | 80 | | | | 82 | |
NewMarket Corp.
4.100%, 12/15/22 | | | 142 | | | | 135 | |
Nufarm Australia Ltd. 144A
6.375%, 10/15/19(4) | | | 115 | | | | 120 | |
PTT Global Chemical plc 144A 4.250%, 9/19/22(4) | | | 200 | | | | 187 | |
Sappi Papier Holding GmbH 144A 6.625%, 4/15/21(4) | | | 230 | | | | 228 | |
Severstal OAO (Steel Capital SA) 144A
6.700%, 10/25/17(4)(9) | | | 100 | | | | 108 | |
Tronox Finance LLC
6.375%, 8/15/20 | | | 55 | | | | 56 | |
Vale Overseas Ltd.
4.375%, 1/11/22 | | | 130 | | | | 126 | |
Vedanta Resources plc 144A
9.500%, 7/18/18(4) | | | 100 | | | | 111 | |
| | | | | | | | |
| | | | | | | 1,932 | |
| | | | | | | | |
|
| Telecommunication Services—0.4% | |
CenturyLink, Inc. Series V
5.625%, 4/1/20 | | | 65 | | | | 67 | |
Crown Castle Towers LLC 144A
4.883%, 8/15/20(4) | | | 250 | | | | 262 | |
T-Mobile USA, Inc. | | | | | | | | |
6.633%, 4/28/21 | | | 10 | | | | 11 | |
6.731%, 4/28/22 | | | 30 | | | | 31 | |
Telefonica Emisiones, S.A.U.
5.462%, 2/16/21 | | | 60 | | | | 63 | |
Windstream Corp.
7.750%, 10/15/20 | | | 80 | | | | 85 | |
| | | | | | | | |
| | | | | | | 519 | |
| | | | | | | | |
|
| Utilities—0.9% | |
AmeriGas Partners LP
6.250%, 8/20/19 | | | 90 | | | | 97 | |
Electricite de France SA 144A
5.250% (3)(4)(6)(7) | | | 170 | | | | 169 | |
Energy Transfer Partners LP
4.150%, 10/1/20 | | | 130 | | | | 132 | |
Entergy Mississippi, Inc.
3.100%, 7/1/23 | | | 175 | | | | 162 | |
Kansas City Power & Light Co.
3.150%, 3/15/23 | | | 110 | | | | 102 | |
NRG Energy, Inc.
6.625%, 3/15/23 | | | 10 | | | | 10 | |
United Energy Distribution Holdings Property Ltd. 144A
5.450%, 4/15/16(4)(8) | | | 500 | | | | 523 | |
| | | | | | | | |
| | | | | | | | 1,195 | |
| TOTAL CORPORATE BONDS | |
| (Identified Cost $23,963) | | | | 24,384 | |
| | | | | | | | |
| | | PAR
VALUE | | | VALUE | |
| LOAN AGREEMENTS(3)—0.9% | |
|
| Consumer Discretionary—0.2% | |
Landry’s, Inc. (Landry’s Restaurant, Inc.) Tranche B,
4.000%, 4/24/18 | | $ | 105 | | | $ | 106 | |
Seminole Hard Rock Entertainment, Inc. (Seminole Hard Rock International LLC) Tranche B,
3.500%, 5/14/20 | | | 45 | | | | 45 | |
SRAM LLC First Lien,
4.420%, 4/10/20 | | | 26 | | | | 26 | |
TI Group Auto Systems LLC
5.500%, 3/28/19 | | | 47 | | | | 47 | |
TWCC Holding Corp. Second Lien,
7.000%, 6/26/20 | | | 32 | | | | 33 | |
| | | | | | | | |
| | | | | | | 257 | |
| | | | | | | | |
| | |
| Energy—0.1% | | | | | | | | |
NGPL Pipeco LLC
6.750%, 9/15/17 | | | 71 | | | | 67 | |
| | | | | | | | |
| | |
| Financials—0.1% | | | | | | | | |
Altisource Solutions S.A.R.L Tranche B, 4.500%, 12/9/20 | | | 50 | | | | 50 | |
Walter Investment Management Corp. Tranche B
4.750%, 12/18/20 | | | 105 | | | | 105 | |
| | | | | | | | |
| | | | | | | 155 | |
| | | | | | | | |
| | |
| Health Care—0.0% | | | | | | | | |
ConvaTec, Inc.
4.000%, 12/22/16 | | | 13 | | | | 13 | |
| | | | | | | | |
| | |
| Industrials—0.2% | | | | | | | | |
American Airlines, Inc.
Tranche B,
3.750%, 6/27/19 | | | 104 | | | | 105 | |
AWAS Finance Luxemborg SA Tranche 2012,
3.500%, 7/16/18 | | | 42 | | | | 42 | |
Brock Holdings Ill, Inc.
First Lien,
6.000%, 3/16/17 | | | 18 | | | | 19 | |
Ceridian Corp. Tranche 2013,
4.410%, 5/9/17 | | | 48 | | | | 48 | |
Delta Air Lines, Inc.
Tranche B-1,
4.000%, 10/18/18 | | | 33 | | | | 33 | |
| | | | | | | | |
| | | | | | | 247 | |
| | | | | | | | |
|
| Information Technology—0.2% | |
Alcatel-Lucent USA, Inc.
0.000%, 1/30/19(11) | | | 55 | | | | 55 | |
5.750%, 1/30/19 | | | 84 | | | | 85 | |
CCC Information Services, Inc. 4.000%, 12/20/19 | | | 34 | | | | 34 | |
| | | | | | | | |
| | | PAR
VALUE | | | VALUE | |
| Information Technology—continued | |
Mood Media Corp. First Lien,
7.000%, 5/6/18 | | $ | 38 | | | $ | 38 | |
Novell, Inc. (Attachmate Corp.) First Lien,
7.250%, 11/22/17 | | | 38 | | | | 39 | |
| | | | | | | | |
| | | | | | | 251 | |
| | | | | | | | |
| | |
| Materials—0.1% | | | | | | | | |
Cyanco Intermediate Corp.
5.500%, 5/1/20 | | | 12 | | | | 12 | |
Fortescue Metals Group Ltd. (FMG Resources Ltd.)
4.250 %, 6/28/19 | | | 63 | | | | 64 | |
Houghton International, Inc. Holding Corp. First Lien,
4.000%, 12/20/19 | | | 79 | | | | 80 | |
Tronox Pigments B.V.
4.500%, 3/19/20 | | | 28 | | | | 28 | |
| | | | | | | | |
| | | | | | | 184 | |
| | | | | | | | |
| | |
| Utilities—0.0% | | | | | | | | |
Texas Compeptitive Electric Holdings Co. LLC 2017 Extended,
4.720%, 10/10/17 | | | 65 | | | | 45 | |
| TOTAL LOAN AGREEMENTS | |
| (Identified Cost $1,215) | | | | 1,219 | |
| | |
| | | SHARES | | | | |
| PREFERRED STOCK—0.5% | |
|
| Financials—0.5% | |
Ally Financial, Inc. Series G,
144A, 7.000%(4) | | | 84 | | | | 80 | |
Banco Bilbao Vizcaya Argentaria S.A. International S.A. Unipersonal 5.919%(3) | | | 110 | (10) | | | 106 | |
JPMorgan Chase & Co.
Series 1, 7.900%(3) | | | 89 | (10) | | | 98 | |
Series Q, 5.150%(3) | | | 105 | (10) | | | 95 | |
PNC Financial Services Group, Inc. (The) Series R,
4.850%(3) | | | 95 | (10) | | | 85 | |
Wells Fargo & Co.
Series K, 7.980%(3) | | | 95 | (10) | | | 106 | |
Zions Bancorp, 6.950% | | | 4,250 | | | | 113 | |
| TOTAL PREFERRED STOCK | |
| (Identified Cost $617) | | | | 683 | |
|
| COMMON STOCKS—60.1% | |
|
| Consumer Discretionary—10.7% | |
Amazon.com, Inc.(2) | | | 4,400 | | | | 1,755 | |
Coach, Inc. | | | 29,000 | | | | 1,628 | |
Comcast Corp. Class A | | | 33,000 | | | | 1,715 | |
Express, Inc.(2) | | | 84,000 | | | | 1,568 | |
Ford Motor Co. | | | 94,000 | | | | 1,451 | |
Goodyear Tire & Rubber Co. (The) | | | 73,000 | | | | 1,741 | |
Lear Corp. | | | 20,000 | | | | 1,619 | |
Refer to Footnote Legend on page 44.
See Notes to Financial Statements
45
VIRTUS STRATEGIC ALLOCATION SERIES
SCHEDULE OF INVESTMENTS (Continued)
DECEMBER 31, 2013
($ reported in thousands)
| | | | | | | | |
| | | SHARES | | | VALUE | |
| Consumer Discretionary—continued | |
Macy’s, Inc. | | | 31,000 | | | $ | 1,655 | |
Michael Kors Holdings Ltd. | | | 20,000 | | | | 1,624 | |
| | | | | | | | |
| | | | | | | 14,756 | |
| | | | | | | | |
|
| Consumer Staples—2.2% | |
PepsiCo, Inc. | | | 18,000 | | | | 1,493 | |
Safeway, Inc. | | | 48,000 | | | | 1,563 | |
| | | | | | | | |
| | | | | | | 3,056 | |
| | | | | | | | |
|
| Energy—7.0% | |
Chevron Corp. | | | 12,000 | | | | 1,499 | |
Continental Resources, Inc.(2)(12) | | | 14,000 | | | | 1,575 | |
Helmerich & Payne, Inc. | | | 19,000 | | | | 1,598 | |
Noble Corp plc | | | 43,000 | | | | 1,611 | |
Schlumberger Ltd. | | | 17,000 | | | | 1,532 | |
Valero Energy Corp. | | | 37,000 | | | | 1,865 | |
| | | | | | | | |
| | | | | | | 9,680 | |
| | | | | | | | |
|
| Financials—12.1% | |
Aflac, Inc. | | | 25,000 | | | | 1,670 | |
BB&T Corp. | | | 46,000 | | | | 1,717 | |
BlackRock, Inc. | | | 5,300 | | | | 1,677 | |
Blackstone Group LP (The)(12) | | | 56,000 | | | | 1,764 | |
Fifth Third Bancorp | | | 77,000 | | | | 1,619 | |
Goldman Sachs Group, Inc. (The) | | | 9,000 | | | | 1,595 | |
JPMorgan Chase & Co. | | | 27,000 | | | | 1,579 | |
Lincoln National Corp. | | | 32,000 | | | | 1,652 | |
T. Rowe Price Group, Inc. | | | 20,000 | | | | 1,676 | |
U.S. Bancorp | | | 40,000 | | | | 1,616 | |
| | | | | | | | |
| | | | | | | 16,565 | |
| | | | | | | | |
|
| Health Care—6.1% | |
Abbott Laboratories | | | 45,000 | | | | 1,725 | |
Biogen Idec, Inc.(2) | | | 5,600 | | | | 1,567 | |
Gilead Sciences, Inc.(2) | | | 22,000 | | | | 1,653 | |
UnitedHealth Group, Inc. | | | 22,000 | | | | 1,656 | |
Zimmer Holdings, Inc. | | | 19,000 | | | | 1,771 | |
| | | | | | | | |
| | | | | | | 8,372 | |
| | | | | | | | |
|
| Industrials—8.7% | |
Alaska Air Group, Inc. | | | 24,000 | | | | 1,761 | |
Cummins, Inc. | | | 13,000 | | | | 1,832 | |
Deere & Co. | | | 18,000 | | | | 1,644 | |
Dover Corp. | | | 18,000 | | | | 1,738 | |
Parker Hannifin Corp. | | | 13,000 | | | | 1,672 | |
Trinity Industries, Inc. | | | 29,000 | | | | 1,581 | |
Union Pacific Corp. | | | 10,000 | | | | 1,680 | |
| | | | | | | | |
| | | | | | | 11,908 | |
| | | | | | | | |
|
| Information Technology—9.8% | |
Apple, Inc. | | | 4,300 | | | | 2,413 | |
Cisco Systems, Inc. | | | 76,000 | | | | 1,706 | |
EMC Corp. | | | 59,000 | | | | 1,484 | |
Google, Inc. Class A(2) | | | 1,500 | | | | 1,681 | |
Jabil Circuit, Inc. | | | 81,000 | | | | 1,413 | |
MasterCard, Inc. Class A | | | 2,000 | | | | 1,671 | |
NetApp, Inc. | | | 35,000 | | | | 1,440 | |
QUALCOMM, Inc. | | | 22,000 | | | | 1,633 | |
| | | | | | | | |
| | | | | | | 13,441 | |
| | | | | | | | |
| | | | | | | | |
| | | SHARES | | | VALUE | |
| Materials—2.4% | |
CF Industries Holdings, Inc. | | | 6,800 | | | $ | 1,585 | |
Freeport-McMoRan Copper & Gold, Inc. | | | 45,000 | | | | 1,698 | |
| | | | | | | | |
| | | | | | | 3,283 | |
| | | | | | | | |
|
| Telecommunication Services—1.1% | |
Verizon Communications, Inc. | | | 32,000 | | | | 1,572 | |
| TOTAL COMMON STOCKS | |
| (Identified Cost $57,500) | | | | 82,633 | |
| TOTAL LONG TERM INVESTMENTS—98.8% | |
| (Identified Cost $109,412) | | | | 135,707 | (14) |
|
| SHORT-TERM INVESTMENTS—0.8% | |
|
| Money Market Mutual Funds—0.8% | |
Fidelity Money Market Portfolio – Institutional Shares (Seven-day effective yield 0.090%) | | | 1,090,962 | | | | 1,091 | |
| TOTAL SHORT-TERM INVESTMENTS | |
| (Identified Cost $1,091) | | | | 1,091 | |
|
| SECURITIES LENDING COLLATERAL—2.4% | |
INVESCO Trust Short-Term Investments Liquid Assets Portfolio (The) Institutional Shares (seven-day effective yield 0.070%)(13) | | | 3,341,646 | | | | 3,342 | |
| TOTAL SECURITIES LENDING COLLATERAL | |
| (Identified Cost $3,342) | | | | 3,342 | |
| TOTAL INVESTMENTS—102.0% | |
| (Identified Cost $113,845) | | | | 140,140 | (1) |
Other assets and liabilities, net—(2.0)% | | | | (2,687 | ) |
| | | | | | | | |
| NET ASSETS—100.0% | | | $ | 137,453 | |
| | | | | | | | |
Abbreviations:
| FGIC | Financial Guaranty Insurance Company |
| FNMA | Federal National Mortgage Association (“Fannie Mae”). |
| GNMA | Government National Mortgage Association (“Ginnie Mae”) |
| NATL | National Public Finance Guarantee Corp. |
| REIT | Real Estate Investment Trust |
Footnote Legend:
| (1) | Federal Income Tax Information: For tax information at December 31, 2013, see Note 11 Federal Income Tax Information in the Notes to Financial Statements. |
| (2) | Non-income producing. |
| (3) | Variable or step coupon security; interest rate shown reflects the rate in effect at December 31, 2013. |
| (4) | Security exempt from registration under Rule 144A of the Securities Act of 1933. These securities may be resold in transactions exempt from registration, normally to qualified |
| | institutional buyers. At December 31, 2013, these securities amounted to a value of $12,929 or 9.4% of net assets. |
| (5) | Regulation S security. Security is offered and sold outside of the United States, therefore, it is exempt from registration with the SEC under rules 903 and 904 of the Securities Act of 1933. |
| (6) | Interest payments may be deferred. |
| (7) | No contractual maturity date |
| (9) | This note was issued for the sole purpose of funding a loan agreement between the issuer and the borrower. As the credit risk for this security lies solely with the borrower, the name represented here is that of the borrower. |
| (10) | Value shown as par value. |
| (11) | This loan will settle after December 31, 2013, at which time the interest rate, based on the London Interbank Offered Rate (“LIBOR”) and the agreed upon spread on trade date, will be known. |
| (12) | All or a portion of security is on loan. |
| (13) | Represents security purchased with cash collateral received for securities on loan. |
| (14) | All or a portion segregated as collateral for unsettled loan transactions. |
Foreign Currencies:
| | | | |
| Country Weightings (unaudited)† | | | |
United States | | | 90 | % |
British Virgin Islands | | | 1 | |
Australia | | | 1 | |
Brazil | | | 1 | |
Luxembourg | | | 1 | |
Switzerland | | | 1 | |
United Kingdom | | | 1 | |
Other | | | 4 | |
Total | | | 100 | % |
† % of total investments as of December 31, 2013 | |
See Notes to Financial Statements
46
VIRTUS STRATEGIC ALLOCATION SERIES
SCHEDULE OF INVESTMENTS (Continued)
DECEMBER 31, 2013
($ reported in thousands)
The following table provides a summary of inputs used to value the Series’ investments as of December 31, 2013 (See Security Valuation Note 2A in the Notes to Financial Statements):
| | | | | | | | | | | | | | | | |
| | | Total
Value at
December 31, 2013 | | | Level 1 –
Quoted
Prices | | | Level 2 –
Significant
Observable
Inputs | | | Level 3 –
Significant
Unobservable
Inputs | |
Debt Securities: | | | | | | | | | | | | | | | | |
Asset-Backed Securities | | $ | 2,852 | | | $ | — | | | $ | 2,852 | | | $ | — | |
Corporate Bonds and Notes | | | 24,384 | | | | — | | | | 24,384 | | | | — | |
Foreign Government Securities | | | 1,536 | | | | — | | | | 1,536 | | | | — | |
Loan Agreements | | | 1,219 | | | | — | | | | 1,219 | | | | — | |
Mortgage-Backed Securities | | | 17,693 | | | | — | | | | 17,693 | | | | — | |
Municipal Bonds | | | 2,618 | | | | — | | | | 2,618 | | | | — | |
U.S. Government Securities | | | 2,089 | | | | — | | | | 2,089 | | | | — | |
Equity Securities: | | | | | | | | | | | | | | | | |
Preferred Stock | | | 683 | | | | 113 | | | | 570 | | | | — | |
Common Stocks | | | 82,633 | | | | 82,633 | | | | — | | | | — | |
Securities Lending Collateral | | | 3,342 | | | | 3,342 | | | | — | | | | — | |
Short-term Investments | | | 1,091 | | | | 1,091 | | | | — | | | | — | |
| | | | | | | | | | | | | | | | |
Total Investments | | $ | 140,140 | | | $ | 87,179 | | | $ | 52,961 | | | $ | — | |
| | | | | | | | | | | | | | | | |
There were no transfers between Level 1 and Level 2 during the period.
The following is a reconciliation of assets of the Series for Level 3 investments for which significant unobservable inputs were used to determine fair value.
| | | | |
| | | Common
Stock | |
Beginning Balance December 31, 2012: | | $ | — | (c) |
Accrued Discount/(Premium) | | | — | |
Realized Gain (Loss) | | | — | (c) |
Change in Unrealized Appreciation (Depreciation) | | | — | |
Purchases | | | — | |
(Sales)(b) | | | — | (c) |
Transfers Into Level 3(a) | | | — | |
Transfers from Level 3(a) | | | — | |
| | | | |
Ending Balance December 31, 2013 | | $ | — | |
| | | | |
| (a) | “Transfers into and/or from” represent the ending value as of December 31, 2013, for any investment security where a change in the pricing level occurred from the beginning to the end of the period. |
| (b) | Includes paydowns on securities. |
| (c) | Amount is less than $500. |
None of the securities in this table are internally fair valued.
See Notes to Financial Statements
47
VIRTUS VARIABLE INSURANCE TRUST SERIES
STATEMENTS OF ASSETS AND LIABILITIES
DECEMBER 31, 2013
(Reported in thousands except shares and per share amounts)
| | | | | | | | | | | | |
| | | Capital Growth
Series | | | Growth & Income
Series | | | International
Series | |
Assets | | | | | | | | | | | | |
Investment in securities at value(1)(3) | | $ | 218,464 | | | $ | 156,169 | | | $ | 316,137 | |
Foreign currency at value(2) | | | — | | | | — | | | | 375 | |
Deposits with broker for written options | | | — | | | | — | (4) | | | — | |
Receivables | | | | | | | | | | | | |
Investment securities sold | | | — | | | | 709 | | | | — | |
Series shares sold | | | — | (4) | | | — | (4) | | | 654 | |
Dividends and interest | | | 77 | | | | 159 | | | | 417 | |
Tax reclaims | | | 4 | | | | — | | | | 591 | |
Prepaid expenses | | | 14 | | | | 10 | | | | 23 | |
Other assets | | | 181 | | | | 129 | | | | 297 | |
| | | | | | | | | | | | |
Total assets | | | 218,740 | | | | 157,176 | | | | 318,494 | |
| | | | | | | | | | | | |
Liabilities | | | | | | | | | | | | |
Payables | | | | | | | | | | | | |
Series shares repurchased | | | 70 | | | | 304 | | | | — | (4) |
Collateral on securities loaned | | | — | | | | 6,205 | | | | — | |
Investment advisory fee | | | 107 | | | | 67 | | | | 197 | |
Administration fees | | | 14 | | | | 10 | | | | 20 | |
Transfer agent fees and expenses | | | — | (4) | | | — | (4) | | | — | (4) |
Trustees’ fees and expenses | | | 1 | | | | — | (4) | | | — | (4) |
Professional fees | | | 35 | | | | 32 | | | | 45 | |
Distribution and service fees | | | 45 | | | | 31 | | | | 66 | |
Trustee deferred compensation plan | | | 181 | | | | 129 | | | | 297 | |
Other accrued expenses | | | 23 | | | | 15 | | | | 39 | |
| | | | | | | | | | | | |
Total liabilities | | | 476 | | | | 6,793 | | | | 664 | |
| | | | | | | | | | | | |
Net Assets | | $ | 218,264 | | | $ | 150,383 | | | $ | 317,830 | |
| | | | | | | | | | | | |
Net Assets Consist of: | | | | | | | | | | | | |
Capital paid in on shares of beneficial interest | | $ | 204,762 | | | $ | 101,459 | | | $ | 222,544 | |
Accumulated undistributed net investment income (loss) | | | (84 | ) | | | 45 | | | | 444 | |
Accumulated undistributed net realized gain (loss) | | | (56,242 | ) | | | 2,650 | | | | (15,783 | ) |
Net unrealized appreciation (depreciation) | | | 69,828 | | | | 46,229 | | | | 110,625 | |
| | | | | | | | | | | | |
Net Assets | | $ | 218,264 | | | $ | 150,383 | | | $ | 317,830 | |
| | | | | | | | | | | | |
Class A | | | | | | | | | | | | |
Net asset value and offering price per share | | $ | 20.41 | | | $ | 17.23 | | | $ | 18.23 | |
| | | | | | | | | | | | |
Shares of beneficial interest outstanding, $1 par value, unlimited authorization | | | 10,691,914 | | | | 8,725,957 | | | | 17,426,619 | |
| | | | | | | | | | | | |
Net assets | | $ | 218,264 | | | $ | 150,383 | | | $ | 317,726 | |
| | | | | | | | | | | | |
Class I | | | | | | | | | | | | |
Net asset value per share | | $ | — | | | $ | — | | | $ | 18.22 | |
| | | | | | | | | | | | |
Shares of beneficial interest outstanding, $1 par value, unlimited authorization | | | — | | | | — | | | | 5,708 | |
| | | | | | | | | | | | |
Net assets | | $ | — | | | $ | — | | | $ | 104 | |
| | | | | | | | | | | | |
(1) Investments in securities at cost | | $ | 148,636 | | | $ | 109,940 | | | $ | 205,533 | |
(2) Foreign currency at cost | | $ | — | | | $ | — | | | $ | 375 | |
(3) Market value of securities on loan | | $ | — | | | $ | 6,073 | | | $ | — | |
(4) Amount is less than $500. | | | | | | | | | | | | |
See Notes to Financial Statements
48
VIRTUS VARIABLE INSURANCE TRUST SERIES
STATEMENTS OF ASSETS AND LIABILITIES (Continued)
DECEMBER 31, 2013
(Reported in thousands except shares and per share amounts)
| | | | | | | | | | | | |
| | | Multi-Sector
Fixed Income
Series | | | Premium
AlphaSector®
Series | | | Real Estate
Securities Series | |
Assets | | | | | | | | | | | | |
Investment in securities at value(1) | | $ | 171,112 | | | $ | 18,878 | | | $ | 90,090 | |
Foreign currency at value(2) | | | — | (3) | | | — | | | | — | |
Cash | | | 205 | | | | — | | | | — | |
Receivables | | | | | | | | | | | | |
Investment securities sold | | | 150 | | | | — | | | | 100 | |
Series shares sold | | | 110 | | | | 124 | | | | 326 | |
Dividends and interest | | | 2,216 | | | | — | (3) | | | 495 | |
Prepaid expenses | | | 13 | | | | — | (3) | | | 7 | |
Other assets | | | 167 | | | | 10 | | | | 90 | |
| | | | | | | | | | | | |
Total assets | | | 173,973 | | | | 19,012 | | | | 91,108 | |
| | | | | | | | | | | | |
Liabilities | | | | | | | | | | | | |
Payables | | | | | | | | | | | | |
Series shares repurchased | | | — | (3) | | | — | (3) | | | — | |
Investment securities purchased | | | 1,501 | | | | 120 | | | | — | |
Investment advisory fee | | | 67 | | | | 10 | | | | 52 | |
Administration fees | | | 11 | | | | 1 | | | | 6 | |
Transfer agent fees and expenses | | | 1 | | | | — | (3) | | | 1 | |
Trustees’ fees and expenses | | | — | (3) | | | — | (3) | | | — | (3) |
Professional fees | | | 40 | | | | 17 | | | | 30 | |
Distribution and service fees | | | 37 | | | | 4 | | | | 19 | |
Trustee deferred compensation plan | | | 167 | | | | 10 | | | | 90 | |
Other accrued expenses | | | 30 | | | | — | (3) | | | 14 | |
| | | | | | | | | | | | |
Total liabilities | | | 1,854 | | | | 162 | | | | 212 | |
| | | | | | | | | | | | |
Net Assets | | $ | 172,119 | | | $ | 18,850 | | | $ | 90,896 | |
| | | | | | | | | | | | |
Net Assets Consist of: | | | | | | | | | | | | |
Capital paid in on shares of beneficial interest | | $ | 173,061 | | | $ | 16,293 | | | $ | 53,922 | |
Accumulated undistributed net investment income (loss) | | | 625 | | | | (4 | ) | | | 107 | |
Accumulated undistributed net realized gain (loss) | | | (3,602 | ) | | | (33 | ) | | | 1,519 | |
Net unrealized appreciation (depreciation) | | | 2,035 | | | | 2,594 | | | | 35,348 | |
| | | | | | | | | | | | |
Net Assets | | $ | 172,119 | | | $ | 18,850 | | | $ | 90,896 | |
| | | | | | | | | | | | |
Class A | | | | | | | | | | | | |
Net asset value and offering price per share | | $ | 9.54 | | | $ | 13.30 | | | $ | 23.33 | |
| | | | | | | | | | | | |
Shares of beneficial interest outstanding, $1 par value, unlimited authorization | | | 18,024,817 | | | | 1,406,445 | | | | 3,892,911 | |
| | | | | | | | | | | | |
Net assets | | $ | 171,995 | | | $ | 18,710 | | | $ | 90,794 | |
| | | | | | | | | | | | |
Class I | | | | | | | | | | | | |
Net asset value per share | | $ | 9.53 | | | $ | 13.30 | | | $ | 23.30 | |
| | | | | | | | | | | | |
Shares of beneficial interest outstanding, $1 par value, unlimited authorization(2) | | | 13,024 | | | | 10,513 | | | | 4,375 | |
| | | | | | | | | | | | |
Net assets | | $ | 124 | | | $ | 140 | | | $ | 102 | |
| | | | | | | | | | | | |
(1) Investments in securities at cost | | $ | 169,073 | | | $ | 16,284 | | | $ | 54,742 | |
(2) Foreign currency at cost | | $ | — | (3) | | $ | — | | | | — | |
(3) Amount is less than $500. | | | | | | | | | | | | |
See Notes to Financial Statements
49
VIRTUS VARIABLE INSURANCE TRUST SERIES
STATEMENTS OF ASSETS AND LIABILITIES (Continued)
DECEMBER 31, 2013
(Reported in thousands except shares and per share amounts)
| | | | | | | | | | | | |
| | | Small-Cap Growth
Series | | | Small-Cap
Value Series | | | Strategic
Allocation Series | |
Assets | | | | | | | | | | | | |
Investment in securities at value(1)(2) | | $ | 70,754 | | | $ | 135,891 | | | $ | 140,140 | |
Cash | | | — | | | | — | | | | 14 | |
Deposits with broker for written options | | | — | | | | — | | | | — | (3) |
Receivables | | | | | | | | | | | | |
Investment securities sold | | | 2,366 | | | | — | | | | 252 | |
Series shares sold | | | 35 | | | | — | | | | 14 | |
Dividends and interest | | | 46 | | | | 108 | | | | 577 | |
Prepaid expenses | | | 5 | | | | 9 | | | | 10 | |
Other assets | | | 59 | | | | 114 | | | | 122 | |
| | | | | | | | | | | | |
Total assets | | | 73,265 | | | | 136,122 | | | | 141,129 | |
| | | | | | | | | | | | |
Liabilities | | | | | | | | | | | | |
Payables | | | | | | | | | | | | |
Series shares repurchased | | | 47 | | | | 483 | | | | 4 | |
Investment securities purchased | | | 1,976 | | | | — | | | | 55 | |
Collateral on securities loaned | | | — | | | | — | | | | 3,342 | |
Investment advisory fee | | | 41 | | | | 83 | | | | 59 | |
Administration fees | | | 5 | | | | 9 | | | | 10 | |
Transfer agent fees and expenses | | | — | (3) | | | 1 | | | | — | (3) |
Trustees’ fees and expenses | | | — | (3) | | | — | (3) | | | — | (3) |
Professional fees | | | 28 | | | | 31 | | | | 37 | |
Distribution and service fees | | | 15 | | | | 29 | | | | 29 | |
Trustee deferred compensation plan | | | 59 | | | | 114 | | | | 122 | |
Other accrued expenses | | | 9 | | | | 20 | | | | 18 | |
| | | | | | | | | | | | |
Total liabilities | | | 2,180 | | | | 770 | | | | 3,676 | |
| | | | | | | | | | | | |
Net Assets | | $ | 71,085 | | | $ | 135,352 | | | $ | 137,453 | |
| | | | | | | | | | | | |
Net Assets Consist of: | | | | | | | | | | | | |
Capital paid in on shares of beneficial interest | | $ | 47,094 | | | $ | 96,408 | | | $ | 109,246 | |
Accumulated undistributed net investment income (loss) | | | (58 | ) | | | 37 | | | | 321 | |
Accumulated undistributed net realized gain (loss) | | | 1,614 | | | | (7,015 | ) | | | 1,591 | |
Net unrealized appreciation (depreciation) | | | 22,435 | | | | 45,922 | | | | 26,295 | |
| | | | | | | | | | | | |
Net Assets | | $ | 71,085 | | | $ | 135,352 | | | $ | 137,453 | |
| | | | | | | | | | | | |
Class A | | | | | | | | | | | | |
Net asset value and offering price per share | | $ | 21.72 | | | $ | 17.72 | | | $ | 14.41 | |
| | | | | | | | | | | | |
Shares of beneficial interest outstanding, $1 par value, unlimited authorization | | | 3,266,979 | | | | 7,637,733 | | | | 9,540,578 | |
| | | | | | | | | | | | |
Net assets | | $ | 70,948 | | | $ | 135,352 | | | $ | 137,453 | |
| | | | | | | | | | | | |
Class I | | | | | | | | | | | | |
Net asset value per share | | $ | 21.75 | | | $ | — | | | $ | — | |
| | | | | | | | | | | | |
Shares of beneficial interest outstanding, $1 par value, unlimited authorization | | | 6,308 | | | | — | | | | — | |
| | | | | | | | | | | | |
Net assets | | $ | 137 | | | $ | — | | | $ | — | |
| | | | | | | | | | | | |
(1) Investments in securities at cost | | $ | 48,319 | | | $ | 89,969 | | | $ | 113,845 | |
(2) Market value of securities on loan | | $ | — | | | $ | — | | | $ | 3,270 | |
(3) Amount is less than $500. | | | | | | | | | | | | |
See Notes to Financial Statements
50
VIRTUS VARIABLE INSURANCE TRUST SERIES
STATEMENTS OF OPERATIONS
YEAR ENDED DECEMBER 31, 2013
($ Reported in thousands)
| | | | | | | | | | | | |
| | | Capital Growth
Series | | | Growth & Income
Series | | | International
Series | |
Investment Income | | | | | | | | | | | | |
Dividends | | $ | 2,458 | | | $ | 2,605 | | | $ | 11,267 | |
Security lending | | | — | (1) | | | 1 | | | | 17 | |
Interest | | | — | | | | — | (1) | | | — | |
Foreign taxes withheld | | | (4 | ) | | | — | | | | (879 | ) |
| | | | | | | | | | | | |
Total investment income | | | 2,454 | | | | 2,606 | | | | 10,405 | |
| | | | | | | | | | | | |
Expenses | | | | | | | | | | | | |
Investment advisory fee | | | 1,409 | | | | 1,005 | | | | 2,435 | |
Administration fee | | | 153 | | | | 109 | | | | 251 | |
Distribution and service fees | | | 503 | | | | 359 | | | | 825 | |
Transfer agent fee and expenses | | | 1 | | | | 1 | | | | 2 | |
Custodian fees | | | 5 | | | | 3 | | | | 69 | |
Printing fees and expenses | | | 26 | | | | 15 | | | | 25 | |
Professional fees | | | 56 | | | | 50 | | | | 75 | |
Trustees’ fee and expenses | | | 80 | | | | 58 | | | | 135 | |
Miscellaneous | | | 52 | | | | 38 | | | | 95 | |
| | | | | | | | | | | | |
Total expenses | | | 2,285 | | | | 1,638 | | | | 3,912 | |
Prime broker interest expense on written options | | | — | | | | — | (1) | | | — | |
Less expenses reimbursed by investment advisor | | | (211 | ) | | | (231 | ) | | | — | |
| | | | | | | | | | | | |
Net expenses | | | 2,074 | | | | 1,407 | | | | 3,912 | |
| | | | | | | | | | | | |
Net investment income | | | 380 | | | | 1,199 | | | | 6,493 | |
| | | | | | | | | | | | |
Net Realized and Unrealized Gain (Loss) on Investments | | | | | | | | | | | | |
Net realized gain (loss) on investments | | | 15,987 | | | | 23,236 | | | | 21,529 | |
Net realized gain (loss) on foreign currency transactions | | | — | | | | — | | | | (19 | ) |
Net realized gain (loss) on written options | | | — | | | | (153 | ) | | | — | |
Net change in unrealized appreciation (depreciation) on investments | | | 35,890 | | | | 15,448 | | | | (3,071 | ) |
Net change in unrealized appreciation (depreciation) on foreign currency translations | | | — | | | | — | | | | 31 | |
Net change in unrealized appreciation (depreciation) on written options | | | — | | | | (29 | ) | | | — | |
| | | | | | | | | | | | |
Net gain (loss) on investments | | | 51,877 | | | | 38,502 | | | | 18,470 | |
| | | | | | | | | | | | |
Net increase in net assets resulting from operations | | $ | 52,257 | | | $ | 39,701 | | | $ | 24,963 | |
| | | | | | | | | | | | |
| (1) | Amount is less than $500. |
See Notes to Financial Statements
51
VIRTUS VARIABLE INSURANCE TRUST SERIES
STATEMENTS OF OPERATIONS (Continued)
YEAR ENDED DECEMBER 31, 2013
($ Reported in thousands)
| | | | | | | | | | | | |
| | | Multi-Sector
Fixed Income
Series | | | Premium
AlphaSector®
Series | | | Real Estate
Securities
Series | |
Investment Income | | | | | | | | | | | | |
Interest | | $ | 11,281 | | | $ | — | | | $ | — | |
Dividends | | | 186 | | | | 235 | | | | 2,370 | |
Foreign taxes withheld | | | (3 | ) | | | — | | | | — | |
| | | | | | | | | | | | |
Total investment income | | | 11,464 | | | | 235 | | | $ | 2,370 | |
| | | | | | | | | | | | |
Expenses | | | | | | | | | | | | |
Investment advisory fee | | | 930 | | | | 116 | | | | 754 | |
Administration fee | | | 141 | | | | 8 | | | | 77 | |
Distribution and service fees | | | 465 | | | | 26 | | | | 251 | |
Transfer agent fee and expenses | | | 2 | | | | 1 | | | | 2 | |
Custodian fees | | | 15 | | | | 2 | | | | 3 | |
Printing fees and expenses | | | 26 | | | | 3 | | | | 24 | |
Professional fees | | | 62 | | | | 27 | | | | 42 | |
Trustees’ fee and expenses | | | 77 | | | | 4 | | | | 42 | |
Miscellaneous | | | 64 | | | | 2 | | | | 28 | |
| | | | | | | | | | | | |
Total expenses | | | 1,782 | | | | 189 | | | | 1,223 | |
Less expenses reimbursed by investment advisor | | | (34 | ) | | | (9 | ) | | | (57 | ) |
| | | | | | | | | | | | |
Net expenses | | | 1,748 | | | | 180 | | | | 1,166 | |
| | | | | | | | | | | | |
Net investment income | | | 9,716 | | | | 55 | | | | 1,204 | |
| | | | | | | | | | | | |
Net Realized and Unrealized Gain (Loss) on Investments | | | | | | | | | | | | |
Net realized gain (loss) on investments | | | 4,748 | | | | 123 | | | | 14,501 | |
Net realized gain (loss) on foreign currency transactions | | | (72 | ) | | | — | | | | — | |
Net change in unrealized appreciation (depreciation) on investments | | | (10,282 | ) | | | 2,416 | | | | (14,293 | ) |
Net change in unrealized appreciation (depreciation) on foreign currency translations | | | (7 | ) | | | — | | | | — | |
| | | | | | | | | | | | |
Net gain (loss) on investments | | | (5,613 | ) | | | 2,539 | | | | 208 | |
| | | | | | | | | | | | |
Net increase in net assets resulting from operations | | $ | 4,103 | | | $ | 2,594 | | | $ | 1,412 | |
| | | | | | | | | | | | |
See Notes to Financial Statements
52
VIRTUS VARIABLE INSURANCE TRUST SERIES
STATEMENTS OF OPERATIONS (Continued)
YEAR ENDED DECEMBER 31, 2013
($ Reported in thousands)
| | | | | | | | | | | | |
| | | Small-Cap Growth
Series | | | Small-Cap Value
Series | | | Strategic
Allocation Series | |
Investment Income | | | | | | | | | | | | |
Dividends | | $ | 369 | | | $ | 1,839 | | | $ | 1,504 | |
Interest | | | — | | | | — | | | | 2,380 | |
Security lending | | | — | | | | — | | | | 1 | |
Foreign taxes withheld | | | (3 | ) | | | — | | | | — | (1) |
| | | | | | | | | | | | |
Total investment income | | | 366 | | | | 1,839 | | | | 3,885 | |
| | | | | | | | | | | | |
Expenses | | | | | | | | | | | | |
Investment advisory fee | | | 557 | | | | 1,144 | | | | 816 | |
Administration fee | | | 50 | | | | 97 | | | | 112 | |
Distribution and service fees | | | 164 | | | | 318 | | | | 340 | |
Transfer agent fee and expenses | | | 1 | | | | 1 | | | | 1 | |
Custodian fees | | | 2 | | | | 2 | | | | 8 | |
Printing fees and expenses | | | 14 | | | | 28 | | | | 22 | |
Professional fees | | | 38 | | | | 46 | | | | 53 | |
Trustees’ fee and expenses | | | 26 | | | | 51 | | | | 55 | |
Miscellaneous | | | 17 | | | | 33 | | | | 38 | |
| | | | | | | | | | | | |
Total expenses | | | 869 | | | | 1,720 | | | | 1,445 | |
Prime broker interest expense on written options | | | — | | | | — | | | | — | (1) |
Less expenses reimbursed by investment advisor | | | (88 | ) | | | (194 | ) | | | (112 | ) |
| | | | | | | | | | | | |
Net expenses | | | 781 | | | | 1,526 | | | | 1,333 | |
| | | | | | | | | | | | |
Net investment income (loss) | | | (415 | ) | | | 313 | | | | 2,552 | |
| | | | | | | | | | | | |
Net Realized and Unrealized Gain (Loss) on Investments | | | | | | | | | | | | |
Net realized gain (loss) on investments | | | 8,789 | | | | 9,947 | | | | 14,524 | |
Net realized gain (loss) on foreign currency transactions | | | — | | | | — | | | | (6 | ) |
Net realized gain (loss) on written options | | | — | | | | — | | | | (90 | ) |
Net change in unrealized appreciation (depreciation) on investments | | | 13,726 | | | | 33,453 | | | | 5,545 | |
Net change in unrealized appreciation (depreciation) on foreign currency translations | | | — | | | | — | | | | — | (1) |
Net change in unrealized appreciation (depreciation) on written options | | | — | | | | — | | | | (17 | ) |
| | | | | | | | | | | | |
Net gain (loss) on investments | | | 22,515 | | | | 43,400 | | | | 19,956 | |
| | | | | | | | | | | | |
Net increase in net assets resulting from operations | | $ | 22,100 | | | $ | 43,713 | | | $ | 22,508 | |
| | | | | | | | | | | | |
| (1) | Amount is less than $500. |
See Notes to Financial Statements
53
VIRTUS VARIABLE INSURANCE TRUST SERIES
STATEMENTS OF CHANGES IN NET ASSETS
(Reported in thousands)
| | | | | | | | | | | | | | | | | | | | | | | | |
| | | Capital Growth Series | | | Growth & Income Series | | | International Series | |
| | | Year Ended
December 31, 2013 | | | Year Ended
December 31, 2012 | | | Year Ended
December 31, 2013 | | | Year Ended
December 31, 2012 | | | Year Ended
December 31, 2013 | | | Year Ended
December 31, 2012 | |
INCREASE/(DECREASE) IN NET ASSETS | | | | | | | | | | | | | | | | | | | | | | | | |
From Operations | | | | | | | | | | | | | | | | | | | | | | | | |
Net investment income (loss) | | $ | 380 | | | $ | 1,341 | | | $ | 1,199 | | | $ | 1,236 | | | $ | 6,493 | | | $ | 8,530 | |
Net realized gain (loss) | | | 15,987 | | | | 5,000 | | | | 23,083 | | | | 13,361 | | | | 21,510 | | | | 8,901 | |
Net change in unrealized appreciation (depreciation) | | | 35,890 | | | | 19,294 | | | | 15,419 | | | | 6,349 | | | | (3,040 | ) | | | 34,278 | |
| | | | | | | | | | | | | | | | | | | | | | | | |
Increase (decrease) in net assets resulting from operations | | | 52,257 | | | | 25,635 | | | | 39,701 | | | | 20,946 | | | | 24,963 | | | | 51,709 | |
| | | | | | | | | | | | | | | | | | | | | | | | |
From Distributions to Shareholders | | | | | | | | | | | | | | | | | | | | | | | | |
Net investment income, Class A | | | (655 | ) | | | (1,129 | ) | | | (1,206 | ) | | | (1,260 | ) | | | (7,001 | ) | | | (9,184 | ) |
Net investment income, Class I | | | — | | | | — | | | | — | | | | — | | | | (2 | ) | | | — | |
Net realized short-term gains, Class A | | | — | | | | — | | | | — | | | | — | | | | — | | | | — | |
Net realized short-term gains, Class I | | | — | | | | — | | | | — | | | | — | | | | — | | | | — | |
Net realized long-term gains, Class A | | | — | | | | — | | | | (11,002 | ) | | | — | | | | — | | | | — | |
Net realized long-term gains, Class I | | | — | | | | — | | | | — | | | | — | | | | — | | | | — | |
| | | | | | | | | | | | | | | | | | | | | | | | |
Decrease in net assets from distributions to shareholders | | | (655 | ) | | | (1,129 | ) | | | (12,208 | ) | | | (1,260 | ) | | | (7,003 | ) | | | (9,184 | ) |
| | | | | | | | | | | | | | | | | | | | | | | | |
From Share Transactions | | | | | | | | | | | | | | | | | | | | | | | | |
Sale of shares | | | | | | | | | | | | | | | | | | | | | | | | |
Class A | | | 3,923 | | | | 3,960 | | | | 1,555 | | | | 1,401 | | | | 4,543 | | | | 3,317 | |
Class I | | | — | | | | — | | | | — | | | | — | | | | 103 | | | | — | |
Reinvestment of distributions | | | | | | | | | | | | | | | | | | | | | | | | |
Class A | | | 655 | | | | 1,129 | | | | 12,208 | | | | 1,260 | | | | 7,001 | | | | 9,184 | |
Class I | | | — | | | | — | | | | — | | | | — | | | | 2 | | | | — | |
Shares repurchased | | | | | | | | | | | | | | | | | | | | | | | | |
Class A | | | (27,891 | ) | | | (29,309 | ) | | | (28,258 | ) | | | (33,245 | ) | | | (53,496 | ) | | | (48,838 | ) |
Class I | | | — | | | | — | | | | — | | | | — | | | | — | | | | — | |
| | | | | | | | | | | | | | | | | | | | | | | | |
Increase (decrease) in net assets from share transactions | | | (23,313 | ) | | | (24,220 | ) | | | (14,495 | ) | | | (30,584 | ) | | | (41,847 | ) | | | (36,337 | ) |
| | | | | | | | | | | | | | | | | | | | | | | | |
Net increase (decrease) in net assets | | | 28,289 | | | | 286 | | | | 12,998 | | | | (10,898 | ) | | | (23,887 | ) | | | 6,188 | |
| | | | | | |
Net Assets | | | | | | | | | | | | | | | | | | | | | | | | |
Beginning of period | | | 189,975 | | | | 189,689 | | | | 137,385 | | | | 148,283 | | | | 341,717 | | | | 335,529 | |
| | | | | | | | | | | | | | | | | | | | | | | | |
End of period | | $ | 218,264 | | | $ | 189,975 | | | $ | 150,383 | | | $ | 137,385 | | | $ | 317,830 | | | $ | 341,717 | |
| | | | | | | | | | | | | | | | | | | | | | | | |
Accumulated undistributed net investment income (loss) at end of period | | $ | (84 | ) | | $ | 201 | | | $ | 45 | | | $ | 54 | | | $ | 443 | | | $ | 974 | |
| | | | | | | | | | | | |
Shares | | | | | | | | | | | | | | | | | | | | | | | | |
Sales of shares | | | | | | | | | | | | | | | | | | | | | | | | |
Class A | | | 222 | | | | 254 | | | | 95 | | | | 101 | | | | 255 | | | | 204 | |
Class I | | | — | | | | — | | | | — | | | | — | | | | 6 | | | | — | |
Reinvestment of distributions | | | | | | | | | | | | | | | | | | | | | | | | |
Class A | | | 36 | | | | 73 | | | | 716 | | | | 92 | | | | 408 | | | | 587 | |
Class I | | | — | | | | — | | | | — | | | | — | | | | — | | | | — | |
Shares repurchased | | | | | | | | | | | | | | | | | | | | | | | | |
Class A | | | (1,571 | ) | | | (1,881 | ) | | | (1,738 | ) | | | (2,392 | ) | | | (2,993 | ) | | | (2,997 | ) |
Class I | | | — | | | | — | | | | — | | | | — | | | | — | | | | — | |
| | | | | | | | | | | | | | | | | | | | | | | | |
Net Increase/(Decrease) | | | (1,313 | ) | | | (1,554 | ) | | | (927 | ) | | | (2,199 | ) | | | (2,324 | ) | | | (2,206 | ) |
| | | | | | | | | | | | | | | | | | | | | | | | |
| (1) | Amount is less than $500. |
See Notes to Financial Statements
54
VIRTUS VARIABLE INSURANCE TRUST SERIES
STATEMENTS OF CHANGES IN NET ASSETS (Continued)
(Reported in thousands)
| | | | | | | | | | | | | | | | | | | | | | | | |
| | | Multi-Sector Fixed Income Series | | | Premium AlphaSector® Series | | | Real Estate Securities Series | |
| | | Year Ended
December 31, 2013 | | | Year Ended
December 31, 2012 | | | Year Ended
December 31, 2013 | | | Year Ended
December 31, 2012 | | | Year Ended
December 31, 2013 | | | Year Ended
December 31, 2012 | |
INCREASE/(DECREASE) IN NET ASSETS | | | | | | | | | | | | | | | | | | | | | | | | |
From Operations | | | | | | | | | | | | | | | | | | | | | | | | |
Net investment income (loss) | | $ | 9,716 | | | $ | 11,855 | | | $ | 55 | | | $ | 33 | | | $ | 1,204 | | | $ | 1,094 | |
Net realized gain (loss) | | | 4,676 | | | | 5,324 | | | | 123 | | | | (3 | ) | | | 14,501 | | | | 10,691 | |
Net change in unrealized appreciation (depreciation) | | | (10,289 | ) | | | 10,349 | | | | 2,416 | | | | 125 | | | | (14,293 | ) | | | 4,887 | |
| | | | | | | | | | | | | | | | | | | | | | | | |
Increase (decrease) in net assets resulting from operations | | | 4,103 | | | | 27,528 | | | | 2,594 | | | | 155 | | | | 1,412 | | | | 16,672 | |
| | | | | | | | | | | | | | | | | | | | | | | | |
From Distributions to Shareholders | | | | | | | | | | | | | | | | | | | | | | | | |
Net investment income, Class A | | | (9,966 | ) | | | (12,324 | ) | | | (57 | ) | | | (35 | ) | | | (1,464 | ) | | | (1,037 | ) |
Net investment income, Class I | | | (6 | ) | | | — | | | | (1 | ) | | | — | | | | (2 | ) | | | — | |
Net realized short-term gains, Class A | | | — | | | | — | | | | — | (1) | | | — | | | | (354 | ) | | | (587 | ) |
Net realized short-term gains, Class I | | | — | | | | — | | | | — | | | | — | | | | — | (1) | | | — | |
Net realized long-term gains, Class A | | | — | | | | — | | | | (55 | ) | | | — | | | | (14,262 | ) | | | (8,191 | ) |
Net realized long-term gains, Class I | | | — | | | | — | | | | — | (1) | | | — | | | | (16 | ) | | | — | |
| | | | | | | | | | | | �� | | | | | | | | | | | | |
Decrease in net assets from distributions to shareholders | | | (9,972 | ) | | | (12,324 | ) | | | (113 | ) | | | (35 | ) | | | (16,098 | ) | | | (9,815 | ) |
| | | | | | | | | | | | | | | | | | | | | | | | |
From Share Transactions | | | | | | | | | | | | | | | | | | | | | | | | |
Sale of shares | | | | | | | | | | | | | | | | | | | | | | | | |
Class A | | | 15,854 | | | | 28,535 | | | | 15,954 | | | | 4,261 | | | | 4,467 | | | | 3,450 | |
Class I | | | 128 | | | | — | | | | 125 | | | | — | | | | 113 | | | | — | |
Reinvestment of distributions | | | | | | | | | | | | | | | | | | | | | | | | |
Class A | | | 9,966 | | | | 12,324 | | | | 112 | | | | 35 | | | | 16,080 | | | | 9,815 | |
Class I | | | 6 | | | | — | | | | 1 | | | | — | | | | 18 | | | | — | |
Shares repurchased | | | | | | | | | | | | | | | | | | | | | | | | |
Class A | | | (51,738 | ) | | | (49,304 | ) | | | (4,778 | ) | | | (708 | ) | | | (17,495 | ) | | | (20,837 | ) |
Class I | | | (3 | ) | | | — | | | | (3 | ) | | | — | | | | — | | | | — | |
| | | | | | | | | | | | | | | | | | | | | | | | |
Increase (decrease) in net assets from share transactions | | | (25,787 | ) | | | (8,445 | ) | | | 11,411 | | | | 3,588 | | | | 3,183 | | | | (7,572 | ) |
| | | | | | | | | | | | | | | | | | | | | | | | |
Net increase (decrease) in net assets | | | (31,656 | ) | | | 6,759 | | | | 13,892 | | | | 3,708 | | | | (11,503 | ) | | | (715 | ) |
| | | | | | |
Net Assets | | | | | | | | | | | | | | | | | | | | | | | | |
Beginning of period | | | 203,775 | | | | 197,016 | | | | 4,958 | | | | 1,250 | | | | 102,399 | | | | 103,114 | |
| | | | | | | | | | | | | | | | | | | | | | | | |
End of period | | $ | 172,119 | | | $ | 203,775 | | | $ | 18,850 | | | $ | 4,958 | | | $ | 90,896 | | | $ | 102,399 | |
| | | | | | | | | | | | | | | | | | | | | | | | |
Accumulated undistributed net investment income (loss) at end of period | | $ | 625 | | | $ | 1,107 | | | $ | (4 | ) | | $ | (1 | ) | | $ | 107 | | | $ | 369 | |
| | | | | | | | | | | | |
Shares | | | | | | | | | | | | | | | | | | | | | | | | |
Sales of shares | | | | | | | | | | | | | | | | | | | | | | | | |
Class A | | | 1,613 | | | | 2,924 | | | | 1,313 | | | | 410 | | | | 158 | | | | 120 | |
Class I | | | 13 | | | | — | | | | 11 | | | | — | | | | 4 | | | | — | |
Reinvestment of distributions | | | | | | | | | | | | | | | | | | | | | | | | |
Class A | | | 1,054 | | | | 1,288 | | | | 9 | | | | 3 | | | | 660 | | | | 353 | |
Class I | | | 1 | | | | — | | | | — | | | | — | | | | 1 | | | | — | |
Shares repurchased | | | | | | | | | | | | | | | | | | | | | | | | |
Class A | | | (5,259 | ) | | | (5,068 | ) | | | (392 | ) | | | (68 | ) | | | (612 | ) | | | (724 | ) |
Class I | | | (1 | ) | | | — | | | | — | | | | — | | | | | | | | — | |
| | | | | | | | | | | | | | | | | | | | | | | | |
Net Increase/(Decrease) | | | (2,579 | ) | | | (856 | ) | | | 941 | | | | 345 | | | | 211 | | | | (251 | ) |
| | | | | | | | | | | | | | | | | | | | | | | | |
| (1) | Amount is less than $500. |
See Notes to Financial Statements
55
VIRTUS VARIABLE INSURANCE TRUST SERIES
STATEMENTS OF CHANGES IN NET ASSETS (Continued)
(Reported in thousands)
| | | | | | | | | | | | | | | | | | | | | | | | |
| | | Small-Cap Growth Series | | | Small-Cap Value Series | | | Strategic Allocation Series | |
| | | Year Ended
December 31, 2013
| | | Year Ended
December 31, 2012 | | | Year Ended
December 31, 2013
| | | Year Ended
December 31, 2012 | | | Year Ended
December 31, 2013
| | | Year Ended
December 31, 2012 | |
INCREASE/(DECREASE) IN NET ASSETS | | | | | | | | | | | | | | | | | | | | | | | | |
From Operations | | | | | | | | | | | | | | | | | | | | | | | | |
Net investment income (loss) | | $ | (415 | ) | | $ | 278 | | | $ | 313 | | | $ | 2,865 | | | $ | 2,552 | | | $ | 3,055 | |
Net realized gain (loss) | | | 8,789 | | | | 4,962 | | | | 9,947 | | | | 3,265 | | | | 14,428 | | | | 11,219 | |
Net change in unrealized appreciation (depreciation) | | | 13,726 | | | | 1,746 | | | | 33,453 | | | | 3,842 | | | | 5,528 | | | | 3,472 | |
| | | | | | | | | | | | | | | | | | | | | | | | |
Increase (decrease) in net assets resulting from operations | | | 22,100 | | | | 6,986 | | | | 43,713 | | | | 9,972 | | | | 22,508 | | | | 17,746 | |
| | | | | | | | | | | | | | | | | | | | | | | | |
From Distributions to Shareholders | | | | | | | | | | | | | | | | | | | | | | | | |
Net investment income, Class A | | | (177 | ) | | | (115 | ) | | | (725 | ) | | | (2,762 | ) | | | (2,599 | ) | | | (3,202 | ) |
Net investment income, Class I | | | — | (1) | | | — | | | | — | | | | — | | | | — | | | | — | |
Net realized short-term gains, Class A | | | — | | | | — | | | | — | | | | — | | | | — | | | | — | |
Net realized short-term gains, Class I | | | — | | | | — | | | | — | | | | — | | | | — | | | | — | |
Net realized long-term gains, Class A | | | (567 | ) | | | — | | | | — | | | | — | | | | (10,364 | ) | | | — | |
Net realized long-term gains, Class I | | | (1 | ) | | | — | | | | — | | | | — | | | | — | | | | — | |
| | | | | | | | | | | | | | | | | | | | | | | | |
Decrease in net assets from distributions to shareholders | | | (745 | ) | | | (115 | ) | | | (725 | ) | | | (2,762 | ) | | | (12,963 | ) | | | (3,202 | ) |
| | | | | | | | | | | | | | | | | | | | | | | | |
From Share Transactions | | | | | | | | | | | | | | | | | | | | | | | | |
Sale of shares | | | | | | | | | | | | | | | | | | | | | | | | |
Class A | | | 1,187 | | | | 1,439 | | | | 932 | | | | 989 | | | | 1,106 | | | | 1,036 | |
Class I | | | 110 | | | | — | | | | — | | | | — | | | | — | | | | — | |
Reinvestment of distributions | | | | | | | | | | | | | | | | | | | | | | | | |
Class A | | | 744 | | | | 115 | | | | 725 | | | | 2,762 | | | | 12,963 | | | | 3,202 | |
Class I | | | 1 | | | | — | | | | — | | | | — | | | | — | | | | — | |
Shares repurchased | | | | | | | | | | | | | | | | | | | | | | | | |
Class A | | | (12,210 | ) | | | (13,395 | ) | | | (28,034 | ) | | | (22,127 | ) | | | (21,207 | ) | | | (21,860 | ) |
Class I | | | — | | | | — | | | | — | | | | — | | | | — | | | | — | |
| | | | | | | | | | | | | | | | | | | | | | | | |
Increase (decrease) in net assets from share transactions | | | (10,168 | ) | | | (11,841 | ) | | | (26,377 | ) | | | (18,376 | ) | | | (7,138 | ) | | | (17,622 | ) |
| | | | | | | | | | | | | | | | | | | | | | | | |
Net increase (decrease) in net assets | | | 11,187 | | | | (4,970 | ) | | | 16,611 | | | | (11,166 | ) | | | 2,407 | | | | (3,078 | ) |
| | | | | | |
Net Assets | | | | | | | | | | | | | | | | | | | | | | | | |
Beginning of period | | | 59,898 | | | | 64,868 | | | | 118,741 | | | | 129,907 | | | | 135,046 | | | | 138,124 | |
| | | | | | | | | | | | | | | | | | | | | | | | |
End of period | | $ | 71,085 | | | $ | 59,898 | | | $ | 135,352 | | | $ | 118,741 | | | $ | 137,453 | | | $ | 135,046 | |
| | | | | | | | | | | | | | | | | | | | | | | | |
Accumulated undistributed net investment income (loss) at end of period | | $ | (59 | ) | | $ | 195 | | | $ | 37 | | | $ | 451 | | | $ | 321 | | | $ | 381 | |
| | | | | | | | | | | | |
Shares | | | | | | | | | | | | | | | | | | | | | | | | |
Sales of shares | | | | | | | | | | | | | | | | | | | | | | | | |
Class A | | | 63 | | | | 97 | | | | 63 | | | | 79 | | | | 77 | | | | 78 | |
Class I | | | 6 | | | | — | | | | — | | | | — | | | | — | | | | — | |
Reinvestment of distributions | | | | | | | | | | | | | | | | | | | | | | | | |
Class A | | | 36 | | | | 7 | | | | 47 | | | | 225 | | | | 906 | | | | 246 | |
Class I | | | — | | | | — | | | | — | | | | — | | | | — | | | | — | |
Shares repurchased | | | | | | | | | | | | | | | | | | | | | | | | |
Class A | | | (657 | ) | | | (902 | ) | | | (1,855 | ) | | | (1,760 | ) | | | (1,464 | ) | | | (1,654 | ) |
Class I | | | — | | | | — | | | | — | | | | — | | | | — | | | | — | |
| | | | | | | | | | | | | | | | | | | | | | | | |
Net Increase/(Decrease) | | | (552 | ) | | | (798 | ) | | | (1,745 | ) | | | (1,456 | ) | | | (481 | ) | | | (1,330 | ) |
| | | | | | | | | | | | | | | | | | | | | | | | |
| (1) | Amount is less than $500. |
See Notes to Financial Statements
56
VIRTUS VARIABLE INSURANCE TRUST
FINANCIAL HIGHLIGHTS
SELECTED PER SHARE DATA AND RATIOS FOR A SHARE OUTSTANDING
THROUGHOUT EACH PERIOD
| | | | | | | | | | | | | | | | | | | | | | | | | | | | | | | | | | | | | | | | | | | | | | | | | | | | | | | | | | | | | | | | | | | | | | | | | | | |
| | | Net Asset Value,
Beginning of Period | | Net Investment Income (Loss)(1) | | Net Realized and
Unrealized Gain (Loss) | | Total from Investment Operations
| | Dividends from
Net Investment Income | | Distributions from
Net Realized Gains | | Total Distributions | | Change in Net Asset Value | | Net Asset Value, End of Period | | Total Return(3) | | Net Assets, End of Period
(in thousands) | | Ratio of Net Expenses to
Average Net Assets(4) | | Ratio of Gross Expenses to
Average Net Assets (before
waivers and reimbursements)(4) | | Ratio of Net Investment Income
to Average Net Assets | | Portfolio Turnover Rate |
Capital Growth Series | | | | | | | | | | | | | | | | | | | | | | | | | | | | | | | | | | | | | | | | | | | | | | | | | | | | | | | | | | | | | | | | | | | | | | | | | | | |
Class A | | | | | | | | | | | | | | | | | | | | | | | | | | | | | | | | | | | | | | | | | | | | | | | | | | | | | | | | | | | | | | | | | | | | | | | | | | | |
1/1/13 to 12/31/13 | | | $ | 15.82 | | | | | 0.04 | | | | | 4.61 | | | | | 4.65 | | | | | (0.06 | ) | | | | — | | | | | (0.06 | ) | | | | 4.59 | | | | $ | 20.41 | | | | | 29.44 | % | | | $ | 218,264 | | | | | 1.03 | % | | | | 1.14 | % | | | | 0.19 | % | | | | 30 | % |
1/1/12 to 12/31/12 | | | | 13.99 | | | | | 0.11 | | | | | 1.81 | | | | | 1.92 | | | | | (0.09 | ) | | | | — | | | | | (0.09 | ) | | | | 1.83 | | | | | 15.82 | | | | | 13.76 | | | | | 189,975 | | | | | 0.96 | (8) | | | | 1.13 | | | | | 0.68 | | | | | 16 | |
1/1/11 to 12/31/11 | | | | 14.67 | | | | | 0.01 | | | | | (0.68 | ) | | | | (0.67 | ) | | | | (0.01 | ) | | | | — | | | | | (0.01 | ) | | | | (0.68 | ) | | | | 13.99 | | | | | (4.60 | ) | | | | 189,689 | | | | | 0.95 | | | | | 1.15 | | | | | 0.04 | | | | | 127 | |
1/1/10 to 12/31/10 | | | | 12.83 | | | | | 0.05 | | | | | 1.85 | | | | | 1.90 | | | | | (0.06 | ) | | | | — | | | | | (0.06 | ) | | | | 1.84 | | | | | 14.67 | | | | | 14.88 | | | | | 228,109 | | | | | 0.95 | | | | | 1.05 | | | | | 0.36 | | | | | 166 | |
| 1/1/09 to 12/31/09 | | | | 9.95 | | | | | 0.09 | | | | | 2.89 | | | | | 2.98 | | | | | (0.10 | ) | | | | — | | | | | (0.10 | ) | | | | 2.88 | | | | | 12.83 | | | | | 29.93 | | | | | 236,409 | | | | | 0.95 | | | | | 1.07 | | | | | 0.85 | | | | | 107 | |
Growth & Income Series | | | | | | | | | | | | | | | | | | | | | | | | | | | | | | | | | | | | | | | | | | | | | | | | | | | | | | | | | | | | | | | | | | | | | | | | | | | |
Class A | | | | | | | | | | | | | | | | | | | | | | | | | | | | | | | | | | | | | | | | | | | | | | | | | | | | | | | | | | | | | | | | | | | | | | | | | | | |
1/1/13 to 12/31/13 | | | $ | 14.23 | | | | | 0.11 | | | | | 4.39 | | | | | 4.50 | | | | | (0.14 | ) | | | | (1.36 | ) | | | | (1.50 | ) | | | | 3.00 | | | | $ | 17.23 | | | | | 31.81 | % | | | $ | 150,383 | | | | | 0.98 | % | | | | 1.14 | % | | | | 0.84 | % | | | | 54 | % |
1/1/12 to 12/31/12 | | | | 12.51 | | | | | 0.12 | | | | | 1.73 | | | | | 1.85 | | | | | (0.13 | ) | | | | — | | | | | (0.13 | ) | | | | 1.72 | | | | | 14.23 | | | | | 14.77 | | | | | 137,385 | | | | | 0.91 | (8) | | | | 1.14 | | | | | 0.83 | | | | | 73 | |
1/1/11 to 12/31/11 | | | | 12.82 | | | | | 0.09 | | | | | (0.30 | ) | | | | (0.21 | ) | | | | (0.10 | ) | | | | — | | | | | (0.10 | ) | | | | (0.31 | ) | | | | 12.51 | | | | | (1.66 | ) | | | | 148,283 | | | | | 0.90 | | | | | 1.16 | | | | | 0.69 | | | | | 36 | |
1/1/10 to 12/31/10 | | | | 11.49 | | | | | 0.11 | | | | | 1.34 | | | | | 1.45 | | | | | (0.12 | ) | | | | — | | | | | (0.12 | ) | | | | 1.33 | | | | | 12.82 | | | | | 12.83 | | | | | 189,361 | | | | | 0.90 | | | | | 1.07 | | | | | 0.98 | | | | | 39 | |
| 1/1/09 to 12/31/09 | | | | 9.45 | | | | | 0.13 | | | | | 2.07 | | | | | 2.20 | | | | | (0.16 | ) | | | | — | | | | | (0.16 | ) | | | | 2.04 | | | | | 11.49 | | | | | 23.50 | | | | | 90,300 | | | | | 0.94 | | | | | 1.11 | | | | | 1.35 | | | | | 109 | |
International Series | | | | | | | | | | | | | | | | | | | | | | | | | | | | | | | | | | | | | | | | | | | | | | | | | | | | | | | | | | | | | | | | | | | | | | | | | | | |
Class A | | | | | | | | | | | | | | | | | | | | | | | | | | | | | | | | | | | | | | | | | | | | | | | | | | | | | | | | | | | | | | | | | | | | | | | | | | | |
1/1/13 to 12/31/13 | | | $ | 17.30 | | | | | 0.35 | | | | | 0.97 | | | | | 1.32 | | | | | (0.39 | ) | | | | — | | | | | (0.39 | ) | | | | 0.93 | | | | $ | 18.23 | | | | | 7.78 | % | | | $ | 317,726 | | | | | 1.18 | %(2) | | | | 1.18 | % | | | | 1.97 | % | | | | 11 | % |
1/1/12 to 12/31/12 | | | | 15.28 | | | | | 0.41 | | | | | 2.06 | | | | | 2.47 | | | | | (0.45 | ) | | | | — | | | | | (0.45 | ) | | | | 2.02 | | | | | 17.30 | | | | | 16.52 | | | | | 341,717 | | | | | 1.06 | (8) | | | | 1.18 | | | | | 2.53 | | | | | 13 | |
1/1/11 to 12/31/11 | | | | 16.45 | | | | | 0.47 | | | | | (1.21 | ) | | | | (0.74 | ) | | | | (0.43 | ) | | | | — | | | | | (0.43 | ) | | | | (1.17 | ) | | | | 15.28 | | | | | (4.57 | ) | | | | 335,529 | | | | | 1.03 | | | | | 1.19 | | | | | 2.91 | | | | | 17 | |
1/1/10 to 12/31/10 | | | | 14.86 | | | | | 0.35 | | | | | 1.61 | | | | | 1.96 | | | | | (0.37 | ) | | | | — | | | | | (0.37 | ) | | | | 1.59 | | | | | 16.45 | | | | | 13.47 | | | | | 403,607 | | | | | 1.03 | | | | | 1.08 | | | | | 2.36 | | | | | 24 | |
1/1/09 to 12/31/09 | | | | 10.95 | | | | | 0.31 | | | | | 4.01 | | | | | 4.32 | | | | | (0.41 | ) | | | | — | | | | | (0.41 | ) | | | | 3.91 | | | | | 14.86 | | | | | 39.87 | | | | | 421,706 | | | | | 1.03 | | | | | 1.08 | | | | | 2.55 | | | | | 26 | |
| | | | | | | | | | | | | | | |
Class I | | | | | | | | | | | | | | | | | | | | | | | | | | | | | | | | | | | | | | | | | | | | | | | | | | | | | | | | | | | | | | | | | | | | | | | | | | | |
| 4/30/13(5) to 12/31/13 | | | $ | 18.40 | | | | | 0.18 | | | | | 0.08 | | | | | 0.26 | | | | | (0.44 | ) | | | | — | | | | | (0.44 | ) | | | | (0.18 | ) | | | $ | 18.22 | | | | | 1.17 | %(7) | | | $ | 104 | | | | | 0.93 | %(6)(2) | | | | 0.93 | %(6) | | | | 1.54 | %(6) | | | | 11 | % |
Multi-Sector Fixed Income Series | | | | | | | | | | | | | | | | | | | | | | | | | | | | | | | | | | | | | | | | | | | | | | | | | | | | | | | | | | | | | | | | | | | | | | | | | | | |
Class A | | | | | | | | | | | | | | | | | | | | | | | | | | | | | | | | | | | | | | | | | | | | | | | | | | | | | | | | | | | | | | | | | | | | | | | | | | | |
1/1/13 to 12/31/13 | | | $ | 9.88 | | | | | 0.51 | | | | | (0.30 | ) | | | | 0.21 | | | | | (0.55 | ) | | | | — | | | | | (0.55 | ) | | | | (0.34 | ) | | | $ | 9.54 | | | | | 2.25 | % | | | $ | 171,995 | | | | | 0.94 | % | | | | 0.96 | % | | | | 5.23 | % | | | | 56 | % |
1/1/12 to 12/31/12 | | | | 9.18 | | | | | 0.58 | | | | | 0.74 | | | | | 1.32 | | | | | (0.62 | ) | | | | — | | | | | (0.62 | ) | | | | 0.70 | | | | | 9.88 | | | | | 14.69 | | | | | 203,775 | | | | | 0.78 | (8) | | | | 0.94 | | | | | 5.94 | | | | | 85 | |
1/1/11 to 12/31/11 | | | | 9.55 | | | | | 0.63 | | | | | (0.34 | ) | | | | 0.29 | | | | | (0.66 | ) | | | | — | | | | | (0.66 | ) | | | | (0.37 | ) | | | | 9.18 | | | | | 2.99 | | | | | 197,016 | | | | | 0.75 | | | | | 0.97 | | | | | 6.50 | | | | | 39 | |
1/1/10 to 12/31/10 | | | | 8.98 | | | | | 0.61 | | | | | 0.65 | | | | | 1.26 | | | | | (0.69 | ) | | | | — | | | | | (0.69 | ) | | | | 0.57 | | | | | 9.55 | | | | | 14.36 | | | | | 227,860 | | | | | 0.75 | | | | | 0.85 | | | | | 6.48 | | | | | 56 | |
1/1/09 to 12/31/09 | | | | 6.86 | | | | | 0.57 | | | | | 2.15 | | | | | 2.72 | | | | | (0.60 | ) | | | | — | | | | | (0.60 | ) | | | | 2.12 | | | | | 8.98 | | | | | 40.13 | | | | | 206,107 | | | | | 0.75 | | | | | 0.84 | | | | | 7.06 | | | | | 72 | |
| | | | | | | | | | | | | | | |
Class I | | | | | | | | | | | | | | | | | | | | | | | | | | | | | | | | | | | | | | | | | | | | | | | | | | | | | | | | | | | | | | | | | | | | | | | | | | | |
| 4/30/13(5) to 12/31/13 | | | $ | 10.19 | | | | | 0.36 | | | | | (0.44 | ) | | | | (0.08 | ) | | | | (0.58 | ) | | | | — | | | | | (0.58 | ) | | | | (0.66 | ) | | | $ | 9.53 | | | | | (0.89 | )%(7) | | | $ | 124 | | | | | 0.69 | %(6) | | | | 0.71 | %(6) | | | | 5.54 | %(6) | | | | 56 | % |
The footnote legend is at the end of the Financial Highlights.
See Notes to Financial Statements
57
VIRTUS VARIABLE INSURANCE TRUST
FINANCIAL HIGHLIGHTS
SELECTED PER SHARE DATA AND RATIOS FOR A SHARE OUTSTANDING
THROUGHOUT EACH PERIOD
| | | | | | | | | | | | | | | | | | | | | | | | | | | | | | | | | | | | | | | | | | | | | | | | | | | | | | | | | | | | | | | | | | | | | | | | | | | |
| | | Net Asset Value,
Beginning of Period | | Net Investment Income (Loss)(1) | | Net Realized and
Unrealized Gain (Loss) | | Total from Investment Operations
| | Dividends from
Net Investment Income | | Distributions from
Net Realized Gains | | Total Distributions | | Change in Net Asset Value | | Net Asset Value, End of Period | | Total Return(3) | | Net Assets, End of Period
(in thousands) | | Ratio of Net Expenses to
Average Net Assets(4) | | Ratio of Gross Expenses to
Average Net Assets (before
waivers and reimbursements)(4) | | Ratio of Net Investment Income
to Average Net Assets | | Portfolio Turnover Rate |
Premium AlphaSector® Series | | | | | | | | | | | | | | | | | | | | | | | | | | | | | | | | | | | | | | | | | | | | | | | | | | | | | | | | | | | | | | | | | | | | | | | | | | | |
Class A | | | | | | | | | | | | | | | | | | | | | | | | | | | | | | | | | | | | | | | | | | | | | | | | | | | | | | | | | | | | | | | | | | | | | | | | | | | |
1/1/13 to 12/31/13 | | | $ | 10.41 | | | | | 0.06 | | | | | 2.92 | | | | | 2.98 | | | | | (0.05 | ) | | | | (0.04 | ) | | | | (0.09 | ) | | | | 2.89 | | | | $ | 13.30 | | | | | 28.71 | % | | | $ | 18,710 | | | | | 1.70 | % | | | | 1.79 | % | | | | 0.52 | % | | | | 108 | % |
1/1/12 to 12/31/12 | | | | 9.49 | | | | | 0.15 | | | | | 0.86 | | | | | 1.01 | | | | | (0.09 | ) | | | | — | | | | | (0.09 | ) | | | | 0.92 | | | | | 10.41 | | | | | 10.69 | | | | | 4,958 | | | | | 1.70 | | | | | 2.07 | | | | | 1.50 | | | | | 272 | |
2/14/11(5) to 12/31/11 | | | | 10.00 | | | | | 0.08 | | | | | (0.52 | ) | | | | (0.44 | ) | | | | (0.07 | ) | | | | — | | | | | (0.07 | ) | | | | (0.51 | ) | | | | 9.49 | | | | | (4.47 | )(7) | | | | 1,250 | | | | | 1.70 | (6) | | | | 7.31 | (6) | | | | 0.98 | (6) | | | | 249 | (7) |
| | | | | | | | | | | | | | | |
Class I | | | | | | | | | | | | | | | | | | | | | | | | | | | | | | | | | | | | | | | | | | | | | | | | | | | | | | | | | | | | | | | | | | | | | | | | | | | |
| 4/30/13(5) to 12/31/13 | | | $ | 11.69 | | | | | 0.07 | | | | | 1.66 | | | | | 1.73 | | | | | (0.08 | ) | | | | (0.04 | ) | | | | (0.12 | ) | | | | 1.61 | | | | $ | 13.30 | | | | | 14.64 | %(7) | | | $ | 140 | | | | | 1.45 | %(6) | | | | 1.50 | %(6) | | | | 0.89 | %(6) | | | | 108 | % |
Real Estate Securities Series | | | | | | | | | | | | | | | | | | | | | | | | | | | | | | | | | | | | | | | | | | | | | | | | | | | | | | | | | | | | | | | | | | | | | | | | | | | |
Class A | | | | | | | | | | | | | | | | | | | | | | | | | | | | | | | | | | | | | | | | | | | | | | | | | | | | | | | | | | | | | | | | | | | | | | | | | | | |
1/1/13 to 12/31/13 | | | $ | 27.78 | | | | | 0.34 | | | | | (0.05 | ) | | | | 0.29 | | | | | (0.43 | ) | | | | (4.31 | ) | | | | (4.74 | ) | | | | (4.45 | ) | | | $ | 23.33 | | | | | 0.90 | % | | | $ | 90,794 | | | | | 1.16 | % | | | | 1.22 | % | | | | 1.20 | % | | | | 26 | % |
1/1/12 to 12/31/12 | | | | 26.18 | | | | | 0.30 | | | | | 4.10 | | | | | 4.40 | | | | | (0.29 | ) | | | | (2.51 | ) | | | | (2.80 | ) | | | | 1.60 | | | | | 27.78 | | | | | 16.98 | | | | | 102,399 | | | | | 1.11 | (8) | | | | 1.20 | | | | | 1.03 | | | | | 18 | |
1/1/11 to 12/31/11 | | | | 25.43 | | | | | 0.24 | | | | | 2.25 | | | | | 2.49 | | | | | (0.19 | ) | | | | (1.55 | ) | | | | (1.74 | ) | | | | 0.75 | | | | | 26.18 | | | | | 9.87 | | | | | 103,114 | | | | | 1.10 | | | | | 1.22 | | | | | 0.90 | | | | | 22 | |
1/1/10 to 12/31/10 | | | | 20.25 | | | | | 0.28 | | | | | 5.35 | | | | | 5.63 | | | | | (0.45 | ) | | | | — | | | | | (0.45 | ) | | | | 5.18 | | | | | 25.43 | | | | | 28.00 | | | | | 110,769 | | | | | 1.10 | | | | | 1.11 | | | | | 1.23 | | | | | 36 | |
1/1/09 to 12/31/09 | | | | 16.26 | | | | | 0.44 | | | | | 4.12 | | | | | 4.56 | | | | | (0.57 | ) | | | | — | | | | | (0.57 | ) | | | | 3.99 | | | | | 20.25 | | | | | 29.11 | | | | | 112,750 | | | | | 1.10 | | | | | 1.11 | | | | | 2.80 | | | | | 43 | |
| | | | | | | | | | | | | | | |
Class I | | | | | | | | | | | | | | | | | | | | | | | | | | | | | | | | | | | | | | | | | | | | | | | | | | | | | | | | | | | | | | | | | | | | | | | | | | | |
| 4/30/13(5) to 12/31/13 | | | $ | 30.96 | | | | | 0.23 | | | | | (3.08 | ) | | | | (2.85 | ) | | | | (0.50 | ) | | | | (4.31 | ) | | | | (4.81 | ) | | | | (7.66 | ) | | | $ | 23.30 | | | | | (10.45 | %)(7) | | | $ | 102 | | | | | 0.91 | %(6) | | | | 0.98 | %(6) | | | | 1.23 | %(6) | | | | 26 | % |
Small-Cap Growth Series | | | | | | | | | | | | | | | | | | | | | | | | | | | | | | | | | | | | | | | | | | | | | | | | | | | | | | | | | | | | | | | | | | | | | | | | | | | |
Class A | | | | | | | | | | | | | | | | | | | | | | | | | | | | | | | | | | | | | | | | | | | | | | | | | | | | | | | | | | | | | | | | | | | | | | | | | | | |
1/1/13 to 12/31/13 | | | $ | 15.66 | | | | | (0.12 | ) | | | | 6.39 | | | | | 6.27 | | | | | (0.05 | ) | | | | (0.16 | ) | | | | (0.21 | ) | | | | 6.06 | | | | $ | 21.72 | | | | | 40.20 | % | | | $ | 70,948 | | | | | 1.19 | % | | | | 1.33 | % | | | | (0.63 | )% | | | | 28 | % |
1/1/12 to 12/31/12 | | | | 14.03 | | | | | 0.07 | | | | | 1.59 | | | | | 1.66 | | | | | (0.03 | ) | | | | — | | | | | (0.03 | ) | | | | 1.63 | | | | | 15.66 | | | | | 11.81 | | | | | 59,898 | | | | | 1.07 | (8) | | | | 1.32 | | | | | 0.44 | | | | | 16 | |
1/1/11 to 12/31/11 | | | | 13.24 | | | | | (0.02 | ) | | | | 2.23 | | | | | 2.21 | | | | | — | | | | | (1.42 | ) | | | | (1.42 | ) | | | | 0.79 | | | | | 14.03 | | | | | 16.59 | | | | | 64,868 | | | | | 1.05 | | | | | 1.35 | | | | | (0.15 | ) | | | | 35 | |
1/1/10 to 12/31/10 | | | | 11.66 | | | | | (0.07 | ) | | | | 1.65 | | | | | 1.58 | | | | | — | | | | | — | | | | | — | | | | | 1.58 | | | | | 13.24 | | | | | 13.53 | | | | | 68,463 | | | | | 1.05 | | | | | 1.33 | | | | | (0.55 | ) | | | | 179 | |
1/1/09 to 12/31/09 | | | | 9.53 | | | | | (0.08 | ) | | | | 2.21 | | | | | 2.13 | | | | | — | | | | | — | | | | | — | | | | | 2.13 | | | | | 11.66 | | | | | 22.39 | | | | | 26,310 | | | | | 1.05 | | | | | 1.41 | | | | | (0.83 | ) | | | | 262 | |
| | | | | | | | | | | | | | | |
Class I | | | | | | | | | | | | | | | | | | | | | | | | | | | | | | | | | | | | | | | | | | | | | | | | | | | | | | | | | | | | | | | | | | | | | | | | | | | |
| 4/30/13(5) to 12/31/13 | | | $ | 17.29 | | | | | (0.03 | ) | | | | 4.70 | | | | | 4.67 | | | | | (0.05 | ) | | | | (0.16 | ) | | | | (0.21 | ) | | | | 4.46 | | | | $ | 21.75 | | | | | 26.28 | %(7) | | | $ | 137 | | | | | 0.94 | %(6) | | | | 1.07 | %(6) | | | | (0.23 | )%(6) | | | | 28 | % |
Small-Cap Value Series | | | | | | | | | | | | | | | | | | | | | | | | | | | | | | | | | | | | | | | | | | | | | | | | | | | | | | | | | | | | | | | | | | | | | | | | | | | |
Class A | | | | | | | | | | | | | | | | | | | | | | | | | | | | | | | | | | | | | | | | | | | | | | | | | | | | | | | | | | | | | | | | | | | | | | | | | | | |
1/1/13 to 12/31/13 | | | $ | 12.66 | | | | | 0.04 | | | | | 5.11 | | | | | 5.15 | | | | | (0.09 | ) | | | | — | | | | | (0.09 | ) | | | | 5.06 | | | | $ | 17.72 | | | | | 40.77 | % | | | $ | 135,352 | | | | | 1.20 | % | | | | 1.35 | % | | | | 0.25 | % | | | | 14 | % |
1/1/12 to 12/31/12 | | | | 11.99 | | | | | 0.29 | | | | | 0.67 | | | | | 0.96 | | | | | (0.29 | ) | | | | — | | | | | (0.29 | ) | | | | 0.67 | | | | | 12.66 | | | | | 8.13 | | | | | 118,741 | | | | | 1.29 | (8) | | | | 1.34 | | | | | 2.29 | | | | | 17 | |
1/1/11 to 12/31/11 | | | | 12.33 | | | | | 0.12 | | | | | 0.48 | | | | | 0.60 | | | | | (0.10 | ) | | | | (0.84 | ) | | | | (0.94 | ) | | | | (0.34 | ) | | | | 11.99 | | | | | 4.54 | | | | | 129,907 | | | | | 1.30 | | | | | 1.36 | | | | | 0.95 | | | | | 22 | |
1/1/10 to 12/31/10 | | | | 10.55 | | | | | 0.15 | | | | | 1.69 | | | | | 1.84 | | | | | (0.06 | ) | | | | — | | | | | (0.06 | ) | | | | 1.78 | | | | | 12.33 | | | | | 17.40 | | | | | 151,281 | | | | | 1.30 | | | | | 1.41 | | | | | 1.34 | | | | | 69 | |
1/1/09 to 12/31/09 | | | | 8.77 | | | | | 0.01 | | | | | 1.81 | | | | | 1.82 | | | | | (0.04 | ) | | | | — | | | | | (0.04 | ) | | | | 1.78 | | | | | 10.55 | | | | | 20.90 | | | | | 38,421 | | | | | 1.30 | | | | | 1.51 | | | | | 0.14 | | | | | 153 | |
The footnote legend is at the end of the Financial Highlights.
See Notes to Financial Statements
58
VIRTUS VARIABLE INSURANCE TRUST
FINANCIAL HIGHLIGHTS
SELECTED PER SHARE DATA AND RATIOS FOR A SHARE OUTSTANDING
THROUGHOUT EACH PERIOD
| | | | | | | | | | | | | | | | | | | | | | | | | | | | | | | | | | | | | | | | | | | | | | | | | | | | | | | | | | | | | | | | | | | | | | | | | | | |
| | | Net Asset Value,
Beginning of Period | | Net Investment Income (Loss)(1) | | Net Realized and
Unrealized Gain (Loss) | | Total from Investment Operations
| | Dividends from
Net Investment Income | | Distributions from
Net Realized Gains | | Total Distributions | | Change in Net Asset Value | | Net Asset Value, End of Period | | Total Return(3) | | Net Assets, End of Period
(in thousands) | | Ratio of Net Expenses to
Average Net Assets(4) | | Ratio of Gross Expenses to
Average Net Assets (before
waivers and reimbursements)(4) | | Ratio of Net Investment Income
to Average Net Assets | | Portfolio Turnover Rate |
Strategic Allocation Series | | | | | | | | | | | | | | | | | | | | | | | | | | | | | | | | | | | | | | | | | | | | | | | | | | | | | | | | | | | | | | | | | | | | | | | | | | | |
Class A | | | | | | | | | | | | | | | | | | | | | | | | | | | | | | | | | | | | | | | | | | | | | | | | | | | | | | | | | | | | | | | | | | | | | | | | | | | |
1/1/13 to 12/31/13 | | | $ | 13.48 | | | | | 0.27 | | | | | 2.13 | | | | | 2.40 | | | | | (0.29 | ) | | | | (1.18 | ) | | | | (1.47 | ) | | | | 0.93 | | | | $ | 14.41 | | | | | 17.99 | % | | | $ | 137,453 | | | | | 0.98 | % | | | | 1.06 | % | | | | 1.88 | % | | | | 49 | % |
1/1/12 to 12/31/12 | | | | 12.17 | | | | | 0.29 | | | | | 1.33 | | | | | 1.62 | | | | | (0.31 | ) | | | | — | | | | | (0.31 | ) | | | | 1.31 | | | | | 13.48 | | | | | 13.42 | | | | | 135,046 | | | | | 0.87 | (8) | | | | 1.05 | | | | | 2.18 | | | | | 72 | |
1/1/11 to 12/31/11 | | | | 12.22 | | | | | 0.30 | | | | | (0.06 | ) | | | | 0.24 | | | | | (0.29 | ) | | | | — | | | | | (0.29 | ) | | | | (0.05 | ) | | | | 12.17 | | | | | 1.91 | | | | | 138,124 | | | | | 0.85 | | | | | 1.07 | | | | | 2.39 | | | | | 43 | |
1/1/10 to 12/31/10 | | | | 11.11 | | | | | 0.30 | | | | | 1.14 | | | | | 1.44 | | | | | (0.33 | ) | | | | — | | | | | (0.33 | ) | | | | 1.11 | | | | | 12.22 | | | | | 13.20 | | | | | 158,322 | | | | | 0.85 | | | | | 0.96 | | | | | 2.61 | | | | | 42 | |
1/1/09 to 12/31/09 | | | | 9.25 | | | | | 0.29 | | | | | 1.94 | | | | | 2.23 | | | | | (0.37 | ) | | | | — | | | | | (0.37 | ) | | | | 1.86 | | | | | 11.11 | | | | | 24.51 | | | | | 170,247 | | | | | 0.85 | | | | | 0.95 | | | | | 2.98 | | | | | 89 | |
Footnote Legend:
| (1) | Computed using average shares outstanding. |
| (2) | Series is currently under its expense limitation. |
| (3) | The total return does not include the expenses associated with the annuity or life insurance policy through which you invest. |
| (4) | Each Series will also indirectly bear its prorated share of expenses of any underlying funds in which it invests. Such expenses are not included in the calculation of this ratio. |
| (8) | Blended net expense ratio. |
See Notes to Financial Statements
59
VIRTUS VARIABLE INSURANCE TRUST
NOTES TO FINANCIAL STATEMENTS
DECEMBER 31, 2013
Note 1—Organization
Virtus Variable Insurance Trust (the “Trust”) is organized as a Delaware statutory trust and is registered under the Investment Company Act of 1940, as amended (“1940 Act”), as an open-end management investment company. It was formed on February 18, 1986 as a Massachusetts business trust, commenced operations on December 5, 1986 and was reorganized as a Delaware statutory trust on February 14, 2011.
The Trust is organized with series, which are currently available only to separate accounts of participating insurance companies to fund variable accumulation annuity contracts and variable universal life insurance policies. As of the date of this report the Trust is comprised of nine series (each a “Series”), each reported in this annual report. Each Series’ investment objective is outlined in the respective Series Summary page.
Each Series offers Class A shares. As of April 30, 2013, the International Series, Multi-Sector Fixed Income Series, Premium AlphaSector® Series, Real Estate Securities Series and Small-Cap Growth Series also offer Class I shares.
Note 2—Significant Accounting Policies
The following is a summary of significant accounting policies consistently followed by the Trust in the preparation of its financial statements. The preparation of financial statements in conformity with accounting principles generally accepted in the United States of America requires management to make estimates and assumptions that affect the reported amounts of assets and liabilities, and disclosure of contingent assets and liabilities at the date of the financial statements and the reported amounts of increases and decreases in net assets from operations during the reporting period. Actual results could differ from those estimates and those differences could be significant.
Security valuation procedures for each Series, which include nightly price variance as well as back-testing such as bi-weekly unchanged price, monthly secondary source and transaction analysis, have been approved by the Board of Trustees (the “Board” or the “Trustees”). All internally fair valued securities are approved by a valuation committee (the “Valuation Committee”) appointed by the Board. The Valuation Committee is comprised of certain members of management as identified by the Board, and convenes independently from portfolio management. All internally fair valued securities are updated daily and reviewed in detail by the Valuation Committee monthly unless changes occur within the period. The Valuation Committee reviews the validity of any model inputs and any changes to the model. Fair valuations are reviewed by the Board at least quarterly.
Each Series utilizes a fair value hierarchy, which prioritizes the inputs to valuation techniques used to measure fair value into three broad levels.
| | |
Ÿ Level 1 – | | quoted prices in active markets for identical securities |
| |
Ÿ Level 2 – | | prices determined using other significant observable inputs (including quoted prices for similar securities, interest rates, prepayment speeds, credit risk, etc.) |
| |
Ÿ Level 3 – | | prices determined using significant unobservable inputs (including the valuation committee’s own assumptions in determining the fair value of investments) |
A description of the valuation techniques applied to a Series’ major categories of assets and liabilities measured at fair value on a recurring basis is as follows:
Equity securities are valued at the official closing price (typically last sale) on the exchange on which the securities are primarily traded, or if no closing price is available, at the last bid price and are categorized as Level 1 in the hierarchy. Restricted equity securities and private placements that are not widely traded, are illiquid or are internally fair valued by the valuation committee, are generally categorized as Level 3 in the hierarchy.
Certain non-U.S. securities may be fair valued in cases where closing prices are not readily available or are deemed not reflective of readily available market prices. For example, significant events (such as movement in the U.S. securities market, or other regional and local developments) may occur between the time that non-U.S. markets close (where the security is principally traded) and the time that a Series calculates its net asset value (“NAV”) (generally 4 p.m. Eastern time, the close of the New York Stock Exchange (“NYSE”)) that may impact the value of securities traded in these non-U.S. markets. In such cases a Series fair values non-U.S. securities using an external pricing service which considers the correlation of the trading patterns of the non-U.S. security to the intraday trading in the U.S. markets for investments such as ADRs, financial futures, ETFs, and certain indexes as well as prices for similar securities. Such fair valuations are categorized as Level 2 in the hierarchy. Because the frequency of significant events is not predictable, fair valuation of certain non-U.S. common stocks may occur on a frequent basis.
Debt securities, including restricted securities, are valued based on evaluated quotations received from independent pricing services or from dealers who make markets in such securities. For most bond types, the pricing service utilizes matrix pricing that considers one or more of the following factors: yield or price of bonds of comparable quality, coupon, maturity, current cash flows, type, and current day trade information, as well as dealer supplied prices. These valuations are generally categorized as Level 2 in the hierarchy. Structured debt instruments such as mortgage-backed and asset-backed securities may also incorporate collateral analysis and utilize cash flow models for valuation and are generally categorized as Level 2 in the hierarchy. Pricing services do not provide pricing for all securities and therefore indicative bids from dealers are utilized based on pricing models used by market makers in the security and are generally categorized as Level 2 in the hierarchy. Debt securities that are not widely traded, are illiquid, or are internally fair valued by the valuation committee are generally categorized as Level 3 in the hierarchy.
Listed derivatives that are actively traded are valued based on quoted prices from the exchange and are categorized as Level 1 in the hierarchy. Over the counter derivative contracts, which include forward currency contracts and equity-linked Instruments, do not require material subjectivity as pricing inputs are observed from actively quoted markets and are categorized as Level 2 in the hierarchy.
Investments in open-end mutual funds are valued at NAV. Investments in closed-end mutual funds are valued as of the close of regular trading on the NYSE each business day. Both are categorized as Level 1 in the hierarchy.
60
VIRTUS VARIABLE INSURANCE TRUST
NOTES TO FINANCIAL STATEMENTS (Continued)
DECEMBER 31, 2013
Short-term notes having a remaining maturity of 60 days or less are valued at amortized cost, which approximates market, and are generally categorized as Level 2 in the hierarchy.
A summary of the inputs used to value a Series’ net assets by each major security type is disclosed at the end of the Schedule of Investments for each Series. The inputs or methodology used for valuing securities is not necessarily an indication of the risk associated with investing in those securities.
| | B. | | Security Transactions and Investment Income |
Security transactions are recorded on the trade date. Realized gains and losses from sales of securities are determined on the identified cost basis. Dividend income is recognized on the ex-dividend date, or in the case of certain non-U.S. securities, as soon as the Series is notified. Interest income is recorded on the accrual basis. Each Series amortizes premiums and accretes discounts using the effective interest method.
Dividend income from REIT investments is recorded using management’s estimate of the income included in distributions received from such investments, distributions received in excess of this estimated amount are recorded as a reduction of the cost of investments or reclassified to capital gains. The actual amounts of income, return of capital, and capital gains are only determined by each REIT after its fiscal year-end, and may differ from the estimated amounts.
Each Series is treated as a separate taxable entity. It is the intention of each Series to comply with the requirements of Subchapter M of the Internal Revenue Code and to distribute substantially all of its taxable income to its shareholders. Therefore, no provision for federal income taxes or excise taxes has been made.
Certain Series may be subject to non-U.S. taxes on income, gains on investments or currency repatriation, a portion of which may be recoverable. Each Series will accrue such taxes and recoveries as applicable based upon current interpretations of the tax rules and regulations that exist in the markets in which it invests.
Management of the Trust has concluded that there are no significant uncertain tax positions that would require recognition in the financial statements.
As of December 31, 2013, the tax years that remain subject to examination by the major tax jurisdictions under the statute of limitations are from the year 2010 forward (with limited exceptions).
| | D. | | Distributions to Shareholders |
Distributions are recorded by each Series on the ex-dividend date. Income and capital gain distributions are determined in accordance with income tax regulations that may differ from accounting principles generally accepted in the United States of America. These differences may include the treatment of non-taxable dividends, market premium and discount, non-deductible expenses, expiring capital loss carryovers, non-U.S. currency gain or loss, gain or loss on futures contracts, partnerships, operating losses and losses deferred due to wash sales. Permanent book and tax basis differences relating to shareholder distributions will result in reclassifications to capital paid in on shares of beneficial interest.
Expenses incurred together by a Series and other affiliated mutual funds are allocated in proportion to the net assets of each such Series/fund, except where allocation of direct expense to each Series/fund or an alternative allocation method can be more appropriately used.
In addition to the net annual operating expenses that a Series bears directly, the contract owners, as investors in the Series, indirectly bear the Series’ pro-rata expenses of any underlying mutual funds in which the Series invests.
| | F. | | Foreign Currency Translation |
Non-U.S. investment securities and other assets and liabilities denominated in foreign currencies are translated into U.S. dollar amounts at the foreign currency exchange rate effective at the end of the reporting period. Cost of investments is translated at the currency exchange rate effective at the trade date. The gain or loss resulting from a change in currency exchange rates between the trade and settlement date of a portfolio transaction is treated as a gain or loss on foreign currency. Likewise, the gain or loss resulting from a change in currency exchange rates between the date income is accrued and paid is treated as a gain or loss on foreign currency. The Series do not isolate that portion of the results of operations arising from changes in foreign exchange rates on investments from the fluctuations arising from changes in the market prices of securities held. Such fluctuations are included with the net realized and unrealized gain or loss on investments.
Certain Series may invest in direct debt instruments which are interests in amounts owed by a corporate, governmental, or other borrower to lenders or lending syndicates. Loan Agreements are generally non-investment grade, and often involve borrowers that are highly leveraged. The Series may invest in obligations of borrowers who are in bankruptcy proceedings. Loan agreements are typically senior in the corporate capital structure of the borrower. A loan is often administered by a bank or other financial institution (the “lender”) that acts as agent for all holders. The agent administers the terms of the loan, as specified in the loan agreement. A Series’ investments in loans may be in the form of participations in loans or assignments of all or a portion of loans from third parties. When investing in loan participations, a Series has the right to receive payments of principal, interest and any fees to which it is entitled only from the lender selling the loan participation and only upon receipt by the lender of payments from the borrower. The Series generally has no right to enforce compliance with the terms of the loan agreement with the borrower. As a result, the Series may be subject to the credit risk of both the borrower and the lender that is selling the loan agreement. When the Series purchases assignments from lenders it acquires direct rights against the borrower on the loan. All loan agreements currently held by the Series are assignment loans.
61
VIRTUS VARIABLE INSURANCE TRUST
NOTES TO FINANCIAL STATEMENTS (Continued)
DECEMBER 31, 2013
A Series may invest in multiple series or tranches of a loan, which may have varying terms and carry different associated risks. Loan agreements may involve foreign borrowers and investments may be denominated in foreign currencies. Direct indebtedness of emerging countries involves a risk that the government entities responsible for the repayment of the debt may be unable, or unwilling, to pay the principal and interest when due.
The loan agreements have floating rate loan interests which generally pay interest at rates that are periodically determined by reference to a base lending rate plus a premium. The base lending rates are generally LIBOR (London Interbank Offered Rate), the prime rate offered by one or more U.S. banks or the certificate of deposit rate. When a loan agreement is purchased the Series may pay an assignment fee. On an ongoing basis, the Series may receive a commitment fee based on the undrawn portion of the underlying line of credit portion of a loan agreement. Prepayment penalty fees are received upon the prepayment of a loan agreement by a borrower. Prepayment penalty, facility, commitment, consent and amendment fees are recorded to income as earned or paid.
The Series currently hold assignment loan
| | H. | | Derivative Financial Instruments |
Enhanced disclosures about derivative instruments and hedging activities are intended to improve financial reporting for derivative instruments by enhancing disclosure that enables investors to understand how and why a fund uses derivatives, how derivatives are accounted for, and how derivative instruments affect a fund’s results of operations and financial position. Summarized below is a specific type of derivative instrument used by certain Series.
Options Contracts: An options contract provides the purchaser with the right, but not the obligation, to buy (call option) or sell (put option) a financial instrument at an agreed-upon price. Certain Series may purchase or write both put and call options on portfolio securities for hedging purposes or to facilitate the rapid implementation of investment strategies if a Series anticipates a significant market or market sector advance. The Series are subject to equity price risk in the normal course of pursuing their investment objectives. A Series may use options contracts to hedge against changes in the values of equities.
When a Series purchases an option, it pays a premium and an amount equal to that premium is recorded as an asset. When a Series writes an option, it receives a premium and an amount equal to that premium is recorded as a liability. The asset or liability is adjusted daily to reflect the current market value of the option. The holdings of a Series designated to cover outstanding written options are noted in the Schedules of Investments. Purchased options are reported as an asset within “Investment in securities at value ” on the Statement of Assets and Liabilities. Options written are reported as a liability within “Written call options at value” on the Statement of Assets and Liabilities. Changes in value of the purchased option are included in “Net change in unrealized appreciation (depreciation) on investments” in the Statement of Operations. Changes in value of written options are included in “Net change in unrealized appreciation (depreciation) on written options” in the Statement of Operations.
If an option expires unexercised, the Series realizes a gain or loss to the extent of the premium received or paid. If an option is exercised, the premium received or paid is recorded as an adjustment to the proceeds from the sale or the cost basis of the purchase. The difference between the premium and the amount received or paid on effecting a closing purchase or sale transaction is also treated as a realized gain or loss. Gain or loss on purchased options is included in “Net realized gain (loss) on investments” in the Statement of Operations. Gain or loss on written options is presented separately as “Net realized gain (loss) on written options” in the Statement of Operations.
The risk in writing call options is that a Series gives up the opportunity for profit if the market price of the security increases and the option is exercised. The risk in writing put options is that a Series may incur a loss if the market price of the security decreases and the option is exercised. The risk in buying options is that a Series pays a premium whether or not the option is exercised. The use of such instruments may involve certain additional risks as a result of unanticipated movements in the market. Writers (sellers) of options are subject to unlimited risk of loss, as the seller will be obligated to deliver or take delivery of the security at a predetermined price which may, upon exercise of the option, be significantly different from the then-market value.
| | I. | | When-issued Purchases and Forward Commitments (Delayed Delivery) |
Certain Series may engage in when-issued or forward commitment transactions. Securities purchased on a when-issued or forward commitment basis are also known as delayed delivery transactions. Delayed delivery transactions involve a commitment by a Series to purchase or sell a security at a future date (ordinarily up to 90 days later). When-issued or forward commitments enable a Series to lock in what is believed to be an attractive price or yield on a particular security for a period of time, regardless of future changes in interest rates. Each Series records when-issued and delayed delivery securities on the trade date. Each Series maintains collateral for the securities purchased. Securities purchased on a when-issued or delayed delivery basis begin earning interest on the settlement date.
Certain Series may loan securities to qualified brokers through an agreement with Brown Brothers Harriman (“BBH”), as a third party lending agent. Under the terms of the agreement, the Series is required to maintain collateral with a market value not less than 100% of the market value of loaned securities. Collateral is adjusted daily in connection with changes in the market value of securities on loan. Collateral may consist of cash and securities issued by the U.S. Government or its agencies. Cash collateral is invested in a short-term money market fund. Dividends earned on the collateral and premiums paid by the broker are recorded as income by the Series net of fees and rebates charged by BBH for its services as securities lending agent and in connection with this securities lending program. Lending portfolio securities involves a risk of delay in the recovery of the loaned securities or in the declining value of the collateral. At December 31, 2013, the following Series had securities on loan ($ reported in thousands):
| | | | | | | | |
| | | Market
Value | | | Cash
Collateral | |
Growth and Income Series | | $ | 6,073 | | | $ | 6,205 | |
Strategic Allocation Series | | | 3,270 | | | | 3,342 | |
62
VIRTUS VARIABLE INSURANCE TRUST
NOTES TO FINANCIAL STATEMENTS (Continued)
DECEMBER 31, 2013
Note 3—Investment Advisory Fees and Related Party Transactions
($ reported in thousands except as noted)
Virtus Investment Advisers, Inc. (“VIA,” or the “Adviser”), an indirect wholly-owned subsidiary of Virtus Investment Partners, Inc. (“Virtus”), is the Adviser to the Trust. The Adviser manages the Series’ investment programs and general operations of the Series, including oversight of the Series’ subadvisers.
As compensation for its service to the Series, the Adviser is entitled to a fee based upon the following annual rates as a percentage of the average daily net assets of each Series:
| | | | | | | | | | | | |
Series | | First
$250 Million | | | Next
$250 Million | | | Over
$500 Million | |
Capital Growth Series | | | 0.70 | % | | | 0.65 | % | | | 0.60 | % |
Growth & Income Series | | | 0.70 | | | | 0.65 | | | | 0.60 | |
International Series | | | 0.75 | | | | 0.70 | | | | 0.65 | |
Multi-Sector Fixed Income Series | | | 0.50 | | | | 0.45 | | | | 0.40 | |
Strategic Allocation Series | | | 0.60 | | | | 0.55 | | | | 0.50 | |
| | | |
| | | First
$1 Billion | | | Next
$1 Billion | | | Over
$2 Billion | |
Real Estate Securities Series | | | 0.75 | % | | | 0.70 | % | | | 0.65 | % |
| | | |
| | | | | | Rate | | | | |
Premium AlphaSector® Series | | | | | | | 1.10 | % | | | | |
Small-Cap Growth Series | | | | | | | 0.85 | | | | | |
Small-Cap Value Series | | | | | | | 0.90 | | | | | |
The subadvisers manage the investments of each Series, for which they are paid a fee by the Adviser. A list of the subadvisers and the Series they serve is as follows:
| | |
Series | | Subadviser |
| Capital Growth Series | | Kayne Anderson Rudnick Investment Management LLC (“Kayne”)* |
| Growth & Income Series | | Euclid Advisors LLC (“Euclid”)* |
| International Series | | Aberdeen Asset Management, Inc. |
| Multi-Sector Fixed Income Series | | Newfleet Asset Management, LLC (“Newfleet”)* |
| | |
Series | | Subadviser |
Premium AlphaSector® Series | | F-Squared Institutional Advisors, LLC and Euclid* |
| Real Estate Securities Series | | Duff & Phelps Investment Management Co.* |
| Small-Cap Growth Series | | Kayne* |
| Small-Cap Value Series | | Kayne* |
| Strategic Allocation Series: | | |
Equity Portfolio | | Euclid* |
Fixed Income Portfolio | | Newfleet* |
| | * | Affiliate of the Adviser. |
Effective November 6, 2012, VIA has contractually agreed to limit total operating expenses of certain Series of the Trust through April 30, 2014, (excluding interest, taxes, extraordinary expenses and acquired fund fees and expenses, if any) so that such expenses do not exceed the following percentages of average net assets:
| | | | | | | | |
| | | Maximum Total Operating Expenses | |
| | | Class A | | | Class I* | |
Capital Growth Series | | | 1.03 | % | | | — | |
Growth & Income Series | | | 0.98 | | | | �� | |
International Series | | | 1.23 | | | | 0.98 | % |
Multi-Sector Fixed Income Series | | | 0.94 | | | | 0.69 | |
Premium AlphaSector® Series | | | 1.70 | | | | 1.45 | |
Real Estate Securities Series | | | 1.16 | | | | 0.91 | |
Small-Cap Growth Series | | | 1.19 | | | | 0.94 | |
Small-Cap Value Series | | | 1.20 | | | | — | |
Strategic Allocation Series | | | 0.98 | | | | — | |
| | * | The inception date for Class I is April 30, 2013 |
63
VIRTUS VARIABLE INSURANCE TRUST
NOTES TO FINANCIAL STATEMENTS (Continued)
DECEMBER 31, 2013
The Adviser may recapture operating expenses waived or reimbursed under this arrangement, within three fiscal years following the end of the fiscal year in which such waiver or reimbursement occurred. Each Series must pay its ordinary operating expenses before the Adviser is entitled to any reimbursement and must remain in compliance with applicable expense limitations. All or a portion of the following Adviser reimbursed expenses may be recaptured by the fiscal year ending:
| | | | | | | | | | | | | | | | |
| | | Expiration Date | |
| | | 2014 | | | 2015 | | | 2016 | | | Total | |
Capital Growth Series | | $ | 423 | | | $ | 334 | | | $ | 211 | | | $ | 968 | |
Growth & Income Series | | | 449 | | | | 335 | | | | 231 | | | | 1,015 | |
International Series | | | 613 | | | | 407 | | | | — | | | | 1,020 | |
Multi-Sector Fixed Income Series | | | 466 | | | | 327 | | | | 34 | | | | 827 | |
Premium AlphaSector® Series | | | 49 | | | | 8 | | | | 9 | | | | 66 | |
Real Estate Securities Series | | | 133 | | | | 95 | | | | 57 | | | | 285 | |
Small-Cap Growth Series | | | 205 | | | | 155 | | | | 88 | | | | 448 | |
Small-Cap Value Series | | | 91 | | | | 69 | | | | 194 | | | | 354 | |
Strategic Allocation Series | | | 330 | | | | 253 | | | | 112 | | | | 695 | |
| | E. | | Administrator and Distributor |
Effective January 1, 2013, with the approval of the Board, VP Distributors LLC (“VP Distributors”), the Trust’s former administrator, assigned its rights and obligations under the Administration Agreement to Virtus Fund Services, LLC. an indirect wholly-owned subsidiary of Virtus.
For the period ended December 31, 2013, the Series incurred administration fees, totaling $998, which are included in the Statement of Operations. A portion of these fees was paid to an outside entity that also provides services to the Series.
VP Distributors serves as the distributor for all the Series’ shares. Each Series pays VP Distributors distribution and/or service fees under a Board approved Rule 12b-1 plan, at the annual rate of 0.25% of the average daily net assets of such Series’ Class A shares. Class I shares are not subject to a Rule 12b-1 plan. For the period ended December 31, 2013, the Series incurred distribution fees totaling $2,999, which are included in the Statement of Operations. A portion of these fees was paid to certain insurance companies for marketing and/or shareholder services provided to contract owners.
At December 31, 2013, Virtus and its affiliates, and the retirement plans of Virtus and its affiliates, held shares of the Series which may be redeemed at any time that aggregate the following:
| | | | | | | | |
| | | Shares | | | Aggregate
Net Asset
Value | |
International Series | | | | | | | | |
Class I | | | 5,552 | | | $ | 101 | |
Multi-Sector Fixed Income Series | | | | | | | | |
Class I | | | 10,400 | | | | 99 | |
Premium AlphaSector® Series | | | | | | | | |
Class I | | | 8,619 | | | | 115 | |
Real Estate Securities Series | | | | | | | | |
Class I | | | 3,843 | | | | 90 | |
Small-Cap Growth Series | | | | | | | | |
Class I | | | 5,806 | | | | 126 | |
The Trust provides a deferred compensation plan for its Trustees who receive compensation from the Trust. Under the deferred compensation plan, Trustees may elect to defer all or a portion of their compensation. Amounts deferred are retained by the Trust, and then, to the extent permitted by the 1940 Act, in turn, may be invested in the shares of affiliated or unaffiliated mutual funds or variable annuities selected by the Trustees. Investments in such instruments are included in “Other Assets” on the Statement of Assets and Liabilities at December 31, 2013.
64
VIRTUS VARIABLE INSURANCE TRUST
NOTES TO FINANCIAL STATEMENTS (Continued)
DECEMBER 31, 2013
Note 4—Purchases and Sales of Securities
($ reported in thousands except as noted)
Purchases and sales of securities (excluding U.S. Government and agency securities, short-term investments, and written options) during the period ended December 31, 2013, were as follows:
| | | | | | | | |
| | | Purchases | | | Sales | |
Capital Growth Series | | $ | 59,320 | | | $ | 87,217 | |
Growth and Income Series | | | 76,681 | | | | 101,787 | |
International Series | | | 35,957 | | | | 81,044 | |
Multi-Sector Fixed Income Series | | | 100,638 | | | | 128,963 | |
Premium AlphaSector® Series | | | 22,868 | | | | 11,468 | |
Real Estate Securities Series | | | 26,012 | | | | 37,680 | |
Small-Cap Growth Series | | | 17,759 | | | | 29,070 | |
Small-Cap Value Series | | | 16,884 | | | | 39,830 | |
Strategic Allocation Series | | | 62,724 | | | | 79,356 | |
Purchases and sales of long-term U.S. Government and agency securities during the period ended December 31, 2013, were as follows:
| | | | | | | | |
| | | Purchases | | | Sales | |
Multi-Sector Fixed Income Series | | $ | 1,773 | | | $ | 649 | |
Strategic Allocation Series | | | 2,871 | | | | 4,525 | |
Note 5—Derivative Transactions
($ reported in thousands)
Certain Series invested in derivative instruments during the reporting period through the form of written covered call options. The primary type of risk associated with these options is equity price risk. The Growth & Income Series and Strategic Allocation Series invest in written covered call options contracts in an attempt to manage such risk and with the purpose of generating realized gains.
For additional information on the written covered call options in which each Series was invested, at the period ended December 31, 2013, refer to the Schedule of Investments and Note 2H.
Written options transactions, during the period ended December 31, 2013, were as follows:
| | | | | | | | | | | | | | | | |
| | | Growth & Income Series | | | Strategic Allocation Series | |
Call options | | Number of
Contracts | | | Premium
Received | | | Number of
Contracts | | | Premium
Received | |
Options outstanding at December 31, 2012 | | | 1,002 | | | $ | 126 | | | | 584 | | | $ | 74 | |
Options written | | | 415 | | | | 61 | | | | 240 | | | | 36 | |
Options closed | | | (1,087 | ) | | | (157 | ) | | | (634 | ) | | | (92 | ) |
Options expired | | | (330 | ) | | | (30 | ) | | | (190 | ) | | | (18 | ) |
Options exercised | | | — | | | | — | | | | — | | | | — | |
| | | | | | | | | | | | | | | | |
Options outstanding at December 31, 2013 | | | — | | | $ | — | | | | — | | | $ | — | |
| | | | | | | | | | | | | | | | |
The following is a summary of the Series’ derivative instrument holdings categorized by primary risk exposure as of December 31, 2013:
| | | | | | | | |
Statements of Assets and Liabilities | |
| | | Growth &
Income Series | | | Strategic
Allocation
Series | |
Assets: None | | $ | | | | $ | | |
| | | | | | | | |
Liabilities: Written call options at value | | | — | | | | — | |
| | | | | | | | |
Net asset (liability) balance | | $ | — | | | $ | — | |
| | | | | | | | |
| | | | | | | | |
Statements of Operations | |
| | | Growth &
Income Series | | | Strategic
Allocation
Series | |
Net realized gain (loss) on written options | | $ | (153 | ) | | $ | (90 | ) |
| | | | | | | | |
Net change in unrealized appreciation (depreciation) on written options | | | (29 | ) | | | (17 | ) |
| | | | | | | | |
Total net realized and unrealized gain (loss) | | $ | (182 | ) | | $ | (107 | ) |
| | | | | | | | |
For the period ended December 31, 2013, the Series’ average volume of derivative activities is as follows:
| | | | |
| | | The average daily
premiums received from
written options | |
| Growth and Income Series | | | ($24 | ) |
| Strategic Allocation Series | | | (14 | ) |
Note 6—Credit Risk and Asset Concentrations
In countries with limited or developing markets, investments may present greater risks than in more developed markets, and the prices of such investments may be volatile. The consequences of political, social or economic changes in these markets may have disruptive effects on the market prices of these investments and the income they generate, as well as a Series’ ability to repatriate such amounts.
65
VIRTUS VARIABLE INSURANCE TRUST
NOTES TO FINANCIAL STATEMENTS (Continued)
DECEMBER 31, 2013
High-yield/high-risk securities typically entail greater price volatility and/or principal and interest rate risk. There is a greater chance that an issuer will not be able to make principal and interest payments on time. Analysis of the creditworthiness of issuers of high-yield securities may be complex, and as a result, it may be more difficult for the Adviser and/or subadvisers to accurately predict risk.
Certain Series may invest in ETFs, which may expose the Series to the risk that the value of an ETF will be more volatile than the underlying portfolio of securities the ETF is designed to track, or that the costs to the Series of owning shares of the ETF will exceed those the Series would incur by investing in such securities directly.
Investing in sector funds or non-diversified funds may be more volatile than investing in broadly diversified funds, and may be more susceptible to adverse economic, political or regulatory developments affecting a single issuer than would be the case if it were more broadly diversified.
Certain Series may invest a high percentage of their assets in specific sectors of the market in the pursuit of their investments objectives. Fluctuations in these sectors of concentration may have a greater impact on a Series, positive or negative, than if the Series did not concentrate its investments in such sectors.
At December 31, 2013, the Series below held securities in specific sectors as detailed below:
| | | | | | |
Series | | Sector | | Percentage of
Total Investments | |
Capital Growth Series | | Information Technology | | | 35 | % |
Small-Cap Growth Series | | Information Technology | | | 34 | |
Small-Cap Value Series | | Information Technology | | | 29 | |
Note 7—Illiquid and Restricted Securities
Investments are generally considered illiquid if they cannot be disposed of in seven days in the ordinary course of business at the approximate amount at which such securities have been valued by the Series. Additionally, the following information is also considered in determining illiquidity: the frequency of trades and quotes for the investment; whether the investment is listed for trading on a recognized domestic exchange and/or whether two or more brokers are willing to purchase or sell the security at a comparable price; the extent of market making activity in the investment; and the nature of the market for investment. Illiquid securities are noted as such within each Series’ Schedule of Investments where applicable. However, a portion of such footnoted securities could be liquid where liquidity is based on average trading volumes that require more than seven days for disposal of such securities.
Restricted securities are not registered under the Securities Act of 1933, as amended. Generally, 144A securities are excluded from this category, except where defined as illiquid.
At December 31, 2013, the Trust did not hold illiquid and restricted securities.
Each Series will bear any costs, including those involved in registration under the Securities Act of 1933, as amended, in connection with the disposition of such securities.
Note 8—Indemnifications
Under the Trust’s organizational documents and in separate agreements between each Trustee and the Trust, its Trustees and officers are indemnified against certain liabilities arising out of the performance of their duties to the Trust and its Series. In addition in the normal course of business, the Series enter into contracts that provide a variety of indemnifications to other parties. The Series’ maximum exposure under these arrangements is unknown as this would involve future claims that may be made against the Series and that have not occurred. However, the Series have not had prior claims or losses pursuant to these arrangements and expect the risk of loss to be remote.
Note 9—Manager of Managers
The Trust and VIA have each received an exemptive order from the SEC that permits VIA, subject to certain conditions and without the approval of shareholders to: (a) employ a new unaffiliated subadviser for a Series pursuant to the terms of a new subadvisory agreement, in each case either as a replacement for an existing subadviser or as an additional subadviser; (b) change the terms of any subadvisory agreement; and (c) continue the employment of an existing subadviser on the same subadvisory agreement terms where an agreement has been assigned because of a change in control of the subadviser. In such circumstances, shareholders would receive notice of such action, including the information concerning the new subadviser that normally is provided in a proxy statement.
Note 10—Mixed and Shared Funding
Shares of the Series are not directly offered to the public. Shares of the Series are currently offered through separate accounts to fund variable accumulation annuity contracts and variable universal life insurance policies issued by participating insurance companies.
The interests of variable annuity contract owners and variable life policy owners could diverge based on differences in U.S. federal and state regulatory requirements, tax laws, investment management or other unanticipated developments. The Trust’s Trustees do not foresee any such differences or disadvantages at this time. However, the Trust’s Trustees intend to monitor for any material conflicts and will determine what action, if any, should be taken in response to such conflicts. If such a conflict should occur, one or more separate accounts may be required to withdraw its investment in the Series, or shares of another Series may be substituted.
66
VIRTUS VARIABLE INSURANCE TRUST
NOTES TO FINANCIAL STATEMENTS (Continued)
DECEMBER 31, 2013
Note 11—Federal Income Tax Information
($ reported in thousands except as noted)
At December 31, 2013, federal tax cost and aggregate gross unrealized appreciation (depreciation) of securities held by each Series were as follows:
| | | | | | | | | | | | | | | | |
Series | | Federal
Tax Cost | | | Unrealized
Appreciation | | | Unrealized
(Depreciation) | | | Net Unrealized
Appreciation
(Depreciation) | |
Capital Growth Series | | | 148,678 | | | | 70,017 | | | | (231 | ) | | | 69,786 | |
Growth & Income Series | | | 110,174 | | | | 47,176 | | | | (1,181 | ) | | | 45,995 | |
International Series | | | 206,118 | | | | 118,584 | | | | (8,565 | ) | | | 110,019 | |
Multi-Sector Fixed Income Series | | | 169,283 | | | | 6,579 | | | | (4,750 | ) | | | 1,829 | |
Premium AlphaSector® Series | | | 16,367 | | | | 2,511 | | | | — | (1) | | | 2,511 | |
Real Estate Securities Series | | | 56,469 | | | | 34,724 | | | | (1,103 | ) | | | 33,621 | |
Small-Cap Growth Series | | | 48,319 | | | | 22,476 | | | | (41 | ) | | | 22,435 | |
Small-Cap Value Series | | | 89,969 | | | | 46,237 | | | | (315 | ) | | | 45,922 | |
Strategic Allocation Series | | | 114,005 | | | | 27,924 | | | | (1,789 | ) | | | 26,135 | |
| | (1) | Amount less than $500. |
The following Series have capital loss carryovers, which may be used to offset future capital gains, as follows:
| | | | | | | | | | | | |
| | | Expiration Year | |
Series | | 2016 | | | 2017 | | | Total | |
Capital Growth Series | | $ | 29,867 | | | $ | 26,333 | | | $ | 56,200 | |
International Series | | | — | | | | 15,194 | | | | 15,194 | |
Multi-Sector Fixed Income Series | | | — | | | | 3,391 | | | | 3,391 | |
Small-Cap Value Series | | | 7,014 | | | | — | | | | 7,014 | |
The Trust may not realize the benefit of these losses to the extent each Series does not realize gains on investments prior to the expiration of the capital loss carryovers. The Small-Cap Value Series amount includes losses acquired in connection with mergers. Utilization of this capital loss carryover is subject to annual limits.
Under the Regulated Investment Company Modernization Act of 2010 (the “Act”), net capital losses recognized for tax years beginning after December 22, 2010 may be carried forward indefinitely, and their character is retained as short-term and/or long-term losses. Previously, net capital losses were carried forward for eight years and treated as short-term losses. As a transition rule, the Act requires that post-enactment net capital losses be used before pre-enactment net capital losses.
For the Period ended December 31, 2013, the following Series utilized losses deferred in prior years against current year capital gains.
| | | | |
| Capital Growth Series | | $ | 16,007 | |
| Growth & Income Series | | | 8,985 | |
| International Series | | | 21,055 | |
| Multi-Sector Fixed Income Series | | | 3,016 | |
| Premium AlphaSector® Series | | | 56 | |
| Small-Cap Growth Series | | | 6,608 | |
| Small-Cap Value Series | | | 9,984 | |
| Strategic Allocation Series | | | 2,307 | |
Capital losses realized after October 31 and certain late year losses may be deferred and treated as occurring on the first day of the following fiscal year. For the fiscal year ended December 31, 2013, the Series deferred and recognized qualified late year losses as follows:
| | | | | | | | | | | | | | | | |
| | | Late Year
Ordinary
Losses
Deferred | | | Late Year
Ordinary
Losses
Recognized | | | Capital
Loss
Deferred | | | Capital
Loss
Recognized | |
International Series | | $ | — | | | $ | — | | | $ | 3 | | | $ | — | |
Multi-Sector Fixed Income Series | | | — | | | | — | | | | — | | | | 1,886 | |
The components of distributable earnings on a tax basis (excluding unrealized appreciation (depreciation) which are disclosed in the beginning of this note) consist of the following:
| | | | | | | | |
| | | Undistributed
Ordinary Income | | | Undistributed
Long-Term Capital Gains | |
Capital Growth Series | | $ | 97 | | | $ | — | |
Growth & Income Series | | | 188 | | | | 2,884 | |
International Series | | | 727 | | | | — | |
Multi-Sector Fixed Income Series | | | 795 | | | | — | |
Premium AlphaSector® Series | | | 44 | | | | 4 | |
Real Estate Securities Series | | | 274 | | | | 3,160 | |
Small-Cap Growth Series | | | — | | | | 1,614 | |
Small-Cap Value Series | | | 142 | | | | — | |
Strategic Allocation Series | | | 450 | | | | 1,752 | |
67
VIRTUS VARIABLE INSURANCE TRUST
NOTES TO FINANCIAL STATEMENTS (Continued)
DECEMBER 31, 2013
The differences between the book and tax basis components of distributable earnings relate principally to the timing of recognition of income and gains for federal tax purposes. Short-term gains distributions reported in the Statements of Changes in Net Assets, if any, are reported as ordinary income for federal tax purposes. Distributions are determined on a tax basis and may differ from net investment income and realized capital gains for financial reporting purposes.
The tax character of dividends and distributions paid during the years ended December 31, 2013 and 2012 was as follows:
| | | | | | | | | | | | | | | | |
| | | | | | Ordinary
Income | | | Long-Term
Capital Gains | | | Total | |
Capital Growth Series | | | 2013 | | | $ | 655 | | | $ | — | | | $ | 655 | |
| | | 2012 | | | | 1,129 | | | | — | | | | 1,129 | |
Growth & Income Series | | | 2013 | | | | 1,206 | | | | 11,002 | | | | 12,208 | |
| | | 2012 | | | | 1,260 | | | | — | | | | 1,260 | |
International Series | | | 2013 | | | | 7,003 | | | | — | | | | 7,003 | |
| | | 2012 | | | | 9,184 | | | | — | | | | 9,184 | |
Multi-Sector Fixed Income Series | | | 2013 | | | | 9,972 | | | | — | | | | 9,972 | |
| | | 2012 | | | | 12,324 | | | | — | | | | 12,324 | |
Premium AlphaSector® Series | | | 2013 | | | | 58 | | | | 55 | | | | 113 | |
| | | 2012 | | | | 35 | | | | — | | | | 35 | |
Real Estate Securities Series | | | 2013 | | | | 1,820 | | | | 14,278 | | | | 16,098 | |
| | | 2012 | | | | 1,624 | | | | 8,191 | | | | 9,815 | |
Small-Cap Growth Series | | | 2013 | | | | 177 | | | | 568 | | | | 745 | |
| | | 2012 | | | | 115 | | | | — | | | | 115 | |
Small-Cap Value Series | | | 2013 | | | | 725 | | | | — | | | | 725 | |
| | | 2012 | | | | 2,762 | | | | — | | | | 2,762 | |
Strategic Allocation Series | | | 2013 | | | | 2,599 | | | | 10,364 | | | | 12,963 | |
| | | 2012 | | | | 3,202 | | | | — | | | | 3,202 | |
Note 12—Reclassification of Capital Accounts
($ reported in thousands)
For financial reporting purposes, book basis capital accounts are adjusted to reflect the tax character of permanent book/tax differences. Permanent reclassifications can arise from differing treatment of certain income and gain transactions, nondeductible current year net operating losses, expiring capital loss carryovers and investments in passive foreign investment companies. The reclassifications have no impact on the net assets or net asset value of the Series. As of December 31, 2013, the Series recorded reclassifications to increase (decrease) the accounts as listed below:
| | | | | | | | | | | | |
| | | Capital Paid In
on Shares of
Beneficial Interest | | | Accumulated
Net Realized
Gain (Loss) | | | Undistributed
Net Investment
Income (Loss) | |
Capital Growth Series | | $ | — | | | $ | 10 | | | $ | (10 | ) |
Growth & Income Series | | | — | | | | 2 | | | | (2 | ) |
International Series | | | — | | | | 19 | | | | (19 | ) |
Multi-Sector Fixed Income Series | | | — | | | | 226 | | | | (226 | ) |
Premium AlphaSector® Series | | | — | (1) | | | — | | | | — | (1) |
Real Estate Securities Series | | | — | | | | — | (1) | | | — | (1) |
Small-Cap Growth Series | | | (343 | ) | | | 4 | | | | 339 | |
Small-Cap Value Series | | | — | | | | 2 | | | | (2 | ) |
Strategic Allocation Series | | | — | | | | 13 | | | | (13 | ) |
| | (1) | Amount less than $500. |
Note 13—Subsequent Events
Management has evaluated the impact of all subsequent events on the Series through the date the financial statements were available for issuance, and has determined that there are no subsequent events requiring recognition or disclosure in these financial statements:
68

REPORT OF INDEPENDENT REGISTERED PUBLIC ACCOUNTING FIRM
To the Board of Trustees and Shareholders of the
Virtus Variable Insurance Trust:
In our opinion, the accompanying statements of assets and liabilities, including the schedules of investments, and the related statements of operations and of changes in net assets and the financial highlights present fairly, in all material respects, the financial position of Virtus Capital Growth Series, Virtus Growth & Income Series, Virtus International Series, Virtus Multi-Sector Fixed Income Series, Virtus Premium AlphaSector Series, Virtus Real Estate Securities Series, Virtus Small-Cap Growth Series, Virtus Small-Cap Value Series and Virtus Strategic Allocation Series (constituting Virtus Variable Insurance Trust, hereafter referred to as the “Trust”) at December 31, 2013, the results of each of their operations for the year then ended, the changes in its net assets for each of the two years in the period then ended and each of the financial highlights for each of the periods indicated, in conformity with accounting principles generally accepted in the United States of America. These financial statements and financial highlights (hereafter referred to as “financial statements”) are the responsibility of the Trust’s management; our responsibility is to express an opinion on these financial statements based on our audits. We conducted our audits of these financial statements in accordance with the standards of the Public Company Accounting Oversight Board (United States). Those standards require that we plan and perform the audit to obtain reasonable assurance about whether the financial statements are free of material misstatement. An audit includes examining, on a test basis, evidence supporting the amounts and disclosures in the financial statements, assessing the accounting principles used and significant estimates made by management, and evaluating the overall financial statement presentation. We believe that our audits, which included confirmation of securities at December 31, 2013 by correspondence with the custodians and broker, provide a reasonable basis for our opinion.

Philadelphia, Pennsylvania
February 20, 2014
69
VIRTUS VARIABLE INSURANCE TRUST
TAX INFORMATION NOTICE (UNAUDITED)
DECEMBER 31, 2013
For the fiscal year ended December 31, 2013, the Series make the following disclosures for federal income tax purposes: the percentages of ordinary income dividends earned by the Series which qualify for the dividends received deduction (“DRD”) for corporate shareholders; the actual percentage of DRD for the calendar year will be designated in year-end tax statements. The Series designate the amounts below, or if subsequently different, as long-term capital gains dividends (“LTCG”) (reported in thousands).
| | | | | | | | |
| | | DRD | | | LTCG | |
| Capital Growth Series | | | 100 | % | | $ | — | |
| Growth & Income Series | | | 100 | | | | 13,886 | |
| International Series | | | — | | | | — | |
| Multi-Sector Fixed Income Series | | | — | | | | — | |
| Premium AlphaSector® Series | | | 100 | | | | 60 | |
| Real Estate Securities Series | | | — | | | | 14,102 | |
| Small-Cap Growth Series | | | — | | | | 2,183 | |
| Small-Cap Value Series | | | 100 | | | | — | |
| Strategic Allocation Series | | | 57 | | | | 12,115 | |
70
CONSIDERATION OF ADVISORY AND SUB-ADVISORY AGREEMENTS
BY THE BOARD OF TRUSTEES
The Board of Trustees (the “Board”) of Virtus Variable Insurance Trust (the “Trust”) is responsible for determining whether to approve the continuation of the investment advisory agreement (the “Advisory Agreement”) between the Trust and Virtus Investment Advisers, Inc. (“VIA”) and of each sub-advisory agreement (each, a “Subadvisory Agreement” and collectively, the “Subadvisory Agreements”)(together with the Advisory Agreement, the “Agreements”) with respect to the series (individually and collectively, the “Series”) of the Trust. At an in-person meeting held on November 11, 2013 (the “Meeting”), the Board, including a majority of the Trustees who are not interested persons of the Trust as defined in Section 2(a)(19) of the Investment Company Act of 1940, as amended, (the “Independent Trustees”), considered and approved the continuation of each Agreement as further discussed below.
In connection with the approval of the Agreements, the Board requested and evaluated information provided by VIA and each subadviser (each, a “Subadviser” and collectively, the “Subadvisers”) which, in the Board’s view, constituted information necessary for the Board to form a judgment as to whether the renewal of each of the Agreements would be in the best interests of each applicable Series and its respective shareholders. The Board also considered information furnished throughout the year at regular Board meetings with respect to the services provided by VIA and the Subadvisers, including quarterly performance reports prepared by management containing reviews of investment results and periodic presentations from the Subadvisers with respect to the Series they manage. The Board noted the affiliation of certain of the Subadvisers with VIA and any potential conflicts of interest.
The Board was separately advised by independent legal counsel throughout the process. For each Agreement, the Board considered all the criteria separately with respect to the applicable Series and its shareholders. In their deliberations, the Board considered various factors, including those discussed below, none of which were controlling, and each Trustee may have attributed different weights to the various factors. The Board also discussed the proposed approval of the Agreements in private sessions with their independent legal counsel at which no representatives of management were present.
In considering whether to approve the renewal of the Agreements with respect to each Series, the Board reviewed and analyzed the factors it deemed relevant, including: (1) the nature, extent and quality of the services to be provided to the Series by VIA and each of the Subadvisers; (2) the performance of the Series as compared to an appropriate peer group and an appropriate index; (3) the level and method of computing each Series’ advisory and subadvisory fees, and comparisons of the Series’ advisory fee rates with those of a group of funds with similar investment objectives; (4) the profitability of VIA under the Advisory Agreement; (5) any “fall-out” benefits to VIA, the Subadvisers and their affiliates (i.e., ancillary benefits realized by VIA, the Subadvisers or their affiliates from VIA’s or the applicable Subadviser’s relationship with the Trust); (6) the anticipated effect of growth in size on each Series’ performance and expenses; (7) fees paid to VIA and the Subadvisers by comparable accounts, as applicable; (8) possible conflicts of interest; and (9) the terms of the Agreements.
Nature, Extent and Quality of Services. The Trustees received in advance of the meeting information from VIA and each Subadviser, including completed questionnaires concerning a number of topics, including such company’s investment philosophy, resources, operations and compliance structure. The Trustees also received a presentation by VIA’s senior management personnel, during which among other items, VIA’s history, investment process, investment strategies, personnel, compliance procedures and the firm’s overall performance were reviewed and discussed. The Trustees noted that the Series are managed using a “manager of managers” structure that generally involves the use of one or more subadvisers to manage some or all of a Series’ portfolio. Under this structure, VIA is responsible for the management of the Series’ investment programs and for evaluating and selecting subadvisers on an ongoing basis and making any recommendations to the Board regarding hiring, retaining or replacing subadvisers. In considering the Agreement with VIA, the Board considered VIA’s process for supervising and managing the Series’ subadvisers, including (a) VIA’s ability to select and monitor the subadvisers; (b) VIA’s ability to provide the services necessary to monitor the subadvisers’ compliance with the Series’ respective investment objectives, policies and restrictions as well as provide other oversight activities; and (c) VIA’s ability and willingness to identify instances in which a subadviser should be replaced and to carry out the required changes. The Trustees also considered: (a) the experience and capability of VIA’s management and other personnel; (b) the financial condition of VIA, and whether it had the financial wherewithal to provide a high level and quality of services to the Series; (c) the quality of VIA’s own regulatory and legal compliance policies, procedures and systems; (d) the nature, extent and quality of administrative and other services provided by VIA and its affiliates to the Series; (e) VIA’s supervision of the Series’ other service providers; and (f) VIA’s risk management processes. The Board noted that affiliates of VIA serve as administrator and distributor to the Series. The Board also took into account its knowledge of VIA’s management and the quality of the performance of VIA’s duties through Board meetings, discussions and reports during the preceding year, as well as information from the Trust’s Chief Compliance Officer (“CCO”) regarding the Series’ compliance policies and procedures established pursuant to Rule 38a-1 under the 1940 Act.
With respect to the services provided by each of the Subadvisers, the Board considered information provided to the Board by each Subadviser, including each Subadviser’s Form ADV, as well as information provided throughout the past year. With respect to the Subadvisory Agreements, the Board noted that each Subadviser provided portfolio management, or in the case of F-Squared Institutional Advisors, LLC, a proprietary quantitative model that supports allocation of Virtus Premium AlphaSector® Series’ assets. The Board also noted that VIA’s and the Subadvisers’ management of the Series is subject to the oversight of the Board and must be carried out in accordance with the investment objectives, policies and restrictions set forth in the Series’ prospectuses and statement of additional information. In considering the renewal of the Subadvisory Agreements, the Board also considered each Subadviser’s investment management process, including (a) the experience and capability of the Subadviser’s management and other personnel committed by the Subadviser to the respective Series; (b) the financial condition of the Subadviser; (c) the quality of the Subadviser’s regulatory and legal compliance policies, procedures and systems; and (d) the Subadviser’s brokerage and trading practices, if applicable, including with respect to best execution and soft dollars. The Board also took into account the Subadviser’s risk assessment and monitoring process. The Board noted each Subadviser’s regulatory history, including whether it was currently involved in any regulatory actions or investigations as well as material litigation, and any settlements and amelioratory actions undertaken, as appropriate.
71
CONSIDERATION OF ADVISORY AND SUB-ADVISORY AGREEMENTS
BY THE BOARD OF TRUSTEES (Continued)
After considering all of the information provided to them, the Trustees concluded that the nature, extent and quality of the services provided by VIA and each Subadviser were satisfactory and that there was a reasonable basis on which to conclude that each would continue to provide a high quality of investment services to the applicable Series.
Investment Performance. The Board considered performance reports and discussions at Board meetings throughout the year, as well as a report (the “Lipper Report”) for the Series prepared by Lipper Inc. (“Lipper”), an independent third party provider of investment company data, furnished in connection with the contract renewal process. The Lipper Report presented each Series’ performance relative to a peer group of other mutual funds (the “Performance Universe”) and relevant indexes, as selected by Lipper. The Board also considered performance information presented by management and took into account management’s discussion of the same, including the effect of market conditions on each Series’ performance. The Board evaluated each Series’ performance in the context of the considerations that a “manager of managers” structure requires. The Board noted that it also reviews on a quarterly basis detailed information about the Series’ performance results and portfolio composition, as well as each Subadviser’s investment strategy. The Board noted VIA’s expertise and resources in monitoring the performance, investment style and risk-adjusted performance of each Subadviser. The Board also noted each Subadviser’s performance record with respect to the Series. The Board was mindful of VIA’s focus on each Subadviser’s performance and noted VIA’s performance in monitoring and responding to any performance issues with respect to the Series. The Board also took into account its discussions with management regarding factors that contributed to the performance of each Series.
The Board considered, among other performance data, the information set forth below with respect to the performance of each Series for the periods ended September 30, 2013:
Virtus International Series. The Board noted that the Series outperformed the median of its Performance Universe and its benchmark for the 3-, 5- and 10-year periods, and underperformed the median of its Performance Universe and its benchmark for the 1-year period. The Board took into account management’s discussion of the factors that contributed to the Series’ performance for the one- year period, including the impact of market conditions. The Board also noted the Series’ strong performance over the long-term and management’s continued monitoring of the Series’ performance.
Virtus Real Estate Securities Series. The Board noted that the Series outperformed the median of its Performance Universe for the 1-, 3- and 10-year periods and underperformed the median of its Performance Universe for the 5-year period. The Board also noted that the Series underperformed its benchmark for the 1- and 3-year periods and outperformed its benchmark for the 5- and 10-year periods. The Board took into account management’s discussion of the factors that contributed to the Series’ performance relative to its benchmark over the one-and three- year periods. The Board also noted the Series’ strong performance over the long-term.
Virtus Growth & Income Series. The Board noted that the Series underperformed the median of its Performance Universe for the 1- and 5-year periods and outperformed the median of its Performance Universe for the 3- and 10-year periods. The Board also noted that the Series underperformed its benchmark for the 1-, 3-, 5- and 10-year periods. The Board took into account management’s discussion of the factors that contributed to the Series’ performance, including the impact of market conditions on the Series’ performance. The Board also noted that management continues to closely monitor the Series’ performance.
Virtus Strategic Allocation Series. The Board noted that the Series outperformed the median of its Performance Universe for the 1-, 3-, 5- and 10-year periods. The Board also noted that the Series outperformed its benchmark for the 1-, 3- and 5-year periods and underperformed its benchmark for the 10-year period.
Virtus Premium AlphaSector® Series. The Board noted that the Series underperformed the median of its Performance Universe and benchmark for the 1-year period. The Board took into account management’s discussion of the Fund’s performance, including the type of fund and the Series’ peer group. The Board also noted that the Series commenced operations on February 14, 2011, and has a relatively limited performance history.
Virtus Capital Growth Series. The Board noted that the Series underperformed the median of its Performance Universe and its benchmark for the 1-, 3-, 5- and 10-year periods. The Board took into account management’s discussion of the Series’ performance, including the impact of market conditions on the Subadviser’s investment style and any actions taken to address the Series’ performance, including the replacement of the Series’ Subadviser in November 2010 and change in the Series’ portfolio manager in 2011. The Board also noted the Series’ more recent improved performance, which is attributable to the current Subadviser.
Virtus Small-Cap Growth Series. The Board noted that the Series outperformed the median of its Performance Universe and benchmark for the 1- and 3-year periods, and underperformed the median of its Performance Universe and benchmark for the 5- and 10-year periods. The Board took into account management’s discussion of the Series’ performance, including the impact of market conditions on the Series’ performance as well as the type of fund. The Board also noted that because the Series’ Subadviser changed in November 2010, 5- and 10-year performance data in part reflects the performance of a prior subadviser.
Virtus Small-Cap Value Series. The Board noted that the Series outperformed the median of its Performance Universe and benchmark for the 1-year period, and underperformed the median of its Performance Universe and benchmark for the 3-, 5- and 10-year periods. The Board took into account management’s discussion of the Series’ performance, including the impact of market conditions on the Series’ performance as well as the type of fund. The Board also noted that because the Series’ Subadviser changed in November 2010, 5- and 10-year performance data in part reflects the performance of a prior subadviser.
Virtus Multi-Sector Fixed Income Series. The Board noted that the Series outperformed the median of its Performance Universe and benchmark for the 1-, 3-, 5- and 10-year periods.
After reviewing these and related factors, the Board concluded that each Series’ overall performance was satisfactory, or where noted above, action was being taken to address performance.
72
CONSIDERATION OF ADVISORY AND SUB-ADVISORY AGREEMENTS
BY THE BOARD OF TRUSTEES (Continued)
Management Fees and Total Expenses. The Board considered the fees charged to the Series for advisory services as well as the total expense levels of the Series. This information included comparisons of each Series’ net management fee and total expense level to those of its peer group (the “Expense Group”). In comparing each Series’ net management fee to that of comparable funds, the Board noted that in the materials presented such fee included both advisory and administrative fees. The Board also noted that all of the Series had fee waivers and/or expense caps in place to limit the total expenses incurred by the Series and its shareholders. The Board also noted that the subadvisory fees were paid by VIA out of its management fees rather than paid separately by the Series. In this regard, the Board took into account management’s discussion with respect to the advisory/subadvisory fee structure, including the amount of the advisory fee retained by VIA after payment of the subadvisory fee. The Board also took into account the size of each of the Series and the impact on expenses. The Subadvisers provided, and the Board considered, expense information of comparable accounts managed by the Subadvisers, as applicable.
In addition to the foregoing, the Board considered, among other data, the information set forth below with respect to each Series’ fees and expenses:
Virtus International Series. The Board considered that the Series’ net management fee and net total expenses were below the median of the Expense Group.
Virtus Real Estate Securities Series. The Board considered that the Series’ net management fee and net total expenses after waivers were above the median of the Expense Group. The Board took into account management’s discussion of the Series’ expenses, including that VIA had waived a portion of its management fee and that the Series’ net total expenses after waivers were close to the average of the Expense Group.
Virtus Growth & Income Series. The Board considered that the Series’ net management fee and net total expenses after waivers were below the median of the Expense Group.
Virtus Strategic Allocation Series. The Board considered that the Series’ net management fee and net total expenses after waivers were below the median of the Expense Group.
Virtus Premium AlphaSector® Series. The Board considered that the Series’ net management fee and net total expenses after waivers were above the median of the Expense Group. The Board took into account management’s discussion of the Series’ expenses, including the type and size of fund. The Board also noted that VIA had waived a portion of its management fee.
Virtus Capital Growth Series. The Board considered that the Series’ net management fee and net total expenses after waivers were below the median of the Expense Group.
Virtus Small-Cap Growth Series. The Board considered that the Series’ net management fee was above the median of the Expense Group and net total expenses after waivers were below the median of the Expense Group. The Board took into account management’s discussion of the Series’ expenses. The Board also noted that VIA had waived a portion of its management fee.
Virtus Small-Cap Value Series. The Board considered that the Series’ net management fee and net total expenses after waivers were equal to the median of the Expense Group.
Virtus Multi-Sector Fixed Income Series. The Board considered that the Series’ net management fee was below the median of the Expense Group and net total expenses after waivers were equal to the median of the Expense Group.
The Board approved the amendment of the sub-advisory fees payable to Duff & Phelps Investment Management Co. for Virtus Real Estate Series, and payable to Newfleet Asset Management, LLC for Virtus Multi-Sector Fixed Income Series and Virtus Strategic Allocation Series, to 50% of the net advisory fee paid to VIA. The Board noted that this change would have no effect on the advisory fees paid by the Series. The Board concluded that the advisory and sub-advisory fees for each Series, including with the proposed amendments, were fair and reasonable in light of the usual and customary charges made for services of the same nature and quality and the other factors considered.
Profitability. The Board also considered certain information relating to profitability that had been provided by VIA. In this regard, the Board considered information regarding the overall profitability, as well as on a Series-by-Series basis, of VIA for its management of the Trust, as well as its profits and those of its affiliates for managing and providing other services to the Trust, such as distribution and administrative services provided to the Series by a VIA affiliate. In addition to the fees paid to VIA and its affiliates, including the applicable Subadvisers, the Board considered any other benefits derived by VIA or its affiliates from their relationships with the Series. The Board reviewed the methodology used to allocate costs to each Series, taking into account the fact that allocation methodologies are inherently subjective and various allocation methodologies may each be reasonable while producing different results. The Board concluded that the profitability to VIA and its affiliates from each Series was reasonable in light of the quality of the services rendered to the Series by VIA and its affiliates.
In considering the profitability to the Subadvisers in connection with their relationship to the Series, the Board noted that the fees under the Subadvisory Agreements are paid by VIA out of the fees that VIA receives under the Advisory Agreement, so that Series shareholders are not directly impacted by those fees. In considering the reasonableness of the fees payable by VIA to the affiliated Subadvisers, the Board noted that, because such Subadvisers are affiliates of VIA, such profitability might be directly or indirectly shared by VIA. In addition, with respect to Aberdeen Asset Management, Inc. and F-Squared Institutional Advisors, LLC, the unaffiliated Subadvisers, the Board relied on the ability of VIA to negotiate the Subadvisory Agreement and the fees thereunder at arm’s length. For each of the above reasons, the Board concluded that the profitability to the Subadvisers and their affiliates from their relationships with the Series was not a material factor in approval of the Subadvisory Agreements.
Economies of Scale. The Board received and discussed information concerning whether VIA realizes economies of scale as the Series’ assets grow. The Board noted that the management fees for several of the Series included breakpoints based on assets under
73
CONSIDERATION OF ADVISORY AND SUB-ADVISORY AGREEMENTS
BY THE BOARD OF TRUSTEES (Continued)
management, and that fee waivers and/or expense caps were also in place for all of the Series. The Board also took into account management’s discussion of the Series’ management fee and sub-advisory fee structure, including with respect to the Series that do not currently have breakpoints. The Board also took into account the current size of each Series. The Board requested, and VIA agreed to implement, an amendment to the Advisory Agreement adding breakpoints to certain Series that did not already have breakpoints in their management fees. The Board also requested, and VIA agreed to implement, a lower expense cap for Virtus International Series and an extension of each Series’ expense cap through April 30, 2015. The Board then concluded that no additional changes to the advisory fee structure of the Series were necessary at this time. The Board noted that VIA and the Series may realize certain economies of scale if the assets of the Series were to increase, particularly in relationship to certain fixed costs, and that shareholders of the Series would have an opportunity to benefit from these economies of scale.
For similar reasons as stated above with respect to the Subadvisers’ profitability, and based upon the current size of the Series managed by each Subadviser, the Board concluded that the potential for economies of scale in the Subadvisers’ management of the Series was not a material factor in the approval of the Subadvisory Agreements at this time.
Other Factors. The Board considered other benefits that may be realized by VIA and each Subadviser and their respective affiliates from their relationships with the applicable Series. Among them, the Board recognized that VP Distributors, LLC, an affiliate of VIA, serves as the Distributor for the Trust, and, as such, receives payments pursuant to Rule 12b-1 from the Series to compensate it for providing shareholder services and selling activities, which could lead to growth in the Trust’s assets and corresponding benefits from such growth, including economies of scale. The Board noted that an affiliate of VIA also provides administrative services to the Trust. The Board noted management’s discussion of the fact that, while certain of the Subadvisers are affiliates of VIA, there are no other direct benefits to the Subadvisers or VIA in providing investment advisory services to the Series, other than the fee to be earned under the Subadvisory Agreement. There may be certain indirect benefits gained, including to the extent that serving the Series could provide the opportunity to provide advisory services to additional portfolios of the Trust or certain reputational benefits.
Based on all of the foregoing considerations, the Board, including a majority of the Independent Trustees, determined that approval of each Agreement, as amended, was in the best interests of each of the applicable Series and its respective shareholders. Accordingly, the Board, and the Independent Trustees voting separately, approved the Agreements, as amended, with respect to each Series.
74
FUND MANAGEMENT TABLES
Information pertaining to the Trustees and officers of the Trust as of December 31, 2013, is set forth below. The statement of additional information (SAI) includes additional information about the Trustees and is available without charge, upon request, by calling (800) 367-5877.
The address of each individual, unless otherwise noted, is c/o Virtus Variable Insurance Trust, 100 Pearl Street, Hartford, CT 06103.
Disinterested Trustees
| | |
| | |
Name
Year of Birth
Year Elected
# of Portfolios in Fund Complex
Overseen by Trustee | | Principal Occupation(s)
During Past 5 Years and
Other Directorships Held by Trustee |
Thomas J. Brown YOB: 1945 Elected: 2011 9 Portfolios | | Director (since 2005), VALIC Company I and VALIC Company II (collectively, 48 funds); and Director (since 2010), D’Youville Senior Care Center. |
Roger A. Gelfenbien YOB: 1943 Elected: 2000 9 Portfolios | | Director (since 1999), USAllianz Variable Insurance Product Trust (41 funds); and Director (2003 to 2009), Webster Bank. |
Eunice S. Groark YOB: 1938 Elected: 1999 9 Portfolios | | Director (since 2007), People’s United Financial Inc. and Director (1995 to 2007), People’s United Bank. |
John R. Mallin YOB: 1950 Elected: 1999 9 Portfolios | | Attorney/Partner, and Chair Real Property Practice Group (since 2003), McCarter & English, LLP (law firm). |
Hassell H. McClellan YOB: 1945 Elected: 2008 9 Portfolios | | Retired. Professor (1984 to 2013), Boston College; Trustee, John Hancock Variable Insurance Trust (since 2000), John Hancock Funds (since 2012), John Hancock Funds II (since 2005) and John Hancock Funds III (since 2012) (collectively, 234 portfolios); and Director (since 2010), Barnes Group, Inc. (diversified global components manufacturer and logistical services company). |
Philip R. McLoughlin YOB: 1946 Elected: 2003 Chairman 64 Portfolios | | Partner (since 2006), Cross Pond Partners, LLC (strategy consulting firm); Managing Director (2009 to 2010), SeaCap Asset Management Fund I, L.P. and SeaCap Partners, LLC (investment management); Director (since 1991) and Chairman (since 2010), World Trust Fund; Trustee (since 1989) and Chairman (since 2002), Virtus Mutual Funds Complex (49 portfolios); Trustee and Chairman (since 2011), Virtus Closed-End Funds (2 portfolios); Director (since 1996), closed-end funds managed by Duff & Phelps Investment Management Co. (4 portfolios); Trustee and Chairman (since 2013), Virtus Alternative Solutions Funds; and Director (1985 to 2009), Argo Group International Holdings Inc. and its predecessor, PXRE Corporation (insurance). |
Interested Trustee
The individual listed below is an “interested person” of the Trust, as defined in Section 2(a)(19) of the 1940 Act, as amended, and the rules and regulations thereunder.
| | |
| | |
Name
Year of Birth
Year Elected
# of Portfolios in Fund Complex
Overseen by Trustee | | Principal Occupation(s)
During Past 5 Years and
Other Directorships Held by Trustee |
George R. Aylward* Trustee and President YOB: 1964 Elected: 2012 62 Funds | | Director, President and Chief Executive Officer (since 2008), Virtus Investment Partners, Inc. and/or certain of its subsidiaries; various senior officer positions with Virtus affiliates (since 2005); Chairman, President and Chief Executive Officer (since 2006), The Zweig Closed-End Funds (2 portfolios); Trustee and President (since 2011), Virtus Closed-End Funds (2 portfolios); Trustee (since 2006), Virtus Mutual Fund Complex (49 portfolios); Director (since 2013), Virtus Global Funds, PLC; and President and Trustee (since 2013), Virtus Alternative Solutions Funds. |
| * | Mr. Aylward is an “interested person,” as defined in the 1940 Act, by reason of his position as President and Chief Executive Officer of Virtus Investment Partners, Inc. (“Virtus”), the ultimate parent company of the Adviser, and various positions with its affiliates, including the Adviser. |
75
FUND MANAGEMENT TABLES
Officers of the Trust Who Are Not Trustees
| | | | |
| | | |
Name, Address and
Year of Birth | | Position(s) Held with
Trust and Length of
Time Served | | Principal Occupation(s)
During Past 5 Years |
W. Patrick Bradley YOB: 1972 | | Senior Vice President (since 2013); Vice President (2011to 2013), Chief Financial Officer and Treasurer (since 2006). | | Senior Vice President, Fund Services (since 2010), Virtus Investment Partners, Inc. and/or certain of its subsidiaries; various officer positions (since 2006) with Virtus affiliates; Senior Vice President (since 2013); Vice President (2011 to 2013), Chief Financial Officer and Treasurer (since 2006), Virtus Mutual Fund Complex (49 portfolios); Senior Vice President (since 2013); Vice President (2011 to 2013), Chief Financial Officer and Treasurer (since 2011), Virtus Closed-End Funds (2 portfolios); Senior Vice President (since 2013), Vice President (2012 to 2013) and Treasurer (Chief Financial Officer) (since 2007), The Zweig Closed-End Funds (2 portfolios); Vice President and Assistant Treasurer (since 2011), Duff & Phelps Global Utility Income Fund Inc.; Director (since 2013), Virtus Global Funds, PLC; and Senior Vice President Chief Financial Officer and Treasurer (since 2013), Virtus Alternative Solutions Funds. |
Nancy J. Engberg YOB: 1956 | | Vice President and Chief Compliance Officer (since 2011). | | Vice President (since 2008) and Chief Compliance Officer (2008 to 2011), Virtus Investment Partners, Inc. and/or certain of its subsidiaries; various officer positions with Virtus affiliates (since 2008); Vice President (since 2008) and Chief Compliance Officer (since 2011), Virtus Mutual Funds; Vice President and Chief Compliance Officer (since 2011), Virtus Closed-End Funds (2 portfolios); Vice President and Chief Compliance Officer (since 2012), The Zweig Closed-End Funds (2 portfolios); and Vice President and Chief Compliance Officer (since 2013), Virtus Alternative Solutions Funds. |
Jennifer S. Fromm YOB: 1973 | | Vice President, Chief Legal Officer, Counsel and Secretary (since 2013); Assistant Secretary (2007 to 2013). | | Senior Counsel (since 2013), Virtus Investment Partners, Inc. and/or certain of its subsidiaries; Securities Counsel (2007 to 2013), Virtus Investment Partners, Inc. and/or certain of its subsidiaries; various officer positions (since 2007) with Virtus affiliates; Vice President, Chief Legal Officer, Counsel and Secretary (since 2013), Virtus Alternative Solutions Funds; Assistant Secretary (since 2007), Virtus Mutual Fund Complex (49 portfolios); and Assistant Secretary (since 2013), Virtus Closed-End Funds (2 portfolios). |
Francis G. Waltman YOB: 1962 | | Executive Vice President (since 2013); Senior Vice President (2010 to 2013). | | Executive Vice President, Product Development (since 2009), Virtus Investment Partners, Inc. and/or certain of its subsidiaries; various senior officer positions with Virtus affiliates (since 2006); Executive Vice President (since 2013) and Senior Vice President (2008 to 2013), Virtus Mutual Funds; Executive Vice President (since 2013) and Senior Vice President (2011 to 2013), Virtus Closed-End Funds (2 portfolios) ; Director (since 2013), Virtus Global Funds, PLC; and Executive Vice President (since 2013), Virtus Alternative Solutions Funds. |
76
Virtus International Series,
a series of Virtus Variable Insurance Trust
Supplement dated August 7, 2013 to the
Summary Prospectus and Statutory Prospectus dated May 1, 2013
IMPORTANT NOTICETO INVESTORS
The following disclosure hereby replaces the current disclosure under “Portfolio Management” in the Series’ summary prospectus and in the summary section of the statutory prospectus:
| | • | | Jamie Cumming, CFA, Senior Investment Manager at Aberdeen. Mr. Cumming has been a Portfolio Manager since 2003. |
| | • | | Stephen Docherty, Head of Global Equities at Aberdeen. Mr. Docherty has been a Portfolio Manager since 2000. |
| | • | | Samantha Fitzpatrick, CFA, Senior Investment Manager at Aberdeen. Ms. Fitzpatrick has been a Portfolio Manager since 2001. |
| | • | | Stewart Methven, Senior Investment Manager at Aberdeen. Mr. Methven has been a Portfolio Manager of the Series since July 2013. |
| | • | | Bruce Stout, Senior Investment Manager at Aberdeen. Mr. Stout has been a Portfolio Manager since 2000. |
The following disclosure hereby replaces the current disclosure under “Portfolio Management” on page 7 of the Series’ statutory prospectus:
The Series is managed by Aberdeen’s Global Equities team of investment professionals. The Series is managed by a team approach. Listed below are five key members of the Global Equities team. The team members are all based in Edinburgh, Scotland. The Global Equities team uses Aberdeen’s regional specialists around the world who formulate a “best ideas” list, which is the global equity buy list. The team operates in an open-plan environment with collective responsibility for investment decisions/ideas.
| | • | | Jamie Cumming, CFA. Mr. Cumming has served on the Series’ portfolio management team since 2003. Mr. Cumming joined Aberdeen in 2003 and currently serves as a Senior Investment Manager on the Global Equities team. |
| | • | | Stephen Docherty. Mr. Docherty has served on the Series’ portfolio management team since 2000. Mr. Docherty joined Aberdeen in 1994 and has been Head of Global Equities since 2003. He is responsible for all matters relating to the management of Aberdeen’s global equity funds. |
| | • | | Samantha Fitzpatrick, CFA. Ms. Fitzpatrick has served on the Series’ portfolio management team since 2011. Ms. Fitzpatrick serves as a Senior Investment Manager on the Global Equities team. She joined Aberdeen in 2001, via the acquisition of Murray Johnstone, where she worked as a performance and risk analyst before joining the Global Equity team in 2000. |
| | • | | Stewart Methven. Mr. Methven has served on the Series’ portfolio management team since July 2013. Mr. Methven serves as a Senior Investment Manager on the Global Equities team. He joined Aberdeen in 2003, via the acquisition of Edinburgh Fund Managers, where he was an investment manager on the Pan-European Equity team (since 1996). |
| | • | | Bruce Stout. Mr. Stout has served on the Series’ portfolio management team since 2000. Mr. Stout joined Aberdeen in 2000 and serves as a Senior Investment Manager on the Global Equities team. |
All other disclosure concerning the fund, including investment strategies, risks, fees and expenses, remains unchanged.
Investors should retain this supplement with the Summary Prospectus
and the Statutory Prospectus for future reference.
VVIT 8514/International PMs (8/13)
Virtus Small-Cap Value Series,
a series of Virtus Variable Insurance Trust
Supplement dated November 26, 2013 to the Summary and
Statutory Prospectuses dated May 1, 2013
IMPORTANT NOTICETO INVESTORS
Kayne Anderson Rudnick Investment Management, LLC, the subadviser to the above-named fund, recently announced upcoming organization changes. Effective January 1, 2014, Doug Foreman, currently Co-Chief Investment Officer and Director of Equities, will assume the title of Chief Investment Officer. Also effective January 1, 2014, Robert Schwarzkopf will no longer serve as a portfolio manager to Virtus Small-Cap Value Series.
Accordingly, the following disclosure changes will be effective on January 1, 2014.
The disclosure under “Portfolio Managers” in the fund’s summary prospectus and in the summary section of the fund’s statutory prospectus will be replaced in its entirety with the following:
| | • | | Julie Kutasov, Portfolio Manager and Senior Research Analyst at Kayne Anderson Rudnick. Ms. Kutasov has served as Portfolio Manager of the fund since 2010. |
| | • | | Craig Stone, Portfolio Manager and Senior Research Analyst at Kayne Anderson Rudnick. Mr. Stone has served as Portfolio Manager of the fund since 2010. |
Additionally, the biographical information for Mr. Schwarzkopf under “Portfolio Management” in the fund’s statutory prospectus will be removed.
Investors should retain this supplement with
the Prospectuses for future reference.
VVIT 8506/KayneChanges (11/2013)
Virtus Variable Insurance Trust
Supplement dated February 11, 2014 to the Summary and Statutory Prospectuses
and the Statement of Additional Information (“SAI”), each dated May 1, 2013
IMPORTANT NOTICETO INVESTORS
The following describes changes to the current disclosure regarding expense limitation arrangements for each affected Series, effective January 1, 2014. For certain funds, the advisory or subadvisory fee structure has also changed effective January 1, 2014 and these changes are described below.
Virtus Capital Growth Series
Footnote (2) to the Fees and Expenses table in the Series’ summary prospectus and summary section of the Series’ statutory prospectus, and the paragraph describing the expense limitation arrangements under “The Adviser” in the Series’ statutory prospectus are hereby revised to state that the date through which the contractual expense limitation arrangements are in place and after which they may be discontinued at any time is April 30, 2015.
Virtus Growth & Income Series
Footnote (2) to the Fees and Expenses table in the Series’ summary prospectus and summary section of the Series’ statutory prospectus, and the paragraph describing the expense limitation arrangements under “The Adviser” in the Series’ statutory prospectus are hereby revised to state that the date through which the contractual expense limitation arrangements are in place and after which they may be discontinued at any time is April 30, 2015.
Virtus International Series
The paragraph describing the expense limitation arrangements under “The Adviser” in the Series’ statutory prospectus is hereby replaced in its entirety with the following:
The Trust has entered into an expense limitation agreement with VIA whereby VIA has agreed to reimburse the Series for expenses necessary or appropriate for the operation of the Series (excluding interest, taxes, extraordinary expenses and acquired fund fees and expenses, if any) to the extent that such expenses exceed 1.18% of the Series’ Class A Shares and 0.93% of the Series’ Class I Shares average net assets. This expense limitation agreement is in place through April 30, 2015. After April 30, 2015, VIA may discontinue this expense reimbursement arrangement at any time. Under certain conditions, VIA may recapture operating expenses reimbursed under an expense reimbursement arrangement for a period of three years following the fiscal year in which such reimbursement occurred.
Virtus Multi-Sector Fixed Income Series
The paragraph describing the expense limitation arrangements under ��The Adviser” in the Series’ statutory prospectus is hereby revised to state that the date through which the contractual expense limitation arrangements are in place and after which they may be discontinued at any time is April 30, 2015.
Additionally, the subadvisory fee described under “The Subadviser” in the Series’ statutory prospectus is hereby replaced with the following: “From its investment advisory fee, VIA, not the Series, pays Newfleet for its subadvisory services at the rate of 50% of the net advisory fee.”
Virtus Premium AlphaSector Series
Footnote (2) to the Fees and Expenses table in the Series’ summary prospectus and summary section of the Series’ statutory prospectus, and the paragraph describing the expense limitation arrangements under “The Adviser” in the Series’ statutory prospectus are hereby revised to state that the date through which the contractual expense limitation arrangements are in place and after which they may be discontinued at any time is April 30, 2015.
Virtus Real Estate Securities Series
Footnote (2) to the Fees and Expenses table in the Series’ summary prospectus and summary section of the Series’ statutory prospectus, and the paragraph describing the expense limitation arrangements under “The Adviser” in the Series’ statutory prospectus are hereby revised to state that the date through which the contractual expense limitation arrangements are in place and after which they may be discontinued at any time is April 30, 2015.
Additionally, the subadvisory fee described under “The Subadviser” in the Series’ statutory prospectus is hereby replaced with the following: “From its investment advisory fee, VIA, not the Series, pays Duff & Phelps for its subadvisory services at the rate of 50% of the net advisory fee.”
Virtus Small-Cap Growth Series
Footnote (2) to the Fees and Expenses table in the Series’ summary prospectus and summary section of the Series’ statutory prospectus, and the paragraph describing the expense limitation arrangements under “The Adviser” in the Series’ statutory prospectus are hereby revised to state that the date through which the contractual expense limitation arrangements are in place and after which they may be discontinued at any time is April 30, 2015.
Additionally, the advisory fee described under “The Adviser” in the Series’ statutory prospectus is hereby replaced with the following:
The Series pays VIA an investment management fee that is accrued daily against the value of the Series’ net assets at the following annual rate:
| | |
1st $1 billion | | Over $1 billion |
0.85% | | 0.80% |
Virtus Small-Cap Value Series
Footnote (2) to the Fees and Expenses table in the Series’ summary prospectus and summary section of the Series’ statutory prospectus, and the paragraph describing the expense limitation arrangements under “The Adviser” in the Series’ statutory prospectus are hereby revised to state that the date through which the contractual expense limitation arrangements are in place and after which they may be discontinued at any time is April 30, 2015.
Additionally, the advisory fee described under “The Adviser” in the Series’ statutory prospectus is hereby replaced with the following:
The Series pays VIA an investment management fee that is accrued daily against the value of the Series’ net assets at the following annual rate:
| | | | |
1st $400 million | | $400 million to $1 billion | | Over $1 billion |
0.90% | | 0.85% | | 0.80% |
Virtus Strategic Allocation Series
Footnote (2) to the Fees and Expenses table in the Series’ summary prospectus and summary section of the Series’ statutory prospectus, and the paragraph describing the expense limitation arrangements under “The Adviser” in the Series’ statutory prospectus are hereby revised to state that the date through which the contractual expense limitation arrangements are in place and after which they may be discontinued at any time is April 30, 2015.
Additionally, the subadvisory fee described under “The Subadviser” in the Series’ statutory prospectus is hereby replaced with the following: “From its investment advisory fee, VIA, not the Series, pays Euclid for its subadvisory services at the rate of 50% of the net advisory fee applicable to the equity portion of the Series’ assets, and pays Newfleet for its subadvisory services at the rate of 50% of the net advisory fee applicable to the fixed income portion of the Series’ assets.”
All Series
To the extent disclosure corresponding to the expense limitation arrangements and the advisory and subadvisory fees amended by the above appears in the SAI, such disclosure is hereby amended to reflect these changes.
Investors should retain this supplement with
the Prospectuses and SAI for future reference.
VVIT ExpenseCaps&Fees (2/14)
VIRTUS VARIABLE INSURANCE TRUST
100 Pearl Street
Hartford, CT 06103-4506
Trustees
George R. Aylward
Thomas J. Brown
Roger A. Gelfenbien
Eunice S. Groark
John R. Mallin
Hassell H. McClellan
Philip R. McLoughlin
Officers
George R. Aylward, President
Francis G. Waltman, Executive Vice President
Mark S. Flynn, Executive Vice President, Anti-Money Laundering Compliance Officer and Assistant Secretary
W. Patrick Bradley, Senior Vice President, Chief Financial Officer and Treasurer
Nancy J. Engberg, Vice President and Chief Compliance Officer
Jennifer Fromm, Vice President, Chief Legal Officer, Counsel and Secretary
Investment Adviser
Virtus Investment Advisers, Inc.
100 Pearl Street
Hartford, CT 06103-4506
Principal Underwriter
VP Distributors, LLC
100 Pearl Street
Hartford, CT 06103-4506
Transfer Agent
Bank of New York Mellon
4400 Computer Drive
Westborough, MA 01581-1722
Custodian
JPMorgan Chase Bank NA
1 Chase Manhattan Plaza
New York, NY 10005-1401
Independent Registered Public Accounting Firm
PricewaterhouseCoopers LLC
2001 Market Street
Philadelphia, PA 19103-7042
How to Contact Us
Mutual Fund Services1-800-367-5877
Web sitewww.Virtus.com
Important Notice to Shareholders
The Securities and Exchange Commission has modified mailing regulations for semiannual and annual shareholder fund reports to allow mutual fund companies to send a single copy of these reports to shareholders who share the same mailing address. If you would like additional copies, please call Mutual Fund Services at 1-800-367-5877.

For more information about the Virtus Variable Insurance Trust, please contact us at 1-800-367-5877 or Virtus.com.
Item 2. Code of Ethics.
| | (a) | The registrant, as of the end of the period covered by this report, has adopted a code of ethics that applies to the registrant’s principal executive officer, principal financial officer, principal accounting officer or controller, or persons performing similar functions, regardless of whether these individuals are employed by the registrant or a third party. |
| | (c) | There have been no amendments, during the period covered by this report, to a provision of the code of ethics that applies to the registrant’s principal executive officer, principal financial officer, principal accounting officer or controller, or persons performing similar functions, regardless of whether these individuals are employed by the registrant or a third party, and that relates to any element of the code of ethics described in Item 2(b) of the instructions for completion of Form N-CSR. |
| | (d) | The registrant has not granted any waivers, during the period covered by this report, including an implicit waiver, from a provision of the code of ethics that applies to the registrant’s principal executive officer, principal financial officer, principal accounting officer or controller, or persons performing similar functions, regardless of whether these individuals are employed by the registrant or a third party, that relates to one or more of the items set forth in paragraph (b) of the instructions for completion of this Item. |
Item 3. Audit Committee Financial Expert.
| (a)(1) | The Registrant’s Board of Trustees has determined that the Registrant has an “audit committee financial expert” serving on its Audit Committee. |
| (a)(2) | The Registrant’s Board of Trustees has determined that Thomas J. Brown possesses the technical attributes identified in Instruction 2(b) of Item 3 to Form N-CSR to qualify as an “audit committee financial expert.” Mr. Brown is an “independent” trustee pursuant to paragraph (a)(2) of Item 3 to Form N-CSR. Mr. Brown began serving in this capacity as of March 1, 2011. Prior to such time, Roger A. Gelfenbien was the Registrant’s “audit committee financial expert” serving on its Audit Committee. |
Item 4. Principal Accountant Fees and Services.
Audit Fees
| | (a) | The aggregate fees billed for each of the last two fiscal years for professional services rendered by the principal accountant for the audit of the registrant’s annual financial statements or services that are normally provided by the accountant in connection with statutory and regulatory filings or engagements for those fiscal years are $209,510 for 2013 and $200,531 for 2012. |
Audit-Related Fees
| | (b) | The aggregate fees billed in each of the last two fiscal years for assurance and related services by the principal accountant that are reasonably related to the performance of the audit of the registrant’s financial statements and are not reported under paragraph (a) of this Item are $26,395 for 2013 and $26,928 for 2012. Such audit-related fees include the review of the semi-annual financial statements, out of pocket expenses and cross fund fees. |
Tax Fees
| | (c) | The aggregate fees billed in each of the last two fiscal years for professional services rendered by the principal accountant for tax compliance, tax advice, and tax planning are $31,375 for 2013 and $29,050 for 2012. |
| | | “Tax Fees” are those primarily associated with review of the Trust’s tax provision and qualification as a regulated investment company (RIC) in connection with audits of the Trust’s financial statement, review of year-end distributions by the Fund to avoid excise tax for the Trust, periodic discussion with management on tax issues affecting the Trust, and reviewing and signing the Fund’s federal income tax returns. |
All Other Fees
| | (d) | The aggregate fees billed in each of the last two fiscal years for products and services provided by the principal accountant, other than the services reported in paragraphs (a) through (c) of this Item are $0 for 2013 and $0 for 2012. |
| | (e)(1) | Disclose the audit committee’s pre-approval policies and procedures described in paragraph (c)(7) of Rule 2-01 of Regulation S-X. |
| | The Virtus Variable Insurance Trust (the “Fund”) Board has adopted policies and procedures with regard to the pre-approval of services provided by PwC. Audit, audit-related and tax compliance services provided to the Fund on an annual basis require specific pre-approval by the Board. The Audit Committee must approve other non-audit services provided to the Fund and those non-audit services provided to the Fund’s Affiliated Service Providers that relate directly to the operations and financial reporting of the Fund. Certain of these non-audit services that the Audit Committee believes are a) consistent with the SEC’s auditor independence rules and b) routine and recurring services that will not impair the independence of the independent auditors may be approved by the Committee without consideration on a specific case-by-case basis (“general pre-approval”). |
| | The Audit Committee has determined that Mr. Brown, Chair of the Audit Committee, may provide pre-approval for such services that meet the above requirements in the event such approval is sought between regularly scheduled meetings. (Prior to Mr. Brown’s appointment as Chair of the Audit Committee, pre-approvals were provided by Mr. Gelfenbien as the prior Chair of the Audit Committee.) In any event, the Audit Committee is informed of each service approved subject to general pre-approval at the next regularly scheduled in-person Audit-Committee meeting. |
| | (e)(2) | The percentage of services described in each of paragraphs (b) through (d) of this Item that were approved by the audit committee pursuant to paragraph (c)(7)(i)(C) of Rule 2-01 of Regulation S-X are as follows: |
(b) 0%
(c) 0%
(d) N/A
| | (f) | The percentage of hours expended on the principal accountant’s engagement to audit the registrant’s financial statements for the most recent fiscal year that were attributed to work performed by persons other than the principal accountant’s full-time, permanent employees was less than fifty percent. |
| | (g) | The aggregate non-audit fees billed by the registrant’s accountant for services rendered to the registrant, and rendered to the registrant’s investment adviser (not including any sub-adviser whose role is primarily portfolio management and is subcontracted with or overseen by another investment adviser), and any entity controlling, controlled by, or under common control with the adviser that provides ongoing services to the registrant for each of the last two fiscal years of the registrant was $434,669 for 2013 and $418,361 for 2012. |
| | (h) | The registrant’s audit committee of the board of directors has considered whether the provision of non-audit services that were rendered to the registrant’s investment adviser (not including any sub-adviser whose role is primarily portfolio management and is subcontracted with or overseen by another investment adviser), and any entity controlling, controlled by, or under common control with the investment adviser that provides ongoing services to the registrant that were not pre-approved pursuant to paragraph (c)(7)(ii) of Rule 2-01 of Regulation S-X is compatible with maintaining the principal accountant’s independence. |
Item 5. Audit Committee of Listed Registrants.
Not applicable.
Item 6. Investments.
| (a) | Schedule of Investments in securities of unaffiliated issuers as of the close of the reporting period is included as part of the report to shareholders filed under Item 1 of this form. |
| Item 7. | Disclosure of Proxy Voting Policies and Procedures for Closed-End Management Investment Companies. |
Not applicable.
Item 8. Portfolio Managers of Closed-End Management Investment Companies.
Not applicable.
| Item 9. | Purchases of Equity Securities by Closed-End Management Investment Company and Affiliated Purchasers. |
Not applicable.
Item 10. Submission of Matters to a Vote of Security Holders.
There have been no material changes to the procedures by which the shareholders may recommend nominees to the registrant’s board of trustees, where those changes were implemented after the registrant last provided disclosure in response to the requirements of Item 407(c)(2)(iv) of Regulation S-K (17 CFR 229.407) (as required by Item 22(b)(15) of Schedule 14A (17 CFR 240.14a-101)), or this Item.
Item 11. Controls and Procedures.
| | (a) | The registrant’s principal executive and principal financial officers, or persons performing similar functions, have concluded that the registrant’s disclosure controls and procedures (as defined in Rule 30a-3(c) under the Investment Company Act of 1940, as amended (the “1940 Act”) (17 CFR 270.30a-3(c))) are effective, as of a date within 90 days of the filing date of the report that includes the disclosure required by this paragraph, based on their evaluation of these controls and procedures required by Rule 30a-3(b) under the 1940 Act (17 CFR 270.30a-3(b)) and Rules 13a-15(b) or 15d-15(b) under the Securities Exchange Act of 1934, as amended (17 CFR 240.13a-15(b) or 240.15d-15(b)). |
| | (b) | There were no changes in the registrant’s internal control over financial reporting (as defined in Rule 30a-3(d) under the 1940 Act (17 CFR 270.30a-3(d)) that occurred during the registrant’s second fiscal quarter of the period covered by this report that has materially affected, or is reasonably likely to materially affect, the registrant’s internal control over financial reporting. |
Item 12. Exhibits.
| | (a)(1) | Code of ethics, or any amendment thereto, that is the subject of disclosure required by Item 2 is attached hereto. |
| | (a)(2) | Certifications pursuant to Rule 30a-2(a) under the 1940 Act and Section 302 of the Sarbanes-Oxley Act of 2002 are attached hereto. |
| | (b) | Certifications pursuant to Rule 30a-2(b) under the 1940 Act and Section 906 of the Sarbanes-Oxley Act of 2002 are attached hereto. |
(12.other) Not applicable.
SIGNATURES
Pursuant to the requirements of the Securities Exchange Act of 1934 and the Investment Company Act of 1940, the registrant has duly caused this report to be signed on its behalf by the undersigned, thereunto duly authorized.
| | | | |
(Registrant) | | Virtus Variable Insurance Trust | | |
| | | | |
| | |
By (Signature and Title)* | | /s/ George R. Aylward | | |
| | George R. Aylward, President | | |
| | (principal executive officer) | | |
Pursuant to the requirements of the Securities Exchange Act of 1934 and the Investment Company Act of 1940, this report has been signed below by the following persons on behalf of the registrant and in the capacities and on the dates indicated.
| | | | |
By (Signature and Title)* | | /s/ George R. Aylward | | |
| | George R. Aylward, President | | |
| | (principal executive officer) | | |
| | | | |
By (Signature and Title)* | | /s/ W. Patrick Bradley | | |
| | W. Patrick Bradley, Senior Vice President, Chief Financial Officer and Treasurer |
| | (principal financial officer) | | |
| * | Print the name and title of each signing officer under his or her signature. |