UNITED STATES
SECURITIES AND EXCHANGE COMMISSION
Washington, D.C. 20549
FORM N-CSR
CERTIFIED SHAREHOLDER REPORT OF REGISTERED MANAGEMENT INVESTMENT COMPANIES
| | |
| Investment Company Act file number: | | 811-04661 |
| |
| Exact name of registrant as specified in charter: | | Prudential Global Total Return Fund, Inc. |
| |
| Address of principal executive offices: | | 655 Broad Street, 17th Floor |
| | Newark, New Jersey 07102 |
| |
| Name and address of agent for service: | | Andrew R. French |
| | 655 Broad Street, 17th Floor |
| | Newark, New Jersey 07102 |
| |
| Registrant’s telephone number, including area code: | | 800-225-1852 |
| |
| Date of fiscal year end: | | 10/31/2018 |
| |
| Date of reporting period: | | 10/31/2018 |
Item 1 – Reports to Stockholders

PGIM GLOBAL TOTAL RETURN FUND
(Formerly known as Prudential Global Total Return Fund, Inc.)
ANNUAL REPORT
OCTOBER 31, 2018
COMING SOON: PAPERLESS SHAREHOLDER REPORTS
Beginning on January 1, 2021, as permitted by regulations adopted by the Securities and Exchange Commission, paper copies of the Fund’s annual and semi-annual shareholder reports will no longer be sent by mail, unless you specifically request paper copies of the reports. Instead, the reports will be made available on the Fund’s website (www.pgiminvestments.com), and you will be notified by mail each time a report is posted and provided with a website link to access the report.
If you already elected to receive shareholder reports electronically, you will not be affected by this change and you need not take any action. You may elect to receive shareholder reports and other communications from the Fund electronically anytime by contacting your financial intermediary (such as a broker-dealer or bank) or, if you are a direct investor, by calling 1-800-225-1852 or by sending an e-mail request to PGIM Investments at shareholderreports@pgim.com.
Beginning on January 1, 2019, you may elect to receive all future reports in paper free of charge. If you invest through a financial intermediary, you can contact your financial intermediary or follow instructions included with this notice to elect to continue to receive paper copies of your shareholder reports. If you invest directly with the Fund, you can call 1-800-225-1852 or send an email request to shareholderreports@pgim.com to let the Fund know you wish to continue receiving paper copies of your shareholder reports. Your election to receive reports in paper will apply to all funds held in your account if you invest through your financial intermediary or all funds held with the fund complex if you invest directly with the Fund.

To enroll in e-delivery, go to pgiminvestments.com/edelivery
|
| Objective: Total return, made up of current income and capital appreciation |
Highlights (unaudited)
| • | | Strong sector and issuer selection across sovereign debt in developed markets, high yield corporate bonds, and high-quality structured products contributed to the Fund’s performance. |
| • | | Yield curve and duration positioning also helped performance. In developed market rates, a yield curve flattener positioning in the euro was the largest contributor. In emerging markets, long-duration positioning in Brazilian rates was a strong contributor. |
| • | | Positioning in emerging market sovereign debt hurt performance. |
| • | | In developed market rates, a yield curve flattener in the US dollar and long-duration positioning in Norwegian rates limited results. |
This report is not authorized for distribution to prospective investors unless preceded or accompanied by a current prospectus.
The views expressed in this report and information about the Fund’s portfolio holdings are for the period covered by this report and are subject to change thereafter.
Mutual funds are distributed by Prudential Investment Management Services LLC (PIMS), member SIPC. PGIM Fixed Income is a unit of PGIM, Inc. (PGIM), a registered investment adviser. PIMS and PGIM are Prudential Financial companies. © 2018 Prudential Financial, Inc. and its related entities. PGIM and the PGIM logo are service marks of Prudential Financial, Inc. and its related entities, registered in many jurisdictions worldwide.
| | |
| 2 | | Visit our website at pgiminvestments.com |
PGIM FUNDS — UPDATE
The Board of Directors/Trustees for the Fund has approved the implementation of an automatic conversion feature for Class C shares, effective as of April 1, 2019. To reflect these changes, effective April 1, 2019, the section of the Fund’s Prospectus entitled “How to Buy, Sell and Exchange Fund Shares—How to Exchange Your Shares—Frequent Purchases and Redemptions of Fund Shares” is restated to read as follows:
This supplement should be read in conjunction with your Summary Prospectus, Statutory Prospectus and Statement of Additional Information, be retained for future reference and is in addition to any existing Fund supplements.
| | 1. | In each Fund’s Statutory Prospectus, the following is added at the end of the section entitled “Fund Distributions And Tax Issues—If You Sell or Exchange Your Shares”: |
Automatic Conversion of Class C Shares
The conversion of Class C shares into Class A shares—which happens automatically approximately 10 years after purchase—is not a taxable event for federal income tax purposes. For more information about the automatic conversion of Class C shares, see Class C Shares Automatically Convert to Class A Shares in How to Buy, Sell and Exchange Fund Shares.
| | 2. | In each Fund’s Statutory Prospectus, the following sentence is added at the end of the section entitled “How to Buy, Sell and Exchange Shares—Closure of Certain Share Classes to New Group Retirement Plans”: |
Shareholders owning Class C shares may continue to hold their Class C shares until the shares automatically convert to Class A shares under the conversion schedule, or until the shareholder redeems their Class C shares.
| | 3. | In each Fund’s Statutory Prospectus, the following disclosure is added immediately following the section entitled “How to Buy, Sell and Exchange Shares—How to Buy Shares—Class B Shares Automatically Convert to Class A Shares”: |
Class C Shares Automatically Convert to Class A Shares
Starting on or about April 1, 2019 (the “Effective Date”), Class C shares will be eligible for automatic conversion into Class A shares on a monthly basis approximately ten years after the original date of purchase (the “Conversion Date”). Conversion will take place based on the relative NAV of the two classes, without the imposition of any sales load, fee or other charge. All such automatic conversions of Class C shares will constitute tax-free exchanges for federal income tax purposes.
For shareholders investing in Class C shares through retirement plans or omnibus accounts, and in certain other instances, the Fund and its agents may not have
| | | | |
| PGIM Global Total Return Fund | | | 3 | |
transparency into how long a shareholder has held Class C shares for purposes of determining whether such Class C shares are eligible for automatic conversion into Class A shares, and the relevant financial intermediary may not have the ability to track purchases in order to credit individual shareholders’ holding periods. In these circumstances, the Fund will not be able to automatically convert Class C shares into Class A shares as described above. In order to determine eligibility for conversion in these circumstances, it is the responsibility of the financial intermediary to notify the Fund that the shareholder is eligible for the conversion of Class C shares to Class A shares, and the financial intermediary may be required to maintain and provide the Fund with records that substantiate the holding period of Class C shares. It is the financial intermediary’s (and not the Fund’s) responsibility to keep records of transactions made in accounts it holds and to ensure that the shareholder is credited with the proper holding period based on such records or those provided to the financial intermediary by the shareholder. Please consult with your financial intermediary for the applicability of this conversion feature to your shares.
A financial intermediary may sponsor and/or control accounts, programs or platforms that impose a different conversion schedule or different eligibility requirements for the exchange of Class C shares for Class A shares (see Appendix A: Waivers and Discounts Available From Certain Financial Intermediaries of the Prospectus). Please consult with your financial intermediary if you have any questions regarding your shares’ conversion from Class C shares to Class A shares.
| | 4. | In Part II of each Fund’s Statement of Additional Information, the following disclosure is added immediately following the section entitled “Purchase, Redemption and Pricing of Fund Shares—Share Classes—Automatic Conversion of Class B Shares”: |
AUTOMATIC CONVERSION OF CLASS C SHARES. Starting on or about April 1, 2019 (the “Effective Date”), Class C shares will be eligible for automatic conversion into Class A shares on a monthly basis approximately ten years after the original date of purchase (the “Conversion Date”). Conversion will take place based on the relative NAV of the two classes, without the imposition of any sales load, fee or other charge. Class C shares of a Fund acquired through automatic reinvestment of dividends or distributions will convert to Class A shares of the Fund on the Conversion Date pro rata with the converting Class C shares of the Fund that were not acquired through reinvestment of dividends or distributions. All such automatic conversions of Class C shares will constitute tax-free exchanges for federal income tax purposes.
For shareholders investing in Class C shares through retirement plans or omnibus accounts, and in certain other instances, the Fund and its agents may not have transparency into how long a shareholder has held Class C shares for purposes of determining whether such Class C shares are eligible for automatic conversion into Class A shares, and the relevant financial intermediary may not have the ability to track purchases in order to credit individual shareholders’ holding periods. In these circumstances, the
| | |
| 4 | | Visit our website at pgiminvestments.com |
Fund will not be able to automatically convert Class C shares into Class A shares as described above. In order to determine eligibility for conversion in these circumstances, it is the responsibility of the financial intermediary to notify the Fund that the shareholder is eligible for the conversion of Class C shares to Class A shares, and the financial intermediary may be required to maintain and provide the Fund with records that substantiate the holding period of Class C shares. It is the financial intermediary’s (and not the Fund’s) responsibility to keep records of transactions made in accounts it holds and to ensure that the shareholder is credited with the proper holding period based on such records or those provided to the financial intermediary by the shareholder. Please consult with your financial intermediary for the applicability of this conversion feature to your shares.
Class C shares were generally closed to investments by new group retirement plans effective June 1, 2018. Group retirement plans (and their successor, related and affiliated plans) that have Class C shares of the Fund available to participants on or before the Effective Date may continue to open accounts for new participants in such share class and purchase additional shares in existing participant accounts.
The Fund has no responsibility for monitoring or implementing a financial intermediary’s process for determining whether a shareholder meets the required holding period for conversion. A financial intermediary may sponsor and/or control accounts, programs or platforms that impose a different conversion schedule or different eligibility requirements for the exchange of Class C shares for Class A shares, as set forth on Appendix A: Waivers and Discounts Available From Certain Financial Intermediaries of the Prospectus. In these cases, Class C shareholders may have their shares exchanged for Class A shares under the policies of the financial intermediary. Financial intermediaries will be responsible for making such exchanges in those circumstances. Please consult with your financial intermediary if you have any questions regarding your shares’ conversion from Class C shares to Class A shares.
LR1094
- Not part of the Annual Report -
| | | | |
| PGIM Global Total Return Fund | | | 5 | |
Table of Contents
| | |
| 6 | | Visit our website at pgiminvestments.com |
Letter from the President

Dear Shareholder:
We hope you find the annual report for PGIM Global Total Return Fund informative and useful. The report covers performance for the 12-month period that ended October 31, 2018.
We have important information to share with you. Effective June 11, 2018, Prudential Mutual Funds were renamed PGIM Funds. This renaming is part of our
ongoing effort to further build our reputation and establish our global brand, which began when our firm adopted PGIM Investments as its name in April 2017. Please note that only the Fund’s name has changed. Your Fund’s management and operation, along with its symbols, remained the same.*
During the reporting period, the global economy continued to grow, and central banks gradually tightened monetary policy. In the US, the economy expanded and employment increased. In September, the Federal Reserve hiked interest rates for the eighth time since 2015, based on confidence in the economy.
Equity returns on the whole were strong, due to optimistic earnings expectations and investor sentiment. Global equities, including emerging markets, generally posted positive returns. However, they trailed the performance of US equities, which rose on higher corporate profits, new regulatory policies, and tax reform benefits. Volatility spiked briefly early in the period on inflation concerns, rising interest rates, and a potential global trade war, and again late in the period on worries that profit growth might slow in 2019.
The overall bond market declined modestly during the period, as measured by the Bloomberg Barclays US Aggregate Bond Index. The best performance came from higher-yielding, economically sensitive sectors, such as high yield bonds and bank loans, which posted small gains. US investment-grade corporate bonds and US Treasury bonds both finished the period with negative returns. A major trend during the period was the flattening of the US Treasury yield curve, which increased the yield on fixed income investments with shorter maturities and made them more attractive to investors.
Regarding your investments with PGIM, we believe it is important to maintain a diversified portfolio of funds consistent with your tolerance for risk, time horizon, and financial goals. Your financial advisor can help you create a diversified investment plan that may include funds covering all the basic asset classes and that reflects your personal investor profile and risk tolerance. However, diversification and asset allocation strategies do not assure a profit or protect against loss in declining markets.
At PGIM Investments, we consider it a great privilege and responsibility to help investors participate in opportunities across global markets while meeting their toughest investment challenges. PGIM is a top-10 global investment manager with more than $1 trillion in assets under management. This investment expertise allows us to deliver actively managed funds and strategies to meet the needs of investors around the globe.
Thank you for choosing our family of funds.
Sincerely,

Stuart S. Parker, President
PGIM Global Total Return Fund
December 14, 2018
*The Prudential Day One Funds did not change their names.
| | | | |
| PGIM Global Total Return Fund | | | 7 | |
Your Fund’s Performance (unaudited)
Performance data quoted represents past performance. Past performance does not guarantee future results. The investment return and principal value of an investment will fluctuate, so that an investor’s shares, when redeemed, may be worth more or less than their original cost. Current performance may be lower or higher than the past performance data quoted. An investor may obtain performance data as of the most recent month-end by visiting our website at www.pgiminvestments.com or by calling (800) 225-1852.
| | | | | | | | | | | | | | |
| | | Average Annual Total Returns as of 10/31/18
(with sales charges) | |
| | | One Year (%) | | Five Years (%) | | | Ten Years (%) | | | Since Inception (%) | |
| Class A | | –7.03 | | | 0.96 | | | | 5.92 | | | | — | |
| Class B | | –7.95 | | | 0.97 | | | | 5.61 | | | | — | |
| Class C | | –4.18 | | | 1.14 | | | | 5.71 | | | | — | |
| Class Z | | –2.25 | | | 2.16 | | | | 6.69 | | | | — | |
| Class R2 | | N/A | | | N/A | | | | N/A | | | | –4.24* (12/27/17) | |
| Class R4 | | N/A | | | N/A | | | | N/A | | | | –3.88* (12/27/17) | |
| Class R6** | | –2.19 | | | 2.38 | | | | N/A | | | | 2.83 (2/3/12) | |
| Bloomberg Barclays Global Aggregate Bond Index | |
| | –2.05 | | | 0.33 | | | | 3.16 | | | | — | |
| Lipper Global Income Funds Average*** | |
| | –1.99 | | | 0.98 | | | | 4.24 | | | | — | |
| Lipper Custom Global Income Funds Average*** | |
| | | –2.72 | | | 0.39 | | | | 3.92 | | | | — | |
| | | | | | | | | | | | | | |
| | | Average Annual Total Returns as of 10/31/18 (without sales charges) | |
| | | One Year (%) | | Five Years (%) | | | Ten Years (%) | | | Since Inception (%) | |
| Class A | | –2.65 | | | 1.89 | | | | 6.41 | | | | — | |
| Class B | | –3.23 | | | 1.14 | | | | 5.61 | | | | — | |
| Class C | | –3.24 | | | 1.14 | | | | 5.71 | | | | — | |
| Class Z | | –2.25 | | | 2.16 | | | | 6.69 | | | | — | |
| Class R2 | | N/A | | | N/A | | | | N/A | | | | –4.24* (12/27/17) | |
| Class R4 | | N/A | | | N/A | | | | N/A | | | | –3.88* (12/27/17) | |
| Class R6** | | –2.19 | | | 2.38 | | | | N/A | | | | 2.83 (2/3/12) | |
| Bloomberg Barclays Global Aggregate Bond Index | |
| | –2.05 | | | 0.33 | | | | 3.16 | | | | — | |
| Lipper Global Income Funds Average*** | |
| | –1.99 | | | 0.98 | | | | 4.24 | | | | — | |
| Lipper Custom Global Income Funds Average*** | |
| | | –2.72 | | | 0.39 | | | | 3.92 | | | | — | |
| | |
| 8 | | Visit our website at pgiminvestments.com |
Growth of a $10,000 Investment (unaudited)
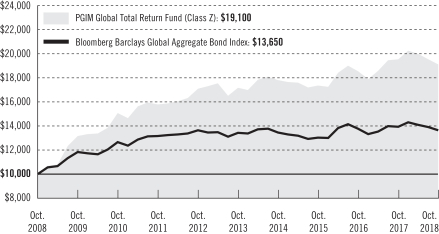
The graph compares a $10,000 investment in Fund’s Class Z shares with a similar investment in the Bloomberg Barclays Global Aggregate Bond Index by portraying the initial account values at the beginning of the 10-year period for Class Z shares (October 31, 2008) and the account values at the end of the current fiscal year (October 31, 2018) as measured on a quarterly basis. For purposes of the graph, and unless otherwise indicated, it has been assumed that (a) all recurring fees (including management fees) were deducted; and (b) all dividends and distributions were reinvested. The line graph provides information for Class Z shares only. As indicated in the tables provided earlier, performance for other share classes will vary due to the differing charges and expenses applicable to each share class (as indicated in the following paragraphs). Without waiver of fees and/or expense reimbursements, if any, the Fund’s returns would have been lower.
Past performance does not predict future performance. Total returns and the ending account values in the graph include changes in share price and reinvestment of dividends and capital gains distributions in a hypothetical investment for the periods shown. The Fund’s total returns do not reflect the deduction of income taxes on an individual’s investment. Taxes may reduce your actual investment returns on income or gains paid by the Fund or any gains you may realize if you sell your shares.
Source: PGIM Investments LLC and Lipper Inc.
*Not annualized
**Formerly known as Class Q shares.
***The Lipper Custom Global Income Funds Average consists only of unhedged funds within Lipper’s Global Income Funds Universe and not the entire Global Income Funds Universe, although Lipper classifies the Fund in the Global Income Funds Performance Universe. The Lipper Custom Global Income Funds Average is utilized because the Fund’s manager believes that the funds included in this universe provide a more appropriate basis for Fund performance comparisons.
Inception returns are provided for any share class with less than 10 fiscal years of returns. Since Inception returns for the Index and the Lipper Average are measured from closest month-end to the class’ inception date.
| | | | |
| PGIM Global Total Return Fund | | | 9 | |
Your Fund’s Performance (continued)
The returns in the tables do not reflect the deduction of taxes that a shareholder would pay on Fund distributions or following the redemption of Fund shares. The average annual total returns take into account applicable sales charges, which are described for each share class in the table below.
| | | | | | | | | | | | | | |
| | | Class A | | Class B* | | Class C | | Class Z | | Class R2 | | Class R4 | | Class R6** |
| Maximum initial sales charge | | 4.50% of the public offering price | | None | | None | | None | | None | | None | | None |
| Contingent deferred sales charge (CDSC) (as a percentage of the lower of original purchase price or net asset value at redemption) | | 1.00% on sales of $1 million or more made within 12 months of purchase | | 5.00% (Yr. 1) 4.00% (Yr. 2) 3.00% (Yr. 3) 2.00% (Yr. 4) 1.00% (Yr. 5/6) 0.00% (Yr. 7) | | 1.00% on sales made within 12 months of purchase | | None | | None | | None | | None |
| Annual distribution and service (12b-1) fees (shown as a percentage of average daily net assets) | | 0.25% | | 1.00% | | 1.00% | | None | | 0.25% | | None | | None |
| Shareholder service fees | | None | | None | | None | | None | | 0.10% | | 0.10% | | None |
*Class B shares are closed to all purchase activity and no additional Class B shares may be purchased or acquired except by exchange from Class B shares of another Fund or through dividend or capital gains reinvestment.
**Formerly known as Class Q shares.
| | |
| 10 | | Visit our website at pgiminvestments.com |
Benchmark Definitions
Bloomberg Barclays Global Aggregate Bond Index—The Bloomberg Barclays Global Aggregate Bond Index is an unmanaged index of global investment-grade fixed income markets. The three major components of this index are the US Aggregate, the Pan-European Aggregate, and the Asian-Pacific Aggregate Indices. The Index also includes euro dollar and euro-yen corporate bonds, and Canadian government, agency and corporate securities. The average annual total return for the Index measured from the month-end closest to the inception date of the Fund’s Class R6 shares is 0.44%. The cumulative total return for the Index measured from the month-end closest to the inception date of the Fund’s Class R2 and Class R4 shares is –3.46%.
Lipper Global Income Funds Average—The Lipper Global Income Funds Average (Lipper Average) is based on the average return of all funds in the Lipper Global Income Funds universe for the periods noted. Funds in the Lipper Average invest primarily in US dollar and non-US dollar debt securities of issuers located in at least three countries, one of which may be the United States. The average annual total return for the Lipper Average measured from the month-end closest to the inception date of the Fund’s Class R6 shares is 1.23%. The cumulative total return for the Lipper Average measured from the month-end closest to the inception date of the Fund’s Class R2 and Class R4 shares is –2.81%.
Lipper Custom Global Income Funds Average—The Lipper Custom Global Income Funds Average (Lipper Custom Average) consists only of unhedged funds within Lipper’s Global Income Funds universe and not the entire Global Income Funds universe, although Lipper classifies the Fund in the Global Income Funds Performance universe. The average annual total return for the Lipper Custom Average measured from the month-end closest to the inception date of the Fund’s Class R6 shares is 0.71%. The cumulative total return for the Lipper Custom Average measured from the month-end closest to the inception date of the Fund’s Class R2 and Class R4 shares is 5.18%.
Investors cannot invest directly in an index or average. The returns for the Index would be lower if they included the effects of sales charges, operating expenses of a mutual fund, or taxes. Returns for the Lipper Averages reflect the deduction of operating expenses of a mutual fund, but not sales charges or taxes.
| | | | | | |
| Distributions and Yields as of 10/31/18 |
| | Total Distributions
Paid for
12 Months ($) | | SEC 30-Day
Subsidized
Yield* (%) | | SEC 30-Day
Unsubsidized
Yield** (%) |
| Class A | | 0.22 | | 2.53 | | 2.29 |
| Class B | | 0.17 | | 1.91 | | 2.39 |
| Class C | | 0.17 | | 1.91 | | 1.77 |
| Class Z | | 0.23 | | 2.88 | | 2.56 |
| Class R2*** | | 0.17 | | 2.42 | | –197.16 |
| Class R4*** | | 0.19 | | 2.66 | | –42.50 |
| Class R6 | | 0.24 | | 2.85 | | 2.85 |
*SEC 30-Day Subsidized Yield (%)—A standardized yield calculation created by the Securities and Exchange Commission, it reflects the income earned during a 30-day period, after the deduction of the Fund’s net expenses (net of any expense waivers or reimbursements).
**SEC 30-Day Unsubsidized Yield (%)—A standardized yield calculation created by the Securities and Exchange Commission, it reflects the income earned during a 30-day period, after the deduction of the Fund’s gross expenses. The investor experience is represented by the SEC 30-Day Subsidized Yield.
***Inception: 12/27/17
| | | | |
| PGIM Global Total Return Fund | | | 11 | |
Your Fund’s Performance (continued)
| | | | |
| Credit Quality expressed as a percentage of total investments as of 10/31/18 (%) | |
| AAA | | | 26.2 | |
| AA | | | 9.6 | |
| A | | | 18.0 | |
| BBB | | | 24.7 | |
| BB | | | 10.3 | |
| B | | | 4.3 | |
| CCC | | | 0.3 | |
| Not Rated | | | 6.5 | |
| Cash/Cash Equivalents | | | 0.1 | |
| Total | | | 100.0 | |
Source: PGIM Fixed Income
Credit ratings reflect the highest rating assigned by a nationally recognized statistical rating organization (NRSRO) such as Moody’s Investors Service, Inc. (Moody’s), S&P Global Ratings (S&P), or Fitch, Inc. (Fitch). Credit ratings reflect the common nomenclature used by both S&P and Fitch. Where applicable, ratings are converted to the comparable S&P/Fitch rating tier nomenclature. These rating agencies are independent and are widely used. The Not Rated category consists of securities that have not been rated by a NRSRO. Credit ratings are subject to change. Values may not sum to 100.0% due to rounding.
| | |
| 12 | | Visit our website at pgiminvestments.com |
Strategy and Performance Overview (unaudited)
How did the Fund perform?
The PGIM Global Total Return Fund’s Class Z shares returned –2.25% in the 12-month reporting period that ended October 31, 2018, underperforming the –2.05% return of the Bloomberg Barclays Global Aggregate Bond Index (the Index) and outperforming the –2.72% return of the Lipper Custom Global Income Funds Average.
What were market conditions?
| • | | At the beginning of the reporting period, the newly passed US tax law package was expected to continue to pressure future budget deficits, which would heighten the need for international deficit financing via increased Treasury issuance. Some thought that this could offset the positive effects of potential regulatory reform and pause the widening in long-dated swap spreads. In Europe, market expectations of diminished asset purchases by the European Central Bank (ECB) improved access to lending channels, and slightly larger bank balance sheets were thought to contribute to higher euro rates, especially in Germany. |
| • | | Long-term interest rates in developed markets continued their ascent in the first quarter of 2018 amid further signs of synchronized global growth and the expected effects of US fiscal stimulus. While the increase in rates was notable for its breadth, the scale of the sell-off created numerous opportunities in developed markets as the second quarter got underway. In the US, yields rose across the curve on hawkish Federal Reserve (Fed) rhetoric, anticipated fiscal stimulus from the recently passed tax law and budget deals, and increased Treasury supply, particularly at the front (short-term) end of the yield curve. In Europe, the ECB’s continued quantitative easing (QE) asset purchases meant there would be zero net issuance. That said, the ECB tapered its monthly QE purchases from $60 billion to $30 billion in the first quarter. Many expected it could have announced a conclusion to the purchases in September 2018, albeit with reinvestments likely to continue. PGIM Fixed Income believes the ECB’s first rate hike could emerge by the second quarter of 2019. |
| • | | In the second quarter of 2018, US rates diverged from other developed market interest rates. With inflation on target, unemployment down, and the Fed continuing its cautious rate-hiking cycle, US long-term yields finished the quarter relatively unchanged. In contrast, the ECB emphasized downside risks in the economy, primarily stemming from trade, indicating the likely need for low rates through the summer of 2019. Similarly, the Bank of Japan (BoJ) signaled easy policy for the long haul as it delayed and lowered its expected path for rising inflation. In line with the central banks’ reading, long-term rates in Japan and Europe ended the second quarter at lows for the year. In China, rates rallied substantially, with yields falling to three-year lows as its central bank eased policy in an effort to support growth. |
| | | | |
| PGIM Global Total Return Fund | | | 13 | |
Strategy and Performance Overview (continued)
| • | | In the third quarter and October 2018, while the markets were volatile, the underlying causes were more or less constant with minor variations. After a decade of balance sheet expansion, the G3 (US, Japan, and eurozone) central banks are finally—at least in aggregate—turning off the liquidity spigot. The Fed is in the lead, hiking rates and implementing its roll-off of securities from its balance sheet at an accelerating pace. The ECB is in the final months of its asset-purchase program, which undoubtedly will be followed by rising anxiety surrounding the timing and pace of eventual rate hikes, in PGIM Fixed Income’s view. Meanwhile, the BoJ is sending mixed messages. Realizing it is taking longer than initially expected to hit its 2% inflation target, the BoJ is trying to improve its long-term policy effectiveness. It has taken steps, such as reducing its amounts of bond purchases and widening its target range for the 10-year Japanese government bond (JGB) yield, with the intent of reducing its stranglehold on the market and steepening the yield curve. These policy changes have tipped the scales, switching the G3 central bank balance sheets from aggressive growth to a path of stasis. The switch from “net buy” to “net hold” means the market’s primary source of steady capital injections over the last decade is more or less gone, leaving open markets to adjust to supply and demand on their own. |
What worked?
| • | | During the reporting period, the Fund’s sector allocation emphasized global spread sectors rather than government bond sectors. |
| • | | Strong sector and issuer selection across sovereign debt in developed markets, high yield corporate bonds, and high-quality structured products contributed to performance. |
| • | | Yield curve and duration positioning also helped performance. In developed market rates, a yield curve flattener positioning in the euro was the largest contributor. In emerging markets, long-duration positioning in Brazilian rates was a strong contributor. |
| • | | Although overall currency positioning hurt performance, tactical positioning in the Turkish lira, as well as underweights in the Chilean peso and Swiss franc, helped offset some of the losses. |
What didn’t work?
| • | | Positioning in emerging market sovereign debt hurt performance during the reporting period. |
| • | | In developed market rates, a yield curve flattener in the US dollar and long-duration positioning in Norwegian rates limited results. |
| • | | Currency positioning hurt performance in the period. Overweights in the Indian rupee, Russian ruble, Brazilian real, and Indonesian rupiah were the largest detractors. |
| | |
| 14 | | Visit our website at pgiminvestments.com |
Did the Fund hold derivatives, and how did they affect performance?
| • | | The Fund used interest rate futures and swaps to implement its investment strategy, as well as to help manage duration and yield curve exposure. The use of interest rate futures and swaps had a positive impact on the Fund’s performance in the reporting period. |
| • | | To implement most currency strategies, the Fund employed foreign exchange derivatives, which negatively impacted performance. |
Current outlook
| • | | As of the end of the period, PGIM Fixed Income maintained its positive view of fundamentals in the credit sectors of the fixed income market. The Fund held positions in spread sectors, including high yield, emerging market (EM), and structured products such as commercial mortgage-backed securities (CMBS), collateralized loan obligations (CLOs), non-agency mortgage-backed securities, and asset-backed securities (ABS). It also ended the period with an underweight in investment-grade corporates. |
| • | | At period-end, the Fund was overweight debt of European peripheral countries as well as a select group of emerging market issuers (mostly sovereign debt). Relative to its benchmark, the Fund held an underweight in the Swiss franc, overweight in the US dollar, and a modest underweight in the euro. The Fund maintained a select set of small underweights and overweights within emerging market and “commodity” currencies. Examples include overweights in the Peruvian nuevo sol, Thai baht, and Indian rupee, and underweights in the Chinese yuan, Hungarian forint, and South Africa rand. |
| • | | In investment-grade corporates, PGIM Fixed Income continues to favor higher-quality financials and electric utilities over industrials subject to event risk. Within industrials, the Fund is focusing on select issuers where an “event” has passed as higher-quality corporates continue to lever up and merger-and-acquisition (M&A) activity remains a concern. |
| • | | A combination of solid fundamentals (strong earnings and low defaults) and favorable technicals (limited net supply and persistent institutional demand from Asia) has left PGIM Fixed Income with a modestly positive view on US high yield in the near term. However, concerns over current valuations, risk appetite on recent lower-quality M&A transactions reminiscent of 2007, as well as broader concerns about trade wars and the timing of the next recession, have prompted PGIM Fixed Income to take a cautious view longer term. |
| • | | Within CMBS, PGIM Fixed Income continues to find value in high-quality securities of new-issue conduit deals. In ABS, the Fund has maintained a fundamentally driven, up-in-quality focus, favoring select securitizations from originators of unsecured consumer, subprime auto, and private refinance student loans that practice strong underwriting and display robust structural features. |
| | | | |
| PGIM Global Total Return Fund | | | 15 | |
Strategy and Performance Overview (continued)
| • | | The Fund has a very small allocation to government-related sectors such as Treasuries and agency mortgage-backed securities, as PGIM Fixed Income finds more compelling value in the aforementioned sectors. |
| | |
| 16 | | Visit our website at pgiminvestments.com |
Fees and Expenses (unaudited)
As a shareholder of the Fund, you incur two types of costs: (1) transaction costs, including sales charges (loads) on purchase payments and redemptions, as applicable, and (2) ongoing costs, including management fees, distribution and/or service (12b-1) fees, and other Fund expenses, as applicable. This example is intended to help you understand your ongoing costs (in dollars) of investing in the Fund and to compare these costs with the ongoing costs of investing in other mutual funds.
The example is based on an investment of $1,000 held through the six-month period ended October 31, 2018. The example is for illustrative purposes only; you should consult the Prospectus for information on initial and subsequent minimum investment requirements.
Actual Expenses
The first line for each share class in the table on the following page provides information about actual account values and actual expenses. You may use the information on this line, together with the amount you invested, to estimate the expenses that you paid over the period. Simply divide your account value by $1,000 (for example, an $8,600 account value ÷ $1,000 = 8.6), then multiply the result by the number on the first line under the heading “Expenses Paid During the Six-Month Period” to estimate the expenses you paid on your account during this period.
Hypothetical Example for Comparison Purposes
The second line for each share class in the table on the following page provides information about hypothetical account values and hypothetical expenses based on the Fund’s actual expense ratio and an assumed rate of return of 5% per year before expenses, which is not the Fund’s actual return. The hypothetical account values and expenses may not be used to estimate the actual ending account balance or expenses you paid for the period. You may use this information to compare the ongoing costs of investing in the Fund and other funds. To do so, compare this 5% hypothetical example with the 5% hypothetical examples that appear in the shareholder reports of the other funds.
The Fund’s transfer agent may charge additional fees to holders of certain accounts that are not included in the expenses shown in the table on the following page. These fees apply to individual retirement accounts (IRAs) and Section 403(b) accounts. As of the close of the six-month period covered by the table, IRA fees included an annual maintenance fee of $15 per account (subject to a maximum annual maintenance fee of $25 for all accounts held by the same shareholder). Section 403(b) accounts are charged an annual $25 fiduciary maintenance fee. Some of the fees may vary in amount, or may be waived, based on your total account balance or the number of PGIM funds, including the Fund, that you own. You should consider the additional fees that were charged to your Fund account over the six-month period when you estimate the total ongoing expenses paid over the period
| | | | |
| PGIM Global Total Return Fund | | | 17 | |
Fees and Expenses (continued)
and the impact of these fees on your ending account value, as these additional expenses are not reflected in the information provided in the expense table. Additional fees have the effect of reducing investment returns.
Please note that the expenses shown in the table are meant to highlight your ongoing costs only and do not reflect any transactional costs such as sales charges (loads). Therefore, the second line for each share class in the table is useful in comparing ongoing costs only and will not help you determine the relative total costs of owning different funds. In addition, if these transactional costs were included, your costs would have been higher.
| | | | | | | | | | | | | | | | | | |
| PGIM Global Total Return Fund | | Beginning Account
Value May 1, 2018 | | | Ending Account
Value October 31, 2018 | | | Annualized
Expense Ratio
Based on the
Six-Month Period | | | Expenses Paid
During the
Six-Month Period* | |
| Class A | | Actual | | $ | 1,000.00 | | | $ | 954.70 | | | | 0.88 | % | | $ | 4.34 | |
| | Hypothetical | | $ | 1,000.00 | | | $ | 1,020.77 | | | | 0.88 | % | | $ | 4.48 | |
| Class B | | Actual | | $ | 1,000.00 | | | $ | 951.10 | | | | 1.63 | % | | $ | 8.02 | |
| | Hypothetical | | $ | 1,000.00 | | | $ | 1,016.99 | | | | 1.63 | % | | $ | 8.29 | |
| Class C | | Actual | | $ | 1,000.00 | | | $ | 951.00 | | | | 1.63 | % | | $ | 8.02 | |
| | Hypothetical | | $ | 1,000.00 | | | $ | 1,016.99 | | | | 1.63 | % | | $ | 8.29 | |
| Class Z | | Actual | | $ | 1,000.00 | | | $ | 956.10 | | | | 0.63 | % | | $ | 3.11 | |
| | Hypothetical | | $ | 1,000.00 | | | $ | 1,022.03 | | | | 0.63 | % | | $ | 3.21 | |
| Class R2 | | Actual | | $ | 1,000.00 | | | $ | 954.20 | | | | 1.08 | % | | $ | 5.32 | |
| | Hypothetical | | $ | 1,000.00 | | | $ | 1,019.76 | | | | 1.08 | % | | $ | 5.50 | |
| Class R4 | | Actual | | $ | 1,000.00 | | | $ | 956.90 | | | | 0.83 | % | | $ | 4.09 | |
| | Hypothetical | | $ | 1,000.00 | | | $ | 1,021.02 | | | | 0.83 | % | | $ | 4.23 | |
| Class R6** | | Actual | | $ | 1,000.00 | | | $ | 956.60 | | | | 0.59 | % | | $ | 2.91 | |
| | | Hypothetical | | $ | 1,000.00 | | | $ | 1,022.23 | | | | 0.59 | % | | $ | 3.01 | |
*Fund expenses (net of fee waivers or subsidies, if any) for each share class are equal to the annualized expense ratio for each share class (provided in the table), multiplied by the average account value over the period, multiplied by the 184 days in the six-month period ended October 31, 2018, and divided by the 365 days in the Fund’s fiscal year ended October 31, 2018 (to reflect the six-month period). Expenses presented in the table include the expenses of any underlying portfolios in which the Fund may invest.
**Formerly known as Class Q shares.
| | |
| 18 | | Visit our website at pgiminvestments.com |
Schedule of Investments
as of October 31, 2018
| | | | | | | | | | | | | | | | |
| Description | | Interest
Rate | | | Maturity
Date | | | Principal
Amount (000)# | | | Value | |
LONG-TERM INVESTMENTS 97.5% | | | | | | | | | | | | | | | | |
| | | | |
ASSET-BACKED SECURITIES 19.3% | | | | | | | | | | | | | | | | |
| | | | |
Cayman Islands 11.7% | | | | | | | | | | | | | | | | |
ArrowMark Colorado Holdings,
Series 2017-06A, Class A1, 144A, 3 Month LIBOR + 1.280% | | | 3.716 | %(c) | | | 07/15/29 | | | | 500 | | | $ | 500,611 | |
Atlas Senior Loan Fund Ltd.,
Series 2017-08A, Class A, 144A, 3 Month LIBOR + 1.300% | | | 3.736 | (c) | | | 01/16/30 | | | | 500 | | | | 499,674 | |
Bain Capital Credit CLO,
Series 2018-01A, Class A1, 144A, 3 Month LIBOR + 0.960% | | | 3.437 | (c) | | | 04/23/31 | | | | 3,500 | | | | 3,497,551 | |
Ballyrock CLO Ltd.,
Series 2016-01A, Class A, 144A, 3 Month LIBOR + 1.590% | | | 4.026 | (c) | | | 10/15/28 | | | | 3,000 | | | | 3,013,763 | |
Battalion CLO Ltd.,
Series 2015-08A, Class A1R, 144A, 3 Month LIBOR + 1.340% | | | 3.673 | (c) | | | 07/18/30 | | | | 2,000 | | | | 2,005,170 | |
Benefit Street Partners CLO Ltd., | | | | | | | | | | | | | | | | |
Series 2013-IIA, Class A1R, 144A, 3 Month LIBOR + 1.250% | | | 3.686 | (c) | | | 07/15/29 | | | | 1,250 | | | | 1,251,673 | |
Series 2017-12A, Class A1, 144A, 3 Month LIBOR + 1.250% | | | 3.686 | (c) | | | 10/15/30 | | | | 750 | | | | 751,097 | |
Brookside Mill CLO Ltd.,
Series 2013-01A, Class BR, 144A, 3 Month LIBOR + 1.350% | | | 3.799 | (c) | | | 01/17/28 | | | | 4,000 | | | | 3,971,276 | |
Canyon Capital CLO Ltd.,
Series 2015-01A, Class AS, 144A, 3 Month LIBOR + 1.250% | | | 3.686 | (c) | | | 04/15/29 | | | | 3,750 | | | | 3,758,104 | |
Carlyle Global Market Strategies CLO Ltd.,
Series 2014-01A, Class A1R2, 144A, 3 Month LIBOR + 0.970% | | | 3.419 | (c) | | | 04/17/31 | | | | 9,000 | | | | 9,008,679 | |
Carlyle US CLO Ltd.,
Series 2018-01A, Class A1, 144A, 3 Month LIBOR + 1.020% | | | 3.489 | (c) | | | 04/20/31 | | | | 12,500 | | | | 12,471,077 | |
Catamaran CLO Ltd.,
Series 2014-01A, Class A1AR, 144A, 3 Month LIBOR + 1.260% | | | 3.729 | (c) | | | 04/22/30 | | | | 2,500 | | | | 2,496,448 | |
Cent CLO Ltd.,
Series C17A, Class A1AR, 144A, 3 Month LIBOR + 1.030% | | | 3.330 | (c) | | | 04/30/31 | | | | 15,000 | | | | 14,976,607 | |
Greywolf CLO Ltd.,
Series 2018-01A, Class A1, 144A, 3 Month LIBOR + 1.030% | | | 3.538 | (c) | | | 04/26/31 | | | | 7,000 | | | | 6,957,979 | |
See Notes to Financial Statements.
| | | | |
| PGIM Global Total Return Fund | | | 19 | |
Schedule of Investments (continued)
as of October 31, 2018
| | | | | | | | | | | | | | | | |
| Description | | Interest
Rate | | | Maturity
Date | | | Principal
Amount (000)# | | | Value | |
ASSET-BACKED SECURITIES (Continued) | | | | | | | | | | | | | | | | |
| | | | |
Cayman Islands (cont’d.) | | | | | | | | | | | | | | | | |
ICG US CLO Ltd.,
Series 2017-02A, Class A1, 144A, 3 Month LIBOR + 1.280% | | | 3.757 | %(c) | | | 10/23/29 | | | | 3,500 | | | $ | 3,506,676 | |
KVK CLO Ltd., | | | | | | | | | | | | | | | | |
Series 2014-01A, Class A1R, 144A, 3 Month LIBOR + 1.300% | | | 3.614 | (c) | | | 05/15/26 | | | | 2,455 | | | | 2,455,679 | |
Series 2018-01A, Class B, 144A, 3 Month LIBOR + 1.650% | | | 3.981 | (c) | | | 05/20/29 | | | | 5,000 | | | | 5,007,854 | |
Mariner CLO Ltd.,
Series 2018-05A, Class A, 144A, 3 Month LIBOR + 1.110% | | | 3.600 | (c) | | | 04/25/31 | | | | 6,250 | | | | 6,227,069 | |
MidOcean Credit CLO, | | | | | | | | | | | | | | | | |
Series 2018-08A, Class B, 144A, 3 Month LIBOR + 1.650% | | | 3.972 | (c) | | | 02/20/31 | | | | 2,000 | | | | 1,991,540 | |
Series 2018-09A, Class A1, 144A, 3 Month LIBOR + 1.150% | | | 3.397 | (c) | | | 07/20/31 | | | | 2,000 | | | | 1,996,008 | |
Mountain View CLO Ltd.,
Series 2015-09A, Class A2R, 144A, 3 Month LIBOR + 1.780% | | | 4.216 | (c) | | | 07/15/31 | | | | 5,750 | | | | 5,743,787 | |
OCP CLO Ltd.,
Series 2017-13A, Class A1A, 144A, 3 Month LIBOR + 1.260% | | | 3.696 | (c) | | | 07/15/30 | | | | 750 | | | | 751,140 | |
OZLM Ltd., | | | | | | | | | | | | | | | | |
Series 2014-06A, Class A1S, 144A, 3 Month LIBOR + 1.080% | | | 3.529 | (c) | | | 04/17/31 | | | | 5,500 | | | | 5,464,156 | |
Series 2014-06A, Class A2AS, 144A, 3 Month LIBOR + 1.750% | | | 4.199 | (c) | | | 04/17/31 | | | | 2,000 | | | | 1,998,625 | |
Series 2015-11A, Class A1R, 144A, 3 Month LIBOR + 1.250% | | | 3.770 | (c) | | | 10/30/30 | | | | 1,000 | | | | 1,001,703 | |
Series 2018-20A, Class A1, 144A, 3 Month LIBOR + 1.050% | | | 3.519 | (c) | | | 04/20/31 | | | | 5,000 | | | | 4,996,101 | |
Series 2018-20A, Class A2, 144A, 3 Month LIBOR + 1.650% | | | 4.119 | (c) | | | 04/20/31 | | | | 3,000 | | | | 2,997,569 | |
Palmer Square CLO Ltd., | | | | | | | | | | | | | | | | |
Series 2015-01A, Class A1R, 144A, 3 Month LIBOR + 1.300% | | | 3.612 | (c) | | | 05/21/29 | | | | 3,750 | | | | 3,756,306 | |
Series 2015-02A, Class A1AR, 144A, 3 Month LIBOR + 1.270% | | | 3.739 | (c) | | | 07/20/30 | | | | 1,750 | | | | 1,752,720 | |
Regatta Funding Ltd., | | | | | | | | | | | | | | | | |
Series 2016-01A, Class A1, 144A, 3 Month LIBOR + 1.520% | | | 3.858 | (c) | | | 12/20/28 | | | | 2,000 | | | | 2,002,251 | |
See Notes to Financial Statements.
| | | | | | | | | | | | | | | | |
| Description | | Interest
Rate | | | Maturity
Date | | | Principal
Amount (000)# | | | Value | |
ASSET-BACKED SECURITIES (Continued) | | | | | | | | | | | | | | | | |
| | | | |
Cayman Islands (cont’d.) | | | | | | | | | | | | | | | | |
Regatta Funding Ltd., (cont’d.) | | | | | | | | | | | | | | | | |
Series 2017-01A, Class A, 144A, 3 Month LIBOR + 1.250% | | | 3.699 | %(c) | | | 10/17/30 | | | | 2,000 | | | $ | 2,003,013 | |
Shackleton CLO Ltd., | | | | | | | | | | | | | | | | |
Series 2014-05RA, Class A, 144A, 3 Month LIBOR + 1.100% | | | 3.463 | (c) | | | 05/07/31 | | | | 5,000 | | | | 4,986,260 | |
Series 2014-05RA, Class B, 144A, 3 Month LIBOR + 1.700% | | | 4.063 | (c) | | | 05/07/31 | | | | 6,500 | | | | 6,498,273 | |
Silver Creek CLO Ltd.,
Series 2014-01A, Class AR, 144A, 3 Month LIBOR + 1.240% | | | 3.709 | (c) | | | 07/20/30 | | | | 500 | | | | 500,694 | |
Sound Point CLO Ltd., | | | | | | | | | | | | | | | | |
Series 2016-02A, Class A, 144A, 3 Month LIBOR + 1.660% | | | 4.129 | (c) | | | 10/20/28 | | | | 1,000 | | | | 1,000,274 | |
Series 2017-03A, Class A1B, 144A, 3 Month LIBOR + 1.220% | | | 3.689 | (c) | | | 10/20/30 | | | | 500 | | | | 498,951 | |
Structured Asset Investment Loan Trust,
Series 2003-BC09, Class 2A, 1 Month LIBOR + 0.950% | | | 3.231 | (c) | | | 08/25/33 | | | | 1,816 | | | | 1,773,030 | |
TCW CLO Ltd.,
Series 2018-01A, Class A1A, 144A, 3 Month LIBOR + 1.050% | | | 3.540 | (c) | | | 04/25/31 | | | | 15,000 | | | | 14,933,722 | |
Telos CLO Ltd.,
Series 2013-03A, Class AR, 144A, 3 Month LIBOR + 1.300% | | | 3.749 | (c) | | | 07/17/26 | | | | 1,000 | | | | 1,001,874 | |
TIAA CLO Ltd.,
Series 2016-01A, Class AR, 144A, 3 Month LIBOR + 1.200% | | | 3.669 | (c) | | | 07/20/31 | | | | 2,000 | | | | 2,000,536 | |
TICP CLO Ltd.,
Series 2015-01A, Class BR, 144A, 3 Month LIBOR + 1.300% | | | 3.769 | (c) | | | 07/20/27 | | | | 5,187 | | | | 5,151,746 | |
Trinitas CLO Ltd., | | | | | | | | | | | | | | | | |
Series 2015-03A, Class BR, 144A, 3 Month LIBOR + 1.400% | | | 3.836 | (c) | | | 07/15/27 | | | | 5,000 | | | | 4,965,239 | |
Series 2016-05A, Class A, 144A, 3 Month LIBOR + 1.700% | | | 4.190 | (c) | | | 10/25/28 | | | | 3,000 | | | | 3,001,076 | |
Series 2017-06A, Class A, 144A, 3 Month LIBOR + 1.320% | | | 3.810 | (c) | | | 07/25/29 | | | | 2,500 | | | | 2,505,193 | |
Tryon Park CLO Ltd., | | | | | | | | | | | | | | | | |
Series 2013-01A, Class A2R, 144A, 3 Month LIBOR + 1.500% | | | 3.936 | (c) | | | 04/15/29 | | | | 3,700 | | | | 3,691,878 | |
See Notes to Financial Statements.
| | | | |
| PGIM Global Total Return Fund | | | 21 | |
Schedule of Investments (continued)
as of October 31, 2018
| | | | | | | | | | | | | | | | |
| Description | | Interest
Rate | | | Maturity
Date | | | Principal
Amount (000)# | | | Value | |
ASSET-BACKED SECURITIES (Continued) | | | | | | | | | | | | | | | | |
| | | | |
Cayman Islands (cont’d.) | | | | | | | | | | | | | | | | |
Voya CLO Ltd.,
Series 2013-02A, Class A1R, 144A, 3 Month LIBOR + 0.970% | | | 3.460 | %(c) | | | 04/25/31 | | | | 4,500 | | | $ | 4,474,766 | |
Wellfleet CLO Ltd., | | | | | | | | | | | | | | | | |
Series 2017-02A, Class A1, 144A, 3 Month LIBOR + 1.250% | | | 3.719 | (c) | | | 10/20/29 | | | | 1,500 | | | | 1,502,488 | |
Series 2017-03A, Class A1, 144A, 3 Month LIBOR + 1.150% | | | 3.599 | (c) | | | 01/17/31 | | | | 2,500 | | | | 2,493,463 | |
York CLO Ltd.,
Series 2015-01A, Class AR, 144A, 3 Month LIBOR + 1.150% | | | 3.619 | (c) | | | 01/22/31 | | | | 5,000 | | | | 4,989,914 | |
Zais CLO Ltd., | | | | | | | | | | | | | | | | |
Series 2015-03A, Class A2R, 144A, 3 Month LIBOR + 2.190% | | | 4.626 | (c) | | | 07/15/31 | | | | 8,500 | | | | 8,504,562 | |
Series 2017-01A, Class A1, 144A, 3 Month LIBOR + 1.370% | | | 3.806 | (c) | | | 07/15/29 | | | | 4,250 | | | | 4,259,903 | |
Series 2017-02A, Class A, 144A, 3 Month LIBOR + 1.290% | | | 3.726 | (c) | | | 04/15/30 | | | | 750 | | | | 754,054 | |
Series 2018-01A, Class A, 144A, 3 Month LIBOR + 0.950% | | | 3.386 | (c) | | | 04/15/29 | | | | 7,250 | | | | 7,187,280 | |
| | | | | | | | | | | | | | | | |
| | | | | | | | | | | | | | | 205,487,082 | |
| | | | |
Ireland 0.9% | | | | | | | | | | | | | | | | |
Arbour CLO Ltd.,
Series 2018-03A, Class B1R, 144A | | | 1.920 | (cc) | | | 03/15/29 | | | EUR | 4,000 | | | | 4,523,311 | |
Armada Euro CLO, | | | | | | | | | | | | | | | | |
Series 2018-02A, Class A1, 144A, 3 Month EURIBOR + 0.760% | | | 0.760 | (c) | | | 11/15/31 | | | EUR | 5,500 | | | | 6,155,865 | |
Series 2018-02A, Class A3, 144A | | | 1.500 | (cc) | | | 11/15/31 | | | EUR | 1,500 | | | | 1,697,781 | |
Oak Hill European Credit Partners,
Series 2017-6A, Class A2, 144A | | | 1.150 | | | | 01/20/32 | | | EUR | 3,000 | | | | 3,401,518 | |
| | | | | | | | | | | | | | | | |
| | | | | | | | | | | | | | | 15,778,475 | |
| | | | |
Netherlands 0.1% | | | | | | | | | | | | | | | | |
St Paul’s CLO DAC,
Series 7A, Class B2R, 144A | | | 2.400 | | | | 04/30/30 | | | EUR | 1,000 | | | | 1,140,022 | |
See Notes to Financial Statements.
| | | | | | | | | | | | | | | | |
| Description | | Interest
Rate | | | Maturity
Date | | | Principal
Amount (000)# | | | Value | |
ASSET-BACKED SECURITIES (Continued) | | | | | | | | | | | | | | | | |
| | | | |
Spain 0.5% | | | | | | | | | | | | | | | | |
TFS,
Series 2018-03, Class A1, 1 Month EURIBOR + 2.900% | | | 2.900 | %(c) | | | 03/16/23 | | | EUR | 8,314 | | | $ | 9,417,198 | |
| | | | |
United States 6.1% | | | | | | | | | | | | | | | | |
ABFC Trust,
Series 2004-OPT5, Class A1, 1 Month LIBOR + 0.700% | | | 2.981 | (c) | | | 06/25/34 | | | | 848 | | | | 855,087 | |
ACE Securities Corp. Home Equity Loan Trust,
Series 2005-HE2, Class M4, 1 Month LIBOR + 0.960% | | | 3.241 | (c) | | | 04/25/35 | | | | 521 | | | | 521,290 | |
Ameriquest Mortgage Securities, Inc., Asset-Backed Pass-Through Certificates, | | | | | | | | | | | | | | | | |
Series 2002-2, Class M3, 1 Month LIBOR + 2.655% | | | 4.936 | (c) | | | 08/25/32 | | | | 580 | | | | 575,576 | |
Series 2002-3, Class M3, 1 Month LIBOR + 2.850% | | | 5.131 | (c) | | | 08/25/32 | | | | 301 | | | | 300,965 | |
Series 2004-R08, Class M1, 1 Month LIBOR + 0.960% | | | 3.241 | (c) | | | 09/25/34 | | | | 96 | | | | 95,963 | |
Argent Securities, Inc., Asset-Backed Pass-Through Certificates, | | | | | | | | | | | | | | | | |
Series 2004-W06, Class M1, 1 Month LIBOR + 0.825% | | | 3.106 | (c) | | | 05/25/34 | | | | 61 | | | | 61,164 | |
Series 2005-W02, Class A2C, 1 Month LIBOR + 0.360% | | | 2.641 | (c) | | | 10/25/35 | | | | 536 | | | | 536,966 | |
Battalion CLO Ltd.,
Series 2018-12A, Class A1, 144A, 3 Month LIBOR + 1.070% | | | 3.400 | (c) | | | 05/17/31 | | | | 15,000 | | | | 14,928,884 | |
Bear Stearns Asset-Backed Securities Trust,
Series 2004-HE02, Class M1, 1 Month LIBOR + 0.900% | | | 3.181 | (c) | | | 03/25/34 | | | | 169 | | | | 169,408 | |
Chase Funding Loan Acquisition Trust,
Series 2004-AQ1, Class A2, 1 Month LIBOR + 0.800% | | | 3.081 | (c) | | | 05/25/34 | | | | 237 | | | | 238,520 | |
Chase Funding Trust,
Series 2003-4, Class 2A2, 1 Month LIBOR + 0.600% | | | 2.881 | (c) | | | 05/25/33 | | | | 880 | | | | 856,603 | |
CHEC Loan Trust,
Series 2004-1, Class A3, 144A, 1 Month LIBOR + 1.000% | | | 3.281 | (c) | | | 07/25/34 | | | | 812 | | | | 795,948 | |
CIT Mortgage Loan Trust,
Series 2007-01, Class 1A, 144A, 1 Month LIBOR + 1.350% | | | 3.631 | (c) | | | 10/25/37 | | | | 1,350 | | | | 1,364,502 | |
Countrywide Asset-Backed Certificates,
Series 2002-5, Class MV1, 1 Month LIBOR + 1.500% | | | 3.781 | (c) | | | 03/25/33 | | | | 125 | | | | 125,175 | |
See Notes to Financial Statements.
| | | | |
| PGIM Global Total Return Fund | | | 23 | |
Schedule of Investments (continued)
as of October 31, 2018
| | | | | | | | | | | | | | | | |
| Description | | Interest
Rate | | | Maturity
Date | | | Principal
Amount (000)# | | | Value | |
ASSET-BACKED SECURITIES (Continued) | |
| | | | |
United States (cont’d.) | | | | | | | | | | | | | | | | |
Credit Suisse Mortgage Trust, | | | | | | | | | | | | | | | | |
Series 2016-RPL01, Class A1, 144A, 1 Month LIBOR + 3.150% | | | 5.406 | %(c) | | | 12/26/46 | | | | 1,532 | | | $ | 1,557,202 | |
Series 2018-03R, Class 1A1, 144A, 1 Month LIBOR + 1.200% | | | 3.474 | (c) | | | 12/25/46 | | | | 3,697 | | | | 3,708,319 | |
Series 2018-RPL08, Class A1, 144A | | | 4.125 | | | | 07/25/58 | | | | 3,490 | | | | 3,465,339 | |
EquiFirst Mortgage Loan Trust,
Series 2004-1, Class 1A1, 1 Month LIBOR + 0.480% | | | 2.761 | (c) | | | 01/25/34 | | | | 818 | | | | 794,492 | |
Finance America Mortgage Loan Trust,
Series 2004-02, Class M1, 1 Month LIBOR + 0.825% | | | 3.106 | (c) | | | 08/25/34 | | | | 601 | | | | 599,205 | |
Fremont Home Loan Trust, | | | | | | | | | | | | | | | | |
Series 2004-01, Class M1, 1 Month LIBOR + 0.675% | | | 2.956 | (c) | | | 02/25/34 | | | | 349 | | | | 350,470 | |
Series 2004-B, Class M1, 1 Month LIBOR + 0.870% | | | 3.151 | (c) | | | 05/25/34 | | | | 695 | | | | 685,977 | |
Home Equity Asset Trust,
Series 2005-9, Class 2A4, 1 Month LIBOR + 0.340% | | | 2.621 | (c) | | | 04/25/36 | | | | 163 | | | | 162,966 | |
Laurel Road Prime Student Loan Trust, | | | | | | | | | | | | | | | | |
Series 2018-A, Class A, 144A | | | 3.723 | (cc) | | | 02/25/43 | | | | 3,430 | | | | 4,726,623 | |
Series 2018-C, Class A, 144A | | | 4.491 | (cc) | | | 08/25/43 | | | | 6,015 | | | | 6,091,439 | |
Lendmark Funding Trust, | | | | | | | | | | | | | | | | |
Series 2017-01A, Class B, 144A | | | 3.770 | | | | 12/22/25 | | | | 700 | | | | 695,045 | |
Series 2017-02A, Class B, 144A | | | 3.380 | | | | 05/20/26 | | | | 2,000 | | | | 1,955,427 | |
Series 2017-02A, Class C, 144A | | | 4.330 | | | | 05/20/26 | | | | 700 | | | | 691,995 | |
Long Beach Mortgage Loan Trust, | | | | | | | | | | | | | | | | |
Series 2003-04, Class AV1, 1 Month LIBOR + 0.620% | | | 2.901 | (c) | | | 08/25/33 | | | | 853 | | | | 853,274 | |
Series 2004-03, Class M1, 1 Month LIBOR + 0.855% | | | 3.136 | (c) | | | 07/25/34 | | | | 156 | | | | 155,987 | |
LSFVT,
Series 2018-01, 1 Month LIBOR + 2.000%^ | | | 3.982 | (c) | | | 04/01/21 | | | | 12,734 | | | | 12,695,642 | |
MASTR Asset-Backed Securities Trust, | | | | | | | | | | | | | | | | |
Series 2004-OPT02, Class A1, 1 Month LIBOR + 0.700% | | | 2.981 | (c) | | | 09/25/34 | | | | 2,250 | | | | 2,226,501 | |
Series 2004-WMC2, Class M1, 1 Month LIBOR + 0.900% | | | 3.181 | (c) | | | 04/25/34 | | | | 2,009 | | | | 1,985,310 | |
Merrill Lynch Mortgage Investors Trust,
Series 2004-HE02, Class M1, 1 Month LIBOR + 1.200% | | | 3.481 | (c) | | | 08/25/35 | | | | 77 | | | | 77,595 | |
Morgan Stanley ABS Capital I, Inc. Trust, | | | | | | | | | | | | | | | | |
Series 2003-NC08, Class M1, 1 Month LIBOR + 1.050% | | | 3.331 | (c) | | | 09/25/33 | | | | 161 | | | | 159,445 | |
See Notes to Financial Statements.
| | | | | | | | | | | | | | | | |
| Description | | Interest
Rate | | | Maturity
Date | | | Principal
Amount (000)# | | | Value | |
ASSET-BACKED SECURITIES (Continued) | | | | | | | | | | | | | | | | |
| | | | |
United States (cont’d.) | | | | | | | | | | | | | | | | |
Morgan Stanley ABS Capital I, Inc. Trust, (cont’d.) | | | | | | | | | | | | | |
Series 2004-OP01, Class M1, 1 Month LIBOR + 0.870% | | | 3.151 | %(c) | | | 11/25/34 | | | | 2,378 | | | $ | 2,369,134 | |
Morgan Stanley Dean Witter Capital I, Inc. Trust,
Series 2002-AM3, Class A3, 1 Month LIBOR + 0.980% | | | 3.261 | (c) | | | 02/25/33 | | | | 230 | | | | 225,289 | |
New Century Home Equity Loan Trust, | | | | | | | | | | | | | | | | |
Series 2003-04, Class M1, 1 Month LIBOR + 1.125% | | | 3.406 | (c) | | | 10/25/33 | | | | 201 | | | | 200,885 | |
Series 2005-C, Class A2C, 1 Month LIBOR + 0.250% | | | 2.531 | (c) | | | 12/25/35 | | | | 68 | | | | 67,729 | |
OneMain Direct Auto Receivables Trust, | | | | | | | | | | | | | |
Series 2017-01A, Class C, 144A | | | 3.910 | | | | 08/16/21 | | | | 1,900 | | | | 1,906,085 | |
Series 2017-02A, Class D, 144A | | | 3.420 | | | | 10/15/24 | | | | 700 | | | | 688,846 | |
Series 2017-02A, Class E, 144A | | | 4.740 | | | | 11/14/25 | | | | 1,000 | | | | 989,296 | |
OneMain Financial Issuance Trust, | | | | | | | | | | | | | | | | |
Series 2015-02A, Class C, 144A | | | 4.320 | | | | 07/18/25 | | | | 2,100 | | | | 2,105,961 | |
Series 2016-01A, Class A, 144A | | | 3.660 | | | | 02/20/29 | | | | 1,000 | | | | 1,002,291 | |
Series 2016-02A, Class A, 144A | | | 4.100 | | | | 03/20/28 | | | | 388 | | | | 389,901 | |
Series 2017-01A, Class C, 144A | | | 3.350 | | | | 09/14/32 | | | | 400 | | | | 390,228 | |
Oportun Funding LLC, | | | | | | | | | | | | | | | | |
Series 2016-C, Class A, 144A | | | 3.280 | | | | 11/08/21 | | | | 1,350 | | | | 1,349,924 | |
Series 2017-A, Class A, 144A | | | 3.230 | | | | 06/08/23 | | | | 1,000 | | | | 985,407 | |
Series 2017-B, Class A, 144A | | | 3.220 | | | | 10/10/23 | | | | 2,600 | | | | 2,559,137 | |
Series 2018-A, Class A, 144A | | | 3.610 | | | | 03/08/24 | | | | 1,330 | | | | 1,312,434 | |
Series 2018-C, Class A, 144A | | | 4.100 | | | | 10/08/24 | | | | 2,100 | | | | 2,099,070 | |
Option One Mortgage Acceptance Corp., Asset-Backed Certificates,
Series 2003-06, Class A2, 1 Month LIBOR + 0.660% | | | 2.941 | (c) | | | 11/25/33 | | | | 825 | | | | 808,768 | |
PNMAC FMSR Issuer Trust,
Series 2018-FT01, Class A, 144A, 1 Month LIBOR + 2.350% | | | 4.631 | (c) | | | 04/25/23 | | | | 4,290 | | | | 4,320,895 | |
PNMAC GMSR Issuer Trust, | | | | | | | | | | | | | | | | |
Series 2018-GT01, Class A, 144A, 1 Month LIBOR + 2.850% | | | 5.131 | (c) | | | 02/25/23 | | | | 1,020 | | | | 1,030,892 | |
Series 2018-GT02, Class A, 144A, 1 Month LIBOR + 2.650% | | | 4.931 | (c) | | | 08/25/25 | | | | 2,300 | | | | 2,316,073 | |
Popular ABS Mortgage Pass-Through Trust,
Series 2004-04, Class M1 | | | 4.358 | (cc) | | | 09/25/34 | | | | 110 | | | | 110,970 | |
Santander Drive Auto Receivables Trust,
Series 2017-03, Class C | | | 2.760 | | | | 12/15/22 | | | | 400 | | | | 394,887 | |
SLM Student Loan Trust,
Series 2004-02X, Class A6, 3 Month EURIBOR + 0.550% | | | 0.233 | (c) | | | 07/25/39 | | | EUR | 3,520 | | | | 3,839,953 | |
See Notes to Financial Statements.
| | | | |
| PGIM Global Total Return Fund | | | 25 | |
Schedule of Investments (continued)
as of October 31, 2018
| | | | | | | | | | | | | | | | |
| Description | | Interest
Rate | | | Maturity
Date | | | Principal
Amount (000)# | | | Value | |
ASSET-BACKED SECURITIES (Continued) | | | | | | | | | | | | | |
| | | | |
United States (cont’d.) | | | | | | | | | | | | | | | | |
SLM Student Loan Trust, (cont’d.) | | | | | | | | | | | | | | | | |
Series 2007-02, Class B, 3 Month LIBOR + 0.170% | | | 2.660 | %(c) | | | 07/25/25 | | | | 6,600 | | | $ | 6,038,931 | |
SpringCastle America Funding LLC,
Series 2016-AA, Class A, 144A | | | 3.050 | | | | 04/25/29 | | | | 1,107 | | | | 1,097,808 | |
Springleaf Funding Trust, | | | | | | | | | | | | | | | | |
Series 2015-AA, Class A, 144A | | | 3.160 | | | | 11/15/24 | | | | 370 | | | | 369,868 | |
Series 2017-AA, Class C, 144A | | | 3.860 | | | | 07/15/30 | | | | 800 | | | | 789,494 | |
Structured Asset Investment Loan Trust, | | | | | | | | | | | | | | | | |
Series 2003-BC03, Class M1, 1 Month LIBOR + 1.425% | | | 3.706 | (c) | | | 04/25/33 | | | | 300 | | | | 299,454 | |
Series 2004-08, Class A8, 1 Month LIBOR + 1.000% | | | 3.281 | (c) | | | 09/25/34 | | | | 376 | | | | 376,092 | |
Structured Asset Securities Corp. Mortgage Loan Trust,
Series 2005-NC2, Class M3, 1 Month LIBOR + 0.430% | | | 2.711 | (c) | | | 05/25/35 | | | | 133 | | | | 133,084 | |
VOLT LLC,
Series 2017-NPL07, Class A1, 144A | | | 3.250 | | | | 06/25/47 | | | | 206 | | | | 204,715 | |
| | | | | | | | | | | | | | | | |
| | | | | | | | | | | | | | | 105,837,805 | |
| | | | | | | | | | | | | | | | |
TOTAL ASSET-BACKED SECURITIES
(cost $338,208,007) | | | | | | | | | | | | | | | 337,660,582 | |
| | | | | | | | | | | | | | | | |
|
BANK LOANS 0.0% | |
| | | | |
France 0.0% | | | | | | | | | | | | | | | | |
OBOL France 3 SAS,
Facility B, 1 - 3 Month EURIBOR + 3.583%^ | | | 3.583 | (c) | | | 04/11/23 | | | EUR | 232 | | | | 262,834 | |
| | | | |
United Kingdom 0.0% | | | | | | | | | | | | | | | | |
Richmond UK Bidco Ltd.,
Facility B, 1 Month GBP LIBOR + 4.250% | | | 4.980 | (c) | | | 03/03/24 | | | GBP | 388 | | | | 481,691 | |
| | | | | | | | | | | | | | | | |
TOTAL BANK LOANS
(cost $788,291) | | | | | | | | | | | | | | | 744,525 | |
| | | | | | | | | | | | | | | | |
|
COMMERCIAL MORTGAGE-BACKED SECURITIES 7.5% | |
| | | | |
United States | | | | | | | | | | | | | | | | |
20 Times Square Trust, | | | | | | | | | | | | | | | | |
Series 2018-20TS, Class G, 144A | | | 3.100 | (cc) | | | 05/15/35 | | | | 1,000 | | | | 901,571 | |
Series 2018-20TS, Class H, 144A | | | 3.100 | (cc) | | | 05/15/35 | | | | 1,000 | | | | 879,664 | |
BANK, | | | | | | | | | | | | | | | | |
Series 2017-BNK05, Class A3 | | | 3.020 | | | | 06/15/60 | | | | 3,600 | | | | 3,432,292 | |
See Notes to Financial Statements.
| | | | | | | | | | | | | | | | |
| Description | | Interest
Rate | | | Maturity
Date | | | Principal
Amount (000)# | | | Value | |
COMMERCIAL MORTGAGE-BACKED SECURITIES (Continued) | | | | | | | | | |
| | | | |
United States (cont’d.) | | | | | | | | | | | | | | | | |
BANK, (cont’d.) | | | | | | | | | | | | | | | | |
Series 2017-BNK06, Class A3 | | | 3.125 | % | | | 07/15/60 | | | | 4,400 | | | $ | 4,221,413 | |
Series 2017-BNK07, Class A4 | | | 3.175 | | | | 09/15/60 | | | | 5,000 | | | | 4,694,325 | |
Series 2017-BNK09, Class A3 | | | 3.279 | | | | 11/15/54 | | | | 3,000 | | | | 2,829,655 | |
Benchmark Mortgage Trust, | | | | | | | | | | | | | | | | |
Series 2018-B02, Class A3 | | | 3.544 | | | | 02/15/51 | | | | 5,000 | | | | 4,911,898 | |
Series 2018-B03, Class A3 | | | 3.746 | | | | 04/10/51 | | | | 7,200 | | | | 7,136,315 | |
Citigroup Commercial Mortgage Trust, | | | | | | | | | | | | | | | | |
Series 2014-GC21, Class XB, IO | | | 0.421 | (cc) | | | 05/10/47 | | | | 27,500 | | | | 645,937 | |
Series 2016-GC37, Class XB, IO | | | 0.689 | (cc) | | | 04/10/49 | | | | 33,868 | | | | 1,557,782 | |
Series 2016-P4, Class XB, IO | | | 1.348 | (cc) | | | 07/10/49 | | | | 9,100 | | | | 801,322 | |
Series 2017-P8, Class A2 | | | 3.109 | | | | 09/15/50 | | | | 2,000 | | | | 1,930,118 | |
Series 2018-B02, Class A3 | | | 3.744 | | | | 03/10/51 | | | | 7,500 | | | | 7,354,676 | |
COMM Mortgage Trust, | | | | | | | | | | | | | | | | |
Series 2012-CR01, Class XA, IO | | | 1.869 | (cc) | | | 05/15/45 | | | | 3,543 | | | | 192,240 | |
Series 2014-CR19, Class A3 | | | 3.530 | | | | 08/10/47 | | | | 1,000 | | | | 995,015 | |
Series 2014-UBS4, Class XB, IO, 144A | | | 0.204 | (cc) | | | 08/10/47 | | | | 50,000 | | | | 595,970 | |
Series 2015-CR24, Class A4 | | | 3.432 | | | | 08/10/48 | | | | 4,100 | | | | 4,001,701 | |
CSAIL Commercial Mortgage Trust,
Series 2018-CX11, Class A3 | | | 4.095 | | | | 04/15/51 | | | | 2,250 | | | | 2,272,849 | |
DBJPM Mortgage Trust, | | | | | | | | | | | | | | | | |
Series 2016-C3, Class A3 | | | 2.362 | | | | 08/10/49 | | | | 1,500 | | | | 1,410,535 | |
Series 2017-C6, Class A3 | | | 3.269 | | | | 06/10/50 | | | | 4,400 | | | | 4,265,686 | |
DBWF Mortgage Trust,
Series 2016-85T, Class E, 144A | | | 3.808 | (cc) | | | 12/10/36 | | | | 3,000 | | | | 2,668,382 | |
Eleven Madison Trust Mortgage Trust,
Series 2015-11MD, Class C, 144A | | | 3.555 | (cc) | | | 09/10/35 | | | | 500 | | | | 478,824 | |
FHLMC Multifamily Structured Pass-Through Certificates, | | | | | | | | | | | | | | | | |
Series K006, Class AX1, IO | | | 0.944 | (cc) | | | 01/25/20 | | | | 18,586 | | | | 158,710 | |
Series K007, Class X1, IO | | | 1.035 | (cc) | | | 04/25/20 | | | | 24,942 | | | | 285,936 | |
Series K008, Class X1, IO | | | 1.518 | (cc) | | | 06/25/20 | | | | 11,385 | | | | 214,314 | |
Series K019, Class X1, IO | | | 1.631 | (cc) | | | 03/25/22 | | | | 9,394 | | | | 430,401 | |
Series K020, Class X1, IO | | | 1.412 | (cc) | | | 05/25/22 | | | | 10,832 | | | | 444,288 | |
Series K025, Class X1, IO | | | 0.856 | (cc) | | | 10/25/22 | | | | 19,215 | | | | 544,707 | |
Series K037, Class X1, IO | | | 0.996 | (cc) | | | 01/25/24 | | | | 10,771 | | | | 449,487 | |
Series K043, Class X1, IO | | | 0.543 | (cc) | | | 12/25/24 | | | | 12,322 | | | | 348,495 | |
Series K049, Class X1, IO | | | 0.607 | (cc) | | | 07/25/25 | | | | 41,434 | | | | 1,400,251 | |
Series K052, Class X1, IO | | | 0.669 | (cc) | | | 11/25/25 | | | | 12,460 | | | | 470,291 | |
Series K053, Class X1, IO | | | 0.890 | (cc) | | | 12/25/25 | | | | 45,940 | | | | 2,424,107 | |
Series K054, Class X1, IO | | | 1.177 | (cc) | | | 01/25/26 | | | | 31,200 | | | | 2,165,824 | |
Series K058, Class X1, IO | | | 0.929 | (cc) | | | 08/25/26 | | | | 41,714 | | | | 2,501,741 | |
See Notes to Financial Statements.
| | | | |
| PGIM Global Total Return Fund | | | 27 | |
Schedule of Investments (continued)
as of October 31, 2018
| | | | | | | | | | | | | | | | |
| Description | | Interest
Rate | | | Maturity
Date | | | Principal
Amount (000)# | | | Value | |
COMMERCIAL MORTGAGE-BACKED SECURITIES (Continued) | | | | | | | | | |
| | | | |
United States (cont’d.) | | | | | | | | | | | | | | | | |
FHLMC Multifamily Structured Pass-Through Certificates, (cont’d.) | | | | | | | | | |
Series K717, Class X1, IO | | | 0.480 | %(cc) | | | 09/25/21 | | | | 11,103 | | | $ | 128,225 | |
Series Q001, Class XA, IO | | | 2.273 | (cc) | | | 02/25/32 | | | | 6,633 | | | | 950,611 | |
GS Mortgage Securities Trust, | | | | | | | | | | | | | | | | |
Series 2014-GC20, Class XB, IO | | | 0.431 | (cc) | | | 04/10/47 | | | | 30,000 | | | | 688,083 | |
Series 2014-GC22, Class XB, IO | | | 0.298 | (cc) | | | 06/10/47 | | | | 35,000 | | | | 648,403 | |
Series 2014-GC24, Class XB, IO | | | 0.021 | (cc) | | | 09/10/47 | | | | 83,262 | | | | 84,170 | |
Series 2014-GC26, Class XB, IO | | | 0.294 | (cc) | | | 11/10/47 | | | | 56,483 | | | | 1,073,369 | |
Series 2018-GS09, Class A3 | | | 3.727 | | | | 03/10/51 | | | | 7,000 | | | | 6,831,431 | |
JPMBB Commercial Mortgage Securities Trust,
Series 2016-C01, Class A3 | | | 3.515 | | | | 03/15/49 | | | | 1,500 | | | | 1,468,664 | |
JPMCC Commercial Mortgage Securities Trust, | | | | | | | | | | | | | | | | |
Series 2017-JP05, Class A3 | | | 3.342 | | | | 03/15/50 | | | | 1,600 | | | | 1,557,427 | |
Series 2017-JP06, Class A3 | | | 3.109 | | | | 07/15/50 | | | | 4,600 | | | | 4,453,604 | |
Series 2017-JP07, Class A3 | | | 3.379 | | | | 09/15/50 | | | | 5,100 | | | | 4,958,535 | |
Morgan Stanley Bank of America Merrill Lynch Trust, | | | | | | | | | | | | | | | | |
Series 2015-C24, Class XA, IO | | | 0.792 | (cc) | | | 05/15/48 | | | | 26,500 | | | | 1,069,217 | |
Series 2016-C31, Class A3 | | | 2.731 | | | | 11/15/49 | | | | 2,211 | | | | 2,102,083 | |
Morgan Stanley Capital I Trust, | | | | | | | | | | | | | | | | |
Series 2016-UBS09, Class A2 | | | 2.982 | | | | 03/15/49 | | | | 1,200 | | | | 1,171,204 | |
Series 2017-H01, Class A3 | | | 3.153 | | | | 06/15/50 | | | | 4,500 | | | | 4,350,413 | |
UBS Commercial Mortgage Trust, | | | | | | | | | | | | | | | | |
Series 2017-C04, Class A3 | | | 3.301 | | | | 10/15/50 | | | | 6,500 | | | | 6,156,234 | |
Series 2017-C06, Class A3 | | | 3.581 | | | | 12/15/50 | | | | 5,000 | | | | 4,916,399 | |
Series 2017-C07, Class A3 | | | 3.418 | | | | 12/15/50 | | | | 4,400 | | | | 4,193,830 | |
UBS-Barclays Commercial Mortgage Trust,
Series 2012-C02, Class XA, IO, 144A | | | 1.329 | (cc) | | | 05/10/63 | | | | 4,508 | | | | 176,434 | |
Wells Fargo Commercial Mortgage Trust, | | | | | | | | | | | | | | | | |
Series 2016-C35, Class XB, IO | | | 0.938 | (cc) | | | 07/15/48 | | | | 24,000 | | | | 1,520,340 | |
Series 2016-LC24, Class XB, IO | | | 1.012 | (cc) | | | 10/15/49 | | | | 20,910 | | | | 1,422,208 | |
Series 2017-C40, Class A3 | | | 3.317 | | | | 10/15/50 | | | | 2,600 | | | | 2,462,158 | |
Series 2018-C43, Class A3 | | | 3.746 | | | | 03/15/51 | | | | 8,350 | | | | 8,153,853 | |
| | | | | | | | | | | | | | | | |
TOTAL COMMERCIAL MORTGAGE-BACKED SECURITIES
(cost $135,489,908) | | | | | | | | | | | | 130,553,617 | |
| | | | | | | | | | | | | | | | |
| | | | |
CONVERTIBLE BOND 0.3% | | | | | | | | | | | | | | | | |
| | | | |
United Arab Emirates | | | | | | | | | | | | | | | | |
Aabar Investments PJSC,
Sr. Unsec’d. Notes, EMTN
(cost $6,482,320) | | | 0.500 | | | | 03/27/20 | | | EUR | 5,900 | | | | 6,154,146 | |
| | | | | | | | | | | | | | | | |
See Notes to Financial Statements.
| | | | | | | | | | | | | | | | |
| Description | | Interest
Rate | | | Maturity
Date | | | Principal
Amount (000)# | | | Value | |
CORPORATE BONDS 22.1% | |
| | | | |
Canada 0.9% | | | | | | | | | | | | | | | | |
Barrick Gold Corp.,
Sr. Unsec’d. Notes | | | 5.250 | % | | | 04/01/42 | | | | 35 | | | $ | 35,274 | |
Barrick North America Finance LLC,
Gtd. Notes | | | 5.700 | | | | 05/30/41 | | | | 45 | | | | 47,894 | |
Barrick PD Australia Finance Pty Ltd.,
Gtd. Notes | | | 5.950 | | | | 10/15/39 | | | | 50 | | | | 53,933 | |
Bombardier, Inc.,
Sr. Unsec’d. Notes, 144A | | | 7.500 | | | | 12/01/24 | | | | 3,000 | | | | 3,048,750 | |
Canadian Natural Resources Ltd.,
Sr. Unsec’d. Notes | | | 3.850 | | | | 06/01/27 | | | | 3,000 | | | | 2,842,644 | |
Cenovus Energy, Inc.,
Sr. Unsec’d. Notes(a) | | | 4.250 | | | | 04/15/27 | | | | 3,500 | | | | 3,299,499 | |
Hydro-Quebec, | | | | | | | | | | | | | | | | |
Local Gov’t. Gtd. Notes | | | 8.400 | | | | 01/15/22 | | | | 72 | | | | 82,052 | |
Local Gov’t. Gtd. Notes | | | 8.625 | | | | 06/15/29 | | | | 600 | | | | 847,019 | |
Local Gov’t. Gtd. Notes | | | 9.400 | | | | 02/01/21 | | | | 730 | | | | 824,601 | |
Kinross Gold Corp.,
Gtd. Notes | | | 5.950 | | | | 03/15/24 | | | | 1,000 | | | | 1,022,500 | |
Methanex Corp.,
Sr. Unsec’d. Notes | | | 4.250 | | | | 12/01/24 | | | | 1,500 | | | | 1,464,128 | |
Nutrien Ltd., | | | | | | | | | | | | | | | | |
Sr. Unsec’d. Notes | | | 3.375 | | | | 03/15/25 | | | | 1,450 | | | | 1,359,537 | |
Sr. Unsec’d. Notes | | | 6.125 | | | | 01/15/41 | | | | 25 | | | | 26,754 | |
Ontario Teachers’ Finance Trust, | | | | | | | | | | | | | | | | |
Local Gov’t. Gtd. Notes, 144A | | | 2.125 | | | | 09/19/22 | | | | 1,250 | | | | 1,193,350 | |
Local Gov’t. Gtd. Notes, 144A | | | 2.750 | | | | 04/16/21 | | | | 250 | | | | 247,019 | |
| | | | | | | | | | | | | | | | |
| | | | | | | | | | | | | | | 16,394,954 | |
| | | | |
China 0.5% | | | | | | | | | | | | | | | | |
Aircraft Finance Co. Ltd.,
Sr. Sec’d. Notes, Ser. C | | | 3.955 | | | | 03/29/23 | | | | 1,798 | | | | 1,731,474 | |
China Development Bank,
Sr. Unsec’d. Notes, EMTN | | | 0.500 | | | | 06/01/21 | | | EUR | 1,000 | | | | 1,135,397 | |
CNAC HK Finbridge Co. Ltd.,
Gtd. Notes | | | 1.750 | | | | 06/14/22 | | | EUR | 4,500 | | | | 5,068,839 | |
Sinopec Group Overseas Development 2015 Ltd.,
Gtd. Notes, 144A | | | 2.500 | | | | 04/28/20 | | | | 500 | | | | 492,100 | |
| | | | | | | | | | | | | | | | |
| | | | | | | | | | | | | | | 8,427,810 | |
See Notes to Financial Statements.
| | | | |
| PGIM Global Total Return Fund | | | 29 | |
Schedule of Investments (continued)
as of October 31, 2018
| | | | | | | | | | | | | | | | |
| Description | | Interest
Rate | | | Maturity
Date | | | Principal
Amount (000)# | | | Value | |
CORPORATE BONDS (Continued) | |
|
Dominican Republic 0.1% | |
Mestenio Ltd. for Dominican Republic,
Pass-Through Certificates | | | 8.500 | % | | | 01/02/20 | | | | 938 | | | $ | 963,291 | |
|
France 1.0% | |
Agence Francaise de Developpement,
Sr. Unsec’d. Notes | | | 1.625 | | | | 01/21/20 | | | | 2,000 | | | | 1,965,352 | |
BNP Paribas SA, | | | | | | | | | | | | | | | | |
Sr. Unsec’d. Notes, 144A | | | 3.375 | | | | 01/09/25 | | | | 4,800 | | | | 4,486,811 | |
Sr. Unsec’d. Notes, EMTN | | | 6.420 | | | | 09/11/23 | | | MXN | 250 | | | | 10,483 | |
Credit Agricole Assurances SA,
Sub. Notes | | | 4.250 | | | | 01/29/49 | | | EUR | 2,000 | | | | 2,342,466 | |
Dexia Credit Local SA, | | | | | | | | | | | | | | | | |
Gov’t. Liquid Gtd. Notes | | | 2.250 | | | | 02/18/20 | | | | 250 | | | | 247,206 | |
Gov’t. Liquid Gtd. Notes, 144A | | | 1.875 | | | | 09/15/21 | | | | 1,500 | | | | 1,442,859 | |
Gov’t. Liquid Gtd. Notes, EMTN | | | 0.875 | | | | 09/07/21 | | | GBP | 200 | | | | 252,161 | |
Gov’t. Liquid Gtd. Notes, EMTN | | | 2.000 | | | | 01/22/21 | | | EUR | 1,000 | | | | 1,187,244 | |
Horizon Parent Holdings Sarl,
Sr. Sec’d. Notes, 144A, Cash coupon 8.250% or PIK 9.00% | | | 8.250 | | | | 02/15/22 | | | EUR | 300 | | | | 351,516 | |
SNCF Mobilites,
Sr. Unsec’d. Notes, EMTN | | | 5.375 | | | | 03/18/27 | | | GBP | 1,000 | | | | 1,610,098 | |
SNCF Reseau EPIC, | | | | | | | | | | | | | | | | |
Sr. Unsec’d. Notes | | | 4.700 | | | | 06/01/35 | | | CAD | 1,500 | | | | 1,296,703 | |
Sr. Unsec’d. Notes, EMTN | | | 5.250 | | | | 12/07/28 | | | GBP | 1,000 | | | | 1,652,826 | |
| | | | | | | | | | | | | | | | |
| | | | | | | | | | | | | | | 16,845,725 | |
| | | | |
Germany 0.7% | | | | | | | | | | | | | | | | |
Deutsche Bahn Finance GmbH,
Gtd. Notes, MTN | | | 3.800 | | | | 09/27/27 | | | AUD | 900 | | | | 654,052 | |
Deutsche Bank AG, | | | | | | | | | | | | | | | | |
Sr. Unsec’d. Notes | | | 3.150 | | | | 01/22/21 | | | | 2,760 | | | | 2,691,238 | |
Sr. Unsec’d. Notes | | | 3.950 | | | | 02/27/23 | | | | 3,040 | | | | 2,924,426 | |
Unsec’d. Notes | | | 4.629 | (s) | | | 11/07/22 | | | | 1,814 | | | | 1,492,106 | |
IHO Verwaltungs GmbH, | | | | | | | | | | | | | | | | |
Sr. Sec’d. Notes, 144A, Cash coupon 3.250% or PIK 4.000% | | | 3.250 | | | | 09/15/23 | | | EUR | 480 | | | | 544,349 | |
Sr. Sec’d. Notes, 144A | | | 3.750 | | | | 09/15/26 | | | EUR | 465 | | | | 522,097 | |
Kreditanstalt fuer Wiederaufbau,
Gov’t. Gtd. Notes | | | 4.700 | | | | 06/02/37 | | | CAD | 179 | | | | 160,628 | |
Nidda Healthcare Holding GmbH,
Sr. Sec’d. Notes, 144A | | | 3.500 | | | | 09/30/24 | | | EUR | 1,000 | | | | 1,115,654 | |
See Notes to Financial Statements.
| | | | | | | | | | | | | | | | |
| Description | | Interest
Rate | | | Maturity
Date | | | Principal
Amount (000)# | | | Value | |
CORPORATE BONDS (Continued) | |
|
Germany (cont’d.) | |
Unitymedia Hessen GmbH & Co. KG/Unitymedia NRW GmbH,
Sr. Sec’d. Notes | | | 4.000 | % | | | 01/15/25 | | | EUR | 350 | | | $ | 415,648 | |
Volkswagen International Finance NV,
Gtd. Notes | | | 3.750 | | | | 12/31/49 | | | EUR | 1,000 | | | | 1,171,059 | |
| | | | | | | | | | | | | | | | |
| | | | | | | | | | | | | | | 11,691,257 | |
|
Hungary 0.0% | |
MFB Magyar Fejlesztesi Bank Zrt,
Gov’t. Gtd. Notes | | | 6.250 | | | | 10/21/20 | | | | 400 | | | | 417,302 | |
|
Indonesia 0.1% | |
Pertamina Persero PT,
Sr. Unsec’d. Notes, 144A, MTN | | | 4.300 | | | | 05/20/23 | | | | 500 | | | | 488,170 | |
Perusahaan Listrik Negara PT,
Sr. Unsec’d. Notes, 144A | | | 2.875 | | | | 10/25/25 | | | EUR | 900 | | | | 1,009,733 | |
| | | | | | | | | | | | | | | | |
| | | | | | | | | | | | | | | 1,497,903 | |
|
Israel 0.3% | |
Israel Electric Corp. Ltd., | | | | | | | | | | | | | | | | |
Sr. Sec’d. Notes, 144A, GMTN | | | 4.250 | | | | 08/14/28 | | | | 3,100 | | | | 2,937,374 | |
Sr. Sec’d. Notes, EMTN | | | 3.700 | | | | 05/23/30 | | | JPY | 100,000 | | | | 1,024,407 | |
Sr. Sec’d. Notes, MTN | | | 7.750 | | | | 12/15/27 | | | | 1,000 | | | | 1,186,850 | |
| | | | | | | | | | | | | | | | |
| | | | | | | | | | | | | | | 5,148,631 | |
|
Italy 0.7% | |
Assicurazioni Generali SpA,
Sub. Notes, EMTN | | | 5.500 | | | | 10/27/47 | | | EUR | 2,075 | | | | 2,439,122 | |
Intesa Sanpaolo SpA, | | | | | | | | | | | | | | | | |
Sr. Unsec’d. Notes, 144A | | | 3.125 | | | | 07/14/22 | | | | 2,500 | | | | 2,271,747 | |
Sr. Unsec’d. Notes, 144A | | | 3.375 | | | | 01/12/23 | | | | 310 | | | | 280,719 | |
Moby SpA,
Sr. Sec’d. Notes, 144A | | | 7.750 | | | | 02/15/23 | | | EUR | 450 | | | | 251,047 | |
Nexi Capital SpA,
Sec’d. Notes, 144A | | | 4.125 | | | | 11/01/23 | | | EUR | 2,255 | | | | 2,556,906 | |
Rossini Sarl,
First Lien, 144A | | | 6.750 | | | | 10/30/25 | | | EUR | 1,980 | | | | 2,281,881 | |
Telecom Italia SpA,
Sr. Unsec’d. Notes, EMTN | | | 5.875 | | | | 05/19/23 | | | GBP | 500 | | | | 687,901 | |
See Notes to Financial Statements.
| | | | |
| PGIM Global Total Return Fund | | | 31 | |
Schedule of Investments (continued)
as of October 31, 2018
| | | | | | | | | | | | | | | | |
| Description | | Interest
Rate | | | Maturity
Date | | | Principal
Amount (000)# | | | Value | |
CORPORATE BONDS (Continued) | |
|
Italy (cont’d.) | |
Wind Tre SpA, | | | | | | | | | | | | | | | | |
Sr. Sec’d. Notes, 144A | | | 2.625 | % | | | 01/20/23 | | | EUR | 640 | | | $ | 673,803 | |
Sr. Sec’d. Notes, 144A | | | 3.125 | | | | 01/20/25 | | | EUR | 1,320 | | | | 1,360,532 | |
| | | | | | | | | | | | | | | | |
| | | | | | | | | | | | | | | 12,803,658 | |
|
Japan 0.3% | |
Development Bank of Japan, Inc.,
Sr. Unsec’d. Notes, GMTN | | | 0.375 | | | | 10/21/19 | | | EUR | 700 | | | | 796,224 | |
East Japan Railway Co.,
Sr. Unsec’d. Notes, EMTN | | | 5.250 | | | | 04/22/33 | | | GBP | 1,500 | | | | 2,557,391 | |
Mitsubishi UFJ Financial Group, Inc.,
Sr. Unsec’d. Notes | | | 3.761 | | | | 07/26/23 | | | | 2,100 | | | | 2,089,086 | |
| | | | | | | | | | | | | | | | |
| | | | | | | | | | | | | | | 5,442,701 | |
|
Kazakhstan 0.1% | |
Kazakhstan Temir Zholy National Co. JSC,
Gtd. Notes | | | 3.638 | | | | 06/20/22 | | | CHF | 1,500 | | | | 1,549,104 | |
|
Mexico 1.3% | |
Petroleos Mexicanos,
| | | | | | | | | | | | | | | | |
Gtd. Notes | | | 3.625 | | | | 11/24/25 | | | EUR | 8,820 | | | | 9,640,272 | |
Gtd. Notes, EMTN | | | 1.875 | | | | 04/21/22 | | | EUR | 1,000 | | | | 1,107,726 | |
Gtd. Notes, EMTN | | | 2.500 | | | | 08/21/21 | | | EUR | 600 | | | | 684,298 | |
Gtd. Notes, EMTN | | | 3.750 | | | | 02/21/24 | | | EUR | 3,300 | | | | 3,784,447 | |
Gtd. Notes, EMTN | | | 3.750 | | | | 11/16/25 | | | GBP | 1,900 | | | | 2,265,535 | |
Gtd. Notes, EMTN | | | 3.750 | | | | 04/16/26 | | | EUR | 700 | | | | 765,119 | |
Gtd. Notes, EMTN | | | 4.875 | | | | 02/21/28 | | | EUR | 1,500 | | | | 1,715,956 | |
Gtd. Notes, EMTN | | | 5.125 | | | | 03/15/23 | | | EUR | 1,600 | | | | 1,975,512 | |
Gtd. Notes, EMTN | | | 8.250 | | | | 06/02/22 | | | GBP | 928 | | | | 1,393,173 | |
| | | | | | | | | | | | | | | | |
| | | | | | | | | | | | | | | 23,332,038 | |
|
Netherlands 0.6% | |
ABN AMRO Bank NV,
Sub. Notes, 144A | | | 4.750 | | | | 07/28/25 | | | | 500 | | | | 496,450 | |
BNG Bank NV, | | | | | | | | | | | | | | | | |
Sr. Unsec’d. Notes | | | 5.150 | | | | 03/07/25 | | | CAD | 1,000 | | | | 841,863 | |
Sr. Unsec’d. Notes, EMTN | | | 0.500 | | | | 03/03/21 | | | NZD | 3,000 | | | | 1,860,656 | |
Sr. Unsec’d. Notes, EMTN | | | 0.500 | | | | 03/29/21 | | | NZD | 2,200 | | | | 1,361,990 | |
Sr. Unsec’d. Notes, EMTN | | | 0.500 | | | | 05/12/21 | | | ZAR | 10,000 | | | | 546,623 | |
Sr. Unsec’d. Notes, EMTN | | | 0.500 | | | | 06/22/21 | | | ZAR | 6,000 | | | | 335,935 | |
See Notes to Financial Statements.
| | | | | | | | | | | | | | | | |
| Description | | Interest
Rate | | | Maturity
Date | | | Principal
Amount (000)# | | | Value | |
CORPORATE BONDS (Continued) | |
|
Netherlands (cont’d.) | |
BNG Bank NV, (cont’d.) | | | | | | | | | | | | | | | | |
Sr. Unsec’d. Notes, EMTN | | | 0.500 | % | | | 06/07/22 | | | ZAR | 10,000 | | | $ | 496,729 | |
Sr. Unsec’d. Notes, EMTN | | | 0.500 | | | | 08/15/22 | | | ZAR | 30,000 | | | | 1,462,060 | |
Sr. Unsec’d. Notes, EMTN | | | 7.000 | | | | 12/09/21 | | | AUD | 2,000 | | | | 1,589,584 | |
Sr. Unsec’d. Notes, MTN | | | 3.184 | (s) | | | 04/05/28 | | | CAD | 700 | | | | 377,839 | |
Sr. Unsec’d. Notes, MTN | | | 5.500 | | | | 05/23/22 | | | AUD | 338 | | | | 263,330 | |
ING Bank NV,
Sub. Notes, 144A | | | 5.800 | | | | 09/25/23 | | | | 500 | | | | 523,538 | |
Ziggo Bond Finance BV,
Sr. Unsec’d. Notes | | | 4.625 | | | | 01/15/25 | | | EUR | 750 | | | | 832,493 | |
| | | | | | | | | | | | | | | | |
| | | | | | | | | | | | | | | 10,989,090 | |
|
Peru 0.1% | |
Peru Enhanced Pass-Through Finance Ltd.,
Pass-Through Certificates | | | 2.933 | (s) | | | 06/02/25 | | | | 1,000 | | | | 863,750 | |
|
Portugal 0.1% | |
Infraestruturas de Portugal SA,
Sr. Unsec’d. Notes | | | 4.250 | | | | 12/13/21 | | | EUR | 1,000 | | | | 1,248,570 | |
|
Romania 0.1% | |
Globalworth Real Estate Investments Ltd.,
Sr. Unsec’d. Notes, EMTN | | | 3.000 | | | | 03/29/25 | | | EUR | 2,100 | | | | 2,372,753 | |
|
Russia 0.5% | |
Gazprom OAO Via Gaz Capital SA, | | | | | | | | | | | | | | | | |
Sr. Unsec’d. Notes | | | 2.250 | | | | 07/19/22 | | | CHF | 1,000 | | | | 998,362 | |
Sr. Unsec’d. Notes | | | 4.250 | | | | 04/06/24 | | | GBP | 3,800 | | | | 4,858,395 | |
Sr. Unsec’d. Notes, EMTN | | | 2.850 | | | | 10/25/19 | | | CHF | 2,000 | | | | 2,028,893 | |
Sr. Unsec’d. Notes, EMTN | | | 5.338 | | | | 09/25/20 | | | GBP | 1,200 | | | | 1,597,495 | |
| | | | | | | | | | | | | | | | |
| | | | | | | | | | | | | | | 9,483,145 | |
|
Singapore 0.0% | |
Temasek Financial I Ltd.,
Gtd. Notes, GMTN | | | 3.265 | | | | 02/19/20 | | | SGD | 500 | | | | 365,375 | |
See Notes to Financial Statements.
| | | | |
| PGIM Global Total Return Fund | | | 33 | |
Schedule of Investments (continued)
as of October 31, 2018
| | | | | | | | | | | | | | | | |
| Description | | Interest
Rate | | | Maturity
Date | | | Principal
Amount (000)# | | | Value | |
CORPORATE BONDS (Continued) | |
|
South Africa 0.1% | |
Eskom Holdings SOC Ltd.,
Gov’t. Gtd. Notes, 144A, MTN | | | 6.350 | % | | | 08/10/28 | | | | 1,350 | | | $ | 1,300,793 | |
Sappi Papier Holding GmbH,
Gtd. Notes | | | 3.375 | | | | 04/01/22 | | | EUR | 600 | | | | 689,685 | |
| | | | | | | | | | | | | | | | |
| | | | | | | | | | | | | | | 1,990,478 | |
|
South Korea 0.2% | |
Korea Development Bank (The),
Sr. Unsec’d. Notes, EMTN | | | 4.500 | | | | 11/10/20 | | | CNH | 16,000 | | | | 2,284,516 | |
Korea Hydro & Nuclear Power Co. Ltd.,
Sr. Unsec’d. Notes, EMTN | | | 3.350 | | | | 03/13/28 | | | HKD | 2,000 | | | | 243,246 | |
| | | | | | | | | | | | | | | | |
| | | | | | | | | | | | | | | 2,527,762 | |
|
Spain 0.3% | |
Adif-Alta Velocidad, | | | | | | | | | | | | | | | | |
Sr. Unsec’d. Notes, EMTN | | | 1.875 | | | | 01/28/25 | | | EUR | 2,000 | | | | 2,358,316 | |
Sr. Unsec’d. Notes, EMTN | | | 3.500 | | | | 05/27/24 | | | EUR | 400 | | | | 512,993 | |
Banco Santander SA,
Sr. Unsec’d. Notes | | | 4.250 | | | | 04/11/27 | | | | 2,200 | | | | 2,044,333 | |
| | | | | | | | | | | | | | | | |
| | | | | | | | | | | | | | | 4,915,642 | |
|
Supranational Bank 2.0% | |
African Development Bank, | | | | | | | | | | | | | | | | |
Sr. Unsec’d. Notes, EMTN | | | 0.500 | | | | 09/29/20 | | | AUD | 445 | | | | 301,195 | |
Sr. Unsec’d. Notes, EMTN | | | 0.500 | | | | 09/21/21 | | | NZD | 3,100 | | | | 1,893,742 | |
Sr. Unsec’d. Notes, EMTN | | | 0.500 | | | | 03/13/23 | | | MXN | 20,000 | | | | 686,332 | |
Corp. Andina de Fomento, | | | | | | | | | | | | | | | | |
Sr. Unsec’d. Notes | | | 2.750 | | | | 01/06/23 | | | | 1,350 | | | | 1,300,374 | |
Sr. Unsec’d. Notes | | | 4.375 | | | | 06/15/22 | | | | 3,300 | | | | 3,378,441 | |
Sr. Unsec’d. Notes, MTN | | | 4.000 | | | | 03/31/21 | | | AUD | 1,636 | | | | 1,184,769 | |
EUROFIMA,
Sr. Unsec’d. Notes, EMTN | | | 5.150 | | | | 12/13/19 | | | CAD | 540 | | | | 421,794 | |
European Bank for Reconstruction & Development, | | | | | | | | | | | | | | | | |
Sr. Unsec’d. Notes, GMTN | | | 0.500 | | | | 09/01/23 | | | AUD | 400 | | | | 252,184 | |
Sr. Unsec’d. Notes, GMTN | | | 0.500 | | | | 11/21/23 | | | AUD | 1,200 | | | | 752,038 | |
Sr. Unsec’d. Notes, GMTN | | | 6.450 | | | | 12/13/22 | | | IDR | 60,560,000 | | | | 3,675,626 | |
European Investment Bank, | | | | | | | | | | | | | | | | |
Sr. Unsec’d. Notes, 144A, MTN | | | 4.600 | | | | 01/30/37 | | | CAD | 1,500 | | | | 1,328,334 | |
Sr. Unsec’d. Notes, EMTN | | | 0.500 | | | | 06/21/23 | | | AUD | 2,500 | | | | 1,589,620 | |
Sr. Unsec’d. Notes, EMTN | | | 0.500 | | | | 07/21/23 | | | AUD | 800 | | | | 506,798 | |
See Notes to Financial Statements.
| | | | | | | | | | | | | | | | |
| Description | | Interest
Rate | | | Maturity
Date | | | Principal
Amount (000)# | | | Value | |
CORPORATE BONDS (Continued) | |
|
Supranational Bank (cont’d.) | |
European Investment Bank, (cont’d.) | | | | | | | | | | | | | | | | |
Sr. Unsec’d. Notes, EMTN | | | 0.500 | % | | | 08/10/23 | | | AUD | 1,210 | | | $ | 763,635 | |
Sr. Unsec’d. Notes, EMTN | | | 0.500 | | | | 10/26/23 | | | AUD | 6,930 | | | | 4,358,333 | |
Sr. Unsec’d. Notes, EMTN | | | 1.250 | | | | 05/12/25 | | | SEK | 16,500 | | | | 1,846,589 | |
Sr. Unsec’d. Notes, EMTN | | | 3.250 | | | | 05/24/23 | | | NOK | 10,000 | | | | 1,261,337 | |
Sr. Unsec’d. Notes, EMTN | | | 4.600 | | | | 01/30/37 | | | CAD | 550 | | | | 486,724 | |
Sr. Unsec’d. Notes, EMTN | | | 4.750 | | | | 01/19/21 | | | MXN | 10,000 | | | | 448,884 | |
Inter-American Development Bank, | | | | | | | | | | | | | | | | |
Sr. Unsec’d. Notes, EMTN | | | 0.500 | | | | 05/23/23 | | | CAD | 744 | | | | 509,531 | |
Unsec’d. Notes, EMTN | | | 0.500 | | | | 10/30/20 | | | ZAR | 2,250 | | | | 129,776 | |
Unsec’d. Notes, EMTN | | | 0.500 | | | | 11/30/20 | | | ZAR | 1,840 | | | | 104,871 | |
International Bank for Reconstruction & Development, | | | | | | | | | | | | | | | | |
Sr. Unsec’d. Notes, MTN | | | 0.500 | | | | 03/07/22 | | | AUD | 1,145 | | | | 751,811 | |
Sr. Unsec’d. Notes, MTN | | | 0.500 | | | | 03/28/22 | | | AUD | 200 | | | | 131,113 | |
Sr. Unsec’d. Notes, MTN | | | 0.500 | | | | 07/29/22 | | | AUD | 350 | | | | 226,910 | |
Sr. Unsec’d. Notes, MTN | | | 7.775 | (s) | | | 09/19/22 | | | MXN | 12,500 | | | | 435,405 | |
International Finance Corp., | | | | | | | | | | | | | | | | |
Notes, EMTN | | | 0.500 | | | | 09/13/19 | | | AUD | 2,000 | | | | 1,387,309 | |
Sr. Unsec’d. Notes | | | 4.250 | | | | 07/13/20 | | | PEN | 6,000 | | | | 1,832,499 | |
Sr. Unsec’d. Notes, GMTN | | | 6.000 | | | | 07/25/22 | | | MXN | 20,000 | | | | 892,413 | |
Nordic Investment Bank,
Sr. Unsec’d. Notes, MTN | | | 3.875 | | | | 09/02/25 | | | NZD | 2,000 | | | | 1,370,099 | |
North American Development Bank,
Sr. Unsec’d. Notes | | | 2.400 | | | | 10/26/22 | | | | 750 | | | | 722,488 | |
| | | | | | | | | | | | | | | | |
| | | | | | | | | | | | | | | 34,930,974 | |
|
Switzerland 0.6% | |
Credit Suisse Group AG, | | | | | | | | | | | | | | | | |
Sr. Unsec’d. Notes, 144A | | | 4.207 | | | | 06/12/24 | | | | 2,850 | | | | 2,830,984 | |
Sr. Unsec’d. Notes, 144A | | | 4.282 | | | | 01/09/28 | | | | 2,975 | | | | 2,850,832 | |
Credit Suisse Group Funding Guernsey Ltd.,
Gtd. Notes, EMTN | | | 1.000 | | | | 04/14/23 | | | CHF | 1,000 | | | | 1,013,553 | |
UBS Group Funding Switzerland AG, | | | | | | | | | | | | | | | | |
Gtd. Notes, 144A | | | 2.859 | | | | 08/15/23 | | | | 990 | | | | 948,446 | |
Gtd. Notes, 144A | | | 3.491 | | | | 05/23/23 | | | | 1,100 | | | | 1,075,279 | |
Gtd. Notes, 144A | | | 4.125 | | | | 09/24/25 | | | | 2,500 | | | | 2,459,503 | |
| | | | | | | | | | | | | | | | |
| | | | | | | | | | | | | | | 11,178,597 | |
|
Tunisia 0.0% | |
Banque Centrale de Tunisie International Bond,
Sr. Unsec’d. Notes | | | 4.200 | | | | 03/17/31 | | | JPY | 100,000 | | | | 700,614 | |
See Notes to Financial Statements.
| | | | |
| PGIM Global Total Return Fund | | | 35 | |
Schedule of Investments (continued)
as of October 31, 2018
| | | | | | | | | | | | | | | | |
| Description | | Interest
Rate | | | Maturity
Date | | | Principal
Amount (000)# | | | Value | |
CORPORATE BONDS (Continued) | |
| | | | |
United Arab Emirates 0.2% | | | | | | | | | | | | | | | | |
Abu Dhabi National Energy Co. PJSC,
Sr. Unsec’d. Notes, 144A | | | 4.375 | % | | | 04/23/25 | | | | 1,070 | | | $ | 1,055,523 | |
DP World Ltd.,
Sr. Unsec’d. Notes, 144A | | | 4.250 | | | | 09/25/30 | | | GBP | 1,840 | | | | 2,332,177 | |
| | | | | | | | | | | | | | | | |
| | | | | | | | | | | | | | | 3,387,700 | |
|
United Kingdom 1.6% | |
B&M European Value Retail SA,
Sr. Sec’d. Notes, 144A, MTN | | | 4.125 | | | | 02/01/22 | | | GBP | 400 | | | | 511,613 | |
Bank of England Euro Note,
Sr. Unsec’d. Notes, 144A, MTN | | | 2.500 | | | | 03/05/21 | | | | 4,000 | | | | 3,950,076 | |
Barclays PLC, | | | | | | | | | | | | | | | | |
Sr. Unsec’d. Notes | | | 3.650 | | | | 03/16/25 | | | | 800 | | | | 744,092 | |
Sr. Unsec’d. Notes | | | 4.337 | | | | 01/10/28 | | | | 2,660 | | | | 2,473,111 | |
Sr. Unsec’d. Notes, MTN | | | 4.972 | | | | 05/16/29 | | | | 2,860 | | | | 2,775,526 | |
Sub. Notes | | | 5.200 | | | | 05/12/26 | | | | 3,780 | | | | 3,668,955 | |
CPUK Finance Ltd., | | | | | | | | | | | | | | | | |
Sec’d. Notes, 144A | | | 4.250 | | | | 02/28/47 | | | GBP | 185 | | | | 237,346 | |
Sec’d. Notes, 144A | | | 4.875 | | | | 02/28/47 | | | GBP | 110 | | | | 140,174 | |
HSBC Holdings PLC, | | | | | | | | | | | | | | | | |
Sr. Unsec’d. Notes | | | 5.100 | | | | 04/05/21 | | | | 85 | | | | 87,913 | |
Sub. Notes | | | 4.250 | | | | 08/18/25 | | | | 1,255 | | | | 1,220,668 | |
Lloyds Banking Group PLC, | | | | | | | | | | | | | | | | |
Sr. Unsec’d. Notes | | | 2.907 | | | | 11/07/23 | | | | 1,850 | | | | 1,758,388 | |
Sub. Notes | | | 4.582 | | | | 12/10/25 | | | | 2,250 | | | | 2,169,980 | |
Reynolds American, Inc.,
Gtd. Notes | | | 8.125 | | | | 06/23/19 | | | | 30 | | | | 30,927 | |
Royal Bank of Scotland Group PLC, | | | | | | | | | | | | | | | | |
Sr. Unsec’d. Notes | | | 3.875 | | | | 09/12/23 | | | | 1,000 | | | | 962,013 | |
Sr. Unsec’d. Notes, EMTN | | | 2.000 | | | | 03/08/23 | | | EUR | 700 | | | | 809,458 | |
Sr. Unsec’d. Notes, EMTN | | | 2.500 | | | | 03/22/23 | | | EUR | 1,500 | | | | 1,769,558 | |
Santander UK Group Holdings PLC,
Sr. Unsec’d. Notes | | | 3.571 | | | | 01/10/23 | | | | 3,065 | | | | 2,960,954 | |
Tesco Corporate Treasury Services PLC,
Gtd. Notes, EMTN | | | 2.500 | | | | 07/01/24 | | | EUR | 750 | | | | 888,890 | |
Virgin Media Secured Finance PLC,
Sr. Sec’d. Notes | | | 5.500 | | | | 01/15/25 | | | GBP | 495 | | | | 644,889 | |
| | | | | | | | | | | | | | | | |
| | | | | | | | | | | | | | | 27,804,531 | |
See Notes to Financial Statements.
| | | | | | | | | | | | | | | | |
| Description | | Interest
Rate | | | Maturity
Date | | | Principal
Amount (000)# | | | Value | |
CORPORATE BONDS (Continued) | |
|
United States 9.7% | |
21st Century Fox America, Inc., | | | | | | | | | | | | | | | | |
Gtd. Notes | | | 6.150 | % | | | 03/01/37 | | | | 415 | | | $ | 497,418 | |
Gtd. Notes | | | 6.900 | | | | 08/15/39 | | | | 60 | | | | 76,794 | |
Actuant Corp.,
Gtd. Notes | | | 5.625 | | | | 06/15/22 | | | | 400 | | | | 401,000 | |
Adient Global Holdings Ltd.,
Gtd. Notes, 144A | | | 3.500 | | | | 08/15/24 | | | EUR | 1,234 | | | | 1,223,881 | |
American International Group, Inc.,
Sr. Unsec’d. Notes | | | 1.875 | | | | 06/21/27 | | | EUR | 2,100 | | | | 2,356,163 | |
Amgen, Inc.,
Sr. Unsec’d. Notes | | | 2.600 | | | | 08/19/26 | | | | 600 | | | | 536,893 | |
Anadarko Petroleum Corp.,
Sr. Unsec’d. Notes | | | 6.450 | | | | 09/15/36 | | | | 35 | | | | 37,905 | |
Anthem, Inc.,
Sr. Unsec’d. Notes(a) | | | 4.101 | | | | 03/01/28 | | | | 1,005 | | | | 971,584 | |
AT&T, Inc.,
Sr. Unsec’d. Notes | | | 5.250 | | | | 03/01/37 | | | | 70 | | | | 66,838 | |
Ball Corp.,
Gtd. Notes | | | 4.375 | | | | 12/15/23 | | | EUR | 200 | | | | 252,525 | |
Bank of America Corp., | | | | | | | | | | | | | | | | |
Sr. Unsec’d. Notes | | | 3.419 | | | | 12/20/28 | | | | 2,789 | | | | 2,570,072 | |
Sr. Unsec’d. Notes, GMTN | | | 3.593 | | | | 07/21/28 | | | | 1,780 | | | | 1,673,004 | |
Beazer Homes USA, Inc.,
Gtd. Notes | | | 8.750 | | | | 03/15/22 | | | | 3,500 | | | | 3,526,250 | |
Brixmor Operating Partnership LP,
Sr. Unsec’d. Notes | | | 3.650 | | | | 06/15/24 | | | | 2,000 | | | | 1,921,532 | |
Caledonia Generating LLC,
Sr. Sec’d. Notes, 144A | | | 1.950 | | | | 02/28/22 | | | | 128 | | | | 125,272 | |
Calpine Corp.,
Sr. Unsec’d. Notes(a) | | | 5.750 | | | | 01/15/25 | | | | 4,750 | | | | 4,244,362 | |
Catalent Pharma Solutions, Inc., | | | | | | | | | | | | | | | | |
Gtd. Notes | | | 4.750 | | | | 12/15/24 | | | EUR | 400 | | | | 473,432 | |
Gtd. Notes, 144A | | | 4.750 | | | | 12/15/24 | | | EUR | 350 | | | | 414,253 | |
CCO Holdings LLC/CCO Holdings Capital Corp., | | | | | | | | | | | | | | | | |
Sr. Unsec’d. Notes, 144A | | | 5.500 | | | | 05/01/26 | | | | 1,000 | | | | 975,000 | |
Sr. Unsec’d. Notes, 144A | | | 5.875 | | | | 04/01/24 | | | | 380 | | | | 383,325 | |
Sr. Unsec’d. Notes, 144A | | | 5.875 | | | | 05/01/27 | | | | 675 | | | | 663,188 | |
Celgene Corp.,
Sr. Unsec’d. Notes | | | 3.450 | | | | 11/15/27 | | | | 3,345 | | | | 3,048,098 | |
Cequel Communications Holdings I LLC/Cequel Capital Corp.,
Sr. Unsec’d. Notes, 144A | | | 5.125 | | | | 12/15/21 | | | | 800 | | | | 797,824 | |
See Notes to Financial Statements.
| | | | |
| PGIM Global Total Return Fund | | | 37 | |
Schedule of Investments (continued)
as of October 31, 2018
| | | | | | | | | | | | | | | | |
| Description | | Interest
Rate | | | Maturity
Date | | | Principal
Amount (000)# | | | Value | |
CORPORATE BONDS (Continued) | |
|
United States (cont’d.) | |
Cequel Communications Holdings I LLC/Cequel Capital Corp., (cont’d.) | |
Sr. Unsec’d. Notes, 144A | | | 5.125 | % | | | 12/15/21 | | | | 700 | | | $ | 698,096 | |
Sr. Unsec’d. Notes, 144A | | | 7.500 | | | | 04/01/28 | | | | 2,150 | | | | 2,228,410 | |
CF Industries, Inc., | | | | | | | | | | | | | | | | |
Gtd. Notes | | | 3.450 | | | | 06/01/23 | | | | 600 | | | | 568,680 | |
Sr. Sec’d. Notes, 144A | | | 4.500 | | | | 12/01/26 | | | | 6,451 | | | | 6,332,390 | |
CHS/Community Health Systems, Inc., | | | | | | | | | | | | | | | | |
Gtd. Notes | | | 6.875 | | | | 02/01/22 | | | | 871 | | | | 440,291 | |
Sec’d. Notes, 144A(a) | | | 8.125 | | | | 06/30/24 | | | | 696 | | | | 549,840 | |
Sr. Sec’d. Notes | | | 5.125 | | | | 08/01/21 | | | | 75 | | | | 71,063 | |
Cinemark USA, Inc.,
Gtd. Notes | | | 4.875 | | | | 06/01/23 | | | | 625 | | | | 610,156 | |
Citigroup, Inc., | | | | | | | | | | | | | | | | |
Jr. Sub. Notes, Ser. P | | | 5.950 | | | | 12/29/49 | | | | 700 | | | | 689,937 | |
Sr. Unsec’d. Notes | | | 2.750 | | | | 04/25/22 | | | | 600 | | | | 580,004 | |
Sub. Notes | | | 4.400 | | | | 06/10/25 | | | | 3,000 | | | | 2,971,171 | |
Comcast Corp.,
Gtd. Notes | | | 3.150 | | | | 02/15/28 | | | | 2,000 | | | | 1,837,437 | |
Continental Airlines 2010-1 Class A Pass-Through Trust,
Pass-Through Certificates | | | 4.750 | | | | 07/12/22 | | | | 54 | | | | 54,921 | |
CVS Health Corp.,
Sr. Unsec’d. Notes(a) | | | 4.300 | | | | 03/25/28 | | | | 1,630 | | | | 1,589,618 | |
Delta Air Lines 2007-1 Class A Pass-Through Trust,
Pass-Through Certificates^ | | | 6.821 | | | | 02/10/24 | | | | 133 | | | | 144,688 | |
Delta Air Lines 2010-2 Class A Pass-Through Trust,
Pass-Through Certificates | | | 4.950 | | | | 11/23/20 | | | | 8 | | | | 7,866 | |
Delta Air Lines 2011-1 Class A Pass-Through Trust,
Pass-Through Certificates | | | 5.300 | | | | 10/15/20 | | | | 98 | | | | 98,769 | |
Discovery Communications LLC, | | | | | | | | | | | | | | | | |
Gtd. Notes | | | 2.500 | | | | 09/20/24 | | | GBP | 1,200 | | | | 1,504,007 | |
Gtd. Notes(a) | | | 3.450 | | | | 03/15/25 | | | | 2,500 | | | | 2,347,860 | |
Gtd. Notes(a) | | | 3.950 | | | | 03/20/28 | | | | 1,415 | | | | 1,317,331 | |
DISH DBS Corp.,
Gtd. Notes(a) | | | 7.750 | | | | 07/01/26 | | | | 3,000 | | | | 2,685,000 | |
Dow Chemical Co. (The),
Sr. Unsec’d. Notes | | | 9.400 | | | | 05/15/39 | | | | 152 | | | | 220,703 | |
DXC Technology Co.,
Sr. Unsec’d. Notes | | | 2.875 | | | | 03/27/20 | | | | 1,000 | | | | 990,214 | |
Enterprise Products Operating LLC,
Gtd. Notes | | | 4.150 | | | | 10/16/28 | | | | 1,665 | | | | 1,634,626 | |
See Notes to Financial Statements.
| | | | | | | | | | | | | | | | | | | | |
| Description | | Interest
Rate | | | Maturity
Date | | | Principal
Amount (000)# | | | Value | |
CORPORATE BONDS (Continued) | | | | | | | | | | | | | | | | | | | | |
| | | | | |
United States (cont’d.) | | | | | | | | | | | | | | | | | | | | |
ERAC USA Finance LLC,
Gtd. Notes, 144A | | | 7.000 | % | | | 10/15/37 | | | | | | | | 190 | | | $ | 232,106 | |
Express Scripts Holding Co.,
Gtd. Notes | | | 3.050 | | | | 11/30/22 | | | | | | | | 3,000 | | | | 2,902,815 | |
Ferrellgas Partners LP/Ferrellgas Partners Finance Corp.,
Sr. Unsec’d. Notes(a) | | | 8.625 | | | | 06/15/20 | | | | | | | | 750 | | | | 678,750 | |
Fidelity National Information Services, Inc.,
Sr. Unsec’d. Notes | | | 1.100 | | | | 07/15/24 | | | | EUR | | | | 2,300 | | | | 2,587,856 | |
First Data Corp.,
Gtd. Notes, 144A | | | 7.000 | | | | 12/01/23 | | | | | | | | 1,130 | | | | 1,171,810 | |
Ford Motor Co.,
Sr. Unsec’d. Notes | | | 7.450 | | | | 07/16/31 | | | | | | | | 1,255 | | | | 1,320,805 | |
Ford Motor Credit Co. LLC, | | | | | | | | | | | | | | | | | | | | |
Sr. Unsec’d. Notes(a) | | | 3.815 | | | | 11/02/27 | | | | | | | | 2,300 | | | | 1,977,560 | |
Sr. Unsec’d. Notes | | | 4.134 | | | | 08/04/25 | | | | | | | | 250 | | | | 228,724 | |
Sr. Unsec’d. Notes | | | 4.687 | | | | 06/09/25 | | | | | | | | 2,015 | | | | 1,914,083 | |
General Electric Co.,
Sr. Unsec’d. Notes | | | 2.125 | | | | 05/17/37 | | | | EUR | | | | 1,600 | | | | 1,541,519 | |
General Motors Financial Co., Inc., | | | | | | | | | | | | | | | | | | | | |
Gtd. Notes | | | 3.200 | | | | 07/06/21 | | | | | | | | 370 | | | | 362,225 | |
Gtd. Notes | | | 3.850 | | | | 01/05/28 | | | | | | | | 3,100 | | | | 2,742,329 | |
Gtd. Notes | | | 3.950 | | | | 04/13/24 | | | | | | | | 250 | | | | 240,194 | |
Goldman Sachs Group, Inc. (The), | | | | | | | | | | | | | | | | | | | | |
Jr. Sub. Notes, Ser. L | | | 5.700 | | | | 12/29/49 | | | | | | | | 2,120 | | | | 2,125,300 | |
Jr. Sub. Notes, Ser. M | | | 5.375 | | | | 12/29/49 | | | | | | | | 700 | | | | 705,250 | |
Sr. Unsec’d. Notes | | | 3.500 | | | | 01/23/25 | | | | | | | | 1,500 | | | | 1,435,817 | |
Griffon Corp.,
Gtd. Notes | | | 5.250 | | | | 03/01/22 | | | | | | | | 2,700 | | | | 2,531,250 | |
HCA, Inc.,
Sr. Sec’d. Notes | | | 6.500 | | | | 02/15/20 | | | | | | | | 750 | | | | 774,375 | |
International Lease Finance Corp.,
Sr. Unsec’d. Notes | | | 6.250 | | | | 05/15/19 | | | | | | | | 125 | | | | 126,994 | |
International Paper Co.,
Sr. Unsec’d. Notes | | | 7.300 | | | | 11/15/39 | | | | | | | | 75 | | | | 90,160 | |
IQVIA, Inc.,
Gtd. Notes, 144A | | | 3.500 | | | | 10/15/24 | | | | EUR | | | | 920 | | | | 1,069,703 | |
Jabil, Inc.,
Sr. Unsec’d. Notes(a) | | | 4.700 | | | | 09/15/22 | | | | | | | | 655 | | | | 656,245 | |
JBS USA LUX SA/JBS USA Finance, Inc.,
Gtd. Notes, 144A | | | 5.750 | | | | 06/15/25 | | | | | | | | 545 | | | | 523,200 | |
See Notes to Financial Statements.
| | | | |
| PGIM Global Total Return Fund | | | 39 | |
Schedule of Investments (continued)
as of October 31, 2018
| | | | | | | | | | | | | | | | | | | | |
| Description | | Interest
Rate | | | Maturity
Date | | | Principal
Amount (000)# | | | Value | |
CORPORATE BONDS (Continued) | | | | | | | | | | | | | | | | | | | | |
| | | | | |
United States (cont’d.) | | | | | | | | | | | | | | | | | | | | |
John Sevier Combined Cycle Generation LLC,
Sec’d. Notes | | | 4.626 | % | | | 01/15/42 | | | | | | | | 2,383 | | | $ | 2,468,899 | |
JPMorgan Chase & Co., | | | | | | | | | | | | | | | | | | | | |
Jr. Sub. Notes, Ser. I, 3 Month LIBOR + 3.470% | | | 5.990 | (c) | | | 12/31/49 | | | | | | | | 322 | | | | 323,726 | |
Jr. Sub. Notes, Ser. V | | | 5.000 | | | | 12/31/49 | | | | | | | | 1,000 | | | | 1,000,000 | |
Jr. Sub. Notes, Ser. X | | | 6.100 | | | | 12/29/49 | | | | | | | | 1,980 | | | | 2,012,769 | |
Jr. Sub. Notes, Ser. Z | | | 5.300 | | | | 12/29/49 | | | | | | | | 1,410 | | | | 1,431,150 | |
Sr. Unsec’d. Notes | | | 3.509 | | | | 01/23/29 | | | | | | | | 3,200 | | | | 2,991,127 | |
KB Home,
Gtd. Notes(a) | | | 7.500 | | | | 09/15/22 | | | | | | | | 1,000 | | | | 1,055,000 | |
Kinder Morgan Energy Partners LP,
Gtd. Notes | | | 4.150 | | | | 02/01/24 | | | | | | | | 2,000 | | | | 1,985,861 | |
Kraft Heinz Foods Co.,
Gtd. Notes(a) | | | 3.000 | | | | 06/01/26 | | | | | | | | 2,000 | | | | 1,784,890 | |
L Brands, Inc.,
Gtd. Notes(a) | | | 5.250 | | | | 02/01/28 | | | | | | | | 3,130 | | | | 2,669,264 | |
Lehman Brothers Holdings, Inc.,
Sr. Unsec’d. Notes(d) | | | 6.875 | | | | 05/02/18 | | | | | | | | 100 | | | | 2,000 | |
Liberty Interactive LLC,
Sr. Unsec’d. Notes | | | 8.250 | | | | 02/01/30 | | | | | | | | 150 | | | | 156,750 | |
Liberty Mutual Group, Inc.,
Gtd. Notes, 144A | | | 6.500 | | | | 03/15/35 | | | | | | | | 90 | | | | 103,894 | |
Sr. Unsec’d. Notes | | | 2.750 | | | | 05/04/26 | | | | EUR | | | | 1,000 | | | | 1,200,400 | |
LKQ Italia Bondco SpA,
Gtd. Notes, 144A | | | 3.875 | | | | 04/01/24 | | | | EUR | | | | 450 | | | | 529,267 | |
LYB International Finance II BV,
Gtd. Notes(a) | | | 3.500 | | | | 03/02/27 | | | | | | | | 5,900 | | | | 5,385,988 | |
MGM Resorts International,
Gtd. Notes | | | 6.625 | | | | 12/15/21 | | | | | | | | 500 | | | | 523,595 | |
Micron Technology, Inc.,
Sr. Unsec’d. Notes | | | 5.500 | | | | 02/01/25 | | | | | | | | 315 | | | | 320,160 | |
Morgan Stanley, | | | | | | | | | | | | | | | | | | | | |
Jr. Sub. Notes, Ser. H | | | 5.450 | | | | 12/31/49 | | | | | | | | 1,415 | | | | 1,427,565 | |
Sr. Unsec’d. Notes, EMTN | | | 1.342 | | | | 10/23/26 | | | | EUR | | | | 600 | | | | 663,546 | |
Sr. Unsec’d. Notes, GMTN | | | 1.375 | | | | 10/27/26 | | | | EUR | | | | 1,600 | | | | 1,762,791 | |
MPLX LP, | | | | | | | | | | | | | | | | | | | | |
Sr. Unsec’d. Notes | | | 4.000 | | | | 03/15/28 | | | | | | | | 515 | | | | 483,658 | |
Sr. Unsec’d. Notes | | | 4.125 | | | | 03/01/27 | | | | | | | | 2,000 | | | | 1,908,100 | |
MPT Operating Partnership LP/MPT Finance Corp.,
Gtd. Notes | | | 3.325 | | | | 03/24/25 | | | | EUR | | | | 1,700 | | | | 1,963,608 | |
Nationstar Mortgage Holdings, Inc.,
Gtd. Notes, 144A | | | 8.125 | | | | 07/15/23 | | | | | | | | 1,540 | | | | 1,566,950 | |
See Notes to Financial Statements.
| | | | | | | | | | | | | | | | |
| Description | | Interest
Rate | | | Maturity
Date | | | Principal
Amount (000)# | | | Value | |
CORPORATE BONDS (Continued) | | | | | | | | | | | | | | | | |
| | | | |
United States (cont’d.) | | | | | | | | | | | | | | | | |
Netflix, Inc.,
Sr. Unsec’d. Notes | | | 3.625 | % | | | 05/15/27 | | | EUR | 700 | | | $ | 785,913 | |
Newell Brands, Inc.,
Sr. Unsec’d. Notes(a) | | | 4.200 | | | | 04/01/26 | | | | 1,300 | | | | 1,194,312 | |
Norfolk Southern Corp., | | | | | | | | | | | | | | | | |
Sr. Unsec’d. Notes | | | 3.942 | | | | 11/01/47 | | | | 232 | | | | 204,912 | |
Sr. Unsec’d. Notes | | | 4.050 | | | | 08/15/52 | | | | 165 | | | | 146,284 | |
NRG Energy, Inc.,
Gtd. Notes | | | 6.625 | | | | 01/15/27 | | | | 1,850 | | | | 1,914,750 | |
ONEOK Partners LP,
Gtd. Notes | | | 4.900 | | | | 03/15/25 | | | | 2,000 | | | | 2,048,035 | |
Owens Corning,
Sr. Unsec’d. Notes | | | 4.200 | | | | 12/15/22 | | | | 270 | | | | 269,201 | |
Pacific Gas & Electric Co.,
Sr. Unsec’d. Notes | | | 3.500 | | | | 06/15/25 | | | | 2,788 | | | | 2,596,362 | |
PetSmart, Inc.,
Sr. Sec’d. Notes, 144A | | | 5.875 | | | | 06/01/25 | | | | 675 | | | | 526,500 | |
Phillips 66 Partners LP,
Sr. Unsec’d. Notes(a) | | | 3.605 | | | | 02/15/25 | | | | 2,000 | | | | 1,907,310 | |
PVH Corp., | | | | | | | | | | | | | | | | |
Sr. Unsec’d. Notes, 144A | | | 3.125 | | | | 12/15/27 | | | EUR | 575 | | | | 635,732 | |
Sr. Unsec’d. Notes, 144A | | | 3.625 | | | | 07/15/24 | | | EUR | 840 | | | | 1,030,817 | |
Sally Holdings LLC/Sally Capital, Inc.,
Gtd. Notes(a) | | | 5.625 | | | | 12/01/25 | | | | 2,000 | | | | 1,857,400 | |
Schlumberger Holdings Corp.,
Sr. Unsec’d. Notes, 144A(a) | | | 4.000 | | | | 12/21/25 | | | | 2,000 | | | | 1,978,130 | |
Scientific Games International, Inc., | | | | | | | | | | | | | | | | |
Gtd. Notes | | | 6.625 | | | | 05/15/21 | | | | 1,537 | | | | 1,487,047 | |
Gtd. Notes | | | 10.000 | | | | 12/01/22 | | | | 2,750 | | | | 2,873,750 | |
Sherwin-Williams Co. (The),
Sr. Unsec’d. Notes | | | 3.450 | | | | 08/01/25 | | | | 600 | | | | 570,734 | |
Shire Acquisitions Investments Ireland DAC,
Gtd. Notes | | | 3.200 | | | | 09/23/26 | | | | 2,470 | | | | 2,238,380 | |
Spectrum Brands, Inc.,
Gtd. Notes, 144A | | | 4.000 | | | | 10/01/26 | | | EUR | 675 | | | | 768,296 | |
Sprint Capital Corp.,
Gtd. Notes | | | 8.750 | | | | 03/15/32 | | | | 4,500 | | | | 4,916,250 | |
Sprint Corp.,
Gtd. Notes(a) | | | 7.625 | | | | 02/15/25 | | | | 300 | | | | 311,625 | |
Tempur Sealy International, Inc.,
Gtd. Notes | | | 5.500 | | | | 06/15/26 | | | | 1,837 | | | | 1,680,855 | |
See Notes to Financial Statements.
| | | | |
| PGIM Global Total Return Fund | | | 41 | |
Schedule of Investments (continued)
as of October 31, 2018
| | | | | | | | | | | | | | | | |
| Description | | Interest
Rate | | | Maturity
Date | | | Principal
Amount (000)# | | | Value | |
CORPORATE BONDS (Continued) | | | | | | | | | | | | | | | | |
| | | | |
United States (cont’d.) | | | | | | | | | | | | | | | | |
Tenet Healthcare Corp.,
Sr. Unsec’d. Notes | | | 8.125 | % | | | 04/01/22 | | | | 2,250 | | | $ | 2,342,812 | |
Textron, Inc.,
Sr. Unsec’d. Notes | | | 7.250 | | | | 10/01/19 | | | | 200 | | | | 206,781 | |
Thermo Fisher Scientific, Inc.,
Sr. Unsec’d. Notes | | | 2.875 | | | | 07/24/37 | | | EUR | 950 | | | | 1,067,971 | |
Time Warner Cable LLC,
Sr. Sec’d. Notes | | | 8.750 | | | | 02/14/19 | | | | 300 | | | | 304,630 | |
Tote Shipholdings, Inc.,
U.S. Gov’t. Gtd. Notes | | | 3.400 | | | | 10/16/40 | | | | 113 | | | | 105,832 | |
U.S. Concrete, Inc.,
Gtd. Notes | | | 6.375 | | | | 06/01/24 | | | | 1,675 | | | | 1,559,844 | |
United Airlines 2007-1 Class A Pass-Through Trust,
Pass-Through Certificates | | | 6.636 | | | | 07/02/22 | | | | 71 | | | | 74,033 | |
United Rentals North America, Inc., | | | | | | | | | | | | | | | | |
Gtd. Notes | | | 4.875 | | | | 01/15/28 | | | | 1,715 | | | | 1,545,129 | |
Gtd. Notes | | | 5.500 | | | | 05/15/27 | | | | 500 | | | | 474,375 | |
Vistra Operations Co. LLC,
Gtd. Notes, 144A | | | 5.500 | | | | 09/01/26 | | | | 2,100 | | | | 2,068,500 | |
Warner Media LLC,
Gtd. Notes | | | 3.800 | | | | 02/15/27 | | | | 85 | | | | 79,644 | |
WestRock MWV LLC,
Sr. Unsec’d. Notes | | | 7.375 | | | | 09/01/19 | | | | 450 | | | | 464,587 | |
WestRock RKT Co.,
Gtd. Notes | | | 4.450 | | | | 03/01/19 | | | | 175 | | | | 175,823 | |
William Lyon Homes, Inc.,
Gtd. Notes | | | 7.000 | | | | 08/15/22 | | | | 800 | | | | 799,000 | |
Williams Cos., Inc. (The), | | | | | | | | | | | | | | | | |
Sr. Unsec’d. Notes | | | 3.750 | | | | 06/15/27 | | | | 2,000 | | | | 1,862,277 | |
Sr. Unsec’d. Notes | | | 4.000 | | | | 09/15/25 | | | | 1,500 | | | | 1,449,746 | |
WMG Acquisition Corp.,
Sr. Sec’d. Notes, 144A | | | 4.125 | | | | 11/01/24 | | | EUR | 180 | | | | 211,949 | |
Xerox Corp.,
Sr. Unsec’d. Notes | | | 3.625 | | | | 03/15/23 | | | | 460 | | | | 421,261 | |
XPO Logistics, Inc.,
Gtd. Notes, 144A | | | 6.500 | | | | 06/15/22 | | | | 530 | | | | 543,250 | |
| | | | | | | | | | | | | | | | |
| | | | | | | | | | | | | | | 168,769,758 | |
| | | | | | | | | | | | | | | | |
TOTAL CORPORATE BONDS
(cost $404,783,483) | | | | | | | | | | | | | | | 386,043,113 | |
| | | | | | | | | | | | | | | | |
See Notes to Financial Statements.
| | | | | | | | | | | | | | | | |
| Description | | Interest
Rate | | | Maturity
Date | | | Principal
Amount (000)# | | | Value | |
MUNICIPAL BONDS 0.0% | | | | | | | | | | | | | | | | |
| | | | |
Puerto Rico | | | | | | | | | | | | | | | | |
Commonwealth of Puerto Rico,
GO | | | 3.483 | %(cc) | | | 07/01/20 | | | | 300 | | | $ | 300,507 | |
Puerto Rico Sales Tax Financing Corp. Sales Tax Rev.,
Series A, CABs | | | 4.850 | (t) | | | 08/01/41 | | | | 1,265 | | | | 425,280 | |
| | | | | | | | | | | | | | | | |
TOTAL MUNICIPAL BONDS
(cost $650,457) | | | | | | | | | | | | | | | 725,787 | |
| | | | | | | | | | | | | | | | |
| | | | |
RESIDENTIAL MORTGAGE-BACKED SECURITIES 3.0% | | | | | | | | | | | | | | | | |
| | | | |
Bermuda 0.5% | | | | | | | | | | | | | | | | |
Bellemeade Re Ltd., | | | | | | | | | | | | | | | | |
Series 2017-01, Class M1, 144A, 1 Month LIBOR + 1.700% | | | 3.981 | (c) | | | 10/25/27 | | | | 525 | | | | 528,233 | |
Series 2018-01A, Class M1B, 144A, 1 Month LIBOR + 1.600% | | | 3.881 | (c) | | | 04/25/28 | | | | 1,459 | | | | 1,466,612 | |
Series 2018-02A, Class M1A, 144A, 1 Month LIBOR + 0.950% | | | 3.231 | (c) | | | 08/25/28 | | | | 1,950 | | | | 1,952,392 | |
Series 2018-02A, Class M1B, 144A, 1 Month LIBOR + 1.350% | | | 3.631 | (c) | | | 08/25/28 | | | | 750 | | | | 752,348 | |
Series 2018-02A, Class M1C, 144A, 1 Month LIBOR + 1.600% | | | 3.881 | (c) | | | 08/25/28 | | | | 750 | | | | 755,130 | |
Oaktown Re Ltd.,
Series 2018-01A, Class M1, 144A, 1 Month LIBOR + 1.550% | | | 3.831 | (c) | | | 07/25/28 | | | | 900 | | | | 901,086 | |
Radnor RE Ltd.,
Series 2018-01, Class M1, 144A, 1 Month LIBOR + 1.400% | | | 3.681 | (c) | | | 03/25/28 | | | | 1,500 | | | | 1,502,377 | |
| | | | | | | | | | | | | | | | |
| | | | | | | | | | | | | | | 7,858,178 | |
| | | | |
Cayman Islands 0.1% | | | | | | | | | | | | | | | | |
LSTAR Securities Investment Ltd., | | | | | | | | | | | | | | | | |
Series 2017-05, Class A, 144A, 1 Month LIBOR + 2.000% | | | 4.256 | (c) | | | 05/01/22 | | | | 912 | | | | 910,847 | |
Series 2017-08, Class A, 144A, 1 Month LIBOR + 1.650% | | | 3.906 | (c) | | | 11/01/22 | | | | 776 | | | | 781,058 | |
Series 2017-09, Class A, 144A, 1 Month LIBOR + 1.550% | | | 3.806 | (c) | | | 12/01/22 | | | | 290 | | | | 289,082 | |
| | | | | | | | | | | | | | | | |
| | | | | | | | | | | | | | | 1,980,987 | |
See Notes to Financial Statements.
| | | | |
| PGIM Global Total Return Fund | | | 43 | |
Schedule of Investments (continued)
as of October 31, 2018
| | | | | | | | | | | | | | | | |
| Description | | Interest
Rate | | | Maturity
Date | | | Principal
Amount (000)# | | | Value | |
RESIDENTIAL MORTGAGE-BACKED SECURITIES (Continued) | | | | | | | | | |
| | | | |
United Kingdom 1.1% | | | | | | | | | | | | | | | | |
Alba PLC,
Series 2007-01, Class B, 3 Month GBP LIBOR + 0.240% | | | 1.037 | %(c) | | | 03/17/39 | | | GBP | 1,599 | | | $ | 1,897,947 | |
Newgate Funding PLC, | | | | | | | | | | | | | | | | |
Series 2006-02, Class M, 3 Month GBP LIBOR + 0.220% | | | 1.019 | (c) | | | 12/01/50 | | | GBP | 1,689 | | | | 2,034,391 | |
Series 2007-02X, Class A3, 3 Month GBP LIBOR + 0.160% | | | 0.957 | (c) | | | 12/15/50 | | | GBP | 2,700 | | | | 3,164,513 | |
Paragon Mortgages PLC, | | | | | | | | | | | | | | | | |
Series 11X, Class BB, 3 Month EURIBOR + 0.480% | | | 0.162 | (c) | | | 10/15/41 | | | EUR | 3,503 | | | | 3,801,507 | |
Series 12X, Class B1B, 3 Month EURIBOR + 0.480% | | | 0.161 | (c) | | | 11/15/38 | | | EUR | 1,320 | | | | 1,435,171 | |
Ripon Mortgages PLC,
Series 01A, Class B1, 144A, 3 Month GBP LIBOR + 1.200% | | | 2.005 | (c) | | | 08/20/56 | | | GBP | 3,500 | | | | 4,463,389 | |
Towd Point Mortgage Funding PLC, | | | | | | | | | | | | | | | | |
Series 2016-V1A, Class A1, 144A, 3 Month GBP LIBOR + 1.200% | | | 2.005 | (c) | | | 02/20/54 | | | GBP | 889 | | | | 1,139,420 | |
Series 2017-A11A, Class A2, 144A, 3 Month GBP LIBOR + 0.950% | | | 1.755 | (c) | | | 05/20/45 | | | GBP | 1,600 | | | | 2,040,617 | |
| | | | | | | | | | | | | | | | |
| | | | | | | | | | | | | | | 19,976,955 | |
| | | | |
United States 1.3% | | | | | | | | | | | | | | | | |
APS Resecuritization Trust,
Series 2016-01, Class 1A, 144A, 1 Month LIBOR + 0.150% | | | 2.406 | (c) | | | 07/27/57 | | | | 2,087 | | | | 2,020,151 | |
Banc of America Funding Trust,
Series 2014-R05, Class 1A1, 144A, 6 Month LIBOR + 1.500% | | | 4.092 | (c) | | | 09/26/45 | | | | 364 | | | | 372,704 | |
Bellemeade Re Ltd., | | | | | | | | | | | | | | | | |
Series 2018-03A, Class M1A, 144A, 1 Month LIBOR + 1.200% (Cap N/A, Floor 1.200%) | | | 3.480 | (c) | | | 10/25/27 | | | | 630 | | | | 629,606 | |
Series 2018-03A, Class M1B, 144A, 1 Month LIBOR + 1.850% (Cap N/A, Floor 1.850%) | | | 4.130 | (c) | | | 10/25/27 | | | | 950 | | | | 949,997 | |
CIM Trust, | | | | | | | | | | | | | | | | |
Series 2017-02, Class A1, 144A, 1 Month LIBOR + 2.000% | | | 4.256 | (c) | | | 12/25/57 | | | | 2,283 | | | | 2,285,385 | |
Series 2017-03, Class A1, 144A, 1 Month LIBOR + 2.000% | | | 4.256 | (c) | | | 01/25/57 | | | | 2,127 | | | | 2,167,345 | |
Series 2017-08, Class A1, 144A | | | 3.000 | (cc) | | | 12/25/65 | | | | 2,646 | | | | 2,581,979 | |
Fannie Mae Connecticut Avenue Securities,
Series 2016-C04, Class 1M1, 1 Month LIBOR + 1.450% | | | 3.731 | (c) | | | 01/25/29 | | | | 224 | | | | 225,270 | |
See Notes to Financial Statements.
| | | | | | | | | | | | | | | | |
| Description | | Interest
Rate | | | Maturity
Date | | | Principal
Amount (000)# | | | Value | |
RESIDENTIAL MORTGAGE-BACKED SECURITIES (Continued) | | | | | | | | | |
| | | | |
United States (cont’d.) | | | | | | | | | | | | | | | | |
Freddie Mac Structured Agency Credit Risk Debt Notes, | | | | | | | | | | | | | | | | |
Series 2015-DNA01, Class M3, 1 Month LIBOR + 3.300% | | | 5.581 | %(c) | | | 10/25/27 | | | | 1,000 | | | $ | 1,118,521 | |
Series 2016-HQA02, Class M2, 1 Month LIBOR + 2.250% | | | 4.531 | (c) | | | 11/25/28 | | | | 501 | | | | 511,106 | |
IndyMac INDX Mortgage Loan Trust,
Series 2004-AR15, Class 3A1 | | | 3.905 | (cc) | | | 02/25/35 | | | | 1,353 | | | | 1,326,675 | |
LSTAR Securities Investment Trust, | | | | | | | | | | | | | | | | |
Series 2017-06, Class A, 144A, 1 Month LIBOR + 1.750% | | | 4.006 | (c) | | | 09/01/22 | | | | 664 | | | | 667,388 | |
Series 2018-02, Class A1, 144A, 1 Month LIBOR + 1.500% | | | 3.756 | (c) | | | 04/01/23 | | | | 4,996 | | | | 4,998,850 | |
New Residential Mortgage Loan Trust,
Series 2018-04A, Class A1S, 144A, 1 Month LIBOR + 0.750% (Cap N/A, Floor 0.750%) | | | 3.031 | (c) | | | 01/25/48 | | | | 2,534 | | | | 2,533,569 | |
| | | | | | | | | | | | | | | | |
| | | | | | | | | | | | | | | 22,388,546 | |
| | | | | | | | | | | | | | | | |
TOTAL RESIDENTIAL MORTGAGE-BACKED SECURITIES
(cost $51,291,995) | | | | | | | | | | | | | | | 52,204,666 | |
| | | | | | | | | | | | | | | | |
| | | | |
SOVEREIGN BONDS 44.7% | | | | | | | | | | | | | | | | |
| | | | |
Albania 0.1% | | | | | | | | | | | | | | | | |
Albania Government International Bond,
Sr. Unsec’d. Notes | | | 5.750 | | | | 11/12/20 | | | EUR | 352 | | | | 431,184 | |
Republic of Albania,
Sr. Unsec’d. Notes, 144A | | | 3.500 | | | | 10/09/25 | | | EUR | 1,000 | | | | 1,127,547 | |
| | | | | | | | | | | | | | | | |
| | | | | | | | | | | | | | | 1,558,731 | |
| | | | |
Argentina 1.7% | | | | | | | | | | | | | | | | |
Argentine Republic Government International Bond, | | | | | | | | | | | | | | | | |
Bonds | | | 2.260 | (cc) | | | 12/31/38 | | | EUR | 1,000 | | | | 620,236 | |
Bonds | | | 4.330 | | | | 12/31/33 | | | JPY | 519,215 | | | | 2,891,725 | |
Sr. Unsec’d. Notes | | | 3.375 | | | | 10/12/20 | | | CHF | 3,860 | | | | 3,602,948 | |
Sr. Unsec’d. Notes | | | 5.250 | | | | 01/15/28 | | | EUR | 2,540 | | | | 2,208,033 | |
Sr. Unsec’d. Notes | | | 7.820 | | | | 12/31/33 | | | EUR | 3,771 | | | | 3,856,578 | |
Sr. Unsec’d. Notes | | | 7.820 | | | | 12/31/33 | | | EUR | 13,431 | | | | 13,691,054 | |
See Notes to Financial Statements.
| | | | |
| PGIM Global Total Return Fund | | | 45 | |
Schedule of Investments (continued)
as of October 31, 2018
| | | | | | | | | | | | | | | | |
| Description | | Interest
Rate | | | Maturity
Date | | | Principal
Amount (000)# | | | Value | |
SOVEREIGN BONDS (Continued) | | | | | | | | | | | | | | | | |
| | | | |
Argentina (cont’d.) | | | | | | | | | | | | | | | | |
Argentine Republic Government International Bond, (cont’d.) | | | | | | | | | | | | | |
Unsec’d. Notes | | | 5.000 | % | | | 01/15/27 | | | EUR | 3,000 | | | $ | 2,616,679 | |
Provincia de Buenos Aires,
Sr. Unsec’d. Notes | | | 5.375 | | | | 01/20/23 | | | EUR | 1,100 | | | | 1,021,041 | |
| | | | | | | | | | | | | | | | |
| | | | | | | | | | | | | | | 30,508,294 | |
| | | | |
Australia 0.1% | | | | | | | | | | | | | | | | |
Australia Government Bond, | | | | | | | | | | | | | | | | |
Sr. Unsec’d. Notes | | | 3.000 | | | | 03/21/47 | | | AUD | 2,400 | | | | 1,659,580 | |
Sr. Unsec’d. Notes | | | 4.250 | | | | 04/21/26 | | | AUD | 600 | | | | 475,386 | |
| | | | | | | | | | | | | | | | |
| | | | | | | | | | | | | | | 2,134,966 | |
| | | | |
Austria 0.2% | | | | | | | | | | | | | | | | |
Republic of Austria Government International Bond, | | | | | | | | | | | | | | | | |
Sr. Unsec’d. Notes, 144A, EMTN | | | 5.000 | | | | 12/20/24 | | | CAD | 3,500 | | | | 2,920,305 | |
Sr. Unsec’d. Notes, 144A, MTN | | | 5.375 | | | | 12/01/34 | | | CAD | 1,440 | | | | 1,332,789 | |
| | | | | | | | | | | | | | | | |
| | | | | | | | | | | | | | | 4,253,094 | |
| | | | |
Belgium 0.4% | | | | | | | | | | | | | | | | |
Kingdom of Belgium Government Bond, | | | | | | | | | | | | | | | | |
Sr. Unsec’d. Notes, 144A | | | 0.800 | | | | 06/22/27 | | | EUR | 680 | | | | 779,825 | |
Sr. Unsec’d. Notes, 144A | | | 0.800 | | | | 06/22/28 | | | EUR | 1,340 | | | | 1,520,695 | |
Unsec’d. Notes | | | 1.250 | | | | 04/22/33 | | | EUR | 500 | | | | 571,025 | |
Kingdom of Belgium Government International Bond, | | | | | | | | | | | | | | | | |
Notes, 144A | | | 8.875 | | | | 12/01/24 | | | | 750 | | | | 952,910 | |
Sr. Unsec’d. Notes | | | 9.375 | | | | 02/21/20 | | | GBP | 2,402 | | | | 3,392,483 | |
Unsec’d. Notes, MTN | | | 5.700 | | | | 05/28/32 | | | GBP | 150 | | | | 267,648 | |
| | | | | | | | | | | | | | | | |
| | | | | | | | | | | | | | | 7,484,586 | |
| | | | |
Brazil 1.9% | | | | | | | | | | | | | | | | |
Brazil Loan Trust 1,
Gov’t. Gtd. Notes | | | 5.477 | | | | 07/24/23 | | | | 8,036 | | | | 8,103,745 | |
Brazil Minas SPE via State of Minas Gerais,
Gov’t. Gtd. Notes | | | 5.333 | | | | 02/15/28 | | | | 16,950 | | | | 16,420,312 | |
Brazilian Government International Bond,
Sr. Unsec’d. Notes | | | 2.875 | | | | 04/01/21 | | | EUR | 7,128 | | | | 8,349,777 | |
| | | | | | | | | | | | | | | | |
| | | | | | | | | | | | | | | 32,873,834 | |
See Notes to Financial Statements.
| | | | | | | | | | | | | | | | |
| Description | | Interest
Rate | | | Maturity
Date | | | Principal
Amount (000)# | | | Value | |
SOVEREIGN BONDS (Continued) | | | | | | | | | | | | | | | | |
| | | | |
Bulgaria 0.4% | | | | | | | | | | | | | | | | |
Bulgaria Government International Bond,
Unsec’d. Notes, GMTN | | | 3.125 | % | | | 03/26/35 | | | EUR | 6,352 | | | $ | 7,626,228 | |
| | | | |
Canada 0.6% | | | | | | | | | | | | | | | | |
Canada Housing Trust No. 1,
Gov’t. Gtd. Notes, 144A | | | 2.350 | | | | 06/15/23 | | | CAD | 1,500 | | | | 1,121,414 | |
Canadian Government Bond,
Bonds | | | 4.000 | | | | 06/01/41 | | | CAD | 650 | | | | 616,558 | |
City of Toronto, | | | | | | | | | | | | | | | | |
Sr. Unsec’d. Notes | | | 3.500 | | | | 06/02/36 | | | CAD | 2,000 | | | | 1,502,875 | |
Unsec’d. Notes | | | 2.400 | | | | 06/07/27 | | | CAD | 1,000 | | | | 708,671 | |
City of Vancouver,
Unsec’d. Notes | | | 4.500 | | | | 06/01/20 | | | CAD | 200 | | | | 156,560 | |
Province of British Columbia, | | | | | | | | | | | | | | | | |
Unsec’d. Notes | | | 3.200 | | | | 06/18/44 | | | CAD | 200 | | | | 150,294 | |
Unsec’d. Notes | | | 7.875 | | | | 11/30/23 | | | CAD | 2,122 | | | | 1,959,703 | |
Province of Manitoba, | | | | | | | | | | | | | | | | |
Unsec’d. Notes | | | 2.550 | | | | 06/02/26 | | | CAD | 250 | | | | 182,994 | |
Unsec’d. Notes | | | 8.800 | | | | 01/15/20 | | | | 360 | | | | 383,137 | |
Province of Nova Scotia,
Sr. Unsec’d. Notes | | | 8.250 | | | | 11/15/19 | | | | 20 | | | | 20,985 | |
Province of Quebec, | | | | | | | | | | | | | | | | |
Debentures | | | 7.125 | | | | 02/09/24 | | | | 1,139 | | | | 1,332,108 | |
Unsec’d. Notes, MTN | | | 6.350 | | | | 01/30/26 | | | | 500 | | | | 577,286 | |
Unsec’d. Notes, MTN | | | 7.140 | | | | 02/27/26 | | | | 430 | | | | 513,986 | |
Province of Saskatchewan,
Unsec’d. Notes | | | 2.750 | | | | 12/02/46 | | | CAD | 800 | | | | 539,627 | |
| | | | | | | | | | | | | | | | |
| | | | | | | | | | | | | | | 9,766,198 | |
| | | | |
Cayman Islands 0.1% | | | | | | | | | | | | | | | | |
Cayman Islands Government Bond,
Sr. Unsec’d. Notes | | | 5.950 | | | | 11/24/19 | | | | 2,150 | | | | 2,214,500 | |
| | | | |
Chile 0.0% | | | | | | | | | | | | | | | | |
Chile Government International Bond, | | | | | | | | | | | | | | | | |
Sr. Unsec’d. Notes | | | 1.440 | | | | 02/01/29 | | | EUR | 450 | | | | 501,484 | |
Sr. Unsec’d. Notes | | | 1.750 | | | | 01/20/26 | | | EUR | 240 | | | | 281,702 | |
| | | | | | | | | | | | | | | | |
| | | | | | | | | | | | | | | 783,186 | |
See Notes to Financial Statements.
| | | | |
| PGIM Global Total Return Fund | | | 47 | |
Schedule of Investments (continued)
as of October 31, 2018
| | | | | | | | | | | | | | | | |
| Description | | Interest
Rate | | | Maturity
Date | | | Principal
Amount (000)# | | | Value | |
SOVEREIGN BONDS (Continued) | | | | | | | | | | | | | | | | |
| | | | |
China 0.0% | | | | | | | | | | | | | | | | |
China Government Bond,
Sr. Unsec’d. Notes | | | 3.600 | % | | | 06/27/28 | | | CNH | 1,000 | | | $ | 139,310 | |
| | | | |
Colombia 1.1% | | | | | | | | | | | | | | | | |
Colombia Government International Bond, | | | | | | | | | | | | | | | | |
Sr. Unsec’d. Notes | | | 4.000 | | | | 02/26/24 | | | | 1,000 | | | | 987,500 | |
Sr. Unsec’d. Notes | | | 8.375 | | | | 02/15/27 | | | | 2,645 | | | | 2,967,690 | |
Sr. Unsec’d. Notes | | | 10.375 | | | | 01/28/33 | | | | 1,300 | | | | 1,950,000 | |
Sr. Unsec’d. Notes | | | 11.750 | | | | 02/25/20 | | | | 1,715 | | | | 1,895,932 | |
Sr. Unsec’d. Notes, EMTN | | | 3.875 | | | | 03/22/26 | | | EUR | 8,398 | | | | 10,700,937 | |
| | | | | | | | | | | | | | | | |
| | | | | | | | | | | | | | | 18,502,059 | |
| | | | |
Costa Rica 0.1% | | | | | | | | | | | | | | | | |
Costa Rica Government International Bond,
Bonds | | | 4.370 | | | | 05/22/19 | | | | 1,200 | | | | 1,192,518 | |
| | | | |
Croatia 0.7% | | | | | | | | | | | | | | | | |
Croatia Government International Bond, | | | | | | | | | | | | | | | | |
Sr. Unsec’d. Notes | | | 3.000 | | | | 03/20/27 | | | EUR | 4,500 | | | | 5,325,453 | |
Sr. Unsec’d. Notes | | | 3.875 | | | | 05/30/22 | | | EUR | 3,000 | | | | 3,751,316 | |
Sr. Unsec’d. Notes | | | 5.500 | | | | 04/04/23 | | | | 1,000 | | | | 1,048,936 | |
Sr. Unsec’d. Notes | | | 6.375 | | | | 03/24/21 | | | | 500 | | | | 524,762 | |
Sr. Unsec’d. Notes | | | 6.625 | | | | 07/14/20 | | | | 1,000 | | | | 1,043,686 | |
| | | | | | | | | | | | | | | | |
| | | | | | | | | | | | | | | 11,694,153 | |
| | | | |
Cyprus 1.7% | | | | | | | | | | | | | | | | |
Cyprus Government International Bond, | | | | | | | | | | | | | | | | |
Sr. Unsec’d. Notes, EMTN | | | 3.750 | | | | 07/26/23 | | | EUR | 12,755 | | | | 16,015,399 | |
Sr. Unsec’d. Notes, EMTN | | | 4.250 | | | | 11/04/25 | | | EUR | 10,514 | | | | 13,716,537 | |
Sr. Unsec’d. Notes, EMTN | | | 4.750 | | | | 06/25/19 | | | EUR | 500 | | | | 583,261 | |
| | | | | | | | | | | | | | | | |
| | | | | | | | | | | | | | | 30,315,197 | |
| | | | |
Czech Republic 0.1% | | | | | | | | | | | | | | | | |
Czech Republic Government Bond,
Bonds, Ser. 089 | | | 2.400 | | | | 09/17/25 | | | CZK | 30,000 | | | | 1,338,247 | |
| | | | |
Denmark 0.2% | | | | | | | | | | | | | | | | |
Denmark Government Bond, | | | | | | | | | | | | | | | | |
Bonds | | | 0.500 | | | | 11/15/27 | | | DKK | 12,110 | | | | 1,865,156 | |
See Notes to Financial Statements.
| | | | | | | | | | | | | | | | |
| Description | | Interest
Rate | | | Maturity
Date | | | Principal
Amount (000)# | | | Value | |
SOVEREIGN BONDS (Continued) | | | | | | | | | | | | | | | | |
| | | | |
Denmark (cont’d.) | | | | | | | | | | | | | | | | |
Denmark Government Bond, (cont’d.) | | | | | | | | | | | | | | | | |
Bonds | | | 1.750 | % | | | 11/15/25 | | | DKK | 3,520 | | | $ | 596,437 | |
Bonds | | | 3.000 | | | | 11/15/21 | | | DKK | 3,000 | | | | 503,567 | |
Bonds | | | 4.500 | | | | 11/15/39 | | | DKK | 1,800 | | | | 468,882 | |
| | | | | | | | | | | | | | | | |
| | | | | | | | | | | | | | | 3,434,042 | |
| | | | |
Dominican Republic 0.2% | | | | | | | | | | | | | | | | |
Dominican Republic International Bond,
Sr. Unsec’d. Notes | | | 7.500 | | | | 05/06/21 | | | | 4,000 | | | | 4,140,000 | |
| | | | |
Egypt 0.1% | | | | | | | | | | | | | | | | |
Egypt Government International Bond, | | | | | | | | | | | | | | | | |
Sr. Unsec’d. Notes, 144A | | | 5.577 | | | | 02/21/23 | | | | 1,835 | | | | 1,751,287 | |
Sr. Unsec’d. Notes, 144A, MTN | | | 4.750 | | | | 04/16/26 | | | EUR | 700 | | | | 742,094 | |
| | | | | | | | | | | | | | | | |
| | | | | | | | | | | | | | | 2,493,381 | |
| | | | |
Finland 0.0% | | | | | | | | | | | | | | | | |
Finland Government International Bond,
Sr. Unsec’d. Notes | | | 6.950 | | | | 02/15/26 | | | | 600 | | | | 719,300 | |
| | | | |
France 1.6% | | | | | | | | | | | | | | | | |
French Republic Government Bond OAT, | | | | | | | | | | | | | | | | |
Bonds | | | 0.750 | | | | 05/25/28 | | | EUR | 3,900 | | | | 4,442,764 | |
Bonds | | | 2.750 | | | | 10/25/27 | | | EUR | 18,000 | | | | 24,269,388 | |
| | | | | | | | | | | | | | | | |
| | | | | | | | | | | | | | | 28,712,152 | |
| | | | |
Germany 0.1% | | | | | | | | | | | | | | | | |
Free & Hanseatic City of Hamburg,
Sr. Unsec’d. Notes, EMTN | | | 0.500 | | | | 04/27/26 | | | EUR | 1,000 | | | | 1,130,439 | |
| | | | |
Greece 2.7% | | | | | | | | | | | | | | | | |
Hellenic Republic Government Bond, | | | | | | | | | | | | | | | | |
Bonds | | | 0.000 | (cc) | | | 10/15/42 | | | EUR | 500,000 | | | | 1,698,966 | |
Bonds | | | 3.000 | (cc) | | | 02/24/23 | | | EUR | 1,165 | | | | 1,307,806 | |
Bonds | | | 3.000 | (cc) | | | 02/24/24 | | | EUR | 3,854 | | | | 4,295,611 | |
Bonds | | | 3.000 | (cc) | | | 02/24/25 | | | EUR | 2,115 | | | | 2,316,611 | |
Bonds | | | 3.000 | (cc) | | | 02/24/26 | | | EUR | 1,445 | | | | 1,579,314 | |
Bonds | | | 3.000 | (cc) | | | 02/24/27 | | | EUR | 4,924 | | | | 5,314,467 | |
Bonds | | | 3.000 | (cc) | | | 02/24/28 | | | EUR | 1,490 | | | | 1,588,516 | |
See Notes to Financial Statements.
| | | | |
| PGIM Global Total Return Fund | | | 49 | |
Schedule of Investments (continued)
as of October 31, 2018
| | | | | | | | | | | | | | | | |
| Description | | Interest
Rate | | | Maturity
Date | | | Principal
Amount (000)# | | | Value | |
SOVEREIGN BONDS (Continued) | | | | | | | | | | | | | | | | |
| | | | |
Greece (cont’d.) | | | | | | | | | | | | | | | | |
Hellenic Republic Government Bond, (cont’d.) | | | | | | | | | | | | | |
Bonds | | | 3.000 | %(cc) | | | 02/24/29 | | | EUR | 1,420 | | | $ | 1,496,173 | |
Bonds | | | 3.000 | (cc) | | | 02/24/30 | | | EUR | 150 | | | | 155,577 | |
Bonds | | | 3.000 | (cc) | | | 02/24/31 | | | EUR | 3,465 | | | | 3,550,321 | |
Bonds | | | 3.000 | (cc) | | | 02/24/32 | | | EUR | 1,055 | | | | 1,065,293 | |
Bonds | | | 3.000 | (cc) | | | 02/24/33 | | | EUR | 50 | | | | 49,662 | |
Bonds | | | 3.000 | (cc) | | | 02/24/34 | | | EUR | 475 | | | | 463,776 | |
Bonds | | | 3.000 | (cc) | | | 02/24/35 | | | EUR | 2,020 | | | | 1,940,110 | |
Bonds | | | 3.000 | (cc) | | | 02/24/36 | | | EUR | 480 | | | | 454,631 | |
Bonds | | | 3.000 | (cc) | | | 02/24/37 | | | EUR | 200 | | | | 187,086 | |
Bonds | | | 3.000 | (cc) | | | 02/24/38 | | | EUR | 270 | | | | 251,917 | |
Bonds | | | 3.000 | (cc) | | | 02/24/39 | | | EUR | 774 | | | | 720,361 | |
Bonds | | | 3.000 | (cc) | | | 02/24/40 | | | EUR | 460 | | | | 427,626 | |
Bonds | | | 3.000 | (cc) | | | 02/24/41 | | | EUR | 465 | | | | 431,891 | |
Bonds | | | 3.000 | (cc) | | | 02/24/42 | | | EUR | 160 | | | | 148,949 | |
Bonds | | | 3.900 | | | | 01/30/33 | | | EUR | 2,080 | | | | 2,138,744 | |
Sr. Unsec’d. Notes, 144A | | | 3.375 | | | | 02/15/25 | | | EUR | 5,345 | | | | 5,867,640 | |
Hellenic Republic Government International Bond, | | | | | | | | | | | | | | | | |
Sr. Unsec’d. Notes | | | 5.000 | | | | 03/11/19 | | | EUR | 258 | | | | 295,180 | |
Sr. Unsec’d. Notes | | | 5.200 | | | | 07/17/34 | | | EUR | 6,000 | | | | 6,776,835 | |
Sr. Unsec’d. Notes | | | 6.140 | | | | 04/14/28 | | | EUR | 1,700 | | | | 2,116,696 | |
| | | | | | | | | | | | | | | | |
| | | | | | | | | | | | | | | 46,639,759 | |
| | | | |
Guernsey 0.1% | | | | | | | | | | | | | | | | |
States of Guernsey Bond,
Sr. Unsec’d. Notes | | | 3.375 | | | | 12/12/46 | | | GBP | 1,280 | | | | 1,830,258 | |
| | | | |
Hong Kong 0.1% | | | | | | | | | | | | | | | | |
Hong Kong SAR Government Bond,
Unsec’d. Notes | | | 5.125 | | | | 07/23/19 | | | HKD | 5,000 | | | | 651,481 | |
Hong Kong Sukuk 2017 Ltd.,
Sr. Unsec’d. Notes | | | 3.132 | | | | 02/28/27 | | | | 1,500 | | | | 1,419,612 | |
| | | | | | | | | | | | | | | | |
| | | | | | | | | | | | | | | 2,071,093 | |
| | | | |
Hungary 1.2% | | | | | | | | | | | | | | | | |
Hungary Government Bond,
Bonds, Ser. 27/A | | | 3.000 | | | | 10/27/27 | | | HUF | 300,000 | | | | 1,001,306 | |
Hungary Government International Bond, | | | | | | | | | | | | | | | | |
Sr. Unsec’d. Notes | | | 5.375 | | | | 02/21/23 | | | | 4,850 | | | | 5,095,303 | |
Sr. Unsec’d. Notes | | | 5.750 | | | | 11/22/23 | | | | 3,050 | | | | 3,267,319 | |
See Notes to Financial Statements.
| | | | | | | | | | | | | | | | |
| Description | | Interest
Rate | | | Maturity
Date | | | Principal
Amount (000)# | | | Value | |
SOVEREIGN BONDS (Continued) | | | | | | | | | | | | | | | | |
| | | | |
Hungary (cont’d.) | | | | | | | | | | | | | | | | |
Hungary Government International Bond, (cont’d.) | | | | | | | | | | | | | | | | |
Sr. Unsec’d. Notes | | | 6.250 | % | | | 01/29/20 | | | | 6,200 | | | $ | 6,401,500 | |
Sr. Unsec’d. Notes | | | 6.375 | | | | 03/29/21 | | | | 4,530 | | | | 4,795,005 | |
| | | | | | | | | | | | | | | | |
| | | | | | | | | | | | | | | 20,560,433 | |
| | | | |
Iceland 0.4% | | | | | | | | | | | | | | | | |
Iceland Government International Bond, | | | | | | | | | | | | | | | | |
Sr. Unsec’d. Notes | | | 5.875 | | | | 05/11/22 | | | | 1,000 | | | | 1,083,461 | |
Sr. Unsec’d. Notes, EMTN | | | 0.500 | | | | 12/20/22 | | | EUR | 500 | | | | 571,655 | |
Sr. Unsec’d. Notes, EMTN | | | 2.500 | | | | 07/15/20 | | | EUR | 5,006 | | | | 5,916,967 | |
| | | | | | | | | | | | | | | | |
| | | | | | | | | | | | | | | 7,572,083 | |
| | | | |
Indonesia 1.5% | | | | | | | | | | | | | | | | |
Indonesia Government International Bond, | | | | | | | | | | | | | | | | |
Sr. Unsec’d. Notes | | | 1.750 | | | | 04/24/25 | | | EUR | 1,600 | | | | 1,749,451 | |
Sr. Unsec’d. Notes | | | 3.375 | | | | 07/30/25 | | | EUR | 5,005 | | | | 6,002,213 | |
Sr. Unsec’d. Notes, 144A, MTN | | | 2.150 | | | | 07/18/24 | | | EUR | 1,395 | | | | 1,581,966 | |
Sr. Unsec’d. Notes, EMTN | | | 2.150 | | | | 07/18/24 | | | EUR | 2,000 | | | | 2,268,052 | |
Sr. Unsec’d. Notes, EMTN | | | 2.625 | | | | 06/14/23 | | | EUR | 1,000 | | | | 1,173,702 | |
Sr. Unsec’d. Notes, EMTN | | | 2.875 | | | | 07/08/21 | | | EUR | 4,546 | | | | 5,412,628 | |
Sr. Unsec’d. Notes, EMTN | | | 3.750 | | | | 06/14/28 | | | EUR | 7,080 | | | | 8,642,910 | |
| | | | | | | | | | | | | | | | |
| | | | | | | | | | | | | | | 26,830,922 | |
| | | | |
Iraq 0.1% | | | | | | | | | | | | | | | | |
Iraq International Bond,
Sr. Unsec’d. Notes | | | 6.752 | | | | 03/09/23 | | | | 1,700 | | | | 1,654,882 | |
| | | | |
Ireland 0.2% | | | | | | | | | | | | | | | | |
Ireland Government Bond, | | | | | | | | | | | | | | | | |
Bonds | | | 2.400 | | | | 05/15/30 | | | EUR | 1,200 | | | | 1,539,081 | |
Bonds | | | 5.400 | | | | 03/13/25 | | | EUR | 900 | | | | 1,334,684 | |
| | | | | | | | | | | | | | | | |
| | | | | | | | | | | | | | | 2,873,765 | |
| | | | |
Isle of Man 0.5% | | | | | | | | | | | | | | | | |
Isle of Man Government International Bond, | | | | | | | | | | | | | | | | |
Unsec’d. Notes | | | 5.375 | | | | 08/14/34 | | | GBP | 1,000 | | | | 1,747,465 | |
Unsec’d. Notes | | | 5.625 | | | | 03/29/30 | | | GBP | 4,000 | | | | 6,681,173 | |
| | | | | | | | | | | | | | | | |
| | | | | | | | | | | | | | | 8,428,638 | |
See Notes to Financial Statements.
| | | | |
| PGIM Global Total Return Fund | | | 51 | |
Schedule of Investments (continued)
as of October 31, 2018
| | | | | | | | | | | | | | | | |
| Description | | Interest
Rate | | | Maturity
Date | | | Principal
Amount (000)# | | | Value | |
SOVEREIGN BONDS (Continued) | | | | | | | | | | | | | | | | |
| | | | |
Israel 0.2% | | | | | | | | | | | | | | | | |
Israel Government Bond-Fixed,
Bonds | | | 2.000 | % | | | 03/31/27 | | | ILS | 1,000 | | | $ | 269,554 | |
Israel Government International Bond, | | | | | | | | | | | | | | | | |
Sr. Unsec’d. Notes, EMTN | | | 1.500 | | | | 01/18/27 | | | EUR | 1,600 | | | | 1,835,862 | |
Sr. Unsec’d. Notes, EMTN | | | 2.875 | | | | 01/29/24 | | | EUR | 1,000 | | | | 1,249,351 | |
Sr. Unsec’d. Notes, EMTN | | | 4.625 | | | | 03/18/20 | | | EUR | 330 | | | | 396,797 | |
| | | | | | | | | | | | | | | | |
| | | | | | | | | | | | | | | 3,751,564 | |
| | | | |
Italy 4.3% | | | | | | | | | | | | | | | | |
Cassa Del Trentino SpA,
Local Gov’t. Gtd. Notes, EMTN | | | 1.160 | | | | 06/17/26 | | | EUR | 809 | | | | 853,322 | |
Italy Buoni Poliennali del Tesoro, | | | | | | | | | | | | | | | | |
Bonds | | | 0.650 | | | | 10/15/23 | | | EUR | 2,000 | | | | 2,068,480 | |
Bonds | | | 0.950 | | | | 03/15/23 | | | EUR | 3,000 | | | | 3,190,019 | |
Bonds | | | 1.350 | | | | 04/15/22 | | | EUR | 535 | | | | 589,009 | |
Bonds | | | 2.000 | | | | 12/01/25 | | | EUR | 2,200 | | | | 2,329,599 | |
Bonds | | | 2.050 | | | | 08/01/27 | | | EUR | 5,000 | | | | 5,157,064 | |
Bonds | | | 3.750 | | | | 09/01/24 | | | EUR | 7,855 | | | | 9,295,215 | |
Bonds | | | 6.500 | | | | 11/01/27 | | | EUR | 2,695 | | | | 3,792,151 | |
Sr. Unsec’d. Notes, 144A | | | 4.750 | | | | 09/01/28 | | | EUR | 5,590 | | | | 7,072,896 | |
Unsec’d. Notes | | | 4.500 | | | | 03/01/26 | | | EUR | 8,545 | | | | 10,572,498 | |
Italy Certificati di Credito del Tesoro/CCTS-eu,
Bonds, 6 Month EURIBOR + 0.550% | | | 0.281 | (c) | | | 09/15/25 | | | EUR | 1,800 | | | | 1,763,886 | |
Region of Lazio,
Sr. Unsec’d. Notes | | | 3.088 | | | | 03/31/43 | | | EUR | 978 | | | | 941,727 | |
Republic of Italy Government International Bond, | | | | | | | | | | | | | | | | |
Sr. Unsec’d. Notes, EMTN, EURIBOR ICE SWAP 11:00 Fft 10Y Index + 0.000% (Cap 7.000%, Floor 2.000%) | | | 2.000 | (c) | | | 06/15/20 | | | EUR | 1,550 | | | | 1,773,224 | |
Sr. Unsec’d. Notes, EMTN | | | 3.444 | | | | 12/31/24 | | | EUR | 4,169 | | | | 4,882,600 | |
Sr. Unsec’d. Notes, EMTN, EURIBOR ICE SWAP 11:00 Fft 30Y Index + 0.000% (Cap N/A, Floor 4.250%) | | | 4.250 | (c) | | | 06/28/29 | | | EUR | 5,818 | | | | 6,973,969 | |
Sr. Unsec’d. Notes, EMTN | | | 5.200 | | | | 07/31/34 | | | EUR | 250 | | | | 320,317 | |
Sr. Unsec’d. Notes, EMTN | | | 5.250 | | | | 12/07/34 | | | GBP | 1,090 | | | | 1,512,756 | |
Sr. Unsec’d. Notes, EMTN | | | 6.000 | | | | 08/04/28 | | | GBP | 7,189 | | | | 10,459,616 | |
Sr. Unsec’d. Notes, MTN | | | 5.375 | | | | 06/15/33 | | | | 590 | | | | 591,212 | |
Republic of Italy Government International Bond Strips Coupon,
Sr. Unsec’d. Notes | | | 3.518 | (s) | | | 03/27/23 | | | | 775 | | | | 629,388 | |
| | | | | | | | | | | | | | | | |
| | | | | | | | | | | | | | | 74,768,948 | |
See Notes to Financial Statements.
| | | | | | | | | | | | | | | | |
| Description | | Interest
Rate | | | Maturity
Date | | | Principal
Amount (000)# | | | Value | |
SOVEREIGN BONDS (Continued) | | | | | | | | | | | | | | | | |
| | | | |
Japan 2.3% | | | | | | | | | | | | | | | | |
Japan Bank for International Cooperation, | | | | | | | | | | | | | | | | |
Gov’t. Gtd. Notes | | | 2.250 | % | | | 02/24/20 | | | | 600 | | | $ | 593,728 | |
Gov’t. Gtd. Notes | | | 3.375 | | | | 10/31/23 | | | | 1,600 | | | | 1,596,468 | |
Japan Finance Organization for Municipalities, | | | | | | | | | | | | | | | | |
Gov’t. Gtd. Notes, EMTN | | | 5.750 | | | | 08/09/19 | | | GBP | 400 | | | | 528,724 | |
Sr. Unsec’d. Notes, 144A, MTN | | | 2.000 | | | | 09/08/20 | | | | 2,200 | | | | 2,147,708 | |
Sr. Unsec’d. Notes, 144A, MTN | | | 2.125 | | | | 04/13/21 | | | | 1,000 | | | | 969,255 | |
Sr. Unsec’d. Notes, EMTN | | | 2.125 | | | | 02/12/21 | | | | 600 | | | | 583,202 | |
Sr. Unsec’d. Notes, EMTN | | | 2.125 | | | | 04/13/21 | | | | 1,200 | | | | 1,163,106 | |
Sr. Unsec’d. Notes, EMTN | | | 2.625 | | | | 04/20/22 | | | | 1,000 | | | | 971,556 | |
Sr. Unsec’d. Notes, EMTN | | | 3.060 | | | | 12/21/20 | | | AUD | 2,000 | | | | 1,427,078 | |
Sr. Unsec’d. Notes, GMTN | | | 0.875 | | | | 09/22/21 | | | EUR | 2,535 | | | | 2,936,659 | |
Japan Government Twenty Year Bond, | | | | | | | | | | | | | | | | |
Sr. Unsec’d. Notes | | | 0.200 | | | | 06/20/36 | | | JPY | 450,000 | | | | 3,759,206 | |
Sr. Unsec’d. Notes | | | 0.400 | | | | 03/20/36 | | | JPY | 100,000 | | | | 867,417 | |
Sr. Unsec’d. Notes | | | 0.500 | | | | 06/20/38 | | | JPY | 514,000 | | | | 4,438,207 | |
Sr. Unsec’d. Notes | | | 0.600 | | | | 12/20/36 | | | JPY | 665,000 | | | | 5,922,027 | |
Sr. Unsec’d. Notes | | | 0.700 | | | | 03/20/37 | | | JPY | 150,000 | | | | 1,356,853 | |
Sr. Unsec’d. Notes(k) | | | 1.400 | | | | 09/20/34 | | | JPY | 145,000 | | | | 1,472,656 | |
Sr. Unsec’d. Notes | | | 1.500 | | | | 06/20/34 | | | JPY | 50,000 | | | | 514,406 | |
Sr. Unsec’d. Notes | | | 1.800 | | | | 12/20/31 | | | JPY | 148,000 | | | | 1,564,641 | |
Japan International Cooperation Agency,
Gov’t. Gtd. Notes | | | 1.875 | | | | 11/13/19 | | | | 2,000 | | | | 1,973,402 | |
Japanese Government CPI Linked Bond,
Sr. Unsec’d. Notes | | | 0.100 | | | | 03/10/27 | | | JPY | 219,530 | | | | 2,021,463 | |
Tokyo Metropolitan Government, | | | | | | | | | | | | | | | | |
Sr. Unsec’d. Notes | | | 2.000 | | | | 05/17/21 | | | | 2,500 | | | | 2,415,453 | |
Sr. Unsec’d. Notes | | | 2.125 | | | | 05/20/19 | | | | 400 | | | | 398,396 | |
Sr. Unsec’d. Notes | | | 2.125 | | | | 05/19/20 | | | | 1,000 | | | | 982,116 | |
| | | | | | | | | | | | | | | | |
| | | | | | | | | | | | | | | 40,603,727 | |
| | | | |
Jersey 0.0% | | | | | | | | | | | | | | | | |
Jersey International Bond,
Sr. Unsec’d. Notes | | | 3.750 | | | | 06/09/54 | | | GBP | 100 | | | | 159,133 | |
| | | | |
Kuwait 0.1% | | | | | | | | | | | | | | | | |
Kuwait International Government Bond,
Sr. Unsec’d. Notes, 144A | | | 2.750 | | | | 03/20/22 | | | | 2,050 | | | | 1,992,518 | |
See Notes to Financial Statements.
| | | | |
| PGIM Global Total Return Fund | | | 53 | |
Schedule of Investments (continued)
as of October 31, 2018
| | | | | | | | | | | | | | | | |
| Description | | Interest
Rate | | | Maturity
Date | | | Principal
Amount (000)# | | | Value | |
SOVEREIGN BONDS (Continued) | | | | | | | | | | | | | | | | |
| | | | |
Latvia 0.1% | | | | | | | | | | | | | | | | |
Latvia Government International Bond, | | | | | | | | | | | | | | | | |
Sr. Unsec’d. Notes | | | 2.750 | % | | | 01/12/20 | | | | 1,000 | | | $ | 991,500 | |
Sr. Unsec’d. Notes, EMTN | | | 2.625 | | | | 01/21/21 | | | EUR | 200 | | | | 239,554 | |
| | | | | | | | | | | | | | | | |
| | | | | | | | | | | | | | | 1,231,054 | |
| | | | |
Lithuania 0.6% | | | | | | | | | | | | | | | | |
Lithuania Government International Bond, | | | | | | | | | | | | | | | | |
Sr. Unsec’d. Notes | | | 6.125 | | | | 03/09/21 | | | | 4,500 | | | | 4,763,358 | |
Sr. Unsec’d. Notes | | | 6.625 | | | | 02/01/22 | | | | 4,220 | | | | 4,605,286 | |
Sr. Unsec’d. Notes | | | 7.375 | | | | 02/11/20 | | | | 1,090 | | | | 1,145,590 | |
| | | | | | | | | | | | | | | | |
| | | | | | | | | | | | | | | 10,514,234 | |
| | | | |
Macedonia 0.2% | | | | | | | | | | | | | | | | |
Macedonia Government International Bond, | | | | | | | | | | | | | | | | |
Sr. Unsec’d. Notes | | | 3.975 | | | | 07/24/21 | | | EUR | 2,000 | | | | 2,384,143 | |
Sr. Unsec’d. Notes | | | 5.625 | | | | 07/26/23 | | | EUR | 1,000 | | | | 1,264,837 | |
Sr. Unsec’d. Notes, 144A | | | 3.975 | | | | 07/24/21 | | | EUR | 500 | | | | 596,036 | |
| | | | | | | | | | | | | | | | |
| | | | | | | | | | | | | | | 4,245,016 | |
| | | | |
Malaysia 0.5% | | | | | | | | | | | | | | | | |
Malaysia Government Bond, | | | | | | | | | | | | | | | | |
Sr. Unsec’d. Notes, Ser. 0111 | | | 4.160 | | | | 07/15/21 | | | MYR | 6,500 | | | | 1,573,084 | |
Sr. Unsec’d. Notes, Ser. 0217 | | | 4.059 | | | | 09/30/24 | | | MYR | 10,000 | | | | 2,393,976 | |
Sr. Unsec’d. Notes, Ser. 0314 | | | 4.048 | | | | 09/30/21 | | | MYR | 20,916 | | | | 5,051,030 | |
Sr. Unsec’d. Notes, Ser. 0416 | | | 3.620 | | | | 11/30/21 | | | MYR | 15 | | | | 3,578 | |
| | | | | | | | | | | | | | | | |
| | | | | | | | | | | | | | | 9,021,668 | |
| | | | |
Mexico 1.6% | | | | | | | | | | | | | | | | |
Mexico Government International Bond, | | | | | | | | | | | | | | | | |
Sr. Unsec’d. Notes(a) | | | 2.750 | | | | 04/22/23 | | | EUR | 4,375 | | | | 5,305,163 | |
Sr. Unsec’d. Notes | | | 4.000 | | | | 03/15/2115 | | | EUR | 950 | | | | 938,820 | |
Sr. Unsec’d. Notes, EMTN | | | 1.750 | | | | 04/17/28 | | | EUR | 800 | | | | 857,837 | |
Sr. Unsec’d. Notes, EMTN | | | 2.375 | | | | 04/09/21 | | | EUR | 4,500 | | | | 5,349,209 | |
Sr. Unsec’d. Notes, EMTN | | | 5.625 | | | | 03/19/2114 | | | GBP | 200 | | | | 254,681 | |
Sr. Unsec’d. Notes, GMTN | | | 1.625 | | | | 03/06/24 | | | EUR | 9,670 | | | | 10,992,097 | |
Sr. Unsec’d. Notes, GMTN | | | 5.500 | | | | 02/17/20 | | | EUR | 1,400 | | | | 1,693,244 | |
See Notes to Financial Statements.
| | | | | | | | | | | | | | | | |
| Description | | Interest
Rate | | | Maturity
Date | | | Principal
Amount (000)# | | | Value | |
SOVEREIGN BONDS (Continued) | | | | | | | | | | | | | | | | |
| | | | |
Mexico (cont’d.) | | | | | | | | | | | | | | | | |
Mexico Government International Bond, (cont’d.) | | | | | | | | | | | | | | | | |
Sr. Unsec’d. Notes, GMTN | | | 6.750 | % | | | 02/06/24 | | | GBP | 1,044 | | | $ | 1,586,317 | |
Sr. Unsec’d. Notes, MTN | | | 7.500 | | | | 04/08/33 | | | | 875 | | | | 1,071,490 | |
| | | | | | | | | | | | | | | | |
| | | | | | | | | | | | | | | 28,048,858 | |
| | | | |
Montenegro 0.1% | | | | | | | | | | | | | | | | |
Montenegro Government International Bond, | | | | | | | | | | | | | | | | |
Sr. Unsec’d. Notes | | | 3.875 | | | | 03/18/20 | | | EUR | 500 | | | | 581,648 | |
Sr. Unsec’d. Notes, 144A | | | 3.375 | | | | 04/21/25 | | | EUR | 750 | | | | 837,760 | |
| | | | | | | | | | | | | | | | |
| | | | | | | | | | | | | | | 1,419,408 | |
| | | | |
New Zealand 0.4% | | | | | | | | | | | | | | | | |
Auckland Council, | | | | | | | | | | | | | | | | |
Sr. Sec’d. Notes | | | 2.900 | | | | 09/16/27 | | | AUD | 1,000 | | | | 678,634 | |
Sr. Sec’d. Notes | | | 3.500 | | | | 03/09/26 | | | AUD | 2,000 | | | | 1,436,001 | |
New Zealand Government Bond,
Sr. Unsec’d. Notes | | | 4.500 | | | | 04/15/27 | | | NZD | 1,500 | | | | 1,136,409 | |
New Zealand Local Government Funding Agency Bond, | | | | | | | | | | | | | | | | |
Local Gov’t. Gtd. Notes | | | 2.750 | | | | 04/15/25 | | | NZD | 1,800 | | | | 1,158,763 | |
Local Gov’t. Gtd. Notes | | | 3.500 | | | | 04/14/33 | | | NZD | 500 | | | | 311,680 | |
Sr. Unsec’d. Notes | | | 4.500 | | | | 04/15/27 | | | NZD | 1,800 | | | | 1,278,864 | |
Sr. Unsec’d. Notes | | | 6.000 | | | | 05/15/21 | | | NZD | 500 | | | | 356,268 | |
| | | | | | | | | | | | | | | | |
| | | | | | | | | | | | | | | 6,356,619 | |
| | | | |
Norway 0.2% | | | | | | | | | | | | | | | | |
City of Oslo, | | | | | | | | | | | | | | | | |
Sr. Unsec’d. Notes | | | 3.600 | | | | 12/06/22 | | | NOK | 1,000 | | | | 125,474 | |
Sr. Unsec’d. Notes | | | 3.650 | | | | 11/08/23 | | | NOK | 9,000 | | | | 1,135,617 | |
Sr. Unsec’d. Notes | | | 4.900 | | | | 11/04/19 | | | NOK | 5,000 | | | | 613,793 | |
Kommunalbanken A/S,
Sr. Unsec’d. Notes, MTN | | | 5.125 | | | | 05/14/21 | | | NZD | 2,850 | | | | 1,983,793 | |
| | | | | | | | | | | | | | | | |
| | | | | | | | | | | | | | | 3,858,677 | |
| | | | |
Panama 0.4% | | | | | | | | | | | | | | | | |
Panama Government International Bond, | | | | | | | | | | | | | | | | |
Sr. Unsec’d. Notes | | | 4.000 | | | | 09/22/24 | | | | 400 | | | | 398,000 | |
Sr. Unsec’d. Notes | | | 8.125 | | | | 04/28/34 | | | | 2,338 | | | | 3,109,540 | |
Sr. Unsec’d. Notes | | | 9.375 | | | | 01/16/23 | | | | 1,553 | | | | 1,914,073 | |
See Notes to Financial Statements.
| | | | |
| PGIM Global Total Return Fund | | | 55 | |
Schedule of Investments (continued)
as of October 31, 2018
| | | | | | | | | | | | | | | | |
| Description | | Interest
Rate | | | Maturity
Date | | | Principal
Amount (000)# | | | Value | |
SOVEREIGN BONDS (Continued) | | | | | | | | | | | | | | | | |
| | | | |
Panama (cont’d.) | | | | | | | | | | | | | | | | |
Panama Government International Bond, (cont’d.) | | | | | | | | | | | | | | | | |
Sr. Unsec’d. Notes | | | 9.375 | % | | | 04/01/29 | | | | 800 | | | $ | 1,108,000 | |
Sr. Unsec’d. Notes | | | 10.750 | | | | 05/15/20 | | | | 275 | | | | 308,000 | |
| | | | | | | | | | | | | | | | |
| | | | | | | | | | | | | | | 6,837,613 | |
| | | | |
Peru 1.0% | | | | | | | | | | | | | | | | |
Peruvian Government International Bond, | | | | | | | | | | | | | | | | |
Sr. Unsec’d. Notes | | | 2.750 | | | | 01/30/26 | | | EUR | 6,551 | | | | 8,043,226 | |
Sr. Unsec’d. Notes | | | 3.750 | | | | 03/01/30 | | | EUR | 6,800 | | | | 9,113,213 | |
| | | | | | | | | | | | | | | | |
| | | | | | | | | | | | | | | 17,156,439 | |
| | | | |
Poland 0.8% | | | | | | | | | | | | | | | | |
Republic of Poland Government Bond, | | | | | | | | | | | | | | | | |
Bonds, Ser. 0721 | | | 1.750 | | | | 07/25/21 | | | PLN | 2,000 | | | | 520,803 | |
Bonds, Ser. 0725 | | | 3.250 | | | | 07/25/25 | | | PLN | 13,550 | | | | 3,607,895 | |
Bonds, Ser. 0727 | | | 2.500 | | | | 07/25/27 | | | PLN | 8,000 | | | | 1,984,806 | |
Republic of Poland Government International Bond,
Sr. Unsec’d. Notes | | | 5.000 | | | | 03/23/22 | | | | 7,355 | | | | 7,693,257 | |
| | | | | | | | | | | | | | | | |
| | | | | | | | | | | | | | | 13,806,761 | |
| | | | |
Portugal 2.9% | | | | | | | | | | | | | | | | |
Metropolitano de Lisboa EPE,
Gov’t. Gtd. Notes | | | 4.799 | | | | 12/07/27 | | | EUR | 2,150 | | | | 2,976,623 | |
Parpublica-Participacoes Publicas SGPS SA,
Sr. Unsec’d. Notes, EMTN | | | 3.750 | | | | 07/05/21 | | | EUR | 1,500 | | | | 1,831,146 | |
Portugal Government International Bond,
Sr. Unsec’d. Notes, EMTN | | | 5.125 | | | | 10/15/24 | | | | 4,971 | | | | 5,163,775 | |
Portugal Obrigacoes do Tesouro OT, | | | | | | | | | | | | | | | | |
Sr. Unsec’d. Notes, 144A | | | 3.875 | | | | 02/15/30 | | | EUR | 23,255 | | | | 30,906,927 | |
Sr. Unsec’d. Notes, 144A | | | 4.100 | | | | 04/15/37 | | | EUR | 6,500 | | | | 8,893,697 | |
| | | | | | | | | | | | | | | | |
| | | | | | | | | | | | | | | 49,772,168 | |
| | | | |
Qatar 0.2% | | | | | | | | | | | | | | | | |
Qatar Government International Bond, | | | | | | | | | | | | | | | | |
Sr. Unsec’d. Notes, 144A | | | 3.875 | | | | 04/23/23 | | | | 1,040 | | | | 1,042,288 | |
Sr. Unsec’d. Notes, 144A | | | 4.500 | | | | 04/23/28 | | | | 2,000 | | | | 2,040,000 | |
| | | | | | | | | | | | | | | | |
| | | | | | | | | | | | | | | 3,082,288 | |
See Notes to Financial Statements.
| | | | | | | | | | | | | | | | |
| Description | | Interest
Rate | | | Maturity
Date | | | Principal
Amount (000)# | | | Value | |
SOVEREIGN BONDS (Continued) | | | | | | | | | | | | | | | | |
| | | | |
Romania 0.5% | | | | | | | | | | | | | | | | |
Romanian Government International Bond, | | | | | | | | | | | | | | | | |
Sr. Unsec’d. Notes, 144A, MTN | | | 2.500 | % | | | 02/08/30 | | | EUR | 4,150 | | | $ | 4,404,343 | |
Sr. Unsec’d. Notes, EMTN | | | 2.375 | | | | 04/19/27 | | | EUR | 1,000 | | | | 1,129,903 | |
Sr. Unsec’d. Notes, EMTN | | | 3.875 | | | | 10/29/35 | | | EUR | 1,000 | | | | 1,123,016 | |
Sr. Unsec’d. Notes, EMTN | | | 6.750 | | | | 02/07/22 | | | | 300 | | | | 323,273 | |
Unsec’d. Notes, 144A, MTN | | | 2.875 | | | | 05/26/28 | | | EUR | 1,100 | | | | 1,252,138 | |
Unsec’d. Notes, MTN | | | 2.875 | | | | 05/26/28 | | | EUR | 700 | | | | 796,815 | |
| | | | | | | | | | | | | | | | |
| | | | | | | | | | | | | | | 9,029,488 | |
| | | | |
Russia 0.1% | | | | | | | | | | | | | | | | |
Russian Federal Bond-OFZ,
Bonds | | | 7.050 | | | | 01/19/28 | | | RUB | 60,000 | | | | 831,928 | |
Russian Foreign Bond-Eurobond,
Sr. Unsec’d. Notes | | | 4.500 | | | | 04/04/22 | | | | 400 | | | | 403,524 | |
| | | | | | | | | | | | | | | | |
| | | | | | | | | | | | | | | 1,235,452 | |
| | | | |
Saudi Arabia 0.4% | | | | | | | | | | | | | | | | |
KSA Sukuk Ltd.,
Sr. Unsec’d. Notes, MTN | | | 2.894 | | | | 04/20/22 | | | | 1,000 | | | | 965,000 | |
Saudi Government International Bond, | | | | | | | | | | | | | | | | |
Sr. Unsec’d. Notes, 144A, MTN | | | 2.375 | | | | 10/26/21 | | | | 1,200 | | | | 1,146,216 | |
Sr. Unsec’d. Notes, 144A, MTN | | | 2.875 | | | | 03/04/23 | | | | 3,335 | | | | 3,168,917 | |
Sr. Unsec’d. Notes, 144A, MTN | | | 4.000 | | | | 04/17/25 | | | | 1,135 | | | | 1,114,488 | |
Sr. Unsec’d. Notes, EMTN | | | 2.875 | | | | 03/04/23 | | | | 1,300 | | | | 1,235,260 | |
| | | | | | | | | | | | | | | | |
| | | | | | | | | | | | | | | 7,629,881 | |
| | | | |
Senegal 0.1% | | | | | | | | | | | | | | | | |
Senegal Government International Bond,
Sr. Unsec’d. Notes, 144A | | | 4.750 | | | | 03/13/28 | | | EUR | 1,395 | | | | 1,472,754 | |
| | | | |
Serbia 0.4% | | | | | | | | | | | | | | | | |
Serbia International Bond, | | | | | | | | | | | | | | | | |
Sr. Unsec’d. Notes | | | 7.250 | | | | 09/28/21 | | | | 3,800 | | | | 4,099,098 | |
Sr. Unsec’d. Notes, 144A | | | 7.250 | | | | 09/28/21 | | | | 200 | | | | 215,742 | |
Unsec’d. Notes | | | 5.875 | | | | 12/03/18 | | | | 2,500 | | | | 2,504,275 | |
| | | | | | | | | | | | | | | | |
| | | | | | | | | | | | | | | 6,819,115 | |
See Notes to Financial Statements.
| | | | |
| PGIM Global Total Return Fund | | | 57 | |
Schedule of Investments (continued)
as of October 31, 2018
| | | | | | | | | | | | | | | | |
| Description | | Interest
Rate | | | Maturity
Date | | | Principal
Amount (000)# | | | Value | |
SOVEREIGN BONDS (Continued) | | | | | | | | | | | | | | | | |
| | | | |
Singapore 0.1% | | | | | | | | | | | | | | | | |
Singapore Government Bond, | | | | | | | | | | | | | | | | |
Sr. Unsec’d. Notes | | | 2.375 | % | | | 06/01/25 | | | SGD | 1,000 | | | $ | 719,778 | |
Sr. Unsec’d. Notes | | | 3.000 | | | | 09/01/24 | | | SGD | 500 | | | | 373,064 | |
| | | | | | | | | | | | | | | | |
| | | | | | | | | | | | | | | 1,092,842 | |
| | | | |
Slovakia 0.1% | | | | | | | | | | | | | | | | |
Slovakia Government International Bond,
Sr. Unsec’d. Notes | | | 2.125 | | | | 10/16/23 | | | CHF | 2,000 | | | | 2,187,559 | |
| | | | |
Slovenia 0.5% | | | | | | | | | | | | | | | | |
Slovenia Government International Bond, | | | | | | | | | | | | | | | | |
Sr. Unsec’d. Notes | | | 5.250 | | | | 02/18/24 | | | | 213 | | | | 228,482 | |
Sr. Unsec’d. Notes, 144A | | | 5.250 | | | | 02/18/24 | | | | 7,709 | | | | 8,269,352 | |
| | | | | | | | | | | | | | | | |
| | | | | | | | | | | | | | | 8,497,834 | |
| | | | |
South Africa 0.5% | | | | | | | | | | | | | | | | |
Republic of South Africa Government Bond, | | | | | | | | | | | | | | | | |
Bonds, Ser. R186 | | | 10.500 | | | | 12/21/26 | | | ZAR | 5,000 | | | | 359,397 | |
Bonds, Ser. R213 | | | 7.000 | | | | 02/28/31 | | | ZAR | 1,800 | | | | 96,922 | |
Sr. Unsec’d. Notes, Ser. R208 | | | 6.750 | | | | 03/31/21 | | | ZAR | 10,000 | | | | 661,515 | |
Republic of South Africa Government International Bond, | | | | | | | | | | | | | | | | |
Notes, EMTN | | | 3.800 | | | | 09/07/21 | | | JPY | 100,000 | | | | 939,757 | |
Sr. Unsec’d. Notes | | | 3.750 | | | | 07/24/26 | | | EUR | 5,415 | | | | 6,278,748 | |
ZAR Sovereign Capital Fund Pty Ltd.,
Sr. Unsec’d. Notes, 144A | | | 3.903 | | | | 06/24/20 | | | | 1,000 | | | | 990,118 | |
| | | | | | | | | | | | | | | | |
| | | | | | | | | | | | | | | 9,326,457 | |
| | | | |
South Korea 0.3% | | | | | | | | | | | | | | | | |
Export-Import Bank of Korea, | | | | | | | | | | | | | | | | |
Sr. Unsec’d. Notes | | | 5.125 | | | | 10/15/19 | | | NZD | 200 | | | | 133,091 | |
Sr. Unsec’d. Notes, EMTN | | | 3.500 | | | | 09/26/19 | | | AUD | 100 | | | | 70,888 | |
Sr. Unsec’d. Notes, EMTN | | | 5.375 | | | | 09/12/19 | | | AUD | 1,000 | | | | 722,647 | |
Sr. Unsec’d. Notes, MTN | | | 2.711 | | | | 12/05/19 | | | CAD | 200 | | | | 151,386 | |
Sr. Unsec’d. Notes, MTN | | | 3.500 | | | | 07/28/21 | | | NZD | 2,000 | | | | 1,316,702 | |
Korea International Bond, | | | | | | | | | | | | | | | | |
Sr. Unsec’d. Notes | | | 2.125 | | | | 06/10/24 | | | EUR | 1,100 | | | | 1,348,267 | |
Sr. Unsec’d. Notes | | | 4.250 | | | | 12/07/21 | | | EUR | 1,700 | | | | 2,176,306 | |
| | | | | | | | | | | | | | | | |
| | | | | | | | | | | | | | | 5,919,287 | |
See Notes to Financial Statements.
| | | | | | | | | | | | | | | | |
| Description | | Interest
Rate | | | Maturity
Date | | | Principal
Amount (000)# | | | Value | |
SOVEREIGN BONDS (Continued) | | | | | | | | | | | | | | | | |
| | | | |
Spain 4.6% | | | | | | | | | | | | | | | | |
Autonomous Community of Catalonia, | | | | | | | | | | | | | | | | |
Sr. Unsec’d. Notes | | | 4.950 | % | | | 02/11/20 | | | EUR | 2,000 | | | $ | 2,368,064 | |
Sr. Unsec’d. Notes | | | 6.250 | | | | 12/15/18 | | | | 1,000 | | | | 1,001,599 | |
Sr. Unsec’d. Notes, EMTN | | | 4.900 | | | | 09/15/21 | | | EUR | 600 | | | | 730,081 | |
Sr. Unsec’d. Notes, EMTN | | | 5.900 | | | | 05/28/30 | | | EUR | 3,000 | | | | 3,985,971 | |
Instituto de Credito Oficial, | | | | | | | | | | | | | | | | |
Gov’t. Gtd. Notes, EMTN | | | 3.250 | | | | 06/28/24 | | | CHF | 1,300 | | | | 1,470,834 | |
Gov’t. Gtd. Notes, EMTN | | | 5.000 | | | | 03/31/20 | | | CAD | 1,800 | | | | 1,404,395 | |
Gov’t. Gtd. Notes, GMTN | | | 0.963 | | | | 09/22/22 | | | SEK | 20,000 | | | | 2,190,953 | |
Spain Government Bond, | | | | | | | | | | | | | | | | |
Bonds, 144A(k) | | | 3.800 | | | | 04/30/24 | | | EUR | 1,880 | | | | 2,478,025 | |
Bonds, 144A | | | 5.150 | | | | 10/31/28 | | | EUR | 8,120 | | | | 12,244,426 | |
Sr. Unsec’d. Notes, 144A | | | 1.400 | | | | 04/30/28 | | | EUR | 6,410 | | | | 7,203,981 | |
Sr. Unsec’d. Notes, 144A | | | 1.450 | | | | 10/31/27 | | | EUR | 4,225 | | | | 4,794,135 | |
Sr. Unsec’d. Notes, 144A(k) | | | 1.600 | | | | 04/30/25 | | | EUR | 300 | | | | 354,207 | |
Sr. Unsec’d. Notes, 144A | | | 1.950 | | | | 07/30/30 | | | EUR | 1,300 | | | | 1,500,231 | |
Sr. Unsec’d. Notes, 144A | | | 2.900 | | | | 10/31/46 | | | EUR | 300 | | | | 360,065 | |
Sr. Unsec’d. Notes, 144A(k) | | | 4.650 | | | | 07/30/25 | | | EUR | 15,050 | | | | 21,109,377 | |
Sr. Unsec’d. Notes, 144A(k) | | | 5.850 | | | | 01/31/22 | | | EUR | 3,705 | | | | 4,973,837 | |
Sr. Unsec’d. Notes, 144A | | | 5.900 | | | | 07/30/26 | | | EUR | 500 | | | | 761,961 | |
Spain Government International Bond,
Sr. Unsec’d. Notes, EMTN | | | 5.250 | | | | 04/06/29 | | | GBP | 7,582 | | | | 11,340,776 | |
| | | | | | | | | | | | | | | | |
| | | | | | | | | | | | | | | 80,272,918 | |
| | | | |
Sweden 0.7% | | | | | | | | | | | | | | | | |
Kommuninvest I Sverige AB, | | | | | | | | | | | | | | | | |
Local Gov’t. Gtd. Notes, EMTN | | | 0.625 | | | | 11/13/23 | | | SEK | 15,000 | | | | 1,623,870 | |
Local Gov’t. Gtd. Notes, EMTN | | | 1.500 | | | | 05/12/25 | | | SEK | 7,000 | | | | 781,207 | |
Local Gov’t. Gtd. Notes, EMTN | | | 1.625 | | | | 01/22/20 | | | CAD | 4,000 | | | | 3,004,523 | |
Local Gov’t. Gtd. Notes, MTN | | | 4.750 | | | | 08/17/22 | | | AUD | 200 | | | | 151,369 | |
Sr. Unsec’d. Notes, EMTN | | | 4.280 | | | | 05/28/19 | | | MXN | 13,200 | | | | 629,463 | |
Svensk Exportkredit AB, | | | | | | | | | | | | | | | | |
Sr. Unsec’d. Notes, EMTN | | | 3.760 | | | | 05/28/19 | | | AUD | 787 | | | | 561,709 | |
Sr. Unsec’d. Notes, EMTN | | | 4.200 | | | | 12/16/20 | | | AUD | 700 | | | | 506,749 | |
Sr. Unsec’d. Notes, EMTN | | | 4.910 | | | | 04/23/19 | | | NZD | 985 | | | | 649,441 | |
Sweden Government International Bond, | | | | | | | | | | | | | | | | |
Sr. Unsec’d. Notes, 144A, MTN | | | 0.125 | | | | 04/24/23 | | | EUR | 720 | | | | 819,498 | |
Sr. Unsec’d. Notes, 144A, MTN | | | 2.375 | | | | 02/15/21 | | | | 3,000 | | | | 2,956,842 | |
| | | | | | | | | | | | | | | | |
| | | | | | | | | | | | | | | 11,684,671 | |
See Notes to Financial Statements.
| | | | |
| PGIM Global Total Return Fund | | | 59 | |
Schedule of Investments (continued)
as of October 31, 2018
| | | | | | | | | | | | | | | | |
| Description | | Interest
Rate | | | Maturity
Date | | | Principal
Amount (000)# | | | Value | |
SOVEREIGN BONDS (Continued) | | | | | | | | | | | | | | | | |
| | | | |
Thailand 0.1% | | | | | | | | | | | | | | | | |
Thailand Government Bond,
Sr. Unsec’d. Notes | | | 3.650 | % | | | 06/20/31 | | | THB | 45,000 | | | $ | 1,428,519 | |
| | | | |
Turkey 0.4% | | | | | | | | | | | | | | | | |
Turkey Government Bond,
Bonds | | | 8.000 | | | | 03/12/25 | | | TRY | 3,450 | | | | 388,847 | |
Turkey Government International Bond, | | | | | | | | | | | | | | | | |
Sr. Unsec’d. Notes | | | 4.125 | | | | 04/11/23 | | | EUR | 2,965 | | | | 3,323,256 | |
Sr. Unsec’d. Notes | | | 5.750 | | | | 03/22/24 | | | | 1,000 | | | | 931,492 | |
Sr. Unsec’d. Notes | | | 5.875 | | | | 04/02/19 | | | EUR | 247 | | | | 283,540 | |
Sr. Unsec’d. Notes | | | 7.000 | | | | 06/05/20 | | | | 1,800 | | | | 1,811,635 | |
Sr. Unsec’d. Notes, EMTN | | | 3.250 | | | | 06/14/25 | | | EUR | 750 | | | | 765,571 | |
| | | | | | | | | | | | | | | | |
| | | | | | | | | | | | | | | 7,504,341 | |
| | | | |
Ukraine 0.1% | | | | | | | | | | | | | | | | |
Ukraine Government International Bond,
Sr. Unsec’d. Notes | | | 7.750 | | | | 09/01/24 | | | | 1,875 | | | | 1,757,813 | |
| | | | |
United Arab Emirates 0.2% | | | | | | | | | | | | | | | | |
Abu Dhabi Government International Bond, | | | | | | | | | | | | | | | | |
Sr. Unsec’d. Notes | | | 2.500 | | | | 10/11/22 | | | | 498 | | | | 477,243 | |
Sr. Unsec’d. Notes, 144A | | | 2.500 | | | | 10/11/22 | | | | 2,365 | | | | 2,266,427 | |
| | | | | | | | | | | | | | | | |
| | | | | | | | | | | | | | | 2,743,670 | |
| | | | |
United Kingdom 1.4% | | | | | | | | | | | | | | | | |
United Kingdom Gilt, | | | | | | | | | | | | | | | | |
Bonds | | | 2.000 | | | | 09/07/25 | | | GBP | 100 | | | | 134,959 | |
Bonds(k) | | | 3.250 | | | | 01/22/44 | | | GBP | 320 | | | | 520,731 | |
Bonds(k) | | | 3.500 | | | | 01/22/45 | | | GBP | 3,080 | | | | 5,245,716 | |
Bonds(k) | | | 4.250 | | | | 03/07/36 | | | GBP | 7,190 | | | | 12,622,363 | |
Bonds | | | 4.250 | | | | 09/07/39 | | | GBP | 2,830 | | | | 5,136,575 | |
| | | | | | | | | | | | | | | | |
| | | | | | | | | | | | | | | 23,660,344 | |
See Notes to Financial Statements.
| | | | | | | | | | | | | | | | |
| Description | | Interest
Rate | | | Maturity
Date | | | Principal
Amount (000)# | | | Value | |
SOVEREIGN BONDS (Continued) | | | | | | | | | | | | | | | | |
| | | | |
Uruguay 0.1% | | | | | | | | | | | | | | | | |
Uruguay Government International Bond, | | | | | | | | | | | | | | | | |
Sr. Unsec’d. Notes | | | 4.375 | % | | | 10/27/27 | | | | 1,000 | | | $ | 987,500 | |
Sr. Unsec’d. Notes | | | 7.000 | | | | 06/28/19 | | | EUR | 119 | | | | 138,176 | |
| | | | | | | | | | | | | | | | |
| | | | | | | | | | | | | | | 1,125,676 | |
| | | | | | | | | | | | | | | | |
TOTAL SOVEREIGN BONDS
(cost $819,378,982) | | | | 781,491,562 | |
| | | | | | | | | | | | | | | | |
|
U.S. GOVERNMENT AGENCY OBLIGATIONS 0.3% | |
Federal National Mortgage Assoc. | | | 5.375 | | | | 12/07/28 | | | GBP | 507 | | | | 842,358 | |
Tennessee Valley Authority | | | | | | | | | | | | | | | | |
Sr. Unsec’d. Notes | | | 5.350 | | | | 06/07/21 | | | GBP | 815 | | | | 1,143,274 | |
Sr. Unsec’d. Notes | | | 5.625 | | | | 06/07/32 | | | GBP | 1,391 | | | | 2,440,732 | |
| | | | | | | | | | | | | | | | |
TOTAL U.S. GOVERNMENT AGENCY OBLIGATIONS
(cost $4,877,346) | | | | | | | | | | | | | | | 4,426,364 | |
| | | | | | | | | | | | | | | | |
|
U.S. TREASURY OBLIGATIONS 0.3% | |
U.S. Treasury Bonds(h)(k) | | | 2.500 | | | | 05/15/46 | | | | 2,580 | | | | 2,161,959 | |
U.S. Treasury Bonds(h) | | | 2.875 | | | | 08/15/45 | | | | 170 | | | | 154,175 | |
U.S. Treasury Notes(h) | | | 1.500 | | | | 02/28/23 | | | | 315 | | | | 296,137 | |
U.S. Treasury Notes | | | 2.500 | | | | 05/31/20 | | | | 420 | | | | 417,769 | |
U.S. Treasury Notes(h) | | | 2.625 | | | | 08/31/20 | | | | 1,020 | | | | 1,015,617 | |
U.S. Treasury Notes(h) | | | 2.625 | | | | 06/15/21 | | | | 310 | | | | 307,711 | |
U.S. Treasury Strips Coupon | | | 1.881 | (s) | | | 05/15/31 | | | | 400 | | | | 264,552 | |
U.S. Treasury Strips Coupon | | | 1.898 | (s) | | | 08/15/29 | | | | 400 | | | | 281,281 | |
U.S. Treasury Strips Coupon | | | 2.100 | (s) | | | 11/15/35 | | | | 800 | | | | 450,800 | |
U.S. Treasury Strips Coupon | | | 2.264 | (s) | | | 08/15/40 | | | | 800 | | | | 378,868 | |
| | | | | | | | | | | | | | | | |
TOTAL U.S. TREASURY OBLIGATIONS
(cost $6,489,912) | | | | 5,728,869 | |
| | | | | | | | | | | | | | | | |
| | | | |
| | | | | | | | | Shares | | | | |
COMMON STOCK 0.0% | | | | | | | | | | | | | | | | |
| | | | |
Colombia | | | | | | | | | | | | | | | | |
Frontera Energy Corp.*
(cost $44,527) | | | | | | | | | | | 2,232 | | | | 29,083 | |
| | | | | | | | | | | | | | | | |
See Notes to Financial Statements.
| | | | |
| PGIM Global Total Return Fund | | | 61 | |
Schedule of Investments (continued)
as of October 31, 2018
| | | | | | | | | | | | | | | | |
| Description | | | | | | | | Shares | | | Value | |
PREFERRED STOCK 0.0% | | | | | | | | | | | | | | | | |
| | | | |
United States | | | | | | | | | | | | | | | | |
Citigroup Capital XIII, 8.890% (Capital Security, fixed to floating preferred)
(cost $100,000) | | | | | | | | | | | 4,000 | | | $ | 105,880 | |
| | | | | | | | | | | | | | | | |
TOTAL LONG-TERM INVESTMENTS
(cost $1,768,585,228) | | | | | | | | | | | | | | | 1,705,868,194 | |
| | | | | | | | | | | | | | | | |
| | | | |
SHORT-TERM INVESTMENTS 5.8% | | | | | | | | | | | | | | | | |
| | | | |
AFFILIATED MUTUAL FUNDS 1.9% | | | | | | | | | | | | | | | | |
PGIM Core Ultra Short Bond Fund(w) | | | | | | | | | | | 4,343,643 | | | | 4,343,643 | |
PGIM Institutional Money Market Fund
(cost $28,959,910; includes $28,890,077 of cash collateral for securities on loan)(b)(w) | | | | | | | | | | | 28,961,591 | | | | 28,961,591 | |
| | | | | | | | | | | | | | | | |
TOTAL AFFILIATED MUTUAL FUNDS
(cost $33,303,553) | | | | | | | | | | | | | | | 33,305,234 | |
| | | | | | | | | | | | | | | | |
| | | | |
OPTIONS PURCHASED*~ 3.9%
(cost $80,244,835) | | | | | | | | | | | | | | | 67,369,003 | |
| | | | | | | | | | | | | | | | |
TOTAL SHORT-TERM INVESTMENTS
(cost $113,548,388) | | | | | | | | | | | | | | | 100,674,237 | |
| | | | | | | | | | | | | | | | |
TOTAL INVESTMENTS, BEFORE OPTIONS WRITTEN 103.3%
(cost $1,882,133,616) | | | | | | | | | | | | | | | 1,806,542,431 | |
| | | | | | | | | | | | | | | | |
| | | | |
OPTIONS WRITTEN*~ (3.9)%
(premiums received $66,877,549) | | | | | | | | | | | | | | | (68,202,257 | ) |
| | | | | | | | | | | | | | | | |
| | | | |
TOTAL INVESTMENTS, NET OF OPTIONS WRITTEN 99.4%
(cost $1,815,256,067) | | | | | | | | | | | | | | | 1,738,340,174 | |
Other assets in excess of liabilities(z) 0.6% | | | | | | | | | | | | | | | 10,553,186 | |
| | | | | | | | | | | | | | | | |
NET ASSETS 100.0% | | | | | | | | | | | | | | $ | 1,748,893,360 | |
| | | | | | | | | | | | | | | | |
The following abbreviations are used in the annual report:
144A—Security was purchased pursuant to Rule 144A under the Securities Act of 1933 and may not be resold subject to that rule except to qualified institutional buyers. Unless otherwise noted, 144A securities are deemed to be liquid.
A—Annual payment frequency for swaps
ABS—Asset-Backed Security
BBR—New Zealand Bank Bill Rate
BBSW—Australian Bank Bill Swap Reference Rate
BIBOR—Bangkok Interbank Offered Rate
BROIS—Brazil Overnight Index Swap
BUBOR—Budapest Interbank Offered Rate
See Notes to Financial Statements.
CABS—Capital Appreciation Bonds
CIBOR—Copenhagen Interbank Offered Rate
CLO—Collateralized Loan Obligation
CLOIS—Sinacofi Chile Interbank Rate Average
CMS—Constant Maturity Swap
COOIS—Colombia Overnight Interbank Reference Rate
CPI—Consumer Price Index
EIBOR—Emirates Interbank Offered Rate
EMTN—Euro Medium Term Note
EONIA—Euro Overnight Index Average
EURIBOR—Euro Interbank Offered Rate
FHLMC—Federal Home Loan Mortgage Corporation
GMAC—General Motors Acceptance Corporation
GMTN—Global Medium Term Note
GO—General Obligation
HICP—Harmonised Index of Consumer Prices
ICE—Intercontinental Exchange
IO—Interest Only (Principal amount represents notional)
JIBAR—Johannesburg Interbank Agreed Rate
KLIBOR—Kuala Lumpur Interbank Offered Rate
KWCDC—Korean Won Certificate of Deposit
LIBOR—London Interbank Offered Rate
M—Monthly payment frequency for swaps
MIBOR—Mumbai Interbank Offered Rate
MTN—Medium Term Note
NIBOR—Norwegian Interbank Offered Rate
NSA—Non-Seasonally Adjusted
OAT—Obligations Assimilables du Tresor
OFZ—Obligatsyi Federal’novo Zaima (Federal Loan Obligations)
OTC—Over-the-counter
PIK—Payment-in-Kind
PJSC—Public Joint-Stock Company
PRIBOR—Prague Interbank Offered Rate
Q—Quarterly payment frequency for swaps
S—Semiannual payment frequency for swaps
SAIBOR—Saudi Arabian Interbank Offered Rate
SIBOR—Singapore Interbank Offered Rate
SONIA—Sterling Overnight Index Average
STIBOR—Stockholm Interbank Offered Rate
Strips—Separate Trading of Registered Interest and Principal of Securities
T—Swap payment upon termination
TAIBOR—Taiwan Interbank Offered Rate
TELBOR—Tel Aviv Interbank Offered Rate
USOIS—United States Overnight Index Swap
WIBOR—Warsaw Interbank Offered Rate
AED—United Arab Emirates Dirham
ARS—Argentine Peso
AUD—Australian Dollar
BRL—Brazilian Real
CAD—Canadian Dollar
CHF—Swiss Franc
CLP—Chilean Peso
See Notes to Financial Statements.
| | | | |
| PGIM Global Total Return Fund | | | 63 | |
Schedule of Investments (continued)
as of October 31, 2018
CNH—Chinese Renminbi
COP—Colombian Peso
CZK—Czech Koruna
DKK—Danish Krone
EUR—Euro
GBP—British Pound
HKD—Hong Kong Dollar
HUF—Hungarian Forint
IDR—Indonesian Rupiah
ILS—Israeli Shekel
INR—Indian Rupee
JPY—Japanese Yen
KRW—South Korean Won
MXN—Mexican Peso
MYR—Malaysian Ringgit
NOK—Norwegian Krone
NZD—New Zealand Dollar
PEN—Peruvian Nuevo Sol
PHP—Philippine Peso
PLN—Polish Zloty
RUB—Russian Ruble
SAR—Saudi Arabian Riyal
SEK—Swedish Krona
SGD—Singapore Dollar
THB—Thai Baht
TRY—Turkish Lira
TWD—New Taiwanese Dollar
USD—US Dollar
ZAR—South African Rand
| * | Non-income producing security. |
| # | Principal or notional amount is shown in U.S. dollars unless otherwise stated. |
| ~ | See tables subsequent to the Schedule of Investments for options detail. |
| ^ | Indicates a Level 3 security. The aggregate value of Level 3 securities is $12,834,510 and 0.7% of net assets. |
| (a) | All or a portion of security is on loan. The aggregate market value of such securities, including those sold and pending settlement, is $28,246,455; cash collateral of $28,890,077 (included in liabilities) was received with which the Fund purchased highly liquid short-term investments. |
| (b) | Represents security purchased with cash collateral received for securities on loan and includes dividend reinvestment. |
| (c) | Variable rate instrument. The interest rate shown reflects the rate in effect at October 31, 2018. |
| (cc) | Variable rate instrument. The rate shown is based on the latest available information as of October 31, 2018. Certain variable rate securities are not based on a published reference rate and spread but are determined by the issuer or agent and are based on current market conditions. These securities do not indicate a reference rate and spread in their description. |
| (d) | Represents issuer in default on interest payments and/or principal repayment. Non-income producing security. Such securities may be post-maturity. |
| (h) | Represents security, or a portion thereof, segregated as collateral for OTC derivatives. |
| (k) | Represents security, or a portion thereof, segregated as collateral for centrally cleared/exchange-traded derivatives. |
| (s) | Represents zero coupon bond or principal only security. Rate represents yield to maturity at purchase date. |
| (t) | Represents zero coupon. Rate quoted represents effective yield at October 31, 2018. |
| (w) | PGIM Investments LLC, the manager of the Fund, also serves as manager of the PGIM Core Ultra Short Bond Fund and PGIM Institutional Money Market Fund. |
| (z) | Includes net unrealized appreciation/(depreciation) and/or market value of the below holdings which are excluded from the Schedule of Investments: |
See Notes to Financial Statements.
Options Purchased:
OTC Traded
| | | | | | | | | | | | | | | | | | | | | | | | | | | | |
Description | | Call/
Put | | Counterparty | | Expiration
Date | | | Strike | | | Contracts | | | Notional
Amount
(000)# | | | Value | |
2- Year 10 CMS Curve CAP | | Call | | Barclays Bank PLC | | | 07/12/21 | | | | 0.11 | % | | | — | | | | | | | | 22,475 | | | $ | 21,111 | |
2- Year 10 CMS Curve CAP | | Call | | Barclays Bank PLC | | | 07/13/21 | | | | 0.11 | % | | | — | | | | | | | | 21,850 | | | | 20,527 | |
2- Year 10 CMS Curve CAP | | Call | | Bank of America | | | 08/16/21 | | | | 0.15 | % | | | — | | | | | | | | 54,630 | | | | 50,366 | |
2- Year 10 CMS Curve CAP | | Call | | Bank of America | | | 08/20/21 | | | | 0.15 | % | | | — | | | | | | | | 108,445 | | | | 311,313 | |
2- Year 10 CMS Curve CAP | | Call | | Bank of America | | | 09/13/21 | | | | 0.14 | % | | | — | | | | | | | | 110,000 | | | | 118,383 | |
Currency Option AUD vs JPY | | Call | | Deutsche Bank AG | | | 11/25/20 | | | | 92.00 | | | | — | | | | AUD | | | | 30,400 | | | | 174,434 | |
Currency Option AUD vs USD | | Call | | Morgan Stanley | | | 08/27/19 | | | | 0.78 | | | | — | | | | AUD | | | | 83,000 | | | | 329,790 | |
Currency Option EUR vs TRY | | Call | | Goldman Sachs International | | | 11/28/18 | | | | 10.00 | | | | — | | | | EUR | | | | 35,500 | | | | 758 | |
Currency Option EUR vs TRY | | Call | | Citibank NA | | | 04/26/19 | | | | 6.00 | | | | — | | | | EUR | | | | 12,000 | | | | 2,277,898 | |
Currency Option EUR vs TRY | | Call | | BNP Paribas | | | 04/28/20 | | | | 10.00 | | | | — | | | | EUR | | | | 35,500 | | | | 3,485,784 | |
Currency Option EUR vs TRY | | Call | | Morgan Stanley | | | 07/28/20 | | | | 12.00 | | | | — | | | | EUR | | | | 35,500 | | | | 2,846,506 | |
Currency Option EUR vs ZAR | | Call | | Morgan Stanley | | | 01/31/19 | | | | 28.00 | | | | — | | | | EUR | | | | 34,500 | | | | 4,462 | |
Currency Option EUR vs ZAR | | Call | | Deutsche Bank AG | | | 11/25/19 | | | | 27.00 | | | | — | | | | EUR | | | | 14,000 | | | | 162,590 | |
Currency Option EUR vs ZAR | | Call | | Morgan Stanley | | | 12/24/19 | | | | 24.00 | | | | — | | | | EUR | | | | 14,750 | | | | 344,044 | |
Currency Option USD vs BRL | | Call | | Deutsche Bank AG | | | 12/10/18 | | | | 6.50 | | | | — | | | | | | | | 80,000 | | | | 45 | |
Currency Option USD vs BRL | | Call | | Deutsche Bank AG | | | 03/14/19 | | | | 8.50 | | | | — | | | | | | | | 40,000 | | | | 777 | |
Currency Option USD vs BRL | | Call | | JPMorgan Chase | | | 04/26/19 | | | | 5.00 | | | | — | | | | | | | | 12,500 | | | | 27,680 | |
Currency Option USD vs BRL | | Call | | Deutsche Bank AG | | | 12/20/19 | | | | 5.00 | | | | — | | | | | | | | 32,500 | | | | 413,762 | |
Currency Option USD vs BRL | | Call | | Deutsche Bank AG | | | 03/27/20 | | | | 4.65 | | | | — | | | | | | | | 33,000 | | | | 845,620 | |
Currency Option USD vs CAD | | Call | | Citibank NA | | | 01/30/19 | | | | 1.50 | | | | — | | | | | | | | 20,000 | | | | 1,343 | |
Currency Option USD vs CAD | | Call | | Hong Kong & Shanghai Bank | | | 07/30/19 | | | | 1.30 | | | | — | | | | | | | | 20,000 | | | | 581,753 | |
Currency Option USD vs CNH | | Call | | Morgan Stanley | | | 11/28/18 | | | | 7.75 | | | | — | | | | | | | | 12,500 | | | | 710 | |
See Notes to Financial Statements.
| | | | |
| PGIM Global Total Return Fund | | | 65 | |
Schedule of Investments (continued)
as of October 31, 2018
Options Purchased (continued):
OTC Traded
| | | | | | | | | | | | | | | | | | | | | | | | | | | | |
Description | | Call/
Put | | Counterparty | | Expiration
Date | | | Strike | | | Contracts | | | Notional
Amount
(000)# | | | Value | |
Currency Option USD vs CNH | | Call | | JPMorgan Chase | | | 11/28/18 | | | | 8.75 | | | | — | | | | | | | | 25,000 | | | $ | 104 | |
Currency Option USD vs CNH | | Call | | Morgan Stanley | | | 03/27/19 | | | | 8.25 | | | | — | | | | | | | | 39,000 | | | | 34,361 | |
Currency Option USD vs CNH | | Call | | Morgan Stanley | | | 06/26/20 | | | | 7.25 | | | | — | | | | | | | | 39,000 | | | | 1,065,095 | |
Currency Option USD vs INR | | Call | | BNP Paribas | | | 11/30/18 | | | | 82.50 | | | | — | | | | | | | | 40,000 | | | | 987 | |
Currency Option USD vs JPY | | Call | | Citibank NA | | | 01/27/21 | | | | 110.00 | | | | — | | | | | | | | 18,000 | | | | 477,417 | |
Currency Option USD vs JPY | | Call | | Morgan Stanley | | | 01/27/21 | | | | 110.00 | | | | — | | | | | | | | 22,000 | | | | 583,510 | |
Currency Option USD vs KRW | | Call | | JPMorgan Chase | | | 04/26/19 | | | | 1,250.00 | | | | — | | | | | | | | 11,000 | | | | 56,530 | |
Currency Option USD vs KRW | | Call | | Goldman Sachs International | | | 04/26/19 | | | | 1,400.00 | | | | — | | | | | | | | 22,000 | | | | 25,540 | |
Currency Option USD vs KRW | | Call | | Goldman Sachs International | | | 05/29/19 | | | | 1,500.00 | | | | — | | | | | | | | 12,000 | | | | 11,135 | |
Currency Option USD vs KRW | | Call | | Morgan Stanley | | | 07/29/19 | | | | 1,150.00 | | | | — | | | | | | | | 15,000 | | | | 367,659 | |
Currency Option USD vs KRW | | Call | | Goldman Sachs International | | | 07/29/19 | | | | 1,450.00 | | | | — | | | | | | | | 30,000 | | | | 60,438 | |
Currency Option USD vs KRW | | Call | | Goldman Sachs International | | | 12/20/19 | | | | 1,200.00 | | | | — | | | | | | | | 18,000 | | | | 370,944 | |
Currency Option USD vs KRW | | Call | | BNP Paribas | | | 12/20/19 | | | | 1,350.00 | | | | — | | | | | | | | 36,000 | | | | 278,141 | |
Currency Option USD vs MXN | | Call | | Citibank NA | | | 11/26/18 | | | | 26.00 | | | | — | | | | | | | | 55,500 | | | | 1,389 | |
Currency Option USD vs MXN | | Call | | BNP Paribas | | | 11/26/18 | | | | 25.00 | | | | — | | | | | | | | 24,500 | | | | 1,493 | |
Currency Option USD vs MXN | | Call | | Deutsche Bank AG | | | 01/29/19 | | | | 30.00 | | | | — | | | | | | | | 10,000 | | | | 1,958 | |
Currency Option USD vs MXN | | Call | | Morgan Stanley | | | 03/27/19 | | | | 24.00 | | | | — | | | | | | | | 24,000 | | | | 173,933 | |
Currency Option USD vs MXN | | Call | | Morgan Stanley | | | 12/26/19 | | | | 22.00 | | | | — | | | | | | | | 16,000 | | | | 898,828 | |
Currency Option USD vs MXN | | Call | | Citibank NA | | | 12/26/19 | | | | 26.00 | | | | — | | | | | | | | 32,000 | | | | 647,838 | |
Currency Option USD vs RUB | | Call | | Goldman Sachs International | | | 01/11/19 | | | | 95.00 | | | | — | | | | | | | | 33,000 | | | | 8,902 | |
Currency Option USD vs RUB | | Call | | Citibank NA | | | 12/23/19 | | | | 85.00 | | | | — | | | | | | | | 18,000 | | | | 356,101 | |
See Notes to Financial Statements.
Options Purchased (continued):
OTC Traded
| | | | | | | | | | | | | | | | | | | | | | | | | | | | |
Description | | Call/
Put | | Counterparty | | Expiration
Date | | | Strike | | | Contracts | | | Notional
Amount
(000)# | | | Value | |
Currency Option USD vs TRY | | Call | | Credit Suisse International | | | 11/29/18 | | | | 5.00 | | | | — | | | | | | | | 8,000 | | | $ | 983,442 | |
Currency Option USD vs TRY | | Call | | BNP Paribas | | | 11/29/18 | | | | 6.00 | | | | — | | | | | | | | 8,000 | | | | 71,928 | |
Currency Option USD vs TRY | | Call | | Morgan Stanley | | | 12/14/18 | | | | 9.00 | | | | — | | | | | | | | 40,000 | | | | 8,293 | |
Currency Option USD vs TRY | | Call | | Citibank NA | | | 08/28/19 | | | | 5.40 | | | | — | | | | | | | | 15,000 | | | | 2,908,136 | |
Currency Option USD vs TRY | | Call | | Goldman Sachs International | | | 12/23/19 | | | | 6.00 | | | | — | | | | | | | | 18,000 | | | | 3,133,249 | |
Currency Option USD vs TRY | | Call | | Morgan Stanley | | | 04/29/20 | | | | 7.00 | | | | — | | | | | | | | 41,000 | | | | 5,969,752 | |
Currency Option USD vs TRY | | Call | | Deutsche Bank AG | | | 06/29/20 | | | | 9.00 | | | | — | | | | | | | | 40,000 | | | | 3,326,471 | |
Currency Option USD vs ZAR | | Call | | Hong Kong & Shanghai Bank | | | 11/28/18 | | | | 24.00 | | | | — | | | | | | | | 9,000 | | | | 12 | |
Currency Option USD vs ZAR | | Call | | BNP Paribas | | | 12/14/18 | | | | 25.00 | | | | — | | | | | | | | 40,000 | | | | 482 | |
Currency Option USD vs ZAR | | Call | | Goldman Sachs International | | | 04/26/19 | | | | 25.00 | | | | — | | | | | | | | 40,000 | | | | 47,732 | |
Currency Option USD vs ZAR | | Call | | Morgan Stanley | | | 06/26/19 | | | | 20.00 | | | | — | | | | | | | | 15,000 | | | | 143,202 | |
Currency Option USD vs ZAR | | Call | | Morgan Stanley | | | 12/24/19 | | | | 14.00 | | | | — | | | | | | | | 18,000 | | | | 2,278,571 | |
Currency Option USD vs ZAR | | Call | | BNP Paribas | | | 12/24/19 | | | | 17.00 | | | | — | | | | | | | | 36,000 | | | | 1,866,733 | |
Currency Option USD vs ZAR | | Call | | Goldman Sachs International | | | 09/28/20 | | | | 17.00 | | | | — | | | | | | | | 40,000 | | | | 3,426,090 | |
Currency Option AUD vs JPY | | Put | | Deutsche Bank AG | | | 11/27/18 | | | | 60.00 | | | | — | | | | AUD | | | | 110,000 | | | | 43 | |
Currency Option AUD vs JPY | | Put | | BNP Paribas | | | 06/26/19 | | | | 80.00 | | | | — | | | | AUD | | | | 77,000 | | | | 2,396,381 | |
Currency Option AUD vs JPY | | Put | | Morgan Stanley | | | 06/26/19 | | | | 70.00 | | | | — | | | | AUD | | | | 154,000 | | | | 997,116 | |
Currency Option AUD vs JPY | | Put | | Morgan Stanley | | | 01/29/20 | | | | 82.00 | | | | — | | | | AUD | | | | 110,000 | | | | 6,375,153 | |
Currency Option AUD vs JPY | | Put | | Deutsche Bank AG | | | 01/29/20 | | | | 73.00 | | | | — | | | | AUD | | | | 220,000 | | | | 4,764,549 | |
Currency Option AUD vs JPY | | Put | | Deutsche Bank AG | | | 02/26/20 | | | | 76.00 | | | | — | | | | AUD | | | | 110,000 | | | | 3,506,563 | |
Currency Option AUD vs USD | | Put | | Citibank NA | | | 01/29/20 | | | | 0.69 | | | | — | | | | AUD | | | | 23,000 | | | | 484,437 | |
See Notes to Financial Statements.
| | | | |
| PGIM Global Total Return Fund | | | 67 | |
Schedule of Investments (continued)
as of October 31, 2018
Options Purchased (continued):
OTC Traded
| | | | | | | | | | | | | | | | | | | | | | | | | | | | |
Description | | Call/
Put | | Counterparty | | Expiration
Date | | | Strike | | | Contracts | | | Notional
Amount
(000)# | | | Value | |
Currency Option EUR vs TRY | | Put | | JPMorgan Chase | | | 02/26/19 | | | | 4.60 | | | | — | | | | EUR | | | | 15,000 | | | $ | 746 | |
Currency Option EUR vs TRY | | Put | | Goldman Sachs International | | | 04/28/20 | | | | 6.00 | | | | — | | | | EUR | | | | 35,500 | | | | 224,488 | |
Currency Option EUR vs TRY | | Put | | BNP Paribas | | | 07/28/20 | | | | 7.00 | | | | — | | | | EUR | | | | 35,500 | | | | 659,982 | |
Currency Option GBP vs USD | | Put | | Hong Kong & Shanghai Bank | | | 04/25/19 | | | | 1.00 | | | | — | | | | GBP | | | | 32,000 | | | | 35,351 | |
Currency Option GBP vs USD | | Put | | Citibank NA | | | 11/25/19 | | | | 1.30 | | | | — | | | | GBP | | | | 12,500 | | | | 643,629 | |
Currency Option GBP vs USD | | Put | | Hong Kong & Shanghai Bank | | | 11/25/19 | | | | 1.15 | | | | — | | | | GBP | | | | 12,500 | | | | 183,302 | |
Currency Option GBP vs USD | | Put | | Hong Kong & Shanghai Bank | | | 09/28/20 | | | | 1.28 | | | | — | | | | GBP | | | | 32,000 | | | | 1,715,494 | |
Currency Option USD vs BRL | | Put | | JPMorgan Chase | | | 03/27/20 | | | | 3.10 | | | | — | | | | | | | | 33,000 | | | | 164,298 | |
Currency Option USD vs BRL | | Put | | Deutsche Bank AG | | | 06/26/20 | | | | 3.50 | | | | — | | | | | | | | 40,000 | | | | 979,261 | |
Currency Option USD vs BRL | | Put | | Deutsche Bank AG | | | 08/27/20 | | | | 3.50 | | | | — | | | | | | | | 40,000 | | | | 1,011,210 | |
Currency Option USD vs BRL | | Put | | Morgan Stanley | | | 08/27/20 | | | | 3.25 | | | | — | | | | | | | | 40,000 | | | | 456,399 | |
Currency Option USD vs CNH | | Put | | Morgan Stanley | | | 06/26/19 | | | | 6.00 | | | | — | | | | | | | | 39,000 | | | | 6,926 | |
Currency Option USD vs INR | | Put | | BNP Paribas | | | 08/27/19 | | | | 69.50 | | | | — | | | | | | | | 40,000 | | | | 76,731 | |
Currency Option USD vs JPY | | Put | | Morgan Stanley | | | 01/07/19 | | | | 91.00 | | | | — | | | | | | | | 40,000 | | | | 1,035 | |
Currency Option USD vs KRW | | Put | | Deutsche Bank AG | | | 07/29/19 | | | | 1,050.00 | | | | — | | | | | | | | 15,000 | | | | 85,790 | |
Currency Option USD vs MXN | | Put | | BNP Paribas | | | 08/27/19 | | | | 17.00 | | | | — | | | | | | | | 24,500 | | | | 37,508 | |
Currency Option USD vs MXN | | Put | | Citibank NA | | | 04/28/20 | | | | 17.00 | | | | — | | | | | | | | 55,500 | | | | 195,984 | |
Currency Option USD vs TRY | | Put | | Goldman Sachs International | | | 04/29/20 | | | | 4.00 | | | | — | | | | | | | | 41,000 | | | | 36,388 | |
Currency Option USD vs TRY | | Put | | Morgan Stanley | | | 06/29/20 | | | | 5.00 | | | | — | | | | | | | | 40,000 | | | | 173,621 | |
Currency Option USD vs ZAR | | Put | | BNP Paribas | | | 07/27/20 | | | | 12.00 | | | | — | | | | | | | | 40,000 | | | | 317,068 | |
| | | | | | | | | | | | | | | | | | | | | | | | | | | | |
Total OTC Traded (cost $80,117,449) | | | | | | | | | | | | | | | | | | | | | | $ | 67,135,505 | |
| | | | | | | | | | | | | | | | | | | | | | | | | | | | |
See Notes to Financial Statements.
Options Purchased (continued):
OTC Swaptions
| | | | | | | | | | | | | | | | | | | | | | | | |
Description | | Call/
Put | | Counterparty | | Expiration
Date | | | Strike | | | Receive | | Pay | | Notional
Amount
(000)# | | | Value | |
CDX.NA.HY.31.V1, 12/20/23 | | Call | | Bank of America | | | 03/20/19 | | | $ | 107.50 | | | 5.00%(Q) | | CDX.NA.HY. 31.V1(Q) | | | 12,250 | | | $ | 11,469 | |
CDX.NA.HY.31.V1, 12/20/23 | | Call | | Deutsche Bank AG | | | 03/20/19 | | | $ | 107.50 | | | 5.00%(Q) | | CDX.NA.HY. 31.V1(Q) | | | 14,250 | | | | 13,342 | |
CDX.NA.HY.31.V1, 12/20/23 | | Call | | Bank of America | | | 03/20/19 | | | $ | 106.50 | | | 5.00%(Q) | | CDX.NA.HY. 31.V1(Q) | | | 12,170 | | | | 27,523 | |
iTraxx.XO.29.V1, 06/20/23 | | Call | | BNP Paribas | | | 12/19/18 | | | | 275.00 | | | 5.00%(Q) | | iTraxx.XO. 29.V1(Q) | | EUR | 22,400 | | | | 40,214 | |
10- Year Interest Rate Swap, 11/19/37 | | Put | | Morgan Stanley | | | 11/17/27 | | | | 1.25 | % | | 6 Month JPY LIBOR(S) | | 1.25%(S) | | JPY | 545,000 | | | | 140,950 | |
| | | | | | | | | | | | | | | | | | | | | | | | |
Total OTC Swaptions (cost $127,386) | | | | | | | | | | | | | | | | | | $ | 233,498 | |
| | | | | | | | | | | | | | | | | | | | | | | | |
Total Options Purchased (cost $80,244,835) | | | | | | | | | | | | | | | | | | $ | 67,369,003 | |
| | | | | | | | | | | | | | | | | | | | | | | | |
Options Written:
OTC Traded
| | | | | | | | | | | | | | | | | | | | | | | | | | | | |
Description | | Call/
Put | | Counterparty | | Expiration
Date | | | Strike | | | Contracts | | | Notional
Amount
(000)# | | | Value | |
Currency Option EUR vs TRY | | Call | | Morgan Stanley | | | 11/28/18 | | | | 10.00 | | | | — | | | | EUR | | | | 35,500 | | | $ | (758 | ) |
Currency Option EUR vs TRY | | Call | | BNP Paribas | | | 04/26/19 | | | | 6.00 | | | | — | | | | EUR | | | | 12,000 | | | | (2,277,898 | ) |
Currency Option EUR vs TRY | | Call | | Goldman Sachs International | | | 04/28/20 | | | | 10.00 | | | | — | | | | EUR | | | | 35,500 | | | | (3,485,784 | ) |
Currency Option EUR vs TRY | | Call | | BNP Paribas | | | 07/28/20 | | | | 12.00 | | | | — | | | | EUR | | | | 35,500 | | | | (2,846,506 | ) |
Currency Option EUR vs ZAR | | Call | | Citibank NA | | | 11/25/19 | | | | 27.00 | | | | — | | | | EUR | | | | 14,000 | | | | (162,590 | ) |
Currency Option EUR vs ZAR | | Call | | Deutsche Bank AG | | | 12/24/19 | | | | 24.00 | | | | — | | | | EUR | | | | 14,750 | | | | (344,044 | ) |
Currency Option EUR vs ZAR | | Call | | Morgan Stanley | | | 08/27/20 | | | | 28.00 | | | | — | | | | EUR | | | | 34,500 | | | | (977,335 | ) |
Currency Option USD vs BRL | | Call | | Hong Kong & Shanghai Bank | | | 04/26/19 | | | | 5.00 | | | | — | | | | | | | | 12,500 | | | | (27,680 | ) |
Currency Option USD vs BRL | | Call | | JPMorgan Chase | | | 12/20/19 | | | | 5.00 | | | | — | | | | | | | | 18,000 | | | | (229,161 | ) |
Currency Option USD vs BRL | | Call | | JPMorgan Chase | | | 12/20/19 | | | | 5.00 | | | | — | | | | | | | | 14,500 | | | | (184,602 | ) |
Currency Option USD vs BRL | | Call | | JPMorgan Chase | | | 03/27/20 | | | | 4.65 | | | | — | | | | | | | | 33,000 | | | | (845,619 | ) |
See Notes to Financial Statements.
| | | | |
| PGIM Global Total Return Fund | | | 69 | |
Schedule of Investments (continued)
as of October 31, 2018
Options Written (continued):
OTC Traded
| | | | | | | | | | | | | | | | | | | | | | | | | | | | |
Description | | Call/
Put | | Counterparty | | Expiration
Date | | | Strike | | | Contracts | | | Notional
Amount
(000)# | | | Value | |
Currency Option USD vs BRL | | Call | | Deutsche Bank AG | | | 07/27/20 | | | | 6.50 | | | | — | | | | | | | | 80,000 | | | $ | (662,043 | ) |
Currency Option USD vs BRL | | Call | | Deutsche Bank AG | | | 08/27/20 | | | | 8.50 | | | | — | | | | | | | | 40,000 | | | | (141,231 | ) |
Currency Option USD vs CAD | | Call | | Hong Kong & Shanghai Bank | | | 07/30/19 | | | | 1.40 | | | | — | | | | | | | | 40,000 | | | | (274,050 | ) |
Currency Option USD vs CNH | | Call | | Morgan Stanley | | | 11/28/18 | | | | 8.75 | | | | — | | | | | | | | 25,000 | | | | (104 | ) |
Currency Option USD vs CNH | | Call | | Hong Kong & Shanghai Bank | | | 11/28/18 | | | | 7.75 | | | | — | | | | | | | | 12,500 | | | | (710 | ) |
Currency Option USD vs CNH | | Call | | Morgan Stanley | | | 06/26/20 | | | | 7.75 | | | | — | | | | | | | | 78,000 | | | | (1,104,625 | ) |
Currency Option USD vs INR | | Call | | BNP Paribas | | | 08/27/19 | | | | 82.50 | | | | — | | | | | | | | 40,000 | | | | (419,852 | ) |
Currency Option USD vs KRW | | Call | | JPMorgan Chase | | | 04/26/19 | | | | 1,400.00 | | | | — | | | | | | | | 22,000 | | | | (25,540 | ) |
Currency Option USD vs KRW | | Call | | Goldman Sachs International | | | 04/26/19 | | | | 1,250.00 | | | | — | | | | | | | | 11,000 | | | | (56,530 | ) |
Currency Option USD vs KRW | | Call | | Morgan Stanley | | | 05/29/19 | | | | 1,500.00 | | | | — | | | | | | | | 12,000 | | | | (11,135 | ) |
Currency Option USD vs KRW | | Call | | Morgan Stanley | | | 07/29/19 | | | | 1,450.00 | | | | — | | | | | | | | 30,000 | | | | (60,438 | ) |
Currency Option USD vs KRW | | Call | | Goldman Sachs International | | | 07/29/19 | | | | 1,150.00 | | | | — | | | | | | | | 15,000 | | | | (367,659 | ) |
Currency Option USD vs KRW | | Call | | Goldman Sachs International | | | 12/20/19 | | | | 1,350.00 | | | | — | | | | | | | | 36,000 | | | | (278,141 | ) |
Currency Option USD vs KRW | | Call | | BNP Paribas | | | 12/20/19 | | | | 1,200.00 | | | | — | | | | | | | | 18,000 | | | | (370,944 | ) |
Currency Option USD vs MXN | | Call | | Morgan Stanley | | | 01/29/19 | | | | 30.00 | | | | — | | | | | | | | 10,000 | | | | (1,958 | ) |
Currency Option USD vs MXN | | Call | | JPMorgan Chase | | | 03/27/19 | | | | 24.00 | | | | — | | | | | | | | 24,000 | | | | (173,933 | ) |
Currency Option USD vs MXN | | Call | | BNP Paribas | | | 08/27/19 | | | | 25.00 | | | | — | | | | | | | | 24,500 | | | | (376,997 | ) |
Currency Option USD vs MXN | | Call | | Morgan Stanley | | | 12/26/19 | | | | 26.00 | | | | — | | | | | | | | 32,000 | | | | (647,838 | ) |
Currency Option USD vs MXN | | Call | | Citibank NA | | | 12/26/19 | | | | 22.00 | | | | — | | | | | | | | 16,000 | | | | (898,828 | ) |
Currency Option USD vs MXN | | Call | | Citibank NA | | | 04/28/20 | | | | 26.00 | | | | — | | | | | | | | 55,500 | | | | (1,611,225 | ) |
Currency Option USD vs RUB | | Call | | Goldman Sachs International | | | 12/23/19 | | | | 85.00 | | | | — | | | | | | | | 18,000 | | | | (356,101 | ) |
See Notes to Financial Statements.
Options Written (continued):
OTC Traded
| | | | | | | | | | | | | | | | | | | | | | | | | | | | |
Description | | Call/
Put | | Counterparty | | Expiration
Date | | | Strike | | | Contracts | | | Notional
Amount
(000)# | | | Value | |
Currency Option USD vs RUB | | Call | | Citibank NA | | | 03/30/20 | | | | 95.00 | | | | — | | | | | | | | 33,000 | | | $ | (525,835 | ) |
Currency Option USD vs TRY | | Call | | BNP Paribas | | | 11/29/18 | | | | 5.00 | | | | — | | | | | | | | 8,000 | | | | (983,442 | ) |
Currency Option USD vs TRY | | Call | | Credit Suisse International | | | 11/29/18 | | | | 6.00 | | | | — | | | | | | | | 8,000 | | | | (71,928 | ) |
Currency Option USD vs TRY | | Call | | Deutsche Bank AG | | | 12/14/18 | | | | 9.00 | | | | — | | | | | | | | 40,000 | | | | (8,293 | ) |
Currency Option USD vs TRY | | Call | | BNP Paribas | | | 08/28/19 | | | | 5.40 | | | | — | | | | | | | | 15,000 | | | | (2,908,136 | ) |
Currency Option USD vs TRY | | Call | | BNP Paribas | | | 12/23/19 | | | | 6.00 | | | | — | | | | | | | | 18,000 | | | | (3,133,249 | ) |
Currency Option USD vs TRY | | Call | | Goldman Sachs International | | | 04/29/20 | | | | 7.00 | | | | — | | | | | | | | 41,000 | | | | (5,969,752 | ) |
Currency Option USD vs TRY | | Call | | Morgan Stanley | | | 06/29/20 | | | | 9.00 | | | | — | | | | | | | | 40,000 | | | | (3,326,471 | ) |
Currency Option USD vs ZAR | | Call | | Credit Suisse International | | | 11/28/18 | | | | 24.00 | | | | — | | | | | | | | 9,000 | | | | (12 | ) |
Currency Option USD vs ZAR | | Call | | Hong Kong & Shanghai Bank | | | 06/26/19 | | | | 20.00 | | | | — | | | | | | | | 13,000 | | | | (124,108 | ) |
Currency Option USD vs ZAR | | Call | | BNP Paribas | | | 06/26/19 | | | | 20.00 | | | | — | | | | | | | | 2,000 | | | | (19,094 | ) |
Currency Option USD vs ZAR | | Call | | Morgan Stanley | | | 12/24/19 | | | | 17.00 | | | | — | | | | | | | | 36,000 | | | | (1,866,733 | ) |
Currency Option USD vs ZAR | | Call | | BNP Paribas | | | 12/24/19 | | | | 14.00 | | | | — | | | | | | | | 18,000 | | | | (2,278,571 | ) |
Currency Option USD vs ZAR | | Call | | BNP Paribas | | | 07/27/20 | | | | 25.00 | | | | — | | | | | | | | 40,000 | | | | (833,970 | ) |
Currency Option USD vs ZAR | | Call | | Goldman Sachs International | | | 09/28/20 | | | | 21.00 | | | | — | | | | | | | | 80,000 | | | | (3,371,914 | ) |
Currency Option AUD vs JPY | | Put | | BNP Paribas | | | 06/26/19 | | | | 70.00 | | | | — | | | | AUD | | | | 154,000 | | | | (997,116 | ) |
Currency Option AUD vs JPY | | Put | | Morgan Stanley | | | 06/26/19 | | | | 80.00 | | | | — | | | | AUD | | | | 77,000 | | | | (2,396,381 | ) |
Currency Option AUD vs JPY | | Put | | Morgan Stanley | | | 01/29/20 | | | | 73.00 | | | | — | | | | AUD | | | | 220,000 | | | | (4,764,549 | ) |
Currency Option AUD vs JPY | | Put | | Deutsche Bank AG | | | 01/29/20 | | | | 82.00 | | | | — | | | | AUD | | | | 110,000 | | | | (6,375,153 | ) |
Currency Option AUD vs JPY | | Put | | Deutsche Bank AG | | | 02/26/20 | | | | 67.00 | | | | — | | | | AUD | | | | 220,000 | | | | (2,670,544 | ) |
Currency Option AUD vs USD | | Put | | Morgan Stanley | | | 01/29/20 | | | | 0.69 | | | | — | | | | AUD | | | | 23,000 | | | | (484,437 | ) |
See Notes to Financial Statements.
| | | | |
| PGIM Global Total Return Fund | | | 71 | |
Schedule of Investments (continued)
as of October 31, 2018
Options Written (continued):
OTC Traded
| | | | | | | | | | | | | | | | | | | | | | | | | | | | |
Description | | Call/
Put | | Counterparty | | Expiration
Date | | | Strike | | | Contracts | | | Notional
Amount
(000)# | | | Value | |
Currency Option EUR vs TRY | | Put | | Morgan Stanley | | | 04/28/20 | | | | 6.00 | | | | — | | | | EUR | | | | 35,500 | | | $ | (224,488 | ) |
Currency Option EUR vs TRY | | Put | | Morgan Stanley | | | 07/28/20 | | | | 7.00 | | | | — | | | | EUR | | | | 35,500 | | | | (659,982 | ) |
Currency Option GBP vs USD | | Put | | Citibank NA | | | 11/25/19 | | | | 1.15 | | | | — | | | | GBP | | | | 12,500 | | | | (183,302 | ) |
Currency Option GBP vs USD | | Put | | Hong Kong & Shanghai Bank | | | 11/25/19 | | | | 1.30 | | | | — | | | | GBP | | | | 12,500 | | | | (643,629 | ) |
Currency Option GBP vs USD | | Put | | Hong Kong & Shanghai Bank | | | 09/28/20 | | | | 1.16 | | | | — | | | | GBP | | | | 64,000 | | | | (1,559,366 | ) |
Currency Option USD vs BRL | | Put | | Deutsche Bank AG | | | 03/27/20 | | | | 3.10 | | | | — | | | | | | | | 33,000 | | | | (164,298 | ) |
Currency Option USD vs BRL | | Put | | Morgan Stanley | | | 08/27/20 | | | | 3.50 | | | | — | | | | | | | | 40,000 | | | | (1,011,210 | ) |
Currency Option USD vs JPY | | Put | | Morgan Stanley | | | 01/27/21 | | | | 91.00 | | | | — | | | | | | | | 40,000 | | | | (621,404 | ) |
Currency Option USD vs KRW | | Put | | Morgan Stanley | | | 07/29/19 | | | | 1,050.00 | | | | — | | | | | | | | 15,000 | | | | (85,790 | ) |
Currency Option USD vs TRY | | Put | | Deutsche Bank AG | | | 04/29/20 | | | | 4.00 | | | | — | | | | | | | | 41,000 | | | | (36,388 | ) |
Currency Option USD vs TRY | | Put | | Deutsche Bank AG | | | 06/29/20 | | | | 5.00 | | | | — | | | | | | | | 40,000 | | | | (173,621 | ) |
Lebanese Republic, 8.25%, 04/12/21^ | | Put | | Deutsche Bank AG | | | 04/08/19 | | | $ | 66.00 | | | | — | | | | | | | | 4,080 | | | | (4,755 | ) |
| | | | | | | | | | | | | | | | | | | | | | | | | | | | |
Total OTC Traded (premiums received $66,311,749) | | | | | | | | | | | | | | | $ | (67,699,780 | ) |
| | | | | | | | | | | | | | | | | | | | | | | | | | | | |
OTC Swaptions
| | | | | | | | | | | | | | | | | | | | | | | | |
Description | | Call/
Put | | Counterparty | | Expiration
Date | | | Strike | | | Receive | | Pay | | Notional
Amount
(000)# | | | Value | |
10- Year Interest Rate Swap, 08/07/29 | | Call | | Morgan Stanley | | | 08/05/19 | | | | 0.41 | % | | 6 Month JPY LIBOR(S) | | 0.41%(S) | | JPY | 1,000,000 | | | $ | (72,120 | ) |
10- Year Interest Rate Swap, 11/19/37 | | Put | | Morgan Stanley | | | 11/17/27 | | | | 1.25 | % | | 1.25%(S) | | 6 Month JPY LIBOR(S) | | JPY | 545,000 | | | | (140,950 | ) |
15- Year Interest Rate Swap, 08/27/34 | | Put | | Morgan Stanley | | | 08/22/19 | | | | 0.60 | % | | 0.60%(S) | | 6 Month JPY LIBOR(S) | | JPY | 1,000,000 | | | | (107,796 | ) |
See Notes to Financial Statements.
Options Written (continued):
OTC Swaptions
| | | | | | | | | | | | | | | | | | | | | | | | | | | | |
Description | | Call/
Put | | Counterparty | | Expiration
Date | | | Strike | | | Receive | | | Pay | | | Notional
Amount
(000)# | | | Value | |
CDX.NA.HY.31.V1, 12/20/23 | | Put | | Deutsche Bank AG | | | 03/20/19 | | | | $98.00 | | | | 5.00%(Q) | | | | CDX.NA.HY. 31.V1(Q) | | | | 14,250 | | | $ | (85,770 | ) |
CDX.NA.HY.31.V1, 12/20/23 | | Put | | Bank of America | | | 03/20/19 | | | | $98.00 | | | | 5.00%(Q) | | | | CDX.NA.HY. 31.V1(Q) | | | | 12,250 | | | | (73,732 | ) |
iTraxx.XO.29.V1, 06/20/23 | | Put | | BNP Paribas | | | 12/19/18 | | | | 400.00 | | | | 5.00%(Q) | | | | iTraxx.XO. 29.V1(Q) | | | EUR | 22,400 | | | | (22,109 | ) |
| | | | | | | | | | | | | | | | | | | | | | | | | | | | |
| Total OTC Swaptions (premiums received $565,800) | | | | | | | $ | (502,477 | ) |
| | | | | | | | | | | | | | | | | | | | | | | | | | | | |
| Total Options Written (premiums received $66,877,549) | | | | | | | $ | (68,202,257 | ) |
| | | | | | | | | | | | | | | | | | | | | | | | | | |
Futures contracts outstanding at October 31, 2018:
| | | | | | | | | | | | | | | | |
Number of
Contracts | | | Type | | Expiration
Date | | | Current
Notional
Amount | | | Value /
Unrealized
Appreciation
(Depreciation) | |
| | Long Positions: | | | | | | | | | | | | |
| | 323 | | | 90 Day Euro Dollar | | | Dec. 2020 | | | $ | 78,161,963 | | | $ | (202,742 | ) |
| | 6,261 | | | 5 Year U.S. Treasury Notes | | | Dec. 2018 | | | | 703,628,789 | | | | (5,401,368 | ) |
| | 4,033 | | | 10 Year U.S. Treasury Notes | | | Dec. 2018 | | | | 477,658,437 | | | | (3,210,102 | ) |
| | 877 | | | 10 Year U.S. Ultra Treasury Notes | | | Dec. 2018 | | | | 130,864,844 | | | | (8,457,957 | ) |
| | 143 | | | 20 Year U.S. Treasury Bonds | | | Dec. 2018 | | | | 19,751,875 | | | | (249,305 | ) |
| | | | | | | | | | | | | | | (17,521,474 | ) |
| | Short Positions: | | | | | | | | | | | | |
| | 323 | | | 90 Day Euro Dollar | | | Dec. 2021 | | | | 78,190,225 | | | | 154,708 | |
| | 2,448 | | | 2 Year U.S. Treasury Notes | | | Dec. 2018 | | | | 515,686,500 | | | | 1,060,651 | |
| | 1,632 | | | 5 Year Euro-Bobl | | | Dec. 2018 | | | | 242,963,540 | | | | (77,756 | ) |
| | 372 | | | 10 Year Euro-Bund | | | Dec. 2018 | | | | 67,524,516 | | | | 76,197 | |
| | 16 | | | 10 Year U.K. Gilt | | | Dec. 2018 | | | | 2,503,432 | | | | 7,358 | |
| | 1,114 | | | Euro Schatz. DUA Index | | | Dec. 2018 | | | | 141,286,174 | | | | (43,872 | ) |
| | | | | | | | | | | | | | | | |
| | | | | | | | | | | | | | | 1,177,286 | |
| | | | | | | | | | | | | | | | |
| | | | | | | | | | | | | | $ | (16,344,188 | ) |
| | | | | | | | | | | | | | | | |
See Notes to Financial Statements.
| | | | |
| PGIM Global Total Return Fund | | | 73 | |
Schedule of Investments (continued)
as of October 31, 2018
Forward foreign currency exchange contracts outstanding at October 31, 2018:
| | | | | | | | | | | | | | | | | | | | | | |
Purchase Contracts | | Counterparty | | Notional
Amount
(000) | | | Value at
Settlement
Date | | | Current
Value | | | Unrealized
Appreciation | | | Unrealized
Depreciation | |
OTC Forward Foreign Currency Exchange Contracts: | |
Argentine Peso, | | | | | | | | | | | | | | | | | | | | | | |
Expiring 11/30/18 | | BNP Paribas | | ARS | 30,607 | | | $ | 800,187 | | | $ | 820,567 | | | $ | 20,380 | | | $ | — | |
Expiring 11/30/18 | | BNP Paribas | | ARS | 30,424 | | | | 797,479 | | | | 815,652 | | | | 18,173 | | | | — | |
Australian Dollar, | | | | | | | | | | | | | | | | | | | | | | |
Expiring 01/18/19 | | Citibank NA | | AUD | 1,366 | | | | 967,921 | | | | 968,370 | | | | 449 | | | | — | |
Expiring 01/18/19 | | Morgan Stanley | | AUD | 5,227 | | | | 3,719,000 | | | | 3,704,950 | | | | — | | | | (14,050 | ) |
Expiring 01/18/19 | | Toronto Dominion | | AUD | 6,386 | | | | 4,560,000 | | | | 4,526,744 | | | | — | | | | (33,256 | ) |
Expiring 01/18/19 | | Toronto Dominion | | AUD | 5,288 | | | | 3,777,000 | | | | 3,748,494 | | | | — | | | | (28,506 | ) |
Expiring 01/18/19 | | Toronto Dominion | | AUD | 3,350 | | | | 2,388,000 | | | | 2,374,615 | | | | — | | | | (13,385 | ) |
Expiring 01/18/19 | | Toronto Dominion | | AUD | 1,710 | | | | 1,213,000 | | | | 1,211,872 | | | | — | | | | (1,128 | ) |
Expiring 01/31/19 | | Deutsche Bank AG | | AUD | 1,091 | | | | 774,000 | | | | 773,390 | | | | — | | | | (610 | ) |
Expiring 01/31/19 | | JPMorgan Chase | | AUD | 2,613 | | | | 1,854,000 | | | | 1,852,333 | | | | — | | | | (1,667 | ) |
Expiring 01/31/19 | | UBS AG | | AUD | 1,769 | | | | 1,253,000 | | | | 1,254,422 | | | | 1,422 | | | | — | |
Expiring 01/31/19 | | UBS AG | | AUD | 887 | | | | 627,000 | | | | 629,056 | | | | 2,056 | | | | — | |
Expiring 06/28/19 | | Goldman Sachs International | | AUD | 3,228 | | | | 2,466,159 | | | | 2,294,992 | | | | — | | | | (171,167 | ) |
Expiring 06/28/19 | | Morgan Stanley | | AUD | 1,390 | | | | 1,075,980 | | | | 988,273 | | | | — | | | | (87,707 | ) |
Expiring 08/29/19 | | Morgan Stanley | | AUD | 6,367 | | | | 4,520,845 | | | | 4,533,806 | | | | 12,961 | | | | — | |
Expiring 01/31/20 | | Citibank NA | | AUD | 3,238 | | | | 2,594,998 | | | | 2,314,677 | | | | — | | | | (280,321 | ) |
Expiring 01/31/20 | | Citibank NA | | AUD | 2,637 | | | | 1,966,670 | | | | 1,885,302 | | | | — | | | | (81,368 | ) |
Expiring 11/30/20 | | Morgan Stanley | | AUD | 2,729 | | | | 1,959,198 | | | | 1,964,869 | | | | 5,671 | | | | — | |
Brazilian Real, | | | | | | | | | | | | | | | | | | | | | | |
Expiring 12/04/18 | | Barclays Bank PLC | | BRL | 5,315 | | | | 1,440,000 | | | | 1,423,503 | | | | — | | | | (16,497 | ) |
Expiring 12/04/18 | | Hong Kong & Shanghai Bank | | BRL | 3,841 | | | | 981,781 | | | | 1,028,645 | | | | 46,864 | | | | — | |
Expiring 12/04/18 | | JPMorgan Chase | | BRL | 8,327 | | | | 2,236,000 | | | | 2,230,147 | | | | — | | | | (5,853 | ) |
Expiring 12/14/18 | | Citibank NA | | BRL | 9,207 | | | | 2,197,000 | | | | 2,463,886 | | | | 266,886 | | | | — | |
See Notes to Financial Statements.
Forward foreign currency exchange contracts outstanding at October 31, 2018 (continued):
| | | | | | | | | | | | | | | | | | | | | | |
Purchase Contracts | | Counterparty | | Notional
Amount
(000) | | | Value at
Settlement
Date | | | Current
Value | | | Unrealized
Appreciation | | | Unrealized
Depreciation | |
OTC Forward Foreign Currency Exchange Contracts (cont’d.): | |
Brazilian Real (cont’d.), | | | | | | | | | | | | | | | | | | | | | | |
Expiring 01/31/19 | | UBS AG | | BRL | 6,582 | | | $ | 1,760,000 | | | $ | 1,754,611 | | | $ | — | | | $ | (5,389 | ) |
Expiring 02/25/19 | | Citibank NA | | BRL | 19,713 | | | | 5,835,702 | | | | 5,244,597 | | | | — | | | | (591,105 | ) |
Expiring 04/30/19 | | JPMorgan Chase | | BRL | 2,358 | | | | 693,000 | | | | 624,257 | | | | — | | | | (68,743 | ) |
Expiring 04/30/19 | | JPMorgan Chase | | BRL | 1,888 | | | | 543,150 | | | | 499,767 | | | | — | | | | (43,383 | ) |
Expiring 04/30/19 | | JPMorgan Chase | | BRL | 1,050 | | | | 262,532 | | | | 277,922 | | | | 15,390 | | | | — | |
Expiring 09/30/19 | | Barclays Bank PLC | | BRL | 3,000 | | | | 877,706 | | | | 781,593 | | | | — | | | | (96,113 | ) |
Expiring 09/30/19 | | Barclays Bank PLC | | BRL | 682 | | | | 198,290 | | | | 177,723 | | | | — | | | | (20,567 | ) |
Expiring 09/30/19 | | JPMorgan Chase | | BRL | 5,925 | | | | 1,689,000 | | | | 1,543,650 | | | | — | | | | (145,350 | ) |
Expiring 12/24/19 | | Barclays Bank PLC | | BRL | 2,271 | | | | 656,862 | | | | 585,901 | | | | — | | | | (70,961 | ) |
Expiring 12/24/19 | | Barclays Bank PLC | | BRL | 455 | | | | 130,617 | | | | 117,305 | | | | — | | | | (13,312 | ) |
Expiring 12/24/19 | | Citibank NA | | BRL | 3,650 | | | | 933,553 | | | | 941,545 | | | | 7,992 | | | | — | |
Expiring 12/24/19 | | Deutsche Bank AG | | BRL | 24,458 | | | | 6,069,000 | | | | 6,308,813 | | | | 239,813 | | | | — | |
Expiring 03/31/20 | | Deutsche Bank AG | | BRL | 47,153 | | | | 11,550,000 | | | | 12,015,774 | | | | 465,774 | | | | — | |
Expiring 06/30/20 | | Deutsche Bank AG | | BRL | 53,533 | | | | 12,146,000 | | | | 13,486,722 | | | | 1,340,722 | | | | — | |
Expiring 06/30/20 | | Morgan Stanley | | BRL | 3,592 | | | | 881,000 | | | | 904,893 | | | | 23,893 | | | | — | |
Expiring 08/31/20 | | Morgan Stanley | | BRL | 16,155 | | | | 3,967,000 | | | | 4,038,122 | | | | 71,122 | | | | — | |
British Pound, | | | | | | | | | | | | | | | | | | | | | | |
Expiring 01/25/19 | | Citibank NA | | GBP | 702 | | | | 900,999 | | | | 901,848 | | | | 849 | | | | — | |
Expiring 01/25/19 | | Toronto Dominion | | GBP | 2,529 | | | | 3,254,000 | | | | 3,247,970 | | | | — | | | | (6,030 | ) |
Expiring 01/25/19 | | Toronto Dominion | | GBP | 2,149 | | | | 2,759,000 | | | | 2,760,502 | | | | 1,502 | | | | — | |
Expiring 01/25/19 | | Toronto Dominion | | GBP | 1,025 | | | | 1,330,000 | | | | 1,316,555 | | | | — | | | | (13,445 | ) |
Expiring 11/27/19 | | Citibank NA | | GBP | 2,666 | | | | 3,624,960 | | | | 3,479,053 | | | | — | | | | (145,907 | ) |
Canadian Dollar, | | | | | | | | | | | | | | | | | | | | | | |
Expiring 01/18/19 | | Citibank NA | | CAD | 10,290 | | | | 7,900,700 | | | | 7,829,683 | | | | — | | | | (71,017 | ) |
See Notes to Financial Statements.
| | | | |
| PGIM Global Total Return Fund | | | 75 | |
Schedule of Investments (continued)
as of October 31, 2018
Forward foreign currency exchange contracts outstanding at October 31, 2018 (continued):
| | | | | | | | | | | | | | | | | | | | | | |
Purchase Contracts | | Counterparty | | Notional
Amount
(000) | | | Value at
Settlement
Date | | | Current
Value | | | Unrealized
Appreciation | | | Unrealized
Depreciation | |
OTC Forward Foreign Currency Exchange Contracts (cont’d.): | |
Canadian Dollar (cont’d.), | | | | | | | | | | | | | | | | | | | | | | |
Expiring 01/18/19 | | Goldman Sachs International | | CAD | 11,241 | | | $ | 8,593,900 | | | $ | 8,553,369 | | | $ | — | | | $ | (40,531 | ) |
Expiring 01/18/19 | | JPMorgan Chase | | CAD | 716 | | | | 544,566 | | | | 544,479 | | | | — | | | | (87 | ) |
Expiring 01/18/19 | | Morgan Stanley | | CAD | 45,709 | | | | 35,116,565 | | | | 34,779,538 | | | | — | | | | (337,027 | ) |
Expiring 01/18/19 | | Toronto Dominion | | CAD | 4,597 | | | | 3,514,000 | | | | 3,497,688 | | | | — | | | | (16,312 | ) |
Expiring 01/18/19 | | Toronto Dominion | | CAD | 4,456 | | | | 3,404,000 | | | | 3,390,901 | | | | — | | | | (13,099 | ) |
Expiring 01/18/19 | | Toronto Dominion | | CAD | 3,979 | | | | 3,045,000 | | | | 3,027,523 | | | | — | | | | (17,477 | ) |
Expiring 01/18/19 | | Toronto Dominion | | CAD | 3,263 | | | | 2,496,000 | | | | 2,482,456 | | | | — | | | | (13,544 | ) |
Expiring 01/18/19 | | Toronto Dominion | | CAD | 2,779 | | | | 2,120,000 | | | | 2,114,844 | | | | — | | | | (5,156 | ) |
Expiring 01/31/19 | | Citibank NA | | CAD | 4,291 | | | | 3,334,000 | | | | 3,265,837 | | | | — | | | | (68,163 | ) |
Expiring 01/31/19 | | Toronto Dominion | | CAD | 878 | | | | 671,381 | | | | 668,468 | | | | — | | | | (2,913 | ) |
Expiring 01/31/19 | | UBS AG | | CAD | 425 | | | | 324,000 | | | | 323,154 | | | | — | | | | (846 | ) |
Expiring 07/31/19 | | JPMorgan Chase | | CAD | 2,119 | | | | 1,624,885 | | | | 1,616,495 | | | | — | | | | (8,390 | ) |
Chilean Peso, | | | | | | | | | | | | | | | | | | | | | | |
Expiring 12/19/18 | | JPMorgan Chase | | CLP | 3,252,226 | | | | 4,869,900 | | | | 4,676,302 | | | | — | | | | (193,598 | ) |
Expiring 12/19/18 | | Morgan Stanley | | CLP | 1,850,035 | | | | 2,652,000 | | | | 2,660,123 | | | | 8,123 | | | | — | |
Expiring 12/19/18 | | Morgan Stanley | | CLP | 897,782 | | | | 1,334,000 | | | | 1,290,900 | | | | — | | | | (43,100 | ) |
Expiring 12/19/18 | | Morgan Stanley | | CLP | 865,981 | | | | 1,311,000 | | | | 1,245,174 | | | | — | | | | (65,826 | ) |
Expiring 12/19/18 | | Morgan Stanley | | CLP | 606,721 | | | | 910,857 | | | | 872,391 | | | | — | | | | (38,466 | ) |
Expiring 12/19/18 | | UBS AG | | CLP | 2,464,687 | | | | 3,585,000 | | | | 3,543,917 | | | | — | | | | (41,083 | ) |
Expiring 12/19/18 | | UBS AG | | CLP | 1,960,974 | | | | 2,933,000 | | | | 2,819,640 | | | | — | | | | (113,360 | ) |
Chinese Renminbi, | | | | | | | | | | | | | | | | | | | | | | |
Expiring 11/30/18 | | BNP Paribas | | CNH | 662 | | | | 97,296 | | | | 94,813 | | | | — | | | | (2,483 | ) |
Expiring 11/30/18 | | Citibank NA | | CNH | 11,274 | | | | 1,630,057 | | | | 1,613,655 | | | | — | | | | (16,402 | ) |
Expiring 11/30/18 | | JPMorgan Chase | | CNH | 2,601 | | | | 375,000 | | | | 372,225 | | | | — | | | | (2,775 | ) |
See Notes to Financial Statements.
Forward foreign currency exchange contracts outstanding at October 31, 2018 (continued):
| | | | | | | | | | | | | | | | | | | | | | |
Purchase Contracts | | Counterparty | | Notional
Amount
(000) | | | Value at
Settlement
Date | | | Current
Value | | | Unrealized
Appreciation | | | Unrealized
Depreciation | |
OTC Forward Foreign Currency Exchange Contracts (cont’d.): | |
Chinese Renminbi (cont’d.), | | | | | | | | | | | | | | | | | | | | | | |
Expiring 11/30/18 | | Morgan Stanley | | CNH | 702 | | | $ | 94,000 | | | $ | 100,549 | | | $ | 6,549 | | | $ | — | |
Expiring 06/28/19 | | Citibank NA | | CNH | 7,979 | | | | 1,139,014 | | | | 1,133,625 | | | | — | | | | (5,389 | ) |
Expiring 02/28/20 | | Citibank NA | | CNH | 9,688 | | | | 1,375,694 | | | | 1,378,152 | | | | 2,458 | | | | — | |
Expiring 02/28/20 | | Morgan Stanley | | CNH | 52,452 | | | | 8,077,000 | | | | 7,461,341 | | | | — | | | | (615,659 | ) |
Colombian Peso, | | | | | | | | | | | | | | | | | | | | | | |
Expiring 12/14/18 | | Citibank NA | | COP | 13,017,923 | | | | 4,120,900 | | | | 4,035,647 | | | | — | | | | (85,253 | ) |
Expiring 12/14/18 | | JPMorgan Chase | | COP | 12,816,894 | | | | 4,006,068 | | | | 3,973,327 | | | | — | | | | (32,741 | ) |
Czech Koruna, | | | | | | | | | | | | | | | | | | | | | | |
Expiring 01/25/19 | | JPMorgan Chase | | CZK | 32,388 | | | | 1,451,000 | | | | 1,425,842 | | | | — | | | | (25,158 | ) |
Expiring 01/25/19 | | UBS AG | | CZK | 76,593 | | | | 3,430,000 | | | | 3,371,876 | | | | — | | | | (58,124 | ) |
Danish Krone, | | | | | | | | | | | | | | | | | | | | | | |
Expiring 01/25/19 | | Toronto Dominion | | DKK | 4,224 | | | | 656,535 | | | | 646,897 | | | | — | | | | (9,638 | ) |
Euro, | | | | | | | | | | | | | | | | | | | | | | |
Expiring 01/31/19 | | Deutsche Bank AG | | EUR | 528 | | | | 603,000 | | | | 603,084 | | | | 84 | | | | — | |
Expiring 02/25/19 | | Citibank NA | | EUR | 1,150 | | | | 1,362,290 | | | | 1,316,933 | | | | — | | | | (45,357 | ) |
Expiring 04/30/19 | | Morgan Stanley | | EUR | 573 | | | | 678,930 | | | | 659,808 | | | | — | | | | (19,122 | ) |
Expiring 01/31/20 | | Morgan Stanley | | EUR | 2,685 | | | | 3,258,785 | | | | 3,176,270 | | | | — | | | | (82,515 | ) |
Expiring 02/28/20 | | Bank of America | | EUR | 3,265 | | | | 4,271,599 | | | | 3,872,907 | | | | — | | | | (398,692 | ) |
Expiring 02/28/20 | | BNP Paribas | | EUR | 5,554 | | | | 6,285,740 | | | | 6,588,094 | | | | 302,354 | | | | — | |
Expiring 02/28/20 | | Morgan Stanley | | EUR | 4,574 | | | | 5,300,808 | | | | 5,425,628 | | | | 124,820 | | | | — | |
Expiring 02/28/20 | | Morgan Stanley | | EUR | 3,595 | | | | 4,373,117 | | | | 4,264,154 | | | | — | | | | (108,963 | ) |
Indian Rupee, | | | | | | | | | | | | | | | | | | | | | | |
Expiring 01/11/19 | | Citibank NA | | INR | 1,427,337 | | | | 18,993,175 | | | | 19,135,572 | | | | 142,397 | | | | — | |
Expiring 01/11/19 | | Citibank NA | | INR | 211,702 | | | | 2,831,000 | | | | 2,838,182 | | | | 7,182 | | | | — | |
Expiring 01/11/19 | | Goldman Sachs International | | INR | 475,779 | | | | 6,351,342 | | | | 6,378,524 | | | | 27,182 | | | | — | |
Expiring 01/11/19 | | Goldman Sachs International | | INR | 454,843 | | | | 6,105,686 | | | | 6,097,846 | | | | — | | | | (7,840 | ) |
See Notes to Financial Statements.
| | | | |
| PGIM Global Total Return Fund | | | 77 | |
Schedule of Investments (continued)
as of October 31, 2018
Forward foreign currency exchange contracts outstanding at October 31, 2018 (continued):
| | | | | | | | | | | | | | | | | | | | | | |
Purchase Contracts | | Counterparty | | Notional
Amount
(000) | | | Value at
Settlement
Date | | | Current
Value | | | Unrealized
Appreciation | | | Unrealized
Depreciation | |
OTC Forward Foreign Currency Exchange Contracts (cont’d.): | |
Indian Rupee (cont’d.), | | | | | | | | | | | | | | | | | | | | | | |
Expiring 01/11/19 | | JPMorgan Chase | | INR | 1,770,843 | | | $ | 23,772,901 | | | $ | 23,740,784 | | | $ | — | | | $ | (32,117 | ) |
Expiring 01/31/19 | | Hong Kong & Shanghai Bank | | INR | 49,872 | | | | 672,000 | | | | 667,037 | | | | — | | | | (4,963 | ) |
Expiring 01/31/19 | | JPMorgan Chase | | INR | 43,476 | | | | 582,665 | | | | 581,487 | | | | — | | | | (1,178 | ) |
Indonesian Rupiah, | | | | | | | | | | | | | | | | | | | | | | |
Expiring 12/14/18 | | Citibank NA | | IDR | 50,498,210 | | | | 3,290,000 | | | | 3,302,078 | | | | 12,078 | | | | — | |
Expiring 12/19/18 | | Barclays Bank PLC | | IDR | 315,950,604 | | | | 20,724,459 | | | | 20,644,528 | | | | — | | | | (79,931 | ) |
Expiring 12/19/18 | | Barclays Bank PLC | | IDR | 223,142,527 | | | | 14,742,503 | | | | 14,580,356 | | | | — | | | | (162,147 | ) |
Expiring 12/19/18 | | Barclays Bank PLC | | IDR | 61,349,288 | | | | 4,004,000 | | | | 4,008,624 | | | | 4,624 | | | | — | |
Expiring 12/19/18 | | Barclays Bank PLC | | IDR | 43,685,421 | | | | 2,853,000 | | | | 2,854,449 | | | | 1,449 | | | | — | |
Expiring 12/19/18 | | Citibank NA | | IDR | 32,453,421 | | | | 2,121,000 | | | | 2,120,539 | | | | — | | | | (461 | ) |
Expiring 12/19/18 | | JPMorgan Chase | | IDR | 183,840,396 | | | | 12,107,428 | | | | 12,012,315 | | | | — | | | | (95,113 | ) |
Expiring 12/19/18 | | JPMorgan Chase | | IDR | 41,987,248 | | | | 2,752,360 | | | | 2,743,489 | | | | — | | | | (8,871 | ) |
Expiring 12/19/18 | | Morgan Stanley | | IDR | 56,104,780 | | | | 3,622,000 | | | | 3,665,942 | | | | 43,942 | | | | — | |
Expiring 12/19/18 | | Morgan Stanley | | IDR | 23,163,840 | | | | 1,512,000 | | | | 1,513,548 | | | | 1,548 | | | | — | |
Expiring 12/19/18 | | UBS AG | | IDR | 30,935,716 | | | | 2,023,000 | | | | 2,021,371 | | | | — | | | | (1,629 | ) |
Israeli Shekel, | | | | | | | | | | | | | | | | | | | | | | |
Expiring 01/28/19 | | Barclays Bank PLC | | ILS | 11,634 | | | | 3,151,200 | | | | 3,150,781 | | | | — | | | | (419 | ) |
Japanese Yen, | | | | | | | | | | | | | | | | | | | | | | |
Expiring 01/25/19 | | Toronto Dominion | | JPY | 665,679 | | | | 5,962,000 | | | | 5,946,127 | | | | — | | | | (15,873 | ) |
Expiring 01/25/19 | | Toronto Dominion | | JPY | 232,121 | | | | 2,074,000 | | | | 2,073,400 | | | | — | | | | (600 | ) |
Expiring 01/25/19 | | UBS AG | | JPY | 29,370,666 | | | | 263,045,784 | | | | 262,351,333 | | | | — | | | | (694,451 | ) |
Expiring 01/25/19 | | UBS AG | | JPY | 200,322 | | | | 1,788,318 | | | | 1,789,362 | | | | 1,044 | | | | — | |
Expiring 01/31/19 | | Morgan Stanley | | JPY | 72,668 | | | | 651,000 | | | | 649,425 | | | | — | | | | (1,575 | ) |
Expiring 01/29/21 | | Citibank NA | | JPY | 449,088 | | | | 4,477,000 | | | | 4,305,538 | | | | — | | | | (171,462 | ) |
Expiring 01/29/21 | | Morgan Stanley | | JPY | 1,488,986 | | | | 14,485,000 | | | | 14,275,344 | | | | — | | | | (209,656 | ) |
See Notes to Financial Statements.
Forward foreign currency exchange contracts outstanding at October 31, 2018 (continued):
| | | | | | | | | | | | | | | | | | | | | | |
Purchase Contracts | | Counterparty | | Notional
Amount
(000) | | | Value at
Settlement
Date | | | Current
Value | | | Unrealized
Appreciation | | | Unrealized
Depreciation | |
OTC Forward Foreign Currency Exchange Contracts (cont’d.): | | | | | | | | | | | | | |
Malaysian Ringgit, | | | | | | | | | | | | | | | | | | | | | | |
Expiring 12/05/18 | | Barclays Bank PLC | | MYR | 14,891 | | | $ | 3,599,031 | | | $ | 3,555,987 | | | $ | — | | | $ | (43,044 | ) |
Mexican Peso, | | | | | | | | | | | | | | | | | | | | | | |
Expiring 12/19/18 | | Deutsche Bank AG | | MXN | 27,995 | | | | 1,458,000 | | | | 1,366,721 | | | | — | | | | (91,279 | ) |
Expiring 12/19/18 | | JPMorgan Chase | | MXN | 27,515 | | | | 1,441,000 | | | | 1,343,310 | | | | — | | | | (97,690 | ) |
Expiring 12/19/18 | | UBS AG | | MXN | 27,466 | | | | 1,428,000 | | | | 1,340,886 | | | | — | | | | (87,114 | ) |
Expiring 01/29/19 | | UBS AG | | MXN | 70,345 | | | | 3,559,000 | | | | 3,410,976 | | | | — | | | | (148,024 | ) |
Expiring 01/29/19 | | UBS AG | | MXN | 64,104 | | | | 3,241,000 | | | | 3,108,324 | | | | — | | | | (132,676 | ) |
Expiring 01/31/19 | | Deutsche Bank AG | | MXN | 5,731 | | | | 300,000 | | | | 277,779 | | | | — | | | | (22,221 | ) |
Expiring 01/31/19 | | Morgan Stanley | | MXN | 36,772 | | | | 1,871,538 | | | | 1,782,467 | | | | — | | | | (89,071 | ) |
Expiring 03/29/19 | | Morgan Stanley | | MXN | 133,265 | | | | 6,292,000 | | | | 6,399,128 | | | | 107,128 | | | | — | |
Expiring 08/29/19 | | Morgan Stanley | | MXN | 28,511 | | | | 1,405,225 | | | | 1,335,436 | | | | — | | | | (69,789 | ) |
Expiring 12/30/19 | | Goldman Sachs International | | MXN | 13,330 | | | | 651,932 | | | | 612,778 | | | | — | | | | (39,154 | ) |
Expiring 04/30/20 | | Citibank NA | | MXN | 32,853 | | | | 1,591,718 | | | | 1,483,911 | | | | — | | | | (107,807 | ) |
Expiring 04/30/20 | | JPMorgan Chase | | MXN | 14,775 | | | | 725,000 | | | | 667,382 | | | | — | | | | (57,618 | ) |
New Taiwanese Dollar, | | | | | | | | | | | | | | | | | | | | |
Expiring 01/11/19 | | Citibank NA | | TWD | 156,314 | | | | 5,090,000 | | | | 5,082,450 | | | | — | | | | (7,550 | ) |
Expiring 01/11/19 | | JPMorgan Chase | | TWD | 161,069 | | | | 5,244,000 | | | | 5,237,074 | | | | — | | | | (6,926 | ) |
Expiring 01/11/19 | | JPMorgan Chase | | TWD | 157,187 | | | | 5,083,000 | | | | 5,110,828 | | | | 27,828 | | | | — | |
Expiring 01/11/19 | | Morgan Stanley | | TWD | 194,529 | | | | 6,294,000 | | | | 6,324,979 | | | | 30,979 | | | | — | |
New Zealand Dollar, | | | | | | | | | | | | | | | | | | | | | | |
Expiring 01/18/19 | | Toronto Dominion | | NZD | 5,185 | | | | 3,407,000 | | | | 3,386,403 | | | | — | | | | (20,597 | ) |
Expiring 01/18/19 | | Toronto Dominion | | NZD | 3,747 | | | | 2,473,000 | | | | 2,447,435 | | | | — | | | | (25,565 | ) |
Expiring 01/18/19 | | Toronto Dominion | | NZD | 3,207 | | | | 2,117,000 | | | | 2,094,550 | | | | — | | | | (22,450 | ) |
Expiring 01/18/19 | | Toronto Dominion | | NZD | 2,621 | | | | 1,724,000 | | | | 1,711,843 | | | | — | | | | (12,157 | ) |
See Notes to Financial Statements.
| | | | |
| PGIM Global Total Return Fund | | | 79 | |
Schedule of Investments (continued)
as of October 31, 2018
Forward foreign currency exchange contracts outstanding at October 31, 2018 (continued):
| | | | | | | | | | | | | | | | | | | | | | |
Purchase Contracts | | Counterparty | | Notional
Amount
(000) | | | Value at
Settlement
Date | | | Current
Value | | | Unrealized
Appreciation | | | Unrealized
Depreciation | |
OTC Forward Foreign Currency Exchange Contracts (cont’d.): | | | | | | | | | | | | | |
New Zealand Dollar (cont’d.), | | | | | | | | | | | | | | | | | | | | |
Expiring 01/18/19 | | Toronto Dominion | | NZD | 2,545 | | | $ | 1,658,000 | | | $ | 1,662,335 | | | $ | 4,335 | | | $ | — | |
Norwegian Krone, | | | | | | | | | | | | | | | | | | | | | | |
Expiring 01/25/19 | | Bank of America | | NOK | 85,879 | | | | 10,450,841 | | | | 10,230,593 | | | | — | | | | (220,248 | ) |
Peruvian Nuevo Sol, | | | | | | | | | | | | | | | | | | | | | | |
Expiring 12/19/18 | | Barclays Bank PLC | | PEN | 6,182 | | | | 1,852,000 | | | | 1,830,052 | | | | — | | | | (21,948 | ) |
Expiring 12/19/18 | | BNP Paribas | | PEN | 68,191 | | | | 20,617,232 | | | | 20,186,751 | | | | — | | | | (430,481 | ) |
Expiring 12/19/18 | | BNP Paribas | | PEN | 10,086 | | | | 3,019,700 | | | | 2,985,792 | | | | — | | | | (33,908 | ) |
Expiring 12/19/18 | | BNP Paribas | | PEN | 7,514 | | | | 2,244,000 | | | | 2,224,382 | | | | — | | | | (19,618 | ) |
Expiring 12/19/18 | | Citibank NA | | PEN | 39,110 | | | | 11,746,637 | | | | 11,577,873 | | | | — | | | | (168,764 | ) |
Expiring 12/19/18 | | JPMorgan Chase | | PEN | 20,017 | | | | 6,030,916 | | | | 5,925,702 | | | | — | | | | (105,214 | ) |
Expiring 12/19/18 | | JPMorgan Chase | | PEN | 19,943 | | | | 6,017,379 | | | | 5,903,673 | | | | — | | | | (113,706 | ) |
Expiring 12/19/18 | | JPMorgan Chase | | PEN | 7,477 | | | | 2,230,000 | | | | 2,213,541 | | | | — | | | | (16,459 | ) |
Philippine Peso, | | | | | | | | | | | | | | | | | | | | | | |
Expiring 12/14/18 | | Barclays Bank PLC | | PHP | 348,910 | | | | 6,390,000 | | | | 6,501,559 | | | | 111,559 | | | | — | |
Expiring 12/14/18 | | Barclays Bank PLC | | PHP | 270,737 | | | | 4,964,000 | | | | 5,044,882 | | | | 80,882 | | | | — | |
Expiring 12/14/18 | | Barclays Bank PLC | | PHP | 249,241 | | | | 4,577,000 | | | | 4,644,327 | | | | 67,327 | | | | — | |
Expiring 12/14/18 | | Barclays Bank PLC | | PHP | 248,166 | | | | 4,546,000 | | | | 4,624,307 | | | | 78,307 | | | | — | |
Expiring 12/14/18 | | Barclays Bank PLC | | PHP | 237,888 | | | | 4,348,000 | | | | 4,432,781 | | | | 84,781 | | | | — | |
Expiring 12/14/18 | | Citibank NA | | PHP | 201,516 | | | | 3,718,000 | | | | 3,755,024 | | | | 37,024 | | | | — | |
Expiring 12/14/18 | | Citibank NA | | PHP | 188,758 | | | | 3,459,000 | | | | 3,517,294 | | | | 58,294 | | | | — | |
Expiring 12/14/18 | | JPMorgan Chase | | PHP | 320,106 | | | | 5,894,000 | | | | 5,964,830 | | | | 70,830 | | | | — | |
Expiring 12/14/18 | | JPMorgan Chase | | PHP | 260,820 | | | | 4,830,000 | | | | 4,860,098 | | | | 30,098 | | | | — | |
Expiring 12/14/18 | | JPMorgan Chase | | PHP | 196,973 | | | | 3,594,000 | | | | 3,670,374 | | | | 76,374 | | | | — | |
Expiring 12/14/18 | | JPMorgan Chase | | PHP | 121,585 | | | | 2,275,900 | | | | 2,265,612 | | | | — | | | | (10,288 | ) |
See Notes to Financial Statements.
Forward foreign currency exchange contracts outstanding at October 31, 2018 (continued):
| | | | | | | | | | | | | | | | | | | | | | |
Purchase Contracts | | Counterparty | | Notional
Amount
(000) | | | Value at
Settlement
Date | | | Current
Value | | | Unrealized
Appreciation | | | Unrealized
Depreciation | |
OTC Forward Foreign Currency Exchange Contracts (cont’d.): | | | | | | | | | | | | | |
Philippine Peso (cont’d.), | | | | | | | | | | | | | | | | | | | | |
Expiring 12/14/18 | | Morgan Stanley | | PHP | 324,096 | | | $ | 5,912,000 | | | $ | 6,039,174 | | | $ | 127,174 | | | $ | — | |
Expiring 12/14/18 | | Morgan Stanley | | PHP | 267,921 | | | | 4,933,000 | | | | 4,992,419 | | | | 59,419 | | | | — | |
Expiring 12/14/18 | | Morgan Stanley | | PHP | 258,188 | | | | 4,740,000 | | | | 4,811,049 | | | | 71,049 | | | | — | |
Polish Zloty, | | | | | | | | | | | | | | | | | | | | | | |
Expiring 01/25/19 | | JPMorgan Chase | | PLN | 6,059 | | | | 1,607,000 | | | | 1,583,195 | | | | — | | | | (23,805 | ) |
Expiring 01/25/19 | | Toronto Dominion | | PLN | 5,060 | | | | 1,357,000 | | | | 1,322,015 | | | | — | | | | (34,985 | ) |
Russian Ruble, | | | | | | | | | | | | | | | | | | | | | | |
Expiring 12/19/18 | | Barclays Bank PLC | | RUB | 223,647 | | | | 3,331,000 | | | | 3,374,010 | | | | 43,010 | | | | — | |
Expiring 12/19/18 | | Barclays Bank PLC | | RUB | 140,059 | | | | 2,137,000 | | | | 2,112,978 | | | | — | | | | (24,022 | ) |
Expiring 12/19/18 | | Barclays Bank PLC | | RUB | 139,311 | | | | 2,112,000 | | | | 2,101,689 | | | | — | | | | (10,311 | ) |
Expiring 12/19/18 | | Barclays Bank PLC | | RUB | 101,864 | | | | 1,545,000 | | | | 1,536,762 | | | | — | | | | (8,238 | ) |
Expiring 12/19/18 | | Barclays Bank PLC | | RUB | 97,226 | | | | 1,469,000 | | | | 1,466,783 | | | | — | | | | (2,217 | ) |
Expiring 06/28/19 | | Bank of America | | RUB | 28,497 | | | | 480,188 | | | | 420,366 | | | | — | | | | (59,822 | ) |
Expiring 06/28/19 | | Barclays Bank PLC | | RUB | 56,095 | | | | 947,662 | | | | 827,484 | | | | — | | | | (120,178 | ) |
Expiring 06/28/19 | | Barclays Bank PLC | | RUB | 27,407 | | | | 437,176 | | | | 404,294 | | | | — | | | | (32,882 | ) |
Expiring 06/28/19 | | Goldman Sachs International | | RUB | 36,993 | | | | 614,000 | | | | 545,704 | | | | — | | | | (68,296 | ) |
Expiring 12/24/19 | | Citibank NA | | RUB | 229,300 | | | | 3,345,000 | | | | 3,310,814 | | | | — | | | | (34,186 | ) |
Expiring 03/31/20 | | Barclays Bank PLC | | RUB | 303,830 | | | | 4,367,879 | | | | 4,339,167 | | | | — | | | | (28,712 | ) |
Saudi Arabian Riyal, | | | | | | | | | | | | | | | | | | | | | | |
Expiring 11/12/19 | | Goldman Sachs International | | SAR | 57,150 | | | | 15,198,256 | | | | 15,218,171 | | | | 19,915 | | | | — | |
Singapore Dollar, | | | | | | | | | | | | | | | | | | | | | | |
Expiring 11/09/18 | | Bank of America | | SGD | 3,666 | | | | 2,694,000 | | | | 2,647,405 | | | | — | | | | (46,595 | ) |
See Notes to Financial Statements.
| | | | |
| PGIM Global Total Return Fund | | | 81 | |
Schedule of Investments (continued)
as of October 31, 2018
Forward foreign currency exchange contracts outstanding at October 31, 2018 (continued):
| | | | | | | | | | | | | | | | | | | | | | |
Purchase Contracts | | Counterparty | | Notional
Amount
(000) | | | Value at
Settlement
Date | | | Current
Value | | | Unrealized
Appreciation | | | Unrealized
Depreciation | |
OTC Forward Foreign Currency Exchange Contracts (cont’d.): | | | | | | | | | | | | | |
Singapore Dollar (cont’d.), | | | | | | | | | | | | | | | | | | | | |
Expiring 11/09/18 | | Bank of America | | SGD | 2,109 | | | $ | 1,534,000 | | | $ | 1,522,642 | | | $ | — | | | $ | (11,358 | ) |
Expiring 11/09/18 | | Citibank NA | | SGD | 3,771 | | | | 2,756,000 | | | | 2,723,198 | | | | — | | | | (32,802 | ) |
Expiring 11/09/18 | | Citibank NA | | SGD | 2,922 | | | | 2,134,000 | | | | 2,109,826 | | | | — | | | | (24,174 | ) |
Expiring 11/09/18 | | Citibank NA | | SGD | 2,425 | | | | 1,759,000 | | | | 1,750,912 | | | | — | | | | (8,088 | ) |
Expiring 11/09/18 | | Citibank NA | | SGD | 2,376 | | | | 1,740,000 | | | | 1,715,588 | | | | — | | | | (24,412 | ) |
Expiring 11/09/18 | | Deutsche Bank AG | | SGD | 8,673 | | | | 6,331,000 | | | | 6,262,533 | | | | — | | | | (68,467 | ) |
Expiring 11/09/18 | | Deutsche Bank AG | | SGD | 4,922 | | | | 3,606,000 | | | | 3,554,226 | | | | — | | | | (51,774 | ) |
Expiring 11/09/18 | | Deutsche Bank AG | | SGD | 2,178 | | | | 1,580,000 | | | | 1,572,613 | | | | — | | | | (7,387 | ) |
Expiring 11/09/18 | | Goldman Sachs International | | SGD | 2,116 | | | | 1,539,000 | | | | 1,527,881 | | | | — | | | | (11,119 | ) |
Expiring 11/09/18 | | JPMorgan Chase | | SGD | 3,612 | | | | 2,654,000 | | | | 2,607,817 | | | | — | | | | (46,183 | ) |
Expiring 11/09/18 | | JPMorgan Chase | | SGD | 3,588 | | | | 2,637,000 | | | | 2,591,143 | | | | — | | | | (45,857 | ) |
Expiring 11/09/18 | | JPMorgan Chase | | SGD | 2,236 | | | | 1,634,000 | | | | 1,614,468 | | | | — | | | | (19,532 | ) |
Expiring 11/09/18 | | Morgan Stanley | | SGD | 2,948 | | | | 2,154,000 | | | | 2,129,024 | | | | — | | | | (24,976 | ) |
Expiring 11/09/18 | | Morgan Stanley | | SGD | 2,234 | | | | 1,639,000 | | | | 1,613,310 | | | | — | | | | (25,690 | ) |
Expiring 11/09/18 | | UBS AG | | SGD | 3,821 | | | | 2,801,000 | | | | 2,758,731 | | | | — | | | | (42,269 | ) |
Expiring 11/09/18 | | UBS AG | | SGD | 3,272 | | | | 2,397,000 | | | | 2,362,905 | | | | — | | | | (34,095 | ) |
Expiring 11/09/18 | | UBS AG | | SGD | 2,299 | | | | 1,687,000 | | | | 1,660,145 | | | | — | | | | (26,855 | ) |
South African Rand, | | | | | | | | | | | | | | | | | | | | | | |
Expiring 11/30/18 | | Hong Kong & Shanghai Bank | | ZAR | 4,425 | | | | 316,000 | | | | 298,792 | | | | — | | | | (17,208 | ) |
Expiring 11/30/18 | | JPMorgan Chase | | ZAR | 7,806 | | | | 630,127 | | | | 527,122 | | | | — | | | | (103,005 | ) |
Expiring 12/07/18 | | Deutsche Bank AG | | ZAR | 20,347 | | | | 1,385,000 | | | | 1,372,801 | | | | — | | | | (12,199 | ) |
Expiring 12/07/18 | | JPMorgan Chase | | ZAR | 26,601 | | | | 1,826,000 | | | | 1,794,774 | | | | — | | | | (31,226 | ) |
Expiring 12/07/18 | | JPMorgan Chase | | ZAR | 21,693 | | | | 1,490,000 | | | | 1,463,626 | | | | — | | | | (26,374 | ) |
Expiring 12/07/18 | | Morgan Stanley | | ZAR | 24,500 | | | | 1,635,000 | | | | 1,652,993 | | | | 17,993 | | | | — | |
See Notes to Financial Statements.
Forward foreign currency exchange contracts outstanding at October 31, 2018 (continued):
| | | | | | | | | | | | | | | | | | | | | | |
Purchase Contracts | | Counterparty | | Notional
Amount
(000) | | | Value at
Settlement
Date | | | Current
Value | | | Unrealized
Appreciation | | | Unrealized
Depreciation | |
OTC Forward Foreign Currency Exchange Contracts (cont’d.): | | | | | | | | | | | | | |
South African Rand (cont’d.), | | | | | | | | | | | | | | | | | | | | |
Expiring 12/07/18 | | Toronto Dominion | | ZAR | 23,805 | | | $ | 1,583,000 | | | $ | 1,606,118 | | | $ | 23,118 | | | $ | — | |
Expiring 12/07/18 | | UBS AG | | ZAR | 51,070 | | | | 3,577,000 | | | | 3,445,630 | | | | — | | | | (131,370 | ) |
Expiring 12/07/18 | | UBS AG | | ZAR | 37,579 | | | | 2,617,000 | | | | 2,535,434 | | | | — | | | | (81,566 | ) |
Expiring 12/07/18 | | UBS AG | | ZAR | 27,982 | | | | 1,947,000 | | | | 1,887,941 | | | | — | | | | (59,059 | ) |
Expiring 12/07/18 | | UBS AG | | ZAR | 22,007 | | | | 1,527,000 | | | | 1,484,802 | | | | — | | | | (42,198 | ) |
Expiring 01/31/19 | | Morgan Stanley | | ZAR | 24,107 | | | | 1,658,372 | | | | 1,614,442 | | | | — | | | | (43,930 | ) |
Expiring 06/28/19 | | JPMorgan Chase | | ZAR | 21,053 | | | | 1,655,217 | | | | 1,384,085 | | | | — | | | | (271,132 | ) |
Expiring 06/28/19 | | Morgan Stanley | | ZAR | 13,104 | | | | 974,000 | | | | 861,520 | | | | — | | | | (112,480 | ) |
Expiring 11/27/19 | | JPMorgan Chase | | ZAR | 24,229 | | | | 1,867,700 | | | | 1,561,207 | | | | — | | | | (306,493 | ) |
Expiring 12/30/19 | | Barclays Bank PLC | | ZAR | 19,528 | | | | 1,517,561 | | | | 1,252,593 | | | | — | | | | (264,968 | ) |
Expiring 12/30/19 | | BNP Paribas | | ZAR | 41,262 | | | | 2,607,000 | | | | 2,646,658 | | | | 39,658 | | | | — | |
Expiring 03/31/20 | | UBS AG | | ZAR | 28,239 | | | | 1,831,000 | | | | 1,788,340 | | | | — | | | | (42,660 | ) |
Expiring 03/31/20 | | UBS AG | | ZAR | 21,550 | | | | 1,510,704 | | | | 1,364,725 | | | | — | | | | (145,979 | ) |
South Korean Won, | | | | | | | | | | | | | | | | | | | | | | |
Expiring 01/16/19 | | Barclays Bank PLC | | KRW | 14,859,556 | | | | 13,080,480 | | | | 13,076,157 | | | | — | | | | (4,323 | ) |
Expiring 01/16/19 | | JPMorgan Chase | | KRW | 7,167,511 | | | | 6,352,487 | | | | 6,307,288 | | | | — | | | | (45,199 | ) |
Expiring 04/30/19 | | BNP Paribas | | KRW | 650,928 | | | | 611,792 | | | | 575,587 | | | | — | | | | (36,205 | ) |
Expiring 04/30/19 | | Deutsche Bank AG | | KRW | 362,239 | | | | 333,630 | | | | 320,312 | | | | — | | | | (13,318 | ) |
Expiring 05/31/19 | | Goldman Sachs International | | KRW | 330,408 | | | | 312,000 | | | | 292,619 | | | | — | | | | (19,381 | ) |
Expiring 05/31/19 | | Morgan Stanley | | KRW | 642,595 | | | | 609,234 | | | | 569,101 | | | | — | | | | (40,133 | ) |
Expiring 07/31/19 | | BNP Paribas | | KRW | 771,696 | | | | 689,199 | | | | 685,520 | | | | — | | | | (3,679 | ) |
Expiring 07/31/19 | | Morgan Stanley | | KRW | 7,414,697 | | | | 6,612,000 | | | | 6,586,690 | | | | — | | | | (25,310 | ) |
Swiss Franc, | | | | | | | | | | | | | | | | | | | | | | |
Expiring 01/25/19 | | Goldman Sachs International | | CHF | 2,777 | | | | 2,812,000 | | | | 2,782,991 | | | | — | | | | (29,009 | ) |
See Notes to Financial Statements.
| | | | |
| PGIM Global Total Return Fund | | | 83 | |
Schedule of Investments (continued)
as of October 31, 2018
Forward foreign currency exchange contracts outstanding at October 31, 2018 (continued):
| | | | | | | | | | | | | | | | | | | | | | |
Purchase Contracts | | Counterparty | | Notional
Amount
(000) | | | Value at
Settlement
Date | | | Current
Value | | | Unrealized
Appreciation | | | Unrealized
Depreciation | |
OTC Forward Foreign Currency Exchange Contracts (cont’d.): | | | | | | | | | | | | | |
Swiss Franc (cont’d.), | | | | | | | | | | | | | | | | | | | | |
Expiring 01/25/19 | | Toronto Dominion | | CHF | 1,955 | | | $ | 1,983,000 | | | $ | 1,959,236 | | | $ | — | | | $ | (23,764 | ) |
Thai Baht, | | | | | | | | | | | | | | | | | | | | |
Expiring 11/09/18 | | Citibank NA | | THB | 260,807 | | | | 8,078,912 | | | | 7,869,170 | | | | — | | | | (209,742 | ) |
Expiring 11/09/18 | | Citibank NA | | THB | 142,093 | | | | 4,358,000 | | | | 4,287,265 | | | | — | | | | (70,735 | ) |
Expiring 11/09/18 | | Citibank NA | | THB | 135,663 | | | | 4,199,000 | | | | 4,093,281 | | | | — | | | | (105,719 | ) |
Expiring 11/09/18 | | Citibank NA | | THB | 123,993 | | | | 3,789,000 | | | | 3,741,162 | | | | — | | | | (47,838 | ) |
Expiring 11/09/18 | | Citibank NA | | THB | 114,601 | | | | 3,461,000 | | | | 3,457,789 | | | | — | | | | (3,211 | ) |
Expiring 11/09/18 | | Citibank NA | | THB | 110,640 | | | | 3,411,000 | | | | 3,338,253 | | | | — | | | | (72,747 | ) |
Expiring 11/09/18 | | Citibank NA | | THB | 109,506 | | | | 3,348,000 | | | | 3,304,063 | | | | — | | | | (43,937 | ) |
Expiring 11/09/18 | | Citibank NA | | THB | 96,147 | | | | 2,973,000 | | | | 2,900,974 | | | | — | | | | (72,026 | ) |
Expiring 11/09/18 | | Citibank NA | | THB | 89,032 | | | | 2,736,000 | | | | 2,686,308 | | | | — | | | | (49,692 | ) |
Expiring 11/09/18 | | Citibank NA | | THB | 87,399 | | | | 2,673,000 | | | | 2,637,034 | | | | — | | | | (35,966 | ) |
Expiring 11/09/18 | | Citibank NA | | THB | 79,076 | | | | 2,416,000 | | | | 2,385,898 | | | | — | | | | (30,102 | ) |
Expiring 11/09/18 | | Citibank NA | | THB | 71,762 | | | | 2,170,000 | | | | 2,165,224 | | | | — | | | | (4,776 | ) |
Expiring 11/09/18 | | Citibank NA | | THB | 69,494 | | | | 2,155,000 | | | | 2,096,809 | | | | — | | | | (58,191 | ) |
Expiring 11/09/18 | | Citibank NA | | THB | 66,785 | | | | 2,074,000 | | | | 2,015,055 | | | | — | | | | (58,945 | ) |
Expiring 11/09/18 | | Citibank NA | | THB | 66,734 | | | | 2,027,000 | | | | 2,013,518 | | | | — | | | | (13,482 | ) |
Expiring 11/09/18 | | Citibank NA | | THB | 62,349 | | | | 1,907,000 | | | | 1,881,226 | | | | — | | | | (25,774 | ) |
Expiring 11/09/18 | | Citibank NA | | THB | 60,781 | | | | 1,841,000 | | | | 1,833,893 | | | | — | | | | (7,107 | ) |
Expiring 11/09/18 | | Deutsche Bank AG | | THB | 135,551 | | | | 4,174,000 | | | | 4,089,879 | | | | — | | | | (84,121 | ) |
Turkish Lira, | | | | | | | | | | | | | | | | | | | | |
Expiring 11/30/18 | | BNP Paribas | | TRY | 982 | | | | 254,000 | | | | 172,320 | | | | — | | | | (81,680 | ) |
Expiring 11/30/18 | | Citibank NA | | TRY | 3,526 | | | | 878,161 | | | | 618,777 | | | | — | | | | (259,384 | ) |
Expiring 11/30/18 | | Credit Suisse International | | TRY | 4,298 | | | | 1,000,000 | | | | 754,333 | | | | — | | | | (245,667 | ) |
Expiring 11/30/18 | | Morgan Stanley | | TRY | 3,969 | | | | 885,316 | | | | 696,587 | | | | — | | | | (188,729 | ) |
Expiring 12/07/18 | | Barclays Bank PLC | | TRY | 14,412 | | | | 2,204,000 | | | | 2,518,932 | | | | 314,932 | | | | — | |
Expiring 12/07/18 | | Barclays Bank PLC | | TRY | 11,806 | | | | 2,045,000 | | | | 2,063,424 | | | | 18,424 | | | | — | |
Expiring 12/07/18 | | Barclays Bank PLC | | TRY | 9,801 | | | | 1,534,999 | | | | 1,713,021 | | | | 178,022 | | | | — | |
Expiring 12/07/18 | | BNP Paribas | | TRY | 7,704 | | | | 1,326,000 | | | | 1,346,548 | | | | 20,548 | | | | — | |
Expiring 12/07/18 | | Deutsche Bank AG | | TRY | 9,570 | | | | 1,544,000 | | | | 1,672,590 | | | | 128,590 | | | | — | |
See Notes to Financial Statements.
Forward foreign currency exchange contracts outstanding at October 31, 2018 (continued):
| | | | | | | | | | | | | | | | | | | | | | | | |
Purchase Contracts | | Counterparty | | | Notional
Amount
(000) | | | Value at
Settlement
Date | | | Current
Value | | | Unrealized
Appreciation | | | Unrealized
Depreciation | |
OTC Forward Foreign Currency Exchange Contracts (cont’d.): | | | | | | | | | | | | | |
Turkish Lira (cont’d.), | | | | | | | | | | | | | | | | | | | | | | | | |
Expiring 12/07/18 | | | JPMorgan Chase | | | TRY | 25,052 | | | $ | 4,007,194 | | | $ | 4,378,672 | | | $ | 371,478 | | | $ | — | |
Expiring 12/07/18 | | | JPMorgan Chase | | | TRY | 9,748 | | | | 1,644,000 | | | | 1,703,754 | | | | 59,754 | | | | — | |
Expiring 12/07/18 | | | Morgan Stanley | | | TRY | 15,658 | | | | 2,426,000 | | | | 2,736,673 | | | | 310,673 | | | | — | |
Expiring 12/07/18 | | | Morgan Stanley | | | TRY | 10,883 | | | | 1,777,000 | | | | 1,902,166 | | | | 125,166 | | | | — | |
Expiring 12/07/18 | | | Toronto Dominion | | | TRY | 11,692 | | | | 1,837,000 | | | | 2,043,589 | | | | 206,589 | | | | — | |
Expiring 12/07/18 | | | UBS AG | | | TRY | 12,714 | | | | 2,183,000 | | | | 2,222,126 | | | | 39,126 | | | | — | |
Expiring 02/28/19 | | | Barclays Bank PLC | | | TRY | 2,565 | | | | 569,627 | | | | 427,024 | | | | — | | | | (142,603 | ) |
Expiring 02/28/19 | | | JPMorgan Chase | | | TRY | 5,650 | | | | 1,115,457 | | | | 940,509 | | | | — | | | | (174,948 | ) |
Expiring 04/30/19 | | | Morgan Stanley | | | TRY | 123 | | | | 26,146 | | | | 19,726 | | | | — | | | | (6,420 | ) |
Expiring 08/29/19 | | | Citibank NA | | | TRY | 19,588 | | | | 4,030,447 | | | | 2,951,127 | | | | — | | | | (1,079,320 | ) |
Expiring 12/24/19 | | | Goldman Sachs International | | | TRY | 33,041 | | | | 5,976,000 | | | | 4,696,253 | | | | — | | | | (1,279,747 | ) |
Expiring 04/30/20 | | | Citibank NA | | | TRY | 5,178 | | | | 881,000 | | | | 693,822 | | | | — | | | | (187,178 | ) |
Expiring 04/30/20 | | | Deutsche Bank AG | | | TRY | 3,736 | | | | 373,000 | | | | 500,522 | | | | 127,522 | | | | — | |
Expiring 04/30/20 | | | Morgan Stanley | | | TRY | 90,834 | | | | 14,164,000 | | | | 12,170,552 | | | | — | | | | (1,993,448 | ) |
Expiring 06/30/20 | | | Bank of America | | | TRY | 7,742 | | | | 1,162,000 | | | | 1,007,238 | | | | — | | | | (154,762 | ) |
Expiring 06/30/20 | | | Deutsche Bank AG | | | TRY | 175,018 | | | | 16,910,000 | | | | 22,770,822 | | | | 5,860,822 | | | | — | |
| | | | | | | | | | | | | | | | | | | | | | | | |
| | | | | | | | | | $ | 1,137,159,969 | | | $ | 1,131,433,260 | | | | 12,256,481 | | | | (17,983,190 | ) |
| | | | | | | | | | | | | | | | | | | | | | | | |
| | | | | | | | | | | | | | | | | | | | | | |
Sale Contracts | | Counterparty | | Notional
Amount
(000) | | | Value at
Settlement
Date | | | Current
Value | | | Unrealized
Appreciation | | | Unrealized
Depreciation | |
OTC Forward Foreign Currency Exchange Contracts: | |
Australian Dollar, | | | | | | | | | | | | | | | | | | | | | | |
Expiring 01/18/19 | | Bank of America | | AUD | 5,634 | | | $ | 3,990,255 | | | $ | 3,993,869 | | | $ | — | | | $ | (3,614 | ) |
See Notes to Financial Statements.
| | | | |
| PGIM Global Total Return Fund | | | 85 | |
Schedule of Investments (continued)
as of October 31, 2018
Forward foreign currency exchange contracts outstanding at October 31, 2018 (continued):
| | | | | | | | | | | | | | | | | | | | | | |
Sale Contracts | | Counterparty | | Notional
Amount
(000) | | | Value at
Settlement
Date | | | Current
Value | | | Unrealized
Appreciation | | | Unrealized
Depreciation | |
OTC Forward Foreign Currency Exchange Contracts (cont’d.): | | | | | | | | | | | | | |
Australian Dollar (cont’d.), | | | | | | | | | | | | | | | | | | | | |
Expiring 01/18/19 | | Morgan Stanley | | AUD | 3,515 | | | $ | 2,490,000 | | | $ | 2,491,452 | | | $ | — | | | $ | (1,452 | ) |
Expiring 01/18/19 | | Toronto Dominion | | AUD | 13,168 | | | | 9,371,795 | | | | 9,334,389 | | | | 37,406 | | | | — | |
Expiring 01/18/19 | | Toronto Dominion | | AUD | 4,092 | | | | 2,891,000 | | | | 2,900,946 | | | | — | | | | (9,946 | ) |
Expiring 01/18/19 | | Toronto Dominion | | AUD | 2,308 | | | | 1,634,000 | | | | 1,636,027 | | | | — | | | | (2,027 | ) |
Expiring 01/31/19 | | Morgan Stanley | | AUD | 1,355 | | | | 960,000 | | | | 960,502 | | | | — | | | | (502 | ) |
Expiring 01/31/19 | | UBS AG | | AUD | 1,573 | | | | 1,114,000 | | | | 1,115,427 | | | | — | | | | (1,427 | ) |
Expiring 01/31/19 | | UBS AG | | AUD | 1,395 | | | | 993,000 | | | | 988,964 | | | | 4,036 | | | | — | |
Expiring 08/29/19 | | Morgan Stanley | | AUD | 16,238 | | | | 11,701,915 | | | | 11,563,010 | | | | 138,905 | | | | — | |
Expiring 01/31/20 | | Morgan Stanley | | AUD | 7,980 | | | | 5,765,949 | | | | 5,704,485 | | | | 61,464 | | | | — | |
Brazilian Real, | | | | | | | | | | | | | | | | | | | | |
Expiring 12/04/18 | | Barclays Bank PLC | | BRL | 6,984 | | | | 1,878,000 | | | | 1,870,418 | | | | 7,582 | | | | — | |
Expiring 12/04/18 | | Citibank NA | | BRL | 7,838 | | | | 2,079,000 | | | | 2,099,137 | | | | — | | | | (20,137 | ) |
Expiring 12/04/18 | | Goldman Sachs International | | BRL | 10,230 | | | | 2,749,931 | | | | 2,739,786 | | | | 10,145 | | | | — | |
Expiring 12/04/18 | | Goldman Sachs International | | BRL | 7,031 | | | | 1,731,103 | | | | 1,883,140 | | | | — | | | | (152,037 | ) |
Expiring 12/04/18 | | JPMorgan Chase | | BRL | 17,278 | | | | 4,625,952 | | | | 4,627,470 | | | | — | | | | (1,518 | ) |
Expiring 12/04/18 | | JPMorgan Chase | | BRL | 9,153 | | | | 2,445,700 | | | | 2,451,448 | | | | — | | | | (5,748 | ) |
Expiring 12/04/18 | | UBS AG | | BRL | 5,621 | | | | 1,495,000 | | | | 1,505,421 | | | | — | | | | (10,421 | ) |
Expiring 01/31/19 | | Bank of America | | BRL | 5,540 | | | | 1,495,000 | | | | 1,476,913 | | | | 18,087 | | | | — | |
Expiring 01/31/19 | | Barclays Bank PLC | | BRL | 2,961 | | | | 795,246 | | | | 789,292 | | | | 5,954 | | | | — | |
Expiring 02/25/19 | | Citibank NA | | BRL | 5,353 | | | | 1,362,226 | | | | 1,424,153 | | | | — | | | | (61,927 | ) |
Expiring 04/30/19 | | Hong Kong & Shanghai Bank | | BRL | 5,296 | | | | 1,458,000 | | | | 1,401,945 | | | | 56,055 | | | | — | |
Expiring 09/30/19 | | JPMorgan Chase | | BRL | 8,232 | | | | 2,357,000 | | | | 2,144,646 | | | | 212,354 | | | | — | |
See Notes to Financial Statements.
Forward foreign currency exchange contracts outstanding at October 31, 2018 (continued):
| | | | | | | | | | | | | | | | | | | | | | |
Sale Contracts | | Counterparty | | Notional
Amount
(000) | | | Value at
Settlement
Date | | | Current
Value | | | Unrealized
Appreciation | | | Unrealized
Depreciation | |
OTC Forward Foreign Currency Exchange Contracts (cont’d.): | | | | | | | | | | | | | |
Brazilian Real (cont’d.), | | | | | | | | | | | | | | | | | | | | |
Expiring 09/30/19 | | JPMorgan Chase | | BRL | 1,375 | | | $ | 338,130 | | | $ | 358,320 | | | $ | — | | | $ | (20,190 | ) |
Expiring 12/24/19 | | BNP Paribas | | BRL | 3,945 | | | | 975,000 | | | | 1,017,475 | | | | — | | | | (42,475 | ) |
Expiring 12/24/19 | | Citibank NA | | BRL | 7,535 | | | | 1,817,000 | | | | 1,943,634 | | | | — | | | | (126,634 | ) |
Expiring 12/24/19 | | JPMorgan Chase | | BRL | 7,093 | | | | 1,998,000 | | | | 1,829,571 | | | | 168,429 | | | | — | |
Expiring 12/24/19 | | JPMorgan Chase | | BRL | 5,126 | | | | 1,450,000 | | | | 1,322,157 | | | | 127,843 | | | | — | |
Expiring 12/24/19 | | UBS AG | | BRL | 3,166 | | | | 790,000 | | | | 816,733 | | | | — | | | | (26,733 | ) |
Expiring 03/31/20 | | JPMorgan Chase | | BRL | 42,174 | | | | 11,787,000 | | | | 10,746,999 | | | | 1,040,001 | | | | — | |
Expiring 03/31/20 | | JPMorgan Chase | | BRL | 9,484 | | | | 2,282,267 | | | | 2,416,759 | | | | — | | | | (134,492 | ) |
Expiring 06/30/20 | | Deutsche Bank AG | | BRL | 88,992 | | | | 21,600,000 | | | | 22,419,802 | | | | — | | | | (819,802 | ) |
Expiring 07/29/20 | | Deutsche Bank AG | | BRL | 29,229 | | | | 6,610,000 | | | | 7,336,813 | | | | — | | | | (726,813 | ) |
Expiring 08/31/20 | | Deutsche Bank AG | | BRL | 28,784 | | | | 6,280,000 | | | | 7,194,882 | | | | — | | | | (914,882 | ) |
British Pound, | | | | | | | | | | | | | | | | | | | | | | |
Expiring 12/19/18 | | Bank of America | | GBP | 38,871 | | | | 50,390,492 | | | | 49,814,918 | | | | 575,574 | | | | — | |
Expiring 11/27/19 | | Hong Kong & Shanghai Bank | | GBP | 1,436 | | | | 2,110,202 | | | | 1,873,939 | | | | 236,263 | | | | — | |
Expiring 11/27/19 | | JPMorgan Chase | | GBP | 911 | | | | 1,333,917 | | | | 1,189,392 | | | | 144,525 | | | | — | |
Expiring 11/27/19 | | UBS AG | | GBP | 292 | | | | 419,347 | | | | 381,322 | | | | 38,025 | | | | — | |
Canadian Dollar, | | | | | | | | | | | | | | | | | | | | | | |
Expiring 01/18/19 | | Goldman Sachs International | | CAD | 10,353 | | | | 7,975,728 | | | | 7,877,425 | | | | 98,303 | | | | — | |
Expiring 01/18/19 | | Hong Kong & Shanghai Bank | | CAD | 2,876 | | | | 2,222,992 | | | | 2,188,229 | | | | 34,763 | | | | — | |
Expiring 01/18/19 | | Toronto Dominion | | CAD | 3,310 | | | | 2,555,000 | | | | 2,518,629 | | | | 36,371 | | | | — | |
Expiring 01/18/19 | | Toronto Dominion | | CAD | 1,644 | | | | 1,267,000 | | | | 1,251,116 | | | | 15,884 | | | | — | |
Expiring 01/31/19 | | Morgan Stanley | | CAD | 2,621 | | | | 2,106,173 | | | | 1,994,485 | | | | 111,688 | | | | — | |
See Notes to Financial Statements.
| | | | |
| PGIM Global Total Return Fund | | | 87 | |
Schedule of Investments (continued)
as of October 31, 2018
Forward foreign currency exchange contracts outstanding at October 31, 2018 (continued):
| | | | | | | | | | | | | | | | | | | | | | |
Sale Contracts | | Counterparty | | Notional
Amount
(000) | | | Value at
Settlement
Date | | | Current
Value | | | Unrealized
Appreciation | | | Unrealized
Depreciation | |
OTC Forward Foreign Currency Exchange Contracts (cont’d.): | | | | | | | | | | | | | |
Canadian Dollar (cont’d.), | | | | | | | | | | | | | | | | | | | | |
Expiring 07/31/19 | | Hong Kong & Shanghai Bank | | CAD | 541 | | | $ | 434,000 | | | $ | 412,657 | | | $ | 21,343 | | | $ | — | |
Chilean Peso, | | | | | | | | | | | | | | | | | | | | |
Expiring 12/19/18 | | Barclays Bank PLC | | CLP | 1,270,072 | | | | 1,877,000 | | | | 1,826,207 | | | | 50,793 | | | | — | |
Expiring 12/19/18 | | Barclays Bank PLC | | CLP | 1,265,914 | | | | 1,853,000 | | | | 1,820,229 | | | | 32,771 | | | | — | |
Expiring 12/19/18 | | Barclays Bank PLC | | CLP | 1,065,700 | | | | 1,563,000 | | | | 1,532,346 | | | | 30,654 | | | | — | |
Expiring 12/19/18 | | BNP Paribas | | CLP | 21,990,252 | | | | 32,683,708 | | | | 31,619,278 | | | | 1,064,430 | | | | — | |
Chinese Renminbi, | | | | | | | | | | | | | | | | | | | | |
Expiring 11/30/18 | | Hong Kong & Shanghai Bank | | CNH | 15,240 | | | | 2,156,000 | | | | 2,181,242 | | | | — | | | | (25,242 | ) |
Expiring 01/28/19 | | Deutsche Bank AG | | CNH | 55,789 | | | | 7,995,000 | | | | 7,961,107 | | | | 33,893 | | | | — | |
Expiring 01/28/19 | | Deutsche Bank AG | | CNH | 24,748 | | | | 3,549,000 | | | | 3,531,483 | | | | 17,517 | | | | — | |
Expiring 01/28/19 | | Morgan Stanley | | CNH | 365,540 | | | | 52,408,723 | | | | 52,162,293 | | | | 246,430 | | | | — | |
Expiring 06/28/19 | | Morgan Stanley | | CNH | 7,979 | | | | 1,192,000 | | | | 1,133,625 | | | | 58,375 | | | | — | |
Expiring 02/28/20 | | Morgan Stanley | | CNH | 71,818 | | | | 10,657,000 | | | | 10,216,095 | | | | 440,905 | | | | — | |
Colombian Peso, | | | | | | | | | | | | | | | | | | | | |
Expiring 12/14/18 | | Barclays Bank PLC | | COP | 4,656,254 | | | | 1,542,000 | | | | 1,443,471 | | | | 98,529 | | | | — | |
Expiring 12/14/18 | | Barclays Bank PLC | | COP | 4,211,578 | | | | 1,400,000 | | | | 1,305,619 | | | | 94,381 | | | | — | |
Expiring 12/14/18 | | Citibank NA | | COP | 41,501,226 | | | | 13,296,348 | | | | 12,865,671 | | | | 430,677 | | | | — | |
Expiring 12/14/18 | | Citibank NA | | COP | 3,706,671 | | | | 1,220,000 | | | | 1,149,094 | | | | 70,906 | | | | — | |
Expiring 12/14/18 | | Morgan Stanley | | COP | 8,035,959 | | | | 2,614,000 | | | | 2,491,203 | | | | 122,797 | | | | — | |
Expiring 12/14/18 | | Morgan Stanley | | COP | 6,508,572 | | | | 2,172,000 | | | | 2,017,703 | | | | 154,297 | | | | — | |
Expiring 12/14/18 | | Morgan Stanley | | COP | 4,252,160 | | | | 1,408,000 | | | | 1,318,199 | | | | 89,801 | | | | — | |
Czech Koruna, | | | | | | | | | | | | | | | | | | | | |
Expiring 01/25/19 | | Citibank NA | | CZK | 382,715 | | | | 17,010,295 | | | | 16,848,412 | | | | 161,883 | | | | — | |
See Notes to Financial Statements.
Forward foreign currency exchange contracts outstanding at October 31, 2018 (continued):
| | | | | | | | | | | | | | | | | | | | | | |
Sale Contracts | | Counterparty | | Notional
Amount
(000) | | | Value at
Settlement
Date | | | Current
Value | | | Unrealized
Appreciation | | | Unrealized
Depreciation | |
OTC Forward Foreign Currency Exchange Contracts (cont’d.): | | | | | | | | | | | | | |
Czech Koruna (cont’d.), | | | | | | | | | | | | | | | | | | | | |
Expiring 01/25/19 | | Deutsche Bank AG | | CZK | 382,715 | | | $ | 17,112,213 | | | $ | 16,848,412 | | | $ | 263,801 | | | $ | — | |
Expiring 01/25/19 | | Goldman Sachs International | | CZK | 31,246 | | | | 1,375,000 | | | | 1,375,564 | | | | — | | | | (564 | ) |
Euro, | | | | | | | | | | | | | | | | | | | | |
Expiring 12/19/18 | | UBS AG | | EUR | 126,835 | | | | 145,058,925 | | | | 144,316,310 | | | | 742,615 | | | | — | |
Expiring 01/25/19 | | Toronto Dominion | | EUR | 2,335 | | | | 2,674,000 | | | | 2,666,327 | | | | 7,673 | | | | — | |
Expiring 01/25/19 | | Toronto Dominion | | EUR | 1,635 | | | | 1,867,000 | | | | 1,867,465 | | | | — | | | | (465 | ) |
Expiring 01/25/19 | | Toronto Dominion | | EUR | 1,530 | | | | 1,768,000 | | | | 1,747,805 | | | | 20,195 | | | | — | |
Expiring 01/25/19 | | Toronto Dominion | | EUR | 1,527 | | | | 1,753,000 | | | | 1,743,868 | | | | 9,132 | | | | — | |
Expiring 01/25/19 | | Toronto Dominion | | EUR | 1,455 | | | | 1,668,000 | | | | 1,662,109 | | | | 5,891 | | | | — | |
Expiring 01/25/19 | | UBS AG | | EUR | 3,561 | | | | 4,065,777 | | | | 4,066,427 | | | | — | | | | (650 | ) |
Expiring 01/25/19 | | UBS AG | | EUR | 1,916 | | | | 2,193,050 | | | | 2,188,433 | | | | 4,617 | | | | — | |
Expiring 01/31/19 | | JPMorgan Chase | | EUR | 575 | | | | 665,000 | | | | 656,691 | | | | 8,309 | | | | — | |
Expiring 02/25/19 | | Citibank NA | | EUR | 4,600 | | | | 5,835,781 | | | | 5,267,733 | | | | 568,048 | | | | — | |
Expiring 02/28/19 | | Deutsche Bank AG | | EUR | 1,536 | | | | 1,927,419 | | | | 1,759,420 | | | | 167,999 | | | | — | |
Expiring 11/27/19 | | Citibank NA | | EUR | 494 | | | | 646,795 | | | | 581,226 | | | | 65,569 | | | | — | |
Expiring 11/27/19 | | Morgan Stanley | | EUR | 654 | | | | 788,438 | | | | 768,238 | | | | 20,200 | | | | — | |
Expiring 12/30/19 | | Deutsche Bank AG | | EUR | 727 | | | | 937,525 | | | | 857,342 | | | | 80,183 | | | | — | |
Expiring 02/28/20 | | Bank of America | | EUR | 6,895 | | | | 8,400,868 | | | | 8,178,773 | | | | 222,095 | | | | — | |
Expiring 02/28/20 | | BNP Paribas | | EUR | 9,958 | | | | 12,566,000 | | | | 11,812,070 | | | | 753,930 | | | | — | |
Expiring 07/29/20 | | UBS AG | | EUR | 3,951 | | | | 4,814,659 | | | | 4,756,072 | | | | 58,587 | | | | — | |
Hong Kong Dollar, | | | | | | | | | | | | | | | | | | | | |
Expiring 01/22/19 | | Bank of America | | HKD | 6,565 | | | | 838,890 | | | | 838,937 | | | | — | | | | (47 | ) |
Hungarian Forint, | | | | | | | | | | | | | | | | | | | | |
Expiring 01/25/19 | | JPMorgan Chase | | HUF | 3,938,241 | | | | 14,199,534 | | | | 13,843,802 | | | | 355,732 | | | | — | |
Expiring 01/25/19 | | Toronto Dominion | | HUF | 5,357,201 | | | | 19,209,078 | | | | 18,831,765 | | | | 377,313 | | | | — | |
See Notes to Financial Statements.
| | | | |
| PGIM Global Total Return Fund | | | 89 | |
Schedule of Investments (continued)
as of October 31, 2018
Forward foreign currency exchange contracts outstanding at October 31, 2018 (continued):
| | | | | | | | | | | | | | | | | | | | | | |
Sale Contracts | | Counterparty | | Notional
Amount
(000) | | | Value at
Settlement
Date | | | Current
Value | | | Unrealized
Appreciation | | | Unrealized
Depreciation | |
OTC Forward Foreign Currency Exchange Contracts (cont’d.): | | | | | | | | | | | | | |
Hungarian Forint (cont’d.), | | | | | | | | | | | | | | | | | | | | |
Expiring 01/25/19 | | Toronto Dominion | | HUF | 2,638,621 | | | $ | 9,477,139 | | | $ | 9,275,347 | | | $ | 201,792 | | | $ | — | |
Expiring 01/25/19 | | UBS AG | | HUF | 505,744 | | | | 1,787,000 | | | | 1,777,802 | | | | 9,198 | | | | — | |
Indian Rupee, | | | | | | | | | | | | | | | | | | | | |
Expiring 01/11/19 | | Barclays Bank PLC | | INR | 160,834 | | | | 2,160,000 | | | | 2,156,213 | | | | 3,787 | | | | — | |
Expiring 01/11/19 | | JPMorgan Chase | | INR | 362,670 | | | | 4,888,000 | | | | 4,862,130 | | | | 25,870 | | | | — | |
Expiring 01/11/19 | | JPMorgan Chase | | INR | 285,053 | | | | 3,815,000 | | | | 3,821,558 | | | | — | | | | (6,558 | ) |
Expiring 01/11/19 | | JPMorgan Chase | | INR | 193,671 | | | | 2,614,000 | | | | 2,596,451 | | | | 17,549 | | | | — | |
Expiring 01/11/19 | | JPMorgan Chase | | INR | 170,053 | | | | 2,275,900 | | | | 2,279,812 | | | | — | | | | (3,912 | ) |
Expiring 01/11/19 | | JPMorgan Chase | | INR | 97,614 | | | | 1,319,000 | | | | 1,308,656 | | | | 10,344 | | | | — | |
Expiring 01/11/19 | | Morgan Stanley | | INR | 188,128 | | | | 2,541,000 | | | | 2,522,135 | | | | 18,865 | | | | — | |
Expiring 08/29/19 | | BNP Paribas | | INR | 931,874 | | | | 12,562,000 | | | | 12,170,312 | | | | 391,688 | | | | — | |
Indonesian Rupiah, | | | | | | | | | | | | | | | | | | | | |
Expiring 12/19/18 | | Barclays Bank PLC | | IDR | 100,166,605 | | | | 6,527,000 | | | | 6,544,986 | | | | — | | | | (17,986 | ) |
Expiring 12/19/18 | | Barclays Bank PLC | | IDR | 98,088,623 | | | | 6,494,000 | | | | 6,409,209 | | | | 84,791 | | | | — | |
Expiring 12/19/18 | | Barclays Bank PLC | | IDR | 93,779,337 | | | | 6,180,000 | | | | 6,127,636 | | | | 52,364 | | | | — | |
Expiring 12/19/18 | | Barclays Bank PLC | | IDR | 61,929,232 | | | | 4,012,000 | | | | 4,046,518 | | | | — | | | | (34,518 | ) |
Expiring 12/19/18 | | Barclays Bank PLC | | IDR | 52,393,987 | | | | 3,413,000 | | | | 3,423,475 | | | | — | | | | (10,475 | ) |
Expiring 12/19/18 | | Barclays Bank PLC | | IDR | 28,313,948 | | | | 1,846,000 | | | | 1,850,062 | | | | — | | | | (4,062 | ) |
Expiring 12/19/18 | | Citibank NA | | IDR | 25,456,100 | | | | 1,660,000 | | | | 1,663,327 | | | | — | | | | (3,327 | ) |
Expiring 12/19/18 | | JPMorgan Chase | | IDR | 118,764,588 | | | | 7,843,000 | | | | 7,760,197 | | | | 82,803 | | | | — | |
Expiring 12/19/18 | | JPMorgan Chase | | IDR | 112,710,195 | | | | 7,482,000 | | | | 7,364,597 | | | | 117,403 | | | | — | |
Expiring 12/19/18 | | JPMorgan Chase | | IDR | 107,234,340 | | | | 7,060,000 | | | | 7,006,799 | | | | 53,201 | | | | — | |
Expiring 12/19/18 | | JPMorgan Chase | | IDR | 105,832,327 | | | | 7,007,000 | | | | 6,915,190 | | | | 91,810 | | | | — | |
See Notes to Financial Statements.
Forward foreign currency exchange contracts outstanding at October 31, 2018 (continued):
| | | | | | | | | | | | | | | | | | | | | | |
Sale Contracts | | Counterparty | | Notional
Amount
(000) | | | Value at
Settlement
Date | | | Current
Value | | | Unrealized
Appreciation | | | Unrealized
Depreciation | |
OTC Forward Foreign Currency Exchange Contracts (cont’d.): | | | | | | | | | | | | | |
Indonesian Rupiah (cont’d.), | | | | | | | | | | | | | | | | | | | | |
Expiring 12/19/18 | | JPMorgan Chase | | IDR | 74,608,320 | | | $ | 4,960,000 | | | $ | 4,874,982 | | | $ | 85,018 | | | $ | — | |
Expiring 12/19/18 | | JPMorgan Chase | | IDR | 55,719,333 | | | | 3,679,058 | | | | 3,640,757 | | | | 38,301 | | | | — | |
Expiring 12/19/18 | | JPMorgan Chase | | IDR | 45,541,860 | | | | 2,964,000 | | | | 2,975,751 | | | | — | | | | (11,751 | ) |
Expiring 12/19/18 | | JPMorgan Chase | | IDR | 43,436,256 | | | | 2,827,942 | | | | 2,838,168 | | | | — | | | | (10,226 | ) |
Expiring 12/19/18 | | JPMorgan Chase | | IDR | 38,528,083 | | | | 2,499,000 | | | | 2,517,463 | | | | — | | | | (18,463 | ) |
Expiring 12/19/18 | | JPMorgan Chase | | IDR | 27,620,318 | | | | 1,828,555 | | | | 1,804,740 | | | | 23,815 | | | | — | |
Expiring 12/19/18 | | Morgan Stanley | | IDR | 61,345,428 | | | | 4,045,198 | | | | 4,008,372 | | | | 36,826 | | | | — | |
Israeli Shekel, | | | | | | | | | | | | | | | | | | | | |
Expiring 01/28/19 | | Citibank NA | | ILS | 52,700 | | | | 14,389,125 | | | | 14,272,255 | | | | 116,870 | | | | — | |
Japanese Yen, | | | | | | | | | | | | | | | | | | | | |
Expiring 01/31/19 | | JPMorgan Chase | | JPY | 66,133 | | | | 591,000 | | | | 591,024 | | | | — | | | | (24 | ) |
Expiring 06/28/19 | | Bank of America | | JPY | 117,369 | | | | 1,070,710 | | | | 1,062,598 | | | | 8,112 | | | | — | |
Expiring 06/28/19 | | JPMorgan Chase | | JPY | 56,489 | | | | 514,123 | | | | 511,419 | | | | 2,704 | | | | — | |
Expiring 06/28/19 | | Morgan Stanley | | JPY | 224,761 | | | | 2,132,745 | | | | 2,034,864 | | | | 97,881 | | | | — | |
Expiring 11/30/20 | | JPMorgan Chase | | JPY | 358,416 | | | | 3,431,792 | | | | 3,415,414 | | | | 16,378 | | | | — | |
Mexican Peso, | | | | | | | | | | | | | | | | | | | | |
Expiring 12/19/18 | | Citibank NA | | MXN | 28,252 | | | | 1,437,000 | | | | 1,379,258 | | | | 57,742 | | | | — | |
Expiring 12/19/18 | | JPMorgan Chase | | MXN | 35,703 | | | | 1,859,458 | | | | 1,743,063 | | | | 116,395 | | | | — | |
Expiring 12/19/18 | | JPMorgan Chase | | MXN | 31,899 | | | | 1,668,000 | | | | 1,557,330 | | | | 110,670 | | | | — | |
Expiring 12/19/18 | | UBS AG | | MXN | 274,752 | | | | 14,504,525 | | | | 13,413,545 | | | | 1,090,980 | | | | — | |
Expiring 01/29/19 | | UBS AG | | MXN | 63,242 | | | | 3,232,000 | | | | 3,066,547 | | | | 165,453 | | | | — | |
Expiring 01/31/19 | | Deutsche Bank AG | | MXN | 27,037 | | | | 1,316,000 | | | | 1,310,584 | | | | 5,416 | | | | — | |
Expiring 01/31/19 | | Morgan Stanley | | MXN | 42,503 | | | | 1,834,000 | | | | 2,060,246 | | | | — | | | | (226,246 | ) |
Expiring 01/31/19 | | UBS AG | | MXN | 35,909 | | | | 1,771,000 | | | | 1,740,620 | | | | 30,380 | | | | — | |
Expiring 01/31/19 | | UBS AG | | MXN | 16,939 | | | | 856,000 | | | | 821,075 | | | | 34,925 | | | | — | |
See Notes to Financial Statements.
| | | | |
| PGIM Global Total Return Fund | | | 91 | |
Schedule of Investments (continued)
as of October 31, 2018
Forward foreign currency exchange contracts outstanding at October 31, 2018 (continued):
| | | | | | | | | | | | | | | | | | | | | | |
Sale Contracts | | Counterparty | | Notional
Amount
(000) | | | Value at
Settlement
Date | | | Current
Value | | | Unrealized
Appreciation | | | Unrealized
Depreciation | |
OTC Forward Foreign Currency Exchange Contracts (cont’d.): | | | | | | | | | | | | | |
Mexican Peso (cont’d.), | | | | | | | | | | | | | | | | | | | | |
Expiring 03/29/19 | | Barclays Bank PLC | | MXN | 4,369 | | | $ | 210,240 | | | $ | 209,794 | | | $ | 446 | | | $ | — | |
Expiring 03/29/19 | | JPMorgan Chase | | MXN | 40,651 | | | | 1,959,387 | | | | 1,951,971 | | | | 7,416 | | | | — | |
Expiring 03/29/19 | | JPMorgan Chase | | MXN | 26,510 | | | | 1,262,000 | | | | 1,272,961 | | | | — | | | | (10,961 | ) |
Expiring 03/29/19 | | JPMorgan Chase | | MXN | 4,765 | | | | 239,779 | | | | 228,811 | | | | 10,968 | | | | — | |
Expiring 08/29/19 | | BNP Paribas | | MXN | 106,687 | | | | 5,377,000 | | | | 4,997,176 | | | | 379,824 | | | | — | |
Expiring 12/30/19 | | Citibank NA | | MXN | 11,746 | | | | 572,000 | | | | 539,942 | | | | 32,058 | | | | — | |
Expiring 12/30/19 | | Morgan Stanley | | MXN | 23,784 | | | | 1,074,000 | | | | 1,093,330 | | | | — | | | | (19,330 | ) |
Expiring 04/30/20 | | Citibank NA | | MXN | 325,325 | | | | 15,608,000 | | | | 14,694,338 | | | | 913,662 | | | | — | |
Expiring 04/30/20 | | UBS AG | | MXN | 30,055 | | | | 1,325,000 | | | | 1,357,536 | | | | — | | | | (32,536 | ) |
New Taiwanese Dollar, | | | | | | | | | | | | | | | | | | | | |
Expiring 01/11/19 | | JPMorgan Chase | | TWD | 104,867 | | | | 3,405,000 | | | | 3,409,692 | | | | — | | | | (4,692 | ) |
Expiring 01/11/19 | | JPMorgan Chase | | TWD | 50,479 | | | | 1,640,000 | | | | 1,641,300 | | | | — | | | | (1,300 | ) |
Expiring 01/11/19 | | Morgan Stanley | | TWD | 88,860 | | | | 2,886,000 | | | | 2,889,226 | | | | — | | | | (3,226 | ) |
Expiring 01/11/19 | | UBS AG | | TWD | 300,208 | | | | 9,865,520 | | | | 9,761,070 | | | | 104,450 | | | | — | |
New Zealand Dollar, | | | | | | | | | | | | | | | | | | | | | | |
Expiring 01/18/19 | | Toronto Dominion | | NZD | 17,742 | | | | 11,552,488 | | | | 11,588,635 | | | | — | | | | (36,147 | ) |
Expiring 01/18/19 | | Toronto Dominion | | NZD | 4,777 | | | | 3,126,000 | | | | 3,120,484 | | | | 5,516 | | | | — | |
Expiring 01/18/19 | | Toronto Dominion | | NZD | 3,601 | | | | 2,348,000 | | | | 2,351,980 | | | | — | | | | (3,980 | ) |
Expiring 01/18/19 | | Toronto Dominion | | NZD | 2,248 | | | | 1,469,000 | | | | 1,468,356 | | | | 644 | | | | — | |
Norwegian Krone, | | | | | | | | | | | | | | | | | | | | | | |
Expiring 01/25/19 | | Toronto Dominion | | NOK | 14,320 | | | | 1,733,000 | | | | 1,705,873 | | | | 27,127 | | | | — | |
Peruvian Nuevo Sol, | | | | | | | | | | | | | | | | | | | | | | |
Expiring 12/19/18 | | Barclays Bank PLC | | PEN | 5,403 | | | | 1,601,000 | | | | 1,599,515 | | | | 1,485 | | | | — | |
Expiring 12/19/18 | | JPMorgan Chase | | PEN | 11,697 | | | | 3,515,000 | | | | 3,462,679 | | | | 52,321 | | | | — | |
Expiring 12/19/18 | | JPMorgan Chase | | PEN | 8,669 | | | | 2,600,000 | | | | 2,566,417 | | | | 33,583 | | | | — | |
See Notes to Financial Statements.
Forward foreign currency exchange contracts outstanding at October 31, 2018 (continued):
| | | | | | | | | | | | | | | | | | | | | | |
Sale Contracts | | Counterparty | | Notional
Amount
(000) | | | Value at
Settlement
Date | | | Current
Value | | | Unrealized
Appreciation | | | Unrealized
Depreciation | |
OTC Forward Foreign Currency Exchange Contracts (cont’d.): | |
Peruvian Nuevo Sol (cont’d.), | | | | | | | | | | | | | | | | | | | | | | |
Expiring 12/19/18 | | JPMorgan Chase | | PEN | 6,157 | | | $ | 1,853,000 | | | $ | 1,822,758 | | | $ | 30,242 | | | $ | — | |
Expiring 12/19/18 | | JPMorgan Chase | | PEN | 5,545 | | | | 1,670,000 | | | | 1,641,409 | | | | 28,591 | | | | — | |
Expiring 12/19/18 | | Morgan Stanley | | PEN | 7,836 | | | | 2,362,000 | | | | 2,319,674 | | | | 42,326 | | | | — | |
Philippine Peso, | | | | | | | | | | | | | | | | | | | | | | |
Expiring 12/14/18 | | Barclays Bank PLC | | PHP | 138,443 | | | | 2,554,300 | | | | 2,579,736 | | | | — | | | | (25,436 | ) |
Expiring 12/14/18 | | Barclays Bank PLC | | PHP | 70,119 | | | | 1,302,000 | | | | 1,306,595 | | | | — | | | | (4,595 | ) |
Expiring 12/14/18 | | Citibank NA | | PHP | 242,453 | | | | 4,445,000 | | | | 4,517,840 | | | | — | | | | (72,840 | ) |
Expiring 12/14/18 | | Citibank NA | | PHP | 132,156 | | | | 2,441,000 | | | | 2,462,579 | | | | — | | | | (21,579 | ) |
Expiring 12/14/18 | | JPMorgan Chase | | PHP | 250,999 | | | | 4,643,000 | | | | 4,677,089 | | | | — | | | | (34,089 | ) |
Expiring 12/14/18 | | JPMorgan Chase | | PHP | 240,987 | | | | 4,459,000 | | | | 4,490,525 | | | | — | | | | (31,525 | ) |
Expiring 12/14/18 | | JPMorgan Chase | | PHP | 236,372 | | | | 4,321,000 | | | | 4,404,530 | | | | — | | | | (83,530 | ) |
Expiring 12/14/18 | | JPMorgan Chase | | PHP | 93,441 | | | | 1,732,000 | | | | 1,741,179 | | | | — | | | | (9,179 | ) |
Expiring 12/14/18 | | JPMorgan Chase | | PHP | 81,030 | | | | 1,507,950 | | | | 1,509,900 | | | | — | | | | (1,950 | ) |
Expiring 12/14/18 | | Morgan Stanley | | PHP | 556,562 | | | | 10,196,237 | | | | 10,370,922 | | | | — | | | | (174,685 | ) |
Polish Zloty, | | | | | | | | | | | | | | | | | | | | | | |
Expiring 01/25/19 | | Goldman Sachs International | | PLN | 128,115 | | | | 34,324,301 | | | | 33,475,300 | | | | 849,001 | | | | — | |
Russian Ruble, | | | | | | | | | | | | | | | | | | | | | | |
Expiring 12/19/18 | | JPMorgan Chase | | RUB | 452,836 | | | | 6,741,132 | | | | 6,831,631 | | | | — | | | | (90,499 | ) |
Expiring 12/19/18 | | JPMorgan Chase | | RUB | 147,718 | | | | 2,188,623 | | | | 2,228,521 | | | | — | | | | (39,898 | ) |
Expiring 06/28/19 | | Morgan Stanley | | RUB | 145,904 | | | | 2,166,000 | | | | 2,152,281 | | | | 13,719 | | | | — | |
Expiring 12/24/19 | | Barclays Bank PLC | | RUB | 48,233 | | | | 739,309 | | | | 696,420 | | | | 42,889 | | | | — | |
Expiring 12/24/19 | | Goldman Sachs International | | RUB | 124,622 | | | | 2,031,000 | | | | 1,799,395 | | | | 231,605 | | | | — | |
See Notes to Financial Statements.
| | | | |
| PGIM Global Total Return Fund | | | 93 | |
Schedule of Investments (continued)
as of October 31, 2018
Forward foreign currency exchange contracts outstanding at October 31, 2018 (continued):
| | | | | | | | | | | | | | | | | | | | | | |
Sale Contracts | | Counterparty | | Notional
Amount
(000) | | | Value at
Settlement
Date | | | Current
Value | | | Unrealized
Appreciation | | | Unrealized
Depreciation | |
OTC Forward Foreign Currency Exchange Contracts (cont’d.): | |
Russian Ruble (cont’d.), | | | | | | | | | | | | | | | | | | | | | | |
Expiring 12/24/19 | | JPMorgan Chase | | RUB | 56,445 | | | $ | 757,906 | | | $ | 814,999 | | | $ | — | | | $ | (57,093 | ) |
Expiring 03/31/20 | | Citibank NA | | RUB | 305,303 | | | | 4,444,000 | | | | 4,360,205 | | | | 83,795 | | | | — | |
Expiring 03/31/20 | | JPMorgan Chase | | RUB | 315,168 | | | | 4,163,386 | | | | 4,501,101 | | | | — | | | | (337,715 | ) |
Saudi Arabian Riyal, | | | | | | | | | | | | | | | | | | | | | | |
Expiring 11/12/19 | | Goldman Sachs International | | SAR | 57,150 | | | | 15,000,000 | | | | 15,218,171 | | | | — | | | | (218,171 | ) |
Singapore Dollar, | | | | | | | | | | | | | | | | | | | | | | |
Expiring 11/09/18 | | Citibank NA | | SGD | 10,348 | | | | 7,571,877 | | | | 7,472,019 | | | | 99,858 | | | | — | |
Expiring 11/09/18 | | Citibank NA | | SGD | 6,619 | | | | 4,849,650 | | | | 4,779,215 | | | | 70,435 | | | | — | |
Expiring 11/09/18 | | Deutsche Bank AG | | SGD | 5,791 | | | | 4,204,000 | | | | 4,181,822 | | | | 22,178 | | | | — | |
Expiring 11/09/18 | | Deutsche Bank AG | | SGD | 4,213 | | | | 3,041,000 | | | | 3,042,338 | | | | — | | | | (1,338 | ) |
Expiring 11/09/18 | | Deutsche Bank AG | | SGD | 3,985 | | | | 2,883,000 | | | | 2,877,146 | | | | 5,854 | | | | — | |
Expiring 11/09/18 | | Deutsche Bank AG | | SGD | 2,240 | | | | 1,618,000 | | | | 1,617,762 | | | | 238 | | | | — | |
Expiring 11/09/18 | | Deutsche Bank AG | | SGD | 1,876 | | | | 1,355,000 | | | | 1,354,291 | | | | 709 | | | | — | |
Expiring 11/09/18 | | Goldman Sachs International | | SGD | 2,875 | | | | 2,092,000 | | | | 2,075,902 | | | | 16,098 | | | | — | |
Expiring 11/09/18 | | Goldman Sachs International | | SGD | 1,979 | | | | 1,436,000 | | | | 1,428,720 | | | | 7,280 | | | | — | |
Expiring 11/09/18 | | JPMorgan Chase | | SGD | 4,574 | | | | 3,338,000 | | | | 3,302,752 | | | | 35,248 | | | | — | |
Expiring 11/09/18 | | JPMorgan Chase | | SGD | 4,214 | | | | 3,062,000 | | | | 3,042,731 | | | | 19,269 | | | | — | |
Expiring 11/09/18 | | JPMorgan Chase | | SGD | 2,836 | | | | 2,053,000 | | | | 2,047,960 | | | | 5,040 | | | | — | |
Expiring 11/09/18 | | Morgan Stanley | | SGD | 1,703 | | | | 1,250,200 | | | | 1,230,016 | | | | 20,184 | | | | — | |
Expiring 11/09/18 | | Toronto Dominion | | SGD | 2,072 | | | | 1,505,000 | | | | 1,495,829 | | | | 9,171 | | | | — | |
Expiring 11/09/18 | | UBS AG | | SGD | 7,859 | | | | 5,686,000 | | | | 5,675,075 | | | | 10,925 | | | | — | |
South African Rand, | | | | | | | | | | | | | | | | | | | | | | |
Expiring 11/09/18 | | Citibank NA | | ZAR | 71,847 | | | | 4,994,940 | | | | 4,864,625 | | | | 130,315 | | | | — | |
See Notes to Financial Statements.
Forward foreign currency exchange contracts outstanding at October 31, 2018 (continued):
| | | | | | | | | | | | | | | | | | | | | | |
Sale Contracts | | Counterparty | | Notional
Amount
(000) | | | Value at
Settlement
Date | | | Current
Value | | | Unrealized
Appreciation | | | Unrealized
Depreciation | |
OTC Forward Foreign Currency Exchange Contracts (cont’d.): | |
South African Rand (cont’d.), | | | | | | | | | | | | | | | | | | | | | | |
Expiring 11/30/18 | | Credit Suisse International | | ZAR | 12,230 | | | $ | 781,000 | | | $ | 825,915 | | | $ | — | | | $ | (44,915 | ) |
Expiring 12/07/18 | | Barclays Bank PLC | | ZAR | 187,481 | | | | 12,259,927 | | | | 12,649,232 | | | | — | | | | (389,305 | ) |
Expiring 12/07/18 | | Barclays Bank PLC | | ZAR | 187,481 | | | | 12,259,927 | | | | 12,649,232 | | | | — | | | | (389,305 | ) |
Expiring 12/07/18 | | Citibank NA | | ZAR | 57,595 | | | | 4,034,814 | | | | 3,885,892 | | | | 148,922 | | | | — | |
Expiring 12/07/18 | | Citibank NA | | ZAR | 44,404 | | | | 3,085,110 | | | | 2,995,886 | | | | 89,224 | | | | — | |
Expiring 12/07/18 | | Citibank NA | | ZAR | 27,894 | | | | 1,921,757 | | | | 1,882,009 | | | | 39,748 | | | | — | |
Expiring 12/07/18 | | Citibank NA | | ZAR | 19,011 | | | | 1,307,244 | | | | 1,282,676 | | | | 24,568 | | | | — | |
Expiring 12/07/18 | | Goldman Sachs International | | ZAR | 49,975 | | | | 3,230,241 | | | | 3,371,783 | | | | — | | | | (141,542 | ) |
Expiring 12/07/18 | | JPMorgan Chase | | ZAR | 53,983 | | | | 3,467,000 | | | | 3,642,203 | | | | — | | | | (175,203 | ) |
Expiring 12/07/18 | | JPMorgan Chase | | ZAR | 48,804 | | | | 3,247,564 | | | | 3,292,799 | | | | — | | | | (45,235 | ) |
Expiring 12/07/18 | | Toronto Dominion | | ZAR | 22,701 | | | | 1,480,000 | | | | 1,531,651 | | | | — | | | | (51,651 | ) |
Expiring 06/28/19 | | BNP Paribas | | ZAR | 5,451 | | | | 350,000 | | | | 358,386 | | | | — | | | | (8,386 | ) |
Expiring 06/28/19 | | Hong Kong & Shanghai Bank | | ZAR | 28,706 | | | | 1,986,000 | | | | 1,887,219 | | | | 98,781 | | | | — | |
Expiring 12/30/19 | | Goldman Sachs International | | ZAR | 27,540 | | | | 1,738,000 | | | | 1,766,506 | | | | — | | | | (28,506 | ) |
Expiring 12/30/19 | | JPMorgan Chase | | ZAR | 5,953 | | | | 394,516 | | | | 381,862 | | | | 12,654 | | | | — | |
Expiring 03/31/20 | | Barclays Bank PLC | | ZAR | 18,478 | | | | 1,229,000 | | | | 1,170,171 | | | | 58,829 | | | | — | |
Expiring 03/31/20 | | Goldman Sachs International | | ZAR | 18,263 | | | | 1,154,000 | | | | 1,156,532 | | | | — | | | | (2,532 | ) |
Expiring 03/31/20 | | JPMorgan Chase | | ZAR | 47,759 | | | | 3,124,596 | | | | 3,024,497 | | | | 100,099 | | | | — | |
Expiring 07/29/20 | | BNP Paribas | | ZAR | 145,671 | | | | 8,926,000 | | | | 9,070,035 | | | | — | | | | (144,035 | ) |
Expiring 09/30/20 | | Goldman Sachs International | | ZAR | 27,092 | | | | 1,693,000 | | | | 1,671,727 | | | | 21,273 | | | | — | |
See Notes to Financial Statements.
| | | | |
| PGIM Global Total Return Fund | | | 95 | |
Schedule of Investments (continued)
as of October 31, 2018
Forward foreign currency exchange contracts outstanding at October 31, 2018 (continued):
| | | | | | | | | | | | | | | | | | | | | | |
Sale Contracts | | Counterparty | | Notional
Amount
(000) | | | Value at
Settlement
Date | | | Current
Value | | | Unrealized
Appreciation | | | Unrealized
Depreciation | |
OTC Forward Foreign Currency Exchange Contracts (cont’d.): | |
South Korean Won, | | | | | | | | | | | | | | | | | | | | | | |
Expiring 01/16/19 | | Barclays Bank PLC | | KRW | 4,497,675 | | | $ | 4,007,194 | | | $ | 3,957,877 | | | $ | 49,317 | | | $ | — | |
Expiring 01/16/19 | | Barclays Bank PLC | | KRW | 1,748,458 | | | | 1,539,000 | | | | 1,538,613 | | | | 387 | | | | — | |
Expiring 01/16/19 | | Goldman Sachs International | | KRW | 4,583,017 | | | | 4,059,000 | | | | 4,032,977 | | | | 26,023 | | | | — | |
Expiring 01/16/19 | | JPMorgan Chase | | KRW | 2,474,874 | | | | 2,176,000 | | | | 2,177,847 | | | | — | | | | (1,847 | ) |
Expiring 01/16/19 | | JPMorgan Chase | | KRW | 2,362,287 | | | | 2,072,000 | | | | 2,078,773 | | | | — | | | | (6,773 | ) |
Expiring 01/16/19 | | JPMorgan Chase | | KRW | 2,034,582 | | | | 1,814,000 | | | | 1,790,398 | | | | 23,602 | | | | — | |
Expiring 01/16/19 | | JPMorgan Chase | | KRW | 1,755,985 | | | | 1,557,000 | | | | 1,545,237 | | | | 11,763 | | | | — | |
Expiring 01/16/19 | | JPMorgan Chase | | KRW | 1,553,612 | | | | 1,372,000 | | | | 1,367,152 | | | | 4,848 | | | | — | |
Expiring 01/16/19 | | JPMorgan Chase | | KRW | 137,335 | | | | 121,061 | | | | 120,853 | | | | 208 | | | | — | |
Expiring 01/16/19 | | Morgan Stanley | | KRW | 5,365,239 | | | | 4,730,000 | | | | 4,721,319 | | | | 8,681 | | | | — | |
Expiring 01/16/19 | | Morgan Stanley | | KRW | 2,279,545 | | | | 2,005,000 | | | | 2,005,961 | | | | — | | | | (961 | ) |
Expiring 04/30/19 | | Goldman Sachs International | | KRW | 375,417 | | | | 354,000 | | | | 331,965 | | | | 22,035 | | | | — | |
Expiring 04/30/19 | | JPMorgan Chase | | KRW | 637,750 | | | | 568,000 | | | | 563,935 | | | | 4,065 | | | | — | |
Expiring 05/31/19 | | Morgan Stanley | | KRW | 1,326,000 | | | | 1,200,000 | | | | 1,174,344 | | | | 25,656 | | | | — | |
Expiring 07/31/19 | | Deutsche Bank AG | | KRW | 5,155,997 | | | | 4,618,000 | | | | 4,580,222 | | | | 37,778 | | | | — | |
Expiring 07/31/19 | | Goldman Sachs International | | KRW | 2,606,370 | | | | 2,460,000 | | | | 2,315,314 | | | | 144,686 | | | | — | |
Expiring 12/24/19 | | Goldman Sachs International | | KRW | 79,350 | | | | 75,000 | | | | 71,016 | | | | 3,984 | | | | — | |
Swedish Krona, | | | | | | | | | | | | | | | | | | | | | | |
Expiring 01/25/19 | | Goldman Sachs International | | SEK | 109,859 | | | | 12,321,548 | | | | 12,109,698 | | | | 211,850 | | | | — | |
See Notes to Financial Statements.
Forward foreign currency exchange contracts outstanding at October 31, 2018 (continued):
| | | | | | | | | | | | | | | | | | | | | | |
Sale Contracts | | Counterparty | | Notional
Amount
(000) | | | Value at
Settlement
Date | | | Current
Value | | | Unrealized
Appreciation | | | Unrealized
Depreciation | |
OTC Forward Foreign Currency Exchange Contracts (cont’d.): | |
Swedish Krona (cont’d.), | |
Expiring 01/25/19 | | Toronto Dominion | | SEK | 17,659 | | | $ | 1,948,000 | | | $ | 1,946,530 | | | $ | 1,470 | | | $ | — | |
Swiss Franc, | | | | | | | | | | | | | | | | | | | | | | |
Expiring 01/25/19 | | BNP Paribas | | CHF | 30,508 | | | | 30,867,643 | | | | 30,574,848 | | | | 292,795 | | | | — | |
Expiring 01/25/19 | | Toronto Dominion | | CHF | 30,508 | | | | 30,897,342 | | | | 30,574,849 | | | | 322,493 | | | | — | |
Expiring 01/25/19 | | Toronto Dominion | | CHF | 3,510 | | | | 3,539,000 | | | | 3,517,780 | | | | 21,220 | | | | — | |
Expiring 01/25/19 | | Toronto Dominion | | CHF | 2,083 | | | | 2,089,000 | | | | 2,087,811 | | | | 1,189 | | | | — | |
Thai Baht, | | | | | | | | | | | | | | | | | | | | | | |
Expiring 11/09/18 | | Citibank NA | | THB | 110,548 | | | | 3,400,000 | | | | 3,335,479 | | | | 64,521 | | | | — | |
Expiring 11/09/18 | | Citibank NA | | THB | 93,796 | | | | 2,828,000 | | | | 2,830,052 | | | | — | | | | (2,052 | ) |
Expiring 11/09/18 | | Citibank NA | | THB | 72,897 | | | | 2,200,000 | | | | 2,199,473 | | | | 527 | | | | — | |
Expiring 11/09/18 | | Citibank NA | | THB | 56,012 | | | | 1,684,000 | | | | 1,689,998 | | | | — | | | | (5,998 | ) |
Expiring 11/09/18 | | Citibank NA | | THB | 49,432 | | | | 1,523,000 | | | | 1,491,479 | | | | 31,521 | | | | — | |
Expiring 11/09/18 | | Citibank NA | | THB | 47,805 | | | | 1,436,000 | | | | 1,442,393 | | | | — | | | | (6,393 | ) |
Expiring 11/09/18 | | Citibank NA | | THB | 43,297 | | | | 1,314,000 | | | | 1,306,386 | | | | 7,614 | | | | — | |
Turkish Lira, | | | | | | | | | | | | | | | | | | | | | | |
Expiring 11/30/18 | | BNP Paribas | | TRY | 10,110 | | | | 2,247,366 | | | | 1,774,385 | | | | 472,981 | | | | — | |
Expiring 11/30/18 | | BNP Paribas | | TRY | 2,664 | | | | 727,000 | | | | 467,633 | | | | 259,367 | | | | — | |
Expiring 12/07/18 | | JPMorgan Chase | | TRY | 22,475 | | | | 3,862,600 | | | | 3,928,116 | | | | — | | | | (65,516 | ) |
Expiring 12/07/18 | | JPMorgan Chase | | TRY | 5,516 | | | | 947,520 | | | | 964,088 | | | | — | | | | (16,568 | ) |
Expiring 04/30/19 | | BNP Paribas | | TRY | 4,751 | | | | 1,093,706 | | | | 763,101 | | | | 330,605 | | | | — | |
Expiring 04/30/19 | | BNP Paribas | | TRY | 914 | | | | 210,240 | | | | 146,736 | | | | 63,504 | | | | — | |
Expiring 08/29/19 | | BNP Paribas | | TRY | 9,857 | | | | 2,392,000 | | | | 1,485,122 | | | | 906,878 | | | | — | |
Expiring 08/29/19 | | Morgan Stanley | | TRY | 9,781 | | | | 2,006,725 | | | | 1,473,619 | | | | 533,106 | | | | — | |
Expiring 12/24/19 | | BNP Paribas | | TRY | 13,966 | | | | 3,000,000 | | | | 1,985,012 | | | | 1,014,988 | | | | — | |
Expiring 12/24/19 | | JPMorgan Chase | | TRY | 19,075 | | | | 3,367,238 | | | | 2,711,240 | | | | 655,998 | | | | — | |
Expiring 01/31/20 | | JPMorgan Chase | | TRY | 28,531 | | | | 4,984,414 | | | | 3,986,166 | | | | 998,248 | | | | — | |
See Notes to Financial Statements.
| | | | |
| PGIM Global Total Return Fund | | | 97 | |
Schedule of Investments (continued)
as of October 31, 2018
Forward foreign currency exchange contracts outstanding at October 31, 2018 (continued):
| | | | | | | | | | | | | | | | | | | | | | |
Sale Contracts | | Counterparty | | Notional
Amount
(000) | | | Value at
Settlement
Date | | | Current
Value | | | Unrealized
Appreciation | | | Unrealized
Depreciation | |
OTC Forward Foreign Currency Exchange Contracts (cont’d.): | | | | | | | | | | | | | |
Turkish Lira (cont’d.), | | | | | | | | | | | | | | | | | | | | | | |
Expiring 04/30/20 | | Citibank NA | | TRY | 42,024 | | | $ | 5,553,900 | | | $ | 5,630,620 | | | $ | — | | | $ | (76,720 | ) |
Expiring 04/30/20 | | Citibank NA | | TRY | 17,501 | | | | 2,708,903 | | | | 2,344,891 | | | | 364,012 | | | | — | |
Expiring 04/30/20 | | Citibank NA | | TRY | 6,043 | | | | 841,000 | | | | 809,629 | | | | 31,371 | | | | — | |
Expiring 04/30/20 | | Goldman Sachs International | | TRY | 62,763 | | | | 10,884,000 | | | | 8,409,380 | | | | 2,474,620 | | | | — | |
Expiring 04/30/20 | | JPMorgan Chase | | TRY | 11,919 | | | | 1,844,000 | | | | 1,597,006 | | | | 246,994 | | | | — | |
Expiring 06/30/20 | | Citibank NA | | TRY | 19,012 | | | | 1,978,358 | | | | 2,473,563 | | | | — | | | | (495,205 | ) |
Expiring 06/30/20 | | Citibank NA | | TRY | 9,131 | | | | 948,000 | | | | 1,188,009 | | | | — | | | | (240,009 | ) |
Expiring 06/30/20 | | JPMorgan Chase | | TRY | 17,985 | | | | 2,452,000 | | | | 2,340,007 | | | | 111,993 | | | | — | |
Expiring 06/30/20 | | Morgan Stanley | | TRY | 80,729 | | | | 12,254,000 | | | | 10,503,311 | | | | 1,750,689 | | | | — | |
| | | | | | | | | | | | | | | | | | | | | | |
| | | | | | | | $ | 1,278,560,295 | | | $ | 1,256,869,125 | | | | 28,803,414 | | | | (7,112,244 | ) |
| | | | | | | | | | | | | | | | | | | | | | |
| | | | | | | | | | | | | | | | $ | 41,059,895 | | | $ | (25,095,434 | ) |
| | | | | | | | | | | | | | | | | | | | | | |
Cross currency exchange contracts outstanding at October 31, 2018:
| | | | | | | | | | | | | | | | | | | | | | | | |
Settlement | | Type | | Notional
Amount
(000) | | | In Exchange
For (000) | | | Unrealized
Appreciation | | | Unrealized
Depreciation | | | Counterparty |
OTC Cross Currency Exchange Contracts: |
01/25/19 | | Buy | | CHF | | | 5,312 | | | EUR | | | 4,663 | | | $ | — | | | $ | (2,245 | ) | | Toronto Dominion |
02/28/19 | | Buy | | EUR | | | 1,536 | | | TRY | | | 8,215 | | | | 391,887 | | | | — | | | JPMorgan Chase |
04/30/19 | | Buy | | EUR | | | 2,559 | | | TRY | | | 12,437 | | | | 949,129 | | | | — | | | BNP Paribas |
04/30/19 | | Buy | | TRY | | | 17,481 | | | EUR | | | 3,132 | | | | — | | | | (798,701 | ) | | Citibank NA |
06/28/19 | | Buy | | AUD | | | 1,120 | | | JPY | | | 94,696 | | | | — | | | | (60,933 | ) | | BNP Paribas |
06/28/19 | | Buy | | JPY | | | 493,315 | | | AUD | | | 5,950 | | | | 235,363 | | | | — | | | Morgan Stanley |
11/27/19 | | Buy | | EUR | | | 2,122 | | | ZAR | | | 41,069 | | | | — | | | | (151,947 | ) | | Citibank NA |
11/27/19 | | Buy | | ZAR | | | 16,841 | | | EUR | | | 974 | | | | — | | | | (59,795 | ) | | Deutsche Bank AG |
12/30/19 | | Buy | | EUR | | | 1,930 | | | ZAR | | | 33,514 | | | | 126,290 | | | | — | | | Deutsche Bank AG |
12/30/19 | | Buy | | ZAR | | | 19,940 | | | EUR | | | 1,203 | | | | — | | | | (139,679 | ) | | Morgan Stanley |
01/31/20 | | Buy | | AUD | | | 4,212 | | | JPY | | | 327,609 | | | | — | | | | (18,382 | ) | | Deutsche Bank AG |
01/31/20 | | Buy | | TRY | | | 37,121 | | | EUR | | | 5,105 | | | | — | | | | (852,708 | ) | | Goldman Sachs International |
01/31/20 | | Buy | | EUR | | | 2,420 | | | TRY | | | 14,760 | | | | 800,655 | | | | — | | | Goldman Sachs International |
03/31/20 | | Buy | | ZAR | | | 142,211 | | | EUR | | | 7,654 | | | | — | | | | (101,343 | ) | | Morgan Stanley |
03/31/20 | | Buy | | EUR | | | 7,374 | | | ZAR | | | 124,584 | | | | 884,495 | | | | — | | | Morgan Stanley |
04/30/20 | | Buy | | TRY | | | 121,707 | | | EUR | | | 13,219 | | | | 532,715 | | | | — | | | BNP Paribas |
04/30/20 | | Buy | | EUR | | | 12,312 | | | TRY | | | 92,869 | | | | 2,248,854 | | | | — | | | Goldman Sachs International |
See Notes to Financial Statements.
Cross currency exchange contracts outstanding at October 31, 2018 (continued):
| | | | | | | | | | | | | | | | | | | | | | | | | | | | | | |
Settlement | | Type | | Notional
Amount
(000) | | | In Exchange
For (000) | | | Unrealized
Appreciation | | | Unrealized
Depreciation | | | Counterparty | |
OTC Cross Currency Exchange Contracts (cont’d.): | | | | | | | | | | | | | |
07/29/20 | | Buy | | | EUR | | | | 14,276 | | | | TRY | | | | 138,149 | | | $ | — | | | $ | (535,303 | ) | | | BNP Paribas | |
07/29/20 | | Buy | | | TRY | | | | 101,116 | | | | EUR | | | | 8,310 | | | | 2,966,601 | | | | — | | | | Morgan Stanley | |
08/31/20 | | Buy | | | EUR | | | | 4,792 | | | | ZAR | | | | 92,438 | | | | 57,731 | | | | — | | | | Morgan Stanley | |
11/30/20 | | Buy | | | JPY | | | | 382,815 | | | | AUD | | | | 4,906 | | | | 115,161 | | | | — | | | | Deutsche Bank AG | |
| | | | | | | | | | | | | | | | | | | | | | | | | | | | | | |
| | | | | | | | | | | | | | | | | | | | $ | 9,308,881 | | | $ | (2,721,036 | ) | | | | |
| | | | | | | | | | | | | | | | | | | | | | | | | | | | | | |
Credit default swap agreements outstanding at October 31, 2018:
| | | | | | | | | | | | | | | | | | | | | | | | | | | | | | |
Reference
Entity/
Obligation | | Termination
Date | | | Fixed
Rate | | | Notional
Amount
(000)#(3) | | | Implied
Credit
Spread at
October 31,
2018(4) | | | Fair
Value | | | Upfront
Premiums
Paid
(Received) | | | Unrealized
Appreciation
(Depreciation) | | | Counterparty |
OTC Credit Default Swap Agreements on asset-backed securities—Sell Protection(2)^: |
Banc of America Commercial Mortgage Trust | | | 11/29/18 | | | | 1.250%(M) | | | | 19 | | | | 6.794 | % | | $ | 21 | | | $ | — | | | $ | 21 | | | Goldman Sachs International |
Banc of America Commercial Mortgage Trust | | | 11/29/18 | | | | 1.250%(M) | | | | 11 | | | | 6.780 | % | | | 12 | | | | — | | | | 12 | | | Goldman Sachs International |
Bear Stearns Asset-Backed Securities Trust | | | 11/30/18 | | | | 1.250%(M) | | | | 535 | | | | * | | | | 575 | | | | — | | | | 575 | | | Goldman Sachs International |
Bear Stearns Asset-Backed Securities Trust | | | 11/30/18 | | | | 1.250%(M) | | | | 310 | | | | * | | | | 333 | | | | — | | | | 333 | | | Goldman Sachs International |
Bear Stearns Asset-Backed Securities Trust | | | 11/30/18 | | | | 1.250%(M) | | | | 168 | | | | * | | | | 180 | | | | — | | | | 180 | | | Goldman Sachs International |
Chase Mortgage | | | 11/30/18 | | | | 1.250%(M) | | | | 648 | | | | * | | | | 697 | | | | — | | | | 697 | | | Goldman Sachs International |
Citigroup Commercial Mortgage Trust | | | 11/29/18 | | | | 1.250%(M) | | | | 153 | | | | * | | | | 170 | | | | — | | | | 170 | | | Goldman Sachs International |
Citigroup Commercial Mortgage Trust | | | 11/29/18 | | | | 1.250%(M) | | | | 58 | | | | * | | | | 64 | | | | — | | | | 64 | | | Goldman Sachs International |
Citigroup Commercial Mortgage Trust | | | 11/29/18 | | | | 1.250%(M) | | | | 53 | | | | * | | | | 59 | | | | — | | | | 59 | | | Goldman Sachs International |
See Notes to Financial Statements.
| | | | |
| PGIM Global Total Return Fund | | | 99 | |
Schedule of Investments (continued)
as of October 31, 2018
Credit default swap agreements outstanding at October 31, 2018 (continued):
| | | | | | | | | | | | | | | | | | | | | | | | | | | | | | |
Reference
Entity/
Obligation | | Termination
Date | | | Fixed
Rate | | | Notional
Amount
(000)#(3) | | | Implied
Credit
Spread at
October 31,
2018(4) | | | Fair
Value | | | Upfront
Premiums
Paid
(Received) | | | Unrealized
Appreciation
(Depreciation) | | | Counterparty |
OTC Credit Default Swap Agreements on asset-backed securities—Sell Protection(2)^ (cont’d.): |
Citigroup Commercial Mortgage Trust | | | 11/29/18 | | | | 1.250%(M) | | | | 12 | | | | * | | | $ | 13 | | | $ | — | | | $ | 13 | | | Goldman Sachs International |
Citigroup Mortgage Loan Trust | | | 11/30/18 | | | | 1.250%(M) | | | | 164 | | | | * | | | | 176 | | | | — | | | | 176 | | | Goldman Sachs International |
COMM Mortgage Trust | | | 11/29/18 | | | | 1.250%(M) | | | | 82 | | | | 4.550 | % | | | 91 | | | | — | | | | 91 | | | Goldman Sachs International |
COMM Mortgage Trust | | | 11/29/18 | | | | 1.250%(M) | | | | 77 | | | | 19.740 | % | | | 85 | | | | — | | | | 85 | | | Goldman Sachs International |
COMM Mortgage Trust | | | 11/29/18 | | | | 1.250%(M) | | | | 74 | | | | * | | | | 82 | | | | — | | | | 82 | | | Goldman Sachs International |
COMM Mortgage Trust | | | 11/29/18 | | | | 1.250%(M) | | | | 67 | | | | * | | | | 74 | | | | — | | | | 74 | | | Goldman Sachs International |
COMM Mortgage Trust | | | 11/29/18 | | | | 1.250%(M) | | | | 61 | | | | * | | | | 68 | | | | — | | | | 68 | | | Goldman Sachs International |
COMM Mortgage Trust | | | 11/29/18 | | | | 1.250%(M) | | | | 40 | | | | * | | | | 44 | | | | — | | | | 44 | | | Goldman Sachs International |
COMM Mortgage Trust | | | 11/29/18 | | | | 1.250%(M) | | | | 28 | | | | 7.460 | % | | | 31 | | | | — | | | | 31 | | | Goldman Sachs International |
COMM Mortgage Trust | | | 11/29/18 | | | | 1.250%(M) | | | | 28 | | | | * | | | | 31 | | | | — | | | | 31 | | | Goldman Sachs International |
COMM Mortgage Trust | | | 11/29/18 | | | | 1.250%(M) | | | | 21 | | | | * | | | | 23 | | | | — | | | | 23 | | | Goldman Sachs International |
Countrywide Alternative Loan Trust | | | 11/30/18 | | | | 1.250%(M) | | | | 372 | | | | * | | | | 400 | | | | — | | | | 400 | | | Goldman Sachs International |
Countrywide Prime Mortgage | | | 11/30/18 | | | | 1.250%(M) | | | | 135 | | | | * | | | | 145 | | | | — | | | | 145 | | | Goldman Sachs International |
See Notes to Financial Statements.
Credit default swap agreements outstanding at October 31, 2018 (continued):
| | | | | | | | | | | | | | | | | | | | | | | | | | | | | | |
Reference
Entity/
Obligation | | Termination
Date | | | Fixed
Rate | | | Notional
Amount
(000)#(3) | | | Implied
Credit
Spread at
October 31,
2018(4) | | | Fair
Value | | | Upfront
Premiums
Paid
(Received) | | | Unrealized
Appreciation
(Depreciation) | | | Counterparty |
OTC Credit Default Swap Agreements on asset-backed securities—Sell Protection(2)^ (cont’d.): |
Deutsche Bank Alta Mortgages | | | 11/30/18 | | | | 1.250%(M) | | | | 527 | | | | * | | | $ | 566 | | | $ | — | | | $ | 566 | | | Goldman Sachs International |
Deutsche Bank Alta Mortgages | | | 11/30/18 | | | | 1.250%(M) | | | | 278 | | | | * | | | | 299 | | | | — | | | | 299 | | | Goldman Sachs International |
Equity One Home Equity | | | 11/30/18 | | | | 1.250%(M) | | | | 443 | | | | * | | | | 476 | | | | — | | | | 476 | | | Goldman Sachs International |
First Franklin Home Equity | | | 11/30/18 | | | | 1.250%(M) | | | | 181 | | | | * | | | | 194 | | | | — | | | | 194 | | | Goldman Sachs International |
First Franklin Home Equity | | | 11/30/18 | | | | 1.250%(M) | | | | 65 | | | | * | | | | 70 | | | | — | | | | 70 | | | Goldman Sachs International |
GMAC Home Equity | | | 11/30/18 | | | | 1.250%(M) | | | | 68 | | | | * | | | | 73 | | | | — | | | | 73 | | | Goldman Sachs International |
GS Mortgage Securities Trust | | | 11/29/18 | | | | 1.250%(M) | | | | 91 | | | | 0.620 | % | | | 101 | | | | — | | | | 101 | | | Goldman Sachs International |
GS Mortgage Securities Trust | | | 11/29/18 | | | | 1.250%(M) | | | | 46 | | | | * | | | | 51 | | | | — | | | | 51 | | | Goldman Sachs International |
GS Mortgage Securities Trust | | | 11/29/18 | | | | 1.250%(M) | | | | 44 | | | | * | | | | 49 | | | | — | | | | 49 | | | Goldman Sachs International |
GS Mortgage Securities Trust | | | 11/29/18 | | | | 1.250%(M) | | | | 37 | | | | * | | | | 41 | | | | — | | | | 41 | | | Goldman Sachs International |
JPMBB Commercial Mortgage Securities Trust | | | 11/29/18 | | | | 1.250%(M) | | | | 109 | | | | * | | | | 121 | | | | — | | | | 121 | | | Goldman Sachs International |
JPMBB Commercial Mortgage Securities Trust | | | 11/29/18 | | | | 1.250%(M) | | | | 86 | | | | * | | | | 95 | | | | — | | | | 95 | | | Goldman Sachs International |
JPMBB Commercial Mortgage Securities Trust | | | 11/29/18 | | | | 1.250%(M) | | | | 12 | | | | * | | | | 13 | | | | — | | | | 13 | | | Goldman Sachs International |
See Notes to Financial Statements.
| | | | |
| PGIM Global Total Return Fund | | | 101 | |
Schedule of Investments (continued)
as of October 31, 2018
Credit default swap agreements outstanding at October 31, 2018 (continued):
| | | | | | | | | | | | | | | | | | | | | | | | | | | | | | |
Reference
Entity/
Obligation | | Termination
Date | | | Fixed
Rate | | | Notional
Amount
(000)#(3) | | | Implied
Credit
Spread at
October 31,
2018(4) | | | Fair
Value | | | Upfront
Premiums
Paid
(Received) | | | Unrealized
Appreciation
(Depreciation) | | | Counterparty |
OTC Credit Default Swap Agreements on asset-backed securities—Sell Protection(2)^ (cont’d.): |
Lehman Home Equity | | | 11/30/18 | | | | 1.250%(M) | | | | 484 | | | | * | | | $ | 520 | | | $ | — | | | $ | 520 | | | Goldman Sachs International |
Lehman Home Equity | | | 11/30/18 | | | | 1.250%(M) | | | | 75 | | | | * | | | | 81 | | | | — | | | | 81 | | | Goldman Sachs International |
Morgan Stanley BAML Trust | | | 11/29/18 | | | | 1.250%(M) | | | | 72 | | | | 7.460 | % | | | 80 | | | | — | | | | 80 | | | Goldman Sachs International |
Morgan Stanley BAML Trust | | | 11/29/18 | | | | 1.250%(M) | | | | 50 | | | | 10.400 | % | | | 55 | | | | — | | | | 55 | | | Goldman Sachs International |
Morgan Stanley BAML Trust | | | 11/29/18 | | | | 1.250%(M) | | | | 47 | | | | * | | | | 52 | | | | — | | | | 52 | | | Goldman Sachs International |
Morgan Stanley BAML Trust | | | 11/29/18 | | | | 1.250%(M) | | | | 37 | | | | * | | | | 41 | | | | — | | | | 41 | | | Goldman Sachs International |
Morgan Stanley BAML Trust | | | 11/29/18 | | | | 1.250%(M) | | | | 15 | | | | 2.593 | % | | | 17 | | | | — | | | | 17 | | | Goldman Sachs International |
Morgan Stanley Home Equity | | | 11/30/18 | | | | 1.250%(M) | | | | 199 | | | | * | | | | 214 | | | | — | | | | 214 | | | Goldman Sachs International |
New Century Home Equity | | | 11/30/18 | | | | 1.250%(M) | | | | 478 | | | | * | | | | 513 | | | | — | | | | 513 | | | Goldman Sachs International |
New Century Home Equity | | | 11/30/18 | | | | 1.250%(M) | | | | 218 | | | | * | | | | 234 | | | | — | | | | 234 | | | Goldman Sachs International |
New Century Home Equity | | | 11/30/18 | | | | 1.250%(M) | | | | 89 | | | | * | | | | 95 | | | | — | | | | 95 | | | Goldman Sachs International |
RAAC Series | | | 11/30/18 | | | | 1.250%(M) | | | | 51 | | | | * | | | | 55 | | | | — | | | | 55 | | | Goldman Sachs International |
Residential Asset Securities Corp. | | | 11/30/18 | | | | 1.250%(M) | | | | 62 | | | | * | | | | 66 | | | | — | | | | 66 | | | Goldman Sachs International |
See Notes to Financial Statements.
Credit default swap agreements outstanding at October 31, 2018 (continued):
| | | | | | | | | | | | | | | | | | | | | | | | | | | | | | |
Reference
Entity/
Obligation | | Termination
Date | | | Fixed
Rate | | | Notional
Amount
(000)#(3) | | | Implied
Credit
Spread at
October 31,
2018(4) | | | Fair
Value | | | Upfront
Premiums
Paid
(Received) | | | Unrealized
Appreciation
(Depreciation) | | | Counterparty |
OTC Credit Default Swap Agreements on asset-backed securities—Sell Protection(2)^ (cont’d.): |
Structured Agency Credit Risk | | | 11/30/18 | | | | 1.250%(M) | | | | 204 | | | | * | | | $ | 219 | | | $ | — | | | $ | 219 | | | Goldman Sachs International |
Wells Fargo Commercial Mortgage Trust | | | 11/29/18 | | | | 1.250%(M) | | | | 169 | | | | * | | | | 187 | | | | — | | | | 187 | | | Goldman Sachs International |
Wells Fargo Commercial Mortgage Trust | | | 11/29/18 | | | | 1.250%(M) | | | | 22 | | | | * | | | | 24 | | | | — | | | | 24 | | | Goldman Sachs International |
Wells Fargo Commercial Mortgage Trust | | | 11/29/18 | | | | 1.250%(M) | | | | 21 | | | | 6.780 | % | | | 23 | | | | — | | | | 23 | | | Goldman Sachs International |
Wells Fargo Commercial Mortgage Trust | | | 11/29/18 | | | | 1.250%(M) | | | | 18 | | | | 8.493 | % | | | 20 | | | | — | | | | 20 | | | Goldman Sachs International |
Wells Fargo Commercial Mortgage Trust | | | 11/29/18 | | | | 1.250%(M) | | | | 12 | | | | 4.670 | % | | | 13 | | | | — | | | | 13 | | | Goldman Sachs International |
Wells Fargo Commercial Mortgage Trust | | | 11/29/18 | | | | 1.250%(M) | | | | 10 | | | | 6.780 | % | | | 11 | | | | — | | | | 11 | | | Goldman Sachs International |
| | | | | | | | | | | | | | | | | | | | | | | | | | | | | | |
| | | | | | | | | | | | | | | | | | $ | 8,043 | | | $ | — | | | $ | 8,043 | | | |
| | | | | | | | | | | | | | | | | | | | | | | | | | | | | | |
| | | | | | | | | | | | | | | | | | | | | | | | | | |
Reference
Entity/
Obligation | | Termination
Date | | | Fixed
Rate | | | Notional
Amount
(000)#(3) | | | Fair
Value | | | Upfront
Premiums
Paid
(Received) | | | Unrealized
Appreciation
(Depreciation) | | | Counterparty |
OTC Credit Default Swap Agreements on corporate and/or sovereign issues—Buy Protection(1): |
Assicurazioni Generali SpA | | | 06/20/23 | | | | 1.000%(Q) | | | EUR | 2,000 | | | $ | 141,401 | | | $ | 132,016 | | | $ | 9,385 | | | Barclays Bank PLC |
Assured Guaranty Corp. | | | 09/20/20 | | | | 5.000%(Q) | | | | 300 | | | | (27,867 | ) | | | (16,607 | ) | | | (11,260 | ) | | Credit Suisse International |
Bank of China Ltd. | | | 06/20/21 | | | | 1.000%(Q) | | | | 1,900 | | | | (30,891 | ) | | | 42,739 | | | | (73,630 | ) | | Deutsche Bank AG |
Central Bank of Tunisia | | | 12/20/22 | | | | 1.000%(Q) | | | | 700 | | | | 51,193 | | | | 70,893 | | | | (19,700 | ) | | Barclays Bank PLC |
China Development Bank Corp. | | | 06/20/21 | | | | 1.000%(Q) | | | | 1,900 | | | | (28,251 | ) | | | 26,990 | | | | (55,241 | ) | | Deutsche Bank AG |
Hellenic Republic | | | 06/20/23 | | | | 1.000%(Q) | | | | 1,400 | | | | 130,527 | | | | 132,290 | | | | (1,763 | ) | | Bank of America |
Kingdom of Spain | | | 06/20/19 | | | | 1.000%(Q) | | | | 700 | | | | (4,559 | ) | | | (2,987 | ) | | | (1,572 | ) | | Deutsche Bank AG |
See Notes to Financial Statements.
| | | | |
| PGIM Global Total Return Fund | | | 103 | |
Schedule of Investments (continued)
as of October 31, 2018
Credit default swap agreements outstanding at October 31, 2018 (continued):
| | | | | | | | | | | | | | | | | | | | | | | | | | |
Reference
Entity/
Obligation | | Termination
Date | | | Fixed
Rate | | | Notional
Amount
(000)#(3) | | | Fair
Value | | | Upfront
Premiums
Paid
(Received) | | | Unrealized
Appreciation
(Depreciation) | | | Counterparty |
OTC Credit Default Swap Agreements on corporate and/or sovereign issues—Buy Protection(1) (cont’d.): |
Kingdom of Spain | | | 06/20/23 | | | | 1.000%(Q) | | | | 3,200 | | | $ | (68,668 | ) | | $ | (79,184 | ) | | $ | 10,516 | | | Bank of America |
Republic of Argentina | | | 03/20/19 | | | | 5.000%(Q) | | | | 9,100 | | | | (129,771 | ) | | | (55,976 | ) | | | (73,795 | ) | | Hong Kong & Shanghai Bank |
Republic of Ireland | | | 06/20/19 | | | | 1.000%(Q) | | | | 700 | | | | (4,765 | ) | | | (10,231 | ) | | | 5,466 | | | Deutsche Bank AG |
Republic of Italy | | | 06/20/19 | | | | 1.000%(Q) | | | EUR | 8,900 | | | | (16,845 | ) | | | (20,017 | ) | | | 3,172 | | | Barclays Bank PLC |
Republic of Italy | | | 06/20/19 | | | | 1.000%(Q) | | | | 900 | | | | (3,015 | ) | | | 5,740 | | | | (8,755 | ) | | Deutsche Bank AG |
Republic of Italy | | | 06/20/23 | | | | 1.000%(Q) | | | | 14,270 | | | | 316,159 | | | | 203,722 | | | | 112,437 | | | Citibank NA |
Republic of Italy | | | 06/20/23 | | | | 1.000%(Q) | | | EUR | 12,700 | | | | 727,613 | | | | 130,775 | | | | 596,838 | | | Barclays Bank PLC |
Republic of Italy | | | 06/20/23 | | | | 1.000%(Q) | | | EUR | 10,455 | | | | 598,991 | | | | 148,823 | | | | 450,168 | | | Barclays Bank PLC |
Republic of Italy | | | 06/20/23 | | | | 1.000%(Q) | | | | 3,700 | | | | 81,975 | | | | 59,329 | | | | 22,646 | | | Citibank NA |
Republic of Italy | | | 06/20/28 | | | | 1.000%(Q) | | | EUR | 5,145 | | | | 666,197 | | | | 318,815 | | | | 347,382 | | | Barclays Bank PLC |
Republic of Portugal | | | 06/20/19 | | | | 1.000%(Q) | | | | 400 | | | | (2,481 | ) | | | 12,675 | | | | (15,156 | ) | | Deutsche Bank AG |
Republic of Turkey | | | 06/20/19 | | | | 1.000%(Q) | | | | 5,510 | | | | 63,822 | | | | 158,864 | | | | (95,042 | ) | | BNP Paribas |
Republic of Turkey | | | 06/20/19 | | | | 1.000%(Q) | | | | 2,760 | | | | 31,969 | | | | 71,206 | | | | (39,237 | ) | | BNP Paribas |
United Mexican States | | | 06/20/23 | | | | 1.000%(Q) | | | | 4,000 | | | | 50,418 | | | | 27,838 | | | | 22,580 | | | Citibank NA |
| | | | | | | | | | | | | | | | | | | | | | | | | | |
| | | | | | | | | | | | | | $ | 2,543,152 | | | $ | 1,357,713 | | | $ | 1,185,439 | | | |
| | | | | | | | | | | | | | | | | | | | | | | | | | |
| | | | | | | | | | | | | | | | | | | | | | | | | | | | | | |
Reference
Entity/
Obligation | | Termination
Date | | | Fixed
Rate | | | Notional
Amount
(000)#(3) | | | Implied
Credit
Spread at
October 31,
2018(4) | | | Fair
Value | | | Upfront
Premiums
Paid
(Received) | | | Unrealized
Appreciation
(Depreciation) | | | Counterparty |
OTC Credit Default Swap Agreements on corporate and/or sovereign issues—Sell Protection(2): |
Arab Republic of Egypt | | | 06/20/19 | | | | 1.000%(Q) | | | | 1,300 | | | | 1.882 | % | | $ | (5,720 | ) | | $ | (3,738 | ) | | $ | (1,982 | ) | | Citibank NA |
Arab Republic of Egypt | | | 06/20/20 | | | | 1.000%(Q) | | | | 1,000 | | | | 2.483 | % | | | (22,199 | ) | | | (24,941 | ) | | | 2,742 | | | Deutsche Bank AG |
Federation of Malaysia | | | 12/20/19 | | | | 1.000%(Q) | | | | 2,000 | | | | 0.241 | % | | | 19,440 | | | | 16,516 | | | | 2,924 | | | Barclays Bank PLC |
Federation of Malaysia | | | 12/20/19 | | | | 1.000%(Q) | | | | 2,000 | | | | 0.241 | % | | | 19,440 | | | | 16,034 | | | | 3,406 | | | Hong Kong & Shanghai Bank |
Federation of Russia | | | 12/20/21 | | | | 1.000%(Q) | | | | 3,000 | | | | 1.114 | % | | | (6,640 | ) | | | (178,672 | ) | | | 172,032 | | | Barclays Bank PLC |
Generalitat de Cataluna | | | 12/20/22 | | | | 1.000%(Q) | | | | 2,960 | | | | 2.520 | % | | | (159,737 | ) | | | (441,383 | ) | | | 281,646 | | | Citibank NA |
Hellenic Republic | | | 06/20/22 | | | | 1.000%(Q) | | | | 410 | | | | 3.398 | % | | | (31,391 | ) | | | (70,771 | ) | | | 39,380 | | | Citibank NA |
Hellenic Republic | | | 06/20/22 | | | | 1.000%(Q) | | | | 200 | | | | 3.398 | % | | | (15,313 | ) | | | (35,500 | ) | | | 20,187 | | | Goldman Sachs International |
See Notes to Financial Statements.
Credit default swap agreements outstanding at October 31, 2018 (continued):
| | | | | | | | | | | | | | | | | | | | | | | | | | | | | | |
Reference
Entity/
Obligation | | Termination
Date | | | Fixed
Rate | | | Notional
Amount
(000)#(3) | | | Implied
Credit
Spread at
October 31,
2018(4) | | | Fair
Value | | | Upfront
Premiums
Paid
(Received) | | | Unrealized
Appreciation
(Depreciation) | | | Counterparty |
OTC Credit Default Swap Agreements on corporate and/or sovereign issues—Sell Protection(2) (cont’d.): |
Hellenic Republic | | | 12/20/22 | | | | 1.000%(Q) | | | | 500 | | | | 3.541 | % | | $ | (45,299 | ) | | $ | (49,577 | ) | | $ | 4,278 | | | Citibank NA |
Hellenic Republic | | | 06/20/23 | | | | 1.000%(Q) | | | | 1,400 | | | | 3.710 | % | | | (148,712 | ) | | | (149,624 | ) | | | 912 | | | Bank of America |
Hellenic Republic | | | 06/20/23 | | | | 1.000%(Q) | | | | 300 | | | | 3.710 | % | | | (31,867 | ) | | | (29,345 | ) | | | (2,522 | ) | | Citibank NA |
Hellenic Republic | | | 06/20/24 | | | | 1.000%(Q) | | | | 1,000 | | | | 3.942 | % | | | (134,555 | ) | | | (216,250 | ) | | | 81,695 | | | Barclays Bank PLC |
Kingdom of Belgium | | | 03/20/20 | | | | 1.000%(Q) | | | | 3,000 | | | | 0.075 | % | | | 41,520 | | | | (14,500 | ) | | | 56,020 | | | JPMorgan Chase |
Kingdom of Belgium | | | 12/20/24 | | | | 1.000%(Q) | | | | 3,500 | | | | 0.289 | % | | | 143,254 | | | | 20,902 | | | | 122,352 | | | Hong Kong & Shanghai Bank |
Kingdom of Belgium | | | 06/20/26 | | | | 1.000%(Q) | | | | 4,000 | | | | 0.344 | % | | | 182,274 | | | | 102,239 | | | | 80,035 | | | Barclays Bank PLC |
Kingdom of Denmark | | | 06/20/26 | | | | 0.250%(Q) | | | | 1,000 | | | | 0.195 | % | | | 4,041 | | | | (16,628 | ) | | | 20,669 | | | Goldman Sachs International |
Kingdom of Saudi Arabia | | | 12/20/21 | | | | 1.000%(Q) | | | | 1,900 | | | | 0.608 | % | | | 24,509 | | | | (38,725 | ) | | | 63,234 | | | Barclays Bank PLC |
Kingdom of Spain | | | 09/20/20 | | | | 1.000%(Q) | | | | 2,500 | | | | 0.453 | % | | | 28,125 | | | | 916 | | | | 27,209 | | | Barclays Bank PLC |
Kingdom of Spain | | | 06/20/21 | | | | 1.000%(Q) | | | | 700 | | | | 0.368 | % | | | 12,075 | | | | (7,646 | ) | | | 19,721 | | | Deutsche Bank AG |
Kingdom of Spain | | | 09/20/21 | | | | 1.000%(Q) | | | | 1,500 | | | | 0.387 | % | | | 27,250 | | | | 18,280 | | | | 8,970 | | | Hong Kong & Shanghai Bank |
Kingdom of Spain | | | 06/20/23 | | | | 1.000%(Q) | | | | 42,665 | | | | 0.773 | % | | | 462,704 | | | | 453,981 | | | | 8,723 | | | Bank of America |
Kingdom of Spain | | | 06/20/23 | | | | 1.000%(Q) | | | | 3,200 | | | | 0.773 | % | | | 34,704 | | | | 48,475 | | | | (13,771 | ) | | Bank of America |
Kingdom of Spain | | | 06/20/24 | | | | 1.000%(Q) | | | | 700 | | | | 0.609 | % | | | 14,820 | | | | (25,398 | ) | | | 40,218 | | | Deutsche Bank AG |
Kingdom of Sweden | | | 06/20/26 | | | | 0.250%(Q) | | | | 1,000 | | | | 0.183 | % | | | 4,866 | | | | (15,719 | ) | | | 20,585 | | | Goldman Sachs International |
Kingdom of Thailand | | | 12/20/21 | | | | 1.000%(Q) | | | | 2,100 | | | | 0.244 | % | | | 50,249 | | | | 3,012 | | | | 47,237 | | | Barclays Bank PLC |
Oriental Republic of Uruguay | | | 06/20/20 | | | | 1.000%(Q) | | | | 4,250 | | | | 1.489 | % | | | (28,130 | ) | | | (27,517 | ) | | | (613 | ) | | Citibank NA |
People’s Republic of China | | | 06/20/19 | | | | 1.000%(Q) | | | | 650 | | | | 0.141 | % | | | 4,306 | | | | 603 | | | | 3,703 | | | Hong Kong & Shanghai Bank |
See Notes to Financial Statements.
| | | | |
| PGIM Global Total Return Fund | | | 105 | |
Schedule of Investments (continued)
as of October 31, 2018
Credit default swap agreements outstanding at October 31, 2018 (continued):
| | | | | | | | | | | | | | | | | | | | | | | | | | | | | | |
Reference
Entity/
Obligation | | Termination
Date | | | Fixed
Rate | | | Notional
Amount
(000)#(3) | | | Implied
Credit
Spread at
October 31,
2018(4) | | | Fair
Value | | | Upfront
Premiums
Paid
(Received) | | | Unrealized
Appreciation
(Depreciation) | | | Counterparty |
OTC Credit Default Swap Agreements on corporate and/or sovereign issues—Sell Protection(2) (cont’d.): |
People’s Republic of China | | | 12/20/19 | | | | 1.000%(Q) | | | | 2,000 | | | | 0.158 | % | | $ | 21,324 | | | $ | 20,407 | | | $ | 917 | | | Citibank NA |
People’s Republic of China | | | 12/20/19 | | | | 1.000%(Q) | | | | 1,000 | | | | 0.158 | % | | | 10,662 | | | | 10,204 | | | | 458 | | | Hong Kong & Shanghai Bank |
People’s Republic of China | | | 06/20/21 | | | | 1.000%(Q) | | | | 4,000 | | | | 0.360 | % | | | 69,873 | | | | (45,657 | ) | | | 115,530 | | | Deutsche Bank AG |
People’s Republic of China | | | 12/20/21 | | | | 1.000%(Q) | | | | 1,500 | | | | 0.414 | % | | | 28,123 | | | | (4,230 | ) | | | 32,353 | | | Barclays Bank PLC |
People’s Republic of China | | | 12/20/21 | | | | 1.000%(Q) | | | | 1,600 | | | | 0.414 | % | | | 29,998 | | | | (5,233 | ) | | | 35,231 | | | Citibank NA |
People’s Republic of China | | | 03/20/22 | | | | 1.000%(Q) | | | | 1,000 | | | | 0.461 | % | | | 18,531 | | | | (17,211 | ) | | | 35,742 | | | Deutsche Bank AG |
People’s Republic of China | | | 03/20/22 | | | | 1.000%(Q) | | | | 2,000 | | | | 0.461 | % | | | 37,063 | | | | (21,992 | ) | | | 59,055 | | | Goldman Sachs International |
Petroleos Mexicanos | | | 09/20/21 | | | | 1.000%(Q) | | | | 2,500 | | | | 1.771 | % | | | (49,483 | ) | | | (70,059 | ) | | | 20,576 | | | Goldman Sachs International |
Republic of Chile | | | 12/20/21 | | | | 1.000%(Q) | | | | 2,500 | | | | 0.300 | % | | | 55,567 | | | | 2,887 | | | | 52,680 | | | Deutsche Bank AG |
Republic of Colombia | | | 12/20/21 | | | | 1.000%(Q) | | | | 2,000 | | | | 0.809 | % | | | 13,700 | | | | (41,036 | ) | | | 54,736 | | | Hong Kong & Shanghai Bank |
Republic of Colombia | | | 06/20/23 | | | | 1.000%(Q) | | | | 5,000 | | | | 1.174 | % | | | (31,178 | ) | | | 3,547 | | | | (34,725 | ) | | Deutsche Bank AG |
Republic of Colombia | | | 12/20/26 | | | | 1.000%(Q) | | | | 1,000 | | | | 1.802 | % | | | (53,172 | ) | | | (91,189 | ) | | | 38,017 | | | Citibank NA |
Republic of France | | | 03/20/19 | | | | 0.250%(Q) | | | | 1,200 | | | | 0.051 | % | | | 1,271 | | | | (14,962 | ) | | | 16,233 | | | Deutsche Bank AG |
Republic of France | | | 12/20/19 | | | | 0.250%(Q) | | | | 2,500 | | | | 0.096 | % | | | 5,086 | | | | (15,171 | ) | | | 20,257 | | | Goldman Sachs International |
Republic of France | | | 12/20/19 | | | | 0.250%(Q) | | | | 7,000 | | | | 0.096 | % | | | 14,241 | | | | (107,630 | ) | | | 121,871 | | | Hong Kong & Shanghai Bank |
Republic of France | | | 03/20/20 | | | | 0.250%(Q) | | | | 3,000 | | | | 0.079 | % | | | 7,906 | | | | (188,678 | ) | | | 196,584 | | | JPMorgan Chase |
Republic of Hungary | | | 06/20/22 | | | | 1.000%(Q) | | | | 3,550 | | | | 0.580 | % | | | 55,527 | | | | (22,288 | ) | | | 77,815 | | | Citibank NA |
See Notes to Financial Statements.
Credit default swap agreements outstanding at October 31, 2018 (continued):
| | | | | | | | | | | | | | | | | | | | | | | | | | | | | | |
Reference
Entity/
Obligation | | Termination
Date | | | Fixed
Rate | | | Notional
Amount
(000)#(3) | | | Implied
Credit
Spread at
October 31,
2018(4) | | | Fair
Value | | | Upfront
Premiums
Paid
(Received) | | | Unrealized
Appreciation
(Depreciation) | | | Counterparty |
OTC Credit Default Swap Agreements on corporate and/or sovereign issues—Sell Protection(2)(cont’d.): |
Republic of Indonesia | | | 12/20/18 | | | | 1.000%(Q) | | | | 1,200 | | | | 0.370 | % | | $ | 2,442 | | | $ | (70,888 | ) | | $ | 73,330 | | | Goldman Sachs International |
Republic of Indonesia | | | 06/20/23 | | | | 1.000%(Q) | | | | 13,885 | | | | 1.440 | % | | | (240,146 | ) | | | (86,238 | ) | | | (153,908 | ) | | Citibank NA |
Republic of Ireland | | | 06/20/21 | | | | 1.000%(Q) | | | | 700 | | | | 0.193 | % | | | 15,235 | | | | 3,081 | | | | 12,154 | | | Deutsche Bank AG |
Republic of Ireland | | | 06/20/23 | | | | 1.000%(Q) | | | | 4,080 | | | | 0.359 | % | | | 117,831 | | | | 48,193 | | | | 69,638 | | | Goldman Sachs International |
Republic of Ireland | | | 06/20/24 | | | | 1.000%(Q) | | | | 700 | | | | 0.323 | % | | | 25,323 | | | | (8,907 | ) | | | 34,230 | | | Deutsche Bank AG |
Republic of Ireland | | | 06/20/24 | | | | 1.000%(Q) | | | | 4,000 | | | | 0.421 | % | | | 124,042 | | | | 86,119 | | | | 37,923 | | | JPMorgan Chase |
Republic of Ireland | | | 12/20/26 | | | | 1.000%(Q) | | | | 2,000 | | | | 0.539 | % | | | 67,565 | | | | 5,096 | | | | 62,469 | | | Goldman Sachs International |
Republic of Ireland | | | 12/20/26 | | | | 1.000%(Q) | | | | 3,100 | | | | 0.539 | % | | | 104,725 | | | | (2,638 | ) | | | 107,363 | | | JPMorgan Chase |
Republic of Ireland | | | 06/20/27 | | | | 1.000%(Q) | | | | 2,800 | | | | 0.559 | % | | | 94,957 | | | | 70,830 | | | | 24,127 | | | Morgan Stanley |
Republic of Italy | | | 06/20/20 | | | | 1.000%(Q) | | | | 6,000 | | | | 1.937 | % | | | (81,817 | ) | | | (14,463 | ) | | | (67,354 | ) | | Hong Kong & Shanghai Bank |
Republic of Italy | | | 09/20/20 | | | | 1.000%(Q) | | | | 1,500 | | | | 2.043 | % | | | (26,535 | ) | | | (13,249 | ) | | | (13,286 | ) | | Barclays Bank PLC |
Republic of Italy | | | 03/20/22 | | | | 1.000%(Q) | | | | 3,000 | | | | 2.399 | % | | | (125,236 | ) | | | (108,518 | ) | | | (16,718 | ) | | Goldman Sachs International |
Republic of Italy | | | 03/20/22 | | | | 1.000%(Q) | | | | 3,000 | | | | 2.399 | % | | | (125,236 | ) | | | (108,435 | ) | | | (16,801 | ) | | JPMorgan Chase |
Republic of Italy | | | 06/20/23 | | | | 1.000%(Q) | | | | 18,300 | | | | 2.605 | % | | | (1,155,454 | ) | | | (1,034,270 | ) | | | (121,184 | ) | | Bank of America |
Republic of Italy | | | 06/20/23 | | | | 1.000%(Q) | | | | 15,000 | | | | 2.605 | % | | | (947,094 | ) | | | (336,767 | ) | | | (610,327 | ) | | Barclays Bank PLC |
Republic of Italy | | | 06/20/23 | | | | 1.000%(Q) | | | | 14,270 | | | | 2.605 | % | | | (901,002 | ) | | | (743,395 | ) | | | (157,607 | ) | | Citibank NA |
Republic of Italy | | | 06/20/23 | | | | 1.000%(Q) | | | | 3,700 | | | | 2.605 | % | | | (233,616 | ) | | | (198,807 | ) | | | (34,809 | ) | | Citibank NA |
Republic of Italy | | | 06/20/23 | | | | 1.000%(Q) | | | | 13,405 | | | | 2.605 | % | | | (846,386 | ) | | | (544,049 | ) | | | (302,337 | ) | | Morgan Stanley |
Republic of Italy | | | 06/20/23 | | | | 1.000%(Q) | | | | 4,000 | | | | 2.605 | % | | | (252,558 | ) | | | — | | | | (252,558 | ) | | Morgan Stanley |
Republic of Italy | | | 06/20/24 | | | | 1.000%(Q) | | | | 900 | | | | 1.666 | % | | | (28,258 | ) | | | (50,860 | ) | | | 22,602 | | | Deutsche Bank AG |
See Notes to Financial Statements.
| | | | |
| PGIM Global Total Return Fund | | | 107 | |
Schedule of Investments (continued)
as of October 31, 2018
Credit default swap agreements outstanding at October 31, 2018 (continued):
| | | | | | | | | | | | | | | | | | | | | | | | | | | | | | |
Reference
Entity/
Obligation | | Termination
Date | | | Fixed
Rate | | | Notional
Amount
(000)#(3) | | | Implied
Credit
Spread at
October 31,
2018(4) | | | Fair
Value | | | Upfront
Premiums
Paid
(Received) | | | Unrealized
Appreciation
(Depreciation) | | | Counterparty |
OTC Credit Default Swap Agreements on corporate and/or sovereign issues—Sell Protection(2)(cont’d.): |
Republic of Italy | | | 06/20/26 | | | | 1.000%(Q) | | | | 5,000 | | | | 2.834 | % | | $ | (533,368 | ) | | $ | (371,094 | ) | | $ | (162,274 | ) | | BNP Paribas |
Republic of Italy | | | 12/20/26 | | | | 1.000%(Q) | | | | 400 | | | | 2.854 | % | | | (45,128 | ) | | | (36,893 | ) | | | (8,235 | ) | | Hong Kong & Shanghai Bank |
Republic of Kazakhstan | | | 06/20/23 | | | | 1.000%(Q) | | | | 7,695 | | | | 0.688 | % | | | 112,524 | | | | — | | | | 112,524 | | | Citibank NA |
Republic of Panama | | | 12/20/20 | | | | 1.000%(Q) | | | | 5,500 | | | | 0.254 | % | | | 92,037 | | | | (206,535 | ) | | | 298,572 | | | JPMorgan Chase |
Republic of Panama | | | 06/20/22 | | | | 1.000%(Q) | | | | 5,000 | | | | 0.443 | % | | | 101,915 | | | | 43,319 | | | | 58,596 | | | Citibank NA |
Republic of Peru | | | 03/20/22 | | | | 1.000%(Q) | | | | 3,000 | | | | 0.513 | % | | | 50,549 | | | | (105,928 | ) | | | 156,477 | | | Barclays Bank PLC |
Republic of Philippines | | | 09/20/20 | | | | 1.000%(Q) | | | | 1,700 | | | | 0.386 | % | | | 21,263 | | | | (8,268 | ) | | | 29,531 | | | JPMorgan Chase |
Republic of Philippines | | | 12/20/20 | | | | 1.000%(Q) | | | | 750 | | | | 0.411 | % | | | 10,065 | | | | (42 | ) | | | 10,107 | | | Deutsche Bank AG |
Republic of Philippines | | | 09/20/21 | | | | 1.000%(Q) | | | | 1,000 | | | | 0.559 | % | | | 13,379 | | | | (15,838 | ) | | | 29,217 | | | Hong Kong & Shanghai Bank |
Republic of Philippines | | | 03/20/22 | | | | 1.000%(Q) | | | | 1,000 | | | | 0.649 | % | | | 12,427 | | | | (17,211 | ) | | | 29,638 | | | Deutsche Bank AG |
Republic of Portugal | | | 09/20/20 | | | | 1.000%(Q) | | | | 1,500 | | | | 0.514 | % | | | 15,201 | | | | (53,625 | ) | | | 68,826 | | | Goldman Sachs International |
Republic of Portugal | | | 06/20/21 | | | | 1.000%(Q) | | | | 700 | | | | 0.456 | % | | | 10,486 | | | | (44,566 | ) | | | 55,052 | | | Deutsche Bank AG |
Republic of Portugal | | | 06/20/23 | | | | 1.000%(Q) | | | | 29,930 | | | | 0.927 | % | | | 127,327 | | | | (109,380 | ) | | | 236,707 | | | Goldman Sachs International |
Republic of Portugal | | | 12/20/23 | | | | 1.000%(Q) | | | | 1,000 | | | | 0.993 | % | | | 1,483 | | | | — | | | | 1,483 | | | BNP Paribas |
Republic of Portugal | | | 12/20/23 | | | | 1.000%(Q) | | | | 4,130 | | | | 0.993 | % | | | 6,123 | | | | (1,911 | ) | | | 8,034 | | | Morgan Stanley |
Republic of Portugal | | | 06/20/24 | | | | 1.000%(Q) | | | | 400 | | | | 0.787 | % | | | 4,792 | | | | (39,790 | ) | | | 44,582 | | | Deutsche Bank AG |
Republic of Serbia | | | 06/20/21 | | | | 1.000%(Q) | | | | 2,000 | | | | 0.608 | % | | | 22,269 | | | | 29,723 | | | | (7,454 | ) | | BNP Paribas |
Republic of Slovenia | | | 06/20/24 | | | | 1.000%(Q) | | | | 900 | | | | 0.846 | % | | | 8,147 | | | | (69,737 | ) | | | 77,884 | | | Hong Kong & Shanghai Bank |
Republic of South Africa | | | 12/20/18 | | | | 1.000%(Q) | | | | 1,200 | | | | 1.072 | % | | | 1,280 | | | | (64,857 | ) | | | 66,137 | | | Goldman Sachs International |
Republic of South Africa | | | 06/20/23 | | | | 1.000%(Q) | | | | 5,000 | | | | 2.236 | % | | | (249,149 | ) | | | (123,048 | ) | | | (126,101 | ) | | Deutsche Bank AG |
See Notes to Financial Statements.
Credit default swap agreements outstanding at October 31, 2018 (continued):
| | | | | | | | | | | | | | | | | | | | | | | | | | | | | | |
Reference
Entity/
Obligation | | Termination
Date | | | Fixed
Rate | | | Notional
Amount
(000)#(3) | | | Implied
Credit
Spread at
October 31,
2018(4) | | | Fair
Value | | | Upfront
Premiums
Paid
(Received) | | | Unrealized
Appreciation
(Depreciation) | | | Counterparty |
OTC Credit Default Swap Agreements on corporate and/or sovereign issues—Sell Protection(2)(cont’d.): |
Republic of Turkey | | | 03/20/20 | | | | 1.000%(Q) | | | | 2,000 | | | | 3.309 | % | | $ | (59,181 | ) | | $ | (76,304 | ) | | $ | 17,123 | | | JPMorgan Chase |
Republic of Turkey | | | 06/20/23 | | | | 1.000%(Q) | | | | 5,510 | | | | 3.775 | % | | | (593,884 | ) | | | (755,848 | ) | | | 161,964 | | | BNP Paribas |
Republic of Turkey | | | 06/20/23 | | | | 1.000%(Q) | | | | 2,760 | | | | 3.775 | % | | | (297,481 | ) | | | (367,820 | ) | | | 70,339 | | | BNP Paribas |
Republic of Uruguay | | | 06/20/21 | | | | 1.000%(Q) | | | | 400 | | | | 1.717 | % | | | (6,683 | ) | | | (5,623 | ) | | | (1,060 | ) | | Citibank NA |
Russian Federation | | | 12/20/21 | | | | 1.000%(Q) | | | | 8,525 | | | | 1.114 | % | | | (18,869 | ) | | | (491,510 | ) | | | 472,641 | | | Barclays Bank PLC |
Russian Federation | | | 12/20/22 | | | | 1.000%(Q) | | | | 7,350 | | | | 1.272 | % | | | (67,636 | ) | | | (17,625 | ) | | | (50,011 | ) | | Citibank NA |
Russian Federation | | | 06/20/23 | | | | 1.000%(Q) | | | | 1,640 | | | | 1.380 | % | | | (24,369 | ) | | | (32,043 | ) | | | 7,674 | | | BNP Paribas |
Russian Federation | | | 06/20/23 | | | | 1.000%(Q) | | | | 7,000 | | | | 1.380 | % | | | (104,013 | ) | | | (115,750 | ) | | | 11,737 | | | Morgan Stanley |
Russian Federation | | | 06/20/23 | | | | 1.000%(Q) | | | | 4,000 | | | | 1.380 | % | | | (59,436 | ) | | | (79,215 | ) | | | 19,779 | | | Morgan Stanley |
Russian Federation | | | 12/20/26 | | | | 1.000%(Q) | | | | 1,200 | | | | 1.857 | % | | | (67,644 | ) | | | (131,616 | ) | | | 63,972 | | | Barclays Bank PLC |
State of Illinois | | | 12/20/22 | | | | 1.000%(Q) | | | | 2,725 | | | | 1.562 | % | | | (53,725 | ) | | | (110,628 | ) | | | 56,903 | | | Citibank NA |
State of Illinois | | | 12/20/24 | | | | 1.000%(Q) | | | | 2,800 | | | | 2.095 | % | | | (151,589 | ) | | | (195,658 | ) | | | 44,069 | | | Goldman Sachs International |
State of Illinois | | | 06/20/28 | | | | 1.000%(Q) | | | | 1,000 | | | | 2.623 | % | | | (107,203 | ) | | | (115,737 | ) | | | 8,534 | | | Citibank NA |
United Mexican States | | | 06/20/23 | | | | 1.000%(Q) | | | | 5,000 | | | | 1.325 | % | | | (63,023 | ) | | | (7,083 | ) | | | (55,940 | ) | | Deutsche Bank AG |
| | | | | | | | | | | | | | | | | | | | | | | | | | | | | | |
| | | | | | | | | | | | | | | | | | $ | (5,623,279 | ) | | $ | (8,079,573 | ) | | $ | 2,456,294 | | | |
| | | | | | | | | | | | | | | | | | | | | | | | | | | | | | |
| | | | | | | | | | | | | | | | | | | | | | | | |
Reference
Entity/
Obligation | | Termination
Date | | | Fixed
Rate | | | Notional
Amount
(000)#(3) | | | Value at
Trade
Date | | | Value at
October 31,
2018 | | | Unrealized
Appreciation
(Depreciation) | |
Centrally Cleared Credit Default Swap Agreements on credit indices—Buy Protection(1): | |
CDX.NA.IG.30.V1 | | | 06/20/28 | | | | 1.000%(Q) | | | | 15,768 | | | $ | 46,553 | | | $ | 119,400 | | | $ | 72,847 | |
CDX.NA.IG.31.V1 | | | 12/20/23 | | | | 1.000%(Q) | | | | 106,700 | | | | (1,961,261 | ) | | | (1,711,577 | ) | | | 249,684 | |
iTraxx.EUR.28.V1 | | | 12/20/27 | | | | 1.000%(Q) | | | EUR | 13,378 | | | | (19,724 | ) | | | 37,917 | | | | 57,641 | |
| | | | | | | | | | | | | | | | | | | | | | | | |
| | | | | | | | | | | | | | $ | (1,934,432 | ) | | $ | (1,554,260 | ) | | $ | 380,172 | |
| | | | | | | | | | | | | | | | | | | | | | | | |
See Notes to Financial Statements.
| | | | |
| PGIM Global Total Return Fund | | | 109 | |
Schedule of Investments (continued)
as of October 31, 2018
Credit default swap agreements outstanding at October 31, 2018 (continued):
| | | | | | | | | | | | | | | | | | | | | | | | | | | | |
Reference
Entity/
Obligation | | Termination
Date | | | Fixed
Rate | | | Notional
Amount
(000)#(3) | | | Implied
Credit
Spread at
October 31,
2018(4) | | | Value at
Trade
Date | | | Value at
October 31,
2018 | | | Unrealized
Appreciation
(Depreciation) | |
Centrally Cleared Credit Default Swap Agreement on credit indices—Sell Protection(2): | |
CDX.NA.HY.30.V1 | | | 06/20/23 | | | | 5.000%(Q) | | | | 4,769 | | | | 3.457 | % | | $ | 351,521 | | | $ | 314,007 | | | $ | (37,514 | ) |
| | | | | | | | | | | | | | | | | | | | | | | | | | | | |
| | | | | | | | | | | | | | | | | | | | | | | | | | | | | | |
Reference
Entity/
Obligation | | Termination
Date | | | Fixed
Rate | | | Notional
Amount
(000)#(3) | | | Implied
Credit
Spread at
October 31,
2018(4) | | | Fair
Value | | | Upfront
Premiums
Paid
(Received) | | | Unrealized
Appreciation
(Depreciation) | | | Counterparty |
OTC Credit Default Swap Agreements on credit indices—Sell Protection(2): |
CDX.EM.27.V2 | | | 06/20/22 | | | | 1.000%(Q) | | | | 10,670 | | | | 1.611 | % | | $ | (205,587 | ) | | $ | (459,877 | ) | | $ | 254,290 | | | Citibank NA |
CMBX.NA.6.AA | | | 05/11/63 | | | | 1.500%(M) | | | | 5,000 | | | | * | | | | 42,172 | | | | (28,411 | ) | | | 70,583 | | | JPMorgan Securities |
| | | | | | | | | | | | | | | | | | | | | | | | | | | | | | |
| | | | | | | | | | | | | | | | | | $ | (163,415 | ) | | $ | (488,288 | ) | | $ | 324,873 | | | |
| | | | | | | | | | | | | | | | | | | | | | | | | | | | | | |
The Fund entered into credit default swaps (“CDS”) to provide a measure of protection against defaults or to take an active long or short position with respect to the likelihood of a particular issuer’s default or the reference entity’s credit soundness. CDS contracts generally trade based on a spread which represents the cost a protection buyer has to pay the protection seller. The protection buyer is said to be short the credit as the value of the contract rises the more the credit deteriorates. The value of the CDS contract increases for the protection buyer if the spread increases.
| (1) | If the Fund is a buyer of protection, it pays the fixed rate. When a credit event occurs, as defined under the terms of that particular swap agreement, the Fund will either (i) receive from the seller of protection an amount equal to the notional amount of the swap and make delivery of the referenced obligation or underlying securities comprising the referenced index or (ii) receive a net settlement amount in the form of cash or securities equal to the notional amount of the swap less the recovery value of the referenced obligation or underlying securities comprising the referenced index. |
| (2) | If the Fund is a seller of protection, it receives the fixed rate. When a credit event occurs, as defined under the terms of that particular swap agreement, the Fund will either (i) pay to the buyer of protection an amount equal to the notional amount of the swap and take delivery of the referenced obligation or underlying securities comprising the referenced index or (ii) pay a net settlement amount in the form of cash or securities equal to the notional amount of the swap less the recovery value of the referenced obligation or underlying securities comprising the referenced index. |
| (3) | Notional amount represents the maximum potential amount the Fund could be required to pay as a seller of credit protection or receive as a buyer of credit protection if a credit event occurs as defined under the terms of that particular swap agreement. |
| (4) | Implied credit spreads, represented in absolute terms, utilized in determining the fair value of credit default swap agreements where the Fund is the seller of protection as of the reporting date serve as an indicator of the current status |
See Notes to Financial Statements.
| | of the payment/ performance risk and represent the likelihood of risk of default for the credit derivative. The implied credit spread of a particular referenced entity reflects the cost of buying/selling protection and may include up-front payments required to be made to enter into the agreement. Wider credit spreads represent a deterioration of the referenced entity’s credit soundness and a greater likelihood of risk of default or other credit event occurring as defined under the terms of the agreement. |
| * | When an implied credit spread is not available, reference the fair value of credit default swap agreements on credit indices and asset-backed securities. Where the Fund is the seller of protection, it serves as an indicator of the current status of the payment/performance risk and represents the likelihood of an expected liability (or profit) for the credit derivative should the notional amount of the swap agreement be closed/sold as of the reporting date. Increasing fair value in absolute terms, when compared to the notional amount of the swap, represents a deterioration of the referenced entity’s credit soundness and a greater likelihood of risk of default or other credit event occurring as defined under the terms of the agreement. |
Forward rate agreements outstanding at October 31, 2018:
| | | | | | | | | | | | | | | | | | | | | | | | | | |
Notional
Amount
(000)# | | | Termination
Date | | | Fixed
Rate | | | Floating Rate | | Fair
Value | | | Upfront
Premiums
Paid
(Received) | | | Unrealized
Appreciation
(Depreciation) | | | Counterparty |
| | OTC Forward Rate Agreements^: |
| | 130,100 | | | | 11/13/18 | | | | —(3) | | | —(3) | | $ | (191,606 | ) | | $ | — | | | $ | (191,606 | ) | | Citigroup Global Markets |
| | 98,900 | | | | 11/26/18 | | | | —(4) | | | —(4) | | | 5,042 | | | | — | | | | 5,042 | | | Citigroup Global Markets |
| | 17,675 | | | | 07/16/19 | | | | 2.180%(T) | | | CM MUNI 5 Year(1)(T) | | | 248,174 | | | | — | | | | 248,174 | | | Citibank NA |
| | 17,675 | | | | 07/16/19 | | | | 3.145%(T) | | | CM MUNI 30 Year(2)(T) | | | (333,552 | ) | | | — | | | | (333,552 | ) | | Citibank NA |
| | | | | | | | | | | | | | | | | | | | | | | | | | |
| | | | | | | | | | | | | | $ | (271,942 | ) | | $ | — | | | $ | (271,942 | ) | | |
| | | | | | | | | | | | | | | | | | | | | | | | | | |
| (1) | The Fund pays the fixed rate and receives the floating rate. |
| (2) | The Fund pays the floating rate and receives the fixed rate. |
| (3) | The Fund pays or receives payments based on CMM102 minus 7 Year CMT minus 1.193% upon termination. |
| (4) | The Fund pays or receives payments based on CMM102 minus 7 Year CMT minus 1.360% upon termination. |
Inflation swap agreements outstanding at October 31, 2018:
| | | | | | | | | | | | | | | | | | | | | | | | |
Notional
Amount
(000)# | | | Termination
Date | | | Fixed
Rate | | | Floating Rate | | Value at
Trade
Date | | | Value at
October 31,
2018 | | | Unrealized
Appreciation
(Depreciation) | |
| Centrally Cleared Inflation Swap Agreements: | |
| EUR | 3,590 | | | | 08/15/22 | | | | 1.240%(T) | | | Eurostat Eurozone HICP ex Tobacco(2)(T) | | $ | — | | | $ | (59,432 | ) | | $ | (59,432 | ) |
| EUR | 5,210 | | | | 09/15/22 | | | | 1.260%(T) | | | Eurostat Eurozone HICP ex Tobacco(2)(T) | | | — | | | | (82,299 | ) | | | (82,299 | ) |
| EUR | 17,225 | | | | 03/15/23 | | | | 1.345%(T) | | | Eurostat Eurozone HICP ex Tobacco(2)(T) | | | — | | | | (157,085 | ) | | | (157,085 | ) |
See Notes to Financial Statements.
| | | | |
| PGIM Global Total Return Fund | | | 111 | |
Schedule of Investments (continued)
as of October 31, 2018
Inflation swap agreements outstanding at October 31, 2018 (continued):
| | | | | | | | | | | | | | | | | | | | | | | | |
Notional
Amount
(000)# | | | Termination
Date | | | Fixed
Rate | | | Floating Rate | | Value at
Trade
Date | | | Value at
October 31,
2018 | | | Unrealized
Appreciation
(Depreciation) | |
| Centrally Cleared Inflation Swap Agreements (cont’d): | |
| EUR | 14,000 | | | | 05/15/23 | | | | 1.485%(T) | | | France CPI ex Tobacco Household(1)(T) | | $ | — | | | $ | (41,646 | ) | | $ | (41,646 | ) |
| EUR | 14,000 | | | | 05/15/23 | | | | 1.510%(T) | | | Eurostat Eurozone HICP ex Tobacco(2)(T) | | | — | | | | (11,789 | ) | | | (11,789 | ) |
| EUR | 1,800 | | | | 08/15/27 | | | | 1.415%(T) | | | Eurostat Eurozone HICP ex Tobacco(1)(T) | | | — | | | | 31,407 | | | | 31,407 | |
| EUR | 2,535 | | | | 09/15/27 | | | | 1.438%(T) | | | Eurostat Eurozone HICP ex Tobacco(1)(T) | | | — | | | | 39,149 | | | | 39,149 | |
| EUR | 8,525 | | | | 03/15/28 | | | | 1.512%(T) | | | Eurostat Eurozone HICP ex Tobacco(1)(T) | | | — | | | | 55,494 | | | | 55,494 | |
| GBP | 2,290 | | | | 07/15/28 | | | | 3.360%(T) | | | U.K. Retail Price Index(2)(T) | | | — | | | | (75,648 | ) | | | (75,648 | ) |
| GBP | 1,460 | | | | 08/15/42 | | | | 3.520%(T) | | | U.K. Retail Price Index(2)(T) | | | (4,364 | ) | | | (77,388 | ) | | | (73,024 | ) |
| GBP | 615 | | | | 08/15/47 | | | | 3.469%(T) | | | U.K. Retail Price Index(1)(T) | | | — | | | | 50,319 | | | | 50,319 | |
| GBP | 210 | | | | 10/15/47 | | | | 3.535%(T) | | | U.K. Retail Price Index(2)(T) | | | — | | | | (5,119 | ) | | | (5,119 | ) |
| GBP | 300 | | | | 08/15/57 | | | | 3.363%(T) | | | U.K. Retail Price Index(1)(T) | | | — | | | | 42,709 | | | | 42,709 | |
| GBP | 130 | | | | 10/15/57 | | | | 3.418%(T) | | | U.K. Retail Price Index(1)(T) | | | — | | | | 8,626 | | | | 8,626 | |
| GBP | 200 | | | | 07/15/68 | | | | 3.243%(T) | | | U.K. Retail Price Index(1)(T) | | | — | | | | 76,591 | | | | 76,591 | |
| | 6,000 | | | | 10/25/27 | | | | 2.160%(T) | | | U.S. CPI Urban Consumers NSA Index(2)(T) | | | (36,000 | ) | | | (80,468 | ) | | | (44,468 | ) |
| | | | | | | | | | | | | | | | | | | | | | | | |
| | | | | | | | | | | | | | $ | (40,364 | ) | | $ | (286,579 | ) | | $ | (246,215 | ) |
| | | | | | | | | | | | | | | | | | | | | | | | |
| (1) | The Fund pays the fixed rate and receives the floating rate. |
| (2) | The Fund pays the floating rate and receives the fixed rate. |
Interest rate swap agreements outstanding at October 31, 2018:
| | | | | | | | | | | | | | | | | | | | | | | | |
Notional
Amount
(000)# | | | Termination
Date | | | Fixed
Rate | | | Floating Rate | | Value at
Trade
Date | | | Value at
October 31,
2018 | | | Unrealized
Appreciation
(Depreciation) | |
| Centrally Cleared Interest Rate Swap Agreements: | |
| AUD | 2,240 | | | | 10/27/21 | | | | 2.173%(S) | | | 6 Month BBSW(2)(S) | | $ | (230 | ) | | $ | (2,978 | ) | | $ | (2,748 | ) |
| AUD | 4,000 | | | | 09/21/22 | | | | 3.830%(S) | | | 6 Month BBSW(2)(S) | | | (72,198 | ) | | | 164,118 | | | | 236,316 | |
| AUD | 7,580 | | | | 09/25/22 | | | | 2.958%(S) | | | 6 Month BBSW(2)(S) | | | — | | | | 45,473 | | | | 45,473 | |
See Notes to Financial Statements.
Interest rate swap agreements outstanding at October 31, 2018 (continued):
| | | | | | | | | | | | | | | | | | | | | | | | |
Notional
Amount
(000)# | | | Termination
Date | | | Fixed
Rate | | | Floating Rate | | Value at
Trade
Date | | | Value at
October 31,
2018 | | | Unrealized
Appreciation
(Depreciation) | |
| Centrally Cleared Interest Rate Swap Agreements (cont’d.): | |
| AUD | 66,380 | | | | 06/21/23 | | | | 2.532%(S) | | | 6 Month BBSW(1)(S) | | $ | (91,106 | ) | | $ | (301,879 | ) | | $ | (210,773 | ) |
| AUD | 1,000 | | | | 05/02/26 | | | | 2.650%(S) | | | 6 Month BBSW(2)(S) | | | 120 | | | | 1,414 | | | | 1,294 | |
| AUD | 2,700 | | | | 06/06/27 | | | | 2.661%(S) | | | 6 Month BBSW(2)(S) | | | — | | | | (7,305 | ) | | | (7,305 | ) |
| AUD | 5,835 | | | | 07/19/32 | | | | 3.130%(S) | | | 6 Month BBSW(2)(S) | | | — | | | | 88,106 | | | | 88,106 | |
| AUD | 1,600 | | | | 07/28/32 | | | | 3.137%(S) | | | 6 Month BBSW(2)(S) | | | — | | | | 25,000 | | | | 25,000 | |
| AUD | 2,000 | | | | 12/19/32 | | | | 4.423%(S) | | | 6 Month BBSW(2)(S) | | | (5,183 | ) | | | 257,742 | | | | 262,925 | |
| AUD | 4,780 | | | | 07/10/33 | | | | 2.987%(S) | | | 6 Month BBSW(2)(S) | | | — | | | | 3,517 | | | | 3,517 | |
| BRL | 26,379 | | | | 01/02/25 | | | | 9.475%(T) | | | 1 Day BROIS(2)(T) | | | — | | | | 36,437 | | | | 36,437 | |
| BRL | 25,280 | | | | 01/02/25 | | | | 9.560%(T) | | | 1 Day BROIS(2)(T) | | | — | | | | 82,556 | | | | 82,556 | |
| BRL | 31,910 | | | | 01/02/25 | | | | 9.943%(T) | | | 1 Day BROIS(2)(T) | | | — | | | | 411,965 | | | | 411,965 | |
| BRL | 7,002 | | | | 01/02/25 | | | | 9.985%(T) | | | 1 Day BROIS(2)(T) | | | — | | | | 127,266 | | | | 127,266 | |
| BRL | 18,750 | | | | 01/02/25 | | | | 10.040%(T) | | | 1 Day BROIS(2)(T) | | | — | | | | 365,345 | | | | 365,345 | |
| BRL | 30,470 | | | | 01/02/25 | | | | 11.080%(T) | | | 1 Day BROIS(2)(T) | | | — | | | | 857,077 | | | | 857,077 | |
| BRL | 6,701 | | | | 01/02/25 | | | | 12.050%(T) | | | 1 Day BROIS(2)(T) | | | — | | | | 289,600 | | | | 289,600 | |
| BRL | 6,247 | | | | 01/02/25 | | | | 12.090%(T) | | | 1 Day BROIS(2)(T) | | | — | | | | 274,604 | | | | 274,604 | |
| BRL | 13,688 | | | | 01/04/27 | | | | 12.040%(T) | | | 1 Day BROIS(2)(T) | | | — | | | | 690,363 | | | | 690,363 | |
| BRL | 5,804 | | | | 01/04/27 | | | | 12.095%(T) | | | 1 Day BROIS(2)(T) | | | — | | | | 300,840 | | | | 300,840 | |
| CAD | 31,070 | | | | 12/22/18 | | | | 1.180%(S) | | | 3 Month Canadian Banker’s Acceptance(2)(S) | | | 33,376 | | | | (78,387 | ) | | | (111,763 | ) |
| CAD | 15,000 | | | | 02/08/19 | | | | 1.070%(S) | | | 3 Month Canadian Banker’s Acceptance(2)(S) | | | 140 | | | | (55,139 | ) | | | (55,279 | ) |
See Notes to Financial Statements.
| | | | |
| PGIM Global Total Return Fund | | | 113 | |
Schedule of Investments (continued)
as of October 31, 2018
Interest rate swap agreements outstanding at October 31, 2018 (continued):
| | | | | | | | | | | | | | | | | | | | | | | | |
Notional
Amount
(000)# | | | Termination
Date | | | Fixed
Rate | | | Floating Rate | | Value at
Trade
Date | | | Value at
October 31,
2018 | | | Unrealized
Appreciation
(Depreciation) | |
| Centrally Cleared Interest Rate Swap Agreements (cont’d.): | |
| CAD | 134,535 | | | | 07/26/19 | | | | 1.605%(S) | | | 3 Month Canadian Banker’s Acceptance(2)(S) | | $ | (214,184 | ) | | $ | (685,065 | ) | | $ | (470,881 | ) |
| CAD | 28,155 | | | | 01/09/20 | | | | 1.716%(S) | | | 3 Month Canadian Banker’s Acceptance(2)(S) | | | (66,077 | ) | | | (216,553 | ) | | | (150,476 | ) |
| CAD | 3,550 | | | | 03/07/21 | | | | 0.983%(S) | | | 3 Month Canadian Banker’s Acceptance(2)(S) | | | 124 | | | | (109,284 | ) | | | (109,408 | ) |
| CAD | 20,550 | | | | 12/22/21 | | | | 1.560%(S) | | | 3 Month Canadian Banker’s Acceptance(1)(S) | | | (63,051 | ) | | | 569,931 | | | | 632,982 | |
| CAD | 7,930 | | | | 04/05/22 | | | | 1.445%(S) | | | 3 Month Canadian Banker’s Acceptance(1)(S) | | | — | | | | 261,703 | | | | 261,703 | |
| CAD | 4,200 | | | | 08/17/22 | | | | 2.370%(S) | | | 3 Month Canadian Banker’s Acceptance(2)(S) | | | (22,600 | ) | | | (43,004 | ) | | | (20,404 | ) |
| CAD | 1,500 | | | | 04/22/26 | | | | 1.670%(S) | | | 3 Month Canadian Banker’s Acceptance(2)(S) | | | 127 | | | | (91,964 | ) | | | (92,091 | ) |
| CAD | 3,070 | | | | 06/25/30 | | | | 2.651%(S) | | | 3 Month Canadian Banker’s Acceptance(2)(S) | | | 83,226 | | | | (62,252 | ) | | | (145,478 | ) |
| CAD | 4,325 | | | | 03/26/33 | | | | 2.718%(S) | | | 3 Month Canadian Banker’s Acceptance(2)(S) | | | (92 | ) | | | (106,614 | ) | | | (106,522 | ) |
| CAD | 1,500 | | | | 05/30/37 | | | | 2.240%(S) | | | 3 Month Canadian Banker’s Acceptance(2)(S) | | | (41 | ) | | | (132,882 | ) | | | (132,841 | ) |
See Notes to Financial Statements.
Interest rate swap agreements outstanding at October 31, 2018 (continued):
| | | | | | | | | | | | | | | | | | | | | | | | |
Notional Amount (000)# | | | Termination
Date | | | Fixed
Rate | | | Floating Rate | | Value at
Trade
Date | | | Value at
October 31,
2018 | | | Unrealized
Appreciation
(Depreciation) | |
| Centrally Cleared Interest Rate Swap Agreements (cont’d.): | |
| CAD | 4,345 | | | | 01/09/38 | | | | 2.720%(S) | | | 3 Month Canadian Banker’s Acceptance(2)(S) | | $ | (37,095 | ) | | $ | (148,315 | ) | | $ | (111,220 | ) |
| CAD | 1,495 | | | | 05/30/47 | | | | 2.240%(S) | | | 3 Month Canadian Banker’s Acceptance(2)(S) | | | (118,690 | ) | | | (171,520 | ) | | | (52,830 | ) |
| CAD | 1,732 | | | | 01/09/48 | | | | 2.640%(S) | | | 3 Month Canadian Banker’s Acceptance(1)(S) | | | — | | | | 92,025 | | | | 92,025 | |
| CHF | 2,400 | | | | 10/21/21 | | | | (0.522)%(A) | | | 6 Month CHF LIBOR(2)(S) | | | 162 | | | | (10,739 | ) | | | (10,901 | ) |
| CHF | 800 | | | | 10/17/31 | | | | 0.033%(A) | | | 6 Month CHF LIBOR(2)(S) | | | 163 | | | | (67,714 | ) | | | (67,877 | ) |
| CHF | 700 | | | | 04/03/33 | | | | 0.687%(A) | | | 6 Month CHF LIBOR(2)(S) | | | — | | | | (5,870 | ) | | | (5,870 | ) |
| CHF | 6,230 | | | | 10/05/37 | | | | —(3) | | | —(3) | | | — | | | | 11,779 | | | | 11,779 | |
| COP | 25,830,000 | | | | 07/19/28 | | | | 6.150%(Q) | | | 1 Day COOIS(2)(Q) | | | — | | | | (205,564 | ) | | | (205,564 | ) |
| COP | 6,310,000 | | | | 07/27/28 | | | | 6.200%(Q) | | | 1 Day COOIS(2)(Q) | | | 3,948 | | | | (44,495 | ) | | | (48,443 | ) |
| CZK | 213,000 | | | | 04/27/22 | | | | 0.925%(A) | | | 6 Month PRIBOR(2)(S) | | | — | | | | (453,060 | ) | | | (453,060 | ) |
| CZK | 193,410 | | | | 06/29/22 | | | | 0.895%(A) | | | 6 Month PRIBOR(2)(S) | | | — | | | | (476,726 | ) | | | (476,726 | ) |
| CZK | 250,000 | | | | 11/17/22 | | | | 1.505%(A) | | | 6 Month PRIBOR(2)(S) | | | — | | | | (329,062 | ) | | | (329,062 | ) |
| CZK | 108,675 | | | | 04/27/27 | | | | 1.300%(A) | | | 6 Month PRIBOR(1)(S) | | | — | | | | 429,471 | | | | 429,471 | |
| CZK | 98,760 | | | | 06/29/27 | | | | 1.175%(A) | | | 6 Month PRIBOR(1)(S) | | | — | | | | 460,180 | | | | 460,180 | |
| DKK | 15,000 | | | | 01/27/20 | | | | 0.385%(A) | | | 6 Month CIBOR(2)(S) | | | 30 | | | | 21,379 | | | | 21,349 | |
| DKK | 20,900 | | | | 10/17/21 | | | | 0.185%(A) | | | 6 Month CIBOR(2)(S) | | | (59,047 | ) | | | 2,883 | | | | 61,930 | |
| DKK | 13,600 | | | | 05/04/25 | | | | 0.825%(A) | | | 6 Month CIBOR(2)(S) | | | 38 | | | | 26,778 | | | | 26,740 | |
| DKK | 5,000 | | | | 08/29/26 | | | | 0.580%(A) | | | 6 Month CIBOR(2)(S) | | | 28 | | | | (15,373 | ) | | | (15,401 | ) |
| DKK | 1,300 | | | | 10/21/26 | | | | 0.673%(A) | | | 6 Month CIBOR(2)(S) | | | 23 | | | | (3,099 | ) | | | (3,122 | ) |
See Notes to Financial Statements.
| | | | |
| PGIM Global Total Return Fund | | | 115 | |
Schedule of Investments (continued)
as of October 31, 2018
Interest rate swap agreements outstanding at October 31, 2018 (continued):
| | | | | | | | | | | | | | | | | | | | | | | | |
Notional
Amount
(000)# | | | Termination
Date | | | Fixed
Rate | | | Floating Rate | | Value at
Trade
Date | | | Value at
October 31,
2018 | | | Unrealized
Appreciation
(Depreciation) | |
| Centrally Cleared Interest Rate Swap Agreements (cont’d.): | |
| DKK | 13,000 | | | | 03/15/27 | | | | 1.123%(A) | | | 6 Month CIBOR(2)(S) | | $ | — | | | $ | 46,933 | | | $ | 46,933 | |
| DKK | 1,865 | | | | 06/22/27 | | | | 0.987%(A) | | | 6 Month CIBOR(2)(S) | | | — | | | | 1,983 | | | | 1,983 | |
| EUR | 830 | | | | 07/02/19 | | | | 0.656%(A) | | | 6 Month EURIBOR(2)(S) | | | 171 | | | | 8,664 | | | | 8,493 | |
| EUR | 26,226 | | | | 09/08/19 | | | | (0.195)%(A) | | | 6 Month EURIBOR(2)(S) | | | — | | | | 17,678 | | | | 17,678 | |
| EUR | 1,000 | | | | 05/29/20 | | | | 0.373%(A) | | | 6 Month EURIBOR(2)(S) | | | 171 | | | | 13,060 | | | | 12,889 | |
| EUR | 610 | | | | 07/02/21 | | | | 0.994%(A) | | | 6 Month EURIBOR(2)(S) | | | 170 | | | | 21,673 | | | | 21,503 | |
| EUR | 700 | | | | 08/14/21 | | | | 0.841%(A) | | | 3 Month EURIBOR(2)(Q) | | | 172 | | | | 21,938 | | | | 21,766 | |
| EUR | 650 | | | | 03/02/22 | | | | 0.072%(A) | | | 6 Month EURIBOR(2)(S) | | | (63,289 | ) | | | 216 | | | | 63,505 | |
| EUR | 8,200 | | | | 06/29/22 | | | | 0.219%(A) | | | 6 Month EURIBOR(1)(S) | | | — | | | | (41,282 | ) | | | (41,282 | ) |
| EUR | 21,000 | | | | 09/08/22 | | | | 0.140%(A) | | | 6 Month EURIBOR(1)(S) | | | — | | | | 17,777 | | | | 17,777 | |
| EUR | 62,955 | | | | 05/11/23 | | | | 0.390%(A) | | | 6 Month EURIBOR(1)(S) | | | (317,331 | ) | | | (582,355 | ) | | | (265,024 | ) |
| EUR | 26,390 | | | | 05/15/23 | | | | 0.221%(A) | | | 6 Month EURIBOR(2)(S) | | | — | | | | (60,670 | ) | | | (60,670 | ) |
| EUR | 24,776 | | | | 05/15/23 | | | | 0.224%(A) | | | 1 Day EONIA(2)(A) | | | — | | | | 138,118 | | | | 138,118 | |
| EUR | 35,000 | | | | 05/15/23 | | | | 0.266%(A) | | | 6 Month EURIBOR(2)(S) | | | — | | | | 3,180 | | | | 3,180 | |
| EUR | 29,530 | | | | 08/15/23 | | | | 0.390%(A) | | | 6 Month EURIBOR(2)(S) | | | (35,112 | ) | | | 89,138 | | | | 124,250 | |
| EUR | 1,410 | | | | 05/12/25 | | | | 0.895%(A) | | | 6 Month EURIBOR(2)(S) | | | 184 | | | | 43,302 | | | | 43,118 | |
| EUR | 17,940 | | | | 08/15/25 | | | | 0.395%(A) | | | 6 Month EURIBOR(1)(S) | | | 308 | | | | 247,164 | | | | 246,856 | |
| EUR | 5,339 | | | | 09/08/27 | | | | 0.770%(A) | | | 6 Month EURIBOR(2)(S) | | | — | | | | (26,980 | ) | | | (26,980 | ) |
| EUR | 2,000 | | | | 03/04/29 | | | | 2.302%(A) | | | 6 Month EURIBOR(2)(S) | | | 245,068 | | | | 335,887 | | | | 90,819 | |
| EUR | 1,000 | | | | 06/04/29 | | | | 2.002%(A) | | | 6 Month EURIBOR(2)(S) | | | 177 | | | | 126,472 | | | | 126,295 | |
| EUR | 1,360 | | | | 11/11/29 | | | | 1.453%(A) | | | 6 Month EURIBOR(2)(S) | | | 174 | | | | 90,743 | | | | 90,569 | |
See Notes to Financial Statements.
Interest rate swap agreements outstanding at October 31, 2018 (continued):
| | | | | | | | | | | | | | | | | | | | | | | | |
Notional
Amount
(000)# | | | Termination
Date | | | Fixed
Rate | | | Floating Rate | | Value at
Trade
Date | | | Value at
October 31,
2018 | | | Unrealized
Appreciation
(Depreciation) | |
| Centrally Cleared Interest Rate Swap Agreements (cont’d.): | |
| EUR | 1,800 | | | | 01/14/30 | | | | 1.022%(A) | | | 6 Month EURIBOR(2)(S) | | $ | 180 | | | $ | 9,681 | | | $ | 9,501 | |
| EUR | 2,000 | | | | 03/02/31 | | | | 0.825%(A) | | | 6 Month EURIBOR(2)(S) | | | (76,215 | ) | | | (72,570 | ) | | | 3,645 | |
| EUR | 700 | | | | 04/07/31 | | | | 0.819%(A) | | | 6 Month EURIBOR(2)(S) | | | 178 | | | | (27,683 | ) | | | (27,861 | ) |
| EUR | 450 | | | | 05/03/31 | | | | 1.048%(A) | | | 6 Month EURIBOR(2)(S) | | | 179 | | | | (3,356 | ) | | | (3,535 | ) |
| EUR | 1,500 | | | | 07/04/31 | | | | 0.672%(A) | | | 6 Month EURIBOR(2)(S) | | | 182 | | | | (97,083 | ) | | | (97,265 | ) |
| EUR | 570 | | | | 08/02/31 | | | | 0.584%(A) | | | 6 Month EURIBOR(2)(S) | | | 174 | | | | (45,135 | ) | | | (45,309 | ) |
| EUR | 1,500 | | | | 08/26/31 | | | | 0.562%(A) | | | 6 Month EURIBOR(2)(S) | | | 184 | | | | (125,852 | ) | | | (126,036 | ) |
| EUR | 700 | | | | 09/09/31 | | | | 0.558%(A) | | | 6 Month EURIBOR(2)(S) | | | 176 | | | | (59,729 | ) | | | (59,905 | ) |
| EUR | 600 | | | | 10/04/31 | | | | 0.593%(A) | | | 6 Month EURIBOR(2)(S) | | | 175 | | | | (49,329 | ) | | | (49,504 | ) |
| EUR | 1,700 | | | | 12/14/31 | | | | 1.217%(A) | | | 6 Month EURIBOR(2)(S) | | | 176 | | | | 27,399 | | | | 27,223 | |
| EUR | 1,850 | | | | 12/19/31 | | | | 1.160%(A) | | | 6 Month EURIBOR(2)(S) | | | 565 | | | | 13,084 | | | | 12,519 | |
| EUR | 2,300 | | | | 12/19/31 | | | | 1.161%(A) | | | 6 Month EURIBOR(2)(S) | | | (14,197 | ) | | | 16,314 | | | | 30,511 | |
| EUR | 2,600 | | | | 12/27/31 | | | | 1.082%(A) | | | 6 Month EURIBOR(2)(S) | | | 13,245 | | | | (13,957 | ) | | | (27,202 | ) |
| EUR | 6,400 | | | | 02/23/32 | | | | 1.180%(A) | | | 6 Month EURIBOR(2)(S) | | | 220 | | | | 35,560 | | | | 35,340 | |
| EUR | 4,680 | | | | 03/29/32 | | | | 1.170%(A) | | | 6 Month EURIBOR(2)(S) | | | 1,893 | | | | 7,722 | | | | 5,829 | |
| EUR | 1,400 | | | | 04/04/32 | | | | 1.145%(A) | | | 6 Month EURIBOR(2)(S) | | | — | | | | (3,679 | ) | | | (3,679 | ) |
| EUR | 2,000 | | | | 04/10/32 | | | | 1.105%(A) | | | 6 Month EURIBOR(2)(S) | | | — | | | | (18,107 | ) | | | (18,107 | ) |
| EUR | 4,150 | | | | 05/11/32 | | | | 1.100%(A) | | | 6 Month EURIBOR(2)(S) | | | (105,096 | ) | | | (43,065 | ) | | | 62,031 | |
| EUR | 7,000 | | | | 06/28/32 | | | | 0.785%(A) | | | 6 Month EURIBOR(2)(S) | | | (68,585 | ) | | | (428,761 | ) | | | (360,176 | ) |
| EUR | 6,200 | | | | 10/04/32 | | | | 2.000%(A) | | | 1 Day EONIA(2)(A) | | | — | | | | 36,181 | | | | 36,181 | |
| EUR | 6,200 | | | | 10/04/32 | | | | 2.080%(A) | | | 3 Month EURIBOR(1)(Q) | | | — | | | | (39,652 | ) | | | (39,652 | ) |
See Notes to Financial Statements.
| | | | |
| PGIM Global Total Return Fund | | | 117 | |
Schedule of Investments (continued)
as of October 31, 2018
Interest rate swap agreements outstanding at October 31, 2018 (continued):
| | | | | | | | | | | | | | | | | | | | | | | | |
Notional
Amount
(000)# | | | Termination
Date | | | Fixed
Rate | | | Floating Rate | | Value at
Trade
Date | | | Value at
October 31,
2018 | | | Unrealized
Appreciation
(Depreciation) | |
| Centrally Cleared Interest Rate Swap Agreements (cont’d.): | |
| EUR | 3,050 | | | | 10/30/32 | | | | 1.302%(A) | | | 6 Month EURIBOR(2)(S) | | $ | — | | | $ | 24,829 | | | $ | 24,829 | |
| EUR | 3,500 | | | | 05/11/33 | | | | 1.000%(A) | | | 6 Month EURIBOR(2)(S) | | | (155,995 | ) | | | (126,360 | ) | | | 29,635 | |
| EUR | 410 | | | | 05/11/35 | | | | 1.050%(A) | | | 6 Month EURIBOR(1)(S) | | | 26,513 | | | | 19,349 | | | | (7,164 | ) |
| EUR | 3,135 | | | | 12/28/35 | | | | 1.559%(A) | | | 6 Month EURIBOR(2)(S) | | | 48,090 | | | | 148,634 | | | | 100,544 | |
| EUR | 700 | | | | 06/02/36 | | | | 1.072%(A) | | | 6 Month EURIBOR(2)(S) | | | 180 | | | | (37,424 | ) | | | (37,604 | ) |
| EUR | 600 | | | | 09/26/36 | | | | 0.749%(A) | | | 6 Month EURIBOR(2)(S) | | | 177 | | | | (72,859 | ) | | | (73,036 | ) |
| EUR | 600 | | | | 09/28/36 | | | | 0.729%(A) | | | 6 Month EURIBOR(2)(S) | | | 178 | | | | (75,199 | ) | | | (75,377 | ) |
| EUR | 1,000 | | | | 11/02/36 | | | | 0.958%(A) | | | 6 Month EURIBOR(2)(S) | | | 180 | | | | (72,175 | ) | | | (72,355 | ) |
| EUR | 1,500 | | | | 02/02/37 | | | | 1.355%(A) | | | 6 Month EURIBOR(2)(S) | | | 188 | | | | 915 | | | | 727 | |
| EUR | 23,700 | | | | 08/24/37 | | | | 1.960%(A) | | | 1 Day EONIA(2)(A) | | | — | | | | 116,029 | | | | 116,029 | |
| EUR | 23,700 | | | | 08/24/37 | | | | 2.033%(A) | | | 3 Month EURIBOR(1)(Q) | | | (6,141 | ) | | | (145,498 | ) | | | (139,357 | ) |
| EUR | 6,720 | | | | 10/25/37 | | | | 2.085%(A) | | | 3 Month EURIBOR(2)(Q) | | | — | | | | 53,893 | | | | 53,893 | |
| EUR | 6,720 | | | | 10/25/37 | | | | 2.114%(A) | | | 6 Month EURIBOR(1)(S) | | | — | | | | (48,453 | ) | | | (48,453 | ) |
| EUR | 3,190 | | | | 05/11/42 | | | | 1.350%(A) | | | 6 Month EURIBOR(2)(S) | | | (188,099 | ) | | | (77,895 | ) | | | 110,204 | |
| EUR | 1,235 | | | | 07/04/42 | | | | 1.001%(A) | | | 6 Month EURIBOR(2)(S) | | | (143,527 | ) | | | (136,732 | ) | | | 6,795 | |
| EUR | 1,530 | | | | 12/05/47 | | | | 1.442%(A) | | | 6 Month EURIBOR(1)(S) | | | — | | | | 2,543 | | | | 2,543 | |
| EUR | 7,380 | | | | 01/26/48 | | | | 1.853%(A) | | | 3 Month EURIBOR(2)(Q) | | | — | | | | 62,485 | | | | 62,485 | |
| EUR | 7,380 | | | | 01/26/48 | | | | 1.863%(A) | | | 6 Month EURIBOR(1)(S) | | | — | | | | (54,416 | ) | | | (54,416 | ) |
| EUR | 5,000 | | | | 03/19/48 | | | | 1.650%(A) | | | 3 Month EURIBOR(2)(Q) | | | — | | | | (1,299 | ) | | | (1,299 | ) |
| EUR | 5,000 | | | | 03/19/48 | | | | 1.658%(A) | | | 6 Month EURIBOR(1)(S) | | | — | | | | 3,901 | | | | 3,901 | |
| GBP | 690 | | | | 06/30/19 | | | | 2.166%(S) | | | 6 Month GBP LIBOR(2)(S) | | | 203 | | | | 11,233 | | | | 11,030 | |
See Notes to Financial Statements.
Interest rate swap agreements outstanding at October 31, 2018 (continued):
| | | | | | | | | | | | | | | | | | | | | | | | |
Notional
Amount
(000)# | | | Termination
Date | | | Fixed
Rate | | | Floating Rate | | Value at
Trade
Date | | | Value at
October 31,
2018 | | | Unrealized
Appreciation
(Depreciation) | |
| Centrally Cleared Interest Rate Swap Agreements (cont’d.): | |
| GBP | 850 | | | | 08/04/19 | | | | 0.109%(A) | | | 1 Day SONIA(1)(A) | | $ | 199 | | | $ | 6,950 | | | $ | 6,751 | |
| GBP | 1,500 | | | | 03/02/20 | | | | 0.338%(A) | | | 1 Day SONIA(1)(A) | | | — | | | | 15,480 | | | | 15,480 | |
| GBP | 510 | | | | 06/30/21 | | | | 2.469%(S) | | | 6 Month GBP LIBOR(2)(S) | | | 203 | | | | 25,473 | | | | 25,270 | |
| GBP | 18,380 | | | | 10/24/23 | | | | 1.365%(S) | | | 6 Month GBP LIBOR(1)(S) | | | 7,293 | | | | 13,419 | | | | 6,126 | |
| GBP | 2,260 | | | | 05/15/24 | | | | 0.963%(S) | | | 6 Month GBP LIBOR(1)(S) | | | (13,128 | ) | | | 66,478 | | | | 79,606 | |
| GBP | 4,100 | | | | 09/07/25 | | | | 1.075%(S) | | | 6 Month GBP LIBOR(1)(S) | | | 198 | | | | 135,086 | | | | 134,888 | |
| GBP | 2,580 | | | | 12/13/26 | | | | 1.383%(S) | | | 6 Month GBP LIBOR(1)(S) | | | 214 | | | | 27,441 | | | | 27,227 | |
| GBP | 9,080 | | | | 12/07/27 | | | | 1.636%(S) | | | 6 Month GBP LIBOR(2)(S) | | | 106,404 | | | | 62,368 | | | | (44,036 | ) |
| GBP | 10,740 | | | | 06/23/31 | | | | 1.618%(S) | | | 6 Month GBP LIBOR(2)(S) | | | 369 | | | | (17,232 | ) | | | (17,601 | ) |
| GBP | 4,430 | | | | 12/21/31 | | | | 1.534%(S) | | | 6 Month GBP LIBOR(2)(S) | | | 235 | | | | (72,384 | ) | | | (72,619 | ) |
| GBP | 2,100 | | | | 12/22/31 | | | | 1.533%(S) | | | 6 Month GBP LIBOR(2)(S) | | | 3,696 | | | | (34,779 | ) | | | (38,475 | ) |
| GBP | 2,780 | | | | 02/27/32 | | | | 1.374%(S) | | | 6 Month GBP LIBOR(2)(S) | | | 16,473 | | | | (124,827 | ) | | | (141,300 | ) |
| GBP | 7,960 | | | | 05/08/32 | | | | 1.323%(S) | | | 6 Month GBP LIBOR(2)(S) | | | (298,360 | ) | | | (412,564 | ) | | | (114,204 | ) |
| GBP | 3,500 | | | | 05/15/32 | | | | 1.398%(S) | | | 6 Month GBP LIBOR(2)(S) | | | 20,278 | | | | (138,683 | ) | | | (158,961 | ) |
| GBP | 8,500 | | | | 10/30/32 | | | | 1.633%(S) | | | 6 Month GBP LIBOR(2)(S) | | | (19,196 | ) | | | (62,162 | ) | | | (42,966 | ) |
| GBP | 2,200 | | | | 05/08/33 | | | | 1.300%(S) | | | 6 Month GBP LIBOR(2)(S) | | | (128,524 | ) | | | (135,993 | ) | | | (7,469 | ) |
| GBP | 1,000 | | | | 04/21/36 | | | | 1.787%(S) | | | 6 Month GBP LIBOR(2)(S) | | | 87,073 | | | | 15,512 | | | | (71,561 | ) |
| GBP | 3,620 | | | | 12/13/36 | | | | 1.644%(S) | | | 6 Month GBP LIBOR(2)(S) | | | 43,693 | | | | (35,972 | ) | | | (79,665 | ) |
| GBP | 1,500 | | | | 05/08/37 | | | | 1.450%(S) | | | 6 Month GBP LIBOR(2)(S) | | | (79 | ) | | | (77,251 | ) | | | (77,172 | ) |
| GBP | 3,810 | | | | 06/23/46 | | | | 1.626%(S) | | | 6 Month GBP LIBOR(1)(S) | | | 244 | | | | 77,786 | | | | 77,542 | |
| GBP | 1,010 | | | | 12/13/46 | | | | 1.615%(S) | | | 6 Month GBP LIBOR(1)(S) | | | 213 | | | | 23,670 | | | | 23,457 | |
See Notes to Financial Statements.
| | | | |
| PGIM Global Total Return Fund | | | 119 | |
Schedule of Investments (continued)
as of October 31, 2018
Interest rate swap agreements outstanding at October 31, 2018 (continued):
| | | | | | | | | | | | | | | | | | | | | | | | |
Notional
Amount
(000)# | | | Termination
Date | | | Fixed
Rate | | | Floating Rate | | Value at
Trade
Date | | | Value at
October 31,
2018 | | | Unrealized
Appreciation
(Depreciation) | |
| Centrally Cleared Interest Rate Swap Agreements (cont’d.): | |
| GBP | 9,670 | | | | 12/21/46 | | | | 1.551%(S) | | | 6 Month GBP LIBOR(1)(S) | | $ | (33,189 | ) | | $ | 413,459 | | | $ | 446,648 | |
| GBP | 2,320 | | | | 05/08/47 | | | | 1.400%(S) | | | 6 Month GBP LIBOR(1)(S) | | | 177,430 | | | | 205,059 | | | | 27,629 | |
| GBP | 2,000 | | | | 10/30/47 | | | | 1.680%(S) | | | 6 Month GBP LIBOR(1)(S) | | | (73,491 | ) | | | 15,500 | | | | 88,991 | |
| HUF | 11,800,000 | | | | 06/21/20 | | | | 1.400%(A) | | | 3 Month BUBOR(2)(Q) | | | — | | | | 18,585 | | | | 18,585 | |
| HUF | 2,698,000 | | | | 07/02/20 | | | | 1.065%(A) | | | 6 Month BUBOR(2)(S) | | | (4,845 | ) | | | 32,700 | | | | 37,545 | |
| HUF | 3,017,210 | | | | 05/04/22 | | | | 1.360%(A) | | | 6 Month BUBOR(2)(S) | | | — | | | | (128,570 | ) | | | (128,570 | ) |
| HUF | 375,000 | | | | 09/09/23 | | | | 1.365%(A) | | | 6 Month BUBOR(2)(S) | | | (32,218 | ) | | | (56,197 | ) | | | (23,979 | ) |
| HUF | 370,000 | | | | 03/18/26 | | | | 2.140%(A) | | | 6 Month BUBOR(2)(S) | | | 16,300 | | | | (45,090 | ) | | | (61,390 | ) |
| HUF | 1,667,000 | | | | 12/23/26 | | | | 3.755%(A) | | | 6 Month BUBOR(2)(S) | | | 41 | | | | (18,442 | ) | | | (18,483 | ) |
| HUF | 900,000 | | | | 04/18/28 | | | | 2.035%(A) | | | 6 Month BUBOR(2)(S) | | | — | | | | (257,883 | ) | | | (257,883 | ) |
| HUF | 6,237,270 | | | | 06/12/28 | | | | 3.750%(A) | | | 6 Month BUBOR(2)(S) | | | — | | | | (372,470 | ) | | | (372,470 | ) |
| INR | 301,000 | | | | 12/05/22 | | | | 6.550%(S) | | | 1 Day MIBOR(2)(S) | | | — | | | | (95,775 | ) | | | (95,775 | ) |
| INR | 608,000 | | | | 05/09/23 | | | | 6.820%(S) | | | 1 Day MIBOR(2)(S) | | | — | | | | (120,661 | ) | | | (120,661 | ) |
| INR | 424,000 | | | | 05/16/23 | | | | 7.020%(S) | | | 1 Day MIBOR(2)(S) | | | — | | | | (33,736 | ) | | | (33,736 | ) |
| JPY | 32,800 | | | | 07/04/21 | | | | (0.156)%(S) | | | 6 Month JPY LIBOR(2)(S) | | | (15,013 | ) | | | (1,866 | ) | | | 13,147 | |
| JPY | 500,000 | | | | 10/25/21 | | | | (0.047)%(S) | | | 6 Month JPY LIBOR(2)(S) | | | 21 | | | | (15,695 | ) | | | (15,716 | ) |
| JPY | 320,000 | | | | 01/29/22 | | | | 0.316%(S) | | | 6 Month JPY LIBOR(2)(S) | | | 16 | | | | 24,180 | | | | 24,164 | |
| JPY | 5,312,000 | | | | 05/11/23 | | | | 0.130%(S) | | | 6 Month JPY LIBOR(1)(S) | | | (10,034 | ) | | | (55,384 | ) | | | (45,350 | ) |
| JPY | 102,400 | | | | 10/25/23 | | | | (0.015)%(S) | | | 6 Month JPY LIBOR(2)(S) | | | (87,717 | ) | | | (6,555 | ) | | | 81,162 | |
| JPY | 3,276,010 | | | | 12/20/24 | | | | 0.126%(S) | | | 6 Month JPY LIBOR(2)(S) | | | (53,956 | ) | | | (67,649 | ) | | | (13,693 | ) |
| JPY | 1,400,000 | | | | 08/28/25 | | | | 0.215%(S) | | | 6 Month JPY LIBOR(2)(S) | | | — | | | | 17,962 | | | | 17,962 | |
See Notes to Financial Statements.
Interest rate swap agreements outstanding at October 31, 2018 (continued):
| | | | | | | | | | | | | | | | | | | | | | | | |
Notional
Amount
(000)# | | | Termination
Date | | | Fixed
Rate | | | Floating Rate | | Value at
Trade
Date | | | Value at
October 31,
2018 | | | Unrealized
Appreciation
(Depreciation) | |
| Centrally Cleared Interest Rate Swap Agreements (cont’d.): | |
| JPY | 140,000 | | | | 09/21/26 | | | | 0.098%(S) | | | 6 Month JPY LIBOR(2)(S) | | $ | (169,999 | ) | | $ | (14,274 | ) | | $ | 155,725 | |
| JPY | 135,000 | | | | 04/25/27 | | | | 0.221%(S) | | | 6 Month JPY LIBOR(2)(S) | | | — | | | | (4,937 | ) | | | (4,937 | ) |
| JPY | 716,800 | | | | 04/16/28 | | | | 1.235%(S) | | | 6 Month JPY LIBOR(2)(S) | | | (61,410 | ) | | | 554,344 | | | | 615,754 | |
| JPY | 135,000 | | | | 02/20/29 | | | | 1.260%(S) | | | 6 Month JPY LIBOR(2)(S) | | | 49,802 | | | | 113,861 | | | | 64,059 | |
| JPY | 50,000 | | | | 04/02/29 | | | | 1.288%(S) | | | 6 Month JPY LIBOR(2)(S) | | | 5 | | | | 43,014 | | | | 43,009 | |
| JPY | 100,000 | | | | 08/18/29 | | | | 1.070%(S) | | | 6 Month JPY LIBOR(2)(S) | | | 10 | | | | 67,593 | | | | 67,583 | |
| JPY | 100,000 | | | | 08/28/29 | | | | 1.043%(S) | | | 6 Month JPY LIBOR(2)(S) | | | 10 | | | | 64,712 | | | | 64,702 | |
| JPY | 200,000 | | | | 09/09/29 | | | | 1.061%(S) | | | 6 Month JPY LIBOR(2)(S) | | | (1,275 | ) | | | 132,553 | | | | 133,828 | |
| JPY | 655,000 | | | | 09/29/29 | | | | 1.064%(S) | | | 6 Month JPY LIBOR(2)(S) | | | 411,209 | | | | 433,050 | | | | 21,841 | |
| JPY | 200,000 | | | | 04/01/31 | | | | 0.319%(S) | | | 6 Month JPY LIBOR(2)(S) | | | 26 | | | | (29,429 | ) | | | (29,455 | ) |
| JPY | 215,000 | | | | 05/06/31 | | | | 0.354%(S) | | | 6 Month JPY LIBOR(2)(S) | | | 28 | | | | (22,162 | ) | | | (22,190 | ) |
| JPY | 150,000 | | | | 07/07/31 | | | | 0.071%(S) | | | 6 Month JPY LIBOR(2)(S) | | | 15 | | | | (65,938 | ) | | | (65,953 | ) |
| JPY | 256,500 | | | | 08/15/31 | | | | 0.223%(S) | | | 6 Month JPY LIBOR(2)(S) | | | 25 | | | | (71,024 | ) | | | (71,049 | ) |
| JPY | 130,000 | | | | 08/30/31 | | | | 0.217%(S) | | | 6 Month JPY LIBOR(2)(S) | | | 13 | | | | (37,295 | ) | | | (37,308 | ) |
| JPY | 120,000 | | | | 09/08/31 | | | | 0.316%(S) | | | 6 Month JPY LIBOR(2)(S) | | | 12 | | | | (21,212 | ) | | | (21,224 | ) |
| JPY | 190,000 | | | | 09/21/31 | | | | 0.328%(S) | | | 6 Month JPY LIBOR(2)(S) | | | 27 | | | | (31,803 | ) | | | (31,830 | ) |
| JPY | 350,000 | | | | 10/14/31 | | | | 0.270%(S) | | | 6 Month JPY LIBOR(2)(S) | | | 47 | | | | (83,222 | ) | | | (83,269 | ) |
| JPY | 200,000 | | | | 04/06/32 | | | | 0.484%(S) | | | 6 Month JPY LIBOR(2)(S) | | | — | | | | (3,828 | ) | | | (3,828 | ) |
| JPY | 159,520 | | | | 04/07/32 | | | | 0.491%(S) | | | 6 Month JPY LIBOR(2)(S) | | | — | | | | (1,734 | ) | | | (1,734 | ) |
| JPY | 140,000 | | | | 06/07/32 | | | | 0.451%(S) | | | 6 Month JPY LIBOR(2)(S) | | | — | | | | (7,761 | ) | | | (7,761 | ) |
| JPY | 71,000 | | | | 09/21/32 | | | | 0.463%(S) | | | 6 Month JPY LIBOR(2)(S) | | | — | | | | (5,004 | ) | | | (5,004 | ) |
See Notes to Financial Statements.
| | | | |
| PGIM Global Total Return Fund | | | 121 | |
Schedule of Investments (continued)
as of October 31, 2018
Interest rate swap agreements outstanding at October 31, 2018 (continued):
| | | | | | | | | | | | | | | | | | | | | | | | |
Notional
Amount
(000)# | | | Termination
Date | | | Fixed
Rate | | | Floating Rate | | Value at
Trade
Date | | | Value at
October 31,
2018 | | | Unrealized
Appreciation
(Depreciation) | |
| Centrally Cleared Interest Rate Swap Agreements (cont’d.): | |
| JPY | 160,000 | | | | 11/14/32 | | | | 2.390%(S) | | | 6 Month JPY LIBOR(2)(S) | | $ | (26,599 | ) | | $ | 233,691 | | | $ | 260,290 | |
| JPY | 180,000 | | | | 11/05/34 | | | | 1.293%(S) | | | 6 Month JPY LIBOR(2)(S) | | | 85,259 | | | | 178,911 | | | | 93,652 | |
| JPY | 70,000 | | | | 12/03/34 | | | | 1.265%(S) | | | 6 Month JPY LIBOR(2)(S) | | | 9 | | | | 66,194 | | | | 66,185 | |
| JPY | 260,000 | | | | 01/07/35 | | | | 1.108%(S) | | | 6 Month JPY LIBOR(2)(S) | | | 31 | | | | 184,494 | | | | 184,463 | |
| JPY | 50,000 | | | | 01/22/35 | | | | 0.950%(S) | | | 6 Month JPY LIBOR(2)(S) | | | 7 | | | | 23,959 | | | | 23,952 | |
| JPY | 120,000 | | | | 02/12/35 | | | | 1.161%(S) | | | 6 Month JPY LIBOR(2)(S) | | | 15 | | | | 92,969 | | | | 92,954 | |
| JPY | 320,000 | | | | 02/24/35 | | | | 1.200%(S) | | | 6 Month JPY LIBOR(2)(S) | | | 40 | | | | 264,276 | | | | 264,236 | |
| JPY | 160,000 | | | | 03/03/35 | | | | 1.153%(S) | | | 6 Month JPY LIBOR(2)(S) | | | 20 | | | | 120,776 | | | | 120,756 | |
| JPY | 90,000 | | | | 02/04/36 | | | | 0.816%(S) | | | 6 Month JPY LIBOR(2)(S) | | | 11 | | | | 21,429 | | | | 21,418 | |
| JPY | 65,000 | | | | 05/16/36 | | | | 0.446%(S) | | | 6 Month JPY LIBOR(2)(S) | | | 9 | | | | (21,770 | ) | | | (21,779 | ) |
| JPY | 110,000 | | | | 05/27/36 | | | | 0.460%(S) | | | 6 Month JPY LIBOR(2)(S) | | | 18 | | | | (34,892 | ) | | | (34,910 | ) |
| JPY | 60,000 | | | | 07/22/36 | | | | 0.240%(S) | | | 6 Month JPY LIBOR(2)(S) | | | 11 | | | | (40,574 | ) | | | (40,585 | ) |
| JPY | 300,000 | | | | 10/04/36 | | | | 0.363%(S) | | | 6 Month JPY LIBOR(2)(S) | | | 42 | | | | (152,996 | ) | | | (153,038 | ) |
| JPY | 150,000 | | | | 11/02/36 | | | | 0.423%(S) | | | 6 Month JPY LIBOR(2)(S) | | | 21 | | | | (61,135 | ) | | | (61,156 | ) |
| JPY | 400,000 | | | | 12/14/36 | | | | 0.723%(S) | | | 6 Month JPY LIBOR(2)(S) | | | 49 | | | | 22,784 | | | | 22,735 | |
| JPY | 150,000 | | | | 12/22/36 | | | | 0.641%(S) | | | 6 Month JPY LIBOR(2)(S) | | | 19 | | | | (11,282 | ) | | | (11,301 | ) |
| JPY | 250,000 | | | | 01/06/37 | | | | 0.675%(S) | | | 6 Month JPY LIBOR(2)(S) | | | 30 | | | | (6,368 | ) | | | (6,398 | ) |
| JPY | 275,500 | | | | 02/15/37 | | | | 0.729%(S) | | | 6 Month JPY LIBOR(2)(S) | | | 34 | | | | 12,734 | | | | 12,700 | |
| JPY | 130,000 | | | | 02/23/37 | | | | 0.748%(S) | | | 6 Month JPY LIBOR(2)(S) | | | 17 | | | | 9,604 | | | | 9,587 | |
| JPY | 100,000 | | | | 03/02/37 | | | | 0.686%(S) | | | 6 Month JPY LIBOR(2)(S) | | | — | | | | (2,683 | ) | | | (2,683 | ) |
| JPY | 273,000 | | | | 03/09/37 | | | | 0.701%(S) | | | 6 Month JPY LIBOR(2)(S) | | | 15,040 | | | | (1,421 | ) | | | (16,461 | ) |
See Notes to Financial Statements.
Interest rate swap agreements outstanding at October 31, 2018 (continued):
| | | | | | | | | | | | | | | | | | | | | | | | |
Notional
Amount
(000)# | | | Termination
Date | | | Fixed
Rate | | | Floating Rate | | Value at
Trade
Date | | | Value at
October 31,
2018 | | | Unrealized
Appreciation
(Depreciation) | |
| Centrally Cleared Interest Rate Swap Agreements (cont’d.): | |
| JPY | 200,000 | | | | 03/29/37 | | | | 0.684%(S) | | | 6 Month JPY LIBOR(2)(S) | | $ | — | | | $ | (7,772 | ) | | $ | (7,772 | ) |
| JPY | 94,310 | | | | 05/08/37 | | | | 0.623%(S) | | | 6 Month JPY LIBOR(2)(S) | | | — | | | | (11,590 | ) | | | (11,590 | ) |
| JPY | 200,000 | | | | 05/15/37 | | | | 0.688%(S) | | | 6 Month JPY LIBOR(2)(S) | | | — | | | | (3,590 | ) | | | (3,590 | ) |
| JPY | 150,000 | | | | 06/02/37 | | | | 0.640%(S) | | | 6 Month JPY LIBOR(2)(S) | | | — | | | | (15,330 | ) | | | (15,330 | ) |
| JPY | 80,000 | | | | 06/19/37 | | | | 0.625%(S) | | | 6 Month JPY LIBOR(2)(S) | | | — | | | | (10,553 | ) | | | (10,553 | ) |
| JPY | 82,000 | | | | 06/21/37 | | | | 0.628%(S) | | | 6 Month JPY LIBOR(2)(S) | | | — | | | | (10,549 | ) | | | (10,549 | ) |
| JPY | 125,000 | | | | 06/30/37 | | | | 0.629%(S) | | | 6 Month JPY LIBOR(2)(S) | | | — | | | | (16,194 | ) | | | (16,194 | ) |
| JPY | 105,000 | | | | 07/04/37 | | | | 0.659%(S) | | | 6 Month JPY LIBOR(2)(S) | | | — | | | | (8,516 | ) | | | (8,516 | ) |
| JPY | 285,000 | | | | 07/26/37 | | | | 0.676%(S) | | | 6 Month JPY LIBOR(2)(S) | | | — | | | | (17,393 | ) | | | (17,393 | ) |
| JPY | 117,300 | | | | 08/02/37 | | | | 0.683%(S) | | | 6 Month JPY LIBOR(2)(S) | | | — | | | | (6,064 | ) | | | (6,064 | ) |
| JPY | 160,000 | | | | 08/09/37 | | | | 0.679%(S) | | | 6 Month JPY LIBOR(2)(S) | | | — | | | | (9,724 | ) | | | (9,724 | ) |
| JPY | 500,000 | | | | 09/04/37 | | | | 0.663%(S) | | | 6 Month JPY LIBOR(2)(S) | | | — | | | | (48,108 | ) | | | (48,108 | ) |
| JPY | 175,000 | | | | 09/27/37 | | | | 0.670%(S) | | | 6 Month JPY LIBOR(2)(S) | | | — | | | | (15,993 | ) | | | (15,993 | ) |
| JPY | 300,000 | | | | 11/02/37 | | | | 0.734%(S) | | | 6 Month JPY LIBOR(2)(S) | | | — | | | | 9,787 | | | | 9,787 | |
| JPY | 350,000 | | | | 12/04/37 | | | | 0.730%(S) | | | 6 Month JPY LIBOR(2)(S) | | | — | | | | 5,570 | | | | 5,570 | |
| JPY | 570,000 | | | | 01/04/38 | | | | 0.757%(S) | | | 6 Month JPY LIBOR(2)(S) | | | — | | | | 29,112 | | | | 29,112 | |
| JPY | 224,000 | | | | 01/11/38 | | | | 0.831%(S) | | | 6 Month JPY LIBOR(2)(S) | | | — | | | | 38,776 | | | | 38,776 | |
| JPY | 800,000 | | | | 03/28/38 | | | | 0.656%(S) | | | 6 Month JPY LIBOR(2)(S) | | | — | | | | (115,865 | ) | | | (115,865 | ) |
| JPY | 1,000,000 | | | | 04/04/38 | | | | 0.681%(S) | | | 6 Month JPY LIBOR(2)(S) | | | — | | | | (106,307 | ) | | | (106,307 | ) |
| JPY | 675,000 | | | | 04/06/38 | | | | 0.655%(S) | | | 6 Month JPY LIBOR(2)(S) | | | — | | | | (100,870 | ) | | | (100,870 | ) |
| JPY | 1,815,000 | | | | 04/18/38 | | | | 0.675%(S) | | | 6 Month JPY LIBOR(2)(S) | | | (49,290 | ) | | | (217,943 | ) | | | (168,653 | ) |
See Notes to Financial Statements.
| | | | |
| PGIM Global Total Return Fund | | | 123 | |
Schedule of Investments (continued)
as of October 31, 2018
Interest rate swap agreements outstanding at October 31, 2018 (continued):
| | | | | | | | | | | | | | | | | | | | | | | | |
Notional
Amount
(000)# | | | Termination
Date | | | Fixed
Rate | | | Floating Rate | | Value at
Trade
Date | | | Value at
October 31,
2018 | | | Unrealized
Appreciation
(Depreciation) | |
| Centrally Cleared Interest Rate Swap Agreements (cont’d.): | |
| JPY | 600,000 | | | | 08/10/38 | | | | 0.822%(S) | | | 6 Month JPY LIBOR(2)(S) | | $ | — | | | $ | 74,184 | | | $ | 74,184 | |
| JPY | 60,000 | | | | 06/17/41 | | | | 0.318%(S) | | | 6 Month JPY LIBOR(2)(S) | | | 11 | | | | (58,781 | ) | | | (58,792 | ) |
| JPY | 100,000 | | | | 07/07/41 | | | | 0.187%(S) | | | 6 Month JPY LIBOR(2)(S) | | | 18 | | | | (123,904 | ) | | | (123,922 | ) |
| JPY | 61,000 | | | | 10/04/42 | | | | 0.853%(S) | | | 6 Month JPY LIBOR(2)(S) | | | — | | | | (1,081 | ) | | | (1,081 | ) |
| JPY | 166,000 | | | | 05/09/43 | | | | 0.820%(S) | | | 6 Month JPY LIBOR(2)(S) | | | — | | | | (13,617 | ) | | | (13,617 | ) |
| JPY | 610,000 | | | | 07/04/43 | | | | 0.763%(S) | | | 6 Month JPY LIBOR(2)(S) | | | — | | | | (133,529 | ) | | | (133,529 | ) |
| JPY | 110,291 | | | | 04/15/46 | | | | 0.560%(S) | | | 6 Month JPY LIBOR(2)(S) | | | — | | | | (91,359 | ) | | | (91,359 | ) |
| JPY | 26,000 | | | | 10/04/47 | | | | 0.942%(S) | | | 6 Month JPY LIBOR(2)(S) | | | — | | | | (227 | ) | | | (227 | ) |
| JPY | 560,000 | | | | 11/24/47 | | | | 0.888%(S) | | | 6 Month JPY LIBOR(2)(S) | | | — | | | | (64,486 | ) | | | (64,486 | ) |
| KRW | 20,090,000 | | | | 08/16/20 | | | | 1.915%(Q) | | | 3 Month KWCDC(2)(Q) | | | — | | | | 27,709 | | | | 27,709 | |
| KRW | 8,170,000 | | | | 08/16/23 | | | | 2.060%(Q) | | | 3 Month KWCDC(1)(Q) | | | — | | | | (37,747 | ) | | | (37,747 | ) |
| KRW | 4,942,900 | | | | 09/10/28 | | | | 2.043%(Q) | | | 3 Month KWCDC(2)(Q) | | | — | | | | (7,927 | ) | | | (7,927 | ) |
| MXN | 33,500 | | | | 10/12/27 | | | | 7.350%(M) | | | 28 Day Mexican Interbank Rate(2)(M) | | | — | | | | (177,981 | ) | | | (177,981 | ) |
| MXN | 259,220 | | | | 06/30/28 | | | | 8.065%(M) | | | 28 Day Mexican Interbank Rate(2)(M) | | | — | | | | (867,096 | ) | | | (867,096 | ) |
| NOK | 29,500 | | | | 02/23/23 | | | | 1.350%(A) | | | 6 Month NIBOR(2)(S) | | | (3,643 | ) | | | (53,208 | ) | | | (49,565 | ) |
| NOK | 840,400 | | | | 05/23/23 | | | | 1.895%(A) | | | 6 Month NIBOR(2)(S) | | | 31,660 | | | | 204,945 | | | | 173,285 | |
| NOK | 26,300 | | | | 03/15/27 | | | | 2.103%(A) | | | 6 Month NIBOR(2)(S) | | | 18,690 | | | | 11,170 | | | | (7,520 | ) |
| NOK | 6,725 | | | | 06/23/27 | | | | 1.825%(A) | | | 6 Month NIBOR(2)(S) | | | — | | | | (23,438 | ) | | | (23,438 | ) |
| NOK | 20,000 | | | | 04/18/28 | | | | 2.215%(A) | | | 6 Month NIBOR(2)(S) | | | — | | | | 16,528 | | | | 16,528 | |
| NZD | 2,600 | | | | 03/13/19 | | | | 4.550%(S) | | | 3 Month BBR(2)(Q) | | | — | | | | 21,889 | | | | 21,889 | |
See Notes to Financial Statements.
Interest rate swap agreements outstanding at October 31, 2018 (continued):
| | | | | | | | | | | | | | | | | | | | | | | | |
Notional
Amount
(000)# | | | Termination
Date | | | Fixed
Rate | | | Floating Rate | | Value at
Trade
Date | | | Value at
October 31,
2018 | | | Unrealized
Appreciation
(Depreciation) | |
| Centrally Cleared Interest Rate Swap Agreements (cont’d.): | |
| NZD | 8,700 | | | | 05/01/20 | | | | 3.628%(S) | | | 3 Month BBR(2)(Q) | | $ | 214,368 | | | $ | 214,448 | | | $ | 80 | |
| NZD | 1,235 | | | | 10/03/22 | | | | 2.740%(S) | | | 3 Month BBR(2)(Q) | | | — | | | | 16,688 | | | | 16,688 | |
| NZD | 2,830 | | | | 04/26/23 | | | | 2.733%(S) | | | 3 Month BBR(2)(Q) | | | (67,254 | ) | | | 36,630 | | | | 103,884 | |
| NZD | 72,560 | | | | 07/18/23 | | | | 2.513%(S) | | | 3 Month BBR(1)(Q) | | | (394,760 | ) | | | (762,995 | ) | | | (368,235 | ) |
| NZD | 1,750 | | | | 03/13/24 | | | | 5.080%(S) | | | 3 Month BBR(2)(Q) | | | 28,107 | | | | 160,259 | | | | 132,152 | |
| NZD | 2,500 | | | | 03/15/24 | | | | 3.355%(S) | | | 3 Month BBR(2)(Q) | | | 2,492 | | | | 83,536 | | | | 81,044 | |
| NZD | 1,550 | | | | 07/04/24 | | | | 3.100%(S) | | | 3 Month BBR(2)(Q) | | | — | | | | 45,557 | | | | 45,557 | |
| NZD | 3,500 | | | | 01/10/27 | | | | 3.420%(S) | | | 3 Month BBR(2)(Q) | | | 73,670 | | | | 146,035 | | | | 72,365 | |
| NZD | 5,000 | | | | 04/18/28 | | | | 3.193%(S) | | | 3 Month BBR(2)(Q) | | | — | | | | 111,217 | | | | 111,217 | |
| PLN | 15,000 | | | | 10/17/21 | | | | 2.070%(A) | | | 6 Month WIBOR(2)(S) | | | 59 | | | | (14,799 | ) | | | (14,858 | ) |
| PLN | 9,000 | | | | 02/13/22 | | | | 1.990%(A) | | | 6 Month WIBOR(2)(S) | | | 51 | | | | 3,714 | | | | 3,663 | |
| PLN | 6,000 | | | | 03/15/22 | | | | 2.530%(A) | | | 6 Month WIBOR(2)(S) | | | — | | | | 33,998 | | | | 33,998 | |
| PLN | 5,450 | | | | 06/13/22 | | | | 2.220%(A) | | | 6 Month WIBOR(2)(S) | | | 403 | | | | (2,657 | ) | | | (3,060 | ) |
| PLN | 4,000 | | | | 03/14/23 | | | | 3.810%(A) | | | 6 Month WIBOR(2)(S) | | | 65,345 | | | | 81,686 | | | | 16,341 | |
| PLN | 17,000 | | | | 05/24/23 | | | | 2.520%(A) | | | 6 Month WIBOR(2)(S) | | | — | | | | 25,463 | | | | 25,463 | |
| PLN | 73,670 | | | | 08/24/23 | | | | 2.390%(A) | | | 6 Month WIBOR(2)(S) | | | — | | | | (64,091 | ) | | | (64,091 | ) |
| PLN | 11,000 | | | | 09/09/23 | | | | 1.900%(A) | | | 6 Month WIBOR(2)(S) | | | (435,493 | ) | | | (77,556 | ) | | | 357,937 | |
| PLN | 30,000 | | | | 03/28/28 | | | | 2.895%(A) | | | 6 Month WIBOR(2)(S) | | | — | | | | 128,518 | | | | 128,518 | |
| PLN | 38,980 | | | | 06/12/28 | | | | 3.070%(A) | | | 6 Month WIBOR(1)(S) | | | — | | | | (200,503 | ) | | | (200,503 | ) |
| PLN | 3,540 | | | | 07/11/28 | | | | 2.935%(A) | | | 6 Month WIBOR(2)(S) | | | — | | | | 5,670 | | | | 5,670 | |
| SEK | 20,000 | | | | 01/20/20 | | | | 0.485%(A) | | | 3 Month STIBOR(2)(Q) | | | 28 | | | | 26,135 | | | | 26,107 | |
See Notes to Financial Statements.
| | | | |
| PGIM Global Total Return Fund | | | 125 | |
Schedule of Investments (continued)
as of October 31, 2018
Interest rate swap agreements outstanding at October 31, 2018 (continued):
| | | | | | | | | | | | | | | | | | | | | | | | |
Notional
Amount
(000)# | | | Termination
Date | | | Fixed
Rate | | | Floating Rate | | Value at
Trade
Date | | | Value at
October 31,
2018 | | | Unrealized
Appreciation
(Depreciation) | |
| Centrally Cleared Interest Rate Swap Agreements (cont’d.): | |
| SEK | 13,000 | | | | 09/15/21 | | | | (0.003)%(A) | | | 3 Month STIBOR(2)(Q) | | $ | 26 | | | $ | (7,279 | ) | | $ | (7,305 | ) |
| SEK | 27,200 | | | | 12/15/21 | | | | 0.203%(A) | | | 3 Month STIBOR(2)(Q) | | | (607 | ) | | | 3,097 | | | | 3,704 | |
| SEK | 12,700 | | | | 04/25/23 | | | | 0.750%(A) | | | 3 Month STIBOR(2)(Q) | | | 30 | | | | 21,395 | | | | 21,365 | |
| SEK | 38,380 | | | | 07/11/23 | | | | 0.458%(A) | | | 3 Month STIBOR(2)(Q) | | | — | | | | (7,416 | ) | | | (7,416 | ) |
| SEK | 835,900 | | | | 09/12/23 | | | | 0.497%(A) | | | 3 Month STIBOR(2)(Q) | | | (335,277 | ) | | | (198,795 | ) | | | 136,482 | |
| SEK | 15,550 | | | | 03/15/24 | | | | 0.840%(A) | | | 3 Month STIBOR(2)(Q) | | | — | | | | 26,783 | | | | 26,783 | |
| SEK | 12,700 | | | | 08/29/24 | | | | 1.657%(A) | | | 3 Month STIBOR(2)(Q) | | | 22,804 | | | | 79,027 | | | | 56,223 | |
| SEK | 3,000 | | | | 11/16/25 | | | | 1.485%(A) | | | 3 Month STIBOR(2)(Q) | | | 20 | | | | 17,861 | | | | 17,841 | |
| SEK | 6,000 | | | | 12/09/25 | | | | 1.505%(A) | | | 3 Month STIBOR(2)(Q) | | | 23 | | | | 35,815 | | | | 35,792 | |
| SEK | 15,000 | | | | 06/27/26 | | | | 1.001%(A) | | | 3 Month STIBOR(2)(Q) | | | 33 | | | | 7,172 | | | | 7,139 | |
| SEK | 15,390 | | | | 06/22/27 | | | | 1.031%(A) | | | 3 Month STIBOR(2)(Q) | | | — | | | | (4,176 | ) | | | (4,176 | ) |
| SEK | 58,000 | | | | 03/27/28 | | | | 1.267%(A) | | | 3 Month STIBOR(2)(Q) | | | — | | | | 91,675 | | | | 91,675 | |
| SEK | 8,535 | | | | 07/11/28 | | | | 1.141%(A) | | | 3 Month STIBOR(2)(Q) | | | — | | | | (3,613 | ) | | | (3,613 | ) |
| SGD | 15,540 | | | | 05/21/23 | | | | 2.030%(S) | | | 6 Month SIBOR(1)(S) | | | — | | | | 124,429 | | | | 124,429 | |
| SGD | 8,330 | | | | 05/21/28 | | | | 2.436%(S) | | | 6 Month SIBOR(2)(S) | | | — | | | | (80,483 | ) | | | (80,483 | ) |
| | 29,280 | | | | 11/17/18 | | | | 1.080%(T) | | | 1 Day USOIS(1)(T) | | | 216 | | | | 193,260 | | | | 193,044 | |
| | 44,020 | | | | 11/18/18 | | | | 0.911%(A) | | | 1 Day USOIS(1)(A) | | | (2,127 | ) | | | 364,982 | | | | 367,109 | |
| | 104,710 | | | | 02/15/19 | | | | 1.820%(T) | | | 1 Day USOIS(1)(T) | | | — | | | | 162,423 | | | | 162,423 | |
| | 12,038 | | | | 03/31/19 | | | | 1.431%(A) | | | 1 Day USOIS(1)(A) | | | — | | | | 79,134 | | | | 79,134 | |
| | 12,032 | | | | 03/31/19 | | | | 1.431%(A) | | | 1 Day USOIS(1)(A) | | | — | | | | 79,185 | | | | 79,185 | |
| | 33,710 | | | | 06/30/19 | | | | 1.479%(A) | | | 1 Day USOIS(1)(A) | | | — | | | | 277,560 | | | | 277,560 | |
See Notes to Financial Statements.
Interest rate swap agreements outstanding at October 31, 2018 (continued):
| | | | | | | | | | | | | | | | | | | | | | | | |
Notional
Amount
(000)# | | | Termination
Date | | | Fixed
Rate | | | Floating Rate | | Value at
Trade
Date | | | Value at
October 31,
2018 | | | Unrealized
Appreciation
(Depreciation) | |
| Centrally Cleared Interest Rate Swap Agreements (cont’d.): | |
| | 7,950 | | | | 06/30/19 | | | | 1.486%(A) | | | 1 Day USOIS(1)(A) | | $ | — | | | $ | 64,849 | | | $ | 64,849 | |
| | 31,615 | | | | 06/30/19 | | | | 1.502%(A) | | | 1 Day USOIS(1)(A) | | | (16,170 | ) | | | 252,892 | | | | 269,062 | |
| | 19,860 | | | | 09/08/19 | | | | 1.290%(A) | | | 1 Day USOIS(1)(A) | | | — | | | | 232,130 | | | | 232,130 | |
| | 69,545 | | | | 09/30/19 | | | | 1.707%(A) | | | 1 Day USOIS(1)(A) | | | 19,344 | | | | 563,073 | | | | 543,729 | |
| | 163,980 | | | | 12/31/19 | | | | 1.840%(A) | | | 1 Day USOIS(1)(A) | | | 284,662 | | | | 1,500,063 | | | | 1,215,401 | |
| | 82,895 | | | | 12/31/19 | | | | 1.950%(A) | | | 1 Day USOIS(1)(A) | | | 26,216 | | | | 600,524 | | | | 574,308 | |
| | 65,165 | | | | 12/31/19 | | | | 2.040%(A) | | | 1 Day USOIS(1)(A) | | | 733 | | | | 368,456 | | | | 367,723 | |
| | 75,290 | | | | 12/31/19 | | | | 2.107%(A) | | | 1 Day USOIS(1)(A) | | | (129 | ) | | | 341,649 | | | | 341,778 | |
| | 48,465 | | | | 03/08/20 | | | | 2.157%(A) | | | 1 Day USOIS(1)(A) | | | — | | | | 225,565 | | | | 225,565 | |
| | 7,375 | | | | 03/28/20 | | | | 2.190%(A) | | | 1 Day USOIS(1)(A) | | | (379 | ) | | | 35,350 | | | | 35,729 | |
| | 125,670 | | | | 03/31/20 | | | | 2.295%(A) | | | 1 Day USOIS(1)(A) | | | 34,188 | | | | 519,613 | | | | 485,425 | |
| | 146,390 | | | | 03/31/20 | | | | 2.369%(A) | | | 1 Day USOIS(1)(A) | | | (38,353 | ) | | | 421,554 | | | | 459,907 | |
| | 41,940 | | | | 04/24/20 | | | | 2.311%(A) | | | 1 Day USOIS(1)(A) | | | — | | | | 136,917 | | | | 136,917 | |
| | 20,575 | | | | 05/31/22 | | | | 2.353%(A) | | | 1 Day USOIS(1)(A) | | | — | | | | 263,584 | | | | 263,584 | |
| | 36,820 | | | | 06/16/22 | | | | —(4) | | | —(4) | | | — | | | | (135,968 | ) | | | (135,968 | ) |
| | 137,145 | | | | 08/31/22 | | | | 2.550%(A) | | | 1 Day USOIS(1)(A) | | | 4,472 | | | | 1,032,972 | | | | 1,028,500 | |
| | 31,820 | | | | 11/30/22 | | | | 2.614%(A) | | | 1 Day USOIS(1)(A) | | | — | | | | 192,972 | | | | 192,972 | |
| | 25,540 | | | | 06/22/23 | | | | 2.911%(S) | | | 3 Month LIBOR(2)(Q) | | | (255,388 | ) | | | 58,537 | | | | 313,925 | |
| | 39,730 | | | | 02/15/24 | | | | 2.167%(S) | | | 3 Month LIBOR(1)(Q) | | | — | | | | 1,906,982 | | | | 1,906,982 | |
| | 41,965 | | | | 02/15/24 | | | | 2.183%(S) | | | 3 Month LIBOR(1)(Q) | | | (61,081 | ) | | | 1,978,377 | | | | 2,039,458 | |
| | 19,410 | | | | 07/17/24 | | | | 2.926%(S) | | | 3 Month LIBOR(2)(Q) | | | — | | | | (237,107 | ) | | | (237,107 | ) |
| | 9,950 | | | | 08/15/24 | | | | 2.168%(S) | | | 3 Month LIBOR(1)(Q) | | | — | | | | 520,364 | | | | 520,364 | |
See Notes to Financial Statements.
| | | | |
| PGIM Global Total Return Fund | | | 127 | |
Schedule of Investments (continued)
as of October 31, 2018
Interest rate swap agreements outstanding at October 31, 2018 (continued):
| | | | | | | | | | | | | | | | | | | | | | | | |
Notional
Amount
(000)# | | | Termination
Date | | | Fixed
Rate | | | Floating Rate | | Value at
Trade
Date | | | Value at
October 31,
2018 | | | Unrealized
Appreciation
(Depreciation) | |
| Centrally Cleared Interest Rate Swap Agreements (cont’d.): | |
| | 79,885 | | | | 08/15/24 | | | | 2.170%(S) | | | 3 Month LIBOR(1)(Q) | | $ | 239,360 | | | $ | 4,170,444 | | | $ | 3,931,084 | |
| | 30,545 | | | | 08/15/24 | | | | 2.176%(S) | | | 3 Month LIBOR(1)(Q) | | | 100,339 | | | | 1,585,206 | | | | 1,484,867 | |
| | 62,410 | | | | 11/15/24 | | | | 2.334%(S) | | | 3 Month LIBOR(1)(Q) | | | 203,394 | | | | 2,450,062 | | | | 2,246,668 | |
| | 27,885 | | | | 02/28/25 | | | | 2.454%(A) | | | 1 Day USOIS(1)(A) | | | 31,281 | | | | 516,556 | | | | 485,275 | |
| | 22,935 | | | | 02/28/25 | | | | 3.019%(S) | | | 3 Month LIBOR(1)(Q) | | | — | | | | 147,439 | | | | 147,439 | |
| | 95,077 | | | | 05/31/25 | | | | 2.998%(S) | | | 3 Month LIBOR(1)(Q) | | | (64,153 | ) | | | 824,635 | | | | 888,788 | |
| | 11,910 | | | | 07/31/25 | | | | 2.802%(A) | | | 1 Day USOIS(1)(A) | | | — | | | | 13,389 | | | | 13,389 | |
| | 35,410 | | | | 07/31/25 | | | | 3.105%(S) | | | 3 Month LIBOR(1)(Q) | | | 27,937 | | | | 146,131 | | | | 118,194 | |
| | 69,779 | | | | 07/31/25 | | | | 3.109%(S) | | | 3 Month LIBOR(1)(Q) | | | 47,715 | | | | 269,614 | | | | 221,899 | |
| | 1,170 | | | | 01/08/26 | | | | 2.210%(S) | | | 3 Month LIBOR(1)(Q) | | | 46,093 | | | | 66,008 | | | | 19,915 | |
| | 13,586 | | | | 02/15/27 | | | | 1.824%(A) | | | 1 Day USOIS(1)(A) | | | 138,472 | | | | 1,014,936 | | | | 876,464 | |
| | 4,710 | | | | 02/15/27 | | | | 1.899%(A) | | | 1 Day USOIS(1)(A) | | | 22,823 | | | | 323,355 | | | | 300,532 | |
| | 3,045 | | | | 02/15/27 | | | | 1.965%(A) | | | 1 Day USOIS(1)(A) | | | — | | | | 192,759 | | | | 192,759 | |
| | 11,425 | | | | 02/15/27 | | | | 2.068%(A) | | | 1 Day USOIS(1)(A) | | | (6,540 | ) | | | 627,741 | | | | 634,281 | |
| | 3,560 | | | | 05/15/27 | | | | 1.823%(A) | | | 1 Day USOIS(1)(A) | | | — | | | | 276,239 | | | | 276,239 | |
| | 6,645 | | | | 05/15/27 | | | | 2.295%(S) | | | 3 Month LIBOR(1)(Q) | | | (19,143 | ) | | | 413,222 | | | | 432,365 | |
| | 6,140 | | | | 05/21/28 | | | | 2.421%(S) | | | 3 Month LIBOR(1)(Q) | | | — | | | | 367,428 | | | | 367,428 | |
| | 7,225 | | | | 05/03/32 | | | | 2.434%(S) | | | 3 Month LIBOR(2)(Q) | | | — | | | | (632,368 | ) | | | (632,368 | ) |
| | 5,715 | | | | 05/03/37 | | | | 2.508%(S) | | | 3 Month LIBOR(1)(Q) | | | — | | | | 611,416 | | | | 611,416 | |
| | 825 | | | | 03/16/38 | | | | 2.987%(S) | | | 3 Month LIBOR(2)(Q) | | | — | | | | (37,902 | ) | | | (37,902 | ) |
| | 1,680 | | | | 02/15/42 | | | | 1.369%(A) | | | 1 Day USOIS(1)(A) | | | 180 | | | | 447,048 | | | | 446,868 | |
See Notes to Financial Statements.
Interest rate swap agreements outstanding at October 31, 2018 (continued):
| | | | | | | | | | | | | | | | | | | | | | | | |
Notional
Amount
(000)# | | | Termination
Date | | | Fixed
Rate | | | Floating Rate | | Value at
Trade
Date | | | Value at
October 31,
2018 | | | Unrealized
Appreciation
(Depreciation) | |
| Centrally Cleared Interest Rate Swap Agreements (cont’d.): | |
| | 2,820 | | | | 10/04/42 | | | | 2.527%(S) | | | 3 Month LIBOR(2)(Q) | | $ | — | | | $ | (374,844 | ) | | $ | (374,844 | ) |
| | 1,160 | | | | 11/15/43 | | | | 2.659%(S) | | | 3 Month LIBOR(1)(Q) | | | — | | | | 123,549 | | | | 123,549 | |
| | 845 | | | | 09/27/46 | | | | 1.380%(A) | | | 1 Day USOIS(1)(A) | | | 165 | | | | 247,482 | | | | 247,317 | |
| | 2,490 | | | | 10/04/47 | | | | 2.536%(S) | | | 3 Month LIBOR(1)(Q) | | | — | | | | 367,277 | | | | 367,277 | |
| | 620 | | | | 03/16/48 | | | | 2.970%(S) | | | 3 Month LIBOR(1)(Q) | | | — | | | | 38,931 | | | | 38,931 | |
| | 790 | | | | 04/09/48 | | | | 2.545%(S) | | | 3 Month LIBOR(1)(Q) | | | — | | | | 116,171 | | | | 116,171 | |
| | 735 | | | | 05/08/48 | | | | 2.627%(S) | | | 3 Month LIBOR(1)(Q) | | | — | | | | 91,386 | | | | 91,386 | |
| | 4,325 | | | | 07/17/49 | | | | 2.914%(S) | | | 3 Month LIBOR(1)(Q) | | | — | | | | 332,604 | | | | 332,604 | |
| ZAR | 3,320 | | | | 08/26/20 | | | | 7.855%(Q) | | | 3 Month JIBAR(2)(Q) | | | 3 | | | | 1,427 | | | | 1,424 | |
| ZAR | 228,000 | | | | 06/21/21 | | | | 7.465%(Q) | | | 3 Month JIBAR(2)(Q) | | | (979 | ) | | | (100,887 | ) | | | (99,908 | ) |
| ZAR | 148,100 | | | | 09/23/22 | | | | 7.430%(Q) | | | 3 Month JIBAR(2)(Q) | | | — | | | | (187,591 | ) | | | (187,591 | ) |
| ZAR | 17,000 | | | | 11/15/23 | | | | 8.085%(Q) | | | 3 Month JIBAR(2)(Q) | | | (311 | ) | | | (164 | ) | | | 147 | |
| ZAR | 16,800 | | | | 05/12/26 | | | | 8.680%(Q) | | | 3 Month JIBAR(2)(Q) | | | 18 | | | | 18,419 | | | | 18,401 | |
| ZAR | 27,500 | | | | 06/30/27 | | | | 8.015%(Q) | | | 3 Month JIBAR(2)(Q) | | | (155 | ) | | | (61,969 | ) | | | (61,814 | ) |
| ZAR | 68,200 | | | | 11/07/27 | | | | 8.360%(Q) | | | 3 Month JIBAR(2)(Q) | | | 53 | | | | (55,841 | ) | | | (55,894 | ) |
| ZAR | 43,090 | | | | 01/17/28 | | | | 7.833%(Q) | | | 3 Month JIBAR(2)(Q) | | | — | | | | (145,675 | ) | | | (145,675 | ) |
| ZAR | 35,000 | | | | 04/16/28 | | | | 7.655%(Q) | | | 3 Month JIBAR(2)(Q) | | | (1,219 | ) | | | (150,772 | ) | | | (149,553 | ) |
| ZAR | 176,800 | | | | 07/16/28 | | | | 8.170%(Q) | | | 3 Month JIBAR(2)(Q) | | | 695 | | | | (376,827 | ) | | | (377,522 | ) |
| ZAR | 70,000 | | | | 08/14/28 | | | | 8.350%(Q) | | | 3 Month JIBAR(2)(Q) | | | — | | | | (83,863 | ) | | | (83,863 | ) |
| | | | | | | | | | | | | | | | | | | | | | | | |
| | | | | | | | | | | | | | $ | (1,514,628 | ) | | $ | 25,773,760 | | | $ | 27,288,388 | |
| | | | | | | | | | | | | | | | | | | | | | | | |
See Notes to Financial Statements.
| | | | |
| PGIM Global Total Return Fund | | | 129 | |
Schedule of Investments (continued)
as of October 31, 2018
Interest rate swap agreements outstanding at October 31, 2018 (continued):
| | | | | | | | | | | | | | | | | | | | | | | | | | |
Notional Amount (000)# | | | Termination
Date | | | Fixed
Rate | | | Floating Rate | | Fair
Value | | | Upfront
Premiums
Paid
(Received) | | | Unrealized
Appreciation
(Depreciation) | | | Counterparty |
| OTC Interest Rate Swap Agreements: |
| AED | 90,500 | | | | 04/05/21 | | | | 3.005%(A) | | | 3 Month EIBOR(1)(Q) | | $ | (140,317 | ) | | $ | — | | | $ | (140,317 | ) | | BNP Paribas |
| CLP | 2,890,000 | | | | 02/09/27 | | | | 4.120%(S) | | | 1 Day CLOIS(2)(S) | | | (34,501 | ) | | | — | | | | (34,501 | ) | | Morgan Stanley |
| CLP | 94,000 | | | | 12/19/27 | | | | 4.370%(S) | | | 1 Day CLOIS(2)(S) | | | 1,389 | | | | — | | | | 1,389 | | | Morgan Stanley |
| CLP | 2,420,000 | | | | 12/20/27 | | | | 4.260%(S) | | | 1 Day CLOIS(2)(S) | | | (16,967 | ) | | | — | | | | (16,967 | ) | | Morgan Stanley |
| CLP | 842,800 | | | | 01/23/28 | | | | 4.245%(S) | | | 1 Day CLOIS(2)(S) | | | (3,774 | ) | | | — | | | | (3,774 | ) | | Morgan Stanley |
| CLP | 2,168,000 | | | | 01/26/28 | | | | 4.210%(S) | | | 1 Day CLOIS(2)(S) | | | (19,253 | ) | | | — | | | | (19,253 | ) | | Morgan Stanley |
| CLP | 1,080,000 | | | | 02/01/28 | | | | 4.200%(S) | | | 1 Day CLOIS(2)(S) | | | (11,410 | ) | | | — | | | | (11,410 | ) | | Morgan Stanley |
| CLP | 1,750,000 | | | | 03/27/28 | | | | 4.220%(S) | | | 1 Day CLOIS(2)(S) | | | (23,148 | ) | | | — | | | | (23,148 | ) | | Citibank NA |
| CLP | 2,092,000 | | | | 05/17/28 | | | | 4.270%(S) | | | 1 Day CLOIS(2)(S) | | | 1,804 | | | | — | | | | 1,804 | | | Citibank NA |
| CNH | 52,500 | | | | 08/15/23 | | | | 3.115%(Q) | | | 7 Day China Fixing Repo Rates(2)(Q) | | | 10,713 | | | | (110 | ) | | | 10,823 | | | UBS AG |
| COP | 33,000,000 | | | | 12/06/18 | | | | 6.100%(Q) | | | 1 Day COOIS(1)(Q) | | | (50,554 | ) | | | — | | | | (50,554 | ) | | Morgan Stanley |
| COP | 4,351,000 | | | | 11/01/26 | | | | 6.590%(Q) | | | 1 Day COOIS(2)(Q) | | | 32,897 | | | | — | | | | 32,897 | | | Morgan Stanley |
| COP | 10,220,000 | | | | 11/04/26 | | | | 6.770%(Q) | | | 1 Day COOIS(2)(Q) | | | 114,186 | | | | — | | | | 114,186 | | | Morgan Stanley |
| COP | 13,700,000 | | | | 06/02/27 | | | | 5.910%(Q) | | | 1 Day COOIS(2)(Q) | | | (121,850 | ) | | | — | | | | (121,850 | ) | | Morgan Stanley |
| COP | 484,000 | | | | 12/19/27 | | | | 6.085%(Q) | | | 1 Day COOIS(2)(Q) | | | (3,418 | ) | | | — | | | | (3,418 | ) | | Morgan Stanley |
| COP | 5,437,000 | | | | 01/23/28 | | | | 6.035%(Q) | | | 1 Day COOIS(2)(Q) | | | (49,204 | ) | | | — | | | | (49,204 | ) | | Morgan Stanley |
| COP | 6,670,000 | | | | 01/26/28 | | | | 6.000%(Q) | | | 1 Day COOIS(2)(Q) | | | (64,940 | ) | | | — | | | | (64,940 | ) | | Morgan Stanley |
| COP | 5,607,000 | | | | 02/01/28 | | | | 6.020%(Q) | | | 1 Day COOIS(2)(Q) | | | (45,420 | ) | | | — | | | | (45,420 | ) | | Morgan Stanley |
| COP | 13,000,000 | | | | 03/27/28 | | | | 6.150%(Q) | | | 1 Day COOIS(2)(Q) | | | (85,593 | ) | | | — | | | | (85,593 | ) | | Citibank NA |
| COP | 7,890,000 | | | | 05/17/28 | | | | 5.990%(Q) | | | 1 Day COOIS(2)(Q) | | | (79,198 | ) | | | — | | | | (79,198 | ) | | Citibank NA |
| COP | 9,400,000 | | | | 07/18/28 | | | | 6.150%(Q) | | | 1 Day COOIS(2)(Q) | | | (74,564 | ) | | | — | | | | (74,564 | ) | | Morgan Stanley |
| ILS | 6,500 | | | | 11/20/18 | | | | 2.200%(A) | | | 3 Month TELBOR(2)(Q) | | | 38,091 | | | | — | | | | 38,091 | | | Hong Kong & Shanghai Bank |
| ILS | 7,500 | | | | 12/09/22 | | | | 1.530%(A) | | | 3 Month TELBOR(2)(Q) | | | 51,281 | | | | — | | | | 51,281 | | | Citibank NA |
| ILS | 3,200 | | | | 03/06/23 | | | | 3.525%(A) | | | 3 Month TELBOR(2)(Q) | | | 101,154 | | | | — | | | | 101,154 | | | Deutsche Bank AG |
| ILS | 4,200 | | | | 06/27/23 | | | | 3.730%(A) | | | 3 Month TELBOR(2)(Q) | | | 135,430 | | | | — | | | | 135,430 | | | Credit Suisse International |
| ILS | 3,000 | | | | 04/26/26 | | | | 1.685%(A) | | | 3 Month TELBOR(2)(Q) | | | (6,719 | ) | | | — | | | | (6,719 | ) | | JPMorgan Chase |
| ILS | 5,000 | | | | 06/24/26 | | | | 1.660%(A) | | | 3 Month TELBOR(2)(Q) | | | (20,321 | ) | | | — | | | | (20,321 | ) | | Citibank NA |
| ILS | 4,000 | | | | 09/19/26 | | | | 1.600%(A) | | | 3 Month TELBOR(2)(Q) | | | (28,962 | ) | | | — | | | | (28,962 | ) | | Barclays Bank PLC |
| ILS | 7,000 | | | | 01/12/27 | | | | 1.975%(A) | | | 3 Month TELBOR(2)(Q) | | | 21,169 | | | | — | | | | 21,169 | | | Citibank NA |
| ILS | 3,000 | | | | 03/15/27 | | | | 2.130%(A) | | | 3 Month TELBOR(2)(Q) | | | 15,220 | | | | — | | | | 15,220 | | | Citibank NA |
| ILS | 2,745 | | | | 06/22/27 | | | | 1.845%(A) | | | 3 Month TELBOR(2)(Q) | | | (10,034 | ) | | | — | | | | (10,034 | ) | | Citibank NA |
See Notes to Financial Statements.
Interest rate swap agreements outstanding at October 31, 2018 (continued):
| | | | | | | | | | | | | | | | | | | | | | | | | | |
Notional Amount (000)# | | | Termination
Date | | | Fixed
Rate | | | Floating Rate | | Fair
Value | | | Upfront
Premiums
Paid
(Received) | | | Unrealized
Appreciation
(Depreciation) | | | Counterparty |
| OTC Interest Rate Swap Agreements (cont’d.): |
| ILS | 5,600 | | | | 04/26/28 | | | | 1.915%(A) | | | 3 Month TELBOR(2)(Q) | | $ | (23,769 | ) | | $ | — | | | $ | (23,769 | ) | | BNP Paribas |
| ILS | 38,930 | | | | 07/16/28 | | | | 2.045%(A) | | | 3 Month TELBOR(2)(Q) | | | (118,296 | ) | | | — | | | | (118,296 | ) | | JPMorgan Chase |
| JPY | 35,000 | | | | 12/14/32 | | | | 1.575%(S) | | | 6 Month JPY LIBOR(2)(S) | | | 47,102 | | | | — | | | | 47,102 | | | Hong Kong & Shanghai Bank |
| KRW | 1,500,000 | | | | 08/14/21 | | | | 2.773%(Q) | | | 3 Month KRW LIBOR(2)(Q) | | | 34,405 | | | | — | | | | 34,405 | | | Hong Kong & Shanghai Bank |
| KRW | 655,000 | | | | 10/07/22 | | | | 1.765%(Q) | | | 3 Month KRW LIBOR(2)(Q) | | | (3,646 | ) | | | — | | | | (3,646 | ) | | JPMorgan Chase |
| KRW | 3,300,000 | | | | 04/17/23 | | | | 2.170%(Q) | | | 3 Month KWCDC(2)(Q) | | | 27,249 | | | | (183 | ) | | | 27,432 | | | Morgan Stanley |
| KRW | 900,000 | | | | 11/05/24 | | | | 2.425%(Q) | | | 3 Month KRW LIBOR(2)(Q) | | | 20,924 | | | | — | | | | 20,924 | | | Citibank NA |
| KRW | 1,485,000 | | | | 10/28/26 | | | | 1.520%(Q) | | | 3 Month KRW LIBOR(2)(Q) | | | (49,139 | ) | | | (14 | ) | | | (49,125 | ) | | JPMorgan Chase |
| KRW | 2,040,000 | | | | 04/26/27 | | | | 1.880%(Q) | | | 3 Month KRW LIBOR(2)(Q) | | | (22,738 | ) | | | — | | | | (22,738 | ) | | Morgan Stanley |
| KRW | 1,280,000 | | | | 10/17/28 | | | | 1.450%(Q) | | | 3 Month KRW LIBOR(2)(Q) | | | (63,000 | ) | | | — | | | | (63,000 | ) | | Citibank NA |
| KRW | 520,000 | | | | 01/27/31 | | | | 1.870%(Q) | | | 3 Month KRW LIBOR(2)(Q) | | | (11,309 | ) | | | — | | | | (11,309 | ) | | JPMorgan Chase |
| MYR | 16,000 | | | | 08/19/23 | | | | 3.445%(Q) | | | 3 Month KLIBOR(2)(Q) | | | (85,929 | ) | | | — | | | | (85,929 | ) | | Morgan Stanley |
| MYR | 1,700 | | | | 04/28/25 | | | | 4.040%(Q) | | | 3 Month KLIBOR(2)(Q) | | | (385 | ) | | | — | | | | (385 | ) | | Citibank NA |
| RUB | 3,300,000 | | | | 07/31/19 | | | | 7.820%(A) | | | 3 Month MosPRIME(2)(Q) | | | 552,298 | | | | — | | | | 552,298 | | | JPMorgan Chase |
| SAR | 90,500 | | | | 04/05/21 | | | | 3.020%(A) | | | 3 Month SAIBOR(2)(Q) | | | 132,622 | | | | — | | | | 132,622 | | | BNP Paribas |
| SAR | 37,850 | | | | 11/08/22 | | | | 3.090%(A) | | | 3 Month SAIBOR(1)(Q) | | | (40,050 | ) | | | — | | | | (40,050 | ) | | BNP Paribas |
| SAR | 38,780 | | | | 04/05/25 | | | | 3.480%(A) | | | 3 Month SAIBOR(1)(Q) | | | 17,332 | | | | — | | | | 17,332 | | | BNP Paribas |
| THB | 550,000 | | | | 08/08/20 | | | | 1.840%(S) | | | 6 Month BIBOR(2)(S) | | | 39,460 | | | | — | | | | 39,460 | | | Citibank NA |
| THB | 120,000 | | | | 08/23/23 | | | | 1.920%(S) | | | 6 Month BIBOR(2)(S) | | | (51,403 | ) | | | — | | | | (51,403 | ) | | Morgan Stanley |
| THB | 28,900 | | | | 04/30/25 | | | | 2.560%(S) | | | 6 Month BIBOR(2)(S) | | | 8,487 | | | | — | | | | 8,487 | | | Citibank NA |
| TWD | 115,500 | | | | 03/17/21 | | | | 0.780%(Q) | | | 3 Month TAIBOR(2)(Q) | | | 278 | | | | — | | | | 278 | | | Barclays Bank PLC |
See Notes to Financial Statements.
| | | | |
| PGIM Global Total Return Fund | | | 131 | |
Schedule of Investments (continued)
as of October 31, 2018
Interest rate swap agreements outstanding at October 31, 2018 (continued):
| | | | | | | | | | | | | | | | | | | | | | | | | | |
Notional Amount (000)# | | | Termination
Date | | | Fixed
Rate | | | Floating Rate | | Fair
Value | | | Upfront
Premiums
Paid
(Received) | | | Unrealized
Appreciation
(Depreciation) | | | Counterparty |
| OTC Interest Rate Swap Agreements (cont’d.): |
| ZAR | 40,930 | | | | 03/22/42 | | | | 7.800%(Q) | | | 3 Month JIBAR(2)(Q) | | $ | (302,256 | ) | | $ | — | | | $ | (302,256 | ) | | Deutsche Bank AG |
| ZAR | 89,400 | | | | 09/22/42 | | | | 8.020%(Q) | | | 3 Month JIBAR(2)(Q) | | | (524,825 | ) | | | — | | | | (524,825 | ) | | Deutsche Bank AG |
| ZAR | 38,700 | | | | 03/22/47 | | | | 7.650%(Q) | | | 3 Month JIBAR(1)(Q) | | | 308,964 | | | | — | | | | 308,964 | | | Deutsche Bank AG |
| ZAR | 83,965 | | | | 09/22/47 | | | | 7.890%(Q) | | | 3 Month JIBAR(1)(Q) | | | 520,681 | | | | — | | | | 520,681 | | | Deutsche Bank AG |
| | | | | | | | | | | | | | | | | | | | | | | | | | |
| | | | | | | | | | | | | | $ | 46,244 | | | $ | (307 | ) | | $ | 46,551 | | | |
| | | | | | | | | | | | | | | | | | | | | | | | | | |
| (1) | The Fund pays the fixed rate and receives the floating rate. |
| (2) | The Fund pays the floating rate and receives the fixed rate. |
| (3) | The Fund pays the floating rate of 3 Month CHF LIBOR plus 1.75 bps quarterly and receives the floating rate of 6 Month CHF LIBOR semiannually. |
| (4) | The Fund pays the floating rate of 3 Month LIBOR quarterly and receives the floating rate of 1 Day USOIS plus 22.38 bps quarterly. |
Balances Reported in the Statement of Assets and Liabilities for OTC Forward Rate and Swap Agreements:
| | | | | | | | | | | | | | | | |
| | | Premiums Paid | | | Premiums Received | | | Unrealized
Appreciation | | | Unrealized
Depreciation | |
OTC Forward Rate Agreements | | $ | — | | | $ | — | | | $ | 253,216 | | | $ | (525,158 | ) |
OTC Swap Agreements | | $ | 2,547,079 | | | $ | (9,757,534 | ) | | $ | 8,814,806 | | | $ | (4,793,606 | ) |
Summary of Collateral for Centrally Cleared/Exchange-traded Derivatives:
Cash and securities segregated as collateral to cover requirements for open centrally cleared/exchange-traded derivatives are listed by broker as follows:
| | | | | | | | |
Broker | | Cash and/or Foreign Currency | | | Securities Market Value | |
Citigroup Global Markets | | $ | — | | | $ | 24,741,110 | |
JPMorgan Securities | | | — | | | | 15,566,124 | |
| | | | | | | | |
Total | | $ | — | | | $ | 40,307,234 | |
| | | | | | | | |
Fair Value Measurements:
Various inputs are used in determining the value of the Fund’s investments. These inputs are summarized in the three broad levels listed below.
Level 1—unadjusted quoted prices generally in active markets for identical securities.
Level 2—quoted prices for similar securities, interest rates and yield curves, prepayment speeds, foreign currency exchange rates and other observable inputs.
See Notes to Financial Statements.
Level 3—unobservable inputs for securities valued in accordance with Board approved fair valuation procedures.
The following is a summary of the inputs used as of October 31, 2018 in valuing such portfolio securities:
| | | | | | | | | | | | |
| | | Level 1 | | | Level 2 | | | Level 3 | |
Investments in Securities | | | | | | | | | | | | |
Asset-Backed Securities | | | | | | | | | | | | |
Cayman Islands | | $ | — | | | $ | 205,487,082 | | | $ | — | |
Ireland | | | — | | | | 15,778,475 | | | | — | |
Netherlands | | | — | | | | 1,140,022 | | | | — | |
Spain | | | — | | | | 9,417,198 | | | | — | |
United States | | | — | | | | 93,142,163 | | | | 12,695,642 | |
Bank Loans | | | | | | | | | | | | |
France | | | — | | | | — | | | | 262,834 | |
United Kingdom | | | — | | | | 481,691 | | | | — | |
Commercial Mortgage-Backed Securities | | | | | | | | | | | | |
United States | | | — | | | | 130,553,617 | | | | — | |
Convertible Bond | | | | | | | | | | | | |
United Arab Emirates | | | — | | | | 6,154,146 | | | | — | |
Corporate Bonds | | | | | | | | | | | | |
Canada | | | — | | | | 16,394,954 | | | | — | |
China | | | — | | | | 8,427,810 | | | | — | |
Dominican Republic | | | — | | | | 963,291 | | | | — | |
France | | | — | | | | 16,845,725 | | | | — | |
Germany | | | — | | | | 11,691,257 | | | | — | |
Hungary | | | — | | | | 417,302 | | | | — | |
Indonesia | | | — | | | | 1,497,903 | | | | — | |
Israel | | | — | | | | 5,148,631 | | | | — | |
Italy | | | — | | | | 12,803,658 | | | | — | |
Japan | | | — | | | | 5,442,701 | | | | — | |
Kazakhstan | | | — | | | | 1,549,104 | | | | — | |
Mexico | | | — | | | | 23,332,038 | | | | — | |
Netherlands | | | — | | | | 10,989,090 | | | | — | |
Peru | | | — | | | | 863,750 | | | | — | |
Portugal | | | — | | | | 1,248,570 | | | | — | |
Romania | | | — | | | | 2,372,753 | | | | — | |
Russia | | | — | | | | 9,483,145 | | | | — | |
Singapore | | | — | | | | 365,375 | | | | — | |
South Africa | | | — | | | | 1,990,478 | | | | — | |
South Korea | | | — | | | | 2,527,762 | | | | — | |
Spain | | | — | | | | 4,915,642 | | | | — | |
Supranational Bank | | | — | | | | 34,930,974 | | | | — | |
Switzerland | | | — | | | | 11,178,597 | | | | — | |
Tunisia | | | — | | | | 700,614 | | | | — | |
United Arab Emirates | | | — | | | | 3,387,700 | | | | — | |
United Kingdom | | | — | | | | 27,804,531 | | | | — | |
United States | | | — | | | | 168,625,070 | | | | 144,688 | |
Municipal Bonds | | | | | | | | | | | | |
Puerto Rico | | | — | | | | 725,787 | | | | — | |
Residential Mortgage-Backed Securities | | | | | | | | | | | | |
Bermuda | | | — | | | | 7,858,178 | | | | — | |
See Notes to Financial Statements.
| | | | |
| PGIM Global Total Return Fund | | | 133 | |
Schedule of Investments (continued)
as of October 31, 2018
| | | | | | | | | | | | |
| | | Level 1 | | | Level 2 | | | Level 3 | |
Investments in Securities (continued) | | | | | | | | | | | | |
Residential Mortgage-Backed Securities (continued) | | | | | | | | | | | | |
Cayman Islands | | $ | — | | | $ | 1,980,987 | | | $ | — | |
United Kingdom | | | — | | | �� | 19,976,955 | | | | — | |
United States | | | — | | | | 22,388,546 | | | | — | |
Sovereign Bonds | | | | | | | | | | | | |
Albania | | | — | | | | 1,558,731 | | | | — | |
Argentina | | | — | | | | 30,508,294 | | | | — | |
Australia | | | — | | | | 2,134,966 | | | | — | |
Austria | | | — | | | | 4,253,094 | | | | — | |
Belgium | | | — | | | | 7,484,586 | | | | — | |
Brazil | | | — | | | | 32,873,834 | | | | — | |
Bulgaria | | | — | | | | 7,626,228 | | | | — | |
Canada | | | — | | | | 9,766,198 | | | | — | |
Cayman Islands | | | — | | | | 2,214,500 | | | | — | |
Chile | | | — | | | | 783,186 | | | | — | |
China | | | — | | | | 139,310 | | | | — | |
Colombia | | | — | | | | 18,502,059 | | | | — | |
Costa Rica | | | — | | | | 1,192,518 | | | | — | |
Croatia | | | — | | | | 11,694,153 | | | | — | |
Cyprus | | | — | | | | 30,315,197 | | | | — | |
Czech Republic | | | — | | | | 1,338,247 | | | | — | |
Denmark | | | — | | | | 3,434,042 | | | | — | |
Dominican Republic | | | — | | | | 4,140,000 | | | | — | |
Egypt | | | — | | | | 2,493,381 | | | | — | |
Finland | | | — | | | | 719,300 | | | | — | |
France | | | — | | | | 28,712,152 | | | | — | |
Germany | | | — | | | | 1,130,439 | | | | — | |
Greece | | | — | | | | 46,639,759 | | | | — | |
Guernsey | | | — | | | | 1,830,258 | | | | — | |
Hong Kong | | | — | | | | 2,071,093 | | | | — | |
Hungary | | | — | | | | 20,560,433 | | | | — | |
Iceland | | | — | | | | 7,572,083 | | | | — | |
Indonesia | | | — | | | | 26,830,922 | | | | — | |
Iraq | | | — | | | | 1,654,882 | | | | — | |
Ireland | | | — | | | | 2,873,765 | | | | — | |
Isle of Man | | | — | | | | 8,428,638 | | | | — | |
Israel | | | — | | | | 3,751,564 | | | | — | |
Italy | | | — | | | | 74,768,948 | | | | — | |
Japan | | | — | | | | 40,603,727 | | | | — | |
Jersey | | | — | | | | 159,133 | | | | — | |
Kuwait | | | — | | | | 1,992,518 | | | | — | |
Latvia | | | — | | | | 1,231,054 | | | | — | |
Lithuania | | | — | | | | 10,514,234 | | | | — | |
Macedonia | | | — | | | | 4,245,016 | | | | — | |
Malaysia | | | — | | | | 9,021,668 | | | | — | |
Mexico | | | — | | | | 28,048,858 | | | | — | |
Montenegro | | | — | | | | 1,419,408 | | | | — | |
New Zealand | | | — | | | | 6,356,619 | | | | — | |
See Notes to Financial Statements.
| | | | | | | | | | | | |
| | | Level 1 | | | Level 2 | | | Level 3 | |
Investments in Securities (continued) | | | | | | | | | | | | |
Sovereign Bonds (continued) | | | | | | | | | | | | |
Norway | | $ | — | | | $ | 3,858,677 | | | $ | — | |
Panama | | | — | | | | 6,837,613 | | | | — | |
Peru | | | — | | | | 17,156,439 | | | | — | |
Poland | | | — | | | | 13,806,761 | | | | — | |
Portugal | | | — | | | | 49,772,168 | | | | — | |
Qatar | | | — | | | | 3,082,288 | | | | — | |
Romania | | | — | | | | 9,029,488 | | | | — | |
Russia | | | — | | | | 1,235,452 | | | | — | |
Saudi Arabia | | | — | | | | 7,629,881 | | | | — | |
Senegal | | | — | | | | 1,472,754 | | | | — | |
Serbia | | | — | | | | 6,819,115 | | | | — | |
Singapore | | | — | | | | 1,092,842 | | | | — | |
Slovakia | | | — | | | | 2,187,559 | | | | — | |
Slovenia | | | — | | | | 8,497,834 | | | | — | |
South Africa | | | — | | | | 9,326,457 | | | | — | |
South Korea | | | — | | | | 5,919,287 | | | | — | |
Spain | | | — | | | | 80,272,918 | | | | — | |
Sweden | | | — | | | | 11,684,671 | | | | — | |
Thailand | | | — | | | | 1,428,519 | | | | — | |
Turkey | | | — | | | | 7,504,341 | | | | — | |
Ukraine | | | — | | | | 1,757,813 | | | | — | |
United Arab Emirates | | | — | | | | 2,743,670 | | | | — | |
United Kingdom | | | — | | | | 23,660,344 | | | | — | |
Uruguay | | | — | | | | 1,125,676 | | | | — | |
U.S. Government Agency Obligations | | | — | | | | 4,426,364 | | | | — | |
U.S. Treasury Obligations | | | — | | | | 5,728,869 | | | | — | |
Common Stock | | | 29,083 | | | | — | | | | — | |
Preferred Stock | | | 105,880 | | | | — | | | | — | |
Affiliated Mutual Funds | | | 33,305,234 | | | | — | | | | — | |
Options Purchased | | | — | | | | 67,369,003 | | | | — | |
Options Written | | | — | | | | (68,197,502 | ) | | | (4,755 | ) |
Other Financial Instruments* | | | | | | | | | | | | |
Futures Contracts | | | (16,344,188 | ) | | | — | | | | — | |
OTC Forward Foreign Currency Exchange Contracts | | | — | | | | 15,964,461 | | | | — | |
OTC Cross Currency Exchange Contracts | | | — | | | | 6,587,845 | | | | — | |
Centrally Cleared Credit Default Swap Agreements | | | — | | | | 342,658 | | | | — | |
OTC Credit Default Swap Agreements | | | — | | | | (3,243,542 | ) | | | 8,043 | |
OTC Forward Rate Agreements | | | — | | | | — | | | | (271,942 | ) |
Centrally Cleared Inflation Swap Agreements | | | — | | | | (246,215 | ) | | | — | |
Centrally Cleared Interest Rate Swap Agreements | | | — | | | | 27,288,388 | | | | — | |
OTC Interest Rate Swap Agreements | | | — | | | | 46,244 | | | | — | |
| | | | | | | | | | | | |
Total | | $ | 17,096,009 | | | $ | 1,738,541,407 | | | $ | 12,834,510 | |
| | | | | | | | | | | | |
See Notes to Financial Statements.
| | | | |
| PGIM Global Total Return Fund | | | 135 | |
Schedule of Investments (continued)
as of October 31, 2018
| * | Other financial instruments are derivative instruments not reflected in the Schedule of Investments, such as futures, forwards and centrally cleared swap contracts, which are recorded at the unrealized appreciation (depreciation) on the instrument, and OTC swap contracts which are recorded at fair value. |
Industry Classification:
The industry classification of investments and other assets in excess of liabilities shown as a percentage of net assets as of October 31, 2018 were as follows (unaudited):
| | | | |
Sovereign Bonds | | | 44.7 | % |
Collateralized Loan Obligations | | | 13.5 | |
Commercial Mortgage-Backed Securities | | | 7.5 | |
Banks | | | 5.7 | |
Residential Mortgage-Backed Securities | | | 5.1 | |
Options Purchased | | | 3.9 | |
Oil & Gas | | | 2.2 | |
Multi-National | | | 2.0 | |
Affiliated Mutual Funds (1.7% represents investments purchased with collateral from securities on loan) | | | 1.9 | |
Consumer Loans | | | 1.5 | |
Electric | | | 1.5 | |
Student Loans | | | 1.3 | |
Chemicals | | | 1.2 | |
Media | | | 1.0 | |
Commercial Services | | | 0.8 | |
Pipelines | | | 0.7 | |
Home Equity Loans | | | 0.7 | |
Pharmaceuticals | | | 0.6 | |
Auto Manufacturers | | | 0.6 | |
Transportation | | | 0.5 | |
Insurance | | | 0.5 | |
Diversified Financial Services | | | 0.5 | |
Telecommunications | | | 0.4 | |
Home Builders | | | 0.4 | |
Software | | | 0.4 | |
Investment Companies | | | 0.3 | |
Real Estate Investment Trusts (REITs) | | | 0.3 | |
Retail | | | 0.3 | |
Healthcare-Services | | | 0.3 | |
U.S. Treasury Obligations | | | 0.3 | |
Entertainment | | | 0.3 | |
U.S. Government Agency Obligations | | | 0.3 | |
Building Materials | | | 0.3 | |
Automobiles | | | 0.2 | % |
Biotechnology | | | 0.2 | |
Foods | | | 0.2 | |
Aerospace & Defense | | | 0.2 | |
Auto Parts & Equipment | | | 0.1 | |
Miscellaneous Manufacturing | | | 0.1 | |
Oil & Gas Services | | | 0.1 | |
Home Furnishings | | | 0.1 | |
Apparel | | | 0.1 | |
Housewares | | | 0.1 | |
Healthcare-Products | | | 0.1 | |
Computers | | | 0.1 | |
Internet | | | 0.1 | |
Household Products/Wares | | | 0.1 | |
Packaging & Containers | | | 0.0 | * |
Mining | | | 0.0 | * |
Forest Products & Paper | | | 0.0 | * |
Consumer Services | | | 0.0 | * |
Municipal Bonds | | | 0.0 | * |
Electronics | | | 0.0 | * |
Lodging | | | 0.0 | * |
Office/Business Equipment | | | 0.0 | * |
Airlines | | | 0.0 | * |
Semiconductors | | | 0.0 | * |
Agriculture | | | 0.0 | * |
Oil, Gas & Consumable Fuels | | | 0.0 | * |
| | | | |
| | | 103.3 | |
Options Written | | | (3.9 | ) |
Other assets in excess of liabilities | | | 0.6 | |
| | | | |
| | | 100.0 | % |
| | | | |
See Notes to Financial Statements.
Effects of Derivative Instruments on the Financial Statements and Primary Underlying Risk Exposure:
The Fund invested in derivative instruments during the reporting period. The primary types of risk associated with these derivative instruments are credit contracts risk, foreign exchange contracts risk and interest rate contracts risk. The effect of such derivative instruments on the Fund’s financial position and financial performance as reflected in the Statement of Assets and Liabilities and Statement of Operations is presented in the summary below.
Fair values of derivative instruments as of October 31, 2018 as presented in the Statement of Assets and Liabilities:
| | | | | | | | | | | | |
| | | Asset Derivatives | | | Liability Derivatives | |
Derivatives not accounted
for as hedging instruments,
carried at fair value | | Statement of
Assets and
Liabilities Location | | Fair
Value | | | Statement of
Assets and
Liabilities Location | | Fair
Value | |
| Credit contracts | | Due from/to broker-variation
margin swaps | | $ | 380,172 | * | | Due from/to broker-variation
margin swaps | | $ | 37,514 | * |
| Credit contracts | | Premiums paid for OTC
swap agreements | | | 2,547,079 | | | Premiums received for OTC
swap agreements | | | 9,757,227 | |
| Credit contracts | | Unaffiliated investments | | | 92,548 | | | Options written
outstanding, at value | | | 181,611 | |
| Credit contracts | | Unrealized appreciation on
OTC swap agreements | | | 6,581,377 | | | Unrealized depreciation on
OTC swap agreements | | | 2,606,728 | |
| Foreign exchange contracts | | Unaffiliated investments | | | 66,613,805 | | | Options written
outstanding, at value | | | 67,695,025 | |
| Foreign exchange contracts | | Unrealized appreciation on
OTC cross currency
exchange contracts | | | 9,308,881 | | | Unrealized depreciation on
OTC cross currency
exchange contracts | | | 2,721,036 | |
| Foreign exchange contracts | | Unrealized appreciation on
OTC forward foreign
currency exchange contracts | | | 41,059,895 | | | Unrealized depreciation on
OTC forward foreign
currency exchange contracts | | | 25,095,434 | |
| Interest rate contracts | | Due from/to broker-variation
margin futures | | | 1,298,914 | * | | Due from/to broker-variation
margin futures | | | 17,643,102 | * |
| Interest rate contracts | | Due from/to broker-variation
margin swaps | | | 41,202,671 | * | | Due from/to broker-variation
margin swaps | | | 14,160,498 | * |
| Interest rate contracts | | — | | | — | | | Premiums received for OTC
swap agreements | | | 307 | |
| Interest rate contracts | | Unaffiliated investments | | | 662,650 | | | Options written
outstanding, at value | | | 325,621 | |
| Interest rate contracts | | Unrealized appreciation on
OTC forward rate
agreements | | | 253,216 | | | Unrealized depreciation on
OTC forward rate
agreements | | | 525,158 | |
See Notes to Financial Statements.
| | | | |
| PGIM Global Total Return Fund | | | 137 | |
Schedule of Investments (continued)
as of October 31, 2018
| | | | | | | | | | | | | | | | |
| | | Asset Derivatives | | | Liability Derivatives | |
Derivatives not accounted
for as hedging instruments,
carried at fair value | | Statement of
Assets and
Liabilities Location | | | Fair
Value | | | Statement of
Assets and
Liabilities Location | | | Fair
Value | |
| Interest rate contracts | |
| Unrealized appreciation
on OTC swap agreements |
| | $ | 2,233,429 | | |
| Unrealized depreciation
on OTC swap agreements |
| | $ | 2,186,878 | |
| | | | | | | | | | | | | | | | |
| | | | | | $ | 172,234,637 | | | | | | | $ | 142,936,139 | |
| | | | | | | | | | | | | | | | |
| * | Includes cumulative appreciation (depreciation) as reported in the schedule of open futures and centrally cleared swap contracts. Only unsettled variation margin receivable (payable) is reported within the Statement of Assets and Liabilities. |
The effects of derivative instruments on the Statement of Operations for the year ended October 31, 2018 are as follows:
| | | | | | | | | | | | | | | | | | | | | | | | |
Amount of Realized Gain (Loss) on Derivatives Recognized in Income | |
Derivatives not accounted
for as hedging instruments,
carried at fair value | | Options
Purchased(1) | | | Options
Written | | | Futures | | | Forward & Cross
Currency
Exchange
Contracts | | | Forward
Rate
Agreements | | | Swaps | |
Credit contracts | | $ | (975,681 | ) | | $ | 1,187,377 | | | $ | — | | | $ | — | | | $ | — | | | $ | 3,593,122 | |
Foreign exchange contracts | | | (4,401,448 | ) | | | 7,440,467 | | | | — | | | | 13,033,528 | | | | — | | | | — | |
Interest rate contracts | | | (797,831 | ) | | | 678,486 | | | | (17,475,434 | ) | | | — | | | | (162,720 | ) | | | 7,625,490 | |
| | | | | | | | | | | | | | | | | | | | | | | | |
Total | | $ | (6,174,960 | ) | | $ | 9,306,330 | | | $ | (17,475,434 | ) | | $ | 13,033,528 | | | $ | (162,720 | ) | | $ | 11,218,612 | |
| | | | | | | | | | | | | | | | | | | | | | | | |
| (1) | Included in net realized gain (loss) on investment transactions in the Statement of Operations. |
| | | | | | | | | | | | | | | | | | | | | | | | |
Change in Unrealized Appreciation (Depreciation) on Derivatives Recognized in Income | |
Derivatives not accounted
for as hedging instruments,
carried at fair value | | Options
Purchased(2) | | | Options
Written | | | Futures | | | Forward & Cross
Currency
Exchange
Contracts | | | Forward
Rate
Agreements | | | Swaps | |
Credit contracts | | $ | 277,256 | | | $ | 187,177 | | | $ | — | | | $ | — | | | $ | — | | | $ | (1,535,874 | ) |
Foreign exchange contracts | | | (8,929,026 | ) | | | (7,120,295 | ) | | | — | | | | 22,868,108 | | | | — | | | | — | |
Interest rate contracts | | | 708,212 | | | | (395,641 | ) | | | (14,126,096 | ) | | | — | | | | (271,942 | ) | | | 18,929,359 | |
| | | | | | | | | | | | | | | | | | | | | | | | |
Total | | $ | (7,943,558 | ) | | $ | (7,328,759 | ) | | $ | (14,126,096 | ) | | $ | 22,868,108 | | | $ | (271,942 | ) | | $ | 17,393,485 | |
| | | | | | | | | | | | | | | | | | | | | | | | |
| (2) | Included in net change in unrealized appreciation (depreciation) on investments in the Statement of Operations. |
See Notes to Financial Statements.
For the year ended October 31, 2018, the Fund’s average volume of derivative activities is as follows:
| | | | | | | | | | | | | | | | | | |
Options
Purchased(1) | | | Options
Written(2) | | | Futures
Contracts—
Long
Positions(2) | | | Futures
Contracts—
Short
Positions(2) | | | Forward
Foreign
Currency
Exchange
Contracts—
Purchased(3) | |
| $ | 39,394,030 | | | $ | 1,711,595,128 | | | $ | 1,021,289,917 | | | $ | 647,794,673 | | | $ | 828,908,439 | |
| | | | | | | | | | | | | | | | | | |
Forward Foreign Currency Exchange
Contracts— Sold(3) | | | Cross
Currency
Exchange
Contracts(4) | | | Forward
Rate
Agreements(2) | | | Inflation
Swap
Agreements(2) | | | Interest
Rate
Swap
Agreements(2) | |
| $ | 731,470,722 | | | $ | 75,097,241 | | | $ | 79,720,000 | | | $ | 87,558,801 | | | $ | 4,324,998,555 | |
| | | | | | | | | | | | | | |
Credit Default
Swap Agreements— Buy
Protection(2) | | | Credit
Default
Swap
Agreements—
Sell
Protection(2) | | | Currency
Swap
Agreements(2) | | | Total
Return
Swap
Agreements(2) | |
| $ | 104,603,744 | | | $ | 340,883,088 | | | $ | 14,137,800 | | | $ | 5,000,000 | |
| (2) | Notional Amount in USD. |
| (3) | Value at Settlement Date. |
Financial Instruments/Transactions—Summary of Offsetting and Netting Arrangements:
The Fund invested in OTC derivatives and entered into financial instruments/transactions during the reporting period that are either offset in accordance with current requirements or are subject to enforceable master netting arrangements or similar agreements that permit offsetting. The information about offsetting and related netting arrangements for OTC derivatives and financial instruments/transactions, where the legal right to set-off exists, is presented in the summary below.
Offsetting of financial instrument/transaction assets and liabilities:
| | | | | | | | | | | | |
Description | | Gross Market
Value of
Recognized
Assets/(Liabilities) | | | Collateral
Pledged/(Received)(2) | | | Net Amount | |
Securities on Loan | | $ | 28,246,455 | | | $ | (28,246,455 | ) | | $ | — | |
| | | | | | | | | | | | |
Offsetting of OTC derivative assets and liabilities:
| | | | | | | | | | | | | | | | | | | | |
Counterparty | | Gross
Amounts of
Recognized
Assets(1) | | | Gross
Amounts of
Recognized
Liabilities(1) | | | Net Amounts of
Recognized
Assets/(Liabilities) | | | Collateral
Pledged/
(Received)(2) | | | Net Amount | |
Bank of America | | $ | 1,997,819 | | | $ | (2,368,666 | ) | | $ | (370,847 | ) | | $ | 370,847 | | | $ | — | |
Barclays Bank PLC | | | 5,170,951 | | | | (4,248,314 | ) | | | 922,637 | | | | (311,233 | ) | | | 611,404 | |
BNP Paribas | | | 17,698,586 | | | | (20,902,018 | ) | | | (3,203,432 | ) | | | 3,203,432 | | | | — | |
Citibank NA | | | 14,020,555 | | | | (13,367,823 | ) | | | 652,732 | | | | — | | | | 652,732 | |
See Notes to Financial Statements.
| | | | |
| PGIM Global Total Return Fund | | | 139 | |
Schedule of Investments (continued)
as of October 31, 2018
| | | | | | | | | | | | | | | | | | | | |
Counterparty | | Gross
Amounts of
Recognized
Assets(1) | | | Gross
Amounts of
Recognized
Liabilities(1) | | | Net
Amounts of
Recognized
Assets/(Liabilities) | | | Collateral
Pledged/
(Received)(2) | | | Net Amount | |
Citigroup Global Markets | | $ | 5,042 | | | $ | (191,606 | ) | | $ | (186,564 | ) | | $ | 186,564 | | | $ | — | |
Credit Suisse International | | | 1,118,872 | | | | (390,389 | ) | | | 728,483 | | | | (728,483 | ) | | | — | |
Deutsche Bank AG | | | 25,851,914 | | | | (15,197,269 | ) | | | 10,654,645 | | | | (10,654,645 | ) | | | — | |
Goldman Sachs International | | | 15,403,010 | | | | (17,742,898 | ) | | | (2,339,888 | ) | | | 1,956,583 | | | | (383,305 | ) |
Hong Kong & Shanghai Bank | | | 3,618,199 | | | | (3,167,913 | ) | | | 450,286 | | | | (28,294 | ) | | | 421,992 | |
JPMorgan Chase | | | 7,917,134 | | | | (5,663,257 | ) | | | 2,253,877 | | | | (1,631,497 | ) | | | 622,380 | |
JPMorgan Securities | | | 70,583 | | | | (28,411 | ) | | | 42,172 | | | | — | | | | 42,172 | |
Morgan Stanley | | | 32,795,522 | | | | (25,429,496 | ) | | | 7,366,026 | | | | (7,730,000 | ) | | | (363,974 | ) |
Toronto Dominion | | | 1,336,031 | | | | (436,341 | ) | | | 899,690 | | | | (852,830 | ) | | | 46,860 | |
UBS AG | | | 2,348,662 | | | | (1,960,624 | ) | | | 388,038 | | | | — | | | | 388,038 | |
| | | | | | | | | | | | | | | | | | | | |
| | $ | 129,352,880 | | | $ | (111,095,025 | ) | | $ | 18,257,855 | | | $ | (16,219,556 | ) | | $ | 2,038,299 | |
| | | | | | | | | | | | | | | | | | | | |
| (1) | Includes unrealized appreciation/(depreciation) on swaps and forwards, premiums paid/(received) on swap agreements and market value of purchased and written options, as represented on the Statement of Assets and Liabilities. |
| (2) | Collateral amount disclosed by the Portfolio is limited to the market value of financial instruments/transactions and the Portfolio’s OTC derivative exposure by counterparty. |
See Notes to Financial Statements.
Statement of Assets & Liabilities
as of October 31, 2018
| | | | |
Assets | | | | |
Investments at value, including securities on loan of $28,246,455: | | | | |
Unaffiliated investments (cost $1,848,830,063) | | $ | 1,773,237,197 | |
Affiliated investments (cost $33,303,553) | | | 33,305,234 | |
Cash | | | 281,513 | |
Foreign currency, at value (cost $2,826,184) | | | 2,823,256 | |
Cash segregated for counterparty—OTC | | | 4,996,583 | |
Unrealized appreciation on OTC forward foreign currency exchange contracts | | | 41,059,895 | |
Dividends and interest receivable | | | 16,925,607 | |
Unrealized appreciation on OTC cross currency exchange contracts | | | 9,308,881 | |
Unrealized appreciation on OTC swap agreements | | | 8,814,806 | |
Receivable for Fund shares sold | | | 5,045,216 | |
Receivable for investments sold | | | 3,328,674 | |
Premiums paid for OTC swap agreements | | | 2,547,079 | |
Due from broker—variation margin swaps | | | 877,552 | |
Unrealized appreciation on OTC forward rate agreements | | | 253,216 | |
Prepaid expenses | | | 13,934 | |
| | | | |
Total Assets | | | 1,902,818,643 | |
| | | | |
| |
Liabilities | | | | |
Options written outstanding, at value (proceeds received $66,877,549) | | | 68,202,257 | |
Payable to broker for collateral for securities on loan | | | 28,890,077 | |
Unrealized depreciation on OTC forward foreign currency exchange contracts | | | 25,095,434 | |
Premiums received for OTC swap agreements | | | 9,757,534 | |
Payable for Fund shares reacquired | | | 6,828,328 | |
Unrealized depreciation on OTC swap agreements | | | 4,793,606 | |
Due to broker—variation margin futures | | | 3,350,974 | |
Unrealized depreciation on OTC cross currency exchange contracts | | | 2,721,036 | |
Payable for investments purchased | | | 2,301,936 | |
Accrued expenses and other liabilities | | | 532,843 | |
Unrealized depreciation on OTC forward rate agreements | | | 525,158 | |
Management fee payable | | | 480,607 | |
Dividends payable | | | 346,919 | |
Distribution fee payable | | | 71,211 | |
Affiliated transfer agent fee payable | | | 27,325 | |
Affiliated shareholder servicing fee payable | | | 38 | |
| | | | |
Total Liabilities | | | 153,925,283 | |
| | | | |
| |
Net Assets | | $ | 1,748,893,360 | |
| | | | |
| | | | | |
Net assets were comprised of: | | | | |
Common stock, at par | | $ | 2,727,235 | |
Paid-in capital in excess of par | | | 1,825,398,937 | |
Total distributable earnings (loss) | | | (79,232,812 | ) |
| | | | |
Net assets, October 31, 2018 | | $ | 1,748,893,360 | |
| | | | |
See Notes to Financial Statements.
| | | | |
| PGIM Global Total Return Fund | | | 141 | |
Statement of Assets & Liabilities
as of October 31, 2018
| | | | |
Class A | | | | |
Net asset value and redemption price per share, | | | | |
($184,063,521 ÷ 28,922,541 shares of common stock issued and outstanding) | | $ | 6.36 | |
Maximum sales charge (4.50% of offering price) | | | 0.30 | |
| | | | |
Maximum offering price to public | | $ | 6.66 | |
| | | | |
|
Class B | |
Net asset value, offering price and redemption price per share, | | | | |
($2,168,435 ÷ 340,959 shares of common stock issued and outstanding) | | $ | 6.36 | |
| | | | |
|
Class C | |
Net asset value, offering price and redemption price per share, | | | | |
($34,888,745 ÷ 5,492,932 shares of common stock issued and outstanding) | | $ | 6.35 | |
| | | | |
|
Class Z | |
Net asset value, offering price and redemption price per share, | | | | |
($765,708,361 ÷ 119,646,676 shares of common stock issued and outstanding) | | $ | 6.40 | |
| | | | |
|
Class R2 | |
Net asset value, offering price and redemption price per share, | | | | |
($10,366 ÷ 1,609 shares of common stock issued and outstanding) | | $ | 6.44 | |
| | | | |
|
Class R4 | |
Net asset value, offering price and redemption price per share, | | | | |
($127,041 ÷ 19,705 shares of common stock issued and outstanding) | | $ | 6.45 | |
| | | | |
|
Class R6 | |
Net asset value, offering price and redemption price per share, | | | | |
($761,926,891 ÷ 118,299,061 shares of common stock issued and outstanding) | | $ | 6.44 | |
| | | | |
See Notes to Financial Statements.
Statement of Operations
Year Ended October 31, 2018
| | | | |
Net Investment Income (Loss) | |
Income | |
Interest income | | $ | 44,174,561 | |
Affiliated dividend income | | | 824,949 | |
Income from securities lending, net (including affiliated income of $75,828) | | | 203,910 | |
Unaffiliated dividend income | | | 8,446 | |
| | | | |
Total income | | | 45,211,866 | |
| | | | |
|
Expenses | |
Management fee | | | 7,560,300 | |
Distribution fee(a) | | | 862,153 | |
Shareholder servicing fees(a) | | | 38 | |
Transfer agent’s fees and expenses (including affiliated expense of $153,990)(a) | | | 1,209,582 | |
Custodian and accounting fees | | | 428,882 | |
Registration fees(a) | | | 292,681 | |
Shareholders’ reports | | | 227,905 | |
SEC registration fees | | | 171,181 | |
Audit fee | | | 67,318 | |
Directors’ fees | | | 37,520 | |
Legal fees and expenses | | | 35,888 | |
Miscellaneous | | | 29,895 | |
| | | | |
Total expenses | | | 10,923,343 | |
Less: Fee waiver and/or expense reimbursement(a) | | | (882,036 | ) |
| | | | |
Net expenses | | | 10,041,307 | |
| | | | |
Net investment income (loss) | | | 35,170,559 | |
| | | | |
| |
Realized And Unrealized Gain (Loss) On Investment And Foreign Currency Transactions | | | | |
Net realized gain (loss) on: | | | | |
Investment transactions (including affiliated of $(362)) | | | (4,476,822 | ) |
Futures transactions | | | (17,475,434 | ) |
Forward rate agreement transactions | | | (162,720 | ) |
Forward and cross currency contract transactions | | | (13,033,528 | ) |
Options written transactions | | | 9,306,330 | |
Swap agreement transactions | | | 11,218,612 | |
Foreign currency transactions | | | 253,038 | |
| | | | |
| | | (14,370,524 | ) |
| | | | |
Net change in unrealized appreciation (depreciation) on: | | | | |
Investments (including affiliated of $1,483) | | | (96,244,538 | ) |
Futures | | | (14,126,096 | ) |
Forward rate agreements | | | (271,942 | ) |
Forward and cross currency contracts | | | 22,868,108 | |
Options written | | | (7,328,759 | ) |
Swap agreements | | | 17,393,485 | |
Foreign currencies | | | (908,697 | ) |
| | | | |
| | | (78,618,439 | ) |
| | | | |
Net gain (loss) on investment and foreign currency transactions | | | (92,988,963 | ) |
| | | | |
Net Increase (Decrease) In Net Assets Resulting From Operations | | $ | (57,818,404 | ) |
| | | | |
See Notes to Financial Statements.
| | | | |
| PGIM Global Total Return Fund | | | 143 | |
Statement of Operations
Year Ended October 31, 2018
| (a) | Class specific expenses and waivers were as follows: |
| | | | | | | | | | | | | | | | | | | | | | | | | | | | |
| | | Class A | | | Class B | | | Class C | | | Class Z | | | Class R2 | | | Class R4 | | | Class R6 | |
Distribution fee | | | 469,936 | | | | 28,846 | | | | 363,349 | | | | — | | | | 22 | | | | — | | | | — | |
Shareholder servicing fees | | | — | | | | — | | | | — | | | | — | | | | 9 | | | | 29 | | | | — | |
Transfer agent’s fees and expenses | | | 351,697 | | | | 6,200 | | | | 40,744 | | | | 803,073 | | | | 50 | | | | 78 | | | | 7,740 | |
Registration fees | | | 26,764 | | | | 17,043 | | | | 17,677 | | | | 121,106 | | | | 19,707 | | | | 19,707 | | | | 70,677 | |
Fee waiver and/or expense reimbursement | | | (262,076 | ) | | | (21,418 | ) | | | (36,231 | ) | | | (522,814 | ) | | | (19,744 | ) | | | (19,753 | ) | | | — | |
See Notes to Financial Statements.
Statements of Changes in Net Assets
| | | | | | | | |
| | | Year Ended October 31, | |
| | | 2018 | | | 2017 | |
Increase (Decrease) in Net Assets | | | | | | | | |
Operations | | | | | | | | |
Net investment income (loss) | | $ | 35,170,559 | | | $ | 18,524,017 | |
Net realized gain (loss) on investment and foreign currency transactions | | | (14,370,524 | ) | | | (2,589,415 | ) |
Net change in unrealized appreciation (depreciation) on investments and foreign currencies | | | (78,618,439 | ) | | | 36,819,868 | |
| | | | | | | | |
Net increase (decrease) in net assets resulting from operations | | | (57,818,404 | ) | | | 52,754,470 | |
| | | | | | | | |
| | |
Dividends and Distributions | | | | | | | | |
Distributions from distributable earnings* | | | | | | | | |
Class A | | | (6,137,953 | ) | | | — | |
Class B | | | (71,940 | ) | | | — | |
Class C | | | (917,726 | ) | | | — | |
Class Z | | | (22,966,009 | ) | | | — | |
Class R2 | | | (255 | ) | | | — | |
Class R4 | | | (1,015 | ) | | | — | |
Class R6 | | | (22,571,586 | ) | | | — | |
| | | | | | | | |
| | | (52,666,484 | ) | | | — | |
| | | | | | | | |
Tax return of capital distributions | | | | | | | | |
Class A | | | — | | | | (1,212,278 | ) |
Class B | | | — | | | | (19,335 | ) |
Class C | | | — | | | | (168,785 | ) |
Class Z | | | — | | | | (2,517,498 | ) |
Class R6 | | | — | | | | (2,000,759 | ) |
| | | | | | | | |
| | | — | | | | (5,918,655 | ) |
| | | | | | | | |
Dividends from net investment income | | | | | | | | |
Class A | | | | | | | (3,622,440 | ) |
Class B | | | | | | | (57,774 | ) |
Class C | | | | | | | (504,353 | ) |
Class Z | | | | | | | (7,522,604 | ) |
Class R6 | | | | | | | (5,978,521 | ) |
| | | | | | | | |
| | | * | | | | (17,685,692 | ) |
| | | | | | | | |
Distributions from net realized gains | | | | | | | | |
Class A | | | | | | | (1,042,947 | ) |
Class B | | | | | | | (16,634 | ) |
Class C | | | | | | | (145,210 | ) |
Class Z | | | | | | | (2,165,855 | ) |
Class R6 | | | | | | | (1,721,293 | ) |
| | | | | | | | |
| | | * | | | | (5,091,939 | ) |
| | | | | | | | |
See Notes to Financial Statements.
| | | | |
| PGIM Global Total Return Fund | | | 145 | |
Statements of Changes in Net Assets (continued)
| | | | | | | | |
| | | Year Ended October 31, | |
| | | 2018 | | | 2017 | |
Fund share transactions (Net of share conversions) | | | | | | | | |
Net proceeds from shares sold | | $ | 1,290,833,238 | | | $ | 692,691,589 | |
Net asset value of shares issued in reinvestment of dividends and distributions | | | 48,731,606 | | | | 24,476,768 | |
Cost of shares reacquired | | | (540,533,576 | ) | | | (289,373,478 | ) |
| | | | | | | | |
Net increase (decrease) in net assets from Fund share transactions | | | 799,031,268 | | | | 427,794,879 | |
| | | | | | | | |
Total increase (decrease) | | | 688,546,380 | | | | 451,853,063 | |
|
Net Assets: | |
Beginning of year | | | 1,060,346,980 | | | | 608,493,917 | |
| | | | | | | | |
End of year(a) | | $ | 1,748,893,360 | | | $ | 1,060,346,980 | |
| | | | | | | | |
(a) Includes undistributed/(distributions in excess of) net investment income of: | | $ | * | | | $ | (2,289,345 | ) |
| | | | | | | | |
| * | For the year ended October 31, 2018, the Fund has adopted amendments to Regulation S-X (refer to Note 9). |
See Notes to Financial Statements.
Notes to Financial Statements
Prudential Global Total Return Fund, Inc. (the “Company”) is registered under the Investment Company Act of 1940, as amended (“1940 Act”), as an open-end management investment company and currently consists of two funds: PGIM Global Total Return (USD Hedged) Fund and PGIM Global Total Return Fund, each of which are non-diversified funds for purposes of the 1940 Act. These financial statements relate only to the PGIM Global Total Return Fund (the “Fund”). Effective June 11, 2018, the names of the Fund and the other funds which comprise the Company were changed by replacing “Prudential” with “PGIM” and each fund’s Class Q shares were renamed Class R6 shares.
The investment objective of the Fund is to seek total return, made up of current income and capital appreciation.
1. Accounting Policies
The Fund follows the investment company accounting and reporting guidance of the Financial Accounting Standards Board (“FASB”) Accounting Standard Codification (“ASC”) Topic 946 Financial Services—Investment Companies. The following accounting policies conform to U.S. generally accepted accounting principles. The Fund consistently follows such policies in the preparation of its financial statements.
Securities Valuation: The Fund holds securities and other assets and liabilities that are fair valued at the close of each day (generally, 4:00 PM Eastern time) the New York Stock Exchange (“NYSE”) is open for trading. Fair value is the price that would be received to sell an asset or paid to transfer a liability in an orderly transaction between market participants on the measurement date. The Company’s Board of Directors (the “Board”) has adopted valuation procedures for security valuation under which fair valuation responsibilities have been delegated to PGIM Investments LLC (“PGIM Investments” or the “Manager”). Pursuant to the Board’s delegation, a Valuation Committee has been established as two persons, being one or more officers of the Company, including: the Company’s Treasurer (or the Treasurer’s direct reports); and the Company’s Chief or Deputy Chief Compliance Officer (or Vice-President-level direct reports of the Chief or Deputy Chief Compliance Officer). Under the current valuation procedures, the Valuation Committee of the Board is responsible for supervising the valuation of portfolio securities and other assets and liabilities. The valuation procedures permit the Fund to utilize independent pricing vendor services, quotations from market makers, and alternative valuation methods when market quotations are either not readily available or not deemed representative of fair value. A record of the Valuation Committee’s actions is subject to the Board’s review, approval, and ratification at its next regularly scheduled quarterly meeting.
For the fiscal reporting period-end, securities and other assets and liabilities were fair valued at the close of the last U.S. business day. Trading in certain foreign securities may occur
| | | | |
| PGIM Global Total Return Fund | | | 147 | |
Notes to Financial Statements (continued)
when the NYSE is closed (including weekends and holidays). Because such foreign securities trade in markets that are open on weekends and U.S. holidays, the values of some of the Fund’s foreign investments may change on days when investors cannot purchase or redeem Fund shares.
Various inputs determine how the Fund’s investments are valued, all of which are categorized according to the three broad levels (Level 1, 2, or 3) detailed in the Schedule of Investments and referred to herein as the “fair value hierarchy” in accordance with FASB ASC Topic 820—Fair Value Measurements and Disclosures.
Derivative instruments, such as futures or options, that are traded on a national securities exchange are valued at the last sale price as of the close of trading on the applicable exchange where the security principally trades. Securities traded via NASDAQ are valued at the NASDAQ official closing price. To the extent these securities are valued at the last sale price or NASDAQ official closing price, they are classified as Level 1 in the fair value hierarchy.
Investments in open-end, non-exchange-traded mutual funds are valued at their net asset values as of the close of the NYSE on the date of valuation. These securities are classified as Level 1 in the fair value hierarchy since they may be purchased or sold at their net asset values on the date of valuation.
Fixed income securities traded in the OTC market are generally classified as Level 2 in the fair value hierarchy. Such fixed income securities are typically valued using the market approach which generally involves obtaining data from an approved independent third-party vendor source. The Fund utilizes the market approach as the primary method to value securities when market prices of identical or comparable instruments are available. The third-party vendors’ valuation techniques used to derive the evaluated bid price are based on evaluating observable inputs, including but not limited to, yield curves, yield spreads, credit ratings, deal terms, tranche level attributes, default rates, cash flows, prepayment speeds, broker/dealer quotations and reported trades. Certain Level 3 securities are also valued using the market approach when obtaining a single broker quote or when utilizing transaction prices for identical securities that have been used in excess of five business days. During the reporting period, there were no changes to report with respect to the valuation approach and/or valuation techniques discussed above.
Bank loans are generally valued at prices provided by approved independent pricing vendors. The pricing vendors utilize broker/dealer quotations and provide prices based on the average of such quotations. Bank loans valued using such vendor prices are generally classified as Level 2 in the fair value hierarchy. Bank loans valued based on a single broker
quote or at the original transaction price in excess of five business days are classified as Level 3 in the fair value hierarchy.
OTC derivative instruments are generally classified as Level 2 in the fair value hierarchy. Such derivative instruments are typically valued using the market approach and/or income approach which generally involves obtaining data from an approved independent third-party vendor source. The Fund utilizes the market approach when quoted prices in broker-dealer markets are available but also includes consideration of alternative valuation approaches, including the income approach. In the absence of reliable market quotations, the income approach is typically utilized for purposes of valuing OTC derivatives such as interest rate swaps based on a discounted cash flow analysis whereby the value of the instrument is equal to the present value of its future cash inflows or outflows. Such analysis includes projecting future cash flows and determining the discount rate (including the present value factors that affect the discount rate) used to discount the future cash flows. In addition, the third-party vendors’ valuation techniques used to derive the evaluated OTC derivative price is based on evaluating observable inputs, including but not limited to, underlying asset prices, indices, spreads, interest rates and exchange rates. Certain OTC derivatives may be classified as Level 3 when valued using the market approach by obtaining a single broker quote or when utilizing unobservable inputs in the income approach. During the reporting period, there were no changes to report with respect to the valuation approach and/or valuation techniques discussed above.
Centrally cleared swaps listed or traded on a multilateral or trade facility platform, such as a registered exchange, are generally valued at the daily settlement price determined by the respective exchange. These securities are classified as Level 2 in the fair value hierarchy, as the daily settlement price is not public.
Securities and other assets that cannot be priced according to the methods described above are valued based on pricing methodologies approved by the Board. In the event that unobservable inputs are used when determining such valuations, the securities will be classified as Level 3 in the fair value hierarchy.
When determining the fair value of securities, some of the factors influencing the valuation include: the nature of any restrictions on disposition of the securities; assessment of the general liquidity of the securities; the issuer’s financial condition and the markets in which it does business; the cost of the investment; the size of the holding and the capitalization of the issuer; the prices of any recent transactions or bids/offers for such securities or any comparable securities; any available analyst media or other reports or information deemed reliable by the Manager regarding the issuer or the markets or industry in which it operates. Using fair value to price securities may result in a value that is different from a security’s most recent closing price and from the price used by other unaffiliated mutual funds to calculate their net asset values.
Restricted and Illiquid Securities: Subject to guidelines adopted by the Board, the Fund may invest up to 15% of its net assets in illiquid securities, including those which are restricted
| | | | |
| PGIM Global Total Return Fund | | | 149 | |
Notes to Financial Statements (continued)
as to disposition under securities law (“restricted securities”). Restricted securities are valued pursuant to the valuation procedures noted above. Illiquid securities are those that, because of the absence of a readily available market or due to legal or contractual restrictions on resale, cannot be sold within seven days in the ordinary course of business at approximately the amount at which the Fund has valued the investment. Therefore, the Fund may find it difficult to sell illiquid securities at the time considered most advantageous by its subadviser and may incur transaction costs that would not be incurred in the sale of securities that were freely marketable. Certain securities that would otherwise be considered illiquid because of legal restrictions on resale to the general public may be traded among qualified institutional buyers under Rule 144A of the Securities Act of 1933. These Rule 144A securities, as well as commercial paper that is sold in private placements under Section 4(2) of the Securities Act, may be deemed liquid by the Fund’s subadviser under the guidelines adopted by the Board of the Company. However, the liquidity of the Fund’s investments in Rule 144A securities could be impaired if trading does not develop or declines.
Connecticut Avenue Securities (CAS) and Structured Agency Credit Risk (STACR): The Fund purchased government controlled Fannie Mae and Freddie Mac securities that transfer most of the cost of defaults to private investors including the Fund. These are insurance-like products that are called CAS by Fannie Mae and STACR securities by Freddie Mac. Payments on the securities are based primarily on the performance of a reference pool of underlying mortgages. With such securities, the Fund could lose some or all of its principal if the underlying mortgages experience credit defaults.
Foreign Currency Translation: The books and records of the Fund are maintained in U.S. dollars. Foreign currency amounts are translated into U.S. dollars on the following basis:
(i) market value of investment securities, other assets and liabilities—at the current rates of exchange;
(ii) purchases and sales of investment securities, income and expenses—at the rates of exchange prevailing on the respective dates of such transactions.
Although the net assets of the Fund are presented at the foreign exchange rates and market values at the close of the period, the Fund does not generally isolate that portion of the results of operations arising as a result of changes in the foreign exchange rates from the fluctuations arising from changes in the market prices of long-term portfolio securities held at the end of the period. Similarly, the Fund does not isolate the effect of changes in foreign exchange rates from the fluctuations arising from changes in the market prices of long-term portfolio securities sold during the period. Accordingly, holding period realized foreign currency gains (losses) are included in the reported net realized gains (losses) on
investment transactions. Notwithstanding the above, the Fund does isolate the effect of fluctuations in foreign currency exchange rates when determining the gain (loss) upon the sale or maturity of foreign currency denominated debt obligations; such amounts are included in net realized gains (losses) on foreign currency transactions.
Additionally, net realized gains (losses) on foreign currency transactions represent net foreign exchange gains (losses) from the disposition of holdings of foreign currencies, currency gains (losses) realized between the trade and settlement dates on securities transactions, and the difference between the amounts of interest, dividends and foreign withholding taxes recorded on the Fund’s books and the U.S. dollar equivalent amounts actually received or paid. Net unrealized currency gains (losses) arise from valuing foreign currency denominated assets and liabilities (other than investments) at period end exchange rates.
Forward and Cross Currency Contracts: A forward currency contract is a commitment to purchase or sell a foreign currency at a future date at a negotiated forward rate. The Fund enters into forward currency contracts in order to hedge its exposure to changes in foreign currency exchange rates on its foreign portfolio holdings or specific receivables and payables denominated in a foreign currency and to gain exposure to certain currencies. The contracts are valued daily at current forward exchange rates and any unrealized gain (loss) is included in net unrealized appreciation (depreciation) on investments and foreign currencies. Gain (loss) is realized on the settlement date of the contract equal to the difference between the settlement value of the original and negotiated forward contracts. This gain (loss), if any, is included in net realized gain (loss) on forward and cross currency contract transactions. Risks may arise upon entering into these contracts from the potential inability of the counterparties to meet the terms of their contracts. Forward currency contracts involve risks from currency exchange rate and credit risk in excess of the amounts reflected on the Statement of Assets and Liabilities. The Fund’s maximum risk of loss from counterparty credit risk is the net value of the cash flows to be received from the counterparty at the end of the contract’s life. A cross currency contract is a forward contract where a specified amount of one foreign currency will be exchanged for a specified amount of another foreign currency.
Options: The Fund purchased or wrote options in order to hedge against adverse market movements or fluctuations in value caused by changes in prevailing interest rates, value of equities or foreign currency exchange rates with respect to securities or financial instruments which the Fund currently owns or intends to purchase. The Fund may also use options to gain additional market exposure. The Fund’s principal reason for writing options is to realize, through receipt of premiums, a greater current return than would be realized on the underlying security alone. When the Fund purchases an option, it pays a premium and an amount equal to that premium is recorded as an asset. When the Fund writes an option, it receives a premium and an amount equal to that premium is recorded as a liability. The asset or liability is adjusted daily to reflect the current market value of the option. If an option expires unexercised, the Fund realizes a gain (loss) to the extent of the premium received or paid. If an option is exercised, the premium received or paid is recorded as an adjustment to
| | | | |
| PGIM Global Total Return Fund | | | 151 | |
Notes to Financial Statements (continued)
the proceeds from the sale or the cost of the purchase in determining whether the Fund has realized a gain (loss). The difference between the premium and the amount received or paid at the closing of a purchase or sale transaction is also treated as a realized gain (loss). Gain (loss) on purchased options is included in net realized gain (loss) on investment transactions. Gain (loss) on written options is presented separately as net realized gain (loss) on options written transactions.
The Fund, as writer of an option, may have no control over whether the underlying securities or financial instruments may be sold (called) or purchased (put). As a result, the Fund bears the market risk of an unfavorable change in the price of the security or financial instrument underlying the written option. The Fund, as purchaser of an OTC option, bears the risk of the potential inability of the counterparties to meet the terms of their contracts. With exchange-traded options contracts, there is minimal counterparty credit risk to the Fund since the exchanges’ clearinghouse acts as counterparty to all exchange-traded options and guarantees the options contracts against default.
When the Fund writes an option on a swap, an amount equal to any premium received by the Fund is recorded as a liability and is subsequently adjusted to the current market value of the written option on the swap. If a call option on a swap is exercised, the Fund becomes obligated to pay a fixed interest rate (noted as the strike price) and receive a variable interest rate on a notional amount. If a put option on a swap is exercised, the Fund becomes obligated to pay a variable interest rate and receive a fixed interest rate (noted as the strike price) on a notional amount. Premiums received from writing options on swaps that expire or are exercised are treated as realized gains upon the expiration or exercise of such options on swaps. The risk associated with writing put and call options on swaps is that the Fund will be obligated to be party to a swap agreement if an option on a swap is exercised.
Financial Futures Contracts: A financial futures contract is an agreement to purchase (long) or sell (short) an agreed amount of securities at a set price for delivery on a future date. Upon entering into a financial futures contract, the Fund is required to pledge to the broker an amount of cash and/or other assets equal to a certain percentage of the contract amount. This amount is known as the “initial margin.” Subsequent payments, known as “variation margin,” are made or received by the Fund each day, depending on the daily fluctuations in the value of the underlying security. Such variation margin is recorded for financial statement purposes on a daily basis as unrealized gain (loss). When the contract expires or is closed, the gain (loss) is realized and is presented in the Statement of Operations as net realized gain (loss) on futures transactions.
The Fund invested in financial futures contracts in order to hedge its existing portfolio securities, or securities the Fund intends to purchase, against fluctuations in value caused by changes in prevailing interest rates or foreign currency exchange rates. Should interest
rates move unexpectedly, the Fund may not achieve the anticipated benefits of the financial futures contracts and may realize a loss. The use of futures transactions involves the risk of imperfect correlation in movements in the price of futures contracts, interest rates and the underlying hedged assets. Since futures contracts are exchange-traded, there is minimal counterparty credit risk to the Fund since the exchanges’ clearinghouse acts as counterparty to all exchange-traded futures and guarantees the futures contracts against default.
Bank Loans: The Fund invests in bank loans. Bank loans include fixed and floating rate loans that are privately negotiated between a corporate borrower and one or more financial institutions, including, but not limited to, term loans, revolvers, and other instruments issued in the bank loan market. The Fund may acquire interests in loans directly (by way of assignment from the selling institution) or indirectly (by way of the purchase of a participation interest from the selling institution). Under a bank loan assignment, the Fund generally will succeed to all the rights and obligations of an assigning lending institution and becomes a lender under the loan agreement with the relevant borrower in connection with that loan. Under a bank loan participation, the Fund generally will have a contractual relationship only with the lender, not with the relevant borrower. As a result, the Fund generally will have the right to receive payments of principal, interest, and any fees to which it is entitled only from the lender selling the participation and only upon receipt by the lender of the payments from the relevant borrower. The Fund may not directly benefit from the collateral supporting the debt obligation in which it has purchased the participation. As a result, the Fund will assume the credit risk of both the borrower and the institution selling the participation to the Fund.
Forward Rate Agreements: Forward rate agreements represent an agreement between counterparties to exchange cash flows based on the difference between two interest rates, applied to a notional principal amount on a fixed future date. The Fund entered into forward rate agreements to gain yield exposure based on anticipated market conditions at the specified termination date of the agreement.
Swap Agreements: The Fund may enter into credit default, interest rate and other types of swap agreements. A swap agreement is an agreement to exchange the return generated by one instrument for the return generated by another instrument. Swap agreements are negotiated in the OTC market and may be executed either directly with counterparty (“OTC-traded”) or through a central clearing facility, such as a registered exchange. Swap agreements are valued daily at current market value and any change in value is included in the net unrealized appreciation (depreciation) on swap agreements. Centrally cleared swaps pay or receive an amount known as “variation margin”, based on daily changes in the valuation of the swap contract. Any upfront premiums paid and received are shown as swap premiums paid and swap premiums received in the Statement of Assets and Liabilities. Risk of loss may exceed amounts recognized on the Statement of Assets and Liabilities. Swap agreements outstanding at period end, if any, are listed on the Schedule of Investments.
| | | | |
| PGIM Global Total Return Fund | | | 153 | |
Notes to Financial Statements (continued)
Interest Rate Swaps: Interest rate swaps represent an agreement between counterparties to exchange cash flows based on the difference between two interest rates, applied to a notional principal amount for a specified period. The Fund is subject to interest rate risk exposure in the normal course of pursuing its investment objective. The Fund used interest rate swaps to maintain its ability to generate steady cash flow by receiving a stream of fixed-rate payments and to increase exposure to prevailing market rates by receiving floating rate payments. The Fund’s maximum risk of loss from counterparty credit risk is the discounted net present value of the cash flows to be received from the counterparty over the contract’s remaining life.
Inflation Swaps: The Fund entered into inflation swap agreements to protect against fluctuations in inflation rates. Inflation swaps are characterized by one party paying a fixed rate in exchange for a floating rate that is derived from an inflation index, such as the Consumer Price Index or UK Retail Price Index. Inflation swaps subject the Fund to interest rate risk.
Credit Default Swaps (“CDS”): CDS involve one party (the protection buyer) making a stream of payments to another party (the protection seller) in exchange for the right to receive a specified payment in the event of a default or as a result of a default (collectively a “credit event”) for the referenced entity (typically corporate issues or sovereign issues of an emerging country) on its obligation; or in the event of a write-down, principal shortfall, interest shortfall or default of all or part of the referenced entities comprising a credit index.
The Fund is subject to credit risk in the normal course of pursuing its investment objectives, and as such, has entered into CDS contracts to provide a measure of protection against defaults or to take an active long or short position with respect to the likelihood of a particular issuer’s default or the reference entity’s credit soundness. CDS contracts generally trade based on a spread which represents the cost a protection buyer has to pay the protection seller. The protection buyer is said to be short the credit as the value of the contract rises the more the credit deteriorates. The value of the CDS contract increases for the protection buyer if the spread increases. The Fund’s maximum risk of loss from counterparty credit risk for purchased CDS is the inability of the counterparty to honor the contract up to the notional value due to a credit event.
As a seller of protection on credit default swap agreements, the Fund generally receives an agreed upon payment from the buyer of protection throughout the term of the swap, provided no credit event occurs. As the seller, the Fund effectively increases its investment risk because, in addition to its total net assets, the Fund may be subject to investment exposure on the notional amount of the swap.
The maximum amount of the payment that the Fund, as a seller of protection, could be required to make under a credit default swap agreement would be equal to the notional amount of the underlying security or index contract as a result of a credit event. This potential amount will be partially offset by any recovery values of the respective referenced obligations, or net amounts received from the settlement of buy protection credit default swap agreements which the Fund entered into for the same referenced entity or index. As a buyer of protection, the Fund generally receives an amount up to the notional value of the swap if a credit event occurs.
Implied credit spreads, represented in absolute terms, utilized in determining the market value of credit default swap agreements where the Fund is the seller of protection as of period end are disclosed in the footnotes to the Schedule of Investments, if applicable. These spreads serve as indicators of the current status of the payment/performance risk and represent the likelihood of default risk for the credit derivative. The implied credit spread of a particular referenced entity reflects the cost of buying/selling protection and may include upfront payments required to enter into the agreement. Wider credit spreads and increased market value in absolute terms, when compared to the notional amount of the swap, represent a deterioration of the referenced entity’s credit soundness and a greater likelihood of risk of default or other credit event occurring as defined under the terms of the agreement.
Currency Swaps: The Fund entered into currency swap agreements primarily to gain yield exposure on foreign bonds. Currency swap agreements involve two parties exchanging two different currencies with an agreement to reverse the exchange at a later date at specified exchange rates.
Total Return Swaps: In a total return swap, one party receives payments based on the market value of the security or the commodity involved, or total return of a specific referenced asset, such as an equity, index or bond, and in return pays a fixed amount. The Fund is subject to risk exposures associated with the referenced asset in the normal course of pursuing its investment objectives. The Fund entered into total return swaps to manage its exposure to a security or an index. The Fund’s maximum risk of loss from counterparty credit risk is the change in the value of the security, in the Fund’s favor, from the point of entering into the contract.
Master Netting Arrangements: The Fund is subject to various Master Agreements, or netting arrangements, with select counterparties. These are agreements which a subadviser may have negotiated and entered into on behalf of the Fund. A master netting arrangement between the Fund and the counterparty permits the Fund to offset amounts payable by the Fund to the same counterparty against amounts to be received; and by the receipt of collateral from the counterparty by the Fund to cover the Fund’s exposure to the counterparty. However, there is no assurance that such mitigating factors are easily enforceable. In addition to master netting arrangements, the right to set-off exists when all the conditions are met such that each of the parties owes the other determinable amounts, the reporting party has the right to set-off the amount owed with the amount owed by the
| | | | |
| PGIM Global Total Return Fund | | | 155 | |
Notes to Financial Statements (continued)
other party, the reporting party intends to set-off and the right of set-off is enforceable by law. During the reporting period, there was no intention to settle on a net basis and all amounts are presented on a gross basis on the Statement of Assets and Liabilities.
The Company, on behalf of the Fund, is a party to International Swaps and Derivatives Association, Inc. (“ISDA”) Master Agreements with certain counterparties that govern OTC derivative and foreign exchange contracts entered into from time to time. The Master Agreements may contain provisions regarding, among other things, the parties’ general obligations, representations, agreements, collateral requirements, events of default and early termination. With respect to certain counterparties, in accordance with the terms of the Master Agreements, collateral posted to the Fund is held in a segregated account by the Fund’s custodian and with respect to those amounts which can be sold or re-pledged, is presented in the Schedule of Investments. Collateral pledged by the Fund is segregated by the Fund’s custodian and identified in the Schedule of Investments. Collateral can be in the form of cash or debt securities issued by the U.S. Government or related agencies or other securities as agreed to by the Fund and the applicable counterparty. Collateral requirements are determined based on the Fund’s net position with each counterparty. Termination events applicable to the Fund may occur upon a decline in the Fund’s net assets below a specified threshold over a certain period of time. Termination events applicable to counterparties may occur upon a decline in the counterparty’s long-term and short-term credit ratings below a specified level. In each case, upon occurrence, the other party may elect to terminate early and cause settlement of all derivative and foreign exchange contracts outstanding, including the payment of any losses and costs resulting from such early termination, as reasonably determined by the terminating party. Any decision by one or more of the Fund’s counterparties to elect early termination could impact the Fund’s future derivative activity.
In addition to each instrument’s primary underlying risk exposure (e.g. interest rate, credit, equity or foreign exchange, etc.), swap agreements involve, to varying degrees, elements of credit, market and documentation risk. Such risks involve the possibility that no liquid market for these agreements will exist, the counterparty to the agreement may default on its obligation to perform or disagree on the contractual terms of the agreement, and changes in net interest rates will be unfavorable. In connection with these agreements, securities in the portfolio may be identified or received as collateral from the counterparty in accordance with the terms of the respective swap agreements to provide or receive assets of value and to serve as recourse in the event of default or bankruptcy/insolvency of either party. Such OTC derivative agreements include conditions which, when materialized, give the counterparty the right to cause an early termination of the transactions under those agreements. Any election by the counterparty for early termination of the contract(s) may impact the amounts reported on financial statements.
As of October 31, 2018, the Fund has not met conditions under such agreements which give the counterparty the right to call for an early termination.
Forward currency contracts, forward rate agreements, written options, short sales, swaps and financial futures contracts involve elements of both market and credit risk in excess of the amounts reflected on the Statement of Assets and Liabilities. Such risks may be mitigated by engaging in master netting arrangements.
Payment-In-Kind: The Fund invests in the open market or receive pursuant to debt restructuring, securities that pay-in-kind (PIK) the interest due on such debt instruments. The PIK interest, computed at the contractual rate specified, is added to the existing principal balance of the debt when issued bonds have same terms as the bond or recorded as a separate bond when terms are different from the existing debt, and is recorded as interest income.
Securities Lending: The Fund lends its portfolio securities to banks and broker-dealers. The loans are secured by collateral at least equal to the market value of the securities loaned. Collateral pledged by each borrower is invested in an affiliated money market fund and is marked to market daily, based on the previous day’s market value, such that the value of the collateral exceeds the value of the loaned securities. In the event of significant appreciation in value of securities on loan on the last business day of the reporting period, the financial statements may reflect a collateral value that is less than the market value of the loaned securities. Such shortfall is remedied as described above. Loans are subject to termination at the option of the borrower or the Fund. Upon termination of the loan, the borrower will return to the Fund securities identical to the loaned securities. Should the borrower of the securities fail financially, the Fund has the right to repurchase the securities in the open market using the collateral.
The Fund recognizes income, net of any rebate and securities lending agent fees, for lending its securities in the form of fees or interest on the investment of any cash received as collateral. The borrower receives all interest and dividends from the securities loaned and such payments are passed back to the lender in amounts equivalent thereto. The Fund also continues to recognize any unrealized gain (loss) in the market price of the securities loaned and on the change in the value of the collateral invested that may occur during the term of the loan. In addition, realized gain (loss) is recognized on changes in the value of the collateral invested upon liquidation of the collateral. Net earnings from securities lending are disclosed on the Statement of Operations as “Income from securities lending, net”.
Securities Transactions and Net Investment Income: Securities transactions are recorded on the trade date. Realized gains (losses) from investment and currency transactions are calculated on the specific identification method. Dividend income is recorded on the ex-date. Interest income, including amortization of premium and accretion of discount on debt securities, as required, is recorded on the accrual basis.Expenses are recorded on an accrual basis, which may require the use of certain estimates by management that may differ from actual. Net investment income or loss (other than class specific expenses and waivers, which are allocated as noted below) and unrealized and realized gains (losses) are allocated daily to each class of shares based upon the relative proportion of adjusted net assets of each class at the beginning of the day. Class specific expenses and waivers, where
| | | | |
| PGIM Global Total Return Fund | | | 157 | |
Notes to Financial Statements (continued)
applicable, are charged to the respective share classes. Class specific expenses include distribution fees and distribution fee waivers, shareholder servicing fees, transfer agent’s fees and expenses, registration fees and fee waivers and/or expense reimbursements, as applicable.
Taxes: It is the Fund’s policy to continue to meet the requirements of the Internal Revenue Code applicable to regulated investment companies and to distribute all of its taxable net investment income and capital gains, if any, to its shareholders. Therefore, no federal income tax provision is required. Withholding taxes on foreign dividends, interest and capital gains, if any, are recorded, net of reclaimable amounts, at the time the related income is earned.
Dividends and Distributions: The Fund expects to declare dividends of its net investment income daily and pay such dividends monthly. Distributions of net realized capital and currency gains, if any, are declared and paid at least annually. Dividends and distributions to shareholders, which are determined in accordance with federal income tax regulations and which may differ from generally accepted accounting principles, are recorded on the ex-date. Permanent book/tax differences relating to income and gain (loss) are reclassified amongst total distributable earnings (loss) and paid-in capital in excess of par, as appropriate.
Estimates: The preparation of financial statements requires management to make estimates and assumptions that affect the reported amounts and disclosures in the financial statements. Actual results could differ from those estimates.
2. Agreements
The Company, on behalf of the Fund, has a management agreement with PGIM Investments. Pursuant to this agreement, PGIM Investments has responsibility for all investment advisory services and supervises the subadviser’s performance of such services. In addition, under the management agreement, PGIM Investments provides all of the administrative functions necessary for the organization, operation and management of the Fund. PGIM Investments administers the corporate affairs of the Fund and, in connection therewith, furnishes the Fund with office facilities, together with those ordinary clerical and bookkeeping services which are not being furnished by the Fund’s custodian and the Fund’s transfer agent. PGIM Investments is also responsible for the staffing and management of dedicated groups of legal, marketing, compliance and related personnel necessary for the operation of the Fund. The legal, marketing, compliance and related personnel are also responsible for the management and oversight of the various service providers to the Fund, including, but not limited to, the custodian, transfer agent, and accounting agent.
PGIM Investments has entered into a subadvisory agreement with PGIM, Inc., which provides subadvisory services to the Fund through its PGIM Fixed Income unit. The subadvisory agreement provides that PGIM, Inc. will furnish investment advisory services in connection with the management of the Fund. In connection therewith, PGIM, Inc. is obligated to keep certain books and records of the Fund. PGIM Investments pays for the services of PGIM, Inc., the cost of compensation of officers of the Fund, occupancy and certain clerical and bookkeeping costs of the Fund. The Fund bears all other costs and expenses.
The management fee paid to PGIM Investments is accrued daily and payable monthly at an annual rate of 0.500% of the Fund’s average daily net assets up to $2 billion and 0.485% of such assets in excess of $2 billion. The effective management fee rate before any waivers and/or expense reimbursements was 0.500% for the year ended October 31, 2018.
PGIM Investments has contractually agreed, through February 28, 2019, to limit total annual operating expenses after fee waivers and/or expense reimbursements to 0.88% of average daily net assets for Class A shares, 1.63% of average daily net assets for Class B shares, 1.63% of average daily net assets for Class C shares, 0.63% of average daily net assets for Class Z shares, 1.08% of average daily net assets for Class R2 shares, 0.83% of average daily net assets for Class R4 shares, and 0.58% of average daily net assets for Class R6 shares. This contractual waiver excludes interest, brokerage, taxes (such as income and foreign withholding taxes, stamp duty and deferred tax expenses), acquired fund fees and expenses, extraordinary expenses, and certain other Fund expenses such as dividend and interest expense and broker charges on short sales. Expenses waived/reimbursed by the Manager in accordance with this agreement may be recouped by the Manager within the same fiscal year during which such waiver/reimbursement is made if such recoupment can be realized without exceeding the expense limit in effect at the time of the recoupment for that fiscal year. Effective November 1, 2018 this waiver agreement was extended through February 29, 2020.
Where applicable, PGIM Investments voluntarily agreed through October 31, 2018, to waive management fees or shared operating expenses on any share class to the same extent that it waives similar expenses on any other share class and, in addition, total annual operating expenses for Class R6 shares will not exceed total annual operating expenses for Class Z shares. Effective November 1, 2018 this voluntary agreement became part of the Fund’s contractual waiver agreement through February 29, 2020 and is subject to recoupment by the Manager within the same fiscal year during which such wavier/reimbursement is made if such recoupment can be realized without exceeding the expense limit in effect at the time of the recoupment for that fiscal year.
The Company, on behalf of the Fund, has a distribution agreement with Prudential Investment Management Services LLC (“PIMS”), which acts as the distributor of the Class A, Class B, Class C, Class Z, Class R2, Class R4 and Class R6 shares of the Fund. The Fund compensates PIMS for distributing and servicing the Fund’s Class A, Class B, Class C and Class R2 shares, pursuant to the plans of distribution (the “Distribution Plans”),
| | | | |
| PGIM Global Total Return Fund | | | 159 | |
Notes to Financial Statements (continued)
regardless of expenses actually incurred by PIMS. The distribution fees are accrued daily and payable monthly. No distribution or service fees are paid to PIMS as distributor of the Class Z, Class R4 or Class R6 shares of the Fund.
Pursuant to the Distribution Plans, the Fund compensates PIMS for distribution related activities at an annual rate of up to 0.25%, 1%, 1% and 0.25% of the average daily net assets of the Class A, Class B, Class C and Class R2 shares, respectively.
The Fund has adopted a Shareholder Services Plan with respect to Class R2 and Class R4 shares. Under the terms of the Shareholder Services Plan, Class R2 and Class R4 shares are authorized to pay to Prudential Mutual Fund Services LLC (“PMFS”), its affiliates or third-party service providers, as compensation for services rendered to the shareholders of such Class R2 or Class R4 shares, a shareholder service fee at an annual rate of 0.10% of the average daily net assets attributable to Class R2 and Class R4 shares. The shareholder service fee is accrued daily and paid monthly.
PIMS has advised the Fund that it received $517,266 in front-end sales charges resulting from sales of Class A shares during the year ended October 31, 2018. From these fees, PIMS paid such sales charges to broker-dealers, who in turn paid commissions to salespersons and incurred other distribution costs.
PIMS has advised the Fund that for the year ended October 31, 2018, it received $7,144, $1,100 and $7,501 in contingent deferred sales charges imposed upon redemptions by certain Class A, Class B and Class C shareholders, respectively.
PGIM Investments, PGIM, Inc. and PIMS are indirect, wholly-owned subsidiaries of Prudential Financial, Inc. (“Prudential”).
3. Other Transactions with Affiliates
PMFS, an affiliate of PGIM Investments and an indirect, wholly-owned subsidiary of Prudential, serves as the Fund’s transfer agent. Transfer agent’s fees and expenses in the Statement of Operations include certain out-of-pocket expenses paid to non-affiliates, where applicable.
The Fund may enter into certain securities purchase or sale transactions under Board approved Rule 17a-7 procedures. Rule 17a-7 is an exemptive rule under the 1940 Act, that subject to certain conditions, permits purchase and sale transactions among affiliated investment companies, or between an investment company and a person that is affiliated solely by reason of having a common (or affiliated) investment adviser, common directors,
and/or common officers. Such transactions are subject to ratification by the Board. For the reporting period ended October 31, 2018, no such transactions were entered into by the Fund.
The Fund may invest its overnight sweep cash in the PGIM Core Ultra Short Bond Fund (the “Core Fund”), and its securities lending cash collateral in the PGIM Institutional Money Market Fund (the “Money Market Fund”), each a series of Prudential Investment Portfolios 2, registered under the 1940 Act and managed by PGIM Investments. For the reporting period ended October 31, 2018, PGIM, Inc. was compensated $28,397 by PGIM Investments for managing the Fund’s securities lending cash collateral as subadviser to the Money Market Fund. Earnings from the Core Fund and Money Market Fund are disclosed on the Statement of Operations as “Affiliated dividend income” and “Income from securities lending, net”, respectively.
4. Portfolio Securities
The aggregate cost of purchases and proceeds from sales of portfolio securities (excluding short-term investments and U.S. Government securities) for the year ended October 31, 2018, were $1,151,585,598 and $338,970,223, respectively.
A summary of the cost of purchases and proceeds from sales of shares of affiliated mutual funds for the year ended October 31, 2018, is presented as follows:
| | | | | | | | | | | | | | | | | | | | | | | | | | | | | | |
Value,
Beginning
of Year | | | Cost of
Purchases | | | Proceeds
from Sales | | | Change in
Unrealized
Gain
(Loss) | | | Realized
Gain
(Loss) | | | Value,
End of
Year | | | Shares,
End of
Year | | | Income | |
| | PGIM Core Ultra Short Bond Fund* | | | | | | | | | | | | | | | | | |
| $ | 29,860,170 | | | $ | 558,461,934 | | | $ | 583,978,461 | | | $ | — | | | $ | — | | | $ | 4,343,643 | | | | 4,343,643 | | | $ | 824,949 | |
| | PGIM Institutional Money Market Fund* | |
| | 23,169,196 | | | | 181,994,516 | | | | 176,203,242 | | | | 1,483 | | | | (362 | ) | | | 28,961,591 | | | | 28,961,591 | | | | 75,828 | ** |
| | | | | | | | | | | | | | | | | | | | | | | | | | | | | | |
| $ | 53,029,366 | | | $ | 740,456,450 | | | $ | 760,181,703 | | | $ | 1,483 | | | $ | (362 | ) | | $ | 33,305,234 | | | | | | | $ | 900,777 | |
| | | | | | | | | | | | | | | | | | | | | | | | | | | | | | |
| * | The Funds did not have any capital gain distributions during the reporting period. |
| ** | This amount is included in “Income from securities lending, net” on the Statement of Operations. |
5. Distributions and Tax Information
Distributions to shareholders, which are determined in accordance with federal income tax regulations and which may differ from generally accepted accounting principles, are recorded on the ex-date.
For the year ended October 31, 2018, the tax character of dividends paid by the Fund was $52,666,484 of ordinary income. For the year ended October 31, 2017, the tax character of dividends paid by the Fund were $21,066,132 of ordinary income, $5,918,655 tax return of capital and $1,711,499 of long-term capital gains.
| | | | |
| PGIM Global Total Return Fund | | | 161 | |
Notes to Financial Statements (continued)
As of October 31, 2018, the accumulated undistributed earnings on a tax basis was $15,255,174 of ordinary income.
The United States federal income tax basis of the Fund’s investments and the net unrealized depreciation as of October 31, 2018 were as follows:
| | | | | | |
Tax Basis | | Gross Unrealized Appreciation | | Gross Unrealized Depreciation | | Net Unrealized Depreciation |
| $1,834,105,921 | | $23,757,500 | | $(89,391,494) | | $(65,633,994) |
The differences between book basis and tax basis is primarily attributable to deferred losses on wash sales, amortization of premiums, straddle loss deferrals, futures contracts, and other cost basis differences between financial and tax accounting.
For federal income tax purposes, the Fund had a capital loss carryforward as of October 31, 2018 of approximately $28,507,000 which can be carried forward for an unlimited period. No capital gains distributions are expected to be paid to shareholders until net gains have been realized in excess of such losses.
Management has analyzed the Fund’s tax positions taken on federal, state and local income tax returns for all open tax years and has concluded that no provision for income tax is required in the Fund’s financial statements for the current reporting period. The Fund’s federal, state and local income and federal excise tax returns for tax years for which the applicable statutes of limitations have not expired are subject to examination by the Internal Revenue Service and state departments of revenue.
6. Capital and Ownership
The Fund offers Class A, Class B, Class C, Class Z, Class R2, Class R4 and Class R6 shares. Class A shares are sold with a maximum front-end sales charge of 4.50%. Investors who purchase $1 million or more of Class A shares and sell these shares within 12 months of purchase are subject to a contingent deferred sales charge (“CDSC”) of 1%, although they are not subject to an initial sales charge. The Class A CDSC is waived for certain retirement and/or benefit plans. A special exchange privilege is also available for shareholders who qualified to purchase Class A shares at net asset value. Class B shares are sold with a CDSC which declines from 5% to zero depending on the period of time the shares are held. Class B shares will automatically convert to Class A shares on a quarterly basis approximately seven years after purchase. Class B shares are closed to new purchases. Class C shares are sold with a CDSC of 1% on sales made within 12 months of purchase. Class Z and Class R6 shares are not subject to any sales or redemption charge and are available exclusively for sale to a limited group of investors.
Under certain circumstances, an exchange may be made from specified share classes of the Fund to one or more other share classes of the Fund as presented in the table of transactions in shares of common stock.
There are 2 billion shares of common stock, at $0.01 par value per share, authorized and divided into eight classes, designated Class A, Class B, Class C, Class Z, Class R2, Class R4, Class R6 and Class T, each of which consists of 200 million, 50 million, 320 million, 650 million, 90 million, 90 million, 475 million and 125 million authorized shares, respectively. The Fund currently does not have any Class T shares outstanding.
As of October 31, 2018, Prudential, through its affiliated entities, including affiliated funds (if applicable), owned 1,487 Class R2 shares and 1,490 Class R4 shares of the Fund. At reporting period end, five shareholders of record held 68% of the Fund’s outstanding shares.
Transactions in shares of common stock were as follows:
| | | | | | | | |
Class A | | Shares | | | Amount | |
Year ended October 31, 2018: | | | | | | | | |
Shares sold | | | 10,889,230 | | | $ | 73,367,027 | |
Shares issued in reinvestment of dividends and distributions | | | 834,881 | | | | 5,561,624 | |
Shares reacquired | | | (6,967,781 | ) | | | (46,330,288 | ) |
| | | | | | | | |
Net increase (decrease) in shares outstanding before conversion | | | 4,756,330 | | | | 32,598,363 | |
Shares issued upon conversion from other share class(es) | | | 556,745 | | | | 3,674,264 | |
Shares reacquired upon conversion into other share class(es) | | | (2,290,951 | ) | | | (15,493,924 | ) |
| | | | | | | | |
Net increase (decrease) in shares outstanding | | | 3,022,124 | | | $ | 20,778,703 | |
| | | | | | | | |
Year ended October 31, 2017: | | | | | | | | |
Shares sold | | | 11,155,719 | | | $ | 72,006,965 | |
Shares issued in reinvestment of dividends and distributions | | | 789,634 | | | | 5,161,349 | |
Shares reacquired | | | (7,620,733 | ) | | | (49,337,578 | ) |
| | | | | | | | |
Net increase (decrease) in shares outstanding before conversion | | | 4,324,620 | | | | 27,830,736 | |
Shares issued upon conversion from other share class(es) | | | 165,758 | | | | 1,072,429 | |
Shares reacquired upon conversion into other share class(es) | | | (9,124,231 | ) | | | (57,980,151 | ) |
| | | | | | | | |
Net increase (decrease) in shares outstanding | | | (4,633,853 | ) | | $ | (29,076,986 | ) |
| | | | | | | | |
Class B | | | | | | |
Year ended October 31, 2018: | | | | | | | | |
Shares sold | | | 37,578 | | | $ | 257,275 | |
Shares issued in reinvestment of dividends and distributions | | | 8,772 | | | | 58,565 | |
Shares reacquired | | | (85,878 | ) | | | (571,206 | ) |
| | | | | | | | |
Net increase (decrease) in shares outstanding before conversion | | | (39,528 | ) | | | (255,366 | ) |
Shares reacquired upon conversion into other share class(es) | | | (95,908 | ) | | | (633,247 | ) |
| | | | | | | | |
Net increase (decrease) in shares outstanding | | | (135,436 | ) | | $ | (888,613 | ) |
| | | | | | | | |
Year ended October 31, 2017: | | | | | | | | |
Shares sold | | | 23,153 | | | $ | 152,865 | |
Shares issued in reinvestment of dividends and distributions | | | 11,231 | | | | 73,317 | |
Shares reacquired | | | (130,970 | ) | | | (852,802 | ) |
| | | | | | | | |
Net increase (decrease) in shares outstanding before conversion | | | (96,586 | ) | | | (626,620 | ) |
Shares reacquired upon conversion into other share class(es) | | | (60,036 | ) | | | (386,018 | ) |
| | | | | | | | |
Net increase (decrease) in shares outstanding | | | (156,622 | ) | | $ | (1,012,638 | ) |
| | | | | | | | |
| | | | |
| PGIM Global Total Return Fund | | | 163 | |
Notes to Financial Statements (continued)
| | | | | | | | |
Class C | | Shares | | | Amount | |
Year ended October 31, 2018: | | | | | | | | |
Shares sold | | | 2,294,887 | | | $ | 15,542,300 | |
Shares issued in reinvestment of dividends and distributions | | | 121,101 | | | | 804,239 | |
Shares reacquired | | | (1,378,941 | ) | | | (9,141,921 | ) |
| | | | | | | | |
Net increase (decrease) in shares outstanding before conversion | | | 1,037,047 | | | | 7,204,618 | |
Shares reacquired upon conversion into other share class(es) | | | (224,152 | ) | | | (1,509,290 | ) |
| | | | | | | | |
Net increase (decrease) in shares outstanding | | | 812,895 | | | $ | 5,695,328 | |
| | | | | | | | |
Year ended October 31, 2017: | | | | | | | | |
Shares sold | | | 1,120,199 | | | $ | 7,342,949 | |
Shares issued in reinvestment of dividends and distributions | | | 101,400 | | | | 661,926 | |
Shares reacquired | | | (1,543,694 | ) | | | (9,912,641 | ) |
| | | | | | | | |
Net increase (decrease) in shares outstanding before conversion | | | (322,095 | ) | | | (1,907,766 | ) |
Shares reacquired upon conversion into other share class(es) | | | (406,239 | ) | | | (2,637,763 | ) |
| | | | | | | | |
Net increase (decrease) in shares outstanding | | | (728,334 | ) | | $ | (4,545,529 | ) |
| | | | | | | | |
Class Z | | | | | | |
Year ended October 31, 2018: | | | | | | | | |
Shares sold | | | 103,397,910 | | | $ | 701,748,505 | |
Shares issued in reinvestment of dividends and distributions | | | 2,967,604 | | | | 19,758,448 | |
Shares reacquired | | | (45,990,012 | ) | | | (305,303,771 | ) |
| | | | | | | | |
Net increase (decrease) in shares outstanding before conversion | | | 60,375,502 | | | | 416,203,182 | |
Shares issued upon conversion from other share class(es) | | | 2,449,265 | | | | 16,637,716 | |
Shares reacquired upon conversion into other share class(es) | | | (736,644 | ) | | | (4,882,979 | ) |
| | | | | | | | |
Net increase (decrease) in shares outstanding | | | 62,088,123 | | | $ | 427,957,919 | |
| | | | | | | | |
Year ended October 31, 2017: | | | | | | | | |
Shares sold | | | 45,817,966 | | | $ | 299,229,830 | |
Shares issued in reinvestment of dividends and distributions | | | 1,346,439 | | | | 8,880,761 | |
Shares reacquired | | | (27,444,584 | ) | | | (180,541,029 | ) |
| | | | | | | | |
Net increase (decrease) in shares outstanding before conversion | | | 19,719,821 | | | | 127,569,562 | |
Shares issued upon conversion from other share class(es) | | | 9,536,135 | | | | 60,893,400 | |
Shares reacquired upon conversion into other share class(es) | | | (17,252,364 | ) | | | (110,426,883 | ) |
| | | | | | | | |
Net increase (decrease) in shares outstanding | | | 12,003,592 | | | $ | 78,036,079 | |
| | | | | | | | |
Class R2 | | | | | | |
Period ended October 31, 2018*: | | | | | | | | |
Shares sold | | | 1,571 | | | $ | 10,785 | |
Shares issued in reinvestment of dividends and distributions | | | 38 | | | | 255 | |
| | | | | | | | |
Net increase (decrease) in shares outstanding | | | 1,609 | | | $ | 11,040 | |
| | | | | | | | |
Class R4 | | | | | | |
Period ended October 31, 2018*: | | | | | | | | |
Shares sold | | | 19,550 | | | $ | 129,371 | |
Shares issued in reinvestment of dividends and distributions | | | 155 | | | | 1,015 | |
| | | | | | | | |
Net increase (decrease) in shares outstanding | | | 19,705 | | | $ | 130,386 | |
| | | | | | | | |
| | | | | | | | |
Class R6 | | Shares | | | Amount | |
Year ended October 31, 2018: | | | | | | | | |
Shares sold | | | 73,698,438 | | | $ | 499,777,975 | |
Shares issued in reinvestment of dividends and distributions | | | 3,356,092 | | | | 22,547,460 | |
Shares reacquired | | | (26,619,916 | ) | | | (179,186,390 | ) |
| | | | | | | | |
Net increase (decrease) in shares outstanding before conversion | | | 50,434,614 | | | | 343,139,045 | |
Shares issued upon conversion from other share class(es) | | | 363,933 | | | | 2,442,152 | |
Shares reacquired upon conversion into other share class(es) | | | (34,169 | ) | | | (234,692 | ) |
| | | | | | | | |
Net increase (decrease) in shares outstanding | | | 50,764,378 | | | $ | 345,346,505 | |
| | | | | | | | |
Year ended October 31, 2017: | | | | | | | | |
Shares sold | | | 47,261,389 | | | $ | 313,958,980 | |
Shares issued in reinvestment of dividends and distributions | | | 1,444,921 | | | | 9,699,415 | |
Shares reacquired | | | (7,318,705 | ) | | | (48,729,428 | ) |
| | | | | | | | |
Net increase (decrease) in shares outstanding before conversion | | | 41,387,605 | | | | 274,928,967 | |
Shares issued upon conversion from other share class(es) | | | 17,086,484 | | | | 110,223,269 | |
Shares reacquired upon conversion into other share class(es) | | | (117,532 | ) | | | (758,283 | ) |
| | | | | | | | |
Net increase (decrease) in shares outstanding | | | 58,356,557 | | | $ | 384,393,953 | |
| | | | | | | | |
| * | Commencement of offering was December 27, 2017. |
7. Borrowings
The Company, on behalf of the Fund, along with other affiliated registered investment companies (the “Funds”), is a party to a Syndicated Credit Agreement (“SCA”) with a group of banks. The purpose of the SCA is to provide an alternative source of temporary funding for capital share redemptions. The SCA provides for a commitment of $900 million for the period October 4, 2018 through October 3, 2019. The Funds pay an annualized commitment fee of 0.15% of the unused portion of the SCA. The Fund’s portion of the commitment fee for the unused amount, allocated based upon a method approved by the Board, is accrued daily and paid quarterly. Prior to October 4, 2018, the Funds had another SCA that provided a commitment of $900 million and the Funds paid an annualized commitment fee of 0.15% of the unused portion of the SCA. The interest on borrowings under both SCAs is paid monthly and at a per annum interest rate based upon a contractual spread plus the higher of (1) the effective federal funds rate, (2) the 1-month LIBOR rate or (3) zero percent.
Other affiliated registered investment companies that are parties to the SCA include portfolios that are subject to a predetermined mathematical formula used to manage certain benefit guarantees offered under variable annuity contracts. The formula may result in large scale asset flows into and out of these portfolios. Consequently, these portfolios may be more likely to utilize the SCA for purposes of funding redemptions. It may be possible for those portfolios to fully exhaust the committed amount of the SCA, thereby requiring the Manager to allocate available funding per a Board-approved methodology designed to treat the Funds in the SCA equitably.
The Fund did not utilize the SCA during the reporting period ended October 31, 2018.
| | | | |
| PGIM Global Total Return Fund | | | 165 | |
Notes to Financial Statements (continued)
8. Risks of Investing in the Fund
The Fund’s risks include, but are not limited to, some or all of the risks discussed below:
Bond Obligations Risk: The Fund’s holdings, share price, yield and total return may fluctuate in response to bond market movements. The value of bonds may decline for issuer-related reasons, including management performance, financial leverage and reduced demand for the issuer’s goods and services. Certain types of fixed-income obligations also may be subject to “call and redemption risk,” which is the risk that the issuer may call a bond held by the Fund for redemption before it matures and the Fund may not be able to reinvest at the same level and therefore would earn less income.
Derivatives Risk: Derivatives involve special risks and costs and may result in losses to the Fund. The successful use of derivatives requires sophisticated management, and, to the extent that derivatives are used, the Fund will depend on the subadviser’s ability to analyze and manage derivative transactions. The prices of derivatives may move in unexpected ways, especially in abnormal market conditions. Some derivatives are “leveraged” and therefore may magnify or otherwise increase investment losses to the Fund. The Fund’s use of derivatives may also increase the amount of taxes payable by shareholders. Other risks arise from the potential inability to terminate or sell derivatives positions. A liquid secondary market may not always exist for the Fund’s derivatives positions. In fact, many OTC derivative instruments will not have liquidity beyond the counterparty to the instrument. OTC derivative instruments also involve the risk that the other party will not meet its obligations to the Fund.
Emerging Markets Risk: The risks of foreign investments are greater for investments in or exposed to emerging markets. Emerging market countries typically have economic and political systems that are less fully developed, and can be expected to be less stable, than those of more developed countries. For example, the economies of such countries can be subject to rapid and unpredictable rates of inflation or deflation. Low trading volumes may result in a lack of liquidity and price volatility. Emerging market countries may have policies that restrict investment by non-US investors, or that prevent non-US investors from withdrawing their money at will.
Foreign Securities Risk: The Fund’s investments in securities of foreign issuers or issuers with significant exposure to foreign markets involve additional risk. Foreign countries in which the Fund may invest may have markets that are less liquid, less regulated and more volatile than US markets. The value of the Fund’s investments may decline because of factors affecting the particular issuer as well as foreign markets and issuers generally, such as unfavorable government actions, and political or financial instability.
Interest Rate Risk: The value of an investment may go down when interest rates rise. A rise in rates tends to have a greater impact on the prices of longer term or duration securities. When interest rates fall, the issuers of debt obligations may prepay principal more quickly than expected, and the Fund may be required to reinvest the proceeds at a lower interest rate. This is referred to as “prepayment risk.” When interest rates rise, debt obligations may be repaid more slowly than expected, and the value of the Fund’s holdings may fall sharply. This is referred to as “extension risk. The Fund may face a heightened level of interest rate risk as a result of the US Federal Reserve Board’s policies. The Fund’s investments may lose value if short-term or long-term interest rates rise sharply or in a manner not anticipated by the subadviser.
Liquidity Risk: The Fund may invest in instruments that trade in lower volumes and are less liquid than other investments. Liquidity risk exists when particular investments made by the Fund are difficult to purchase or sell. Liquidity risk includes the risk that the Fund may make investments that may become less liquid in response to market developments or adverse investor perceptions. Investments that are illiquid or that trade in lower volumes may be more difficult to value. If the Fund is forced to sell these investments to pay redemption proceeds or for other reasons, the Fund may lose money. In addition, when there is no willing buyer and investments cannot be readily sold at the desired time or price, the Fund may have to accept a lower price or may not be able to sell the instrument at all. The reduction in dealer market-making capacity in the fixed-income markets that has occurred in recent years also has the potential to reduce liquidity. An inability to sell a portfolio position can adversely affect the Fund’s value or prevent the Fund from being able to take advantage of other investment opportunities.
Non-diversification Risk: The Fund is non-diversified, meaning that the Fund may invest a greater percentage of its assets in the securities of a single company or industry than a diversified fund. Investing in a non-diversified fund involves greater risk than investing in a diversified fund because a loss resulting from the decline in value of any one security may represent a greater portion of the total assets of a non-diversified fund.
9. Recent Accounting Pronouncements and Reporting Updates
In August 2018, the Securities and Exchange Commission (the “SEC”) adopted amendments to Regulation S-X to update and simplify the disclosure requirements for registered investment companies by eliminating requirements that are redundant or duplicative of US GAAP requirements or other SEC disclosure requirements. The new amendments require the presentation of the total, rather than the components, of distributable earnings on the Statement of Assets and Liabilities and the total, rather than the components, of dividends from net investment income and distributions from net realized gains on the Statements of Changes in Net Assets. The amendments also removed the requirement for the parenthetical disclosure of undistributed net investment income on the Statements of Changes in Net Assets and certain tax adjustments that were reflected in the Notes to Financial Statements. All of these have been reflected in the Fund’s financial statements.
| | | | |
| PGIM Global Total Return Fund | | | 167 | |
Notes to Financial Statements (continued)
In August 2018, the FASB issued Accounting Standards Update (“ASU”) No. 2018-13, which changes certain fair value measurement disclosure requirements. The new ASU, in addition to other modifications and additions, removes the requirement to disclose the amount and reasons for transfers between Level 1 and Level 2 of the fair value hierarchy, and the Fund’s policy for the timing of transfers between levels. The amendments are effective for financial statements issued for fiscal years beginning after December 15, 2019, and interim periods within those fiscal years. Management has evaluated the implications of certain provisions of the ASU and has determined to early adopt aspects related to the removal and modification of certain fair value measurement disclosures under the ASU effective immediately. At this time, management is evaluating the implications of certain other provisions of the ASU related to new disclosure requirements and any impact on the financial statement disclosures has not yet been determined.
Financial Highlights
| | | | | | | | | | | | | | | | | | | | |
| Class A Shares | |
| | | Year Ended October 31, | |
| | | 2018 | | | 2017 | | | 2016 | | | 2015 | | | 2014 | |
| Per Share Operating Performance(a): | | | | | | | | | | | | | | | | | | | | |
| Net Asset Value, Beginning of Year | | | $6.75 | | | | $6.64 | | | | $6.45 | | | | $6.88 | | | | $6.92 | |
| Income (loss) from investment operations: | | | | | | | | | | | | | | | | | | | | |
| Net investment income (loss) | | | 0.14 | | | | 0.14 | | | | 0.17 | | | | 0.17 | | | | 0.19 | |
| Net realized and unrealized gain (loss) on investment and foreign currency transactions | | | (0.31 | ) | | | 0.19 | | | | 0.25 | | | | (0.37 | ) | | | 0.06 | |
| Total from investment operations | | | (0.17 | ) | | | 0.33 | | | | 0.42 | | | | (0.20 | ) | | | 0.25 | |
| Less Dividends and Distributions: | | | | | | | | | | | | | | | | | | | | |
| Dividends from net investment income* | | | (0.22 | ) | | | (0.13 | ) | | | (0.12 | ) | | | (0.04 | ) | | | (0.15 | ) |
| Tax return of capital distributions | | | - | | | | (0.05 | ) | | | (0.03 | ) | | | (0.19 | ) | | | (0.14 | ) |
| Distributions from net realized gains | | | - | | | | (0.04 | ) | | | (0.08 | ) | | | - | | | | - | |
| Total dividends and distributions | | | (0.22 | ) | | | (0.22 | ) | | | (0.23 | ) | | | (0.23 | ) | | | (0.29 | ) |
| Net asset value, end of year | | | $6.36 | | | | $6.75 | | | | $6.64 | | | | $6.45 | | | | $6.88 | |
| Total Return(b): | | | (2.65)% | | | | 5.12% | | | | 6.60% | | | | (2.90)% | | | | 3.67% | |
| |
| Ratios/Supplemental Data: | |
| Net assets, end of year (000) | | | $184,064 | | | | $174,732 | | | | $202,770 | | | | $157,404 | | | | $190,394 | |
| Average net assets (000) | | | $187,975 | | | | $175,014 | | | | $169,299 | | | | $175,942 | | | | $163,155 | |
| Ratios to average net assets(c)(d): | | | | | | | | | | | | | | | | | | | | |
| Expenses after waivers and/or expense reimbursement | | | 0.88% | | | | 0.88% | | | | 0.97% | | | | 1.05% | | | | 1.25% | |
| Expenses before waivers and/or expense reimbursement | | | 1.02% | (e) | | | 0.99% | | | | 1.14% | | | | 1.24% | | | | 1.30% | |
| Net investment income (loss) | | | 2.11% | | | | 2.12% | | | | 2.57% | | | | 2.50% | | | | 2.79% | |
| Portfolio turnover rate(f) | | | 40% | | | | 75% | | | | 86% | | | | 95% | | | | 65% | |
| * | Dividends from net investment income may include other items that are ordinary income for tax purposes. |
| (a) | Calculated based on average shares outstanding during the year. |
| (b) | Total return does not consider the effects of sales loads. Total return is calculated assuming a purchase of a share on the first day and a sale on the last day of each year reported and includes reinvestment of dividends and distributions, if any. Total returns may reflect adjustments to conform to generally accepted accounting principles. |
| (c) | Does not include expenses of the underlying funds in which the Fund invests. |
| (d) | The distributor of the Fund had contractually agreed to limit its distribution and service (12b-1) fees to 0.25% of the average daily net assets through March 8, 2015. Effective March 9, 2015, the contractual distribution and service (12b-1) fees were reduced from 0.30% to 0.25% of the average daily net assets. |
| (e) | Effective November 1, 2017, class specific expenses include transfer agent fees and expenses and registration fees, which are charged to their respective share class. |
| (f) | The Fund’s portfolio turnover rate is calculated in accordance with regulatory requirements, without regard to transactions involving short term investments and certain derivatives. If such transactions were included, the Fund’s portfolio turnover rate may be higher. |
See Notes to Financial Statements.
| | | | |
| PGIM Global Total Return Fund | | | 169 | |
Financial Highlights (continued)
| | | | | | | | | | | | | | | | | | | | |
| Class B Shares | |
| | | Year Ended October 31, | |
| | | 2018 | | | 2017 | | | 2016 | | | 2015 | | | 2014 | |
| Per Share Operating Performance(a): | | | | | | | | | | | | | | | | | | | | |
| Net Asset Value, Beginning of Year | | | $6.74 | | | | $6.64 | | | | $6.44 | | | | $6.88 | | | | $6.92 | |
| Income (loss) from investment operations: | | | | | | | | | | | | | | | | | | | | |
| Net investment income (loss) | | | 0.09 | | | | 0.09 | | | | 0.12 | | | | 0.12 | | | | 0.14 | |
| Net realized and unrealized gain (loss) on investment and foreign currency transactions | | | (0.30 | ) | | | 0.18 | | | | 0.26 | | | | (0.38 | ) | | | 0.06 | |
| Total from investment operations | | | (0.21 | ) | | | 0.27 | | | | 0.38 | | | | (0.26 | ) | | | 0.20 | |
| Less Dividends and Distributions: | | | | | | | | | | | | | | | | | | | | |
| Dividends from net investment income* | | | (0.17 | ) | | | (0.10 | ) | | | (0.08 | ) | | | (0.03 | ) | | | (0.10 | ) |
| Tax return of capital distributions | | | - | | | | (0.03 | ) | | | (0.02 | ) | | | (0.15 | ) | | | (0.14 | ) |
| Distributions from net realized gains | | | - | | | | (0.04 | ) | | | (0.08 | ) | | | - | | | | - | |
| Total dividends and distributions | | | (0.17 | ) | | | (0.17 | ) | | | (0.18 | ) | | | (0.18 | ) | | | (0.24 | ) |
| Net asset value, end of year | | | $6.36 | | | | $6.74 | | | | $6.64 | | | | $6.44 | | | | $6.88 | |
| Total Return(b): | | | (3.23)% | | | | 4.20% | | | | 5.99% | | | | (3.75)% | | | | 2.90% | |
| |
| Ratios/Supplemental Data: | |
| Net assets, end of year (000) | | | $2,168 | | | | $3,212 | | | | $4,202 | | | | $4,660 | | | | $6,548 | |
| Average net assets (000) | | | $2,885 | | | | $3,559 | | | | $4,457 | | | | $5,469 | | | | $6,790 | |
| Ratios to average net assets(c): | | | | | | | | | | | | | | | | | | | | |
| Expenses after waivers and/or expense reimbursement | | | 1.63% | | | | 1.63% | | | | 1.72% | | | | 1.80% | | | | 2.00% | |
| Expenses before waivers and/or expense reimbursement | | | 2.37% | (d) | | | 1.74% | | | | 1.89% | | | | 1.97% | | | | 2.00% | |
| Net investment income (loss) | | | 1.34% | | | | 1.39% | | | | 1.85% | | | | 1.77% | | | | 2.05% | |
| Portfolio turnover rate(e) | | | 40% | | | | 75% | | | | 86% | | | | 95% | | | | 65% | |
| * | Dividends from net investment income may include other items that are ordinary income for tax purposes. |
| (a) | Calculated based on average shares outstanding during the year. |
| (b) | Total return does not consider the effects of sales loads. Total return is calculated assuming a purchase of a share on the first day and a sale on the last day of each year reported and includes reinvestment of dividends and distributions, if any. Total returns may reflect adjustments to conform to generally accepted accounting principles. |
| (c) | Does not include expenses of the underlying funds in which the Fund invests. |
| (d) | Effective November 1, 2017, class specific expenses include transfer agent fees and expenses and registration fees, which are charged to their respective share class. |
| (e) | The Fund’s portfolio turnover rate is calculated in accordance with regulatory requirements, without regard to transactions involving short term investments and certain derivatives. If such transactions were included, the Fund’s portfolio turnover rate may be higher. |
See Notes to Financial Statements.
| | | | | | | | | | | | | | | | | | | | |
| Class C Shares | |
| | | Year Ended October 31, | |
| | | 2018 | | | 2017 | | | 2016 | | | 2015 | | | 2014 | |
| Per Share Operating Performance(a): | | | | | | | | | | | | | | | | | | | | |
| Net Asset Value, Beginning of Year | | | $6.73 | | | | $6.63 | | | | $6.44 | | | | $6.86 | | | | $6.90 | |
| Income (loss) from investment operations: | | | | | | | | | | | | | | | | | | | | |
| Net investment income (loss) | | | 0.09 | | | | 0.09 | | | | 0.12 | | | | 0.12 | | | | 0.14 | |
| Net realized and unrealized gain (loss) on investment and foreign currency transactions | | | (0.30 | ) | | | 0.18 | | | | 0.25 | | | | (0.36 | ) | | | 0.06 | |
| Total from investment operations | | | (0.21 | ) | | | 0.27 | | | | 0.37 | | | | (0.24 | ) | | | 0.20 | |
| Less Dividends and Distributions: | | | | | | | | | | | | | | | | | | | | |
| Dividends from net investment income* | | | (0.17 | ) | | | (0.10 | ) | | | (0.08 | ) | | | (0.03 | ) | | | (0.10 | ) |
| Tax return of capital distributions | | | - | | | | (0.03 | ) | | | (0.02 | ) | | | (0.15 | ) | | | (0.14 | ) |
| Distributions from net realized gains | | | - | | | | (0.04 | ) | | | (0.08 | ) | | | - | | | | - | |
| Total dividends and distributions | | | (0.17 | ) | | | (0.17 | ) | | | (0.18 | ) | | | (0.18 | ) | | | (0.24 | ) |
| Net asset value, end of year | | | $6.35 | | | | $6.73 | | | | $6.63 | | | | $6.44 | | | | $6.86 | |
| Total Return(b): | | | (3.24)% | | | | 4.19% | | | | 5.82% | | | | (3.48)% | | | | 2.90% | |
| |
| Ratios/Supplemental Data: | |
| Net assets, end of year (000) | | | $34,889 | | | | $31,509 | | | | $35,848 | | | | $29,427 | | | | $34,691 | |
| Average net assets (000) | | | $36,335 | | | | $31,191 | | | | $30,873 | | | | $33,144 | | | | $30,378 | |
| Ratios to average net assets(c): | | | | | | | | | | | | | | | | | | | | |
| Expenses after waivers and/or expense reimbursement | | | 1.63% | | | | 1.63% | | | | 1.72% | | | | 1.80% | | | | 2.00% | |
| Expenses before waivers and/or expense reimbursement | | | 1.73% | (d) | | | 1.74% | | | | 1.89% | | | | 1.97% | | | | 2.00% | |
| Net investment income (loss) | | | 1.37% | | | | 1.39% | | | | 1.83% | | | | 1.76% | | | | 2.05% | |
| Portfolio turnover rate(e) | | | 40% | | | | 75% | | | | 86% | | | | 95% | | | | 65% | |
| * | Dividends from net investment income may include other items that are ordinary income for tax purposes. |
| (a) | Calculated based on average shares outstanding during the year. |
| (b) | Total return does not consider the effects of sales loads. Total return is calculated assuming a purchase of a share on the first day and a sale on the last day of each year reported and includes reinvestment of dividends and distributions, if any. Total returns may reflect adjustments to conform to generally accepted accounting principles. |
| (c) | Does not include expenses of the underlying funds in which the Fund invests. |
| (d) | Effective November 1, 2017, class specific expenses include transfer agent fees and expenses and registration fees, which are charged to their respective share class. |
| (e) | The Fund’s portfolio turnover rate is calculated in accordance with regulatory requirements, without regard to transactions involving short term investments and certain derivatives. If such transactions were included, the Fund’s portfolio turnover rate may be higher. |
See Notes to Financial Statements.
| | | | |
| PGIM Global Total Return Fund | | | 171 | |
Financial Highlights (continued)
| | | | | | | | | | | | | | | | | | | | |
| Class Z Shares | |
| | | Year Ended October 31, | |
| | | 2018 | | | 2017 | | | 2016 | | | 2015 | | | 2014 | |
| Per Share Operating Performance(a): | | | | | | | | | | | | | | | | | | | | |
| Net Asset Value, Beginning of Year | | | $6.78 | | | | $6.67 | | | | $6.47 | | | | $6.90 | | | | $6.94 | |
| Income (loss) from investment operations: | | | | | | | | | | | | | | | | | | | | |
| Net investment income (loss) | | | 0.16 | | | | 0.15 | | | | 0.18 | | | | 0.18 | | | | 0.21 | |
| Net realized and unrealized gain (loss) on investment and foreign currency transactions | | | (0.31 | ) | | | 0.20 | | | | 0.27 | | | | (0.36 | ) | | | 0.06 | |
| Total from investment operations | | | (0.15 | ) | | | 0.35 | | | | 0.45 | | | | (0.18 | ) | | | 0.27 | |
| Less Dividends and Distributions: | | | | | | | | | | | | | | | | | | | | |
| Dividends from net investment income* | | | (0.23 | ) | | | (0.15 | ) | | | (0.14 | ) | | | (0.05 | ) | | | (0.17 | ) |
| Tax return of capital distributions | | | - | | | | (0.05 | ) | | | (0.03 | ) | | | (0.20 | ) | | | (0.14 | ) |
| Distributions from net realized gains | | | - | | | | (0.04 | ) | | | (0.08 | ) | | | - | | | | - | |
| Total dividends and distributions | | | (0.23 | ) | | | (0.24 | ) | | | (0.25 | ) | | | (0.25 | ) | | | (0.31 | ) |
| Net asset value, end of year | | | $6.40 | | | | $6.78 | | | | $6.67 | | | | $6.47 | | | | $6.90 | |
| Total Return(b): | | | (2.25)% | | | | 5.35% | | | | 7.00% | | | | (2.66)% | | | | 3.92% | |
| |
| Ratios/Supplemental Data: | |
| Net assets, end of year (000) | | | $765,708 | | | | $390,194 | | | | $303,960 | | | | $115,119 | | | | $119,628 | |
| Average net assets (000) | | | $648,173 | | | | $340,627 | | | | $153,146 | | | | $129,045 | | | | $71,247 | |
| Ratios to average net assets(c): | | | | | | | | | | | | | | | | | | | | |
| Expenses after waivers and/or expense reimbursement | | | 0.63% | | | | 0.63% | | | | 0.72% | | | | 0.80% | | | | 1.00% | |
| Expenses before waivers and/or expense reimbursement | | | 0.71% | (d) | | | 0.74% | | | | 0.89% | | | | 0.96% | | | | 1.00% | |
| Net investment income (loss) | | | 2.39% | | | | 2.35% | | | | 2.77% | | | | 2.73% | | | | 3.00% | |
| Portfolio turnover rate(e) | | | 40% | | | | 75% | | | | 86% | | | | 95% | | | | 65% | |
| * | Dividends from net investment income may include other items that are ordinary income for tax purposes. |
| (a) | Calculated based on average shares outstanding during the year. |
| (b) | Total return is calculated assuming a purchase of a share on the first day and a sale on the last day of each year reported and includes reinvestment of dividends and distributions, if any. Total returns may reflect adjustments to conform to generally accepted accounting principles. |
| (c) | Does not include expenses of the underlying funds in which the Fund invests. |
| (d) | Effective November 1, 2017, class specific expenses include transfer agent fees and expenses and registration fees, which are charged to their respective share class. |
| (e) | The Fund’s portfolio turnover rate is calculated in accordance with regulatory requirements, without regard to transactions involving short term investments and certain derivatives. If such transactions were included, the Fund’s portfolio turnover rate may be higher. |
See Notes to Financial Statements.
| | | | |
| Class R2 Shares | | | |
| | | December 27,
2017(a)
through
October 31,
2018 | |
| Per Share Operating Performance(b): | | | | |
| Net Asset Value, Beginning of Period | | | $6.90 | |
| Income (loss) from investment operations: | | | | |
| Net investment income (loss) | | | 0.09 | |
| Net realized and unrealized gain (loss) on investment and foreign currency transactions | | | (0.38 | ) |
| Total from investment operations | | | (0.29 | ) |
| Less Dividends and Distributions: | | | | |
| Dividends from net investment income* | | | (0.17 | ) |
| Net asset value, end of period | | | $6.44 | |
| Total Return(c): | | | (4.24)% | |
| |
| Ratios/Supplemental Data: | | | |
| Net assets, end of period (000) | | | $10 | |
| Average net assets (000) | | | $10 | |
| Ratios to average net assets(d): | | | | |
| Expenses after waivers and/or expense reimbursement | | | 1.08% | (e) |
| Expenses before waivers and/or expense reimbursement | | | 236.32% | (e) |
| Net investment income (loss) | | | 1.67% | (e) |
| Portfolio turnover rate(f) | | | 40% | |
| * | Dividends from net investment income may include other items that are ordinary income for tax purposes. |
| (a) | Commencement of offering. |
| (b) | Calculated based on average shares outstanding during the period. |
| (c) | Total return is calculated assuming a purchase of a share on the first day and a sale on the last day of each period reported and includes reinvestment of dividends and distributions, if any. Total returns may reflect adjustments to conform to generally accepted accounting principles. Total returns for periods less than one full year are not annualized. |
| (d) | Does not include expenses of the underlying funds in which the Fund invests. |
| (f) | The Fund’s portfolio turnover rate is calculated in accordance with regulatory requirements, without regard to transactions involving short term investments and certain derivatives. If such transactions were included, the Fund’s portfolio turnover rate may be higher. |
See Notes to Financial Statements.
| | | | |
| PGIM Global Total Return Fund | | | 173 | |
Financial Highlights (continued)
| | | | |
| Class R4 Shares | | | |
| | | December 27,
2017(a)
through
October 31,
2018 | |
| Per Share Operating Performance(b): | | | | |
| Net Asset Value, Beginning of Period | | | $6.90 | |
| Income (loss) from investment operations: | | | | |
| Net investment income (loss) | | | 0.12 | |
| Net realized and unrealized gain (loss) on investment and foreign currency transactions | | | (0.38 | ) |
| Total from investment operations | | | (0.26 | ) |
| Less Dividends and Distributions: | | | | |
| Dividends from net investment income* | | | (0.19 | ) |
| Net asset value, end of period | | | $6.45 | |
| Total Return(c): | | | (3.88)% | |
| |
| Ratios/Supplemental Data: | | | |
| Net assets, end of period (000) | | | $127 | |
| Average net assets (000) | | | $33 | |
| Ratios to average net assets(d): | | | | |
| Expenses after waivers and/or expense reimbursement | | | 0.83% | (e) |
| Expenses before waivers and/or expense reimbursement | | | 70.94% | (e) |
| Net investment income (loss) | | | 2.23% | (e) |
| Portfolio turnover rate(f) | | | 40% | |
| * | Dividends from net investment income may include other items that are ordinary income for tax purposes. |
| (a) | Commencement of offering. |
| (b) | Calculated based on average shares outstanding during the period. |
| (c) | Total return is calculated assuming a purchase of a share on the first day and a sale on the last day of each period reported and includes reinvestment of dividends and distributions, if any. Total returns may reflect adjustments to conform to generally accepted accounting principles. Total returns for periods less than one full year are not annualized. |
| (d) | Does not include expenses of the underlying funds in which the Fund invests. |
| (f) | The Fund’s portfolio turnover rate is calculated in accordance with regulatory requirements, without regard to transactions involving short term investments and certain derivatives. If such transactions were included, the Fund’s portfolio turnover rate may be higher. |
See Notes to Financial Statements.
| | | | | | | | | | | | | | | | | | | | |
| Class R6 Shares | |
| | | Year Ended October 31, | |
| | | 2018 | | | 2017 | | | 2016 | | | 2015 | | | 2014 | |
| Per Share Operating Performance(a): | | | | | | | | | | | | | | | | | | | | |
| Net Asset Value, Beginning of Year | | | $6.82 | | | | $6.72 | | | | $6.53 | | | | $6.97 | | | | $6.94 | |
| Income (loss) from investment operations: | | | | | | | | | | | | | | | | | | | | |
| Net investment income (loss) | | | 0.16 | | | | 0.16 | | | | 0.19 | | | | 0.17 | | | | 0.23 | |
| Net realized and unrealized gain (loss) on investment and foreign currency transactions | | | (0.30 | ) | | | 0.18 | | | | 0.26 | | | | (0.36 | ) | | | 0.12 | |
| Total from investment operations | | | (0.14 | ) | | | 0.34 | | | | 0.45 | | | | (0.19 | ) | | | 0.35 | |
| Less Dividends and Distributions: | | | | | | | | | | | | | | | | | | | | |
| Dividends from net investment income* | | | (0.24 | ) | | | (0.15 | ) | | | (0.15 | ) | | | (0.05 | ) | | | (0.18 | ) |
| Tax return of capital distributions | | | - | | | | (0.05 | ) | | | (0.03 | ) | | | (0.20 | ) | | | (0.14 | ) |
| Distributions from net realized gains | | | - | | | | (0.04 | ) | | | (0.08 | ) | | | - | | | | - | |
| Total dividends and distributions | | | (0.24 | ) | | | (0.24 | ) | | | (0.26 | ) | | | (0.25 | ) | | | (0.32 | ) |
| Net asset value, end of year | | | $6.44 | | | | $6.82 | | | | $6.72 | | | | $6.53 | | | | $6.97 | |
| Total Return(b): | | | (2.19)% | | | | 5.21% | | | | 6.90% | | | | (2.71)% | | | | 5.09% | |
| |
| Ratios/Supplemental Data: | |
| Net assets, end of year (000) | | | $761,927 | | | | $460,700 | | | | $61,713 | | | | $27,141 | | | | $869 | |
| Average net assets (000) | | | $636,670 | | | | $271,620 | | | | $40,135 | | | | $19,157 | | | | $295 | |
| Ratios to average net assets(c): | | | | | | | | | | | | | | | | | | | | |
| Expenses after waivers and/or expense reimbursement | | | 0.58% | | | | 0.58% | | | | 0.59% | | | | 0.72% | | | | 0.87% | |
| Expenses before waivers and/or expense reimbursement | | | 0.58% | (d) | | | 0.59% | | | | 0.76% | | | | 0.82% | | | | 0.87% | |
| Net investment income (loss) | | | 2.39% | | | | 2.33% | | | | 2.86% | | | | 2.64% | | | | 3.24% | |
| Portfolio turnover rate(e) | | | 40% | | | | 75% | | | | 86% | | | | 95% | | | | 65% | |
| * | Dividends from net investment income may include other items that are ordinary income for tax purposes. |
| (a) | Calculated based on average shares outstanding during the year. |
| (b) | Total return is calculated assuming a purchase of a share on the first day and a sale on the last day of each year reported and includes reinvestment of dividends and distributions, if any. Total returns may reflect adjustments to conform to generally accepted accounting principles. |
| (c) | Does not include expenses of the underlying funds in which the Fund invests. |
| (d) | Effective November 1, 2017, class specific expenses include transfer agent fees and expenses and registration fees, which are charged to their respective share class. |
| (e) | The Fund’s portfolio turnover rate is calculated in accordance with regulatory requirements, without regard to transactions involving short term investments and certain derivatives. If such transactions were included, the Fund’s portfolio turnover rate may be higher. |
See Notes to Financial Statements.
| | | | |
| PGIM Global Total Return Fund | | | 175 | |
Report of Independent Registered Public
Accounting Firm
The Board of Directors and Shareholders
Prudential Global Total Return Fund, Inc.:
Opinion on the Financial Statements
We have audited the accompanying statement of assets and liabilities of PGIM Global Total Return Fund (formerly Prudential Global Total Return Fund) (the “Fund”), a series of Prudential Global Total Return Fund, Inc., including the schedule of investments, as of October 31, 2018, the related statement of operations for the year then ended, the statements of changes in net assets for each of the years in the two-year period then ended, and the related notes (collectively, the financial statements) and the financial highlights for the years or periods indicated therein. In our opinion, the financial statements and financial highlights present fairly, in all material respects, the financial position of the Fund as of October 31, 2018, the results of its operations for the year then ended, the changes in its net assets for each of the years in the two-year period then ended, and the financial highlights for the years or periods indicated therein, in conformity with U.S. generally accepted accounting principles.
Basis for Opinion
These financial statements and financial highlights are the responsibility of the Fund’s management. Our responsibility is to express an opinion on these financial statements and financial highlights based on our audits. We are a public accounting firm registered with the Public Company Accounting Oversight Board (United States) (“PCAOB”) and are required to be independent with respect to the Fund in accordance with the U.S. federal securities laws and the applicable rules and regulations of the Securities and Exchange Commission and the PCAOB.
We conducted our audits in accordance with the standards of the PCAOB. Those standards require that we plan and perform the audit to obtain reasonable assurance about whether the financial statements and financial highlights are free of material misstatement, whether due to error or fraud. Our audits included performing procedures to assess the risks of material misstatement of the financial statements and financial highlights, whether due to error or fraud, and performing procedures that respond to those risks. Such procedures included examining, on a test basis, evidence regarding the amounts and disclosures in the financial statements and financial highlights. Such procedures also included confirmation of securities owned as of October 31, 2018, by correspondence with the custodians, transfer agents and brokers or by other appropriate auditing procedures when replies from brokers were not received. Our audits also included evaluating the accounting principles used and significant estimates made by management, as well as evaluating the overall presentation of the financial statements and financial highlights. We believe that our audits provide a reasonable basis for our opinion.

We have served as the auditor of one or more PGIM and/or Prudential Retail investment companies since 2003.
New York, New York
December 18, 2018
Federal Income Tax Information (unaudited)
For the year ended October 31, 2018, the Fund reports the maximum amount allowable but not less than 27.56% as interest related dividends in accordance with Sections 871(k)(1) and 881(e)(1) of the Internal Revenue Code.
In January 2019, you will be advised on IRS Form 1099-DIV or substitute 1099-DIV as to the federal tax status of distributions received by you in calendar year 2018.
| | | | |
| PGIM Global Total Return Fund | | | 177 | |
INFORMATION ABOUT BOARD MEMBERS AND OFFICERS (unaudited)
Information about Board Members and Officers of the Fund is set forth below. Board Members who are not deemed to be “interested persons” of the Fund, as defined in the 1940 Act, are referred to as “Independent Board Members.” Board Members who are deemed to be “interested persons” of the Fund are referred to as “Interested Board Members.” The Board Members are responsible for the overall supervision of the operations of the Fund and perform the various duties imposed on the directors of investment companies by the 1940 Act. The Board in turn elects the Officers, who are responsible for administering the day-to-day operations of the Fund.
| | | | | | |
| Independent Board Members | | | | |
| | | | |
Name, Address, Age Position(s) Portfolios Overseen | | Principal Occupation(s) During Past Five Years | | Other Directorships Held During Past Five Years | | Length of Board Service |
| | | | |
Ellen S. Alberding (60) Board Member Portfolios Overseen: 93 | | President and Board Member, The Joyce Foundation (charitable foundation) (since 2002); Vice Chair, City Colleges of Chicago (community college system) (2011-2015); Trustee, National Park Foundation (charitable foundation for national park system) (2009-2018); Trustee, Economic Club of Chicago (since 2009); Trustee, Loyola University (since 2018). | | None. | | Since September 2013 |
| | | | |
Kevin J. Bannon (66) Board Member Portfolios Overseen: 93 | | Retired; Managing Director (April 2008-May 2015) and Chief Investment Officer (October 2008-November 2013) of Highmount Capital LLC (registered investment adviser); formerly Executive Vice President and Chief Investment Officer (April 1993-August 2007) of Bank of New York Company; President (May 2003-May 2007) of BNY Hamilton Family of Mutual Funds. | | Director of Urstadt Biddle Properties (equity real estate investment trust) (since September 2008). | | Since July 2008 |
| | | | |
Linda W. Bynoe (66) Board Member Portfolios Overseen: 93 | | President and Chief Executive Officer (since March 1995) and formerly Chief Operating Officer (December 1989-February 1995) of Telemat Ltd. (management consulting); formerly Vice President (January 1985-June 1989) at Morgan Stanley & Co. (broker-dealer). | | Director of Anixter International, Inc. (communication products distributor) (since January 2006); Director of Northern Trust Corporation (financial services) (since April 2006); Trustee of Equity Residential (residential real estate) (since December 2009). | | Since March 2005 |
PGIM Global Total Return Fund
| | | | | | |
Independent Board Members | | | | |
| | | | |
Name, Address, Age Position(s) Portfolios Overseen | | Principal Occupation(s) During Past Five Years | | Other Directorships Held During Past Five Years | | Length of Board Service |
| | | | |
Barry H. Evans (58) Board Member Portfolios Overseen: 92 | | Retired; formerly President (2005 – 2016), Global Chief Operating Officer (2014– 2016), Chief Investment Officer – Global Head of Fixed Income (1998-2014), and various portfolio manager roles (1986-2006), Manulife Asset Management U.S. | | Director, Manulife Trust Company (since 2011); formerly Director, Manulife Asset Management Limited (2015-2017); formerly Chairman of the Board of Directors of Manulife Asset Management U.S. (2005-2016); formerly Chairman of the Board, Declaration Investment Management and Research (2008-2016). | | Since September 2017 |
| | | | |
Keith F. Hartstein (62) Board Member & Independent Chair Portfolios Overseen: 93 | | Retired; Member (since November 2014) of the Governing Council of the Independent Directors Council (organization of independent mutual fund directors); formerly President and Chief Executive Officer (2005-2012), Senior Vice President (2004-2005), Senior Vice President of Sales and Marketing (1997-2004), and various executive management positions (1990-1997), John Hancock Funds, LLC (asset management); Chairman, Investment Company Institute’s Sales Force Marketing Committee (2003-2008). | | None. | | Since September 2013 |
Visit our website at pgiminvestments.com
| | | | | | |
| Independent Board Members | | | | |
| | | | |
Name, Address, Age Position(s) Portfolios Overseen | | Principal Occupation(s) During Past Five Years | | Other Directorships Held During Past Five Years | | Length of Board Service |
| | | | |
Laurie Simon Hodrick (56) Board Member Portfolios Overseen: 92 | | A. Barton Hepburn Professor Emerita of Economics in the Faculty of Business, Columbia Business School (since 2018); Visiting Professor of Law, Stanford Law School (since 2015); Visiting Fellow at the Hoover Institution, Stanford University (since 2015); Sole Member, ReidCourt LLC (since 2008) (a consulting firm); formerly A. Barton Hepburn Professor of Economics in the Faculty of Business, Columbia Business School (1996-2017); formerly Managing Director, Global Head of Alternative Investment Strategies, Deutsche Bank (2006-2008). | | Independent Director, Corporate Capital Trust (since April 2017) (a business development company); Independent Director, Kabbage, Inc. (since July 2018) (financial services). | | Since September 2017 |
| | | | |
Michael S. Hyland, CFA (73) Board Member Portfolios Overseen: 93 | | Retired (since February 2005); formerly Senior Managing Director (July 2001-February 2005) of Bear Stearns & Co, Inc.; Global Partner, INVESCO (1999-2001); Managing Director and President of Salomon Brothers Asset Management (1989-1999). | | None. | | Since July 2008 |
| | | | |
Richard A. Redeker (75) Board Member Portfolios Overseen: 93 | | Retired Mutual Fund Senior Executive (50 years); Management Consultant; Director, Mutual Fund Directors Forum (since 2014); Independent Directors Council (organization of independent mutual fund directors)-Executive Committee, Chair of Policy Steering Committee, Governing Council. | | None. | | Since October 1993 |
PGIM Global Total Return Fund
| | | | | | |
| Independent Board Members | | | | |
| | | | |
Name, Address, Age Position(s) Portfolios Overseen | | Principal Occupation(s) During Past Five Years | | Other Directorships Held During Past Five Years | | Length of Board Service |
| | | | |
Brian K. Reid (56)# Board Member Portfolios Overseen: 92 | | Retired; formerly Chief Economist for the Investment Company Institute (ICI) (2005-2017); formerly Senior Economist and Director of Industry and Financial Analysis at the ICI (1998-2004); formerly Senior Economist, Industry and Financial Analysis at the ICI (1996-1998); formerly Staff Economist at the Federal Reserve Board (1989-1996); Director, ICI Mutual Insurance Company (2012-2017). | | None. | | Since March 2018 |
| # | Mr. Reid joined the Board effective as of March 1, 2018. |
| | | | | | |
| Interested Board Members | | | | |
| | | | |
Name, Address, Age Position(s) Portfolios Overseen | | Principal Occupation(s) During Past Five Years | | Other Directorships Held During Past Five Years | | Length of
Board Service |
| | | | |
Stuart S. Parker (56) Board Member & President Portfolios Overseen: 93 | | President of PGIM Investments LLC (formerly known as Prudential Investments LLC) (since January 2012); Executive Vice President of Prudential Investment Management Services LLC (since December 2012); formerly Executive Vice President of Jennison Associates LLC and Head of Retail Distribution of PGIM Investments LLC (June 2005-December 2011). | | None. | | Since January 2012 |
Visit our website at pgiminvestments.com
| | | | | | |
| Interested Board Members | | | | |
| | | | |
Name, Address, Age Position(s) Portfolios Overseen | | Principal Occupation(s) During Past Five Years | | Other Directorships Held During Past Five Years | | Length of Board Service |
| | | | |
Scott E. Benjamin (45) Board Member & Vice President Portfolios Overseen:93 | | Executive Vice President (since June 2009) of PGIM Investments LLC; Executive Vice President (June 2009-June 2012) and Vice President (since June 2012) of Prudential Investment Management Services LLC; Executive Vice President (since September 2009) of AST Investment Services, Inc.; Senior Vice President of Product Development and Marketing, PGIM Investments (since February 2006); formerly Vice President of Product Development and Product Management, PGIM Investments LLC (2003-2006). | | None. | | Since March 2010 |
| | | | |
Grace C. Torres* (59) Board Member Portfolios Overseen: 92 | | Retired; formerly Treasurer and Principal Financial and Accounting Officer of the PGIM Funds, Target Funds, Advanced Series Trust, Prudential Variable Contract Accounts and The Prudential Series Fund (1998-June 2014); Assistant Treasurer (March 1999-June 2014) and Senior Vice President (September 1999-June 2014) of PGIM Investments LLC; Assistant Treasurer (May 2003-June 2014) and Vice President (June 2005-June 2014) of AST Investment Services, Inc.; Senior Vice President and Assistant Treasurer (May 2003-June 2014) of Prudential Annuities Advisory Services, Inc. | | Formerly Director (July 2015-January 2018) of Sun Bancorp, Inc. N.A. and Sun National Bank; Director (since January 2018) of OceanFirst Financial Corp. and OceanFirst Bank. | | Since November 2014 |
* Note: Prior to her retirement in 2014, Ms. Torres was employed by PGIM Investments LLC. Due to her prior employment, she is considered to be an “interested person” under the 1940 Act. Ms. Torres is a Non-Management Interested Board Member.
PGIM Global Total Return Fund
| | | | |
| Fund Officers(a) | | | | |
| | | |
Name, Address and Age Position with Fund | | Principal Occupation(s) During Past Five Years | | Length of Service as Fund Officer |
| | | |
Raymond A. O’Hara (63) Chief Legal Officer | | Vice President and Corporate Counsel (since July 2010) of Prudential Insurance Company of America (Prudential); Vice President (March 2011-Present) of Pruco Life Insurance Company and Pruco Life Insurance Company of New Jersey; Vice President and Corporate Counsel (March 2011-Present) of Prudential Annuities Life Assurance Corporation; Chief Legal Officer of PGIM Investments LLC (since June 2012); Chief Legal Officer of Prudential Mutual Fund Services LLC (since June 2012) and Corporate Counsel of AST Investment Services, Inc. (since June 2012); formerly Assistant Vice President and Corporate Counsel (September 2008-July 2010) of The Hartford Financial Services Group, Inc.; formerly Associate (September 1980-December 1987) and Partner (January 1988–August 2008) of Blazzard & Hasenauer, P.C. (formerly, Blazzard, Grodd & Hasenauer, P.C.). | | Since June 2012 |
| | | |
Chad A. Earnst (43) Chief Compliance Officer | | Chief Compliance Officer (September 2014-Present) of PGIM Investments LLC; Chief Compliance Officer (September 2014-Present) of the PGIM Funds, Target Funds, Advanced Series Trust, The Prudential Series Fund, Prudential’s Gibraltar Fund, Inc., PGIM Global Short Duration High Yield Income Fund, Inc., PGIM Short Duration High Yield Fund, Inc. and PGIM Jennison MLP Income Fund, Inc.; formerly Assistant Director (March 2010-August 2014) of the Asset Management Unit, Division of Enforcement, US Securities & Exchange Commission; Assistant Regional Director (January 2010-August 2014), Branch Chief (June 2006–December 2009) and Senior Counsel (April 2003-May 2006) of the Miami Regional Office, Division of Enforcement, US Securities & Exchange Commission. | | Since September 2014 |
| | | |
Dino Capasso (44) Deputy Chief Compliance Officer | | Vice President and Deputy Chief Compliance Officer (June 2017-Present) of PGIM Investments LLC; formerly, Senior Vice President and Senior Counsel (January 2016-June 2017), and Vice President and Counsel (February 2012-December 2015) of Pacific Investment Management Company LLC. | | Since March 2018 |
| | | |
Andrew R. French (56) Secretary | | Vice President and Corporate Counsel (since February 2010) of Prudential; formerly Director and Corporate Counsel (2006-2010) of Prudential; Vice President and Assistant Secretary (since January 2007) of PGIM Investments LLC; Vice President and Assistant Secretary (since January 2007) of Prudential Mutual Fund Services LLC. | | Since October 2006 |
Visit our website at pgiminvestments.com
| | | | |
| Fund Officers(a) | | | | |
| | | |
Name, Address and Age Position with Fund | | Principal Occupation(s) During Past Five Years | | Length of Service as Fund Officer |
| | | |
Jonathan D. Shain (60) Assistant Secretary | | Vice President and Corporate Counsel (since August 1998) of Prudential; Vice President and Assistant Secretary (since May 2001) of PGIM Investments LLC; Vice President and Assistant Secretary (since February 2001) of Prudential Mutual Fund Services LLC; formerly Vice President and Assistant Secretary (May 2003-June 2005) of AST Investment Services, Inc. | | Since May 2005 |
| | | |
Claudia DiGiacomo (44) Assistant Secretary | | Vice President and Corporate Counsel (since January 2005) of Prudential; Vice President and Assistant Secretary of PGIM Investments LLC (since December 2005); formerly Associate at Sidley Austin Brown & Wood LLP (1999-2004). | | Since December 2005 |
| | | |
Charles H. Smith (45) Anti-Money Laundering Compliance Officer | | Vice President, Corporate Compliance, Anti-Money Laundering Unit (since January 2015) of Prudential; committee member of the American Council of Life Insurers Anti-Money Laundering and Critical Infrastructure Committee (since January 2016); formerly Global Head of Economic Sanctions Compliance at AIG Property Casualty (February 2007 – December 2014); Assistant Attorney General at the New York State Attorney General’s Office, Division of Public Advocacy. (August 1998 —January 2007). | | Since January 2017 |
| | | |
Brian D. Nee (52) Treasurer and Principal Financial and Accounting Officer | | Vice President and Head of Finance of PGIM Investments LLC (since August 2015) and PGIM Global Partners (since February 2017); formerly, Vice President, Treasurer’s Department of Prudential (September 2007-August 2015). | | Since July 2018 |
| | | |
Peter Parrella (60) Assistant Treasurer | | Vice President (since 2007) and Director (2004-2007) within Prudential Mutual Fund Administration; formerly Tax Manager at SSB Citi Fund Management LLC (1997-2004). | | Since June 2007 |
| | | |
Lana Lomuti (51) Assistant Treasurer | | Vice President (since 2007) and Director (2005-2007), within Prudential Mutual Fund Administration; formerly Assistant Treasurer (December 2007-February 2014) of The Greater China Fund, Inc. | | Since April 2014 |
| | | |
Linda McMullin (57) Assistant Treasurer | | Vice President (since 2011) and Director (2008-2011) within Prudential Mutual Fund Administration. | | Since April 2014 |
| | | |
Kelly A. Coyne (50) Assistant Treasurer | | Director, Investment Operations of Prudential Mutual Fund Services LLC (since 2010). | | Since March 2015 |
(a) Excludes Mr. Parker and Mr. Benjamin, interested Board Members who also serve as President and Vice President, respectively.
Explanatory Notes to Tables:
| ∎ | | Board Members are deemed to be “Interested,” as defined in the 1940 Act, by reason of their affiliation with PGIM Investments LLC and/or an affiliate of PGIM Investments LLC. |
| ∎ | | Unless otherwise noted, the address of all Board Members and Officers is c/o PGIM Investments LLC, 655 Broad Street, Newark, New Jersey 07102-4410. |
| ∎ | | There is no set term of office for Board Members or Officers. The Board Members have adopted a retirement policy, which calls for the retirement of Board Members on December 31 of the year in which they reach the age of 75. |
PGIM Global Total Return Fund
| ∎ | | “Other Directorships Held” includes only directorships of companies required to register or file reports with the SEC under the 1934 Act (that is, “public companies”) or other investment companies registered under the 1940 Act. |
| ∎ | | “Portfolios Overseen” includes all investment companies managed by PGIM Investments LLC. The investment companies for which PGIM Investments LLC serves as manager include the PGIM Funds, The Prudential Variable Contract Accounts, PGIM ETF Trust, PGIM Short Duration High Yield Fund, Inc., PGIM Global Short Duration High Yield Fund, Inc., The Prudential Series Fund, Prudential’s Gibraltar Fund, Inc. and the Advanced Series Trust. |
Visit our website at pgiminvestments.com
Approval of Advisory Agreements (unaudited)
The Fund’s Board of Directors
The Board of Directors (the “Board”) of PGIM Global Total Return Fund1 (the “Fund”) consists of twelve individuals, nine of whom are not “interested persons” of the Fund, as defined in the Investment Company Act of 1940, as amended (the “1940 Act”) (the “Independent Directors”). The Board is responsible for the oversight of the Fund and its operations, and performs the various duties imposed on the directors of investment companies by the 1940 Act. The Independent Directors have retained independent legal counsel to assist them in connection with their duties. The Chair of the Board is an Independent Director. The Board has established four standing committees: the Audit Committee, the Nominating and Governance Committee, and two Investment Committees. Each committee is chaired by, and composed of, Independent Directors.
Annual Approval of the Fund’s Advisory Agreements
As required under the 1940 Act, the Board determines annually whether to renew the Fund’s management agreement with PGIM Investments LLC (“PGIM Investments”), the Fund’s subadvisory agreement with PGIM, Inc. (“PGIM”), on behalf of its PGIM Fixed Income unit, and the Fund’s sub-subadvisory agreement with PGIM Limited (“PGIML”). In considering the renewal of the agreements, the Board, including all of the Independent Directors, met on June 7, 2018 and on June 19-21, 2018 and approved the renewal of the agreements through July 31, 2019, after concluding that the renewal of the agreements was in the best interests of the Fund and its shareholders.
In advance of the meetings, the Board requested and received materials relating to the agreements, and had the opportunity to ask questions and request further information in connection with its consideration. Among other things, the Board considered comparative fee information from PGIM Investments, PGIM, and where appropriate, affiliates of PGIM. Also, the Board considered comparisons with other mutual funds in relevant Peer Universes and Peer Groups, as is further discussed below.
In approving the agreements, the Board, including the Independent Directors advised by independent legal counsel, considered the factors it deemed relevant, including the nature, quality and extent of services provided by PGIM Investments, the subadviser, and, as relevant, its affiliates, the performance of the Fund, the profitability of PGIM Investments and its affiliates, expenses and fees, and the potential for economies of scale that may be shared with the Fund and its shareholders as the Fund’s assets grow. In their deliberations, the Directors did not identify any single factor which alone was responsible for the Board’s decision to approve the agreements with respect to the Fund. In connection with its deliberations, the Board considered information provided by PGIM Investments throughout
| 1 | PGIM Global Total Return Fund is a series of Prudential Global Total Return Fund, Inc. |
| | |
| PGIM Global Total Return Fund |
Approval of Advisory Agreements (continued)
the year at regular Board meetings, presentations from portfolio managers and other information, as well as information furnished at or in advance of the meetings on June 7, 2018 and on June 19-21, 2018.
The Directors determined that the overall arrangements between the Fund and PGIM Investments, which serves as the Fund’s investment manager pursuant to a management agreement, between PGIM Investments and PGIM, which, through its PGIM Fixed Income unit, serves as the Fund’s subadviser pursuant to the terms of a subadvisory agreement with PGIM Investments, and between PGIM and PGIML, which serves as the Fund’s sub-subadviser pursuant to the terms of a sub-subadvisory agreement with PGIM, are in the best interests of the Fund and its shareholders in light of the services performed, fees charged and such other matters as the Directors considered relevant in the exercise of their business judgment.
The material factors and conclusions that formed the basis for the Directors’ reaching their determinations to approve the continuance of the agreements are separately discussed below.
Nature, Quality and Extent of Services
The Board received and considered information regarding the nature, quality and extent of services provided to the Fund by PGIM Investments, PGIM Fixed Income, and PGIML. The Board considered the services provided by PGIM Investments, including but not limited to the oversight of the subadviser and sub-subadviser for the Fund, as well as the provision of fund recordkeeping, compliance, and other services to the Fund. With respect to PGIM Investments’ oversight of the subadviser and sub-subadviser, the Board noted that PGIM Investments’ Strategic Investment Research Group (“SIRG”), which is a business unit of PGIM Investments, is responsible for monitoring and reporting to PGIM Investments’ senior management on the performance and operations of the subadviser and sub-subadviser. The Board also considered that PGIM Investments pays the salaries of all of the officers and interested Directors of the Fund who are part of Fund management. The Board also considered the investment subadvisory services provided by PGIM Fixed Income and PGIML, including investment research and security selection, as well as adherence to the Fund’s investment restrictions and compliance with applicable Fund policies and procedures. The Board considered PGIM Investments’ evaluation of the subadviser and sub-subadviser, as well as PGIM Investments’ recommendation, based on its review of the subadviser and sub-subadviser, to renew the subadvisory and sub-subadvisory agreements.
The Board considered the qualifications, backgrounds and responsibilities of PGIM Investments’ senior management responsible for the oversight of the Fund, PGIM Fixed
| | |
| Visit our website at pgiminvestments.com | | |
Income, and PGIML, and also considered the qualifications, backgrounds and responsibilities of PGIM Fixed Income’s portfolio managers who are responsible for the day-to-day management of the Fund’s portfolio. The Board was provided with information pertaining to PGIM Investments’, PGIM Fixed Income’s, and PGIML’s organizational structure, senior management, investment operations, and other relevant information pertaining to PGIM Investments, PGIM Fixed Income, and PGIML. The Board also noted that it received favorable compliance reports from the Fund’s Chief Compliance Officer (“CCO”) as to PGIM Investments, PGIM Fixed Income, and PGIML. The Board noted that PGIM Fixed Income and PGIML are affiliated with PGIM Investments.
The Board concluded that it was satisfied with the nature, extent and quality of the investment management services provided by PGIM Investments, the subadvisory services provided to the Fund by PGIM Fixed Income, and the sub-subadvisory services provided by PGIML, and that there was a reasonable basis on which to conclude that the Fund benefits from the services provided by PGIM Investments, PGIM Fixed Income, and PGIML under the management, subadvisory and sub-subadvisory agreements.
Costs of Services and Profits Realized by PGIM Investments
The Board was provided with information on the profitability of PGIM Investments and its affiliates in serving as the Fund’s investment manager. The Board discussed with PGIM Investments the methodology utilized in assembling the information regarding profitability and considered its reasonableness. The Board recognized that it is difficult to make comparisons of profitability from fund management contracts because comparative information is not generally publicly available and is affected by numerous factors, including the structure of the particular adviser, the types of funds it manages, its business mix, numerous assumptions regarding allocations and the adviser’s capital structure and cost of capital. The Board noted that the cost of services provided by PGIM Investments to the Fund during the year ended December 31, 2017 exceeded the management fees paid by the Fund, resulting in an operating loss to PGIM Investments. Taking these factors into account, the Board concluded that the profitability of PGIM Investments and its affiliates in relation to the services rendered was not unreasonable.
Economies of Scale
The Board received and discussed information concerning economies of scale that PGIM Investments may realize as the Fund’s assets grow beyond current levels. The Board noted that the management fee schedule for the Fund includes breakpoints, which have the effect of decreasing the fee rate as assets increase. During the course of time, the Board has considered information regarding the launch date of the Fund, the management fees of the Fund compared to those of similarly managed funds and PGIM Investments’
| | |
| PGIM Global Total Return Fund |
Approval of Advisory Agreements (continued)
investment in the Fund over time. The Board noted that economies of scale can be shared with the Fund in other ways, including low management fees from inception, additional technological and personnel investments to enhance shareholder services, and maintaining existing expense structures in the face of a rising cost environment. The Board also considered PGIM Investments’ assertion that it continually evaluates the management fee schedule of the Fund and the potential to share economies of scale through breakpoints or fee waivers as asset levels increase.
The Board recognized the inherent limitations of any analysis of economies of scale, stemming largely from the Board’s understanding that most of PGIM Investments’ costs are not specific to individual funds, but rather are incurred across a variety of products and services.
Other Benefits to PGIM Investments, PGIM Fixed Income, and PGIML
The Board considered potential ancillary benefits that might be received by PGIM Investments, PGIM Fixed Income, PGIML and their affiliates as a result of their relationship with the Fund. The Board concluded that potential benefits to be derived by PGIM Investments included transfer agency fees received by the Fund’s transfer agent (which is affiliated with PGIM Investments), as well as benefits to its reputation or other intangible benefits resulting from PGIM Investments’ association with the Fund. The Board concluded that the potential benefits to be derived by PGIM Fixed Income and PGIML included the ability to use soft dollar credits, as well as the potential benefits consistent with those generally resulting from an increase in assets under management, specifically, potential access to additional research resources and benefits to their reputations. The Board concluded that the benefits derived by PGIM Investments, PGIM Fixed Income, and PGIML were consistent with the types of benefits generally derived by investment managers and subadvisers to mutual funds.
Performance of the Fund / Fees and Expenses
The Board considered certain additional specific factors and made related conclusions relating to the historical performance of the Fund for the one-, three-, five- and ten-year periods ended December 31, 2017.
The Board also considered the Fund’s actual management fee, as well as the Fund’s net total expense ratio, for the fiscal year ended October 31, 2017. The Board considered the management fee for the Fund as compared to the management fee charged by PGIM Investments to other funds and the fee charged by other advisers to comparable mutual funds in a Peer Group. The actual management fee represents the fee rate actually paid by Fund shareholders and includes any fee waivers or reimbursements. The net total expense ratio for the Fund represents the actual expense ratio incurred by Fund shareholders.
| | |
| Visit our website at pgiminvestments.com | | |
The mutual funds included in the Peer Universe, which was used to consider performance, and the Peer Group, which was used to consider expenses and fees, were objectively determined by Broadridge, an independent provider of mutual fund data. In certain circumstances, PGIM Investments also may have provided supplemental Peer Universe or Peer Group information, for reasons addressed with the Board. The comparisons placed the Fund in various quartiles, with the first quartile being the best 25% of the mutual funds (for performance, the best performing mutual funds and, for expenses, the lowest cost mutual funds).
The section below summarizes key factors considered by the Board and the Board’s conclusions regarding the Fund’s performance, fees and overall expenses. The table sets forth gross performance comparisons (which do not reflect the impact on performance of fund expenses, or any subsidies, expense caps or waivers that may be applicable) with the Peer Universe, actual management fees with the Peer Group (which reflect the impact of any subsidies or fee waivers), and net total expenses with the Peer Group, each of which were key factors considered by the Board.
| | | | | | | | |
Gross
Performance | | 1 Year | | 3 Years | | 5 Years | | 10 Years |
| | 1st Quartile | | 1st Quartile | | 1st Quartile | | 1st Quartile |
| Actual Management Fees: 1st Quartile |
| Net Total Expenses: 1st Quartile |
| • | | The Board noted that the Fund outperformed its benchmark index over all periods. |
| • | | The Board and PGIM Investments agreed to retain the Fund’s existing contractual expense cap, which (exclusive of certain fees and expenses) caps the Fund’s annual operating expenses at 0.88% for Class A shares, 1.63% for Class B shares, 1.63% for Class C shares, 0.63% for Class Z shares, 1.08% for Class R2 shares, 0.83% for Class R4 shares, and 0.58% for Class R6 shares through February 29, 2020. |
| • | | The Board concluded that, in light of the above, it would be in the best interests of the Fund and its shareholders to renew the agreements. |
| • | | The Board concluded that the management fees (including subadvisory fees) and total expenses were reasonable in light of the services provided. |
* * *
After full consideration of these factors, the Board concluded that the approval of the agreements was in the best interests of the Fund and its shareholders.
| | |
| PGIM Global Total Return Fund |
| | | | |
| ∎ MAIL | | ∎ TELEPHONE | | ∎ WEBSITE |
655 Broad Street Newark, NJ 07102 | | (800) 225-1852 | | www.pgiminvestments.com |
|
| PROXY VOTING |
| The Board of Directors of the Fund has delegated to the Fund’s subadviser the responsibility for voting any proxies and maintaining proxy recordkeeping with respect to the Fund. A description of these proxy voting policies and procedures is available without charge, upon request, by calling (800) 225-1852. Information regarding how the Fund voted proxies relating to portfolio securities during the most recent 12-month period ended June 30 is available on the Fund’s website and on the Securities and Exchange Commission’s website. |
|
| DIRECTORS |
| Ellen S. Alberding • Kevin J. Bannon • Scott E. Benjamin • Linda W. Bynoe • Barry H. Evans • Keith F. Hartstein • Laurie Simon Hodrick • Michael S. Hyland • Stuart S. Parker • Richard A. Redeker • Brian K. Reid • Grace C. Torres |
|
| OFFICERS |
| Stuart S. Parker, President • Scott E. Benjamin, Vice President • Brian D. Nee, Treasurer and Principal Financial and Accounting Officer • Raymond A. O’Hara, Chief Legal Officer • Andrew R. French, Secretary • Chad A. Earnst, Chief Compliance Officer • Dino Capasso, Vice President and Deputy Chief Compliance Officer • Charles H. Smith, Anti-Money Laundering Compliance Officer • Jonathan D. Shain, Assistant Secretary • Claudia DiGiacomo, Assistant Secretary • Peter Parrella, Assistant Treasurer • Lana Lomuti, Assistant Treasurer • Linda McMullin, Assistant Treasurer • Kelly A. Coyne, Assistant Treasurer |
| | | | |
| MANAGER | | PGIM Investments LLC | | 655 Broad Street
Newark, NJ 07102 |
|
| SUBADVISER | | PGIM Fixed Income | | 655 Broad Street
Newark, NJ 07102 |
|
| DISTRIBUTOR | | Prudential Investment Management Services LLC | | 655 Broad Street
Newark, NJ 07102 |
|
| CUSTODIAN | | The Bank of New York Mellon | | 225 Liberty Street
New York, NY 10286 |
|
| TRANSFER AGENT | | Prudential Mutual Fund Services LLC | | PO Box 9658
Providence, RI 02940 |
|
INDEPENDENT REGISTERED
PUBLIC ACCOUNTING FIRM | | KPMG LLP | | 345 Park Avenue
New York, NY 10154 |
|
| FUND COUNSEL | | Willkie Farr & Gallagher LLP | | 787 Seventh Avenue
New York, NY 10019 |
|
|
| An investor should consider the investment objectives, risks, charges, and expenses of the Fund carefully before investing. The prospectus and summary prospectus contain this and other information about the Fund. An investor may obtain a prospectus and summary prospectus by visiting our website at www.pgiminvestments.com or by calling (800) 225-1852. The prospectus and summary prospectus should be read carefully before investing. |
|
| E-DELIVERY |
| To receive your mutual fund documents online, go to www.pgiminvestments.com/edelivery and enroll. Instead of receiving printed documents by mail, you will receive notification via email when new materials are available. You can cancel your enrollment or change your email address at any time by visiting the website address above. |
|
| SHAREHOLDER COMMUNICATIONS WITH DIRECTORS |
| Shareholders can communicate directly with the Board of Directors by writing to the Chair of the Board, PGIM Global Total Return Fund, PGIM Investments, Attn: Board of Directors, 655 Broad Street, Newark, NJ 07102. Shareholders can communicate directly with an individual Director by writing to the same address. Communications are not screened before being delivered to the addressee. |
|
| AVAILABILITY OF PORTFOLIO SCHEDULE |
| The Fund files its complete schedule of portfolio holdings with the Securities and Exchange Commission for the first and third quarters of each fiscal year on Form N-Q. The Fund’s Forms N-Q are available on the Commission’s website at www.sec.gov. The Fund’s schedule of portfolio holdings is also available on the Fund’s website as of the end of each month no sooner than 15 days after the end of the month. |
|
| The Fund’s Statement of Additional Information contains additional information about the Fund’s Directors and is available without charge, upon request, by calling (800) 225-1852. |
Mutual Funds:
| | | | |
| ARE NOT INSURED BY THE FDIC OR ANY FEDERAL GOVERNMENT AGENCY | | MAY LOSE VALUE | | ARE NOT A DEPOSIT OF OR GUARANTEED BY ANY BANK OR ANY BANK AFFILIATE |
PGIM GLOBAL TOTAL RETURN FUND
| | | | | | | | | | | | | | |
| SHARE CLASS | | A | | B | | C | | Z | | R2 | | R4 | | R6* |
| NASDAQ | | GTRAX | | PBTRX | | PCTRX | | PZTRX | | PGTOX | | PGTSX | | PGTQX |
| CUSIP | | 74439A103 | | 74439A202 | | 74439A301 | | 74439A400 | | 74439A863 | | 74439A855 | | 74439A509 |
*Formerly known as Class Q shares.
MF169E

PGIM GLOBAL TOTAL RETURN (USD HEDGED) FUND
(Formerly known as Prudential Global Total Return (USD Hedged) Fund)
ANNUAL REPORT
OCTOBER 31, 2018
COMING SOON: PAPERLESS SHAREHOLDER REPORTS
Beginning on January 1, 2021, as permitted by regulations adopted by the Securities and Exchange Commission, paper copies of the Fund’s annual and semi-annual shareholder reports will no longer be sent by mail, unless you specifically request paper copies of the reports. Instead, the reports will be made available on the Fund’s website (www.pgiminvestments.com), and you will be notified by mail each time a report is posted and provided with a website link to access the report.
If you already elected to receive shareholder reports electronically, you will not be affected by this change and you need not take any action. You may elect to receive shareholder reports and other communications from the Fund electronically anytime by contacting your financial intermediary (such as a broker-dealer or bank) or, if you are a direct investor, by calling 1-800-225-1852 or by sending an e-mail request to PGIM Investments at shareholderreports@pgim.com.
Beginning on January 1, 2019, you may elect to receive all future reports in paper free of charge. If you invest through a financial intermediary, you can contact your financial intermediary or follow instructions included with this notice to elect to continue to receive paper copies of your shareholder reports. If you invest directly with the Fund, you can call 1-800-225-1852 or send an email request to shareholderreports@pgim.com to let the Fund know you wish to continue receiving paper copies of your shareholder reports. Your election to receive reports in paper will apply to all funds held in your account if you invest through your financial intermediary or all funds held with the fund complex if you invest directly with the Fund.

To enroll in e-delivery, go to pgiminvestments.com/edelivery
|
Objective: Total return, through a combination of current income and
capital appreciation |
Highlights (unaudited)
| • | | The Fund underperformed the Bloomberg Barclays Global Aggregate (USD Hedged) Index, with duration and yield curve positioning, currency selection, and sector and security selection all detracting from performance. |
| • | | Positioning in developed market Treasuries and high-quality structured products added to performance. |
| • | | Although overall yield curve and duration positioning hurt performance, in developed market rates a yield curve flattener positioning in the euro added to performance. In emerging markets, long-duration positioning in Brazilian rates was a strong contributor. |
| • | | Positioning in developed and emerging market sovereign debt, and security selection in investment-grade corporate bonds, hurt performance. |
| • | | In developed market rates, long-duration positioning and yield curve-flattener positioning in the US was the largest detractor from performance. Long-duration positioning in Norwegian rates also limited results. In emerging markets, positioning in Mexican rates hurt performance. |
This report is not authorized for distribution to prospective investors unless preceded or accompanied by a current prospectus.
The views expressed in this report and information about the Fund’s portfolio holdings are for the period covered by this report and are subject to change thereafter.
Mutual funds are distributed by Prudential Investment Management Services LLC (PIMS), member SIPC. PGIM Fixed Income is a unit of PGIM, Inc. (PGIM), a registered investment adviser. PIMS and PGIM are Prudential Financial companies. © 2018 Prudential Financial, Inc. and its related entities. PGIM and the PGIM logo are service marks of Prudential Financial, Inc. and its related entities, registered in many jurisdictions worldwide.
| | |
| 2 | | Visit our website at pgiminvestments.com |
PGIM FUNDS — UPDATE
The Board of Directors/Trustees for the Fund has approved the implementation of an automatic conversion feature for Class C shares, effective as of April 1, 2019. To reflect these changes, effective April 1, 2019, the section of the Fund’s Prospectus entitled “How to Buy, Sell and Exchange Fund Shares—How to Exchange Your Shares—Frequent Purchases and Redemptions of Fund Shares” is restated to read as follows:
This supplement should be read in conjunction with your Summary Prospectus, Statutory Prospectus and Statement of Additional Information, be retained for future reference and is in addition to any existing Fund supplements.
| | 1. | In each Fund’s Statutory Prospectus, the following is added at the end of the section entitled “Fund Distributions And Tax Issues—If You Sell or Exchange Your Shares”: |
Automatic Conversion of Class C Shares
The conversion of Class C shares into Class A shares—which happens automatically approximately 10 years after purchase—is not a taxable event for federal income tax purposes. For more information about the automatic conversion of Class C shares, see Class C Shares Automatically Convert to Class A Shares in How to Buy, Sell and Exchange Fund Shares.
| | 2. | In each Fund’s Statutory Prospectus, the following sentence is added at the end of the section entitled “How to Buy, Sell and Exchange Shares—Closure of Certain Share Classes to New Group Retirement Plans”: |
Shareholders owning Class C shares may continue to hold their Class C shares until the shares automatically convert to Class A shares under the conversion schedule, or until the shareholder redeems their Class C shares.
| | 3. | In each Fund’s Statutory Prospectus, the following disclosure is added immediately following the section entitled “How to Buy, Sell and Exchange Shares—How to Buy Shares—Class B Shares Automatically Convert to Class A Shares”: |
Class C Shares Automatically Convert to Class A Shares
Starting on or about April 1, 2019 (the “Effective Date”), Class C shares will be eligible for automatic conversion into Class A shares on a monthly basis approximately ten years after the original date of purchase (the “Conversion Date”). Conversion will take place based on the relative NAV of the two classes, without the imposition of any sales load, fee or other charge. All such automatic conversions of Class C shares will constitute tax-free exchanges for federal income tax purposes.
For shareholders investing in Class C shares through retirement plans or omnibus accounts, and in certain other instances, the Fund and its agents may not have
| | | | |
| PGIM Global Total Return (USD Hedged) Fund | | | 3 | |
transparency into how long a shareholder has held Class C shares for purposes of determining whether such Class C shares are eligible for automatic conversion into Class A shares, and the relevant financial intermediary may not have the ability to track purchases in order to credit individual shareholders’ holding periods. In these circumstances, the Fund will not be able to automatically convert Class C shares into Class A shares as described above. In order to determine eligibility for conversion in these circumstances, it is the responsibility of the financial intermediary to notify the Fund that the shareholder is eligible for the conversion of Class C shares to Class A shares, and the financial intermediary may be required to maintain and provide the Fund with records that substantiate the holding period of Class C shares. It is the financial intermediary’s (and not the Fund’s) responsibility to keep records of transactions made in accounts it holds and to ensure that the shareholder is credited with the proper holding period based on such records or those provided to the financial intermediary by the shareholder. Please consult with your financial intermediary for the applicability of this conversion feature to your shares.
A financial intermediary may sponsor and/or control accounts, programs or platforms that impose a different conversion schedule or different eligibility requirements for the exchange of Class C shares for Class A shares (see Appendix A: Waivers and Discounts Available From Certain Financial Intermediaries of the Prospectus). Please consult with your financial intermediary if you have any questions regarding your shares’ conversion from Class C shares to Class A shares.
| | 4. | In Part II of each Fund’s Statement of Additional Information, the following disclosure is added immediately following the section entitled “Purchase, Redemption and Pricing of Fund Shares—Share Classes—Automatic Conversion of Class B Shares”: |
AUTOMATIC CONVERSION OF CLASS C SHARES. Starting on or about April 1, 2019 (the “Effective Date”), Class C shares will be eligible for automatic conversion into Class A shares on a monthly basis approximately ten years after the original date of purchase (the “Conversion Date”). Conversion will take place based on the relative NAV of the two classes, without the imposition of any sales load, fee or other charge. Class C shares of a Fund acquired through automatic reinvestment of dividends or distributions will convert to Class A shares of the Fund on the Conversion Date pro rata with the converting Class C shares of the Fund that were not acquired through reinvestment of dividends or distributions. All such automatic conversions of Class C shares will constitute tax-free exchanges for federal income tax purposes.
For shareholders investing in Class C shares through retirement plans or omnibus accounts, and in certain other instances, the Fund and its agents may not have transparency into how long a shareholder has held Class C shares for purposes of determining whether such Class C shares are eligible for automatic conversion into Class A shares, and the relevant financial intermediary may not have the ability to track purchases in order to credit individual shareholders’ holding periods. In these circumstances, the
| | |
| 4 | | Visit our website at pgiminvestments.com |
Fund will not be able to automatically convert Class C shares into Class A shares as described above. In order to determine eligibility for conversion in these circumstances, it is the responsibility of the financial intermediary to notify the Fund that the shareholder is eligible for the conversion of Class C shares to Class A shares, and the financial intermediary may be required to maintain and provide the Fund with records that substantiate the holding period of Class C shares. It is the financial intermediary’s (and not the Fund’s) responsibility to keep records of transactions made in accounts it holds and to ensure that the shareholder is credited with the proper holding period based on such records or those provided to the financial intermediary by the shareholder. Please consult with your financial intermediary for the applicability of this conversion feature to your shares.
Class C shares were generally closed to investments by new group retirement plans effective June 1, 2018. Group retirement plans (and their successor, related and affiliated plans) that have Class C shares of the Fund available to participants on or before the Effective Date may continue to open accounts for new participants in such share class and purchase additional shares in existing participant accounts.
The Fund has no responsibility for monitoring or implementing a financial intermediary’s process for determining whether a shareholder meets the required holding period for conversion. A financial intermediary may sponsor and/or control accounts, programs or platforms that impose a different conversion schedule or different eligibility requirements for the exchange of Class C shares for Class A shares, as set forth on Appendix A: Waivers and Discounts Available From Certain Financial Intermediaries of the Prospectus. In these cases, Class C shareholders may have their shares exchanged for Class A shares under the policies of the financial intermediary. Financial intermediaries will be responsible for making such exchanges in those circumstances. Please consult with your financial intermediary if you have any questions regarding your shares’ conversion from Class C shares to Class A shares.
LR1094
- Not part of the Annual Report -
| | | | |
| PGIM Global Total Return (USD Hedged) Fund | | | 5 | |
Table of Contents
| | |
| 6 | | Visit our website at pgiminvestments.com |
Letter from the President

Dear Shareholder:
We hope you find the annual report for PGIM Global Total Return (USD Hedged) Fund informative and useful. The report covers performance for the 12-month period that ended October 31, 2018.
We have important information to share with you. Effective June 11, 2018.
Prudential Mutual Funds were renamed PGIM Funds. This renaming is part of our
ongoing effort to further build our reputation and establish our global brand, which began when our firm adopted PGIM Investments as its name in April 2017. Please note that only the Fund’s name has changed. Your Fund’s management and operation, along with its symbols, remained the same.*
During the reporting period, the global economy continued to grow, and central banks gradually tightened monetary policy. In the US, the economy expanded and employment increased. In September, the Federal Reserve hiked interest rates for the eighth time since 2015, based on confidence in the economy.
Equity returns on the whole were strong, due to optimistic earnings expectations and investor sentiment. Global equities, including emerging markets, generally posted positive returns. However, they trailed the performance of US equities, which rose on higher corporate profits, new regulatory policies, and tax reform benefits. Volatility spiked briefly early in the period on inflation concerns, rising interest rates, and a potential global trade war, and again late in the period on worries that profit growth might slow in 2019.
The overall bond market declined modestly during the period, as measured by the Bloomberg Barclays US Aggregate Bond Index. The best performance came from higher-yielding, economically sensitive sectors, such as high yield bonds and bank loans, which posted small gains. US investment-grade corporate bonds and US Treasury bonds both finished the period with negative returns. A major trend during the period was the flattening of the US Treasury yield curve, which increased the yield on fixed income investments with shorter maturities and made them more attractive to investors.
Regarding your investments with PGIM, we believe it is important to maintain a diversified portfolio of funds consistent with your tolerance for risk, time horizon, and financial goals. Your financial advisor can help you create a diversified investment plan that may include funds covering all the basic asset classes and that reflects your personal investor profile and risk tolerance. However, diversification and asset allocation strategies do not assure a profit or protect against loss in declining markets.
At PGIM Investments, we consider it a great privilege and responsibility to help investors participate in opportunities across global markets while meeting their toughest investment challenges. PGIM is a top-10 global investment manager with more than $1 trillion in assets under management. This investment expertise allows us to deliver actively managed funds and strategies to meet the needs of investors around the globe.
Thank you for choosing our family of funds.

Stuart S. Parker, President
PGIM Global Total Return (USD Hedged) Fund
December 14, 2018
*The Prudential Day One Funds did not change their names.
| | | | |
| PGIM Global Total Return (USD Hedged) Fund | | | 7 | |
Your Fund’s Performance (unaudited)
Performance data quoted represents past performance. Past performance does not guarantee future results. The investment return and principal value of an investment will fluctuate, so that an investor’s shares, when redeemed, may be worth more or less than their original cost. Current performance may be lower or higher than the past performance data quoted. An investor may obtain performance data as of the most recent month-end by visiting our website at www.pgiminvestments.com or by calling (800) 225-1852.
| | |
| | | Total Returns as of 10/31/18
(without sales charges) |
| | | Since Inception* (%) |
| Class A | | –2.54 (12/12/17) |
| Class C | | –3.19 (12/12/17) |
| Class Z | | –2.34 (12/12/17) |
| Class R6** | | –2.29 (12/12/17) |
| Bloomberg Barclays Global Aggregate (USD Hedged) Index | | 0.05 |
| Lipper Global Income Funds Average | | –2.50 |
Growth of a $10,000 Investment
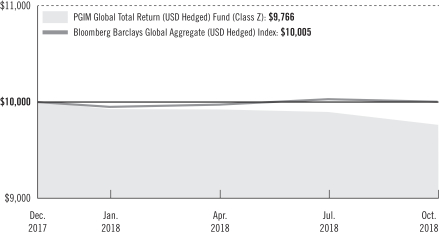
The graph compares a $10,000 investment in the Fund’s Class Z shares with a similar investment in the Bloomberg Barclays Global Aggregate (USD Hedged) Index by portraying the initial account values at the commencement of operations for Class Z shares (December 12, 2017) and the account values at the end of the current fiscal period (October 31, 2018) as measured on a quarterly basis. For purposes of the graph, and unless otherwise indicated, it has been assumed that (a) all recurring fees (including
| | |
| 8 | | Visit our website at pgiminvestments.com |
management fees) were deducted; and (b) all dividends and distributions were reinvested. The line graph provides information for Class Z shares only. As indicated in the tables provided earlier, performance for other share classes will vary due to the differing charges and expenses applicable to each share class (as indicated in the following paragraphs). Without waiver of fees and/or expense reimbursements, if any, the Fund’s returns would have been lower.
Past performance does not predict future performance. Total returns and the ending account values in the graph include changes in share price and reinvestment of dividends and capital gains distributions in a hypothetical investment for the periods shown. The Fund’s total returns do not reflect the deduction of income taxes on an individual’s investment. Taxes may reduce your actual investment returns on income or gains paid by the Fund or any gains you may realize if you sell your shares.
Source: PGIM Investments LLC and Lipper Inc.
*Not annualized
**Formerly known as Class Q shares.
Since Inception returns for the Index and the Lipper Average are measured from the closest month-end to the Fund’s inception date.
The returns in the tables do not reflect the deduction of taxes that a shareholder would pay on Fund distributions or following the redemption of Fund shares. The average annual total returns take into account applicable sales charges, which are described for each share class in the table below.
| | | | | | | | |
| | | Class A | | Class C | | Class Z | | Class R6* |
| Maximum initial sales charge | | 4.50% of the public offering price | | None | | None | | None |
| Contingent deferred sales charge (CDSC) (as a percentage of the lower of original purchase price or net asset value at redemption) | | 1.00% on sales of $1 million or more made within 12 months of purchase | | 1.00% on sales made within 12 months of purchase | | None | | None |
| Annual distribution and service (12b-1) fees (shown as a percentage of average daily net assets) | | 0.25% | | 1.00% | | None | | None |
*Formerly known as Class Q shares.
Benchmark Definitions
Bloomberg Barclays Global Aggregate (USD Hedged) Index—The Bloomberg Barclays Global Aggregate (USD Hedged) Index is an unmanaged index of global investment-grade fixed income markets. The three major components of this index are the US Aggregate, the Pan-European Aggregate, and the Asian-Pacific Aggregate Indices. Returns for the index are hedged to the US Dollar.
| | | | |
| PGIM Global Total Return (USD Hedged) Fund | | | 9 | |
Your Fund’s Performance (continued)
Lipper Global Income Funds Average—The Lipper Global Income Funds Average (Lipper Average) is based on the average return of all funds in the Lipper Global Income Funds universe. Funds in the Lipper Average invest primarily in US dollar and non-US dollar debt securities of issuers located in at least three countries, one of which may be the United States.
Investors cannot invest directly in an index or average. The returns for the Index would be lower if they included the effects of sales charges, operating expenses of a mutual fund, or taxes. Returns for the Lipper Average reflect the deduction of operating expenses of a mutual fund, but not sales charges or taxes.
| | | | | | |
| Distributions and Yields as of 10/31/18 |
| | Total Distributions
Paid for
the Period* ($) | | SEC 30-Day
Subsidized
Yield** (%) | | SEC 30-Day
Unsubsidized
Yield*** (%) |
| Class A | | 0.26 | | 2.42 | | –166.13 |
| Class C | | 0.19 | | 1.78 | | –199.97 |
| Class Z | | 0.28 | | 2.78 | | –80.73 |
| Class R6**** | | 0.28 | | 2.83 | | 0.11 |
*Inception date: 12/27/17
**SEC 30-Day Subsidized Yield (%)—A standardized yield calculation created by the Securities and Exchange Commission, it reflects the income earned during a 30-day period, after the deduction of the Fund’s net expenses (net of any expense waivers or reimbursements).
***SEC 30-Day Unsubsidized Yield (%)—A standardized yield calculation created by the Securities and Exchange Commission, it reflects the income earned during a 30-day period, after the deduction of the Fund’s gross expenses. The investor experience is represented by the SEC 30-Day Subsidized Yield.
****Formerly known as Class Q shares.
| | |
| 10 | | Visit our website at pgiminvestments.com |
| | | | |
| Credit Quality expressed as a percentage of total investments as of 10/31/18 (%) | |
| AAA | | | 29.3 | |
| AA | | | 9.8 | |
| A | | | 13.4 | |
| BBB | | | 26.4 | |
| BB | | | 8.0 | |
| B | | | 4.2 | |
| CCC | | | 0.2 | |
| Not Rated | | | 5.2 | |
| Cash/Cash Equivalents | | | 3.6 | |
| Total | | | 100.0 | |
Source: PGIM Fixed Income
Credit ratings reflect the highest rating assigned by a nationally recognized statistical rating organization (NRSRO) such as Moody’s Investors Service, Inc. (Moody’s), S&P Global Ratings (S&P), or Fitch, Inc. (Fitch). Credit ratings reflect the common nomenclature used by both S&P and Fitch. Where applicable, ratings are converted to the comparable S&P/Fitch rating tier nomenclature. These rating agencies are independent and are widely used. The Not Rated category consists of securities that have not been rated by a NRSRO. Credit ratings are subject to change. Values may not sum to 100.0% due to rounding.
| | | | |
| PGIM Global Total Return (USD Hedged) Fund | | | 11 | |
Strategy and Performance Overview (unaudited)
How did the Fund perform?
The PGIM Global Total Return (USD Hedged) Fund’s Class Z shares returned –2.34% since the Fund’s inception on December 12, 2017, through October 31, 2018 (the reporting period), underperforming the 0.05% return of the Bloomberg Barclays Global Aggregate (USD Hedged) Index (the Index) and outperforming the –2.50% return of the Lipper Global Income Funds Average.
What were market conditions?
| • | | At the beginning of the reporting period, the newly passed US tax law package was expected to continue to pressure future budget deficits, which would heighten the need for international deficit financing via increased Treasury issuance. Some thought that this could offset the positive effects of potential regulatory reform and pause the widening in long-dated swap spreads. In Europe, market expectations of diminished asset purchases by the European Central Bank (ECB) improved access to lending channels, and slightly larger bank balance sheets were thought to contribute to higher euro rates, especially in Germany. |
| • | | Long-term interest rates in developed markets continued their ascent in the first quarter of 2018 amid further signs of synchronized global growth and the expected effects of US fiscal stimulus. While the increase in rates was notable for its breadth, the scale of the sell-off created numerous opportunities in developed markets as the second quarter got underway. In the US, yields rose across the curve on hawkish Federal Reserve (Fed) rhetoric, anticipated fiscal stimulus from the recently passed tax law and budget deals, and increased Treasury supply, particularly at the front (short-term) end of the yield curve. In Europe, the ECB’s continued quantitative easing (QE) asset purchases meant there would be zero net issuance. That said, the ECB tapered its monthly QE purchases from $60 billion to $30 billion in the first quarter. Many expected it could have announced a conclusion to the purchases in September 2018, albeit with reinvestments likely to continue. PGIM Fixed Income believes the ECB’s first rate hike could emerge by the second quarter of 2019. |
| • | | In the second quarter of 2018, US rates diverged from other developed-market interest rates. With inflation on target, unemployment down, and the Fed continuing its cautious rate-hiking cycle, US long-term yields finished the quarter relatively unchanged. In contrast, the ECB emphasized downside risks in the economy, primarily stemming from trade, indicating the likely need for low rates through the summer of 2019. Similarly, the Bank of Japan (BoJ) signaled easy policy for the long haul as it delayed and lowered its expected path for rising inflation. In line with the central banks’ reading, long-term rates in Japan and Europe ended the second quarter at lows for the year. In China, rates rallied substantially, with yields falling to three-year lows as its central bank eased policy in an effort to support growth. |
| | |
| 12 | | Visit our website at pgiminvestments.com |
| • | | In the third quarter and October 2018, while the markets were volatile, the underlying causes were more or less constant with minor variations. After a decade of balance sheet expansion, the G3 (US, Japan, and eurozone) central banks are finally—at least in aggregate—turning off the liquidity spigot. The Fed is in the lead, hiking rates and implementing its roll-off of securities from its balance sheet at an accelerating pace. The ECB is in the final months of its asset-purchase program, which undoubtedly will be followed by rising anxiety surrounding the timing and pace of eventual rate hikes, in PGIM Fixed Income’s view. Meanwhile, the BoJ is sending mixed messages. Realizing it is taking longer than initially expected to hit its 2% inflation target, the BoJ is trying to improve its long-term policy effectiveness. It has taken steps, such as reducing its amounts of bond purchases and widening its target range for the 10-year Japanese government bond (JGB) yield, with the intent of reducing its stranglehold on the market and steepening the yield curve. These policy changes have tipped the scales, switching the G3 central bank balance sheets from aggressive growth to a path of stasis. The switch from “net buy” to “net hold” means the market’s primary source of steady capital injections over the last decade is more or less gone, leaving open markets to adjust to supply and demand on their own. |
What worked?
| • | | Positioning in developed market Treasuries and high-quality structured products added to performance. |
| • | | Although overall yield curve and duration positioning hurt performance, in developed market rates a yield curve flattener positioning in the euro added to performance. In emerging markets, long-duration positioning in Brazilian rates was a strong contributor. |
| • | | Although overall currency positioning hurt performance, underweights in the Chilean peso, Chinese yuan, and Swiss franc helped offset some of the losses. |
What didn’t work?
| • | | The Fund underperformed its Index during the reporting period, with duration and yield curve positioning, currency selection, and sector and security selection all detracting from performance. |
| • | | Positioning in developed and emerging market sovereign debt, and security selection in investment-grade corporate bonds, hurt performance. |
| • | | In developed market rates, long-duration positioning and yield curve-flattener positioning in the US was the largest detractor from performance. Long-duration positioning in Norwegian rates also limited results. In emerging markets, positioning in Mexican rates hurt performance. |
| • | | Currency positioning hurt performance in the period. Overweights in the Indian rupee, Brazilian real, Russian ruble, and Indonesian rupiah were the largest detractors. |
| | | | |
| PGIM Global Total Return (USD Hedged) Fund | | | 13 | |
Strategy and Performance Overview (continued)
Did the Fund hold derivatives, and how did they affect performance?
| • | | The Fund used interest rate futures and swaps to implement its investment strategy, as well as to help manage duration and yield curve exposure. The use of interest rate futures and swaps had a positive impact on the Fund’s performance in the reporting period. |
| • | | To implement most currency strategies, the Fund employed foreign exchange derivatives, which negatively impacted performance. |
Current outlook
| • | | As of the end of the period, PGIM Fixed Income maintained its positive view of fundamentals in the credit sectors of the fixed income market. The Fund held positions in spread sectors, including high yield, emerging market (EM), and structured products such as commercial mortgage-backed securities (CMBS), collateralized loan obligations (CLOs), non-agency mortgage-backed securities, and asset-backed securities (ABS). It also ended the period with an underweight in investment-grade corporates. |
| • | | At period-end, the Fund was overweight debt of European peripheral countries as well as a select group of emerging market issuers (mostly sovereign debt). Relative to its benchmark, the Fund held an underweight in the Swiss franc and the euro and an overweight in the US dollar. The Fund maintained a select set of small underweights and overweights within emerging market and “commodity” currencies. Examples include overweights in the Peruvian nuevo sol, Thai baht, and Indian rupee, and underweights in the Chinese yuan, Hungarian forint, and South Africa rand. |
| • | | In investment-grade corporates, PGIM Fixed Income continues to favor higher-quality financials and electric utilities over industrials subject to event risk. Within industrials, the Fund is focusing on select issuers where an “event” has passed as higher-quality corporates continue to lever up and merger-and-acquisition (M&A) activity remains a concern. |
| • | | A combination of solid fundamentals (strong earnings and low defaults) and favorable technicals (limited net supply and persistent institutional demand from Asia) has left PGIM Fixed Income with a modestly positive view on US high yield in the near term. However, concerns over current valuations, risk appetite on recent lower-quality M&A transactions reminiscent of 2007, as well as broader concerns about trade wars and the timing of the next recession, have prompted PGIM Fixed Income to take a cautious view longer term. |
| • | | Within CMBS, PGIM Fixed Income continues to find value in high-quality securities of new-issue conduit deals. In ABS, the Fund has maintained a fundamentally driven, up-in-quality focus, favoring select securitizations from originators of unsecured consumer, subprime auto, and private refinance student loans that practice strong underwriting and display robust structural features. |
| • | | The Fund has a very small allocation to government-related sectors such as Treasuries and agency mortgage-backed securities, as PGIM Fixed Income finds more compelling value in the aforementioned sectors. |
| | |
| 14 | | Visit our website at pgiminvestments.com |
Fees and Expenses (unaudited)
As a shareholder of the Fund, you incur two types of costs: (1) transaction costs, including sales charges (loads) on purchase payments and redemptions, as applicable, and (2) ongoing costs, including management fees, distribution and/or service (12b-1) fees, and other Fund expenses, as applicable. This example is intended to help you understand your ongoing costs (in dollars) of investing in the Fund and to compare these costs with the ongoing costs of investing in other mutual funds.
The example is based on an investment of $1,000 held through the six-month period ended October 31, 2018. The example is for illustrative purposes only; you should consult the Prospectus for information on initial and subsequent minimum investment requirements.
Actual Expenses
The first line for each share class in the table on the following page provides information about actual account values and actual expenses. You may use the information on this line, together with the amount you invested, to estimate the expenses that you paid over the period. Simply divide your account value by $1,000 (for example, an $8,600 account value ÷ $1,000 = 8.6), then multiply the result by the number on the first line under the heading “Expenses Paid During the Six-Month Period” to estimate the expenses you paid on your account during this period.
Hypothetical Example for Comparison Purposes
The second line for each share class in the table on the following page provides information about hypothetical account values and hypothetical expenses based on the Fund’s actual expense ratio and an assumed rate of return of 5% per year before expenses, which is not the Fund’s actual return. The hypothetical account values and expenses may not be used to estimate the actual ending account balance or expenses you paid for the period. You may use this information to compare the ongoing costs of investing in the Fund and other funds. To do so, compare this 5% hypothetical example with the 5% hypothetical examples that appear in the shareholder reports of the other funds.
The Fund’s transfer agent may charge additional fees to holders of certain accounts that are not included in the expenses shown in the table on the following page. These fees apply to individual retirement accounts (IRAs) and Section 403(b) accounts. As of the close of the six-month period covered by the table, IRA fees included an annual maintenance fee of $15 per account (subject to a maximum annual maintenance fee of $25 for all accounts held by the same shareholder). Section 403(b) accounts are charged an annual $25 fiduciary maintenance fee. Some of the fees may vary in amount, or may be waived, based on your total account balance or the number of PGIM funds, including the Fund, that you own. You should consider the additional fees that were charged to your Fund account over the six-month period when you estimate the total ongoing expenses paid over the period
| | | | |
| PGIM Global Total Return (USD Hedged) Fund | | | 15 | |
Fees and Expenses (continued)
and the impact of these fees on your ending account value, as these additional expenses are not reflected in the information provided in the expense table. Additional fees have the effect of reducing investment returns.
Please note that the expenses shown in the table are meant to highlight your ongoing costs only and do not reflect any transactional costs such as sales charges (loads). Therefore, the second line for each share class in the table is useful in comparing ongoing costs only and will not help you determine the relative total costs of owning different funds. In addition, if these transactional costs were included, your costs would have been higher.
| | | | | | | | | | | | | | | | | | |
PGIM Global Total Return
(USD Hedged) Fund | | Beginning Account
Value May 1, 2018 | | | Ending Account
Value
October 31, 2018 | | | Annualized
Expense Ratio
Based on the
Six-Month Period | | | Expenses Paid
During the
Six-Month Period* | |
| Class A | | Actual | | $ | 1,000.00 | | | $ | 982.90 | | | | 0.88 | % | | $ | 4.40 | |
| | Hypothetical | | $ | 1,000.00 | | | $ | 1,020.77 | | | | 0.88 | % | | $ | 4.48 | |
| Class C | | Actual | | $ | 1,000.00 | | | $ | 979.20 | | | | 1.63 | % | | $ | 8.13 | |
| | Hypothetical | | $ | 1,000.00 | | | $ | 1,016.99 | | | | 1.63 | % | | $ | 8.29 | |
| Class Z | | Actual | | $ | 1,000.00 | | | $ | 984.10 | | | | 0.63 | % | | $ | 3.15 | |
| | Hypothetical | | $ | 1,000.00 | | | $ | 1,022.03 | | | | 0.63 | % | | $ | 3.21 | |
| Class R6** | | Actual | | $ | 1,000.00 | | | $ | 984.40 | | | | 0.58 | % | | $ | 2.90 | |
| | | Hypothetical | | $ | 1,000.00 | | | $ | 1,022.28 | | | | 0.58 | % | | $ | 2.96 | |
*Fund expenses (net of fee waivers or subsidies, if any) for each share class are equal to the annualized expense ratio for each share class (provided in the table), multiplied by the average account value over the period, multiplied by the 184 days in the six-month period ended October 31, 2018, and divided by the 365 days in the Fund’s fiscal year ended October 31, 2018 (to reflect the six-month period). Expenses presented in the table include the expenses of any underlying portfolios in which the Fund may invest.
**Formerly known as Class Q shares.
| | |
| 16 | | Visit our website at pgiminvestments.com |
Schedule of Investments
as of October 31, 2018
| | | | | | | | | | | | | | | | |
| Description | | Interest
Rate | | | Maturity
Date | | | Principal
Amount (000)# | | | Value | |
LONG-TERM INVESTMENTS 94.1% | | | | | | | | | | | | | | | | |
| | | | |
ASSET-BACKED SECURITIES 20.6% | | | | | | | | | | | | | | | | |
| | | | |
Cayman Islands 14.2% | | | | | | | | | | | | | | | | |
Bain Capital Credit CLO, Series 2018-01A, Class A1, 144A, 3 Month LIBOR + 0.960% | | | 3.437 | %(c) | | | 04/23/31 | | | | 250 | | | $ | 249,825 | |
Brookside Mill CLO Ltd., Series 2013-01A, Class BR, 144A, 3 Month LIBOR + 1.350% | | | 3.799 | (c) | | | 01/17/28 | | | | 250 | | | | 248,205 | |
Carlyle Global Market Strategies CLO Ltd., Series 2014-01A, Class A1R2, 144A, 3 Month LIBOR + 0.970% | | | 3.419 | (c) | | | 04/17/31 | | | | 250 | | | | 250,241 | |
Cent CLO Ltd., Series C17A, Class A1AR, 144A, 3 Month LIBOR + 1.030% | | | 3.330 | (c) | | | 04/30/31 | | | | 250 | | | | 249,610 | |
Greenwood Park CLO Ltd., Series 2018-01A, Class A2, 144A, 3 Month LIBOR + 1.010% | | | 3.446 | (c) | | | 04/15/31 | | | | 250 | | | | 249,265 | |
Greywolf CLO Ltd., Series 2018-01A, Class A1, 144A, 3 Month LIBOR + 1.030% | | | 3.538 | (c) | | | 04/26/31 | | | | 250 | | | | 248,499 | |
MidOcean Credit CLO, | | | | | | | | | | | | | | | | |
Series 2018-08A, Class A1, 144A, 3 Month LIBOR + 1.150% | | | 3.472 | (c) | | | 02/20/31 | | | | 250 | | | | 249,592 | |
Series 2018-08A, Class B, 144A, 3 Month LIBOR + 1.650% | | | 3.972 | (c) | | | 02/20/31 | | | | 250 | | | | 248,943 | |
OZLM Ltd., Series 2014-06A, Class A2AS, 144A, 3 Month LIBOR + 1.750% | | | 4.199 | (c) | | | 04/17/31 | | | | 250 | | | | 249,828 | |
Telos CLO Ltd., Series 2013-04A, Class AR, 144A, 3 Month LIBOR + 1.240% | | | 3.689 | (c) | | | 01/17/30 | | | | 250 | | | | 249,256 | |
TICP CLO Ltd., Series 2015-01A, Class BR, 144A, 3 Month LIBOR + 1.300% | | | 3.769 | (c) | | | 07/20/27 | | | | 250 | | | | 248,277 | |
Tryon Park CLO Ltd., Series 2013-01A, Class A2R, 144A, 3 Month LIBOR + 1.500% | | | 3.936 | (c) | | | 04/15/29 | | | | 250 | | | | 249,451 | |
See Notes to Financial Statements.
| | | | |
| PGIM Global Total Return (USD Hedged) Fund | | | 17 | |
Schedule of Investments (continued)
as of October 31, 2018
| | | | | | | | | | | | | | | | |
| Description | | Interest
Rate | | | Maturity
Date | | | Principal
Amount (000)# | | | Value | |
ASSET-BACKED SECURITIES (Continued) | | | | | | | | | | | | | | | | |
| | | | |
Cayman Islands (cont’d.) | | | | | | | | | | | | | | | | |
Venture CLO Ltd., Series 2016-24A, Class A1D, 144A, 3 Month LIBOR + 1.420% | | | 3.889 | %(c) | | | 10/20/28 | | | | 250 | | | $ | 250,095 | |
Voya CLO Ltd., Series 2013-02A, Class A1R, 144A, 3 Month LIBOR + 0.970% | | | 3.460 | (c) | | | 04/25/31 | | | | 250 | | | | 248,598 | |
| | | | | | | | | | | | | | | | |
| | | | | | | | | | | | | | | 3,489,685 | |
| | | | |
Ireland 2.3% | | | | | | | | | | | | | | | | |
Arbour CLO Ltd., Series 2018-03A, Class B1R, 144A | | | 1.920 | (cc) | | | 03/15/29 | | | EUR | 250 | | | | 282,707 | |
Armada Euro CLO, Series 2018-02A, Class A3, 144A | | | 1.500 | (cc) | | | 11/15/31 | | | EUR | 250 | | | | 282,964 | |
| | | | | | | | | | | | | | | | |
| | | | | | | | | | | | | | | 565,671 | |
| | | | |
Spain 0.6% | | | | | | | | | | | | | | | | |
TFS, Series 2018-03, Class A1, 1 Month EURIBOR + 2.900% | | | 2.900 | (c) | | | 03/16/23 | | | EUR | 140 | | | | 158,272 | |
| | | | |
United States 3.5% | | | | | | | | | | | | | | | | |
Battalion CLO Ltd., Series 2018-12A, Class A1, 144A, 3 Month LIBOR + 1.070% | | | 3.400 | (c) | | | 05/17/31 | | | | 250 | | | | 248,814 | |
Citibank Credit Card Issuance Trust, Series 2018-A07, Class A7 | | | 3.960 | | | | 10/13/30 | | | | 100 | | | | 100,619 | |
Credit Suisse Mortgage Trust, Series 2018-03R, Class 1A1, 144A, 1 Month LIBOR + 1.200% | | | 3.474 | (c) | | | 12/25/46 | | | | 63 | | | | 62,853 | |
Oportun Funding LLC, Series 2018-A, Class A, 144A | | | 3.610 | | | | 03/08/24 | | | | 250 | | | | 246,698 | |
PNMAC GMSR Issuer Trust, | | | | | | | | | | | | | | | | |
Series 2018-GT01, Class A, 144A, 1 Month LIBOR + 2.850% | | | 5.131 | (c) | | | 02/25/23 | | | | 100 | | | | 101,068 | |
Series 2018-GT02, Class A, 144A, 1 Month LIBOR + 2.650% | | | 4.931 | (c) | | | 08/25/25 | | | | 100 | | | | 100,699 | |
| | | | | | | | | | | | | | | | |
| | | | | | | | | | | | | | | 860,751 | |
| | | | | | | | | | | | | | | | |
TOTAL ASSET-BACKED SECURITIES
(cost $5,136,325) | | | | | | | | | | | | | | | 5,074,379 | |
| | | | | | | | | | | | | | | | |
See Notes to Financial Statements.
| | | | | | | | | | | | | | | | |
| Description | | Interest
Rate | | | Maturity
Date | | | Principal
Amount (000)# | | | Value | |
COMMERCIAL MORTGAGE-BACKED SECURITIES 9.6% | | | | | | | | | | | | | |
| | | | |
United States | | | | | | | | | | | | | | | | |
BANK, Series 2018-BN10, Class A4 | | | 3.428 | % | | | 02/15/61 | | | | 250 | | | $ | 238,370 | |
Benchmark Mortgage Trust, | | | | | | | | | | | | | | | | |
Series 2018-B02, Class A3 | | | 3.544 | | | | 02/15/51 | | | | 200 | | | | 196,476 | |
Series 2018-B03, Class A3 | | | 3.746 | | | | 04/10/51 | | | | 125 | | | | 123,894 | |
Series 2018-B1, Class A3 | | | 3.355 | | | | 01/15/51 | | | | 175 | | | | 170,904 | |
Citigroup Commercial Mortgage Trust, Series 2018-B02, Class A3 | | | 3.744 | | | | 03/10/51 | | | | 150 | | | | 147,094 | |
FHLMC Multifamily Structured Pass-Through Certificates, Series K052, Class X1, IO | | | 0.669 | (cc) | | | 11/25/25 | | | | 4,648 | | | | 175,441 | |
GS Mortgage Securities Trust, Series 2018-GS09, Class A3 | | | 3.727 | | | | 03/10/51 | | | | 125 | | | | 121,990 | |
UBS Commercial Mortgage Trust, | | | | | | | | | | | | | | | | |
Series 2017-C07, Class A3 | | | 3.418 | | | | 12/15/50 | | | | 750 | | | | 714,857 | |
Series 2018-C08, Class A3 | | | 3.720 | | | | 02/15/51 | | | | 250 | | | | 243,653 | |
Wells Fargo Commercial Mortgage Trust, Series 2016-LC24, Class A3 | | | 2.684 | | | | 10/15/49 | | | | 250 | | | | 229,424 | |
| | | | | | | | | | | | | | | | |
TOTAL COMMERCIAL MORTGAGE-BACKED SECURITIES
(cost $2,462,279) | | | | | | | | | | | | | | | 2,362,103 | |
| | | | | | | | | | | | | | | | |
| | | | |
CORPORATE BONDS 21.7% | | | | | | | | | | | | | | | | |
| | | | |
Canada 1.0% | | | | | | | | | | | | | | | | |
Bombardier, Inc., Sr. Unsec’d. Notes, 144A | | | 7.500 | | | | 12/01/24 | | | | 25 | | | | 25,406 | |
Hydro-Quebec, Local Gov’t. Gtd. Notes | | | 9.375 | | | | 04/15/30 | | | | 150 | | | | 224,406 | |
| | | | | | | | | | | | | | | | |
| | | | | | | | | | | | | | | 249,812 | |
| | | | |
China 0.9% | | | | | | | | | | | | | | | | |
CNAC HK Finbridge Co. Ltd., Gtd. Notes | | | 1.750 | | | | 06/14/22 | | | EUR | 100 | | | | 112,641 | |
Sinopec Group Overseas Development Ltd., Gtd. Notes | | | 1.000 | | | | 04/28/22 | | | EUR | 100 | | | | 114,752 | |
| | | | | | | | | | | | | | | | |
| | | | | | | | | | | | | | | 227,393 | |
| | | | |
France 0.5% | | | | | | | | | | | | | | | | |
Credit Agricole Assurances SA, Sub. Notes | | | 4.250 | | | | 01/29/49 | | | EUR | 100 | | | | 117,123 | |
See Notes to Financial Statements.
| | | | |
| PGIM Global Total Return (USD Hedged) Fund | | | 19 | |
Schedule of Investments (continued)
as of October 31, 2018
| | | | | | | | | | | | | | | | |
| Description | | Interest
Rate | | | Maturity
Date | | | Principal
Amount (000)# | | | Value | |
CORPORATE BONDS (Continued) | | | | | | | | | | | | | | | | |
| | | | |
Germany 1.9% | �� | | | | | | | | | | | | | | | |
Deutsche Bahn Finance GmbH, Gtd. Notes, MTN | | | 3.800 | % | | | 09/27/27 | | | AUD | 100 | | | $ | 72,673 | |
Deutsche Bank AG, Sr. Unsec’d. Notes | | | 3.150 | | | | 01/22/21 | | | | 200 | | | | 195,017 | |
Nidda Healthcare Holding GmbH, Sr. Sec’d. Notes | | | 3.500 | | | | 09/30/24 | | | EUR | 100 | | | | 111,565 | |
Takko Luxembourg SCA, Sr. Sec’d. Notes, MTN | | | 5.375 | | | | 11/15/23 | | | EUR | 100 | | | | 82,400 | |
| | | | | | | | | | | | | | | | |
| | | | | | | | | | | | | | | 461,655 | |
| | | | |
Italy 1.7% | | | | | | | | | | | | | | | | |
Assicurazioni Generali SpA, Sub. Notes, EMTN | | | 5.500 | | | | 10/27/47 | | | EUR | 100 | | | | 117,548 | |
Intesa Sanpaolo SpA, Sr. Unsec’d. Notes, 144A | | | 3.375 | | | | 01/12/23 | | | | 200 | | | | 181,109 | |
Rossini Sarl, Sr. Sec’d. Notes, 144A | | | 6.750 | | | | 10/30/25 | | | EUR | 100 | | | | 115,247 | |
| | | | | | | | | | | | | | | | |
| | | | | | | | | | | | | | | 413,904 | |
| | | | |
Kazakhstan 0.2% | | | | | | | | | | | | | | | | |
Kazakhstan Temir Zholy National Co. JSC, Gtd. Notes | | | 3.638 | | | | 06/20/22 | | | CHF | 50 | | | | 51,637 | |
| | | | |
Mexico 1.3% | | | | | | | | | | | | | | | | |
Petroleos Mexicanos, Gtd. Notes | | | 3.625 | | | | 11/24/25 | | | EUR | 300 | | | | 327,900 | |
| | | | |
Netherlands 0.6% | | | | | | | | | | | | | | | | |
Nederlandse Waterschapsbank NV, Sr. Unsec’d. Notes, MTN | | | 3.400 | | | | 07/22/25 | | | AUD | 200 | | | | 144,841 | |
| | | | |
Russia 0.5% | | | | | | | | | | | | | | | | |
Gazprom OAO Via Gaz Capital SA, Sr. Unsec’d. Notes | | | 4.250 | | | | 04/06/24 | | | GBP | 100 | | | | 127,853 | |
| | | | |
Spain 0.5% | | | | | | | | | | | | | | | | |
Adif-Alta Velocidad, Sr. Unsec’d. Notes, EMTN | | | 1.875 | | | | 01/28/25 | | | EUR | 100 | | | | 117,916 | |
See Notes to Financial Statements.
| | | | | | | | | | | | | | | | |
| Description | | Interest
Rate | | | Maturity
Date | | | Principal
Amount (000)# | | | Value | |
CORPORATE BONDS (Continued) | | | | | | | | | | | | | | | | |
| | | | |
Supranational Bank 0.5% | | | | | | | | | | | | | | | | |
African Development Bank, Sr. Unsec’d. Notes, EMTN | | | 0.500 | % | | | 09/21/21 | | | NZD | 200 | | | $ | 122,177 | |
| | | | |
Switzerland 0.8% | | | | | | | | | | | | | | | | |
UBS Group Funding Switzerland AG, Gtd. Notes, 144A | | | 4.125 | | | | 09/24/25 | | | | 200 | | | | 196,760 | |
| | | | |
United Kingdom 1.7% | | | | | | | | | | | | | | | | |
CPUK Finance Ltd., Sec’d. Notes | | | 4.875 | | | | 02/28/47 | | | GBP | 100 | | | | 127,431 | |
DS Smith PLC, Sr. Unsec’d. Notes, MTN | | | 1.375 | | | | 07/26/24 | | | EUR | 100 | | | | 109,227 | |
Royal Bank of Scotland Group PLC, Sr. Unsec’d. Notes | | | 3.875 | | | | 09/12/23 | | | | 200 | | | | 192,403 | |
| | | | | | | | | | | | | | | | |
| | | | | | | | | | | | | | | 429,061 | |
| | | | |
United States 9.6% | | | | | | | | | | | | | | | | |
American International Group, Inc., Sr. Unsec’d. Notes | | | 1.875 | | | | 06/21/27 | | | EUR | 100 | | | | 112,198 | |
Beazer Homes USA, Inc., Gtd. Notes | | | 8.750 | | | | 03/15/22 | | | | 50 | | | | 50,375 | |
Calpine Corp., Sr. Unsec’d. Notes | | | 5.375 | | | | 01/15/23 | | | | 100 | | | | 94,750 | |
CCO Holdings LLC/CCO Holdings Capital Corp., Sr. Unsec’d. Notes, 144A | | | 5.000 | | | | 02/01/28 | | | | 75 | | | | 69,891 | |
Celgene Corp., Sr. Unsec’d. Notes | | | 3.450 | | | | 11/15/27 | | | | 100 | | | | 91,124 | |
CHS/Community Health Systems, Inc., Sr. Sec’d. Notes | | | 6.250 | | | | 03/31/23 | | | | 50 | | | | 45,985 | |
Discovery Communications LLC, Gtd. Notes | | | 4.900 | | | | 03/11/26 | | | | 100 | | | | 101,125 | |
DISH DBS Corp., Gtd. Notes | | | 7.750 | | | | 07/01/26 | | | | 75 | | | | 67,125 | |
First Data Corp., Gtd. Notes, 144A | | | 7.000 | | | | 12/01/23 | | | | 100 | | | | 103,700 | |
Ford Motor Credit Co. LLC, Sr. Unsec’d. Notes | | | 3.815 | | | | 11/02/27 | | | | 200 | | | | 171,962 | |
General Motors Financial Co., Inc., Gtd. Notes | | | 3.850 | | | | 01/05/28 | | | | 100 | | | | 88,462 | |
Kinder Morgan, Inc., Gtd. Notes | | | 4.300 | | | | 03/01/28 | | | | 200 | | | | 193,347 | |
See Notes to Financial Statements.
| | | | |
| PGIM Global Total Return (USD Hedged) Fund | | | 21 | |
Schedule of Investments (continued)
as of October 31, 2018
| | | | | | | | | | | | | | | | |
| Description | | Interest
Rate | | | Maturity
Date | | | Principal
Amount (000)# | | | Value | |
CORPORATE BONDS (Continued) | | | | | | | | | | | | | | | | |
| | | | |
United States (cont’d.) | | | | | | | | | | | | | | | | |
Kraft Heinz Foods Co., Gtd. Notes | | | 3.000 | % | | | 06/01/26 | | | | 100 | | | $ | 89,245 | |
L Brands, Inc., Gtd. Notes | | | 5.250 | | | | 02/01/28 | | | | 40 | | | | 34,112 | |
Liberty Mutual Group, Inc., Gtd. Notes | | | 2.750 | | | | 05/04/26 | | | EUR | 100 | | | | 120,040 | |
Morgan Stanley, | | | | | | | | | | | | | | | | |
Sr. Unsec’d. Notes, EMTN | | | 1.342 | | | | 10/23/26 | | | EUR | 100 | | | | 110,591 | |
Sub. Notes, GMTN | | | 4.350 | | | | 09/08/26 | | | | 100 | | | | 97,385 | |
MPLX LP, Sr. Unsec’d. Notes | | | 4.000 | | | | 03/15/28 | | | | 25 | | | | 23,479 | |
Nationstar Mortgage Holdings, Inc., Gtd. Notes, 144A | | | 8.125 | | | | 07/15/23 | | | | 15 | | | | 15,262 | |
Newell Brands, Inc., Sr. Unsec’d. Notes | | | 4.200 | | | | 04/01/26 | | | | 100 | | | | 91,870 | |
NRG Energy, Inc., Gtd. Notes | | | 5.750 | | | | 01/15/28 | | | | 53 | | | | 52,867 | |
Sally Holdings LLC/Sally Capital, Inc., Gtd. Notes | | | 5.500 | | | | 11/01/23 | | | | 50 | | | | 48,125 | |
Scientific Games International, Inc., Gtd. Notes | | | 6.625 | | | | 05/15/21 | | | | 50 | | | | 48,375 | |
Shire Acquisitions Investments Ireland DAC, Gtd. Notes | | | 3.200 | | | | 09/23/26 | | | | 25 | | | | 22,656 | |
United Rentals North America, Inc., Gtd. Notes | | | 5.500 | | | | 05/15/27 | | | | 100 | | | | 94,875 | |
Vistra Energy Corp., Gtd. Notes | | | 5.875 | | | | 06/01/23 | | | | 50 | | | | 50,750 | |
Vistra Operations Co. LLC, Gtd. Notes, 144A | | | 5.500 | | | | 09/01/26 | | | | 10 | | | | 9,850 | |
William Lyon Homes, Inc., Gtd. Notes | | | 6.000 | | | | 09/01/23 | | | | 50 | | | | 45,625 | |
Williams Cos., Inc. (The), Sr. Unsec’d. Notes | | | 3.600 | | | | 03/15/22 | | | | 100 | | | | 98,372 | |
Zimmer Biomet Holdings, Inc., Sr. Unsec’d. Notes | | | 1.414 | | | | 12/13/22 | | | EUR | 100 | | | | 115,441 | |
| | | | | | | | | | | | | | | | |
| | | | | | | | | | | | | | | 2,358,964 | |
| | | | | | | | | | | | | | | | |
TOTAL CORPORATE BONDS
(cost $5,725,632) | | | | | | | | | | | | | | | 5,346,996 | |
| | | | | | | | | | | | | | | | |
See Notes to Financial Statements.
| | | | | | | | | | | | | | | | |
| Description | | Interest
Rate | | | Maturity
Date | | | Principal
Amount (000)# | | | Value | |
RESIDENTIAL MORTGAGE-BACKED SECURITIES 1.0% | | | | | | | | | | | | | | | | |
| | | | |
Bermuda 0.7% | | | | | | | | | | | | | | | | |
Bellemeade Re Ltd., Series 2018-01A, Class M1B, 144A, 1 Month LIBOR + 1.600% | | | 3.881 | %(c) | | | 04/25/28 | | | | 167 | | | $ | 167,871 | |
| | | | |
United States 0.3% | | | | | | | | | | | | | | | | |
LSTAR Securities Investment Trust, Series 2018-02, Class A1, 144A, 1 Month LIBOR + 1.500% | | | 3.756 | (c) | | | 04/01/23 | | | | 80 | | | | 79,618 | |
| | | | | | | | | | | | | | | | |
TOTAL RESIDENTIAL MORTGAGE-BACKED SECURITIES
(cost $246,568) | | | | | | | | | | | | | | | 247,489 | |
| | | | | | | | | | | | | | | | |
| | | | |
SOVEREIGN BONDS 37.3% | | | | | | | | | | | | | | | | |
| | | | |
Argentina 2.0% | | | | | | | | | | | | | | | | |
Argentine Republic Government International Bond, | | | | | | | | | | | | | | | | |
Sr. Unsec’d. Notes | | | 3.375 | | | | 01/15/23 | | | EUR | 200 | | | | 189,206 | |
Sr. Unsec’d. Notes | | | 7.820 | | | | 12/31/33 | | | EUR | 137 | | | | 140,751 | |
Sr. Unsec’d. Notes | | | 7.820 | | | | 12/31/33 | | | EUR | 69 | | | | 70,138 | |
Provincia de Buenos Aires, Sr. Unsec’d. Notes | | | 5.375 | | | | 01/20/23 | | | EUR | 100 | | | | 92,822 | |
| | | | | | | | | | | | | | | | |
| | | | | | | | | | | | | | | 492,917 | |
| | | | |
Austria 0.6% | | | | | | | | | | | | | | | | |
Republic of Austria Government International Bond, Sr. Unsec’d. Notes, 144A, MTN | | | 5.375 | | | | 12/01/34 | | | CAD | 160 | | | | 148,088 | |
| | | | |
Brazil 0.8% | | | | | | | | | | | | | | | | |
Brazil Minas SPE via State of Minas Gerais, Gov’t. Gtd. Notes | | | 5.333 | | | | 02/15/28 | | | | 200 | | | | 193,750 | |
| | | | |
Bulgaria 0.5% | | | | | | | | | | | | | | | | |
Bulgaria Government International Bond, Unsec’d. Notes, GMTN | | | 3.125 | | | | 03/26/35 | | | EUR | 100 | | | | 120,060 | |
| | | | |
Canada 0.5% | | | | | | | | | | | | | | | | |
City of Toronto Canada, Unsec’d. Notes | | | 3.500 | | | | 12/06/21 | | | CAD | 150 | | | | 116,288 | |
See Notes to Financial Statements.
| | | | |
| PGIM Global Total Return (USD Hedged) Fund | | | 23 | |
Schedule of Investments (continued)
as of October 31, 2018
| | | | | | | | | | | | | | | | |
| Description | | Interest
Rate | | | Maturity
Date | | | Principal
Amount (000)# | | | Value | |
SOVEREIGN BONDS (Continued) | | | | | | | | | | | | | | | | |
| | | | |
Chile 0.5% | | | | | | | | | | | | | | | | |
Chile Government International Bond, Sr. Unsec’d. Notes | | | 1.440 | % | | | 02/01/29 | | | EUR | 115 | | | $ | 128,157 | |
| | | | |
Colombia 1.0% | | | | | | | | | | | | | | | | |
Colombia Government International Bond, Sr. Unsec’d. Notes, EMTN | | | 3.875 | | | | 03/22/26 | | | EUR | 200 | | | | 254,845 | |
| | | | |
Croatia 0.9% | | | | | | | | | | | | | | | | |
Croatia Government International Bond, Sr. Unsec’d. Notes | | | 6.000 | | | | 01/26/24 | | | | 200 | | | | 215,423 | |
| | | | |
Cyprus 1.7% | | | | | | | | | | | | | | | | |
Cyprus Government International Bond, | | | | | | | | | | | | | | | | |
Sr. Unsec’d. Notes, EMTN | | | 4.250 | | | | 11/04/25 | | | EUR | 50 | | | | 65,230 | |
Unsec’d. Notes, EMTN | | | 2.750 | | | | 06/27/24 | | | EUR | 300 | | | | 361,323 | |
| | | | | | | | | | | | | | | | |
| | | | | | | | | | | | | | | 426,553 | |
| | | | |
Dominican Republic 0.4% | | | | | | | | | | | | | | | | |
Dominican Republic International Bond, Sr. Unsec’d. Notes | | | 5.950 | | | | 01/25/27 | | | | 100 | | | | 99,500 | |
| | | | |
France 1.4% | | | | | | | | | | | | | | | | |
French Republic Government Bond OAT, Bonds | | | 2.750 | | | | 10/25/27 | | | EUR | 260 | | | | 350,558 | |
| | | | |
Greece 1.9% | | | | | | | | | | | | | | | | |
Hellenic Republic Government Bond, | | | | | | | | | | | | | | | | |
Bonds | | | 0.000 | (cc) | | | 10/15/42 | | | EUR | 6,000 | | | | 20,387 | |
Bonds | | | 3.000 | (cc) | | | 02/24/37 | | | EUR | 400 | | | | 374,172 | |
Sr. Unsec’d. Notes, 144A | | | 3.375 | | | | 02/15/25 | | | EUR | 20 | | | | 21,956 | |
Hellenic Republic Government International Bond, Sr. Unsec’d. Notes | | | 5.200 | | | | 07/17/34 | | | EUR | 50 | | | | 56,473 | |
| | | | | | | | | | | | | | | | |
| | | | | | | | | | | | | | | 472,988 | |
| | | | |
Hungary 0.7% | | | | | | | | | | | | | | | | |
Hungary Government International Bond, | | | | | | | | | | | | | | | | |
Sr. Unsec’d. Notes | | | 1.750 | | | | 10/10/27 | | | EUR | 100 | | | | 114,297 | |
Sr. Unsec’d. Notes | | | 6.375 | | | | 03/29/21 | | | | 50 | | | | 52,925 | |
| | | | | | | | | | | | | | | | |
| | | | | | | | | | | | | | | 167,222 | |
See Notes to Financial Statements.
| | | | | | | | | | | | | | | | |
| Description | | Interest
Rate | | | Maturity
Date | | | Principal
Amount (000)# | | | Value | |
SOVEREIGN BONDS (Continued) | | | | | | | | | | | | | | | | |
| | | | |
Indonesia 0.8% | | | | | | | | | | | | | | | | |
Indonesia Government International Bond, Sr. Unsec’d. Notes, MTN | | | 4.125 | % | | | 01/15/25 | | | | 200 | | | $ | 192,043 | |
| | | | |
Israel 0.5% | | | | | | | | | | | | | | | | |
Israel Government International Bond, Sr. Unsec’d. Notes, EMTN | | | 1.500 | | | | 01/18/27 | | | EUR | 100 | | | | 114,741 | |
| | | | |
Italy 5.8% | | | | | | | | | | | | | | | | |
Italy Buoni Poliennali del Tesoro, | | | | | | | | | | | | | | | | |
Bonds | | | 2.000 | | | | 12/01/25 | | | EUR | 275 | | | | 291,200 | |
Bonds | | | 2.000 | | | | 02/01/28 | | | EUR | 180 | | | | 183,975 | |
Bonds | | | 9.000 | | | | 11/01/23 | | | EUR | 300 | | | | 439,585 | |
Bonds, 144A | | | 2.800 | | | | 03/01/67 | | | EUR | 105 | | | | 95,166 | |
Unsec’d. Notes | | | 4.500 | | | | 03/01/26 | | | EUR | 250 | | | | 309,318 | |
Republic of Italy Government International Bond, Sr. Unsec’d. Notes, EMTN, EURIBOR ICE SWAP 11:00 Fft 10Y Index + 0.000% (Cap 7.000%, Floor 2.000%) | | | 2.000 | (c) | | | 06/15/20 | | | EUR | 100 | | | | 114,402 | |
| | | | | | | | | | | | | | | | |
| | | | | | | | | | | | | | | 1,433,646 | |
| | | | |
Malaysia 0.4% | | | | | | | | | | | | | | | | |
Malaysia Government Bond, Sr. Unsec’d. Notes, Ser. 0314 | | | 4.048 | | | | 09/30/21 | | | MYR | 457 | | | | 110,361 | |
| | | | |
Mexico 1.4% | | | | | | | | | | | | | | | | |
Mexico Government International Bond, | | | | | | | | | | | | | | | | |
Sr. Unsec’d. Notes, EMTN | | | 1.750 | | | | 04/17/28 | | | EUR | 100 | | | | 107,230 | |
Sr. Unsec’d. Notes, EMTN | | | 2.375 | | | | 04/09/21 | | | EUR | 100 | | | | 118,871 | |
Sr. Unsec’d. Notes, GMTN | | | 5.500 | | | | 02/17/20 | | | EUR | 100 | | | | 120,946 | |
| | | | | | | | | | | | | | | | |
| | | | | | | | | | | | | | | 347,047 | |
| | | | |
New Zealand 0.6% | | | | | | | | | | | | | | | | |
New Zealand Local Government Funding Agency Bond, Sr. Unsec’d. Notes | | | 4.500 | | | | 04/15/27 | | | NZD | 200 | | | | 142,096 | |
| | | | |
Panama 0.8% | | | | | | | | | | | | | | | | |
Panama Government International Bond, Sr. Unsec’d. Notes | | | 3.875 | | | | 03/17/28 | | | | 200 | | | | 192,102 | |
See Notes to Financial Statements.
| | | | |
| PGIM Global Total Return (USD Hedged) Fund | | | 25 | |
Schedule of Investments (continued)
as of October 31, 2018
| | | | | | | | | | | | | | | | |
| Description | | Interest
Rate | | | Maturity
Date | | | Principal
Amount (000)# | | | Value | |
SOVEREIGN BONDS (Continued) | | | | | | | | | | | | | | | | |
| | | | |
Peru 0.5% | | | | | | | | | | | | | | | | |
Peruvian Government International Bond, Sr. Unsec’d. Notes | | | 2.750 | % | | | 01/30/26 | | | EUR | 100 | | | $ | 122,779 | |
| | | | |
Poland 0.8% | | | | | | | | | | | | | | | | |
Republic of Poland Government International Bond, Sr. Unsec’d. Notes | | | 5.000 | | | | 03/23/22 | | | | 200 | | | | 209,198 | |
| | | | |
Portugal 2.6% | | | | | | | | | | | | | | | | |
Portugal Obrigacoes do Tesouro OT, | | | | | | | | | | | | | | | | |
Sr. Unsec’d. Notes, 144A | | | 3.875 | | | | 02/15/30 | | | EUR | 435 | | | | 578,134 | |
Sr. Unsec’d. Notes, 144A | | | 4.100 | | | | 04/15/37 | | | EUR | 55 | | | | 75,255 | |
| | | | | | | | | | | | | | | | |
| | | | | | | | | | | | | | | 653,389 | |
| | | | |
Romania 0.5% | | | | | | | | | | | | | | | | |
Romanian Government International Bond, Sr. Unsec’d. Notes, EMTN | | | 3.875 | | | | 10/29/35 | | | EUR | 100 | | | | 112,302 | |
| | | | |
Saudi Arabia 0.8% | | | | | | | | | | | | | | | | |
Saudi Government International Bond, Sr. Unsec’d. Notes, EMTN | | | 2.875 | | | | 03/04/23 | | | | 200 | | | | 190,040 | |
| | | | |
Senegal 0.4% | | | | | | | | | | | | | | | | |
Senegal Government International Bond, Sr. Unsec’d. Notes, 144A | | | 4.750 | | | | 03/13/28 | | | EUR | 100 | | | | 105,574 | |
| | | | |
Spain 5.6% | | | | | | | | | | | | | | | | |
Instituto de Credito Oficial, Gov’t. Gtd. Notes, GMTN | | | 0.963 | | | | 09/22/22 | | | SEK | 1,000 | | | | 109,548 | |
Spain Government Bond, | | | | | | | | | | | | | | | | |
Bonds, 144A | | | 5.150 | | | | 10/31/28 | | | EUR | 200 | | | | 301,587 | |
Sr. Unsec’d. Notes, 144A | | | 3.450 | | | | 07/30/66 | | | EUR | 60 | | | | 76,581 | |
Sr. Unsec’d. Notes, 144A | | | 5.500 | | | | 04/30/21 | | | EUR | 400 | | | | 515,716 | |
Sr. Unsec’d. Notes, 144A | | | 5.900 | | | | 07/30/26 | | | EUR | 250 | | | | 380,980 | |
| | | | | | | | | | | | | | | | |
| | | | | | | | | | | | | | | 1,384,412 | |
See Notes to Financial Statements.
| | | | | | | | | | | | | | | | |
| Description | | Interest
Rate | | | Maturity
Date | | | Principal
Amount (000)# | | | Value | |
SOVEREIGN BONDS (Continued) | | | | | | | | | | | | | | | | |
| | | | |
Sweden 1.2% | | | | | | | | | | | | | | | | |
Svensk Exportkredit AB, Sr. Unsec’d. Notes, EMTN | | | 0.500 | % | | | 03/15/22 | | | ZAR | 2,000 | | | $ | 99,945 | |
Sweden Government International Bond, Sr. Unsec’d. Notes, 144A, MTN | | | 0.125 | | | | 04/24/23 | | | EUR | 180 | | | | 204,874 | |
| | | | | | | | | | | | | | | | |
| | | | | | | | | | | | | | | 304,819 | |
| | | | |
Turkey 0.5% | | | | | | | | | | | | | | | | |
Turkey Government International Bond, Sr. Unsec’d. Notes | | | 4.125 | | | | 04/11/23 | | | EUR | 100 | | | | 112,083 | |
| | | | |
United Arab Emirates 0.8% | | | | | | | | | | | | | | | | |
Abu Dhabi Government International Bond, Sr. Unsec’d. Notes | | | 2.500 | | | | 10/11/22 | | | | 200 | | | | 191,664 | |
| | | | |
Uruguay 0.4% | | | | | | | | | | | | | | | | |
Uruguay Government International Bond, Sr. Unsec’d. Notes | | | 4.375 | | | | 10/27/27 | | | | 100 | | | | 98,750 | |
| | | | | | | | | | | | | | | | |
TOTAL SOVEREIGN BONDS (cost $9,962,167) | | | | | | | | | | | | | | | 9,203,395 | |
| | | | | | | | | | | | | | | | |
| | | | |
U.S. GOVERNMENT AGENCY OBLIGATION 0.5% | | | | | | | | | | | | | | | | |
Indonesia Government USAID Bond Gov’t. Gtd. Notes
(cost $137,017) | | | 9.300 | | | | 07/01/20 | | | | 129 | | | | 135,760 | |
| | | | | | | | | | | | | | | | |
| | | | |
U.S. TREASURY OBLIGATIONS 3.4% | | | | | | | | | | | | | | | | |
U.S. Treasury Bonds(k) | | | 2.750 | | | | 08/15/47 | | | | 830 | | | | 730,205 | |
U.S. Treasury Notes | | | 2.875 | | | | 10/31/23 | | | | 35 | | | | 34,818 | |
U.S. Treasury Notes | | | 2.875 | | | | 08/15/28 | | | | 65 | | | | 63,459 | |
| | | | | | | | | | | | | | | | |
TOTAL U.S. TREASURY OBLIGATIONS
(cost $920,233) | | | | | | | | | | | | | | | 828,482 | |
| | | | | | | | | | | | | | | | |
TOTAL LONG-TERM INVESTMENTS
(cost $24,590,221) | | | | | | | | | | | | | | | 23,198,604 | |
| | | | | | | | | | | | | | | | |
See Notes to Financial Statements.
| | | | |
| PGIM Global Total Return (USD Hedged) Fund | | | 27 | |
Schedule of Investments (continued)
as of October 31, 2018
| | | | | | | | | | | | | | | | |
| Description | | | | | | | | Shares | | | Value | |
SHORT-TERM INVESTMENTS 2.2% | | | | | | | | | | | | | | | | |
| | | | |
AFFILIATED MUTUAL FUND 2.2% | | | | | | | | | | | | | | | | |
PGIM Core Ultra Short Bond Fund
(cost $527,951)(w) | | | | | | | | | | | 527,951 | | | $ | 527,951 | |
| | | | | | | | | | | | | | | | |
OPTIONS PURCHASED*~ 0.0%
(cost $6,773) | | | | | | | | | | | | | | | 8,993 | |
| | | | | | | | | | | | | | | | |
TOTAL SHORT-TERM INVESTMENTS
(cost $534,724) | | | | | | | | | | | | | | | 536,944 | |
| | | | | | | | | | | | | | | | |
| | | | |
TOTAL INVESTMENTS, BEFORE OPTIONS WRITTEN 96.3%
(cost $25,124,945) | | | | | | | | | | | | | | | 23,735,548 | |
| | | | | | | | | | | | | | | | |
OPTIONS WRITTEN*~ (0.0)%
(premiums received $6,010) | | | | | | | | | | | | | | | (2,703 | ) |
| | | | | | | | | | | | | | | | |
| | | | |
TOTAL INVESTMENTS, NET OF OPTIONS WRITTEN 96.3%
(cost $25,118,935) | | | | | | | | | | | | | | | 23,732,845 | |
Other assets in excess of liabilities(z) 3.7% | | | | | | | | | | | | | | | 919,362 | |
| | | | | | | | | | | | | | | | |
NET ASSETS 100.0% | | | | | | | | | | | | | | $ | 24,652,207 | |
| | | | | | | | | | | | | | | | |
The following abbreviations are used in the annual report:
144A—Security was purchased pursuant to Rule 144A under the Securities Act of 1933 and may not be resold subject to that rule except to qualified institutional buyers. Unless otherwise noted, 144A securities are deemed to be liquid.
A—Annual payment frequency for swaps
BBR—New Zealand Bank Bill Rate
BBSW—Australian Bank Bill Swap Reference Rate
BIBOR—Bangkok Interbank Offered Rate
BROIS—Brazil Overnight Index Swap
BUBOR—Budapest Interbank Offered Rate
CDX—Credit Derivative Index
CLO—Collateralized Loan Obligation
CLOIS—Sinacofi Chile Interbank Rate Average
CMBX—Commercial Mortgage-Backed Index
CMS—Constant Maturity Swap
COOIS—Colombia Overnight Interbank Reference Rate
EIBOR—Emirates Interbank Offered Rate
EMTN—Euro Medium Term Note
EURIBOR—Euro Interbank Offered Rate
FHLMC—Federal Home Loan Mortgage Corporation
GMTN—Global Medium Term Note
ICE—Intercontinental Exchange
IO—Interest Only (Principal amount represents notional)
iTraxx—International Credit Derivative Index
JIBAR—Johannesburg Interbank Agreed Rate
LIBOR—London Interbank Offered Rate
M—Monthly payment frequency for swaps
MIBOR—Mumbai Interbank Offered Rate
See Notes to Financial Statements.
MTN—Medium Term Note
NIBOR—Norwegian Interbank Offered Rate
OAT—Obligations Assimilables du Tresor
OTC—Over-the-counter
Q—Quarterly payment frequency for swaps
S—Semiannual payment frequency for swaps
SAIBOR—Saudi Arabian Interbank Offered Rate
STIBOR—Stockholm Interbank Offered Rate
T—Swap payment upon termination
TELBOR—Tel Aviv Interbank Offered Rate
USAID—United States Agency for International Development
USOIS—United States Overnight Index Swap
WIBOR—Warsaw Interbank Offered Rate
AED—United Arab Emirates Dirham
ARS—Argentine Peso
AUD—Australian Dollar
BRL—Brazilian Real
CAD—Canadian Dollar
CHF—Swiss Franc
CLP—Chilean Peso
CNH—Chinese Renminbi
COP—Colombian Peso
CZK—Czech Koruna
EUR—Euro
GBP—British Pound
HUF—Hungarian Forint
IDR—Indonesian Rupiah
ILS—Israeli Shekel
INR—Indian Rupee
JPY—Japanese Yen
KRW—South Korean Won
MXN—Mexican Peso
MYR—Malaysian Ringgit
NOK—Norwegian Krone
NZD—New Zealand Dollar
PEN—Peruvian Nuevo Sol
PHP—Philippine Peso
PLN—Polish Zloty
RUB—Russian Ruble
SAR—Saudi Arabian Riyal
SEK—Swedish Krona
SGD—Singapore Dollar
THB—Thai Baht
TRY—Turkish Lira
TWD—New Taiwanese Dollar
USD—US Dollar
ZAR—South African Rand
| * | Non-income producing security. |
| # | Principal or notional amount is shown in U.S. dollars unless otherwise stated. |
| ~ | See tables subsequent to the Schedule of Investments for options detail. |
| ^ | Indicates a Level 3 security. The aggregate value of Level 3 securities is $(1,411) and (0.0)% of net assets. |
| (c) | Variable rate instrument. The interest rate shown reflects the rate in effect at October 31, 2018. |
See Notes to Financial Statements.
| | | | |
| PGIM Global Total Return (USD Hedged) Fund | | | 29 | |
Schedule of Investments (continued)
as of October 31, 2018
| (cc) | Variable rate instrument. The rate shown is based on the latest available information as of October 31, 2018. Certain variable rate securities are not based on a published reference rate and spread but are determined by the issuer or agent and are based on current market conditions. These securities do not indicate a reference rate and spread in their description. |
| (k) | Represents security, or a portion thereof, segregated as collateral for centrally cleared/exchange-traded derivatives. |
| (w) | PGIM Investments LLC, the manager of the Fund, also serves as manager of the PGIM Core Ultra Short Bond Fund. |
| (z) | Includes net unrealized appreciation/(depreciation) and/or market value of the below holdings which are excluded from the Schedule of Investments: |
Options Purchased:
OTC Traded
| | | | | | | | | | | | | | | | | | | | | | | | |
Description | | Call/
Put | | Counterparty | | Expiration
Date | | | Strike | | | Contracts | | | Notional
Amount
(000)# | | | Value | |
2- Year 10 CMS Curve CAP | | Call | | Barclays Bank PLC | | | 07/12/21 | | | | 0.11 | % | | | — | | | | 325 | | | $ | 305 | |
2- Year 10 CMS Curve CAP | | Call | | Barclays Bank PLC | | | 07/13/21 | | | | 0.11 | % | | | — | | | | 315 | | | | 296 | |
2- Year 10 CMS Curve CAP | | Call | | Bank of America | | | 08/16/21 | | | | 0.15 | % | | | — | | | | 790 | | | | 728 | |
2- Year 10 CMS Curve CAP | | Call | | Bank of America | | | 08/20/21 | | | | 0.15 | % | | | — | | | | 1,565 | | | | 4,493 | |
2- Year 10 CMS Curve CAP | | Call | | Bank of America | | | 09/13/21 | | | | 0.14 | % | | | — | | | | 1,600 | | | | 1,722 | |
| | | | | | | | | | | | | | | | | | | | | | | | |
Total OTC Traded (cost $4,713) | | | | | | | | | | | | | | | | | | | | $ | 7,544 | |
| | | | | | | | | | | | | | | | | | | | | | | | |
OTC Swaptions
| | | | | | | | | | | | | | | | | | | | | | | | | | | | |
Description | | Call/
Put | | Counterparty | | Expiration
Date | | | Strike | | | Receive | | | Pay | | | Notional
Amount
(000)# | | | Value | |
CDX.NA.HY.31.V1, 12/20/23 | | Call | | Bank of America | | | 03/20/19 | | | $ | 107.50 | | | | 5.00%(Q) | | | | CDX.NA.HY. 31.V1(Q) | | | | 185 | | | $ | 173 | |
CDX.NA.HY.31.V1, 12/20/23 | | Call | | Deutsche Bank AG | | | 03/20/19 | | | $ | 107.50 | | | | 5.00%(Q) | | | | CDX.NA.HY. 31.V1(Q) | | | | 185 | | | | 173 | |
CDX.NA.HY.31.V1, 12/20/23 | | Call | | Bank of America | | | 03/20/19 | | | $ | 106.50 | | | | 5.00%(Q) | | | | CDX.NA.HY. 31.V1(Q) | | | | 170 | | | | 385 | |
iTraxx.XO.29.V1, 06/20/23 | | Call | | BNP Paribas | | | 12/19/18 | | | | 275.00 | | | | 5.00%(Q) | | | | iTraxx.XO.29.V1(Q) | | | | EUR 400 | | | | 718 | |
| | | | | | | | | | | | | | | | | | | | | | | | | | | | |
Total OTC Swaptions (cost $2,060) | | | | | | | | | | | | | | | | | | | $ | 1,449 | |
| | | | | | | | | | | | | | | | | | | | | | | | | | | | |
Total Options Purchased (cost $6,773) | | | | | | | | | | | | | | | | | | | $ | 8,993 | |
| | | | | | | | | | | | | | | | | | | | | | | | | | | | |
Options Written:
OTC Traded
| | | | | | | | | | | | | | | | | | | | | | | | | | |
Description | | Call/
Put | | Counterparty | | | Expiration
Date | | | Strike | | | Contracts | | | Notional
Amount
(000)# | | | Value | |
Lebanese Republic, 8.25%, 04/12/21^ | | Put | | | Deutsche Bank AG | | | | 04/08/19 | | | $ | 66.00 | | | | — | | | | 70 | | | $ | (82 | ) |
| | | | | | | | | | | | | | | | | | | | | | | | | | |
(premiums received $371) | | | | | | | | | | | | | | | | | |
See Notes to Financial Statements.
Options Written (continued):
OTC Swaptions
| | | | | | | | | | | | | | | | | | | | | | | | | | | | | | |
Description | | Call/
Put | | Counterparty | | | Expiration
Date | | | Strike | | | Receive | | | Pay | | | Notional
Amount
(000)# | | | Value | |
CDX.NA.HY.31.V1, 12/20/23 | | Put | | | Deutsche Bank AG | | | | 03/20/19 | | | $ | 98.00 | | | | 5.00 | %(Q) | | | CDX.NA.HY. 31.V1 | (Q) | | | 185 | | | $ | (1,113 | ) |
CDX.NA.HY.31.V1, 12/20/23 | | Put | | | Bank of America | | | | 03/20/19 | | | $ | 98.00 | | | | 5.00 | %(Q) | | | CDX.NA.HY. 31.V1 | (Q) | | | 185 | | | | (1,113 | ) |
iTraxx.XO.29.V1, 06/20/23 | | Put | | | BNP Paribas | | | | 12/19/18 | | | | 400.00 | | | | 5.00 | %(Q) | | | iTraxx.XO.29.V1 | (Q) | | | EUR 400 | | | | (395 | ) |
| | | | | | | | | | | | | | | | | | | | | | | | | | | | | | |
Total OTC Swaptions (premiums received $5,639) | | | | | | | | | | | $ | (2,621 | ) |
| | | | | | | | | | | | | | | | | | | | | | | | | | | | | | |
Total Options Written (premiums received $6,010) | | | | | | | | | | | $ | (2,703 | ) |
| | | | | | | | | | | | | | | | | | | | | | | | | | | | | | |
Futures contracts outstanding at October 31, 2018:
| | | | | | | | | | | | | | | | |
Number of
Contracts | | | Type | | Expiration
Date | | | Current
Notional
Amount | | | Value /
Unrealized
Appreciation
(Depreciation) | |
| | | | Long Positions: | | | | | | | | | | | | |
| | 4 | | | 90 Day Euro Dollar | | | Dec. 2020 | | | $ | 967,950 | | | $ | (2,575 | ) |
| | 5 | | | 10 Year U.K. Gilt | | | Dec. 2018 | | | | 782,322 | | | | 550 | |
| | 25 | | | 10 Year U.S. Treasury Notes | | | Dec. 2018 | | | | 2,960,938 | | | | 984 | |
| | 6 | | | 20 Year U.S. Treasury Bonds | | | Dec. 2018 | | | | 828,750 | | | | (32,102 | ) |
| | 8 | | | 30 Year U.S. Ultra Treasury Bonds | | | Dec. 2018 | | | | 1,193,750 | | | | (82,668 | ) |
| | 116 | | | 5 Year U.S. Treasury Notes | | | Dec. 2018 | | | | 13,036,406 | | | | (108,523 | ) |
| | | | | | | | | | | | | | | | |
| | | | | | | | | | | | | | | (224,334 | ) |
| | | | | | | | | | | | | | | | |
| | | | Short Positions: | | | | | | | | | | | | |
| | 3 | | | 10 Year Euro-Bund | | | Dec. 2018 | | | | 544,553 | | | | (759 | ) |
| | 4 | | | 90 Day Euro Dollar | | | Dec. 2021 | | | | 968,300 | | | | 1,950 | |
| | 20 | | | 2 Year U.S. Treasury Notes | | | Dec. 2018 | | | | 4,213,125 | | | | 4,178 | |
| | 1 | | | 30 Year Euro Buxl | | | Dec. 2018 | | | | 200,365 | | | | (68 | ) |
| | 24 | | | 5 Year Euro-Bobl | | | Dec. 2018 | | | | 3,572,993 | | | | (45 | ) |
| | 23 | | | Euro Schatz. DUA Index | | | Dec. 2018 | | | | 2,917,039 | | | | (1,048 | ) |
| | | | | | | | | | | | | | | | |
| | | | | | | | | | | | | | | 4,208 | |
| | | | | | | | | | | | | | | | |
| | | | | | | | | | | | | | $ | (220,126 | ) |
| | | | | | | | | | | | | | | | |
See Notes to Financial Statements.
| | | | |
| PGIM Global Total Return (USD Hedged) Fund | | | 31 | |
Schedule of Investments (continued)
as of October 31, 2018
Forward foreign currency exchange contracts outstanding at October 31, 2018:
| | | | | | | | | | | | | | | | | | | | | | |
Purchase Contracts | | Counterparty | | Notional
Amount
(000) | | | Value at
Settlement
Date | | | Current
Value | | | Unrealized
Appreciation | | | Unrealized
Depreciation | |
OTC Forward Foreign Currency Exchange Contracts: | | | | | |
Argentine Peso, | | | | | | | | | | | | | | | | | | | | | | |
Expiring 11/30/18 | | BNP Paribas | | ARS | 428 | | | $ | 11,191 | | | $ | 11,476 | | | $ | 285 | | | $ | — | |
Expiring 11/30/18 | | BNP Paribas | | ARS | 426 | | | | 11,164 | | | | 11,418 | | | | 254 | | | | — | |
Australian Dollar, | | | | | | | | | | | | | | | | | | | | | | |
Expiring 01/18/19 | | Toronto Dominion | | AUD | 146 | | | | 104,000 | | | | 103,214 | | | | — | | | | (786 | ) |
Expiring 01/18/19 | | Toronto Dominion | | AUD | 136 | | | | 97,000 | | | | 96,292 | | | | — | | | | (708 | ) |
British Pound, | | | | | | | | | | | | | | | | | | | | | | |
Expiring 01/25/19 | | Toronto Dominion | | GBP | 81 | | | | 104,000 | | | | 104,057 | | | | 57 | | | | — | |
Canadian Dollar, | | | | | | | | | | | | | | | | | | | | | | |
Expiring 01/18/19 | | Citibank NA | | CAD | 144 | | | | 110,300 | | | | 109,309 | | | | — | | | | (991 | ) |
Expiring 01/18/19 | | Goldman Sachs
International | | CAD | 147 | | | | 112,300 | | | | 111,771 | | | | — | | | | (529 | ) |
Expiring 01/18/19 | | Toronto Dominion | | CAD | 119 | | | | 91,000 | | | | 90,650 | | | | — | | | | (350 | ) |
Expiring 01/18/19 | | Toronto Dominion | | CAD | 109 | | | | 83,000 | | | | 82,615 | | | | — | | | | (385 | ) |
Chilean Peso, | | | | | | | | | | | | | | | | | | | | | | |
Expiring 12/19/18 | | JPMorgan Chase | | CLP | 58,000 | | | | 86,850 | | | | 83,397 | | | | — | | | | (3,453 | ) |
Colombian Peso, | | | | | | | | | | | | | | | | | | | | | | |
Expiring 12/14/18 | | Citibank NA | | COP | 187,171 | | | | 59,250 | | | | 58,024 | | | | — | | | | (1,226 | ) |
Expiring 12/14/18 | | JPMorgan Chase | | COP | 184,658 | | | | 57,717 | | | | 57,245 | | | | — | | | | (472 | ) |
Czech Koruna, | | | | | | | | | | | | | | | | | | | | | | |
Expiring 01/25/19 | | UBS AG | | CZK | 1,876 | | | | 84,000 | | | | 82,577 | | | | — | | | | (1,423 | ) |
Euro, | | | | | | | | | | | | | | | | | | | | | | |
Expiring 01/25/19 | | Deutsche Bank AG | | EUR | 22 | | | | 25,000 | | | | 24,872 | | | | — | | | | (128 | ) |
Indian Rupee, | | | | | | | | | | | | | | | | | | | | | | |
Expiring 01/11/19 | | Goldman Sachs
International | | INR | 6,460 | | | | 86,234 | | | | 86,603 | | | | 369 | | | | — | |
Expiring 01/11/19 | | Goldman Sachs
International | | INR | 6,176 | | | | 82,899 | | | | 82,792 | | | | — | | | | (107 | ) |
Expiring 01/11/19 | | JPMorgan Chase | | INR | 24,043 | | | | 322,772 | | | | 322,335 | | | | — | | | | (437 | ) |
Expiring 01/11/19 | | JPMorgan Chase | | INR | 19,379 | | | | 257,619 | | | | 259,809 | | | | 2,190 | | | | — | |
Indonesian Rupiah, | | | | | | | | | | | | | | | | | | | | | | |
Expiring 12/19/18 | | Barclays Bank PLC | | IDR | 4,540,938 | | | | 297,858 | | | | 296,708 | | | | — | | | | (1,150 | ) |
Expiring 12/19/18 | | Barclays Bank PLC | | IDR | 3,207,072 | | | | 211,883 | | | | 209,552 | | | | — | | | | (2,331 | ) |
Expiring 12/19/18 | | Barclays Bank PLC | | IDR | 1,378,980 | | | | 90,000 | | | | 90,104 | | | | 104 | | | | — | |
Expiring 12/19/18 | | JPMorgan Chase | | IDR | 2,642,210 | | | | 174,012 | | | | 172,644 | | | | — | | | | (1,368 | ) |
Expiring 12/19/18 | | JPMorgan Chase | | IDR | 603,453 | | | | 39,558 | | | | 39,430 | | | | — | | | | (128 | ) |
Israeli Shekel, | | | | | | | | | | | | | | | | | | | | | | |
Expiring 01/28/19 | | Barclays Bank PLC | | ILS | 118 | | | | 32,000 | | | | 31,996 | | | | — | | | | (4 | ) |
Japanese Yen, | | | | | | | | | | | | | | | | | | | | | | |
Expiring 01/25/19 | | Toronto Dominion | | JPY | 7,722 | | | | 69,000 | | | | 68,980 | | | | — | | | | (20 | ) |
New Taiwanese Dollar, | | | | | | | | | | | | | | | | | | | | | | |
Expiring 01/11/19 | | Citibank NA | | TWD | 2,150 | | | | 70,000 | | | | 69,896 | | | | — | | | | (104 | ) |
Expiring 01/11/19 | | JPMorgan Chase | | TWD | 2,242 | | | | 73,000 | | | | 72,903 | | | | — | | | | (97 | ) |
See Notes to Financial Statements.
Forward foreign currency exchange contracts outstanding at October 31, 2018 (continued):
| | | | | | | | | | | | | | | | | | | | | | |
Purchase Contracts | | Counterparty | | Notional
Amount
(000) | | | Value at
Settlement
Date | | | Current
Value | | | Unrealized
Appreciation | | | Unrealized
Depreciation | |
OTC Forward Foreign Currency Exchange Contracts (cont’d.): | | | | | | | | | | | | | |
New Taiwanese Dollar (cont’d.), | | | | | | | | | | | | | | | | | | | | |
Expiring 01/11/19 | | JPMorgan Chase | | TWD | 2,196 | | | $ | 70,999 | | | $ | 71,388 | | | $ | 389 | | | $ | — | |
Expiring 01/11/19 | | Morgan Stanley | | TWD | 2,720 | | | | 88,000 | | | | 88,433 | | | | 433 | | | | — | |
New Zealand Dollar, | | | | | | | | | | | | | | | | | | | | | | |
Expiring 01/18/19 | | Toronto Dominion | | NZD | 117 | | | | 77,000 | | | | 76,183 | | | | — | | | | (817 | ) |
Expiring 01/18/19 | | Toronto Dominion | | NZD | 108 | | | | 71,000 | | | | 70,570 | | | | — | | | | (430 | ) |
Norwegian Krone, | | | | | | | | | | | | | | | | | | | | | | |
Expiring 01/25/19 | | Bank of America | | NOK | 1,197 | | | | 145,707 | | | | 142,636 | | | | — | | | | (3,071 | ) |
Peruvian Nuevo Sol, | | | | | | | | | | | | | | | | | | | | | | |
Expiring 12/19/18 | | BNP Paribas | | PEN | 952 | | | | 287,785 | | | | 281,776 | | | | — | | | | (6,009 | ) |
Expiring 12/19/18 | | BNP Paribas | | PEN | 124 | | | | 37,000 | �� | | | 36,584 | | | | — | | | | (416 | ) |
Expiring 12/19/18 | | Citibank NA | | PEN | 546 | | | | 163,965 | | | | 161,609 | | | | — | | | | (2,356 | ) |
Expiring 12/19/18 | | JPMorgan Chase | | PEN | 279 | | | | 84,182 | | | | 82,713 | | | | — | | | | (1,469 | ) |
Expiring 12/19/18 | | JPMorgan Chase | | PEN | 278 | | | | 83,993 | | | | 82,406 | | | | — | | | | (1,587 | ) |
Expiring 12/19/18 | | UBS AG | | PEN | 224 | | | | 67,000 | | | | 66,305 | | | | — | | | | (695 | ) |
Philippine Peso, | | | | | | | | | | | | | | | | | | | | | | |
Expiring 12/14/18 | | Barclays Bank PLC | | PHP | 6,878 | | | | 126,000 | | | | 128,170 | | | | 2,170 | | | | — | |
Expiring 12/14/18 | | Barclays Bank PLC | | PHP | 4,860 | | | | 89,000 | | | | 90,554 | | | | 1,554 | | | | — | |
Expiring 12/14/18 | | Barclays Bank PLC | | PHP | 3,763 | | | | 69,000 | | | | 70,124 | | | | 1,124 | | | | — | |
Expiring 12/14/18 | | Citibank NA | | PHP | 5,149 | | | | 95,000 | | | | 95,946 | | | | 946 | | | | — | |
Expiring 12/14/18 | | JPMorgan Chase | | PHP | 4,453 | | | | 82,000 | | | | 82,985 | | | | 985 | | | | — | |
Expiring 12/14/18 | | JPMorgan Chase | | PHP | 3,618 | | | | 67,000 | | | | 67,417 | | | | 417 | | | | — | |
Expiring 12/14/18 | | JPMorgan Chase | | PHP | 1,838 | | | | 34,400 | | | | 34,244 | | | | — | | | | (156 | ) |
Expiring 12/14/18 | | Morgan Stanley | | PHP | 6,463 | | | | 119,000 | | | | 120,433 | | | | 1,433 | | | | — | |
Expiring 12/14/18 | | Morgan Stanley | | PHP | 6,210 | | | | 114,000 | | | | 115,709 | | | | 1,709 | | | | — | |
Expiring 12/14/18 | | Morgan Stanley | | PHP | 4,550 | | | | 83,000 | | | | 84,785 | | | | 1,785 | | | | — | |
Russian Ruble, | | | | | | | | | | | | | | | | | | | | | | |
Expiring 12/19/18 | | Barclays Bank PLC | | RUB | 5,607 | | | | 85,000 | | | | 84,585 | | | | — | | | | (415 | ) |
Expiring 12/19/18 | | Barclays Bank PLC | | RUB | 4,699 | | | | 71,000 | | | | 70,893 | | | | — | | | | (107 | ) |
Singapore Dollar, | | | | | | | | | | | | | | | | | | | | | | |
Expiring 11/09/18 | | Citibank NA | | SGD | 115 | | | | 84,000 | | | | 82,821 | | | | — | | | | (1,179 | ) |
Expiring 11/09/18 | | Deutsche Bank AG | | SGD | 189 | | | | 138,000 | | | | 136,508 | | | | — | | | | (1,492 | ) |
Expiring 11/09/18 | | JPMorgan Chase | | SGD | 101 | | | | 74,000 | | | | 72,712 | | | | — | | | | (1,288 | ) |
Expiring 11/09/18 | | UBS AG | | SGD | 125 | | | | 92,000 | | | | 90,612 | | | | — | | | | (1,388 | ) |
Expiring 11/09/18 | | UBS AG | | SGD | 117 | | | | 86,000 | | | | 84,777 | | | | — | | | | (1,223 | ) |
South African Rand, | | | | | | | | | | | | | | | | | | | | | | |
Expiring 12/07/18 | | JPMorgan Chase | | ZAR | 1,150 | | | | 79,000 | | | | 77,601 | | | | — | | | | (1,399 | ) |
Expiring 12/07/18 | | UBS AG | | ZAR | 1,256 | | | | 88,000 | | | | 84,768 | | | | — | | | | (3,232 | ) |
South Korean Won, | | | | | | | | | | | | | | | | | | | | | | |
Expiring 01/16/19 | | JPMorgan Chase | | KRW | 100,211 | | | | 88,816 | | | | 88,184 | | | | — | | | | (632 | ) |
Thai Baht, | | | | | | | | | | | | | | | | | | | | | | |
Expiring 11/09/18 | | Citibank NA | | THB | 3,731 | | | | 114,000 | | | | 112,561 | | | | — | | | | (1,439 | ) |
Expiring 11/09/18 | | Citibank NA | | THB | 3,621 | | | | 112,157 | | | | 109,245 | | | | — | | | | (2,912 | ) |
See Notes to Financial Statements.
| | | | |
| PGIM Global Total Return (USD Hedged) Fund | | | 33 | |
Schedule of Investments (continued)
as of October 31, 2018
Forward foreign currency exchange contracts outstanding at October 31, 2018 (continued):
| | | | | | | | | | | | | | | | | | | | | | |
Purchase Contracts | | Counterparty | | Notional
Amount
(000) | | | Value at
Settlement
Date | | | Current
Value | | | Unrealized
Appreciation | | | Unrealized
Depreciation | |
OTC Forward Foreign Currency Exchange Contracts (cont’d.): | | | | | | | | | |
Thai Baht (cont’d.), | | | | | | | | | | | | | | | | | | | | | | |
Expiring 11/09/18 | | Citibank NA | | THB | 3,303 | | | $ | 101,000 | | | $ | 99,675 | | | $ | — | | | $ | (1,325 | ) |
Expiring 11/09/18 | | Citibank NA | | THB | 2,779 | | | | 86,000 | | | | 83,835 | | | | — | | | | (2,165 | ) |
Expiring 11/09/18 | | Citibank NA | | THB | 2,740 | | | | 83,000 | | | | 82,680 | | | | — | | | | (320 | ) |
Expiring 11/09/18 | | Citibank NA | | THB | 2,517 | | | | 76,000 | | | | 75,929 | | | | — | | | | (71 | ) |
Expiring 11/09/18 | | Deutsche Bank AG | | THB | 3,865 | | | | 119,000 | | | | 116,602 | | | | — | | | | (2,398 | ) |
Turkish Lira, | | | | | | | | | | | | | | | | | | | | | | |
Expiring 12/07/18 | | Barclays Bank PLC | | TRY | 549 | | | | 86,000 | | | | 95,968 | | | | 9,968 | | | | — | |
Expiring 12/07/18 | | JPMorgan Chase | | TRY | 350 | | | | 55,946 | | | | 61,129 | | | | 5,183 | | | | — | |
Expiring 12/07/18 | | Morgan Stanley | | TRY | 441 | | | | 72,000 | | | | 77,067 | | | | 5,067 | | | | — | |
Expiring 12/07/18 | | UBS AG | | TRY | 483 | | | | 83,000 | | | | 84,483 | | | | 1,483 | | | | — | |
| | | | | | | | | | | | | | | | | | | | | | |
| | | | | | | | $ | 6,772,557 | | | $ | 6,754,274 | | | | 37,905 | | | | (56,188 | ) |
| | | | | | | | | | | | | | | | | | | | | | |
| | | | | | | | | | | | | | | | | | | | | | |
Sale Contracts | | Counterparty | | Notional
Amount
(000) | | | Value at
Settlement
Date | | | Current
Value | | | Unrealized
Appreciation | | | Unrealized
Depreciation | |
OTC Forward Foreign Currency Exchange Contracts: | | | | | | | | | | | | | | | | | |
Australian Dollar, | | | | | | | | | | | | | | | | | | | | | | |
Expiring 01/18/19 | | Bank of America | | AUD | 79 | | | $ | 55,730 | | | $ | 55,780 | | | $ | — | | | $ | (50 | ) |
Expiring 01/18/19 | | Morgan Stanley | | AUD | 106 | | | | 75,000 | | | | 75,043 | | | | — | | | | (43 | ) |
Expiring 01/18/19 | | Toronto Dominion | | AUD | 471 | | | | 335,003 | | | | 333,663 | | | | 1,340 | | | | — | |
Brazilian Real, | | | | | | | | | | | | | | | | | | | | | | |
Expiring 12/04/18 | | Goldman Sachs
International | | BRL | 138 | | | | 37,108 | | | | 36,971 | | | | 137 | | | | — | |
Expiring 12/04/18 | | Goldman Sachs
International | | BRL | 93 | | | | 22,895 | | | | 24,906 | | | | — | | | | (2,011 | ) |
Expiring 12/04/18 | | JPMorgan Chase | | BRL | 140 | | | | 37,572 | | | | 37,584 | | | | — | | | | (12 | ) |
Expiring 12/04/18 | | UBS AG | | BRL | 92 | | | | 24,440 | | | | 24,610 | | | | — | | | | (170 | ) |
British Pound, | | | | | | | | | | | | | | | | | | | | | | |
Expiring 12/19/18 | | Bank of America | | GBP | 536 | | | | 694,685 | | | | 686,745 | | | | 7,940 | | | | — | |
Expiring 01/25/19 | | UBS AG | | GBP | 12 | | | | 14,886 | | | | 14,896 | | | | — | | | | (10 | ) |
Canadian Dollar, | | | | | | | | | | | | | | | | | | | | | | |
Expiring 01/18/19 | | Deutsche Bank AG | | CAD | 216 | | | | 165,895 | | | | 164,428 | | | | 1,467 | | | | — | |
Expiring 01/18/19 | | Goldman Sachs
International | | CAD | 144 | | | | 111,119 | | | | 109,750 | | | | 1,369 | | | | — | |
Expiring 01/18/19 | | Toronto Dominion | | CAD | 95 | | | | 73,000 | | | | 72,085 | | | | 915 | | | | — | |
Chilean Peso, | | | | | | | | | | | | | | | | | | | | | | |
Expiring 12/19/18 | | BNP Paribas | | CLP | 274,260 | | | | 407,627 | | | | 394,351 | | | | 13,276 | | | | — | |
Chinese Renminbi, | | | | | | | | | | | | | | | | | | | | | | |
Expiring 01/28/19 | | Deutsche Bank AG | | CNH | 775 | | | | 111,000 | | | | 110,529 | | | | 471 | | | | — | |
Expiring 01/28/19 | | Deutsche Bank AG | | CNH | 551 | | | | 79,000 | | | | 78,610 | | | | 390 | | | | — | |
See Notes to Financial Statements.
Forward foreign currency exchange contracts outstanding at October 31, 2018 (continued):
| | | | | | | | | | | | | | | | | | | | | | |
Sale Contracts | | Counterparty | | Notional
Amount
(000) | | | Value at
Settlement
Date | | | Current
Value | | | Unrealized
Appreciation | | | Unrealized
Depreciation | |
OTC Forward Foreign Currency Exchange Contracts (cont’d.): | | | | | | | | | |
Chinese Renminbi (cont’d.), | | | | | | | | | | | | | | | | | | | | |
Expiring 01/28/19 | | Morgan Stanley | | CNH | 4,662 | | | $ | 668,350 | | | $ | 665,207 | | | $ | 3,143 | | | $ | — | |
Colombian Peso, | | | | | | | | | | | | | | | | | | | | | | |
Expiring 12/14/18 | | Barclays Bank PLC | | COP | 226,471 | | | | 75,000 | | | | 70,208 | | | | 4,792 | | | | — | |
Expiring 12/14/18 | | Barclays Bank PLC | | COP | 207,571 | | | | 69,000 | | | | 64,348 | | | | 4,652 | | | | — | |
Expiring 12/14/18 | | Citibank NA | | COP | 534,990 | | | | 171,402 | | | | 165,851 | | | | 5,551 | | | | — | |
Czech Koruna, | | | | | | | | | | | | | | | | | | | | | | |
Expiring 01/25/19 | | Citibank NA | | CZK | 5,879 | | | | 261,303 | | | | 258,816 | | | | 2,487 | | | | — | |
Expiring 01/25/19 | | Deutsche Bank AG | | CZK | 5,879 | | | | 262,869 | | | | 258,817 | | | | 4,052 | | | | — | |
Euro, | | | | | | | | | | | | | | | | | | | | | | |
Expiring 12/19/18 | | UBS AG | | EUR | 8,220 | | | | 9,400,835 | | | | 9,352,656 | | | | 48,179 | | | | — | |
Expiring 01/25/19 | | Morgan Stanley | | EUR | 80 | | | | 91,886 | | | | 91,365 | | | | 521 | | | | — | |
Expiring 01/25/19 | | Toronto Dominion | | EUR | 77 | | | | 88,000 | | | | 88,022 | | | | — | | | | (22 | ) |
Expiring 01/25/19 | | Toronto Dominion | | EUR | 62 | | | | 71,000 | | | | 70,749 | | | | 251 | | | | — | |
Expiring 01/25/19 | | UBS AG | | EUR | 29 | | | | 33,150 | | | | 33,080 | | | | 70 | | | | — | |
Hungarian Forint, | | | | | | | | | | | | | | | | | | | | | | |
Expiring 01/25/19 | | JPMorgan Chase | | HUF | 51,535 | | | | 185,811 | | | | 181,156 | | | | 4,655 | | | | — | |
Expiring 01/25/19 | | Toronto Dominion | | HUF | 70,103 | | | | 251,365 | | | | 246,428 | | | | 4,937 | | | | — | |
Expiring 01/25/19 | | Toronto Dominion | | HUF | 34,528 | | | | 124,015 | | | | 121,374 | | | | 2,641 | | | | — | |
Expiring 01/25/19 | | UBS AG | | HUF | 20,377 | | | | 72,000 | | | | 71,629 | | | | 371 | | | | — | |
Indian Rupee, | | | | | | | | | | | | | | | | | | | | | | |
Expiring 01/11/19 | | JPMorgan Chase | | INR | 9,645 | | | | 130,000 | | | | 129,312 | | | | 688 | | | | — | |
Expiring 01/11/19 | | JPMorgan Chase | | INR | 2,570 | | | | 34,400 | | | | 34,459 | | | | — | | | | (59 | ) |
Indonesian Rupiah, | | | | | | | | | | | | | | | | | | | | | | |
Expiring 12/19/18 | | Barclays Bank PLC | | IDR | 2,194,549 | | | | 143,000 | | | | 143,394 | | | | — | | | | (394 | ) |
Expiring 12/19/18 | | Barclays Bank PLC | | IDR | 1,359,405 | | | | 90,000 | | | | 88,825 | | | | 1,175 | | | | — | |
Expiring 12/19/18 | | Barclays Bank PLC | | IDR | 1,305,020 | | | | 86,000 | | | | 85,271 | | | | 729 | | | | — | |
Expiring 12/19/18 | | JPMorgan Chase | | IDR | 1,635,417 | | | | 108,000 | | | | 106,859 | | | | 1,141 | | | | — | |
Expiring 12/19/18 | | JPMorgan Chase | | IDR | 1,566,675 | | | | 104,000 | | | | 102,368 | | | | 1,632 | | | | — | |
Expiring 12/19/18 | | JPMorgan Chase | | IDR | 1,551,865 | | | | 101,000 | | | | 101,400 | | | | — | | | | (400 | ) |
Expiring 12/19/18 | | JPMorgan Chase | | IDR | 1,473,333 | | | | 97,000 | | | | 96,269 | | | | 731 | | | | — | |
Expiring 12/19/18 | | JPMorgan Chase | | IDR | 1,465,069 | | | | 97,000 | | | | 95,729 | | | | 1,271 | | | | — | |
Expiring 12/19/18 | | JPMorgan Chase | | IDR | 1,037,898 | | | | 69,000 | | | | 67,817 | | | | 1,183 | | | | — | |
Expiring 12/19/18 | | JPMorgan Chase | | IDR | 779,225 | | | | 51,451 | | | | 50,915 | | | | 536 | | | | — | |
Expiring 12/19/18 | | JPMorgan Chase | | IDR | 607,460 | | | | 39,549 | | | | 39,692 | | | | — | | | | (143 | ) |
Expiring 12/19/18 | | Morgan Stanley | | IDR | 848,527 | | | | 55,953 | | | | 55,443 | | | | 510 | | | | — | |
Israeli Shekel, | | | | | | | | | | | | | | | | | | | | | | |
Expiring 01/28/19 | | Citibank NA | | ILS | 941 | | | | 256,956 | | | | 254,869 | | | | 2,087 | | | | — | |
Japanese Yen, | | | | | | | | | | | | | | | | | | | | | | |
Expiring 01/25/19 | | UBS AG | | JPY | 1,912 | | | | 17,065 | | | | 17,076 | | | | — | | | | (11 | ) |
Mexican Peso, | | | | | | | | | | | | | | | | | | | | | | |
Expiring 12/19/18 | | JPMorgan Chase | | MXN | 499 | | | | 25,998 | | | | 24,370 | | | | 1,628 | | | | — | |
Expiring 12/19/18 | | UBS AG | | MXN | 3,277 | | | | 172,991 | | | | 159,978 | | | | 13,013 | | | | — | |
See Notes to Financial Statements.
| | | | |
| PGIM Global Total Return (USD Hedged) Fund | | | 35 | |
Schedule of Investments (continued)
as of October 31, 2018
Forward foreign currency exchange contracts outstanding at October 31, 2018 (continued):
| | | | | | | | | | | | | | | | | | | | | | |
Sale Contracts | | Counterparty | | Notional
Amount
(000) | | | Value at
Settlement
Date | | | Current
Value | | | Unrealized
Appreciation | | | Unrealized
Depreciation | |
OTC Forward Foreign Currency Exchange Contracts (cont’d.): | | | | | | | | | |
New Taiwanese Dollar, | | | | | | | | | | | | | | | | | | | | | | |
Expiring 01/11/19 | | JPMorgan Chase | | TWD | 2,155 | | | $ | 70,000 | | | $ | 70,055 | | | $ | — | | | $ | (55 | ) |
Expiring 01/11/19 | | UBS AG | | TWD | 4,108 | | | | 135,010 | | | | 133,580 | | | | 1,430 | | | | — | |
New Zealand Dollar, | | | | | | | | | | | | | | | | | | | | | | |
Expiring 01/18/19 | | Toronto Dominion | | NZD | 395 | | | | 256,974 | | | | 257,775 | | | | — | | | | (801 | ) |
Peruvian Nuevo Sol, | | | | | | | | | | | | | | | | | | | | | | |
Expiring 12/19/18 | | JPMorgan Chase | | PEN | 302 | | | | 91,000 | | | | 89,515 | | | | 1,485 | | | | — | |
Expiring 12/19/18 | | JPMorgan Chase | | PEN | 283 | | | | 85,000 | | | | 83,902 | | | | 1,098 | | | | — | |
Philippine Peso, | | | | | | | | | | | | | | | | | | | | | | |
Expiring 12/14/18 | | Barclays Bank PLC | | PHP | 3,585 | | | | 66,150 | | | | 66,809 | | | | — | | | | (659 | ) |
Expiring 12/14/18 | | JPMorgan Chase | | PHP | 6,920 | | | | 128,000 | | | | 128,940 | | | | — | | | | (940 | ) |
Expiring 12/14/18 | | JPMorgan Chase | | PHP | 6,674 | | | | 122,000 | | | | 124,358 | | | | — | | | | (2,358 | ) |
Expiring 12/14/18 | | JPMorgan Chase | | PHP | 3,216 | | | | 59,850 | | | | 59,927 | | | | — | | | | (77 | ) |
Expiring 12/14/18 | | Morgan Stanley | | PHP | 7,047 | | | | 129,101 | | | | 131,313 | | | | — | | | | (2,212 | ) |
Polish Zloty, | | | | | | | | | | | | | | | | | | | | | | |
Expiring 01/25/19 | | Goldman Sachs
International | | PLN | 1,623 | | | | 434,768 | | | | 424,015 | | | | 10,753 | | | | — | |
Russian Ruble, | | | | | | | | | | | | | | | | | | | | | | |
Expiring 12/19/18 | | JPMorgan Chase | | RUB | 7,821 | | | | 116,424 | | | | 117,987 | | | | — | | | | (1,563 | ) |
Expiring 12/19/18 | | JPMorgan Chase | | RUB | 3,204 | | | | 47,468 | | | | 48,333 | | | | — | | | | (865 | ) |
Singapore Dollar, | | | | | | | | | | | | | | | | | | | | | | |
Expiring 11/09/18 | | Citibank NA | | SGD | 242 | | | | 177,236 | | | | 174,899 | | | | 2,337 | | | | — | |
Expiring 11/09/18 | | Citibank NA | | SGD | 92 | | | | 67,764 | | | | 66,780 | | | | 984 | | | | — | |
Expiring 11/09/18 | | Deutsche Bank AG | | SGD | 101 | | | | 73,000 | | | | 72,989 | | | | 11 | | | | — | |
Expiring 11/09/18 | | Deutsche Bank AG | | SGD | 98 | | | | 71,000 | | | | 71,031 | | | | — | | | | (31 | ) |
Expiring 11/09/18 | | JPMorgan Chase | | SGD | 137 | | | | 100,000 | | | | 98,944 | | | | 1,056 | | | | — | |
Expiring 11/09/18 | | UBS AG | | SGD | 109 | | | | 79,000 | | | | 78,848 | | | | 152 | | | | — | |
South African Rand, | | | | | | | | | | | | | | | | | | | | | | |
Expiring 11/09/18 | | Citibank NA | | ZAR | 994 | | | | 69,136 | | | | 67,332 | | | | 1,804 | | | | — | |
Expiring 12/07/18 | | Barclays Bank PLC | | ZAR | 3,091 | | | | 202,153 | | | | 208,572 | | | | — | | | | (6,419 | ) |
Expiring 12/07/18 | | Barclays Bank PLC | | ZAR | 3,091 | | | | 202,153 | | | | 208,572 | | | | — | | | | (6,419 | ) |
Expiring 12/07/18 | | Citibank NA | | ZAR | 800 | | | | 56,030 | | | | 53,962 | | | | 2,068 | | | | — | |
Expiring 12/07/18 | | Citibank NA | | ZAR | 615 | | | | 42,702 | | | | 41,467 | | | | 1,235 | | | | — | |
Expiring 12/07/18 | | Citibank NA | | ZAR | 387 | | | | 26,659 | | | | 26,108 | | | | 551 | | | | — | |
Expiring 12/07/18 | | Citibank NA | | ZAR | 265 | | | | 18,219 | | | | 17,877 | | | | 342 | | | | — | |
Expiring 12/07/18 | | Goldman Sachs
International | | ZAR | 693 | | | | 44,780 | | | | 46,742 | | | | — | | | | (1,962 | ) |
Expiring 12/07/18 | | JPMorgan Chase | | ZAR | 676 | | | | 45,016 | | | | 45,643 | | | | — | | | | (627 | ) |
South Korean Won, | | | | | | | | | | | | | | | | | | | | | | |
Expiring 01/16/19 | | Barclays Bank PLC | | KRW | 194,174 | | | | 170,927 | | | | 170,870 | | | | 57 | | | | — | |
Expiring 01/16/19 | | Barclays Bank PLC | | KRW | 62,794 | | | | 55,946 | | | | 55,257 | | | | 689 | | | | — | |
Expiring 01/16/19 | | Goldman Sachs
International | | KRW | 130,976 | | | | 116,000 | | | | 115,256 | | | | 744 | | | | — | |
See Notes to Financial Statements.
Forward foreign currency exchange contracts outstanding at October 31, 2018 (continued):
| | | | | | | | | | | | | | | | | | | | | | |
Sale Contracts | | Counterparty | | Notional
Amount
(000) | | | Value at
Settlement
Date | | | Current
Value | | | Unrealized
Appreciation | | | Unrealized
Depreciation | |
OTC Forward Foreign Currency Exchange Contracts (cont’d.): | | | | | | | | | |
South Korean Won (cont’d.), | | | | | | | | | | | | | | | | | | | | |
Expiring 01/16/19 | | JPMorgan Chase | | KRW | 86,648 | | | $ | 76,000 | | | $ | 76,248 | | | $ | — | | | $ | (248 | ) |
Swedish Krona, | | | | | | | | | | | | | | | | | | | | | | |
Expiring 01/25/19 | | Goldman Sachs
International | | SEK | 2,481 | | | | 278,258 | | | | 273,474 | | | | 4,784 | | | | — | |
Swiss Franc, | | | | | | | | | | | | | | | | | | | | | | |
Expiring 01/25/19 | | BNP Paribas | | CHF | 399 | | | | 403,764 | | | | 399,934 | | | | 3,830 | | | | — | |
Expiring 01/25/19 | | Toronto Dominion | | CHF | 399 | | | | 404,151 | | | | 399,932 | | | | 4,219 | | | | — | |
Expiring 01/25/19 | | Toronto Dominion | | CHF | 77 | | | | 77,000 | | | | 76,956 | | | | 44 | | | | — | |
Thai Baht, | | | | | | | | | | | | | | | | | | | | | | |
Expiring 11/09/18 | | Citibank NA | | THB | 2,364 | | | | 71,000 | | | | 71,316 | | | | — | | | | (316 | ) |
Expiring 11/09/18 | | Citibank NA | | THB | 2,319 | | | | 70,000 | | | | 69,983 | | | | 17 | | | | — | |
Turkish Lira, | | | | | | | | | | | | | | | | | | | | | | |
Expiring 12/07/18 | | JPMorgan Chase | | TRY | 285 | | | | 49,000 | | | | 49,828 | | | | — | | | | (828 | ) |
Expiring 12/07/18 | | JPMorgan Chase | | TRY | 71 | | | | 12,220 | | | | 12,433 | | | | — | | | | (213 | ) |
| | | | | | | | | | | | | | | | | | | | | | |
| | | | | | | | $ | 20,551,168 | | | $ | 20,401,465 | | | | 179,621 | | | | (29,918 | ) |
| | | | | | | | | | | | | | | | | | | | | | |
| | | | | | | | | | | | | | | | $ | 217,526 | | | $ | (86,106 | ) |
| | | | | | | | | | | | | | | | | | | | | | |
Cross currency exchange contracts outstanding at October 31, 2018:
| | | | | | | | | | | | | | | | | | | | | | |
Settlement | | Type | | Notional
Amount
(000) | | | In Exchange
For (000) | | | Unrealized
Appreciation | | | Unrealized
Depreciation | | | Counterparty | |
OTC Cross Currency Exchange Contract: | | | | | | | | | |
01/25/19 | | Buy | | | CHF 74 | | | EUR | 65 | | | $ | — | | | $ | (31 | ) | | | Toronto Dominion | |
| | | | | | | | | | | | | | | | | | | | | | |
Credit default swap agreements outstanding at October 31, 2018:
| | | | | | | | | | | | | | | | | | | | | | | | | | |
Reference Entity/
Obligation | | Termination
Date | | | Fixed
Rate | | | Notional
Amount
(000)#(3) | | | Fair
Value | | | Upfront
Premiums
Paid
(Received) | | | Unrealized
Appreciation
(Depreciation) | | | Counterparty |
OTC Credit Default Swap Agreements on corporate and/or sovereign issues - Buy Protection(1): |
Assicurazioni Generali SpA | | | 06/20/23 | | | | 1.000%(Q) | | | EUR | 100 | | | $ | 7,067 | | | $ | 6,597 | | | $ | 470 | | | Barclays Bank PLC |
Kingdom of Spain | | | 06/20/23 | | | | 1.000%(Q) | | | | 100 | | | | (2,146 | ) | | | (2,474 | ) | | | 328 | | | Bank of America |
Republic of Argentina | | | 03/20/19 | | | | 5.000%(Q) | | | | 100 | | | | (1,426 | ) | | | (560 | ) | | | (866 | ) | | Hong Kong & Shanghai Bank |
Republic of Italy | | | 06/20/19 | | | | 1.000%(Q) | | | EUR | 60 | | | | (114 | ) | | | (127 | ) | | | 13 | | | Barclays Bank PLC |
Republic of Italy | | | 06/20/23 | | | | 1.000%(Q) | | | | 205 | | | | 4,542 | | | | 2,949 | | | | 1,593 | | | Citibank NA |
Republic of Italy | | | 06/20/23 | | | | 1.000%(Q) | | | EUR | 90 | | | | 5,154 | | | | 1,296 | | | | 3,858 | | | Barclays Bank PLC |
See Notes to Financial Statements.
| | | | |
| PGIM Global Total Return (USD Hedged) Fund | | | 37 | |
Schedule of Investments (continued)
as of October 31, 2018
Credit default swap agreements outstanding at October 31, 2018 (continued):
| | | | | | | | | | | | | | | | | | | | | | | | | | |
Reference Entity/ Obligation | | Termination
Date | | | Fixed
Rate | | | Notional
Amount
(000)#(3) | | | Fair
Value | | | Upfront
Premiums
Paid
(Received) | | | Unrealized
Appreciation
(Depreciation) | | | Counterparty |
OTC Credit Default Swap Agreements on corporate and/or sovereign issues—Buy Protection(1)(cont’d.): |
Republic of Italy | | | 06/20/28 | | | | 1.000%(Q) | | | EUR | 45 | | | $ | 5,826 | | | $ | 2,796 | | | $ | 3,030 | | | Barclays Bank PLC |
Republic of Turkey | | | 06/20/19 | | | | 1.000%(Q) | | | | 80 | | | | 927 | | | | 2,315 | | | | (1,388 | ) | | BNP Paribas |
Republic of Turkey | | | 06/20/19 | | | | 1.000%(Q) | | | | 40 | | | | 463 | | | | 1,032 | | | | (569 | ) | | BNP Paribas |
| | | | | | | | | | | | | | | | | | | | | | | | | | |
| | | | | | | | | | | | | | $ | 20,293 | | | $ | 13,824 | | | $ | 6,469 | | | |
| | | | | | | | | | | | | | | | | | | | | | | | | | |
| | | | | | | | | | | | | | | | | | | | | | | | | | | | | | |
Reference
Entity/
Obligation | | Termination
Date | | | Fixed
Rate | | | Notional
Amount
(000)#(3) | | | Implied
Credit
Spread at
October 31,
2018(4) | | | Fair
Value | | | Upfront
Premiums
Paid
(Received) | | | Unrealized
Appreciation
(Depreciation) | | | Counterparty |
OTC Credit Default Swap Agreements on corporate and/or sovereign issues—Sell Protection(2): | | | |
Arab Republic of Egypt | | | 06/20/19 | | | | 1.000%(Q) | | | | 70 | | | | 1.882 | % | | $ | (308 | ) | | $ | (209 | ) | | $ | (99 | ) | | Citibank NA |
Kingdom of Spain | | | 06/20/23 | | | | 1.000%(Q) | | | | 100 | | | | 0.773 | % | | | 1,085 | | | | 1,515 | | | | (430 | ) | | Bank of America |
Kingdom of Spain | | | 06/20/23 | | | | 1.000%(Q) | | | | 375 | | | | 0.773 | % | | | 4,066 | | | | 3,949 | | | | 117 | | | Bank of America |
Republic of Indonesia | | | 06/20/23 | | | | 1.000%(Q) | | | | 475 | | | | 1.440 | % | | | (8,215 | ) | | | (3,003 | ) | | | (5,212 | ) | | Citibank NA |
Republic of Italy | | | 06/20/23 | | | | 1.000%(Q) | | | | 205 | | | | 2.605 | % | | | (12,944 | ) | | | (10,702 | ) | | | (2,242 | ) | | Citibank NA |
Republic of Kazakhstan | | | 06/20/23 | | | | 1.000%(Q) | | | | 85 | | | | 0.688 | % | | | 1,243 | | | | — | | | | 1,243 | | | Citibank NA |
Republic of Portugal | | | 06/20/23 | | | | 1.000%(Q) | | | | 455 | | | | 0.927 | % | | | 1,936 | | | | (1,726 | ) | | | 3,662 | | | Goldman Sachs International |
Republic of Portugal | | | 12/20/23 | | | | 1.000%(Q) | | | | 50 | | | | 0.993 | % | | | 74 | | | | (29 | ) | | | 103 | | | Morgan Stanley |
Republic of Turkey | | | 06/20/23 | | | | 1.000%(Q) | | | | 40 | | | | 3.775 | % | | | (4,311 | ) | | | (5,331 | ) | | | 1,020 | | | BNP Paribas |
Republic of Turkey | | | 06/20/23 | | | | 1.000%(Q) | | | | 80 | | | | 3.775 | % | | | (8,623 | ) | | | (10,983 | ) | | | 2,360 | | | BNP Paribas |
Russian Federation | | | 12/20/22 | | | | 1.000%(Q) | | | | 50 | | | | 1.272 | % | | | (460 | ) | | | (125 | ) | | | (335 | ) | | Citibank NA |
Russian Federation | | | 06/20/23 | | | | 1.000%(Q) | | | | 50 | | | | 1.380 | % | | | (743 | ) | | | (980 | ) | | | 237 | | | BNP Paribas |
Russian Federation | | | 06/20/23 | | | | 1.000%(Q) | | | | 100 | | | | 1.380 | % | | | (1,486 | ) | | | (1,665 | ) | | | 179 | | | Morgan Stanley |
Russian Federation | | | 06/20/23 | | | | 1.000%(Q) | | | | 150 | | | | 1.380 | % | | | (2,229 | ) | | | (2,987 | ) | | | 758 | | | Morgan Stanley |
| | | | | | | | | | | | | | | | | | | | | | | | | | | | | | |
| | | | | | | | | | | | | | | | | | $ | (30,915 | ) | | $ | (32,276 | ) | | $ | 1,361 | | | |
| | | | | | | | | | | | | | | | | | | | | | | | | | | | | | |
See Notes to Financial Statements.
Credit default swap agreements outstanding at October 31, 2018 (continued):
| | | | | | | | | | | | | | | | | | | | | | | | |
Reference Entity/ Obligation | | Termination
Date | | | Fixed
Rate | | | Notional
Amount
(000)#(3) | | | Value at
Trade Date | | | Value at
October 31,
2018 | | | Unrealized
Appreciation
(Depreciation) | |
Centrally Cleared Credit Default Swap Agreements on credit indices—Buy Protection(1): | |
CDX.NA.IG.30.V1 | | | 06/20/28 | | | | 1.000%(Q) | | | | 220 | | | $ | 660 | | | $ | 1,666 | | | $ | 1,006 | |
iTraxx.EUR.28.V1 | | | 12/20/27 | | | | 1.000%(Q) | | | EUR | 186 | | | | (583 | ) | | | 523 | | | | 1,106 | |
| | | | | | | | | | | | | | | | | | | | | | | | |
| | | | | | | | | | | | | | $ | 77 | | | $ | 2,189 | | | $ | 2,112 | |
| | | | | | | | | | | | | | | | | | | | | | | | |
| | | | | | | | | | | | | | | | | | | | | | | | | | | | |
Reference Entity/ Obligation | | Termination
Date | | | Fixed
Rate | | | Notional
Amount
(000)#(3) | | | Implied
Credit
Spread at
October 31,
2018(4) | | | Value at
Trade Date | | | Value at
October 31,
2018 | | | Unrealized
Appreciation
(Depreciation) | |
Centrally Cleared Credit Default Swap Agreement on credit indices—Sell Protection(2): | | | | | |
CDX.NA.HY.30.V1 | | | 06/20/23 | | | | 5.000%(Q) | | | | 61 | | | | 3.457 | % | | $ | 4,496 | | | $ | 4,017 | | | $ | (479 | ) |
| | | | | | | | | | | | | | | | | | | | | | | | | | | | |
| | | | | | | | | | | | | | | | | | | | | | | | | | | | | | |
Reference
Entity/
Obligation | | Termination
Date | | | Fixed
Rate | | | Notional
Amount
(000)#(3) | | | Implied
Credit
Spread at
October 31,
2018(4) | | | Fair
Value | | | Upfront
Premiums
Paid
(Received) | | | Unrealized
Appreciation
(Depreciation) | | | Counterparty |
OTC Credit Default Swap Agreement on credit indices—Sell Protection(2): | | | |
CMBX.NA.6.AA | | | 05/11/63 | | | | 1.500%(M) | | | | 200 | | | | * | | | $ | 1,687 | | | $ | (1,136 | ) | | $ | 2,823 | | | JPMorgan Securities |
| | | | | | | | | | | | | | | | | | | | | | | | | | | | | | |
The Fund entered into credit default swaps (“CDS”) to provide a measure of protection against defaults or to take an active long or short position with respect to the likelihood of a particular issuer’s default or the reference entity’s credit soundness. CDS contracts generally trade based on a spread which represents the cost a protection buyer has to pay the protection seller. The protection buyer is said to be short the credit as the value of the contract rises the more the credit deteriorates. The value of the CDS contract increases for the protection buyer if the spread increases.
| (1) | If the Fund is a buyer of protection, it pays the fixed rate. When a credit event occurs, as defined under the terms of that particular swap agreement, the Fund will either (i) receive from the seller of protection an amount equal to the notional amount of the swap and make delivery of the referenced obligation or underlying securities comprising the referenced index or (ii) receive a net settlement amount in the form of cash or securities equal to the notional amount of the swap less the recovery value of the referenced obligation or underlying securities comprising the referenced index. |
| (2) | If the Fund is a seller of protection, it receives the fixed rate. When a credit event occurs, as defined under the terms of that particular swap agreement, the Fund will either (i) pay to the buyer of protection an amount equal to the notional amount of the swap and take delivery of the referenced obligation or underlying securities comprising the referenced index or (ii) pay a net settlement amount in the form of cash or securities equal to the notional amount of the swap less the recovery value of the referenced obligation or underlying securities comprising the referenced index. |
See Notes to Financial Statements.
| | | | |
| PGIM Global Total Return (USD Hedged) Fund | | | 39 | |
Schedule of Investments (continued)
as of October 31, 2018
| (3) | Notional amount represents the maximum potential amount the Fund could be required to pay as a seller of credit protection or receive as a buyer of credit protection if a credit event occurs as defined under the terms of that particular swap agreement. |
| (4) | Implied credit spreads, represented in absolute terms, utilized in determining the fair value of credit default swap agreements where the Fund is the seller of protection as of the reporting date serve as an indicator of the current status of the payment/ performance risk and represent the likelihood of risk of default for the credit derivative. The implied credit spread of a particular referenced entity reflects the cost of buying/selling protection and may include up-front payments required to be made to enter into the agreement. Wider credit spreads represent a deterioration of the referenced entity’s credit soundness and a greater likelihood of risk of default or other credit event occurring as defined under the terms of the agreement. |
| * | When an implied credit spread is not available, reference the fair value of credit default swap agreements on credit indices and asset-backed securities. Where the Fund is the seller of protection, it serves as an indicator of the current status of the payment/performance risk and represents the likelihood of an expected liability (or profit) for the credit derivative should the notional amount of the swap agreement be closed/sold as of the reporting date. Increasing fair value in absolute terms, when compared to the notional amount of the swap, represents a deterioration of the referenced entity’s credit soundness and a greater likelihood of risk of default or other credit event occurring as defined under the terms of the agreement. |
Forward rate agreements outstanding at October 31, 2018:
| | | | | | | | | | | | | | | | | | | | | | | | | | |
Notional
Amount
(000)# | | | Termination
Date | | | Fixed
Rate | | | Floating Rate | | Fair
Value | | | Upfront
Premiums
Paid
(Received) | | | Unrealized
Appreciation
(Depreciation) | | | Counterparty |
| | OTC Forward Rate Agreements^: | | | | | | | | | | | | | | |
| | 275 | | | | 07/16/19 | | | | 3.145%(T) | | | CM MUNI 30 Year(2)(T) | | $ | (5,190 | ) | | $ | — | | | $ | (5,190 | ) | | Citibank NA |
| | 275 | | | | 07/16/19 | | | | 2.180%(T) | | | CM MUNI 5 Year(1)(T) | | | 3,861 | | | | — | | | | 3,861 | | | Citibank NA |
| | | | | | | | | | | | | | | | | | | | | | | | | | |
| | | | | | | | | | | | | | $ | (1,329 | ) | | $ | — | | | $ | (1,329 | ) | | |
| | | | | | | | | | | | | | | | | | | | | | | | | | |
| (1) | The Fund pays the fixed rate and receives the floating rate. |
| (2) | The Fund pays the floating rate and receives the fixed rate. |
Inflation swap agreements outstanding at October 31, 2018:
| | | | | | | | | | | | | | | | | | | | | | | | |
Notional
Amount
(000)# | | | Termination
Date | | | Fixed
Rate | | | Floating Rate | | Value at
Trade
Date | | | Value at
October 31,
2018 | | | Unrealized
Appreciaton
(Depreciation) | |
| | Centrally Cleared Inflation Swap Agreements: | | | | | | | | | | | | |
| EUR | 200 | | | | 05/15/23 | | | | 1.485%(T) | | | France CPI ex Tobacco
Household(1)(T) | | $ | — | | | $ | (595 | ) | | $ | (595 | ) |
| EUR | 200 | | | | 05/15/23 | | | | 1.510%(T) | | | Eurostat Eurozone HICP ex
Tobacco(2)(T) | | | — | | | | (168 | ) | | | (168 | ) |
| | | | | | | | | | | | | | | | | | | | | | | | |
| | | | | | | | | | | | | | $ | — | | | $ | (763 | ) | | $ | (763 | ) |
| | | | | | | | | | | | | | | | | | | | | | | | |
| (1) | The Fund pays the fixed rate and receives the floating rate. |
| (2) | The Fund pays the floating rate and receives the fixed rate. |
See Notes to Financial Statements.
Interest rate swap agreements outstanding at October 31, 2018:
| | | | | | | | | | | | | | | | | | | | | | | | |
Notional
Amount
(000)# | | | Termination
Date | | | Fixed
Rate | | | Floating Rate | | Value at
Trade
Date | | | Value at
October 31,
2018 | | | Unrealized
Appreciaton
(Depreciation) | |
| | Centrally Cleared Interest Rate Swap Agreements: | | | | | | | | | | | | |
| AUD | 920 | | | | 06/21/23 | | | | 2.532%(S) | | | 6 Month BBSW(1)(S) | | $ | (1,410 | ) | | $ | (4,244 | ) | | $ | (2,834 | ) |
| AUD | 400 | | | | 12/18/27 | | | | 2.696%(S) | | | 6 Month BBSW(2)(S) | | | — | | | | (1,160 | ) | | | (1,160 | ) |
| BRL | 569 | | | | 01/02/25 | | | | 9.943%(T) | | | 1 Day BROIS(2)(T) | | | — | | | | 7,345 | | | | 7,345 | |
| BRL | 609 | | | | 01/02/25 | | | | 11.080%(T) | | | 1 Day BROIS(2)(T) | | | — | | | | 17,142 | | | | 17,142 | |
| BRL | 293 | | | | 01/02/25 | | | | 12.050%(T) | | | 1 Day BROIS(2)(T) | | | — | | | | 12,683 | | | | 12,683 | |
| BRL | 98 | | | | 01/02/25 | | | | 12.090%(T) | | | 1 Day BROIS(2)(T) | | | — | | | | 4,291 | | | | 4,291 | |
| BRL | 78 | | | | 01/04/27 | | | | 12.040%(T) | | | 1 Day BROIS(2)(T) | | | — | | | | 3,945 | | | | 3,945 | |
| CAD | 5,350 | | | | 01/09/20 | | | | 1.716%(S) | | | 3 Month Canadian Banker’s Acceptance(2)(S) | | | (14,644 | ) | | | (40,762 | ) | | | (26,118 | ) |
| CAD | 1,260 | | | | 05/08/22 | | | | 1.367%(S) | | | 3 Month Canadian Banker’s Acceptance(1)(S) | | | 27,453 | | | | 47,314 | | | | 19,861 | |
| CAD | 50 | | | | 01/09/38 | | | | 2.720%(S) | | | 3 Month Canadian Banker’s Acceptance(2)(S) | | | — | | | | (1,703 | ) | | | (1,703 | ) |
| CAD | 50 | | | | 05/30/47 | | | | 2.240%(S) | | | 3 Month Canadian Banker’s Acceptance(2)(S) | | | (1,614 | ) | | | (5,705 | ) | | | (4,091 | ) |
| CAD | 40 | | | | 01/09/48 | | | | 2.640%(S) | | | 3 Month Canadian Banker’s Acceptance(1)(S) | | | — | | | | 2,122 | | | | 2,122 | |
| CHF | 40 | | | | 04/03/28 | | | | 0.410%(A) | | | 6 Month CHF LIBOR(2)(S) | | | — | | | | (18 | ) | | | (18 | ) |
| CHF | 20 | | | | 04/03/33 | | | | 0.687%(A) | | | 6 Month CHF LIBOR(2)(S) | | | — | | | | (177 | ) | | | (177 | ) |
| EUR | 915 | | | | 05/11/20 | | | | (0.054)%(A) | | | 6 Month EURIBOR(2)(S) | | | 1,838 | | | | 2,093 | | | | 255 | |
| EUR | 880 | | | | 05/11/23 | | | | 0.390%(A) | | | 6 Month EURIBOR(1)(S) | | | (2,662 | ) | | | (6,879 | ) | | | (4,217 | ) |
| EUR | 390 | | | | 05/15/23 | | | | 0.221%(A) | | | 6 Month EURIBOR(2)(S) | | | — | | | | (1,066 | ) | | | (1,066 | ) |
| EUR | 500 | | | | 05/15/23 | | | | 0.266%(A) | | | 6 Month EURIBOR(2)(S) | | | — | | | | (170 | ) | | | (170 | ) |
| EUR | 380 | | | | 08/15/23 | | | | 0.390%(A) | | | 6 Month EURIBOR(2)(S) | | | (332 | ) | | | 1,147 | | | | 1,479 | |
| EUR | 235 | | | | 10/30/32 | | | | 1.302%(A) | | | 6 Month EURIBOR(2)(S) | | | 5,922 | | | | 1,909 | | | | (4,013 | ) |
| EUR | 150 | | | | 01/26/48 | | | | 1.853%(A) | | | 3 Month EURIBOR(2)(Q) | | | — | | | | 1,270 | | | | 1,270 | |
| EUR | 150 | | | | 01/26/48 | | | | 1.863%(A) | | | 6 Month EURIBOR(1)(S) | | | — | | | | (1,106 | ) | | | (1,106 | ) |
See Notes to Financial Statements.
| | | | |
| PGIM Global Total Return (USD Hedged) Fund | | | 41 | |
Schedule of Investments (continued)
as of October 31, 2018
Interest rate swap agreements outstanding at October 31, 2018 (continued):
| | | | | | | | | | | | | | | | | | | | | | | | |
Notional
Amount
(000)# | | | Termination
Date | | | Fixed
Rate | | | Floating Rate | | Value at
Trade
Date | | | Value at
October 31,
2018 | | | Unrealized
Appreciaton
(Depreciation) | |
| | Centrally Cleared Interest Rate Swap Agreements (cont’d.): | | | | | | | | | | | | |
| EUR | 100 | | | | 03/19/48 | | | | 1.650%(A) | | | 3 Month EURIBOR(2)(Q) | | $ | — | | | $ | (26 | ) | | $ | (26 | ) |
| EUR | 100 | | | | 03/19/48 | | | | 1.658%(A) | | | 6 Month EURIBOR(1)(S) | | | — | | | | 78 | | | | 78 | |
| GBP | 260 | | | | 10/24/23 | | | | 1.365%(S) | | | 6 Month GBP LIBOR(1)(S) | | | 103 | | | | 192 | | | | 89 | |
| GBP | 475 | | | | 12/21/31 | | | | 1.534%(S) | | | 6 Month GBP LIBOR(2)(S) | | | 15,273 | | | | (7,735 | ) | | | (23,008 | ) |
| GBP | 420 | | | | 05/08/37 | | | | 1.450%(S) | | | 6 Month GBP LIBOR(2)(S) | | | (3,902 | ) | | | (21,615 | ) | | | (17,713 | ) |
| GBP | 290 | | | | 05/08/47 | | | | 1.400%(S) | | | 6 Month GBP LIBOR(1)(S) | | | 6,890 | | | | 25,623 | | | | 18,733 | |
| HUF | 197,600 | | | | 07/02/20 | | | | 1.065%(A) | | | 6 Month BUBOR(2)(S) | | | (327 | ) | | | 2,460 | | | | 2,787 | |
| HUF | 43,000 | | | | 03/18/26 | | | | 2.140%(A) | | | 6 Month BUBOR(2)(S) | | | 9,737 | | | | (5,135 | ) | | | (14,872 | ) |
| HUF | 90,865 | | | | 06/12/28 | | | | 3.750%(A) | | | 6 Month BUBOR(2)(S) | | | — | | | | (5,426 | ) | | | (5,426 | ) |
| INR | 20,000 | | | | 05/16/23 | | | | 7.020%(S) | | | 1 Month MIBOR(2)(S) | | | (8 | ) | | | (2,368 | ) | | | (2,360 | ) |
| JPY | 11,500 | | | | 01/04/23 | | | | 0.115%(S) | | | 6 Month JPY LIBOR(2)(S) | | | — | | | | 79 | | | | 79 | |
| JPY | 69,000 | | | | 05/11/23 | | | | 0.130%(S) | | | 6 Month JPY LIBOR(1)(S) | | | (110 | ) | | | (723 | ) | | | (613 | ) |
| JPY | 59,000 | | | | 12/18/27 | | | | 0.290%(S) | | | 6 Month JPY LIBOR(2)(S) | | | — | | | | 58 | | | | 58 | |
| JPY | 53,000 | | | | 12/18/32 | | | | 0.516%(S) | | | 6 Month JPY LIBOR(2)(S) | | | — | | | | 29 | | | | 29 | |
| JPY | 176,500 | | | | 12/18/37 | | | | 0.715%(S) | | | 6 Month JPY LIBOR(2)(S) | | | — | | | | (2,337 | ) | | | (2,337 | ) |
| JPY | 4,500 | | | | 01/04/38 | | | | 0.757%(S) | | | 6 Month JPY LIBOR(2)(S) | | | — | | | | 227 | | | | 227 | |
| JPY | 5,000 | | | | 07/04/43 | | | | 0.763%(S) | | | 6 Month JPY LIBOR(2)(S) | | | — | | | | (1,095 | ) | | | (1,095 | ) |
| JPY | 16,700 | | | | 12/18/47 | | | | 0.918%(S) | | | 6 Month JPY LIBOR(2)(S) | | | — | | | | (830 | ) | | | (830 | ) |
| MXN | 1,150 | | | | 12/23/27 | | | | 7.845%(M) | | | 28 Day Mexican Interbank Rate(2)(M) | | | — | | | | (4,317 | ) | | | (4,317 | ) |
| MXN | 3,330 | | | | 06/30/28 | | | | 8.065%(M) | | | 28 Day Mexican Interbank Rate(2)(M) | | | — | | | | (11,022 | ) | | | (11,022 | ) |
See Notes to Financial Statements.
Interest rate swap agreements outstanding at October 31, 2018 (continued):
| | | | | | | | | | | | | | | | | | | | | | | | |
Notional
Amount
(000)# | | | Termination
Date | | | Fixed
Rate | | | Floating Rate | | Value at
Trade
Date | | | Value at
October 31,
2018 | | | Unrealized
Appreciaton
(Depreciation) | |
| | Centrally Cleared Interest Rate Swap Agreements (cont’d.): | | | | | | | | | | | | |
| NOK | 11,800 | | | | 05/23/23 | | | | 1.895%(A) | | | 6 Month NIBOR(2)(S) | | $ | 546 | | | $ | 3,041 | | | $ | 2,495 | |
| NOK | 1,680 | | | | 03/15/27 | | | | 2.103%(A) | | | 6 Month NIBOR(2)(S) | | | 5,750 | | | | 791 | | | | (4,959 | ) |
| NZD | 1,010 | | | | 07/18/23 | | | | 2.513%(S) | | | 3 Month BBR(1)(Q) | | | (5,170 | ) | | | (10,624 | ) | | | (5,454 | ) |
| PLN | 1,030 | | | | 08/24/23 | | | | 2.390%(A) | | | 6 Month WIBOR(2)(S) | | | — | | | | (884 | ) | | | (884 | ) |
| PLN | 2,100 | | | | 09/09/23 | | | | 1.900%(A) | | | 6 Month WIBOR(2)(S) | | | (19,526 | ) | | | (14,784 | ) | | | 4,742 | |
| PLN | 570 | | | | 06/12/28 | | | | 3.070%(A) | | | 6 Month WIBOR(1)(S) | | | — | | | | (2,960 | ) | | | (2,960 | ) |
| PLN | 45 | | | | 07/11/28 | | | | 2.935%(A) | | | 6 Month WIBOR(2)(S) | | | — | | | | 77 | | | | 77 | |
| SEK | 2,000 | | | | 04/25/23 | | | | 0.750%(A) | | | 3 Month STIBOR(2)(Q) | | | 4,078 | | | | 3,371 | | | | (707 | ) |
| SEK | 11,700 | | | | 09/12/23 | | | | 0.497%(A) | | | 3 Month STIBOR(2)(Q) | | | (4,410 | ) | | | (3,283 | ) | | | 1,127 | |
| SEK | 2,325 | | | | 06/22/27 | | | | 1.031%(A) | | | 3 Month STIBOR(2)(Q) | | | (351 | ) | | | (712 | ) | | | (361 | ) |
| | 2,000 | | | | 02/15/19 | | | | 1.820%(T) | | | 1 Day USOIS(1)(T) | | | — | | | | 3,408 | | | | 3,408 | |
| | 6,100 | | | | 09/08/19 | | | | 1.290%(A) | | | 1 Day USOIS(1)(A) | | | 47,587 | | | | 71,283 | | | | 23,696 | |
| | 3,525 | | | | 12/31/19 | | | | 1.840%(A) | | | 1 Day USOIS(1)(A) | | | 12,785 | | | | 32,770 | | | | 19,985 | |
| | 2,120 | | | | 12/31/19 | | | | 1.950%(A) | | | 1 Day USOIS(1)(A) | | | — | | | | 15,550 | | | | 15,550 | |
| | 2,750 | | | | 12/31/19 | | | | 2.040%(A) | | | 1 Day USOIS(1)(A) | | | 31 | | | | 16,030 | | | | 15,999 | |
| | 5,385 | | | | 03/31/20 | | | | 2.369%(A) | | | 1 Day USOIS(1)(A) | | | — | | | | 15,645 | | | | 15,645 | |
| | 650 | | | | 04/24/20 | | | | 2.311%(A) | | | 1 Day USOIS(1)(A) | | | — | | | | 2,155 | | | | 2,155 | |
| | 915 | | | | 05/31/22 | | | | 2.353%(A) | | | 1 Day USOIS(1)(A) | | | — | | | | 11,766 | | | | 11,766 | |
| | 5,715 | | | | 08/31/22 | | | | 2.550%(A) | | | 1 Day USOIS(1)(A) | | | — | | | | 42,843 | | | | 42,843 | |
| | 360 | | | | 06/22/23 | | | | 2.911%(S) | | | 3 Month LIBOR(2)(Q) | | | (3,564 | ) | | | (488 | ) | | | 3,076 | |
| | 300 | | | | 07/17/24 | | | | 2.926%(S) | | | 3 Month LIBOR(2)(Q) | | | — | | | | (3,665 | ) | | | (3,665 | ) |
| | 1,595 | | | | 11/15/24 | | | | 2.334%(S) | | | 3 Month LIBOR(1)(Q) | | | 11,002 | | | | 62,621 | | | | 51,619 | |
| | 590 | | | | 02/28/25 | | | | 2.454%(A) | | | 1 Day USOIS(1)(A) | | | — | | | | 10,673 | | | | 10,673 | |
| | 600 | | | | 02/28/25 | | | | 3.019%(S) | | | 3 Month LIBOR(1)(Q) | | | — | | | | 3,857 | | | | 3,857 | |
| | 360 | | | | 05/31/25 | | | | 2.998%(S) | | | 3 Month LIBOR(1)(Q) | | | (215 | ) | | | 3,130 | | | | 3,345 | |
| | 595 | | | | 07/31/25 | | | | 2.802%(A) | | | 1 Day USOIS(1)(A) | | | — | | | | 669 | | | | 669 | |
| | 475 | | | | 07/31/25 | | | | 3.105%(S) | | | 3 Month LIBOR(1)(Q) | | | 375 | | | | 1,960 | | | | 1,585 | |
See Notes to Financial Statements.
| | | | |
| PGIM Global Total Return (USD Hedged) Fund | | | 43 | |
Schedule of Investments (continued)
as of October 31, 2018
Interest rate swap agreements outstanding at October 31, 2018 (continued):
| | | | | | | | | | | | | | | | | | | | | | | | |
Notional
Amount
(000)# | | | Termination
Date | | | Fixed
Rate | | | Floating Rate | | Value at
Trade
Date | | | Value at
October 31,
2018 | | | Unrealized
Appreciaton
(Depreciation) | |
| | Centrally Cleared Interest Rate Swap Agreements (cont’d.): | | | | | |
| | 592 | | | | 07/31/25 | | | | 3.109%(S) | | | 3 Month LIBOR(1)(Q) | | $ | 94 | | | $ | 2,287 | | | $ | 2,193 | |
| | 145 | | | | 11/15/43 | | | | 2.659%(S) | | | 3 Month LIBOR(1)(Q) | | | — | | | | 15,444 | | | | 15,444 | |
| | 65 | | | | 07/17/49 | | | | 2.914%(S) | | | 3 Month LIBOR(1)(Q) | | | — | | | | 4,999 | | | | 4,999 | |
| ZAR | 3,700 | | | | 11/07/27 | | | | 8.360%(Q) | | | 3 Month JIBAR(2)(Q) | | | 3,468 | | | | (3,069 | ) | | | (6,537 | ) |
| ZAR | 3,200 | | | | 07/16/28 | | | | 8.170%(Q) | | | 3 Month JIBAR(2)(Q) | | | (45 | ) | | | (6,825 | ) | | | (6,780 | ) |
| | | | | | | | | | | | | | | | | | | | | | | | |
| | | | | | | | | | | | | | $ | 94,642 | | | $ | 281,464 | | | $ | 186,822 | |
| | | | | | | | | | | | | | | | | | | | | | | | |
| | | | | | | | | | | | | | | | | | | | | | | | | | |
Notional
Amount
(000)# | | | Termination
Date | | | Fixed
Rate | | | Floating Rate | | Fair
Value | | | Upfront
Premiums
Paid
(Received) | | | Unrealized
Appreciaton
(Depreciation) | | | Counterparty |
| | OTC Interest Rate Swap Agreements: | | | | | | | | | | | |
| AED | 1,500 | | | | 04/05/21 | | | | 3.005%(A) | | | 3 Month EIBOR(1)(Q) | | $ | (2,325 | ) | | $ | — | | | $ | (2,325 | ) | | BNP Paribas |
| CLP | 95,000 | | | | 12/20/27 | | | | 4.260%(S) | | | 1 Day CLOIS(2)(S) | | | 7 | | | | — | | | | 7 | | | JPMorgan Chase |
| CLP | 100,000 | | | | 05/17/28 | | | | 4.270%(S) | | | 1 Day CLOIS(2)(S) | | | 86 | | | | — | | | | 86 | | | Citibank NA |
| CNH | 700 | | | | 08/15/23 | | | | 3.115%(Q) | | | 7 Day China Fixing Repo Rates(2)(Q) | | | 161 | | | | — | | | | 161 | | | UBS AG |
| COP | 485,000 | | | | 12/20/27 | | | | 5.970%(Q) | | | 1 Day COOIS(2)(Q) | | | (4,678 | ) | | | — | | | | (4,678 | ) | | JPMorgan Chase |
| COP | 500,000 | | | | 05/17/28 | | | | 5.990%(Q) | | | 1 Day COOIS(2)(Q) | | | (5,019 | ) | | | — | | | | (5,019 | ) | | Citibank NA |
| COP | 503,000 | | | | 08/03/28 | | | | 6.160%(Q) | | | 1 Day COOIS(2)(Q) | | | (3,274 | ) | | | — | | | | (3,274 | ) | | JPMorgan Chase |
| ILS | 550 | | | | 04/26/28 | | | | 1.915%(A) | | | 3 Month TELBOR(2)(Q) | | | (2,297 | ) | | | — | | | | (2,297 | ) | | BNP Paribas |
| ILS | 510 | | | | 07/16/28 | | | | 2.045%(A) | | | 3 Month TELBOR(2)(Q) | | | (1,532 | ) | | | — | | | | (1,532 | ) | | JPMorgan Chase |
| SAR | 1,500 | | | | 04/05/21 | | | | 3.020%(A) | | | 3 Month SAIBOR(2)(Q) | | | 2,199 | | | | — | | | | 2,199 | | | BNP Paribas |
| SAR | 640 | | | | 04/05/25 | | | | 3.480%(A) | | | 3 Month SAIBOR(1)(Q) | | | 286 | | | | — | | | | 286 | | | BNP Paribas |
| THB | 10,000 | | | | 08/08/20 | | | | 1.840%(S) | | | 6 Month BIBOR(2)(S) | | | 708 | | | | — | | | | 708 | | | Citibank NA |
| | | | | | | | | | | | | | | | | | | | | | | | | | |
| | | | | | | | | | | | | | $ | (15,678 | ) | | $ | — | | | $ | (15,678 | ) | | |
| | | | | | | | | | | | | | | | | | | | | | | | | | |
| (1) | The Fund pays the fixed rate and receives the floating rate. |
| (2) | The Fund pays the floating rate and receives the fixed rate. |
Balances Reported in the Statement of Assets and Liabilities for OTC Forward Rate and Swap Agreements:
| | | | | | | | | | | | | | | | |
| | | Premiums
Paid | | | Premiums
Received | | | Unrealized
Appreciation | | | Unrealized
Depreciation | |
| OTC Forward Rate Agreements | | $ | — | | | $ | — | | | $ | 3,861 | | | $ | (5,190 | ) |
| OTC Swap Agreements | | $ | 22,449 | | | $ | (42,037 | ) | | $ | 25,241 | | | $ | (30,266 | ) |
See Notes to Financial Statements.
Summary of Collateral for Centrally Cleared/Exchange-traded Derivatives:
Cash and securities segregated as collateral to cover requirements for open centrally cleared/exchange-traded derivatives are listed by broker as follows:
| | | | | | | | |
Broker | | Cash and/or
Foreign Currency | | | Securities
Market Value | |
JPMorgan Chase | | $ | 300,463 | | | $ | 730,205 | |
| | | | | | | | |
Fair Value Measurements:
Various inputs are used in determining the value of the Fund’s investments. These inputs are summarized in the three broad levels listed below.
Level 1—unadjusted quoted prices generally in active markets for identical securities.
Level 2—quoted prices for similar securities, interest rates and yield curves, prepayment speeds, foreign currency exchange rates and other observable inputs.
Level 3—unobservable inputs for securities valued in accordance with Board approved fair valuation procedures.
The following is a summary of the inputs used as of October 31, 2018 in valuing such portfolio securities:
| | | | | | | | | | | | |
| | | Level 1 | | | Level 2 | | | Level 3 | |
Investments in Securities | | | | | | | | | | | | |
Asset-Backed Securities | | | | | | | | | | | | |
Cayman Islands | | $ | — | | | $ | 3,489,685 | | | $ | — | |
Ireland | | | — | | | | 565,671 | | | | — | |
Spain | | | — | | | | 158,272 | | | | — | |
United States | | | — | | | | 860,751 | | | | — | |
Commercial Mortgage-Backed Securities | | | | | | | | | | | | |
United States | | | — | | | | 2,362,103 | | | | — | |
Corporate Bonds | | | | | | | | | | | | |
Canada | | | — | | | | 249,812 | | | | — | |
China | | | — | | | | 227,393 | | | | — | |
France | | | — | | | | 117,123 | | | | — | |
Germany | | | — | | | | 461,655 | | | | — | |
Italy | | | — | | | | 413,904 | | | | — | |
Kazakhstan | | | — | | | | 51,637 | | | | — | |
Mexico | | | — | | | | 327,900 | | | | — | |
Netherlands | | | — | | | | 144,841 | | | | — | |
Russia | | | — | | | | 127,853 | | | | — | |
Spain | | | — | | | | 117,916 | | | | — | |
Supranational Bank | | | — | | | | 122,177 | | | | — | |
Switzerland | | | — | | | | 196,760 | | | | — | |
United Kingdom | | | — | | | | 429,061 | | | | — | |
United States | | | — | | | | 2,358,964 | | | | — | |
Residential Mortgage-Backed Securities | | | | | | | | | | | | |
Bermuda | | | — | | | | 167,871 | | | | — | |
United States | | | — | | | | 79,618 | | | | — | |
See Notes to Financial Statements.
| | | | |
| PGIM Global Total Return (USD Hedged) Fund | | | 45 | |
Schedule of Investments (continued)
as of October 31, 2018
| | | | | | | | | | | | |
| | | Level 1 | | | Level 2 | | | Level 3 | |
Investments in Securities (continued) | | | | | | | | | | | | |
Sovereign Bonds | | | | | | | | | | | | |
Argentina | | $ | — | | | $ | 492,917 | | | $ | — | |
Austria | | | — | | | | 148,088 | | | | — | |
Brazil | | | — | | | | 193,750 | | | | — | |
Bulgaria | | | — | | | | 120,060 | | | | — | |
Canada | | | — | | | | 116,288 | | | | — | |
Chile | | | — | | | | 128,157 | | | | — | |
Colombia | | | — | | | | 254,845 | | | | — | |
Croatia | | | — | | | | 215,423 | | | | — | |
Cyprus | | | — | | | | 426,553 | | | | — | |
Dominican Republic | | | — | | | | 99,500 | | | | — | |
France | | | — | | | | 350,558 | | | | — | |
Greece | | | — | | | | 472,988 | | | | — | |
Hungary | | | — | | | | 167,222 | | | | — | |
Indonesia | | | — | | | | 192,043 | | | | — | |
Israel | | | — | | | | 114,741 | | | | — | |
Italy | | | — | | | | 1,433,646 | | | | — | |
Malaysia | | | — | | | | 110,361 | | | | — | |
Mexico | | | — | | | | 347,047 | | | | — | |
New Zealand | | | — | | | | 142,096 | | | | — | |
Panama | | | — | | | | 192,102 | | | | — | |
Peru | | | — | | | | 122,779 | | | | — | |
Poland | | | — | | | | 209,198 | | | | — | |
Portugal | | | — | | | | 653,389 | | | | — | |
Romania | | | — | | | | 112,302 | | | | — | |
Saudi Arabia | | | — | | | | 190,040 | | | | — | |
Senegal | | | — | | | | 105,574 | | | | — | |
Spain | | | — | | | | 1,384,412 | | | | — | |
Sweden | | | — | | | | 304,819 | | | | — | |
Turkey | | | — | | | | 112,083 | | | | — | |
United Arab Emirates | | | — | | | | 191,664 | | | | — | |
Uruguay | | | — | | | | 98,750 | | | | — | |
U.S. Government Agency Obligation | | | — | | | | 135,760 | | | | — | |
U.S. Treasury Obligations | | | — | | | | 828,482 | | | | — | |
Affiliated Mutual Fund | | | 527,951 | | | | — | | | | — | |
Options Purchased | | | — | | | | 8,993 | | | | — | |
Options Written | | | — | | | | (2,621 | ) | | | (82 | ) |
Other Financial Instruments* | | | | | | | | | | | | |
Futures Contracts | | | (220,126 | ) | | | — | | | | — | |
OTC Forward Foreign Currency Exchange Contracts | | | — | | | | 131,420 | | | | — | |
OTC Cross Currency Exchange Contract | | | — | | | | (31 | ) | | | — | |
Centrally Cleared Credit Default Swap Agreements | | | — | | | | 1,633 | | | | — | |
OTC Credit Default Swap Agreements | | | — | | | | (8,935 | ) | | | — | |
OTC Forward Rate Agreements | | | — | | | | — | | | | (1,329 | ) |
Centrally Cleared Inflation Swap Agreements | | | — | | | | (763 | ) | | | — | |
See Notes to Financial Statements.
| | | | | | | | | | | | |
| | | Level 1 | | | Level 2 | | | Level 3 | |
Other Financial Instruments* (continued) | | | | | | | | | | | | |
Centrally Cleared Interest Rate Swap Agreements | | $ | — | | | $ | 186,822 | | | $ | — | |
OTC Interest Rate Swap Agreements | | | — | | | | (15,678 | ) | | | — | |
| | | | | | | | | | | | |
Total | | $ | 307,825 | | | $ | 23,499,444 | | | $ | (1,411 | ) |
| | | | | | | | | | | | |
| * | Other financial instruments are derivative instruments not reflected in the Schedule of Investments, such as futures, forwards and centrally cleared swap contracts, which are recorded at the unrealized appreciation (depreciation) on the instrument, and OTC swap contracts which are recorded at fair value. |
Industry Classification:
The industry classification of investments and other assets in excess of liabilities shown as a percentage of net assets as of October 31, 2018 were as follows (unaudited):
| | | | |
Sovereign Bonds | | | 37.3 | % |
Collateralized Loan Obligations | | | 17.5 | |
Commercial Mortgage-Backed Securities | | | 9.6 | |
Banks | | | 4.5 | |
U.S. Treasury Obligations | | | 3.4 | |
Oil & Gas | | | 2.3 | |
Affiliated Mutual Fund | | | 2.2 | |
Residential Mortgage-Backed Securities | | | 1.9 | |
Insurance | | | 1.9 | |
Consumer Loans | | | 1.8 | |
Electric | | | 1.7 | |
Pipelines | | | 1.3 | |
Pharmaceuticals | | | 1.1 | |
Auto Manufacturers | | | 1.0 | |
Media | | | 1.0 | |
Commercial Services | | | 0.9 | |
Entertainment | | | 0.7 | |
U.S. Government Agency Obligation | | | 0.5 | |
Transportation | | | 0.5 | |
Multi-National | | | 0.5 | |
Healthcare-Products | | | 0.5 | |
Chemicals | | | 0.4 | |
| | | | |
Packaging & Containers | | | 0.4 | % |
Software | | | 0.4 | |
Credit Card | | | 0.4 | |
Home Builders | | | 0.4 | |
Housewares | | | 0.4 | |
Biotechnology | | | 0.4 | |
Foods | | | 0.4 | |
Apparel | | | 0.3 | |
Retail | | | 0.3 | |
Healthcare-Services | | | 0.2 | |
Aerospace & Defense | | | 0.1 | |
Diversified Financial Services | | | 0.1 | |
Options Purchased | | | 0.0 | * |
| | | | |
| | | 96.3 | |
Options Written | | | (0.0 | )* |
Other assets in excess of liabilities | | | 3.7 | |
| | | | |
| | | 100.0 | % |
| | | | |
Effects of Derivative Instruments on the Financial Statements and Primary Underlying Risk Exposure:
The Fund invested in derivative instruments during the reporting period. The primary types of risk associated with these derivative instruments are credit contracts risk, foreign exchange contracts risk and interest rate contracts risk. The effect of such derivative instruments on the Fund’s financial position and financial performance as reflected in the Statement of Assets and Liabilities and Statement of Operations is presented in the summary below.
See Notes to Financial Statements.
| | | | |
| PGIM Global Total Return (USD Hedged) Fund | | | 47 | |
Schedule of Investments (continued)
as of October 31, 2018
Fair values of derivative instruments as of October 31, 2018 as presented in the Statement of Assets and Liabilities:
| | | | | | | | | | | | |
Derivatives not accounted
for as hedging instruments,
carried at fair value | | Asset Derivatives | | | Liability Derivatives | |
| | Statement of Assets and Liabilities Location | | Fair
Value | | | Statement of Assets and Liabilities Location | | Fair
Value | |
| Credit contracts | | Due from/to broker—variation margin swaps | | $ | 2,112 | * | | Due from/to broker—variation margin swaps | | $ | 479 | * |
| Credit contracts | | Premiums paid for OTC swap agreements | | | 22,449 | | | Premiums received for OTC swap agreements | | | 42,037 | |
| Credit contracts | | Unaffiliated investments | | | 1,449 | | | Options written outstanding, at value | | | 2,621 | |
| Credit contracts | | Unrealized appreciation on OTC swap agreements | | | 21,794 | | | Unrealized depreciation on OTC swap agreements | | | 11,141 | |
| Foreign exchange contracts | | — | | | — | | | Unrealized depreciation on OTC cross currency exchange contracts | | | 31 | |
| Foreign exchange contracts | | Unrealized appreciation on OTC forward foreign currency exchange contracts | | | 217,526 | | | Unrealized depreciation on OTC forward foreign currency exchange contracts | | | 86,106 | |
| Interest rate contracts | | Due from/to broker-variation margin futures | | | 7,662 | * | | Due from/to broker-variation margin futures | | | 227,788 | * |
| Interest rate contracts | | Due from/to broker-variation margin swaps | | | 349,421 | * | | Due from/to broker-variation margin swaps | | | 163,362 | * |
| Interest rate contracts | | Unaffiliated investments | | | 7,544 | | | Options written outstanding, at value | | | 82 | |
| Interest rate contracts | | Unrealized appreciation on OTC forward rate agreements | | | 3,861 | | | Unrealized depreciation on OTC forward rate agreements | | | 5,190 | |
| Interest rate contracts | | Unrealized appreciation on OTC swap agreements | | | 3,447 | | | Unrealized depreciation on OTC swap agreements | | | 19,125 | |
| | | | | | | | | | | | |
| | | | $ | 637,265 | | | | | $ | 557,962 | |
| | | | | | | | | | | | |
| * | Includes cumulative appreciation (depreciation) as reported in the schedule of open futures and centrally cleared swap contracts. Only unsettled variation margin receivable (payable) is reported within the Statement of Assets and Liabilities. |
See Notes to Financial Statements.
The effects of derivative instruments on the Statement of Operations for the period ended October 31, 2018 are as follows:
| | | | | | | | | | | | | | | | | | | | |
Amount of Realized Gain (Loss) on Derivatives Recognized in Income | |
Derivatives not accounted for as hedging instruments, carried at fair value | | Options
Purchased(1) | | | Options
Written | | | Futures | | | Forward
& Cross
Currency
Exchange
Contracts | | | Swaps | |
Credit contracts | | $ | (568 | ) | | $ | 4,404 | | | $ | — | | | $ | — | | | $ | (13,027 | ) |
Foreign exchange contracts | | | — | | | | — | | | | — | | | | 442,613 | | | | — | |
Interest rate contracts | | | 3,195 | | | | (1,816 | ) | | | (22,587 | ) | | | — | | | | 51,016 | |
| | | | | | | | | | | | | | | | | | | | |
Total | | $ | 2,627 | | | $ | 2,588 | | | $ | (22,587 | ) | | $ | 442,613 | | | $ | 37,989 | |
| | | | | | | | | | | | | | | | | | | | |
| (1) | Included in net realized gain (loss) on investment transactions in the Statement of Operations. |
| | | | | | | | | | | | | | | | | | | | | | | | |
Change in Unrealized Appreciation (Depreciation) on Derivatives Recognized in Income | |
Derivatives not accounted for as hedging instruments, carried at fair value | | Options
Purchased(2) | | | Options
Written | | | Futures | | | Forward
& Cross
Currency
Exchange
Contracts | | | Forward
Rate
Agreements | | | Swaps | |
Credit contracts | | $ | (611 | ) | | $ | 3,018 | | | $ | — | | | $ | — | | | $ | — | | | $ | 12,286 | |
Foreign exchange contracts | | | — | | | | — | | | | — | | | | 131,389 | | | | — | | | | — | |
Interest rate contracts | | | 2,831 | | | | 289 | | | | (220,126 | ) | | | — | | | | (1,329 | ) | | | 170,381 | |
| | | | | | | | | | | | | | | | | | | | | | | | |
Total | | $ | 2,220 | | | $ | 3,307 | | | $ | (220,126 | ) | | $ | 131,389 | | | $ | (1,329 | ) | | $ | 182,667 | |
| | | | | | | | | | | | | | | | | | | | | | | | |
| (2) | Included in net change in unrealized appreciation (depreciation) on investments in the Statement of Operations. |
For the period ended October 31, 2018, the Fund’s average volume of derivative activities is as follows:
| | | | | | | | | | | | | | | | | | |
Options Purchased(1) | | | Options
Written(2) | | | Futures
Contracts—
Long
Positions(2) | | | Futures
Contracts—
Short
Positions(2) | | | Forward
Foreign
Currency
Exchange
Contracts—
Purchased(3) | |
| $ | 3,843 | | | $ | 944,445 | | | $ | 11,442,074 | | | $ | 9,934,279 | | | $ | 6,452,643 | |
| | | | | | | | | | | | | | | | | | |
Forward Foreign Currency Exchange
Contracts— Sold(3) | | | Cross
Currency
Exchange
Contracts(4) | | | Forward
Rate
Agreements(2) | | | Interest
Rate
Swap
Agreements(2) | | | Credit
Default
Swap
Agreements—
Buy
Protection(2) | |
| $ | 17,237,425 | | | $ | 248,788 | | | $ | 275,000 | | | $ | 59,131,782 | | | $ | 932,693 | |
| | | | | | |
Credit Default
Swap Agreements—
Sell Protection(2) | | | Inflation Swap
Agreements(2) | |
| $ | 2,563,200 | | | $ | 425,428 | |
See Notes to Financial Statements.
| | | | |
| PGIM Global Total Return (USD Hedged) Fund | | | 49 | |
Schedule of Investments (continued)
as of October 31, 2018
| (2) | Notional Amount in USD. |
| (3) | Value at Settlement Date. |
Financial Instruments/Transactions—Summary of Offsetting and Netting Arrangements:
The Fund invested in OTC derivatives during the reporting period that are either offset in accordance with current requirements or are subject to enforceable master netting arrangements or similar agreements that permit offsetting. The information about offsetting and related netting arrangements for OTC derivatives where the legal right to set-off exists, is presented in the summary below.
Offsetting of OTC derivative assets and liabilities:
| | | | | | | | | | | | | | | | | | | | |
Counterparty | | Gross
Amounts of
Recognized
Assets(1) | | | Gross
Amounts of
Recognized
Liabilities(1) | | | Net Amounts of
Recognized
Assets/(Liabilities) | | | Collateral
Pledged/
(Received)(2) | | | Net
Amount | |
Bank of America | | $ | 21,350 | | | $ | (7,138 | ) | | $ | 14,212 | | | $ | — | | | $ | 14,212 | |
Barclays Bank PLC | | | 45,675 | | | | (18,025 | ) | | | 27,650 | | | | — | | | | 27,650 | |
BNP Paribas | | | 27,812 | | | | (30,693 | ) | | | (2,881 | ) | | | — | | | | (2,881 | ) |
Citibank NA | | | 30,849 | | | | (46,540 | ) | | | (15,691 | ) | | | — | | | | (15,691 | ) |
Deutsche Bank AG | | | 6,564 | | | | (5,244 | ) | | | 1,320 | | | | — | | | | 1,320 | |
Goldman Sachs International | | | 21,818 | | | | (6,335 | ) | | | 15,483 | | | | (10,000 | ) | | | 5,483 | |
Hong Kong & Shanghai Bank | | | — | | | | (1,426 | ) | | | (1,426 | ) | | | — | | | | (1,426 | ) |
JPMorgan Chase | | | 26,275 | | | | (30,358 | ) | | | (4,083 | ) | | | — | | | | (4,083 | ) |
JPMorgan Securities | | | 2,823 | | | | (1,136 | ) | | | 1,687 | | | | — | | | | 1,687 | |
Morgan Stanley | | | 15,641 | | | | (6,936 | ) | | | 8,705 | | | | — | | | | 8,705 | |
Toronto Dominion | | | 14,404 | | | | (4,350 | ) | | | 10,054 | | | | — | | | | 10,054 | |
UBS AG | | | 64,859 | | | | (8,152 | ) | | | 56,707 | | | | — | | | | 56,707 | |
| | | | | | | | | | | | | | | | | | | | |
| | $ | 278,070 | | | $ | (166,333 | ) | | $ | 111,737 | | | $ | (10,000 | ) | | $ | 101,737 | |
| | | | | | | | | | | | | | | �� | | | | | |
| (1) | Includes unrealized appreciation/(depreciation) on swaps and forwards, premiums paid/(received) on swap agreements and market value of purchased and written options, as represented on the Statement of Assets and Liabilities. |
| (2) | Collateral amount disclosed by the Fund is limited to the Fund’s OTC derivative exposure by counterparty. |
See Notes to Financial Statements.
Statement of Assets & Liabilities
as of October 31, 2018
| | | | |
Assets | | | | |
Investments at value: | | | | |
Unaffiliated investments (cost $24,596,994) | | $ | 23,207,597 | |
Affiliated investments (cost $527,951) | | | 527,951 | |
Foreign currency, at value (cost $288,824) | | | 286,613 | |
Deposit with broker for centrally cleared/exchange-traded derivatives | | | 300,463 | |
Dividends and interest receivable | | | 224,410 | |
Unrealized appreciation on OTC forward foreign currency exchange contracts | | | 217,526 | |
Due from Manager | | | 85,820 | |
Unrealized appreciation on OTC swap agreements | | | 25,241 | |
Premiums paid for OTC swap agreements | | | 22,449 | |
Due from broker—variation margin swaps | | | 7,942 | |
Unrealized appreciation on OTC forward rate agreements | | | 3,861 | |
Prepaid expenses | | | 844 | |
| | | | |
Total Assets | | | 24,910,717 | |
| | | | |
| |
Liabilities | | | | |
Unrealized depreciation on OTC forward foreign currency exchange contracts | | | 86,106 | |
Due to broker—variation margin futures | | | 46,044 | |
Premiums received for OTC swap agreements | | | 42,037 | |
Unrealized depreciation on OTC swap agreements | | | 30,266 | |
Custodian and accounting fees payable | | | 29,626 | |
Accrued expenses and other liabilities | | | 16,418 | |
Unrealized depreciation on OTC forward rate agreements | | | 5,190 | |
Options written outstanding, at value (proceeds received $6,010) | | | 2,703 | |
Affiliated transfer agent fee payable | | | 64 | |
Unrealized depreciation on OTC cross currency exchange contracts | | | 31 | |
Distribution fee payable | | | 25 | |
| | | | |
Total Liabilities | | | 258,510 | |
| | | | |
| |
Net Assets | | $ | 24,652,207 | |
| | | | |
| | | | | |
Net assets were comprised of: | | | | |
Common stock, at par | | $ | 25,993 | |
Paid-in capital in excess of par | | | 25,940,588 | |
Total distributable earnings (loss) | | | (1,314,374 | ) |
| | | | |
Net assets, October 31, 2018 | | $ | 24,652,207 | |
| | | | |
See Notes to Financial Statements.
| | | | |
| PGIM Global Total Return (USD Hedged) Fund | | | 51 | |
Statement of Assets & Liabilities
as of October 31, 2018
| | | | |
Class A | | | | |
Net asset value, offering price and redemption price per share,
($49,364 ÷ 5,206 shares of common stock issued and outstanding) | | $ | 9.48 | |
Maximum sales charge (4.50% of offering price) | | | 0.45 | |
| | | | |
Maximum offering price to public | | $ | 9.93 | |
| | | | |
| |
Class C | | | | |
Net asset value, offering price and redemption price per share,
($17,158 ÷ 1,809 shares of common stock issued and outstanding) | | $ | 9.48 | |
| | | | |
| |
Class Z | | | | |
Net asset value, offering price and redemption price per share,
($164,281 ÷ 17,322 shares of common stock issued and outstanding) | | $ | 9.48 | |
| | | | |
| |
Class R6 | | | | |
Net asset value, offering price and redemption price per share,
($24,421,404 ÷ 2,574,939 shares of common stock issued and outstanding) | | $ | 9.48 | |
| | | | |
See Notes to Financial Statements.
Statement of Operations
Period Ended October 31, 2018*
| | | | |
Net Investment Income (Loss) | | | | |
Income | | | | |
Interest income (net of $5,424 foreign withholding tax) | | $ | 577,309 | |
Affiliated dividend income | | | 20,217 | |
| | | | |
Total income | | | 597,526 | |
| | | | |
| |
Expenses | | | | |
Management fee | | | 110,025 | |
Distribution fee(a) | | | 215 | |
Registration fees(a) | | | 130,100 | |
Custodian and accounting fees | | | 93,316 | |
Shareholders’ reports | | | 39,517 | |
Audit fee | | | 38,000 | |
Legal fees and expenses | | | 33,885 | |
Directors’ fees | | | 10,343 | |
Transfer agent’s fees and expenses (including affiliated expense of $272)(a) | | | 368 | |
Miscellaneous | | | 9,434 | |
| | | | |
Total expenses | | | 465,203 | |
Less: Fee waiver and/or expense reimbursement(a) | | | (337,262 | ) |
| | | | |
Net expenses | | | 127,941 | |
| | | | |
Net investment income (loss) | | | 469,585 | |
| | | | |
| |
Realized And Unrealized Gain (Loss) On Investment And Foreign Currency Transactions | | | | |
Net realized gain (loss) on: | | | | |
Investment transactions | | | (252,438 | ) |
Futures transactions | | | (22,587 | ) |
Forward and cross currency contract transactions | | | 442,613 | |
Options written transactions | | | 2,588 | |
Swap agreement transactions | | | 37,989 | |
Foreign currency transactions | | | 28,598 | |
| | | | |
| | | 236,763 | |
| | | | |
Net change in unrealized appreciation (depreciation) on: | | | | |
Investments | | | (1,389,397 | ) |
Futures | | | (220,126 | ) |
Forward rate agreements | | | (1,329 | ) |
Forward and cross currency contracts | | | 131,389 | |
Options written | | | 3,307 | |
Swap agreements | | | 182,667 | |
Foreign currencies | | | (7,137 | ) |
| | | | |
| | | (1,300,626 | ) |
| | | | |
Net gain (loss) on investment and foreign currency transactions | | | (1,063,863 | ) |
| | | | |
Net Increase (Decrease) In Net Assets Resulting From Operations | | $ | (594,278 | ) |
| | | | |
| * | Commencement of operations was December 12, 2017. |
See Notes to Financial Statements.
| | | | |
| PGIM Global Total Return (USD Hedged) Fund | | | 53 | |
Statement of Operations
Period Ended October 31, 2018*
| (a) | Class specific expenses and waivers were as follows: |
| | | | | | | | | | | | | | | | |
| | | Class A | | | Class C | | | Class Z | | | Class R6 | |
Distribution fee | | | 102 | | | | 113 | | | | — | | | | — | |
Registration fees | | | 32,325 | | | | 32,325 | | | | 32,725 | | | | 32,725 | |
Transfer agent’s fees and expenses | | | 105 | | | | 63 | | | | 130 | | | | 70 | |
Fee waiver and/or expense reimbursement | | | (32,800 | ) | | | (32,492 | ) | | | (34,127 | ) | | | (237,843 | ) |
See Notes to Financial Statements.
Statement of Changes in Net Assets
| | | | |
| | | December 12,
2017** through
October 31, 2018 | |
Increase (Decrease) in Net Assets | | | | |
Operations | | | | |
Net investment income (loss) | | $ | 469,585 | |
Net realized gain (loss) on investment and foreign currency transactions | | | 236,763 | |
Net change in unrealized appreciation (depreciation) on investments and foreign currencies | | | (1,300,626 | ) |
| | | | |
Net increase (decrease) in net assets resulting from operations | | | (594,278 | ) |
| | | | |
| |
Dividends and Distributions | | | | |
Distributions from distributable earnings* | | | | |
Class A | | | (1,243 | ) |
Class C | | | (258 | ) |
Class Z | | | (4,661 | ) |
Class R6 | | | (717,845 | ) |
| | | | |
| | | (724,007 | ) |
| | | | |
| |
Fund share transactions | | | | |
Net proceeds from shares sold | | | 25,246,480 | |
Net asset value of shares issued in reinvestment of dividends and distributions | | | 724,012 | |
| | | | |
Net increase (decrease) in net assets from Fund share transactions | | | 25,970,492 | |
| | | | |
Total increase (decrease) | | | 24,652,207 | |
| |
Net Assets: | | | | |
Beginning of period | | | — | |
| | | | |
End of period | | $ | 24,652,207 | |
| | | | |
| * | For the period ended October 31, 2018, the Fund has adopted amendments to Regulation S-X (refer to Note 9). |
| ** | Commencement of operations. |
See Notes to Financial Statements.
| | | | |
| PGIM Global Total Return (USD Hedged) Fund | | | 55 | |
Notes to Financial Statements
Prudential Global Total Return Fund, Inc. (the “Company”) is registered under the Investment Company Act of 1940, as amended (“1940 Act”), as an open-end management investment company and currently consists of two funds: PGIM Global Total Return (USD Hedged) Fund and PGIM Global Total Return Fund, each of which are non-diversified funds for purposes of the 1940 Act. These financial statements relate only to the PGIM Global Total Return (USD Hedged) Fund (the “Fund”). The Fund commenced operations on December 12, 2017. Effective June 11, 2018, the names of the Fund and the other funds which comprise the Company were changed by replacing “Prudential” with “PGIM” and each fund’s Class Q shares were renamed Class R6 shares.
The investment objective of the Fund is total return, through a combination of current income and capital appreciation.
1. Accounting Policies
The Fund follows the investment company accounting and reporting guidance of the Financial Accounting Standards Board (“FASB”) Accounting Standard Codification (“ASC”) Topic 946 Financial Services—Investment Companies. The following accounting policies conform to U.S. generally accepted accounting principles. The Fund consistently follows such policies in the preparation of its financial statements.
Securities Valuation: The Fund holds securities and other assets and liabilities that are fair valued at the close of each day (generally, 4:00 PM Eastern time) the New York Stock Exchange (“NYSE”) is open for trading. Fair value is the price that would be received to sell an asset or paid to transfer a liability in an orderly transaction between market participants on the measurement date. The Company’s Board of Directors (the “Board”) has adopted valuation procedures for security valuation under which fair valuation responsibilities have been delegated to PGIM Investments LLC (“PGIM Investments” or the “Manager”). Pursuant to the Board’s delegation, a Valuation Committee has been established as two persons, being one or more officers of the Company, including: the Company’s Treasurer (or the Treasurer’s direct reports); and the Company’s Chief or Deputy Chief Compliance Officer (or Vice-President-level direct reports of the Chief or Deputy Chief Compliance Officer). Under the current valuation procedures, the Valuation Committee of the Board is responsible for supervising the valuation of portfolio securities and other assets and liabilities. The valuation procedures permit the Fund to utilize independent pricing vendor services, quotations from market makers, and alternative valuation methods when market quotations are either not readily available or not deemed representative of fair value. A record of the Valuation Committee’s actions is subject to the Board’s review, approval, and ratification at its next regularly scheduled quarterly meeting.
For the fiscal reporting period-end, securities and other assets and liabilities were fair valued at the close of the last U.S. business day. Trading in certain foreign securities may occur when the NYSE is closed (including weekends and holidays). Because such foreign securities trade in markets that are open on weekends and U.S. holidays, the values of some of the Fund’s foreign investments may change on days when investors cannot purchase or redeem Fund shares.
Various inputs determine how the Fund’s investments are valued, all of which are categorized according to the three broad levels (Level 1, 2, or 3) detailed in the Schedule of Investments and referred to herein as the “fair value hierarchy” in accordance with FASB ASC Topic 820—Fair Value Measurements and Disclosures.
Derivative instruments, such as futures or options, that are traded on a national securities exchange are valued at the last sale price as of the close of trading on the applicable exchange where the security principally trades. Securities traded via NASDAQ are valued at the NASDAQ official closing price. To the extent these securities are valued at the last sale price or NASDAQ official closing price, they are classified as Level 1 in the fair value hierarchy.
Investments in open-end, non-exchange-traded mutual funds are valued at their net asset values as of the close of the NYSE on the date of valuation. These securities are classified as Level 1 in the fair value hierarchy since they may be purchased or sold at their net asset values on the date of valuation.
Fixed income securities traded in the OTC market are generally classified as Level 2 in the fair value hierarchy. Such fixed income securities are typically valued using the market approach which generally involves obtaining data from an approved independent third-party vendor source. The Fund utilizes the market approach as the primary method to value securities when market prices of identical or comparable instruments are available. The third-party vendors’ valuation techniques used to derive the evaluated bid price are based on evaluating observable inputs, including but not limited to, yield curves, yield spreads, credit ratings, deal terms, tranche level attributes, default rates, cash flows, prepayment speeds, broker/dealer quotations and reported trades. Certain Level 3 securities are also valued using the market approach when obtaining a single broker quote or when utilizing transaction prices for identical securities that have been used in excess of five business days. During the reporting period, there were no changes to report with respect to the valuation approach and/or valuation techniques discussed above.
OTC derivative instruments are generally classified as Level 2 in the fair value hierarchy. Such derivative instruments are typically valued using the market approach and/or income approach which generally involves obtaining data from an approved independent third-party vendor source. The Fund utilizes the market approach when quoted prices in broker-dealer markets are available but also includes consideration of alternative valuation approaches, including the income approach. In the absence of reliable market quotations, the income approach is typically utilized for purposes of valuing OTC derivatives such as interest rate
| | | | |
| PGIM Global Total Return (USD Hedged) Fund | | | 57 | |
Notes to Financial Statements (continued)
swaps based on a discounted cash flow analysis whereby the value of the instrument is equal to the present value of its future cash inflows or outflows. Such analysis includes projecting future cash flows and determining the discount rate (including the present value factors that affect the discount rate) used to discount the future cash flows. In addition, the third-party vendors’ valuation techniques used to derive the evaluated OTC derivative price is based on evaluating observable inputs, including but not limited to, underlying asset prices, indices, spreads, interest rates and exchange rates. Certain OTC derivatives may be classified as Level 3 when valued using the market approach by obtaining a single broker quote or when utilizing unobservable inputs in the income approach. During the reporting period, there were no changes to report with respect to the valuation approach and/or valuation techniques discussed above.
Centrally cleared swaps listed or traded on a multilateral or trade facility platform, such as a registered exchange, are generally valued at the daily settlement price determined by the respective exchange. These securities are classified as Level 2 in the fair value hierarchy, as the daily settlement price is not public.
Securities and other assets that cannot be priced according to the methods described above are valued based on pricing methodologies approved by the Board. In the event that unobservable inputs are used when determining such valuations, the securities will be classified as Level 3 in the fair value hierarchy.
When determining the fair value of securities, some of the factors influencing the valuation include: the nature of any restrictions on disposition of the securities; assessment of the general liquidity of the securities; the issuer’s financial condition and the markets in which it does business; the cost of the investment; the size of the holding and the capitalization of the issuer; the prices of any recent transactions or bids/offers for such securities or any comparable securities; any available analyst media or other reports or information deemed reliable by the Manager regarding the issuer or the markets or industry in which it operates. Using fair value to price securities may result in a value that is different from a security’s most recent closing price and from the price used by other unaffiliated mutual funds to calculate their net asset values.
Restricted and Illiquid Securities: Subject to guidelines adopted by the Board, the Fund may invest up to 15% of its net assets in illiquid securities, including those which are restricted as to disposition under securities law (“restricted securities”). Restricted securities are valued pursuant to the valuation procedures noted above. Illiquid securities are those that, because of the absence of a readily available market or due to legal or contractual restrictions on resale, cannot be sold within seven days in the ordinary course of business at approximately the amount at which the Fund has valued the investment. Therefore, the Fund may find it difficult to sell illiquid securities at the time considered most advantageous
by its subadviser and may incur transaction costs that would not be incurred in the sale of securities that were freely marketable. Certain securities that would otherwise be considered illiquid because of legal restrictions on resale to the general public may be traded among qualified institutional buyers under Rule 144A of the Securities Act of 1933. These Rule 144A securities, as well as commercial paper that is sold in private placements under Section 4(2) of the Securities Act, may be deemed liquid by the Fund’s subadviser under the guidelines adopted by the Board of the Company. However, the liquidity of the Fund’s investments in Rule 144A securities could be impaired if trading does not develop or declines.
Foreign Currency Translation: The books and records of the Fund are maintained in U.S. dollars. Foreign currency amounts are translated into U.S. dollars on the following basis:
(i) market value of investment securities, other assets and liabilities—at the current rates of exchange;
(ii) purchases and sales of investment securities, income and expenses—at the rates of exchange prevailing on the respective dates of such transactions.
Although the net assets of the Fund are presented at the foreign exchange rates and market values at the close of the period, the Fund does not generally isolate that portion of the results of operations arising as a result of changes in the foreign exchange rates from the fluctuations arising from changes in the market prices of long-term portfolio securities held at the end of the period. Similarly, the Fund does not isolate the effect of changes in foreign exchange rates from the fluctuations arising from changes in the market prices of long-term portfolio securities sold during the period. Accordingly, holding period realized foreign currency gains (losses) are included in the reported net realized gains (losses) on investment transactions.
Additionally, net realized gains (losses) on foreign currency transactions represent net foreign exchange gains (losses) from the disposition of holdings of foreign currencies, currency gains (losses) realized between the trade and settlement dates on securities transactions, and the difference between the amounts of interest, dividends and foreign withholding taxes recorded on the Fund’s books and the U.S. dollar equivalent amounts actually received or paid. Net unrealized currency gains (losses) arise from valuing foreign currency denominated assets and liabilities (other than investments) at period end exchange rates.
Forward and Cross Currency Contracts: A forward currency contract is a commitment to purchase or sell a foreign currency at a future date at a negotiated forward rate. The Fund enters into forward currency contracts in order to hedge its exposure to changes in foreign currency exchange rates on its foreign portfolio holdings or specific receivables and payables denominated in a foreign currency and to gain exposure to certain currencies. The contracts are valued daily at current forward exchange rates and any unrealized gain (loss) is included in net unrealized appreciation (depreciation) on investments and foreign
| | | | |
| PGIM Global Total Return (USD Hedged) Fund | | | 59 | |
Notes to Financial Statements (continued)
currencies. Gain (loss) is realized on the settlement date of the contract equal to the difference between the settlement value of the original and negotiated forward contracts. This gain (loss), if any, is included in net realized gain (loss) on forward and cross currency contract transactions. Risks may arise upon entering into these contracts from the potential inability of the counterparties to meet the terms of their contracts. Forward currency contracts involve risks from currency exchange rate and credit risk in excess of the amounts reflected on the Statement of Assets and Liabilities. The Fund’s maximum risk of loss from counterparty credit risk is the net value of the cash flows to be received from the counterparty at the end of the contract’s life. A cross currency contract is a forward contract where a specified amount of one foreign currency will be exchanged for a specified amount of another foreign currency.
Options: The Fund purchased or wrote options in order to hedge against adverse market movements or fluctuations in value caused by changes in prevailing interest rates, value of equities or foreign currency exchange rates with respect to securities or financial instruments which the Fund currently owns or intends to purchase. The Fund may also use options to gain additional market exposure. The Fund’s principal reason for writing options is to realize, through receipt of premiums, a greater current return than would be realized on the underlying security alone. When the Fund purchases an option, it pays a premium and an amount equal to that premium is recorded as an asset. When the Fund writes an option, it receives a premium and an amount equal to that premium is recorded as a liability. The asset or liability is adjusted daily to reflect the current market value of the option. If an option expires unexercised, the Fund realizes a gain (loss) to the extent of the premium received or paid. If an option is exercised, the premium received or paid is recorded as an adjustment to the proceeds from the sale or the cost of the purchase in determining whether the Fund has realized a gain (loss). The difference between the premium and the amount received or paid at the closing of a purchase or sale transaction is also treated as a realized gain (loss). Gain (loss) on purchased options is included in net realized gain (loss) on investment transactions. Gain (loss) on written options is presented separately as net realized gain (loss) on options written transactions.
The Fund, as writer of an option, may have no control over whether the underlying securities or financial instruments may be sold (called) or purchased (put). As a result, the Fund bears the market risk of an unfavorable change in the price of the security or financial instrument underlying the written option. The Fund, as purchaser of an OTC option, bears the risk of the potential inability of the counterparties to meet the terms of their contracts. With exchange-traded options contracts, there is minimal counterparty credit risk to the Fund since the exchanges’ clearinghouse acts as counterparty to all exchange-traded options and guarantees the options contracts against default.
When the Fund writes an option on a swap, an amount equal to any premium received by the Fund is recorded as a liability and is subsequently adjusted to the current market value of the written option on the swap. If a call option on a swap is exercised, the Fund becomes obligated to pay a fixed interest rate (noted as the strike price) and receive a variable interest rate on a notional amount. If a put option on a swap is exercised, the Fund becomes obligated to pay a variable interest rate and receive a fixed interest rate (noted as the strike price) on a notional amount. Premiums received from writing options on swaps that expire or are exercised are treated as realized gains upon the expiration or exercise of such options on swaps. The risk associated with writing put and call options on swaps is that the Fund will be obligated to be party to a swap agreement if an option on a swap is exercised.
Financial Futures Contracts: A financial futures contract is an agreement to purchase (long) or sell (short) an agreed amount of securities at a set price for delivery on a future date. Upon entering into a financial futures contract, the Fund is required to pledge to the broker an amount of cash and/or other assets equal to a certain percentage of the contract amount. This amount is known as the “initial margin.” Subsequent payments, known as “variation margin,” are made or received by the Fund each day, depending on the daily fluctuations in the value of the underlying security. Such variation margin is recorded for financial statement purposes on a daily basis as unrealized gain (loss). When the contract expires or is closed, the gain (loss) is realized and is presented in the Statement of Operations as net realized gain (loss) on futures transactions.
The Fund invested in financial futures contracts in order to hedge its existing portfolio securities, or securities the Fund intends to purchase, against fluctuations in value caused by changes in prevailing interest rates or foreign currency exchange rates. Should interest rates move unexpectedly, the Fund may not achieve the anticipated benefits of the financial futures contracts and may realize a loss. The use of futures transactions involves the risk of imperfect correlation in movements in the price of futures contracts, interest rates and the underlying hedged assets. Since futures contracts are exchange-traded, there is minimal counterparty credit risk to the Fund since the exchanges’ clearinghouse acts as counterparty to all exchange-traded futures and guarantees the futures contracts against default.
Forward Rate Agreements: Forward rate agreements represent an agreement between counterparties to exchange cash flows based on the difference between two interest rates, applied to a notional principal amount on a fixed future date. The Fund entered into forward rate agreements to gain yield exposure based on anticipated market conditions at the specified termination date of the agreement.
Swap Agreements: The Fund may enter into credit default, interest rate and other types of swap agreements. A swap agreement is an agreement to exchange the return generated by one instrument for the return generated by another instrument. Swap agreements are negotiated in the OTC market and may be executed either directly with counterparty (“OTC-traded”) or through a central clearing facility, such as a registered exchange. Swap agreements are valued daily at current market value and any change in value is included in
| | | | |
| PGIM Global Total Return (USD Hedged) Fund | | | 61 | |
Notes to Financial Statements (continued)
the net unrealized appreciation (depreciation) on swap agreements. Centrally cleared swaps pay or receive an amount known as “variation margin”, based on daily changes in the valuation of the swap contract. Any upfront premiums paid and received are shown as swap premiums paid and swap premiums received in the Statement of Assets and Liabilities. Risk of loss may exceed amounts recognized on the Statement of Assets and Liabilities. Swap agreements outstanding at period end, if any, are listed on the Schedule of Investments.
Interest Rate Swaps: Interest rate swaps represent an agreement between counterparties to exchange cash flows based on the difference between two interest rates, applied to a notional principal amount for a specified period. The Fund is subject to interest rate risk exposure in the normal course of pursuing its investment objective. The Fund used interest rate swaps to maintain its ability to generate steady cash flow by receiving a stream of fixed-rate payments and to increase exposure to prevailing market rates by receiving floating rate payments. The Fund’s maximum risk of loss from counterparty credit risk is the discounted net present value of the cash flows to be received from the counterparty over the contract’s remaining life.
Inflation Swaps: The Fund entered into inflation swap agreements to protect against fluctuations in inflation rates. Inflation swaps are characterized by one party paying a fixed rate in exchange for a floating rate that is derived from an inflation index, such as the Consumer Price Index or UK Retail Price Index. Inflation swaps subject the Fund to interest rate risk.
Credit Default Swaps (“CDS”): CDS involve one party (the protection buyer) making a stream of payments to another party (the protection seller) in exchange for the right to receive a specified payment in the event of a default or as a result of a default (collectively a “credit event”) for the referenced entity (typically corporate issues or sovereign issues of an emerging country) on its obligation; or in the event of a write-down, principal shortfall, interest shortfall or default of all or part of the referenced entities comprising a credit index.
The Fund is subject to credit risk in the normal course of pursuing its investment objectives, and as such, has entered into CDS contracts to provide a measure of protection against defaults or to take an active long or short position with respect to the likelihood of a particular issuer’s default or the reference entity’s credit soundness. CDS contracts generally trade based on a spread which represents the cost a protection buyer has to pay the protection seller. The protection buyer is said to be short the credit as the value of the contract rises the more the credit deteriorates. The value of the CDS contract increases for the protection buyer if the spread increases. The Fund’s maximum risk of loss from counterparty credit risk for purchased CDS is the inability of the counterparty to honor the contract up to the notional value due to a credit event.
As a seller of protection on credit default swap agreements, the Fund generally receives an agreed upon payment from the buyer of protection throughout the term of the swap, provided no credit event occurs. As the seller, the Fund effectively increases its investment risk because, in addition to its total net assets, the Fund may be subject to investment exposure on the notional amount of the swap.
The maximum amount of the payment that the Fund, as a seller of protection, could be required to make under a credit default swap agreement would be equal to the notional amount of the underlying security or index contract as a result of a credit event. This potential amount will be partially offset by any recovery values of the respective referenced obligations, or net amounts received from the settlement of buy protection credit default swap agreements which the Fund entered into for the same referenced entity or index. As a buyer of protection, the Fund generally receives an amount up to the notional value of the swap if a credit event occurs.
Implied credit spreads, represented in absolute terms, utilized in determining the market value of credit default swap agreements where the Fund is the seller of protection as of period end are disclosed in the footnotes to the Schedule of Investments, if applicable. These spreads serve as indicators of the current status of the payment/performance risk and represent the likelihood of default risk for the credit derivative. The implied credit spread of a particular referenced entity reflects the cost of buying/selling protection and may include upfront payments required to enter into the agreement. Wider credit spreads and increased market value in absolute terms, when compared to the notional amount of the swap, represent a deterioration of the referenced entity’s credit soundness and a greater likelihood of risk of default or other credit event occurring as defined under the terms of the agreement.
Master Netting Arrangements: The Fund is subject to various Master Agreements, or netting arrangements, with select counterparties. These are agreements which a subadviser may have negotiated and entered into on behalf of the Fund. A master netting arrangement between the Fund and the counterparty permits the Fund to offset amounts payable by the Fund to the same counterparty against amounts to be received; and by the receipt of collateral from the counterparty by the Fund to cover the Fund’s exposure to the counterparty. However, there is no assurance that such mitigating factors are easily enforceable. In addition to master netting arrangements, the right to set-off exists when all the conditions are met such that each of the parties owes the other determinable amounts, the reporting party has the right to set-off the amount owed with the amount owed by the other party, the reporting party intends to set-off and the right of set-off is enforceable by law. During the reporting period, there was no intention to settle on a net basis and all amounts are presented on a gross basis on the Statement of Assets and Liabilities.
The Company, on behalf of the Fund, is a party to International Swaps and Derivatives Association, Inc. (“ISDA”) Master Agreements with certain counterparties that govern OTC derivative and foreign exchange contracts entered into from time to time. The Master Agreements may contain provisions regarding, among other things, the parties’ general
| | | | |
| PGIM Global Total Return (USD Hedged) Fund | | | 63 | |
Notes to Financial Statements (continued)
obligations, representations, agreements, collateral requirements, events of default and early termination. With respect to certain counterparties, in accordance with the terms of the Master Agreements, collateral posted to the Fund is held in a segregated account by the Fund’s custodian and with respect to those amounts which can be sold or re-pledged, is presented in the Schedule of Investments. Collateral pledged by the Fund is segregated by the Fund’s custodian and identified in the Schedule of Investments. Collateral can be in the form of cash or debt securities issued by the U.S. Government or related agencies or other securities as agreed to by the Fund and the applicable counterparty. Collateral requirements are determined based on the Fund’s net position with each counterparty. Termination events applicable to the Fund may occur upon a decline in the Fund’s net assets below a specified threshold over a certain period of time. Termination events applicable to counterparties may occur upon a decline in the counterparty’s long-term and short-term credit ratings below a specified level. In each case, upon occurrence, the other party may elect to terminate early and cause settlement of all derivative and foreign exchange contracts outstanding, including the payment of any losses and costs resulting from such early termination, as reasonably determined by the terminating party. Any decision by one or more of the Fund’s counterparties to elect early termination could impact the Fund’s future derivative activity.
In addition to each instrument’s primary underlying risk exposure (e.g. interest rate, credit, equity or foreign exchange, etc.), swap agreements involve, to varying degrees, elements of credit, market and documentation risk. Such risks involve the possibility that no liquid market for these agreements will exist, the counterparty to the agreement may default on its obligation to perform or disagree on the contractual terms of the agreement, and changes in net interest rates will be unfavorable. In connection with these agreements, securities in the portfolio may be identified or received as collateral from the counterparty in accordance with the terms of the respective swap agreements to provide or receive assets of value and to serve as recourse in the event of default or bankruptcy/insolvency of either party. Such OTC derivative agreements include conditions which, when materialized, give the counterparty the right to cause an early termination of the transactions under those agreements. Any election by the counterparty for early termination of the contract(s) may impact the amounts reported on financial statements.
As of October 31, 2018, the Fund has not met conditions under such agreements which give the counterparty the right to call for an early termination.
Forward currency contracts, forward rate agreements, written options, short sales, swaps and financial futures contracts involve elements of both market and credit risk in excess of the amounts reflected on the Statement of Assets and Liabilities. Such risks may be mitigated by engaging in master netting arrangements.
Securities Lending: The Fund lends its portfolio securities to banks and broker-dealers. The loans are secured by collateral at least equal to the market value of the securities loaned. Collateral pledged by each borrower is invested in an affiliated money market fund and is
marked to market daily, based on the previous day’s market value, such that the value of the collateral exceeds the value of the loaned securities. In the event of significant appreciation in value of securities on loan on the last business day of the reporting period, the financial statements may reflect a collateral value that is less than the market value of the loaned securities. Such shortfall is remedied as described above. Loans are subject to termination at the option of the borrower or the Fund. Upon termination of the loan, the borrower will return to the Fund securities identical to the loaned securities. Should the borrower of the securities fail financially, the Fund has the right to repurchase the securities in the open market using the collateral.
The Fund recognizes income, net of any rebate and securities lending agent fees, for lending its securities in the form of fees or interest on the investment of any cash received as collateral. The borrower receives all interest and dividends from the securities loaned and such payments are passed back to the lender in amounts equivalent thereto. The Fund also continues to recognize any unrealized gain (loss) in the market price of the securities loaned and on the change in the value of the collateral invested that may occur during the term of the loan. In addition, realized gain (loss) is recognized on changes in the value of the collateral invested upon liquidation of the collateral. Net earnings from securities lending are disclosed on the Statement of Operations as “Income from securities lending, net”.
Securities Transactions and Net Investment Income: Securities transactions are recorded on the trade date. Realized gains (losses) from investment and currency transactions are calculated on the specific identification method. Dividend income is recorded on the ex-date. Expenses are recorded on an accrual basis, which may require the use of certain estimates by management that may differ from actual. Net investment income or loss (other than class specific expenses and waivers, which are allocated as noted below) and unrealized and realized gains (losses) are allocated daily to each class of shares based upon the relative proportion of adjusted net assets of each class at the beginning of the day. Class specific expenses and waivers, where applicable, are charged to the respective share classes. Class specific expenses include distribution fees and distribution fee waivers, shareholder servicing fees, transfer agent’s fees and expenses, registration fees and fee waivers and/or expense reimbursements, as applicable.
Taxes: It is the Fund’s policy to meet the requirements of the Internal Revenue Code applicable to regulated investment companies and to distribute all of its taxable net investment income and capital gains, if any, to its shareholders. Therefore, no federal income tax provision is required. Withholding taxes on foreign dividends, interest and capital gains, if any, are recorded, net of reclaimable amounts, at the time the related income is earned.
Dividends and Distributions: The Fund expects to declare dividends of its net investment income daily and pay such dividends monthly. Distributions of net realized capital and currency gains, if any, are declared and paid at least annually. Dividends and distributions to shareholders, which are determined in accordance with federal income tax regulations and which may differ from generally accepted accounting principles, are recorded on the
| | | | |
| PGIM Global Total Return (USD Hedged) Fund | | | 65 | |
Notes to Financial Statements (continued)
ex-date. Permanent book/tax differences relating to income and gain (loss) are reclassified amongst total distributable earnings (loss) and paid-in capital in excess of par, as appropriate.
Estimates: The preparation of financial statements requires management to make estimates and assumptions that affect the reported amounts and disclosures in the financial statements. Actual results could differ from those estimates.
2. Agreements
The Company, on behalf of the Fund, has a management agreement with PGIM Investments. Pursuant to this agreement, PGIM Investments has responsibility for all investment advisory services and supervises the subadviser’s performance of such services. In addition, under the management agreement, PGIM Investments provides all of the administrative functions necessary for the organization, operation and management of the Fund. PGIM Investments administers the corporate affairs of the Fund and, in connection therewith, furnishes the Fund with office facilities, together with those ordinary clerical and bookkeeping services which are not being furnished by the Fund’s custodian and the Fund’s transfer agent. PGIM Investments is also responsible for the staffing and management of dedicated groups of legal, marketing, compliance and related personnel necessary for the operation of the Fund. The legal, marketing, compliance and related personnel are also responsible for the management and oversight of the various service providers to the Fund, including, but not limited to, the custodian, transfer agent, and accounting agent.
PGIM Investments has entered into a subadvisory agreement with PGIM, Inc., which provides subadvisory services to the Fund through its PGIM Fixed Income unit. The subadvisory agreement provides that furnish investment advisory services in connection with the management of the Fund. In connection therewith, is obligated to keep certain books and records of the Fund. PGIM Investments pays the cost of compensation of officers of the Fund, occupancy and certain clerical and bookkeeping costs of the Fund. The Fund bears all other costs and expenses.
The management fee paid to PGIM Investments is accrued daily and payable monthly at an annual rate of 0.500% of the Fund’s average daily net assets up to $2 billion and 0.485% of such assets in excess of $2 billion. The effective management fee rate before any waivers and/or expense reimbursements was 0.500% for the period ended October 31, 2018.
PGIM Investments has contractually agreed, through February 28, 2019, to limit total annual operating expenses after fee waivers and/or expense reimbursements to 0.88% of average daily net assets for Class A shares, 1.63% of average daily net assets for Class C shares, 0.63% of average daily net assets for Class Z shares, and 0.58% of average daily net
assets for Class R6 shares. This contractual waiver excludes interest, brokerage, taxes (such as income and foreign withholding taxes, stamp duty and deferred tax expenses), acquired fund fees and expenses, extraordinary expenses, and certain other Fund expenses such as dividend and interest expense and broker charges on short sales. Expenses waived/reimbursed by the Manager in accordance with this agreement may be recouped by the Manager within the same fiscal year during which such waiver/reimbursement is made if such recoupment can be realized without exceeding the expense limit in effect at the time of the recoupment for that fiscal year. Effective November 1, 2018 this waiver agreement was extended through February 29, 2020.
Where applicable, PGIM Investments voluntarily agreed through October 31, 2018, to waive management fees or shared operating expenses on any share class to the same extent that it waives similar expenses on any other share class and, in addition, total annual operating expenses for Class R6 shares will not exceed total annual operating expenses for Class Z shares. Effective November 1, 2018 this voluntary agreement became part of the Fund’s contractual waiver agreement through February 29, 2020 and is subject to recoupment by the Manager within the same fiscal year during which such wavier/reimbursement is made if such recoupment can be realized without exceeding the expense limit in effect at the time of the recoupment for that fiscal year.
The Company, on behalf of the Fund, has a distribution agreement with Prudential Investment Management Services LLC (“PIMS”), which acts as the distributor of the Class A, Class C, Class Z and Class R6 shares of the Fund. The Fund compensates PIMS for distributing and servicing the Fund’s Class A and Class C shares, pursuant to the plans of distribution (the “Distribution Plans”), regardless of expenses actually incurred by PIMS. The distribution fees are accrued daily and payable monthly. No distribution or service fees are paid to PIMS as distributor of the Class Z or Class R6 shares of the Fund.
Pursuant to the Distribution Plans, the Fund compensates PIMS for distribution related activities at an annual rate of up to 0.25% and 1% of the average daily net assets of the Class A and Class C shares, respectively.
PIMS has advised the Fund that it received $980 in front-end sales charges resulting from sales of Class A shares during the period ended October 31, 2018. From these fees, PIMS paid such sales charges to broker-dealers, who in turn paid commissions to salespersons and incurred other distribution costs.
PIMS has advised the Fund that for the period ended October 31, 2018, it has not received any contingent deferred sales charges imposed upon redemptions by certain Class A and Class C shareholders, respectively.
PGIM Investments, PGIM, Inc. and PIMS are indirect, wholly-owned subsidiaries of Prudential Financial, Inc. (“Prudential”).
| | | | |
| PGIM Global Total Return (USD Hedged) Fund | | | 67 | |
Notes to Financial Statements (continued)
3. Other Transactions with Affiliates
Prudential Mutual Fund Services LLC (“PMFS”), an affiliate of PGIM Investments and an indirect, wholly-owned subsidiary of Prudential, serves as the Fund’s transfer agent. Transfer agent’s fees and expenses in the Statement of Operations include certain out-of-pocket expenses paid to non-affiliates, where applicable.
The Fund may enter into certain securities purchase or sale transactions under Board approved Rule 17a-7 procedures. Rule 17a-7 is an exemptive rule under the 1940 Act, that, subject to certain conditions, permits purchase and sale transactions among affiliated investment companies, or between an investment company and a person that is affiliated solely by reason of having a common (or affiliated) investment adviser, common directors, and/or common officers. Such transactions are subject to ratification by the Board. For the reporting period ended October 31, 2018, no such transactions were entered into by the Fund.
The Fund may invest its overnight sweep cash in the PGIM Core Ultra Short Bond Fund (the “Core Fund”), a series of Prudential Investment Portfolios 2, registered under the 1940 Act and managed by PGIM Investments. Earnings from the Core Fund are disclosed on the Statement of Operations as “Affiliated dividend income”.
4. Portfolio Securities
The aggregate cost of purchases and proceeds from sales of portfolio securities (excluding short-term investments and U.S. Government securities) for the period ended October 31, 2018, were $30,187,311 and $6,540,821, respectively.
A summary of the cost of purchases and proceeds from sales of shares of an affiliated mutual fund for the period ended October 31, 2018, is presented as follows:
| | | | | | | | | | | | | | | | | | | | | | | | | | | | | | |
Value,
Beginning
of Period | | | Cost of
Purchases | | | Proceeds
from Sales | | | Change in
Unrealized
Gain
(Loss) | | | Realized
Gain
(Loss) | | | Value,
End of
Period | | | Shares,
End of
Period | | | Income | |
| | PGIM Core Ultra Short Bond Fund* | | | | | | | | | |
| $ | — | | | $ | 33,821,374 | | | $ | 33,293,423 | | | $ | — | | | $ | — | | | $ | 527,951 | | | | 527,951 | | | $ | 20,217 | |
| | | | | | | | | | | | | | | | | | | | | | | | | | | | | | |
| * | The Fund did not have any capital gain distributions during the reporting period. |
5. Distributions and Tax Information
Distributions to shareholders, which are determined in accordance with federal income tax regulations and which may differ from generally accepted accounting principles, are
recorded on the ex-date. In order to present total distributable earnings (loss) and paid-in capital in excess of par on the Statement of Assets and Liabilities that more closely represent their tax character, certain adjustments have been made to total distributable earnings (loss) and paid-in capital in excess of par. For the period ended October 31, 2018, the adjustments were to decrease total distributable loss and decrease paid-in capital in excess of par by $3,911 due to non-deductible offering costs. Net investment income, net realized gain (loss) on investments and foreign currency transactions and net assets were not affected by this change.
For the period ended October 31, 2018, the tax character of dividends paid by the Fund was $724,007 of ordinary income.
As of October 31, 2018, the accumulated undistributed earnings on a tax basis was $600,943 of ordinary income.
The United States federal income tax basis of the Fund’s investments and the net unrealized depreciation as of October 31, 2018 were as follows:
| | | | | | |
Tax Basis | | Gross Unrealized Appreciation | | Gross Unrealized Depreciation | | Net Unrealized Depreciation |
| $25,187,656 | | $400,984 | | $(1,782,782) | | $(1,381,798) |
The differences between book basis and tax basis is primarily attributable to bond premium amortization, futures and forward contracts and other cost basis differences between financial and tax accounting.
For federal income tax purposes, the Fund had a capital loss carryforward as of October 31, 2018 of approximately $534,000 which can be carried forward for an unlimited period. No capital gains distributions are expected to be paid to shareholders until net gains have been realized in excess of such losses.
Management has analyzed the Fund’s tax positions and has concluded that no provision for income tax is required in the Fund’s financial statements for the current reporting period. The Fund’s federal excise tax returns for tax years for which the applicable statutes of limitations have not expired are subject to examination by the Internal Revenue Service and state departments of revenue.
6. Capital and Ownership
The Fund offers Class A, Class C, Class Z and Class R6 shares. Class A shares are sold with a maximum front-end sales charge of 4.50%. Investors who purchase $1 million or more of Class A shares and sell these shares within 12 months of purchase are subject to a contingent deferred sales charge (“CDSC”) of 1%, although they are not subject to an initial sales charge. The Class A CDSC is waived for certain retirement and/or benefit plans. A special exchange privilege is also available for shareholders who qualified to purchase
| | | | |
| PGIM Global Total Return (USD Hedged) Fund | | | 69 | |
Notes to Financial Statements (continued)
Class A shares at net asset value. Class C shares are sold with a CDSC of 1% on sales made within 12 months of purchase. Class Z and Class R6 shares are not subject to any sales or redemption charge and are available exclusively for sale to a limited group of investors.
Under certain circumstances, an exchange may be made from specified share classes of the Fund to one or more other share classes of the Fund as presented in the table of transactions in shares of common stock.
There are 1.5 billion shares of common stock, at $0.01 par value per share, authorized and divided into four classes, designated Class A, Class C, Class Z and Class R6, each of which consists of 200 million, 300 million, 600 million and 400 million authorized shares, respectively.
As of October 31, 2018, Prudential, through its affiliated entities, including affiliated funds (if applicable), owned 1,027 Class A shares, 1,020 Class C shares, 1,029 Class Z shares and 2,574,939 Class R6 shares of the Fund. At reporting period end, one shareholders of record held 99% of the Fund’s outstanding shares on behalf of multiple beneficial owners, of which 99% were held by an affiliate of Prudential.
Transactions in shares of common stock were as follows:
| | | | | | | | |
Class A | | Shares | | | Amount | |
Period ended October 31, 2018*: | | | | | | | | |
Shares sold | | | 5,077 | | | $ | 50,519 | |
Shares issued in reinvestment of dividends and distributions | | | 129 | | | | 1,248 | |
| | | | | | | | |
Net increase (decrease) in shares outstanding | | | 5,206 | | | $ | 51,767 | |
| | | | | | | | |
Class C | | | | | | |
Period ended October 31, 2018*: | | | | | | | | |
Shares sold | | | 1,782 | | | $ | 17,520 | |
Shares issued in reinvestment of dividends and distributions | | | 27 | | | | 258 | |
| | | | | | | | |
Net increase (decrease) in shares outstanding | | | 1,809 | | | $ | 17,778 | |
| | | | | | | | |
Class Z | | | | | | |
Period ended October 31, 2018*: | | | | | | | | |
Shares sold | | | 16,841 | | | $ | 168,445 | |
Shares issued in reinvestment of dividends and distributions | | | 481 | | | | 4,661 | |
| | | | | | | | |
Net increase (decrease) in shares outstanding | | | 17,322 | | | $ | 173,106 | |
| | | | | | | | |
Class R6 | | | | | | |
Period ended October 31, 2018*: | | | | | | | | |
Shares sold | | | 2,501,000 | | | $ | 25,009,996 | |
Shares issued in reinvestment of dividends and distributions | | | 73,939 | | | | 717,845 | |
| | | | | | | | |
Net increase (decrease) in shares outstanding | | | 2,574,939 | | | $ | 25,727,841 | |
| | | | | | | | |
| * | Commencement of offering was December 12, 2017. |
7. Borrowings
The Company, on behalf of the Fund, along with other affiliated registered investment companies (the “Funds”), is a party to a Syndicated Credit Agreement (“SCA”) with a group of banks. The purpose of the SCA is to provide an alternative source of temporary funding for capital share redemptions. The SCA provides for a commitment of $900 million for the period October 4, 2018 through October 3, 2019. The Funds pay an annualized commitment fee of 0.15% of the unused portion of the SCA. The Fund’s portion of the commitment fee for the unused amount, allocated based upon a method approved by the Board, is accrued daily and paid quarterly. Prior to October 4, 2018, the Funds had another SCA that provided a commitment of $900 million and the Funds paid an annualized commitment fee of 0.15% of the unused portion of the SCA. The interest on borrowings under both SCAs is paid monthly and at a per annum interest rate based upon a contractual spread plus the higher of (1) the effective federal funds rate, (2) the 1-month LIBOR rate or (3) zero percent.
Other affiliated registered investment companies that are parties to the SCA include portfolios that are subject to a predetermined mathematical formula used to manage certain benefit guarantees offered under variable annuity contracts. The formula may result in large scale asset flows into and out of these portfolios. Consequently, these portfolios may be more likely to utilize the SCA for purposes of funding redemptions. It may be possible for those portfolios to fully exhaust the committed amount of the SCA, thereby requiring the Manager to allocate available funding per a Board-approved methodology designed to treat the Funds in the SCA equitably.
The Fund did not utilize the SCA during the reporting period ended October 31, 2018.
8. Risks of Investing in the Fund
The Fund’s risks include, but are not limited to, some or all of the risks discussed below:
Bond Obligations Risk: The Fund’s holdings, share price, yield and total return may fluctuate in response to bond market movements. The value of bonds may decline for issuer-related reasons, including management performance, financial leverage and reduced demand for the issuer’s goods and services. Certain types of fixed-income obligations also may be subject to “call and redemption risk,” which is the risk that the issuer may call a bond held by the Fund for redemption before it matures and the Fund may not be able to reinvest at the same level and therefore would earn less income.
Derivatives Risk: Derivatives involve special risks and costs and may result in losses to the Fund. The successful use of derivatives requires sophisticated management, and, to the extent that derivatives are used, the Fund will depend on the subadviser’s ability to analyze and manage derivative transactions. The prices of derivatives may move in unexpected ways, especially in abnormal market conditions. Some derivatives are “leveraged” and therefore may magnify or otherwise increase investment losses to the Fund. The Fund’s use of derivatives may also increase the amount of taxes payable by shareholders. Other risks
| | | | |
| PGIM Global Total Return (USD Hedged) Fund | | | 71 | |
Notes to Financial Statements (continued)
arise from the potential inability to terminate or sell derivatives positions. A liquid secondary market may not always exist for the Fund’s derivatives positions. In fact, many OTC derivative instruments will not have liquidity beyond the counterparty to the instrument. OTC derivative instruments also involve the risk that the other party will not meet its obligations to the Fund.
Emerging Markets Risk: The risks of foreign investments are greater for investments in or exposed to emerging markets. Emerging market countries typically have economic and political systems that are less fully developed, and can be expected to be less stable, than those of more developed countries. For example, the economies of such countries can be subject to rapid and unpredictable rates of inflation or deflation. Low trading volumes may result in a lack of liquidity and price volatility. Emerging market countries may have policies that restrict investment by non-US investors, or that prevent non-US investors from withdrawing their money at will.
Foreign Securities Risk: The Fund’s investments in securities of foreign issuers or issuers with significant exposure to foreign markets involve additional risk. Foreign countries in which the Fund may invest may have markets that are less liquid, less regulated and more volatile than US markets. The value of the Fund’s investments may decline because of factors affecting the particular issuer as well as foreign markets and issuers generally, such as unfavorable government actions, and political or financial instability.
Interest Rate Risk: The value of an investment may go down when interest rates rise. A rise in rates tends to have a greater impact on the prices of longer term or duration securities. When interest rates fall, the issuers of debt obligations may prepay principal more quickly than expected, and the Fund may be required to reinvest the proceeds at a lower interest rate. This is referred to as “prepayment risk.” When interest rates rise, debt obligations may be repaid more slowly than expected, and the value of the Fund’s holdings may fall sharply. This is referred to as “extension risk. The Fund may face a heightened level of interest rate risk as a result of the US Federal Reserve Board’s policies. The Fund’s investments may lose value if short-term or long-term interest rates rise sharply or in a manner not anticipated by the subadviser.
Liquidity Risk: The Fund may invest in instruments that trade in lower volumes and are less liquid than other investments. Liquidity risk exists when particular investments made by the Fund are difficult to purchase or sell. Liquidity risk includes the risk that the Fund may make investments that may become less liquid in response to market developments or adverse investor perceptions. Investments that are illiquid or that trade in lower volumes may be more difficult to value. If the Fund is forced to sell these investments to pay redemption proceeds or for other reasons, the Fund may lose money. In addition, when there is no willing buyer and investments cannot be readily sold at the desired time or price, the Fund
may have to accept a lower price or may not be able to sell the instrument at all. The reduction in dealer market-making capacity in the fixed-income markets that has occurred in recent years also has the potential to reduce liquidity. An inability to sell a portfolio position can adversely affect the Fund’s value or prevent the Fund from being able to take advantage of other investment opportunities.
Non-diversification Risk: The Fund is non-diversified, meaning that the Fund may invest a greater percentage of its assets in the securities of a single company or industry than a diversified fund. Investing in a non-diversified fund involves greater risk than investing in a diversified fund because a loss resulting from the decline in value of any one security may represent a greater portion of the total assets of a non-diversified fund.
9. Recent Accounting Pronouncements and Reporting Updates
In August 2018, the Securities and Exchange Commission (the “SEC”) adopted amendments to Regulation S-X to update and simplify the disclosure requirements for registered investment companies by eliminating requirements that are redundant or duplicative of US GAAP requirements or other SEC disclosure requirements. The new amendments require the presentation of the total, rather than the components, of distributable earnings on the Statement of Assets and Liabilities and the total, rather than the components, of dividends from net investment income and distributions from net realized gains on the Statements of Changes in Net Assets. The amendments also removed the requirement for the parenthetical disclosure of undistributed net investment income on the Statements of Changes in Net Assets and certain tax adjustments that were reflected in the Notes to Financial Statements. All of these have been reflected in the Fund’s financial statements.
In August 2018, the FASB issued Accounting Standards Update (“ASU”) No. 2018-13, which changes certain fair value measurement disclosure requirements. The new ASU, in addition to other modifications and additions, removes the requirement to disclose the amount and reasons for transfers between Level 1 and Level 2 of the fair value hierarchy, and the Fund’s policy for the timing of transfers between levels. The amendments are effective for financial statements issued for fiscal years beginning after December 15, 2019, and interim periods within those fiscal years. Management has evaluated the implications of certain provisions of the ASU and has determined to early adopt aspects related to the removal and modification of certain fair value measurement disclosures under the ASU effective immediately. At this time, management is evaluating the implications of certain other provisions of the ASU related to new disclosure requirements and any impact on the financial statement disclosures has not yet been determined.
| | | | |
| PGIM Global Total Return (USD Hedged) Fund | | | 73 | |
Financial Highlights
| | | | |
| Class A Shares | | | |
| | | December 12,
2017(a)
through
October 31,
2018 | |
| Per Share Operating Performance(b): | | | | |
| Net Asset Value, Beginning of Period | | | $10.00 | |
| Income (loss) from investment operations: | | | | |
| Net investment income (loss) | | | 0.16 | |
| Net realized and unrealized gain (loss) on investment and foreign currency transactions | | | (0.42 | ) |
| Total from investment operations | | | (0.26 | ) |
| Less Dividends and Distributions: | | | | |
| Dividends from net investment income | | | (0.26 | ) |
| Net asset value, end of period | | | $9.48 | |
| Total Return(c): | | | (2.65)% | |
| |
| Ratios/Supplemental Data: | | | |
| Net assets, end of period (000) | | | $49 | |
| Average net assets (000) | | | $46 | |
| Ratios to average net assets(d): | | | | |
| Expenses after waivers and/or expense reimbursement | | | 0.88% | (e) |
| Expenses before waivers and/or expense reimbursement | | | 80.88% | (e) |
| Net investment income (loss) | | | 1.86% | (e) |
| Portfolio turnover rate(f) | | | 67% | |
| (a) | Commencement of operations. |
| (b) | Calculated based on average shares outstanding during the period. |
| (c) | Total return does not consider the effects of sales loads. Total return is calculated assuming a purchase of a share on the first day and a sale on the last day of each period reported and includes reinvestment of dividends and distributions, if any. Total returns may reflect adjustments to conform to generally accepted accounting principles. Total returns for periods less than one full year are not annualized. |
| (d) | Does not include expenses of the underlying funds in which the Fund invests. |
| (f) | The Fund’s portfolio turnover rate is calculated in accordance with regulatory requirements, without regard to transactions involving short term investments and certain derivatives. If such transactions were included, the Fund’s portfolio turnover rate may be higher. |
See Notes to Financial Statements.
| | | | |
| Class C Shares | | | |
| | | December 12,
2017(a)
through
October 31,
2018 | |
| Per Share Operating Performance(b): | | | | |
| Net Asset Value, Beginning of Period | | | $10.00 | |
| Income (loss) from investment operations: | | | | |
| Net investment income (loss) | | | 0.10 | |
| Net realized and unrealized gain (loss) on investment and foreign currency transactions | | | (0.43 | ) |
| Total from investment operations | | | (0.33 | ) |
| Less Dividends and Distributions: | | | | |
| Dividends from net investment income | | | (0.19 | ) |
| Net asset value, end of period | | | $9.48 | |
| Total Return(c): | | | (3.29)% | |
| |
| Ratios/Supplemental Data: | | | |
| Net assets, end of period (000) | | | $17 | |
| Average net assets (000) | | | $13 | |
| Ratios to average net assets(d): | | | | |
| Expenses after waivers and/or expense reimbursement | | | 1.63% | (e) |
| Expenses before waivers and/or expense reimbursement | | | 290.47% | (e) |
| Net investment income (loss) | | | 1.13% | (e) |
| Portfolio turnover rate(f) | | | 67% | |
| (a) | Commencement of operations. |
| (b) | Calculated based on average shares outstanding during the period. |
| (c) | Total return does not consider the effects of sales loads. Total return is calculated assuming a purchase of a share on the first day and a sale on the last day of each period reported and includes reinvestment of dividends and distributions, if any. Total returns may reflect adjustments to conform to generally accepted accounting principles. Total returns for periods less than one full year are not annualized. |
| (d) | Does not include expenses of the underlying funds in which the Fund invests. |
| (f) | The Fund’s portfolio turnover rate is calculated in accordance with regulatory requirements, without regard to transactions involving short term investments and certain derivatives. If such transactions were included, the Fund’s portfolio turnover rate may be higher. |
See Notes to Financial Statements.
| | | | |
| PGIM Global Total Return (USD Hedged) Fund | | | 75 | |
Financial Highlights (continued)
| | | | |
| Class Z Shares | | | |
| | | December 12,
2017(a)
through
October 31,
2018 | |
| Per Share Operating Performance(b): | | | | |
| Net Asset Value, Beginning of Period | | | $10.00 | |
| Income (loss) from investment operations: | | | | |
| Net investment income (loss) | | | 0.18 | |
| Net realized and unrealized gain (loss) on investment and foreign currency transactions | | | (0.42 | ) |
| Total from investment operations | | | (0.24 | ) |
| Less Dividends and Distributions: | | | | |
| Dividends from net investment income | | | (0.28 | ) |
| Net asset value, end of period | | | $9.48 | |
| Total Return(c): | | | (2.44)% | |
| |
| Ratios/Supplemental Data: | | | |
| Net assets, end of period (000) | | | $164 | |
| Average net assets (000) | | | $160 | |
| Ratios to average net assets(d): | | | | |
| Expenses after waivers and/or expense reimbursement | | | 0.63% | (e) |
| Expenses before waivers and/or expense reimbursement | | | 24.70% | (e) |
| Net investment income (loss) | | | 2.11% | (e) |
| Portfolio turnover rate(f) | | | 67% | |
| (a) | Commencement of operations. |
| (b) | Calculated based on average shares outstanding during the period. |
| (c) | Total return is calculated assuming a purchase of a share on the first day and a sale on the last day of each period reported and includes reinvestment of dividends and distributions, if any. Total returns may reflect adjustments to conform to generally accepted accounting principles. Total returns for periods less than one full year are not annualized. |
| (d) | Does not include expenses of the underlying funds in which the Fund invests. |
| (f) | The Fund’s portfolio turnover rate is calculated in accordance with regulatory requirements, without regard to transactions involving short term investments and certain derivatives. If such transactions were included, the Fund’s portfolio turnover rate may be higher. |
See Notes to Financial Statements.
| | | | |
| Class R6 Shares | | | |
| | | December 12,
2017(a)
through
October 31,
2018 | |
| Per Share Operating Performance(b): | | | | |
| Net Asset Value, Beginning of Period | | | $10.00 | |
| Income (loss) from investment operations: | | | | |
| Net investment income (loss) | | | 0.18 | |
| Net realized and unrealized gain (loss) on investment and foreign currency transactions | | | (0.42 | ) |
| Total from investment operations | | | (0.24 | ) |
| Less Dividends and Distributions: | | | | |
| Dividends from net investment income | | | (0.28 | ) |
| Net asset value, end of period | | | $9.48 | |
| Total Return(c): | | | (2.40)% | |
| |
| Ratios/Supplemental Data: | | | |
| Net assets, end of period (000) | | | $24,421 | |
| Average net assets (000) | | | $24,571 | |
| Ratios to average net assets(d): | | | | |
| Expenses after waivers and/or expense reimbursement | | | 0.58% | (e) |
| Expenses before waivers and/or expense reimbursement | | | 1.67% | (e) |
| Net investment income (loss) | | | 2.14% | (e) |
| Portfolio turnover rate(f) | | | 67% | |
| (a) | Commencement of operations. |
| (b) | Calculated based on average shares outstanding during the period. |
| (c) | Total return is calculated assuming a purchase of a share on the first day and a sale on the last day of each period reported and includes reinvestment of dividends and distributions, if any. Total returns may reflect adjustments to conform to generally accepted accounting principles. Total returns for periods less than one full year are not annualized. |
| (d) | Does not include expenses of the underlying funds in which the Fund invests. |
| (f) | The Fund’s portfolio turnover rate is calculated in accordance with regulatory requirements, without regard to transactions involving short term investments and certain derivatives. If such transactions were included, the Fund’s portfolio turnover rate may be higher. |
See Notes to Financial Statements.
| | | | |
| PGIM Global Total Return (USD Hedged) Fund | | | 77 | |
Report of Independent Registered Public
Accounting Firm
The Board of Directors and Shareholders
Prudential Global Total Return Fund, Inc.:
Opinion on the Financial Statements
We have audited the accompanying statement of assets and liabilities of PGIM Global Total Return (USD Hedged) Fund (the “Fund”), a series of Prudential Global Total Return Fund, Inc., including the schedule of investments, as of October 31, 2018, the related statements of operations and changes in net assets for the period from December 12, 2017 (commencement of operations) to October 31, 2018, and the related notes (collectively, the financial statements) and the financial highlights for the period from December 12, 2017 to October 31, 2018. In our opinion, the financial statements and financial highlights present fairly, in all material respects, the financial position of the Fund as of October 31, 2018, the results of its operations, the changes in its net assets, and the financial highlights for the period from December 12, 2017 to October 31, 2018, in conformity with U.S. generally accepted accounting principles.
Basis for Opinion
These financial statements and financial highlights are the responsibility of the Fund’s management. Our responsibility is to express an opinion on these financial statements and financial highlights based on our audit. We are a public accounting firm registered with the Public Company Accounting Oversight Board (United States) (“PCAOB”) and are required to be independent with respect to the Fund in accordance with the U.S. federal securities laws and the applicable rules and regulations of the Securities and Exchange Commission and the PCAOB.
We conducted our audit in accordance with the standards of the PCAOB. Those standards require that we plan and perform the audit to obtain reasonable assurance about whether the financial statements and financial highlights are free of material misstatement, whether due to error or fraud. Our audit included performing procedures to assess the risks of material misstatement of the financial statements and financial highlights, whether due to error or fraud, and performing procedures that respond to those risks. Such procedures included examining, on a test basis, evidence regarding the amounts and disclosures in the financial statements and financial highlights. Such procedures also included confirmation of securities owned as of October 31, 2018, by correspondence with the custodians, transfer agents and brokers or by other appropriate auditing procedures when replies from brokers were not received. Our audit also included evaluating the accounting principles used and significant estimates made by management, as well as evaluating the overall presentation of the financial statements and financial highlights. We believe that our audit provides a reasonable basis for our opinion.

We have served as the auditor of one or more PGIM and/or Prudential Retail investment companies since 2003.
New York, New York
December 18, 2018
Federal Income Tax Information (unaudited)
For the period ended October 31, 2018, the Fund reports the maximum amount allowable but not less than 38.01% as interest related dividends in accordance with Sections 871(k)(1) and 881(e)(1) of the Internal Revenue Code.
In January 2019, you will be advised on IRS Form 1099-DIV or substitute 1099-DIV as to the federal tax status of distributions received by you in calendar year 2018.
| | | | |
| PGIM Global Total Return (USD Hedged) Fund | | | 79 | |
INFORMATION ABOUT BOARD MEMBERS AND OFFICERS (unaudited)
Information about Board Members and Officers of the Fund is set forth below. Board Members who are not deemed to be “interested persons” of the Fund, as defined in the 1940 Act, are referred to as “Independent Board Members.” Board Members who are deemed to be “interested persons” of the Fund are referred to as “Interested Board Members.” The Board Members are responsible for the overall supervision of the operations of the Fund and perform the various duties imposed on the directors of investment companies by the 1940 Act. The Board in turn elects the Officers, who are responsible for administering the day-to-day operations of the Fund.
| | | | | | |
| Independent Board Members | | | | |
| | | | |
Name, Address, Age Position(s) Portfolios Overseen | | Principal Occupation(s) During Past Five Years | | Other Directorships Held During Past Five Years | | Length of Board Service |
| | | | |
Ellen S. Alberding (60) Board Member Portfolios Overseen: 93 | | President and Board Member, The Joyce Foundation (charitable foundation) (since 2002); Vice Chair, City Colleges of Chicago (community college system) (2011-2015); Trustee, National Park Foundation (charitable foundation for national park system) (2009-2018); Trustee, Economic Club of Chicago (since 2009); Trustee, Loyola University (since 2018). | | None. | | Since September 2013 |
| | | | |
Kevin J. Bannon (66) Board Member Portfolios Overseen: 93 | | Retired; Managing Director (April 2008-May 2015) and Chief Investment Officer (October 2008-November 2013) of Highmount Capital LLC (registered investment adviser); formerly Executive Vice President and Chief Investment Officer (April 1993-August 2007) of Bank of New York Company; President (May 2003-May 2007) of BNY Hamilton Family of Mutual Funds. | | Director of Urstadt Biddle Properties (equity real estate investment trust) (since September 2008). | | Since July 2008 |
| | | | |
Linda W. Bynoe (66) Board Member Portfolios Overseen: 93 | | President and Chief Executive Officer (since March 1995) and formerly Chief Operating Officer (December 1989-February 1995) of Telemat Ltd. (management consulting); formerly Vice President (January 1985-June 1989) at Morgan Stanley & Co. (broker-dealer). | | Director of Anixter International, Inc. (communication products distributor) (since January 2006); Director of Northern Trust Corporation (financial services) (since April 2006); Trustee of Equity Residential (residential real estate) (since December 2009). | | Since March 2005 |
PGIM Global Total Return (USD Hedged) Fund
| | | | | | |
Independent Board Members | | | | |
| | | | |
Name, Address, Age Position(s) Portfolios Overseen | | Principal Occupation(s) During Past Five Years | | Other Directorships Held During Past Five Years | | Length of Board Service |
| | | | |
Barry H. Evans (58) Board Member Portfolios Overseen: 92 | | Retired; formerly President (2005 – 2016), Global Chief Operating Officer (2014– 2016), Chief Investment Officer – Global Head of Fixed Income (1998-2014), and various portfolio manager roles (1986-2006), Manulife Asset Management U.S. | | Director, Manulife Trust Company (since 2011); formerly Director, Manulife Asset Management Limited (2015-2017); formerly Chairman of the Board of Directors of Manulife Asset Management U.S. (2005-2016); formerly Chairman of the Board, Declaration Investment Management and Research (2008-2016). | | Since September 2017 |
| | | | |
Keith F. Hartstein (62) Board Member & Independent Chair Portfolios Overseen: 93 | | Retired; Member (since November 2014) of the Governing Council of the Independent Directors Council (organization of independent mutual fund directors); formerly President and Chief Executive Officer (2005-2012), Senior Vice President (2004-2005), Senior Vice President of Sales and Marketing (1997-2004), and various executive management positions (1990-1997), John Hancock Funds, LLC (asset management); Chairman, Investment Company Institute’s Sales Force Marketing Committee (2003-2008). | | None. | | Since September 2013 |
Visit our website at pgiminvestments.com
| | | | | | |
| Independent Board Members | | | | |
| | | | |
Name, Address, Age Position(s) Portfolios Overseen | | Principal Occupation(s) During Past Five Years | | Other Directorships Held During Past Five Years | | Length of Board Service |
| | | | |
Laurie Simon Hodrick (56) Board Member Portfolios Overseen: 92 | | A. Barton Hepburn Professor Emerita of Economics in the Faculty of Business, Columbia Business School (since 2018); Visiting Professor of Law, Stanford Law School (since 2015); Visiting Fellow at the Hoover Institution, Stanford University (since 2015); Sole Member, ReidCourt LLC (since 2008) (a consulting firm); formerly A. Barton Hepburn Professor of Economics in the Faculty of Business, Columbia Business School (1996-2017); formerly Managing Director, Global Head of Alternative Investment Strategies, Deutsche Bank (2006-2008). | | Independent Director, Corporate Capital Trust (since April 2017) (a business development company); Independent Director, Kabbage, Inc. (since July 2018) (financial services). | | Since September 2017 |
| | | | |
Michael S. Hyland, CFA (73) Board Member Portfolios Overseen: 93 | | Retired (since February 2005); formerly Senior Managing Director (July 2001-February 2005) of Bear Stearns & Co, Inc.; Global Partner, INVESCO (1999-2001); Managing Director and President of Salomon Brothers Asset Management (1989-1999). | | None. | | Since July 2008 |
| | | | |
Richard A. Redeker (75) Board Member Portfolios Overseen: 93 | | Retired Mutual Fund Senior Executive (50 years); Management Consultant; Director, Mutual Fund Directors Forum (since 2014); Independent Directors Council (organization of independent mutual fund directors)-Executive Committee, Chair of Policy Steering Committee, Governing Council. | | None. | | Since October 1993 |
PGIM Global Total Return (USD Hedged) Fund
| | | | | | |
| Independent Board Members | | | | |
| | | | |
Name, Address, Age Position(s) Portfolios Overseen | | Principal Occupation(s) During Past Five Years | | Other Directorships Held During Past Five Years | | Length of Board Service |
| | | | |
Brian K. Reid (56)# Board Member Portfolios Overseen: 92 | | Retired; formerly Chief Economist for the Investment Company Institute (ICI) (2005-2017); formerly Senior Economist and Director of Industry and Financial Analysis at the ICI (1998-2004); formerly Senior Economist, Industry and Financial Analysis at the ICI (1996-1998); formerly Staff Economist at the Federal Reserve Board (1989-1996); Director, ICI Mutual Insurance Company (2012-2017). | | None. | | Since March 2018 |
| # | Mr. Reid joined the Board effective as of March 1, 2018. |
| | | | | | |
| Interested Board Members | | | | |
| | | | |
Name, Address, Age Position(s) Portfolios Overseen | | Principal Occupation(s) During Past Five Years | | Other Directorships Held During Past Five Years | | Length of
Board Service |
| | | | |
Stuart S. Parker (56) Board Member & President Portfolios Overseen: 93 | | President of PGIM Investments LLC (formerly known as Prudential Investments LLC) (since January 2012); Executive Vice President of Prudential Investment Management Services LLC (since December 2012); formerly Executive Vice President of Jennison Associates LLC and Head of Retail Distribution of PGIM Investments LLC (June 2005-December 2011). | | None. | | Since January 2012 |
Visit our website at pgiminvestments.com
| | | | | | |
| Interested Board Members | | | | |
| | | | |
Name, Address, Age Position(s) Portfolios Overseen | | Principal Occupation(s) During Past Five Years | | Other Directorships Held During Past Five Years | | Length of Board Service |
| | | | |
Scott E. Benjamin (45) Board Member & Vice President Portfolios Overseen:93 | | Executive Vice President (since June 2009) of PGIM Investments LLC; Executive Vice President (June 2009-June 2012) and Vice President (since June 2012) of Prudential Investment Management Services LLC; Executive Vice President (since September 2009) of AST Investment Services, Inc.; Senior Vice President of Product Development and Marketing, PGIM Investments (since February 2006); formerly Vice President of Product Development and Product Management, PGIM Investments LLC (2003-2006). | | None. | | Since March 2010 |
| | | | |
Grace C. Torres* (59) Board Member Portfolios Overseen: 92 | | Retired; formerly Treasurer and Principal Financial and Accounting Officer of the PGIM Funds, Target Funds, Advanced Series Trust, Prudential Variable Contract Accounts and The Prudential Series Fund (1998-June 2014); Assistant Treasurer (March 1999-June 2014) and Senior Vice President (September 1999-June 2014) of PGIM Investments LLC; Assistant Treasurer (May 2003-June 2014) and Vice President (June 2005-June 2014) of AST Investment Services, Inc.; Senior Vice President and Assistant Treasurer (May 2003-June 2014) of Prudential Annuities Advisory Services, Inc. | | Formerly Director (July 2015-January 2018) of Sun Bancorp, Inc. N.A. and Sun National Bank; Director (since January 2018) of OceanFirst Financial Corp. and OceanFirst Bank. | | Since November 2014 |
* Note: Prior to her retirement in 2014, Ms. Torres was employed by PGIM Investments LLC. Due to her prior employment, she is considered to be an “interested person” under the 1940 Act. Ms. Torres is a Non-Management Interested Board Member.
PGIM Global Total Return (USD Hedged) Fund
| | | | |
| Fund Officers(a) | | | | |
| | | |
Name, Address and Age Position with Fund | | Principal Occupation(s) During Past Five Years | | Length of Service as Fund Officer |
| | | |
Raymond A. O’Hara (63) Chief Legal Officer | | Vice President and Corporate Counsel (since July 2010) of Prudential Insurance Company of America (Prudential); Vice President (March 2011-Present) of Pruco Life Insurance Company and Pruco Life Insurance Company of New Jersey; Vice President and Corporate Counsel (March 2011-Present) of Prudential Annuities Life Assurance Corporation; Chief Legal Officer of PGIM Investments LLC (since June 2012); Chief Legal Officer of Prudential Mutual Fund Services LLC (since June 2012) and Corporate Counsel of AST Investment Services, Inc. (since June 2012); formerly Assistant Vice President and Corporate Counsel (September 2008-July 2010) of The Hartford Financial Services Group, Inc.; formerly Associate (September 1980-December 1987) and Partner (January 1988–August 2008) of Blazzard & Hasenauer, P.C. (formerly, Blazzard, Grodd & Hasenauer, P.C.). | | Since June 2012 |
| | | |
Chad A. Earnst (43) Chief Compliance Officer | | Chief Compliance Officer (September 2014-Present) of PGIM Investments LLC; Chief Compliance Officer (September 2014-Present) of the PGIM Funds, Target Funds, Advanced Series Trust, The Prudential Series Fund, Prudential’s Gibraltar Fund, Inc., PGIM Global Short Duration High Yield Income Fund, Inc., PGIM Short Duration High Yield Fund, Inc. and PGIM Jennison MLP Income Fund, Inc.; formerly Assistant Director (March 2010-August 2014) of the Asset Management Unit, Division of Enforcement, US Securities & Exchange Commission; Assistant Regional Director (January 2010-August 2014), Branch Chief (June 2006–December 2009) and Senior Counsel (April 2003-May 2006) of the Miami Regional Office, Division of Enforcement, US Securities & Exchange Commission. | | Since September 2014 |
| | | |
Dino Capasso (44) Deputy Chief Compliance Officer | | Vice President and Deputy Chief Compliance Officer (June 2017-Present) of PGIM Investments LLC; formerly, Senior Vice President and Senior Counsel (January 2016-June 2017), and Vice President and Counsel (February 2012-December 2015) of Pacific Investment Management Company LLC. | | Since March 2018 |
| | | |
Andrew R. French (56) Secretary | | Vice President and Corporate Counsel (since February 2010) of Prudential; formerly Director and Corporate Counsel (2006-2010) of Prudential; Vice President and Assistant Secretary (since January 2007) of PGIM Investments LLC; Vice President and Assistant Secretary (since January 2007) of Prudential Mutual Fund Services LLC. | | Since October 2006 |
Visit our website at pgiminvestments.com
| | | | |
| Fund Officers(a) | | | | |
| | | |
Name, Address and Age Position with Fund | | Principal Occupation(s) During Past Five Years | | Length of Service as Fund Officer |
| | | |
Jonathan D. Shain (60) Assistant Secretary | | Vice President and Corporate Counsel (since August 1998) of Prudential; Vice President and Assistant Secretary (since May 2001) of PGIM Investments LLC; Vice President and Assistant Secretary (since February 2001) of Prudential Mutual Fund Services LLC; formerly Vice President and Assistant Secretary (May 2003-June 2005) of AST Investment Services, Inc. | | Since May 2005 |
| | | |
Claudia DiGiacomo (44) Assistant Secretary | | Vice President and Corporate Counsel (since January 2005) of Prudential; Vice President and Assistant Secretary of PGIM Investments LLC (since December 2005); formerly Associate at Sidley Austin Brown & Wood LLP (1999-2004). | | Since December 2005 |
| | | |
Charles H. Smith (45) Anti-Money Laundering Compliance Officer | | Vice President, Corporate Compliance, Anti-Money Laundering Unit (since January 2015) of Prudential; committee member of the American Council of Life Insurers Anti-Money Laundering and Critical Infrastructure Committee (since January 2016); formerly Global Head of Economic Sanctions Compliance at AIG Property Casualty (February 2007 – December 2014); Assistant Attorney General at the New York State Attorney General’s Office, Division of Public Advocacy. (August 1998 —January 2007). | | Since January 2017 |
| | | |
Brian D. Nee (52) Treasurer and Principal Financial and Accounting Officer | | Vice President and Head of Finance of PGIM Investments LLC (since August 2015) and PGIM Global Partners (since February 2017); formerly, Vice President, Treasurer’s Department of Prudential (September 2007-August 2015). | | Since July 2018 |
| | | |
Peter Parrella (60) Assistant Treasurer | | Vice President (since 2007) and Director (2004-2007) within Prudential Mutual Fund Administration; formerly Tax Manager at SSB Citi Fund Management LLC (1997-2004). | | Since June 2007 |
| | | |
Lana Lomuti (51) Assistant Treasurer | | Vice President (since 2007) and Director (2005-2007), within Prudential Mutual Fund Administration; formerly Assistant Treasurer (December 2007-February 2014) of The Greater China Fund, Inc. | | Since April 2014 |
| | | |
Linda McMullin (57) Assistant Treasurer | | Vice President (since 2011) and Director (2008-2011) within Prudential Mutual Fund Administration. | | Since April 2014 |
| | | |
Kelly A. Coyne (50) Assistant Treasurer | | Director, Investment Operations of Prudential Mutual Fund Services LLC (since 2010). | | Since March 2015 |
(a) Excludes Mr. Parker and Mr. Benjamin, interested Board Members who also serve as President and Vice President, respectively.
Explanatory Notes to Tables:
| ∎ | | Board Members are deemed to be “Interested,” as defined in the 1940 Act, by reason of their affiliation with PGIM Investments LLC and/or an affiliate of PGIM Investments LLC. |
| ∎ | | Unless otherwise noted, the address of all Board Members and Officers is c/o PGIM Investments LLC, 655 Broad Street, Newark, New Jersey 07102-4410. |
| ∎ | | There is no set term of office for Board Members or Officers. The Board Members have adopted a retirement policy, which calls for the retirement of Board Members on December 31 of the year in which they reach the age of 75. |
PGIM Global Total Return (USD Hedged) Fund
| ∎ | | “Other Directorships Held” includes only directorships of companies required to register or file reports with the SEC under the 1934 Act (that is, “public companies”) or other investment companies registered under the 1940 Act. |
| ∎ | | “Portfolios Overseen” includes all investment companies managed by PGIM Investments LLC. The investment companies for which PGIM Investments LLC serves as manager include the PGIM Funds, The Prudential Variable Contract Accounts, PGIM ETF Trust, PGIM Short Duration High Yield Fund, Inc., PGIM Global Short Duration High Yield Fund, Inc., The Prudential Series Fund, Prudential’s Gibraltar Fund, Inc. and the Advanced Series Trust. |
Visit our website at pgiminvestments.com
Approval of Advisory Agreements (unaudited)
Initial Approval of the Fund’s Advisory Agreements
As required by the Investment Company Act of 1940 (the 1940 Act), the Board of Prudential Global Total Return Fund considered the proposed management agreement with PGIM Investments LLC (the Manager) and the proposed subadvisory agreement between the Manager, PGIM, Inc. (PGIM) on behalf of its PGIM Fixed Income unit, and PGIM Limited (PGIML, and together with PGIM, the Subadviser), with respect to the Prudential Global Total Return (USD Hedged) Fund (the Fund) prior to the Fund’s commencement of operations. The Board, including a majority of the Independent Directors, met on September 12-14, 2017 and approved the agreements for an initial two-year period, after concluding that approval of the agreements was in the best interests of the Fund.
In advance of the meetings, the Board requested and received materials relating to the agreements, and had the opportunity to ask questions and request further information in connection with its consideration.
In approving the agreements, the Board, including the Independent Directors advised by independent legal counsel, considered the factors it deemed relevant, including, among other things, the nature, quality and extent of services to be provided to the Fund by the Manager, PGIM and PGIML; any relevant comparable performance and the qualifications and track record of PGIM and PGIML in serving other affiliated mutual funds; the fees proposed to be paid by the Fund to the Manager and by the Manager to the Subadviser, under the agreements; and the potential for economies of scale that may be shared with the Fund and its shareholders. In connection with its deliberations, the Board considered information provided by the Manager, PGIM and PGIML at or in advance of the meetings on September 12-14, 2017. The Board also considered information provided by the Manager with respect to other funds managed by the Manager, PGIM and PGIML, which information had been provided throughout the year at regular Board meetings. In their deliberations, the Directors did not identify any single factor which alone was responsible for the Board’s decision to approve the agreements with respect to the Fund.
The Directors determined that the overall arrangements between the Fund and the Manager, which will serve as the Fund’s investment manager pursuant to a management agreement, and between the Manager, PGIM and PGIML, which will serve as the Fund’s subadvisers pursuant to the terms of a subadvisory agreement, were in the best interests of the Fund in light of the services to be performed and the fees to be charged under the agreements and such other matters as the Directors considered relevant in the exercise of their business judgment.
Certain factors and conclusions that formed the basis for the Directors’ reaching their determinations to approve the agreements are separately discussed below.
| | |
| PGIM Global Total Return (USD Hedged) Fund |
Approval of Advisory Agreements (continued)
Nature, quality and extent of services
With respect to the Manager, the Board noted that it had received and considered information about the Manager at the June 6-8, 2017 meetings in connection with the renewal of the management agreements between the Manager and the other Prudential Retail Funds. The Board also noted that it received and considered information at other regular meetings throughout the year, regarding the nature, quality and extent of services provided by the Manager to other Prudential Retail Funds. The Board considered the services to be provided by the Manager, including but not limited to the oversight of PGIM and PGIML, as well as the provision of fund recordkeeping, compliance and other services to the Fund. With respect to the Manager’s oversight of PGIM and PGIML, the Board noted that the Manager’s Strategic Investment Research Group, which is a business unit of the Manager, is responsible for monitoring and reporting to the Manager’s senior management on the performance and operations of PGIM and PGIML. The Board also noted that the Manager pays the salaries of all the officers and interested Directors of the Fund who are members of management. The Board reviewed the qualifications, backgrounds and responsibilities of the Manager’s senior management responsible for the oversight of the Fund, PGIM and PGIML, and was also provided with information pertaining to the Manager’s organizational structure, senior management, investment operations and other relevant information. The Board further noted that it received favorable compliance reports from the Fund’s Chief Compliance Officer as to the Manager. The Board noted that it had concluded that it was satisfied with the nature, quality and extent of the services provided by the Manager to other Prudential Retail Funds and determined that it was reasonable to conclude that the nature, quality and extent of services to be provided by the Manager under the management agreement for the Fund would be similar in nature to those provided under other similar management agreements.
With respect to the Subadviser, the Board noted that it had received and considered information about PGIM and PGIML at the June 6-8, 2017 meetings in connection with the renewal of the subadvisory agreements between the Manager and PGIM and sub-subadvisory agreements between PGIM and PGIML with respect to other Prudential Retail Funds. The Board also noted that it received and considered information at other regular meetings throughout the year, regarding the nature, quality and extent of services provided by PGIM and PGIML to other Prudential Retail Funds. The Board considered, among other things, the qualifications, background and experience of PGIM’s and PGIML’s portfolio managers who will be responsible for the day-to-day management of the Fund’s portfolio, as well as information on the organizational structure, senior management, investment operations and other relevant information of PGIM and PGIML. The Board further noted that it received favorable compliance reports from the Fund’s Chief Compliance Officer as to PGIM and PGIML. The Board noted that PGIM and PGIML are affiliated with the Manager. The Board noted that it was satisfied with the nature, quality and extent of
| | |
| Visit our website at pgiminvestments.com | | |
services provided by PGIM and PGIML with respect to the other Prudential Retail Funds served by PGIM and PGIML and determined that it was reasonable to conclude that the nature, quality and extent of services to be provided by PGIM and PGIML under the subadvisory agreement for the Fund would be similar in nature to those provided under other similar subadvisory agreements.
Performance
Because the Fund had not yet commenced operations, no investment performance for the Fund existed for Board review. The Board considered the background and professional experience of the proposed portfolio management team for the Fund. The Board noted that the Manager will provide information relating to performance to the Board in connection with future annual reviews of the management agreement and subadvisory agreement.
Fee Rates
The Board considered the proposed management fees to be paid by the Fund to the Manager and the proposed subadvisory fees to be paid by the Manager to the Subadviser. The Board considered information provided by the Manager comparing the Fund’s proposed management fee rate and net total expenses for Class A shares to a Peer Group of comparable funds chosen by Broadridge. The Board noted that the Fund’s proposed contractual management fee was in the first quartile of the Broadridge Peer Group (first quartile being among the lowest fees). The Board further noted that the Fund’s net total expense ratio, after waivers and reimbursements, ranked in the first quartile of the Broadridge Peer Group (first quartile being among the lowest expenses).
The Board noted that the Manager has contractually agreed, through February 28, 2019, to limit Total annual Fund operating expenses.
Profitability
Because the Fund had not yet commenced operations and the actual asset base of the Fund has not yet been determined, the Board noted that there was no historical profitability information with respect to the Fund to be reviewed. The Board noted that PGIM and PGIML were affiliated with the Manager and, as a result, their profitability will be reflected in the Manager’s profitability report. The Board noted that it would review profitability information in connection with the annual renewal of the advisory and subadvisory agreements after their initial two-year terms.
Economies of Scale
The Board noted that the proposed management fees payable by the Fund to the Manager contained breakpoints that would reduce the fee rates on assets above specified levels, as
| | |
| PGIM Global Total Return (USD Hedged) Fund |
Approval of Advisory Agreements (continued)
did the subadvisory fees payable by the Manager to the Subadviser. The Board considered the potential for the Manager and the Subadviser to experience economies of scale as the amount of assets managed by the Manager and the Subadviser, respectively, increased in size. Because the Fund had not yet commenced operations and the actual asset base of the Fund has not yet been determined, the Board noted that there was no historical information regarding economies of scale with respect to the Fund to be reviewed. The Board noted that it would review such information in connection with the annual renewal of the advisory and subadvisory agreements after their initial two-year terms.
Other Benefits to the Manager and the Subadviser
The Board considered potential “fall-out” or ancillary benefits anticipated to be received by the Manager, PGIM, PGIML and their affiliates as a result of their relationships with the Fund. The Board concluded that any potential benefits to be derived by the Manager were likely to be similar to benefits derived by the Manager in connection with its management of other Prudential Retail Funds, which are reviewed on an annual basis. The Board also concluded that any potential benefits to be derived by PGIM and PGIML were likely to be consistent with those generally derived by subadvisers to the Prudential Retail Funds, and that those benefits are reviewed on an annual basis. The Board concluded that any potential benefits derived by the Manager, PGIM and PGIML were consistent with the types of benefits generally derived by investment managers and subadvisers to mutual funds.
* * *
After full consideration of these factors, among others, the Board concluded that the approval of the agreements was in the best interests of the Fund.
| | |
| Visit our website at pgiminvestments.com | | |
| | | | |
| ∎ MAIL | | ∎ TELEPHONE | | ∎ WEBSITE |
655 Broad Street Newark, NJ 07102 | | (800) 225-1852 | | www.pgiminvestments.com |
|
| PROXY VOTING |
| The Board of Directors of the Fund has delegated to the Fund’s subadviser the responsibility for voting any proxies and maintaining proxy recordkeeping with respect to the Fund. A description of these proxy voting policies and procedures is available without charge, upon request, by calling (800) 225-1852. Information regarding how the Fund voted proxies relating to portfolio securities during the most recent 12-month period ended June 30 is available on the Fund’s website and on the Securities and Exchange Commission’s website. |
|
| DIRECTORS |
| Ellen S. Alberding • Kevin J. Bannon • Scott E. Benjamin • Linda W. Bynoe • Barry H. Evans • Keith F. Hartstein • Laurie Simon Hodrick • Michael S. Hyland • Stuart S. Parker • Richard A. Redeker • Brian K. Reid • Grace C. Torres |
|
| OFFICERS |
| Stuart S. Parker, President • Scott E. Benjamin, Vice President • Brian D. Nee, Treasurer and Principal Financial and Accounting Officer • Raymond A. O’Hara, Chief Legal Officer • Andrew R. French, Secretary • Chad A. Earnst, Chief Compliance Officer • Dino Capasso, Vice President and Deputy Chief Compliance Officer • Charles H. Smith, Anti-Money Laundering Compliance Officer • Jonathan D. Shain, Assistant Secretary • Claudia DiGiacomo, Assistant Secretary • Peter Parrella, Assistant Treasurer • Lana Lomuti, Assistant Treasurer • Linda McMullin, Assistant Treasurer • Kelly A. Coyne, Assistant Treasurer |
| | | | |
| MANAGER | | PGIM Investments LLC | | 655 Broad Street
Newark, NJ 07102 |
|
| SUBADVISER | | PGIM Fixed Income | | 655 Broad Street
Newark, NJ 07102 |
|
| DISTRIBUTOR | | Prudential Investment Management Services LLC | | 655 Broad Street
Newark, NJ 07102 |
|
| CUSTODIAN | | The Bank of New York Mellon | | 225 Liberty Street
New York, NY 10286 |
|
| TRANSFER AGENT | | Prudential Mutual Fund Services LLC | | PO Box 9658
Providence, RI 02940 |
|
INDEPENDENT REGISTERED
PUBLIC ACCOUNTING FIRM | | KPMG LLP | | 345 Park Avenue
New York, NY 10154 |
|
| FUND COUNSEL | | Willkie Farr & Gallagher LLP | | 787 Seventh Avenue
New York, NY 10019 |
|
|
| An investor should consider the investment objectives, risks, charges, and expenses of the Fund carefully before investing. The prospectus and summary prospectus contain this and other information about the Fund. An investor may obtain a prospectus and summary prospectus by visiting our website at www.pgiminvestments.com or by calling (800) 225-1852. The prospectus and summary prospectus should be read carefully before investing. |
|
| E-DELIVERY |
| To receive your mutual fund documents online, go to www.pgiminvestments.com/edelivery and enroll. Instead of receiving printed documents by mail, you will receive notification via email when new materials are available. You can cancel your enrollment or change your email address at any time by visiting the website address above. |
|
| SHAREHOLDER COMMUNICATIONS WITH DIRECTORS |
| Shareholders can communicate directly with the Board of Directors by writing to the Chair of the Board, PGIM Global Total Return (USD Hedged) Fund, PGIM Investments, Attn: Board of Directors, 655 Broad Street, Newark, NJ 07102. Shareholders can communicate directly with an individual Director by writing to the same address. Communications are not screened before being delivered to the addressee. |
|
| AVAILABILITY OF PORTFOLIO SCHEDULE |
| The Fund files its complete schedule of portfolio holdings with the Securities and Exchange Commission for the first and third quarters of each fiscal year on Form N-Q. The Fund’s Forms N-Q are available on the Commission’s website at www.sec.gov. The Fund’s schedule of portfolio holdings is also available on the Fund’s website as of the end of each month no sooner than 15 days after the end of the month. |
|
| The Fund’s Statement of Additional Information contains additional information about the Fund’s Directors and is available without charge, upon request, by calling (800) 225-1852. |
Mutual Funds:
| | | | |
| ARE NOT INSURED BY THE FDIC OR ANY FEDERAL GOVERNMENT AGENCY | | MAY LOSE VALUE | | ARE NOT A DEPOSIT OF OR GUARANTEED BY ANY BANK OR ANY BANK AFFILIATE |
PGIM GLOBAL TOTAL RETURN (USD HEDGED) FUND
| | | | | | | | |
| SHARE CLASS | | A | | C | | Z | | R6* |
| NASDAQ | | PHEAX | | PHECX | | PHEZX | | PHEQX |
| CUSIP | | 74439A707 | | 74439A806 | | 74439A871 | | 74439A889 |
*Formerly known as Class Q shares.
MF238E
Item 2 – Code of Ethics – – See Exhibit (a)
As of the end of the period covered by this report, the registrant has adopted a code of ethics (the “Section 406 Standards for Investment Companies – Ethical Standards for Principal Executive and Financial Officers”) that applies to the registrant’s Principal Executive Officer and Principal Financial Officer; the registrant’s Principal Financial Officer also serves as the Principal Accounting Officer.
The registrant hereby undertakes to provide any person, without charge, upon request, a copy of the code of ethics. To request a copy of the code of ethics, contact the registrant 800-225-1852, and ask for a copy of the Section 406 Standards for Investment Companies - Ethical Standards for Principal Executive and Financial Officers.
Item 3 – Audit Committee Financial Expert –
The registrant’s Board has determined that Mr. Kevin J. Bannon, member of the Board’s Audit Committee is an “audit committee financial expert,” and that he is “independent,” for purposes of this Item.
Item 4 – Principal Accountant Fees and Services –
(a) Audit Fees
For the fiscal years ended October 31, 2018 and October 31, 2017, KPMG LLP (“KPMG”), the Registrant’s principal accountant, billed the Registrant $105,318 and $66,651 respectively, for professional services rendered for the audit of the Registrant’s annual financial statements or services that are normally provided in connection with statutory and regulatory filings.
(b) Audit-Related Fees
For the fiscal years ended October 31, 2018 and October 31, 2017: none.
(c) Tax Fees
For the fiscal years ended October 31, 2018 and October 31, 2017: none.
(d) All Other Fees
For the fiscal years ended October 31, 2018 and October 31, 2017: none.
(e) (1) Audit Committee Pre-Approval Policies and Procedures
THE PRUDENTIAL MUTUAL FUNDS
AUDIT COMMITTEE POLICY
on
Pre-Approval of Services Provided by the Independent Accountants
The Audit Committee of each Prudential Mutual Fund is charged with the responsibility to monitor the independence of the Fund’s independent accountants. As part of this responsibility, the Audit Committee must pre-approve the independent accounting firm’s engagement to render audit and/or permissible non-audit services, as required by law. In evaluating a proposed engagement of the independent accountants, the Audit Committee will assess the effect that the engagement might reasonably be expected to have on the accountant’s independence. The Committee’s evaluation will be based on:
| | • | | a review of the nature of the professional services expected to be provided, |
| | • | | a review of the safeguards put into place by the accounting firm to safeguard independence, and |
| | • | | periodic meetings with the accounting firm. |
Policy for Audit and Non-Audit Services Provided to the Funds
On an annual basis, the scope of audits for each Fund, audit fees and expenses, and audit-related and non-audit services (and fees proposed in respect thereof) proposed to be performed by the Fund’s independent accountants will be presented by the Treasurer and the independent accountants to the Audit Committee for review and, as appropriate, approval prior to the initiation of such services. Such presentation shall be accompanied by confirmation by both the Treasurer and the independent accountants that the proposed non-audit services will not adversely affect the independence of the independent accountants. Such proposed non-audit services shall be described in sufficient detail to enable the Audit Committee to assess the appropriateness of such services and fees, and the compatibility of the provision of such services with the auditor’s independence. The Committee shall receive periodic reports on the progress of the audit and other services which are approved by the Committee or by the Committee Chair pursuant to authority delegated in this Policy.
The categories of services enumerated under “Audit Services”, “Audit-related Services”, and “Tax Services” are intended to provide guidance to the Treasurer and the independent accountants as to those categories of services which the Committee believes are generally consistent with the independence of the independent accountants and which the Committee (or the Committee Chair) would expect upon the presentation of specific proposals to pre-approve. The enumerated categories are not intended as an exclusive list of audit, audit-related or tax services, which the Committee (or the Committee Chair) would consider for pre-approval.
Audit Services
The following categories of audit services are considered to be consistent with the role of the Fund’s independent accountants:
| | ➣ | Annual Fund financial statement audits |
| | ➣ | Seed audits (related to new product filings, as required) |
| | ➣ | SEC and regulatory filings and consents |
Audit-related Services
The following categories of audit-related services are considered to be consistent with the role of the Fund’s independent accountants:
| | ➣ | Accounting consultations |
| | ➣ | Fund merger support services |
| | ➣ | Agreed Upon Procedure Reports |
| | ➣ | Other Internal Control Reports |
Individual audit-related services that fall within one of these categories (except for fund merger support services) and are not presented to the Audit Committee as part of the annual pre-approval process are subject to an authorized pre-approval by the Audit Committee so long as the estimated fee for those services does not exceed $30,000. Any services provided under such pre-approval will be reported to the Audit Committee at its next regular meeting. Should the amount of such services exceed $30,000 any additional fees will be subject to pre-approval by the Committee Chair (or any other Committee member on whom this responsibility has been delegated). Fees related to fund merger support services are subject to a separate authorized pre-approval by the Audit Committee with fees determined on a per occurrence and merger complexity basis.
Tax Services
The following categories of tax services are considered to be consistent with the role of the Fund’s independent accountants:
| | ➣ | Tax compliance services related to the filing or amendment of the following: |
| | ◾ | Federal, state and local income tax compliance; and, |
| | ◾ | Sales and use tax compliance |
| | ➣ | Timely RIC qualification reviews |
| | ➣ | Tax distribution analysis and planning |
| | ➣ | Tax authority examination services |
| | ➣ | Tax appeals support services |
| | ➣ | Accounting methods studies |
| | ➣ | Fund merger support services |
| | ➣ | Tax consulting services and related projects |
Individual tax services that fall within one of these categories and are not presented to the Audit Committee as part of the annual pre-approval process are subject to an authorized pre-approval by the Audit Committee so long as the estimated fee for those services does not exceed $30,000. Any services provided under such pre-approval will be reported to the Audit Committee at its next regular meeting. Should the amount of such services exceed $30,000 any additional fees will be subject to pre-approval by the Committee Chair (or any other Committee member on whom this responsibility has been delegated).
Other Non-Audit Services
Certain non-audit services that the independent accountants are legally permitted to render will be subject to pre-approval by the Committee or by one or more Committee members to whom the Committee has delegated this authority and who will report to the full Committee any pre-approval decisions made pursuant to this Policy. Non-audit services presented for pre-approval pursuant to this paragraph will be accompanied by a confirmation from both the Treasurer and the independent accountants that the proposed services will not adversely affect the independence of the independent accountants.
Proscribed Services
The Fund’s independent accountants will not render services in the following categories of non-audit services:
➣ Bookkeeping or other services related to the accounting records or financial statements of the Fund
➣ Financial information systems design and implementation
➣ Appraisal or valuation services, fairness opinions, or contribution-in-kind reports
➣ Actuarial services
➣ Internal audit outsourcing services
➣ Management functions or human resources
➣ Broker or dealer, investment adviser, or investment banking services
➣ Legal services and expert services unrelated to the audit
➣ Any other service that the Public Company Accounting Oversight Board determines, by regulation, is impermissible.
Pre-approval of Non-Audit Services Provided to Other Entities Within the Prudential Fund Complex
Certain non-audit services provided to PGIM Investments LLC or any of its affiliates that also provide ongoing services to the Prudential Mutual Funds will be subject to pre-approval by the Audit Committee. The only non-audit services provided to these entities that will require pre-approval are those related directly to the operations and financial reporting of the Funds. Individual projects that are not presented to the Audit Committee as part of the annual pre-approval process will be subject to pre-approval by the Committee Chair (or any other Committee member on whom this responsibility has been delegated) so long as the estimated fee for those services does not exceed $30,000. Services presented for pre-approval pursuant to this paragraph will be accompanied by a confirmation from both the Treasurer and the independent accountants that the proposed services will not adversely affect the independence of the independent accountants.
Although the Audit Committee will not pre-approve all services provided to PGIM Investments LLC and its affiliates, the Committee will receive an annual report from the Fund’s independent accounting firm showing the aggregate fees for all services provided to PGIM Investments and its affiliates.
(e) (2) Percentage of services referred to in 4(b) – 4(d) that were approved by the audit committee –
For the fiscal years ended October 31, 2018 and October 31, 2017: none.
(f) Percentage of hours expended attributable to work performed by other than full time employees of principal accountant if greater than 50%.
The percentage of hours expended on the principal accountant’s engagement to audit the registrant’s financial statements for the most recent fiscal year that were attributed to work performed by persons other than the principal accountant’s full-time, permanent employees was 0%.
(g) Non-Audit Fees
The aggregate non-audit fees billed by KPMG for services rendered to the registrant’s investment adviser and any entity controlling, controlled by, or under common control with the investment adviser that provides ongoing services to the registrant for the fiscal years ended October 31, 2018 and October 31, 2017 was $0 and $0, respectively.
(h) Principal Accountant’s Independence
Not applicable as KPMG has not provided non-audit services to the registrant’s investment adviser and any entity controlling, controlled by, or under common control with the investment adviser that provides ongoing services to the registrant that were not pre-approved pursuant to Rule 2-01(c)(7)(ii) of Regulation S-X.
| | |
Item 5 – | | Audit Committee of Listed Registrants – Not applicable. |
| |
Item 6 – | | Schedule of Investments – The schedule is included as part of the report to shareholders filed under Item 1 of this Form. |
| |
Item 7 – | | Disclosure of Proxy Voting Policies and Procedures for Closed-End Management Investment Companies – Not applicable. |
| |
Item 8 – | | Portfolio Managers of Closed-End Management Investment Companies – Not applicable. |
| |
Item 9 – | | Purchases of Equity Securities by Closed-End Management Investment Company and Affiliated Purchasers – Not applicable. |
| | |
| |
Item 10 – | | Submission of Matters to a Vote of Security Holders – Not applicable. |
| |
Item 11 – | | Controls and Procedures |
| | (a) | It is the conclusion of the registrant’s principal executive officer and principal financial officer that the effectiveness of the registrant’s current disclosure controls and procedures (such disclosure controls and procedures having been evaluated within 90 days of the date of this filing) provide reasonable assurance that the information required to be disclosed by the registrant has been recorded, processed, summarized and reported within the time period specified in the Commission’s rules and forms and that the information required to be disclosed by the registrant has been accumulated and communicated to the registrant’s principal executive officer and principal financial officer in order to allow timely decisions regarding required disclosure. |
| | (b) | There has been no significant change in the registrant’s internal control over financial reporting that occurred during the registrant’s most recent fiscal quarter of the period covered by this report that has materially affected, or is likely to materially affect, the registrant’s internal control over financial reporting. |
| | | | |
| Item 12 – Exhibits |
| | |
| | (a) | | (1) Code of Ethics – Attached hereto as Exhibit EX-99.CODE-ETH |
| | |
| | | | (2) Certifications pursuant to Section 302 of the Sarbanes-Oxley Act – Attached hereto as Exhibit EX-99.CERT. |
| | |
| | | | (3) Any written solicitation to purchase securities under Rule 23c-1. – Not applicable. |
| | |
| | (b) | | Certifications pursuant to Section 906 of the Sarbanes-Oxley Act – Attached hereto as Exhibit EX-99.906CERT. |
SIGNATURES
Pursuant to the requirements of the Securities Exchange Act of 1934 and the Investment Company Act of 1940, the registrant has duly caused this report to be signed on its behalf by the undersigned, thereunto duly authorized.
| | |
| Registrant: | | Prudential Global Total Return Fund, Inc. |
| |
| By: | | /s/ Andrew R. French |
| | Andrew R. French |
| | Secretary |
| |
| Date: | | December 18, 2018 |
Pursuant to the requirements of the Securities Exchange Act of 1934 and the Investment Company Act of 1940, this report has been signed below by the following persons on behalf of the registrant and in the capacities and on the dates indicated.
| | |
| By: | | /s/ Stuart S. Parker |
| | Stuart S. Parker |
| | President and Principal Executive Officer |
| |
| Date: | | December 18, 2018 |
| |
| By: | | /s/ Brian D. Nee |
| | Brian D. Nee |
| | Treasurer and Principal Financial and Accounting Officer |
| |
| Date: | | December 18, 2018 |