UNITED STATES
SECURITIES AND EXCHANGE COMMISSION
Washington, D.C. 20549
CERTIFIED SHAREHOLDER REPORT OF REGISTERED MANAGEMENT INVESTMENT COMPANIES
| | |
| Investment Company Act file number: | | 811-04661 |
| |
| Exact name of registrant as specified in charter: | | Prudential Global Total Return Fund, Inc. |
| |
| Address of principal executive offices: | | 655 Broad Street, 6 th Floor |
| | Newark, New Jersey 07102 |
| |
| Name and address of agent for service: | | Andrew R. French |
| | | 655 Broad Street, 6 th Floor |
| | Newark, New Jersey 07102 |
| |
| Registrant’s telephone number, including area code: | | |
| |
| Date of fiscal year end: | | 10/31/2024 |
| |
| Date of reporting period: | | 10/31/2024 |
Item 1 – Reports to Stockholders
(a) Report transmitted to stockholders pursuant to Rule
30e-1
under the Act (17 CFR
270.30e-1).
PGIM Global Total Return Fund
ANNUAL SHAREHOLDER REPORT – October 31, 2024
This annual shareholder report contains important information about the Class A shares of PGIM Global Total Return Fund (the “Fund”) for the
period of November 1, 2023 to October 31, 2024.
You can find additional information about the Fund at
pgim.com/investments/mutual-funds/prospectuses-fact-sheets
. You can also request
this information by contacting us at (800) 225-1852 or (973) 367-3529 from outside the US.
WHAT WERE THE FUND COSTS FOR THE LAST YEAR?
(Based on a hypothetical $10,000 investment)
| Costs of a $10,000 investment | Costs paid as a percentage of a $10,000 investment |
PGIM Global Total Return Fund—Class A | | |
WHAT AFFECTED THE FUND’S PERFORMANCE DURING THE REPORTING PERIOD?
■
Global fixed income markets posted strong returns during the reporting period as spreads across investment grade corporates, high yield,
securitized credit, and emerging markets tightened. Moderating inflation data and a cooling of the labor market set the table for the first interest
rate cut by the US Federal Reserve (Fed) of this rate-cutting cycle, with US Treasury yields declining across the curve leading up to the Fed’s
0.50% rate cut in September.
■
Overall security selection and sector allocation both contributed to performance. Within sector allocation, overweights to emerging-markets high
yield, non-agency commercial mortgage-backed securities (CMBS) AA-and-below, and AAA collateralized loan obligations (CLOs) contributed
positively. For credit, security selection in banking, health care & pharmaceuticals, and consumer non-cyclicals contributed to performance.
■
Duration and yield curve positioning both detracted from performance, with positioning in developed-market rates detracting the most. Within
sector allocation, positioning in sovereigns and an underweight in mortgage-backed securities (MBS) detracted from performance. Within credit,
security selection in electric utilities and media & entertainment detracted.
■
The Fund used interest rate futures, options, and swaps as well as credit default swaps and foreign exchange forwards to help manage duration
positioning and yield curve exposure, manage currency exposure, and/or to hedge credit risk imposed by certain issuers. Overall, the use of
derivatives contributed to Fund performance.
HOW HAS THE FUND PERFORMED OVER THE PAST 10 YEARS?
The Fund’s past performance is not a good predictor of the Fund’s future performance.
The returns do not reflect the deduction of
taxes that a shareholder would pay on Fund distributions or redemption of Fund shares.
Visit
pgim.com/investments/mutual-funds/prospectuses-fact-sheets
or call (800) 225-1852 or (973) 367-3529 from outside the US for more recent performance data.
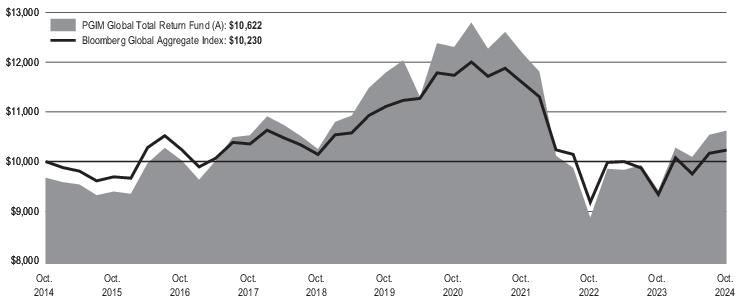
The line graph reflects a hypothetical $10,000 investment in Class A shares and assumes that all recurring fees (including management fees)
were deducted and dividend and distributions were reinvested. Without waiver of fees and/or expense reimbursements, if any, the returns would
have been lower.
Cumulative Performance: October 31, 2014 to October 31, 2024 Initial Investment of $10,000 |
The line graph reflects the return on the Fund's Class A shares with sales charges.
Average Annual Total Returns as of 10/31/2024 |
| | | |
Class A with sales charges | | | |
Class A without sales charges | | | |
Broad-Based Securities Market Index: Bloomberg Global Aggregate | | | |
WHAT ARE SOME KEY FUND STATISTICS AS OF 10/31/2024?
| |
| |
Total advisory fees paid for the year | |
Portfolio turnover rate for the year | |
WHAT ARE SOME CHARACTERISTICS OF THE FUND’S HOLDINGS AS OF 10/31/2024?
Credit Quality expressed as a percentage of total investments as of 10/31/2024 (%) |
| |
| |
| |
| |
| |
| |
| |
| |
| |
| |
Credit ratings reflect the highest rating assigned by a nationally recognized statistical rating organization (NRSRO) such as Moody’s Investors Service, Inc. (Moody’s), S&P Global
Ratings (S&P), or Fitch Ratings, Inc. (Fitch). Credit ratings reflect the common nomenclature used by both S&P and Fitch. Where applicable, ratings are converted to the comparable
S&P/Fitch rating tier nomenclature. The Not Rated category consists of securities that have not been rated by an NRSRO. Credit ratings are subject to change.
You can find additional information at
pgim.com/investments/mutual-funds/prospectuses-fact-sheets
or by scanning the QR code below,
including the Fund’s prospectus, financial information, fund holdings, and proxy voting information. You can also request this information by
contacting us at (800) 225-1852 or (973) 367-3529 from outside the US.
To receive your fund documents online, go to
pgim.com/investments/resource/edelivery
and enroll.
PGIM Global Total Return Fund
PGIM Global Total Return Fund
ANNUAL SHAREHOLDER REPORT – October 31, 2024
This annual shareholder report contains important information about the Class C shares of PGIM Global Total Return Fund (the “Fund”) for the
period of November 1, 2023 to October 31, 2024.
You can find additional information about the Fund at
pgim.com/investments/mutual-funds/prospectuses-fact-sheets
. You can also request
this information by contacting us at (800) 225-1852 or (973) 367-3529 from outside the US.
WHAT WERE THE FUND COSTS FOR THE LAST YEAR?
(Based on a hypothetical $10,000 investment)
| Costs of a $10,000 investment | Costs paid as a percentage of a $10,000 investment |
PGIM Global Total Return Fund—Class C | | |
WHAT AFFECTED THE FUND’S PERFORMANCE DURING THE REPORTING PERIOD?
■
Global fixed income markets posted strong returns during the reporting period as spreads across investment grade corporates, high yield,
securitized credit, and emerging markets tightened. Moderating inflation data and a cooling of the labor market set the table for the first interest
rate cut by the US Federal Reserve (Fed) of this rate-cutting cycle, with US Treasury yields declining across the curve leading up to the Fed’s
0.50% rate cut in September.
■
Overall security selection and sector allocation both contributed to performance. Within sector allocation, overweights to emerging-markets high
yield, non-agency commercial mortgage-backed securities (CMBS) AA-and-below, and AAA collateralized loan obligations (CLOs) contributed
positively. For credit, security selection in banking, health care & pharmaceuticals, and consumer non-cyclicals contributed to performance.
■
Duration and yield curve positioning both detracted from performance, with positioning in developed-market rates detracting the most. Within
sector allocation, positioning in sovereigns and an underweight in mortgage-backed securities (MBS) detracted from performance. Within credit,
security selection in electric utilities and media & entertainment detracted.
■
The Fund used interest rate futures, options, and swaps as well as credit default swaps and foreign exchange forwards to help manage duration
positioning and yield curve exposure, manage currency exposure, and/or to hedge credit risk imposed by certain issuers. Overall, the use of
derivatives contributed to Fund performance.
HOW HAS THE FUND PERFORMED OVER THE PAST 10 YEARS?
The Fund’s past performance is not a good predictor of the Fund’s future performance.
The returns do not reflect the deduction of
taxes that a shareholder would pay on Fund distributions or redemption of Fund shares.
Visit
pgim.com/investments/mutual-funds/prospectuses-fact-sheets
or call (800) 225-1852 or (973) 367-3529 from outside the US for more recent performance data.
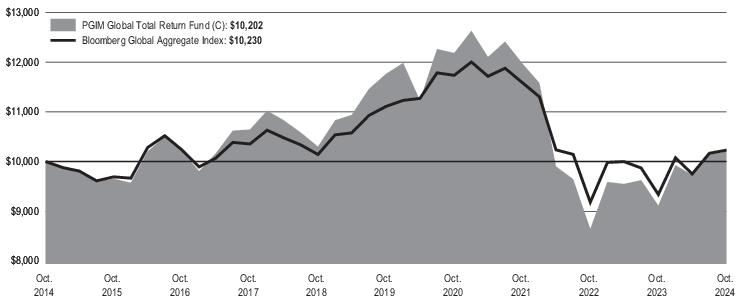
The line graph reflects a hypothetical $10,000 investment in Class C shares and assumes that all recurring fees (including management fees)
were deducted and dividend and distributions were reinvested. Without waiver
of
fees and/or expense reimbursements, if any, the returns would
have been lower.
Cumulative Performance: October 31, 2014 to October 31, 2024 Initial Investment of $10,000 |
Average Annual Total Returns as of 10/31/2024 |
| | | |
Class C with sales charges | | | |
Class C without sales charges | | | |
Broad-Based Securities Market Index: Bloomberg Global Aggregate | | | |
WHAT ARE SOME KEY FUND STATISTICS AS OF 10/31/2024?
| |
| |
Total advisory fees paid for the year | |
Portfolio turnover rate for the year | |
WHAT ARE SOME CHARACTERISTICS OF THE FUND’S HOLDINGS AS OF 10/31/2024?
Credit Quality expressed as a percentage of total investments as of 10/31/2024 (%) |
| |
| |
| |
| |
| |
| |
| |
| |
| |
| |
Credit ratings reflect the highest rating assigned by a nationally recognized statistical rating organization (NRSRO) such as Moody’s Investors Service, Inc. (Moody’s), S&P Global
Ratings (S&P), or Fitch Ratings, Inc. (Fitch). Credit ratings reflect the common nomenclature used by both S&P and Fitch. Where applicable, ratings are converted to the comparable
S&P/Fitch rating tier nomenclature. The Not Rated category consists of securities that have not been rated by an NRSRO. Credit ratings are subject to change.
You can find additional information at
pgim.com/investments/mutual-funds/prospectuses-fact-sheets
or by scanning the QR code below,
including the Fund’s prospectus, financial information, fund holdings, and proxy voting information. You can also request this information by
contacting us at (800) 225-1852 or (973) 367-3529 from outside the US.
To receive your fund documents online, go to
pgim.com/investments/resource/edelivery
and enroll.
PGIM Global Total Return Fund
PGIM Global Total Return Fund
ANNUAL SHAREHOLDER REPORT – October 31, 2024
This annual shareholder report contains important information about the Class Z shares of PGIM Global Total Return Fund (the “Fund”) for the
period of November 1, 2023 to October 31, 2024.
You can find additional information about the Fund at
pgim.com/investments/mutual-funds/prospectuses-fact-sheets
. You can also request
this information by contacting us at (800) 225-1852 or (973) 367-3529 from outside the US.
WHAT WERE THE FUND COSTS FOR THE LAST YEAR?
(Based on a hypothetical $10,000 investment)
| Costs of a $10,000 investment | Costs paid as a percentage of a $10,000 investment |
PGIM Global Total Return Fund—Class Z | | |
WHAT AFFECTED THE FUND’S PERFORMANCE DURING THE REPORTING PERIOD?
■
Global fixed income markets posted strong returns during the reporting period as spreads across investment grade corporates, high yield,
securitized credit, and emerging markets tightened. Moderating inflation data and a cooling of the labor market set the table for the first interest
rate cut by the US Federal Reserve (Fed) of this rate-cutting cycle, with US Treasury yields declining across the curve leading up to the Fed’s
0.50% rate cut in September.
■
Overall security selection and sector allocation both contributed to performance. Within sector allocation, overweights to emerging-markets high
yield, non-agency commercial mortgage-backed securities (CMBS) AA-and-below, and AAA collateralized loan obligations (CLOs) contributed
positively. For credit, security selection in banking, health care & pharmaceuticals, and consumer non-cyclicals contributed to performance.
■
Duration and yield curve positioning both detracted from performance, with positioning in developed-market rates detracting the most. Within
sector allocation, positioning in sovereigns and an underweight in mortgage-backed securities (MBS) detracted from performance. Within credit,
security selection in electric utilities and media & entertainment detracted.
■
The Fund used interest rate futures, options, and swaps as well as credit default swaps and foreign exchange forwards to help manage duration
positioning and yield curve exposure, manage currency exposure, and/or to hedge credit risk imposed by certain issuers. Overall, the use of
derivatives contributed to Fund performance.
HOW HAS THE FUND PERFORMED OVER THE PAST 10 YEARS?
The Fund’s past performance is not a good predictor of the Fund’s future performance.
The returns do not reflect the deduction of
taxes that a shareholder would pay on Fund distributions or redemption of Fund shares.
Visit
pgim.com/investments/mutual-funds/prospectuses-fact-sheets
or call (800) 225-1852 or (973) 367-3529 from outside the US for more recent performance data.
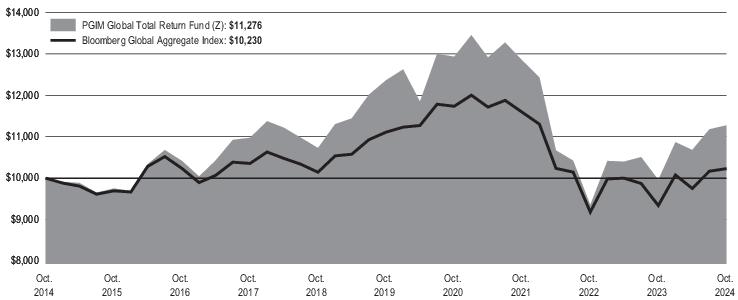
The line graph reflects a hypothetical $10,000 investment in Class Z shares and assumes that all recurring fees (including management fees)
were deducted and dividend and distributions were reinvested. Without waiver of fees and/or expense reimbursements, if any, the returns would
have been lower.
Cumulative Performance: October 31, 2014 to October 31, 2024 Initial Investment of $10,000 |
Average Annual Total Returns as of 10/31/2024 |
| | | |
| | | |
Broad-Based Securities Market Index: Bloomberg Global Aggregate | | | |
WHAT ARE SOME KEY FUND STATISTICS AS OF 10/31/2024?
| |
| |
Total advisory fees paid for the year | |
Portfolio turnover rate for the year | |
WHAT ARE SOME CHARACTERISTICS OF THE FUND’S HOLDINGS AS OF 10/31/2024?
Credit Quality expressed as a percentage of total investments as of 10/31/2024 (%) |
| |
| |
| |
| |
| |
| |
| |
| |
| |
| |
Credit ratings reflect the highest rating assigned by a nationally recognized statistical rating organization (NRSRO) such as Moody’s Investors Service, Inc. (Moody’s), S&P Global
Ratings (S&P), or Fitch Ratings, Inc. (Fitch). Credit ratings reflect the common nomenclature used by both S&P and Fitch. Where applicable, ratings are converted to the comparable
S&P/Fitch rating tier nomenclature. The Not Rated category consists of securities that have not been rated by an NRSRO. Credit ratings are subject to change.
You can find additional information at
pgim.com/investments/mutual-funds/prospectuses-fact-sheets
or by scanning the QR code below,
including the Fund’s prospectus, financial information, fund holdings, and proxy voting information. You can also request this information by
contacting us at (800) 225-1852 or (973) 367-3529 from outside the US.
To receive your fund documents online, go to
pgim.com/investments/resource/edelivery
and enroll.
PGIM Global Total Return Fund
PGIM Global Total Return Fund
ANNUAL SHAREHOLDER REPORT – October 31, 2024
This annual shareholder report contains important information about the Class R2 shares of PGIM Global Total Return Fund (the “Fund”) for the
period of November 1, 2023 to October 31, 2024.
You can find additional information about the Fund at
pgim.com/investments/mutual-funds/prospectuses-fact-sheets
. You can also request
this information by contacting us at (800) 225-1852 or (973) 367-3529 from outside the US.
WHAT WERE THE FUND COSTS FOR THE LAST YEAR?
(Based on a hypothetical $10,000 investment)
| Costs of a $10,000 investment | Costs paid as a percentage of a $10,000 investment |
PGIM Global Total Return Fund—Class R2 | | |
WHAT AFFECTED THE FUND’S PERFORMANCE DURING THE REPORTING PERIOD?
■
Global fixed income markets posted strong returns during the reporting period as spreads across investment grade corporates, high yield,
securitized credit, and emerging markets tightened. Moderating inflation data and a cooling of the labor market set the table for the first interest
rate cut by the US Federal Reserve (Fed) of this rate-cutting cycle, with US Treasury yields declining across the curve leading up to the Fed’s
0.50% rate cut in September.
■
Overall security selection and sector allocation both contributed to performance. Within sector allocation, overweights to emerging-markets high
yield, non-agency commercial mortgage-backed securities (CMBS) AA-and-below, and AAA collateralized loan obligations (CLOs) contributed
positively. For credit, security selection in banking, health care & pharmaceuticals, and consumer non-cyclicals contributed to performance.
■
Duration and yield curve positioning both detracted from performance, with positioning in developed-market rates detracting the most. Within
sector allocation, positioning in sovereigns and an underweight in mortgage-backed securities (MBS) detracted from performance. Within credit,
security selection in electric utilities and media & entertainment detracted.
■
The Fund used interest rate futures, options, and swaps as well as credit default swaps and foreign exchange forwards to help manage duration
positioning and yield curve exposure, manage currency exposure, and/or to hedge credit risk imposed by certain issuers. Overall, the use of
derivatives contributed to Fund performance.
HOW HAS THE FUND PERFORMED OVER THE PAST 10 YEARS?
The Fund’s past performance is not a good predictor of the Fund’s future performance.
The returns do not reflect the deduction of
taxes that a shareholder would pay on Fund distributions or redemption of Fund shares.
Visit
pgim.com/investments/mutual-funds/prospectuses-fact-sheets
or call (800) 225-1852 or (973) 367-3529 from outside the US for more recent performance data.
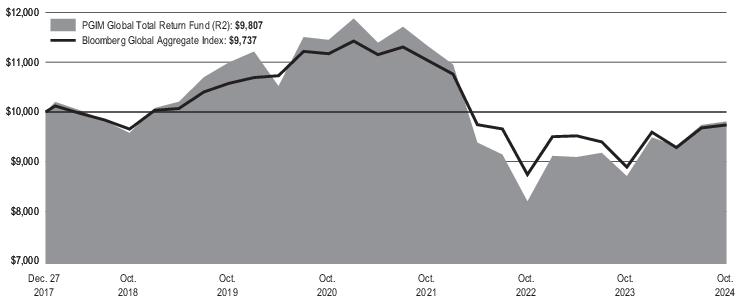
The line graph reflects a hypothetical $10,000 investment in Class R2 shares and assumes that all recurring fees (including management fees)
were deducted and dividend and distributions were reinvested. Without waiver of fees and/or expense reimbursements, if any, the returns would
have been lower.
Cumulative Performance: December 27, 2017 to October 31, 2024 Initial Investment of $10,000 |
Average Annual Total Returns as of 10/31/2024 |
| | | |
| | | |
Broad-Based Securities Market Index: Bloomberg Global | | | |
Since Inception returns are provided for the share class since it has less than 10
fiscal
years of returns. Since Inception returns for the Index are measured from the
closest month-end to the class’s inception date.
WHAT ARE SOME KEY FUND STATISTICS AS OF 10/31/2024?
| |
| |
Total advisory fees paid for the year | |
Portfolio turnover rate for the year | |
WHAT ARE SOME CHARACTERISTICS OF THE FUND’S HOLDINGS AS OF 10/31/2024?
Credit Quality expressed as a percentage of total investments as of 10/31/2024 (%) |
| |
| |
| |
| |
| |
| |
| |
| |
| |
| |
Credit ratings reflect the highest rating assigned by a nationally recognized statistical rating organization (NRSRO) such as Moody’s Investors Service, Inc. (Moody’s), S&P Global
Ratings (S&P), or Fitch Ratings, Inc. (Fitch). Credit ratings reflect the common nomenclature used by both S&P and Fitch. Where applicable, ratings are converted to the comparable
S&P/Fitch rating tier nomenclature. The Not Rated category consists of securities that have not been rated by an NRSRO. Credit ratings are subject to change.
You can find additional information at
pgim.com/investments/mutual-funds/prospectuses-fact-sheets
or by scanning the QR code below,
including the Fund’s prospectus, financial information, fund holdings, and proxy voting information. You can also request this information by
contacting us at (800) 225-1852 or (973) 367-3529 from outside the US.
To receive your fund documents online, go to
pgim.com/investments/resource/edelivery
and enroll.
PGIM Global Total Return Fund
PGIM Global Total Return Fund
ANNUAL SHAREHOLDER REPORT – October 31, 2024
This annual shareholder report contains important information about the Class R4 shares of PGIM Global Total Return Fund (the “Fund”) for the
period of November 1, 2023 to October 31, 2024.
You can find additional information about the Fund at
pgim.com/investments/mutual-funds/prospectuses-fact-sheets
. You can also request
this information by contacting us at (800) 225-1852 or (973) 367-3529 from outside the US.
WHAT WERE THE FUND COSTS FOR THE LAST YEAR?
(Based on a hypothetical $10,000 investment)
| Costs of a $10,000 investment | Costs paid as a percentage of a $10,000 investment |
PGIM Global Total Return Fund—Class R4 | | |
WHAT AFFECTED THE FUND’S PERFORMANCE DURING THE REPORTING PERIOD?
■
Global fixed income markets posted strong returns during the reporting period as spreads across investment grade corporates, high yield,
securitized credit, and emerging markets tightened. Moderating inflation data and a cooling of the labor market set the table for the first interest
rate cut by the US Federal Reserve (Fed) of this rate-cutting cycle, with US Treasury yields declining across the curve leading up to the Fed’s
0.50% rate cut in September.
■
Overall security selection and sector allocation both contributed to performance. Within sector allocation, overweights to emerging-markets high
yield, non-agency commercial mortgage-backed securities (CMBS) AA-and-below, and AAA collateralized loan obligations (CLOs) contributed
positively. For credit, security selection in banking, health care & pharmaceuticals, and consumer non-cyclicals contributed to performance.
■
Duration and yield curve positioning both detracted from performance, with positioning in developed-market rates detracting the most. Within
sector allocation, positioning in sovereigns and an underweight in mortgage-backed securities (MBS) detracted from performance. Within credit,
security selection in electric utilities and media & entertainment detracted.
■
The Fund used interest rate futures, options, and swaps as well as credit default swaps and foreign exchange forwards to help manage duration
positioning and yield curve exposure, manage currency exposure, and/or to hedge credit risk imposed by certain issuers. Overall, the use of
derivatives contributed to Fund performance.
HOW HAS THE FUND PERFORMED OVER THE PAST 10 YEARS?
The Fund’s past performance is not a good predictor of the Fund’s future performance.
The returns do not reflect the deduction of
taxes that a shareholder would pay on Fund distributions or redemption of Fund shares.
Visit
pgim.com/investments/mutual-funds/prospectuses-fact-sheets
or call (800) 225-1852 or (973) 367-3529 from outside the US for more recent performance data.
The line graph reflects a hypothetical $10,000 investment in Class R4 shares and assumes that all recurring fees (including management fees)
were deducted and dividend and distributions were reinvested. Without waiver of fees and/or expense reimbursements, if any, the returns would
have been lower.
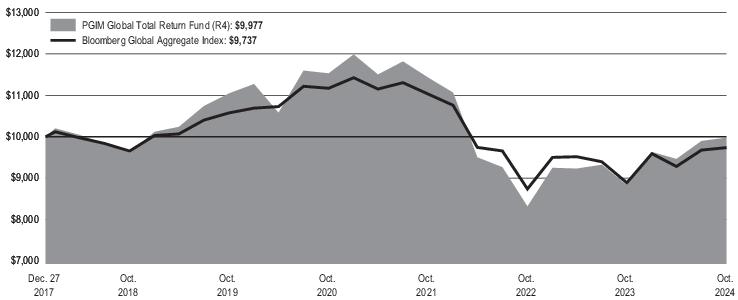
Cumulative Performance: December 27, 2017 to October 31, 2024 Initial Investment of $10,000 |
Average Annual Total Returns as of 10/31/2024 |
| | | |
| | | |
Broad-Based Securities Market Index: Bloomberg Global | | | |
Since Inception returns are provided for the share class since it has less than 10
fiscal
years of returns. Since Inception returns for the Index are measured from the
closest month-end to the class’s inception date.
WHAT ARE SOME KEY FUND STATISTICS AS OF 10/31/2024?
| |
| |
Total advisory fees paid for the year | |
Portfolio turnover rate for the year | |
WHAT ARE SOME CHARACTERISTICS OF THE FUND’S HOLDINGS AS OF 10/31/2024?
Credit Quality expressed as a percentage of total investments as of 10/31/2024 (%) |
| |
| |
| |
| |
| |
| |
| |
| |
| |
| |
Credit ratings reflect the highest rating assigned by a nationally recognized statistical rating organization (NRSRO) such as Moody’s Investors Service, Inc. (Moody’s), S&P Global
Ratings (S&P), or Fitch Ratings, Inc. (Fitch). Credit ratings reflect the common nomenclature used by both S&P and Fitch. Where applicable, ratings are converted to the comparable
S&P/Fitch rating tier nomenclature. The Not Rated category consists of securities that have not been rated by an NRSRO. Credit ratings are subject to change.
You can find additional information at
pgim.com/investments/mutual-funds/prospectuses-fact-sheets
or by scanning the QR code below,
including the Fund’s prospectus, financial information, fund holdings, and proxy voting information. You can also request this information by
contacting us at (800) 225-1852 or (973) 367-3529 from outside the US.
To receive your fund documents online, go to
pgim.com/investments/resource/edelivery
and enroll.
PGIM Global Total Return Fund
PGIM Global Total Return Fund
ANNUAL SHAREHOLDER REPORT – October 31, 2024
This annual shareholder report contains important information about the Class R6 shares of PGIM Global Total Return Fund (the “Fund”) for the
period of November 1, 2023 to October 31, 2024.
You can find additional information about the Fund at
pgim.com/investments/mutual-funds/prospectuses-fact-sheets
. You can also request
this information by contacting us at (800) 225-1852 or (973) 367-3529 from outside the US.
WHAT WERE THE FUND COSTS FOR THE LAST YEAR?
(Based on a hypothetical $10,000 investment)
| Costs of a $10,000 investment | Costs paid as a percentage of a $10,000 investment |
PGIM Global Total Return Fund—Class R6 | | |
WHAT AFFECTED THE FUND’S PERFORMANCE DURING THE REPORTING PERIOD?
■
Global fixed income markets posted strong returns during the reporting period as spreads across investment grade corporates, high yield,
securitized credit, and emerging markets tightened. Moderating inflation data and a cooling of the labor market set the table for the first interest
rate cut by the US Federal Reserve (Fed) of this rate-cutting cycle, with US Treasury yields declining across the curve leading up to the Fed’s
0.50% rate cut in September.
■
Overall security selection and sector allocation both contributed to performance. Within sector allocation, overweights to emerging-markets high
yield, non-agency commercial mortgage-backed securities (CMBS) AA-and-below, and AAA collateralized loan obligations (CLOs) contributed
positively. For credit, security selection in banking, health care & pharmaceuticals, and consumer non-cyclicals contributed to performance.
■
Duration and yield curve positioning both detracted from performance, with positioning in developed-market rates detracting the most. Within
sector allocation, positioning in sovereigns and an underweight in mortgage-backed securities (MBS) detracted from performance. Within credit,
security selection in electric utilities and media & entertainment detracted.
■
The Fund used interest rate futures, options, and swaps as well as credit default swaps and foreign exchange forwards to help manage duration
positioning and yield curve exposure, manage currency exposure, and/or to hedge credit risk imposed by certain issuers. Overall, the use of
derivatives contributed to Fund performance.
HOW HAS THE FUND PERFORMED OVER THE PAST 10 YEARS?
The Fund’s past performance is not a good predictor of the Fund’s future performance.
The returns do not reflect the deduction of
taxes that a shareholder would pay on Fund distributions or redemption of Fund shares.
Visit
pgim.com/investments/mutual-funds/prospectuses-fact-sheets
or call (800) 225-1852 or (973) 367-3529 from outside the US for more recent performance data.
The line graph reflects a hypothetical $10,000 investment in Class R6 shares and assumes that all recurring fees (including management fees)
were deducted and dividend and distributions were reinvested. Without waiver of fees and/or expense reimbursements, if any, the returns would
have been lower.
Cumulative Performance: October 31, 2014 to October 31, 2024 Initial Investment of $10,000 |
Average Annual Total Returns as of 10/31/2024 |
| | | |
| | | |
Broad-Based Securities Market Index: Bloomberg Global Aggregate | | | |
WHAT ARE SOME KEY FUND STATISTICS AS OF 10/31/2024?
| |
| |
Total advisory fees paid for the year | |
Portfolio turnover rate for the year | |
WHAT ARE SOME CHARACTERISTICS OF THE FUND’S HOLDINGS AS OF 10/31/2024?
Credit Quality expressed as a percentage of total investments as of 10/31/2024 (%) |
| |
| |
| |
| |
| |
| |
| |
| |
| |
| |
Credit ratings reflect the highest rating assigned by a nationally recognized statistical rating organization (NRSRO) such as Moody’s Investors Service, Inc. (Moody’s), S&P Global
Ratings (S&P), or Fitch Ratings, Inc. (Fitch). Credit ratings reflect the common nomenclature used by both S&P and Fitch. Where applicable, ratings are converted to the comparable
S&P/Fitch rating tier nomenclature. The Not Rated category consists of securities that have not been rated by an NRSRO. Credit ratings are subject to change.
You can find additional information at
pgim.com/investments/mutual-funds/prospectuses-fact-sheets
or by scanning the QR code below,
including the Fund’s prospectus, financial information, fund holdings, and proxy voting information. You can also request this information by
contacting us at (800) 225-1852 or (973) 367-3529 from outside the US.
To receive your fund documents online, go to
pgim.com/investments/resource/edelivery
and enroll.
PGIM Global Total Return Fund
PGIM Global Total Return (USD Hedged) Fund
ANNUAL SHAREHOLDER REPORT – October 31, 2024
This annual shareholder report contains important information about the Class A shares of PGIM Global Total Return (USD Hedged) Fund (the
“Fund”) for the period of November 1, 2023 to October 31, 2024.
You can find additional information about the Fund at
pgim.com/investments/mutual-funds/prospectuses-fact-sheets
. You can also request
this information by contacting us at (800) 225-1852 or (973) 367-3529 from outside the US.
WHAT WERE THE FUND COSTS FOR THE LAST YEAR?
(Based on a hypothetical $10,000 investment)
| Costs of a $10,000 investment | Costs paid as a percentage of a $10,000 investment |
PGIM Global Total Return (USD Hedged) Fund— | | |
WHAT AFFECTED THE FUND’S PERFORMANCE DURING THE REPORTING PERIOD?
■
Global fixed income markets posted strong returns during the reporting period as spreads across investment grade corporates, high yield,
securitized credit, and emerging markets tightened. Moderating inflation data and a cooling of the labor market set the table for the first interest
rate cut by the US Federal Reserve (Fed) of this rate-cutting cycle, with US Treasury yields declining across the curve leading up to the Fed’s
0.50% rate cut in September.
■
Overall, security selection and sector allocation both contributed to the Fund’s performance. Within security allocation, overweights to emerging
markets high yield, US investment grade corporates, and AAA collateralized loan obligations (CLOs) relative to the Bloomberg Global
Aggregate (USD Hedged) Index contributed the most. Within credit security selection, health care & pharmaceuticals, retailers & restaurants,
and consumer non-cyclicals contributed to performance.
■
Duration and yield curve positioning detracted from performance, with positioning in developed-market rates detracting the most. On a sector
level, an underweight to mortgage-backed securities (MBS) and positioning in sovereigns detracted from performance. Within credit, security
selection in telecommunications, electric utilities, and media & entertainment detracted.
■
The Fund used interest rate futures, options, swaps, credit default swaps, and foreign exchange forwards to help manage duration positioning
and yield curve exposure and/or hedge credit risk imposed by certain issuers, and to managed foreign currency exposure, which collectively
contributed to performance.
HOW HAS THE FUND PERFORMED OVER THE PAST 10 YEARS?
The Fund’s past performance is not a good predictor of the Fund’s future performance.
The returns do not reflect the deduction of
taxes that a shareholder would pay on Fund distributions or redemption of Fund shares.
Visit
pgim.com/investments/mutual-funds/prospectuses-fact-sheets
or call (800) 225-1852 or (973) 367-3529 from outside the US for more recent performance data.
The line graph reflects a hypothetical $10,000 investment in Class A shares and assumes that all recurring fees (including management fees)
were deducted and dividend and distributions were reinvested. Without waiver of fees and/or expense reimbursements, if any, the returns would
have been lower.
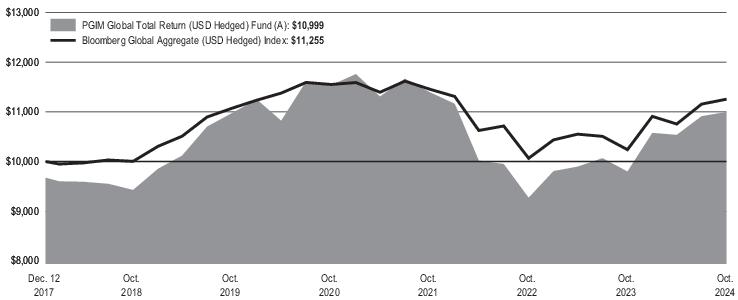
Cumulative Performance: December 12, 2017 to October 31, 2024 Initial Investment of $10,000 |
The line graph reflects the return on the Fund's Class A shares with sales charges.
Average Annual Total Returns as of 10/31/2024 |
| | | |
Class A with sales charges | | | |
Class A without sales charges | | | |
Broad-Based Securities Market Index: Bloomberg Global Aggregate (USD Hedged) Index | | | |
Since Inception returns are provided for the share class since it has less than 10 fiscal
years
of returns. Since Inception returns for the Index are measured from the
closest month-end to the class’s inception date.
WHAT ARE SOME KEY FUND STATISTICS AS OF 10/31/2024?
| |
| |
Total advisory fees paid for the year | |
Portfolio turnover rate for the year | |
WHAT ARE SOME CHARACTERISTICS OF THE FUND’S HOLDINGS AS OF 10/31/2024?
Credit Quality expressed as a percentage of total investments as of 10/31/2024 (%) |
| |
| |
| |
| |
| |
| |
| |
| |
| |
| |
| |
Credit ratings reflect the highest rating assigned by a nationally recognized statistical rating organization (NRSRO) such as Moody’s Investors Service, Inc. (Moody’s), S&P Global
Ratings (S&P), or Fitch Ratings, Inc. (Fitch). Credit ratings reflect the common nomenclature used by both S&P and Fitch. Where applicable, ratings are converted to the comparable
S&P/Fitch rating tier nomenclature. The Not Rated category consists of securities that have not been rated by an NRSRO. Credit ratings are subject to change.
You can find additional information at
pgim.com/investments/mutual-funds/prospectuses-fact-sheets
or by scanning the QR code below,
including the Fund’s prospectus, financial information, fund holdings, and proxy voting information. You can also request this information by
contacting us at (800) 225-1852 or (973) 367-3529 from outside the US.
To receive your fund documents online, go to
pgim.com/investments/resource/edelivery
and enroll.
PGIM Global Total Return (USD Hedged) Fund
PGIM Global Total Return (USD Hedged) Fund
ANNUAL SHAREHOLDER REPORT – October 31, 2024
This annual shareholder report contains important information about the Class C shares of PGIM Global Total Return (USD Hedged) Fund (the
“Fund”) for the period of November 1, 2023 to October 31, 2024.
You can find additional information about the Fund at
pgim.com/investments/mutual-funds/prospectuses-fact-sheets
. You can also request
this information by contacting us at (800) 225-1852 or (973) 367-3529 from outside the US.
WHAT WERE THE FUND COSTS FOR THE LAST YEAR?
(Based on a hypothetical $10,000 investment)
| Costs of a $10,000 investment | Costs paid as a percentage of a $10,000 investment |
PGIM Global Total Return USD Hedged Fund— | | |
WHAT AFFECTED THE FUND’S PERFORMANCE DURING THE REPORTING PERIOD?
■
Global fixed income markets posted strong returns during the reporting period as spreads across investment grade corporates, high yield,
securitized credit, and emerging markets tightened. Moderating inflation data and a cooling of the labor market set the table for the first interest
rate cut by the US Federal Reserve (Fed) of this rate-cutting cycle, with US Treasury yields declining across the curve leading up to the Fed’s
0.50% rate cut in September.
■
Overall, security selection and sector allocation both contributed to the Fund’s performance. Within security allocation, overweights to emerging
markets high yield, US investment grade corporates, and AAA collateralized loan obligations (CLOs) relative to the Bloomberg Global
Aggregate (USD Hedged) Index contributed the most. Within credit security selection, health care & pharmaceuticals, retailers & restaurants,
and consumer non-cyclicals contributed to performance.
■
Duration and yield curve positioning detracted from performance, with positioning in developed-market rates detracting the most. On a sector
level, an underweight to mortgage-backed securities (MBS) and positioning in sovereigns detracted from performance. Within credit, security
selection in telecommunications, electric utilities, and media & entertainment detracted.
■
The Fund used interest rate futures, options, swaps, credit default swaps, and foreign exchange forwards to help manage duration positioning
and yield curve exposure and/or hedge credit risk imposed by certain issuers, and to managed foreign currency exposure, which collectively
contributed to performance.
HOW HAS THE FUND PERFORMED OVER THE PAST 10 YEARS?
The Fund’s past performance is not a good predictor of the Fund’s future performance.
The returns do not reflect the deduction of
taxes that a shareholder would pay on Fund distributions or redemption of Fund shares.
Visit
pgim.com/investments/mutual-funds/prospectuses-fact-sheets
or call (800) 225-1852 or (973) 367-3529 from outside the US for more recent performance data.
The line graph reflects a hypothetical $10,000 investment in Class C shares and assumes that all recurring fees (including management fees)
were deducted and dividend and distributions were reinvested. Without waiver of fees and/or expense reimbursements, if any, the returns would
have been lower.
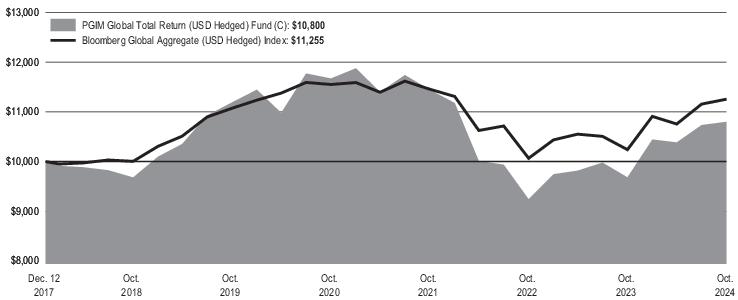
Cumulative Performance: December 12, 2017 to October 31, 2024 Initial Investment of $10,000 |
Average Annual Total Returns as of 10/31/2024 |
| | | |
Class C with sales charges | | | |
Class C without sales charges | | | |
Broad-Based Securities Market Index: Bloomberg Global Aggregate (USD Hedged) Index | | | |
Since Inception returns are provided for the share class since it has less than 10 fiscal years of returns. Since Inception returns for the Index are measured from the
closest month-end to the class’s inception date.
WHAT ARE SOME KEY FUND STATISTICS AS OF 10/31/2024?
| |
| |
Total advisory fees paid for the year | |
Portfolio turnover rate for the year | |
WHAT ARE SOME CHARACTERISTICS OF THE FUND’S HOLDINGS AS OF 10/31/2024?
Credit Quality expressed as a percentage of total investments as of 10/31/2024 (%) |
| |
| |
| |
| |
| |
| |
| |
| |
| |
| |
| |
Credit ratings reflect the highest rating assigned by a nationally recognized statistical rating organization (NRSRO) such as Moody’s Investors Service, Inc. (Moody’s), S&P Global
Ratings (S&P), or Fitch Ratings, Inc. (Fitch). Credit ratings reflect the common nomenclature used by both S&P and Fitch. Where applicable, ratings are converted to the comparable
S&P/Fitch rating tier nomenclature. The Not Rated category consists of securities that have not been rated by an NRSRO. Credit ratings are subject to change.
You can find additional information at
pgim.com/investments/mutual-funds/prospectuses-fact-sheets
or by scanning the QR code below,
including the Fund’s prospectus, financial information, fund holdings, and proxy voting information. You can also request this information by
contacting us at (800) 225-1852 or (973) 367-3529 from outside the US.
To receive your fund documents online, go to
pgim.com/investments/resource/edelivery
and enroll.
PGIM Global Total Return (USD Hedged) Fund
PGIM Global Total Return (USD Hedged) Fund
ANNUAL SHAREHOLDER REPORT – October 31, 2024
This annual shareholder report contains important information about the Class Z shares of PGIM Global Total Return (USD Hedged) Fund (the
“Fund”) for the period of November 1, 2023 to October 31, 2024.
You can find additional information about the Fund at
pgim.com/investments/mutual-funds/prospectuses-fact-sheets
. You can also request
this information by contacting us at (800) 225-1852 or (973) 367-3529 from outside the US.
WHAT WERE THE FUND COSTS FOR THE LAST YEAR?
(Based on a hypothetical $10,000 investment)
| Costs of a $10,000 investment | Costs paid as a percentage of a $10,000 investment |
PGIM Global Total Return USD Hedged Fund— | | |
WHAT AFFECTED THE FUND’S PERFORMANCE DURING THE REPORTING PERIOD?
■
Global fixed income markets posted strong returns during the reporting period as spreads across investment grade corporates, high yield,
securitized credit, and emerging markets tightened. Moderating inflation data and a cooling of the labor market set the table for the first interest
rate cut by the US Federal Reserve (Fed) of this rate-cutting cycle, with US Treasury yields declining across the curve leading up to the Fed’s
0.50% rate cut in September.
■
Overall, security selection and sector allocation both contributed to the Fund’s performance. Within security allocation, overweights to emerging
markets high yield, US investment grade corporates, and AAA collateralized loan obligations (CLOs) relative to the Bloomberg Global
Aggregate (USD Hedged) Index contributed the most. Within credit security selection, health care & pharmaceuticals, retailers & restaurants,
and consumer non-cyclicals contributed to performance.
■
Duration and yield curve positioning detracted from performance, with positioning in developed-market rates detracting the most. On a sector
level, an underweight to mortgage-backed securities (MBS) and positioning in sovereigns detracted from performance. Within credit, security
selection in telecommunications, electric utilities, and media & entertainment detracted.
■
The Fund used interest rate futures, options, swaps, credit default swaps, and foreign exchange forwards to help manage duration positioning
and yield curve exposure and/or hedge credit risk imposed by certain issuers, and to managed foreign currency exposure, which collectively
contributed to performance.
HOW HAS THE FUND PERFORMED OVER THE PAST 10 YEARS?
The Fund’s past performance is not a good predictor of the Fund’s future performance.
The returns do not reflect the deduction of
taxes that a shareholder would pay on Fund distributions or redemption of Fund shares.
Visit
pgim.com/investments/mutual-funds/prospectuses-fact-sheets
or call (800) 225-1852 or (973) 367-3529 from outside the US for more recent performance data.
The line graph reflects a hypothetical $10,000 investment in Class Z shares and assumes that all recurring fees (including management fees)
were deducted and dividend and distributions were reinvested. Without waiver of fees and/or expense reimbursements, if any, the returns would
have been lower.
Cumulative Performance: December 12, 2017 to October 31, 2024 Initial Investment of $10,000 |
Average Annual Total Returns as of 10/31/2024 |
| | | |
| | | |
Broad-Based Securities Market Index: Bloomberg Global Aggregate (USD Hedged) Index | | | |
Since Inception returns are provided for the share class since it has less than 10 fiscal years of returns. Since Inception
returns
for the Index are measured from the
closest month-end to the class’s inception date.
WHAT ARE SOME KEY FUND STATISTICS AS OF 10/31/2024?
| |
| |
Total advisory fees paid for the year | |
Portfolio turnover rate for the year | |
WHAT ARE SOME CHARACTERISTICS OF THE FUND’S HOLDINGS AS OF 10/31/2024?
Credit Quality expressed as a percentage of total investments as of 10/31/2024 (%) |
| |
| |
| |
| |
| |
| |
| |
| |
| |
| |
| |
Credit ratings reflect the highest rating assigned by a nationally recognized statistical rating organization (NRSRO) such as Moody’s Investors Service, Inc. (Moody’s), S&P Global
Ratings (S&P), or Fitch Ratings, Inc. (Fitch). Credit ratings reflect the common nomenclature used by both S&P and Fitch. Where applicable, ratings are converted to the comparable
S&P/Fitch rating tier nomenclature. The Not Rated category consists of securities that have not been rated by an NRSRO. Credit ratings are subject to change.
You can find additional information at
pgim.com/investments/mutual-funds/prospectuses-fact-sheets
or by scanning the QR code below,
including the Fund’s prospectus, financial information, fund holdings, and proxy voting information. You can also request this information by
contacting us at (800) 225-1852 or (973) 367-3529 from outside the US.
To receive your fund documents online, go to
pgim.com/investments/resource/edelivery
and enroll.
PGIM Global Total Return (USD Hedged) Fund
PGIM Global Total Return (USD Hedged) Fund
ANNUAL SHAREHOLDER REPORT – October 31, 2024
This annual shareholder report contains important information about the Class R6 shares of PGIM Global Total Return (USD Hedged) Fund (the
“Fund”) for the period of November 1, 2023 to October 31, 2024.
You can find additional information about the Fund at
pgim.com/investments/mutual-funds/prospectuses-fact-sheets
. You can also request
this information by contacting us at (800) 225-1852 or (973) 367-3529 from outside the US.
WHAT WERE THE FUND COSTS FOR THE LAST YEAR?
(Based on a hypothetical $10,000 investment)
| Costs of a $10,000 investment | Costs paid as a percentage of a $10,000 investment |
PGIM Global Total Return USD Hedged Fund— | | |
WHAT AFFECTED THE FUND’S PERFORMANCE DURING THE REPORTING PERIOD?
■
Global fixed income markets posted strong returns during the reporting period as spreads across investment grade corporates, high yield,
securitized credit, and emerging markets tightened. Moderating inflation data and a cooling of the labor market set the table for the first interest
rate cut by the US Federal Reserve (Fed) of this rate-cutting cycle, with US Treasury yields declining across the curve leading up to the Fed’s
0.50% rate cut in September.
■
Overall, security selection and sector allocation both contributed to the Fund’s performance. Within security allocation, overweights to emerging
markets high yield, US investment grade corporates, and AAA collateralized loan obligations (CLOs) relative to the Bloomberg Global
Aggregate (USD Hedged) Index contributed the most. Within credit security selection, health care & pharmaceuticals, retailers & restaurants,
and consumer non-cyclicals contributed to performance.
■
Duration and yield curve positioning detracted from performance, with positioning in developed-market rates detracting the most. On a sector
level, an underweight to mortgage-backed securities (MBS) and positioning in sovereigns detracted from performance. Within credit, security
selection in telecommunications, electric utilities, and media & entertainment detracted.
■
The Fund used interest rate futures, options, swaps, credit default swaps, and foreign exchange forwards to help manage duration positioning
and yield curve exposure and/or hedge credit risk imposed by certain issuers, and to managed foreign currency exposure, which collectively
contributed to performance.
HOW HAS THE FUND PERFORMED OVER THE PAST 10 YEARS?
The Fund’s past performance is not a good predictor of the Fund’s future performance.
The returns do not reflect the deduction of
taxes that a shareholder would pay on Fund distributions or redemption of Fund shares.
Visit
pgim.com/investments/mutual-funds/prospectuses-fact-sheets
or call (800) 225-1852 or (973) 367-3529 from outside the US for more recent performance data.
The line graph reflects a hypothetical $10,000 investment in Class R6 shares and assumes that all recurring fees (including management fees)
were deducted and dividend and distributions were reinvested. Without waiver of fees and/or expense reimbursements, if any, the returns would
have been lower.
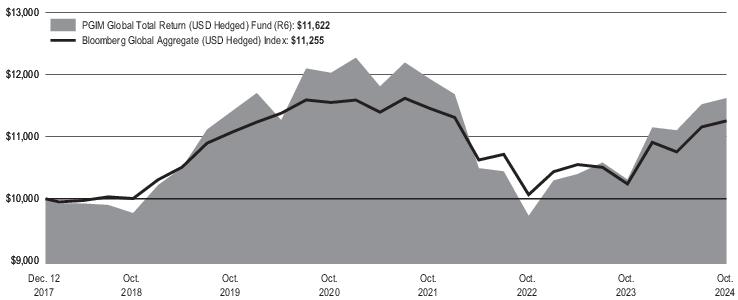
Cumulative Performance: December 12, 2017 to October 31, 2024 Initial Investment of $10,000 |
Average Annual Total Returns as of 10/31/2024 |
| | | |
| | | |
Broad-Based Securities Market Index: Bloomberg Global Aggregate (USD Hedged) Index | | | |
Since Inception returns are provided for the share class since it has less
than
10 fiscal years of returns. Since Inception returns for the Index are measured from the
closest month-end to the class’s inception date.
WHAT ARE SOME KEY FUND STATISTICS AS OF 10/31/2024?
| |
| |
Total advisory fees paid for the year | |
Portfolio turnover rate for the year | |
WHAT ARE SOME CHARACTERISTICS OF THE FUND’S HOLDINGS AS OF 10/31/2024?
Credit Quality expressed as a percentage of total investments as of 10/31/2024 (%) |
| |
| |
| |
| |
| |
| |
| |
| |
| |
| |
| |
Credit ratings reflect the highest rating assigned by a nationally recognized statistical rating organization (NRSRO) such as Moody’s Investors Service, Inc. (Moody’s), S&P Global
Ratings (S&P), or Fitch Ratings, Inc. (Fitch). Credit ratings reflect the common nomenclature used by both S&P and Fitch. Where applicable, ratings are converted to the comparable
S&P/Fitch rating tier nomenclature. The Not Rated category consists of securities that have not been rated by an NRSRO. Credit ratings are subject to change.
You can find additional information at
pgim.com/investments/mutual-funds/prospectuses-fact-sheets
or by scanning the QR code below,
including the Fund’s prospectus, financial information, fund holdings, and proxy voting information. You can also request this information by
contacting us at (800) 225-1852 or (973) 367-3529 from outside the US.
To receive your fund documents online, go to
pgim.com/investments/resource/edelivery
and enroll.
PGIM Global Total Return (USD Hedged) Fund
| | (b) | Copy of each notice transmitted to stockholders in reliance on Rule 30e-3 under the Act (17 CFR 270.30e-3) that contains disclosures specified by paragraph (c)(3) of that rule – Not applicable. |
Item 2 – Code of Ethics – See Exhibit (a)
As of the end of the period covered by this report, the registrant has adopted a code of ethics (the “Section 406 Standards for Investment Companies – Ethical Standards for Principal Executive and Financial Officers”) that applies to the registrant’s Principal Executive Officer, Principal Financial Officer and Principal Accounting Officer.
The registrant hereby undertakes to provide any person, without charge, upon request, a copy of the code of ethics. To request a copy of the code of ethics, contact the registrant 800-225-1852, and ask for a copy of the Section 406 Standards for Investment Companies - Ethical Standards for Principal Executive and Financial Officers.
Item 3 – Audit Committee Financial Expert –
The registrant’s Board has determined that Ms. Grace C. Torres, member of the Board’s Audit Committee is an “audit committee financial expert,” and that she is “independent,” for purposes of this item.
Item 4 – Principal Accountant Fees and Services –
For the fiscal years ended October 31, 2024 and October 31, 2023, PricewaterhouseCoopers LLP (“PwC”), the Registrant’s principal accountant, billed the Registrant $119,785 and $112,890, respectively, for professional services rendered for the audit of the Registrant’s annual financial statements or services that are normally provided in connection with statutory and regulatory filings.
For the fiscal years ended October 31, 2024 and October 31, 2023: none.
For the fiscal years ended October 31, 2024 and October 31, 2023: none.
For the fiscal years ended October 31, 2024 and October 31, 2023: none.
| | (e) | (1) Audit Committee Pre-Approval Policies and Procedures |
THE PGIM MUTUAL FUNDS
AUDIT COMMITTEE POLICY
on
Pre-Approval of Services Provided by the Independent Accountants
The Audit Committee of each PGIM Mutual Fund is charged with the responsibility to monitor the independence of the Fund’s independent accountants. As part of this responsibility, the Audit Committee must pre-approve the independent accounting firm’s engagement to render audit and/or permissible non-audit services, as required by law. In evaluating a proposed engagement of the independent accountants, the Audit Committee will assess the effect that the engagement might reasonably be expected to have on the accountant’s independence. The Committee’s evaluation will be based on:
| | • | | a review of the nature of the professional services expected to be provided, |
| | • | | a review of the safeguards put into place by the accounting firm to safeguard independence, and |
| | • | | periodic meetings with the accounting firm. |
Policy for Audit and Non-Audit Services Provided to the Funds
On an annual basis, the scope of audits for each Fund, audit fees and expenses, and audit-related and non-audit services (and fees proposed in respect thereof) proposed to be performed by the Fund’s independent accountants will be presented by the Treasurer and the independent accountants to the Audit Committee for review and, as appropriate, approval prior to the initiation of such services.
Such presentation shall be accompanied by confirmation by both the Treasurer and the independent accountants that the proposed non-audit services will not adversely affect the independence of the independent accountants. Such proposed non-audit services shall be described in sufficient detail to enable the Audit Committee to assess the appropriateness of such services and fees, and the compatibility of the provision of such services with the auditor’s independence. The Committee shall receive periodic reports on the progress of the audit and other services which are approved by the Committee or by the Committee Chair pursuant to authority delegated in this Policy.
The categories of services enumerated under “Audit Services”, “Audit-related Services”, and “Tax Services” are intended to provide guidance to the Treasurer and the independent accountants as to those categories of services which the Committee believes are generally consistent with the independence of the independent accountants and which the Committee (or the Committee Chair) would expect upon the presentation of specific proposals to pre-approve. The enumerated categories are not intended as an exclusive list of audit, audit-related or tax services, which the Committee (or the Committee Chair) would consider for pre-approval.
Audit Services
The following categories of audit services are considered to be consistent with the role of the Fund’s independent accountants:
| | • | | Annual Fund financial statement audits |
| | • | | Seed audits (related to new product filings, as required) |
| | • | | SEC and regulatory filings and consents |
Audit-related Services
The following categories of audit-related services are considered to be consistent with the role of the Fund’s independent accountants:
| | • | | Accounting consultations |
| | • | | Fund merger support services |
| | • | | Agreed Upon Procedure Reports |
| | • | | Other Internal Control Reports |
Individual audit-related services that fall within one of these categories (except for fund merger support services) and are not presented to the Audit Committee as part of the annual pre-approval process are subject to an authorized pre-approval by the Audit Committee so long as the estimated fee for those services does not exceed $30,000. Any services provided under such pre-approval will be reported to the Audit Committee at its next regular meeting. Should the amount of such services exceed $30,000 any additional fees will be subject to pre-approval by the Committee Chair (or any other Committee member on whom this responsibility has been delegated). Fees related to fund merger support services are subject to a separate authorized pre-approval by the Audit Committee with fees determined on a per occurrence and merger complexity basis.
Tax Services
The following categories of tax services are considered to be consistent with the role of the Fund’s independent accountants:
| | • | | Tax compliance services related to the filing or amendment of the following: |
| | • | | Federal, state and local income tax compliance; and, |
| | • | | Sales and use tax compliance |
| | • | | Timely RIC qualification reviews |
| | • | | Tax distribution analysis and planning |
| | • | | Tax authority examination services |
| | • | | Tax appeals support services |
| | • | | Accounting methods studies |
| | • | | Fund merger support services |
| | • | | Tax consulting services and related projects |
Individual tax services that fall within one of these categories and are not presented to the Audit Committee as part of the annual pre-approval process are subject to an authorized pre-approval by the Audit Committee so long as the estimated fee for those services does not exceed $30,000. Any services provided under such pre-approval will be reported to the Audit Committee at its next regular meeting. Should the amount of such services exceed $30,000 any additional fees will be subject to pre-approval by the Committee Chair (or any other Committee member on whom this responsibility has been delegated).
Other Non-Audit Services
Certain non-audit services that the independent accountants are legally permitted to render will be subject to pre-approval by the Committee or by one or more Committee members to whom the Committee has delegated this authority and who will report to the full Committee any pre-approval decisions made pursuant to this Policy. Non-audit services presented for pre-approval pursuant to this paragraph will be accompanied by a confirmation from both the Treasurer and the independent accountants that the proposed services will not adversely affect the independence of the independent accountants.
Proscribed Services
The Fund’s independent accountants will not render services in the following categories of non-audit services:
| | • | | Bookkeeping or other services related to the accounting records or financial statements of the Fund |
| | • | | Financial information systems design and implementation |
| | • | | Appraisal or valuation services, fairness opinions, or contribution-in-kind reports |
| | • | | Internal audit outsourcing services |
| | • | | Management functions or human resources |
| | • | | Broker or dealer, investment adviser, or investment banking services |
| | • | | Legal services and expert services unrelated to the audit |
| | • | | Any other service that the Public Company Accounting Oversight Board determines, by regulation, is impermissible. |
Pre-approval of Non-Audit Services Provided to Other Entities Within the PGIM Fund Complex
Certain non-audit services provided to PGIM Investments LLC or any of its affiliates that also provide ongoing services to the PGIM Mutual Funds will be subject to pre-approval by the Audit Committee. The only non-audit services provided to these entities that will require pre-approval are those related directly to the operations and financial reporting of the Funds. Individual projects that are not presented to the Audit Committee as part of the annual pre-approval process will be subject to pre-approval by the Committee Chair (or any other Committee member on whom this responsibility has been delegated) so long as the estimated fee for those services does not exceed $30,000. Services presented for pre-approval pursuant to this paragraph will be accompanied by a confirmation from both the Treasurer and the independent accountants that the proposed services will not adversely affect the independence of the independent accountants.
Although the Audit Committee will not pre-approve all services provided to PGIM Investments LLC and its affiliates, the Committee will receive an annual report from the Fund’s independent accounting firm showing the aggregate fees for all services provided to PGIM Investments and its affiliates.
| | |
| (e) (2) | | Percentage of services described in each of paragraphs (b) through (d) of this Item that were approved by the audit committee pursuant to paragraph (c)(7)(i)(C) of Rule 2-01 of Regulation S-X – |
| | |
| | | | | | | | |
| | | | | Fiscal Year Ended October 31,
2024 | | Fiscal Year Ended October 31,
2023 | | |
| | 4(b) | | Not applicable. | | Not applicable. | | |
| | 4(c) | | Not applicable. | | Not applicable. | | |
| | 4(d) | | Not applicable. | | Not applicable. | | |
| (f) | Percentage of hours expended attributable to work performed by other than full time employees of principal accountant if greater than 50%. |
The percentage of hours expended on the principal accountant’s engagement to audit the registrant’s financial statements for the most recent fiscal year that were attributed to work performed by persons other than the principal accountant’s full-time, permanent employees was 0%.
The aggregate non-audit fees billed by the Registrant’s principal accountant for services rendered to the registrant’s investment adviser and any entity controlling, controlled by, or under common control with the investment adviser that provides ongoing services to the registrant for the fiscal years ended October 31, 2024 and October 31, 2023 was $0 and $0, respectively.
| (h) | Principal Accountant’s Independence |
Not applicable as the Registrant’s principal accountant has not provided non-audit services to the registrant’s investment adviser and any entity controlling, controlled by, or under common control with the investment adviser that provides ongoing services to the registrant that were not pre-approved pursuant to Rule 2-01(c)(7)(ii) of Regulation S-X.
Item 5 – Audit Committee of Listed Registrants – Not applicable.
| | |
| Item 6 – | | Investments – The registrant’s Schedule of Investments is included in the financial statements filed under Item 7 of this Form. |
| Items 7 | – 11 (Refer to Report below) |

PRUDENTIAL GLOBAL TOTAL RETURN FUND, INC.
PGIM Global Total Return Fund
PGIM Global Total Return (USD Hedged) Fund
FINANCIAL STATEMENTS AND OTHER INFORMATION
OCTOBER 31, 2024

| | | | |
Table of Contents | | Financial Statements and Other Information | | October 31, 2024 |
Form N-CSR Item 7 - Financial Statements and Financial Highlights for Open-End Management Investment Companies.
Other Information - Form N-CSR Items 8-11
Glossary
The following abbreviations are used in the Funds’ descriptions:
AUD—Australian Dollar
BRL—Brazilian Real
CAD—Canadian Dollar
CHF—Swiss Franc
CLP—Chilean Peso
CNH—Chinese Renminbi
CNY—China Yuan
COP—Colombian Peso
CZK—Czech Koruna
DKK—Danish Krone
EUR—Euro
GBP—British Pound
HKD—Hong Kong Dollar
HUF—Hungarian Forint
IDR—Indonesian Rupiah
ILS—Israeli Shekel
ITL—Italian Lira
JPY—Japanese Yen
KRW—South Korean Won
MXN—Mexican Peso
MYR—Malaysian Ringgit
NOK—Norwegian Krone
NZD—New Zealand Dollar
PEN—Peruvian Nuevo Sol
PLN—Polish Zloty
RON—Romanian Leu
SAR—Saudi Arabian Riyal
SEK—Swedish Krona
SGD—Singapore Dollar
THB—Thai Baht
TWD—New Taiwanese Dollar
USD—US Dollar
USD—US Dollar
ZAR—South African Rand
144A—Security was purchased pursuant to Rule 144A under the Securities Act of 1933 and, pursuant to the requirements of Rule 144A, may not be resold except to qualified institutional buyers.
1
A—Annual payment frequency for swaps
AID—Agency for International Development
BARC—Barclays Bank PLC
BBR—New Zealand Bank Bill Rate
BBSW—Australian Bank Bill Swap Reference Rate
BNP—BNP Paribas S.A.
BNYM—Bank of New York Mellon
BOA—Bank of America, N.A.
BROIS—Brazil Overnight Index Swap
BTP—Buoni del Tesoro Poliennali
BUBOR—Budapest Interbank Offered Rate
CAC—French Stock Market Index
CDX—Credit Derivative Index
CF—CF Secured, LLC
CIBOR—Copenhagen Interbank Offered Rate
CITI—Citibank, N.A.
CLO—Collateralized Loan Obligation
CLOIS—Sinacofi Chile Interbank Rate Average
CME—Chicago Mercantile Exchange
CMS—Constant Maturity Swap
CORRA—Canadian Overnight Repo Rate Average
DAC—Designated Activity Company
DB—Deutsche Bank AG
EMTN—Euro Medium Term Note
ETF—Exchange-Traded Fund
EURIBOR—Euro Interbank Offered Rate
EuroSTR—Euro Short-Term Rate
FHLMC—Federal Home Loan Mortgage Corporation
GMTN—Global Medium Term Note
GS—Goldman Sachs & Co. LLC
GSI—Goldman Sachs International
HSBC—HSBC Bank PLC
ICE—Intercontinental Exchange
IG—Investment Grade
IO—Interest Only (Principal amount represents notional)
JIBAR—Johannesburg Interbank Agreed Rate
JPM—JPMorgan Chase Bank N.A.
JPS—J.P. Morgan Securities LLC
KLIBOR—Kuala Lumpur Interbank Offered Rate
2
KWCDC—Korean Won Certificate of Deposit
LIBOR—London Interbank Offered Rate
LP—Limited Partnership
M—Monthly payment frequency for swaps
MASTR—Morgan Stanley Structured Asset Security
MPLE—Maple Bonds
MSI—Morgan Stanley & Co International PLC
MTN—Medium Term Note
MUNIPSA—Municipal Swap Weekly Yield Index
N/A—Not Applicable
NIBOR—Norwegian Interbank Offered Rate
OAT—Obligations Assimilables du Tresor
OTC—Over-the-counter
PIK—Payment-in-Kind
PJSC—Public Joint-Stock Company
PRIBOR—Prague Interbank Offered Rate
Q—Quarterly payment frequency for swaps
REMIC—Real Estate Mortgage Investment Conduit
S—Semiannual payment frequency for swaps
SAIBOR—Saudi Arabian Interbank Offered Rate
SARON—Swiss Average Rate Overnight
SCB—Standard Chartered Bank
SOFR—Secured Overnight Financing Rate
SONIA—Sterling Overnight Index Average
SORA—Singapore Overnight Rate Average
SSB—State Street Bank & Trust Company
STIBOR—Stockholm Interbank Offered Rate
T—Swap payment upon termination
TAIBOR—Taiwan Interbank Offered Rate
TELBOR—Tel Aviv Interbank Offered Rate
THOR—Thai Overnight Repurchase Rate
TONAR—Tokyo Overnight Average Rate
UBS—UBS Securities LLC
USOIS—United States Overnight Index Swap
WIBOR—Warsaw Interbank Offered Rate
3
PGIM Global Total Return Fund
Schedule of Investments
as of October 31, 2024
| | | | | | | | | | | | | | | | |
| | | | |
| Description | | Interest Rate | | Maturity Date | | Principal Amount (000)# | | | Value | |
| | | | | |
LONG-TERM INVESTMENTS 98.8% | | | | | | | | | | | | | | | | |
| | | | | |
ASSET-BACKED SECURITIES 11.5% | | | | | | | | | | | | | | | | |
| | | | | |
Canada 0.2% | | | | | | | | | | | | | | | | |
| | | | | |
Evergreen Credit Card Trust, | | | | | | | | | | | | | | | | |
Series 2024-CRT04, Class C, 144A | | 5.640% | | 10/16/28 | | | | | | | 5,600 | | | $ | 5,585,218 | |
Fairstone Financial Issuance Trust, | | | | | | | | | | | | | | | | |
Series 2020-01A, Class A, 144A | | 2.509 | | 10/20/39 | | | CAD | | | | 360 | | | | 256,578 | |
| | | | | | | | | | | | | | | | |
| | | | | |
| | | | | | | | | | | | | | | 5,841,796 | |
| | | | | |
Cayman Islands 2.0% | | | | | | | | | | | | | | | | |
| | | | | |
Battalion CLO Ltd., | | | | | | | | | | | | | | | | |
Series 2015-08A, Class A1R2, 144A, 3 Month SOFR + 1.332% (Cap N/A,
Floor 1.070%) | | 5.964(c) | | 07/18/30 | | | | | | | 2,302 | | | | 2,308,846 | |
Carlyle CLO Ltd., | | | | | | | | | | | | | | | | |
Series C17A, Class A1AR, 144A, 3 Month SOFR + 1.292% (Cap N/A, Floor 0.000%) | | 5.881(c) | | 04/30/31 | | | | | | | 7,292 | | | | 7,296,965 | |
MidOcean Credit CLO, | | | | | | | | | | | | | | | | |
Series 2018-08A, Class B, 144A, 3 Month SOFR + 1.912% (Cap N/A, Floor 0.000%) | | 7.040(c) | | 02/20/31 | | | | | | | 2,000 | | | | 2,000,000 | |
Series 2018-09A, Class A1, 144A, 3 Month SOFR + 1.412% (Cap N/A, Floor 1.150%) | | 6.029(c) | | 07/20/31 | | | | | | | 769 | | | | 769,663 | |
Mountain View CLO Ltd., | | | | | | | | | | | | | | | | |
Series 2015-09A, Class A2R, 144A, 3 Month SOFR + 2.042% (Cap N/A, Floor 0.000%) | | 6.698(c) | | 07/15/31 | | | | | | | 5,750 | | | | 5,751,545 | |
Series 2019-01A, Class A1R, 144A, 3 Month SOFR + 1.512% (Cap N/A, Floor 1.250%) | | 6.168(c) | | 10/15/34 | | | | | | | 15,000 | | | | 15,012,345 | |
OZLM Ltd., | | | | | | | | | | | | | | | | |
Series 2018-20A, Class A1, 144A, 3 Month SOFR + 1.312% (Cap N/A, Floor 1.050%) | | 5.929(c) | | 04/20/31 | | | | | | | 1,604 | | | | 1,607,985 | |
Shackleton CLO Ltd., | | | | | | | | | | | | | | | | |
Series 2014-05RA, Class A, 144A, 3 Month SOFR + 1.362% (Cap N/A, Floor 0.262%) | | 6.494(c) | | 05/07/31 | | | | | | | 2,783 | | | | 2,783,558 | |
Series 2014-05RA, Class B, 144A, 3 Month SOFR + 1.962% (Cap N/A, Floor 0.262%) | | 7.094(c) | | 05/07/31 | | | | | | | 6,500 | | | | 6,512,621 | |
Voya CLO Ltd., | | | | | | | | | | | | | | | | |
Series 2013-02A, Class A1R, 144A, 3 Month SOFR + 1.232% (Cap N/A, Floor 0.970%) | | 5.857(c) | | 04/25/31 | | | | | | | 1,737 | | | | 1,737,482 | |
See Notes to Financial Statements.
4
PGIM Global Total Return Fund
Schedule of Investments (continued)
as of October 31, 2024
| | | | | | | | | | | | | | | | |
| | | | |
| Description | | Interest Rate | | Maturity Date | | Principal Amount (000)# | | | Value | |
| | | | | |
ASSET-BACKED SECURITIES (Continued) | | | | | | | | | | | | | | | | |
| | | | | |
Cayman Islands (cont’d.) | | | | | | | | | | | | | | | | |
| | | | | |
Zais CLO Ltd., | | | | | | | | | | | | | | | | |
Series 2015-03A, Class A2R, 144A, 3 Month SOFR + 2.452% (Cap N/A, Floor 0.000%) | | 7.108%(c) | | 07/15/31 | | | | | | | 8,500 | | | $ | 8,515,137 | |
Series 2017-02A, Class A, 144A, 3 Month SOFR + 1.552% (Cap N/A, Floor 0.000%) | | 6.208(c) | | 04/15/30 | | | | | | | 82 | | | | 81,544 | |
| | | | | | | | | | | | | | | | |
| | | | | |
| | | | | | | | | | | | | | | 54,377,691 | |
| | | | | |
Ireland 6.4% | | | | | | | | | | | | | | | | |
| | | | | |
Anchorage Capital Europe CLO DAC, | | | | | | | | | | | | | | | | |
Series 04A, Class A, 144A, 3 Month EURIBOR + 0.870% (Cap N/A, Floor 0.870%) | | 3.956(c) | | 04/25/34 | | | EUR | | | | 4,000 | | | | 4,339,811 | |
Ares European CLO DAC, | | | | | | | | | | | | | | | | |
Series 2013-06A, Class B1RR, 144A, 3 Month EURIBOR + 1.250% (Cap N/A, Floor 1.250%) | | 4.434(c) | | 04/15/30 | | | EUR | | | | 8,000 | | | | 8,698,283 | |
BNPP AM Euro CLO DAC, | | | | | | | | | | | | | | | | |
Series 2018-01A, Class AR, 144A, 3 Month EURIBOR + 0.600% (Cap N/A, Floor 0.600%) | | 3.779(c) | | 04/15/31 | | | EUR | | | | 9,990 | | | | 10,792,957 | |
Bosphorus CLO DAC, | | | | | | | | | | | | | | | | |
Series 06A, Class A, 144A, 3 Month EURIBOR + 0.850% (Cap N/A, Floor 0.850%) | | 4.391(c) | | 05/25/34 | | | EUR | | | | 20,000 | | | | 21,643,516 | |
Capital Four CLO DAC, | | | | | | | | | | | | | | | | |
Series 02A, Class A, 144A, 3 Month EURIBOR + 1.050% (Cap N/A, Floor 1.050%) | | 4.234(c) | | 01/15/34 | | | EUR | | | | 23,000 | | | | 25,023,264 | |
Carlyle Euro CLO DAC, | | | | | | | | | | | | | | | | |
Series 2019-01A, Class A1R, 144A, 3 Month EURIBOR + 0.750% (Cap N/A, Floor 0.750%) | | 4.231(c) | | 03/15/32 | | | EUR | | | | 19,044 | | | | 20,640,590 | |
CIFC European Funding CLO DAC, | | | | | | | | | | | | | | | | |
Series 03A, Class A, 144A, 3 Month EURIBOR + 1.050% (Cap N/A, Floor 1.050%) | | 4.234(c) | | 01/15/34 | | | EUR | | | | 15,000 | | | | 16,319,725 | |
Series 03A, Class B2, 144A | | 2.000 | | 01/15/34 | | | EUR | | | | 11,500 | | | | 11,585,272 | |
Hayfin Emerald CLO DAC, | | | | | | | | | | | | | | | | |
Series 05A, Class A, 144A, 3 Month EURIBOR + 1.100% (Cap N/A, Floor 1.100%) | | 4.649(c) | | 11/17/32 | | | EUR | | | | 18,390 | | | | 20,003,785 | |
See Notes to Financial Statements.
PGIM Global Total Return Fund 5
PGIM Global Total Return Fund
Schedule of Investments (continued)
as of October 31, 2024
| | | | | | | | | | | | | | | | |
| | | | |
| Description | | Interest Rate | | Maturity Date | | Principal Amount (000)# | | | Value | |
| | | | | |
ASSET-BACKED SECURITIES (Continued) | | | | | | | | | | | | | | | | |
| | | | | |
Ireland (cont’d.) | | | | | | | | | | | | | | | | |
| | | | | |
Henley CLO DAC, | | | | | | | | | | | | | | | | |
Series 04A, Class A, 144A, 3 Month EURIBOR + 0.900% (Cap N/A, Floor 0.900%) | | 3.986%(c) | | 04/25/34 | | | EUR | | | | 5,000 | | | $ | 5,425,205 | |
Invesco Euro CLO DAC, | | | | | | | | | | | | | | | | |
Series 01A, Class A2R, 144A | | 0.800 | | 07/15/31 | | | EUR | | | | 30,000 | | | | 31,381,422 | |
| | | | | | | | | | | | | | | | |
| | | | | |
| | | | | | | | | | | | | | | 175,853,830 | |
| | | | | |
Spain 0.1% | | | | | | | | | | | | | | | | |
| | | | | |
LSF11 Boson Investments Sarl Compartment 2, | | | | | | | | | | | | | | | | |
Series 2021-NPLA, Class A1, 144A, 3 Month EURIBOR + 2.000% (Cap N/A, Floor 0.000%) | | 5.541(c) | | 11/25/60 | | | EUR | | | | 309 | | | | 323,957 | |
TFS, | | | | | | | | | | | | | | | | |
Series 2018-03, Class A1^ | | 0.000(s) | | 04/16/40 | | | EUR | | | | —(r | ) | | | 1 | |
Series 2018-03, Class A1, 1 Month EURIBOR + 3.250%^ | | 6.856(c) | | 03/15/26 | | | EUR | | | | 2,505 | | | | 2,095,014 | |
| | | | | | | | | | | | | | | | |
| | | | | |
| | | | | | | | | | | | | | | 2,418,972 | |
| | | | | |
United Kingdom 1.0% | | | | | | | | | | | | | | | | |
| | | | | |
Apidos CLO Ltd., | | | | | | | | | | | | | | | | |
Series 2023-44A, Class A1R, 144A, 3 Month SOFR + 1.360% (Cap N/A, Floor 1.360%) | | 5.977(c) | | 10/26/37 | | | | | | | 25,000 | | | | 25,004,400 | |
NewDay Funding, | | | | | | | | | | | | | | | | |
Series 2024-01A, Class B, 144A, SONIA + 1.650% (Cap N/A, Floor 0.000%) | | 6.610(c) | | 03/15/32 | | | GBP | | | | 2,600 | | | | 3,382,827 | |
| | | | | | | | | | | | | | | | |
| | | | | |
| | | | | | | | | | | | | | | 28,387,227 | |
| | | | | |
United States 1.8% | | | | | | | | | | | | | | | | |
| | | | | |
Ally Bank Auto Credit-Linked Notes, | | | | | | | | | | | | | | | | |
Series 2024-B, Class E, 144A | | 6.678 | | 09/15/32 | | | | | | | 4,000 | | | | 3,998,116 | |
Ameriquest Mortgage Securities, Inc., Asset-Backed Pass-Through Certificates, | | | | | | | | | | | | | | | | |
Series 2002-02, Class M3, 1 Month SOFR + 2.769% (Cap N/A, Floor 2.655%) | | 4.740(c) | | 08/25/32 | | | | | | | 104 | | | | 102,541 | |
Series 2002-03, Class M3, 1 Month SOFR + 2.964% (Cap N/A, Floor 2.850%) | | 7.702(c) | | 08/25/32 | | | | | | | 77 | | | | 76,340 | |
See Notes to Financial Statements.
6
PGIM Global Total Return Fund
Schedule of Investments (continued)
as of October 31, 2024
| | | | | | | | | | | | | | |
| | | | |
| Description | | Interest Rate | | Maturity Date | | Principal Amount (000)# | | | Value | |
| | | | | |
ASSET-BACKED SECURITIES (Continued) | | | | | | | | | | | | | | |
| | | | | |
United States (cont’d.) | | | | | | | | | | | | | | |
| | | | | |
Bayview Opportunity Master Fund VII LLC, | | | | | | | | | | | | | | |
Series 2024-CAR01, Class D, 144A, 30 Day Average SOFR + 2.050% (Cap N/A, Floor 0.000%) | | 6.907%(c) | | 12/26/31 | | | | | 772 | | | $ | 774,238 | |
Bayview Opportunity Master Fund VII Trust, | | | | | | | | | | | | | | |
Series 2024-CAR1F, Class A, 144A | | 6.971 | | 07/29/32 | | | | | 1,290 | | | | 1,287,868 | |
Chase Funding Trust, | | | | | | | | | | | | | | |
Series 2003-04, Class 2A2, 1 Month SOFR + 0.714% (Cap N/A, Floor 0.600%) | | 5.452(c) | | 05/25/33 | | | | | 335 | | | | 330,880 | |
EquiFirst Mortgage Loan Trust, | | | | | | | | | | | | | | |
Series 2004-01, Class 1A1, 1 Month SOFR + 0.594% (Cap N/A, Floor 0.480%) | | 5.332(c) | | 01/25/34 | | | | | 360 | | | | 348,234 | |
Ford Credit Auto Owner Trust, | | | | | | | | | | | | | | |
Series 2020-02, Class C, 144A | | 1.740 | | 04/15/33 | | | | | 1,300 | | | | 1,255,214 | |
GreenSky Home Improvement Trust, | | | | | | | | | | | | | | |
Series 2024-01, Class A4, 144A | | 5.670 | | 06/25/59 | | | | | 288 | | | | 290,147 | |
Huntington Bank Auto Credit-Linked Notes, | | | | | | | | | | | | | | |
Series 2024-02, Class C, 144A, 30 Day Average SOFR + 2.600% (Cap N/A, Floor 0.000%) | | 7.455(c) | | 10/20/32 | | | | | 3,200 | | | | 3,200,000 | |
JPMorgan Chase Bank NA, | | | | | | | | | | | | | | |
Series 2020-01, Class R, 144A | | 33.784 | | 01/25/28 | | | | | 348 | | | | 355,984 | |
Series 2020-02, Class R, 144A | | 31.355 | | 02/25/28 | | | | | 256 | | | | 258,955 | |
Series 2021-01, Class F, 144A | | 4.280 | | 09/25/28 | | | | | 46 | | | | 46,115 | |
Series 2021-01, Class R, 144A | | 28.348 | | 09/25/28 | | | | | 1,830 | | | | 1,987,011 | |
Series 2021-02, Class F, 144A | | 4.393 | | 12/26/28 | | | | | 600 | | | | 598,843 | |
Series 2021-03, Class F, 144A | | 3.694 | | 02/26/29 | | | | | 600 | | | | 594,937 | |
Laurel Road Prime Student Loan Trust, | | | | | | | | | | | | | | |
Series 2018-A, Class A, 144A | | 0.000 | | 02/25/43 | | | | | 3,430 | | | | 576,411 | |
Series 2018-C, Class A, 144A | | 0.000(cc) | | 08/25/43 | | | | | 577 | | | | 552,166 | |
Series 2019-A, Class R, 144A | | 0.000 | | 10/25/48 | | | | | 1,427 | | | | 380,944 | |
Lending Funding Trust, | | | | | | | | | | | | | | |
Series 2020-02A, Class A, 144A | | 2.320 | | 04/21/31 | | | | | 1,100 | | | | 1,050,778 | |
Mariner Finance Issuance Trust, | | | | | | | | | | | | | | |
Series 2020-AA, Class A, 144A | | 2.190 | | 08/21/34 | | | | | 24 | | | | 23,591 | |
MASTR Asset-Backed Securities Trust, | | | | | | | | | | | | | | |
Series 2004-WMC02, Class M1, 1 Month SOFR + 1.014% (Cap N/A, Floor 0.900%) | | 5.752(c) | | 04/25/34 | | | | | 664 | | | | 641,330 | |
Morgan Stanley Dean Witter Capital I, Inc. Trust, | | | | | | | | | | | | | | |
Series 2002-AM03, Class A3, 1 Month SOFR + 1.094% (Cap N/A, Floor 0.980%) | | 5.832(c) | | 02/25/33 | | | | | 49 | | | | 49,081 | |
See Notes to Financial Statements.
PGIM Global Total Return Fund 7
PGIM Global Total Return Fund
Schedule of Investments (continued)
as of October 31, 2024
| | | | | | | | | | | | | | | | |
| | | | | |
| Description | | Interest Rate | | Maturity Date | | | | | Principal Amount (000)# | | | Value | |
| | | | | |
ASSET-BACKED SECURITIES (Continued) | | | | | | | | | | | | | | | | |
| | | | | |
United States (cont’d.) | | | | | | | | | | | | | | | | |
| | | | | |
OneMain Direct Auto Receivables Trust, | | | | | | | | | | | | | | | | |
Series 2019-01A, Class B, 144A | | 3.950% | | 11/14/28 | | | | | | | 1,300 | | | $ | 1,277,467 | |
OneMain Financial Issuance Trust, | | | | | | | | | | | | | | | | |
Series 2023-02A, Class C, 144A | | 6.740 | | 09/15/36 | | | | | | | 1,300 | | | | 1,341,098 | |
Series 2023-02A, Class D, 144A | | 7.520 | | 09/15/36 | | | | | | | 3,700 | | | | 3,836,481 | |
RCKT Mortgage Trust, | | | | | | | | | | | | | | | | |
Series 2024-CES01, Class A1A, 144A | | 6.025(cc) | | 02/25/44 | | | | | | | 1,655 | | | | 1,659,226 | |
Series 2024-CES06, Class A1A, 144A | | 5.344 | | 09/25/44 | | | | | | | 6,359 | | | | 6,300,972 | |
Santander Bank Auto Credit-Linked Notes, | | | | | | | | | | | | | | | | |
Series 2022-A, Class C, 144A | | 7.375 | | 05/15/32 | | | | | | | 315 | | | | 316,863 | |
Santander Bank NA, | | | | | | | | | | | | | | | | |
Series 2021-01A, Class D, 144A | | 5.004 | | 12/15/31 | | | | | | | 1,300 | | | | 1,297,549 | |
Santander Consumer Auto Receivables Trust, | | | | | | | | | | | | | | | | |
Series 2021-AA, Class D, 144A | | 1.570 | | 01/15/27 | | | | | | | 850 | | | | 824,498 | |
Series 2021-AA, Class R, 144A | | 0.000 | | 08/15/28 | | | | | | | 6 | | | | 305,933 | |
Santander Drive Auto Receivables Trust, | | | | | | | | | | | | | | | | |
Series 2023-06, Class C | | 6.400 | | 03/17/31 | | | | | | | 500 | | | | 518,307 | |
Sunrun Vesta Issuer LLC, | | | | | | | | | | | | | | | | |
Series 2024-03A, Class A1, 144A | | 5.490 | | 10/30/59 | | | | | | | 954 | | | | 927,553 | |
Series 2024-03A, Class A2, 144A | | 5.880 | | 10/30/59 | | | | | | | 3,796 | | | | 3,647,889 | |
Towd Point Mortgage Trust, | | | | | | | | | | | | | | | | |
Series 2024-CES01, Class A1A, 144A | | 5.848(cc) | | 01/25/64 | | | | | | | 686 | | | | 685,774 | |
Series 2024-CES02, Class A1A, 144A | | 6.125(cc) | | 02/25/64 | | | | | | | 520 | | | | 521,222 | |
Series 2024-CES05, Class A1, 144A | | 5.167(cc) | | 09/25/64 | | | | | | | 5,914 | | | | 5,848,765 | |
Wellfleet CLO Ltd., | | | | | | | | | | | | | | | | |
Series 2017-03A, Class A1, 144A, 3 Month SOFR + 1.412% (Cap N/A, Floor 1.150%) | | 6.059(c) | | 01/17/31 | | | | | | | 749 | | | | 748,849 | |
| | | | | | | | | | | | | | | | |
| | | | | |
| | | | | | | | | | | | | | | 48,838,170 | |
| | | | | | | | | | | | | | | | |
| | | | | |
TOTAL ASSET-BACKED SECURITIES (cost $338,721,789) | | | | | | | | | | | | | | | 315,717,686 | |
| | | | | | | | | | | | | | | | |
| | | | | |
COMMERCIAL MORTGAGE-BACKED SECURITIES 3.7% | | | | | | | | | | | | | | | | |
| | | | | |
Canada 0.0% | | | | | | | | | | | | | | | | |
| | | | | |
Real Estate Asset Liquidity Trust, | | | | | | | | | | | | | | | | |
Series 2020-01A, Class A1, 144A | | 2.381(cc) | | 02/12/55 | | | CAD | | | | 1,334 | | | | 916,814 | |
| | | | | | | | | | | | | | | | |
See Notes to Financial Statements.
8
PGIM Global Total Return Fund
Schedule of Investments (continued)
as of October 31, 2024
| | | | | | | | | | | | | | |
| | | | |
| Description | | Interest
Rate | | Maturity
Date | | Principal Amount (000)# | | | Value | |
| | |
COMMERCIAL MORTGAGE-BACKED SECURITIES (Continued) | | | | | | | | |
| | | | | |
United Kingdom 0.5% | | | | | | | | | | | | | | |
| | | | | |
Taurus DAC, | | | | | | | | | | | | | | |
Series 2021-UK01A, Class D, 144A, SONIA + 2.600% (Cap N/A, Floor 2.600%) | | 7.580%(c) | | 05/17/31 | | GBP | | | 546 | | | $ | 702,119 | |
Series 2021-UK04A, Class C, 144A, SONIA + 1.750% (Cap N/A, Floor 1.750%) | | 6.730(c) | | 08/17/31 | | GBP | | | 5,126 | | | | 6,600,284 | |
Series 2021-UK04A, Class D, 144A, SONIA + 2.100% (Cap N/A, Floor 2.100%) | | 7.080(c) | | 08/17/31 | | GBP | | | 4,636 | | | | 5,921,296 | |
| | | | | | | | | | | | | | |
| | | | | |
| | | | | | | | | | | | | 13,223,699 | |
| | | | | |
United States 3.2% | | | | | | | | | | | | | | |
| | | | | |
20 Times Square Trust, | | | | | | | | | | | | | | |
Series 2018-20TS, Class G, 144A | | 3.100(cc) | | 05/15/35 | | | | | 1,000 | | | | 763,535 | |
Series 2018-20TS, Class H, 144A | | 3.100(cc) | | 05/15/35 | | | | | 1,000 | | | | 743,535 | |
Benchmark Mortgage Trust, | | | | | | | | | | | | | | |
Series 2020-B17, Class A4 | | 2.042 | | 03/15/53 | | | | | 6,200 | | | | 5,282,760 | |
BX Commercial Mortgage Trust, | | | | | | | | | | | | | | |
Series 2024-PURE, Class A, 144A, CORRA + 1.900% (Cap N/A, Floor 1.900%) | | 5.856(c) | | 11/15/29 | | CAD | | | 7,100 | | | | 5,100,481 | |
CF Mortgage Trust, | | | | | | | | | | | | | | |
Series 2020-P01, Class A1, 144A | | 2.840(cc) | | 04/15/25 | | | | | 9,177 | | | | 9,121,284 | |
Citigroup Commercial Mortgage Trust, | | | | | | | | | | | | | | |
Series 2014-GC21, Class XB, IO | | 0.246(cc) | | 05/10/47 | | | | | 12,585 | | | | 126 | |
Series 2016-GC37, Class XB, IO | | 0.679(cc) | | 04/10/49 | | | | | 33,868 | | | | 242,221 | |
Series 2016-P04, Class XB, IO | | 1.311(cc) | | 07/10/49 | | | | | 9,100 | | | | 168,067 | |
Series 2017-P08, Class A2 | | 3.109 | | 09/15/50 | | | | | 1,767 | | | | 1,727,986 | |
Commercial Mortgage Trust, | | | | | | | | | | | | | | |
Series 2014-UBS04, Class XB, IO, 144A | | 0.214(cc) | | 08/10/47 | | | | | 50,000 | | | | 500 | |
CSAIL Commercial Mortgage Trust, | | | | | | | | | | | | | | |
Series 2018-CX11, Class A3 | | 4.095 | | 04/15/51 | | | | | 40 | | | | 38,889 | |
Eleven Madison Mortgage Trust, | | | | | | | | | | | | | | |
Series 2015-11MD, Class C, 144A | | 3.555(cc) | | 09/10/35 | | | | | 500 | | | | 474,064 | |
ELP Commercial Mortgage Trust, | | | | | | | | | | | | | | |
Series 2021-ELP, Class F, 144A, 1 Month SOFR + 2.781% (Cap N/A, Floor 2.667%) | | 7.585(c) | | 11/15/38 | | | | | 13,584 | | | | 13,490,797 | |
FHLMC Multifamily Structured Pass-Through Certificates, | | | | | | | | | | | | | | |
Series K043, Class X1, IO | | 0.489(cc) | | 12/25/24 | | | | | 9,039 | | | | 251 | |
Series K049, Class X1, IO | | 0.542(cc) | | 07/25/25 | | | | | 35,915 | | | | 97,393 | |
Series K052, Class X1, IO | | 0.617(cc) | | 11/25/25 | | | | | 5,196 | | | | 26,966 | |
See Notes to Financial Statements.
PGIM Global Total Return Fund 9
PGIM Global Total Return Fund
Schedule of Investments (continued)
as of October 31, 2024
| | | | | | | | | | | | | | | | |
| | | | |
| Description | | Interest
Rate | | Maturity
Date | | Principal Amount (000)# | | | Value | |
| | | |
COMMERCIAL MORTGAGE-BACKED SECURITIES (Continued) | | | | | | | | | | | | |
| | | | | |
United States (cont’d.) | | | | | | | | | | | | | | | | |
| | | | | |
FHLMC Multifamily Structured Pass-Through Certificates, (cont’d.) | | | | | | | | | | | | | | | | |
Series K053, Class X1, IO | | 0.863%(cc) | | 12/25/25 | | | | | | | 42,605 | | | $ | 283,336 | |
Series K054, Class X1, IO | | 1.140(cc) | | 01/25/26 | | | | | | | 28,445 | | | | 310,269 | |
Series K058, Class X1, IO | | 0.902(cc) | | 08/25/26 | | | | | | | 38,000 | | | | 527,784 | |
Series K090, Class X1, IO | | 0.707(cc) | | 02/25/29 | | | | | | | 22,626 | | | | 605,251 | |
Series K111, Class X1, IO | | 1.569(cc) | | 05/25/30 | | | | | | | 29,120 | | | | 2,032,630 | |
Series K113, Class X1, IO | | 1.379(cc) | | 06/25/30 | | | | | | | 117,950 | | | | 7,248,726 | |
Series K114, Class X1, IO | | 1.114(cc) | | 06/25/30 | | | | | | | 74,967 | | | | 3,823,270 | |
Series K116, Class X1, IO | | 1.419(cc) | | 07/25/30 | | | | | | | 48,618 | | | | 3,063,463 | |
Series K121, Class X1, IO | | 1.019(cc) | | 10/25/30 | | | | | | | 125,240 | | | | 5,905,602 | |
Series KG03, Class X1, IO | | 1.372(cc) | | 06/25/30 | | | | | | | 100,398 | | | | 6,005,365 | |
Series Q001, Class XA, IO | | 2.097(cc) | | 02/25/32 | | | | | | | 5,311 | | | | 355,113 | |
GS Mortgage Securities Trust, | | | | | | | | | | | | | | | | |
Series 2014-GC22, Class XB, IO | | 0.182(cc) | | 06/10/47 | | | | | | | 35,000 | | | | 112,766 | |
Series 2014-GC24, Class XB, IO | | 0.021(cc) | | 09/10/47 | | | | | | | 83,262 | | | | 833 | |
Series 2014-GC26, Class XB, IO | | 0.254(cc) | | 11/10/47 | | | | | | | 56,483 | | | | 565 | |
JPMCC Commercial Mortgage Securities Trust, | | | | | | | | | | | | | | | | |
Series 2017-JP06, Class A3 | | 3.109 | | 07/15/50 | | | | | | | 2,240 | | | | 2,156,962 | |
JPMDB Commercial Mortgage Securities Trust, | | | | | | | | | | | | | | | | |
Series 2020-COR07, Class A4 | | 1.915 | | 05/13/53 | | | | | | | 5,000 | | | | 4,070,196 | |
JPMorgan Chase Commercial Mortgage Securities Trust, | | | | | | | | | | | | | | | | |
Series 2018-AON, Class E, 144A | | 4.613(cc) | | 07/05/31 | | | | | | | 5,564 | | | | 1,919,581 | |
Morgan Stanley Capital I Trust, | | | | | | | | | | | | | | | | |
Series 2019-MEAD, Class E, 144A | | 3.177(cc) | | 11/10/36 | | | | | | | 1,700 | | | | 1,695,531 | |
Series 2020-HR08, Class XB, IO | | 0.856(cc) | | 07/15/53 | | | | | | | 54,413 | | | | 2,378,545 | |
ONE Mortgage Trust, | | | | | | | | | | | | | | | | |
Series 2021-PARK, Class C, 144A, 1 Month SOFR + 1.214% (Cap N/A, Floor 1.100%) | | 6.018(c) | | 03/15/36 | | | | | | | 1,500 | | | | 1,437,187 | |
Wells Fargo Commercial Mortgage Trust, | | | | | | | | | | | | | | | | |
Series 2016-C35, Class XB, IO | | 0.925(cc) | | 07/15/48 | | | | | | | 24,000 | | | | 304,690 | |
Series 2016-LC24, Class XB, IO | | 0.974(cc) | | 10/15/49 | | | | | | | 20,910 | | | | 337,481 | |
Series 2021-FCMT, Class B, 144A, 1 Month SOFR + 1.964% (Cap N/A, Floor 1.850%) | | 6.768(c) | | 05/15/31 | | | | | | | 1,800 | | | | 1,755,000 | |
See Notes to Financial Statements.
10
PGIM Global Total Return Fund
Schedule of Investments (continued)
as of October 31, 2024
| | | | | | | | | | | | | | | | |
| | | | |
| Description | | Interest
Rate | | Maturity
Date | | Principal Amount (000)# | | | Value | |
| | | | | |
COMMERCIAL MORTGAGE-BACKED SECURITIES (Continued) | | | | | | | | | | | | | | | | |
| | | | | |
United States (cont’d.) | | | | | | | | | | | | | | | | |
| | | | | |
Wells Fargo Commercial Mortgage Trust, (cont’d.) | | | | | | | | | | | | | | | | |
Series 2021-FCMT, Class C, 144A, 1 Month SOFR + 2.514% (Cap N/A, Floor 2.400%) | | 7.318%(c) | | 05/15/31 | | | | | | | 1,700 | | | $ | 1,644,750 | |
Series 2021-FCMT, Class D, 144A, 1 Month SOFR + 3.614% (Cap N/A, Floor 3.500%) | | 8.418(c) | | 05/15/31 | | | | | | | 2,200 | | | | 2,123,000 | |
| | | | | | | | | | | | | | | | |
| | | | | |
| | | | | | | | | | | | | | | 87,376,751 | |
| | | | | | | | | | | | | | | | |
| | | | | |
TOTAL COMMERCIAL MORTGAGE-BACKED SECURITIES
| | | | | | | | | | | | | | | | |
(cost $111,162,951) | | | | | | | | | | | | | | | 101,517,264 | |
| | | | | | | | | | | | | | | | |
| | | | | |
CORPORATE BONDS 44.0% | | | | | | | | | | | | | | | | |
| | | | | |
Brazil 0.8% | | | | | | | | | | | | | | | | |
| | | | | |
Petrobras Global Finance BV, | | | | | | | | | | | | | | | | |
Gtd. Notes | | 5.375 | | 10/01/29 | | | GBP | | | | 9,284 | | | | 11,425,664 | |
Gtd. Notes | | 6.625 | | 01/16/34 | | | GBP | | | | 7,100 | | | | 8,907,038 | |
Gtd. Notes, EMTN | | 6.250 | | 12/14/26 | | | GBP | | | | 2,000 | | | | 2,585,618 | |
Suzano Austria GmbH, | | | | | | | | | | | | | | | | |
Gtd. Notes | | 6.000 | | 01/15/29 | | | | | | | 200 | | | | 202,038 | |
| | | | | | | | | | | | | | | | |
| | | | | |
| | | | | | | | | | | | | | | 23,120,358 | |
| | | | | |
Bulgaria 0.5% | | | | | | | | | | | | | | | | |
| | | | | |
Bulgarian Energy Holding EAD, | | | | | | | | | | | | | | | | |
Sr. Unsec’d. Notes | | 2.450 | | 07/22/28 | | | EUR | | | | 13,000 | | | | 13,078,780 | |
| | | | | |
Canada 0.7% | | | | | | | | | | | | | | | | |
| | | | | |
Barrick PD Australia Finance Pty Ltd., | | | | | | | | | | | | | | | | |
Gtd. Notes | | 5.950 | | 10/15/39 | | | | | | | 50 | | | | 51,961 | |
Bombardier, Inc., | | | | | | | | | | | | | | | | |
Sr. Unsec’d. Notes, 144A | | 7.125 | | 06/15/26 | | | | | | | 1,509 | | | | 1,525,976 | |
Sr. Unsec’d. Notes, 144A | | 7.500 | | 02/01/29 | | | | | | | 275 | | | | 286,215 | |
Sr. Unsec’d. Notes, 144A | | 7.875 | | 04/15/27 | | | | | | | 428 | | | | 428,535 | |
Brookfield Residential Properties, Inc./Brookfield Residential US LLC, | | | | | | | | | | | | | | | | |
Gtd. Notes, 144A | | 4.875 | | 02/15/30 | | | | | | | 2,320 | | | | 2,151,800 | |
Gtd. Notes, 144A | | 6.250 | | 09/15/27 | | | | | | | 2,175 | | | | 2,151,684 | |
Sr. Unsec’d. Notes, 144A | | 5.000 | | 06/15/29 | | | | | | | 1,675 | | | | 1,572,406 | |
See Notes to Financial Statements.
PGIM Global Total Return Fund 11
PGIM Global Total Return Fund
Schedule of Investments (continued)
as of October 31, 2024
| | | | | | | | | | | | | | | | |
| | | | |
| Description | | Interest
Rate | | Maturity
Date | | Principal Amount (000)# | | | Value | |
| | | | | |
CORPORATE BONDS (Continued) | | | | | | | | | | | | | | | | |
| | | | | |
Canada (cont’d.) | | | | | | | | | | | | | | | | |
| | | | | |
Cenovus Energy, Inc., | | | | | | | | | | | | | | | | |
Sr. Unsec’d. Notes(a) | | 2.650% | | 01/15/32 | | | | | | | 1,340 | | | $ | 1,121,021 | |
Sr. Unsec’d. Notes | | 3.750 | | 02/15/52 | | | | | | | 955 | | | | 677,982 | |
Hydro-Quebec, | | | | | | | | | | | | | | | | |
Local Gov’t. Gtd. Notes, Series JT, SOFR Index + 0.491% | | 5.437(c) | | 03/31/25(oo) | | | | | | | 500 | | | | 385,000 | |
Methanex Corp., | | | | | | | | | | | | | | | | |
Sr. Unsec’d. Notes | | 4.250 | | 12/01/24 | | | | | | | 1,500 | | | | 1,496,250 | |
Ontario Electricity Financial Corp., | | | | | | | | | | | | | | | | |
Local Gov’t. Gtd. Notes, Series 40 | | 4.026(s) | | 04/11/31 | | | CAD | | | | 10,000 | | | | 5,710,920 | |
Ontario Teachers’ Cadillac Fairview Properties Trust, | | | | | | | | | | | | | | | | |
Sr. Unsec’d. Notes, 144A | | 2.500 | | 10/15/31 | | | | | | | 1,775 | | | | 1,485,277 | |
Rogers Communications, Inc., | | | | | | | | | | | | | | | | |
Gtd. Notes | | 3.250 | | 05/01/29 | | | CAD | | | | 700 | | | | 484,699 | |
Royal Bank of Canada, | | | | | | | | | | | | | | | | |
Sr. Unsec’d. Notes, EMTN | | 3.650 | | 03/10/26 | | | CNH | | | | 3,000 | | | | 427,970 | |
| | | | | | | | | | | | | | | | |
| | | | | |
| | | | | | | | | | | | | | | 19,957,696 | |
| | | | | |
Chile 0.1% | | | | | | | | | | | | | | | | |
| | | | | |
Chile Electricity Lux Mpc II Sarl, | | | | | | | | | | | | | | | | |
Gov’t. Gtd. Notes, 144A | | 5.580 | | 10/20/35 | | | | | | | 3,010 | | | | 2,990,284 | |
| | | | | |
China 0.6% | | | | | | | | | | | | | | | | |
| | | | | |
Agricultural Development Bank of China, | | | | | | | | | | | | | | | | |
Sr. Unsec’d. Notes | | 3.800 | | 10/27/30 | | | CNH | | | | 55,000 | | | | 8,307,885 | |
Aircraft Finance Co. Ltd., | | | | | | | | | | | | | | | | |
Sr. Sec’d. Notes, Series B | | 4.100 | | 03/29/26 | | | | | | | 732 | | | | 718,388 | |
China Development Bank, | | | | | | | | | | | | | | | | |
Sr. Unsec’d. Notes | | 4.300 | | 08/02/32 | | | CNH | | | | 25,000 | | | | 3,952,533 | |
Unsec’d. Notes | | 4.200 | | 01/19/27 | | | CNH | | | | 16,000 | | | | 2,347,586 | |
NXP BV/NXP Funding LLC/NXP USA, Inc., | | | | | | | | | | | | | | | | |
Gtd. Notes | | 3.150 | | 05/01/27 | | | | | | | 575 | | | | 552,046 | |
Gtd. Notes | | 3.400 | | 05/01/30 | | | | | | | 725 | | | | 666,630 | |
| | | | | | | | | | | | | | | | |
| | | | | |
| | | | | | | | | | | | | | | 16,545,068 | |
See Notes to Financial Statements.
12
PGIM Global Total Return Fund
Schedule of Investments (continued)
as of October 31, 2024
| | | | | | | | | | | | | | | | |
| | | | |
| Description | | Interest
Rate | | Maturity
Date | | Principal Amount (000)# | | | Value | |
| | | | | |
CORPORATE BONDS (Continued) | | | | | | | | | | | | | | | | |
| | | | | |
Denmark 0.2% | | | | | | | | | | | | | | | | |
| | | | | |
Danske Bank A/S, | | | | | | | | | | | | | | | | |
Sr. Non-Preferred Notes, 144A | | 1.621%(ff) | | 09/11/26 | | | | | | | 4,645 | | | $ | 4,504,355 | |
Sr. Non-Preferred Notes, 144A | | 3.244(ff) | | 12/20/25 | | | | | | | 1,095 | | | | 1,091,403 | |
| | | | | | | | | | | | | | | | |
| | | | | |
| | | | | | | | | | | | | | | 5,595,758 | |
| | | | | |
France 1.6% | | | | | | | | | | | | | | | | |
| | | | | |
Agence Francaise de Developpement EPIC, | | | | | | | | | | | | | | | | |
Sr. Unsec’d. Notes | | 3.000 | | 01/17/34 | | | EUR | | | | 2,400 | | | | 2,555,621 | |
Banque Federative du Credit Mutuel SA, | | | | | | | | | | | | | | | | |
Sr. Preferred Notes, Series 19 | | 0.999 | | 10/15/25 | | | JPY | | | | 200,000 | | | | 1,318,932 | |
BNP Paribas SA, | | | | | | | | | | | | | | | | |
Sub. Notes, EMTN | | 4.625 | | 03/09/27 | | | AUD | | | | 370 | | | | 236,665 | |
BPCE SA, | | | | | | | | | | | | | | | | |
Sr. Non-Preferred Notes, Series 3 | | 0.989 | | 07/12/28 | | | JPY | | | | 300,000 | | | | 1,941,261 | |
Sr. Preferred Notes, EMTN | | 3.610 | | 01/25/29 | | | CNH | | | | 4,000 | | | | 570,296 | |
Credit Agricole SA, | | | | | | | | | | | | | | | | |
Sr. Non-Preferred Notes, 144A | | 6.316(ff) | | 10/03/29 | | | | | | | 1,980 | | | | 2,068,517 | |
Sub. Notes, EMTN | | 4.200(ff) | | 05/29/34 | | | AUD | | | | 400 | | | | 242,334 | |
Eutelsat SA, | | | | | | | | | | | | | | | | |
Sr. Unsec’d. Notes, 144A | | 9.750 | | 04/13/29 | | | EUR | | | | 4,175 | | | | 4,644,536 | |
Gestion Securite de Stocks Securite SA, | | | | | | | | | | | | | | | | |
Sr. Unsec’d. Notes, EMTN | | 2.875 | | 09/07/32 | | | EUR | | | | 1,100 | | | | 1,152,282 | |
Regie Autonome des Transports Parisiens EPIC, | | | | | | | | | | | | | | | | |
Sr. Unsec’d. Notes, EMTN | | 0.350 | | 06/20/29 | | | EUR | | | | 1,000 | | | | 964,337 | |
SNCF Reseau, | | | | | | | | | | | | | | | | |
Sr. Unsec’d. Notes, Series MPLE | | 4.700 | | 06/01/35 | | | CAD | | | | 6,400 | | | | 4,796,495 | |
Societe Generale SA, | | | | | | | | | | | | | | | | |
Sr. Non-Preferred Notes, 144A | | 2.889(ff) | | 06/09/32 | | | | | | | 1,685 | | | | 1,424,737 | |
Sr. Non-Preferred Notes, 144A | | 3.337(ff) | | 01/21/33 | | | | | | | 4,915 | | | | 4,218,327 | |
Sr. Non-Preferred Notes, 144A, MTN | | 6.691(ff) | | 01/10/34 | | | | | | | 805 | | | | 848,530 | |
Sr. Non-Preferred Notes, EMTN | | 3.500 | | 07/09/26 | | | CNH | | | | 32,000 | | | | 4,513,644 | |
Sr. Non-Preferred Notes, EMTN | | 3.550 | | 06/16/29 | | | CNH | | | | 13,000 | | | | 1,824,947 | |
Sub. Notes, EMTN | | 5.000 | | 05/19/27 | | | AUD | | | | 220 | | | | 141,720 | |
Sogecap SA, | | | | | | | | | | | | | | | | |
Sub. Notes | | 6.500(ff) | | 05/16/44 | | | EUR | | | | 3,900 | | | | 4,666,023 | |
TotalEnergies SE, | | | | | | | | | | | | | | | | |
Jr. Sub. Notes, Series NC7, EMTN | | 1.625(ff) | | 10/25/27(oo) | | | EUR | | | | 5,500 | | | | 5,584,691 | |
| | | | | | | | | | | | | | | | |
| | | | | |
| | | | | | | | | | | | | | | 43,713,895 | |
See Notes to Financial Statements.
PGIM Global Total Return Fund 13
PGIM Global Total Return Fund
Schedule of Investments (continued)
as of October 31, 2024
| | | | | | | | | | | | | | | | |
| | | | |
| Description | | Interest
Rate | | Maturity
Date | | Principal Amount (000)# | | | Value | |
| | | | | |
CORPORATE BONDS (Continued) | | | | | | | | | | | | | | | | |
| | | | | |
Germany 1.3% | | | | | | | | | | | | | | | | |
| | | | | |
Deutsche Bahn Finance GmbH, | | | | | | | | | | | | | | | | |
Gtd. Notes, Series CB | | 1.600%(ff) | | 07/18/29(oo) | | | EUR | | | | 4,200 | | | $ | 4,054,908 | |
Deutsche Bahn Finance GMBH, | | | | | | | | | | | | | | | | |
Gtd. Notes, MTN | | 1.987 | | 07/08/30 | | | AUD | | | | 1,000 | | | | 550,179 | |
Deutsche Bank AG, | | | | | | | | | | | | | | | | |
Sr. Non-Preferred Notes | | 2.129(ff) | | 11/24/26 | | | | | | | 3,760 | | | | 3,640,091 | |
Sub. Notes, EMTN | | 3.662(ff) | | 04/10/25 | | | CNH | | | | 53,000 | | | | 7,460,709 | |
Hamburg Commercial Bank AG, | | | | | | | | | | | | | | | | |
Sub. Notes, EMTN, SOFR + 0.667% | | 5.538(c) | | 03/21/31 | | | | | | | 8,160 | | | | 7,751,832 | |
Volkswagen Bank GmbH, | | | | | | | | | | | | | | | | |
Sr. Non-Preferred Notes, EMTN | | 4.625 | | 05/03/31 | | | EUR | | | | 11,000 | | | | 12,355,916 | |
| | | | | | | | | | | | | | | | |
| | | | | |
| | | | | | | | | | | | | | | 35,813,635 | |
| | | | | |
Hong Kong 0.5% | | | | | | | | | | | | | | | | |
| | | | | |
HKT Capital No. 3 Ltd., | | | | | | | | | | | | | | | | |
Gtd. Notes | | 1.650 | | 04/10/27 | | | EUR | | | | 9,300 | | | | 9,416,662 | |
Sun Hung Kai Properties Capital Market Ltd., | | | | | | | | | | | | | | | | |
Gtd. Notes, EMTN | | 3.150 | | 07/11/28 | | | CNH | | | | 13,000 | | | | 1,823,267 | |
Gtd. Notes, EMTN | | 3.160 | | 01/25/28 | | | CNH | | | | 4,000 | | | | 563,567 | |
Gtd. Notes, EMTN | | 3.200 | | 08/14/27 | | | CNH | | | | 5,000 | | | | 707,295 | |
| | | | | | | | | | | | | | | | |
| | | | | |
| | | | | | | | | | | | | | | 12,510,791 | |
| | | | | |
Hungary 0.3% | | | | | | | | | | | | | | | | |
| | | | | |
MFB Magyar Fejlesztesi Bank Zrt, | | | | | | | | | | | | | | | | |
Gov’t. Gtd. Notes | | 0.375 | | 06/09/26 | | | EUR | | | | 100 | | | | 103,065 | |
Gov’t. Gtd. Notes | | 1.375 | | 06/24/25 | | | EUR | | | | 3,470 | | | | 3,716,101 | |
MVM Energetika Zrt, | | | | | | | | | | | | | | | | |
Sr. Unsec’d. Notes | | 0.875 | | 11/18/27 | | | EUR | | | | 5,530 | | | | 5,490,787 | |
| | | | | | | | | | | | | | | | |
| | | | | |
| | | | | | | | | | | | | | | 9,309,953 | |
| | | | | |
Iceland 0.2% | | | | | | | | | | | | | | | | |
| | | | | |
Landsvirkjun, | | | | | | | | | | | | | | | | |
Gov’t. Gtd. Notes, EMTN, 3 Month EURIBOR + 0.090% | | 3.188(c) | | 07/24/26 | | | EUR | | | | 5,600 | | | | 5,971,521 | |
See Notes to Financial Statements.
14
PGIM Global Total Return Fund
Schedule of Investments (continued)
as of October 31, 2024
| | | | | | | | | | | | | | | | |
| | | | |
| Description | | Interest
Rate | | Maturity
Date | | Principal Amount (000)# | | | Value | |
| | | | | |
CORPORATE BONDS (Continued) | | | | | | | | | | | | | | | | |
| | | | | |
India 0.7% | | | | | | | | | | | | | | | | |
| | | | | |
NTPC Ltd., | | | | | | | | | | | | | | | | |
Sr. Unsec’d. Notes, EMTN | | 2.750% | | 02/01/27 | | | EUR | | | | 12,350 | | | $ | 13,110,766 | |
Power Finance Corp. Ltd., | | | | | | | | | | | | | | | | |
Sr. Unsec’d. Notes, GMTN | | 1.841 | | 09/21/28 | | | EUR | | | | 6,419 | | | | 6,396,455 | |
| | | | | | | | | | | | | | | | |
| | | | | |
| | | | | | | | | | | | | | | 19,507,221 | |
| | | | | |
Indonesia 0.5% | | | | | | | | | | | | | | | | |
| | | | | |
Freeport Indonesia PT, | | | | | | | | | | | | | | | | |
Sr. Unsec’d. Notes, EMTN | | 5.315 | | 04/14/32 | | | | | | | 2,490 | | | | 2,452,650 | |
Perusahaan Perseroan Persero PT Perusahaan Listrik Negara, | | | | | | | | | | | | | | | | |
Sr. Unsec’d. Notes | | 1.875 | | 11/05/31 | | | EUR | | | | 7,500 | | | | 6,911,461 | |
Sr. Unsec’d. Notes | | 2.875 | | 10/25/25 | | | EUR | | | | 3,536 | | | | 3,813,591 | |
| | | | | | | | | | | | | | | | |
| | | | | |
| | | | | | | | | | | | | | | 13,177,702 | |
| | | | | |
Israel 0.6% | | | | | | | | | | | | | | | | |
| | | | | |
Israel Electric Corp. Ltd., | | | | | | | | | | | | | | | | |
Sec’d. Notes, 144A, GMTN | | 3.750 | | 02/22/32 | | | | | | | 600 | | | | 510,672 | |
Sr. Sec’d. Notes | | 7.875 | | 12/15/26 | | | | | | | 5,889 | | | | 6,076,977 | |
Sr. Sec’d. Notes, EMTN | | 3.700 | | 05/23/30 | | | JPY | | | | 200,000 | | | | 1,441,183 | |
Sr. Sec’d. Notes, EMTN | | 7.750 | | 12/15/27 | | | | | | | 8,650 | | | | 9,073,244 | |
| | | | | | | | | | | | | | | | |
| | | | | |
| | | | | | | | | | | | | | | 17,102,076 | |
| | | |
Italy 0.6% | | | | | | | | | | | | |
| | | | | |
Cassa Depositi e Prestiti SpA, | | | | | | | | | | | | | | | | |
Sr. Unsec’d. Notes, 144A | | 5.875 | | 04/30/29 | | | | | | | 4,200 | | | | 4,299,888 | |
Sr. Unsec’d. Notes, EMTN | | 4.750 | | 10/18/30 | | | EUR | | | | 1,500 | | | | 1,731,326 | |
Ferrovie dello Stato Italiane SpA, | | | | | | | | | | | | | | | | |
Sr. Unsec’d. Notes, EMTN | | 3.750 | | 04/14/27 | | | EUR | | | | 700 | | | | 773,355 | |
Intesa Sanpaolo SpA, | | | | | | | | | | | | | | | | |
Sr. Non-Preferred Notes, 144A | | 7.778(ff) | | 06/20/54 | | | | | | | 1,140 | | | | 1,255,523 | |
Sub. Notes, 144A | | 4.198(ff) | | 06/01/32 | | | | | | | 1,430 | | | | 1,252,454 | |
UniCredit SpA, | | | | | | | | | | | | | | | | |
Sr. Preferred Notes, 144A | | 1.982(ff) | | 06/03/27 | | | | | | | 8,485 | | | | 8,076,116 | |
| | | | | | | | | | | | | | | | |
| | | | | |
| | | | | | | | | | | | | | | 17,388,662 | |
See Notes to Financial Statements.
PGIM Global Total Return Fund 15
PGIM Global Total Return Fund
Schedule of Investments (continued)
as of October 31, 2024
| | | | | | | | | | | | | | | | |
| | | | |
| Description | | Interest
Rate | | Maturity
Date | | Principal Amount (000)# | | | Value | |
| | | |
CORPORATE BONDS (Continued) | | | | | | | | | | | | |
| | | |
Jamaica 0.4% | | | | | | | | | | | | |
| | | | | |
Digicel Group Holdings Ltd., | | | | | | | | | | | | | | | | |
Sr. Sec’d. Notes, Series 1B14, 144A (original cost $38; purchased 11/14/23)^(f) | | 0.000% | | 12/31/30 | | | | | | | 385 | | | $ | 28,696 | |
Sr. Sec’d. Notes, Series 3A14, 144A (original cost $4,419; purchased 11/14/23)^(f) | | 0.000 | | 12/31/30 | | | | | | | 2 | | | | 1,931 | |
Sr. Sec’d. Notes, Series 3B14, 144A (original cost $24; purchased 11/14/23)^(f) | | 0.000 | | 12/31/30 | | | | | | | 237 | | | | 1,613 | |
Digicel Intermediate Holdings Ltd./Digicel International Finance Ltd./DIFL US LLC, | | | | | | | | | | | | | | | | |
Sr. Sec’d. Notes, Cash coupon 9.000% and PIK 1.500% (original cost $7,620,925; purchased 01/29/24 - 05/15/24)(f) | | 10.500 | | 05/25/27 | | | | | | | 8,209 | | | | 8,260,443 | |
Digicel MidCo Ltd./DIFL US II LLC, | | | | | | | | | | | | | | | | |
Sr. Unsec’d. Notes, PIK 10.500% (original cost $856,250; purchased 01/30/24 - 05/15/24)(f) | | 10.500 | | 11/25/28 | | | | | | | 1,305 | | | | 1,208,454 | |
| | | | | | | | | | | | | | | | |
| | | | | |
| | | | | | | | | | | | | | | 9,501,137 | |
| | | |
Japan 0.1% | | | | | | | | | | | | |
| | | | | |
Nomura International Funding Pte Ltd., | | | | | | | | | | | | | | | | |
Gtd. Notes, EMTN | | 3.130 | | 01/07/31 | | | CNH | | | | 10,000 | | | | 1,413,747 | |
| | | | | |
Luxembourg 0.8% | | | | | | | | | | | | | | | | |
| | | | | |
Blackstone Property Partners Europe Holdings Sarl, | | | | | | | | | | | | | | | | |
Sr. Unsec’d. Notes, EMTN | | 1.000 | | 10/20/26 | | | EUR | | | | 1,700 | | | | 1,761,099 | |
Sr. Unsec’d. Notes, EMTN | | 1.000 | | 05/04/28 | | | EUR | | | | 9,850 | | | | 9,778,333 | |
Sr. Unsec’d. Notes, EMTN | | 1.625 | | 04/20/30 | | | EUR | | | | 2,400 | | | | 2,308,305 | |
Logicor Financing Sarl, | | | | | | | | | | | | | | | | |
Gtd. Notes, EMTN | | 1.625 | | 07/15/27 | | | EUR | | | | 4,300 | | | | 4,448,112 | |
P3 Group Sarl, | | | | | | | | | | | | | | | | |
Sr. Unsec’d. Notes, EMTN | | 1.625 | | 01/26/29 | | | EUR | | | | 1,900 | | | | 1,896,675 | |
SELP Finance Sarl, | | | | | | | | | | | | | | | | |
Gtd. Notes, EMTN | | 3.750 | | 08/10/27 | | | EUR | | | | 2,500 | | | | 2,744,611 | |
| | | | | | | | | | | | | | | | |
| | | | | |
| | | | | | | | | | | | | | | 22,937,135 | |
| | | |
Malta 0.1% | | | | | | | | | | | | |
| | | | | |
Freeport Terminal Malta PLC, | | | | | | | | | | | | | | | | |
Gov’t. Gtd. Notes, 144A | | 7.250 | | 05/15/28 | | | | | | | 3,000 | | | | 3,179,093 | |
See Notes to Financial Statements.
16
PGIM Global Total Return Fund
Schedule of Investments (continued)
as of October 31, 2024
| | | | | | | | | | | | | | | | |
| | | | |
| Description | | Interest
Rate | | Maturity
Date | | Principal Amount (000)# | | | Value | |
| | | |
CORPORATE BONDS (Continued) | | | | | | | | | | | | |
| | | |
Mexico 1.9% | | | | | | | | | | | | |
| | | | | |
Comision Federal de Electricidad, | | | | | | | | | | | | | | | | |
Sr. Unsec’d. Notes | | 5.000% | | 09/29/36 | | | | | | | 9,960 | | | $ | 8,863,603 | |
Mexico City Airport Trust, | | | | | | | | | | | | | | | | |
Sr. Sec’d. Notes | | 3.875 | | 04/30/28 | | | | | | | 389 | | | | 370,044 | |
Sr. Sec’d. Notes | | 5.500 | | 07/31/47 | | | | | | | 3,137 | | | | 2,610,580 | |
Petroleos Mexicanos, | | | | | | | | | | | | | | | | |
Gtd. Notes | | 4.750 | | 02/26/29 | | | EUR | | | | 1,900 | | | | 1,907,587 | |
Gtd. Notes | | 5.350 | | 02/12/28 | | | | | | | 50 | | | | 43,714 | |
Gtd. Notes | | 5.950 | | 01/28/31 | | | | | | | 1,050 | | | | 905,225 | |
Gtd. Notes | | 6.500 | | 03/13/27 | | | | | | | 178 | | | | 174,670 | |
Gtd. Notes | | 6.700 | | 02/16/32 | | | | | | | 100 | | | | 88,547 | |
Gtd. Notes | | 6.840 | | 01/23/30 | | | | | | | 4,050 | | | | 3,689,307 | |
Gtd. Notes | | 6.875 | | 10/16/25 | | | | | | | 100 | | | | 100,178 | |
Gtd. Notes | | 9.500 | | 09/15/27 | | | | | | | 1,000 | | | | 1,045,570 | |
Gtd. Notes | | 9.500 | | 09/15/27 | | | | | | | 6,379 | | | | 6,510,280 | |
Gtd. Notes | | 10.000 | | 02/07/33 | | | | | | | 1,990 | | | | 2,068,426 | |
Gtd. Notes, EMTN | | 2.750 | | 04/21/27 | | | EUR | | | | 5,300 | | | | 5,318,282 | |
Gtd. Notes, EMTN | | 4.875 | | 02/21/28 | | | EUR | | | | 16,500 | | | | 17,100,960 | |
Gtd. Notes, EMTN | | 6.750 | | 09/21/47 | | | | | | | 28 | | | | 20,047 | |
| | | | | | | | | | | | | | | | |
| | | | | |
| | | | | | | | | | | | | | | 50,817,020 | |
| | | | | |
Netherlands 0.3% | | | | | | | | | | | | | | | | |
| | | | | |
ABN AMRO Bank NV, | | | | | | | | | | | | | | | | |
Sr. Non-Preferred Notes, 144A, MTN | | 6.575(ff) | | 10/13/26 | | | | | | | 5,800 | | | | 5,870,122 | |
Sub. Notes, 144A, MTN | | 4.750 | | 07/28/25 | | | | | | | 500 | | | | 497,349 | |
Cooperatieve Rabobank UA, | | | | | | | | | | | | | | | | |
Sr. Preferred Notes, GMTN | | 3.500 | | 12/14/26 | | | AUD | | | | 2,882 | | | | 1,831,703 | |
Sr. Preferred Notes, GMTN | | 9.298(s) | | 03/11/39 | | | MXN | | | | 22,000 | | | | 229,480 | |
| | | | | | | | | | | | | | | | |
| | | | | |
| | | | | | | | | | | | | | | 8,428,654 | |
| | | |
Norway 0.1% | | | | | | | | | | | | |
| | | | | |
Equinor ASA, | | | | | | | | | | | | | | | | |
Gtd. Notes | | 6.800 | | 01/15/28 | | | | | | | 2,140 | | | | 2,276,412 | |
See Notes to Financial Statements.
PGIM Global Total Return Fund 17
PGIM Global Total Return Fund
Schedule of Investments (continued)
as of October 31, 2024
| | | | | | | | | | | | | | | | |
| | | | |
| Description | | Interest
Rate | | Maturity
Date | | Principal Amount (000)# | | | Value | |
| | | | | |
CORPORATE BONDS (Continued) | | | | | | | | | | | | | | | | |
| | | |
Peru 0.0% | | | | | | | | | | | | |
| | | | | |
Lima Metro Line 2 Finance Ltd., | | | | | | | | | | | | | | | | |
Sr. Sec’d. Notes | | 5.875% | | 07/05/34 | | | | | | | 83 | | | $ | 82,323 | |
Peru Enhanced Pass-Through Finance Ltd., | | | | | | | | | | | | | | | | |
Pass-Through Certificates | | 3.439(s) | | 06/02/25 | | | | | | | 540 | | | | 528,726 | |
| | | | | | | | | | | | | | | | |
| | | | | |
| | | | | | | | | | | | | | | 611,049 | |
| | | | | |
Philippines 0.3% | | | | | | | | | | | | | | | | |
| | | | | |
Bangko Sentral ng Pilipinas International Bond, | | | | | | | | | | | | | | | | |
Sr. Unsec’d. Notes, Series A | | 8.600 | | 06/15/27 | | | | | | | 3,560 | | | | 3,820,165 | |
Power Sector Assets & Liabilities Management Corp., | | | | | | | | | | | | | | | | |
Gov’t. Gtd. Notes | | 9.625 | | 05/15/28 | | | | | | | 4,320 | | | | 4,976,208 | |
| | | | | | | | | | | | | | | | |
| | | | | |
| | | | | | | | | | | | | | | 8,796,373 | |
| | | | | |
Poland 0.4% | | | | | | | | | | | | | | | | |
| | | | | |
Bank Gospodarstwa Krajowego, | | | | | | | | | | | | | | | | |
Gov’t. Gtd. Notes | | 1.625 | | 04/30/28 | | | EUR | | | | 4,760 | | | | 4,930,662 | |
Gov’t. Gtd. Notes, EMTN | | 0.500 | | 07/08/31 | | | EUR | | | | 500 | | | | 450,921 | |
Gov’t. Gtd. Notes, EMTN | | 1.750 | | 05/06/26 | | | EUR | | | | 4,700 | | | | 5,029,093 | |
Gov’t. Gtd. Notes, EMTN | | 3.000 | | 05/30/29 | | | EUR | | | | 300 | | | | 324,844 | |
Gov’t. Gtd. Notes, EMTN | | 4.000 | | 03/13/32 | | | EUR | | | | 700 | | | | 777,072 | |
| | | | | | | | | | | | | | | | |
| | | | | |
| | | | | | | | | | | | | | | 11,512,592 | |
| | | | | |
Qatar 0.3% | | | | | | | | | | | | | | | | |
| | | | | |
QNB Finance Ltd., | | | | | | | | | | | | | | | | |
Gtd. Notes, EMTN | | 3.150 | | 02/04/26 | | | CNH | | | | 20,500 | | | | 2,899,535 | |
Gtd. Notes, EMTN | | 3.500 | | 03/09/26 | | | CNH | | | | 41,660 | | | | 5,919,680 | |
Gtd. Notes, EMTN | | 3.800 | | 06/17/25 | | | CNH | | | | 1,010 | | | | 143,083 | |
Gtd. Notes, EMTN | | 3.950 | | 11/17/27 | | | CNH | | | | 1,300 | | | | 188,009 | |
Gtd. Notes, MTN | | 4.900 | | 02/01/28 | | | AUD | | | | 250 | | | | 162,094 | |
| | | | | | | | | | | | | | | | |
| | | | | |
| | | | | | | | | | | | | | | 9,312,401 | |
| | | | | |
Russia 0.4% | | | | | | | | | | | | | | | | |
| | | | | |
Gazprom PJSC Via Gaz Capital SA, | | | | | | | | | | | | | | | | |
Sr. Unsec’d. Notes | | 2.500 | | 03/21/26(d) | | | EUR | | | | 3,500 | | | | 2,474,631 | |
Sr. Unsec’d. Notes, EMTN | | 4.364 | | 03/21/25(d) | | | EUR | | | | 4,000 | | | | 3,154,475 | |
See Notes to Financial Statements.
18
PGIM Global Total Return Fund
Schedule of Investments (continued)
as of October 31, 2024
| | | | | | | | | | | | | | | | |
| | | | |
| Description | | Interest Rate | | Maturity Date | | Principal Amount (000)# | | | Value | |
| | | | | |
CORPORATE BONDS (Continued) | | | | | | | | | | | | | | | | |
| | | | | |
Russia (cont’d.) | | | | | | | | | | | | | | | | |
| | | | | |
Gazprom PJSC via Gaz Finance PLC, | | | | | | | | | | | | | | | | |
Sr. Unsec’d. Notes | | 3.000% | | 06/29/27(d) | | | | | | | 1,410 | | | $ | 824,850 | |
Sr. Unsec’d. Notes, EMTN | | 1.540 | | 06/30/27 | | | CHF | | | | 6,000 | | | | 3,647,733 | |
| | | | | | | | | | | | | | | | |
| | | | | |
| | | | | | | | | | | | | | | 10,101,689 | |
| | | | | |
Saudi Arabia 0.0% | | | | | | | | | | | | | | | | |
| | | | | |
Gaci First Investment Co., | | | | | | | | | | | | | | | | |
Gtd. Notes, EMTN | | 5.125 | | 06/11/29 | | | GBP | | | | 130 | | | | 166,789 | |
| | | | | |
Singapore 0.0% | | | | | | | | | | | | | | | | |
| | | | | |
DBS Group Holdings Ltd., | | | | | | | | | | | | | | | | |
Sub. Notes, EMTN | | 3.700 | | 03/03/31 | | | CNH | | | | 8,780 | | | | 1,252,289 | |
| | | | | |
Slovenia 0.5% | | | | | | | | | | | | | | | | |
| | | | | |
United Group BV, | | | | | | | | | | | | | | | | |
Sr. Sec’d. Notes | | 3.625 | | 02/15/28 | | | EUR | | | | 5,275 | | | | 5,522,251 | |
Sr. Sec’d. Notes | | 4.000 | | 11/15/27 | | | EUR | | | | 200 | | | | 213,878 | |
Sr. Sec’d. Notes | | 4.625 | | 08/15/28 | | | EUR | | | | 100 | | | | 106,622 | |
Sr. Sec’d. Notes, 144A | | 5.250 | | 02/01/30 | | | EUR | | | | 6,500 | | | | 6,857,698 | |
| | | | | | | | | | | | | | | | |
| | | | | |
| | | | | | | | | | | | | | | 12,700,449 | |
| | | | | |
South Africa 0.5% | | | | | | | | | | | | | | | | |
| | | | | |
Eskom Holdings SOC Ltd., | | | | | | | | | | | | | | | | |
Gov’t. Gtd. Notes, 144A, MTN | | 6.350 | | 08/10/28 | | | | | | | 1,350 | | | | 1,348,312 | |
Gov’t. Gtd. Notes, MTN | | 6.350 | | 08/10/28 | | | | | | | 12,000 | | | | 11,985,000 | |
| | | | | | | | | | | | | | | | |
| | | | | |
| | | | | | | | | | | | | | | 13,333,312 | |
| | | | | |
South Korea 0.8% | | | | | | | | | | | | | | | | |
| | | | | |
Korea Development Bank (The), | | | | | | | | | | | | | | | | |
Sr. Unsec’d. Notes, EMTN | | 1.830 | | 08/10/27 | | | SEK | | | | 74,000 | | | | 6,696,912 | |
Sr. Unsec’d. Notes, EMTN | | 3.000 | | 07/31/26 | | | CNH | | | | 6,000 | | | | 853,059 | |
Sr. Unsec’d. Notes, EMTN | | 3.050 | | 06/26/26 | | | CNH | | | | 5,000 | | | | 709,129 | |
Sr. Unsec’d. Notes, EMTN | | 6.000 | | 01/22/25 | | | IDR | | | | 15,000,000 | | | | 950,582 | |
See Notes to Financial Statements.
PGIM Global Total Return Fund 19
PGIM Global Total Return Fund
Schedule of Investments (continued)
as of October 31, 2024
| | | | | | | | | | | | | | | | |
| | | | |
| Description | | Interest Rate | | Maturity Date | | Principal Amount (000)# | | | Value | |
| | | | |
CORPORATE BONDS (Continued) | | | | | | | | | | | | | | |
| | | | |
South Korea (cont’d.) | | | | | | | | | | | | | | |
| | | | | |
Korea Expressway Corp., | | | | | | | | | | | | | | | | |
Sr. Unsec’d. Notes, GMTN | | 2.310% | | 04/28/32 | | | SEK | | | | 80,000 | | | $ | 6,873,113 | |
Sr. Unsec’d. Notes, GMTN | | 3.030 | | 05/11/32 | | | CAD | | | | 7,500 | | | | 5,090,690 | |
| | | | | | | | | | | | | | | | |
| | | | | |
| | | | | | | | | | | | | | | 21,173,485 | |
| | | | | |
Spain 0.7% | | | | | | | | | | | | | | | | |
| | | | | |
Adif Alta Velocidad, | | | | | | | | | | | | | | | | |
Sr. Unsec’d. Notes, EMTN | | 3.250 | | 05/31/29 | | | EUR | | | | 5,000 | | | | 5,464,646 | |
Banco Santander SA, | | | | | | | | | | | | | | | | |
Sub. Notes | | 2.749 | | 12/03/30 | | | | | | | 600 | | | | 514,596 | |
Cellnex Finance Co. SA, | | | | | | | | | | | | | | | | |
Gtd. Notes, EMTN | | 2.000 | | 02/15/33 | | | EUR | | | | 11,900 | | | | 11,354,516 | |
Codere Finance 2 Luxembourg SA, | | | | | | | | | | | | | | | | |
Sr. Sec’d. Notes, PIK 11.000%^ | | 11.000 | | 12/31/28 | | | EUR | | | | 461 | | | | 496,306 | |
| | | | | | | | | | | | | | | | |
| | | | | |
| | | | | | | | | | | | | | | 17,830,064 | |
| | | | | |
Supranational Bank 0.5% | | | | | | | | | | | | | | | | |
| | | | | |
African Export-Import Bank (The), | | | | | | | | | | | | | | | | |
Sr. Unsec’d. Notes | | 3.798 | | 05/17/31 | | | | | | | 300 | | | | 263,814 | |
Asian Infrastructure Investment Bank (The), | | | | | | | | | | | | | | | | |
Sr. Unsec’d. Notes, EMTN^ | | 0.375 | | 09/09/25 | | | THB | | | | 72,000 | | | | 2,102,968 | |
European Investment Bank, | | | | | | | | | | | | | | | | |
Sr. Unsec’d. Notes, EMTN | | 1.000 | | 02/25/28 | | | PLN | | | | 3,985 | | | | 860,597 | |
Inter-American Development Bank, | | | | | | | | | | | | | | | | |
Sr. Unsec’d. Notes, GMTN | | 7.500 | | 12/05/24 | | | MXN | | | | 600 | | | | 29,868 | |
International Bank for Reconstruction & Development, | | | | | | | | | | | | | | | | |
Sr. Unsec’d. Notes, SOFR Index + 0.262% (Cap 1.820%, Floor 0.000%) | | 1.820(c) | | 08/11/26 | | | | | | | 72 | | | | 67,150 | |
Sr. Unsec’d. Notes, SOFR Index + 0.262% (Cap 2.330%, Floor 0.000%) | | 2.330(c) | | 05/31/26 | | | | | | | 4 | | | | 3,856 | |
Sr. Unsec’d. Notes, EMTN | | 6.630 | | 07/24/28 | | | MXN | | | | 33,700 | | | | 1,489,352 | |
Sr. Unsec’d. Notes, MTN | | 2.700 | | 12/28/37 | | | | | | | 300 | | | | 231,586 | |
Sr. Unsec’d. Notes, EMTN | | 1.928(s) | | 04/23/32 | | | AUD | | | | 8,758 | | | | 4,044,726 | |
International Finance Corp., | | | | | | | | | | | | | | | | |
Sr. Unsec’d. Notes, GMTN | | 7.020 | | 04/06/28 | | | MXN | | | | 44,300 | | | | 2,041,618 | |
Sr. Unsec’d. Notes, GMTN | | 8.215(s) | | 01/27/37 | | | MXN | | | | 78,000 | | | | 1,252,865 | |
| | | | | | | | | | | | | | | | |
| | | | | |
| | | | | | | | | | | | | | | 12,388,400 | |
See Notes to Financial Statements.
20
PGIM Global Total Return Fund
Schedule of Investments (continued)
as of October 31, 2024
| | | | | | | | | | | | | | | | |
| | | | |
| Description | | Interest Rate | | Maturity Date | | Principal Amount (000)# | | | Value | |
| | | | | |
CORPORATE BONDS (Continued) | | | | | | | | | | | | | | | | |
| | | |
Switzerland 1.2% | | | | | | | | | | | | |
| | | | | |
UBS AG, | | | | | | | | | | | | | | | | |
Sr. Unsec’d. Notes, EMTN | | 3.550% | | 05/27/31 | | | CNH | | | | 120,000 | | | $ | 17,150,151 | |
UBS Group AG, | | | | | | | | | | | | | | | | |
Sr. Unsec’d. Notes, 144A | | 1.494(ff) | | 08/10/27 | | | | | | | 13,125 | | | | 12,337,900 | |
Sr. Unsec’d. Notes, 144A | | 3.869(ff) | | 01/12/29 | | | | | | | 900 | | | | 869,625 | |
Sr. Unsec’d. Notes, 144A | | 4.282 | | 01/09/28 | | | | | | | 2,075 | | | | 2,027,350 | |
| | | | | | | | | | | | | | | | |
| | | | | |
| | | | | | | | | | | | | | | 32,385,026 | |
| | | | | |
United Arab Emirates 0.8% | | | | | | | | | | | | | | | | |
| | | | | |
ADCB Finance Cayman Ltd., | | | | | | | | | | | | | | | | |
Gtd. Notes, EMTN | | 8.160 | | 04/29/29 | | | IDR | | | | 3,000,000 | | | | 192,043 | |
Gtd. Notes, MTN | | 4.500 | | 10/25/27 | | | AUD | | | | 2,270 | | | | 1,462,097 | |
DP World Ltd., | | | | | | | | | | | | | | | | |
Sr. Unsec’d. Notes | | 2.375 | | 09/25/26 | | | EUR | | | | 1,361 | | | | 1,449,427 | |
Sr. Unsec’d. Notes | | 4.250 | | 09/25/30 | | | GBP | | | | 5,440 | | | | 6,663,878 | |
Emirates NBD Bank PJSC, | | | | | | | | | | | | | | | | |
Sr. Unsec’d. Notes, EMTN | | 3.670 | | 07/13/28 | | | CNH | | | | 7,000 | | | | 1,009,872 | |
Sr. Unsec’d. Notes, EMTN | | 4.050 | | 09/24/25 | | | CNH | | | | 2,400 | | | | 342,016 | |
Emirates Telecommunications Group Co. PJSC, | | | | | | | | | | | | | | | | |
Sr. Unsec’d. Notes, EMTN | | 0.875 | | 05/17/33 | | | EUR | | | | 1,600 | | | | 1,433,393 | |
First Abu Dhabi Bank PJSC, | | | | | | | | | | | | | | | | |
Sr. Unsec’d. Notes, EMTN | | 0.875 | | 12/09/25 | | | GBP | | | | 1,168 | | | | 1,433,620 | |
Sr. Unsec’d. Notes, EMTN | | 3.150 | | 01/29/26 | | | CNH | | | | 55,290 | | | | 7,836,095 | |
Sr. Unsec’d. Notes, EMTN | | 3.500 | | 07/02/25 | | | CNH | | | | 2,170 | | | | 306,957 | |
| | | | | | | | | | | | | | | | |
| | | | | |
| | | | | | | | | | | | | | | 22,129,398 | |
| | | |
United Kingdom 1.8% | | | | | | | | | | | | |
| | | | | |
Barclays Bank PLC, | | | | | | | | | | | | | | | | |
Sr. Unsec’d. Notes, EMTN | | 2.100 | | 11/13/25 | | | CNH | | | | 18,000 | | | | 2,511,381 | |
Sr. Unsec’d. Notes, EMTN | | 3.600 | | 04/30/27 | | | CNH | | | | 12,000 | | | | 1,725,277 | |
Barclays PLC, | | | | | | | | | | | | | | | | |
Sr. Unsec’d. Notes, EMTN | | 0.654(ff) | | 06/09/27 | | | JPY | | | | 200,000 | | | | 1,291,734 | |
Sr. Unsec’d. Notes, MTN | | 5.244 | | 06/15/28 | | | AUD | | | | 1,000 | | | | 650,665 | |
Bellis Acquisition Co. PLC, | | | | | | | | | | | | | | | | |
Sr. Sec’d. Notes, 144A | | 8.125 | | 05/14/30 | | | GBP | | | | 2,350 | | | | 2,985,815 | |
Bellis Finco PLC, | | | | | | | | | | | | | | | | |
Sr. Unsec’d. Notes, 144A | | 4.000 | | 02/16/27 | | | GBP | | | | 6,700 | | | | 8,053,569 | |
See Notes to Financial Statements.
PGIM Global Total Return Fund 21
PGIM Global Total Return Fund
Schedule of Investments (continued)
as of October 31, 2024
| | | | | | | | | | | | | | | | |
| | | | |
| Description | | Interest Rate | | Maturity Date | | Principal Amount (000)# | | | Value | |
| | | | |
CORPORATE BONDS (Continued) | | | | | | | | | | | | | | |
| | | | |
United Kingdom (cont’d.) | | | | | | | | | | | | | | |
| | | | | |
British American Tobacco PLC, | | | | | | | | | | | | | | | | |
Jr. Sub. Notes, Series 5.25 | | 3.000%(ff) | | 09/27/26(oo) | | | EUR | | | | 8,300 | | | $ | 8,812,548 | |
Hammerson Ireland Finance DAC, | | | | | | | | | | | | | | | | |
Gtd. Notes | | 1.750 | | 06/03/27 | | | EUR | | | | 6,897 | | | | 7,179,617 | |
HSBC Bank PLC, | | | | | | | | | | | | | | | | |
Sr. Unsec’d. Notes, 144A, EMTN | | 3.120 | | 04/04/26 | | | CNH | | | | 36,800 | | | | 5,203,726 | |
Sr. Unsec’d. Notes, EMTN | | 3.150 | | 03/06/26 | | | CNH | | | | 35,000 | | | | 4,955,343 | |
HSBC Holdings PLC, | | | | | | | | | | | | | | | | |
Sr. Unsec’d. Notes | | 3.973(ff) | | 05/22/30 | | | | | | | 2,400 | | | | 2,285,641 | |
Sr. Unsec’d. Notes, EMTN | | 3.400 | | 06/29/27 | | | CNH | | | | 1,000 | | | | 142,087 | |
Lloyds Bank PLC, | | | | | | | | | | | | | | | | |
Sr. Unsec’d. Notes, EMTN | | 0.000 | | 04/02/32 | | | | | | | 2,800 | | | | 1,845,172 | |
Lloyds Banking Group PLC, | | | | | | | | | | | | | | | | |
Sub. Notes | | 4.582 | | 12/10/25 | | | | | | | 2,250 | | | | 2,232,078 | |
| | | | | | | | | | | | | | | | |
| | | | | |
| | | | | | | | | | | | | | | 49,874,653 | |
| | | | | |
United States 22.9% | | | | | | | | | | | | | | | | |
| | | | | |
3M Co., | | | | | | | | | | | | | | | | |
Sr. Unsec’d. Notes, 3 Month SOFR + (0.088)% | | 4.665(c) | | 12/21/40 | | | | | | | 1,425 | | | | 1,401,436 | |
Aflac, Inc., | | | | | | | | | | | | | | | | |
Sr. Unsec’d. Notes | | 0.500 | | 12/17/29 | | | JPY | | | | 100,000 | | | | 632,105 | |
Sr. Unsec’d. Notes | | 0.830 | | 03/12/35 | | | JPY | | | | 100,000 | | | | 588,605 | |
Sr. Unsec’d. Notes | | 0.932 | | 01/25/27 | | | JPY | | | | 80,000 | | | | 524,601 | |
Sr. Unsec’d. Notes | | 1.159 | | 10/18/30 | | | JPY | | | | 700,000 | | | | 4,536,265 | |
Albertson’s Cos., Inc./Safeway, Inc./New Albertson’s LP/Albertson’s LLC, | | | | | | | | | | | | | | | | |
Gtd. Notes, 144A | | 3.500 | | 03/15/29 | | | | | | | 1,460 | | | | 1,349,609 | |
Altria Group, Inc., | | | | | | | | | | | | | | | | |
Gtd. Notes | | 3.125 | | 06/15/31 | | | EUR | | | | 2,900 | | | | 3,014,416 | |
American International Group, Inc., | | | | | | | | | | | | | | | | |
Sr. Unsec’d. Notes | | 1.875 | | 06/21/27 | | | EUR | | | | 1,342 | | | | 1,417,390 | |
American Medical Systems Europe BV, | | | | | | | | | | | | | | | | |
Gtd. Notes | | 3.375 | | 03/08/29 | | | EUR | | | | 5,400 | | | | 5,923,954 | |
Antero Midstream Partners LP/Antero Midstream Finance Corp., | | | | | | | | | | | | | | | | |
Gtd. Notes, 144A | | 5.375 | | 06/15/29 | | | | | | | 1,425 | | | | 1,391,199 | |
Ascent Resources Utica Holdings LLC/ARU Finance Corp., | | | | | | | | | | | | | | | | |
Gtd. Notes, 144A | | 9.000 | | 11/01/27 | | | | | | | 579 | | | | 687,324 | |
See Notes to Financial Statements.
22
PGIM Global Total Return Fund
Schedule of Investments (continued)
as of October 31, 2024
| | | | | | | | | | | | | | | | |
| | | | |
| Description | | Interest Rate | | Maturity Date | | Principal Amount (000)# | | | Value | |
| | | | | |
CORPORATE BONDS (Continued) | | | | | | | | | | | | | | | | |
| | | | | |
United States (cont’d.) | | | | | | | | | | | | | | | | |
| | | | | |
Ascent Resources Utica Holdings LLC/ARU Finance Corp., (cont’d.) | | | | | | | | | | | | | | | | |
Sr. Unsec’d. Notes, 144A | | 8.250% | | 12/31/28 | | | | | | | 1,825 | | | $ | 1,862,409 | |
Ashland, Inc., | | | | | | | | | | | | | | | | |
Sr. Unsec’d. Notes, 144A | | 3.375 | | 09/01/31 | | | | | | | 1,600 | | | | 1,388,318 | |
Ashton Woods USA LLC/Ashton Woods Finance Co., | | | | | | | | | | | | | | | | |
Sr. Unsec’d. Notes, 144A | | 6.625 | | 01/15/28 | | | | | | | 5,782 | | | | 5,781,304 | |
AT&T, Inc., | | | | | | | | | | | | | | | | |
Sr. Unsec’d. Notes | | 2.550 | | 12/01/33 | | | | | | | 97 | | | | 78,967 | |
Sr. Unsec’d. Notes | | 3.950 | | 04/30/31 | | | EUR | | | | 6,500 | | | | 7,296,486 | |
Sr. Unsec’d. Notes, EMTN | | 7.000 | | 04/30/40 | | | GBP | | | | 1,550 | | | | 2,200,511 | |
Sr. Unsec’d. Notes, Series MPLE | | 4.850 | | 05/25/47 | | | CAD | | | | 150 | | | | 102,002 | |
Sr. Unsec’d. Notes, Series MPLE | | 5.100 | | 11/25/48 | | | CAD | | | | 4,575 | | | | 3,216,244 | |
Bank of America Corp., | | | | | | | | | | | | | | | | |
Sr. Unsec’d. Notes | | 2.687(ff) | | 04/22/32 | | | | | | | 6,950 | | | | 6,027,326 | |
Sr. Unsec’d. Notes, Series H, MTN, 3 Month SOFR + 0.162% | | 5.242(c) | | 11/27/40 | | | | | | | 519 | | | | 506,459 | |
Sub. Notes, EMTN | | 8.125 | | 06/02/28 | | | GBP | | | | 500 | | | | 689,856 | |
Bank of New York Mellon (The), | | | | | | | | | | | | | | | | |
Sr. Unsec’d. Notes, 3 Month SOFR + 0.062% | | 4.665(c) | | 06/30/38 | | | | | | | 1,092 | | | | 1,070,297 | |
Bausch Health Americas, Inc., | | | | | | | | | | | | | | | | |
Gtd. Notes, 144A | | 8.500 | | 01/31/27 | | | | | | | 400 | | | | 320,982 | |
Bausch Health Cos., Inc., | | | | | | | | | | | | | | | | |
Gtd. Notes, 144A | | 5.000 | | 01/30/28 | | | | | | | 1,090 | | | | 697,600 | |
Gtd. Notes, 144A | | 5.000 | | 02/15/29 | | | | | | | 175 | | | | 100,625 | |
Gtd. Notes, 144A | | 5.250 | | 01/30/30 | | | | | | | 5,500 | | | | 3,025,000 | |
Gtd. Notes, 144A | | 5.250 | | 02/15/31 | | | | | | | 2,000 | | | | 1,080,000 | |
Gtd. Notes, 144A | | 6.250 | | 02/15/29 | | | | | | | 400 | | | | 247,500 | |
Gtd. Notes, 144A | | 7.000 | | 01/15/28 | | | | | | | 375 | | | | 247,500 | |
Gtd. Notes, 144A | | 9.000 | | 12/15/25 | | | | | | | 100 | | | | 98,054 | |
Sr. Sec’d. Notes, 144A | | 4.875 | | 06/01/28 | | | | | | | 575 | | | | 442,750 | |
Beazer Homes USA, Inc., | | | | | | | | | | | | | | | | |
Gtd. Notes | | 5.875 | | 10/15/27 | | | | | | | 1,375 | | | | 1,363,708 | |
Gtd. Notes | | 7.250 | | 10/15/29 | | | | | | | 1,600 | | | | 1,626,259 | |
Becton Dickinson & Co., | | | | | | | | | | | | | | | | |
Gtd. Notes | | 3.828 | | 06/07/32 | | | EUR | | | | 4,100 | | | | 4,548,227 | |
Berkshire Hathaway, Inc., | | | | | | | | | | | | | | | | |
Sr. Unsec’d. Notes | | 0.440 | | 09/13/29 | | | JPY | | | | 2,240,000 | | | | 14,155,196 | |
Sr. Unsec’d. Notes | | 0.787 | | 09/13/34 | | | JPY | | | | 100,000 | | | | 596,544 | |
Sr. Unsec’d. Notes | | 0.965 | | 09/13/39 | | | JPY | | | | 300,000 | | | | 1,672,028 | |
See Notes to Financial Statements.
PGIM Global Total Return Fund 23
PGIM Global Total Return Fund
Schedule of Investments (continued)
as of October 31, 2024
| | | | | | | | | | | | | | | | |
| | | | |
| Description | | Interest Rate | | Maturity Date | | Principal Amount (000)# | | | Value | |
| | | | | |
CORPORATE BONDS (Continued) | | | | | | | | | | | | | | | | |
| | | | | |
United States (cont’d.) | | | | | | | | | | | | | | | | |
| | | | | |
Boeing Co. (The), | | | | | | | | | | | | | | | | |
Sr. Unsec’d. Notes | | 3.250% | | 02/01/35 | | | | | | | 480 | | | $ | 382,217 | |
Sr. Unsec’d. Notes | | 5.805 | | 05/01/50 | | | | | | | 3,760 | | | | 3,546,587 | |
BP Capital Markets PLC, | | | | | | | | | | | | | | | | |
Gtd. Notes | | 4.375(ff) | | 06/22/25(oo) | | | | | | | 3,000 | | | | 2,974,744 | |
Brixmor Operating Partnership LP, | | | | | | | | | | | | | | | | |
Sr. Unsec’d. Notes | | 2.500 | | 08/16/31 | | | | | | | 1,880 | | | | 1,590,672 | |
Broadcom, Inc., | | | | | | | | | | | | | | | | |
Sr. Unsec’d. Notes, 144A | | 3.419 | | 04/15/33 | | | | | | | 6,765 | | | | 5,967,672 | |
Caesars Entertainment, Inc., | | | | | | | | | | | | | | | | |
Gtd. Notes, 144A | | 4.625 | | 10/15/29 | | | | | | | 500 | | | | 468,625 | |
Caledonia Generating LLC, | | | | | | | | | | | | | | | | |
Sr. Sec’d. Notes, 144A | | 1.950 | | 02/28/34 | | | | | | | 9,781 | | | | 8,159,688 | |
Calpine Corp., | | | | | | | | | | | | | | | | |
Sr. Unsec’d. Notes, 144A | | 4.625 | | 02/01/29 | | | | | | | 2,770 | | | | 2,631,000 | |
Sr. Unsec’d. Notes, 144A | | 5.125 | | 03/15/28 | | | | | | | 4,150 | | | | 4,058,405 | |
Carnival Holdings Bermuda Ltd., | | | | | | | | | | | | | | | | |
Gtd. Notes, 144A | | 10.375 | | 05/01/28 | | | | | | | 2,475 | | | | 2,646,963 | |
Carrier Global Corp., | | | | | | | | | | | | | | | | |
Sr. Unsec’d. Notes | | 4.375 | | 05/29/25 | | | EUR | | | | 3,900 | | | | 4,242,225 | |
Sr. Unsec’d. Notes | | 4.500 | | 11/29/32 | | | EUR | | | | 3,000 | | | | 3,473,958 | |
CCO Holdings LLC/CCO Holdings Capital Corp., | | | | | | | | | | | | | | | | |
Sr. Unsec’d. Notes, 144A | | 4.250 | | 02/01/31 | | | | | | | 723 | | | | 627,431 | |
CDW LLC/CDW Finance Corp., | | | | | | | | | | | | | | | | |
Gtd. Notes | | 2.670 | | 12/01/26 | | | | | | | 7,675 | | | | 7,327,084 | |
Charter Communications Operating LLC/Charter Communications Operating Capital, | | | | | | | | | | | | | | | | |
Sr. Sec’d. Notes | | 3.900 | | 06/01/52 | | | | | | | 695 | | | | 447,453 | |
Sr. Sec’d. Notes | | 6.384 | | 10/23/35 | | | | | | | 17 | | | | 16,996 | |
CitiFinancial Credit Co., | | | | | | | | | | | | | | | | |
Sr. Unsec’d. Notes | | 7.875 | | 02/01/25 | | | | | | | 662 | | | | 664,404 | |
Citigroup Global Markets Holdings, Inc., | | | | | | | | | | | | | | | | |
Gtd. Notes, GMTN | | 3.790 | | 09/28/28 | | | HKD | | | | 6,000 | | | | 763,777 | |
Gtd. Notes, MTN, SOFR ICE SWAP 10Y Index + 0.000% (Cap N/A, Floor 0.000%) | | 3.555(c) | | 09/21/27 | | | | | | | 1,500 | | | | 1,441,630 | |
Gtd. Notes, MTN, SOFR + 0.100% | | 4.942(c) | | 10/20/57 | | | | | | | 885 | | | | 860,222 | |
Citigroup, Inc., | | | | | | | | | | | | | | | | |
Jr. Sub. Notes, Series X | | 3.875(ff) | | 02/18/26(oo) | | | | | | | 19,245 | | | | 18,606,759 | |
Sr. Unsec’d. Notes | | 2.520(ff) | | 11/03/32 | | | | | | | 1,660 | | | | 1,399,127 | |
Sr. Unsec’d. Notes | | 2.561(ff) | | 05/01/32 | | | | | | | 6,600 | | | | 5,644,636 | |
See Notes to Financial Statements.
24
PGIM Global Total Return Fund
Schedule of Investments (continued)
as of October 31, 2024
| | | | | | | | | | | | | | | | |
| | | | |
| Description | | Interest Rate | | Maturity Date | | Principal Amount (000)# | | | Value | |
| | | | | |
CORPORATE BONDS (Continued) | | | | | | | | | | | | | | | | |
| | | | | |
United States (cont’d.) | | | | | | | | | | | | | | | | |
| | | | | |
Citigroup, Inc., (cont’d.) | | | | | | | | | | | | | | | | |
Sr. Unsec’d. Notes, EMTN | | 6.500% | | 08/16/30 | | | GBP | | | | 7 | | | $ | 9,360 | |
Sub. Notes | | 5.827(ff) | | 02/13/35 | | | | | | | 1,230 | | | | 1,240,512 | |
Civitas Resources, Inc., | | | | | | | | | | | | | | | | |
Gtd. Notes, 144A | | 5.000 | | 10/15/26 | | | | | | | 1,755 | | | | 1,723,955 | |
Cleveland-Cliffs, Inc., | | | | | | | | | | | | | | | | |
Gtd. Notes, 144A | | 6.875 | | 11/01/29 | | | | | | | 635 | | | | 637,201 | |
Gtd. Notes, 144A | | 7.375 | | 05/01/33 | | | | | | | 395 | | | | 397,969 | |
Colgate-Palmolive Co., | | | | | | | | | | | | | | | | |
Sr. Unsec’d. Notes, Series E, MTN, 3 Month SOFR + (0.038)% | | 4.560(c) | | 04/04/45 | | | | | | | 1,300 | | | | 1,289,683 | |
Sr. Unsec’d. Notes, Series E, MTN, 3 Month SOFR + (0.038)% | | 5.083(c) | | 08/22/42 | | | | | | | 485 | | | | 479,653 | |
Columbia Pipelines Operating Co. LLC, | | | | | | | | | | | | | | | | |
Sr. Unsec’d. Notes, 144A | | 6.036 | | 11/15/33 | | | | | | | 2,040 | | | | 2,111,598 | |
Comerica, Inc., | | | | | | | | | | | | | | | | |
Sr. Unsec’d. Notes | | 5.982(ff) | | 01/30/30 | | | | | | | 2,792 | | | | 2,829,253 | |
Dana, Inc., | | | | | | | | | | | | | | | | |
Sr. Unsec’d. Notes | | 4.500 | | 02/15/32 | | | | | | | 2,075 | | | | 1,773,849 | |
Sr. Unsec’d. Notes | | 5.375 | | 11/15/27 | | | | | | | 1,800 | | | | 1,760,728 | |
DaVita, Inc., | | | | | | | | | | | | | | | | |
Gtd. Notes, 144A | | 3.750 | | 02/15/31 | | | | | | | 1,125 | | | | 978,960 | |
Gtd. Notes, 144A | | 4.625 | | 06/01/30 | | | | | | | 1,125 | | | | 1,034,816 | |
Dcli Bidco LLC, | | | | | | | | | | | | | | | | |
Second Mortgage, 144A | | 7.750 | | 11/15/29 | | | | | | | 425 | | | | 432,255 | |
Diamond Sports Group LLC/Diamond Sports Finance Co., | | | | | | | | | | | | | | | | |
Gtd. Notes, 144A (original cost $3,451,125; purchased 07/18/19 - 02/27/20)(f) | | 6.625 | | 08/15/27(d) | | | | | | | 3,740 | | | | 23,705 | |
Sec’d. Notes, 144A (original cost $10,000; purchased 10/03/24)(f) | | 5.375 | | 08/15/26(d) | | | | | | | 1,000 | | | | 6,757 | |
DISH DBS Corp., | | | | | | | | | | | | | | | | |
Gtd. Notes | | 5.125 | | 06/01/29 | | | | | | | 575 | | | | 381,908 | |
Gtd. Notes | | 7.375 | | 07/01/28 | | | | | | | 475 | | | | 347,832 | |
Gtd. Notes | | 7.750 | | 07/01/26 | | | | | | | 4,950 | | | | 4,182,138 | |
DISH Network Corp., | | | | | | | | | | | | | | | | |
Sr. Sec’d. Notes, 144A | | 11.750 | | 11/15/27 | | | | | | | 1,300 | | | | 1,368,569 | |
Diversified Healthcare Trust, | | | | | | | | | | | | | | | | |
Gtd. Notes | | 9.750 | | 06/15/25 | | | | | | | 166 | | | | 166,000 | |
See Notes to Financial Statements.
PGIM Global Total Return Fund 25
PGIM Global Total Return Fund
Schedule of Investments (continued)
as of October 31, 2024
| | | | | | | | | | | | | | | | |
| | | | |
| Description | | Interest
Rate | | Maturity Date | | Principal Amount (000)# | | | Value | |
| | | | | |
CORPORATE BONDS (Continued) | | | | | | | | | | | | | | | | |
| | | | | |
United States (cont’d.) | | | | | | | | | | | | | | | | |
| | | | | |
Dow Chemical Co. (The), | | | | | | | | | | | | | | | | |
Sr. Unsec’d. Notes | | 9.400% | | 05/15/39 | | | | | | | 88 | | | $ | 117,665 | |
Energy Transfer LP, | | | | | | | | | | | | | | | | |
Jr. Sub. Notes, Series G | | 7.125(ff) | | 05/15/30(oo) | | | | | | | 7,800 | | | | 7,934,800 | |
Jr. Sub. Notes, Series H | | 6.500(ff) | | 11/15/26(oo) | | | | | | | 5,045 | | | | 5,035,232 | |
Sr. Unsec’d. Notes | | 5.400 | | 10/01/47 | | | | | | | 2,200 | | | | 2,005,287 | |
Sr. Unsec’d. Notes | | 6.000 | | 06/15/48 | | | | | | | 2,350 | | | | 2,311,055 | |
Expand Energy Corp., | | | | | | | | | | | | | | | | |
Gtd. Notes | | 5.375 | | 02/01/29 | | | | | | | 2,000 | | | | 1,969,560 | |
Gtd. Notes, 144A | | 5.500 | | 02/01/26 | | | | | | | 650 | | | | 649,033 | |
Gtd. Notes, 144A | | 5.875 | | 02/01/29 | | | | | | | 600 | | | | 599,726 | |
Fertitta Entertainment LLC/Fertitta Entertainment Finance Co., Inc., | | | | | | | | | | | | | | | | |
Sr. Sec’d. Notes, 144A | | 4.625 | | 01/15/29 | | | | | | | 25 | | | | 23,346 | |
Fidelity National Information Services, Inc., | | | | | | | | | | | | | | | | |
Sr. Unsec’d. Notes | | 1.500 | | 05/21/27 | | | EUR | | | | 5,600 | | | | 5,869,119 | |
Ford Motor Credit Co. LLC, | | | | | | | | | | | | | | | | |
Sr. Unsec’d. Notes | | 4.134 | | 08/04/25 | | | | | | | 200 | | | | 198,226 | |
Sr. Unsec’d. Notes, EMTN | | 3.683 | | 12/03/24 | | | AUD | | | | 500 | | | | 328,314 | |
Fortive Corp., | | | | | | | | | | | | | | | | |
Sr. Unsec’d. Notes | | 3.700 | | 02/13/26 | | | EUR | | | | 6,050 | | | | 6,632,924 | |
Sr. Unsec’d. Notes | | 3.700 | | 08/15/29 | | | EUR | | | | 3,850 | | | | 4,228,296 | |
General Electric Co., | | | | | | | | | | | | | | | | |
Sr. Unsec’d. Notes, Series A, MTN | | 0.000(cc) | | 10/16/38 | | | | | | | 400 | | | | 392,736 | |
General Mills, Inc., | | | | | | | | | | | | | | | | |
Sr. Unsec’d. Notes | | 3.650 | | 10/23/30 | | | EUR | | | | 8,200 | | | | 9,084,861 | |
GN Bondco LLC, | | | | | | | | | | | | | | | | |
Sr. Sec’d. Notes, 144A | | 9.500 | | 10/15/31 | | | | | | | 2,350 | | | | 2,496,093 | |
Goldman Sachs Group, Inc. (The), | | | | | | | | | | | | | | | | |
Jr. Sub. Notes, Series U | | 3.650(ff) | | 08/10/26(oo) | | | | | | | 11,370 | | | | 10,830,023 | |
Sr. Unsec’d. Notes | | 1.992(ff) | | 01/27/32 | | | | | | | 2,450 | | | | 2,040,658 | |
Sr. Unsec’d. Notes | | 2.383(ff) | | 07/21/32 | | | | | | | 1,770 | | | | 1,492,378 | |
Sr. Unsec’d. Notes | | 2.615(ff) | | 04/22/32 | | | | | | | 9,660 | | | | 8,308,425 | |
Sr. Unsec’d. Notes | | 4.500 | | 05/16/28 | | | AUD | | | | 210 | | | | 133,667 | |
Sr. Unsec’d. Notes, EMTN | | 1.000 | | 08/16/32 | | | JPY | | | | 200,000 | | | | 1,238,744 | |
Sr. Unsec’d. Notes, EMTN | | 1.300 | | 03/22/30 | | | JPY | | | | 10,000 | | | | 64,873 | |
Sr. Unsec’d. Notes, EMTN, EURIBOR ICE SWAP 11:00 Fft 10Y Index + 0.000% (Cap 7.000%, Floor N/A) | | 2.807(c) | | 06/30/25 | | | EUR | | | | 2,227 | | | | 2,371,548 | |
See Notes to Financial Statements.
26
PGIM Global Total Return Fund
Schedule of Investments (continued)
as of October 31, 2024
| | | | | | | | | | | | | | | | |
| | | | |
| Description | | Interest Rate | | Maturity Date | | Principal Amount (000)# | | | Value | |
| | | | | |
CORPORATE BONDS (Continued) | | | | | | | | | | | | | | | | |
| | | | | |
United States (cont’d.) | | | | | | | | | | | | | | | | |
| | | | | |
Goldman Sachs Group, Inc. (The), (cont’d.) | | | | | | | | | | | | | | | | |
Sr. Unsec’d. Notes, EMTN, 6 Month EURIBOR + 0.000% (Cap 5.500%,
Floor 0.000%) | | 3.488%(c) | | 08/12/25 | | | EUR | | | | 3,216 | | | $ | 3,477,879 | |
Sr. Unsec’d. Notes, EMTN, EURIBOR ICE SWAP 11:00 Fft 10Y Index + 0.000% (Cap 12.000%, Floor 5.220%)^ | | 5.220(c) | | 08/24/30 | | | EUR | | | | 5,000 | | | | 5,778,672 | |
Sr. Unsec’d. Notes, EMTN, 3 Month SOFR + 0.262% (Cap N/A, Floor 0.000%) | | 5.277(c) | | 11/30/24 | | | | | | | 40 | | | | 39,920 | |
Greystone Commercial Capital Trust, | | | | | | | | | | | | | | | | |
Sr. Unsec’d. Notes, Series A, 144A, 1 Month LIBOR + 2.270% (original cost $19,079,706; purchased 05/18/21)^(f) | | 7.230(c) | | 05/31/25(d) | | | | | | | 19,080 | | | | 16,980,939 | |
HCA, Inc., | | | | | | | | | | | | | | | | |
Gtd. Notes | | 7.500 | | 11/06/33 | | | | | | | 2,000 | | | | 2,247,010 | |
Gtd. Notes, MTN | | 7.750 | | 07/15/36 | | | | | | | 2,000 | | | | 2,302,789 | |
Hilcorp Energy I LP/Hilcorp Finance Co., | | | | | | | | | | | | | | | | |
Sr. Unsec’d. Notes, 144A | | 8.375 | | 11/01/33 | | | | | | | 1,000 | | | | 1,045,571 | |
Honeywell International, Inc., | | | | | | | | | | | | | | | | |
Sr. Unsec’d. Notes | | 0.750 | | 03/10/32 | | | EUR | | | | 3,000 | | | | 2,728,077 | |
Sr. Unsec’d. Notes | | 3.750 | | 05/17/32 | | | EUR | | | | 4,900 | | | | 5,451,552 | |
Housing & Urban Development Corp. Ltd. AID Bond, | | | | | | | | | | | | | | | | |
U.S. Gov’t. Gtd. Notes, 6 Month LIBOR + 0.035% | | 5.034(c) | | 09/15/30 | | | | | | | 600 | | | | 599,904 | |
Hunt Cos., Inc., | | | | | | | | | | | | | | | | |
Sr. Sec’d. Notes, 144A | | 5.250 | | 04/15/29 | | | | | | | 5,575 | | | | 5,286,822 | |
International Game Technology PLC, | | | | | | | | | | | | | | | | |
Sr. Sec’d. Notes, 144A | | 4.125 | | 04/15/26 | | | | | | | 4,000 | | | | 3,944,040 | |
JBS USA Holding Lux Sarl/JBS USA Food Co./JBS Lux Co. Sarl, | | | | | | | | | | | | | | | | |
Gtd. Notes | | 5.125 | | 02/01/28 | | | | | | | 1,373 | | | | 1,369,682 | |
Jefferies Financial Group, Inc., | | | | | | | | | | | | | | | | |
Sr. Unsec’d. Notes | | 2.750 | | 10/15/32 | | | | | | | 9,275 | | | | 7,701,078 | |
Johnsonville Aeroderivative Combustion Turbine Generation LLC, | | | | | | | | | | | | | | | | |
Sr. Sec’d. Notes | | 5.078 | | 10/01/54 | | | | | | | 2,990 | | | | 2,932,079 | |
JPMorgan Chase & Co., | | | | | | | | | | | | | | | | |
Jr. Sub. Notes, Series HH | | 4.600(ff) | | 02/01/25(oo) | | | | | | | 23,506 | | | | 23,369,378 | |
JPMorgan Chase Bank NA, | | | | | | | | | | | | | | | | |
Sr. Unsec’d. Notes | | 4.762(s) | | 03/17/48 | | | ITL(jj) | | | | 29,800,000 | | | | 4,316,109 | |
JPMorgan Chase Financial Co. LLC, | | | | | | | | | | | | | | | | |
Gtd. Notes, EMTN | | 3.330 | | 08/31/26 | | | CNH | | | | 14,000 | | | | 1,990,603 | |
See Notes to Financial Statements.
PGIM Global Total Return Fund 27
PGIM Global Total Return Fund
Schedule of Investments (continued)
as of October 31, 2024
| | | | | | | | | | | | | | | | |
| | | | |
| Description | | Interest Rate | | Maturity Date | | Principal Amount (000)# | | | Value | |
| | | | | |
CORPORATE BONDS (Continued) | | | | | | | | | | | | | | | | |
| | | | | |
United States (cont’d.) | | | | | | | | | | | | | | | | |
| | | | | |
JPMorgan Chase Financial Co. LLC, (cont’d.) | | | | | | | | | | | | | | | | |
Gtd. Notes, EMTN | | 3.500% | | 07/27/28 | | | CNH | | | | 38,000 | | | $ | 5,475,703 | |
KB Home, | | | | | | | | | | | | | | | | |
Gtd. Notes | | 6.875 | | 06/15/27 | | | | | | | 1,650 | | | | 1,703,329 | |
Kimco Realty OP LLC, | | | | | | | | | | | | | | | | |
Gtd. Notes(a) | | 2.250 | | 12/01/31 | | | | | | | 4,160 | | | | 3,481,360 | |
Kraft Heinz Foods Co., | | | | | | | | | | | | | | | | |
Gtd. Notes | | 4.875 | | 10/01/49 | | | | | | | 15 | | | | 13,373 | |
Lamb Weston Holdings, Inc., | | | | | | | | | | | | | | | | |
Gtd. Notes, 144A | | 4.125 | | 01/31/30 | | | | | | | 75 | | | | 69,631 | |
Gtd. Notes, 144A | | 4.375 | | 01/31/32 | | | | | | | 1,650 | | | | 1,510,623 | |
Level 3 Financing, Inc., | | | | | | | | | | | | | | | | |
Sec’d. Notes, 144A | | 4.875 | | 06/15/29 | | | | | | | 200 | | | | 171,052 | |
Sr. Sec’d. Notes, 144A | | 10.500 | | 04/15/29 | | | | | | | 4,042 | | | | 4,505,577 | |
Sr. Sec’d. Notes, 144A | | 10.500 | | 05/15/30 | | | | | | | 775 | | | | 849,002 | |
Sr. Sec’d. Notes, 144A | | 11.000 | | 11/15/29 | | | | | | | 5,202 | | | | 5,870,040 | |
Liberty Mutual Group, Inc., | | | | | | | | | | | | | | | | |
Gtd. Notes, 144A | | 3.951 | | 10/15/50 | | | | | | | 90 | | | | 66,640 | |
LifePoint Health, Inc., | | | | | | | | | | | | | | | | |
Gtd. Notes, 144A | | 5.375 | | 01/15/29 | | | | | | | 3,000 | | | | 2,743,595 | |
Sr. Sec’d. Notes, 144A | | 4.375 | | 02/15/27 | | | | | | | 75 | | | | 72,781 | |
Medline Borrower LP, | | | | | | | | | | | | | | | | |
Sr. Sec’d. Notes, 144A | | 3.875 | | 04/01/29 | | | | | | | 1,800 | | | | 1,684,896 | |
Medtronic Global Holdings SCA, | | | | | | | | | | | | | | | | |
Gtd. Notes | | 1.500 | | 07/02/39 | | | EUR | | | | 500 | | | | 409,081 | |
Gtd. Notes | | 1.750 | | 07/02/49 | | | EUR | | | | 2,100 | | | | 1,538,497 | |
Medtronic, Inc., | | | | | | | | | | | | | | | | |
Gtd. Notes | | 3.650 | | 10/15/29 | | | EUR | | | | 11,300 | | | | 12,592,104 | |
MetLife, Inc., | | | | | | | | | | | | | | | | |
Sr. Unsec’d. Notes | | 0.769 | | 05/23/29 | | | JPY | | | | 600,000 | | | | 3,842,649 | |
Sr. Unsec’d. Notes | | 1.415 | | 03/07/31 | | | JPY | | | | 700,000 | | | | 4,597,676 | |
Morgan Guaranty Trust Co., | | | | | | | | | | | | | | | | |
Sr. Unsec’d. Notes | | 1.146(s) | | 01/21/27 | | | ITL(jj) | | | | 2,275,000 | | | | 1,185,662 | |
Morgan Stanley, | | | | | | | | | | | | | | | | |
Sr. Unsec’d. Notes | | 0.406(ff) | | 10/29/27 | | | EUR | | | | 10,000 | | | | 10,313,719 | |
Sr. Unsec’d. Notes | | 4.654(ff) | | 10/18/30 | | | | | | | 1,685 | | | | 1,662,681 | |
Sr. Unsec’d. Notes | | 5.173(ff) | | 01/16/30 | | | | | | | 5,575 | | | | 5,623,690 | |
Sr. Unsec’d. Notes, EMTN | | 0.000 | | 04/02/32 | | | | | | | 22,400 | | | | 14,644,000 | |
Sr. Unsec’d. Notes, EMTN | | 0.500(cc) | | 06/26/43 | | | MXN | | | | 16,700 | | | | 137,967 | |
See Notes to Financial Statements.
28
PGIM Global Total Return Fund
Schedule of Investments (continued)
as of October 31, 2024
| | | | | | | | | | | | | | | | |
| | | | |
| Description | | Interest Rate | | Maturity Date | | Principal Amount (000)# | | | Value | |
| | | | | |
CORPORATE BONDS (Continued) | | | | | | | | | | | | | | | | |
| | | | | |
United States (cont’d.) | | | | | | | | | | | | | | | | |
| | | | | |
Morgan Stanley, (cont’d.) | | | | | | | | | | | | | | | | |
Sr. Unsec’d. Notes, EMTN | | 0.500%(cc) | | 09/25/43 | | | MXN | | | | 33,900 | | | $ | 277,264 | |
Sr. Unsec’d. Notes, EMTN | | 3.955(ff) | | 03/21/35 | | | EUR | | | | 5,600 | | | | 6,165,106 | |
Sr. Unsec’d. Notes, EMTN | | 7.500 | | 12/15/27 | | | MXN | | | | 33,300 | | | | 1,571,222 | |
Sr. Unsec’d. Notes, GMTN | | 1.875 | | 03/06/30 | | | EUR | | | | 1,100 | | | | 1,093,743 | |
Sr. Unsec’d. Notes, EMTN | | 5.632(s) | | 10/05/26 | | | IDR | | | | 2,000,000 | | | | 109,994 | |
Sr. Unsec’d. Notes, EMTN | | 7.118(s) | | 06/28/27 | | | MXN | | | | 27,000 | | | | 1,029,815 | |
Sr. Unsec’d. Notes, EMTN | | 7.926(s) | | 04/05/32 | | | MXN | | | | 71,000 | | | | 1,636,069 | |
Sr. Unsec’d. Notes, EMTN | | 7.950(s) | | 11/07/31 | | | MXN | | | | 56,000 | | | | 1,350,996 | |
Morgan Stanley Finance LLC, | | | | | | | | | | | | | | | | |
Gtd. Notes, EMTN | | 3.100 | | 03/08/28 | | | CNH | | | | 5,000 | | | | 707,262 | |
Gtd. Notes, EMTN | | 3.460 | | 08/10/28 | | | CNH | | | | 2,000 | | | | 287,310 | |
MPLX LP, | | | | | | | | | | | | | | | | |
Sr. Unsec’d. Notes | | 4.000 | | 03/15/28 | | | | | | | 515 | | | | 501,159 | |
National City Bank, | | | | | | | | | | | | | | | | |
Sr. Unsec’d. Notes, 1 Month LIBOR + (0.320)% (Cap N/A, Floor 0.000%) | | 4.990(c) | | 07/03/37 | | | | | | | 803 | | | | 789,318 | |
Nationstar Mortgage Holdings, Inc., | | | | | | | | | | | | | | | | |
Gtd. Notes, 144A | | 5.125 | | 12/15/30 | | | | | | | 225 | | | | 210,810 | |
Gtd. Notes, 144A | | 6.000 | | 01/15/27 | | | | | | | 735 | | | | 732,154 | |
Newell Brands, Inc., | | | | | | | | | | | | | | | | |
Sr. Unsec’d. Notes | | 6.375 | | 05/15/30 | | | | | | | 365 | | | | 366,976 | |
Sr. Unsec’d. Notes | | 6.625 | | 05/15/32 | | | | | | | 185 | | | | 185,668 | |
NRG Energy, Inc., | | | | | | | | | | | | | | | | |
Jr. Sub. Notes, 144A | | 10.250(ff) | | 03/15/28(oo) | | | | | | | 650 | | | | 717,718 | |
Occidental Petroleum Corp., | | | | | | | | | | | | | | | | |
Sr. Unsec’d. Notes | | 6.450 | | 09/15/36 | | | | | | | 35 | | | | 36,206 | |
OneMain Finance Corp., | | | | | | | | | | | | | | | | |
Gtd. Notes | | 4.000 | | 09/15/30 | | | | | | | 1,500 | | | | 1,320,311 | |
ONEOK, Inc., | | | | | | | | | | | | | | | | |
Gtd. Notes | | 6.050 | | 09/01/33 | | | | | | | 5,600 | | | | 5,821,280 | |
Organon & Co./Organon Foreign Debt Co-Issuer BV, | | | | | | | | | | | | | | | | |
Sr. Sec’d. Notes, 144A | | 4.125 | | 04/30/28 | | | | | | | 800 | | | | 757,947 | |
Sr. Unsec’d. Notes, 144A | | 5.125 | | 04/30/31 | | | | | | | 1,725 | | | | 1,572,858 | |
Pactiv Evergreen Group Issuer LLC/Pactiv Evergreen Group Issuer, Inc., | | | | | | | | | | | | | | | | |
Sr. Sec’d. Notes, 144A | | 4.375 | | 10/15/28 | | | | | | | 725 | | | | 682,014 | |
Pactiv Evergreen Group Issuer, Inc./Pactiv Evergreen Group Issuer LLC, | | | | | | | | | | | | | | | | |
Sr. Sec’d. Notes, 144A | | 4.000 | | 10/15/27 | | | | | | | 1,942 | | | | 1,855,397 | |
See Notes to Financial Statements.
PGIM Global Total Return Fund 29
PGIM Global Total Return Fund
Schedule of Investments (continued)
as of October 31, 2024
| | | | | | | | | | | | | | | | |
| | | | |
| Description | | Interest Rate | | Maturity Date | | Principal Amount (000)# | | | Value | |
| | | | | |
CORPORATE BONDS (Continued) | | | | | | | | | | | | | | | | |
| | | | | |
United States (cont’d.) | | | | | | | | | | | | | | | | |
| | | | | |
Permian Resources Operating LLC, | | | | | | | | | | | | | | | | |
Gtd. Notes, 144A | | 8.000% | | 04/15/27 | | | | | | | 1,825 | | | $ | 1,875,510 | |
Post Holdings, Inc., | | | | | | | | | | | | | | | | |
Sr. Sec’d. Notes, 144A | | 6.250 | | 02/15/32 | | | | | | | 400 | | | | 404,980 | |
Procter & Gamble Co. (The), | | | | | | | | | | | | | | | | |
Sr. Unsec’d. Notes, 3 Month SOFR + (0.038)% | | 4.908(c) | | 12/15/54 | | | | | | | 587 | | | | 583,157 | |
Prologis LP, | | | | | | | | | | | | | | | | |
Sr. Unsec’d. Notes | | 3.250 | | 09/11/29 | | | CNH | | | | 40,660 | | | | 5,717,122 | |
Sr. Unsec’d. Notes | | 3.500 | | 02/06/27 | | | CNH | | | | 26,000 | | | | 3,678,437 | |
Prologis Yen Finance LLC, | | | | | | | | | | | | | | | | |
Gtd. Notes | | 0.885 | | 06/27/36 | | | JPY | | | | 300,000 | | | | 1,660,629 | |
Gtd. Notes | | 0.972 | | 09/25/28 | | | JPY | | | | 700,000 | | | | 4,503,242 | |
Gtd. Notes | | 1.003 | | 06/24/32 | | | JPY | | | | 1,500,000 | | | | 9,211,259 | |
Gtd. Notes | | 1.222 | | 06/22/35 | | | JPY | | | | 200,000 | | | | 1,172,045 | |
Realty Income Corp., | | | | | | | | | | | | | | | | |
Sr. Unsec’d. Notes | | 2.200 | | 06/15/28 | | | | | | | 480 | | | | 439,438 | |
Sr. Unsec’d. Notes | | 4.875 | | 07/06/30 | | | EUR | | | | 4,400 | | | | 5,087,624 | |
Sr. Unsec’d. Notes | | 5.000 | | 10/15/29 | | | GBP | | | | 6,300 | | | | 7,991,750 | |
Sally Holdings LLC/Sally Capital, Inc., | | | | | | | | | | | | | | | | |
Gtd. Notes | | 6.750 | | 03/01/32 | | | | | | | 685 | | | | 694,128 | |
Southaven Combined Cycle Generation LLC, | | | | | | | | | | | | | | | | |
Sec’d. Notes | | 3.846 | | 08/15/33 | | | | | | | 9 | | | | 8,443 | |
Sprint Capital Corp., | | | | | | | | | | | | | | | | |
Gtd. Notes | | 8.750 | | 03/15/32 | | | | | | | 1,985 | | | | 2,399,922 | |
Sprint LLC, | | | | | | | | | | | | | | | | |
Gtd. Notes | | 7.625 | | 02/15/25 | | | | | | | 300 | | | | 300,403 | |
Tallgrass Energy Partners LP/Tallgrass Energy Finance Corp., | | | | | | | | | | | | | | | | |
Gtd. Notes, 144A | | 5.500 | | 01/15/28 | | | | | | | 2,075 | | | | 1,993,913 | |
Gtd. Notes, 144A | | 6.000 | | 12/31/30 | | | | | | | 1,700 | | | | 1,595,566 | |
Taylor Morrison Communities, Inc., | | | | | | | | | | | | | | | | |
Gtd. Notes, 144A | | 5.750 | | 01/15/28 | | | | | | | 2,723 | | | | 2,722,282 | |
Sr. Unsec’d. Notes, 144A | | 5.125 | | 08/01/30 | | | | | | | 175 | | | | 169,567 | |
Tenet Healthcare Corp., | | | | | | | | | | | | | | | | |
Sr. Sec’d. Notes | | 4.375 | | 01/15/30 | | | | | | | 675 | | | | 633,007 | |
Sr. Sec’d. Notes | | 4.625 | | 06/15/28 | | | | | | | 275 | | | | 266,033 | |
Sr. Sec’d. Notes | | 5.125 | | 11/01/27 | | | | | | | 455 | | | | 451,326 | |
Tenneco, Inc., | | | | | | | | | | | | | | | | |
Sr. Sec’d. Notes, 144A | | 8.000 | | 11/17/28 | | | | | | | 2,375 | | | | 2,197,596 | |
See Notes to Financial Statements.
30
PGIM Global Total Return Fund
Schedule of Investments (continued)
as of October 31, 2024
| | | | | | | | | | | | | | | | |
| | | | |
| Description | | Interest Rate | | Maturity Date | | Principal Amount (000)# | | | Value | |
| | | | | |
CORPORATE BONDS (Continued) | | | | | | | | | | | | | | | | |
| | | | | |
United States (cont’d.) | | | | | | | | | | | | | | | | |
| | | | | |
Time Warner Cable Enterprises LLC, | | | | | | | | | | | | | | | | |
Sr. Sec’d. Notes | | 8.375% | | 07/15/33 | | | | | | | 2,065 | | | $ | 2,318,436 | |
Tote Shipholdings LLC, | | | | | | | | | | | | | | | | |
U.S. Gov’t. Gtd. Notes | | 3.400 | | 10/16/40 | | | | | | | 82 | | | | 71,293 | |
Truist Financial Corp., | | | | | | | | | | | | | | | | |
Sr. Unsec’d. Notes, MTN | | 5.867(ff) | | 06/08/34 | | | | | | | 780 | | | | 802,183 | |
U.S. Bancorp, | | | | | | | | | | | | | | | | |
Jr. Sub. Notes | | 3.700(ff) | | 01/15/27(oo) | | | | | | | 18,150 | | | | 17,020,989 | |
U.S. Bank NA, | | | | | | | | | | | | | | | | |
Sr. Unsec’d. Notes, 3 Month SOFR + 0.012% | | 5.116(c) | | 08/09/47 | | | | | | | 3,414 | | | | 3,321,278 | |
United Airlines, Inc., | | | | | | | | | | | | | | | | |
Sr. Sec’d. Notes, 144A | | 4.375 | | 04/15/26 | | | | | | | 3,750 | | | | 3,684,385 | |
Sr. Sec’d. Notes, 144A | | 4.625 | | 04/15/29 | | | | | | | 950 | | | | 909,687 | |
United Rentals North America, Inc., | | | | | | | | | | | | | | | | |
Gtd. Notes | | 3.750 | | 01/15/32 | | | | | | | 250 | | | | 221,704 | |
Gtd. Notes | | 3.875 | | 02/15/31 | | | | | | | 391 | | | | 354,836 | |
Gtd. Notes(a) | | 4.875 | | 01/15/28 | | | | | | | 3,115 | | | | 3,046,444 | |
Univision Communications, Inc., | | | | | | | | | | | | | | | | |
Sr. Sec’d. Notes, 144A | | 6.625 | | 06/01/27 | | | | | | | 3,335 | | | | 3,313,838 | |
Venture Global LNG, Inc., | | | | | | | | | | | | | | | | |
Jr. Sub. Notes, 144A | | 9.000(ff) | | 09/30/29(oo) | | | | | | | 1,555 | | | | 1,554,346 | |
Verizon Communications, Inc., | | | | | | | | | | | | | | | | |
Sr. Unsec’d. Notes | | 2.500 | | 04/08/31 | | | GBP | | | | 1,400 | | | | 1,535,168 | |
Sr. Unsec’d. Notes, MTN | | 2.650 | | 05/06/30 | | | AUD | | | | 1,600 | | | | 909,088 | |
Sr. Unsec’d. Notes, MTN | | 3.000 | | 03/23/31 | | | AUD | | | | 1,000 | | | | 561,636 | |
Sr. Unsec’d. Notes, Series MPLE | | 4.050 | | 03/22/51 | | | CAD | | | | 3,200 | | | | 1,935,578 | |
Viatris, Inc., | | | | | | | | | | | | | | | | |
Gtd. Notes | | 3.850 | | 06/22/40 | | | | | | | 4,410 | | | | 3,299,738 | |
Gtd. Notes | | 4.000 | | 06/22/50 | | | | | | | 3,240 | | | | 2,237,324 | |
VICI Properties LP/VICI Note Co., Inc., | | | | | | | | | | | | | | | | |
Gtd. Notes, 144A | | 4.250 | | 12/01/26 | | | | | | | 4,000 | | | | 3,925,546 | |
Vistra Corp., | | | | | | | | | | | | | | | | |
Jr. Sub. Notes, 144A | | 7.000(ff) | | 12/15/26(oo) | | | | | | | 2,650 | | | | 2,675,675 | |
Jr. Sub. Notes, 144A | | 8.000(ff) | | 10/15/26(oo) | | | | | | | 9,650 | | | | 9,924,228 | |
Vistra Operations Co. LLC, | | | | | | | | | | | | | | | | |
Gtd. Notes, 144A | | 5.000 | | 07/31/27 | | | | | | | 3,520 | | | | 3,475,731 | |
Wachovia Bank NA, | | | | | | | | | | | | | | | | |
Sr. Unsec’d. Notes, 3 Month SOFR + 0.062% | | 5.133(c) | | 11/27/40 | | | | | | | 511 | | | | 507,344 | |
Warnermedia Holdings, Inc., | | | | | | | | | | | | | | | | |
Gtd. Notes | | 4.054 | | 03/15/29 | | | | | | | 30 | | | | 28,028 | |
See Notes to Financial Statements.
PGIM Global Total Return Fund 31
PGIM Global Total Return Fund
Schedule of Investments (continued)
as of October 31, 2024
| | | | | | | | | | | | | | | | |
| | | | |
| Description | | Interest Rate | | Maturity Date | | Principal Amount (000)# | | | Value | |
| | | | | |
CORPORATE BONDS (Continued) | | | | | | | | | | | | | | | | |
| | | | | |
United States (cont’d.) | | | | | | | | | | | | | | | | |
| | | | | |
Warnermedia Holdings, Inc., (cont’d.) | | | | | | | | | | | | | | | | |
Gtd. Notes | | 5.050% | | 03/15/42 | | | | | | | 4,355 | | | $ | 3,479,573 | |
Gtd. Notes | | 5.141 | | 03/15/52 | | | | | | | 2,770 | | | | 2,086,077 | |
Wells Fargo & Co., | | | | | | | | | | | | | | | | |
Sr. Unsec’d. Notes | | 4.000 | | 04/27/27 | | | AUD | | | | 4,198 | | | | 2,689,529 | |
Sr. Unsec’d. Notes, 3 Month SOFR + 0.012% | | 4.601(c) | | 07/06/46 | | | | | | | 450 | | | | 439,133 | |
Sr. Unsec’d. Notes, GMTN | | 3.700 | | 07/27/26 | | | AUD | | | | 1,458 | | | | 935,135 | |
Sr. Unsec’d. Notes, MTN | | 2.572(ff) | | 02/11/31 | | | | | | | 7,890 | | | | 6,987,786 | |
Sr. Unsec’d. Notes, MTN, 3 Month SOFR + 0.012% | | 4.943(c) | | 06/12/48 | | | | | | | 175 | | | | 173,289 | |
Sr. Unsec’d. Notes, MTN | | 5.198(ff) | | 01/23/30 | | | | | | | 6,615 | | | | 6,682,788 | |
Welltower OP LLC, | | | | | | | | | | | | | | | | |
Gtd. Notes | | 2.800 | | 06/01/31 | | | | | | | 5,060 | | | | 4,457,020 | |
WPC Eurobond BV, | | | | | | | | | | | | | | | | |
Gtd. Notes | | 0.950 | | 06/01/30 | | | EUR | | | | 9,950 | | | | 9,377,253 | |
Wynn Resorts Finance LLC/Wynn Resorts Capital Corp., | | | | | | | | | | | | | | | | |
Gtd. Notes, 144A | | 7.125 | | 02/15/31 | | | | | | | 820 | | | | 862,338 | |
XPO, Inc., | | | | | | | | | | | | | | | | |
Gtd. Notes, 144A | | 7.125 | | 02/01/32 | | | | | | | 735 | | | | 762,906 | |
| | | | | | | | | | | | | | | | |
| | | | | |
| | | | | | | | | | | | | | | 627,815,359 | |
| | | | | | | | | | | | | | | | |
| | | | | |
TOTAL CORPORATE BONDS | | | | | | | | | | | | | | | | |
(cost $1,305,280,222) | | | | | | | | | | | | | | | 1,205,719,926 | |
| | | | | | | | | | | | | | | | |
| | | | | |
FLOATING RATE AND OTHER LOANS 0.8% | | | | | | | | | | | | | | | | |
| | | | |
Jamaica 0.0% | | | | | | | | | | | | | | |
| | | | | |
Digicel International Finance Ltd., | | | | | | | | | | | | | | | | |
Initial Term Loan, 3 Month SOFR + 6.750% | | 11.335(c) | | 05/25/27 | | | | | | | 445 | | | | 443,158 | |
| | | | | |
United Kingdom 0.8% | | | | | | | | | | | | | | | | |
| | | | | |
CD&R Firefly Bidco Ltd., | | | | | | | | | | | | | | | | |
Facility B6 Loan, SONIA + 5.750% | | 10.950(c) | | 06/21/28 | | | GBP | | | | 2,200 | | | | 2,834,662 | |
EG Finco Ltd., | | | | | | | | | | | | | | | | |
Additional Second Lien Loan Facility, 1 Month EURIBOR + 7.000% | | 10.146(c) | | 04/30/27 | | | EUR | | | | 14,588 | | | | 15,302,796 | |
See Notes to Financial Statements.
32
PGIM Global Total Return Fund
Schedule of Investments (continued)
as of October 31, 2024
| | | | | | | | | | | | | | | | |
| | | | |
| Description | | Interest Rate | | Maturity Date | | Principal Amount (000)# | | | Value | |
| | | | | |
FLOATING RATE AND OTHER LOANS (Continued) | | | | | | | | | | | | | | | | |
| | | | | |
United Kingdom (cont’d.) | | | | | | | | | | | | | | | | |
| | | | | |
WSH Services Holdings Ltd., | | | | | | | | | | | | | | | | |
Term Facility B2, SONIA + 5.500% | | 10.453%(c) | | 05/16/31 | | | GBP | | | | 375 | | | $ | 483,786 | |
Zegona Holdco Ltd., | | | | | | | | | | | | | | | | |
Facility B (EUR) Loan, 6 Month EURIBOR + 4.250% | | 7.886(c) | | 07/17/29 | | | EUR | | | | 2,325 | | | | 2,540,083 | |
| | | | | | | | | | | | | | | | |
| | | | | |
| | | | | | | | | | | | | | | 21,161,327 | |
| | | |
United States 0.0% | | | | | | | | | | | | |
| | | | | |
Bausch Health Cos., Inc., | | | | | | | | | | | | | | | | |
Second Amendment Term Loan, 1 Month SOFR + 5.350% | | 10.706(c) | | 02/01/27 | | | | | | | 250 | | | | 244,167 | |
Diamond Sports Group LLC, | | | | | | | | | | | | | | | | |
Dip Term Loan | | 10.000 | | 12/02/24 | | | | | | | 656 | | | | 692,720 | |
First Lien Term Loan, 1 Month SOFR + 10.100% | | 14.944(c) | | 05/25/26 | | | | | | | 110 | | | | 94,201 | |
Second Lien Term Loan | | 8.176 | | 08/24/26 | | | | | | | 7,155 | | | | 20,305 | |
Level 3 Financing, Inc., | | | | | | | | | | | | | | | | |
Term B-1, 1 Month SOFR + 6.560% | | 11.278(c) | | 04/15/29 | | | | | | | 194 | | | | 198,367 | |
Term B-2, 1 Month SOFR + 6.560% | | 11.278(c) | | 04/15/30 | | | | | | | 196 | | | | 199,557 | |
| | | | | | | | | | | | | | | | |
| | | | | |
| | | | | | | | | | | | | | | 1,449,317 | |
| | | | | | | | | | | | | | | | |
| | | | | |
TOTAL FLOATING RATE AND OTHER LOANS | | | | | | | | | | | | | | | | |
(cost $27,304,750) | | | | | | | | | | | | | | | 23,053,802 | |
| | | | | | | | | | | | | | | | |
| | | | | |
MUNICIPAL BOND 0.2% | | | | | | | | | | | | | | | | |
| | | | | |
Louisiana | | | | | | | | | | | | | | | | |
| | | | | |
Plaquemines Port Harbor & Terminal District, | | | | | | | | | | | | | | | | |
Taxable, Revenue Bonds, Series B | | | | | | | | | | | | | | | | |
(cost $4,900,000) | | 12.000 | | 12/01/34 | | | | | | | 4,900 | | | | 4,937,358 | |
| | | | | | | | | | | | | | | | |
| | | | | |
RESIDENTIAL MORTGAGE-BACKED SECURITIES 2.4% | | | | | | | | | | | | | | | | |
| | | | | |
United States | | | | | | | | | | | | | | | | |
| | | | | |
Bayview Financing Trust, | | | | | | | | | | | | | | | | |
Series 2023-01F, Class A, 144A, 30 Day Average SOFR + 4.000% (Cap N/A,
Floor 4.000%)^ | | 8.855(c) | | 07/01/26 | | | | | | | 2,114 | | | | 2,116,164 | |
See Notes to Financial Statements.
PGIM Global Total Return Fund 33
PGIM Global Total Return Fund
Schedule of Investments (continued)
as of October 31, 2024
| | | | | | | | | | | | | | | | |
| | | | |
| Description | | Interest Rate | | Maturity Date | | Principal Amount (000)# | | | Value | |
| | | |
RESIDENTIAL MORTGAGE-BACKED SECURITIES (Continued) | | | | | | | | | | | | |
| | | | | |
United States (cont’d.) | | | | | | | | | | | | | | | | |
| | | | | |
Bellemeade Re Ltd., | | | | | | | | | | | | | | | | |
Series 2021-03A, Class M1B, 144A, 30 Day Average SOFR + 1.400% (Cap N/A, Floor 1.400%) | | 6.257%(c) | | 09/25/31 | | | | | | | 731 | | | $ | 732,120 | |
CIM Trust, | | | | | | | | | | | | | | | | |
Series 2024-R01, Class A1, 144A | | 4.750(cc) | | 06/25/64 | | | | | | | 960 | | | | 937,279 | |
Connecticut Avenue Securities Trust, | | | | | | | | | | | | | | | | |
Series 2021-R01, Class 1B1, 144A, 30 Day Average SOFR + 3.100% (Cap N/A, Floor 0.000%) | | 7.957(c) | | 10/25/41 | | | | | | | 1,000 | | | | 1,026,527 | |
Series 2021-R01, Class 1M2, 144A, 30 Day Average SOFR + 1.550% (Cap N/A, Floor 0.000%) | | 6.407(c) | | 10/25/41 | | | | | | | 117 | | | | 117,590 | |
Series 2022-R01, Class 1B1, 144A, 30 Day Average SOFR + 3.150% (Cap N/A, Floor 0.000%) | | 8.007(c) | | 12/25/41 | | | | | | | 340 | | | | 348,500 | |
Series 2022-R04, Class 1M2, 144A, 30 Day Average SOFR + 3.100% (Cap N/A, Floor 0.000%) | | 7.957(c) | | 03/25/42 | | | | | | | 1,200 | | | | 1,246,356 | |
Series 2023-R06, Class 1M2, 144A, 30 Day Average SOFR + 2.700% (Cap N/A, Floor 0.000%) | | 7.557(c) | | 07/25/43 | | | | | | | 170 | | | | 175,817 | |
Series 2023-R08, Class 1M2, 144A, 30 Day Average SOFR + 2.500% (Cap N/A, Floor 0.000%) | | 7.357(c) | | 10/25/43 | | | | | | | 380 | | | | 390,098 | |
Series 2024-R05, Class 2M2, 144A, 30 Day Average SOFR + 1.700% (Cap N/A, Floor 1.900%) | | 6.557(c) | | 07/25/44 | | | | | | | 250 | | | | 251,192 | |
Credit Suisse Mortgage Trust, | | | | | | | | | | | | | | | | |
Series 2020-RPL06, Class A1, 144A | | 3.442(cc) | | 03/25/59 | | | | | | | 1,750 | | | | 1,741,380 | |
Eagle Re Ltd., | | | | | | | | | | | | | | | | |
Series 2021-01, Class M1C, 144A, 30 Day Average SOFR + 2.700% (Cap N/A, Floor 2.700%) | | 7.557(c) | | 10/25/33 | | | | | | | 297 | | | | 297,616 | |
Series 2021-02, Class M1C, 144A, 30 Day Average SOFR + 3.450% (Cap N/A, Floor 3.450%) | | 8.307(c) | | 04/25/34 | | | | | | | 3,500 | | | | 3,560,218 | |
Series 2023-01, Class M1A, 144A, 30 Day Average SOFR + 2.000% (Cap N/A, Floor 2.000%) | | 6.857(c) | | 09/26/33 | | | | | | | 645 | | | | 648,124 | |
See Notes to Financial Statements.
34
PGIM Global Total Return Fund
Schedule of Investments (continued)
as of October 31, 2024
| | | | | | | | | | | | | | | | |
| | | | |
| Description | | Interest Rate | | Maturity Date | | Principal Amount (000)# | | | Value | |
| | | |
RESIDENTIAL MORTGAGE-BACKED SECURITIES (Continued) | | | | | | | | | | | | |
| | | | | |
United States (cont’d.) | | | | | | | | | | | | | | | | |
| | | | | |
Fannie Mae Connecticut Avenue Securities, | | | | | | | | | | | | | | | | |
Series 2021-R02, Class 2B1, 144A, 30 Day Average SOFR + 3.300% (Cap N/A, Floor 0.000%) | | 8.157%(c) | | 11/25/41 | | | | | | | 260 | | | $ | 267,933 | |
Series 2021-R02, Class 2M2, 144A, 30 Day Average SOFR + 2.000% (Cap N/A, Floor 0.000%) | | 6.857(c) | | 11/25/41 | | | | | | | 1,440 | | | | 1,447,162 | |
Fannie Mae REMIC, | | | | | | | | | | | | | | | | |
Series 2012-107, Class GI, IO | | 3.500 | | 09/25/27 | | | | | | | 661 | | | | 12,024 | |
FHLMC Structured Agency Credit Risk REMIC Trust, | | | | | | | | | | | | | | | | |
Series 2020-DNA06, Class B1, 144A, 30 Day Average SOFR + 3.000% (Cap N/A, Floor 0.000%) | | 7.857(c) | | 12/25/50 | | | | | | | 400 | | | | 432,435 | |
Series 2020-HQA05, Class B1, 144A, 30 Day Average SOFR + 4.000% (Cap N/A, Floor 0.000%) | | 8.857(c) | | 11/25/50 | | | | | | | 595 | | | | 669,850 | |
Series 2021-DNA05, Class M2, 144A, 30 Day Average SOFR + 1.650% (Cap N/A, Floor 0.000%) | | 6.507(c) | | 01/25/34 | | | | | | | 806 | | | | 809,250 | |
Series 2021-DNA06, Class B1, 144A, 30 Day Average SOFR + 3.400% (Cap N/A, Floor 0.000%) | | 8.257(c) | | 10/25/41 | | | | | | | 320 | | | | 329,436 | |
Series 2021-DNA06, Class M2, 144A, 30 Day Average SOFR + 1.500% (Cap N/A, Floor 0.000%) | | 6.357(c) | | 10/25/41 | | | | | | | 100 | | | | 100,319 | |
Series 2021-DNA07, Class M2, 144A, 30 Day Average SOFR + 1.800% (Cap N/A, Floor 0.000%) | | 6.657(c) | | 11/25/41 | | | | | | | 830 | | | | 836,748 | |
Series 2021-HQA03, Class B1, 144A, 30 Day Average SOFR + 3.350% (Cap N/A, Floor 0.000%) | | 8.207(c) | | 09/25/41 | | | | | | | 150 | | | | 153,657 | |
Series 2021-HQA03, Class M2, 144A, 30 Day Average SOFR + 2.100% (Cap N/A, Floor 0.000%) | | 6.957(c) | | 09/25/41 | | | | | | | 3,350 | | | | 3,377,160 | |
Series 2021-HQA04, Class M2, 144A, 30 Day Average SOFR + 2.350% (Cap N/A, Floor 0.000%) | | 7.207(c) | | 12/25/41 | | | | | | | 2,350 | | | | 2,372,043 | |
Series 2022-DNA01, Class M1B, 144A, 30 Day Average SOFR + 1.850% (Cap N/A, Floor 0.000%) | | 6.707(c) | | 01/25/42 | | | | | | | 300 | | | | 303,000 | |
See Notes to Financial Statements.
PGIM Global Total Return Fund 35
PGIM Global Total Return Fund
Schedule of Investments (continued)
as of October 31, 2024
| | | | | | | | | | | | | | | | |
| | | | |
| Description | | Interest Rate | | Maturity Date | | Principal Amount (000)# | | | Value | |
| | | |
RESIDENTIAL MORTGAGE-BACKED SECURITIES (Continued) | | | | | | | | | | | | |
| | | | | |
United States (cont’d.) | | | | | | | | | | | | | | | | |
| | | | | |
FHLMC Structured Agency Credit Risk REMIC Trust, (cont’d.) | | | | | | | | | | | | | | | | |
Series 2022-DNA01, Class M2, 144A, 30 Day Average SOFR + 2.500% (Cap N/A, Floor 0.000%) | | 7.357%(c) | | 01/25/42 | | | | | | | 100 | | | $ | 101,813 | |
Series 2022-DNA02, Class M1B, 144A, 30 Day Average SOFR + 2.400% (Cap N/A, Floor 0.000%) | | 7.257(c) | | 02/25/42 | | | | | | | 700 | | | | 715,806 | |
Series 2022-DNA04, Class M1B, 144A, 30 Day Average SOFR + 3.350% (Cap N/A, Floor 0.000%) | | 8.207(c) | | 05/25/42 | | | | | | | 300 | | | | 312,375 | |
Freddie Mac REMIC, | | | | | | | | | | | | | | | | |
Series 4166, Class IO, IO | | 3.500 | | 02/15/43 | | | | | | | 3,818 | | | | 637,250 | |
GCAT Asset-Backed Notes, | | | | | | | | | | | | | | | | |
Series 2021-01, Class A1, 144A | | 2.487 | | 11/25/49 | | | | | | | 8,977 | | | | 8,888,900 | |
Home Re Ltd., | | | | | | | | | | | | | | | | |
Series 2021-02, Class M1C, 144A, 30 Day Average SOFR + 2.800% (Cap N/A, Floor 0.000%) | | 7.657(c) | | 01/25/34 | | | | | | | 3,156 | | | | 3,190,196 | |
LHOME Mortgage Trust, | | | | | | | | | | | | | | | | |
Series 2024-RTL04, Class A1, 144A | | 5.921 | | 07/25/39 | | | | | | | 1,500 | | | | 1,502,276 | |
New Residential Mortgage Loan Trust, | | | | | | | | | | | | | | | | |
Series 2018-04A, Class A1S, 144A, 1 Month SOFR + 0.864% (Cap N/A, Floor 0.750%) | | 5.602(c) | | 01/25/48 | | | | | | | 390 | | | | 382,024 | |
Oaktown Re VI Ltd., | | | | | | | | | | | | | | | | |
Series 2021-01A, Class M1B, 144A, 30 Day Average SOFR + 2.050% (Cap N/A, Floor 2.050%) | | 6.907(c) | | 10/25/33 | | | | | | | 59 | | | | 58,562 | |
Oaktown Re VII Ltd., | | | | | | | | | | | | | | | | |
Series 2021-02, Class M1A, 144A, 30 Day Average SOFR + 1.600% (Cap N/A, Floor 1.600%) | | 6.457(c) | | 04/25/34 | | | | | | | 331 | | | | 331,315 | |
Series 2021-02, Class M1B, 144A, 30 Day Average SOFR + 2.900% (Cap N/A, Floor 2.900%) | | 7.757(c) | | 04/25/34 | | | | | | | 700 | | | | 711,419 | |
PMT Credit Risk Transfer Trust, | | | | | | | | | | | | | | | | |
Series 2024-01R, Class A, 144A, 30 Day Average SOFR + 3.500% (Cap N/A, Floor 0.000%) | | 8.357(c) | | 05/25/33 | | | | | | | 5,641 | | | | 5,696,796 | |
Series 2024-02R, Class A, 144A, 30 Day Average SOFR + 3.350% (Cap N/A, Floor 0.000%) | | 8.206(c) | | 03/29/27 | | | | | | | 5,202 | | | | 5,238,062 | |
See Notes to Financial Statements.
36
PGIM Global Total Return Fund
Schedule of Investments (continued)
as of October 31, 2024
| | | | | | | | | | | | | | | | |
| | | | |
| Description | | Interest Rate | | Maturity Date | | Principal Amount (000)# | | | Value | |
| | | | | |
RESIDENTIAL MORTGAGE-BACKED SECURITIES (Continued) | | | | | | | | | | | | | | | | |
| | | | | |
United States (cont’d.) | | | | | | | | | | | | | | | | |
| | | | | |
PMT Credit Risk Transfer Trust, (cont’d.) | | | | | | | | | | | | | | | | |
Series 2024-03R, Class A, 144A, 30 Day Average SOFR + 3.100% (Cap N/A, Floor 0.000%) | | 7.957%(c) | | 09/27/28 | | | | | | | 4,570 | | | $ | 4,572,512 | |
Radnor Re Ltd., | | | | | | | | | | | | | | | | |
Series 2021-02, Class M1B, 144A, 30 Day Average SOFR + 3.700% (Cap N/A, Floor 3.700%) | | 8.557(c) | | 11/25/31 | | | | | | | 4,397 | | | | 4,499,606 | |
RCKT Mortgage Trust, | | | | | | | | | | | | | | | | |
Series 2024-CES05, Class A1A, 144A | | 5.846 | | 08/25/44 | | | | | | | 725 | | | | 725,599 | |
Series 2024-CES07, Class A1A, 144A | | 5.158 | | 10/25/44 | | | | | | | 3,271 | | | | 3,227,240 | |
| | | | | | | | | | | | | | | | |
| | | | | |
TOTAL RESIDENTIAL MORTGAGE-BACKED SECURITIES
(cost $64,830,946) | | | | | | | | | | | | | | | 65,491,749 | |
| | | | | | | | | | | | | | | | |
| | | | | |
SOVEREIGN BONDS 29.4% | | | | | | | | | | | | | | | | |
| | | | | |
Andorra 0.0% | | | | | | | | | | | | | | | | |
| | | | | |
Andorra International Bond, | | | | | | | | | | | | | | | | |
Sr. Unsec’d. Notes, EMTN | | 1.250 | | 02/23/27 | | | EUR | | | | 700 | | | | 727,108 | |
Sr. Unsec’d. Notes, EMTN | | 1.250 | | 05/06/31 | | | EUR | | | | 400 | | | | 380,775 | |
| | | | | | | | | | | | | | | | |
| | | | | |
| | | | | | | | | | | | | | | 1,107,883 | |
| | | | | |
Argentina 0.1% | | | | | | | | | | | | | | | | |
| | | | | |
Argentine Republic Government International Bond, | | | | | | | | | | | | | | | | |
Bonds | | 4.330(cc) | | 12/31/33(d) | | | JPY | | | | 493,254 | | | | 511,304 | |
Sr. Unsec’d. Notes | | 0.670(cc) | | 12/31/38(d) | | | JPY | | | | 1,637,456 | | | | 1,347,124 | |
Sr. Unsec’d. Notes | | 0.670(cc) | | 12/31/38(d) | | | JPY | | | | 70,829 | | | | 46,849 | |
Sr. Unsec’d. Notes | | 0.670(cc) | | 12/31/38 | | | JPY | | | | 1,812 | | | | 1,199 | |
Sr. Unsec’d. Notes | | 4.330 | | 12/31/33 | | | JPY | | | | 61,640 | | | | 63,896 | |
| | | | | | | | | | | | | | | | |
| | | | | |
| | | | | | | | | | | | | | | 1,970,372 | |
| | | | | |
Austria 0.1% | | | | | | | | | | | | | | | | |
| | | | | |
Republic of Austria Government International Bond, | | | | | | | | | | | | | | | | |
Sr. Unsec’d. Notes, 144A, EMTN | | 5.000 | | 12/20/24 | | | CAD | | | | 276 | | | | 197,126 | |
Sr. Unsec’d. Notes, 144A, MTN | | 5.375 | | 12/01/34 | | | CAD | | | | 2,213 | | | | 1,739,597 | |
| | | | | | | | | | | | | | | | |
| | | | | |
| | | | | | | | | | | | | | | 1,936,723 | |
See Notes to Financial Statements.
PGIM Global Total Return Fund 37
PGIM Global Total Return Fund
Schedule of Investments (continued)
as of October 31, 2024
| | | | | | | | | | | | | | | | |
| | | | |
| Description | | Interest Rate | | Maturity Date | | Principal Amount (000)# | | | Value | |
| | | | |
SOVEREIGN BONDS (Continued) | | | | | | | | | | | | | | |
| | | | |
Brazil 0.6% | | | | | | | | | | | | | | |
| | | | | |
Brazil Minas SPE via State of Minas Gerais, | | | | | | | | | | | | | | | | |
Gov’t. Gtd. Notes | | 5.333% | | 02/15/28 | | | | | | | 16,729 | | | $ | 16,713,516 | |
Brazilian Government International Bond, | | | | | | | | | | | | | | | | |
Sr. Unsec’d. Notes | | 10.250 | | 01/10/28 | | | BRL | | | | 2,890 | | | | 506,120 | |
| | | | | | | | | | | | | | | | |
| | | | | |
| | | | | | | | | | | | | | | 17,219,636 | |
| | | | | |
Bulgaria 0.3% | | | | | | | | | | | | | | | | |
| | | | | |
Bulgaria Government International Bond, | | | | | | | | | | | | | | | | |
Sr. Unsec’d. Notes, GMTN | | 3.125 | | 03/26/35 | | | EUR | | | | 8,212 | | | | 8,575,299 | |
| | | | | |
Canada 0.4% | | | | | | | | | | | | | | | | |
| | | | | |
Canadian Government Bond, | | | | | | | | | | | | | | | | |
Bonds(k) | | 4.000 | | 06/01/41 | | | CAD | | | | 650 | | | | 510,118 | |
City of Toronto, | | | | | | | | | | | | | | | | |
Unsec’d. Notes | | 3.250 | | 06/24/46 | | | CAD | | | | 3,000 | | | | 1,788,963 | |
Province of Alberta, | | | | | | | | | | | | | | | | |
Unsec’d. Notes | | 3.050 | | 12/01/48 | | | CAD | | | | 3,500 | | | | 2,057,106 | |
Province of British Columbia, | | | | | | | | | | | | | | | | |
Unsec’d. Notes | | 2.800 | | 06/18/48 | | | CAD | | | | 3,000 | | | | 1,684,383 | |
Province of Manitoba, | | | | | | | | | | | | | | | | |
Unsec’d. Notes | | 3.200 | | 03/05/50 | | | CAD | | | | 3,000 | | | | 1,775,081 | |
Province of Nova Scotia, | | | | | | | | | | | | | | | | |
Unsec’d. Notes | | 3.450 | | 06/01/45 | | | CAD | | | | 3,000 | | | | 1,892,757 | |
Province of Saskatchewan, | | | | | | | | | | | | | | | | |
Unsec’d. Notes | | 3.300 | | 06/02/48 | | | CAD | | | | 3,500 | | | | 2,155,439 | |
| | | | | | | | | | | | | | | | |
| | | | | |
| | | | | | | | | | | | | | | 11,863,847 | |
| | | | | |
Chile 0.1% | | | | | | | | | | | | | | | | |
| | | | | |
Bonos de la Tesoreria de la Republica en pesos, | | | | | | | | | | | | | | | | |
Bonds | | 5.000 | | 03/01/35 | | | CLP | | | | 505,000 | | | | 503,510 | |
Chile Government International Bond, | | | | | | | | | | | | | | | | |
Sr. Unsec’d. Notes | | 1.440 | | 02/01/29 | | | EUR | | | | 1,884 | | | | 1,906,509 | |
Sr. Unsec’d. Notes | | 3.875 | | 07/09/31 | | | EUR | | | | 200 | | | | 220,813 | |
| | | | | | | | | | | | | | | | |
| | | | | |
| | | | | | | | | | | | | | | 2,630,832 | |
See Notes to Financial Statements.
38
PGIM Global Total Return Fund
Schedule of Investments (continued)
as of October 31, 2024
| | | | | | | | | | | | | | | | |
| | | | |
| Description | | Interest Rate | | Maturity Date | | Principal Amount (000)# | | | Value | |
| | | | |
SOVEREIGN BONDS (Continued) | | | | | | | | | | | | | | |
| | | | | |
China 2.1% | | | | | | | | | | | | | | | | |
| | | | | |
China Government Bond, | | | | | | | | | | | | | | | | |
Sr. Unsec’d. Notes | | 2.390% | | 03/15/29 | | | CNH | | | | 500 | | | $ | 71,208 | |
Sr. Unsec’d. Notes | | 3.310 | | 11/30/25 | | | CNH | | | | 4,000 | | | | 569,929 | |
Sr. Unsec’d. Notes | | 3.480 | | 06/29/27 | | | CNH | | | | 2,000 | | | | 291,328 | |
Sr. Unsec’d. Notes | | 3.600 | | 05/21/30 | | | CNH | | | | 21,500 | | | | 3,226,813 | |
Sr. Unsec’d. Notes | | 3.900 | | 07/04/36 | | | CNH | | | | 16,000 | | | | 2,568,051 | |
Sr. Unsec’d. Notes | | 3.950 | | 06/29/43 | | | CNH | | | | 55,500 | | | | 9,150,521 | |
Sr. Unsec’d. Notes | | 4.000 | | 11/30/35 | | | CNH | | | | 76,500 | | | | 12,325,144 | |
Sr. Unsec’d. Notes | | 4.100 | | 05/21/45 | | | CNH | | | | 62,000 | | | | 10,504,436 | |
Sr. Unsec’d. Notes | | 4.150 | | 12/12/31 | | | CNH | | | | 41,500 | | | | 6,509,446 | |
Sr. Unsec’d. Notes | | 4.290 | | 05/22/29 | | | CNH | | | | 3,500 | | | | 537,938 | |
Sr. Unsec’d. Notes | | 4.400 | | 12/12/46 | | | CNH | | | | 48,500 | | | | 8,662,494 | |
Sr. Unsec’d. Notes | | 4.500 | | 05/22/34 | | | CNH | | | | 24,000 | | | | 3,951,616 | |
Export-Import Bank of China (The), | | | | | | | | | | | | | | | | |
Sr. Unsec’d. Notes | | 4.150 | | 06/18/27 | | | CNH | | | | 4,000 | | | | 589,387 | |
| | | | | | | | | | | | | | | | |
| | | | | |
| | | | | | | | | | | | | | | 58,958,311 | |
| | | | | |
Colombia 2.3% | | | | | | | | | | | | | | | | |
| | | | | |
Colombia Government International Bond, | | | | | | | | | | | | | | | | |
Sr. Unsec’d. Notes | | 8.000 | | 04/20/33 | | | | | | | 1,600 | | | | 1,642,400 | |
Sr. Unsec’d. Notes | | 8.375 | | 02/15/27 | | | | | | | 3,279 | | | | 3,452,820 | |
Sr. Unsec’d. Notes | | 9.850 | | 06/28/27 | | | COP | | | | 23,612,000 | | | | 5,194,786 | |
Sr. Unsec’d. Notes | | 11.850 | | 03/09/28 | | | | | | | 1,000 | | | | 1,144,650 | |
Sr. Unsec’d. Notes, EMTN | | 3.875 | | 03/22/26 | | | EUR | | | | 47,879 | | | | 51,972,576 | |
| | | | | | | | | | | | | | | | |
| | | | | |
| | | | | | | | | | | | | | | 63,407,232 | |
| | | | | |
Cyprus 0.8% | | | | | | | | | | | | | | | | |
| | | | | |
Cyprus Government International Bond, | | | | | | | | | | | | | | | | |
Sr. Unsec’d. Notes, EMTN | | 1.250 | | 01/21/40 | | | EUR | | | | 7,550 | | | | 6,001,376 | |
Sr. Unsec’d. Notes, EMTN | | 2.250 | | 04/16/50 | | | EUR | | | | 2,000 | | | | 1,636,890 | |
Sr. Unsec’d. Notes, EMTN | | 2.750 | | 02/26/34 | | | EUR | | | | 10,200 | | | | 10,772,406 | |
Sr. Unsec’d. Notes, EMTN | | 2.750 | | 05/03/49 | | | EUR | | | | 3,000 | | | | 2,815,238 | |
| | | | | | | | | | | | | | | | |
| | | | | |
| | | | | | | | | | | | | | | 21,225,910 | |
| | | | | |
Czech Republic 0.2% | | | | | | | | | | | | | | | | |
| | | | | |
Czech Republic Government Bond, | | | | | | | | | | | | | | | | |
Sr. Unsec’d. Notes, Series 103 | | 2.000 | | 10/13/33 | | | CZK | | | | 115,000 | | | | 4,161,024 | |
See Notes to Financial Statements.
PGIM Global Total Return Fund 39
PGIM Global Total Return Fund
Schedule of Investments (continued)
as of October 31, 2024
| | | | | | | | | | | | | | | | |
| | | | |
| Description | | Interest Rate | | Maturity Date | | Principal Amount (000)# | | | Value | |
| | | | | |
SOVEREIGN BONDS (Continued) | | | | | | | | | | | | | | | | |
| | | | | |
Denmark 0.1% | | | | | | | | | | | | | | | | |
| | | | | |
Denmark Government Bond, | | | | | | | | | | | | | | | | |
Bonds | | 0.250% | | 11/15/52 | | | DKK | | | | 5,000 | | | $ | 413,131 | |
Bonds | | 0.500 | | 11/15/27 | | | DKK | | | | 12,110 | | | | 1,688,310 | |
Bonds | | 0.500 | | 11/15/29 | | | DKK | | | | 4,300 | | | | 580,571 | |
Bonds | | 1.750 | | 11/15/25 | | | DKK | | | | 3,520 | | | | 511,312 | |
Bonds | | 4.500 | | 11/15/39 | | | DKK | | | | 1,800 | | | | 330,479 | |
| | | | | | | | | | | | | | | | |
| | | | | |
| | | | | | | | | | | | | | | 3,523,803 | |
| | | | | |
Egypt 0.2% | | | | | | | | | | | | | | | | |
| | | | | |
Egypt Government International Bond, | | | | | | | | | | | | | | | | |
Sr. Unsec’d. Notes, 144A, MTN | | 4.750 | | 04/16/26 | | | EUR | | | | 700 | | | | 740,486 | |
Sr. Unsec’d. Notes, EMTN | | 5.625 | | 04/16/30 | | | EUR | | | | 4,700 | | | | 4,332,780 | |
| | | | | | | | | | | | | | | | |
| | | | | |
| | | | | | | | | | | | | | | 5,073,266 | |
| | | | | |
Finland 0.0% | | | | | | | | | | | | | | | | |
| | | | | |
Kuntarahoitus OYJ, | | | | | | | | | | | | | | | | |
Local Gov’t. Gtd. Notes, EMTN | | 3.050 | | 09/24/32 | | | SEK | | | | 13,000 | | | | 1,119,853 | |
| | | | | |
France 1.2% | | | | | | | | | | | | | | | | |
| | | | | |
Agence France Locale, | | | | | | | | | | | | | | | | |
Gtd. Notes, EMTN | | 3.125 | | 03/20/34 | | | EUR | | | | 2,300 | | | | 2,469,045 | |
Bpifrance SACA, | | | | | | | | | | | | | | | | |
Gtd. Notes, EMTN | | 0.625 | | 07/22/31 | | | EUR | | | | 4,500 | | | | 4,181,802 | |
Caisse Francaise de Financement Local SA, | | | | | | | | | | | | | | | | |
Covered Bonds, EMTN | | 4.680 | | 03/09/29 | | | CAD | | | | 28,712 | | | | 21,353,991 | |
French Republic Government Bond OAT, | | | | | | | | | | | | | | | | |
Bonds, Series 51Y, 144A(k) | | 0.500 | | 05/25/72 | | | EUR | | | | 100 | | | | 38,997 | |
SFIL SA, | | | | | | | | | | | | | | | | |
Sr. Unsec’d. Notes, EMTN | | 2.875 | | 01/22/31 | | | EUR | | | | 4,000 | | | | 4,300,436 | |
| | | | | | | | | | | | | | | | |
| | | | | |
| | | | | | | | | | | | | | | 32,344,271 | |
| | | | | |
Germany 0.0% | | | | | | | | | | | | | | | | |
| | | | | |
State of North Rhine-Westphalia, | | | | | | | | | | | | | | | | |
Sr. Unsec’d. Notes, EMTN | | 7.500 | | 06/08/27 | | | MXN | | | | 500 | | | | 23,068 | |
See Notes to Financial Statements.
40
PGIM Global Total Return Fund
Schedule of Investments (continued)
as of October 31, 2024
| | | | | | | | | | | | | | | | |
| | | | |
| Description | | Interest Rate | | Maturity Date | | Principal Amount (000)# | | | Value | |
| | | | | |
SOVEREIGN BONDS (Continued) | | | | | | | | | | | | | | | | |
| | | | | |
Greece 3.1% | | | | | | | | | | | | | | | | |
| | | | | |
Hellenic Republic Government Bond, | | | | | | | | | | | | | | | | |
Bonds | | 4.300% | | 02/24/25 | | | EUR | | | | 29 | | | $ | 29,930 | |
Bonds | | 4.300 | | 02/24/26 | | | EUR | | | | 52 | | | | 54,720 | |
Bonds | | 4.300 | | 02/24/27 | | | EUR | | | | 99 | | | | 105,612 | |
Bonds | | 4.300 | | 02/24/28 | | | EUR | | | | 64 | | | | 68,965 | |
Bonds | | 4.300 | | 02/24/29 | | | EUR | | | | 194 | | | | 216,245 | |
Bonds | | 4.300 | | 02/24/30 | | | EUR | | | | 501 | | | | 531,441 | |
Bonds | | 4.300 | | 02/24/31 | | | EUR | | | | 169 | | | | 178,021 | |
Bonds | | 4.300 | | 02/24/32 | | | EUR | | | | 158 | | | | 165,724 | |
Bonds | | 4.300 | | 02/24/33 | | | EUR | | | | 46 | | | | 47,477 | |
Bonds | | 4.300 | | 02/24/34 | | | EUR | | | | 95 | | | | 98,558 | |
Bonds | | 4.300 | | 02/24/35 | | | EUR | | | | 199 | | | | 203,179 | |
Bonds | | 4.300 | | 02/24/36 | | | EUR | | | | 131 | | | | 132,479 | |
Bonds | | 4.300 | | 02/24/37 | | | EUR | | | | 157 | | | | 156,215 | |
Bonds | | 4.300 | | 02/24/38 | | | EUR | | | | 268 | | | | 265,617 | |
Bonds | | 4.300 | | 02/24/39 | | | EUR | | | | 319 | | | | 312,498 | |
Bonds | | 4.300 | | 02/24/40 | | | EUR | | | | 378 | | | | 423,819 | |
Bonds | | 4.300 | | 02/24/41 | | | EUR | | | | 300 | | | | 336,503 | |
Bonds | | 4.300 | | 02/24/42 | | | EUR | | | | 923 | | | | 1,035,504 | |
Sr. Unsec’d. Notes, 144A | | 1.875 | | 02/04/35 | | | EUR | | | | 60,000 | | | | 56,882,474 | |
Sr. Unsec’d. Notes, 144A | | 1.875 | | 01/24/52 | | | EUR | | | | 7,585 | | | | 5,636,707 | |
Hellenic Republic Government International Bond, | | | | | | | | | | | | | | | | |
Sr. Unsec’d. Notes | | 5.200 | | 07/17/34 | | | EUR | | | | 10,198 | | | | 12,330,580 | |
Sr. Unsec’d. Notes | | 6.140 | | 04/14/28 | | | EUR | | | | 5,400 | | | | 6,470,868 | |
| | | | | | | | | | | | | | | | |
| | | | | |
| | | | | | | | | | | | | | | 85,683,136 | |
| | | | |
Hong Kong 0.1% | | | | | | | | | | | | | | |
| | | | | |
Hong Kong Government International Bond, | | | | | | | | | | | | | | | | |
Sr. Unsec’d. Notes, GMTN | | 3.300 | | 06/07/33 | | | CNH | | | | 22,000 | | | | 3,257,168 | |
| | | | | |
Hungary 0.4% | | | | | | | | | | | | | | | | |
| | | | | |
Hungary Government Bond, | | | | | | | | | | | | | | | | |
Bonds, Series 27/A | | 3.000 | | 10/27/27 | | | HUF | | | | 800,000 | | | | 1,929,069 | |
Hungary Government International Bond, | | | | | | | | | | | | | | | | |
Sr. Unsec’d. Notes | | 2.125 | | 09/22/31 | | | | | | | 1,375 | | | | 1,101,719 | |
Sr. Unsec’d. Notes, Series 12Y | | 1.625 | | 04/28/32 | | | EUR | | | | 4,176 | | | | 3,832,687 | |
See Notes to Financial Statements.
PGIM Global Total Return Fund 41
PGIM Global Total Return Fund
Schedule of Investments (continued)
as of October 31, 2024
| | | | | | | | | | | | | | | | |
| | | | |
| Description | | Interest Rate | | Maturity Date | | Principal Amount (000)# | | | Value | |
| | | | | |
SOVEREIGN BONDS (Continued) | | | | | | | | | | | | | | | | |
| | | | | |
Hungary (cont’d.) | | | | | | | | | | | | | | | | |
| | | | | |
Magyar Export-Import Bank Zrt, | | | | | | | | | | | | | | | | |
Gov’t. Gtd. Notes | | 6.000% | | 05/16/29 | | | EUR | | | | 3,600 | | | $ | 4,198,589 | |
| | | | | | | | | | | | | | | | |
| | | | | |
| | | | | | | | | | | | | | | 11,062,064 | |
| | | | | |
India 0.3% | | | | | | | | | | | | | | | | |
| | | | | |
Export-Import Bank of India, | | | | | | | | | | | | | | | | |
Sr. Unsec’d. Notes, EMTN | | 3.450 | | 06/25/26 | | | CNH | | | | 50,000 | | | | 7,118,865 | |
| | | | | |
Indonesia 1.8% | | | | | | | | | | | | | | | | |
| | | | | |
Indonesia Government International Bond, | | | | | | | | | | | | | | | | |
Sr. Unsec’d. Notes | | 0.900 | | 02/14/27 | | | EUR | | | | 10,300 | | | | 10,587,615 | |
Sr. Unsec’d. Notes | | 1.000 | | 07/28/29 | | | EUR | | | | 8,500 | | | | 8,283,726 | |
Sr. Unsec’d. Notes | | 1.400 | | 10/30/31 | | | EUR | | | | 9,560 | | | | 9,021,037 | |
Sr. Unsec’d. Notes | | 1.750 | | 04/24/25 | | | EUR | | | | 2,600 | | | | 2,803,517 | |
Sr. Unsec’d. Notes | | 3.650 | | 09/10/32 | | | EUR | | | | 3,200 | | | | 3,463,396 | |
Sr. Unsec’d. Notes, EMTN | | 3.750 | | 06/14/28 | | | EUR | | | | 13,980 | | | | 15,430,094 | |
| | | | | | | | | | | | | | | | |
| | | | | |
| | | | | | | | | | | | | | | 49,589,385 | |
| | | | | |
Israel 0.2% | | | | | | | | | | | | | | | | |
| | | | | |
Israel Government International Bond, | | | | | | | | | | | | | | | | |
Sr. Unsec’d. Notes, EMTN | | 6.875 | | 10/21/34 | | | GBP | | | | 3,435 | | | | 4,758,798 | |
State of Israel, | | | | | | | | | | | | | | | | |
Sr. Unsec’d. Notes, EMTN | | 6.250 | | 11/21/27 | | | | | | | 1,500 | | | | 1,543,590 | |
| | | | | | | | | | | | | | | | |
| | | | | |
| | | | | | | | | | | | | | | 6,302,388 | |
| | | |
Italy 2.5% | | | | | | | | | | | | |
| | | | | |
Cassa Del Trentino SPA, | | | | | | | | | | | | | | | | |
Local Gov’t. Gtd. Notes, EMTN | | 1.160 | | 06/17/26 | | | EUR | | | | 628 | | | | 671,479 | |
Italy Buoni Poliennali Del Tesoro, | | | | | | | | | | | | | | | | |
Sr. Unsec’d. Notes, Series 10Y | | 3.850 | | 07/01/34 | | | EUR | | | | 500 | | | | 556,844 | |
Sr. Unsec’d. Notes, Series 10Y | | 4.200 | | 03/01/34 | | | EUR | | | | 250 | | | | 286,797 | |
Sr. Unsec’d. Notes, Series 11Y | | 3.850 | | 02/01/35 | | | EUR | | | | 1,185 | | | | 1,313,535 | |
Sr. Unsec’d. Notes, Series 26Y, 144A | | 3.350 | | 03/01/35 | | | EUR | | | | 1,285 | | | | 1,370,894 | |
Sr. Unsec’d. Notes, Series VALR | | 4.100(cc) | | 10/10/28 | | | EUR | | | | 1,000 | | | | 1,132,130 | |
Region of Lazio, | | | | | | | | | | | | | | | | |
Sr. Unsec’d. Notes | | 3.088 | | 03/31/43 | | | EUR | | | | 6,195 | | | | 6,126,850 | |
See Notes to Financial Statements.
42
PGIM Global Total Return Fund
Schedule of Investments (continued)
as of October 31, 2024
| | | | | | | | | | | | | | | | |
| | | | |
| Description | | Interest Rate | | Maturity Date | | Principal Amount (000)# | | | Value | |
| | | | | |
SOVEREIGN BONDS (Continued) | | | | | | | | | | | | | | | | |
| | | | | |
Italy (cont’d.) | | | | | | | | | | | | | | | | |
| | | | | |
Region of Lombardy, | | | | | | | | | | | | | | | | |
Sr. Unsec’d. Notes | | 5.804% | | 10/25/32 | | | | | | | 2,695 | | | $ | 2,581,173 | |
Region of Umbria, | | | | | | | | | | | | | | | | |
Sr. Unsec’d. Notes, 6 Month EURIBOR + 0.200% | | 3.396(c) | | 03/26/31 | | | EUR | | | | 708 | | | | 781,652 | |
Repubic of Italy Government International Bond Coupon Strips, | | | | | | | | | | | | | | | | |
Sr. Unsec’d. Notes | | 1.812(s) | | 02/20/31 | | | EUR | | | | 5,458 | | | | 4,834,247 | |
Republic of Italy Government International Bond, | | | | | | | | | | | | | | | | |
Sr. Unsec’d. Notes, EMTN | | 3.444 | | 12/31/24 | | | EUR | | | | 1 | | | | 1,456 | |
Sr. Unsec’d. Notes, EMTN, EURIBOR ICE SWAP 11:00 Fft 30Y Index + 0.000% (Cap N/A, Floor 4.250%) | | 4.250(c) | | 06/28/29 | | | EUR | | | | 7,892 | | | | 8,942,498 | |
Sr. Unsec’d. Notes, EMTN | | 4.425 | | 03/28/36 | | | EUR | | | | 1,400 | | | | 1,573,730 | |
Sr. Unsec’d. Notes, EMTN | | 5.200 | | 07/31/34 | | | EUR | | | | 1,635 | | | | 1,963,403 | |
Sr. Unsec’d. Notes, EMTN | | 5.250 | | 12/07/34 | | | GBP | | | | 17,018 | | | | 20,479,546 | |
Sr. Unsec’d. Notes, EMTN | | 5.345 | | 01/27/48 | | | EUR | | | | 2,100 | | | | 2,498,842 | |
Sr. Unsec’d. Notes, Series 10Y | | 2.875 | | 10/17/29 | | | | | | | 3,300 | | | | 3,017,803 | |
Sr. Unsec’d. Notes, Series 30Y | | 3.875 | | 05/06/51 | | | | | | | 1,492 | | | | 1,048,123 | |
Sr. Unsec’d. Notes, Series 30Y, MTN | | 5.375 | | 06/15/33 | | | | | | | 5,900 | | | | 6,036,481 | |
Sr. Unsec’d. Notes, Series 67, EMTN, EURIBOR ICE SWAP 11:00 Fft 10Y Index + 0.000% (Cap 8.800%, Floor N/A) | | 2.787(c) | | 05/11/26 | | | EUR | | | | 3,000 | | | | 3,230,436 | |
| | | | | | | | | | | | | | | | |
| | | | | |
| | | | | | | | | | | | | | | 68,447,919 | |
| | | | | |
Japan 0.2% | | | | | | | | | | | | | | | | |
| | | | | |
Japan Government Twenty Year Bond, | | | | | | | | | | | | | | | | |
Bonds, Series 159 | | 0.600 | | 12/20/36 | | | JPY | | | | 350,000 | | | | 2,154,118 | |
Bonds, Series 189 | | 1.900 | | 06/20/44 | | | JPY | | | | 377,000 | | | | 2,536,209 | |
| | | | | | | | | | | | | | | | |
| | | | | |
| | | | | | | | | | | | | | | 4,690,327 | |
| | | | | |
Malta 0.1% | | | | | | | | | | | | | | | | |
| | | | | |
Malta Government Bond, | | | | | | | | | | | | | | | | |
Bonds, Series 16Y | | 1.200 | | 05/13/37 | | | EUR | | | | 1,000 | | | | 793,495 | |
Bonds, Series I | | 1.000 | | 04/23/31 | | | EUR | | | | 2,500 | | | | 2,302,336 | |
| | | | | | | | | | | | | | | | |
| | | | | |
| | | | | | | | | | | | | | | 3,095,831 | |
See Notes to Financial Statements.
PGIM Global Total Return Fund 43
PGIM Global Total Return Fund
Schedule of Investments (continued)
as of October 31, 2024
| | | | | | | | | | | | | | | | |
| | | | |
| Description | | Interest Rate | | Maturity Date | | Principal Amount (000)# | | | Value | |
| | | | | |
SOVEREIGN BONDS (Continued) | | | | | | | | | | | | | | | | |
| | | | | |
Mexico 0.8% | | | | | | | | | | | | | | | | |
| | | | | |
Mexico Government International Bond, | | | | | | | | | | | | | | | | |
Sr. Unsec’d. Notes | | 1.125% | | 01/17/30 | | | EUR | | | | 10,100 | | | $ | 9,482,529 | |
Sr. Unsec’d. Notes | | 1.450 | | 10/25/33 | | | EUR | | | | 4,825 | | | | 4,052,744 | |
Sr. Unsec’d. Notes | | 2.875 | | 04/08/39 | | | EUR | | | | 5,000 | | | | 4,291,514 | |
Sr. Unsec’d. Notes | | 4.000 | | 03/15/2115 | | | EUR | | | | 950 | | | | 753,063 | |
Sr. Unsec’d. Notes, EMTN | | 5.625 | | 03/19/2114 | | | GBP | | | | 340 | | | | 320,449 | |
Sr. Unsec’d. Notes, Series 28 | | 2.000 | | 04/20/38 | | | JPY | | | | 300,000 | | | | 1,779,387 | |
Sr. Unsec’d. Notes, Series A, MTN | | 7.500 | | 04/08/33 | | | | | | | 875 | | | | 971,967 | |
| | | | | | | | | | | | | | | | |
| | | | | |
| | | | | | | | | | | | | | | 21,651,653 | |
| | | | | |
Montenegro 0.0% | | | | | | | | | | | | | | | | |
| | | | | |
Montenegro Government International Bond, | | | | | | | | | | | | | | | | |
Sr. Unsec’d. Notes, 144A | | 3.375 | | 04/21/25 | | | EUR | | | | 750 | | | | 812,704 | |
| | | | | |
New Zealand 0.2% | | | | | | | | | | | | | | | | |
| | | | | |
New Zealand Government Bond, | | | | | | | | | | | | | | | | |
Unsec’d. Notes, Series 528 | | 0.250 | | 05/15/28 | | | NZD | | | | 8,000 | | | | 4,216,457 | |
| | | | | |
Norway 0.1% | | | | | | | | | | | | | | | | |
| | | | | |
Norway Government Bond, | | | | | | | | | | | | | | | | |
Sr. Unsec’d. Notes, Series 479, 144A | | 1.750 | | 02/17/27 | | | NOK | | | | 22,000 | | | | 1,906,207 | |
| | | | | |
Panama 0.6% | | | | | | | | | | | | | | | | |
| | | | | |
Panama Government International Bond, | | | | | | | | | | | | | | | | |
Sr. Unsec’d. Notes | | 6.875 | | 01/31/36 | | | | | | | 300 | | | | 296,156 | |
Sr. Unsec’d. Notes | | 8.125 | | 04/28/34 | | | | | | | 14,336 | | | | 15,345,541 | |
| | | | | | | | | | | | | | | | |
| | | | | |
| | | | | | | | | | | | | | | 15,641,697 | |
| | | |
Peru 0.5% | | | | | | | | | | | | |
| | | | | |
Peru Government Bond, | | | | | | | | | | | | | | | | |
Bonds | | 5.940 | | 02/12/29 | | | PEN | | | | 6,000 | | | | 1,628,340 | |
Peruvian Government International Bond, | | | | | | | | | | | | | | | | |
Sr. Unsec’d. Notes | | 1.250 | | 03/11/33 | | | EUR | | | | 1,200 | | | | 1,056,069 | |
Sr. Unsec’d. Notes | | 3.750 | | 03/01/30 | | | EUR | | | | 9,408 | | | | 10,297,512 | |
| | | | | | | | | | | | | | | | |
| | | | | |
| | | | | | | | | | | | | | | 12,981,921 | |
See Notes to Financial Statements.
44
PGIM Global Total Return Fund
Schedule of Investments (continued)
as of October 31, 2024
| | | | | | | | | | | | | | | | |
| | | | |
| Description | | Interest Rate | | Maturity Date | | Principal Amount (000)# | | | Value | |
| | | | | |
SOVEREIGN BONDS (Continued) | | | | | | | | | | | | | | | | |
| | | | | |
Philippines 1.0% | | | | | | | | | | | | | | | | |
| | | | | |
Philippine Government International Bond, | | | | | | | | | | | | | | | | |
Sr. Unsec’d. Notes | | 0.700% | | 02/03/29 | | | EUR | | | | 5,365 | | | $ | 5,221,198 | |
Sr. Unsec’d. Notes | | 1.200 | | 04/28/33 | | | EUR | | | | 1,350 | | | | 1,221,577 | |
Sr. Unsec’d. Notes | | 1.750 | | 04/28/41 | | | EUR | | | | 1,085 | | | | 849,750 | |
Sr. Unsec’d. Notes, EMTN | | 0.875 | | 05/17/27 | | | EUR | | | | 4,000 | | | | 4,091,300 | |
Sr. Unsec’d. Notes, Series 11 | | 0.990 | | 08/15/28 | | | JPY | | | | 800,000 | | | | 5,176,781 | |
Sr. Unsec’d. Notes, Series 15 | | 0.590 | | 08/15/29 | | | JPY | | | | 1,700,000 | | | | 10,715,852 | |
| | | | | | | | | | | | | | | | |
| | | | | |
| | | | | | | | | | | | | | | 27,276,458 | |
| | | | | |
Poland 0.2% | | | | | | | | | | | | | | | | |
| | | | | |
Republic of Poland Government Bond, | | | | | | | | | | | | | | | | |
Bonds, Series 0428 | | 2.750 | | 04/25/28 | | | PLN | | | | 1,000 | | | | 229,742 | |
Bonds, Series 0429 | | 5.750 | | 04/25/29 | | | PLN | | | | 1,000 | | | | 250,568 | |
Bonds, Series 0432 | | 1.750 | | 04/25/32 | | | PLN | | | | 1,000 | | | | 189,873 | |
Bonds, Series 0527 | | 3.750 | | 05/25/27 | | | PLN | | | | 1,000 | | | | 241,785 | |
Bonds, Series 0726 | | 2.500 | | 07/25/26 | | | PLN | | | | 1,000 | | | | 239,531 | |
Bonds, Series 0727 | | 2.500 | | 07/25/27 | | | PLN | | | | 1,000 | | | | 233,500 | |
Bonds, Series 0728 | | 7.500 | | 07/25/28 | | | PLN | | | | 5,000 | | | | 1,334,910 | |
Bonds, Series 0729 | | 4.750 | | 07/25/29 | | | PLN | | | | 1,000 | | | | 239,835 | |
Bonds, Series 1026 | | 0.250 | | 10/25/26 | | | PLN | | | | 1,000 | | | | 227,888 | |
Bonds, Series 1029 | | 2.750 | | 10/25/29 | | | PLN | | | | 1,000 | | | | 219,739 | |
Bonds, Series 1030 | | 1.250 | | 10/25/30 | | | PLN | | | | 1,000 | | | | 195,058 | |
Bonds, Series 1033 | | 6.000 | | 10/25/33 | | | PLN | | | | 1,000 | | | | 251,472 | |
Bonds, Series 1034 | | 5.000 | | 10/25/34 | | | PLN | | | | 1,000 | | | | 232,110 | |
Bonds, Series 1025 | | 5.022(s) | | 10/25/25 | | | PLN | | | | 1,000 | | | | 240,332 | |
Bonds, Series 0426 | | 5.048(s) | | 04/25/26 | | | PLN | | | | 1,000 | | | | 232,605 | |
Republic of Poland Government International Bond, | | | | | | | | | | | | | | | | |
Sr. Unsec’d. Notes, EMTN | | 3.220 | | 08/04/34 | | | JPY | | | | 100,000 | | | | 737,945 | |
| | | | | | | | | | | | | | | | |
| | | | | |
| | | | | | | | | | | | | | | 5,296,893 | |
| | | | | |
Portugal 0.1% | | | | | | | | | | | | | | | | |
| | | | | |
Autonomous Region of the Azores, | | | | | | | | | | | | | | | | |
Sr. Unsec’d. Notes | | 0.491 | | 10/01/27 | | | EUR | | | | 400 | | | | 404,635 | |
Sr. Unsec’d. Notes | | 1.006 | | 06/15/29 | | | EUR | | | | 300 | | | | 297,126 | |
Sr. Unsec’d. Notes | | 1.095 | | 09/27/36 | | | EUR | | | | 500 | | | | 409,787 | |
See Notes to Financial Statements.
PGIM Global Total Return Fund 45
PGIM Global Total Return Fund
Schedule of Investments (continued)
as of October 31, 2024
| | | | | | | | | | | | | | | | |
| | | | |
| Description | | Interest Rate | | Maturity Date | | Principal Amount (000)# | | | Value | |
| | | | | |
SOVEREIGN BONDS (Continued) | | | | | | | | | | | | | | | | |
| | | | | |
Portugal (cont’d.) | | | | | | | | | | | | | | | | |
| | | | | |
Regiao Autonoma Madeira, | | | | | | | | | | | | | | | | |
Sr. Unsec’d. Notes | | 1.141% | | 12/04/34 | | | EUR | | | | 1,000 | | | $ | 857,849 | |
| | | | | | | | | | | | | | | | |
| | | | | |
| | | | | | | | | | | | | | | 1,969,397 | |
| | | | | |
Romania 0.8% | | | | | | | | | | | | | | | | |
| | | | | |
Romania Government Bond, | | | | | | | | | | | | | | | | |
Bonds, Series 04Y | | 3.500 | | 11/25/25 | | | RON | | | | 500 | | | | 106,665 | |
Bonds, Series 04Y | | 7.200 | | 10/28/26 | | | RON | | | | 500 | | | | 111,195 | |
Bonds, Series 04Y | | 7.200 | | 05/31/27 | | | RON | | | | 500 | | | | 111,401 | |
Bonds, Series 05Y | | 3.250 | | 06/24/26 | | | RON | | | | 500 | | | | 104,533 | |
Bonds, Series 05Y | | 4.250 | | 04/28/36 | | | RON | | | | 500 | | | | 86,586 | |
Bonds, Series 05Y | | 6.300 | | 04/25/29 | | | RON | | | | 500 | | | | 107,514 | |
Bonds, Series 06Y | | 8.750 | | 10/30/28 | | | RON | | | | 500 | | | | 117,423 | |
Bonds, Series 07Y | | 2.500 | | 10/25/27 | | | RON | | | | 500 | | | | 98,288 | |
Bonds, Series 07Y | | 4.850 | | 04/22/26 | | | RON | | | | 500 | | | | 107,474 | |
Bonds, Series 07Y | | 8.000 | | 04/29/30 | | | RON | | | | 500 | | | | 115,077 | |
Bonds, Series 08Y | | 4.150 | | 01/26/28 | | | RON | | | | 500 | | | | 102,415 | |
Bonds, Series 08Y | | 4.850 | | 07/25/29 | | | RON | | | | 500 | | | | 101,293 | |
Bonds, Series 08Y | | 7.350 | | 04/28/31 | | | RON | | | | 500 | | | | 111,628 | |
Bonds, Series 10Y | | 4.150 | | 10/24/30 | | | RON | | | | 500 | | | | 95,569 | |
Bonds, Series 10Y | | 5.000 | | 02/12/29 | | | RON | | | | 500 | | | | 102,770 | |
Bonds, Series 10Y | | 6.700 | | 02/25/32 | | | RON | | | | 500 | | | | 107,699 | |
Bonds, Series 10Y | | 7.200 | | 10/30/33 | | | RON | | | | 500 | | | | 111,630 | |
Bonds, Series 10Y | | 8.250 | | 09/29/32 | | | RON | | | | 500 | | | | 117,860 | |
Bonds, Series 11Y | | 7.100 | | 07/31/34 | | | RON | | | | 500 | | | | 110,042 | |
Bonds, Series 15Y | | 3.650 | | 09/24/31 | | | RON | | | | 500 | | | | 90,368 | |
Bonds, Series 15Y | | 4.750 | | 10/11/34 | | | RON | | | | 500 | | | | 92,542 | |
Bonds, Series 15Y | | 5.800 | | 07/26/27 | | | RON | | | | 500 | | | | 107,958 | |
Bonds, Series 15Y | | 7.900 | | 02/24/38 | | | RON | | | | 500 | | | | 118,121 | |
Romanian Government International Bond, | | | | | | | | | | | | | | | | |
Sr. Unsec’d. Notes, 144A, MTN | | 2.124 | | 07/16/31 | | | EUR | | | | 3,600 | | | | 3,275,885 | |
Sr. Unsec’d. Notes, 144A, MTN | | 2.500 | | 02/08/30 | | | EUR | | | | 4,150 | | | | 4,062,746 | |
Sr. Unsec’d. Notes, 144A, MTN | | 2.875 | | 05/26/28 | | | EUR | | | | 1,100 | | | | 1,149,167 | |
Sr. Unsec’d. Notes, EMTN | | 2.124 | | 07/16/31 | | | EUR | | | | 2,000 | | | | 1,819,936 | |
Sr. Unsec’d. Notes, EMTN | | 2.375 | | 04/19/27 | | | EUR | | | | 1,000 | | | | 1,054,715 | |
Sr. Unsec’d. Notes, EMTN | | 3.375 | | 02/08/38 | | | EUR | | | | 2,138 | | | | 1,787,231 | |
Sr. Unsec’d. Notes, EMTN | | 3.500 | | 04/03/34 | | | EUR | | | | 1,000 | | | | 932,746 | |
Sr. Unsec’d. Notes, EMTN | | 3.875 | | 10/29/35 | | | EUR | | | | 1,000 | | | | 923,913 | |
See Notes to Financial Statements.
46
PGIM Global Total Return Fund
Schedule of Investments (continued)
as of October 31, 2024
| | | | | | | | | | | | | | | | |
| | | | |
| Description | | Interest Rate | | Maturity Date | | Principal Amount (000)# | | | Value | |
| | | | | |
SOVEREIGN BONDS (Continued) | | | | | | | | | | | | | | | | |
| | | | | |
Romania (cont’d.) | | | | | | | | | | | | | | | | |
| | | | | |
Romanian Government International Bond, (cont’d.) | | | | | | | | | | | | | | | | |
Sr. Unsec’d. Notes, EMTN | | 4.125% | | 03/11/39 | | | EUR | | | | 2,966 | | | $ | 2,661,670 | |
Sr. Unsec’d. Notes, MTN | | 2.875 | | 05/26/28 | | | EUR | | | | 700 | | | | 731,288 | |
| | | | | | | | | | | | | | | | |
| | | | | |
| | | | | | | | | | | | | | | 20,835,348 | |
| | | | | |
Saudi Arabia 0.5% | | | | | | | | | | | | | | | | |
| | | | | |
Saudi Government International Bond, | | | | | | | | | | | | | | | | |
Sr. Unsec’d. Notes | | 2.000 | | 07/09/39 | | | EUR | | | | 16,656 | | | | 14,012,803 | |
| | | |
Serbia 1.1% | | | | | | | | | | | | |
| | | | | |
Serbia International Bond, | | | | | | | | | | | | | | | | |
Sr. Unsec’d. Notes | | 1.500 | | 06/26/29 | | | EUR | | | | 6,000 | | | | 5,867,731 | |
Sr. Unsec’d. Notes | | 2.125 | | 12/01/30 | | | | | | | 9,015 | | | | 7,448,644 | |
Sr. Unsec’d. Notes | | 3.125 | | 05/15/27 | | | EUR | | | | 15,595 | | | | 16,693,106 | |
| | | | | | | | | | | | | | | | |
| | | | | |
| | | | | | | | | | | | | | | 30,009,481 | |
| | | | | |
Slovakia 0.1% | | | | | | | | | | | | | | | | |
| | | | | |
Slovakia Government Bond, | | | | | | | | | | | | | | | | |
Bonds, Series 247 | | 3.625 | | 06/08/33 | | | EUR | | | | 1,530 | | | | 1,703,472 | |
| | | | | |
Slovenia 0.1% | | | | | | | | | | | | | | | | |
| | | | | |
Slovenia Government Bond, | | | | | | | | | | | | | | | | |
Sr. Unsec’d. Notes, Series RS86 | | 0.000 | | 02/12/31 | | | EUR | | | | 100 | | | | 91,374 | |
Slovenia Government International Bond, | | | | | | | | | | | | | | | | |
Bonds | | 5.000 | | 09/19/33 | | | | | | | 3,200 | | | | 3,224,576 | |
| | | | | | | | | | | | | | | | |
| | | | | |
| | | | | | | | | | | | | | | 3,315,950 | |
| | | | | |
South Africa 0.1% | | | | | | | | | | | | | | | | |
| | | | | |
Republic of South Africa Government International Bond, | | | | | | | | | | | | | | | | |
Sr. Unsec’d. Notes | | 3.750 | | 07/24/26 | | | EUR | | | | 2,200 | | | | 2,372,111 | |
See Notes to Financial Statements.
PGIM Global Total Return Fund 47
PGIM Global Total Return Fund
Schedule of Investments (continued)
as of October 31, 2024
| | | | | | | | | | | | | | | | |
| | | | |
| Description | | Interest Rate | | Maturity Date | | Principal Amount (000)# | | | Value | |
| | | | | |
SOVEREIGN BONDS (Continued) | | | | | | | | | | | | | | | | |
| | | | | |
South Korea 0.0% | | | | | | | | | | | | | | | | |
| | | | | |
Export-Import Bank of Korea, | | | | | | | | | | | | | | | | |
Sr. Unsec’d. Notes, 144A, MTN | | 6.700% | | 12/02/24 | | | IDR | | | | 40,000 | | | $ | 2,543 | |
Sr. Unsec’d. Notes, EMTN | | 7.250 | | 12/07/24 | | | IDR | | | | 10,000,000 | | | | 635,814 | |
| | | | | | | | | | | | | | | | |
| | | | | |
| | | | | | | | | | | | | | | 638,357 | |
| | | |
Spain 2.2% | | | | | | | | | | | | |
| | | | | |
Autonomous Community of Catalonia, | | | | | | | | | | | | | | | | |
Sr. Unsec’d. Notes | | 4.690 | | 10/28/34 | | | EUR | | | | 598 | | | | 684,955 | |
Sr. Unsec’d. Notes, EMTN, EURIBOR ICE SWAP 11:00 Fft 10Y Index + 0.000% (Cap 12.000%, Floor 5.480%) | | 5.480(c) | | 05/11/29 | | | EUR | | | | 1,000 | | | | 1,181,057 | |
Sr. Unsec’d. Notes, EMTN | | 5.900 | | 05/28/30 | | | EUR | | | | 3,250 | | | | 3,867,311 | |
Sr. Unsec’d. Notes, EMTN | | 6.350 | | 11/30/41 | | | EUR | | | | 2,100 | | | | 2,786,486 | |
Spain Government Bond, | | | | | | | | | | | | | | | | |
Sr. Unsec’d. Notes, 144A | | 1.000 | | 10/31/50 | | | EUR | | | | 10,600 | | | | 6,529,371 | |
Sr. Unsec’d. Notes, 144A | | 1.200 | | 10/31/40 | | | EUR | | | | 2,500 | | | | 1,969,812 | |
Sr. Unsec’d. Notes, 144A | | 1.850 | | 07/30/35 | | | EUR | | | | 7,225 | | | | 6,950,174 | |
Sr. Unsec’d. Notes, 144A | | 3.450 | | 07/30/66 | | | EUR | | | | 4,200 | | | | 4,269,060 | |
Spain Government Bond Coupon Strips, | | | | | | | | | | | | | | | | |
Sr. Unsec’d. Notes | | 0.320(s) | | 01/31/33 | | | EUR | | | | 2,100 | | | | 1,794,594 | |
Bonds | | 0.449(s) | | 07/30/29 | | | EUR | | | | 438 | | | | 419,016 | |
Sr. Unsec’d. Notes, Series CAC(k) | | 0.579(s) | | 07/30/29 | | | EUR | | | | 3,600 | | | | 3,434,226 | |
Sr. Unsec’d. Notes | | 0.958(s) | | 01/31/35 | | | EUR | | | | 168 | | | | 130,959 | |
Sr. Unsec’d. Notes | | 1.027(s) | | 01/31/36 | | | EUR | | | | 168 | | | | 125,459 | |
Sr. Unsec’d. Notes | | 1.078(s) | | 01/31/37 | | | EUR | | | | 168 | | | | 120,954 | |
Sr. Unsec’d. Notes, Series CAC | | 1.128(s) | | 07/30/36 | | | EUR | | | | 862 | | | | 636,184 | |
Sr. Unsec’d. Notes, Series CAC | | 1.212(s) | | 07/30/37 | | | EUR | | | | 862 | | | | 608,159 | |
Sr. Unsec’d. Notes | | 1.296(s) | | 07/30/41 | | | EUR | | | | 436 | | | | 259,710 | |
Sr. Unsec’d. Notes, Series CAC | | 1.297(s) | | 07/30/38 | | | EUR | | | | 862 | | | | 582,732 | |
Sr. Unsec’d. Notes, Series CAC | | 1.365(s) | | 07/30/42 | | | EUR | | | | 300 | | | | 169,240 | |
Sr. Unsec’d. Notes, Series CAC | | 1.405(s) | | 07/30/43 | | | EUR | | | | 300 | | | | 161,814 | |
Sr. Unsec’d. Notes, Series CAC | | 1.455(s) | | 07/30/44 | | | EUR | | | | 300 | | | | 158,658 | |
Sr. Unsec’d. Notes, Series CAC | | 1.475(s) | | 07/30/45 | | | EUR | | | | 300 | | | | 153,414 | |
Sr. Unsec’d. Notes, Series CAC | | 1.485(s) | | 07/30/46 | | | EUR | | | | 300 | | | | 148,456 | |
Sr. Unsec’d. Notes, Series CAC | | 1.504(s) | | 07/30/47 | | | EUR | | | | 300 | | | | 143,561 | |
Sr. Unsec’d. Notes, Series CAC | | 1.514(s) | | 07/30/48 | | | EUR | | | | 300 | | | | 138,733 | |
Sr. Unsec’d. Notes, Series CAC | | 1.544(s) | | 07/30/49 | | | EUR | | | | 300 | | | | 133,858 | |
Sr. Unsec’d. Notes, Series CAC | | 1.564(s) | | 07/30/50 | | | EUR | | | | 300 | | | | 124,551 | |
Sr. Unsec’d. Notes, Series CAC | | 1.594(s) | | 07/30/51 | | | EUR | | | | 300 | | | | 119,099 | |
See Notes to Financial Statements.
48
PGIM Global Total Return Fund
Schedule of Investments (continued)
as of October 31, 2024
| | | | | | | | | | | | | | | | |
| | | | |
| Description | | Interest Rate | | Maturity Date | | Principal Amount (000)# | | | Value | |
| | | | | |
SOVEREIGN BONDS (Continued) | | | | | | | | | | | | | | | | |
| | | | | |
Spain (cont’d.) | | | | | | | | | | | | | | | | |
| | | | | |
Spain Government Bond Coupon Strips, (cont’d.) | | | | | | | | | | | | | | | | |
Sr. Unsec’d. Notes, Series CAC | | 1.623%(s) | | 07/30/52 | | | EUR | | | | 300 | | | $ | 116,250 | |
Sr. Unsec’d. Notes, Series CAC | | 1.663(s) | | 07/30/53 | | | EUR | | | | 300 | | | | 108,396 | |
Sr. Unsec’d. Notes, Series CAC | | 1.683(s) | | 07/30/54 | | | EUR | | | | 300 | | | | 100,959 | |
Sr. Unsec’d. Notes, Series CAC | | 1.703(s) | | 07/30/55 | | | EUR | | | | 300 | | | | 96,293 | |
Sr. Unsec’d. Notes, Series CAC | | 1.732(s) | | 07/30/56 | | | EUR | | | | 300 | | | | 88,064 | |
Sr. Unsec’d. Notes, Series CAC | | 1.772(s) | | 07/30/57 | | | EUR | | | | 300 | | | | 84,580 | |
Sr. Unsec’d. Notes, Series CAC | | 1.782(s) | | 07/30/58 | | | EUR | | | | 300 | | | | 85,063 | |
Sr. Unsec’d. Notes, Series CAC | | 1.812(s) | | 07/30/59 | | | EUR | | | | 300 | | | | 78,543 | |
Sr. Unsec’d. Notes, Series CAC | | 1.851(s) | | 07/30/60 | | | EUR | | | | 300 | | | | 78,151 | |
Sr. Unsec’d. Notes, Series CAC | | 1.871(s) | | 07/30/61 | | | EUR | | | | 300 | | | | 74,563 | |
Sr. Unsec’d. Notes, Series CAC | | 1.891(s) | | 07/30/62 | | | EUR | | | | 300 | | | | 70,231 | |
Sr. Unsec’d. Notes, Series CAC | | 1.921(s) | | 07/30/63 | | | EUR | | | | 300 | | | | 68,204 | |
Sr. Unsec’d. Notes, Series CAC | | 1.950(s) | | 07/30/64 | | | EUR | | | | 300 | | | | 65,266 | |
Sr. Unsec’d. Notes, Series CAC | | 1.980(s) | | 07/30/65 | | | EUR | | | | 300 | | | | 62,685 | |
Sr. Unsec’d. Notes, Series CAC | | 2.010(s) | | 07/30/66 | | | EUR | | | | 300 | | | | 62,416 | |
Spain Government Bond Principal Strips, | | | | | | | | | | | | | | | | |
Sr. Unsec’d. Notes | | 0.794(s) | | 07/30/41 | | | EUR | | | | 1,700 | | | | 1,007,543 | |
Spain Government International Bond, | | | | | | | | | | | | | | | | |
Sr. Unsec’d. Notes, EMTN | | 5.250 | | 04/06/29 | | | GBP | | | | 16,080 | | | | 20,957,043 | |
| | | | | | | | | | | | | | | | |
| | | | | |
| | | | | | | | | | | | | | | 61,005,853 | |
| | | | | |
Sweden 0.2% | | | | | | | | | | | | | | | | |
| | | | | |
Svensk Exportkredit AB, | | | | | | | | | | | | | | | | |
Sr. Preferred Notes, EMTN | | 3.375 | | 08/30/30 | | | EUR | | | | 1,700 | | | | 1,909,518 | |
Sr. Unsec’d. Notes, MTN | | 2.665(s) | | 05/11/37 | | | | | | | 110 | | | | 57,540 | |
Sr. Unsec’d. Notes, EMTN | | 8.904(s) | | 06/25/27 | | | ZAR | | | | 1,400 | | | | 63,787 | |
Sr. Unsec’d. Notes, EMTN | | 10.550(s) | | 03/30/32 | | | MXN | | | | 43,890 | | | | 1,023,380 | |
Sweden Government Bond, | | | | | | | | | | | | | | | | |
Bonds, Series 1053 | | 3.500 | | 03/30/39 | | | SEK | | | | 10,000 | | | | 1,077,630 | |
| | | | | | | | | | | | | | | | |
| | | | | |
| | | | | | | | | | | | | | | 4,131,855 | |
| | | | | |
Tunisia 0.0% | | | | | | | | | | | | | | | | |
| | | | | |
Tunisian Republic, | | | | | | | | | | | | | | | | |
Sr. Unsec’d. Notes | | 4.200 | | 03/17/31 | | | JPY | | | | 100,000 | | | | 474,694 | |
See Notes to Financial Statements.
PGIM Global Total Return Fund 49
PGIM Global Total Return Fund
Schedule of Investments (continued)
as of October 31, 2024
| | | | | | | | | | | | | | | | |
| | | | |
| Description | | Interest Rate | | Maturity Date | | Principal Amount (000)# | | | Value | |
| | | | | |
SOVEREIGN BONDS (Continued) | | | | | | | | | | | | | | | | |
| | | | | |
United Arab Emirates 0.2% | | | | | | | | | | | | | | | | |
| | | | | |
Finance Department Government of Sharjah, | | | | | | | | | | | | | | | | |
Sr. Unsec’d. Notes | | 4.625% | | 01/17/31 | | | EUR | | | | 2,000 | | | $ | 2,178,894 | |
Sr. Unsec’d. Notes, 144A, MTN | | 4.625 | | 01/17/31 | | | EUR | | | | 3,600 | | | | 3,922,009 | |
| | | | | | | | | | | | | | | | |
| | | | | |
| | | | | | | | | | | | | | | 6,100,903 | |
| | | |
United Kingdom 2.2% | | | | | | | | | | | | |
| | | | | |
HM Treasury UK Sovereign Sukuk PLC, | | | | | | | | | | | | | | | | |
Unsec’d. Notes(k) | | 0.333 | | 07/22/26 | | | GBP | | | | 500 | | | | 600,947 | |
Jersey International Bond, | | | | | | | | | | | | | | | | |
Sr. Unsec’d. Notes | | 3.750 | | 06/09/54 | | | GBP | | | | 834 | | | | 824,370 | |
United Kingdom Gilt, | | | | | | | | | | | | | | | | |
Bonds(k) | | 0.875 | | 01/31/46 | | | GBP | | | | 100 | | | | 61,872 | |
Bonds(k) | | 1.125 | | 01/31/39 | | | GBP | | | | 100 | | | | 82,463 | |
Bonds(k) | | 1.250 | | 10/22/41 | | | GBP | | | | 100 | | | | 77,205 | |
Bonds(k) | | 1.250 | | 07/31/51 | | | GBP | | | | 100 | | | | 60,097 | |
Bonds(k) | | 1.500 | | 07/22/47 | | | GBP | | | | 100 | | | | 70,098 | |
Bonds(k) | | 1.625 | | 10/22/71 | | | GBP | | | | 100 | | | | 55,954 | |
Bonds(k) | | 1.750 | | 01/22/49 | | | GBP | | | | 100 | | | | 72,599 | |
Bonds(k) | | 1.750 | | 07/22/57 | | | GBP | | | | 100 | | | | 64,913 | |
Bonds(k) | | 2.500 | | 07/22/65 | | | GBP | | | | 100 | | | | 77,199 | |
Bonds(k) | | 3.250 | | 01/22/44 | | | GBP | | | | 100 | | | | 103,585 | |
Bonds | | 3.500 | | 07/22/68 | | | GBP | | | | 100 | | | | 99,749 | |
Bonds(k) | | 3.750 | | 07/22/52 | | | GBP | | | | 100 | | | | 107,210 | |
Bonds | | 4.000 | | 01/22/60 | | | GBP | | | | 100 | | | | 111,412 | |
Bonds(k) | | 4.250 | | 03/07/36 | | | GBP | | | | 300 | | | | 378,205 | |
Bonds(k) | | 4.250 | | 09/07/39 | | | GBP | | | | 180 | | | | 221,478 | |
Bonds(k) | | 4.250 | | 12/07/40 | | | GBP | | | | 100 | | | | 121,967 | |
Bonds(k) | | 4.250 | | 12/07/46 | | | GBP | | | | 4,475 | | | | 5,290,374 | |
Bonds(k) | | 4.250 | | 12/07/49 | | | GBP | | | | 100 | | | | 117,469 | |
Bonds | | 4.250 | | 12/07/55 | | | GBP | | | | 100 | | | | 116,492 | |
Bonds(k) | | 4.500 | | 06/07/28 | | | GBP | | | | 40,700 | | | | 52,750,365 | |
Bonds(k) | | 4.500 | | 12/07/42 | | | GBP | | | | 100 | | | | 124,453 | |
Bonds(k) | | 4.750 | | 12/07/38 | | | GBP | | | | 100 | | | | 130,513 | |
| | | | | | | | | | | | | | | | |
| | | | | |
| | | | | | | | | | | | | | | 61,720,989 | |
| | | |
Uruguay 0.0% | | | | | | | | | | | | |
| | | | | |
Uruguay Government International Bond, | | | | | | | | | | | | | | | | |
Sr. Unsec’d. Notes, Series 8 | | 1.320 | | 12/09/36 | | | JPY | | | | 100,000 | | | | 578,106 | |
See Notes to Financial Statements.
50
PGIM Global Total Return Fund
Schedule of Investments (continued)
as of October 31, 2024
| | | | | | | | | | | | | | | | |
| | | | |
| Description | | Interest Rate | | Maturity Date | | Principal Amount (000)# | | | Value | |
| | | | | |
SOVEREIGN BONDS (Continued) | | | | | | | | | | | | | | | | |
| | | | | |
Vietnam 1.2% | | | | | | | | | | | | | | | | |
| | | | | |
Vietnam Government International Bond, | | | | | | | | | | | | | | | | |
Sec’d. Notes, Series 30Y | | 5.500%(cc) | | 03/12/28 | | | | | | | 35,786 | | | $ | 33,996,510 | |
| | | | | | | | | | | | | | | | |
| | | | | |
TOTAL SOVEREIGN BONDS | | | | | | | | | | | | | | | | |
(cost $935,896,287) | | | | | | | | | | | | | | | 807,038,232 | |
| | | | | | | | | | | | | | | | |
| | | | | |
U.S. GOVERNMENT AGENCY OBLIGATIONS 0.7% | | | | | | | | | | | | | | | | |
Federal National Mortgage Assoc. | | 5.375 | | 12/07/28 | | | GBP | | | | 15,000 | | | | 19,710,597 | |
Sri Lanka Government AID Bond | | | | | | | | | | | | | | | | |
U.S. Gov’t. Gtd. Notes, Series 1, 3 Month LIBOR + 0.300%^ | | 5.861(c) | | 11/01/24 | | | USD | | | | 250 | | | | 249,875 | |
| | | | | | | | | | | | | | | | |
| | | | | |
TOTAL U.S. GOVERNMENT AGENCY OBLIGATIONS
| | | | | | | | | | | | | | | | |
(cost $24,484,354) | | | | | | | | | | | | | | | 19,960,472 | |
| | | | | | | | | | | | | | | | |
| | | | | |
U.S. TREASURY OBLIGATIONS 5.6% | | | | | | | | | | | | | | | | |
U.S. Treasury Bonds(k) | | 1.125 | | 08/15/40 | | | | | | | 160 | | | | 98,925 | |
U.S. Treasury Bonds | | 1.250 | | 05/15/50 | | | | | | | 1,000 | | | | 502,344 | |
U.S. Treasury Bonds | | 1.375 | | 08/15/50 | | | | | | | 1,000 | | | | 517,031 | |
U.S. Treasury Bonds | | 1.625 | | 11/15/50 | | | | | | | 1,000 | | | | 552,656 | |
U.S. Treasury Bonds | | 1.875 | | 02/15/51 | | | | | | | 1,000 | | | | 589,219 | |
U.S. Treasury Bonds | | 1.875 | | 11/15/51 | | | | | | | 1,000 | | | | 585,313 | |
U.S. Treasury Bonds | | 2.000 | | 02/15/50 | | | | | | | 1,000 | | | | 613,438 | |
U.S. Treasury Bonds | | 2.000 | | 08/15/51 | | | | | | | 1,000 | | | | 605,469 | |
U.S. Treasury Bonds(k) | | 2.250 | | 05/15/41 | | | | | | | 545 | | | | 400,405 | |
U.S. Treasury Bonds | | 2.250 | | 08/15/49 | | | | | | | 1,000 | | | | 651,875 | |
U.S. Treasury Bonds | | 2.250 | | 02/15/52 | | | | | | | 1,000 | | | | 642,031 | |
U.S. Treasury Bonds | | 2.375 | | 11/15/49 | | | | | | | 1,000 | | | | 669,531 | |
U.S. Treasury Bonds | | 2.375 | | 05/15/51 | | | | | | | 1,000 | | | | 664,375 | |
U.S. Treasury Bonds(h) | | 2.875 | | 05/15/49 | | | | | | | 3,000 | | | | 2,233,594 | |
U.S. Treasury Bonds | | 2.875 | | 05/15/52 | | | | | | | 1,000 | | | | 738,750 | |
U.S. Treasury Bonds(h) | | 3.000 | | 02/15/49 | | | | | | | 3,000 | | | | 2,288,437 | |
U.S. Treasury Bonds | | 3.000 | | 08/15/52 | | | | | | | 1,000 | | | | 758,438 | |
U.S. Treasury Bonds | | 3.625 | | 02/15/53 | | | | | | | 1,000 | | | | 858,125 | |
U.S. Treasury Bonds | | 3.625 | | 05/15/53 | | | | | | | 1,000 | | | | 858,906 | |
U.S. Treasury Bonds | | 4.000 | | 11/15/52 | | | | | | | 1,000 | | | | 918,750 | |
U.S. Treasury Bonds(h) | | 4.125 | | 08/15/44 | | | | | | | 21,410 | | | | 20,101,983 | |
U.S. Treasury Bonds(h) | | 4.125 | | 08/15/53 | | | | | | | 1,000 | | | | 939,687 | |
U.S. Treasury Bonds(h) | | 4.250 | | 02/15/54 | | | | | | | 1,000 | | | | 961,406 | |
U.S. Treasury Bonds(h) | | 4.625 | | 05/15/54 | | | | | | | 1,000 | | | | 1,023,281 | |
See Notes to Financial Statements.
PGIM Global Total Return Fund 51
PGIM Global Total Return Fund
Schedule of Investments (continued)
as of October 31, 2024
| | | | | | | | | | | | | | | | |
| | | | |
| Description | | Interest Rate | | Maturity Date | | Principal Amount (000)# | | | Value | |
| | | | | |
U.S. TREASURY OBLIGATIONS (Continued) | | | | | | | | | | | | | | | | |
U.S. Treasury Bonds(h) | | 4.750% | | 11/15/53 | | | | | | | 3,260 | | | $ | 3,399,059 | |
U.S. Treasury Notes(k) | | 1.500 | | 11/30/28 | | | | | | | 55 | | | | 49,552 | |
U.S. Treasury Notes | | 1.750 | | 03/15/25 | | | | | | | 325 | | | | 321,699 | |
U.S. Treasury Notes(k) | | 1.875 | | 02/15/32 | | | | | | | 1,615 | | | | 1,376,787 | |
U.S. Treasury Notes(k) | | 2.875 | | 05/15/32 | | | | | | | 2,035 | | | | 1,855,984 | |
U.S. Treasury Notes(a) | | 3.500 | | 09/30/26 | | | | | | | 11,220 | | | | 11,083,694 | |
U.S. Treasury Notes(a)(k) | | 3.500 | | 09/30/29 | | | | | | | 35,622 | | | | 34,606,217 | |
U.S. Treasury Notes(k) | | 3.875 | | 12/31/27 | | | | | | | 1,025 | | | | 1,017,312 | |
U.S. Treasury Notes(h)(k) | | 3.875 | | 08/15/34 | | | | | | | 56,000 | | | | 54,180,000 | |
U.S. Treasury Notes | | 4.000 | | 02/15/34 | | | | | | | 2,400 | | | | 2,348,625 | |
U.S. Treasury Notes | | 4.500 | | 11/15/33 | | | | | | | 3,535 | | | | 3,594,653 | |
U.S. Treasury Strips Coupon | | 1.872(s) | | 05/15/31 | | | | | | | 85 | | | | 64,102 | |
U.S. Treasury Strips Coupon | | 1.888(s) | | 08/15/29 | | | | | | | 345 | | | | 281,674 | |
U.S. Treasury Strips Coupon | | 2.089(s) | | 11/15/35 | | | | | | | 800 | | | | 488,844 | |
U.S. Treasury Strips Coupon | | 2.251(s) | | 08/15/40 | | | | | | | 800 | | | | 379,719 | |
| | | | | | | | | | | | | | | | |
| | | | | |
TOTAL U.S. TREASURY OBLIGATIONS | | | | | | | | | | | | | | | | |
(cost $157,187,537) | | | | | | | | | | | | | | | 153,821,890 | |
| | | | | | | | | | | | | | | | |
| | | | |
| | | | | | | Shares | | | | |
| | | | | |
AFFILIATED EXCHANGE-TRADED FUND 0.3% | | | | | | | | | | | | | | | | |
| | | | | |
United States | | | | | | | | | | | | | | | | |
| | | | | |
PGIM AAA CLO ETF | | | | | | | | | | | | | | | | |
(cost $7,319,579)(wa) | | | | | | | | | | | 143,700 | | | | 7,368,936 | |
| | | | | | | | | | | | | | | | |
| | | | | |
COMMON STOCKS 0.2% | | | | | | | | | | | | | | | | |
| | | | | |
Jamaica 0.0% | | | | | | | | | | | | | | | | |
| | | | | |
Digicel International Finance Ltd. | | | | | | | | | | | | | | | | |
(original cost $71,768; purchased 01/29/24 - 01/30/24)*^(f) | | | | | | | | | | | 59,495 | | | | 149,333 | |
| | | | | | | | | | | | | | | | |
| | | | | |
Spain 0.0% | | | | | | | | | | | | | | | | |
| | | | | |
Codere Group Topco SA (Class A1 Stock)*^ | | | | | | | | | | | 17,640 | | | | 479,698 | |
Codere Group Topco SA (Class A2 Stock)*^ | | | | | | | | | | | 8,212 | | | | 223,315 | |
| | | | | | | | | | | | | | | | |
| | | | | |
| | | | | | | | | | | | | | | 703,013 | |
See Notes to Financial Statements.
52
PGIM Global Total Return Fund
Schedule of Investments (continued)
as of October 31, 2024
| | | | | | | | | | | | |
| | | | | |
| Description | | | | | | | | Shares | | Value | |
|
COMMON STOCKS (Continued) | |
|
United States 0.2% | |
| | | | | |
Expand Energy Corp. | | | | | | | | 36,731 | | $ | 3,111,850 | |
Ferrellgas Partners LP (Class B Stock)^ | | | | | | | | 2,731 | | | 485,466 | |
| | | | | | | | | | | | |
| | | | | |
| | | | | | | | | | | 3,597,316 | |
| | | | | | | | | | | | |
| | | | | |
TOTAL COMMON STOCKS
| | | | | | | | | | | | |
(cost $901,626) | | | | | | | | | | | 4,449,662 | |
| | | | | | | | | | | | |
| | | | | |
PREFERRED STOCKS 0.0% | | | | | | | | | | | | |
| |
Jamaica 0.0% | | | | |
| | | | | |
Digicel International Finance Ltd. | | | | | | | | | | | | |
(original cost $37,850; purchased 01/26/24 - 01/29/24)*^(f) | | | | | | | | | | | | |
| | | | | | | | 6,287 | | | 68,559 | |
| | | | | | | | | | | | |
| | | | | |
United States 0.0% | | | | | | | | | | | | |
| | | | | |
Citigroup Capital XIII | | | | | | | | | | | | |
11.887%(c), 3 Month SOFR + 6.632%, Maturing 10/30/40 | | | | | | | | 4,000 | | | 121,160 | |
Ferrellgas Escrow LLC | | | | | | | | | | | | |
8.956%, Maturing 03/30/31^ | | | | | | | | 633 | | | 633,000 | |
| | | | | | | | | | | | |
| | | | | |
| | | | | | | | | | | 754,160 | |
| | | | | | | | | | | | |
| | | | | |
TOTAL PREFERRED STOCKS
| | | | | | | | | | | | |
(cost $777,180) | | | | | | | | | | | 822,719 | |
| | | | | | | | | | | | |
| | | | | |
| | | | | | | | | Units | | | |
| | | | | |
WARRANTS* 0.0% | | | | | | | | | | | | |
| | | | | |
Spain | | | | | | | | | | | | |
| | | | | |
Codere Group Topco SA (Spain), expiring 09/30/34^
(cost $815) | | | | | | | | 21 | | | 228 | |
| | | | | | | | | | | | |
| | | | | |
TOTAL LONG-TERM INVESTMENTS | | | | | | | | | | | | |
(cost $2,978,768,036) | | | | | | | | | | | 2,709,899,924 | |
| | | | | | | | | | | | |
See Notes to Financial Statements.
PGIM Global Total Return Fund 53
PGIM Global Total Return Fund
Schedule of Investments (continued)
as of October 31, 2024
| | | | | | | | | | | | | | | | |
| | | | |
| Description | | | | | | | | Shares | | | Value | |
SHORT-TERM INVESTMENTS 2.1% | | | | | | | | | | | | | | | | |
| | | | |
AFFILIATED MUTUAL FUNDS 1.7% | | | | | | | | | | | | | | | | |
PGIM Core Government Money Market Fund (7-day effective yield 5.011%)(wa) | | | | | | | | | | | 6,258,778 | | | $ | 6,258,778 | |
PGIM Institutional Money Market Fund (7-day effective yield 5.096%) (cost $39,964,868; includes $39,904,369 of cash collateral for securities on loan)(b)(wa) | | | | | | | | | | | 39,984,860 | | | | 39,964,868 | |
| | | | | | | | | | | | | | | | |
| | | | |
TOTAL AFFILIATED MUTUAL FUNDS
| | | | | | | | | | | | | | | | |
(cost $46,223,646) | | | | | | | | | | | | | | | 46,223,646 | |
| | | | | | | | | | | | | | | | |
| | | | |
| | | | | | | | | Principal
Amount
(000)# | | | | |
| | | | |
U.S. TREASURY OBLIGATION(k)(n) 0.4% | | | | | | | | | | | | | | | | |
U.S. Treasury Bills
| | | | | | | | | | | | | | | | |
(cost $12,595,008) | | | 4.672% | | | | 07/10/25 | | | | 13,000 | | | | 12,624,649 | |
| | | | | | | | | | | | | | | | |
| | | | |
OPTIONS PURCHASED*~ 0.0% | | | | | | | | | | | | | | | | |
(cost $263,058) | | | | | | | | | | | | | | | 374,044 | |
| | | | | | | | | | | | | | | | |
| | | | |
TOTAL SHORT-TERM INVESTMENTS | | | | | | | | | | | | | | | | |
(cost $59,081,712) | | | | | | | | | | | | | | | 59,222,339 | |
| | | | | | | | | | | | | | | | |
| | | | |
TOTAL INVESTMENTS, BEFORE OPTIONS WRITTEN 100.9% | | | | | | | | | | | | | | | | |
(cost $3,037,849,748) | | | | | | | | | | | | | | | 2,769,122,263 | |
| | | | | | | | | | | | | | | | |
| | | | |
OPTIONS WRITTEN*~ (0.0)% | | | | | | | | | | | | | | | | |
(premiums received $293,193) | | | | | | | | | | | | | | | (315,419 | ) |
| | | | | | | | | | | | | | | | |
| | | | |
TOTAL INVESTMENTS, NET OF OPTIONS WRITTEN 100.9% | | | | | | | | | | | | | | | | |
(cost $3,037,556,555) | | | | | | | | | | | | | | | 2,768,806,844 | |
Liabilities in excess of other assets(z) (0.9)% | | | | | | | | | | | | | | | (25,955,842 | ) |
| | | | | | | | | | | | | | | | |
| | | | |
NET ASSETS 100.0% | | | | | | | | | | | | | | $ | 2,742,851,002 | |
| | | | | | | | | | | | | | | | |
See the Glossary for a list of the abbreviation(s) used in the annual report.
| * | Non-income producing security. |
| # | Principal or notional amount is shown in U.S. dollars unless otherwise stated. |
| ~ | See tables subsequent to the Schedule of Investments for options detail. Options with maturity dates greater than one year from date of acquisition would be considered long-term investments. |
| ^ | Indicates a Level 3 instrument. The aggregate value of Level 3 instruments is $31,891,778 and 1.2% of net assets. |
See Notes to Financial Statements.
54
PGIM Global Total Return Fund
Schedule of Investments (continued)
as of October 31, 2024
| (a) | All or a portion of security is on loan. The aggregate market value of such securities, including those sold and pending settlement, is $39,114,649; cash collateral of $39,904,369 (included in liabilities) was received with which the Fund purchased highly liquid short-term investments. In the event of significant appreciation in value of securities on loan on the last business day of the reporting period, the Fund may reflect a collateral value that is less than the market value of the loaned securities and such shortfall is remedied the following business day. |
| (b) | Represents security, or portion thereof, purchased with cash collateral received for securities on loan and includes dividend reinvestment. |
| (c) | Variable rate instrument. The interest rate shown reflects the rate in effect at October 31, 2024. |
| (cc) | Variable rate instrument. The rate shown is based on the latest available information as of October 31, 2024. Certain variable rate securities are not based on a published reference rate and spread but are determined by the issuer or agent and are based on current market conditions. These securities do not indicate a reference rate and spread in their description. |
| (d) | Represents issuer in default on interest payments and/or principal repayment. Non-income producing security. Such securities may be post-maturity. |
| (f) | Indicates a restricted security that is acquired in unregistered, private sales from the issuing company or from an affiliate of the issuer and is considered restricted as to disposition under federal securities law; the aggregate original cost of such securities is $31,132,105. The aggregate value of $26,730,430 is 1.0% of net assets. |
| (ff) | Variable rate security. Security may be issued at a fixed coupon rate, which converts to a variable rate at a specified date. Rate shown is the rate in effect as of period end. |
| (h) | Represents security, or a portion thereof, segregated as collateral for OTC derivatives. |
| (jj) | Represents original contract currency denomination, settlement to occur in Euro currency. |
| (k) | Represents security, or a portion thereof, segregated as collateral for centrally cleared/exchange-traded derivatives. |
| (n) | Rate shown reflects yield to maturity at purchased date. |
| (oo) | Perpetual security. Maturity date represents next call date. |
| (r) | Principal or notional amount is less than $500 par. |
| (s) | Represents zero coupon bond or principal only security. Rate represents yield to maturity at purchase date. |
| (wa) | Represents investments in Funds affiliated with the Manager. |
| (z) | Includes net unrealized appreciation/(depreciation) and/or market value of the below holdings which are excluded from the Schedule of Investments: |
Options Purchased:
OTC Traded
| | | | | | | | | | | | | | | | | | | | | | | | | | | | | | | | | | | |
Description | | Call/
Put | | Counterparty | | Expiration
Date | | Strike | | Contracts | | Notional
Amount
(000)# | | Value |
| | | | | | | |
2-Year 10 CMS Curve CAP | | | | Call | | | | | JPM | | | | | 01/02/25 | | | | | 0.19 | % | | | | — | | | | | 120,450 | | | | $ | 41,942 | |
2-Year 10 CMS Curve CAP | | | | Call | | | | | JPM | | | | | 01/21/25 | | | | | 0.13 | % | | | | — | | | | | 80,300 | | | | | 51,152 | |
| | | | | | | | | | | | | | | | | | | | | | | | | | | | | | | | | | | |
| | | | | | | |
Total OTC Traded (cost $176,058) | | | | | | | | | | | | | | | | | | | | | | | | | | | | | | | | | $ | 93,094 | |
| | | | | | | | | | | | | | | | | | | | | | | | | | | | | | | | | | | |
OTC Swaptions
| | | | | | | | | | | | | | | | | | | | | | | | |
Description | | Call/
Put | | Counterparty | | Expiration
Date | | Strike | | Receive | | | Pay | | | Notional
Amount
(000)# | | | Value | |
| | | | | | | | |
2-Year Interest Rate Swap, 01/08/27 | | Call | | CITI | | 01/06/25 | | 2.83% | | | 2.83%(A) | | |
| 1 Day SOFR(A)/
4.900% |
| | | 72,755 | | | $ | 27,756 | |
See Notes to Financial Statements.
PGIM Global Total Return Fund 55
PGIM Global Total Return Fund
Schedule of Investments (continued)
as of October 31, 2024
Options Purchased (continued):
OTC Swaptions
| | | | | | | | | | | | | | | | | | | | | | | | | | | | | | | | | | | | | | | | |
Description | | Call/
Put | | Counterparty | | Expiration
Date | | Strike | | Receive | | Pay | | Notional
Amount
(000)# | | Value |
| | | | | | | | |
2-Year Interest Rate Swap, 11/13/26 | | | | Call | | | | | JPM | | | | | 11/08/24 | | | | | 3.44% | | | | | 3.44%(A) | | | |
| 1 Day SOFR(A)/
4.900% |
| | | | 72,755 | | | | $ | 1,656 | |
2-Year Interest Rate Swap, 11/13/26 | | | | Put | | | | | JPM | | | | | 11/08/24 | | | | | 3.84% | | | |
| 1 Day SOFR(A)/
4.900% |
| | | | 3.84%(A) | | | | | 72,755 | | | | | 176,276 | |
CDX.EM.42.V1, 12/20/29 | | | | Put | | | | | MSI | | | | | 01/15/25 | | | | | 0.97% | | | | | CDX.EM.42.V1(Q) | | | | | 1.00%(Q) | | | | | 20,000 | | | | | 75,262 | |
| | | | | | | | | | | | | | | | | | | | | | | | | | | | | | | | | | | | | | | | |
| | | | | | | | |
Total OTC Swaptions (cost $87,000) | | | | | | | | | | | | | | | | | | | | | | | | | | | | | | | | | | | | | | $ | 280,950 | |
| | | | | | | | | | | | | | | | | | | | | | | | | | | | | | | | | | | | | | | | |
| | | | | | |
Total Options Purchased (cost $263,058) | | | | | | | | | | | | | | | | | | | | | | | | | | | | | $ | 374,044 | |
| | | | | | | | | | | | | | | | | | | | | | | | | | | | | | | | | | | | | | | | |
Options Written:
OTC Traded
| | | | | | | | | | | | | | | | | | | | | | | | | | | | | | | | | | | |
Description | | Call/
Put | | Counterparty | | Expiration
Date | | Strike | | Contracts | | Notional
Amount
(000)# | | Value |
| | | | | | | |
2-Year 10 CMS Curve CAP | | | | Call | | | | | JPM | | | | | 01/02/25 | | | | | 0.49% | | | | | — | | | | | 120,450 | | | | $ | (7,555 | ) |
2-Year 10 CMS Curve CAP | | | | Call | | | | | JPM | | | | | 01/21/25 | | | | | 0.43% | | | | | — | | | | | 80,300 | | | | | (12,733 | ) |
| | | | | | | | | | | | | | | | | | | | | | | | | | | | | | | | | | | |
| | | | | | | |
Total OTC Traded (premiums received $46,574) | | | | | | | | | | | | | | | | | | | | | | | | | | | | | | | | | $ | (20,288 | ) |
| | | | | | | | | | | | | | | | | | | | | | | | | | | | | | | | | | | |
OTC Swaptions
| | | | | | | | | | | | | | | | | | | | | | | | | | | | | | | | | | | | | | | | |
Description | | Call/
Put | | Counterparty | | Expiration
Date | | Strike | | Receive | | Pay | | Notional
Amount
(000)# | | Value |
| | | | | | | | |
2-Year Interest Rate Swap, 01/08/27 | | | | Call | | | | | CITI | | | | | 01/06/25 | | | | | 2.52% | | | |
| 1 Day SOFR(A)/
4.900% |
| | | | 2.52%(A) | | | | | 145,510 | | | | $ | (25,376 | ) |
2-Year Interest Rate Swap, 11/13/26 | | | | Call | | | | | JPM | | | | | 11/08/24 | | | | | 3.24% | | | |
| 1 Day SOFR(A)/
4.900% |
| | | | 3.24%(A) | | | | | 145,510 | | | | | (300 | ) |
CDX.NA.IG.43.V1, 12/20/29 | | | | Call | | | | | GSI | | | | | 11/20/24 | | | | | 0.48% | | | |
| CDX.NA.IG.43.
V1(Q) |
| | | | 1.00%(Q) | | | | | 60,000 | | | | | (7,019 | ) |
CDX.NA.IG.43.V1, 12/20/29 | | | | Call | | | | | JPM | | | | | 11/20/24 | | | | | 0.50% | | | |
| CDX.NA.IG.43.
V1(Q) |
| | | | 1.00%(Q) | | | | | 186,340 | | | | | (49,645 | ) |
CDX.NA.IG.43.V1, 12/20/29 | | | | Call | | | | | MSI | | | | | 01/15/25 | | | | | 0.50% | | | |
| CDX.NA.IG.43.
V1(Q) |
| | | | 1.00%(Q) | | | | | 60,000 | | | | | (35,239 | ) |
See Notes to Financial Statements.
56
PGIM Global Total Return Fund
Schedule of Investments (continued)
as of October 31, 2024
Options Written (continued):
OTC Swaptions
| | | | | | | | | | | | | | | | | | | | | | | | | | | | | | | | | | | | | | | | |
Description | | Call/
Put | | Counterparty | | Expiration
Date | | Strike | | Receive | | Pay | | Notional
Amount
(000)# | | Value |
| | | | | | | | |
2-Year Interest Rate Swap, 11/13/26 | | | | Put | | | | | JPM | | | | | 11/08/24 | | | | | 3.99% | | | | | 3.99%(A) | | | |
| 1 Day SOFR(A)/
4.900% |
| | | | 145,510 | | | | $ | (136,859 | ) |
CDX.NA.IG.43.V1, 12/20/29 | | | | Put | | | | | MSI | | | | | 01/15/25 | | | | | 0.75% | | | | | 1.00%(Q) | | | |
| CDX.NA.IG.43.
V1(Q) |
| | | | 60,000 | | | | | (40,693 | ) |
| | | | | | | | | | | | | | | | | | | | | | | | | | | | | | | | | | | | | | | | |
| | | | |
Total OTC Swaptions (premiums received $246,619) | | | | | | | | | | | | | | | | | | | $ | (295,131 | ) |
| | | | | | | | | | | | | | | | | | | | | | | | | | | | | | | | | | | | | | | | |
| | | | |
Total Options Written (premiums received $293,193) | | | | | | | | | | | | | | | | | | | $ | (315,419 | ) |
| | | | | | | | | | | | | | | | | | | | | | | | | | | | | | | | | | | | | | | | |
Futures contracts outstanding at October 31, 2024:
| | | | | | | | | | | | | | | | | |
Number of Contracts | | Type | | Expiration
Date | | Current
Notional
Amount | | Value /
Unrealized
Appreciation
(Depreciation) |
| | | |
Long Positions: | | | | | | | | | | | | | | | |
5,825 | | 1 Day Interbank Deposit | | | | Dec. 2028 | | | | $ | 13,071,965 | | | | $ | (131,083 | ) |
5 | | 1 Day Interbank Deposit | | | | Dec. 2029 | | | | | 11,211 | | | | | (118 | ) |
1,500 | | 1 Day Interbank Deposit | | | | Dec. 2030 | | | | | 3,350,343 | | | | | (43,268 | ) |
5 | | 1 Day Interbank Deposit | | | | Dec. 2031 | | | | | 11,123 | | | | | (131 | ) |
1,425 | | 1 Day Interbank Deposit | | | | Dec. 2032 | | | | | 3,158,669 | | | | | (34,705 | ) |
5 | | 1 Day Interbank Deposit | | | | Dec. 2033 | | | | | 11,010 | | | | | (87 | ) |
367 | | 2 Year U.S. Treasury Notes | | | | Dec. 2024 | | | | | 75,581,930 | | | | | (344,582 | ) |
585 | | 5 Year U.S. Treasury Notes | | | | Dec. 2024 | | | | | 62,732,112 | | | | | (940,526 | ) |
119 | | 10 Year U.S. Treasury Notes | | | | Dec. 2024 | | | | | 13,145,781 | | | | | (85,070 | ) |
23 | | 30 Year Euro Buxl | | | | Dec. 2024 | | | | | 3,311,416 | | | | | (69,072 | ) |
100 | | Bloomberg IG Duration-Hedged Credit | | | | Dec. 2024 | | | | | 10,287,500 | | | | | 98,067 | |
119 | | Euro Schatz Index | | | | Dec. 2024 | | | | | 13,790,777 | | | | | (14,337 | ) |
18 | | Euro-BTP Italian Government Bond | | | | Dec. 2024 | | | | | 2,340,729 | | | | | (45,284 | ) |
555 | | Euro-OAT | | | | Dec. 2024 | | | | | 75,257,398 | | | | | (978,455 | ) |
1,931 | | Japanese Yen Currency | | | | Dec. 2024 | | | | | 159,621,288 | | | | | (8,876,674 | ) |
| | | | | | | | | | | | | | | | | |
| | | | |
| | | | | | | | | | | | | | | | (11,465,325 | ) |
| | | | | | | | | | | | | | | | | |
| | | |
Short Positions: | | | | | | | | | | | | | | | |
754 | | 3 Month CME SOFR | | | | Dec. 2024 | | | | | 179,499,125 | | | | | (246,430 | ) |
81 | | 3 Month CME SOFR | | | | Mar. 2025 | | | | | 19,363,050 | | | | | 106,871 | |
145 | | 3 Month CME SOFR | | | | Jun. 2025 | | | | | 34,776,438 | | | | | 185,244 | |
349 | | 3 Month CME SOFR | | | | Sep. 2025 | | | | | 83,895,238 | | | | | 144,097 | |
349 | | 3 Month CME SOFR | | | | Dec. 2025 | | | | | 84,004,300 | | | | | 143,331 | |
19 | | 3 Month CME SOFR | | | | Mar. 2026 | | | | | 4,576,150 | | | | | (25,447 | ) |
19 | | 3 Month CME SOFR | | | | Jun. 2026 | | | | | 4,577,338 | | | | | (22,821 | ) |
See Notes to Financial Statements.
PGIM Global Total Return Fund 57
PGIM Global Total Return Fund
Schedule of Investments (continued)
as of October 31, 2024
Futures contracts outstanding at October 31, 2024 (continued):
| | | | | | | | | | | | | | | | | |
Number of Contracts | | Type | | Expiration
Date | | Current
Notional
Amount | | Value /
Unrealized
Appreciation
(Depreciation) |
| | | |
Short Positions (cont’d): | | | | | | | | | | | | | | | |
593 | | 5 Year Euro-Bobl | | | | Dec. 2024 | | | | $ | 76,210,974 | | | | $ | 628,671 | |
1,370 | | 10 Year Euro-Bund | | | | Dec. 2024 | | | | | 196,410,667 | | | | | 2,696,449 | |
232 | | 10 Year U.S. Ultra Treasury Notes | | | | Dec. 2024 | | | | | 26,390,000 | | | | | (83,694 | ) |
3 | | 20 Year U.S. Treasury Bonds | | | | Dec. 2024 | | | | | 353,906 | | | | | 2,808 | |
107 | | 30 Year U.S. Ultra Treasury Bonds | | | | Dec. 2024 | | | | | 13,441,875 | | | | | 53,433 | |
1,470 | | British Pound Currency | | | | Dec. 2024 | | | | | 118,344,188 | | | | | 2,649,003 | |
482 | | Euro Currency | | | | Dec. 2024 | | | | | 65,612,250 | | | | | 1,490,324 | |
| | | | | | | | | | | | | | | | | |
| | | | |
| | | | | | | | | | | | | | | | 7,721,839 | |
| | | | | | | | | | | | | | | | | |
| | | | |
| | | | | | | | | | | | | | | $ | (3,743,486 | ) |
| | | | | | | | | | | | | | | | | |
Forward foreign currency exchange contracts outstanding at October 31, 2024:
| | | | | | | | | | | | | | | | | | | | | | | | | | | | | | | | | | | | |
Purchase Contracts | | Counterparty | | | Notional
Amount
(000) | | | Value at
Settlement
Date | | Current
Value | | Unrealized
Appreciation | | Unrealized
Depreciation |
| | | | | |
OTC Forward Foreign Currency Exchange Contracts: | | | | | | | | | | | | | | | | | | | | | |
Australian Dollar, | | | | | | | | | | | | | | | | | | | | | | | | | | | | | | | | | | | | |
Expiring 01/21/25 | | | CITI | | | | AUD | | | | 36,970 | | | $ | 24,726,800 | | | $ | 24,345,722 | | | | | | | $ | — | | | | | | | $ | (381,078 | ) |
British Pound, | | | | | | | | | | | | | | | | | | | | | | | | | | | | | | | | | | | | |
Expiring 01/21/25 | | | DB | | | | GBP | | | | 1,264 | | | | 1,644,686 | | | | 1,630,010 | | | | | | | | — | | | | | | | | (14,676 | ) |
Expiring 01/21/25 | | | MSI | | | | GBP | | | | 13,931 | | | | 18,130,165 | | | | 17,958,929 | | | | | | | | — | | | | | | | | (171,236 | ) |
Canadian Dollar, | | | | | | | | | | | | | | | | | | | | | | | | | | | | | | | | | | | | |
Expiring 01/21/25 | | | HSBC | | | | CAD | | | | 24,492 | | | | 17,801,760 | | | | 17,641,811 | | | | | | | | — | | | | | | | | (159,949 | ) |
Chilean Peso, | | | | | | | | | | | | | | | | | | | | | | | | | | | | | | | | | | | | |
Expiring 12/18/24 | | | GSI | | | | CLP | | | | 1,149,859 | | | | 1,218,898 | | | | 1,195,628 | | | | | | | | — | | | | | | | | (23,270 | ) |
China Yuan, | | | | | | | | | | | | | | | | | | | | | | | | | | | | | | | | | | | | |
Expiring 12/18/24 | | | JPM | | | | CNY | | | | 353,761 | | | | 50,171,772 | | | | 50,013,322 | | | | | | | | — | | | | | | | | (158,450 | ) |
Chinese Renminbi, | | | | | | | | | | | | | | | | | | | | | | | | | | | | | | | | | | | | |
Expiring 12/18/24 | | | BOA | | | | CNH | | | | 21,493 | | | | 3,057,293 | | | | 3,027,864 | | | | | | | | — | | | | | | | | (29,429 | ) |
Expiring 12/18/24 | | | GSI | | | | CNH | | | | 24,912 | | | | 3,544,391 | | | | 3,509,478 | | | | | | | | — | | | | | | | | (34,913 | ) |
Expiring 12/18/24 | | | MSI | | | | CNH | | | | 269,916 | | | | 38,205,113 | | | | 38,025,117 | | | | | | | | — | | | | | | | | (179,996 | ) |
Czech Koruna, | | | | | | | | | | | | | | | | | | | | | | | | | | | | | | | | | | | | |
Expiring 01/21/25 | | | CITI | | | | CZK | | | | 18,779 | | | | 810,577 | | | | 808,632 | | | | | | | | — | | | | | | | | (1,945 | ) |
Danish Krone, | | | | | | | | | | | | | | | | | | | | | | | | | | | | | | | | | | | | |
Expiring 01/21/25 | | | GSI | | | | DKK | | | | 15,166 | | | | 2,222,238 | | | | 2,221,449 | | | | | | | | — | | | | | | | | (789 | ) |
Euro, | | | | | | | | | | | | | | | | | | | | | | | | | | | | | | | | | | | | |
Expiring 01/21/25 | | | JPM | | | | EUR | | | | 18,871 | | | | 20,509,968 | | | | 20,601,217 | | | | | | | | 91,249 | | | | | | | | — | |
Hungarian Forint, | | | | | | | | | | | | | | | | | | | | | | | | | | | | | | | | | | | | |
Expiring 01/21/25 | | | BNP | | | | HUF | | | | 278,170 | | | | 752,297 | | | | 737,984 | | | | | | | | — | | | | | | | | (14,313 | ) |
See Notes to Financial Statements.
58
PGIM Global Total Return Fund
Schedule of Investments (continued)
as of October 31, 2024
Forward foreign currency exchange contracts outstanding at October 31, 2024 (continued):
| | | | | | | | | | | | | | | | | | | | | | | | | | | | | | | | | | | | | | | | |
Purchase Contracts | | Counterparty | | | | | | Notional
Amount
(000) | | | Value at
Settlement
Date | | | Current
Value | | | Unrealized
Appreciation | | | Unrealized
Depreciation | |
| | | | | |
OTC Forward Foreign Currency Exchange Contracts (cont’d.): | | | | | | | | | | | | | | | | | | | | | |
Indonesian Rupiah, | | | | | | | | | | | | | | | | | | | | | | | | | | | | | | | | | | | | | | | | |
Expiring 12/18/24 | | | MSI | | | | | | | | IDR | | | | 145,033,000 | | | $ | 9,373,235 | | | $ | 9,216,769 | | | | | | | $ | — | | | | | | | $ | (156,466 | ) |
Israeli Shekel, | | | | | | | | | | | | | | | | | | | | | | | | | | | | | | | | | | | | | | | | |
Expiring 12/18/24 | | | CITI | | | | | | | | ILS | | | | 17,431 | | | | 4,660,758 | | | | 4,673,634 | | | | | | | | 12,876 | | | | | | | | — | |
Japanese Yen, | | | | | | | | | | | | | | | | | | | | | | | | | | | | | | | | | | | | | | | | |
Expiring 01/21/25 | | | GSI | | | | | | | | JPY | | | | 3,821,930 | | | | 25,932,966 | | | | 25,430,397 | | | | | | | | — | | | | | | | | (502,569 | ) |
Malaysian Ringgit, | | | | | | | | | | | | | | | | | | | | | | | | | | | | | | | | | | | | | | | | |
Expiring 12/18/24 | | | BARC | | | | | | | | MYR | | | | 52,331 | | | | 12,150,267 | | | | 11,970,155 | | | | | | | | — | | | | | | | | (180,112 | ) |
Mexican Peso, | | | | | | | | | | | | | | | | | | | | | | | | | | | | | | | | | | | | | | | | |
Expiring 12/18/24 | | | CITI | | | | | | | | MXN | | | | 33,514 | | | | 1,710,759 | | | | 1,660,936 | | | | | | | | — | | | | | | | | (49,823 | ) |
Expiring 12/18/24 | | | MSI | | | | | | | | MXN | | | | 21,638 | | | | 1,107,152 | | | | 1,072,376 | | | | | | | | — | | | | | | | | (34,776 | ) |
Norwegian Krone, | | | | | | | | | | | | | | | | | | | | | | | | | | | | | | | | | | | | | | | | |
Expiring 01/21/25 | | | HSBC | | | | | | | | NOK | | | | 10,657 | | | | 985,897 | | | | 969,119 | | | | | | | | — | | | | | | | | (16,778 | ) |
Polish Zloty, | | | | | | | | | | | | | | | | | | | | | | | | | | | | | | | | | | | | | | | | |
Expiring 01/21/25 | | | DB | | | | | | | | PLN | | | | 3,336 | | | | 842,281 | | | | 831,074 | | | | | | | | — | | | | | | | | (11,207 | ) |
Singapore Dollar, | | | | | | | | | | | | | | | | | | | | | | | | | | | | | | | | | | | | | | | | |
Expiring 12/18/24 | | | CITI | | | | | | | | SGD | | | | 9,382 | | | | 7,218,761 | | | | 7,120,377 | | | | | | | | — | | | | | | | | (98,384 | ) |
South Korean Won, | | | | | | | | | | | | | | | | | | | | | | | | | | | | | | | | | | | | | | | | |
Expiring 12/18/24 | | | MSI | | | | | | | | KRW | | | | 46,863,353 | | | | 35,256,148 | | | | 34,153,960 | | | | | | | | — | | | | | | | | (1,102,188 | ) |
Swiss Franc, | | | | | | | | | | | | | | | | | | | | | | | | | | | | | | | | | | | | | | | | |
Expiring 01/21/25 | | | HSBC | | | | | | | | CHF | | | | 10,107 | | | | 11,845,611 | | | | 11,813,549 | | | | | | | | — | | | | | | | | (32,062 | ) |
Thai Baht, | | | | | | | | | | | | | | | | | | | | | | | | | | | | | | | | | | | | | | | | |
Expiring 12/18/24 | | | SSB | | | | | | | | THB | | | | 293,289 | | | | 8,747,067 | | | | 8,720,514 | | | | | | | | — | | | | | | | | (26,553 | ) |
| | | | | | | | | | | | | | | | | | | | | | | | | | | | | | | | | | | | | | | | |
| | | | | | | | | | |
| | | | | | | | | | | | | | | | | | $ | 302,626,860 | | | $ | 299,350,023 | | | | | | | | 104,125 | | | | | | | | (3,380,962 | ) |
| | | | | | | | | | | | | | | | | | | | | | | | | | | | | | | | | | | | | | | | |
| | | | | | | | | | | | | | | | | | | | | | | | | | | | | | | | | | | | | | | | |
Sale Contracts | | Counterparty | | | | | | Notional
Amount
(000) | | | Value at
Settlement
Date | | | Current
Value | | | Unrealized
Appreciation | | | Unrealized
Depreciation | |
| | | | | | |
OTC Forward Foreign Currency Exchange Contracts: | | | | | | | | | | | | | | | | | | | | | | | | | |
Brazilian Real, | | | | | | | | | | | | | | | | | | | | | | | | | | | | | | | | | | | | | | | | |
Expiring 11/04/24 | | | HSBC | | | | | | | | BRL | | | | 12,002 | | | $ | 2,158,252 | | | $ | 2,074,582 | | | | | | | $ | 83,670 | | | | | | | $ | — | |
British Pound, | | | | | | | | | | | | | | | | | | | | | | | | | | | | | | | | | | | | | | | | |
Expiring 01/21/25 | | | CITI | | | | | | | | GBP | | | | 2,655 | | | | 3,412,766 | | | | 3,422,827 | | | | | | | | — | | | | | | | | (10,061 | ) |
Canadian Dollar, | | | | | | | | | | | | | | | | | | | | | | | | | | | | | | | | | | | | | | | | |
Expiring 01/21/25 | | | CITI | | | | | | | | CAD | | | | 4,017 | | | | 2,889,833 | | | | 2,893,501 | | | | | | | | — | | | | | | | | (3,668 | ) |
Expiring 01/21/25 | | | HSBC | | | | | | | | CAD | | | | 6,119 | | | | 4,456,592 | | | | 4,407,503 | | | | | | | | 49,089 | | | | | | | | — | |
Chinese Renminbi, | | | | | | | | | | | | | | | | | | | | | | | | | | | | | | | | | | | | | | | | |
Expiring 12/18/24 | | | BOA | | | | | | | | CNH | | | | 39,440 | | | | 5,547,451 | | | | 5,556,249 | | | | | | | | — | | | | | | | | (8,798 | ) |
Expiring 12/18/24 | | | DB | | | | | | | | CNH | | | | 27,535 | | | | 3,870,605 | | | | 3,879,135 | | | | | | | | — | | | | | | | | (8,530 | ) |
See Notes to Financial Statements.
PGIM Global Total Return Fund 59
PGIM Global Total Return Fund
Schedule of Investments (continued)
as of October 31, 2024
Forward foreign currency exchange contracts outstanding at October 31, 2024 (continued):
| | | | | | | | | | | | | | | | | | | | | | | | | | | | | | | | | | | | | | | | |
Sale Contracts | | Counterparty | | | | | | Notional
Amount
(000) | | | Value at
Settlement
Date | | | Current
Value | | | Unrealized
Appreciation | | | Unrealized
Depreciation | |
| | | | | |
OTC Forward Foreign Currency Exchange Contracts (cont’d.): | | | | | | | | | | | | | | | | | | | | | |
Chinese Renminbi (cont’d.), | | | | | | | | | | | | | | | | | | | | | | | | | | | | | | | | | | | | | | | | |
Expiring 12/18/24 | | | GSI | | | | | | | | CNH | | | | 19,994 | | | $ | 2,872,457 | | | $ | 2,816,692 | | | | | | | $ | 55,765 | | | | | | | $ | — | |
Euro, | | | | | | | | | | | | | | | | | | | | | | | | | | | | | | | | | | | | | | | | |
Expiring 01/21/25 | | | BARC | | | | | | | | EUR | | | | 111,416 | | | | 122,332,222 | | | | 121,629,225 | | | | | | | | 702,997 | | | | | | | | — | |
Expiring 01/21/25 | | | BNYM | | | | | | | | EUR | | | | 7,309 | | | | 7,973,934 | | | | 7,979,294 | | | | | | | | — | | | | | | | | (5,360 | ) |
Expiring 01/21/25 | | | CITI | | | | | | | | EUR | | | | 7,265 | | | | 7,913,878 | | | | 7,930,764 | | | | | | | | — | | | | | | | | (16,886 | ) |
Expiring 01/21/25 | | | GSI | | | | | | | | EUR | | | | 111,416 | | | | 121,729,795 | | | | 121,629,224 | | | | | | | | 100,571 | | | | | | | | — | |
Expiring 01/21/25 | | | JPM | | | | | | | | EUR | | | | 755 | | | | 832,069 | | | | 824,000 | | | | | | | | 8,069 | | | | | | | | — | |
Expiring 01/21/25 | | | JPM | | | | | | | | EUR | | | | 452 | | | | 497,552 | | | | 493,024 | | | | | | | | 4,528 | | | | | | | | — | |
Expiring 01/21/25 | | | SCB | | | | | | | | EUR | | | | 1,115 | | | | 1,210,225 | | | | 1,216,716 | | | | | | | | — | | | | | | | | (6,491 | ) |
Expiring 01/21/25 | | | SSB | | | | | | | | EUR | | | | 72,672 | | | | 80,132,805 | | | | 79,333,944 | | | | | | | | 798,861 | | | | | | | | — | |
Israeli Shekel, | | | | | | | | | | | | | | | | | | | | | | | | | | | | | | | | | | | | | | | | |
Expiring 12/18/24 | | | CITI | | | | | | | | ILS | | | | 7,325 | | | | 1,954,036 | | | | 1,963,807 | | | | | | | | — | | | | | | | | (9,771 | ) |
Mexican Peso, | | | | | | | | | | | | | | | | | | | | | | | | | | | | | | | | | | | | | | | | |
Expiring 12/18/24 | | | JPM | | | | | | | | MXN | | | | 59,757 | | | | 2,984,355 | | | | 2,961,497 | | | | | | | | 22,858 | | | | | | | | — | |
Expiring 12/18/24 | | | MSI | | | | | | | | MXN | | | | 59,757 | | | | 2,949,985 | | | | 2,961,499 | | | | | | | | — | | | | | | | | (11,514 | ) |
Swedish Krona, | | | | | | | | | | | | | | | | | | | | | | | | | | | | | | | | | | | | | | | | |
Expiring 01/21/25 | | | BNP | | | | | | | | SEK | | | | 38,328 | | | | 3,717,327 | | | | 3,613,783 | | | | | | | | 103,544 | | | | | | | | — | |
Expiring 01/21/25 | | | CITI | | | | | | | | SEK | | | | 40,757 | | | | 3,825,246 | | | | 3,842,724 | | | | | | | | — | | | | | | | | (17,478 | ) |
| | | | | | | | | | | | | | | | | | | | | | | | | | | | | | | | | | | | | | | | |
| | | | | | | | | | |
| | | | | | | | | | | | | | | | | | $ | 383,261,385 | | | $ | 381,429,990 | | | | | | | | 1,929,952 | | | | | | | | (98,557 | ) |
| | | | | | | | | | | | | | | | | | | | | | | | | | | | | | | | | | | | | | | | |
| | | | | | | | | | |
| | | | | | | | | | | | | | | | | | | | | | | | | | | | | | $ | 2,034,077 | | | | | | | $ | (3,479,519 | ) |
| | | | | | | | | | | | | | | | | | | | | | | | | | | | | | | | | | | | | | | | |
Credit default swap agreements outstanding at October 31, 2024:
| | | | | | | | | | | | | | | | | | | | | | | | | | | | | | | | | | | |
Reference Entity/ Obligation | | Termination
Date | | Fixed
Rate | | Notional
Amount
(000)#(3) | | Fair
Value | | Upfront
Premiums
Paid
(Received) | | Unrealized
Appreciation
(Depreciation) | | Counterparty |
|
OTC Packaged Credit Default Swap Agreements on corporate and/or sovereign issues - Buy Protection(1)**: | |
Arab Republic of Egypt | | | | 12/20/29 | | | | | 1.000%(Q) | | | | | 2,000 | | | | $ | 391,613 | | | | $ | 327 | | | | $ | 391,286 | | | | | GSI | |
Dominican Republic | | | | 12/20/29 | | | | | 1.000%(Q) | | | | | 2,000 | | | | | 62,545 | | | | | 327 | | | | | 62,218 | | | | | GSI | |
Emirate of Abu Dhabi | | | | 12/20/29 | | | | | 1.000%(Q) | | | | | 2,000 | | | | | (55,920 | ) | | | | 327 | | | | | (56,247 | ) | | | | GSI | |
Federal Republic of Nigeria | | | | 12/20/29 | | | | | 1.000%(Q) | | | | | 2,000 | | | | | 375,683 | | | | | 327 | | | | | 375,356 | | | | | GSI | |
Federation of Malaysia | | | | 12/20/29 | | | | | 1.000%(Q) | | | | | 3,000 | | | | | (85,931 | ) | | | | 491 | | | | | (86,422 | ) | | | | GSI | |
Federative Republic of Brazil | | | | 12/20/29 | | | | | 1.000%(Q) | | | | | 9,000 | | | | | 220,043 | | | | | 1,472 | | | | | 218,571 | | | | | GSI | |
Kingdom of Bahrain | | | | 12/20/29 | | | | | 1.000%(Q) | | | | | 2,000 | | | | | 75,837 | | | | | 327 | | | | | 75,510 | | | | | GSI | |
See Notes to Financial Statements.
60
PGIM Global Total Return Fund
Schedule of Investments (continued)
as of October 31, 2024
Credit default swap agreements outstanding at October 31, 2024 (continued):
| | | | | | | | | | | | | | | | | | | | | | | | | | | | | | | | | | | |
Reference Entity/ Obligation | | Termination
Date | | Fixed
Rate | | Notional
Amount
(000)#(3) | | Fair
Value | | Upfront
Premiums
Paid
(Received) | | Unrealized
Appreciation
(Depreciation) | | Counterparty |
|
OTC Packaged Credit Default Swap Agreements on corporate and/or sovereign issues - Buy Protection(1)**(cont’d.): | |
Kingdom of Morocco | | | | 12/20/29 | | | | | 1.000%(Q) | | | | | 2,000 | | | | $ | (6,952 | ) | | | $ | 327 | | | | $ | (7,279 | ) | | | | GSI | |
Kingdom of Saudi Arabia | | | | 12/20/29 | | | | | 1.000%(Q) | | | | | 5,000 | | | | | (93,536 | ) | | | | 818 | | | | | (94,354 | ) | | | | GSI | |
People’s Republic of China | | | | 12/20/29 | | | | | 1.000%(Q) | | | | | 9,000 | | | | | (160,955 | ) | | | | 1,472 | | | | | (162,427 | ) | | | | GSI | |
Republic of Argentina | | | | 12/20/29 | | | | | 1.000%(Q) | | | | | 2,000 | | | | | 923,634 | | | | | 327 | | | | | 923,307 | | | | | GSI | |
Republic of Chile | | | | 12/20/29 | | | | | 1.000%(Q) | | | | | 6,000 | | | | | (120,701 | ) | | | | 981 | | | | | (121,682 | ) | | | | GSI | |
Republic of Colombia | | | | 12/20/29 | | | | | 1.000%(Q) | | | | | 7,000 | | | | | 352,248 | | | | | 1,145 | | | | | 351,103 | | | | | GSI | |
Republic of Indonesia | | | | 12/20/29 | | | | | 1.000%(Q) | | | | | 8,000 | | | | | (121,107 | ) | | | | 1,308 | | | | | (122,415 | ) | | | | GSI | |
Republic of Panama | | | | 12/20/29 | | | | | 1.000%(Q) | | | | | 2,000 | | | | | 71,009 | | | | | 327 | | | | | 70,682 | | | | | GSI | |
Republic of Peru | | | | 12/20/29 | | | | | 1.000%(Q) | | | | | 3,000 | | | | | (29,688 | ) | | | | 491 | | | | | (30,179 | ) | | | | GSI | |
Republic of Philippines | | | | 12/20/29 | | | | | 1.000%(Q) | | | | | 3,000 | | | | | (58,750 | ) | | | | 491 | | | | | (59,241 | ) | | | | GSI | |
Republic of South Africa | | | | 12/20/29 | | | | | 1.000%(Q) | | | | | 9,000 | | | | | 356,362 | | | | | 1,472 | | | | | 354,890 | | | | | GSI | |
Republic of Turkey | | | | 12/20/29 | | | | | 1.000%(Q) | | | | | 9,000 | | | | | 642,668 | | | | | 1,472 | | | | | 641,196 | | | | | GSI | |
State of Qatar | | | | 12/20/29 | | | | | 1.000%(Q) | | | | | 2,000 | | | | | (56,437 | ) | | | | 327 | | | | | (56,764 | ) | | | | GSI | |
Sultanate of Oman | | | | 12/20/29 | | | | | 1.000%(Q) | | | | | 2,000 | | | | | (1,303 | ) | | | | 327 | | | | | (1,630 | ) | | | | GSI | |
United Mexican States | | | | 12/20/29 | | | | | 1.000%(Q) | | | | | 9,000 | | | | | 100,150 | | | | | 1,472 | | | | | 98,678 | | | | | GSI | |
| | | | | | | | | | | | | | | | | | | | | | | | | | | | | | | | | | | |
| | | | | | | |
| | | | | | | | | | | | | | | | | | $ | 2,780,512 | | | | $ | 16,355 | | | | $ | 2,764,157 | | | | | | |
| | | | | | | | | | | | | | | | | | | | | | | | | | | | | | | | | | | |
| | | | | | | | | | | | | | | | | | | | | | | | | | | | | | | | | | | | | | | | |
Reference Entity/ Obligation | | Termination
Date | | Fixed
Rate | | Notional
Amount
(000)#(3) | | Implied
Credit
Spread at
October 31,
2024(4) | | Fair
Value | | Upfront
Premiums
Paid
(Received) | | Unrealized
Appreciation
(Depreciation) | | Counterparty |
|
OTC Packaged Credit Default Swap Agreement on credit indices— Sell Protection(2)**: | |
CDX.EM.42.V1 | | | | 12/20/29 | | | | | 1.000%(Q) | | | | | 100,000 | | | | | 1.679 | % | | | $ | (2,903,285 | ) | | | $ | (65,411 | ) | | | $ | (2,837,874 | ) | | | | GSI | |
| | | | | | | | | | | | | | | | | | | | | | | | | | | | | | | | | | | | | | | | |
| ** | The Fund entered into multiple credit default swap agreements in a packaged trade consisting of two parts. The Fund bought/sold protection on an Emerging Market CDX Index and bought/sold protection on the countries which comprise the index. The upfront premium is attached to the index of the trade for the Emerging Markets CDX package(s). Each swap is priced individually. If any of the component swaps are closed out early, the Index exposure will be reduced by an amount proportionate to the terminated swap(s). |
See Notes to Financial Statements.
PGIM Global Total Return Fund 61
PGIM Global Total Return Fund
Schedule of Investments (continued)
as of October 31, 2024
Credit default swap agreements outstanding at October 31, 2024 (continued):
| | | | | | | | | | | | | | | | | | | | | | | | | | | | | | | | | | | |
Reference Entity/ Obligation | | Termination
Date | | Fixed
Rate | | Notional
Amount
(000)#(3) | | Fair
Value | | Upfront
Premiums
Paid
(Received) | | Unrealized
Appreciation
(Depreciation) | | Counterparty |
|
OTC Credit Default Swap Agreements on corporate and/or sovereign issues - Buy Protection(1): | |
Arab Republic of Egypt | | | | 06/20/30 | | | | | 1.000%(Q) | | | | | 4,700 | | | | $ | 1,004,505 | | | | $ | 998,706 | | | | $ | 5,799 | | | | | GSI | |
China Development Bank | | | | 06/20/29 | | | | | 1.000%(Q) | | | | | 6,695 | | | | | (122,762 | ) | | | | (63,483 | ) | | | | (59,279 | ) | | | | JPM | |
Gazprom PAO | | | | 06/20/25 | | | | | 1.000%(Q) | | | | EUR | 2,000 | | | | | 191,019 | | | | | 4,258 | | | | | 186,761 | | | | | BARC | |
Gazprom PAO | | | | 12/20/25 | | | | | 1.000%(Q) | | | | | 2,000 | | | | | 344,275 | | | | | 304,636 | | | | | 39,639 | | | | | GSI | |
Gazprom PAO | | | | 06/20/26 | | | | | 1.000%(Q) | | | | | 4,400 | | | | | 851,469 | | | | | 1,006,036 | | | | | (154,567 | ) | | | | HSBC | |
Gazprom PAO | | | | 06/20/27 | | | | | 1.000%(Q) | | | | | 8,650 | | | | | 2,018,289 | | | | | 2,585,583 | | | | | (567,294 | ) | | | | HSBC | |
Gazprom PAO | | | | 06/20/27 | | | | | 1.000%(Q) | | | | | 1,000 | | | | | 233,328 | | | | | 208,697 | | | | | 24,631 | | | | | HSBC | |
Gazprom PAO | | | | 06/20/27 | | | | | 1.000%(Q) | | | | | 600 | | | | | 139,997 | | | | | 208,036 | | | | | (68,039 | ) | | | | JPM | |
Gazprom PAO | | | | 12/20/27 | | | | | 1.000%(Q) | | | | | 3,300 | | | | | 831,007 | | | | | 1,012,021 | | | | | (181,014 | ) | | | | JPM | |
Industrial & Commercial Bank of China Ltd. | | | | 06/20/29 | | | | | 1.000%(Q) | | | | | 6,695 | | | | | (127,065 | ) | | | | (55,340 | ) | | | | (71,725 | ) | | | | JPM | |
Kingdom of Morocco | | | | 12/20/27 | | | | | 1.000%(Q) | | | | | 4,305 | | | | | (66,369 | ) | | | | 72,606 | | | | | (138,975 | ) | | | | BNP | |
Petroleos Mexicanos | | | | 12/20/24 | | | | | 1.000%(Q) | | | | | 5,000 | | | | | (3,988 | ) | | | | 2,715 | | | | | (6,703 | ) | | | | MSI | |
Petroleos Mexicanos | | | | 12/20/24 | | | | | 1.000%(Q) | | | | | 1,000 | | | | | (797 | ) | | | | 544 | | | | | (1,341 | ) | | | | BARC | |
Petroleos Mexicanos | | | | 09/20/27 | | | | | 1.000%(Q) | | | | | 4,500 | | | | | 253,160 | | | | | 352,292 | | | | | (99,132 | ) | | | | MSI | |
Petroleos Mexicanos | | | | 06/20/29 | | | | | 1.000%(Q) | | | | | 1,000 | | | | | 117,259 | | | | | 157,113 | | | | | (39,854 | ) | | | | BARC | |
Petroleos Mexicanos | | | | 12/20/29 | | | | | 1.000%(Q) | | | | | 4,050 | | | | | 547,636 | | | | | 764,116 | | | | | (216,480 | ) | | | | BARC | |
Petroleos Mexicanos | | | | 12/20/30 | | | | | 1.000%(Q) | | | | | 1,000 | | | | | 168,334 | | | | | 222,294 | | | | | (53,960 | ) | | | | BARC | |
Republic of Estonia | | | | 12/20/25 | | | | | 1.000%(Q) | | | | | 10,000 | | | | | (110,589 | ) | | | | (53,928 | ) | | | | (56,661 | ) | | | | BARC | |
Republic of Italy | | | | 12/20/27 | | | | | 1.000%(Q) | | | | EUR | 4,935 | | | | | (155,345 | ) | | | | (115,991 | ) | | | | (39,354 | ) | | | | BARC | |
Republic of Serbia | | | | 12/20/25 | | | | | 1.000%(Q) | | | | | 5,000 | | | | | (50,107 | ) | | | | 10,682 | | | | | (60,789 | ) | | | | BNP | |
Republic of South Africa | | | | 06/20/26 | | | | | 1.000%(Q) | | | | | 1,000 | | | | | (6,168 | ) | | | | 12,969 | | | | | (19,137 | ) | | | | GSI | |
Swiss Confederation | | | | 12/20/27 | | | | | 0.250%(Q) | | | | | 5,000 | | | | | (32,284 | ) | | | | — | | | | | (32,284 | ) | | | | BARC | |
U.S. Treasury Notes | | | | 06/20/25 | | | | | 0.250%(Q) | | | | EUR | 4,885 | | | | | 293 | | | | | (1,675 | ) | | | | 1,968 | | | | | BARC | |
U.S. Treasury Notes | | | | 06/20/25 | | | | | 0.250%(Q) | | | | EUR | 1,630 | | | | | 97 | | | | | (557 | ) | | | | 654 | | | | | BARC | |
| | | | | | | | | | | | | | | | | | | | | | | | | | | | | | | | | | | |
| | | | | | | |
| | | | | | | | | | | | | | | | | | $ | 6,025,194 | | | | $ | 7,632,330 | | | | $ | (1,607,136 | ) | | | | | |
| | | | | | | | | | | | | | | | | | | | | | | | | | | | | | | | | | | |
See Notes to Financial Statements.
62
PGIM Global Total Return Fund
Schedule of Investments (continued)
as of October 31, 2024
Credit default swap agreements outstanding at October 31, 2024 (continued):
| | | | | | | | | | | | | | | | | | | | | | | | | | | | | | | | | | | | | | | | |
Reference Entity/ Obligation | | Termination
Date | | Fixed
Rate | | Notional
Amount
(000)#(3) | | Implied
Credit
Spread at
October 31,
2024(4) | | Fair
Value | | Upfront
Premiums
Paid
(Received) | | Unrealized
Appreciation
(Depreciation) | | Counterparty |
|
OTC Credit Default Swap Agreements on corporate and/or sovereign issues - Sell Protection(2): | |
Australian Government Bond | | | | 12/20/27 | | | | | 1.000%(Q) | | | | | 5,000 | | | | | 0.090 | % | | | $ | 140,990 | | | | $ | 106,040 | | | | $ | 34,950 | | | | | DB | |
Bank of America Corp. | | | | 12/20/25 | | | | | 1.000%(Q) | | | | | 3,340 | | | | | 0.289 | % | | | | 30,395 | | | | | 27,244 | | | | | 3,151 | | | | | GSI | |
BNP Paribas SA | | | | 12/20/24 | | | | | 1.000%(Q) | | | | EUR | 3,600 | | | | | 0.192 | % | | | | 8,924 | | | | | 4,459 | | | | | 4,465 | | | | | BARC | |
Citigroup, Inc. | | | | 12/20/25 | | | | | 1.000%(Q) | | | | | 3,340 | | | | | 0.239 | % | | | | 32,273 | | | | | 27,620 | | | | | 4,653 | | | | | GSI | |
Comision Federal de Electricidad | | | | 06/20/29 | | | | | 1.000%(Q) | | | | | 4,540 | | | | | 2.266 | % | | | | (227,143 | ) | | | | (227,979 | ) | | | | 836 | | | | | CITI | |
DP World PLC | | | | 12/20/24 | | | | | 1.000%(Q) | | | | | 2,000 | | | | | 0.678 | % | | | | 3,214 | | | | | 252 | | | | | 2,962 | | | | | BARC | |
Emirate of Dubai | | | | 12/20/24 | | | | | 1.000%(Q) | | | | | 1,000 | | | | | 0.084 | % | | | | 2,423 | | | | | 101 | | | | | 2,322 | | | | | CITI | |
Federative Republic of Brazil | | | | 06/20/29 | | | | | 0.940%(Q) | | | | BRL | 33,000 | | | | | 1.425 | % | | | | (89,202 | ) | | | | (148 | ) | | | | (89,054 | ) | | | | BOA | |
Gazprom PAO | | | | 12/20/26 | | | | | 1.000%(Q) | | | | | 8,600 | | | | | 13.929 | % | | | | (1,837,237 | ) | | | | (2,310,469 | ) | | | | 473,232 | | | | | HSBC | |
Generalitat de Cataluna | | | | 12/20/25 | | | | | 1.000%(Q) | | | | | 4,900 | | | | | 0.302 | % | | | | 43,910 | | | | | (10,610 | ) | | | | 54,520 | | | | | DB | |
Hellenic Republic | | | | 12/20/29 | | | | | 1.000%(Q) | | | | EUR | 5,000 | | | | | 0.470 | % | | | | 146,080 | | | | | 11,212 | | | | | 134,868 | | | | | CITI | |
Israel Electric Corp. Ltd. | | | | 12/20/24 | | | | | 1.000%(Q) | | | | | 1,000 | | | | | 0.684 | % | | | | 1,600 | | | | | 345 | | | | | 1,255 | | | | | BARC | |
Japan Govt. | | | | 06/20/28 | | | | | 1.000%(Q) | | | | | 15,000 | | | | | 0.147 | % | | | | 453,804 | | | | | 380,540 | | | | | 73,264 | | | | | CITI | |
Kingdom of Spain | | | | 06/20/25 | | | | | 1.000%(Q) | | | | | 9,940 | | | | | 0.057 | % | | | | 70,759 | | | | | (12,107 | ) | | | | 82,866 | | | | | BOA | |
Kingdom of Spain | | | | 06/20/25 | | | | | 1.000%(Q) | | | | | 7,500 | | | | | 0.057 | % | | | | 53,389 | | | | | (11,310 | ) | | | | 64,699 | | | | | JPM | |
Kingdom of Spain | | | | 06/20/25 | | | | | 1.000%(Q) | | | | | 1,645 | | | | | 0.057 | % | | | | 11,711 | | | | | 2,730 | | | | | 8,981 | | | | | BARC | |
Lincoln National Corp. | | | | 12/20/29 | | | | | 1.000%(Q) | | | | | 7,100 | | | | | 1.350 | % | | | | (104,112 | ) | | | | (117,300 | ) | | | | 13,188 | | | | | JPM | |
Morgan Stanley | | | | 12/20/25 | | | | | 1.000%(Q) | | | | | 3,340 | | | | | 0.254 | % | | | | 31,701 | | | | | 27,244 | | | | | 4,457 | | | | | GSI | |
People’s Republic of China | | | | 06/20/29 | | | | | 1.000%(Q) | | | | | 13,390 | | | | | 0.593 | % | | | | 244,930 | | | | | 154,298 | | | | | 90,632 | | | | | JPM | |
See Notes to Financial Statements.
PGIM Global Total Return Fund 63
PGIM Global Total Return Fund
Schedule of Investments (continued)
as of October 31, 2024
Credit default swap agreements outstanding at October 31, 2024 (continued):
| | | | | | | | | | | | | | | | | | | | | | | | | | | | | | | | | | | | | | | | |
Reference Entity/ Obligation | | Termination
Date | | Fixed
Rate | | Notional
Amount
(000)#(3) | | Implied
Credit
Spread at
October 31,
2024(4) | | Fair
Value | | Upfront
Premiums
Paid
(Received) | | Unrealized
Appreciation
(Depreciation) | | Counterparty |
|
OTC Credit Default Swap Agreements on corporate and/or sovereign issues - Sell Protection(2)(cont’d.): | |
People’s Republic of China | | | | 12/20/24 | | | | | 1.000%(Q) | | | | | 1,000 | | | | | 0.234 | % | | | $ | 2,217 | | | | $ | 568 | | | | $ | 1,649 | | | | | CITI | |
Republic of Colombia | | | | 12/20/26 | | | | | 1.000%(Q) | | | | | 1,000 | | | | | 0.993 | % | | | | 1,303 | | | | | (24,907 | ) | | | | 26,210 | | | | | CITI | |
Republic of Cyprus | | | | 12/20/28 | | | | | 1.000%(Q) | | | | | 1,000 | | | | | 0.497 | % | | | | 20,326 | | | | | 16,640 | | | | | 3,686 | | | | | BARC | |
Republic of Estonia | | | | 12/20/25 | | | | | 1.000%(Q) | | | | EUR | 10,000 | | | | | 0.097 | % | | | | 123,815 | | | | | 40,384 | | | | | 83,431 | | | | | DB | |
Republic of Estonia | | | | 12/20/26 | | | | | 1.000%(Q) | | | | | 3,150 | | | | | 0.267 | % | | | | 51,194 | | | | | 12,737 | | | | | 38,457 | | | | | JPM | |
Republic of Finland | | | | 06/20/27 | | | | | 0.250%(Q) | | | | | 2,000 | | | | | 0.091 | % | | | | 8,603 | | | | | 4,446 | | | | | 4,157 | | | | | BOA | |
Republic of France | | | | 06/20/34 | | | | | 0.250%(Q) | | | | | 6,850 | | | | | 0.494 | % | | | | (130,550 | ) | | | | (145,468 | ) | | | | 14,918 | | | | | CITI | |
Republic of Ireland | | | | 12/20/26 | | | | | 1.000%(Q) | | | | | 2,000 | | | | | 0.074 | % | | | | 40,532 | | | | | 1,392 | | | | | 39,140 | | | | | GSI | |
Republic of Ireland | | | | 06/20/27 | | | | | 1.000%(Q) | | | | | 2,800 | | | | | 0.092 | % | | | | 67,359 | | | | | 22,435 | | | | | 44,924 | | | | | MSI | |
Republic of Italy | | | | 12/20/24 | | | | | 1.000%(Q) | | | | | 5,145 | | | | | 0.076 | % | | | | 12,530 | | | | | 6,682 | | | | | 5,848 | | | | | BARC | |
Republic of Italy | | | | 06/20/26 | | | | | 1.000%(Q) | | | | | 4,200 | | | | | 0.200 | % | | | | 58,347 | | | | | (53,618 | ) | | | | 111,965 | | | | | BOA | |
Republic of Italy | | | | 06/20/30 | | | | | 1.000%(Q) | | | | | 1,200 | | | | | 0.659 | % | | | | 21,940 | | | | | (19,452 | ) | | | | 41,392 | | | | | BARC | |
Republic of Italy | | | | 12/20/33 | | | | | 1.000%(Q) | | | | | 50,000 | | | | | 1.032 | % | | | | (59,726 | ) | | | | (1,239,707 | ) | | | | 1,179,981 | | | | | BARC | |
Republic of Italy | | | | 12/20/34 | | | | | 1.000%(Q) | | | | | 1,380 | | | | | 1.105 | % | | | | (9,929 | ) | | | | (8,692 | ) | | | | (1,237 | ) | | | | CITI | |
Republic of Italy | | | | 12/20/34 | | | | | 1.000%(Q) | | | | | 1,380 | | | | | 1.105 | % | | | | (9,930 | ) | | | | (8,693 | ) | | | | (1,237 | ) | | | | CITI | |
Republic of Kazakhstan | | | | 06/20/29 | | | | | 1.000%(Q) | | | | | 10,000 | | | | | 0.970 | % | | | | 24,209 | | | | | 40,887 | | | | | (16,678 | ) | | | | BARC | |
Republic of Panama | | | | 12/20/26 | | | | | 1.000%(Q) | | | | | 4,200 | | | | | 0.845 | % | | | | 18,186 | | | | | 5,162 | | | | | 13,024 | | | | | CITI | |
Republic of Serbia | | | | 12/20/25 | | | | | 1.000%(Q) | | | | EUR | 5,000 | | | | | 0.207 | % | | | | 55,084 | | | | | (98,060 | ) | | | | 153,144 | | | | | DB | |
See Notes to Financial Statements.
64
PGIM Global Total Return Fund
Schedule of Investments (continued)
as of October 31, 2024
Credit default swap agreements outstanding at October 31, 2024 (continued):
| | | | | | | | | | | | | | | | | | | | | | | | | | | | | | | | | | | | | | | | |
Reference Entity/ Obligation | | Termination
Date | | Fixed
Rate | | Notional
Amount
(000)#(3) | | Implied
Credit
Spread at
October 31,
2024(4) | | Fair
Value | | Upfront
Premiums
Paid
(Received) | | Unrealized
Appreciation
(Depreciation) | | Counterparty |
|
OTC Credit Default Swap Agreements on corporate and/or sovereign issues - Sell Protection(2)(cont’d.): | |
Republic of Serbia | | | | 12/20/25 | | | | | 5.000%(Q) | | | | | 4,500 | | | | | 0.207 | % | | | $ | 267,211 | | | | $ | 200,571 | | | | $ | 66,640 | | | | | CITI | |
Republic of Serbia | | | | 12/20/25 | | | | | 1.000%(Q) | | | | | 1,000 | | | | | 0.207 | % | | | | 10,022 | | | | | (330 | ) | | | | 10,352 | | | | | BNP | |
Republic of South Africa | | | | 06/20/31 | | | | | 1.000%(Q) | | | | | 3,000 | | | | | 2.366 | % | | | | (222,570 | ) | | | | (252,978 | ) | | | | 30,408 | | | | | MSI | |
State of Illinois | | | | 12/20/24 | | | | | 1.000%(Q) | | | | | 2,800 | | | | | 1.081 | % | | | | 2,956 | | | | | (4,518 | ) | | | | 7,474 | | | | | GSI | |
State of Illinois | | | | 06/20/28 | | | | | 1.000%(Q) | | | | | 1,000 | | | | | 1.854 | % | | | | (26,079 | ) | | | | (45,172 | ) | | | | 19,093 | | | | | CITI | |
State of Qatar | | | | 12/20/26 | | | | | 1.000%(Q) | | | | | 4,000 | | | | | 0.204 | % | | | | 70,272 | | | | | 47,151 | | | | | 23,121 | | | | | CITI | |
U.S. Treasury Notes | | | | 12/20/24 | | | | | 0.250%(Q) | | | | EUR | 4,885 | | | | | 0.189 | % | | | | 1,999 | | | | | 1,066 | | | | | 933 | | | | | BARC | |
U.S. Treasury Notes | | | | 12/20/24 | | | | | 0.250%(Q) | | | | EUR | 1,710 | | | | | 0.189 | % | | | | 700 | | | | | 498 | | | | | 202 | | | | | DB | |
U.S. Treasury Notes | | | | 12/20/24 | | | | | 0.250%(Q) | | | | EUR | 1,630 | | | | | 0.189 | % | | | | 667 | | | | | 353 | | | | | 314 | | | | | BARC | |
U.S. Treasury Notes | | | | 03/20/25 | | | | | 0.250%(Q) | | | | EUR | 3,320 | | | | | 0.242 | % | | | | 1,170 | | | | | 1,620 | | | | | (450 | ) | | | | BARC | |
UBS Group AG | | | | 12/20/24 | | | | | 1.000%(Q) | | | | EUR | 8,600 | | | | | 0.247 | % | | | | 20,619 | | | | | 3,240 | | | | | 17,379 | | | | | BOA | |
UBS Group AG | | | | 12/20/24 | | | | | 1.000%(Q) | | | | EUR | 5,000 | | | | | 0.165 | % | | | | 12,603 | | | | | 6,320 | | | | | 6,283 | | | | | BARC | |
UBS Group AG | | | | 03/20/25 | | | | | 1.000%(Q) | | | | EUR | 6,100 | | | | | 0.186 | % | | | | 28,524 | | | | | 20,261 | | | | | 8,263 | | | | | GSI | |
United Kingdom of Great Britain and Northern Ireland | | | | 12/20/27 | | | | | 1.000%(Q) | | | | | 1,000 | | | | | 0.127 | % | | | | 27,083 | | | | | 13,963 | | | | | 13,120 | | | | | DB | |
United Kingdom of Great Britain and Northern Ireland | | | | 12/20/28 | | | | | 1.000%(Q) | | | | | 5,000 | | | | | 0.165 | % | | | | 166,303 | | | | | 120,092 | | | | | 46,211 | | | | | BARC | |
United Mexican States | | | | 12/20/26 | | | | | 1.000%(Q) | | | | | 4,000 | | | | | 0.607 | % | | | | 36,892 | | | | | 2,018 | | | | | 34,874 | | | | | GSI | |
| | | | | | | | | | | | | | | | | | | | | | | | | | | | | | | | | | | | | | | | |
| | | | | | | | |
| | | | | | | | | | | | | | | | | | | | | | | $ | (287,709 | ) | | | $ | (3,280,947 | ) | | | $ | 2,993,238 | | | | | | |
| | | | | | | | | | | | | | | | | | | | | | | | | | | | | | | | | | | | | | | | |
See Notes to Financial Statements.
PGIM Global Total Return Fund 65
PGIM Global Total Return Fund
Schedule of Investments (continued)
as of October 31, 2024
Credit default swap agreements outstanding at October 31, 2024 (continued):
| | | | | | | | | | | | | | | | | | | | | | | | | | | | | | | | | | | |
Reference Entity/ Obligation | | Termination
Date | | Fixed
Rate | | Notional
Amount
(000)#(3) | | Fair
Value | | Upfront
Premiums
Paid
(Received) | | Unrealized
Appreciation
(Depreciation) | | Counterparty |
|
OTC Credit Default Swap Agreement on credit indices - Buy Protection(1): | |
CDX.EM.39.V1 | | | | 06/20/28 | | | | | 1.000%(Q) | | | | | 200,000 | | | | $ | 1,770,536 | | | | $ | 6,538,841 | | | | $ | (4,768,305 | ) | | | | MSI | |
| | | | | | | | | | | | | | | | | | | | | | | | | | | | | | | | | | | |
| | | | | | | | | | | | | | | | | | | | | | | | | | | | | | | | | | | | | | | | |
Reference Entity/ Obligation | | Termination
Date | | Fixed
Rate | | Notional
Amount
(000)#(3) | | Implied
Credit
Spread at
October 31,
2024(4) | | Fair
Value | | Upfront
Premiums
Paid
(Received) | | Unrealized
Appreciation
(Depreciation) | | Counterparty |
|
OTC Credit Default Swap Agreement on credit indices - Sell Protection(2): | |
CDX.EM.39.V1 | | | | 06/20/28 | | | | | 1.000%(Q) | | | | | 200,000 | | | | | 1.302 | % | | | $ | (1,770,536 | ) | | | $ | (4,667,058 | ) | | | $ | 2,896,522 | | | | | MSI | |
| | | | | | | | | | | | | | | | | | | | | | | | | | | | | | | | | | | | | | | | |
The Fund entered into credit default swaps (“CDS”) to provide a measure of protection against defaults or to take an active long or short position with respect to the likelihood of a particular issuer’s default or the reference entity’s credit soundness. CDS contracts generally trade based on a spread which represents the cost a protection buyer has to pay the protection seller. The protection buyer is said to be short the credit as the value of the contract rises the more the credit deteriorates. The value of the CDS contract increases for the protection buyer if the spread increases.
| (1) | If the Fund is a buyer of protection, it pays the fixed rate. When a credit event occurs, as defined under the terms of that particular swap agreement, the Fund will either (i) receive from the seller of protection an amount equal to the notional amount of the swap and make delivery of the referenced obligation or underlying securities comprising the referenced index or (ii) receive a net settlement amount in the form of cash or securities equal to the notional amount of the swap less the recovery value of the referenced obligation or underlying securities comprising the referenced index. |
| (2) | If the Fund is a seller of protection, it receives the fixed rate. When a credit event occurs, as defined under the terms of that particular swap agreement, the Fund will either (i) pay to the buyer of protection an amount equal to the notional amount of the swap and take delivery of the referenced obligation or underlying securities comprising the referenced index or (ii) pay a net settlement amount in the form of cash or securities equal to the notional amount of the swap less the recovery value of the referenced obligation or underlying securities comprising the referenced index. |
| (3) | Notional amount represents the maximum potential amount the Fund could be required to pay as a seller of credit protection or receive as a buyer of credit protection if a credit event occurs as defined under the terms of that particular swap agreement. |
| (4) | Implied credit spreads, represented in absolute terms, utilized in determining the fair value of credit default swap agreements where the Fund is the seller of protection as of the reporting date serve as an indicator of the current status |
See Notes to Financial Statements.
66
PGIM Global Total Return Fund
Schedule of Investments (continued)
as of October 31, 2024
| | of the payment/ performance risk and represent the likelihood of risk of default for the credit derivative. The implied credit spread of a particular referenced entity reflects the cost of buying/selling protection and may include up-front payments required to be made to enter into the agreement. Wider credit spreads represent a deterioration of the referenced entity’s credit soundness and a greater likelihood of risk of default or other credit event occurring as defined under the terms of the agreement. |
Currency swap agreements outstanding at October 31, 2024:
| | | | | | | | | | | | | | | | | | | | | | | | | | | | | | | | | | | | | | | | | | | | | | |
Notional
Amount
(000)# | | | Fund
Receives | | | Notional
Amount
(000)# | | | Fund Pays | | Counterparty | | Termination
Date | | | Fair
Value | | | Upfront Premiums Paid (Received) | | | Unrealized
Appreciation
(Depreciation) | |
| | | | | | | | | |
| OTC Currency Swap Agreement: | | | | | | | | | | | | | | | | | | | | | | | | | | |
| CNH | 10,000 | | | | 2.350%(Q) | | | | 1,564 | | | 1 Day SOFR(Q)/4.900% | | SCB | | | 01/10/27 | | | $ | (148,134 | ) | | | | | | $ | — | | | | | | | | | | | $ | (148,134 | ) | | | | |
| | | | | | | | | | | | | | | | | | | | | | | | | | | | | | | | | | | | | | | | | | | | | | |
Interest rate swap agreements outstanding at October 31, 2024:
| | | | | | | | | | | | | | | | | | | | | | |
Notional
Amount
(000)# | | | Termination
Date | | | Fixed Rate | | Floating Rate | | Value at
Trade Date | | | Value at
October 31,
2024 | | | Unrealized
Appreciation
(Depreciation) | |
|
| Centrally Cleared Interest Rate Swap Agreements: | |
| AUD | 18,000 | | | | 12/03/29 | | | 2.700%(S) | | 6 Month BBSW(2)(S)/4.637% | | $ | (662,060 | ) | | $ | (959,192 | ) | | $ | (297,132 | ) |
| AUD | 10,000 | | | | 07/10/33 | | | 2.987%(S) | | 6 Month BBSW(2)(S)/4.637% | | | 96,875 | | | | (764,441 | ) | | | (861,316 | ) |
| AUD | 24,750 | | | | 12/03/33 | | | 2.800%(S) | | 6 Month BBSW(2)(S)/4.637% | | | (1,897,310 | ) | | | (2,240,781 | ) | | | (343,471 | ) |
| AUD | 2,485 | | | | 12/03/34 | | | 2.850%(S) | | 6 Month BBSW(2)(S)/4.637% | | | (167,887 | ) | | | (242,287 | ) | | | (74,400 | ) |
| AUD | 10,000 | | | | 03/26/36 | | | 2.101%(S) | | 6 Month BBSW(2)(S)/4.637% | | | — | | | | (1,508,759 | ) | | | (1,508,759 | ) |
| CAD | 51,805 | | | | 04/03/25 | | | 0.970%(S) | | 1 Day CORRA(2)(S)/3.840% | | | 159,599 | | | | (532,803 | ) | | | (692,402 | ) |
| CAD | 1,845 | | | | 12/03/34 | | | 3.500%(S) | | 1 Day CORRA(1)(S)/3.840% | | | (21,039 | ) | | | (43,919 | ) | | | (22,880 | ) |
| CAD | 3,410 | | | | 12/03/48 | | | 3.450%(S) | | 1 Day CORRA(2)(S)/3.840% | | | (65,330 | ) | | | 84,949 | | | | 150,279 | |
See Notes to Financial Statements.
PGIM Global Total Return Fund 67
PGIM Global Total Return Fund
Schedule of Investments (continued)
as of October 31, 2024
Interest rate swap agreements outstanding at October 31, 2024 (continued):
| | | | | | | | | | | | | | | | | | | | | | |
Notional
Amount
(000)# | | | Termination
Date | | | Fixed Rate | | Floating Rate | | Value at
Trade Date | | | Value at
October 31,
2024 | | | Unrealized
Appreciation
(Depreciation) | |
|
| Centrally Cleared Interest Rate Swap Agreements (cont’d.): | |
| CAD | 2,765 | | | | 12/03/49 | | | 3.400%(S) | | 1 Day CORRA(2)(S)/3.840% | | $ | 141,442 | | | $ | 59,470 | | | $ | (81,972 | ) |
| CAD | 415 | | | | 12/03/54 | | | 3.250%(S) | | 1 Day CORRA(1)(S)/3.840% | | | (1,955 | ) | | | (6,474 | ) | | | (4,519 | ) |
| CHF | 14,500 | | | | 01/31/29 | | | 0.260%(A) | | 1 Day SARON(2)(S)/0.949% | | | (40,840 | ) | | | (153,663 | ) | | | (112,823 | ) |
| CHF | 800 | | | | 10/17/31 | | | 0.033%(A) | | 1 Day SARON(2)(S)/0.949% | | | (559 | ) | | | (32,336 | ) | | | (31,777 | ) |
| CHF | 4,000 | | | | 11/05/31 | | | 0.125%(A) | | 1 Day SARON(2)(A)/0.949% | | | — | | | | (168,495 | ) | | | (168,495 | ) |
| CHF | 700 | | | | 04/03/33 | | | 0.687%(A) | | 1 Day SARON(2)(S)/0.949% | | | (3,229 | ) | | | 9,985 | | | | 13,214 | |
| CHF | 390 | | | | 03/20/34 | | | 1.258%(A) | | 1 Day SARON(2)(A)/0.949% | | | — | | | | 31,048 | | | | 31,048 | |
| CLP | 634,000 | | | | 02/11/30 | | | 3.085%(S) | | 1 Day CLOIS(2)(S)/5.250% | | | — | | | | (63,140 | ) | | | (63,140 | ) |
| CLP | 800,000 | | | | 07/13/30 | | | 2.030%(S) | | 1 Day CLOIS(2)(S)/5.250% | | | — | | | | (134,128 | ) | | | (134,128 | ) |
| CNH | 98,660 | | | | 11/01/24 | | | 3.120%(Q) | | 7 Day China Fixing Repo Rates(2)(Q)/1.704% | | | 11 | | | | 40,821 | | | | 40,810 | |
| CNH | 92,700 | | | | 02/04/25 | | | 2.600%(Q) | | 7 Day China Fixing Repo Rates(2)(Q)/1.704% | | | — | | | | 44,408 | | | | 44,408 | |
| CNH | 330,000 | | | | 02/05/25 | | | 2.600%(Q) | | 7 Day China Fixing Repo Rates(2)(Q)/1.704% | | | (3 | ) | | | 158,500 | | | | 158,503 | |
See Notes to Financial Statements.
68
PGIM Global Total Return Fund
Schedule of Investments (continued)
as of October 31, 2024
Interest rate swap agreements outstanding at October 31, 2024 (continued):
| | | | | | | | | | | | | | | | | | | | | | |
Notional
Amount
(000)# | | | Termination
Date | | | Fixed
Rate | | Floating Rate | | Value at
Trade Date | | | Value at
October 31,
2024 | | | Unrealized
Appreciation
(Depreciation) | |
|
| Centrally Cleared Interest Rate Swap Agreements (cont’d.): | |
| CNH | 18,100 | | | | 03/10/25 | | | 2.300%(Q) | | 7 Day China Fixing Repo Rates(2)(Q)/1.704% | | $ | (4 | ) | | $ | 5,112 | | | $ | 5,116 | |
| CNH | 25,000 | | | | 03/12/25 | | | 2.400%(Q) | | 7 Day China Fixing Repo Rates(2)(Q)/1.704% | | | 3 | | | | 9,060 | | | | 9,057 | |
| CNH | 149,980 | | | | 05/08/25 | | | 1.860%(Q) | | 7 Day China Fixing Repo Rates(2)(Q)/1.704% | | | (42 | ) | | | 4,057 | | | | 4,099 | |
| CNH | 80,785 | | | | 06/01/25 | | | 1.973%(Q) | | 7 Day China Fixing Repo Rates(2)(Q)/1.704% | | | 5 | | | | 13,836 | | | | 13,831 | |
| CNH | 118,700 | | | | 07/02/25 | | | 2.330%(Q) | | 7 Day China Fixing Repo Rates(2)(Q)/1.704% | | | (10 | ) | | | 68,105 | | | | 68,115 | |
| CNH | 161,860 | | | | 07/13/25 | | | 2.653%(Q) | | 7 Day China Fixing Repo Rates(2)(Q)/1.704% | | | (27 | ) | | | 152,974 | | | | 153,001 | |
| CNH | 48,542 | | | | 08/06/25 | | | 2.555%(Q) | | 7 Day China Fixing Repo Rates(2)(Q)/1.704% | | | (10 | ) | | | 52,269 | | | | 52,279 | |
| CNH | 129,600 | | | | 09/01/25 | | | 2.735%(Q) | | 7 Day China Fixing Repo Rates(2)(Q)/1.704% | | | (29 | ) | | | 174,138 | | | | 174,167 | |
| CNH | 225,740 | | | | 11/02/25 | | | 2.588%(Q) | | 7 Day China Fixing Repo Rates(2)(Q)/1.704% | | | 142 | | | | 333,362 | | | | 333,220 | |
| CNH | 200,000 | | | | 12/09/25 | | | 2.855%(Q) | | 7 Day China Fixing Repo Rates(2)(Q)/1.704% | | | — | | | | 393,270 | | | | 393,270 | |
See Notes to Financial Statements.
PGIM Global Total Return Fund 69
PGIM Global Total Return Fund
Schedule of Investments (continued)
as of October 31, 2024
Interest rate swap agreements outstanding at October 31, 2024 (continued):
| | | | | | | | | | | | | | | | | | | | | | |
Notional
Amount
(000)# | | | Termination
Date | | | Fixed
Rate | | Floating Rate | | Value at
Trade Date | | | Value at
October 31,
2024 | | | Unrealized
Appreciation
(Depreciation) | |
|
| Centrally Cleared Interest Rate Swap Agreements (cont’d.): | |
| CNH | 192,490 | | | | 01/05/26 | | | 2.660%(Q) | | 7 Day China Fixing Repo Rates(2)(Q)/1.704% | | $ | (145 | ) | | $ | 318,446 | | | $ | 318,591 | |
| CNH | 40,000 | | | | 03/03/26 | | | 2.840%(Q) | | 7 Day China Fixing Repo Rates(2)(Q)/1.704% | | | (35 | ) | | | 94,297 | | | | 94,332 | |
| CNH | 50,000 | | | | 03/23/26 | | | 2.875%(Q) | | 7 Day China Fixing Repo Rates(2)(Q)/1.704% | | | — | | | | 121,672 | | | | 121,672 | |
| CNH | 345,920 | | | | 04/12/26 | | | 2.810%(Q) | | 7 Day China Fixing Repo Rates(2)(Q)/1.704% | | | (399 | ) | | | 816,096 | | | | 816,495 | |
| CNH | 6,300 | | | | 12/22/26 | | | 2.460%(Q) | | 7 Day China Fixing Repo Rates(2)(Q)/1.704% | | | — | | | | 15,425 | | | | 15,425 | |
| CNH | 434,070 | | | | 05/11/28 | | | 2.600%(Q) | | 7 Day China Fixing Repo Rates(2)(Q)/1.704% | | | 769,150 | | | | 1,971,376 | | | | 1,202,226 | |
| CNH | 69,650 | | | | 12/06/28 | | | 2.400%(Q) | | 7 Day China Fixing Repo Rates(2)(Q)/1.704% | | | — | | | | 266,787 | | | | 266,787 | |
| CNH | 286,750 | | | | 05/15/29 | | | 2.027%(Q) | | 7 Day China Fixing Repo Rates(2)(Q)/1.704% | | | — | | | | 494,409 | | | | 494,409 | |
| DKK | 13,600 | | | | 05/04/25 | | | 0.825%(A) | | 6 Month CIBOR(2)(S)/2.930% | | | (1 | ) | | | (52,262 | ) | | | (52,261) | |
| DKK | 5,000 | | | | 08/29/26 | | | 0.580%(A) | | 6 Month CIBOR(2)(S)/2.930% | | | 7 | | | | (29,846 | ) | | | (29,853) | |
| DKK | 1,300 | | | | 10/21/26 | | | 0.673%(A) | | 6 Month CIBOR(2)(S)/2.930% | | | 3 | | | | (6,902 | ) | | | (6,905) | |
See Notes to Financial Statements.
70
PGIM Global Total Return Fund
Schedule of Investments (continued)
as of October 31, 2024
Interest rate swap agreements outstanding at October 31, 2024 (continued):
| | | | | | | | | | | | | | | | | | | | | | |
Notional
Amount
(000)# | | | Termination
Date | | | Fixed
Rate | | Floating Rate | | Value at
Trade Date | | | Value at
October 31,
2024 | | | Unrealized
Appreciation
(Depreciation) | |
|
| Centrally Cleared Interest Rate Swap Agreements (cont’d.): | |
| DKK | 13,000 | | | | 03/15/27 | | | 1.123%(A) | | 6 Month CIBOR(2)(S)/2.930% | | $ | — | | | $ | (57,381 | ) | | $ | (57,381) | |
| DKK | 1,865 | | | | 06/22/27 | | | 0.987%(A) | | 6 Month CIBOR(2)(S)/2.930% | | | — | | | | (13,498 | ) | | | (13,498) | |
| EUR | 447,550 | | | | 11/23/24 | | | (0.046)%(A) | | 6 Month EURIBOR(2)(S)/2.864% | | | — | | | | (9,772,897 | ) | | | (9,772,897) | |
| EUR | 65,650 | | | | 04/23/26 | | | 3.076%(A) | | 1 Day EuroSTR(1)(A)/3.155% | | | — | | | | (598,263 | ) | | | (598,263) | |
| EUR | 27,230 | | | | 08/15/30 | | | (0.191)%(A) | | 1 Day EuroSTR(2)(A)/3.155% | | | (8,813 | ) | | | (4,084,506 | ) | | | (4,075,693) | |
| EUR | 17,280 | | | | 05/11/31 | | | 2.650%(A) | | 1 Day EuroSTR(1)(A)/3.155% | | | (428,030 | ) | | | (462,159 | ) | | | (34,129) | |
| EUR | 6,400 | | | | 02/23/32 | | | 1.180%(A) | | 6 Month EURIBOR(2)(S)/2.864% | | | 119 | | | | (558,045 | ) | | | (558,164) | |
| EUR | 4,680 | | | | 03/29/32 | | | 1.170%(A) | | 6 Month EURIBOR(2)(S)/2.864% | | | 1,128 | | | | (402,390 | ) | | | (403,518) | |
| EUR | 4,150 | | | | 05/11/32 | | | 1.100%(A) | | 6 Month EURIBOR(2)(S)/2.864% | | | (62,189 | ) | | | (459,358 | ) | | | (397,169) | |
| EUR | 7,000 | | | | 06/28/32 | | | 0.785%(A) | | 6 Month EURIBOR(2)(S)/2.864% | | | (40,873 | ) | | | (934,836 | ) | | | (893,963) | |
| EUR | 3,050 | | | | 10/30/32 | | | 1.302%(A) | | 6 Month EURIBOR(2)(S)/2.864% | | | — | | | | (263,265 | ) | | | (263,265) | |
| EUR | 19,945 | | | | 03/20/33 | | | 2.996%(A) | | 6 Month EURIBOR(2)(S)/2.864% | | | — | | | | 1,276,602 | | | | 1,276,602 | |
| EUR | 14,225 | | | | 05/11/33 | | | 1.000%(A) | | 6 Month EURIBOR(2)(S)/2.864% | | | (257,176 | ) | | | (1,881,418 | ) | | | (1,624,242) | |
See Notes to Financial Statements.
PGIM Global Total Return Fund 71
PGIM Global Total Return Fund
Schedule of Investments (continued)
as of October 31, 2024
Interest rate swap agreements outstanding at October 31, 2024 (continued):
| | | | | | | | | | | | | | | | | | | | | | |
Notional
Amount
(000)# | | | Termination
Date | | | Fixed
Rate | | Floating Rate | | Value at
Trade Date | | | Value at
October 31,
2024 | | | Unrealized
Appreciation
(Depreciation) | |
|
| Centrally Cleared Interest Rate Swap Agreements (cont’d.): | |
| EUR | 4,290 | | | | 03/20/34 | | | 2.560%(A) | | 1 Day EuroSTR(1)(A)/3.155% | | $ | — | | | $ | (78,256 | ) | | $ | (78,256) | |
| EUR | 12,390 | | | | 05/11/34 | | | 2.650%(A) | | 1 Day EuroSTR(2)(A)/3.155% | | | 347,266 | | | | 397,623 | | | | 50,357 | |
| EUR | 14,280 | | | | 03/20/38 | | | 2.982%(A) | | 6 Month EURIBOR(1)(S)/2.864% | | | — | | | | (1,145,926 | ) | | | (1,145,926) | |
| EUR | 365 | | | | 05/11/39 | | | 1.100%(A) | | 1 Day EuroSTR(2)(A)/3.155% | | | (2,649 | ) | | | (67,211 | ) | | | (64,562) | |
| EUR | 12,485 | | | | 11/24/41 | | | 0.565%(A) | | 6 Month EURIBOR(1)(S)/2.864% | | | — | | | | 1,957,403 | | | | 1,957,403 | |
| EUR | 12,485 | | | | 11/24/41 | | | 0.600%(A) | | 3 Month EURIBOR(2)(Q)/3.062% | | | — | | | | (2,000,402 | ) | | | (2,000,402) | |
| EUR | 30,272 | | | | 11/25/41 | | | 0.629%(A) | | 6 Month EURIBOR(1)(S)/2.864% | | | — | | | | 4,587,182 | | | | 4,587,182 | |
| EUR | 30,272 | | | | 11/25/41 | | | 0.663%(A) | | 3 Month EURIBOR(2)(Q)/3.062% | | | — | | | | (4,695,179 | ) | | | (4,695,179) | |
| EUR | 8,450 | | | | 02/17/42 | | | 0.536%(A) | | 6 Month EURIBOR(2)(S)/2.864% | | | — | | | | (2,503,555 | ) | | | (2,503,555) | |
| EUR | 17,040 | | | | 03/22/42 | | | 1.257%(A) | | 6 Month EURIBOR(1)(S)/2.864% | | | — | | | | 1,686,670 | | | | 1,686,670 | |
| EUR | 17,040 | | | | 03/22/42 | | | 1.310%(A) | | 3 Month EURIBOR(2)(Q)/3.062% | | | — | | | | (1,725,378 | ) | | | (1,725,378) | |
| EUR | 1,235 | | | | 07/04/42 | | | 1.001%(A) | | 6 Month EURIBOR(2)(S)/2.864% | | | (110,502 | ) | | | (289,122 | ) | | | (178,620) | |
| EUR | 15,130 | | | | 02/24/43 | | | 2.910%(A) | | 6 Month EURIBOR(1)(S)/2.864% | | | 12,548 | | | | (1,377,954 | ) | | | (1,390,502) | |
See Notes to Financial Statements.
72
PGIM Global Total Return Fund
Schedule of Investments (continued)
as of October 31, 2024
Interest rate swap agreements outstanding at October 31, 2024 (continued):
| | | | | | | | | | | | | | | | | | | | | | |
Notional
Amount
(000)# | | | Termination
Date | | | Fixed
Rate | | Floating Rate | | Value at
Trade Date | | | Value at
October 31,
2024 | | | Unrealized
Appreciation
(Depreciation) | |
|
| Centrally Cleared Interest Rate Swap Agreements (cont’d.): | |
| EUR | 15,130 | | | | 02/24/43 | | | 2.960%(A) | | 3 Month EURIBOR(2)(Q)/3.062% | | $ | (7,245 | ) | | $ | 1,436,519 | | | $ | 1,443,764 | |
| EUR | 14,270 | | | | 03/09/46 | | | 0.425%(A) | | 6 Month EURIBOR(2)(S)/2.864% | | | — | | | | (5,061,942 | ) | | | (5,061,942) | |
| EUR | 3,000 | | | | 05/11/49 | | | 1.450%(A) | | 6 Month EURIBOR(2)(S)/2.864% | | | (100,763 | ) | | | (546,504 | ) | | | (445,741) | |
| GBP | 5,330 | | | | 05/08/25 | | | 1.000%(A) | | 1 Day SONIA(1)(A)/4.950% | | | 430,155 | | | | 263,609 | | | | (166,546) | |
| GBP | 38,240 | | | | 05/08/27 | | | 1.050%(A) | | 1 Day SONIA(1)(A)/4.950% | | | 2,893,276 | | | | 4,592,758 | | | | 1,699,482 | |
| GBP | 40,655 | | | | 05/08/28 | | | 1.100%(A) | | 1 Day SONIA(1)(A)/4.950% | | | 8,130,379 | | | | 6,130,861 | | | | (1,999,518) | |
| GBP | 30,750 | | | | 06/07/28 | | | 4.059%(A) | | 1 Day SONIA(2)(A)/4.950% | | | 952 | | | | (264,833 | ) | | | (265,785) | |
| GBP | 38,880 | | | | 05/08/29 | | | 1.100%(A) | | 1 Day SONIA(1)(A)/4.950% | | | 5,919,338 | | | | 7,010,717 | | | | 1,091,379 | |
| GBP | 8,290 | | | | 05/08/30 | | | 1.100%(A) | | 1 Day SONIA(1)(A)/4.950% | | | 2,099,979 | | | | 1,729,840 | | | | (370,139) | |
| GBP | 6,355 | | | | 05/08/32 | | | 1.150%(A) | | 1 Day SONIA(2)(A)/4.950% | | | (800,449 | ) | | | (1,638,828 | ) | | | (838,379) | |
| GBP | 14,450 | | | | 05/08/33 | | | 1.150%(A) | | 1 Day SONIA(1)(A)/4.950% | | | 4,631,444 | | | | 4,127,833 | | | | (503,611) | |
| GBP | 2,120 | | | | 05/08/37 | | | 1.200%(A) | | 1 Day SONIA(2)(A)/4.950% | | | (605,769 | ) | | | (804,970 | ) | | | (199,201) | |
| GBP | 4,100 | | | | 05/08/42 | | | 1.250%(A) | | 1 Day SONIA(2)(A)/4.950% | | | 21,170 | | | | (1,966,208 | ) | | | (1,987,378) | |
See Notes to Financial Statements.
PGIM Global Total Return Fund 73
PGIM Global Total Return Fund
Schedule of Investments (continued)
as of October 31, 2024
Interest rate swap agreements outstanding at October 31, 2024 (continued):
| | | | | | | | | | | | | | | | | | | | | | | | | | | | | | |
Notional
Amount
(000)# | | | Termination
Date | | | Fixed
Rate | | | | Floating Rate | | | | | Value at
Trade Date | | | Value at
October 31,
2024 | | | Unrealized Appreciation (Depreciation) | |
| | | | | | | | | | | | | | | | | | | | | | | | | |
| | |
Centrally Cleared Interest Rate Swap Agreements (cont’d.): | | | | | | | | | |
| GBP | | | 13,725 | | | | 05/08/46 | | | 1.250%(A) | | | | 1 Day SONIA(2)(A)/4.950% | | | | | | $ | 2,259,662 | | | $ | (7,520,985 | ) | | $ | (9,780,647) | |
| GBP | | | 3,440 | | | | 05/08/49 | | | 1.250%(A) | | | | 1 Day SONIA(2)(A)/4.950% | | | | | | | 632,393 | | | | (2,026,655 | ) | | | (2,659,048) | |
| GBP | | | 3,540 | | | | 09/03/50 | | | 0.328%(A) | | | | 1 Day SONIA(2)(A)/4.950% | | | | | | | (31 | ) | | | (2,753,295 | ) | | | (2,753,264) | |
| GBP | | | 1,800 | | | | 05/08/52 | | | 1.250%(A) | | | | 1 Day SONIA(2)(A)/4.950% | | | | | | | (222,672 | ) | | | (1,121,227 | ) | | | (898,555) | |
| GBP | | | 3,700 | | | | 05/08/54 | | | 1.250%(A) | | | | 1 Day SONIA(2)(A)/4.950% | | | | | | | (2,099,178 | ) | | | (2,378,652 | ) | | | (279,474) | |
| HUF | | | 500,000 | | | | 03/31/31 | | | 2.460%(A) | | | | 6 Month BUBOR(2)(S)/6.430% | | | | | | | — | | | | (279,997 | ) | | | (279,997) | |
| ILS | | | 40,440 | | | | 04/16/28 | | | 0.928%(A) | | | | 3 Month TELBOR(2)(Q)/4.522% | | | | | | | (292 | ) | | | (1,157,625 | ) | | | (1,157,333) | |
| JPY | | | 3,276,010 | | | | 12/20/24 | | | 0.126%(S) | | | | 1 Day TONAR(2)(S)/0.227% | | | | | | | (2,998 | ) | | | (17,657 | ) | | | (14,659) | |
| JPY | | | 950,000 | | | | 01/15/25 | | | 0.000%(S) | | | | 1 Day TONAR(2)(S)/0.227% | | | | | | | 215 | | | | (9,029 | ) | | | (9,244) | |
| JPY | | | 9,000,000 | | | | 03/02/26 | | | 0.029%(S) | | | | 1 Day TONAR(2)(S)/0.227% | | | | | | | 9 | | | | (416,746 | ) | | | (416,755) | |
| JPY | | | 5,000,000 | | | | 06/02/26 | | | 0.009%(S) | | | | 1 Day TONAR(2)(S)/0.227% | | | | | | | 21 | | | | (311,585 | ) | | | (311,606) | |
| JPY | | | 2,000,000 | | | | 01/04/27 | | | (0.033)%(S) | | | | 1 Day TONAR(2)(S)/0.227% | | | | | | | 2,262 | | | | (192,282 | ) | | | (194,544) | |
| JPY | | | 2,100,000 | | | | 05/06/27 | | | 0.020%(S) | | | | 1 Day TONAR(2)(S)/0.227% | | | | | | | 34 | | | | (221,823 | ) | | | (221,857) | |
See Notes to Financial Statements.
74
PGIM Global Total Return Fund
Schedule of Investments (continued)
as of October 31, 2024
Interest rate swap agreements outstanding at October 31, 2024 (continued):
| | | | | | | | | | | | | | | | | | | | | | | | | | | | | | |
Notional
Amount
(000)# | | | Termination
Date | | | Fixed
Rate | | | | Floating Rate | | | | | Value at
Trade Date | | | Value at
October 31,
2024 | | | Unrealized
Appreciation
(Depreciation) | |
| | |
Centrally Cleared Interest Rate Swap Agreements (cont’d.): | | | | | | | | | |
| JPY | | | 7,080,000 | | | | 07/08/28 | | | (0.050)%(A) | | | | 1 Day TONAR(1)(A)/0.227% | | | | | | $ | 1,970,701 | | | $ | 1,153,088 | | | $ | (817,613) | |
| JPY | | | 3,674,000 | | | | 07/31/28 | | | 0.268%(A) | | | | 1 Day TONAR(2)(A)/0.227% | | | | | | | — | | | | (304,012 | ) | | | (304,012) | |
| JPY | | | 1,800,000 | | | | 11/12/28 | | | 0.011%(S) | | | | 1 Day TONAR(2)(S)/0.227% | | | | | | | 51 | | | | (327,983 | ) | | | (328,034) | |
| JPY | | | 135,000 | | | | 02/20/29 | | | 1.260%(S) | | | | 1 Day TONAR(2)(S)/0.227% | | | | | | | (2,935 | ) | | | 23,150 | | | | 26,085 | |
| JPY | | | 2,500,000 | | | | 03/22/29 | | | 0.068%(S) | | | | 1 Day TONAR(2)(S)/0.227% | | | | | | | (1,284 | ) | | | (452,227 | ) | | | (450,943) | |
| JPY | | | 50,000 | | | | 04/02/29 | | | 1.288%(S) | | | | 1 Day TONAR(2)(S)/0.227% | | | | | | | (680 | ) | | | 8,732 | | | | 9,412 | |
| JPY | | | 100,000 | | | | 08/18/29 | | | 1.070%(S) | | | | 1 Day TONAR(2)(S)/0.227% | | | | | | | (1,931 | ) | | | 12,117 | | | | 14,048 | |
| JPY | | | 100,000 | | | | 08/28/29 | | | 1.043%(S) | | | | 1 Day TONAR(2)(S)/0.227% | | | | | | | (1,662 | ) | | | 11,059 | | | | 12,721 | |
| JPY | | | 200,000 | | | | 09/09/29 | | | 1.061%(S) | | | | 1 Day TONAR(2)(S)/0.227% | | | | | | | (3,082 | ) | | | 23,135 | | | | 26,217 | |
| JPY | | | 655,000 | | | | 09/29/29 | | | 1.064%(S) | | | | 1 Day TONAR(2)(S)/0.227% | | | | | | | (7,891 | ) | | | 74,699 | | | | 82,590 | |
| JPY | | | 300,000 | | | | 07/02/30 | | | 0.047%(S) | | | | 1 Day TONAR(2)(S)/0.227% | | | | | | | (163 | ) | | | (79,188 | ) | | | (79,025) | |
| JPY | | | 200,000 | | | | 04/01/31 | | | 0.319%(S) | | | | 1 Day TONAR(2)(S)/0.227% | | | | | | | (708 | ) | | | (39,253 | ) | | | (38,545) | |
| JPY | | | 215,000 | | | | 05/06/31 | | | 0.354%(S) | | | | 1 Day TONAR(2)(S)/0.227% | | | | | | | (397 | ) | | | (39,694 | ) | | | (39,297) | |
See Notes to Financial Statements.
PGIM Global Total Return Fund 75
PGIM Global Total Return Fund
Schedule of Investments (continued)
as of October 31, 2024
Interest rate swap agreements outstanding at October 31, 2024 (continued):
| | | | | | | | | | | | | | | | | | | | | | | | | | | | | | | | |
Notional
Amount
(000)# | | | Termination
Date | | | Fixed
Rate | | | | | Floating Rate | | | | | Value at
Trade Date | | | Value at
October 31,
2024 | | | Unrealized
Appreciation
(Depreciation) | |
| | |
Centrally Cleared Interest Rate Swap Agreements (cont’d.): | | | | | | | | | |
| JPY | | | 150,000 | | | | 07/07/31 | | | 0.071%(S) | | | | | | 1 Day TONAR(2)(S)/0.227% | | | | | | $ | (184 | ) | | $ | (48,140 | ) | | $ | (47,956) | |
| JPY | | | 2,945,000 | | | | 07/08/31 | | | 0.000%(A) | | | | | | 1 Day TONAR(1)(A)/0.227% | | | | | | | 1,073,710 | | | | 963,581 | | | | (110,129) | |
| JPY | | | 700,000 | | | | 08/05/31 | | | 0.026%(S) | | | | | | 1 Day TONAR(2)(S)/0.227% | | | | | | | 39 | | | | (242,454 | ) | | | (242,493) | |
| JPY | | | 256,500 | | | | 08/15/31 | | | 0.223%(S) | | | | | | 1 Day TONAR(2)(S)/0.227% | | | | | | | (1,062 | ) | | | (66,489 | ) | | | (65,427) | |
| JPY | | | 130,000 | | | | 08/30/31 | | | 0.217%(S) | | | | | | 1 Day TONAR(2)(S)/0.227% | | | | | | | (438 | ) | | | (34,319 | ) | | | (33,881) | |
| JPY | | | 120,000 | | | | 09/08/31 | | | 0.316%(S) | | | | | | 1 Day TONAR(2)(S)/0.227% | | | | | | | (568 | ) | | | (26,519 | ) | | | (25,951) | |
| JPY | | | 190,000 | | | | 09/21/31 | | | 0.328%(S) | | | | | | 1 Day TONAR(2)(S)/0.227% | | | | | | | (806 | ) | | | (41,449 | ) | | | (40,643) | |
| JPY | | | 350,000 | | | | 10/14/31 | | | 0.270%(S) | | | | | | 1 Day TONAR(2)(S)/0.227% | | | | | | | (863 | ) | | | (86,660 | ) | | | (85,797) | |
| JPY | | | 200,000 | | | | 04/06/32 | | | 0.484%(S) | | | | | | 1 Day TONAR(2)(S)/0.227% | | | | | | | (1,061 | ) | | | (34,856 | ) | | | (33,795) | |
| JPY | | | 159,520 | | | | 04/07/32 | | | 0.491%(S) | | | | | | 1 Day TONAR(2)(S)/0.227% | | | | | | | (847 | ) | | | (27,273 | ) | | | (26,426) | |
| JPY | | | 1,200,000 | | | | 05/19/32 | | | 0.023%(S) | | | | | | 1 Day TONAR(2)(S)/0.227% | | | | | | | (20 | ) | | | (492,627 | ) | | | (492,607) | |
| JPY | | | 800,000 | | | | 05/29/32 | | | 0.016%(S) | | | | | | 1 Day TONAR(2)(S)/0.227% | | | | | | | (2 | ) | | | (333,043 | ) | | | (333,041) | |
| JPY | | | 140,000 | | | | 06/07/32 | | | 0.451%(S) | | | | | | 1 Day TONAR(2)(S)/0.227% | | | | | | | — | | | | (27,167 | ) | | | (27,167) | |
See Notes to Financial Statements.
76
PGIM Global Total Return Fund
Schedule of Investments (continued)
as of October 31, 2024
Interest rate swap agreements outstanding at October 31, 2024 (continued):
| | | | | | | | | | | | | | | | | | | | | | | | | | | | | | | | |
Notional
Amount
(000)# | | | Termination
Date | | | Fixed
Rate | | | | | Floating Rate | | | | | Value at
Trade Date | | | Value at
October 31,
2024 | | | Unrealized
Appreciation
(Depreciation) | |
| | |
Centrally Cleared Interest Rate Swap Agreements (cont’d.): | | | | | | | | | |
| JPY | | | 71,000 | | | | 09/21/32 | | | 0.463%(S) | | | | | | 1 Day TONAR(2)(S)/0.227% | | | | | | $ | (449 | ) | | $ | (14,838 | ) | | $ | (14,389) | |
| JPY | | | 160,000 | | | | 11/14/32 | | | 2.390%(S) | | | | | | 1 Day TONAR(2)(S)/0.227% | | | | | | | — | | | | 134,361 | | | | 134,361 | |
| JPY | | | 530,000 | | | | 07/08/33 | | | 0.100%(A) | | | | | | 1 Day TONAR(2)(A)/0.227% | | | | | | | (240,783 | ) | | | (226,299 | ) | | | 14,484 | |
| JPY | | | 1,509,190 | | | | 06/27/34 | | | 0.995%(A) | | | | | | 1 Day TONAR(1)(A)/0.227% | | | | | | | 130 | | | | (87,743 | ) | | | (87,873) | |
| JPY | | | 900,000 | | | | 01/04/38 | | | 0.757%(S) | | | | | | 1 Day TONAR(2)(S)/0.227% | | | | | | | (21,172 | ) | | | (317,592 | ) | | | (296,420) | |
| JPY | | | 800,000 | | | | 03/28/38 | | | 0.656%(S) | | | | | | 1 Day TONAR(2)(S)/0.227% | | | | | | | (7,290 | ) | | | (368,807 | ) | | | (361,517) | |
| JPY | | | 675,000 | | | | 04/06/38 | | | 0.655%(S) | | | | | | 1 Day TONAR(2)(S)/0.227% | | | | | | | (5,451 | ) | | | (313,432 | ) | | | (307,981) | |
| JPY | | | 285,000 | | | | 07/08/38 | | | 0.200%(A) | | | | | | 1 Day TONAR(1)(A)/0.227% | | | | | | | 318,796 | | | | 234,075 | | | | (84,721) | |
| JPY | | | 600,000 | | | | 08/10/38 | | | 0.822%(S) | | | | | | 1 Day TONAR(2)(S)/0.227% | | | | | | | (11,733 | ) | | | (206,369 | ) | | | (194,636) | |
| JPY | | | 2,430,385 | | | | 12/03/38 | | | 0.600%(S) | | | | | | 1 Day TONAR(2)(S)/0.227% | | | | | | | (1,175 | ) | | | (1,354,662 | ) | | | (1,353,487) | |
| JPY | | | 969,000 | | | | 12/03/39 | | | 0.650%(S) | | | | | | 1 Day TONAR(2)(S)/0.227% | | | | | | | (513 | ) | | | (578,356 | ) | | | (577,843) | |
| JPY | | | 166,000 | | | | 05/09/43 | | | 0.820%(S) | | | | | | 1 Day TONAR(2)(S)/0.227% | | | | | | | (801 | ) | | | (119,431 | ) | | | (118,630) | |
| JPY | | | 2,000,000 | | | | 10/23/45 | | | 0.333%(S) | | | | | | 1 Day TONAR(2)(S)/0.227% | | | | | | | (6,040 | ) | | | (3,043,721 | ) | | | (3,037,681) | |
See Notes to Financial Statements.
PGIM Global Total Return Fund 77
PGIM Global Total Return Fund
Schedule of Investments (continued)
as of October 31, 2024
Interest rate swap agreements outstanding at October 31, 2024 (continued):
| | | | | | | | | | | | | | | | | | | | | | | | | | | | | | | | |
Notional
Amount
(000)# | | | Termination
Date | | | Fixed
Rate | | | | | Floating Rate | | | | | Value at
Trade Date | | | Value at
October 31,
2024 | | | Unrealized
Appreciation
(Depreciation) | |
| | |
Centrally Cleared Interest Rate Swap Agreements (cont’d.): | | | | | | | | | |
| JPY | | | 775,000 | | | | 04/12/46 | | | 0.496%(S) | | | | | | 1 Day TONAR(2)(S)/0.227% | | | | | | $ | (4,489 | ) | | $ | (1,057,907 | ) | | $ | (1,053,418) | |
| JPY | | | 110,291 | | | | 04/15/46 | | | 0.560%(S) | | | | | | 1 Day TONAR(2)(S)/0.227% | | | | | | | (672 | ) | | | (141,878 | ) | | | (141,206) | |
| JPY | | | 26,000 | | | | 10/04/47 | | | 0.942%(S) | | | | | | 1 Day TONAR(2)(S)/0.227% | | | | | | | (334 | ) | | | (23,674 | ) | | | (23,340) | |
| JPY | | | 560,000 | | | | 11/24/47 | | | 0.888%(S) | | | | | | 1 Day TONAR(2)(S)/0.227% | | | | | | | (1,393 | ) | | | (546,312 | ) | | | (544,919) | |
| JPY | | | 500,000 | | | | 05/29/50 | | | 0.186%(S) | | | | | | 1 Day TONAR(2)(S)/0.227% | | | | | | | (154 | ) | | | (1,078,336 | ) | | | (1,078,182) | |
| JPY | | | 500,000 | | | | 08/26/50 | | | 0.334%(S) | | | | | | 1 Day TONAR(2)(S)/0.227% | | | | | | | (3,483 | ) | | | (982,707 | ) | | | (979,224) | |
| JPY | | | 1,000,000 | | | | 12/16/50 | | | 0.338%(S) | | | | | | 1 Day TONAR(2)(S)/0.227% | | | | | | | (11,992 | ) | | | (1,982,863 | ) | | | (1,970,871) | |
| JPY | | | 1,200,000 | | | | 02/08/51 | | | 0.467%(S) | | | | | | 1 Day TONAR(2)(S)/0.227% | | | | | | | (14,265 | ) | | | (2,170,543 | ) | | | (2,156,278) | |
| JPY | | | 1,650,000 | | | | 03/30/51 | | | 0.520%(S) | | | | | | 1 Day TONAR(2)(S)/0.227% | | | | | | | (12,328 | ) | | | (2,876,267 | ) | | | (2,863,939) | |
| JPY | | | 701,000 | | | | 07/31/53 | | | 1.102%(A) | | | | | | 1 Day TONAR(1)(A)/0.227% | | | | | | | — | | | | 642,384 | | | | 642,384 | |
| JPY | | | 1,000,000 | | | | 07/08/54 | | | 0.450%(A) | | | | | | 1 Day TONAR(1)(A)/0.227% | | | | | | | 1,781,890 | | | | 1,996,589 | | | | 214,699 | |
| JPY | | | 1,155,000 | | | | 07/08/54 | | | 1.750%(A) | | | | | | 1 Day TONAR(2)(A)/0.227% | | | | | | | 198,391 | | | | 92,912 | | | | (105,479) | |
| KRW | | | 18,824,000 | | | | 08/06/25 | | | 0.830%(Q) | | | | | | 3 Month KWCDC(2)(Q)/3.430% | | | | | | | (4 | ) | | | (329,591 | ) | | | (329,587) | |
See Notes to Financial Statements.
78
PGIM Global Total Return Fund
Schedule of Investments (continued)
as of October 31, 2024
Interest rate swap agreements outstanding at October 31, 2024 (continued):
| | | | | | | | | | | | | | | | | | | | | | |
Notional
Amount
(000)# | | | Termination
Date | | | Fixed
Rate | | Floating Rate | | Value at
Trade Date | | | Value at
October 31,
2024 | | | Unrealized
Appreciation
(Depreciation) |
| | | |
| Centrally Cleared Interest Rate Swap Agreements (cont’d.): | | | | | | | | |
| KRW | 19,850,000 | | | | 04/19/28 | | | 3.135%(Q) | | 3 Month KWCDC(2)(Q)/3.430% | | $ | — | | | $ | 79,067 | | | $ | 79,067 | |
| KRW | 20,447,900 | | | | 09/10/28 | | | 2.043%(Q) | | 3 Month KWCDC(2)(Q)/3.430% | | | 346,770 | | | | (536,375 | ) | | | (883,145 | ) |
| KRW | 11,000,000 | | | | 02/05/30 | | | 1.319%(Q) | | 3 Month KWCDC(2)(Q)/3.430% | | | 9 | | | | (689,200 | ) | | | (689,209 | ) |
| KRW | 5,000,000 | | | | 01/05/31 | | | 1.258%(Q) | | 3 Month KWCDC(2)(Q)/3.430% | | | — | | | | (362,578 | ) | | | (362,578 | ) |
| KRW | 4,000,000 | | | | 08/13/31 | | | 1.630%(Q) | | 3 Month KWCDC(2)(Q)/3.430% | | | — | | | | (254,925 | ) | | | (254,925 | ) |
| KRW | 1,067,160 | | | | 03/10/33 | | | 3.150%(Q) | | 3 Month KWCDC(2)(Q)/3.430% | | | (15,091 | ) | | | 9,186 | | | | 24,277 | |
| KRW | 2,640,000 | | | | 11/24/33 | | | 3.610%(Q) | | 3 Month KWCDC(2)(Q)/3.430% | | | — | | | | 97,148 | | | | 97,148 | |
| KRW | 30,916,085 | | | | 03/10/34 | | | 3.150%(Q) | | 3 Month KWCDC(2)(Q)/3.430% | | | 7,953 | | | | 284,413 | | | | 276,460 | |
| KRW | 3,830,000 | | | | 03/10/35 | | | 3.200%(Q) | | 3 Month KWCDC(2)(Q)/3.430% | | | 106,022 | | | | 49,182 | | | | (56,840 | ) |
| MXN | 170,735 | | | | 06/14/34 | | | 9.425%(M) | | 28 Day Mexican Interbank Rate(2)(M)/10.708% | | | 43,947 | | | | (63,908 | ) | | | (107,855 | ) |
| NOK | 36,000 | | | | 02/07/29 | | | 2.083%(A) | | 6 Month NIBOR(2)(S)/4.730% | | | — | | | | (244,034 | ) | | | (244,034 | ) |
| NOK | 48,000 | | | | 10/07/29 | | | 1.660%(A) | | 6 Month NIBOR(2)(S)/4.730% | | | — | | | | (473,680 | ) | | | (473,680 | ) |
| NZD | 6,450 | | | | 11/28/28 | | | 2.950%(S) | | 3 Month BBR(2)(Q)/4.520% | | | — | | | | (95,122 | ) | | | (95,122 | ) |
See Notes to Financial Statements.
PGIM Global Total Return Fund 79
PGIM Global Total Return Fund
Schedule of Investments (continued)
as of October 31, 2024
Interest rate swap agreements outstanding at October 31, 2024 (continued):
| | | | | | | | | | | | | | | | | | | | | | |
Notional
Amount
(000)# | | | Termination
Date | | | Fixed
Rate | | Floating Rate | | Value at
Trade Date | | | Value at
October 31,
2024 | | | Unrealized
Appreciation
(Depreciation) |
| | | |
| Centrally Cleared Interest Rate Swap Agreements (cont’d.): | | | | | | | | |
| PLN | 151,250 | | | | 10/18/26 | | | 5.163%(A) | | 6 Month WIBOR(2)(S)/5.840% | | $ | — | | | $ | (78,176 | ) | | $ | (78,176 | ) |
| PLN | 128,000 | | | | 10/18/26 | | | 5.166%(A) | | 6 Month WIBOR(2)(S)/5.840% | | | — | | | | (64,083 | ) | | | (64,083 | ) |
| PLN | 10,000 | | | | 03/26/31 | | | 1.675%(A) | | 6 Month WIBOR(2)(S)/5.840% | | | — | | | | (439,910 | ) | | | (439,910 | ) |
| SEK | 60,000 | | | | 07/10/32 | | | 3.150%(A) | | 3 Month STIBOR(1)(Q)/2.850% | | | (346,154 | ) | | | (361,830 | ) | | | (15,676 | ) |
| SGD | 17,215 | | | | 07/29/31 | | | 1.120%(S) | | 1 Day SORA(2)(S)/3.156% | | | 80,928 | | | | (1,257,296 | ) | | | (1,338,224 | ) |
| THB | 173,600 | | | | 04/28/30 | | | 1.020%(Q) | | 1 Day THOR(2)(Q)/2.238% | | | — | | | | (288,221 | ) | | | (288,221 | ) |
| THB | 23,000 | | | | 05/29/30 | | | 2.645%(Q) | | 1 Day THOR(2)(Q)/2.238% | | | (734 | ) | | | 20,056 | | | | 20,790 | |
| THB | 72,900 | | | | 06/25/30 | | | 0.990%(Q) | | 1 Day THOR(2)(Q)/2.238% | | | — | | | | (131,823 | ) | | | (131,823 | ) |
| THB | 200,200 | | | | 07/03/30 | | | 1.028%(Q) | | 1 Day THOR(2)(Q)/2.238% | | | — | | | | (349,709 | ) | | | (349,709 | ) |
| THB | 115,500 | | | | 08/17/31 | | | 1.320%(Q) | | 1 Day THOR(2)(Q)/2.238% | | | — | | | | (196,194 | ) | | | (196,194 | ) |
| THB | 260,500 | | | | 04/18/34 | | | 2.895%(Q) | | 1 Day THOR(2)(Q)/2.238% | | | — | | | | 351,457 | | | | 351,457 | |
| THB | 218,530 | | | | 04/22/34 | | | 2.818%(Q) | | 1 Day THOR(2)(Q)/2.238% | | | — | | | | 251,261 | | | | 251,261 | |
| THB | 110,000 | | | | 04/23/34 | | | 2.855%(Q) | | 1 Day THOR(2)(Q)/2.238% | | | — | | | | 136,825 | | | | 136,825 | |
See Notes to Financial Statements.
80
PGIM Global Total Return Fund
Schedule of Investments (continued)
as of October 31, 2024
Interest rate swap agreements outstanding at October 31, 2024 (continued):
| | | | | | | | | | | | | | | | | | | | | | |
Notional
Amount
(000)# | | | Termination
Date | | | Fixed
Rate | | Floating Rate | | Value at
Trade Date | | | Value at
October 31,
2024 | | | Unrealized
Appreciation
(Depreciation) |
| | | |
| Centrally Cleared Interest Rate Swap Agreements (cont’d.): | | | | | | | | |
| TWD | 564,000 | | | | 02/17/28 | | | 1.390%(Q) | | 3 Month TAIBOR(1)(Q)/1.674% | | $ | — | | | $ | 282,612 | | | $ | 282,612 | |
| TWD | 255,000 | | | | 02/24/33 | | | 1.415%(Q) | | 3 Month TAIBOR(1)(Q)/1.674% | | | — | | | | 415,947 | | | | 415,947 | |
| | 139,780 | | | | 04/30/25 | | | 5.241%(T) | | 1 Day SOFR(2)(T)/4.900% | | | — | | | | 451,679 | | | | 451,679 | |
| | 132,430 | | | | 05/11/25 | | | 0.450%(A) | | 1 Day SOFR(1)(A)/4.900% | | | 6,373,303 | | | | 5,835,268 | | | | (538,035 | ) |
| | 282,225 | | | | 08/19/25 | | | 4.395%(T) | | 1 Day SOFR(2)(T)/4.900% | | | (14,272 | ) | | | (188,465 | ) | | | (174,193 | ) |
| | 71,770 | | | | 04/23/26 | | | 4.861%(A) | | 1 Day SOFR(2)(A)/4.900% | | | — | | | | 658,208 | | | | 658,208 | |
| | 139,215 | | | | 05/11/26 | | | 4.750%(A) | | 1 Day SOFR(2)(A)/4.900% | | | 2,378,355 | | | | 1,100,222 | | | | (1,278,133 | ) |
| | 50,180 | | | | 09/25/26 | | | 4.699%(A) | | 1 Day SOFR(1)(A)/4.900% | | | — | | | | (666,207 | ) | | | (666,207 | ) |
| | 32,215 | | | | 09/05/28 | | | 4.027%(A) | | 1 Day SOFR(1)(A)/4.900% | | | — | | | | (184,623 | ) | | | (184,623 | ) |
| | 27,150 | | | | 09/28/28 | | | 4.396%(A) | | 1 Day SOFR(1)(A)/4.900% | | | — | | | | (552,638 | ) | | | (552,638 | ) |
| | 30,430 | | | | 11/07/28 | | | 4.223%(A) | | 1 Day SOFR(1)(A)/4.900% | | | — | | | | (100,143 | ) | | | (100,143 | ) |
| | 30,780 | | | | 05/17/29 | | | 4.143%(A) | | 1 Day SOFR(1)(A)/4.900% | | | — | | | | (267,680 | ) | | | (267,680 | ) |
| | 13,000 | | | | 04/26/33 | | | 3.070%(A) | | 1 Day SOFR(2)(A)/4.900% | | | — | | | | (337,778 | ) | | | (337,778 | ) |
See Notes to Financial Statements.
PGIM Global Total Return Fund 81
PGIM Global Total Return Fund
Schedule of Investments (continued)
as of October 31, 2024
Interest rate swap agreements outstanding at October 31, 2024 (continued):
| | | | | | | | | | | | | | | | | | | | | | | | |
Notional
Amount
(000)# | | | Termination
Date | | | Fixed
Rate | | | Floating Rate | | Value at
Trade Date | | | Value at October 31, 2024 | | | Unrealized Appreciation (Depreciation) | |
| | | | | | | | | | | | | | | | | | | |
| |
| Centrally Cleared Interest Rate Swap Agreements (cont’d.): | | | | |
| | 38,155 | | | | 08/15/39 | | | | 3.771%(A) | | | 1 Day SOFR(2)(A)/4.900% | | $ | — | | | $ | (310,158 | ) | | $ | (310,158 | ) |
| | 29,415 | | | | 05/11/49 | | | | 1.350%(A) | | | 1 Day SOFR(2)(A)/4.900% | | | (11,798,631 | ) | | | (11,737,959 | ) | | | 60,672 | |
| | 7,710 | | | | 04/30/54 | | | | 4.027%(A) | | | 1 Day SOFR(1)(A)/4.900% | | | — | | | | (465,503 | ) | | | (465,503 | ) |
| | 15,125 | | | | 05/10/54 | | | | 3.850%(A) | | | 1 Day SOFR(2)(A)/4.900% | | | (88,163 | ) | | | 431,628 | | | | 519,791 | |
| | 27,110 | | | | 05/11/54 | | | | 1.350%(A) | | | 1 Day SOFR(1)(A)/4.900% | | | 11,885,095 | | | | 11,618,066 | | | | (267,029 | ) |
| | 16,430 | | | | 05/10/74 | | | | 3.420%(A) | | | 1 Day SOFR(1)(A)/4.900% | | | 169,941 | | | | (372,829 | ) | | | (542,770 | ) |
| | 24,840 | | | | 05/11/74 | | | | 1.950%(A) | | | 1 Day SOFR(1)(A)/4.900% | | | 111,923 | | | | 247,268 | | | | 135,345 | |
| | | | | | | | | | | | | | | | | | | | | | | | |
| | | | | | |
| | | | | | | | | | | | | | $ | 35,152,848 | | | $ | (41,976,134 | ) | | $ | (77,128,982 | ) |
| | | | | | | | | | | | | | | | | | | | | | | | |
| | | | | | | | | | | | | | | | | | | | | | | | | | | | | | | | | | | | | | | | |
Notional
Amount
(000)# | | | Termination
Date | | | Fixed
Rate | | Floating Rate | | Fair
Value | | | Upfront Premiums Paid(Received) | | | Unrealized Appreciation (Depreciation) | | | Counterparty |
| | | | | | | | | | | | | | | | | | | | | | | | | | | | | | | | |
| | | | | | | | |
| OTC Interest Rate Swap Agreements: | | | | | | | | | | | | | | | | | | | | | | | |
| CNH | 10,000 | | | | 04/02/26 | | | 3.120%(Q) | | 7 Day China Fixing Repo Rates(2)(Q)/1.704% | | $ | 29,663 | | | | | | | $ | 3 | | | | | | | | | | | $ | 29,660 | | | | | | | CITI |
| CNH | 1,000 | | | | 06/15/28 | | | 2.365%(Q) | | 7 Day China Fixing Repo Rates(1)(Q)/1.704% | | | (3,337 | ) | | | | | | | — | | | | | | | | | | | | (3,337 | ) | | | | | | MSI |
| CNH | 1,000 | | | | 06/15/28 | | | 2.410%(Q) | | 7 Day China Fixing Repo Rates(2)(Q)/1.704% | | | 3,520 | | | | | | | | — | | | | | | | | | | | | 3,520 | | | | | | | MSI |
| CNH | 75,000 | | | | 07/12/28 | | | 2.410%(Q) | | 7 Day China Fixing Repo Rates(1)(Q)/1.704% | | | (268,581 | ) | | | | | | | — | | | | | | | | | | | | (268,581 | ) | | | | | | MSI |
See Notes to Financial Statements.
82
PGIM Global Total Return Fund
Schedule of Investments (continued)
as of October 31, 2024
Interest rate swap agreements outstanding at October 31, 2024 (continued):
| | | | | | | | | | | | | | | | | | | | | | | | | | | | | | | | | | | | | | | | |
Notional
Amount
(000)# | | | Termination
Date | | | Fixed
Rate | | Floating Rate | | Fair
Value | | | Upfront
Premiums
Paid(Received) | | | Unrealized
Appreciation (Depreciation) | | | Counterparty |
| | | | | | | | | | | | | | | | | | | | | | | | | | | | | | | | |
| | | | | | | | |
| OTC Interest Rate Swap Agreements (cont’d.): | | | | | | | | | | | | | | | | | | | | | | | |
| CNH | 75,000 | | | | 07/12/28 | | | 2.455%(Q) | | 7 Day China Fixing Repo Rates(2)(Q)/1.704% | | $ | 282,497 | | | | | | | $ | — | | | | | | | | | | | $ | 282,497 | | | | | | | MSI |
| CNH | 34,800 | | | | 07/31/30 | | | 2.515%(Q) | | 7 Day China Fixing Repo Rates(2)(Q)/1.704% | | | 190,837 | | | | | | | | — | | | | | | | | | | | | 190,837 | | | | | | | MSI |
| CNH | 16,100 | | | | 11/24/30 | | | 2.495%(Q) | | 7 Day China Fixing Repo Rates(2)(Q)/1.704% | | | 91,148 | | | | | | | | — | | | | | | | | | | | | 91,148 | | | | | | | MSI |
| CNH | 5,000 | | | | 10/14/31 | | | 2.675%(Q) | | 7 Day China Fixing Repo Rates(2)(Q)/1.704% | | | 38,774 | | | | | | | | — | | | | | | | | | | | | 38,774 | | | | | | | SCB |
| CNH | 30,000 | | | | 11/02/31 | | | 2.700%(Q) | | 7 Day China Fixing Repo Rates(2)(Q)/1.704% | | | 246,837 | | | | | | | | — | | | | | | | | | | | | 246,837 | | | | | | | SCB |
| JPY | 35,000 | | | | 12/14/32 | | | 1.575%(S) | | 6 Month JPY LIBOR(2)(S)/0.072% | | | 14,101 | | | | | | | | — | | | | | | | | | | | | 14,101 | | | | | | | HSBC |
| KRW | 900,000 | | | | 11/05/24 | | | 2.425%(Q) | | 3 Month KWCDC(2)(Q)/3.430% | | | (1,768 | ) | | | | | | | — | | | | | | | | | | | | (1,768 | ) | | | | | | CITI |
| KRW | 1,485,000 | | | | 10/28/26 | | | 1.520%(Q) | | 3 Month KWCDC(2)(Q)/3.430% | | | (31,102 | ) | | | | | | | (7 | ) | | | | | | | | | | | (31,095 | ) | | | | | | JPM |
| KRW | 2,040,000 | | | | 04/26/27 | | | 1.880%(Q) | | 3 Month KWCDC(2)(Q)/3.430% | | | (39,583 | ) | | | | | | | — | | | | | | | | | | | | (39,583 | ) | | | | | | MSI |
| KRW | 1,280,000 | | | | 10/17/28 | | | 1.450%(Q) | | 3 Month KWCDC(2)(Q)/3.430% | | | (53,719 | ) | | | | | | | — | | | | | | | | | | | | (53,719 | ) | | | | | | CITI |
| KRW | 520,000 | | | | 01/27/31 | | | 1.870%(Q) | | 3 Month KWCDC(2)(Q)/3.430% | | | (24,038 | ) | | | | | | | — | | | | | | | | | | | | (24,038 | ) | | | | | | JPM |
| KRW | 8,100,000 | | | | 05/30/34 | | | 3.418%(Q) | | 3 Month KWCDC(2)(Q)/3.430% | | | 211,470 | | | | | | | | — | | | | | | | | | | | | 211,470 | | | | | | | GSI |
| KRW | 3,330,000 | | | | 05/30/54 | | | 2.968%(Q) | | 3 Month KWCDC(1)(Q)/3.430% | | | (213,570 | ) | | | | | | | — | | | | | | | | | | | | (213,570 | ) | | | | | | GSI |
See Notes to Financial Statements.
PGIM Global Total Return Fund 83
PGIM Global Total Return Fund
Schedule of Investments (continued)
as of October 31, 2024
Interest rate swap agreements outstanding at October 31, 2024 (continued):
| | | | | | | | | | | | | | | | | | | | | | | | | | | | | | | | | | | | | | | | | | | | |
Notional
Amount
(000)# | | | Termination
Date | | | Fixed
Rate | | | Floating Rate | | Fair
Value | | | Upfront
Premiums
Paid(Received) | | | Unrealized Appreciation (Depreciation) | | | Counterparty | |
| | | | | | | | |
| OTC Interest Rate Swap Agreements (cont’d.): | | | | | | | | | | | | | | | | | | | | | | | | |
| MYR | 1,700 | | | | 04/28/25 | | | | 4.040%(Q) | | | 3 Month KLIBOR(2)(Q)/3.580% | | $ | 894 | | | | | | | $ | — | | | | | | | | | | | $ | 894 | | | | | | | | CITI | |
| MYR | 23,575 | | | | 04/09/26 | | | | 2.625%(Q) | | | 3 Month KLIBOR(2)(Q)/3.580% | | | (72,103 | ) | | | | | | | (144 | ) | | | | | | | | | | | (71,959 | ) | | | | | | | MSI | |
| MYR | 45,900 | | | | 08/12/26 | | | | 2.605%(Q) | | | 3 Month KLIBOR(2)(Q)/3.580% | | | (188,614 | ) | | | | | | | (308 | ) | | | | | | | | | | | (188,306 | ) | | | | | | | HSBC | |
| MYR | 3,160 | | | | 07/11/29 | | | | 3.528%(Q) | | | 3 Month KLIBOR(2)(Q)/3.580% | | | (866 | ) | | | | | | | (6 | ) | | | | | | | | | | | (860 | ) | | | | | | | MSI | |
| MYR | 11,700 | | | | 11/19/29 | | | | 3.245%(Q) | | | 3 Month KLIBOR(2)(Q)/3.580% | | | (42,238 | ) | | | | | | | 17 | | | | | | | | | | | | (42,255 | ) | | | | | | | MSI | |
| MYR | 17,800 | | | | 02/04/30 | | | | 3.060%(Q) | | | 3 Month KLIBOR(2)(Q)/3.580% | | | (108,047 | ) | | | | | | | 9 | | | | | | | | | | | | (108,056 | ) | | | | | | | MSI | |
| SAR | 49,500 | | | | 04/26/33 | | | | 4.495%(A) | | | 3 Month SAIBOR(1)(Q)/5.587% | | | 205,224 | | | | | | | | — | | | | | | | | | | | | 205,224 | | | | | | | | MSI | |
| | 10,000 | | | | 09/22/28 | | | | 3.290%(S) | | | 1 Week MUNIPSA(1)(Q)/3.240% | | | (157,545 | ) | | | | | | | — | | | | | | | | | | | | (157,545 | ) | | | | | | | JPM | |
| ZAR | 40,930 | | | | 03/22/42 | | | | 7.800%(Q) | | | 3 Month JIBAR(2)(Q)/8.017% | | | (342,050 | ) | | | | | | | — | | | | | | | | | | | | (342,050 | ) | | | | | | | CITI | |
| ZAR | 89,400 | | | | 09/22/42 | | | | 8.020%(Q) | | | 3 Month JIBAR(2)(Q)/8.017% | | | (658,979 | ) | | | | | | | — | | | | | | | | | | | | (658,979 | ) | | | | | | | CITI | |
| ZAR | 38,700 | | | | 03/22/47 | | | | 7.650%(Q) | | | 3 Month JIBAR(1)(Q)/8.017% | | | 393,783 | | | | | | | | — | | | | | | | | | | | | 393,783 | | | | | | | | CITI | |
| ZAR | 83,965 | | | | 09/22/47 | | | | 7.890%(Q) | | | 3 Month JIBAR(1)(Q)/8.017% | | | 747,379 | | | | | | | | — | | | | | | | | | | | | 747,379 | | | | | | | | CITI | |
| | | | | | | | | | | | | | | | | | | | | | | | | | | | | | | | | | | | | | | | | | | | |
| | | | | | | | | | | |
| | | | | | | | | | | | | | $ | 249,987 | | | | | | | $ | (436 | ) | | | | | | | | | | $ | 250,423 | | | | | | | | | |
| | | | | | | | | | | | | | | | | | | | | | | | | | | | | | | | | | | | | | | | | | | | |
| (1) | The Fund pays the fixed rate and receives the floating rate. |
| (2) | The Fund pays the floating rate and receives the fixed rate. |
See Notes to Financial Statements.
84
PGIM Global Total Return Fund
Schedule of Investments (continued)
as of October 31, 2024
Total return swap agreements outstanding at October 31, 2024:
| | | | | | | | | | | | | | | | | | | | | | | | | | | | | | | | | | | | | | | | | | |
Reference Entity | | Financing Rate | | Counterparty | | | Termination
Date | | | Long
(Short)
Notional
Amount
(000)#(1) | | | Fair
Value | | | Upfront
Premiums
Paid
(Received) | | | Unrealized Appreciation (Depreciation)(2) | |
| | | | | | | | | |
OTC Total Return Swap Agreements: | | | | | | | | | | | | | | | | | | | | | | | | | | | | | | | | | | | | | |
Bloomberg U.S. Treasury 1-3 Year Index(T) | | 1 Day USOIS +23bps(T)/5.060% | | | DB | | | | 05/07/25 | | | | 21,000 | | | $ | 93,382 | | | | | | | $ | — | | | | | | | | | | | $ | 93,382 | | | | | |
U.S. Treasury Bond(T) | | 1 Day USOIS -20bps(T)/4.630% | | | JPM | | | | 12/09/24 | | | | 78,455 | | | | (5,105,856 | ) | | | | | | | — | | | | | | | | | | | | (5,105,856 | ) | | | | |
U.S. Treasury Bond(T) | | 1 Day USOIS +22bps(T)/5.050% | | | JPM | | | | 12/10/24 | | | | 41,310 | | | | (2,721,811 | ) | | | | | | | — | | | | | | | | | | | | (2,721,811 | ) | | | | |
U.S. Treasury Bond(T) | | 1 Day USOIS +22bps(T)/5.050% | | | JPM | | | | 12/10/24 | | | | 44,110 | | | | (2,616,280 | ) | | | | | | | — | | | | | | | | | | | | (2,616,280 | ) | | | | |
U.S. Treasury Bond(T) | | 1 Day USOIS +23bps(T)/5.060% | | | JPM | | | | 12/12/24 | | | | 45,637 | | | | (2,811,538 | ) | | | | | | | — | | | | | | | | | | | | (2,811,538 | ) | | | | |
U.S. Treasury Bond(T) | | 1 Day USOIS +21bps(T)/5.040% | | | JPM | | | | 02/11/25 | | | | 57,900 | | | | (266,558 | ) | | | | | | | — | | | | | | | | | | | | (266,558 | ) | | | | |
U.S. Treasury Bond(T) | | 1 Day USOIS +21bps(T)/5.040% | | | JPM | | | | 02/11/25 | | | | 103,200 | | | | (452,408 | ) | | | | | | | — | | | | | | | | | | | | (452,408 | ) | | | | |
| | | | | | | | | | | | | | | | | | | | | | | | | | | | | | | | | | | | | | | | | | |
| | | | | | | | | | | |
| | | | | | | | | | | | | | | | $ | (13,881,069 | ) | | | | | | $ | — | | | | | | | | | | | $ | (13,881,069 | ) | | | | |
| | | | | | | | | | | | | | | | | | | | | | | | | | | | | | | | | | | | | | | | | | |
| (1) | On a long total return swap, the Fund receives payments for any positive return on the reference entity (makes payments for any negative return) and pays the financing rate. On a short total return swap, the Fund makes payments for any positive return on the reference entity (receives payments for any negative return) and receives the financing rate. |
| (2) | Upfront/recurring fees or commissions, as applicable, are included in the net unrealized appreciation (depreciation). |
See Notes to Financial Statements.
PGIM Global Total Return Fund 85
PGIM Global Total Return Fund
Schedule of Investments (continued)
as of October 31, 2024
Balances Reported in the Statement of Assets and Liabilities for OTC Swap Agreements:
| | | | | | | | | | |
| | | Premiums Paid | | Premiums Received | | Unrealized Appreciation | | Unrealized Depreciation | |
| |
| OTC Swap Agreements | | $15,789,100 | | $(9,615,426) | | $12,370,171 | | $ | (26,708,349 | ) |
| |
Summary of Collateral for Centrally Cleared/Exchange-traded Derivatives:
Cash and securities segregated as collateral, including pending settlement for closed positions, to cover requirements for centrally cleared/exchange-traded derivatives are listed by broker as follows:
| | | | | | | | | | |
Broker | | Cash and/or Foreign Currency | | Securities Market Value |
JPS | | | | $— | | | | | $42,830,192 | |
| | | | | | | | | | |
Fair Value Measurements:
Various inputs are used in determining the value of the Fund’s investments. These inputs are summarized in the three broad levels listed below.
Level 1—unadjusted quoted prices generally in active markets for identical securities.
Level 2—quoted prices for similar securities, interest rates and yield curves, prepayment speeds, foreign currency exchange rates and other observable inputs.
Level 3—unobservable inputs for securities valued in accordance with Board approved fair valuation procedures.
The following is a summary of the inputs used as of October 31, 2024 in valuing such portfolio securities:
| | | | | | | | | | | | |
| | | Level 1 | | | Level 2 | | | Level 3 | |
Investments in Securities | | | | | | | | | | | | |
Assets | | | | | | | | | | | | |
Long-Term Investments | | | | | | | | | | | | |
Asset-Backed Securities | | | | | | | | | | | | |
Canada | | $ | — | | | $ | 5,841,796 | | | $ | — | |
Cayman Islands | | | — | | | | 54,377,691 | | | | — | |
Ireland | | | — | | | | 175,853,830 | | | | — | |
Spain | | | — | | | | 323,957 | | | | 2,095,015 | |
United Kingdom | | | — | | | | 28,387,227 | | | | — | |
United States | | | — | | | | 48,838,170 | | | | — | |
Commercial Mortgage-Backed Securities | | | | | | | | | | | | |
Canada | | | — | | | | 916,814 | | | | — | |
United Kingdom | | | — | | | | 13,223,699 | | | | — | |
United States | | | — | | | | 87,376,751 | | | | — | |
Corporate Bonds | | | | | | | | | | | | |
Brazil | | | — | | | | 23,120,358 | | | | — | |
Bulgaria | | | — | | | | 13,078,780 | | | | — | |
Canada | | | — | | | | 19,957,696 | | | | — | |
See Notes to Financial Statements.
86
PGIM Global Total Return Fund
Schedule of Investments (continued)
as of October 31, 2024
| | | | | | | | | | | | |
| | | Level 1 | | | Level 2 | | | Level 3 | |
Investments in Securities (continued) | | | | | | | | | | | | |
Assets (continued) | | | | | | | | | | | | |
Long-Term Investments (continued) | | | | | | | | | | | | |
Corporate Bonds (continued) | | | | | | | | | | | | |
Chile | | $ | — | | | $ | 2,990,284 | | | $ | — | |
China | | | — | | | | 16,545,068 | | | | — | |
Denmark | | | — | | | | 5,595,758 | | | | — | |
France | | | — | | | | 43,713,895 | | | | — | |
Germany | | | — | | | | 35,813,635 | | | | — | |
Hong Kong | | | — | | | | 12,510,791 | | | | — | |
Hungary | | | — | | | | 9,309,953 | | | | — | |
Iceland | | | — | | | | 5,971,521 | | | | — | |
India | | | — | | | | 19,507,221 | | | | — | |
Indonesia | | | — | | | | 13,177,702 | | | | — | |
Israel | | | — | | | | 17,102,076 | | | | — | |
Italy | | | — | | | | 17,388,662 | | | | — | |
Jamaica | | | — | | | | 9,468,897 | | | | 32,240 | |
Japan | | | — | | | | 1,413,747 | | | | — | |
Luxembourg | | | — | | | | 22,937,135 | | | | — | |
Malta | | | — | | | | 3,179,093 | | | | — | |
Mexico | | | — | | | | 50,817,020 | | | | — | |
Netherlands | | | — | | | | 8,428,654 | | | | — | |
Norway | | | — | | | | 2,276,412 | | | | — | |
Peru | | | — | | | | 611,049 | | | | — | |
Philippines | | | — | | | | 8,796,373 | | | | — | |
Poland | | | — | | | | 11,512,592 | | | | — | |
Qatar | | | — | | | | 9,312,401 | | | | — | |
Russia | | | — | | | | 10,101,689 | | | | — | |
Saudi Arabia | | | — | | | | 166,789 | | | | — | |
Singapore | | | — | | | | 1,252,289 | | | | — | |
Slovenia | | | — | | | | 12,700,449 | | | | — | |
South Africa | | | — | | | | 13,333,312 | | | | — | |
South Korea | | | — | | | | 21,173,485 | | | | — | |
Spain | | | — | | | | 17,333,758 | | | | 496,306 | |
Supranational Bank | | | — | | | | 10,285,432 | | | | 2,102,968 | |
Switzerland | | | — | | | | 32,385,026 | | | | — | |
United Arab Emirates | | | — | | | | 22,129,398 | | | | — | |
United Kingdom | | | — | | | | 49,874,653 | | | | — | |
United States | | | — | | | | 605,055,748 | | | | 22,759,611 | |
Floating Rate and Other Loans | | | | | | | | | | | | |
Jamaica | | | — | | | | 443,158 | | | | — | |
United Kingdom | | | — | | | | 21,161,327 | | | | — | |
United States | | | — | | | | 1,449,317 | | | | — | |
Municipal Bond | | | | | | | | | | | | |
Louisiana | | | — | | | | 4,937,358 | | | | — | |
See Notes to Financial Statements.
PGIM Global Total Return Fund 87
PGIM Global Total Return Fund
Schedule of Investments (continued)
as of October 31, 2024
| | | | | | | | | | | | |
| | | Level 1 | | | Level 2 | | | Level 3 | |
Investments in Securities (continued) | | | | | | | | | | | | |
Assets (continued) | | | | | | | | | | | | |
Long-Term Investments (continued) | | | | | | | | | | | | |
Residential Mortgage-Backed Securities | | | | | | | | | | | | |
United States | | $ | — | | | $ | 63,375,585 | | | $ | 2,116,164 | |
Sovereign Bonds | | | | | | | | | | | | |
Andorra | | | — | | | | 1,107,883 | | | | — | |
Argentina | | | — | | | | 1,970,372 | | | | — | |
Austria | | | — | | | | 1,936,723 | | | | — | |
Brazil | | | — | | | | 17,219,636 | | | | — | |
Bulgaria | | | — | | | | 8,575,299 | | | | — | |
Canada | | | — | | | | 11,863,847 | | | | — | |
Chile | | | — | | | | 2,630,832 | | | | — | |
China | | | — | | | | 58,958,311 | | | | — | |
Colombia | | | — | | | | 63,407,232 | | | | — | |
Cyprus | | | — | | | | 21,225,910 | | | | — | |
Czech Republic | | | — | | | | 4,161,024 | | | | — | |
Denmark | | | — | | | | 3,523,803 | | | | — | |
Egypt | | | — | | | | 5,073,266 | | | | — | |
Finland | | | — | | | | 1,119,853 | | | | — | |
France | | | — | | | | 32,344,271 | | | | — | |
Germany | | | — | | | | 23,068 | | | | — | |
Greece | | | — | | | | 85,683,136 | | | | — | |
Hong Kong | | | — | | | | 3,257,168 | | | | — | |
Hungary | | | — | | | | 11,062,064 | | | | — | |
India | | | — | | | | 7,118,865 | | | | — | |
Indonesia | | | — | | | | 49,589,385 | | | | — | |
Israel | | | — | | | | 6,302,388 | | | | — | |
Italy | | | — | | | | 68,447,919 | | | | — | |
Japan | | | — | | | | 4,690,327 | | | | — | |
Malta | | | — | | | | 3,095,831 | | | | — | |
Mexico | | | — | | | | 21,651,653 | | | | — | |
Montenegro | | | — | | | | 812,704 | | | | — | |
New Zealand | | | — | | | | 4,216,457 | | | | — | |
Norway | | | — | | | | 1,906,207 | | | | — | |
Panama | | | — | | | | 15,641,697 | | | | — | |
Peru | | | — | | | | 12,981,921 | | | | — | |
Philippines | | | — | | | | 27,276,458 | | | | — | |
Poland | | | — | | | | 5,296,893 | | | | — | |
Portugal | | | — | | | | 1,969,397 | | | | — | |
Romania | | | — | | | | 20,835,348 | | | | — | |
Saudi Arabia | | | — | | | | 14,012,803 | | | | — | |
Serbia | | | — | | | | 30,009,481 | | | | — | |
Slovakia | | | — | | | | 1,703,472 | | | | — | |
Slovenia | | | — | | | | 3,315,950 | | | | — | |
South Africa | | | — | | | | 2,372,111 | | | | — | |
See Notes to Financial Statements.
88
PGIM Global Total Return Fund
Schedule of Investments (continued)
as of October 31, 2024
| | | | | | | | | | | | |
| | | Level 1 | | | Level 2 | | | Level 3 | |
Investments in Securities (continued) | | | | | | | | | | | | |
Assets (continued) | | | | | | | | | | | | |
Long-Term Investments (continued) | | | | | | | | | | | | |
Sovereign Bonds (continued) | | | | | | | | | | | | |
South Korea | | $ | — | | | $ | 638,357 | | | $ | — | |
Spain | | | — | | | | 61,005,853 | | | | — | |
Sweden | | | — | | | | 4,131,855 | | | | — | |
Tunisia | | | — | | | | 474,694 | | | | — | |
United Arab Emirates | | | — | | | | 6,100,903 | | | | — | |
United Kingdom | | | — | | | | 61,720,989 | | | | — | |
Uruguay | | | — | | | | 578,106 | | | | — | |
Vietnam | | | — | | | | 33,996,510 | | | | — | |
U.S. Government Agency Obligations | | | — | | | | 19,710,597 | | | | 249,875 | |
U.S. Treasury Obligations | | | — | | | | 153,821,890 | | | | — | |
Affiliated Exchange-Traded Fund | | | 7,368,936 | | | | — | | | | — | |
Common Stocks | | | | | | | | | | | | |
Jamaica | | | — | | | | — | | | | 149,333 | |
Spain | | | — | | | | — | | | | 703,013 | |
United States | | | 3,111,850 | | | | — | | | | 485,466 | |
Preferred Stocks | | | | | | | | | | | | |
Jamaica | | | — | | | | — | | | | 68,559 | |
United States | | | 121,160 | | | | — | | | | 633,000 | |
Warrants | | | | | | | | | | | | |
Spain | | | — | | | | — | | | | 228 | |
Short-Term Investments | | | | | | | | | | | | |
Affiliated Mutual Funds | | | 46,223,646 | | | | — | | | | — | |
U.S. Treasury Obligation | | | — | | | | 12,624,649 | | | | — | |
Options Purchased | | | — | | | | 374,044 | | | | — | |
| | | | | | | | | | | | |
| | | |
Total | | $ | 56,825,592 | | | $ | 2,680,404,893 | | | $ | 31,891,778 | |
| | | | | | | | | | | | |
| | | |
Liabilities | | | | | | | | | | | | |
Options Written | | $ | — | | | $ | (315,419 | ) | | $ | — | |
| | | | | | | | | | | | |
| | | |
Other Financial Instruments* | | | | | | | | | | | | |
Assets | | | | | | | | | | | | |
Futures Contracts | | $ | 8,198,298 | | | $ | — | | | $ | — | |
OTC Forward Foreign Currency Exchange Contracts | | | — | | | | 2,034,077 | | | | — | |
OTC Packaged Credit Default Swap Agreements | | | — | | | | 3,571,792 | | | | — | |
OTC Credit Default Swap Agreements | | | — | | | | 10,899,973 | | | | — | |
Centrally Cleared Interest Rate Swap Agreements | | | — | | | | 23,705,733 | | | | — | |
OTC Interest Rate Swap Agreements | | | — | | | | 2,456,127 | | | | — | |
OTC Total Return Swap Agreement | | | — | | | | 93,382 | | | | — | |
| | | | | | | | | | | | |
| | | |
Total | | $ | 8,198,298 | | | $ | 42,761,084 | | | $ | — | |
| | | | | | | | | | | | |
See Notes to Financial Statements.
PGIM Global Total Return Fund 89
PGIM Global Total Return Fund
Schedule of Investments (continued)
as of October 31, 2024
| | | | | | | | | | | | |
| | | Level 1 | | | Level 2 | | | Level 3 | |
Other Financial Instruments* (continued) | | | | | | | | | | | | |
Liabilities | | | | | | | | | | | | |
Futures Contracts | | $ | (11,941,784 | ) | | $ | — | | | $ | — | |
OTC Forward Foreign Currency Exchange Contracts | | | — | | | | (3,479,519 | ) | | | — | |
OTC Packaged Credit Default Swap Agreements | | | — | | | | (3,694,565 | ) | | | — | |
OTC Credit Default Swap Agreements | | | — | | | | (5,162,488 | ) | | | — | |
OTC Currency Swap Agreement | | | — | | | | (148,134 | ) | | | — | |
Centrally Cleared Interest Rate Swap Agreements | | | — | | | | (100,834,715 | ) | | | — | |
OTC Interest Rate Swap Agreements | | | — | | | | (2,206,140 | ) | | | — | |
OTC Total Return Swap Agreements | | | — | | | | (13,974,451 | ) | | | — | |
| | | | | | | | | | | | |
| | | |
Total | | $ | (11,941,784 | ) | | $ | (129,500,012 | ) | | $ | — | |
| | | | | | | | | | | | |
| * | Other financial instruments are derivative instruments not reflected in the Schedule of Investments, such as futures, forwards and centrally cleared swap contracts, which are recorded at unrealized appreciation (depreciation) on the instrument, and OTC swap contracts which are recorded at fair value. |
The following is a reconciliation of assets in which unobservable inputs (Level 3) were used in determining fair value:
| | | | | | | | | | | | | | | | | | | | | | | | | | | | | | | | | | | | |
| | | Asset-Backed Securities- Spain | | Corporate
Bonds-
Jamaica | | | Corporate
Bonds-
Spain | | | Corporate
Bonds-
Supranational
Bank | | | Corporate
Bonds-
United States |
Balance as of 10/31/23 | | | | $ | 2,667,065 | | | | | $ | — | | | $ | — | | | | | | | $ | 1,922,030 | | | | | | | | | $ | 23,699,245 | | | |
Realized gain (loss) | | | | | (24,145 | ) | | | | | 11,365 | | | | — | | | | | | | | — | | | | | | | | | | — | | | |
Change in unrealized appreciation (depreciation) | | | | | (46,793 | ) | | | | | 27,770 | | | | 8,754 | | | | | | | | 172,327 | | | | | | | | | | (292,785 | ) | | |
Purchases/Exchanges/Issuances | | | | | — | | | | | | 12,038 | | | | 487,419 | | | | | | | | — | | | | | | | | | | — | | | |
Sales/Paydowns | | | | | (501,112 | ) | | | | | (18,898 | ) | | | — | | | | | | | | — | | | | | | | | | | (20,293 | ) | | |
Accrued discount/premium | | | | | — | | | | | | (35 | ) | | | 133 | | | | | | | | 8,611 | | | | | | | | | | (213,348 | ) | | |
Transfers into Level 3* | | | | | — | | | | | | — | | | | — | | | | | | | | — | | | | | | | | | | — | | | |
Transfers out of Level 3* | | | | | — | | | | | | — | | | | — | | | | | | | | — | | | | | | | | | | (413,208 | ) | | |
| | | | | | | | | | | | | | | | | | | | | | | | | | | | | | | | | | | | |
| | | | | | | | | | | |
Balance as of 10/31/24 | | | | $ | 2,095,015 | | | | | $ | 32,240 | | | $ | 496,306 | | | | | | | $ | 2,102,968 | | | | | | | | | $ | 22,759,611 | | | |
| | | | | | | | | | | | | | | | | | | | | | | | | | | | | | | | | | | | |
| | | | | | | | | | | |
Change in unrealized appreciation (depreciation) relating to securities still held at reporting period end | | | | $ | (46,793 | ) | | | | $ | 27,770 | | | $ | 8,754 | | | | | | | $ | 172,327 | | | | | | | | | $ | (292,785 | ) | | |
| | | | | | | | | | | | | | | | | | | | | | | | | | | | | | | | | | | | |
| | | | | | | | | | | | | | | | | | | | | | | | | | | | |
| | | Residential
Mortgage-
Backed
Securities | | | U.S. Government Agency Obligations | | Common
Stocks-
Jamaica | | | Common
Stocks-
Spain | | | Common Stocks- United States |
Balance as of 10/31/23 | | $ | — | | | | | $ | 734,250 | | | | | $ | — | | | $ | — | | | | | $ | — | | | |
See Notes to Financial Statements.
90
PGIM Global Total Return Fund
Schedule of Investments (continued)
as of October 31, 2024
| | | | | | | | | | | | | | | | | | | | | | | | | | | | | | | | | | | | |
| | | Residential Mortgage- Backed Securities | | | U.S. Government Agency Obligations | | Common
Stocks-
Jamaica | | | Common
Stocks-
Spain | | | Common Stocks- United States |
Realized gain (loss) | | | | | | $ | — | | | | | | | | | $ | 10,978 | | | | | $ | (1 | ) | | $ | — | | | | | $ | — | | | |
Change in unrealized appreciation (depreciation) | | | | | | | 1,903 | | | | | | | | | | (6,569 | ) | | | | | 77,565 | | | | 281,620 | | | | | | 228,739 | | | |
Purchases/Exchanges/Issuances | | | | | | | 2,360,000 | | | | | | | | | | — | | | | | | 71,770 | | | | 421,393 | | | | | | — | | | |
Sales/Paydowns | | | | | | | (245,739 | ) | | | | | | | | | (500,000 | ) | | | | | (1 | ) | | | — | | | | | | (210,068 | ) | | |
Accrued discount/premium | | | | | | | — | | | | | | | | | | 11,216 | | | | | | — | | | | — | | | | | | — | | | |
Transfers into Level 3* | | | | | | | — | | | | | | | | | | — | | | | | | — | | | | — | | | | | | 466,795 | | | |
Transfers out of Level 3* | | | | | | | — | | | | | | | | | | — | | | | | | — | | | | — | | | | | | — | | | |
| | | | | | | | | | | | | | | | | | | | | | | | | | | | | | | | | | | | |
| | | | | | | | | | | |
Balance as of 10/31/24 | | | | | | $ | 2,116,164 | | | | | | | | | $ | 249,875 | | | | | $ | 149,333 | | | $ | 703,013 | | | | | $ | 485,466 | | | |
| | | | | | | | | | | | | | | | | | | | | | | | | | | | | | | | | | | | |
| | | | | | | | | | | |
Change in unrealized appreciation (depreciation) relating to securities still held at reporting period end | | | | | | $ | 1,903 | | | | | | | | | $ | (6,569 | ) | | | | $ | 77,565 | | | $ | 281,620 | | | | | $ | 228,739 | | | |
| | | | | | | | | | | | | | | | | | | | | | | | | | | | | | | | | | | | |
| | | | | | | | | | | | | | | | | | | | | | | | | | | | | | | | | | | | | | | | | | | | | | | | | | | | |
| | | Preferred
Stocks-
Jamaica | | | Preferred
Stocks-
United States | | | Warrants | | | Options Written | | | OTC Credit
Default Swap
Agreements | |
Balance as of 10/31/23 | | $ | — | | | | | | | $ | — | | | | | | | | | | | $ | — | | | | | | | | | | | $ | (254 | ) | | | | | | | | | | $ | 28,151 | | | | | |
Realized gain (loss) | | | 4,534 | | | | | | | | — | | | | | | | | | | | | — | | | | | | | | | | | | — | | | | | | | | | | | | 7,797 | | | | | |
Change in unrealized appreciation (depreciation) | | | 30,709 | | | | | | | | (6,330 | ) | | | | | | | | | | | (587 | ) | | | | | | | | | | | 254 | | | | | | | | | | | | (18,832 | ) | | | | |
Purchases/Exchanges/Issuances | | | 165,830 | | | | | | | | 639,330 | | | | | | | | | | | | 815 | | | | | | | | | | | | — | | | | | | | | | | | | — | | | | | |
Sales/Paydowns | | | (132,514 | ) | | | | | | | — | | | | | | | | | | | | — | | | | | | | | | | | | — | | | | | | | | | | | | (17,116 | ) | | | | |
Accrued discount/premium | | | — | | | | | | | | — | | | | | | | | | | | | — | | | | | | | | | | | | — | | | | | | | | | | | | — | | | | | |
Transfers into Level 3* | | | — | | | | | | | | — | | | | | | | | | | | | — | | | | | | | | | | | | — | | | | | | | | | | | | — | | | | | |
Transfers out of Level 3* | | | — | | | | | | | | — | | | | | | | | | | | | — | | | | | | | | | | | | — | | | | | | | | | | | | — | | | | | |
| | | | | | | | | | | | | | | | | | | | | | | | | | | | | | | | | | | | | | | | | | | | | | | | | | | | |
| | | | | | | | | | | | | |
Balance as of 10/31/24 | | $ | 68,559 | | | | | | | $ | 633,000 | | | | | | | | | | | $ | 228 | | | | | | | | | | | $ | — | | | | | | | | | | | $ | — | | | | | |
| | | | | | | | | | | | | | | | | | | | | | | | | | | | | | | | | | | | | | | | | | | | | | | | | | | | |
| | | | | | | | | | | | | |
Change in unrealized appreciation (depreciation) relating to securities still held at reporting period end | | $ | 30,709 | | | | | | | $ | (6,330 | ) | | | | | | | | | | $ | (587 | ) | | | | | | | | | | $ | — | | | | | | | | | | | $ | — | | | | | |
| | | | | | | | | | | | | | | | | | | | | | | | | | | | | | | | | | | | | | | | | | | | | | | | | | | | |
| * | It is the Fund’s policy to recognize transfers in and transfers out at the securities’ fair values as of the beginning of period. Securities transferred between Level 2 and Level 3 are due to changes in the method utilized in valuing the investments. Transfers from Level 2 to Level 3 are typically a result of a change from the use of methods used by independent pricing services (Level 2) to the use of a single broker quote or valuation technique which utilizes significant unobservable inputs due to an absence of current or reliable market quotations (Level 3). Transfers from Level 3 to Level 2 are a result of the availability of current and reliable market data provided by independent pricing services or other valuation techniques which utilize observable inputs. In accordance with the requirements of ASC 820, the amounts of transfers into and out of Level 3, if material, are disclosed in the Notes to the Schedule of Investments of the Fund. |
See Notes to Financial Statements.
PGIM Global Total Return Fund 91
PGIM Global Total Return Fund
Schedule of Investments (continued)
as of October 31, 2024
Level 3 securities as presented in the table above are being fair valued using pricing methodologies approved by the Board, which contain unobservable inputs as follows:
| | | | | | | | | | | | | | | | | | | | | | | | | | | | |
Level 3 Securities** | | Fair Value as
of
October 31,
2024 | | | Valuation
Approach | | | Valuation
Methodology | | | Unobservable
Inputs | | | Inputs
(Range) | |
Asset-Backed Securities - Spain | | | | | | $ | 2,095,015 | | | | | | | | Market | | |
| Yield and
Spread |
| |
| Adjusted
Spread |
| | | 400 bps | |
Corporate Bonds - Jamaica | | | | | | | 32,240 | | | | | | | | Market | | | | Recovery Value | | | | Recovery Rate | | | | 0.68% - 100% | |
Common Stocks - Jamaica | | | | | | | 149,333 | | | | | | | | Market | | |
| Enterprise
Value |
| |
| EBITDA
Multiple |
| | | 4.0x | |
Common Stocks - United States | | | | | | | 485,466 | | | | | | | | Market | | |
| Adjusted Trade
Price |
| | | Premium Rate | | | | 20% | |
Preferred Stocks - Jamaica | | | | | | | 68,559 | | | | | | | | Market | | |
| Enterprise
Value |
| | | Recovery Rate | | | | 10.90% | |
Preferred Stocks - United States | | | | | | | 633,000 | | | | | | | | Market | | |
| Transaction
Based |
| |
| Unadjusted
Price |
| | | NA | |
| | | | | | | | | | | | | | | | | | | | | | | | | | | | |
| | | | | | | |
| | | | | | $ | 3,463,613 | | | | | | | | | | | | | | | | | | | | | |
| | | | | | | | | | | | | | | | | | | | | | | | | | | | |
| ** | The table does not include Level 3 securities and/or derivatives that are valued by independent pricing vendors or brokers. As of October 31, 2024, the aggregate value of these securities and/or derivatives was $28,428,165. The unobservable inputs for these investments were not developed by the Fund and are not readily available (e.g. single broker quotes). |
Industry Classification:
The industry classification of investments and liabilities in excess of other assets shown as a percentage of net assets as of October 31, 2024 were as follows:
| | | | |
Sovereign Bonds | | | 29.4 | % |
Banks | | | 14.0 | |
Collateralized Loan Obligations | | | 9.3 | |
U.S. Treasury Obligations | | | 6.1 | |
Electric | | | 4.8 | |
Commercial Mortgage-Backed Securities | | | 3.7 | |
Oil & Gas | | | 3.5 | |
Real Estate Investment Trusts (REITs) | | | 2.6 | |
Residential Mortgage-Backed Securities | | | 2.5 | |
Telecommunications | | | 2.2 | |
Diversified Financial Services | | | 1.9 | |
Affiliated Mutual Funds (1.5% represents investments purchased with collateral from securities on loan) | | | 1.7 | |
Insurance | | | 1.4 | |
Pipelines | | | 1.2 | |
Commercial Services | | | 1.2 | |
| | | | |
Real Estate | | | 1.1 | % |
Foods | | | 0.9 | |
Healthcare-Products | | | 0.8 | |
U.S. Government Agency Obligations | | | 0.7 | |
Retail | | | 0.7 | |
Home Builders | | | 0.7 | |
Electronics | | | 0.7 | |
Pharmaceuticals | | | 0.7 | |
Automobiles | | | 0.7 | |
Home Equity Loans | | | 0.6 | |
Transportation | | | 0.5 | |
Engineering & Construction | | | 0.5 | |
Media | | | 0.5 | |
Auto Manufacturers | | | 0.5 | |
Internet | | | 0.5 | |
Multi-National | | | 0.5 | |
Entertainment | | | 0.4 | |
See Notes to Financial Statements.
92
PGIM Global Total Return Fund
Schedule of Investments (continued)
as of October 31, 2024
Industry Classification (continued):
| | | | |
Agriculture | | | 0.4 | % |
Healthcare-Services | | | 0.4 | |
Credit Cards | | | 0.3 | |
Building Materials | | | 0.3 | |
Affiliated Exchange-Traded Fund | | | 0.3 | |
Office/Business Equipment | | | 0.3 | |
Semiconductors | | | 0.3 | |
Consumer Loans | | | 0.2 | |
Aerospace & Defense | | | 0.2 | |
Software | | | 0.2 | |
Auto Parts & Equipment | | | 0.2 | |
Municipal Bond | | | 0.2 | |
Airlines | | | 0.2 | |
Other | | | 0.2 | |
Oil, Gas & Consumable Fuels | | | 0.1 | |
Chemicals | | | 0.1 | |
Leisure Time | | | 0.1 | |
Packaging & Containers | | | 0.1 | |
Mining | | | 0.1 | |
Cosmetics/Personal Care | | | 0.1 | |
| | | | |
Student Loans | | | 0.1 | % |
Miscellaneous Manufacturing | | | 0.0 | * |
Iron/Steel | | | 0.0 | * |
Electronic Equipment, Instruments & Components | | | 0.0 | * |
Housewares | | | 0.0 | * |
Gas Utilities | | | 0.0 | * |
Options Purchased | | | 0.0 | * |
Wireless Telecommunication Services | | | 0.0 | * |
Forest Products & Paper | | | 0.0 | * |
Investment Companies | | | 0.0 | * |
| | | | |
| |
| | | 100.9 | |
Options Written | | | (0.0 | )* |
Liabilities in excess of other assets | | | (0.9 | ) |
| | | | |
| |
| | | 100.0 | % |
| | | | |
Effects of Derivative Instruments on the Financial Statements and Primary Underlying Risk Exposure:
The Fund invested in derivative instruments during the reporting period. The primary types of risk associated with these derivative instruments are credit risk, foreign exchange risk and interest rate risk. See the Notes to Financial Statements for additional detail regarding these derivative instruments and their risks. The effect of such derivative instruments on the Fund’s financial position and financial performance as reflected in the Statement of Assets and Liabilities and Statement of Operations is presented in the summary below.
Fair values of derivative instruments as of October 31, 2024 as presented in the Statement of Assets and Liabilities:
| | | | | | | | | | | | |
| | | Asset Derivatives | | | Liability Derivatives | |
Derivatives not accounted for as hedging instruments, carried at fair value | | Statement of Assets and Liabilities Location | | Fair
Value | | | Statement of Assets and Liabilities Location | | Fair
Value | |
| | | | |
Credit contracts | | Premiums paid for OTC swap agreements | | $ | 15,789,071 | | | Premiums received for OTC swap agreements | | $ | 9,614,961 | |
Credit contracts | | Unaffiliated investments | | | 75,262 | | | Options written outstanding, at value | | | 132,596 | |
Credit contracts | | Unrealized appreciation on OTC swap agreements | | | 9,820,665 | | | Unrealized depreciation on OTC swap agreements | | | 10,380,063 | |
See Notes to Financial Statements.
PGIM Global Total Return Fund 93
PGIM Global Total Return Fund
Schedule of Investments (continued)
as of October 31, 2024
| | | | | | | | | | | | |
| | | Asset Derivatives | | | Liability Derivatives | |
Derivatives not accounted for as hedging instruments, carried at fair value | | Statement of Assets and Liabilities Location | | Fair
Value | | | Statement of Assets and Liabilities Location | | Fair
Value | |
| | | | | | | | | | | |
| | | | |
Foreign exchange contracts | | Due from/to broker-variation margin futures | | $ | 4,139,327* | | | Due from/to broker-variation margin futures | | $ | 8,876,674* | |
Foreign exchange contracts | | Unrealized appreciation on OTC forward foreign currency exchange contracts | | | 2,034,077 | | | Unrealized depreciation on OTC forward foreign currency exchange contracts | | | 3,479,519 | |
Interest rate contracts | | Due from/to broker-variation margin futures | | | 4,058,971 | * | | Due from/to broker-variation margin futures | | | 3,065,110 | * |
Interest rate contracts | | Due from/to broker-variation margin swaps | | | 23,705,733 | * | | Due from/to broker-variation margin swaps | | | 100,834,715 | * |
Interest rate contracts | | Premiums paid for OTC swap agreements | | | 29 | | | Premiums received for OTC swap agreements | | | 465 | |
Interest rate contracts | | Unaffiliated investments | | | 298,782 | | | Options written outstanding, at value | | | 182,823 | |
Interest rate contracts | | Unrealized appreciation on OTC swap agreements | | | 2,549,506 | | | Unrealized depreciation on OTC swap agreements | | | 16,328,286 | |
| | | | | | | | | | | | |
| | | | |
| | | | $ | 62,471,423 | | | | | $ | 152,895,212 | |
| | | | | | | | | | | | |
| * | Includes cumulative appreciation (depreciation) as reported in the schedule of open futures and centrally cleared swap contracts. Only unsettled variation margin receivable (payable) is reported within the Statement of Assets and Liabilities. |
The effects of derivative instruments on the Statement of Operations for the year ended October 31, 2024 are as follows:
| | | | | | | | | | | | | | | | | | | | | | | | | | | | | | | | | | | | |
Amount of Realized Gain (Loss) on Derivatives Recognized in Income | |
| | | | | |
Derivatives not accounted for as hedging instruments, carried at fair value | | Options Purchased(1) | | | Options Written | | | Futures | | | Forward & Cross Currency Exchange Contracts | | | Swaps | |
| | | | | | | | | | | | | | | | | | | | | | | | | | | | |
| | | | | | | | | |
Credit contracts | | | | | | $ | (1,894,959 | ) | | | | | | $ | 5,452,432 | | | $ | — | | | | | | | $ | — | | | | | | | $ | (1,658,443 | ) |
Foreign exchange contracts | | | | | | | — | | | | | | | | — | | | | (14,285,720 | ) | | | | | | | (5,533,502 | ) | | | | | | | — | |
Interest rate contracts | | | | | | | 198,240 | | | | | | | | (105,639 | ) | | | (8,002,848 | ) | | | | | | | — | | | | | | | | (5,553,012 | ) |
| | | | | | | | | | | | | | | | | | | | | | | | | | | | | | | | | | | | |
| | | | | | | | | |
Total | | | | | | $ | (1,696,719 | ) | | | | | | $ | 5,346,793 | | | $ | (22,288,568 | ) | | | | | | $ | (5,533,502 | ) | | | | | | $ | (7,211,455 | ) |
| | | | | | | | | | | | | | | | | | | | | | | | | | | | | | | | | | | | |
| (1) | Included in net realized gain (loss) on investment transactions in the Statement of Operations. |
See Notes to Financial Statements.
94
PGIM Global Total Return Fund
Schedule of Investments (continued)
as of October 31, 2024
| | | | | | | | | | | | | | | | | | | | | | | | | | | | | | | | | | | | |
Change in Unrealized Appreciation (Depreciation) on Derivatives Recognized in Income | |
| | | | | |
Derivatives not accounted for as hedging instruments, carried at fair value | | Options Purchased(2) | | | Options Written | | | Futures | | | Forward & Cross Currency Exchange Contracts | | | Swaps | |
| | | | | | | | | | | | | | | | | | | | | | | | | | | | |
| | | | | | | | | |
Credit contracts | | | | | | $ | (11,738 | ) | | | | | | $ | 114,277 | | | $ | — | | | | | | | $ | — | | | | | | | $ | 1,565,918 | |
Foreign exchange contracts | | | | | | | — | | | | | | | | — | | | | (3,853,697 | ) | | | | | | | 4,362,184 | | | | | | | | — | |
Interest rate contracts | | | | | | | 111,599 | | | | | | | | 211,702 | | | | 8,495,732 | | | | | | | | — | | | | | | | | 24,692,814 | |
| | | | | | | | | | | | | | | | | | | | | | | | | | | | | | | | | | | | |
| | | | | | | | | |
Total | | | | | | $ | 99,861 | | | | | | | $ | 325,979 | | | $ | 4,642,035 | | | | | | | $ | 4,362,184 | | | | | | | $ | 26,258,732 | |
| | | | | | | | | | | | | | | | | | | | | | | | | | | | | | | | | | | | |
| (2) | Included in net change in unrealized appreciation (depreciation) on investments in the Statement of Operations. |
For the year ended October 31, 2024, the Fund’s average volume of derivative activities is as follows:
| | | | | |
| Derivative Contract Type | | Average Volume of Derivative Activities* |
| |
Options Purchased (1) | | | $ | 546,497 | |
Options Written (2) | | | | 500,122,068 | |
Futures Contracts - Long Positions (2) | | | | 767,656,211 | |
Futures Contracts - Short Positions (2) | | | | 915,269,528 | |
Forward Foreign Currency Exchange Contracts - Purchased (3) | | | | 428,800,277 | |
Forward Foreign Currency Exchange Contracts - Sold (3) | | | | 309,070,612 | |
Cross Currency Exchange Contracts (4) | | | | 2,868,496 | |
Interest Rate Swap Agreements (2) | | | | 4,404,953,610 | |
Credit Default Swap Agreements - Buy Protection (2) | | | | 434,599,499 | |
Credit Default Swap Agreements - Sell Protection (2) | | | | 634,499,000 | |
Currency Swap Agreements (2) | | | | 10,342,019 | |
Total Return Swap Agreements (2) | | | | 197,365,400 | |
Inflation Swap Agreements (2) | | | | 4,776,930 | |
| * | Average volume is based on average quarter end balances for the year ended October 31, 2024. |
| (2) | Notional Amount in USD. |
| (3) | Value at Settlement Date. |
Financial Instruments/Transactions—Summary of Offsetting and Netting Arrangements:
The Fund invested in OTC derivatives and entered into financial instruments/transactions during the reporting period that are either offset in accordance with current requirements or are subject to enforceable master netting arrangements or similar agreements that permit offsetting. The information about offsetting and related netting arrangements for OTC derivatives and financial instruments/transactions where the legal right to set-off exists is presented in the summary below.
Offsetting of financial instrument/transaction assets and liabilities:
See Notes to Financial Statements.
PGIM Global Total Return Fund 95
PGIM Global Total Return Fund
Schedule of Investments (continued)
as of October 31, 2024
| | | | | | | | |
| Description | | Gross Market Value of Recognized Assets/(Liabilities) | | | | Collateral Pledged/(Received)(2) | | Net Amount |
Securities on Loan | | $39,114,649 | | | | $(39,114,649) | | $— |
Offsetting of OTC derivative assets and liabilities:
| | | | | | | | | | | | | | | | | | | | | | | | | | | | | | | | | | | | | | | | | | | | | | | | | | | | | | | | | | | | |
Counterparty | | Gross Amounts of
Recognized
Assets(1) | | | Gross Amounts of
Recognized
Liabilities(1) | | | Net Amounts of Recognized Assets/(Liabilities) | | | Collateral Pledged/(Received)(2) | | | Net Amount | |
| | | | | | | | | | | | | | | |
BARC | | | | | | $ | 3,544,462 | | | | | | | | | | | $ | (2,068,484 | ) | | | | | | | | | | $ | 1,475,978 | | | | | | | | | | | $ | (1,475,978 | ) | | | | | | | | | | $ | — | | | | | |
BNP | | | | | | | 197,184 | | | | | | | | | | | | (214,407 | ) | | | | | | | | | | | (17,223 | ) | | | | | | | | | | | — | | | | | | | | | | | | (17,223 | ) | | | | |
BNYM | | | | | | | — | | | | | | | | | | | | (5,360 | ) | | | | | | | | | | | (5,360 | ) | | | | | | | | | | | — | | | | | | | | | | | | (5,360 | ) | | | | |
BOA | | | | | | | 224,053 | | | | | | | | | | | | (193,154 | ) | | | | | | | | | | | 30,899 | | | | | | | | | | | | (30,899 | ) | | | | | | | | | | | — | | | | | |
CITI | | | | | | | 2,233,601 | | | | | | | | | | | | (2,134,371 | ) | | | | | | | | | | | 99,230 | | | | | | | | | | | | (99,230 | ) | | | | | | | | | | | — | | | | | |
DB | | | | | | | 593,634 | | | | | | | | | | | | (143,083 | ) | | | | | | | | | | | 450,551 | | | | | | | | | | | | (393,981 | ) | | | | | | | | | | | 56,570 | | | | | |
GSI | | | | | | | 5,516,498 | | | | | | | | | | | | (4,507,710 | ) | | | | | | | | | | | 1,008,788 | | | | | | | | | | | | (1,000,000 | ) | | | | | | | | | | | 8,788 | | | | | |
HSBC | | | | | | | 4,445,039 | | | | | | | | | | | | (3,429,733 | ) | | | | | | | | | | | 1,015,306 | | | | | | | | | | | | (950,000 | ) | | | | | | | | | | | 65,306 | | | | | |
JPM | | | | | | | 1,991,798 | | | | | | | | | | | | (15,180,168 | ) | | | | | | | | | | | (13,188,370 | ) | | | | | | | | | | | 13,188,370 | | | | | | | | | | | | — | | | | | |
MSI | | | | | | | 10,736,651 | | | | | | | | | | | | (12,061,065 | ) | | | | | | | | | | | (1,324,414 | ) | | | | | | | | | | | 1,324,414 | | | | | | | | | | | | — | | | | | |
SCB | | | | | | | 285,611 | | | | | | | | | | | | (154,625 | ) | | | | | | | | | | | 130,986 | | | | | | | | | | | | — | | | | | | | | | | | | 130,986 | | | | | |
SSB | | | | | | | 798,861 | | | | | | | | | | | | (26,553 | ) | | | | | | | | | | | 772,308 | | | | | | | | | | | | (772,308 | ) | | | | | | | | | | | — | | | | | |
| | | | | | | | | | | | | | | | | | | | | | | | | | | | | | | | | | | | | | | | | | | | | | | | | | | | | | | | | | | | |
| | | | | | | | | | | | | | | |
| | | | | | $ | 30,567,392 | | | | | | | | | | | $ | (40,118,713 | ) | | | | | | | | | | $ | (9,551,321 | ) | | | | | | | | | | $ | 9,790,388 | | | | | | | | | | | $ | 239,067 | | | | | |
| | | | | | | | | | | | | | | | | | | | | | | | | | | | | | | | | | | | | | | | | | | | | | | | | | | | | | | | | | | | |
| (1) | Includes unrealized appreciation/(depreciation) on swaps and forwards, premiums paid/(received) on swap agreements and market value of purchased and written options, as represented on the Statement of Assets and Liabilities. |
| (2) | Collateral amount disclosed by the Fund is limited to the market value of financial instruments/transactions and the Fund’s OTC derivative exposure by counterparty. |
See Notes to Financial Statements.
96
PGIM Global Total Return Fund
Statement of Assets & Liabilities
as of October 31, 2024
| | | | |
Assets | | | | |
| |
Investments at value, including securities on loan of $39,114,649: | | | | |
Unaffiliated investments (cost $2,984,306,523) | | $ | 2,715,529,681 | |
Affiliated investments (cost $53,543,225) | | | 53,592,582 | |
Foreign currency, at value (cost $3,391,517) | | | 3,371,945 | |
Dividends and interest receivable | | | 31,403,829 | |
Premiums paid for OTC swap agreements | | | 15,789,100 | |
Unrealized appreciation on OTC swap agreements | | | 12,370,171 | |
Receivable for Fund shares sold | | | 5,085,559 | |
Due from broker—variation margin futures | | | 2,040,438 | |
Unrealized appreciation on OTC forward foreign currency exchange contracts | | | 2,034,077 | |
Receivable for investments sold | | | 1,073,804 | |
Due from broker—variation margin swaps | | | 381,974 | |
Tax reclaim receivable | | | 26,024 | |
Prepaid expenses | | | 24,805 | |
| | | | |
| |
Total Assets | | | 2,842,723,989 | |
| | | | |
| |
Liabilities | | | | |
| |
Payable to broker for collateral for securities on loan | | | 39,904,369 | |
Unrealized depreciation on OTC swap agreements | | | 26,708,349 | |
Premiums received for OTC swap agreements | | | 9,615,426 | |
Payable for investments purchased | | | 9,147,154 | |
Payable for Fund shares purchased | | | 8,232,810 | |
Unrealized depreciation on OTC forward foreign currency exchange contracts | | | 3,479,519 | |
Management fee payable | | | 1,195,485 | |
Accrued expenses and other liabilities | | | 867,321 | |
Dividends payable | | | 333,979 | |
Options written outstanding, at value (premiums received $293,193) | | | 315,419 | |
Distribution fee payable | | | 46,514 | |
Affiliated transfer agent fee payable | | | 23,628 | |
Directors’ fees payable | | | 3,014 | |
| | | | |
| |
Total Liabilities | | | 99,872,987 | |
| | | | |
| |
Net Assets | | $ | 2,742,851,002 | |
| | | | |
| | | | |
| |
Net assets were comprised of: | | | | |
Common stock, at par | | $ | 5,226,897 | |
Paid-in capital in excess of par | | | 3,952,989,813 | |
Total distributable earnings (loss) | | | (1,215,365,708 | ) |
| | | | |
| |
Net assets, October 31, 2024 | | $ | 2,742,851,002 | |
| | | | |
See Notes to Financial Statements.
PGIM Global Total Return Fund 97
PGIM Global Total Return Fund
Statement of Assets & Liabilities (continued)
as of October 31, 2024
| | | | | | | | |
Class A | | | | | | | | |
| | |
Net asset value and redemption price per share, ($163,150,023 ÷ 31,362,790 shares of common stock issued and outstanding) | | $ | 5.20 | | | | | |
Maximum sales charge (3.25% of offering price) | | | 0.17 | | | | | |
| | | | | | | | |
| | |
Maximum offering price to public | | $ | 5.37 | | | | | |
| | | | | | | | |
| | |
Class C | | | | | | | | |
| | |
Net asset value, offering price and redemption price per share, ($12,383,074 ÷ 2,385,158 shares of common stock issued and outstanding) | | $ | 5.19 | | | | | |
| | | | | | | | |
| | |
Class Z | | | | | | | | |
| | |
Net asset value, offering price and redemption price per share, ($996,286,848 ÷ 190,489,298 shares of common stock issued and outstanding) | | $ | 5.23 | | | | | |
| | | | | | | | |
| | |
Class R2 | | | | | | | | |
| | |
Net asset value, offering price and redemption price per share, ($3,509,728 ÷ 666,330 shares of common stock issued and outstanding) | | $ | 5.27 | | | | | |
| | | | | | | | |
| | |
Class R4 | | | | | | | | |
| | |
Net asset value, offering price and redemption price per share, ($13,178,400 ÷ 2,500,398 shares of common stock issued and outstanding) | | $ | 5.27 | | | | | |
| | | | | | | | |
| | |
Class R6 | | | | | | | | |
| | |
Net asset value, offering price and redemption price per share, ($1,554,342,929 ÷ 295,285,746 shares of common stock issued and outstanding) | | $ | 5.26 | | | | | |
| | | | | | | | |
See Notes to Financial Statements.
98
PGIM Global Total Return Fund
Statement of Operations
Year Ended October 31, 2024
| | | | |
Net Investment Income (Loss) | | | | |
| |
Income | | | | |
Interest income (net of $16,206 foreign withholding tax) | | $ | 117,608,859 | |
Affiliated dividend income | | | 3,433,890 | |
Affiliated income from securities lending, net | | | 152,659 | |
Unaffiliated dividend income | | | 101,778 | |
| | | | |
| |
Total income | | | 121,297,186 | |
| | | | |
| |
Expenses | | | | |
Management fee | | | 13,638,763 | |
Distribution fee(a) | | | 565,484 | |
Shareholder servicing fees(a) | | | 16,914 | |
Transfer agent’s fees and expenses (including affiliated expense of $145,582)(a) | | | 1,709,362 | |
Custodian and accounting fees | | | 211,348 | |
Shareholders’ reports | | | 206,193 | |
Registration fees(a) | | | 130,790 | |
Audit fee | | | 72,345 | |
Professional fees | | | 59,627 | |
Directors’ fees | | | 47,530 | |
Miscellaneous | | | 85,344 | |
| | | | |
| |
Total expenses | | | 16,743,700 | |
Less: Fee waiver and/or expense reimbursement(a) | | | (363,319 | ) |
| | | | |
| |
Net expenses | | | 16,380,381 | |
| | | | |
| |
Net investment income (loss) | | | 104,916,805 | |
| | | | |
| |
Realized And Unrealized Gain (Loss) On Investment And Foreign Currency Transactions | | | | |
| |
Net realized gain (loss) on: | | | | |
Investment transactions (including affiliated of $(9,545)) | | | (62,181,543 | ) |
Futures transactions | | | (22,288,568 | ) |
Forward and cross currency contract transactions | | | (5,533,502 | ) |
Options written transactions | | | 5,346,793 | |
Swap agreement transactions | | | (7,211,455 | ) |
Foreign currency transactions | | | (16,842,264 | ) |
| | | | |
| |
| | | (108,710,539 | ) |
| | | | |
| |
Net change in unrealized appreciation (depreciation) on: | | | | |
Investments (including affiliated of $30,373) | | | 313,169,276 | |
Futures | | | 4,642,035 | |
Forward and cross currency contracts | | | 4,362,184 | |
Options written | | | 325,979 | |
Swap agreements | | | 26,258,732 | |
Foreign currencies | | | (6,394,887 | ) |
| | | | |
| |
| | | 342,363,319 | |
| | | | |
| |
Net gain (loss) on investment and foreign currency transactions | | | 233,652,780 | |
| | | | |
| |
Net Increase (Decrease) In Net Assets Resulting From Operations | | $ | 338,569,585 | |
| | | | |
See Notes to Financial Statements.
PGIM Global Total Return Fund 99
PGIM Global Total Return Fund
Statement of Operations (continued)
Year Ended October 31, 2024
| (a) | Class specific expenses and waivers were as follows: |
| | | | | | | | | | | | | | | | | | | | | | | | |
| | | Class A | | | Class C | | | Class Z | | | Class R2 | | | Class R4 | | | Class R6 | |
Distribution fee | | | 413,681 | | | | 141,575 | | | | — | | | | 10,228 | | | | — | | | | — | |
Shareholder servicing fees | | | — | | | | — | | | | — | | | | 4,091 | | | | 12,823 | | | | — | |
Transfer agent’s fees and expenses | | | 272,261 | | | | 18,005 | | | | 1,289,612 | | | | 9,930 | | | | 21,129 | | | | 98,425 | |
Registration fees | | | 28,706 | | | | 19,763 | | | | 30,277 | | | | 8,112 | | | | 8,862 | | | | 35,070 | |
Fee waiver and/or expense reimbursement | | | (119,998) | | | | (22,362) | | | | (205,509) | | | | (9,496) | | | | (3,062) | | | | (2,892) | |
See Notes to Financial Statements.
100
PGIM Global Total Return Fund
Statements of Changes in Net Assets
| | | | | | | | |
| |
| | | Year Ended
October 31, | |
| | | 2024 | | | 2023 | |
Increase (Decrease) in Net Assets | | | | | | | | |
| | |
Operations | | | | | | | | |
Net investment income (loss) | | $ | 104,916,805 | | | $ | 110,191,979 | |
Net realized gain (loss) on investment and foreign currency transactions | | | (108,710,539 | ) | | | (325,788,411 | ) |
Net change in unrealized appreciation (depreciation) on investments and foreign currencies | | | 342,363,319 | | | | 445,423,585 | |
| | | | | | | | |
| | |
Net increase (decrease) in net assets resulting from operations | | | 338,569,585 | | | | 229,827,153 | |
| | | | | | | | |
| | |
Dividends and Distributions | | | | | | | | |
Distributions from distributable earnings | | | | | | | | |
Class A | | | (5,625,571 | ) | | | (2,591,039 | ) |
Class C | | | (376,500 | ) | | | (207,879 | ) |
Class Z | | | (37,060,982 | ) | | | (17,226,169 | ) |
Class R2 | | | (131,469 | ) | | | (63,272 | ) |
Class R4 | | | (440,800 | ) | | | (177,628 | ) |
Class R6 | | | (57,548,559 | ) | | | (25,701,554 | ) |
| | | | | | | | |
| | |
| | | (101,183,881 | ) | | | (45,967,541 | ) |
| | | | | | | | |
Tax return of capital distributions | | | | | | | | |
Class A | | | — | | | | (4,498,457 | ) |
Class C | | | — | | | | (360,910 | ) |
Class Z | | | — | | | | (29,907,380 | ) |
Class R2 | | | — | | | | (109,851 | ) |
Class R4 | | | — | | | | (308,391 | ) |
Class R6 | | | — | | | | (44,622,003 | ) |
| | | | | | | | |
| | |
| | | — | | | | (79,806,992 | ) |
| | | | | | | | |
| | |
Fund share transactions (Net of share conversions) | | | | | | | | |
Net proceeds from shares sold | | | 764,647,292 | | | | 798,034,832 | |
Net asset value of shares issued in reinvestment of dividends and distributions | | | 96,786,362 | | | | 120,225,775 | |
Cost of shares purchased | | | (1,020,525,267 | ) | | | (1,692,708,500 | ) |
| | | | | | | | |
| | |
Net increase (decrease) in net assets from Fund share transactions | | | (159,091,613 | ) | | | (774,447,893 | ) |
| | | | | | | | |
Total increase (decrease) | | | 78,294,091 | | | | (670,395,273 | ) |
| | |
Net Assets: | | | | | | | | |
| | |
Beginning of year | | | 2,664,556,911 | | | | 3,334,952,184 | |
| | | | | | | | |
| | |
End of year | | $ | 2,742,851,002 | | | $ | 2,664,556,911 | |
| | | | | | | | |
See Notes to Financial Statements.
PGIM Global Total Return Fund 101
PGIM Global Total Return Fund
Financial Highlights
| | | | | | | | | | | | | | | | | | | | |
| | | | | | |
Class A Shares | | | | | | | | | | | | | | | | | | | | |
| | | Year Ended October 31, | |
| | | | | | |
| | | 2024 | | | 2023 | | | 2022 | | | 2021 | | | 2020 | |
| | | | | | |
Per Share Operating Performance(a): | | | | | | | | | | | | | | | | | | | | |
Net Asset Value, Beginning of Year | | | $4.77 | | | | $4.67 | | | | $6.67 | | | | $6.96 | | | | $7.07 | |
Income (loss) from investment operations: | | | | | | | | | | | | | | | | | | | | |
Net investment income (loss) | | | 0.18 | | | | 0.17 | (b) | | | 0.13 | | | | 0.11 | | | | 0.13 | |
| Net realized and unrealized gain (loss) on investment and foreign currency transactions | | | 0.42 | | | | 0.13 | (c) | | | (1.91 | ) | | | (0.17 | ) | | | 0.16 | |
Total from investment operations | | | 0.60 | | | | 0.30 | | | | (1.78 | ) | | | (0.06 | ) | | | 0.29 | |
Less Dividends and Distributions: | | | | | | | | | | | | | | | | | | | | |
Dividends from net investment income* | | | (0.17 | ) | | | (0.07 | ) | | | (0.03 | ) | | | (0.23 | ) | | | (0.23 | ) |
Tax return of capital distributions | | | - | | | | (0.13 | ) | | | (0.19 | ) | | | - | | | | - | |
Distributions from net realized gains | | | - | | | | - | | | | - | | | | - | | | | (0.17 | ) |
Total dividends and distributions | | | (0.17 | ) | | | (0.20 | ) | | | (0.22 | ) | | | (0.23 | ) | | | (0.40 | ) |
Net asset value, end of year | | | $5.20 | | | | $4.77 | | | | $4.67 | | | | $6.67 | | | | $6.96 | |
Total Return(d): | | | 12.76 | % | | | 6.22 | % | | | (27.22 | )% | | | (0.97 | )% | | | 4.35 | % |
| |
| | | | | | |
Ratios/Supplemental Data: | | | | | | | | | | | | | | | | | | | | |
Net assets, end of year (000) | | | $163,150 | | | | $161,661 | | | | $185,414 | | | | $337,257 | | | | $326,416 | |
Average net assets (000) | | | $165,472 | | | | $180,957 | | | | $257,676 | | | | $344,592 | | | | $285,380 | |
Ratios to average net assets(e): | | | | | | | | | | | | | | | | | | | | |
Expenses after waivers and/or expense reimbursement | | | 0.88 | % | | | 0.89 | %(f) | | | 0.88 | % | | | 0.88 | % | | | 0.88 | % |
Expenses before waivers and/or expense reimbursement | | | 0.95 | % | | | 0.98 | % | | | 0.93 | % | | | 0.91 | % | | | 0.96 | % |
Net investment income (loss) | | | 3.54 | % | | | 3.40 | % | | | 2.29 | % | | | 1.58 | % | | | 1.94 | % |
Portfolio turnover rate(g) | | | 35 | % | | | 6 | % | | | 13 | % | | | 23 | % | | | 20 | % |
| * | Dividends from net investment income may include other items that are ordinary income for tax purposes. |
| (a) | Calculated based on average shares outstanding during the year. |
| (b) | The per share amount of net investment income (loss) does not directly correlate to the amounts reported in the Statement of Operations due to class specific expenses. |
| (c) | The per share amount of realized and unrealized gain (loss) on investments does not directly correlate to the amounts reported in the Statement of Operations due to the timing of portfolio share transactions in relation to fluctuating market values. |
| (d) | Total return does not consider the effects of sales loads. Total return is calculated assuming a purchase of a share on the first day and a sale on the last day of each year reported and includes reinvestment of dividends and distributions, if any. Total returns may reflect adjustments to conform to GAAP. |
| (e) | Does not include expenses of the underlying funds in which the Fund invests. |
| (f) | Includes interest expense on borrowings from the Syndicated Credit Agreement of 0.01% which are being excluded from the Fund’s contractual waiver, if applicable, for the year ended October 31, 2023. |
| (g) | The Fund’s portfolio turnover rate is calculated in accordance with regulatory requirements, without regard to transactions involving short-term investments, certain derivatives and in-kind transactions (if any). If such transactions were included, the Fund’s portfolio turnover rate may be higher. |
See Notes to Financial Statements.
102
PGIM Global Total Return Fund
Financial Highlights (continued)
| | | | | | | | | | | | | | | | | | | | |
| | | | | | |
Class C Shares | | | | | | | | | | | | | | | | | | | | |
| | | Year Ended October 31, | |
| | | | | | |
| | | 2024 | | | 2023 | | | 2022 | | | 2021 | | | 2020 | |
| | | | | | |
Per Share Operating Performance(a): | | | | | | | | | | | | | | | | | | | | |
Net Asset Value, Beginning of Year | | | $4.76 | | | | $4.66 | | | | $6.66 | | | | $6.95 | | | | $7.06 | |
Income (loss) from investment operations: | | | | | | | | | | | | | | | | | | | | |
Net investment income (loss) | | | 0.14 | | | | 0.13 | | | | 0.09 | | | | 0.06 | | | | 0.08 | |
| Net realized and unrealized gain (loss) on investment and foreign currency transactions | | | 0.43 | | | | 0.13 | | | | (1.90 | ) | | | (0.17 | ) | | | 0.16 | |
Total from investment operations | | | 0.57 | | | | 0.26 | | | | (1.81 | ) | | | (0.11 | ) | | | 0.24 | |
Less Dividends and Distributions: | | | | | | | | | | | | | | | | | | | | |
Dividends from net investment income* | | | (0.14 | ) | | | (0.03 | ) | | | - | | | | (0.18 | ) | | | (0.18 | ) |
Tax return of capital distributions | | | - | | | | (0.13 | ) | | | (0.19 | ) | | | - | | | | - | |
Distributions from net realized gains | | | - | | | | - | | | | - | | | | - | | | | (0.17 | ) |
Total dividends and distributions | | | (0.14 | ) | | | (0.16 | ) | | | (0.19 | ) | | | (0.18 | ) | | | (0.35 | ) |
Net asset value, end of year | | | $5.19 | | | | $4.76 | | | | $4.66 | | | | $6.66 | | | | $6.95 | |
Total Return(b): | | | 11.95 | % | | | 5.43 | % | | | (27.82 | )% | | | (1.72 | )% | | | 3.57 | % |
| |
| | | | | | |
Ratios/Supplemental Data: | | | | | | | | | | | | | | | | | | | | |
Net assets, end of year (000) | | | $12,383 | | | | $15,099 | | | | $19,422 | | | | $42,012 | | | | $46,157 | |
Average net assets (000) | | | $14,158 | | | | $17,962 | | | | $29,474 | | | | $45,988 | | | | $42,925 | |
Ratios to average net assets(c): | | | | | | | | | | | | | | | | | | | | |
Expenses after waivers and/or expense reimbursement | | | 1.63 | % | | | 1.64 | %(d) | | | 1.63 | % | | | 1.63 | % | | | 1.63 | % |
Expenses before waivers and/or expense reimbursement | | | 1.79 | % | | | 1.73 | % | | | 1.69 | % | | | 1.66 | % | | | 1.68 | % |
Net investment income (loss) | | | 2.79 | % | | | 2.65 | % | | | 1.51 | % | | | 0.83 | % | | | 1.20 | % |
Portfolio turnover rate(e) | | | 35 | % | | | 6 | % | | | 13 | % | | | 23 | % | | | 20 | % |
| * | Dividends from net investment income may include other items that are ordinary income for tax purposes. |
| (a) | Calculated based on average shares outstanding during the year. |
| (b) | Total return does not consider the effects of sales loads. Total return is calculated assuming a purchase of a share on the first day and a sale on the last day of each year reported and includes reinvestment of dividends and distributions, if any. Total returns may reflect adjustments to conform to GAAP. |
| (c) | Does not include expenses of the underlying funds in which the Fund invests. |
| (d) | Includes interest expense on borrowings from the Syndicated Credit Agreement of 0.01% which are being excluded from the Fund’s contractual waiver, if applicable, for the year ended October 31, 2023. |
| (e) | The Fund’s portfolio turnover rate is calculated in accordance with regulatory requirements, without regard to transactions involving short-term investments, certain derivatives and in-kind transactions (if any). If such transactions were included, the Fund’s portfolio turnover rate may be higher. |
See Notes to Financial Statements.
PGIM Global Total Return Fund 103
PGIM Global Total Return Fund
Financial Highlights (continued)
| | | | | | | | | | | | | | | | | | | | |
| | | | | | |
Class Z Shares | | | | | | | | | | | | | | | | | | | | |
| | | Year Ended October 31, | |
| | | | | | |
| | | 2024 | | | 2023 | | | 2022 | | | 2021 | | | 2020 | |
| | | | | | |
Per Share Operating Performance(a): | | | | | | | | | | | | | | | | | | | | |
Net Asset Value, Beginning of Year | | | $4.79 | | | | $4.69 | | | | $6.71 | | | | $7.00 | | | | $7.11 | |
Income (loss) from investment operations: | | | | | | | | | | | | | | | | | | | | |
Net investment income (loss) | | | 0.20 | | | | 0.18 | (b) | | | 0.15 | | | | 0.13 | | | | 0.15 | |
| Net realized and unrealized gain (loss) on investment and foreign currency transactions | | | 0.43 | | | | 0.13 | (c) | | | (1.94 | ) | | | (0.17 | ) | | | 0.16 | |
Total from investment operations | | | 0.63 | | | | 0.31 | | | | (1.79 | ) | | | (0.04 | ) | | | 0.31 | |
Less Dividends and Distributions: | | | | | | | | | | | | | | | | | | | | |
Dividends from net investment income* | | | (0.19 | ) | | | (0.08 | ) | | | (0.04 | ) | | | (0.25 | ) | | | (0.25 | ) |
Tax return of capital distributions | | | - | | | | (0.13 | ) | | | (0.19 | ) | | | - | | | | - | |
Distributions from net realized gains | | | - | | | | - | | | | - | | | | - | | | | (0.17 | ) |
Total dividends and distributions | | | (0.19 | ) | | | (0.21 | ) | | | (0.23 | ) | | | (0.25 | ) | | | (0.42 | ) |
Net asset value, end of year | | | $5.23 | | | | $4.79 | | | | $4.69 | | | | $6.71 | | | | $7.00 | |
Total Return(d): | | | 13.22 | % | | | 6.47 | % | | | (27.16 | )% | | | (0.70 | )% | | | 4.61 | % |
| |
| | | | | | |
Ratios/Supplemental Data: | | | | | | | | | | | | | | | | | | | | |
Net assets, end of year (000) | | | $996,287 | | | | $993,606 | | | | $1,303,382 | | | | $2,907,890 | | | | $2,264,938 | |
Average net assets (000) | | | $1,016,673 | | | | $1,131,695 | | | | $2,068,163 | | | | $2,809,784 | | | | $1,726,788 | |
Ratios to average net assets(e): | | | | | | | | | | | | | | | | | | | | |
Expenses after waivers and/or expense reimbursement | | | 0.63 | % | | | 0.64 | %(f) | | | 0.63 | % | | | 0.63 | % | | | 0.63 | % |
Expenses before waivers and/or expense reimbursement | | | 0.65 | % | | | 0.67 | % | | | 0.65 | % | | | 0.65 | % | | | 0.68 | % |
Net investment income (loss) | | | 3.78 | % | | | 3.65 | % | | | 2.51 | % | | | 1.82 | % | | | 2.18 | % |
Portfolio turnover rate(g) | | | 35 | % | | | 6 | % | | | 13 | % | | | 23 | % | | | 20 | % |
| * | Dividends from net investment income may include other items that are ordinary income for tax purposes. |
| (a) | Calculated based on average shares outstanding during the year. |
| (b) | The per share amount of net investment income (loss) does not directly correlate to the amounts reported in the Statement of Operations due to class specific expenses. |
| (c) | The per share amount of realized and unrealized gain (loss) on investments does not directly correlate to the amounts reported in the Statement of Operations due to the timing of portfolio share transactions in relation to fluctuating market values. |
| (d) | Total return is calculated assuming a purchase of a share on the first day and a sale on the last day of each year reported and includes reinvestment of dividends and distributions, if any. Total returns may reflect adjustments to conform to GAAP. |
| (e) | Does not include expenses of the underlying funds in which the Fund invests. |
| (f) | Includes interest expense on borrowings from the Syndicated Credit Agreement of 0.01% which are being excluded from the Fund’s contractual waiver, if applicable, for the year ended October 31, 2023. |
See Notes to Financial Statements.
104
PGIM Global Total Return Fund
Financial Highlights (continued)
| (g) | The Fund’s portfolio turnover rate is calculated in accordance with regulatory requirements, without regard to transactions involving short-term investments, certain derivatives and in-kind transactions (if any). If such transactions were included, the Fund’s portfolio turnover rate may be higher. |
See Notes to Financial Statements.
PGIM Global Total Return Fund 105
PGIM Global Total Return Fund
Financial Highlights (continued)
| | | | | | | | | | | | | | | | | | | | |
| | | | | | |
Class R2 Shares | | | | | | | | | | | | | | | | | | | | |
| | | Year Ended October 31, | |
| | | | | | |
| | | 2024 | | | 2023 | | | 2022 | | | 2021 | | | 2020 | |
| | | | | | |
Per Share Operating Performance(a): | | | | | | | | | | | | | | | | | | | | |
Net Asset Value, Beginning of Year | | | $4.83 | | | | $4.72 | | | | $6.76 | | | | $7.05 | | | | $7.16 | |
Income (loss) from investment operations: | | | | | | | | | | | | | | | | | | | | |
Net investment income (loss) | | | 0.17 | | | | 0.16 | (b) | | | 0.12 | | | | 0.10 | | | | 0.11 | |
| Net realized and unrealized gain (loss) on investment and foreign currency transactions | | | 0.44 | | | | 0.14 | (c) | | | (1.95 | ) | | | (0.17 | ) | | | 0.17 | |
Total from investment operations | | | 0.61 | | | | 0.30 | | | | (1.83 | ) | | | (0.07 | ) | | | 0.28 | |
Less Dividends and Distributions: | | | | | | | | | | | | | | | | | | | | |
Dividends from net investment income* | | | (0.17 | ) | | | (0.06 | ) | | | (0.02 | ) | | | (0.22 | ) | | | (0.22 | ) |
Tax return of capital distributions | | | - | | | | (0.13 | ) | | | (0.19 | ) | | | - | | | | - | |
Distributions from net realized gains | | | - | | | | - | | | | - | | | | - | | | | (0.17 | ) |
Total dividends and distributions | | | (0.17 | ) | | | (0.19 | ) | | | (0.21 | ) | | | (0.22 | ) | | | (0.39 | ) |
Net asset value, end of year | | | $5.27 | | | | $4.83 | | | | $4.72 | | | | $6.76 | | | | $7.05 | |
Total Return(d): | | | 12.64 | % | | | 6.20 | % | | | (27.57 | )% | | | (1.12 | )% | | | 4.13 | % |
| |
| | | | | | |
Ratios/Supplemental Data: | | | | | | | | | | | | | | | | | | | | |
Net assets, end of year (000) | | | $3,510 | | | | $4,393 | | | | $4,350 | | | | $9,324 | | | | $18,443 | |
Average net assets (000) | | | $4,091 | | | | $4,659 | | | | $6,242 | | | | $14,831 | | | | $9,990 | |
Ratios to average net assets(e): | | | | | | | | | | | | | | | | | | | | |
Expenses after waivers and/or expense reimbursement | | | 1.08 | % | | | 1.09 | %(f) | | | 1.08 | % | | | 1.08 | % | | | 1.08 | % |
Expenses before waivers and/or expense reimbursement | | | 1.31 | % | | | 1.26 | % | | | 1.29 | % | | | 1.13 | % | | | 1.25 | % |
Net investment income (loss) | | | 3.35 | % | | | 3.20 | % | | | 2.08 | % | | | 1.38 | % | | | 1.62 | % |
Portfolio turnover rate(g) | | | 35 | % | | | 6 | % | | | 13 | % | | | 23 | % | | | 20 | % |
| * | Dividends from net investment income may include other items that are ordinary income for tax purposes. |
| (a) | Calculated based on average shares outstanding during the year. |
| (b) | The per share amount of net investment income (loss) does not directly correlate to the amounts reported in the Statement of Operations due to class specific expenses. |
| (c) | The per share amount of realized and unrealized gain (loss) on investments does not directly correlate to the amounts reported in the Statement of Operations due to the timing of portfolio share transactions in relation to fluctuating market values. |
| (d) | Total return is calculated assuming a purchase of a share on the first day and a sale on the last day of each year reported and includes reinvestment of dividends and distributions, if any. Total returns may reflect adjustments to conform to GAAP. |
| (e) | Does not include expenses of the underlying funds in which the Fund invests. |
| (f) | Includes interest expense on borrowings from the Syndicated Credit Agreement of 0.01% which are being excluded from the Fund’s contractual waiver, if applicable, for the year ended October 31, 2023. |
| (g) | The Fund’s portfolio turnover rate is calculated in accordance with regulatory requirements, without regard to transactions involving short-term investments, certain derivatives and in-kind transactions (if any). If such transactions were included, the Fund’s portfolio turnover rate may be higher. |
See Notes to Financial Statements.
106
PGIM Global Total Return Fund
Financial Highlights (continued)
| | | | | | | | | | | | | | | | | | | | |
| | | | | | |
Class R4 Shares | | | | | | | | | | | | | | | | | | | | |
| | | Year Ended October 31, | |
| | | | | | |
| | | 2024 | | | 2023 | | | 2022 | | | 2021 | | | 2020 | |
| | | | | | |
Per Share Operating Performance(a): | | | | | | | | | | | | | | | | | | | | |
Net Asset Value, Beginning of Year | | | $4.83 | | | | $4.73 | | | | $6.76 | | | | $7.05 | | | | $7.16 | |
Income (loss) from investment operations: | | | | | | | | | | | | | | | | | | | | |
Net investment income (loss) | | | 0.19 | | | | 0.17 | (b) | | | 0.14 | | | | 0.11 | | | | 0.13 | |
| Net realized and unrealized gain (loss) on investment and foreign currency transactions | | | 0.43 | | | | 0.13 | (c) | | | (1.95 | ) | | | (0.17 | ) | | | 0.17 | |
Total from investment operations | | | 0.62 | | | | 0.30 | | | | (1.81 | ) | | | (0.06 | ) | | | 0.30 | |
Less Dividends and Distributions: | | | | | | | | | | | | | | | | | | | | |
Dividends from net investment income* | | | (0.18 | ) | | | (0.07 | ) | | | (0.03 | ) | | | (0.23 | ) | | | (0.24 | ) |
Tax return of capital distributions | | | - | | | | (0.13 | ) | | | (0.19 | ) | | | - | | | | - | |
Distributions from net realized gains | | | - | | | | - | | | | - | | | | - | | | | (0.17 | ) |
Total dividends and distributions | | | (0.18 | ) | | | (0.20 | ) | | | (0.22 | ) | | | (0.23 | ) | | | (0.41 | ) |
Net asset value, end of year | | | $5.27 | | | | $4.83 | | | | $4.73 | | | | $6.76 | | | | $7.05 | |
Total Return(d): | | | 12.92 | % | | | 6.24 | % | | | (27.24 | )% | | | (0.87 | )% | | | 4.39 | % |
| |
| | | | | | |
Ratios/Supplemental Data: | | | | | | | | | | | | | | | | | | | | |
Net assets, end of year (000) | | | $13,178 | | | | $11,582 | | | | $12,251 | | | | $14,654 | | | | $8,932 | |
Average net assets (000) | | | $12,822 | | | | $12,256 | | | | $14,017 | | | | $12,787 | | | | $5,178 | |
Ratios to average net assets(e): | | | | | | | | | | | | | | | | | | | | |
Expenses after waivers and/or expense reimbursement | | | 0.83 | % | | | 0.84 | %(f) | | | 0.83 | % | | | 0.83 | % | | | 0.83 | % |
Expenses before waivers and/or expense reimbursement | | | 0.85 | % | | | 0.86 | % | | | 0.86 | % | | | 0.87 | % | | | 1.13 | % |
Net investment income (loss) | | | 3.57 | % | | | 3.45 | % | | | 2.40 | % | | | 1.63 | % | | | 1.91 | % |
Portfolio turnover rate(g) | | | 35 | % | | | 6 | % | | | 13 | % | | | 23 | % | | | 20 | % |
| * | Dividends from net investment income may include other items that are ordinary income for tax purposes. |
| (a) | Calculated based on average shares outstanding during the year. |
| (b) | The per share amount of net investment income (loss) does not directly correlate to the amounts reported in the Statement of Operations due to class specific expenses. |
| (c) | The per share amount of realized and unrealized gain (loss) on investments does not directly correlate to the amounts reported in the Statement of Operations due to the timing of portfolio share transactions in relation to fluctuating market values. |
| (d) | Total return is calculated assuming a purchase of a share on the first day and a sale on the last day of each year reported and includes reinvestment of dividends and distributions, if any. Total returns may reflect adjustments to conform to GAAP. |
| (e) | Does not include expenses of the underlying funds in which the Fund invests. |
| (f) | Includes interest expense on borrowings from the Syndicated Credit Agreement of 0.01% which are being excluded from the Fund’s contractual waiver, if applicable, for the year ended October 31, 2023. |
| (g) | The Fund’s portfolio turnover rate is calculated in accordance with regulatory requirements, without regard to transactions involving short-term investments, certain derivatives and in-kind transactions (if any). If such transactions were included, the Fund’s portfolio turnover rate may be higher. |
See Notes to Financial Statements.
PGIM Global Total Return Fund 107
PGIM Global Total Return Fund
Financial Highlights (continued)
| | | | | | | | | | | | | | | | | | | | |
| | | | | | |
Class R6 Shares | | | | | | | | | | | | | | | | | | | | |
| | | Year Ended October 31, | |
| | | | | | |
| | | 2024 | | | 2023 | | | 2022 | | | 2021 | | | 2020 | |
| | | | | | |
Per Share Operating Performance(a): | | | | | | | | | | | | | | | | | | | | |
Net Asset Value, Beginning of Year | | | $4.82 | | | | $4.72 | | | | $6.75 | | | | $7.04 | | | | $7.16 | |
Income (loss) from investment operations: | | | | | | | | | | | | | | | | | | | | |
Net investment income (loss) | | | 0.20 | | | | 0.19 | (b) | | | 0.15 | | | | 0.14 | | | | 0.16 | |
| Net realized and unrealized gain (loss) on investment and foreign currency transactions | | | 0.43 | | | | 0.13 | (c) | | | (1.94 | ) | | | (0.17 | ) | | | 0.15 | |
Total from investment operations | | | 0.63 | | | | 0.32 | | | | (1.79 | ) | | | (0.03 | ) | | | 0.31 | |
Less Dividends and Distributions: | | | | | | | | | | | | | | | | | | | | |
Dividends from net investment income* | | | (0.19 | ) | | | (0.09 | ) | | | (0.05 | ) | | | (0.26 | ) | | | (0.26 | ) |
Tax return of capital distributions | | | - | | | | (0.13 | ) | | | (0.19 | ) | | | - | | | | - | |
Distributions from net realized gains | | | - | | | | - | | | | - | | | | - | | | | (0.17 | ) |
Total dividends and distributions | | | (0.19 | ) | | | (0.22 | ) | | | (0.24 | ) | | | (0.26 | ) | | | (0.43 | ) |
Net asset value, end of year | | | $5.26 | | | | $4.82 | | | | $4.72 | | | | $6.75 | | | | $7.04 | |
Total Return(d): | | | 13.28 | % | | | 6.56 | % | | | (27.06 | )% | | | (0.58 | )% | | | 4.69 | % |
| |
| | | | | | |
Ratios/Supplemental Data: | | | | | | | | | | | | | | | | | | | | |
| Net assets, end of year (000) | | | $1,554,343 | | | | $1,478,216 | | | | $1,810,132 | | | | $2,766,815 | | | | $1,787,693 | |
| Average net assets (000) | | | $1,537,044 | | | | $1,651,821 | | | | $2,351,483 | | | | $2,396,559 | | | | $1,513,154 | |
| Ratios to average net assets(e): | | | | | | | | | | | | | | | | | | | | |
| Expenses after waivers and/or expense reimbursement | | | 0.53 | % | | | 0.54 | %(f) | | | 0.53 | % | | | 0.52 | % | | | 0.55 | % |
| Expenses before waivers and/or expense reimbursement | | | 0.53 | % | | | 0.54 | % | | | 0.53 | % | | | 0.52 | % | | | 0.55 | % |
| Net investment income (loss) | | | 3.88 | % | | | 3.74 | % | | | 2.66 | % | | | 1.93 | % | | | 2.27 | % |
| Portfolio turnover rate(g) | | | 35 | % | | | 6 | % | | | 13 | % | | | 23 | % | | | 20 | % |
| * | Dividends from net investment income may include other items that are ordinary income for tax purposes. |
| (a) | Calculated based on average shares outstanding during the year. |
| (b) | The per share amount of net investment income (loss) does not directly correlate to the amounts reported in the Statement of Operations due to class specific expenses. |
| (c) | The per share amount of realized and unrealized gain (loss) on investments does not directly correlate to the amounts reported in the Statement of Operations due to the timing of portfolio share transactions in relation to fluctuating market values. |
| (d) | Total return is calculated assuming a purchase of a share on the first day and a sale on the last day of each year reported and includes reinvestment of dividends and distributions, if any. Total returns may reflect adjustments to conform to GAAP. |
| (e) | Does not include expenses of the underlying funds in which the Fund invests. |
| (f) | Includes interest expense on borrowings from the Syndicated Credit Agreement of 0.01% which are being excluded from the Fund’s contractual waiver, if applicable, for the year ended October 31, 2023. |
See Notes to Financial Statements.
108
PGIM Global Total Return Fund
Financial Highlights (continued)
| (g) | The Fund’s portfolio turnover rate is calculated in accordance with regulatory requirements, without regard to transactions involving short-term investments, certain derivatives and in-kind transactions (if any). If such transactions were included, the Fund’s portfolio turnover rate may be higher. |
See Notes to Financial Statements.
PGIM Global Total Return Fund 109
PGIM Global Total Return (USD Hedged) Fund
Schedule of Investments
as of October 31, 2024
| | | | | | | | | | | | | | | | |
| | | | |
| Description | | Interest Rate | | Maturity
Date | | Principal Amount (000)# | | | Value | |
| | | | | |
LONG-TERM INVESTMENTS 96.0% | | | | | | | | | | | | | | | | |
| | | | | |
ASSET-BACKED SECURITIES 11.2% | | | | | | | | | | | | | | | | |
| | | | | |
Cayman Islands 3.6% | | | | | | | | | | | | | | | | |
| | | | | |
Battalion CLO Ltd., | | | | | | | | | | | | | | | | |
Series 2018-12A, Class A1, 144A, 3 Month SOFR + 1.332% (Cap N/A, Floor 1.070%) | | 6.433%(c) | | 05/17/31 | | | | | | | 193 | | | $ | 193,318 | |
Broad River BSL Funding CLO Ltd., | | | | | | | | | | | | | | | | |
Series 2020-01A, Class AR, 144A, 3 Month SOFR + 1.432% (Cap N/A, Floor 1.170%) | | 6.049(c) | | 07/20/34 | | | | | | | 250 | | | | 250,325 | |
Carlyle CLO Ltd., | | | | | | | | | | | | | | | | |
Series C17A, Class A1AR, 144A, 3 Month SOFR + 1.292% (Cap N/A, Floor 0.000%) | | 5.881(c) | | 04/30/31 | | | | | | | 122 | | | | 121,616 | |
Carlyle Global Market Strategies CLO Ltd., | | | | | | | | | | | | | | | | |
Series 2014-01A, Class A1R2, 144A, 3 Month SOFR + 1.232% (Cap N/A, Floor 0.970%) | | 5.879(c) | | 04/17/31 | | | | | | | 110 | | | | 110,576 | |
Greenwood Park CLO Ltd., | | | | | | | | | | | | | | | | |
Series 2018-01A, Class A2, 144A, 3 Month SOFR + 1.272% (Cap N/A, Floor 0.000%) | | 5.928(c) | | 04/15/31 | | | | | | | 117 | | | | 117,326 | |
MidOcean Credit CLO, | | | | | | | | | | | | | | | | |
Series 2018-08A, Class B, 144A, 3 Month SOFR + 1.912% (Cap N/A, Floor 0.000%) | | 7.040(c) | | 02/20/31 | | | | | | | 250 | | | | 250,000 | |
TCW CLO Ltd., | | | | | | | | | | | | | | | | |
Series 2017-01A, Class A1RR, 144A, 3 Month SOFR + 1.442% (Cap N/A, Floor 1.180%) | | 6.046(c) | | 10/29/34 | | | | | | | 250 | | | | 250,493 | |
Telos CLO Ltd., | | | | | | | | | | | | | | | | |
Series 2013-04A, Class AR, 144A, 3 Month SOFR + 1.502% (Cap N/A, Floor 0.000%) | | 6.149(c) | | 01/17/30 | | | | | | | 28 | | | | 28,056 | |
Voya CLO Ltd., | | | | | | | | | | | | | | | | |
Series 2013-02A, Class A1R, 144A, 3 Month SOFR + 1.232% (Cap N/A, Floor 0.970%) | | 5.857(c) | | 04/25/31 | | | | | | | 97 | | | | 96,527 | |
Wind River CLO Ltd., | | | | | | | | | | | | | | | | |
Series 2016-01KRA, Class A1R2, 144A, 3 Month SOFR + 1.472% (Cap N/A, Floor 1.210%) | | 6.128(c) | | 10/15/34 | | | | | | | 250 | | | | 250,202 | |
| | | | | | | | | | | | | | | | |
| | | | | |
| | | | | | | | | | | | | | | 1,668,439 | |
| | | | | |
Ireland 2.8% | | | | | | | | | | | | | | | | |
| | | | | |
Ares European CLO DAC, | | | | | | | | | | | | | | | | |
Series 11A, Class B2R, 144A | | 1.950 | | 04/15/32 | | | EUR | | | | 500 | | | | 510,241 | |
See Notes to Financial Statements.
110
PGIM Global Total Return (USD Hedged) Fund
Schedule of Investments (continued)
as of October 31, 2024
| | | | | | | | | | | | | | | | |
| | | | |
| Description | | Interest Rate | | Maturity
Date | | Principal Amount (000)# | | | Value | |
| | | | | |
ASSET-BACKED SECURITIES (Continued) | | | | | | | | | | | | | | | | |
| | | | | |
Ireland (cont’d.) | | | | | | | | | | | | | | | | |
| | | | | |
Carlyle Euro CLO DAC, | | | | | | | | | | | | | | | | |
Series 2021-02A, Class A1, 144A, 3 Month EURIBOR + 0.990% (Cap N/A, Floor 0.990%) | | 4.174%(c) | | 10/15/35 | | | EUR | | | | 300 | | | $ | 325,503 | |
Carlyle Global Market Strategies Euro CLO Ltd., | | | | | | | | | | | | | | | | |
Series 2014-02A, Class AR1, 144A, 3 Month EURIBOR + 0.750% (Cap N/A, Floor 0.750%) | | 4.292(c) | | 11/15/31 | | | EUR | | | | 426 | | | | 461,719 | |
| | | | | | | | | | | | | | | | |
| | | | | |
| | | | | | | | | | | | | | | 1,297,463 | |
| | | | | |
Spain 0.1% | | | | | | | | | | | | | | | | |
| | | | | |
TFS, | | | | | | | | | | | | | | | | |
Series 2018-03, Class A1^ | | 0.000(s) | | 04/16/40 | | | EUR | | | | —(r | ) | | | 1 | |
Series 2018-03, Class A1, 1 Month EURIBOR + 3.250%^ | | 6.856(c) | | 03/15/26 | | | EUR | | | | 42 | | | | 35,210 | |
| | | | | | | | | | | | | | | | |
| | | | | |
| | | | | | | | | | | | | | | 35,211 | |
| | | | | |
United States 4.7% | | | | | | | | | | | | | | | | |
| | | | | |
Avis Budget Rental Car Funding AESOP LLC, | | | | | | | | | | | | | | | | |
Series 2022-05A, Class C, 144A | | 6.240 | | 04/20/27 | | | | | | | 100 | | | | 100,339 | |
Series 2023-02A, Class C, 144A | | 6.180 | | 10/20/27 | | | | | | | 100 | | | | 100,093 | |
Chase Auto Owner Trust, | | | | | | | | | | | | | | | | |
Series 2022-AA, Class D, 144A | | 5.400 | | 06/25/30 | | | | | | | 200 | | | | 199,654 | |
Enterprise Fleet Financing LLC, | | | | | | | | | | | | | | | | |
Series 2023-02, Class A2, 144A | | 5.560 | | 04/22/30 | | | | | | | 146 | | | | 147,441 | |
Exeter Automobile Receivables Trust, | | | | | | | | | | | | | | | | |
Series 2021-03A, Class D | | 1.550 | | 06/15/27 | | | | | | | 100 | | | | 97,118 | |
Ford Credit Auto Owner Trust, | | | | | | | | | | | | | | | | |
Series 2023-02, Class D, 144A | | 6.600 | | 02/15/36 | | | | | | | 100 | | | | 101,815 | |
Ford Credit Floorplan Master Owner Trust, | | | | | | | | | | | | | | | | |
Series 2023-01, Class A1, 144A | | 4.920 | | 05/15/28 | | | | | | | 200 | | | | 200,692 | |
JPMorgan Mortgage Trust, | | | | | | | | | | | | | | | | |
Series 2023-HE02, Class A1, 144A, 30 Day Average SOFR + 1.700% (Cap N/A, Floor 0.000%) | | 6.590(c) | | 03/20/54 | | | | | | | 16 | | | | 16,535 | |
Mariner Finance Issuance Trust, | | | | | | | | | | | | | | | | |
Series 2020-AA, Class A, 144A | | 2.190 | | 08/21/34 | | | | | | | 1 | | | | 1,311 | |
OneMain Direct Auto Receivables Trust, | | | | | | | | | | | | | | | | |
Series 2019-01A, Class A, 144A | | 3.630 | | 09/14/27 | | | | | | | 49 | | | | 49,042 | |
Series 2019-01A, Class D, 144A | | 4.680 | | 04/14/31 | | | | | | | 100 | | | | 98,376 | |
See Notes to Financial Statements.
PGIM Global Total Return (USD Hedged) Fund 111
PGIM Global Total Return (USD Hedged) Fund
Schedule of Investments (continued)
as of October 31, 2024
| | | | | | | | | | | | | | | | |
| | | | |
| Description | | Interest Rate | | Maturity
Date | | Principal Amount (000)# | | | Value | |
| | | | | |
ASSET-BACKED SECURITIES (Continued) | | | | | | | | | | | | | | | | |
| | | | | |
United States (cont’d.) | | | | | | | | | | | | | | | | |
| | | | | |
OneMain Direct Auto Receivables Trust, (cont’d.) | | | | | | | | | | | | | | | | |
Series 2023-01A, Class D, 144A | | 7.070% | | 02/14/33 | | | | | | | 200 | | | $ | 206,036 | |
OneMain Financial Issuance Trust, | | | | | | | | | | | | | | | | |
Series 2023-02A, Class C, 144A | | 6.740 | | 09/15/36 | | | | | | | 100 | | | | 103,161 | |
Series 2023-02A, Class D, 144A | | 7.520 | | 09/15/36 | | | | | | | 100 | | | | 103,689 | |
RCKT Mortgage Trust, | | | | | | | | | | | | | | | | |
Series 2024-CES06, Class A1A, 144A | | 5.344 | | 09/25/44 | | | | | | | 294 | | | | 290,814 | |
Regional Management Issuance Trust, | | | | | | | | | | | | | | | | |
Series 2022-01, Class A, 144A | | 3.070 | | 03/15/32 | | | | | | | 100 | | | | 98,135 | |
Santander Drive Auto Receivables Trust, | | | | | | | | | | | | | | | | |
Series 2022-06, Class C | | 4.960 | | 11/15/28 | | | | | | | 100 | | | | 100,124 | |
Towd Point Mortgage Trust, | | | | | | | | | | | | | | | | |
Series 2024-CES01, Class A1A, 144A | | 5.848(cc) | | 01/25/64 | | | | | | | 86 | | | | 85,722 | |
Series 2024-CES02, Class A1A, 144A | | 6.125(cc) | | 02/25/64 | | | | | | | 87 | | | | 86,870 | |
| | | | | | | | | | | | | | | | |
| | | | | |
| | | | | | | | | | | | | | | 2,186,967 | |
| | | | | | | | | | | | | | | | |
TOTAL ASSET-BACKED SECURITIES
(cost $5,366,873) | | | | | | | | | | | | | | | 5,188,080 | |
| | | | | | | | | | | | | | | | |
| | | | | |
COMMERCIAL MORTGAGE-BACKED SECURITIES 7.4% | | | | | | | | | | | | | | | | |
| | | | | |
Canada 0.0% | | | | | | | | | | | | | | | | |
| | | | | |
Real Estate Asset Liquidity Trust, | | | | | | | | | | | | | | | | |
Series 2020-01A, Class A1, 144A | | 2.381(cc) | | 02/12/55 | | | CAD | | | | 14 | | | | 9,858 | |
| | | | | | | | | | | | | | | | |
| | | | | |
Ireland 0.2% | | | | | | | | | | | | | | | | |
| | | | | |
Last Mile Logistics Pan Euro Finance DAC, | | | | | | | | | | | | | | | | |
Series 01A, Class D, 144A, 3 Month EURIBOR + | | | | | | | | | | | | | | | | |
1.900% (Cap N/A, Floor 1.900%) | | 5.449(c) | | 08/17/33 | | | EUR | | | | 98 | | | | 106,024 | |
| | | | | | | | | | | | | | | | |
| | | | | |
United Kingdom 0.7% | | | | | | | | | | | | | | | | |
| | | | | |
Deco DAC, | | | | | | | | | | | | | | | | |
Series 2019-RAM, Class B, SONIA + 3.607% | | | | | | | | | | | | | | | | |
(Cap N/A, Floor 3.607%) | | 8.590(c) | | 08/07/30 | | | GBP | | | | 139 | | | | 174,267 | |
See Notes to Financial Statements.
112
PGIM Global Total Return (USD Hedged) Fund
Schedule of Investments (continued)
as of October 31, 2024
| | | | | | | | | | | | | | | | |
| | | | |
| Description | | Interest Rate | | Maturity
Date | | Principal Amount (000)# | | | Value | |
| | | |
COMMERCIAL MORTGAGE-BACKED SECURITIES (Continued) | | | | | | | | | | | | |
| | | | | |
United Kingdom (cont’d.) | | | | | | | | | | | | | | | | |
| | | | | |
Taurus DAC, | | | | | | | | | | | | | | | | |
Series 2021-UK04A, Class C, 144A, SONIA + | | | | | | | | | | | | | | | | |
1.750% (Cap N/A, Floor 1.750%) | | 6.730%(c) | | 08/17/31 | | | GBP | | | | 59 | | | $ | 75,865 | |
Series 2021-UK04A, Class D, 144A, SONIA + | | | | | | | | | | | | | | | | |
2.100% (Cap N/A, Floor 2.100%) | | 7.080(c) | | 08/17/31 | | | GBP | | | | 64 | | | | 81,673 | |
| | | | | | | | | | | | | | | | |
| | | | | |
| | | | | | | | | | | | | | | 331,805 | |
| | | | | |
United States 6.5% | | | | | | | | | | | | | | | | |
| | | | | |
BANK, | | | | | | | | | | | | | | | | |
Series 2018-BN10, Class A4 | | 3.428 | | 02/15/61 | | | | | | | 237 | | | | 226,207 | |
Series 2020-BN26, Class A3 | | 2.155 | | 03/15/63 | | | | | | | 200 | | | | 173,199 | |
Barclays Commercial Mortgage Securities Trust, | | | | | | | | | | | | | | | | |
Series 2018-CHRS, Class C, 144A | | 4.267(cc) | | 08/05/38 | | | | | | | 130 | | | | 115,400 | |
Benchmark Mortgage Trust, | | | | | | | | | | | | | | | | |
Series 2018-B02, Class A3 | | 3.544 | | 02/15/51 | | | | | | | 200 | | | | 192,433 | |
Series 2020-B17, Class A4 | | 2.042 | | 03/15/53 | | | | | | | 75 | | | | 63,904 | |
Series 2020-B20, Class A3 | | 1.945 | | 10/15/53 | | | | | | | 100 | | | | 88,412 | |
BX Commercial Mortgage Trust, | | | | | | | | | | | | | | | | |
Series 2022-AHP, Class E, 144A, 1 Month SOFR + | | | | | | | | | | | | | | | | |
3.040% (Cap N/A, Floor 3.040%) | | 7.844(c) | | 01/17/39 | | | | | | | 125 | | | | 117,656 | |
Series 2024-PURE, Class A, 144A, CORRA + | | | | | | | | | | | | | | | | |
1.900% (Cap N/A, Floor 1.900%) | | 5.856(c) | | 11/15/29 | | | CAD | | | | 200 | | | | 143,676 | |
BX Trust, | | | | | | | | | | | | | | | | |
Series 2022-LBA06, Class E, 144A, 1 Month | | | | | | | | | | | | | | | | |
SOFR + 2.700% (Cap N/A, Floor 2.700%) | | 7.486(c) | | 01/15/39 | | | | | | | 125 | | | | 123,281 | |
Citigroup Commercial Mortgage Trust, | | | | | | | | | | | | | | | | |
Series 2018-B02, Class A3 | | 3.744 | | 03/10/51 | | | | | | | 150 | | | | 145,134 | |
Commercial Mortgage Trust, | | | | | | | | | | | | | | | | |
Series 2014-UBS04, Class A5 | | 3.694 | | 08/10/47 | | | | | | | 98 | | | | 97,468 | |
FHLMC Multifamily Structured Pass-Through Certificates, | | | | | | | | | | | | | | | | |
Series K052, Class X1, IO | | 0.617(cc) | | 11/25/25 | | | | | | | 1,934 | | | | 10,040 | |
Series K111, Class X1, IO | | 1.569(cc) | | 05/25/30 | | | | | | | 317 | | | | 22,086 | |
Series K113, Class X1, IO | | 1.379(cc) | | 06/25/30 | | | | | | | 911 | | | | 55,984 | |
Series KG03, Class X1, IO | | 1.372(cc) | | 06/25/30 | | | | | | | 1,040 | | | | 62,206 | |
GS Mortgage Securities Trust, | | | | | | | | | | | | | | | | |
Series 2018-GS09, Class A3 | | 3.727 | | 03/10/51 | | | | | | | 121 | | | | 116,126 | |
See Notes to Financial Statements.
PGIM Global Total Return (USD Hedged) Fund 113
PGIM Global Total Return (USD Hedged) Fund
Schedule of Investments (continued)
as of October 31, 2024
| | | | | | | | | | | | | | | | |
| | | | |
| Description | | Interest Rate | | Maturity
Date | | Principal Amount (000)# | | | Value | |
| | | |
COMMERCIAL MORTGAGE-BACKED SECURITIES (Continued) | | | | | | | | | | | | |
| | | | | |
United States (cont’d.) | | | | | | | | | | | | | | | | |
| | | | | |
ONE Mortgage Trust, | | | | | | | | | | | | | | | | |
Series 2021-PARK, Class D, 144A, 1 Month SOFR + 1.614% (Cap N/A, Floor 1.500%) | | 6.418%(c) | | 03/15/36 | | | | | | | 100 | | | $ | 95,320 | |
UBS Commercial Mortgage Trust, | | | | | | | | | | | | | | | | |
Series 2018-C08, Class A3 | | 3.720 | | 02/15/51 | | | | | | | 200 | | | | 192,765 | |
Wells Fargo Commercial Mortgage Trust, | | | | | | | | | | | | | | | | |
Series 2016-LC24, Class A3 | | 2.684 | | 10/15/49 | | | | | | | 213 | | | | 206,294 | |
Series 2021-C59, Class A3 | | 1.958 | | 04/15/54 | | | | | | | 600 | | | | 517,286 | |
Series 2021-FCMT, Class C, 144A, 1 Month SOFR + 2.514% (Cap N/A, Floor 2.400%) | | 7.318(c) | | 05/15/31 | | | | | | | 100 | | | | 96,750 | |
Series 2021-FCMT, Class E, 144A, 1 Month SOFR + 4.614% (Cap N/A, Floor 4.500%) | | 9.418(c) | | 05/15/31 | | | | | | | 125 | | | | 119,063 | |
| | | | | | | | | | | | | | | | |
| | | | | |
| | | | | | | | | | | | | | | 2,980,690 | |
| | | | | | | | | | | | | | | | |
| | | | | |
TOTAL COMMERCIAL MORTGAGE-BACKED SECURITIES (cost $3,669,826) | | | | | | | | | | | | | | | 3,428,377 | |
| | | | | | | | | | | | | | | | |
| | | | | |
CORPORATE BONDS 42.3% | | | | | | | | | | | | | | | | |
| | | | | |
Brazil 0.5% | | | | | | | | | | | | | | | | |
| | | | | |
Petrobras Global Finance BV, | | | | | | | | | | | | | | | | |
Gtd. Notes | | 5.375 | | 10/01/29 | | | GBP | | | | 100 | | | | 123,069 | |
Gtd. Notes | | 6.625 | | 01/16/34 | | | GBP | | | | 100 | | | | 125,451 | |
| | | | | | | | | | | | | | | | |
| | | | | |
| | | | | | | | | | | | | | | 248,520 | |
| | | | | |
Bulgaria 0.4% | | | | | | | | | | | | | | | | |
| | | | | |
Bulgarian Energy Holding EAD, | | | | | | | | | | | | | | | | |
Sr. Unsec’d. Notes | | 2.450 | | 07/22/28 | | | EUR | | | | 200 | | | | 201,212 | |
| | | | | |
Canada 1.4% | | | | | | | | | | | | | | | | |
| | | | | |
Bombardier, Inc., | | | | | | | | | | | | | | | | |
Sr. Unsec’d. Notes, 144A | | 7.125 | | 06/15/26 | | | | | | | 6 | | | | 6,068 | |
Sr. Unsec’d. Notes, 144A | | 7.500 | | 02/01/29 | | | | | | | 20 | | | | 20,816 | |
Brookfield Residential Properties, Inc./Brookfield Residential US LLC, | | | | | | | | | | | | | | | | |
Gtd. Notes, 144A | | 4.875 | | 02/15/30 | | | | | | | 35 | | | | 32,462 | |
Cenovus Energy, Inc., | | | | | | | | | | | | | | | | |
Sr. Unsec’d. Notes | | 2.650 | | 01/15/32 | | | | | | | 15 | | | | 12,549 | |
See Notes to Financial Statements.
114
PGIM Global Total Return (USD Hedged) Fund
Schedule of Investments (continued)
as of October 31, 2024
| | | | | | | | | | | | | | | | |
| | | | |
| Description | | Interest Rate | | Maturity
Date | | Principal Amount (000)# | | | Value | |
| | | | | |
CORPORATE BONDS (Continued) | | | | | | | | | | | | | | | | |
| | | | | |
Canada (cont’d.) | | | | | | | | | | | | | | | | |
| | | | | |
Cenovus Energy, Inc., (cont’d.) | | | | | | | | | | | | | | | | |
Sr. Unsec’d. Notes | | 3.750% | | 02/15/52 | | | | | | | 10 | | | $ | 7,099 | |
Fairfax Financial Holdings Ltd., | | | | | | | | | | | | | | | | |
Sr. Unsec’d. Notes | | 5.625 | | 08/16/32 | | | | | | | 200 | | | | 203,016 | |
Mattamy Group Corp., | | | | | | | | | | | | | | | | |
Sr. Unsec’d. Notes, 144A | | 4.625 | | 03/01/30 | | | | | | | 25 | | | | 23,346 | |
Ontario Teachers’ Cadillac Fairview Properties Trust, | | | | | | | | | | | | | | | | |
Sr. Unsec’d. Notes, 144A | | 3.875 | | 03/20/27 | | | | | | | 300 | | | | 293,287 | |
Rogers Communications, Inc., | | | | | | | | | | | | | | | | |
Gtd. Notes | | 5.000 | | 02/15/29 | | | | | | | 40 | | | | 40,006 | |
| | | | | | | | | | | | | | | | |
| | | | | |
| | | | | | | | | | | | | | | 638,649 | |
| | | | | |
China 0.1% | | | | | | | | | | | | | | | | |
| | | | | |
Aircraft Finance Co. Ltd., | | | | | | | | | | | | | | | | |
Sr. Sec’d. Notes, Series B | | 4.100 | | 03/29/26 | | | | | | | 31 | | | | 30,248 | |
| | | | | |
France 4.5% | | | | | | | | | | | | | | | | |
| | | | | |
Ayvens SA, | | | | | | | | | | | | | | | | |
Sr. Preferred Notes | | 3.875 | | 01/24/28 | | | EUR | | | | 200 | | | | 221,443 | |
BNP Paribas SA, | | | | | | | | | | | | | | | | |
Sr. Non-Preferred Notes, 144A | | 2.159(ff) | | 09/15/29 | | | | | | | 200 | | | | 179,182 | |
Sr. Non-Preferred Notes, 144A | | 2.871(ff) | | 04/19/32 | | | | | | | 200 | | | | 173,370 | |
Sub. Notes, EMTN | | 2.500(ff) | | 03/31/32 | | | EUR | | | | 200 | | | | 211,006 | |
BPCE SA, | | | | | | | | | | | | | | | | |
Sr. Non-Preferred Notes, 144A | | 2.045(ff) | | 10/19/27 | | | | | | | 250 | | | | 235,530 | |
Sr. Preferred Notes, EMTN | | 3.610 | | 01/25/29 | | | CNH | | | | 1,000 | | | | 142,574 | |
La Poste SA, | | | | | | | | | | | | | | | | |
Sr. Unsec’d. Notes, EMTN | | 1.375 | | 04/21/32 | | | EUR | | | | 200 | | | | 188,754 | |
Regie Autonome des Transports Parisiens EPIC, | | | | | | | | | | | | | | | | |
Sr. Unsec’d. Notes, EMTN | | 0.400 | | 12/19/36 | | | EUR | | | | 48 | | | | 43,115 | |
SNCF Reseau, | | | | | | | | | | | | | | | | |
Sr. Unsec’d. Notes, Series MPLE | | 4.700 | | 06/01/35 | | | CAD | | | | 100 | | | | 74,945 | |
Societe Generale SA, | | | | | | | | | | | | | | | | |
Gtd. Notes, 144A | | 2.797(ff) | | 01/19/28 | | | | | | | 200 | | | | 189,219 | |
Sr. Non-Preferred Notes, 144A | | 1.488(ff) | | 12/14/26 | | | | | | | 200 | | | | 191,254 | |
TotalEnergies SE, | | | | | | | | | | | | | | | | |
Jr. Sub. Notes, Series NC7, EMTN | | 1.625(ff) | | 10/25/27(oo)EUR | | | | 200 | | | | 203,080 | |
| | | | | | | | | | | | | | | | |
| | | | | |
| | | | | | | | | | | | | | | 2,053,472 | |
See Notes to Financial Statements.
PGIM Global Total Return (USD Hedged) Fund 115
PGIM Global Total Return (USD Hedged) Fund
Schedule of Investments (continued)
as of October 31, 2024
| | | | | | | | | | | | | | | | |
| | | | |
| Description | | Interest Rate | | Maturity
Date | | Principal Amount (000)# | | | Value | |
| | | | | |
CORPORATE BONDS (Continued) | | | | | | | | | | | | | | | | |
| | | | | |
Germany 1.1% | | | | | | | | | | | | | | | | |
| | | | | |
Deutsche Bahn Finance GmbH, | | | | | | | | | | | | | | | | |
Gtd. Notes, Series CB | | 1.600%(ff) | | 07/18/29(oo) | | | EUR | | | | 100 | | | $ | 96,545 | |
Deutsche Bahn Finance GMBH, | | | | | | | | | | | | | | | | |
Gtd. Notes, MTN | | 3.800 | | 09/27/27 | | | AUD | | | | 100 | | | | 63,969 | |
Deutsche Bank AG, | | | | | | | | | | | | | | | | |
Sr. Non-Preferred Notes | | 2.552(ff) | | 01/07/28 | | | | | | | 150 | | | | 141,641 | |
Volkswagen Bank GmbH, | | | | | | | | | | | | | | | | |
Sr. Non-Preferred Notes, EMTN | | 4.625 | | 05/03/31 | | | EUR | | | | 100 | | | | 112,327 | |
Volkswagen International Finance NV, | | | | | | | | | | | | | | | | |
Gtd. Notes | | 4.625(ff) | | 03/24/26(oo) | | | EUR | | | | 100 | | | | 107,989 | |
| | | | | | | | | | | | | | | | |
| | | | | |
| | | | | | | | | | | | | | | 522,471 | |
| | | | | |
Hong Kong 0.8% | | | | | | | | | | | | | | | | |
| | | | | |
HKT Capital No. 3 Ltd., | | | | | | | | | | | | | | | | |
Gtd. Notes | | 1.650 | | 04/10/27 | | | EUR | | | | 200 | | | | 202,509 | |
Sun Hung Kai Properties Capital Market Ltd., | | | | | | | | | | | | | | | | |
Gtd. Notes, EMTN | | 3.200 | | 08/14/27 | | | CNH | | | | 1,000 | | | | 141,459 | |
| | | | | | | | | | | | | | | | |
| | | | | |
| | | | | | | | | | | | | | | 343,968 | |
| | | | | |
Hungary 0.4% | | | | | | | | | | | | | | | | |
| | | | | |
MFB Magyar Fejlesztesi Bank Zrt, | | | | | | | | | | | | | | | | |
Gov’t. Gtd. Notes | | 0.375 | | 06/09/26 | | | EUR | | | | 100 | | | | 103,064 | |
MVM Energetika Zrt, | | | | | | | | | | | | | | | | |
Sr. Unsec’d. Notes | | 0.875 | | 11/18/27 | | | EUR | | | | 100 | | | | 99,291 | |
| | | | | | | | | | | | | | | | |
| | | | | |
| | | | | | | | | | | | | | | 202,355 | |
| | | | | |
India 1.1% | | | | | | | | | | | | | | | | |
| | | | | |
NTPC Ltd., | | | | | | | | | | | | | | | | |
Sr. Unsec’d. Notes, EMTN | | 2.750 | | 02/01/27 | | | EUR | | | | 300 | | | | 318,480 | |
Power Finance Corp. Ltd., | | | | | | | | | | | | | | | | |
Sr. Unsec’d. Notes, GMTN | | 1.841 | | 09/21/28 | | | EUR | | | | 200 | | | | 199,298 | |
| | | | | | | | | | | | | | | | |
| | | | | |
| | | | | | | | | | | | | | | 517,778 | |
See Notes to Financial Statements.
116
PGIM Global Total Return (USD Hedged) Fund
Schedule of Investments (continued)
as of October 31, 2024
| | | | | | | | | | | | | | | | |
| | | | |
| Description | | Interest
Rate | | Maturity
Date | | Principal Amount (000)# | | | Value | |
| | | | | |
CORPORATE BONDS (Continued) | | | | | | | | | | | | | | | | |
| | | | | |
Indonesia 0.4% | | | | | | | | | | | | | | | | |
| | | | | |
Perusahaan Perseroan Persero PT Perusahaan Listrik Negara, | | | | | | | | | | | | | | | | |
Sr. Unsec’d. Notes | | 1.875% | | 11/05/31 | | | EUR | | | | 100 | | | $ | 92,153 | |
Sr. Unsec’d. Notes | | 2.875 | | 10/25/25 | | | EUR | | | | 100 | | | | 107,850 | |
| | | | | | | | | | | | | | | | |
| | | | | |
| | | | | | | | | | | | | | | 200,003 | |
| | | | | |
Israel 0.4% | | | | | | | | | | | | | | | | |
| | | | | |
Israel Electric Corp. Ltd., | | | | | | | | | | | | | | | | |
Sec’d. Notes, 144A, GMTN | | 3.750 | | 02/22/32 | | | | | | | 200 | | | | 170,224 | |
| | | | | |
Italy 0.4% | | | | | | | | | | | | | | | | |
| | | | | |
Cassa Depositi e Prestiti SpA, | | | | | | | | | | | | | | | | |
Sr. Unsec’d. Notes, 144A | | 5.750 | | 05/05/26 | | | | | | | 200 | | | | 201,352 | |
| | | | | |
Jamaica 0.5% | | | | | | | | | | | | | | | | |
| | | | | |
Digicel Group Holdings Ltd., | | | | | | | | | | | | | | | | |
Sr. Sec’d. Notes, Series 1B14, 144A (original cost $1; purchased 11/14/23)^(f) | | 0.000 | | 12/31/30 | | | | | | | 11 | | | | 814 | |
Sr. Sec’d. Notes, Series 3A14, 144A (original cost $92; purchased 11/14/23)^(f) | | 0.000 | | 12/31/30 | | | | | | | —(r | ) | | | 40 | |
Sr. Sec’d. Notes, Series 3B14, 144A (original cost $0; purchased 11/14/23)^(f) | | 0.000 | | 12/31/30 | | | | | | | 5 | | | | 33 | |
Digicel Intermediate Holdings Ltd./Digicel International Finance Ltd./DIFL US LLC, | | | | | | | | | | | | | | | | |
Sr. Sec’d. Notes, Cash coupon 9.000% and PIK 1.500% (original cost $190,646; purchased 01/30/24 - 05/15/24)(f) | | 10.500 | | 05/25/27 | | | | | | | 205 | | | | 206,511 | |
Digicel MidCo Ltd./DIFL US II LLC, | | | | | | | | | | | | | | | | |
Sr. Unsec’d. Notes, PIK 10.500% (original cost $3,731; purchased 01/30/24 - 05/15/24)(f) | | 10.500 | | 11/25/28 | | | | | | | 6 | | | | 5,264 | |
| | | | | | | | | | | | | | | | |
| | | | | |
| | | | | | | | | | | | | | | 212,662 | |
| | | | | |
Luxembourg 2.0% | | | | | | | | | | | | | | | | |
| | | | | |
Blackstone Property Partners Europe Holdings Sarl, | | | | | | | | | | | | | | | | |
Sr. Unsec’d. Notes, EMTN | | 1.000 | | 10/20/26 | | | EUR | | | | 200 | | | | 207,188 | |
Sr. Unsec’d. Notes, EMTN | | 1.000 | | 05/04/28 | | | EUR | | | | 400 | | | | 397,090 | |
See Notes to Financial Statements.
PGIM Global Total Return (USD Hedged) Fund 117
PGIM Global Total Return (USD Hedged) Fund
Schedule of Investments (continued)
as of October 31, 2024
| | | | | | | | | | | | | | | | |
| | | | |
| Description | | Interest
Rate | | Maturity
Date | | Principal Amount (000)# | | | Value | |
| | | | | |
CORPORATE BONDS (Continued) | | | | | | | | | | | | | | | | |
| | | | | |
Luxembourg (cont’d.) | | | | | | | | | | | | | | | | |
| | | | | |
P3 Group Sarl, | | | | | | | | | | | | | | | | |
Sr. Unsec’d. Notes, EMTN | | 1.625% | | 01/26/29 | | | EUR | | | | 100 | | | $ | 99,825 | |
SELP Finance Sarl, | | | | | | | | | | | | | | | | |
Gtd. Notes, EMTN | | 3.750 | | 08/10/27 | | | EUR | | | | 200 | | | | 219,569 | |
| | | | | | | | | | | | | | | | |
| | | | | |
| | | | | | | | | | | | | | | 923,672 | |
| | | | | |
Malta 0.5% | | | | | | | | | | | | | | | | |
| | | | | |
Freeport Terminal Malta PLC, | | | | | | | | | | | | | | | | |
Gov’t. Gtd. Notes, 144A | | 7.250 | | 05/15/28 | | | | | | | 200 | | | | 211,940 | |
| | | | | |
Mexico 1.6% | | | | | | | | | | | | | | | | |
| | | | | |
Comision Federal de Electricidad, | | | | | | | | | | | | | | | | |
Sr. Unsec’d. Notes | | 5.000 | | 09/29/36 | | | | | | | 133 | | | | 118,182 | |
Mexico City Airport Trust, | | | | | | | | | | | | | | | | |
Sr. Sec’d. Notes, 144A | | 3.875 | | 04/30/28 | | | | | | | 200 | | | | 190,254 | |
Petroleos Mexicanos, | | | | | | | | | | | | | | | | |
Gtd. Notes | | 4.750 | | 02/26/29 | | | EUR | | | | 100 | | | | 100,399 | |
Gtd. Notes, EMTN | | 2.750 | | 04/21/27 | | | EUR | | | | 100 | | | | 100,345 | |
Gtd. Notes, EMTN | | 4.875 | | 02/21/28 | | | EUR | | | | 200 | | | | 207,284 | |
| | | | | | | | | | | | | | | | |
| | | | | |
| | | | | | | | | | | | | | | 716,464 | |
| | | | | |
Netherlands 0.4% | | | | | | | | | | | | | | | | |
| | | | | |
Cooperatieve Rabobank UA, | | | | | | | | | | | | | | | | |
Sr. Preferred Notes, GMTN | | 3.500 | | 12/14/26 | | | AUD | | | | 90 | | | | 57,201 | |
JDE Peet’s NV, | | | | | | | | | | | | | | | | |
Gtd. Notes, 144A | | 1.375 | | 01/15/27 | | | | | | | 150 | | | | 138,750 | |
| | | | | | | | | | | | | | | | |
| | | | | |
| | | | | | | | | | | | | | | 195,951 | |
| | | | | |
Norway 0.3% | | | | | | | | | | | | | | | | |
| | | | | |
Aker BP ASA, | | | | | | | | | | | | | | | | |
Sr. Unsec’d. Notes, 144A | | 5.600 | | 06/13/28 | | | | | | | 155 | | | | 156,805 | |
| | | | | |
Peru 0.0% | | | | | | | | | | | | | | | | |
| | | | | |
Peru Enhanced Pass-Through Finance Ltd., | | | | | | | | | | | | | | | | |
Pass-Through Certificates | | 1.962(s) | | 06/02/25 | | | | | | | 14 | | | | 14,166 | |
See Notes to Financial Statements.
118
PGIM Global Total Return (USD Hedged) Fund
Schedule of Investments (continued)
as of October 31, 2024
| | | | | | | | | | | | | | | | |
| | | | |
| Description | | Interest
Rate | | Maturity
Date | | Principal Amount (000)# | | | Value | |
| | | | | |
CORPORATE BONDS (Continued) | | | | | | | | | | | | | | | | |
| | | | | |
Philippines 0.6% | | | | | | | | | | | | | | | | |
| | | | | |
Bangko Sentral ng Pilipinas International Bond, | | | | | | | | | | | | | | | | |
Sr. Unsec’d. Notes, Series A | | 8.600% | | 06/15/27 | | | | | | | 276 | | | $ | 296,170 | |
| | | | | |
Portugal 0.3% | | | | | | | | | | | | | | | | |
| | | | | |
CP - Comboios de Portugal EPE, | | | | | | | | | | | | | | | | |
Sr. Unsec’d. Notes | | 5.700 | | 03/05/30 | | | EUR | | | | 100 | | | | 119,423 | |
| | | | | |
South Africa 0.4% | | | | | | | | | | | | | | | | |
| | | | | |
Eskom Holdings SOC Ltd., | | | | | | | | | | | | | | | | |
Gov’t. Gtd. Notes, MTN | | 6.350 | | 08/10/28 | | | | | | | 200 | | | | 199,750 | |
| | | | | |
Spain 0.5% | | | | | | | | | | | | | | | | |
| | | | | |
Iberdrola International BV, | | | | | | | | | | | | | | | | |
Gtd. Notes, Series NC6 | | 1.450(ff) | | 11/09/26(oo) | | | EUR | | | | 200 | | | | 207,058 | |
| | | | | |
Supranational Bank 0.7% | | | | | | | | | | | | | | | | |
| | | | | |
Corp. Andina de Fomento, | | | | | | | | | | | | | | | | |
Sr. Unsec’d. Notes | | 4.500 | | 03/07/28 | | | EUR | | | | 100 | | | | 113,139 | |
European Investment Bank, | | | | | | | | | | | | | | | | |
Sr. Unsec’d. Notes, 144A | | 5.400 | | 01/05/45 | | | CAD | | | | 50 | | | | 40,319 | |
Sr. Unsec’d. Notes, 144A, MTN | | 4.579(s) | | 05/28/37 | | | CAD | | | | 150 | | | | 63,899 | |
International Bank for Reconstruction & Development, | | | | | | | | | | | | | | | | |
Sr. Unsec’d. Notes, SOFR Index + 0.262% (Cap 1.820%, Floor 0.000%) | | 1.820(c) | | 08/11/26 | | | | | | | 100 | | | | 93,264 | |
| | | | | | | | | | | | | | | | |
| | | | | |
| | | | | | | | | | | | | | | 310,621 | |
| | | | | |
Sweden 0.2% | | | | | | | | | | | | | | | | |
| | | | | |
Heimstaden Bostad Treasury BV, | | | | | | | | | | | | | | | | |
Gtd. Notes, EMTN | | 1.375 | | 03/03/27 | | | EUR | | | | 100 | | | | 103,271 | |
| | | | | |
Switzerland 0.8% | | | | | | | | | | | | | | | | |
| | | | | |
Helvetia Europe SA, | | | | | | | | | | | | | | | | |
Gtd. Notes | | 2.750(ff) | | 09/30/41 | | | EUR | | | | 200 | | | | 197,732 | |
UBS Group AG, | | | | | | | | | | | | | | | | |
Sr. Unsec’d. Notes, 144A | | 1.494(ff) | | 08/10/27 | | | | | | | 200 | | | | 188,006 | |
| | | | | | | | | | | | | | | | |
| | | | | |
| | | | | | | | | | | | | | | 385,738 | |
See Notes to Financial Statements.
PGIM Global Total Return (USD Hedged) Fund 119
PGIM Global Total Return (USD Hedged) Fund
Schedule of Investments (continued)
as of October 31, 2024
| | | | | | | | | | | | | | | | |
| | | | |
| Description | | Interest
Rate | | Maturity
Date | | Principal Amount (000)# | | | Value | |
| | | | | |
CORPORATE BONDS (Continued) | | | | | | | | | | | | | | | | |
| | | | | |
United Arab Emirates 2.0% | | | | | | | | | | | | | | | | |
| | | | | |
DP World Ltd., | | | | | | | | | | | | | | | | |
Sr. Unsec’d. Notes | | 2.375% | | 09/25/26 | | | EUR | | | | 200 | | | $ | 212,995 | |
Sr. Unsec’d. Notes | | 4.250 | | 09/25/30 | | | GBP | | | | 100 | | | | 122,498 | |
Emirates NBD Bank PJSC, | | | | | | | | | | | | | | | | |
Sr. Unsec’d. Notes, MTN | | 4.750 | | 02/09/28 | | | AUD | | | | 400 | | | | 259,252 | |
First Abu Dhabi Bank PJSC, | | | | | | | | | | | | | | | | |
Sr. Unsec’d. Notes, EMTN | | 0.875 | | 12/09/25 | | | GBP | | | | 100 | | | | 122,741 | |
MDGH GMTN RSC Ltd., | | | | | | | | | | | | | | | | |
Gtd. Notes, GMTN | | 0.375 | | 03/10/27 | | | EUR | | | | 200 | | | | 203,205 | |
| | | | | | | | | | | | | | | | |
| | | | | |
| | | | | | | | | | | | | | | 920,691 | |
| | | | | |
United Kingdom 4.4% | | | | | | | | | | | | | | | | |
| | | | | |
Barclays Bank PLC, | | | | | | | | | | | | | | | | |
Sr. Unsec’d. Notes, EMTN | | 0.500 | | 01/28/33 | | | MXN | | | | 10,000 | | | | 202,763 | |
Barclays PLC, | | | | | | | | | | | | | | | | |
Sub. Notes, EMTN | | 1.125(ff) | | 03/22/31 | | | EUR | | | | 200 | | | | 209,698 | |
Bellis Finco PLC, | | | | | | | | | | | | | | | | |
Sr. Unsec’d. Notes, 144A | | 4.000 | | 02/16/27 | | | GBP | | | | 100 | | | | 120,203 | |
British American Tobacco PLC, | | | | | | | | | | | | | | | | |
Jr. Sub. Notes, Series 5.25 | | 3.000(ff) | | 09/27/26(oo) | | | EUR | | | | 300 | | | | 318,526 | |
eG Global Finance PLC, | | | | | | | | | | | | | | | | |
Sr. Sec’d. Notes | | 11.000 | | 11/30/28 | | | EUR | | | | 195 | | | | 232,262 | |
Hammerson Ireland Finance DAC, | | | | | | | | | | | | | | | | |
Gtd. Notes | | 1.750 | | 06/03/27 | | | EUR | | | | 300 | | | | 312,293 | |
Lloyds Bank PLC, | | | | | | | | | | | | | | | | |
Sr. Unsec’d. Notes, EMTN | | 0.000 | | 04/02/32 | | | | | | | 200 | | | | 131,798 | |
Reckitt Benckiser Treasury Services PLC, | | | | | | | | | | | | | | | | |
Gtd. Notes, EMTN | | 3.875 | | 09/14/33 | | | EUR | | | | 200 | | | | 222,938 | |
TalkTalk Telecom Group Ltd., | | | | | | | | | | | | | | | | |
Gtd. Notes | | 3.875 | | 02/20/25 | | | GBP | | | | 200 | | | | 154,734 | |
Virgin Media Secured Finance PLC, | | | | | | | | | | | | | | | | |
Sr. Sec’d. Notes | | 4.250 | | 01/15/30 | | | GBP | | | | 100 | | | | 112,878 | |
| | | | | | | | | | | | | | | | |
| | | | | |
| | | | | | | | | | | | | | | 2,018,093 | |
| | | | | |
United States 15.6% | | | | | | | | | | | | | | | | |
| | | | | |
Albertson’s Cos., Inc./Safeway, Inc./New Albertson’s LP/Albertson’s LLC, | | | | | | | | | | | | | | | | |
Gtd. Notes, 144A | | 3.500 | | 03/15/29 | | | | | | | 25 | | | | 23,110 | |
See Notes to Financial Statements.
120
PGIM Global Total Return (USD Hedged) Fund
Schedule of Investments (continued)
as of October 31, 2024
| | | | | | | | | | | | | | | | |
| | | | |
| Description | | Interest
Rate | | Maturity
Date | | Principal Amount (000)# | | | Value | |
| | | | | |
CORPORATE BONDS (Continued) | | | | | | | | | | | | | | | | |
| | | | | |
United States (cont’d.) | | | | | | | | | | | | | | | | |
| | | | | |
American Airlines, Inc./AAdvantage Loyalty IP Ltd., | | | | | | | | | | | | | | | | |
Sr. Sec’d. Notes, 144A | | 5.750% | | 04/20/29 | | | | | | | 25 | | | $ | 24,732 | |
American Medical Systems Europe BV, | | | | | | | | | | | | | | | | |
Gtd. Notes | | 3.375 | | 03/08/29 | | | EUR | | | | 100 | | | | 109,703 | |
AmeriGas Partners LP/AmeriGas Finance Corp., | | | | | | | | | | | | | | | | |
Sr. Unsec’d. Notes | | 5.875 | | 08/20/26 | | | | | | | 25 | | | | 24,482 | |
Ascent Resources Utica Holdings LLC/ARU Finance Corp., | | | | | | | | | | | | | | | | |
Gtd. Notes, 144A | | 9.000 | | 11/01/27 | | | | | | | 25 | | | | 29,677 | |
Ashland, Inc., | | | | | | | | | | | | | | | | |
Sr. Unsec’d. Notes, 144A | | 3.375 | | 09/01/31 | | | | | | | 25 | | | | 21,692 | |
Ashton Woods USA LLC/Ashton Woods Finance Co., | | | | | | | | | | | | | | | | |
Sr. Unsec’d. Notes, 144A | | 4.625 | | 08/01/29 | | | | | | | 25 | | | | 23,363 | |
Sr. Unsec’d. Notes, 144A | | 4.625 | | 04/01/30 | | | | | | | 25 | | | | 23,021 | |
AT&T, Inc., | | | | | | | | | | | | | | | | |
Sr. Unsec’d. Notes | | 3.950 | | 04/30/31 | | | EUR | | | | 200 | | | | 224,507 | |
Sr. Unsec’d. Notes | | 4.100 | | 01/19/26 | | | AUD | | | | 100 | | | | 65,099 | |
Bank of America Corp., | | | | | | | | | | | | | | | | |
Sr. Unsec’d. Notes | | 1.734(ff) | | 07/22/27 | | | | | | | 130 | | | | 123,345 | |
Sr. Unsec’d. Notes | | 2.572(ff) | | 10/20/32 | | | | | | | 28 | | | | 23,790 | |
Sr. Unsec’d. Notes | | 2.687(ff) | | 04/22/32 | | | | | | | 75 | | | | 65,043 | |
Sr. Unsec’d. Notes, MTN | | 2.087(ff) | | 06/14/29 | | | | | | | 100 | | | | 90,664 | |
Sr. Unsec’d. Notes, MTN | | 3.194(ff) | | 07/23/30 | | | | | | | 25 | | | | 23,138 | |
Bausch Health Americas, Inc., | | | | | | | | | | | | | | | | |
Gtd. Notes, 144A | | 8.500 | | 01/31/27 | | | | | | | 85 | | | | 68,209 | |
Bausch Health Cos., Inc., | | | | | | | | | | | | | | | | |
Gtd. Notes, 144A | | 5.000 | | 01/30/28 | | | | | | | 5 | | | | 3,200 | |
Gtd. Notes, 144A | | 5.000 | | 02/15/29 | | | | | | | 25 | | | | 14,375 | |
Gtd. Notes, 144A | | 5.250 | | 01/30/30 | | | | | | | 25 | | | | 13,750 | |
Gtd. Notes, 144A | | 5.250 | | 02/15/31 | | | | | | | 25 | | | | 13,500 | |
Gtd. Notes, 144A | | 6.250 | | 02/15/29 | | | | | | | 10 | | | | 6,188 | |
Gtd. Notes, 144A | | 7.000 | | 01/15/28 | | | | | | | 25 | | | | 16,500 | |
Gtd. Notes, 144A | | 9.000 | | 12/15/25 | | | | | | | 25 | | | | 24,514 | |
Sr. Sec’d. Notes, 144A | | 4.875 | | 06/01/28 | | | | | | | 25 | | | | 19,250 | |
Beazer Homes USA, Inc., | | | | | | | | | | | | | | | | |
Gtd. Notes | | 7.250 | | 10/15/29 | | | | | | | 20 | | | | 20,328 | |
Becton Dickinson & Co., | | | | | | | | | | | | | | | | |
Gtd. Notes | | 3.828 | | 06/07/32 | | | EUR | | | | 100 | | | | 110,932 | |
Big River Steel LLC/BRS Finance Corp., | | | | | | | | | | | | | | | | |
Sr. Sec’d. Notes, 144A | | 6.625 | | 01/31/29 | | | | | | | 50 | | | | 50,366 | |
See Notes to Financial Statements.
PGIM Global Total Return (USD Hedged) Fund 121
PGIM Global Total Return (USD Hedged) Fund
Schedule of Investments (continued)
as of October 31, 2024
| | | | | | | | | | | | | | | | |
| | | | |
| Description | | Interest
Rate | | Maturity
Date | | Principal Amount (000)# | | | Value | |
| | | | | |
CORPORATE BONDS (Continued) | | | | | | | | | | | | | | | | |
| | | | | |
United States (cont’d.) | | | | | | | | | | | | | | | | |
| | | | | |
Boeing Co. (The), | | | | | | | | | | | | | | | | |
Sr. Unsec’d. Notes, 144A | | 6.528% | | 05/01/34 | | | | | | | 80 | | | $ | 84,339 | |
BP Capital Markets PLC, | | | | | | | | | | | | | | | | |
Gtd. Notes | | 4.375(ff) | | 06/22/25(oo) | | | | | | | 32 | | | | 31,731 | |
Brixmor Operating Partnership LP, | | | | | | | | | | | | | | | | |
Sr. Unsec’d. Notes | | 2.500 | | 08/16/31 | | | | | | | 10 | | | | 8,461 | |
Broadcom, Inc., | | | | | | | | | | | | | | | | |
Gtd. Notes, 144A | | 2.450 | | 02/15/31 | | | | | | | 80 | | | | 69,063 | |
Sr. Unsec’d. Notes, 144A | | 3.137 | | 11/15/35 | | | | | | | 82 | | | | 67,305 | |
Sr. Unsec’d. Notes, 144A | | 3.419 | | 04/15/33 | | | | | | | 25 | | | | 22,053 | |
Caledonia Generating LLC, | | | | | | | | | | | | | | | | |
Sr. Sec’d. Notes, 144A | | 1.950 | | 02/28/34 | | | | | | | 301 | | | | 251,067 | |
Calpine Corp., | | | | | | | | | | | | | | | | |
Sr. Unsec’d. Notes, 144A | | 4.625 | | 02/01/29 | | | | | | | 60 | | | | 56,989 | |
Cantor Fitzgerald LP, | | | | | | | | | | | | | | | | |
Sr. Unsec’d. Notes, 144A | | 4.500 | | 04/14/27 | | | | | | | 115 | | | | 112,512 | |
Capital One Financial Corp., | | | | | | | | | | | | | | | | |
Sr. Unsec’d. Notes | | 5.463(ff) | | 07/26/30 | | | | | | | 55 | | | | 55,485 | |
CDW LLC/CDW Finance Corp., | | | | | | | | | | | | | | | | |
Gtd. Notes | | 2.670 | | 12/01/26 | | | | | | | 80 | | | | 76,374 | |
CF Industries, Inc., | | | | | | | | | | | | | | | | |
Gtd. Notes | | 4.950 | | 06/01/43 | | | | | | | 20 | | | | 17,958 | |
Gtd. Notes | | 5.375 | | 03/15/44 | | | | | | | 20 | | | | 18,792 | |
Citigroup, Inc., | | | | | | | | | | | | | | | | |
Jr. Sub. Notes, Series X | | 3.875(ff) | | 02/18/26(oo) | | | | | | | 150 | | | | 145,025 | |
Sr. Unsec’d. Notes | | 1.462(ff) | | 06/09/27 | | | | | | | 100 | | | | 94,860 | |
Sr. Unsec’d. Notes | | 2.520(ff) | | 11/03/32 | | | | | | | 15 | | | | 12,643 | |
Sr. Unsec’d. Notes | | 2.561(ff) | | 05/01/32 | | | | | | | 40 | | | | 34,210 | |
Sr. Unsec’d. Notes | | 3.106(ff) | | 04/08/26 | | | | | | | 100 | | | | 99,140 | |
Sr. Unsec’d. Notes | | 5.174(ff) | | 02/13/30 | | | | | | | 115 | | | | 115,640 | |
Sub. Notes | | 5.827(ff) | | 02/13/35 | | | | | | | 15 | | | | 15,128 | |
Columbia Pipelines Operating Co. LLC, | | | | | | | | | | | | | | | | |
Sr. Unsec’d. Notes, 144A | | 6.036 | | 11/15/33 | | | | | | | 50 | | | | 51,755 | |
Comerica, Inc., | | | | | | | | | | | | | | | | |
Sr. Unsec’d. Notes | | 5.982(ff) | | 01/30/30 | | | | | | | 69 | | | | 69,921 | |
Crescent Energy Finance LLC, | | | | | | | | | | | | | | | | |
Gtd. Notes, 144A | | 7.625 | | 04/01/32 | | | | | | | 35 | | | | 34,569 | |
Dana, Inc., | | | | | | | | | | | | | | | | |
Sr. Unsec’d. Notes | | 5.375 | | 11/15/27 | | | | | | | 25 | | | | 24,455 | |
See Notes to Financial Statements.
122
PGIM Global Total Return (USD Hedged) Fund
Schedule of Investments (continued)
as of October 31, 2024
| | | | | | | | | | | | | | | | |
| | | | |
| Description | | Interest
Rate | | Maturity
Date | | Principal Amount (000)# | | | Value | |
| | | | | |
CORPORATE BONDS (Continued) | | | | | | | | | | | | | | | | |
| | | | | |
United States (cont’d.) | | | | | | | | | | | | | | | | |
| | | | | |
DaVita, Inc., | | | | | | | | | | | | | | | | |
Gtd. Notes, 144A | | 3.750% | | 02/15/31 | | | | | | | 50 | | | $ | 43,509 | |
Dcli Bidco LLC, | | | | | | | | | | | | | | | | |
Second Mortgage, 144A | | 7.750 | | 11/15/29 | | | | | | | 10 | | | | 10,171 | |
Diamond Sports Group LLC/Diamond Sports Finance Co., | | | | | | | | | | | | | | | | |
Gtd. Notes, 144A (original cost $43,125;purchased 07/18/19 - 12/04/19)(f) | | 6.625 | | 08/15/27(d) | | | | | | | 45 | | | | 285 | |
Sec’d. Notes, 144A (original cost $10,313;purchased 01/31/24)(f) | | 5.375 | | 08/15/26(d) | | | | | | | 150 | | | | 1,013 | |
DISH DBS Corp., | | | | | | | | | | | | | | | | |
Gtd. Notes | | 5.125 | | 06/01/29 | | | | | | | 25 | | | | 16,605 | |
Gtd. Notes | | 7.375 | | 07/01/28 | | | | | | | 25 | | | | 18,307 | |
Gtd. Notes | | 7.750 | | 07/01/26 | | | | | | | 100 | | | | 84,488 | |
DISH Network Corp., | | | | | | | | | | | | | | | | |
Sr. Sec’d. Notes, 144A | | 11.750 | | 11/15/27 | | | | | | | 50 | | | | 52,637 | |
Energy Transfer LP, | | | | | | | | | | | | | | | | |
Jr. Sub. Notes, Series G | | 7.125(ff) | | 05/15/30(oo) | | | | | | | 100 | | | | 101,728 | |
Jr. Sub. Notes, Series H | | 6.500(ff) | | 11/15/26(oo) | | | | | | | 50 | | | | 49,903 | |
Sr. Unsec’d. Notes | | 6.250 | | 04/15/49 | | | | | | | 25 | | | | 25,409 | |
Sr. Unsec’d. Notes | | 6.550 | | 12/01/33 | | | | | | | 30 | | | | 32,201 | |
EQM Midstream Partners LP, | | | | | | | | | | | | | | | | |
Sr. Unsec’d. Notes, 144A | | 6.500 | | 07/01/27 | | | | | | | 25 | | | | 25,572 | |
Expand Energy Corp., | | | | | | | | | | | | | | | | |
Gtd. Notes | | 5.375 | | 02/01/29 | | | | | | | 55 | | | | 54,163 | |
GN Bondco LLC, | | | | | | | | | | | | | | | | |
Sr. Sec’d. Notes, 144A | | 9.500 | | 10/15/31 | | | | | | | 75 | | | | 79,663 | |
Goldman Sachs Group, Inc. (The), | | | | | | | | | | | | | | | | |
Jr. Sub. Notes, Series U | | 3.650(ff) | | 08/10/26(oo) | | | | | | | 130 | | | | 123,826 | |
Sr. Unsec’d. Notes | | 1.542(ff) | | 09/10/27 | | | | | | | 100 | | | | 94,198 | |
Sr. Unsec’d. Notes | | 1.992(ff) | | 01/27/32 | | | | | | | 20 | | | | 16,658 | |
Sr. Unsec’d. Notes | | 2.615(ff) | | 04/22/32 | | | | | | | 75 | | | | 64,506 | |
Sr. Unsec’d. Notes | | 5.049(ff) | | 07/23/30 | | | | | | | 100 | | | | 100,224 | |
Hilcorp Energy I LP/Hilcorp Finance Co., | | | | | | | | | | | | | | | | |
Sr. Unsec’d. Notes, 144A | | 6.250 | | 04/15/32 | | | | | | | 25 | | | | 23,458 | |
Honeywell International, Inc., | | | | | | | | | | | | | | | | |
Sr. Unsec’d. Notes | | 3.750 | | 05/17/32 | | | EUR | | | | 100 | | | | 111,256 | |
Howard Hughes Corp. (The), | | | | | | | | | | | | | | | | |
Gtd. Notes, 144A | | 5.375 | | 08/01/28 | | | | | | | 50 | | | | 48,597 | |
See Notes to Financial Statements.
PGIM Global Total Return (USD Hedged) Fund 123
PGIM Global Total Return (USD Hedged) Fund
Schedule of Investments (continued)
as of October 31, 2024
| | | | | | | | | | | | | | | | |
| | | | |
| Description | | Interest
Rate | | Maturity
Date | | Principal Amount (000)# | | | Value | |
| | | | | |
CORPORATE BONDS (Continued) | | | | | | | | | | | | | | | | |
| | | | | |
United States (cont’d.) | | | | | | | | | | | | | | | | |
| | | | | |
Huntington Bancshares, Inc., | | | | | | | | | | | | | | | | |
Sr. Unsec’d. Notes | | 5.709%(ff) | | 02/02/35 | | | | | | | 130 | | | $ | 131,561 | |
JELD-WEN, Inc., | | | | | | | | | | | | | | | | |
Gtd. Notes, 144A | | 4.875 | | 12/15/27 | | | | | | | 25 | | | | 24,197 | |
JPMorgan Chase & Co., | | | | | | | | | | | | | | | | |
Jr. Sub. Notes, Series HH | | 4.600(ff) | | 02/01/25(oo) | | | | | | | 80 | | | | 79,535 | |
Sr. Unsec’d. Notes | | 2.069(ff) | | 06/01/29 | | | | | | | 90 | | | | 81,804 | |
Sr. Unsec’d. Notes | | 2.545(ff) | | 11/08/32 | | | | | | | 30 | | | | 25,590 | |
Sr. Unsec’d. Notes | | 2.580(ff) | | 04/22/32 | | | | | | | 45 | | | | 38,992 | |
Sr. Unsec’d. Notes | | 3.702(ff) | | 05/06/30 | | | | | | | 25 | | | | 23,771 | |
Sr. Unsec’d. Notes | | 5.294(ff) | | 07/22/35 | | | | | | | 20 | | | | 20,112 | |
Lamb Weston Holdings, Inc., | | | | | | | | | | | | | | | | |
Gtd. Notes, 144A | | 4.375 | | 01/31/32 | | | | | | | 50 | | | | 45,776 | |
Level 3 Financing, Inc., | | | | | | | | | | | | | | | | |
Sr. Sec’d. Notes, 144A | | 11.000 | | 11/15/29 | | | | | | | 75 | | | | 84,637 | |
M/I Homes, Inc., | | | | | | | | | | | | | | | | |
Gtd. Notes | | 4.950 | | 02/01/28 | | | | | | | 25 | | | | 24,172 | |
MGM Resorts International, | | | | | | | | | | | | | | | | |
Gtd. Notes | | 6.500 | | 04/15/32 | | | | | | | 30 | | | | 30,004 | |
Morgan Stanley, | | | | | | | | | | | | | | | | |
Sr. Unsec’d. Notes | | 1.593(ff) | | 05/04/27 | | | | | | | 30 | | | | 28,604 | |
Sr. Unsec’d. Notes | | 5.173(ff) | | 01/16/30 | | | | | | | 80 | | | | 80,699 | |
Sr. Unsec’d. Notes, EMTN | | 7.500 | | 12/15/27 | | | MXN | | | | 1,000 | | | | 47,184 | |
Sr. Unsec’d. Notes, GMTN | | 2.239(ff) | | 07/21/32 | | | | | | | 30 | | | | 25,121 | |
Sr. Unsec’d. Notes, MTN | | 1.928(ff) | | 04/28/32 | | | | | | | 60 | | | | 49,607 | |
Morgan Stanley Finance LLC, | | | | | | | | | | | | | | | | |
Gtd. Notes, EMTN | | 3.100 | | 03/08/28 | | | CNH | | | | 1,000 | | | | 141,452 | |
MPLX LP, | | | | | | | | | | | | | | | | |
Sr. Unsec’d. Notes | | 4.950 | | 09/01/32 | | | | | | | 70 | | | | 68,236 | |
Newell Brands, Inc., | | | | | | | | | | | | | | | | |
Sr. Unsec’d. Notes | | 6.625 | | 05/15/32 | | | | | | | 5 | | | | 5,018 | |
Novelis Corp., | | | | | | | | | | | | | | | | |
Gtd. Notes, 144A | | 3.250 | | 11/15/26 | | | | | | | 25 | | | | 24,042 | |
NRG Energy, Inc., | | | | | | | | | | | | | | | | |
Jr. Sub. Notes, 144A | | 10.250(ff) | | 03/15/28(oo) | | | | | | | 25 | | | | 27,605 | |
OneMain Finance Corp., | | | | | | | | | | | | | | | | |
Gtd. Notes | | 4.000 | | 09/15/30 | | | | | | | 25 | | | | 22,005 | |
ONEOK, Inc., | | | | | | | | | | | | | | | | |
Gtd. Notes | | 6.050 | | 09/01/33 | | | | | | | 90 | | | | 93,556 | |
See Notes to Financial Statements.
124
PGIM Global Total Return (USD Hedged) Fund
Schedule of Investments (continued)
as of October 31, 2024
| | | | | | | | | | | | | | | | |
| | | | |
| Description | | Interest
Rate | | Maturity
Date | | Principal Amount (000)# | | | Value | |
| | | | | |
CORPORATE BONDS (Continued) | | | | | | | | | | | | | | | | |
| | | | | |
United States (cont’d.) | | | | | | | | | | | | | | | | |
| | | | | |
Pactiv Evergreen Group Issuer LLC/Pactiv Evergreen Group Issuer, Inc., | | | | | | | | | | | | | | | | |
Sr. Sec’d. Notes, 144A | | 4.375% | | 10/15/28 | | | | | | | 25 | | | $ | 23,518 | |
Pactiv Evergreen Group Issuer, Inc./Pactiv Evergreen Group Issuer LLC, | | | | | | | | | | | | | | | | |
Sr. Sec’d. Notes, 144A | | 4.000 | | 10/15/27 | | | | | | | 75 | | | | 71,655 | |
Penn Entertainment, Inc., | | | | | | | | | | | | | | | | |
Sr. Unsec’d. Notes, 144A | | 5.625 | | 01/15/27 | | | | | | | 25 | | | | 24,543 | |
PennyMac Financial Services, Inc., | | | | | | | | | | | | | | | | |
Gtd. Notes, 144A | | 5.750 | | 09/15/31 | | | | | | | 50 | | | | 47,825 | |
Permian Resources Operating LLC, | | | | | | | | | | | | | | | | |
Gtd. Notes, 144A | | 8.000 | | 04/15/27 | | | | | | | 25 | | | | 25,692 | |
Post Holdings, Inc., | | | | | | | | | | | | | | | | |
Sr. Sec’d. Notes, 144A | | 6.250 | | 02/15/32 | | | | | | | 20 | | | | 20,249 | |
Realty Income Corp., | | | | | | | | | | | | | | | | |
Sr. Unsec’d. Notes | | 2.200 | | 06/15/28 | | | | | | | 5 | | | | 4,577 | |
Sr. Unsec’d. Notes | | 4.875 | | 07/06/30 | | | EUR | | | | 200 | | | | 231,256 | |
Sr. Unsec’d. Notes | | 5.000 | | 10/15/29 | | | GBP | | | | 300 | | | | 380,560 | |
Sally Holdings LLC/Sally Capital, Inc., | | | | | | | | | | | | | | | | |
Gtd. Notes | | 6.750 | | 03/01/32 | | | | | | | 25 | | | | 25,333 | |
Southwest Airlines Co., | | | | | | | | | | | | | | | | |
Sr. Unsec’d. Notes | | 5.125 | | 06/15/27 | | | | | | | 80 | | | | 80,536 | |
Targa Resources Corp., | | | | | | | | | | | | | | | | |
Gtd. Notes | | 4.200 | | 02/01/33 | | | | | | | 20 | | | | 18,379 | |
Taylor Morrison Communities, Inc., | | | | | | | | | | | | | | | | |
Gtd. Notes, 144A | | 5.875 | | 06/15/27 | | | | | | | 25 | | | | 25,138 | |
Sr. Unsec’d. Notes, 144A | | 5.125 | | 08/01/30 | | | | | | | 10 | | | | 9,690 | |
Tenneco, Inc., | | | | | | | | | | | | | | | | |
Sr. Sec’d. Notes, 144A | | 8.000 | | 11/17/28 | | | | | | | 75 | | | | 69,398 | |
Truist Financial Corp., | | | | | | | | | | | | | | | | |
Sr. Unsec’d. Notes, MTN | | 5.867(ff) | | 06/08/34 | | | | | | | 25 | | | | 25,711 | |
U.S. Bancorp, | | | | | | | | | | | | | | | | |
Jr. Sub. Notes | | 3.700(ff) | | 01/15/27(oo) | | | | | | | 120 | | | | 112,535 | |
Univision Communications, Inc., | | | | | | | | | | | | | | | | |
Sr. Sec’d. Notes, 144A | | 8.000 | | 08/15/28 | | | | | | | 30 | | | | 30,486 | |
Venture Global Calcasieu Pass LLC, | | | | | | | | | | | | | | | | |
Sr. Sec’d. Notes, 144A | | 3.875 | | 08/15/29 | | | | | | | 5 | | | | 4,618 | |
Sr. Sec’d. Notes, 144A | | 4.125 | | 08/15/31 | | | | | | | 5 | | | | 4,552 | |
Venture Global LNG, Inc., | | | | | | | | | | | | | | | | |
Jr. Sub. Notes, 144A | | 9.000(ff) | | 09/30/29(oo) | | | | | | | 40 | | | | 39,983 | |
See Notes to Financial Statements.
PGIM Global Total Return (USD Hedged) Fund 125
PGIM Global Total Return (USD Hedged) Fund
Schedule of Investments (continued)
as of October 31, 2024
| | | | | | | | | | | | | | | | |
| | | | |
| Description | | Interest
Rate | | Maturity
Date | | Principal Amount (000)# | | | Value | |
| | | | | |
CORPORATE BONDS (Continued) | | | | | | | | | | | | | | | | |
| | | | | |
United States (cont’d.) | | | | | | | | | | | | | | | | |
| | | | | |
Viatris, Inc., | | | | | | | | | | | | | | | | |
Gtd. Notes | | 3.850% | | 06/22/40 | | | | | | | 70 | | | $ | 52,377 | |
Gtd. Notes | | 4.000 | | 06/22/50 | | | | | | | 10 | | | | 6,905 | |
VICI Properties LP, | | | | | | | | | | | | | | | | |
Sr. Unsec’d. Notes | | 4.950 | | 02/15/30 | | | | | | | 60 | | | | 58,866 | |
Vistra Corp., | | | | | | | | | | | | | | | | |
Jr. Sub. Notes, 144A | | 7.000(ff) | | 12/15/26(oo) | | | | | | | 25 | | | | 25,242 | |
Jr. Sub. Notes, 144A | | 8.000(ff) | | 10/15/26(oo) | | | | | | | 125 | | | | 128,552 | |
Warnermedia Holdings, Inc., | | | | | | | | | | | | | | | | |
Gtd. Notes | | 3.755 | | 03/15/27 | | | | | | | 80 | | | | 77,025 | |
Gtd. Notes | | 5.050 | | 03/15/42 | | | | | | | 45 | | | | 35,954 | |
Gtd. Notes | | 5.141 | | 03/15/52 | | | | | | | 90 | | | | 67,779 | |
Wells Fargo & Co., | | | | | | | | | | | | | | | | |
Sr. Unsec’d. Notes, MTN | | 2.164(ff) | | 02/11/26 | | | | | | | 25 | | | | 24,785 | |
Sr. Unsec’d. Notes, MTN | | 2.879(ff) | | 10/30/30 | | | | | | | 50 | | | | 45,334 | |
Sr. Unsec’d. Notes, MTN | | 5.198(ff) | | 01/23/30 | | | | | | | 100 | | | | 101,025 | |
Welltower OP LLC, | | | | | | | | | | | | | | | | |
Gtd. Notes | | 3.100 | | 01/15/30 | | | | | | | 30 | | | | 27,554 | |
Williams Cos., Inc. (The), | | | | | | | | | | | | | | | | |
Sr. Unsec’d. Notes | | 3.500 | | 10/15/51 | | | | | | | 30 | | | | 20,939 | |
Wynn Resorts Finance LLC/Wynn Resorts Capital Corp., | | | | | | | | | | | | | | | | |
Gtd. Notes, 144A | | 7.125 | | 02/15/31 | | | | | | | 30 | | | | 31,549 | |
| | | | | | | | | | | | | | | | |
| | | | | |
| | | | | | | | | | | | | | | 7,207,730 | |
| | | | | | | | | | | | | | | | |
| | | | | |
TOTAL CORPORATE BONDS
(cost $20,392,160) | | | | | | | | | | | | | | | 19,530,457 | |
| | | | | | | | | | | | | | | | |
| | | | | |
FLOATING RATE AND OTHER LOANS 0.1% | | | | | | | | | | | | | | | | |
| | | | | |
Jamaica 0.0% | | | | | | | | | | | | | | | | |
| | | | | |
Digicel International Finance Ltd., | | | | | | | | | | | | | | | | |
Initial Term Loan, 3 Month SOFR + 6.750% | | 11.335(c) | | 05/25/27 | | | | | | | 10 | | | | 10,187 | |
| | | | | |
United States 0.1% | | | | | | | | | | | | | | | | |
| | | | | |
Bausch Health Cos., Inc., | | | | | | | | | | | | | | | | |
Second Amendment Term Loan, 1 Month SOFR + 5.350% | | 10.706(c) | | 02/01/27 | | | | | | | 5 | | | | 4,883 | |
See Notes to Financial Statements.
126
PGIM Global Total Return (USD Hedged) Fund
Schedule of Investments (continued)
as of October 31, 2024
| | | | | | | | | | | | | | | | |
| | | | |
| Description | | Interest Rate | | Maturity Date | | Principal Amount (000)# | | | Value | |
| | | | | |
FLOATING RATE AND OTHER LOANS (Continued) | | | | | | | | | | | | | | | | |
| | | | | |
United States (cont’d.) | | | | | | | | | | | | | | | | |
| | | | | |
Diamond Sports Group LLC, | | | | | | | | | | | | | | | | |
Dip Term Loan | | 10.000% | | 12/02/24 | | | | | | | 21 | | | $ | 21,896 | |
First Lien Term Loan, 1 Month SOFR + 10.100% | | 14.944(c) | | 05/25/26 | | | | | | | 2 | | | | 2,030 | |
Second Lien Term Loan | | 8.175 | | 08/24/26 | | | | | | | 149 | | | | 422 | |
| | | | | | | | | | | | | | | | |
| | | | | |
| | | | | | | | | | | | | | | 29,231 | |
| | | | | | | | | | | | | | | | |
| | | | | |
TOTAL FLOATING RATE AND OTHER LOANS | | | | | | | | | | | | | | | | |
(cost $ 93,195) | | | | | | | | | | | | | | | 39,418 | |
| | | | | | | | | | | | | | | | |
| | | | | |
MUNICIPAL BOND 0.2% | | | | | | | | | | | | | | | | |
| | | | | |
Louisiana | | | | | | | | | | | | | | | | |
| | | | | |
Plaquemines Port Harbor & Terminal District, | | | | | | | | | | | | | | | | |
Taxable, Revenue Bonds, Series B
(cost $ 100,000) | | 12.000 | | 12/01/34 | | | | | | | 100 | | | | 100,762 | |
| | | | | | | | | | | | | | | | |
| | | | | |
RESIDENTIAL MORTGAGE-BACKED SECURITIES 3.4% | | | | | | | | | | | | | | | | |
| | | | | |
United States | | | | | | | | | | | | | | | | |
| | | | | |
Connecticut Avenue Securities Trust, | | | | | | | | | | | | | | | | |
Series 2022-R03, Class 1B1, 144A, 30 Day Average SOFR + 6.250% (Cap N/A, Floor 0.000%) | | 11.107(c) | | 03/25/42 | | | | | | | 25 | | | | 27,475 | |
Series 2022-R04, Class 1B1, 144A, 30 Day Average SOFR + 5.250% (Cap N/A, Floor 0.000%) | | 10.107(c) | | 03/25/42 | | | | | | | 20 | | | | 21,559 | |
Series 2023-R05, Class 1M2, 144A, 30 Day Average SOFR + 3.100% (Cap N/A, Floor 3.100%) | | 7.957(c) | | 06/25/43 | | | | | | | 100 | | | | 104,545 | |
Eagle Re Ltd., | | | | | | | | | | | | | | | | |
Series 2023-01, Class M1A, 144A, 30 Day Average SOFR + 2.000% (Cap N/A, Floor 2.000%) | | 6.857(c) | | 09/26/33 | | | | | | | 138 | | | | 138,884 | |
FHLMC Structured Agency Credit Risk REMIC Trust, | | | | | | | | | | | | | | | | |
Series 2020-HQA05, Class B1, 144A, 30 Day Average SOFR + 4.000% (Cap N/A, Floor 0.000%) | | 8.857(c) | | 11/25/50 | | | | | | | 35 | | | | 39,403 | |
See Notes to Financial Statements.
PGIM Global Total Return (USD Hedged) Fund 127
PGIM Global Total Return (USD Hedged) Fund
Schedule of Investments (continued)
as of October 31, 2024
| | | | | | | | | | | | | | | | |
| | | | |
| Description | | Interest Rate | | Maturity Date | | Principal Amount (000)# | | | Value | |
| | | |
RESIDENTIAL MORTGAGE-BACKED SECURITIES (Continued) | | | | | | | | | | | | |
| | | | | |
United States (cont’d.) | | | | | | | | | | | | | | | | |
| | | | | |
FHLMC Structured Agency Credit Risk REMIC Trust, (cont’d.) | | | | | | | | | | | | | | | | |
Series 2021-DNA05, Class M2, 144A, 30 Day Average SOFR + 1.650% (Cap N/A, Floor 0.000%) | | 6.507%(c) | | 01/25/34 | | | | | | | 9 | | | $ | 9,302 | |
Series 2021-HQA03, Class M2, 144A, 30 Day Average SOFR + 2.100% (Cap N/A, Floor 0.000%) | | 6.957(c) | | 09/25/41 | | | | | | | 70 | | | | 70,568 | |
Series 2022-DNA01, Class M1B, 144A, 30 Day Average SOFR + 1.850% (Cap N/A, Floor 0.000%) | | 6.707(c) | | 01/25/42 | | | | | | | 100 | | | | 101,000 | |
Series 2022-DNA03, Class M1B, 144A, 30 Day Average SOFR + 2.900% (Cap N/A, Floor 0.000%) | | 7.757(c) | | 04/25/42 | | | | | | | 140 | | | | 144,826 | |
GCAT Asset-Backed Notes, | | | | | | | | | | | | | | | | |
Series 2021-01, Class A1, 144A | | 2.487 | | 11/25/49 | | | | | | | 107 | | | | 106,276 | |
Legacy Mortgage Asset Trust, | | | | | | | | | | | | | | | | |
Series 2019-PR01, Class A1, 144A | | 7.858 | | 09/25/59 | | | | | | | 38 | | | | 37,576 | |
MFA Trust, | | | | | | | | | | | | | | | | |
Series 2021-RPL01, Class A1, 144A | | 1.131(cc) | | 07/25/60 | | | | | | | 124 | | | | 110,758 | |
Oaktown Re VII Ltd., | | | | | | | | | | | | | | | | |
Series 2021-02, Class M1A, 144A, 30 Day Average SOFR + 1.600% (Cap N/A, Floor 1.600%) | | 6.457(c) | | 04/25/34 | | | | | | | 45 | | | | 45,179 | |
PMT Credit Risk Transfer Trust, | | | | | | | | | | | | | | | | |
Series 2024-01R, Class A, 144A, 30 Day Average SOFR + 3.500% (Cap N/A, Floor 0.000%) | | 8.357(c) | | 05/25/33 | | | | | | | 282 | | | | 284,840 | |
Series 2024-02R, Class A, 144A, 30 Day Average SOFR + 3.350% (Cap N/A, Floor 0.000%) | | 8.206(c) | | 03/29/27 | | | | | | | 189 | | | | 190,475 | |
Radnor Re Ltd., | | | | | | | | | | | | | | | | |
Series 2023-01, Class M1A, 144A, 30 Day Average SOFR + 2.700% (Cap N/A, Floor 2.700%) | | 7.557(c) | | 07/25/33 | | | | | | | 140 | | | | 141,911 | |
| | | | | | | | | | | | | | | | |
| | | | |
TOTAL RESIDENTIAL MORTGAGE-BACKED SECURITIES | | | | | | | | | | | | | | |
(cost $1,561,831) | | | | | | | | | | | | | | | 1,574,577 | |
| | | | | | | | | | | | | | | | |
See Notes to Financial Statements.
128
PGIM Global Total Return (USD Hedged) Fund
Schedule of Investments (continued)
as of October 31, 2024
| | | | | | | | | | | | | | | | |
| | | | |
| Description | | Interest Rate | | Maturity Date | | Principal Amount (000)# | | | Value | |
| | | | | |
SOVEREIGN BONDS 24.2% | | | | | | | | | | | | | | | | |
| | | | | |
Andorra 0.4% | | | | | | | | | | | | | | | | |
| | | | | |
Andorra International Bond, | | | | | | | | | | | | | | | | |
Sr. Unsec’d. Notes, EMTN | | 1.250% | | 05/06/31 | | | EUR | | | | 200 | | | $ | 190,388 | |
| | | | | |
Austria 0.5% | | | | | | | | | | | | | | | | |
| | | | | |
Republic of Austria Government International Bond, | | | | | | | | | | | | | | | | |
Sr. Unsec’d. Notes, 144A, MTN | | 5.375 | | 12/01/34 | | | CAD | | | | 280 | | | | 220,103 | |
| | | | | |
Brazil 1.5% | | | | | | | | | | | | | | | | |
| | | | | |
Brazil Minas SPE via State of Minas Gerais, | | | | | | | | | | | | | | | | |
Gov’t. Gtd. Notes | | 5.333 | | 02/15/28 | | | | | | | 676 | | | | 675,768 | |
| | | | | |
Bulgaria 0.4% | | | | | | | | | | | | | | | | |
| | | | | |
Bulgaria Government International Bond, | | | | | | | | | | | | | | | | |
Sr. Unsec’d. Notes, GMTN | | 3.125 | | 03/26/35 | | | EUR | | | | 100 | | | | 104,424 | |
Sr. Unsec’d. Notes, Series 30Y | | 1.375 | | 09/23/50 | | | EUR | | | | 100 | | | | 65,401 | |
| | | | | | | | | | | | | | | | |
| | | | | |
| | | | | | | | | | | | | | | 169,825 | |
| | | | | |
Chile 0.2% | | | | | | | | | | | | | | | | |
| | | | | |
Chile Government International Bond, | | | | | | | | | | | | | | | | |
Sr. Unsec’d. Notes | | 1.440 | | 02/01/29 | | | EUR | | | | 115 | | | | 116,374 | |
| | | | | |
China 0.9% | | | | | | | | | | | | | | | | |
| | | | | |
China Government Bond, | | | | | | | | | | | | | | | | |
Sr. Unsec’d. Notes | | 3.950 | | 06/29/43 | | | CNH | | | | 1,500 | | | | 247,311 | |
Sr. Unsec’d. Notes | | 4.000 | | 11/30/35 | | | CNH | | | | 500 | | | | 80,557 | |
Sr. Unsec’d. Notes | | 4.400 | | 12/12/46 | | | CNH | | | | 500 | | | | 89,304 | |
| | | | | | | | | | | | | | | | |
| | | | | |
| | | | | | | | | | | | | | | 417,172 | |
| | | | | |
Colombia 1.4% | | | | | | | | | | | | | | | | |
| | | | | |
Colombia Government International Bond, | | | | | | | | | | | | | | | | |
Sr. Unsec’d. Notes | | 3.000 | | 01/30/30 | | | | | | | 200 | | | | 166,300 | |
Sr. Unsec’d. Notes | | 9.850 | | 06/28/27 | | | COP | | | | 200,000 | | | | 44,001 | |
Sr. Unsec’d. Notes, EMTN | | 3.875 | | 03/22/26 | | | EUR | | | | 400 | | | | 434,199 | |
| | | | | | | | | | | | | | | | |
| | | | | |
| | | | | | | | | | | | | | | 644,500 | |
See Notes to Financial Statements.
PGIM Global Total Return (USD Hedged) Fund 129
PGIM Global Total Return (USD Hedged) Fund
Schedule of Investments (continued)
as of October 31, 2024
| | | | | | | | | | | | | | | | |
| | | | |
| Description | | Interest Rate | | Maturity Date | | Principal Amount (000)# | | | Value | |
| | | | | |
SOVEREIGN BONDS (Continued) | | | | | | | | | | | | | | | | |
| | | | | |
Croatia 0.4% | | | | | | | | | | | | | | | | |
| | | | | |
Croatia Government International Bond, | | | | | | | | | | | | | | | | |
Sr. Unsec’d. Notes | | 1.125% | | 03/04/33 | | | EUR | | | | 200 | | | $ | 187,025 | |
| | | | | |
Cyprus 0.6% | | | | | | | | | | | | | | | | |
| | | | | |
Cyprus Government International Bond, | | | | | | | | | | | | | | | | |
Sr. Unsec’d. Notes, EMTN | | 1.250 | | 01/21/40 | | | EUR | | | | 20 | | | | 15,898 | |
Sr. Unsec’d. Notes, EMTN | | 2.750 | | 02/26/34 | | | EUR | | | | 200 | | | | 211,224 | |
Sr. Unsec’d. Notes, EMTN | | 2.750 | | 05/03/49 | | | EUR | | | | 30 | | | | 28,152 | |
| | | | | | | | | | | | | | | | |
| | | | | |
| | | | | | | | | | | | | | | 255,274 | |
| | | | | |
France 0.3% | | | | | | | | | | | | | | | | |
| | | | | |
Caisse Francaise de Financement Local SA, Covered Bonds, EMTN | | 4.680 | | 03/09/29 | | | CAD | | | | 200 | | | | 148,746 | |
| | | | | |
Greece 2.9% | | | | | | | | | | | | | | | | |
| | | | | |
Hellenic Republic Government Bond, | | | | | | | | | | | | | | | | |
Bonds | | 4.300 | | 02/24/25 | | | EUR | | | | 13 | | | | 13,609 | |
Bonds | | 4.300 | | 02/24/26 | | | EUR | | | | 34 | | | | 35,880 | |
Bonds | | 4.300 | | 02/24/27 | | | EUR | | | | 145 | | | | 154,287 | |
Bonds | | 4.300 | | 02/24/28 | | | EUR | | | | 42 | | | | 44,954 | |
Bonds | | 4.300 | | 02/24/29 | | | EUR | | | | 25 | | | | 27,846 | |
Bonds | | 4.300 | | 02/24/30 | | | EUR | | | | 10 | | | | 10,605 | |
Bonds | | 4.300 | | 02/24/31 | | | EUR | | | | 23 | | | | 24,215 | |
Bonds | | 4.300 | | 02/24/32 | | | EUR | | | | 24 | | | | 25,119 | |
Bonds | | 4.300 | | 02/24/33 | | | EUR | | | | 46 | | | | 47,764 | |
Bonds | | 4.300 | | 02/24/34 | | | EUR | | | | 22 | | | | 22,788 | |
Bonds | | 4.300 | | 02/24/35 | | | EUR | | | | 33 | | | | 33,624 | |
Bonds | | 4.300 | | 02/24/36 | | | EUR | | | | 24 | | | | 24,251 | |
Bonds | | 4.300 | | 02/24/37 | | | EUR | | | | 16 | | | | 15,918 | |
Bonds | | 4.300 | | 02/24/38 | | | EUR | | | | 15 | | | | 14,852 | |
Bonds | | 4.300 | | 02/24/39 | | | EUR | | | | 23 | | | | 22,537 | |
Bonds | | 4.300 | | 02/24/40 | | | EUR | | | | 23 | | | | 25,807 | |
Bonds | | 4.300 | | 02/24/41 | | | EUR | | | | 23 | | | | 25,792 | |
Bonds | | 4.300 | | 02/24/42 | | | EUR | | | | 37 | | | | 41,524 | |
Sr. Unsec’d. Notes, 144A | | 1.875 | | 02/04/35 | | | EUR | | | | 600 | | | | 568,825 | |
Sr. Unsec’d. Notes, 144A | | 4.375 | | 07/18/38 | | | EUR | | | | 85 | | | | 99,433 | |
See Notes to Financial Statements.
130
PGIM Global Total Return (USD Hedged) Fund
Schedule of Investments (continued)
as of October 31, 2024
| | | | | | | | | | | | | | | | |
| | | | |
| Description | | Interest Rate | | Maturity Date | | Principal Amount (000)# | | | Value | |
| | | | | |
SOVEREIGN BONDS (Continued) | | | | | | | | | | | | | | | | |
| | | | | |
Greece (cont’d.) | | | | | | | | | | | | | | | | |
| | | | | |
Hellenic Republic Government International Bond, | | | | | | | | | | | | | | | | |
Sr. Unsec’d. Notes | | 5.200% | | 07/17/34 | | | EUR | | | | 55 | | | $ | 66,501 | |
| | | | | | | | | | | | | | | | |
| | | | | |
| | | | | | | | | | | | | | | 1,346,131 | |
| | | | | |
Hong Kong 0.3% | | | | | | | | | | | | | | | | |
| | | | | |
Hong Kong Government International Bond, | | | | | | | | | | | | | | | | |
Sr. Unsec’d. Notes, GMTN | | 1.000 | | 11/24/41 | | | EUR | | | | 200 | | | | 149,566 | |
| | | | | |
Hungary 0.8% | | | | | | | | | | | | | | | | |
| | | | | |
Hungary Government International Bond, | | | | | | | | | | | | | | | | |
Sr. Unsec’d. Notes | | 2.125 | | 09/22/31 | | | | | | | 200 | | | | 160,250 | |
Sr. Unsec’d. Notes, Series 15Y | | 1.750 | | 06/05/35 | | | EUR | | | | 100 | | | | 84,301 | |
Magyar Export-Import Bank Zrt, | | | | | | | | | | | | | | | | |
Gov’t. Gtd. Notes | | 6.000 | | 05/16/29 | | | EUR | | | | 100 | | | | 116,627 | |
| | | | | | | | | | | | | | | | |
| | | | | |
| | | | | | | | | | | | | | | 361,178 | |
| | | | | |
Indonesia 1.7% | | | | | | | | | | | | | | | | |
| | | | | |
Indonesia Government International Bond, | | | | | | | | | | | | | | | | |
Sr. Unsec’d. Notes | | 1.100 | | 03/12/33 | | | EUR | | | | 200 | | | | 178,323 | |
Sr. Unsec’d. Notes | | 1.300 | | 03/23/34 | | | EUR | | | | 200 | | | | 176,760 | |
Sr. Unsec’d. Notes | | 3.650 | | 09/10/32 | | | EUR | | | | 200 | | | | 216,462 | |
Sr. Unsec’d. Notes, EMTN | | 3.750 | | 06/14/28 | | | EUR | | | | 200 | | | | 220,745 | |
| | | | | | | | | | | | | | | | |
| | | | | |
| | | | | | | | | | | | | | | 792,290 | |
| | | | | |
Israel 0.8% | | | | | | | | | | | | | | | | |
| | | | | |
Israel Government International Bond, | | | | | | | | | | | | | | | | |
Sr. Unsec’d. Notes, EMTN | | 1.500 | | 01/18/27 | | | EUR | | | | 100 | | | | 102,390 | |
Sr. Unsec’d. Notes, EMTN | | 1.500 | | 01/16/29 | | | EUR | | | | 270 | | | | 263,557 | |
| | | | | | | | | | | | | | | | |
| | | | | |
| | | | | | | | | | | | | | | 365,947 | |
| | | | | |
Italy 3.2% | | | | | | | | | | | | | | | | |
| | | | | |
Italy Buoni Poliennali Del Tesoro, | | | | | | | | | | | | | | | | |
Sr. Unsec’d. Notes, Series 21Y, 144A | | 1.800 | | 03/01/41 | | | EUR | | | | 500 | | | | 404,246 | |
Sr. Unsec’d. Notes, Series 50Y, 144A | | 2.800 | | 03/01/67 | | | EUR | | | | 105 | | | | 86,592 | |
Region of Lazio, | | | | | | | | | | | | | | | | |
Sr. Unsec’d. Notes | | 3.088 | | 03/31/43 | | | EUR | | | | 160 | | | | 158,542 | |
See Notes to Financial Statements.
PGIM Global Total Return (USD Hedged) Fund 131
PGIM Global Total Return (USD Hedged) Fund
Schedule of Investments (continued)
as of October 31, 2024
| | | | | | | | | | | | | | | | | | | | |
| | | | |
| Description | | Interest
Rate | | | Maturity
Date | | | Principal Amount (000)# | | | Value | |
| | | | | |
SOVEREIGN BONDS (Continued) | | | | | | | | | | | | | | | | | | | | |
| | | | | |
Italy (cont’d.) | | | | | | | | | | | | | | | | | | | | |
| | | | | |
Repubic of Italy Government International Bond | | | | | | | | | | | | | | | | | | | | |
Coupon Strips, | | | | | | | | | | | | | | | | | | | | |
Sr. Unsec’d. Notes | | | 1.737%(s) | | | | 02/20/31 | | | | EUR | | | | 85 | | | $ | 74,844 | |
Republic of Italy Government International Bond, | | | | | | | | | | | | | | | | | | | | |
Sr. Unsec’d. Notes, EMTN | | | 5.200 | | | | 07/31/34 | | | | EUR | | | | 300 | | | | 360,257 | |
Sr. Unsec’d. Notes, EMTN | | | 5.345 | | | | 01/27/48 | | | | EUR | | | | 50 | | | | 59,496 | |
Sr. Unsec’d. Notes, EMTN | | | 6.000 | | | | 08/04/28 | | | | GBP | | | | 100 | | | | 130,775 | |
Sr. Unsec’d. Notes, Series 10Y | | | 2.875 | | | | 10/17/29 | | | | | | | | 200 | | | | 182,897 | |
| | | | | | | | | | | | | | | | | | | | |
| | | | | |
| | | | | | | | | | | | | | | | | | | 1,457,649 | |
| | | | | |
Latvia 0.4% | | | | | | | | | | | | | | | | | | | | |
| | | | | |
Latvia Government International Bond, | | | | | | | | | | | | | | | | | | | | |
Sr. Unsec’d. Notes, GMTN | | | 0.250 | | | | 01/23/30 | | | | EUR | | | | 200 | | | | 188,433 | |
| | | | | |
Lithuania 0.4% | | | | | | | | | | | | | | | | | | | | |
| | | | | |
Lithuania Government International Bond, | | | | | | | | | | | | | | | | | | | | |
Sr. Unsec’d. Notes, EMTN | | | 2.125 | | | | 10/22/35 | | | | EUR | | | | 200 | | | | 192,124 | |
| | | | | |
Mexico 0.6% | | | | | | | | | | | | | | | | | | | | |
| | | | | |
Mexico Government International Bond, | | | | | | | | | | | | | | | | | | | | |
Sr. Unsec’d. Notes | | | 2.375 | | | | 02/11/30 | | | | EUR | | | | 100 | | | | 99,665 | |
Sr. Unsec’d. Notes | | | 2.875 | | | | 04/08/39 | | | | EUR | | | | 200 | | | | 171,661 | |
| | | | | | | | | | | | | | | | | | | | |
| | | | | |
| | | | | | | | | | | | | | | | | | | 271,326 | |
| | | | | |
Panama 0.8% | | | | | | | | | | | | | | | | | | | | |
| | | | | |
Panama Government International Bond, | | | | | | | | | | | | | | | | | | | | |
Sr. Unsec’d. Notes | | | 3.160 | | | | 01/23/30 | | | | | | | | 200 | | | | 172,012 | |
Sr. Unsec’d. Notes | | | 3.875 | | | | 03/17/28 | | | | | | | | 200 | | | | 187,700 | |
| | | | | | | | | | | | | | | | | | | | |
| | | | | |
| | | | | | | | | | | | | | | | | | | 359,712 | |
| | | | | |
Peru 0.2% | | | | | | | | | | | | | | | | | | | | |
| | | | | |
Peruvian Government International Bond, | | | | | | | | | | | | | | | | | | | | |
Sr. Unsec’d. Notes | | | 1.250 | | | | 03/11/33 | | | | EUR | | | | 105 | | | | 92,406 | |
| | | | | |
Philippines 0.6% | | | | | | | | | | | | | | | | | | | | |
| | | | | |
Philippine Government International Bond, | | | | | | | | | | | | | | | | | | | | |
Sr. Unsec’d. Notes | | | 0.700 | | | | 02/03/29 | | | | EUR | | | | 300 | | | | 291,959 | |
See Notes to Financial Statements.
132
PGIM Global Total Return (USD Hedged) Fund
Schedule of Investments (continued)
as of October 31, 2024
| | | | | | | | | | | | | | | | | | | | |
| | | | |
| Description | | Interest Rate | | | Maturity Date | | | Principal Amount (000)# | | | Value | |
| | | | | |
SOVEREIGN BONDS (Continued) | | | | | | | | | | | | | | | | | | | | |
| | | | | |
Romania 0.8% | | | | | | | | | | | | | | | | | | | | |
| | | | | |
Romanian Government International Bond, | | | | | | | | | | | | | | | | | | | | |
Sr. Unsec’d. Notes, 144A, MTN | | | 2.124% | | | | 07/16/31 | | | | EUR | | | | 50 | | | $ | 45,498 | |
Sr. Unsec’d. Notes, 144A, MTN | | | 2.125 | | | | 03/07/28 | | | | EUR | | | | 80 | | | | 81,431 | |
Sr. Unsec’d. Notes, EMTN | | | 1.750 | | | | 07/13/30 | | | | EUR | | | | 150 | | | | 138,943 | |
Sr. Unsec’d. Notes, EMTN | | | 3.875 | | | | 10/29/35 | | | | EUR | | | | 100 | | | | 92,391 | |
| | | | | | | | | | | | | | | | | | | | |
| | | | | |
| | | | | | | | | | | | | | | | | | | 358,263 | |
| | | | | |
Saudi Arabia 0.6% | | | | | | | | | | | | | | | | | | | | |
| | | | | |
Saudi Government International Bond, | | | | | | | | | | | | | | | | | | | | |
Sr. Unsec’d. Notes | | | 2.000 | | | | 07/09/39 | | | | EUR | | | | 325 | | | | 273,425 | |
| | | | | |
Serbia 0.7% | | | | | | | | | | | | | | | | | | | | |
| | | | | |
Serbia International Bond, | | | | | | | | | | | | | | | | | | | | |
Sr. Unsec’d. Notes | | | 1.650 | | | | 03/03/33 | | | | EUR | | | | 100 | | | | 86,816 | |
Sr. Unsec’d. Notes, EMTN | | | 2.050 | | | | 09/23/36 | | | | EUR | | | | 300 | | | | 245,152 | |
| | | | | | | | | | | | | | | | | | | | |
| | | | | |
| | | | | | | | | | | | | | | | | | | 331,968 | |
| | | | | |
Slovakia 0.3% | | | | | | | | | | | | | | | | | | | | |
| | | | | |
Slovakia Government Bond, | | | | | | | | | | | | | | | | | | | | |
Unsec’d. Notes, Series 242 | | | 0.375 | | | | 04/21/36 | | | | EUR | | | | 200 | | | | 152,013 | |
| | | | | |
Spain 1.7% | | | | | | | | | | | | | | | | | | | | |
| | | | | |
Autonomous Community of Catalonia, | | | | | | | | | | | | | | | | | | | | |
Sr. Unsec’d. Notes | | | 4.220 | | | | 04/26/35 | | | | EUR | | | | 100 | | | | 110,885 | |
Sr. Unsec’d. Notes, EMTN | | | 5.900 | | | | 05/28/30 | | | | EUR | | | | 50 | | | | 59,497 | |
Spain Government Bond, | | | | | | | | | | | | | | | | | | | | |
Sr. Unsec’d. Notes, 144A | | | 1.000 | | | | 10/31/50 | | | | EUR | | | | 190 | | | | 117,036 | |
Sr. Unsec’d. Notes, 144A | | | 3.450 | | | | 07/30/43 | | | | EUR | | | | 300 | | | | 320,788 | |
Sr. Unsec’d. Notes, 144A | | | 3.450 | | | | 07/30/66 | | | | EUR | | | | 60 | | | | 60,986 | |
Spain Government International Bond, | | | | | | | | | | | | | | | | | | | | |
Sr. Unsec’d. Notes, EMTN | | | 5.250 | | | | 04/06/29 | | | | GBP | | | | 100 | | | | 130,330 | |
| | | | | | | | | | | | | | | | | | | | |
| | | | | |
| | | | | | | | | | | | | | | | | | | 799,522 | |
| | | | | |
United Arab Emirates 0.2% | | | | | | | | | | | | | | | | | | | | |
| | | | | |
Finance Department Government of Sharjah, | | | | | | | | | | | | | | | | | | | | |
Sr. Unsec’d. Notes, 144A, MTN | | | 4.625 | | | | 01/17/31 | | | | EUR | | | | 100 | | | | 108,945 | |
See Notes to Financial Statements.
PGIM Global Total Return (USD Hedged) Fund 133
PGIM Global Total Return (USD Hedged) Fund
Schedule of Investments (continued)
as of October 31, 2024
| | | | | | | | | | | | | | | | | | | | |
| | | | |
| Description | | Interest
Rate | | | Maturity
Date | | | Principal Amount (000)# | | | Value | |
| | | | | |
SOVEREIGN BONDS (Continued) | | | | | | | | | | | | | | | | | | | | |
| | | | | |
United Kingdom 0.6% | | | | | | | | | | | | | | | | | | | | |
| | | | | |
Isle of Man Government International Bond, | | | | | | | | | | | | | | | | | | | | |
Unsec’d. Notes | | | 5.375% | | | | 08/14/34 | | | | GBP | | | | 100 | | | $ | 129,172 | |
Unsec’d. Notes | | | 5.625 | | | | 03/29/30 | | | | GBP | | | | 100 | | | | 133,052 | |
| | | | | | | | | | | | | | | | | | | | |
| | | | | |
| | | | | | | | | | | | | | | | | | | 262,224 | |
| | | | | | | | | | | | | | | | | | | | |
| | | | | |
TOTAL SOVEREIGN BONDS | | | | | | | | | | | | | | | | | | | | |
(cost $12,759,225) | | | | | | | | | | | | | | | | | | | 11,180,256 | |
| | | | | | | | | | | | | | | | | | | | |
| | | | | |
U.S. GOVERNMENT AGENCY OBLIGATION 0.0% | | | | | | | | | | | | | | | | | | | | |
Federal Home Loan Bank | | | | | | | | | | | | | | | | | | | | |
(cost $12,037) | | | 3.280 | | | | 03/28/29 | | | | | | | | 13 | | | | 12,031 | |
| | | | | | | | | | | | | | | | | | | | |
| | | | | |
U.S. TREASURY OBLIGATIONS 2.5% | | | | | | | | | | | | | | | | | | | | |
U.S. Treasury Bonds(k) | | | 3.000 | | | | 02/15/47 | | | | | | | | 70 | | | | 54,097 | |
U.S. Treasury Notes(k) | | | 1.125 | | | | 02/15/31 | | | | | | | | 345 | | | | 287,455 | |
U.S. Treasury Notes | | | 3.500 | | | | 09/30/29 | | | | | | | | 290 | | | | 281,730 | |
U.S. Treasury Notes(k) | | | 4.875 | | | | 04/30/26 | | | | | | | | 530 | | | | 534,969 | |
| | | | | | | | | | | | | | | | | | | | |
| | | | | |
TOTAL U.S. TREASURY OBLIGATIONS | | | | | | | | | | | | | | | | | | | | |
(cost $1,202,499) | | | | | | | | | | | | | | | | | | | 1,158,251 | |
| | | | | | | | | | | | | | | | | | | | |
| | | | | |
| | | | | | | | | | | | Shares | | | | |
| | | | | |
AFFILIATED EXCHANGE-TRADED FUND 4.6% | | | | | | | | | | | | | | | | | | | | |
| | | | | |
United States | | | | | | | | | | | | | | | | | | | | |
| | | | | |
PGIM AAA CLO ETF | | | | | | | | | | | | | | | | | | | | |
(cost $2,081,766)(wa) | | | | | | | | | | | | | | | 40,859 | | | | 2,095,249 | |
| | | | | | | | | | | | | | | | | | | | |
| | | | | |
COMMON STOCK 0.1% | | | | | | | | | | | | | | | | | | | | |
| | | | | |
Jamaica | | | | | | | | | | | | | | | | | | | | |
| | | | | |
Digicel International Finance Ltd. | | | | | | | | | | | | | | | | | | | | |
(original cost $12,001; purchased 01/29/24 - 02/08/24)*^(f)
(cost $12,001) | | | | | | | | | | | | | | | 9,900 | | | | 24,849 | |
| | | | | | | | | | | | | | | | | | | | |
See Notes to Financial Statements.
134
PGIM Global Total Return (USD Hedged) Fund
Schedule of Investments (continued)
as of October 31, 2024
| | | | | | | | |
| | |
| Description | | Shares | | | Value | |
| | |
PREFERRED STOCK 0.0% | | | | | | | | |
| | |
Jamaica | | | | | | | | |
| | |
Digicel International Finance Ltd. | | | | | | | | |
(original cost $6,340; purchased 01/26/24 - 01/29/24)*^(f) (cost $6,340) | | | 1,051 | | | $ | 11,461 | |
| | | | | | | | |
| | |
TOTAL LONG-TERM INVESTMENTS | | | | | | | | |
(cost $47,257,753) | | | | | | | 44,343,768 | |
| | | | | | | | |
| | |
SHORT-TERM INVESTMENTS 2.5% | | | | | | | | |
| | |
AFFILIATED MUTUAL FUND 2.5% | | | | | | | | |
PGIM Core Government Money Market Fund (7-day effective yield 5.011%) (cost $1,154,597)(wa) | | | 1,154,597 | | | | 1,154,597 | |
| | | | | | | | |
| | |
OPTIONS PURCHASED*~ 0.0% | | | | | | | | |
(cost $2,605) | | | | | | | 6,749 | |
| | | | | | | | |
| | |
TOTAL SHORT-TERM INVESTMENTS | | | | | | | | |
(cost $1,157,202) | | | | | | | 1,161,346 | |
| | | | | | | | |
| | |
TOTAL INVESTMENTS, BEFORE OPTIONS WRITTEN 98.5% | | | | | | | | |
(cost $48,414,955) | | | | | | | 45,505,114 | |
| | | | | | | | |
| | |
OPTIONS WRITTEN*~ (0.0)% | | | | | | | | |
(premiums received $689) | | | | | | | (4,546 | ) |
| | | | | | | | |
| | |
TOTAL INVESTMENTS, NET OF OPTIONS WRITTEN 98.5% | | | | | | | | |
(cost $48,414,266) | | | | | | | 45,500,568 | |
Other assets in excess of liabilities(z) 1.5% | | | | 709,469 | |
| | | | | | | | |
| | |
NET ASSETS 100.0% | | | | | | $ | 46,210,037 | |
| | | | | | | | |
See the Glossary for a list of the abbreviation(s) used in the annual report.
| * | Non-income producing security. |
| # | Principal or notional amount is shown in U.S. dollars unless otherwise stated. |
| ~ | See tables subsequent to the Schedule of Investments for options detail. Options with maturity dates greater than one year from date of acquisition would be considered long-term investments. |
| ^ | Indicates a Level 3 instrument. The aggregate value of Level 3 instruments is $72,408 and 0.2% of net assets. |
| (c) | Variable rate instrument. The interest rate shown reflects the rate in effect at October 31, 2024. |
| (cc) | Variable rate instrument. The rate shown is based on the latest available information as of October 31, 2024. Certain variable rate securities are not based on a published reference rate and spread but are determined by the issuer or agent and are based on current market conditions. These securities do not indicate a reference rate and spread in their description. |
| (d) | Represents issuer in default on interest payments and/or principal repayment. Non-income producing security. Such securities may be post-maturity. |
See Notes to Financial Statements.
PGIM Global Total Return (USD Hedged) Fund 135
PGIM Global Total Return (USD Hedged) Fund
Schedule of Investments (continued)
as of October 31, 2024
| (f) | Indicates a restricted security that is acquired in unregistered, private sales from the issuing company or from an affiliate of the issuer and is considered restricted as to disposition under federal securities law; the aggregate original cost of such securities is $266,249. The aggregate value of $250,270 is 0.5% of net assets. |
| (ff) | Variable rate security. Security may be issued at a fixed coupon rate, which converts to a variable rate at a specified date. Rate shown is the rate in effect as of period end. |
| (k) | Represents security, or a portion thereof, segregated as collateral for centrally cleared/exchange-traded derivatives. |
| (oo) | Perpetual security. Maturity date represents next call date. |
| (r) | Principal or notional amount is less than $500 par. |
| (s) | Represents zero coupon bond or principal only security. Rate represents yield to maturity at purchase date. |
| (wa) | Represents investments in Funds affiliated with the Manager. |
| (z) | Includes net unrealized appreciation/(depreciation) and/or market value of the below holdings which are excluded from the Schedule of Investments: |
Options Purchased:
OTC Traded
| | | | | | | | | | | | | | | | | | | | | | | | | | |
Description | | Call/
Put | | Counterparty | | | Expiration
Date | | | Strike | | | Contracts | | | Notional
Amount
(000)# | | Value | |
| | | | | | | |
2-Year 10 CMS Curve CAP | | Call | | | JPM | | | | 01/02/25 | | | | 0.19% | | | | — | | | | 1,780 | | | $ | 620 | |
2-Year 10 CMS Curve CAP | | Call | | | JPM | | | | 01/21/25 | | | | 0.13% | | | | — | | | | 1,190 | | | | 758 | |
| | | | | | | | | | | | | | | | | | | | | | | | | | |
| | | | | | |
Total OTC Traded (cost $2,605) | | | | | | | | | | | | | | | | | | | | | | $ | 1,378 | |
| | | | | | | | | | | | | | | | | | | | | | | | | | |
OTC Swaptions
| | | | | | | | | | | | | | | | | | | | | | | | | | |
Description | | Call/
Put | | Counterparty | | Expiration
Date | | Strike | | | Receive | | | Pay | | | Notional
Amount
(000)# | | Value | |
| | | | | | | | |
2-Year Interest Rate Swap, 01/08/27 | | Call | | CITI | | 01/06/25 | | | 2.83% | | | | 2.83%(A) | | |
| 1 Day SOFR(A)/
4.900% |
| | | 1,900 | | | $ | 725 | |
2-Year Interest Rate Swap, 11/13/26 | | Call | | JPM | | 11/08/24 | | | 3.44% | | | | 3.44%(A) | | |
| 1 Day SOFR(A)/
4.900% |
| | | 1,900 | | | | 43 | |
2-Year Interest Rate Swap, 11/13/26 | | Put | | JPM | | 11/08/24 | | | 3.84% | | |
| 1 Day SOFR(A)/
4.900% |
| | | 3.84%(A) | | | | 1,900 | | | | 4,603 | |
| | | | | | | | | | | | | | | | | | | | | | | | | | |
| | | | | |
Total OTC Swaptions (cost $0) | | | | | | | | | | | | | | | | | | $ | 5,371 | |
| | | | | | | | | | | | | | | | | | | | | | | | | | |
| | | | | |
Total Options Purchased (cost $2,605) | | | | | | | | | | | | | | | | | | $ | 6,749 | |
| | | | | | | | | | | | | | | | | | | | | | | | | | |
See Notes to Financial Statements.
136
PGIM Global Total Return (USD Hedged) Fund
Schedule of Investments (continued)
as of October 31, 2024
Options Written:
OTC Traded
| | | | | | | | | | | | | | | | | | | | | | | | | | | | |
Description | | Call/
Put | | | Counterparty | | | Expiration
Date | | | Strike | | | Contracts | | | Notional
Amount
(000)# | | | Value | |
| | | | | | | |
2-Year 10 CMS Curve CAP | | | Call | | | | JPM | | | | 01/02/25 | | | | 0.49% | | | | — | | | | 1,780 | | | $ | (112 | ) |
2-Year 10 CMS Curve CAP | | | Call | | | | JPM | | | | 01/21/25 | | | | 0.43% | | | | — | | | | 1,190 | | | | (189 | ) |
| | | | | | | | | | | | | | | | | | | | | | | | | | | | |
| | | | | | | |
Total OTC Traded (premiums received $689) | | | | | | | | | | | | | | | | | | | | | | | | | | $ | (301 | ) |
| | | | | | | | | | | | | | | | | | | | | | | | | | | | |
OTC Swaptions
| | | | | | | | | | | | | | | | | | | | | | |
Description | | Call/
Put | | Counterparty | | Expiration
Date | | Strike | | | Receive | | Pay | | Notional
Amount
(000)# | | | Value | |
| | | | | | | | |
2-Year Interest Rate Swap, 01/08/27 | | Call | | CITI | | 01/06/25 | | | 2.52% | | | 1 Day SOFR(A)/4.900% | | 2.52%(A) | | | 3,800 | | | $ | (663 | ) |
2-Year Interest Rate Swap, 11/13/26 | | Call | | JPM | | 11/08/24 | | | 3.24% | | | 1 Day SOFR(A)/4.900% | | 3.24%(A) | | | 3,800 | | | | (8 | ) |
2-Year Interest Rate Swap, 11/13/26 | | Put | | JPM | | 11/08/24 | | | 3.99% | | | 3.99%(A) | | 1 Day SOFR(A)/4.900% | | | 3,800 | | | | (3,574 | ) |
| | | | | | | | | | | | | | | | | | | | | | |
| | | | | |
Total OTC Swaptions (premiums received $0) | | | | | | | | | | | | | | $ | (4,245 | ) |
| | | | | | | | | | | | | | | | | | | | | | |
| | | | | |
Total Options Written (premiums received $689) | | | | | | | | | | | | | | $ | (4,546 | ) |
| | | | | | | | | | | | | | | | | | | | | | |
Futures contracts outstanding at October 31, 2024:
| | | | | | | | | | | | | | | | | | |
Number of Contracts | | | Type | | Expiration
Date | | | Current
Notional
Amount | | | Value /
Unrealized
Appreciation
(Depreciation) |
| | | | |
| Long Positions: | | | | | | | | | | | |
| | 57 | | | 2 Year U.S. Treasury Notes | | | Dec. 2024 | | | $ | 11,738,883 | | | $ | (100,461 | ) | | |
| | 21 | | | 5 Year U.S. Treasury Notes | | | Dec. 2024 | | | | 2,251,922 | | | | (24,602 | ) | | |
| | 3 | | | 10 Year Mini Japanese Government Bonds | | | Dec. 2024 | | | | 284,343 | | | | (436 | ) | | |
| | 2 | | | 10 Year U.S. Treasury Notes | | | Dec. 2024 | | | | 220,938 | | | | (1,190 | ) | | |
| | 5 | | | 10 Year U.S. Ultra Treasury Notes | | | Dec. 2024 | | | | 568,750 | | | | (17,364 | ) | | |
| | 12 | | | 20 Year U.S. Treasury Bonds | | | Dec. 2024 | | | | 1,415,625 | | | | (64,822 | ) | | |
| | 4 | | | Euro Schatz Index | | | Dec. 2024 | | | | 463,556 | | | | (1,091 | ) | | |
| | 8 | | | Euro-OAT | | | Dec. 2024 | | | | 1,084,791 | | | | (14,104 | ) | | |
| | | | | | | | | | | | | | | | | | |
| | | | | |
| | | | | | | | | | | | | | | (224,070 | ) | | |
| | | | | | | | | | | | | | | | | | |
| | | | |
| Short Positions: | | | | | | | | | | | |
| | 31 | | | 3 Month CME SOFR | | | Dec. 2024 | | | | 7,379,938 | | | | (10,132 | ) | | |
| | 9 | | | 3 Month CME SOFR | | | Mar. 2025 | | | | 2,151,450 | | | | 11,875 | | | |
See Notes to Financial Statements.
PGIM Global Total Return (USD Hedged) Fund 137
PGIM Global Total Return (USD Hedged) Fund
Schedule of Investments (continued)
as of October 31, 2024
Futures contracts outstanding at October 31, 2024 (continued):
| | | | | | | | | | | | | | | | |
Number of Contracts | | | Type | | Expiration Date | | Current
Notional
Amount | | | Value /
Unrealized
Appreciation
(Depreciation) |
| | | | |
| Short Positions (cont’d): | | | | | | | | | | |
| | 9 | | | 3 Month CME SOFR | | Jun. 2025 | | $ | 2,158,538 | | | $ | 11,498 | | | |
| | 21 | | | 3 Month CME SOFR | | Sep. 2025 | | | 5,048,138 | | | | 9,057 | | | |
| | 21 | | | 3 Month CME SOFR | | Dec. 2025 | | | 5,054,700 | | | | 8,991 | | | |
| | 6 | | | 3 Month CME SOFR | | Mar. 2026 | | | 1,445,100 | | | | (8,036 | ) | | |
| | 6 | | | 3 Month CME SOFR | | Jun. 2026 | | | 1,445,475 | | | | (7,207 | ) | | |
| | 12 | | | 5 Year Euro-Bobl | | Dec. 2024 | | | 1,542,212 | | | | 16,230 | | | |
| | 34 | | | 10 Year Euro-Bund | | Dec. 2024 | | | 4,874,425 | | | | 80,188 | | | |
| | 3 | | | 30 Year U.S. Ultra Treasury Bonds | | Dec. 2024 | | | 376,875 | | | | 3,498 | | | |
| | 4 | | | British Pound Currency | | Dec. 2024 | | | 322,025 | | | | 7,204 | | | |
| | 29 | | | Euro Currency | | Dec. 2024 | | | 3,947,625 | | | | 77,315 | | | |
| | | | | | | | | | | | | | | | |
| | | | | |
| | | | | | | | | | | | | 200,481 | | | |
| | | | | | | | | | | | | | | | |
| | | | | |
| | | | | | | | | | | | $ | (23,589 | ) | | |
| | | | | | | | | | | | | | | | |
Forward foreign currency exchange contracts outstanding at October 31, 2024:
| | | | | | | | | | | | | | | | | | | | | | | | | | | | | | | | |
Purchase Contracts | | Counterparty | | | | | Notional
Amount
(000) | | | Value at
Settlement
Date | | | Current
Value | | | Unrealized
Appreciation | | | Unrealized
Depreciation |
| | | | | | | | |
OTC Forward Foreign Currency Exchange Contracts: | | | | | | | | | | | | | | | | | | | | | | | | | | | | | | |
Australian Dollar, | | | | | | | | | | | | | | | | | | | | | | | | | | | | | | | | |
Expiring 11/05/24 | | BOA | | | | | | | AUD | | | | 505 | | | $ | 335,175 | | | $ | 332,420 | | | $ | — | | | $ | (2,755 | ) | | |
British Pound, | | | | | | | | | | | | | | | | | | | | | | | | | | | | | | | | |
Expiring 11/05/24 | | BOA | | | | | | | GBP | | | | 32 | | | | 42,132 | | | | 41,540 | | | | — | | | | (592 | ) | | |
Expiring 11/05/24 | | CITI | | | | | | | GBP | | | | 1,207 | | | | 1,569,355 | | | | 1,556,847 | | | | — | | | | (12,508 | ) | | |
Expiring 11/05/24 | | HSBC | | | | | | | GBP | | | | 156 | | | | 204,840 | | | | 201,767 | | | | — | | | | (3,073 | ) | | |
Chinese Renminbi, | | | | | | | | | | | | | | | | | | | | | | | | | | | | | | | | |
Expiring 12/18/24 | | BOA | | | | | | | CNH | | | | 789 | | | | 112,096 | | | | 111,216 | | | | — | | | | (880 | ) | | |
Expiring 12/18/24 | | SSB | | | | | | | CNH | | | | 2,059 | | | | 291,605 | | | | 290,035 | | | | — | | | | (1,570 | ) | | |
Euro, | | | | | | | | | | | | | | | | | | | | | | | | | | | | | | | | |
Expiring 11/05/24 | | BOA | | | | | | | EUR | | | | 104 | | | | 114,321 | | | | 113,217 | | | | — | | | | (1,104 | ) | | |
Expiring 11/05/24 | | BOA | | | | | | | EUR | | | | 91 | | | | 100,244 | | | | 99,286 | | | | — | | | | (958 | ) | | |
Expiring 11/05/24 | | HSBC | | | | | | | EUR | | | | 955 | | | | 1,049,114 | | | | 1,038,919 | | | | — | | | | (10,195 | ) | | |
Expiring 11/05/24 | | HSBC | | | | | | | EUR | | | | 788 | | | | 866,150 | | | | 857,718 | | | | — | | | | (8,432 | ) | | |
Expiring 11/05/24 | | JPM | | | | | | | EUR | | | | 12,325 | | | | 13,337,284 | | | | 13,410,072 | | | | 72,788 | | | | — | | | |
Expiring 11/05/24 | | MSI | | | | | | | EUR | | | | 82 | | | | 88,919 | | | | 89,312 | | | | 393 | | | | — | | | |
Expiring 12/03/24 | | CITI | | | | | | | EUR | | | | 68 | | | | 73,459 | | | | 73,616 | | | | 157 | | | | — | | | |
Israeli Shekel, | | | | | | | | | | | | | | | | | | | | | | | | | | | | | | | | |
Expiring 12/18/24 | | JPM | | | | | | | ILS | | | | 209 | | | | 55,624 | | | | 55,998 | | | | 374 | | | | — | | | |
See Notes to Financial Statements.
138
PGIM Global Total Return (USD Hedged) Fund
Schedule of Investments (continued)
as of October 31, 2024
Forward foreign currency exchange contracts outstanding at October 31, 2024 (continued):
| | | | | | | | | | | | | | | | | | | | | | | | | | | | | | | | | | |
Purchase Contracts | | Counterparty | | | | Notional
Amount
(000) | | | Value at
Settlement
Date | | | Current
Value | | | Unrealized
Appreciation | | | Unrealized
Depreciation |
| | | | | | |
OTC Forward Foreign Currency Exchange Contracts (cont’d.): | | | | | | | | | | | | | | | | | | | | | | | |
Japanese Yen, | | | | | | | | | | | | | | | | | | | | | | | | | | | | | | | | | | |
Expiring 11/05/24 | | BOA | | | | | JPY | | | | 91,672 | | | $ | 603,714 | | | $ | 603,733 | | | | $ 19 | | | | | | | $ | — | | | |
Expiring 01/21/25 | | GSI | | | | | JPY | | | | 131,046 | | | | 889,189 | | | | 871,957 | | | | — | | | | | | | | (17,232 | ) | | |
Mexican Peso, | | | | | | | | | | | | | | | | | | | | | | | | | | | | | | | | | | |
Expiring 12/18/24 | | MSI | | | | | MXN | | | | 63 | | | | 3,113 | | | | 3,098 | | | | — | | | | | | | | (15 | ) | | |
Polish Zloty, | | | | | | | | | | | | | | | | | | | | | | | | | | | | | | | | | | |
Expiring 01/21/25 | | DB | | | | | PLN | | | | 280 | | | | 70,739 | | | | 69,798 | | | | — | | | | | | | | (941 | ) | | |
Singapore Dollar, | | | | | | | | | | | | | | | | | | | | | | | | | | | | | | | | | | |
Expiring 12/18/24 | | SSB | | | | | SGD | | | | 41 | | | | 31,343 | | | | 31,179 | | | | — | | | | | | | | (164 | ) | | |
South Korean Won, | | | | | | | | | | | | | | | | | | | | | | | | | | | | | | | | | | |
Expiring 12/18/24 | | MSI | | | | | KRW | | | | 48,032 | | | | 36,135 | | | | 35,005 | | | | — | | | | | | | | (1,130 | ) | | |
| | | | | | | | | | | | | | | | | | | | | | | | | | | | | | | | | | |
| | | | | | | | | | |
| | | | | | | | | | | | | | $ | 19,874,551 | | | $ | 19,886,733 | | | | 73,731 | | | | | | | | (61,549 | ) | | |
| | | | | | | | | | | | | | | | | | | | | | | | | | | | | | | | | | |
| | | | | | | |
Sale Contracts | | Counterparty | | | | Notional
Amount
(000) | | | Value at
Settlement
Date | | | Current
Value | | | Unrealized
Appreciation | | | Unrealized
Depreciation |
| | | | | | | |
OTC Forward Foreign Currency Exchange Contracts: | | | | | | | | | | | | | | | | | | | | | | | | | | | |
Australian Dollar, | | | | | | | | | | | | | | | | | | | | | | | | | | | | | | | | | | |
Expiring 11/05/24 | | DB | | | | | AUD | | | | 375 | | | $ | 258,227 | | | $ | 246,948 | | | | $ 11,279 | | | | | | | $ | — | | | |
Expiring 11/05/24 | | GSI | | | | | AUD | | | | 130 | | | | 90,145 | | | | 85,472 | | | | 4,673 | | | | | | | | — | | | |
Expiring 12/03/24 | | BOA | | | | | AUD | | | | 505 | | | | 335,271 | | | | 332,511 | | | | 2,760 | | | | | | | | — | | | |
British Pound, | | | | | | | | | | | | | | | | | | | | | | | | | | | | | | | | | | |
Expiring 11/05/24 | | HSBC | | | | | GBP | | | | 1,396 | | | | 1,868,782 | | | | 1,800,155 | | | | 68,627 | | | | | | | | — | | | |
Expiring 12/03/24 | | CITI | | | | | GBP | | | | 1,207 | | | | 1,569,304 | | | | 1,556,777 | | | | 12,527 | | | | | | | | — | | | |
Canadian Dollar, | | | | | | | | | | | | | | | | | | | | | | | | | | | | | | | | | | |
Expiring 01/21/25 | | HSBC | | | | | CAD | | | | 798 | | | | 580,032 | | | | 574,820 | | | | 5,212 | | | | | | | | — | | | |
Expiring 01/21/25 | | HSBC | | | | | CAD | | | | 199 | | | | 145,045 | | | | 143,447 | | | | 1,598 | | | | | | | | — | | | |
Chinese Renminbi, | | | | | | | | | | | | | | | | | | | | | | | | | | | | | | | | | | |
Expiring 12/18/24 | | MSI | | | | | CNH | | | | 10,071 | | | | 1,425,451 | | | | 1,418,735 | | | | 6,716 | | | | | | | | — | | | |
Colombian Peso, | | | | | | | | | | | | | | | | | | | | | | | | | | | | | | | | | | |
Expiring 12/18/24 | | CITI | | | | | COP | | | | 273,723 | | | | 62,918 | | | | 61,451 | | | | 1,467 | | | | | | | | — | | | |
Euro, | | | | | | | | | | | | | | | | | | | | | | | | | | | | | | | | | | |
Expiring 11/05/24 | | GSI | | | | | EUR | | | | 207 | | | | 231,677 | | | | 225,383 | | | | 6,294 | | | | | | | | — | | | |
Expiring 11/05/24 | | GSI | | | | | EUR | | | | 105 | | | | 117,507 | | | | 114,397 | | | | 3,110 | | | | | | | | — | | | |
Expiring 11/05/24 | | JPM | | | | | EUR | | | | 13,769 | | | | 15,404,516 | | | | 14,980,657 | | | | 423,859 | | | | | | | | — | | | |
Expiring 11/05/24 | | JPM | | | | | EUR | | | | 102 | | | | 112,665 | | | | 110,956 | | | | 1,709 | | | | | | | | — | | | |
Expiring 11/05/24 | | MSI | | | | | EUR | | | | 163 | | | | 180,428 | | | | 177,130 | | | | 3,298 | | | | | | | | — | | | |
Expiring 12/03/24 | | JPM | | | | | EUR | | | | 12,325 | | | | 13,352,690 | | | | 13,425,149 | | | | — | | | | | | | | (72,459 | ) | | |
Expiring 12/03/24 | | SCB | | | | | EUR | | | | 114 | | | | 123,287 | | | | 123,958 | | | | — | | | | | | | | (671 | ) | | |
See Notes to Financial Statements.
PGIM Global Total Return (USD Hedged) Fund 139
PGIM Global Total Return (USD Hedged) Fund
Schedule of Investments (continued)
as of October 31, 2024
Forward foreign currency exchange contracts outstanding at October 31, 2024 (continued):
| | | | | | | | | | | | | | | | | | | | | | | | | | | | | | | | | | | | | | | | |
Sale Contracts | | Counterparty | | | | | | Notional
Amount
(000) | | | Value at
Settlement
Date | | | Current
Value | | | Unrealized Appreciation | | Unrealized Depreciation |
| | | | | | |
OTC Forward Foreign Currency Exchange Contracts (cont’d.): | | | | | | | | | | | | | | | | | |
Israeli Shekel, | | | | | | | | | | | | | | | | | | | | | | | | | | | | | | | | | | | | | | | | |
Expiring 12/18/24 | | | CITI | | | | | | | | ILS | | | | 167 | | | $ | 44,556 | | | $ | 44,679 | | | | | $ | — | | | | | | | $ | (123 | ) | | |
Japanese Yen, | | | | | | | | | | | | | | | | | | | | | | | | | | | | | | | | | | | | | | | | |
Expiring 11/05/24 | | | MSI | | | | | | | | JPY | | | | 91,672 | | | | 641,751 | | | | 603,732 | | | | | | 38,019 | | | | | | | | — | | | |
Expiring 12/03/24 | | | BOA | | | | | | | | JPY | | | | 91,672 | | | | 605,905 | | | | 605,942 | | | | | | — | | | | | | | | (37 | ) | | |
Mexican Peso, | | | | | | | | | | | | | | | | | | | | | | | | | | | | | | | | | | | | | | | | |
Expiring 12/18/24 | | | BOA | | | | | | | | MXN | | | | 1,311 | | | | 67,739 | | | | 64,977 | | | | | | 2,762 | | | | | | | | — | | | |
Expiring 12/18/24 | | | GSI | | | | | | | | MXN | | | | 2,068 | | | | 102,404 | | | | 102,483 | | | | | | — | | | | | | | | (79 | ) | | |
Expiring 12/18/24 | | | JPM | | | | | | | | MXN | | | | 817 | | | | 40,795 | | | | 40,483 | | | | | | 312 | | | | | | | | — | | | |
Expiring 12/18/24 | | | MSI | | | | | | | | MXN | | | | 1,045 | | | | 53,635 | | | | 51,798 | | | | | | 1,837 | | | | | | | | — | | | |
Expiring 12/18/24 | | | MSI | | | | | | | | MXN | | | | 817 | | | | 40,326 | | | | 40,483 | | | | | | — | | | | | | | | (157 | ) | | |
Singapore Dollar, | | | | | | | | | | | | | | | | | | | | | | | | | | | | | | | | | | | | | | | | |
Expiring 12/18/24 | | | SCB | | | | | | | | SGD | | | | 41 | | | | 31,173 | | | | 30,748 | | | | | | 425 | | | | | | | | — | | | |
Swiss Franc, | | | | | | | | | | | | | | | | | | | | | | | | | | | | | | | | | | | | | | | | |
Expiring 01/21/25 | | | HSBC | | | | | | | | CHF | | | | 43 | | | | 50,893 | | | | 50,755 | | | | | | 138 | | | | | | | | — | | | |
| | | | | | | | | | | | | | | | | | | | | | | | | | | | | | | | | | | | | | | | |
| | | | | | | | | | | | |
| | | | | | | | | | | | | | | | | | $ | 37,537,122 | | | $ | 37,014,026 | | | | | | 596,622 | | | | | | | | (73,526 | ) | | |
| | | | | | | | | | | | | | | | | | | | | | | | | | | | | | | | | | | | | | | | |
| | | | | | | | | | | | |
| | | | | | | | | | | | | | | | | | | | | | | | | | | | $ | 670,353 | | | | | | | $ | (135,075 | ) | | |
| | | | | | | | | | | | | | | | | | | | | | | | | | | | | | | | | | | | | | | | |
Credit default swap agreements outstanding at October 31, 2024:
| | | | | | | | | | | | | | | | | | | | | | | | | | | | | | | | | | | | | | | | | | |
Reference Entity/ Obligation | | Termination
Date | | | Fixed
Rate | | Notional
Amount
(000)#(3) | | | Fair
Value | | | Upfront
Premiums
Paid
(Received) | | | Unrealized
Appreciation
(Depreciation) | | | Counterparty | |
| | | |
OTC Credit Default Swap Agreements on corporate and/or sovereign issues - Buy Protection(1): | | | | | | | | | | | | | |
China Development Bank | | | 06/20/29 | | | 1.000%(Q) | | | 205 | | | $ | (3,759 | ) | | | | | | $ | (1,944 | ) | | | | | | | | | | $ | (1,815 | ) | | | | | | | JPM | |
Industrial & Commercial Bank of China Ltd. | | | 06/20/29 | | | 1.000%(Q) | | | 205 | | | | (3,890 | ) | | | | | | | (1,694 | ) | | | | | | | | | | | (2,196 | ) | | | | | | | JPM | |
Kingdom of Morocco | | | 12/20/27 | | | 1.000%(Q) | | | 115 | | | | (1,772 | ) | | | | | | | 1,940 | | | | | | | | | | | | (3,712 | ) | | | | | | | BNP | |
Republic of Italy | | | 12/20/27 | | | 1.000%(Q) | | EUR | 70 | | | | (2,203 | ) | | | | | | | (1,645 | ) | | | | | | | | | | | (558 | ) | | | | | | | BARC | |
U.S. Treasury Notes | | | 06/20/25 | | | 0.250%(Q) | | EUR | 165 | | | | 9 | | | | | | | | (57 | ) | | | | | | | | | | | 66 | | | | | | | | BARC | |
U.S. Treasury Notes | | | 06/20/25 | | | 0.250%(Q) | | EUR | 55 | | | | 3 | | | | | | | | (19 | ) | | | | | | | | | | | 22 | | | | | | | | BARC | |
| | | | | | | | | | | | | | | | | | | | | | | | | | | | | | | | | | | | | | | | | | |
| | | | | | | | | | | |
| | | | | | | | | | | | $ | (11,612 | ) | | | | | | $ | (3,419 | ) | | | | | | | | | | $ | (8,193 | ) | | | | | | | | |
| | | | | | | | | | | | | | | | | | | | | | | | | | | | | | | | | | | | | | | | | | |
See Notes to Financial Statements.
140
PGIM Global Total Return (USD Hedged) Fund
Schedule of Investments (continued)
as of October 31, 2024
Credit default swap agreements outstanding at October 31, 2024 (continued):
| | | | | | | | | | | | | | | | | | | | | | | | | | | | | | | | | | | | | | | | | | |
Reference Entity/ Obligation | | Termination
Date | | Fixed
Rate | | | Notional
Amount
(000)#(3) | | | Implied
Credit
Spread at
October 31,
2024(4) | | Fair
Value | | | Upfront Premiums Paid (Received) | | | Unrealized Appreciation (Depreciation) | | | Counterparty |
| | | |
OTC Credit Default Swap Agreements on corporate and/or sovereign issues - Sell Protection(2): | | | | | | | | | | | |
Bank of America Corp. | | 12/20/25 | | | 1.000%(Q) | | | | 90 | | | 0.289% | | $ | 819 | | | | | | | $ | 734 | | | | | | | | | | | $ | 85 | | | | | | | GSI |
BNP Paribas SA | | 12/20/24 | | | 1.000%(Q) | | | EUR | 100 | | | 0.192% | | | 248 | | | | | | | | 124 | | | | | | | | | | | | 124 | | | | | | | BARC |
Citigroup, Inc. | | 12/20/25 | | | 1.000%(Q) | | | | 90 | | | 0.239% | | | 869 | | | | | | | | 744 | | | | | | | | | | | | 125 | | | | | | | GSI |
Comision Federal de Electricidad | | 06/20/29 | | | 1.000%(Q) | | | | 140 | | | 2.266% | | | (7,004 | ) | | | | | | | (7,030 | ) | | | | | | | | | | | 26 | | | | | | | CITI |
DP World PLC | | 12/20/24 | | | 1.000%(Q) | | | | 100 | | | 0.678% | | | 161 | | | | | | | | 13 | | | | | | | | | | | | 148 | | | | | | | BARC |
Generalitat de Catalunya | | 12/20/25 | | | 1.000%(Q) | | | | 100 | | | 0.302% | | | 896 | | | | | | | | (217 | ) | | | | | | | | | | | 1,113 | | | | | | | DB |
Kingdom of Spain | | 06/20/25 | | | 1.000%(Q) | | | | 1,000 | | | 0.057% | | | 7,118 | | | | | | | | (1,168 | ) | | | | | | | | | | | 8,286 | | | | | | | BOA |
Kingdom of Spain | | 06/20/25 | | | 1.000%(Q) | | | | 170 | | | 0.057% | | | 1,210 | | | | | | | | (207 | ) | | | | | | | | | | | 1,417 | | | | | | | BOA |
Kingdom of Spain | | 06/20/25 | | | 1.000%(Q) | | | | 15 | | | 0.057% | | | 107 | | | | | | | | 25 | | | | | | | | | | | | 82 | | | | | | | BARC |
Morgan Stanley | | 12/20/25 | | | 1.000%(Q) | | | | 90 | | | 0.254% | | | 854 | | | | | | | | 734 | | | | | | | | | | | | 120 | | | | | | | GSI |
People’s Republic of China | | 06/20/29 | | | 1.000%(Q) | | | | 410 | | | 0.593% | | | 7,500 | | | | | | | | 4,725 | | | | | | | | | | | | 2,775 | | | | | | | JPM |
Republic of Estonia | | 12/20/26 | | | 1.000%(Q) | | | | 50 | | | 0.267% | | | 812 | | | | | | | | 202 | | | | | | | | | | | | 610 | | | | | | | JPM |
Republic of France | | 06/20/34 | | | 0.250%(Q) | | | | 195 | | | 0.494% | | | (3,716 | ) | | | | | | | (4,141 | ) | | | | | | | | | | | 425 | | | | | | | CITI |
Republic of Italy | | 12/20/24 | | | 1.000%(Q) | | | | 85 | | | 0.076% | | | 207 | | | | | | | | 110 | | | | | | | | | | | | 97 | | | | | | | BARC |
Republic of Italy | | 06/20/30 | | | 1.000%(Q) | | | | 100 | | | 0.659% | | | 1,828 | | | | | | | | (1,621 | ) | | | | | | | | | | | 3,449 | | | | | | | BARC |
Republic of Panama | | 12/20/26 | | | 1.000%(Q) | | | | 45 | | | 0.845% | | | 195 | | | | | | | | 55 | | | | | | | | | | | | 140 | | | | | | | CITI |
U.S. Treasury Notes | | 12/20/24 | | | 0.250%(Q) | | | EUR | 165 | | | 0.189% | | | 68 | | | | | | | | 36 | | | | | | | | | | | | 32 | | | | | | | BARC |
U.S. Treasury Notes | | 12/20/24 | | | 0.250%(Q) | | | EUR | 60 | | | 0.189% | | | 24 | | | | | | | | 17 | | | | | | | | | | | | 7 | | | | | | | DB |
U.S. Treasury Notes | | 12/20/24 | | | 0.250%(Q) | | | EUR | 55 | | | 0.189% | | | 23 | | | | | | | | 12 | | | | | | | | | | | | 11 | | | | | | | BARC |
U.S. Treasury Notes | | 03/20/25 | | | 0.250%(Q) | | | EUR | 110 | | | 0.242% | | | 39 | | | | | | | | 54 | | | | | | | | | | | | (15 | ) | | | | | | BARC |
| | | | | | | | | | | | | | | | | | | | | | | | | | | | | | | | | | | | | | | | | | |
| | | | | | | | | | | | |
| | | | | | | | | | | | | | $ | 12,258 | | | | | | | $ | (6,799 | ) | | | | | | | | | | $ | 19,057 | | | | | | | |
| | | | | | | | | | | | | | | | | | | | | | | | | | | | | | | | | | | | | | | | | | |
The Fund entered into credit default swaps (“CDS”) to provide a measure of protection against defaults or to take an active long or short position with respect to the likelihood of a particular issuer’s default or the reference entity’s credit soundness. CDS contracts generally trade based on a spread which represents the cost a protection buyer has to pay the protection seller. The protection buyer is said to be short the credit as the value of the contract rises the more the credit deteriorates. The value of the CDS contract increases for the protection buyer if the spread increases.
See Notes to Financial Statements.
PGIM Global Total Return (USD Hedged) Fund 141
PGIM Global Total Return (USD Hedged) Fund
Schedule of Investments (continued)
as of October 31, 2024
| (1) | If the Fund is a buyer of protection, it pays the fixed rate. When a credit event occurs, as defined under the terms of that particular swap agreement, the Fund will either (i) receive from the seller of protection an amount equal to the notional amount of the swap and make delivery of the referenced obligation or underlying securities comprising the referenced index or (ii) receive a net settlement amount in the form of cash or securities equal to the notional amount of the swap less the recovery value of the referenced obligation or underlying securities comprising the referenced index. |
| (2) | If the Fund is a seller of protection, it receives the fixed rate. When a credit event occurs, as defined under the terms of that particular swap agreement, the Fund will either (i) pay to the buyer of protection an amount equal to the notional amount of the swap and take delivery of the referenced obligation or underlying securities comprising the referenced index or (ii) pay a net settlement amount in the form of cash or securities equal to the notional amount of the swap less the recovery value of the referenced obligation or underlying securities comprising the referenced index. |
| (3) | Notional amount represents the maximum potential amount the Fund could be required to pay as a seller of credit protection or receive as a buyer of credit protection if a credit event occurs as defined under the terms of that particular swap agreement. |
| (4) | Implied credit spreads, represented in absolute terms, utilized in determining the fair value of credit default swap agreements where the Fund is the seller of protection as of the reporting date serve as an indicator of the current status of the payment/ performance risk and represent the likelihood of risk of default for the credit derivative. The implied credit spread of a particular referenced entity reflects the cost of buying/selling protection and may include up-front payments required to be made to enter into the agreement. Wider credit spreads represent a deterioration of the referenced entity’s credit soundness and a greater likelihood of risk of default or other credit event occurring as defined under the terms of the agreement. |
Interest rate swap agreements outstanding at October 31, 2024:
| | | | | | | | | | | | | | | | | | | | | | | | | | | | | | |
Notional Amount (000)# | | | Termination
Date | | | Fixed
Rate | | | | Floating Rate | | | | | Value at
Trade Date | | | Value at
October 31,
2024 | | | Unrealized Appreciation (Depreciation) |
| | |
Centrally Cleared Interest Rate Swap Agreements: | | | | | | | | | |
| AUD | | | 730 | | | | 12/03/33 | | | 2.800%(S) | | | | 6 Month BBSW(2)(S)/4.637% | | | | | | $ | (59,328) | | | $ | (66,092) | | | $ | (6,764) | |
| AUD | | | 65 | | | | 12/03/34 | | | 2.850%(S) | | | | 6 Month BBSW(2)(S)/4.637% | | | | | | | (4,391) | | | | (6,337) | | | | (1,946) | |
| AUD | | | 85 | | | | 12/03/38 | | | 2.900%(S) | | | | 6 Month BBSW(2)(S)/4.637% | | | | | | | (8,931) | | | | (10,958) | | | | (2,027) | |
| BRL | | | 7,198 | | | | 01/02/29 | | | 11.235%(T) | | | | 1 Day BROIS(2)(T)/0.040% | | | | | | | — | | | | (77,583) | | | | (77,583) | |
| BRL | | | 4,741 | | | | 01/02/29 | | | 11.510%(T) | | | | 1 Day BROIS(2)(T)/0.040% | | | | | | | — | | | | (41,935) | | | | (41,935) | |
See Notes to Financial Statements.
142
PGIM Global Total Return (USD Hedged) Fund
Schedule of Investments (continued)
as of October 31, 2024
Interest rate swap agreements outstanding at October 31, 2024 (continued):
| | | | | | | | | | | | | | | | | | | | | | | | | | | | | | |
Notional Amount (000)# | | | Termination
Date | | | Fixed
Rate | | | | Floating Rate | | | | | Value at
Trade Date | | | Value at
October 31,
2024 | | | Unrealized Appreciation (Depreciation) |
| | |
Centrally Cleared Interest Rate Swap Agreements (cont’d.): | | | | | | | | | |
| BRL | | | 3,202 | | | | 01/02/31 | | | 11.710%(T) | | | | 1 Day BROIS(2)(T)/0.040% | | | | | | $ | — | | | $ | (32,854) | | | $ | (32,854 | ) |
| CAD | | | 700 | | | | 12/03/25 | | | 4.100%(S) | | | | 1 Day CORRA(2)(S)/3.840% | | | | | | | (1,107) | | | | 3,786 | | | | 4,893 | |
| CAD | | | 80 | | | | 12/03/28 | | | 2.600%(S) | | | | 1 Day CORRA(2)(S)/3.840% | | | | | | | 31 | | | | (1,833) | | | | (1,864 | ) |
| CAD | | | 70 | | | | 12/03/29 | | | 3.500%(S) | | | | 1 Day CORRA(2)(S)/3.840% | | | | | | | 730 | | | | 1,289 | | | | 559 | |
| CAD | | | 310 | | | | 12/03/30 | | | 3.500%(S) | | | | 1 Day CORRA(2)(S)/3.840% | | | | | | | (2,400) | | | | 6,504 | | | | 8,904 | |
| CAD | | | 330 | | | | 12/03/34 | | | 3.500%(S) | | | | 1 Day CORRA(1)(S)/3.840% | | | | | | | (7,143) | | | | (7,856) | | | | (713 | ) |
| CAD | | | 60 | | | | 12/03/43 | | | 3.550%(S) | | | | 1 Day CORRA(2)(S)/3.840% | | | | | | | (3,629) | | | | 1,578 | | | | 5,207 | |
| CAD | | | 85 | | | | 12/03/44 | | | 3.500%(S) | | | | 1 Day CORRA(1)(S)/3.840% | | | | | | | (4,631) | | | | (1,865) | | | | 2,766 | |
| CAD | | | 350 | | | | 12/03/48 | | | 3.450%(S) | | | | 1 Day CORRA(2)(S)/3.840% | | | | | | | (6,675) | | | | 8,719 | | | | 15,394 | |
| CAD | | | 160 | | | | 12/03/49 | | | 3.400%(S) | | | | 1 Day CORRA(2)(S)/3.840% | | | | | | | 7,517 | | | | 3,442 | | | | (4,075 | ) |
| CAD | | | 105 | | | | 12/03/53 | | | 3.300%(S) | | | | 1 Day CORRA(2)(S)/3.840% | | | | | | | (4,665) | | | | 2,100 | | | | 6,765 | |
| CAD | | | 180 | | | | 12/03/54 | | | 3.250%(S) | | | | 1 Day CORRA(1)(S)/3.840% | | | | | | | (9,812) | | | | (2,808) | | | | 7,004 | |
| CHF | | | 70 | | | | 04/03/28 | | | 0.410%(A) | | | | 1 Day SARON(2)(S)/0.949% | | | | | | | (158) | | | | 42 | | | | 200 | |
| CHF | | | 130 | | | | 01/31/29 | | | 0.260%(A) | | | | 1 Day SARON(2)(S)/0.949% | | | | | | | (366) | | | | (1,378) | | | | (1,012 | ) |
| CHF | | | 100 | | | | 05/08/31 | | | 2.000%(A) | | | | 1 Day SARON(2)(A)/0.949% | | | | | | | 4,663 | | | | 12,186 | | | | 7,523 | |
| CHF | | | 40 | | | | 04/03/33 | | | 0.687%(A) | | | | 1 Day SARON(2)(S)/0.949% | | | | | | | (184) | | | | 571 | | | | 755 | |
| CHF | | | 110 | | | | 03/20/34 | | | 1.258%(A) | | | | 1 Day SARON(1)(A)/0.949% | | | | | | | (4,218) | | | | (8,757) | | | | (4,539 | ) |
| CHF | | | 100 | | | | 12/15/41 | | | 0.025%(A) | | | | 1 Day SARON(2)(A)/0.949% | | | | | | | (18,512) | | | | (12,888) | | | | 5,624 | |
| CLP | | | 30,200 | | | | 07/12/29 | | | 3.135%(S) | | | | 1 Day CLOIS(2)(S)/5.250% | | | | | | | — | | | | (2,687) | | | | (2,687 | ) |
| CNH | | | 1,680 | | | | 11/01/24 | | | 3.120%(Q) | | | | 7 Day China Fixing Repo Rates(2)(Q)/1.704% | | | | | | | (5) | | | | 695 | | | | 700 | |
See Notes to Financial Statements.
PGIM Global Total Return (USD Hedged) Fund 143
PGIM Global Total Return (USD Hedged) Fund
Schedule of Investments (continued)
as of October 31, 2024
Interest rate swap agreements outstanding at October 31, 2024 (continued):
| | | | | | | | | | | | | | | | | | | | | | | | | | | | | | |
Notional Amount (000)# | | | Termination
Date | | | Fixed
Rate | | | | Floating Rate | | | | | Value at
Trade Date | | | Value at
October 31,
2024 | | | Unrealized Appreciation (Depreciation) |
|
Centrally Cleared Interest Rate Swap Agreements (cont’d.): | |
| CNH | | | 1,200 | | | | 02/04/25 | | | 2.600%(Q) | | | | 7 Day China Fixing Repo Rates(2)(Q)/1.704% | | | | | | $ | — | | | $ | 575 | | | $ | 575 | |
| CNH | | | 2,800 | | | | 03/06/25 | | | 2.425%(Q) | | | | 7 Day China Fixing Repo Rates(2)(Q)/1.704% | | | | | | | 6 | | | | 1,042 | | | | 1,036 | |
| CNH | | | 5,000 | | | | 03/12/25 | | | 2.400%(Q) | | | | 7 Day China Fixing Repo Rates(2)(Q)/1.704% | | | | | | | (2) | | | | 1,812 | | | | 1,814 | |
| CNH | | | 3,200 | | | | 07/13/25 | | | 2.653%(Q) | | | | 7 Day China Fixing Repo Rates(2)(Q)/1.704% | | | | | | | (4) | | | | 3,025 | | | | 3,029 | |
| CNH | | | 2,000 | | | | 01/09/28 | | | 2.757%(Q) | | | | 7 Day China Fixing Repo Rates(2)(Q)/1.704% | | | | | | | (60) | | | | 9,569 | | | | 9,629 | |
| CNH | | | 1,925 | | | | 04/26/28 | | | 2.790%(Q) | | | | 7 Day China Fixing Repo Rates(2)(Q)/1.704% | | | | | | | — | | | | 10,052 | | | | 10,052 | |
| CNH | | | 8,700 | | | | 05/10/29 | | | 2.650%(Q) | | | | 7 Day China Fixing Repo Rates(2)(Q)/1.704% | | | | | | | 42,002 | | | | 49,502 | | | | 7,500 | |
| CNH | | | 3,360 | | | | 05/15/29 | | | 2.027%(Q) | | | | 7 Day China Fixing Repo Rates(2)(Q)/1.704% | | | | | | | — | | | | 5,793 | | | | 5,793 | |
| CZK | | | 5,145 | | | | 03/31/30 | | | 0.710%(A) | | | | 6 Month PRIBOR(2)(S)/3.860% | | | | | | | — | | | | (31,731) | | | | (31,731 | ) |
| DKK | | | 500 | | | | 04/08/32 | | | 1.581%(A) | | | | 6 Month CIBOR(2)(S)/2.930% | | | | | | | (2,768) | | | | (4,406) | | | | (1,638 | ) |
| EUR | | | 5,485 | | | | 11/23/24 | | | (0.046)%(A) | | | | 6 Month EURIBOR(2)(S)/2.864% | | | | | | | — | | | | (119,773) | | | | (119,773 | ) |
| EUR | | | 3,245 | | | | 12/02/24 | | | (0.285)%(A) | | | | 6 Month EURIBOR(2)(S)/2.864% | | | | | | | — | | | | (77,673) | | | | (77,673 | ) |
| EUR | | | 200 | | | | 05/11/25 | | | 0.100%(A) | | | | 1 Day EuroSTR(1)(A)/3.155% | | | | | | | 692 | | | | 6,767 | | | | 6,075 | |
See Notes to Financial Statements.
144
PGIM Global Total Return (USD Hedged) Fund
Schedule of Investments (continued)
as of October 31, 2024
Interest rate swap agreements outstanding at October 31, 2024 (continued):
| | | | | | | | | | | | | | | | | | | | | | | | | | | | | | |
Notional Amount (000)# | | | Termination
Date | | | Fixed
Rate | | | | Floating Rate | | | | | Value at
Trade Date | | | Value at
October 31,
2024 | | | Unrealized Appreciation (Depreciation) |
| | |
Centrally Cleared Interest Rate Swap Agreements (cont’d.): | | | | | | | | | |
| EUR | | | 2,020 | | | | 04/23/26 | | | 3.076%(A) | | | | 1 Day EuroSTR(1)(A)/3.155% | | | | | | $ | — | | | $ | (18,408) | | | $ | (18,408 | ) |
| EUR | | | 350 | | | | 04/27/30 | | | (0.016)%(A) | | | | 6 Month EURIBOR(2)(S)/2.864% | | | | | | | — | | | | (46,642) | | | | (46,642 | ) |
| EUR | | | 342 | | | | 08/15/30 | | | (0.191)%(A) | | | | 1 Day EuroSTR(2)(A)/3.155% | | | | | | | (113) | | | | (51,300) | | | | (51,187 | ) |
| EUR | | | 100 | | | | 05/11/31 | | | 0.750%(A) | | | | 1 Day EuroSTR(1)(A)/3.155% | | | | | | | 683 | | | | 11,191 | | | | 10,508 | |
| EUR | | | 570 | | | | 05/11/31 | | | 2.650%(A) | | | | 1 Day EuroSTR(1)(A)/3.155% | | | | | | | (14,119) | | | | (15,245) | | | | (1,126 | ) |
| EUR | | | 235 | | | | 10/30/32 | | | 1.302%(A) | | | | 6 Month EURIBOR(2)(S)/2.864% | | | | | | | 3,711 | | | | (20,285) | | | | (23,996 | ) |
| EUR | | | 820 | | | | 03/20/33 | | | 2.996%(A) | | | | 6 Month EURIBOR(2)(S)/2.864% | | | | | | | — | | | | 52,485 | | | | 52,485 | |
| EUR | | | 430 | | | | 05/11/33 | | | 1.000%(A) | | | | 6 Month EURIBOR(2)(S)/2.864% | | | | | | | (6,597) | | | | (56,873) | | | | (50,276 | ) |
| EUR | | | 55 | | | | 03/20/34 | | | 2.560%(A) | | | | 1 Day EuroSTR(2)(A)/3.155% | | | | | | | 195 | | | | 1,003 | | | | 808 | |
| EUR | | | 410 | | | | 05/11/34 | | | 2.650%(A) | | | | 1 Day EuroSTR(2)(A)/3.155% | | | | | | | 11,491 | | | | 13,157 | | | | 1,666 | |
| EUR | | | 590 | | | | 03/20/38 | | | 2.982%(A) | | | | 6 Month EURIBOR(1)(S)/2.864% | | | | | | | — | | | | (47,346) | | | | (47,346 | ) |
| EUR | | | 150 | | | | 11/24/41 | | | 0.565%(A) | | | | 6 Month EURIBOR(1)(S)/2.864% | | | | | | | — | | | | 23,517 | | | | 23,517 | |
| EUR | | | 150 | | | | 11/24/41 | | | 0.600%(A) | | | | 3 Month EURIBOR(2)(Q)/3.062% | | | | | | | — | | | | (24,034) | | | | (24,034 | ) |
See Notes to Financial Statements.
PGIM Global Total Return (USD Hedged) Fund 145
PGIM Global Total Return (USD Hedged) Fund
Schedule of Investments (continued)
as of October 31, 2024
Interest rate swap agreements outstanding at October 31, 2024 (continued):
| | | | | | | | | | | | | | | | | | | | | | | | | | | | | | |
Notional
Amount
(000)# | | | Termination
Date | | | Fixed
Rate | | | | Floating Rate | | | | | Value at
Trade Date | | | Value at
October 31,
2024 | | | Unrealized Appreciation (Depreciation) |
| | |
Centrally Cleared Interest Rate Swap Agreements (cont’d.): | | | | | | | | | |
| EUR | | | 364 | | | | 11/25/41 | | | 0.629%(A) | | | | 6 Month EURIBOR(1)(S)/2.864% | | | | | | $ | — | | | $ | 55,158 | | | $ | 55,158 | |
| EUR | | | 364 | | | | 11/25/41 | | | 0.663%(A) | | | | 3 Month EURIBOR(2)(Q)/3.062% | | | | | | | — | | | | (56,456) | | | | (56,456 | ) |
| EUR | | | 570 | | | | 03/22/42 | | | 1.257%(A) | | | | 6 Month EURIBOR(1)(S)/2.864% | | | | | | | — | | | | 56,420 | | | | 56,420 | |
| EUR | | | 570 | | | | 03/22/42 | | | 1.310%(A) | | | | 3 Month EURIBOR(2)(Q)/3.062% | | | | | | | — | | | | (57,715) | | | | (57,715 | ) |
| EUR | | | 400 | | | | 02/24/43 | | | 2.910%(A) | | | | 6 Month EURIBOR(1)(S)/2.864% | | | | | | | 332 | | | | (36,429) | | | | (36,761 | ) |
| EUR | | | 400 | | | | 02/24/43 | | | 2.960%(A) | | | | 3 Month EURIBOR(2)(Q)/3.062% | | | | | | | (193) | | | | 37,978 | | | | 38,171 | |
| EUR | | | 120 | | | | 05/11/49 | | | 1.450%(A) | | | | 6 Month EURIBOR(2)(S)/2.864% | | | | | | | 5,200 | | | | (21,860) | | | | (27,060 | ) |
| GBP | | | 200 | | | | 05/08/25 | | | 1.000%(A) | | | | 1 Day SONIA(2)(A)/4.950% | | | | | | | (5,720) | | | | (9,891) | | | | (4,171 | ) |
| GBP | | | 700 | | | | 05/08/29 | | | 4.000%(A) | | | | 1 Day SONIA(1)(A)/4.950% | | | | | | | (18,026) | | | | 7,887 | | | | 25,913 | |
| GBP | | | 35 | | | | 05/08/30 | | | 1.100%(A) | | | | 1 Day SONIA(1)(A)/4.950% | | | | | | | 5,939 | | | | 7,263 | | | | 1,324 | |
| GBP | | | 530 | | | | 05/08/34 | | | 3.850%(A) | | | | 1 Day SONIA(1)(A)/4.950% | | | | | | | (8,640) | | | | 12,834 | | | | 21,474 | |
| GBP | | | 155 | | | | 05/08/37 | | | 1.200%(A) | | | | 1 Day SONIA(2)(A)/4.950% | | | | | | | (44,290) | | | | (58,854) | | | | (14,564 | ) |
| GBP | | | 220 | | | | 05/08/38 | | | 1.200%(A) | | | | 1 Day SONIA(2)(A)/4.950% | | | | | | | (71,888) | | | | (88,770) | | | | (16,882 | ) |
| GBP | | | 55 | | | | 05/08/39 | | | 3.900%(A) | | | | 1 Day SONIA(2)(A)/4.950% | | | | | | | (262) | | | | (1,872) | | | | (1,610 | ) |
| GBP | | | 55 | | | | 05/08/44 | | | 3.950%(A) | | | | 1 Day SONIA(1)(A)/4.950% | | | | | | | (2,898) | | | | 2,036 | | | | 4,934 | |
| GBP | | | 225 | | | | 05/08/46 | | | 1.250%(A) | | | | 1 Day SONIA(2)(A)/4.950% | | | | | | | 44,472 | | | | (123,295) | | | | (167,767 | ) |
| GBP | | | 170 | | | | 05/08/47 | | | 1.250%(A) | | | | 1 Day SONIA(2)(A)/4.950% | | | | | | | (31,380) | | | | (95,449) | | | | (64,069 | ) |
See Notes to Financial Statements.
146
PGIM Global Total Return (USD Hedged) Fund
Schedule of Investments (continued)
as of October 31, 2024
Interest rate swap agreements outstanding at October 31, 2024 (continued):
| | | | | | | | | | | | | | | | | | | | | | | | | | | | | | | | |
Notional
Amount
(000)# | | | Termination
Date | | | Fixed
Rate | | | | | Floating Rate | | | | | Value at Trade Date | | | Value at
October 31,
2024 | | | Unrealized Appreciation (Depreciation) | |
| | |
Centrally Cleared Interest Rate Swap Agreements (cont’d.): | | | | | | | | | |
| GBP | | | 190 | | | | 05/08/48 | | | 1.250%(A) | | | | | | 1 Day SONIA(2)(A)/4.950% | | | | | | $ | (93,112) | | | $ | (109,309) | | | $ | (16,197) | |
| GBP | | | 150 | | | | 05/08/49 | | | 1.250%(A) | | | | | | 1 Day SONIA(1)(A)/4.950% | | | | | | | 76,745 | | | | 88,372 | | | | 11,627 | |
| GBP | | | 45 | | | | 05/08/49 | | | 3.950%(A) | | | | | | 1 Day SONIA(1)(A)/4.950% | | | | | | | (2,668) | | | | 1,812 | | | | 4,480 | |
| GBP | | | 35 | | | | 09/03/50 | | | 0.328%(A) | | | | | | 1 Day SONIA(2)(A)/4.950% | | | | | | | — | | | | (27,222) | | | | (27,222) | |
| GBP | | | 60 | | | | 05/08/52 | | | 1.250%(A) | | | | | | 1 Day SONIA(2)(A)/4.950% | | | | | | | (3,483) | | | | (37,375) | | | | (33,892) | |
| GBP | | | 260 | | | | 05/08/54 | | | 1.250%(A) | | | | | | 1 Day SONIA(2)(A)/4.950% | | | | | | | (142,447) | | | | (167,149) | | | | (24,702) | |
| GBP | | | 65 | | | | 05/08/54 | | | 3.900%(A) | | | | | | 1 Day SONIA(2)(A)/4.950% | | | | | | | (233) | | | | (3,092) | | | | (2,859) | |
| HUF | | | 90,865 | | | | 06/12/28 | | | 3.750%(A) | | | | | | 6 Month BUBOR(2)(S)/6.430% | | | | | | | — | | | | (25,615) | | | | (25,615) | |
| JPY | | | 130,000 | | | | 03/06/25 | | | 0.197%(A) | | | | | | 1 Day TONAR(2)(A)/0.227% | | | | | | | — | | | | 48 | | | | 48 | |
| JPY | | | 179,000 | | | | 04/08/26 | | | 0.018%(S) | | | | | | 1 Day TONAR(2)(S)/0.227% | | | | | | | 4 | | | | (8,957) | | | | (8,961) | |
| JPY | | | 59,000 | | | | 12/18/27 | | | 0.290%(S) | | | | | | 1 Day TONAR(2)(S)/0.227% | | | | | | | (390) | | | | (4,154) | | | | (3,764) | |
| JPY | | | 10,000 | | | | 07/08/28 | | | (0.050)%(A) | | | | | | 1 Day TONAR(2)(A)/0.227% | | | | | | | (928) | | | | (1,629) | | | | (701) | |
| JPY | | | 119,700 | | | | 07/31/28 | | | 0.268%(A) | | | | | | 1 Day TONAR(2)(A)/0.227% | | | | | | | — | | | | (9,905) | | | | (9,905) | |
| JPY | | | 163,000 | | | | 11/12/28 | | | 0.011%(S) | | | | | | 1 Day TONAR(2)(S)/0.227% | | | | | | | 4 | | | | (29,700) | | | | (29,704) | |
| JPY | | | 60,000 | | | | 07/08/29 | | | (0.050)%(A) | | | | | | 1 Day TONAR(1)(A)/0.227% | | | | | | | 11,802 | | | | 13,129 | | | | 1,327 | |
| JPY | | | 85,000 | | | | 07/08/30 | | | (0.050)%(A) | | | | | | 1 Day TONAR(1)(A)/0.227% | | | | | | | 23,074 | | | | 23,813 | | | | 739 | |
| JPY | | | 30,000 | | | | 07/08/31 | | | 0.000%(A) | | | | | | 1 Day TONAR(1)(A)/0.227% | | | | | | | 10,938 | | | | 9,816 | | | | (1,122) | |
| JPY | | | 53,000 | | | | 12/18/32 | | | 0.516%(S) | | | | | | 1 Day TONAR(2)(S)/0.227% | | | | | | | (845) | | | | (10,039) | | | | (9,194) | |
| JPY | | | 30,000 | | | | 07/08/33 | | | 0.100%(A) | | | | | | 1 Day TONAR(2)(A)/0.227% | | | | | | | (17,060) | | | | (12,809) | | | | 4,251 | |
| JPY | | | 50,364 | | | | 06/27/34 | | | 0.995%(A) | | | | | | 1 Day TONAR(1)(A)/0.227% | | | | | | | 4 | | | | (2,929) | | | | (2,933) | |
See Notes to Financial Statements.
PGIM Global Total Return (USD Hedged) Fund 147
PGIM Global Total Return (USD Hedged) Fund
Schedule of Investments (continued)
as of October 31, 2024
Interest rate swap agreements outstanding at October 31, 2024 (continued):
| | | | | | | | | | | | | | | | | | | | | | | | | | | | | | | | |
Notional
Amount
(000)# | | | Termination
Date | | | Fixed
Rate | | | | | Floating Rate | | | | | Value at Trade Date | | | Value at
October 31,
2024 | | | Unrealized Appreciation (Depreciation) | |
| | |
Centrally Cleared Interest Rate Swap Agreements (cont’d.): | | | | | | | | | |
| JPY | | | 111,500 | | | | 12/18/37 | | | 0.715%(S) | | | | | | 1 Day TONAR(2)(S)/0.227% | | | | | | $ | (2,712) | | | $ | (42,564) | | | $ | (39,852) | |
| JPY | | | 57,555 | | | | 01/04/38 | | | 0.757%(S) | | | | | | 1 Day TONAR(2)(S)/0.227% | | | | | | | (1,354) | | | | (20,310) | | | | (18,956) | |
| JPY | | | 11,780 | | | | 12/03/38 | | | 0.600%(S) | | | | | | 1 Day TONAR(2)(S)/0.227% | | | | | | | (5) | | | | (6,566) | | | | (6,561) | |
| JPY | | | 126,500 | | | | 07/08/39 | | | 0.200%(A) | | | | | | 1 Day TONAR(1)(A)/0.227% | | | | | | | 114,742 | | | | 117,172 | | | | 2,430 | |
| JPY | | | 70,000 | | | | 07/08/39 | | | 1.350%(A) | | | | | | 1 Day TONAR(2)(A)/0.227% | | | | | | | 9,027 | | | | 9,043 | | | | 16 | |
| JPY | | | 10,000 | | | | 10/04/39 | | | 0.203%(S) | | | | | | 1 Day TONAR(2)(S)/0.227% | | | | | | | (22) | | | | (10,030) | | | | (10,008) | |
| JPY | | | 21,500 | | | | 12/03/39 | | | 0.650%(S) | | | | | | 1 Day TONAR(2)(S)/0.227% | | | | | | | (11) | | | | (12,833) | | | | (12,822) | |
| JPY | | | 20,000 | | | | 02/06/40 | | | 0.223%(S) | | | | | | 1 Day TONAR(2)(S)/0.227% | | | | | | | (102) | | | | (20,474) | | | | (20,372) | |
| JPY | | | 25,000 | | | | 07/08/42 | | | 0.300%(A) | | | | | | 1 Day TONAR(2)(A)/0.227% | | | | | | | (17,222) | | | | (28,920) | | | | (11,698) | |
| JPY | | | 5,000 | | | | 07/04/43 | | | 0.763%(S) | | | | | | 1 Day TONAR(2)(S)/0.227% | | | | | | | (126) | | | | (4,021) | | | | (3,895) | |
| JPY | | | 30,000 | | | | 07/08/44 | | | 1.550%(A) | | | | | | 1 Day TONAR(1)(A)/0.227% | | | | | | | (6,849) | | | | (3,148) | | | | 3,701 | |
| JPY | | | 91,700 | | | | 12/18/47 | | | 0.918%(S) | | | | | | 1 Day TONAR(2)(S)/0.227% | | | | | | | (3,081) | | | | (86,481) | | | | (83,400) | |
| JPY | | | 40,000 | | | | 07/08/48 | | | 0.450%(A) | | | | | | 1 Day TONAR(2)(A)/0.227% | | | | | | | (48,474) | | | | (61,612) | | | | (13,138) | |
| JPY | | | 25,000 | | | | 07/08/49 | | | 0.450%(A) | | | | | | 1 Day TONAR(2)(A)/0.227% | | | | | | | (37,692) | | | | (40,587) | | | | (2,895) | |
| JPY | | | 75,000 | | | | 07/08/49 | | | 1.700%(A) | | | | | | 1 Day TONAR(1)(A)/0.227% | | | | | | | (23,673) | | | | (9,261) | | | | 14,412 | |
| JPY | | | 30,000 | | | | 07/08/52 | | | 0.450%(A) | | | | | | 1 Day TONAR(2)(A)/0.227% | | | | | | | (24,470) | | | | (55,604) | | | | (31,134) | |
| JPY | | | 40,000 | | | | 07/08/54 | | | 0.450%(A) | | | | | | 1 Day TONAR(1)(A)/0.227% | | | | | | | 70,582 | | | | 79,864 | | | | 9,282 | |
| JPY | | | 45,000 | | | | 07/08/54 | | | 1.750%(A) | | | | | | 1 Day TONAR(2)(A)/0.227% | | | | | | | 3,987 | | | | 3,620 | | | | (367) | |
| KRW | | | 700,000 | | | | 09/10/28 | | | 2.043%(Q) | | | | | | 3 Month KWCDC(2)(Q)/3.430% | | | | | | | (19,258) | | | | (18,355) | | | | 903 | |
See Notes to Financial Statements.
148
PGIM Global Total Return (USD Hedged) Fund
Schedule of Investments (continued)
as of October 31, 2024
Interest rate swap agreements outstanding at October 31, 2024 (continued):
| | | | | | | | | | | | | | | | | | | | | | | | | | | | | | | | |
Notional
Amount
(000)# | | | Termination
Date | | | Fixed
Rate | | | | | Floating Rate | | | | | Value at Trade Date | | | Value at
October 31,
2024 | | | Unrealized Appreciation (Depreciation) |
| | |
Centrally Cleared Interest Rate Swap Agreements (cont’d.): | | | | | | | | | |
| KRW | | | 470,000 | | | | 04/27/30 | | | 1.065%(Q) | | | | | | 3 Month KWCDC(2)(Q)/3.430% | | | | | | $ | (7,876) | | | $ | (33,347) | | | $ | (25,471) | |
| KRW | | | 461,780 | | | | 03/10/33 | | | 3.150%(Q) | | | | | | 3 Month KWCDC(2)(Q)/3.430% | | | | | | | (4,209) | | | | 3,975 | | | | 8,184 | |
| KRW | | | 953,000 | | | | 03/10/34 | | | 3.150%(Q) | | | | | | 3 Month KWCDC(2)(Q)/3.430% | | | | | | | 3,048 | | | | 8,767 | | | | 5,719 | |
| MXN | | | 5,700 | | | | 06/14/34 | | | 9.425%(M) | | | | | | 28 Day Mexican Interbank Rate(2)(M)/10.708% | | | | | | | 1,494 | | | | (2,133) | | | | (3,627) | |
| NOK | | | 1,680 | | | | 03/15/27 | | | 2.103%(A) | | | | | | 6 Month NIBOR(2)(S)/4.730% | | | | | | | 2,309 | | | | (6,233) | | | | (8,542) | |
| NZD | | | 100 | | | | 11/05/29 | | | 1.393%(S) | | | | | | 3 Month BBR(2)(Q)/4.520% | | | | | | | — | | | | (6,834) | | | | (6,834) | |
| PLN | | | 2,220 | | | | 10/18/26 | | | 5.163%(A) | | | | | | 6 Month WIBOR(2)(S)/5.840% | | | | | | | — | | | | (1,147) | | | | (1,147) | |
| PLN | | | 2,000 | | | | 10/18/26 | | | 5.166%(A) | | | | | | 6 Month WIBOR(2)(S)/5.840% | | | | | | | — | | | | (1,001) | | | | (1,001) | |
| PLN | | | 890 | | | | 07/11/28 | | | 2.935%(A) | | | | | | 6 Month WIBOR(2)(S)/5.840% | | | | | | | 12,027 | | | | (17,203) | | | | (29,230) | |
| SEK | | | 1,200 | | | | 11/05/29 | | | 0.457%(A) | | | | | | 3 Month STIBOR(2)(Q)/2.850% | | | | | | | (1,489) | | | | (9,974) | | | | (8,485) | |
| SGD | | | 165 | | | | 07/29/31 | | | 1.120%(S) | | | | | | 1 Day SORA(2)(S)/3.156% | | | | | | | 775 | | | | (12,051) | | | | (12,826) | |
| THB | | | 16,000 | | | | 07/03/30 | | | 1.028%(Q) | | | | | | 1 Day THOR(2)(Q)/2.238% | | | | | | | (32,333) | | | | (27,949) | | | | 4,384 | |
| THB | | | 8,800 | | | | 04/18/34 | | | 2.895%(Q) | | | | | | 1 Day THOR(2)(Q)/2.238% | | | | | | | — | | | | 11,873 | | | | 11,873 | |
| THB | | | 7,680 | | | | 04/22/34 | | | 2.818%(Q) | | | | | | 1 Day THOR(2)(Q)/2.238% | | | | | | | — | | | | 8,830 | | | | 8,830 | |
| TWD | | | 14,600 | | | | 02/17/28 | | | 1.390%(Q) | | | | | | 3 Month TAIBOR(1)(Q)/1.674% | | | | | | | — | | | | 7,316 | | | | 7,316 | |
See Notes to Financial Statements.
PGIM Global Total Return (USD Hedged) Fund 149
PGIM Global Total Return (USD Hedged) Fund
Schedule of Investments (continued)
as of October 31, 2024
Interest rate swap agreements outstanding at October 31, 2024 (continued):
| | | | | | | | | | | | | | | | | | | | | | | | | | | | | | | | | | | | | | | | | | |
Notional
Amount
(000)# | | | Termination
Date | | | Fixed
Rate | | | | | | Floating Rate | | Value at Trade Date | | | Value at
October 31,
2024 | | | Unrealized Appreciation (Depreciation) | |
| | | |
Centrally Cleared Interest Rate Swap Agreements (cont’d.): | | | | | | | | | | | | | |
| TWD | | | 8,480 | | | | 07/21/33 | | | | 1.410%(Q) | | | | | | | 3 Month TAIBOR(1)(Q)/1.674% | | | | | | $ | — | | | $ | 14,815 | | | | | | | $ | 14,815 | | | | | |
| | | 4,320 | | | | 04/30/25 | | | | 5.241%(T) | | | | | | | 1 Day SOFR(2)(T)/4.900% | | | | | | | — | | | | 13,959 | | | | | | | | 13,959 | | | | | |
| | | 5,740 | | | | 08/19/25 | | | | 4.395%(T) | | | | | | | 1 Day SOFR(2)(T)/4.900% | | | | | | | (154 | ) | | | (3,833 | ) | | | | | | | (3,679 | ) | | | | |
| | | 4,705 | | | | 09/06/25 | | | | 4.200%(T) | | | | | | | 1 Day SOFR(2)(T)/4.900% | | | | | | | 1,660 | | | | (8,346 | ) | | | | | | | (10,006 | ) | | | | |
| | | 2,210 | | | | 04/23/26 | | | | 4.861%(A) | | | | | | | 1 Day SOFR(2)(A)/4.900% | | | | | | | — | | | | 20,268 | | | | | | | | 20,268 | | | | | |
| | | 2,210 | | | | 05/11/26 | | | | 4.750%(A) | | | | | | | 1 Day SOFR(2)(A)/4.900% | | | | | | | 37,756 | | | | 17,466 | | | | | | | | (20,290 | ) | | | | |
| | | 2,395 | | | | 09/06/26 | | | | 3.660%(A) | | | | | | | 1 Day SOFR(1)(A)/4.900% | | | | | | | (841 | ) | | | 18,012 | | | | | | | | 18,853 | | | | | |
| | | 1,795 | | | | 09/25/26 | | | | 4.699%(A) | | | | | | | 1 Day SOFR(1)(A)/4.900% | | | | | | | — | | | | (23,831 | ) | | | | | | | (23,831 | ) | | | | |
| | | 493 | | | | 08/15/28 | | | | 1.220%(A) | | | | | | | 1 Day SOFR(1)(A)/4.900% | | | | | | | — | | | | 49,143 | | | | | | | | 49,143 | | | | | |
| | | 1,265 | | | | 09/05/28 | | | | 4.027%(A) | | | | | | | 1 Day SOFR(1)(A)/4.900% | | | | | | | — | | | | (7,250 | ) | | | | | | | (7,250 | ) | | | | |
| | | 980 | | | | 09/28/28 | | | | 4.396%(A) | | | | | | | 1 Day SOFR(1)(A)/4.900% | | | | | | | — | | | | (19,948 | ) | | | | | | | (19,948 | ) | | | | |
| | | 1,100 | | | | 11/07/28 | | | | 4.223%(A) | | | | | | | 1 Day SOFR(1)(A)/4.900% | | | | | | | — | | | | (3,620 | ) | | | | | | | (3,620 | ) | | | | |
| | | 950 | | | | 05/17/29 | | | | 4.143%(A) | | | | | | | 1 Day SOFR(1)(A)/4.900% | | | | | | | — | | | | (8,262 | ) | | | | | | | (8,262 | ) | | | | |
| | | 1,020 | | | | 05/11/49 | | | | 1.350%(A) | | | | | | | 1 Day SOFR(2)(A)/4.900% | | | | | | | (409,132 | ) | | | (407,028 | ) | | | | | | | 2,104 | | | | | |
| | | 240 | | | | 04/30/54 | | | | 4.027%(A) | | | | | | | 1 Day SOFR(1)(A)/4.900% | | | | | | | — | | | | (14,490 | ) | | | | | | | (14,490 | ) | | | | |
| | | 465 | | | | 05/10/54 | | | | 3.850%(A) | | | | | | | 1 Day SOFR(2)(A)/4.900% | | | | | | | (2,710 | ) | | | 13,270 | | | | | | | | 15,980 | | | | | |
| | | 940 | | | | 05/11/54 | | | | 1.350%(A) | | | | | | | 1 Day SOFR(1)(A)/4.900% | | | | | | | 412,098 | | | | 402,839 | | | | | | | | (9,259 | ) | | | | |
| | | 510 | | | | 05/10/74 | | | | 3.420%(A) | | | | | | | 1 Day SOFR(1)(A)/4.900% | | | | | | | 5,260 | | | | (11,573 | ) | | | | | | | (16,833 | ) | | | | |
| | | 800 | | | | 05/11/74 | | | | 1.950%(A) | | | | | | | 1 Day SOFR(1)(A)/4.900% | | | | | | | 3,605 | | | | 7,964 | | | | | | | | 4,359 | | | | | |
| | | | | | | | | | | | | | | | | | | | | | | | | | | | | | | | | | | | | | | | | | |
| | | | | | | | | | | |
| | | | | | | | | | | | | | | | | | | | | | | | $ | (319,471 | ) | | $ | (1,481,677 | ) | | | | | | $ | (1,162,206 | ) | | | | |
| | | | | | | | | | | | | | | | | | | | | | | | | | | | | | | | | | | | | | | | | | |
See Notes to Financial Statements.
150
PGIM Global Total Return (USD Hedged) Fund
Schedule of Investments (continued)
as of October 31, 2024
Interest rate swap agreements outstanding at October 31, 2024 (continued):
| | | | | | | | | | | | | | | | | | | | | | | | | | | | | | | | | | | | | | | | | | |
Notional
Amount
(000)# | | | Termination
Date | | Fixed
Rate | | | Floating Rate | | Fair
Value | | | Upfront
Premiums
Paid(Received) | | | Unrealized
Appreciation
(Depreciation) | | | Counterparty | |
|
| OTC Interest Rate Swap Agreements: | |
| CNH | 2,100 | | | 07/31/30 | | | 2.515%(Q) | | | 7 Day China Fixing Repo Rates(2)(Q)/1.704% | | $ | 11,516 | | | | | | | $ | — | | | | | | | | | | | $ | 11,516 | | | | | | | | MSI | |
| CNH | 6,000 | | | 09/01/30 | | | 2.360%(Q) | | | 7 Day China Fixing Repo Rates(2)(Q)/1.704% | | | 26,546 | | | | | | | | — | | | | | | | | | | | | 26,546 | | | | | | | | MSI | |
| CNH | 2,700 | | | 11/24/30 | | | 2.495%(Q) | | | 7 Day China Fixing Repo Rates(2)(Q)/1.704% | | | 15,286 | | | | | | | | — | | | | | | | | | | | | 15,286 | | | | | | | | MSI | |
| CNH | 3,000 | | | 10/14/31 | | | 2.675%(Q) | | | 7 Day China Fixing Repo Rates(2)(Q)/1.704% | | | 23,264 | | | | | | | | — | | | | | | | | | | | | 23,264 | | | | | | | | SCB | |
| MYR | 450 | | | 04/09/26 | | | 2.625%(Q) | | | 3 Month KLIBOR(2)(Q)/3.580% | | | (1,376 | ) | | | | | | | (8 | ) | | | | | | | | | | | (1,368 | ) | | | | | | | MSI | |
| MYR | 900 | | | 08/12/26 | | | 2.605%(Q) | | | 3 Month KLIBOR(2)(Q)/3.580% | | | (3,699 | ) | | | | | | | (4 | ) | | | | | | | | | | | (3,695 | ) | | | | | | | HSBC | |
| MYR | 200 | | | 07/11/29 | | | 3.528%(Q) | | | 3 Month KLIBOR(2)(Q)/3.580% | | | (54 | ) | | | | | | | — | | | | | | | | | | | | (54 | ) | | | | | | | MSI | |
| MYR | 790 | | | 11/23/30 | | | 3.880%(Q) | | | 3 Month KLIBOR(2)(Q)/3.580% | | | 2,744 | | | | | | | | (1 | ) | | | | | | | | | | | 2,745 | | | | | | | | MSI | |
| MYR | 200 | | | 04/07/32 | | | 3.870%(Q) | | | 3 Month KLIBOR(2)(Q)/3.580% | | | 583 | | | | | | | | (2 | ) | | | | | | | | | | | 585 | | | | | | | | CITI | |
| MYR | 230 | | | 07/12/32 | | | 3.650%(Q) | | | 3 Month KLIBOR(2)(Q)/3.580% | | | (155 | ) | | | | | | | (1 | ) | | | | | | | | | | | (154 | ) | | | | | | | GSI | |
| | | | | | | | | | | | | | | | | | | | | | | | | | | | | | | | | | | | | | | | | | |
| | | | | | | | | | | |
| | | | | | | | | | | | $ | 74,655 | | | | | | | $ | (16 | ) | | | | | | | | | | $ | 74,671 | | | | | | | | | |
| | | | | | | | | | | | | | | | | | | | | | | | | | | | | | | | | | | | | | | | | | |
| (1) | The Fund pays the fixed rate and receives the floating rate. |
| (2) | The Fund pays the floating rate and receives the fixed rate. |
See Notes to Financial Statements.
PGIM Global Total Return (USD Hedged) Fund 151
PGIM Global Total Return (USD Hedged) Fund
Schedule of Investments (continued)
as of October 31, 2024
Total return swap agreements outstanding at October 31, 2024:
| | | | | | | | | | | | | | | | | | | | | | | | | | | | | | | | | | | | | | | | | | |
Reference Entity | | Financing Rate | | Counterparty | | | Termination
Date | | | Long
(Short)
Notional
Amount
(000)#(1) | | | Fair
Value | | | Upfront
Premiums
Paid
(Received) | | | Unrealized Appreciation (Depreciation)(2) | |
| | | | | | | | | |
OTC Total Return Swap Agreements: | | | | | | | | | | | | | | | | | | | | | | | | | | | | | | | | | | | | | |
U.S. Treasury Bond(T) | | 1 Day USOIS -20bps(T)/4.630% | | | JPM | | | | 12/09/24 | | | | 635 | | | $ | (41,326 | ) | | | | | | $ | — | | | | | | | | | | | $ | (41,326 | ) | | | | |
U.S. Treasury Bond(T) | | 1 Day USOIS +22bps(T)/5.050% | | | JPM | | | | 12/10/24 | | | | 1,300 | | | | (85,654 | ) | | | | | | | — | | | | | | | | | | | | (85,654 | ) | | | | |
U.S. Treasury Bond(T) | | 1 Day USOIS +22bps(T)/5.050% | | | JPM | | | | 12/10/24 | | | | 1,390 | | | | (82,444 | ) | | | | | | | — | | | | | | | | | | | | (82,444 | ) | | | | |
U.S. Treasury Bond(T) | | 1 Day USOIS +23bps(T)/5.060% | | | JPM | | | | 12/12/24 | | | | 1,278 | | | | (78,733 | ) | | | | | | | — | | | | | | | | | | | | (78,733 | ) | | | | |
| | | | | | | | | | | | | | | | | | | | | | | | | | | | | | | | | | | | | | | | | | |
| | | | | | | | | | | |
| | | | | | | | | | | | | | | | $ | (288,157 | ) | | | | | | $ | — | | | | | | | | | | | $ | (288,157 | ) | | | | |
| | | | | | | | | | | | | | | | | | | | | | | | | | | | | | | | | | | | | | | | | | |
| (1) | On a long total return swap, the Fund receives payments for any positive return on the reference entity (makes payments for any negative return) and pays the financing rate. On a short total return swap, the Fund makes payments for any positive return on the reference entity (receives payments for any negative return) and receives the financing rate. |
| (2) | Upfront/recurring fees or commissions, as applicable, are included in the net unrealized appreciation (depreciation). |
Balances Reported in the Statement of Assets and Liabilities for OTC Swap Agreements:
| | | | | | | | | | | | | | | | | | | | |
| | | Premiums Paid | | Premiums Received | | Unrealized Appreciation | | Unrealized Depreciation |
OTC Swap Agreements | | | | $9,525 | | | | | $(19,759) | | | | | $99,102 | | | | | $(301,724) | |
Summary of Collateral for Centrally Cleared/Exchange-traded Derivatives:
Cash and securities segregated as collateral, including pending settlement for closed positions, to cover requirements for centrally cleared/exchange-traded derivatives are listed by broker as follows:
| | | | | | | | | | | | |
Broker | | Cash and/or Foreign Currency | | Securities Market Value |
JPS | | | | $— | | | | | | $872,299 | | |
| | | | | | | | | | | | |
Fair Value Measurements:
Various inputs are used in determining the value of the Fund’s investments. These inputs are summarized in the three broad levels listed below.
See Notes to Financial Statements.
152
PGIM Global Total Return (USD Hedged) Fund
Schedule of Investments (continued)
as of October 31, 2024
Level 1—unadjusted quoted prices generally in active markets for identical securities.
Level 2—quoted prices for similar securities, interest rates and yield curves, prepayment speeds, foreign currency exchange rates and other observable inputs.
Level 3—unobservable inputs for securities valued in accordance with Board approved fair valuation procedures.
The following is a summary of the inputs used as of October 31, 2024 in valuing such portfolio securities:
| | | | | | | | | | | | |
| | | Level 1 | | | Level 2 | | | Level 3 | |
Investments in Securities | | | | | | | | | | | | |
Assets | | | | | | | | | | | | |
Long-Term Investments | | | | | | | | | | | | |
Asset-Backed Securities | | | | | | | | | | | | |
Cayman Islands | | $ | — | | | $ | 1,668,439 | | | $ | — | |
Ireland | | | — | | | | 1,297,463 | | | | — | |
Spain | | | — | | | | — | | | | 35,211 | |
United States | | | — | | | | 2,186,967 | | | | — | |
Commercial Mortgage-Backed Securities | | | | | | | | | | | | |
Canada | | | — | | | | 9,858 | | | | — | |
Ireland | | | — | | | | 106,024 | | | | — | |
United Kingdom | | | — | | | | 331,805 | | | | — | |
United States | | | — | | | | 2,980,690 | | | | — | |
Corporate Bonds | | | | | | | | | | | | |
Brazil | | | — | | | | 248,520 | | | | — | |
Bulgaria | | | — | | | | 201,212 | | | | — | |
Canada | | | — | | | | 638,649 | | | | — | |
China | | | — | | | | 30,248 | | | | — | |
France | | | — | | | | 2,053,472 | | | | — | |
Germany | | | — | | | | 522,471 | | | | — | |
Hong Kong | | | — | | | | 343,968 | | | | — | |
Hungary | | | — | | | | 202,355 | | | | — | |
India | | | — | | | | 517,778 | | | | — | |
Indonesia | | | — | | | | 200,003 | | | | — | |
Israel | | | — | | | | 170,224 | | | | — | |
Italy | | | — | | | | 201,352 | | | | — | |
Jamaica | | | — | | | | 211,775 | | | | 887 | |
Luxembourg | | | — | | | | 923,672 | | | | — | |
Malta | | | — | | | | 211,940 | | | | — | |
Mexico | | | — | | | | 716,464 | | | | — | |
Netherlands | | | — | | | | 195,951 | | | | — | |
Norway | | | — | | | | 156,805 | | | | — | |
Peru | | | — | | | | 14,166 | | | | — | |
Philippines | | | — | | | | 296,170 | | | | — | |
Portugal | | | — | | | | 119,423 | | | | — | |
South Africa | | | — | | | | 199,750 | | | | — | |
Spain | | | — | | | | 207,058 | | | | — | |
Supranational Bank | | | — | | | | 310,621 | | | | — | |
Sweden | | | — | | | | 103,271 | | | | — | |
See Notes to Financial Statements.
PGIM Global Total Return (USD Hedged) Fund 153
PGIM Global Total Return (USD Hedged) Fund
Schedule of Investments (continued)
as of October 31, 2024
| | | | | | | | | | | | |
| | | Level 1 | | | Level 2 | | | Level 3 | |
Investments in Securities (continued) | | | | | | | | | | | | |
Assets (continued) | | | | | | | | | | | | |
Long-Term Investments (continued) | | | | | | | | | | | | |
Corporate Bonds (continued) | | | | | | | | | | | | |
Switzerland | | $ | — | | | $ | 385,738 | | | $ | — | |
United Arab Emirates | | | — | | | | 920,691 | | | | — | |
United Kingdom | | | — | | | | 2,018,093 | | | | — | |
United States | | | — | | | | 7,207,730 | | | | — | |
Floating Rate and Other Loans | | | | | | | | | | | | |
Jamaica | | | — | | | | 10,187 | | | | — | |
United States | | | — | | | | 29,231 | | | | — | |
Municipal Bond | | | | | | | | | | | | |
Louisiana | | | — | | | | 100,762 | | | | — | |
Residential Mortgage-Backed Securities | | | | | | | | | | | | |
United States | | | — | | | | 1,574,577 | | | | — | |
Sovereign Bonds | | | | | | | | | | | | |
Andorra | | | — | | | | 190,388 | | | | — | |
Austria | | | — | | | | 220,103 | | | | — | |
Brazil | | | — | | | | 675,768 | | | | — | |
Bulgaria | | | — | | | | 169,825 | | | | — | |
Chile | | | — | | | | 116,374 | | | | — | |
China | | | — | | | | 417,172 | | | | — | |
Colombia | | | — | | | | 644,500 | | | | — | |
Croatia | | | — | | | | 187,025 | | | | — | |
Cyprus | | | — | | | | 255,274 | | | | — | |
France | | | — | | | | 148,746 | | | | — | |
Greece | | | — | | | | 1,346,131 | | | | — | |
Hong Kong | | | — | | | | 149,566 | | | | — | |
Hungary | | | — | | | | 361,178 | | | | — | |
Indonesia | | | — | | | | 792,290 | | | | — | |
Israel | | | — | | | | 365,947 | | | | — | |
Italy | | | — | | | | 1,457,649 | | | | — | |
Latvia | | | — | | | | 188,433 | | | | — | |
Lithuania | | | — | | | | 192,124 | | | | — | |
Mexico | | | — | | | | 271,326 | | | | — | |
Panama | | | — | | | | 359,712 | | | | — | |
Peru | | | — | | | | 92,406 | | | | — | |
Philippines | | | — | | | | 291,959 | | | | — | |
Romania | | | — | | | | 358,263 | | | | — | |
Saudi Arabia | | | — | | | | 273,425 | | | | — | |
Serbia | | | — | | | | 331,968 | | | | — | |
Slovakia | | | — | | | | 152,013 | | | | — | |
Spain | | | — | | | | 799,522 | | | | — | |
United Arab Emirates | | | — | | | | 108,945 | | | | — | |
United Kingdom | | | — | | | | 262,224 | | | | — | |
U.S. Government Agency Obligation | | | — | | | | 12,031 | | | | — | |
See Notes to Financial Statements.
154
PGIM Global Total Return (USD Hedged) Fund
Schedule of Investments (continued)
as of October 31, 2024
| | | | | | | | | | | | |
| | | Level 1 | | | Level 2 | | | Level 3 | |
Investments in Securities (continued) | | | | | | | | | | | | |
Assets (continued) | | | | | | | | | | | | |
U.S. Treasury Obligations | | $ | — | | | $ | 1,158,251 | | | $ | — | |
Affiliated Exchange-Traded Fund | | | 2,095,249 | | | | — | | | | — | |
Common Stock | | | | | | | | | | | | |
Jamaica | | | — | | | | — | | | | 24,849 | |
Preferred Stock | | | | | | | | | | | | |
Jamaica | | | — | | | | — | | | | 11,461 | |
Short-Term Investments | | | | | | | | | | | | |
Affiliated Mutual Fund | | | 1,154,597 | | | | — | | | | — | |
Options Purchased | | | — | | | | 6,749 | | | | — | |
| | | | | | | | | | | | |
| | | |
Total | | $ | 3,249,846 | | | $ | 42,182,860 | | | $ | 72,408 | |
| | | | | | | | | | | | |
| | | |
Liabilities | | | | | | | | | | | | |
Options Written | | $ | — | | | $ | (4,546 | ) | | $ | — | |
| | | | | | | | | | | | |
| | | |
Other Financial Instruments* | | | | | | | | | | | | |
Assets | | | | | | | | | | | | |
Futures Contracts | | $ | 225,856 | | | $ | — | | | $ | — | |
OTC Forward Foreign Currency Exchange Contracts | | | — | | | | 670,353 | | | | — | |
OTC Credit Default Swap Agreements | | | — | | | | 22,990 | | | | — | |
Centrally Cleared Interest Rate Swap Agreements | | | — | | | | 643,178 | | | | — | |
OTC Interest Rate Swap Agreements | | | — | | | | 79,939 | | | | — | |
| | | | | | | | | | | | |
| | | |
Total | | $ | 225,856 | | | $ | 1,416,460 | | | $ | — | |
| | | | | | | | | | | | |
| | | |
Liabilities | | | | | | | | | | | | |
Futures Contracts | | $ | (249,445 | ) | | $ | — | | | $ | — | |
OTC Forward Foreign Currency Exchange Contracts | | | — | | | | (135,075 | ) | | | — | |
OTC Credit Default Swap Agreements | | | — | | | | (22,344 | ) | | | — | |
Centrally Cleared Interest Rate Swap Agreements | | | — | | | | (1,805,384 | ) | | | — | |
OTC Interest Rate Swap Agreements | | | — | | | | (5,284 | ) | | | — | |
OTC Total Return Swap Agreements | | | — | | | | (288,157 | ) | | | — | |
| | | | | | | | | | | | |
| | | |
Total | | $ | (249,445 | ) | | $ | (2,256,244 | ) | | $ | — | |
| | | | | | | | | | | | |
| * | Other financial instruments are derivative instruments not reflected in the Schedule of Investments, such as futures, forwards and centrally cleared swap contracts, which are recorded at unrealized appreciation (depreciation) on the instrument, and OTC swap contracts which are recorded at fair value. |
Industry Classification:
The industry classification of investments and other assets in excess of liabilities shown as a percentage of net assets as of October 31, 2024 were as follows:
See Notes to Financial Statements.
PGIM Global Total Return (USD Hedged) Fund 155
PGIM Global Total Return (USD Hedged) Fund
Schedule of Investments (continued)
as of October 31, 2024
Industry Classification (continued):
| | | | |
Sovereign Bonds | | | 24.2 | % |
Banks | | | 12.2 | |
Commercial Mortgage-Backed Securities | | | 7.4 | |
Collateralized Loan Obligations | | | 6.4 | |
Affiliated Exchange-Traded Fund | | | 4.6 | |
Electric | | | 4.3 | |
Residential Mortgage-Backed Securities | | | 3.5 | |
Automobiles | | | 3.0 | |
Real Estate | | | 2.8 | |
Real Estate Investment Trusts (REITs) | | | 2.7 | |
Oil & Gas | | | 2.7 | |
U.S. Treasury Obligations | | | 2.5 | |
Affiliated Mutual Fund | | | 2.5 | |
Telecommunications | | | 2.1 | |
Commercial Services | | | 1.7 | |
Transportation | | | 1.4 | |
Pipelines | | | 1.2 | |
Diversified Financial Services | | | 1.0 | |
Home Equity Loans | | | 1.0 | |
Insurance | | | 0.9 | |
Pharmaceuticals | | | 0.8 | |
Media | | | 0.7 | |
Agriculture | | | 0.7 | |
Multi-National | | | 0.7 | |
Consumer Loans | | | 0.7 | |
Retail | | | 0.6 | |
Entertainment | | | 0.5 | |
Household Products/Wares | | | 0.5 | |
Auto Manufacturers | | | 0.5 | |
Foods | | | 0.5 | |
Investment Companies | | | 0.4 | |
Engineering & Construction | | | 0.4 | |
| | | | |
Home Builders | | | 0.4 | % |
Semiconductors | | | 0.3 | |
Beverages | | | 0.3 | |
Electronics | | | 0.2 | |
Aerospace & Defense | | | 0.2 | |
Healthcare-Products | | | 0.2 | |
Airlines | | | 0.2 | |
Municipal Bond | | | 0.2 | |
Packaging & Containers | | | 0.2 | |
Auto Parts & Equipment | | | 0.2 | |
Office/Business Equipment | | | 0.2 | |
Chemicals | | | 0.1 | |
Iron/Steel | | | 0.1 | |
Healthcare-Services | | | 0.1 | |
Wireless Telecommunication Services | | | 0.1 | |
Lodging | | | 0.1 | |
Gas | | | 0.1 | |
Building Materials | | | 0.1 | |
Mining | | | 0.1 | |
U.S. Government Agency Obligation | | | 0.0 | * |
Options Purchased | | | 0.0 | * |
Housewares | | | 0.0 | * |
| | | | |
| |
| | | 98.5 | |
Options Written | | | (0.0 | )* |
Other assets in excess of liabilities | | | 1.5 | |
| | | | |
| |
| | | 100.0 | % |
| | | | |
Effects of Derivative Instruments on the Financial Statements and Primary Underlying Risk Exposure:
The Fund invested in derivative instruments during the reporting period. The primary types of risk associated with these derivative instruments are credit risk, foreign exchange risk and interest rate risk. See the Notes to Financial Statements for additional detail regarding these derivative instruments and their risks. The effect of such derivative instruments on the Fund’s financial position and financial performance as reflected in the Statement of Assets and Liabilities and Statement of Operations is presented in the summary below.
Fair values of derivative instruments as of October 31, 2024 as presented in the Statement of Assets and Liabilities:
See Notes to Financial Statements.
156
PGIM Global Total Return (USD Hedged) Fund
Schedule of Investments (continued)
as of October 31, 2024
| | | | | | | | | | | | |
| | | Asset Derivatives | | | Liability Derivatives | |
| | | | |
Derivatives not accounted for as hedging instruments, carried at fair value | | Statement of Assets and Liabilities Location | | Fair
Value | | | Statement of Assets and Liabilities Location | | Fair
Value | |
| | | | | | | | | | | |
| | | | |
Credit contracts | | Premiums paid for OTC swap agreements | | $ | 9,525 | | | Premiums received for OTC swap agreements | | $ | 19,743 | |
Credit contracts | | Unrealized appreciation on OTC swap agreements | | | 19,160 | | | Unrealized depreciation on OTC swap agreements | | | 8,296 | |
Foreign exchange contracts | | Due from/to broker-variation margin futures | | | 84,519* | | | — | | | — | |
Foreign exchange contracts | | Unrealized appreciation on OTC forward foreign currency exchange contracts | | | 670,353 | | | Unrealized depreciation on OTC forward foreign currency exchange contracts | | | 135,075 | |
Interest rate contracts | | Due from/to broker-variation margin futures | | | 141,337 | * | | Due from/to broker-variation margin futures | | | 249,445 | * |
Interest rate contracts | | Due from/to broker-variation margin swaps | | | 643,178 | * | | Due from/to broker-variation margin swaps | | | 1,805,384 | * |
Interest rate contracts | | — | | | — | | | Premiums received for OTC swap agreements | | | 16 | |
Interest rate contracts | | Unaffiliated investments | | | 6,749 | | | Options written outstanding, at value | | | 4,546 | |
Interest rate contracts | | Unrealized appreciation on OTC swap agreements | | | 79,942 | | | Unrealized depreciation on OTC swap agreements | | | 293,428 | |
| | | | | | | | | | | | |
| | | | |
| | | | $ | 1,654,763 | | | | | $ | 2,515,933 | |
| | | | | | | | | | | | |
| * | Includes cumulative appreciation (depreciation) as reported in the schedule of open futures and centrally cleared swap contracts. Only unsettled variation margin receivable (payable) is reported within the Statement of Assets and Liabilities. |
See Notes to Financial Statements.
PGIM Global Total Return (USD Hedged) Fund 157
PGIM Global Total Return (USD Hedged) Fund
Schedule of Investments (continued)
as of October 31, 2024
The effects of derivative instruments on the Statement of Operations for the year ended October 31, 2024 are as follows:
| | | | | | | | | | | | | | | | | | | | | | | | | | | | | | | | | | | | | | | | | | | | |
Amount of Realized Gain (Loss) on Derivatives Recognized in Income | |
| | | | | |
Derivatives not accounted for as hedging instruments, carried at fair value | | Options
Purchased(1) | | | Options Written | | | Futures | | | Forward & Cross Currency Exchange Contracts | | | Swaps | |
| | | | | | | | | | | | | | | | | | | | | | | | | | | | | | | | | | |
| | | | | | | | | | | |
Credit contracts | | | | | | $ | — | | | | | | | | | | | $ | — | | | | | | | $ | — | | | | | | | $ | — | | | | | | | $ | 1,024,139 | |
Foreign exchange contracts | | | | | | | — | | | | | | | | | | | | — | | | | | | | | (230,002 | ) | | | | | | | (596,166 | ) | | | | | | | — | |
Interest rate contracts | | | | | | | 7,113 | | | | | | | | | | | | (4,124 | ) | | | | | | | (73,574 | ) | | | | | | | — | | | | | | | | (290,277 | ) |
| | | | | | | | | | | | | | | | | | | | | | | | | | | | | | | | | | | | | | | | | | | | |
| | | | | | | | | | | |
Total | | | | | | $ | 7,113 | | | | | | | | | | | $ | (4,124 | ) | | | | | | $ | (303,576 | ) | | | | | | $ | (596,166 | ) | | | | | | $ | 733,862 | |
| | | | | | | | | | | | | | | | | | | | | | | | | | | | | | | | | | | | | | | | | | | | |
| (1) | Included in net realized gain (loss) on investment transactions in the Statement of Operations. |
| | | | | | | | | | | | | | | | | | | | | | | | | | | | | | | | | | | | | | | | | | | | |
Change in Unrealized Appreciation (Depreciation) on Derivatives Recognized in Income | |
| | | | | |
Derivatives not accounted for as hedging instruments, carried at fair value | | Options
Purchased(2) | | | Options Written | | | Futures | | | Forward & Cross Currency Exchange Contracts | | | Swaps | |
| | | | | | | | | | | | | | | | | | | | | | | | | | | | | | | | | | |
| | | | | | | | | | | |
Credit contracts | | | | | | $ | — | | | | | | | | | | | $ | — | | | | | | | $ | — | | | | | | | $ | — | | | | | | | $ | 186,697 | |
Foreign exchange contracts | | | | | | | — | | | | | | | | | | | | — | | | | | | | | (253,222 | ) | | | | | | | 454,751 | | | | | | | | — | |
Interest rate contracts | | | | | | | 4,144 | | | | | | | | | | | | (3,857 | ) | | | | | | | (192,267 | ) | | | | | | | — | | | | | | | | 864,244 | |
| | | | | | | | | | | | | | | | | | | | | | | | | | | | | | | | | | | | | | | | | | | | |
| | | | | | | | | | | |
Total | | | | | | $ | 4,144 | | | | | | | | | | | $ | (3,857 | ) | | | | | | $ | (445,489 | ) | | | | | | $ | 454,751 | | | | | | | $ | 1,050,941 | |
| | | | | | | | | | | | | | | | | | | | | | | | | | | | | | | | | | | | | | | | | | | | |
| (2) | Included in net change in unrealized appreciation (depreciation) on investments in the Statement of Operations. |
For the year ended October 31, 2024, the Fund’s average volume of derivative activities is as follows:
| | | | | | | | | | | | |
| Derivative Contract Type | | Average Volume of Derivative Activities* | |
| | | |
Options Purchased (1) | | | | | | $ | 521 | | | | | |
Options Written (2) | | | | | | | 2,874,000 | | | | | |
Futures Contracts - Long Positions (2) | | | | | | | 25,420,116 | | | | | |
Futures Contracts - Short Positions (2) | | | | | | | 46,808,586 | | | | | |
Forward Foreign Currency Exchange Contracts - Purchased (3) | | | | | | | 16,349,348 | | | | | |
Forward Foreign Currency Exchange Contracts - Sold (3) | | | | | | | 33,654,983 | | | | | |
Cross Currency Exchange Contracts (4) | | | | | | | 63,064 | | | | | |
Interest Rate Swap Agreements (2) | | | | | | | 115,314,727 | | | | | |
Credit Default Swap Agreements - Buy Protection (2) | | | | | | | 1,084,744 | | | | | |
Credit Default Swap Agreements - Sell Protection (2) | | | | | | | 11,174,483 | | | | | |
Currency Swap Agreements (2) | | | | | | | 19,344 | | | | | |
Total Return Swap Agreements (2) | | | | | | | 2,225,600 | | | | | |
See Notes to Financial Statements.
158
PGIM Global Total Return (USD Hedged) Fund
Schedule of Investments (continued)
as of October 31, 2024
| | |
| Derivative Contract Type | | Average Volume of Derivative Activities* |
Inflation Swap Agreements (2) | | $ 186,867 |
| * | Average volume is based on average quarter end balances for the year ended October 31, 2024. |
| (2) | Notional Amount in USD. |
| (3) | Value at Settlement Date. |
Financial Instruments/Transactions—Summary of Offsetting and Netting Arrangements:
The Fund invested in OTC derivatives during the reporting period that are either offset in accordance with current requirements or are subject to enforceable master netting arrangements or similar agreements that permit offsetting. The information about offsetting and related netting arrangements for OTC derivatives where the legal right to set-off exists is presented in the summary below.
| | | | | | | | | | | | | | | | | | | | | | | | | | | | | | | | | | | | | | | | | | | | | | | | | | | | | | | | | | | | | | |
Counterparty | | | | Gross Amounts of
Recognized
Assets(1) | | | Gross Amounts of
Recognized
Liabilities(1) | | | Net Amounts of
Recognized
Assets/(Liabilities) | | | Collateral
Pledged/(Received)(2) | | | Net Amount | |
| | | | | | | | | | | | | | | | |
| BARC | | | | | | | | $ | 4,405 | | | | | | | | | | | $ | (3,915 | ) | | | | | | | | | | $ | 490 | | | | | | | | | | | $ | — | | | | | | | | | | | $ | 490 | | | | | |
| BNP | | | | | | | | | 1,940 | | | | | | | | | | | | (3,712 | ) | | | | | | | | | | | (1,772 | ) | | | | | | | | | | | — | | | | | | | | | | | | (1,772 | ) | | | | |
| BOA | | | | | | | | | 15,244 | | | | | | | | | | | | (7,701 | ) | | | | | | | | | | | 7,543 | | | | | | | | | | | | — | | | | | | | | | | | | 7,543 | | | | | |
| CITI | | | | | | | | | 16,107 | | | | | | | | | | | | (24,467 | ) | | | | | | | | | | | (8,360 | ) | | | | | | | | | | | — | | | | | | | | | | | | (8,360 | ) | | | | |
| DB | | | | | | | | | 12,416 | | | | | | | | | | | | (1,158 | ) | | | | | | | | | | | 11,258 | | | | | | | | | | | | — | | | | | | | | | | | | 11,258 | | | | | |
| GSI | | | | | | | | | 16,619 | | | | | | | | | | | | (17,466 | ) | | | | | | | | | | | (847 | ) | | | | | | | | | | | — | | | | | | | | | | | | (847 | ) | | | | |
| HSBC | | | | | | | | | 75,575 | | | | | | | | | | | | (25,399 | ) | | | | | | | | | | | 50,176 | | | | | | | | | | | | — | | | | | | | | | | | | 50,176 | | | | | |
| JPM | | | | | | | | | 513,378 | | | | | | | | | | | | (372,148 | ) | | | | | | | | | | | 141,230 | | | | | | | | | | | | (141,230 | ) | | | | | | | | | | | — | | | | | |
| MSI | | | | | | | | | 106,356 | | | | | | | | | | | | (2,733 | ) | | | | | | | | | | | 103,623 | | | | | | | | | | | | — | | | | | | | | | | | | 103,623 | | | | | |
| SCB | | | | | | | | | 23,689 | | | | | | | | | | | | (671 | ) | | | | | | | | | | | 23,018 | | | | | | | | | | | | — | | | | | | | | | | | | 23,018 | | | | | |
| SSB | | | | | | | | | — | | | | | | | | | | | | (1,734 | ) | | | | | | | | | | | (1,734 | ) | | | | | | | | | | | — | | | | | | | | | | | | (1,734 | ) | | | | |
| | | | | | | | | | | | | | | | | | | | | | | | | | | | | | | | | | | | | | | | | | | | | | | | | | | | | | | | | | | | | | |
| | | | | | | | | | | | | | | | |
| | | | | | | | $ | 785,729 | | | | | | | | | | | $ | (461,104 | ) | | | | | | | | | | $ | 324,625 | | | | | | | | | | | $ | (141,230 | ) | | | | | | | | | | $ | 183,395 | | | | | |
| | | | | | | | | | | | | | | | | | | | | | | | | | | | | | | | | | | | | | | | | | | | | | | | | | | | | | | | | | | | | | |
| (1) | Includes unrealized appreciation/(depreciation) on swaps and forwards, premiums paid/(received) on swap agreements and market value of purchased and written options, as represented on the Statement of Assets and Liabilities. |
| (2) | Collateral amount disclosed by the Fund is limited to the market value of financial instruments/transactions and the Fund’s OTC derivative exposure by counterparty. |
See Notes to Financial Statements.
PGIM Global Total Return (USD Hedged) Fund 159
PGIM Global Total Return (USD Hedged) Fund
Statement of Assets & Liabilities
as of October 31, 2024
| | | | | | |
Assets | | | | | | |
| | |
Investments at value: | | | | | | |
Unaffiliated investments (cost $45,178,592) | | $ | 42,255,268 | | | |
Affiliated investments (cost $3,236,363) | | | 3,249,846 | | | |
Foreign currency, at value (cost $40,020) | | | 39,620 | | | |
Unrealized appreciation on OTC forward foreign currency exchange contracts | | | 670,353 | | | |
Dividends and interest receivable | | | 438,408 | | | |
Receivable for Fund shares sold | | | 99,322 | | | |
Unrealized appreciation on OTC swap agreements | | | 99,102 | | | |
Due from Manager | | | 40,768 | | | |
Premiums paid for OTC swap agreements | | | 9,525 | | | |
Due from broker—variation margin futures | | | 2,468 | | | |
Prepaid expenses and other assets | | | 14,102 | | | |
| | | | | | |
| | |
Total Assets | | | 46,918,782 | | | |
| | | | | | |
| | |
Liabilities | | | | | | |
| | |
Unrealized depreciation on OTC swap agreements | | | 301,724 | | | |
Unrealized depreciation on OTC forward foreign currency exchange contracts | | | 135,075 | | | |
Payable for Fund shares purchased | | | 87,096 | | | |
Audit fee payable | | | 46,190 | | | |
Dividends payable | | | 39,701 | | | |
Accrued expenses and other liabilities | | | 24,656 | | | |
Premiums received for OTC swap agreements | | | 19,759 | | | |
Shareholders’ reports fee payable | | | 19,223 | | | |
Custodian and accounting fee payable | | | 13,588 | | | |
Payable for investments purchased | | | 9,837 | | | |
Due to broker—variation margin swaps | | | 5,182 | | | |
Options written outstanding, at value (premiums received $689) | | | 4,546 | | | |
Directors’ fees payable | | | 1,010 | | | |
Affiliated transfer agent fee payable | | | 994 | | | |
Distribution fee payable | | | 164 | | | |
| | | | | | |
| | |
Total Liabilities | | | 708,745 | | | |
| | | | | | |
| | |
Net Assets | | $ | 46,210,037 | | | |
| | | | | | |
| | | | | | | |
| | |
Net assets were comprised of: | | | | | | |
Common stock, at par | | $ | 54,019 | | | |
Paid-in capital in excess of par | | | 56,122,079 | | | |
Total distributable earnings (loss) | | | (9,966,061 | ) | | |
| | | | | | |
| | |
Net assets, October 31, 2024 | | $ | 46,210,037 | | | |
| | | | | | |
See Notes to Financial Statements.
160
PGIM Global Total Return (USD Hedged) Fund
Statement of Assets & Liabilities (continued)
as of October 31, 2024
| | | | | | | | |
Class A | | | | | | | | |
| | |
Net asset value, offering price and redemption price per share, ($593,248 ÷ 69,342 shares of common stock issued and outstanding) | | $ | 8.56 | | | | | |
Maximum sales charge (3.25% of offering price) | | | 0.29 | | | | | |
| | | | | | | | |
| | |
Maximum offering price to public | | $ | 8.85 | | | | | |
| | | | | | | | |
| | |
Class C | | | | | | | | |
| | |
Net asset value, offering price and redemption price per share, ($44,369 ÷ 5,189 shares of common stock issued and outstanding) | | $ | 8.55 | | | | | |
| | | | | | | | |
| | |
Class Z | | | | | | | | |
| | |
Net asset value, offering price and redemption price per share, ($21,623,664 ÷ 2,528,907 shares of common stock issued and outstanding) | | $ | 8.55 | | | | | |
| | | | | | | | |
| | |
Class R6 | | | | | | | | |
| | |
Net asset value, offering price and redemption price per share, ($23,948,756 ÷ 2,798,490 shares of common stock issued and outstanding) | | $ | 8.56 | | | | | |
| | | | | | | | |
See Notes to Financial Statements.
PGIM Global Total Return (USD Hedged) Fund 161
PGIM Global Total Return (USD Hedged) Fund
Statement of Operations
Year Ended October 31, 2024
| | | | |
Net Investment Income (Loss) | | | | |
| |
Income | | | | |
Interest income | | $ | 4,072,015 | |
Affiliated dividend income | | | 108,410 | |
Unaffiliated dividend income | | | 46,886 | |
Income from securities lending, net (including affiliated income of $459) | | | 468 | |
| | | | |
| |
Total income | | | 4,227,779 | |
| | | | |
| |
Expenses | | | | |
Management fee | | | 457,984 | |
Distribution fee(a) | | | 1,914 | |
Custodian and accounting fees | | | 54,289 | |
Registration fees(a) | | | 46,327 | |
Audit fee | | | 46,190 | |
Shareholders’ reports | | | 41,575 | |
Professional fees | | | 40,860 | |
Transfer agent’s fees and expenses (including affiliated expense of $6,146)(a) | | | 32,652 | |
Commitment fees | | | 25,615 | |
Interest expense | | | 19,722 | |
Directors’ fees | | | 10,987 | |
Miscellaneous | | | 30,281 | |
| | | | |
| |
Total expenses | | | 808,396 | |
Less: Fee waiver and/or expense reimbursement(a) | | | (245,370 | ) |
| | | | |
| |
Net expenses | | | 563,026 | |
| | | | |
| |
Net investment income (loss) | | | 3,664,753 | |
| | | | |
| |
Realized And Unrealized Gain (Loss) On Investment And Foreign Currency Transactions | | | | |
| |
Net realized gain (loss) on: | | | | |
Investment transactions (including affiliated of $99) | | | (3,236,105 | ) |
Futures transactions | | | (303,576 | ) |
Forward and cross currency contract transactions | | | (596,166 | ) |
Options written transactions | | | (4,124 | ) |
Swap agreement transactions | | | 733,862 | |
Foreign currency transactions | | | (998,698 | ) |
| | | | |
| |
| | | (4,404,807 | ) |
| | | | |
| |
Net change in unrealized appreciation (depreciation) on: | | | | |
Investments (including affiliated of $13,457) | | | 12,079,524 | |
Futures | | | (445,489 | ) |
Forward and cross currency contracts | | | 454,751 | |
Options written | | | (3,857 | ) |
Swap agreements | | | 1,050,941 | |
Foreign currencies | | | 50,080 | |
| | | | |
| |
| | | 13,185,950 | |
| | | | |
| |
Net gain (loss) on investment and foreign currency transactions | | | 8,781,143 | |
| | | | |
| |
Net Increase (Decrease) In Net Assets Resulting From Operations | | $ | 12,445,896 | |
| | | | |
See Notes to Financial Statements.
162
PGIM Global Total Return (USD Hedged) Fund
Statement of Operations (continued)
Year Ended October 31, 2024
| (a) | Class specific expenses and waivers were as follows: |
| | | | | | | | | | | | | | | | |
| | | Class A | | | Class C | | | Class Z | | | Class R6 | |
| | | | |
Distribution fee | | | 1,413 | | | | 501 | | | | — | | | | — | |
Registration fees | | | 9,617 | | | | 7,467 | | | | 15,492 | | | | 13,751 | |
Transfer agent’s fees and expenses | | | 1,466 | | | | 320 | | | | 23,816 | | | | 7,050 | |
Fee waiver and/or expense reimbursement | | | (12,123) | | | | (7,872) | | | | (73,972) | | | | (151,403) | |
See Notes to Financial Statements.
PGIM Global Total Return (USD Hedged) Fund 163
PGIM Global Total Return (USD Hedged) Fund
Statements of Changes in Net Assets
| | | | | | | | | | | | |
| |
| | | Year Ended
October 31, | |
| | | |
| | | 2024 | | | | | | 2023 | |
Increase (Decrease) in Net Assets | | | | | | | | | | | | |
| | | |
Operations | | | | | | | | | | | | |
Net investment income (loss) | | $ | 3,664,753 | | | | | | | $ | 3,417,833 | |
Net realized gain (loss) on investment and foreign currency transactions | | | (4,404,807 | ) | | | | | | | (1,439,046 | ) |
Net change in unrealized appreciation (depreciation) on investments and foreign currencies | | | 13,185,950 | | | | | | | | 2,301,905 | |
| | | | | | | | | | | | |
| | | |
Net increase (decrease) in net assets resulting from operations | | | 12,445,896 | | | | | | | | 4,280,692 | |
| | | | | | | | | | | | |
Dividends and Distributions | | | | | | | | | | | | |
| | | |
Distributions from distributable earnings | | | | | | | | | | | | |
Class A | | | (14,909 | ) | | | | | | | (20,492 | ) |
Class C | | | (1,074 | ) | | | | | | | (2,273 | ) |
Class Z | | | (475,963 | ) | | | | | | | (295,803 | ) |
Class R6 | | | (2,198,164 | ) | | | | | | | (3,808,260 | ) |
| | | | | | | | | | | | |
| | | |
| | | (2,690,110 | ) | | | | | | | (4,126,828 | ) |
| | | | | | | | | | | | |
Tax return of capital distributions | | | | | | | | | | | | |
Class A | | | (5,608 | ) | | | | | | | (1,739 | ) |
Class C | | | (404 | ) | | | | | | | (193 | ) |
Class Z | | | (179,011 | ) | | | | | | | (25,095 | ) |
Class R6 | | | (826,738 | ) | | | | | | | (323,086 | ) |
| | | | | | | | | | | | |
| | | |
| | | (1,011,761 | ) | | | | | | | (350,113 | ) |
| | | | | | | | | | | | |
| | | |
Fund share transactions (Net of share conversions) | | | | | | | | | | | | |
Net proceeds from shares sold | | | 36,048,165 | | | | | | | | 42,782,589 | |
Net asset value of shares issued in reinvestment of dividends and distributions | | | 3,107,979 | | | | | | | | 4,476,015 | |
Cost of shares purchased | | | (98,883,762 | ) | | | | | | | (24,605,971 | ) |
| | | | | | | | | | | | |
| | | |
Net increase (decrease) in net assets from Fund share transactions | | | (59,727,618 | ) | | | | | | | 22,652,633 | |
| | | | | | | | | | | | |
| | | |
Total increase (decrease) | | | (50,983,593 | ) | | | | | | | 22,456,384 | |
| | | |
Net Assets: | | | | | | | | | | | | |
| | | |
Beginning of year | | | 97,193,630 | | | | | | | | 74,737,246 | |
| | | | | | | | | | | | |
| | | |
End of year | | $ | 46,210,037 | | | | | | | $ | 97,193,630 | |
| | | | | | | | | | | | |
See Notes to Financial Statements.
164
PGIM Global Total Return (USD Hedged) Fund
Financial Highlights
| | | | | | | | | | | | | | | | | | | | |
| | | | | | |
| Class A Shares | | | | | | | | | | | | | | | | | | | | |
| | |
| | | Year Ended October 31, | |
| | | | | | |
| | | 2024 | | | 2023 | | | 2022 | | | 2021 | | | 2020 | |
| | | | | | |
| Per Share Operating Performance(a): | | | | | | | | | | | | | | | | | | | | |
| Net Asset Value, Beginning of Year | | | $7.90 | | | | $7.85 | | | | $10.03 | | | | $10.41 | | | | $10.43 | |
| Income (loss) from investment operations: | | | | | | | | | | | | | | | | | | | | |
| Net investment income (loss) | | | 0.31 | | | | 0.29 | | | | 0.20 | | | | 0.15 | | | | 0.21 | |
| Net realized and unrealized gain (loss) on investment and foreign currency transactions | | | 0.66 | | | | 0.16 | | | | (2.03 | ) | | | (0.27 | ) | | | 0.30 | |
| Total from investment operations | | | 0.97 | | | | 0.45 | | | | (1.83 | ) | | | (0.12 | ) | | | 0.51 | |
| Less Dividends and Distributions: | | | | | | | | | | | | | | | | | | | | |
| Dividends from net investment income | | | (0.22 | ) | | | (0.37 | ) | | | (0.35 | ) | | | (0.26 | ) | | | (0.28 | ) |
| Tax return of capital distributions | | | (0.09 | ) | | | (0.03 | ) | | | - | | | | - | | | | (0.14 | ) |
| Distributions from net realized gains | | | - | | | | - | | | | - | | | | - | | | | (0.11 | ) |
| Total dividends and distributions | | | (0.31 | ) | | | (0.40 | ) | | | (0.35 | ) | | | (0.26 | ) | | | (0.53 | ) |
| Net asset value, end of year | | | $8.56 | | | | $7.90 | | | | $7.85 | | | | $10.03 | | | | $10.41 | |
| Total Return(b): | | | 12.24 | % | | | 5.69 | % | | | (18.63 | )% | | | (1.22 | )% | | | 5.12 | % |
| | | | | | | | | | | | | | | | | | | | | |
| Ratios/Supplemental Data: | | | | | | | | | | | | | | | | | | | | |
| Net assets, end of year (000) | | | $593 | | | | $469 | | | | $465 | | | | $841 | | | | $729 | |
| Average net assets (000) | | | $565 | | | | $451 | | | | $570 | | | | $825 | | | | $1,716 | |
| Ratios to average net assets(c): | | | | | | | | | | | | | | | | | | | | |
| Expenses after waivers and/or expense reimbursement | | | 0.91 | %(d) | | | 0.89 | %(d) | | | 0.88 | % | | | 0.88 | % | | | 0.88 | % |
| Expenses before waivers and/or expense reimbursement | | | 3.05 | % | | | 2.76 | % | | | 3.10 | % | | | 2.96 | % | | | 2.30 | % |
| Net investment income (loss) | | | 3.65 | % | | | 3.64 | % | | | 2.27 | % | | | 1.48 | % | | | 2.03 | % |
| Portfolio turnover rate(e) | | | 52 | % | | | 20 | % | | | 30 | % | | | 20 | % | | | 33 | % |
| (a) | Calculated based on average shares outstanding during the year. |
| (b) | Total return does not consider the effects of sales loads. Total return is calculated assuming a purchase of a share on the first day and a sale on the last day of each year reported and includes reinvestment of dividends and distributions, if any. Total returns may reflect adjustments to conform to GAAP. |
| (c) | Does not include expenses of the underlying funds in which the Fund invests. |
| (d) | Includes interest expense on borrowings from the Syndicated Credit Agreement of 0.03% for the year ended October 31, 2024 and interest expense on borrowings from the Syndicated Credit Agreement and certain non-recurring expenses of 0.01% for the year ended October 31, 2023 which are being excluded from the Fund’s contractual waiver, if applicable. |
| (e) | The Fund’s portfolio turnover rate is calculated in accordance with regulatory requirements, without regard to transactions involving short-term investments, certain derivatives and in-kind transactions (if any). If such transactions were included, the Fund’s portfolio turnover rate may be higher. |
See Notes to Financial Statements.
PGIM Global Total Return (USD Hedged) Fund 165
PGIM Global Total Return (USD Hedged) Fund
Financial Highlights (continued)
| | | | | | | | | | | | | | | | | | | | |
| | | | | | |
| Class C Shares | | | | | | | | | | | | | | | | | | | | |
| | |
| | | Year Ended October 31, | |
| | | | | | |
| | | 2024 | | | 2023 | | | 2022 | | | 2021 | | | 2020 | |
| | | | | | |
| Per Share Operating Performance(a): | | | | | | | | | | | | | | | | | | | | |
| Net Asset Value, Beginning of Year | | | $7.89 | | | | $7.85 | | | | $10.03 | | | | $10.41 | | | | $10.43 | |
| Income (loss) from investment operations: | | | | | | | | | | | | | | | | | | | | |
| Net investment income (loss) | | | 0.25 | | | | 0.23 | | | | 0.14 | | | | 0.08 | | | | 0.12 | |
| Net realized and unrealized gain (loss) on investment and foreign currency transactions | | | 0.65 | | | | 0.15 | | | | (2.04 | ) | | | (0.28 | ) | | | 0.31 | |
| Total from investment operations | | | 0.90 | | | | 0.38 | | | | (1.90 | ) | | | (0.20 | ) | | | 0.43 | |
| Less Dividends and Distributions: | | | | | | | | | | | | | | | | | | | | |
| Dividends from net investment income | | | (0.15 | ) | | | (0.31 | ) | | | (0.28 | ) | | | (0.18 | ) | | | (0.20 | ) |
| Tax return of capital distributions | | | (0.09 | ) | | | (0.03 | ) | | | - | | | | - | | | | (0.14 | ) |
| Distributions from net realized gains | | | - | | | | - | | | | - | | | | - | | | | (0.11 | ) |
| Total dividends and distributions | | | (0.24 | ) | | | (0.34 | ) | | | (0.28 | ) | | | (0.18 | ) | | | (0.45 | ) |
| Net asset value, end of year | | | $8.55 | | | | $7.89 | | | | $7.85 | | | | $10.03 | | | | $10.41 | |
| Total Return(b): | | | 11.54 | % | | | 4.77 | % | | | (19.24 | )% | | | (1.96 | )% | | | 4.32 | % |
| | | | | | | | | | | | | | | | | | | | | |
| Ratios/Supplemental Data: | | | | | | | | | | | | | | | | | | | | |
| Net assets, end of year (000) | | | $44 | | | | $58 | | | | $119 | | | | $139 | | | | $162 | |
| Average net assets (000) | | | $50 | | | | $59 | | | | $166 | | | | $150 | | | | $85 | |
| Ratios to average net assets(c): | | | | | | | | | | | | | | | | | | | | |
| Expenses after waivers and/or expense reimbursement | | | 1.66 | %(d) | | | 1.64 | %(d) | | | 1.63 | % | | | 1.63 | % | | | 1.63 | % |
| Expenses before waivers and/or expense reimbursement | | | 17.38 | % | | | 12.14 | % | | | 7.58 | % | | | 10.05 | % | | | 15.56 | % |
| Net investment income (loss) | | | 2.94 | % | | | 2.89 | % | | | 1.54 | % | | | 0.74 | % | | | 1.15 | % |
| Portfolio turnover rate(e) | | | 52 | % | | | 20 | % | | | 30 | % | | | 20 | % | | | 33 | % |
| (a) | Calculated based on average shares outstanding during the year. |
| (b) | Total return does not consider the effects of sales loads. Total return is calculated assuming a purchase of a share on the first day and a sale on the last day of each year reported and includes reinvestment of dividends and distributions, if any. Total returns may reflect adjustments to conform to GAAP. |
| (c) | Does not include expenses of the underlying funds in which the Fund invests. |
| (d) | Includes interest expense on borrowings from the Syndicated Credit Agreement of 0.03% for the year ended October 31, 2024 and interest expense on borrowings from the Syndicated Credit Agreement and certain non-recurring expenses of 0.01% for the year ended October 31, 2023 which are being excluded from the Fund’s contractual waiver, if applicable. |
| (e) | The Fund’s portfolio turnover rate is calculated in accordance with regulatory requirements, without regard to transactions involving short-term investments, certain derivatives and in-kind transactions (if any). If such transactions were included, the Fund’s portfolio turnover rate may be higher. |
See Notes to Financial Statements.
166
PGIM Global Total Return (USD Hedged) Fund
Financial Highlights (continued)
| | | | | | | | | | | | | | | | | | | | |
| | | | | | |
| Class Z Shares | | | | | | | | | | | | | | | | | | | | |
| | |
| | | Year Ended October 31, | |
| | | | | | |
| | | 2024 | | | 2023 | | | 2022 | | | 2021 | | | 2020 | |
| | | | | | |
| Per Share Operating Performance(a): | | | | | | | | | | | | | | | | | | | | |
| Net Asset Value, Beginning of Year | | | $7.89 | | | | $7.85 | | | | $10.03 | | | | $10.41 | | | | $10.43 | |
| Income (loss) from investment operations: | | | | | | | | | | | | | | | | | | | | |
| Net investment income (loss) | | | 0.33 | | | | 0.31 | | | | 0.23 | | | | 0.17 | | | | 0.22 | |
| Net realized and unrealized gain (loss) on investment and foreign currency transactions | | | 0.66 | | | | 0.15 | | | | (2.04 | ) | | | (0.27 | ) | | | 0.32 | |
| Total from investment operations | | | 0.99 | | | | 0.46 | | | | (1.81 | ) | | | (0.10 | ) | | | 0.54 | |
| Less Dividends and Distributions: | | | | | | | | | | | | | | | | | | | | |
| Dividends from net investment income | | | (0.24 | ) | | | (0.39 | ) | | | (0.37 | ) | | | (0.28 | ) | | | (0.31 | ) |
| Tax return of capital distributions | | | (0.09 | ) | | | (0.03 | ) | | | - | | | | - | | | | (0.14 | ) |
| Distributions from net realized gains | | | - | | | | - | | | | - | | | | - | | | | (0.11 | ) |
| Total dividends and distributions | | | (0.33 | ) | | | (0.42 | ) | | | (0.37 | ) | | | (0.28 | ) | | | (0.56 | ) |
| Net asset value, end of year | | | $8.55 | | | | $7.89 | | | | $7.85 | | | | $10.03 | | | | $10.41 | |
| Total Return(b): | | | 12.66 | % | | | 5.82 | % | | | (18.42 | )% | | | (0.98 | )% | | | 5.37 | % |
| | | | | | | | | | | | | | | | | | | | | |
| Ratios/Supplemental Data: | | | | | | | | | | | | | | | | | | | | |
| Net assets, end of year (000) | | | $21,624 | | | | $10,693 | | | | $5,442 | | | | $10,982 | | | | $8,864 | |
| Average net assets (000) | | | $17,134 | | | | $6,320 | | | | $7,255 | | | | $17,287 | | | | $6,563 | |
| Ratios to average net assets(c): | | | | | | | | | | | | | | | | | | | | |
| Expenses after waivers and/or expense reimbursement | | | 0.67 | %(d) | | | 0.64 | %(d) | | | 0.63 | % | | | 0.63 | % | | | 0.63 | % |
| Expenses before waivers and/or expense reimbursement | | | 1.10 | % | | | 1.03 | % | | | 1.12 | % | | | 1.09 | % | | | 1.56 | % |
| Net investment income (loss) | | | 3.87 | % | | | 3.88 | % | | | 2.53 | % | | | 1.65 | % | | | 2.17 | % |
| Portfolio turnover rate(e) | | | 52 | % | | | 20 | % | | | 30 | % | | | 20 | % | | | 33 | % |
| (a) | Calculated based on average shares outstanding during the year. |
| (b) | Total return is calculated assuming a purchase of a share on the first day and a sale on the last day of each year reported and includes reinvestment of dividends and distributions, if any. Total returns may reflect adjustments to conform to GAAP. |
| (c) | Does not include expenses of the underlying funds in which the Fund invests. |
| (d) | Includes interest expense on borrowings from the Syndicated Credit Agreement of 0.04% for the year ended October 31, 2024 and interest expense on borrowings from the Syndicated Credit Agreement and certain non-recurring expenses of 0.01% for the year ended October 31, 2023 which are being excluded from the Fund’s contractual waiver, if applicable. |
| (e) | The Fund’s portfolio turnover rate is calculated in accordance with regulatory requirements, without regard to transactions involving short-term investments, certain derivatives and in-kind transactions (if any). If such transactions were included, the Fund’s portfolio turnover rate may be higher. |
See Notes to Financial Statements.
PGIM Global Total Return (USD Hedged) Fund 167
PGIM Global Total Return (USD Hedged) Fund
Financial Highlights (continued)
| | | | | | | | | | | | | | | | | | | | |
| | | | | | |
| Class R6 Shares | | | | | | | | | | | | | | | | | | | | |
| | |
| | | Year Ended October 31, | |
| | | | | | |
| | | 2024 | | | 2023 | | | 2022 | | | 2021 | | | 2020 | |
| | | | | | |
| Per Share Operating Performance(a): | | | | | | | | | | | | | | | | | | | | |
| Net Asset Value, Beginning of Year | | | $7.90 | | | | $7.85 | | | | $10.04 | | | | $10.41 | | | | $10.43 | |
| Income (loss) from investment operations: | | | | | | | | | | | | | | | | | | | | |
| Net investment income (loss) | | | 0.34 | | | | 0.32 | | | | 0.24 | | | | 0.18 | | | | 0.23 | |
| Net realized and unrealized gain (loss) on investment and foreign currency transactions | | | 0.65 | | | | 0.15 | | | | (2.06 | ) | | | (0.26 | ) | | | 0.31 | |
| Total from investment operations | | | 0.99 | | | | 0.47 | | | | (1.82 | ) | | | (0.08 | ) | | | 0.54 | |
| Less Dividends and Distributions: | | | | | | | | | | | | | | | | | | | | |
| Dividends from net investment income | | | (0.24 | ) | | | (0.39 | ) | | | (0.37 | ) | | | (0.29 | ) | | | (0.31 | ) |
| Tax return of capital distributions | | | (0.09 | ) | | | (0.03 | ) | | | - | | | | - | | | | (0.14 | ) |
| Distributions from net realized gains | | | - | | | | - | | | | - | | | | - | | | | (0.11 | ) |
| Total dividends and distributions | | | (0.33 | ) | | | (0.42 | ) | | | (0.37 | ) | | | (0.29 | ) | | | (0.56 | ) |
| Net asset value, end of year | | | $8.56 | | | | $7.90 | | | | $7.85 | | | | $10.04 | | | | $10.41 | |
| Total Return(b): | | | 12.71 | % | | | 6.01 | % | | | (18.47 | )% | | | (0.82 | )% | | | 5.42 | % |
| | | | | | | | | | | | | | | | | | | | | |
| Ratios/Supplemental Data: | | | | | | | | | | | | | | | | | | | | |
| Net assets, end of year (000) | | | $23,949 | | | | $85,974 | | | | $68,712 | | | | $62,187 | | | | $30,314 | |
| Average net assets (000) | | | $73,848 | | | | $79,863 | | | | $73,367 | | | | $37,302 | | | | $29,230 | |
| Ratios to average net assets(c): | | | | | | | | | | | | | | | | | | | | |
| Expenses after waivers and/or expense reimbursement | | | 0.60 | %(d) | | | 0.59 | %(d) | | | 0.58 | % | | | 0.58 | % | | | 0.58 | % |
| Expenses before waivers and/or expense reimbursement | | | 0.81 | % | | | 0.80 | % | | | 0.76 | % | | | 0.89 | % | | | 1.19 | % |
| Net investment income (loss) | | | 4.04 | % | | | 3.95 | % | | | 2.69 | % | | | 1.74 | % | | | 2.25 | % |
| Portfolio turnover rate(e) | | | 52 | % | | | 20 | % | | | 30 | % | | | 20 | % | | | 33 | % |
| (a) | Calculated based on average shares outstanding during the year. |
| (b) | Total return is calculated assuming a purchase of a share on the first day and a sale on the last day of each year reported and includes reinvestment of dividends and distributions, if any. Total returns may reflect adjustments to conform to GAAP. |
| (c) | Does not include expenses of the underlying funds in which the Fund invests. |
| (d) | Includes interest expense on borrowings from the Syndicated Credit Agreement of 0.02% for the year ended October 31, 2024 and interest expense on borrowings from the Syndicated Credit Agreement and certain non-recurring expenses of 0.01% for the year ended October 31, 2023 which are being excluded from the Fund’s contractual waiver, if applicable. |
| (e) | The Fund’s portfolio turnover rate is calculated in accordance with regulatory requirements, without regard to transactions involving short-term investments, certain derivatives and in-kind transactions (if any). If such transactions were included, the Fund’s portfolio turnover rate may be higher. |
See Notes to Financial Statements.
168
Notes to Financial Statements
Prudential Global Total Return Fund, Inc. (the “Registered Investment Company” or “RIC”) is registered under the Investment Company Act of 1940, as amended (“1940 Act”), as an open-end management investment company. The RIC is organized as a Maryland Corporation. These financial statements relate to the following series of the RIC: PGIM Global Total Return Fund and PGIM Global Total Return (USD Hedged) Fund (each, a “Fund” and collectively, the “Funds”). The Funds are classified as diversified funds for the purposes of the 1940 Act.
The Funds have the following investment objectives:
| | |
| | |
| Fund | | Investment Objective(s) |
PGIM Global Total Return Fund (“Global Total Return”) | | To seek total return, made up of current income and capital appreciation |
PGIM Global Total Return (USD Hedged) Fund (“Global Total Return (USD Hedged)”) | | To seek total return, through a combination of current income and capital appreciation |
| | | |
The Funds follow the investment company accounting and reporting guidance of the Financial Accounting Standards Board (“FASB”) Accounting Standard Codification (“ASC”) Topic 946 Financial Services —Investment Companies. The following is a summary of significant accounting policies followed by the Funds in the preparation of their financial statements. The policies conform to U.S. generally accepted accounting principles (“GAAP”). The Funds consistently follow such policies in the preparation of their financial statements.
Securities Valuation: The Funds hold securities and other assets and liabilities that are fair valued as of the close of each day (generally, 4:00 PM Eastern time) the New York Stock Exchange (“NYSE”) is open for trading. As described in further detail below, the Funds’ investments are valued daily based on a number of factors, including the type of investment and whether market quotations are readily available. The RIC’s Board of Directors (the “Board”) has approved the Funds’ valuation policies and procedures for security valuation and designated PGIM Investments LLC (“PGIM Investments” or the “Manager”) as the “Valuation Designee,” as defined by Rule 2a-5(b) under the 1940 Act, to perform the fair value determination relating to all Funds investments. Pursuant to the Board’s oversight, the Valuation Designee has established a Valuation Committee to perform the duties and responsibilities of the Valuation Designee under Rule 2a-5. The valuation procedures permit the Funds to utilize independent pricing vendor services, quotations from market makers, and alternative valuation methods when market quotations are either not readily available or
169
Notes to Financial Statements (continued)
not deemed representative of fair value. Fair value is the estimated price that would be received to sell an asset or paid to transfer a liability in an orderly transaction between market participants on the measurement date.
For the fiscal reporting year-end, securities and other assets and liabilities were fair valued at the close of the last U.S. business day. Trading in certain foreign securities may occur when the NYSE is closed (including weekends and holidays). Because such foreign securities trade in markets that are open on weekends and U.S. holidays, the values of some of the Funds’ foreign investments may change on days when investors cannot purchase or redeem Fund shares.
Various inputs determine how the Funds’ investments are valued, all of which are categorized according to the three broad levels (Level 1, 2, or 3) detailed in the Schedule of Investments and referred to herein as the “fair value hierarchy” in accordance with FASB ASC Topic 820 Fair Value Measurement.
Common or preferred stocks, exchange-traded funds (“ETFs”) and derivative instruments, if applicable, that are traded on a national securities exchange are valued at the last sale price as of the close of trading on the applicable exchange where the security principally trades. Securities traded via NASDAQ are valued at the NASDAQ official closing price. To the extent these securities are valued at the last sale price or NASDAQ official closing price, they are classified as Level 1 in the fair value hierarchy. In the event that no sale or official closing price on a valuation date exists, these securities are generally valued at the mean between the last reported bid and ask prices, or at the last bid price in the absence of an ask price. These securities are classified as Level 2 in the fair value hierarchy.
Investments in open-end funds (other than ETFs) are valued at their net asset values as of the close of the NYSE on the date of valuation. These securities are classified as Level 1 in the fair value hierarchy since they may be purchased or sold at their net asset values on the date of valuation.
Fixed income securities traded in the OTC market are generally classified as Level 2 in the fair value hierarchy. Such fixed income securities are typically valued using the market approach which generally involves obtaining data from an approved independent third-party vendor source. The Funds utilize the market approach as the primary method to value securities when market prices of identical or comparable instruments are available. The third-party vendors’ valuation techniques used to derive the evaluated bid price are based on evaluating observable inputs, including but not limited to, yield curves, yield spreads, credit ratings, deal terms, tranche level attributes, default rates, cash flows, prepayment speeds, broker/dealer quotations and reported trades. Certain Level 3 securities are also valued using the market approach when obtaining a single broker quote or when utilizing
170
transaction prices for identical securities that have been used in excess of five business days. During the reporting period, there were no changes to report with respect to the valuation approach and/or valuation techniques discussed above.
Floating rate and other loans are generally valued at prices provided by approved independent pricing vendors. The pricing vendors utilize broker/dealer quotations and provide prices based on the average of such quotations. Floating rate and other loans valued using such vendor prices are generally classified as Level 2 in the fair value hierarchy. Floating rate and other loans valued based on a single broker quote or at the original transaction price in excess of five business days are classified as Level 3 in the fair value hierarchy.
OTC and centrally cleared derivative instruments are generally classified as Level 2 in the fair value hierarchy. Such derivative instruments are typically valued using the market approach and/or income approach which generally involves obtaining data from an approved independent third-party vendor source. The Funds utilize the market approach when quoted prices in broker-dealer markets are available but also include consideration of alternative valuation approaches, including the income approach. In the absence of reliable market quotations, the income approach is typically utilized for purposes of valuing derivatives such as interest rate swaps based on a discounted cash flow analysis whereby the value of the instrument is equal to the present value of its future cash inflows or outflows. Such analysis includes projecting future cash flows and determining the discount rate (including the present value factors that affect the discount rate) used to discount the future cash flows. In addition, the third-party vendors’ valuation techniques used to derive the evaluated derivative price is based on evaluating observable inputs, including but not limited to, underlying asset prices, indices, spreads, interest rates and exchange rates. Certain derivatives may be classified as Level 3 when valued using the market approach by obtaining a single broker quote or when utilizing unobservable inputs in the income approach. During the reporting period, there were no changes to report with respect to the valuation approach and/or valuation techniques discussed above.
Securities and other assets that cannot be priced according to the methods described above are valued based on policies and procedures approved by the Board. In the event that unobservable inputs are used when determining such valuations, the securities will be classified as Level 3 in the fair value hierarchy. Altering one or more unobservable inputs may result in a significant change to a Level 3 security’s fair value measurement.
When determining the fair value of securities, some of the factors influencing the valuation include: the nature of any restrictions on disposition of the securities; assessment of the general liquidity of the securities; the issuer’s financial condition and the markets in which it does business; the cost of the investment; the size of the holding and the capitalization of the issuer; the prices of any recent transactions or bids/offers for such securities or any comparable securities; and any available analyst media or other reports or information deemed reliable by the Valuation Designee regarding the issuer or the markets or industry in which it operates. Using fair value to price securities may result in a value that is different
171
Notes to Financial Statements (continued)
from a security’s most recent closing price and from the price used by other unaffiliated mutual funds to calculate their net asset values.
Foreign Currency Translation: The books and records of the Funds are maintained in U.S. dollars. Foreign currency amounts are translated into U.S. dollars on the following basis:
(i) market value of investment securities, other assets and liabilities—at the exchange rate as of the valuation date;
(ii) purchases and sales of investment securities, income and expenses—at the rates of exchange prevailing on the respective dates of such transactions.
Although the net assets of the Funds are presented at the foreign exchange rates and market values at the close of the period, the Funds do not generally isolate that portion of the results of operations arising as a result of changes in the foreign exchange rates from the fluctuations arising from changes in the market prices of long-term portfolio securities held at the end of the period. Similarly, the Funds do not isolate the effect of changes in foreign exchange rates from the fluctuations arising from changes in the market prices of long-term portfolio securities sold during the period. Accordingly, holding period unrealized and realized foreign currency gains (losses) are included in the reported net change in unrealized appreciation (depreciation) on investments and net realized gains (losses) on investment transactions on the Statements of Operations. Notwithstanding the above, the Funds do isolate the effect of fluctuations in foreign currency exchange rates when determining the gain (loss) upon the sale or maturity of foreign currency denominated debt obligations; such amounts are included in net realized gains (losses) on foreign currency transactions.
Additionally, net realized gains (losses) on foreign currency transactions represent net foreign exchange gains (losses) from the disposition of holdings of foreign currencies, currency gains (losses) realized between the trade and settlement dates on investment transactions, and the difference between the amounts of interest, dividends and foreign withholding taxes recorded on the Funds’ books and the U.S. dollar equivalent amounts actually received or paid. Net unrealized currency gains (losses) arise from valuing foreign currency denominated assets and liabilities (other than investments) at period end exchange rates.
Forward and Cross Currency Contracts: A forward currency contract is a commitment to purchase or sell a foreign currency at a future date at a negotiated forward rate. The Funds entered into forward currency contracts, as defined in the prospectus, in order to hedge their exposure to changes in foreign currency exchange rates on their foreign portfolio holdings or on specific receivables and payables denominated in a foreign currency and to
172
gain exposure to certain currencies. The contracts are valued daily at current forward exchange rates and any unrealized gain (loss) is included in net unrealized appreciation or depreciation on forward and cross currency contracts. Gain (loss) is realized on the settlement date of the contract equal to the difference between the settlement value of the original and negotiated forward contracts. This gain (loss), if any, is included in net realized gain (loss) on forward and cross currency contract transactions. Risks may arise upon entering into these contracts from the potential inability of the counterparties to meet the terms of their contracts. Forward currency contracts involve risks from currency exchange rate and credit risk in excess of the amounts reflected on the Statement of Assets and Liabilities. The Funds’ maximum risk of loss from counterparty credit risk is the net value of the cash flows to be received from the counterparty at the end of the contract’s life. A cross currency contract is a forward contract where a specified amount of one foreign currency will be exchanged for a specified amount of another foreign currency.
Options: The Funds purchased and/or wrote options in order to hedge against adverse market movements or fluctuations in value caused by changes in prevailing interest rates, value of equities or foreign currency exchange rates with respect to securities or financial instruments which the Funds currently own or intend to purchase. The Funds may also use options to gain additional market exposure. The Funds’ principal reason for writing options is to realize, through receipt of premiums, a greater current return than would be realized on the underlying security alone. When the Funds purchase an option, they pay a premium and an amount equal to that premium is recorded as an asset. When the Funds write an option, it receives a premium and an amount equal to that premium is recorded as a liability. The asset or liability is adjusted daily to reflect the current market value of the option. If an option expires unexercised, the Funds realize a gain (loss) to the extent of the premium received or paid. If an option is exercised, the premium received or paid is recorded as an adjustment to the proceeds from the sale or the cost of the purchase in determining whether the Funds have realized a gain (loss). The difference between the premium and the amount received or paid at the closing of a purchase or sale transaction is also treated as a realized gain (loss). Gain (loss) on purchased options is included in net realized gain (loss) on investment transactions. Gain (loss) on written options is presented separately as net realized gain (loss) on options written transactions.
The Funds, as writer of an option, may have no control over whether the underlying securities or financial instruments may be sold (called) or purchased (put). As a result, the Funds bear the market risk of an unfavorable change in the price of the security or financial instrument underlying the written option. The Funds, as purchaser of an OTC option, bear the risk of the potential inability of the counterparties to meet the terms of their contracts. With exchange-traded options contracts, there is minimal counterparty credit risk to the Funds since the exchanges’ clearinghouse acts as counterparty to all exchange-traded options and guarantees the options contracts against default.
When the Funds write an option on a swap, an amount equal to any premium received by the Funds is recorded as a liability and is subsequently adjusted to the current market value of the written option on the swap. If a call option on a swap is exercised, the Funds become
173
Notes to Financial Statements (continued)
obligated to pay a fixed interest rate (noted as the strike price) and receive a variable interest rate on a notional amount. If a put option on a swap is exercised, the Funds become obligated to pay a variable interest rate and receive a fixed interest rate (noted as the strike price) on a notional amount. Premiums received from writing options on swaps that expire or are exercised are treated as realized gains upon the expiration or exercise of such options on swaps. The risk associated with writing put and call options on swaps is that the Funds will be obligated to be party to a swap agreement if an option on a swap is exercised.
Financial Futures Contracts: A financial futures contract is an agreement to purchase (long) or sell (short) an agreed amount of securities at a set price for delivery on a future date. Upon entering into a financial futures contract, the Funds are required to pledge to the broker an amount of cash and/or other assets equal to a certain percentage of the contract amount. This amount is known as the “initial margin.” Subsequent payments, known as “variation margin,” are made or received by the Funds each day, depending on the daily fluctuations in the value of the underlying security. Such variation margin is recorded for financial statement purposes on a daily basis as unrealized gain (loss). When the contract expires or is closed, the gain (loss) is realized and is presented in the Statement of Operations as net realized gain (loss) on futures transactions.
The Funds invested in financial futures contracts in order to hedge their existing portfolio securities, or securities the Funds intend to purchase, against fluctuations in value caused by changes in prevailing interest rates. Should interest rates move unexpectedly, the Funds may not achieve the anticipated benefits of the financial futures contracts and may realize a loss. The use of futures transactions involves the risk of imperfect correlation in movements in the price of futures contracts, interest rates and the underlying hedged assets. Since futures contracts are exchange-traded, there is minimal counterparty credit risk to the Funds since the exchanges’ clearinghouse acts as counterparty to all exchange-traded futures and guarantees the futures contracts against default.
Swap Agreements: The Funds entered into certain types of swap agreements detailed in the disclosures below. A swap agreement is an agreement to exchange the return generated by one instrument for the return generated by another instrument. Swap agreements are negotiated in the OTC market and may be executed either directly with a counterparty (“OTC-traded”) or through a central clearing facility, such as a registered exchange. Swap agreements are valued daily at current market value and any change in value is included in the net unrealized appreciation or depreciation on swap agreements. Centrally cleared swaps pay or receive an amount known as “variation margin”, based on daily changes in the valuation of the swap contract. For OTC-traded, upfront premiums paid and received are shown as swap premiums paid and swap premiums received in the Statement of Assets and
174
Liabilities. Risk of loss may exceed amounts recognized on the Statement of Assets and Liabilities. Swap agreements outstanding at period end, if any, are listed on the Schedule of Investments.
Interest Rate Swaps: Interest rate swaps represent an agreement between counterparties to exchange cash flows based on the difference between two interest rates, applied to a notional principal amount for a specified period. The Funds are subject to interest rate risk exposure in the normal course of pursuing their investment objective. The Funds used interest rate swaps to maintain their ability to generate steady cash flow by receiving a stream of fixed rate payments or to increase exposure to prevailing market rates by receiving floating rate payments. The Funds’ maximum risk of loss from counterparty credit risk is the discounted net present value of the cash flows to be received from the counterparty over the contract’s remaining life.
Credit Default Swaps (“CDS”): CDS involve one party (the protection buyer) making a stream of payments to another party (the protection seller) in exchange for the right to receive a specified payment in the event of a default or as a result of a default (collectively a “credit event”) for the referenced entity (typically corporate issues or sovereign issues of an emerging country) on its obligation; or in the event of a write-down, principal shortfall, interest shortfall or default of all or part of the referenced entities comprising a credit index.
The Funds are subject to credit risk in the normal course of pursuing their investment objectives, and as such, have entered into CDS contracts to provide a measure of protection against defaults or to take an active long or short position with respect to the likelihood of a particular issuer’s default or the reference entity’s credit soundness. CDS contracts generally trade based on a spread which represents the cost a protection buyer has to pay the protection seller. The protection buyer is said to be “short the credit” because the higher the contract value rises, the more the credit deteriorates. The value of the CDS contract increases for the protection buyer if the spread increases. The Funds’ maximum risk of loss from counterparty credit risk for purchased CDS is the inability of the counterparty to honor the contract up to the notional value due to a credit event.
As a seller of protection on credit default swap agreements, the Funds generally receive an agreed upon payment from the buyer of protection throughout the term of the swap, provided no credit event occurs. As the seller, the Funds effectively increase their investment risk because, in addition to their total net assets, the Funds may be subject to investment exposure on the notional amount of the swap.
The maximum amount of the payment that the Funds, as a seller of protection, could be required to make under a credit default swap agreement would be equal to the notional amount of the underlying security or index contract as a result of a credit event. This potential amount will be partially offset by any recovery values of the respective referenced obligations or net amounts received from the settlement of buy protection credit default swap agreements which the Funds entered into for the same referenced entity or index. As a
175
Notes to Financial Statements (continued)
buyer of protection, the Funds generally receive an amount up to the notional value of the swap if a credit event occurs.
Implied credit spreads, represented in absolute terms, utilized in determining the market value of credit default swap agreements where the Funds are the seller of protection as of period end are disclosed in the footnotes to the Schedule of Investments, if applicable. These spreads serve as indicators of the current status of the payment/performance risk and represent the likelihood of default risk for the credit derivative. The implied credit spread of a particular referenced entity reflects the cost of buying/selling protection and may include upfront payments required to enter into the agreement. Wider credit spreads and increased market value in absolute terms, when compared to the notional amount of the swap, represent a deterioration of the referenced entity’s credit soundness and a greater likelihood of risk of default or other credit event occurring as defined under the terms of the agreement.
Currency Swaps: The Funds may enter into currency swap agreements primarily to gain yield exposure on foreign bonds. Currency swap agreements involve two parties exchanging two different currencies with an agreement to reverse the exchange at a later date at specified exchange rates.
Total Return Swaps: In a total return swap, one party receives payments based on the market value of the security or the commodity involved, or total return of a specific referenced asset, such as an equity, index or bond, and in return pays a defined amount. The Funds are subject to risk exposures associated with the referenced asset in the normal course of pursuing their investment objectives. The Funds entered into total return swaps to manage their exposure to a security or an index. The Funds’ maximum risk of loss from counterparty credit risk is the change in the value of the security, in the Funds’ favor, from the point of entering into the contract.
Floating Rate and Other Loans: The Funds invested in floating rate and other loans. Floating rate and other loans include loans that are privately negotiated between a corporate borrower and one or more financial institutions, including, but not limited to, term loans, revolvers, and other instruments issued in the floating rate and other loans market. The Funds acquire interests in loans directly (by way of assignment from the selling institution) and/or indirectly (by way of the purchase of a participation interest from the selling institution). Under a floating rate and other loans assignment, the Funds generally will succeed to all the rights and obligations of an assigning lending institution and become a lender under the loan agreement with the relevant borrower in connection with that loan. Under a floating rate and other loans participation, the Funds generally will have a contractual relationship only with the lender, not with the relevant borrower. As a result, the Funds generally will have the right to receive payments of principal, interest, and any fees to
176
which they are entitled only from the lender selling the participation and only upon receipt by the lender of the payments from the relevant borrower. The Funds may not directly benefit from the collateral supporting the debt obligation in which they have purchased the participation. As a result, the Funds will assume the credit risk of both the borrower and the institution selling the participation to the Funds.
Mortgage-Backed and Asset-Backed Securities: Mortgage-backed securities are pass-through securities, meaning that principal and interest payments made by the borrower on the underlying mortgages are passed through to the Funds. Asset-backed securities directly or indirectly represent a participation interest in, or are secured by and payable from, a stream of payments generated by particular assets such as motor vehicle or credit card receivables. Asset-backed securities may be classified as pass-through certificates or collateralized obligations, such as collateralized bond obligations, collateralized loan obligations and other similarly structured securities. The value of mortgage-backed and asset-backed securities varies with changes in interest rates and may be affected by changes in credit quality or value of the mortgage loans or other assets that support the securities.
Stripped mortgage-backed securities are usually structured with two classes that receive different proportions of the interest (“IO”) and principal (“PO”) distributions on a pool of mortgage assets. Payments received for IOs are included in interest income on the Statements of Operations. Because no principal will be received at the maturity of an IO, adjustments are made to the cost of the security on a monthly basis until maturity. These adjustments are included in interest income on the Statements of Operations. Payments received for POs are treated as reductions to the cost and par value of the securities.
Master Netting Arrangements: The RIC, on behalf of each Fund, is subject to various Master Agreements, or netting arrangements, with select counterparties. These are agreements which a subadviser may have negotiated and entered into on behalf of all or a portion of each Fund. A master netting arrangement between each Fund and the counterparty permits each Fund to offset amounts payable by each Fund to the same counterparty against amounts to be received and by the receipt of collateral from the counterparty by each Fund to cover each Fund’s exposure to the counterparty. However, there is no assurance that such mitigating factors are easily enforceable. In addition to master netting arrangements, the right to set-off exists when all the conditions are met such that each of the parties owes the other determinable amounts, the reporting party has the right to set-off the amount owed with the amount owed by the other party, the reporting party intends to set-off and the right of set-off is enforceable by law.
The RIC, on behalf of each Fund, is a party to International Swaps and Derivatives Association, Inc. (“ISDA”) Master Agreements with certain counterparties that govern OTC derivative and foreign exchange contracts entered into from time to time. The Master Agreements may contain provisions regarding, among other things, the parties’ general obligations, representations, agreements, collateral requirements, events of default and early termination. With respect to certain counterparties, in accordance with the terms of the
177
Notes to Financial Statements (continued)
Master Agreements, collateral posted to each Fund is held in a segregated account by each Fund’s custodian and with respect to those amounts which can be sold or re-pledged, is presented in the Schedule of Investments. Collateral pledged by each Fund is segregated by each Fund’s custodian and identified in the Schedule of Investments. Collateral can be in the form of cash or debt securities issued by the U.S. Government or related agencies or other securities as agreed to by each Fund and the applicable counterparty. Collateral requirements are determined based on each Fund’s net position with each counterparty. Termination events applicable to each Fund may occur upon a decline in each Fund’s net assets below a specified threshold over a certain period of time. Termination events applicable to counterparties may occur upon a decline in the counterparty’s long-term and short-term credit ratings below a specified level. In each case, upon occurrence, the other party may elect to terminate early and cause settlement of all derivative and foreign exchange contracts outstanding, including the payment of any losses and costs resulting from such early termination, as reasonably determined by the terminating party. Any decision by one or more of each Fund’s counterparties to elect early termination could impact each Fund’s future derivative activity.
In addition to each instrument’s primary underlying risk exposure (e.g. interest rate, credit, equity or foreign exchange, etc.), swap agreements involve, to varying degrees, elements of credit, market and documentation risk. Such risks involve the possibility that no liquid market for these agreements will exist, the counterparty to the agreement may default on its obligation to perform or disagree on the contractual terms of the agreement, and changes in net interest rates will be unfavorable. In connection with these agreements, securities in the portfolio may be identified or received as collateral from the counterparty in accordance with the terms of the respective swap agreements to provide or receive assets of value and to serve as recourse in the event of default or bankruptcy/insolvency of either party. Such OTC derivative agreements include conditions which, when materialized, give the counterparty the right to cause an early termination of the transactions under those agreements. Any election by the counterparty for early termination of the contract(s) may impact the amounts reported on financial statements.
Short sales and OTC contracts, including forward foreign currency exchange contracts, swaps, forward rate agreements and written options involve elements of both market and credit risk in excess of the amounts reflected on the Statement of Assets and Liabilities, if applicable. Such risks may be mitigated by engaging in master netting arrangements.
Warrants: The Funds may hold warrants acquired either through a direct purchase or pursuant to corporate actions. Warrants entitle the holder to buy a proportionate amount of common stock, or such other security that the issuer may specify, at a specific price and time through the expiration dates. Such warrants are held as long positions by the Funds
178
until exercised, sold or expired. Warrants are valued at fair value in accordance with the Board approved fair valuation procedures.
Payment-In-Kind: The Funds invested in the open market or received pursuant to debt restructuring securities that pay-in-kind (“PIK”) the interest due on such debt instruments. The PIK interest, computed at the contractual rate specified, is added to the existing principal balance of the debt when issued bonds have the same terms as the bond or recorded as a separate bond when terms are different from the existing debt, and is recorded as interest income.
Securities Lending: The Funds may lend their portfolio securities to banks and broker-dealers. The loans are secured by collateral at least equal to the market value of the securities loaned. Collateral pledged by each borrower is invested in an affiliated money market fund and is marked to market daily, based on the previous day’s market value, such that the value of the collateral exceeds the value of the loaned securities. In the event of significant appreciation in value of the securities on loan on the last business day of the reporting period, the financial statements may reflect a collateral value that is less than the market value of the loaned securities. Such shortfall is remedied as described above. Loans are subject to termination at the option of the borrower or the Funds. Upon termination of the loan, the borrower will return to the Funds securities identical to the loaned securities. The remaining open loans of the securities lending transactions are considered overnight and continuous. Should the borrower of the securities fail financially, the Funds have the right to repurchase the securities in the open market using the collateral.
The Funds recognize income, net of any rebate and securities lending agent fees, for lending their securities in the form of fees or interest on the investment of any cash received as collateral. The borrower receives all interest and dividends from the securities loaned and such payments are passed back to the lender in amounts equivalent thereto, which are reflected in interest income or unaffiliated dividend income based on the nature of the payment on the Statement of Operations. The Funds also continue to recognize any unrealized gain (loss) in the market price of the securities loaned and on the change in the value of the collateral invested that may occur during the term of the loan. In addition, realized gain (loss) is recognized on changes in the value of the collateral invested upon liquidation of the collateral. Net earnings from securities lending are disclosed in the Statement of Operations.
Securities Transactions and Net Investment Income: Securities transactions are recorded on the trade date. Realized gains (losses) from investment and currency transactions are calculated on the specific identification method. Dividend income is recorded on the ex-date, or for certain foreign securities, when the Funds become aware of such dividends. Interest income, including amortization of premium and accretion of discount on debt securities, as required, is recorded on the accrual basis. Expenses are recorded on an accrual basis, which may require the use of certain estimates by management that may differ from actual expense amounts. Net investment income or loss (other than class specific expenses and waivers, which are allocated as noted below) and unrealized and
179
Notes to Financial Statements (continued)
realized gains (losses) are allocated daily to each class of shares based upon the relative proportion of adjusted net assets of each class at the beginning of the day. Class specific expenses and waivers, where applicable, are charged to the respective share classes. Such class specific expenses and waivers include distribution fees and distribution fee waivers, shareholder servicing fees, transfer agent’s fees and expenses, registration fees and fee waivers and/or expense reimbursements, as applicable.
Taxes: It is each Fund’s policy to continue to meet the requirements of the Internal Revenue Code applicable to regulated investment companies and to distribute all of its taxable net investment income and capital gains, if any, to its shareholders. Therefore, no federal income tax provision is required. Withholding taxes on foreign dividends, interest and capital gains, if any, are recorded, net of reclaimable amounts, at the time the related income is earned.
Dividends and Distributions: Dividends and distributions to shareholders, which are determined in accordance with federal income tax regulations and which may differ from GAAP, are recorded on the ex-date. Permanent book/tax differences relating to income and gain (loss) are reclassified between total distributable earnings (loss) and paid-in capital in excess of par, as appropriate. The chart below sets forth the expected frequency of dividend and capital gains distributions to shareholders. Various factors may impact the frequency of dividend distributions to shareholders, including but not limited to adverse market conditions or portfolio holding-specific events.
| | | | |
| | |
| Expected Distribution Schedule to Shareholders* | | Frequency | |
Net Investment Income | | | Monthly | |
Short-Term Capital Gains | | | Annually | |
Long-Term Capital Gains | | | Annually | |
| * | Under certain circumstances, each Fund may make more than one distribution of short-term and/or long-term capital gains during a fiscal year. |
Estimates: The preparation of financial statements requires management to make estimates and assumptions that affect the reported amounts and disclosures in the financial statements. Actual results could differ from those estimates.
The RIC, on behalf of each Fund, has entered into management agreements with the Manager pursuant to which it has responsibility for all investment advisory services, including supervision of each subadviser’s performance of such services, and for rendering administrative services with respect to each Fund.
180
The Manager has entered into subadvisory agreements with PGIM, Inc., which provides subadvisory services to each Fund through its business unit PGIM Fixed Income, and (with respect to Global Total Return) PGIM Limited (collectively the “subadviser”). With respect to Global Total Return (USD Hedged), PGIM, Inc. has entered into a sub-subadvisory agreement with PGIM Limited. The Manager pays for the services of the subadviser.
Fees payable under the management agreement are computed daily and paid monthly. For the reporting period ended October 31, 2024, the contractual and effective management fee rates were as follows:
| | | | |
| | | |
| Fund | | Management Fee | | Effective Management Fee, before any waiver and/or expense reimbursements |
| | |
Global Total Return | | 0.50% on average daily net assets up to
$2 billion;
0.485% of average daily net assets
over $2 billion. | | 0.50% |
| | |
Global Total Return (USD Hedged) | | 0.50% on average daily net assets up
to $2 billion;
0.485% of average daily net assets
over $2 billion. | | 0.50 |
The Manager has contractually agreed, through February 28, 2026, to limit total annual operating expenses after fee waivers and/or expense reimbursements. This contractual waiver excludes interest, brokerage, taxes (such as income and foreign withholding taxes, stamp duty and deferred tax expenses), acquired fund fees and expenses, extraordinary expenses, and certain other Fund expenses such as dividend and interest expense and broker charges on short sales.
Where applicable, the Manager agrees to waive management fees or shared operating expenses on any share class to the same extent that it waives such expenses on any other share class. In addition, total annual operating expenses for Class R6 shares will not exceed total annual operating expenses for Class Z shares. Fees and/or expenses waived and/or reimbursed by the Manager for the purpose of preventing the expenses from exceeding a certain expense ratio limit may be recouped by the Manager within the same fiscal year during which such waiver and/or reimbursement is made if such recoupment can be realized without exceeding the expense limit in effect at the time of the waiver/reimbursement and/or recoupment for that fiscal year, as applicable. The expense limitations attributable to each class are as follows:
| | |
| | |
| Fund | | Class Expense Limitation |
Global Total Return - Class A | | 0.88% |
Global Total Return - Class C | | 1.63 |
Global Total Return - Class Z | | 0.63 |
Global Total Return - Class R2 | | 1.08 |
Global Total Return - Class R4 | | 0.83 |
Global Total Return - Class R6 | | 0.58 |
181
Notes to Financial Statements (continued)
| | | | | |
| | |
| Fund | | Class Expense Limitation |
Global Total Return (USD Hedged) - Class A | | | | 0.88 | % |
Global Total Return (USD Hedged) - Class C | | | | 1.63 | |
Global Total Return (USD Hedged) - Class Z | | | | 0.63 | |
Global Total Return (USD Hedged) - Class R6 | | | | 0.58 | |
Separately, the Manager has contractually agreed that to the extent the Funds invest in an ETF advised by PGIM Investments (“PGIM ETF”), the Manager will waive any management fees it receives from the Funds in an amount equal to the unitary management fee received by PGIM Investments from the PGIM ETF attributable to the Funds’ investment in such PGIM ETF. This waiver will be effective at any time the Funds are invested in the PGIM ETF and will remain in effect for so long as the Funds are invested in the PGIM ETF, unless earlier terminated by agreement of the Board of the Funds.
The RIC, on behalf of each Fund, has distribution agreements with Prudential Investment Management Services LLC (“PIMS”), which acts as the distributor of the Class A, Class C, Class Z, Class R2, Class R4 and Class R6 shares of each Fund, as applicable. Each Fund compensates PIMS for distributing and servicing each Fund’s Class A, Class C and Class R2 shares, as applicable, pursuant to the plans of distribution (the “Distribution Plans”), regardless of expenses actually incurred by PIMS.
Pursuant to the Distribution Plans, each Fund compensates PIMS for distribution related activities at an annual rate based on average daily net assets per class. The distribution fees are accrued daily and payable monthly.
Global Total Return has adopted a Shareholder Services Plan with respect to Class R2 and Class R4 shares. Under the terms of the Shareholder Services Plan, Class R2 and Class R4 shares are authorized to compensate Prudential Mutual Fund Services LLC (“PMFS”), its affiliates or third-party service providers for services rendered to the shareholders of such Class R2 or Class R4 shares. The shareholder service fee is accrued daily and paid monthly, as applicable.
Each Fund’s annual gross and net distribution rates and maximum shareholder service fee, where applicable, are as follows:
| | | | | | | | | | | | | | | |
| | | | |
| Fund | | Gross Distribution Fee | | Net Distribution Fee | | Shareholder Service Fee |
Global Total Return - Class A | | | | 0.25 | % | | | | 0.25 | % | | | | N/A | % |
Global Total Return - Class C | | | | 1.00 | | | | | 1.00 | | | | | N/A | |
Global Total Return - Class Z | | | | N/A | | | | | N/A | | | | | N/A | |
182
| | | | | | | | | | | | | | | |
| | | | |
| Fund | | Gross Distribution Fee | | Net Distribution Fee | | Shareholder Service Fee |
Global Total Return - Class R2 | | | | 0.25 | % | | | | 0.25 | % | | | | 0.10 | % |
Global Total Return - Class R4 | | | | N/A | | | | | N/A | | | | | 0.10 | |
Global Total Return - Class R6 | | | | N/A | | | | | N/A | | | | | N/A | |
Global Total Return (USD Hedged) - Class A | | | | 0.25 | | | | | 0.25 | | | | | N/A | |
Global Total Return (USD Hedged) - Class C | | | | 1.00 | | | | | 1.00 | | | | | N/A | |
Global Total Return (USD Hedged) - Class Z | | | | N/A | | | | | N/A | | | | | N/A | |
Global Total Return (USD Hedged) - Class R6 | | | | N/A | | | | | N/A | | | | | N/A | |
For the year ended October 31, 2024, PIMS received front-end sales charges (“FESL”) resulting from sales of certain class shares and contingent deferred sales charges (“CDSC”) imposed upon redemptions by certain shareholders. From these fees, PIMS paid such sales charges to broker-dealers, who in turn paid commissions to salespersons and incurred other distribution costs. The sales charges are as follows where applicable:
| | | | | | | | |
| | | |
| Fund | | FESL | | | CDSC | |
Global Total Return - Class A | | $ | 104,365 | | | $ | 2,011 | |
Global Total Return - Class C | | | — | | | | 182 | |
Global Total Return (USD Hedged) - Class A | | | — | | | | — | |
Global Total Return (USD Hedged) - Class C | | | — | | | | — | |
PGIM Investments, PGIM, Inc., PGIM Limited, PIMS and PMFS are indirect, wholly-owned subsidiaries of Prudential Financial, Inc. (“Prudential”).
| 4. | Other Transactions with Affiliates |
PMFS serves as the Funds’ transfer agent and shareholder servicing agent. Transfer agent’s and shareholder servicing agent’s fees and expenses in the Statement of Operations include certain out-of-pocket expenses paid to non-affiliates, where applicable.
The Funds may invest their overnight sweep cash in the PGIM Core Government Money Market Fund (the “Core Government Fund”), a series of the Prudential Government Money Market Fund, Inc., and their securities lending cash collateral in the PGIM Institutional Money Market Fund (the “Money Market Fund”), a series of Prudential Investment Portfolios 2, each registered under the 1940 Act and managed by PGIM Investments. PGIM Investments and/or its affiliates are paid fees or reimbursed for providing their services to the Core Government Fund and the Money Market Fund. In addition to the realized and unrealized gains on investments in the Core Government Fund and the Money Market Fund, earnings from such investments are disclosed on the Statement of Operations as “Affiliated dividend income” and “Affiliated income from securities lending, net”, respectively.
183
Notes to Financial Statements (continued)
The Funds may enter into certain securities purchase or sale transactions under Board approved Rule 17a-7 procedures. Rule 17a-7 is an exemptive rule under the 1940 Act that, subject to certain conditions, permits purchase and sale transactions among affiliated investment companies, or between an investment company and a person that is affiliated solely by reason of having a common (or affiliated) investment adviser, common directors/trustees, and/or common officers. For the year ended October 31, 2024, no Rule 17a-7 transactions were entered into by the Funds.
The aggregate cost of purchases and proceeds from sales of portfolio securities (excluding short-term investments and U.S. Government securities) for the reporting period ended October 31, 2024, were as follows:
| | | | | | | | |
| | | |
| Fund | | Cost of Purchases | | | Proceeds from Sales | |
Global Total Return | | $ | 779,817,217 | | | $ | 1,018,812,719 | |
| |
Global Total Return (USD Hedged) | | | 22,436,931 | | | | 69,443,721 | |
| |
A summary of the cost of purchases and proceeds from sales of shares of affiliated mutual funds for the year ended October 31, 2024, is presented as follows:
Global Total Return:
| | | | | | | | | | | | | | | | | | | | | | | | | | | | | | | | | | | | | | | | | | | | | | | | | | | | | | | | | | | | | | | | | | | | | | | | | | | | |
| | | | | | | | |
Value, Beginning of Year | | Cost of Purchases | | | Proceeds from Sales | | | Change in Unrealized Gain (Loss) | | | Realized Gain (Loss) | | | Value, End of Year | | | Shares, End of Year | | | Income | |
Long-Term Investment - Affiliated Exchange-Traded Fund(1)(wa): | | | | | |
PGIM AAA CLO ETF | |
| | | | | | | | | | | | | | | | | | | | |
$ — | | | | | | $ | 7,319,579 | | | | | | | | | | | $ | — | | | | | | | | | | | $ | 49,357 | | | | | | | | | | | $ | — | | | | | | | | | | | $ | 7,368,936 | | | | | | | | | | | | 143,700 | | | | | | | $ | 132,769 | |
| |
Short-Term Investments - Affiliated Mutual Funds: | | | | | |
|
PGIM Core Government Money Market Fund (7-day effective yield 5.011%)(1)(wa) | |
| | | | | | | | | | | | | | | | | | | |
$29,538,661 | | | | | | $ | 763,846,475 | | | | | | | | | | | $ | 787,126,358 | | | | | | | | | | | $ | — | | | | | | | | | | | $ | — | | | | | | | | | | | $ | 6,258,778 | | | | | | | | | | | | 6,258,778 | | | | | | | $ | 3,301,121 | |
|
PGIM Institutional Money Market Fund (7-day effective yield 5.096%)(1)(b)(wa) | |
| | | | | | | | | | | | | | | | | | | |
39,033,559 | | | | | | | 345,296,233 | | | | | | | | | | | | 344,336,395 | | | | | | | | | | | | (18,984 | ) | | | | | | | | | | | (9,545 | ) | | | | | | | | | | | 39,964,868 | | | | | | | | | | | | 39,984,860 | | | | | | | | 152,659 | (2) |
| | | | | | | | | | | | | | | | | | | |
$68,572,220 | | | | | | $ | 1,109,142,708 | | | | | | | | | | | $ | 1,131,462,753 | | | | | | | | | | | $ | (18,984 | ) | | | | | | | | | | $ | (9,545 | ) | | | | | | | | | | $ | 46,223,646 | | | | | | | | | | | | | | | | | | | $ | 3,453,780 | |
| | | | | | | | | | | | | | | | | | | |
$68,572,220 | | | | | | $ | 1,116,462,287 | | | | | | | | | | | $ | 1,131,462,753 | | | | | | | | | | | $ | 30,373 | | | | | | | | | | | $ | (9,545 | ) | | | | | | | | | | $ | 53,592,582 | | | | | | | | | | | | | | | | | | | $ | 3,586,549 | |
184
Global Total Return (USD Hedged):
| | | | | | | | | | | | | | | | | | | | | | | | | | | | | | | | | | | | | | | | | | | | | | | | | | | | | | | | | | | | | | | | | | | | | | | | |
| | | | | | | | |
Value, Beginning of Year | | Cost of Purchases | | | Proceeds from Sales | | | Change in Unrealized Gain (Loss) | | | Realized Gain (Loss) | | | Value, End of Year | | | Shares, End of Year | | | Income | |
Long-Term Investment - Affiliated Exchange-Traded Fund(1)(wa): | | | | | |
PGIM AAA CLO ETF | |
| | | | | | | | | | | | | | | | | | | |
| $ — | | | | | | $ | 2,081,766 | | | | | | | | | | | $ | — | | | | | | | | | | | $ | 13,483 | | | | | | | | | | | $ | — | | | | | | | | | | | $ | 2,095,249 | | | | | | | | 40,859 | | | | | | | $ | 24,070 | |
| |
Short-Term Investments - Affiliated Mutual Funds: | | | | | |
|
PGIM Core Government Money Market Fund (7-day effective yield 5.011%)(1)(wa) | |
| | | | | | | | | | | | | | | | | | |
$1,547,455 | | | | | | $ | 35,136,812 | | | | | | | | | | | $ | 35,529,670 | | | | | | | | | | | $ | — | | | | | | | | | | | $ | — | | | | | | | | | | | $ | 1,154,597 | | | | | | | | 1,154,597 | | | | | | | $ | 84,340 | |
|
PGIM Institutional Money Market Fund (7-day effective yield 5.096%)(1)(b)(wa) | |
| | | | | | | | | | | | | | | | | | |
262,686 | | | | | | | 739,120 | | | | | | | | | | | | 1,001,879 | | | | | | | | | | | | (26 | ) | | | | | | | | | | | 99 | | | | | | | | | | | | — | | | | | | | | — | | | | | | | | 459 | (2) |
| | | | | | | | | | | | | | | | | | |
$1,810,141 | | | | | | $ | 35,875,932 | | | | | | | | | | | $ | 36,531,549 | | | | | | | | | | | $ | (26 | ) | | | | | | | | | | $ | 99 | | | | | | | | | | | $ | 1,154,597 | | | | | | | | | | | | | | | $ | 84,799 | |
| | | | | | | | | | | | | | | | | | |
$1,810,141 | | | | | | $ | 37,957,698 | | | | | | | | | | | $ | 36,531,549 | | | | | | | | | | | $ | 13,457 | | | | | | | | | | | $ | 99 | | | | | | | | | | | $ | 3,249,846 | | | | | | | | | | | | | | | $ | 108,869 | |
| (1) | The Fund did not have any capital gain distributions during the reporting period. |
| (2) | The amount, or a portion thereof, represents the affiliated securities lending income shown on the Statement of Operations. |
| (b) | Represents security, or portion thereof, purchased with cash collateral received for securities on loan and includes dividend reinvestment. |
| (wa) | Represents investments in Funds affiliated with the Manager. |
| 6. | Distributions and Tax Information |
Distributions to shareholders, which are determined in accordance with federal income tax regulations and which may differ from GAAP, are recorded on the ex-date. In order to present total distributable earnings (loss) and paid-in capital in excess of par on the Statement of Assets and Liabilities that more closely represent their tax character, certain adjustments have been made to total distributable earnings (loss) and paid-in capital in excess of par for the Funds indicated below.
For the year ended October 31, 2024, the adjustments were as follows:
| | | | | | | | |
| | | |
| Fund | | Total Distributable Earnings (Loss) | | | Paid-in Capital in Excess of Par | |
Global Total Return (a) | | | $(416,149 | ) | | | $416,149 | |
Global Total Return (USD Hedged) (a) | | | (222 | ) | | | 222 | |
| (a) | Prior year post financial statement adjustments. |
For the year ended October 31, 2024, the tax character of dividends paid as reflected in the Statement of Changes in Net Assets were as follows:
| | | | | | | | | | | | |
| | | | | |
| Fund | | Ordinary Income | | | Long-Term Capital Gains | | Tax Return of Capital | | Total Dividends and Distributions | |
Global Total Return | | | $101,183,881 | | | $— | | $ — | | | $101,183,881 | |
Global Total Return (USD Hedged) | | | 2,690,110 | | | — | | 1,011,761 | | | 3,701,871 | |
185
Notes to Financial Statements (continued)
For the year ended October 31, 2023, the tax character of dividends paid as reflected in the Statement of Changes in Net Assets were as follows:
| | | | | | | | | | | | | | |
| | | | | |
| Fund | | Ordinary Income | | | Long-Term Capital Gains | | Tax Return of Capital | | | Total Dividends and Distributions | |
Global Total Return | | | $45,967,541 | | | $— | | | $79,806,992 | | | | $125,774,533 | |
Global Total Return (USD Hedged) | | | 4,126,828 | | | — | | | 350,113 | | | | 4,476,941 | |
For the year ended October 31, 2024, the Funds indicated below had the following amounts of accumulated undistributed earnings on a tax basis:
| | | | | | | | | | |
| | | |
| Fund | | Undistributed Ordinary Income | | Undistributed Long-Term Capital Gains |
Global Total Return | | | $ | 27,078,877 | | | | | $— | |
Global Total Return (USD Hedged) | | | | — | | | | | — | |
The United States federal income tax basis of the Funds’ investments and the net unrealized appreciation/(depreciation) as of October 31, 2024 were as follows:
| | | | | | | | | | | | | | | | |
| | | | | |
| Fund | | Tax Basis | | | Gross
Unrealized
Appreciation | | | Gross
Unrealized
Depreciation | | | Net
Unrealized
Depreciation |
Global Total Return | | | $3,088,810,786 | | | | $70,732,609 | | | | $(481,218,965) | | | | $(410,486,356) | |
Global Total Return (USD Hedged) | | | 49,331,981 | | | | 1,621,922 | | | | (6,316,708) | | | | (4,694,786) | |
The differences between GAAP basis and tax basis were primarily attributable to deferred losses on wash sales, amortization of premiums, interest accrual on defaulted securities, straddle loss deferrals, mark-to-market of futures contracts, swaps, and other GAAP to tax differences.
For federal income tax purposes, the following Funds had an approximated capital loss carryforward as of October 31, 2024 which can be carried forward for an unlimited period. No capital gains distributions are expected to be paid to shareholders until net gains have been realized in excess of such losses.
| | | | | | |
| | | |
| Fund | | Capital Loss Carryforward | | | Capital Loss Carryforward Utilized |
Global Total Return | | | $711,880,000 | | | $— |
Global Total Return (USD Hedged) | | | 5,245,000 | | | — |
The Manager has analyzed the Funds’ tax positions taken on federal, state and local income tax returns for all open tax years and has concluded that no provision for income tax is required in the Funds’ financial statements for the current reporting period. Since tax authorities can examine previously filed tax returns, the Funds’ U.S. federal and state tax returns for each of the four fiscal years up to the most recent fiscal year ended October 31, 2024 are subject to such review.
186
The Funds offer Class A, Class C, Class Z, Class R2, Class R4 and Class R6 shares, as applicable. Class A shares are sold with a maximum front-end sales charge of 3.25%. Investors who purchase $500,000 or more of Class A shares and sell those shares within 12 months of purchase are subject to a CDSC of 1% on sales although these purchases are not subject to a front-end sales charge. The Class A CDSC is waived for certain retirement and/or benefit plans. A special exchange privilege is also available for shareholders who qualified to purchase Class A shares at net asset value. Class C shares are sold with a CDSC of 1% on sales made within 12 months of purchase. Class C shares will automatically convert to Class A shares on a monthly basis approximately eight years (ten years prior to January 22, 2021) after purchase. Class Z, Class R2, Class R4 and Class R6 shares are not subject to any sales or redemption charges and are available exclusively for sale to a limited group of investors.
Under certain circumstances, an exchange may be made from specified share classes of each Fund to one or more other share classes of each Fund as presented in the table of transactions in shares of beneficial interest, below.
The RIC is authorized to issue 18,075,000,000 shares of common stock, $0.01 par value per share. The authorized shares of each Fund are currently classified and designated as follows:
| | | | |
| | |
| Fund | | Number of Shares |
Global Total Return - Class A | | | 900,000,000 | |
Global Total Return - Class B | | | 50,000,000 | |
Global Total Return - Class C | | | 300,000,000 | |
Global Total Return - Class Z | | | 8,000,000,000 | |
Global Total Return - Class T | | | 125,000,000 | |
Global Total Return - Class R2 | | | 100,000,000 | |
Global Total Return - Class R4 | | | 100,000,000 | |
Global Total Return - Class R6 | | | 7,000,000,000 | |
Global Total Return (USD Hedged) - Class A | | | 200,000,000 | |
Global Total Return (USD Hedged) - Class C | | | 300,000,000 | |
Global Total Return (USD Hedged) - Class Z | | | 600,000,000 | |
Global Total Return (USD Hedged) - Class R6 | | | 400,000,000 | |
The Funds currently do not have any Class B or Class T shares outstanding, as applicable.
As of October 31, 2024, Prudential, through its affiliated entities, including affiliated funds (if applicable), owned shares of each Fund as follows:
| | | | | | | | | | |
| | | |
| Fund | | Number of Shares | | Percentage of Outstanding Shares |
Global Total Return (USD Hedged)–Class C | | | | 1,263 | | | | | 24.3 | % |
Global Total Return (USD Hedged)–Class Z | | | | 19,500 | | | | | 0.8 | |
Global Total Return (USD Hedged)–Class R6 | | | | 2,012,896 | | | | | 71.9 | |
187
Notes to Financial Statements (continued)
At the reporting period end, the number of shareholders holding greater than 5% of each Fund are as follows:
| | | | | | | | | | |
| | | |
| Fund | | Number of Shareholders | | Percentage of Outstanding Shares |
Affiliated: | | | | | | | | | | |
Global Total Return | | | | — | | | | | — | % |
Global Total Return (USD Hedged) | | | | 2 | | | | | 37.3 | |
Unaffiliated: | | | | | | | | | | |
Global Total Return | | | | 5 | | | | | 67.3 | |
Global Total Return (USD Hedged) | | | | 3 | | | | | 46.0 | |
Transactions in shares of common stock were as follows:
Global Total Return:
| | | | | | | | |
| | | |
| Share Class | | Shares | | | Amount | |
| | |
Class A | | | | | | | | |
Year ended October 31, 2024: | | | | | | | | |
Shares sold | | | 6,382,547 | | | $ | 32,912,710 | |
Shares issued in reinvestment of dividends and distributions | | | 1,041,134 | | | | 5,362,772 | |
Shares purchased | | | (9,806,493 | ) | | | (50,275,734 | ) |
Net increase (decrease) in shares outstanding before conversion | | | (2,382,812 | ) | | | (12,000,252 | ) |
Shares issued upon conversion from other share class(es) | | | 583,192 | | | | 3,001,233 | |
Shares purchased upon conversion into other share class(es) | | | (748,368 | ) | | | (3,856,911 | ) |
Net increase (decrease) in shares outstanding | | | (2,547,988 | ) | | $ | (12,855,930 | ) |
| | |
Year ended October 31, 2023: | | | | | | | | |
Shares sold | | | 3,767,793 | | | $ | 18,848,635 | |
Shares issued in reinvestment of dividends and distributions | | | 1,345,311 | | | | 6,713,132 | |
Shares purchased | | | (10,671,742 | ) | | | (53,154,739 | ) |
Net increase (decrease) in shares outstanding before conversion | | | (5,558,638 | ) | | | (27,592,972 | ) |
Shares issued upon conversion from other share class(es) | | | 851,850 | | | | 4,235,539 | |
Shares purchased upon conversion into other share class(es) | | | (1,107,271 | ) | | | (5,520,685 | ) |
Net increase (decrease) in shares outstanding | | | (5,814,059 | ) | | $ | (28,878,118 | ) |
| | |
Class C | | | | | | | | |
Year ended October 31, 2024: | | | | | | | | |
Shares sold | | | 224,440 | | | $ | 1,153,111 | |
Shares issued in reinvestment of dividends and distributions | | | 69,981 | | | | 359,386 | |
Shares purchased | | | (697,069 | ) | | | (3,578,229 | ) |
Net increase (decrease) in shares outstanding before conversion | | | (402,648 | ) | | | (2,065,732 | ) |
Shares purchased upon conversion into other share class(es) | | | (385,720 | ) | | | (1,986,345 | ) |
Net increase (decrease) in shares outstanding | | | (788,368 | ) | | $ | (4,052,077 | ) |
188
Global Total Return (cont’d.):
| | | | | | | | |
| | | |
| Share Class | | Shares | | | Amount | |
| | |
Year ended October 31, 2023: | | | | | | | | |
Shares sold | | | 411,729 | | | $ | 2,043,191 | |
Shares issued in reinvestment of dividends and distributions | | | 108,049 | | | | 538,164 | |
Shares purchased | | | (1,194,338 | ) | | | (5,932,167 | ) |
Net increase (decrease) in shares outstanding before conversion | | | (674,560 | ) | | | (3,350,812 | ) |
Shares purchased upon conversion into other share class(es) | | | (321,257 | ) | | | (1,596,270 | ) |
Net increase (decrease) in shares outstanding | | | (995,817 | ) | | $ | (4,947,082 | ) |
| | |
Class Z | | | | | | | | |
Year ended October 31, 2024: | | | | | | | | |
Shares sold | | | 56,230,357 | | | $ | 290,765,477 | |
Shares issued in reinvestment of dividends and distributions | | | 6,746,633 | | | | 34,936,496 | |
Shares purchased | | | (78,746,322 | ) | | | (405,927,968 | ) |
Net increase (decrease) in shares outstanding before conversion | | | (15,769,332 | ) | | | (80,225,995 | ) |
Shares issued upon conversion from other share class(es) | | | 536,089 | | | | 2,773,809 | |
Shares purchased upon conversion into other share class(es) | | | (1,578,063 | ) | | | (8,331,021 | ) |
Net increase (decrease) in shares outstanding | | | (16,811,306 | ) | | $ | (85,783,207 | ) |
| | |
Year ended October 31, 2023: | | | | | | | | |
Shares sold | | | 69,270,261 | | | $ | 348,122,170 | |
Shares issued in reinvestment of dividends and distributions | | | 8,866,477 | | | | 44,484,549 | |
Shares purchased | | | (146,553,067 | ) | | | (735,914,893 | ) |
Net increase (decrease) in shares outstanding before conversion | | | (68,416,329 | ) | | | (343,308,174 | ) |
Shares issued upon conversion from other share class(es) | | | 1,255,255 | | | | 6,297,796 | |
Shares purchased upon conversion into other share class(es) | | | (3,283,756 | ) | | | (16,230,800 | ) |
Net increase (decrease) in shares outstanding | | | (70,444,830 | ) | | $ | (353,241,178 | ) |
| | |
Class R2 | | | | | | | | |
Year ended October 31, 2024: | | | | | | | | |
Shares sold | | | 216,451 | | | $ | 1,132,084 | |
Shares issued in reinvestment of dividends and distributions | | | 25,147 | | | | 131,071 | |
Shares purchased | | | (485,557 | ) | | | (2,538,231 | ) |
Net increase (decrease) in shares outstanding | | | (243,959 | ) | | $ | (1,275,076 | ) |
| | |
Year ended October 31, 2023: | | | | | | | | |
Shares sold | | | 225,590 | | | $ | 1,132,535 | |
Shares issued in reinvestment of dividends and distributions | | | 34,171 | | | | 172,503 | |
Shares purchased | | | (270,207 | ) | | | (1,349,188 | ) |
Net increase (decrease) in shares outstanding | | | (10,446 | ) | | $ | (44,150 | ) |
189
Notes to Financial Statements (continued)
Global Total Return (cont’d.):
| | | | | | | | |
| | | |
| Share Class | | Shares | | | Amount | |
| | |
Class R4 | | | | | | | | |
Year ended October 31, 2024: | | | | | | | | |
Shares sold | | | 970,392 | | | $ | 5,079,822 | |
Shares issued in reinvestment of dividends and distributions | | | 53,585 | | | | 279,667 | |
Shares purchased | | | (921,420 | ) | | | (4,828,817 | ) |
Net increase (decrease) in shares outstanding | | | 102,557 | | | $ | 530,672 | |
| | |
Year ended October 31, 2023: | | | | | | | | |
Shares sold | | | 703,023 | | | $ | 3,541,791 | |
Shares issued in reinvestment of dividends and distributions | | | 60,922 | | | | 308,043 | |
Shares purchased | | | (956,751 | ) | | | (4,827,447 | ) |
Net increase (decrease) in shares outstanding | | | (192,806 | ) | | $ | (977,613 | ) |
| | |
Class R6 | | | | | | | | |
Year ended October 31, 2024: | | | | | | | | |
Shares sold | | | 83,258,500 | | | $ | 433,604,088 | |
Shares issued in reinvestment of dividends and distributions | | | 10,688,320 | | | | 55,716,970 | |
Shares purchased | | | (106,682,962 | ) | | | (553,376,288 | ) |
Net increase (decrease) in shares outstanding before conversion | | | (12,736,142 | ) | | | (64,055,230 | ) |
Shares issued upon conversion from other share class(es) | | | 1,733,037 | | | | 9,197,430 | |
Shares purchased upon conversion into other share class(es) | | | (153,278 | ) | | | (798,195 | ) |
Net increase (decrease) in shares outstanding | | | (11,156,383 | ) | | $ | (55,655,995 | ) |
| | |
Year ended October 31, 2023: | | | | | | | | |
Shares sold | | | 83,582,493 | | | $ | 424,346,510 | |
Shares issued in reinvestment of dividends and distributions | | | 13,474,590 | | | | 68,009,384 | |
Shares purchased | | | (176,475,165 | ) | | | (891,530,066 | ) |
Net increase (decrease) in shares outstanding before conversion | | | (79,418,082 | ) | | | (399,174,172 | ) |
Shares issued upon conversion from other share class(es) | | | 2,823,491 | | | | 14,022,182 | |
Shares purchased upon conversion into other share class(es) | | | (237,969 | ) | | | (1,207,762 | ) |
Net increase (decrease) in shares outstanding | | | (76,832,560 | ) | | $ | (386,359,752 | ) |
190
Global Total Return (USD Hedged):
| | | | | | | | |
| | | |
| Share Class | | Shares | | | Amount | |
| | |
Class A | | | | | | | | |
Year ended October 31, 2024: | | | | | | | | |
Shares sold | | | 15,904 | | | $ | 132,812 | |
Shares issued in reinvestment of dividends and distributions | | | 2,425 | | | | 20,515 | |
Shares purchased | | | (7,390 | ) | | | (62,175 | ) |
Net increase (decrease) in shares outstanding before conversion | | | 10,939 | | | | 91,152 | |
Shares purchased upon conversion into other share class(es) | | | (929 | ) | | | (7,981 | ) |
Net increase (decrease) in shares outstanding | | | 10,010 | | | $ | 83,171 | |
| | |
Year ended October 31, 2023: | | | | | | | | |
Shares sold | | | 9,440 | | | $ | 76,719 | |
Shares issued in reinvestment of dividends and distributions | | | 2,751 | | | | 22,230 | |
Shares purchased | | | (12,058 | ) | | | (97,613 | ) |
Net increase (decrease) in shares outstanding | | | 133 | | | $ | 1,336 | |
| | |
Class C | | | | | | | | |
Year ended October 31, 2024: | | | | | | | | |
Shares sold | | | 924 | | | $ | 7,785 | |
Shares issued in reinvestment of dividends and distributions | | | 169 | | | | 1,426 | |
Shares purchased | | | (3,304 | ) | | | (27,964 | ) |
Net increase (decrease) in shares outstanding | | | (2,211 | ) | | $ | (18,753 | ) |
| | |
Year ended October 31, 2023: | | | | | | | | |
Shares sold | | | 965 | | | $ | 7,774 | |
Shares issued in reinvestment of dividends and distributions | | | 305 | | | | 2,466 | |
Shares purchased | | | (8,972 | ) | | | (70,532 | ) |
Net increase (decrease) in shares outstanding | | | (7,702 | ) | | $ | (60,292 | ) |
| | |
Class Z | | | | | | | | |
Year ended October 31, 2024: | | | | | | | | |
Shares sold | | | 1,848,244 | | | $ | 15,615,526 | |
Shares issued in reinvestment of dividends and distributions | | | 76,481 | | | | 648,129 | |
Shares purchased | | | (751,335 | ) | | | (6,481,099 | ) |
Net increase (decrease) in shares outstanding before conversion | | | 1,173,390 | | | | 9,782,556 | |
Shares issued upon conversion from other share class(es) | | | 930 | | | | 7,981 | |
Net increase (decrease) in shares outstanding | | | 1,174,320 | | | $ | 9,790,537 | |
| | |
Year ended October 31, 2023: | | | | | | | | |
Shares sold | | | 774,874 | | | $ | 6,289,087 | |
Shares issued in reinvestment of dividends and distributions | | | 39,795 | | | | 320,757 | |
Shares purchased | | | (153,572 | ) | | | (1,240,474 | ) |
Net increase (decrease) in shares outstanding before conversion | | | 661,097 | | | | 5,369,370 | |
Shares issued upon conversion from other share class(es) | | | 27 | | | | 218 | |
Net increase (decrease) in shares outstanding | | | 661,124 | | | $ | 5,369,588 | |
191
Notes to Financial Statements (continued)
Global Total Return (USD Hedged) (cont’d.):
| | | | | | | | |
| | | |
| Share Class | | Shares | | | Amount | |
| | |
Class R6 | | | | | | | | |
Year ended October 31, 2024: | | | | | | | | |
Shares sold | | | 2,411,040 | | | $ | 20,292,042 | |
Shares issued in reinvestment of dividends and distributions | | | 289,063 | | | | 2,437,909 | |
Shares purchased | | | (10,784,589 | ) | | | (92,312,524 | ) |
Net increase (decrease) in shares outstanding | | | (8,084,486 | ) | | $ | (69,582,573 | ) |
| | |
Year ended October 31, 2023: | | | | | | | | |
Shares sold | | | 4,494,847 | | | $ | 36,409,009 | |
Shares issued in reinvestment of dividends and distributions | | | 510,799 | | | | 4,130,562 | |
Shares purchased | | | (2,872,277 | ) | | | (23,197,352 | ) |
Net increase (decrease) in shares outstanding before conversion | | | 2,133,369 | | | | 17,342,219 | |
Shares purchased upon conversion into other share class(es) | | | (27 | ) | | | (218 | ) |
Net increase (decrease) in shares outstanding | | | 2,133,342 | | | $ | 17,342,001 | |
The RIC, on behalf of each Fund, along with other affiliated registered investment companies (the “Participating Funds”), is a party to a Syndicated Credit Agreement (“SCA”) with a group of banks. The purpose of the SCA is to provide an alternative source of temporary funding for capital share redemptions. The table below provides details of the current SCA in effect at the reporting period-end as well as the prior SCA.
| | | | | | |
| | | | |
| | | Current SCA | | | | Prior SCA |
Term of Commitment | | 9/27/2024 – 9/25/2025 | | | | 9/29/2023 – 9/26/2024 |
Total Commitment | | $ 1,200,000,000 | | | | $ 1,200,000,000 |
Annualized Commitment Fee on the Unused Portion of the SCA | | 0.15% | | | | 0.15% |
Annualized Interest Rate on Borrowings | | 1.00% plus the higher of (1)
the effective federal funds
rate, (2) the daily SOFR
rate plus 0.10% or (3) zero
percent | | | | 1.00% plus the higher of (1)
the effective federal funds
rate, (2) the daily SOFR
rate plus 0.10% or (3) zero
percent |
Certain affiliated registered investment companies that are parties to the SCA include portfolios that are subject to a predetermined mathematical formula used to manage certain benefit guarantees offered under variable annuity contracts. The formula may result in large scale asset flows into and out of these portfolios. Consequently, these portfolios may be more likely to utilize the SCA for purposes of funding redemptions. It may be possible for those portfolios to fully exhaust the committed amount of the SCA, thereby requiring the Manager
192
to allocate available funding per a Board-approved methodology designed to treat the Participating Funds in the SCA equitably.
Each Fund indicated below utilized the SCA during the year ended October 31, 2024. The average balance outstanding is for the number of days each Fund utilized the credit facility.
| | | | | | | | | | | | |
| | | | | | |
| Fund | | Average Balance Outstanding | | | Weighted Average Interest Rates | | Number of Days Outstanding | | Maximum Balance Outstanding | | Balance Outstanding at October 31, 2024 |
Global Total Return | | | $50,756,000 | | | 6.42% | | 1 | | $50,756,000 | | $— |
Global Total Return (USD Hedged) | | | 7,628,400 | | | 6.20 | | 15 | | 13,040,000 | | — |
| 9. | Risks of Investing in the Funds |
Each Fund’s principal risks include, but are not limited to, some or all of the risks discussed below. For further information on the risks applicable to any given Fund, please refer to the Prospectus and Statement of Additional Information of that Fund.
Credit Risk: This is the risk that the issuer, the guarantor or the insurer of a fixed income security, or the counterparty to a contract, may be unable or unwilling to make timely principal and interest payments, or to otherwise honor its obligations. Additionally, fixed income securities could lose value due to a loss of confidence in the ability of the issuer, guarantor, insurer or counterparty to pay back debt. The lower the credit quality of a bond, the more sensitive it is to credit risk.
Currency Risk: The Fund’s net asset value could decline as a result of changes in exchange rates, which could adversely affect the Fund’s investments in currencies, or in securities that trade in, and receive revenues related to, currencies, or in derivatives that provide exposure to currencies. Certain foreign countries may impose restrictions on the ability of issuers of foreign securities to make payment of principal and interest or dividends to investors located outside the country, due to blockage of foreign currency exchanges or otherwise.
Debt Obligations Risk: Debt obligations are fixed income investments that are subject to credit risk, market risk and interest rate risk. The Fund’s holdings, share price, yield and total return may also fluctuate in response to bond market movements. The value of bonds may decline for issuer-related reasons, including management performance, financial leverage and reduced demand for the issuer’s goods and services. Certain types of fixed income obligations also may be subject to “call and redemption risk,” which is the risk that the issuer may call a bond held by the Fund for redemption before it matures and the Fund may not be able to reinvest at the same rate of interest and therefore would earn less income.
Derivatives Risk: Derivatives involve special risks and costs and may result in losses to the Fund. The successful use of derivatives requires sophisticated management, and, to the
193
Notes to Financial Statements (continued)
extent that derivatives are used, the Fund will depend on the subadviser’s ability to analyze and manage derivatives transactions. The prices of derivatives may move in unexpected ways, especially in abnormal market conditions. Some derivatives are “leveraged” or may create economic leverage for the Fund and therefore may magnify or otherwise increase investment losses to the Fund. The Fund’s use of derivatives may also increase the amount of taxes payable by shareholders.
Other risks arise from the potential inability to terminate or sell derivatives positions. A liquid secondary market may not always exist for the Fund’s derivatives positions. In fact, many over-the-counter derivative instruments will not have liquidity beyond the counterparty to the instrument. Over-the-counter derivative instruments also involve the risk that the other party will not meet its obligations to the Fund. The use of derivatives also exposes the Fund to operational issues, such as documentation and settlement issues, systems failures, inadequate control and human error.
Derivatives may also involve legal risks, such as insufficient documentation, the lack of capacity or authority of a counterparty to execute or settle a transaction, and the legality and enforceability of derivatives contracts. The U.S. Government and foreign governments have adopted (and may adopt further) regulations governing derivatives markets, including mandatory clearing of certain derivatives, margin and reporting requirements and risk exposure limitations. Regulation of derivatives may make derivatives more costly, limit their availability or utility to the Fund, or otherwise adversely affect their performance or disrupt markets.
Economic and Market Events Risk: Events in the U.S. and global financial markets, including actions taken by the U.S. Federal Reserve or foreign central banks to stimulate or stabilize economic growth or the functioning of the securities markets, or otherwise reduce inflation, may at times result in unusually high market volatility, which could negatively impact performance. Governmental efforts to curb inflation often have negative effects on the level of economic activity. Relatively reduced liquidity in credit and fixed income markets could adversely affect issuers worldwide.
Emerging Markets Risk: The risks of foreign investments are greater for investments in or exposed to emerging markets. Emerging market countries typically have economic and political systems that are less fully developed, and can be expected to be less stable, than those of more developed countries. For example, the economies of such countries can be subject to rapid and unpredictable rates of inflation or deflation. Low trading volumes may result in a lack of liquidity and price volatility. Emerging market countries may have policies that restrict investment by non-U.S. investors, or that prevent non-U.S. investors from withdrawing their money at will.
194
The Fund may invest in some emerging markets that subject it to risks such as those associated with illiquidity, custody of assets, different settlement and clearance procedures and asserting legal title under a developing legal and regulatory regime to a greater degree than in developed markets or even in other emerging markets.
Foreign Securities Risk: Investments in securities of non-U.S. issuers (including those denominated in U.S. dollars) may involve more risk than investing in securities of U.S. issuers. Foreign political, economic and legal systems, especially those in developing and emerging market countries, may be less stable and more volatile than in the United States. Foreign legal systems generally have fewer regulatory requirements than the U.S. legal system, particularly those of emerging markets. In general, less information is publicly available with respect to non-U.S. companies than U.S. companies. Non-U.S. companies generally are not subject to the same accounting, auditing, and financial reporting standards as are U.S. companies. Additionally, the changing value of foreign currencies and changes in exchange rates could also affect the value of the assets the Fund holds and the Fund’s performance. Certain foreign countries may impose restrictions on the ability of issuers of foreign securities to make payment of principal and interest or dividends to investors located outside the country, due to blockage of foreign currency exchanges or otherwise. Investments in emerging markets are subject to greater volatility and price declines.
In addition, the Fund’s investments in non-U.S. securities may be subject to the risks of nationalization or expropriation of assets, imposition of currency exchange controls or restrictions on the repatriation of non-U.S. currency, confiscatory taxation and adverse diplomatic developments. Special U.S. tax considerations may apply.
Increase in Expenses Risk: Your actual cost of investing in the Fund may be higher than the expenses shown in the expense table in the Fund’s prospectus for a variety of reasons. For example, expense ratios may be higher than those shown if average net assets decrease. Net assets are more likely to decrease and Fund expense ratios are more likely to increase when markets are volatile. Active and frequent trading of Fund securities can increase expenses.
Interest Rate Risk: The value of your investment may go down when interest rates rise. A rise in rates tends to have a greater impact on the prices of longer term or duration debt securities. Similarly, a rise in interest rates may also have a greater negative impact on the value of equity securities whose issuers expect earnings further out in the future. For example, a fixed income security with a duration of three years is expected to decrease in value by approximately 3% if interest rates increase by 1%. This is referred to as “duration risk”. When interest rates fall, the issuers of debt obligations may prepay principal more quickly than expected, and the Fund may be required to reinvest the proceeds at a lower interest rate. This is referred to as “prepayment risk”. For premium bonds (bonds acquired at prices that exceed their par or principal value) purchased by the Fund, prepayment risk may be elevated. When interest rates rise, debt obligations may be repaid more slowly than expected, and the value of the Fund’s holdings may fall sharply. This is referred to as
195
Notes to Financial Statements (continued)
“extension risk”. The Fund may lose money if short-term or long-term interest rates rise sharply or in a manner not anticipated by the subadviser.
Junk Bonds Risk: High-yield, high-risk bonds have predominantly speculative characteristics, including particularly high credit risk. Junk bonds tend to have lower market liquidity than higher-rated securities. The liquidity of particular issuers or industries within a particular investment category may shrink or disappear suddenly and without warning. The non-investment grade bond market can experience sudden and sharp price swings and become illiquid due to a variety of factors, including changes in economic forecasts, stock market activity, large sustained sales by major investors, a high profile default or a change in the market’s psychology.
Large Shareholder and Large Scale Redemption Risk: Certain individuals, accounts, funds (including funds affiliated with the Manager) or institutions, including the Manager and its affiliates, may from time to time own or control a substantial amount of the Fund’s shares. There is no requirement that these entities maintain their investment in the Fund. There is a risk that such large shareholders or that the Fund’s shareholders generally may redeem all or a substantial portion of their investments in the Fund in a short period of time, which could have a significant negative impact on the Fund’s NAV, liquidity, and brokerage costs. Large redemptions could also result in tax consequences to shareholders and impact the Fund’s ability to implement its investment strategy. The Fund’s ability to pursue its investment objective after one or more large scale redemptions may be impaired and, as a result, the Fund may invest a larger portion of its assets in cash or cash equivalents.
Liquidity Risk: Liquidity risk is the risk that the Fund could not meet requests to redeem shares issued by the Fund without significant dilution of remaining investors’ interests in the Fund. The Fund may invest in instruments that trade in lower volumes and are more illiquid than other investments. If the Fund is forced to sell these investments to pay redemption proceeds or for other reasons, the Fund may lose money. In addition, when there is no willing buyer and investments cannot be readily sold at the desired time or price, the Fund may have to accept a lower price or may not be able to sell the instrument at all. An inability to sell a portfolio position can adversely affect the Fund’s value or prevent the Fund from being able to take advantage of other investment opportunities.
Management Risk: Actively managed funds are subject to management risk. The subadviser will apply investment techniques and risk analyses in making investment decisions for the Fund, but the subadviser’s judgments about the attractiveness, value or market trends affecting a particular security, industry or sector or about market movements may be incorrect. Additionally, the investments selected for the Fund may underperform the markets in general, the Fund’s benchmark and other funds with similar investment objectives.
196
Market Disruption and Geopolitical Risks: Market disruption can be caused by economic, financial or political events and factors, including but not limited to, international wars or conflicts (including Russia’s military invasion of Ukraine and the Israel-Hamas war), geopolitical developments (including trading and tariff arrangements, sanctions and cybersecurity attacks), instability in regions such as Asia, Eastern Europe and the Middle East, terrorism, natural disasters and public health epidemics (including the outbreak of COVID-19 globally).
The extent and duration of such events and resulting market disruptions cannot be predicted, but could be substantial and could magnify the impact of other risks to the Fund. These and other similar events could adversely affect the U.S. and foreign financial markets and lead to increased market volatility, reduced liquidity in the securities markets, significant negative impacts on issuers and the markets for certain securities and commodities and/or government intervention. They may also cause short- or long-term economic uncertainties in the United States and worldwide. As a result, whether or not the Fund invests in securities of issuers located in or with significant exposure to the countries directly affected, the value and liquidity of the Fund’s investments may be negatively impacted. Further, due to closures of certain markets and restrictions on trading certain securities, the value of certain securities held by the Fund could be significantly impacted, which could lead to such securities being valued at zero.
Market Risk: Securities markets may be volatile and the market prices of the Fund’s securities may decline. Securities fluctuate in price based on changes in an issuer’s financial condition and overall market and economic conditions. If the market prices of the securities owned by the Fund fall, the value of your investment in the Fund will decline.
Mortgage-Backed and Asset-Backed Securities Risk: Mortgage-backed and asset-backed securities tend to increase in value less than other debt securities when interest rates decline, but are subject to similar risk of decline in market value during periods of rising interest rates. The values of mortgage-backed and asset-backed securities become more volatile as interest rates rise. In a period of declining interest rates, the Fund may be required to reinvest more frequent prepayments on mortgage-backed and asset-backed securities in lower-yielding investments.
U.S. Government and Agency Securities Risk: U.S. Treasury obligations are backed by the “full faith and credit” of the U.S. Government. Securities issued or guaranteed by federal agencies or authorities and U.S. Government-sponsored instrumentalities or enterprises may or may not be backed by the full faith and credit of the U.S. Government. For example, securities issued by the Federal Home Loan Mortgage Corporation, the Federal National Mortgage Association and the Federal Home Loan Banks are neither insured nor guaranteed by the U.S. Government. These securities may be supported by the ability to borrow from the U.S. Treasury or only by the credit of the issuing agency, authority, instrumentality or enterprise and, as a result, are subject to greater credit risk than securities issued or guaranteed by the U.S. Treasury. Further, the U.S. Government and its agencies, authorities, instrumentalities and enterprises do not guarantee the market value of their
197
Notes to Financial Statements (continued)
securities; consequently, the value of such securities will fluctuate. This may be the case especially when there is any controversy or ongoing uncertainty regarding the status of negotiations in the U.S. Congress to increase the statutory debt ceiling. Such controversy or uncertainty could, among other things, result in the credit quality rating of the U. S. Government being downgraded and reduced prices of U.S. Treasury securities. If the U. S. Congress is unable to negotiate an adjustment to the statutory debt ceiling, there is also the risk that the U.S. Government may default on payments on certain U.S. Government securities, including those held by the Fund, which could have a negative impact on the Fund. An increase in demand for U.S. Government securities resulting from an increase in demand for government money market funds may lead to lower yields on such securities.
198
Report of Independent Registered Public Accounting Firm
To the Board of Directors of Prudential Global Total Return Fund, Inc. and Shareholders of PGIM Global Total Return Fund and PGIM Global Total Return (USD Hedged) Fund
Opinions on the Financial Statements
We have audited the accompanying statements of assets and liabilities, including the schedules of investments, of PGIM Global Total Return Fund and PGIM Global Total Return (USD Hedged) Fund (constituting Prudential Global Total Return Fund, Inc., referred to hereafter as the “Funds”) as of October 31, 2024, the related statements of operations for the year ended October 31, 2024, the statements of changes in net assets for each of the two years in the period ended October 31, 2024, including the related notes, and the financial highlights for each of the five years in the period ended October 31, 2024 (collectively referred to as the “financial statements”). In our opinion, the financial statements present fairly, in all material respects, the financial position of each of the Funds as of October 31, 2024, the results of each of their operations for the year then ended, the changes in each of their net assets for each of the two years in the period ended October 31, 2024 and each of the financial highlights for each of the five years in the period ended October 31, 2024 in conformity with accounting principles generally accepted in the United States of America.
Basis for Opinions
These financial statements are the responsibility of the Funds’ management. Our responsibility is to express an opinion on the Funds’ financial statements based on our audits. We are a public accounting firm registered with the Public Company Accounting Oversight Board (United States) (PCAOB) and are required to be independent with respect to the Funds in accordance with the U.S. federal securities laws and the applicable rules and regulations of the Securities and Exchange Commission and the PCAOB.
We conducted our audits of these financial statements in accordance with the standards of the PCAOB. Those standards require that we plan and perform the audit to obtain reasonable assurance about whether the financial statements are free of material misstatement, whether due to error or fraud.
Our audits included performing procedures to assess the risks of material misstatement of the financial statements, whether due to error or fraud, and performing procedures that respond to those risks. Such procedures included examining, on a test basis, evidence regarding the amounts and disclosures in the financial statements. Our audits also included evaluating the accounting principles used and significant estimates made by management, as well as evaluating the overall presentation of the financial statements. Our procedures included confirmation of securities owned as of October 31, 2024 by correspondence with the custodian, transfer agent, agent banks and brokers; when replies were not received from brokers, we performed other auditing procedures. We believe that our audits provide a reasonable basis for our opinions.
/s/PricewaterhouseCoopers LLP
New York, New York
December 19, 2024
We have served as the auditor of one or more investment companies in the PGIM Retail Funds complex since 2020.
199
Other Information
Form N-CSR Item 8 - Changes in and Disagreements with Accountants for Open-End Management Investment Companies - None.
Form N-CSR Item 9 - Proxy Disclosures for Open-End Management Investment Companies-None.
Form N-CSR Item 10 - Remuneration Paid to Directors, Officers, and Others of Open-End Management Investment Companies - Included within the Statement of Operations of the financial statements filed under Item 7 of this Form.
Form N-CSR Item 11 - Statement Regarding Basis for Approval of Investment Advisory Contract.
Approval of Advisory Agreements
PGIM Global Total Return Fund
The Fund’s Board of Directors
The Board of Directors (the “Board”) of PGIM Global Total Return Fund1 (the “Fund”) consists of ten individuals, eight of whom are not “interested persons” of the Fund, as defined in the Investment Company Act of 1940, as amended (the “1940 Act”) (the “Independent Directors”). The Board is responsible for the oversight of the Fund and its operations, and performs the various duties imposed on the directors of investment companies by the 1940 Act. The Independent Directors have retained independent legal counsel to assist them in connection with their duties. The Chair of the Board is an Independent Director. The Board has established five standing committees: the Audit Committee, the Nominating and Governance Committee, the Compliance Committee and two Investment Committees. Each committee is chaired by, and composed of, Independent Directors.
Annual Approval of the Fund’s Advisory Agreements
As required under the 1940 Act, the Board determines annually whether to renew the Fund’s management agreement with PGIM Investments LLC (“PGIM Investments”), the Fund’s subadvisory agreement with PGIM, Inc. (“PGIM”), on behalf of its PGIM Fixed Income unit (“PGIM Fixed Income”), and the Fund’s sub-subadvisory agreement with PGIM Limited (“PGIML”). In considering the renewal of the agreements, the Board, including all of the Independent Directors, met on May 28 and June 4-6, 2024 (the “Board Meeting”) and approved the renewal of the agreements through July 31, 2025, after concluding that the renewal of the agreements was in the best interests of the Fund and its shareholders.
In advance of the meetings, the Board requested and received materials relating to the agreements, and had the opportunity to ask questions and request further information in connection with its consideration. Among other things, the Board considered comparative fee information from PGIM Investments, PGIM, and where appropriate, affiliates of PGIM. Also, the Board considered comparisons with other mutual funds in relevant peer universes and peer groups, as is further discussed below.
In approving the agreements, the Board, including the Independent Directors advised by independent legal counsel, considered the factors it deemed relevant, including the nature, quality and extent of services provided by PGIM Investments, the subadviser, and, as relevant, its affiliates, the performance of the Fund, the profitability of PGIM Investments
| 1 | PGIM Global Total Return Fund is a series of Prudential Global Total Return Fund, Inc. |
PGIM Global Total Return Fund
Approval of Advisory Agreements (continued)
and its affiliates, expenses and fees, and the potential for economies of scale that may be shared with the Fund and its shareholders as the Fund’s assets grow. In their deliberations, the Directors did not identify any single factor which alone was responsible for the Board’s decision to approve an agreement with respect to the Fund. In connection with its deliberations, the Board considered information provided by PGIM Investments throughout the year at regular and special Board meetings, presentations from portfolio managers and other information, as well as information furnished at or in advance of the Board Meeting.
The Directors determined that the overall arrangements between the Fund and PGIM Investments, which serves as the Fund’s investment manager pursuant to a management agreement, between PGIM Investments and PGIM, which, through its PGIM Fixed Income unit, serves as the Fund’s subadviser pursuant to the terms of a subadvisory agreement with PGIM Investments, and between PGIM and PGIML, which serves as the Fund’s sub-subadviser pursuant to the terms of a sub-subadvisory agreement with PGIM, are in the best interests of the Fund and its shareholders in light of the services performed, fees charged and such other matters as the Directors considered relevant in the exercise of their business judgment. The Board considered the approval of the agreements for the Fund as part of its consideration of agreements for multiple funds, but its approvals were made on a fund-by-fund basis.
The material factors and conclusions that formed the basis for the Directors’ reaching their determinations to approve the continuance of the agreements are separately discussed below.
Nature, Quality and Extent of Services
The Board received and considered information regarding the nature, quality and extent of services provided to the Fund by PGIM Investments, PGIM Fixed Income, and PGIML. The Board noted that PGIM Fixed Income and PGIML are affiliated with PGIM Investments. The Board considered the services provided by PGIM Investments, including but not limited to the oversight of the subadviser and sub-subadviser for the Fund, as well as the provision of accounting oversight, fund recordkeeping, compliance and other services to the Fund, such as PGIM Investments’ role as administrator for the Fund’s liquidity risk management program and as valuation designee. With respect to PGIM Investments’ oversight of the subadviser and sub-subadviser, the Board noted that PGIM Investments’ Strategic Investment Research Group (“SIRG”), which is a business unit of PGIM Investments, is responsible for monitoring and reporting to PGIM Investments’ senior management on the performance and operations of the subadviser and sub-subadviser. The Board also considered that PGIM Investments pays the salaries of all of the officers and interested Directors of the Fund who are part of Fund management. The Board also considered the investment subadvisory services provided by PGIM Fixed Income and PGIML, including
Visit our website at pgim.com/investments
investment research and security selection, as well as adherence to the Fund’s investment restrictions and compliance with applicable Fund policies and procedures. The Board considered PGIM Investments’ evaluation of the subadviser and sub-subadviser, as well as PGIM Investments’ recommendation, based on its review of the subadviser and sub-subadviser, to renew the subadvisory and sub-subadvisory agreements.
The Board considered the qualifications, backgrounds and responsibilities of PGIM Investments’ senior management responsible for the oversight of the Fund, PGIM Fixed Income, and PGIML, and also considered the qualifications, backgrounds and responsibilities of PGIM Fixed Income’s portfolio managers who are responsible for the day-to-day management of the Fund’s portfolio. The Board was provided with information pertaining to PGIM Investments’, PGIM Fixed Income’s, and PGIML’s organizational structure, senior management, investment operations, and other relevant information pertaining to PGIM Investments, PGIM Fixed Income, and PGIML. The Board also noted that it received favorable compliance reports from the Fund’s Chief Compliance Officer (“CCO”) as to PGIM Investments, PGIM Fixed Income, and PGIML.
The Board concluded that it was satisfied with the nature, extent and quality of the investment management services provided by PGIM Investments, the subadvisory services provided to the Fund by PGIM Fixed Income, and the sub-subadvisory services provided by PGIML, and that there was a reasonable basis on which to conclude that the Fund benefits from the services provided by PGIM Investments, PGIM Fixed Income, and PGIML under the management, subadvisory and sub-subadvisory agreements.
Costs of Services and Profits Realized by PGIM Investments
The Board was provided with information on the profitability of PGIM Investments and its affiliates in serving as the Fund’s investment manager. The Board discussed with PGIM Investments the methodology utilized in assembling the information regarding profitability and considered its reasonableness. The Board recognized that it is difficult to make comparisons of profitability from fund management contracts because comparative information is not generally publicly available and is affected by numerous factors, including the structure of the particular adviser, the types of funds it manages, its business mix, numerous assumptions regarding allocations of direct and indirect costs, and the adviser’s capital structure and cost of capital. Taking these factors into account, the Board concluded that the profitability of PGIM Investments and its affiliates in relation to the services rendered was not unreasonable.
Economies of Scale
The Board received and discussed information concerning economies of scale that PGIM Investments may realize as the Fund’s assets grow beyond current levels. The Board noted
PGIM Global Total Return Fund
Approval of Advisory Agreements (continued)
that the management fee schedule for the Fund includes breakpoints, which have the effect of decreasing the fee rate as assets increase. During the course of time, the Board has considered information regarding the launch date of the Fund, the management fees of the Fund compared to those of similarly managed funds and PGIM Investments’ investment in the Fund over time. The Board noted that economies of scale can be shared with the Fund in other ways, including low management fees from inception, additional technological and personnel investments to enhance shareholder services, and maintaining existing expense structures in the face of a rising cost environment. The Board also considered PGIM Investments’ assertion that it continually evaluates the management fee schedule of the Fund and the potential to share economies of scale through breakpoints or fee waivers as asset levels increase.
The Board recognized the inherent limitations of any analysis of economies of scale, stemming largely from the Board’s understanding that most of PGIM Investments’ costs are not specific to individual funds, but rather are incurred across a variety of products and services.
Other Benefits to PGIM Investments, PGIM Fixed Income, and PGIML
The Board considered potential ancillary benefits that might be received by PGIM Investments, PGIM Fixed Income, PGIML and their affiliates as a result of their relationship with the Fund. The Board concluded that potential benefits to be derived by PGIM Investments included transfer agency fees received by the Fund’s transfer agent (which is affiliated with PGIM Investments), as well as benefits to its reputation or other intangible benefits resulting from PGIM Investments’ association with the Fund. The Board concluded that the potential benefits to be derived by PGIM Fixed Income and PGIML included the ability to use soft dollar credits, as well as the potential benefits consistent with those generally resulting from an increase in assets under management, specifically, potential access to additional research resources and benefits to their reputations. The Board concluded that the benefits derived by PGIM Investments, PGIM Fixed Income, and PGIML were consistent with the types of benefits generally derived by investment managers and subadvisers to mutual funds.
Performance of the Fund / Fees and Expenses
The Board considered certain additional factors and made related conclusions relating to the historical performance of the Fund for the one-, three-, five- and ten-year periods ended December 31, 2023.
The Board also considered the Fund’s actual management fee, as well as the Fund’s net total expense ratio, for the fiscal year ended October 31, 2023. The Board considered the management fee for the Fund as compared to the management fee charged by PGIM
Visit our website at pgim.com/investments
Investments to other funds and the fee charged by other advisers to comparable mutual funds in a peer group. The actual management fee represents the fee rate actually paid by Fund shareholders and includes any fee waivers or reimbursements. The net total expense ratio for the Fund represents the actual expense ratio incurred by Fund shareholders.
The mutual funds included in the peer universe, which was used to consider performance, and the peer group, which was used to consider expenses and fees, were objectively determined by Broadridge, an independent provider of mutual fund data. In certain circumstances, PGIM Investments also provided supplemental peer universe or peer group information, for reasons addressed with the Board. The comparisons placed the Fund in various quartiles over various periods, with the first quartile being the best 25% of the mutual funds (for performance, the best performing mutual funds and, for expenses, the lowest cost mutual funds).
The section below summarizes key factors considered by the Board and the Board’s conclusions regarding the Fund’s performance, fees and overall expenses. The table sets forth net performance comparisons (which reflect the impact on performance of fund expenses, or any subsidies, expense caps or waivers that may be applicable) with the peer universe, actual management fees with the peer group (which reflect the impact of any subsidies or fee waivers), and net total expenses with the peer group, each of which were key factors considered by the Board.
| | | | | | | | |
| | | | | |
Net Performance | | 1 Year | | 3 Years | | 5 Years | | 10 Years |
| | | | | |
| | | 1st Quartile | | 4th Quartile | | 3rd Quartile | | 1st Quartile |
| |
Actual Management Fees: 2nd Quartile |
| |
Net Total Expenses: 2nd Quartile |
| · | | The Board noted that the Fund outperformed its benchmark index over the one-, five-and ten-year period and underperformed its benchmark index over the three- year period. |
| · | | The Board and PGIM Investments agreed to retain the Fund’s existing contractual expense cap, which (exclusive of certain fees and expenses) caps total annual operating expenses at 0.88% for Class A shares, 1.63% for Class C shares, 0.63% for Class Z shares, 1.08% for Class R2 shares, 0.83% for Class R4 shares, and 0.58% for Class R6 shares through February 28, 2025. |
| · | | In addition, PGIM Investments will waive management fees or shared operating expenses on any share class to the same extent that it waives such expenses on any other share class, and has agreed that total annual fund operating expenses for Class R6 shares will not exceed total annual fund operating expenses for Class Z shares. |
PGIM Global Total Return Fund
Approval of Advisory Agreements (continued)
| · | | The Board concluded that, in light of the above, it would be in the best interests of the Fund and its shareholders to renew the agreements. |
| · | | The Board concluded that the management fees (including subadvisory fees) and total expenses were reasonable in light of the services provided. |
* * *
After full consideration of these factors, the Board concluded that the approval of the agreements was in the best interests of the Fund and its shareholders.
Visit our website at pgim.com/investments
Approval of Advisory Agreements
PGIM Global Total Return (USD Hedged) Fund
The Fund’s Board of Directors
The Board of Directors (the “Board”) of PGIM Global Total Return (USD Hedged) Fund (the “Fund”)1 consists of ten individuals, eight of whom are not “interested persons” of the Fund, as defined in the Investment Company Act of 1940, as amended (the “1940 Act”) (the “Independent Directors”). The Board is responsible for the oversight of the Fund and its operations, and performs the various duties imposed on the directors of investment companies by the 1940 Act. The Independent Directors have retained independent legal counsel to assist them in connection with their duties. The Chair of the Board is an Independent Director. The Board has established five standing committees: the Audit Committee, the Nominating and Governance Committee, the Compliance Committee and two Investment Committees. Each committee is chaired by, and composed of, Independent Directors.
Annual Approval of the Fund’s Advisory Agreements
As required under the 1940 Act, the Board determines annually whether to renew the Fund’s management agreement with PGIM Investments LLC (“PGIM Investments”) and the Fund’s subadvisory agreement with each of PGIM, Inc. (“PGIM”) on behalf of its PGIM Fixed Income unit (“PGIM Fixed Income”) and PGIM Limited (“PGIML”). In considering the renewal of the agreements, the Board, including all of the Independent Directors, met on May 28 and June 4-6 2024 (the “Board Meeting”) and approved the renewal of the agreements through July 31, 2025, after concluding that the renewal of the agreements was in the best interests of the Fund and its shareholders.
In advance of the meetings, the Board requested and received materials relating to the agreements, and had the opportunity to ask questions and request further information in connection with its consideration. Among other things, the Board considered comparative fee information from PGIM Investments, PGIM and PGIML. Also, the Board considered comparisons with other mutual funds in relevant peer universes and peer groups, as is further discussed below.
In approving the agreements, the Board, including the Independent Directors advised by independent legal counsel, considered the factors it deemed relevant, including the nature, quality and extent of services provided by PGIM Investments and the subadvisers, the performance of the Fund, the profitability of PGIM Investments and its affiliates, expenses
| 1 | PGIM Global Total Return (USD Hedged) Fund is a series of Prudential Global Total Return Fund, Inc. |
PGIM Global Total Return (USD Hedged) Fund
Approval of Advisory Agreements (continued)
and fees, and the potential for economies of scale that may be shared with the Fund and its shareholders as the Fund’s assets grow. In their deliberations, the Directors did not identify any single factor which alone was responsible for the Board’s decision to approve an agreement with respect to the Fund. In connection with its deliberations, the Board considered information provided by PGIM Investments throughout the year at regular and special Board meetings, presentations from portfolio managers and other information, as well as information furnished at or in advance of the Board Meeting.
The Directors determined that the overall arrangements between the Fund and PGIM Investments, which serves as the Fund’s investment manager pursuant to a management agreement, and between each of PGIM Investments and PGIM, which, through its PGIM Fixed Income unit, and PGIML, which serve as the Fund’s subadvisers pursuant to the terms of subadvisory agreement with PGIM Investments, are in the best interests of the Fund and its shareholders in light of the services performed, fees charged and such other matters as the Directors considered relevant in the exercise of their business judgment. The Board considered the approval of the agreements for the Fund as part of its consideration of agreements for multiple funds, but its approvals were made on a fund-by-fund basis.
The material factors and conclusions that formed the basis for the Directors’ reaching their determinations to approve the continuance of the agreements are separately discussed below.
Nature, Quality and Extent of Services
The Board received and considered information regarding the nature, quality and extent of services provided to the Fund by PGIM Investments, PGIM Fixed Income, and PGIML. The Board noted that PGIM Fixed Income and PGIML are affiliated with PGIM Investments. The Board considered the services provided by PGIM Investments, including but not limited to the oversight of the subadvisers for the Fund, as well as the provision of accounting oversight, fund recordkeeping, compliance and other services to the Fund, such as PGIM Investments’ role as administrator for the Fund’s liquidity risk management program and as valuation designee. With respect to PGIM Investments’ oversight of the subadvisers, the Board noted that PGIM Investments’ Strategic Investment Research Group (“SIRG”), which is a business unit of PGIM Investments, is responsible for monitoring and reporting to PGIM Investments senior management on the performance and operations of the subadvisers. The Board also considered that PGIM Investments pays the salaries of all of the officers and interested Directors of the Fund who are part of Fund management. The Board also considered the investment subadvisory services provided by PGIM Fixed Income and PGIML, including investment research and security selection, as well as adherence to the Fund’s investment restrictions and compliance with applicable Fund policies and
Visit our website at pgim.com/investments
procedures. The Board considered PGIM Investments’ evaluation of the subadvisers, as well as PGIM Investments’ recommendation, based on its review of the subadvisers, to renew the subadvisory agreement.
The Board considered the qualifications, backgrounds and responsibilities of PGIM Investments’ senior management responsible for the oversight of the Fund, PGIM Fixed Income, and PGIML, and also considered the qualifications, backgrounds and responsibilities of PGIM Fixed Income’s portfolio managers who are responsible for the day-to-day management of the Fund’s portfolio. The Board was provided with information pertaining to PGIM Investments’, PGIM Fixed Income’s, and PGIML’s organizational structure, senior management, investment operations, and other relevant information pertaining to PGIM Investments, PGIM Fixed Income, and PGIML. The Board also noted that it received favorable compliance reports from the Fund’s Chief Compliance Officer (“CCO”) as to PGIM Investments, PGIM Fixed Income, and PGIML.
The Board concluded that it was satisfied with the nature, extent and quality of the investment management services provided by PGIM Investments, the subadvisory services provided to the Fund by PGIM Fixed Income and PGIML, and that there was a reasonable basis on which to conclude that the Fund benefits from the services provided by PGIM Investments, PGIM Fixed Income, and PGIML under the management and subadvisory agreement.
Costs of Services and Profits Realized by PGIM Investments
The Board was provided with information on the profitability of PGIM Investments and its affiliates in serving as the Fund’s investment manager. The Board discussed with PGIM Investments the methodology utilized in assembling the information regarding profitability and considered its reasonableness. The Board recognized that it is difficult to make comparisons of profitability from fund management contracts because comparative information is not generally publicly available and is affected by numerous factors, including the structure of the particular adviser, the types of funds it manages, its business mix, numerous assumptions regarding allocations of direct and indirect costs, and the adviser’s capital structure and cost of capital. However, the Board considered that the cost of services provided by PGIM Investments during the year ended December 31, 2023 exceeded the management fees received by PGIM Investments, resulting in an operating loss to PGIM Investments. Taking these factors into account, the Board concluded that the profitability of PGIM Investments and its affiliates in relation to the services rendered was not unreasonable.
Economies of Scale
The Board received and discussed information concerning economies of scale that PGIM Investments may realize as the Fund’s assets grow beyond current levels. The Board noted
PGIM Global Total Return (USD Hedged) Fund
Approval of Advisory Agreements (continued)
that the management fee schedule for the Fund includes breakpoints, which have the effect of decreasing the fee rate as assets increase. During the course of time, the Board has considered information regarding the launch date of the Fund, the management fees of the Fund compared to those of similarly managed funds and PGIM Investments’ investment in the Fund over time. The Board noted that economies of scale can be shared with the Fund in other ways, including low management fees from inception, additional technological and personnel investments to enhance shareholder services, and maintaining existing expense structures in the face of a rising cost environment. The Board also considered PGIM Investments’ assertion that it continually evaluates the management fee schedule of the Fund and the potential to share economies of scale through breakpoints or fee waivers as asset levels increase.
The Board recognized the inherent limitations of any analysis of economies of scale, stemming largely from the Board’s understanding that most of PGIM Investments’ costs are not specific to individual funds, but rather are incurred across a variety of products and services.
Other Benefits to PGIM Investments, PGIM Fixed Income, and PGIML
The Board considered potential ancillary benefits that might be received by PGIM Investments, PGIM Fixed Income, PGIML and their affiliates as a result of their relationship with the Fund. The Board concluded that potential benefits to be derived by PGIM Investments included transfer agency fees received by the Fund’s transfer agent (which is affiliated with PGIM Investments), as well as benefits to its reputation or other intangible benefits resulting from PGIM Investments’ association with the Fund. The Board concluded that the potential benefits to be derived by PGIM Fixed Income and PGIML included the ability to use soft dollar credits, as well as the potential benefits consistent with those generally resulting from an increase in assets under management, specifically, potential access to additional research resources and benefits to their reputations. The Board concluded that the benefits derived by PGIM Investments, PGIM Fixed Income, and PGIML were consistent with the types of benefits generally derived by investment managers and subadvisers to mutual funds.
Performance of the Fund / Fees and Expenses
The Board considered certain additional factors and made related conclusions relating to the historical performance of the Fund for the one- and three-year periods ended December 31, 2023. The Board considered that the Fund commenced operations on December 12, 2017 and that longer-term performance was not yet available.
The Board also considered the Fund’s actual management fee, as well as the Fund’s net total expense ratio, for the fiscal year ended October 31, 2023. The Board considered the
Visit our website at pgim.com/investments
management fee for the Fund as compared to the management fee charged by PGIM Investments to other funds and the fee charged by other advisers to comparable mutual funds in a peer group. The actual management fee represents the fee rate actually paid by Fund shareholders and includes any fee waivers or reimbursements. The net total expense ratio for the Fund represents the actual expense ratio incurred by Fund shareholders.
The mutual funds included in the peer universe, which was used to consider performance, and the peer group, which was used to consider expenses and fees, were objectively determined by Broadridge, an independent provider of mutual fund data. In certain circumstances, PGIM Investments also provided supplemental peer universe or peer group information, for reasons addressed with the Board. The comparisons placed the Fund in various quartiles over various periods, with the first quartile being the best 25% of the mutual funds (for performance, the best performing mutual funds and, for expenses, the lowest cost mutual funds).
The section below summarizes key factors considered by the Board and the Board’s conclusions regarding the Fund’s performance, fees and overall expenses. The table sets forth net performance comparisons (which reflect the impact on performance of fund expenses, or any subsidies, expense caps or waivers that may be applicable) with the peer universe, actual management fees with the peer group (which reflect the impact of any subsidies or fee waivers), and net total expenses with the peer group, each of which were key factors considered by the Board.
| | | | | | | | |
| | | | | |
Net Performance | | 1 Year | | 3 Years | | 5 Years | | 10 Years |
| | | | | |
| | | 1st Quartile | | 3rd Quartile | | 1st Quartile | | N/A |
| |
Actual Management Fees: 1st Quartile |
| |
Net Total Expenses: 1st Quartile |
| · | | The Board noted that the Fund outperformed its benchmark index over the one- and five-year periods and underperformed its benchmark index over the three-year period. |
| · | | The Board and PGIM Investments agreed to retain the existing contractual expense cap, which (exclusive of certain fees and expenses) caps total annual operating expenses at 0.88% for Class A shares, 1.63% for Class C shares, 0.63% for Class Z shares and 0.58% for Class R6 shares through February 28, 2025. |
| · | | In addition, PGIM Investments will waive management fees or shared operating expenses on any share class to the same extent that it waives such expenses on any other share class, and has agreed that total annual fund operating expenses for Class R6 shares will not exceed total annual fund operating expenses for Class Z shares. |
| · | | The Board concluded that, in light of the above, it would be in the best interests of the Fund and its shareholders to renew the agreements. |
PGIM Global Total Return (USD Hedged) Fund
Approval of Advisory Agreements (continued)
| · | | The Board concluded that the management fees (including subadvisory fees) and total expenses were reasonable in light of the services provided. |
* * *
After full consideration of these factors, the Board concluded that the approval of the agreements was in the best interests of the Fund and its shareholders.
Visit our website at pgim.com/investments
| Item 12 | – Disclosure of Proxy Voting Policies and Procedures for Closed-End Management Investment Companies – Not applicable. |
| Item 13 | – Portfolio Managers of Closed-End Management Investment Companies – Not applicable. |
| Item 14 | – Purchases of Equity Securities by Closed-End Management Investment Company and Affiliated Purchasers – Not applicable. |
| Item 15 | – Submission of Matters to a Vote of Security Holders – There have been no material changes to the procedures by which shareholders may recommend nominees to the registrant’s board of directors. |
| Item 16 | – Controls and Procedures |
| | (a) | It is the conclusion of the registrant’s principal executive officer and principal financial officer that the effectiveness of the registrant’s current disclosure controls and procedures (such disclosure controls and procedures having been evaluated within 90 days of the date of this filing) provide reasonable assurance that the information required to be disclosed by the registrant has been recorded, processed, summarized and reported within the time period specified in the Commission’s rules and forms and that the information required to be disclosed by the registrant has been accumulated and communicated to the registrant’s principal executive officer and principal financial officer in order to allow timely decisions regarding required disclosure. |
| | (b) | There has been no significant change in the registrant’s internal control over financial reporting (as defined in Rule 30a-3(d) under the Act (17 CFR 270.30a-3(d))) that occurred during the period covered by this report that has materially affected, or is reasonably likely to materially affect, the registrant’s internal control over financial reporting. |
| Item 17 | – Disclosure of Securities Lending Activities for Closed-End Management Investment Companies – Not applicable. |
| Item 18 | – Recovery of Erroneously Awarded Compensation – Not applicable. |
SIGNATURES
Pursuant to the requirements of the Securities Exchange Act of 1934 and the Investment Company Act of 1940, the registrant has duly caused this report to be signed on its behalf by the undersigned, thereunto duly authorized.
| | |
| Registrant: | | Prudential Global Total Return Fund, Inc. |
| |
| By: | | /s/ Andrew R. French |
| | Andrew R. French |
| | Secretary |
| |
| Date: | | December 19, 2024 |
Pursuant to the requirements of the Securities Exchange Act of 1934 and the Investment Company Act of 1940, this report has been signed below by the following persons on behalf of the registrant and in the capacities and on the dates indicated.
| | |
| By: | | /s/ Stuart S. Parker |
| | Stuart S. Parker |
| | President and Principal Executive Officer |
| |
| Date: | | December 19, 2024 |
| |
| By: | | /s/ Christian J. Kelly |
| | Christian J. Kelly |
| | Chief Financial Officer (Principal Financial Officer) |
| |
| Date: | | December 19, 2024 |