UNITED STATES
SECURITIES AND EXCHANGE COMMISSION
Washington, D.C. 20549
FORM N-CSR
CERTIFIED SHAREHOLDER REPORT OF REGISTERED MANAGEMENT INVESTMENT
COMPANIES
| | |
| Investment Company Act file number: | | 811- 04661 |
| |
| Exact name of registrant as specified in charter: | | Prudential Global Total Return Fund, Inc. |
| |
| Address of principal executive offices: | | 655 Broad Street, 6th Floor |
| | Newark, New Jersey 07102 |
| |
| Name and address of agent for service: | | Andrew R. French |
| | 655 Broad Street, 6th Floor |
| | Newark, New Jersey 07102 |
| |
| Registrant’s telephone number, including area code: | | 800-225-1852 |
| |
| Date of fiscal year end: | | 10/31/2023 |
| |
| Date of reporting period: | | 10/31/2023 |
Item 1 – Reports to Stockholders

PGIM GLOBAL TOTAL RETURN FUND
ANNUAL REPORT
OCTOBER 31, 2023

To enroll in e-delivery, go to pgim.com/investments/resource/edelivery
Table of Contents
This report is not authorized for distribution to prospective investors unless preceded or accompanied by a current prospectus.
The views expressed in this report and information about the Fund’s portfolio holdings are for the period covered by this report and are subject to change thereafter.
Mutual funds are distributed by Prudential Investment Management Services LLC (PIMS), member SIPC. PGIM Fixed Income is a unit of PGIM, Inc. (PGIM), a registered investment adviser. PIMS and PGIM are Prudential Financial companies. © 2023 Prudential Financial, Inc. and its related entities. PGIM and the PGIM logo are service marks of Prudential Financial, Inc. and its related entities, registered in many jurisdictions worldwide.
2 Visit our website at pgim.com/investments
Letter from the President
| | |

| | Dear Shareholder: We hope you find the annual report for the PGIM Global Total Return Fund informative and useful. The report covers performance for the 12-month period that ended October 31, 2023. Although central banks raised interest rates aggressively to tame surging inflation during the period, the global economy and financial markets demonstrated resilience. Employers continued hiring, consumers continued spending, home prices rose, and recession fears receded. |
Early in the period, stocks began a rally that eventually ended a bear market and continued to rise globally for much of 2023 as inflation cooled and the Federal Reserve (the Fed) slowed the pace of its rate hikes. However, stocks declined late in the period when the Fed signaled that rates may remain elevated longer than investors had expected. For the entire period, large-cap US stocks and equities in international markets posted gains, while small-cap US stocks declined.
Bond markets benefited during the period as the Fed moderated its rate-hiking cycle, and the higher level of interest rates offered investors an additional cushion from fixed income volatility. US and global investment-grade bonds, along with US high yield corporate bonds and emerging market debt, all posted gains.
Regarding your investments with PGIM, we believe it is important to maintain a diversified portfolio of funds consistent with your tolerance for risk, time horizon, and financial goals. Your financial advisor can help you create a diversified investment plan that may include funds covering all the basic asset classes and that reflects your personal investor profile and risk tolerance. However, diversification and asset allocation strategies do not assure a profit or protect against loss in declining markets.
At PGIM Investments, we provide access to active investment strategies across the global markets in the pursuit of consistent outperformance for investors. PGIM is the world’s 14th-largest investment manager with more than $1.3 trillion in assets under management. Our scale and investment expertise allow us to deliver a diversified suite of actively managed solutions across a broad spectrum of asset classes and investment styles.
Thank you for choosing our family of funds.
Sincerely,
|
 |
| Stuart S. Parker, President |
|
| PGIM Global Total Return Fund |
| December 15, 2023 |
PGIM Global Total Return Fund 3
Your Fund’s Performance (unaudited)
Performance data quoted represent past performance. Past performance does not guarantee future results. The investment return and principal value of an investment will fluctuate so that an investor’s shares, when redeemed, may be worth more or less than their original cost. Current performance may be lower or higher than the past performance data quoted. An investor may obtain performance data as of the most recent month-end by visiting our website at pgim.com/investments or by calling (800) 225-1852.
| | | | | | | | |
| |
| | | Average Annual Total Returns as of 10/31/23 |
| | | | |
| | | One Year (%) | | Five Years (%) | | Ten Years (%) | | Since Inception (%) |
| | | | |
Class A | | | | | | | | |
| | | | |
(with sales charges) | | 2.76 | | -2.33 | | -0.24 | | — |
| | | | |
(without sales charges) | | 6.22 | | -1.68 | | 0.09 | | — |
| | | | |
Class C | | | | | | | | |
| | | | |
(with sales charges) | | 4.43 | | -2.42 | | -0.66 | | — |
| | | | |
(without sales charges) | | 5.43 | | -2.42 | | -0.66 | | — |
| | | | |
Class Z | | | | | | | | |
| | | | |
(without sales charges) | | 6.47 | | -1.48 | | 0.33 | | — |
| | | | |
Class R2 | | | | | | | | |
| | | | |
(without sales charges) | | 6.20 | | -1.88 | | N/A | | -2.34 (12/27/2017) |
| | | | |
Class R4 | | | | | | | | |
| | | | |
(without sales charges) | | 6.24 | | -1.67 | | N/A | | -2.10 (12/27/2017) |
| | | | |
Class R6 | | | | | | | | |
| | | | |
(without sales charges) | | 6.56 | | -1.39 | | 0.48 | | — |
| | | | |
Bloomberg Global Aggregate Index | | | | | | | | |
| | | | |
| | | 1.72 | | -1.64 | | -0.66 | | — |
| | |
|
| Average Annual Total Returns as of 10/31/23 Since Inception (%) |
| |
| | | Class R2, Class R4 |
| |
| | | (12/27/2017) |
| |
Bloomberg Global Aggregate Index | | -2.00 |
Since Inception returns are provided for any share class that has less than 10 fiscal years of returns. Since Inception returns for the Index are measured from the closest month-end to the class’s inception date.
4 Visit our website at pgim.com/investments
Growth of a $10,000 Investment (unaudited)
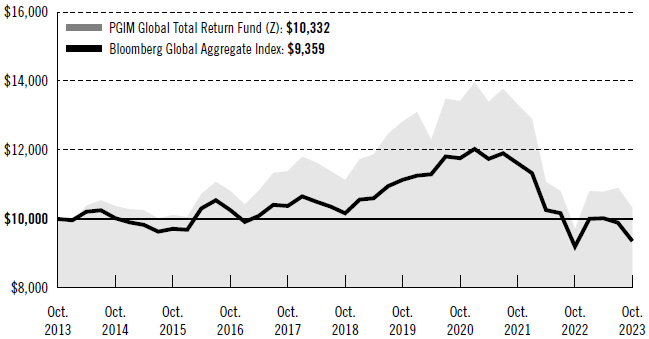
The graph compares a $10,000 investment in the Fund’s Class Z shares with a similar investment in the Bloomberg Global Aggregate Index by portraying the initial account values at the beginning of the 10-year period for Class Z shares (October 31, 2013) and the account values at the end of the current fiscal year (October 31, 2023) as measured on a quarterly basis. For purposes of the graph, and unless otherwise indicated, it has been assumed that (a) all recurring fees (including management fees) were deducted and (b) all dividends and distributions were reinvested. The line graph provides information for Class Z shares only. As indicated in the tables provided earlier, performance for other share classes will vary due to the differing fees and expenses applicable to each share class (as indicated in the following paragraphs). Without waiver of fees and/or expense reimbursements, if any, the returns would have been lower.
Past performance does not predict future performance. Total returns and the ending account values in the graphs include changes in share price and reinvestment of dividends and capital gains distributions in a hypothetical investment for the periods shown. The Fund’s total returns do not reflect the deduction of income taxes on an individual’s investment. Taxes may reduce your actual investment returns on income or gains paid by the Fund or any gains you may realize if you sell your shares.
PGIM Global Total Return Fund 5
Your Fund’s Performance (continued)
The returns in the tables do not reflect the deduction of taxes that a shareholder would pay on Fund distributions or following the redemption of Fund shares. The average annual total returns take into account applicable sales charges, which are described for each share class in the table below.
| | | | | | | | | | | | |
| | | | | | |
| | | Class A | | Class C | | Class Z | | Class R2 | | Class R4 | | Class R6 |
| Maximum initial sales charge | | 3.25% of the public offering price | | None | | None | | None | | None | | None |
| | | | | | | |
| Contingent deferred sales charge (CDSC) (as a percentage of the lower of the original purchase price or the net asset value at redemption) | | 1.00% on sales of $500,000 or more made within 12 months of purchase | | 1.00% on sales made within 12 months of purchase | | None | | None | | None | | None |
| | | | | | | |
| Annual distribution or distribution and service (12b-1) fees (shown as a percentage of average daily net assets) | | 0.25% | | 1.00% | | None | | 0.25% | | None | | None |
| | | | | | | |
| Shareholder service fees | | None | | None | | None | | 0.10%* | | 0.10%* | | None |
*Shareholder service fee reflects maximum allowable fees under a shareholder services plan.
Benchmark Definition
Bloomberg Global Aggregate Index—The Bloomberg Global Aggregate Index is an unmanaged index of global investment-grade fixed income markets. The three major components of this index are the U.S. Aggregate, the Pan-European Aggregate, and the Asian-Pacific Aggregate Indices. The Index also includes Eurodollar and Euro-Yen corporate bonds, and Canadian government, agency, and corporate securities.
Investors cannot invest directly in an index. The returns for the Index would be lower if they included the effects of sales charges, operating expenses of a mutual fund, or taxes that may be paid by an investor.
6 Visit our website at pgim.com/investments
| | | | |
| |
| Credit Quality expressed as a percentage of total investments as of 10/31/23 (%) | | | |
| |
AAA | | | 14.5 | |
| |
AA | | | 9.0 | |
| |
A | | | 13.9 | |
| |
BBB | | | 35.1 | |
| |
BB | | | 15.2 | |
| |
B | | | 4.7 | |
| |
CCC | | | 2.0 | |
| |
Not Rated | | | 2.2 | |
| |
Cash/Cash Equivalents | | | 3.4 | |
| | |
Total | | | 100.0 | |
Credit ratings reflect the highest rating assigned by a nationally recognized statistical rating organization (NRSRO) such as Moody’s Investors Service, Inc. (Moody’s), S&P Global Ratings (S&P), or Fitch Ratings Inc. (Fitch). Credit ratings reflect the common nomenclature used by both S&P and Fitch. Where applicable, ratings are converted to the comparable S&P/Fitch rating tier nomenclature. These rating agencies are independent and are widely used. The Not Rated category consists of securities that have not been rated by an NRSRO. Credit ratings are subject to change.
| | | | | | |
|
| Distributions and Yields as of 10/31/23 |
| | | |
| | | Total Distributions | | SEC 30-Day | | SEC 30-Day |
| | | Paid for | | Subsidized | | Unsubsidized |
| | | One Year ($) | | Yield* (%) | | Yield** (%) |
| | | |
Class A | | 0.20 | | 5.86 | | 5.94 |
| | | |
Class C | | 0.16 | | 5.30 | | 5.48 |
| | | |
Class Z | | 0.21 | | 6.32 | | 6.48 |
| | | |
Class R2 | | 0.19 | | 5.86 | | 5.96 |
| | | |
Class R4 | | 0.20 | | 6.11 | | 6.22 |
| | | |
Class R6 | | 0.22 | | 6.52 | | 6.52 |
*SEC 30-Day Subsidized Yield (%)—A standardized yield calculation created by the Securities and Exchange Commission, it reflects the income earned during a 30-day period, after the deduction of the Fund’s net expenses (net of any expense waivers or reimbursements). The investor experience is represented by the SEC 30-Day Subsidized Yield.
**SEC 30-Day Unsubsidized Yield (%)—A standardized yield calculation created by the Securities and Exchange Commission, it reflects the income earned during a 30-day period, after the deduction of the Fund’s gross expenses. The investor experience is represented by the SEC 30-Day Subsidized Yield.
PGIM Global Total Return Fund 7
Strategy and Performance Overview* (unaudited)
How did the Fund perform?
The PGIM Global Total Return Fund’s Class Z shares returned 6.47% in the 12-month reporting period that ended October 31, 2023, outperforming the 1.72% return of the Bloomberg Global Aggregate Bond Index (the Index).
What were the market conditions?
| ● | | In the US, interest rate volatility increased as markets sought to price in both the aggressive Federal Open Market Committee (FOMC) policy tightening and the potential for a hard economic landing. Toward the end of the reporting period, macroeconomic and market conditions raised hopes of a soft landing as the FOMC held interest rates steady, and Federal Reserve (Fed) Chairman Jerome Powell acknowledged that higher yields on US Treasuries have aided in the tightening of financial conditions. (When central banks raise interest rates enough to cause a significant economic slowdown or a recession, it is known as a hard landing. When they raise rates just enough to slow the economy and lower inflation without causing a recession, it is known as a soft landing.) The 10-year/2-year US Treasury spread narrowed from –0.41% as of October 31, 2022 to –0.19% as of October 31, 2023, while the 10-year US Treasury yield rose by 79 basis points (bps) to end the reporting period at 4.88%. (One basis point equals 0.01%.) |
| ● | | Despite the debt ceiling debate and threats of a government shutdown, inflation that remained above the Fed’s 2% target, and geopolitical risks abroad, the economy proved resilient, posting strong growth for the third quarter of 2023 (i.e., annualized gross domestic product (GDP) of 4.9%) that was driven by consumer spending. With that stated, the durability of the third quarter’s economic momentum doesn’t appear to be repeatable. While September’s payrolls report of 336,000 jobs added came in much stronger than expected, October’s payrolls report of 150,000 jobs added surprised to the downside and provided further evidence of labor market rebalancing. |
| ● | | In Europe, German 10-year bond yields rose to end the reporting period at 2.83%. While the decision of the European Central Bank (ECB) to keep monetary policy unchanged appeared prudent and justified, headwinds from higher global interest rates, high energy prices, and persistent inflation continued to paint a challenging picture for the euro economy. Similarly, United Kingdom 10-year bond yields rose over the reporting period, ending it at 4.54%. The Bank of England also remained on hold in October 2023. This was the second meeting at which the Bank of England kept its key rate at 5.25%, reflecting the fact that the real economy and inflation both came in slightly weaker than what was expected at the time of its August 2023 report. |
| ● | | Euro-area inflation fell off a bit more than expected to 2.9% year-over-year in October 2023, down from 4.3% the previous month. The decline was led mostly by energy, while core inflation dropped a bit as well to 4.2% year-over-year from 4.5% in September. With inflation now within striking distance of the ECB’s 2% target and core inflation starting to show some signs of a downward trend, barring any major changes, the ECB increasingly appears to have hit peak rates. |
8 Visit our website at pgim.com/investments
| ● | | In the elevated volatility environment, US investment-grade corporate spreads tightened as expectations for a hard landing dissipated, and fundamentals remained solid. US high yield bonds posted gains over the reporting period amid limited new issuance, resilient economic data, and an ongoing supply deficit. Securitized credit spreads were mixed, with high-quality collateralized loan obligation (CLO) spreads tightening over the reporting period and commercial mortgage-backed securities (CMBS) spreads widening slightly as the commercial real estate sector remained challenged. The emerging-markets sector posted positive total returns, and spreads tightened through October 2023. Meanwhile, agency mortgage-backed securities (MBS) posted negative returns over the reporting period, as elevated interest-rate volatility weighed on the sector over the first half of the reporting period. |
What worked?
| ● | | The Fund’s duration and yield curve positioning in both developed-markets and emerging-markets rates contributed to performance during the reporting period. (Duration measures the sensitivity of the price—the value of principal—of a bond to a change in interest rates.) (A yield curve is a line graph that illustrates the relationship between the yields and maturities of fixed income securities. It is created by plotting the yields of different maturities for the same type of bonds.) |
| ● | | Overall security selection contributed to performance, with selection in developed high yield, emerging sovereigns, and emerging agencies contributing most. |
| ● | | Overall sector allocation also contributed, with overweights to emerging-markets sovereigns, developed-markets investment-grade corporates, and emerging-markets Treasuries contributing most. |
| ● | | Within credit, positioning in foreign non-corporates, retailers & restaurants, and telecom contributed. |
| ● | | In individual security selection, the Fund benefited from selection in the Republic of Greece, the Republic of Ukraine, and Colombia. |
What didn’t work?
| ● | | Within security selection, positions in developed-markets futures and emerging-markets Treasuries detracted the most from performance during the reporting period. |
| ● | | Within sector allocation, an overweight to developed-markets high yields, along with underweights to developed-markets local authorities and developed-markets agencies, detracted most from performance. |
| ● | | Within credit, positioning in transportation & environmental services, banking, and media & entertainment detracted from performance. |
| ● | | In individual security selection, positioning in the Republic of Panama (emerging sovereigns), the Republic of Panama, and US Bancorp (banking) detracted from performance. |
PGIM Global Total Return Fund 9
Strategy and Performance Overview* (continued)
Did the Fund use derivatives?
The Fund uses derivatives when they facilitate implementation of the overall investment approach. During the reporting period, the Fund used interest rate futures, options, and swaps to help manage duration positioning and yield curve exposure, which detracted from performance. Credit default swaps and credit default swap index positions were used to either add risk exposure to certain issuers or to hedge credit risk imposed by certain issuers. Overall, credit derivative exposure detracted from performance during the reporting period.
Current outlook
| ● | | The main forces pushing the yield curve higher are the central banks and a heavy supply of government bond issuance. In PGIM Fixed Income’s view, upward momentum in long-dated yields could easily continue through year-end—pushing US Treasuries toward 5% and German Bunds to 3%—and yields could go beyond those levels if fundamentals heat up again. |
| ● | | PGIM Fixed Income believes that the Fed is at or nearing the end of its aggressive tightening cycle. With inflation in the US receding, the real question is where it troughs and whether it is within an acceptable tolerance band for the Fed. After a series of hikes, the Fed once again held rates steady at the November 2023 FOMC meeting. While there were no surprises in the “higher-for-longer” interest rate messaging, it was reiterated that monetary policy works with an uncertain lag. Fed officials are increasingly expressing a desire to “wait and watch” the incoming data for signs that the effects of prior hikes transmit to the real economy and whether the October surge in market-determined rates provided the last dose of tightening in financial conditions. |
| ● | | As the economic backdrop slows and revenue growth begins to run slower than wage growth, PGIM Fixed Income expects companies will first cut hours, then wages, and then head count. If revenue growth continues to run slower than wage growth, the risk of further cuts to head count would grow—a scenario consistent with PGIM Fixed Income’s baseline US economic view whereby tight monetary, fiscal, and credit conditions slow momentum to a below-trend pace of real GDP. Under this “weakflation” scenario, PGIM Fixed Income still expects real GDP growth of between 1.0%-1.5%, inflation descending to 2.5%-3.0%, and the Fed “fine-tuning” its policy rates, with 50 bps of easing next year. |
| ● | | PGIM Fixed Income maintains its positive view of the spread sectors over the medium to long term, and the Fund is overweight investment-grade corporates, high yield, securitized products (CLOs and CMBS), and emerging markets. The Fund holds a significant underweight relative to the Index to MBS and US Treasuries in favor of more attractive opportunities across spread sectors. |
| ● | | From a long-term perspective, exposure to developed-markets duration is becoming more compelling after the broad repricing and with the looming moderation in global growth. While acknowledging the immediate trajectory of inflation is going to dictate market volatility and the path of the US Treasury 10-year yield, PGIM Fixed Income’s |
10 Visit our website at pgim.com/investments
| | base case is that implied volatility will ultimately decline, and the 10-year yield will stay below the terminal rate of this hiking cycle when it is eventually reached. In the meantime, the best course will be to focus on the micro-alpha opportunities within and across sectors. (Alpha is a measure of an investment’s active return compared to a market or index.) |
*This strategy and performance overview, which discusses what strategies or holdings (including derivatives, if applicable) affected the Fund’s performance, is compiled based on how the Fund performed relative to the Index and is viewed for performance attribution purposes at the aggregate Fund level, which in most instances will not directly correlate to the amounts disclosed in the Statement of Operations which conform to US generally accepted accounting principles.
PGIM Global Total Return Fund 11
Fees and Expenses (unaudited)
As a shareholder of the Fund, you incur two types of costs: (1) transaction costs, including sales charges (loads) on purchase payments and redemptions, as applicable, and (2) ongoing costs, including management fees, distribution and/or service (12b-1) fees, and other Fund expenses, as applicable. This example is intended to help you understand your ongoing costs (in dollars) of investing in the Fund and to compare these costs with the ongoing costs of investing in other mutual funds.
The example is based on an investment of $1,000 held through the six-month period ended October 31, 2023. The example is for illustrative purposes only; you should consult the Prospectus for information on initial and subsequent minimum investment requirements.
Actual Expenses
The first line for each share class in the table on the following page provides information about actual account values and actual expenses. You may use the information on this line, together with the amount you invested, to estimate the expenses that you paid over the period. Simply divide your account value by $1,000 (for example, an $8,600 account value ÷ $1,000 = 8.6), then multiply the result by the number on the first line under the heading “Expenses Paid During the Six-Month Period” to estimate the expenses you paid on your account during this period.
Hypothetical Example for Comparison Purposes
The second line for each share class in the table on the following page provides information about hypothetical account values and hypothetical expenses based on the Fund’s actual expense ratio and an assumed rate of return of 5% per year before expenses, which is not the Fund’s actual return. The hypothetical account values and expenses may not be used to estimate the actual ending account balance or expenses you paid for the period. You may use this information to compare the ongoing costs of investing in the Fund and other funds. To do so, compare this 5% hypothetical example with the 5% hypothetical examples that appear in the shareholder reports of the other funds.
The Fund’s transfer agent may charge additional fees to holders of certain accounts that are not included in the expenses shown in the table on the following page. These fees apply to individual retirement accounts (IRAs) and Section 403(b) accounts. As of the close of the six-month period covered by the table, IRA fees included an annual maintenance fee of $15 per account (subject to a maximum annual maintenance fee of $25 for all accounts held by the same shareholder). Section 403(b) accounts are charged an annual $25 fiduciary maintenance fee. Some of the fees may vary in amount, or may be waived, based on your total account balance or the number of PGIM funds, including the Fund, that you own. You should consider the additional fees that were charged to your Fund account over the six-month period when you estimate the total ongoing expenses paid over the period and the impact of these fees on your ending account value, as these additional expenses are not reflected in the information
12 Visit our website at pgim.com/investments
provided in the expense table. Additional fees have the effect of reducing investment returns.
Please note that the expenses shown in the table are meant to highlight your ongoing costs only and do not reflect any transactional costs such as sales charges (loads). Therefore, the second line for each share class in the table is useful in comparing ongoing costs only and will not help you determine the relative total costs of owning different funds. In addition, if these transactional costs were included, your costs would have been higher.
| | | | | | | | | | |
| | | | | |
| PGIM Global Total Return Fund | | Beginning
Account Value May 1, 2023 | | Ending Account Value
October 31, 2023 | | Annualized Expense Ratio Based on the Six-Month Period | | Expenses Paid During the Six-Month Period* |
| | | | | |
Class A | | Actual | | $1,000.00 | | $ 958.00 | | 0.88% | | $4.34 |
| | | | | |
| | Hypothetical | | $1,000.00 | | $1,020.77 | | 0.88% | | $4.48 |
| | | | | |
Class C | | Actual | | $1,000.00 | | $ 954.30 | | 1.63% | | $8.03 |
| | | | | |
| | Hypothetical | | $1,000.00 | | $1,016.99 | | 1.63% | | $8.29 |
| | | | | |
Class Z | | Actual | | $1,000.00 | | $ 957.60 | | 0.63% | | $3.11 |
| | | | | |
| | Hypothetical | | $1,000.00 | | $1,022.03 | | 0.63% | | $3.21 |
| | | | | |
Class R2 | | Actual | | $1,000.00 | | $ 957.80 | | 1.08% | | $5.33 |
| | | | | |
| | Hypothetical | | $1,000.00 | | $1,019.76 | | 1.08% | | $5.50 |
| | | | | |
Class R4 | | Actual | | $1,000.00 | | $ 957.10 | | 0.83% | | $4.09 |
| | | | | |
| | Hypothetical | | $1,000.00 | | $1,021.02 | | 0.83% | | $4.23 |
| | | | | |
Class R6 | | Actual | | $1,000.00 | | $ 958.50 | | 0.53% | | $2.62 |
| | | | | |
| | | Hypothetical | | $1,000.00 | | $1,022.53 | | 0.53% | | $2.70 |
*Fund expenses (net of fee waivers or subsidies, if any) for each share class are equal to the annualized expense ratio for each share class (provided in the table), multiplied by the average account value over the period, multiplied by the 184 days in the six-month period ended October 31, 2023, and divided by the 365 days in the Fund’s fiscal year ended October 31, 2023 (to reflect the six-month period). Expenses presented in the table include the expenses of any underlying portfolios in which the Fund may invest.
PGIM Global Total Return Fund 13
Schedule of Investments
as of October 31, 2023
| | | | | | | | | | | | | | | | | | |
| | | | |
Description | | Interest
Rate | | Maturity Date | | | Principal Amount (000)# | | | Value | |
| | | | | |
LONG-TERM INVESTMENTS 97.2% | | | | | | | | | | | | | | | | | | |
| | | | | |
ASSET-BACKED SECURITIES 12.6% | | | | | | | | | | | | | | | | | | |
| | | | | |
Canada 0.1% | | | | | | | | | | | | | | | | | | |
Fairstone Financial Issuance Trust, | | | | | | | | | | | | | | | | | | |
Series 2020-01A, Class A, 144A | | 2.509% | | | 10/20/39 | | | | CAD | | | | 1,500 | | | $ | 1,047,171 | |
Ford Auto Securitization Trust, | | | | | | | | | | | | | | | | | | |
Series 2020-AA, Class B, 144A | | 1.872 | | | 06/15/26 | | | | CAD | | | | 400 | | | | 273,806 | |
Series 2020-AA, Class C, 144A | | 2.763 | | | 04/15/28 | | | | CAD | | | | 500 | | | | 345,329 | |
| | | | | | | | | | | | | | | | | | |
| | | | | |
| | | | | | | | | | | | | | | | | 1,666,306 | |
| | | | | |
Cayman Islands 3.9% | | | | | | | | | | | | | | | | | | |
Battalion CLO Ltd., | | | | | | | | | | | | | | | | | | |
Series 2015-08A, Class A1R2, 144A, 3 Month SOFR + 1.332% (Cap N/A, Floor 1.070%) | | 6.727(c) | | | 07/18/30 | | | | | | | | 4,731 | | | | 4,707,874 | |
Carlyle CLO Ltd., | | | | | | | | | | | | | | | | | | |
Series C17A, Class A1AR, 144A, 3 Month SOFR + 1.292% (Cap N/A, Floor 0.000%) | | 6.682(c) | | | 04/30/31 | | | | | | | | 14,620 | | | | 14,545,856 | |
Carlyle US CLO Ltd., | | | | | | | | | | | | | | | | | | |
Series 2018-01A, Class A1, 144A, 3 Month SOFR + 1.282% (Cap N/A, Floor 0.000%) | | 6.697(c) | | | 04/20/31 | | | | | | | | 11,639 | | | | 11,602,235 | |
Elevation CLO Ltd., | | | | | | | | | | | | | | | | | | |
Series 2017-06A, Class A1, 144A, 3 Month SOFR + 1.542% (Cap N/A, Floor 1.542%) | | 6.935(c) | | | 07/15/29 | | | | | | | | 170 | | | | 168,666 | |
MidOcean Credit CLO, | | | | | | | | | | | | | | | | | | |
Series 2018-08A, Class B, 144A, 3 Month SOFR + 1.912% (Cap N/A, Floor 0.000%) | | 7.291(c) | | | 02/20/31 | | | | | | | | 2,000 | | | | 1,956,673 | |
Series 2018-09A, Class A1, 144A, 3 Month SOFR + 1.412% (Cap N/A, Floor 1.150%) | | 6.827(c) | | | 07/20/31 | | | | | | | | 1,788 | | | | 1,780,323 | |
Mountain View CLO Ltd., | | | | | | | | | | | | | | | | | | |
Series 2015-09A, Class A2R, 144A, 3 Month SOFR + 2.042% (Cap N/A, Floor 0.000%) | | 7.435(c) | | | 07/15/31 | | | | | | | | 5,750 | | | | 5,599,411 | |
Series 2019-01A, Class A1R, 144A, 3 Month SOFR + 1.512% (Cap N/A, Floor 1.250%) | | 6.905(c) | | | 10/15/34 | | | | | | | | 15,000 | | | | 14,853,464 | |
OZLM Ltd., | | | | | | | | | | | | | | | | | | |
Series 2014-06A, Class A2AS, 144A, 3 Month SOFR + 2.012% (Cap N/A, Floor 0.000%) | | 7.414(c) | | | 04/17/31 | | | | | | | | 2,000 | | | | 1,974,087 | |
Series 2018-20A, Class A1, 144A, 3 Month SOFR + 1.312% (Cap N/A, Floor 1.050%) | | 6.727(c) | | | 04/20/31 | | | | | | | | 4,758 | | | | 4,739,889 | |
Race Point CLO Ltd., | | | | | | | | | | | | | | | | | | |
Series 2013-08A, Class AR2, 144A, 3 Month SOFR + 1.302% (Cap N/A, Floor 1.040%) | | 6.681(c) | | | 02/20/30 | | | | | | | | 6,713 | | | | 6,683,274 | |
See Notes to Financial Statements.
PGIM Global Total Return Fund 15
Schedule of Investments (continued)
as of October 31, 2023
| | | | | | | | | | | | | | | | |
| | | | | |
Description | | Interest
Rate | | Maturity
Date | | | | | Principal
Amount
(000)# | | | Value | |
| | | | | |
ASSET-BACKED SECURITIES (Continued) | | | | | | | | | | | | | | | | |
| | | | | |
Cayman Islands (cont’d.) | | | | | | | | | | | | | | | | |
Shackleton CLO Ltd., | | | | | | | | | | | | | | | | |
Series 2014-05RA, Class A, 144A, 3 Month SOFR + 1.362% (Cap N/A, Floor 0.262%) | | 6.731%(c) | | 05/07/31 | | | | | | | 4,967 | | | $ | 4,931,375 | |
Series 2014-05RA, Class B, 144A, 3 Month SOFR + 1.962% (Cap N/A, Floor 0.262%) | | 7.331(c) | | 05/07/31 | | | | | | | 6,500 | | | | 6,363,722 | |
Series 2017-10A, Class BR, 144A, 3 Month SOFR + 1.812% (Cap N/A, Floor 0.000%) | | 7.227(c) | | 04/20/29 | | | | | | | 10,000 | | | | 9,822,871 | |
Voya CLO Ltd., | | | | | | | | | | | | | | | | |
Series 2013-02A, Class A1R, 144A, 3 Month SOFR + 1.232% (Cap N/A, Floor 0.970%) | | 6.610(c) | | 04/25/31 | | | | | | | 3,959 | | | | 3,945,099 | |
Zais CLO Ltd., | | | | | | | | | | | | | | | | |
Series 2015-03A, Class A2R, 144A, 3 Month SOFR + 2.452% (Cap N/A, Floor 0.000%) | | 7.845(c) | | 07/15/31 | | | | | | | 8,500 | | | | 8,312,819 | |
Series 2017-02A, Class A, 144A, 3 Month SOFR + 1.552% (Cap N/A, Floor 0.000%) | | 6.945(c) | | 04/15/30 | | | | | | | 392 | | | | 390,532 | |
| | | | | | | | | | | | | | | | |
| | | | | |
| | | | | | | | | | | | | | | 102,378,170 | |
| | | | | |
Ireland 7.1% | | | | | | | | | | | | | | | | |
Anchorage Capital Europe CLO DAC, | | | | | | | | | | | | | | | | |
Series 04A, Class A, 144A, 3 Month EURIBOR + 0.870% (Cap N/A, Floor 0.870%) | | 4.826(c) | | 04/25/34 | | | EUR | | | | 4,000 | | | | 4,118,400 | |
Ares European CLO DAC, | | | | | | | | | | | | | | | | |
Series 2013-06A, Class B1RR, 144A, 3 Month EURIBOR + 1.250% (Cap N/A, Floor 1.250%) | | 5.215(c) | | 04/15/30 | | | EUR | | | | 8,000 | | | | 8,198,782 | |
Armada Euro CLO DAC, | | | | | | | | | | | | | | | | |
Series 02A, Class A3, 144A | | 1.500 | | 11/15/31 | | | EUR | | | | 1,369 | | | | 1,373,751 | |
BNPP AM Euro CLO DAC, | | | | | | | | | | | | | | | | |
Series 2018-01A, Class AR, 144A, 3 Month EURIBOR + 0.600% (Cap N/A, Floor 0.600%) | | 4.565(c) | | 04/15/31 | | | EUR | | | | 10,000 | | | | 10,363,050 | |
Bosphorus CLO DAC, | | | | | | | | | | | | | | | | |
Series 06A, Class A, 144A, 3 Month EURIBOR + 0.850% (Cap N/A, Floor 0.850%) | | 4.676(c) | | 05/25/34 | | | EUR | | | | 20,000 | | | | 20,616,217 | |
Capital Four CLO DAC, | | | | | | | | | | | | | | | | |
Series 02A, Class A, 144A, 3 Month EURIBOR + 1.050% (Cap N/A, Floor 1.050%) | | 5.015(c) | | 01/15/34 | | | EUR | | | | 23,000 | | | | 23,811,714 | |
Carlyle Euro CLO DAC, | | | | | | | | | | | | | | | | |
Series 2017-02A, Class AA2R, 144A, 3 Month EURIBOR + 1.300% (Cap N/A, Floor 1.300%) | | 5.081(c) | | 08/15/30 | | | EUR | | | | 9,500 | | | | 9,695,754 | |
Series 2019-01A, Class A1R, 144A, 3 Month EURIBOR + 0.750% (Cap N/A, Floor 0.750%) | | 4.595(c) | | 03/15/32 | | | EUR | | | | 20,000 | | | | 20,787,716 | |
See Notes to Financial Statements.
16
| | | | | | | | | | | | | | | | |
| | | | | |
Description | | Interest
Rate | | Maturity
Date | | | | | Principal
Amount
(000)# | | | Value | |
| | | | | |
ASSET-BACKED SECURITIES (Continued) | | | | | | | | | | | | | | | | |
| | | | | |
Ireland (cont’d.) | | | | | | | | | | | | | | | | |
CIFC European Funding CLO DAC, | | | | | | | | | | | | | | | | |
Series 03A, Class A, 144A, 3 Month EURIBOR + 1.050% (Cap N/A, Floor 1.050%) | | 5.015%(c) | | 01/15/34 | | | EUR | | | | 15,000 | | | $ | 15,543,844 | |
Series 03A, Class B2, 144A | | 2.000 | | 01/15/34 | | | EUR | | | | 11,500 | | | | 10,416,452 | |
Hayfin Emerald CLO DAC, | | | | | | | | | | | | | | | | |
Series 05A, Class A, 144A, 3 Month EURIBOR + 1.100% (Cap N/A, Floor 1.100%) | | 4.887(c) | | 11/17/32 | | | EUR | | | | 18,500 | | | | 19,312,477 | |
Henley CLO DAC, | | | | | | | | | | | | | | | | |
Series 04A, Class A, 144A, 3 Month EURIBOR + 0.900% (Cap N/A, Floor 0.900%) | | 4.856(c) | | 04/25/34 | | | EUR | | | | 5,000 | | | | 5,151,852 | |
Invesco Euro CLO DAC, | | | | | | | | | | | | | | | | |
Series 01A, Class A2R, 144A | | 0.800 | | 07/15/31 | | | EUR | | | | 30,000 | | | | 29,629,929 | |
OAK Hill European Credit Partners DAC, | | | | | | | | | | | | | | | | |
Series 2017-06A, Class A2, 144A | | 1.150 | | 01/20/32 | | | EUR | | | | 2,292 | | | | 2,320,666 | |
Providus CLO DAC, | | | | | | | | | | | | | | | | |
Series 02A, Class B1R, 144A, 3 Month EURIBOR + 1.650% (Cap N/A, Floor 1.650%) | | 5.615(c) | | 07/15/31 | | | EUR | | | | 7,500 | | | | 7,695,612 | |
Rathlin Residential DAC, | | | | | | | | | | | | | | | | |
Series 2021-01A, Class A, 144A, 1 Month EURIBOR + 2.000% (Cap N/A, Floor 0.000%) | | 5.845(c) | | 09/27/75 | | | EUR | | | | 894 | | | | 921,219 | |
| | | | | | | | | | | | | | | | |
| | | | | |
| | | | | | | | | | | | | | | 189,957,435 | |
| | | | | |
Spain 0.1% | | | | | | | | | | | | | | | | |
LSF11 Boson Investments Sarl Compartment 2, | | | | | | | | | | | | | | | | |
Series 2021-NPLA, Class A1, 144A, 3 Month EURIBOR + 2.000% (Cap 3.000%, Floor 0.000%) | | 5.826(c) | | 11/25/60 | | | EUR | | | | 1,083 | | | | 1,093,580 | |
TFS, | | | | | | | | | | | | | | | | |
Series 2018-03, Class A1^ | | 0.000(s) | | 04/16/40 | | | EUR | | | | —(r) | | | | 1 | |
Series 2018-03, Class A1, 1 Month EURIBOR + 3.000%^ | | 7.122(c) | | 03/15/26 | | | EUR | | | | 2,965 | | | | 2,667,064 | |
| | | | | | | | | | | | | | | | |
| | | | | |
| | | | | | | | | | | | | | | 3,760,645 | |
| | | | | |
United Kingdom 0.1% | | | | | | | | | | | | | | | | |
Newday Funding Master Issuer PLC, | | | | | | | | | | | | | | | | |
Series 2021-01A, Class A2, 144A, SOFR + 1.100% (Cap N/A, Floor 0.000%) | | 6.418(c) | | 03/15/29 | | | | | | | 3,500 | | | | 3,491,876 | |
See Notes to Financial Statements.
PGIM Global Total Return Fund 17
Schedule of Investments (continued)
as of October 31, 2023
| | | | | | | | | | | | | | | | |
| | | | |
Description | | Interest
Rate | | Maturity
Date | | Principal
Amount
(000)# | | | Value | |
| | | | | |
ASSET-BACKED SECURITIES (Continued) | | | | | | | | | | | | | | | | |
| | | | | |
United States 1.3% | | | | | | | | | | | | | | | | |
Ameriquest Mortgage Securities, Inc., Asset-Backed Pass-Through Certificates, | | | | | | | | | | | | | | | | |
Series 2002-02, Class M3, 1 Month SOFR + 2.769% (Cap N/A, Floor 2.655%) | | 4.870%(c) | | 08/25/32 | | | | | | | 150 | | | $ | 146,198 | |
Series 2002-03, Class M3, 1 Month SOFR + 2.964% (Cap N/A, Floor 2.850%) | | 8.289(c) | | 08/25/32 | | | | | | | 101 | | | | 99,311 | |
Chase Funding Trust, | | | | | | | | | | | | | | | | |
Series 2003-04, Class 2A2, 1 Month SOFR + 0.714% (Cap N/A, Floor 0.600%) | | 6.039(c) | | 05/25/33 | | | | | | | 423 | | | | 409,600 | |
Commonbond Student Loan Trust, | | | | | | | | | | | | | | | | |
Series 2020-AGS, Class A, 144A | | 1.980 | | 08/25/50 | | | | | | | 1,764 | | | | 1,476,494 | |
EquiFirst Mortgage Loan Trust, | | | | | | | | | | | | | | | | |
Series 2004-01, Class 1A1, 1 Month SOFR + 0.594% (Cap N/A, Floor 0.480%) | | 5.919(c) | | 01/25/34 | | | | | | | 394 | | | | 369,144 | |
Ford Credit Auto Owner Trust, | | | | | | | | | | | | | | | | |
Series 2020-02, Class C, 144A | | 1.740 | | 04/15/33 | | | | | | | 1,300 | | | | 1,180,251 | |
JPMorgan Chase Bank, NA, | | | | | | | | | | | | | | | | |
Series 2020-01, Class R, 144A | | 33.784 | | 01/25/28 | | | | | | | 1,175 | | | | 1,343,488 | |
Series 2020-02, Class E, 144A | | 3.072 | | 02/25/28 | | | | | | | 146 | | | | 145,275 | |
Series 2020-02, Class R, 144A | | 31.355 | | 02/25/28 | | | | | | | 553 | | | | 653,124 | |
Series 2021-01, Class E, 144A | | 2.365 | | 09/25/28 | | | | | | | 89 | | | | 86,704 | |
Series 2021-01, Class F, 144A | | 4.280 | | 09/25/28 | | | | | | | 600 | | | | 571,362 | |
Series 2021-01, Class R, 144A | | 28.348 | | 09/25/28 | | | | | | | 1,855 | | | | 2,168,412 | |
Series 2021-02, Class F, 144A | | 4.393 | | 12/26/28 | | | | | | | 600 | | | | 562,523 | |
Series 2021-03, Class F, 144A | | 3.694 | | 02/26/29 | | | | | | | 600 | | | | 534,627 | |
Laurel Road Prime Student Loan Trust, | | | | | | | | | | | | | | | | |
Series 2018-A, Class A, 144A | | 0.000(cc) | | 02/25/43 | | | | | | | 3,430 | | | | 689,814 | |
Series 2018-C, Class A, 144A | | 0.000(cc) | | 08/25/43 | | | | | | | 696 | | | | 638,489 | |
Series 2019-A, Class R, 144A | | 0.000 | | 10/25/48 | | | | | | | 1,772 | | | | 340,722 | |
Lending Funding Trust, | | | | | | | | | | | | | | | | |
Series 2020-02A, Class A, 144A | | 2.320 | | 04/21/31 | | | | | | | 1,100 | | | | 977,688 | |
Lendmark Funding Trust, | | | | | | | | | | | | | | | | |
Series 2021-01A, Class D, 144A | | 5.050 | | 11/20/31 | | | | | | | 1,900 | | | | 1,492,796 | |
Long Beach Mortgage Loan Trust, | | | | | | | | | | | | | | | | |
Series 2004-03, Class M1, 1 Month SOFR + 0.969% (Cap N/A, Floor 0.855%) | | 6.294(c) | | 07/25/34 | | | | | | | 101 | | | | 96,049 | |
Mariner Finance Issuance Trust, | | | | | | | | | | | | | | | | |
Series 2020-AA, Class A, 144A | | 2.190 | | 08/21/34 | | | | | | | 1,433 | | | | 1,393,238 | |
MASTR Asset-Backed Securities Trust, | | | | | | | | | | | | | | | | |
Series 2004-WMC02, Class M1, 1 Month SOFR + 1.014% (Cap N/A, Floor 0.900%) | | 6.339(c) | | 04/25/34 | | | | | | | 790 | | | | 760,964 | |
See Notes to Financial Statements.
18
| | | | | | | | | | | | | | | | | | | | |
| | | | |
Description | | Interest
Rate | | | Maturity
Date | | | Principal
Amount
(000)# | | | Value | |
| | | | | |
ASSET-BACKED SECURITIES (Continued) | | | | | | | | | | | | | | | | | | | | |
| | | | | |
United States (cont’d.) | | | | | | | | | | | | | | | | | | | | |
Merrill Lynch Mortgage Investors Trust, | | | | | | | | | | | | | | | | | | | | |
Series 2004-HE02, Class M1, 1 Month SOFR + 1.314% (Cap N/A, Floor 1.200%) | | | 6.639%(c) | | | | 08/25/35 | | | | | | | | 14 | | | $ | 13,155 | |
Morgan Stanley ABS Capital I, Inc. Trust, | | | | | | | | | | | | | | | | | | | | |
Series 2003-NC08, Class M1, 1 Month SOFR + 1.164% (Cap N/A, Floor 1.050%) | | | 6.489(c) | | | | 09/25/33 | | | | | | | | 61 | | | | 59,867 | |
Morgan Stanley Dean Witter Capital I, Inc. Trust, | | | | | | | | | | | | | | | | | | | | |
Series 2002-AM03, Class A3, 1 Month SOFR + 1.094% (Cap N/A, Floor 0.980%) | | | 6.419(c) | | | | 02/25/33 | | | | | | | | 78 | | | | 76,882 | |
OneMain Direct Auto Receivables Trust, | | | | | | | | | | | | | | | | | | | | |
Series 2019-01A, Class B, 144A | | | 3.950 | | | | 11/14/28 | | | | | | | | 1,300 | | | | 1,228,782 | |
OneMain Financial Issuance Trust, | | | | | | | | | | | | | | | | | | | | |
Series 2023-02A, Class C, 144A | | | 6.740 | | | | 09/15/36 | | | | | | | | 1,300 | | | | 1,266,647 | |
Series 2023-02A, Class D, 144A | | | 7.520 | | | | 09/15/36 | | | | | | | | 3,700 | | | | 3,607,219 | |
Santander Bank Auto Credit-Linked Notes, | | | | | | | | | | | | | | | | | | | | |
Series 2022-A, Class C, 144A | | | 7.375 | | | | 05/15/32 | | | | | | | | 1,059 | | | | 1,051,952 | |
Santander Bank, NA, | | | | | | | | | | | | | | | | | | | | |
Series 2021-01A, Class D, 144A | | | 5.004 | | | | 12/15/31 | | | | | | | | 1,300 | | | | 1,242,372 | |
Santander Consumer Auto Receivables Trust, | | | | | | | | | | | | | | | | | | | | |
Series 2021-AA, Class D, 144A | | | 1.570 | | | | 01/15/27 | | | | | | | | 850 | | | | 781,727 | |
Series 2021-AA, Class R, 144A | | | 0.000 | | | | 08/15/28 | | | | | | | | 6 | | | | 294,246 | |
Silver Creek CLO Ltd., | | | | | | | | | | | | | | | | | | | | |
Series 2014-01A, Class AR, 144A, 3 Month SOFR + 1.502% (Cap N/A, Floor 0.000%) | | | 6.917(c) | | | | 07/20/30 | | | | | | | | 198 | | | | 198,130 | |
SoFi RR Funding III Trust, | | | | | | | | | | | | | | | | | | | | |
Series 2020-01, Class A, 144A, 1 Month SOFR + 2.364% (Cap N/A, Floor 1.250%) | | | 7.689(c) | | | | 11/29/24 | | | | | | | | 2,132 | | | | 2,131,378 | |
TH MSR Issuer Trust, | | | | | | | | | | | | | | | | | | | | |
Series 2019-FT01, Class A, 144A, 1 Month SOFR + 2.914% (Cap N/A, Floor 2.800%) | | | 8.239(c) | | | | 06/25/24 | | | | | | | | 4,730 | | | | 4,610,479 | |
Wellfleet CLO Ltd., | | | | | | | | | | | | | | | | | | | | |
Series 2017-03A, Class A1, 144A, 3 Month SOFR + 1.412% (Cap N/A, Floor 1.150%) | | | 6.814(c) | | | | 01/17/31 | | | | | | | | 2,205 | | | | 2,192,719 | |
| | | | | | | | | | | | | | | | | | | | |
| | | | | |
| | | | | | | | | | | | | | | | | | | 34,891,828 | |
| | | | | | | | | | | | | | | | | | | | |
| | | | | |
TOTAL ASSET-BACKED SECURITIES (cost $374,656,732) | | | | | | | | | | | | | | | | | | | 336,146,260 | |
| | | | | | | | | | | | | | | | | | | | |
See Notes to Financial Statements.
PGIM Global Total Return Fund 19
Schedule of Investments (continued)
as of October 31, 2023
| | | | | | | | | | | | | | | | |
| | | | |
Description | | Interest Rate | | Maturity
Date | | Principal
Amount (000)# | | | Value | |
| | | | | |
COMMERCIAL MORTGAGE-BACKED SECURITIES 8.2% | | | | | | | | | | | | | | | | |
| | | | | |
Canada 0.0% | | | | | | | | | | | | | | | | |
Real Estate Asset Liquidity Trust, | | | | | | | | | | | | | | | | |
Series 2020-01A, Class A1, 144A | | 2.381%(cc) | | 02/12/55 | | | CAD | | | | 1,635 | | | $ | 1,081,160 | |
| | | | | | | | | | | | | | | | |
| | | | | |
United Kingdom 0.9% | | | | | | | | | | | | | | | | |
Taurus DAC, | | | | | | | | | | | | | | | | |
Series 2021-UK1A, Class D, 144A, SONIA + 2.600% (Cap N/A, Floor 2.600%) | | 7.819(c) | | 05/17/31 | | | GBP | | | | 546 | | | | 628,038 | |
Series 2021-UK4A, Class B, 144A, SONIA + 1.500% (Cap N/A, Floor 1.500%) | | 6.719(c) | | 08/17/31 | | | GBP | | | | 4,973 | | | | 5,821,068 | |
Series 2021-UK4A, Class C, 144A, SONIA + 1.750% (Cap N/A, Floor 1.750%) | | 6.969(c) | | 08/17/31 | | | GBP | | | | 8,164 | | | | 9,437,602 | |
Series 2021-UK4A, Class D, 144A, SONIA + 2.100% (Cap N/A, Floor 2.100%) | | 7.319(c) | | 08/17/31 | | | GBP | | | | 6,790 | | | | 7,715,591 | |
| | | | | | | | | | | | | | | | |
| | | | | |
| | | | | | | | | | | | | | | 23,602,299 | |
| | | | | |
United States 7.3% | | | | | | | | | | | | | | | | |
20 Times Square Trust, | | | | | | | | | | | | | | | | |
Series 2018-20TS, Class G, 144A (original cost $909,111; purchased 05/09/18)(f) | | 3.100(cc) | | 05/15/35 | | | | | | | 1,000 | | | | 680,000 | |
Series 2018-20TS, Class H, 144A (original cost $885,052; purchased 05/09/18)(f) | | 3.100(cc) | | 05/15/35 | | | | | | | 1,000 | | | | 660,000 | |
BANK, | | | | | | | | | | | | | | | | |
Series 2017-BNK05, Class A3 | | 3.020 | | 06/15/60 | | | | | | | 3,156 | | | | 3,054,366 | |
Benchmark Mortgage Trust, | | | | | | | | | | | | | | | | |
Series 2020-B17, Class A4 | | 2.042 | | 03/15/53 | | | | | | | 6,200 | | | | 4,759,134 | |
BX Commercial Mortgage Trust, | | | | | | | | | | | | | | | | |
Series 2019-XL, Class F, 144A, 1 Month SOFR + 2.114% (Cap N/A, Floor 2.000%) | | 7.449(c) | | 10/15/36 | | | | | | | 2,805 | | | | 2,762,576 | |
Series 2019-XL, Class G, 144A, 1 Month SOFR + 2.414% (Cap N/A, Floor 2.300%) | | 7.749(c) | | 10/15/36 | | | | | | | 7,416 | | | | 7,263,027 | |
Series 2019-XL, Class J, 144A, 1 Month SOFR + 2.764% (Cap N/A, Floor 2.650%) | | 8.099(c) | | 10/15/36 | | | | | | | 22,142 | | | | 21,604,110 | |
Cantor Commercial Real Estate Lending, | | | | | | | | | | | | | | | | |
Series 2019-CF02, Class A3 | | 2.647 | | 11/15/52 | | | | | | | 16,531 | | | | 15,409,997 | |
CF Mortgage Trust, | | | | | | | | | | | | | | | | |
Series 2020-P01, Class A1, 144A | | 2.840(cc) | | 04/15/25 | | | | | | | 9,272 | | | | 8,711,586 | |
Citigroup Commercial Mortgage Trust, | | | | | | | | | | | | | | | | |
Series 2014-GC21, Class XB, IO | | 0.434(cc) | | 05/10/47 | | | | | | | 27,500 | | | | 24,758 | |
Series 2016-GC37, Class XB, IO | | 0.681(cc) | | 04/10/49 | | | | | | | 33,868 | | | | 467,734 | |
Series 2016-P04, Class XB, IO | | 1.313(cc) | | 07/10/49 | | | | | | | 9,100 | | | | 277,959 | |
Series 2017-P08, Class A2 | | 3.109 | | 09/15/50 | | | | | | | 1,767 | | | | 1,582,478 | |
See Notes to Financial Statements.
20
| | | | | | | | | | | | | | | | |
| | | | |
Description | | Interest
Rate | | Maturity
Date | | Principal Amount (000)# | | | Value | |
| | | | |
COMMERCIAL MORTGAGE-BACKED SECURITIES (Continued) | | | | | | | | | | | | | | |
| | | | | |
United States (cont’d.) | | | | | | | | | | | | | | | | |
Cold Storage Trust, | | | | | | | | | | | | | | | | |
Series 2020-ICE05, Class E, 144A, 1 Month SOFR + 2.880% (Cap N/A, Floor 2.766%) | | 8.216%(c) | | 11/15/37 | | | | | | | 4,399 | | | $ | 4,343,692 | |
Commercial Mortgage Trust, | | | | | | | | | | | | | | | | |
Series 2014-UBS04, Class XB, IO, 144A | | 0.216(cc) | | 08/10/47 | | | | | | | 50,000 | | | | 50,165 | |
Credit Suisse Mortgage Capital Certificates, | | | | | | | | | | | | | | | | |
Series 2019-ICE04, Class E, 144A, 1 Month SOFR + 2.197% (Cap N/A, Floor 2.150%) | | 7.532(c) | | 05/15/36 | | | | | | | 14,090 | | | | 13,866,475 | |
CSAIL Commercial Mortgage Trust, | | | | | | | | | | | | | | | | |
Series 2018-CX11, Class A3 | | 4.095 | | 04/15/51 | | | | | | | 1,037 | | | | 983,234 | |
DBWF Mortgage Trust, | | | | | | | | | | | | | | | | |
Series 2016-85T, Class E, 144A | | 3.808(cc) | | 12/10/36 | | | | | | | 3,000 | | | | 1,804,875 | |
Eleven Madison Mortgage Trust, | | | | | | | | | | | | | | | | |
Series 2015-11MD, Class C, 144A | | 3.555(cc) | | 09/10/35 | | | | | | | 500 | | | | 384,955 | |
ELP Commercial Mortgage Trust, | | | | | | | | | | | | | | | | |
Series 2021-ELP, Class F, 144A, 1 Month SOFR + 2.781% (Cap N/A, Floor 2.667%) | | 8.116(c) | | 11/15/38 | | | | | | | 13,600 | | | | 12,918,436 | |
FHLMC Multifamily Structured Pass-Through Certificates, | | | | | | | | | | | | | | | | |
Series K037, Class X1, IO | | 0.947(cc) | | 01/25/24 | | | | | | | 7,093 | | | | 3,689 | |
Series K043, Class X1, IO | | 0.501(cc) | | 12/25/24 | | | | | | | 11,269 | | | | 50,233 | |
Series K049, Class X1, IO | | 0.549(cc) | | 07/25/25 | | | | | | | 36,782 | | | | 281,707 | |
Series K052, Class X1, IO | | 0.628(cc) | | 11/25/25 | | | | | | | 11,309 | | | | 116,651 | |
Series K053, Class X1, IO | | 0.871(cc) | | 12/25/25 | | | | | | | 43,321 | | | | 653,990 | |
Series K054, Class X1, IO | | 1.149(cc) | | 01/25/26 | | | | | | | 29,044 | | | | 595,679 | |
Series K058, Class X1, IO | | 0.910(cc) | | 08/25/26 | | | | | | | 39,000 | | | | 801,797 | |
Series K090, Class X1, IO | | 0.708(cc) | | 02/25/29 | | | | | | | 22,821 | | | | 727,329 | |
Series K111, Class X1, IO | | 1.571(cc) | | 05/25/30 | | | | | | | 29,235 | | | | 2,267,219 | |
Series K113, Class X1, IO | | 1.380(cc) | | 06/25/30 | | | | | | | 118,391 | | | | 8,193,239 | |
Series K114, Class X1, IO | | 1.116(cc) | | 06/25/30 | | | | | | | 75,146 | | | | 4,305,594 | |
Series K116, Class X1, IO | | 1.424(cc) | | 07/25/30 | | | | | | | 48,918 | | | | 3,472,028 | |
Series K121, Class X1, IO | | 1.022(cc) | | 10/25/30 | | | | | | | 126,215 | | | | 6,645,971 | |
Series KG03, Class X1, IO | | 1.377(cc) | | 06/25/30 | | | | | | | 101,085 | | | | 6,673,871 | |
Series Q001, Class XA, IO | | 2.109(cc) | | 02/25/32 | | | | | | | 5,486 | | | | 410,993 | |
Greystone Commercial Capital Trust, | | | | | | | | | | | | | | | | |
Series 2021-03, Class A, 144A, 1 Month SOFR + 2.344% (Cap N/A, Floor 2.230%) | | 7.680(c) | | 08/01/24 | | | | | | | 17,250 | | | | 17,072,485 | |
GS Mortgage Securities Corp. Trust, | | | | | | | | | | | | | | | | |
Series 2021-RENT, Class C, 144A, 1 Month SOFR + 1.664% (Cap N/A, Floor 1.550%) | | 6.999(c) | | 11/21/35 | | | | | | | 7,700 | | | | 7,378,712 | |
Series 2021-RENT, Class D, 144A, 1 Month SOFR + 1.964% (Cap N/A, Floor 1.850%) | | 7.299(c) | | 11/21/35 | | | | | | | 4,454 | | | | 4,189,950 | |
See Notes to Financial Statements.
PGIM Global Total Return Fund 21
Schedule of Investments (continued)
as of October 31, 2023
| | | | | | | | | | | | | | | | | | |
| | | | |
Description | | Interest Rate | | Maturity
Date | | | Principal
Amount
(000)# | | | Value | |
| | | | |
COMMERCIAL MORTGAGE-BACKED SECURITIES (Continued) | | | | | | | | | | | | | | | | |
| | | | | |
United States (cont’d.) | | | | | | | | | | | | | | | | | | |
GS Mortgage Securities Trust, | | | | | | | | | | | | | | | | | | |
Series 2014-GC20, Class XB, IO | | 0.472%(cc) | | | 04/10/47 | | | | | | | | 30,000 | | | $ | 10,602 | |
Series 2014-GC22, Class XB, IO | | 0.294(cc) | | | 06/10/47 | | | | | | | | 35,000 | | | | 43,911 | |
Series 2014-GC24, Class XB, IO | | 0.021(cc) | | | 09/10/47 | | | | | | | | 83,262 | | | | 11,490 | |
Series 2014-GC26, Class XB, IO | | 0.295(cc) | | | 11/10/47 | | | | | | | | 56,483 | | | | 146,884 | |
JPMCC Commercial Mortgage Securities Trust, | | | | | | | | | | | | | | | | | | |
Series 2017-JP06, Class A3 | | 3.109 | | | 07/15/50 | | | | | | | | 2,240 | | | | 2,068,808 | |
JPMDB Commercial Mortgage Securities Trust, | | | | | | | | | | | | | | | | | | |
Series 2020-COR07, Class A4 | | 1.915 | | | 05/13/53 | | | | | | | | 5,000 | | | | 3,668,211 | |
JPMorgan Chase Commercial Mortgage Securities Trust, | | | | | | | | | | | | | | | | | | |
Series 2018-AON, Class E, 144A | | 4.613(cc) | | | 07/05/31 | | | | | | | | 5,564 | | | | 1,892,449 | |
Morgan Stanley Capital I Trust, | | | | | | | | | | | | | | | | | | |
Series 2019-MEAD, Class E, 144A | | 3.177(cc) | | | 11/10/36 | | | | | | | | 1,700 | | | | 1,336,361 | |
Series 2020-HR08, Class XB, IO | | 0.876(cc) | | | 07/15/53 | | | | | | | | 54,413 | | | | 2,630,700 | |
One New York Plaza Trust, | | | | | | | | | | | | | | | | | | |
Series 2020-01NYP, Class C, 144A, 1 Month SOFR + 2.314% (Cap N/A, Floor 2.200%) | | 7.649(c) | | | 01/15/36 | | | | | | | | 8,475 | | | | 7,246,125 | |
Series 2020-01NYP, Class D, 144A, 1 Month SOFR + 2.864% (Cap N/A, Floor 2.750%) | | 8.199(c) | | | 01/15/36 | | | | | | | | 2,975 | | | | 2,290,750 | |
UBS-Barclays Commercial Mortgage Trust, | | | | | | | | | | | | | | | | | | |
Series 2012-C02, Class XA, IO, 144A | | 0.775(cc) | | | 05/10/63 | | | | | | | | 349 | | | | 4 | |
Wells Fargo Commercial Mortgage Trust, | | | | | | | | | | | | | | | | | | |
Series 2016-C35, Class XB, IO | | 0.929(cc) | | | 07/15/48 | | | | | | | | 24,000 | | | | 504,214 | |
Series 2016-LC24, Class XB, IO | | 0.975(cc) | | | 10/15/49 | | | | | | | | 20,910 | | | | 497,154 | |
Series 2021-FCMT, Class B, 144A, 1 Month SOFR + 1.964% (Cap N/A, Floor 1.850%) | | 7.299(c) | | | 05/15/31 | | | | | | | | 1,800 | | | | 1,690,315 | |
Series 2021-FCMT, Class C, 144A, 1 Month SOFR + 2.514% (Cap N/A, Floor 2.400%) | | 7.849(c) | | | 05/15/31 | | | | | | | | 1,700 | | | | 1,565,629 | |
Series 2021-FCMT, Class D, 144A, 1 Month SOFR + 3.614% (Cap N/A, Floor 3.500%) | | 8.949(c) | | | 05/15/31 | | | | | | | | 2,200 | | | | 1,996,176 | |
| | | | | | | | | | | | | | | | | | |
| | | | | |
| | | | | | | | | | | | | | | | | 193,050,477 | |
| | | | | | | | | | | | | | | | | | |
| | | | |
TOTAL COMMERCIAL MORTGAGE-BACKED SECURITIES
(cost $242,210,557) | | | | | | | | | | | | | | | 217,733,936 | |
| | | | | | | | | | | | | | | | | | |
See Notes to Financial Statements.
22
| | | | | | | | | | | | | | | | |
| | | | |
Description | | Interest
Rate | | Maturity Date | | Principal
Amount (000)# | | | Value | |
| | | | |
CONVERTIBLE BOND 0.0% | | | | | | | | | | | | | | |
| | | | | |
Jamaica | | | | | | | | | | | | | | | | |
Digicel Group Holdings Ltd., | | | | | | | | | | | | | | | | |
Sub. Notes, 144A, Cash coupon 7.000% (original cost $36,600; purchased
03/21/23 - 04/03/23)(f) (cost $36,600) | | 7.000% | | 11/16/23(d)(oo) | | | | | | | 248 | | | $ | 12,420 | |
| | | | | | | | | | | | | | | | |
| | | | | |
CORPORATE BONDS 44.2% | | | | | | | | | | | | | | | | |
| | | | | |
Australia 0.0% | | | | | | | | | | | | | | | | |
Australia & New Zealand Banking Group Ltd., | | | | | | | | | | | | | | | | |
Sr. Unsec’d. Notes, EMTN | | 3.700 | | 03/18/24 | | | CNH | | | | 2,000 | | | | 272,257 | |
| | | | | |
Brazil 0.7% | | | | | | | | | | | | | | | | |
Petrobras Global Finance BV, | | | | | | | | | | | | | | | | |
Gtd. Notes | | 5.375 | | 10/01/29 | | | GBP | | | | 9,184 | | | | 9,740,789 | |
Gtd. Notes(a) | | 6.625 | | 01/16/34 | | | GBP | | | | 7,100 | | | | 7,585,157 | |
Gtd. Notes, EMTN | | 6.250 | | 12/14/26 | | | GBP | | | | 2,000 | | | | 2,343,971 | |
Suzano Austria GmbH, | | | | | | | | | | | | | | | | |
Gtd. Notes | | 6.000 | | 01/15/29 | | | | | | | 200 | | | | 192,660 | |
| | | | | | | | | | | | | | | | |
| | | | | |
| | | | | | | | | | | | | | | 19,862,577 | |
| | | | | |
Bulgaria 0.5% | | | | | | | | | | | | | | | | |
Bulgarian Energy Holding EAD, | | | | | | | | | | | | | | | | |
Sr. Unsec’d. Notes | | 2.450 | | 07/22/28 | | | EUR | | | | 14,580 | | | | 12,650,220 | |
| | | | | |
Canada 0.8% | | | | | | | | | | | | | | | | |
Barrick North America Finance LLC, | | | | | | | | | | | | | | | | |
Gtd. Notes | | 5.700 | | 05/30/41 | | | | | | | 45 | | | | 41,273 | |
Barrick PD Australia Finance Pty Ltd., | | | | | | | | | | | | | | | | |
Gtd. Notes | | 5.950 | | 10/15/39 | | | | | | | 50 | | | | 46,579 | |
Bombardier, Inc., | | | | | | | | | | | | | | | | |
Sr. Unsec’d. Notes, 144A | | 7.125 | | 06/15/26 | | | | | | | 3,900 | | | | 3,741,184 | |
Sr. Unsec’d. Notes, 144A(a) | | 7.500 | | 02/01/29 | | | | | | | 375 | | | | 347,344 | |
Sr. Unsec’d. Notes, 144A | | 7.875 | | 04/15/27 | | | | | | | 2,535 | | | | 2,439,937 | |
Brookfield Residential Properties, Inc./Brookfield Residential US LLC, | | | | | | | | | | | | | | | | |
Gtd. Notes, 144A | | 4.875 | | 02/15/30 | | | | | | | 2,320 | | | | 1,763,200 | |
Gtd. Notes, 144A | | 6.250 | | 09/15/27 | | | | | | | 2,175 | | | | 1,889,531 | |
Sr. Unsec’d. Notes, 144A | | 5.000 | | 06/15/29 | | | | | | | 1,675 | | | | 1,306,500 | |
Cenovus Energy, Inc., | | | | | | | | | | | | | | | | |
Sr. Unsec’d. Notes(a) | | 2.650 | | 01/15/32 | | | | | | | 1,340 | | | | 1,013,961 | |
See Notes to Financial Statements.
PGIM Global Total Return Fund 23
Schedule of Investments (continued)
as of October 31, 2023
| | | | | | | | | | | | | | | | |
| | | | |
Description | | Interest
Rate | | Maturity
Date | | Principal Amount (000)# | | | Value | |
| | | | | |
CORPORATE BONDS (Continued) | | | | | | | | | | | | | | | | |
| | | | | |
Canada (cont’d.) | | | | | | | | | | | | | | | | |
Cenovus Energy, Inc., (cont’d.) | | | | | | | | | | | | | | | | |
Sr. Unsec’d. Notes | | 3.750% | | 02/15/52 | | | | | | | 955 | | | $ | 595,476 | |
MEG Energy Corp., | | | | | | | | | | | | | | | | |
Gtd. Notes, 144A | | 7.125 | | 02/01/27 | | | | | | | 605 | | | | 609,538 | |
Methanex Corp., | | | | | | | | | | | | | | | | |
Sr. Unsec’d. Notes | | 4.250 | | 12/01/24 | | | | | | | 1,500 | | | | 1,458,750 | |
Ontario Teachers’ Cadillac Fairview Properties Trust, | | | | | | | | | | | | | | | | |
Sr. Unsec’d. Notes, 144A | | 2.500 | | 10/15/31 | | | | | | | 1,775 | | | | 1,306,884 | |
Rogers Communications, Inc., | | | | | | | | | | | | | | | | |
Gtd. Notes | | 3.250 | | 05/01/29 | | | CAD | | | | 700 | | | | 442,942 | |
Teck Resources Ltd., | | | | | | | | | | | | | | | | |
Sr. Unsec’d. Notes | | 5.400 | | 02/01/43 | | | | | | | 1,403 | | | | 1,124,363 | |
Sr. Unsec’d. Notes | | 6.000 | | 08/15/40 | | | | | | | 4,142 | | | | 3,581,691 | |
| | | | | | | | | | | | | | | | |
| | | | | |
| | | | | | | | | | | | | | | 21,709,153 | |
| | | | | |
China 0.6% | | | | | | | | | | | | | | | | |
Agricultural Development Bank of China, | | | | | | | | | | | | | | | | |
Sr. Unsec’d. Notes | | 3.800 | | 10/27/30 | | | CNH | | | | 55,000 | | | | 7,824,826 | |
Aircraft Finance Co. Ltd., | | | | | | | | | | | | | | | | |
Sr. Sec’d. Notes, Series B | | 4.100 | | 03/29/26 | | | | | | | 1,099 | | | | 1,049,691 | |
China Development Bank, | | | | | | | | | | | | | | | | |
Sr. Unsec’d. Notes | | 4.300 | | 08/02/32 | | | CNH | | | | 25,000 | | | | 3,688,780 | |
Unsec’d. Notes | | 4.200 | | 01/19/27 | | | CNH | | | | 16,000 | | | | 2,262,279 | |
NXP BV/NXP Funding LLC/NXP USA, Inc., | | | | | | | | | | | | | | | | |
Gtd. Notes | | 3.150 | | 05/01/27 | | | | | | | 575 | | | | 519,863 | |
Gtd. Notes | | 3.400 | | 05/01/30 | | | | | | | 725 | | | | 606,267 | |
| | | | | | | | | | | | | | | | |
| | | | | |
| | | | | | | | | | | | | | | 15,951,706 | |
| | | | | |
Denmark 0.2% | | | | | | | | | | | | | | | | |
Danske Bank A/S, | | | | | | | | | | | | | | | | |
Sr. Unsec’d. Notes, 144A | | 1.621(ff) | | 09/11/26 | | | | | | | 4,645 | | | | 4,230,503 | |
Sr. Unsec’d. Notes, 144A | | 3.244(ff) | | 12/20/25 | | | | | | | 1,095 | | | | 1,048,219 | |
| | | | | | | | | | | | | | | | |
| | | | | |
| | | | | | | | | | | | | | | 5,278,722 | |
| | | | | |
France 2.2% | | | | | | | | | | | | | | | | |
Altice France SA, | | | | | | | | | | | | | | | | |
Sr. Sec’d. Notes | | 3.375 | | 01/15/28 | | | EUR | | | | 8,475 | | | | 6,454,239 | |
Banque Federative du Credit Mutuel SA, | | | | | | | | | | | | | | | | |
Sr. Unsec’d. Notes, Series 19 | | 0.999 | | 10/15/25 | | | JPY | | | | 200,000 | | | | 1,322,751 | |
See Notes to Financial Statements.
24
| | | | | | | | | | | | | | | | |
| | | | |
Description | | Interest
Rate | | Maturity
Date | | Principal
Amount (000)# | | | Value | |
| | | | | |
CORPORATE BONDS (Continued) | | | | | | | | | | | | | | | | |
| | | | | |
France (cont’d.) | | | | | | | | | | | | | | | | |
BNP Paribas SA, | | | | | | | | | | | | | | | | |
Sr. Unsec’d. Notes, 144A | | 2.159%(ff) | | 09/15/29 | | | | | | | 23,127 | | | $ | 18,802,374 | |
Sr. Unsec’d. Notes, 144A | | 2.871(ff) | | 04/19/32 | | | | | | | 5,220 | | | | 3,968,113 | |
Sr. Unsec’d. Notes, 144A | | 5.335(ff) | | 06/12/29 | | | | | | | 2,450 | | | | 2,352,461 | |
Sub. Notes, EMTN | | 4.625 | | 03/09/27 | | | AUD | | | | 370 | | | | 216,319 | |
BPCE SA, | | | | | | | | | | | | | | | | |
Sr. Unsec’d. Notes, Series 03 | | 0.989 | | 07/12/28 | | | JPY | | | | 300,000 | | | | 1,903,951 | |
Credit Agricole Assurances SA, | | | | | | | | | | | | | | | | |
Sub. Notes | | 4.250(ff) | | 01/13/25(oo) | | | EUR | | | | 2,000 | | | | 2,075,357 | |
Credit Agricole Corporate & Investment Bank SA, | | | | | | | | | | | | | | | | |
Sr. Unsec’d. Notes, EMTN | | 2.670 | | 02/20/24 | | | NZD | | | | 1,400 | | | | 806,660 | |
Credit Agricole SA, | | | | | | | | | | | | | | | | |
Sub. Notes, EMTN | | 4.200(ff) | | 05/29/34 | | | AUD | | | | 400 | | | | 214,536 | |
Iliad Holding SASU, | | | | | | | | | | | | | | | | |
Sr. Sec’d. Notes, 144A | | 5.125 | | 10/15/26 | | | EUR | | | | 6,850 | | | | 7,009,726 | |
Loxam SAS, | | | | | | | | | | | | | | | | |
Sr. Sub. Notes | | 4.500 | | 04/15/27 | | | EUR | | | | 1,900 | | | | 1,764,720 | |
SNCF Reseau, | | | | | | | | | | | | | | | | |
Sr. Unsec’d. Notes, Series MPLE | | 4.700 | | 06/01/35 | | | CAD | | | | 6,400 | | | | 4,443,425 | |
Societe Generale SA, | | | | | | | | | | | | | | | | |
Gtd. Notes, 144A(a) | | 3.337(ff) | | 01/21/33 | | | | | | | 4,915 | | | | 3,684,254 | |
Sr. Unsec’d. Notes, 144A | | 2.889(ff) | | 06/09/32 | | | | | | | 1,685 | | | | 1,237,884 | |
Sr. Unsec’d. Notes, 144A, MTN(a) | | 6.446(ff) | | 01/10/29 | | | | | | | 1,500 | | | | 1,463,467 | |
Sub. Notes, EMTN | | 5.000 | | 05/19/27 | | | AUD | | | | 220 | | | | 129,867 | |
| | | | | | | | | | | | | | | | |
| | | | | |
| | | | | | | | | | | | | | | 57,850,104 | |
| | | | | |
Germany 0.4% | | | | | | | | | | | | | | | | |
Deutsche Bahn Finance GMBH, | | | | | | | | | | | | | | | | |
Gtd. Notes, MTN | | 1.987 | | 07/08/30 | | | AUD | | | | 1,000 | | | | 486,864 | |
Deutsche Bank AG, | | | | | | | | | | | | | | | | |
Sr. Unsec’d. Notes | | 2.129(ff) | | 11/24/26 | | | | | | | 3,760 | | | | 3,383,306 | |
Sub. Notes, EMTN | | 3.662(ff) | | 04/10/25 | | | CNH | | | | 53,000 | | | | 7,133,388 | |
| | | | | | | | | | | | | | | | |
| | | | | |
| | | | | | | | | | | | | | | 11,003,558 | |
| | | | | |
Hong Kong 0.4% | | | | | | | | | | | | | | | | |
HKT Capital No. 3 Ltd., | | | | | | | | | | | | | | | | |
Gtd. Notes | | 1.650 | | 04/10/27 | | | EUR | | | | 9,300 | | | | 8,698,163 | |
See Notes to Financial Statements.
PGIM Global Total Return Fund 25
Schedule of Investments (continued)
as of October 31, 2023
| | | | | | | | | | | | | | | | |
| | | | |
Description | | Interest
Rate | | Maturity
Date | | Principal Amount (000)# | | | Value | |
| | | | | |
CORPORATE BONDS (Continued) | | | | | | | | | | | | | | | | |
| | | | | |
Hong Kong (cont’d.) | | | | | | | | | | | | | | | | |
Sun Hung Kai Properties Capital Market Ltd., | | | | | | | | | | | | | | | | |
Gtd. Notes, EMTN | | 3.160% | | 01/25/28 | | | CNH | | | | 4,000 | | | $ | 532,268 | |
Gtd. Notes, EMTN | | 3.200 | | 08/14/27 | | | CNH | | | | 3,000 | | | | 401,754 | |
| | | | | | | | | | | | | | | | |
| | | | | |
| | | | | | | | | | | | | | | 9,632,185 | |
| | | | | |
Hungary 0.1% | | | | | | | | | | | | | | | | |
MFB Magyar Fejlesztesi Bank Zrt, | | | | | | | | | | | | | | | | |
Gov’t. Gtd. Notes | | 1.375 | | 06/24/25 | | | EUR | | | | 3,470 | | | | 3,444,518 | |
| | | | | |
Iceland 0.2% | | | | | | | | | | | | | | | | |
Landsvirkjun, | | | | | | | | | | | | | | | | |
Gov’t. Gtd. Notes, EMTN, 3 Month EURIBOR + 0.090% | | 4.059(c) | | 07/24/26 | | | EUR | | | | 5,100 | | | | 5,296,194 | |
| | | | | |
India 0.6% | | | | | | | | | | | | | | | | |
NTPC Ltd., | | | | | | | | | | | | | | | | |
Sr. Unsec’d. Notes, EMTN | | 2.750 | | 02/01/27 | | | EUR | | | | 11,600 | | | | 11,417,851 | |
Power Finance Corp. Ltd., | | | | | | | | | | | | | | | | |
Sr. Unsec’d. Notes, GMTN | | 1.841 | | 09/21/28 | | | EUR | | | | 5,000 | | | | 4,449,734 | |
| | | | | | | | | | | | | | | | |
| | | | | |
| | | | | | | | | | | | | | | 15,867,585 | |
| | | | | |
Indonesia 0.4% | | | | | | | | | | | | | | | | |
Freeport Indonesia PT, | | | | | | | | | | | | | | | | |
Sr. Unsec’d. Notes, 144A, MTN | | 5.315 | | 04/14/32 | | | | | | | 1,890 | | | | 1,678,811 | |
Sr. Unsec’d. Notes, EMTN | | 5.315 | | 04/14/32 | | | | | | | 600 | | | | 532,956 | |
Perusahaan Perseroan Persero PT Perusahaan Listrik Negara, | | | | | | | | | | | | | | | | |
Sr. Unsec’d. Notes | | 2.875 | | 10/25/25 | | | EUR | | | | 2,636 | | | | 2,682,355 | |
Sr. Unsec’d. Notes, 144A | | 1.875 | | 11/05/31 | | | EUR | | | | 6,900 | | | | 5,561,891 | |
Sr. Unsec’d. Notes, 144A | | 2.875 | | 10/25/25 | | | EUR | | | | 900 | | | | 915,827 | |
| | | | | | | | | | | | | | | | |
| | | | | |
| | | | | | | | | | | | | | | 11,371,840 | |
| | | | | |
Israel 0.6% | | | | | | | | | | | | | | | | |
Israel Electric Corp. Ltd., | | | | | | | | | | | | | | | | |
Sec’d. Notes, 144A, GMTN | | 3.750 | | 02/22/32 | | | | | | | 600 | | | | 456,000 | |
Sr. Sec’d. Notes | | 7.875 | | 12/15/26 | | | | | | | 5,889 | | | | 5,898,246 | |
Sr. Sec’d. Notes, EMTN | | 3.700 | | 05/23/30 | | | JPY | | | | 200,000 | | | | 1,411,896 | |
Sr. Sec’d. Notes, EMTN | | 7.750 | | 12/15/27 | | | | | | | 8,650 | | | | 8,722,487 | |
| | | | | | | | | | | | | | | | |
| | | | | |
| | | | | | | | | | | | | | | 16,488,629 | |
See Notes to Financial Statements.
26
| | | | | | | | | | | | | | | | |
| | | | |
Description | | Interest
Rate | | Maturity
Date | | Principal
Amount (000)# | | | Value | |
| | | | | |
CORPORATE BONDS (Continued) | | | | | | | | | | | | | | | | |
| | | | | |
Italy 0.4% | | | | | | | | | | | | | | | | |
Intesa Sanpaolo SpA, | | | | | | | | | | | | | | | | |
Sr. Unsec’d. Notes, 144A | | 7.778%(ff) | | 06/20/54 | | | | | | | 1,985 | | | $ | 1,714,287 | |
Sub. Notes, 144A | | 4.198(ff) | | 06/01/32 | | | | | | | 1,430 | | | | 1,018,317 | |
UniCredit SpA, | | | | | | | | | | | | | | | | |
Sr. Unsec’d. Notes, 144A | | 1.982(ff) | | 06/03/27 | | | | | | | 8,485 | | | | 7,487,525 | |
| | | | | | | | | | | | | | | | |
| | | | | |
| | | | | | | | | | | | | | | 10,220,129 | |
| | | | | |
Jamaica 0.3% | | | | | | | | | | | | | | | | |
Digicel Group Holdings Ltd., | | | | | | | | | | | | | | | | |
Sr. Unsec’d. Notes, 144A, Cash coupon 5.000% and PIK 3.000% (original cost $205,016; purchased 03/21/23 - 03/22/23)(f) | | 8.000 | | 04/01/25(d) | | | | | | | 522 | | | | 104,467 | |
Digicel International Finance Ltd./Digicel International Holdings Ltd., | | | | | | | | | | | | | | | | |
Gtd. Notes, 144A (original cost $1,071,125; purchased 04/16/21)(f) | | 8.000 | | 12/31/26(d) | | | | | | | 1,100 | | | | 22,000 | |
Gtd. Notes, 144A, Cash coupon 13.000% (original cost $803,828; purchased 10/19/23)(f) | | 13.000 | | 12/31/25(d) | | | | | | | 1,148 | | | | 792,370 | |
Sr. Sec’d. Notes, 144A (original cost $678,023; purchased 10/19/23)(f) | | 8.750 | | 05/25/24 | | | | | | | 750 | | | | 686,949 | |
Sr. Sec’d. Notes, 144A (original cost $6,852,555; purchased 10/19/23)(f) | | 8.750 | | 05/25/24 | | | | | | | 7,250 | | | | 6,640,523 | |
Digicel Ltd., | | | | | | | | | | | | | | | | |
Gtd. Notes, 144A | | 6.750 | | 03/01/23(d) | | | | | | | 700 | | | | 17,500 | |
| | | | | | | | | | | | | | | | |
| | | | | |
| | | | | | | | | | | | | | | 8,263,809 | |
| | | | | |
Japan 0.3% | | | | | | | | | | | | | | | | |
Nomura Holdings, Inc., | | | | | | | | | | | | | | | | |
Sr. Unsec’d. Notes | | 2.608 | | 07/14/31 | | | | | | | 2,070 | | | | 1,541,885 | |
Sr. Unsec’d. Notes(a) | | 2.999 | | 01/22/32 | | | | | | | 7,475 | | | | 5,635,214 | |
| | | | | | | | | | | | | | | | |
| | | | | |
| | | | | | | | | | | | | | | 7,177,099 | |
| | | | | |
Kazakhstan 0.4% | | | | | | | | | | | | | | | | |
Kazakhstan Temir Zholy National Co. JSC, | | | | | | | | | | | | | | | | |
Gtd. Notes | | 3.250 | | 12/05/23 | | | CHF | | | | 9,300 | | | | 9,921,704 | |
See Notes to Financial Statements.
PGIM Global Total Return Fund 27
Schedule of Investments (continued)
as of October 31, 2023
| | | | | | | | | | | | | | |
| | | | |
Description | | Interest
Rate | | Maturity Date | | Principal Amount (000)# | | | Value | |
| | | | | |
CORPORATE BONDS (Continued) | | | | | | | | | | | | | | |
| | | | | |
Luxembourg 0.4% | | | | | | | | | | | | | | |
Blackstone Property Partners Europe Holdings Sarl, | | | | | | | | | | | | | | |
Sr. Unsec’d. Notes, EMTN | | 1.000% | | 05/04/28 | | EUR | | | 9,850 | | | $ | 8,180,868 | |
Sr. Unsec’d. Notes, EMTN | | 1.625 | | 04/20/30 | | EUR | | | 2,400 | | | | 1,853,563 | |
| | | | | | | | | | | | | | |
| | | | | |
| | | | | | | | | | | | | 10,034,431 | |
| | | | | |
Malta 0.1% | | | | | | | | | | | | | | |
Freeport Terminal Malta PLC, | | | | | | | | | | | | | | |
Gov’t. Gtd. Notes, 144A | | 7.250 | | 05/15/28 | | | | | 3,000 | | | | 3,150,940 | |
| | | | | |
Mexico 1.4% | | | | | | | | | | | | | | |
Comision Federal de Electricidad, | | | | | | | | | | | | | | |
Sr. Unsec’d. Notes | | 5.000 | | 09/29/36 | | | | | 10,590 | | | | 8,630,850 | |
Mexico City Airport Trust, | | | | | | | | | | | | | | |
Sr. Sec’d. Notes | | 3.875 | | 04/30/28 | | | | | 389 | | | | 343,363 | |
Sr. Sec’d. Notes | | 5.500 | | 07/31/47 | | | | | 3,137 | | | | 2,232,007 | |
Petroleos Mexicanos, | | | | | | | | | | | | | | |
Gtd. Notes | | 9.500 | | 09/15/27 | | | | | 2,000 | | | | 1,881,840 | |
Gtd. Notes, EMTN | | 2.750 | | 04/21/27 | | EUR | | | 4,500 | | | | 3,685,219 | |
Gtd. Notes, EMTN | | 4.875 | | 02/21/28 | | EUR | | | 23,000 | | | | 19,488,509 | |
U.S. Gov’t. Gtd. Notes, 3 Month SOFR + 0.692% | | 6.056(c) | | 02/15/24 | | | | | 375 | | | | 375,104 | |
| | | | | | | | | | | | | | |
| | | | | |
| | | | | | | | | | | | | 36,636,892 | |
| | | | | |
Netherlands 0.9% | | | | | | | | | | | | | | |
ABN AMRO Bank NV, | | | | | | | | | | | | | | |
Sr. Unsec’d. Notes, 144A, MTN | | 6.575(ff) | | 10/13/26 | | | | | 5,800 | | | | 5,789,004 | |
Sub. Notes, 144A, MTN | | 4.750 | | 07/28/25 | | | | | 500 | | | | 481,363 | |
Cooperatieve Rabobank UA, | | | | | | | | | | | | | | |
Sr. Unsec’d. Notes, EMTN | | 2.750 | | 03/04/24 | | NZD | | | 376 | | | | 216,651 | |
Sr. Unsec’d. Notes, GMTN | | 3.500 | | 12/14/26 | | AUD | | | 2,882 | | | | 1,703,459 | |
Sr. Unsec’d. Notes, GMTN | | 9.298(s) | | 03/11/39 | | MXN | | | 22,000 | | | | 219,646 | |
OCI NV, | | | | | | | | | | | | | | |
Sr. Sec’d. Notes, 144A | | 3.625 | | 10/15/25 | | EUR | | | 8,370 | | | | 8,656,499 | |
TMNL Holding BV, | | | | | | | | | | | | | | |
Sr. Sec’d. Notes, 144A | | 3.750 | | 01/15/29 | | EUR | | | 2,300 | | | | 2,095,769 | |
Ziggo Bond Co. BV, | | | | | | | | | | | | | | |
Gtd. Notes, 144A | | 3.375 | | 02/28/30 | | EUR | | | 6,000 | | | | 4,647,048 | |
| | | | | | | | | | | | | | |
| | | | | |
| | | | | | | | | | | | | 23,809,439 | |
See Notes to Financial Statements.
28
| | | | | | | | | | | | | | | | |
| | | | |
Description | | Interest
Rate | | Maturity Date | | Principal Amount (000)# | | | Value | |
| | | | | |
CORPORATE BONDS (Continued) | | | | | | | | | | | | | | | | |
| | | | | |
Norway 0.1% | | | | | | | | | | | | | | | | |
Equinor ASA, | | | | | | | | | | | | | | | | |
Gtd. Notes | | 6.800% | | 01/15/28 | | | | | | | 2,140 | | | $ | 2,205,311 | |
| | | | | |
Peru 0.0% | | | | | | | | | | | | | | | | |
Lima Metro Line 2 Finance Ltd., | | | | | | | | | | | | | | | | |
Sr. Sec’d. Notes | | 5.875 | | 07/05/34 | | | | | | | 89 | | | | 84,330 | |
Peru Enhanced Pass-Through Finance Ltd., | | | | | | | | | | | | | | | | |
Pass-Through Certificates | | 3.002(s) | | 06/02/25 | | | | | | | 836 | | | | 790,601 | |
| | | | | | | | | | | | | | | | |
| | | | | |
| | | | | | | | | | | | | | | 874,931 | |
| | | | | |
Philippines 0.2% | | | | | | | | | | | | | | | | |
Bangko Sentral ng Pilipinas International Bond, | | | | | | | | | | | | | | | | |
Sr. Unsec’d. Notes, Series A | | 8.600 | | 06/15/27 | | | | | | | 3,560 | | | | 4,091,544 | |
| | | | | |
Poland 0.3% | | | | | | | | | | | | | | | | |
Bank Gospodarstwa Krajowego, | | | | | | | | | | | | | | | | |
Gov’t. Gtd. Notes | | 1.625 | | 04/30/28 | | | EUR | | | | 600 | | | | 560,264 | |
Gov’t. Gtd. Notes, 144A, MTN | | 5.375 | | 05/22/33 | | | | | | | 1,215 | | | | 1,129,950 | |
Gov’t. Gtd. Notes, EMTN | | 0.500 | | 07/08/31 | | | EUR | | | | 500 | | | | 384,223 | |
Gov’t. Gtd. Notes, EMTN(a) | | 1.750 | | 05/06/26 | | | EUR | | | | 4,700 | | | | 4,649,820 | |
| | | | | | | | | | | | | | | | |
| | | | | |
| | | | | | | | | | | | | | | 6,724,257 | |
| | | | | |
Qatar 0.0% | | | | | | | | | | | | | | | | |
QNB Finance Ltd., | | | | | | | | | | | | | | | | |
Gtd. Notes, EMTN | | 3.500 | | 03/09/26 | | | CNH | | | | 7,400 | | | | 995,247 | |
Gtd. Notes, MTN | | 4.900 | | 02/01/28 | | | AUD | | | | 250 | | | | 151,462 | |
| | | | | | | | | | | | | | | | |
| | | | | |
| | | | | | | | | | | | | | | 1,146,709 | |
| | | | | |
Russia 0.7% | | | | | | | | | | | | | | | | |
Gazprom PJSC Via Gaz Capital SA, | | | | | | | | | | | | | | | | |
Sr. Unsec’d. Notes | | 2.500 | | 03/21/26(d) | | | EUR | | | | 3,500 | | | | 2,407,178 | |
Sr. Unsec’d. Notes | | 4.250 | | 04/06/24 | | | GBP | | | | 7,927 | | | | 7,611,549 | |
Sr. Unsec’d. Notes, EMTN | | 4.364 | | 03/21/25(d) | | | EUR | | | | 4,000 | | | | 2,962,680 | |
Gazprom PJSC via Gaz Finance PLC, | | | | | | | | | | | | | | | | |
Sr. Unsec’d. Notes | | 3.000 | | 06/29/27(d) | | | | | | | 1,410 | | | | 930,600 | |
Sr. Unsec’d. Notes, EMTN | | 1.540 | | 06/30/27 | | | CHF | | | | 6,000 | | | | 4,056,505 | |
| | | | | | | | | | | | | | | | |
| | | | | |
| | | | | | | | | | | | | | | 17,968,512 | |
See Notes to Financial Statements.
PGIM Global Total Return Fund 29
Schedule of Investments (continued)
as of October 31, 2023
| | | | | | | | | | | | | | |
| | | | |
Description | | Interest
Rate | | Maturity Date | | Principal Amount (000)# | | | Value | |
| | | | | |
CORPORATE BONDS (Continued) | | | | | | | | | | | | | | |
| | | | | |
Slovenia 0.5% | | | | | | | | | | | | | | |
United Group BV, | | | | | | | | | | | | | | |
Sr. Sec’d. Notes | | 3.625% | | 02/15/28 | | EUR | | | 5,275 | | | $ | 4,588,979 | |
Sr. Sec’d. Notes | | 4.000 | | 11/15/27 | | EUR | | | 200 | | | | 181,617 | |
Sr. Sec’d. Notes | | 4.625 | | 08/15/28 | | EUR | | | 100 | | | | 88,346 | |
Sr. Sec’d. Notes, 144A | | 3.125 | | 02/15/26 | | EUR | | | 3,800 | | | | 3,643,430 | |
Sr. Sec’d. Notes, 144A | | 5.250 | | 02/01/30 | | EUR | | | 6,500 | | | | 5,565,738 | |
| | | | | | | | | | | | | | |
| | | | | |
| | | | | | | | | | | | | 14,068,110 | |
| | | | | |
South Africa 0.5% | | | | | | | | | | | | | | |
Eskom Holdings SOC Ltd., | | | | | | | | | | | | | | |
Gov’t. Gtd. Notes, 144A, MTN | | 6.350 | | 08/10/28 | | | | | 1,350 | | | | 1,221,750 | |
Gov’t. Gtd. Notes, MTN | | 6.350 | | 08/10/28 | | | | | 12,000 | | | | 10,860,000 | |
| | | | | | | | | | | | | | |
| | | | | |
| | | | | | | | | | | | | 12,081,750 | |
| | | | | |
South Korea 0.7% | | | | | | | | | | | | | | |
Korea Development Bank (The), | | | | | | | | | | | | | | |
Sr. Unsec’d. Notes, EMTN | | 1.830 | | 08/10/27 | | SEK | | | 74,000 | | | | 6,309,939 | |
Sr. Unsec’d. Notes, EMTN | | 6.000 | | 01/22/25 | | IDR | | | 15,000,000 | | | | 932,427 | |
Korea Expressway Corp., | | | | | | | | | | | | | | |
Sr. Unsec’d. Notes, GMTN | | 2.310 | | 04/28/32 | | SEK | | | 80,000 | | | | 6,489,772 | |
Sr. Unsec’d. Notes, GMTN | | 3.030 | | 05/11/32 | | CAD | | | 7,500 | | | | 4,671,193 | |
| | | | | | | | | | | | | | |
| | | | | |
| | | | | | | | | | | | | 18,403,331 | |
| | | | | |
Spain 0.8% | | | | | | | | | | | | | | |
Banco Santander SA, | | | | | | | | | | | | | | |
Sr. Unsec’d. Notes | | 3.306 | | 06/27/29 | | | | | 1,600 | | | | 1,363,251 | |
Sub. Notes | | 2.749 | | 12/03/30 | | | | | 600 | | | | 437,171 | |
Cellnex Finance Co. SA, | | | | | | | | | | | | | | |
Gtd. Notes, EMTN | | 2.000 | | 02/15/33 | | EUR | | | 11,900 | | | | 9,529,164 | |
Codere Finance 2 Luxembourg SA, | | | | | | | | | | | | | | |
Sr. Sec’d. Notes, 144A, Cash coupon 8.000% and PIK 3.000% | | 11.000 | | 09/30/26(d) | | EUR | | | 1,126 | | | | 810,003 | |
Sr. Sec’d. Notes, 144A | | 13.000 | | 09/30/24 | | EUR | | | 185 | | | | 195,240 | |
Sr. Sec’d. Notes, 144A, Cash coupon 2.000% and PIK 11.625% | | 13.625 | | 11/30/27(d) | | | | �� | 453 | | | | 37,934 | |
Lorca Telecom Bondco SA, | | | | | | | | | | | | | | |
Sr. Sec’d. Notes, 144A | | 4.000 | | 09/18/27 | | EUR | | | 10,300 | | | | 10,102,736 | |
| | | | | | | | | | | | | | |
| | | | | |
| | | | | | | | | | | | | 22,475,499 | |
See Notes to Financial Statements.
30
| | | | | | | | | | | | | | | | |
| | | | |
Description | | Interest
Rate | | Maturity Date | | Principal Amount (000)# | | | Value | |
| | | | | |
CORPORATE BONDS (Continued) | | | | | | | | | | | | | | | | |
| | | | | |
Supranational Bank 0.5% | | | | | | | | | | | | | | | | |
African Development Bank, | | | | | | | | | | | | | | | | |
Sr. Unsec’d. Notes, EMTN | | 0.500% | | 09/07/32 | | | MXN | | | | 64,600 | | | $ | 1,480,221 | |
African Export-Import Bank (The), | | | | | | | | | | | | | | | | |
Sr. Unsec’d. Notes | | 3.798 | | 05/17/31 | | | | | | | 300 | | | | 226,728 | |
Asian Infrastructure Investment Bank (The), | | | | | | | | | | | | | | | | |
Sr. Unsec’d. Notes, EMTN^ | | 0.375 | | 09/09/25 | | | THB | | | | 72,000 | | | | 1,922,030 | |
European Investment Bank, | | | | | | | | | | | | | | | | |
Sr. Unsec’d. Notes, EMTN | | 1.000 | | 02/25/28 | | | PLN | | | | 3,985 | | | | 774,568 | |
Sr. Unsec’d. Notes, EMTN | | 6.270 | | 08/28/24 | | | IDR | | | | 10,000,000 | | | | 626,566 | |
Inter-American Development Bank, | | | | | | | | | | | | | | | | |
Sr. Unsec’d. Notes, GMTN | | 7.500 | | 12/05/24 | | | MXN | | | | 600 | | | | 31,818 | |
International Bank for Reconstruction & Development, | | | | | | | | | | | | | | | | |
Sr. Unsec’d. Notes, SOFR Index + 0.262% (Cap 1.820%, Floor 0.000%) | | 1.820(c) | | 08/11/26 | | | | | | | 72 | | | | 65,047 | |
Sr. Unsec’d. Notes | | 2.330(ff) | | 05/31/26 | | | | | | | 4 | | | | 3,682 | |
Sr. Unsec’d. Notes, EMTN | | 1.928(s) | | 04/23/32 | | | AUD | | | | 8,758 | | | | 3,460,807 | |
Sr. Unsec’d. Notes, EMTN | | 6.630 | | 07/24/28 | | | MXN | | | | 33,700 | | | | 1,562,245 | |
Sr. Unsec’d. Notes, MTN | | 2.700 | | 12/28/37 | | | | | | | 300 | | | | 211,699 | |
International Finance Corp., | | | | | | | | | | | | | | | | |
Sr. Unsec’d. Notes, GMTN | | 7.020 | | 04/06/28 | | | MXN | | | | 44,300 | | | | 2,152,511 | |
Sr. Unsec’d. Notes, GMTN | | 8.215(s) | | 01/27/37 | | | MXN | | | | 78,000 | | | | 1,142,073 | |
| | | | | | | | | | | | | | | | |
| | | | | |
| | | | | | | | | | | | | | | 13,659,995 | |
| | | | | |
Switzerland 0.8% | | | | | | | | | | | | | | | | |
UBS Group AG, | | | | | | | | | �� | | | | | | | |
Sr. Unsec’d. Notes, 144A | | 1.305(ff) | | 02/02/27 | | | | | | | 6,440 | | | | 5,707,450 | |
Sr. Unsec’d. Notes, 144A | | 1.494(ff) | | 08/10/27 | | | | | | | 13,125 | | | | 11,370,686 | |
Sr. Unsec’d. Notes, 144A | | 2.593(ff) | | 09/11/25 | | | | | | | 1,390 | | | | 1,337,826 | |
Sr. Unsec’d. Notes, 144A | | 3.869(ff) | | 01/12/29 | | | | | | | 900 | | | | 805,500 | |
Sr. Unsec’d. Notes, 144A | | 4.282 | | 01/09/28 | | | | | | | 2,075 | | | | 1,887,263 | |
| | | | | | | | | | | | | | | | |
| | | | | |
| | | | | | | | | | | | | | | 21,108,725 | |
| | | | | |
United Arab Emirates 0.4% | | | | | | | | | | | | | | | | |
ADCB Finance Cayman Ltd., | | | | | | | | | | | | | | | | |
Gtd. Notes, MTN | | 4.500 | | 10/25/27 | | | AUD | | | | 2,270 | | | | 1,361,049 | |
DP World Ltd., | | | | | | | | | | | | | | | | |
Sr. Unsec’d. Notes | | 4.250 | | 09/25/30 | | | GBP | | | | 4,500 | | | | 4,712,816 | |
Sr. Unsec’d. Notes, 144A | | 4.250 | | 09/25/30 | | | GBP | | | | 1,840 | | | | 1,931,035 | |
See Notes to Financial Statements.
PGIM Global Total Return Fund 31
Schedule of Investments (continued)
as of October 31, 2023
| | | | | | | | | | | | | | | | |
| | | | |
Description | | Interest
Rate | | Maturity
Date | | Principal Amount (000)# | | | Value | |
| | | | | |
CORPORATE BONDS (Continued) | | | | | | | | | | | | | | | | |
| | | | | |
United Arab Emirates (cont’d.) | | | | | | | | | | | | | | | | |
First Abu Dhabi Bank PJSC, | | | | | | | | | | | | | | | | |
Sr. Unsec’d. Notes, EMTN | | 0.875% | | 12/09/25 | | | GBP | | | | 1,268 | | | $ | 1,366,327 | |
Sr. Unsec’d. Notes, EMTN | | 3.500 | | 07/02/25 | | | CNH | | | | 2,170 | | | | 293,694 | |
| | | | | | | | | | | | | | | | |
| | | | | |
| | | | | | | | | | | | | | | 9,664,921 | |
| | | | | |
United Kingdom 2.6% | | | | | | | | | | | | | | | | |
Barclays Bank PLC, | | | | | | | | | | | | | | | | |
Sr. Unsec’d. Notes, EMTN | | 2.100 | | 11/13/25 | | | CNH | | | | 18,000 | | | | 2,365,981 | |
Barclays PLC, | | | | | | | | | | | | | | | | |
Sr. Unsec’d. Notes, MTN | | 3.250 | | 06/26/24 | | | AUD | | | | 1,750 | | | | 1,091,032 | |
Sr. Unsec’d. Notes, MTN | | 5.244 | | 06/15/28 | | | AUD | | | | 1,000 | | | | 590,937 | |
Sub. Notes | | 7.119(ff) | | 06/27/34 | | | | | | | 3,780 | | | | 3,496,213 | |
Bellis Acquisition Co. PLC, | | | | | | | | | | | | | | | | |
Sr. Sec’d. Notes, 144A | | 3.250 | | 02/16/26 | | | GBP | | | | 14,700 | | | | 15,388,053 | |
Bellis Finco PLC, | | | | | | | | | | | | | | | | |
Sr. Unsec’d. Notes, 144A | | 4.000 | | 02/16/27 | | | GBP | | | | 6,700 | | | | 6,020,175 | |
BP Capital Markets PLC, | | | | | | | | | | | | | | | | |
Gtd. Notes | | 4.375(ff) | | 06/22/25(oo) | | | | | | | 14,500 | | | | 13,775,000 | |
Constellation Automotive Financing PLC, | | | | | | | | | | | | | | | | |
Sr. Sec’d. Notes | | 4.875 | | 07/15/27 | | | GBP | | | | 5,000 | | | | 4,695,003 | |
HSBC Bank PLC, | | | | | | | | | | | | | | | | |
Sr. Unsec’d. Notes, 144A, EMTN | | 3.120 | | 04/04/26 | | | CNH | | | | 36,800 | | | | 4,933,698 | |
HSBC Holdings PLC, | | | | | | | | | | | | | | | | |
Sr. Unsec’d. Notes | | 2.206(ff) | | 08/17/29 | | | | | | | 4,300 | | | | 3,494,925 | |
Sr. Unsec’d. Notes | | 3.973(ff) | | 05/22/30 | | | | | | | 2,400 | | | | 2,073,712 | |
Lloyds Bank PLC, | | | | | | | | | | | | | | | | |
Sr. Unsec’d. Notes, EMTN | | 0.000 | | 04/02/32 | | | | | | | 1,200 | | | | 702,228 | |
Lloyds Banking Group PLC, | | | | | | | | | | | | | | | | |
Sub. Notes | | 4.582 | | 12/10/25 | | | | | | | 2,250 | | | | 2,138,633 | |
Virgin Media Secured Finance PLC, | | | | | | | | | | | | | | | | |
Sr. Sec’d. Notes | | 5.000 | | 04/15/27 | | | GBP | | | | 2,800 | | | | 3,152,082 | |
Sr. Sec’d. Notes, 144A | | 5.000 | | 04/15/27 | | | GBP | | | | 5,900 | | | | 6,641,888 | |
| | | | | | | | | | | | | | | | |
| | | | | |
| | | | | | | | | | | | | | | 70,559,560 | |
| | | | | |
United States 24.2% | | | | | | | | | | | | | | | | |
Aflac, Inc., | | | | | | | | | | | | | | | | |
Sr. Unsec’d. Notes | | 0.500 | | 12/17/29 | | | JPY | | | | 100,000 | | | | 612,133 | |
Sr. Unsec’d. Notes | | 0.830 | | 03/12/35 | | | JPY | | | | 100,000 | | | | 571,885 | |
Sr. Unsec’d. Notes | | 0.932 | | 01/25/27 | | | JPY | | | | 80,000 | | | | 525,013 | |
Sr. Unsec’d. Notes | | 1.159 | | 10/18/30 | | | JPY | | | | 600,000 | | | | 3,845,288 | |
See Notes to Financial Statements.
32
| | | | | | | | | | | | | | | | |
| | | | |
Description | | Interest Rate | | Maturity
Date | | Principal Amount (000)# | | | Value | |
| | | | | |
CORPORATE BONDS (Continued) | | | | | | | | | | | | | | | | |
| | | | | |
United States (cont’d.) | | | | | | | | | | | | | | | | |
Albertson’s Cos., Inc./Safeway, Inc./New Albertson’s | | | | | | | | | | | | | | | | |
LP/Albertson’s LLC, | | | | | | | | | | | | | | | | |
Gtd. Notes, 144A(a) | | 3.500% | | 03/15/29 | | | | | | | 2,310 | | | $ | 1,969,286 | |
Altria Group, Inc., | | | | | | | | | | | | | | | | |
Gtd. Notes | | 3.125 | | 06/15/31 | | | EUR | | | | 2,900 | | | | 2,600,852 | |
American International Group, Inc., | | | | | | | | | | | | | | | | |
Sr. Unsec’d. Notes | | 1.875 | | 06/21/27 | | | EUR | | | | 2,100 | | | | 2,042,292 | |
Antero Midstream Partners LP/Antero Midstream | | | | | | | | | | | | | | | | |
Finance Corp., | | | | | | | | | | | | | | | | |
Gtd. Notes, 144A | | 7.875 | | 05/15/26 | | | | | | | 3,550 | | | | 3,583,005 | |
Ascent Resources Utica Holdings LLC/ARU Finance | | | | | | | | | | | | | | | | |
Corp., | | | | | | | | | | | | | | | | |
Gtd. Notes, 144A | | 7.000 | | 11/01/26 | | | | | | | 575 | | | | 555,677 | |
Gtd. Notes, 144A | | 9.000 | | 11/01/27 | | | | | | | 579 | | | | 731,864 | |
Sr. Unsec’d. Notes, 144A | | 8.250 | | 12/31/28 | | | | | | | 1,825 | | | | 1,812,403 | |
Ashton Woods USA LLC/Ashton Woods Finance Co., | | | | | | | | | | | | | | | | |
Sr. Unsec’d. Notes, 144A | | 6.625 | | 01/15/28 | | | | | | | 6,582 | | | | 6,027,804 | |
AT&T, Inc., | | | | | | | | | | | | | | | | |
Sr. Unsec’d. Notes | | 2.550 | | 12/01/33 | | | | | | | 97 | | | | 69,608 | |
Sr. Unsec’d. Notes | | 3.500 | | 09/15/53 | | | | | | | 1,421 | | | | 836,795 | |
Sr. Unsec’d. Notes | | 3.950 | | 04/30/31 | | | EUR | | | | 6,500 | | | | 6,693,202 | |
Sr. Unsec’d. Notes, EMTN | | 7.000 | | 04/30/40 | | | GBP | | | | 1,550 | | | | 1,936,641 | |
Sr. Unsec’d. Notes, Series MPLE | | 4.850 | | 05/25/47 | | | CAD | | | | 150 | | | | 85,753 | |
Sr. Unsec’d. Notes, Series MPLE | | 5.100 | | 11/25/48 | | | CAD | | | | 4,575 | | | | 2,684,429 | |
Ball Corp., | | | | | | | | | | | | | | | | |
Gtd. Notes | | 6.000 | | 06/15/29 | | | | | | | 900 | | | | 861,991 | |
Bank of America Corp., | | | | | | | | | | | | | | | | |
Sr. Unsec’d. Notes | | 2.687(ff) | | 04/22/32 | | | | | | | 8,140 | | | | 6,242,540 | |
Sr. Unsec’d. Notes, MTN | | 2.087(ff) | | 06/14/29 | | | | | | | 19,350 | | | | 15,957,768 | |
Sub. Notes | | 6.800 | | 03/15/28 | | | | | | | 377 | | | | 387,614 | |
Sub. Notes, EMTN | | 8.125 | | 06/02/28 | | | GBP | | | | 500 | | | | 639,066 | |
Bausch Health Americas, Inc., | | | | | | | | | | | | | | | | |
Gtd. Notes, 144A | | 8.500 | | 01/31/27 | | | | | | | 1,550 | | | | 696,415 | |
Bausch Health Cos., Inc., | | | | | | | | | | | | | | | | |
Gtd. Notes, 144A | | 5.000 | | 01/30/28 | | | | | | | 2,590 | | | | 958,300 | |
Gtd. Notes, 144A | | 5.000 | | 02/15/29 | | | | | | | 175 | | | | 60,813 | |
Gtd. Notes, 144A | | 5.250 | | 01/30/30 | | | | | | | 5,500 | | | | 1,904,375 | |
Gtd. Notes, 144A | | 5.250 | | 02/15/31 | | | | | | | 2,000 | | | | 700,000 | |
Gtd. Notes, 144A | | 6.250 | | 02/15/29 | | | | | | | 400 | | | | 145,000 | |
Beazer Homes USA, Inc., | | | | | | | | | | | | | | | | |
Gtd. Notes | | 5.875 | | 10/15/27 | | | | | | | 1,375 | | | | 1,227,982 | |
Gtd. Notes | | 6.750 | | 03/15/25 | | | | | | | 2,075 | | | | 2,056,528 | |
See Notes to Financial Statements.
PGIM Global Total Return Fund 33
Schedule of Investments (continued)
as of October 31, 2023
| | | | | | | | | | | | | | | | |
| | | | |
Description | | Interest Rate | | Maturity
Date | | Principal Amount (000)# | | | Value | |
| | | | | |
CORPORATE BONDS (Continued) | | | | | | | | | | | | | | | | |
| | | | | |
United States (cont’d.) | | | | | | | | | | | | | | | | |
Beazer Homes USA, Inc., (cont’d.) | | | | | | | | | | | | | | | | |
Gtd. Notes | | 7.250% | | 10/15/29 | | | | | | | 1,600 | | | $ | 1,460,104 | |
Berkshire Hathaway, Inc., | | | | | | | | | | | | | | | | |
Sr. Unsec’d. Notes | | 0.440 | | 09/13/29 | | | JPY | | | | 1,640,000 | | | | 10,109,294 | |
Sr. Unsec’d. Notes | | 0.787 | | 09/13/34 | | | JPY | | | | 100,000 | | | | 567,558 | |
Sr. Unsec’d. Notes | | 0.965 | | 09/13/39 | | | JPY | | | | 300,000 | | | | 1,586,766 | |
Boeing Co. (The), | | | | | | | | | | | | | | | | |
Sr. Unsec’d. Notes | | 5.805 | | 05/01/50 | | | | | | | 4,030 | | | | 3,472,730 | |
Boxer Parent Co., Inc., | | | | | | | | | | | | | | | | |
Sr. Sec’d. Notes, 144A | | 7.125 | | 10/02/25 | | | | | | | 4,800 | | | | 4,736,927 | |
Brixmor Operating Partnership LP, | | | | | | | | | | | | | | | | |
Sr. Unsec’d. Notes | | 2.500 | | 08/16/31 | | | | | | | 1,880 | | | | 1,382,569 | |
Sr. Unsec’d. Notes | | 4.125 | | 05/15/29 | | | | | | | 2,865 | | | | 2,509,851 | |
Broadcom, Inc., | | | | | | | | | | | | | | | | |
Gtd. Notes, 144A | | 3.500 | | 02/15/41 | | | | | | | 3,765 | | | | 2,501,452 | |
Sr. Unsec’d. Notes, 144A | | 3.137 | | 11/15/35 | | | | | | | 4,626 | | | | 3,261,273 | |
Sr. Unsec’d. Notes, 144A | | 3.419 | | 04/15/33 | | | | | | | 6,765 | | | | 5,258,370 | |
Caesars Entertainment, Inc., | | | | | | | | | | | | | | | | |
Sr. Sec’d. Notes, 144A | | 6.250 | | 07/01/25 | | | | | | | 2,660 | | | | 2,617,844 | |
Sr. Unsec’d. Notes, 144A | | 4.625 | | 10/15/29 | | | | | | | 525 | | | | 431,763 | |
Caledonia Generating LLC, | | | | | | | | | | | | | | | | |
Sr. Sec’d. Notes, 144A | | 1.950 | | 02/28/34 | | | | | | | 2,311 | | | | 1,857,388 | |
Calpine Corp., | | | | | | | | | | | | | | | | |
Sr. Unsec’d. Notes, 144A | | 4.625 | | 02/01/29 | | | | | | | 2,770 | | | | 2,335,778 | |
Sr. Unsec’d. Notes, 144A | | 5.000 | | 02/01/31 | | | | | | | 2,180 | | | | 1,759,881 | |
Sr. Unsec’d. Notes, 144A | | 5.125 | | 03/15/28 | | | | | | | 5,000 | | | | 4,474,820 | |
CCO Holdings LLC/CCO Holdings Capital Corp., | | | | | | | | | | | | | | | | |
Sr. Unsec’d. Notes, 144A | | 4.250 | | 02/01/31 | | | | | | | 9,500 | | | | 7,391,804 | |
Sr. Unsec’d. Notes, 144A | | 4.500 | | 06/01/33 | | | | | | | 2,675 | | | | 1,995,556 | |
CDW LLC/CDW Finance Corp., | | | | | | | | | | | | | | | | |
Gtd. Notes | | 2.670 | | 12/01/26 | | | | | | | 7,675 | | | | 6,876,761 | |
Central Garden & Pet Co., | | | | | | | | | | | | | | | | |
Gtd. Notes, 144A | | 4.125 | | 04/30/31 | | | | | | | 675 | | | | 538,360 | |
CF Industries, Inc., | | | | | | | | | | | | | | | | |
Gtd. Notes | | 4.950 | | 06/01/43 | | | | | | | 1,230 | | | | 949,237 | |
Gtd. Notes | | 5.375 | | 03/15/44 | | | | | | | 3,560 | | | | 2,893,230 | |
Chart Industries, Inc., | | | | | | | | | | | | | | | | |
Sr. Sec’d. Notes, 144A | | 7.500 | | 01/01/30 | | | | | | | 600 | | | | 589,513 | |
Charter Communications Operating LLC/Charter | | | | | | | | | | | | | | | | |
Communications Operating Capital, | | | | | | | | | | | | | | | | |
Sr. Sec’d. Notes | | 2.800 | | 04/01/31 | | | | | | | 3,625 | | | | 2,781,814 | |
Sr. Sec’d. Notes | | 3.900 | | 06/01/52 | | | | | | | 3,365 | | | | 1,905,879 | |
See Notes to Financial Statements.
34
| | | | | | | | | | | | | | | | |
| | | | |
Description | | Interest Rate | | Maturity
Date | | Principal Amount (000)# | | | Value | |
| | | | | |
CORPORATE BONDS (Continued) | | | | | | | | | | | | | | | | |
| | | | | |
United States (cont’d.) | | | | | | | | | | | | | | | | |
Charter Communications Operating LLC/Charter Communications Operating Capital, (cont’d.) | | | | | |
Sr. Sec’d. Notes | | 4.800% | | 03/01/50 | | | | | | | 5,250 | | | $ | 3,459,933 | |
Sr. Sec’d. Notes | | 6.384 | | 10/23/35 | | | | | | | 2,357 | | | | 2,131,457 | |
Chesapeake Energy Corp., | | | | | | | | | | | | | | | | |
Gtd. Notes, 144A | | 5.500 | | 02/01/26 | | | | | | | 650 | | | | 631,138 | |
Gtd. Notes, 144A | | 5.875 | | 02/01/29 | | | | | | | 600 | | | | 565,055 | |
CitiFinancial Credit Co., | | | | | | | | | | | | | | | | |
Sr. Unsec’d. Notes | | 7.875 | | 02/01/25 | | | | | | | 662 | | | | 676,619 | |
Citigroup Global Markets Holdings, Inc., | | | | | | | | | | | | | | | | |
Gtd. Notes, GMTN | | 3.790 | | 09/28/28 | | | HKD | | | | 6,000 | | | | 705,357 | |
Citigroup, Inc., | | | | | | | | | | | | | | | | |
Jr. Sub. Notes | | 3.875(ff) | | 02/18/26(oo) | | | | | | | 19,245 | | | | 16,111,961 | |
Sr. Unsec’d. Notes | | 2.520(ff) | | 11/03/32 | | | | | | | 1,660 | | | | 1,234,862 | |
Sr. Unsec’d. Notes | | 2.561(ff) | | 05/01/32 | | | | | | | 6,600 | | | | 5,010,588 | |
Sr. Unsec’d. Notes, EMTN | | 6.500 | | 08/16/30 | | | GBP | | | | 7 | | | | 8,726 | |
Sub. Notes | | 6.174(ff) | | 05/25/34 | | | | | | | 1,280 | | | | 1,193,753 | |
Columbia Pipelines Operating Co. LLC, | | | | | | | | | | | | | | | | |
Sr. Unsec’d. Notes, 144A | | 6.036 | | 11/15/33 | | | | | | | 2,040 | | | | 1,937,638 | |
Dana, Inc., | | | | | | | | | | | | | | | | |
Sr. Unsec’d. Notes | | 4.500 | | 02/15/32 | | | | | | | 4,025 | | | | 3,150,555 | |
Sr. Unsec’d. Notes | | 5.375 | | 11/15/27 | | | | | | | 2,625 | | | | 2,413,939 | |
DaVita, Inc., | | | | | | | | | | | | | | | | |
Gtd. Notes, 144A | | 3.750 | | 02/15/31 | | | | | | | 1,125 | | | | 809,126 | |
Gtd. Notes, 144A | | 4.625 | | 06/01/30 | | | | | | | 1,125 | | | | 882,024 | |
Diamond Sports Group LLC/Diamond Sports Finance Co., | | | | | | | | | | | | | | | | |
Gtd. Notes, 144A (original cost $3,451,125; purchased 07/18/19 - 02/27/20)(f) | | 6.625 | | 08/15/27(d) | | | | | | | 3,740 | | | | 37,764 | |
Discovery Communications LLC, | | | | | | | | | | | | | | | | |
Gtd. Notes | | 5.300 | | 05/15/49 | | | | | | | 2,480 | | | | 1,788,116 | |
DISH DBS Corp., | | | | | | | | | | | | | | | | |
Gtd. Notes | | 7.750 | | 07/01/26 | | | | | | | 4,950 | | | | 3,314,088 | |
Diversified Healthcare Trust, | | | | | | | | | | | | | | | | |
Gtd. Notes | | 9.750 | | 06/15/25 | | | | | | | 888 | | | | 861,752 | |
Dow Chemical Co. (The), | | | | | | | | | | | | | | | | |
Sr. Unsec’d. Notes | | 9.400 | | 05/15/39 | | | | | | | 88 | | | | 108,123 | |
Energy Transfer LP, | | | | | | | | | | | | | | | | |
Jr. Sub. Notes, Series G | | 7.125(ff) | | 05/15/30(oo) | | | | | | | 7,800 | | | | 6,558,866 | |
Jr. Sub. Notes, Series H | | 6.500(ff) | | 11/15/26(oo) | | | | | | | 5,045 | | | | 4,572,653 | |
Sr. Unsec’d. Notes | | 5.400 | | 10/01/47 | | | | | | | 2,200 | | | | 1,732,691 | |
Sr. Unsec’d. Notes | | 6.000 | | 06/15/48 | | | | | | | 2,350 | | | | 2,001,134 | |
Sr. Unsec’d. Notes | | 6.050 | | 12/01/26 | | | | | | | 6,665 | | | | 6,656,510 | |
See Notes to Financial Statements.
PGIM Global Total Return Fund 35
Schedule of Investments (continued)
as of October 31, 2023
| | | | | | | | | | | | | | | | |
| | | | |
Description | | Interest Rate | | Maturity
Date | | Principal Amount (000)# | | | Value | |
| | | | | |
CORPORATE BONDS (Continued) | | | | | | | | | | | | | | | | |
| | | | | |
United States (cont’d.) | | | | | | | | | | | | | | | | |
ERAC USA Finance LLC, | | | | | | | | | | | | | | | | |
Gtd. Notes, 144A | | 7.000% | | 10/15/37 | | | | | | | 190 | | | $ | 197,498 | |
Fidelity National Information Services, Inc., | | | | | | | | | | | | | | | | |
Sr. Unsec’d. Notes | | 1.500 | | 05/21/27 | | | EUR | | | | 5,600 | | | | 5,356,407 | |
Ford Motor Co., | | | | | | | | | | | | | | | | |
Sr. Unsec’d. Notes | | 4.750 | | 01/15/43 | | | | | | | 5,000 | | | | 3,468,101 | |
Sr. Unsec’d. Notes(a) | | 5.291 | | 12/08/46 | | | | | | | 3,000 | | | | 2,178,882 | |
Ford Motor Credit Co. LLC, | | | | | | | | | | | | | | | | |
Sr. Unsec’d. Notes | | 4.134 | | 08/04/25 | | | | | | | 200 | | | | 190,707 | |
Sr. Unsec’d. Notes, EMTN | | 3.683 | | 12/03/24 | | | AUD | | | | 500 | | | | 306,575 | |
Sr. Unsec’d. Notes, EMTN | | 4.125 | | 06/20/24 | | | SGD | | | | 2,000 | | | | 1,439,592 | |
Forward Air Corp., | | | | | | | | | | | | | | | | |
Sr. Sec’d. Notes, 144A(a) | | 9.500 | | 10/15/31 | | | | | | | 1,000 | | | | 974,838 | |
General Motors Co., | | | | | | | | | | | | | | | | |
Sr. Unsec’d. Notes | | 5.000 | | 04/01/35 | | | | | | | 2,200 | | | | 1,828,708 | |
Sr. Unsec’d. Notes | | 5.400 | | 04/01/48 | | | | | | | 2,050 | | | | 1,538,765 | |
Sr. Unsec’d. Notes | | 6.250 | | 10/02/43 | | | | | | | 2,705 | | | | 2,320,087 | |
General Motors Financial Co., Inc., | | | | | | | | | | | | | | | | |
Gtd. Notes | | 3.850 | | 01/05/28 | | | | | | | 2,900 | | | | 2,609,711 | |
Golden Entertainment, Inc., | | | | | | | | | | | | | | | | |
Sr. Unsec’d. Notes, 144A | | 7.625 | | 04/15/26 | | | | | | | 1,000 | | | | 1,002,908 | |
Goldman Sachs Group, Inc. (The), | | | | | | | | | | | | | | | | |
Jr. Sub. Notes, Series U | | 3.650(ff) | | 08/10/26(oo) | | | | | | | 11,370 | | | | 8,785,019 | |
Sr. Unsec’d. Notes | | 1.992(ff) | | 01/27/32 | | | | | | | 2,450 | | | | 1,798,420 | |
Sr. Unsec’d. Notes | | 2.383(ff) | | 07/21/32 | | | | | | | 1,770 | | | | 1,314,892 | |
Sr. Unsec’d. Notes | | 2.615(ff) | | 04/22/32 | | | | | | | 9,660 | | | | 7,359,662 | |
Sr. Unsec’d. Notes | | 4.500 | | 05/16/28 | | | AUD | | | | 210 | | | | 122,515 | |
Sr. Unsec’d. Notes, EMTN | | 1.000 | | 08/06/24 | | | JPY | | | | 100,000 | | | | 664,960 | |
Sr. Unsec’d. Notes, EMTN | | 1.000 | | 08/16/32 | | | JPY | | | | 200,000 | | | | 1,191,912 | |
Sr. Unsec’d. Notes, EMTN | | 1.300 | | 03/22/30 | | | JPY | | | | 10,000 | | | | 63,810 | |
Sr. Unsec’d. Notes, EMTN | | 1.428(s) | | 12/15/23 | | | EUR | | | | 200 | | | | 210,448 | |
Sr. Unsec’d. Notes, EMTN, EURIBOR ICE SWAP 11:00 Fft 10Y Index + 0.000% (Cap 7.000%, Floor N/A) | | 2.979(c) | | 06/30/25 | | | EUR | | | | 2,227 | | | | 2,286,640 | |
Sr. Unsec’d. Notes, EMTN, 6 Month EURIBOR + 0.000% (Cap 5.500%, Floor 0.000%) | | 3.937(c) | | 08/12/25 | | | EUR | | | | 3,216 | | | | 3,358,987 | |
Sr. Unsec’d. Notes, EMTN, EURIBOR ICE SWAP 11:00 Fft 20Y Index + 0.000% (Cap 12.000%, Floor 5.220%)^ | | 5.220(c) | | 08/24/30 | | | EUR | | | �� | 5,000 | | | | 5,236,537 | |
Sr. Unsec’d. Notes, EMTN, 3 Month SOFR + 0.262% (Cap N/A, Floor 0.000%) | | 5.684(c) | | 11/30/24 | | | | | | | 40 | | | | 39,400 | |
See Notes to Financial Statements.
36
| | | | | | | | | | | | | | | | |
| | | | |
Description | | Interest Rate | | Maturity
Date | | Principal Amount (000)# | | | Value | |
| | | | | |
CORPORATE BONDS (Continued) | | | | | | | | | | | | | | | | |
| | | | | |
United States (cont’d.) | | | | | | | | | | | | | | | | |
Greystone Commercial Capital Trust, | | | | | | | | | | | | | | | | |
Sr. Unsec’d. Notes, Series A, 144A, 1 Month LIBOR + 2.270%^ | | 7.720%(c) | | 05/31/25 | | | | | | | 19,100 | | | $ | 18,049,500 | |
HCA, Inc., | | | | | | | | | | | | | | | | |
Gtd. Notes | | 5.250 | | 06/15/49 | | | | | | | 1,500 | | | | 1,153,360 | |
Gtd. Notes | | 5.625 | | 09/01/28 | | | | | | | 700 | | | | 676,842 | |
Gtd. Notes | | 7.500 | | 11/06/33 | | | | | | | 2,000 | | | | 2,049,136 | |
Gtd. Notes, MTN | | 7.750 | | 07/15/36 | | | | | | | 2,000 | | | | 2,067,145 | |
Honeywell International, Inc., | | | | | | | | | | | | | | | | |
Sr. Unsec’d. Notes | | 0.750 | | 03/10/32 | | | EUR | | | | 3,000 | | | | 2,441,354 | |
Sr. Unsec’d. Notes | | 3.750 | | 05/17/32 | | | EUR | | | | 4,900 | | | | 4,988,101 | |
Housing & Urban Development Corp. Ltd. AID Bond, | | | | | | | | | | | | | | | | |
U.S. Gov’t. Gtd. Notes, 6 Month LIBOR + 0.035% | | 5.937(c) | | 09/15/30 | | | | | | | 800 | | | | 796,072 | |
Hunt Cos., Inc., | | | | | | | | | | | | | | | | |
Sr. Sec’d. Notes, 144A | | 5.250 | | 04/15/29 | | | | | | | 5,750 | | | | 4,533,569 | |
Huntington Bancshares, Inc., | | | | | | | | | | | | | | | | |
Sr. Unsec’d. Notes | | 6.208(ff) | | 08/21/29 | | | | | | | 1,505 | | | | 1,446,563 | |
International Game Technology PLC, | | | | | | | | | | | | | | | | |
Sr. Sec’d. Notes, 144A | | 4.125 | | 04/15/26 | | | | | | | 4,000 | | | | 3,770,000 | |
IQVIA, Inc., | | | | | | | | | | | | | | | | |
Gtd. Notes, 144A | | 2.250 | | 01/15/28 | | | EUR | | | | 1,800 | | | | 1,671,421 | |
JBS USA LUX SA/JBS USA Food Co./JBS USA Finance, Inc., | | | | | | | | | | | | | | | | |
Gtd. Notes | | 5.125 | | 02/01/28 | | | | | | | 1,373 | | | | 1,288,579 | |
Jefferies Financial Group, Inc., | | | | | | | | | | | | | | | | |
Sr. Unsec’d. Notes | | 2.750 | | 10/15/32 | | | | | | | 9,275 | | | | 6,713,955 | |
John Sevier Combined Cycle Generation LLC, | | | | | | | | | | | | | | | | |
Sec’d. Notes | | 4.626 | | 01/15/42 | | | | | | | 3,755 | | | | 3,241,583 | |
JPMorgan Chase & Co., | | | | | | | | | | | | | | | | |
Jr. Sub. Notes, Series HH | | 4.600(ff) | | 02/01/25(oo) | | | | | | | 23,506 | | | | 21,970,550 | |
JPMorgan Chase Bank, NA, | | | | | | | | | | | | | | | | |
Sr. Unsec’d. Notes | | 4.762(s) | | 03/17/48 | | | ITL(jj) | | | | 29,800,000 | | | | 3,496,758 | |
KB Home, | | | | | | | | | | | | | | | | |
Gtd. Notes | | 6.875 | | 06/15/27 | | | | | | | 1,650 | | | | 1,637,770 | |
Kimco Realty OP LLC, | | | | | | | | | | | | | | | | |
Gtd. Notes | | 2.250 | | 12/01/31 | | | | | | | 4,160 | | | | 3,042,409 | |
Kraft Heinz Foods Co., | | | | | | | | | | | | | | | | |
Gtd. Notes | | 4.875 | | 10/01/49 | | | | | | | 15 | | | | 11,740 | |
Lamb Weston Holdings, Inc., | | | | | | | | | | | | | | | | |
Gtd. Notes, 144A | | 4.125 | | 01/31/30 | | | | | | | 75 | | | | 63,740 | |
Gtd. Notes, 144A | | 4.375 | | 01/31/32 | | | | | | | 1,650 | | | | 1,363,948 | |
See Notes to Financial Statements.
PGIM Global Total Return Fund 37
Schedule of Investments (continued)
as of October 31, 2023
| | | | | | | | | | | | | | | | |
| | | | |
Description | | Interest
Rate | | Maturity
Date | | Principal Amount (000)# | | | Value | |
| | | | | |
CORPORATE BONDS (Continued) | | | | | | | | | | | | | | | | |
| | | | | |
United States (cont’d.) | | | | | | | | | | | | | | | | |
Legacy LifePoint Health LLC, | | | | | | | | | | | | | | | | |
Sr. Sec’d. Notes, 144A | | 4.375% | | 02/15/27 | | | | | | | 75 | | | $ | 62,001 | |
Level 3 Financing, Inc., | | | | | | | | | | | | | | | | |
Sr. Sec’d. Notes, 144A | | 3.400 | | 03/01/27 | | | | | | | 4,042 | | | | 3,759,100 | |
Liberty Mutual Group, Inc., | | | | | | | | | | | | | | | | |
Gtd. Notes, 144A | | 3.951 | | 10/15/50 | | | | | | | 90 | | | | 56,860 | |
LifePoint Health, Inc., | | | | | | | | | | | | | | | | |
Gtd. Notes, 144A | | 5.375 | | 01/15/29 | | | | | | | 3,000 | | | | 1,813,386 | |
Marathon Petroleum Corp., | | | | | | | | | | | | | | | | |
Sr. Unsec’d. Notes | | 6.500 | | 03/01/41 | | | | | | | 9,050 | | | | 8,585,193 | |
Marriott International, Inc., | | | | | | | | | | | | | | | | |
Sr. Unsec’d. Notes, Series HH | | 2.850 | | 04/15/31 | | | | | | | 9,115 | | | | 7,158,001 | |
Medline Borrower LP, | | | | | | | | | | | | | | | | |
Sr. Sec’d. Notes, 144A | | 3.875 | | 04/01/29 | | | | | | | 5,450 | | | | 4,599,403 | |
Sr. Unsec’d. Notes, 144A | | 5.250 | | 10/01/29 | | | | | | | 550 | | | | 468,306 | |
Medtronic Global Holdings SCA, | | | | | | | | | | | | | | | | |
Gtd. Notes | | 1.500 | | 07/02/39 | | | EUR | | | | 500 | | | | 353,829 | |
Gtd. Notes | | 1.750 | | 07/02/49 | | | EUR | | | | 2,100 | | | | 1,285,068 | |
Gtd. Notes | | 2.250 | | 03/07/39 | | | EUR | | | | 1,910 | | | | 1,531,451 | |
MetLife, Inc., | | | | | | | | | | | | | | | | |
Sr. Unsec’d. Notes | | 0.769 | | 05/23/29 | | | JPY | | | | 600,000 | | | | 3,769,120 | |
Morgan Guaranty Trust Co., | | | | | | | | | | | | | | | | |
Sr. Unsec’d. Notes | | 1.146(s) | | 01/21/27 | | | ITL(jj) | | | | 2,275,000 | | | | 1,054,654 | |
Morgan Stanley, | | | | | | | | | | | | | | | | |
Sr. Unsec’d. Notes | | 0.406(ff) | | 10/29/27 | | | EUR | | | | 10,000 | | | | 9,387,463 | |
Sr. Unsec’d. Notes, EMTN | | 0.000 | | 04/02/32 | | | | | | | 17,400 | | | | 9,961,500 | |
Sr. Unsec’d. Notes, EMTN^ | | 0.500(cc) | | 06/26/43 | | | MXN | | | | 16,700 | | | | 138,026 | |
Sr. Unsec’d. Notes, EMTN^ | | 0.500(cc) | | 09/25/43 | | | MXN | | | | 33,900 | | | | 275,182 | |
Sr. Unsec’d. Notes, EMTN | | 5.632(s) | | 10/05/26 | | | IDR | | | | 2,000,000 | | | | 100,194 | |
Sr. Unsec’d. Notes, EMTN | | 7.118(s) | | 06/28/27 | | | MXN | | | | 27,000 | | | | 989,683 | |
Sr. Unsec’d. Notes, EMTN | | 7.500 | | 12/15/27 | | | MXN | | | | 33,300 | | | | 1,597,637 | |
Sr. Unsec’d. Notes, EMTN | | 7.926(s) | | 04/05/32 | | | MXN | | | | 71,000 | | | | 1,542,959 | |
Sr. Unsec’d. Notes, EMTN | | 7.950(s) | | 11/07/31 | | | MXN | | | | 56,000 | | | | 1,279,269 | |
Sr. Unsec’d. Notes, GMTN | | 1.875 | | 03/06/30 | | | EUR | | | | 1,100 | | | | 982,619 | |
MPLX LP, | | | | | | | | | | | | | | | | |
Sr. Unsec’d. Notes | | 4.000 | | 03/15/28 | | | | | | | 515 | | | | 471,879 | |
MPT Operating Partnership LP/MPT Finance Corp., | | | | | | | | | | | | | | | | |
Gtd. Notes(a) | | 3.325 | | 03/24/25 | | | EUR | | | | 1,700 | | | | 1,600,366 | |
Nationstar Mortgage Holdings, Inc., | | | | | | | | | | | | | | | | |
Gtd. Notes, 144A | | 5.125 | | 12/15/30 | | | | | | | 225 | | | | 182,858 | |
Gtd. Notes, 144A | | 5.500 | | 08/15/28 | | | | | | | 2,265 | | | | 2,000,379 | |
Gtd. Notes, 144A | | 6.000 | | 01/15/27 | | | | | | | 735 | | | | 684,073 | |
See Notes to Financial Statements.
38
| | | | | | | | | | | | | | | | |
| | | | |
Description | | Interest
Rate | | Maturity
Date | | Principal Amount (000)# | | | Value | |
| | | | | |
CORPORATE BONDS (Continued) | | | | | | | | | | | | | | | | |
| | | | | |
United States (cont’d.) | | | | | | | | | | | | | | | | |
NRG Energy, Inc., | | | | | | | | | | | | | | | | |
Jr. Sub. Notes, 144A | | 10.250%(ff) | | 03/15/28(oo) | | | | | | | 650 | | | $ | 627,250 | |
Sr. Sec’d. Notes, 144A | | 3.750 | | 06/15/24 | | | | | | | 5,600 | | | | 5,490,370 | |
Occidental Petroleum Corp., | | | | | | | | | | | | | | | | |
Sr. Unsec’d. Notes | | 6.450 | | 09/15/36 | | | | | | | 35 | | | | 33,997 | |
OneMain Finance Corp., | | | | | | | | | | | | | | | | |
Gtd. Notes(a) | | 4.000 | | 09/15/30 | | | | | | | 1,500 | | | | 1,098,671 | |
ONEOK, Inc., | | | | | | | | | | | | | | | | |
Gtd. Notes | | 3.100 | | 03/15/30 | | | | | | | 7,350 | | | | 6,065,323 | |
Gtd. Notes | | 4.450 | | 09/01/49 | | | | | | | 2,000 | | | | 1,370,212 | |
Gtd. Notes | | 5.550 | | 11/01/26 | | | | | | | 2,080 | | | | 2,054,902 | |
Gtd. Notes | | 5.650 | | 11/01/28 | | | | | | | 1,510 | | | | 1,473,720 | |
Gtd. Notes(a) | | 6.050 | | 09/01/33 | | | | | | | 5,600 | | | | 5,369,974 | |
Organon & Co./Organon Foreign Debt Co-Issuer BV, | | | | | | | | | | | | | | | | |
Sr. Sec’d. Notes, 144A | | 4.125 | | 04/30/28 | | | | | | | 800 | | | | 691,118 | |
Sr. Unsec’d. Notes, 144A(a) | | 5.125 | | 04/30/31 | | | | | | | 1,725 | | | | 1,347,905 | |
Pactiv Evergreen Group Issuer LLC/Pactiv Evergreen | | | | | | | | | | | | | | | | |
Group Issuer, Inc., | | | | | | | | | | | | | | | | |
Sr. Sec’d. Notes, 144A | | 4.375 | | 10/15/28 | | | | | | | 725 | | | | 619,655 | |
Pactiv Evergreen Group Issuer, Inc./Pactiv | | | | | | | | | | | | | | | | |
Evergreen Group Issuer LLC, | | | | | | | | | | | | | | | | |
Sr. Sec’d. Notes, 144A | | 4.000 | | 10/15/27 | | | | | | | 492 | | | | 432,790 | |
Pilgrim’s Pride Corp., | | | | | | | | | | | | | | | | |
Gtd. Notes | | 4.250 | | 04/15/31 | | | | | | | 4,550 | | | | 3,752,442 | |
Post Holdings, Inc., | | | | | | | | | | | | | | | | |
Sr. Unsec’d. Notes, 144A(a) | | 4.500 | | 09/15/31 | | | | | | | 2,325 | | | | 1,887,217 | |
Prologis Yen Finance LLC, | | | | | | | | | | | | | | | | |
Gtd. Notes | | 0.885 | | 06/27/36 | | | JPY | | | | 200,000 | | | | 1,069,750 | |
Gtd. Notes | | 0.972 | | 09/25/28 | | | JPY | | | | 700,000 | | | | 4,459,532 | |
Gtd. Notes | | 1.003 | | 06/24/32 | | | JPY | | | | 1,500,000 | | | | 8,855,283 | |
Gtd. Notes | | 1.222 | | 06/22/35 | | | JPY | | | | 200,000 | | | | 1,122,599 | |
Realty Income Corp., | | | | | | | | | | | | | | | | |
Sr. Unsec’d. Notes | | 2.200 | | 06/15/28 | | | | | | | 480 | | | | 404,448 | |
Sr. Unsec’d. Notes | | 4.875 | | 07/06/30 | | | EUR | | | | 6,300 | | | | 6,603,529 | |
Sally Holdings LLC/Sally Capital, Inc., | | | | | | | | | | | | | | | | |
Gtd. Notes | | 5.625 | | 12/01/25 | | | | | | | 4,525 | | | | 4,373,332 | |
Service Properties Trust, | | | | | | | | | | | | | | | | |
Sr. Unsec’d. Notes | | 4.350 | | 10/01/24 | | | | | | | 3,600 | | | | 3,451,432 | |
Southaven Combined Cycle Generation LLC, | | | | | | | | | | | | | | | | |
Sec’d. Notes | | 3.846 | | 08/15/33 | | | | | | | 7 | | | | 6,024 | |
Sprint Capital Corp., | | | | | | | | | | | | | | | | |
Gtd. Notes | | 8.750 | | 03/15/32 | | | | | | | 1,985 | | | | 2,232,020 | |
See Notes to Financial Statements.
PGIM Global Total Return Fund 39
Schedule of Investments (continued)
as of October 31, 2023
| | | | | | | | | | | | | | | | |
| | | | |
Description | | Interest
Rate | | Maturity
Date | | Principal
Amount
(000)# | | | Value | |
| | | | | |
CORPORATE BONDS (Continued) | | | | | | | | | | | | | | | | |
| | | | | |
United States (cont’d.) | | | | | | | | | | | | | | | | |
Sprint LLC, | | | | | | | | | | | | | | | | |
Gtd. Notes | | 7.625% | | 02/15/25 | | | | | | | 300 | | | $ | 304,123 | |
Standard Industries, Inc., | | | | | | | | | | | | | | | | |
Sr. Unsec’d. Notes, 144A | | 4.375 | | 07/15/30 | | | | | | | 4,550 | | | | 3,722,398 | |
Stellantis Finance US, Inc., | | | | | | | | | | | | | | | | |
Gtd. Notes, 144A | | 2.691 | | 09/15/31 | | | | | | | 3,645 | | | | 2,756,558 | |
Tallgrass Energy Partners LP/Tallgrass Energy | | | | | | | | | | | | | | | | |
Finance Corp., | | | | | | | | | | | | | | | | |
Gtd. Notes, 144A | | 5.500 | | 01/15/28 | | | | | | | 2,625 | | | | 2,310,223 | |
Gtd. Notes, 144A(a) | | 6.000 | | 12/31/30 | | | | | | | 1,700 | | | | 1,441,123 | |
Gtd. Notes, 144A | | 7.500 | | 10/01/25 | | | | | | | 1,075 | | | | 1,061,742 | |
Taylor Morrison Communities, Inc., | | | | | | | | | | | | | | | | |
Gtd. Notes, 144A | | 5.750 | | 01/15/28 | | | | | | | 2,723 | | | | 2,477,660 | |
Sr. Unsec’d. Notes, 144A | | 5.125 | | 08/01/30 | | | | | | | 175 | | | | 147,464 | |
Tenet Healthcare Corp., | | | | | | | | | | | | | | | | |
Gtd. Notes(a) | | 6.125 | | 10/01/28 | | | | | | | 850 | | | | 786,365 | |
Sr. Sec’d. Notes | | 4.250 | | 06/01/29 | | | | | | | 600 | | | | 514,094 | |
Sr. Sec’d. Notes | | 4.375 | | 01/15/30 | | | | | | | 150 | | | | 127,018 | |
Sr. Sec’d. Notes | | 5.125 | | 11/01/27 | | | | | | | 1,955 | | | | 1,806,297 | |
Texas Capital Bank NA, | | | | | | | | | | | | | | | | |
Sr. Unsec’d. Notes, 144A, 3 Month LIBOR + 4.500% | | 10.156(c) | | 09/30/24 | | | | | | | 10,924 | | | | 10,831,820 | |
Thermo Fisher Scientific, Inc., | | | | | | | | | | | | | | | | |
Sr. Unsec’d. Notes | | 2.875 | | 07/24/37 | | | EUR | | | | 450 | | | | 407,114 | |
Sr. Unsec’d. Notes | | 3.650 | | 11/21/34 | | | EUR | | | | 2,100 | | | | 2,131,693 | |
Time Warner Cable Enterprises LLC, | | | | | | | | | | | | | | | | |
Sr. Sec’d. Notes | | 8.375 | | 07/15/33 | | | | | | | 2,065 | | | | 2,150,325 | |
Tote Shipholdings LLC, | | | | | | | | | | | | | | | | |
U.S. Gov’t. Gtd. Notes | | 3.400 | | 10/16/40 | | | | | | | 88 | | | | 76,923 | |
Truist Financial Corp., | | | | | | | | | | | | | | | | |
Sr. Unsec’d. Notes, MTN | | 5.867(ff) | | 06/08/34 | | | | | | | 780 | | | | 709,864 | |
Sr. Unsec’d. Notes, MTN | | 7.161(ff) | | 10/30/29 | | | | | | | 2,345 | | | | 2,358,553 | |
U.S. Bancorp, | | | | | | | | | | | | | | | | |
Jr. Sub. Notes | | 3.700(ff) | | 01/15/27(oo) | | | | | | | 18,150 | | | | 12,733,979 | |
UGI International LLC, | | | | | | | | | | | | | | | | |
Gtd. Notes, 144A | | 2.500 | | 12/01/29 | | | EUR | | | | 8,225 | | | | 7,038,448 | |
United Airlines, Inc., | | | | | | | | | | | | | | | | |
Sr. Sec’d. Notes, 144A | | 4.375 | | 04/15/26 | | | | | | | 3,750 | | | | 3,487,848 | |
Sr. Sec’d. Notes, 144A | | 4.625 | | 04/15/29 | | | | | | | 950 | | | | 803,174 | |
United Rentals North America, Inc., | | | | | | | | | | | | | | | | |
Gtd. Notes | | 3.750 | | 01/15/32 | | | | | | | 250 | | | | 198,906 | |
Gtd. Notes | | 3.875 | | 02/15/31 | | | | | | | 391 | | | | 321,231 | |
See Notes to Financial Statements.
40
| | | | | | | | | | | | | | | | |
| | | | |
Description | | Interest
Rate | | Maturity
Date | | Principal
Amount (000)# | | | Value | |
| | | | | |
CORPORATE BONDS (Continued) | | | | | | | | | | | | | | | | |
| | | | | |
United States (cont’d.) | | | | | | | | | | | | | | | | |
United Rentals North America, Inc., (cont’d.) | | | | | | | | | | | | | | | | |
Gtd. Notes(a) | | 4.875% | | 01/15/28 | | | | | | | 3,115 | | | $ | 2,894,054 | |
Gtd. Notes | | 5.250 | | 01/15/30 | | | | | | | 2,340 | | | | 2,139,983 | |
Univision Communications, Inc., | | | | | | | | | | | | | | | | |
Sr. Sec’d. Notes, 144A | | 6.625 | | 06/01/27 | | | | | | | 3,335 | | | | 3,046,208 | |
Vector Group Ltd., | | | | | | | | | | | | | | | | |
Sr. Sec’d. Notes, 144A | | 5.750 | | 02/01/29 | | | | | | | 4,750 | | | | 4,027,157 | |
Ventas Realty LP, | | | | | | | | | | | | | | | | |
Gtd. Notes | | 2.500 | | 09/01/31 | | | | | | | 7,995 | | | | 6,006,937 | |
Verizon Communications, Inc., | | | | | | | | | | | | | | | | |
Sr. Unsec’d. Notes | | 2.500 | | 04/08/31 | | | GBP | | | | 1,400 | | | | 1,351,814 | |
Sr. Unsec’d. Notes, MTN | | 2.650 | | 05/06/30 | | | AUD | | | | 1,600 | | | | 806,893 | |
Sr. Unsec’d. Notes, MTN | | 3.000 | | 03/23/31 | | | AUD | | | | 1,000 | | | | 494,991 | |
Sr. Unsec’d. Notes, Series MPLE | | 4.050 | | 03/22/51 | | | CAD | | | | 3,200 | | | | 1,675,861 | |
Viatris, Inc., | | | | | | | | | | | | | | | | |
Gtd. Notes | | 3.850 | | 06/22/40 | | | | | | | 4,410 | | | | 2,740,435 | |
Gtd. Notes | | 4.000 | | 06/22/50 | | | | | | | 4,425 | | | | 2,539,300 | |
VICI Properties LP/VICI Note Co., Inc., | | | | | | | | | | | | | | | | |
Gtd. Notes, 144A | | 4.250 | | 12/01/26 | | | | | | | 4,000 | | | | 3,693,910 | |
Vistra Corp., | | | | | | | | | | | | | | | | |
Jr. Sub. Notes, 144A | | 7.000(ff) | | 12/15/26(oo) | | | | | | | 2,650 | | | | 2,422,449 | |
Jr. Sub. Notes, 144A | | 8.000(ff) | | 10/15/26(oo) | | | | | | | 9,650 | | | | 9,168,319 | |
Vistra Operations Co. LLC, | | | | | | | | | | | | | | | | |
Gtd. Notes, 144A | | 5.000 | | 07/31/27 | | | | | | | 3,520 | | | | 3,229,434 | |
Sr. Sec’d. Notes, 144A | | 3.550 | | 07/15/24 | | | | | | | 14,300 | | | | 13,945,454 | |
Warnermedia Holdings, Inc., | | | | | | | | | | | | | | | | |
Gtd. Notes | | 5.050 | | 03/15/42 | | | | | | | 4,355 | | | | 3,220,653 | |
Gtd. Notes | | 5.141 | | 03/15/52 | | | | | | | 2,610 | | | | 1,847,594 | |
Gtd. Notes | | 5.391 | | 03/15/62 | | | | | | | 154 | | | | 107,860 | |
Wells Fargo & Co., | | | | | | | | | | | | | | | | |
Sr. Unsec’d. Notes | | 4.000 | | 04/27/27 | | | AUD | | | | 4,198 | | | | 2,481,584 | |
Sr. Unsec’d. Notes, GMTN | | 3.700 | | 07/27/26 | | | AUD | | | | 1,458 | | | | 872,569 | |
Sr. Unsec’d. Notes, MTN | | 2.572(ff) | | 02/11/31 | | | | | | | 7,890 | | | | 6,253,399 | |
Welltower OP LLC, | | | | | | | | | | | | | | | | |
Gtd. Notes | | 2.050 | | 01/15/29 | | | | | | | 3,100 | | | | 2,524,792 | |
Gtd. Notes | | 2.800 | | 06/01/31 | | | | | | | 10,300 | | | | 8,062,605 | |
Gtd. Notes | | 3.100 | | 01/15/30 | | | | | | | 5,600 | | | | 4,647,986 | |
See Notes to Financial Statements.
PGIM Global Total Return Fund 41
Schedule of Investments (continued)
as of October 31, 2023
| | | | | | | | | | | | | | | | | | | | |
| | | | |
Description | | Interest
Rate | | | Maturity
Date | | | Principal
Amount
(000)# | | | Value | |
| | | | | |
CORPORATE BONDS (Continued) | | | | | | | | | | | | | | | | | | | | |
| | | | | |
United States (cont’d.) | | | | | | | | | | | | | | | | | | | | |
WPC Eurobond BV, | | | | | | | | | | | | | | | | | | | | |
Gtd. Notes | | | 0.950% | | | | 06/01/30 | | | | EUR | | | | 9,950 | | | $ | 7,979,559 | |
| | | | | | | | | | | | | | | | | | | | |
| | | | | |
| | | | | | | | | | | | | | | | | | | 645,614,045 | |
| | | | | | | | | | | | | | | | | | | | |
| | | | | |
TOTAL CORPORATE BONDS | | | | | | | | | | | | | | | | | | | | |
(cost $1,449,037,652) | | | | | | | | | | | | | | | | | | | 1,176,540,891 | |
| | | | | | | | | | | | | | | | | | | | |
| | | | | |
FLOATING RATE AND OTHER LOANS 0.8% | | | | | | | | | | | | | | | | | | | | |
| | | | | |
Jamaica 0.0% | | | | | | | | | | | | | | | | | | | | |
Digicel International Finance Ltd., | | | | | | | | | | | | | | | | | | | | |
First Lien Initial Term B Loan, 6 Month LIBOR + 3.250% | | | 8.981(c) | | | | 05/27/24 | | | | | | | | 432 | | | | 394,515 | |
| | | | | |
United Kingdom 0.8% | | | | | | | | | | | | | | | | | | | | |
Constellation Automotive Group Ltd., | | | | | | | | | | | | | | | | | | | | |
Facility B2 (First Lien), SONIA + 4.750% | | | 9.938(c) | | | | 07/28/28 | | | | GBP | | | | 3,850 | | | | 4,247,800 | |
EG Group Ltd., | | | | | | | | | | | | | | | | | | | | |
Additional Second Lien Loan Facility, 3 Month
EURIBOR + 7.000% | | | 10.972(c) | | | | 04/30/27 | | | | EUR | | | | 16,813 | | | | 15,936,722 | |
| | | | | | | | | | | | | | | | | | | | |
| | | | | |
| | | | | | | | | | | | | | | | | | | 20,184,522 | |
| | | | | |
United States 0.0% | | | | | | | | | | | | | | | | | | | | |
Diamond Sports Group LLC, | | | | | | | | | | | | | | | | | | | | |
First Lien Term Loan, 1 Month SOFR + 10.100% | | | 12.775(c) | | | | 05/25/26 | | | | | | | | 247 | | | | 92,737 | |
Second Lien Term Loan, 6 Month SOFR + 3.500% | | | 8.669(c) | | | | 08/24/26 | | | | | | | | 7,155 | | | | 80,490 | |
| | | | | | | | | | | | | | | | | | | | |
| | | | | |
| | | | | | | | | | | | | | | | | | | 173,227 | |
| | | | | | | | | | | | | | | | | | | | |
| | | | | |
TOTAL FLOATING RATE AND OTHER LOANS | | | | | | | | | | | | | | | | | | | | |
(cost $28,342,677) | | | | | | | | | | | | | | | | | | | 20,752,264 | |
| | | | | | | | | | | | | | | | | | | | |
| | | | | |
MUNICIPAL BOND 0.2% | | | | | | | | | | | | | | | | | | | | |
| | | | | |
Puerto Rico | | | | | | | | | | | | | | | | | | | | |
Commonwealth of Puerto Rico, | | | | | | | | | | | | | | | | | | | | |
General Obligation, Sub-Series C | | | | | | | | | | | | | | | | | | | | |
(cost $6,071,252) | | | 0.000(cc) | | | | 11/01/43 | | | | | | | | 10,573 | | | | 5,432,304 | |
| | | | | | | | | | | | | | | | | | | | |
See Notes to Financial Statements.
42
| | | | | | | | | | | | | | | | |
| | | | |
Description | | Interest
Rate | | Maturity
Date | | Principal
Amount (000)# | | | Value | |
| | | | | |
RESIDENTIAL MORTGAGE-BACKED SECURITIES 4.3% | | | | | | | | | | | | | | | | |
| | | | | |
Spain 0.0% | | | | | | | | | | | | | | | | |
Retiro Mortgage Securities DAC, | | | | | | | | | | | | | | | | |
Series 01A, Class A1, 144A, 3 Month EURIBOR + 2.000% (Cap 5.000%, Floor 0.000%) | | 5.000%(c) | | 07/30/75 | | | EUR | | | | 1,693 | | | $ | 1,757,725 | |
| | | | | |
United States 4.3% | | | | | | | | | | | | | | | | |
APS Resecuritization Trust, | | | | | | | | | | | | | | | | |
Series 2016-01, Class 1A, 144A, 1 Month SOFR + 0.264% (Cap N/A, Floor 0.150%) | | 5.579(c) | | 07/27/57 | | | | | | | 23 | | | | 23,081 | |
Bellemeade Re Ltd., | | | | | | | | | | | | | | | | |
Series 2021-01A, Class M1C, 144A, 30 Day Average SOFR + 2.950% (Cap N/A, Floor 2.950%) | | 8.271(c) | | 03/25/31 | | | | | | | 1,750 | | | | 1,778,938 | |
Series 2021-03A, Class M1B, 144A, 30 Day Average SOFR + 1.400% (Cap N/A, Floor 1.400%) | | 6.721(c) | | 09/25/31 | | | | | | | 1,200 | | | | 1,195,995 | |
Connecticut Avenue Securities Trust, | | | | | | | | | | | | | | | | |
Series 2019-R07, Class 1M2, 144A, 30 Day Average SOFR + 2.214% (Cap N/A, Floor 0.000%) | | 7.535(c) | | 10/25/39 | | | | | | | 16 | | | | 15,512 | |
Series 2020-R01, Class 1M2, 144A, 30 Day Average SOFR + 2.164% (Cap N/A, Floor 0.000%) | | 7.485(c) | | 01/25/40 | | | | | | | 373 | | | | 376,868 | |
Series 2021-R01, Class 1B1, 144A, 30 Day Average SOFR + 3.100% (Cap N/A, Floor 0.000%) | | 8.421(c) | | 10/25/41 | | | | | | | 1,250 | | | | 1,246,108 | |
Series 2021-R01, Class 1M2, 144A, 30 Day Average SOFR + 1.550% (Cap N/A, Floor 0.000%) | | 6.871(c) | | 10/25/41 | | | | | | | 240 | | | | 237,777 | |
Series 2022-R01, Class 1B1, 144A, 30 Day Average SOFR + 3.150% (Cap N/A, Floor 0.000%) | | 8.471(c) | | 12/25/41 | | | | | | | 340 | | | | 338,940 | |
Series 2022-R01, Class 1M2, 144A, 30 Day Average SOFR + 1.900% (Cap N/A, Floor 0.000%) | | 7.221(c) | | 12/25/41 | | | | | | | 100 | | | | 98,501 | |
Series 2022-R04, Class 1M2, 144A, 30 Day Average SOFR + 3.100% (Cap N/A, Floor 0.000%) | | 8.421(c) | | 03/25/42 | | | | | | | 1,200 | | | | 1,221,664 | |
Series 2023-R06, Class 1M2, 144A, 30 Day Average SOFR + 2.700% (Cap N/A, Floor 0.000%) | | 8.021(c) | | 07/25/43 | | | | | | | 270 | | | | 272,202 | |
Credit Suisse Mortgage Trust, | | | | | | | | | | | | | | | | |
Series 2020-RPL06, Class A1, 144A | | 2.688(cc) | | 03/25/59 | | | | | | | 1,932 | | | | 1,887,018 | |
See Notes to Financial Statements.
PGIM Global Total Return Fund 43
Schedule of Investments (continued)
as of October 31, 2023
| | | | | | | | | | | | | | | | |
| | | | |
Description | | Interest
Rate | | Maturity
Date | | Principal
Amount
(000)# | | | Value | |
| | | | | |
RESIDENTIAL MORTGAGE-BACKED SECURITIES (Continued) | | | | | | | | | | | | | | | | |
| | | | | |
United States (cont’d.) | | | | | | | | | | | | | | | | |
Eagle Re Ltd., | | | | | | | | | | | | | | | | |
Series 2021-01, Class M1C, 144A, 30 Day Average SOFR + 2.700% (Cap N/A, Floor 2.700%) | | 8.021%(c) | | 10/25/33 | | | | | | | 2,751 | | | $ | 2,763,122 | |
Series 2021-02, Class M1C, 144A, 30 Day Average SOFR + 3.450% (Cap N/A, Floor 3.450%) | | 8.771(c) | | 04/25/34 | | | | | | | 3,500 | | | | 3,529,614 | |
Series 2023-01, Class M1A, 144A, 30 Day Average SOFR + 2.000% (Cap N/A, Floor 2.000%) | | 7.321(c) | | 09/26/33 | | | | | | | 700 | | | | 700,408 | |
Fannie Mae Connecticut Avenue Securities, | | | | | | | | | | | | | | | | |
Series 2021-R02, Class 2B1, 144A, 30 Day Average SOFR + 3.300% (Cap N/A, Floor 0.000%) | | 8.621(c) | | 11/25/41 | | | | | | | 260 | | | | 258,050 | |
Series 2021-R02, Class 2M2, 144A, 30 Day Average SOFR + 2.000% (Cap N/A, Floor 0.000%) | | 7.321(c) | | 11/25/41 | | | | | | | 1,440 | | | | 1,413,144 | |
Fannie Mae REMIC, | | | | | | | | | | | | | | | | |
Series 2012-107, Class GI, IO | | 3.500 | | 09/25/27 | | | | | | | 1,285 | | | | 43,385 | |
FHLMC Structured Agency Credit Risk Debt Notes, | | | | | | | | | | | | | | | | |
Series 2020-HQA05, Class B1, 144A, 30 Day Average SOFR + 4.000% (Cap N/A, Floor 0.000%) | | 9.321(c) | | 11/25/50 | | | | | | | 595 | | | | 630,757 | |
Series 2020-HQA05, Class M2, 144A, 30 Day Average SOFR + 2.600% (Cap N/A, Floor 0.000%) | | 7.921(c) | | 11/25/50 | | | | | | | 1,372 | | | | 1,388,519 | |
Series 2021-DNA02, Class B1, 144A, 30 Day Average SOFR + 3.400% (Cap N/A, Floor 0.000%) | | 8.721(c) | | 08/25/33 | | | | | | | 1,700 | | | | 1,732,310 | |
FHLMC Structured Agency Credit Risk REMIC Trust, | | | | | | | | | | | | | | | | |
Series 2020-DNA02, Class M2, 144A, 30 Day Average SOFR + 1.964% (Cap N/A, Floor 0.000%) | | 7.285(c) | | 02/25/50 | | | | | | | 1,378 | | | | 1,389,031 | |
Series 2020-DNA06, Class B1, 144A, 30 Day Average SOFR + 3.000% (Cap N/A, Floor 0.000%) | | 8.321(c) | | 12/25/50 | | | | | | | 400 | | | | 401,496 | |
Series 2020-HQA02, Class M2, 144A, 30 Day Average SOFR + 3.214% (Cap N/A, Floor 0.000%) | | 8.535(c) | | 03/25/50 | | | | | | | 110 | | | | 113,318 | |
Series 2020-HQA04, Class B1, 144A, 30 Day Average SOFR + 5.364% (Cap N/A, Floor 0.000%) | | 10.685(c) | | 09/25/50 | | | | | | | 1,163 | | | | 1,253,572 | |
See Notes to Financial Statements.
44
| | | | | | | | | | | | | | | | |
| | | | |
Description | | Interest
Rate | | Maturity
Date | | Principal
Amount
(000)# | | | Value | |
| | | | |
RESIDENTIAL MORTGAGE-BACKED SECURITIES (Continued) | | | | | | | | | | | | | | |
| | | | | |
United States (cont’d.) | | | | | | | | | | | | | | | | |
FHLMC Structured Agency Credit Risk REMIC Trust, (cont’d.) | | | | | | | | | | | | | | |
Series 2021-DNA01, Class B1, 144A, 30 Day Average SOFR + 2.650% (Cap N/A, Floor 0.000%) | | 7.971%(c) | | 01/25/51 | | | | | | | 2,995 | | | $ | 2,923,902 | |
Series 2021-DNA01, Class M2, 144A, 30 Day Average SOFR + 1.800% (Cap N/A, Floor 0.000%) | | 7.121(c) | | 01/25/51 | | | | | | | 8,702 | | | | 8,658,194 | |
Series 2021-DNA03, Class B1, 144A, 30 Day Average SOFR + 3.500% (Cap N/A, Floor 0.000%) | | 8.821(c) | | 10/25/33 | | | | | | | 600 | | | | 612,372 | |
Series 2021-DNA05, Class B1, 144A, 30 Day Average SOFR + 3.050% (Cap N/A, Floor 0.000%) | | 8.371(c) | | 01/25/34 | | | | | | | 2,430 | | | | 2,430,000 | |
Series 2021-DNA05, Class M2, 144A, 30 Day Average SOFR + 1.650% (Cap N/A, Floor 0.000%) | | 6.971(c) | | 01/25/34 | | | | | | | 1,139 | | | | 1,139,368 | |
Series 2021-DNA06, Class B1, 144A, 30 Day Average SOFR + 3.400% (Cap N/A, Floor 0.000%) | | 8.721(c) | | 10/25/41 | | | | | | | 1,630 | | | | 1,638,150 | |
Series 2021-DNA06, Class M2, 144A, 30 Day Average SOFR + 1.500% (Cap N/A, Floor 0.000%) | | 6.821(c) | | 10/25/41 | | | | | | | 100 | | | | 98,481 | |
Series 2021-DNA07, Class M2, 144A, 30 Day Average SOFR + 1.800% (Cap N/A, Floor 0.000%) | | 7.121(c) | | 11/25/41 | | | | | | | 200 | | | | 196,441 | |
Series 2021-HQA01, Class B1, 144A, 30 Day Average SOFR + 3.000% (Cap N/A, Floor 0.000%) | | 8.321(c) | | 08/25/33 | | | | | | | 13,800 | | | | 13,601,694 | |
Series 2021-HQA01, Class M2, 144A, 30 Day Average SOFR + 2.250% (Cap N/A, Floor 0.000%) | | 7.571(c) | | 08/25/33 | | | | | | | 16,231 | | | | 16,043,466 | |
Series 2021-HQA02, Class B1, 144A, 30 Day Average SOFR + 3.150% (Cap N/A, Floor 0.000%) | | 8.471(c) | | 12/25/33 | | | | | | | 2,000 | | | | 1,975,000 | |
Series 2021-HQA03, Class B1, 144A, 30 Day Average SOFR + 3.350% (Cap N/A, Floor 0.000%) | | 8.671(c) | | 09/25/41 | | | | | | | 500 | | | | 496,250 | |
Series 2021-HQA03, Class M2, 144A, 30 Day Average SOFR + 2.100% (Cap N/A, Floor 0.000%) | | 7.421(c) | | 09/25/41 | | | | | | | 3,350 | | | | 3,253,687 | |
See Notes to Financial Statements.
PGIM Global Total Return Fund 45
Schedule of Investments (continued)
as of October 31, 2023
| | | | | | | | | | | | | | | | |
| | | | |
Description | | Interest
Rate | | Maturity
Date | | Principal
Amount
(000)# | | | Value | |
| | | | |
RESIDENTIAL MORTGAGE-BACKED SECURITIES (Continued) | | | | | | | | | | | | | | |
| | | | | |
United States (cont’d.) | | | | | | | | | | | | | | | | |
FHLMC Structured Agency Credit Risk REMIC Trust, (cont’d.) | | | | | | | | | | | | | | |
Series 2021-HQA04, Class M2, 144A, 30 Day Average SOFR + 2.350% (Cap N/A, Floor 0.000%) | | 7.671%(c) | | 12/25/41 | | | | | | | 2,100 | | | $ | 2,034,375 | |
Series 2022-DNA01, Class M1B, 144A, 30 Day Average SOFR + 1.850% (Cap N/A, Floor 0.000%) | | 7.171(c) | | 01/25/42 | | | | | | | 300 | | | | 295,503 | |
Series 2022-DNA02, Class M1B, 144A, 30 Day Average SOFR + 2.400% (Cap N/A, Floor 0.000%) | | 7.721(c) | | 02/25/42 | | | | | | | 700 | | | | 701,310 | |
Series 2022-DNA04, Class M1B, 144A, 30 Day Average SOFR + 3.350% (Cap N/A, Floor 0.000%) | | 8.671(c) | | 05/25/42 | | | | | | | 300 | | | | 309,711 | |
Freddie Mac REMIC, | | | | | | | | | | | | | | | | |
Series 4166, Class IO, IO | | 3.500 | | 02/15/43 | | | | | | | 4,218 | | | | 715,284 | |
GCAT Asset-Backed Notes, | | | | | | | | | | | | | | | | |
Series 2021-01, Class A1, 144A | | 2.487 | | 11/25/49 | | | | | | | 10,964 | | | | 9,906,055 | |
Home Re Ltd., | | | | | | | | | | | | | | | | |
Series 2019-01, Class M1, 144A, 1 Month LIBOR + 1.650% (Cap N/A, Floor 0.000%) | | 7.089(c) | | 05/25/29 | | | | | | | 378 | | | | 377,944 | |
Series 2021-02, Class M1C, 144A, 30 Day Average SOFR + 2.800% (Cap N/A, Floor 0.000%) | | 8.121(c) | | 01/25/34 | | | | | | | 4,790 | | | | 4,838,511 | |
Legacy Mortgage Asset Trust, | | | | | | | | | | | | | | | | |
Series 2020-GS01, Class A1, 144A | | 5.882(cc) | | 10/25/59 | | | | | | | 4,661 | | | | 4,622,377 | |
New Residential Mortgage Loan Trust, | | | | | | | | | | | | | | | | |
Series 2018-04A, Class A1S, 144A, 1 Month SOFR + 0.864% (Cap N/A, Floor 0.750%) | | 6.189(c) | | 01/25/48 | | | | | | | 497 | | | | 480,709 | |
Oaktown Re VI Ltd., | | | | | | | | | | | | | | | | |
Series 2021-01A, Class M1B, 144A, 30 Day Average SOFR + 2.050% (Cap N/A, Floor 2.050%) | | 7.371(c) | | 10/25/33 | | | | | | | 1,191 | | | | 1,193,056 | |
Oaktown Re VII Ltd., | | | | | | | | | | | | | | | | |
Series 2021-02, Class M1A, 144A, 30 Day Average SOFR + 1.600% (Cap N/A, Floor 1.600%) | | 6.921(c) | | 04/25/34 | | | | | | | 1,590 | | | | 1,587,041 | |
Series 2021-02, Class M1B, 144A, 30 Day Average SOFR + 2.900% (Cap N/A, Floor 2.900%) | | 8.221(c) | | 04/25/34 | | | | | | | 700 | | | | 706,647 | |
PNMAC GMSR Issuer Trust, | | | | | | | | | | | | | | | | |
Series 2018-GT01, Class A, 144A, 1 Month LIBOR + 3.850% (Cap N/A, Floor 2.850%) | | 9.289(c) | | 02/25/25 | | | | | | | 1,020 | | | | 1,019,993 | |
See Notes to Financial Statements.
46
| | | | | | | | | | | | | | | | | | | | |
| | | | |
Description | | Interest
Rate | | | Maturity
Date | | | Principal Amount (000)# | | | Value | |
| | | | |
RESIDENTIAL MORTGAGE-BACKED SECURITIES (Continued) | | | | | | | | | | | | | | | | | |
| | | | | |
United States (cont’d.) | | | | | | | | | | | | | | | | | | | | |
PNMAC GMSR Issuer Trust, (cont’d.) | | | | | | | | | | | | | | | | | | | | |
Series 2018-GT02, Class A, 144A, 1 Month LIBOR + 2.650% (Cap N/A, Floor 0.000%) | | | 8.089%(c) | | | | 08/25/25 | | | | | | | | 2,300 | | | $ | 2,298,635 | |
Radnor Re Ltd., | | | | | | | | | | | | | | | | | | | | |
Series 2021-02, Class M1B, 144A, 30 Day Average SOFR + 3.700% (Cap N/A, Floor 3.700%) | | | 9.021(c) | | | | 11/25/31 | | | | | | | | 5,100 | | | | 5,219,179 | |
| | | | | | | | | | | | | | | | | | | | |
| | | | | |
| | | | | | | | | | | | | | | | | | | 113,682,665 | |
| | | | | | | | | | | | | | | | | | | | |
| | | | | |
TOTAL RESIDENTIAL MORTGAGE-BACKED SECURITIES
(cost $116,406,156) | | | | | | | | | | | | | | | | | | | 115,440,390 | |
| | | | | | | | | | | | | | | | | | | | |
| | | | | |
SOVEREIGN BONDS 25.7% | | | | | | | | | | | | | | | | | | | | |
| | | | | |
Albania 0.0% | | | | | | | | | | | | | | | | | | | | |
Albania Government International Bond, | | | | | | | | | | | | | | | | | | | | |
Sr. Unsec’d. Notes, 144A | | | 3.500 | | | | 10/09/25 | | | | EUR | | | | 1,000 | | | | 1,009,576 | |
| | | | | |
Andorra 0.0% | | | | | | | | | | | | | | | | | | | | |
Andorra International Bond, | | | | | | | | | | | | | | | | | | | | |
Sr. Unsec’d. Notes, EMTN | | | 1.250 | | | | 05/06/31 | | | | EUR | | | | 400 | | | | 340,539 | |
| | | | | |
Argentina 0.1% | | | | | | | | | | | | | | | | | | | | |
Argentine Republic Government International Bond, | | | | | | | | | | | | | | | | | | | | |
Bonds | | | 4.330 | | | | 12/31/33(d) | | | | JPY | | | | 519,215 | | | | 616,584 | |
Sr. Unsec’d. Notes | | | 0.670 | | | | 12/31/38(d) | | | | JPY | | | | 1,637,456 | | | | 1,280,044 | |
Sr. Unsec’d. Notes | | | 0.670 | | | | 12/31/38(d) | | | | JPY | | | | 64,960 | | | | 50,892 | |
Sr. Unsec’d. Notes | | | 0.670 | | | | 12/31/38 | | | | JPY | | | | 1,812 | | | | 1,420 | |
Sr. Unsec’d. Notes | | | 4.330 | | | | 12/31/33 | | | | JPY | | | | 64,884 | | | | 77,052 | |
| | | | | | | | | | | | | | | | | | | | |
| | | | | |
| | | | | | | | | | | | | | | | | | | 2,025,992 | |
| | | | | |
Austria 0.1% | | | | | | | | | | | | | | | | | | | | |
Republic of Austria Government International Bond, Sr. Unsec’d. Notes, 144A, MTN | | | 5.375 | | | | 12/01/34 | | | | CAD | | | | 2,143 | | | | 1,619,655 | |
| | | | | |
Brazil 0.8% | | | | | | | | | | | | | | | | | | | | |
Brazil Minas SPE via State of Minas Gerais, | | | | | | | | | | | | | | | | | | | | |
Gov’t. Gtd. Notes | | | 5.333 | | | | 02/15/28 | | | | | | | | 20,912 | | | | 20,277,463 | |
Brazilian Government International Bond, | | | | | | | | | | | | | | | | | | | | |
Sr. Unsec’d. Notes | | | 8.500 | | | | 01/05/24 | | | | BRL | | | | 30 | | | | 5,889 | |
See Notes to Financial Statements.
PGIM Global Total Return Fund 47
Schedule of Investments (continued)
as of October 31, 2023
| | | | | | | | | | | | | | | | |
| | | | |
Description | | Interest
Rate | | Maturity
Date | | Principal Amount (000)# | | | Value | |
| | | | | |
SOVEREIGN BONDS (Continued) | | | | | | | | | | | | | | | | |
| | | | | |
Brazil (cont’d.) | | | | | | | | | | | | | | | | |
Brazilian Government International Bond, (cont’d.) | | | | | | | | | | | | | | | | |
Sr. Unsec’d. Notes | | 10.250% | | 01/10/28 | | | BRL | | | | 2,890 | | | $ | 558,746 | |
Sr. Unsec’d. Notes, Series B | | 8.875 | | 04/15/24 | | | | | | | 208 | | | | 209,279 | |
| | | | | | | | | | | | | | | | |
| | | | | |
| | | | | | | | | | | | | | | 21,051,377 | |
| | | | | |
Bulgaria 0.3% | | | | | | | | | | | | | | | | |
Bulgaria Government International Bond, | | | | | | | | | | | | | | | | |
Sr. Unsec’d. Notes, GMTN | | 3.125 | | 03/26/35 | | | EUR | | | | 8,212 | | | | 7,321,450 | |
| | | | | |
Canada 0.0% | | | | | | | | | | | | | | | | |
Canadian Government Bond, | | | | | | | | | | | | | | | | |
Bonds(k) | | 4.000 | | 06/01/41 | | | CAD | | | | 650 | | | | 467,447 | |
City of Toronto, | | | | | | | | | | | | | | | | |
Unsec’d. Notes | | 3.250 | | 06/24/46 | | | CAD | | | | 1,000 | | | | 532,946 | |
| | | | | | | | | | | | | | | | |
| | | | | |
| | | | | | | | | | | | | | | 1,000,393 | |
| | | | | |
Chile 0.1% | | | | | | | | | | | | | | | | |
Bonos de la Tesoreria de la Republica en pesos, | | | | | | | | | | | | | | | | |
Bonds | | 5.000 | | 03/01/35 | | | CLP | | | | 505,000 | | | | 497,699 | |
Chile Government International Bond, | | | | | | | | | | | | | | | | |
Sr. Unsec’d. Notes(a) | | 1.440 | | 02/01/29 | | | EUR | | | | 1,884 | | | | 1,724,044 | |
| | | | | | | | | | | | | | | | |
| | | | | |
| | | | | | | | | | | | | | | 2,221,743 | |
| | | | | |
China 1.9% | | | | | | | | | | | | | | | | |
China Government Bond, | | | | | | | | | | | | | | | | |
Sr. Unsec’d. Notes | | 3.310 | | 11/30/25 | | | CNH | | | | 4,000 | | | | 551,422 | |
Sr. Unsec’d. Notes | | 3.480 | | 06/29/27 | | | CNH | | | | 2,000 | | | | 278,966 | |
Sr. Unsec’d. Notes | | 3.600 | | 05/21/30 | | | CNH | | | | 18,500 | | | | 2,621,178 | |
Sr. Unsec’d. Notes | | 3.900 | | 07/04/36 | | | CNH | | | | 16,000 | | | | 2,332,273 | |
Sr. Unsec’d. Notes | | 3.950 | | 06/29/43 | | | CNH | | | | 40,000 | | | | 5,834,223 | |
Sr. Unsec’d. Notes | | 4.000 | | 11/30/35 | | | CNH | | | | 76,500 | | | | 11,248,701 | |
Sr. Unsec’d. Notes | | 4.100 | | 05/21/45 | | | CNH | | | | 62,000 | | | | 9,212,012 | |
Sr. Unsec’d. Notes | | 4.150 | | 12/12/31 | | | CNH | | | | 41,500 | | | | 6,148,301 | |
Sr. Unsec’d. Notes | | 4.400 | | 12/12/46 | | | CNH | | | | 48,500 | | | | 7,576,540 | |
Sr. Unsec’d. Notes | | 4.500 | | 05/22/34 | | | CNH | | | | 24,000 | | | | 3,677,925 | |
Export-Import Bank of China (The), | | | | | | | | | | | | | | | | |
Sr. Unsec’d. Notes | | 4.150 | | 06/18/27 | | | CNH | | | | 4,000 | | | | 566,616 | |
| | | | | | | | | | | | | | | | |
| | | | | |
| | | | | | | | | | | | | | | 50,048,157 | |
See Notes to Financial Statements.
48
| | | | | | | | | | | | | | | | |
| | | | |
Description | | Interest
Rate | | Maturity
Date | | Principal Amount (000)# | | | Value | |
| | | | | |
SOVEREIGN BONDS (Continued) | | | | | | | | | | | | | | | | |
| | | | | |
Colombia 2.2% | | | | | | | | | | | | | | | | |
Colombia Government International Bond, | | | | | | | | | | | | | | | | |
Sr. Unsec’d. Notes | | 8.000% | | 04/20/33 | | | | | | | 1,600 | | | $ | 1,557,600 | |
Sr. Unsec’d. Notes | | 8.375 | | 02/15/27 | | | | | | | 3,168 | | | | 3,364,036 | |
Sr. Unsec’d. Notes | | 9.850 | | 06/28/27 | | | COP | | | | 17,662,000 | | | | 4,010,456 | |
Sr. Unsec’d. Notes | | 11.850 | | 03/09/28 | | | | | | | 1,000 | | | | 1,138,560 | |
Sr. Unsec’d. Notes, EMTN | | 3.875 | | 03/22/26 | | | EUR | | | | 47,879 | | | | 48,700,705 | |
| | | | | | | | | | | | | | | | |
| | | | | |
| | | | | | | | | | | | | | | 58,771,357 | |
| | | | | |
Cyprus 0.9% | | | | | | | | | | | | | | | | |
Cyprus Government International Bond, | | | | | | | | | | | | | | | | |
Sr. Unsec’d. Notes, EMTN | | 1.250 | | 01/21/40 | | | EUR | | | | 7,550 | | | | 4,985,080 | |
Sr. Unsec’d. Notes, EMTN | | 2.250 | | 04/16/50 | | | EUR | | | | 2,000 | | | | 1,353,797 | |
Sr. Unsec’d. Notes, EMTN | | 2.375 | | 09/25/28 | | | EUR | | | | 4,694 | | | | 4,657,266 | |
Sr. Unsec’d. Notes, EMTN | | 2.750 | | 02/26/34 | | | EUR | | | | 10,200 | | | | 9,427,246 | |
Sr. Unsec’d. Notes, EMTN | | 2.750 | | 05/03/49 | | | EUR | | | | 3,000 | | | | 2,295,431 | |
| | | | | | | | | | | | | | | | |
| | | | | |
| | | | | | | | | | | | | | | 22,718,820 | |
| | | | | |
Denmark 0.1% | | | | | | | | | | | | | | | | |
Denmark Government Bond, | | | | | | | | | | | | | | | | |
Bonds | | 1.750 | | 11/15/25 | | | DKK | | | | 3,520 | | | | 485,478 | |
Bonds | | 4.500 | | 11/15/39 | | | DKK | | | | 1,800 | | | | 295,685 | |
Bonds, Series 10YR | | 0.500 | | 11/15/27 | | | DKK | | | | 12,110 | | | | 1,564,157 | |
Bonds, Series 10YR | | 0.500 | | 11/15/29 | | | DKK | | | | 4,300 | | | | 530,315 | |
Bonds, Series 30YR | | 0.250 | | 11/15/52 | | | DKK | | | | 5,000 | | | | 320,354 | |
| | | | | | | | | | | | | | | | |
| | | | | |
| | | | | | | | | | | | | | | 3,195,989 | |
| | | | | |
Egypt 0.0% | | | | | | | | | | | | | | | | |
Egypt Government International Bond, | | | | | | | | | | | | | | | | |
Sr. Unsec’d. Notes, 144A, MTN | | 4.750 | | 04/16/26 | | | EUR | | | | 700 | | | | 501,110 | |
| | | | | |
Finland 0.0% | | | | | | | | | | | | | | | | |
Kuntarahoitus OYJ, | | | | | | | | | | | | | | | | |
Local Gov’t. Gtd. Notes, EMTN | | 3.050 | | 09/24/32 | | | SEK | | | | 13,000 | | | | 1,075,863 | |
See Notes to Financial Statements.
PGIM Global Total Return Fund 49
Schedule of Investments (continued)
as of October 31, 2023
| | | | | | | | | | | | | | | | |
| | | | |
Description | | Interest Rate | | Maturity Date | | Principal
Amount (000)# | | | Value | |
| | | | | |
SOVEREIGN BONDS (Continued) | | | | | | | | | | | | | | | | |
| | | | | |
France 0.7% | | | | | | | | | | | | | | | | |
Caisse Francaise de Financement Local, | | | | | | | | | | | | | | | | |
Covered Bonds, EMTN | | 4.680% | | 03/09/29 | | | CAD | | | | 28,712 | | | $ | 19,881,510 | |
French Republic Government Bond OAT, | | | | | | | | | | | | | | | | |
Bonds, 144A(k) | | 0.500 | | 05/25/72 | | | EUR | | | | 100 | | | | 32,159 | |
| | | | | | | | | | | | | | | | |
| | | | | |
| | | | | | | | | | | | | | | 19,913,669 | |
| | | | | |
Germany 0.0% | | | | | | | | | | | | | | | | |
State of North Rhine-Westphalia, | | | | | | | | | | | | | | | | |
Sr. Unsec’d. Notes, EMTN | | 7.500 | | 06/08/27 | | | MXN | | | | 500 | | | | 24,685 | |
| | | | | |
Greece 2.7% | | | | | | | | | | | | | | | | |
Hellenic Republic Government Bond, | | | | | | | | | | | | | | | | |
Bonds | | 4.300 | | 02/24/25 | | | EUR | | | | 1 | | | | 1,054 | |
Bonds | | 4.300 | | 02/24/29 | | | EUR | | | | 1 | | | | 1,014 | |
Bonds | | 4.300 | | 02/24/30 | | | EUR | | | | 2 | | | | 2,003 | |
Bonds | | 4.300 | | 02/24/31 | | | EUR | | | | 34 | | | | 33,777 | |
Bonds | | 4.300 | | 02/24/32 | | | EUR | | | | 60 | | | | 58,994 | |
Bonds | | 4.300 | | 02/24/36 | | | EUR | | | | 2 | | | | 1,831 | |
Bonds | | 4.300 | | 02/24/39 | | | EUR | | | | 1 | | | | 940 | |
Sr. Unsec’d. Notes, 144A | | 1.875 | | 02/04/35 | | | EUR | | | | 60,000 | | | | 49,688,956 | |
Sr. Unsec’d. Notes, 144A | | 1.875 | | 01/24/52 | | | EUR | | | | 7,585 | | | | 4,628,953 | |
Hellenic Republic Government International Bond, | | | | | | | | | | | | | | | | |
Sr. Unsec’d. Notes | | 5.200 | | 07/17/34 | | | EUR | | | | 10,023 | | | | 10,842,935 | |
Sr. Unsec’d. Notes | | 6.140 | | 04/14/28 | | | EUR | | | | 5,400 | | | | 6,181,481 | |
| | | | | | | | | | | | | | | | |
| | | | | |
| | | | | | | | | | | | | | | 71,441,938 | |
| | | | | |
Hungary 0.2% | | | | | | | | | | | | | | | | |
Hungary Government International Bond, | | | | | | | | | | | | | | | | |
Sr. Unsec’d. Notes | | 1.625 | | 04/28/32 | | | EUR | | | | 4,176 | | | | 3,290,639 | |
Sr. Unsec’d. Notes, 144A | | 2.125 | | 09/22/31 | | | | | | | 1,375 | | | | 989,173 | |
| | | | | | | | | | | | | | | | |
| | | | | |
| | | | | | | | | | | | | | | 4,279,812 | |
| | | | | |
Indonesia 1.6% | | | | | | | | | | | | | | | | |
Indonesia Government International Bond, | | | | | | | | | | | | | | | | |
Sr. Unsec’d. Notes | | 0.900 | | 02/14/27 | | | EUR | | | | 10,300 | | | | 9,654,810 | |
Sr. Unsec’d. Notes | | 1.000 | | 07/28/29 | | | EUR | | | | 8,500 | | | | 7,344,468 | |
Sr. Unsec’d. Notes | | 1.400 | | 10/30/31 | | | EUR | | | | 9,560 | | | | 7,848,946 | |
See Notes to Financial Statements.
50
| | | | | | | | | | | | | | | | |
| | | | |
Description | | Interest Rate | | Maturity Date | | Principal Amount (000)# | | | Value | |
| | | | | |
SOVEREIGN BONDS (Continued) | | | | | | | | | | | | | | | | |
| | | | | |
Indonesia (cont’d.) | | | | | | | | | | | | | | | | |
Indonesia Government International Bond, (cont’d.) | | | | | | | | | | | | | | | | |
Sr. Unsec’d. Notes | | 1.750% | | 04/24/25 | | | EUR | | | | 2,600 | | | $ | 2,640,660 | |
Sr. Unsec’d. Notes, EMTN | | 3.750 | | 06/14/28 | | | EUR | | | | 13,980 | | | | 14,410,303 | |
| | | | | | | | | | | | | | | | |
| | | | | |
| | | | | | | | | | | | | | | 41,899,187 | |
| | | | | |
Israel 0.2% | | | | | | | | | | | | | | | | |
Israel Government International Bond, | | | | | | | | | | | | | | | | |
Sr. Unsec’d. Notes, EMTN | | 6.875 | | 10/21/34 | | | GBP | | | | 3,435 | | | | 4,574,041 | |
| | | | | |
Italy 5.3% | | | | | | | | | | | | | | | | |
Cassa Del Trentino SPA, | | | | | | | | | | | | | | | | |
Local Gov’t. Gtd. Notes, EMTN | | 1.160 | | 06/17/26 | | | EUR | | | | 937 | | | | 948,382 | |
Region of Lazio, | | | | | | | | | | | | | | | | |
Sr. Unsec’d. Notes | | 3.088 | | 03/31/43 | | | EUR | | | | 6,249 | | | | 5,190,778 | |
Region of Umbria, | | | | | | | | | | | | | | | | |
Sr. Unsec’d. Notes, 6 Month EURIBOR + 0.200% | | 4.282(c) | | 03/26/31 | | | EUR | | | | 817 | | | | 820,700 | |
Repubic of Italy Government International Bond Coupon Strips, | | | | | | | | | | | | | | | | |
Sr. Unsec’d. Notes | | 1.812(s) | | 02/20/31 | | | EUR | | | | 5,458 | | | | 4,170,488 | |
Republic of Italy Government International Bond, | | | | | | | | | | | | | | | | |
Sr. Unsec’d. Notes | | 2.875 | | 10/17/29 | | | | | | | 3,300 | | | | 2,797,829 | |
Sr. Unsec’d. Notes, EMTN | | 3.444 | | 12/31/24 | | | EUR | | | | 35 | | | | 36,897 | |
Sr. Unsec’d. Notes, EMTN, EURIBOR ICE SWAP 11:00 Fft 30Y Index + 0.000% (Cap N/A, Floor 4.250%) | | 4.250(c) | | 06/28/29 | | | EUR | | | | 7,892 | | | | 8,413,154 | |
Sr. Unsec’d. Notes, EMTN | | 4.425 | | 03/28/36 | | | EUR | | | | 1,400 | | | | 1,364,928 | |
Sr. Unsec’d. Notes, EMTN | | 5.250 | | 12/07/34 | | | GBP | | | | 17,018 | | | | 18,719,705 | |
Sr. Unsec’d. Notes, EMTN | | 5.345 | | 01/27/48 | | | EUR | | | | 2,100 | | | | 2,117,632 | |
Sr. Unsec’d. Notes, EMTN | | 6.000 | | 08/04/28 | | | GBP | | | | 69,287 | | | | 84,922,289 | |
Sr. Unsec’d. Notes, MTN | | 5.375 | | 06/15/33 | | | | | | | 10,632 | | | | 9,888,367 | |
Sr. Unsec’d. Notes, Series 67, EMTN, EURIBOR ICE SWAP 11:00 Fft 10Y Index + 0.000% (Cap 8.800%, Floor N/A) | | 2.988(c) | | 05/11/26 | | | EUR | | | | 3,000 | | | | 3,118,177 | |
| | | | | | | | | | | | | | | | |
| | | | | |
| | | | | | | | | | | | | | | 142,509,326 | |
| | | | | |
Japan 0.1% | | | | | | | | | | | | | | | | |
Japan Government Twenty Year Bond, | | | | | | | | | | | | | | | | |
Bonds, Series 159 (k) | | 0.600 | | 12/20/36 | | | JPY | | | | 350,000 | | | | 2,131,728 | |
See Notes to Financial Statements.
PGIM Global Total Return Fund 51
Schedule of Investments (continued)
as of October 31, 2023
| | | | | | | | | | | | | | | | |
| | | | |
Description | | Interest Rate | | Maturity Date | | Principal Amount (000)# | | | Value | |
| | | | | |
SOVEREIGN BONDS (Continued) | | | | | | | | | | | | | | | | |
| | | | | |
Kazakhstan 0.3% | | | | | | | | | | | | | | | | |
Kazakhstan Government International Bond, | | | | | | | | | | | | | | | | |
Sr. Unsec’d. Notes, EMTN (a) | | 1.500% | | 09/30/34 | | | EUR | | | | 9,400 | | | $ | 6,977,217 | |
| | | | | |
Mexico 0.7% | | | | | | | | | | | | | | | | |
Mexico Government International Bond, | | | | | | | | | | | | | | | | |
Sr. Unsec’d. Notes | | 1.125 | | 01/17/30 | | | EUR | | | | 10,100 | | | | 8,612,180 | |
Sr. Unsec’d. Notes | | 1.450 | | 10/25/33 | | | EUR | | | | 4,825 | | | | 3,576,439 | |
Sr. Unsec’d. Notes | | 2.875 | | 04/08/39 | | | EUR | | | | 5,000 | | | | 3,725,041 | |
Sr. Unsec’d. Notes | | 4.000 | | 03/15/2115 | | | EUR | | | | 950 | | | | 668,002 | |
Sr. Unsec’d. Notes, EMTN | | 5.625 | | 03/19/2114 | | | GBP | | | | 340 | | | | 283,595 | |
Sr. Unsec’d. Notes, Series 28 | | 2.000 | | 04/20/38 | | | JPY | | | | 300,000 | | | | 1,544,567 | |
Sr. Unsec’d. Notes, Series A, MTN | | 7.500 | | 04/08/33 | | | | | | | 875 | | | | 921,796 | |
| | | | | | | | | | | | | | | | |
| | | | | |
| | | | | | | | | | | | | | | 19,331,620 | |
| | | | | |
Montenegro 0.0% | | | | | | | | | | | | | | | | |
Montenegro Government International Bond, | | | | | | | | | | | | | | | | |
Sr. Unsec’d. Notes, 144A | | 3.375 | | 04/21/25 | | | EUR | | | | 750 | | | | 761,903 | |
| | | | | |
Panama 0.5% | | | | | | | | | | | | | | | | |
Panama Government International Bond, | | | | | | | | | | | | | | | | |
Sr. Unsec’d. Notes | | 8.125 | | 04/28/34 | | | | | | | 14,636 | | | | 14,540,866 | |
| | | | | |
Peru 0.7% | | | | | | | | | | | | | | | | |
Peruvian Government International Bond, | | | | | | | | | | | | | | | | |
Sr. Unsec’d. Notes | | 1.250 | | 03/11/33 | | | EUR | | | | 1,200 | | | | 918,388 | |
Sr. Unsec’d. Notes | | 2.750 | | 01/30/26 | | | EUR | | | | 7,718 | | | | 7,834,124 | |
Sr. Unsec’d. Notes | | 3.750 | | 03/01/30 | | | EUR | | | | 9,408 | | | | 9,379,229 | |
| | | | | | | | | | | | | | | | |
| | | | | |
| | | | | | | | | | | | | | | 18,131,741 | |
| | | | | |
Philippines 1.0% | | | | | | | | | | | | | | | | |
Philippine Government International Bond, | | | | | | | | | | | | | | | | |
Sr. Unsec’d. Notes | | 0.700 | | 02/03/29 | | | EUR | | | | 5,365 | | | | 4,701,903 | |
Sr. Unsec’d. Notes | | 1.200 | | 04/28/33 | | | EUR | | | | 1,350 | | | | 1,054,014 | |
Sr. Unsec’d. Notes | | 1.750 | | 04/28/41 | | | EUR | | | | 1,085 | | | | 714,287 | |
Sr. Unsec’d. Notes, EMTN | | 0.875 | | 05/17/27 | | | EUR | | | | 4,000 | | | | 3,746,774 | |
Sr. Unsec’d. Notes, Series 11 | | 0.990 | | 08/15/28 | | | JPY | | | | 800,000 | | | | 5,154,834 | |
Sr. Unsec’d. Notes, Series 15 | | 0.590 | | 08/15/29 | | | JPY | | | | 1,700,000 | | | | 10,457,397 | |
| | | | | | | | | | | | | | | | |
| | | | | |
| | | | | | | | | | | | | | | 25,829,209 | |
See Notes to Financial Statements.
52
| | | | | | | | | | | | | | | | |
| | | | |
Description | | Interest Rate | | Maturity Date | | Principal Amount (000)# | | | Value | |
| | | | | |
SOVEREIGN BONDS (Continued) | | | | | �� | | | | | | | | | | | |
| | | | | |
Poland 0.0% | | | | | | | | | | | | | | | | |
Republic of Poland Government International Bond, | | | | | | | | | | | | | | | | |
Sr. Unsec’d. Notes, EMTN | | 3.220% | | 08/04/34 | | | JPY | | | | 100,000 | | | $ | 721,623 | |
| | | | | |
Portugal 0.2% | | | | | | | | | | | | | | | | |
Regiao Autonoma Madeira, | | | | | | | | | | | | | | | | |
Gov’t. Gtd. Notes | | 0.943 | | 05/29/32 | | | EUR | | | | 5,000 | | | | 4,187,416 | |
| | | | | |
Romania 0.6% | | | | | | | | | | | | | | | | |
Romanian Government International Bond, | | | | | | | | | | | | | | | | |
Sr. Unsec’d. Notes, 144A, MTN | | 2.500 | | 02/08/30 | | | EUR | | | | 4,150 | | | | 3,617,840 | |
Sr. Unsec’d. Notes, EMTN | | 2.124 | | 07/16/31 | | | EUR | | | | 2,000 | | | | 1,557,693 | |
Sr. Unsec’d. Notes, EMTN | | 2.375 | | 04/19/27 | | | EUR | | | | 1,000 | | | | 964,987 | |
Sr. Unsec’d. Notes, EMTN | | 3.375 | | 02/08/38 | | | EUR | | | | 2,138 | | | | 1,588,978 | |
Sr. Unsec’d. Notes, EMTN | | 3.500 | | 04/03/34 | | | EUR | | | | 1,000 | | | | 822,800 | |
Sr. Unsec’d. Notes, EMTN | | 3.875 | | 10/29/35 | | | EUR | | | | 1,000 | | | | 826,971 | |
Sr. Unsec’d. Notes, EMTN | | 4.125 | | 03/11/39 | | | EUR | | | | 2,966 | | | | 2,329,045 | |
Sr. Unsec’d. Notes, MTN | | 2.875 | | 05/26/28 | | | EUR | | | | 700 | | | | 665,818 | |
Unsec’d. Notes, 144A, MTN | | 2.124 | | 07/16/31 | | | EUR | | | | 3,600 | | | | 2,803,846 | |
Unsec’d. Notes, 144A, MTN | | 2.875 | | 05/26/28 | | | EUR | | | | 1,100 | | | | 1,046,285 | |
| | | | | | | | | | | | | | | | |
| | | | | |
| | | | | | | | | | | | | | | 16,224,263 | |
| | | | | |
Saudi Arabia 0.4% | | | | | | | | | | | | | | | | |
Saudi Government International Bond, | | | | | | | | | | | | | | | | |
Sr. Unsec’d. Notes | | 2.000 | | 07/09/39 | | | EUR | | | | 13,756 | | | | 9,847,518 | |
| | | | | |
Serbia 1.0% | | | | | | | | | | | | | | | | |
Serbia International Bond, | | | | | | | | | | | | | | | | |
Sr. Unsec’d. Notes | | 1.500 | | 06/26/29 | | | EUR | | | | 6,000 | | | | 4,896,358 | |
Sr. Unsec’d. Notes | | 3.125 | | 05/15/27 | | | EUR | | | | 15,595 | | | | 14,922,742 | |
Sr. Unsec’d. Notes, 144A(a) | | 2.125 | | 12/01/30 | | | | | | | 9,015 | | | | 6,597,357 | |
| | | | | | | | | | | | | | | | |
| | | | | |
| | | | | | | | | | | | | | | 26,416,457 | |
| | | | | |
Slovenia 0.1% | | �� | | | | | | | | | | | | | | |
Slovenia Government Bond, | | | | | | | | | | | | | | | | |
Unsec’d. Notes, Series RS86 | | 0.000 | | 02/12/31 | | | EUR | | | | 100 | | | | 81,625 | |
Slovenia Government International Bond, | | | | | | | | | | | | | | | | |
Bonds, 144A | | 5.000 | | 09/19/33 | | | | | | | 3,200 | | | | 3,049,280 | |
| | | | | | | | | | | | | | | | |
| | | | | |
| | | | | | | | | | | | | | | 3,130,905 | |
See Notes to Financial Statements.
PGIM Global Total Return Fund 53
Schedule of Investments (continued)
as of October 31, 2023
| | | | | | | | | | | | | | | | |
| | | | |
Description | | Interest Rate | | Maturity Date | | Principal Amount (000)# | | | Value | |
| | | | | |
SOVEREIGN BONDS (Continued) | | | | | | | | | | | | | | | | |
| | | | | |
South Korea 0.1% | | | | | | | | | | | | | | | | |
Export-Import Bank of Korea, | | | | | | | | | | | | | | | | |
Sr. Unsec’d. Notes, 144A, MTN | | 6.700% | | 12/02/24 | | | IDR | | | | 40,000 | | | $ | 2,516 | |
Sr. Unsec’d. Notes, 144A, MTN | | 8.000 | | 05/15/24 | | | IDR | | | | 6,800,000 | | | | 430,123 | |
Sr. Unsec’d. Notes, EMTN | | 7.250 | | 12/07/24 | | | IDR | | | | 10,000,000 | | | | 632,477 | |
Sr. Unsec’d. Notes, EMTN | | 8.000 | | 05/15/24 | | | IDR | | | | 19,600,000 | | | | 1,240,901 | |
| | | | | | | | | | | | | | | | |
| | | | | |
| | | | | | | | | | | | | | | 2,306,017 | |
| | | | | |
Spain 2.1% | | | | | | | | | | | | | | | | |
Autonomous Community of Catalonia, | | | | | | | | | | | | | | | | |
Sr. Unsec’d. Notes | | 4.690 | | 10/28/34 | | | EUR | | | | 588 | | | | 613,029 | |
Sr. Unsec’d. Notes, EMTN, EURIBOR ICE SWAP 11:00 Fft 10Y Index + 0.000% (Cap 12.000%, Floor 5.480%) | | 5.480(c) | | 05/11/29 | | | EUR | | | | 1,000 | | | | 1,120,158 | |
Sr. Unsec’d. Notes, EMTN | | 5.900 | | 05/28/30 | | | EUR | | | | 3,250 | | | | 3,651,435 | |
Sr. Unsec’d. Notes, EMTN | | 6.350 | | 11/30/41 | | | EUR | | | | 2,100 | | | | 2,473,786 | |
Spain Government Bond, | | | | | | | | | | | | | | | | |
Sr. Unsec’d. Notes, 144A | | 1.000 | | 10/31/50 | | | EUR | | | | 10,600 | | | | 5,191,077 | |
Sr. Unsec’d. Notes, 144A | | 1.200 | | 10/31/40 | | | EUR | | | | 2,500 | | | | 1,661,217 | |
Sr. Unsec’d. Notes, 144A(k) | | 1.850 | | 07/30/35 | | | EUR | | | | 7,225 | | | | 6,122,775 | |
Sr. Unsec’d. Notes, 144A(k) | | 3.450 | | 07/30/66 | | | EUR | | | | 4,200 | | | | 3,477,252 | |
Spain Government Bond Coupon Strips, | | | | | | | | | | | | | | | | |
Bonds | | 0.246(s) | | 01/31/32 | | | EUR | | | | 3,900 | | | | 3,017,448 | |
Bonds(k) | | 0.320(s) | | 01/31/33 | | | EUR | | | | 2,100 | | | | 1,566,381 | |
Bonds | | 0.449(s) | | 07/30/29 | | | EUR | | | | 438 | | | | 379,539 | |
Bonds | | 0.958(s) | | 01/31/35 | | | EUR | | | | 168 | | | | 112,077 | |
Bonds | | 1.027(s) | | 01/31/36 | | | EUR | | | | 168 | | | | 106,232 | |
Bonds | | 1.078(s) | | 01/31/37 | | | EUR | | | | 168 | | | | 101,369 | |
Bonds | | 1.296(s) | | 07/30/41 | | | EUR | | | | 436 | | | | 209,160 | |
Bonds, Series CAC(k) | | 0.579(s) | | 07/30/29 | | | EUR | | | | 3,600 | | | | 3,112,094 | |
Bonds, Series CAC | | 1.128(s) | | 07/30/36 | | | EUR | | | | 862 | | | | 536,960 | |
Bonds, Series CAC | | 1.212(s) | | 07/30/37 | | | EUR | | | | 862 | | | | 508,456 | |
Bonds, Series CAC | | 1.297(s) | | 07/30/38 | | | EUR | | | | 862 | | | | 482,709 | |
Bonds, Series CAC | | 1.365(s) | | 07/30/42 | | | EUR | | | | 300 | | | | 138,705 | |
Bonds, Series CAC | | 1.405(s) | | 07/30/43 | | | EUR | | | | 300 | | | | 132,461 | |
Bonds, Series CAC | | 1.455(s) | | 07/30/44 | | | EUR | | | | 300 | | | | 126,382 | |
Bonds, Series CAC | | 1.475(s) | | 07/30/45 | | | EUR | | | | 300 | | | | 120,815 | |
Bonds, Series CAC | | 1.485(s) | | 07/30/46 | | | EUR | | | | 300 | | | | 115,149 | |
Bonds, Series CAC | | 1.504(s) | | 07/30/47 | | | EUR | | | | 300 | | | | 110,479 | |
Bonds, Series CAC | | 1.514(s) | | 07/30/48 | | | EUR | | | | 300 | | | | 106,127 | |
Bonds, Series CAC | | 1.544(s) | | 07/30/49 | | | EUR | | | | 300 | | | | 100,904 | |
Bonds, Series CAC | | 1.564(s) | | 07/30/50 | | | EUR | | | | 300 | | | | 93,196 | |
Bonds, Series CAC | | 1.594(s) | | 07/30/51 | | | EUR | | | | 300 | | | | 87,910 | |
See Notes to Financial Statements.
54
| | | | | | | | | | | | | | | | |
| | | | |
Description | | Interest Rate | | Maturity Date | | Principal Amount (000)# | | | Value | |
| | | | | |
SOVEREIGN BONDS (Continued) | | | | | | | | | | | | | | | | |
| | | | | |
Spain (cont’d.) | | | | | | | | | | | | | | | | |
Spain Government Bond Coupon Strips, (cont’d.) | | | | | | | | | | | | | | | | |
Bonds, Series CAC | | 1.623%(s) | | 07/30/52 | | | EUR | | | | 300 | | | $ | 84,277 | |
Bonds, Series CAC | | 1.663(s) | | 07/30/53 | | | EUR | | | | 300 | | | | 79,310 | |
Bonds, Series CAC | | 1.683(s) | | 07/30/54 | | | EUR | | | | 300 | | | | 75,797 | |
Bonds, Series CAC | | 1.703(s) | | 07/30/55 | | | EUR | | | | 300 | | | | 72,106 | |
Bonds, Series CAC | | 1.732(s) | | 07/30/56 | | | EUR | | | | 300 | | | | 64,941 | |
Bonds, Series CAC | | 1.772(s) | | 07/30/57 | | | EUR | | | | 300 | | | | 61,484 | |
Bonds, Series CAC | | 1.782(s) | | 07/30/58 | | | EUR | | | | 300 | | | | 60,998 | |
Bonds, Series CAC | | 1.812(s) | | 07/30/59 | | | EUR | | | | 300 | | | | 55,439 | |
Bonds, Series CAC | | 1.851(s) | | 07/30/60 | | | EUR | | | | 300 | | | | 54,365 | |
Bonds, Series CAC | | 1.871(s) | | 07/30/61 | | | EUR | | | | 300 | | | | 51,057 | |
Bonds, Series CAC | | 1.891(s) | | 07/30/62 | | | EUR | | | | 300 | | | | 47,311 | |
Bonds, Series CAC | | 1.921(s) | | 07/30/63 | | | EUR | | | | 300 | | | | 45,208 | |
Bonds, Series CAC | | 1.950(s) | | 07/30/64 | | | EUR | | | | 300 | | | | 42,538 | |
Bonds, Series CAC | | 1.980(s) | | 07/30/65 | | | EUR | | | | 300 | | | | 40,152 | |
Bonds, Series CAC | | 2.010(s) | | 07/30/66 | | | EUR | | | | 300 | | | | 39,301 | |
Spain Government Bond Principal Strips, | | | | | | | | | | | | | | | | |
Bonds | | 0.794(s) | | 07/30/41 | | | EUR | | | | 1,700 | | | | 811,438 | |
Spain Government International Bond, | | | | | | | | | | | | | | | | |
Sr. Unsec’d. Notes, EMTN | | 5.250 | | 04/06/29 | | | GBP | | | | 16,080 | | | | 19,524,616 | |
| | | | | | | | | | | | | | | | |
| | | | | |
| | | | | | | | | | | | | | | 56,785,620 | |
| | | | | |
Sweden 0.0% | | | | | | | | | | | | | | | | |
Svensk Exportkredit AB, | | | | | | | | | | | | | | | | |
Sr. Unsec’d. Notes, EMTN | | 8.904(s) | | 06/25/27 | | | ZAR | | | | 1,400 | | | | 53,297 | |
Sr. Unsec’d. Notes, MTN | | 2.665(s) | | 05/11/37 | | | | | | | 110 | | | | 50,717 | |
Sweden Government Bond, | | | | | | | | | | | | | | | | |
Bonds, Series 1053(k) | | 3.500 | | 03/30/39 | | | SEK | | | | 10,000 | | | | 943,258 | |
| | | | | | | | | | | | | | | | |
| | | | | |
| | | | | | | | | | | | | | | 1,047,272 | |
| | | | | |
Tunisia 0.0% | | | | | | | | | | | | | | | | |
Tunisian Republic, | | | | | | | | | | | | | | | | |
Sr. Unsec’d. Notes | | 4.200 | | 03/17/31 | | | JPY | | | | 100,000 | | | | 276,893 | |
| | | | | |
Ukraine 0.4% | | | | | | | | | | | | | | | | |
Ukraine Government International Bond, | | | | | | | | | | | | | | | | |
Sr. Unsec’d. Notes | | 4.375 | | 01/27/32(d) | | | EUR | | | | 43,601 | | | | 10,279,281 | |
See Notes to Financial Statements.
PGIM Global Total Return Fund 55
Schedule of Investments (continued)
as of October 31, 2023
| | | | | | | | | | | | | | | | | | | | |
| | | | |
Description | | Interest Rate | | | Maturity Date | | | Principal Amount (000)# | | | Value | |
| | | | | |
SOVEREIGN BONDS (Continued) | | | | | | | | | | | | | | | | | | | | |
| | | | | |
United Kingdom 0.3% | | | | | | | | | | | | | | | | | | | | |
HM Treasury UK Sovereign Sukuk PLC, | | | | | | | | | | | | | | | | | | | | |
Unsec’d. Notes(k) | | | 0.333% | | | | 07/22/26 | | | | GBP | | | | 500 | | | $ | 541,505 | |
Jersey International Bond, | | | | | | | | | | | | | | | | | | | | |
Sr. Unsec’d. Notes | | | 3.750 | | | | 06/09/54 | | | | GBP | | | | 834 | | | | 733,249 | |
United Kingdom Gilt, | | | | | | | | | | | | | | | | | | | | |
Bonds(k) | | | 1.250 | | | | 10/22/41 | | | | GBP | | | | 100 | | | | 68,895 | |
Bonds(k) | | | 1.250 | | | | 07/31/51 | | | | GBP | | | | 100 | | | | 54,197 | |
Bonds(k) | | | 1.500 | | | | 07/22/47 | | | | GBP | | | | 100 | | | | 63,121 | |
Bonds(k) | | | 1.625 | | | | 10/22/71 | | | | GBP | | | | 100 | | | | 51,271 | |
Bonds(k) | | | 1.750 | | | | 01/22/49 | | | | GBP | | | | 100 | | | | 65,711 | |
Bonds(k) | | | 1.750 | | | | 07/22/57 | | | | GBP | | | | 100 | | | | 59,235 | |
Bonds(k) | | | 2.500 | | | | 07/22/65 | | | | GBP | | | | 100 | | | | 71,398 | |
Bonds(k) | | | 3.250 | | | | 01/22/44 | | | | GBP | | | | 100 | | | | 94,981 | |
Bonds(k) | | | 3.500 | | | | 07/22/68 | | | | GBP | | | | 100 | | | | 92,709 | |
Bonds(k) | | | 3.750 | | | | 07/22/52 | | | | GBP | | | | 100 | | | | 99,147 | |
Bonds(k) | | | 4.000 | | | | 01/22/60 | | | | GBP | | | | 100 | | | | 103,514 | |
Bonds(k) | | | 4.250 | | | | 03/07/36 | | | | GBP | | | | 300 | | | | 350,082 | |
Bonds(k) | | | 4.250 | | | | 09/07/39 | | | | GBP | | | | 180 | | | | 203,926 | |
Bonds(k) | | | 4.250 | | | | 12/07/40 | | | | GBP | | | | 100 | | | | 112,424 | |
Bonds(k) | | | 4.250 | | | | 12/07/46 | | | | GBP | | | | 4,475 | | | | 4,891,689 | |
Bonds(k) | | | 4.250 | | | | 12/07/49 | | | | GBP | | | | 100 | | | | 108,500 | |
Bonds(k) | | | 4.250 | | | | 12/07/55 | | | | GBP | | | | 100 | | | | 108,297 | |
Bonds(k) | | | 4.500 | | | | 12/07/42 | | | | GBP | | | | 100 | | | | 114,867 | |
Bonds(k) | | | 4.750 | | | | 12/07/38 | | | | GBP | | | | 100 | | | | 120,691 | |
Unsec’d. Notes(k) | | | 0.875 | | | | 01/31/46 | | | | GBP | | | | 100 | | | | 55,147 | |
Unsec’d. Notes(k) | | | 1.125 | | | | 01/31/39 | | | | GBP | | | | 100 | | | | 73,069 | |
| | | | | | | | | | | | | | | | | | | | |
| | | | | |
| | | | | | | | | | | | | | | | | | | 8,237,625 | |
| | | | | |
Uruguay 0.0% | | | | | | | | | | | | | | | | | | | | |
Uruguay Government International Bond, | | | | | | | | | | | | | | | | | | | | |
Sr. Unsec’d. Notes, Series 8 | | | 1.320 | | | | 12/09/36 | | | | JPY | | | | 100,000 | | | | 554,326 | |
| | | | | | | | | | | | | | | | | | | | |
| | | | | |
TOTAL SOVEREIGN BONDS | | | | | | | | | | | | | | | | | | | | |
(cost $917,546,045) | | | | | | | | | | | | | | | | | | | 685,264,179 | |
| | | | | | | | | | | | | | | | | | | | |
| | | | | |
U.S. GOVERNMENT AGENCY OBLIGATIONS 0.7% | | | | | | | | | | | | | | | | | | | | |
Federal National Mortgage Assoc.(k) | | | 5.375 | | | | 12/07/28 | | | | GBP | | | | 15,000 | | | | 18,525,647 | |
See Notes to Financial Statements.
56
| | | | | | | | | | | | | | | | | | | | |
| | | | |
Description | | Interest
Rate | | | Maturity
Date | | | Principal Amount (000)# | | | Value | |
| | | | | |
U.S. GOVERNMENT AGENCY OBLIGATIONS (Continued) | | | | | | | | | | | | | | | | | | | | |
Sri Lanka Government AID Bond | | | | | | | | | | | | | | | | | | | | |
U.S. Gov’t. Gtd. Notes, 3 Month LIBOR + 0.300%^ | | | 5.953%(c) | | | | 11/01/24 | | | | USD | | | | 750 | | | $ | 734,250 | |
| | | | | | | | | | | | | | | | | | | | |
| | | | | |
TOTAL U.S. GOVERNMENT AGENCY OBLIGATIONS | | | | | | | | | | | | | | | | | | | | |
(cost $25,819,911) | | | | | | | | | | | | | | | | | | | 19,259,897 | |
| | | | | | | | | | | | | | | | | | | | |
| | | | | |
U.S. TREASURY OBLIGATIONS 0.4% | | | | | | | | | | | | | | | | | | | | |
U.S. Treasury Bonds | | | 1.125 | | | | 08/15/40 | | | | | | | | 160 | | | | 86,375 | |
U.S. Treasury Bonds(h) | | | 2.250 | | | | 05/15/41 | | | | | | | | 545 | | | | 357,231 | |
U.S. Treasury Notes(h)(k) | | | 1.500 | | | | 11/30/28 | | | | | | | | 55 | | | | 46,716 | |
U.S. Treasury Notes(h) | | | 1.750 | | | | 03/15/25 | | | | | | | | 325 | | | | 309,918 | |
U.S. Treasury Notes(h) | | | 1.875 | | | | 02/15/32 | | | | | | | | 1,615 | | | | 1,283,420 | |
U.S. Treasury Notes(h)(k) | | | 2.875 | | | | 05/15/32 | | | | | | | | 2,035 | | | | 1,746,284 | |
U.S. Treasury Notes(h)(k) | | | 3.875 | | | | 12/31/27 | | | | | | | | 1,025 | | | | 987,283 | |
U.S. Treasury Notes(h)(k) | | | 4.375 | | | | 10/31/24 | | | | | | | | 3,400 | | | | 3,364,406 | |
U.S. Treasury Strips Coupon(k) | | | 1.872(s) | | | | 05/15/31 | | | | | | | | 85 | | | | 58,557 | |
U.S. Treasury Strips Coupon(k) | | | 1.888(s) | | | | 08/15/29 | | | | | | | | 345 | | | | 259,788 | |
U.S. Treasury Strips Coupon(k) | | | 2.089(s) | | | | 11/15/35 | | | | | | | | 800 | | | | 429,625 | |
U.S. Treasury Strips Coupon(k) | | | 2.251(s) | | | | 08/15/40 | | | | | | | | 800 | | | | 321,031 | |
| | | | | | | | | | | | | | | | | | | | |
| | | | | |
TOTAL U.S. TREASURY OBLIGATIONS | | | | | | | | | | | | | | | | | | | | |
(cost $10,657,209) | | | | | | | | | | | | | | | | | | | 9,250,634 | |
| | | | | | | | | | | | | | | | | | | | |
| | | | |
| | | | | | | | | Shares | | | | |
| | | | | |
COMMON STOCKS 0.1% | | | | | | | | | | | | | | | | | | | | |
| | | | | |
United States | | | | | | | | | | | | | | | | | | | | |
Chesapeake Energy Corp.(a) | | | | | | | | | | | | | | | 36,731 | | | | 3,161,804 | |
Ferrellgas Partners LP (Class B Stock) | | | | | | | | | | | | | | | | | | | | |
(original cost $749,975; purchased 10/20/14)(f) | | | | | | | | | | | | | | | 2,731 | | | | 466,795 | |
| | | | | | | | | | | | | | | | | | | | |
| | | | | |
TOTAL COMMON STOCKS | | | | | | | | | | | | | | | | | | | | |
(cost $618,533) | | | | | | | | | | | | | | | | | | | 3,628,599 | |
| | | | | | | | | | | | | | | | | | | | |
See Notes to Financial Statements.
PGIM Global Total Return Fund 57
Schedule of Investments (continued)
as of October 31, 2023
| | | | | | | | | | | | | | | | | | | | |
| | | | |
Description | | | | | | | | Shares | | | Value | |
| | | | | |
PREFERRED STOCK 0.0% | | | | | | | | | | | | | | | | | | | | |
| | | | | |
United States | | | | | | | | | | | | | | | | | | | | |
Citigroup Capital XIII, 12.022%(c), 3 Month SOFR + 6.632%, | | | | | | | | | | | | | | | | | | | | |
Maturing 10/30/40 | | | | | | | | | | | | | | | | | | | | |
(cost $100,000) | | | | | | | | | | | | | | | 4,000 | | | $ | 114,680 | |
| | | | | | | | | | | | | | | | | | | | |
| | | | | |
TOTAL LONG-TERM INVESTMENTS | | | | | | | | | | | | | | | | | | | | |
(cost $3,171,503,324) | | | | | | | | | | | | | | | | | | | 2,589,576,454 | |
| | | | | | | | | | | | | | | | | | | | |
| | | | | |
SHORT-TERM INVESTMENTS 2.5% | | | | | | | | | | | | | | | | | | | | |
| | | | | |
AFFILIATED MUTUAL FUNDS 2.5% | | | | | | | | | | | | | | | | | | | | |
PGIM Core Government Money Market Fund(wb) | | | | | | | | | | | | | | | 29,538,661 | | | | 29,538,661 | |
PGIM Institutional Money Market Fund | | | | | | | | | | | | | | | | | | | | |
(cost $39,014,575; includes $38,852,822 of cash collateral for securities on loan)(b)(wb) | | | | | | | | | | | | | | | 39,053,086 | | | | 39,033,559 | |
| | | | | | | | | | | | | | | | | | | | |
| | | | | |
TOTAL AFFILIATED MUTUAL FUNDS | | | | | | | | | | | | | | | | | | | | |
(cost $68,553,236) | | | | | | | | | | | | | | | | | | | 68,572,220 | |
| | | | | | | | | | | | | | | | | | | | |
| | | | | |
OPTION PURCHASED*~ 0.0% | | | | | | | | | | | | | | | | | | | | |
(cost $0) | | | | | | | | | | | | | | | | | | | 11,125 | |
| | | | | | | | | | | | | | | | | | | | |
| | | | | |
TOTAL SHORT-TERM INVESTMENTS | | | | | | | | | | | | | | | | | | | | |
(cost $68,553,236) | | | | | | | | | | | | | | | | | | | 68,583,345 | |
| | | | | | | | | | | | | | | | | | | | |
| | | | | |
TOTAL INVESTMENTS, BEFORE OPTIONS WRITTEN 99.7% | | | | | | | | | | | | | | | | | | | | |
(cost $3,240,056,560) | | | | | | | | | | | | | | | | | | | 2,658,159,799 | |
| | | | | | | | | | | | | | | | | | | | |
| | | | | |
OPTIONS WRITTEN*~ (0.0)% | | | | | | | | | | | | | | | | | | | | |
(premiums received $8,781) | | | | | | | | | | | | | | | | | | | (356,986) | |
| | | | | | | | | | | | | | | | | | | | |
| | | | | |
TOTAL INVESTMENTS, NET OF OPTIONS WRITTEN 99.7% | | | | | | | | | | | | | | | | | | | | |
(cost $3,240,047,779) | | | | | | | | | | | | | | | | | | | 2,657,802,813 | |
Other assets in excess of liabilities(z) 0.3% | | | | | | | | | | | | | | | | | | | 6,754,098 | |
| | | | | | | | | | | | | | | | | | | | |
| | | | | |
NET ASSETS 100.0% | | | | | | | | | | | | | | | | | | $ | 2,664,556,911 | |
| | | | | | | | | | | | | | | | | | | | |
Below is a list of the abbreviation(s) used in the annual report:
AUD—Australian Dollar
BRL—Brazilian Real
CAD—Canadian Dollar
CHF—Swiss Franc
CLP—Chilean Peso
CNH—Chinese Renminbi
COP—Colombian Peso
CZK—Czech Koruna
DKK—Danish Krone
EUR—Euro
See Notes to Financial Statements.
58
|
GBP—British Pound |
HKD—Hong Kong Dollar |
HUF—Hungarian Forint |
IDR—Indonesian Rupiah |
ILS—Israeli Shekel |
ITL—Italian Lira |
JPY—Japanese Yen |
KRW—South Korean Won |
MXN—Mexican Peso |
MYR—Malaysian Ringgit |
NOK—Norwegian Krone |
NZD—New Zealand Dollar |
PEN—Peruvian Nuevo Sol |
PLN—Polish Zloty |
RON—Romanian Leu |
SAR—Saudi Arabian Riyal |
SEK—Swedish Krona |
SGD—Singapore Dollar |
THB—Thai Baht |
TWD—New Taiwanese Dollar |
USD—US Dollar |
ZAR—South African Rand |
144A—Security was purchased pursuant to Rule 144A under the Securities Act of 1933 and, pursuant to the requirements of Rule 144A, may not be resold except to qualified institutional buyers. |
A—Annual payment frequency for swaps |
ABS—Asset-Backed Security |
AID—Agency for International Development |
BARC—Barclays Bank PLC |
BBR—New Zealand Bank Bill Rate |
BBSW—Australian Bank Bill Swap Reference Rate |
BNP—BNP Paribas S.A. |
BOA—Bank of America, N.A. |
BUBOR—Budapest Interbank Offered Rate |
CAC—French Stock Market Index |
CDOR—Canadian Dollar Offered Rate |
CDX—Credit Derivative Index |
CGM—Citigroup Global Markets, Inc. |
CIBOR—Copenhagen Interbank Offered Rate |
CITI—Citibank, N.A. |
CLO—Collateralized Loan Obligation |
CLOIS—Sinacofi Chile Interbank Rate Average |
CME—Chicago Mercantile Exchange |
CORRA—Canadian Overnight Repo Rate Average |
DAC—Designated Activity Company |
DB—Deutsche Bank AG |
EMTN—Euro Medium Term Note |
EURIBOR—Euro Interbank Offered Rate |
EuroSTR—Euro Short-Term Rate |
GMTN—Global Medium Term Note |
GS—Goldman Sachs & Co. LLC |
GSI—Goldman Sachs International |
HSBC—HSBC Bank PLC |
See Notes to Financial Statements.
PGIM Global Total Return Fund 59
Schedule of Investments (continued)
as of October 31, 2023
| | |
| | ICE—Intercontinental Exchange |
| | IO—Interest Only (Principal amount represents notional) |
| | JIBAR—Johannesburg Interbank Agreed Rate |
| | JPM—JPMorgan Chase Bank N.A. |
| | JPS—J.P. Morgan Securities LLC |
| | KLIBOR—Kuala Lumpur Interbank Offered Rate |
| | KWCDC—Korean Won Certificate of Deposit |
| | LIBOR—London Interbank Offered Rate |
| | LP—Limited Partnership |
| | M—Monthly payment frequency for swaps |
| | MASTR—Morgan Stanley Structured Asset Security |
| | MPLE—Maple Bonds |
| | MSI—Morgan Stanley & Co International PLC |
| | MTN—Medium Term Note |
| | MUNIPSA—Municipal Swap Weekly Yield Index |
| | NIBOR—Norwegian Interbank Offered Rate |
| | OAT—Obligations Assimilables du Tresor |
| | OTC—Over-the-counter |
| | PIK—Payment-in-Kind |
| | PJSC—Public Joint-Stock Company |
| | PRIBOR—Prague Interbank Offered Rate |
| | Q—Quarterly payment frequency for swaps |
| | REMIC—Real Estate Mortgage Investment Conduit |
| | S—Semiannual payment frequency for swaps |
| | SAIBOR—Saudi Arabian Interbank Offered Rate |
| | SARON—Swiss Average Rate Overnight |
| | SCB—Standard Chartered Bank |
| | SOFR—Secured Overnight Financing Rate |
| | SONIA—Sterling Overnight Index Average |
| | SORA—Singapore Overnight Rate Average |
| | SSB—State Street Bank & Trust Company |
| | STRIPs—Separate Trading of Registered Interest and Principal of Securities |
| | T—Swap payment upon termination |
| | TAIBOR—Taiwan Interbank Offered Rate |
| | TD—The Toronto-Dominion Bank |
| | TELBOR—Tel Aviv Interbank Offered Rate |
| | THOR—Thai Overnight Repurchase Rate |
| | TONAR—Tokyo Overnight Average Rate |
| | UBS—UBS Securities LLC |
| | USOIS—United States Overnight Index Swap |
| | WIBOR—Warsaw Interbank Offered Rate |
| * | | Non-income producing security. |
| # | | Principal or notional amount is shown in U.S. dollars unless otherwise stated. |
| ~ | | See tables subsequent to the Schedule of Investments for options detail. Options with maturity dates greater than one year from date of acquisition would be considered long-term investments. |
| ^ | | Indicates a Level 3 instrument. The aggregate value of Level 3 instruments is $29,050,487 and 1.1% of net assets. |
| (a) | | All or a portion of security is on loan. The aggregate market value of such securities, including those sold and pending settlement, is $37,778,546; cash collateral of $38,852,822 (included in liabilities) was received with which the Fund purchased highly liquid short-term investments. In the event of significant appreciation in value of securities on loan on the last business day of the reporting period, the Fund may reflect a collateral value that is less than the market value of the loaned securities and such shortfall is remedied the following business day. |
See Notes to Financial Statements.
60
��
| | |
| (b) | | Represents security, or portion thereof, purchased with cash collateral received for securities on loan and includes dividend reinvestment. |
| (c) | | Variable rate instrument. The interest rate shown reflects the rate in effect at October 31, 2023. |
| (cc) | | Variable rate instrument. The rate shown is based on the latest available information as of October 31, 2023. Certain variable rate securities are not based on a published reference rate and spread but are determined by the issuer or agent and are based on current market conditions. These securities do not indicate a reference rate and spread in their description. |
| (d) | | Represents issuer in default on interest payments and/or principal repayment. Non-income producing security. Such securities may be post-maturity. |
| (f) | | Indicates a restricted security that is acquired in unregistered, private sales from the issuing company or from an affiliate of the issuer and is considered restricted as to disposition under federal securities law; the aggregate original cost of such securities is $15,642,410. The aggregate value of $10,103,288 is 0.4% of net assets. |
| (ff) | | Variable rate security. Security may be issued at a fixed coupon rate, which converts to a variable rate at a specified date. Rate shown is the rate in effect as of period end. |
| (h) | | Represents security, or a portion thereof, segregated as collateral for OTC derivatives. |
| (jj) | | Represents original contract currency denomination, settlement to occur in Euro currency. |
| (k) | | Represents security, or a portion thereof, segregated as collateral for centrally cleared/exchange-traded derivatives. |
| (oo) | | Perpetual security. Maturity date represents next call date. |
| (r) | | Principal or notional amount is less than $500 par. |
| (s) | | Represents zero coupon bond or principal only security. Rate represents yield to maturity at purchase date. |
| (wb) | | Represents an investment in a Fund affiliated with the Manager. |
| (z) | | Includes net unrealized appreciation/(depreciation) and/or market value of the below holdings which are excluded from the Schedule of Investments: |
Option Purchased:
OTC Swaptions
| | | | | | | | | | | | | | | | | | | | | | | | | | | | | | |
Description | | Call/
Put | | | Counterparty | | Expiration
Date | | | Strike | | | Receive | | | Pay | | | Notional
Amount
(000)# | | | Value | |
5- Year Interest Rate Swap, 01/30/29 | | | Call | | | GSI | | | 01/26/24 | | | | 2.85% | | | | 2.85% | (A) | |
| 3 Month
TELBOR(Q)/
4.661% |
| | | ILS 75,000 | | | $ | 11,125 | |
| | | | | | | | | | | | | | | | | | | | | | | | | | | | | | |
(cost $0) | | | | | | | | | | | | | | | | | | | | | | | | | | | | | | |
Options Written:
OTC Swaptions
| | | | | | | | | | | | | | | | | | | | | | | | | | | | |
Description | | Call/
Put | | Counterparty | | Expiration
Date | | | Strike | | | Receive | | | Pay | | | Notional
Amount
(000)# | | | Value | |
| | | | | | | | |
5- Year Interest Rate Swap, 01/30/29 | | Call | | GSI | | | 01/26/24 | | | | 2.35% | | |
| 3 Month
TELBOR(Q)/
4.661% |
| | | 2.35%(A) | | | | ILS 75,000 | | | $ | (2,487 | ) |
5- Year Interest Rate Swap, 01/30/29 | | Put | | GSI | | | 01/26/24 | | | | 3.65% | | | | 3.65%(A) | | |
| 3 Month
TELBOR(Q)/
4.661% |
| | | ILS 75,000 | | | | (354,245 | ) |
GS_21-PJA†† ^ | | Put | | GSI | | | 06/17/24 | | | | 0.25% | | | | 0.25%(M) | | | | GS_21-PJA(M) | | | | 69,580 | | | | (254 | ) |
| | | | | | | | | | | | | | | | | | | | | | | | | | | | |
| | | | | |
Total Options Written (premiums received $8,781) | | | | | | | | | | | | | | | | | | | $ | (356,986 | ) |
| | | | | | | | | | | | | | | | | | | | | | | | | | | | |
| †† | The value of the contract, GS_21-PJA is derived from the aggregate credit performance of a pool of senior prime jumbo |
See Notes to Financial Statements.
PGIM Global Total Return Fund 61
Schedule of Investments (continued)
as of October 31, 2023
| | mortgages. The pool of prime jumbo mortgages is reset monthly. |
| | | | | | | | | | | | | | | | |
| | Futures contracts outstanding at October 31, 2023: | |
Number of
Contracts | | | Type | | Expiration
Date | | | Current
Notional
Amount | | | Value /
Unrealized
Appreciation
(Depreciation) | |
| | Long Positions: | | | | | | | | | | | | |
| | 25 | | | 1 Day Interbank Deposit | | | Dec. 2028 | | | $ | 57,470 | | | $ | (5,304 | ) |
| | 64 | | | 3 Month CME SOFR | | | Dec. 2023 | | | | 15,144,000 | | | | 43,883 | |
| | 64 | | | 3 Month CME SOFR | | | Mar. 2024 | | | | 15,129,600 | | | | 2,245 | |
| | 64 | | | 3 Month CME SOFR | | | Jun. 2024 | | | | 15,140,000 | | | | (41,755 | ) |
| | 64 | | | 3 Month CME SOFR | | | Sep. 2024 | | | | 15,172,000 | | | | (81,680 | ) |
| | 64 | | | 3 Month CME SOFR | | | Dec. 2024 | | | | 15,213,600 | | | | (106,517 | ) |
| | 64 | | | 3 Month CME SOFR | | | Mar. 2025 | | | | 15,256,800 | | | | (112,917 | ) |
| | 1,186 | | | 2 Year U.S. Treasury Notes | | | Dec. 2023 | | | | 240,072,345 | | | | (1,227 | ) |
| | 228 | | | 10 Year U.S. Treasury Notes | | | Dec. 2023 | | | | 24,207,189 | | | | (24,831 | ) |
| | 179 | | | 20 Year U.S. Treasury Bonds | | | Dec. 2023 | | | | 19,589,313 | | | | (1,395,345 | ) |
| | 5 | | | 30 Year Euro Buxl | | | Dec. 2023 | | | | 637,082 | | | | 4,757 | |
| | 1,107 | | | 30 Year U.S. Ultra Treasury Bonds | | | Dec. 2023 | | | | 124,606,687 | | | | (15,521,565 | ) |
| | 1,831 | | | Japanese Yen Currency | | | Dec. 2023 | | | | 152,121,769 | | | | (7,102,323 | ) |
| | | | | | | | | | | | | | | | |
| | | | |
| | | | | | | | | | | | | | | (24,342,579 | ) |
| | | | | | | | | | | | | | | | |
| Short Positions: | | | | | | | | | | | | |
| | 285 | | | 5 Year Euro-Bobl | | | Dec. 2023 | | | | 35,068,238 | | | | 311,211 | |
| | 3,278 | | | 5 Year U.S. Treasury Notes | | | Dec. 2023 | | | | 342,474,164 | | | | 5,603,508 | |
| | 791 | | | 10 Year Euro-Bund | | | Dec. 2023 | | | | 107,959,096 | | | | 2,182,563 | |
| | 188 | | | 10 Year U.S. Ultra Treasury Notes | | | Dec. 2023 | | | | 20,459,688 | | | | 946,584 | |
| | 1,993 | | | British Pound Currency | | | Dec. 2023 | | | | 151,393,262 | | | | 5,146,330 | |
| | 475 | | | Euro Currency | | | Dec. 2023 | | | | 62,952,344 | | | | 1,072,343 | |
| | 2,310 | | | Euro Schatz Index | | | Dec. 2023 | | | | 257,069,892 | | | | 694,519 | |
| | | | | | | | | | | | | | | | |
| | | | |
| | | | | | | | | | | | | | | 15,957,058 | |
| | | | | | | | | | | | | | | | |
| | | | |
| | | | | | | | | | | | | | $ | (8,385,521 | ) |
| | | | | | | | | | | | | | | | |
Forward foreign currency exchange contracts outstanding at October 31, 2023:
| | | | | | | | | | | | | | | | | | | | | | | | | | | | |
Purchase Contracts | | Counterparty | | | Notional
Amount
(000) | | | Value at
Settlement
Date | | | Current
Value | | | Unrealized
Appreciation | | | Unrealized
Depreciation | |
| OTC Forward Foreign Currency Exchange Contracts: | | | | | | | | | | | | | | | | | |
Australian Dollar, | | | | | | | | | | | | | | | | | | | | | | | | | | | | |
Expiring 01/19/24 | | | JPM | | | | AUD | | | | 54,319 | | | $ | 34,975,840 | | | $ | 34,548,883 | | | $ | — | | | $ | (426,957 | ) |
Brazilian Real, | | | | | | | | | | | | | | | | | | | | | | | | | | | | |
Expiring 11/03/23 | | | CITI | | | | BRL | | | | 19,292 | | | | 3,845,407 | | | | 3,824,677 | | | | — | | | | (20,730 | ) |
British Pound, | | | | | | | | | | | | | | | | | | | | | | | | | | | | |
Expiring 01/19/24 | | | SCB | | | | GBP | | | | 578 | | | | 701,683 | | | | 703,104 | | | | 1,421 | | | | — | |
Canadian Dollar, | | | | | | | | | | | | | | | | | | | | | | | | | | | | |
Expiring 01/19/24 | | | JPM | | | | CAD | | | | 53,116 | | | | 39,166,574 | | | | 38,357,941 | | | | — | | | | (808,633 | ) |
See Notes to Financial Statements.
62
Forward foreign currency exchange contracts outstanding at October 31, 2023 (continued):
| | | | | | | | | | | | | | | | | | | | | | | | | | | | |
Purchase Contracts | | Counterparty | | | Notional
Amount
(000) | | | Value at
Settlement
Date | | | Current
Value | | | Unrealized
Appreciation | | | Unrealized
Depreciation | |
| OTC Forward Foreign Currency Exchange Contracts (cont’d.): | | | | | | | | | | | | | | | | | |
Chilean Peso, | | | | | | | | | | | | | | | | | | | | | | | | | | | | |
Expiring 12/20/23 | | | BOA | | | | CLP | | | | 1,149,859 | | | $ | 1,279,398 | | | $ | 1,280,830 | | | $ | 1,432 | | | $ | — | |
Chinese Renminbi, | | | | | | | | | | | | | | | | | | | | | | | | | | | | |
Expiring 11/16/23 | | | BNP | | | | CNH | | | | 815,220 | | | | 112,358,078 | | | | 111,175,259 | | | | — | | | | (1,182,819 | ) |
Expiring 11/16/23 | | | DB | | | | CNH | | | | 24,766 | | | | 3,390,311 | | | | 3,377,410 | | | | — | | | | (12,901 | ) |
Expiring 11/16/23 | | | JPM | | | | CNH | | | | 353,761 | | | | 48,757,655 | | | | 48,244,039 | | | | — | | | | (513,616 | ) |
Czech Koruna, | | | | | | | | | | | | | | | | | | | | | | | | | | | | |
Expiring 01/19/24 | | | BARC | | | | CZK | | | | 116,874 | | | | 5,045,404 | | | | 5,026,067 | | | | — | | | | (19,337 | ) |
Danish Krone, | | | | | | | | | | | | | | | | | | | | | | | | | | | | |
Expiring 01/19/24 | | | CITI | | | | DKK | | | | 15,166 | | | | 2,169,486 | | | | 2,160,059 | | | | — | | | | (9,427 | ) |
Euro, | | | | | | | | | | | | | | | | | | | | | | | | | | | | |
Expiring 01/19/24 | | | JPM | | | | EUR | | | | 2,663 | | | | 2,832,253 | | | | 2,828,193 | | | | — | | | | (4,060 | ) |
Expiring 01/19/24 | | | MSI | | | | EUR | | | | 9,252 | | | | 9,792,429 | | | | 9,826,762 | | | | 34,333 | | | | — | |
Expiring 01/19/24 | | | MSI | | | | EUR | | | | 2,078 | | | | 2,206,306 | | | | 2,206,672 | | | | 366 | | | | — | |
Hungarian Forint, | | | | | | | | | | | | | | | | | | | | | | | | | | | | |
Expiring 01/19/24 | | | BARC | | | | HUF | | | | 7,300,095 | | | | 19,783,991 | | | | 19,967,888 | | | | 183,897 | | | | — | |
Indonesian Rupiah, | | | | | | | | | | | | | | | | | | | | | | | | | | | | |
Expiring 12/20/23 | | | MSI | | | | IDR | | | | 91,542,091 | | | | 5,950,667 | | | | 5,742,064 | | | | — | | | | (208,603 | ) |
Israeli Shekel, | | | | | | | | | | | | | | | | | | | | | | | | | | | | |
Expiring 12/20/23 | | | BARC | | | | ILS | | | | 17,431 | | | | 4,587,047 | | | | 4,325,191 | | | | — | | | | (261,856 | ) |
Japanese Yen, | | | | | | | | | | | | | | | | | | | | | | | | | | | | |
Expiring 01/19/24 | | | HSBC | | | | JPY | | | | 14,856,047 | | | | 101,377,401 | | | | 99,340,984 | | | | — | | | | (2,036,417 | ) |
Malaysian Ringgit, | | | | | | | | | | | | | | | | | | | | | | | | | | | | |
Expiring 12/20/23 | | | BARC | | | | MYR | | | | 52,331 | | | | 11,252,570 | | | | 11,019,924 | | | | — | | | | (232,646 | ) |
Mexican Peso, | | | | | | | | | | | | | | | | | | | | | | | | | | | | |
Expiring 12/20/23 | | | BARC | | | | MXN | | | | 70,393 | | | | 3,945,969 | | | | 3,872,158 | | | | — | | | | (73,811 | ) |
New Zealand Dollar, | | | | | | | | | | | | | | | | | | | | | | | | | | | | |
Expiring 01/19/24 | | | CITI | | | | NZD | | | | 13,564 | | | | 8,165,463 | | | | 7,904,375 | | | | — | | | | (261,088 | ) |
Norwegian Krone, | | | | | | | | | | | | | | | | | | | | | | | | | | | | |
Expiring 01/19/24 | | | HSBC | | | | NOK | | | | 87,186 | | | | 8,047,414 | | | | 7,822,539 | | | | — | | | | (224,875 | ) |
Polish Zloty, | | | | | | | | | | | | | | | | | | | | | | | | | | | | |
Expiring 01/19/24 | | | HSBC | | | | PLN | | | | 86,922 | | | | 20,333,977 | | | | 20,582,483 | | | | 248,506 | | | | — | |
Romanian Leu, | | | | | | | | | | | | | | | | | | | | | | | | | | | | |
Expiring 01/19/24 | | | BARC | | | | RON | | | | 11,188 | | | | 2,389,057 | | | | 2,381,344 | | | | — | | | | (7,713 | ) |
Singapore Dollar, | | | | | | | | | | | | | | | | | | | | | | | | | | | | |
Expiring 12/20/23 | | | HSBC | | | | SGD | | | | 7,299 | | | | 5,384,852 | | | | 5,342,992 | | | | — | | | | (41,860 | ) |
South Korean Won, | | | | | | | | | | | | | | | | | | | | | | | | | | | | |
Expiring 12/20/23 | | | JPM | | | | KRW | | | | 49,183,698 | | | | 37,187,130 | | | | 36,455,906 | | | | — | | | | (731,224 | ) |
Swiss Franc, | | | | | | | | | | | | | | | | | | | | | | | | | | | | |
Expiring 01/19/24 | | | JPM | | | | CHF | | | | 1,566 | | | | 1,754,288 | | | | 1,737,471 | | | | — | | | | (16,817 | ) |
See Notes to Financial Statements.
PGIM Global Total Return Fund 63
Schedule of Investments (continued)
as of October 31, 2023
Forward foreign currency exchange contracts outstanding at October 31, 2023 (continued):
| | | | | | | | | | | | | | | | | | | | | | | | | | | | |
Purchase Contracts | | Counterparty | | | Notional
Amount
(000) | | | Value at
Settlement
Date | | | Current
Value | | | Unrealized
Appreciation | | | Unrealized
Depreciation | |
| OTC Forward Foreign Currency Exchange Contracts (cont’d.): | | | | | | | | | | | | | | | | | |
Thai Baht, | | | | | | | | | | | | | | | | | | | | | | | | | | | | |
Expiring 12/20/23 | | | CITI | | | | THB | | | | 293,289 | | | $ | 8,250,046 | | | $ | 8,197,261 | | | $ | — | | | $ | (52,785 | ) |
| | | | | | | | | | | | | | | | | | | | | | | | | | | | |
| | | | | | | | | | | | | | $ | 504,930,696 | | | $ | 498,252,476 | | | | 469,955 | | | | (7,148,175 | ) |
| | | | | | | | | | | | | | | | | | | | | | | | | | | | |
| | | | | | | | | | | | | | | | | | | | | | | | | | | | |
Sale Contracts | | Counterparty | | | Notional
Amount
(000) | | | Value at
Settlement
Date | | | Current
Value | | | Unrealized
Appreciation | | | Unrealized
Depreciation | |
| OTC Forward Foreign Currency Exchange Contracts: | | | | | | | | | | | | | | | | | | | | | |
Australian Dollar, | | | | | | | | | | | | | | | | | | | | | | | | | | | | |
Expiring 01/19/24 | | | SSB | | | | AUD | | | | 6,461 | | | $ | 4,085,711 | | | $ | 4,109,400 | | | $ | — | | | $ | (23,689 | ) |
Brazilian Real, | | | | | | | | | | | | | | | | | | | | | | | | | | | | |
Expiring 11/03/23 | | | DB | | | | BRL | | | | 19,292 | | | | 3,905,187 | | | | 3,824,676 | | | | 80,511 | | | | — | |
Expiring 12/04/23 | | | CITI | | | | BRL | | | | 19,292 | | | | 3,831,165 | | | | 3,810,538 | | | | 20,627 | | | | — | |
British Pound, | | | | | | | | | | | | | | | | | | | | | | | | | | | | |
Expiring 01/19/24 | | | HSBC | | | | GBP | | | | 22,647 | | | | 27,870,361 | | | | 27,544,548 | | | | 325,813 | | | | — | |
Chinese Renminbi, | | | | | | | | | | | | | | | | | | | | | | | | | | | | |
Expiring 11/16/23 | | | BOA | | | | CNH | | | | 19,651 | | | | 2,684,374 | | | | 2,679,924 | | | | 4,450 | | | | — | |
Euro, | | | | | | | | | | | | | | | | | | | | | | | | | | | | |
Expiring 01/19/24 | | | BNP | | | | EUR | | | | 68,414 | | | | 72,908,365 | | | | 72,666,534 | | | | 241,831 | | | | — | |
Expiring 01/19/24 | | | GSI | | | | EUR | | | | 6,498 | | | | 6,906,038 | | | | 6,901,705 | | | | 4,333 | | | | — | |
Expiring 01/19/24 | | | MSI | | | | EUR | | | | 43,602 | | | | 46,509,202 | | | | 46,311,912 | | | | 197,290 | | | | — | |
Expiring 01/19/24 | | | SSB | | | | EUR | | | | 76,193 | | | | 80,551,023 | | | | 80,929,489 | | | | — | | | | (378,466 | ) |
Expiring 01/19/24 | | | TD | | | | EUR | | | | 3,577 | | | | 3,795,346 | | | | 3,799,715 | | | | — | | | | (4,369 | ) |
Japanese Yen, | | | | | | | | | | | | | | | | | | | | | | | | | | | | |
Expiring 01/19/24 | | | CITI | | | | JPY | | | | 1,054,258 | | | | 7,104,498 | | | | 7,049,724 | | | | 54,774 | | | | — | |
Expiring 01/19/24 | | | GSI | | | | JPY | | | | 640,198 | | | | 4,330,016 | | | | 4,280,944 | | | | 49,072 | | | | — | |
Peruvian Nuevo Sol, | | | | | | | | | | | | | | | | | | | | | | | | | | | | |
Expiring 12/20/23 | | | CITI | | | | PEN | | | | 25,265 | | | | 6,776,118 | | | | 6,563,341 | | | | 212,777 | | | | — | |
Swedish Krona, | | | | | | | | | | | | | | | | | | | | | | | | | | | | |
Expiring 01/19/24 | | | JPM | | | | SEK | | | | 38,328 | | | | 3,532,935 | | | | 3,447,295 | | | | 85,640 | | | | — | |
| | | | | | | | | | | | | | | | | | | | | | | | | | | | |
| | | | | | | | | | | | | | $ | 274,790,339 | | | $ | 273,919,745 | | | | 1,277,118 | | | | (406,524 | ) |
| | | | | | | | | | | | | | | | | | | | | | | | | | | | |
| | | | | | | | | �� | | | | | | | | | | | | | $ | 1,747,073 | | | $ | (7,554,699 | ) |
| | | | | | | | | | | | | | | | | | | | | | | | | | | | |
See Notes to Financial Statements.
64
Credit default swap agreements outstanding at October 31, 2023:
| | | | | | | | | | | | | | | | | | | | | | | | |
Reference Entity/ Obligation | | Termination
Date | | Fixed
Rate | | | Notional
Amount
(000)#(3) | | | Fair
Value | | | Upfront
Premiums
Paid
(Received) | | | Unrealized
Appreciation
(Depreciation) | | | Counterparty |
| | | | | | | | | | | | | | | | | | | | |
|
| OTC Packaged Credit Default Swap Agreements on corporate and/or sovereign issues - Buy Protection(1)**: |
Arab Republic of Egypt (D01) | | 12/20/28 | | | 1.000%(Q) | | | | 2,000 | | | $ | 880,465 | | | $ | 766 | | | $ | 879,699 | | | BARC |
Dominican Republic (D01) | | 12/20/28 | | | 1.000%(Q) | | | | 2,000 | | | | 144,260 | | | | 766 | | | | 143,494 | | | BARC |
Emirate of Abu Dhabi (D01) | | 12/20/28 | | | 1.000%(Q) | | | | 2,000 | | | | (47,454) | | | | 766 | | | | (48,220) | | | BARC |
Federal Republic of Nigeria (D01) | | 12/20/28 | | | 1.000%(Q) | | | | 2,000 | | | | 462,282 | | | | 766 | | | | 461,516 | | | BARC |
Federation of Malaysia (D01) | | 12/20/28 | | | 1.000%(Q) | | | | 3,000 | | | | (51,492) | | | | 1,150 | | | | (52,642) | | | BARC |
Federative Republic of Brazil (D01) | | 12/20/28 | | | 1.000%(Q) | | | | 9,000 | | | | 313,955 | | | | 3,449 | | | | 310,506 | | | BARC |
Kingdom of Bahrain (D01) | | 12/20/28 | | | 1.000%(Q) | | | | 2,000 | | | | 128,959 | | | | 766 | | | | 128,193 | | | BARC |
Kingdom of Morocco (D01) | | 12/20/28 | | | 1.000%(Q) | | | | 2,000 | | | | 41,250 | | | | 766 | | | | 40,484 | | | BARC |
Kingdom of Saudi Arabia (D01) | | 12/20/28 | | | 1.000%(Q) | | | | 4,000 | | | | (63,035) | | | | 1,533 | | | | (64,568) | | | BARC |
People’s Republic of China (D01) | | 12/20/28 | | | 1.000%(Q) | | | | 9,000 | | | | (86,876) | | | | 3,449 | | | | (90,325) | | | BARC |
Republic of Argentina (D01) | | 12/20/28 | | | 1.000%(Q) | | | | 2,000 | | | | 1,546,614 | | | | 766 | | | | 1,545,848 | | | BARC |
Republic of Chile (D01) | | 12/20/28 | | | 1.000%(Q) | | | | 7,000 | | | | (75,744) | | | | 2,682 | | | | (78,426) | | | BARC |
Republic of Colombia (D01) | | 12/20/28 | | | 1.000%(Q) | | | | 6,000 | | | | 306,930 | | | | 2,299 | | | | 304,631 | | | BARC |
Republic of Indonesia (D01) | | 12/20/28 | | | 1.000%(Q) | | | | 9,000 | | | | (17,972) | | | | 3,449 | | | | (21,421) | | | BARC |
Republic of Panama (D01) | | 12/20/28 | | | 1.000%(Q) | | | | 2,000 | | | | 63,031 | | | | 766 | | | | 62,265 | | | BARC |
Republic of Peru (D01) | | 12/20/28 | | | 1.000%(Q) | | | | 3,000 | | | | (3,127) | | | | 1,150 | | | | (4,277) | | | BARC |
Republic of Philippines (D01) | | 12/20/28 | | | 1.000%(Q) | | | | 3,000 | | | | (18,242) | | | | 1,150 | | | | (19,392) | | | BARC |
Republic of South Africa (D01) | | 12/20/28 | | | 1.000%(Q) | | | | 9,000 | | | | 666,742 | | | | 3,449 | | | | 663,293 | | | BARC |
Republic of Turkey (D01) | | 12/20/28 | | | 1.000%(Q) | | | | 9,000 | | | | 1,090,991 | | | | 3,449 | | | | 1,087,542 | | | BARC |
State of Qatar (D01) | | 12/20/28 | | | 1.000%(Q) | | | | 2,000 | | | | (41,040) | | | | 766 | | | | (41,806) | | | BARC |
Sultanate of Oman (D01) | | 12/20/28 | | | 1.000%(Q) | | | | 2,000 | | | | 43,789 | | | | 766 | | | | 43,023 | | | BARC |
United Mexican States (D01) | | 12/20/28 | | | 1.000%(Q) | | | | 9,000 | | | | 75,834 | | | | 3,449 | | | | 72,385 | | | BARC |
See Notes to Financial Statements.
PGIM Global Total Return Fund 65
Schedule of Investments (continued)
as of October 31, 2023
Credit default swap agreements outstanding at October 31, 2023 (continued):
| | | | | | | | | | | | | | | | | | | | | | | | |
Reference Entity/ Obligation | | Termination
Date | | Fixed
Rate | | | Notional
Amount
(000)#(3) | | | Fair
Value | | | Upfront
Premiums
Paid
(Received) | | | Unrealized
Appreciation
(Depreciation) | | | Counterparty |
| | | | | | | | | | | | | | | | | | | | |
|
| OTC Packaged Credit Default Swap Agreements on corporate and/or sovereign issues - Buy Protection(1)**(cont’d.): |
Arab Republic of Egypt (D02) | | 12/20/28 | | | 1.000%(Q) | | | | 2,000 | | | $ | 880,465 | | | $ | 766 | | | $ | 879,699 | | | GSI |
Dominican Republic (D02) | | 12/20/28 | | | 1.000%(Q) | | | | 2,000 | | | | 144,260 | | | | 766 | | | | 143,494 | | | GSI |
Emirate of Abu Dhabi (D02) | | 12/20/28 | | | 1.000%(Q) | | | | 2,000 | | | | (47,454) | | | | 766 | | | | (48,220) | | | GSI |
Federal Republic of Nigeria (D02) | | 12/20/28 | | | 1.000%(Q) | | | | 2,000 | | | | 462,282 | | | | 766 | | | | 461,516 | | | GSI |
Federation of Malaysia (D02) | | 12/20/28 | | | 1.000%(Q) | | | | 3,000 | | | | (51,492) | | | | 1,150 | | | | (52,642) | | | GSI |
Federative Republic of Brazil (D02) | | 12/20/28 | | | 1.000%(Q) | | | | 9,000 | | | | 313,955 | | | | 3,449 | | | | 310,506 | | | GSI |
Kingdom of Bahrain (D02) | | 12/20/28 | | | 1.000%(Q) | | | | 2,000 | | | | 128,959 | | | | 766 | | | | 128,193 | | | GSI |
Kingdom of Morocco (D02) | | 12/20/28 | | | 1.000%(Q) | | | | 2,000 | | | | 41,250 | | | | 766 | | | | 40,484 | | | GSI |
Kingdom of Saudi Arabia (D02) | | 12/20/28 | | | 1.000%(Q) | | | | 4,000 | | | | (63,035) | | | | 1,533 | | | | (64,568) | | | GSI |
People’s Republic of China (D02) | | 12/20/28 | | | 1.000%(Q) | | | | 9,000 | | | | (86,876) | | | | 3,449 | | | | (90,325) | | | GSI |
Republic of Argentina (D02) | | 12/20/28 | | | 1.000%(Q) | | | | 2,000 | | | | 1,546,614 | | | | 766 | | | | 1,545,848 | | | GSI |
Republic of Chile (D02) | | 12/20/28 | | | 1.000%(Q) | | | | 7,000 | | | | (75,744) | | | | 2,682 | | | | (78,426) | | | GSI |
Republic of Colombia (D02) | | 12/20/28 | | | 1.000%(Q) | | | | 6,000 | | | | 306,930 | | | | 2,299 | | | | 304,631 | | | GSI |
Republic of Indonesia (D02) | | 12/20/28 | | | 1.000%(Q) | | | | 9,000 | | | | (17,972) | | | | 3,449 | | | | (21,421) | | | GSI |
Republic of Panama (D02) | | 12/20/28 | | | 1.000%(Q) | | | | 2,000 | | | | 63,031 | | | | 766 | | | | 62,265 | | | GSI |
Republic of Peru (D02) | | 12/20/28 | | | 1.000%(Q) | | | | 3,000 | | | | (3,127) | | | | 1,150 | | | | (4,277) | | | GSI |
Republic of Philippines (D02) | | 12/20/28 | | | 1.000%(Q) | | | | 3,000 | | | | (18,242) | | | | 1,150 | | | | (19,392) | | | GSI |
Republic of South Africa (D02) | | 12/20/28 | | | 1.000%(Q) | | | | 9,000 | | | | 666,742 | | | | 3,449 | | | | 663,293 | | | GSI |
Republic of Turkey (D02) | | 12/20/28 | | | 1.000%(Q) | | | | 9,000 | | | | 1,090,991 | | | | 3,449 | | | | 1,087,542 | | | GSI |
State of Qatar (D02) | | 12/20/28 | | | 1.000%(Q) | | | | 2,000 | | | | (41,040) | | | | 766 | | | | (41,806) | | | GSI |
Sultanate of Oman (D02) | | 12/20/28 | | | 1.000%(Q) | | | | 2,000 | | | | 43,789 | | | | 766 | | | | 43,023 | | | GSI |
United Mexican States (D02) | | 12/20/28 | | | 1.000%(Q) | | | | 9,000 | | | | 75,834 | | | | 3,449 | | | | 72,385 | | | GSI |
See Notes to Financial Statements.
66
Credit default swap agreements outstanding at October 31, 2023 (continued):
| | | | | | | | | | | | | | | | | | | | | | |
Reference Entity/ Obligation | | Termination
Date | | Fixed
Rate | | Notional
Amount
(000)#(3) | | | Fair
Value | | | Upfront
Premiums
Paid
(Received) | | | Unrealized
Appreciation
(Depreciation) | | | Counterparty |
| | | | | | | | | | | | | | | | | | | |
|
| OTC Packaged Credit Default Swap Agreements on corporate and/or sovereign issues - Buy Protection(1)**(cont’d.): |
Arab Republic of Egypt (D03) | | 12/20/28 | | 1.000%(Q) | | | 2,000 | | | $ | 880,466 | | | $ | 877 | | | $ | 879,589 | | | GSI |
Dominican Republic (D03) | | 12/20/28 | | 1.000%(Q) | | | 2,000 | | | | 144,261 | | | | 877 | | | | 143,384 | | | GSI |
Emirate of Abu Dhabi (D03) | | 12/20/28 | | 1.000%(Q) | | | 2,000 | | | | (47,454 | ) | | | 877 | | | | (48,331 | ) | | GSI |
Federal Republic of Nigeria (D03) | | 12/20/28 | | 1.000%(Q) | | | 2,000 | | | | 462,283 | | | | 877 | | | | 461,406 | | | GSI |
Federation of Malaysia (D03) | | 12/20/28 | | 1.000%(Q) | | | 3,000 | | | | (51,493 | ) | | | 1,315 | | | | (52,808 | ) | | GSI |
Federative Republic of Brazil (D03) | | 12/20/28 | | 1.000%(Q) | | | 9,000 | | | | 313,954 | | | | 3,945 | | | | 310,009 | | | GSI |
Kingdom of Bahrain (D03) | | 12/20/28 | | 1.000%(Q) | | | 2,000 | | | | 128,959 | | | | 877 | | | | 128,082 | | | GSI |
Kingdom of Morocco (D03) | | 12/20/28 | | 1.000%(Q) | | | 2,000 | | | | 41,251 | | | | 877 | | | | 40,374 | | | GSI |
Kingdom of Saudi Arabia (D03) | | 12/20/28 | | 1.000%(Q) | | | 4,000 | | | | (63,035 | ) | | | 1,753 | | | | (64,788 | ) | | GSI |
People’s Republic of China (D03) | | 12/20/28 | | 1.000%(Q) | | | 9,000 | | | | (86,876 | ) | | | 3,945 | | | | (90,821 | ) | | GSI |
Republic of Argentina (D03) | | 12/20/28 | | 1.000%(Q) | | | 2,000 | | | | 1,546,614 | | | | 877 | | | | 1,545,737 | | | GSI |
Republic of Chile (D03) | | 12/20/28 | | 1.000%(Q) | | | 7,000 | | | | (75,743 | ) | | | 3,069 | | | | (78,812 | ) | | GSI |
Republic of Colombia (D03) | | 12/20/28 | | 1.000%(Q) | | | 6,000 | | | | 306,929 | | | | 2,630 | | | | 304,299 | | | GSI |
Republic of Indonesia (D03) | | 12/20/28 | | 1.000%(Q) | | | 9,000 | | | | (17,973 | ) | | | 3,945 | | | | (21,918 | ) | | GSI |
Republic of Panama (D03) | | 12/20/28 | | 1.000%(Q) | | | 2,000 | | | | 63,032 | | | | 877 | | | | 62,155 | | | GSI |
Republic of Peru (D03) | | 12/20/28 | | 1.000%(Q) | | | 3,000 | | | | (3,127 | ) | | | 1,315 | | | | (4,442 | ) | | GSI |
Republic of Philippines (D03) | | 12/20/28 | | 1.000%(Q) | | | 3,000 | | | | (18,243 | ) | | | 1,315 | | | | (19,558 | ) | | GSI |
Republic of South Africa (D03) | | 12/20/28 | | 1.000%(Q) | | | 9,000 | | | | 666,741 | | | | 3,945 | | | | 662,796 | | | GSI |
Republic of Turkey (D03) | | 12/20/28 | | 1.000%(Q) | | | 9,000 | | | | 1,090,990 | | | | 3,945 | | | | 1,087,045 | | | GSI |
State of Qatar (D03) | | 12/20/28 | | 1.000%(Q) | | | 2,000 | | | | (41,040 | ) | | | 877 | | | | (41,917 | ) | | GSI |
See Notes to Financial Statements.
PGIM Global Total Return Fund 67
Schedule of Investments (continued)
as of October 31, 2023
Credit default swap agreements outstanding at October 31, 2023 (continued):
| | | | | | | | | | | | | | | | | | | | | | | | | | | | |
Reference Entity/ Obligation | | Termination
Date | | | Fixed
Rate | | | Notional
Amount
(000)#(3) | | | Fair
Value | | | Upfront
Premiums
Paid
(Received) | | | Unrealized
Appreciation
(Depreciation) | | | Counterparty | |
| | | | | | | | | | | | | | | | | | | | | | |
|
| OTC Packaged Credit Default Swap Agreements on corporate and/or sovereign issues - Buy Protection(1)**(cont’d.): | |
Sultanate of Oman (D03) | | | 12/20/28 | | | | 1.000 | %(Q) | | | 2,000 | | | $ | 43,789 | | | $ | 877 | | | $ | 42,912 | | | | GSI | |
United Mexican States (D03) | | | 12/20/28 | | | | 1.000 | %(Q) | | | 9,000 | | | | 75,833 | | | | 3,945 | | | | 71,888 | | | | GSI | |
| | | | | | | | | | | | | | | | | | | | | | | | | | | | |
| | | | | | | | | | | | | | $ | 16,080,358 | | | $ | 120,473 | | | $ | 15,959,885 | | | | | |
| | | | | | | | | | | | | | | | | | | | | | | | | | | | |
| | | | | | | | | | | | | | | | | | | | | | | | | | | | | | | | |
Reference Entity/ Obligation | | Termination
Date | | | Fixed
Rate | | | Notional
Amount
(000)#(3) | | | Implied
Credit
Spread at
October 31,
2023(4) | | | Fair
Value | | | Upfront
Premiums
Paid
(Received) | | | Unrealized
Appreciation
(Depreciation) | | | Counterparty | |
| | | | | | | | | | | | | | | | | | | | | | | | | |
| |
| OTC Packaged Credit Default Swap Agreements on credit indices—Sell Protection(2)**: | | | | | |
CDX.EM.40.V1 (D01) | | | 12/20/28 | | | | 1.000%(Q) | | | | 100,000 | | | | 2.279 | % | | $ | (5,351,560 | ) | | $ | (136,846 | ) | | $ | (5,214,714 | ) | | | BARC | |
CDX.EM.40.V1 (D02) | | | 12/20/28 | | | | 1.000%(Q) | | | | 100,000 | | | | 2.279 | % | | | (5,351,560 | ) | | | (136,846 | ) | | | (5,214,714 | ) | | | GSI | |
CDX.EM.40.V1 (D03) | | | 12/20/28 | | | | 1.000%(Q) | | | | 100,000 | | | | 2.279 | % | | | (5,351,561 | ) | | | (142,470 | ) | | | (5,209,091 | ) | | | GSI | |
| | | | | | | | | | | | | | | | | | | | | | | | | | | | | | | | |
| | | | | | | | | | | | | | | | | | $ | (16,054,681 | ) | | $ | (416,162 | ) | | $ | (15,638,519 | ) | | | | |
| | | | | | | | | | | | | | | | | | | | | | | | | | | | | | | | |
| ** | The Fund entered into multiple credit default swap agreements in a packaged trade consisting of two parts. The Fund bought/sold protection on an Emerging Market CDX Index and bought/sold protection on the countries which comprise the index. The upfront premium is attached to the index of the trade for the Emerging Markets CDX package(s). Each swap is priced individually. If any of the component swaps are closed out early, the Index exposure will be reduced by an amount proportionate to the terminated swap(s). Individual packages in the tables above are denoted by the corresponding footnotes (D01 - D03). |
| | | | | | | | | | | | | | | | | | | | | | | | | | |
Reference Entity/ Obligation | | Termination
Date | | Fixed
Rate | | Notional
Amount
(000)#(3) | | | Implied
Credit
Spread at
October 31,
2023(4) | | Fair
Value | | | Upfront
Premiums
Paid
(Received) | | | Unrealized
Appreciation
(Depreciation) | | | Counterparty | |
| | | | | | | | | | | | | | | | | | | | | | |
| |
| OTC Credit Default Swap Agreement on asset-backed and/or mortgage-backed securities - Sell Protection(2)^: | | | | | |
GS_21-PJA†† | | 11/14/23 | | 0.500%(M) | | | 43,187 | | | * | | $ | 28,151 | | | $ | (278 | ) | | $ | 28,429 | | | | GSI | |
| | | | | | | | | | | | | | | | | | | | | | | | | | |
| †† | The value of the contract, GS_21-PJA is derived from the aggregate credit performance of a pool of senior prime jumbo mortgages. The pool of prime jumbo mortgages is reset monthly. |
See Notes to Financial Statements.
68
Credit default swap agreements outstanding at October 31, 2023 (continued):
| | | | | | | | | | | | | | | | | | | | | | | | | | | | |
Reference Entity/ Obligation | | Termination
Date | | | Fixed
Rate | | | Notional
Amount
(000)#(3) | | | Fair
Value | | | Upfront
Premiums
Paid
(Received) | | | Unrealized
Appreciation
(Depreciation) | | | Counterparty | |
| | | | | | | | | | | | | | | | | | | | | | |
| OTC Credit Default Swap Agreements on corporate and/or sovereign issues - Buy Protection(1): | | | | | |
Eskom Holdings SOC Ltd. | | | 12/20/23 | | | | 1.000 | %(Q) | | | EUR 2,640 | | | $ | (5,706 | ) | | $ | 25,458 | | | $ | (31,164 | ) | | | DB | |
Gazprom PAO | | | 12/20/23 | | | | 1.000 | %(Q) | | | 1,410 | | | | 54,803 | | | | 36,862 | | | | 17,941 | | | | CITI | |
Gazprom PAO | | | 06/20/24 | | | | 1.000 | %(Q) | | | 723 | | | | 87,507 | | | | 92,050 | | | | (4,543 | ) | | | HSBC | |
Gazprom PAO | | | 06/20/25 | | | | 1.000 | %(Q) | | | EUR 2,000 | | | | 432,670 | | | | 8,574 | | | | 424,096 | | | | BARC | |
Gazprom PAO | | | 12/20/25 | | | | 1.000 | %(Q) | | | 2,000 | | | | 431,710 | | | | 573,952 | | | | (142,242 | ) | | | GSI | |
Gazprom PAO | | | 06/20/26 | | | | 1.000 | %(Q) | | | 4,400 | | | | 1,019,163 | | | | 1,623,836 | | | | (604,673 | ) | | | HSBC | |
Gazprom PAO | | | 06/20/27 | | | | 1.000 | %(Q) | | | 8,650 | | | | 2,208,681 | | | | 3,570,311 | | | | (1,361,630 | ) | | | HSBC | |
Gazprom PAO | | | 06/20/27 | | | | 1.000 | %(Q) | | | 1,000 | | | | 255,339 | | | | 288,180 | | | | (32,841 | ) | | | HSBC | |
Gazprom PAO | | | 06/20/27 | | | | 1.000 | %(Q) | | | 600 | | | | 153,204 | | | | 287,267 | | | | (134,063 | ) | | | JPM | |
Gazprom PAO | | | 12/20/27 | | | | 1.000 | %(Q) | | | 3,300 | | | | 870,437 | | | | 1,335,797 | | | | (465,360 | ) | | | JPM | |
Kingdom of Morocco | | | 12/20/27 | | | | 1.000 | %(Q) | | | 4,305 | | | | 37,663 | | | | 95,835 | | | | (58,172 | ) | | | BNP | |
Petroleos Mexicanos | | | 03/20/24 | | | | 1.000 | %(Q) | | | 2,230 | | | | 7,182 | | | | 19,780 | | | | (12,598 | ) | | | MSI | |
Republic of Italy | | | 12/20/27 | | | | 1.000 | %(Q) | | | EUR 4,935 | | | | (77,112 | ) | | | (154,556 | ) | | | 77,444 | | | | BARC | |
Republic of South Africa | | | 06/20/26 | | | | 1.000 | %(Q) | | | 1,000 | | | | 17,978 | | | | 20,933 | | | | (2,955 | ) | | | GSI | |
Swiss Confederation | | | 12/20/27 | | | | 0.250 | %(Q) | | | 5,000 | | | | (35,124 | ) | | | — | | | | (35,124 | ) | | | BARC | |
| | | | | | | | | | | | | | | | | | | | | | | | | | | | |
| | | | | | | | | | | | | | $ | 5,458,395 | | | $ | 7,824,279 | | | $ | (2,365,884 | ) | | | | |
| | | | | | | | | | | | | | | | | | | | | | | | | | | | |
| | | | | | | | | | | | | | | | | | | | | | | | |
Reference Entity/ Obligation | | Termination
Date | | Fixed
Rate | | Notional
Amount
(000)#(3) | | | Implied
Credit
Spread at
October 31,
2023(4) | | Fair
Value | | | Upfront
Premiums
Paid
(Received) | | | Unrealized
Appreciation
(Depreciation) | | | Counterparty |
| | | | | | | | | | | | | | | | | | | | | |
|
| OTC Credit Default Swap Agreements on corporate and/or sovereign issues - Sell Protection(2): |
American International Group, Inc. | | 06/20/26 | | 1.000%(Q) | | | 3,260 | | | 0.656% | | $ | 31,402 | | | $ | 25,867 | | | $ | 5,535 | | | BOA |
Australian Government Bond | | 12/20/27 | | 1.000%(Q) | | | 5,000 | | | 0.187% | | | 159,025 | | | | 139,966 | | | | 19,059 | | | DB |
Barclays PLC | | 12/20/26 | | 1.000%(Q) | | | EUR 3,000 | | | 1.012% | | | 2,560 | | | | 19,764 | | | | (17,204 | ) | | CITI |
DP World PLC | | 12/20/24 | | 1.000%(Q) | | | 2,000 | | | 1.397% | | | (6,406 | ) | | | 2,137 | | | | (8,543 | ) | | BARC |
Emirate of Abu Dhabi | | 06/20/24 | | 1.000%(Q) | | | 3,480 | | | 0.197% | | | 21,682 | | | | 19,138 | | | | 2,544 | | | BNP |
Emirate of Dubai | | 12/20/24 | | 1.000%(Q) | | | 1,000 | | | 0.339% | | | 8,502 | | | | 859 | | | | 7,643 | | | CITI |
Eskom Holdings SOC Ltd. | | 12/20/23 | | 1.000%(Q) | | | 3,000 | | | 0.363% | | | 6,117 | | | | (15,571 | ) | | | 21,688 | | | DB |
See Notes to Financial Statements.
PGIM Global Total Return Fund 69
Schedule of Investments (continued)
as of October 31, 2023
Credit default swap agreements outstanding at October 31, 2023 (continued):
| | | | | | | | | | | | | | | | | | | | | | | | |
Reference Entity/ Obligation | | Termination
Date | | Fixed
Rate | | Notional
Amount
(000)#(3) | | | Implied
Credit
Spread at
October 31,
2023(4) | | Fair
Value | | | Upfront
Premiums
Paid
(Received) | | | Unrealized
Appreciation
(Depreciation) | | | Counterparty |
| | | | | | | | | | | | | | | | | | | | | |
|
| OTC Credit Default Swap Agreements on corporate and/or sovereign issues - Sell Protection(2)(cont’d.): |
Federative Republic of Brazil | | 12/20/23 | | 1.000%(M) | | | 2,700 | | | 0.209% | | $ | 6,075 | | | $ | 2,775 | | | $ | 3,300 | | | CITI |
Gazprom PAO | | 12/20/26 | | 1.000%(Q) | | | 8,600 | | | 12.369% | | | (2,120,093 | ) | | | (3,396,003 | ) | | | 1,275,910 | | | HSBC |
Generalitat de Cataluna | | 12/20/25 | | 1.000%(Q) | | | 4,900 | | | 0.405% | | | 64,885 | | | | (19,989 | ) | | | 84,874 | | | DB |
Halliburton Co. | | 12/20/26 | | 1.000%(Q) | | | 4,240 | | | 0.360% | | | 83,933 | | | | 25,502 | | | | 58,431 | | | GSI |
Hellenic Republic | | 06/20/24 | | 1.000%(Q) | | | 1,000 | | | 0.163% | | | 6,446 | | | | (25,874 | ) | | | 32,320 | | | BARC |
Hellenic Republic | | 06/20/29 | | 1.000%(Q) | | | 5,400 | | | 0.957% | | | 17,474 | | | | (41,230 | ) | | | 58,704 | | | BARC |
Hellenic Republic | | 12/20/29 | | 1.000%(Q) | | | EUR 5,000 | | | 0.826% | | | 56,684 | | | | 13,183 | | | | 43,501 | | | CITI |
Hellenic Republic | | 12/20/31 | | 1.000%(Q) | | | 6,000 | | | 1.265% | | | (96,009 | ) | | | (145,313 | ) | | | 49,304 | | | CITI |
International Bank for Reconstruction & Development | | 03/20/24 | | 0.250%(Q) | | | 34,770 | | | 0.059% | | | 35,701 | | | | 13,186 | | | | 22,515 | | | BOA |
Israel Electric Corp. Ltd. | | 12/20/24 | | 1.000%(Q) | | | 1,000 | | | 1.564% | | | (5,045 | ) | | | 2,923 | | | | (7,968 | ) | | BARC |
Japan Govt. | | 06/20/28 | | 1.000%(Q) | | | 15,000 | | | 0.278% | | | 469,812 | | | | 485,496 | | | | (15,684 | ) | | CITI |
Kingdom of Spain | | 06/20/24 | | 1.000%(Q) | | | 700 | | | 0.095% | | | 4,815 | | | | (3,039 | ) | | | 7,854 | | | MSI |
Kingdom of Spain | | 06/20/25 | | 1.000%(Q) | | | 9,940 | | | 0.223% | | | 133,425 | | | | (31,291 | ) | | | 164,716 | | | BOA |
Kingdom of Spain | | 06/20/25 | | 1.000%(Q) | | | 7,500 | | | 0.223% | | | 100,673 | | | | (29,229 | ) | | | 129,902 | | | JPM |
Kingdom of Spain | | 06/20/25 | | 1.000%(Q) | | | 1,645 | | | 0.223% | | | 22,081 | | | | 7,054 | | | | 15,027 | | | BARC |
People’s Republic of China | | 12/20/24 | | 1.000%(Q) | | | 1,000 | | | 0.328% | | | 8,620 | | | | 4,808 | | | | 3,812 | | | CITI |
Republic of Colombia | | 12/20/26 | | 1.000%(Q) | | | 1,000 | | | 1.309% | | | (7,722 | ) | | | (36,610 | ) | | | 28,888 | | | CITI |
Republic of Estonia | | 12/20/26 | | 1.000%(Q) | | | 3,150 | | | 0.572% | | | 42,849 | | | | 18,721 | | | | 24,128 | | | JPM |
Republic of Finland | | 06/20/27 | | 0.250%(Q) | | | 2,000 | | | 0.178% | | | 5,440 | | | | 6,139 | | | | (699 | ) | | BOA |
See Notes to Financial Statements.
70
Credit default swap agreements outstanding at October 31, 2023 (continued):
| | | | | | | | | | | | | | | | | | | | | | | | | | | | |
Reference Entity/ Obligation | | Termination
Date | | Fixed
Rate | | Notional
Amount
(000)#(3) | | | Implied
Credit
Spread at
October 31,
2023(4) | | | Fair
Value | | | Upfront
Premiums
Paid
(Received) | | | Unrealized
Appreciation
(Depreciation) | | | Counterparty | |
| | | | | | | | | | | | | | | | | | | | | | | |
| |
| OTC Credit Default Swap Agreements on corporate and/or sovereign issues - Sell Protection(2)(cont’d.): | | | | | |
Republic of Ireland | | 12/20/26 | | 1.000%(Q) | | | 2,000 | | | | 0.180 | % | | $ | 50,240 | | | $ | 2,046 | | | $ | 48,194 | | | | GSI | |
Republic of Ireland | | 06/20/27 | | 1.000%(Q) | | | 2,800 | | | | 0.207 | % | | | 77,586 | | | | 30,980 | | | | 46,606 | | | | MSI | |
Republic of Italy | | 06/20/24 | | 1.000%(Q) | | | 6,000 | | | | 0.225 | % | | | 36,337 | | | | (39,626 | ) | | | 75,963 | | | | BOA | |
Republic of Italy | | 06/20/24 | | 1.000%(Q) | | | 900 | | | | 0.119 | % | | | 6,050 | | | | (6,085 | ) | | | 12,135 | | | | DB | |
Republic of Italy | | 06/20/26 | | 1.000%(Q) | | | 4,200 | | | | 0.607 | % | | | 45,616 | | | | (86,544 | ) | | | 132,160 | | | | BOA | |
Republic of Italy | | 06/20/30 | | 1.000%(Q) | | | 1,200 | | | | 1.341 | % | | | (21,041 | ) | | | (22,913 | ) | | | 1,872 | | | | BARC | |
Republic of Panama | | 12/20/26 | | 1.000%(Q) | | | 4,200 | | | | 1.211 | % | | | (20,587 | ) | | | 7,587 | | | | (28,174 | ) | | | CITI | |
Republic of Poland | | 06/20/24 | | 1.000%(Q) | | | 6,615 | | | | 0.136 | % | | | 43,767 | | | | 3,269 | | | | 40,498 | | | | BNP | |
Republic of Serbia | | 12/20/25 | | 5.000%(Q) | | | 4,500 | | | | 1.134 | % | | | 377,371 | | | | 377,888 | | | | (517 | ) | | | CITI | |
Republic of Serbia | | 12/20/25 | | 1.000%(Q) | | | 1,000 | | | | 1.134 | % | | | (1,538 | ) | | | (623 | ) | | | (915 | ) | | | BNP | |
Republic of Slovenia | | 06/20/24 | | 1.000%(Q) | | | 900 | | | | 0.064 | % | | | 6,366 | | | | (8,344 | ) | | | 14,710 | | | | HSBC | |
Republic of South Africa | | 12/20/23 | | 1.000%(Q) | | | 3,000 | | | | 0.725 | % | | | 4,627 | | | | (4,607 | ) | | | 9,234 | | | | BOA | |
Republic of South Africa | | 06/20/31 | | 1.000%(Q) | | | 3,000 | | | | 3.432 | % | | | (414,343 | ) | | | (291,207 | ) | | | (123,136 | ) | | | MSI | |
State of Illinois | | 12/20/24 | | 1.000%(Q) | | | 2,800 | | | | 1.332 | % | | | (6,888 | ) | | | (38,265 | ) | | | 31,377 | | | | GSI | |
State of Illinois | | 06/20/28 | | 1.000%(Q) | | | 1,000 | | | | 2.066 | % | | | (39,371 | ) | | | (57,630 | ) | | | 18,259 | | | | CITI | |
State of Qatar | | 12/20/26 | | 1.000%(Q) | | | 4,000 | | | | 0.409 | % | | | 73,451 | | | | 69,305 | | | | 4,146 | | | | CITI | |
UBS Group AG | | 12/20/24 | | 1.000%(Q) | | | EUR 8,600 | | | | 0.784 | % | | | 32,597 | | | | 38,377 | | | | (5,780 | ) | | | BOA | |
United Kingdom of Great Britain and Northern Ireland | | 12/20/27 | | 1.000%(Q) | | | 1,000 | | | | 0.268 | % | | | 28,695 | | | | 18,430 | | | | 10,265 | | | | DB | |
See Notes to Financial Statements.
PGIM Global Total Return Fund 71
Schedule of Investments (continued)
as of October 31, 2023
Credit default swap agreements outstanding at October 31, 2023 (continued):
| | | | | | | | | | | | | | | | | | | | | | | | | | | | | | | | |
Reference Entity/ Obligation | | Termination
Date | | | Fixed
Rate | | | Notional
Amount
(000)#(3) | | | Implied
Credit
Spread at
October 31,
2023(4) | | | Fair
Value | | | Upfront
Premiums
Paid
(Received) | | | Unrealized
Appreciation
(Depreciation) | | | Counterparty | |
| | | | | | | | | | | | | | | | | | | | | | | | | |
|
| OTC Credit Default Swap Agreements on corporate and/or sovereign issues - Sell Protection(2)(cont’d.): | |
United Mexican States | | | 12/20/26 | | | | 1.000%(Q) | | | | 4,000 | | | | 0.716% | | | $ | 37,613 | | | $ | 2,967 | | | $ | 34,646 | | | | GSI | |
Verizon Communications, Inc. | | | 06/20/26 | | | | 1.000%(Q) | | | | 9,960 | | | | 0.811% | | | | 57,855 | | | | 110,142 | | | | (52,287 | ) | | | GSI | |
| | | | | | | | | | | | | | | | | | | | | | | | | | | | | | | | |
| | | | | | | | | | | | | | | | | | $ | (572,671 | ) | | $ | (2,851,484 | ) | | $ | 2,278,813 | | | | | |
| | | | | | | | | | | | | | | | | | | | | | | | | | | | | | | | |
| | | | | | | | | | | | | | | | | | | | | | |
Reference Entity/ Obligation | | Termination
Date | | Fixed
Rate | | Notional
Amount
(000)#(3) | | | Fair
Value | | | Upfront
Premiums
Paid
(Received) | | | Unrealized
Appreciation
(Depreciation) | | | Counterparty |
| | | | | | | | | | | | | | | | | | | |
|
| OTC Credit Default Swap Agreement on credit indices - Buy Protection(1): |
CDX.EM.39.V1 | | 06/20/28 | | 1.000%(Q) | | | 200,000 | | | $ | 8,593,707 | | | $ | 8,342,319 | | | $ | 251,388 | | | MSI |
| | | | | | | | | | | | | | | | | | | | | | |
| | | | | | | | | | | | | | | | | | | | | | | | |
Reference Entity/ Obligation | | Termination
Date | | Fixed
Rate | | Notional
Amount
(000)#(3) | | | Implied
Credit
Spread at
October 31,
2023(4) | | Fair
Value | | | Upfront
Premiums
Paid
(Received) | | | Unrealized
Appreciation
(Depreciation) | | | Counterparty |
| | | | | | | | | | | | | | | | | | | | | |
|
| OTC Credit Default Swap Agreement on credit indices - Sell Protection(2): |
CDX.EM.39.V1 | | 06/20/28 | | 1.000%(Q) | | | 200,000 | | | 2.119% | | $ | (8,593,707 | ) | | $ | (5,954,279 | ) | | $ | (2,639,428 | ) | | MSI |
| | | | | | | | | | | | | | | | | | | | | | | | |
The Fund entered into credit default swaps (“CDS”) to provide a measure of protection against defaults or to take an active long or short position with respect to the likelihood of a particular issuer’s default or the reference entity’s credit soundness. CDS contracts generally trade based on a spread which represents the cost a protection buyer has to pay the protection seller. The protection buyer is said to be short the credit as the value of the contract rises the more the credit deteriorates. The value of the CDS contract increases for the protection buyer if the spread increases.
| (1) | If the Fund is a buyer of protection, it pays the fixed rate. When a credit event occurs, as defined under the terms of that particular swap agreement, the Fund will either (i) receive from the seller of protection an amount equal to the notional amount of the swap and make delivery of the referenced obligation or underlying securities comprising the referenced index or (ii) receive a net settlement amount in the form of cash or securities equal to the notional amount of the swap less the recovery value of the referenced obligation or underlying securities comprising the referenced index. |
| (2) | If the Fund is a seller of protection, it receives the fixed rate. When a credit event occurs, as defined under the terms of that particular swap agreement, the Fund will either (i) pay to the buyer of protection an amount equal to the notional amount of the swap and take delivery of the referenced obligation or underlying securities comprising the referenced |
See Notes to Financial Statements.
72
| | index or (ii) pay a net settlement amount in the form of cash or securities equal to the notional amount of the swap less the recovery value of the referenced obligation or underlying securities comprising the referenced index. |
| (3) | Notional amount represents the maximum potential amount the Fund could be required to pay as a seller of credit protection or receive as a buyer of credit protection if a credit event occurs as defined under the terms of that particular swap agreement. |
| (4) | Implied credit spreads, represented in absolute terms, utilized in determining the fair value of credit default swap agreements where the Fund is the seller of protection as of the reporting date serve as an indicator of the current status of the payment/ performance risk and represent the likelihood of risk of default for the credit derivative. The implied credit spread of a particular referenced entity reflects the cost of buying/selling protection and may include up-front payments required to be made to enter into the agreement. Wider credit spreads represent a deterioration of the referenced entity’s credit soundness and a greater likelihood of risk of default or other credit event occurring as defined under the terms of the agreement. |
| * | When an implied credit spread is not available, reference the fair value of credit default swap agreements on credit indices and asset-backed securities. Where the Fund is the seller of protection, it serves as an indicator of the current status of the payment/performance risk and represents the likelihood of an expected liability (or profit) for the credit derivative should the notional amount of the swap agreement be closed/sold as of the reporting date. Increasing fair value in absolute terms, when compared to the notional amount of the swap, represents a deterioration of the referenced entity’s credit soundness and a greater likelihood of risk of default or other credit event occurring as defined under the terms of the agreement. |
Currency swap agreements outstanding at October 31, 2023:
| | | | | | | | | | | | | | | | | | | | | | | | | | | | | | | | | | | | | | | | | | |
Notional Amount (000)# | | Fund
Receives | | Notional
Amount
(000)# | | Fund
Pays | | Counterparty | | Termination
Date | | Fair
Value | | Upfront
Premiums
Paid
(Received) | | Unrealized
Appreciation
(Depreciation) |
| | | | | | | | | | | | | | | | | | | | | | | | | | | | | | | | | | | | | | | | | | |
| | | | | | |
| OTC Currency Swap Agreements: | | | | | | | | | | | | | | | | | | | | | | | | | | | | | | |
CNH | | | | 10,000 | | | | | 2.350%(Q) | | | 1,564 | | | | 1 Day SOFR(Q)/5.350% | | | | | SCB | | | | | 01/10/27 | | | | $ | (211,041 | ) | | | $ | — | | | | $ | (211,041 | ) |
IDR | | | | 50,000,000 | | | | | 8.220%(S) | | | 3,454 | | | | 6 Month LIBOR(S)/5.871% | | | | | CITI | | | | | 11/29/23 | | | | | (280,639 | ) | | | | — | | | | | (280,639 | ) |
PEN | | | | 32,632 | | | | | 3.420%(S) | | | 8,000 | | | | 6 Month LIBOR(S)/5.871% | | | | | MSI | | | | | 08/12/24 | | | | | 235,003 | | | | | — | | | | | 235,003 | |
| | | | | | | | | | | | | | | | | | | | | | | | | | | | | | | | | | | | | | | | | | |
| | | | | | | | | | | | | | | | | | | | | | | | | | | | | | $ | (256,677 | ) | | | $ | — | | | | $ | (256,677 | ) |
| | | | | | | | | | | | | | | | | | | | | | | | | | | | | | | | | | | | | | | | | | |
See Notes to Financial Statements.
PGIM Global Total Return Fund 73
Schedule of Investments (continued)
as of October 31, 2023
Interest rate swap agreements outstanding at October 31, 2023:
| | | | | | | | | | | | | | | | | | | | | | | | |
Notional
Amount
(000)# | | | Termination
Date | | | Fixed
Rate | | Floating
Rate | | Value at
Trade Date | | | Value at
October 31,
2023 | | | Unrealized
Appreciation
(Depreciation) | |
| | | | | | | | | | | | | | | | | | | | | | | | |
|
| Centrally Cleared Interest Rate Swap Agreements: | |
| AUD | | | 18,000 | | | | 12/03/29 | | | 2.700%(S) | | 6 Month BBSW(2)(S)/4.750% | | | $ (786,079 | ) | | | $ (1,462,662 | ) | | $ | (676,583 | ) |
| AUD | | | 10,000 | | | | 07/10/33 | | | 2.987%(S) | | 6 Month BBSW(2)(S)/4.750% | | | 106,908 | | | | (1,136,449 | ) | | | (1,243,357 | ) |
| AUD | | | 10,000 | | | | 03/26/36 | | | 2.101%(S) | | 6 Month BBSW(2)(S)/4.750% | | | — | | | | (1,908,101 | ) | | | (1,908,101 | ) |
| CAD | | | 51,805 | | | | 04/03/25 | | | 0.970%(S) | | 3 Month CDOR(2)(S)/5.580% | | | 47,833 | | | | (2,323,669 | ) | | | (2,371,502 | ) |
| CAD | | | 4,800 | | | | 12/03/32 | | | 3.450%(S) | | 1 Day CORRA(2)(S)/5.050% | | | 139,121 | | | | (204,982 | ) | | | (344,103 | ) |
| CAD | | | 12,150 | | | | 12/03/48 | | | 2.800%(S) | | 3 Month CDOR(2)(S)/5.580% | | | (214,510 | ) | | | (2,306,104 | ) | | | (2,091,594 | ) |
| CAD | | | 3,000 | | | | 12/03/53 | | | 3.300%(S) | | 1 Day CORRA(2)(S)/5.050% | | | (55,136 | ) | | | (265,723 | ) | | | (210,587 | ) |
| CHF | | | 14,500 | | | | 01/31/29 | | | 0.260%(A) | | 1 Day SARON(2)(S)/1.702% | | | (51,105 | ) | | | (1,044,567 | ) | | | (993,462 | ) |
| CHF | | | 800 | | | | 10/17/31 | | | 0.033%(A) | | 1 Day SARON(2)(S)/1.702% | | | (644 | ) | | | (105,827 | ) | | | (105,183 | ) |
| CHF | | | 4,000 | | | | 11/05/31 | | | 0.125%(A) | | 1 Day SARON(2)(A)/1.702% | | | — | | | | (525,286 | ) | | | (525,286 | ) |
| CHF | | | 700 | | | | 04/03/33 | | | 0.687%(A) | | 1 Day SARON(2)(S)/1.702% | | | (3,636 | ) | | | (65,632 | ) | | | (61,996 | ) |
| CLP | | | 634,000 | | | | 02/11/30 | | | 3.085%(S) | | 1 Day CLOIS(2)(S)/9.000% | | | — | | | | (121,782 | ) | | | (121,782 | ) |
| CLP | | | 800,000 | | | | 07/13/30 | | | 2.030%(S) | | 1 Day CLOIS(2)(S)/9.000% | | | — | | | | (222,145 | ) | | | (222,145 | ) |
| CLP | | | 7,540,000 | | | | 02/06/33 | | | 5.200%(S) | | 1 Day CLOIS(1)(S)/9.000% | | | — | | | | 575,595 | | | | 575,595 | |
See Notes to Financial Statements.
74
Interest rate swap agreements outstanding at October 31, 2023 (continued):
| | | | | | | | | | | | | | | | | | | | | | | | |
Notional
Amount
(000)# | | | Termination
Date | | | Fixed
Rate | | Floating
Rate | | Value at
Trade Date | | | Value at
October 31,
2023 | | | Unrealized
Appreciation
(Depreciation) | |
| | | | | | | | | | | | | | | | | | | | | | | | |
|
| Centrally Cleared Interest Rate Swap Agreements (cont’d.): | |
| CLP | | | 3,100,000 | | | | 02/23/33 | | | 5.570%(S) | | 1 Day CLOIS(1)(S)/9.000% | | $ | — | | | $ | 134,459 | | | $ | 134,459 | |
| CLP | | | 818,000 | | | | 02/27/33 | | | 5.550%(S) | | 1 Day CLOIS(1)(S)/9.000% | | | — | | | | 36,271 | | | | 36,271 | |
| CLP | | | 5,294,000 | | | | 03/16/33 | | | 5.295%(S) | | 1 Day CLOIS(1)(S)/9.000% | | | — | | | | 331,804 | | | | 331,804 | |
| CNH | | | 78,000 | | | | 09/03/24 | | | 2.860%(Q) | | 7 Day China Fixing
Repo Rates(2)(Q)/2.500% | | | (14 | ) | | | 82,902 | | | | 82,916 | |
| CNH | | | 76,000 | | | | 10/09/24 | | | 2.860%(Q) | | 7 Day China Fixing
Repo Rates(2)(Q)/2.500% | | | (4 | ) | | | 80,174 | | | | 80,178 | |
| CNH | | | 98,660 | | | | 11/01/24 | | | 3.120%(Q) | | 7 Day China Fixing
Repo Rates(2)(Q)/2.500% | | | (62 | ) | | | 176,980 | | | | 177,042 | |
| CNH | | | 92,700 | | | | 02/04/25 | | | 2.600%(Q) | | 7 Day China Fixing
Repo Rates(2)(Q)/2.500% | | | — | | | | 101,028 | | | | 101,028 | |
| CNH | | | 330,000 | | | | 02/05/25 | | | 2.600%(Q) | | 7 Day China Fixing
Repo Rates(2)(Q)/2.500% | | | (29 | ) | | | 359,382 | | | | 359,411 | |
| CNH | | | 18,100 | | | | 03/10/25 | | | 2.300%(Q) | | 7 Day China Fixing
Repo Rates(2)(Q)/2.500% | | | (7 | ) | | | 8,150 | | | | 8,157 | |
| CNH | | | 25,000 | | | | 03/12/25 | | | 2.400%(Q) | | 7 Day China Fixing
Repo Rates(2)(Q)/2.500% | | | — | | | | 16,371 | | | | 16,371 | |
| CNH | | | 149,980 | | | | 05/08/25 | | | 1.860%(Q) | | 7 Day China Fixing
Repo Rates(2)(Q)/2.500% | | | (166 | ) | | | (77,543 | ) | | | (77,377 | ) |
See Notes to Financial Statements.
PGIM Global Total Return Fund 75
Schedule of Investments (continued)
as of October 31, 2023
Interest rate swap agreements outstanding at October 31, 2023 (continued):
| | | | | | | | | | | | | | | | | | | | | | | | |
Notional
Amount
(000)# | | | Termination
Date | | | Fixed
Rate | | Floating
Rate | | Value at
Trade Date | | | Value at
October 31,
2023 | | | Unrealized
Appreciation
(Depreciation) | |
| | | | | | | | | | | | | | | | | | | | | | | | |
|
| Centrally Cleared Interest Rate Swap Agreements (cont’d.): | |
| CNH | | | 80,785 | | | | 06/01/25 | | | 1.973%(Q) | | 7 Day China Fixing
Repo Rates(2)(Q)/2.500% | | $ | 16 | | | $ | (22,079 | ) | | $ | (22,095 | ) |
| CNH | | | 118,700 | | | | 07/02/25 | | | 2.330%(Q) | | 7 Day China Fixing
Repo Rates(2)(Q)/2.500% | | | (28 | ) | | | 65,332 | | | | 65,360 | |
| CNH | | | 161,860 | | | | 07/13/25 | | | 2.653%(Q) | | 7 Day China Fixing
Repo Rates(2)(Q)/2.500% | | | (70 | ) | | | 209,789 | | | | 209,859 | |
| CNH | | | 48,542 | | | | 08/06/25 | | | 2.555%(Q) | | 7 Day China Fixing
Repo Rates(2)(Q)/2.500% | | | (28 | ) | | | 60,329 | | | | 60,357 | |
| CNH | | | 129,600 | | | | 09/01/25 | | | 2.735%(Q) | | 7 Day China Fixing
Repo Rates(2)(Q)/2.500% | | | (62 | ) | | | 218,394 | | | | 218,456 | |
| CNH | | | 225,740 | | | | 11/02/25 | | | 2.588%(Q) | | 7 Day China Fixing
Repo Rates(2)(Q)/2.500% | | | 265 | | | | 323,842 | | | | 323,577 | |
| CNH | | | 200,000 | | | | 12/09/25 | | | 2.855%(Q) | | 7 Day China Fixing
Repo Rates(2)(Q)/2.500% | | | — | | | | 436,612 | | | | 436,612 | |
| CNH | | | 192,490 | | | | 01/05/26 | | | 2.660%(Q) | | 7 Day China Fixing
Repo Rates(2)(Q)/2.500% | | | (240 | ) | | | 300,677 | | | | 300,917 | |
| CNH | | | 40,000 | | | | 03/03/26 | | | 2.840%(Q) | | 7 Day China Fixing
Repo Rates(2)(Q)/2.500% | | | (57 | ) | | | 91,826 | | | | 91,883 | |
| CNH | | | 50,000 | | | | 03/23/26 | | | 2.875%(Q) | | 7 Day China Fixing
Repo Rates(2)(Q)/2.500% | | | — | | | | 118,720 | | | | 118,720 | |
See Notes to Financial Statements.
76
Interest rate swap agreements outstanding at October 31, 2023 (continued):
| | | | | | | | | | | | | | | | | | | | | | | | |
Notional
Amount
(000)# | | | Termination
Date | | | Fixed
Rate | | Floating
Rate | | Value at
Trade Date | | | Value at
October 31,
2023 | | | Unrealized
Appreciation
(Depreciation) | |
| | | | | | | | | | | | | | | | | | | | | | | | |
|
| Centrally Cleared Interest Rate Swap Agreements (cont’d.): | |
| CNH | | | 345,920 | | | | 04/12/26 | | | 2.810%(Q) | | 7 Day China Fixing
Repo Rates(2)(Q)/2.500% | | $ | (626 | ) | | $ | 737,100 | | | $ | 737,726 | |
| CNH | | | 6,300 | | | | 12/22/26 | | | 2.460%(Q) | | 7 Day China Fixing
Repo Rates(2)(Q)/2.500% | | | — | | | | 6,107 | | | | 6,107 | |
| CNH | | | 197,265 | | | | 05/11/28 | | | 2.600%(Q) | | 7 Day China Fixing
Repo Rates(2)(Q)/2.500% | | | 237,909 | | | | 283,603 | | | | 45,694 | |
| CZK | | | 875,720 | | | | 01/28/24 | | | 1.938%(A) | | 6 Month PRIBOR(2)(S)/6.880% | | | — | | | | (627,035 | ) | | | (627,035 | ) |
| DKK | | | 13,600 | | | | 05/04/25 | | | 0.825%(A) | | 6 Month CIBOR(2)(S)/4.140% | | | 7 | | | | (113,204 | ) | | | (113,211 | ) |
| DKK | | | 5,000 | | | | 08/29/26 | | | 0.580%(A) | | 6 Month CIBOR(2)(S)/4.140% | | | 11 | | | | (60,028 | ) | | | (60,039 | ) |
| DKK | | | 1,300 | | | | 10/21/26 | | | 0.673%(A) | | 6 Month CIBOR(2)(S)/4.140% | | | 7 | | | | (14,929 | ) | | | (14,936 | ) |
| DKK | | | 13,000 | | | | 03/15/27 | | | 1.123%(A) | | 6 Month CIBOR(2)(S)/4.140% | | | — | | | | (133,928 | ) | | | (133,928 | ) |
| DKK | | | 1,865 | | | | 06/22/27 | | | 0.987%(A) | | 6 Month CIBOR(2)(S)/4.140% | | | — | | | | (25,033 | ) | | | (25,033 | ) |
| EUR | | | 447,550 | | | | 11/23/24 | | | (0.046)%(A) | | 6 Month EURIBOR(2)(S)/4.092% | | | — | | | | (18,387,142 | ) | | | (18,387,142 | ) |
| EUR | | | 27,230 | | | | 08/15/30 | | | (0.191)%(A) | | 1 Day EuroSTR(2)(A)/3.880% | | | (10,193 | ) | | | (5,919,869 | ) | | | (5,909,676 | ) |
| EUR | | | 6,400 | | | | 02/23/32 | | | 1.180%(A) | | 6 Month EURIBOR(2)(S)/4.092% | | | 135 | | | | (1,033,280 | ) | | | (1,033,415 | ) |
| EUR | | | 4,680 | | | | 03/29/32 | | | 1.170%(A) | | 6 Month EURIBOR(2)(S)/4.092% | | | 1,259 | | | | (757,236 | ) | | | (758,495 | ) |
See Notes to Financial Statements.
PGIM Global Total Return Fund 77
Schedule of Investments (continued)
as of October 31, 2023
Interest rate swap agreements outstanding at October 31, 2023 (continued):
| | | | | | | | | | | | | | | | | | | | | | | | |
Notional
Amount
(000)# | | | Termination
Date | | | Fixed
Rate | | Floating
Rate | | Value at
Trade Date | | | Value at
October 31,
2023 | | | Unrealized
Appreciation
(Depreciation) | |
| | | | | | | | | | | | | | | | | | | | | | | | |
|
| Centrally Cleared Interest Rate Swap Agreements (cont’d.): | |
| EUR | | | 4,150 | | | | 05/11/32 | | | 1.100%(A) | | 6 Month EURIBOR(2)(S)/4.092% | | $ | (69,542 | ) | | $ | (770,032 | ) | | $ | (700,490 | ) |
| EUR | | | 7,000 | | | | 06/28/32 | | | 0.785%(A) | | 6 Month EURIBOR(2)(S)/4.092% | | | (45,623 | ) | | | (1,480,952 | ) | | | (1,435,329 | ) |
| EUR | | | 3,050 | | | | 10/30/32 | | | 1.302%(A) | | 6 Month EURIBOR(2)(S)/4.092% | | | — | | | | (504,833 | ) | | | (504,833 | ) |
| EUR | | | 19,945 | | | | 03/20/33 | | | 2.996%(A) | | 6 Month EURIBOR(2)(S)/4.092% | | | — | | | | (276,523 | ) | | | (276,523 | ) |
| EUR | | | 14,225 | | | | 05/11/33 | | | 1.000%(A) | | 6 Month EURIBOR(2)(S)/4.092% | | | (284,944 | ) | | | (3,047,702 | ) | | | (2,762,758 | ) |
| EUR | | | 14,280 | | | | 03/20/38 | | | 2.982%(A) | | 6 Month EURIBOR(1)(S)/4.092% | | | — | | | | 556,815 | | | | 556,815 | |
| EUR | | | 365 | | | | 05/11/39 | | | 1.100%(A) | | 1 Day EuroSTR(2)(A)/3.880% | | | (2,817 | ) | | | (108,123 | ) | | | (105,306 | ) |
| EUR | | | 12,485 | | | | 11/24/41 | | | 0.565%(A) | | 6 Month EURIBOR(1)(S)/4.092% | | | — | | | | 2,516,487 | | | | 2,516,487 | |
| EUR | | | 12,485 | | | | 11/24/41 | | | 0.600%(A) | | 3 Month EURIBOR(2)(Q)/3.972% | | | — | | | | (2,603,479 | ) | | | (2,603,479 | ) |
| EUR | | | 30,272 | | | | 11/25/41 | | | 0.629%(A) | | 6 Month EURIBOR(1)(S)/4.092% | | | — | | | | 5,967,133 | | | | 5,967,133 | |
| EUR | | | 30,272 | | | | 11/25/41 | | | 0.663%(A) | | 3 Month EURIBOR(2)(Q)/3.972% | | | — | | | | (6,181,128 | ) | | | (6,181,128 | ) |
| EUR | | | 8,450 | | | | 02/17/42 | | | 0.536%(A) | | 6 Month EURIBOR(2)(S)/4.092% | | | — | | | | (3,520,651 | ) | | | (3,520,651 | ) |
| EUR | | | 17,040 | | | | 03/22/42 | | | 1.257%(A) | | 6 Month EURIBOR(1)(S)/4.092% | | | — | | | | 2,580,140 | | | | 2,580,140 | |
| EUR | | | 17,040 | | | | 03/22/42 | | | 1.310%(A) | | 3 Month EURIBOR(2)(Q)/3.972% | | | — | | | | (2,683,261 | ) | | | (2,683,261 | ) |
See Notes to Financial Statements.
78
Interest rate swap agreements outstanding at October 31, 2023 (continued):
| | | | | | | | | | | | | | | | | | | | | | | | |
Notional
Amount
(000)# | | | Termination
Date | | | Fixed
Rate | | Floating
Rate | | Value at
Trade Date | | | Value at
October 31,
2023 | | | Unrealized
Appreciation
(Depreciation) | |
| | | | | | | | | | | | | | | | | | | | | | | | |
|
| Centrally Cleared Interest Rate Swap Agreements (cont’d.): | |
| EUR | | | 1,235 | | | | 07/04/42 | | | 1.001%(A) | | 6 Month EURIBOR(2)(S)/4.092% | | $ | (116,162 | ) | | $ | (443,704 | ) | | $ | (327,542 | ) |
| EUR | | | 15,130 | | | | 02/24/43 | | | 2.910%(A) | | 6 Month EURIBOR(1)(S)/4.092% | | | 12,548 | | | | 856,291 | | | | 843,743 | |
| EUR | | | 15,130 | | | | 02/24/43 | | | 2.960%(A) | | 3 Month EURIBOR(2)(Q)/3.972% | | | (7,651 | ) | | | (837,810 | ) | | | (830,159 | ) |
| EUR | | | 14,270 | | | | 03/09/46 | | | 0.425%(A) | | 6 Month EURIBOR(2)(S)/4.092% | | | — | | | | (6,863,170 | ) | | | (6,863,170 | ) |
| EUR | | | 3,000 | | | | 05/11/49 | | | 1.450%(A) | | 6 Month EURIBOR(2)(S)/4.092% | | | (105,135 | ) | | | (1,002,437 | ) | | | (897,302 | ) |
| GBP | | | 5,330 | | | | 05/08/25 | | | 1.000%(A) | | 1 Day SONIA(1)(A)/5.186% | | | 430,155 | | | | 505,748 | | | | 75,593 | |
| GBP | | | 86,340 | | | | 05/08/27 | | | 1.050%(A) | | 1 Day SONIA(1)(A)/5.186% | | | 5,485,601 | | | | 13,994,368 | | | | 8,508,767 | |
| GBP | | | 40,655 | | | | 05/08/28 | | | 1.100%(A) | | 1 Day SONIA(1)(A)/5.186% | | | 8,130,379 | | | | 7,718,785 | | | | (411,594 | ) |
| GBP | | | 8,000 | | | | 05/08/29 | | | 1.100%(A) | | 1 Day SONIA(1)(A)/5.186% | | | 823,701 | | | | 1,745,279 | | | | 921,578 | |
| GBP | | | 8,290 | | | | 05/08/30 | | | 1.100%(A) | | 1 Day SONIA(1)(A)/5.186% | | | 2,099,979 | | | | 2,034,920 | | | | (65,059 | ) |
| GBP | | | 6,355 | | | | 05/08/32 | | | 1.150%(A) | | 1 Day SONIA(2)(A)/5.186% | | | (917,801 | ) | | | (1,879,642 | ) | | | (961,841 | ) |
| GBP | | | 14,450 | | | | 05/08/33 | | | 1.150%(A) | | 1 Day SONIA(1)(A)/5.186% | | | 4,631,444 | | | | 4,628,271 | | | | (3,173 | ) |
| GBP | | | 7,500 | | | | 05/08/37 | | | 1.200%(A) | | 1 Day SONIA(2)(A)/5.186% | | | (2,343,112 | ) | | | (3,075,831 | ) | | | (732,719 | ) |
| GBP | | | 5,150 | | | | 05/08/38 | | | 1.200%(A) | | 1 Day SONIA(1)(A)/5.186% | | | 2,163,665 | | | | 2,222,662 | | | | 58,997 | |
See Notes to Financial Statements.
PGIM Global Total Return Fund 79
Schedule of Investments (continued)
as of October 31, 2023
Interest rate swap agreements outstanding at October 31, 2023 (continued):
| | | | | | | | | | | | | | | | | | | | | | | | |
Notional
Amount
(000)# | | | Termination
Date | | | Fixed
Rate | | Floating
Rate | | Value at
Trade Date | | | Value at
October 31,
2023 | | | Unrealized
Appreciation
(Depreciation) | |
| | | | | | | | | | | | | | | | | | | | | | | | |
|
| Centrally Cleared Interest Rate Swap Agreements (cont’d.): | |
| GBP | | | 15,305 | | | | 05/08/42 | | | 1.250%(A) | | 1 Day SONIA(2)(A)/5.186% | | $ | 83,303 | | | $ | (7,642,393 | ) | | | $ (7,725,696 | ) |
| GBP | | | 10,915 | | | | 05/08/43 | | | 1.250%(A) | | 1 Day SONIA(1)(A)/5.186% | | | 5,389,266 | | | | 5,626,491 | | | | 237,225 | |
| GBP | | | 13,725 | | | | 05/08/46 | | | 1.250%(A) | | 1 Day SONIA(2)(A)/5.186% | | | 2,361,379 | | | | (7,672,140 | ) | | | (10,033,519 | ) |
| GBP | | | 3,440 | | | | 05/08/49 | | | 1.250%(A) | | 1 Day SONIA(2)(A)/5.186% | | | 659,191 | | | | (2,046,286 | ) | | | (2,705,477 | ) |
| GBP | | | 3,540 | | | | 09/03/50 | | | 0.328%(A) | | 1 Day SONIA(2)(A)/5.186% | | | (32 | ) | | | (2,729,522 | ) | | | (2,729,490 | ) |
| GBP | | | 1,800 | | | | 05/08/52 | | | 1.250%(A) | | 1 Day SONIA(2)(A)/5.186% | | | (230,941 | ) | | | (1,128,119 | ) | | | (897,178 | ) |
| HUF | | | 500,000 | | | | 03/31/31 | | | 2.460%(A) | | 6 Month BUBOR(2)(S)/11.18% | | | — | | | | (394,154 | ) | | | (394,154 | ) |
| ILS | | | 40,440 | | | | 04/16/28 | | | 0.928%(A) | | 3 Month TELBOR(2)(Q)/4.661% | | | (363 | ) | | | (1,175,924 | ) | | | (1,175,561 | ) |
| JPY | | | 3,276,010 | | | | 12/20/24 | | | 0.126%(S) | | 1 Day TONAR(2)(S)/(0.020)% | | | (6,423 | ) | | | (8,907 | ) | | | (2,484 | ) |
| JPY | | | 950,000 | | | | 01/15/25 | | | 0.000%(S) | | 1 Day TONAR(2)(S)/(0.020)% | | | 437 | | | | (15,560 | ) | | | (15,997 | ) |
| JPY | | | 9,000,000 | | | | 03/02/26 | | | 0.029%(S) | | 1 Day TONAR(2)(S)/(0.020)% | | | 12 | | | | (519,944 | ) | | | (519,956 | ) |
| JPY | | | 5,000,000 | | | | 06/02/26 | | | 0.009%(S) | | 1 Day TONAR(2)(S)/(0.020)% | | | 29 | | | | (370,539 | ) | | | (370,568 | ) |
| JPY | | | 2,000,000 | | | | 01/04/27 | | | (0.033)%(S) | | 1 Day TONAR(2)(S)/(0.020)% | | | 2,897 | | | | (236,388 | ) | | | (239,285 | ) |
| JPY | | | 2,100,000 | | | | 05/06/27 | | | 0.020%(S) | | 1 Day TONAR(2)(S)/(0.020)% | | | 43 | | | | (266,335 | ) | | | (266,378 | ) |
See Notes to Financial Statements.
80
Interest rate swap agreements outstanding at October 31, 2023 (continued):
| | | | | | | | | | | | | | | | | | | | | | | | |
Notional
Amount
(000)# | | | Termination
Date | | | Fixed
Rate | | Floating
Rate | | Value at
Trade Date | | | Value at
October 31,
2023 | | | Unrealized
Appreciation
(Depreciation) | |
| | | | | | | | | | | | | | | | | | | | | | | | |
|
| Centrally Cleared Interest Rate Swap Agreements (cont’d.): | |
| JPY | | | 7,080,000 | | | | 07/08/28 | | | (0.050)%(A) | | 1 Day TONAR(1)(A)/(0.020)% | | $ | 1,970,701 | | | $ | 1,503,200 | | | | $ (467,501 | ) |
| JPY | | | 3,674,000 | | | | 07/31/28 | | | 0.268%(A) | | 1 Day TONAR(2)(A)/(0.020)% | | | — | | | | (416,486 | ) | | | (416,486 | ) |
| JPY | | | 1,800,000 | | | | 11/12/28 | | | 0.011%(S) | | 1 Day TONAR(2)(S)/(0.020)% | | | 60 | | | | (430,641 | ) | | | (430,701 | ) |
| JPY | | | 135,000 | | | | 02/20/29 | | | 1.260%(S) | | 1 Day TONAR(2)(S)/(0.020)% | | | (3,395 | ) | | | 25,048 | | | | 28,443 | |
| JPY | | | 2,500,000 | | | | 03/22/29 | | | 0.068%(S) | | 1 Day TONAR(2)(S)/(0.020)% | | | (1,482 | ) | | | (622,554 | ) | | | (621,072 | ) |
| JPY | | | 50,000 | | | | 04/02/29 | | | 1.288%(S) | | 1 Day TONAR(2)(S)/(0.020)% | | | (785 | ) | | | 9,240 | | | | 10,025 | |
| JPY | | | 100,000 | | | | 08/18/29 | | | 1.070%(S) | | 1 Day TONAR(2)(S)/(0.020)% | | | (2,206 | ) | | | 10,714 | | | | 12,920 | |
| JPY | | | 100,000 | | | | 08/28/29 | | | 1.043%(S) | | 1 Day TONAR(2)(S)/(0.020)% | | | (1,897 | ) | | | 9,337 | | | | 11,234 | |
| JPY | | | 200,000 | | | | 09/09/29 | | | 1.061%(S) | | 1 Day TONAR(2)(S)/(0.020)% | | | (3,515 | ) | | | 19,603 | | | | 23,118 | |
| JPY | | | 655,000 | | | | 09/29/29 | | | 1.064%(S) | | 1 Day TONAR(2)(S)/(0.020)% | | | (8,990 | ) | | | 61,507 | | | | 70,497 | |
| JPY | | | 300,000 | | | | 07/02/30 | | | 0.047%(S) | | 1 Day TONAR(2)(S)/(0.020)% | | | (183 | ) | | | (111,984 | ) | | | (111,801 | ) |
| JPY | | | 200,000 | | | | 04/01/31 | | | 0.319%(S) | | 1 Day TONAR(2)(S)/(0.020)% | | | (785 | ) | | | (63,588 | ) | | | (62,803 | ) |
| JPY | | | 215,000 | | | | 05/06/31 | | | 0.354%(S) | | 1 Day TONAR(2)(S)/(0.020)% | | | (440 | ) | | | (64,671 | ) | | | (64,231 | ) |
| JPY | | | 150,000 | | | | 07/07/31 | | | 0.071%(S) | | 1 Day TONAR(2)(S)/(0.020)% | | | (203 | ) | | | (69,484 | ) | | | (69,281 | ) |
See Notes to Financial Statements.
PGIM Global Total Return Fund 81
Schedule of Investments (continued)
as of October 31, 2023
Interest rate swap agreements outstanding at October 31, 2023 (continued):
| | | | | | | | | | | | | | | | | | | | | | | | |
Notional
Amount
(000)# | | | Termination
Date | | | Fixed
Rate | | Floating
Rate | | Value at
Trade Date | | | Value at
October 31,
2023 | | | Unrealized
Appreciation
(Depreciation) | |
| | | | | | | | | | | | | | | | | | | | | | | | |
|
| Centrally Cleared Interest Rate Swap Agreements (cont’d.): | |
| JPY | | | 700,000 | | | | 08/05/31 | | | 0.026%(S) | | 1 Day TONAR(2)(S)/(0.020)% | | $ | 43 | | | $ | (346,334 | ) | | $ | (346,377 | ) |
| JPY | | | 256,500 | | | | 08/15/31 | | | 0.223%(S) | | 1 Day TONAR(2)(S)/(0.020)% | | | (1,172 | ) | | | (101,832 | ) | | | (100,660 | ) |
| JPY | | | 130,000 | | | | 08/30/31 | | | 0.217%(S) | | 1 Day TONAR(2)(S)/(0.020)% | | | (483 | ) | | | (52,496 | ) | | | (52,013 | ) |
| JPY | | | 120,000 | | | | 09/08/31 | | | 0.316%(S) | | 1 Day TONAR(2)(S)/(0.020)% | | | (626 | ) | | | (42,705 | ) | | | (42,079 | ) |
| JPY | | | 190,000 | | | | 09/21/31 | | | 0.328%(S) | | 1 Day TONAR(2)(S)/(0.020)% | | | (888 | ) | | | (67,293 | ) | | | (66,405 | ) |
| JPY | | | 350,000 | | | | 10/14/31 | | | 0.270%(S) | | 1 Day TONAR(2)(S)/(0.020)% | | | (950 | ) | | | (136,559 | ) | | | (135,609 | ) |
| JPY | | | 200,000 | | | | 04/06/32 | | | 0.484%(S) | | 1 Day TONAR(2)(S)/(0.020)% | | | (1,162 | ) | | | (63,464 | ) | | | (62,302 | ) |
| JPY | | | 159,520 | | | | 04/07/32 | | | 0.491%(S) | | 1 Day TONAR(2)(S)/(0.020)% | | | (927 | ) | | | (50,038 | ) | | | (49,111 | ) |
| JPY | | | 1,200,000 | | | | 05/19/32 | | | 0.023%(S) | | 1 Day TONAR(2)(S)/(0.020)% | | | (24 | ) | | | (696,200 | ) | | | (696,176 | ) |
| JPY | | | 800,000 | | | | 05/29/32 | | | 0.016%(S) | | 1 Day TONAR(2)(S)/(0.020)% | | | (2 | ) | | | (469,970 | ) | | | (469,968 | ) |
| JPY | | | 140,000 | | | | 06/07/32 | | | 0.451%(S) | | 1 Day TONAR(2)(S)/(0.020)% | | | — | | | | (47,484 | ) | | | (47,484 | ) |
| JPY | | | 71,000 | | | | 09/21/32 | | | 0.463%(S) | | 1 Day TONAR(2)(S)/(0.020)% | | | (489 | ) | | | (25,943 | ) | | | (25,454 | ) |
| JPY | | | 160,000 | | | | 11/14/32 | | | 2.390%(S) | | 1 Day TONAR(2)(S)/(0.020)% | | | — | | | | 128,143 | | | | 128,143 | |
| JPY | | | 530,000 | | | | 07/08/33 | | | 0.100%(A) | | 1 Day TONAR(2)(A)/(0.020)% | | | (268,105 | ) | | | (328,263 | ) | | | (60,158 | ) |
See Notes to Financial Statements.
82
Interest rate swap agreements outstanding at October 31, 2023 (continued):
| | | | | | | | | | | | | | | | | | | | | | | | |
Notional
Amount
(000)# | | | Termination
Date | | | Fixed
Rate | | Floating
Rate | | Value at
Trade Date | | | Value at
October 31,
2023 | | | Unrealized
Appreciation
(Depreciation) | |
| | | | | | | | | | | | | | | | | | | | | | | | |
|
| Centrally Cleared Interest Rate Swap Agreements (cont’d.): | |
| JPY | | | 900,000 | | | | 01/04/38 | | | 0.757%(S) | | 1 Day TONAR(2)(S)/(0.020)% | | $ | (22,342 | ) | | $ | (527,959 | ) | | $ | (505,617 | ) |
| JPY | | | 800,000 | | | | 03/28/38 | | | 0.656%(S) | | 1 Day TONAR(2)(S)/(0.020)% | | | (7,686 | ) | | | (564,333 | ) | | | (556,647 | ) |
| JPY | | | 675,000 | | | | 04/06/38 | | | 0.655%(S) | | 1 Day TONAR(2)(S)/(0.020)% | | | (5,747 | ) | | | (478,833 | ) | | | (473,086 | ) |
| JPY | | | 285,000 | | | | 07/08/38 | | | 0.200%(A) | | 1 Day TONAR(1)(A)/(0.020)% | | | 318,796 | | | | 308,743 | | | | (10,053 | ) |
| JPY | | | 600,000 | | | | 08/10/38 | | | 0.822%(S) | | 1 Day TONAR(2)(S)/(0.020)% | | | (12,354 | ) | | | (348,332 | ) | | | (335,978 | ) |
| JPY | | | 2,430,385 | | | | 12/03/38 | | | 0.600%(S) | | 1 Day TONAR(2)(S)/(0.020)% | | | (1,236 | ) | | | (1,955,035 | ) | | | (1,953,799 | ) |
| JPY | | | 969,000 | | | | 12/03/39 | | | 0.650%(S) | | 1 Day TONAR(2)(S)/(0.020)% | | | (538 | ) | | | (821,397 | ) | | | (820,859 | ) |
| JPY | | | 166,000 | | | | 05/09/43 | | | 0.820%(S) | | 1 Day TONAR(2)(S)/(0.020)% | | | (833 | ) | | | (157,918 | ) | | | (157,085 | ) |
| JPY | | | 2,000,000 | | | | 10/23/45 | | | 0.333%(S) | | 1 Day TONAR(2)(S)/(0.020)% | | | (6,253 | ) | | | (3,499,272 | ) | | | (3,493,019 | ) |
| JPY | | | 775,000 | | | | 04/12/46 | | | 0.496%(S) | | 1 Day TONAR(2)(S)/(0.020)% | | | (4,644 | ) | | | (1,224,470 | ) | | | (1,219,826 | ) |
| JPY | | | 110,291 | | | | 04/15/46 | | | 0.560%(S) | | 1 Day TONAR(2)(S)/(0.020)% | | | (696 | ) | | | (165,361 | ) | | | (164,665 | ) |
| JPY | | | 26,000 | | | | 10/04/47 | | | 0.942%(S) | | 1 Day TONAR(2)(S)/(0.020)% | | | (345 | ) | | | (28,280 | ) | | | (27,935 | ) |
| JPY | | | 560,000 | | | | 11/24/47 | | | 0.888%(S) | | 1 Day TONAR(2)(S)/(0.020)% | | | (1,438 | ) | | | (642,237 | ) | | | (640,799 | ) |
| JPY | | | 500,000 | | | | 05/29/50 | | | 0.186%(S) | | 1 Day TONAR(2)(S)/(0.020)% | | | (157 | ) | | | (1,150,448 | ) | | | (1,150,291 | ) |
See Notes to Financial Statements.
PGIM Global Total Return Fund 83
Schedule of Investments (continued)
as of October 31, 2023
Interest rate swap agreements outstanding at October 31, 2023 (continued):
| | | | | | | | | | | | | | | | | | | | | | | | |
Notional
Amount
(000)# | | | Termination
Date | | | Fixed
Rate | | Floating
Rate | | Value at
Trade Date | | | Value at
October 31,
2023 | | | Unrealized
Appreciation
(Depreciation) | |
| | | | | | | | | | | | | | | | | | | | | | | | |
|
| Centrally Cleared Interest Rate Swap Agreements (cont’d.): | |
| JPY | | | 500,000 | | | | 08/26/50 | | | 0.334%(S) | | 1 Day TONAR(2)(S)/(0.020)% | | $ | (3,583 | ) | | $ | (1,052,093 | ) | | $ | (1,048,510 | ) |
| JPY | | | 1,000,000 | | | | 12/16/50 | | | 0.338%(S) | | 1 Day TONAR(2)(S)/(0.020)% | | | (12,333 | ) | | | (2,113,199 | ) | | | (2,100,866 | ) |
| JPY | | | 1,200,000 | | | | 02/08/51 | | | 0.467%(S) | | 1 Day TONAR(2)(S)/(0.020)% | | | (14,668 | ) | | | (2,321,933 | ) | | | (2,307,265 | ) |
| JPY | | | 1,650,000 | | | | 03/30/51 | | | 0.520%(S) | | 1 Day TONAR(2)(S)/(0.020)% | | | (12,675 | ) | | | (3,081,639 | ) | | | (3,068,964 | ) |
| JPY | | | 701,000 | | | | 07/31/53 | | | 1.102%(A) | | 1 Day TONAR(1)(A)/(0.020)% | | | — | | | | 684,515 | | | | 684,515 | |
| KRW | | | 18,824,000 | | | | 08/06/25 | | | 0.830%(Q) | | 3 Month KWCDC(2)(Q)/3.820% | | | (9 | ) | | | (862,847 | ) | | | (862,838 | ) |
| KRW | | | 19,850,000 | | | | 04/19/28 | | | 3.135%(Q) | | 3 Month KWCDC(2)(Q)/3.820% | | | — | | | | (576,010 | ) | | | (576,010 | ) |
| KRW | | | 20,447,900 | | | | 09/10/28 | | | 2.043%(Q) | | 3 Month KWCDC(2)(Q)/3.820% | | | 418,954 | | | | (1,412,548 | ) | | | (1,831,502 | ) |
| KRW | | | 11,000,000 | | | | 02/05/30 | | | 1.319%(Q) | | 3 Month KWCDC(2)(Q)/3.820% | | | 13 | | | | (1,315,514 | ) | | | (1,315,527 | ) |
| KRW | | | 5,000,000 | | | | 01/05/31 | | | 1.258%(Q) | | 3 Month KWCDC(2)(Q)/3.820% | | | — | | | | (673,450 | ) | | | (673,450 | ) |
| KRW | | | 4,000,000 | | | | 08/13/31 | | | 1.630%(Q) | | 3 Month KWCDC(2)(Q)/3.820% | | | — | | | | (509,553 | ) | | | (509,553 | ) |
| KRW | | | 1,067,160 | | | | 03/10/33 | | | 3.150%(Q) | | 3 Month KWCDC(2)(Q)/3.820% | | | (16,781 | ) | | | (61,499 | ) | | | (44,718 | ) |
| NOK | | | 36,000 | | | | 02/07/29 | | | 2.083%(A) | | 6 Month NIBOR(2)(S)/5.030% | | | — | | | | (334,727 | ) | | | (334,727 | ) |
| NOK | | | 48,000 | | | | 10/07/29 | | | 1.660%(A) | | 6 Month NIBOR(2)(S)/5.030% | | | — | | | | (606,803 | ) | | | (606,803 | ) |
See Notes to Financial Statements.
84
Interest rate swap agreements outstanding at October 31, 2023 (continued):
| | | | | | | | | | | | | | | | | | | | | | | | |
Notional
Amount
(000)# | | | Termination
Date | | | Fixed
Rate | | Floating
Rate | | Value at
Trade Date | | | Value at
October 31,
2023 | | | Unrealized
Appreciation
(Depreciation) | |
| | | | | | | | | | | | | | | | | | | | | | | | |
|
| Centrally Cleared Interest Rate Swap Agreements (cont’d.): | |
| NZD | | | 6,450 | | | | 11/28/28 | | | 2.950%(S) | | 3 Month BBR(2)(Q)/5.640% | | $ | — | | | $ | (381,629 | ) | | $ | (381,629 | ) |
| PLN | | | 10,000 | | | | 03/26/31 | | | 1.675%(A) | | 6 Month WIBOR(2)(S)/5.560% | | | — | | | | (435,671 | ) | | | (435,671 | ) |
| SGD | | | 17,215 | | | | 07/29/31 | | | 1.120%(S) | | 1 Day SORA(2)(S)/3.690% | | | 93,274 | | | | (2,037,194 | ) | | | (2,130,468 | ) |
| THB | | | 60,000 | | | | 07/04/24 | | | 1.590%(Q) | | 1 Day THOR(2)(Q)/2.481% | | | — | | | | (11,753 | ) | | | (11,753 | ) |
| THB | | | 173,600 | | | | 04/28/30 | | | 1.020%(Q) | | 1 Day THOR(2)(Q)/2.481% | | | — | | | | (571,790 | ) | | | (571,790 | ) |
| THB | | | 23,000 | | | | 05/29/30 | | | 2.645%(Q) | | 1 Day THOR(2)(Q)/2.481% | | | (867 | ) | | | (13,295 | ) | | | (12,428 | ) |
| THB | | | 72,900 | | | | 06/25/30 | | | 0.990%(Q) | | 1 Day THOR(2)(Q)/2.481% | | | — | | | | (253,749 | ) | | | (253,749 | ) |
| THB | | | 200,200 | | | | 07/03/30 | | | 1.028%(Q) | | 1 Day THOR(2)(Q)/2.481% | | | — | | | | (684,754 | ) | | | (684,754 | ) |
| THB | | | 115,500 | | | | 08/17/31 | | | 1.320%(Q) | | 1 Day THOR(2)(Q)/2.481% | | | — | | | | (412,024 | ) | | | (412,024 | ) |
| TWD | | | 564,000 | | | | 02/17/28 | | | 1.390%(Q) | | 3 Month TAIBOR(1)(Q)/1.494% | | | — | | | | 205,361 | | | | 205,361 | |
| TWD | | | 255,000 | | | | 02/24/33 | | | 1.415%(Q) | | 3 Month TAIBOR(1)(Q)/1.494% | | | — | | | | 243,270 | | | | 243,270 | |
| | | 332,950 | | | | 12/23/23 | | | 4.758%(T) | | 1 Day SOFR(2)(T)/5.350% | | | — | | | | (888,826 | ) | | | (888,826 | ) |
| | | 334,175 | | | | 02/21/24 | | | 5.170%(T) | | 1 Day SOFR(2)(T)/5.350% | | | — | | | | (168,925 | ) | | | (168,925 | ) |
| | | 370,490 | | | | 06/18/24 | | | 5.456%(T) | | 1 Day SOFR(2)(T)/5.350% | | | — | | | | (15,994 | ) | | | (15,994 | ) |
See Notes to Financial Statements.
PGIM Global Total Return Fund 85
Schedule of Investments (continued)
as of October 31, 2023
Interest rate swap agreements outstanding at October 31, 2023 (continued):
| | | | | | | | | | | | | | | | | | | | | | | | |
Notional
Amount
(000)# | | | Termination
Date | | | Fixed
Rate | | Floating
Rate | | Value at
Trade Date | | | Value at October 31, 2023 | | | Unrealized
Appreciation
(Depreciation) | |
| | | | | | | | | | | | | | | | | | | | | | | | |
| Centrally Cleared Interest Rate Swap Agreements (cont’d.): | | | | | | | | | | | | |
| | | 142,505 | | | | 07/10/24 | | | 5.435%(T) | | 1 Day SOFR(2)(T)/5.350% | | $ | — | | | $ | (32,303 | ) | | $ | (32,303 | ) |
| | | 301,810 | | | | 07/31/24 | | | 5.406%(T) | | 1 Day SOFR(2)(T)/5.350% | | | — | | | | (179,857 | ) | | | (179,857 | ) |
| | | 565,140 | | | | 08/14/24 | | | 5.298%(T) | | 1 Day SOFR(2)(T)/5.350% | | | — | | | | (905,222 | ) | | | (905,222 | ) |
| | | 284,850 | | | | 10/04/24 | | | 5.472%(T) | | 1 Day SOFR(2)(T)/5.350% | | | — | | | | 121,567 | | | | 121,567 | |
| | | | 180,200 | | | | 03/08/25 | | | 4.919%(A) | | 1 Day SOFR(2)(A)/5.350% | | | — | | | | (1,012,905 | ) | | | (1,012,905 | ) |
| | | 342,911 | | | | 04/22/25 | | | 3.595%(T) | | 1 Day SOFR(1)(T)/5.350% | | | (611,135 | ) | | | 4,597,344 | | | | 5,208,479 | |
| | | 50,180 | | | | 09/25/26 | | | 4.699%(A) | | 1 Day SOFR(1)(A)/5.350% | | | — | | | | 64,959 | | | | 64,959 | |
| | | 32,215 | | | | 09/05/28 | | | 4.027%(A) | | 1 Day SOFR(1)(A)/5.350% | | | — | | | | 774,772 | | | | 774,772 | |
| | | 27,150 | | | | 09/28/28 | | | 4.396%(A) | | 1 Day SOFR(1)(A)/5.350% | | | — | | | | 188,995 | | | | 188,995 | |
| | | 13,000 | | | | 04/26/33 | | | 3.070%(A) | | 1 Day SOFR(2)(A)/5.350% | | | — | | | | (661,929 | ) | | | (661,929 | ) |
| | | 38,155 | | | | 08/15/39 | | | 3.771%(A) | | 1 Day SOFR(2)(A)/5.350% | | | — | | | | (3,407,042 | ) | | | (3,407,042 | ) |
| | | | | | | | | | | | | | | | | | | | | | | | |
| | | | | | | | | | | | | | $ | 29,321,070 | | | $ | (76,453,110 | ) | | $ | (105,774,180 | ) |
| | | | | | | | | | | | | | | | | | | | | | | | |
| | | | | | | | | | | | | | | | | | | | | | |
Notional
Amount
(000)# | | | Termination
Date | | Fixed
Rate | | Floating
Rate | | Fair
Value | | | | Upfront
Premiums
Paid (Received) | | | | Unrealized
Appreciation
(Depreciation) | | Counterparty |
| | | | | | | | | | | | | | | | | | | | | | |
OTC Interest Rate Swap Agreements: |
| CNH | | | 10,000 | | | 04/02/26 | | 3.120%(Q) | | 7 Day China Fixing Repo
Rates(2)(Q)/ 2.500% | | $ 31,663 | | | | $ 3 | | | | $ 31,660 | | CITI |
See Notes to Financial Statements.
86
Interest rate swap agreements outstanding at October 31, 2023 (continued):
| | | | | | | | | | | | | | | | | | | | | | | | | | | | | | | | | | |
Notional
Amount
(000)# | | | Termination
Date | | Fixed
Rate | | Floating Rate | | Fair
Value | | | Upfront
Premiums
Paid(Received) | | | Unrealized
Appreciation
(Depreciation) | | | Counterparty | |
| | | | | | | | | | | | | | | | | | | | | | | | | | | | | | | | | | |
OTC Interest Rate Swap Agreements (cont’d.): | | | | | | | | | | | | | | | | | | | | | |
| CNH | | | 1,000 | | | 06/15/28 | | 2.365%(Q) | | 7 Day China Fixing Repo Rates(1)(Q)/2.500% | | $ | 93 | | | | | | | $ | — | | | | | | | $ | 93 | | | | MSI | |
| CNH | | | 1,000 | | | 06/15/28 | | 2.410%(Q) | | 7 Day China Fixing Repo Rates(2)(Q)/2.500% | | | (95 | ) | | | | | | | — | | | | | | | | (95 | ) | | | MSI | |
| CNH | | | 75,000 | | | 07/12/28 | | 2.410%(Q) | | 7 Day China Fixing Repo Rates(1)(Q)/2.500% | | | (8,525 | ) | | | | | | | — | | | | | | | | (8,525 | ) | | | MSI | |
| CNH | | | 75,000 | | | 07/12/28 | | 2.455%(Q) | | 7 Day China Fixing Repo Rates(2)(Q)/2.500% | | | 7,604 | | | | | | | | — | | | | | | | | 7,604 | | | | MSI | |
| CNH | | | 34,800 | | | 07/31/30 | | 2.515%(Q) | | 7 Day China Fixing Repo Rates(2)(Q)/2.500% | | | 6,873 | | | | | | | | — | | | | | | | | 6,873 | | | | MSI | |
| CNH | | | 5,000 | | | 10/14/31 | | 2.675%(Q) | | 7 Day China Fixing Repo Rates(2)(Q)/2.500% | | | 7,122 | | | | | | | | — | | | | | | | | 7,122 | | | | SCB | |
| CNH | | | 30,000 | | | 11/02/31 | | 2.700%(Q) | | 7 Day China Fixing Repo Rates(2)(Q)/2.500% | | | 55,652 | | | | | | | | — | | | | | | | | 55,652 | | | | SCB | |
| JPY | | | 35,000 | | | 12/14/32 | | 1.575%(S) | | 6 Month JPY LIBOR(2)(S)/0.072% | | | 11,317 | | | | | | | | — | | | | | | | | 11,317 | | | | HSBC | |
| KRW | | | 900,000 | | | 11/05/24 | | 2.425%(Q) | | 3 Month KWCDC(2)(Q)/3.820% | | | (12,787 | ) | | | | | | | — | | | | | | | | (12,787 | ) | | | CITI | |
| KRW | | | 1,485,000 | | | 10/28/26 | | 1.520%(Q) | | 3 Month KWCDC(2)(Q)/3.820% | | | (79,502 | ) | | | | | | | (7 | ) | | | | | | | (79,495 | ) | | | JPM | |
| KRW | | | 2,040,000 | | | 04/26/27 | | 1.880%(Q) | | 3 Month KWCDC(2)(Q)/3.820% | | | (108,750 | ) | | | | | | | — | | | | | | | | (108,750 | ) | | | MSI | |
| KRW | | | 1,280,000 | | | 10/17/28 | | 1.450%(Q) | | 3 Month KWCDC(2)(Q)/3.820% | | | (114,357 | ) | | | | | | | — | | | | | | | | (114,357 | ) | | | CITI | |
| KRW | | | 520,000 | | | 01/27/31 | | 1.870%(Q) | | 3 Month KWCDC(2)(Q)/3.820% | | | (54,813 | ) | | | | | | | — | | | | | | | | (54,813 | ) | | | JPM | |
| MYR | | | 1,700 | | | 04/28/25 | | 4.040%(Q) | | 3 Month KLIBOR(2)(Q)/3.650% | | | 1,373 | | | | | | | | — | | | | | | | | 1,373 | | | | CITI | |
See Notes to Financial Statements.
PGIM Global Total Return Fund 87
Schedule of Investments (continued)
as of October 31, 2023
Interest rate swap agreements outstanding at October 31, 2023 (continued):
| | | | | | | | | | | | | | | | | | | | | | | | | | | | | | | | | | | | | | | | | | | | | | |
Notional
Amount
(000)# | | | Termination
Date | | | Fixed
Rate | | | Floating Rate | | Fair
Value | | | Upfront
Premiums
Paid(Received) | | | Unrealized
Appreciation
(Depreciation) | | | Counterparty | |
| | | | | | | | | | | | | | | | | | | | | | | | | | | | | | | | | | | | | | | | | | | | | | |
OTC Interest Rate Swap Agreements (cont’d.): | | | | | | | | | | | | | | | | | | | | | | | | | | | | | |
| MYR | | | 23,575 | | | | 04/09/26 | | | | 2.625%(Q) | | | 3 Month KLIBOR(2)(Q)/3.650% | | $ | (140,679 | ) | | | | | | $ | (221 | ) | | | | | | | | | | $ | (140,458 | ) | | | | | | | MSI | |
| MYR | | | 45,900 | | | | 08/12/26 | | | | 2.605%(Q) | | | 3 Month KLIBOR(2)(Q)/3.650% | | | (333,423 | ) | | | | | | | (454 | ) | | | | | | | | | | | (332,969 | ) | | | | | | | HSBC | |
| MYR | | | 3,160 | | | | 07/11/29 | | | | 3.528%(Q) | | | 3 Month KLIBOR(2)(Q)/3.650% | | | (16,560 | ) | | | | | | | (6 | ) | | | | | | | | | | | (16,554 | ) | | | | | | | MSI | |
| MYR | | | 11,700 | | | | 11/19/29 | | | | 3.245%(Q) | | | 3 Month KLIBOR(2)(Q)/3.650% | | | (108,567 | ) | | | | | | | 17 | | | | | | | | | | | | (108,584 | ) | | | | | | | MSI | |
| MYR | | | 17,800 | | | | 02/04/30 | | | | 3.060%(Q) | | | 3 Month KLIBOR(2)(Q)/3.650% | | | (215,688 | ) | | | | | | | 9 | | | | | | | | | | | | (215,697 | ) | | | | | | | MSI | |
| SAR | | | 49,500 | | | | 04/26/33 | | | | 4.495%(A) | | | 3 Month SAIBOR(1)(Q)/6.284% | | | 470,716 | | | | | | | | — | | | | | | | | | | | | 470,716 | | | | | | | | MSI | |
| | | 10,000 | | | | 09/22/28 | | | | 3.290%(S) | | | 1 Week MUNIPSA(1)(Q)/4.090% | | | 90,236 | | | | | | | | — | | | | | | | | | | | | 90,236 | | | | | | | | JPM | |
| ZAR | | | 40,930 | | | | 03/22/42 | | | | 7.800%(Q) | | | 3 Month JIBAR(2)(Q)/8.358% | | | (465,462 | ) | | | | | | | — | | | | | | | | | | | | (465,462 | ) | | | | | | | CITI | |
| ZAR | | | 89,400 | | | | 09/22/42 | | | | 8.020%(Q) | | | 3 Month JIBAR(2)(Q)/8.358% | | | (935,386 | ) | | | | | | | — | | | | | | | | | | | | (935,386 | ) | | | | | | | CITI | |
| ZAR | | | 38,700 | | | | 03/22/47 | | | | 7.650%(Q) | | | 3 Month JIBAR(1)(Q)/8.358% | | | 490,669 | | | | | | | | — | | | | | | | | | | | | 490,669 | | | | | | | | CITI | |
| ZAR | | | 83,965 | | | | 09/22/47 | | | | 7.890%(Q) | | | 3 Month JIBAR(1)(Q)/8.358% | | | 962,590 | | | | | | | | — | | | | | | | | | | | | 962,590 | | | | | | | | CITI | |
| | | | | | | | | | | | | | | | | | | | | | | | | | | | | | | | | | | | | | | | | | | | | | |
| | | | | | | | | | | | | | | | $ | (458,686 | ) | | | | | | $ | (659 | ) | | | | | | | | | | $ | (458,027 | ) | | | | | | | | |
| | | | | | | | | | | | | | | | | | | | | | | | | | | | | | | | | | | | | | | | | | | | | | |
| (1) | The Fund pays the fixed rate and receives the floating rate. |
| (2) | The Fund pays the floating rate and receives the fixed rate. |
See Notes to Financial Statements.
88
Total return swap agreements outstanding at October 31, 2023:
| | | | | | | | | | | | | | | | | | | | | | | | | | | | | | | | | | | | | | | | | | |
Reference Entity | | Financing Rate | | Counterparty | | Termination
Date | | Long
(Short)
Notional
Amount
(000)#(1) | | Fair
Value | | Upfront
Premiums
Paid
(Received) | | Unrealized
Appreciation
(Depreciation)(2) |
| | | | | | | | | | | | | | | | | | | | | | | | | | | | | | | | | | | | | | | | | | |
OTC Total Return Swap Agreements: | |
ICE Bank of America 1-10 Year US Municipal Securities Index(T) | | 1 Day SOFR -245bps(T)/ 2.900% | | | | DB | | | | | 09/21/24 | | | | | 28,000 | | | | $ | (526,717 | ) | | | | | | | | $ | — | | | | | | | | | $ | (526,717 | ) |
U.S. Treasury Bond(T) | | 1 Day USOIS -10bps(T)/ 5.230% | | | | JPM | | | | | 11/29/23 | | | | | 80,245 | | | | | (8,584,975 | ) | | | | | | | | | — | | | | | | | | | | (8,584,975 | ) |
| | | | | | | | | | | | | | | | | | | | | | | | | | | | | | | | | | | | | | | | | | |
| | | | | | | | | | | | | | | | | | | | $ | (9,111,692 | ) | | | | | | | | $ | — | | | | | | | | | $ | (9,111,692 | ) |
| | | | | | | | | | | | | | | | | | | | | | | | | | | | | | | | | | | | | | | | | | |
| (1) | On a long total return swap, the Fund receives payments for any positive return on the reference entity (makes payments for any negative return) and pays the financing rate. On a short total return swap, the Fund makes payments for any positive return on the reference entity (receives payments for any negative return) and receives the financing rate. |
| (2) | Upfront/recurring fees or commissions, as applicable, are included in the net unrealized appreciation (depreciation). |
See Notes to Financial Statements.
PGIM Global Total Return Fund 89
Schedule of Investments (continued)
as of October 31, 2023
Reverse repurchase agreements:
During the reporting period ended October 31, 2023, the Fund held reverse repurchase agreements the entire period with an average value of $4,158,928 and a daily weighted average interest rate of 4.786%. At October 31, 2023, the Fund did not hold any reverse repurchase agreements.
Balances Reported in the Statement of Assets and Liabilities for OTC Swap Agreements:
| | | | | | | | | | |
| | | Premiums Paid | | Premiums Received | | Unrealized
Appreciation | | Unrealized
Depreciation | |
| |
OTC Swap Agreements | | $17,890,165 | | $(10,825,956) | | $22,935,360 | | $ | (34,887,072 | ) |
| |
Summary of Collateral for Centrally Cleared/Exchange-traded Derivatives:
Cash and securities segregated as collateral, including pending settlement for closed positions, to cover requirements for centrally cleared/exchange-traded derivatives are listed by broker as follows:
| | | | | | | | | | | | | | | | | | | | | | | | |
Broker | | Cash and/or Foreign Currency | | | Securities Market Value | |
CGM | | | | | | $ | 11,900,000 | | | | | | | | | | | $ | 11,462,489 | | | | | |
JPS | | | | | | | 3,112,000 | | | | | | | | | | | | 15,754,761 | | | | | |
| | | | | | | | | | | | | | | | | | | | | | | | |
Total | | | | | | $ | 15,012,000 | | | | | | | | | | | $ | 27,217,250 | | | | | |
| | | | | | | | | | | | | | | | | | | | | | | | |
Fair Value Measurements:
Various inputs are used in determining the value of the Fund’s investments. These inputs are summarized in the three broad levels listed below.
Level 1—unadjusted quoted prices generally in active markets for identical securities.
Level 2—quoted prices for similar securities, interest rates and yield curves, prepayment speeds, foreign currency exchange rates and other observable inputs.
Level 3—unobservable inputs for securities valued in accordance with Board approved fair valuation procedures.
The following is a summary of the inputs used as of October 31, 2023 in valuing such portfolio securities:
| | | | | | | | | | | | | | | | | | | | |
| | | Level 1 | | | | | | Level 2 | | | | | | Level 3 | |
Investments in Securities | | | | | | | | | | | | | | | | | | | | |
Assets | | | | | | | | | | | | | | | | | | | | |
Long-Term Investments | | | | | | | | | | | | | | | | | | | | |
Asset-Backed Securities | | | | | | | | | | | | | | | | | | | | |
Canada | | $ | — | | | | | | | $ | 1,666,306 | | | | | | | $ | — | |
Cayman Islands | | | — | | | | | | | | 102,378,170 | | | | | | | | — | |
Ireland. | | | — | | | | | | | | 189,957,435 | | | | | | | | — | |
Spain | | | — | | | | | | | | 1,093,580 | | | | | | | | 2,667,065 | |
United Kingdom | | | — | | | | | | | | 3,491,876 | | | | | | | | — | |
United States | | | — | | | | | | | | 34,891,828 | | | | | | | | — | |
See Notes to Financial Statements.
90
| | | | | | | | | | | | | | | | | | | | |
| | | Level 1 | | | | | | Level 2 | | | | | | Level 3 | |
Investments in Securities (continued) | | | | | | | | | | | | | | | | | | | | |
Assets (continued) | | | | | | | | | | | | | | | | | | | | |
Long-Term Investments (continued) | | | | | | | | | | | | | | | | | | | | |
Commercial Mortgage-Backed Securities | | | | | | | | | | | | | | | | | | | | |
Canada | | $ | — | | | | | | | $ | 1,081,160 | | | | | | | $ | — | |
United Kingdom | | | — | | | | | | | | 23,602,299 | | | | | | | | — | |
United States | | | — | | | | | | | | 193,050,477 | | | | | | | | — | |
Convertible Bond | | | | | | | | | | | | | | | | | | | | |
Jamaica | | | — | | | | | | | | 12,420 | | | | | | | | — | |
Corporate Bonds | | | | | | | | | | | | | | | | | | | | |
Australia | | | — | | | | | | | | 272,257 | | | | | | | | — | |
Brazil | | | — | | | | | | | | 19,862,577 | | | | | | | | — | |
Bulgaria | | | — | | | | | | | | 12,650,220 | | | | | | | | — | |
Canada | | | — | | | | | | | | 21,709,153 | | | | | | | | — | |
China | | | — | | | | | | | | 15,951,706 | | | | | | | | — | |
Denmark | | | — | | | | | | | | 5,278,722 | | | | | | | | — | |
France | | | — | | | | | | | | 57,850,104 | | | | | | | | — | |
Germany | | | — | | | | | | | | 11,003,558 | | | | | | | | — | |
Hong Kong | | | — | | | | | | | | 9,632,185 | | | | | | | | — | |
Hungary | | | — | | | | | | | | 3,444,518 | | | | | | | | — | |
Iceland | | | — | | | | | | | | 5,296,194 | | | | | | | | — | |
India | | | — | | | | | | | | 15,867,585 | | | | | | | | — | |
Indonesia | | | — | | | | | | | | 11,371,840 | | | | | | | | — | |
Israel | | | — | | | | | | | | 16,488,629 | | | | | | | | — | |
Italy | | | — | | | | | | | | 10,220,129 | | | | | | | | — | |
Jamaica | | | — | | | | | | | | 8,263,809 | | | | | | | | — | |
Japan | | | — | | | | | | | | 7,177,099 | | | | | | | | — | |
Kazakhstan | | | — | | | | | | | | 9,921,704 | | | | | | | | — | |
Luxembourg | | | — | | | | | | | | 10,034,431 | | | | | | | | — | |
Malta | | | — | | | | | | | | 3,150,940 | | | | | | | | — | |
Mexico | | | — | | | | | | | | 36,636,892 | | | | | | | | — | |
Netherlands | | | — | | | | | | | | 23,809,439 | | | | | | | | — | |
Norway | | | — | | | | | | | | 2,205,311 | | | | | | | | — | |
Peru | | | — | | | | | | | | 874,931 | | | | | | | | — | |
Philippines | | | — | | | | | | | | 4,091,544 | | | | | | | | — | |
Poland | | | — | | | | | | | | 6,724,257 | | | | | | | | — | |
Qatar | | | — | | | | | | | | 1,146,709 | | | | | | | | — | |
Russia | | | — | | | | | | | | 17,968,512 | | | | | | | | — | |
Slovenia | | | — | | | | | | | | 14,068,110 | | | | | | | | — | |
South Africa | | | — | | | | | | | | 12,081,750 | | | | | | | | — | |
South Korea | | | — | | | | | | | | 18,403,331 | | | | | | | | — | |
Spain | | | — | | | | | | | | 22,475,499 | | | | | | | | — | |
Supranational Bank | | | — | | | | | | | | 11,737,965 | | | | | | | | 1,922,030 | |
Switzerland | | | — | | | | | | | | 21,108,725 | | | | | | | | — | |
United Arab Emirates | | | — | | | | | | | | 9,664,921 | | | | | | | | — | |
United Kingdom | | | — | | | | | | | | 70,559,560 | | | | | | | | — | |
United States | | | — | | | | | | | | 621,914,800 | | | | | | | | 23,699,245 | |
Floating Rate and Other Loans | | | | | | | | | | | | | | | | | | | | |
Jamaica | | | — | | | | | | | | 394,515 | | | | | | | | — | |
See Notes to Financial Statements.
PGIM Global Total Return Fund 91
Schedule of Investments (continued)
as of October 31, 2023
| | | | | | | | | | | | | | | | | | | | |
| | | Level 1 | | | | | | Level 2 | | | | | | Level 3 | |
Investments in Securities (continued) | | | | | | | | | | | | | | | | | | | | |
Assets (continued) | | | | | | | | | | | | | | | | | | | | |
Long-Term Investments (continued) | | | | | | | | | | | | | | | | | | | | |
Floating Rate and Other Loans (continued) | | | | | | | | | | | | | | | | | | | | |
United Kingdom | | $ | — | | | | | | | $ | 20,184,522 | | | | | | | $ | — | |
United States | | | — | | | | | | | | 173,227 | | | | | | | | — | |
Municipal Bond | | | | | | | | | | | | | | | | | | | | |
Puerto Rico | | | — | | | | | | | | 5,432,304 | | | | | | | | — | |
Residential Mortgage-Backed Securities | | | | | | | | | | | | | | | | | | | | |
Spain | | | — | | | | | | | | 1,757,725 | | | | | | | | — | |
United States | | | — | | | | | | | | 113,682,665 | | | | | | | | — | |
Sovereign Bonds | | | | | | | | | | | | | | | | | | | | |
Albania | | | — | | | | | | | | 1,009,576 | | | | | | | | — | |
Andorra | | | — | | | | | | | | 340,539 | | | | | | | | — | |
Argentina | | | — | | | | | | | | 2,025,992 | | | | | | | | — | |
Austria | | | — | | | | | | | | 1,619,655 | | | | | | | | — | |
Brazil | | | — | | | | | | | | 21,051,377 | | | | | | | | — | |
Bulgaria | | | — | | | | | | | | 7,321,450 | | | | | | | | — | |
Canada | | | — | | | | | | | | 1,000,393 | | | | | | | | — | |
Chile | | | — | | | | | | | | 2,221,743 | | | | | | | | — | |
China | | | — | | | | | | | | 50,048,157 | | | | | | | | — | |
Colombia | | | — | | | | | | | | 58,771,357 | | | | | | | | — | |
Cyprus | | | — | | | | | | | | 22,718,820 | | | | | | | | — | |
Denmark | | | — | | | | | | | | 3,195,989 | | | | | | | | — | |
Egypt | | | — | | | | | | | | 501,110 | | | | | | | | — | |
Finland | | | — | | | | | | | | 1,075,863 | | | | | | | | — | |
France | | | — | | | | | | | | 19,913,669 | | | | | | | | — | |
Germany | | | — | | | | | | | | 24,685 | | | | | | | | — | |
Greece | | | — | | | | | | | | 71,441,938 | | | | | | | | — | |
Hungary | | | — | | | | | | | | 4,279,812 | | | | | | | | — | |
Indonesia | | | — | | | | | | | | 41,899,187 | | | | | | | | — | |
Israel | | | — | | | | | | | | 4,574,041 | | | | | | | | — | |
Italy | | | — | | | | | | | | 142,509,326 | | | | | | | | — | |
Japan | | | — | | | | | | | | 2,131,728 | | | | | | | | — | |
Kazakhstan | | | — | | | | | | | | 6,977,217 | | | | | | | | — | |
Mexico | | | — | | | | | | | | 19,331,620 | | | | | | | | — | |
Montenegro | | | — | | | | | | | | 761,903 | | | | | | | | — | |
Panama | | | — | | | | | | | | 14,540,866 | | | | | | | | — | |
Peru | | | — | | | | | | | | 18,131,741 | | | | | | | | — | |
Philippines | | | — | | | | | | | | 25,829,209 | | | | | | | | — | |
Poland | | | — | | | | | | | | 721,623 | | | | | | | | — | |
Portugal | | | — | | | | | | | | 4,187,416 | | | | | | | | — | |
Romania | | | — | | | | | | | | 16,224,263 | | | | | | | �� | — | |
Saudi Arabia | | | — | | | | | | | | 9,847,518 | | | | | | | | — | |
Serbia | | | — | | | | | | | | 26,416,457 | | | | | | | | — | |
Slovenia | | | — | | | | | | | | 3,130,905 | | | | | | | | — | |
South Korea | | | — | | | | | | | | 2,306,017 | | | | | | | | — | |
Spain | | | — | | | | | | | | 56,785,620 | | | | | | | | — | |
Sweden | | | — | | | | | | | | 1,047,272 | | | | | | | | — | |
See Notes to Financial Statements.
92
| | | | | | | | | | | | | | | | | | | | |
| | | Level 1 | | | | | | Level 2 | | | | | | Level 3 | |
Investments in Securities (continued) | | | | | | | | | | | | | | | | | | | | |
Assets (continued) | | | | | | | | | | | | | | | | | | | | |
Long-Term Investments (continued) | | | | | | | | | | | | | | | | | | | | |
Sovereign Bonds (continued) | | | | | | | | | | | | | | | | | | | | |
Tunisia | | $ | — | | | | | | | $ | 276,893 | | | | | | | $ | — | |
Ukraine | | | — | | | | | | | | 10,279,281 | | | | | | | | — | |
United Kingdom | | | — | | | | | | | | 8,237,625 | | | | | | | | — | |
Uruguay | | | — | | | | | | | | 554,326 | | | | | | | | — | |
U.S. Government Agency Obligations | | | — | | | | | | | | 18,525,647 | | | | | | | | 734,250 | |
U.S. Treasury Obligations | | | — | | | | | | | | 9,250,634 | | | | | | | | — | |
Common Stocks | | | | | | | | | | | | | | | | | | | | |
United States | | | 3,161,804 | | | | | | | | 466,795 | | | | | | | | — | |
Preferred Stock | | | | | | | | | | | | | | | | | | | | |
United States | | | 114,680 | | | | | | | | — | | | | | | | | — | |
Short-Term Investments | | | | | | | | | | | | | | | | | | | | |
Affiliated Mutual Funds | | | 68,572,220 | | | | | | | | — | | | | | | | | — | |
Option Purchased | | | — | | | | | | | | 11,125 | | | | | | | | — | |
| | | | | | | | | | | | | | | | | | | | |
Total | | $ | 71,848,704 | | | | | | | $ | 2,557,288,505 | | | | | | | $ | 29,022,590 | |
| | | | | | | | | | | | | | | | | | | | |
| | | | | |
| Liabilities | | | | | | | | | | | | | | | | | | | | |
Options Written | | $ | — | | | | | | | $ | (356,732) | | | | | | | $ | (254) | |
| | | | | | | | | | | | | | | | | | | | |
| | | | | |
Other Financial Instruments* | | | | | | | | | | | | | | | | | | | | |
Assets | | | | | | | | | | | | | | | | | | | | |
Futures Contracts | | $ | 16,007,943 | | | | | | | $ | — | | | | | | | $ | — | |
OTC Forward Foreign Currency Exchange Contracts | | | — | | | | | | | | 1,747,073 | | | | | | | | — | |
OTC Packaged Credit Default Swap Agreements | | | — | | | | | | | | 17,295,306 | | | | | | | | — | |
OTC Credit Default Swap Agreements | | | — | | | | | | | | 16,336,416 | | | | | | | | 28,151 | |
OTC Currency Swap Agreement | | | — | | | | | | | | 235,003 | | | | | | | | — | |
Centrally Cleared Interest Rate Swap Agreements | | | — | | | | | | | | 34,561,276 | | | | | | | | — | |
OTC Interest Rate Swap Agreements | | | — | | | | | | | | 2,135,908 | | | | | | | | — | |
| | | | | | | | | | | | | | | | | | | | |
Total | | $ | 16,007,943 | | | | | | | $ | 72,310,982 | | | | | | | $ | 28,151 | |
| | | | | | | | | | | | | | | | | | | | |
| | | | | |
| Liabilities | | | | | | | | | | | | | | | | | | | | |
Futures Contracts | | $ | (24,393,464) | | | | | | | $ | — | | | | | | | $ | — | |
OTC Forward Foreign Currency Exchange Contracts | | | — | | | | | | | | (7,554,699) | | | | | | | | — | |
OTC Packaged Credit Default Swap Agreements | | | — | | | | | | | | (17,269,629) | | | | | | | | — | |
OTC Credit Default Swap Agreements | | | — | | | | | | | | (11,450,692) | | | | | | | | — | |
OTC Currency Swap Agreements | | | — | | | | | | | | (491,680) | | | | | | | | — | |
Centrally Cleared Interest Rate Swap Agreements | | | — | | | | | | | | (140,335,456) | | | | | | | | — | |
OTC Interest Rate Swap Agreements | | | — | | | | | | | | (2,594,594) | | | | | | | | — | |
OTC Total Return Swap Agreements | | | — | | | | | | | | (9,111,692) | | | | | | | | — | |
| | | | | | | | | | | | | | | | | | | | |
Total | | $ | (24,393,464) | | | | | | | $ | (188,808,442) | | | | | | | $ | — | |
| | | | | | | | | | | | | | | | | | | | |
See Notes to Financial Statements.
PGIM Global Total Return Fund 93
Schedule of Investments (continued)
as of October 31, 2023
| * | Other financial instruments are derivative instruments not reflected in the Schedule of Investments, such as futures, forwards and centrally cleared swap contracts, which are recorded at the unrealized appreciation (depreciation) on the instrument, and OTC swap contracts which are recorded at fair value. |
The following is a reconciliation of assets in which unobservable inputs (Level 3) were used in determining fair value:
| | | | | | | | | | | | | | | | | | | | | | | | | | | | | | | | | | | |
| | | Asset-Backed
Securities-
Spain | | | | Corporate Bonds-
Supranational
Bank | | | | Corporate Bonds-
United States | | | | Residential
Mortgage-Backed
Securities |
Balance as of 10/31/22 | | | $ | 3,352,191 | | | | | | | | | $ | — | | | | | | | | | $ | 23,647,391 | | | | | | | | | $ | 5,623,505 | |
Realized gain (loss) | | | | (35,856) | | | | | | | | | | — | | | | | | | | | | — | | | | | | | | | | — | |
Change in unrealized appreciation (depreciation) | | | | (4,709) | | | | | | | | | | 59,634 | | | | | | | | | | (56,802) | | | | | | | | | | 28,259 | |
Purchases/Exchanges/Issuances | | | | — | | | | | | | | | | — | | | | | | | | | | — | | | | | | | | | | — | |
Sales/Paydowns | | | | (644,561) | | | | | | | | | | — | | | | | | | | | | — | | | | | | | | | | (5,651,764) | |
Accrued discount/premium | | | | — | | | | | | | | | | 8,670 | | | | | | | | | | (169,096) | | | | | | | | | | — | |
Transfers into Level 3* | | | | — | | | | | | | | | | 1,853,726 | | | | | | | | | | 277,752 | | | | | | | | | | — | |
Transfers out of Level 3* | | | | — | | | | | | | | | | — | | | | | | | | | | — | | | | | | | | | | — | |
| | | | | | | | | | | | | | | | | | | | | | | | | | | | | | | | | | | |
Balance as of 10/31/23 | | | $ | 2,667,065 | | | | | | | | | $ | 1,922,030 | | | | | | | | | $ | 23,699,245 | | | | | | | | | $ | — | |
| | | | | | | | | | | | | | | | | | | | | | | | | | | | | | | | | | | |
| | | | | | | |
Change in unrealized appreciation (depreciation) relating to securities still held at reporting period end | | | $ | (4,709) | | | | | | | | | $ | 59,634 | | | | | | | | | $ | (56,802) | | | | | | | | | $ | — | |
| | | | | | | | | | | | | | | | | | | | | | | | | | | | | | | | | | | |
| | | | | | | |
| | | U.S. Government
Agency
Obligations | | | | Common Stocks | | | | Options Written | | | | OTC Credit
Default Swap
Agreements |
Balance as of 10/31/22 | | | $ | — | | | | | | | | | $ | 569,523 | | | | | | | | | $ | (2,026) | | | | | | | | | $ | 19,312 | |
Realized gain (loss) | | | | 11,100 | | | | | | | | | | — | | | | | | | | | | — | | | | | | | | | | 5,130 | |
Change in unrealized appreciation (depreciation) | | | | 6,444 | | | | | | | | | | 2,307 | | | | | | | | | | 1,772 | | | | | | | | | | 28,151 | |
Purchases/Exchanges/Issuances | | | | 952,500 | | | | | | | | | | — | | | | | | | | | | — | | | | | | | | | | — | |
Sales/Paydowns | | | | (250,000) | | | | | | | | | | — | | | | | | | | | | — | | | | | | | | | | (24,442) | |
Accrued discount/premium | | | | 14,206 | | | | | | | | | | — | | | | | | | | | | — | | | | | | | | | | — | |
Transfers into Level 3* | | | | — | | | | | | | | | | — | | | | | | | | | | — | | | | | | | | | | — | |
Transfers out of Level 3* | | | | — | | | | | | | | | | (571,830) | | | | | | | | | | — | | | | | | | | | | — | |
| | | | | | | | | | | | | | | | | | | | | | | | | | | | | | | | | | | |
Balance as of 10/31/23 | | | $ | 734,250 | | | | | | | | | $ | — | | | | | | | | | $ | (254) | | | | | | | | | $ | 28,151 | |
| | | | | | | | | | | | | | | | | | | | | | | | | | | | | | | | | | | |
| | | | | | | |
Change in unrealized appreciation (depreciation) relating to securities still held at reporting period end | | | $ | 6,444 | | | | | | | | | $ | — | | | | | | | | | $ | 1,074 | | | | | | | | | $ | 28,151 | |
| | | | | | | | | | | | | | | | | | | | | | | | | | | | | | | | | | | |
| * | It is the Fund’s policy to recognize transfers in and transfers out at the securities’ fair values as of the beginning of period. Securities transferred between Level 2 and Level 3 are due to changes in the method utilized in valuing the investments. Transfers from Level 2 to Level 3 are typically a result of a change from the use of methods used by independent pricing services (Level 2) to the use of a single broker quote or valuation technique which utilizes significant unobservable inputs due to an absence of current or reliable market quotations (Level 3). Transfers from |
See Notes to Financial Statements.
94
| | Level 3 to Level 2 are a result of the availability of current and reliable market data provided by independent pricing services or other valuation techniques which utilize observable inputs. In accordance with the requirements of ASC 820, the amounts of transfers into and out of Level 3, if material, are disclosed in the Notes to the Schedule of Investments of the Fund. |
Level 3 securities as presented in the table above are being fair valued using pricing methodologies approved by the Board, which contain unobservable inputs as follows:
| | | | | | | | | | | | | | | | | | | | |
Level 3 Securities** | | Fair Value as of
October 31, 2023 | | | Valuation
Approach | | | Valuation Methodology | | Unobservable Inputs |
| | | | | | |
Asset-Backed Securities-Spain | | | | | | $ | 1 | | | | | | | | Market | | | Contingent Value | | Property Price Appreciation Forecast |
Asset-Backed Securities-Spain | | | | | | | 2,667,064 | | | | | | | | Market | | | Transaction Based | | Unadjusted Trade Price |
| | | | | | | | | | | | | | | | | | | | |
| | | | | | $ | 2,667,065 | | | | | | | | | | | | | |
| | | | | | | | | | | | | | | | | | | | |
| ** | The table does not include Level 3 securities and/or derivatives that are valued by independent pricing vendors or brokers. As of October 31, 2023, the aggregate value of these securities and/or derivatives was $26,383,422. The unobservable inputs for these investments were not developed by the Fund and are not readily available (e.g. single broker quotes). |
Industry Classification:
The industry classification of investments and other assets in excess of liabilities shown as a percentage of net assets as of October 31, 2023 were as follows:
| | | | |
Sovereign Bonds | | | 25.7 | % |
Banks | | | 12.2 | |
Collateralized Loan Obligations | | | 11.0 | |
Commercial Mortgage-Backed Securities | | | 8.2 | |
Electric | | | 4.7 | |
Residential Mortgage-Backed Securities | | | 4.5 | |
Oil & Gas | | | 3.5 | |
Affiliated Mutual Funds (1.5% represents investments purchased with collateral from securities on loan) | | | 2.5 | |
Real Estate Investment Trusts (REITs) | | | 2.6 | |
Telecommunications | | | 2.5 | |
Pipelines | | | 1.8 | |
Media | | | 1.7 | |
Diversified Financial Services | | | 1.7 | |
Foods | | | 1.2 | |
Retail | | | 1.1 | |
Commercial Services | | | 1.1 | |
Insurance | | | 1.0 | |
Home Builders | | | 0.7 | |
U.S. Government Agency Obligations | | | 0.7 | |
Auto Manufacturers | | | 0.7 | |
Real Estate | | | 0.6 | |
| | | | |
Transportation | | | 0.6 | % |
Healthcare-Services | | | 0.5 | |
Internet | | | 0.5 | |
Chemicals | | | 0.5 | |
Entertainment | | | 0.5 | |
Multi-National | | | 0.5 | |
Automobiles | | | 0.5 | |
Semiconductors | | | 0.5 | |
Engineering & Construction | | | 0.4 | |
Pharmaceuticals | | | 0.4 | |
Healthcare-Products | | | 0.4 | |
Software | | | 0.4 | |
Aerospace & Defense | | | 0.4 | |
Consumer Loans | | | 0.4 | |
U.S. Treasury Obligations | | | 0.4 | |
Electronics | | | 0.3 | |
Lodging | | | 0.3 | |
Gas | | | 0.3 | |
Office/Business Equipment | | | 0.3 | |
Agriculture | | | 0.2 | |
Auto Parts & Equipment | | | 0.2 | |
Municipal Bond | | | 0.2 | |
Student Loans | | | 0.2 | |
See Notes to Financial Statements.
PGIM Global Total Return Fund 95
Schedule of Investments (continued)
as of October 31, 2023
Industry Classification (continued):
| | | | |
Coal | | | 0.2 | % |
Other | | | 0.2 | |
Airlines | | | 0.2 | |
Building Materials | | | 0.1 | |
Credit Cards | | | 0.1 | |
Oil, Gas & Consumable Fuels | | | 0.1 | |
Mining | | | 0.1 | |
Packaging & Containers | | | 0.1 | |
Home Equity Loans | | | 0.0 | * |
Machinery-Diversified | | | 0.0 | * |
Household Products/Wares | | | 0.0 | * |
Gas Utilities | | | 0.0 | * |
| | | | |
Forest Products & Paper | | | 0.0 | *% |
Option Purchased | | | 0.0 | * |
| | | | |
| | | 99.7 | |
Options Written | | | (0.0 | )* |
Other assets in excess of liabilities | | | 0.3 | |
| | | | |
| | | 100.0 | % |
| | | | |
Effects of Derivative Instruments on the Financial Statements and Primary Underlying Risk Exposure:
The Fund invested in derivative instruments during the reporting period. The primary types of risk associated with these derivative instruments are credit risk, equity risk, foreign exchange risk and interest rate risk. See the Notes to Financial Statements for additional detail regarding these derivative instruments and their risks. The effect of such derivative instruments on the Fund’s financial position and financial performance as reflected in the Statement of Assets and Liabilities and Statement of Operations is presented in the summary below.
Fair values of derivative instruments as of October 31, 2023 as presented in the Statement of Assets and Liabilities:
| | | | | | | | | | | | |
| | | Asset Derivatives | | | Liability Derivatives | |
Derivatives not accounted for as hedging instruments, carried at fair value | | Statement of Assets and Liabilities Location | | Fair
Value | | | Statement of Assets and Liabilities Location | | Fair
Value | |
Credit contracts | | Premiums paid for OTC swap agreements | | $ | 17,890,136 | | | Premiums received for OTC swap agreements | | $ | 10,825,268 | |
| | | | |
Credit contracts | | — | | | — | | | Options written outstanding, at value | | | 254 | |
Credit contracts | | Unrealized appreciation on OTC swap agreements | | | 20,564,452 | | | Unrealized depreciation on OTC swap agreements | | | 22,689,768 | |
Foreign exchange contracts | | Due from/to broker-variation margin futures | | | 6,218,673* | | | Due from/to broker-variation margin futures | | | 7,102,323* | |
Foreign exchange contracts | | Unrealized appreciation on OTC forward foreign currency exchange contracts | | | 1,747,073 | | | Unrealized depreciation on OTC forward foreign currency exchange contracts | | | 7,554,699 | |
Interest rate contracts | | Due from/to broker-variation margin futures | | | 9,789,270 | * | | Due from/to broker-variation margin futures | | | 17,291,141 | * |
See Notes to Financial Statements.
96
| | | | | | | | | | | | |
| | | Asset Derivatives | | | Liability Derivatives | |
Derivatives not accounted for as hedging instruments, carried at fair value | | Statement of Assets and Liabilities Location | | Fair
Value | | | Statement of Assets and Liabilities Location | | Fair
Value | |
| | | | |
Interest rate contracts | | Due from/to broker-variation margin swaps | | $ | 34,561,276 | * | | Due from/to broker-variation margin swaps | | $ | 140,335,456 | * |
Interest rate contracts | | Premiums paid for OTC swap agreements | | | 29 | | | Premiums received for OTC swap agreements | | | 688 | |
Interest rate contracts | | Unaffiliated investments | | | 11,125 | | | Options written outstanding, at value | | | 356,732 | |
Interest rate contracts | | Unrealized appreciation on OTC swap agreements | | | 2,370,908 | | | Unrealized depreciation on OTC swap agreements | | | 12,197,304 | |
| | | | | | | | | | | | |
| | | | $ | 93,152,942 | | | | | $ | 218,353,633 | |
| | | | | | | | | | | | |
| * | Includes cumulative appreciation (depreciation) as reported in the schedule of open futures and centrally cleared swap contracts. Only unsettled variation margin receivable (payable) is reported within the Statement of Assets and Liabilities. |
The effects of derivative instruments on the Statement of Operations for the year ended October 31, 2023 are as follows:
| | | | | | | | | | | | | | | | | | | | |
| Amount of Realized Gain (Loss) on Derivatives Recognized in Income | |
Derivatives not accounted for as hedging instruments, carried at fair value | | Options
Purchased(1) | | | Options
Written | | | Futures | | | Forward
& Cross
Currency
Exchange
Contracts | | | Swaps | |
| | | | | |
Credit contracts | | $ | (1,651,988 | ) | | $ | 47,574,353 | | | $ | — | | | $ | — | | | $ | (44,543,845 | ) |
Equity contracts | | | — | | | | — | | | | — | | | | — | | | | 1,779,106 | |
Foreign exchange contracts | | | — | | | | — | | | | (30,656,972 | ) | | | (35,512,364 | ) | | | — | |
Interest rate contracts | | | (1,103,861 | ) | | | 701,692 | | | | 2,391,121 | | | | — | | | | (33,100,552 | ) |
| | | | | | | | | | | | | | | | | | | | |
Total | | $ | (2,755,849 | ) | | $ | 48,276,045 | | | $ | (28,265,851 | ) | | $ | (35,512,364 | ) | | $ | (75,865,291 | ) |
| | | | | | | | | | | | | | | | | | | | |
| (1) | Included in net realized gain (loss) on investment transactions in the Statement of Operations. |
| | | | | | | | | | | | | | | | | | | | |
| Change in Unrealized Appreciation (Depreciation) on Derivatives Recognized in Income | |
Derivatives not accounted for as hedging instruments, carried at fair value | | Options Purchased(2) | | | Options Written | | | Futures | | | Forward & Cross Currency Exchange Contracts | | | Swaps | |
| | | | | |
Credit contracts | | $ | — | | | $ | 1,772 | | | $ | — | | | $ | — | | | $ | (1,229,225 | ) |
Foreign exchange contracts | | | — | | | | — | | | | 8,790,097 | | | | 18,551,419 | | | | — | |
Interest rate contracts | | | (3,591,216 | ) | | | 3,687,420 | | | | 11,106,316 | | | | — | | | | (4,648,548 | ) |
| | | | | | | | | | | | | | | | | | | | |
Total | | $ | (3,591,216 | ) | | $ | 3,689,192 | | | $ | 19,896,413 | | | $ | 18,551,419 | | | $ | (5,877,773 | ) |
| | | | | | | | | | | | | | | | | | | | |
See Notes to Financial Statements.
PGIM Global Total Return Fund 97
Schedule of Investments (continued)
as of October 31, 2023
| (2) | Included in net change in unrealized appreciation (depreciation) on investments in the Statement of Operations. |
For the year ended October 31, 2023, the Fund’s average volume of derivative activities is as follows:
| | | | | |
Derivative Contract Type | | Average Volume of Derivative Activities* |
Options Purchased (1) | | | $ | 690,857 | |
Options Written (2) | | | | 221,294,108 | |
Futures Contracts - Long Positions (2) | | | | 693,318,210 | |
Futures Contracts - Short Positions (2) | | | | 1,194,284,739 | |
Forward Foreign Currency Exchange Contracts - Purchased (3) | | | | 620,249,420 | |
Forward Foreign Currency Exchange Contracts - Sold (3) | | | | 402,930,425 | |
Cross Currency Exchange Contracts (4) | | | | 11,562,982 | |
Interest Rate Swap Agreements (2) | | | | 3,550,288,505 | |
Credit Default Swap Agreements - Buy Protection (2) | | | | 267,082,602 | |
Credit Default Swap Agreements - Sell Protection (2) | | | | 503,704,194 | |
Currency Swap Agreements (2) | | | | 13,018,197 | |
Total Return Swap Agreements (2) | | | | 26,687,510 | |
Inflation Swap Agreements (2) | | | | 17,792,880 | |
| * | Average volume is based on average quarter end balances as noted for the year ended October 31, 2023. |
| (2) | Notional Amount in USD. |
| (3) | Value at Settlement Date. |
Financial Instruments/Transactions—Summary of Offsetting and Netting Arrangements:
The Fund invested in OTC derivatives and entered into financial instruments/transactions during the reporting period that are either offset in accordance with current requirements or are subject to enforceable master netting arrangements or similar agreements that permit offsetting. The information about offsetting and related netting arrangements for OTC derivatives and financial instruments/transactions where the legal right to set-off exists is presented in the summary below.
Offsetting of financial instrument/transaction assets and liabilities:
| | | | | | | | | | |
| Description | | Gross Market
Value of
Recognized
Assets/(Liabilities) | | | | Collateral
Pledged/(Received)(2) | | | | Net
Amount |
Securities on Loan | | $37,778,546 | | | | $(37,778,546) | | | | $— |
Offsetting of OTC derivative assets and liabilities:
| | | | | | | | | | | | | | | | | | | | | | | | | |
Counterparty | | Gross Amounts of
Recognized
Assets(1) | | Gross Amounts of
Recognized
Liabilities(1) | | Net Amounts of
Recognized
Assets/(Liabilities) | | Collateral
Pledged/(Received)(2) | | Net Amount |
| | | | | |
BARC | | $ 6,595,245 | | $ (6,664,208) | | $ (68,963) | | $ 68,963 | | | $ | — | |
See Notes to Financial Statements.
98
| | | | | | | | | | | | | | | | | | | | | | | | | |
Counterparty | | Gross Amounts of
Recognized
Assets(1) | | Gross Amounts of
Recognized
Liabilities(1) | | Net Amounts of
Recognized
Assets/(Liabilities) | | Collateral
Pledged/(Received)(2) | | Net Amount |
| | | | | |
BNP | | | $ | 403,115 | | | | $ | (1,242,529 | ) | | | $ | (839,414 | ) | | | $ | 839,414 | | | | $ | — | |
BOA | | | | 499,574 | | | | | (168,547 | ) | | | | 331,027 | | | | | (296,664 | ) | | | | 34,363 | |
CITI | | | | 2,969,794 | | | | | (2,453,793 | ) | | | | 516,001 | | | | | (516,001 | ) | | | | — | |
DB | | | | 412,386 | | | | | (612,427 | ) | | | | (200,041 | ) | | | | 200,041 | | | | | — | |
GSI | | | | 12,565,859 | | | | | (12,140,606 | ) | | | | 425,253 | | | | | — | | | | | 425,253 | |
HSBC | | | | 7,450,633 | | | | | (8,044,609 | ) | | | | (593,976 | ) | | | | — | | | | | (593,976 | ) |
JPM | | | | 1,971,691 | | | | | (11,849,249 | ) | | | | (9,877,558 | ) | | | | 8,622,847 | | | | | (1,254,711 | ) |
MSI | | | | 9,651,231 | | | | | (9,831,180 | ) | | | | (179,949 | ) | | | | 179,949 | | | | | — | |
SCB | | | | 64,195 | | | | | (211,041 | ) | | | | (146,846 | ) | | | | — | | | | | (146,846 | ) |
SSB | | | | — | | | | | (402,155 | ) | | | | (402,155 | ) | | | | 402,155 | | | | | — | |
TD | | | | — | | | | | (4,369 | ) | | | | (4,369 | ) | | | | — | | | | | (4,369 | ) |
| | | | | | | | | | | | | | | | | | | | | | | | | |
| | | $ | 42,583,723 | | | | $ | (53,624,713 | ) | | | $ | (11,040,990 | ) | | | $ | 9,500,704 | | | | $ | (1,540,286 | ) |
| | | | | | | | | | | | | | | | | | | | | | | | | |
| (1) | Includes unrealized appreciation/(depreciation) on swaps and forwards, premiums paid/(received) on swap agreements and market value of purchased and written options, as represented on the Statement of Assets and Liabilities. |
| (2) | Collateral amount disclosed by the Fund is limited to the market value of financial instruments/transactions and the Fund’s OTC derivative exposure by counterparty. |
See Notes to Financial Statements.
PGIM Global Total Return Fund 99
Statement of Assets and Liabilities
as of October 31, 2023
| | | | |
Assets | | | | |
| |
Investments at value, including securities on loan of $37,778,546: | | | | |
Unaffiliated investments (cost $3,171,503,324) | | $ | 2,589,587,579 | |
Affiliated investments (cost $68,553,236) | | | 68,572,220 | |
Cash | | | 16,648 | |
Foreign currency, at value (cost $1,916,472) | | | 1,913,445 | |
Cash segregated for counterparty - OTC | | | 13,735,131 | |
Dividends and interest receivable | | | 29,162,641 | |
Unrealized appreciation on OTC swap agreements | | | 22,935,360 | |
Premiums paid for OTC swap agreements | | | 17,890,165 | |
Deposit with broker for centrally cleared/exchange-traded derivatives | | | 15,012,000 | |
Receivable for investments sold | | | 6,710,944 | |
Receivable for Fund shares sold | | | 3,641,168 | |
Unrealized appreciation on OTC forward foreign currency exchange contracts | | | 1,747,073 | |
Due from broker—variation margin swaps | | | 1,434,342 | |
Tax reclaim receivable | | | 25,437 | |
Prepaid expenses | | | 23,653 | |
| | | | |
Total Assets | | | 2,772,407,806 | |
| | | | |
| |
Liabilities | | | | |
| |
Payable to broker for collateral for securities on loan | | | 38,852,822 | |
Unrealized depreciation on OTC swap agreements | | | 34,887,072 | |
Premiums received for OTC swap agreements | | | 10,825,956 | |
Unrealized depreciation on OTC forward foreign currency exchange contracts | | | 7,554,699 | |
Payable for Fund shares purchased | | | 7,254,126 | |
Due to broker—variation margin futures | | | 2,594,753 | |
Payable for investments purchased | | | 2,155,147 | |
Accrued expenses and other liabilities | | | 1,631,303 | |
Management fee payable | | | 1,278,903 | |
Dividends payable | | | 376,042 | |
Options written outstanding, at value (premiums received $8,781) | | | 356,986 | |
Distribution fee payable | | | 48,684 | |
Affiliated transfer agent fee payable | | | 31,148 | |
Directors’ fees payable | | | 3,254 | |
| | | | |
Total Liabilities | | | 107,850,895 | |
| | | | |
| |
Net Assets | | $ | 2,664,556,911 | |
| | | | |
| |
| | | | | |
| |
Net assets were comprised of: | | | | |
Common stock, at par | | $ | 5,541,352 | |
Paid-in capital in excess of par | | | 4,111,350,822 | |
Total distributable earnings (loss) | | | (1,452,335,263) | |
| | | | |
Net assets, October 31, 2023 | | $ | 2,664,556,911 | |
| | | | |
See Notes to Financial Statements.
100
| | | | |
Class A | | | | |
| | |
Net asset value and redemption price per share, | | | | |
($161,661,203 ÷ 33,910,778 shares of common stock issued and outstanding) | | $4.77 | | |
Maximum sales charge (3.25% of offering price) | | 0.16 | | |
| | | | |
Maximum offering price to public | | $4.93 | | |
| | | | |
| | |
Class C | | | | |
| | |
Net asset value, offering price and redemption price per share, | | | | |
($15,099,271 ÷ 3,173,526 shares of common stock issued and outstanding) | | $4.76 | | |
| | | | |
| | |
Class Z | | | | |
| | |
Net asset value, offering price and redemption price per share, | | | | |
($993,605,624 ÷ 207,300,604 shares of common stock issued and outstanding) | | $4.79 | | |
| | | | |
| | |
Class R2 | | | | |
| | |
Net asset value, offering price and redemption price per share, | | | | |
($4,392,699 ÷ 910,289 shares of common stock issued and outstanding) | | $4.83 | | |
| | | | |
| | |
Class R4 | | | | |
| | |
Net asset value, offering price and redemption price per share, | | | | |
($11,582,305 ÷ 2,397,841 shares of common stock issued and outstanding) | | $4.83 | | |
| | | | |
| | |
Class R6 | | | | |
| | |
Net asset value, offering price and redemption price per share, | | | | |
($1,478,215,809 ÷ 306,442,129 shares of common stock issued and outstanding) | | $4.82 | | |
| | | | |
See Notes to Financial Statements.
PGIM Global Total Return Fund 101
Statement of Operations
Year Ended October 31, 2023
| | | | |
Net Investment Income (Loss) | | | | |
| |
Income | | | | |
Interest income (net of $581 foreign withholding tax) | | $ | 127,445,167 | |
Unaffiliated dividend income | | | 433,310 | |
Affiliated dividend income | | | 284,719 | |
Income from securities lending, net (including affiliated income of $243,593) | | | 243,868 | |
| |
| | | | |
Total income | | | 128,407,064 | |
| | | | |
| |
Expenses | | | | |
Management fee | | | 14,846,846 | |
Distribution fee(a) | | | 643,663 | |
Shareholder servicing fees(a) | | | 16,914 | |
Transfer agent’s fees and expenses (including affiliated expense of $183,196)(a) | | | 1,910,840 | |
Shareholders’ reports | | | 313,613 | |
Custodian and accounting fees | | | 138,812 | |
Registration fees(a) | | | 106,313 | |
Audit fee | | | 68,900 | |
Professional fees | | | 60,183 | |
Directors’ fees | | | 48,787 | |
Miscellaneous | | | 541,269 | |
| |
| | | | |
Total expenses | | | 18,696,140 | |
Less: Fee waiver and/or expense reimbursement(a) | | | (481,055 | ) |
| | | | |
Net expenses | | | 18,215,085 | |
| | | | |
Net investment income (loss) | | | 110,191,979 | |
| | | | |
| |
Realized And Unrealized Gain (Loss) On Investment And Foreign Currency Transactions | | | | |
| |
Net realized gain (loss) on: | | | | |
Investment transactions (including affiliated of $35,476) | | | (173,053,697 | ) |
Futures transactions | | | (28,265,851 | ) |
Forward and cross currency contract transactions | | | (35,512,364 | ) |
Options written transactions | | | 48,276,045 | |
Swap agreement transactions | | | (75,865,291 | ) |
Foreign currency transactions | | | (61,367,253 | ) |
| | | | |
| | | (325,788,411 | ) |
| | | | |
Net change in unrealized appreciation (depreciation) on: | | | | |
Investments (including affiliated of $6,194) | | | 407,202,272 | |
Futures | | | 19,896,413 | |
Forward and cross currency contracts | | | 18,551,419 | |
Options written | | | 3,689,192 | |
Swap agreements | | | (5,877,773 | ) |
Foreign currencies | | | 1,962,062 | |
| | | | |
| | | 445,423,585 | |
| | | | |
Net gain (loss) on investment and foreign currency transactions | | | 119,635,174 | |
| | | | |
Net Increase (Decrease) In Net Assets Resulting From Operations | | $ | 229,827,153 | |
| | | | |
See Notes to Financial Statements.
102
(a) Class specific expenses and waivers were as follows:
| | | | | | | | | | | | | | | | | | | | | | | | |
| | | Class A | | | Class C | | | Class Z | | | Class R2 | | | Class R4 | | | Class R6 | |
Distribution fee | | | 452,392 | | | | 179,625 | | | | — | | | | 11,646 | | | | — | | | | — | |
Shareholder servicing fees | | | — | | | | — | | | | — | | | | 4,658 | | | | 12,256 | | | | — | |
Transfer agent’s fees and expenses | | | 324,496 | | | | 23,793 | | | | 1,413,378 | | | | 11,278 | | | | 20,897 | | | | 116,998 | |
Registration fees | | | 16,388 | | | | 11,216 | | | | 31,092 | | | | 6,201 | | | | 6,951 | | | | 34,465 | |
Fee waiver and/or expense reimbursement | | | (157,333) | | | | (16,866) | | | | (295,786) | | | | (8,019) | | | | (3,051) | | | | — | |
See Notes to Financial Statements.
PGIM Global Total Return Fund 103
Statements of Changes in Net Assets
| | | | | | | | |
| |
| | | Year Ended
October 31, | |
| | | 2023 | | | 2022 | |
| | |
Increase (Decrease) in Net Assets | | | | | | | | |
| | |
Operations | | | | | | | | |
Net investment income (loss) | | $ | 110,191,979 | | | $ | 121,405,667 | |
Net realized gain (loss) on investment and foreign currency transactions | | | (325,788,411 | ) | | | (395,489,590 | ) |
Net change in unrealized appreciation (depreciation) on investments and foreign currencies | | | 445,423,585 | | | | (1,203,023,686 | ) |
| | | | | | | | |
Net increase (decrease) in net assets resulting from operations | | | 229,827,153 | | | | (1,477,107,609 | ) |
| | | | | | | | |
| | |
Dividends and Distributions | | | | | | | | |
Distributions from distributable earnings | | | | | | | | |
Class A | | | (2,591,039 | ) | | | (1,884,548 | ) |
Class C | | | (207,879 | ) | | | (174,602 | ) |
Class Z | | | (17,226,169 | ) | | | (16,129,577 | ) |
Class R2 | | | (63,272 | ) | | | (43,177 | ) |
Class R4 | | | (177,628 | ) | | | (102,780 | ) |
Class R6 | | | (25,701,554 | ) | | | (18,672,780 | ) |
| | | | | | | | |
| | | (45,967,541 | ) | | | (37,007,464 | ) |
| | | | | | | | |
| | |
Tax return of capital distributions | | | | | | | | |
Class A | | | (4,498,457 | ) | | | (8,092,166 | ) |
Class C | | | (360,910 | ) | | | (749,735 | ) |
Class Z | | | (29,907,380 | ) | | | (69,259,710 | ) |
Class R2 | | | (109,851 | ) | | | (185,403 | ) |
Class R4 | | | (308,391 | ) | | | (441,331 | ) |
Class R6 | | | (44,622,003 | ) | | | (80,180,115 | ) |
| | | | | | | | |
| | | (79,806,992 | ) | | | (158,908,460 | ) |
| | | | | | | | |
| | |
Fund share transactions (Net of share conversions) | | | | | | | | |
Net proceeds from shares sold | | | 798,034,832 | | | | 1,390,121,445 | |
Net asset value of shares issued in reinvestment of dividends and distributions | | | 120,225,775 | | | | 187,460,081 | |
Cost of shares purchased | | | (1,692,708,500 | ) | | | (2,647,557,772 | ) |
| | | | | | | | |
Net increase (decrease) in net assets from Fund share transactions | | | (774,447,893 | ) | | | (1,069,976,246 | ) |
| | | | | | | | |
Total increase (decrease) | | | (670,395,273 | ) | | | (2,742,999,779 | ) |
| | |
Net Assets: | | | | | | | | |
| | |
Beginning of year | | | 3,334,952,184 | | | | 6,077,951,963 | |
| | | | | | | | |
End of year | | $ | 2,664,556,911 | | | $ | 3,334,952,184 | |
| | | | | | | | |
See Notes to Financial Statements.
104
Financial Highlights
| | | | | | | | | | | | | | | | | | | | |
| | | | | | |
| Class A Shares | | | | | | | | | | | | | | | |
| | | Year Ended October 31, | |
| | | 2023 | | | 2022 | | | 2021 | | | 2020 | | | 2019 | |
Per Share Operating Performance(a): | | | | | | | | | | | | | | | | | | | | |
Net Asset Value, Beginning of Year | | | $4.67 | | | | $6.67 | | | | $6.96 | | | | $7.07 | | | | $6.36 | |
Income (loss) from investment operations: | | | | | | | | | | | | | | | | | | | | |
Net investment income (loss) | | | 0.17 | (b) | | | 0.13 | | | | 0.11 | | | | 0.13 | | | | 0.16 | |
| Net realized and unrealized gain (loss) on investment and foreign currency transactions | | | 0.13 | (c) | | | (1.91 | ) | | | (0.17 | ) | | | 0.16 | | | | 0.78 | |
Total from investment operations | | | 0.30 | | | | (1.78 | ) | | | (0.06 | ) | | | 0.29 | | | | 0.94 | |
Less Dividends and Distributions: | | | | | | | | | | | | | | | | | | | | |
Dividends from net investment income* | | | (0.07 | ) | | | (0.03 | ) | | | (0.23 | ) | | | (0.23 | ) | | | (0.23 | ) |
Tax return of capital distributions | | | (0.13 | ) | | | (0.19 | ) | | | - | | | | - | | | | - | |
Distributions from net realized gains | | | - | | | | - | | | | - | | | | (0.17 | ) | | | - | |
Total dividends and distributions | | | (0.20 | ) | | | (0.22 | ) | | | (0.23 | ) | | | (0.40 | ) | | | (0.23 | ) |
Net asset value, end of year | | | $4.77 | | | | $4.67 | | | | $6.67 | | | | $6.96 | | | | $7.07 | |
Total Return(d): | | | 6.22 | % | | | (27.22 | )% | | | (0.97 | )% | | | 4.35 | % | | | 15.05 | % |
| | | | | | | | | | | | | | | | | | | | |
| | | | | | |
| Ratios/Supplemental Data: | | | | | | | | | | | | | | | |
Net assets, end of year (000) | | | $161,661 | | | | $185,414 | | | | $337,257 | | | | $326,416 | | | | $216,708 | |
Average net assets (000) | | | $180,957 | | | | $257,676 | | | | $344,592 | | | | $285,380 | | | | $188,633 | |
Ratios to average net assets(e): | | | | | | | | | | | | | | | | | | | | |
Expenses after waivers and/or expense reimbursement | | | 0.89 | %(f) | | | 0.88 | % | | | 0.88 | % | | | 0.88 | % | | | 0.88 | % |
Expenses before waivers and/or expense reimbursement | | | 0.98 | % | | | 0.93 | % | | | 0.91 | % | | | 0.96 | % | | | 1.02 | % |
Net investment income (loss) | | | 3.40 | % | | | 2.29 | % | | | 1.58 | % | | | 1.94 | % | | | 2.40 | % |
Portfolio turnover rate(g) | | | 6 | % | | | 13 | % | | | 23 | % | | | 20 | % | | | 37 | % |
| * | Dividends from net investment income may include other items that are ordinary income for tax purposes. |
| (a) | Calculated based on average shares outstanding during the year. |
| (b) | The per share amount of net investment income (loss) does not directly correlate to the amounts reported in the Statement of Operations due to class specific expenses. |
| (c) | The per share amount of realized and unrealized gain (loss) on investments does not directly correlate to the amounts reported in the Statement of Operations due to the timing of portfolio share transactions in relation to fluctuating market values. |
| (d) | Total return does not consider the effects of sales loads. Total return is calculated assuming a purchase of a share on the first day and a sale on the last day of each year reported and includes reinvestment of dividends and distributions, if any. Total returns may reflect adjustments to conform to GAAP. |
| (e) | Does not include expenses of the underlying funds in which the Fund invests. |
| (f) | Includes interest expense on borrowings from the Syndicated Credit Agreement of 0.01% which are being excluded from the Fund’s contractual waiver for the year ended October 31, 2023. |
| (g) | The Fund’s portfolio turnover rate is calculated in accordance with regulatory requirements, without regard to transactions involving short-term investments, certain derivatives and in-kind transactions (if any). If such transactions were included, the Fund’s portfolio turnover rate may be higher. |
See Notes to Financial Statements.
PGIM Global Total Return Fund 105
Financial Highlights (continued)
| | | | | | | | | | | | | | | | | | | | |
| | | | | | |
| Class C Shares | | | | | | | | | | | | | | | |
| | | Year Ended October 31, | |
| | | 2023 | | | 2022 | | | 2021 | | | 2020 | | | 2019 | |
Per Share Operating Performance(a): | | | | | | | | | | | | | | | | | | | | |
Net Asset Value, Beginning of Year | | | $4.66 | | | | $6.66 | | | | $6.95 | | | | $7.06 | | | | $6.35 | |
Income (loss) from investment operations: | | | | | | | | | | | | | | | | | | | | |
Net investment income (loss) | | | 0.13 | | | | 0.09 | | | | 0.06 | | | | 0.08 | | | | 0.11 | |
| Net realized and unrealized gain (loss) on investment and foreign currency transactions | | | 0.13 | | | | (1.90 | ) | | | (0.17 | ) | | | 0.16 | | | | 0.78 | |
Total from investment operations | | | 0.26 | | | | (1.81 | ) | | | (0.11 | ) | | | 0.24 | | | | 0.89 | |
Less Dividends and Distributions: | | | | | | | | | | | | | | | | | | | | |
Dividends from net investment income* | | | (0.03 | ) | | | - | | | | (0.18 | ) | | | (0.18 | ) | | | (0.18 | ) |
Tax return of capital distributions | | | (0.13 | ) | | | (0.19 | ) | | | - | | | | - | | | | - | |
Distributions from net realized gains | | | - | | | | - | | | | - | | | | (0.17 | ) | | | - | |
Total dividends and distributions | | | (0.16 | ) | | | (0.19 | ) | | | (0.18 | ) | | | (0.35 | ) | | | (0.18 | ) |
Net asset value, end of year | | | $4.76 | | | | $4.66 | | | | $6.66 | | | | $6.95 | | | | $7.06 | |
Total Return(b): | | | 5.43 | % | | | (27.82 | )% | | | (1.72 | )% | | | 3.57 | % | | | 14.21 | % |
| | | | | | | | | | | | | | | | | | | | |
| | | | | | |
| Ratios/Supplemental Data: | | | | | | | | | | | | | | | |
Net assets, end of year (000) | | | $15,099 | | | | $19,422 | | | | $42,012 | | | | $46,157 | | | | $37,486 | |
Average net assets (000) | | | $17,962 | | | | $29,474 | | | | $45,988 | | | | $42,925 | | | | $34,321 | |
Ratios to average net assets(c): | | | | | | | | | | | | | | | | | | | | |
Expenses after waivers and/or expense reimbursement | | | 1.64 | %(d) | | | 1.63 | % | | | 1.63 | % | | | 1.63 | % | | | 1.63 | % |
Expenses before waivers and/or expense reimbursement | | | 1.73 | % | | | 1.69 | % | | | 1.66 | % | | | 1.68 | % | | | 1.69 | % |
Net investment income (loss) | | | 2.65 | % | | | 1.51 | % | | | 0.83 | % | | | 1.20 | % | | | 1.65 | % |
Portfolio turnover rate(e) | | | 6 | % | | | 13 | % | | | 23 | % | | | 20 | % | | | 37 | % |
| * | Dividends from net investment income may include other items that are ordinary income for tax purposes. |
| (a) | Calculated based on average shares outstanding during the year. |
| (b) | Total return does not consider the effects of sales loads. Total return is calculated assuming a purchase of a share on the first day and a sale on the last day of each year reported and includes reinvestment of dividends and distributions, if any. Total returns may reflect adjustments to conform to GAAP. |
| (c) | Does not include expenses of the underlying funds in which the Fund invests. |
| (d) | Includes interest expense on borrowings from the Syndicated Credit Agreement of 0.01% which are being excluded from the Fund’s contractual waiver for the year ended October 31, 2023. |
| (e) | The Fund’s portfolio turnover rate is calculated in accordance with regulatory requirements, without regard to transactions involving short-term investments, certain derivatives and in-kind transactions (if any). If such transactions were included, the Fund’s portfolio turnover rate may be higher. |
See Notes to Financial Statements.
106
| | | | | | | | | | | | | | | | | | | | |
| | | | | | |
| Class Z Shares | | | | | | | | | | | | | | | |
| | | Year Ended October 31, | |
| | | 2023 | | | 2022 | | | 2021 | | | 2020 | | | 2019 | |
Per Share Operating Performance(a): | | | | | | | | | | | | | | | | | | | | |
Net Asset Value, Beginning of Year | | | $4.69 | | | | $6.71 | | | | $7.00 | | | | $7.11 | | | | $6.40 | |
Income (loss) from investment operations: | | | | | | | | | | | | | | | | | | | | |
Net investment income (loss) | | | 0.18 | (b) | | | 0.15 | | | | 0.13 | | | | 0.15 | | | | 0.18 | |
| Net realized and unrealized gain (loss) on investment and foreign currency transactions | | | 0.13 | (c) | | | (1.94 | ) | | | (0.17 | ) | | | 0.16 | | | | 0.78 | |
Total from investment operations | | | 0.31 | | | | (1.79 | ) | | | (0.04 | ) | | | 0.31 | | | | 0.96 | |
Less Dividends and Distributions: | | | | | | | | | | | | | | | | | | | | |
Dividends from net investment income* | | | (0.08 | ) | | | (0.04 | ) | | | (0.25 | ) | | | (0.25 | ) | | | (0.25 | ) |
Tax return of capital distributions | | | (0.13 | ) | | | (0.19 | ) | | | - | | | | - | | | | - | |
Distributions from net realized gains | | | - | | | | - | | | | - | | | | (0.17 | ) | | | - | |
Total dividends and distributions | | | (0.21 | ) | | | (0.23 | ) | | | (0.25 | ) | | | (0.42 | ) | | | (0.25 | ) |
Net asset value, end of year | | | $4.79 | | | | $4.69 | | | | $6.71 | | | | $7.00 | | | | $7.11 | |
Total Return(d): | | | 6.47 | % | | | (27.16 | )% | | | (0.70 | )% | | | 4.61 | % | | | 15.25 | % |
| | | | | | | | | | | | | | | | | | | | |
| | | | | | |
| Ratios/Supplemental Data: | | | | | | | | | | | | | | | |
Net assets, end of year (000) | | | $993,606 | | | | $1,303,382 | | | | $2,907,890 | | | | $2,264,938 | | | | $1,254,507 | |
Average net assets (000) | | | $1,131,695 | | | | $2,068,163 | | | | $2,809,784 | | | | $1,726,788 | | | | $888,961 | |
Ratios to average net assets(e): | | | | | | | | | | | | | | | | | | | | |
Expenses after waivers and/or expense reimbursement | | | 0.64 | %(f) | | | 0.63 | % | | | 0.63 | % | | | 0.63 | % | | | 0.63 | % |
Expenses before waivers and/or expense reimbursement | | | 0.67 | % | | | 0.65 | % | | | 0.65 | % | | | 0.68 | % | | | 0.68 | % |
Net investment income (loss) | | | 3.65 | % | | | 2.51 | % | | | 1.82 | % | | | 2.18 | % | | | 2.61 | % |
Portfolio turnover rate(g) | | | 6 | % | | | 13 | % | | | 23 | % | | | 20 | % | | | 37 | % |
| * | Dividends from net investment income may include other items that are ordinary income for tax purposes. |
| (a) | Calculated based on average shares outstanding during the year. |
| (b) | The per share amount of net investment income (loss) does not directly correlate to the amounts reported in the Statement of Operations due to class specific expenses. |
| (c) | The per share amount of realized and unrealized gain (loss) on investments does not directly correlate to the amounts reported in the Statement of Operations due to the timing of portfolio share transactions in relation to fluctuating market values. |
| (d) | Total return is calculated assuming a purchase of a share on the first day and a sale on the last day of each year reported and includes reinvestment of dividends and distributions, if any. Total returns may reflect adjustments to conform to GAAP. |
| (e) | Does not include expenses of the underlying funds in which the Fund invests. |
| (f) | Includes interest expense on borrowings from the Syndicated Credit Agreement of 0.01% which are being excluded from the Fund’s contractual waiver for the year ended October 31, 2023. |
| (g) | The Fund’s portfolio turnover rate is calculated in accordance with regulatory requirements, without regard to transactions involving short-term investments, certain derivatives and in-kind transactions (if any). If such transactions were included, the Fund’s portfolio turnover rate may be higher. |
See Notes to Financial Statements.
PGIM Global Total Return Fund 107
Financial Highlights (continued)
| | | | | | | | | | | | | | | | | | | | |
| | | | | | |
| Class R2 Shares | | | | | | | | | | | | | | | |
| | | Year Ended October 31, | |
| | | 2023 | | | 2022 | | | 2021 | | | 2020 | | | 2019 | |
Per Share Operating Performance(a): | | | | | | | | | | | | | | | | | | | | |
Net Asset Value, Beginning of Year | | | $4.72 | | | | $6.76 | | | | $7.05 | | | | $7.16 | | | | $6.44 | |
Income (loss) from investment operations: | | | | | | | | | | | | | | | | | | | | |
Net investment income (loss) | | | 0.16 | (b) | | | 0.12 | | | | 0.10 | | | | 0.11 | | | | 0.15 | |
| Net realized and unrealized gain (loss) on investment and foreign currency transactions | | | 0.14 | (c) | | | (1.95 | ) | | | (0.17 | ) | | | 0.17 | | | | 0.79 | |
Total from investment operations | | | 0.30 | | | | (1.83 | ) | | | (0.07 | ) | | | 0.28 | | | | 0.94 | |
Less Dividends and Distributions: | | | | | | | | | | | | | | | | | | | | |
Dividends from net investment income* | | | (0.06 | ) | | | (0.02 | ) | | | (0.22 | ) | | | (0.22 | ) | | | (0.22 | ) |
Tax return of capital distributions | | | (0.13 | ) | | | (0.19 | ) | | | - | | | | - | | | | - | |
Distributions from net realized gains | | | - | | | | - | | | | - | | | | (0.17 | ) | | | - | |
Total dividends and distributions | | | (0.19 | ) | | | (0.21 | ) | | | (0.22 | ) | | | (0.39 | ) | | | (0.22 | ) |
Net asset value, end of year | | | $4.83 | | | | $4.72 | | | | $6.76 | | | | $7.05 | | | | $7.16 | |
Total Return(d): | | | 6.20 | % | | | (27.57 | )% | | | (1.12 | )% | | | 4.13 | % | | | 14.81 | % |
| | | | | | | | | | | | | | | | | | | | |
| | | | | | |
| Ratios/Supplemental Data: | | | | | | | | | | | | | | | |
Net assets, end of year (000) | | | $4,393 | | | | $4,350 | | | | $9,324 | | | | $18,443 | | | | $185 | |
Average net assets (000) | | | $4,659 | | | | $6,242 | | | | $14,831 | | | | $9,990 | | | | $78 | |
Ratios to average net assets(e): | | | | | | | | | | | | | | | | | | | | |
Expenses after waivers and/or expense reimbursement | | | 1.09 | %(f) | | | 1.08 | % | | | 1.08 | % | | | 1.08 | % | | | 1.08 | % |
Expenses before waivers and/or expense reimbursement | | | 1.26 | % | | | 1.29 | % | | | 1.13 | % | | | 1.25 | % | | | 19.82 | % |
Net investment income (loss) | | | 3.20 | % | | | 2.08 | % | | | 1.38 | % | | | 1.62 | % | | | 2.11 | % |
Portfolio turnover rate(g) | | | 6 | % | | | 13 | % | | | 23 | % | | | 20 | % | | | 37 | % |
| * | Dividends from net investment income may include other items that are ordinary income for tax purposes. |
| (a) | Calculated based on average shares outstanding during the year. |
| (b) | The per share amount of net investment income (loss) does not directly correlate to the amounts reported in the Statement of Operations due to class specific expenses. |
| (c) | The per share amount of realized and unrealized gain (loss) on investments does not directly correlate to the amounts reported in the Statement of Operations due to the timing of portfolio share transactions in relation to fluctuating market values. |
| (d) | Total return is calculated assuming a purchase of a share on the first day and a sale on the last day of each year reported and includes reinvestment of dividends and distributions, if any. Total returns may reflect adjustments to conform to GAAP. |
| (e) | Does not include expenses of the underlying funds in which the Fund invests. |
| (f) | Includes interest expense on borrowings from the Syndicated Credit Agreement of 0.01% which are being excluded from the Fund’s contractual waiver for the year ended October 31, 2023. |
| (g) | The Fund’s portfolio turnover rate is calculated in accordance with regulatory requirements, without regard to transactions involving short-term investments, certain derivatives and in-kind transactions (if any). If such transactions were included, the Fund’s portfolio turnover rate may be higher. |
See Notes to Financial Statements.
108
| | | | | | | | | | | | | | | | | | | | |
| | | | | | |
| Class R4 Shares | | | | | | | | | | | | | | | |
| | | Year Ended October 31, | |
| | | 2023 | | | 2022 | | | 2021 | | | 2020 | | | 2019 | |
Per Share Operating Performance(a): | | | | | | | | | | | | | | | | | | | | |
Net Asset Value, Beginning of Year | | | $4.73 | | | | $6.76 | | | | $7.05 | | | | $7.16 | | | | $6.45 | |
Income (loss) from investment operations: | | | | | | | | | | | | | | | | | | | | |
Net investment income (loss) | | | 0.17 | (b) | | | 0.14 | | | | 0.11 | | | | 0.13 | | | | 0.16 | |
| Net realized and unrealized gain (loss) on investment and foreign currency transactions | | | 0.13 | (c) | | | (1.95 | ) | | | (0.17 | ) | | | 0.17 | | | | 0.79 | |
Total from investment operations | | | 0.30 | | | | (1.81 | ) | | | (0.06 | ) | | | 0.30 | | | | 0.95 | |
Less Dividends and Distributions: | | | | | | | | | | | | | | | | | | | | |
Dividends from net investment income* | | | (0.07 | ) | | | (0.03 | ) | | | (0.23 | ) | | | (0.24 | ) | | | (0.24 | ) |
Tax return of capital distributions | | | (0.13 | ) | | | (0.19 | ) | | | - | | | | - | | | | - | |
Distributions from net realized gains | | | - | | | | - | | | | - | | | | (0.17 | ) | | | - | |
Total dividends and distributions | | | (0.20 | ) | | | (0.22 | ) | | | (0.23 | ) | | | (0.41 | ) | | | (0.24 | ) |
Net asset value, end of year | | | $4.83 | | | | $4.73 | | | | $6.76 | | | | $7.05 | | | | $7.16 | |
Total Return(d): | | | 6.24 | % | | | (27.24 | )% | | | (0.87 | )% | | | 4.39 | % | | | 14.92 | % |
| | | | | | | | | | | | | | | | | | | | |
| | | | | | |
| Ratios/Supplemental Data: | | | | | | | | | | | | | | | |
Net assets, end of year (000) | | | $11,582 | | | | $12,251 | | | | $14,654 | | | | $8,932 | | | | $1,453 | |
Average net assets (000) | | | $12,256 | | | | $14,017 | | | | $12,787 | | | | $5,178 | | | | $804 | |
Ratios to average net assets(e): | | | | | | | | | | | | | | | | | | | | |
Expenses after waivers and/or expense reimbursement | | | 0.84 | %(f) | | | 0.83 | % | | | 0.83 | % | | | 0.83 | % | | | 0.83 | % |
Expenses before waivers and/or expense reimbursement | | | 0.86 | % | | | 0.86 | % | | | 0.87 | % | | | 1.13 | % | | | 2.63 | % |
Net investment income (loss) | | | 3.45 | % | | | 2.40 | % | | | 1.63 | % | | | 1.91 | % | | | 2.34 | % |
Portfolio turnover rate(g) | | | 6 | % | | | 13 | % | | | 23 | % | | | 20 | % | | | 37 | % |
| * | Dividends from net investment income may include other items that are ordinary income for tax purposes. |
| (a) | Calculated based on average shares outstanding during the year. |
| (b) | The per share amount of net investment income (loss) does not directly correlate to the amounts reported in the Statement of Operations due to class specific expenses. |
| (c) | The per share amount of realized and unrealized gain (loss) on investments does not directly correlate to the amounts reported in the Statement of Operations due to the timing of portfolio share transactions in relation to fluctuating market values. |
| (d) | Total return is calculated assuming a purchase of a share on the first day and a sale on the last day of each year reported and includes reinvestment of dividends and distributions, if any. Total returns may reflect adjustments to conform to GAAP. |
| (e) | Does not include expenses of the underlying funds in which the Fund invests. |
| (f) | Includes interest expense on borrowings from the Syndicated Credit Agreement of 0.01% which are being excluded from the Fund’s contractual waiver for the year ended October 31, 2023. |
| (g) | The Fund’s portfolio turnover rate is calculated in accordance with regulatory requirements, without regard to transactions involving short-term investments, certain derivatives and in-kind transactions (if any). If such transactions were included, the Fund’s portfolio turnover rate may be higher. |
See Notes to Financial Statements.
PGIM Global Total Return Fund 109
Financial Highlights (continued)
| | | | | | | | | | | | | | | | | | | | |
| | | | | | |
| Class R6 Shares | | | | | | | | | | | | | | | |
| | | Year Ended October 31, | |
| | | 2023 | | | 2022 | | | 2021 | | | 2020 | | | 2019 | |
Per Share Operating Performance(a): | | | | | | | | | | | | | | | | | | | | |
Net Asset Value, Beginning of Year | | | $4.72 | | | | $6.75 | | | | $7.04 | | | | $7.16 | | | | $6.44 | |
Income (loss) from investment operations: | | | | | | | | | | | | | | | | | | | | |
Net investment income (loss) | | | 0.19 | (b) | | | 0.15 | | | | 0.14 | | | | 0.16 | | | | 0.18 | |
| Net realized and unrealized gain (loss) on investment and foreign currency transactions | | | 0.13 | (c) | | | (1.94 | ) | | | (0.17 | ) | | | 0.15 | | | | 0.80 | |
Total from investment operations | | | 0.32 | | | | (1.79 | ) | | | (0.03 | ) | | | 0.31 | | | | 0.98 | |
Less Dividends and Distributions: | | | | | | | | | | | | | | | | | | | | |
Dividends from net investment income* | | | (0.09 | ) | | | (0.05 | ) | | | (0.26 | ) | | | (0.26 | ) | | | (0.26 | ) |
Tax return of capital distributions | | | (0.13 | ) | | | (0.19 | ) | | | - | | | | - | | | | - | |
Distributions from net realized gains | | | - | | | | - | | | | - | | | | (0.17 | ) | | | - | |
Total dividends and distributions | | | (0.22 | ) | | | (0.24 | ) | | | (0.26 | ) | | | (0.43 | ) | | | (0.26 | ) |
Net asset value, end of year | | | $4.82 | | | | $4.72 | | | | $6.75 | | | | $7.04 | | | | $7.16 | |
Total Return(d): | | | 6.56 | % | | | (27.06 | )% | | | (0.58 | )% | | | 4.69 | % | | | 15.25 | % |
| | | | | | | | | | | | | | | | | | | | |
| | | | | | |
| Ratios/Supplemental Data: | | | | | | | | | | | | | | | |
Net assets, end of year (000) | | | $1,478,216 | | | | $1,810,132 | | | | $2,766,815 | | | | $1,787,693 | | | | $1,139,781 | |
Average net assets (000) | | | $1,651,821 | | | | $2,351,483 | | | | $2,396,559 | | | | $1,513,154 | | | | $925,868 | |
Ratios to average net assets(e): | | | | | | | | | | | | | | | | | | | | |
Expenses after waivers and/or expense reimbursement | | | 0.54 | %(f) | | | 0.53 | % | | | 0.52 | % | | | 0.55 | % | | | 0.56 | % |
Expenses before waivers and/or expense reimbursement | | | 0.54 | % | | | 0.53 | % | | | 0.52 | % | | | 0.55 | % | | | 0.56 | % |
Net investment income (loss) | | | 3.74 | % | | | 2.66 | % | | | 1.93 | % | | | 2.27 | % | | | 2.67 | % |
Portfolio turnover rate(g) | | | 6 | % | | | 13 | % | | | 23 | % | | | 20 | % | | | 37 | % |
| * | Dividends from net investment income may include other items that are ordinary income for tax purposes. |
| (a) | Calculated based on average shares outstanding during the year. |
| (b) | The per share amount of net investment income (loss) does not directly correlate to the amounts reported in the Statement of Operations due to class specific expenses. |
| (c) | The per share amount of realized and unrealized gain (loss) on investments does not directly correlate to the amounts reported in the Statement of Operations due to the timing of portfolio share transactions in relation to fluctuating market values. |
| (d) | Total return is calculated assuming a purchase of a share on the first day and a sale on the last day of each year reported and includes reinvestment of dividends and distributions, if any. Total returns may reflect adjustments to conform to GAAP. |
| (e) | Does not include expenses of the underlying funds in which the Fund invests. |
| (f) | Includes interest expense on borrowings from the Syndicated Credit Agreement of 0.01% which are being excluded from the Fund’s contractual waiver for the year ended October 31, 2023. |
| (g) | The Fund’s portfolio turnover rate is calculated in accordance with regulatory requirements, without regard to transactions involving short-term investments, certain derivatives and in-kind transactions (if any). If such transactions were included, the Fund’s portfolio turnover rate may be higher. |
See Notes to Financial Statements.
110
Notes to Financial Statements
Prudential Global Total Return Fund, Inc. (the “Registered Investment Company” or “RIC”) is registered under the Investment Company Act of 1940, as amended (“1940 Act”), as an open-end management investment company. The RIC is organized as a Maryland Corporation. These financial statements relate only to the PGIM Global Total Return Fund (the “Fund”), a series of the RIC. The Fund is classified as a diversified fund for purposes of the 1940 Act.
The investment objective of the Fund is to seek total return, made up of current income and capital appreciation.
The Fund follows the investment company accounting and reporting guidance of the Financial Accounting Standards Board (“FASB”) Accounting Standard Codification (“ASC”) Topic 946 Financial Services — Investment Companies. The following is a summary of significant accounting policies followed by the Fund in the preparation of its financial statements. The policies conform to U.S. generally accepted accounting principles (“GAAP”). The Fund consistently follows such policies in the preparation of its financial statements.
Securities Valuation: The Fund holds securities and other assets and liabilities that are fair valued as of the close of each day (generally, 4:00 PM Eastern time) the New York Stock Exchange (“NYSE”) is open for trading. As described in further detail below, the Fund’s investments are valued daily based on a number of factors, including the type of investment and whether market quotations are readily available. The RIC’s Board of Directors (the “Board”) has approved the Fund’s valuation policies and procedures for security valuation and designated PGIM Investments LLC (“PGIM Investments” or the “Manager”) as the “Valuation Designee,” as defined by Rule 2a-5(b) under the 1940 Act, to perform the fair value determination relating to all Fund investments. Pursuant to the Board’s oversight, the Valuation Designee has established a Valuation Committee to perform the duties and responsibilities as Valuation Designee under Rule 2a-5. The valuation procedures permit the Fund to utilize independent pricing vendor services, quotations from market makers, and alternative valuation methods when market quotations are either not readily available or not deemed representative of fair value. Fair value is the estimated price that would be received to sell an asset or paid to transfer a liability in an orderly transaction between market participants on the measurement date.
For the fiscal reporting year-end, securities and other assets and liabilities were fair valued at the close of the last U.S. business day. Trading in certain foreign securities may occur when the NYSE is closed (including weekends and holidays). Because such foreign securities
PGIM Global Total Return Fund 111
Notes to Financial Statements (continued)
trade in markets that are open on weekends and U.S. holidays, the values of some of the Fund’s foreign investments may change on days when investors cannot purchase or redeem Fund shares.
Various inputs determine how the Fund’s investments are valued, all of which are categorized according to the three broad levels (Level 1, 2, or 3) detailed in the Schedule of Investments and referred to herein as the “fair value hierarchy” in accordance with FASB ASC Topic 820 — Fair Value Measurement.
Common or preferred stocks, exchange-traded funds (ETFs) and derivative instruments, if applicable, that are traded on a national securities exchange are valued at the last sale price as of the close of trading on the applicable exchange where the security principally trades. Securities traded via NASDAQ are valued at the NASDAQ official closing price. To the extent these securities are valued at the last sale price or NASDAQ official closing price, they are classified as Level 1 in the fair value hierarchy. In the event that no sale or official closing price on a valuation date exists, these securities are generally valued at the mean between the last reported bid and ask prices, or at the last bid price in the absence of an ask price. These securities are classified as Level 2 in the fair value hierarchy.
Investments in open-end funds (other than ETFs) are valued at their net asset values as of the close of the NYSE on the date of valuation. These securities are classified as Level 1 in the fair value hierarchy since they may be purchased or sold at their net asset values on the date of valuation.
Fixed income securities traded in the OTC market are generally classified as Level 2 in the fair value hierarchy. Such fixed income securities are typically valued using the market approach which generally involves obtaining data from an approved independent third-party vendor source. The Fund utilizes the market approach as the primary method to value securities when market prices of identical or comparable instruments are available. The third-party vendors’ valuation techniques used to derive the evaluated bid price are based on evaluating observable inputs, including but not limited to, yield curves, yield spreads, credit ratings, deal terms, tranche level attributes, default rates, cash flows, prepayment speeds, broker/dealer quotations and reported trades. Certain Level 3 securities are also valued using the market approach when obtaining a single broker quote or when utilizing transaction prices for identical securities that have been used in excess of five business days. During the reporting period, there were no changes to report with respect to the valuation approach and/or valuation techniques discussed above.
Floating rate and other loans are generally valued at prices provided by approved independent pricing vendors. The pricing vendors utilize broker/dealer quotations and provide prices based on the average of such quotations. Floating rate and other loans valued
112
using such vendor prices are generally classified as Level 2 in the fair value hierarchy. Floating rate and other loans valued based on a single broker quote or at the original transaction price in excess of five business days are classified as Level 3 in the fair value hierarchy.
OTC and centrally cleared derivative instruments are generally classified as Level 2 in the fair value hierarchy. Such derivative instruments are typically valued using the market approach and/or income approach which generally involves obtaining data from an approved independent third-party vendor source. The Fund utilizes the market approach when quoted prices in broker-dealer markets are available but also includes consideration of alternative valuation approaches, including the income approach. In the absence of reliable market quotations, the income approach is typically utilized for purposes of valuing derivatives such as interest rate swaps based on a discounted cash flow analysis whereby the value of the instrument is equal to the present value of its future cash inflows or outflows. Such analysis includes projecting future cash flows and determining the discount rate (including the present value factors that affect the discount rate) used to discount the future cash flows. In addition, the third-party vendors’ valuation techniques used to derive the evaluated derivative price is based on evaluating observable inputs, including but not limited to, underlying asset prices, indices, spreads, interest rates and exchange rates. Certain derivatives may be classified as Level 3 when valued using the market approach by obtaining a single broker quote or when utilizing unobservable inputs in the income approach. During the reporting period, there were no changes to report with respect to the valuation approach and/or valuation techniques discussed above.
Securities and other assets that cannot be priced according to the methods described above are valued based on policies and procedures approved by the Board. In the event that unobservable inputs are used when determining such valuations, the securities will be classified as Level 3 in the fair value hierarchy. Altering one or more unobservable inputs may result in a significant change to a Level 3 security’s fair value measurement.
When determining the fair value of securities, some of the factors influencing the valuation include: the nature of any restrictions on disposition of the securities; assessment of the general liquidity of the securities; the issuer’s financial condition and the markets in which it does business; the cost of the investment; the size of the holding and the capitalization of the issuer; the prices of any recent transactions or bids/offers for such securities or any comparable securities; and any available analyst media or other reports or information deemed reliable by the Valuation Designee regarding the issuer or the markets or industry in which it operates. Using fair value to price securities may result in a value that is different from a security’s most recent closing price and from the price used by other unaffiliated mutual funds to calculate their net asset values.
Foreign Currency Translation: The books and records of the Fund are maintained in U.S. dollars. Foreign currency amounts are translated into U.S. dollars on the following basis:
PGIM Global Total Return Fund 113
Notes to Financial Statements (continued)
(i) market value of investment securities, other assets and liabilities — at the exchange rate as of the valuation date;
(ii) purchases and sales of investment securities, income and expenses — at the rates of exchange prevailing on the respective dates of such transactions.
Although the net assets of the Fund are presented at the foreign exchange rates and market values at the close of the period, the Fund does not generally isolate that portion of the results of operations arising as a result of changes in the foreign exchange rates from the fluctuations arising from changes in the market prices of long-term portfolio securities held at the end of the period. Similarly, the Fund does not isolate the effect of changes in foreign exchange rates from the fluctuations arising from changes in the market prices of long-term portfolio securities sold during the period. Accordingly, holding period unrealized and realized foreign currency gains (losses) are included in the reported net change in unrealized appreciation (depreciation) on investments and net realized gains (losses) on investment transactions on the Statements of Operations. Notwithstanding the above, the Fund does isolate the effect of fluctuations in foreign currency exchange rates when determining the gain (loss) upon the sale or maturity of foreign currency denominated debt obligations; such amounts are included in net realized gains (losses) on foreign currency transactions.
Additionally, net realized gains (losses) on foreign currency transactions represent net foreign exchange gains (losses) from the disposition of holdings of foreign currencies, currency gains (losses) realized between the trade and settlement dates on investment transactions, and the difference between the amounts of interest, dividends and foreign withholding taxes recorded on the Fund’s books and the U.S. dollar equivalent amounts actually received or paid. Net unrealized currency gains (losses) arise from valuing foreign currency denominated assets and liabilities (other than investments) at period end exchange rates.
Forward and Cross Currency Contracts: A forward currency contract is a commitment to purchase or sell a foreign currency at a future date at a negotiated forward rate. The Fund enters into forward currency contracts, as defined in the prospectus, in order to hedge its exposure to changes in foreign currency exchange rates on its foreign portfolio holdings or on specific receivables and payables denominated in a foreign currency and to gain exposure to certain currencies. The contracts are valued daily at current forward exchange rates and any unrealized gain (loss) is included in net unrealized appreciation or depreciation on forward and cross currency contracts. Gain (loss) is realized on the settlement date of the contract equal to the difference between the settlement value of the original and negotiated forward contracts. This gain (loss), if any, is included in net realized gain (loss) on forward and cross currency contract transactions. Risks may arise upon
114
entering into these contracts from the potential inability of the counterparties to meet the terms of their contracts. Forward currency contracts involve risks from currency exchange rate and credit risk in excess of the amounts reflected on the Statement of Assets and Liabilities. The Fund’s maximum risk of loss from counterparty credit risk is the net value of the cash flows to be received from the counterparty at the end of the contract’s life. A cross currency contract is a forward contract where a specified amount of one foreign currency will be exchanged for a specified amount of another foreign currency.
Options: The Fund purchased and/or wrote options in order to hedge against adverse market movements or fluctuations in value caused by changes in prevailing interest rates, value of equities or foreign currency exchange rates with respect to securities or financial instruments which the Fund currently owns or intends to purchase. The Fund may also use options to gain additional market exposure. The Fund’s principal reason for writing options is to realize, through receipt of premiums, a greater current return than would be realized on the underlying security alone. When the Fund purchases an option, it pays a premium and an amount equal to that premium is recorded as an asset. When the Fund writes an option, it receives a premium and an amount equal to that premium is recorded as a liability. The asset or liability is adjusted daily to reflect the current market value of the option. If an option expires unexercised, the Fund realizes a gain (loss) to the extent of the premium received or paid. If an option is exercised, the premium received or paid is recorded as an adjustment to the proceeds from the sale or the cost of the purchase in determining whether the Fund has realized a gain (loss). The difference between the premium and the amount received or paid at the closing of a purchase or sale transaction is also treated as a realized gain (loss). Gain (loss) on purchased options is included in net realized gain (loss) on investment transactions. Gain (loss) on written options is presented separately as net realized gain (loss) on options written transactions.
The Fund, as writer of an option, may have no control over whether the underlying securities or financial instruments may be sold (called) or purchased (put). As a result, the Fund bears the market risk of an unfavorable change in the price of the security or financial instrument underlying the written option. The Fund, as purchaser of an OTC option, bears the risk of the potential inability of the counterparties to meet the terms of their contracts. With exchange-traded options contracts, there is minimal counterparty credit risk to the Fund since the exchanges’ clearinghouse acts as counterparty to all exchange-traded options and guarantees the options contracts against default.
When the Fund writes an option on a swap, an amount equal to any premium received by the Fund is recorded as a liability and is subsequently adjusted to the current market value of the written option on the swap. If a call option on a swap is exercised, the Fund becomes obligated to pay a fixed interest rate (noted as the strike price) and receive a variable interest rate on a notional amount. If a put option on a swap is exercised, the Fund becomes obligated to pay a variable interest rate and receive a fixed interest rate (noted as the strike price) on a notional amount. Premiums received from writing options on swaps that expire or are exercised are treated as realized gains upon the expiration or exercise of such options on
PGIM Global Total Return Fund 115
Notes to Financial Statements (continued)
swaps. The risk associated with writing put and call options on swaps is that the Fund will be obligated to be party to a swap agreement if an option on a swap is exercised.
Financial Futures Contracts: A financial futures contract is an agreement to purchase (long) or sell (short) an agreed amount of securities at a set price for delivery on a future date. Upon entering into a financial futures contract, the Fund is required to pledge to the broker an amount of cash and/or other assets equal to a certain percentage of the contract amount. This amount is known as the “initial margin.” Subsequent payments, known as “variation margin,” are made or received by the Fund each day, depending on the daily fluctuations in the value of the underlying security. Such variation margin is recorded for financial statement purposes on a daily basis as unrealized gain (loss). When the contract expires or is closed, the gain (loss) is realized and is presented in the Statement of Operations as net realized gain (loss) on futures transactions.
The Fund invested in financial futures contracts in order to hedge its existing portfolio securities, or securities the Fund intends to purchase, against fluctuations in value caused by changes in prevailing interest rates. Should interest rates move unexpectedly, the Fund may not achieve the anticipated benefits of the financial futures contracts and may realize a loss. The use of futures transactions involves the risk of imperfect correlation in movements in the price of futures contracts, interest rates and the underlying hedged assets. Since futures contracts are exchange-traded, there is minimal counterparty credit risk to the Fund since the exchanges’ clearinghouse acts as counterparty to all exchange-traded futures and guarantees the futures contracts against default.
Swap Agreements: The Fund entered into certain types of swap agreements detailed in the disclosures below. A swap agreement is an agreement to exchange the return generated by one instrument for the return generated by another instrument. Swap agreements are negotiated in the OTC market and may be executed either directly with a counterparty (“OTC-traded”) or through a central clearing facility, such as a registered exchange. Swap agreements are valued daily at current market value and any change in value is included in the net unrealized appreciation or depreciation on swap agreements. Centrally cleared swaps pay or receive an amount known as “variation margin”, based on daily changes in the valuation of the swap contract. For OTC-traded, upfront premiums paid and received are shown as swap premiums paid and swap premiums received in the Statement of Assets and Liabilities. Risk of loss may exceed amounts recognized on the Statement of Assets and Liabilities. Swap agreements outstanding at period end, if any, are listed on the Schedule of Investments.
Interest Rate Swaps: Interest rate swaps represent an agreement between counterparties to exchange cash flows based on the difference between two interest rates, applied to a notional principal amount for a specified period. The Fund is subject to interest rate risk
116
exposure in the normal course of pursuing its investment objective. The Fund used interest rate swaps to maintain its ability to generate steady cash flow by receiving a stream of fixed rate payments or to increase exposure to prevailing market rates by receiving floating rate payments. The Fund’s maximum risk of loss from counterparty credit risk is the discounted net present value of the cash flows to be received from the counterparty over the contract’s remaining life.
Inflation Swaps: The Fund entered into inflation swap agreements to protect against fluctuations in inflation rates. Inflation swaps are characterized by one party paying a fixed rate in exchange for a floating rate that is derived from an inflation index, such as the Consumer Price Index or UK Retail Price Index. Inflation swaps subject the Fund to interest rate risk.
Credit Default Swaps (“CDS”): CDS involve one party (the protection buyer) making a stream of payments to another party (the protection seller) in exchange for the right to receive a specified payment in the event of a default or as a result of a default (collectively a “credit event”) for the referenced entity (typically corporate issues or sovereign issues of an emerging country) on its obligation; or in the event of a write-down, principal shortfall, interest shortfall or default of all or part of the referenced entities comprising a credit index.
The Fund is subject to credit risk in the normal course of pursuing its investment objectives, and as such, has entered into CDS contracts to provide a measure of protection against defaults or to take an active long or short position with respect to the likelihood of a particular issuer’s default or the reference entity’s credit soundness. CDS contracts generally trade based on a spread which represents the cost a protection buyer has to pay the protection seller. The protection buyer is said to be “short the credit” because the higher the contract value rises, the more the credit deteriorates. The value of the CDS contract increases for the protection buyer if the spread increases. The Fund’s maximum risk of loss from counterparty credit risk for purchased CDS is the inability of the counterparty to honor the contract up to the notional value due to a credit event.
As a seller of protection on credit default swap agreements, the Fund generally receives an agreed upon payment from the buyer of protection throughout the term of the swap, provided no credit event occurs. As the seller, the Fund effectively increases its investment risk because, in addition to its total net assets, the Fund may be subject to investment exposure on the notional amount of the swap.
The maximum amount of the payment that the Fund, as a seller of protection, could be required to make under a credit default swap agreement would be equal to the notional amount of the underlying security or index contract as a result of a credit event. This potential amount will be partially offset by any recovery values of the respective referenced obligations or net amounts received from the settlement of buy protection credit default swap agreements which the Fund entered into for the same referenced entity or index. As a buyer of protection, the Fund generally receives an amount up to the notional value of the swap if a credit event occurs.
PGIM Global Total Return Fund 117
Notes to Financial Statements (continued)
Implied credit spreads, represented in absolute terms, utilized in determining the market value of credit default swap agreements where the Fund is the seller of protection as of period end are disclosed in the footnotes to the Schedule of Investments, if applicable. These spreads serve as indicators of the current status of the payment/performance risk and represent the likelihood of default risk for the credit derivative. The implied credit spread of a particular referenced entity reflects the cost of buying/selling protection and may include upfront payments required to enter into the agreement. Wider credit spreads and increased market value in absolute terms, when compared to the notional amount of the swap, represent a deterioration of the referenced entity’s credit soundness and a greater likelihood of risk of default or other credit event occurring as defined under the terms of the agreement.
Currency Swaps: The Fund entered into currency swap agreements primarily to gain yield exposure on foreign bonds. Currency swap agreements involve two parties exchanging two different currencies with an agreement to reverse the exchange at a later date at specified exchange rates.
Total Return Swaps: In a total return swap, one party receives payments based on the market value of the security or the commodity involved, or total return of a specific referenced asset, such as an equity, index or bond, and in return pays a defined amount. The Fund is subject to risk exposures associated with the referenced asset in the normal course of pursuing its investment objectives. The Fund entered into total return swaps to manage its exposure to a security or an index. The Fund’s maximum risk of loss from counterparty credit risk is the change in the value of the security, in the Fund’s favor, from the point of entering into the contract.
Floating Rate and Other Loans: The Fund invested in floating rate and other loans. Floating rate and other loans include loans that are privately negotiated between a corporate borrower and one or more financial institutions, including, but not limited to, term loans, revolvers, and other instruments issued in the floating rate and other loans market. The Fund acquires interests in loans directly (by way of assignment from the selling institution) and/or indirectly (by way of the purchase of a participation interest from the selling institution). Under a floating rate and other loans assignment, the Fund generally will succeed to all the rights and obligations of an assigning lending institution and becomes a lender under the loan agreement with the relevant borrower in connection with that loan. Under a floating rate and other loans participation, the Fund generally will have a contractual relationship only with the lender, not with the relevant borrower. As a result, the Fund generally will have the right to receive payments of principal, interest, and any fees to which it is entitled only from the lender selling the participation and only upon receipt by the lender of the payments from the relevant borrower. The Fund may not directly benefit from the collateral supporting the debt obligation in which it has purchased the
118
participation. As a result, the Fund will assume the credit risk of both the borrower and the institution selling the participation to the Fund.
Reverse Repurchase Agreements: The Fund enters reverse repurchase agreements with qualified third-party broker-dealers in which the Fund sells securities to a bank or broker-dealer and agrees to repurchase the same securities at a mutually agreed upon date and price. The Fund receives securities and/or cash as collateral with a market value in-excess of the repurchase price to be paid by the Fund upon the maturity of the transaction. During the term of the agreement, the Fund continues to receive the principal and interest payments on the securities sold. Certain agreements have no stated maturity and can be terminated by either party at any time. Due to the short-term nature of reverse repurchase agreements, face value approximates fair value. Cash received in exchange for securities delivered plus accrued interest due to the counterparty is recorded as a liability in the Statement of Assets and Liabilities. Interest payments made by the Fund to the counterparties are recorded as a component of interest expense in the Statement of Operations.
Mortgage-Backed and Asset-Backed Securities: Mortgage-backed securities are pass-through securities, meaning that principal and interest payments made by the borrower on the underlying mortgages are passed through to the Fund. Asset-backed securities directly or indirectly represent a participation interest in, or are secured by and payable from, a stream of payments generated by particular assets such as motor vehicle or credit card receivables. Asset-backed securities may be classified as pass-through certificates or collateralized obligations, such as collateralized bond obligations, collateralized loan obligations and other similarly structured securities. The value of mortgage-backed and asset-backed securities varies with changes in interest rates and may be affected by changes in credit quality or value of the mortgage loans or other assets that support the securities.
Stripped mortgage-backed securities are usually structured with two classes that receive different proportions of the interest (“IO”) and principal (“PO”) distributions on a pool of mortgage assets. Payments received for IOs are included in interest income on the Statements of Operations. Because no principal will be received at the maturity of an IO, adjustments are made to the cost of the security on a monthly basis until maturity. These adjustments are included in interest income on the Statements of Operations. Payments received for POs are treated as reductions to the cost and par value of the securities.
Master Netting Arrangements: The RIC, on behalf of the Fund, is subject to various Master Agreements, or netting arrangements, with select counterparties. These are agreements which a subadviser may have negotiated and entered into on behalf of all or a portion of the Fund. A master netting arrangement between the Fund and the counterparty permits the Fund to offset amounts payable by the Fund to the same counterparty against amounts to be received and by the receipt of collateral from the counterparty by the Fund to cover the Fund’s exposure to the counterparty. However, there is no assurance that such mitigating factors are easily enforceable. In addition to master netting arrangements, the
PGIM Global Total Return Fund 119
Notes to Financial Statements (continued)
right to set-off exists when all the conditions are met such that each of the parties owes the other determinable amounts, the reporting party has the right to set-off the amount owed with the amount owed by the other party, the reporting party intends to set-off and the right of set-off is enforceable by law.
The RIC, on behalf of the Fund, is a party to International Swaps and Derivatives Association, Inc. (“ISDA”) Master Agreements with certain counterparties that govern OTC derivative and foreign exchange contracts entered into from time to time. The Master Agreements may contain provisions regarding, among other things, the parties’ general obligations, representations, agreements, collateral requirements, events of default and early termination. With respect to certain counterparties, in accordance with the terms of the Master Agreements, collateral posted to the Fund is held in a segregated account by the Fund’s custodian and with respect to those amounts which can be sold or re-pledged, is presented in the Schedule of Investments. Collateral pledged by the Fund is segregated by the Fund’s custodian and identified in the Schedule of Investments. Collateral can be in the form of cash or debt securities issued by the U.S. Government or related agencies or other securities as agreed to by the Fund and the applicable counterparty. Collateral requirements are determined based on the Fund’s net position with each counterparty. Termination events applicable to the Fund may occur upon a decline in the Fund’s net assets below a specified threshold over a certain period of time. Termination events applicable to counterparties may occur upon a decline in the counterparty’s long-term and short-term credit ratings below a specified level. In each case, upon occurrence, the other party may elect to terminate early and cause settlement of all derivative and foreign exchange contracts outstanding, including the payment of any losses and costs resulting from such early termination, as reasonably determined by the terminating party. Any decision by one or more of the Fund’s counterparties to elect early termination could impact the Fund’s future derivative activity.
In addition to each instrument’s primary underlying risk exposure (e.g. interest rate, credit, equity or foreign exchange, etc.), swap agreements involve, to varying degrees, elements of credit, market and documentation risk. Such risks involve the possibility that no liquid market for these agreements will exist, the counterparty to the agreement may default on its obligation to perform or disagree on the contractual terms of the agreement, and changes in net interest rates will be unfavorable. In connection with these agreements, securities in the portfolio may be identified or received as collateral from the counterparty in accordance with the terms of the respective swap agreements to provide or receive assets of value and to serve as recourse in the event of default or bankruptcy/insolvency of either party. Such OTC derivative agreements include conditions which, when materialized, give the counterparty the right to cause an early termination of the transactions under those agreements. Any election by the counterparty for early termination of the contract(s) may impact the amounts reported on financial statements.
120
Short sales and OTC contracts, including forward foreign currency exchange contracts, swaps, forward rate agreements and written options involve elements of both market and credit risk in excess of the amounts reflected on the Statement of Assets and Liabilities, if applicable. Such risks may be mitigated by engaging in master netting arrangements.
Payment-In-Kind: The Fund invested in the open market or received pursuant to debt restructuring securities that pay-in-kind (PIK) the interest due on such debt instruments. The PIK interest, computed at the contractual rate specified, is added to the existing principal balance of the debt when issued bonds have the same terms as the bond or recorded as a separate bond when terms are different from the existing debt, and is recorded as interest income.
Securities Lending: The Fund lends its portfolio securities to banks and broker-dealers. The loans are secured by collateral at least equal to the market value of the securities loaned. Collateral pledged by each borrower is invested in an affiliated money market fund and is marked to market daily, based on the previous day’s market value, such that the value of the collateral exceeds the value of the loaned securities. In the event of significant appreciation in value of the securities on loan on the last business day of the reporting period, the financial statements may reflect a collateral value that is less than the market value of the loaned securities. Such shortfall is remedied as described above. Loans are subject to termination at the option of the borrower or the Fund. Upon termination of the loan, the borrower will return to the Fund securities identical to the loaned securities. The remaining open loans of the securities lending transactions are considered overnight and continuous. Should the borrower of the securities fail financially, the Fund has the right to repurchase the securities in the open market using the collateral.
The Fund recognizes income, net of any rebate and securities lending agent fees, for lending its securities in the form of fees or interest on the investment of any cash received as collateral. The borrower receives all interest and dividends from the securities loaned and such payments are passed back to the lender in amounts equivalent thereto, which are reflected in interest income or unaffiliated dividend income based on the nature of the payment on the Statement of Operations. The Fund also continues to recognize any unrealized gain (loss) in the market price of the securities loaned and on the change in the value of the collateral invested that may occur during the term of the loan. In addition, realized gain (loss) is recognized on changes in the value of the collateral invested upon liquidation of the collateral. Net earnings from securities lending are disclosed in the Statement of Operations.
Securities Transactions and Net Investment Income: Securities transactions are recorded on the trade date. Realized gains (losses) from investment and currency transactions are calculated on the specific identification method. Dividend income is recorded on the ex-date, or for certain foreign securities, when the Fund becomes aware of such dividends. Interest income, including amortization of premium and accretion of discount on debt securities, as required, is recorded on the accrual basis. Expenses are recorded on an accrual basis, which may require the use of certain estimates by management that may
PGIM Global Total Return Fund 121
Notes to Financial Statements (continued)
differ from actual expense amounts. Net investment income or loss (other than class specific expenses and waivers, which are allocated as noted below) and unrealized and realized gains (losses) are allocated daily to each class of shares based upon the relative proportion of adjusted net assets of each class at the beginning of the day. Class specific expenses and waivers, where applicable, are charged to the respective share classes. Such class specific expenses and waivers include distribution fees and distribution fee waivers, shareholder servicing fees, transfer agent’s fees and expenses, registration fees and fee waivers and/or expense reimbursements, as applicable.
Taxes: It is the Fund’s policy to continue to meet the requirements of the Internal Revenue Code applicable to regulated investment companies and to distribute all of its taxable net investment income and capital gains, if any, to its shareholders. Therefore, no federal income tax provision is required. Withholding taxes on foreign dividends, interest and capital gains, if any, are recorded, net of reclaimable amounts, at the time the related income is earned.
Dividends and Distributions: Dividends and distributions to shareholders, which are determined in accordance with federal income tax regulations and which may differ from GAAP, are recorded on the ex-date. Permanent book/tax differences relating to income and gain (loss) are reclassified between total distributable earnings (loss) and paid-in capital in excess of par, as appropriate. The chart below sets forth the expected frequency of dividend and capital gains distributions to shareholders. Various factors may impact the frequency of dividend distributions to shareholders, including but not limited to adverse market conditions or portfolio holding-specific events.
| | | | |
| | |
| Expected Distribution Schedule to Shareholders* | | Frequency | |
| |
Net Investment Income | | | Monthly | |
| |
Short-Term Capital Gains | | | Annually | |
| |
Long-Term Capital Gains | | | Annually | |
| * | Under certain circumstances, the Fund may make more than one distribution of short-term and/or long-term capital gains during a fiscal year. |
Estimates: The preparation of financial statements requires management to make estimates and assumptions that affect the reported amounts and disclosures in the financial statements. Actual results could differ from those estimates.
The RIC, on behalf of the Fund, has a management agreement with the Manager pursuant to which it has responsibility for all investment advisory services, including supervision of the subadviser’s performance of such services, and for rendering administrative services.
122
The Manager has entered into a subadvisory agreement with PGIM, Inc., which provides subadvisory services to the Fund through its business unit PGIM Fixed Income, and PGIM, Inc. has entered into a sub-subadvisory agreement with PGIM Limited (collectively the “subadviser”). The Manager pays for the services of the subadviser.
Fees payable under the management agreement are computed daily and paid monthly. For the reporting period ended October 31, 2023, the contractual and effective management fee rates were as follows:
| | | | |
| | |
| Contractual Management Rate | | Effective Management Fee, before any waivers
and/or expense reimbursements | |
| |
0.50% on average daily net assets up to $2 billion; | | | 0.50% | |
| |
0.485% of average daily net assets over $ 2 billion. | | | | |
The Manager has contractually agreed, through February 28, 2025, to limit total annual operating expenses after fee waivers and/or expense reimbursements. This contractual waiver excludes interest, brokerage, taxes (such as income and foreign withholding taxes, stamp duty and deferred tax expenses), acquired fund fees and expenses, extraordinary expenses, and certain other Fund expenses such as dividend and interest expense and broker charges on short sales.
Where applicable, the Manager agrees to waive management fees or shared operating expenses on any share class to the same extent that it waives such expenses on any other share class. In addition, total annual operating expenses for Class R6 shares will not exceed total annual operating expenses for Class Z shares. Fees and/or expenses waived and/or reimbursed by the Manager for the purpose of preventing the expenses from exceeding a certain expense ratio limit may be recouped by the Manager within the same fiscal year during which such waiver and/or reimbursement is made if such recoupment can be realized without exceeding the expense limit in effect at the time of the recoupment for that fiscal year. The expense limitations attributable to each class are as follows:
| | |
| | |
| Class | | Expense
Limitations |
| |
A | | 0.88% |
| |
C | | 1.63 |
| |
Z | | 0.63 |
| |
R2 | | 1.08 |
| |
R4 | | 0.83 |
| |
R6 | | 0.58 |
The RIC, on behalf of the Fund, has a distribution agreement with Prudential Investment Management Services LLC (“PIMS”), which acts as the distributor of the Class A, Class C, Class Z, Class R2, Class R4 and Class R6 shares of the Fund. The Fund compensates PIMS for distributing and servicing the Fund’s Class A, Class C and Class R2 shares, pursuant to the plans of distribution (the “Distribution Plans”), regardless of expenses actually incurred by PIMS.
PGIM Global Total Return Fund 123
Notes to Financial Statements (continued)
Pursuant to the Distribution Plans, the Fund compensates PIMS for distribution related activities at an annual rate based on average daily net assets per class. The distribution fees are accrued daily and payable monthly.
The Fund has adopted a Shareholder Services Plan with respect to Class R2 and Class R4 shares. Under the terms of the Shareholder Services Plan, Class R2 and Class R4 shares are authorized to compensate Prudential Mutual Fund Services LLC (“PMFS”), its affiliates or third-party service providers for services rendered to the shareholders of such Class R2 or Class R4 shares. The shareholder service fee is accrued daily and paid monthly, as applicable.
The Fund’s annual gross and net distribution rates and maximum shareholder service fee, where applicable, are as follows:
| | | | | | |
| | | | |
| Class | | Gross Distribution Fee | | Net Distribution Fee | | Shareholder Service Fee |
| | | |
A | | 0.25% | | 0.25% | | N/A% |
| | | |
C | | 1.00 | | 1.00 | | N/A |
| | | |
Z | | N/A | | N/A | | N/A |
| | | |
R2 | | 0.25 | | 0.25 | | 0.10 |
| | | |
R4 | | N/A | | N/A | | 0.10 |
| | | |
R6 | | N/A | | N/A | | N/A |
For the year ended October 31, 2023, PIMS received front-end sales charges (“FESL”) resulting from sales of certain class shares and contingent deferred sales charges (“CDSC”) imposed upon redemptions by certain shareholders. From these fees, PIMS paid such sales charges to broker-dealers, who in turn paid commissions to salespersons and incurred other distribution costs. The sales charges are as follows where applicable:
| | | | | | | | |
| | | |
| Class | | FESL | | | CDSC | |
| | |
A | | $ | 95,890 | | | | $639 | |
| | |
C | | | — | | | | 747 | |
PGIM Investments, PGIM, Inc., PGIM Limited, PIMS and PMFS are indirect, wholly-owned subsidiaries of Prudential Financial, Inc. (“Prudential”).
| 4. | Other Transactions with Affiliates |
PMFS serves as the Fund’s transfer agent and shareholder servicing agent. Transfer agent’s and shareholder servicing agent’s fees and expenses in the Statement of Operations include certain out-of-pocket expenses paid to non-affiliates, where applicable.
The Fund may invest its overnight sweep cash in the PGIM Core Government Money Market Fund (the “Core Government Fund”), a series of the Prudential Government Money Market
124
Fund, Inc., and its securities lending cash collateral in the PGIM Institutional Money Market Fund (the “Money Market Fund”), a series of Prudential Investment Portfolios 2, each registered under the 1940 Act and managed by PGIM Investments. PGIM Investments and/or its affiliates are paid fees or reimbursed for providing their services to the Core Government Fund and the Money Market Fund. In addition to the realized and unrealized gains on investments in the Core Government Fund and the Money Market Fund, earnings from such investments are disclosed on the Statement of Operations as “Affiliated dividend income” and “Income from securities lending, net”, respectively.
The Fund may enter into certain securities purchase or sale transactions under Board approved Rule 17a-7 procedures. Rule 17a-7 is an exemptive rule under the 1940 Act that, subject to certain conditions, permits purchase and sale transactions among affiliated investment companies, or between an investment company and a person that is affiliated solely by reason of having a common (or affiliated) investment adviser, common directors/trustees, and/or common officers. For the year ended October 31, 2023, no Rule 17a-7 transactions were entered into by the Fund.
The aggregate cost of purchases and proceeds from sales of portfolio securities (excluding short-term investments and U.S. Government securities) for the reporting period ended October 31, 2023, were as follows:
| | |
| | |
| Cost of Purchases | | Proceeds from Sales |
| |
$161,133,960 | | $1,037,370,366 |
A summary of the cost of purchases and proceeds from sales of shares of affiliated mutual funds for the year ended October 31, 2023, is presented as follows:
| | | | | | | | | | | | | | | | | | | | | | | | | | | | |
| | | | | | | | |
Value,
Beginning
of Year | | Cost of
Purchases | | | Proceeds
from Sales | | | Change in
Unrealized
Gain
(Loss) | | | Realized
Gain
(Loss) | | | Value,
End of Year | | | Shares,
End
of Year | | | Income | |
|
Short-Term Investments - Affiliated Mutual Funds: | |
| |
PGIM Core Government Money Market Fund(1)(wb) | | | | | |
| | | | | | | |
$ — | | $ | 369,911,429 | | | $ | 340,372,768 | | | | $ — | | | $ | — | | | $ | 29,538,661 | | | | 29,538,661 | | | $ | 284,719 | |
|
PGIM Institutional Money Market Fund(1)(b)(wb) | |
| | | | | | | |
123,119,971 | | | 320,570,905 | | | | 404,698,987 | | | | 6,194 | | | | 35,476 | | | | 39,033,559 | | | | 39,053,086 | | | | 243,593(2) | |
| | | | | | | |
$123,119,971 | | $ | 690,482,334 | | | $ | 745,071,755 | | | | $6,194 | | | $ | 35,476 | | | $ | 68,572,220 | | | | | | | $ | 528,312 | |
| (1) | The Fund did not have any capital gain distributions during the reporting period. |
| (2) | The amount, or a portion thereof, represents the affiliated securities lending income shown on the Statement of Operations. |
| (b) | Represents security, or portion thereof, purchased with cash collateral received for securities on loan and includes dividend reinvestment. |
| (wb) | Represents an investment in a Fund affiliated with the Manager. |
PGIM Global Total Return Fund 125
Notes to Financial Statements (continued)
6. Distributions and Tax Information
Distributions to shareholders, which are determined in accordance with federal income tax regulations and which may differ from GAAP, are recorded on the ex-date.
For the year ended October 31, 2023, the tax character of dividends paid as reflected in the Statement of Changes in Net Assets were as follows:
| | | | | | |
| | | | |
Ordinary Income | | Long-Term Capital Gains | | Tax Return of Capital | | Total Dividends
and Distributions |
| | | |
$45,967,541 | | $— | | $79,806,992 | | $125,774,533 |
For the year ended October 31, 2022, the tax character of dividends paid as reflected in the Statement of Changes in Net Assets were as follows:
| | | | | | |
| | | | |
Ordinary Income | | Long-Term Capital Gains | | Tax Return of Capital | | Total Dividends and Distributions |
| | | |
$37,007,464 | | $— | | $158,908,460 | | $195,915,924 |
As of October 31, 2023, there were no accumulated undistributed earnings on a tax basis.
The United States federal income tax basis of the Fund’s investments and the net unrealized depreciation as of October 31, 2023 were as follows:
| | | | | | |
| | | | |
| Tax Basis | | Gross Unrealized Appreciation | | Gross Unrealized Depreciation | | Net Unrealized Depreciation |
| | | |
$3,278,107,433 | | $81,428,732 | | $(826,588,182) | | $(745,159,450) |
The differences between GAAP basis and tax basis is primarily attributable to deferred losses on wash sales, amortization of premiums, interest accrual on defaulted securities, straddle loss deferrals, mark-to-market of futures contracts, swaps, and other GAAP to tax differences.
For federal income tax purposes, the Fund had an approximated capital loss carryforward as of October 31, 2023 which can be carried forward for an unlimited period. No capital gains distributions are expected to be paid to shareholders until net gains have been realized in excess of such losses.
| | |
| | |
Capital Loss Carryforward | | Capital Loss Carryforward Utilized |
| |
$624,134,000 | | $— |
The Manager has analyzed the Fund’s tax positions taken on federal, state and local income tax returns for all open tax years and has concluded that no provision for income tax is
126
required in the Fund’s financial statements for the current reporting period. Since tax authorities can examine previously filed tax returns, the Fund’s U.S. federal and state tax returns for each of the four fiscal years up to the most recent fiscal year ended October 31, 2023 are subject to such review.
The Fund offers Class A, Class C, Class Z, Class R2, Class R4 and Class R6 shares. Class A shares are sold with a maximum front-end sales charge of 3.25%. Investors who purchase $500,000 or more of Class A shares and sell those shares within 12 months of purchase are subject to a CDSC of 1% on sales although these purchases are not subject to a front-end sales charge. The Class A CDSC is waived for certain retirement and/or benefit plans. A special exchange privilege is also available for shareholders who qualified to purchase Class A shares at net asset value. Class C shares are sold with a CDSC of 1% on sales made within 12 months of purchase. Class C shares will automatically convert to Class A shares on a monthly basis approximately eight years (ten years prior to January 22, 2021) after purchase. Class Z, Class R2, Class R4 and Class R6 shares are not subject to any sales or redemption charges and are available exclusively for sale to a limited group of investors.
Under certain circumstances, an exchange may be made from specified share classes of the Fund to one or more other share classes of the Fund as presented in the table of transactions in shares of common stock, below.
The RIC is authorized to issue 18,075,000,000 shares of common stock, $0.01 par value per share, 16,575,000,000 of which are designated as shares of the Fund. The authorized shares of the Fund are currently classified and designated as follows:
| | | | |
| Class | | Number of Shares | |
| |
A | | | 900,000,000 | |
| |
B | | | 50,000,000 | |
| |
C | | | 300,000,000 | |
| |
Z | | | 8,000,000,000 | |
| |
T | | | 125,000,000 | |
| |
R2 | | | 100,000,000 | |
| |
R4 | | | 100,000,000 | |
R6 | | | 7,000,000,000 | |
The Fund currently does not have any Class B or Class T shares outstanding.
At the reporting period end, the number of shareholders holding greater than 5% of the Fund are as follows:
| | | | |
| | | Number of Shareholders | | Percentage of Outstanding Shares |
| | |
Affiliated | | — | | —% |
| | |
Unaffiliated | | 4 | | 58.8 |
PGIM Global Total Return Fund 127
Notes to Financial Statements (continued)
Transactions in shares of common stock were as follows:
| | | | | | | | |
| | | |
| Share Class | | Shares | | | Amount | |
| | |
Class A | | | | | | | | |
| | |
Year ended October 31, 2023: | | | | | | | | |
| | |
Shares sold | | | 3,767,793 | | | $ | 18,848,635 | |
| | |
Shares issued in reinvestment of dividends and distributions | | | 1,345,311 | | | | 6,713,132 | |
| | |
Shares purchased | | | (10,671,742 | ) | | | (53,154,739 | ) |
| | |
Net increase (decrease) in shares outstanding before conversion | | | (5,558,638 | ) | | | (27,592,972 | ) |
| | |
Shares issued upon conversion from other share class(es) | | | 851,850 | | | | 4,235,539 | |
| | |
Shares purchased upon conversion into other share class(es) | | | (1,107,271 | ) | | | (5,520,685 | ) |
| | |
Net increase (decrease) in shares outstanding | | | (5,814,059 | ) | | $ | (28,878,118 | ) |
| | |
Year ended October 31, 2022: | | | | | | | | |
| | |
Shares sold | | | 5,662,013 | | | $ | 33,565,516 | |
| | |
Shares issued in reinvestment of dividends and distributions | | | 1,640,896 | | | | 9,336,907 | |
| | |
Shares purchased | | | (18,400,439 | ) | | | (105,289,993 | ) |
| | |
Net increase (decrease) in shares outstanding before conversion | | | (11,097,530 | ) | | | (62,387,570 | ) |
| | |
Shares issued upon conversion from other share class(es) | | | 1,095,732 | | | | 6,164,308 | |
| | |
Shares purchased upon conversion into other share class(es) | | | (806,242 | ) | | | (4,638,386 | ) |
| | |
Net increase (decrease) in shares outstanding | | | (10,808,040 | ) | | $ | (60,861,648 | ) |
| | |
Class C | | | | | | | | |
| | |
Year ended October 31, 2023: | | | | | | | | |
| | |
Shares sold | | | 411,729 | | | $ | 2,043,191 | |
| | |
Shares issued in reinvestment of dividends and distributions | | | 108,049 | | | | 538,164 | |
| | |
Shares purchased | | | (1,194,338 | ) | | | (5,932,167 | ) |
| | |
Net increase (decrease) in shares outstanding before conversion | | | (674,560 | ) | | | (3,350,812 | ) |
| | |
Shares purchased upon conversion into other share class(es) | | | (321,257 | ) | | | (1,596,270 | ) |
| | |
Net increase (decrease) in shares outstanding | | | (995,817 | ) | | $ | (4,947,082 | ) |
| | |
Year ended October 31, 2022: | | | | | | | | |
| | |
Shares sold | | | 485,420 | | | $ | 2,719,675 | |
| | |
Shares issued in reinvestment of dividends and distributions | | | 150,903 | | | | 865,125 | |
| | |
Shares purchased | | | (2,392,336 | ) | | | (13,711,545 | ) |
| | |
Net increase (decrease) in shares outstanding before conversion | | | (1,756,013 | ) | | | (10,126,745 | ) |
| | |
Shares purchased upon conversion into other share class(es) | | | (381,924 | ) | | | (2,146,526 | ) |
| | |
Net increase (decrease) in shares outstanding | | | (2,137,937 | ) | | $ | (12,273,271 | ) |
128
| | | | | | | | |
| | | |
| Share Class | | Shares | | | Amount | |
| | |
Class Z | | | | | | | | |
| | |
Year ended October 31, 2023: | | | | | | | | |
| | |
Shares sold | | | 69,270,261 | | | $ | 348,122,170 | |
| | |
Shares issued in reinvestment of dividends and distributions | | | 8,866,477 | | | | 44,484,549 | |
| | |
Shares purchased | | | (146,553,067 | ) | | | (735,914,893 | ) |
| | |
Net increase (decrease) in shares outstanding before conversion | | | (68,416,329 | ) | | | (343,308,174 | ) |
| | |
Shares issued upon conversion from other share class(es) | | | 1,255,255 | | | | 6,297,796 | |
| | |
Shares purchased upon conversion into other share class(es) | | | (3,283,756 | ) | | | (16,230,800 | ) |
| | |
Net increase (decrease) in shares outstanding | | | (70,444,830 | ) | | $ | (353,241,178 | ) |
| | |
Year ended October 31, 2022: | | | | | | | | |
| | |
Shares sold | | | 119,435,727 | | | $ | 704,572,056 | |
| | |
Shares issued in reinvestment of dividends and distributions | | | 13,876,384 | | | | 79,920,248 | |
| | |
Shares purchased | | | (285,801,898 | ) | | | (1,644,229,227 | ) |
| | |
Net increase (decrease) in shares outstanding before conversion | | | (152,489,787 | ) | | | (859,736,923 | ) |
| | |
Shares issued upon conversion from other share class(es) | | | 1,446,413 | | | | 8,643,019 | |
| | |
Shares purchased upon conversion into other share class(es) | | | (4,560,430 | ) | | | (26,397,564 | ) |
| | |
Net increase (decrease) in shares outstanding | | | (155,603,804 | ) | | $ | (877,491,468 | ) |
| | |
Class R2 | | | | | | | | |
| | |
Year ended October 31, 2023: | | | | | | | | |
| | |
Shares sold | | | 225,590 | | | $ | 1,132,535 | |
| | |
Shares issued in reinvestment of dividends and distributions | | | 34,171 | | | | 172,503 | |
| | |
Shares purchased | | | (270,207 | ) | | | (1,349,188 | ) |
| | |
Net increase (decrease) in shares outstanding | | | (10,446 | ) | | $ | (44,150 | ) |
| | |
Year ended October 31, 2022: | | | | | | | | |
| | |
Shares sold | | | 211,199 | | | $ | 1,244,101 | |
| | |
Shares issued in reinvestment of dividends and distributions | | | 39,230 | | | | 226,544 | |
| | |
Shares purchased | | | (709,823 | ) | | | (4,205,815 | ) |
| | |
Net increase (decrease) in shares outstanding before conversion | | | (459,394 | ) | | | (2,735,170 | ) |
| | |
Shares issued upon conversion from other share class(es) | | | 1,024 | | | | 6,890 | |
| | |
Shares purchased upon conversion into other share class(es) | | | (1,050 | ) | | | (5,564 | ) |
| | |
Net increase (decrease) in shares outstanding | | | (459,420 | ) | | $ | (2,733,844 | ) |
| | |
Class R4 | | | | | | | | |
| | |
Year ended October 31, 2023: | | | | | | | | |
| | |
Shares sold | | | 703,023 | | | $ | 3,541,791 | |
| | |
Shares issued in reinvestment of dividends and distributions | | | 60,922 | | | | 308,043 | |
| | |
Shares purchased | | | (956,751 | ) | | | (4,827,447 | ) |
| | |
Net increase (decrease) in shares outstanding | | | (192,806 | ) | | $ | (977,613 | ) |
PGIM Global Total Return Fund 129
Notes to Financial Statements (continued)
| | | | | | | | |
| | | |
| Share Class | | Shares | | | Amount | |
| | |
Year ended October 31, 2022: | | | | | | | | |
| | |
Shares sold | | | 933,545 | | | $ | 5,483,827 | |
| | |
Shares issued in reinvestment of dividends and distributions | | | 64,362 | | | | 364,931 | |
| | |
Shares purchased | | | (574,471 | ) | | | (3,243,341 | ) |
| | |
Net increase (decrease) in shares outstanding | | | 423,436 | | | $ | 2,605,417 | |
| | |
Class R6 | | | | | | | | |
| | |
Year ended October 31, 2023: | | | | | | | | |
| | |
Shares sold | | | 83,582,493 | | | $ | 424,346,510 | |
| | |
Shares issued in reinvestment of dividends and distributions | | | 13,474,590 | | | | 68,009,384 | |
| | |
Shares purchased | | | (176,475,165 | ) | | | (891,530,066 | ) |
| | |
Net increase (decrease) in shares outstanding before conversion | | | (79,418,082 | ) | | | (399,174,172 | ) |
| | |
Shares issued upon conversion from other share class(es) | | | 2,823,491 | | | | 14,022,182 | |
| | |
Shares purchased upon conversion into other share class(es) | | | (237,969 | ) | | | (1,207,762 | ) |
| | |
Net increase (decrease) in shares outstanding | | | (76,832,560 | ) | | $ | (386,359,752 | ) |
| | |
Year ended October 31, 2022: | | | | | | | | |
| | |
Shares sold | | | 108,033,044 | | | $ | 642,536,270 | |
| | |
Shares issued in reinvestment of dividends and distributions | | | 16,892,556 | | | | 96,746,326 | |
| | |
Shares purchased | | | (154,558,538 | ) | | | (876,877,851 | ) |
| | |
Net increase (decrease) in shares outstanding before conversion | | | (29,632,938 | ) | | | (137,595,255 | ) |
| | |
Shares issued upon conversion from other share class(es) | | | 3,864,792 | | | | 22,565,057 | |
| | |
Shares purchased upon conversion into other share class(es) | | | (680,308 | ) | | | (4,191,234 | ) |
| | |
Net increase (decrease) in shares outstanding | | | (26,448,454 | ) | | $ | (119,221,432 | ) |
The RIC, on behalf of the Fund, along with other affiliated registered investment companies (the “Participating Funds”), is a party to a Syndicated Credit Agreement (“SCA”) with a group of banks. The purpose of the SCA is to provide an alternative source of temporary funding for capital share redemptions. The table below provides details of the current SCA in effect at the reporting period-end as well as the prior SCA.
| | | | |
| | | Current SCA | | Prior SCA |
| | |
Term of Commitment | | 9/29/2023 - 9/26/2024 | | 9/30/2022 – 9/28/2023 |
| | |
Total Commitment | | $ 1,200,000,000 | | $1,200,000,000 |
| | |
Annualized Commitment Fee on the Unused Portion of the SCA | | 0.15% | | 0.15% |
130
| | | | |
| | | Current SCA | | Prior SCA |
Annualized Interest Rate on Borrowings | | 1.00% plus the higher of (1) the effective federal funds rate, (2) the daily SOFR rate plus 0.10% or (3) zero percent | | 1.00% plus the higher of (1) the effective federal funds rate, (2) the daily SOFR rate plus 0.10% or (3) zero percent |
Certain affiliated registered investment companies that are parties to the SCA include portfolios that are subject to a predetermined mathematical formula used to manage certain benefit guarantees offered under variable annuity contracts. The formula may result in large scale asset flows into and out of these portfolios. Consequently, these portfolios may be more likely to utilize the SCA for purposes of funding redemptions. It may be possible for those portfolios to fully exhaust the committed amount of the SCA, thereby requiring the Manager to allocate available funding per a Board-approved methodology designed to treat the Participating Funds in the SCA equitably.
The Fund utilized the SCA during the year ended October 31, 2023. The average daily balance for the 98 days that the Fund had loans outstanding during the period was approximately $11,067,612, borrowed at a weighted average interest rate of 5.36%. The maximum loan outstanding amount during the period was $49,149,000. At October 31, 2023, the Fund did not have an outstanding loan amount.
| 9. | Risks of Investing in the Fund |
The Fund’s risks include, but are not limited to, some or all of the risks discussed below. For further information on the Fund’s risks, please refer to the Fund’s Prospectus and Statement of Additional Information.
Credit Risk: This is the risk that the issuer, the guarantor or the insurer of a fixed income security, or the counterparty to a contract, may be unable or unwilling to make timely principal and interest payments, or to otherwise honor its obligations. Additionally, fixed income securities could lose value due to a loss of confidence in the ability of the issuer, guarantor, insurer or counterparty to pay back debt. The lower the credit quality of a bond, the more sensitive it is to credit risk.
Currency Risk: The Fund’s net asset value could decline as a result of changes in exchange rates, which could adversely affect the Fund’s investments in currencies, or in securities that trade in, and receive revenues related to, currencies, or in derivatives that provide exposure to currencies. Certain foreign countries may impose restrictions on the ability of issuers of foreign securities to make payment of principal and interest or dividends to investors located outside the country, due to blockage of foreign currency exchanges or otherwise.
Debt Obligations Risk: Debt obligations are subject to credit risk, market risk and interest rate risk. The Fund’s holdings, share price, yield and total return may also fluctuate in response to bond market movements. The value of bonds may decline for issuer-related reasons, including management performance, financial leverage and reduced demand for
PGIM Global Total Return Fund 131
Notes to Financial Statements (continued)
the issuer’s goods and services. Certain types of fixed income obligations also may be subject to “call and redemption risk,” which is the risk that the issuer may call a bond held by the Fund for redemption before it matures and the Fund may not be able to reinvest at the same rate of interest and therefore would earn less income.
Derivatives Risk: Derivatives involve special risks and costs and may result in losses to the Fund. The successful use of derivatives requires sophisticated management, and, to the extent that derivatives are used, the Fund will depend on the subadviser’s ability to analyze and manage derivatives transactions. The prices of derivatives may move in unexpected ways, especially in abnormal market conditions. Some derivatives are “leveraged” or may create economic leverage for the Fund and therefore may magnify or otherwise increase investment losses to the Fund. The Fund’s use of derivatives may also increase the amount of taxes payable by shareholders.
Other risks arise from the potential inability to terminate or sell derivatives positions. A liquid secondary market may not always exist for the Fund’s derivatives positions. In fact, many over-the-counter derivative instruments will not have liquidity beyond the counterparty to the instrument. Over-the-counter derivative instruments also involve the risk that the other party will not meet its obligations to the Fund. The use of derivatives also exposes the Fund to operational issues, such as documentation and settlement issues, systems failures, inadequate control and human error.
Derivatives may also involve legal risks, such as insufficient documentation, the lack of capacity or authority of a counterparty to execute or settle a transaction, and the legality and enforceability of derivatives contracts. The U.S. Government and foreign governments have adopted (and may adopt further) regulations governing derivatives markets, including mandatory clearing of certain derivatives, margin and reporting requirements and risk exposure limitations. Regulation of derivatives may make derivatives more costly, limit their availability or utility to the Fund, or otherwise adversely affect their performance or disrupt markets.
Economic and Market Events Risk: Events in the U.S. and global financial markets, including actions taken by the U.S. Federal Reserve or foreign central banks to stimulate or stabilize economic growth or the functioning of the securities markets, or otherwise reduce inflation, may at times result in unusually high market volatility, which could negatively impact performance. Governmental efforts to curb inflation often have negative effects on the level of economic activity. Relatively reduced liquidity in credit and fixed income markets could adversely affect issuers worldwide.
Emerging Markets Risk: The risks of foreign investments are greater for investments in or exposed to emerging markets. Emerging market countries typically have economic and
132
political systems that are less fully developed, and can be expected to be less stable, than those of more developed countries. For example, the economies of such countries can be subject to rapid and unpredictable rates of inflation or deflation. Low trading volumes may result in a lack of liquidity and price volatility. Emerging market countries may have policies that restrict investment by non-U.S. investors, or that prevent non-U.S. investors from withdrawing their money at will.
The Fund may invest in some emerging markets that subject it to risks such as those associated with illiquidity, custody of assets, different settlement and clearance procedures and asserting legal title under a developing legal and regulatory regime to a greater degree than in developed markets or even in other emerging markets.
Foreign Securities Risk: Investments in securities of non-U.S. issuers (including those denominated in U.S. dollars) may involve more risk than investing in securities of U.S. issuers. Foreign political, economic and legal systems, especially those in developing and emerging market countries, may be less stable and more volatile than in the United States. Foreign legal systems generally have fewer regulatory requirements than the U.S. legal system, particularly those of emerging markets. In general, less information is publicly available with respect to non-U.S. companies than U.S. companies. Non-U.S. companies generally are not subject to the same accounting, auditing, and financial reporting standards as are U.S. companies. Additionally, the changing value of foreign currencies and changes in exchange rates could also affect the value of the assets the Fund holds and the Fund’s performance. Certain foreign countries may impose restrictions on the ability of issuers of foreign securities to make payment of principal and interest or dividends to investors located outside the country, due to blockage of foreign currency exchanges or otherwise. Investments in emerging markets are subject to greater volatility and price declines.
In addition, the Fund’s investments in non-U.S. securities may be subject to the risks of nationalization or expropriation of assets, imposition of currency exchange controls or restrictions on the repatriation of non-U.S. currency, confiscatory taxation and adverse diplomatic developments. Special U.S. tax considerations may apply.
Increase in Expenses Risk: Your actual cost of investing in the Fund may be higher than the expenses shown in the expense table in the Fund’s prospectus for a variety of reasons. For example, expense ratios may be higher than those shown if average net assets decrease. Net assets are more likely to decrease and Fund expense ratios are more likely to increase when markets are volatile. Active and frequent trading of Fund securities can increase expenses.
Interest Rate Risk: The value of your investment may go down when interest rates rise. A rise in rates tends to have a greater impact on the prices of longer term or duration debt securities. Similarly, a rise in interest rates may also have a greater negative impact on the value of equity securities whose issuers expect earnings further out in the future. For example, a fixed income security with a duration of three years is expected to decrease in value by approximately 3% if interest rates increase by 1%. This is referred to as “duration
PGIM Global Total Return Fund 133
Notes to Financial Statements (continued)
risk.” When interest rates fall, the issuers of debt obligations may prepay principal more quickly than expected, and the Fund may be required to reinvest the proceeds at a lower interest rate. This is referred to as “prepayment risk.” When interest rates rise, debt obligations may be repaid more slowly than expected, and the value of the Fund’s holdings may fall sharply. This is referred to as “extension risk.” The Fund may lose money if short-term or long-term interest rates rise sharply or in a manner not anticipated by the subadviser.
Junk Bonds Risk: High-yield, high-risk bonds have predominantly speculative characteristics, including particularly high credit risk. Junk bonds tend to have lower market liquidity than higher-rated securities. The liquidity of particular issuers or industries within a particular investment category may shrink or disappear suddenly and without warning. The non-investment grade bond market can experience sudden and sharp price swings and become illiquid due to a variety of factors, including changes in economic forecasts, stock market activity, large sustained sales by major investors, a high profile default or a change in the market’s psychology.
Large Shareholder and Large Scale Redemption Risk: Certain individuals, accounts, funds (including funds affiliated with the Manager) or institutions, including the Manager and its affiliates, may from time to time own or control a substantial amount of the Fund’s shares. There is no requirement that these entities maintain their investment in the Fund. There is a risk that such large shareholders or that the Fund’s shareholders generally may redeem all or a substantial portion of their investments in the Fund in a short period of time, which could have a significant negative impact on the Fund’s NAV, liquidity, and brokerage costs. Large redemptions could also result in tax consequences to shareholders and impact the Fund’s ability to implement its investment strategy. The Fund’s ability to pursue its investment objective after one or more large scale redemptions may be impaired and, as a result, the Fund may invest a larger portion of its assets in cash or cash equivalents.
Liquidity Risk: Liquidity risk is the risk that the Fund could not meet requests to redeem shares issued by the Fund without significant dilution of remaining investors’ interests in the Fund. The Fund may invest in instruments that trade in lower volumes and are more illiquid than other investments. If the Fund is forced to sell these investments to pay redemption proceeds or for other reasons, the Fund may lose money. In addition, when there is no willing buyer and investments cannot be readily sold at the desired time or price, the Fund may have to accept a lower price or may not be able to sell the instrument at all. An inability to sell a portfolio position can adversely affect the Fund’s value or prevent the Fund from being able to take advantage of other investment opportunities.
Management Risk: Actively managed funds are subject to management risk. The subadviser will apply investment techniques and risk analyses in making investment decisions for the
134
Fund, but the subadviser’s judgments about the attractiveness, value or market trends affecting a particular security, industry or sector or about market movements may be incorrect. Additionally, the investments selected for the Fund may underperform the markets in general, the Fund’s benchmark and other funds with similar investment objectives.
Market Disruption and Geopolitical Risks: Market disruption can be caused by economic, financial or political events and factors, including but not limited to, international wars or conflicts (including Russia’s military invasion of Ukraine), geopolitical developments (including trading and tariff arrangements, sanctions and cybersecurity attacks), instability in regions such as Asia, Eastern Europe and the Middle East, terrorism, natural disasters and public health epidemics (including the outbreak of COVID-19 globally).
The extent and duration of such events and resulting market disruptions cannot be predicted, but could be substantial and could magnify the impact of other risks to the Fund. These and other similar events could adversely affect the U.S. and foreign financial markets and lead to increased market volatility, reduced liquidity in the securities markets, significant negative impacts on issuers and the markets for certain securities and commodities and/or government intervention. They may also cause short- or long-term economic uncertainties in the United States and worldwide. As a result, whether or not the Fund invests in securities of issuers located in or with significant exposure to the countries directly affected, the value and liquidity of the Fund’s investments may be negatively impacted. Further, due to closures of certain markets and restrictions on trading certain securities, the value of certain securities held by the Fund could be significantly impacted, which could lead to such securities being valued at zero.
Market Risk: Securities markets may be volatile and the market prices of the Fund’s securities may decline. Securities fluctuate in price based on changes in an issuer’s financial condition and overall market and economic conditions. If the market prices of the securities owned by the Fund fall, the value of your investment in the Fund will decline.
Mortgage-Backed and Asset-Backed Securities Risk: Mortgage-backed and asset-backed securities tend to increase in value less than other debt securities when interest rates decline, but are subject to similar risk of decline in market value during periods of rising interest rates. The values of mortgage-backed and asset-backed securities become more volatile as interest rates rise. In a period of declining interest rates, the Fund may be required to reinvest more frequent prepayments on mortgage-backed and asset-backed securities in lower-yielding investments.
U.S. Government and Agency Securities Risk: U.S. Treasury obligations are backed by the “full faith and credit” of the U.S. Government. Securities issued or guaranteed by federal agencies or authorities and U.S. Government-sponsored instrumentalities or enterprises may or may not be backed by the full faith and credit of the U.S. Government. For example, securities issued by the Federal Home Loan Mortgage Corporation, the Federal National Mortgage Association and the Federal Home Loan Banks are neither insured nor
PGIM Global Total Return Fund 135
Notes to Financial Statements (continued)
guaranteed by the U.S. Government. These securities may be supported by the ability to borrow from the U.S. Treasury or only by the credit of the issuing agency, authority, instrumentality or enterprise and, as a result, are subject to greater credit risk than securities issued or guaranteed by the U.S. Treasury. Further, the U.S. Government and its agencies, authorities, instrumentalities and enterprises do not guarantee the market value of their securities; consequently, the value of such securities will fluctuate. This may be the case especially when there is any controversy or ongoing uncertainty regarding the status of negotiations in the U.S. Congress to increase the statutory debt ceiling. Such controversy or uncertainty could, among other things, result in the credit quality rating of the U.S. Government being downgraded and reduced prices of U.S. Treasury securities. If the U.S. Congress is unable to negotiate an adjustment to the statutory debt ceiling, there is also the risk that the U.S. Government may default on payments on certain U.S. Government securities, including those held by the Fund, which could have a negative impact on the Fund. An increase in demand for U.S. Government securities resulting from an increase in demand for government money market funds may lead to lower yields on such securities.
| 10. | Recent Regulatory Developments |
Effective January 24, 2023, the SEC adopted rule and form amendments to require mutual funds and ETFs to transmit concise and visually engaging streamlined annual and semiannual reports to shareholders that highlight key information deemed important for retail investors to assess and monitor their fund investments (the “Rule”). Other information, including financial statements, will no longer appear in the funds’ streamlined shareholder reports but must be available online, delivered free of charge upon request, and filed on a semiannual basis on Form N-CSR. The Rule and form amendments have a compliance date of July 24, 2024. At this time, management is evaluating the Rule and its impact to the Fund.
136
Report of Independent Registered Public Accounting Firm
To the Board of Directors of Prudential Global Total Return Fund, Inc. and Shareholders of PGIM Global Total Return Fund
Opinion on the Financial Statements
We have audited the accompanying statement of assets and liabilities, including the schedule of investments, of PGIM Global Total Return Fund (one of the funds constituting Prudential Global Total Return Fund, Inc., referred to hereafter as the “Fund”) as of October 31, 2023, the related statement of operations for the year ended October 31, 2023, the statements of changes in net assets for each of the two years in the period ended October 31, 2023, including the related notes, and the financial highlights for each of the four years in the period ended October 31, 2023 (collectively referred to as the “financial statements”). In our opinion, the financial statements present fairly, in all material respects, the financial position of the Fund as of October 31, 2023, the results of its operations for the year then ended, the changes in its net assets for each of the two years in the period ended October 31, 2023 and the financial highlights for each of the four years in the period ended October 31, 2023 in conformity with accounting principles generally accepted in the United States of America.
The financial statements of the Fund as of and for the year ended October 31, 2019 and the financial highlights for the period ended October 31, 2019 (not presented herein, other than the financial highlights) were audited by other auditors whose report dated December 19, 2019 expressed an unqualified opinion on those financial statements and financial highlights.
Basis for Opinion
These financial statements are the responsibility of the Fund’s management. Our responsibility is to express an opinion on the Fund’s financial statements based on our audits. We are a public accounting firm registered with the Public Company Accounting Oversight Board (United States) (PCAOB) and are required to be independent with respect to the Fund in accordance with the U.S. federal securities laws and the applicable rules and regulations of the Securities and Exchange Commission and the PCAOB.
We conducted our audits of these financial statements in accordance with the standards of the PCAOB. Those standards require that we plan and perform the audit to obtain reasonable assurance about whether the financial statements are free of material misstatement, whether due to error or fraud.
Our audits included performing procedures to assess the risks of material misstatement of the financial statements, whether due to error or fraud, and performing procedures that respond to those risks. Such procedures included examining, on a test basis, evidence regarding the amounts and disclosures in the financial statements. Our audits also included evaluating the accounting principles used and significant estimates made by management, as well as evaluating the overall presentation of the financial statements. Our procedures included confirmation of securities owned as of October 31, 2023 by correspondence with the custodian, transfer agent, brokers and agent banks; when replies were not received from brokers, we performed other auditing procedures. We believe that our audits provide a reasonable basis for our opinion.
/s/PricewaterhouseCoopers LLP
New York, New York
December 19, 2023
We have served as the auditor of one or more investment companies in the PGIM Retail Funds complex since 2020.
PGIM Global Total Return Fund 137
Tax Information (unaudited)
For the year ended October 31, 2023, the Fund reports the maximum amount allowable but not less than 85.27% as interest related dividends in accordance with Sections 871(k)(1) and 881(e)(1) of the Internal Revenue Code.
For the year ended October 31, 2023 the Fund reports the maximum amount allowable but not less than 100.00% as interest dividends that are eligible to be treated as interest income in accordance with Section 163(j) of the Internal Revenue Code.
In January 2024, you will be advised on IRS Form 1099-DIV or substitute 1099-DIV as to the federal tax status of distributions received by you in calendar year 2023.
138
INFORMATION ABOUT BOARD MEMBERS AND OFFICERS (unaudited)
Information about Board Members and Officers of the Fund is set forth below. Board Members who are not deemed to be “interested persons” of the Fund, as defined in the 1940 Act, are referred to as “Independent Board Members.” Board Members who are deemed to be “interested persons” of the Fund are referred to as “Interested Board Members.” The Board Members are responsible for the overall supervision of the operations of the Fund and perform the various duties imposed on the directors of investment companies by the 1940 Act. The Board in turn elects the Officers, who are responsible for administering the day-to-day operations of the Fund.
| | | | | | |
| |
Independent Board Members |
| | | | |
Name
Year of Birth
Position(s)
Portfolios Overseen | | Principal Occupation(s)
During Past Five Years
| | Other Directorships
Held During
Past Five Years
| | Length of
Board Service |
| | | | |
Ellen S. Alberding
1958
Board Member
Portfolios Overseen:
100 | | Chief Executive Officer and President, The Joyce Foundation (charitable foundation) (since 2002); formerly Vice Chair, City Colleges of Chicago (community college system) (2011-2015); formerly Trustee, National Park Foundation (charitable foundation for national park system) (2009-2018); formerly Trustee, Economic Club of Chicago (2009-2016); Trustee, Loyola University (since 2018). | | None. | | Since September 2013 |
| | | | |
Kevin J. Bannon
1952
Board Member
Portfolios Overseen:
101 | | Retired; formerly Managing Director (April 2008-May 2015) and Chief Investment Officer (October 2008-November 2013) of Highmount Capital LLC (registered investment adviser); formerly Executive Vice President and Chief Investment Officer (April 1993-August 2007) of Bank of New York Company; formerly President (May 2003-May 2007) of BNY Hamilton Family of Mutual Funds. | | Director of Urstadt Biddle Properties (equity real estate investment trust) (September 2008-August 2023). | | Since July 2008 |
PGIM Global Total Return Fund
| | | | | | |
| |
Independent Board Members |
| | | | |
Name
Year of Birth
Position(s)
Portfolios Overseen | | Principal Occupation(s)
During Past Five Years | | Other Directorships
Held During
Past Five Years | | Length of
Board Service |
| | | | |
Linda W. Bynoe
1952
Board Member
Portfolios Overseen: 98 | | President and Chief Executive Officer (since March 1995) and formerly Chief Operating Officer (December 1989-February 1995) of Telemat Limited LLC (formerly Telemat Ltd) (management consulting); formerly Vice President (January 1985-June 1989) at Morgan Stanley & Co. (broker-dealer). | | Trustee of Equity Residential (residential real estate) (since December 2009); Director of Northern Trust Corporation (financial services) (since April 2006); formerly Director of Anixter International, Inc. (communication products distributor) (January 2006-June 2020). | | Since March 2005 |
| | | | |
Barry H. Evans
1960
Board Member
Portfolios Overseen:
101 | | Retired; formerly President (2005-2016), Global Chief Operating Officer (2014-2016), Chief Investment Officer - Global Head of Fixed Income (1998-2014), and various portfolio manager roles (1986-2006), Manulife Asset Management (asset management). | | Formerly Director, Manulife Trust Company (2011-2018); formerly Director, Manulife Asset Management Limited (2015-2017); formerly Chairman of the Board of Directors of Manulife Asset Management U.S. (2005-2016); formerly Chairman of the Board, Declaration Investment Management and Research (2008-2016). | | Since September 2017 |
| | | | |
Keith F. Hartstein
1956
Board Member &
Independent Chair
Portfolios Overseen:
101 | | Retired; formerly Member (November 2014-September 2022) of the Governing Council of the Independent Directors Council (IDC) (organization of independent mutual fund directors); formerly Executive Committee of the IDC Board of Governors (October 2019-December 2021); formerly President and Chief Executive Officer (2005-2012), Senior Vice President (2004-2005), Senior Vice President of Sales and Marketing (1997-2004), and various executive management positions (1990-1997), John Hancock Funds, LLC (asset management); formerly Chairman, Investment Company Institute’s Sales Force Marketing Committee (2003-2008). | | None. | | Since September 2013 |
Visit our website at pgim.com/investments
| | | | | | |
| |
Independent Board Members |
| | | | |
Name
Year of Birth
Position(s)
Portfolios Overseen | | Principal Occupation(s)
During Past Five Years | | Other Directorships
Held During
Past Five Years | | Length of
Board Service |
| | | | |
Laurie Simon Hodrick
1962
Board Member
Portfolios Overseen: 98
| | A. Barton Hepburn Professor Emerita of Economics in the Faculty of Business, Columbia Business School (since 2018); Visiting Fellow at the Hoover Institution, Stanford University (since 2015); Sole Member, ReidCourt LLC (since 2008) (a consulting firm); formerly Visiting Professor of Law, Stanford Law School (2015-2021); formerly A. Barton Hepburn Professor of Economics in the Faculty of Business, Columbia Business School (1996-2017); formerly Managing Director, Global Head of Alternative Investment Strategies, Deutsche Bank (2006-2008). | | Independent Director, Andela (since January 2022) (global talent network); Independent Director, Roku (since December 2020) (communication services); formerly Independent Director, Synnex Corporation (2019-2021) (information technology); formerly Independent Director, Kabbage, Inc. (2018-2020) (financial services); formerly Independent Director, Corporate Capital Trust (2017-2018) (a business development company). | | Since September 2017 |
| | | | |
Brian K. Reid
1961
Board Member
Portfolios Overseen:
101 | | Retired; formerly Chief Economist for the Investment Company Institute (ICI) (2005-2017); formerly Senior Economist and Director of Industry and Financial Analysis at the ICI (1998-2004); formerly Senior Economist, Industry and Financial Analysis at the ICI (1996-1998); formerly Staff Economist at the Federal Reserve Board (1989-1996); formerly Director, ICI Mutual Insurance Company (2012-2017). | | None. | | Since March 2018 |
PGIM Global Total Return Fund
| | | | | | |
| |
Independent Board Members |
| | | | |
Name
Year of Birth
Position(s)
Portfolios Overseen | | Principal Occupation(s)
During Past Five Years
| | Other Directorships
Held During
Past Five Years | | Length of
Board Service |
| | | | |
Grace C. Torres
1959
Board Member
Portfolios Overseen:
101 | | Retired; formerly Treasurer and Principal Financial and Accounting Officer of the PGIM Funds, Target Funds, Advanced Series Trust, Prudential Variable Contract Accounts and The Prudential Series Fund (1998-June 2014); Assistant Treasurer (March 1999-June 2014) and Senior Vice President (September 1999-June 2014) of PGIM Investments LLC; Assistant Treasurer (May 2003-June 2014) and Vice President (June 2005-June 2014) of AST Investment Services, Inc.; Senior Vice President and Assistant Treasurer (May 2003-June 2014) of Prudential Annuities Advisory Services, Inc. | | Director (since January 2018) of OceanFirst Financial Corp. and OceanFirst Bank; formerly Director (July 2015-January 2018) of Sun Bancorp, Inc. N.A. and Sun National Bank. | | Since November 2014 |
Visit our website at pgim.com/investments
| | | | | | |
| |
Interested Board Members |
| | | | |
Name
Year of Birth
Position(s)
Portfolios Overseen | | Principal Occupation(s)
During Past Five Years
| | Other Directorships
Held During
Past Five Years | | Length
of Board Service |
| | | | |
Stuart S. Parker
1962
Board Member &
President
Portfolios Overseen: 101 | | President, Chief Executive Officer, Chief Operating Officer and Officer in Charge of PGIM Investments LLC (formerly known as Prudential Investments LLC) (since January 2012); President and Principal Executive Officer (“PEO”) (since December 2023) of the PGIM Credit Income Fund; President and PEO (since September 2022) of the PGIM Private Credit Fund; President and PEO (since March 2022) of the PGIM Private Real Estate Fund, Inc.; formerly Executive Vice President of Jennison Associates LLC and Head of Retail Distribution of PGIM Investments LLC (June 2005-December 2011); Investment Company Institute - Board of Governors (since May 2012). | | None. | | Since January 2012 |
| | | | |
Scott E. Benjamin
1973
Board Member & Vice
President
Portfolios Overseen:
101 | | Executive Vice President (since May 2009) of PGIM Investments LLC; Vice President (since June 2012) of Prudential Investment Management Services LLC; Executive Vice President (since September 2009) of AST Investment Services, Inc.; Senior Vice President of Product Development and Marketing, PGIM Investments (since February 2006); Vice President (since December 2023) of the PGIM Credit Income Fund; Vice President (since September 2022) of the PGIM Private Credit Fund; Vice President (since March 2022) of the PGIM Private Real Estate Fund, Inc.; formerly Vice President of Product Development and Product Management, PGIM Investments LLC (2003-2006). | | None. | | Since March 2010 |
PGIM Global Total Return Fund
| | | | |
| |
Fund Officers(a) |
| | | |
Name
Year of Birth
Fund Position | | Principal Occupation(s) During Past Five Years | | Length of
Service as Fund
Officer |
| | | |
Claudia DiGiacomo
1974
Chief Legal Officer
| | Chief Legal Officer (since December 2023) of the PGIM Credit Income Fund; Chief Legal Officer (since September 2022) of the PGIM Private Credit Fund; Chief Legal Officer (since July 2022) of the PGIM Private Real Estate Fund, Inc.; Chief Legal Officer, Executive Vice President and Secretary of PGIM Investments LLC (since August 2020); Chief Legal Officer of Prudential Mutual Fund Services LLC (since August 2020); Chief Legal Officer of PIFM Holdco, LLC (since August 2020); Vice President and Corporate Counsel (since January 2005) of Prudential; and Corporate Counsel of AST Investment Services, Inc. (since August 2020); formerly Vice President and Assistant Secretary of PGIM Investments LLC (2005-2020); formerly Associate at Sidley Austin Brown & Wood LLP (1999-2004). | | Since December 2005 |
| | | |
Andrew Donohue
1972
Chief Compliance Officer
| | Chief Compliance Officer (since May 2023) of the PGIM Funds, Target Funds, PGIM ETF Trust, PGIM Global High Yield Fund, Inc., PGIM High Yield Bond Fund, Inc., PGIM Short Duration High Yield Opportunities Fund, Advanced Series Trust, The Prudential Series Fund, Prudential’s Gibraltar Fund, Inc., PGIM Private Credit Fund, PGIM Private Real Estate Fund, Inc.; Chief Compliance Officer of AST Investment Services, Inc. (since October 2022); Vice President, Chief Compliance Officer of PGIM Investments LLC (since September 2022); Chief Compliance Officer (since December 2023) of the PGIM Credit Income Fund; formerly various senior compliance roles within Principal Global Investors, LLC., global asset management for Principal Financial (2011-2022), most recently as Global Chief Compliance Officer (2016-2022). | | Since May 2023 |
| | | |
Andrew R. French
1962
Secretary
| | Vice President (since December 2018) of PGIM Investments LLC; Secretary (since December 2023) of the PGIM Credit Income Fund; Secretary (since September 2022) of the PGIM Private Credit Fund; Secretary (since March 2022) of the PGIM Private Real Estate Fund, Inc.; formerly Vice President and Corporate Counsel (2010-2018) of Prudential; formerly Director and Corporate Counsel (2006-2010) of Prudential; Vice President and Assistant Secretary (since January 2007) of PGIM Investments LLC; Vice President and Assistant Secretary (since January 2007) of Prudential Mutual Fund Services LLC. | | Since October 2006 |
Visit our website at pgim.com/investments
| | | | |
| |
Fund Officers(a) |
| | | |
Name
Year of Birth
Fund Position | | Principal Occupation(s) During Past Five Years | | Length of
Service as Fund
Officer |
| | | |
Melissa Gonzalez
1980
Assistant Secretary
| | Vice President and Corporate Counsel (since September 2018) of Prudential; Vice President and Assistant Secretary (since August 2020) of PGIM Investments LLC; Assistant Secretary (since December 2023) of the PGIM Credit Income Fund; Assistant Secretary (since September 2022) of the PGIM Private Credit Fund; Assistant Secretary (since March 2022) of the PGIM Private Real Estate Fund, Inc.; formerly Director and Corporate Counsel (March 2014-September 2018) of Prudential. | | Since March 2020 |
| | | |
Patrick E. McGuinness
1986
Assistant Secretary
| | Vice President and Assistant Secretary (since August 2020) of PGIM Investments LLC; Director and Corporate Counsel (since February 2017) of Prudential; Assistant Secretary (since December 2023) of the PGIM Credit Income Fund; Assistant Secretary (since September 2022) of the PGIM Private Credit Fund; Assistant Secretary (since March 2022) of the PGIM Private Real Estate Fund, Inc. | | Since June 2020 |
| | | |
Debra Rubano
1975
Assistant Secretary
| | Vice President and Corporate Counsel (since November 2020) of Prudential; Assistant Secretary (since December 2023) of the PGIM Credit Income Fund; Assistant Secretary (since September 2022) of the PGIM Private Credit Fund; Assistant Secretary (since March 2022) of the PGIM Private Real Estate Fund, Inc; formerly Director and Senior Counsel of Allianz Global Investors U.S. Holdings LLC (2010-2020) and Assistant Secretary of numerous funds in the Allianz fund complex (2015-2020). | | Since December 2020 |
| | | |
George Hoyt
1965
Assistant Secretary
| | Vice President and Corporate Counsel of Prudential (since September 2023); formerly Associate General Counsel of Franklin Templeton and Secretary and Chief Legal Officer of certain funds in the Franklin Templeton complex (2020- 2023) and Managing Director (2016-2020) and Associate General Counsel for Legg Mason, Inc. and its predecessors (2004-2020). | | Since December 2023 |
| | | |
Devan Goolsby
1991
Assistant Secretary
| | Vice President and Corporate Counsel of Prudential (since May 2023); formerly Associate at Eversheds Sutherland (US) LLP (2021-2023); Compliance Officer at Bloomberg LP (2019-2021); and an Examiner at the Financial Industry Regulatory Authority (2015-2019). | | Since December 2023 |
| | | |
Kelly A. Coyne
1968
Assistant Secretary
| | Director, Investment Operations of Prudential Mutual Fund Services LLC (since 2010); Assistant Secretary (since December 2023) of the PGIM Credit Income Fund; Assistant Secretary (since September 2022) of the PGIM Private Credit Fund; Assistant Secretary (since March 2022) of the PGIM Private Real Estate Fund, Inc. | | Since March 2015 |
PGIM Global Total Return Fund
| | | | |
| |
Fund Officers(a) |
| | | |
Name
Year of Birth
Fund Position | | Principal Occupation(s) During Past Five Years | | Length of
Service as Fund
Officer |
| | | |
Christian J. Kelly
1975
Chief Financial Officer | | Vice President, Global Head of Fund Administration of PGIM Investments LLC (since November 2018); Chief Financial Officer (since March 2023) of PGIM Investments mutual funds, closed end funds and ETFs, Advanced Series Trust Portfolios, Prudential Series Funds and Prudential Gibraltar Fund; Chief Financial Officer (since December 2023) of the PGIM Credit Income Fund; Chief Financial Officer of PGIM Private Credit Fund (since September 2022); Chief Financial Officer of PGIM Private Real Estate Fund, Inc. (since July 2022); formerly Treasurer and Principal Financial Officer (January 2019- March 2023) of PGIM Investments mutual funds, closed end funds and ETFs, Advanced Series Trust Portfolios, Prudential Series Funds and Prudential Gibraltar Fund; formerly Treasurer and Principal Financial Officer (March 2022 – July 2022) of the PGIM Private Real Estate Fund, Inc.; formerly Director of Fund Administration of Lord Abbett & Co. LLC (2009-2018), Treasurer and Principal Accounting Officer of the Lord Abbett Family of Funds (2017-2018); Director of Accounting, Avenue Capital Group (2008-2009); Senior Manager, Investment Management Practice of Deloitte & Touche LLP (1998-2007). | | Since January 2019 |
| | | |
Russ Shupak
1973
Treasurer and Principal
Accounting Officer | | Vice President (since 2017) within PGIM Investments Fund Administration; Treasurer and Principal Accounting Officer of PGIM Investments mutual funds, closed end funds and ETFs (since March 2023); Treasurer and Principal Accounting Officer (since December 2023) of the PGIM Credit Income Fund; Treasurer and Principal Accounting Officer (since July 2022) of the PGIM Private Real Estate Fund, Inc.; Assistant Treasurer (since September 2022) of the PGIM Private Credit Fund; formerly Assistant Treasurer (March 2022 – July 2022) of the PGIM Private Real Estate Fund, Inc.; Assistant Treasurer of Advanced Series Trust Portfolios, Prudential Series Funds and Prudential Gibraltar Fund (since October 2019); formerly Director (2013-2017) within PGIM Investments Fund Administration. | | Since October 2019 |
| | | |
Lana Lomuti
1967
Assistant Treasurer | | Vice President (since 2007) within PGIM Investments Fund Administration; formerly Assistant Treasurer (December 2007-February 2014) of The Greater China Fund, Inc.; formerly Director (2005-2007) within PGIM Investments Fund Administration. | | Since April 2014 |
| | | |
Deborah Conway
1969
Assistant Treasurer | | Vice President (since 2017) within PGIM Investments Fund Administration; formerly Director (2007-2017) within PGIM Investments Fund Administration. | | Since October 2019 |
Visit our website at pgim.com/investments
| | | | |
| |
Fund Officers(a) |
| | | |
Name
Year of Birth
Fund Position | | Principal Occupation(s) During Past Five Years | | Length of
Service as Fund
Officer |
| | | |
Elyse M. McLaughlin
1974
Assistant Treasurer | | Vice President (since 2017) within PGIM Investments Fund Administration; Treasurer and Principal Accounting Officer of the Advanced Series Trust, the Prudential Series Fund and the Prudential Gibraltar Fund (since March 2023); Assistant Treasurer (since December 2023) of the PGIM Credit Income Fund; Treasurer and Principal Accounting Officer (since September 2022) of the PGIM Private Credit Fund; Assistant Treasurer (since March 2022) of the PGIM Private Real Estate Fund, Inc.; Assistant Treasurer of PGIM Investments mutual funds, closed end funds and ETFs (since October 2019); formerly Director (2011-2017) within PGIM Investments Fund Administration. | | Since October 2019 |
| | | |
Robert W. McCormack
1973
Assistant Treasurer | | Vice President (since 2019) within PGIM Investments Fund Administration; Assistant Treasurer (since March 2023) of PGIM Investments mutual funds, closed end funds, ETFs, Advanced Series Trust Portfolios, Prudential Series Funds and Prudential Gibraltar Fund; Assistant Treasurer (since December 2023) of the PGIM Credit Income Fund; Assistant Treasurer (since September 2022) of the PGIM Private Credit Fund; Assistant Treasurer (since March 2022) of the PGIM Private Real Estate Fund, Inc.; formerly Director (2016-2019) within PGIM Investments Fund Administration; formerly Vice President within Goldman, Sachs & Co. Investment Management Controllers (2008-2016), Assistant Treasurer of Goldman Sachs Family of Funds (2015-2016). | | Since March 2023 |
| | | |
Kelly Florio
1978
Anti-Money Laundering
Compliance Officer | | Vice President, Corporate Compliance, Global Compliance Programs and Compliance Risk Management (since December 2021) of Prudential; formerly Head of Fraud Risk Management (October 2019-December 2021) at New York Life Insurance Company; formerly Head of Key Risk Area Operations (November 2018-October 2019), Director of the US Anti-Money Laundering Compliance Unit (2009-2018) and Bank Loss Prevention Associate (2006-2009) at MetLife. | | Since June 2022 |
(a) Excludes Mr. Parker and Mr. Benjamin, interested Board Members who also serve as President and Vice President, respectively.
Explanatory Notes to Tables:
| ∎ | Board Members are deemed to be “Interested,” as defined in the 1940 Act, by reason of their affiliation with PGIM Investments LLC and/or an affiliate of PGIM Investments LLC. |
| ∎ | Unless otherwise noted, the address of all Board Members and Officers is c/o PGIM Investments LLC, 655 Broad Street, Newark, New Jersey 07102-4410. |
| ∎ | There is no set term of office for Board Members or Officers. The Board Members have adopted a retirement policy, which calls for the retirement of Board Members on December 31 of the year in which they reach the age of 75. |
| ∎ | “Other Directorships Held” includes all directorships of companies required to register or file reports with the SEC under the 1934 Act (that is, “public companies”) or other investment companies registered under the 1940 Act. |
PGIM Global Total Return Fund
| ∎ | “Portfolios Overseen” includes such applicable investment companies managed by PGIM Investments LLC and overseen by the Board Member. The investment companies for which PGIM Investments LLC serves as manager include the PGIM Mutual Funds, Target Funds, PGIM ETF Trust, PGIM Private Real Estate Fund, Inc., PGIM Private Credit Fund, PGIM Credit Income Fund, PGIM High Yield Bond Fund, Inc., PGIM Global High Yield Fund, Inc., PGIM Short Duration High Yield Opportunities Fund, The Prudential Series Fund, Prudential’s Gibraltar Fund, Inc. and the Advanced Series Trust. |
| ∎ | As used in the Fund Officers table “Prudential” means The Prudential Insurance Company of America. |
Visit our website at pgim.com/investments
Approval of Advisory Agreements (unaudited)
The Fund’s Board of Directors
The Board of Directors (the “Board”) of PGIM Global Total Return Fund1 (the “Fund”) consists of ten individuals, eight of whom are not “interested persons” of the Fund, as defined in the Investment Company Act of 1940, as amended (the “1940 Act”) (the “Independent Directors”). The Board is responsible for the oversight of the Fund and its operations, and performs the various duties imposed on the directors of investment companies by the 1940 Act. The Independent Directors have retained independent legal counsel to assist them in connection with their duties. The Chair of the Board is an Independent Director. The Board has established five standing committees: the Audit Committee, the Nominating and Governance Committee, the Compliance Committee and two Investment Committees. Each committee is chaired by, and composed of, Independent Directors.
Annual Approval of the Fund’s Advisory Agreements
As required under the 1940 Act, the Board determines annually whether to renew the Fund’s management agreement with PGIM Investments LLC (“PGIM Investments”), the Fund’s subadvisory agreement with PGIM, Inc. (“PGIM”), on behalf of its PGIM Fixed Income unit (“PGIM Fixed Income”), and the Fund’s sub-subadvisory agreement with PGIM Limited (“PGIML”). In considering the renewal of the agreements, the Board, including all of the Independent Directors, met on May 25 and June 6-8, 2023 (the “Board Meeting”) and approved the renewal of the agreements through July 31, 2024, after concluding that the renewal of the agreements was in the best interests of the Fund and its shareholders.
In advance of the meetings, the Board requested and received materials relating to the agreements, and had the opportunity to ask questions and request further information in connection with its consideration. Among other things, the Board considered comparative fee information from PGIM Investments, PGIM, and where appropriate, affiliates of PGIM. Also, the Board considered comparisons with other mutual funds in relevant Peer Universes and Peer Groups, as is further discussed below.
In approving the agreements, the Board, including the Independent Directors advised by independent legal counsel, considered the factors it deemed relevant, including the nature, quality and extent of services provided by PGIM Investments, the subadviser, and, as relevant, its affiliates, the performance of the Fund, the profitability of PGIM Investments and its affiliates, expenses and fees, and the potential for economies of scale that may be shared with the Fund and its shareholders as the Fund’s assets grow. In their deliberations, the Directors did not identify any single factor which alone was responsible for the Board’s decision to approve the agreements with respect to the Fund. In connection with its deliberations, the Board considered information provided by PGIM Investments throughout the year at regular Board meetings, presentations from portfolio managers and other information, as well as information furnished at or in advance of the Board Meeting.
1 PGIM Global Total Return Fund is a series of Prudential Global Total Return Fund, Inc.
PGIM Global Total Return Fund
Approval of Advisory Agreements (continued)
The Directors determined that the overall arrangements between the Fund and PGIM Investments, which serves as the Fund’s investment manager pursuant to a management agreement, between PGIM Investments and PGIM, which, through its PGIM Fixed Income unit, serves as the Fund’s subadviser pursuant to the terms of a subadvisory agreement with PGIM Investments, and between PGIM and PGIML, which serves as the Fund’s sub-subadviser pursuant to the terms of a sub-subadvisory agreement with PGIM, are in the best interests of the Fund and its shareholders in light of the services performed, fees charged and such other matters as the Directors considered relevant in the exercise of their business judgment.
The material factors and conclusions that formed the basis for the Directors’ reaching their determinations to approve the continuance of the agreements are separately discussed below.
Nature, Quality and Extent of Services
The Board received and considered information regarding the nature, quality and extent of services provided to the Fund by PGIM Investments, PGIM Fixed Income, and PGIML. The Board noted that PGIM Fixed Income and PGIML are affiliated with PGIM Investments. The Board considered the services provided by PGIM Investments, including but not limited to the oversight of the subadviser and sub-subadviser for the Fund, as well as the provision of fund recordkeeping, compliance and other services to the Fund, and PGIM Investments’ role as administrator for the Fund’s liquidity risk management program. With respect to PGIM Investments’ oversight of the subadviser and sub-subadviser, the Board noted that PGIM Investments’ Strategic Investment Research Group (“SIRG”), which is a business unit of PGIM Investments, is responsible for monitoring and reporting to PGIM Investments’ senior management on the performance and operations of the subadviser and sub-subadviser. The Board also considered that PGIM Investments pays the salaries of all of the officers and interested Directors of the Fund who are part of Fund management. The Board also considered the investment subadvisory services provided by PGIM Fixed Income and PGIML, including investment research and security selection, as well as adherence to the Fund’s investment restrictions and compliance with applicable Fund policies and procedures. The Board considered PGIM Investments’ evaluation of the subadviser and sub-subadviser, as well as PGIM Investments’ recommendation, based on its review of the subadviser and sub-subadviser, to renew the subadvisory and sub-subadvisory agreements.
The Board considered the qualifications, backgrounds and responsibilities of PGIM Investments’ senior management responsible for the oversight of the Fund, PGIM Fixed Income, and PGIML, and also considered the qualifications, backgrounds and responsibilities of PGIM Fixed Income’s portfolio managers who are responsible for the day-to-day management of the Fund’s portfolio. The Board was provided with information pertaining to PGIM Investments’, PGIM Fixed Income’s, and PGIML’s organizational structure, senior management, investment operations, and other relevant
Visit our website at pgim.com/investments
information pertaining to PGIM Investments, PGIM Fixed Income, and PGIML. The Board also noted that it received favorable compliance reports from the Fund’s Chief Compliance Officer (“CCO”) as to PGIM Investments, PGIM Fixed Income, and PGIML.
The Board concluded that it was satisfied with the nature, extent and quality of the investment management services provided by PGIM Investments, the subadvisory services provided to the Fund by PGIM Fixed Income, and the sub-subadvisory services provided by PGIML, and that there was a reasonable basis on which to conclude that the Fund benefits from the services provided by PGIM Investments, PGIM Fixed Income, and PGIML under the management, subadvisory and sub-subadvisory agreements.
Costs of Services and Profits Realized by PGIM Investments
The Board was provided with information on the profitability of PGIM Investments and its affiliates in serving as the Fund’s investment manager. The Board discussed with PGIM Investments the methodology utilized in assembling the information regarding profitability and considered its reasonableness. The Board recognized that it is difficult to make comparisons of profitability from fund management contracts because comparative information is not generally publicly available and is affected by numerous factors, including the structure of the particular adviser, the types of funds it manages, its business mix, numerous assumptions regarding allocations and the adviser’s capital structure and cost of capital. Taking these factors into account, the Board concluded that the profitability of PGIM Investments and its affiliates in relation to the services rendered was not unreasonable.
Economies of Scale
The Board received and discussed information concerning economies of scale that PGIM Investments may realize as the Fund’s assets grow beyond current levels. The Board noted that the management fee schedule for the Fund includes breakpoints, which have the effect of decreasing the fee rate as assets increase. During the course of time, the Board has considered information regarding the launch date of the Fund, the management fees of the Fund compared to those of similarly managed funds and PGIM Investments’ investment in the Fund over time. The Board noted that economies of scale can be shared with the Fund in other ways, including low management fees from inception, additional technological and personnel investments to enhance shareholder services, and maintaining existing expense structures in the face of a rising cost environment. The Board also considered PGIM Investments’ assertion that it continually evaluates the management fee schedule of the Fund and the potential to share economies of scale through breakpoints or fee waivers as asset levels increase.
The Board recognized the inherent limitations of any analysis of economies of scale, stemming largely from the Board’s understanding that most of PGIM Investments’ costs are not specific to individual funds, but rather are incurred across a variety of products and services.
PGIM Global Total Return Fund
Approval of Advisory Agreements (continued)
Other Benefits to PGIM Investments, PGIM Fixed Income, and PGIML
The Board considered potential ancillary benefits that might be received by PGIM Investments, PGIM Fixed Income, PGIML and their affiliates as a result of their relationship with the Fund. The Board concluded that potential benefits to be derived by PGIM Investments included transfer agency fees received by the Fund’s transfer agent (which is affiliated with PGIM Investments), as well as benefits to its reputation or other intangible benefits resulting from PGIM Investments’ association with the Fund. The Board concluded that the potential benefits to be derived by PGIM Fixed Income and PGIML included the ability to use soft dollar credits, as well as the potential benefits consistent with those generally resulting from an increase in assets under management, specifically, potential access to additional research resources and benefits to their reputations. The Board concluded that the benefits derived by PGIM Investments, PGIM Fixed Income, and PGIML were consistent with the types of benefits generally derived by investment managers and subadvisers to mutual funds.
Performance of the Fund / Fees and Expenses
The Board considered certain additional factors and made related conclusions relating to the historical performance of the Fund for the one-, three-, five- and ten-year periods ended December 31, 2022.
The Board also considered the Fund’s actual management fee, as well as the Fund’s net total expense ratio, for the fiscal year ended October 31, 2022. The Board considered the management fee for the Fund as compared to the management fee charged by PGIM Investments to other funds and the fee charged by other advisers to comparable mutual funds in a Peer Group. The actual management fee represents the fee rate actually paid by Fund shareholders and includes any fee waivers or reimbursements. The net total expense ratio for the Fund represents the actual expense ratio incurred by Fund shareholders.
The mutual funds included in the Peer Universe, which was used to consider performance, and the Peer Group, which was used to consider expenses and fees, were objectively determined by Broadridge, an independent provider of mutual fund data. In certain circumstances, PGIM Investments also provided supplemental Peer Universe or Peer Group information, for reasons addressed with the Board. The comparisons placed the Fund in various quartiles over various periods, with the first quartile being the best 25% of the mutual funds (for performance, the best performing mutual funds and, for expenses, the lowest cost mutual funds).
The section below summarizes key factors considered by the Board and the Board’s conclusions regarding the Fund’s performance, fees and overall expenses. The table sets forth net performance comparisons (which reflect the impact on performance of fund expenses, or any subsidies, expense caps or waivers that may be applicable) with the Peer Universe, actual management fees with the Peer Group (which reflect the impact of any subsidies or fee waivers), and net total expenses with the Peer Group, each of which were key factors considered by the Board.
Visit our website at pgim.com/investments
| | | | | | | | |
| | | | | |
| Net Performance | | 1 Year | | 3 Years | | 5 Years | | 10 Years |
| | | | | |
| | | 4th Quartile | | 4th Quartile | | 4th Quartile | | 1st Quartile |
| |
| Actual Management Fees: 1st Quartile |
| |
| Net Total Expenses: 2nd Quartile |
| | ● | | The Board noted that the Fund outperformed its benchmark index over the ten-year period and underperformed its benchmark index over the remaining periods. |
| | ● | | The Board also considered that Fund outperformed its benchmark index and peer group in the fourth quarter of 2022 and first quarter of 2023 (ranking in the 11th and 28th percentiles, respectively). The Board also noted that the Fund has outperformed its peer group median in eight out of the last ten calendar years and has outperformed its benchmark in six out of the last ten calendar years. |
| | ● | | The Board noted that PGIM Investments is encouraged by the Fund’s strong returns versus peers over the long term as demonstrated by its ten-year performance and calendar year performance prior to 2021. |
| | ● | | The Board and PGIM Investments agreed to retain the Fund’s existing contractual expense cap, which (exclusive of certain fees and expenses) caps total annual operating expenses at 0.88% for Class A shares, 1.63% for Class C shares, 0.63% for Class Z shares, 1.08% for Class R2 shares, 0.83% for Class R4 shares, and 0.58% for Class R6 shares through February 29, 2024. |
| | ● | | In addition, PGIM Investments will waive management fees or shared operating expenses on any share class to the same extent that it waives such expenses on any other share class, and has agreed that total annual fund operating expenses for Class R6 shares will not exceed total annual fund operating expenses for Class Z shares. |
| | ● | | The Board concluded that, in light of the above, it would be in the best interests of the Fund and its shareholders to renew the agreements. |
| | ● | | The Board concluded that the management fees (including subadvisory fees) and total expenses were reasonable in light of the services provided. |
* * *
After full consideration of these factors, the Board concluded that the approval of the agreements was in the best interests of the Fund and its shareholders.
PGIM Global Total Return Fund
| | | | |
∎ MAIL | | ∎ TELEPHONE | | ∎ WEBSITE |
655 Broad Street | | (800) 225-1852 | | pgim.com/investments |
Newark, NJ 07102 | | | | |
PROXY VOTING
The Board of Directors of the Fund has delegated to the Fund’s subadviser the responsibility for voting any proxies and maintaining proxy recordkeeping with respect to the Fund. A description of these proxy voting policies and procedures is available without charge, upon request, by calling (800) 225-1852 or by visiting the Securities and Exchange Commission’s website at sec.gov. Information regarding how the Fund voted proxies relating to portfolio securities during the most recent 12-month period ended June 30 is available on the Fund’s website and on the Securities and Exchange Commission’s website.
DIRECTORS
Ellen S. Alberding ● Kevin J. Bannon ● Scott E. Benjamin ● Linda W. Bynoe ● Barry H. Evans ● Keith F. Hartstein ● Laurie Simon Hodrick ● Stuart S. Parker ● Brian K. Reid ● Grace C. Torres
OFFICERS
Stuart S. Parker, President ● Scott E. Benjamin, Vice President ● Christian J. Kelly, Chief Financial Officer ● Claudia DiGiacomo, Chief Legal Officer ● Andrew Donohue, Chief Compliance Officer ● Russ Shupak, Treasurer and Principal Accounting Officer ● Kelly Florio, Anti-Money Laundering Compliance Officer ● Andrew R. French, Secretary ● Melissa Gonzalez, Assistant Secretary ● Kelly A. Coyne, Assistant Secretary ● Patrick E. McGuinness, Assistant Secretary ● Debra Rubano, Assistant Secretary ● George Hoyt, Assistant Secretary ● Devan Goolsby, Assistant Secretary ● Lana Lomuti, Assistant Treasurer ● Elyse M. McLaughlin, Assistant Treasurer ● Deborah Conway, Assistant Treasurer ● Robert W. McCormack, Assistant Treasurer
| | | | |
| MANAGER | | PGIM Investments LLC | | 655 Broad Street Newark, NJ 07102 |
| | |
| SUBADVISER | | PGIM Fixed Income | | 655 Broad Street Newark, NJ 07102 |
| | |
| SUB-SUBADVISER | | PGIM Limited | | Grand Buildings, 1-3 Strand Trafalgar Square London, WC2N 5HR United Kingdom |
| | |
| DISTRIBUTOR | | Prudential Investment Management Services LLC | | 655 Broad Street Newark, NJ 07102 |
| | |
| CUSTODIAN | | The Bank of New York Mellon | | 240 Greenwich Street New York, NY 10286 |
| | |
| TRANSFER AGENT | | Prudential Mutual Fund Services LLC | | PO Box 534432 Pittsburgh, PA 15253 |
| | |
INDEPENDENT REGISTERED PUBLIC ACCOUNTING FIRM | | PricewaterhouseCoopers LLP | | 300 Madison Avenue New York, NY 10017 |
| | |
| FUND COUNSEL | | Willkie Farr & Gallagher LLP | | 787 Seventh Avenue New York, NY 10019 |
An investor should consider the investment objectives, risks, charges, and expenses of the Fund carefully before investing. The prospectus and summary prospectus contain this and other information about the Fund. An investor may obtain the prospectus and summary prospectus by visiting our website at pgim.com/investments or by calling (800) 225-1852. The prospectus and summary prospectus should be read carefully before investing.
E-DELIVERY
To receive your mutual fund documents online,go to pgim.com/investments/resource/edelivery and enroll. Instead of receiving printed documents by mail, you will receive notification via email when new materials are available. You can cancel your enrollment or change your email address at any time by visiting the website address above.
SHAREHOLDER COMMUNICATIONS WITH DIRECTORS
Shareholders can communicate directly with the Board of Directors by writing to the Chair of the Board, PGIM Global Total Return Fund, PGIM Investments, Attn: Board of Directors, 655 Broad Street, Newark, NJ 07102. Shareholders can communicate directly with an individual Director by writing to that Director at the same address. Communications are not screened before being delivered to the addressee.
AVAILABILITY OF PORTFOLIO HOLDINGS
The Fund files its complete schedule of portfolio holdings with the Securities and Exchange Commission for the first and third quarters of each fiscal year as an exhibit to its reports on Form N-PORT. The Fund’s Form N-PORT filings are available on the Commission’s website at sec.gov.
The Fund’s Statement of Additional Information contains additional information about the Fund’s Directors and is available without charge, upon request, by calling (800) 225-1852.
Mutual Funds:
| | | | |
| ARE NOT INSURED BY THE FDIC OR ANY | | MAY LOSE VALUE | | ARE NOT A DEPOSIT OF OR GUARANTEED |
| FEDERAL GOVERNMENT AGENCY | | BY ANY BANK OR ANY BANK AFFILIATE |

PGIM GLOBAL TOTAL RETURN FUND
| | | | | | | | | | | | |
| | | | | | |
| SHARE CLASS | | A | | C | | Z | | R2 | | R4 | | R6 |
| | | | | | |
NASDAQ | | GTRAX | | PCTRX | | PZTRX | | PGTOX | | PGTSX | | PGTQX |
| | | | | | |
CUSIP | | 74439A103 | | 74439A301 | | 74439A400 | | 74439A863 | | 74439A855 | | 74439A509 |
MF169E

PGIM GLOBAL TOTAL RETURN (USD HEDGED) FUND
ANNUAL REPORT
OCTOBER 31, 2023

To enroll in e-delivery, go to pgim.com/investments/resource/edelivery
Table of Contents
This report is not authorized for distribution to prospective investors unless preceded or accompanied by a current prospectus.
The views expressed in this report and information about the Fund’s portfolio holdings are for the period covered by this report and are subject to change thereafter.
Mutual funds are distributed by Prudential Investment Management Services LLC (PIMS), member SIPC. PGIM Fixed Income is a unit of PGIM, Inc. (PGIM), a registered investment adviser. PIMS and PGIM are Prudential Financial companies. © 2023 Prudential Financial, Inc. and its related entities. PGIM and the PGIM logo are service marks of Prudential Financial, Inc. and its related entities, registered in many jurisdictions worldwide.
2 Visit our website at pgim.com/investments
Letter from the President
| | |
 | | Dear Shareholder: We hope you find the annual report for the PGIM Global Total Return (USD Hedged) Fund informative and useful. The report covers performance for the 12-month period that ended October 31, 2023. Although central banks raised interest rates aggressively to tame surging inflation during the period, the global economy and financial markets demonstrated resilience. Employers continued hiring, consumers continued spending, home prices rose, and recession fears receded. |
Early in the period, stocks began a rally that eventually ended a bear market and continued to rise globally for much of 2023 as inflation cooled and the Federal Reserve (the Fed) slowed the pace of its rate hikes. However, stocks declined late in the period when the Fed signaled that rates may remain elevated longer than investors had expected. For the entire period, large-cap US stocks and equities in international markets posted gains, while small-cap US stocks declined.
Bond markets benefited during the period as the Fed moderated its rate-hiking cycle, and the higher level of interest rates offered investors an additional cushion from fixed income volatility. US and global investment-grade bonds, along with US high yield corporate bonds and emerging market debt, all posted gains.
Regarding your investments with PGIM, we believe it is important to maintain a diversified portfolio of funds consistent with your tolerance for risk, time horizon, and financial goals. Your financial advisor can help you create a diversified investment plan that may include funds covering all the basic asset classes and that reflects your personal investor profile and risk tolerance. However, diversification and asset allocation strategies do not assure a profit or protect against loss in declining markets.
At PGIM Investments, we provide access to active investment strategies across the global markets in the pursuit of consistent outperformance for investors. PGIM is the world’s 14th-largest investment manager with more than $1.3 trillion in assets under management. Our scale and investment expertise allow us to deliver a diversified suite of actively managed solutions across a broad spectrum of asset classes and investment styles.
Thank you for choosing our family of funds.
Sincerely,

Stuart S. Parker, President
PGIM Global Total Return (USD Hedged) Fund
December 15, 2023
PGIM Global Total Return (USD Hedged) Fund 3
Your Fund’s Performance (unaudited)
Performance data quoted represent past performance. Past performance does not guarantee future results. The investment return and principal value of an investment will fluctuate so that an investor’s shares, when redeemed, may be worth more or less than their original cost. Current performance may be lower or higher than the past performance data quoted. An investor may obtain performance data as of the most recent month-end by visiting our website at pgim.com/investments or by calling (800) 225-1852.
| | | | | | | | |
| |
| | | Average Annual Total Returns as of 10/31/23 | |
| | | |
| | | One Year (%) | | Five Years (%) | | Since Inception (%) | |
| | | |
Class A | | | | | | | | |
| | | |
(with sales charges) | | 2.25 | | 0.11 | | | -0.34 (12/12/2017 | ) |
| | | |
(without sales charges) | | 5.69 | | 0.77 | | | 0.22 (12/12/2017 | ) |
| | | |
Class C | | | | | | | | |
| | | |
(with sales charges) | | 3.77 | | 0.00 | | | -0.55 (12/12/2017 | ) |
| | | |
(without sales charges) | | 4.77 | | 0.00 | | | -0.55 (12/12/2017 | ) |
| | | |
Class Z | | | | | | | | |
| | | |
(without sales charges) | | 5.82 | | 1.00 | | | 0.45 (12/12/2017 | ) |
| | | |
Class R6 | | | | | | | | |
| | | |
(without sales charges) | | 6.01 | | 1.08 | | | 0.52 (12/12/2017 | ) |
| | | |
Bloomberg Global Aggregate (USD Hedged) Index | | | | | | | | |
| | | |
| | | 1.72 | | 0.47 | | | 0.40 | |
Since Inception returns are provided since the Fund has less than 10 fiscal years of returns. Since Inception returns for the Index are measured from the closest month-end to the Fund’s inception date.
4 Visit our website at pgim.com/investments
Growth of a $10,000 Investment (unaudited)
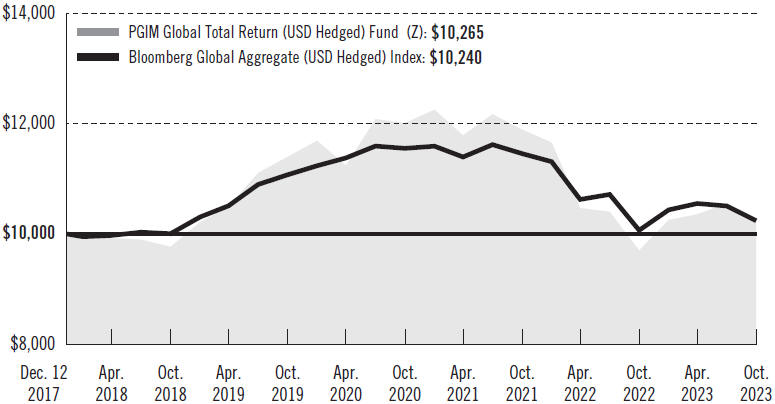
The graph compares a $10,000 investment in the Fund’s Class Z shares with a similar investment in the Bloomberg Global Aggregate (USD Hedged) Index by portraying the initial account values at the commencement of operations for Class Z shares (December 12, 2017) and the account values at the end of the current fiscal year (October 31, 2023) as measured on a quarterly basis. For purposes of the graph, and unless otherwise indicated, it has been assumed that (a) all recurring fees (including management fees) were deducted and (b) all dividends and distributions were reinvested. The line graph provides information for Class Z shares only. As indicated in the tables provided earlier, performance for other share classes will vary due to the differing fees and expenses applicable to each share class (as indicated in the following paragraphs). Without waiver of fees and/or expense reimbursements, if any, the returns would have been lower.
Past performance does not predict future performance. Total returns and the ending account values in the graphs include changes in share price and reinvestment of dividends and capital gains distributions in a hypothetical investment for the periods shown. The Fund’s total returns do not reflect the deduction of income taxes on an individual’s investment. Taxes may reduce your actual investment returns on income or gains paid by the Fund or any gains you may realize if you sell your shares.
PGIM Global Total Return (USD Hedged) Fund 5
Your Fund’s Performance (continued)
The returns in the tables do not reflect the deduction of taxes that a shareholder would pay on Fund distributions or following the redemption of Fund shares. The average annual total returns take into account applicable sales charges, which are described for each share class in the table below.
| | | | | | | | |
| | | | | |
| | | Class A | | Class C | | Class Z | | Class R6 |
| | | | | |
| Maximum initial sales charge | | 3.25% of the public offering price | | None | | None | | None |
| | | | | |
| Contingent deferred sales charge (CDSC) (as a percentage of the lower of the original purchase price or the net asset value at redemption) | | 1.00% on sales of $500,000 or more made within 12 months of purchase | | 1.00% on sales made within 12 months of purchase | | None | | None |
| | | | | |
| Annual distribution and service (12b-1) fees (shown as a percentage of average daily net assets) | | 0.25% | | 1.00% | | None | | None |
Benchmark Definition
Bloomberg Global Aggregate (USD Hedged) Index—The Bloomberg Global Aggregate (USD Hedged) Index is an unmanaged index which tracks the performance of global investment-grade fixed income markets, including Treasury, government-related, corporate, and securitized fixed rate bonds from both developed and emerging market issuers. The index includes hedge financial instruments to reduce any gains or losses that could be attributed to non-U.S. dollar exposure.
Investors cannot invest directly in an index. The returns for the Index would be lower if they included the effects of sales charges, operating expenses of a mutual fund, or taxes that may be paid by an investor.
6 Visit our website at pgim.com/investments
| | | | |
| |
| Credit Quality expressed as a percentage of total investments as of 10/31/23 (%) | | | |
| |
AAA | | | 32.8 | |
| |
AA | | | 7.5 | |
| |
A | | | 17.2 | |
| |
BBB | | | 26.5 | |
| |
BB | | | 8.2 | |
| |
B | | | 2.5 | |
| |
CCC | | | 0.5 | |
| |
Not Rated | | | 0.4 | |
| |
Cash/Cash Equivalents | | | 4.4 | |
| | |
Total | | | 100.0 | |
Credit ratings reflect the highest rating assigned by a nationally recognized statistical rating organization (NRSRO) such as Moody’s Investors Service, Inc. (Moody’s), S&P Global Ratings (S&P), or Fitch Ratings Inc. (Fitch). Credit ratings reflect the common nomenclature used by both S&P and Fitch. Where applicable, ratings are converted to the comparable S&P/Fitch rating tier nomenclature. These rating agencies are independent and are widely used. The Not Rated category consists of securities that have not been rated by an NRSRO. Credit ratings are subject to change.
| | | | | | |
| | | |
| Distributions and Yields as of 10/31/23 | | | | | | |
| | | |
| | | Total Distributions | | SEC 30-Day | | SEC 30-Day |
| | | Paid for | | Subsidized | | Unsubsidized |
| | | One Year ($) | | Yield* (%) | | Yield** (%) |
| | | |
Class A | | 0.40 | | 5.18 | | 5.74 |
| | | |
Class C | | 0.34 | | 4.60 | | 11.90 |
| | | |
Class Z | | 0.42 | | 5.61 | | 5.16 |
| | | |
Class R6 | | 0.42 | | 5.66 | | 5.57 |
*SEC 30-Day Subsidized Yield (%)—A standardized yield calculation created by the Securities and Exchange Commission, it reflects the income earned during a 30-day period, after the deduction of the Fund’s net expenses (net of any expense waivers or reimbursements). The investor experience is represented by the SEC 30-Day Subsidized Yield.
**SEC 30-Day Unsubsidized Yield (%)—A standardized yield calculation created by the Securities and Exchange Commission, it reflects the income earned during a 30-day period, after the deduction of the Fund’s gross expenses. The investor experience is represented by the SEC 30-Day Subsidized Yield.
PGIM Global Total Return (USD Hedged) Fund 7
Strategy and Performance Overview* (unaudited)
How did the Fund perform?
The PGIM Global Total Return (USD Hedged) Fund’s Class Z shares returned 5.82% in the 12-month reporting period that ended October 31, 2023, outperforming the 1.72% return of the Bloomberg Global Aggregate (US Hedged) Index (the Index).
What were the market conditions?
| · | | In the US, interest rate volatility increased as markets sought to price in both the aggressive Federal Open Market Committee (FOMC) policy tightening and the potential for a hard economic landing. Toward the end of the reporting period, macroeconomic and market conditions raised hopes of a soft landing as the FOMC held interest rates steady, and Federal Reserve (Fed) Chairman Jerome Powell acknowledged that higher yields on US Treasuries have aided in the tightening of financial conditions. (When central banks raise interest rates enough to cause a significant economic slowdown or a recession, it is known as a hard landing. When they raise rates just enough to slow the economy and lower inflation without causing a recession, it is known as a soft landing.) The 10-year/2-year US Treasury spread narrowed from –0.41% as of October 31, 2022 to –0.19% as of October 31, 2023, while the 10-year US Treasury yield rose by 79 basis points (bps) to end the reporting period at 4.88%. (One basis point equals 0.01%.) |
| · | | Despite the debt ceiling debate and threats of a government shutdown, inflation that remained above the Fed’s 2% target, and geopolitical risks abroad, the economy proved resilient, posting strong growth for the third quarter of 2023 (i.e., annualized gross domestic product (GDP) of 4.9%) that was driven by consumer spending. With that stated, the durability of the third quarter’s economic momentum doesn’t appear to be repeatable. While September’s payrolls report of 336,000 jobs added came in much stronger than expected, October’s payrolls report of 150,000 jobs added surprised to the downside and provided further evidence of labor market rebalancing. |
| · | | In Europe, German 10-year bond yields rose to end the reporting period at 2.83%. While the decision of the European Central Bank (ECB) to keep monetary policy unchanged appeared prudent and justified, headwinds from higher global interest rates, high energy prices, and persistent inflation continued to paint a challenging picture for the euro economy. Similarly, United Kingdom 10-year bond yields rose over the reporting period, ending it at 4.54%. The Bank of England also remained on hold in October 2023. This was the second meeting at which the Bank of England kept its key rate at 5.25%, reflecting the fact that the real economy and inflation both came in slightly weaker than what was expected at the time of its August 2023 report. |
| · | | Euro-area inflation fell off a bit more than expected to 2.9% year-over-year in October 2023, down from 4.3% the previous month. The decline was led mostly by energy, while core inflation dropped a bit as well to 4.2% year-over-year from 4.5% in September. With inflation now within striking distance of the ECB’s 2% target and core inflation starting to show some signs of a downward trend, barring any major changes, the ECB increasingly appears to have hit peak rates. |
8 Visit our website at pgim.com/investments
| · | | In the elevated volatility environment, US investment-grade corporate spreads tightened as expectations for a hard landing dissipated, and fundamentals remained solid. US high yield bonds posted gains over the reporting period amid limited new issuance, resilient economic data, and an ongoing supply deficit. Securitized credit spreads were mixed, with high-quality collateralized loan obligation (CLO) spreads tightening over the reporting period and commercial mortgage-backed securities (CMBS) spreads widening slightly as the commercial real estate sector remained challenged. The emerging-markets sector posted positive total returns, and spreads tightened through October 2023. Meanwhile, agency mortgage-backed securities (MBS) posted negative returns over the reporting period, as elevated interest-rate volatility weighed on the sector over the first half of the reporting period. |
What worked?
| · | | The Fund’s duration and yield curve positioning contributed to performance during the reporting period. (Duration measures the sensitivity of the price—the value of principal—of a bond to a change in interest rates.) (A yield curve is a line graph that illustrates the relationship between the yields and maturities of fixed income securities. It is created by plotting the yields of different maturities for the same type of bonds.) |
| · | | Overall security selection contributed to performance, with selection in developed-markets high yield corporates, emerging-markets agencies, developed-markets other asset-backed securities (ABS), and developed-markets sovereigns contributing the most. |
| · | | Overall sector allocation contributed, with overweights relative to the Index to developed-markets investment-grade corporates, emerging-markets sovereigns, and developed-markets other ABS contributing. |
| · | | Within credit, positioning in foreign non-corporates, retailers & restaurants, and telecom contributed. |
| · | | In individual security selection, the Fund benefited from positioning in the Republic of Ukraine, the Republic of Greece, and EG Global Finance plc (banking). |
What didn’t work?
| · | | Within security selection, positions in developed CMBS detracted the most from performance during the reporting period. |
| · | | Within sector allocation, an overweight relative to the Index to developed-markets high yield corporates, along with underweights relative to the Index to developed-markets agencies and developed-markets local authorities, detracted from performance. |
| · | | Within credit, positioning in media & entertainment and other financial detracted. |
| · | | In individual security selection, the Fund’s positioning in the Republic of the Philippines (emerging sovereigns) and Diamond Sports Group (media & entertainment) detracted from performance. |
PGIM Global Total Return (USD Hedged) Fund 9
Strategy and Performance Overview* (continued)
Did the Fund use derivatives?
The Fund uses derivatives when they facilitate implementation of the overall investment approach. During the reporting period, the Fund used interest-rate futures, options, and swaps to help manage duration positioning and yield curve exposure, which detracted from performance. Credit default swaps and credit default swap index positions may be used to either add risk exposure to certain issuers or to hedge credit risk imposed by certain issuers. Overall, credit derivative exposure detracted from performance during the reporting period. In addition, the Fund traded foreign-exchange derivatives, which had a negative impact on performance over the reporting period.
Current outlook
| · | | The main forces pushing the yield curve higher are the central banks and a heavy supply of government bond issuance. In PGIM Fixed Income’s view, upward momentum in long-dated yields could easily continue through year-end—pushing US Treasuries toward 5% and German Bunds to 3%—and yields could go beyond those levels if fundamentals heat up again. |
| · | | PGIM Fixed Income believes that the Fed is at or nearing the end of its aggressive tightening cycle. With inflation in the US receding, the real question is where it troughs and whether it is within an acceptable tolerance band for the Fed. After a series of hikes, the Fed once again held rates steady at the November 2023 FOMC meeting. While there were no surprises in the “higher-for-longer” interest rate messaging, it was reiterated that monetary policy works with an uncertain lag. Fed officials are increasingly expressing a desire to “wait and watch” the incoming data for signs that the effects of prior hikes transmit to the real economy and whether the October surge in market-determined rates provided the last dose of tightening in financial conditions. |
| · | | As the economic backdrop slows and revenue growth begins to run slower than wage growth, PGIM Fixed Income expects companies will first cut hours, then wages, and then head count. If revenue growth continues to run slower than wage growth, the risk of further cuts to head count would grow—a scenario consistent with PGIM Fixed Income’s baseline US economic view whereby tight monetary, fiscal, and credit conditions slow momentum to a below-trend pace of real GDP. Under this “weakflation” scenario, PGIM Fixed Income still expects real GDP growth of between 1.0%-1.5%, inflation descending to 2.5%-3.0%, and the Fed “fine-tuning” its policy rates, with 50 bps of easing next year. |
| · | | PGIM Fixed Income maintains its positive view of the spread sectors over the medium to long term, and the Fund is overweight investment-grade corporates, high yield, securitized products (CLOs and CMBS), and emerging markets. The Fund holds a significant underweight relative to the Index to MBS and US Treasuries in favor of more attractive opportunities across spread sectors. |
| · | | From a long-term perspective, exposure to developed-markets duration is becoming more compelling after the broad repricing and with the looming moderation in global growth. While acknowledging the immediate trajectory of inflation is going to dictate |
10 Visit our website at pgim.com/investments
| | market volatility and the path of the US Treasury 10-year yield, PGIM Fixed Income’s base case is that implied volatility will ultimately decline, and the 10-year yield will stay below the terminal rate of this hiking cycle when it is eventually reached. In the meantime, the best course will be to focus on the micro-alpha opportunities within and across sectors. (Alpha is a measure of an investment’s active return compared to a market or index.) |
*This strategy and performance overview, which discusses what strategies or holdings (including derivatives, if applicable) affected the Fund’s performance, is compiled based on how the Fund performed relative to the Index and is viewed for performance attribution purposes at the aggregate Fund level, which in most instances will not directly correlate to the amounts disclosed in the Statement of Operations which conform to US generally accepted accounting principles.
PGIM Global Total Return (USD Hedged) Fund 11
Fees and Expenses (unaudited)
As a shareholder of the Fund, you incur two types of costs: (1) transaction costs, including sales charges (loads) on purchase payments and redemptions, as applicable, and (2) ongoing costs, including management fees, distribution and/or service (12b-1) fees, and other Fund expenses, as applicable. This example is intended to help you understand your ongoing costs (in dollars) of investing in the Fund and to compare these costs with the ongoing costs of investing in other mutual funds.
The example is based on an investment of $1,000 held through the six-month period ended October 31, 2023. The example is for illustrative purposes only; you should consult the Prospectus for information on initial and subsequent minimum investment requirements.
Actual Expenses
The first line for each share class in the table on the following page provides information about actual account values and actual expenses. You may use the information on this line, together with the amount you invested, to estimate the expenses that you paid over the period. Simply divide your account value by $1,000 (for example, an $8,600 account value ÷ $1,000 = 8.6), then multiply the result by the number on the first line under the heading “Expenses Paid During the Six-Month Period” to estimate the expenses you paid on your account during this period.
Hypothetical Example for Comparison Purposes
The second line for each share class in the table on the following page provides information about hypothetical account values and hypothetical expenses based on the Fund’s actual expense ratio and an assumed rate of return of 5% per year before expenses, which is not the Fund’s actual return. The hypothetical account values and expenses may not be used to estimate the actual ending account balance or expenses you paid for the period. You may use this information to compare the ongoing costs of investing in the Fund and other funds. To do so, compare this 5% hypothetical example with the 5% hypothetical examples that appear in the shareholder reports of the other funds.
The Fund’s transfer agent may charge additional fees to holders of certain accounts that are not included in the expenses shown in the table on the following page. These fees apply to individual retirement accounts (IRAs) and Section 403(b) accounts. As of the close of the six-month period covered by the table, IRA fees included an annual maintenance fee of $15 per account (subject to a maximum annual maintenance fee of $25 for all accounts held by the same shareholder). Section 403(b) accounts are charged an annual $25 fiduciary maintenance fee. Some of the fees may vary in amount, or may be waived, based on your total account balance or the number of PGIM funds, including the Fund, that you own. You should consider the additional fees that were charged to your Fund account over the six-month period when you estimate the total ongoing expenses paid over the period and the impact of these fees on your ending account value, as these additional expenses are not reflected in the information
12 Visit our website at pgim.com/investments
provided in the expense table. Additional fees have the effect of reducing investment returns.
Please note that the expenses shown in the table are meant to highlight your ongoing costs only and do not reflect any transactional costs such as sales charges (loads). Therefore, the second line for each share class in the table is useful in comparing ongoing costs only and will not help you determine the relative total costs of owning different funds. In addition, if these transactional costs were included, your costs would have been higher.
| | | | | | | | | | |
| | | | |
PGIM Global Total Return (USD Hedged) Fund | | Beginning Account Value May 1, 2023 | | Ending Account Value October 31, 2023 | | Annualized Expense Ratio Based on the Six-Month Period | | Expenses Paid During the Six-Month Period* |
| | | | | |
Class A | | Actual | | $1,000.00 | | $ 990.00 | | 0.89% | | $4.46 |
| | | | | |
| | Hypothetical | | $1,000.00 | | $1,020.72 | | 0.89% | | $4.53 |
| | | | | |
Class C | | Actual | | $1,000.00 | | $ 986.30 | | 1.64% | | $8.21 |
| | | | | |
| | Hypothetical | | $1,000.00 | | $1,016.94 | | 1.64% | | $8.34 |
| | | | | |
Class Z | | Actual | | $1,000.00 | | $ 991.20 | | 0.64% | | $3.21 |
| | | | | |
| | Hypothetical | | $1,000.00 | | $1,021.98 | | 0.64% | | $3.26 |
| | | | | |
Class R6 | | Actual | | $1,000.00 | | $ 991.60 | | 0.59% | | $2.96 |
| | | | | |
| | | Hypothetical | | $1,000.00 | | $1,022.23 | | 0.59% | | $3.01 |
*Fund expenses (net of fee waivers or subsidies, if any) for each share class are equal to the annualized expense ratio for each share class (provided in the table), multiplied by the average account value over the period, multiplied by the 184 days in the six-month period ended October 31, 2023, and divided by the 365 days in the Fund’s fiscal year ended October 31, 2023 (to reflect the six-month period). Expenses presented in the table include the expenses of any underlying portfolios in which the Fund may invest.
PGIM Global Total Return (USD Hedged) Fund 13
Schedule of Investments
as of October 31, 2023
| | | | | | | | | | | | | | | | |
| | | | |
| Description | | Interest Rate | | | Maturity Date | | | Principal Amount (000)# | | | Value | |
| | | | |
LONG-TERM INVESTMENTS 97.9% | | | | | | | | | | | | | | | | |
| | | | |
ASSET-BACKED SECURITIES 16.2% | | | | | | | | | | | | | | | | |
| | | | |
Cayman Islands 11.8% | | | | | | | | | | | | | | | | |
| | | | |
Atlas Static Senior Loan Fund Ltd., | | | | | | | | | | | | | | | | |
Series 2022-01A, Class A, 144A, 3 Month SOFR + 2.600% (Cap N/A, Floor 2.600%) | | | 7.994%(c) | | | | 07/15/30 | | | | 410 | | | $ | 412,378 | |
Bain Capital Credit CLO Ltd., | | | | | | | | | | | | | | | | |
Series 2018-01A, Class A1, 144A, 3 Month SOFR + 1.222% (Cap N/A, Floor 0.262%) | | | 6.634(c) | | | | 04/23/31 | | | | 237 | | | | 236,272 | |
Series 2019-03A, Class AR, 144A, 3 Month SOFR + 1.422% (Cap N/A, Floor 1.422%) | | | 6.834(c) | | | | 10/21/34 | | | | 500 | | | | 495,000 | |
Balboa Bay Loan Funding Ltd., | | | | | | | | | | | | | | | | |
Series 2020-01A, Class AR, 144A, 3 Month SOFR + 1.382% (Cap N/A, Floor 1.120%) | | | 6.794(c) | | | | 01/20/32 | | | | 1,000 | | | | 997,783 | |
Battalion CLO Ltd., | | | | | | | | | | | | | | | | |
Series 2018-12A, Class A1, 144A, 3 Month SOFR + 1.332% (Cap N/A, Floor 1.070%) | | | 6.708(c) | | | | 05/17/31 | | | | 247 | | | | 245,448 | |
Broad River BSL Funding CLO Ltd., | | | | | | | | | | | | | | | | |
Series 2020-01A, Class AR, 144A, 3 Month SOFR + 1.432% (Cap N/A, Floor 1.170%) | | | 6.847(c) | | | | 07/20/34 | | | | 750 | | | | 741,978 | |
Carlyle CLO Ltd., | | | | | | | | | | | | | | | | |
Series C17A, Class A1AR, 144A, 3 Month SOFR + 1.292% (Cap N/A, Floor 0.000%) | | | 6.682(c) | | | | 04/30/31 | | | | 244 | | | | 242,431 | |
Carlyle Global Market Strategies CLO Ltd., | | | | | | | | | | | | | | | | |
Series 2014-01A, Class A1R2, 144A, 3 Month SOFR + 1.232% (Cap N/A, Floor 0.970%) | | | 6.634(c) | | | | 04/17/31 | | | | 238 | | | | 237,007 | |
CIFC Funding Ltd., | | | | | | | | | | | | | | | | |
Series 2014-02RA, Class A1, 144A, 3 Month SOFR + 1.312% (Cap N/A, Floor 1.050%) | | | 6.710(c) | | | | 04/24/30 | | | | 399 | | | | 397,528 | |
Clover CLO Ltd., | | | | | | | | | | | | | | | | |
Series 2019-02A, Class AR, 144A, 3 Month SOFR + 1.362% (Cap N/A, Floor 1.362%) | | | 6.740(c) | | | | 10/25/33 | | | | 500 | | | | 495,315 | |
Greenwood Park CLO Ltd., | | | | | | | | | | | | | | | | |
Series 2018-01A, Class A2, 144A, 3 Month SOFR + 1.272% (Cap N/A, Floor 0.000%) | | | 6.665(c) | | | | 04/15/31 | | | | 246 | | | | 245,320 | |
Greywolf CLO Ltd., | | | | | | | | | | | | | | | | |
Series 2018-01A, Class A1, 144A, 3 Month SOFR + 1.290% (Cap N/A, Floor 0.000%) | | | 6.670(c) | | | | 04/26/31 | | | | 749 | | | | 745,566 | |
Jamestown CLO Ltd., | | | | | | | | | | | | | | | | |
Series 2019-14A, Class A1AR, 144A, 3 Month SOFR + 1.462% (Cap N/A, Floor 1.200%) | | | 6.877(c) | | | | 10/20/34 | | | | 250 | | | | 246,047 | |
Madison Park Funding Ltd., | | | | | | | | | | | | | | | | |
Series 2019-33A, Class AR, 144A, 3 Month SOFR + 1.290% (Cap N/A, Floor 1.290%) | | | 6.684(c) | | | | 10/15/32 | | | | 750 | | | | 744,492 | |
See Notes to Financial Statements.
PGIM Global Total Return (USD Hedged) Fund 15
Schedule of Investments (continued)
as of October 31, 2023
| | | | | | | | | | | | | | | | |
| | | | |
| Description | | Interest Rate | | | Maturity Date | | | Principal Amount (000)# | | | Value | |
ASSET-BACKED SECURITIES (Continued) | | | | | | | | | | | | | | | | |
| | | | |
Cayman Islands (cont’d.) | | | | | | | | | | | | | | | | |
| | | | |
MidOcean Credit CLO, | | | | | | | | | | | | | | | | |
Series 2018-08A, Class B, 144A, 3 Month SOFR + 1.912% (Cap N/A, Floor 0.000%) | | | 7.291%(c) | | | | 02/20/31 | | | | 250 | | | $ | 244,584 | |
Oaktree CLO Ltd., | | | | | | | | | | | | | | | | |
Series 2019-01A, Class A1R, 144A, 3 Month SOFR + 1.372% (Cap N/A, Floor 1.110%) | | | 6.784(c) | | | | 04/22/30 | | | | 900 | | | | 892,985 | |
OZLM Ltd., | | | | | | | | | | | | | | | | |
Series 2014-06A, Class A2AS, 144A, 3 Month SOFR + 2.012% (Cap N/A, Floor 0.000%) | | | 7.414(c) | | | | 04/17/31 | | | | 250 | | | | 246,761 | |
Palmer Square CLO Ltd., | | | | | | | | | | | | | | | | |
Series 2015-01A, Class A1A4, 144A, 3 Month SOFR + 1.392% (Cap N/A, Floor 1.392%) | | | 6.771(c) | | | | 05/21/34 | | | | 750 | | | | 743,524 | |
TCW CLO Ltd., | | | | | | | | | | | | | | | | |
Series 2017-01A, Class A1RR, 144A, 3 Month SOFR + 1.442% (Cap N/A, Floor 1.180%) | | | 6.832(c) | | | | 10/29/34 | | | | 250 | | | | 246,752 | |
Series 2020-01A, Class A1RR, 144A, 3 Month SOFR + 1.422% (Cap N/A, Floor 1.160%) | | | 6.837(c) | | | | 04/20/34 | | | | 750 | | | | 744,047 | |
Telos CLO Ltd., | | | | | | | | | | | | | | | | |
Series 2013-04A, Class AR, 144A, 3 Month SOFR + 1.502% (Cap N/A, Floor 0.000%) | | | 6.904(c) | | | | 01/17/30 | | | | 137 | | | | 135,735 | |
Trimaran Cavu Ltd., | | | | | | | | | | | | | | | | |
Series 2021-01A, Class A, 144A, 3 Month SOFR + 1.472% (Cap N/A, Floor 1.210%) | | | 6.884(c) | | | | 04/23/32 | | | | 500 | | | | 496,588 | |
Voya CLO Ltd., | | | | | | | | | | | | | | | | |
Series 2013-02A, Class A1R, 144A, 3 Month SOFR + 1.232% (Cap N/A, Floor 0.970%) | | | 6.610(c) | | | | 04/25/31 | | | | 220 | | | | 219,172 | |
Wellfleet CLO Ltd., | | | | | | | | | | | | | | | | |
Series 2018-03A, Class A1A, 144A, 3 Month SOFR + 1.512% (Cap N/A, Floor 1.250%) | | | 6.927(c) | | | | 01/20/32 | | | | 750 | | | | 746,276 | |
Wind River CLO Ltd., | | | | | | | | | | | | | | | | |
Series 2016-01KRA, Class A1R2, 144A, 3 Month SOFR + 1.472% (Cap N/A, Floor 1.210%) | | | 6.865(c) | | | | 10/15/34 | | | | 250 | | | | 246,498 | |
| | | | | | | | | | | | | | | | |
| | | | |
| | | | | | | | | | | | | | | 11,445,487 | |
| | | | |
Ireland 1.6% | | | | | | | | | | | | | | | | |
| | | | |
Ares European CLO DAC, | | | | | | | | | | | | | | | | |
Series 11A, Class B2R, 144A | | | 1.950 | | | | 04/15/32 | | | EUR | 500 | | | | 462,390 | |
Armada Euro CLO DAC, | | | | | | | | | | | | | | | | |
Series 02A, Class A3, 144A | | | 1.500 | | | | 11/15/31 | | | EUR | 228 | | | | 228,959 | |
See Notes to Financial Statements.
16
| | | | | | | | | | | | | | | | |
| | | | |
| Description | | Interest Rate | | | Maturity Date | | | Principal Amount (000)# | | | Value | |
ASSET-BACKED SECURITIES (Continued) | | | | | | | | | | | | | | | | |
| | | | |
Ireland (cont’d.) | | | | | | | | | | | | | | | | |
| | | | |
Carlyle Euro CLO DAC, | | | | | | | | | | | | | | | | |
Series 2021-02A, Class A1, 144A, 3 Month EURIBOR + 0.990% (Cap N/A, Floor 0.990%) | | | 4.955%(c) | | | | 10/15/35 | | | EUR | 300 | | | $ | 308,877 | |
Carlyle Global Market Strategies Euro CLO Ltd., | | | | | | | | | | | | | | | | |
Series 2014-02A, Class AR1, 144A, 3 Month EURIBOR + 0.750% (Cap N/A, Floor 0.750%) | | | 4.531(c) | | | | 11/15/31 | | | EUR | 500 | | | | 518,018 | |
| | | | | | | | | | | | | | | | |
| | | | |
| | | | | | | | | | | | | | | 1,518,244 | |
| | | | |
Spain 0.0% | | | | | | | | | | | | | | | | |
| | | | |
TFS, | | | | | | | | | | | | | | | | |
Series 2018-03, Class A1^ | | | 0.000(cc) | | | | 04/16/40 | | | EUR | —(r | ) | | | 1 | |
Series 2018-03, Class A1, 1 Month EURIBOR + 3.000%^ | | | 7.122(c) | | | | 03/15/26 | | | EUR | 50 | | | | 44,825 | |
| | | | | | | | | | | | | | | | |
| | | | |
| | | | | | | | | | | | | | | 44,826 | |
| | | | |
United States 2.8% | | | | | | | | | | | | | | | | |
| | | | |
Chase Auto Owner Trust, | | | | | | | | | | | | | | | | |
Series 2022-AA, Class D, 144A | | | 5.400 | | | | 06/25/30 | | | | 200 | | | | 187,928 | |
Enterprise Fleet Financing LLC, | | | | | | | | | | | | | | | | |
Series 2023-02, Class A2, 144A | | | 5.560 | | | | 04/22/30 | | | | 200 | | | | 198,254 | |
Exeter Automobile Receivables Trust, | | | | | | | | | | | | | | | | |
Series 2021-03A, Class D | | | 1.550 | | | | 06/15/27 | | | | 100 | | | | 91,647 | |
Ford Credit Auto Owner Trust, | | | | | | | | | | | | | | | | |
Series 2023-02, Class D, 144A | | | 6.600 | | | | 02/15/36 | | | | 100 | | | | 96,689 | |
Ford Credit Floorplan Master Owner Trust A, | | | | | | | | | | | | | | | | |
Series 2023-01, Class A1, 144A | | | 4.920 | | | | 05/15/28 | | | | 200 | | | | 195,735 | |
JPMorgan Mortgage Trust, | | | | | | | | | | | | | | | | |
Series 2023-HE02, Class A1, 144A, 30 Day Average SOFR + 1.700%
(Cap N/A, Floor 0.000%) | | | 7.021(c) | | | | 03/25/54 | | | | 24 | | | | 23,750 | |
Mariner Finance Issuance Trust, | | | | | | | | | | | | | | | | |
Series 2020-AA, Class A, 144A | | | 2.190 | | | | 08/21/34 | | | | 80 | | | | 77,402 | |
OneMain Direct Auto Receivables Trust, | | | | | | | | | | | | | | | | |
Series 2019-01A, Class A, 144A | | | 3.630 | | | | 09/14/27 | | | | 100 | | | | 96,826 | |
Series 2019-01A, Class D, 144A | | | 4.680 | | | | 04/14/31 | | | | 100 | | | | 93,693 | |
Series 2023-01A, Class D, 144A | | | 7.070 | | | | 02/14/33 | | | | 200 | | | | 194,770 | |
OneMain Financial Issuance Trust, | | | | | | | | | | | | | | | | |
Series 2023-01A, Class A, 144A | | | 5.500 | | | | 06/14/38 | | | | 300 | | | | 287,229 | |
Series 2023-02A, Class C, 144A | | | 6.740 | | | | 09/15/36 | | | | 100 | | | | 97,435 | |
Series 2023-02A, Class D, 144A | | | 7.520 | | | | 09/15/36 | | | | 100 | | | | 97,493 | |
Oportun Issuance Trust, | | | | | | | | | | | | | | | | |
Series 2022-02, Class A, 144A | | | 5.940 | | | | 10/09/29 | | | | 38 | | | | 38,076 | |
See Notes to Financial Statements.
PGIM Global Total Return (USD Hedged) Fund 17
Schedule of Investments (continued)
as of October 31, 2023
| | | | | | | | | | | | | | | | |
| | | | |
| Description | | Interest Rate | | | Maturity Date | | | Principal Amount (000)# | | | Value | |
ASSET-BACKED SECURITIES (Continued) | | | | | | | | | | | | | | | | |
| | | | |
United States (cont’d.) | | | | | | | | | | | | | | | | |
| | | | |
Regional Management Issuance Trust, | | | | | | | | | | | | | | | | |
Series 2022-01, Class A, 144A | | | 3.070% | | | | 03/15/32 | | | | 100 | | | $ | 93,339 | |
Santander Drive Auto Receivables Trust, | | | | | | | | | | | | | | | | |
Series 2022-05, Class C | | | 4.740 | | | | 10/16/28 | | | | 200 | | | | 193,680 | |
Series 2022-06, Class C | | | 4.960 | | | | 11/15/28 | | | | 100 | | | | 97,186 | |
TSTAT Ltd., | | | | | | | | | | | | | | | | |
Series 2022-01A, Class A1, 144A, 3 Month SOFR + 2.300% (Cap N/A, Floor 2.300%) | | | 7.626(c) | | | | 07/20/31 | | | | 602 | | | | 605,034 | |
| | | | | | | | | | | | | | | | |
| | | | |
| | | | | | | | | | | | | | | 2,766,166 | |
| | | | | | | | | | | | | | | | |
| | | | |
TOTAL ASSET-BACKED SECURITIES
(cost $16,191,866) | | | | | | | | | | | | | | | 15,774,723 | |
| | | | | | | | | | | | | | | | |
| | | | |
COMMERCIAL MORTGAGE-BACKED SECURITIES 8.8% | | | | | | | | | | | | | | | | |
| | | | |
Canada 0.0% | | | | | | | | | | | | | | | | |
| | | | |
Real Estate Asset Liquidity Trust, | | | | | | | | | | | | | | | | |
Series 2020-01A, Class A1, 144A | | | 2.381(cc) | | | | 02/12/55 | | | CAD | 18 | | | | 11,626 | |
| | | | | | | | | | | | | | | | |
| | | | |
Ireland 0.1% | | | | | | | | | | | | | | | | |
| | | | |
Last Mile Logistics Pan Euro Finance DAC, | | | | | | | | | | | | | | | | |
Series 01A, Class D, 144A, 3 Month EURIBOR + 1.900% (Cap N/A, Floor 1.900%) | | | 5.687(c) | | | | 08/17/33 | | | EUR | 98 | | | | 96,280 | |
| | | | | | | | | | | | | | | | |
| | | | |
United Kingdom 0.6% | | | | | | | | | | | | | | | | |
| | | | |
Deco DAC, | | | | | | | | | | | | | | | | |
Series 2019-RAM, Class B, SONIA + 3.607% (Cap N/A, Floor 3.607%) | | | 8.820(c) | | | | 08/07/30 | | | GBP | 167 | | | | 191,804 | |
Taurus DAC, | | | | | | | | | | | | | | | | |
Series 2021-UK4A, Class B, 144A, SONIA + 1.500% (Cap N/A, Floor 1.500%) | | | 6.719(c) | | | | 08/17/31 | | | GBP | 94 | | | | 109,832 | |
Series 2021-UK4A, Class C, 144A, SONIA + 1.750% (Cap N/A, Floor 1.750%) | | | 6.969(c) | | | | 08/17/31 | | | GBP | 94 | | | | 108,478 | |
Series 2021-UK4A, Class D, 144A, SONIA + 2.100% (Cap N/A, Floor 2.100%) | | | 7.319(c) | | | | 08/17/31 | | | GBP | 93 | | | | 106,422 | |
| | | | | | | | | | | | | | | | |
| | | | |
| | | | | | | | | | | | | | | 516,536 | |
| | | | |
United States 8.1% | | | | | | | | | | | | | | | | |
| | | | |
BANK, | | | | | | | | | | | | | | | | |
Series 2018-BN10, Class A4 | | | 3.428 | | | | 02/15/61 | | | | 243 | | | | 218,298 | |
See Notes to Financial Statements.
18
| | | | | | | | | | | | | | | | |
| | | | |
| Description | | Interest Rate | | | Maturity Date | | | Principal Amount (000)# | | | Value | |
| | | |
COMMERCIAL MORTGAGE-BACKED SECURITIES (Continued) | | | | | | | | | | | | | |
| | | | |
United States (cont’d.) | | | | | | | | | | | | | | | | |
| | | | |
BANK, (cont’d.) | | | | | | | | | | | | | | | | |
Series 2020-BN26, Class A3 | | | 2.155% | | | | 03/15/63 | | | | 200 | | | $ | 156,242 | |
Barclays Commercial Mortgage Securities Trust, | | | | | | | | | | | | | | | | |
Series 2018-CHRS, Class C, 144A | | | 4.267(cc) | | | | 08/05/38 | | | | 380 | | | | 284,041 | |
Benchmark Mortgage Trust, | | | | | | | | | | | | | | | | |
Series 2018-B02, Class A3 | | | 3.544 | | | | 02/15/51 | | | | 200 | | | | 188,097 | |
Series 2020-B17, Class A4 | | | 2.042 | | | | 03/15/53 | | | | 75 | | | | 57,570 | |
Series 2020-B20, Class A3 | | | 1.945 | | | | 10/15/53 | | | | 100 | | | | 79,989 | |
BX Commercial Mortgage Trust, | | | | | | | | | | | | | | | | |
Series 2019-XL, Class F, 144A, 1 Month SOFR + 2.114% (Cap N/A, Floor 2.000%) | | | 7.449(c) | | | | 10/15/36 | | | | 85 | | | | 83,714 | |
Series 2019-XL, Class G, 144A, 1 Month SOFR + 2.414% (Cap N/A, Floor 2.300%) | | | 7.749(c) | | | | 10/15/36 | | | | 85 | | | | 83,244 | |
Series 2019-XL, Class J, 144A, 1 Month SOFR + 2.764% (Cap N/A, Floor 2.650%) | | | 8.099(c) | | | | 10/15/36 | | | | 517 | | | | 504,243 | |
Series 2022-AHP, Class E, 144A, 1 Month SOFR + 3.040% (Cap N/A, Floor 3.040%) | | | 8.375(c) | | | | 01/17/39 | | | | 400 | | | | 381,640 | |
BX Trust, | | | | | | | | | | | | | | | | |
Series 2022-LBA06, Class E, 144A, 1 Month SOFR + 2.700% (Cap N/A, Floor 2.700%) | | | 8.035(c) | | | | 01/15/39 | | | | 350 | | | | 333,777 | |
Citigroup Commercial Mortgage Trust, | | | | | | | | | | | | | | | | |
Series 2018-B02, Class A3 | | | 3.744 | | | | 03/10/51 | | | | 150 | | | | 135,397 | |
Cold Storage Trust, | | | | | | | | | | | | | | | | |
Series 2020-ICE05, Class E, 144A, 1 Month SOFR + 2.880% (Cap N/A, Floor 2.766%) | | | 8.216(c) | | | | 11/15/37 | | | | 98 | | | | 97,066 | |
Commercial Mortgage Trust, | | | | | | | | | | | | | | | | |
Series 2014-CR17, Class A5 | | | 3.977 | | | | 05/10/47 | | | | 1,000 | | | | 985,942 | |
Series 2014-UBS04, Class A5 | | | 3.694 | | | | 08/10/47 | | | | 1,000 | | | | 974,231 | |
Credit Suisse Mortgage Capital Certificates, | | | | | | | | | | | | | | | | |
Series 2019-ICE04, Class E, 144A, 1 Month SOFR + 2.197% (Cap N/A, Floor 2.150%) | | | 7.532(c) | | | | 05/15/36 | | | | 199 | | | | 196,340 | |
FHLMC Multifamily Structured Pass-Through Certificates, | | | | | | | | | | | | | | | | |
Series K052, Class X1, IO | | | 0.628(cc) | | | | 11/25/25 | | | | 4,219 | | | | 43,516 | |
Series K111, Class X1, IO | | | 1.571(cc) | | | | 05/25/30 | | | | 318 | | | | 24,635 | |
Series K113, Class X1, IO | | | 1.380(cc) | | | | 06/25/30 | | | | 914 | | | | 63,279 | |
Series KG03, Class X1, IO | | | 1.377(cc) | | | | 06/25/30 | | | | 1,047 | | | | 69,130 | |
GS Mortgage Securities Trust, | | | | | | | | | | | | | | | | |
Series 2014-GC26, Class A5 | | | 3.629 | | | | 11/10/47 | | | | 1,000 | | | | 965,313 | |
Series 2018-GS09, Class A3 | | | 3.727 | | | | 03/10/51 | | | | 125 | | | | 113,658 | |
See Notes to Financial Statements.
PGIM Global Total Return (USD Hedged) Fund 19
Schedule of Investments (continued)
as of October 31, 2023
| | | | | | | | | | | | |
| | | | |
| Description | | Interest Rate | | Maturity Date | | Principal Amount (000)# | | | Value | |
| | | |
COMMERCIAL MORTGAGE-BACKED SECURITIES (Continued) | | | | | | | | | | |
| | | | |
United States (cont’d.) | | | | | | | | | | | | |
| | | | |
JPMorgan Chase Commercial Mortgage Securities Trust, | | | | | | | | | | | | |
Series 2021-NYAH, Class G, 144A, 1 Month SOFR + 2.754% (Cap N/A, Floor 2.640%) | | 8.089%(c) | | 06/15/38 | | | 150 | | | $ | 109,004 | |
ONE Mortgage Trust, | | | | | | | | | | | | |
Series 2021-PARK, Class E, 144A, 1 Month SOFR + 1.864% (Cap N/A, Floor 1.750%) | | 7.198(c) | | 03/15/36 | | | 100 | | | | 90,303 | |
One New York Plaza Trust, | | | | | | | | | | | | |
Series 2020-01NYP, Class C, 144A, 1 Month SOFR + 2.314% (Cap N/A, Floor 2.200%) | | 7.649(c) | | 01/15/36 | | | 100 | | | | 85,500 | |
Series 2020-01NYP, Class D, 144A, 1 Month SOFR + 2.864% (Cap N/A, Floor 2.750%) | | 8.199(c) | | 01/15/36 | | | 100 | | | | 77,000 | |
UBS Commercial Mortgage Trust, | | | | | | | | | | | | |
Series 2018-C08, Class A3 | | 3.720 | | 02/15/51 | | | 200 | | | | 178,742 | |
Wells Fargo Commercial Mortgage Trust, | | | | | | | | | | | | |
Series 2016-LC24, Class A3 | | 2.684 | | 10/15/49 | | | 213 | | | | 194,126 | |
Series 2021-C59, Class A3 | | 1.958 | | 04/15/54 | | | 600 | | | | 489,357 | |
Series 2021-FCMT, Class C, 144A, 1 Month SOFR + 2.514% (Cap N/A, Floor 2.400%) | | 7.849(c) | | 05/15/31 | | | 100 | | | | 92,096 | |
Series 2021-FCMT, Class E, 144A, 1 Month SOFR + 4.614% (Cap N/A, Floor 4.500%) | | 9.949(c) | | 05/15/31 | | | 600 | | | | 524,157 | |
| | | | | | | | | | | | |
| | | | |
| | | | | | | | | | | 7,879,647 | |
| | | | | | | | | | | | |
| | | | |
TOTAL COMMERCIAL MORTGAGE-BACKED SECURITIES
(cost $9,198,228) | | | | | | | | | | | 8,504,089 | |
| | | | | | | | | | | | |
| | | | |
CONVERTIBLE BOND 0.0% | | | | | | | | | | | | |
| | | | |
Jamaica | | | | | | | | | | | | |
Digicel Group Holdings Ltd., | | | | | | | | | | | | |
Sub. Notes, 144A, Cash coupon 7.000% (original cost $763; purchased 03/21/23 - 04/03/23)(f) (cost $763) | | 7.000 | | 11/16/23(d)(oo) | | | 5 | | | | 259 | |
| | | | | | | | | | | | |
| | | | |
CORPORATE BONDS 36.1% | | | | | | | | | | | | |
| | | | |
Belgium 0.1% | | | | | | | | | | | | |
Anheuser-Busch Cos. LLC/Anheuser-Busch InBev Worldwide, Inc.,
Gtd. Notes | | 4.900 | | 02/01/46 | | | 140 | | | | 115,889 | |
See Notes to Financial Statements.
20
| | | | | | | | | | | | |
| | | | |
| Description | | Interest Rate | | Maturity Date | | Principal Amount (000)# | | | Value | |
| | | | |
CORPORATE BONDS (Continued) | | | | | | | | | | | | |
| | | | |
Brazil 0.4% | | | | | | | | | | | | |
| | | | |
Petrobras Global Finance BV, | | | | | | | | | | | | |
Gtd. Notes | | 5.375% | | 10/01/29 | | GBP | 100 | | | $ | 106,063 | |
Gtd. Notes | | 6.625 | | 01/16/34 | | GBP | 300 | | | | 320,499 | |
| | | | | | | | | | | | |
| | | | |
| | | | | | | | | | | 426,562 | |
| | | | |
Bulgaria 0.3% | | | | | | | | | | | | |
Bulgarian Energy Holding EAD, | | | | | | | | | | | | |
Sr. Unsec’d. Notes | | 2.450 | | 07/22/28 | | EUR | 300 | | | | 260,293 | |
| | | | |
Canada 1.1% | | | | | | | | | | | | |
Bombardier, Inc., | | | | | | | | | | | | |
Sr. Unsec’d. Notes, 144A | | 7.125 | | 06/15/26 | | | 25 | | | | 23,982 | |
Sr. Unsec’d. Notes, 144A | | 7.500 | | 03/15/25 | | | 9 | | | | 8,966 | |
Sr. Unsec’d. Notes, 144A | | 7.500 | | 02/01/29 | | | 25 | | | | 23,156 | |
Sr. Unsec’d. Notes, 144A | | 7.875 | | 04/15/27 | | | 80 | | | | 77,000 | |
Brookfield Residential Properties, Inc./Brookfield Residential US LLC, | | | | | | | | | | | | |
Gtd. Notes, 144A | | 4.875 | | 02/15/30 | | | 35 | | | | 26,600 | |
Cenovus Energy, Inc., | | | | | | | | | | | | |
Sr. Unsec’d. Notes | | 2.650 | | 01/15/32 | | | 15 | | | | 11,350 | |
Sr. Unsec’d. Notes | | 3.750 | | 02/15/52 | | | 10 | | | | 6,235 | |
Fairfax Financial Holdings Ltd., | | | | | | | | | | | | |
Sr. Unsec’d. Notes | | 5.625 | | 08/16/32 | | | 300 | | | | 275,986 | |
Hydro-Quebec, | | | | | | | | | | | | |
Local Gov’t. Gtd. Notes, Series HK | | 9.375 | | 04/15/30 | | | 150 | | | | 179,884 | |
Local Gov’t. Gtd. Notes, Series JN | | 5.000 | | 02/15/50 | | CAD | 50 | | | | 36,733 | |
Mattamy Group Corp., | | | | | | | | | | | | |
Sr. Unsec’d. Notes, 144A | | 4.625 | | 03/01/30 | | | 125 | | | | 101,719 | |
Ontario Teachers’ Cadillac Fairview Properties Trust, | | | | | | | | | | | | |
Sr. Unsec’d. Notes, 144A | | 3.875 | | 03/20/27 | | | 300 | | | | 274,490 | |
Teck Resources Ltd., | | | | | | | | | | | | |
Sr. Unsec’d. Notes | | 5.400 | | 02/01/43 | | | 60 | | | | 48,084 | |
| | | | | | | | | | | | |
| | | | |
| | | | | | | | | | | 1,094,185 | |
| | | | |
China 1.8% | | | | | | | | | | | | |
Agricultural Development Bank of China, | | | | | | | | | | | | |
Sr. Unsec’d. Notes | | 3.800 | | 10/27/30 | | CNH | 6,000 | | | | 853,617 | |
Aircraft Finance Co. Ltd., | | | | | | | | | | | | |
Sr. Sec’d. Notes, Series B | | 4.100 | | 03/29/26 | | | 46 | | | | 44,198 | |
See Notes to Financial Statements.
PGIM Global Total Return (USD Hedged) Fund 21
Schedule of Investments (continued)
as of October 31, 2023
| | | | | | | | | | | | |
| | | | |
| Description | | Interest Rate | | Maturity Date | | Principal Amount (000)# | | | Value | |
| | | | |
CORPORATE BONDS (Continued) | | | | | | | | | | | | |
| | | | |
China (cont’d.) | | | | | | | | | | | | |
| | | | |
China Development Bank, | | | | | | | | | | | | |
Sr. Unsec’d. Notes | �� | 4.300% | | 08/02/32 | | CNH | 5,000 | | | $ | 737,756 | |
Unsec’d. Notes | | 4.200 | | 01/19/27 | | CNH | 1,000 | | | | 141,392 | |
| | | | | | | | | | | | |
| | | | |
| | | | | | | | | | | 1,776,963 | |
| | | | |
Denmark 0.2% | | | | | | | | | | | | |
| | | | |
Danske Bank A/S, | | | | | | | | | | | | |
Sub. Notes, EMTN | | 2.500(ff) | | 06/21/29 | | EUR | 150 | | | | 155,422 | |
| | | | |
France 2.3% | | | | | | | | | | | | |
| | | | |
Banque Federative du Credit Mutuel SA, | | | | | | | | | | | | |
Sr. Unsec’d. Notes, 144A | | 1.604 | | 10/04/26 | | | 200 | | | | 175,526 | |
BNP Paribas SA, | | | | | | | | | | | | |
Sr. Unsec’d. Notes, 144A | | 2.159(ff) | | 09/15/29 | | | 200 | | | | 162,601 | |
Sr. Unsec’d. Notes, 144A | | 2.871(ff) | | 04/19/32 | | | 400 | | | | 304,070 | |
BPCE SA, | | | | | | | | | | | | |
Sr. Unsec’d. Notes, 144A | | 2.045(ff) | | 10/19/27 | | | 250 | | | | 217,715 | |
Credit Agricole Assurances SA, | | | | | | | | | | | | |
Sub. Notes | | 4.250(ff) | | 01/13/25(oo) | | EUR | 100 | | | | 103,768 | |
La Poste SA, | | | | | | | | | | | | |
Sr. Unsec’d. Notes, EMTN | | 1.375 | | 04/21/32 | | EUR | 200 | | | | 170,952 | |
Regie Autonome des Transports Parisiens EPIC, | | | | | | | | | | | | |
Sr. Unsec’d. Notes, EMTN | | 0.400 | | 12/19/36 | | EUR | 63 | | | | 55,242 | |
SNCF Reseau, | | | | | | | | | | | | |
Sr. Unsec’d. Notes, Series MPLE | | 4.700 | | 06/01/35 | | CAD | 100 | | | | 69,429 | |
Societe Generale SA, | | | | | | | | | | | | |
Gtd. Notes, 144A | | 2.797(ff) | | 01/19/28 | | | 200 | | | | 175,719 | |
Sr. Unsec’d. Notes, 144A | | 1.488(ff) | | 12/14/26 | | | 200 | | | | 178,355 | |
Sr. Unsec’d. Notes, 144A, MTN | | 2.625 | | 01/22/25 | | | 255 | | | | 242,699 | |
Sr. Unsec’d. Notes, EMTN | | 0.250 | | 07/08/27 | | EUR | 400 | | | | 367,304 | |
| | | | | | | | | | | | |
| | | | |
| | | | | | | | | | | 2,223,380 | |
| | | | |
Germany 1.2% | | | | | | | | | | | | |
| | | | |
Allianz SE, | | | | | | | | | | | | |
Jr. Sub. Notes | | 3.375(ff) | | 09/18/24(oo) | | EUR | 100 | | | | 103,607 | |
Deutsche Bahn Finance GMBH, | | | | | | | | | | | | |
Gtd. Notes, MTN | | 3.800 | | 09/27/27 | | AUD | 100 | | | | 59,332 | |
Deutsche Bank AG, | | | | | | | | | | | | |
Sr. Unsec’d. Notes | | 0.898 | | 05/28/24 | | | 265 | | | | 256,988 | |
Sr. Unsec’d. Notes | | 1.447(ff) | | 04/01/25 | | | 210 | | | | 204,975 | |
Sr. Unsec’d. Notes | | 2.552(ff) | | 01/07/28 | | | 150 | | | | 129,622 | |
See Notes to Financial Statements.
22
| | | | | | | | | | | | | | | | |
| | | | |
| Description | | Interest Rate | | | Maturity Date | | | Principal Amount (000)# | | | Value | |
| | | | |
CORPORATE BONDS (Continued) | | | | | | | | | | | | | | | | |
| | | | |
Germany (cont’d.) | | | | | | | | | | | | | | | | |
| | | | |
Deutsche Bank AG, (cont’d.) | | | | | | | | | | | | | | | | |
Sub. Notes, EMTN | | | 3.662%(ff) | | | | 04/10/25 | | | CNH | 1,000 | | | $ | 134,592 | |
TK Elevator Midco GmbH, | | | | | | | | | | | | | | | | |
Sr. Sec’d. Notes | | | 4.375 | | | | 07/15/27 | | | EUR | 153 | | | | 145,879 | |
Volkswagen International Finance NV, | | | | | | | | | | | | | | | | |
Gtd. Notes | | | 4.625(ff) | | | | 03/24/26(oo) | | | EUR | 100 | | | | 99,821 | |
| | | | | | | | | | | | | | | | |
| | | | |
| | | | | | | | | | | | | | | 1,134,816 | |
| | | | |
Hong Kong 0.3% | | | | | | | | | | | | | | | | |
| | | | |
HKT Capital No. 3 Ltd., | | | | | | | | | | | | | | | | |
Gtd. Notes | | | 1.650 | | | | 04/10/27 | | | EUR | 200 | | | | 187,057 | |
Sun Hung Kai Properties Capital Market Ltd., | | | | | | | | | | | | | | | | |
Gtd. Notes, EMTN | | | 3.200 | | | | 08/14/27 | | | CNH | 1,000 | | | | 133,918 | |
| | | | | | | | | | | | | | | | |
| | | | |
| | | | | | | | | | | | | | | 320,975 | |
| | | | |
Hungary 0.1% | | | | | | | | | | | | | | | | |
| | | | |
MFB Magyar Fejlesztesi Bank Zrt, | | | | | | | | | | | | | | | | |
Gov’t. Gtd. Notes | | | 0.375 | | | | 06/09/26 | | | EUR | 100 | | | | 93,401 | |
| | | | |
India 0.5% | | | | | | | | | | | | | | | | |
| | | | |
NTPC Ltd., | | | | | | | | | | | | | | | | |
Sr. Unsec’d. Notes, EMTN | | | 2.750 | | | | 02/01/27 | | | EUR | 300 | | | | 295,289 | |
Power Finance Corp. Ltd., | | | | | | | | | | | | | | | | |
Sr. Unsec’d. Notes, GMTN | | | 1.841 | | | | 09/21/28 | | | EUR | 200 | | | | 177,990 | |
| | | | | | | | | | | | | | | | |
| | | | |
| | | | | | | | | | | | | | | 473,279 | |
| | | | |
Indonesia 0.2% | | | | | | | | | | | | | | | | |
| | | | |
Perusahaan Perseroan Persero PT Perusahaan Listrik Negara, | | | | | | | | | | | | | | | | |
Sr. Unsec’d. Notes | | | 2.875 | | | | 10/25/25 | | | EUR | 100 | | | | 101,759 | |
Sr. Unsec’d. Notes, 144A | | | 1.875 | | | | 11/05/31 | | | EUR | 100 | | | | 80,607 | |
| | | | | | | | | | | | | | | | |
| | | | |
| | | | | | | | | | | | | | | 182,366 | |
| | | | |
Israel 0.2% | | | | | | | | | | | | | | | | |
| | | | |
Israel Electric Corp. Ltd.,
Sec’d. Notes, 144A, GMTN | | | 3.750 | | | | 02/22/32 | | | | 200 | | | | 152,000 | |
See Notes to Financial Statements.
PGIM Global Total Return (USD Hedged) Fund 23
Schedule of Investments (continued)
as of October 31, 2023
| | | | | | | | | | | | | | | | |
| | | | |
| Description | | Interest Rate | | | Maturity Date | | | Principal Amount (000)# | | | Value | |
| | | | |
CORPORATE BONDS (Continued) | | | | | | | | | | | | | | | | |
| | | | |
Italy 0.7% | | | | | | | | | | | | | | | | |
| | | | |
Cassa Depositi e Prestiti SpA, | | | | | | | | | | | | | | | | |
Sr. Unsec’d. Notes, 144A | | | 5.750% | | | | 05/05/26 | | | | 200 | | | $ | 195,812 | |
Nexi SpA, | | | | | | | | | | | | | | | | |
Sr. Unsec’d. Notes | | | 2.125 | | | | 04/30/29 | | | EUR | 414 | | | | 358,876 | |
Rossini Sarl, | | | | | | | | | | | | | | | | |
Sr. Sec’d. Notes, 144A | | | 6.750 | | | | 10/30/25 | | | EUR | 100 | | | | 105,429 | |
| | | | | | | | | | | | | | | | |
| | | | |
| | | | | | | | | | | | | | | 660,117 | |
| | | | |
Jamaica 0.2% | | | | | | | | | | | | | | | | |
| | | | |
Digicel Group Holdings Ltd., | | | | | | | | | | | | | | | | |
Sr. Unsec’d. Notes, 144A, Cash coupon 5.000% and PIK 3.000% (original cost $5,816; purchased 03/21/23 - 03/22/23)(f) | | | 8.000 | | | | 04/01/25(d) | | | | 15 | | | | 2,964 | |
Digicel International Finance Ltd./Digicel International Holdings Ltd., | | | | | | | | | | | | | | | | |
Gtd. Notes, 144A (original cost $97,375; purchased 04/16/21)(f) | | | 8.000 | | | | 12/31/26(d) | | | | 100 | | | | 2,000 | |
Gtd. Notes, 144A, Cash coupon 13.000% (original cost $3,502; purchased 10/19/23)(f) | | | 13.000 | | | | 12/31/25(d) | | | | 5 | | | | 3,452 | |
Sr. Sec’d. Notes, 144A (original cost $180,806; purchased 10/19/23)(f) | | | 8.750 | | | | 05/25/24 | | | | 200 | | | | 183,186 | |
Digicel Ltd., | | | | | | | | | | | | | | | | |
Gtd. Notes, 144A | | | 6.750 | | | | 03/01/23(d) | | | | 200 | | | | 5,000 | |
| | | | | | | | | | | | | | | | |
| | | | |
| | | | | | | | | | | | | | | 196,602 | |
| | | | |
Japan 0.3% | | | | | | | | | | | | | | | | |
| | | | |
Mitsubishi UFJ Financial Group, Inc., | | | | | | | | | | | | | | | | |
Sr. Unsec’d. Notes | | | 1.538(ff) | | | | 07/20/27 | | | | 210 | | | | 185,419 | |
Nomura Holdings, Inc., | | | | | | | | | | | | | | | | |
Sr. Unsec’d. Notes | | | 2.999 | | | | 01/22/32 | | | | 200 | | | | 150,775 | |
| | | | | | | | | | | | | | | | |
| | | | |
| | | | | | | | | | | | | | | 336,194 | |
| | | | |
Kazakhstan 0.3% | | | | | | | | | | | | | | | | |
| | | | |
Kazakhstan Temir Zholy National Co. JSC, | | | | | | | | | | | | | | | | |
Gtd. Notes | | | 3.250 | | | | 12/05/23 | | | CHF | 300 | | | | 320,055 | |
| | | | |
Luxembourg 0.3% | | | | | | | | | | | | | | | | |
| | | | |
Blackstone Property Partners Europe Holdings Sarl, | | | | | | | | | | | | | | | | |
Sr. Unsec’d. Notes, EMTN | | | 1.000 | | | | 05/04/28 | | | EUR | 400 | | | | 332,218 | |
See Notes to Financial Statements.
24
| | | | | | | | | | | | | | | | |
| | | | |
| Description | | Interest Rate | | | Maturity Date | | | Principal Amount (000)# | | | Value | |
| | | | |
CORPORATE BONDS (Continued) | | | | | | | | | | | | | | | | |
| | | | |
Malta 0.2% | | | | | | | | | | | | | | | | |
| | | | |
Freeport Terminal Malta PLC, | | | | | | | | | | | | | | | | |
Gov’t. Gtd. Notes, 144A | | | 7.250% | | | | 05/15/28 | | | | 200 | | | $ | 210,063 | |
| | | | |
Mexico 1.0% | | | | | | | | | | | | | | | | |
| | | | |
Comision Federal de Electricidad, | | | | | | | | | | | | | | | | |
Sr. Unsec’d. Notes | | | 5.000 | | | | 09/29/36 | | | | 141 | | | | 115,078 | |
Mexico City Airport Trust, | | | | | | | | | | | | | | | | |
Sr. Sec’d. Notes, 144A | | | 3.875 | | | | 04/30/28 | | | | 200 | | | | 176,536 | |
Petroleos Mexicanos, | | | | | | | | | | | | | | | | |
Gtd. Notes | | | 3.625 | | | | 11/24/25 | | | EUR | 200 | | | | 190,411 | |
Gtd. Notes, EMTN | | | 2.750 | | | | 04/21/27 | | | EUR | 200 | | | | 163,788 | |
Gtd. Notes, EMTN | | | 4.875 | | | | 02/21/28 | | | EUR | 400 | | | | 338,931 | |
| | | | | | | | | | | | | | | | |
| | | | |
| | | | | | | | | | | | | | | 984,744 | |
| | | | |
Netherlands 0.7% | | | | | | | | | | | | | | | | |
| | | | |
ABN AMRO Bank NV, | | | | | | | | | | | | | | | | |
Sr. Unsec’d. Notes, 144A, MTN | | | 6.575(ff) | | | | 10/13/26 | | | | 300 | | | | 299,431 | |
Cooperatieve Rabobank UA, | | | | | | | | | | | | | | | | |
Sr. Unsec’d. Notes, GMTN | | | 3.500 | | | | 12/14/26 | | | AUD | 90 | | | | 53,196 | |
JDE Peet’s NV, | | | | | | | | | | | | | | | | |
Gtd. Notes, 144A | | | 1.375 | | | | 01/15/27 | | | | 150 | | | | 128,810 | |
OCI NV, | | | | | | | | | | | | | | | | |
Sr. Sec’d. Notes | | | 3.625 | | | | 10/15/25 | | | EUR | 225 | | | | 232,702 | |
| | | | | | | | | | | | | | | | |
| | | | |
| | | | | | | | | | | | | | | 714,139 | |
| | | | |
Norway 0.2% | | | | | | | | | | | | | | | | |
| | | | |
Aker BP ASA, | | | | | | | | | | | | | | | | |
Sr. Unsec’d. Notes, 144A | | | 5.600 | | | | 06/13/28 | | | | 155 | | | | 150,389 | |
| | | | |
Peru 0.0% | | | | | | | | | | | | | | | | |
| | | | |
Peru Enhanced Pass-Through Finance Ltd., | | | | | | | | | | | | | | | | |
Pass-Through Certificates | | | 1.962(s) | | | | 06/02/25 | | | | 37 | | | | 35,232 | |
| | | | |
Philippines 0.5% | | | | | | | | | | | | | | | | |
| | | | |
Bangko Sentral ng Pilipinas International Bond, | | | | | | | | | | | | | | | | |
Sr. Unsec’d. Notes, Series A | | | 8.600 | | | | 06/15/27 | | | | 276 | | | | 317,209 | |
Power Sector Assets & Liabilities Management Corp., | | | | | | | | | | | | | | | | |
Gov’t. Gtd. Notes | | | 7.390 | | | | 12/02/24 | | | | 123 | | | | 124,341 | |
| | | | | | | | | | | | | | | | |
| | | | |
| | | | | | | | | | | | | | | 441,550 | |
See Notes to Financial Statements.
PGIM Global Total Return (USD Hedged) Fund 25
Schedule of Investments (continued)
as of October 31, 2023
| | | | | | | | | | | | | | | | |
| | | | |
| Description | | Interest Rate | | | Maturity Date | | | Principal Amount (000)# | | | Value | |
| | | | |
CORPORATE BONDS (Continued) | | | | | | | | | | | | | | | | |
| | | | |
Poland 0.3% | | | | | | | | | | | | | | | | |
| | | | |
Bank Gospodarstwa Krajowego, | | | | | | | | | | | | | | | | |
Gov’t. Gtd. Notes, 144A, MTN | | | 5.375% | | | | 05/22/33 | | | | 200 | | | $ | 186,000 | |
Gov’t. Gtd. Notes, EMTN | | | 3.000 | | | | 05/30/29 | | | EUR | 100 | | | | 97,874 | |
| | | | | | | | | | | | | | | | |
| | | | |
| | | | | | | | | | | | | | | 283,874 | |
| | | | |
Portugal 0.1% | | | | | | | | | | | | | | | | |
| | | | |
CP - Comboios de Portugal EPE, | | | | | | | | | | | | | | | | |
Sr. Unsec’d. Notes | | | 5.700 | | | | 03/05/30 | | | EUR | 100 | | | | 113,321 | |
| | | | |
Russia 0.3% | | | | | | | | | | | | | | | | |
| | | | |
Gazprom PJSC Via Gaz Capital SA, | | | | | | | | | | | | | | | | |
Sr. Unsec’d. Notes | | | 4.250 | | | | 04/06/24 | | | GBP | 300 | | | | 288,062 | |
| | | | |
Saudi Arabia 0.3% | | | | | | | | | | | | | | | | |
| | | | |
Gaci First Investment Co., | | | | | | | | | | | | | | | | |
Gtd. Notes | | | 4.750 | | | | 02/14/30 | | | | 300 | | | | 281,625 | |
| | | | |
Singapore 0.1% | | | | | | | | | | | | | | | | |
| | | | |
Singapore Telecommunications Ltd., | | | | | | | | | | | | | | | | |
Sr. Unsec’d. Notes, 144A | | | 7.375 | | | | 12/01/31 | | | | 67 | | | | 73,222 | |
| | | | |
Slovenia 0.1% | | | | | | | | | | | | | | | | |
| | | | |
United Group BV, | | | | | | | | | | | | | | | | |
Sr. Sec’d. Notes | | | 3.625 | | | | 02/15/28 | | | EUR | 150 | | | | 130,492 | |
| | | | |
South Africa 0.6% | | | | | | | | | | | | | | | | |
| | | | |
Eskom Holdings SOC Ltd., | | | | | | | | | | | | | | | | |
Gov’t. Gtd. Notes, MTN | | | 6.350 | | | | 08/10/28 | | | | 600 | | | | 543,000 | |
| | | | |
Spain 0.9% | | | | | | | | | | | | | | | | |
| | | | |
Banco Santander SA, | | | | | | | | | | | | | | | | |
Sr. Unsec’d. Notes | | | 1.722(ff) | | | | 09/14/27 | | | | 200 | | | | 173,034 | |
Sr. Unsec’d. Notes | | | 5.147 | | | | 08/18/25 | | | | 200 | | | | 194,608 | |
Cellnex Finance Co. SA, | | | | | | | | | | | | | | | | |
Gtd. Notes, EMTN | | | 2.000 | | | | 02/15/33 | | | EUR | 300 | | | | 240,231 | |
Cellnex Telecom SA, | | | | | | | | | | | | | | | | |
Sr. Unsec’d. Notes, EMTN | | | 1.750 | | | | 10/23/30 | | | EUR | 100 | | | | 84,819 | |
Iberdrola International BV, | | | | | | | | | | | | | | | | |
Gtd. Notes, Series NC6 | | | 1.450(ff) | | | | 11/09/26(oo) | | | EUR | 200 | | | | 183,889 | |
| | | | | | | | | | | | | | | | |
| | | | |
| | | | | | | | | | | | | | | 876,581 | |
See Notes to Financial Statements.
26
| | | | | | | | | | | | | | | | |
| | | | |
| Description | | Interest Rate | | | Maturity Date | | | Principal Amount (000)# | | | Value | |
| | | | |
CORPORATE BONDS (Continued) | | | | | | | | | | | | | | | | |
| | | | |
Supranational Bank 0.4% | | | | | | | | | | | | | | | | |
| | | | |
Corp. Andina de Fomento, | | | | | | | | | | | | | | | | |
Sr. Unsec’d. Notes | | | 4.500% | | | | 03/07/28 | | | EUR | 200 | | | $ | 213,733 | |
European Bank for Reconstruction & Development, | | | | | | | | | | | | | | | | |
Sr. Unsec’d. Notes, EMTN | | | 4.250 | | | | 02/07/28 | | | IDR | 300,000 | | | | 17,316 | |
European Investment Bank, | | | | | | | | | | | | | | | | |
Sr. Unsec’d. Notes, 144A, EMTN | | | 5.400 | | | | 01/05/45 | | | CAD | 50 | | | | 37,858 | |
International Bank for Reconstruction & Development, | | | | | | | | | | | | | | | | |
Sr. Unsec’d. Notes, SOFR Index + 0.262% (Cap 1.820%, Floor 0.000%) | | | 1.820(c) | | | | 08/11/26 | | | | 100 | | | | 90,343 | |
| | | | | | | | | | | | | | | | |
| | | | |
| | | | | | | | | | | | | | | 359,250 | |
| | | | |
Switzerland 1.3% | | | | | | | | | | | | | | | | |
| | | | |
Credit Suisse AG, | | | | | | | | | | | | | | | | |
Sr. Unsec’d. Notes | | | 5.000 | | | | 07/09/27 | | | | 450 | | | | 429,515 | |
Sr. Unsec’d. Notes | | | 7.500 | | | | 02/15/28 | | | | 250 | | | | 259,732 | |
UBS Group AG, | | | | | | | | | | | | | | | | |
Sr. Unsec’d. Notes, 144A | | | 1.364(ff) | | | | 01/30/27 | | | | 200 | | | | 177,436 | |
Sr. Unsec’d. Notes, 144A | | | 1.494(ff) | | | | 08/10/27 | | | | 200 | | | | 173,268 | |
Sr. Unsec’d. Notes, 144A | | | 2.593(ff) | | | | 09/11/25 | | | | 250 | | | | 240,616 | |
| | | | | | | | | | | | | | | | |
| | | | |
| | | | | | | | | | | | | | | 1,280,567 | |
| | | | |
United Arab Emirates 1.1% | | | | | | | | | | | | | | | | |
| | | | |
DP World Ltd., | | | | | | | | | | | | | | | | |
Sr. Unsec’d. Notes | | | 2.375 | | | | 09/25/26 | | | EUR | 200 | | | | 197,587 | |
Sr. Unsec’d. Notes | | | 4.250 | | | | 09/25/30 | | | GBP | 100 | | | | 104,729 | |
Emirates NBD Bank PJSC, | | | | | | | | | | | | | | | | |
Sr. Unsec’d. Notes, MTN | | | 4.750 | | | | 02/09/28 | | | AUD | 400 | | | | 241,251 | |
First Abu Dhabi Bank PJSC, | | | | | | | | | | | | | | | | |
Sr. Unsec’d. Notes, EMTN | | | 0.875 | | | | 12/09/25 | | | GBP | 200 | | | | 215,509 | |
MDGH GMTN RSC Ltd., | | | | | | | | | | | | | | | | |
Gtd. Notes, EMTN | | | 6.875 | | | | 03/14/26 | | | GBP | 100 | | | | 123,225 | |
Gtd. Notes, GMTN | | | 0.375 | | | | 03/10/27 | | | EUR | 200 | | | | 185,923 | |
| | | | | | | | | | | | | | | | |
| | | | |
| | | | | | | | | | | | | | | 1,068,224 | |
| | | | |
United Kingdom 3.2% | | | | | | | | | | | | | | | | |
| | | | |
Barclays Bank PLC, | | | | | | | | | | | | | | | | |
Sr. Unsec’d. Notes, EMTN | | | 0.500 | | | | 01/28/33 | | | MXN | 10,000 | | | | 227,146 | |
Barclays PLC, | | | | | | | | | | | | | | | | |
Sr. Unsec’d. Notes | | | 3.932(ff) | | | | 05/07/25 | | | | 200 | | | | 197,184 | |
Sr. Unsec’d. Notes | | | 5.501(ff) | | | | 08/09/28 | | | | 240 | | | | 227,596 | |
See Notes to Financial Statements.
PGIM Global Total Return (USD Hedged) Fund 27
Schedule of Investments (continued)
as of October 31, 2023
| | | | | | | | | | | | | | | | |
| | | | |
| Description | | Interest Rate | | | Maturity Date | | | Principal Amount (000)# | | | Value | |
| | | | |
CORPORATE BONDS (Continued) | | | | | | | | | | | | | | | | |
| | | | |
United Kingdom (cont’d.) | | | | | | | | | | | | | | | | |
| | | | |
BAT Capital Corp., | | | | | | | | | | | | | | | | |
Gtd. Notes | | | 2.259% | | | | 03/25/28 | | | | 80 | | | $ | 67,178 | |
Bellis Acquisition Co. PLC, | | | | | | | | | | | | | | | | |
Sr. Sec’d. Notes, 144A | | | 3.250 | | | | 02/16/26 | | | GBP | 200 | | | | 209,361 | |
Bellis Finco PLC, | | | | | | | | | | | | | | | | |
Sr. Unsec’d. Notes, 144A | | | 4.000 | | | | 02/16/27 | | | GBP | 100 | | | | 89,853 | |
BP Capital Markets PLC, | | | | | | | | | | | | | | | | |
Gtd. Notes | | | 4.375(ff) | | | | 06/22/25(oo) | | | | 150 | | | | 142,500 | |
DS Smith PLC, | | | | | | | | | | | | | | | | |
Sr. Unsec’d. Notes, EMTN | | | 0.875 | | | | 09/12/26 | | | EUR | 100 | | | | 95,851 | |
eG Global Finance PLC, | | | | | | | | | | | | | | | | |
Sr. Sec’d. Notes | | | 6.250 | | | | 10/30/25 | | | EUR | 185 | | | | 191,833 | |
Sr. Sec’d. Notes, 144A | | | 6.250 | | | | 10/30/25 | | | EUR | 92 | | | | 96,086 | |
HSBC Holdings PLC, | | | | | | | | | | | | | | | | |
Sr. Unsec’d. Notes | | | 1.589(ff) | | | | 05/24/27 | | | | 200 | | | | 176,119 | |
Sr. Unsec’d. Notes | | | 2.013(ff) | | | | 09/22/28 | | | | 200 | | | | 167,863 | |
Sr. Unsec’d. Notes | | | 2.804(ff) | | | | 05/24/32 | | | | 200 | | | | 150,168 | |
Lloyds Bank PLC, | | | | | | | | | | | | | | | | |
Sr. Unsec’d. Notes, EMTN | | | 0.000 | | | | 04/02/32 | | | | 200 | | | | 117,038 | |
Santander UK Group Holdings PLC, | | | | | | | | | | | | | | | | |
Sr. Unsec’d. Notes | | | 1.673(ff) | | | | 06/14/27 | | | | 350 | | | | 304,971 | |
Sherwood Financing PLC, | | | | | | | | | | | | | | | | |
Sr. Sec’d. Notes, 144A | | | 6.000 | | | | 11/15/26 | | | GBP | 175 | | | | 176,399 | |
TalkTalk Telecom Group Ltd., | | | | | | | | | | | | | | | | |
Gtd. Notes | | | 3.875 | | | | 02/20/25 | | | GBP | 200 | | | | 183,685 | |
Virgin Media Secured Finance PLC, | | | | | | | | | | | | | | | | |
Sr. Sec’d. Notes | | | 4.250 | | | | 01/15/30 | | | GBP | 300 | | | | 293,571 | |
| | | | | | | | | | | | | | | | |
| | | | |
| | | | | | | | | | | | | | | 3,114,402 | |
| | | | |
United States 14.3% | | | | | | | | | | | | | | | | |
| | | | |
AbbVie, Inc., | | | | | | | | | | | | | | | | |
Sr. Unsec’d. Notes | | | 4.050 | | | | 11/21/39 | | | | 50 | | | | 39,014 | |
Albertson’s Cos., Inc./Safeway, Inc./New Albertson’s LP/Albertson’s LLC, | | | | | | | | | | | | | | | | |
Gtd. Notes, 144A | | | 3.500 | | | | 03/15/29 | | | | 25 | | | | 21,313 | |
Allied Universal Holdco LLC/Allied Universal Finance | | | | | | | | | | | | | | | | |
Corp., | | | | | | | | | | | | | | | | |
Sr. Sec’d. Notes, 144A | | | 6.625 | | | | 07/15/26 | | | | 175 | | | | 163,831 | |
American Axle & Manufacturing, Inc., | | | | | | | | | | | | | | | | |
Gtd. Notes | | | 6.500 | | | | 04/01/27 | | | | 50 | | | | 47,161 | |
See Notes to Financial Statements.
28
| | | | | | | | | | | | | | | | |
| | | | |
| Description | | Interest Rate | | | Maturity Date | | | Principal Amount (000)# | | | Value | |
| | | | |
CORPORATE BONDS (Continued) | | | | | | | | | | | | | | | | |
| | | | |
United States (cont’d.) | | | | | | | | | | | | | | | | |
| | | | |
American International Group, Inc., | | | | | | | | | | | | | | | | |
Sr. Unsec’d. Notes | | | 1.875% | | | | 06/21/27 | | | EUR | 100 | | | $ | 97,252 | |
American Medical Systems Europe BV, | | | | | | | | | | | | | | | | |
Gtd. Notes | | | 1.625 | | | | 03/08/31 | | | EUR | 100 | | | | 90,109 | |
AmeriGas Partners LP/AmeriGas Finance Corp., | | | | | | | | | | | | | | | | |
Sr. Unsec’d. Notes | | | 5.875 | | | | 08/20/26 | | | | 75 | | | | 70,316 | |
Amgen, Inc., | | | | | | | | | | | | | | | | |
Sr. Unsec’d. Notes | | | 5.250 | | | | 03/02/30 | | | | 125 | | | | 120,023 | |
Antero Midstream Partners LP/Antero Midstream Finance Corp., | | | | | | | | | | | | | | | | |
Gtd. Notes, 144A | | | 7.875 | | | | 05/15/26 | | | | 150 | | | | 151,395 | |
Ascent Resources Utica Holdings LLC/ARU Finance Corp., | | | | | | | | | | | | | | | | |
Gtd. Notes, 144A | | | 7.000 | | | | 11/01/26 | | | | 25 | | | | 24,160 | |
Gtd. Notes, 144A | | | 9.000 | | | | 11/01/27 | | | | 25 | | | | 31,600 | |
Ashton Woods USA LLC/Ashton Woods Finance Co., | | | | | | | | | | | | | | | | |
Sr. Unsec’d. Notes, 144A | | | 4.625 | | | | 08/01/29 | | | | 25 | | | | 20,265 | |
Sr. Unsec’d. Notes, 144A | | | 4.625 | | | | 04/01/30 | | | | 25 | | | | 19,515 | |
AT&T, Inc., | | | | | | | | | | | | | | | | |
Sr. Unsec’d. Notes | | | 3.550 | | | | 09/15/55 | | | | 40 | | | | 23,277 | |
Sr. Unsec’d. Notes | | | 3.650 | | | | 09/15/59 | | | | 69 | | | | 39,896 | |
Sr. Unsec’d. Notes | | | 3.950 | | | | 04/30/31 | | | EUR | 200 | | | | 205,945 | |
Sr. Unsec’d. Notes | | | 4.100 | | | | 01/19/26 | | | AUD | 100 | | | | 61,453 | |
B&G Foods, Inc., | | | | | | | | | | | | | | | | |
Gtd. Notes | | | 5.250 | | | | 04/01/25 | | | | 18 | | | | 17,279 | |
Ball Corp., | | | | | | | | | | | | | | | | |
Gtd. Notes | | | 6.000 | | | | 06/15/29 | | | | 50 | | | | 47,888 | |
Bank of America Corp., | | | | | | | | | | | | | | | | |
Sr. Unsec’d. Notes | | | 1.734(ff) | | | | 07/22/27 | | | | 270 | | | | 238,195 | |
Sr. Unsec’d. Notes | | | 2.572(ff) | | | | 10/20/32 | | | | 130 | | | | 97,446 | |
Sr. Unsec’d. Notes | | | 2.687(ff) | | | | 04/22/32 | | | | 195 | | | | 149,545 | |
Sr. Unsec’d. Notes, MTN | | | 2.087(ff) | | | | 06/14/29 | | | | 300 | | | | 247,407 | |
Sr. Unsec’d. Notes, MTN | | | 3.194(ff) | | | | 07/23/30 | | | | 85 | | | | 71,262 | |
Bausch Health Americas, Inc., | | | | | | | | | | | | | | | | |
Gtd. Notes, 144A | | | 8.500 | | | | 01/31/27 | | | | 135 | | | | 60,656 | |
Bausch Health Cos., Inc., | | | | | | | | | | | | | | | | |
Gtd. Notes, 144A | | | 5.000 | | | | 01/30/28 | | | | 5 | | | | 1,850 | |
Gtd. Notes, 144A | | | 5.250 | | | | 01/30/30 | | | | 25 | | | | 8,656 | |
Gtd. Notes, 144A | | | 6.250 | | | | 02/15/29 | | | | 10 | | | | 3,625 | |
Beazer Homes USA, Inc., | | | | | | | | | | | | | | | | |
Gtd. Notes | | | 6.750 | | | | 03/15/25 | | | | 50 | | | | 49,555 | |
Gtd. Notes | | | 7.250 | | | | 10/15/29 | | | | 20 | | | | 18,251 | |
See Notes to Financial Statements.
PGIM Global Total Return (USD Hedged) Fund 29
Schedule of Investments (continued)
as of October 31, 2023
| | | | | | | | | | | | | | | | |
| | | | |
| Description | | Interest Rate | | | Maturity Date | | | Principal Amount (000)# | | | Value | |
| | | | |
CORPORATE BONDS (Continued) | | | | | | | | | | | | | | | | |
| | | | |
United States (cont’d.) | | | | | | | | | | | | | | | | |
| | | | |
Black Knight InfoServ LLC, | | | | | | | | | | | | | | | | |
Gtd. Notes, 144A | | | 3.625% | | | | 09/01/28 | | | | 100 | | | $ | 89,188 | |
Bristol-Myers Squibb Co., | | | | | | | | | | | | | | | | |
Sr. Unsec’d. Notes | | | 2.350 | | | | 11/13/40 | | | | 10 | | | | 6,005 | |
Brixmor Operating Partnership LP, | | | | | | | | | | | | | | | | |
Sr. Unsec’d. Notes | | | 2.500 | | | | 08/16/31 | | | | 10 | | | | 7,354 | |
Sr. Unsec’d. Notes | | | 4.125 | | | | 05/15/29 | | | | 65 | | | | 56,943 | |
Broadcom, Inc., | | | | | | | | | | | | | | | | |
Gtd. Notes, 144A | | | 2.450 | | | | 02/15/31 | | | | 240 | | | | 184,122 | |
Gtd. Notes, 144A | | | 3.500 | | | | 02/15/41 | | | | 30 | | | | 19,932 | |
Sr. Unsec’d. Notes, 144A | | | 3.137 | | | | 11/15/35 | | | | 102 | | | | 71,909 | |
Sr. Unsec’d. Notes, 144A | | | 3.419 | | | | 04/15/33 | | | | 65 | | | | 50,524 | |
Caledonia Generating LLC, | | | | | | | | | | | | | | | | |
Sr. Sec’d. Notes, 144A | | | 1.950 | | | | 02/28/34 | | | | 330 | | | | 265,341 | |
Calpine Corp., | | | | | | | | | | | | | | | | |
Sr. Sec’d. Notes, 144A | | | 3.750 | | | | 03/01/31 | | | | 75 | | | | 59,863 | |
Sr. Unsec’d. Notes, 144A | | | 4.625 | | | | 02/01/29 | | | | 60 | | | | 50,594 | |
Sr. Unsec’d. Notes, 144A | | | 5.000 | | | | 02/01/31 | | | | 10 | | | | 8,073 | |
Sr. Unsec’d. Notes, 144A | | | 5.125 | | | | 03/15/28 | | | | 50 | | | | 44,748 | |
Cantor Fitzgerald LP, | | | | | | | | | | | | | | | | |
Sr. Unsec’d. Notes, 144A | | | 4.500 | | | | 04/14/27 | | | | 235 | | | | 218,037 | |
CCO Holdings LLC/CCO Holdings Capital Corp., | | | | | | | | | | | | | | | | |
Sr. Unsec’d. Notes, 144A | | | 4.250 | | | | 02/01/31 | | | | 50 | | | | 38,904 | |
Sr. Unsec’d. Notes, 144A | | | 5.000 | | | | 02/01/28 | | | | 75 | | | | 67,129 | |
CDW LLC/CDW Finance Corp., | | | | | | | | | | | | | | | | |
Gtd. Notes | | | 2.670 | | | | 12/01/26 | | | | 100 | | | | 89,600 | |
CF Industries, Inc., | | | | | | | | | | | | | | | | |
Gtd. Notes | | | 4.950 | | | | 06/01/43 | | | | 40 | | | | 30,870 | |
Gtd. Notes | | | 5.375 | | | | 03/15/44 | | | | 40 | | | | 32,508 | |
Chart Industries, Inc., | | | | | | | | | | | | | | | | |
Sr. Sec’d. Notes, 144A | | | 7.500 | | | | 01/01/30 | | | | 25 | | | | 24,563 | |
Charter Communications Operating LLC/Charter Communications Operating Capital, | | | | | | | | | | | | | | | | |
Sr. Sec’d. Notes | | | 2.300 | | | | 02/01/32 | | | | 40 | | | | 28,594 | |
Sr. Sec’d. Notes | | | 3.900 | | | | 06/01/52 | | | | 135 | | | | 76,462 | |
Sr. Sec’d. Notes | | | 4.800 | | | | 03/01/50 | | | | 35 | | | | 23,066 | |
Sr. Sec’d. Notes | | | 6.384 | | | | 10/23/35 | | | | 100 | | | | 90,431 | |
Cigna Group (The), | | | | | | | | | | | | | | | | |
Sr. Unsec’d. Notes | | | 2.400 | | | | 03/15/30 | | | | 25 | | | | 20,181 | |
Citigroup, Inc., | | | | | | | | | | | | | | | | |
Jr. Sub. Notes | | | 3.875(ff) | | | | 02/18/26(oo) | | | | 150 | | | | 125,580 | |
Sr. Unsec’d. Notes | | | 1.462(ff) | | | | 06/09/27 | | | | 300 | | | | 264,002 | |
See Notes to Financial Statements.
30
| | | | | | | | | | | | | | | | |
| | | | |
| Description | | Interest Rate | | | Maturity Date | | | Principal Amount (000)# | | | Value | |
| | | | |
CORPORATE BONDS (Continued) | | | | | | | | | | | | | | | | |
| | | | |
United States (cont’d.) | | | | | | | | | | | | | | | | |
| | | | |
Citigroup, Inc., (cont’d.) | | | | | | | | | | | | | | | | |
Sr. Unsec’d. Notes | | | 2.520%(ff) | | | | 11/03/32 | | | | 35 | | | $ | 26,036 | |
Sr. Unsec’d. Notes | | | 2.561(ff) | | | | 05/01/32 | | | | 100 | | | | 75,918 | |
Sr. Unsec’d. Notes | | | 3.106(ff) | | | | 04/08/26 | | | | 300 | | | | 286,197 | |
Sub. Notes | | | 6.174(ff) | | | | 05/25/34 | | | | 35 | | | | 32,642 | |
CNA Financial Corp., | | | | | | | | | | | | | | | | |
Sr. Unsec’d. Notes | | | 3.900 | | | | 05/01/29 | | | | 100 | | | | 89,707 | |
Columbia Pipelines Operating Co. LLC, | | | | | | | | | | | | | | | | |
Sr. Unsec’d. Notes, 144A | | | 6.036 | | | | 11/15/33 | | | | 70 | | | | 66,488 | |
Corebridge Financial, Inc., | | | | | | | | | | | | | | | | |
Sr. Unsec’d. Notes | | | 3.900 | | | | 04/05/32 | | | | 230 | | | | 188,141 | |
Cox Communications, Inc., | | | | | | | | | | | | | | | | |
Gtd. Notes, 144A | | | 5.450 | | | | 09/15/28 | | | | 135 | | | | 131,497 | |
CSC Holdings LLC, | | | | | | | | | | | | | | | | |
Sr. Unsec’d. Notes, 144A | | | 4.625 | | | | 12/01/30 | | | | 200 | | | | 101,120 | |
Dana, Inc., | | | | | | | | | | | | | | | | |
Sr. Unsec’d. Notes | | | 4.500 | | | | 02/15/32 | | | | 50 | | | | 39,137 | |
Sr. Unsec’d. Notes | | | 5.375 | | | | 11/15/27 | | | | 25 | | | | 22,990 | |
DaVita, Inc., | | | | | | | | | | | | | | | | |
Gtd. Notes, 144A | | | 3.750 | | | | 02/15/31 | | | | 50 | | | | 35,961 | |
Gtd. Notes, 144A | | | 4.625 | | | | 06/01/30 | | | | 100 | | | | 78,402 | |
Diamond Sports Group LLC/Diamond Sports Finance Co., | | | | | | | | | | | | | | | | |
Gtd. Notes, 144A (original cost $43,125; purchased 07/18/19 - 12/04/19)(f) | | | 6.625 | | | | 08/15/27(d) | | | | 45 | | | | 454 | |
Discovery Communications LLC, | | | | | | | | | | | | | | | | |
Gtd. Notes | | | 5.300 | | | | 05/15/49 | | | | 60 | | | | 43,261 | |
DISH DBS Corp., | | | | | | | | | | | | | | | | |
Gtd. Notes | | | 7.750 | | | | 07/01/26 | | | | 100 | | | | 66,951 | |
Diversified Healthcare Trust, | | | | | | | | | | | | | | | | |
Gtd. Notes | | | 9.750 | | | | 06/15/25 | | | | 37 | | | | 35,906 | |
Elevance Health, Inc., | | | | | | | | | | | | | | | | |
Sr. Unsec’d. Notes | | | 2.875 | | | | 09/15/29 | | | | 100 | | | | 84,925 | |
Endeavor Energy Resources LP/EER Finance, Inc., | | | | | | | | | | | | | | | | |
Sr. Unsec’d. Notes, 144A | | | 5.750 | | | | 01/30/28 | | | | 75 | | | | 71,986 | |
Energy Transfer LP, | | | | | | | | | | | | | | | | |
Jr. Sub. Notes, Series G | | | 7.125(ff) | | | | 05/15/30(oo) | | | | 100 | | | | 84,088 | |
Jr. Sub. Notes, Series H | | | 6.500(ff) | | | | 11/15/26(oo) | | | | 50 | | | | 45,319 | |
Sr. Unsec’d. Notes | | | 5.000 | | | | 05/15/50 | | | | 20 | | | | 14,993 | |
Sr. Unsec’d. Notes | | | 6.050 | | | | 12/01/26 | | | | 240 | | | | 239,694 | |
Sr. Unsec’d. Notes | | | 6.250 | | | | 04/15/49 | | | | 25 | | | | 22,048 | |
See Notes to Financial Statements.
PGIM Global Total Return (USD Hedged) Fund 31
Schedule of Investments (continued)
as of October 31, 2023
| | | | | | | | | | | | | | | | |
| | | | |
| Description | | Interest Rate | | | Maturity Date | | | Principal Amount (000)# | | | Value | |
| | | | |
CORPORATE BONDS (Continued) | | | | | | | | | | | | | | | | |
| | | | |
United States (cont’d.) | | | | | | | | | | | | | | | | |
| | | | |
Enterprise Products Operating LLC, | | | | | | | | | | | | | | | | |
Gtd. Notes | | | 3.700% | | | | 01/31/51 | | | | 15 | | | $ | 10,048 | |
Gtd. Notes | | | 4.450 | | | | 02/15/43 | | | | 20 | | | | 15,769 | |
Fidelity National Information Services, Inc., | | | | | | | | | | | | | | | | |
Sr. Unsec’d. Notes | | | 1.500 | | | | 05/21/27 | | | EUR | 100 | | | | 95,650 | |
Ford Motor Co., | | | | | | | | | | | | | | | | |
Sr. Unsec’d. Notes | | | 5.291 | | | | 12/08/46 | | | | 125 | | | | 90,787 | |
Forward Air Corp., | | | | | | | | | | | | | | | | |
Sr. Sec’d. Notes, 144A | | | 9.500 | | | | 10/15/31 | | | | 50 | | | | 48,742 | |
Gen Digital, Inc., | | | | | | | | | | | | | | | | |
Sr. Unsec’d. Notes, 144A | | | 5.000 | | | | 04/15/25 | | | | 75 | | | | 72,948 | |
General Motors Co., | | | | | | | | | | | | | | | | |
Sr. Unsec’d. Notes | | | 5.150 | | | | 04/01/38 | | | | 50 | | | | 40,214 | |
General Motors Financial Co., Inc., | | | | | | | | | | | | | | | | |
Sr. Unsec’d. Notes | | | 2.700 | | | | 06/10/31 | | | | 75 | | | | 56,446 | |
Goldman Sachs Group, Inc. (The), | | | | | | | | | | | | | | | | |
Jr. Sub. Notes, Series U | | | 3.650(ff) | | | | 08/10/26(oo) | | | | 130 | | | | 100,444 | |
Sr. Unsec’d. Notes | | | 1.542(ff) | | | | 09/10/27 | | | | 300 | | | | 260,834 | |
Sr. Unsec’d. Notes | | | 1.992(ff) | | | | 01/27/32 | | | | 20 | | | | 14,681 | |
Sr. Unsec’d. Notes | | | 2.615(ff) | | | | 04/22/32 | | | | 195 | | | | 148,565 | |
Sr. Unsec’d. Notes | | | 4.482(ff) | | | | 08/23/28 | | | | 375 | | | | 351,098 | |
HCA, Inc., | | | | | | | | | | | | | | | | |
Gtd. Notes | | | 5.250 | | | | 04/15/25 | | | | 100 | | | | 98,604 | |
Hilcorp Energy I LP/Hilcorp Finance Co., | | | | | | | | | | | | | | | | |
Sr. Unsec’d. Notes, 144A | | | 6.000 | | | | 04/15/30 | | | | 25 | | | | 22,206 | |
Sr. Unsec’d. Notes, 144A | | | 6.250 | | | | 04/15/32 | | | | 25 | | | | 21,822 | |
Honeywell International, Inc., | | | | | | | | | | | | | | | | |
Sr. Unsec’d. Notes | | | 3.750 | | | | 05/17/32 | | | EUR | 100 | | | | 101,798 | |
Hunt Cos., Inc., | | | | | | | | | | | | | | | | |
Sr. Sec’d. Notes, 144A | | | 5.250 | | | | 04/15/29 | | | | 50 | | | | 39,422 | |
Huntington Bancshares, Inc., | | | | | | | | | | | | | | | | |
Sr. Unsec’d. Notes | | | 6.208(ff) | | | | 08/21/29 | | | | 50 | | | | 48,059 | |
Jefferies Financial Group, Inc., | | | | | | | | | | | | | | | | |
Sr. Unsec’d. Notes | | | 2.625 | | | | 10/15/31 | | | | 150 | | | | 110,585 | |
JPMorgan Chase & Co., | | | | | | | | | | | | | | | | |
Jr. Sub. Notes, Series HH | | | 4.600(ff) | | | | 02/01/25(oo) | | | | 200 | | | | 186,936 | |
Sr. Unsec’d. Notes | | | 2.069(ff) | | | | 06/01/29 | | | | 190 | | | | 157,864 | |
Sr. Unsec’d. Notes | | | 2.083(ff) | | | | 04/22/26 | | | | 90 | | | | 84,574 | |
Sr. Unsec’d. Notes | | | 2.545(ff) | | | | 11/08/32 | | | | 90 | | | | 68,199 | |
Sr. Unsec’d. Notes | | | 2.580(ff) | | | | 04/22/32 | | | | 105 | | | | 81,056 | |
Sr. Unsec’d. Notes | | | 3.702(ff) | | | | 05/06/30 | | | | 65 | | | | 57,000 | |
See Notes to Financial Statements.
32
| | | | | | | | | | | | | | | | |
| | | | |
| Description | | Interest Rate | | | Maturity Date | | | Principal Amount (000)# | | | Value | |
| | | | |
CORPORATE BONDS (Continued) | | | | | | | | | | | | | | | | |
| | | | |
United States (cont’d.) | | | | | | | | | | | | | | | | |
| | | | |
Kimco Realty OP LLC, | | | | | | | | | | | | | | | | |
Gtd. Notes | | | 1.900% | | | | 03/01/28 | | | | 135 | | | $ | 112,140 | |
Kontoor Brands, Inc., | | | | | | | | | | | | | | | | |
Gtd. Notes, 144A | | | 4.125 | | | | 11/15/29 | | | | 53 | | | | 43,877 | |
Kraft Heinz Foods Co., | | | | | | | | | | | | | | | | |
Gtd. Notes | | | 3.000 | | | | 06/01/26 | | | | 93 | | | | 86,874 | |
Lamb Weston Holdings, Inc., | | | | | | | | | | | | | | | | |
Gtd. Notes, 144A | | | 4.375 | | | | 01/31/32 | | | | 50 | | | | 41,332 | |
Marathon Petroleum Corp., | | | | | | | | | | | | | | | | |
Sr. Unsec’d. Notes | | | 6.500 | | | | 03/01/41 | | | | 50 | | | | 47,432 | |
Marriott International, Inc., | | | | | | | | | | | | | | | | |
Sr. Unsec’d. Notes, Series HH | | | 2.850 | | | | 04/15/31 | | | | 75 | | | | 58,897 | |
Masonite International Corp., | | | | | | | | | | | | | | | | |
Gtd. Notes, 144A | | | 3.500 | | | | 02/15/30 | | | | 50 | | | | 39,625 | |
Medline Borrower LP, | | | | | | | | | | | | | | | | |
Sr. Sec’d. Notes, 144A | | | 3.875 | | | | 04/01/29 | | | | 50 | | | | 42,196 | |
Sr. Unsec’d. Notes, 144A | | | 5.250 | | | | 10/01/29 | | | | 25 | | | | 21,287 | |
Morgan Stanley, | | | | | | | | | | | | | | | | |
Sr. Unsec’d. Notes | | | 0.406(ff) | | | | 10/29/27 | | | EUR | 200 | | | | 187,749 | |
Sr. Unsec’d. Notes | | | 1.593(ff) | | | | 05/04/27 | | | | 110 | | | | 97,692 | |
Sr. Unsec’d. Notes, EMTN | | | 7.500 | | | | 12/15/27 | | | MXN | 1,000 | | | | 47,977 | |
Sr. Unsec’d. Notes, GMTN | | | 2.239(ff) | | | | 07/21/32 | | | | 50 | | | | 36,892 | |
Sr. Unsec’d. Notes, MTN | | | 1.928(ff) | | | | 04/28/32 | | | | 180 | | | | 130,484 | |
MPLX LP, | | | | | | | | | | | | | | | | |
Sr. Unsec’d. Notes | | | 4.000 | | | | 03/15/28 | | | | 25 | | | | 22,907 | |
Sr. Unsec’d. Notes | | | 4.950 | | | | 09/01/32 | | | | 450 | | | | 399,828 | |
Nationstar Mortgage Holdings, Inc., | | | | | | | | | | | | | | | | |
Gtd. Notes, 144A | | | 5.500 | | | | 08/15/28 | | | | 15 | | | | 13,248 | |
Gtd. Notes, 144A | | | 6.000 | | | | 01/15/27 | | | | 35 | | | | 32,575 | |
NRG Energy, Inc., | | | | | | | | | | | | | | | | |
Gtd. Notes | | | 5.750 | | | | 01/15/28 | | | | 53 | | | | 49,771 | |
Jr. Sub. Notes, 144A | | | 10.250(ff) | | | | 03/15/28(oo) | | | | 25 | | | | 24,125 | |
OneMain Finance Corp., | | | | | | | | | | | | | | | | |
Gtd. Notes | | | 4.000 | | | | 09/15/30 | | | | 25 | | | | 18,311 | |
ONEOK, Inc., | | | | | | | | | | | | | | | | |
Gtd. Notes | | | 4.450 | | | | 09/01/49 | | | | 120 | | | | 82,213 | |
Gtd. Notes | | | 5.550 | | | | 11/01/26 | | | | 100 | | | | 98,793 | |
Gtd. Notes | | | 5.650 | | | | 11/01/28 | | | | 65 | | | | 63,438 | |
Gtd. Notes | | | 6.050 | | | | 09/01/33 | | | | 250 | | | | 239,731 | |
Pactiv Evergreen Group Issuer LLC/Pactiv Evergreen Group Issuer, Inc., | | | | | | | | | | | | | | | | |
Sr. Sec’d. Notes, 144A | | | 4.375 | | | | 10/15/28 | | | | 25 | | | | 21,367 | |
See Notes to Financial Statements.
PGIM Global Total Return (USD Hedged) Fund 33
Schedule of Investments (continued)
as of October 31, 2023
| | | | | | | | | | | | | | | | |
| | | | |
| Description | | Interest Rate | | | Maturity Date | | | Principal Amount (000)# | | | Value | |
| | | | |
CORPORATE BONDS (Continued) | | | | | | | | | | | | | | | | |
| | | | |
United States (cont’d.) | | | | | | | | | | | | | | | | |
| | | | |
Pactiv Evergreen Group Issuer, Inc./Pactiv Evergreen Group Issuer LLC, | | | | | | | | | | | | | | | | |
Sr. Sec’d. Notes, 144A | | | 4.000% | | | | 10/15/27 | | | | 25 | | | $ | 21,991 | |
Penn Entertainment, Inc., | | | | | | | | | | | | | | | | |
Sr. Unsec’d. Notes, 144A | | | 5.625 | | | | 01/15/27 | | | | 75 | | | | 68,610 | |
PNC Financial Services Group, Inc. (The), | | | | | | | | | | | | | | | | |
Sr. Unsec’d. Notes | | | 6.875(ff) | | | | 10/20/34 | | | | 90 | | | | 89,946 | |
Post Holdings, Inc., | | | | | | | | | | | | | | | | |
Sr. Unsec’d. Notes, 144A | | | 4.500 | | | | 09/15/31 | | | | 50 | | | | 40,585 | |
Realty Income Corp., | | | | | | | | | | | | | | | | |
Sr. Unsec’d. Notes | | | 2.200 | | | | 06/15/28 | | | | 5 | | | | 4,213 | |
Sr. Unsec’d. Notes | | | 2.850 | | | | 12/15/32 | | | | 5 | | | | 3,788 | |
Sr. Unsec’d. Notes | | | 4.875 | | | | 07/06/30 | | | EUR | 200 | | | | 209,636 | |
Skyworks Solutions, Inc., | | | | | | | | | | | | | | | | |
Sr. Unsec’d. Notes | | | 3.000 | | | | 06/01/31 | | | | 40 | | | | 30,654 | |
Smyrna Ready Mix Concrete LLC, | | | | | | | | | | | | | | | | |
Sr. Sec’d. Notes, 144A | | | 6.000 | | | | 11/01/28 | | | | 60 | | | | 55,481 | |
Southwest Airlines Co., | | | | | | | | | | | | | | | | |
Sr. Unsec’d. Notes | | | 5.125 | | | | 06/15/27 | | | | 180 | | | | 173,749 | |
Standard Industries, Inc., | | | | | | | | | | | | | | | | |
Sr. Unsec’d. Notes, 144A | | | 4.375 | | | | 07/15/30 | | | | 25 | | | | 20,453 | |
Stryker Corp., | | | | | | | | | | | | | | | | |
Sr. Unsec’d. Notes | | | 2.625 | | | | 11/30/30 | | | EUR | 100 | | | | 96,911 | |
Suburban Propane Partners LP/Suburban Energy Finance Corp., | | | | | | | | | | | | | | | | |
Sr. Unsec’d. Notes | | | 5.875 | | | | 03/01/27 | | | | 50 | | | | 47,611 | |
Swiss Re Finance UK PLC, | | | | | | | | | | | | | | | | |
Gtd. Notes, EMTN | | | 2.714(ff) | | | | 06/04/52 | | | EUR | 100 | | | | 85,272 | |
Tallgrass Energy Partners LP/Tallgrass Energy Finance Corp., | | | | | | | | | | | | | | | | |
Gtd. Notes, 144A | | | 5.500 | | | | 01/15/28 | | | | 50 | | | | 44,004 | |
Gtd. Notes, 144A | | | 7.500 | | | | 10/01/25 | | | | 50 | | | | 49,383 | |
Targa Resources Corp., | | | | | | | | | | | | | | | | |
Gtd. Notes | | | 4.200 | | | | 02/01/33 | | | | 40 | | | | 33,168 | |
Taylor Morrison Communities, Inc., | | | | | | | | | | | | | | | | |
Gtd. Notes, 144A | | | 5.875 | | | | 06/15/27 | | | | 25 | | | | 23,437 | |
Sr. Unsec’d. Notes, 144A | | | 5.125 | | | | 08/01/30 | | | | 10 | | | | 8,427 | |
Tenet Healthcare Corp., | | | | | | | | | | | | | | | | |
Gtd. Notes | | | 6.125 | | | | 10/01/28 | | | | 50 | | | | 46,257 | |
Thermo Fisher Scientific, Inc., | | | | | | | | | | | | | | | | |
Sr. Unsec’d. Notes | | | 3.650 | | | | 11/21/34 | | | EUR | 100 | | | | 101,509 | |
See Notes to Financial Statements.
34
| | | | | | | | | | | | | | | | |
| | | | |
| Description | | Interest Rate | | | Maturity Date | | | Principal Amount (000)# | | | Value | |
| | | | |
CORPORATE BONDS (Continued) | | | | | | | | | | | | | | | | |
| | | | |
United States (cont’d.) | | | | | | | | | | | | | | | | |
| | | | |
T-Mobile USA, Inc., | | | | | | | | | | | | | | | | |
Gtd. Notes | | | 4.375% | | | | 04/15/40 | | | | 30 | | | $ | 23,194 | |
Gtd. Notes | | | 4.500 | | | | 04/15/50 | | | | 40 | | | | 29,171 | |
Tri Pointe Homes, Inc., | | | | | | | | | | | | | | | | |
Gtd. Notes | | | 5.700 | | | | 06/15/28 | | | | 50 | | | | 44,700 | |
Truist Financial Corp., | | | | | | | | | | | | | | | | |
Sr. Unsec’d. Notes, MTN | | | 5.867(ff) | | | | 06/08/34 | | | | 25 | | | | 22,752 | |
Sr. Unsec’d. Notes, MTN | | | 7.161(ff) | | | | 10/30/29 | | | | 90 | | | | 90,520 | |
U.S. Bancorp, | | | | | | | | | | | | | | | | |
Jr. Sub. Notes | | | 3.700(ff) | | | | 01/15/27(oo) | | | | 200 | | | | 140,319 | |
UGI International LLC, | | | | | | | | | | | | | | | | |
Gtd. Notes, 144A | | | 2.500 | | | | 12/01/29 | | | EUR | 150 | | | | 128,361 | |
United Airlines 2019-2 Class AA Pass-Through Trust,
Pass-Through Certificates | | | 2.700 | | | | 11/01/33 | | | | 21 | | | | 17,187 | |
United Airlines, Inc., | | | | | | | | | | | | | | | | |
Sr. Sec’d. Notes, 144A | | | 4.375 | | | | 04/15/26 | | | | 60 | | | | 55,806 | |
Sr. Sec’d. Notes, 144A | | | 4.625 | | | | 04/15/29 | | | | 10 | | | | 8,454 | |
United Rentals North America, Inc., | | | | | | | | | | | | | | | | |
Gtd. Notes | | | 5.250 | | | | 01/15/30 | | | | 60 | | | | 54,871 | |
Vector Group Ltd., | | | | | | | | | | | | | | | | |
Sr. Sec’d. Notes, 144A | | | 5.750 | | | | 02/01/29 | | | | 125 | | | | 105,978 | |
Ventas Realty LP, | | | | | | | | | | | | | | | | |
Gtd. Notes | | | 2.500 | | | | 09/01/31 | | | | 130 | | | | 97,674 | |
Venture Global Calcasieu Pass LLC, | | | | | | | | | | | | | | | | |
Sr. Sec’d. Notes, 144A | | | 3.875 | | | | 08/15/29 | | | | 5 | | | | 4,171 | |
Sr. Sec’d. Notes, 144A | | | 4.125 | | | | 08/15/31 | | | | 5 | | | | 4,028 | |
Verizon Communications, Inc., | | | | | | | | | | | | | | | | |
Sr. Unsec’d. Notes | | | 2.550 | | | | 03/21/31 | | | | 31 | | | | 24,204 | |
Sr. Unsec’d. Notes | | | 2.650 | | | | 11/20/40 | | | | 45 | | | | 27,203 | |
Sr. Unsec’d. Notes | | | 3.400 | | | | 03/22/41 | | | | 20 | | | | 13,478 | |
Viatris, Inc., | | | | | | | | | | | | | | | | |
Gtd. Notes | | | 3.850 | | | | 06/22/40 | | | | 110 | | | | 68,356 | |
Gtd. Notes | | | 4.000 | | | | 06/22/50 | | | | 15 | | | | 8,608 | |
VICI Properties LP, | | | | | | | | | | | | | | | | |
Sr. Unsec’d. Notes | | | 4.950 | | | | 02/15/30 | | | | 160 | | | | 142,590 | |
Vistra Corp., | | | | | | | | | | | | | | | | |
Jr. Sub. Notes, 144A | | | 7.000(ff) | | | | 12/15/26(oo) | | | | 25 | | | | 22,853 | |
Jr. Sub. Notes, 144A | | | 8.000(ff) | | | | 10/15/26(oo) | | | | 125 | | | | 118,761 | |
Vistra Operations Co. LLC, | | | | | | | | | | | | | | | | |
Gtd. Notes, 144A | | | 5.000 | | | | 07/31/27 | | | | 45 | | | | 41,285 | |
Gtd. Notes, 144A | | | 5.625 | | | | 02/15/27 | | | | 75 | | | | 70,584 | |
See Notes to Financial Statements.
PGIM Global Total Return (USD Hedged) Fund 35
Schedule of Investments (continued)
as of October 31, 2023
| | | | | | | | | | | | | | | | |
| | | | |
| Description | | Interest Rate | | | Maturity Date | | | Principal Amount (000)# | | | Value | |
| | | | |
CORPORATE BONDS (Continued) | | | | | | | | | | | | | | | | |
| | | | |
United States (cont’d.) | | | | | | | | | | | | | | | | |
| | | | |
Warnermedia Holdings, Inc., | | | | | | | | | | | | | | | | |
Gtd. Notes | | | 3.755% | | | | 03/15/27 | | | | 100 | | | $ | 92,072 | |
Gtd. Notes | | | 5.050 | | | | 03/15/42 | | | | 65 | | | | 48,069 | |
Gtd. Notes | | | 5.141 | | | | 03/15/52 | | | | 130 | | | | 92,026 | |
Wells Fargo & Co., | | | | | | | | | | | | | | | | |
Sr. Unsec’d. Notes, MTN | | | 2.164(ff) | | | | 02/11/26 | | | | 85 | | | | 80,410 | |
Sr. Unsec’d. Notes, MTN | | | 2.879(ff) | | | | 10/30/30 | | | | 130 | | | | 106,248 | |
Welltower OP LLC, | | | | | | | | | | | | | | | | |
Gtd. Notes | | | 2.050 | | | | 01/15/29 | | | | 50 | | | | 40,722 | |
Gtd. Notes | | | 3.100 | | | | 01/15/30 | | | | 70 | | | | 58,100 | |
Williams Cos., Inc. (The), | | | | | | | | | | | | | | | | |
Sr. Unsec’d. Notes | | | 3.500 | | | | 10/15/51 | | | | 30 | | | | 18,173 | |
WPC Eurobond BV, | | | | | | | | | | | | | | | | |
Gtd. Notes | | | 0.950 | | | | 06/01/30 | | | EUR | 100 | | | | 80,197 | |
| | | | | | | | | | | | | | | | |
| | | | |
| | | | | | | | | | | | | | | 13,847,846 | |
| | | | | | | | | | | | | | | | |
| | | | |
TOTAL CORPORATE BONDS
(cost $40,761,164) | | | | | | | | | | | | | | | 35,051,300 | |
| | | | | | | | | | | | | | | | |
| | | | |
FLOATING RATE AND OTHER LOANS 0.0% | | | | | | | | | | | | | | | | |
| | | | |
Jamaica 0.0% | | | | | | | | | | | | | | | | |
| | | | |
Digicel International Finance Ltd., | | | | | | | | | | | | | | | | |
First Lien Initial Term B Loan, 6 Month LIBOR + 3.250% | | | 8.981(c) | | | | 05/27/24 | | | | 10 | | | | 9,069 | |
| | | | |
United States 0.0% | | | | | | | | | | | | | | | | |
| | | | |
Diamond Sports Group LLC, | | | | | | | | | | | | | | | | |
First Lien Term Loan, 1 Month SOFR + 10.100% | | | 12.775(c) | | | | 05/25/26 | | | | 5 | | | | 1,999 | |
Second Lien Term Loan, 6 Month SOFR + 3.500% | | | 8.669(c) | | | | 08/24/26 | | | | 149 | | | | 1,672 | |
| | | | | | | | | | | | | | | | |
| | | | |
| | | | | | | | | | | | | | | 3,671 | |
| | | | | | | | | | | | | | | | |
| | | | |
TOTAL FLOATING RATE AND OTHER LOANS
(cost $70,287) | | | | | | | | | | | | | | | 12,740 | |
| | | | | | | | | | | | | | | | |
| | | | |
MUNICIPAL BOND 0.2% | | | | | | | | | | | | | | | | |
| | | | |
Puerto Rico | | | | | | | | | | | | | | | | |
| | | | |
Commonwealth of Puerto Rico, | | | | | | | | | | | | | | | | |
General Obligation, Sub-Series C (cost $159,899) | | | 0.000(cc) | | | | 11/01/43 | | | | 283 | | | | 145,474 | |
| | | | | | | | | | | | | | | | |
See Notes to Financial Statements.
36
| | | | | | | | | | | | | | | | |
| | | | |
| Description | | Interest Rate | | | Maturity Date | | | Principal Amount (000)# | | | Value | |
| | | | |
RESIDENTIAL MORTGAGE-BACKED SECURITIES 2.2% | | | | | | | | | | | | | | | | |
| | | | |
Spain 0.0% | | | | | | | | | | | | | | | | |
| | | | |
Retiro Mortgage Securities DAC, | | | | | | | | | | | | | | | | |
Series 01A, Class A1, 144A, 3 Month EURIBOR + 2.000% (Cap 5.000%, Floor 0.000%) | | | 5.000%(c) | | | | 07/30/75 | | | EUR | 16 | | | $ | 16,606 | |
| | | | |
United States 2.2% | | | | | | | | | | | | | | | | |
| | | | |
Connecticut Avenue Securities Trust, | | | | | | | | | | | | | | | | |
Series 2022-R01, Class 1B1, 144A, 30 Day Average SOFR + 3.150% (Cap N/A, Floor 0.000%) | | | 8.471(c) | | | | 12/25/41 | | | | 110 | | | | 109,657 | |
Series 2022-R03, Class 1B1, 144A, 30 Day Average SOFR + 6.250% (Cap N/A, Floor 0.000%) | | | 11.571(c) | | | | 03/25/42 | | | | 25 | | | | 27,216 | |
Series 2022-R04, Class 1B1, 144A, 30 Day Average SOFR + 5.250% (Cap N/A, Floor 0.000%) | | | 10.571(c) | | | | 03/25/42 | | | | 20 | | | | 21,184 | |
Series 2023-R05, Class 1M2, 144A, 30 Day Average SOFR + 3.100% (Cap N/A, Floor 3.100%) | | | 8.421(c) | | | | 06/25/43 | | | | 100 | | | | 101,983 | |
Series 2023-R06, Class 1M2, 144A, 30 Day Average SOFR + 2.700% (Cap N/A, Floor 0.000%) | | | 8.021(c) | | | | 07/25/43 | | | | 100 | | | | 100,815 | |
Eagle Re Ltd., | | | | | | | | | | | | | | | | |
Series 2023-01, Class M1A, 144A, 30 Day Average SOFR + 2.000%
(Cap N/A, Floor 2.000%) | | | 7.321(c) | | | | 09/26/33 | | | | 150 | | | | 150,087 | |
FHLMC Structured Agency Credit Risk Debt Notes, | | | | | | | | | | | | | | | | |
Series 2020-HQA05, Class B1, 144A, 30 Day Average SOFR + 4.000%
(Cap N/A, Floor 0.000%) | | | 9.321(c) | | | | 11/25/50 | | | | 35 | | | | 37,103 | |
Series 2020-HQA05, Class M2, 144A, 30 Day Average SOFR + 2.600% (Cap N/A, Floor 0.000%) | | | 7.921(c) | | | | 11/25/50 | | | | 79 | | | | 79,689 | |
FHLMC Structured Agency Credit Risk REMIC Trust, | | | | | | | | | | | | | | | | |
Series 2021-DNA01, Class B1, 144A, 30 Day Average SOFR + 2.650% (Cap N/A, Floor 0.000%) | | | 7.971(c) | | | | 01/25/51 | | | | 10 | | | | 9,763 | |
Series 2021-DNA01, Class M2, 144A, 30 Day Average SOFR + 1.800% (Cap N/A, Floor 0.000%) | | | 7.121(c) | | | | 01/25/51 | | | | 55 | | | | 54,994 | |
Series 2021-DNA03, Class B1, 144A, 30 Day Average SOFR + 3.500% (Cap N/A, Floor 0.000%) | | | 8.821(c) | | | | 10/25/33 | | | | 45 | | | | 45,928 | |
Series 2021-DNA05, Class M2, 144A, 30 Day Average SOFR + 1.650% (Cap N/A, Floor 0.000%) | | | 6.971(c) | | | | 01/25/34 | | | | 13 | | | | 13,096 | |
Series 2021-HQA03, Class M2, 144A, 30 Day Average SOFR + 2.100% (Cap N/A, Floor 0.000%) | | | 7.421(c) | | | | 09/25/41 | | | | 70 | | | | 67,987 | |
Series 2022-DNA01, Class M1B, 144A, 30 Day Average SOFR + 1.850% (Cap N/A, Floor 0.000%) | | | 7.171(c) | | | | 01/25/42 | | | | 100 | | | | 98,501 | |
Series 2022-DNA03, Class M1B, 144A, 30 Day Average SOFR + 2.900% (Cap N/A, Floor 0.000%) | | | 8.221(c) | | | | 04/25/42 | | | | 140 | | | | 142,625 | |
GCAT Asset-Backed Notes, | | | | | | | | | | | | | | | | |
Series 2021-01, Class A1, 144A | | | 2.487 | | | | 11/25/49 | | | | 131 | | | | 118,437 | |
See Notes to Financial Statements.
PGIM Global Total Return (USD Hedged) Fund 37
Schedule of Investments (continued)
as of October 31, 2023
| | | | | | | | | | | | | | | | |
| | | | |
| Description | | Interest Rate | | | Maturity Date | | | Principal Amount (000)# | | | Value | |
| | | |
RESIDENTIAL MORTGAGE-BACKED SECURITIES (Continued) | | | | | | | | | | | | | |
| | | | |
United States (cont’d.) | | | | | | | | | | | | | | | | |
| | | | |
Legacy Mortgage Asset Trust, | | | | | | | | | | | | | | | | |
Series 2019-PR01, Class A1, 144A | | | 7.858% | | | | 09/25/59 | | | | 50 | | | $ | 49,444 | |
Series 2020-GS01, Class A1, 144A | | | 5.882 | | | | 10/25/59 | | | | 61 | | | | 60,031 | |
MFA Trust, | | | | | | | | | | | | | | | | |
Series 2021-RPL01, Class A1, 144A | | | 1.131(cc) | | | | 07/25/60 | | | | 147 | | | | 125,294 | |
Oaktown Re VII Ltd., | | | | | | | | | | | | | | | | |
Series 2021-02, Class M1A, 144A, 30 Day Average SOFR + 1.600% (Cap N/A, Floor 1.600%) | | | 6.921(c) | | | | 04/25/34 | | | | 217 | | | | 216,415 | |
PMT Credit Risk Transfer Trust, | | | | | | | | | | | | | | | | |
Series 2023-01R, Class A, 144A, 30 Day Average SOFR + 4.400%
(Cap N/A, Floor 0.000%) | | | 9.720(c) | | | | 03/27/25 | | | | 187 | | | | 187,419 | |
PNMAC GMSR Issuer Trust, | | | | | | | | | | | | | | | | |
Series 2018-GT01, Class A, 144A, 1 Month LIBOR + 3.850%
(Cap N/A, Floor 2.850%) | | | 9.289(c) | | | | 02/25/25 | | | | 100 | | | | 99,999 | |
Series 2018-GT02, Class A, 144A, 1 Month LIBOR + 2.650%
(Cap N/A, Floor 0.000%) | | | 8.089(c) | | | | 08/25/25 | | | | 100 | | | | 99,941 | |
Radnor Re Ltd., | | | | | | | | | | | | | | | | |
Series 2023-01, Class M1A, 144A, 30 Day Average SOFR + 2.700%
(Cap N/A, Floor 2.700%) | | | 8.021(c) | | | | 07/25/33 | | | | 150 | | | | 150,887 | |
| | | | | | | | | | | | | | | | |
| | | | |
| | | | | | | | | | | | | | | 2,168,495 | |
| | | | | | | | | | | | | | | | |
| | | | |
TOTAL RESIDENTIAL MORTGAGE-BACKED SECURITIES
(cost $2,212,329) | | | | | | | | | | | | | | | 2,185,101 | |
| | | | | | | | | | | | | | | | |
| | | | |
SOVEREIGN BONDS 21.5% | | | | | | | | | | | | | | | | |
| | | | |
Andorra 0.2% | | | | | | | | | | | | | | | | |
| | | | |
Andorra International Bond, | | | | | | | | | | | | | | | | |
Sr. Unsec’d. Notes, EMTN | | | 1.250 | | | | 05/06/31 | | | EUR | 200 | | | | 170,269 | |
| | | | |
Austria 0.2% | | | | | | | | | | | | | | | | |
| | | | |
Republic of Austria Government International Bond, | | | | | | | | | | | | | | | | |
Sr. Unsec’d. Notes, 144A, MTN | | | 5.375 | | | | 12/01/34 | | | CAD | 280 | | | | 211,621 | |
| | | | |
Brazil 0.9% | | | | | | | | | | | | | | | | |
| | | | |
Brazil Minas SPE via State of Minas Gerais, | | | | | | | | | | | | | | | | |
Gov’t. Gtd. Notes | | | 5.333 | | | | 02/15/28 | | | | 846 | | | | 819,864 | |
| | | | |
Bulgaria 0.3% | | | | | | | | | | | | | | | | |
| | | | |
Bulgaria Government International Bond, | | | | | | | | | | | | | | | | |
Sr. Unsec’d. Notes | | | 1.375 | | | | 09/23/50 | | | EUR | 100 | | | | 54,162 | |
See Notes to Financial Statements.
38
| | | | | | | | | | | | | | | | |
| | | | |
| Description | | Interest Rate | | | Maturity Date | | | Principal Amount (000)# | | | Value | |
| | | | |
SOVEREIGN BONDS (Continued) | | | | | | | | | | | | | | | | |
| | | | |
Bulgaria (cont’d.) | | | | | | | | | | | | | | | | |
| | | | |
Bulgaria Government International Bond, (cont’d.) | | | | | | | | | | | | | | | | |
Sr. Unsec’d. Notes | | | 4.125% | | | | 09/23/29 | | | EUR | 100 | | | $ | 103,620 | |
Sr. Unsec’d. Notes, GMTN | | | 3.125 | | | | 03/26/35 | | | EUR | 100 | | | | 89,155 | |
| | | | | | | | | | | | | | | | |
| | | | |
| | | | | | | | | | | | | | | 246,937 | |
| | | | |
Canada 0.1% | | | | | | | | | | | | | | | | |
| | | | |
Province of Nova Scotia, | | | | | | | | | | | | | | | | |
Unsec’d. Notes | | | 3.450 | | | | 06/01/45 | | | CAD | 50 | | | | 28,402 | |
Province of Saskatchewan, | | | | | | | | | | | | | | | | |
Unsec’d. Notes | | | 3.300 | | | | 06/02/48 | | | CAD | 100 | | | | 55,207 | |
| | | | | | | | | | | | | | | | |
| | | | |
| | | | | | | | | | | | | | | 83,609 | |
| | | | |
Chile 0.1% | | | | | | | | | | | | | | | | |
| | | | |
Chile Government International Bond, | | | | | | | | | | | | | | | | |
Sr. Unsec’d. Notes | | | 1.440 | | | | 02/01/29 | | | EUR | 115 | | | | 105,236 | |
| | | | |
China 0.9% | | | | | | | | | | | | | | | | |
| | | | |
China Government Bond, | | | | | | | | | | | | | | | | |
Sr. Unsec’d. Notes | | | 3.600 | | | | 06/27/28 | | | CNH | 2,000 | | | | 280,864 | |
Sr. Unsec’d. Notes | | | 3.950 | | | | 06/29/43 | | | CNH | 1,500 | | | | 218,783 | |
Sr. Unsec’d. Notes | | | 4.000 | | | | 11/30/35 | | | CNH | 500 | | | | 73,521 | |
Sr. Unsec’d. Notes | | | 4.400 | | | | 12/12/46 | | | CNH | 500 | | | | 78,109 | |
China Government International Bond, | | | | | | | | | | | | | | | | |
Sr. Unsec’d. Notes | | | 0.250 | | | | 11/25/30 | | | EUR | 100 | | | | 83,205 | |
Export-Import Bank of China (The), | | | | | | | | | | | | | | | | |
Sr. Unsec’d. Notes | | | 4.400 | | | | 05/14/24 | | | CNH | 1,000 | | | | 137,256 | |
| | | | | | | | | | | | | | | | |
| | | | |
| | | | | | | | | | | | | | | 871,738 | |
| | | | |
Colombia 0.8% | | | | | | | | | | | | | | | | |
| | | | |
Colombia Government International Bond, | | | | | | | | | | | | | | | | |
Sr. Unsec’d. Notes | | | 3.000 | | | | 01/30/30 | | | | 200 | | | | 153,600 | |
Sr. Unsec’d. Notes | | | 9.850 | | | | 06/28/27 | | | COP | 200,000 | | | | 45,414 | |
Sr. Unsec’d. Notes, EMTN | | | 3.875 | | | | 03/22/26 | | | EUR | 600 | | | | 610,297 | |
| | | | | | | | | | | | | | | | |
| | | | |
| | | | | | | | | | | | | | | 809,311 | |
See Notes to Financial Statements.
PGIM Global Total Return (USD Hedged) Fund 39
Schedule of Investments (continued)
as of October 31, 2023
| | | | | | | | | | | | | | | | |
| | | | |
| Description | | Interest Rate | | | Maturity Date | | | Principal Amount (000)# | | | Value | |
| | | | |
SOVEREIGN BONDS (Continued) | | | | | | | | | | | | | | | | |
| | | | |
Croatia 0.4% | | | | | | | | | | | | | | | | |
| | | | |
Croatia Government International Bond, | | | | | | | | | | | | | | | | |
Sr. Unsec’d. Notes | | | 1.125% | | | | 06/19/29 | | | EUR | 200 | | | $ | 181,437 | |
Sr. Unsec’d. Notes | | | 1.125 | | | | 03/04/33 | | | EUR | 300 | | | | 245,297 | |
| | | | | | | | | | | | | | | | |
| | | | |
| | | | | | | | | | | | | | | 426,734 | |
| | | | |
Cyprus 0.8% | | | | | | | | | | | | | | | | |
| | | | |
Cyprus Government International Bond, | | | | | | | | | | | | | | | | |
Sr. Unsec’d. Notes, EMTN | | | 0.625 | | | | 01/21/30 | | | EUR | 100 | | | | 87,531 | |
Sr. Unsec’d. Notes, EMTN | | | 0.950 | | | | 01/20/32 | | | EUR | 300 | | | | 252,293 | |
Sr. Unsec’d. Notes, EMTN | | | 1.250 | | | | 01/21/40 | | | EUR | 20 | | | | 13,206 | |
Sr. Unsec’d. Notes, EMTN | | | 2.375 | | | | 09/25/28 | | | EUR | 100 | | | | 99,218 | |
Sr. Unsec’d. Notes, EMTN | | | 2.750 | | | | 06/27/24 | | | EUR | 100 | | | | 105,022 | |
Sr. Unsec’d. Notes, EMTN | | | 2.750 | | | | 02/26/34 | | | EUR | 200 | | | | 184,848 | |
Sr. Unsec’d. Notes, EMTN | | | 2.750 | | | | 05/03/49 | | | EUR | 30 | | | | 22,954 | |
Sr. Unsec’d. Notes, EMTN | | | 4.250 | | | | 11/04/25 | | | EUR | 50 | | | | 53,700 | |
| | | | | | | | | | | | | | | | |
| | | | |
| | | | | | | | | | | | | | | 818,772 | |
| | | | |
Denmark 0.0% | | | | | | | | | | | | | | | | |
| | | | |
Denmark Government Bond, | | | | | | | | | | | | | | | | |
Bonds, Series 30YR | | | 0.250 | | | | 11/15/52 | | | DKK | 300 | | | | 19,221 | |
| | | | |
Dominican Republic 0.1% | | | | | | | | | | | | | | | | |
| | | | |
Dominican Republic International Bond, | | | | | | | | | | | | | | | | |
Sr. Unsec’d. Notes | | | 5.950 | | | | 01/25/27 | | | | 100 | | | | 96,091 | |
| | | | |
Estonia 0.2% | | | | | | | | | | | | | | | | |
| | | | |
Estonia Government International Bond, | | | | | | | | | | | | | | | | |
Sr. Unsec’d. Notes | | | 4.000 | | | | 10/12/32 | | | EUR | 200 | | | | 213,874 | |
| | | | |
France 0.2% | | | | | | | | | | | | | | | | |
| | | | |
Caisse Francaise de Financement Local, | | | | | | | | | | | | | | | | |
Covered Bonds, EMTN | | | 4.680 | | | | 03/09/29 | | | CAD | 200 | | | | 138,489 | |
| | | | |
Germany 0.2% | | | | | | | | | | | | | | | | |
| | | | |
Bundesrepublik Deutschland Bundesanleihe, | | | | | | | | | | | | | | | | |
Bonds(k) | | | 0.000 | | | | 08/15/31 | | | EUR | 100 | | | | 86,186 | |
Bonds | | | 1.700 | | | | 08/15/32 | | | EUR | 110 | | | | 107,137 | |
| | | | | | | | | | | | | | | | |
| | | | |
| | | | | | | | | | | | | | | 193,323 | |
See Notes to Financial Statements.
40
| | | | | | | | | | | | | | | | |
| | | | |
| Description | | Interest Rate | | | Maturity Date | | | Principal Amount (000)# | | | Value | |
| | | | |
SOVEREIGN BONDS (Continued) | | | | | | | | | | | | | | | | |
| | | | |
Greece 2.1% | | | | | | | | | | | | | | | | |
| | | | |
Hellenic Republic Government Bond, | | | | | | | | | | | | | | | | |
Bonds | | | 4.300% | | | | 02/24/24 | | | EUR | 21 | | | $ | 21,593 | |
Bonds | | | 4.300 | | | | 02/24/25 | | | EUR | 13 | | | | 13,709 | |
Bonds | | | 4.300 | | | | 02/24/26 | | | EUR | 34 | | | | 34,857 | |
Bonds | | | 4.300 | | | | 02/24/27 | | | EUR | 65 | | | | 66,586 | |
Bonds | | | 4.300 | | | | 02/24/28 | | | EUR | 42 | | | | 43,773 | |
Bonds | | | 4.300 | | | | 02/24/29 | | | EUR | 25 | | | | 25,351 | |
Bonds | | | 4.300 | | | | 02/24/30 | | | EUR | 10 | | | | 10,013 | |
Bonds | | | 4.300 | | | | 02/24/31 | | | EUR | 23 | | | | 22,849 | |
Bonds | | | 4.300 | | | | 02/24/32 | | | EUR | 24 | | | | 23,598 | |
Bonds | | | 4.300 | | | | 02/24/33 | | | EUR | 46 | | | | 44,388 | |
Bonds | | | 4.300 | | | | 02/24/34 | | | EUR | 22 | | | | 21,009 | |
Bonds | | | 4.300 | | | | 02/24/35 | | | EUR | 33 | | | | 31,223 | |
Bonds | | | 4.300 | | | | 02/24/36 | | | EUR | 24 | | | | 21,972 | |
Bonds | | | 4.300 | | | | 02/24/37 | | | EUR | 16 | | | | 15,739 | |
Bonds | | | 4.300 | | | | 02/24/38 | | | EUR | 15 | | | | 14,783 | |
Bonds | | | 4.300 | | | | 02/24/39 | | | EUR | 23 | | | | 21,619 | |
Bonds | | | 4.300 | | | | 02/24/40 | | | EUR | 23 | | | | 19,328 | |
Bonds | | | 4.300 | | | | 02/24/41 | | | EUR | 23 | | | | 18,952 | |
Bonds | | | 4.300 | | | | 02/24/42 | | | EUR | 37 | | | | 34,133 | |
Bonds, 144A | | | 0.750 | | | | 06/18/31 | | | EUR | 500 | | | | 419,749 | |
Sr. Unsec’d. Notes, 144A | | | 1.875 | | | | 02/04/35 | | | EUR | 1,019 | | | | 843,884 | |
Sr. Unsec’d. Notes, 144A | | | 1.875 | | | | 01/24/52 | | | EUR | 345 | | | | 210,546 | |
Hellenic Republic Government International Bond, | | | | | | | | | | | | | | | | |
Sr. Unsec’d. Notes | | | 5.200 | | | | 07/17/34 | | | EUR | 50 | | | | 54,090 | |
| | | | | | | | | | | | | | | | |
| | | | |
| | | | | | | | | | | | | | | 2,033,744 | |
| | | | |
Hong Kong 0.3% | | | | | | | | | | | | | | | | |
| | | | |
Airport Authority, | | | | | | | | | | | | | | | | |
Sr. Unsec’d. Notes, 144A | | | 2.500 | | | | 01/12/32 | | | | 245 | | | | 194,518 | |
Hong Kong Government International Bond, | | | | | | | | | | | | | | | | |
Sr. Unsec’d. Notes, GMTN | | | 1.000 | | | | 11/24/41 | | | EUR | 200 | | | | 123,787 | |
| | | | | | | | | | | | | | | | |
| | | | |
| | | | | | | | | | | | | | | 318,305 | |
| | | | |
Hungary 0.3% | | | | | | | | | | | | | | | | |
| | | | |
Hungary Government International Bond, | | | | | | | | | | | | | | | | |
Sr. Unsec’d. Notes | | | 1.750 | | | | 10/10/27 | | | EUR | 100 | | | | 94,632 | |
Sr. Unsec’d. Notes | | | 1.750 | | | | 06/05/35 | | | EUR | 100 | | | | 71,754 | |
Sr. Unsec’d. Notes, 144A | | | 2.125 | | | | 09/22/31 | | | | 200 | | | | 143,880 | |
| | | | | | | | | | | | | | | | |
| | | | |
| | | | | | | | | | | | | | | 310,266 | |
See Notes to Financial Statements.
PGIM Global Total Return (USD Hedged) Fund 41
Schedule of Investments (continued)
as of October 31, 2023
| | | | | | | | | | | | | | | | |
| | | | |
| Description | | Interest Rate | | | Maturity Date | | | Principal Amount (000)# | | | Value | |
| | | | |
SOVEREIGN BONDS (Continued) | | | | | | | | | | | | | | | | |
| | | | |
Iceland 0.1% | | | | | | | | | | | | | | | | |
| | | | |
Iceland Government International Bond, | | | | | | | | | | | | | | | | |
Sr. Unsec’d. Notes | | | 0.000% | | | | 04/15/28 | | | EUR | 100 | | | $ | 89,285 | |
| | | | |
India 0.1% | | | | | | | | | | | | | | | | |
| | | | |
Export-Import Bank of India, | | | | | | | | | | | | | | | | |
Sr. Unsec’d. Notes, EMTN | | | 3.450 | | | | 06/25/26 | | | CNH | 1,000 | | | | 133,462 | |
| | | | |
Indonesia 1.2% | | | | | | | | | | | | | | | | |
| | | | |
Indonesia Government International Bond, | | | | | | | | | | | | | | | | |
Sr. Unsec’d. Notes | | | 0.900 | | | | 02/14/27 | | | EUR | 100 | | | | 93,736 | |
Sr. Unsec’d. Notes | | | 1.100 | | | | 03/12/33 | | | EUR | 300 | | | | 227,232 | |
Sr. Unsec’d. Notes | | | 1.300 | | | | 03/23/34 | | | EUR | 300 | | | | 224,950 | |
Sr. Unsec’d. Notes | | | 1.450 | | | | 09/18/26 | | | EUR | 100 | | | | 96,707 | |
Sr. Unsec’d. Notes | | | 1.750 | | | | 04/24/25 | | | EUR | 200 | | | | 203,128 | |
Sr. Unsec’d. Notes | | | 3.375 | | | | 07/30/25 | | | EUR | 100 | | | | 103,748 | |
Sr. Unsec’d. Notes, EMTN | | | 3.750 | | | | 06/14/28 | | | EUR | 200 | | | | 206,156 | |
| | | | | | | | | | | | | | | | |
| | | | |
| | | | | | | | | | | | | | | 1,155,657 | |
| | | | |
Israel 0.4% | | | | | | | | | | | | | | | | |
| | | | |
Israel Government Bond - Fixed, | | | | | | | | | | | | | | | | |
Bonds, Series 0537 | | | 1.500 | | | | 05/31/37 | | | ILS | 300 | | | | 49,050 | |
Israel Government International Bond, | | | | | | | | | | | | | | | | |
Sr. Unsec’d. Notes, EMTN | | | 1.500 | | | | 01/18/27 | | | EUR | 100 | | | | 94,658 | |
Sr. Unsec’d. Notes, EMTN | | | 1.500 | | | | 01/16/29 | | | EUR | 270 | | | | 240,536 | |
| | | | | | | | | | | | | | | | |
| | | | |
| | | | | | | | | | | | | | | 384,244 | |
| | | | |
Italy 2.6% | | | | | | | | | | | | | | | | |
| | | | |
Italy Buoni Poliennali Del Tesoro, | | | | | | | | | | | | | | | | |
Sr. Unsec’d. Notes, Series 10YR, 144A | | | 0.950 | | | | 12/01/31 | | | EUR | 100 | | | | 81,094 | |
Sr. Unsec’d. Notes, Series 16YR, 144A | | | 1.450 | | | | 03/01/36 | | | EUR | 250 | | | | 181,731 | |
Sr. Unsec’d. Notes, Series 21YR, 144A | | | 1.800 | | | | 03/01/41 | | | EUR | 715 | | | | 477,022 | |
Sr. Unsec’d. Notes, Series 26YR, 144A | | | 3.350 | | | | 03/01/35 | | | EUR | 335 | | | | 309,170 | |
Sr. Unsec’d. Notes, Series 31YR, 144A | | | 1.700 | | | | 09/01/51 | | | EUR | 150 | | | | 81,771 | |
Sr. Unsec’d. Notes, Series 50YR, 144A | | | 2.800 | | | | 03/01/67 | | | EUR | 105 | | | | 67,939 | |
Region of Lazio, | | | | | | | | | | | | | | | | |
Sr. Unsec’d. Notes | | | 3.088 | | | | 03/31/43 | | | EUR | 167 | | | | 138,421 | |
Repubic of Italy Government International Bond Coupon Strips, | | | | | | | | | | | | | | | | |
Sr. Unsec’d. Notes | | | 1.737(s) | | | | 02/20/31 | | | EUR | 85 | | | | 64,568 | |
See Notes to Financial Statements.
42
| | | | | | | | | | | | | | | | |
| | | | |
| Description | | Interest Rate | | | Maturity Date | | | Principal Amount (000)# | | | Value | |
| | | | |
SOVEREIGN BONDS (Continued) | | | | | | | | | | | | | | | | |
| | | | |
Italy (cont’d.) | | | | | | | | | | | | | | | | |
| | | | |
Republic of Italy Government International Bond, | | | | | | | | | | | | | | | | |
Sr. Unsec’d. Notes | | | 2.875% | | | | 10/17/29 | | | | 200 | | | $ | 169,565 | |
Sr. Unsec’d. Notes, EMTN | | | 5.200 | | | | 07/31/34 | | | EUR | 300 | | | | 318,838 | |
Sr. Unsec’d. Notes, EMTN | | | 5.345 | | | | 01/27/48 | | | EUR | 50 | | | | 50,420 | |
Sr. Unsec’d. Notes, EMTN | | | 6.000 | | | | 08/04/28 | | | GBP | 100 | | | | 122,566 | |
Sr. Unsec’d. Notes, MTN | | | 5.125 | | | | 07/31/24 | | | EUR | 350 | | | | 372,767 | |
Sr. Unsec’d. Notes, MTN | | | 5.375 | | | | 06/15/33 | | | | 100 | | | | 93,006 | |
| | | | | | | | | | | | | | | | |
| | | | |
| | | | | | | | | | | | | | | 2,528,878 | |
| | | | |
Kazakhstan 0.3% | | | | | | | | | | | | | | | | |
| | | | |
Kazakhstan Government International Bond, | | | | | | | | | | | | | | | | |
Sr. Unsec’d. Notes, EMTN | | | 0.600 | | | | 09/30/26 | | | EUR | 200 | | | | 187,495 | |
Sr. Unsec’d. Notes, EMTN | | | 2.375 | | | | 11/09/28 | | | EUR | 115 | | | | 108,540 | |
| | | | | | | | | | | | | | | | |
| | | | |
| | | | | | | | | | | | | | | 296,035 | |
| | | | |
Latvia 0.3% | | | | | | | | | | | | | | | | |
| | | | |
Latvia Government International Bond, | | | | | | | | | | | | | | | | |
Sr. Unsec’d. Notes, GMTN | | | 0.250 | | | | 01/23/30 | | | EUR | 300 | | | | 251,408 | |
| | | | |
Lithuania 0.2% | | | | | | | | | | | | | | | | |
| | | | |
Lithuania Government International Bond, | | | | | | | | | | | | | | | | |
Sr. Unsec’d. Notes, EMTN | | | 2.125 | | | | 10/22/35 | | | EUR | 200 | | | | 170,919 | |
| | | | |
Mexico 1.2% | | | | | | | | | | | | | | | | |
| | | | |
Mexico Government International Bond, | | | | | | | | | | | | | | | | |
Sr. Unsec’d. Notes | | | 2.375 | | | | 02/11/30 | | | EUR | 100 | | | | 91,831 | |
Sr. Unsec’d. Notes | | | 2.875 | | | | 04/08/39 | | | EUR | 200 | | | | 149,002 | |
Sr. Unsec’d. Notes, EMTN | | | 1.750 | | | | 04/17/28 | | | EUR | 100 | | | | 94,059 | |
Sr. Unsec’d. Notes, GMTN | | | 6.750 | | | | 02/06/24 | | | GBP | 100 | | | | 121,363 | |
Sr. Unsec’d. Notes, Series 19 | | | 1.440 | | | | 07/24/24 | | | JPY | 100,000 | | | | 662,276 | |
| | | | | | | | | | | | | | | | |
| | | | |
| | | | | | | | | | | | | | | 1,118,531 | |
| | | | |
New Zealand 0.1% | | | | | | | | | | | | | | | | |
| | | | |
New Zealand Local Government Funding Agency Bond, | | | | | | | | | | | | | | | | |
Local Gov’t. Gtd. Notes | | | 3.500 | | | | 04/14/33 | | | NZD | 100 | | | | 46,499 | |
See Notes to Financial Statements.
PGIM Global Total Return (USD Hedged) Fund 43
Schedule of Investments (continued)
as of October 31, 2023
| | | | | | | | | | | | | | | | |
| | | | |
| Description | | Interest Rate | | | Maturity Date | | | Principal Amount (000)# | | | Value | |
| | | | |
SOVEREIGN BONDS (Continued) | | | | | | | | | | | | | | | | |
| | | | |
Panama 0.4% | | | | | | | | | | | | | | | | |
| | | | |
Panama Government International Bond, | | | | | | | | | | | | | | | | |
Sr. Unsec’d. Notes | | | 3.160% | | | | 01/23/30 | | | | 200 | | | $ | 160,400 | |
Sr. Unsec’d. Notes | | | 3.875 | | | | 03/17/28 | | | | 200 | | | | 179,200 | |
| | | | | | | | | | | | | | | | |
| | | | |
| | | | | | | | | | | | | | | 339,600 | |
| | | | |
Peru 0.4% | | | | | | | | | | | | | | | | |
| | | | |
Peru Government Bond, | | | | | | | | | | | | | | | | |
Sr. Unsec’d. Notes | | | 6.150 | | | | 08/12/32 | | | PEN | 30 | | | | 7,133 | |
Peruvian Government International Bond, | | | | | | | | | | | | | | | | |
Sr. Unsec’d. Notes | | | 1.250 | | | | 03/11/33 | | | EUR | 105 | | | | 80,359 | |
Sr. Unsec’d. Notes | | | 2.750 | | | | 01/30/26 | | | EUR | 300 | | | | 304,514 | |
Sr. Unsec’d. Notes | | | 6.900 | | | | 08/12/37 | | | PEN | 100 | | | | 24,167 | |
| | | | | | | | | | | | | | | | |
| | | | |
| | | | | | | | | | | | | | | 416,173 | |
| | | | |
Philippines 0.5% | | | | | | | | | | | | | | | | |
| | | | |
Philippine Government International Bond, | | | | | | | | | | | | | | | | |
Sr. Unsec’d. Notes | | | 0.700 | | | | 02/03/29 | | | EUR | 500 | | | | 438,201 | |
Sr. Unsec’d. Notes | | | 1.750 | | | | 04/28/41 | | | EUR | 100 | | | | 65,833 | |
| | | | | | | | | | | | | | | | |
| | | | |
| | | | | | | | | | | | | | | 504,034 | |
| | | | |
Portugal 0.9% | | | | | | | | | | | | | | | | |
| | | | |
Portugal Obrigacoes do Tesouro OT, | | | | | | | | | | | | | | | | |
Sr. Unsec’d. Notes, 144A | | | 0.300 | | | | 10/17/31 | | | EUR | 200 | | | | 166,371 | |
Sr. Unsec’d. Notes, 144A | | | 0.900 | | | | 10/12/35 | | | EUR | 150 | | | | 114,833 | |
Sr. Unsec’d. Notes, 144A | | | 1.150 | | | | 04/11/42 | | | EUR | 85 | | | | 56,041 | |
Sr. Unsec’d. Notes, 144A | | | 4.100 | | | | 04/15/37 | | | EUR | 195 | | | | 210,209 | |
Sr. Unsec’d. Notes, 144A | | | 4.100 | | | | 02/15/45 | | | EUR | 135 | | | | 141,625 | |
Sr. Unsec’d. Notes, Series 15YR, 144A | | | 2.250 | | | | 04/18/34 | | | EUR | 50 | | | | 46,451 | |
Unsec’d. Notes, 144A | | | 1.000 | | | | 04/12/52 | | | EUR | 260 | | | | 131,470 | |
| | | | | | | | | | | | | | | | |
| | | | |
| | | | | | | | | | | | | | | 867,000 | |
| | | | |
Qatar 0.2% | | | | | | | | | | | | | | | | |
| | | | |
Qatar Government International Bond, | | | | | | | | | | | | | | | | |
Sr. Unsec’d. Notes, 144A | | | 3.400 | | | | 04/16/25 | | | | 200 | | | | 193,300 | |
| | | | |
Romania 0.5% | | | | | | | | | | | | | | | | |
| | | | |
Romanian Government International Bond, | | | | | | | | | | | | | | | | |
Sr. Unsec’d. Notes, 144A, MTN | | | 2.125 | | | | 03/07/28 | | | EUR | 180 | | | | 165,044 | |
Sr. Unsec’d. Notes, EMTN | | | 1.750 | | | | 07/13/30 | | | EUR | 200 | | | | 160,324 | |
See Notes to Financial Statements.
44
| | | | | | | | | | | | | | | | |
| | | | |
| Description | | Interest Rate | | | Maturity Date | | | Principal Amount (000)# | | | Value | |
| | | | |
SOVEREIGN BONDS (Continued) | | | | | | | | | | | | | | | | |
| | | | |
Romania (cont’d.) | | | | | | | | | | | | | | | | |
| | | | |
Romanian Government International Bond, (cont’d.) | | | | | | | | | | | | | | | | |
Sr. Unsec’d. Notes, EMTN | | | 3.500% | | | | 04/03/34 | | | EUR | 50 | | | $ | 41,140 | |
Sr. Unsec’d. Notes, EMTN | | | 3.875 | | | | 10/29/35 | | | EUR | 100 | | | | 82,697 | |
Unsec’d. Notes, 144A, MTN | | | 2.124 | | | | 07/16/31 | | | EUR | 50 | | | | 38,942 | |
| | | | | | | | | | | | | | | | |
| | | | |
| | | | | | | | | | | | | | | 488,147 | |
| | | | |
Saudi Arabia 0.3% | | | | | | | | | | | | | | | | |
| | | | |
Saudi Government International Bond, | | | | | | | | | | | | | | | | |
Sr. Unsec’d. Notes | | | 2.000 | | | | 07/09/39 | | | EUR | 425 | | | | 304,245 | |
| | | | |
Serbia 0.5% | | | | | | | | | | | | | | | | |
| | | | |
Serbia International Bond, | | | | | | | | | | | | | | | | |
Sr. Unsec’d. Notes | | | 1.650 | | | | 03/03/33 | | | EUR | 100 | | | | 69,822 | |
Sr. Unsec’d. Notes | | | 3.125 | | | | 05/15/27 | | | EUR | 250 | | | | 239,223 | |
Sr. Unsec’d. Notes, 144A | | | 2.125 | | | | 12/01/30 | | | | 200 | | | | 146,364 | |
| | | | | | | | | | | | | | | | |
| | | | |
| | | | | | | | | | | | | | | 455,409 | |
| | | | |
Singapore 0.0% | | | | | | | | | | | | | | | | |
| | | | |
Singapore Government Bond, | | | | | | | | | | | | | | | | |
Bonds | | | 2.750 | | | | 03/01/46 | | | SGD | 40 | | | | 26,866 | |
| | | | |
Slovakia 0.1% | | | | | | | | | | | | | | | | |
| | | | |
Slovakia Government Bond, | | | | | | | | | | | | | | | | |
Unsec’d. Notes, Series 242 | | | 0.375 | | | | 04/21/36 | | | EUR | 200 | | | | 130,589 | |
| | | | |
Slovenia 0.8% | | | | | | | | | | | | | | | | |
| | | | |
Slovenia Government Bond, | | | | | | | | | | | | | | | | |
Unsec’d. Notes, Series RS86 | | | 0.000 | | | | 02/12/31 | | | EUR | 300 | | | | 244,876 | |
Slovenia Government International Bond, | | | | | | | | | | | | | | | | |
Bonds, 144A | | | 5.000 | | | | 09/19/33 | | | | 600 | | | | 571,740 | |
| | | | | | | | | | | | | | | | |
| | | | |
| | | | | | | | | | | | | | | 816,616 | |
| | | | |
Spain 1.3% | | | | | | | | | | | | | | | | |
| | | | |
Autonomous Community of Catalonia, | | | | | | | | | | | | | | | | |
Sr. Unsec’d. Notes | | | 4.220 | | | | 04/26/35 | | | EUR | 100 | | | | 99,766 | |
Sr. Unsec’d. Notes, EMTN | | | 5.900 | | | | 05/28/30 | | | EUR | 50 | | | | 56,176 | |
Spain Government Bond, | | | | | | | | | | | | | | | | |
Sr. Unsec’d. Notes, 144A | | | 0.500 | | | | 04/30/30 | | | EUR | 35 | | | | 30,685 | |
Sr. Unsec’d. Notes, 144A | | | 0.500 | | | | 10/31/31 | | | EUR | 250 | | | | 207,635 | |
See Notes to Financial Statements.
PGIM Global Total Return (USD Hedged) Fund 45
Schedule of Investments (continued)
as of October 31, 2023
| | | | | | | | | | | | | | | | |
| | | | |
| Description | | Interest Rate | | | Maturity Date | | | Principal Amount (000)# | | | Value | |
| | | | |
SOVEREIGN BONDS (Continued) | | | | | | | | | | | | | | | | |
| | | | |
Spain (cont’d.) | | | | | | | | | | | | | | | | |
| | | | |
Spain Government Bond, (cont’d.) | | | | | | | | | | | | | | | | |
Sr. Unsec’d. Notes, 144A | | | 0.850% | | | | 07/30/37 | | | EUR | 110 | | | $ | 76,427 | |
Sr. Unsec’d. Notes, 144A | | | 1.000 | | | | 10/31/50 | | | EUR | 190 | | | | 93,047 | |
Sr. Unsec’d. Notes, 144A(k) | | | 1.850 | | | | 07/30/35 | | | EUR | 285 | | | | 241,521 | |
Sr. Unsec’d. Notes, 144A(k) | | | 3.450 | | | | 07/30/43 | | | EUR | 300 | | | | 276,863 | |
Sr. Unsec’d. Notes, 144A | | | 3.450 | | | | 07/30/66 | | | EUR | 60 | | | | 49,675 | |
Spain Government International Bond, | | | | | | | | | | | | | | | | |
Sr. Unsec’d. Notes, EMTN | | | 5.250 | | | | 04/06/29 | | | GBP | 100 | | | | 121,422 | |
| | | | | | | | | | | | | | | | |
| | | | |
| | | | | | | | | | | | | | | 1,253,217 | |
| | | | |
Ukraine 0.2% | | | | | | | | | | | | | | | | |
| | | | |
Ukraine Government International Bond, | | | | | | | | | | | | | | | | |
Sr. Unsec’d. Notes | | | 4.375 | | | | 01/27/32 | (d) | | EUR | 641 | | | | 151,121 | |
Sr. Unsec’d. Notes | | | 6.750 | | | | 06/20/28 | (d) | | EUR | 200 | | | | 52,376 | |
| | | | | | | | | | | | | | | | |
| | | | |
| | | | | | | | | | | | | | | 203,497 | |
| | | | |
United Arab Emirates 0.2% | | | | | | | | | | | | | | | | |
| | | | |
UAE International Government Bond, | | | | | | | | | | | | | | | | |
Sr. Unsec’d. Notes, 144A, MTN | | | 2.000 | | | | 10/19/31 | | | | 205 | | | | 160,700 | |
| | | | |
United Kingdom 0.6% | | | | | | | | | | | | | | | | |
| | | | |
Isle of Man Government International Bond, | | | | | | | | | | | | | | | | |
Unsec’d. Notes | | | 5.375 | | | | 08/14/34 | | | GBP | 100 | | | | 119,861 | |
Unsec’d. Notes | | | 5.625 | | | | 03/29/30 | | | GBP | 100 | | | | 124,474 | |
United Kingdom Gilt, | | | | | | | | | | | | | | | | |
Bonds(k) | | | 4.250 | | | | 12/07/46 | | | GBP | 330 | | | | 360,728 | |
| | | | | | | | | | | | | | | | |
| | | | |
| | | | | | | | | | | | | | | 605,063 | |
| | | | |
Uruguay 0.0% | | | | | | | | | | | | | | | | |
| | | | |
Uruguay Government International Bond, | | | | | | | | | | | | | | | | |
Sr. Unsec’d. Notes | | | 4.375 | | | | 10/27/27 | | | | 39 | | | | 38,921 | |
| | | | | | | | | | | | | | | | |
| | | | |
TOTAL SOVEREIGN BONDS
(cost $27,270,180) | | | | | | | | | | | | | | | 20,865,699 | |
| | | | | | | | | | | | | | | | |
| | | | |
U.S. GOVERNMENT AGENCY OBLIGATIONS 0.1% | | | | | | | | | | | | | | | | |
Federal Home Loan Bank | | | 3.280 | | | | 03/28/29 | | | USD | 9 | | | | 7,747 | |
See Notes to Financial Statements.
46
| | | | | | | | | | | | | | | | |
| | | | |
| Description | | Interest Rate | | | Maturity Date | | | Principal Amount (000)# | | | Value | |
| | | | |
U.S. GOVERNMENT AGENCY OBLIGATIONS (Continued) | | | | | | | | | | | | | | | | |
| | | | |
Tennessee Valley Authority | | | | | | | | | | | | | | | | |
Sr. Unsec’d. Notes | | | 5.625% | | | | 06/07/32 | | | GBP | 100 | | | $ | 124,440 | |
| | | | | | | | | | | | | | | | |
| | | | |
TOTAL U.S. GOVERNMENT AGENCY OBLIGATIONS
(cost $192,437) | | | | | | | | | | | | | | | 132,187 | |
| | | | | | | | | | | | | | | | |
| | | | |
U.S. TREASURY OBLIGATIONS 11.8% | | | | | | | | | | | | | | | | |
U.S. Treasury Bonds(k) | | | 1.875 | | | | 02/15/41 | | | | 2,255 | | | | 1,389,996 | |
U.S. Treasury Bonds(k) | | | 2.375 | | | | 05/15/51 | | | | 145 | | | | 86,366 | |
U.S. Treasury Bonds(k) | | | 2.750 | | | | 08/15/47 | | | | 280 | | | | 184,406 | |
U.S. Treasury Bonds | | | 3.000 | | | | 02/15/47 | | | | 1,650 | | | | 1,145,977 | |
U.S. Treasury Bonds | | | 3.000 | | | | 08/15/48 | | | | 2,040 | | | | 1,404,412 | |
U.S. Treasury Bonds | | | 3.250 | | | | 05/15/42 | | | | 750 | | | | 571,055 | |
U.S. Treasury Bonds | | | 3.875 | | | | 05/15/43 | | | | 600 | | | | 498,187 | |
U.S. Treasury Bonds(k) | | | 4.375 | | | | 08/15/43 | | | | 2,635 | | | | 2,349,267 | |
U.S. Treasury Notes(k) | | | 1.125 | | | | 02/15/31 | | | | 1,490 | | | | 1,154,052 | |
U.S. Treasury Notes | | | 5.000 | | | | 08/31/25 | | | | 1,500 | | | | 1,496,895 | |
U.S. Treasury Notes | | | 5.000 | | | | 09/30/25 | | | | 1,215 | | | | 1,212,769 | |
| | | | | | | | | | | | | | | | |
| | | | |
TOTAL U.S. TREASURY OBLIGATIONS
(cost $13,068,720) | | | | | | | | | | | | | | | 11,493,382 | |
| | | | | | | | | | | | | | | | |
| | | | |
| | | | | | | | | Shares | | | | |
| | | | |
UNAFFILIATED EXCHANGE-TRADED FUNDS 1.0% | | | | | | | | | | | | | | | | |
iShares Floating Rate Bond ETF | | | | | | | | | | | 13,700 | | | | 697,193 | |
iShares Preferred & Income Securities ETF(a) | | | | | | | | | | | 10,000 | | | | 285,800 | |
| | | | | | | | | | | | | | | | |
| | | | |
TOTAL UNAFFILIATED EXCHANGE-TRADED FUNDS
(cost $1,011,465) | | | | | | | | | | | | | | | 982,993 | |
| | | | | | | | | | | | | | | | |
| | | | |
TOTAL LONG-TERM INVESTMENTS
(cost $110,137,338) | | | | | | | | | | | | | | | 95,147,947 | |
| | | | | | | | | | | | | | | | |
| | | | |
SHORT-TERM INVESTMENTS 1.9% | | | | | | | | | | | | | | | | |
| | | | |
AFFILIATED MUTUAL FUNDS | | | | | | | | | | | | | | | | |
PGIM Core Government Money Market Fund(wb) | | | | | | | | | | | 1,547,455 | | | | 1,547,455 | |
See Notes to Financial Statements.
PGIM Global Total Return (USD Hedged) Fund 47
Schedule of Investments (continued)
as of October 31, 2023
| | | | | | | | | | | | | | | | |
| | | | |
| Description | | | | | | | | Shares | | | Value | |
AFFILIATED MUTUAL FUNDS (Continued) | | | | | | | | | | | | | | | | |
PGIM Institutional Money Market Fund
(cost $262,660; includes $261,452 of cash collateral for securities on loan)(b)(wb) | | | | | | | | | | | 262,818 | | | $ | 262,686 | |
| | | | | | | | | | | | | | | | |
| | | | |
TOTAL SHORT-TERM INVESTMENTS
(cost $1,810,115) | | | | | | | | | | | | | | | 1,810,141 | |
| | | | | | | | | | | | | | | | |
| | | | |
TOTAL INVESTMENTS 99.8%
(cost $111,947,453) | | | | | | | | | | | | | | | 96,958,088 | |
Other assets in excess of liabilities(z) 0.2% | | | | | | | | | | | | | | | 235,542 | |
| | | | | | | | | | | | | | | | |
| | | | |
NET ASSETS 100.0% | | | | | | | | | | | | | | $ | 97,193,630 | |
| | | | | | | | | | | | | | | | |
Below is a list of the abbreviation(s) used in the annual report:
AUD—Australian Dollar
CAD—Canadian Dollar
CHF—Swiss Franc
CLP—Chilean Peso
CNH—Chinese Renminbi
COP—Colombian Peso
CZK—Czech Koruna
DKK—Danish Krone
EUR—Euro
GBP—British Pound
HUF—Hungarian Forint
IDR—Indonesian Rupiah
ILS—Israeli Shekel
JPY—Japanese Yen
KRW—South Korean Won
MXN—Mexican Peso
MYR—Malaysian Ringgit
NOK—Norwegian Krone
NZD—New Zealand Dollar
PEN—Peruvian Nuevo
Sol PLN—Polish Zloty
SEK—Swedish Krona
SGD—Singapore Dollar
THB—Thai Baht
TWD—New Taiwanese Dollar
USD—US Dollar
144A—Security was purchased pursuant to Rule 144A under the Securities Act of 1933 and, pursuant to the requirements of Rule 144A, may not be resold except to qualified institutional buyers.
A—Annual payment frequency for swaps
BARC—Barclays Bank PLC
BBR—New Zealand Bank Bill Rate
BBSW—Australian Bank Bill Swap Reference Rate
BNP—BNP Paribas S.A.
See Notes to Financial Statements.
48
BNYM—Bank of New York Mellon
BOA—Bank of America, N.A.
BUBOR—Budapest Interbank Offered Rate
CDOR—Canadian Dollar Offered Rate
CDX—Credit Derivative Index
CIBOR—Copenhagen Interbank Offered Rate
CITI—Citibank, N.A.
CLO—Collateralized Loan Obligation
CLOIS—Sinacofi Chile Interbank Rate Average
CORRA—Canadian Overnight Repo Rate Average
DAC—Designated Activity Company
DB—Deutsche Bank AG
EMTN—Euro Medium Term Note
ETF—Exchange-Traded Fund
EURIBOR—Euro Interbank Offered Rate
EuroSTR—Euro Short-Term Rate
FHLMC—Federal Home Loan Mortgage Corporation
GMTN—Global Medium Term Note
GSI—Goldman Sachs International
HSBC—HSBC Bank PLC
ICE—Intercontinental Exchange
IO—Interest Only (Principal amount represents notional)
JPM—JPMorgan Chase Bank N.A.
JPS—J.P. Morgan Securities LLC
KLIBOR—Kuala Lumpur Interbank Offered Rate
KWCDC—Korean Won Certificate of Deposit
LIBOR—London Interbank Offered Rate
LP—Limited Partnership
MSI—Morgan Stanley & Co International PLC
MTN—Medium Term Note
NIBOR—Norwegian Interbank Offered Rate
OTC—Over-the-counter
PIK—Payment-in-Kind
PJSC—Public Joint-Stock Company
PRIBOR—Prague Interbank Offered Rate
Q—Quarterly payment frequency for swaps
REMIC—Real Estate Mortgage Investment Conduit
S—Semiannual payment frequency for swaps
SARON—Swiss Average Rate Overnight
SCB—Standard Chartered Bank
SOFR—Secured Overnight Financing Rate
SONIA—Sterling Overnight Index Average
SORA—Singapore Overnight Rate Average
STIBOR—Stockholm Interbank Offered Rate
T—Swap payment upon termination
TAIBOR—Taiwan Interbank Offered Rate
TD—The Toronto-Dominion Bank
THOR—Thai Overnight Repurchase Rate
TONAR—Tokyo Overnight Average Rate
UAG—UBS AG
USOIS—United States Overnight Index Swap
See Notes to Financial Statements.
PGIM Global Total Return (USD Hedged) Fund 49
Schedule of Investments (continued)
as of October 31, 2023
WIBOR—Warsaw Interbank Offered Rate
| # | Principal or notional amount is shown in U.S. dollars unless otherwise stated. |
| ^ | Indicates a Level 3 instrument. The aggregate value of Level 3 instruments is $44,826 and 0.0% of net assets. |
| (a) | All or a portion of security is on loan. The aggregate market value of such securities, including those sold and pending settlement, is $257,220; cash collateral of $261,452 (included in liabilities) was received with which the Fund purchased highly liquid short-term investments. In the event of significant appreciation in value of securities on loan on the last business day of the reporting period, the Fund may reflect a collateral value that is less than the market value of the loaned securities and such shortfall is remedied the following business day. |
| (b) | Represents security, or portion thereof, purchased with cash collateral received for securities on loan and includes dividend reinvestment. |
| (c) | Variable rate instrument. The interest rate shown reflects the rate in effect at October 31, 2023. |
| (cc) | Variable rate instrument. The rate shown is based on the latest available information as of October 31, 2023. Certain variable rate securities are not based on a published reference rate and spread but are determined by the issuer or agent and are based on current market conditions. These securities do not indicate a reference rate and spread in their description. |
| (d) | Represents issuer in default on interest payments and/or principal repayment. Non-income producing security. Such securities may be post-maturity. |
| (f) | Indicates a restricted security that is acquired in unregistered, private sales from the issuing company or from an affiliate of the issuer and is considered restricted as to disposition under federal securities law; the aggregate original cost of such securities is $331,387. The aggregate value of $192,315 is 0.2% of net assets. |
| (ff) | Variable rate security. Security may be issued at a fixed coupon rate, which converts to a variable rate at a specified date. Rate shown is the rate in effect as of period end. |
| (k) | Represents security, or a portion thereof, segregated as collateral for centrally cleared/exchange-traded derivatives. |
| (oo) | Perpetual security. Maturity date represents next call date. |
| (r) | Principal or notional amount is less than $500 par. |
| (s) | Represents zero coupon bond or principal only security. Rate represents yield to maturity at purchase date. |
| (wb) | Represents an investment in a Fund affiliated with the Manager. |
| (z) | Includes net unrealized appreciation/(depreciation) and/or market value of the below holdings which are excluded from the Schedule of Investments: |
Futures contracts outstanding at October 31, 2023:
| | | | | | | | | | | | | | | | | | | | |
Number of Contracts | | Type | | Expiration Date | | Current
Notional
Amount | | | Value / Unrealized Appreciation (Depreciation) | |
| | | | | |
Long Positions: | | | | | | | | | | | | | | | | | | |
10 | | 3 Month EuroSTR | | Dec. 2023 | | $ | 2,541,821 | | | | | | | $ | 316 | | | | | |
54 | | 2 Year U.S. Treasury Notes | | Dec. 2023 | | | 10,930,781 | | | | | | | | (6,709 | ) | | | | |
3 | | 10 Year U.S. Treasury Notes | | Dec. 2023 | | | 318,516 | | | | | | | | 183 | | | | | |
2 | | 10 Year U.S. Ultra Treasury Notes | | Dec. 2023 | | | 217,656 | | | | | | | | 497 | | | | | |
19 | | 30 Year U.S. Ultra Treasury Bonds | | Dec. 2023 | | | 2,138,688 | | | | | | | | (254,123 | ) | | | | |
| | | | | | | | | | | | | | | | | | | | |
| | | | | | |
| | | | | | | | | | | | | | | (259,836 | ) | | | | |
| | | | | | | | | | | | | | | | | | | | |
| | | | | |
Short Positions: | | | | | | | | | | | | | | | | | | |
1 | | 5 Year Euro-Bobl | | Dec. 2023 | | | 123,046 | | | | | | | | 1,146 | | | | | |
126 | | 5 Year U.S. Treasury Notes | | Dec. 2023 | | | 13,164,047 | | | | | | | | 212,462 | | | | | |
26 | | 10 Year Euro-Bund | | Dec. 2023 | | | 3,548,592 | | | | | | | | 70,047 | | | | | |
12 | | 20 Year U.S. Treasury Bonds | | Dec. 2023 | | | 1,313,250 | | | | | | | | 49,836 | | | | | |
32 | | British Pound Currency | | Dec. 2023 | | | 2,430,800 | | | | | | | | 82,699 | | | | | |
See Notes to Financial Statements.
50
Futures contracts outstanding at October 31, 2023 (continued):
| | | | | | | | | | | | | | | | | | | | |
Number of Contracts | | Type | | Expiration Date | | Current
Notional
Amount | | | Value / Unrealized Appreciation (Depreciation) | |
| | | | | |
Short Positions (cont’d): | | | | | | | | | | | | | | | | | | |
113 | | Euro Currency | | Dec. 2023 | | $ | 14,976,031 | | | | | | | $ | 255,042 | | | | | |
33 | | Euro Schatz Index | | Dec. 2023 | | | 3,672,427 | | | | | | | | 10,504 | | | | | |
| | | | | | | | | | | | | | | | | | | | |
| | | | | | | | | | | | | | | 681,736 | | | | | |
| | | | | | | | | | | | | | | | | | | | |
| | | | | | | | | | | | | | $ | 421,900 | | | | | |
| | | | | | | | | | | | | | | | | | | | |
Forward foreign currency exchange contracts outstanding at October 31, 2023:
| | | | | | | | | | | | | | | | | | | | | | | | | | | | | | | | | | | | | | | | | | | | |
Purchase Contracts | | Counterparty | | | | Notional
Amount
(000) | | | Value at
Settlement
Date | | | Current
Value | | | Unrealized
Appreciation | | | Unrealized
Depreciation | |
| | | | | | | |
OTC Forward Foreign Currency Exchange Contracts: | | | | | | | | | | | | | | | | | | | | | | | | | | | | | |
Australian Dollar, | | | | | | | | | | | | | | | | | | | | | | | | | | | | | | | | | | | | | | | | | | | | |
Expiring 11/02/23 | | SCB | | | | | AUD | | | | 375 | | | $ | 237,430 | | | $ | 238,037 | | | | | | | $ | 607 | | | | | | | | | | | $ | — | | | | | |
British Pound, | | | | | | | | | | | | | | | | | | | | | | | | | | | | | | | | | | | | | | | | | | | | |
Expiring 11/02/23 | | BNP | | | | | GBP | | | | 851 | | | | 1,032,462 | | | | 1,034,869 | | | | | | | | 2,407 | | | | | | | | | | | | — | | | | | |
Expiring 11/02/23 | | JPM | | | | | GBP | | | | 152 | | | | 186,476 | | | | 185,151 | | | | | | | | — | | | | | | | | | | | | (1,325 | ) | | | | |
Chinese Renminbi, | | | | | | | | | | | | | | | | | | | | | | | | | | | | | | | | | | | | | | | | | | | | |
Expiring 11/16/23 | | MSI | | | | | CNH | | | | 1,035 | | | | 142,295 | | | | 141,083 | | | | | | | | — | | | | | | | | | | | | (1,212 | ) | | | | |
Euro, | | | | | | | | | | | | | | | | | | | | | | | | | | | | | | | | | | | | | | | | | | | | |
Expiring 11/02/23 | | BNP | | | | | EUR | | | | 428 | | | | 453,244 | | | | 452,559 | | | | | | | | — | | | | | | | | | | | | (685 | ) | | | | |
Expiring 11/02/23 | | BNYM | | | | | EUR | | | | 8,801 | | | | 9,306,526 | | | | 9,313,421 | | | | | | | | 6,895 | | | | | | | | | | | | — | | | | | |
Hungarian Forint, | | | | | | | | | | | | | | | | | | | | | | | | | | | | | | | | | | | | | | | | | | | | |
Expiring 01/19/24 | | BARC | | | | | HUF | | | | 71,672 | | | | 194,239 | | | | 196,045 | | | | | | | | 1,806 | | | | | | | | | | | | — | | | | | |
Japanese Yen, | | | | | | | | | | | | | | | | | | | | | | | | | | | | | | | | | | | | | | | | | | | | |
Expiring 11/02/23 | | SCB | | | | | JPY | | | | 38,455 | | | | 256,965 | | | | 253,779 | | | | | | | | — | | | | | | | | | | | | (3,186 | ) | | | | |
Expiring 11/02/23 | | UAG | | | | | JPY | | | | 55,470 | | | | 370,380 | | | | 366,073 | | | | | | | | — | | | | | | | | | | | | (4,307 | ) | | | | |
Expiring 01/19/24 | | MSI | | | | | JPY | | | | 36,828 | | | | 246,366 | | | | 246,266 | | | | | | | | — | | | | | | | | | | | | (100 | ) | | | | |
Norwegian Krone, | | | | | | | | | | | | | | | | | | | | | | | | | | | | | | | | | | | | | | | | | | | | |
Expiring 01/19/24 | | HSBC | | | | | NOK | | | | 553 | | | | 51,039 | | | | 49,613 | | | | | | | | — | | | | | | | | | | | | (1,426 | ) | | | | |
Polish Zloty, | | | | | | | | | | | | | | | | | | | | | | | | | | | | | | | | | | | | | | | | | | | | |
Expiring 01/19/24 | | HSBC | | | | | PLN | | | | 912 | | | | 213,351 | | | | 215,958 | | | | | | | | 2,607 | | | | | | | | | | | | — | | | | | |
South Korean Won, | | | | | | | | | | | | | | | | | | | | | | | | | | | | | | | | | | | | | | | | | | | | |
Expiring 12/20/23 | | JPM | | | | | KRW | | | | 192,755 | | | | 145,739 | | | | 142,873 | | | | | | | | — | | | | | | | | | | | | (2,866 | ) | | | | |
| | | | | | | | | | | | | | | | | | | | | | | | | | | | | | | | | | | | | | | | | | | | |
| | | | | | | | | | | | | | $ | 12,836,512 | | | $ | 12,835,727 | | | | | | | | 14,322 | | | | | | | | | | | | (15,107 | ) | | | | |
| | | | | | | | | | | | | | | | | | | | | | | | | | | | | | | | | | | | | | | | | | | | |
See Notes to Financial Statements.
PGIM Global Total Return (USD Hedged) Fund 51
Schedule of Investments (continued)
as of October 31, 2023
Forward foreign currency exchange contracts outstanding at October 31, 2023 (continued):
| | | | | | | | | | | | | | | | | | | | | | | | | | | | | | | | | | | | | | | | | | |
Sale Contracts | | Counterparty | | Notional
Amount
(000) | | | Value at
Settlement
Date | | | Current
Value | | | Unrealized
Appreciation | | | Unrealized
Depreciation | |
| | | | | | | | | |
OTC Forward Foreign Currency Exchange Contracts: | | | | | | | | | | | | | | | | | | | | | | | | | | | | | | | | | | | | | |
Australian Dollar, | | | | | | | | | | | | | | | | | | | | | | | | | | | | | | | | | | | | | | | | | | |
Expiring 11/02/23 | | CITI | | | AUD | | | | 375 | | | $ | 241,177 | | | $ | 238,037 | | | | | | | $ | 3,140 | | | | | | | | | | | $ | — | | | | | |
Expiring 12/04/23 | | SCB | | | AUD | | | | 375 | | | | 237,679 | | | | 238,297 | | | | | | | | — | | | | | | | | | | | | (618 | ) | | | | |
British Pound, | | | | | | | | | | | | | | | | | | | | | | | | | | | | | | | | | | | | | | | | | | |
Expiring 11/02/23 | | BARC | | | GBP | | | | 1,004 | | | | 1,225,876 | | | | 1,220,019 | | | | | | | | 5,857 | | | | | | | | | | | | — | | | | | |
Expiring 12/04/23 | | BNP | | | GBP | | | | 851 | | | | 1,032,643 | | | | 1,035,096 | | | | | | | | — | | | | | | | | | | | | (2,453 | ) | | | | |
Canadian Dollar, | | | | | | | | | | | | | | | | | | | | | | | | | | | | | | | | | | | | | | | | | | |
Expiring 01/19/24 | | JPM | | | CAD | | | | 414 | | | | 304,984 | | | | 298,687 | | | | | | | | 6,297 | | | | | | | | | | | | — | | | | | |
Chinese Renminbi, | | | | | | | | | | | | | | | | | | | | | | | | | | | | | | | | | | | | | | | | | | |
Expiring 11/16/23 | | BNP | | | CNH | | | | 731 | | | | 100,258 | | | | 99,709 | | | | | | | | 549 | | | | | | | | | | | | — | | | | | |
Expiring 11/16/23 | | CITI | | | CNH | | | | 745 | | | | 102,232 | | | | 101,656 | | | | | | | | 576 | | | | | | | | | | | | — | | | | | |
Expiring 11/16/23 | | MSI | | | CNH | | | | 23,141 | | | | 3,174,284 | | | | 3,155,867 | | | | | | | | 18,417 | | | | | | | | | | | | — | | | | | |
Colombian Peso, | | | | | | | | | | | | | | | | | | | | | | | | | | | | | | | | | | | | | | | | | | |
Expiring 12/20/23 | | CITI | | | COP | | | | 273,723 | | | | 67,911 | | | | 65,756 | | | | | | | | 2,155 | | | | | | | | | | | | — | | | | | |
Euro, | | | | | | | | | | | | | | | | | | | | | | | | | | | | | | | | | | | | | | | | | | |
Expiring 11/02/23 | | BNP | | | EUR | | | | 9,229 | | | | 9,789,666 | | | | 9,765,979 | | | | | | | | 23,687 | | | | | | | | | | | | — | | | | | |
Expiring 12/04/23 | | BNYM | | | EUR | | | | 8,801 | | | | 9,318,504 | | | | 9,326,676 | | | | | | | | — | | | | | | | | | | | | (8,172 | ) | | | | |
Expiring 01/19/24 | | TD | | | EUR | | | | 99 | | | | 105,449 | | | | 105,571 | | | | | | | | — | | | | | | | | | | | | (122 | ) | | | | |
Indonesian Rupiah, | | | | | | | | | | | | | | | | | | | | | | | | | | | | | | | | | | | | | | | | | | |
Expiring 12/20/23 | | BOA | | | IDR | | | | 1,526,380 | | | | 99,022 | | | | 95,743 | | | | | | | | 3,279 | | | | | | | | | | | | — | | | | | |
Israeli Shekel, | | | | | | | | | | | | | | | | | | | | | | | | | | | | | | | | | | | | | | | | | | |
Expiring 12/20/23 | | BARC | | | ILS | | | | 167 | | | | 43,852 | | | | 41,349 | | | | | | | | 2,503 | | | | | | | | | | | | — | | | | | |
Japanese Yen, | | | | | | | | | | | | | | | | | | | | | | | | | | | | | | | | | | | | | | | | | | |
Expiring 11/02/23 | | MSI | | | JPY | | | | 93,925 | | | | 634,584 | | | | 619,852 | | | | | | | | 14,732 | | | | | | | | | | | | — | | | | | |
Expiring 12/04/23 | | UAG | | | JPY | | | | 55,470 | | | | 372,262 | | | | 368,072 | | | | | | | | 4,190 | | | | | | | | | | | | — | | | | | |
Mexican Peso, | | | | | | | | | | | | | | | | | | | | | | | | | | | | | | | | | | | | | | | | | | |
Expiring 12/20/23 | | BARC | | | MXN | | | | 3,835 | | | | 214,955 | | | | 210,934 | | | | | | | | 4,021 | | | | | | | | | | | | — | | | | | |
Singapore Dollar, | | | | | | | | | | | | | | | | | | | | | | | | | | | | | | | | | | | | | | | | | | |
Expiring 12/20/23 | | JPM | | | SGD | | | | 41 | | | | 29,895 | | | | 29,657 | | | | | | | | 238 | | | | | | | | | | | | — | | | | | |
Swiss Franc, | | | | | | | | | | | | | | | | | | | | | | | | | | | | | | | | | | | | | | | | | | |
Expiring 01/19/24 | | GSI | | | CHF | | | | 278 | | | | 311,539 | | | | 308,503 | | | | | | | | 3,036 | | | | | | | | | | | | — | | | | | |
| | | | | | | | | | | | | | | | | | | | | | | | | | | | | | | | | | | | | | | | | | |
| | | | | | | | | | | |
| | | | | | | | | | | | $ | 27,406,772 | | | $ | 27,325,460 | | | | | | | | 92,677 | | | | | | | | | | | | (11,365 | ) | | | | |
| | | | | | | | | | | | | | | | | | | | | | | | | | | | | | | | | | | | | | | | | | |
| | | | | | | | | | | |
| | | | | | | | | | | | | | | | | | | | | | | | $ | 106,999 | | | | | | | | | | | $ | (26,472 | ) | | | | |
| | | | | | | | | | | | | | | | | | | | | | | | | | | | | | | | | | | | | | | | | | |
See Notes to Financial Statements.
52
Credit default swap agreements outstanding at October 31, 2023:
| | | | | | | | | | | | | | | | | | | | | | | | | | | | | | | | | | | | | | | | | | |
Reference Entity/ Obligation | | Termination
Date | | | Fixed
Rate | | | Notional
Amount
(000)#(3) | | | Fair
Value | | | Upfront
Premiums
Paid
(Received) | | | Unrealized
Appreciation
(Depreciation) | | | Counterparty |
| | | | | | | | | | | | | | | | | | | | | | | | | | | | | | | | | |
|
OTC Credit Default Swap Agreements on corporate and/or sovereign issues - Buy Protection(1): |
Gazprom PAO | | | 06/20/24 | | | | 1.000 | %(Q) | | | 134 | | | $ | 16,218 | | | | | | | $ | 17,060 | | | | | | | | | | | $ | (842 | ) | | | | | | HSBC |
Gazprom PAO | | | 06/20/24 | | | | 1.000 | %(Q) | | | 121 | | | | 14,645 | | | | | | | | 24,683 | | | | | | | | | | | | (10,038 | ) | | | | | | BARC |
Kingdom of Morocco | | | 12/20/27 | | | | 1.000 | %(Q) | | | 115 | | | | 1,006 | | | | | | | | 2,560 | | | | | | | | | | | | (1,554 | ) | | | | | | BNP |
Republic of Italy | | | 12/20/27 | | | | 1.000 | %(Q) | | EUR | 70 | | | | (1,093 | ) | | | | | | | (2,192 | ) | | | | | | | | | | | 1,099 | | | | | | | BARC |
Republic of South Africa | | | 12/20/28 | | | | 1.000 | %(Q) | | | 400 | | | | 29,633 | | | | | | | | 39,318 | | | | | | | | | | | | (9,685 | ) | | | | | | MSI |
| | | | | | | | | | | | | | | | | | | | | | | | | | | | | | | | | | | | | | | | | | |
| | | | | | | | | | | | | | $ | 60,409 | | | | | | | $ | 81,429 | | | | | | | | | | | $ | (21,020 | ) | | | | | | |
| | | | | | | | | | | | | | | | | | | | | | | | | | | | | | | | | | | | | | | | | | |
| | | | | | | | | | | | | | | | | | | | | | | | | | | | |
Reference
Entity/
Obligation | | Termination
Date | | Fixed
Rate | | | Notional
Amount
(000)#(3) | | | Implied
Credit
Spread at
October 31,
2023(4) | | | Fair
Value | | | Upfront
Premiums
Paid
(Received) | | | Unrealized
Appreciation
(Depreciation) | | Counterparty |
| | | | | | | | | | | | | | | | | | | | | | |
|
OTC Credit Default Swap Agreements on corporate and/or sovereign issues - Sell Protection(2): |
DP World PLC | | 12/20/24 | | | 1.000% | (Q) | | | 100 | | | | 1.397% | | | $ | (320 | ) | | $ | 107 | | | $ | (427 | ) | | BARC |
Emirate of Abu Dhabi | | 06/20/24 | | | 1.000% | (Q) | | | 110 | | | | 0.197% | | | | 685 | | | | 605 | | | | 80 | | | BNP |
Federative Republic of Brazil | | 12/20/23 | | | 1.000% | (Q) | | | 300 | | | | 0.209% | | | | 675 | | | | 308 | | | | 367 | | | CITI |
Generalitat de Catalunya | | 12/20/25 | | | 1.000% | (Q) | | | 100 | | | | 0.405% | | | | 1,324 | | | | (408 | ) | | | 1,732 | | | DB |
Halliburton Co. | | 12/20/26 | | | 1.000% | (Q) | | | 50 | | | | 0.360% | | | | 990 | | | | 301 | | | | 689 | | | GSI |
Hellenic Republic | | 12/20/31 | | | 1.000% | (Q) | | | 140 | | | | 1.265% | | | | (2,240 | ) | | | (3,477 | ) | | | 1,237 | | | BARC |
International Bank for Reconstruction & Development | | 03/20/24 | | | 0.250% | (Q) | | | 740 | | | | 0.059% | | | | 760 | | | | 281 | | | | 479 | | | BOA |
Kingdom of Spain | | 06/20/25 | | | 1.000% | (Q) | | | 1,000 | | | | 0.223% | | | | 13,423 | | | | (3,018 | ) | | | 16,441 | | | BOA |
Kingdom of Spain | | 06/20/25 | | | 1.000% | (Q) | | | 170 | | | | 0.223% | | | | 2,282 | | | | (535 | ) | | | 2,817 | | | BOA |
Kingdom of Spain | | 06/20/25 | | | 1.000% | (Q) | | | 15 | | | | 0.223% | | | | 201 | | | | 64 | | | | 137 | | | BARC |
Republic of Estonia | | 12/20/26 | | | 1.000% | (Q) | | | 50 | | | | 0.572% | | | | 680 | | | | 297 | | | | 383 | | | JPM |
Republic of Italy | | 06/20/30 | | | 1.000% | (Q) | | | 100 | | | | 1.341% | | | | (1,753 | ) | | | (1,909 | ) | | | 156 | | | BARC |
Republic of Panama | | 12/20/26 | | | 1.000% | (Q) | | | 45 | | | | 1.211% | | | | (221 | ) | | | 81 | | | | (302 | ) | | CITI |
Republic of Poland | | 06/20/24 | | | 1.000% | (Q) | | | 145 | | | | 0.136% | | | | 960 | | | | 72 | | | | 888 | | | BNP |
See Notes to Financial Statements.
PGIM Global Total Return (USD Hedged) Fund 53
Schedule of Investments (continued)
as of October 31, 2023
Credit default swap agreements outstanding at October 31, 2023 (continued):
| | | | | | | | | | | | | | | | | | | | | | | | | | | | | | | | | | | | | | | | |
Reference
Entity/
Obligation | | Termination
Date | | Fixed
Rate | | Notional
Amount
(000)#(3) | | Implied
Credit
Spread at
October 31,
2023(4) | | Fair
Value | | Upfront
Premiums
Paid
(Received) | | Unrealized
Appreciation
(Depreciation) | | Counterparty |
| | | | | | | | | | | | | | | | | |
|
OTC Credit Default Swap Agreements on corporate and/or sovereign issues - Sell Protection(2)(cont’d.): | |
Republic of South Africa | | | | 12/20/23 | | | | | 1.000% | (Q) | | | | 300 | | | | | 0.725% | | | | $ | 462 | | | | $ | (434 | ) | | | $ | 896 | | | | | BOA | |
Verizon Communications, Inc. | | | | 06/20/26 | | | | | 1.000% | (Q) | | | | 170 | | | | | 0.811% | | | | | 988 | | | | | 1,880 | | | | | (892 | ) | | | | GSI | |
| | | | | | | | | | | | | | | | | | | | | | | | | | | | | | | | | | | | | | | | |
| | | | | | | | | | | | | | | | | | | | | | | $ | 18,896 | | | | $ | (5,785 | ) | | | $ | 24,681 | | | | | | |
| | | | | | | | | | | | | | | | | | | | | | | | | | | | | | | | | | | | | | | | |
| | | | | | | | | | | | | | | | | | | | | | | | | | | | | | | | | | | | | | | | |
Reference
Entity/
Obligation | | Termination
Date | | | Fixed
Rate | | Notional
Amount
(000)#(3) | | | Implied Credit
Spread at
October 31,
2023(4) | | Value at
Trade Date | | | Value at
October 31,
2023 | | | Unrealized
Appreciation
(Depreciation) | |
| | | | | | | | | | | | | | | | | | | | | | | | | | | | | | | | |
| | |
Centrally Cleared Credit Default Swap Agreement on credit indices - Sell Protection(2): | | | | | | | | | |
CDX.NA.HY.41.V1 | | | 12/20/28 | | | 5.000%(Q) | | | 17,795 | | | 5.161% | | $ | 173,038 | | | | | | | $ | (6,456 | ) | | | | | | | | | | $ | (179,494 | ) | | | | |
| | | | | | | | | | | | | | | | | | | | | | | | | | | | | | | | | | | | | | | | |
The Fund entered into credit default swaps (“CDS”) to provide a measure of protection against defaults or to take an active long or short position with respect to the likelihood of a particular issuer’s default or the reference entity’s credit soundness. CDS contracts generally trade based on a spread which represents the cost a protection buyer has to pay the protection seller. The protection buyer is said to be short the credit as the value of the contract rises the more the credit deteriorates. The value of the CDS contract increases for the protection buyer if the spread increases.
| (1) | If the Fund is a buyer of protection, it pays the fixed rate. When a credit event occurs, as defined under the terms of that particular swap agreement, the Fund will either (i) receive from the seller of protection an amount equal to the notional amount of the swap and make delivery of the referenced obligation or underlying securities comprising the referenced index or (ii) receive a net settlement amount in the form of cash or securities equal to the notional amount of the swap less the recovery value of the referenced obligation or underlying securities comprising the referenced index. |
| (2) | If the Fund is a seller of protection, it receives the fixed rate. When a credit event occurs, as defined under the terms of that particular swap agreement, the Fund will either (i) pay to the buyer of protection an amount equal to the notional amount of the swap and take delivery of the referenced obligation or underlying securities comprising the referenced index or (ii) pay a net settlement amount in the form of cash or securities equal to the notional amount of the swap less the recovery value of the referenced obligation or underlying securities comprising the referenced index. |
| (3) | Notional amount represents the maximum potential amount the Fund could be required to pay as a seller of credit protection or receive as a buyer of credit protection if a credit event occurs as defined under the terms of that particular swap agreement. |
See Notes to Financial Statements.
54
| (4) | Implied credit spreads, represented in absolute terms, utilized in determining the fair value of credit default swap agreements where the Fund is the seller of protection as of the reporting date serve as an indicator of the current status of the payment/ performance risk and represent the likelihood of risk of default for the credit derivative. The implied credit spread of a particular referenced entity reflects the cost of buying/selling protection and may include up-front payments required to be made to enter into the agreement. Wider credit spreads represent a deterioration of the referenced entity’s credit soundness and a greater likelihood of risk of default or other credit event occurring as defined under the terms of the agreement. |
Currency swap agreement outstanding at October 31, 2023:
| | | | | | | | | | | | | | | | | | | | | | | | | | | | | | | | | | | | |
Notional
Amount
(000)# | | Fund
Receives | | Notional
Amount
(000)# | | Fund
Pays | | Counterparty | | Termination
Date | | Fair
Value | | Upfront
Premiums
Paid
(Received) | | | Unrealized
Appreciation
(Depreciation) | |
| | | | | | | | | | | | | | | | | | | | | | | | | | | | | | | |
| |
OTC Currency Swap Agreement: | | | | | |
| IDR 1,400,000 | | 8.22%(S) | | 97 | | 6 Month LIBOR(S)/ 5.871% | | CITI | | 11/29/23 | | $(7,858) | | | | | | $ | — | | | | | | | | | | | $ | (7,858 | ) | | | | |
| | | | | | | | | | | | | | | | | | | | | | | | | | | | | | | | | | | | |
Interest rate swap agreements outstanding at October 31, 2023:
| | | | | | | | | | | | | | | | | | | | | | | | |
Notional
Amount
(000)# | | | Termination
Date | | | Fixed Rate | | Floating Rate | | Value at
Trade Date | | | Value at
October 31,
2023 | | | Unrealized
Appreciation
(Depreciation) | |
| | | | | | | | | | | | | | | | | | | | |
| | | |
Centrally Cleared Interest Rate Swap Agreements: | | | | | | | | | | | | |
| AUD | | | 970 | | | | 02/19/31 | | | 1.398%(S) | | 6 Month BBSW(2)(S)/4.750% | | $ | (2,433 | ) | | $ | (143,306 | ) | | $ | (140,873) | |
| AUD | | | 225 | | | | 12/03/33 | | | 2.800%(S) | | 6 Month BBSW(2)(S)/4.750% | | | (18,860 | ) | | | (28,696 | ) | | | (9,836) | |
| AUD | | | 85 | | | | 12/03/38 | | | 2.900%(S) | | 6 Month BBSW(2)(S)/4.750% | | | (9,566 | ) | | | (14,521 | ) | | | (4,955) | |
| CAD | | | 1,230 | | | | 04/03/25 | | | 0.970%(S) | | 3 Month CDOR(2)(S)/5.580% | | | (1,703 | ) | | | (55,171 | ) | | | (53,468) | |
| CAD | | | 455 | | | | 12/03/27 | | | 3.650%(S) | | 1 Day CORRA(2)(S)/5.050% | | | 3,955 | | | | (8,908 | ) | | | (12,863) | |
| CAD | | | 80 | | | | 12/03/28 | | | 2.600%(S) | | 3 Month CDOR(2)(S)/5.580% | | | 418 | | | | (5,615 | ) | | | (6,033) | |
| CAD | | | 340 | | | | 12/03/29 | | | 2.650%(S) | | 3 Month CDOR(2)(S)/5.580% | | | (12,808 | ) | | | (26,369 | ) | | | (13,561) | |
| CAD | | | 70 | | | | 12/03/29 | | | 3.500%(S) | | 1 Day CORRA(2)(S)/5.050% | | | 871 | | | | (2,005 | ) | | | (2,876) | |
| CAD | | | 315 | | | | 12/03/30 | | | 3.500%(S) | | 1 Day CORRA(2)(S)/5.050% | | | (5,810 | ) | | | (10,164 | ) | | | (4,354) | |
See Notes to Financial Statements.
PGIM Global Total Return (USD Hedged) Fund 55
Schedule of Investments (continued)
as of October 31, 2023
Interest rate swap agreements outstanding at October 31, 2023 (continued):
| | | | | | | | | | | | | | | | | | | | | | | | |
Notional
Amount
(000)# | | | Termination
Date | | | Fixed Rate | | Floating Rate | | Value at
Trade Date | | | Value at
October 31,
2023 | | | Unrealized
Appreciation
(Depreciation) | |
| | | | | | | | | | | | | | | | | | | | |
| | | |
Centrally Cleared Interest Rate Swap Agreements (cont’d.): | | | | | | | | | | | | |
| CAD | | | 60 | | | | 12/03/32 | | | 2.700%(S) | | 3 Month CDOR(2)(S)/5.580% | | $ | (2,495 | ) | | $ | (6,279 | ) | | $ | (3,784) | |
| CAD | | | 50 | | | | 01/09/38 | | | 2.720%(S) | | 3 Month CDOR(2)(S)/5.580% | | | (1 | ) | | | (7,355 | ) | | | (7,354) | |
| CAD | | | 120 | | | | 12/03/40 | | | 2.800%(S) | | 3 Month CDOR(2)(S)/5.580% | | | 15,611 | | | | (19,464 | ) | | | (35,075) | |
| CAD | | | 60 | | | | 12/03/43 | | | 3.550%(S) | | 1 Day CORRA(2)(S)/5.050% | | | (3,818 | ) | | | (4,171 | ) | | | (353) | |
| CAD | | | 50 | | | | 05/30/47 | | | 2.240%(S) | | 3 Month CDOR(2)(S)/5.580% | | | (1,375 | ) | | | (12,462 | ) | | | (11,087) | |
| CAD | | | 295 | | | | 12/03/51 | | | 2.800%(S) | | 3 Month CDOR(2)(S)/5.580% | | | (28,390 | ) | | | (56,794 | ) | | | (28,404) | |
| CAD | | | 105 | | | | 12/03/53 | | | 3.300%(S) | | 1 Day CORRA(2)(S)/5.050% | | | (4,825 | ) | | | (9,300 | ) | | | (4,475) | |
| CHF | | | 70 | | | | 04/03/28 | | | 0.410%(A) | | 1 Day SARON(2)(S)/1.702% | | | (207 | ) | | | (3,446 | ) | | | (3,239) | |
| CHF | | | 130 | | | | 01/31/29 | | | 0.260%(A) | | 1 Day SARON(2)(S)/1.702% | | | (458 | ) | | | (9,365 | ) | | | (8,907) | |
| CHF | | | 40 | | | | 04/03/33 | | | 0.687%(A) | | 1 Day SARON(2)(S)/1.702% | | | (208 | ) | | | (3,750 | ) | | | (3,542) | |
| CHF | | | 100 | | | | 12/15/41 | | | 0.025%(A) | | 1 Day SARON(2)(A)/1.702% | | | (19,667 | ) | | | (31,235 | ) | | | (11,568) | |
| CLP | | | 30,200 | | | | 07/12/29 | | | 3.135%(S) | | 1 Day CLOIS(2)(S)/9.000% | | | — | | | | (5,531 | ) | | | (5,531) | |
| CLP | | | 190,000 | | | | 02/06/33 | | | 5.200%(S) | | 1 Day CLOIS(1)(S)/9.000% | | | — | | | | 14,504 | | | | 14,504 | |
| CLP | | | 76,000 | | | | 02/23/33 | | | 5.570%(S) | | 1 Day CLOIS(1)(S)/9.000% | | | — | | | | 3,296 | | | | 3,296 | |
| CLP | | | 157,000 | | | | 02/27/33 | | | 5.550%(S) | | 1 Day CLOIS(1)(S)/9.000% | | | — | | | | 6,962 | | | | 6,962 | |
| CNH | | | 700 | | | | 03/13/24 | | | 2.945%(Q) | | 7 Day China Fixing Repo Rates(2)(Q)/2.500% | | | (1 | ) | | | 377 | | | | 378 | |
| CNH | | | 1,400 | | | | 04/01/24 | | | 2.923%(Q) | | 7 Day China Fixing Repo Rates(2)(Q)/2.500% | | | — | | | | 725 | | | | 725 | |
See Notes to Financial Statements.
56
Interest rate swap agreements outstanding at October 31, 2023 (continued):
| | | | | | | | | | | | | | | | | | | | | | | | |
Notional
Amount
(000)# | | | Termination
Date | | | Fixed Rate | | Floating Rate | | Value at
Trade Date | | | Value at
October 31,
2023 | | | Unrealized
Appreciation
(Depreciation) | |
| | | | | | | | | | | | | | | | | | | | |
| | |
Centrally Cleared Interest Rate Swap Agreements (cont’d.): | | | | | | | | | |
| CNH | | | 1,440 | | | | 06/03/24 | | | 2.975%(Q) | | 7 Day China Fixing Repo Rates(2)(Q)/2.500% | | $ | — | | | $ | 1,274 | | | $ | 1,274 | |
| CNH | | | 2,220 | | | | 06/20/24 | | | 2.900%(Q) | | 7 Day China Fixing Repo Rates(2)(Q)/2.500% | | | (3 | ) | | | 1,804 | | | | 1,807 | |
| CNH | | | 1,500 | | | | 09/03/24 | | | 2.860%(Q) | | 7 Day China Fixing Repo Rates(2)(Q)/2.500% | | | (1 | ) | | | 1,594 | | | | 1,595 | |
| CNH | | | 1,500 | | | | 10/10/24 | | | 2.860%(Q) | | 7 Day China Fixing Repo Rates(2)(Q)/2.500% | | | (1 | ) | | | 1,591 | | | | 1,592 | |
| CNH | | | 1,680 | | | | 11/01/24 | | | 3.120%(Q) | | 7 Day China Fixing Repo Rates(2)(Q)/2.500% | | | (5 | ) | | | 3,014 | | | | 3,019 | |
| CNH | | | 1,200 | | | | 02/04/25 | | | 2.600%(Q) | | 7 Day China Fixing Repo Rates(2)(Q)/2.500% | | | — | | | | 1,308 | | | | 1,308 | |
| CNH | | | 2,800 | | | | 03/06/25 | | | 2.425%(Q) | | 7 Day China Fixing Repo Rates(2)(Q)/2.500% | | | 2 | | | | 1,948 | | | | 1,946 | |
| CNH | | | 5,000 | | | | 03/12/25 | | | 2.400%(Q) | | 7 Day China Fixing Repo Rates(2)(Q)/2.500% | | | (2 | ) | | | 3,274 | | | | 3,276 | |
| CNH | | | 3,200 | | | | 07/13/25 | | | 2.653%(Q) | | 7 Day China Fixing Repo Rates(2)(Q)/2.500% | | | (4 | ) | | | 4,148 | | | | 4,152 | |
| CNH | | | 5,910 | | | | 11/02/25 | | | 2.588%(Q) | | 7 Day China Fixing Repo Rates(2)(Q)/2.500% | | | 6 | | | | 8,478 | | | | 8,472 | |
| CNH | | | 5,280 | | | | 04/12/26 | | | 2.810%(Q) | | 7 Day China Fixing Repo Rates(2)(Q)/2.500% | | | (10 | ) | | | 11,250 | | | | 11,260 | |
| CNH | | | 7,230 | | | | 08/04/27 | | | 2.388%(Q) | | 7 Day China Fixing Repo Rates(2)(Q)/2.500% | | | — | | | | 3,754 | | | | 3,754 | |
| CNH | | | 2,000 | | | | 01/09/28 | | | 2.757%(Q) | | 7 Day China Fixing Repo Rates(2)(Q)/2.500% | | | (79 | ) | | | 4,474 | | | | 4,553 | |
| CNH | | | 4,750 | | | | 03/01/28 | | | 2.955%(Q) | | 7 Day China Fixing Repo Rates(2)(Q)/2.500% | | | — | | | | 16,547 | | | | 16,547 | |
See Notes to Financial Statements.
PGIM Global Total Return (USD Hedged) Fund 57
Schedule of Investments (continued)
as of October 31, 2023
Interest rate swap agreements outstanding at October 31, 2023 (continued):
| | | | | | | | | | | | | | | | | | | | | | | | |
Notional
Amount
(000)# | | | Termination
Date | | | Fixed Rate | | Floating Rate | | Value at
Trade Date | | | Value at
October 31,
2023 | | | Unrealized
Appreciation
(Depreciation) | |
| | | | | | | | | | | | | | | | | | | | |
| | | |
Centrally Cleared Interest Rate Swap Agreements (cont’d.): | | | | | | | | | | | | |
| CNH | | | 1,925 | | | | 04/26/28 | | | 2.790%(Q) | | 7 Day China Fixing Repo Rates(2)(Q)/2.500% | | $ | — | | | $ | 4,576 | | | $ | 4,576 | |
| CNH | | | 10,025 | | | | 05/11/28 | | | 2.600%(Q) | | 7 Day China Fixing Repo Rates(2)(Q)/2.500% | | | 10,554 | | | | 14,413 | | | | 3,859 | |
| CNH | | | 5,400 | | | | 06/01/28 | | | 2.473%(Q) | | 7 Day China Fixing Repo Rates(2)(Q)/2.500% | | | — | | | | 3,203 | | | | 3,203 | |
| CZK | | | 5,145 | | | | 03/31/30 | | | 0.710%(A) | | 6 Month PRIBOR(2)(S)/6.880% | | | — | | | | (47,385 | ) | | | (47,385) | |
| DKK | | | 500 | | | | 04/08/32 | | | 1.581%(A) | | 6 Month CIBOR(2)(S)/4.140% | | | (3,153 | ) | | | (9,355 | ) | | | (6,202) | |
| EUR | | | 5,485 | | | | 11/23/24 | | | (0.046)%(A) | | 6 Month EURIBOR(2)(S)/4.092% | | | — | | | | (225,346 | ) | | | (225,346) | |
| EUR | | | 3,245 | | | | 12/02/24 | | | (0.285)%(A) | | 6 Month EURIBOR(2)(S)/4.092% | | | — | | | | (215,029 | ) | | | (215,029) | |
| EUR | | | 200 | | | | 05/11/25 | | | 0.100%(A) | | 1 Day EuroSTR(1)(A)/3.880% | | | 692 | | | | 14,216 | | | | 13,524 | |
| EUR | | | 350 | | | | 04/27/30 | | | (0.016)%(A) | | 6 Month EURIBOR(2)(S)/4.092% | | | — | | | | (70,709 | ) | | | (70,709) | |
| EUR | | | 342 | | | | 08/15/30 | | | (0.191)%(A) | | 1 Day EuroSTR(2)(A)/3.880% | | | (129 | ) | | | (74,352 | ) | | | (74,223) | |
| EUR | | | 100 | | | | 05/11/31 | | | 0.750%(A) | | 1 Day EuroSTR(1)(A)/3.880% | | | 683 | | | | 17,753 | | | | 17,070 | |
| EUR | | | 235 | | | | 10/30/32 | | | 1.302%(A) | | 6 Month EURIBOR(2)(S)/4.092% | | | 4,128 | | | | (38,897 | ) | | | (43,025) | |
| EUR | | | 820 | | | | 03/20/33 | | | 2.996%(A) | | 6 Month EURIBOR(2)(S)/4.092% | | | — | | | | (11,369 | ) | | | (11,369) | |
| EUR | | | 430 | | | | 05/11/33 | | | 1.000%(A) | | 6 Month EURIBOR(2)(S)/4.092% | | | (7,326 | ) | | | (92,128 | ) | | | (84,802) | |
See Notes to Financial Statements.
58
Interest rate swap agreements outstanding at October 31, 2023 (continued):
| | | | | | | | | | | | | | | | | | | | | | | | |
Notional
Amount
(000)# | | | Termination
Date | | | Fixed Rate | | Floating Rate | | Value at
Trade Date | | | Value at
October 31,
2023 | | | Unrealized
Appreciation
(Depreciation) | |
| | | | | | | | | | | | | | | | | | | | |
| | | |
Centrally Cleared Interest Rate Swap Agreements (cont’d.): | | | | | | | | | | | | |
| EUR | | | 590 | | | | 03/20/38 | | | 2.982%(A) | | 6 Month EURIBOR(1)(S)/4.092% | | $ | — | | | $ | 23,006 | | | $ | 23,006 | |
| EUR | | | 150 | | | | 11/24/41 | | | 0.565%(A) | | 6 Month EURIBOR(1)(S)/4.092% | | | — | | | | 30,234 | | | | 30,234 | |
| EUR | | | 150 | | | | 11/24/41 | | | 0.600%(A) | | 3 Month EURIBOR(2)(Q)/3.972% | | | — | | | | (31,279 | ) | | | (31,279) | |
| EUR | | | 364 | | | | 11/25/41 | | | 0.629%(A) | | 6 Month EURIBOR(1)(S)/4.092% | | | — | | | | 71,751 | | | | 71,751 | |
| EUR | | | 364 | | | | 11/25/41 | | | 0.663%(A) | | 3 Month EURIBOR(2)(Q)/3.972% | | | — | | | | (74,324 | ) | | | (74,324) | |
| EUR | | | 570 | | | | 03/22/42 | | | 1.257%(A) | | 6 Month EURIBOR(1)(S)/4.092% | | | — | | | | 86,308 | | | | 86,308 | |
| EUR | | | 570 | | | | 03/22/42 | | | 1.310%(A) | | 3 Month EURIBOR(2)(Q)/3.972% | | | — | | | | (89,757 | ) | | | (89,757) | |
| EUR | | | 400 | | | | 02/24/43 | | | 2.910%(A) | | 6 Month EURIBOR(1)(S)/4.092% | | | 332 | | | | 22,639 | | | | 22,307 | |
| EUR | | | 400 | | | | 02/24/43 | | | 2.960%(A) | | 3 Month EURIBOR(2)(Q)/3.972% | | | (203 | ) | | | (22,150 | ) | | | (21,947) | |
| EUR | | | 120 | | | | 05/11/49 | | | 1.450%(A) | | 6 Month EURIBOR(2)(S)/4.092% | | | 5,402 | | | | (40,098 | ) | | | (45,500) | |
| GBP | | | 200 | | | | 05/08/25 | | | 1.000%(A) | | 1 Day SONIA(2)(A)/5.186% | | | (16,802 | ) | | | (18,977 | ) | | | (2,175) | |
| GBP | | | 35 | | | | 05/08/30 | | | 1.100%(A) | | 1 Day SONIA(1)(A)/5.186% | | | 5,939 | | | | 8,633 | | | | 2,694 | |
| GBP | | | 155 | | | | 05/08/37 | | | 1.200%(A) | | 1 Day SONIA(2)(A)/5.186% | | | (48,424 | ) | | | (63,567 | ) | | | (15,143) | |
| GBP | | | 220 | | | | 05/08/38 | | | 1.200%(A) | | 1 Day SONIA(2)(A)/5.186% | | | (77,351 | ) | | | (94,948 | ) | | | (17,597) | |
| GBP | | | 225 | | | | 05/08/46 | | | 1.250%(A) | | 1 Day SONIA(2)(A)/5.186% | | | 46,483 | | | | (125,773 | ) | | | (172,256) | |
| GBP | | | 170 | | | | 05/08/47 | | | 1.250%(A) | | 1 Day SONIA(2)(A)/5.186% | | | (32,843 | ) | | | (97,404 | ) | | | (64,561) | |
See Notes to Financial Statements.
PGIM Global Total Return (USD Hedged) Fund 59
Schedule of Investments (continued)
as of October 31, 2023
Interest rate swap agreements outstanding at October 31, 2023 (continued):
| | | | | | | | | | | | | | | | | | | | | | | | |
Notional
Amount
(000)# | | | Termination
Date | | | Fixed Rate | | Floating Rate | | Value at
Trade Date | | | Value at
October 31,
2023 | | | Unrealized
Appreciation
(Depreciation) | |
| | | | | | | | | | | | | | | | | | | | |
| | | |
Centrally Cleared Interest Rate Swap Agreements (cont’d.): | | | | | | | | | | | | |
| GBP | | | 190 | | | | 05/08/48 | | | 1.250%(A) | | 1 Day SONIA(2)(A)/5.186% | | $ | (97,156 | ) | | $ | (110,859 | ) | | $ | (13,703) | |
| GBP | | | 35 | | | | 09/03/50 | | | 0.328%(A) | | 1 Day SONIA(2)(A)/5.186% | | | — | | | | (26,986 | ) | | | (26,986) | |
| GBP | | | 60 | | | | 05/08/52 | | | 1.250%(A) | | 1 Day SONIA(2)(A)/5.186% | | | (3,605 | ) | | | (37,604 | ) | | | (33,999) | |
| HUF | | | 90,865 | | | | 06/12/28 | | | 3.750%(A) | | 6 Month BUBOR(2)(S)/11.180% | | | — | | | | (49,996 | ) | | | (49,996) | |
| JPY | | | 130,000 | | | | 03/06/25 | | | 0.197%(A) | | 1 Day TONAR(2)(A)/(0.020)% | | | — | | | | 1,669 | | | | 1,669 | |
| JPY | | | 179,000 | | | | 04/08/26 | | | 0.018%(S) | | 1 Day TONAR(2)(S)/(0.020)% | | | 7 | | | | (11,604 | ) | | | (11,611) | |
| JPY | | | 59,000 | | | | 12/18/27 | | | 0.290%(S) | | 1 Day TONAR(2)(S)/(0.020)% | | | (471 | ) | | | (5,197 | ) | | | (4,726) | |
| JPY | | | 110,000 | | | | 07/08/28 | | | (0.050)%(A) | | 1 Day TONAR(2)(A)/(0.020)% | | | (12,489 | ) | | | (23,355 | ) | | | (10,866) | |
| JPY | | | 119,700 | | | | 07/31/28 | | | 0.268%(A) | | 1 Day TONAR(2)(A)/(0.020)% | | | — | | | | (13,569 | ) | | | (13,569) | |
| JPY | | | 163,000 | | | | 11/12/28 | | | 0.011%(S) | | 1 Day TONAR(2)(S)/(0.020)% | | | 5 | | | | (38,997 | ) | | | (39,002) | |
| JPY | | | 25,000 | | | | 07/08/29 | | | (0.050)%(A) | | 1 Day TONAR(2)(A)/(0.020)% | | | (3,212 | ) | | | (7,401 | ) | | | (4,189) | |
| JPY | | | 85,000 | | | | 07/08/30 | | | (0.050)%(A) | | 1 Day TONAR(2)(A)/(0.020)% | | | (19,902 | ) | | | (33,310 | ) | | | (13,408) | |
| JPY | | | 60,000 | | | | 07/08/31 | | | 0.000%(A) | | 1 Day TONAR(2)(A)/(0.020)% | | | (17,006 | ) | | | (28,178 | ) | | | (11,172) | |
| JPY | | | 130,000 | | | | 07/08/32 | | | 0.050%(A) | | 1 Day TONAR(2)(A)/(0.020)% | | | (9,551 | ) | | | (70,966 | ) | | | (61,415) | |
| JPY | | | 53,000 | | | | 12/18/32 | | | 0.516%(S) | | 1 Day TONAR(2)(S)/(0.020)% | | | (918 | ) | | | (18,320 | ) | | | (17,402) | |
| JPY | | | 115,000 | | | | 07/08/33 | | | 0.100%(A) | | 1 Day TONAR(2)(A)/(0.020)% | | | (59,804 | ) | | | (71,227 | ) | | | (11,423) | |
| JPY | | | 111,500 | | | | 12/18/37 | | | 0.715%(S) | | 1 Day TONAR(2)(S)/(0.020)% | | | (2,863 | ) | | | (68,770 | ) | | | (65,907) | |
| JPY | | | 57,555 | | | | 01/04/38 | | | 0.757%(S) | | 1 Day TONAR(2)(S)/(0.020)% | | | (1,429 | ) | | | (33,763 | ) | | | (32,334) | |
| JPY | | | 11,780 | | | | 12/03/38 | | | 0.600%(S) | | 1 Day TONAR(2)(S)/(0.020)% | | | (6 | ) | | | (9,476 | ) | | | (9,470) | |
| JPY | | | 10,000 | | | | 10/04/39 | | | 0.203%(S) | | 1 Day TONAR(2)(S)/(0.020)% | | | (24 | ) | | | (12,776 | ) | | | (12,752) | |
| JPY | | | 21,500 | | | | 12/03/39 | | | 0.650%(S) | | 1 Day TONAR(2)(S)/(0.020)% | | | (12 | ) | | | (18,225 | ) | | | (18,213) | |
See Notes to Financial Statements.
60
Interest rate swap agreements outstanding at October 31, 2023 (continued):
| | | | | | | | | | | | | | | | | | | | | | | | |
Notional
Amount
(000)# | | | Termination
Date | | | Fixed Rate | | Floating Rate | | Value at
Trade Date | | | Value at
October 31,
2023 | | | Unrealized
Appreciation
(Depreciation) | |
| | | | | | | | | | | | | | | | | | | | |
| | | |
Centrally Cleared Interest Rate Swap Agreements (cont’d.): | | | | | | | | | | | | |
| JPY | | | 20,000 | | | | 02/06/40 | | | 0.223%(S) | | 1 Day TONAR(2)(S)/(0.020)% | | $ | (106 | ) | | $ | (25,897 | ) | | $ | (25,791) | |
| JPY | | | 25,000 | | | | 07/08/42 | | | 0.300%(A) | | 1 Day TONAR(2)(A)/(0.020)% | | | (18,099 | ) | | | (35,304 | ) | | | (17,205) | |
| JPY | | | 5,000 | | | | 07/04/43 | | | 0.763%(S) | | 1 Day TONAR(2)(S)/(0.020)% | | | (129 | ) | | | (5,191 | ) | | | (5,062) | |
| JPY | | | 45,000 | | | | 07/08/43 | | | 0.300%(A) | | 1 Day TONAR(2)(A)/(0.020)% | | | (45,149 | ) | | | (67,902 | ) | | | (22,753) | |
| JPY | | | 38,600 | | | | 07/08/45 | | | 0.350%(A) | | 1 Day TONAR(2)(A)/(0.020)% | | | (42,104 | ) | | | (62,677 | ) | | | (20,573) | |
| JPY | | | 91,700 | | | | 12/18/47 | | | 0.918%(S) | | 1 Day TONAR(2)(S)/(0.020)% | | | (3,179 | ) | | | (102,069 | ) | | | (98,890) | |
| JPY | | | 75,000 | | | | 07/08/48 | | | 0.450%(A) | | 1 Day TONAR(2)(A)/(0.020)% | | | (92,139 | ) | | | (128,458 | ) | | | (36,319) | |
| JPY | | | 30,000 | | | | 07/08/52 | | | 0.450%(A) | | 1 Day TONAR(2)(A)/(0.020)% | | | (25,252 | ) | | | (58,486 | ) | | | (33,234) | |
| KRW | | | 761,000 | | | | 08/04/24 | | | 3.145%(Q) | | 3 Month KWCDC(2)(Q)/3.820% | | | — | | | | (4,433 | ) | | | (4,433) | |
| KRW | | | 230,000 | | | | 04/19/28 | | | 3.135%(Q) | | 3 Month KWCDC(2)(Q)/3.820% | | | — | | | | (6,674 | ) | | | (6,674) | |
| KRW | | | 979,000 | | | | 09/10/28 | | | 2.043%(Q) | | 3 Month KWCDC(2)(Q)/3.820% | | | (20,183 | ) | | | (67,640 | ) | | | (47,457) | |
| KRW | | | 118,000 | | | | 02/13/29 | | | 1.780%(Q) | | 3 Month KWCDC(2)(Q)/3.820% | | | — | | | | (10,065 | ) | | | (10,065) | |
| KRW | | | 33,500 | | | | 04/17/29 | | | 1.740%(Q) | | 3 Month KWCDC(2)(Q)/3.820% | | | — | | | | (2,909 | ) | | | (2,909) | |
| KRW | | | 470,000 | | | | 04/27/30 | | | 1.065%(Q) | | 3 Month KWCDC(2)(Q)/3.820% | | | (8,988 | ) | | | (61,233 | ) | | | (52,245) | |
| KRW | | | 261,780 | | | | 03/10/33 | | | 3.150%(Q) | | 3 Month KWCDC(2)(Q)/3.820% | | | (4,116 | ) | | | (15,086 | ) | | | (10,970) | |
| NOK | | | 1,680 | | | | 03/15/27 | | | 2.103%(A) | | 6 Month NIBOR(2)(S)/5.030% | | | 2,906 | | | | (10,301 | ) | | | (13,207) | |
| NZD | | | 100 | | | | 11/05/29 | | | 1.393%(S) | | 3 Month BBR(2)(Q)/5.640% | | | — | | | | (12,078 | ) | | | (12,078) | |
See Notes to Financial Statements.
PGIM Global Total Return (USD Hedged) Fund 61
Schedule of Investments (continued)
as of October 31, 2023
Interest rate swap agreements outstanding at October 31, 2023 (continued):
| | | | | | | | | | | | | | | | | | | | | | | | |
Notional
Amount
(000)# | | | Termination
Date | | | Fixed Rate | | Floating Rate | | Value at
Trade Date | | | Value at
October 31,
2023 | | | Unrealized
Appreciation
(Depreciation) | |
| | | | | | | | | | | | | | | | | | | | |
| | | |
Centrally Cleared Interest Rate Swap Agreements (cont’d.): | | | | | | | | | | | | |
| PLN | | | 890 | | | | 07/11/28 | | | 2.935%(A) | | 6 Month WIBOR(2)(S)/5.560% | | $ | 14,982 | | | $ | (18,038 | ) | | $ | (33,020) | |
| PLN | | | 760 | | | | 08/30/31 | | | 1.765%(A) | | 6 Month WIBOR(2)(S)/5.560% | | | — | | | | (36,689 | ) | | | (36,689) | |
| SEK | | | 2,200 | | | | 11/05/29 | | | 0.457%(A) | | 3 Month STIBOR(2)(Q)/4.062% | | | (3,138 | ) | | | (31,914 | ) | | | (28,776) | |
| SGD | | | 165 | | | | 07/29/31 | | | 1.120%(S) | | 1 Day SORA(2)(S)/3.690% | | | 894 | | | | (19,526 | ) | | | (20,420) | |
| THB | | | 6,000 | | | | 07/04/24 | | | 1.590%(Q) | | 1 Day THOR(2)(Q)/2.481% | | | — | | | | (1,175 | ) | | | (1,175) | |
| THB | | | 3,000 | | | | 07/03/30 | | | 1.028%(Q) | | 1 Day THOR(2)(Q)/2.481% | | | — | | | | (10,261 | ) | | | (10,261) | |
| TWD | | | 14,600 | | | | 02/17/28 | | | 1.390%(Q) | | 3 Month TAIBOR(1)(Q)/1.494% | | | — | | | | 5,316 | | | | 5,316 | |
| TWD | | | 8,480 | | | | 07/21/33 | | | 1.410%(Q) | | 3 Month TAIBOR(1)(Q)/1.494% | | | — | | | | 8,598 | | | | 8,598 | |
| | | 7,960 | | | | 12/23/23 | | | 4.758%(T) | | 1 Day SOFR(2)(T)/5.350% | | | — | | | | (21,250 | ) | | | (21,250) | |
| | | 12,055 | | | | 02/21/24 | | | 5.170%(T) | | 1 Day SOFR(2)(T)/5.350% | | | — | | | | (6,094 | ) | | | (6,094) | |
| | | 11,870 | | | | 06/18/24 | | | 5.456%(T) | | 1 Day SOFR(2)(T)/5.350% | | | — | | | | (512 | ) | | | (512) | |
| | | 3,760 | | | | 07/10/24 | | | 5.435%(T) | | 1 Day SOFR(2)(T)/5.350% | | | — | | | | (852 | ) | | | (852) | |
| | | 10,265 | | | | 07/31/24 | | | 5.406%(T) | | 1 Day SOFR(2)(T)/5.350% | | | — | | | | (6,117 | ) | | | (6,117) | |
| | | 19,100 | | | | 08/14/24 | | | 5.298%(T) | | 1 Day SOFR(2)(T)/5.350% | | | — | | | | (30,594 | ) | | | (30,594) | |
| | | 10,290 | | | | 10/04/24 | | | 5.472%(T) | | 1 Day SOFR(2)(T)/5.350% | | | — | | | | 4,392 | | | | 4,392 | |
| | | 3,604 | | | | 03/08/25 | | | 4.919%(A) | | 1 Day SOFR(2)(A)/5.350% | | | — | | | | (20,258 | ) | | | (20,258) | |
| | | 10,150 | | | | 04/22/25 | | | 3.595%(T) | | 1 Day SOFR(1)(T)/5.350% | | | (15,992 | ) | | | 136,079 | | | | 152,071 | |
| | | 1,795 | | | | 09/25/26 | | | 4.699%(A) | | 1 Day SOFR(1)(A)/5.350% | | | — | | | | 2,324 | | | | 2,324 | |
| | | 493 | | | | 08/15/28 | | | 1.220%(A) | | 1 Day SOFR(1)(A)/5.350% | | | — | | | | 74,011 | | | | 74,011 | |
See Notes to Financial Statements.
62
Interest rate swap agreements outstanding at October 31, 2023 (continued):
| | | | | | | | | | | | | | | | | | | | | | | | | | | | |
Notional
Amount
(000)# | | | Termination
Date | | | Fixed Rate | | Floating Rate | | Value at
Trade Date | | | Value at
October 31,
2023 | | | Unrealized Appreciation (Depreciation) |
| | | | | | | | | | | | | | | | | | | | | | | | |
| | | | | |
Centrally Cleared Interest Rate Swap Agreements (cont’d.): | | | | | | | | | | | | | | | | |
| | | | 1,265 | | | | 09/05/28 | | | 4.027%(A) | | 1 Day SOFR(1)(A)/5.350% | | $ | — | | | $ | 30,423 | | | | | $ | 30,423 | | | |
| | | 980 | | | | 09/28/28 | | | 4.396%(A) | | 1 Day SOFR(1)(A)/5.350% | | | — | | | | 6,822 | | | | | | 6,822 | | | |
| | | | | | | | | | | | | | | | | | | | | | | | | | | | |
| | | | | | | | | | | | | | $ | (692,113 | ) | | $ | (2,820,328 | ) | | | | $ | (2,128,215 | ) | | |
| | | | | | | | | | | | | | | | | | | | | | | | | | | | |
| | | | | | | | | | | | | | | | | | | | | | | | | | | | | | | | | | | | | | | | | | | | |
Notional
Amount
(000)# | | | Termination
Date | | | Fixed Rate | | Floating Rate | | Fair
Value | | | Upfront
Premiums
Paid(Received) | | | Unrealized
Appreciation
(Depreciation) | | | Counterparty | |
| | | | | | | | | | | | | | | | | | | | | | | | | | | | | | | | | | | |
| | | | | |
OTC Interest Rate Swap Agreements: | | | | | | | | | | | | | | | | | | | | | |
| CNH | | | 2,100 | | | | 07/31/30 | | | 2.515%(Q) | | 7 Day China Fixing Repo Rates(2)(Q)/2.500% | | $ | 415 | | | | | | | $ | — | | | | | | | | | | | $ | 415 | | | | | | | | MSI | |
| CNH | | | 6,000 | | | | 09/01/30 | | | 2.360%(Q) | | 7 Day China Fixing Repo Rates(2)(Q)/2.500% | | | (6,588 | ) | | | | | | | — | | | | | | | | | | | | (6,588 | ) | | | | | | | MSI | |
| CNH | | | 3,000 | | | | 10/14/31 | | | 2.675%(Q) | | 7 Day China Fixing Repo Rates(2)(Q)/2.500% | | | 4,273 | | | | | | | | — | | | | | | | | | | | | 4,273 | | | | | | | | SCB | |
| MYR | | | 450 | | | | 04/09/26 | | | 2.625%(Q) | | 3 Month KLIBOR(2)(Q)/3.650% | | | (2,685 | ) | | | | | | | (8 | ) | | | | | | | | | | | (2,677 | ) | | | | | | | MSI | |
| MYR | | | 900 | | | | 08/12/26 | | | 2.605%(Q) | | 3 Month KLIBOR(2)(Q)/3.650% | | | (6,537 | ) | | | | | | | (7 | ) | | | | | | | | | | | (6,530 | ) | | | | | | | HSBC | |
| MYR | | | 200 | | | | 07/11/29 | | | 3.528%(Q) | | 3 Month KLIBOR(2)(Q)/3.650% | | | (1,048 | ) | | | | | | | — | | | | | | | | | | | | (1,048 | ) | | | | | | | MSI | |
| MYR | | | 200 | | | | 04/07/32 | | | 3.870%(Q) | | 3 Month KLIBOR(2)(Q)/3.650% | | | (894 | ) | | | | | | | (2 | ) | | | | | | | | | | | (892 | ) | | | | | | | CITI | |
| MYR | | | 230 | | | | 07/12/32 | | | 3.650%(Q) | | 3 Month KLIBOR(2)(Q)/3.650% | | | (1,931 | ) | | | | | | | (1 | ) | | | | | | | | | | | (1,930 | ) | | | | | | | GSI | |
| | | | | | | | | | | | | | | | | | | | | | | | | | | | | | | | | | | | | | | | | | | | |
| | | | | | | | | | | | | | $ | (14,995 | ) | | | | | | $ | (18 | ) | | | | | | | | | | $ | (14,977 | ) | | | | | | | | |
| | | | | | | | | | | | | | | | | | | | | | | | | | | | | | | | | | | | | | | | | | | | |
| (1) | The Fund pays the fixed rate and receives the floating rate. |
| (2) | The Fund pays the floating rate and receives the fixed rate. |
See Notes to Financial Statements.
PGIM Global Total Return (USD Hedged) Fund 63
Schedule of Investments (continued)
as of October 31, 2023
Total return swap agreements outstanding at October 31, 2023:
| | | | | | | | | | | | | | | | | | | | | | | | | | | | | | | | | | | | | | | | |
Reference Entity | | Financing Rate | | Counterparty | | Termination
Date | | | Long
(Short)
Notional
Amount
(000)#(1) | | | Fair
Value | | | Upfront
Premiums
Paid
(Received) | | | Unrealized
Appreciation
(Depreciation)(2) | |
| | | | | | | | | | | | | | | | | | | | | | | | | | | | | | | | |
| | | | | | |
OTC Total Return Swap Agreements: | | | | | | | | | | | | | | | | | | | | | | | | | |
ICE Bank of America 1-10 Year US Municipal Securities Index(T) | | 1 Day SOFR-245bps(T)/2.900% | | DB | | | 09/21/24 | | | | 1,000 | | | $ | (18,811 | ) | | | | | | $ | — | | | | | | | | | | | $ | (18,811 | ) | | | | |
U.S. Treasury Bonds(T) | | 1 Day USOIS-10bps(T)/5.230% | | JPM | | | 11/29/23 | | | | 655 | | | | (70,075 | ) | | | | | | | — | | | | | | | | | | | | (70,075 | ) | | | | |
| | | | | | | | | | | | | | | | | | | | | | | | | | | | | | | | | | | | | | | | |
| | | | | | | | | | | | | | $ | (88,886 | ) | | | | | | $ | — | | | | | | | | | | | $ | (88,886 | ) | | | | |
| | | | | | | | | | | | | | | | | | | | | | | | | | | | | | | | | | | | | | | | |
| (1) | On a long total return swap, the Fund receives payments for any positive return on the reference entity (makes payments for any negative return) and pays the financing rate. On a short total return swap, the Fund makes payments for any positive return on the reference entity (receives payments for any negative return) and receives the financing rate. |
| (2) | Upfront/recurring fees or commissions, as applicable, are included in the net unrealized appreciation (depreciation). |
Balances Reported in the Statement of Assets and Liabilities for OTC Swap Agreements:
| | | | | | | | |
| | | Premiums Paid | | Premiums Received | | Unrealized Appreciation | | Unrealized
Depreciation |
| | | | |
OTC Swap Agreements | | $87,617 | | $(11,991) | | $32,089 | | $(140,149) |
Summary of Collateral for Centrally Cleared/Exchange-traded Derivatives:
Cash and securities segregated as collateral, including pending settlement for closed positions, to cover requirements for centrally cleared/exchange-traded derivatives are listed by broker as follows:
| | | | | | | | | | |
Broker | | Cash and/or Foreign Currency | | Securities Market Value |
| | |
JPS | | | $ | — | | | | $ | 3,627,160 | |
| | | | | | | | | | |
Fair Value Measurements:
Various inputs are used in determining the value of the Fund’s investments. These inputs are summarized in the three broad levels listed below.
Level 1—unadjusted quoted prices generally in active markets for identical securities.
Level 2—quoted prices for similar securities, interest rates and yield curves, prepayment speeds, foreign currency exchange rates and other observable inputs.
Level 3—unobservable inputs for securities valued in accordance with Board approved fair valuation procedures.
See Notes to Financial Statements.
64
The following is a summary of the inputs used as of October 31, 2023 in valuing such portfolio securities:
| | | | | | | | | | | | |
| | | Level 1 | | | Level 2 | | | Level 3 | |
Investments in Securities | | | | | | | | | | | | |
Assets | | | | | | | | | | | | |
Long-Term Investments | | | | | | | | | | | | |
Asset-Backed Securities | | | | | | | | | | | | |
Cayman Islands | | $ | — | | | $ | 11,445,487 | | | $ | — | |
Ireland | | | — | | | | 1,518,244 | | | | — | |
Spain | | | — | | | | — | | | | 44,826 | |
United States | | | — | | | | 2,766,166 | | | | — | |
Commercial Mortgage-Backed Securities | | | | | | | | | | | | |
Canada | | | — | | | | 11,626 | | | | — | |
Ireland | | | — | | | | 96,280 | | | | — | |
United Kingdom | | | — | | | | 516,536 | | | | — | |
United States | | | — | | | | 7,879,647 | | | | — | |
Convertible Bond | | | | | | | | | | | | |
Jamaica | | | — | | | | 259 | | | | — | |
Corporate Bonds | | | | | | | | | | | | |
Belgium | | | — | | | | 115,889 | | | | — | |
Brazil | | | — | | | | 426,562 | | | | — | |
Bulgaria | | | — | | | | 260,293 | | | | — | |
Canada | | | — | | | | 1,094,185 | | | | — | |
China | | | — | | | | 1,776,963 | | | | — | |
Denmark | | | — | | | | 155,422 | | | | — | |
France | | | — | | | | 2,223,380 | | | | — | |
Germany | | | — | | | | 1,134,816 | | | | — | |
Hong Kong | | | — | | | | 320,975 | | | | — | |
Hungary | | | — | | | | 93,401 | | | | — | |
India | | | — | | | | 473,279 | | | | — | |
Indonesia | | | — | | | | 182,366 | | | | — | |
Israel | | | — | | | | 152,000 | | | | — | |
Italy | | | — | | | | 660,117 | | | | — | |
Jamaica | | | — | | | | 196,602 | | | | — | |
Japan | | | — | | | | 336,194 | | | | — | |
Kazakhstan | | | — | | | | 320,055 | | | | — | |
Luxembourg | | | — | | | | 332,218 | | | | — | |
Malta | | | — | | | | 210,063 | | | | — | |
Mexico | | | — | | | | 984,744 | | | | — | |
Netherlands | | | — | | | | 714,139 | | | | — | |
Norway | | | — | | | | 150,389 | | | | — | |
Peru | | | — | | | | 35,232 | | | | — | |
Philippines | | | — | | | | 441,550 | | | | — | |
Poland | | | — | | | | 283,874 | | | | — | |
Portugal | | | — | | | | 113,321 | | | | — | |
Russia | | | — | | | | 288,062 | | | | — | |
Saudi Arabia | | | — | | | | 281,625 | | | | — | |
Singapore | | | — | | | | 73,222 | | | | — | |
Slovenia | | | — | | | | 130,492 | | | | — | |
South Africa | | | — | | | | 543,000 | | | | — | |
Spain | | | — | | | | 876,581 | | | | — | |
See Notes to Financial Statements.
PGIM Global Total Return (USD Hedged) Fund 65
Schedule of Investments (continued)
as of October 31, 2023
| | | | | | | | | | | | |
| | | Level 1 | | | Level 2 | | | Level 3 | |
| | | |
Investments in Securities (continued) | | | | | | | | | | | | |
Assets (continued) | | | | | | | | | | | | |
Long-Term Investments (continued) | | | | | | | | | | | | |
Corporate Bonds (continued) | | | | | | | | | | | | |
Supranational Bank | | $ | — | | | $ | 359,250 | | | $ | — | |
Switzerland | | | — | | | | 1,280,567 | | | | — | |
United Arab Emirates | | | — | | | | 1,068,224 | | | | — | |
United Kingdom | | | — | | | | 3,114,402 | | | | — | |
United States | | | — | | | | 13,847,846 | | | | — | |
Floating Rate and Other Loans | | | | | | | | | | | | |
Jamaica | | | — | | | | 9,069 | | | | — | |
United States | | | — | | | | 3,671 | | | | — | |
Municipal Bond | | | | | | | | | | | | |
Puerto Rico | | | — | | | | 145,474 | | | | — | |
Residential Mortgage-Backed Securities | | | | | | | | | | | | |
Spain | | | — | | | | 16,606 | | | | — | |
United States | | | — | | | | 2,168,495 | | | | — | |
Sovereign Bonds | | | | | | | | | | | | |
Andorra | | | — | | | | 170,269 | | | | — | |
Austria | | | — | | | | 211,621 | | | | — | |
Brazil | | | — | | | | 819,864 | | | | — | |
Bulgaria | | | — | | | | 246,937 | | | | — | |
Canada | | | — | | | | 83,609 | | | | — | |
Chile | | | — | | | | 105,236 | | | | — | |
China | | | — | | | | 871,738 | | | | — | |
Colombia | | | — | | | | 809,311 | | | | — | |
Croatia | | | — | | | | 426,734 | | | | — | |
Cyprus | | | — | | | | 818,772 | | | | — | |
Denmark | | | — | | | | 19,221 | | | | — | |
Dominican Republic | | | — | | | | 96,091 | | | | — | |
Estonia | | | — | | | | 213,874 | | | | — | |
France | | | — | | | | 138,489 | | | | — | |
Germany | | | — | | | | 193,323 | | | | — | |
Greece | | | — | | | | 2,033,744 | | | | — | |
Hong Kong | | | — | | | | 318,305 | | | | — | |
Hungary | | | — | | | | 310,266 | | | | — | |
Iceland | | | — | | | | 89,285 | | | | — | |
India | | | — | | | | 133,462 | | | | — | |
Indonesia | | | — | | | | 1,155,657 | | | | — | |
Israel | | | — | | | | 384,244 | | | | — | |
Italy | | | — | | | | 2,528,878 | | | | — | |
Kazakhstan | | | — | | | | 296,035 | | | | — | |
Latvia | | | — | | | | 251,408 | | | | — | |
Lithuania | | | — | | | | 170,919 | | | | — | |
Mexico | | | — | | | | 1,118,531 | | | | — | |
New Zealand | | | — | | | | 46,499 | | | | — | |
Panama | | | — | | | | 339,600 | | | | — | |
Peru | | | — | | | | 416,173 | | | | — | |
Philippines | | | — | | | | 504,034 | | | | — | |
See Notes to Financial Statements.
66
| | | | | | | | | | | | |
| | | Level 1 | | | Level 2 | | | Level 3 | |
| | | |
Investments in Securities (continued) | | | | | | | | | | | | |
Assets (continued) | | | | | | | | | | | | |
Long-Term Investments (continued) | | | | | | | | | | | | |
Sovereign Bonds (continued) | | | | | | | | | | | | |
Portugal | | $ | — | | | $ | 867,000 | | | $ | — | |
Qatar | | | — | | | | 193,300 | | | | — | |
Romania | | | — | | | | 488,147 | | | | — | |
Saudi Arabia | | | — | | | | 304,245 | | | | — | |
Serbia | | | — | | | | 455,409 | | | | — | |
Singapore | | | — | | | | 26,866 | | | | — | |
Slovakia | | | — | | | | 130,589 | | | | — | |
Slovenia | | | — | | | | 816,616 | | | | — | |
Spain | | | — | | | | 1,253,217 | | | | — | |
Ukraine | | | — | | | | 203,497 | | | | — | |
United Arab Emirates | | | — | | | | 160,700 | | | | — | |
United Kingdom | | | — | | | | 605,063 | | | | — | |
Uruguay | | | — | | | | 38,921 | | | | — | |
U.S. Government Agency Obligations | | | — | | | | 132,187 | | | | — | |
U.S. Treasury Obligations | | | — | | | | 11,493,382 | | | | — | |
Unaffiliated Exchange-Traded Funds | | | 982,993 | | | | — | | | | — | |
Short-Term Investments | | | | | | | | | | | | |
Affiliated Mutual Funds | | | 1,810,141 | | | | — | | | | — | |
| | | | | | | | | | | | |
| | | |
Total | | $ | 2,793,134 | | | $ | 94,120,128 | | | $ | 44,826 | |
| | | | | | | | | | | | |
| | | |
Other Financial Instruments* | | | | | | | | | | | | |
Assets | | | | | | | | | | | | |
Futures Contracts | | $ | 682,732 | | | $ | — | | | $ | — | |
OTC Forward Foreign Currency Exchange Contracts | | | — | | | | 106,999 | | | | — | |
OTC Credit Default Swap Agreements | | | — | | | | 84,932 | | | | — | |
Centrally Cleared Interest Rate Swap Agreements | | | — | | | | 654,578 | | | | — | |
OTC Interest Rate Swap Agreements | | | — | | | | 4,688 | | | | — | |
| | | | | | | | | | | | |
| | | |
Total | | $ | 682,732 | | | $ | 851,197 | | | $ | — | |
| | | | | | | | | | | | |
| | | |
Liabilities | | | | | | | | | | | | |
Futures Contracts | | $ | (260,832 | ) | | $ | — | | | $ | — | |
OTC Forward Foreign Currency Exchange Contracts | | | — | | | | (26,472 | ) | | | — | |
Centrally Cleared Credit Default Swap Agreement | | | — | | | | (179,494 | ) | | | — | |
OTC Credit Default Swap Agreements | | | — | | | | (5,627 | ) | | | — | |
OTC Currency Swap Agreement | | | — | | | | (7,858 | ) | | | — | |
Centrally Cleared Interest Rate Swap Agreements | | | — | | | | (2,782,793 | ) | | | — | |
OTC Interest Rate Swap Agreements | | | — | | | | (19,683 | ) | | | — | |
OTC Total Return Swap Agreements | | | — | | | | (88,886 | ) | | | — | |
| | | | | | | | | | | | |
| | | |
Total | | $ | (260,832 | ) | | $ | (3,110,813 | ) | | $ | — | |
| | | | | | | | | | | | |
See Notes to Financial Statements.
PGIM Global Total Return (USD Hedged) Fund 67
Schedule of Investments (continued)
as of October 31, 2023
| * | Other financial instruments are derivative instruments not reflected in the Schedule of Investments, such as futures, forwards and centrally cleared swap contracts, which are recorded at the unrealized appreciation (depreciation) on the instrument, and OTC swap contracts which are recorded at fair value. |
Industry Classification:
The industry classification of investments and other assets in excess of liabilities shown as a percentage of net assets as of October 31, 2023 were as follows:
| | | | |
Sovereign Bonds | | | 21.5 | % |
Banks | | | 14.1 | |
Collateralized Loan Obligations | | | 14.0 | |
U.S. Treasury Obligations | | | 11.8 | |
Commercial Mortgage-Backed Securities | | | 8.8 | |
Electric | | | 2.8 | |
Residential Mortgage-Backed Securities | | | 2.2 | |
Oil & Gas | | | 2.0 | |
Affiliated Mutual Funds (0.3% represents investments purchased with collateral from securities on loan) | | | 1.9 | |
Pipelines | | | 1.8 | |
Automobiles | | | 1.5 | |
Diversified Financial Services | | | 1.1 | |
Telecommunications | | | 1.1 | |
Commercial Services | | | 1.1 | |
Unaffiliated Exchange-Traded Funds | | | 1.0 | |
Media | | | 1.0 | |
Insurance | | | 1.0 | |
Real Estate Investment Trusts (REITs) | | | 0.9 | |
Transportation | | | 0.9 | |
Real Estate | | | 0.8 | |
Consumer Loans | | | 0.7 | |
Investment Companies | | | 0.6 | |
Foods | | | 0.5 | |
Engineering & Construction | | | 0.5 | |
Multi-National | | | 0.4 | |
Semiconductors | | | 0.4 | |
Healthcare-Products | | | 0.4 | |
Healthcare-Services | | | 0.4 | |
Retail | | | 0.3 | |
Pharmaceuticals | | | 0.3 | |
| | | | |
Home Builders | | | 0.3 | % |
Entertainment | | | 0.3 | |
Chemicals | | | 0.3 | |
Auto Manufacturers | | | 0.3 | |
Airlines | | | 0.3 | |
Beverages | | | 0.3 | |
Internet | | | 0.2 | |
Gas | | | 0.2 | |
Packaging & Containers | | | 0.2 | |
Software | | | 0.2 | |
Agriculture | | | 0.2 | |
Machinery-Diversified | | | 0.2 | |
Municipal Bond | | | 0.2 | |
Aerospace & Defense | | | 0.1 | |
U.S. Government Agency Obligations | | | 0.1 | |
Biotechnology | | | 0.1 | |
Building Materials | | | 0.1 | |
Auto Parts & Equipment | | | 0.1 | |
Electronics | | | 0.1 | |
Office/Business Equipment | | | 0.1 | |
Lodging | | | 0.1 | |
Coal | | | 0.0 | * |
Apparel | | | 0.0 | * |
Home Equity Loans | | | 0.0 | * |
| | | | |
| |
| | | 99.8 | |
Other assets in excess of liabilities | | | 0.2 | |
| | | | |
| |
| | | 100.0 | % |
| | | | |
Effects of Derivative Instruments on the Financial Statements and Primary Underlying Risk Exposure:
The Fund invested in derivative instruments during the reporting period. The primary types of risk associated with these derivative instruments are credit risk, foreign exchange risk and interest rate risk. See the Notes to Financial Statements for
See Notes to Financial Statements.
68
additional detail regarding these derivative instruments and their risks. The effect of such derivative instruments on the Fund’s financial position and financial performance as reflected in the Statement of Assets and Liabilities and Statement of Operations is presented in the summary below.
Fair values of derivative instruments as of October 31, 2023 as presented in the Statement of Assets and Liabilities:
| | | | | | | | | | | | | | | | | | | | |
| | | | | Asset Derivatives | | Liability Derivatives | |
| | | | | | | | |
Derivatives not accounted for as hedging instruments, carried at fair value | | | | Statement of Assets and Liabilities Location | | | | Fair
Value | | | | | Statement of Assets and Liabilities Location | | | | Fair
Value | |
| | | | | | | | |
Credit contracts | | | | — | | | | $ | — | | | | | Due from/to broker-variation margin swaps | | | | $ | 179,494* | |
Credit contracts | | | | Premiums paid for OTC swap agreements | | | | | 87,617 | | | | | Premiums received for OTC swap agreements | | | | | 11,973 | |
Credit contracts | | | | Unrealized appreciation on OTC swap agreements | | | | | 27,401 | | | | | Unrealized depreciation on OTC swap agreements | | | | | 23,740 | |
Foreign exchange contracts | | | | Due from/to broker-variation margin futures | | | | | 337,741* | | | | | — | | | | | — | |
Foreign exchange contracts | | | | Unrealized appreciation on OTC forward foreign currency exchange contracts | | | | | 106,999 | | | | | Unrealized depreciation on OTC forward foreign currency exchange contracts | | | | | 26,472 | |
Interest rate contracts | | | | Due from/to broker-variation margin futures | | | | | 344,991 | * | | | | Due from/to broker-variation margin futures | | | | | 260,832 | * |
Interest rate contracts | | | | Due from/to broker-variation margin swaps | | | | | 654,578 | * | | | | Due from/to broker-variation margin swaps | | | | | 2,782,793 | * |
Interest rate contracts | | | | — | | | | | — | | | | | Premiums received for OTC swap agreements | | | | | 18 | |
Interest rate contracts | | | | Unrealized appreciation on OTC swap agreements | | | | | 4,688 | | | | | Unrealized depreciation on OTC swap agreements | | | | | 116,409 | |
| | | | | | | | | | | | | | | | | | | | |
| | | | | | | | |
| | | | | | | | $ | 1,564,015 | | | | | | | | | $ | 3,401,731 | |
| | | | | | | | | | | | | | | | | | | | |
| * | Includes cumulative appreciation (depreciation) as reported in the schedule of open futures and centrally cleared swap contracts. Only unsettled variation margin receivable (payable) is reported within the Statement of Assets and Liabilities. |
See Notes to Financial Statements.
PGIM Global Total Return (USD Hedged) Fund 69
Schedule of Investments (continued)
as of October 31, 2023
The effects of derivative instruments on the Statement of Operations for the year ended October 31, 2023 are as follows:
| | | | | | | | | | | | | | | | | | | | | | | | | | | | | | | | |
Amount of Realized Gain (Loss) on Derivatives Recognized in Income | |
| | | | | |
Derivatives not accounted for as hedging instruments, carried at fair value | | Options Purchased(1) | | Options Written | | Futures | | | Forward
Currency
Exchange Contracts | | Swaps | |
| | | | | | | | | | | |
Credit contracts | | | | $ | — | | | | | | | $ | 152 | | | | | $ | — | | | | | $ | — | | | | | $ | 291,366 | |
Foreign exchange contracts | | | | | — | | | | | | | | — | | | | | | (1,000,995 | ) | | | | | (23,968 | ) | | | | | — | |
Interest rate contracts | | | | | (12,193 | ) | | | | | | | 10,615 | | | | | | 212,926 | | | | | | — | | | | | | (21,157 | ) |
| | | | | | | | | | | | | | | | | | | | | | | | | | | | | | | | |
| | | | | | | | | | | |
Total | | | | $ | (12,193 | ) | | | | | | $ | 10,767 | | | | | $ | (788,069 | ) | | | | $ | (23,968 | ) | | | | $ | 270,209 | |
| | | | | | | | | | | | | | | | | | | | | | | | | | | | | | | | |
| (1) | Included in net realized gain (loss) on investment transactions in the Statement of Operations. |
| | | | | | | | | | | | | | | | | | | | | | | | | | | | | | | | |
Change in Unrealized Appreciation (Depreciation) on Derivatives Recognized in Income | |
| | | | | |
Derivatives not accounted for as hedging instruments, carried at fair value | | Options Purchased(2) | | Options Written | | Futures | | | Forward Currency Exchange Contracts | | Swaps | |
| | | | | | | | | | | |
Credit contracts | | | | $ | — | | | | | | | $ | — | | | | | $ | — | | | | | $ | — | | | | | $ | (211,695 | ) |
Foreign exchange contracts | | | | | — | | | | | | | | — | | | | | | 233,073 | | | | | | 28,777 | | | | | | — | |
Interest rate contracts | | | | | (35,535 | ) | | | | | | | 39,806 | | | | | | 533,785 | | | | | | — | | | | | | (601,594 | ) |
| | | | | | | | | | | | | | | | | | | | | | | | | | | | | | | | |
| | | | | | | | | | | |
Total | | | | $ | (35,535 | ) | | | | | | $ | 39,806 | | | | | $ | 766,858 | | | | | $ | 28,777 | | | | | $ | (813,289 | ) |
| | | | | | | | | | | | | | | | | | | | | | | | | | | | | | | | |
| (2) | Included in net change in unrealized appreciation (depreciation) on investments in the Statement of Operations. |
For the year ended October 31, 2023, the Fund’s average volume of derivative activities is as follows:
| | | | |
| Derivative Contract Type | | Average Volume of Derivative Activities* |
| |
Options Purchased (1) | | | $ 8,188 | |
| |
Options Written (2) | | | 1,361,000 | |
| |
Futures Contracts - Long Positions (2) | | | 12,734,817 | |
| |
Futures Contracts - Short Positions (2) | | | 44,015,830 | |
| |
Forward Foreign Currency Exchange Contracts - Purchased (3) | | | 12,340,811 | |
| |
Forward Foreign Currency Exchange Contracts - Sold (3) | | | 26,319,818 | |
| |
Interest Rate Swap Agreements (2) | | | 83,113,798 | |
| |
Credit Default Swap Agreements - Buy Protection (2) | | | 2,994,206 | |
| |
Credit Default Swap Agreements - Sell Protection (2) | | | 18,994,665 | |
| |
Currency Swap Agreements (2) | | | 96,718 | |
| |
Total Return Swap Agreements (2) | | | 331,000 | |
| |
Inflation Swap Agreements (2) | | | 254,184 | |
| * | Average volume is based on average quarter end balances as noted for the year ended October 31, 2023. |
| (2) | Notional Amount in USD. |
| (3) | Value at Settlement Date. |
See Notes to Financial Statements.
70
Financial Instruments/Transactions—Summary of Offsetting and Netting Arrangements:
The Fund invested in OTC derivatives and entered into financial instruments/transactions during the reporting period that are either offset in accordance with current requirements or are subject to enforceable master netting arrangements or similar agreements that permit offsetting. The information about offsetting and related netting arrangements for OTC derivatives and financial instruments/transactions where the legal right to set-off exists is presented in the summary below.
Offsetting of financial instrument/transaction assets and liabilities:
| | | | | | | | |
| Description | | Gross Market Value of Recognized
Assets/(Liabilities) | | | | Collateral
Pledged/(Received)(2) | | Net Amount |
| | | | |
Securities on Loan | | $257,220 | | | | $(257,220) | | $— |
Offsetting of OTC derivative assets and liabilities:
| | | | | | | | | | | | | | | | | | | | | | | | | |
Counterparty | | Gross Amounts of
Recognized
Assets(1) | | Gross Amounts of
Recognized
Liabilities(1) | | Net Amounts of
Recognized
Assets/(Liabilities) | | Collateral Pledged/(Received)(2) | | Net Amount |
| | | | | |
BARC | | | $ | 41,670 | | | | $ | (18,043 | ) | | | $ | 23,627 | | | | $ | — | | | | $ | 23,627 | |
BNP | | | | 30,848 | | | | | (4,692 | ) | | | | 26,156 | | | | | — | | | | | 26,156 | |
BNYM | | | | 6,895 | | | | | (8,172 | ) | | | | (1,277 | ) | | | | — | | | | | (1,277 | ) |
BOA | | | | 24,193 | | | | | (3,987 | ) | | | | 20,206 | | | | | — | | | | | 20,206 | |
CITI | | | | 6,627 | | | | | (9,054 | ) | | | | (2,427 | ) | | | | — | | | | | (2,427 | ) |
DB | | | | 1,732 | | | | | (19,219 | ) | | | | (17,487 | ) | | | | — | | | | | (17,487 | ) |
GSI | | | | 5,906 | | | | | (2,823 | ) | | | | 3,083 | | | | | — | | | | | 3,083 | |
HSBC | | | | 19,667 | | | | | (8,805 | ) | | | | 10,862 | | | | | — | | | | | 10,862 | |
JPM | | | | 7,215 | | | | | (74,266 | ) | | | | (67,051 | ) | | | | — | | | | | (67,051 | ) |
MSI | | | | 72,882 | | | | | (21,318 | ) | | | | 51,564 | | | | | — | | | | | 51,564 | |
SCB | | | | 4,880 | | | | | (3,804 | ) | | | | 1,076 | | | | | — | | | | | 1,076 | |
TD | | | | — | | | | | (122 | ) | | | | (122 | ) | | | | — | | | | | (122 | ) |
UAG | | | | 4,190 | | | | | (4,307 | ) | | | | (117 | ) | | | | — | | | | | (117 | ) |
| | | | | | | | | | | | | | | | | | | | | | | | | |
| | | | | |
| | | $ | 226,705 | | | | $ | (178,612 | ) | | | $ | 48,093 | | | | $ | — | | | | $ | 48,093 | |
| | | | | | | | | | | | | | | | | | | | | | | | | |
| (1) | Includes unrealized appreciation/(depreciation) on swaps and forwards, premiums paid/(received) on swap agreements and market value of purchased and written options, as represented on the Statement of Assets and Liabilities. |
| (2) | Collateral amount disclosed by the Fund is limited to the market value of financial instruments/transactions and the Fund’s OTC derivative exposure by counterparty. |
See Notes to Financial Statements.
PGIM Global Total Return (USD Hedged) Fund 71
Statement of Assets and Liabilities
as of October 31, 2023
| | | | |
| |
Assets | | | | |
| |
Investments at value, including securities on loan of $257,220: | | | | |
Unaffiliated investments (cost $110,137,338) | | $ | 95,147,947 | |
Affiliated investments (cost $1,810,115) | | | 1,810,141 | |
Foreign currency, at value (cost $172,242) | | | 170,938 | |
Dividends and interest receivable | | | 854,392 | |
Receivable for Fund shares sold | | | 137,083 | |
Due from broker—variation margin swaps | | | 131,883 | |
Unrealized appreciation on OTC forward foreign currency exchange contracts | | | 106,999 | |
Receivable for investments sold | | | 100,818 | |
Premiums paid for OTC swap agreements | | | 87,617 | |
Due from broker—variation margin futures | | | 47,646 | |
Unrealized appreciation on OTC swap agreements | | | 32,089 | |
Prepaid expenses and other assets | | | 1,100 | |
| | | | |
| |
Total Assets | | | 98,628,653 | |
| | | | |
| |
Liabilities | | | | |
| |
Payable for Fund shares purchased | | | 735,340 | |
Payable to broker for collateral for securities on loan | | | 261,452 | |
Unrealized depreciation on OTC swap agreements | | | 140,149 | |
Payable for investments purchased | | | 99,294 | |
Accrued expenses and other liabilities | | | 66,551 | |
Audit fees payable | | | 43,990 | |
Management fee payable | | | 30,943 | |
Unrealized depreciation on OTC forward foreign currency exchange contracts | | | 26,472 | |
Premiums received for OTC swap agreements | | | 11,991 | |
Shareholders’ reports fee payable | | | 10,319 | |
Professional fees payable | | | 6,474 | |
Directors’ fees payable | | | 983 | |
Affiliated transfer agent fee payable | | | 905 | |
Distribution fee payable | | | 149 | |
Dividends payable | | | 11 | |
| | | | |
| |
Total Liabilities | | | 1,435,023 | |
| | | | |
| |
Net Assets | | $ | 97,193,630 | |
| | | | |
| |
| | | | |
| |
Net assets were comprised of: | | | | |
Common stock, at par | | $ | 123,043 | |
Paid-in capital in excess of par | | | 116,792,212 | |
Total distributable earnings (loss) | | | (19,721,625 | ) |
| | | | |
| |
Net assets, October 31, 2023 | | $ | 97,193,630 | |
| | | | |
See Notes to Financial Statements.
72
| | | | |
Class A | | | | |
| |
Net asset value, offering price and redemption price per share, ($468,544 ÷ 59,332 shares of common stock issued and outstanding) | | $ | 7.90 | |
Maximum sales charge (3.25% of offering price) | | | 0.27 | |
| | | | |
| |
Maximum offering price to public | | $ | 8.17 | |
| | | | |
| |
Class C | | | | |
| |
Net asset value, offering price and redemption price per share, ($58,411 ÷ 7,400 shares of common stock issued and outstanding) | | $ | 7.89 | |
| | | | |
| |
Class Z | | | | |
| |
Net asset value, offering price and redemption price per share, ($10,692,784 ÷ 1,354,587 shares of common stock issued and outstanding) | | $ | 7.89 | |
| | | | |
| |
Class R6 | | | | |
| |
Net asset value, offering price and redemption price per share, ($85,973,891 ÷ 10,882,976 shares of common stock issued and outstanding) | | $ | 7.90 | |
| | | | |
See Notes to Financial Statements.
PGIM Global Total Return (USD Hedged) Fund 73
Statement of Operations
Year Ended October 31, 2023
| | | | |
Net Investment Income (Loss) | | | | |
| |
Income | | | | |
Interest income | | $ | 3,752,927 | |
Unaffiliated dividend income | | | 109,688 | |
Affiliated dividend income | | | 67,876 | |
Affiliated income from securities lending, net | | | 1,408 | |
| | | | |
| |
Total income | | | 3,931,899 | |
| | | | |
| |
Expenses | | | | |
Management fee | | | 433,464 | |
Distribution fee(a) | | | 1,722 | |
Custodian and accounting fees | | | 59,820 | |
Audit fee | | | 43,990 | |
Professional fees | | | 43,809 | |
Registration fees(a) | | | 32,822 | |
Shareholders’ reports | | | 30,717 | |
Fund data services | | | 21,880 | |
Transfer agent’s fees and expenses (including affiliated expense of $6,101)(a) | | | 14,701 | |
Directors’ fees | | | 10,942 | |
Miscellaneous | | | 23,599 | |
| | | | |
| |
Total expenses | | | 717,466 | |
Less: Fee waiver and/or expense reimbursement(a) | | | (203,400 | ) |
| | | | |
| |
Net expenses | | | 514,066 | |
| | | | |
| |
Net investment income (loss) | | | 3,417,833 | |
| | | | |
| |
Realized And Unrealized Gain (Loss) On Investment And Foreign Currency Transactions | | | | |
| |
Net realized gain (loss) on: | | | | |
Investment transactions (including affiliated of $467) | | | (631,485 | ) |
Futures transactions | | | (788,069 | ) |
Forward currency contract transactions | | | (23,968 | ) |
Options written transactions | | | 10,767 | |
Swap agreement transactions | | | 270,209 | |
Foreign currency transactions | | | (276,500 | ) |
| | | | |
| |
| | | (1,439,046 | ) |
| | | | |
| |
Net change in unrealized appreciation (depreciation) on: | | | | |
Investments (including affiliated of $26) | | | 2,295,406 | |
Futures | | | 766,858 | |
Forward currency contracts | | | 28,777 | |
Options written | | | 39,806 | |
Swap agreements | | | (813,289 | ) |
Foreign currencies | | | (15,653 | ) |
| | | | |
| |
| | | 2,301,905 | |
| | | | |
| |
Net gain (loss) on investment and foreign currency transactions | | | 862,859 | |
| | | | |
| |
Net Increase (Decrease) In Net Assets Resulting From Operations | | $ | 4,280,692 | |
| | | | |
See Notes to Financial Statements.
74
| (a) | Class specific expenses and waivers were as follows: |
| | | | | | | | | | | | | | | | |
| | | Class A | | Class C | | Class Z | | Class R6 |
| | | | |
Distribution fee | | | 1,127 | | | | 595 | | | | — | | | | — | |
Registration fees | | | 6,528 | | | | 5,778 | | | | 11,578 | | | | 8,938 | |
Transfer agent’s fees and expenses | | | 1,328 | | | | 389 | | | | 5,084 | | | | 7,900 | |
Fee waiver and/or expense reimbursement | | | (8,449 | ) | | | (6,244 | ) | | | (24,705 | ) | | | (164,002 | ) |
See Notes to Financial Statements.
PGIM Global Total Return (USD Hedged) Fund 75
Statements of Changes in Net Assets
| | | | | | | | |
| |
| | | Year Ended October 31, | |
| | | | |
| | |
| | | 2023 | | | 2022 | |
| | |
Increase (Decrease) in Net Assets | | | | | | | | |
| | |
Operations | | | | | | | | |
Net investment income (loss) | | $ | 3,417,833 | | | $ | 2,169,263 | |
Net realized gain (loss) on investment and foreign currency transactions | | | (1,439,046 | ) | | | 1,362,084 | |
Net change in unrealized appreciation (depreciation) on investments and foreign currencies | | | 2,301,905 | | | | (20,035,154 | ) |
| | | | | | | | |
| | |
Net increase (decrease) in net assets resulting from operations | | | 4,280,692 | | | | (16,503,807 | ) |
| | | | | | | | |
| | |
Dividends and Distributions | | | | | | | | |
Distributions from distributable earnings | | | | | | | | |
Class A | | | (20,492 | ) | | | (21,897 | ) |
Class C | | | (2,273 | ) | | | (5,305 | ) |
Class Z | | | (295,803 | ) | | | (300,048 | ) |
Class R6 | | | (3,808,260 | ) | | | (3,029,090 | ) |
| | | | | | | | |
| | |
| | | (4,126,828 | ) | | | (3,356,340 | ) |
| | | | | | | | |
| | |
Tax return of capital distributions | | | | | | | | |
Class A | | | (1,739 | ) | | | — | |
Class C | | | (193 | ) | | | — | |
Class Z | | | (25,095 | ) | | | — | |
Class R6 | | | (323,086 | ) | | | — | |
| | | | | | | | |
| | |
| | | (350,113 | ) | | | — | |
| | | | | | | | |
| | |
Fund share transactions (Net of share conversions) | | | | | | | | |
Net proceeds from shares sold | | | 42,782,589 | | | | 51,891,519 | |
Net asset value of shares issued in reinvestment of dividends and distributions | | | 4,476,015 | | | | 3,349,091 | |
Cost of shares purchased | | | (24,605,971 | ) | | | (34,793,306 | ) |
| | | | | | | | |
| | |
Net increase (decrease) in net assets from Fund share transactions | | | 22,652,633 | | | | 20,447,304 | |
| | | | | | | | |
| | |
Total increase (decrease) | | | 22,456,384 | | | | 587,157 | |
| | |
Net Assets: | | | | | | | | |
| | |
Beginning of year | | | 74,737,246 | | | | 74,150,089 | |
| | | | | | | | |
| | |
End of year | | $ | 97,193,630 | | | $ | 74,737,246 | |
| | | | | | | | |
See Notes to Financial Statements.
76
Financial Highlights
| | | | | | | | | | | | | | | | | | | | |
| | | | | | |
Class A Shares | | | | | | | | | | | | | | | | | | | | |
| | | Year Ended October 31, | |
| | | | | | |
| | | 2023 | | | 2022 | | | 2021 | | | 2020 | | | 2019 | |
Per Share Operating Performance(a): | | | | | | | | | | | | | | | | | | | | |
Net Asset Value, Beginning of Year | | | $7.85 | | | | $10.03 | | | | $10.41 | | | | $10.43 | | | | $9.48 | |
Income (loss) from investment operations: | | | | | | | | | | | | | | | | | | | | |
Net investment income (loss) | | | 0.29 | | | | 0.20 | | | | 0.15 | | | | 0.21 | | | | 0.18 | |
Net realized and unrealized gain (loss) on investment and foreign currency transactions | | | 0.16 | | | | (2.03 | ) | | | (0.27 | ) | | | 0.30 | | | | 1.33 | |
Total from investment operations | | | 0.45 | | | | (1.83 | ) | | | (0.12 | ) | | | 0.51 | | | | 1.51 | |
Less Dividends and Distributions: | | | | | | | | | | | | | | | | | | | | |
Dividends from net investment income | | | (0.37 | ) | | | (0.35 | ) | | | (0.26 | ) | | | (0.28 | ) | | | (0.56 | ) |
Tax return of capital distributions | | | (0.03 | ) | | | - | | | | - | | | | (0.14 | ) | | | - | |
Distributions from net realized gains | | | - | | | | - | | | | - | | | | (0.11 | ) | | | - | |
Total dividends and distributions | | | (0.40 | ) | | | (0.35 | ) | | | (0.26 | ) | | | (0.53 | ) | | | (0.56 | ) |
Net asset value, end of year | | | $7.90 | | | | $7.85 | | | | $10.03 | | | | $10.41 | | | | $10.43 | |
Total Return(b): | | | 5.69 | % | | | (18.63 | )% | | | (1.22 | )% | | | 5.12 | % | | | 16.40 | % |
| | | | | | | | | | | | | | | | | | | | |
| | | | | | |
Ratios/Supplemental Data: | | | | | | | | | | | | | | | | | | | | |
Net assets, end of year (000) | | | $469 | | | | $465 | | | | $841 | | | | $729 | | | | $2,036 | |
Average net assets (000) | | | $451 | | | | $570 | | | | $825 | | | | $1,716 | | | | $234 | |
Ratios to average net assets(c): | | | | | | | | | | | | | | | | | | | | |
Expenses after waivers and/or expense reimbursement | | | 0.89 | %(d) | | | 0.88 | % | | | 0.88 | % | | | 0.88 | % | | | 0.88 | % |
Expenses before waivers and/or expense reimbursement | | | 2.76 | % | | | 3.10 | % | | | 2.96 | % | | | 2.30 | % | | | 8.27 | % |
Net investment income (loss) | | | 3.64 | % | | | 2.27 | % | | | 1.48 | % | | | 2.03 | % | | | 1.69 | % |
Portfolio turnover rate(e) | | | 20 | % | | | 30 | % | | | 20 | % | | | 33 | % | | | 31 | % |
| (a) | Calculated based on average shares outstanding during the year. |
| (b) | Total return does not consider the effects of sales loads. Total return is calculated assuming a purchase of a share on the first day and a sale on the last day of each year reported and includes reinvestment of dividends and distributions, if any. Total returns may reflect adjustments to conform to GAAP. |
| (c) | Does not include expenses of the underlying funds in which the Fund invests. |
| (d) | Includes interest expense on borrowings from the Syndicated Credit Agreement and certain non-recurring expenses of 0.01% which are being excluded from the Fund’s contractual waiver for the year ended October 31, 2023. |
| (e) | The Fund’s portfolio turnover rate is calculated in accordance with regulatory requirements, without regard to transactions involving short-term investments, certain derivatives and in-kind transactions (if any). If such transactions were included, the Fund’s portfolio turnover rate may be higher. |
See Notes to Financial Statements.
PGIM Global Total Return (USD Hedged) Fund 77
Financial Highlights (continued)
| | | | | | | | | | | | | | | | | | | | |
| | | | | | |
Class C Shares | | | | | | | | | | | | | | | | | | | | |
| | | Year Ended October 31, | |
| | | | | | |
| | | 2023 | | | 2022 | | | 2021 | | | 2020 | | | 2019 | |
Per Share Operating Performance(a): | | | | | | | | | | | | | | | | | | | | |
Net Asset Value, Beginning of Year | | | $7.85 | | | | $10.03 | | | | $10.41 | | | | $10.43 | | | | $9.48 | |
Income (loss) from investment operations: | | | | | | | | | | | | | | | | | | | | |
Net investment income (loss) | | | 0.23 | | | | 0.14 | | | | 0.08 | | | | 0.12 | | | | 0.17 | |
Net realized and unrealized gain (loss) on investment and foreign currency transactions | | | 0.15 | | | | (2.04 | ) | | | (0.28 | ) | | | 0.31 | | | | 1.27 | |
Total from investment operations | | | 0.38 | | | | (1.90 | ) | | | (0.20 | ) | | | 0.43 | | | | 1.44 | |
Less Dividends and Distributions: | | | | | | | | | | | | | | | | | | | | |
Dividends from net investment income | | | (0.31 | ) | | | (0.28 | ) | | | (0.18 | ) | | | (0.20 | ) | | | (0.49 | ) |
Tax return of capital distributions | | | (0.03 | ) | | | - | | | | - | | | | (0.14 | ) | | | - | |
Distributions from net realized gains | | | - | | | | - | | | | - | | | | (0.11 | ) | | | - | |
Total dividends and distributions | | | (0.34 | ) | | | (0.28 | ) | | | (0.18 | ) | | | (0.45 | ) | | | (0.49 | ) |
Net asset value, end of year | | | $7.89 | | | | $7.85 | | | | $10.03 | | | | $10.41 | | | | $10.43 | |
Total Return(b): | | | 4.77 | % | | | (19.24 | )% | | | (1.96 | )% | | | 4.32 | % | | | 15.59 | % |
| | | | | | | | | | | | | | | | | | | | |
| | | | | | |
Ratios/Supplemental Data: | | | | | | | | | | | | | | | | | | | | |
Net assets, end of year (000) | | | $58 | | | | $119 | | | | $139 | | | | $162 | | | | $39 | |
Average net assets (000) | | | $59 | | | | $166 | | | | $150 | | | | $85 | | | | $16 | |
Ratios to average net assets(c): | | | | | | | | | | | | | | | | | | | | |
Expenses after waivers and/or expense reimbursement | | | 1.64 | %(d) | | | 1.63 | % | | | 1.63 | % | | | 1.63 | % | | | 1.63 | % |
Expenses before waivers and/or expense reimbursement | | | 12.14 | % | | | 7.58 | % | | | 10.05 | % | | | 15.56 | % | | | 97.66 | % |
Net investment income (loss) | | | 2.89 | % | | | 1.54 | % | | | 0.74 | % | | | 1.15 | % | | | 1.70 | % |
Portfolio turnover rate(e) | | | 20 | % | | | 30 | % | | | 20 | % | | | 33 | % | | | 31 | % |
| (a) | Calculated based on average shares outstanding during the year. |
| (b) | Total return does not consider the effects of sales loads. Total return is calculated assuming a purchase of a share on the first day and a sale on the last day of each year reported and includes reinvestment of dividends and distributions, if any. Total returns may reflect adjustments to conform to GAAP. |
| (c) | Does not include expenses of the underlying funds in which the Fund invests. |
| (d) | Includes interest expense on borrowings from the Syndicated Credit Agreement and certain non-recurring expenses of 0.01% which are being excluded from the Fund’s contractual waiver for the year ended October 31, 2023. |
| (e) | The Fund’s portfolio turnover rate is calculated in accordance with regulatory requirements, without regard to transactions involving short-term investments, certain derivatives and in-kind transactions (if any). If such transactions were included, the Fund’s portfolio turnover rate may be higher. |
See Notes to Financial Statements.
78
| | | | | | | | | | | | | | | | | | | | |
| | | | | | |
Class Z Shares | | | | | | | | | | | | | | | | | | | | |
| | | Year Ended October 31, | |
| | | | | | |
| | | 2023 | | | 2022 | | | 2021 | | | 2020 | | | 2019 | |
Per Share Operating Performance(a): | | | | | | | | | | | | | | | | | | | | |
Net Asset Value, Beginning of Year | | | $7.85 | | | | $10.03 | | | | $10.41 | | | | $10.43 | | | | $9.48 | |
Income (loss) from investment operations: | | | | | | | | | | | | | | | | | | | | |
Net investment income (loss) | | | 0.31 | | | | 0.23 | | | | 0.17 | | | | 0.22 | | | | 0.18 | |
Net realized and unrealized gain (loss) on investment and foreign currency transactions | | | 0.15 | | | | (2.04 | ) | | | (0.27 | ) | | | 0.32 | | | | 1.36 | |
Total from investment operations | | | 0.46 | | | | (1.81 | ) | | | (0.10 | ) | | | 0.54 | | | | 1.54 | |
Less Dividends and Distributions: | | | | | | | | | | | | | | | | | | | | |
Dividends from net investment income | | | (0.39 | ) | | | (0.37 | ) | | | (0.28 | ) | | | (0.31 | ) | | | (0.59 | ) |
Tax return of capital distributions | | | (0.03 | ) | | | - | | | | - | | | | (0.14 | ) | | | - | |
Distributions from net realized gains | | | - | | | | - | | | | - | | | | (0.11 | ) | | | - | |
Total dividends and distributions | | | (0.42 | ) | | | (0.37 | ) | | | (0.28 | ) | | | (0.56 | ) | | | (0.59 | ) |
Net asset value, end of year | | | $7.89 | | | | $7.85 | | | | $10.03 | | | | $10.41 | | | | $10.43 | |
Total Return(b): | | | 5.82 | % | | | (18.42 | )% | | | (0.98 | )% | | | 5.37 | % | | | 16.71 | % |
| | | | | | | | | | | | | | | | | | | | |
| | | | | | |
Ratios/Supplemental Data: | | | | | | | | | | | | | | | | | | | | |
Net assets, end of year (000) | | | $10,693 | | | | $5,442 | | | | $10,982 | | | | $8,864 | | | | $3,854 | |
Average net assets (000) | | | $6,320 | | | | $7,255 | | | | $17,287 | | | | $6,563 | | | | $1,214 | |
Ratios to average net assets(c): | | | | | | | | | | | | | | | | | | | | |
Expenses after waivers and/or expense reimbursement | | | 0.64 | %(d) | | | 0.63 | % | | | 0.63 | % | | | 0.63 | % | | | 0.63 | % |
Expenses before waivers and/or expense reimbursement | | | 1.03 | % | | | 1.12 | % | | | 1.09 | % | | | 1.56 | % | | | 3.11 | % |
Net investment income (loss) | | | 3.88 | % | | | 2.53 | % | | | 1.65 | % | | | 2.17 | % | | | 1.72 | % |
Portfolio turnover rate(e) | | | 20 | % | | | 30 | % | | | 20 | % | | | 33 | % | | | 31 | % |
| (a) | Calculated based on average shares outstanding during the year. |
| (b) | Total return is calculated assuming a purchase of a share on the first day and a sale on the last day of each year reported and includes reinvestment of dividends and distributions, if any. Total returns may reflect adjustments to conform to GAAP. |
| (c) | Does not include expenses of the underlying funds in which the Fund invests. |
| (d) | Includes interest expense on borrowings from the Syndicated Credit Agreement and certain non-recurring expenses of 0.01% which are being excluded from the Fund’s contractual waiver for the year ended October 31, 2023. |
| (e) | The Fund’s portfolio turnover rate is calculated in accordance with regulatory requirements, without regard to transactions involving short-term investments, certain derivatives and in-kind transactions (if any). If such transactions were included, the Fund’s portfolio turnover rate may be higher. |
See Notes to Financial Statements.
PGIM Global Total Return (USD Hedged) Fund 79
Financial Highlights (continued)
| | | | | | | | | | | | | | | | | | | | |
| | | | | | |
Class R6 Shares | | | | | | | | | | | | | | | | | | | | |
| | | Year Ended October 31, | |
| | | | | | |
| | | 2023 | | | 2022 | | | 2021 | | | 2020 | | | 2019 | |
Per Share Operating Performance(a): | | | | | | | | | | | | | | | | | | | | |
Net Asset Value, Beginning of Year | | | $7.85 | | | | $10.04 | | | | $10.41 | | | | $10.43 | | | | $9.48 | |
Income (loss) from investment operations: | | | | | | | | | | | | | | | | | | | | |
Net investment income (loss) | | | 0.32 | | | | 0.24 | | | | 0.18 | | | | 0.23 | | | | 0.26 | |
Net realized and unrealized gain (loss) on investment and foreign currency transactions | | | 0.15 | | | | (2.06 | ) | | | (0.26 | ) | | | 0.31 | | | | 1.28 | |
Total from investment operations | | | 0.47 | | | | (1.82 | ) | | | (0.08 | ) | | | 0.54 | | | | 1.54 | |
Less Dividends and Distributions: | | | | | | | | | | | | | | | | | | | | |
Dividends from net investment income | | | (0.39 | ) | | | (0.37 | ) | | | (0.29 | ) | | | (0.31 | ) | | | (0.59 | ) |
Tax return of capital distributions | | | (0.03 | ) | | | - | | | | - | | | | (0.14 | ) | | | - | |
Distributions from net realized gains | | | - | | | | - | | | | - | | | | (0.11 | ) | | | - | |
Total dividends and distributions | | | (0.42 | ) | | | (0.37 | ) | | | (0.29 | ) | | | (0.56 | ) | | | (0.59 | ) |
Net asset value, end of year | | | $7.90 | | | | $7.85 | | | | $10.04 | | | | $10.41 | | | | $10.43 | |
Total Return(b): | | | 6.01 | % | | | (18.47 | )% | | | (0.82 | )% | | | 5.42 | % | | | 16.79 | % |
| | | | | | | | | | | | | | | | | | | | |
| | | | | | |
Ratios/Supplemental Data: | | | | | | | | | | | | | | | | | | | | |
Net assets, end of year (000) | | | $85,974 | | | | $68,712 | | | | $62,187 | | | | $30,314 | | | | $28,565 | |
Average net assets (000) | | | $79,863 | | | | $73,367 | | | | $37,302 | | | | $29,230 | | | | $26,482 | |
Ratios to average net assets(c): | | | | | | | | | | | | | | | | | | | | |
Expenses after waivers and/or expense reimbursement | | | 0.59 | %(d) | | | 0.58 | % | | | 0.58 | % | | | 0.58 | % | | | 0.58 | % |
Expenses before waivers and/or expense reimbursement | | | 0.80 | % | | | 0.76 | % | | | 0.89 | % | | | 1.19 | % | | | 1.49 | % |
Net investment income (loss) | | | 3.95 | % | | | 2.69 | % | | | 1.74 | % | | | 2.25 | % | | | 2.66 | % |
Portfolio turnover rate(e) | | | 20 | % | | | 30 | % | | | 20 | % | | | 33 | % | | | 31 | % |
| (a) | Calculated based on average shares outstanding during the year. |
| (b) | Total return is calculated assuming a purchase of a share on the first day and a sale on the last day of each year reported and includes reinvestment of dividends and distributions, if any. Total returns may reflect adjustments to conform to GAAP. |
| (c) | Does not include expenses of the underlying funds in which the Fund invests. |
| (d) | Includes interest expense on borrowings from the Syndicated Credit Agreement and certain non-recurring expenses of 0.01% which are being excluded from the Fund’s contractual waiver for the year ended October 31, 2023. |
| (e) | The Fund’s portfolio turnover rate is calculated in accordance with regulatory requirements, without regard to transactions involving short-term investments, certain derivatives and in-kind transactions (if any). If such transactions were included, the Fund’s portfolio turnover rate may be higher. |
See Notes to Financial Statements.
80
Notes to Financial Statements
Prudential Global Total Return Fund, Inc. (the “Registered Investment Company” or “RIC”) is registered under the Investment Company Act of 1940, as amended (“1940 Act”), as an open-end management investment company. The RIC is organized as a Maryland Corporation. These financial statements relate only to the PGIM Global Total Return (USD Hedged) Fund (the “Fund”), a series of the RIC. The Fund is classified as a diversified fund for purposes of the 1940 Act.
The investment objective of the Fund is to seek total return, through a combination of current income and capital appreciation.
The Fund follows the investment company accounting and reporting guidance of the Financial Accounting Standards Board (“FASB”) Accounting Standard Codification (“ASC”) Topic 946 Financial Services — Investment Companies. The following is a summary of significant accounting policies followed by the Fund in the preparation of its financial statements. The policies conform to U.S. generally accepted accounting principles (“GAAP”). The Fund consistently follows such policies in the preparation of its financial statements.
Securities Valuation: The Fund holds securities and other assets and liabilities that are fair valued as of the close of each day (generally, 4:00 PM Eastern time) the New York Stock Exchange (“NYSE”) is open for trading. As described in further detail below, the Fund’s investments are valued daily based on a number of factors, including the type of investment and whether market quotations are readily available. The RIC’s Board of Directors (the “Board”) has approved the Fund’s valuation policies and procedures for security valuation and designated PGIM Investments LLC (“PGIM Investments” or the “Manager”) as the “Valuation Designee,” as defined by Rule 2a-5(b) under the 1940 Act, to perform the fair value determination relating to all Fund investments. Pursuant to the Board’s oversight, the Valuation Designee has established a Valuation Committee to perform the duties and responsibilities as Valuation Designee under Rule 2a-5. The valuation procedures permit the Fund to utilize independent pricing vendor services, quotations from market makers, and alternative valuation methods when market quotations are either not readily available or not deemed representative of fair value. Fair value is the estimated price that would be received to sell an asset or paid to transfer a liability in an orderly transaction between market participants on the measurement date.
For the fiscal reporting year-end, securities and other assets and liabilities were fair valued at the close of the last U.S. business day. Trading in certain foreign securities may occur when the NYSE is closed (including weekends and holidays). Because such foreign securities
PGIM Global Total Return (USD Hedged) Fund 81
Notes to Financial Statements (continued)
trade in markets that are open on weekends and U.S. holidays, the values of some of the Fund’s foreign investments may change on days when investors cannot purchase or redeem Fund shares.
Various inputs determine how the Fund’s investments are valued, all of which are categorized according to the three broad levels (Level 1, 2, or 3) detailed in the Schedule of Investments and referred to herein as the “fair value hierarchy” in accordance with FASB ASC Topic 820 — Fair Value Measurement.
Common or preferred stocks, exchange-traded funds (ETFs) and derivative instruments, if applicable, that are traded on a national securities exchange are valued at the last sale price as of the close of trading on the applicable exchange where the security principally trades. Securities traded via NASDAQ are valued at the NASDAQ official closing price. To the extent these securities are valued at the last sale price or NASDAQ official closing price, they are classified as Level 1 in the fair value hierarchy. In the event that no sale or official closing price on a valuation date exists, these securities are generally valued at the mean between the last reported bid and ask prices, or at the last bid price in the absence of an ask price. These securities are classified as Level 2 in the fair value hierarchy.
Investments in open-end funds (other than ETFs) are valued at their net asset values as of the close of the NYSE on the date of valuation. These securities are classified as Level 1 in the fair value hierarchy since they may be purchased or sold at their net asset values on the date of valuation.
Fixed income securities traded in the OTC market are generally classified as Level 2 in the fair value hierarchy. Such fixed income securities are typically valued using the market approach which generally involves obtaining data from an approved independent third-party vendor source. The Fund utilizes the market approach as the primary method to value securities when market prices of identical or comparable instruments are available. The third-party vendors’ valuation techniques used to derive the evaluated bid price are based on evaluating observable inputs, including but not limited to, yield curves, yield spreads, credit ratings, deal terms, tranche level attributes, default rates, cash flows, prepayment speeds, broker/dealer quotations and reported trades. Certain Level 3 securities are also valued using the market approach when obtaining a single broker quote or when utilizing transaction prices for identical securities that have been used in excess of five business days. During the reporting period, there were no changes to report with respect to the valuation approach and/or valuation techniques discussed above.
Floating rate and other loans are generally valued at prices provided by approved independent pricing vendors. The pricing vendors utilize broker/dealer quotations and provide prices based on the average of such quotations. Floating rate and other loans valued
82
using such vendor prices are generally classified as Level 2 in the fair value hierarchy. Floating rate and other loans valued based on a single broker quote or at the original transaction price in excess of five business days are classified as Level 3 in the fair value hierarchy.
OTC and centrally cleared derivative instruments are generally classified as Level 2 in the fair value hierarchy. Such derivative instruments are typically valued using the market approach and/or income approach which generally involves obtaining data from an approved independent third-party vendor source. The Fund utilizes the market approach when quoted prices in broker-dealer markets are available but also includes consideration of alternative valuation approaches, including the income approach. In the absence of reliable market quotations, the income approach is typically utilized for purposes of valuing derivatives such as interest rate swaps based on a discounted cash flow analysis whereby the value of the instrument is equal to the present value of its future cash inflows or outflows. Such analysis includes projecting future cash flows and determining the discount rate (including the present value factors that affect the discount rate) used to discount the future cash flows. In addition, the third-party vendors’ valuation techniques used to derive the evaluated derivative price is based on evaluating observable inputs, including but not limited to, underlying asset prices, indices, spreads, interest rates and exchange rates. Certain derivatives may be classified as Level 3 when valued using the market approach by obtaining a single broker quote or when utilizing unobservable inputs in the income approach. During the reporting period, there were no changes to report with respect to the valuation approach and/or valuation techniques discussed above.
Securities and other assets that cannot be priced according to the methods described above are valued based on policies and procedures approved by the Board. In the event that unobservable inputs are used when determining such valuations, the securities will be classified as Level 3 in the fair value hierarchy. Altering one or more unobservable inputs may result in a significant change to a Level 3 security’s fair value measurement.
When determining the fair value of securities, some of the factors influencing the valuation include: the nature of any restrictions on disposition of the securities; assessment of the general liquidity of the securities; the issuer’s financial condition and the markets in which it does business; the cost of the investment; the size of the holding and the capitalization of the issuer; the prices of any recent transactions or bids/offers for such securities or any comparable securities; and any available analyst media or other reports or information deemed reliable by the Valuation Designee regarding the issuer or the markets or industry in which it operates. Using fair value to price securities may result in a value that is different from a security’s most recent closing price and from the price used by other unaffiliated mutual funds to calculate their net asset values.
Foreign Currency Translation: The books and records of the Fund are maintained in U.S. dollars. Foreign currency amounts are translated into U.S. dollars on the following basis:
PGIM Global Total Return (USD Hedged) Fund 83
Notes to Financial Statements (continued)
(i) market value of investment securities, other assets and liabilities — at the exchange rate as of the valuation date;
(ii) purchases and sales of investment securities, income and expenses — at the rates of exchange prevailing on the respective dates of such transactions.
Although the net assets of the Fund are presented at the foreign exchange rates and market values at the close of the period, the Fund does not generally isolate that portion of the results of operations arising as a result of changes in the foreign exchange rates from the fluctuations arising from changes in the market prices of long-term portfolio securities held at the end of the period. Similarly, the Fund does not isolate the effect of changes in foreign exchange rates from the fluctuations arising from changes in the market prices of long-term portfolio securities sold during the period. Accordingly, holding period unrealized and realized foreign currency gains (losses) are included in the reported net change in unrealized appreciation (depreciation) on investments and net realized gains (losses) on investment transactions on the Statements of Operations.
Additionally, net realized gains (losses) on foreign currency transactions represent net foreign exchange gains (losses) from the disposition of holdings of foreign currencies, currency gains (losses) realized between the trade and settlement dates on investment transactions, and the difference between the amounts of interest, dividends and foreign withholding taxes recorded on the Fund’s books and the U.S. dollar equivalent amounts actually received or paid. Net unrealized currency gains (losses) arise from valuing foreign currency denominated assets and liabilities (other than investments) at period end exchange rates.
Forward and Cross Currency Contracts: A forward currency contract is a commitment to purchase or sell a foreign currency at a future date at a negotiated forward rate. The Fund enters into forward currency contracts, as defined in the prospectus, in order to hedge its exposure to changes in foreign currency exchange rates on its foreign portfolio holdings or on specific receivables and payables denominated in a foreign currency and to gain exposure to certain currencies. The contracts are valued daily at current forward exchange rates and any unrealized gain (loss) is included in net unrealized appreciation or depreciation on forward and cross currency contracts. Gain (loss) is realized on the settlement date of the contract equal to the difference between the settlement value of the original and negotiated forward contracts. This gain (loss), if any, is included in net realized gain (loss) on forward and cross currency contract transactions. Risks may arise upon entering into these contracts from the potential inability of the counterparties to meet the terms of their contracts. Forward currency contracts involve risks from currency exchange rate and credit risk in excess of the amounts reflected on the Statement of Assets and Liabilities. The Fund’s maximum risk of loss from counterparty credit risk is the net value of
84
the cash flows to be received from the counterparty at the end of the contract’s life. A cross currency contract is a forward contract where a specified amount of one foreign currency will be exchanged for a specified amount of another foreign currency.
Options: The Fund purchased and/or wrote options in order to hedge against adverse market movements or fluctuations in value caused by changes in prevailing interest rates, value of equities or foreign currency exchange rates with respect to securities or financial instruments which the Fund currently owns or intends to purchase. The Fund may also use options to gain additional market exposure. The Fund’s principal reason for writing options is to realize, through receipt of premiums, a greater current return than would be realized on the underlying security alone. When the Fund purchases an option, it pays a premium and an amount equal to that premium is recorded as an asset. When the Fund writes an option, it receives a premium and an amount equal to that premium is recorded as a liability. The asset or liability is adjusted daily to reflect the current market value of the option. If an option expires unexercised, the Fund realizes a gain (loss) to the extent of the premium received or paid. If an option is exercised, the premium received or paid is recorded as an adjustment to the proceeds from the sale or the cost of the purchase in determining whether the Fund has realized a gain (loss). The difference between the premium and the amount received or paid at the closing of a purchase or sale transaction is also treated as a realized gain (loss). Gain (loss) on purchased options is included in net realized gain (loss) on investment transactions. Gain (loss) on written options is presented separately as net realized gain (loss) on options written transactions.
The Fund, as writer of an option, may have no control over whether the underlying securities or financial instruments may be sold (called) or purchased (put). As a result, the Fund bears the market risk of an unfavorable change in the price of the security or financial instrument underlying the written option. The Fund, as purchaser of an OTC option, bears the risk of the potential inability of the counterparties to meet the terms of their contracts. With exchange-traded options contracts, there is minimal counterparty credit risk to the Fund since the exchanges’ clearinghouse acts as counterparty to all exchange-traded options and guarantees the options contracts against default.
When the Fund writes an option on a swap, an amount equal to any premium received by the Fund is recorded as a liability and is subsequently adjusted to the current market value of the written option on the swap. If a call option on a swap is exercised, the Fund becomes obligated to pay a fixed interest rate (noted as the strike price) and receive a variable interest rate on a notional amount. If a put option on a swap is exercised, the Fund becomes obligated to pay a variable interest rate and receive a fixed interest rate (noted as the strike price) on a notional amount. Premiums received from writing options on swaps that expire or are exercised are treated as realized gains upon the expiration or exercise of such options on swaps. The risk associated with writing put and call options on swaps is that the Fund will be obligated to be party to a swap agreement if an option on a swap is exercised.
Financial Futures Contracts: A financial futures contract is an agreement to purchase (long) or sell (short) an agreed amount of securities at a set price for delivery on a future date.
PGIM Global Total Return (USD Hedged) Fund 85
Notes to Financial Statements (continued)
Upon entering into a financial futures contract, the Fund is required to pledge to the broker an amount of cash and/or other assets equal to a certain percentage of the contract amount. This amount is known as the “initial margin.” Subsequent payments, known as “variation margin,” are made or received by the Fund each day, depending on the daily fluctuations in the value of the underlying security. Such variation margin is recorded for financial statement purposes on a daily basis as unrealized gain (loss). When the contract expires or is closed, the gain (loss) is realized and is presented in the Statement of Operations as net realized gain (loss) on futures transactions.
The Fund invested in financial futures contracts in order to hedge its existing portfolio securities, or securities the Fund intends to purchase, against fluctuations in value caused by changes in prevailing interest rates. Should interest rates move unexpectedly, the Fund may not achieve the anticipated benefits of the financial futures contracts and may realize a loss. The use of futures transactions involves the risk of imperfect correlation in movements in the price of futures contracts, interest rates and the underlying hedged assets. Since futures contracts are exchange-traded, there is minimal counterparty credit risk to the Fund since the exchanges’ clearinghouse acts as counterparty to all exchange-traded futures and guarantees the futures contracts against default.
Swap Agreements: The Fund entered into certain types of swap agreements detailed in the disclosures below. A swap agreement is an agreement to exchange the return generated by one instrument for the return generated by another instrument. Swap agreements are negotiated in the OTC market and may be executed either directly with a counterparty (“OTC-traded”) or through a central clearing facility, such as a registered exchange. Swap agreements are valued daily at current market value and any change in value is included in the net unrealized appreciation or depreciation on swap agreements. Centrally cleared swaps pay or receive an amount known as “variation margin”, based on daily changes in the valuation of the swap contract. For OTC-traded, upfront premiums paid and received are shown as swap premiums paid and swap premiums received in the Statement of Assets and Liabilities. Risk of loss may exceed amounts recognized on the Statement of Assets and Liabilities. Swap agreements outstanding at period end, if any, are listed on the Schedule of Investments.
Interest Rate Swaps: Interest rate swaps represent an agreement between counterparties to exchange cash flows based on the difference between two interest rates, applied to a notional principal amount for a specified period. The Fund is subject to interest rate risk exposure in the normal course of pursuing its investment objective. The Fund used interest rate swaps to maintain its ability to generate steady cash flow by receiving a stream of fixed rate payments or to increase exposure to prevailing market rates by receiving floating rate
86
payments. The Fund’s maximum risk of loss from counterparty credit risk is the discounted net present value of the cash flows to be received from the counterparty over the contract’s remaining life.
Inflation Swaps: The Fund entered into inflation swap agreements to protect against fluctuations in inflation rates. Inflation swaps are characterized by one party paying a fixed rate in exchange for a floating rate that is derived from an inflation index, such as the Consumer Price Index or UK Retail Price Index. Inflation swaps subject the Fund to interest rate risk.
Credit Default Swaps (“CDS”): CDS involve one party (the protection buyer) making a stream of payments to another party (the protection seller) in exchange for the right to receive a specified payment in the event of a default or as a result of a default (collectively a “credit event”) for the referenced entity (typically corporate issues or sovereign issues of an emerging country) on its obligation; or in the event of a write-down, principal shortfall, interest shortfall or default of all or part of the referenced entities comprising a credit index.
The Fund is subject to credit risk in the normal course of pursuing its investment objectives, and as such, has entered into CDS contracts to provide a measure of protection against defaults or to take an active long or short position with respect to the likelihood of a particular issuer’s default or the reference entity’s credit soundness. CDS contracts generally trade based on a spread which represents the cost a protection buyer has to pay the protection seller. The protection buyer is said to be “short the credit” because the higher the contract value rises, the more the credit deteriorates. The value of the CDS contract increases for the protection buyer if the spread increases. The Fund’s maximum risk of loss from counterparty credit risk for purchased CDS is the inability of the counterparty to honor the contract up to the notional value due to a credit event.
As a seller of protection on credit default swap agreements, the Fund generally receives an agreed upon payment from the buyer of protection throughout the term of the swap, provided no credit event occurs. As the seller, the Fund effectively increases its investment risk because, in addition to its total net assets, the Fund may be subject to investment exposure on the notional amount of the swap.
The maximum amount of the payment that the Fund, as a seller of protection, could be required to make under a credit default swap agreement would be equal to the notional amount of the underlying security or index contract as a result of a credit event. This potential amount will be partially offset by any recovery values of the respective referenced obligations or net amounts received from the settlement of buy protection credit default swap agreements which the Fund entered into for the same referenced entity or index. As a buyer of protection, the Fund generally receives an amount up to the notional value of the swap if a credit event occurs.
Implied credit spreads, represented in absolute terms, utilized in determining the market value of credit default swap agreements where the Fund is the seller of protection as of
PGIM Global Total Return (USD Hedged) Fund 87
Notes to Financial Statements (continued)
period end are disclosed in the footnotes to the Schedule of Investments, if applicable. These spreads serve as indicators of the current status of the payment/performance risk and represent the likelihood of default risk for the credit derivative. The implied credit spread of a particular referenced entity reflects the cost of buying/selling protection and may include upfront payments required to enter into the agreement. Wider credit spreads and increased market value in absolute terms, when compared to the notional amount of the swap, represent a deterioration of the referenced entity’s credit soundness and a greater likelihood of risk of default or other credit event occurring as defined under the terms of the agreement.
Currency Swaps: The Fund entered into currency swap agreements primarily to gain yield exposure on foreign bonds. Currency swap agreements involve two parties exchanging two different currencies with an agreement to reverse the exchange at a later date at specified exchange rates.
Total Return Swaps: In a total return swap, one party receives payments based on the market value of the security or the commodity involved, or total return of a specific referenced asset, such as an equity, index or bond, and in return pays a defined amount. The Fund is subject to risk exposures associated with the referenced asset in the normal course of pursuing its investment objectives. The Fund entered into total return swaps to manage its exposure to a security or an index. The Fund’s maximum risk of loss from counterparty credit risk is the change in the value of the security, in the Fund’s favor, from the point of entering into the contract.
Floating Rate and Other Loans: The Fund invested in floating rate and other loans. Floating rate and other loans include loans that are privately negotiated between a corporate borrower and one or more financial institutions, including, but not limited to, term loans, revolvers, and other instruments issued in the floating rate and other loans market. The Fund acquire interests in loans directly (by way of assignment from the selling institution) and/or indirectly (by way of the purchase of a participation interest from the selling institution). Under a floating rate and other loans assignment, the Fund generally will succeed to all the rights and obligations of an assigning lending institution and become a lender under the loan agreement with the relevant borrower in connection with that loan. Under a floating rate and other loans participation, the Fund generally will have a contractual relationship only with the lender, not with the relevant borrower. As a result, the Fund generally will have the right to receive payments of principal, interest, and any fees to which they are entitled only from the lender selling the participation and only upon receipt by the lender of the payments from the relevant borrower. The Fund may not directly benefit from the collateral supporting the debt obligation in which they have purchased the participation. As a result, the Fund will assume the credit risk of both the borrower and the institution selling the participation to the Fund.
88
Mortgage-Backed and Asset-Backed Securities: Mortgage-backed securities are pass-through securities, meaning that principal and interest payments made by the borrower on the underlying mortgages are passed through to the Fund. Asset-backed securities directly or indirectly represent a participation interest in, or are secured by and payable from, a stream of payments generated by particular assets such as motor vehicle or credit card receivables. Asset-backed securities may be classified as pass-through certificates or collateralized obligations, such as collateralized bond obligations, collateralized loan obligations and other similarly structured securities. The value of mortgage-backed and asset-backed securities varies with changes in interest rates and may be affected by changes in credit quality or value of the mortgage loans or other assets that support the securities.
Stripped mortgage-backed securities are usually structured with two classes that receive different proportions of the interest (“IO”) and principal (“PO”) distributions on a pool of mortgage assets. Payments received for IOs are included in interest income on the Statements of Operations. Because no principal will be received at the maturity of an IO, adjustments are made to the cost of the security on a monthly basis until maturity. These adjustments are included in interest income on the Statements of Operations. Payments received for POs are treated as reductions to the cost and par value of the securities.
Master Netting Arrangements: The Fund is subject to various Master Agreements, or netting arrangements, with select counterparties. These are agreements which a subadviser may have negotiated and entered into on behalf of all or a portion of the Fund. A master netting arrangement between the Fund and the counterparty permits the Fund to offset amounts payable by the Fund to the same counterparty against amounts to be received and by the receipt of collateral from the counterparty by the Fund to cover the Fund’s exposure to the counterparty. However, there is no assurance that such mitigating factors are easily enforceable. In addition to master netting arrangements, the right to set-off exists when all the conditions are met such that each of the parties owes the other determinable amounts, the reporting party has the right to set-off the amount owed with the amount owed by the other party, the reporting party intends to set-off and the right of set-off is enforceable by law.
The RIC, on behalf of the Fund, is a party to International Swaps and Derivatives Association, Inc. (“ISDA”) Master Agreements with certain counterparties that govern OTC derivative and foreign exchange contracts entered into from time to time. The Master Agreements may contain provisions regarding, among other things, the parties’ general obligations, representations, agreements, collateral requirements, events of default and early termination. With respect to certain counterparties, in accordance with the terms of the Master Agreements, collateral posted to the Fund is held in a segregated account by the Fund’s custodian and with respect to those amounts which can be sold or re-pledged, is presented in the Schedule of Investments. Collateral pledged by the Fund is segregated by the Fund’s custodian and identified in the Schedule of Investments. Collateral can be in the form of cash or debt securities issued by the U.S. Government or related agencies or other securities as agreed to by the Fund and the applicable counterparty. Collateral requirements
PGIM Global Total Return (USD Hedged) Fund 89
Notes to Financial Statements (continued)
are determined based on the Fund’s net position with each counterparty. Termination events applicable to the Fund may occur upon a decline in the Fund’s net assets below a specified threshold over a certain period of time. Termination events applicable to counterparties may occur upon a decline in the counterparty’s long-term and short-term credit ratings below a specified level. In each case, upon occurrence, the other party may elect to terminate early and cause settlement of all derivative and foreign exchange contracts outstanding, including the payment of any losses and costs resulting from such early termination, as reasonably determined by the terminating party. Any decision by one or more of the Fund’s counterparties to elect early termination could impact the Fund’s future derivative activity.
In addition to each instrument’s primary underlying risk exposure (e.g. interest rate, credit, equity or foreign exchange, etc.), swap agreements involve, to varying degrees, elements of credit, market and documentation risk. Such risks involve the possibility that no liquid market for these agreements will exist, the counterparty to the agreement may default on its obligation to perform or disagree on the contractual terms of the agreement, and changes in net interest rates will be unfavorable. In connection with these agreements, securities in the portfolio may be identified or received as collateral from the counterparty in accordance with the terms of the respective swap agreements to provide or receive assets of value and to serve as recourse in the event of default or bankruptcy/insolvency of either party. Such OTC derivative agreements include conditions which, when materialized, give the counterparty the right to cause an early termination of the transactions under those agreements. Any election by the counterparty for early termination of the contract(s) may impact the amounts reported on financial statements.
Short sales and OTC contracts, including forward foreign currency exchange contracts, swaps, forward rate agreements and written options involve elements of both market and credit risk in excess of the amounts reflected on the Statement of Assets and Liabilities, if applicable. Such risks may be mitigated by engaging in master netting arrangements.
Payment-In-Kind: The Fund invested in the open market or received pursuant to debt restructuring securities that pay-in-kind (PIK) the interest due on such debt instruments. The PIK interest, computed at the contractual rate specified, is added to the existing principal balance of the debt when issued bonds have the same terms as the bond or recorded as a separate bond when terms are different from the existing debt, and is recorded as interest income.
Securities Lending: The Fund lends its portfolio securities to banks and broker-dealers. The loans are secured by collateral at least equal to the market value of the securities loaned. Collateral pledged by each borrower is invested in an affiliated money market fund and is marked to market daily, based on the previous day’s market value, such that the value of the collateral exceeds the value of the loaned securities. In the event of significant appreciation
90
in value of the securities on loan on the last business day of the reporting period, the financial statements may reflect a collateral value that is less than the market value of the loaned securities. Such shortfall is remedied as described above. Loans are subject to termination at the option of the borrower or the Fund. Upon termination of the loan, the borrower will return to the Fund securities identical to the loaned securities. The remaining open loans of the securities lending transactions are considered overnight and continuous. Should the borrower of the securities fail financially, the Fund has the right to repurchase the securities in the open market using the collateral.
The Fund recognizes income, net of any rebate and securities lending agent fees, for lending its securities in the form of fees or interest on the investment of any cash received as collateral. The borrower receives all interest and dividends from the securities loaned and such payments are passed back to the lender in amounts equivalent thereto, which are reflected in interest income or unaffiliated dividend income based on the nature of the payment on the Statement of Operations. The Fund also continues to recognize any unrealized gain (loss) in the market price of the securities loaned and on the change in the value of the collateral invested that may occur during the term of the loan. In addition, realized gain (loss) is recognized on changes in the value of the collateral invested upon liquidation of the collateral. Net earnings from securities lending are disclosed in the Statement of Operations.
Securities Transactions and Net Investment Income: Securities transactions are recorded on the trade date. Realized gains (losses) from investment and currency transactions are calculated on the specific identification method. Dividend income is recorded on the ex-date, or for certain foreign securities, when the Fund becomes aware of such dividends. Expenses are recorded on an accrual basis, which may require the use of certain estimates by management that may differ from actual expense amounts. Net investment income or loss (other than class specific expenses and waivers, which are allocated as noted below) and unrealized and realized gains (losses) are allocated daily to each class of shares based upon the relative proportion of adjusted net assets of each class at the beginning of the day. Class specific expenses and waivers, where applicable, are charged to the respective share classes. Such class specific expenses and waivers include distribution fees and distribution fee waivers, shareholder servicing fees, transfer agent’s fees and expenses, registration fees and fee waivers and/or expense reimbursements, as applicable.
Taxes: It is the Fund’s policy to continue to meet the requirements of the Internal Revenue Code applicable to regulated investment companies and to distribute all of its taxable net investment income and capital gains, if any, to its shareholders. Therefore, no federal income tax provision is required. Withholding taxes on foreign dividends, interest and capital gains, if any, are recorded, net of reclaimable amounts, at the time the related income is earned.
Dividends and Distributions: Dividends and distributions to shareholders, which are determined in accordance with federal income tax regulations and which may differ from GAAP, are recorded on the ex-date. Permanent book/tax differences relating to income and
PGIM Global Total Return (USD Hedged) Fund 91
Notes to Financial Statements (continued)
gain (loss) are reclassified between total distributable earnings (loss) and paid-in capital in excess of par, as appropriate. The chart below sets forth the expected frequency of dividend and capital gains distributions to shareholders. Various factors may impact the frequency of dividend distributions to shareholders, including but not limited to adverse market conditions or portfolio holding-specific events.
| | |
| | |
| Expected Distribution Schedule to Shareholders* | | Frequency |
Net Investment Income | | Monthly |
Short-Term Capital Gains | | Annually |
Long-Term Capital Gains | | Annually |
| * | Under certain circumstances, the Fund may make more than one distribution of short-term and/or long-term capital gains during a fiscal year. |
Estimates: The preparation of financial statements requires management to make estimates and assumptions that affect the reported amounts and disclosures in the financial statements. Actual results could differ from those estimates.
The Fund has a management agreement with the Manager pursuant to which it has responsibility for all investment advisory services, including supervision of the subadviser’s performance of such services, and for rendering administrative services.
The Manager has entered into a subadvisory agreement with PGIM, Inc., which provides subadvisory services to the Fund through its PGIM Fixed Income unit, and PGIM Limited (collectively the “subadviser”). The Manager pays for the services of the subadviser.
Fees payable under the management agreement are computed daily and paid monthly. For the reporting period ended October 31, 2023, the contractual and effective management fee rates were as follows:
| | |
| | |
| Contractual Management Rate | | Effective Management Fee, before any waivers and/or expense reimbursements |
0.50% on average daily net assets up to $2 billion; | | 0.50% |
0.485% of average daily net assets over $2 billion. | | |
The Manager has contractually agreed, through February 28, 2025, to limit total annual operating expenses after fee waivers and/or expense reimbursements. This contractual waiver excludes interest, brokerage, taxes (such as income and foreign withholding taxes, stamp duty and deferred tax expenses), acquired fund fees and expenses, extraordinary expenses, and certain other Fund expenses such as dividend and interest expense and broker charges on short sales.
92
Where applicable, the Manager agrees to waive management fees or shared operating expenses on any share class to the same extent that it waives such expenses on any other share class. In addition, total annual operating expenses for Class R6 shares will not exceed total annual operating expenses for Class Z shares. Fees and/or expenses waived and/or reimbursed by the Manager for the purpose of preventing the expenses from exceeding a certain expense ratio limit may be recouped by the Manager within the same fiscal year during which such waiver and/or reimbursement is made if such recoupment can be realized without exceeding the expense limit in effect at the time of the recoupment for that fiscal year. The expense limitations attributable to each class are as follows:
| | |
| | |
| Class | | Expense Limitations |
A | | 0.88% |
C | | 1.63 |
Z | | 0.63 |
R6 | | 0.58 |
The RIC, on behalf of the Fund, has a distribution agreement with Prudential Investment Management Services LLC (“PIMS”), which acts as the distributor of the Class A, Class C, Class Z and Class R6 shares of the Fund. The Fund compensates PIMS for distributing and servicing the Fund’s Class A and Class C shares, pursuant to the plans of distribution (the “Distribution Plans”), regardless of expenses actually incurred by PIMS.
Pursuant to the Distribution Plans, the Fund compensates PIMS for distribution related activities at an annual rate based on average daily net assets per class. The distribution fees are accrued daily and payable monthly.
The Fund’s annual gross and net distribution rates, where applicable, are as follows:
| | | | | | | | |
| | | |
| Class | | Gross Distribution Fee | | Net Distribution Fee |
A | | | 0.25 | % | | | 0.25 | % |
C | | | 1.00 | | | | 1.00 | |
Z | | | N/A | | | | N/A | |
R6 | | | N/A | | | | N/A | |
For the year ended October 31, 2023, PIMS has not received any front-end sales charges (“FESL”) resulting from sales of certain class shares. Additionally, for the year ended October 31, 2023, PIMS did not receive any contingent deferred sales charges (“CDSC”) imposed upon redemptions by certain Class A and Class C shareholders, respectively.
PGIM Investments, PGIM, Inc., PGIM Limited and PIMS are indirect, wholly-owned subsidiaries of Prudential Financial, Inc. (“Prudential”).
| 4. | Other Transactions with Affiliates |
Prudential Mutual Fund Services LLC (“PMFS”), an affiliate of PGIM Investments and an indirect, wholly-owned subsidiary of Prudential, serves as the Funds’ transfer agent and
PGIM Global Total Return (USD Hedged) Fund 93
Notes to Financial Statements (continued)
shareholder servicing agent. Transfer agent’s fees and expenses in the Statement of Operations include certain out-of-pocket expenses paid to non-affiliates, where applicable.
The Fund may invest its overnight sweep cash in the PGIM Core Government Money Market Fund (the “Core Government Fund”), a series of the Prudential Government Money Market Fund, Inc., and its securities lending cash collateral in the PGIM Institutional Money Market Fund (the “Money Market Fund”), a series of Prudential Investment Portfolios 2, each registered under the 1940 Act and managed by PGIM Investments. PGIM Investments and/or its affiliates are paid fees or reimbursed for providing their services to the Core Government Fund and the Money Market Fund. In addition to the realized and unrealized gains on investments in the Core Government Fund and the Money Market Fund, earnings from such investments are disclosed on the Statement of Operations as “Affiliated dividend income” and “Affiliated income from securities lending, net”, respectively.
The Fund may enter into certain securities purchase or sale transactions under Board approved Rule 17a-7 procedures. Rule 17a-7 is an exemptive rule under the 1940 Act that, subject to certain conditions, permits purchase and sale transactions among affiliated investment companies, or between an investment company and a person that is affiliated solely by reason of having a common (or affiliated) investment adviser, common directors/trustees, and/or common officers. For the year ended October 31, 2023, no Rule 17a-7 transactions were entered into by the Fund.
The aggregate cost of purchases and proceeds from sales of portfolio securities (excluding short-term investments and U.S. Government securities) for the reporting period ended October 31, 2023, were as follows:
| | |
| | |
| Cost of Purchases | | Proceeds from Sales |
$24,322,376 | | $12,415,397 |
A summary of the cost of purchases and proceeds from sales of shares of an affiliated mutual fund for the year ended October 31, 2023, is presented as follows:
| | | | | | | | | | | | | | | | | | |
| | | | | | | | |
Value, Beginning of Year | | Cost of Purchases | | Proceeds from Sales | | Change in Unrealized Gain (Loss) | | Realized Gain (Loss) | | Value, End of Year | | Shares, End of Year | | | Income | |
|
| Short-Term Investments - Affiliated Mutual Funds: | |
| | |
| PGIM Core Government Money Market Fund(1)(wb) | | | | | | | | |
| $ — | | $29,660,757 | | $28,113,302 | | $— | | $ — | | $1,547,455 | | | 1,547,455 | | | | $67,876 | |
94
| | | | | | | | | | | | | | | | | | |
| | | | | | | | |
Value, Beginning of Year | | Cost of Purchases | | Proceeds from Sales | | Change in Unrealized Gain (Loss) | | Realized Gain (Loss) | | Value, End of Year | | Shares, End of Year | | | Income | |
| | |
| PGIM Institutional Money Market Fund(1)(b)(wb) | | | | | | | | |
$878,894 | | $ 5,801,782 | | $ 6,418,483 | | $26 | | $467 | | $ 262,686 | | | 262,818 | | | | $ 1,408 | (2) |
$878,894 | | $ 35,462,539 | | $ 34,531,785 | | $26 | | $467 | | $1,810,141 | | | | | | | $69,284 | |
| (1) | The Fund did not have any capital gain distributions during the reporting period. |
| (2) | The amount, or a portion thereof, represents the affiliated securities lending income shown on the Statement of Operations. |
| (b) | Represents security, or portion thereof, purchased with cash collateral received for securities on loan and includes dividend reinvestment. |
| (wb) | Represents an investment in a Fund affiliated with the Manager. |
| 6. | Distributions and Tax Information |
Distributions to shareholders, which are determined in accordance with federal income tax regulations and which may differ from GAAP, are recorded on the ex-date.
For the year ended October 31, 2023, the tax character of dividends paid as reflected in the Statement of Changes in Net Assets were as follows:
| | | | | | |
| | | | |
Ordinary
Income | | Long-Term Capital Gains | | Tax Return of Capital | | Total Dividends and Distributions |
$4,126,828 | | $— | | $350,113 | | $4,476,941 |
For the year ended October 31, 2022, the tax character of dividends paid as reflected in the Statement of Changes in Net Assets were as follows:
| | | | | | |
| | | | |
Ordinary
Income | | Long-Term Capital Gains | | Tax Return of Capital | | Total Dividends and Distributions |
$3,356,340 | | $— | | $— | | $3,356,340 |
As of October 31, 2023, there were no accumulated undistributed earnings on a tax basis.
The United States federal income tax basis of the Fund’s investments and the net unrealized depreciation as of October 31, 2023 were as follows:
| | | | | | |
| | | | |
| Tax Basis | | Gross Unrealized Appreciation | | Gross Unrealized Depreciation | | Net Unrealized Depreciation |
$112,909,753 | | $1,008,031 | | $(18,797,412) | | $(17,789,381) |
The differences between GAAP and tax basis were primarily attributable to bond premium amortization, mark-to-market of options, futures and forward contracts, straddles, interest accrual on defaulted securities, and other GAAP to tax differences.
For federal income tax purposes, the Fund had an approximated capital loss carryforward as of October 31, 2023 which can be carried forward for an unlimited period. No capital gains
PGIM Global Total Return (USD Hedged) Fund 95
Notes to Financial Statements (continued)
distributions are expected to be paid to shareholders until net gains have been realized in excess of such losses.
| | |
| | |
Capital Loss
Carryforward | | Capital Loss Carryforward Utilized |
$1,794,000 | | $— |
The Manager has analyzed the Fund’s tax positions taken on federal, state and local income tax returns for all open tax years and has concluded that no provision for income tax is required in the Fund’s financial statements for the current reporting period. Since tax authorities can examine previously filed tax returns, the Fund’s U.S. federal and state tax returns for each of the four fiscal years up to the most recent fiscal year ended October 31, 2023 are subject to such review.
The Fund offers Class A, Class C, Class Z and Class R6 shares. Class A shares are sold with a maximum front-end sales charge of 3.25%. Investors who purchase $500,000 or more of Class A shares and sell those shares within 12 months of purchase are subject to a CDSC of 1% on sales although these purchases are not subject to a front-end sales charge. The Class A CDSC is waived for certain retirement and/or benefit plans. A special exchange privilege is also available for shareholders who qualified to purchase Class A shares at net asset value. Class C shares are sold with a CDSC of 1% on sales made within 12 months of purchase. Class C shares will automatically convert to Class A shares on a monthly basis approximately eight years (ten years prior to January 22, 2021) after purchase. Class Z and Class R6 shares are not subject to any sales or redemption charges and are available exclusively for sale to a limited group of investors.
Under certain circumstances, an exchange may be made from specified share classes of the Fund to one or more other share classes of the Fund as presented in the table of transactions in shares of common stock, below.
The RIC is authorized to issue 18,075,000,000 shares of common stock, $0.01 par value per share, 1,500,000,000 of which are designated as shares of the Fund. The authorized shares of the Fund are currently classified and designated as follows:
| | |
| | |
| Class | | Number of Shares |
A | | 200,000,000 |
C | | 300,000,000 |
Z | | 600,000,000 |
R6 | | 400,000,000 |
96
As of October 31, 2023, Prudential, through its affiliated entities, including affiliated funds (if applicable), owned shares of the Fund as follows:
| | | | | | |
| | | |
| Class | | Number of Shares | | Percentage of Outstanding Shares |
C | | 1,227 | | | 16.6 | % |
R6 | | 2,418,570 | | | 22.2 | |
At the reporting period end, the number of shareholders holding greater than 5% of the Fund are as follows:
| | | | | | |
| | | |
| | | Number of Shareholders | | Percentage of Outstanding Shares |
Affiliated | | 1 | | | 19.6 | % |
Unaffiliated | | 2 | | | 71.8 | |
Transactions in shares of common stock were as follows:
| | | | | | | | | | | | |
| | | | |
| Share Class | | Shares | | | | | | Amount | |
| | | |
Class A | | | | | | | | | | | | |
Year ended October 31, 2023: | | | | | | | | | | | | |
Shares sold | | | 9,440 | | | | | | | $ | 76,719 | |
Shares issued in reinvestment of dividends and distributions | | | 2,751 | | | | | | | | 22,230 | |
Shares purchased | | | (12,058 | ) | | | | | | | (97,613 | ) |
Net increase (decrease) in shares outstanding | | | 133 | | | | | | | $ | 1,336 | |
| | | |
Year ended October 31, 2022: | | | | | | | | | | | | |
Shares sold | | | 20,179 | | | | | | | $ | 197,882 | |
Shares issued in reinvestment of dividends and distributions | | | 2,442 | | | | | | | | 21,782 | |
Shares purchased | | | (47,130 | ) | | | | | | | (455,935 | ) |
Net increase (decrease) in shares outstanding before conversion | | | (24,509 | ) | | | | | | | (236,271 | ) |
Shares purchased upon conversion into other share class(es) | | | (137 | ) | | | | | | | (1,130 | ) |
Net increase (decrease) in shares outstanding | | | (24,646 | ) | | | | | | $ | (237,401 | ) |
| | | |
Class C | | | | | | | | | | | | |
Year ended October 31, 2023: | | | | | | | | | | | | |
Shares sold | | | 965 | | | | | | | $ | 7,774 | |
Shares issued in reinvestment of dividends and distributions | | | 305 | | | | | | | | 2,466 | |
Shares purchased | | | (8,972 | ) | | | | | | | (70,532 | ) |
Net increase (decrease) in shares outstanding | | | (7,702 | ) | | | | | | $ | (60,292 | ) |
| | | |
Year ended October 31, 2022: | | | | | | | | | | | | |
Shares sold | | | 13,681 | | | | | | | $ | 133,973 | |
Shares issued in reinvestment of dividends and distributions | | | 588 | | | | | | | | 5,264 | |
Shares purchased | | | (13,062 | ) | | | | | | | (115,662 | ) |
Net increase (decrease) in shares outstanding | | | 1,207 | | | | | | | $ | 23,575 | |
PGIM Global Total Return (USD Hedged) Fund 97
Notes to Financial Statements (continued)
| | | | | | | | | | | | |
| | | | |
| Share Class | | Shares | | | | | | Amount | |
| | | |
Class Z | | | | | | | | | | | | |
Year ended October 31, 2023: | | | | | | | | | | | | |
Shares sold | | | 774,874 | | | | | | | $ | 6,289,087 | |
Shares issued in reinvestment of dividends and distributions | | | 39,795 | | | | | | | | 320,757 | |
Shares purchased | | | (153,572 | ) | | | | | | | (1,240,474 | ) |
Net increase (decrease) in shares outstanding before conversion | | | 661,097 | | | | | | | | 5,369,370 | |
Shares issued upon conversion from other share class(es) | | | 27 | | | | | | | | 218 | |
Net increase (decrease) in shares outstanding | | | 661,124 | | | | | | | $ | 5,369,588 | |
| | | |
Year ended October 31, 2022: | | | | | | | | | | | | |
Shares sold | | | 366,207 | | | | | | | $ | 3,138,737 | |
Shares issued in reinvestment of dividends and distributions | | | 32,847 | | | | | | | | 293,266 | |
Shares purchased | | | (800,314 | ) | | | | | | | (7,312,632 | ) |
Net increase (decrease) in shares outstanding before conversion | | | (401,260 | ) | | | | | | | (3,880,629 | ) |
Shares issued upon conversion from other share class(es) | | | 241 | | | | | | | | 2,062 | |
Net increase (decrease) in shares outstanding | | | (401,019 | ) | | | | | | $ | (3,878,567 | ) |
| | | |
Class R6 | | | | | | | | | | | | |
Year ended October 31, 2023: | | | | | | | | | | | | |
Shares sold | | | 4,494,847 | | | | | | | $ | 36,409,009 | |
Shares issued in reinvestment of dividends and distributions | | | 510,799 | | | | | | | | 4,130,562 | |
Shares purchased | | | (2,872,277 | ) | | | | | | | (23,197,352 | ) |
Net increase (decrease) in shares outstanding before conversion | | | 2,133,369 | | | | | | | | 17,342,219 | |
Shares purchased upon conversion into other share class(es) | | | (27 | ) | | | | | | | (218 | ) |
Net increase (decrease) in shares outstanding | | | 2,133,342 | | | | | | | $ | 17,342,001 | |
| | | |
Year ended October 31, 2022: | | | | | | | | | | | | |
Shares sold | | | 5,392,636 | | | | | | | $ | 48,420,927 | |
Shares issued in reinvestment of dividends and distributions | | | 344,850 | | | | | | | | 3,028,779 | |
Shares purchased | | | (3,184,359 | ) | | | | | | | (26,909,077 | ) |
Net increase (decrease) in shares outstanding before conversion | | | 2,553,127 | | | | | | | | 24,540,629 | |
Shares purchased upon conversion into other share class(es) | | | (103 | ) | | | | | | | (932 | ) |
Net increase (decrease) in shares outstanding | | | 2,553,024 | | | | | | | $ | 24,539,697 | |
The RIC, on behalf of the Fund, along with other affiliated registered investment companies (the “Participating Funds”), is a party to a Syndicated Credit Agreement (“SCA”) with a group of banks. The purpose of the SCA is to provide an alternative source of temporary
98
funding for capital share redemptions. The table below provides details of the current SCA in effect at the reporting period-end as well as the prior SCA.
| | | | | | | | |
| | | | | |
| | | Current SCA | | | | Prior SCA | | |
Term of Commitment | | 9/29/2023 - 9/26/2024 | | | | 9/30/2022 – 9/28/2023 | | |
Total Commitment | | $ 1,200,000,000 | | | | $ 1,200,000,000 | | |
Annualized Commitment Fee on the Unused Portion of the SCA | | 0.15% | | | | 0.15% | | |
Annualized Interest Rate on Borrowings | | 1.00% plus the higher of (1) the effective federal funds rate, (2) the daily SOFR rate plus 0.10% or (3) zero percent | | | | 1.00% plus the higher of (1) the effective federal funds rate, (2) the daily SOFR rate plus 0.10% or (3) zero percent | | |
Certain affiliated registered investment companies that are parties to the SCA include portfolios that are subject to a predetermined mathematical formula used to manage certain benefit guarantees offered under variable annuity contracts. The formula may result in large scale asset flows into and out of these portfolios. Consequently, these portfolios may be more likely to utilize the SCA for purposes of funding redemptions. It may be possible for those portfolios to fully exhaust the committed amount of the SCA, thereby requiring the Manager to allocate available funding per a Board-approved methodology designed to treat the Participating Funds in the SCA equitably.
The Fund utilized the SCA during the year ended October 31, 2023. The average daily balance for the 8 days that the Fund had loans outstanding during the period was approximately $1,486,875, borrowed at a weighted average interest rate of 5.70%. The maximum loan outstanding amount during the period was $2,535,000. At October 31, 2023, the Fund did not have an outstanding loan amount.
| 9. | Risks of Investing in the Fund |
The Fund’s risks include, but are not limited to, some or all of the risks discussed below. For further information on the Fund’s risks, please refer to the Fund’s Prospectus and Statement of Additional Information.
Credit Risk: This is the risk that the issuer, the guarantor or the insurer of a fixed income security, or the counterparty to a contract, may be unable or unwilling to make timely principal and interest payments, or to otherwise honor its obligations. Additionally, fixed income securities could lose value due to a loss of confidence in the ability of the issuer, guarantor, insurer or counterparty to pay back debt. The lower the credit quality of a bond, the more sensitive it is to credit risk.
Currency Risk: The Fund’s net asset value could decline as a result of changes in exchange rates, which could adversely affect the Fund’s investments in currencies, or in securities that trade in, and receive revenues related to, currencies, or in derivatives that provide exposure to currencies. Certain foreign countries may impose restrictions on the ability of issuers of
PGIM Global Total Return (USD Hedged) Fund 99
Notes to Financial Statements (continued)
foreign securities to make payment of principal and interest or dividends to investors located outside the country, due to blockage of foreign currency exchanges or otherwise.
Debt Obligations Risk: Debt obligations are subject to credit risk, market risk and interest rate risk. The Fund’s holdings, share price, yield and total return may also fluctuate in response to bond market movements. The value of bonds may decline for issuer-related reasons, including management performance, financial leverage and reduced demand for the issuer’s goods and services. Certain types of fixed income obligations also may be subject to “call and redemption risk,” which is the risk that the issuer may call a bond held by the Fund for redemption before it matures and the Fund may not be able to reinvest at the same rate of interest and therefore would earn less income.
Derivatives Risk: Derivatives involve special risks and costs and may result in losses to the Fund. The successful use of derivatives requires sophisticated management, and, to the extent that derivatives are used, the Fund will depend on the subadviser’s ability to analyze and manage derivatives transactions. The prices of derivatives may move in unexpected ways, especially in abnormal market conditions. Some derivatives are “leveraged” or may create economic leverage for the Fund and therefore may magnify or otherwise increase investment losses to the Fund. The Fund’s use of derivatives may also increase the amount of taxes payable by shareholders.
Other risks arise from the potential inability to terminate or sell derivatives positions. A liquid secondary market may not always exist for the Fund’s derivatives positions. In fact, many over-the-counter derivative instruments will not have liquidity beyond the counterparty to the instrument. Over-the-counter derivative instruments also involve the risk that the other party will not meet its obligations to the Fund. The use of derivatives also exposes the Fund to operational issues, such as documentation and settlement issues, systems failures, inadequate control and human error.
Derivatives may also involve legal risks, such as insufficient documentation, the lack of capacity or authority of a counterparty to execute or settle a transaction, and the legality and enforceability of derivatives contracts. The U.S. Government and foreign governments have adopted (and may adopt further) regulations governing derivatives markets, including mandatory clearing of certain derivatives, margin and reporting requirements and risk exposure limitations. Regulation of derivatives may make derivatives more costly, limit their availability or utility to the Fund, or otherwise adversely affect their performance or disrupt markets.
Economic and Market Events Risk: Events in the U.S. and global financial markets, including actions taken by the U.S. Federal Reserve or foreign central banks to stimulate or stabilize economic growth or the functioning of the securities markets, or otherwise reduce
100
inflation, may at times result in unusually high market volatility, which could negatively impact performance. Governmental efforts to curb inflation often have negative effects on the level of economic activity. Relatively reduced liquidity in credit and fixed income markets could adversely affect issuers worldwide.
Emerging Markets Risk: The risks of foreign investments are greater for investments in or exposed to emerging markets. Emerging market countries typically have economic and political systems that are less fully developed, and can be expected to be less stable, than those of more developed countries. For example, the economies of such countries can be subject to rapid and unpredictable rates of inflation or deflation. Low trading volumes may result in a lack of liquidity and price volatility. Emerging market countries may have policies that restrict investment by non-U.S. investors, or that prevent non-U.S. investors from withdrawing their money at will.
The Fund may invest in some emerging markets that subject it to risks such as those associated with illiquidity, custody of assets, different settlement and clearance procedures and asserting legal title under a developing legal and regulatory regime to a greater degree than in developed markets or even in other emerging markets.
Foreign Securities Risk: Investments in securities of non-U.S. issuers (including those denominated in U.S. dollars) may involve more risk than investing in securities of U.S. issuers. Foreign political, economic and legal systems, especially those in developing and emerging market countries, may be less stable and more volatile than in the United States. Foreign legal systems generally have fewer regulatory requirements than the U.S. legal system, particularly those of emerging markets. In general, less information is publicly available with respect to non-U.S. companies than U.S. companies. Non-U.S. companies generally are not subject to the same accounting, auditing, and financial reporting standards as are U.S. companies. Additionally, the changing value of foreign currencies and changes in exchange rates could also affect the value of the assets the Fund holds and the Fund’s performance. Certain foreign countries may impose restrictions on the ability of issuers of foreign securities to make payment of principal and interest or dividends to investors located outside the country, due to blockage of foreign currency exchanges or otherwise. Investments in emerging markets are subject to greater volatility and price declines.
In addition, the Fund’s investments in non-U.S. securities may be subject to the risks of nationalization or expropriation of assets, imposition of currency exchange controls or restrictions on the repatriation of non-U.S. currency, confiscatory taxation and adverse diplomatic developments. Special U.S. tax considerations may apply.
Increase in Expenses Risk: Your actual cost of investing in the Fund may be higher than the expenses shown in the expense table in the Fund’s prospectus for a variety of reasons. For example, expense ratios may be higher than those shown if average net assets decrease. Net assets are more likely to decrease and Fund expense ratios are more likely to increase when markets are volatile. Active and frequent trading of Fund securities can increase expenses.
PGIM Global Total Return (USD Hedged) Fund 101
Notes to Financial Statements (continued)
Interest Rate Risk: The value of your investment may go down when interest rates rise. A rise in rates tends to have a greater impact on the prices of longer term or duration debt securities. Similarly, a rise in interest rates may also have a greater negative impact on the value of equity securities whose issuers expect earnings further out in the future. For example, a fixed income security with a duration of three years is expected to decrease in value by approximately 3% if interest rates increase by 1%. This is referred to as “duration risk.” When interest rates fall, the issuers of debt obligations may prepay principal more quickly than expected, and the Fund may be required to reinvest the proceeds at a lower interest rate. This is referred to as “prepayment risk.” When interest rates rise, debt obligations may be repaid more slowly than expected, and the value of the Fund’s holdings may fall sharply. This is referred to as “extension risk.” The Fund may lose money if short-term or long-term interest rates rise sharply or in a manner not anticipated by the subadviser.
Junk Bonds Risk: High-yield, high-risk bonds have predominantly speculative characteristics, including particularly high credit risk. Junk bonds tend to have lower market liquidity than higher-rated securities. The liquidity of particular issuers or industries within a particular investment category may shrink or disappear suddenly and without warning. The non-investment grade bond market can experience sudden and sharp price swings and become illiquid due to a variety of factors, including changes in economic forecasts, stock market activity, large sustained sales by major investors, a high profile default or a change in the market’s psychology.
Large Shareholder and Large Scale Redemption Risk: Certain individuals, accounts, funds (including funds affiliated with the Manager) or institutions, including the Manager and its affiliates, may from time to time own or control a substantial amount of the Fund’s shares. There is no requirement that these entities maintain their investment in the Fund. There is a risk that such large shareholders or that the Fund’s shareholders generally may redeem all or a substantial portion of their investments in the Fund in a short period of time, which could have a significant negative impact on the Fund’s NAV, liquidity, and brokerage costs. Large redemptions could also result in tax consequences to shareholders and impact the Fund’s ability to implement its investment strategy. The Fund’s ability to pursue its investment objective after one or more large scale redemptions may be impaired and, as a result, the Fund may invest a larger portion of its assets in cash or cash equivalents.
Liquidity Risk: Liquidity risk is the risk that the Fund could not meet requests to redeem shares issued by the Fund without significant dilution of remaining investors’ interests in the Fund. The Fund may invest in instruments that trade in lower volumes and are more illiquid than other investments. If the Fund is forced to sell these investments to pay redemption proceeds or for other reasons, the Fund may lose money. In addition, when there is no willing buyer and investments cannot be readily sold at the desired time or price, the Fund
102
may have to accept a lower price or may not be able to sell the instrument at all. An inability to sell a portfolio position can adversely affect the Fund’s value or prevent the Fund from being able to take advantage of other investment opportunities.
Management Risk: Actively managed funds are subject to management risk. The subadviser will apply investment techniques and risk analyses in making investment decisions for the Fund, but the subadviser’s judgments about the attractiveness, value or market trends affecting a particular security, industry or sector or about market movements may be incorrect. Additionally, the investments selected for the Fund may underperform the markets in general, the Fund’s benchmark and other funds with similar investment objectives.
Market Disruption and Geopolitical Risks: Market disruption can be caused by economic, financial or political events and factors, including but not limited to, international wars or conflicts (including Russia’s military invasion of Ukraine), geopolitical developments (including trading and tariff arrangements, sanctions and cybersecurity attacks), instability in regions such as Asia, Eastern Europe and the Middle East, terrorism, natural disasters and public health epidemics (including the outbreak of COVID-19 globally).
The extent and duration of such events and resulting market disruptions cannot be predicted, but could be substantial and could magnify the impact of other risks to the Fund. These and other similar events could adversely affect the U.S. and foreign financial markets and lead to increased market volatility, reduced liquidity in the securities markets, significant negative impacts on issuers and the markets for certain securities and commodities and/or government intervention. They may also cause short- or long-term economic uncertainties in the United States and worldwide. As a result, whether or not the Fund invests in securities of issuers located in or with significant exposure to the countries directly affected, the value and liquidity of the Fund’s investments may be negatively impacted. Further, due to closures of certain markets and restrictions on trading certain securities, the value of certain securities held by the Fund could be significantly impacted, which could lead to such securities being valued at zero.
Market Risk: Securities markets may be volatile and the market prices of the Fund’s securities may decline. Securities fluctuate in price based on changes in an issuer’s financial condition and overall market and economic conditions. If the market prices of the securities owned by the Fund fall, the value of your investment in the Fund will decline.
Mortgage-Backed and Asset-Backed Securities Risk: Mortgage-backed and asset-backed securities tend to increase in value less than other debt securities when interest rates decline, but are subject to similar risk of decline in market value during periods of rising interest rates. The values of mortgage-backed and asset-backed securities become more volatile as interest rates rise. In a period of declining interest rates, the Fund may be required to reinvest more frequent prepayments on mortgage-backed and asset-backed securities in lower-yielding investments.
PGIM Global Total Return (USD Hedged) Fund 103
Notes to Financial Statements (continued)
U.S. Government and Agency Securities Risk: U.S. Treasury obligations are backed by the “full faith and credit” of the U.S. Government. Securities issued or guaranteed by federal agencies or authorities and U.S. Government-sponsored instrumentalities or enterprises may or may not be backed by the full faith and credit of the U.S. Government. For example, securities issued by the Federal Home Loan Mortgage Corporation, the Federal National Mortgage Association and the Federal Home Loan Banks are neither insured nor guaranteed by the U.S. Government. These securities may be supported by the ability to borrow from the U.S. Treasury or only by the credit of the issuing agency, authority, instrumentality or enterprise and, as a result, are subject to greater credit risk than securities issued or guaranteed by the U.S. Treasury. Further, the U.S. Government and its agencies, authorities, instrumentalities and enterprises do not guarantee the market value of their securities; consequently, the value of such securities will fluctuate. This may be the case especially when there is any controversy or ongoing uncertainty regarding the status of negotiations in the U.S. Congress to increase the statutory debt ceiling. Such controversy or uncertainty could, among other things, result in the credit quality rating of the U.S. Government being downgraded and reduced prices of U.S. Treasury securities. If the U.S. Congress is unable to negotiate an adjustment to the statutory debt ceiling, there is also the risk that the U.S. Government may default on payments on certain U.S. Government securities, including those held by the Fund, which could have a negative impact on the Fund. An increase in demand for U.S. Government securities resulting from an increase in demand for government money market funds may lead to lower yields on such securities.
| 10. | Recent Regulatory Developments |
Effective January 24, 2023, the SEC adopted rule and form amendments to require mutual funds and ETFs to transmit concise and visually engaging streamlined annual and semiannual reports to shareholders that highlight key information deemed important for retail investors to assess and monitor their fund investments (the “Rule”). Other information, including financial statements, will no longer appear in the funds’ streamlined shareholder reports but must be available online, delivered free of charge upon request, and filed on a semiannual basis on Form N-CSR. The Rule and form amendments have a compliance date of July 24, 2024. At this time, management is evaluating the Rule and its impact to the Fund.
104
Report of Independent Registered Public Accounting Firm
To the Board of Directors of Prudential Global Total Return Fund, Inc. and Shareholders of PGIM Global Total Return (USD Hedged) Fund
Opinion on the Financial Statements
We have audited the accompanying statement of assets and liabilities, including the schedule of investments, of PGIM Global Total Return (USD Hedged) Fund (one of the funds constituting Prudential Global Total Return Fund, Inc., referred to hereafter as the “Fund”) as of October 31, 2023, the related statement of operations for the year ended October 31, 2023, the statements of changes in net assets for each of the two years in the period ended October 31, 2023, including the related notes, and the financial highlights for each of the four years in the period ended October 31, 2023 (collectively referred to as the “financial statements”). In our opinion, the financial statements present fairly, in all material respects, the financial position of the Fund as of October 31, 2023, the results of its operations for the year then ended, the changes in its net assets for each of the two years in the period ended October 31, 2023 and the financial highlights for each of the four years in the period ended October 31, 2023 in conformity with accounting principles generally accepted in the United States of America.
The financial statements of the Fund as of and for the year ended October 31, 2019 and the financial highlights for the period ended October 31, 2019 (not presented herein, other than the financial highlights) were audited by other auditors whose report dated December 19, 2019 expressed an unqualified opinion on those financial statements and financial highlights.
Basis for Opinion
These financial statements are the responsibility of the Fund’s management. Our responsibility is to express an opinion on the Fund’s financial statements based on our audits. We are a public accounting firm registered with the Public Company Accounting Oversight Board (United States) (PCAOB) and are required to be independent with respect to the Fund in accordance with the U.S. federal securities laws and the applicable rules and regulations of the Securities and Exchange Commission and the PCAOB.
We conducted our audits of these financial statements in accordance with the standards of the PCAOB. Those standards require that we plan and perform the audit to obtain reasonable assurance about whether the financial statements are free of material misstatement, whether due to error or fraud.
Our audits included performing procedures to assess the risks of material misstatement of the financial statements, whether due to error or fraud, and performing procedures that respond to those risks. Such procedures included examining, on a test basis, evidence regarding the amounts and disclosures in the financial statements. Our audits also included evaluating the accounting principles used and significant estimates made by management, as well as evaluating the overall presentation of the financial statements. Our procedures included confirmation of securities owned as of October 31, 2023 by correspondence with the custodian, transfer agent, brokers and agent banks. We believe that our audits provide a reasonable basis for our opinion.
/s/PricewaterhouseCoopers LLP
New York, New York
December 19, 2023
We have served as the auditor of one or more investment companies in the PGIM Retail Funds complex since 2020.
PGIM Global Total Return (USD Hedged) Fund 105
Tax Information (unaudited)
For the year ended October 31, 2023, the Fund reports the maximum amount allowable but not less than 28.57% as interest related dividends in accordance with Sections 871(k)(1) and 881(e)(1) of the Internal Revenue Code.
For the tax year ended October 31, 2023, the Fund reports the maximum amount allowable but not less than 85.71% of interest dividends that are eligible to be treated as interest income in accordance with Section 163(j) of the Internal Revenue Code.
In January 2024, you will be advised on IRS Form 1099-DIV or substitute 1099-DIV as to the federal tax status of distributions received by you in calendar year 2023.
We are required by Massachusetts, Missouri and Oregon to inform you that dividends which have been derived from Interest on federal obligations are not taxable to shareholders providing the Mutual Fund meets certain requirements mandated by the respective state’s taxing authorities. We are pleased to report that 3.56% of the dividends paid by the Fund qualifies for such deduction.
Please consult your tax adviser or state/local authorities to properly report this information on your tax return. If you have any questions concerning the amounts listed above, please call your financial adviser.
106
INFORMATION ABOUT BOARD MEMBERS AND OFFICERS (unaudited)
Information about Board Members and Officers of the Fund is set forth below. Board Members who are not deemed to be “interested persons” of the Fund, as defined in the 1940 Act, are referred to as “Independent Board Members.” Board Members who are deemed to be “interested persons” of the Fund are referred to as “Interested Board Members.” The Board Members are responsible for the overall supervision of the operations of the Fund and perform the various duties imposed on the directors of investment companies by the 1940 Act. The Board in turn elects the Officers, who are responsible for administering the day-to-day operations of the Fund.
| | | | | | |
| | | |
| Independent Board Members | | | | |
| | | | |
Name Year of Birth Position(s) Portfolios Overseen | | Principal Occupation(s) During Past Five Years | | Other Directorships Held During Past Five Years | | Length of Board Service |
| | | | |
Ellen S. Alberding 1958 Board Member Portfolios Overseen: 100 | | Chief Executive Officer and President, The Joyce Foundation (charitable foundation) (since 2002); formerly Vice Chair, City Colleges of Chicago (community college system) (2011-2015); formerly Trustee, National Park Foundation (charitable foundation for national park system) (2009-2018); formerly Trustee, Economic Club of Chicago (2009-2016); Trustee, Loyola University (since 2018). | | None. | | Since September 2013 |
| | | | |
Kevin J. Bannon 1952 Board Member Portfolios Overseen: 101 | | Retired; formerly Managing Director (April 2008-May 2015) and Chief Investment Officer (October 2008-November 2013) of Highmount Capital LLC (registered investment adviser); formerly Executive Vice President and Chief Investment Officer (April 1993-August 2007) of Bank of New York Company; formerly President (May 2003-May 2007) of BNY Hamilton Family of Mutual Funds. | | Director of Urstadt Biddle Properties (equity real estate investment trust) (September 2008-August 2023). | | Since July 2008 |
PGIM Global Total Return (USD Hedged) Fund
| | | | | | |
| | | |
| Independent Board Members | | | | |
| | | | |
Name Year of Birth Position(s) Portfolios Overseen | | Principal Occupation(s) During Past Five Years | | Other Directorships Held During Past Five Years | | Length of Board Service |
| | | | |
Linda W. Bynoe 1952 Board Member Portfolios Overseen: 98 | | President and Chief Executive Officer (since March 1995) and formerly Chief Operating Officer (December 1989-February 1995) of Telemat Limited LLC (formerly Telemat Ltd) (management consulting); formerly Vice President (January 1985-June 1989) at Morgan Stanley & Co. (broker-dealer). | | Trustee of Equity Residential (residential real estate) (since December 2009); Director of Northern Trust Corporation (financial services) (since April 2006); formerly Director of Anixter International, Inc. (communication products distributor) (January 2006-June 2020). | | Since March 2005 |
| | | | |
Barry H. Evans 1960 Board Member Portfolios Overseen: 101 | | Retired; formerly President (2005-2016), Global Chief Operating Officer (2014-2016), Chief Investment Officer - Global Head of Fixed Income (1998-2014), and various portfolio manager roles (1986-2006), Manulife Asset Management (asset management). | | Formerly Director, Manulife Trust Company (2011-2018); formerly Director, Manulife Asset Management Limited (2015-2017); formerly Chairman of the Board of Directors of Manulife Asset Management U.S. (2005-2016); formerly Chairman of the Board, Declaration Investment Management and Research (2008-2016). | | Since September 2017 |
| | | | |
Keith F. Hartstein 1956 Board Member & Independent Chair Portfolios Overseen: 101 | | Retired; formerly Member (November 2014-September 2022) of the Governing Council of the Independent Directors Council (IDC) (organization of independent mutual fund directors); formerly Executive Committee of the IDC Board of Governors (October 2019-December 2021); formerly President and Chief Executive Officer (2005-2012), Senior Vice President (2004-2005), Senior Vice President of Sales and Marketing (1997-2004), and various executive management positions (1990-1997), John Hancock Funds, LLC (asset management); formerly Chairman, Investment Company Institute’s Sales Force Marketing Committee (2003-2008). | | None. | | Since September 2013 |
Visit our website at pgim.com/investments
| | | | | | |
| | | |
| Independent Board Members | | | | |
| | | | |
Name Year of Birth Position(s) Portfolios Overseen | | Principal Occupation(s) During Past Five Years | | Other Directorships Held During Past Five Years | | Length of Board Service |
| | | | |
Laurie Simon Hodrick 1962 Board Member Portfolios Overseen: 98 | | A. Barton Hepburn Professor Emerita of Economics in the Faculty of Business, Columbia Business School (since 2018); Visiting Fellow at the Hoover Institution, Stanford University (since 2015); Sole Member, ReidCourt LLC (since 2008) (a consulting firm); formerly Visiting Professor of Law, Stanford Law School (2015-2021); formerly A. Barton Hepburn Professor of Economics in the Faculty of Business, Columbia Business School (1996-2017); formerly Managing Director, Global Head of Alternative Investment Strategies, Deutsche Bank (2006-2008). | | Independent Director, Andela (since January 2022) (global talent network); Independent Director, Roku (since December 2020) (communication services); formerly Independent Director, Synnex Corporation (2019-2021) (information technology); formerly Independent Director, Kabbage, Inc. (2018-2020) (financial services); formerly Independent Director, Corporate Capital Trust (2017-2018) (a business development company). | | Since September 2017 |
| | | | |
Brian K. Reid 1961 Board Member Portfolios Overseen: 101 | | Retired; formerly Chief Economist for the Investment Company Institute (ICI) (2005-2017); formerly Senior Economist and Director of Industry and Financial Analysis at the ICI (1998-2004); formerly Senior Economist, Industry and Financial Analysis at the ICI (1996-1998); formerly Staff Economist at the Federal Reserve Board (1989-1996); formerly Director, ICI Mutual Insurance Company (2012-2017). | | None. | | Since March 2018 |
PGIM Global Total Return (USD Hedged) Fund
| | | | | | |
| | | |
| Independent Board Members | | | | |
| | | | |
Name Year of Birth Position(s) Portfolios Overseen | | Principal Occupation(s) During Past Five Years | | Other Directorships Held During Past Five Years | | Length of Board Service |
| | | | |
Grace C. Torres 1959 Board Member Portfolios Overseen: 101 | | Retired; formerly Treasurer and Principal Financial and Accounting Officer of the PGIM Funds, Target Funds, Advanced Series Trust, Prudential Variable Contract Accounts and The Prudential Series Fund (1998-June 2014); Assistant Treasurer (March 1999-June 2014) and Senior Vice President (September 1999-June 2014) of PGIM Investments LLC; Assistant Treasurer (May 2003-June 2014) and Vice President (June 2005-June 2014) of AST Investment Services, Inc.; Senior Vice President and Assistant Treasurer (May 2003-June 2014) of Prudential Annuities Advisory Services, Inc. | | Director (since January 2018) of OceanFirst Financial Corp. and OceanFirst Bank; formerly Director (July 2015-January 2018) of Sun Bancorp, Inc. N.A. and Sun National Bank. | | Since November 2014 |
Visit our website at pgim.com/investments
| | | | | | |
| | | |
| Interested Board Members | | | | |
| | | | |
Name Year of Birth Position(s) Portfolios Overseen | | Principal Occupation(s) During Past Five Years | | Other Directorships Held During Past Five Years | | Length of Board Service |
| | | | |
Stuart S. Parker 1962 Board Member & President Portfolios Overseen: 101 | | President, Chief Executive Officer, Chief Operating Officer and Officer in Charge of PGIM Investments LLC (formerly known as Prudential Investments LLC) (since January 2012); President and Principal Executive Officer (“PEO”) (since December 2023) of the PGIM Credit Income Fund; President and PEO (since September 2022) of the PGIM Private Credit Fund; President and PEO (since March 2022) of the PGIM Private Real Estate Fund, Inc.; formerly Executive Vice President of Jennison Associates LLC and Head of Retail Distribution of PGIM Investments LLC (June 2005-December 2011); Investment Company Institute - Board of Governors (since May 2012). | | None. | | Since January 2012 |
| | | | |
Scott E. Benjamin 1973 Board Member & Vice President Portfolios Overseen: 101 | | Executive Vice President (since May 2009) of PGIM Investments LLC; Vice President (since June 2012) of Prudential Investment Management Services LLC; Executive Vice President (since September 2009) of AST Investment Services, Inc.; Senior Vice President of Product Development and Marketing, PGIM Investments (since February 2006); Vice President (since December 2023) of the PGIM Credit Income Fund; Vice President (since September 2022) of the PGIM Private Credit Fund; Vice President (since March 2022) of the PGIM Private Real Estate Fund, Inc.; formerly Vice President of Product Development and Product Management, PGIM Investments LLC (2003-2006). | | None. | | Since March 2010 |
PGIM Global Total Return (USD Hedged) Fund
| | | | |
| | | |
| Fund Officers(a) | | | | |
| | | |
Name Year of Birth Fund Position | | Principal Occupation(s) During Past Five Years | | Length of Service as Fund Officer |
| | | |
Claudia DiGiacomo 1974 Chief Legal Officer | | Chief Legal Officer (since December 2023) of the PGIM Credit Income Fund; Chief Legal Officer (since September 2022) of the PGIM Private Credit Fund; Chief Legal Officer (since July 2022) of the PGIM Private Real Estate Fund, Inc.; Chief Legal Officer, Executive Vice President and Secretary of PGIM Investments LLC (since August 2020); Chief Legal Officer of Prudential Mutual Fund Services LLC (since August 2020); Chief Legal Officer of PIFM Holdco, LLC (since August 2020); Vice President and Corporate Counsel (since January 2005) of Prudential; and Corporate Counsel of AST Investment Services, Inc. (since August 2020); formerly Vice President and Assistant Secretary of PGIM Investments LLC (2005-2020); formerly Associate at Sidley Austin Brown & Wood LLP (1999-2004). | | Since December 2005 |
| | | |
Andrew Donohue 1972 Chief Compliance Officer | | Chief Compliance Officer (since May 2023) of the PGIM Funds, Target Funds, PGIM ETF Trust, PGIM Global High Yield Fund, Inc., PGIM High Yield Bond Fund, Inc., PGIM Short Duration High Yield Opportunities Fund, Advanced Series Trust, The Prudential Series Fund, Prudential’s Gibraltar Fund, Inc., PGIM Private Credit Fund, PGIM Private Real Estate Fund, Inc.; Chief Compliance Officer of AST Investment Services, Inc. (since October 2022); Vice President, Chief Compliance Officer of PGIM Investments LLC (since September 2022); Chief Compliance Officer (since December 2023) of the PGIM Credit Income Fund; formerly various senior compliance roles within Principal Global Investors, LLC., global asset management for Principal Financial (2011-2022), most recently as Global Chief Compliance Officer (2016-2022). | | Since May 2023 |
| | | |
Andrew R. French 1962 Secretary | | Vice President (since December 2018) of PGIM Investments LLC; Secretary (since December 2023) of the PGIM Credit Income Fund; Secretary (since September 2022) of the PGIM Private Credit Fund; Secretary (since March 2022) of the PGIM Private Real Estate Fund, Inc.; formerly Vice President and Corporate Counsel (2010-2018) of Prudential; formerly Director and Corporate Counsel (2006-2010) of Prudential; Vice President and Assistant Secretary (since January 2007) of PGIM Investments LLC; Vice President and Assistant Secretary (since January 2007) of Prudential Mutual Fund Services LLC. | | Since October 2006 |
Visit our website at pgim.com/investments
| | | | |
| | | |
| Fund Officers(a) | | | | |
| | | |
Name Year of Birth Fund Position | | Principal Occupation(s) During Past Five Years | | Length of Service as Fund Officer |
| | | |
Melissa Gonzalez 1980 Assistant Secretary | | Vice President and Corporate Counsel (since September 2018) of Prudential; Vice President and Assistant Secretary (since August 2020) of PGIM Investments LLC; Assistant Secretary (since December 2023) of the PGIM Credit Income Fund; Assistant Secretary (since September 2022) of the PGIM Private Credit Fund; Assistant Secretary (since March 2022) of the PGIM Private Real Estate Fund, Inc.; formerly Director and Corporate Counsel (March 2014-September 2018) of Prudential. | | Since March 2020 |
| | | |
Patrick E. McGuinness 1986 Assistant Secretary | | Vice President and Assistant Secretary (since August 2020) of PGIM Investments LLC; Director and Corporate Counsel (since February 2017) of Prudential; Assistant Secretary (since December 2023) of the PGIM Credit Income Fund; Assistant Secretary (since September 2022) of the PGIM Private Credit Fund; Assistant Secretary (since March 2022) of the PGIM Private Real Estate Fund, Inc. | | Since June 2020 |
| | | |
Debra Rubano 1975 Assistant Secretary | | Vice President and Corporate Counsel (since November 2020) of Prudential; Assistant Secretary (since December 2023) of the PGIM Credit Income Fund; Assistant Secretary (since September 2022) of the PGIM Private Credit Fund; Assistant Secretary (since March 2022) of the PGIM Private Real Estate Fund, Inc; formerly Director and Senior Counsel of Allianz Global Investors U.S. Holdings LLC (2010-2020) and Assistant Secretary of numerous funds in the Allianz fund complex (2015-2020). | | Since December 2020 |
| | | |
George Hoyt 1965 Assistant Secretary | | Vice President and Corporate Counsel of Prudential (since September 2023); formerly Associate General Counsel of Franklin Templeton and Secretary and Chief Legal Officer of certain funds in the Franklin Templeton complex (2020-2023) and Managing Director (2016-2020) and Associate General Counsel for Legg Mason, Inc. and its predecessors (2004-2020). | | Since December 2023 |
| | | |
Devan Goolsby 1991 Assistant Secretary | | Vice President and Corporate Counsel of Prudential (since May 2023); formerly Associate at Eversheds Sutherland (US) LLP (2021-2023); Compliance Officer at Bloomberg LP (2019-2021); and an Examiner at the Financial Industry Regulatory Authority (2015-2019). | | Since December 2023 |
| | | |
Kelly A. Coyne 1968 Assistant Secretary | | Director, Investment Operations of Prudential Mutual Fund Services LLC (since 2010); Assistant Secretary (since December 2023) of the PGIM Credit Income Fund; Assistant Secretary (since September 2022) of the PGIM Private Credit Fund; Assistant Secretary (since March 2022) of the PGIM Private Real Estate Fund, Inc. | | Since March 2015 |
PGIM Global Total Return (USD Hedged) Fund
| | | | |
| | | |
| Fund Officers(a) | | | | |
| | | |
Name Year of Birth Fund Position | | Principal Occupation(s) During Past Five Years | | Length of Service as Fund Officer |
| | | |
Christian J. Kelly 1975 Chief Financial Officer | | Vice President, Global Head of Fund Administration of PGIM Investments LLC (since November 2018); Chief Financial Officer (since March 2023) of PGIM Investments mutual funds, closed end funds and ETFs, Advanced Series Trust Portfolios, Prudential Series Funds and Prudential Gibraltar Fund; Chief Financial Officer (since December 2023) of the PGIM Credit Income Fund; Chief Financial Officer of PGIM Private Credit Fund (since September 2022); Chief Financial Officer of PGIM Private Real Estate Fund, Inc. (since July 2022); formerly Treasurer and Principal Financial Officer (January 2019- March 2023) of PGIM Investments mutual funds, closed end funds and ETFs, Advanced Series Trust Portfolios, Prudential Series Funds and Prudential Gibraltar Fund; formerly Treasurer and Principal Financial Officer (March 2022 – July 2022) of the PGIM Private Real Estate Fund, Inc.; formerly Director of Fund Administration of Lord Abbett & Co. LLC (2009-2018), Treasurer and Principal Accounting Officer of the Lord Abbett Family of Funds (2017-2018); Director of Accounting, Avenue Capital Group (2008-2009); Senior Manager, Investment Management Practice of Deloitte & Touche LLP (1998-2007). | | Since January 2019 |
| | | |
Russ Shupak 1973 Treasurer and Principal Accounting Officer | | Vice President (since 2017) within PGIM Investments Fund Administration; Treasurer and Principal Accounting Officer of PGIM Investments mutual funds, closed end funds and ETFs (since March 2023); Treasurer and Principal Accounting Officer (since December 2023) of the PGIM Credit Income Fund; Treasurer and Principal Accounting Officer (since July 2022) of the PGIM Private Real Estate Fund, Inc.; Assistant Treasurer (since September 2022) of the PGIM Private Credit Fund; formerly Assistant Treasurer (March 2022 – July 2022) of the PGIM Private Real Estate Fund, Inc.; Assistant Treasurer of Advanced Series Trust Portfolios, Prudential Series Funds and Prudential Gibraltar Fund (since October 2019); formerly Director (2013-2017) within PGIM Investments Fund Administration. | | Since October 2019 |
| | | |
Lana Lomuti 1967 Assistant Treasurer | | Vice President (since 2007) within PGIM Investments Fund Administration; formerly Assistant Treasurer (December 2007-February 2014) of The Greater China Fund, Inc.; formerly Director (2005-2007) within PGIM Investments Fund Administration. | | Since April 2014 |
| | | |
Deborah Conway 1969 Assistant Treasurer | | Vice President (since 2017) within PGIM Investments Fund Administration; formerly Director (2007-2017) within PGIM Investments Fund Administration. | | Since October 2019 |
Visit our website at pgim.com/investments
| | | | |
| | | |
| Fund Officers(a) | | | | |
| | | |
Name Year of Birth Fund Position | | Principal Occupation(s) During Past Five Years | | Length of Service as Fund Officer |
| | | |
Elyse M. McLaughlin 1974 Assistant Treasurer | | Vice President (since 2017) within PGIM Investments Fund Administration; Treasurer and Principal Accounting Officer of the Advanced Series Trust, the Prudential Series Fund and the Prudential Gibraltar Fund (since March 2023); Assistant Treasurer (since December 2023) of the PGIM Credit Income Fund; Treasurer and Principal Accounting Officer (since September 2022) of the PGIM Private Credit Fund; Assistant Treasurer (since March 2022) of the PGIM Private Real Estate Fund, Inc.; Assistant Treasurer of PGIM Investments mutual funds, closed end funds and ETFs (since October 2019); formerly Director (2011-2017) within PGIM Investments Fund Administration. | | Since October 2019 |
| | | |
Robert W. McCormack 1973 Assistant Treasurer | | Vice President (since 2019) within PGIM Investments Fund Administration; Assistant Treasurer (since March 2023) of PGIM Investments mutual funds, closed end funds, ETFs, Advanced Series Trust Portfolios, Prudential Series Funds and Prudential Gibraltar Fund; Assistant Treasurer (since December 2023) of the PGIM Credit Income Fund; Assistant Treasurer (since September 2022) of the PGIM Private Credit Fund; Assistant Treasurer (since March 2022) of the PGIM Private Real Estate Fund, Inc.; formerly Director (2016-2019) within PGIM Investments Fund Administration; formerly Vice President within Goldman, Sachs & Co. Investment Management Controllers (2008-2016), Assistant Treasurer of Goldman Sachs Family of Funds (2015-2016). | | Since March 2023 |
| | | |
Kelly Florio 1978 Anti-Money Laundering Compliance Officer | | Vice President, Corporate Compliance, Global Compliance Programs and Compliance Risk Management (since December 2021) of Prudential; formerly Head of Fraud Risk Management (October 2019-December 2021) at New York Life Insurance Company; formerly Head of Key Risk Area Operations (November 2018-October 2019), Director of the US Anti-Money Laundering Compliance Unit (2009-2018) and Bank Loss Prevention Associate (2006-2009) at MetLife. | | Since June 2022 |
(a) Excludes Mr. Parker and Mr. Benjamin, interested Board Members who also serve as President and Vice President, respectively.
Explanatory Notes to Tables:
| ∎ | | Board Members are deemed to be “Interested,” as defined in the 1940 Act, by reason of their affiliation with PGIM Investments LLC and/or an affiliate of PGIM Investments LLC. |
| ∎ | | Unless otherwise noted, the address of all Board Members and Officers is c/o PGIM Investments LLC, 655 Broad Street, Newark, New Jersey 07102-4410. |
| ∎ | | There is no set term of office for Board Members or Officers. The Board Members have adopted a retirement policy, which calls for the retirement of Board Members on December 31 of the year in which they reach the age of 75. |
| ∎ | | “Other Directorships Held” includes all directorships of companies required to register or file reports with the SEC under the 1934 Act (that is, “public companies”) or other investment companies registered under the 1940 Act. |
PGIM Global Total Return (USD Hedged) Fund
| ∎ | | “Portfolios Overseen” includes such applicable investment companies managed by PGIM Investments LLC and overseen by the Board Member. The investment companies for which PGIM Investments LLC serves as manager include the PGIM Mutual Funds, Target Funds, PGIM ETF Trust, PGIM Private Real Estate Fund, Inc., PGIM Private Credit Fund, PGIM Credit Income Fund, PGIM High Yield Bond Fund, Inc., PGIM Global High Yield Fund, Inc., PGIM Short Duration High Yield Opportunities Fund, The Prudential Series Fund, Prudential’s Gibraltar Fund, Inc. and the Advanced Series Trust. |
| ∎ | | As used in the Fund Officers table “Prudential” means The Prudential Insurance Company of America. |
Visit our website at pgim.com/investments
Approval of Advisory Agreements (unaudited)
The Fund’s Board of Directors
The Board of Directors (the “Board”) of PGIM Global Total Return (USD Hedged) Fund (the “Fund”)1 consists of ten individuals, eight of whom are not “interested persons” of the Fund, as defined in the Investment Company Act of 1940, as amended (the “1940 Act”) (the “Independent Directors”). The Board is responsible for the oversight of the Fund and its operations, and performs the various duties imposed on the directors of investment companies by the 1940 Act. The Independent Directors have retained independent legal counsel to assist them in connection with their duties. The Chair of the Board is an Independent Trustee. The Board has established five standing committees: the Audit Committee, the Nominating and Governance Committee, the Compliance Committee and two Investment Committees. Each committee is chaired by, and composed of, Independent Directors.
Annual Approval of the Fund’s Advisory Agreements
As required under the 1940 Act, the Board determines annually whether to renew the Fund’s management agreement with PGIM Investments LLC (“PGIM Investments”) and the Fund’s subadvisory agreements with each of PGIM, Inc. (“PGIM”) on behalf of its PGIM Fixed Income unit (“PGIM Fixed Income”) and PGIM Limited (“PGIML”). In considering the renewal of the agreements, the Board, including all of the Independent Directors, met on May 25 and June 6-8, 2023 (the “Board Meeting”) and approved the renewal of the agreements through July 31, 2024, after concluding that the renewal of the agreements was in the best interests of the Fund and its shareholders.
In advance of the meetings, the Board requested and received materials relating to the agreements, and had the opportunity to ask questions and request further information in connection with its consideration. Among other things, the Board considered comparative fee information from PGIM Investments, PGIM and PGIML. Also, the Board considered comparisons with other mutual funds in relevant Peer Universes and Peer Groups, as is further discussed below.
In approving the agreements, the Board, including the Independent Directors advised by independent legal counsel, considered the factors it deemed relevant, including the nature, quality and extent of services provided by PGIM Investments and the subadvisers, the performance of the Fund, the profitability of PGIM Investments and its affiliates, expenses and fees, and the potential for economies of scale that may be shared with the Fund and its shareholders as the Fund’s assets grow. In their deliberations, the Directors did not identify any single factor which alone was responsible for the Board’s decision to approve the agreements with respect to the Fund. In connection with its deliberations, the Board considered information provided by PGIM Investments throughout the year at regular Board meetings, presentations from portfolio managers and other information, as well as information furnished at or in advance of the Board Meeting.
The Directors determined that the overall arrangements between the Fund and PGIM Investments, which serves as the Fund’s investment manager pursuant to a
1PGIM Global Total Return (USD Hedged) Fund is a series of Prudential Global Total Return Fund, Inc.
PGIM Global Total Return (USD Hedged) Fund
Approval of Advisory Agreements (continued)
management agreement, and between each of PGIM Investments and PGIM, which, through its PGIM Fixed Income unit, and PGIML, which serve as the Fund’s subadvisers pursuant to the terms of subadvisory agreements with PGIM Investments, are in the best interests of the Fund and its shareholders in light of the services performed, fees charged and such other matters as the Directors considered relevant in the exercise of their business judgment.
The material factors and conclusions that formed the basis for the Directors’ reaching their determinations to approve the continuance of the agreements are separately discussed below.
Nature, Quality and Extent of Services
The Board received and considered information regarding the nature, quality and extent of services provided to the Fund by PGIM Investments, PGIM Fixed Income, and PGIML. The Board noted that PGIM Fixed Income and PGIML are affiliated with PGIM Investments. The Board considered the services provided by PGIM Investments, including but not limited to the oversight of the subadvisers for the Fund, as well as the provision of fund recordkeeping, compliance and other services to the Fund, and PGIM Investments’ role as administrator for the Fund’s liquidity risk management program. With respect to PGIM Investments’ oversight of the subadvisers, the Board noted that PGIM Investments’ Strategic Investment Research Group (“SIRG”), which is a business unit of PGIM Investments, is responsible for monitoring and reporting to PGIM Investments senior management on the performance and operations of the subadvisers. The Board also considered that PGIM Investments pays the salaries of all of the officers and interested Directors of the Fund who are part of Fund management. The Board also considered the investment subadvisory services provided by PGIM Fixed Income and PGIML, including investment research and security selection, as well as adherence to the Fund’s investment restrictions and compliance with applicable Fund policies and procedures. The Board considered PGIM Investments’ evaluation of the subadvisers, as well as PGIM Investments’ recommendation, based on its review of the subadvisers, to renew the subadvisory agreements.
The Board considered the qualifications, backgrounds and responsibilities of PGIM Investments’ senior management responsible for the oversight of the Fund, PGIM Fixed Income, and PGIML, and also considered the qualifications, backgrounds and responsibilities of PGIM Fixed Income’s portfolio managers who are responsible for the day-to-day management of the Fund’s portfolio. The Board was provided with information pertaining to PGIM Investments’, PGIM Fixed Income’s, and PGIML’s organizational structure, senior management, investment operations, and other relevant information pertaining to PGIM Investments, PGIM Fixed Income, and PGIML. The Board also noted that it received favorable compliance reports from the Fund’s Chief Compliance Officer (“CCO”) as to PGIM Investments, PGIM Fixed Income, and PGIML.
The Board concluded that it was satisfied with the nature, extent and quality of the investment management services provided by PGIM Investments, the subadvisory services provided to the Fund by PGIM Fixed Income and PGIML, and that there was a reasonable basis on which to conclude that the Fund benefits from the services
Visit our website at pgim.com/investments
provided by PGIM Investments, PGIM Fixed Income, and PGIML under the management and subadvisory agreements.
Costs of Services and Profits Realized by PGIM Investments
The Board was provided with information on the profitability of PGIM Investments and its affiliates in serving as the Fund’s investment manager. The Board discussed with PGIM Investments the methodology utilized in assembling the information regarding profitability and considered its reasonableness. The Board recognized that it is difficult to make comparisons of profitability from fund management contracts because comparative information is not generally publicly available and is affected by numerous factors, including the structure of the particular adviser, the types of funds it manages, its business mix, numerous assumptions regarding allocations and the adviser’s capital structure and cost of capital. However, the Board considered that the cost of services provided by PGIM Investments during the year ended December 31, 2022 exceeded the management fees received by PGIM Investments, resulting in an operating loss to PGIM Investments. Taking these factors into account, the Board concluded that the profitability of PGIM Investments and its affiliates in relation to the services rendered was not unreasonable.
Economies of Scale
The Board received and discussed information concerning economies of scale that PGIM Investments may realize as the Fund’s assets grow beyond current levels. The Board noted that the management fee schedule for the Fund includes breakpoints, which have the effect of decreasing the fee rate as assets increase. During the course of time, the Board has considered information regarding the launch date of the Fund, the management fees of the Fund compared to those of similarly managed funds and PGIM Investments’ investment in the Fund over time. The Board noted that economies of scale can be shared with the Fund in other ways, including low management fees from inception, additional technological and personnel investments to enhance shareholder services, and maintaining existing expense structures in the face of a rising cost environment. The Board also considered PGIM Investments’ assertion that it continually evaluates the management fee schedule of the Fund and the potential to share economies of scale through breakpoints or fee waivers as asset levels increase.
The Board recognized the inherent limitations of any analysis of economies of scale, stemming largely from the Board’s understanding that most of PGIM Investments’ costs are not specific to individual funds, but rather are incurred across a variety of products and services.
Other Benefits to PGIM Investments, PGIM Fixed Income, and PGIML
The Board considered potential ancillary benefits that might be received by PGIM Investments, PGIM Fixed Income, PGIML and their affiliates as a result of their relationship with the Fund. The Board concluded that potential benefits to be derived by PGIM Investments included transfer agency fees received by the Fund’s transfer agent (which is affiliated with PGIM Investments), as well as benefits to its reputation or other intangible benefits resulting from PGIM Investments’ association with the Fund. The Board concluded that the potential benefits to be derived by PGIM Fixed Income and
PGIM Global Total Return (USD Hedged) Fund
Approval of Advisory Agreements (continued)
PGIML included the ability to use soft dollar credits, as well as the potential benefits consistent with those generally resulting from an increase in assets under management, specifically, potential access to additional research resources and benefits to their reputations. The Board concluded that the benefits derived by PGIM Investments, PGIM Fixed Income, and PGIML were consistent with the types of benefits generally derived by investment managers and subadvisers to mutual funds.
Performance of the Fund / Fees and Expenses
The Board considered certain additional factors and made related conclusions relating to the historical performance of the Fund for the one- and three-year periods ended December 31, 2022. The Board considered that the Fund commenced operations on December 12, 2017 and that longer-term performance was not yet available.
The Board also considered the Fund’s actual management fee, as well as the Fund’s net total expense ratio, for the fiscal period ended October 31, 2022. The Board considered the management fee for the Fund as compared to the management fee charged by PGIM Investments to other funds and the fee charged by other advisers to comparable mutual funds in a Peer Group. The actual management fee represents the fee rate actually paid by Fund shareholders and includes any fee waivers or reimbursements. The net total expense ratio for the Fund represents the actual expense ratio incurred by Fund shareholders.
The mutual funds included in the Peer Universe, which was used to consider performance, and the Peer Group, which was used to consider expenses and fees, were objectively determined by Broadridge, an independent provider of mutual fund data. In certain circumstances, PGIM Investments also provided supplemental Peer Universe or Peer Group information, for reasons addressed with the Board. The comparisons placed the Fund in various quartiles over various periods, with the first quartile being the best 25% of the mutual funds (for performance, the best performing mutual funds and, for expenses, the lowest cost mutual funds).
The section below summarizes key factors considered by the Board and the Board’s conclusions regarding the Fund’s performance, fees and overall expenses. The table sets forth net performance comparisons (which reflect the impact on performance of fund expenses, or any subsidies, expense caps or waivers that may be applicable) with the Peer Universe, actual management fees with the Peer Group (which reflect the impact of any subsidies or fee waivers), and net total expenses with the Peer Group, each of which were key factors considered by the Board.
Visit our website at pgim.com/investments
| | | | | | | | |
| | | | | |
| Net Performance | | 1 Year | | 3 Years | | 5 Years | | 10 Years |
| | 4th Quartile | | 3rd Quartile | | 2nd Quartile | | N/A |
| |
| Actual Management Fees: 1st Quartile |
| |
| Net Total Expenses: 1st Quartile |
| | · | | The Board noted that the Fund underperformed its benchmark index over all periods. |
| | · | | The Board considered PGIM Investments’ assertions that the Fund’s meaningful exposure to credit may detract during periods of heightened volatility and global risk-off sentiment, and that the Fund is expected to rebound versus the benchmark and peers as credit markets recover. |
| | · | | The Board also considered that the Fund outperformed its benchmark index in the fourth quarter of 2022 and outperformed its benchmark index and peer group in the first quarter of 2023 (ranking in the 17th percentile). The Board also noted that the Fund outperformed its peer group average for the five-year period and outperformed its benchmark index for the three-year period ended March 31, 2023. |
| | · | | The Board and PGIM Investments agreed to retain the existing contractual expense cap, which (exclusive of certain fees and expenses) caps total annual operating expenses at 0.88% for Class A shares, 1.63% for Class C shares, 0.63% for Class Z shares and 0.58% for Class R6 shares through February 29, 2024. |
| | · | | In addition, PGIM Investments will waive management fees or shared operating expenses on any share class to the same extent that it waives such expenses on any other share class, and has agreed that total annual fund operating expenses for Class R6 shares will not exceed total annual fund operating expenses for Class Z shares. |
| | · | | The Board concluded that, in light of the above, it would be in the best interests of the Fund and its shareholders to continue to allow the Fund to create a longer-term performance record, and to renew the agreements. |
| | · | | The Board concluded that the management fees (including subadvisory fees) and total expenses were reasonable in light of the services provided. |
* * *
After full consideration of these factors, the Board concluded that the approval of the agreements was in the best interests of the Fund and its shareholders.
PGIM Global Total Return (USD Hedged) Fund
| | | | |
∎ MAIL 655 Broad Street Newark, NJ 07102 | | ∎ TELEPHONE (800) 225-1852 | | ∎ WEBSITE pgim.com/investments |
PROXY VOTING
The Board of Directors of the Fund has delegated to the Fund’s subadvisers the responsibility for voting any proxies and maintaining proxy recordkeeping with respect to the Fund. A description of these proxy voting policies and procedures is available without charge, upon request, by calling (800) 225-1852 or by visiting the Securities and Exchange Commission’s website at sec.gov. Information regarding how the Fund voted proxies relating to portfolio securities during the most recent 12-month period ended June 30 is available on the Fund’s website and on the Securities and Exchange Commission’s website.
DIRECTORS
Ellen S. Alberding · Kevin J. Bannon · Scott E. Benjamin · Linda W. Bynoe · Barry H. Evans · Keith F. Hartstein · Laurie Simon Hodrick · Stuart S. Parker · Brian K. Reid · Grace C. Torres
OFFICERS
Stuart S. Parker, President · Scott E. Benjamin, Vice President · Christian J. Kelly, Chief Financial Officer · Claudia DiGiacomo, Chief Legal Officer · Andrew Donohue, Chief Compliance Officer · Russ Shupak, Treasurer and Principal Accounting Officer · Kelly Florio, Anti-Money Laundering Compliance Officer · Andrew R. French, Secretary · Melissa Gonzalez, Assistant Secretary · Kelly A. Coyne, Assistant Secretary · Patrick E. McGuinness, Assistant Secretary · Debra Rubano, Assistant Secretary · George Hoyt, Assistant Secretary · Devan Goolsby, Assistant Secretary · Lana Lomuti, Assistant Treasurer · Elyse M. McLaughlin, Assistant Treasurer · Deborah Conway, Assistant Treasurer · Robert W. McCormack, Assistant Treasurer
| | | | |
| | |
| MANAGER | | PGIM Investments LLC | | 655 Broad Street Newark, NJ 07102 |
| | |
| SUBADVISERS | | PGIM Fixed Income | | 655 Broad Street Newark, NJ 07102 |
| | |
| | | PGIM Limited | | Grand Buildings, 1-3 Strand Trafalgar Square London, WC2N 5HR United Kingdom |
| | |
| DISTRIBUTOR | | Prudential Investment Management Services LLC | | 655 Broad Street Newark, NJ 07102 |
| | |
| CUSTODIAN | | The Bank of New York Mellon | | 240 Greenwich Street New York, NY 10286 |
| | |
| TRANSFER AGENT | | Prudential Mutual Fund Services LLC | | PO Box 534432 Pittsburgh, PA 15253 |
| | |
| INDEPENDENT REGISTERED PUBLIC ACCOUNTING FIRM | | PricewaterhouseCoopers LLP | | 300 Madison Avenue New York, NY 10017 |
| | |
| FUND COUNSEL | | Willkie Farr & Gallagher LLP | | 787 Seventh Avenue New York, NY 10019 |
An investor should consider the investment objectives, risks, charges, and expenses of the Fund carefully before investing. The prospectus and summary prospectus contain this and other information about the Fund. An investor may obtain the prospectus and summary prospectus by visiting our website at pgim.com/investments or by calling (800) 225-1852. The prospectus and summary prospectus should be read carefully before investing.
E-DELIVERY
To receive your mutual fund documents online, go to pgim.com/investments/resource/edelivery and enroll. Instead of receiving printed documents by mail, you will receive notification via email when new materials are available. You can cancel your enrollment or change your email address at any time by visiting the website address above.
SHAREHOLDER COMMUNICATIONS WITH DIRECTORS
Shareholders can communicate directly with the Board of Directors by writing to the Chair of the Board, PGIM Global Total Return (USD Hedged) Fund, PGIM Investments, Attn: Board of Directors, 655 Broad Street, Newark, NJ 07102. Shareholders can communicate directly with an individual Director by writing to that Director at the same address. Communications are not screened before being delivered to the addressee.
AVAILABILITY OF PORTFOLIO HOLDINGS
The Fund files its complete schedule of portfolio holdings with the Securities and Exchange Commission for the first and third quarters of each fiscal year as an exhibit to its reports on Form N-PORT. The Fund’s Form N-PORT filings are available on the Commission’s website at sec.gov.
The Fund’s Statement of Additional Information contains additional information about the Fund’s Directors and is available without charge, upon request, by calling (800) 225-1852.
Mutual Funds:
| | | | |
| | | |
ARE NOT INSURED BY THE FDIC OR ANY FEDERAL GOVERNMENT AGENCY | | MAY LOSE VALUE | | ARE NOT A DEPOSIT OF OR GUARANTEED BY ANY BANK OR ANY BANK AFFILIATE |
PGIM GLOBAL TOTAL RETURN (USD HEDGED) FUND
| | | | | | | | |
| | | | |
SHARE CLASS | | A | | C | | Z | | R6 |
| | | | |
NASDAQ | | PHEAX | | PHECX | | PHEZX | | PHEQX |
| | | | |
CUSIP | | 74439A707 | | 74439A806 | | 74439A871 | | 74439A889 |
MF238E
Item 2 – Code of Ethics — See Exhibit (a)
As of the end of the period covered by this report, the registrant has adopted a code of ethics (the “Section 406 Standards for Investment Companies – Ethical Standards for Principal Executive and Financial Officers”) that applies to the registrant’s Principal Executive Officer and Principal Financial Officer; the registrant’s Principal Financial Officer also serves as the Principal Accounting Officer.
The registrant hereby undertakes to provide any person, without charge, upon request, a copy of the code of ethics. To request a copy of the code of ethics, contact the registrant 800-225-1852, and ask for a copy of the Section 406 Standards for Investment Companies - Ethical Standards for Principal Executive and Financial Officers.
Item 3 – Audit Committee Financial Expert –
The registrant’s Board has determined that Ms. Grace C. Torres, member of the Board’s Audit Committee is an “audit committee financial expert,” and that she is “independent,” for purposes of this item.
Item 4 – Principal Accountant Fees and Services –
(a) Audit Fees
For the fiscal years ended October 31, 2023 and October 31, 2022, PricewaterhouseCoopers LLP (“PwC”), the Registrant’s principal accountant, billed the Registrant $112,890 and $108,800, respectively, for professional services rendered for the audit of the Registrant’s annual financial statements or services that are normally provided in connection with statutory and regulatory filings.
(b) Audit-Related Fees
For the fiscal years ended October 31, 2023 and October 31, 2022: none.
(c) Tax Fees
For the fiscal years ended October 31, 2023 and October 31, 2022: none.
(d) All Other Fees
For the fiscal years ended October 31, 2023 and October 31, 2022: none.
(e) (1) Audit Committee Pre-Approval Policies and Procedures
THE PGIM MUTUAL FUNDS
AUDIT COMMITTEE POLICY
on
Pre-Approval of Services Provided by the Independent
Accountants
The Audit Committee of each PGIM Mutual Fund is charged with the responsibility to monitor the independence of the Fund’s independent accountants. As part of this responsibility, the Audit Committee must pre-approve the independent accounting firm’s engagement to render audit and/or permissible non-audit services, as required by law. In evaluating a proposed engagement of the independent accountants, the Audit Committee will assess the effect that the engagement might reasonably be expected to have on the accountant’s independence. The Committee’s evaluation will be based on:
| | • | | a review of the nature of the professional services expected to be provided, |
| | • | | a review of the safeguards put into place by the accounting firm to safeguard independence, and |
| | • | | periodic meetings with the accounting firm. |
Policy for Audit and Non-Audit Services Provided to the Funds
On an annual basis, the scope of audits for each Fund, audit fees and expenses, and audit-related and non-audit services (and fees proposed in respect thereof) proposed to be performed by the Fund’s independent accountants will be presented by the Treasurer and the independent accountants to the Audit Committee for review and, as appropriate, approval prior to the initiation of such services.
Such presentation shall be accompanied by confirmation by both the Treasurer and the independent accountants that the proposed
non-audit services will not adversely affect the independence of the independent accountants. Such proposed non-audit services shall be described in sufficient detail to enable the Audit Committee to assess the appropriateness of such services and fees, and the compatibility of the provision of such services with the auditor’s independence. The Committee shall receive periodic reports on the progress of the audit and other services which are approved by the Committee or by the Committee Chair pursuant to authority delegated in this Policy.
The categories of services enumerated under “Audit Services”, “Audit-related Services”, and “Tax Services” are intended to provide guidance to the Treasurer and the independent accountants as to those categories of services which the Committee believes are generally consistent with the independence of the independent accountants and which the Committee (or the Committee Chair) would expect upon the presentation of specific proposals to pre-approve. The enumerated categories are not intended as an exclusive list of audit, audit-related or tax services, which the Committee (or the Committee Chair) would consider for pre-approval.
Audit Services
The following categories of audit services are considered to be consistent with the role of the Fund’s independent accountants:
| | • | | Annual Fund financial statement audits |
| | • | | Seed audits (related to new product filings, as required) |
| | • | | SEC and regulatory filings and consents |
Audit-related Services
The following categories of audit-related services are considered to be consistent with the role of the Fund’s independent accountants:
| | • | | Accounting consultations |
| | • | | Fund merger support services |
| | • | | Agreed Upon Procedure Reports |
| | • | | Other Internal Control Reports |
Individual audit-related services that fall within one of these categories (except for fund merger support services) and are not presented to the Audit Committee as part of the annual pre-approval process are subject to an authorized pre-approval by the Audit Committee so long as the estimated fee for those services does not exceed $30,000. Any services provided under such pre-approval will be reported to the Audit Committee at its next regular meeting. Should the amount of such services exceed $30,000 any additional fees will be subject to pre-approval by the Committee Chair (or any other Committee member on whom this responsibility has been delegated). Fees related to fund merger support services are subject to a separate authorized pre-approval by the Audit Committee with fees determined on a per occurrence and merger complexity basis.
Tax Services
The following categories of tax services are considered to be consistent with the role of the Fund’s independent accountants:
| | • | | Tax compliance services related to the filing or amendment of the following: |
| | • | | Federal, state and local income tax compliance; and, |
| | • | | Sales and use tax compliance |
| | • | | Timely RIC qualification reviews |
| | • | | Tax distribution analysis and planning |
| | • | | Tax authority examination services |
| | • | | Tax appeals support services |
| | • | | Accounting methods studies |
| | • | | Fund merger support services |
| | • | | Tax consulting services and related projects |
Individual tax services that fall within one of these categories and are not presented to the Audit Committee as part of the annual pre-approval process are subject to an authorized pre-approval by the Audit Committee so long as the estimated fee for those services does not exceed $30,000. Any services provided under such pre-approval will be reported to the Audit Committee at its next regular meeting. Should the amount of such services exceed $30,000 any additional fees will be subject to pre-approval by the Committee Chair (or any other Committee member on whom this responsibility has been delegated).
Other Non-Audit Services
Certain non-audit services that the independent accountants are legally permitted to render will be subject to pre-approval by the Committee or by one or more Committee members to whom the Committee has delegated this authority and who will report to the full Committee any pre-approval decisions made pursuant to this Policy. Non-audit services presented for pre-approval pursuant to this paragraph will be accompanied by a confirmation from both the Treasurer and the independent accountants that the proposed services will not adversely affect the independence of the independent accountants.
Proscribed Services
The Fund’s independent accountants will not render services in the following categories of non-audit services:
| | • | | Bookkeeping or other services related to the accounting records or financial statements of the Fund |
| | • | | Financial information systems design and implementation |
| | • | | Appraisal or valuation services, fairness opinions, or contribution-in-kind reports |
| | • | | Internal audit outsourcing services |
| | • | | Management functions or human resources |
| | • | | Broker or dealer, investment adviser, or investment banking services |
| | • | | Legal services and expert services unrelated to the audit |
| | • | | Any other service that the Public Company Accounting Oversight Board determines, by regulation, is impermissible. |
Pre-approval of Non-Audit Services Provided to Other Entities Within the PGIM Fund Complex
Certain non-audit services provided to PGIM Investments LLC or any of its affiliates that also provide ongoing services to the PGIM Mutual Funds will be subject to pre-approval by the Audit Committee. The only non-audit services provided to these entities that will require pre-approval are those related directly to the operations and financial reporting of the Funds. Individual projects that are not presented to the Audit Committee as part of the annual pre-approval process will be subject
to pre-approval by the Committee Chair (or any other Committee member on whom this responsibility has been delegated) so long as the estimated fee for those services does not exceed $30,000. Services presented for pre-approval pursuant to this paragraph will be accompanied by a confirmation from both the Treasurer and the independent accountants that the proposed services will not adversely affect the independence of the independent accountants.
Although the Audit Committee will not pre-approve all services provided to PGIM Investments LLC and its affiliates, the Committee will receive an annual report from the Fund’s independent accounting firm showing the aggregate fees for all services provided to PGIM Investments and its affiliates.
(e) (2) Percentage of services described in each of paragraphs (b) through (d) of this Item that were approved by the audit committee pursuant to paragraph (c)(7)(i)(C) of Rule 2-01 of Regulation S-X –
| | | | | | |
| | | Fiscal Year Ended October 31, 2023 | | | | Fiscal Year Ended October 31, 2022 |
4(b) | | Not applicable. | | | | Not applicable. |
4(c) | | Not applicable. | | | | Not applicable. |
4(d) | | Not applicable. | | | | Not applicable. |
(f) Percentage of hours expended attributable to work performed by other than full time employees of principal accountant if greater than 50%.
The percentage of hours expended on the principal accountant’s engagement to audit the registrant’s financial statements for the most recent fiscal year that were attributed to work performed by persons other than the principal accountant’s full-time, permanent employees was 0%.
(g) Non-Audit Fees
The aggregate non-audit fees billed by the Registrant’s principal accountant for services rendered to the registrant’s investment adviser and any entity controlling, controlled by, or under common control with the investment adviser that provides ongoing services to the registrant for the fiscal years ended October 31, 2023 and October 31, 2022 was $0 and $0, respectively.
(h) Principal Accountant’s Independence
Not applicable as the Registrant’s principal accountant has not provided non-audit services to the registrant’s investment adviser and any entity controlling, controlled by, or under common control with the investment adviser that provides ongoing services to the registrant that were not pre-approved pursuant to Rule 2-01(c)(7)(ii) of Regulation S-X.
(i) Not applicable.
(j) Not applicable.
Item 5 – Audit Committee of Listed Registrants – Not applicable.
Item 6 – Schedule of Investments – The schedule is included as part of the report to shareholders filed under Item 1 of this Form.
Item 7 – Disclosure of Proxy Voting Policies and Procedures for Closed-End Management Investment Companies – Not applicable.
Item 8 – Portfolio Managers of Closed-End Management Investment Companies – Not applicable.
Item 9 – Purchases of Equity Securities by Closed-End Management Investment Company and Affiliated Purchasers – Not applicable.
Item 10 – Submission of Matters to a Vote of Security Holders – There have been no material changes to these procedures.
Item 11 – Controls and Procedures
| | (a) | It is the conclusion of the registrant’s principal executive officer and principal financial officer that the effectiveness of the registrant’s current disclosure controls and procedures (such disclosure controls and procedures having been evaluated within 90 days of the date of this filing) provide reasonable assurance that the information required to be disclosed by the registrant has been recorded, processed, summarized and reported within the time period specified in the Commission’s rules and forms and that the information required to be disclosed by the registrant has been accumulated and communicated to the registrant’s principal executive officer and principal financial officer in order to allow timely decisions regarding required disclosure. |
| | (b) | There has been no significant change in the registrant’s internal control over financial reporting (as defined in Rule 30a-3(d) under the Act (17 CFR 270.30a-3(d))) that occurred during the period covered by this report that has materially affected, or is reasonably likely to materially affect, the registrant’s internal control over financial reporting. |
Item 12 – Controls and Procedures - Disclosure of Securities Lending Activities for Closed-End Management Investment Companies – Not applicable.
Item 13 – Exhibits
(a)(1) Code of Ethics – Attached hereto as Exhibit EX-99.CODE-ETH.
(a)(2) Certifications pursuant to Section 302 of the Sarbanes-Oxley Act – Attached hereto as Exhibit EX-99.CERT.
(a)(2)(1) Any written solicitation to purchase securities under Rule 23c-1 – Not applicable.
(a)(2)(2) Change in the registrant’s independent public accountant – Not applicable.
(b) Certifications pursuant to Section 906 of the Sarbanes-Oxley Act – Attached hereto as Exhibit EX-99.906CERT.
SIGNATURES
Pursuant to the requirements of the Securities Exchange Act of 1934 and the Investment Company Act of 1940, the registrant has duly caused this report to be signed on its behalf by the undersigned, thereunto duly authorized.
| | |
| Registrant: | | Prudential Global Total Return Fund, Inc. |
| |
| By: | | /s/ Andrew R. French |
| | Andrew R. French |
| | Secretary |
| |
| Date: | | December 19, 2023 |
Pursuant to the requirements of the Securities Exchange Act of 1934 and the Investment Company Act of 1940, this report has been signed below by the following persons on behalf of the registrant and in the capacities and on the dates indicated.
| | |
| By: | | /s/ Stuart S. Parker |
| | Stuart S. Parker |
| | President and Principal Executive Officer |
| |
| Date: | | December 19, 2023 |
| |
| By: | | /s/ Christian J. Kelly |
| | Christian J. Kelly |
| | Chief Financial Officer (Principal Financial Officer) |
| |
| Date: | | December 19, 2023 |