| UNITED STATES |
| SECURITIES AND EXCHANGE COMMISSION |
| Washington, D.C. 20549 |
| |
FORM N-CSR |
| |
CERTIFIED SHAREHOLDER REPORT OF REGISTERED |
MANAGEMENT INVESTMENT COMPANIES |
| |
| |
| |
| Investment Company Act File Number: 811-4519 |
|
| |
| T. Rowe Price Capital Appreciation Fund |
|
| (Exact name of registrant as specified in charter) |
| |
| 100 East Pratt Street, Baltimore, MD 21202 |
|
| (Address of principal executive offices) |
| |
| David Oestreicher |
| 100 East Pratt Street, Baltimore, MD 21202 |
|
| (Name and address of agent for service) |
| |
| |
| Registrant’s telephone number, including area code: (410) 345-2000 |
| |
| |
| Date of fiscal year end: December 31 |
| |
| |
| Date of reporting period: June 30, 2011 |
Item 1: Report to Shareholders| Capital Appreciation Fund | June 30, 2011 |
The views and opinions in this report were current as of June 30, 2011. They are not guarantees of performance or investment results and should not be taken as investment advice. Investment decisions reflect a variety of factors, and the managers reserve the right to change their views about individual stocks, sectors, and the markets at any time. As a result, the views expressed should not be relied upon as a forecast of the fund’s future investment intent. The report is certified under the Sarbanes-Oxley Act, which requires mutual funds and other public companies to affirm that, to the best of their knowledge, the information in their financial reports is fairly and accurately stated in all material respects.
REPORTS ON THE WEB
Sign up for our E-mail Program, and you can begin to receive updated fund reports and prospectuses online rather than through the mail. Log in to your account at troweprice.com for more information.
Manager’s Letter
Fellow Shareholders
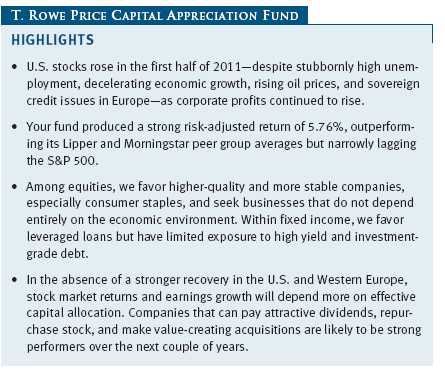
In the first half of 2011, the U.S. equity market continued to grind higher, albeit at a slower rate than in the second half of 2010. The S&P 500 was able to generate a solid 6% return despite the stubbornly high unemployment rate, record budget deficits, and decelerating gross domestic product (GDP) growth in the U.S., along with rising oil prices driven by unrest in the Middle East and North Africa, the continued sovereign credit issues in Europe, and the horrible nuclear tragedy in Japan. In spite of these macroeconomic headwinds, corporate profits in the U.S. continued to rise, with both profit margins and absolute profit levels expected to reach record levels in 2011. Why is there such a disconnect between the weak macroeconomic data and the strong corporate profit environment?
The most important factor behind this is simply that many companies are benefiting from the continued growth in emerging markets, which is more than offsetting sluggish growth in more developed economies like the U.S. and those in Western Europe. Today, more than 40% of the profits of the S&P 500 are being generated outside the U.S. Second, the aggressive restructuring companies undertook in 2008 and 2009 combined with a rebound in demand (again, mostly from emerging markets) will likely lead to record S&P 500 profit margins in 2011. Third, the extremely low interest rate environment is allowing firms to lower their interest expense burden and borrow extremely low-cost debt to fund accretive acquisitions and engage in share repurchase activity. But how sustainable is this disconnect between the macroeconomic environment and strength in corporate profits, and how much longer can it persist?
With profit margins having risen to near-record levels and most of the restructuring actions already completed, it will be difficult for margins to continue to expand without improved economic growth in developed markets. While the long-term story in emerging markets is positive, a combination of monetary tightening and potentially overheated construction and housing markets in many of the largest emerging markets will likely result in decelerating growth rates for U.S. companies operating in those markets.
With operating margins quite elevated and emerging market growth likely to decelerate, stock market returns and earnings growth will become much more dependent on effective capital allocation in the absence of a stronger recovery in the U.S. and Western Europe. Those companies that can pay attractive dividends, repurchase stock, and make value-creating accretive acquisitions are likely to be strong performers over the next couple of years. In addition, we believe merger and acquisition (M&A) activity is likely to take off as equity valuations are much cheaper than other parts of the capital structure (namely debt). Today, private equity firms and public acquirers can buy reasonably valued public companies and use inexpensive debt to fund the transaction and take advantage of this arbitrage and still create value for their shareholders. We are currently spending a significant amount of time on identifying potential takeover targets and companies that deploy capital effectively.
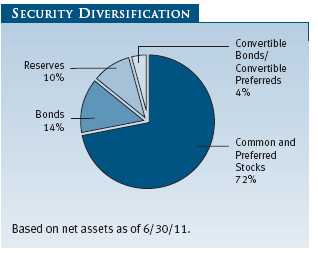
As investors in this fund understand, we are not economists and do not pretend to have a crystal ball about the future. While we have views on the economy, those views do not drive our investment process. We focus our time and energy on businesses, valuations, and capital allocation and try to identify stocks, bonds, leveraged loans, and convertible instruments where the risk/reward trade-off is highly skewed in our favor—no matter how the economy plays out.
Before we discuss fund performance, I would like to review the three objectives of the Capital Appreciation Fund:
(1) Generate strong risk-adjusted returns annually
(2) Preserve shareholder capital over the intermediate term (i.e., three years)
(3) Generate equity-like returns with less risk than that of the overall market over a full market cycle (i.e., five years)
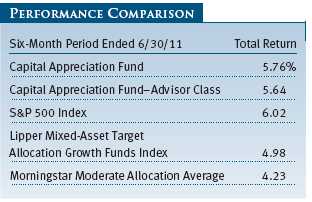
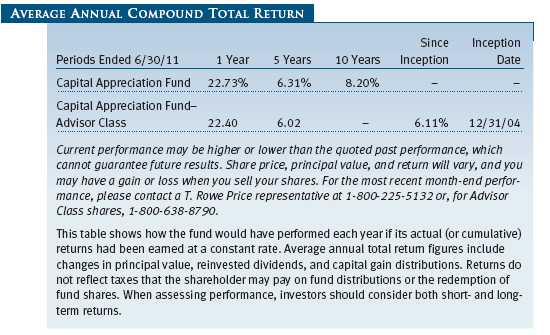
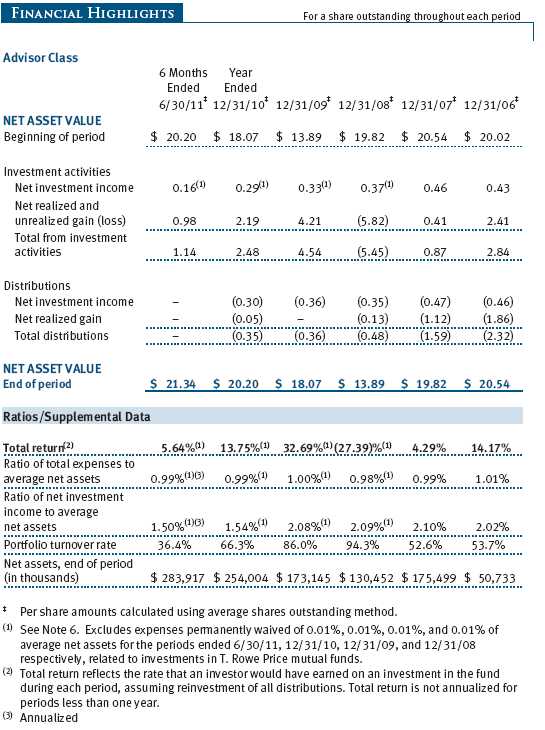
Against these objectives, the Capital Appreciation Fund generated strong absolute and relative performance and achieved all of its objectives. For the first half of 2011, your fund generated a 5.76% return relative to the S&P 500’s return of 6.02%, as shown in the Performance Comparison table on page 1. (The performance of Advisor Class shares was slightly lower, reflecting a different fee structure.) The fund generated strong risk-adjusted returns during this period by delivering 96% of the equity market’s return while only taking on 75% of the market’s risk. Using a more academic way of measuring the fund’s risk-adjusted return, your fund had a Sharpe ratio of 1.41 versus the S&P 500’s ratio of 1.11 (please see glossary for full definition).
As for our second objective—intermediate-term capital preservation—your fund generated a cumulative total return of 21.04% versus the S&P 500’s cumulative total return of 10.35% in the three-year period ended June 30, 2011. As for our final objective—equity-like returns with less risk than the market over a full market cycle—your fund generated a 35.82% cumulative return in the five-year period ended June 30, 2011, versus the S&P 500’s cumulative total return of 15.61%. Over the last five years, we were able to generate for our shareholders a return that was more than double the broader market’s return while assuming only 81% of the market’s risk. The fund’s five-year Sharpe ratio was 0.31 versus 0.06 for the S&P 500.
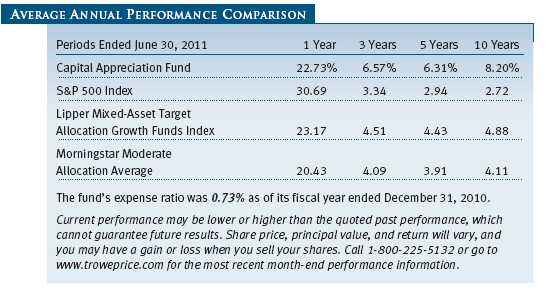
Finally, for the three- and five-year periods, we outperformed our Lipper and Morningstar peer group averages on an annualized basis.
In the last six months, we outperformed the peer group averages on a cumulative basis, as shown in the Performance Comparison table on page 1, but we did modestly underperform our more equity-sensitive Lipper benchmark over the last year. However, as I have stated in previous letters, we do not manage your fund to beat these benchmarks. The Capital Appreciation Fund has very different objectives than most of its benchmark peers. It is a unique fund with a focus on strong risk-adjusted returns, intermediate-term capital preservation, and long-term capital appreciation that does not fit neatly into any current benchmark.
Before we review the portfolio, we want to briefly discuss the Capital Appreciation Fund’s covered call overwriting strategy, which we have employed for more than three years. Covered call overwriting involves buying a stock and then selling a call option—a contract whereby we agree at a future date to sell the stock at a predetermined (strike) price if the stock is above the predetermined (strike) price. In return for selling this call option, we are paid a premium (typically 3% to 6% per annum) that provides extra income to the fund and its investors. While this strategy caps our upside in an individual stock (usually 10% or higher), it provides incremental income that can enhance total returns and lower our downside risk. Over the last three years, this strategy (return combination of underlying stocks, call income, and dividend income) has generated a stronger return than the fund itself and has done so with materially lower risk. As of June 30, 2011, a little more than 20% of our equity holdings have calls written against them. Given the excellent returns and even more excellent risk/reward profile of this strategy, we believe it will continue to play a meaningful role in your fund.
PORTFOLIO REVIEW
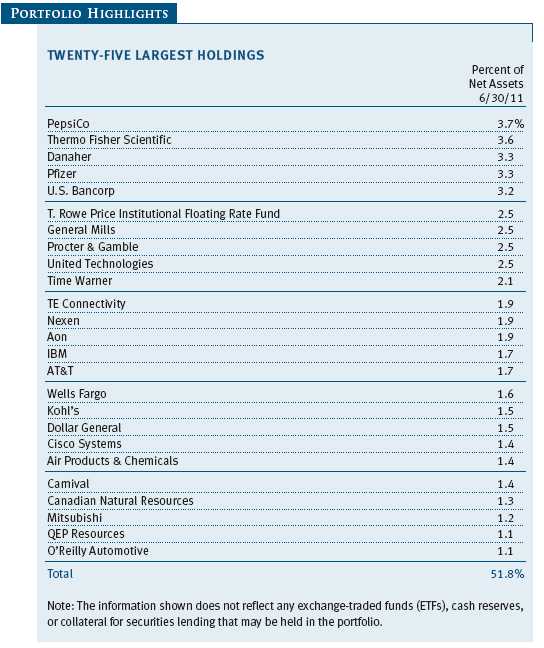
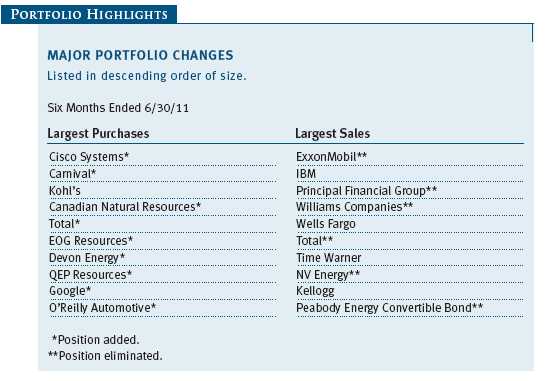
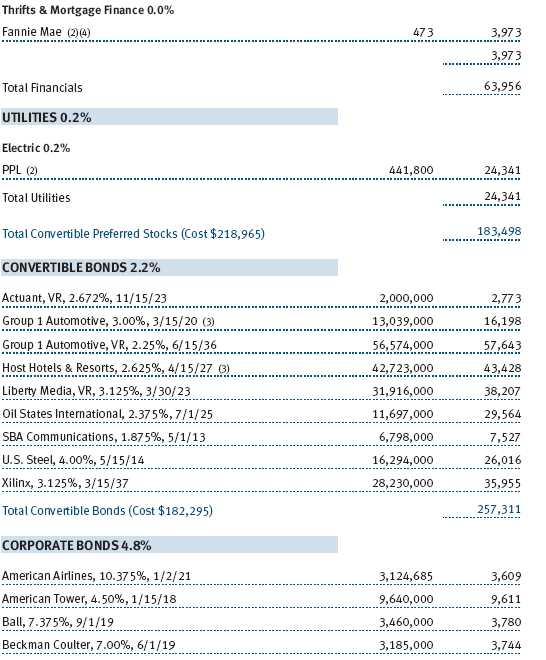
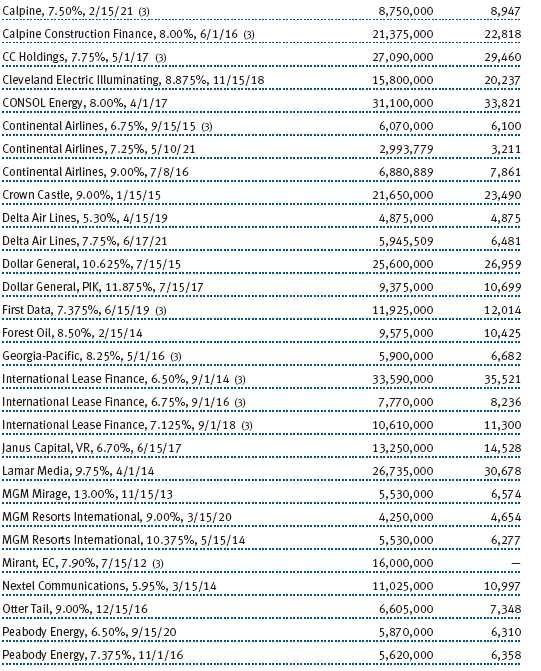
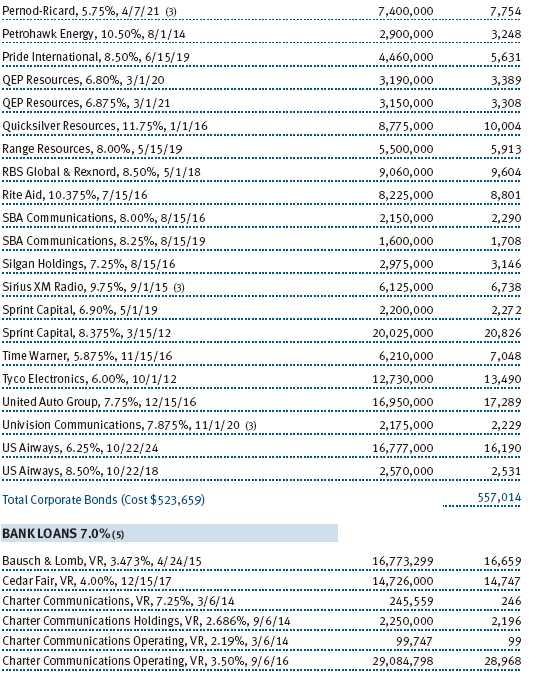
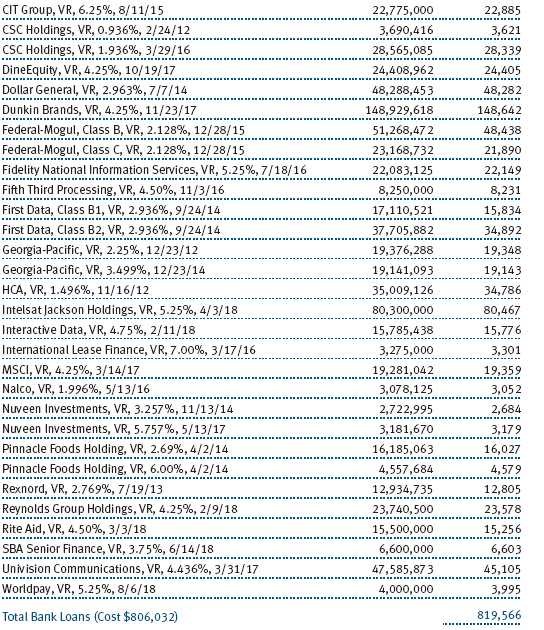
Within the equity part of the portfolio, financials was both a relative and absolute contributor to fund performance. This is despite the fact that financials was the worst-performing sector in the first half of the year, as our strong stock selection more than made up for this weakness. Aon was our top contributor within financials. Aon was primarily a large insurance brokerage firm, but it is beefing up its consulting business through its recent acquisition of Hewitt at the end of last year. Aon’s stock benefited from early signs that the soft insurance market globally is stabilizing, which positively affects Aon pricing trends. In addition, early signs are positive that the integration of Hewitt is on plan. Within financials, your fund initiated positions in a number of regional banks within the second quarter, including KeyCorp, SunTrust Bank, and Fifth Third Bancorp. We believe that regional bank valuations are enticing here. Also, M&A activity within the banking sector should be heating up over the next 12 to 24 months, and many of our holdings are potential takeover targets. (Please refer to the fund’s portfolio of investments for a complete list of holdings and the amount each represents in the portfolio.)

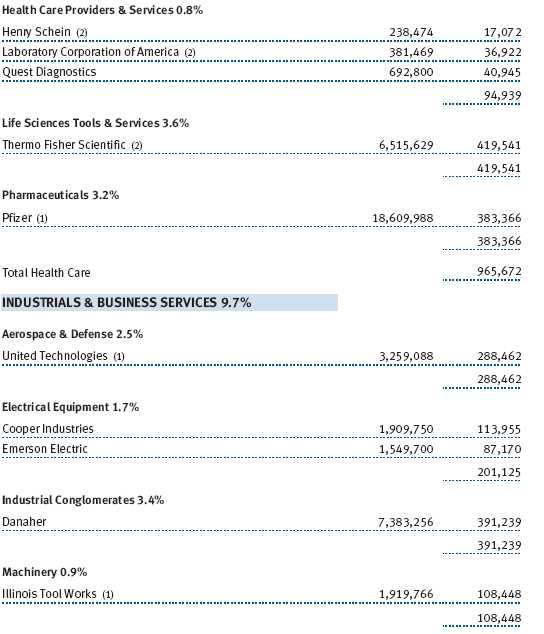
Our investments in the health care sector also added to your fund’s relative and absolute performance. In the first half of 2011, the health care sector was the best-performing sector in the market, and for the vast majority of this period, your fund was overweight this sector. The two largest contributors were Thermo Fisher Scientific and Pfizer. Thermo Fisher Scientific announced that it would be acquiring two life science companies that would add nicely to earnings as well as augment its revenue growth rate going forward. In addition, management continues to aggressively buy back its shares. The combination of these acquisitions and an aggressive share repurchase program is driving an expected acceleration in the company’s earnings per share growth rate for both 2011 and 2012. Pfizer’s share price benefited from increased share repurchase activity that is likely to support the company’s 2012 earnings projections despite a more difficult macro and regulatory environment. In addition, its new CEO Ian Read announced plans to sell or spin off Pfizer’s nutritional and animal health businesses. Near the end of the second quarter, your fund began to reduce its exposure to the health care sector given its year-to-date strength. In addition, we are concerned about the potential implications of global deficit reduction on the health care space.
Our investments in the energy sector added to the fund’s absolute returns but detracted from relative returns. Your fund was underweight energy during a period when it outperformed, and our energy holdings modestly underperformed the sector. Turmoil throughout the Middle East and North Africa resulted in a virtual elimination of Libyan oil exports thereby reducing OPEC’s spare capacity and driving oil prices higher. Your fund benefited from its exposure to Williams Companies and El Paso Corporation, which both announced corporate restructurings that will result in spin-offs of their exploration and production businesses from their midstream and pipeline businesses. However, the strength in these two stocks was offset by continued weakness in our holdings of Nexen. Nexen underperformed as the U.K. government raised taxes on North Sea oil production—Nexen’s largest source of cash flow. Also, the company continued to struggle to ramp up production at its Long Lake Canadian oil sands project and had some temporary operational challenges in the North Sea. While Nexen has been a frustrating stock, we continue to believe there is value here to be unlocked. The Nexen assets, with the exception of Long Lake, are high-quality assets, and with the stock trading at a significant discount to the underlying value of those assets, we see the potential for material upside.
PORTFOLIO STRATEGY AND OUTLOOK
Today, we find ourselves at a crossroads with regard to both the market and the economy. On the positive side of the ledger, corporate balance sheets are in great shape, interest rates remain low, M&A activity could make a strong comeback, and emerging market economies are still growing nicely. While equity valuations are reasonable on an absolute basis, they appear much more attractive relative to other asset classes that are very expensive on a historical basis (such as government bonds, high yield bonds, investment-grade bonds, and convertibles). In addition, large U.S. publicly traded companies have access to very inexpensive debt and, in many cases, are sitting with excess cash on their balance sheets. The use of this excess cash and cheap borrowing capacity could drive earnings growth and shareholder wealth if management teams focus on shareholder returns instead of on building empires.
On the negative side of the ledger, the U.S. economy, despite the extension of tax cuts and significant economic and monetary stimulus, cannot seem to create enough jobs to drive down the unemployment rate. The sovereign credit challenges of Greece, Spain, Ireland, and Portugal now appear to be spreading to Italy. After going through a painful deleveraging of the U.S. consumer and the negative impacts of this on global economic growth since 2008, the question of whether the developed market governments need to go through a similar deleveraging to reduce their deficits is now front and center. Moving from fiscal stimulus to fiscal austerity is likely to depress developed market economic growth for the foreseeable future. If developed market governments reduce their budget deficits and economic growth slows, global growth will depend even more on emerging markets to generate the lion’s share of this growth.
As we highlighted previously in this letter, we are not economists and do not pretend to have a crystal ball with regard to the future. Today, we can paint a very real scenario whereby the U.S. and Western European economies deal with their debt challenges in a thoughtful way; the current U.S. soft patch is just that, with stronger growth in the second half of the year; M&A activity takes off and drives the stock market higher; and emerging markets continue to grow at high rates. We can paint another very real scenario that the sovereign credit issues in Europe worsen and spread; the soft patch in the U.S. continues and worsens in 2012 when fiscal policy is expected to be a headwind to GDP growth; and emerging market growth slows more dramatically than expected, driven by rate hikes and overheated construction markets. The expected outcome is likely somewhere in the middle, but the binary outcomes discussed before cannot be ruled out.
So how are we positioning the portfolio, and where do we see value today? Among equities, we continue to tilt the portfolio toward higher-quality and more stable companies. The consumer staples sector remains our largest overweight. In addition, we are looking for companies that are not entirely dependent on the economic environment in order to create value for shareholders. Companies that are paying attractive dividends, are buying back stock, and could be M&A candidates where we are not paying for that optionality possess the attractive features we are seeking today. Within fixed income, we have very limited exposure to high yield and investment-grade debt, as those asset classes are not attractive from either an absolute yield perspective or a risk-adjusted return perspective. We continue to favor leveraged loans, especially those with strict covenants. While the expected yields from high-quality leveraged loans are only 5% to 7%, we are somewhat protected from higher interest rates given the floating rate feature of these instruments. In addition, if the economy were to turn south, the ultimate risk of loss in most of these holdings is small because leveraged loans are at the top of a company’s capital structure and thus senior to stocks and bonds in the unlikely event of bankruptcy.
IN CLOSING
As always, I would like to thank the members of the fund’s Investment Advisory Committee for their valuable input in the first half of 2011. This team, which comprises portfolio managers, quantitative analysts and portfolio managers, fixed income analysts, and equity analysts with many decades of combined investment experience, is responsible for the oversight of your fund and is supported by a growing global equity and fixed income platform of more than 185 analysts.
Respectfully submitted,

David R. Giroux
Chairman of the fund’s Investment Advisory Committee
July 26, 2011
The committee chairman has day-to-day responsibility for managing the portfolio and works with committee members in developing and executing the fund’s investment program.
RISKS OF INVESTING
As with all stock and bond mutual funds, the fund’s share price can fall because of weakness in the stock or bond markets, a particular industry, or specific holdings. Stock markets can decline for many reasons, including adverse political or economic developments, changes in investor psychology, or heavy institutional selling. The prospects for an industry or company may deteriorate because of a variety of factors, including disappointing earnings or changes in the competitive environment. In addition, the investment manager’s assessment of companies held in a fund may prove incorrect, resulting in losses or poor performance even in rising markets. A sizable cash or fixed income position may hinder the fund from participating fully in a strong, rapidly rising bull market. In addition, significant exposure to bonds increases the risk that the fund’s share value could be hurt by rising interest rates or credit downgrades or defaults. Convertible securities are also exposed to price fluctuations of the company’s stock.
GLOSSARY
Lipper indexes: Fund benchmarks that consist of a small number of the largest mutual funds in a particular category as tracked by Lipper Inc.
Morningstar Moderate Allocation Average: Tracks the performance of funds that seek both moderate capital appreciation and income by investing in stocks, bonds, and cash.
Sharpe ratio: A measure of the risk-adjusted return of a portfolio. The Sharpe ratio measures how much a portfolio’s return is above or below the Treasury rate (excess return) per unit risk (measured by standard deviation). In general, the larger the number, the better the portfolio’s historical risk-adjusted return.
S&P 500 Stock Index: An unmanaged index that tracks the stocks of 500 primarily large-cap U.S. companies.
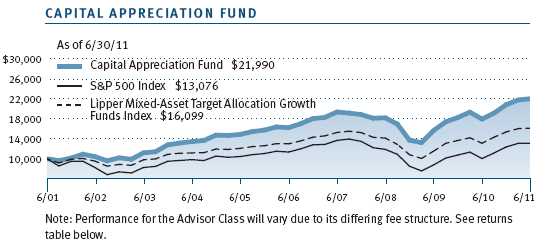
Performance and Expenses
This chart shows the value of a hypothetical $10,000 investment in the fund over the past 10 fiscal year periods or since inception (for funds lacking 10-year records). The result is compared with benchmarks, which may include a broad-based market index and a peer group average or index. Market indexes do not include expenses, which are deducted from fund returns as well as mutual fund averages and indexes.
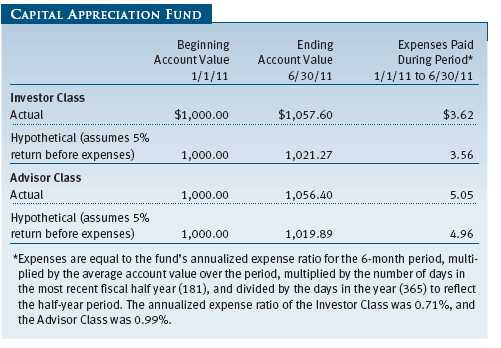
As a mutual fund shareholder, you may incur two types of costs: (1) transaction costs, such as redemption fees or sales loads, and (2) ongoing costs, including management fees, distribution and service (12b-1) fees, and other fund expenses. The following example is intended to help you understand your ongoing costs (in dollars) of investing in the fund and to compare these costs with the ongoing costs of investing in other mutual funds. The example is based on an investment of $1,000 invested at the beginning of the most recent six-month period and held for the entire period.
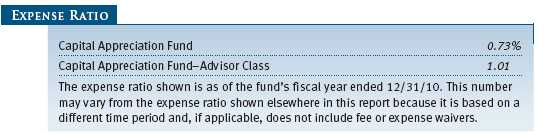
Please note that the fund has two share classes: The original share class (“investor class”) charges no distribution and service (12b-1) fee, and the Advisor Class shares are offered only through unaffiliated brokers and other financial intermediaries and charge a 0.25% 12b-1 fee. Each share class is presented separately in the table.
Actual Expenses
The first line of the following table (“Actual”) provides information about actual account values and expenses based on the fund’s actual returns. You may use the information on this line, together with your account balance, to estimate the expenses that you paid over the period. Simply divide your account value by $1,000 (for example, an $8,600 account value divided by $1,000 = 8.6), then multiply the result by the number on the first line under the heading “Expenses Paid During Period” to estimate the expenses you paid on your account during this period.
Hypothetical Example for Comparison Purposes
The information on the second line of the table (“Hypothetical”) is based on hypothetical account values and expenses derived from the fund’s actual expense ratio and an assumed 5% per year rate of return before expenses (not the fund’s actual return). You may compare the ongoing costs of investing in the fund with other funds by contrasting this 5% hypothetical example and the 5% hypothetical examples that appear in the shareholder reports of the other funds. The hypothetical account values and expenses may not be used to estimate the actual ending account balance or expenses you paid for the period.
Note: T. Rowe Price charges an annual account service fee of $20, generally for accounts with less than $10,000 ($1,000 for UGMA/UTMA). The fee is waived for any investor whose T. Rowe Price mutual fund accounts total $50,000 or more; accounts employing automatic investing; accounts electing to receive electronic delivery of account statements, transaction confirmations, and prospectuses and shareholder reports; accounts of an investor who is a T. Rowe Price Preferred Services, Personal Services, or Enhanced Personal Services client (enrollment in these programs generally requires T. Rowe Price assets of at least $100,000); and IRAs and other retirement plan accounts that utilize a prototype plan sponsored by T. Rowe Price (although a separate custodial or administrative fee may apply to such accounts). This fee is not included in the accompanying table. If you are subject to the fee, keep it in mind when you are estimating the ongoing expenses of investing in the fund and when comparing the expenses of this fund with other funds.
You should also be aware that the expenses shown in the table highlight only your ongoing costs and do not reflect any transaction costs, such as redemption fees or sales loads. Therefore, the second line of the table is useful in comparing ongoing costs only and will not help you determine the relative total costs of owning different funds. To the extent a fund charges transaction costs, however, the total cost of owning that fund is higher.
Unaudited
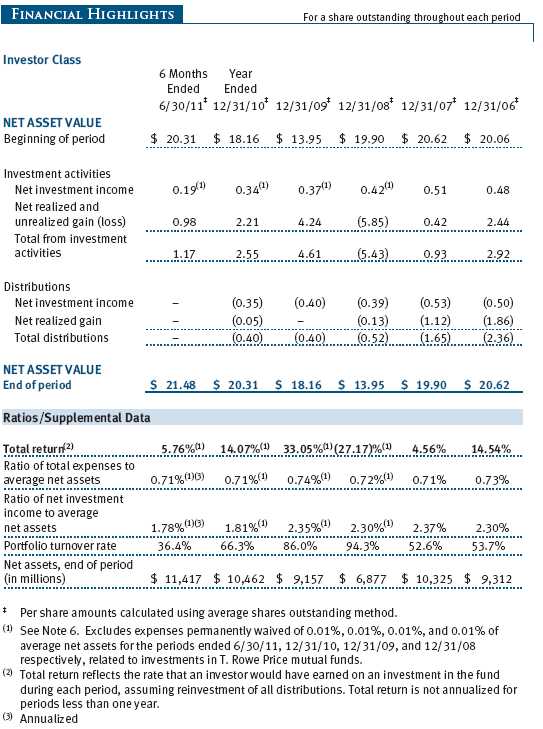
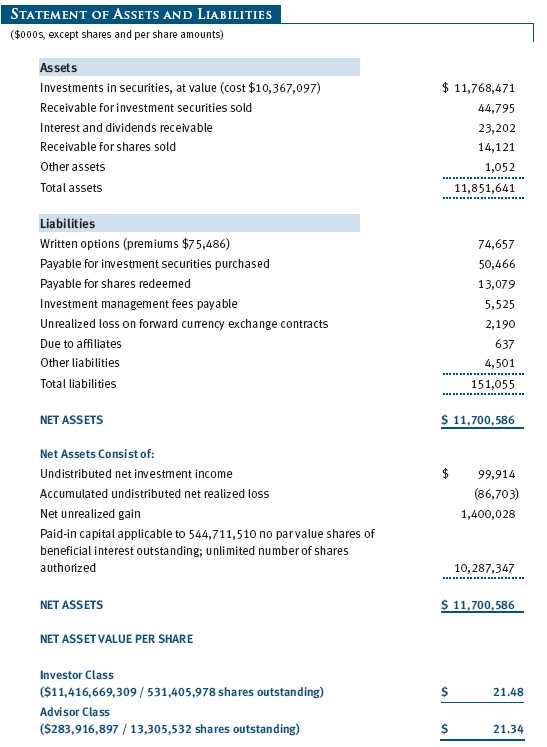
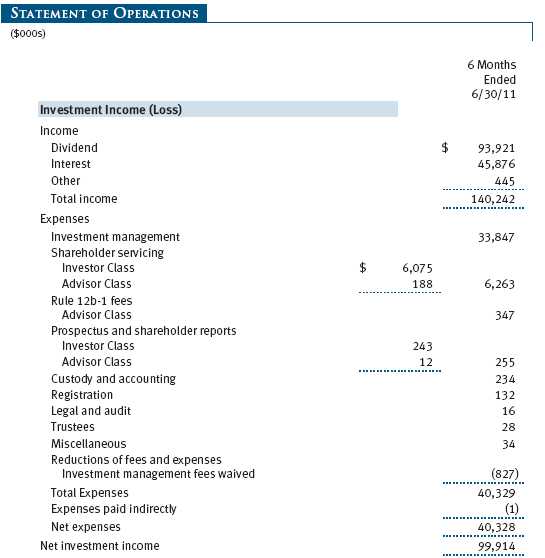
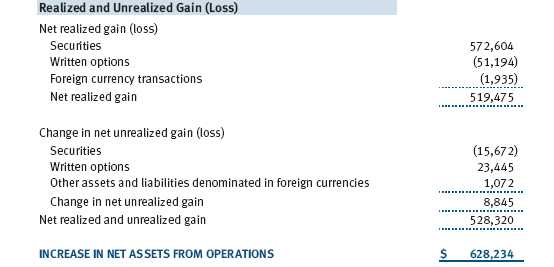
The accompanying notes are an integral part of these financial statements.
Unaudited
The accompanying notes are an integral part of these financial statements.
Unaudited


The accompanying notes are an integral part of these financial statements.
Unaudited
The accompanying notes are an integral part of these financial statements.
Unaudited
The accompanying notes are an integral part of these financial statements.
Unaudited

The accompanying notes are an integral part of these financial statements.
Unaudited
| NOTES TO FINANCIAL STATEMENTS |
T. Rowe Price Capital Appreciation Fund (the fund), is registered under the Investment Company Act of 1940 (the 1940 Act) as a diversified, open-end management investment company. The fund seeks long-term capital appreciation by investing primarily in common stocks. It may also hold fixed-income and other securities to help preserve principal value. The fund has two classes of shares: the Capital Appreciation Fund original share class, referred to in this report as the Investor Class, offered since June 30, 1986, and the Capital Appreciation Fund—Advisor Class (Advisor Class), offered since December 31, 2004. Advisor Class shares are sold only through unaffiliated brokers and other unaffiliated financial intermediaries that are compensated by the class for distribution, shareholder servicing, and/or certain administrative services under a Board-approved Rule 12b-1 plan. Each class has exclusive voting rights on matters related solely to that class; separate voting rights on matters that relate to both classes; and, in all other respects, the same rights and obligations as the other class.
NOTE 1 - SIGNIFICANT ACCOUNTING POLICIES
Basis of Preparation The accompanying financial statements were prepared in accordance with accounting principles generally accepted in the United States of America (GAAP), which require the use of estimates made by management. Management believes that estimates and valuations are appropriate; however, actual results may differ from those estimates, and the valuations reflected in the accompanying financial statements may differ from the value ultimately realized upon sale or maturity.
Investment Transactions, Investment Income, and Distributions Income and expenses are recorded on the accrual basis. Premiums and discounts on debt securities are amortized for financial reporting purposes. Dividends received from mutual fund investments are reflected as dividend income; capital gain distributions are reflected as realized gain/loss. Dividend income and capital gain distributions are recorded on the ex-dividend date. Income tax-related interest and penalties, if incurred, would be recorded as income tax expense. Investment transactions are accounted for on the trade date. Realized gains and losses are reported on the identified cost basis. Distributions to shareholders are recorded on the ex-dividend date. Income distributions are declared and paid by each class annually. Capital gain distributions, if any, are generally declared and paid by the fund annually.
Currency Translation Assets, including investments, and liabilities denominated in foreign currencies are translated into U.S. dollar values each day at the prevailing exchange rate, using the mean of the bid and asked prices of such currencies against U.S. dollars as quoted by a major bank. Purchases and sales of securities, income, and expenses are translated into U.S. dollars at the prevailing exchange rate on the date of the transaction. The effect of changes in foreign currency exchange rates on realized and unrealized security gains and losses is reflected as a component of security gains and losses.
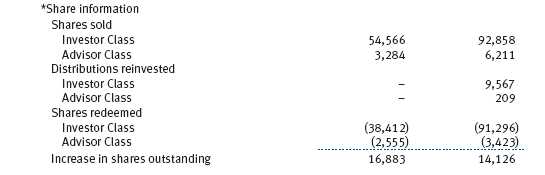
Class Accounting The Advisor Class pays distribution, shareholder servicing, and/or certain administrative expenses in the form of Rule 12b-1 fees, in an amount not exceeding 0.25% of the class’s average daily net assets. Shareholder servicing, prospectus, and shareholder report expenses incurred by each class are charged directly to the class to which they relate. Expenses common to both classes, investment income, and realized and unrealized gains and losses are allocated to the classes based upon the relative daily net assets of each class.
Rebates and Credits Subject to best execution, the fund may direct certain security trades to brokers who have agreed to rebate a portion of the related brokerage commission to the fund in cash. Commission rebates are reflected as realized gain on securities in the accompanying financial statements and totaled $112,000 for the six months ended June 30, 2011. Additionally, the fund earns credits on temporarily uninvested cash balances held at the custodian, which reduce the fund’s custody charges. Custody expense in the accompanying financial statements is presented before reduction for credits, which are reflected as expenses paid indirectly.
NOTE 2 - VALUATION
The fund’s financial instruments are reported at fair value as defined by GAAP. The fund determines the values of its assets and liabilities and computes each class’s net asset value per share at the close of the New York Stock Exchange (NYSE), normally 4 p.m. ET, each day that the NYSE is open for business.
Valuation Methods Equity securities listed or regularly traded on a securities exchange or in the over-the-counter (OTC) market are valued at the last quoted sale price or, for certain markets, the official closing price at the time the valuations are made, except for OTC Bulletin Board securities, which are valued at the mean of the latest bid and asked prices. A security that is listed or traded on more than one exchange is valued at the quotation on the exchange determined to be the primary market for such security. Listed securities not traded on a particular day are valued at the mean of the latest bid and asked prices for domestic securities and the last quoted sale price for international securities.
Debt securities are generally traded in the OTC market. Securities with remaining maturities of one year or more at the time of acquisition are valued at prices furnished by dealers who make markets in such securities or by an independent pricing service, which considers the yield or price of bonds of comparable quality, coupon, maturity, and type, as well as prices quoted by dealers who make markets in such securities. Securities with remaining maturities of less than one year at the time of acquisition generally use amortized cost in local currency to approximate fair value. However, if amortized cost is deemed not to reflect fair value or the fund holds a significant amount of such securities with remaining maturities of more than 60 days, the securities are valued at prices furnished by dealers who make markets in such securities or by an independent pricing service.
Investments in mutual funds are valued at the mutual fund’s closing net asset value per share on the day of valuation. Purchased and written options are valued at the mean of the closing bid and asked prices. Forward currency exchange contracts are valued using the prevailing forward exchange rate.
Other investments, including restricted securities, and those financial instruments for which the above valuation procedures are inappropriate or are deemed not to reflect fair value are stated at fair value as determined in good faith by the T. Rowe Price Valuation Committee, established by the fund’s Board of Trustees.
For valuation purposes, the last quoted prices of non-U.S. equity securities may be adjusted under the circumstances described below. If the fund determines that developments between the close of a foreign market and the close of the NYSE will, in its judgment, materially affect the value of some or all of its portfolio securities, the fund will adjust the previous closing prices to reflect what it believes to be the fair value of the securities as of the close of the NYSE. In deciding whether it is necessary to adjust closing prices to reflect fair value, the fund reviews a variety of factors, including developments in foreign markets, the performance of U.S. securities markets, and the performance of instruments trading in U.S. markets that represent foreign securities and baskets of foreign securities. A fund may also fair value securities in other situations, such as when a particular foreign market is closed but the fund is open. The fund uses outside pricing services to provide it with closing prices and information to evaluate and/or adjust those prices. The fund cannot predict how often it will use closing prices and how often it will determine it necessary to adjust those prices to reflect fair value. As a means of evaluating its security valuation process, the fund routinely compares closing prices, the next day’s opening prices in the same markets, and adjusted prices.
Valuation Inputs Various inputs are used to determine the value of the fund’s financial instruments. These inputs are summarized in the three broad levels listed below:
Level 1 – quoted prices in active markets for identical financial instruments
Level 2 – observable inputs other than Level 1 quoted prices (including, but not limited to, quoted prices for similar financial instruments, interest rates, prepayment speeds, and credit risk)
Level 3 – unobservable inputs
Observable inputs are those based on market data obtained from sources independent of the fund, and unobservable inputs reflect the fund’s own assumptions based on the best information available. The input levels are not necessarily an indication of the risk or liquidity associated with financial instruments at that level. For example, non-U.S. equity securities actively traded in foreign markets generally are reflected in Level 2 despite the availability of closing prices because the fund evaluates and determines whether those closing prices reflect fair value at the close of the NYSE or require adjustment, as described above. The following table summarizes the fund’s financial instruments, based on the inputs used to determine their values on June 30, 2011:

NOTE 3 - DERIVATIVE INSTRUMENTS
During the six months ended June 30, 2011, the fund invested in derivative instruments. As defined by GAAP, a derivative is a financial instrument whose value is derived from an underlying security price, foreign exchange rate, interest rate, index of prices or rates, or other variable; it requires little or no initial investment and permits or requires net settlement. The fund invests in derivatives only if the expected risks and rewards are consistent with its investment objectives, policies, and overall risk profile, as described in its prospectus and Statement of Additional Information. The fund may use derivatives for a variety of purposes, such as seeking to hedge against declines in principal value, increase yield, invest in an asset with greater efficiency and at a lower cost than is possible through direct investment, or to adjust credit exposure. The risks associated with the use of derivatives are different from, and potentially much greater than, the risks associated with investing directly in the instruments on which the derivatives are based. Investments in derivatives can magnify returns positively or negatively; however, the fund at all times maintains sufficient cash reserves, liquid assets, or other SEC-permitted asset types to cover the settlement obligations under its open derivative contracts.
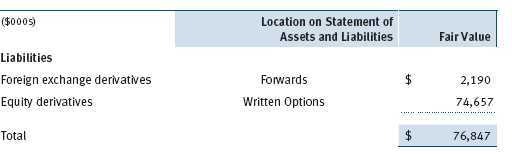
The fund values its derivatives at fair value, as described below and in Note 2, and recognizes changes in fair value currently in its results of operations. Accordingly, the fund does not follow hedge accounting, even for derivatives employed as economic hedges. The fund does not offset the fair value of derivative instruments against the right to reclaim or obligation to return collateral. The following table summarizes the fair value of the fund’s derivative instruments held as of June 30, 2011, and the related location on the accompanying Statement of Assets and Liabilities, presented by primary underlying risk exposure:
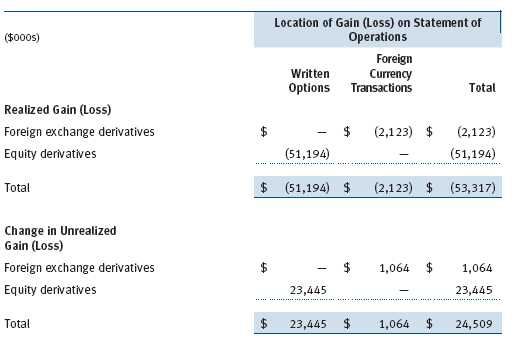
Additionally, the amount of gains and losses on derivative instruments recognized in fund earnings during the six months ended June 30, 2011, and the related location on the accompanying Statement of Operations is summarized in the following table by primary underlying risk exposure:
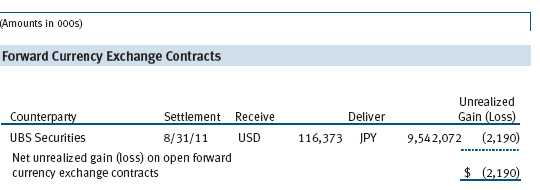
Forward Currency Exchange Contracts The fund is subject to foreign currency exchange rate risk in the normal course of pursuing its investment objectives. It uses forward currency exchange contracts (forwards) primarily to protect its non-U.S. dollar-denominated securities from adverse currency movements relative to the U.S. dollar. A forward involves an obligation to purchase or sell a fixed amount of a specific currency on a future date at a price set at the time of the contract. Although certain forwards may be settled by exchanging only the net gain or loss on the contract, most forwards are settled with the exchange of the underlying currencies in accordance with the specified terms. Forwards are valued at the unrealized gain or loss on the contract, which reflects the net amount the fund either is entitled to receive or obligated to deliver, as measured by the difference between the forward exchange rates at the date of entry into the contract and the forward rates at the reporting date. Appreciated forwards are reflected as assets, and depreciated forwards are reflected as liabilities on the accompanying Statement of Assets and Liabilities. Risks related to the use of forwards include the possible failure of counterparties to meet the terms of the agreements; that anticipated currency movements will not occur, thereby reducing the fund’s total return; and the potential for losses in excess of the fund’s initial investment. During the six months ended June 30, 2011, the fund’s exposure to forwards, based on underlying notional amounts, was generally between 0% and 2% of net assets.
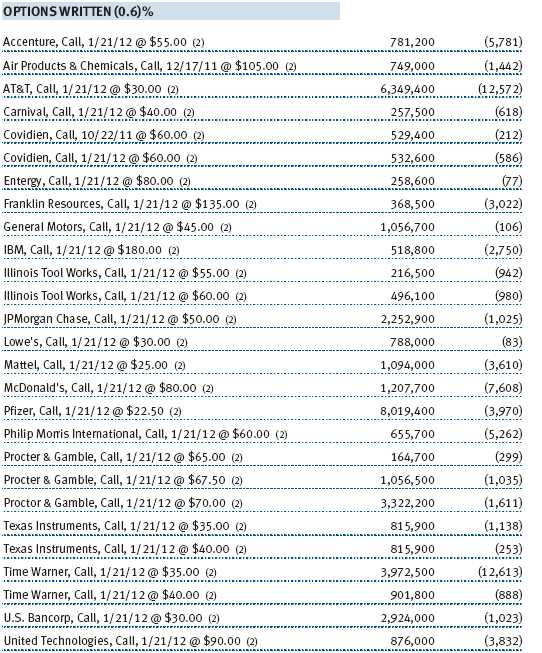
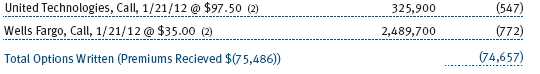
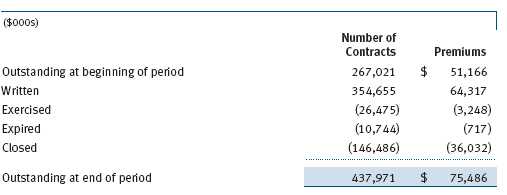
Options The fund is subject to equity price risk in the normal course of pursuing its investment objectives and uses options to help manage such risk. The fund may use call and put options to manage exposure to interest rates, security prices, foreign currencies, and credit quality; as an efficient means of adjusting exposure to all or a part of a target market; to enhance income; as a cash management tool; and/or to adjust credit exposure. Call and put options give the holder the right, in return for a premium paid, to purchase or sell, respectively, a security at a specified exercise price at any time during the period of the option. Options are included in net assets at fair value; purchased options are included in Investments in Securities; and written options are separately reflected as a liability on the accompanying Statement of Assets and Liabilities. Premiums on unexercised, expired options are recorded as realized gains or losses; premiums on exercised options are recorded as an adjustment to the proceeds from the sale or cost of the purchase. The difference between the premium and the amount received or paid in a closing transaction is also treated as realized gain or loss. Risks related to the use of options include possible illiquidity of the options markets; trading restrictions imposed by an exchange; movements in underlying security values; and for written options, potential losses in excess of the fund’s initial investment. During the six months ended June 30, 2011, the fund’s exposure to options, based on underlying notional amounts, was generally less than 1% of net assets. Transactions in written options and related premiums received during the six months ended June 30, 2011, were as follows:
NOTE 4 - OTHER INVESTMENT TRANSACTIONS
Consistent with its investment objective, the fund engages in the following practices to manage exposure to certain risks and/or to enhance performance. The investment objective, policies, program, and risk factors of the fund are described more fully in the fund’s prospectus and Statement of Additional Information.
Restricted Securities The fund may invest in securities that are subject to legal or contractual restrictions on resale. Prompt sale of such securities at an acceptable price may be difficult and may involve substantial delays and additional costs.
Bank Loans The fund may invest in bank loans, which represent an interest in amounts owed by a borrower to a syndication of lenders. Bank loans may involve multiple loans with the same borrower under a single credit agreement (each loan, a tranche) and each tranche may have different terms and associated risks. A bank or other financial institution typically acts as the agent and administers a bank loan in accordance with the associated credit agreement. Bank loans are generally noninvestment grade and often involve borrowers whose financial condition is troubled or uncertain and companies that are highly leveraged. The fund may buy and sell bank loans in the form of either loan assignments or loan participations. A loan assignment transfers all legal, beneficial, and economic rights to the buyer. Although loan assignments continue to be administered by the agent, the buyer acquires direct rights against the borrower. In many cases, a loan assignment requires the consent of both the borrower and the agent. In contrast, a loan participation generally entitles the buyer to receive the cash flows from principal, interest, and any fee payments that the seller is entitled to receive from the borrower; however, the seller continues to hold legal title to the loan. As a result, with loan participations, the buyer generally has no right to enforce compliance with the terms of the credit agreement against the borrower, and the buyer is subject to the credit risk of both the borrower and the seller. Bank loans often have extended settlement periods, during which the fund is subject to nonperformance by the counterparty. A portion of the fund’s bank loans may require additional principal to be funded at the borrowers’ discretion at a later date (unfunded commitments) and bank loans usually may be repaid at any time at the option of the borrower. The fund reflects both the funded portion of the bank loan as well as any unfunded commitment on the loan in the Portfolio of Investments.
Counterparty Risk and Collateral The fund has entered into collateral agreements with certain counterparties to mitigate counterparty risk associated with certain over-the-counter (OTC) financial instruments, including swaps, forward currency exchange contracts, TBA purchase commitments, and OTC options (collectively, covered OTC instruments). Subject to certain minimum exposure requirements (which typically range from $100,000 to $500,000), collateral requirements generally are determined and transfers made based on the net aggregate unrealized gain or loss on all OTC instruments covered by a particular collateral agreement with a specified counterparty. Collateral, both pledged by the fund to a counterparty and pledged by a counterparty to the fund, is held in a segregated account by a third-party agent and can be in the form of cash or debt securities issued by the U.S. government or related agencies. Securities posted as collateral by the fund to a counterparty are so noted in the accompanying Portfolio of Investments and remain in the fund’s net assets. In accordance with GAAP, cash pledge by counterparties to the fund is included in the fund’s net assets; however, securities pledged by counterparties to the fund are not recorded by the fund. As of June 30, 2011, no collateral was pledged by either the fund or counterparties.
At any point in time, the fund’s risk of loss from counterparty credit risk on covered OTC instruments is the aggregate unrealized gain on appreciated covered OTC instruments in excess of collateral, if any, pledged by the counterparty to the fund. Counterparty risk related to exchange-traded futures and options contracts is minimal because the exchange’s clearinghouse provides protection against counterparty defaults. In accordance with the terms of the relevant derivatives agreements, counterparties to OTC derivatives may be able to terminate derivative contracts prior to maturity after the occurrence of certain stated events, such as a decline in net assets above a certain percentage or a failure by the fund to perform its obligations under the contract. Upon termination, all transactions would typically be liquidated and a net amount would be owed by or payable to the fund. Generally, for exchange-traded derivatives such as futures and options, each broker, in its sole discretion, may change margin requirements applicable to the fund.
Other Purchases and sales of portfolio securities other than short-term securities aggregated $4,259,239,000 and $3,675,358,000, respectively, for the six months ended June 30, 2011.
NOTE 5 - FEDERAL INCOME TAXES
No provision for federal income taxes is required since the fund intends to continue to qualify as a regulated investment company under Subchapter M of the Internal Revenue Code and distribute to shareholders all of its taxable income and gains. Distributions determined in accordance with federal income tax regulations may differ in amount or character from net investment income and realized gains for financial reporting purposes. Financial reporting records are adjusted for permanent book/tax differences to reflect tax character but are not adjusted for temporary differences. The amount and character of tax-basis distributions and composition of net assets are finalized at fiscal year-end; accordingly, tax-basis balances have not been determined as of the date of this report.
In accordance with federal tax regulations, the fund recognized capital losses in the current period for tax purposes that had been recognized in the prior fiscal year for financial reporting purposes. Such deferrals relate to net capital losses realized between November 1, 2010 and December 31, 2010, and totaled $3,385,000. The fund intends to retain realized gains to the extent of available capital loss carryforwards. As of December 31, 2010, the fund had $580,983,000 of unused capital loss carryforwards, which expire in fiscal 2017.
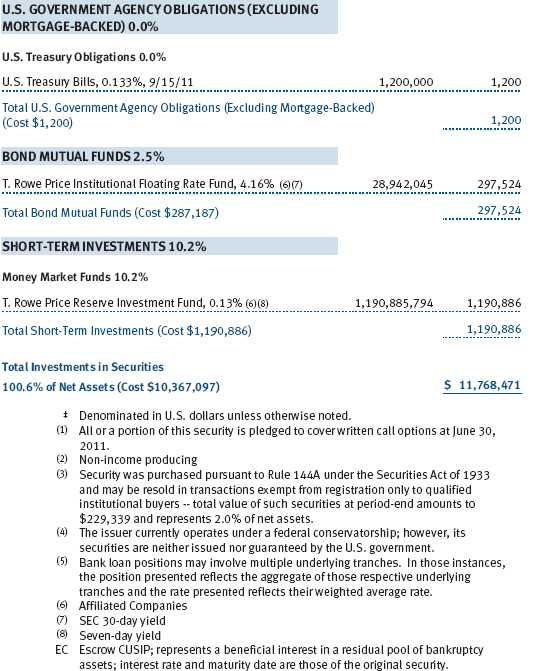
At June 30, 2011, the cost of investments for federal income tax purposes was $10,367,097,000. Net unrealized gain aggregated $1,400,028,000 at period-end, of which $1,536,037,000 related to appreciated investments and $136,009,000 related to depreciated investments.
NOTE 6 - RELATED PARTY TRANSACTIONS
The fund is managed by T. Rowe Price Associates, Inc. (Price Associates), a wholly owned subsidiary of T. Rowe Price Group, Inc. (Price Group). The investment management agreement between the fund and Price Associates provides for an annual investment management fee, which is computed daily and paid monthly. The fee consists of an individual fund fee, equal to 0.30% of the fund’s average daily net assets, and a group fee. The group fee rate is calculated based on the combined net assets of certain mutual funds sponsored by Price Associates (the group) applied to a graduated fee schedule, with rates ranging from 0.48% for the first $1 billion of assets to 0.28% for assets in excess of $300 billion. The fund’s group fee is determined by applying the group fee rate to the fund’s average daily net assets. At June 30, 2011, the effective annual group fee rate was 0.30%.
In addition, the fund has entered into service agreements with Price Associates and two wholly owned subsidiaries of Price Associates (collectively, Price). Price Associates computes the daily share prices and provides certain other administrative services to the fund. T. Rowe Price Services, Inc., provides shareholder and administrative services in its capacity as the fund’s transfer and dividend disbursing agent. T. Rowe Price Retirement Plan Services, Inc., provides subaccounting and recordkeeping services for certain retirement accounts invested in the Investor Class. For the six months ended June 30, 2011, expenses incurred pursuant to these service agreements were $102,000 for Price Associates; $2,429,000 for T. Rowe Price Services, Inc.; and $738,000 for T. Rowe Price Retirement Plan Services, Inc. The total amount payable at period-end pursuant to these service agreements is reflected as Due to Affiliates in the accompanying financial statements.
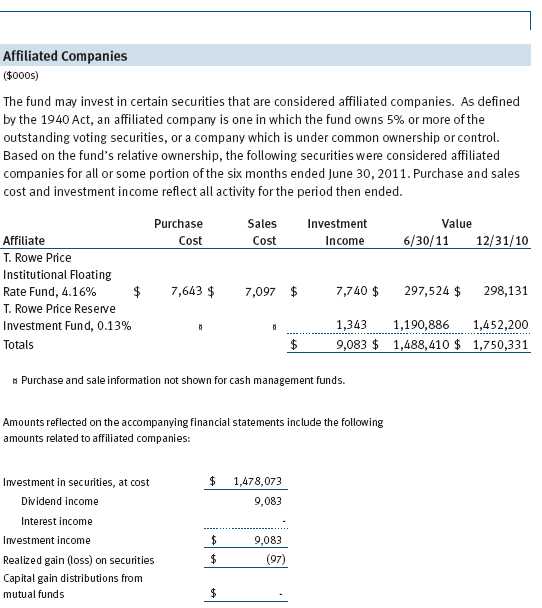
The fund may invest in the T. Rowe Price Reserve Investment Fund and the T. Rowe Price Government Reserve Investment Fund (collectively, the T. Rowe Price Reserve Investment Funds), open-end management investment companies managed by Price Associates and considered affiliates of the fund. The T. Rowe Price Reserve Investment Funds are offered as cash management options to mutual funds, trusts, and other accounts managed by Price Associates and/or its affiliates and are not available for direct purchase by members of the public. The T. Rowe Price Reserve Investment Funds pay no investment management fees.
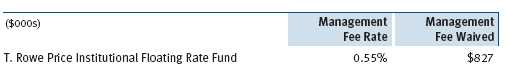
The fund may also invest in certain T. Rowe Price institutional funds (underlying institutional funds) as a means of gaining efficient and cost-effective exposure to certain markets. The underlying institutional funds are open-end management investment companies managed by Price Associates, and are considered affiliates of the fund. Each underlying institutional fund pays an all-inclusive management and administrative fee to Price Associates. To ensure that the fund does not incur duplicate fees, Price Associates has agreed to permanently waive a portion of its management fee charged to the fund in an amount sufficient to fully offset the management fees paid by the underlying institutional funds related to fund assets invested therein. Accordingly, the accompanying Statement of Operations includes management fees permanently waived pursuant to this agreement. Annual fee rates and amounts waived within the accompanying Statement of Operations related to shares of the underlying institutional funds for the six months ended June 30, 2011, are as follows:
| INFORMATION ON PROXY VOTING POLICIES, PROCEDURES, AND RECORDS |
A description of the policies and procedures used by T. Rowe Price funds and portfolios to determine how to vote proxies relating to portfolio securities is available in each fund’s Statement of Additional Information, which you may request by calling 1-800-225-5132 or by accessing the SEC’s website, sec.gov. The description of our proxy voting policies and procedures is also available on our website, troweprice.com. To access it, click on the words “Our Company” at the top of our corporate homepage. Then, when the next page appears, click on the words “Proxy Voting Policies” on the left side of the page.
Each fund’s most recent annual proxy voting record is available on our website and through the SEC’s website. To access it through our website, follow the directions above, then click on the words “Proxy Voting Records” on the right side of the Proxy Voting Policies page.
| HOW TO OBTAIN QUARTERLY PORTFOLIO HOLDINGS |
The fund files a complete schedule of portfolio holdings with the Securities and Exchange Commission for the first and third quarters of each fiscal year on Form N-Q. The fund’s Form N-Q is available electronically on the SEC’s website (sec.gov); hard copies may be reviewed and copied at the SEC’s Public Reference Room, 450 Fifth St. N.W., Washington, DC 20549. For more information on the Public Reference Room, call 1-800-SEC-0330.
| APPROVAL OF INVESTMENT MANAGEMENT AGREEMENT |
On March 9, 2011, the fund’s Board of Directors (Board) unanimously approved the continuation of the investment advisory contract (Contract) between the fund and its investment advisor, T. Rowe Price Associates, Inc. (Advisor). The Board considered a variety of factors in connection with its review of the Contract, also taking into account information provided by the Advisor during the course of the year, as discussed below:
Services Provided by the Advisor
The Board considered the nature, quality, and extent of the services provided to the fund by the Advisor. These services included, but were not limited to, management of the fund’s portfolio and a variety of related activities, as well as financial and administrative services, reporting, and communications. The Board also reviewed the background and experience of the Advisor’s senior management team and investment personnel involved in the management of the fund. The Board concluded that it was satisfied with the nature, quality, and extent of the services provided by the Advisor.
Investment Performance of the Fund
The Board reviewed the fund’s average annual total returns over the 1-, 3-, 5-, and 10-year periods, as well as the fund’s year-by-year returns, and compared these returns with a wide variety of previously agreed upon comparable performance measures and market data, including those supplied by Lipper and Morningstar, which are independent providers of mutual fund data. On the basis of this evaluation and the Board’s ongoing review of investment results, and factoring in the relative market conditions during certain of the performance periods, the Board concluded that the fund’s performance was satisfactory.
Costs, Benefits, Profits, and Economies of Scale
The Board reviewed detailed information regarding the revenues received by the Advisor under the Contract and other benefits that the Advisor (and its affiliates) may have realized from its relationship with the fund, including research received under “soft dollar” agreements and commission-sharing arrangements with broker-dealers. The Board considered that the Advisor may receive some benefit from soft-dollar arrangements pursuant to which research is received from broker-dealers that execute the applicable fund’s portfolio transactions. The Board also received information on the estimated costs incurred and profits realized by the Advisor and its affiliates from advising T. Rowe Price mutual funds, as well as estimates of the gross profits realized from managing the fund in particular. The Board concluded that the Advisor’s profits were reasonable in light of the services provided to the fund. The Board also considered whether the fund or other funds benefit under the fee levels set forth in the Contract from any economies of scale realized by the Advisor. Under the Contract, the fund pays a fee to the Advisor composed of two components—a group fee rate based on the aggregate assets of certain T. Rowe Price mutual funds (including the fund) that declines at certain asset levels and an individual fund fee rate that is assessed on the assets of the fund. The Board determined that it would be appropriate to introduce another breakpoint into the group fee rate, effective May 1, 2011, to allow fund shareholders to participate in additional economies of scale. The Board concluded that the advisory fee structure for the fund continued to provide for a reasonable sharing of benefits from any economies of scale with the fund’s investors.
Fees
The Board reviewed the fund’s management fee rate, operating expenses, and total expense ratio (for the Investor Class and Advisor Class) and compared them with fees and expenses of other comparable funds based on information and data supplied by Lipper. The information provided to the Board indicated that the fund’s management fee rate was above the median for certain groups of comparable funds but at or below the median for other groups of comparable funds. The information also indicated that the total expense ratio for both classes was below the median for comparable funds. The Board also reviewed the fee schedules for institutional accounts of the Advisor and its affiliates with similar mandates. Management provided the Board with information about the Advisor’s responsibilities and services provided to institutional account clients, which are more limited than its responsibilities for the fund and other T. Rowe Price mutual funds that it advises, and showing that the Advisor performs significant additional services and assumes greater risk for the fund and other T. Rowe Price mutual funds that it advises than it does for institutional account clients. On the basis of the information provided, the Board concluded that the fees paid by the fund under the Contract were reasonable.
Approval of the Contract
As noted, the Board approved the continuation of the Contract. No single factor was considered in isolation or to be determinative to the decision. Rather, the Board was assisted by the advice of independent legal counsel and concluded, in light of a weighting and balancing of all factors considered, that it was in the best interests of the fund to approve the continuation of the Contract (including the fees to be charged for services thereunder).
Item 2. Code of Ethics.
A code of ethics, as defined in Item 2 of Form N-CSR, applicable to its principal executive officer, principal financial officer, principal accounting officer or controller, or persons performing similar functions is filed as an exhibit to the registrant’s annual Form N-CSR. No substantive amendments were approved or waivers were granted to this code of ethics during the registrant’s most recent fiscal half-year.
Item 3. Audit Committee Financial Expert.
Disclosure required in registrant’s annual Form N-CSR.
Item 4. Principal Accountant Fees and Services.
Disclosure required in registrant’s annual Form N-CSR.
Item 5. Audit Committee of Listed Registrants.
Not applicable.
Item 6. Investments.
(a) Not applicable. The complete schedule of investments is included in Item 1 of this Form N-CSR.
(b) Not applicable.
Item 7. Disclosure of Proxy Voting Policies and Procedures for Closed-End Management Investment Companies.
Not applicable.
Item 8. Portfolio Managers of Closed-End Management Investment Companies.
Not applicable.
Item 9. Purchases of Equity Securities by Closed-End Management Investment Company and Affiliated Purchasers.
Not applicable.
Item 10. Submission of Matters to a Vote of Security Holders.
Not applicable.
Item 11. Controls and Procedures.
(a) The registrant’s principal executive officer and principal financial officer have evaluated the registrant’s disclosure controls and procedures within 90 days of this filing and have concluded that the registrant’s disclosure controls and procedures were effective, as of that date, in ensuring that information required to be disclosed by the registrant in this Form N-CSR was recorded, processed, summarized, and reported timely.
(b) The registrant’s principal executive officer and principal financial officer are aware of no change in the registrant’s internal control over financial reporting that occurred during the registrant’s second fiscal quarter covered by this report that has materially affected, or is reasonably likely to materially affect, the registrant’s internal control over financial reporting.
Item 12. Exhibits.
(a)(1) The registrant’s code of ethics pursuant to Item 2 of Form N-CSR is filed with the registrant’s annual Form N-CSR.
(2) Separate certifications by the registrant's principal executive officer and principal financial officer, pursuant to Section 302 of the Sarbanes-Oxley Act of 2002 and required by Rule 30a-2(a) under the Investment Company Act of 1940, are attached.
(3) Written solicitation to repurchase securities issued by closed-end companies: not applicable.
(b) A certification by the registrant's principal executive officer and principal financial officer, pursuant to Section 906 of the Sarbanes-Oxley Act of 2002 and required by Rule 30a-2(b) under the Investment Company Act of 1940, is attached.
| | |
SIGNATURES |
| |
| | Pursuant to the requirements of the Securities Exchange Act of 1934 and the Investment |
| Company Act of 1940, the registrant has duly caused this report to be signed on its behalf by the |
| undersigned, thereunto duly authorized. |
| |
| T. Rowe Price Capital Appreciation Fund |
| |
| |
| |
| By | /s/ Edward C. Bernard |
| | Edward C. Bernard |
| | Principal Executive Officer |
| |
| Date | August 17, 2011 |
| |
| |
| |
| | Pursuant to the requirements of the Securities Exchange Act of 1934 and the Investment |
| Company Act of 1940, this report has been signed below by the following persons on behalf of |
| the registrant and in the capacities and on the dates indicated. |
| |
| |
| By | /s/ Edward C. Bernard |
| | Edward C. Bernard |
| | Principal Executive Officer |
| |
| Date | August 17, 2011 |
| |
| |
| |
| By | /s/ Gregory K. Hinkle |
| | Gregory K. Hinkle |
| | Principal Financial Officer |
| |
| Date | August 17, 2011 |