UNITED STATES
SECURITIES AND EXCHANGE COMMISSION
Washington, D.C. 20549
FORM N-CSR
CERTIFIED SHAREHOLDER REPORT OF REGISTERED
MANAGEMENT INVESTMENT COMPANIES
Investment Company Act File Number: 811-04519
| T. Rowe Price Capital Appreciation Fund |
|
| (Exact name of registrant as specified in charter) |
| |
| 100 East Pratt Street, Baltimore, MD 21202 |
|
| (Address of principal executive offices) |
| |
| David Oestreicher |
| 100 East Pratt Street, Baltimore, MD 21202 |
|
| (Name and address of agent for service) |
Registrant’s telephone number, including area code: (410) 345-2000
Date of fiscal year end: December 31
Date of reporting period: June 30, 2013
Item 1. Report to Shareholders
| Capital Appreciation Fund | June 30, 2013 |
The views and opinions in this report were current as of June 30, 2013. They are not guarantees of performance or investment results and should not be taken as investment advice. Investment decisions reflect a variety of factors, and the managers reserve the right to change their views about individual stocks, sectors, and the markets at any time. As a result, the views expressed should not be relied upon as a forecast of the fund’s future investment intent. The report is certified under the Sarbanes-Oxley Act, which requires mutual funds and other public companies to affirm that, to the best of their knowledge, the information in their financial reports is fairly and accurately stated in all material respects.
REPORTS ON THE WEB
Sign up for our E-mail Program, and you can begin to receive updated fund reports and prospectuses online rather than through the mail. Log in to your account at troweprice.com for more information.
*Based on the standard deviation of the fund (3.15%) compared with that of the S&P 500 (4.96%) for the six-month period ended June 30, 2013. Standard deviation indicates the volatility of a portfolio’s total returns as measured against its mean performance. In general, the higher the standard deviation, the greater the volatility or risk.
Manager’s Letter
Fellow Shareholders
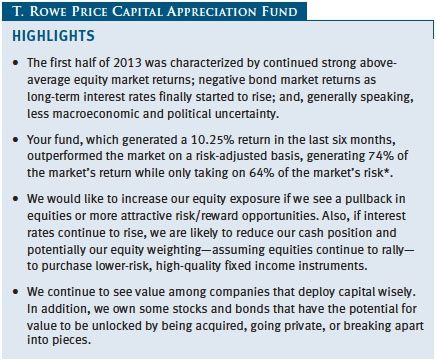
The first half of 2013 was characterized by continued strong above-average equity market returns; negative bond market returns as long-term interest rates finally started to rise; and, generally speaking, less macroeconomic and political uncertainty. While U.S. corporate earnings continued to grow at a modest pace, equity valuations rose to levels consistent with their long-term averages. Driving this upward movement in equity valuations was a sense that the U.S. economy appears be growing modestly despite the twin headwinds of decelerating government spending and higher taxes. In addition, the U.S. is consistently creating close to 200,000 net new jobs per month, political uncertainty has waned as deficits (at least temporarily) have come down to more manageable levels, and there is a sense in Europe that many of those challenged economies are starting to contract at a decelerating rate and Europe as a whole is getting closer to stabilizing into a no-growth continent.
A modestly improving macroeconomic environment helped push Federal Reserve policymakers to begin to communicate a strategy of pulling back from their aggressive quantitative easing policy. As a result, most fixed rate bonds declined in value, and both investment-grade corporates and Treasuries generated negative returns.
While on the margin the global economy is slightly better, it is important to point out that not every region of the globe is doing well. Emerging market economies are clearly decelerating (Brazil, China, and India, in particular). In addition, while Europe appears to be getting “less bad,” prospects for growth continue to be limited. Most of the largest countries in Europe, with the exception of Germany, have yet to make the necessary structural changes to their economies to enable them to compete globally over the long term. While the U.S. equity market has been strong in the first half of the year and the U.S. economy appears to be modestly improving, there is clearly the risk that housing activity could slow as interest rates rise and that equity valuations could compress as the Federal Reserve begins to remove the quantitative easing “punch bowl” from the U.S. market in the second half of the year.
As we had discussed in previous shareholder letters, we do not have a crystal ball about the future. While we have views on the prospects for the U.S., European, and Chinese economies, those views do not drive our investment process. We continue to focus our time, energy, and resources on analyzing businesses, valuations, and capital allocation in order to identify stocks, bonds, leveraged loans, covered calls, and convertibles where the risk/reward trade-off is highly skewed in our favor.
Before we discuss fund performance, I would like to review the three objectives we pursue in managing the Capital Appreciation Fund:
| (1) | Generate strong risk-adjusted returns annually. |
| |
| (2) | Preserve shareholder capital over the intermediate term (i.e., three years). |
| |
| (3) | Generate equity-like returns with less risk than that of the overall market over a full market cycle (i.e., normally around five years). |
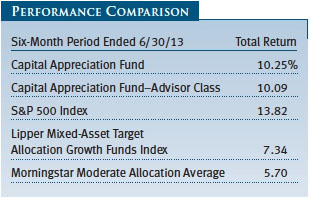
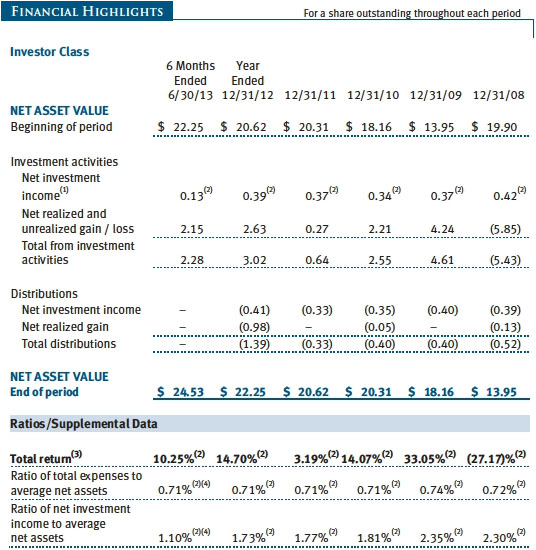
We are pleased to report that the Capital Appreciation Fund generated solid investment performance and achieved our three objectives. For the first half of 2013, your fund generated a 10.25% return relative to the S&P 500’s 13.82% return. (The performance of the Advisor Class was slightly lower, reflecting a different fee structure.)
Your fund outperformed the market on a risk-adjusted basis over this period, generating 74% of the market’s return while only taking on 64% of the market’s risk. We arrived at this number by comparing the standard deviation of the S&P 500 (4.96%) with that of the fund (3.15%) for the six-month period. Standard deviation indicates the volatility of a portfolio’s total returns as measured against its mean performance. In general, the higher the standard deviation, the greater the volatility or risk. (The S&P 500 Index is an unmanaged equity benchmark that tracks the performance of 500 mostly large-cap U.S. stocks.)
Using a more academic measure of the fund’s risk-adjusted return, your fund produced a Sharpe ratio of 2.96 versus 2.54 for the S&P 500. The Sharpe ratio is a measure of the risk-adjusted return of a portfolio. It measures how much a portfolio’s return is above or below the risk-free Treasury rate (excess return) per unit risk (measured by standard deviation). In general, the larger the number, the better the portfolio’s historical risk-adjusted return. Our stocks and fixed income investments both outperformed their respective benchmarks. In addition, our fixed income investments generated a positive total return despite rising rates as we maintained a very low duration (around 1.8 years) helped by considerable exposure to floating rate securities that have minimal interest rate sensitivity.
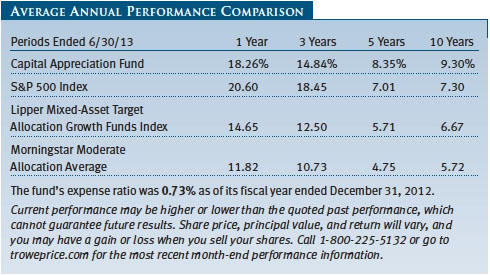
As for our second objective in managing the fund—capital preservation over the intermediate term—your fund generated a 51.44% cumulative total return over the last three years. Preserving shareholder capital over the last three years has been a relatively simple objective given the strength in most asset classes. However, we are mindful that the investment backdrop will not always be as favorable and continue to focus on downside risk potential with all our investments. Limiting losses over the intermediate term remains an important focus for us.
As for our final focus—equity-like returns with less risk than the market over a full market cycle—your fund outperformed the S&P 500. Over the last five years, your fund generated a cumulative return of 49.34% versus the S&P 500’s total return of 40.33%, despite taking on much less risk than the market.
For the six-month and 1-, 3-, 5-, and 10-year periods ended June 30, 2013, we outperformed our Lipper peer group index and Morningstar peer group average during each of those time periods. However, let me reiterate that we do not manage your fund to beat these benchmarks. The Capital Appreciation Fund has very different objectives than most of its benchmark peers. It is a unique fund with a focus on strong risk-adjusted returns, intermediate-term capital preservation, and long-term capital appreciation that does not fit neatly into any current benchmark.
In our last shareholder letter, we highlighted the challenge of being able to generate equity-like returns through a full economic cycle in the current interest rate environment. We also highlighted that our cash position was higher than we would have liked it given the lack of attractive fixed income alternatives. We made some progress in the second quarter in bringing our cash levels down as we put some of this cash to work in very short-duration bonds, as well as in some higher-yielding securities as interest rates rose and credit spreads widened. As we approach a more normalized interest rate environment (in which the 10-year Treasury yields 3.5% to 4.0%), we would expect to be able to purchase higher-quality high yield bonds with 6% to 8% yields that are reasonably close to our long-term equity market total return assumptions of 7% to 9%. A more normalized interest rate environment should be a very good environment for our shareholders, as it should allow us to earn higher yields, reduce our cash exposure, and make our objectives easier to accomplish. As we said in our last letter, we will not reach for yield in lower-quality credits or increase duration given our ongoing focus on intermediate-term capital preservation unless we are adequately compensated for taking on such risks.
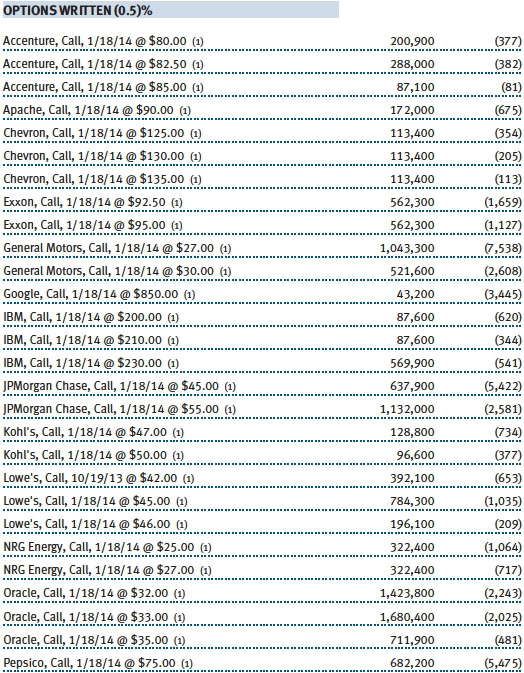
Before we review the portfolio, we want to briefly discuss the Capital Appreciation Fund’s covered call overwriting strategy, which we have employed for more than five years. Covered call overwriting involves buying a stock and then selling a call option—a contract whereby we agree at a future date to sell the stock at a predetermined (strike) price. In return for selling this call option, we are paid a premium (typically a 2% to 5% annualized incremental yield) that provides extra income to the fund. While the strategy caps our upside in an individual stock (usually 10% or higher), it provides incremental income that can enhance total returns, lower our downside risk, and generally has produced excellent risk-adjusted returns. Over the last five years, this strategy (a return combination of underlying stocks, calls, and dividend income) has generated a stronger return than the fund itself and has done so with less risk. However, in the first six months of 2013, this strategy produced subpar total and risk-adjusted returns mainly due to poor stock selection. Given the excellent long-term risk-adjusted returns of this strategy, we believe it will continue to play a meaningful role in your fund. As of June 30, 2013, we had calls written on about 14% of our equity holdings.
PORTFOLIO REVIEW
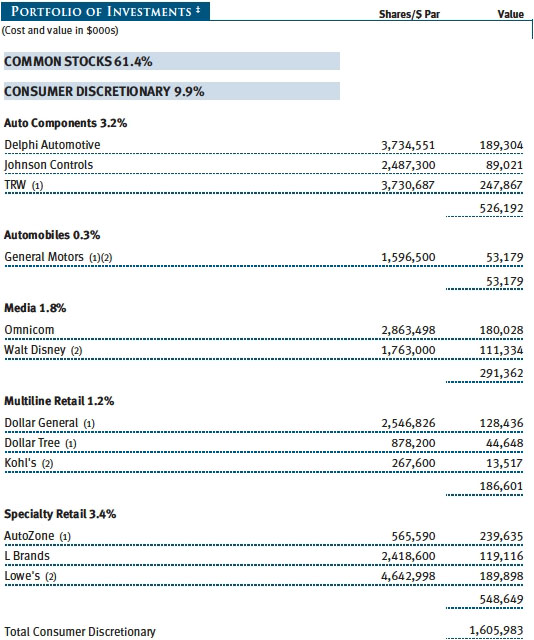
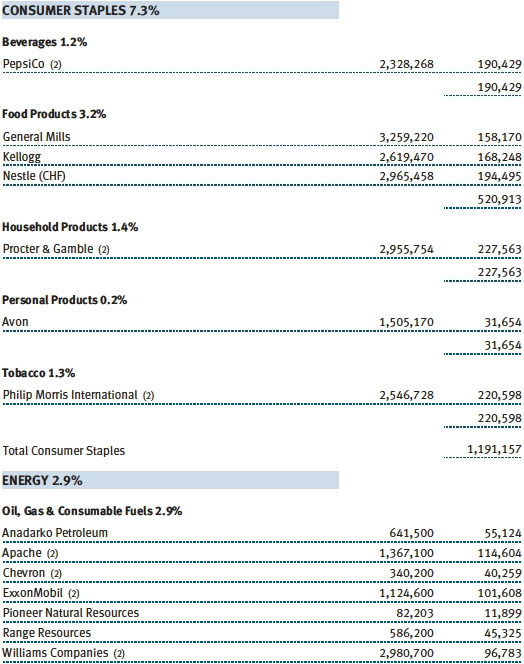
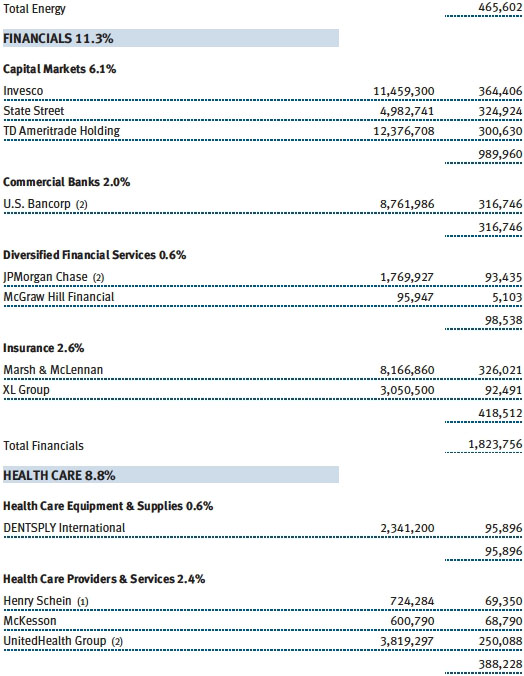
Within the equity portion of the portfolio, our financial holdings were the strongest contributors to both absolute and relative returns in the first half of 2013. Three of our four largest contributors to fund performance were financials: State Street, TD Ameritrade Holding, and Invesco. State Street and TD Ameritrade both benefited from rising interest rates as both companies generate incremental profits from excess cash reserves or float held by their customers in a rising interest rate environment. Both companies continue to manage expenses very tightly in a slow growth environment and return excess free cash flow to shareholders. Invesco shares performed well as the company significantly increased its dividend again, reported strong net flows into its mutual funds, and improved margins substantially following a year in which margins failed to expand. (Please refer to the fund’s portfolio of investments for a complete list of holdings and the amount each represents in the portfolio.)
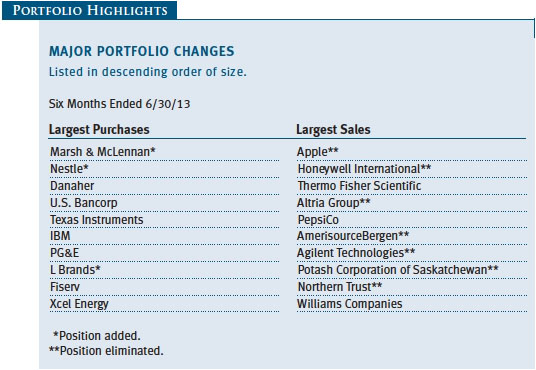
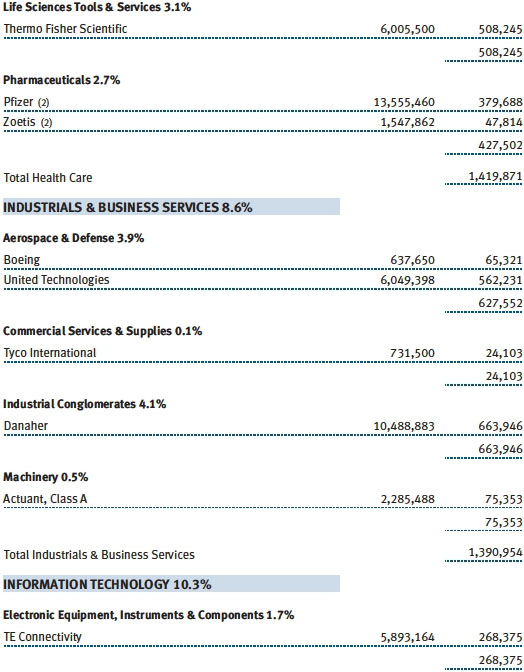
Our overweight in the health care sector also contributed to both absolute and relative returns in the first half. Thermo Fisher Scientific, just like last year, was your fund’s largest positive contributor to performance. Thermo announced the acquisition of Life Technologies earlier this year, which is likely to generate significant future value for Thermo shareholders. While we tend not to be fans of large acquisitions, CEO Marc Casper appears to have done a transformative acquisition that meets all of our criteria for what we consider to be a shareholder-friendly deal. The Life transaction is likely to (1) be materially accretive to earnings and free cash flow over the next couple of years, (2) generate returns in excess of Thermo’s cost of capital within three years, (3) reduce the cyclicality of Thermo as Life generates 80% of its revenues from consumables and services, and (4) generate significant tax and operational synergies. In addition, Thermo is taking advantage of the very low interest rate environment to fund the acquisition with as little equity dilution as possible. We eliminated our position in AmerisourceBergen in the second quarter as the stock has performed well and its valuation has gone from below normal to well above normal. Also, its fundamentals are likely to worsen beyond 2015 as the pace of branded drugs converting to generics slows in the second half of the decade.
In these letters, we normally highlight a sector where our holdings underperformed the market (through a combination of group weight and stock selection). In the first half of 2013, our holdings in all 10 sectors outperformed. Within the energy sector, our stocks matched the sector’s return, but we still added value as we were underweight to the sector and it underperformed the market. However, that does not mean that we did not have a couple of names that detracted from performance. Apple, while a large underweight for us, still hurt the fund’s absolute returns, declining by 25% in the first half as earnings expectations came under pressure amid what appears to be the beginning of a commoditization trend in the smartphone space. We sold our last remaining shares of Apple in the second quarter. Nestle was up only marginally in the first half as decelerating revenue growth in emerging markets, currency headwinds, and weakness in Europe caused the stock to underperform its peers. Unlike Apple, we feel very positive about the long-term outlook for Nestle due to its strong revenue growth (even if it decelerates modestly), margin expansion opportunity, and a new focus on improving free cash flow and returns on invested capital.
PORTFOLIO STRATEGY AND OUTLOOK
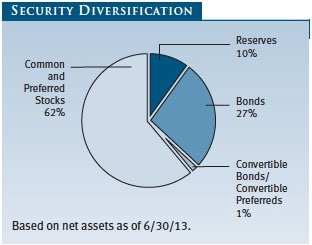
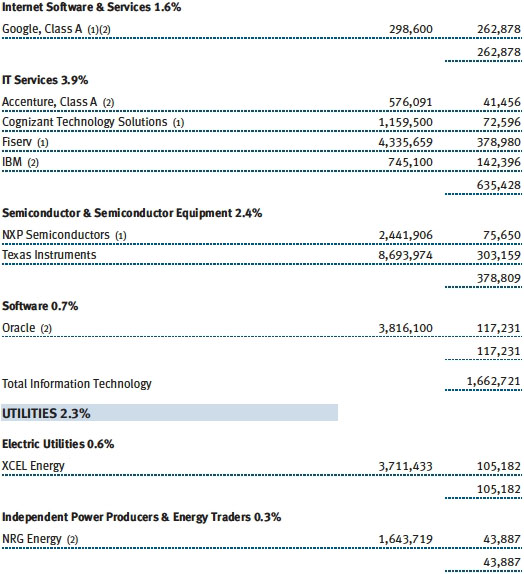
Our net equity exposure (beta-adjusted equity exposure) increased modestly from the end of 2012 but remained in the low 60s. We added to names such as Nestle, Marsh & McLennan, U.S. Bancorp, and Danaher on relative weakness and started new positions in L Brands and NXP Semiconductor at attractive valuations. We eliminated our position in Honeywell International and, as mentioned earlier, AmerisourceBergen, as both have been very good stocks over the last 12 to 18 months. We consider the low 60s net equity weight to be a somewhat neutral level for your fund. We would very much like to have the opportunity to increase this exposure if we see a pullback in equities and/or more attractive risk/reward opportunities present themselves.
We commented in our last shareholder letter that we felt that equities were the most attractive asset class in which we currently invest given the dearth of attractive fixed income investment opportunities amid both historically low interest rates and tighter-than-normal credit spreads. While this statement remains true today, it is less true due to the increase in rates and spread widening we witnessed in the second quarter of 2013, which has made fixed income relatively more attractive. While we are not yet there, we are getting closer to the point at which we will start adding to high-quality bonds with more duration as opposed to investing primarily in short-duration bonds. It is likely that, if interest rates continue to rise in the second half of this year, you should expect for us to continue to reduce our cash position and potentially lower our equity weight (assuming equities continue to rally) to add to lower-risk, high-quality fixed income instruments.
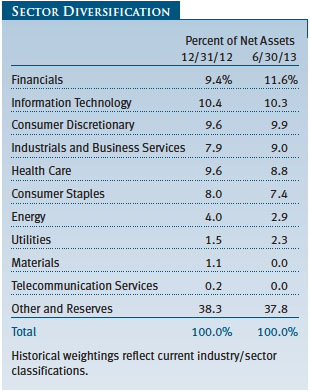
The rise in interest rates has also negatively affected the relative performance of the so-called bond proxy stocks with high dividend yields. We have commented in past letters that we felt that stocks with high dividend yields were overvalued as investors were paying historically high relative valuations for them. As a result, we were underweight to this class of stocks, which was predominantly made up of utility; telecom; and, to a lesser extent, consumer staples companies. As these securities underperformed, especially in the second quarter of the year, their relative attractiveness improved. In general, we tend to like these lower-risk stocks as they usually hold up better than the market in periods of market weakness and help us achieve our second objective of capital preservation over the intermediate term. To the extent these stocks continue to come under pressure relative to the market as a whole due to rising interest rates, you should expect us to use that as an opportunity to add to high-quality, higher-dividend stocks. We did add modestly in the second quarter to select utilities, including Xcel Energy and PG&E (Pacific Gas and Electric). Both of these utilities have been relative underperformers in the recent past, have strong management teams, have around 4% dividend yields, and are better-than-average utilities that trade at a discount to their peers due to near-term uncertainty despite attractive long-term fundamentals.
We continue to see value in the following areas:
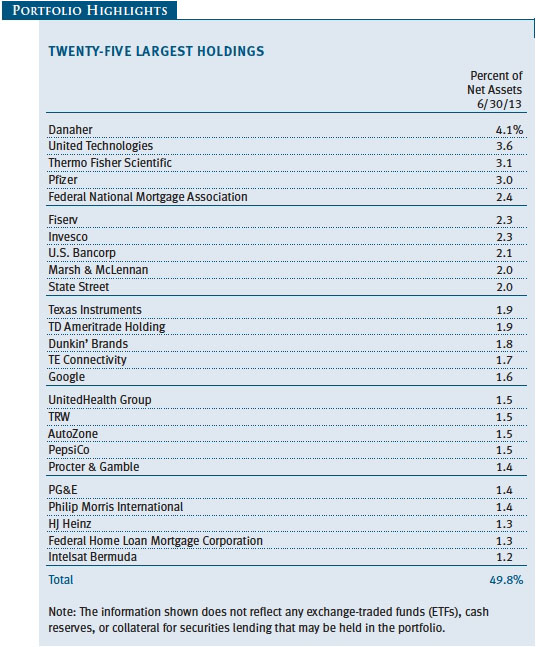
- Good Capital Allocation. We believe the market fundamentally underappreciates good capital allocation. We believe your fund is materially overweight relative to the market companies that deploy capital wisely (through reasonable dividends, stock repurchases, and intelligent acquisitions). We believe 19 of our top 20 holdings are excellent when it comes to capital allocation. We estimate that only about 35% to 40% of the companies in the S&P 500 are excellent at capital allocation.
- Positioned for Rising Rates. While your fund continues to be positioned for rising interest rates within our equities and our fixed income portfolio, as we discussed before, we may start to pull back modestly from this bet as interest rates continue to rise. We still believe fair value for the 10-year Treasury is around 3.5% to 4.0% (assuming 2.0% long-term inflation plus a 1.5% to 2.0% real return). While we are not currently at that level, long-term rates are up almost 100 basis points from year-end. In a 3.5% to 4.0% 10-year Treasury yield environment, where bonds are more reasonably valued, you should expect us to increase our bond holdings, increase our bond duration, lower our cash levels, and potentially lower our equity exposure—all else being equal.
- Free Optionality. Every year it seems as if we have one or more companies get acquired, go private, or break up into pieces, which creates value for our shareholders. This is not accidental. We try to find investment opportunities, both in equities and fixed income, where the odds of an event are small (usually 10% to 20% odds), but where we are acquiring that option for free. We own 20 to 30 equities and bonds where we think the odds of an event are modest, but it seems every year, one or more of these free options pays off. In mid-July, AT&T announced the acquisition of Leap Wireless (which operates under the Cricket brand), and our Cricket Communications bond rallied more than 12% after the announcement. Over an 18-month period, we made more than a 35% total return on this bond where we knew that the downside on the bond was very limited due to the value of Leap’s spectrum. Of course, past performance cannot guarantee future results, and there is no assurance this trend will continue.
IN CLOSING
We would like to thank the members of the fund’s Investment Advisory Committee for their valuable input in the first half of 2013. This team, which comprises portfolio managers, quantitative analysts, fixed income analysts, and equity analysts with many decades of combined investment experience, is responsible for the oversight of your fund and is supported by a growing global equity and fixed income platform of more than 200 analysts.
We are also very happy to announce two new members of the Capital Appreciation team this year. Sushama Dasari joined the team as a research associate in April from Morgan Stanley, where she was an associate analyst covering restaurants and, prior to that, worked in investment banking at Morgan Stanley. Tyler Krus, a three-year T. Rowe Price veteran, is now spending a significant amount of his time on the Capital Appreciation strategy doing a series of special projects for us. With the arrival of Steven Krichbaum as associate portfolio manager for the Capital Appreciation Fund last year, we now have a four-member team that is absolutely dedicated and committed to creating value for our shareholders.
While the Capital Appreciation team has grown and the organization has put more resources on this strategy, our investment process has not changed. We continue to look for attractive risk/reward opportunities across multiple asset classes with an eye toward generating strong risk-adjusted returns year in and year out, preserving shareholder capital over the intermediate term, and generating equity-like returns with less risk than the market over the long term.
Respectfully submitted,

David R. Giroux
Chairman of the fund’s Investment Advisory Committee

Steven D. Krichbaum
Associate portfolio manager
July 17, 2013
The committee chairman has day-to-day responsibility for managing the portfolio and works with committee members in developing and executing the fund’s investment program.
RISKS OF INVESTING
As with all stock and bond mutual funds, the fund’s share price can fall because of weakness in the stock or bond markets, a particular industry, or specific holdings. Stock markets can decline for many reasons, including adverse political or economic developments, changes in investor psychology, or heavy institutional selling. The prospects for an industry or company may deteriorate because of a variety of factors, including disappointing earnings or changes in the competitive environment. In addition, the investment manager’s assessment of companies held in a fund may prove incorrect, resulting in losses or poor performance even in rising markets. A sizable cash or fixed income position may hinder the fund from participating fully in a strong, rapidly rising bull market. In addition, significant exposure to bonds increases the risk that the fund’s share value could be hurt by rising interest rates or credit downgrades or defaults. Convertible securities are also exposed to price fluctuations of the company’s stock.
GLOSSARY
Lipper indexes: Fund benchmarks that consist of a small number of the largest mutual funds in a particular category as tracked by Lipper Inc.
Morningstar Moderate Allocation Average: Tracks the performance of funds that seek both moderate capital appreciation and income by investing in stocks, bonds, and cash.
Sharpe ratio: A measure of the risk-adjusted return of a portfolio. The Sharpe ratio measures how much a portfolio’s return is above or below the risk-free Treasury rate (excess return) per unit risk (measured by standard deviation). In general, the larger the number, the better the portfolio’s historical risk-adjusted return.
S&P 500 Index: An unmanaged index that tracks the stocks of 500 primarily large-cap U.S. companies.
Standard deviation: A measure of risk that indicates the volatility of a portfolio’s total returns as measured against its mean performance. In general, the higher the standard deviation, the greater the volatility or risk.
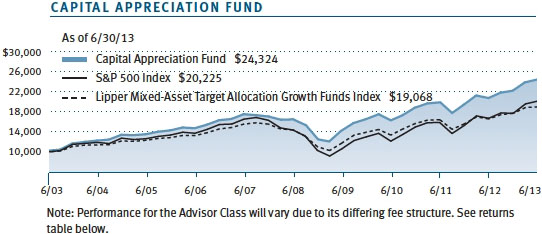
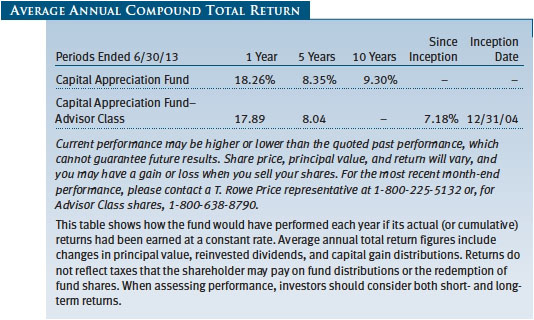
Performance and Expenses
This chart shows the value of a hypothetical $10,000 investment in the fund over the past 10 fiscal year periods or since inception (for funds lacking 10-year records). The result is compared with benchmarks, which may include a broad-based market index and a peer group average or index. Market indexes do not include expenses, which are deducted from fund returns as well as mutual fund averages and indexes.
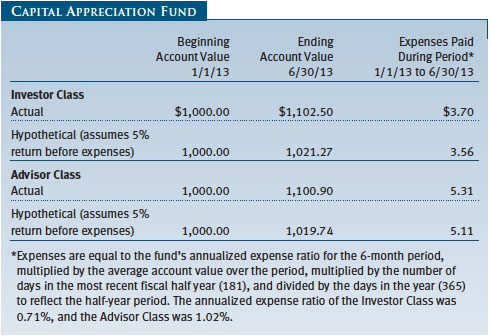
As a mutual fund shareholder, you may incur two types of costs: (1) transaction costs, such as redemption fees or sales loads, and (2) ongoing costs, including management fees, distribution and service (12b-1) fees, and other fund expenses. The following example is intended to help you understand your ongoing costs (in dollars) of investing in the fund and to compare these costs with the ongoing costs of investing in other mutual funds. The example is based on an investment of $1,000 invested at the beginning of the most recent six-month period and held for the entire period.
Please note that the fund has two share classes: The original share class (Investor Class) charges no distribution and service (12b-1) fee, and the Advisor Class shares are offered only through unaffiliated brokers and other financial intermediaries and charge a 0.25% 12b-1 fee. Each share class is presented separately in the table.
Actual Expenses
The first line of the following table (Actual) provides information about actual account values and expenses based on the fund’s actual returns. You may use the information on this line, together with your account balance, to estimate the expenses that you paid over the period. Simply divide your account value by $1,000 (for example, an $8,600 account value divided by $1,000 = 8.6), then multiply the result by the number on the first line under the heading “Expenses Paid During Period” to estimate the expenses you paid on your account during this period.
Hypothetical Example for Comparison Purposes
The information on the second line of the table (Hypothetical) is based on hypothetical account values and expenses derived from the fund’s actual expense ratio and an assumed 5% per year rate of return before expenses (not the fund’s actual return). You may compare the ongoing costs of investing in the fund with other funds by contrasting this 5% hypothetical example and the 5% hypothetical examples that appear in the shareholder reports of the other funds. The hypothetical account values and expenses may not be used to estimate the actual ending account balance or expenses you paid for the period.
Note: T. Rowe Price charges an annual account service fee of $20, generally for accounts with less than $10,000. The fee is waived for any investor whose T. Rowe Price mutual fund accounts total $50,000 or more; accounts electing to receive electronic delivery of account statements, transaction confirmations, prospectuses, and shareholder reports; or accounts of an investor who is a T. Rowe Price Preferred Services, Personal Services, or Enhanced Personal Services client (enrollment in these programs generally requires T. Rowe Price assets of at least $100,000). This fee is not included in the accompanying table. If you are subject to the fee, keep it in mind when you are estimating the ongoing expenses of investing in the fund and when comparing the expenses of this fund with other funds.
You should also be aware that the expenses shown in the table highlight only your ongoing costs and do not reflect any transaction costs, such as redemption fees or sales loads. Therefore, the second line of the table is useful in comparing ongoing costs only and will not help you determine the relative total costs of owning different funds. To the extent a fund charges transaction costs, however, the total cost of owning that fund is higher.
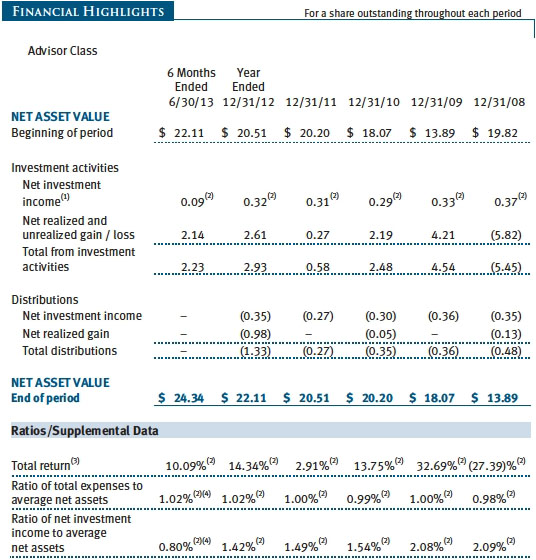
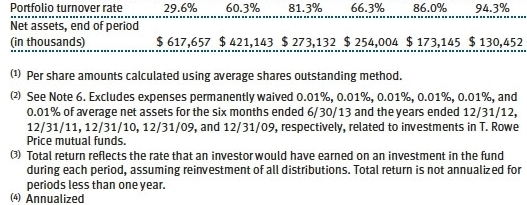
Unaudited
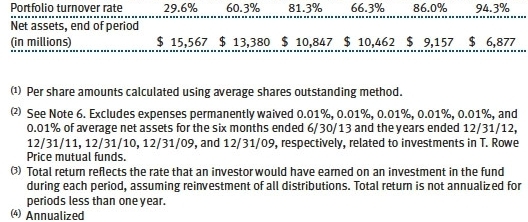
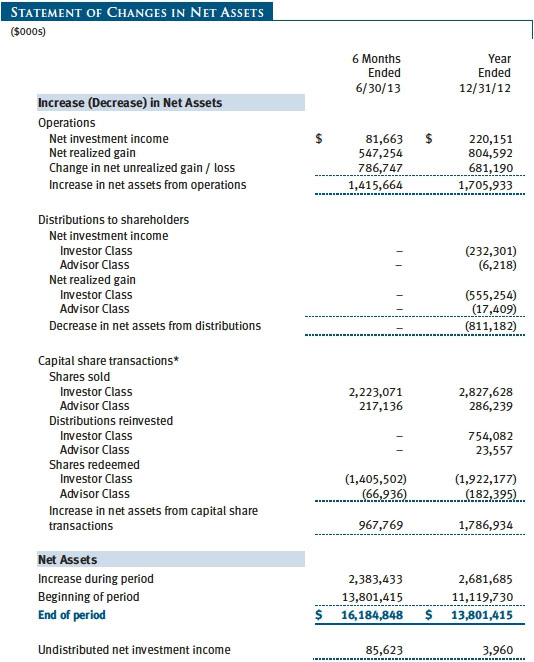
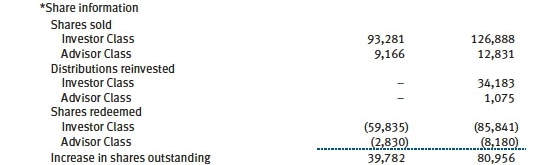
The accompanying notes are an integral part of these financial statements.
Unaudited
The accompanying notes are an integral part of these financial statements.
Unaudited

The accompanying notes are an integral part of these financial statements.
Unaudited
The accompanying notes are an integral part of these financial statements.
Unaudited
The accompanying notes are an integral part of these financial statements.
Unaudited
The accompanying notes are an integral part of these financial statements.
Unaudited
| Notes to Financial Statements |
T. Rowe Price Capital Appreciation Fund (the fund), is registered under the Investment Company Act of 1940 (the 1940 Act) as a diversified, open-end management investment company. The fund seeks long-term capital appreciation by investing primarily in common stocks. It may also hold fixed-income and other securities to help preserve principal value. The fund has two classes of shares: the Capital Appreciation Fund original share class, referred to in this report as the Investor Class, offered since June 30, 1986, and the Capital Appreciation Fund–Advisor Class (Advisor Class), offered since December 31, 2004. Advisor Class shares are sold only through unaffiliated brokers and other unaffiliated financial intermediaries that are compensated by the class for distribution, shareholder servicing, and/or certain administrative services under a Board-approved Rule 12b-1 plan. Each class has exclusive voting rights on matters related solely to that class; separate voting rights on matters that relate to both classes; and, in all other respects, the same rights and obligations as the other class.
NOTE 1 - SIGNIFICANT ACCOUNTING POLICIES
Basis of Preparation The accompanying financial statements were prepared in accordance with accounting principles generally accepted in the United States of America (GAAP), which require the use of estimates made by management. Management believes that estimates and valuations are appropriate; however, actual results may differ from those estimates, and the valuations reflected in the accompanying financial statements may differ from the value ultimately realized upon sale or maturity.
Investment Transactions, Investment Income, and Distributions Income and expenses are recorded on the accrual basis. Premiums and discounts on debt securities are amortized for financial reporting purposes. Paydown gains and losses are recorded as an adjustment to interest income. Dividends received from mutual fund investments are reflected as dividend income; capital gain distributions are reflected as realized gain/loss. Dividend income and capital gain distributions are recorded on the ex-dividend date. Income tax-related interest and penalties, if incurred, would be recorded as income tax expense. Investment transactions are accounted for on the trade date. Realized gains and losses are reported on the identified cost basis. Distributions to shareholders are recorded on the ex-dividend date. Income distributions are declared and paid by each class annually. Capital gain distributions, if any, are generally declared and paid by the fund annually.
Currency Translation Assets, including investments, and liabilities denominated in foreign currencies are translated into U.S. dollar values each day at the prevailing exchange rate, using the mean of the bid and asked prices of such currencies against U.S. dollars as quoted by a major bank. Purchases and sales of securities, income, and expenses are translated into U.S. dollars at the prevailing exchange rate on the date of the transaction. The effect of changes in foreign currency exchange rates on realized and unrealized security gains and losses is reflected as a component of security gains and losses.
Class Accounting The Advisor Class pays distribution, shareholder servicing, and/or certain administrative expenses in the form of Rule 12b-1 fees, in an amount not exceeding 0.25% of the class’s average daily net assets. Shareholder servicing, prospectus, and shareholder report expenses incurred by each class are charged directly to the class to which they relate. Expenses common to both classes, investment income, and realized and unrealized gains and losses are allocated to the classes based upon the relative daily net assets of each class.
Rebates and Credits Subject to best execution, the fund may direct certain security trades to brokers who have agreed to rebate a portion of the related brokerage commission to the fund in cash. Commission rebates are reflected as realized gain on securities in the accompanying financial statements and totaled $94,000 for the six months ended June 30, 2013. Additionally, the fund earns credits on temporarily uninvested cash balances held at the custodian, which reduce the fund’s custody charges. Custody expense in the accompanying financial statements is presented before reduction for credits, which are reflected as expenses paid indirectly.
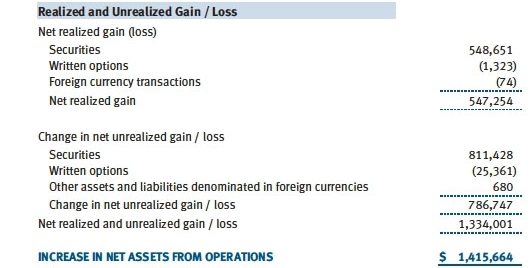
In-Kind Redemptions In accordance with guidelines described in the fund’s prospectus, the fund may distribute portfolio securities rather than cash as payment for a redemption of fund shares (in-kind redemption). For financial reporting purposes, the fund recognizes a gain on in-kind redemptions to the extent the value of the distributed securities on the date of redemption exceeds the cost of those securities. Gains and losses realized on in-kind redemptions are not recognized for tax purposes and are reclassified from undistributed realized gain (loss) to paid-in capital. During the six months ended June 30, 2013, the fund realized $89,012,000 of net gain on $329,317,000 of in-kind redemptions.
New Accounting Guidance In December 2011, the Financial Accounting Standards Board issued amended guidance requiring an entity to disclose information about offsetting and related arrangements to enable users of its financial statements to understand the effect of those arrangements on its financial position. The guidance is effective for fiscal years and interim periods beginning on or after January 1, 2013. Adoption had no effect on the fund’s net assets or results of operations.
NOTE 2 - VALUATION
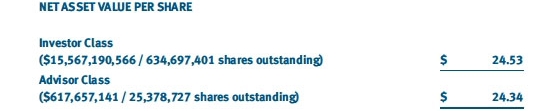
The fund’s financial instruments are valued and each class’s net asset value (NAV) per share is computed at the close of the New York Stock Exchange (NYSE), normally 4 p.m. ET, each day the NYSE is open for business.
Fair Value The fund’s financial instruments are reported at fair value, which GAAP defines as the price that would be received to sell an asset or paid to transfer a liability in an orderly transaction between market participants at the measurement date. The T. Rowe Price Valuation Committee (the Valuation Committee) has been established by the fund’s Board of Trustees (the Board) to ensure that financial instruments are appropriately priced at fair value in accordance with GAAP and the 1940 Act. Subject to oversight by the Board, the Valuation Committee develops and oversees pricing-related policies and procedures and approves all fair value determinations. Specifically, the Valuation Committee establishes procedures to value securities; determines pricing techniques, sources, and persons eligible to effect fair value pricing actions; oversees the selection, services, and performance of pricing vendors; oversees valuation-related business continuity practices; and provides guidance on internal controls and valuation-related matters. The Valuation Committee reports to the fund’s Board; is chaired by the fund’s treasurer; and has representation from legal, portfolio management and trading, operations, and risk management.
Various valuation techniques and inputs are used to determine the fair value of financial instruments. GAAP establishes the following fair value hierarchy that categorizes the inputs used to measure fair value:
Level 1 – quoted prices (unadjusted) in active markets for identical financial instruments that the fund can access at the reporting date
Level 2 – inputs other than Level 1 quoted prices that are observable, either directly or indirectly (including, but not limited to, quoted prices for similar financial instruments in active markets, quoted prices for identical or similar financial instruments in inactive markets, interest rates and yield curves, implied volatilities, and credit spreads)
Level 3 – unobservable inputs
Observable inputs are developed using market data, such as publicly available information about actual events or transactions, and reflect the assumptions that market participants would use to price the financial instrument. Unobservable inputs are those for which market data are not available and are developed using the best information available about the assumptions that market participants would use to price the financial instrument. GAAP requires valuation techniques to maximize the use of relevant observable inputs and minimize the use of unobservable inputs. When multiple inputs are used to derive fair value, the financial instrument is assigned to the level within the fair value hierarchy based on the lowest-level input that is significant to the fair value of the financial instrument. Input levels are not necessarily an indication of the risk or liquidity associated with financial instruments at that level but rather the degree of judgment used in determining those values.
Valuation Techniques Equity securities listed or regularly traded on a securities exchange or in the over-the-counter (OTC) market are valued at the last quoted sale price or, for certain markets, the official closing price at the time the valuations are made. OTC Bulletin Board securities are valued at the mean of the closing bid and asked prices. A security that is listed or traded on more than one exchange is valued at the quotation on the exchange determined to be the primary market for such security. Listed securities not traded on a particular day are valued at the mean of the closing bid and asked prices for domestic securities and the last quoted sale or closing price for international securities.
For valuation purposes, the last quoted prices of non-U.S. equity securities may be adjusted to reflect the fair value of such securities at the close of the NYSE. If the fund determines that developments between the close of a foreign market and the close of the NYSE will, in its judgment, materially affect the value of some or all of its portfolio securities, the fund will adjust the previous quoted prices to reflect what it believes to be the fair value of the securities as of the close of the NYSE. In deciding whether it is necessary to adjust quoted prices to reflect fair value, the fund reviews a variety of factors, including developments in foreign markets, the performance of U.S. securities markets, and the performance of instruments trading in U.S. markets that represent foreign securities and baskets of foreign securities. The fund may also fair value securities in other situations, such as when a particular foreign market is closed but the fund is open. The fund uses outside pricing services to provide it with quoted prices and information to evaluate and/or adjust those prices. The fund cannot predict how often it will use quoted prices and how often it will determine it necessary to adjust those prices to reflect fair value. As a means of evaluating its security valuation process, the fund routinely compares quoted prices, the next day’s opening prices in the same markets, and adjusted prices.
Actively traded domestic equity securities generally are categorized in Level 1 of the fair value hierarchy. Non-U.S. equity securities generally are categorized in Level 2 of the fair value hierarchy despite the availability of quoted prices because, as described above, the fund evaluates and determines whether those quoted prices reflect fair value at the close of the NYSE or require adjustment. OTC Bulletin Board securities, certain preferred securities, and equity securities traded in inactive markets generally are categorized in Level 2 of the fair value hierarchy.
Debt securities generally are traded in the OTC market. Securities with remaining maturities of one year or more at the time of acquisition are valued at prices furnished by dealers who make markets in such securities or by an independent pricing service, which considers the yield or price of bonds of comparable quality, coupon, maturity, and type, as well as prices quoted by dealers who make markets in such securities. Generally, debt securities are categorized in Level 2 of the fair value hierarchy; however, to the extent the valuations include significant unobservable inputs, the securities would be categorized in Level 3.
Investments in mutual funds are valued at the mutual fund’s closing net asset value per share on the day of valuation and are categorized in Level 1 of the fair value hierarchy. Listed options, and OTC options with a listed equivalent, are valued at the mean of the closing bid and asked prices and generally are categorized in Level 2 of the fair value hierarchy. Assets and liabilities other than financial instruments, including short-term receivables and payables, are carried at cost, or estimated realizable value, if less, which approximates fair value.
Thinly traded financial instruments and those for which the above valuation procedures are inappropriate or are deemed not to reflect fair value are stated at fair value as determined in good faith by the Valuation Committee. The objective of any fair value pricing determination is to arrive at a price that could reasonably be expected from a current sale. Financial instruments fair valued by the Valuation Committee are primarily private placements, restricted securities, warrants, rights, and other securities that are not publicly traded.
Subject to oversight by the Board, the Valuation Committee regularly makes good faith judgments to establish and adjust the fair valuations of certain securities as events occur and circumstances warrant. For instance, in determining the fair value of an equity investment with limited market activity, such as a private placement or a thinly traded public company stock, the Valuation Committee considers a variety of factors, which may include, but are not limited to, the issuer’s business prospects, its financial standing and performance, recent investment transactions in the issuer, new rounds of financing, negotiated transactions of significant size between other investors in the company, relevant market valuations of peer companies, strategic events affecting the company, market liquidity for the issuer, and general economic conditions and events. In consultation with the investment and pricing teams, the Valuation Committee will determine an appropriate valuation technique based on available information, which may include both observable and unobservable inputs. The Valuation Committee typically will afford greatest weight to actual prices in arm’s length transactions, to the extent they represent orderly transactions between market participants; transaction information can be reliably obtained; and prices are deemed representative of fair value. However, the Valuation Committee may also consider other valuation methods such as market-based valuation multiples; a discount or premium from market value of a similar, freely traded security of the same issuer; or some combination. Fair value determinations are reviewed on a regular basis and updated as information becomes available, including actual purchase and sale transactions of the issue. Because any fair value determination involves a significant amount of judgment, there is a degree of subjectivity inherent in such pricing decisions and fair value prices determined by the Valuation Committee could differ from those of other market participants. Depending on the relative significance of unobservable inputs, including the valuation technique(s) used, fair valued securities may be categorized in Level 2 or 3 of the fair value hierarchy.
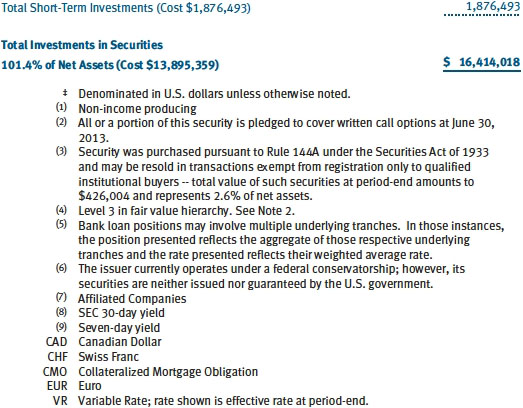
Valuation Inputs The following table summarizes the fund’s financial instruments, based on the inputs used to determine their fair values on June 30, 2013:
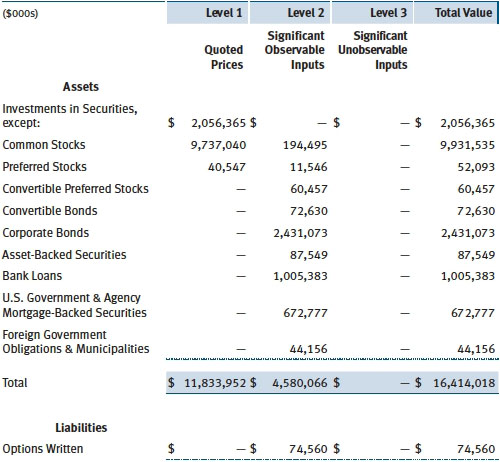
There were no material transfers between Levels 1 and 2 during the period.
NOTE 3 - DERIVATIVE INSTRUMENTS
During the six months ended June 30, 2013, the fund invested in derivative instruments. As defined by GAAP, a derivative is a financial instrument whose value is derived from an underlying security price, foreign exchange rate, interest rate, index of prices or rates, or other variable; it requires little or no initial investment and permits or requires net settlement. The fund invests in derivatives only if the expected risks and rewards are consistent with its investment objectives, policies, and overall risk profile, as described in its prospectus and Statement of Additional Information. The fund may use derivatives for a variety of purposes, such as seeking to hedge against declines in principal value, increase yield, invest in an asset with greater efficiency and at a lower cost than is possible through direct investment, or to adjust credit exposure. The risks associated with the use of derivatives are different from, and potentially much greater than, the risks associated with investing directly in the instruments on which the derivatives are based. Investments in derivatives can magnify returns positively or negatively; however, the fund at all times maintains sufficient cash reserves, liquid assets, or other SEC-permitted asset types to cover the settlement obligations under its open derivative contracts.
The fund values its derivatives at fair value, as described below and in Note 2, and recognizes changes in fair value currently in its results of operations. Accordingly, the fund does not follow hedge accounting, even for derivatives employed as economic hedges. Generally, the fund accounts for its derivatives on a gross basis. It does not offset the fair value of derivative liabilities against the fair value of derivative assets on its financial statements, nor does it offset the fair value of derivative instruments against the right to reclaim or obligation to return collateral.
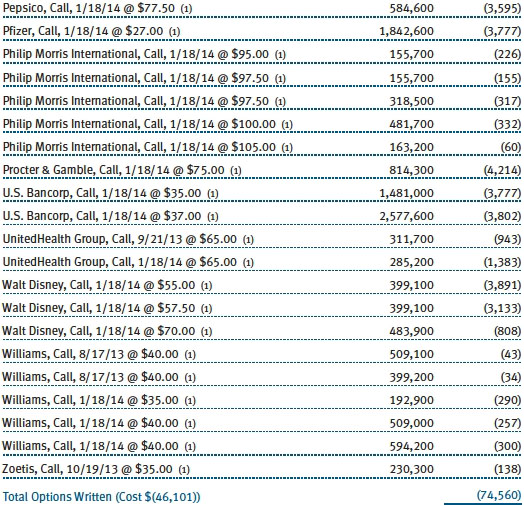
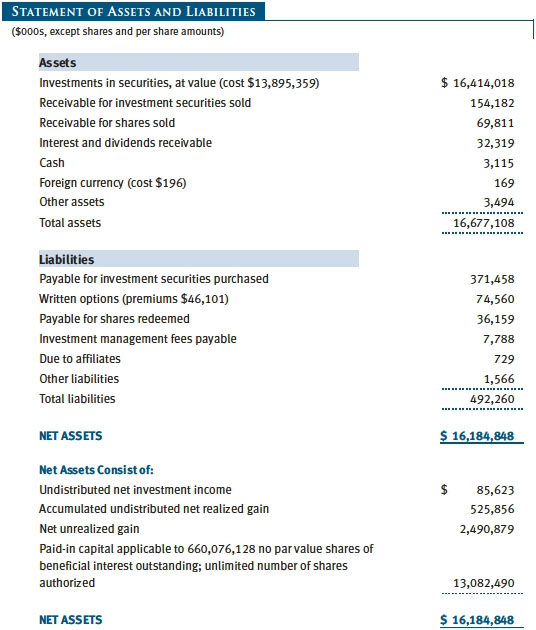
As of June 30, 2013, the fund held equity derivatives with a fair value of $74,560,000, included in Written options, on the accompanying Statement of Assets and Liabilities.
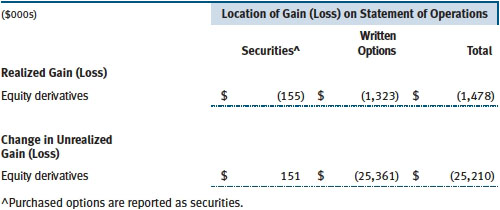
Additionally, the amount of gains and losses on derivative instruments recognized in fund earnings during the six months ended June 30, 2013, and the related location on the accompanying Statement of Operations is summarized in the following table by primary underlying risk exposure:
Counterparty Risk and Collateral The fund invests in derivatives in various markets, which expose it to differing levels of counterparty risk. Counterparty risk on exchange-traded and centrally cleared derivative contracts, such as futures, exchange-traded options, and centrally cleared swaps, is minimal because the exchange’s clearinghouse provides protection against counterparty defaults. For futures and centrally cleared swaps, the clearinghouse typically requires daily settlement of changes in contract value and imposes margin requirements to ensure performance by the parties to the contract. Each clearing broker, in its sole discretion, may adjust the margin requirements applicable to the fund.
Derivatives, such as swaps, forward currency exchange contracts, and options, that are transacted in OTC markets expose the fund to greater counterparty risk. To mitigate this risk, the fund has entered into master netting arrangements (MNAs) with certain counterparties that permit net settlement under specified conditions and, for certain counterparties, also provide collateral agreements. MNAs may be in the form of International Swaps and Derivatives Association master agreements (ISDAs) and/or foreign exchange letter agreements (FX letters).
MNAs govern the ability to offset amounts the fund owes a counterparty against amounts the counterparty owes the fund (net settlement). Both ISDAs and FX letters generally allow net settlement in the event of contract termination and permit termination by either party prior to maturity upon the occurrence of certain stated events, such as failure to pay or bankruptcy. In addition, ISDAs specify other events, the occurrence of which would allow one of the parties to terminate. For example, a downgrade in credit rating of a counterparty would allow the fund to terminate while a decline in the fund’s net assets of more than a certain percentage would allow the counterparty to terminate. Upon termination, all derivatives with the counterparty typically would be liquidated and a net amount settled. ISDAs typically include collateral agreements whereas F/X letters do not. Collateral requirements are determined based on the net aggregate unrealized gain or loss on all OTC derivatives with each counterparty, subject to minimum transfer amounts that typically range from $100,000 to $250,000. Any additional collateral required due to changes in security values is tranferred the next business day.
Collateral may be in the form of cash or debt securities issued by the U.S. government or related agencies. For OTC derivatives, collateral posted pursuant to an ISDA is held in a segregated account by the fund’s custodian. For exchange-traded and centrally cleared derivatives (other than exchange-traded options), required margin posted by the fund is held by the clearing broker. Cash posted by the fund as collateral or required margin is reflected as restricted cash in the accompanying financial statements, and securities posted by the fund are so noted in the accompanying Portfolio of Investments; both remain in the fund’s assets. Collateral pledged by counterparties is not included in the fund’s assets because the fund does not obtain effective control over those assets. As of June 30, 2013, no collateral had been posted by the fund to counterparties for OTC derivatives. As of June 30, 2013, no margin had been posted by the fund for exchange-traded and/or centrally cleared derivatives.
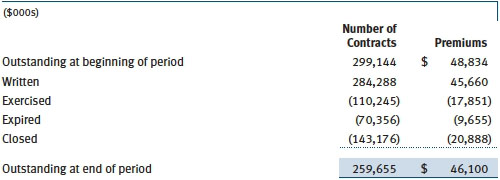
Options The fund is subject to equity price risk in the normal course of pursuing its investment objectives and uses options to help manage such risk. The fund may use call and put options to manage exposure to interest rates, security prices, foreign currencies, and credit quality; as an efficient means of adjusting exposure to all or a part of a target market; to enhance income; as a cash management tool; and/or to adjust credit exposure. In return for a premium paid, call and put options give the holder the right, but not the obligation, to purchase or sell, respectively, a security at a specified exercise price at any time during the period of the option. Options are included in net assets at fair value; purchased options are included in Investments in Securities; and written options are separately reflected as a liability on the accompanying Statement of Assets and Liabilities. Premiums on unexercised, expired options are recorded as realized gains or losses; premiums on exercised options are recorded as an adjustment to the proceeds from the sale or cost of the purchase. The difference between the premium and the amount received or paid in a closing transaction is also treated as realized gain or loss. Risks related to the use of options include possible illiquidity of the options markets; trading restrictions imposed by an exchange; movements in underlying security values; and, for written options, potential losses in excess of the fund’s initial investment. During the six months ended June 30, 2013, the fund’s exposure to options, based on underlying notional amounts, was generally less than 1% of net assets. Transactions in written options and related premiums received during the six months ended June 30, 2013, were as follows:
NOTE 4 - OTHER INVESTMENT TRANSACTIONS
Consistent with its investment objective, the fund engages in the following practices to manage exposure to certain risks and/or to enhance performance. The investment objective, policies, program, and risk factors of the fund are described more fully in the fund’s prospectus and Statement of Additional Information.
Noninvestment-Grade Debt Securities At June 30, 2013, approximately 11% of the fund’s net assets were invested, either directly or through its investment in T. Rowe Price institutional funds, in noninvestment-grade debt securities, commonly referred to as “high yield” or “junk” bonds. The noninvestment-grade bond market may experience sudden and sharp price swings due to a variety of factors, including changes in economic forecasts, stock market activity, large sustained sales by major investors, a high-profile default, or a change in market psychology. These events may decrease the ability of issuers to make principal and interest payments and adversely affect the liquidity or value, or both, of such securities.
Restricted Securities The fund may invest in securities that are subject to legal or contractual restrictions on resale. Prompt sale of such securities at an acceptable price may be difficult and may involve substantial delays and additional costs.
Bank Loans The fund may invest in bank loans, which represent an interest in amounts owed by a borrower to a syndication of lenders. Bank loans may involve multiple loans with the same borrower under a single credit agreement (each loan, a tranche), and each tranche may have different terms and associated risks. A bank or other financial institution typically acts as the agent and administers a bank loan in accordance with the associated credit agreement. Bank loans are generally noninvestment grade and often involve borrowers whose financial condition is troubled or uncertain and companies that are highly leveraged. The fund may buy and sell bank loans in the form of either loan assignments or loan participations. A loan assignment transfers all legal, beneficial, and economic rights to the buyer. Although loan assignments continue to be administered by the agent, the buyer acquires direct rights against the borrower. In many cases, a loan assignment requires the consent of both the borrower and the agent. In contrast, a loan participation generally entitles the buyer to receive the cash flows from principal, interest, and any fee payments that the seller is entitled to receive from the borrower; however, the seller continues to hold legal title to the loan. As a result, with loan participations, the buyer generally has no right to enforce compliance with the terms of the credit agreement against the borrower, and the buyer is subject to the credit risk of both the borrower and the seller. Bank loans often have extended settlement periods, during which the fund is subject to nonperformance risk by the counterparty. A portion of the fund’s bank loans may require additional principal to be funded at the borrowers’ discretion at a later date (unfunded commitments), and bank loans usually may be repaid at any time at the option of the borrower. The fund reflects both the funded portion of the bank loan as well as any unfunded commitment on the loan in the Portfolio of Investments.
Other Purchases and sales of portfolio securities other than short-term and U.S. government securities aggregated $5,072,670,000 and $3,878,608,000, respectively, for the six months ended June 30, 2013. Purchases and sales of U.S. government securities aggregated $32,701,000 and $0, respectively, for the six months ended June 30, 2013.
NOTE 5 - FEDERAL INCOME TAXES
No provision for federal income taxes is required since the fund intends to continue to qualify as a regulated investment company under Subchapter M of the Internal Revenue Code and distribute to shareholders all of its taxable income and gains. Distributions determined in accordance with federal income tax regulations may differ in amount or character from net investment income and realized gains for financial reporting purposes. Financial reporting records are adjusted for permanent book/tax differences to reflect tax character but are not adjusted for temporary differences. The amount and character of tax-basis distributions and composition of net assets are finalized at fiscal year-end; accordingly, tax-basis balances have not been determined as of the date of this report.
The fund intends to retain realized gains to the extent of available capital loss carryforwards. Net realized capital losses may be carried forward indefinitely to offset future realized capital gains.
At June 30, 2013, the cost of investments for federal income tax purposes was $13,928,363,000. Net unrealized gain aggregated $2,457,875,000 at period-end, of which $2,559,194,000 related to appreciated investments and $101,319,000 related to depreciated investments.
NOTE 6 - RELATED PARTY TRANSACTIONS
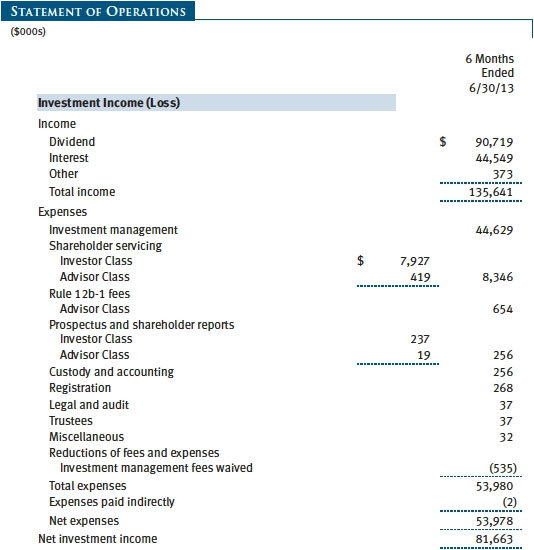
The fund is managed by T. Rowe Price Associates, Inc. (Price Associates), a wholly owned subsidiary of T. Rowe Price Group, Inc. (Price Group). The investment management agreement between the fund and Price Associates provides for an annual investment management fee, which is computed daily and paid monthly. The fee consists of an individual fund fee, equal to 0.30% of the fund’s average daily net assets, and a group fee. The group fee rate is calculated based on the combined net assets of certain mutual funds sponsored by Price Associates (the group) applied to a graduated fee schedule, with rates ranging from 0.48% for the first $1 billion of assets to 0.275% for assets in excess of $400 billion. The fund’s group fee is determined by applying the group fee rate to the fund’s average daily net assets. At June 30, 2013, the effective annual group fee rate was 0.30%.
In addition, the fund has entered into service agreements with Price Associates and two wholly owned subsidiaries of Price Associates (collectively, Price). Price Associates computes the daily share prices and provides certain other administrative services to the fund. T. Rowe Price Services, Inc., provides shareholder and administrative services in its capacity as the fund’s transfer and dividend disbursing agent. T. Rowe Price Retirement Plan Services, Inc., provides subaccounting and recordkeeping services for certain retirement accounts invested in the Investor Class. For the six months ended June 30, 2013, expenses incurred pursuant to these service agreements were $101,000 for Price Associates; $2,284,000 for T. Rowe Price Services, Inc.; and $952,000 for T. Rowe Price Retirement Plan Services, Inc. The total amount payable at period-end pursuant to these service agreements is reflected as Due to Affiliates in the accompanying financial statements.
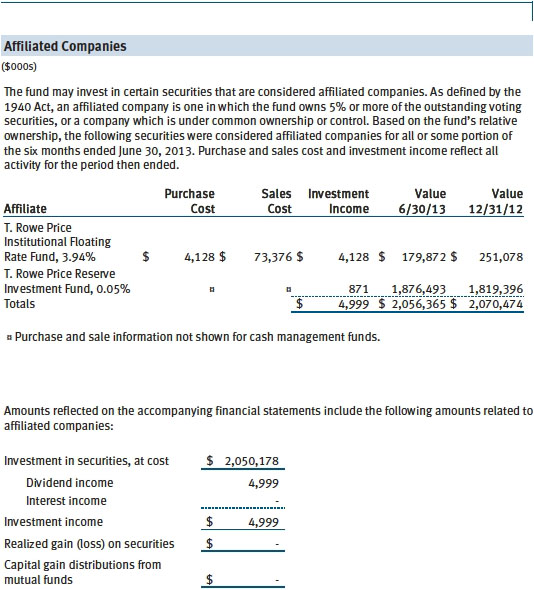
The fund may invest in the T. Rowe Price Reserve Investment Fund and the T. Rowe Price Government Reserve Investment Fund (collectively, the T. Rowe Price Reserve Investment Funds), open-end management investment companies managed by Price Associates and considered affiliates of the fund. The T. Rowe Price Reserve Investment Funds are offered as cash management options to mutual funds, trusts, and other accounts managed by Price Associates and/or its affiliates and are not available for direct purchase by members of the public. The T. Rowe Price Reserve Investment Funds pay no investment management fees.
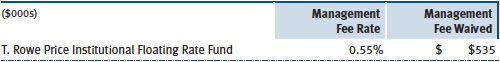
The fund may also invest in certain T. Rowe Price institutional funds (underlying institutional funds) as a means of gaining efficient and cost-effective exposure to certain markets. The underlying institutional funds are open-end management investment companies managed by Price Associates and are considered affiliates of the fund. Each underlying institutional fund pays an all-inclusive management and administrative fee to Price Associates. To ensure that the fund does not incur duplicate fees, Price Associates has agreed to permanently waive a portion of its management fee charged to the fund in an amount sufficient to fully offset the management fees paid by the underlying institutional funds related to fund assets invested therein. Accordingly, the accompanying Statement of Operations includes management fees permanently waived pursuant to this agreement. Annual fee rates and amounts waived within the accompanying Statement of Operations related to shares of the underlying institutional funds for the six months ended June 30, 2013, are as follows:
| Information on Proxy Voting Policies, Procedures, and Records |
A description of the policies and procedures used by T. Rowe Price funds and portfolios to determine how to vote proxies relating to portfolio securities is available in each fund’s Statement of Additional Information. You may request this document by calling 1-800-225-5132 or by accessing the SEC’s website, sec.gov.
The description of our proxy voting policies and procedures is also available on our website, troweprice.com. To access it, click on the words “Social Responsibility” at the top of our corporate homepage. Next, click on the words “Conducting Business Responsibly” on the left side of the page that appears. Finally, click on the words “Proxy Voting Policies” on the left side of the page that appears.
Each fund’s most recent annual proxy voting record is available on our website and through the SEC’s website. To access it through our website, follow the above directions to reach the “Conducting Business Responsibly” page. Click on the words “Proxy Voting Records” on the left side of that page, and then click on the “View Proxy Voting Records” link at the bottom of the page that appears.
| How to Obtain Quarterly Portfolio Holdings |
The fund files a complete schedule of portfolio holdings with the Securities and Exchange Commission for the first and third quarters of each fiscal year on Form N-Q. The fund’s Form N-Q is available electronically on the SEC’s website (sec.gov); hard copies may be reviewed and copied at the SEC’s Public Reference Room, 100 F St. N.E., Washington, DC 20549. For more information on the Public Reference Room, call 1-800-SEC-0330.
| Approval of Investment Management Agreement |
On March 5, 2013, the fund’s Board of Trustees (Board), including a majority of the fund’s independent trustees, approved the continuation of the investment management agreement (Advisory Contract) between the fund and its investment advisor, T. Rowe Price Associates, Inc. (Advisor). In connection with its deliberations, the Board requested, and the Advisor provided, such information as the Board (with advice from independent legal counsel) deemed reasonably necessary. The Board considered a variety of factors in connection with its review of the Advisory Contract, also taking into account information provided by the Advisor during the course of the year, as discussed below:
Services Provided by the Advisor
The Board considered the nature, quality, and extent of the services provided to the fund by the Advisor. These services included, but were not limited to, directing the fund’s investments in accordance with its investment program and the overall management of the fund’s portfolio, as well as a variety of related activities such as financial, investment operations, and administrative services; compliance; maintaining the fund’s records and registrations; and shareholder communications. The Board also reviewed the background and experience of the Advisor’s senior management team and investment personnel involved in the management of the fund, as well as the Advisor’s compliance record. The Board concluded that it was satisfied with the nature, quality, and extent of the services provided by the Advisor.
Investment Performance of the Fund
The Board reviewed the fund’s three-month, one-year, and year-by-year returns, as well as the fund’s average annualized total returns over the 3-, 5-, and 10-year periods, and compared these returns with a wide variety of previously agreed upon comparable performance measures and market data, including those supplied by Lipper and Morningstar, which are independent providers of mutual fund data.
On the basis of this evaluation and the Board’s ongoing review of investment results, and factoring in the relative market conditions during certain performance periods, the Board concluded that the fund’s performance was satisfactory.
Costs, Benefits, Profits, and Economies of Scale
The Board reviewed detailed information regarding the revenues received by the Advisor under the Advisory Contract and other benefits that the Advisor (and its affiliates) may have realized from its relationship with the fund, including any research received under “soft dollar” agreements and commission-sharing arrangements with broker-dealers. The Board considered that the Advisor may receive some benefit from soft-dollar arrangements pursuant to which research is received from broker-dealers that execute the applicable fund’s portfolio transactions. The Board received information on the estimated costs incurred and profits realized by the Advisor from managing T. Rowe Price mutual funds. The Board also reviewed estimates of the profits realized from managing the fund in particular, and the Board concluded that the Advisor’s profits were reasonable in light of the services provided to the fund.
The Board also considered whether the fund benefits under the fee levels set forth in the Advisory Contract from any economies of scale realized by the Advisor. Under the Advisory Contract, the fund pays a fee to the Advisor for investment management services composed of two components—a group fee rate based on the combined average net assets of most of the T. Rowe Price mutual funds (including the fund) that declines at certain asset levels and an individual fund fee rate based on the fund’s average daily net assets—and the fund pays its own expenses of operations. The Board concluded that the advisory fee structure for the fund continued to provide for a reasonable sharing of benefits from any economies of scale with the fund’s investors.
Fees
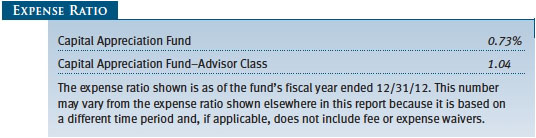
The Board was provided with information regarding industry trends in management fees and expenses, and the Board reviewed the fund’s management fee rate, operating expenses, and total expense ratio (for the Investor Class and Advisor Class) in comparison with fees and expenses of other comparable funds based on information and data supplied by Lipper. The information provided to the Board indicated that the fund’s management fee rate was above the median for certain groups of comparable funds and at or below the median for other groups of comparable funds. The information also indicated that the total expense ratio for the Investor Class was above the median for certain groups of comparable funds and below the median for other groups of comparable funds, and the total expense ratio for the Advisor Class was below the median for comparable funds.
The Board also reviewed the fee schedules for institutional accounts and private accounts with similar mandates that are advised or subadvised by the Advisor and its affiliates. Management provided the Board with information about the Advisor’s responsibilities and services provided to institutional account clients, including information about how the requirements and economics of the institutional business are fundamentally different from those of the mutual fund business. The Board considered information showing that the mutual fund business is generally more complex from a business and compliance perspective than the institutional business and that the Advisor generally performs significant additional services and assumes greater risk in managing the fund and other T. Rowe Price mutual funds than it does for institutional account clients.
On the basis of the information provided and the factors considered, the Board concluded that the fees paid by the fund under the Advisory Contract are reasonable.
Approval of the Advisory Contract
As noted, the Board approved the continuation of the Advisory Contract. No single factor was considered in isolation or to be determinative to the decision. Rather, the Board concluded, in light of a weighting and balancing of all factors considered, that it was in the best interests of the fund and its shareholders for the Board to approve the continuation of the Advisory Contract (including the fees to be charged for services thereunder). The independent trustees were advised throughout the process by independent legal counsel.
Item 2. Code of Ethics.
A code of ethics, as defined in Item 2 of Form N-CSR, applicable to its principal executive officer, principal financial officer, principal accounting officer or controller, or persons performing similar functions is filed as an exhibit to the registrant’s annual Form N-CSR. No substantive amendments were approved or waivers were granted to this code of ethics during the registrant’s most recent fiscal half-year.
Item 3. Audit Committee Financial Expert.
Disclosure required in registrant’s annual Form N-CSR.
Item 4. Principal Accountant Fees and Services.
Disclosure required in registrant’s annual Form N-CSR.
Item 5. Audit Committee of Listed Registrants.
Not applicable.
Item 6. Investments.
(a) Not applicable. The complete schedule of investments is included in Item 1 of this Form N-CSR.
(b) Not applicable.
Item 7. Disclosure of Proxy Voting Policies and Procedures for Closed-End Management Investment Companies.
Not applicable.
Item 8. Portfolio Managers of Closed-End Management Investment Companies.
Not applicable.
Item 9. Purchases of Equity Securities by Closed-End Management Investment Company and Affiliated Purchasers.
Not applicable.
Item 10. Submission of Matters to a Vote of Security Holders.
Not applicable.
Item 11. Controls and Procedures.
(a) The registrant’s principal executive officer and principal financial officer have evaluated the registrant’s disclosure controls and procedures within 90 days of this filing and have concluded that the registrant’s disclosure controls and procedures were effective, as of that date, in ensuring that information required to be disclosed by the registrant in this Form N-CSR was recorded, processed, summarized, and reported timely.
(b) The registrant’s principal executive officer and principal financial officer are aware of no change in the registrant’s internal control over financial reporting that occurred during the registrant’s second fiscal quarter covered by this report that has materially affected, or is reasonably likely to materially affect, the registrant’s internal control over financial reporting.
Item 12. Exhibits.
(a)(1) The registrant’s code of ethics pursuant to Item 2 of Form N-CSR is filed with the registrant’s annual Form N-CSR.
(2) Separate certifications by the registrant's principal executive officer and principal financial officer, pursuant to Section 302 of the Sarbanes-Oxley Act of 2002 and required by Rule 30a-2(a) under the Investment Company Act of 1940, are attached.
(3) Written solicitation to repurchase securities issued by closed-end companies: not applicable.
(b) A certification by the registrant's principal executive officer and principal financial officer, pursuant to Section 906 of the Sarbanes-Oxley Act of 2002 and required by Rule 30a-2(b) under the Investment Company Act of 1940, is attached.
SIGNATURES
Pursuant to the requirements of the Securities Exchange Act of 1934 and the Investment Company Act of 1940, the registrant has duly caused this report to be signed on its behalf by the undersigned, thereunto duly authorized.
T. Rowe Price Capital Appreciation Fund
| | By | /s/ Edward C. Bernard |
| | Edward C. Bernard |
| | Principal Executive Officer |
| |
| Date August 16, 2013 | | |
Pursuant to the requirements of the Securities Exchange Act of 1934 and the Investment Company Act of 1940, this report has been signed below by the following persons on behalf of the registrant and in the capacities and on the dates indicated.
| | By | /s/ Edward C. Bernard |
| | Edward C. Bernard |
| | Principal Executive Officer |
| |
| Date August 16, 2013 | | |
| |
| |
| By | /s/ Gregory K. Hinkle |
| | Gregory K. Hinkle |
| | Principal Financial Officer |
| |
| Date August 16, 2013 | | |