UNITED STATES
SECURITIES AND EXCHANGE COMMISSION
Washington, D.C. 20549
FORM N-CSR
CERTIFIED SHAREHOLDER REPORT OF REGISTERED
MANAGEMENT INVESTMENT COMPANIES
Investment Company Act File Number: 811-04519
| T. Rowe Price Capital Appreciation Fund |
|
| (Exact name of registrant as specified in charter) |
| |
| 100 East Pratt Street, Baltimore, MD 21202 |
|
| (Address of principal executive offices) |
| |
| David Oestreicher |
| 100 East Pratt Street, Baltimore, MD 21202 |
|
| (Name and address of agent for service) |
Registrant’s telephone number, including area code: (410) 345-2000
Date of fiscal year end: December 31
Date of reporting period: June 30, 2012
Item 1. Report to Shareholders
| Capital Appreciation Fund | June 30, 2012 |
The views and opinions in this report were current as of June 30, 2012. They are not guarantees of performance or investment results and should not be taken as investment advice. Investment decisions reflect a variety of factors, and the managers reserve the right to change their views about individual stocks, sectors, and the markets at any time. As a result, the views expressed should not be relied upon as a forecast of the fund’s future investment intent. The report is certified under the Sarbanes-Oxley Act, which requires mutual funds and other public companies to affirm that, to the best of their knowledge, the information in their financial reports is fairly and accurately stated in all material respects.
REPORTS ON THE WEB
Sign up for our E-mail Program, and you can begin to receive updated fund reports and prospectuses online rather than through the mail. Log in to your account at troweprice.com for more information.
Manager’s Letter
Fellow Shareholders
As we look back at the first half of 2012, several important macroeconomic developments have had, and may continue to have, an impact on the financial markets:
- Growth in China has slowed materially. Industrial firms that were growing revenues in the mid-teens are now reporting flat revenue trends in China. Companies tied to the high-end Chinese consumer have also seen revenue growth decelerate dramatically in the last few months in China.
- The European debt crisis continues to play out with a one-step-forward and one-step-backward pattern. Modest signs of progress by European leaders to deal with the crisis are often followed by rising government bond yields in countries such as Italy and Spain as budget deficits, structural reform plans, and economic growth continue to disappoint.
- On the positive side of the ledger, oil and gasoline prices have declined throughout the year. This is a function of slower global demand (especially in China), stronger supply growth in North America (due to shale oil drilling technology), and a modest lessening of concerns surrounding a possible attack on Iran’s nuclear facilities by Israel. This decline in oil and gasoline prices puts more money in consumers’ pockets and lowers transportation costs for businesses.
- The upcoming “fiscal cliff” in the U.S. is attracting more and more attention, not only from the investment community but also from businesses, and some of the stagnation in the unemployment rate in recent months is likely attributable to this uncertainty. If nothing is done in the meantime, the impact on the U.S. economy from the combined effects of automatic spending cuts, tax rates rising with the expiration of the Bush and payroll tax cuts, and extended unemployment insurance ending would likely drive the U.S. economy into a recession in 2013.
As we have discussed in previous shareholder letters, we do not have a crystal ball about the future. While we have views on the U.S. economy, Europe, and China, they do not drive our investment process. We focus our time, energy, and resources on analyzing businesses, valuations, and capital allocation and try to identify stocks, bonds, leveraged loans, covered calls, and convertibles where the risk/reward trade-off is highly skewed in our favor.
Before we discuss fund performance, I would like to review the three objectives of the Capital Appreciation Fund:
| (1) | Generate strong risk-adjusted returns annually; |
| |
| (2) | Preserve capital; and |
| |
| (3) | Generate equity-like returns with less risk than that of the overall market over a full market cycle (i.e., five years). |
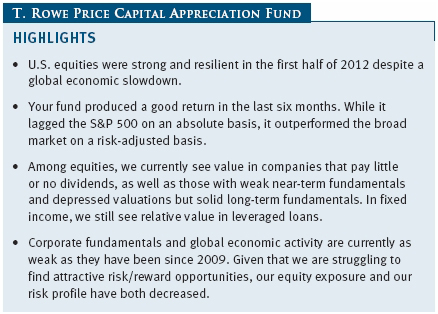
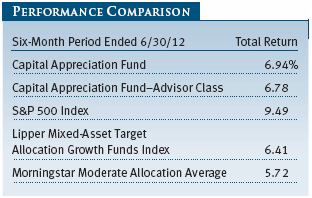
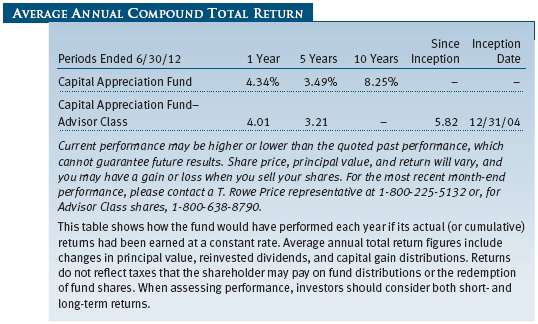
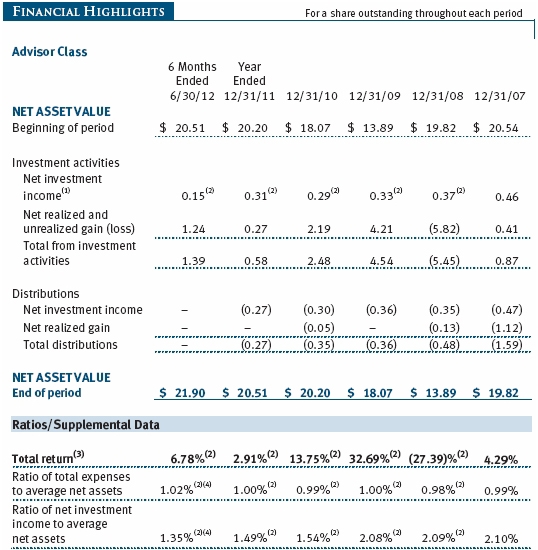
Against these objectives, the Capital Appreciation Fund generated reasonably solid performance and achieved these objectives. In the first half of 2012, your fund generated a 6.94% return relative to the S&P 500’s return of 9.49%. (The performance of the Advisor Class was slightly lower, reflecting a different fee structure.)
Your fund modestly outperformed the market on a risk-adjusted basis over this period by generating 73% of the market’s return while only taking on 65% of the market’s risk. We arrived at this number by comparing the standard deviation of the S&P 500 (13.25) with that of the fund (8.66) for the first six months of 2012. Standard deviation indicates the volatility of a portfolio’s total returns as measured against its mean performance. In general, the higher the standard deviation, the greater the volatility or risk. (The S&P 500 Index is an unmanaged equity benchmark that tracks the performance of 500 mostly large-cap U.S. stocks.)
Using a more academic measurement of the fund’s risk-adjusted return, your fund produced a Sharpe ratio of 1.03 versus 0.92 for the S&P 500. The Sharpe ratio is a measure of the risk-adjusted return of a portfolio. It measures how much a portfolio’s return is above or below the risk-free Treasury rate (excess return) per unit risk (measured by standard deviation). In general, the larger the number, the better the portfolio’s historical risk-adjusted return.
As for our second objective—capital preservation—your fund generated cumulative returns of 4.34%, 46.75%, 18.73%, and 120.84% in the 1-, 3-, 5-, and 10-year periods ended June 30, 2012, respectively, versus 5.45%, 57.70%, 1.09%, and 68.13% for the S&P 500. As for our final objective—equity-like returns with less risk than the market over a full market cycle—your fund significantly outperformed the S&P 500 in the last five years despite taking on much less risk than the market. The fund generated 1,586% of the market’s return while only taking on 80% of the market’s risk. We arrived at this number by comparing the standard deviation of the S&P 500 (19.05) with that of the fund (15.31) in the last five years.
For the six-month, one-year, three-year, and five-year periods ended June 30, 2012, we outperformed our Lipper and Morningstar peer group averages during every time period. However, let me reiterate that we do not manage your fund to beat these benchmarks. The Capital Appreciation Fund has very different objectives than most of its benchmark peers. It is a unique fund with a focus on strong risk-adjusted returns, intermediate-term capital preservation, and long-term capital appreciation that does not fit neatly into any current benchmark.

Before we review the portfolio, we want to briefly discuss the Capital Appreciation Fund’s covered call overwriting strategy, which we have employed for more than four years. Covered call overwriting involves buying a stock and then selling a call option—a contract whereby we agree at a future date to sell the stock at a predetermined (strike) price if the stock is above the predetermined (strike) price. In return for selling this call option, we are paid a premium (typically a 3% to 6% annualized yield) that provides extra income to the fund and its investors. While this strategy caps our upside in an individual stock (usually 10% or higher), it provides incremental income that can enhance total returns and lower our downside risk. Over the last four years, this strategy (return combination of underlying stocks, call income, and dividend income) has generated a stronger return than the fund itself and has done so with materially lower risk. As of June 30, 2012, a little more than 24% of our equity holdings have calls written against them. Given the excellent returns and even more excellent risk/reward profile of this strategy, we believe it will continue to play a meaningful role in your fund.
PORTFOLIO REVIEW
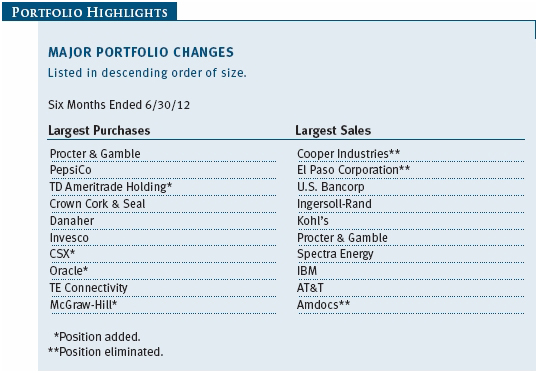
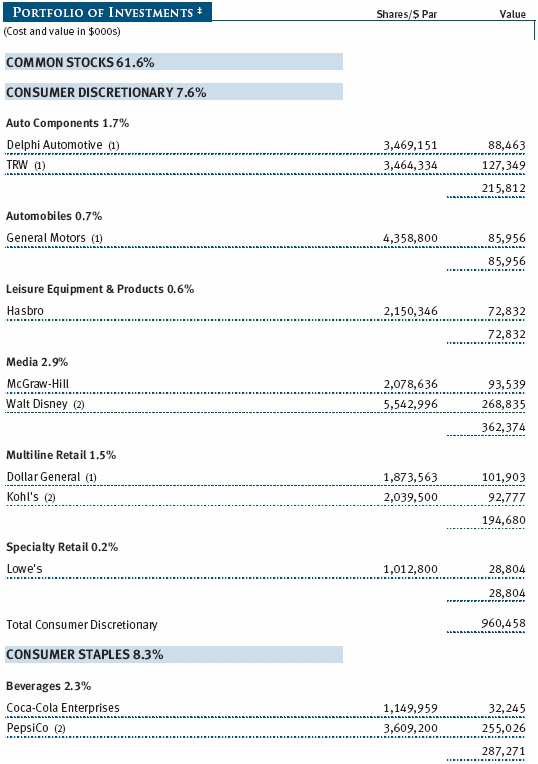
Within the equity part of the portfolio, industrials were by far the largest contributor to both absolute and relative returns in the first half of 2012. Cooper Industries was the top contributor to performance as it traded up meaningfully following the announcement that Eaton Corporation had agreed to acquire it for about a 30% premium. While we owned Cooper on the basis of its attractive business model, strong management team, and very intelligent capital deployment, we always believed that it was a potential takeover target for a European industrial conglomerate trying to enter the U.S. electrical market or for a U.S. industrial conglomerate trying to get bigger in the electrical space. We spend quite a bit of time looking for investments with what we call “free optionality,” including potential takeover candidates. While we thought that Cooper could be acquired down the road, the market was not valuing that possibility based on where it was trading earlier this year and thus we essentially received this “optionality” for free. Every year, it seems we have one or more corporate takeovers, break-ups, or spin-offs that create value for our shareholders. This is not simply by chance, but rather because we seek out those companies where the market is not appropriately valuing the potential for a corporate action. (Please refer to the fund’s portfolio of investments for a complete list of holdings and the amount each represents in the portfolio.)
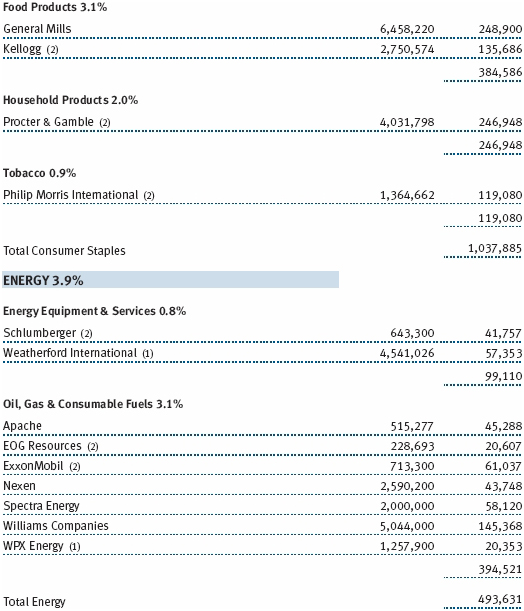
Our large underweight in the energy space benefited relative performance as the energy sector was the worst-performing sector in the first half of the year. Based on the differentiated work of T. Rowe Price’s energy analysts, we believe that oil prices are likely to decline in real (inflation-adjusted) terms or at a minimum plateau in the coming years after a decade of almost continual increases. While the weakness in China resulted in slower global demand growth in the first half of 2012, the crux of our thesis is that the shale oil production in North America has fundamentally altered the global supply growth dynamic. After 40 years of declining North American oil production, it is now rising at a fast clip. While we continue to expect oil prices to be volatile in the short term and sensitive to geopolitical risks, we believe the intermediate-term trend line on oil prices is flat to down in real terms. Our investments in the energy sector are principally companies that operate pipelines and midstream businesses that benefit from more North American production (such as Spectra Energy and Williams Companies) or are mispriced on even-lower oil price assumptions (such as Nexen and Apache).
While our overweight in consumer staples added to absolute performance, it detracted from relative returns due principally to stock selection. Our biggest detractors were General Mills, Procter & Gamble, and Kellogg. In the first half of the year, all three companies lowered their earnings projections due to a combination of high input costs, weakening European demand, and/or lower-than-expected volume growth. The lower-than-expected volume growth for all companies is a function of these companies trying to raise prices to offset higher commodity input costs, which resulted in reduced demand for their products. We believe that volume trends will improve in the second half of the year due to easier comparisons and lower year-over-year pricing increases. In addition, what we like about these firms is their attractive 3.4%+ dividend yields, their defensive nature, and, even when things go against us (as they did in the first half of the year), their earnings per share typically don’t decline but are relatively stable to up modestly.
PORTFOLIO STRATEGY AND OUTLOOK
We are struggling to find as many investments with strong risk-adjusted return potential as we would like given the current market valuation and fundamental outlook. As of early July, it appears that the global economy is growing at the slowest pace since the Great Recession of 2008–2009. Chinese growth is slowing; Northern Europe (which exports a lot of goods to China) is also slowing; Southern Europe was already in bad shape and may be getting worse due to additional austerity measures; and the U.S., which until April had been the strongest region globally, has begun to weaken as well. This feels a little different to us than the past two summers, when the market declined on macro headlines but recovered once it became clear that corporate fundamentals were still strong. Given the quantity and magnitude of weak earnings pre-announcements that we are currently seeing across multiple sectors (including consumer, industrials, staples, materials, and technology), it appears that corporate fundamentals are weakening for the first time since 2009.
Why has the market been fairly resilient so far this year? First, investors are hopeful that this is just a temporary growth deceleration and that the global economy will reaccelerate later in the year. Second, the market believes the Federal Reserve and other central banks around the world will run to the rescue with more plans to print money (a less fancy term than “quantitative easing”).
We have no unique insight as to whether this will be a temporary slowdown or something more serious. However, given how much stocks are up year-to-date, the market is placing pretty high odds on fundamentals bouncing back. If they don’t bounce back and the U.S. joins Europe in a recession, the equity market has material downside from current levels. Again, we don’t have any unique insight into which outcome is more likely, but it appears to us that the risk/reward is skewed against the equity market today. From a bottom-up perspective, that skew is manifesting itself in your portfolio management team finding fewer attractive risk/reward prospective equity investments. We would contrast this with the late-summer period last year, when we were finding bargains galore in the equity market because, in many ways, it was pricing in a reasonably high probability of a recession.
Your portfolio management team is surprised at how much time and attention the market focuses on the prospects for additional quantitative easing from the Federal Reserve. In the last month, we have seen equities rally on poor economic data as the market assumes (maybe correctly) that this increases the odds of another Fed easing. The problem with this logic is that with interest rates at record lows, the tangible benefits from each successive Fed action are having less and less of an impact. The phrase “pushing on a string” comes to mind. This is not to say the equity market may not have a short-term rally on further Fed action from purely a psychological perspective, but we feel very comfortable saying that the real-world impact of further Fed action would be minimal.
Your portfolio management team takes seriously its dual mandate of capital preservation and capital appreciation. Given that we are struggling to find attractive risk/reward opportunities and that investors are putting a lot of faith in and high odds on an economic rebound and/or impactful Fed action in the back half of the year, we are focusing more on capital preservation than on capital appreciation. If we are wrong and the equity market strengthens in the second half of the year, we would hope to participate on the way up and generate strong risk-adjusted returns as we did in the first half of the year.
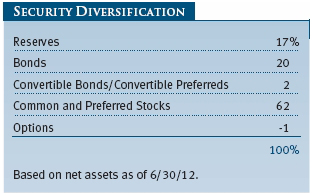
This heightened near-term focus on capital preservation, combined with the very low interest rate environment, has driven our cash reserves to about 17% of assets. This is materially higher than what we would normally describe as normal (5% to 10%). While we would love to deploy this cash into fixed income investments, the challenge with such a strategy is that with interest rates so low, a small increase in rates would likely generate negative total returns for our shareholders. Moreover, given how low rates are today, the opportunity cost of holding cash is very low. Nevertheless, we would hope to reduce our cash reserves in the second half through a combination of opportunistically adding to equities and leveraged loans as well as purchasing low-risk investment-grade floating rate securities and short-duration fixed income assets.
So where are we seeing value in general right now? Not among Treasuries. We continue to believe that the risk/reward trade-off of U.S. government debt is heavily skewed to the downside. The nominal 10-year Treasury bond yield is materially lower than the expected inflation rate over the next 10 years, and a return to where rates were only 18 months ago would lead to double-digit declines in total returns for investors owning Treasury bonds.
Within fixed income, we still see relative value in high-quality leveraged loans. They generally are yielding between 4% and 5%; have very limited risk of ultimate loss given that they are at the top of a company’s capital structure; have restrictive covenants; and, if rates rise, will generate more interest because of their floating rate feature.
Within equities, we continue to believe the highest dividend-yielding stocks are overvalued. We believe investors’ quest for yield has driven many telecommunication, utility, and consumer staples firms to unreasonable valuations. We also believe that a select group of high-performing growth stocks trading at or above 1.5 times the market’s multiple are also overvalued and not immune to slowing global growth and clearly not priced for potential earnings disappointments.
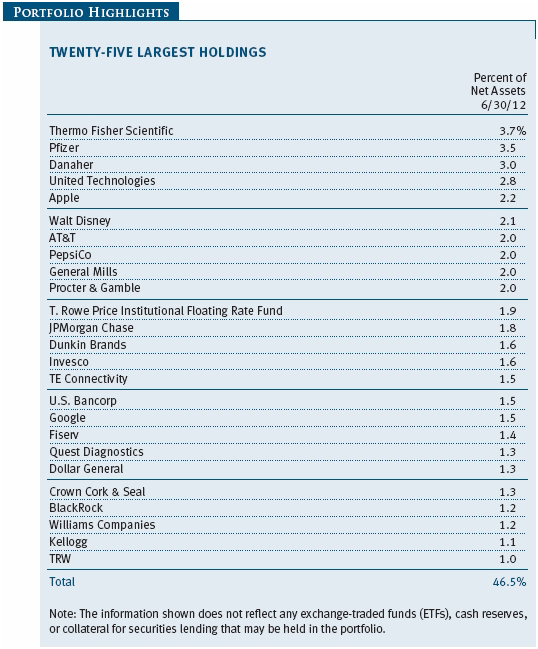
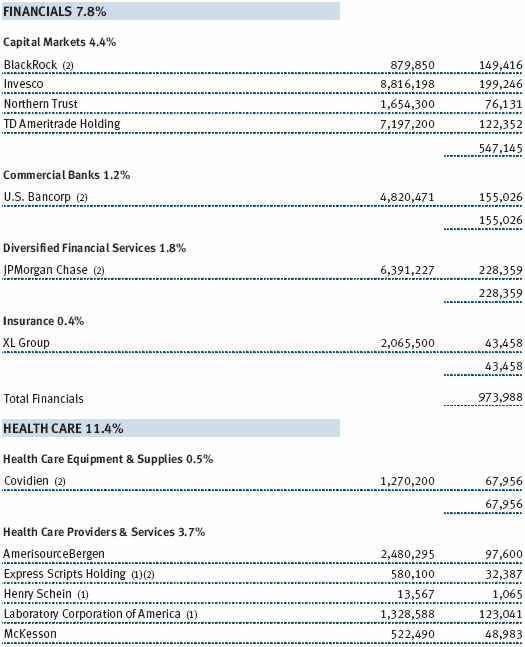
We see value in the equity market in the middle of the two extremes. We think many companies that pay little or no dividends are attractively priced relative to history and relative to the market. Many of these stocks also return significant capital to shareholders each year through share repurchases, but they are not currently being rewarded for it by the market. Companies such as Thermo Fisher Scientific, Crown Holdings, and Quest Diagnostics all fit this category. Other companies that are compelling to us are those whose near-term fundamentals are not strong and earnings estimates may be too high but whose long-term fundamentals are solid and the valuations are depressed. These include TRW, Delphi Automotive, TE Connectivity, United Technologies, Invesco, and BlackRock.
As always, we remain focused on achieving our three objectives by finding the best risk-adjusted opportunities in the various markets in which we participate.
IN CLOSING
It is my pleasure to announce that in mid-May we appointed Steven Krichbaum to the portfolio management team on the Capital Appreciation Fund. Steven will serve as the associate portfolio manager for the strategy, and we are very lucky to have him working for our shareholders. Steven has been an analyst with T. Rowe Price for the last five years covering utilities, midstream and pipeline firms, and the rating agencies. Over the last three years, Steven has had a very favorable impact on the Capital Appreciation strategy. Moreover, Steven, at his core, understands what the mission of Capital Appreciation is and what it is not and should help create additional long-term value for our shareholders.
I would like to thank the members of the fund’s Investment Advisory Committee for their valuable input in the first half of 2012. This team, which comprises portfolio managers, quantitative analysts, fixed income analysts, and equity analysts with many decades of combined investment experience, is responsible for the oversight of your fund and is supported by a growing global equity and fixed income platform of 190 analysts.
Respectfully submitted,

David R. Giroux
Chairman of the fund’s Investment Advisory Committee

Steven D. Krichbaum
Associate portfolio manager
July 17, 2012
The committee chairman has day-to-day responsibility for managing the portfolio and works with committee members in developing and executing the fund’s investment program.
RISKS OF INVESTING
As with all stock and bond mutual funds, the fund’s share price can fall because of weakness in the stock or bond markets, a particular industry, or specific holdings. Stock markets can decline for many reasons, including adverse political or economic developments, changes in investor psychology, or heavy institutional selling. The prospects for an industry or company may deteriorate because of a variety of factors, including disappointing earnings or changes in the competitive environment. In addition, the investment manager’s assessment of companies held in a fund may prove incorrect, resulting in losses or poor performance even in rising markets. A sizable cash or fixed income position may hinder the fund from participating fully in a strong, rapidly rising bull market. In addition, significant exposure to bonds increases the risk that the fund’s share value could be hurt by rising interest rates or credit downgrades or defaults. Convertible securities are also exposed to price fluctuations of the company’s stock.
GLOSSARY
Lipper indexes: Fund benchmarks that consist of a small number of the largest mutual funds in a particular category as tracked by Lipper Inc.
Morningstar Moderate Allocation Average: Tracks the performance of funds that seek both moderate capital appreciation and income by investing in stocks, bonds, and cash.
Sharpe ratio: A measure of the risk-adjusted return of a portfolio. The Sharpe ratio measures how much a portfolio’s return is above or below the risk-free Treasury rate (excess return) per unit risk (measured by standard deviation). In general, the larger the number, the better the portfolio’s historical risk-adjusted return.
S&P 500 Index: An unmanaged index that tracks the stocks of 500 primarily large-cap U.S. companies.
Standard deviation: A measure of risk that indicates the volatility of a portfolio’s total returns as measured against its mean performance. In general, the higher the standard deviation, the greater the volatility or risk.
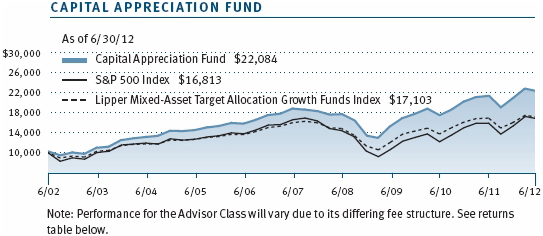
Performance and Expenses
This chart shows the value of a hypothetical $10,000 investment in the fund over the past 10 fiscal year periods or since inception (for funds lacking 10-year records). The result is compared with benchmarks, which may include a broad-based market index and a peer group average or index. Market indexes do not include expenses, which are deducted from fund returns as well as mutual fund averages and indexes.
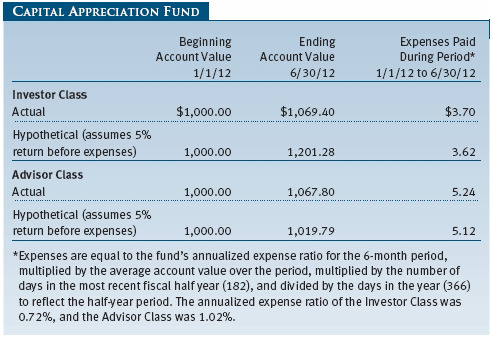
As a mutual fund shareholder, you may incur two types of costs: (1) transaction costs, such as redemption fees or sales loads, and (2) ongoing costs, including management fees, distribution and service (12b-1) fees, and other fund expenses. The following example is intended to help you understand your ongoing costs (in dollars) of investing in the fund and to compare these costs with the ongoing costs of investing in other mutual funds. The example is based on an investment of $1,000 invested at the beginning of the most recent six-month period and held for the entire period.
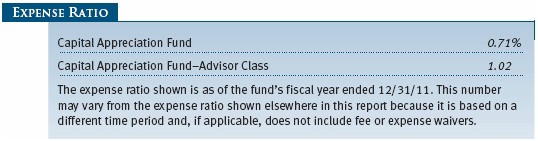
Please note that the fund has two share classes: The original share class (Investor Class) charges no distribution and service (12b-1) fee, and the Advisor Class shares are offered only through unaffiliated brokers and other financial intermediaries and charge a 0.25% 12b-1 fee. Each share class is presented separately in the table.
Actual Expenses
The first line of the following table (Actual) provides information about actual account values and expenses based on the fund’s actual returns. You may use the information on this line, together with your account balance, to estimate the expenses that you paid over the period. Simply divide your account value by $1,000 (for example, an $8,600 account value divided by $1,000 = 8.6), then multiply the result by the number on the first line under the heading “Expenses Paid During Period” to estimate the expenses you paid on your account during this period.
Hypothetical Example for Comparison Purposes
The information on the second line of the table (Hypothetical) is based on hypothetical account values and expenses derived from the fund’s actual expense ratio and an assumed 5% per year rate of return before expenses (not the fund’s actual return). You may compare the ongoing costs of investing in the fund with other funds by contrasting this 5% hypothetical example and the 5% hypothetical examples that appear in the shareholder reports of the other funds. The hypothetical account values and expenses may not be used to estimate the actual ending account balance or expenses you paid for the period.
Note: T. Rowe Price charges an annual account service fee of $20, generally for accounts with less than $10,000. The fee is waived for any investor whose T. Rowe Price mutual fund accounts total $50,000 or more; accounts electing to receive electronic delivery of account statements, transaction confirmations, prospectuses, and shareholder reports; or accounts of an investor who is a T. Rowe Price Preferred Services, Personal Services, or Enhanced Personal Services client (enrollment in these programs generally requires T. Rowe Price assets of at least $100,000). This fee is not included in the accompanying table. If you are subject to the fee, keep it in mind when you are estimating the ongoing expenses of investing in the fund and when comparing the expenses of this fund with other funds.
You should also be aware that the expenses shown in the table highlight only your ongoing costs and do not reflect any transaction costs, such as redemption fees or sales loads. Therefore, the second line of the table is useful in comparing ongoing costs only and will not help you determine the relative total costs of owning different funds. To the extent a fund charges transaction costs, however, the total cost of owning that fund is higher.
Unaudited

The accompanying notes are an integral part of these financial statements.
Unaudited
The accompanying notes are an integral part of these financial statements.
Unaudited

The accompanying notes are an integral part of these financial statements.
Unaudited
The accompanying notes are an integral part of these financial statements.
Unaudited
The accompanying notes are an integral part of these financial statements.
Unaudited
The accompanying notes are an integral part of these financial statements.
Unaudited
| Notes to Financial Statements |
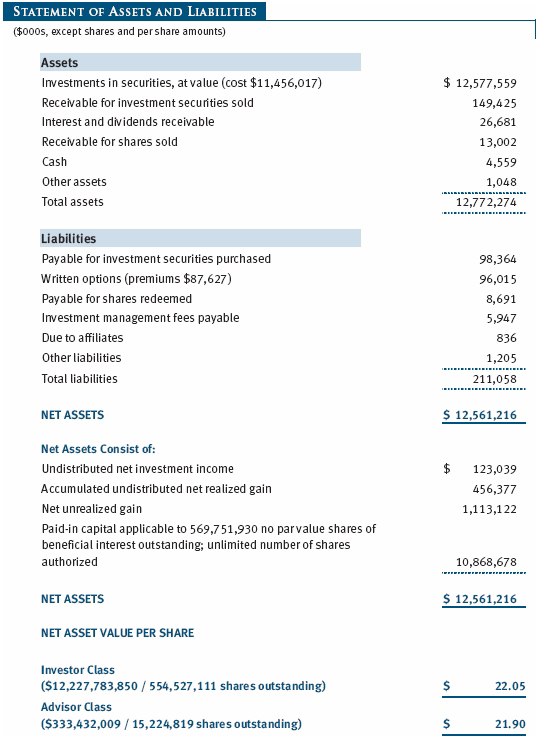
T. Rowe Price Capital Appreciation Fund (the fund), is registered under the Investment Company Act of 1940 (the 1940 Act) as a diversified, open-end management investment company. The fund seeks long-term capital appreciation by investing primarily in common stocks. It may also hold fixed-income and other securities to help preserve principal value. The fund has two classes of shares: the Capital Appreciation Fund original share class, referred to in this report as the Investor Class, offered since June 30, 1986, and the Capital Appreciation Fund–Advisor Class (Advisor Class), offered since December 31, 2004. Advisor Class shares are sold only through unaffiliated brokers and other unaffiliated financial intermediaries that are compensated by the class for distribution, shareholder servicing, and/or certain administrative services under a Board-approved Rule 12b-1 plan. Each class has exclusive voting rights on matters related solely to that class; separate voting rights on matters that relate to both classes; and, in all other respects, the same rights and obligations as the other class.
NOTE 1 - SIGNIFICANT ACCOUNTING POLICIES
Basis of Preparation The accompanying financial statements were prepared in accordance with accounting principles generally accepted in the United States of America (GAAP), which require the use of estimates made by management. Management believes that estimates and valuations are appropriate; however, actual results may differ from those estimates, and the valuations reflected in the accompanying financial statements may differ from the value ultimately realized upon sale or maturity.
Investment Transactions, Investment Income, and Distributions Income and expenses are recorded on the accrual basis. Premiums and discounts on debt securities are amortized for financial reporting purposes. Dividends received from mutual fund investments are reflected as dividend income; capital gain distributions are reflected as realized gain/loss. Dividend income and capital gain distributions are recorded on the ex-dividend date. Income tax-related interest and penalties, if incurred, would be recorded as income tax expense. Investment transactions are accounted for on the trade date. Realized gains and losses are reported on the identified cost basis. Distributions to shareholders are recorded on the ex-dividend date. Income distributions are declared and paid by each class annually. Capital gain distributions, if any, are generally declared and paid by the fund annually.
Currency Translation Assets, including investments, and liabilities denominated in foreign currencies are translated into U.S. dollar values each day at the prevailing exchange rate, using the mean of the bid and asked prices of such currencies against U.S. dollars as quoted by a major bank. Purchases and sales of securities, income, and expenses are translated into U.S. dollars at the prevailing exchange rate on the date of the transaction. The effect of changes in foreign currency exchange rates on realized and unrealized security gains and losses is reflected as a component of security gains and losses.
Class Accounting The Advisor Class pays distribution, shareholder servicing, and/or certain administrative expenses in the form of Rule 12b-1 fees, in an amount not exceeding 0.25% of the class’s average daily net assets. Shareholder servicing, prospectus, and shareholder report expenses incurred by each class are charged directly to the class to which they relate. Expenses common to both classes, investment income, and realized and unrealized gains and losses are allocated to the classes based upon the relative daily net assets of each class.
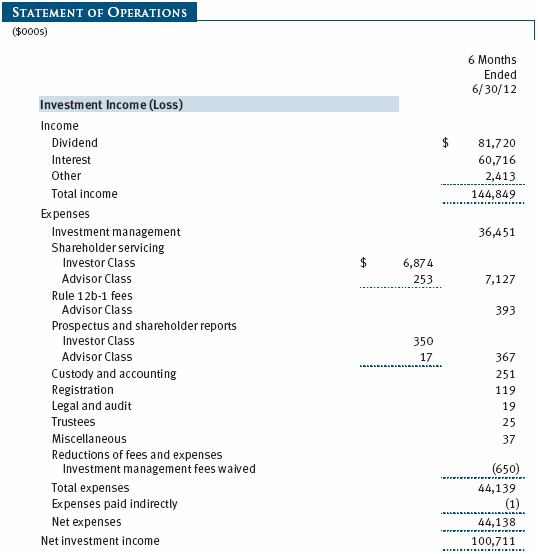
Rebates and Credits Subject to best execution, the fund may direct certain security trades to brokers who have agreed to rebate a portion of the related brokerage commission to the fund in cash. Commission rebates are reflected as realized gain on securities in the accompanying financial statements and totaled $83,000 for the six months ended June 30, 2012. Additionally, the fund earns credits on temporarily uninvested cash balances held at the custodian, which reduce the fund’s custody charges. Custody expense in the accompanying financial statements is presented before reduction for credits, which are reflected as expenses paid indirectly.
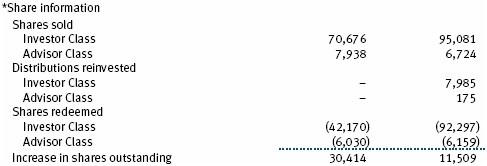
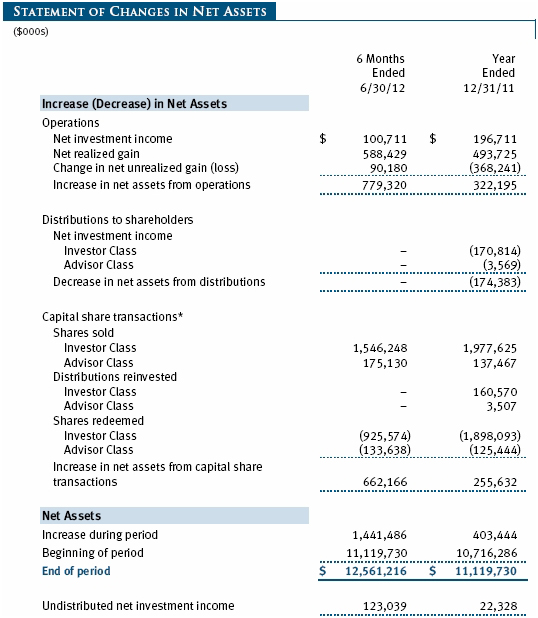
In-Kind Redemptions In accordance with guidelines described in the fund’s prospectus, the fund may distribute portfolio securities rather than cash as payment for a redemption of fund shares (in-kind redemption). For financial reporting purposes, the fund recognizes a gain on in-kind redemptions to the extent the value of the distributed securities on the date of redemption exceeds the cost of those securities. Gains and losses realized on in-kind redemptions are not recognized for tax purposes and are reclassified from undistributed realized gain (loss) to paid-in capital. During the six months ended June 30, 2012, the fund realized $7,538,000 of net gain on $27,500,000 of in-kind redemptions.
New Accounting Pronouncements In May 2011, the Financial Accounting Standards Board (FASB) issued amended guidance to align fair value measurement and disclosure requirements in U.S. GAAP with International Financial Reporting Standards. The guidance is effective for fiscal years and interim periods beginning on or after December 15, 2011. Adoption had no effect on net assets or results of operations.
In December 2011, the FASB issued amended guidance to enhance disclosure for offsetting assets and liabilities. The guidance is effective for fiscal years and interim periods beginning on or after January 1, 2013. Adoption will have no effect on the fund’s net assets or results of operations.
NOTE 2 - VALUATION
The fund’s financial instruments are reported at fair value as defined by GAAP. The fund determines the values of its assets and liabilities and computes each class’s net asset value per share at the close of the New York Stock Exchange (NYSE), normally 4 p.m. ET, each day that the NYSE is open for business.
Valuation Methods Equity securities listed or regularly traded on a securities exchange or in the over-the-counter (OTC) market are valued at the last quoted sale price or, for certain markets, the official closing price at the time the valuations are made, except for OTC Bulletin Board securities, which are valued at the mean of the latest bid and asked prices. A security that is listed or traded on more than one exchange is valued at the quotation on the exchange determined to be the primary market for such security. Listed securities not traded on a particular day are valued at the mean of the latest bid and asked prices for domestic securities and the last quoted sale price for international securities.
Debt securities are generally traded in the OTC market. Securities with remaining maturities of one year or more at the time of acquisition are valued at prices furnished by dealers who make markets in such securities or by an independent pricing service, which considers the yield or price of bonds of comparable quality, coupon, maturity, and type, as well as prices quoted by dealers who make markets in such securities. Securities with remaining maturities of less than one year at the time of acquisition generally use amortized cost in local currency to approximate fair value. However, if amortized cost is deemed not to reflect fair value or the fund holds a significant amount of such securities with remaining maturities of more than 60 days, the securities are valued at prices furnished by dealers who make markets in such securities or by an independent pricing service.
Investments in mutual funds are valued at the mutual fund’s closing net asset value per share on the day of valuation. Purchased and written options, and OTC options with a listed equivalent, are valued at the mean of the closing bid and asked prices.
Other investments, including restricted securities and private placements, and those financial instruments for which the above valuation procedures are inappropriate or are deemed not to reflect fair value, are stated at fair value as determined in good faith by the T. Rowe Price Valuation Committee, established by the fund’s Board of Trustees (the Board). Subject to oversight by the Board, the Valuation Committee develops pricing-related policies and procedures and approves all fair-value determinations. The Valuation Committee regularly makes good faith judgments, using a wide variety of sources and information, to establish and adjust valuations of certain securities as events occur and circumstances warrant. For instance, in determining the fair value of private-equity instruments, the Valuation Committee considers a variety of factors, including the company’s business prospects, its financial performance, strategic events impacting the company, relevant valuations of similar companies, new rounds of financing, and any negotiated transactions of significant size between other investors in the company. Because any fair-value determination involves a significant amount of judgment, there is a degree of subjectivity inherent in such pricing decisions.
For valuation purposes, the last quoted prices of non-U.S. equity securities may be adjusted under the circumstances described below. If the fund determines that developments between the close of a foreign market and the close of the NYSE will, in its judgment, materially affect the value of some or all of its portfolio securities, the fund will adjust the previous closing prices to reflect what it believes to be the fair value of the securities as of the close of the NYSE. In deciding whether it is necessary to adjust closing prices to reflect fair value, the fund reviews a variety of factors, including developments in foreign markets, the performance of U.S. securities markets, and the performance of instruments trading in U.S. markets that represent foreign securities and baskets of foreign securities. A fund may also fair value securities in other situations, such as when a particular foreign market is closed but the fund is open. The fund uses outside pricing services to provide it with closing prices and information to evaluate and/or adjust those prices. The fund cannot predict how often it will use closing prices and how often it will determine it necessary to adjust those prices to reflect fair value. As a means of evaluating its security valuation process, the fund routinely compares closing prices, the next day’s opening prices in the same markets, and adjusted prices. Additionally, trading in the underlying securities of the fund may take place in various foreign markets on certain days when the fund is not open for business and does not calculate a net asset value. As a result, net asset values may be significantly affected on days when shareholders cannot make transactions.
Valuation Inputs Various inputs are used to determine the value of the fund’s financial instruments. These inputs are summarized in the three broad levels listed below:
Level 1 – quoted prices in active markets for identical financial instruments
Level 2 – observable inputs other than Level 1 quoted prices (including, but not limited to, quoted prices for similar financial instruments, interest rates, prepayment speeds, and credit risk)
Level 3 – unobservable inputs
Observable inputs are those based on market data obtained from sources independent of the fund, and unobservable inputs reflect the fund’s own assumptions based on the best information available. The input levels are not necessarily an indication of the risk or liquidity associated with financial instruments at that level. For example, non-U.S. equity securities actively traded in foreign markets generally are reflected in Level 2 despite the availability of closing prices because the fund evaluates and determines whether those closing prices reflect fair value at the close of the NYSE or require adjustment, as described above. The following table summarizes the fund's financial instruments, based on the inputs used to determine their values on June 30, 2012:

NOTE 3 - DERIVATIVE INSTRUMENTS
During the six months ended June 30, 2012, the fund invested in derivative instruments. As defined by GAAP, a derivative is a financial instrument whose value is derived from an underlying security price, foreign exchange rate, interest rate, index of prices or rates, or other variable; it requires little or no initial investment and permits or requires net settlement. The fund invests in derivatives only if the expected risks and rewards are consistent with its investment objectives, policies, and overall risk profile, as described in its prospectus and Statement of Additional Information. The fund may use derivatives for a variety of purposes, such as seeking to hedge against declines in principal value, increase yield, invest in an asset with greater efficiency and at a lower cost than is possible through direct investment, or to adjust credit exposure. The risks associated with the use of derivatives are different from, and potentially much greater than, the risks associated with investing directly in the instruments on which the derivatives are based. Investments in derivatives can magnify returns positively or negatively; however, the fund at all times maintains sufficient cash reserves, liquid assets, or other SEC-permitted asset types to cover the settlement obligations under its open derivative contracts.
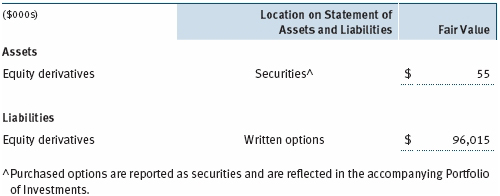
The fund values its derivatives at fair value, as described below and in Note 2, and recognizes changes in fair value currently in its results of operations. Accordingly, the fund does not follow hedge accounting, even for derivatives employed as economic hedges. The fund does not offset the fair value of derivative instruments against the right to reclaim or obligation to return collateral. The following table summarizes the fair value of the fund’s derivative instruments held as of June 30, 2012, and the related location on the accompanying Statement of Assets and Liabilities, presented by primary underlying risk exposure:
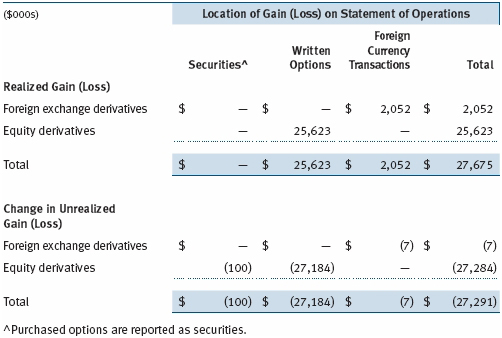
Additionally, the amount of gains and losses on derivative instruments recognized in fund earnings during the six months ended June 30, 2012, and the related location on the accompanying Statement of Operations is summarized in the following table by primary underlying risk exposure:
Forward Currency Exchange Contracts The fund is subject to foreign currency exchange rate risk in the normal course of pursuing its investment objectives. It uses forward currency exchange contracts (forwards) primarily to protect its non-U.S. dollar-denominated securities from adverse currency movements relative to the U.S. dollar. A forward involves an obligation to purchase or sell a fixed amount of a specific currency on a future date at a price set at the time of the contract. Although certain forwards may be settled by exchanging only the net gain or loss on the contract, most forwards are settled with the exchange of the underlying currencies in accordance with the specified terms. Forwards are valued at the unrealized gain or loss on the contract, which reflects the net amount the fund either is entitled to receive or obligated to deliver, as measured by the difference between the forward exchange rates at the date of entry into the contract and the forward rates at the reporting date. Appreciated forwards are reflected as assets, and depreciated forwards are reflected as liabilities on the accompanying Statement of Assets and Liabilities. Risks related to the use of forwards include the possible failure of counterparties to meet the terms of the agreements; that anticipated currency movements will not occur, thereby reducing the fund’s total return; and the potential for losses in excess of the fund’s initial investment. During the six months ended June 30, 2012, the fund’s exposure to forwards, based on underlying notional amounts, was generally less than 1% of net assets.
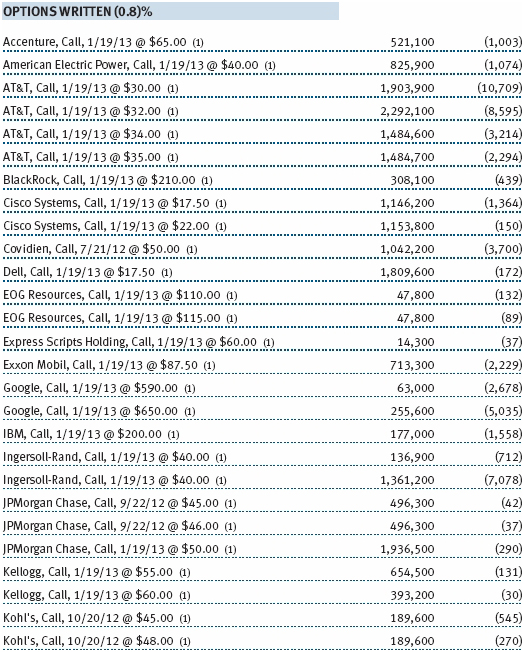
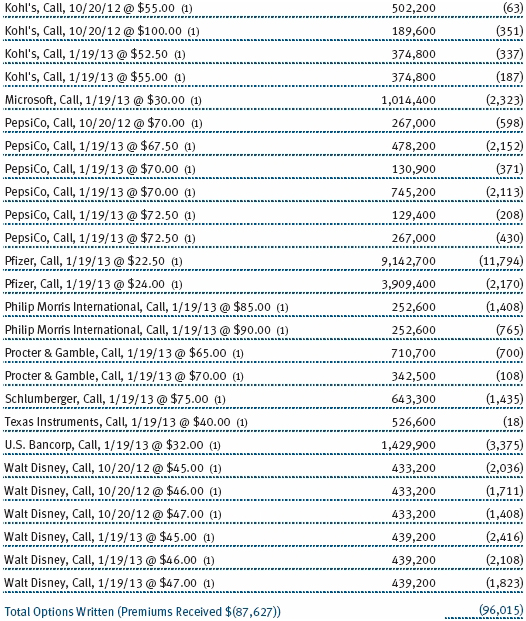
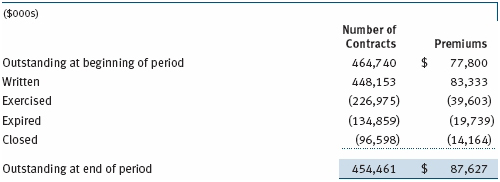
Options The fund is subject to equity price risk in the normal course of pursuing its investment objectives and uses options to help manage such risk. The fund may use call and put options to manage exposure to interest rates, security prices, foreign currencies, and credit quality; as an efficient means of adjusting exposure to all or a part of a target market; to enhance income; as a cash management tool; and/or to adjust credit exposure. Call and put options give the holder the right, in return for a premium paid, to purchase or sell, respectively, a security at a specified exercise price at any time during the period of the option. Options are included in net assets at fair value; purchased options are included in Investments in Securities; and written options are separately reflected as a liability on the accompanying Statement of Assets and Liabilities. Premiums on unexercised, expired options are recorded as realized gains or losses; premiums on exercised options are recorded as an adjustment to the proceeds from the sale or cost of the purchase. The difference between the premium and the amount received or paid in a closing transaction is also treated as realized gain or loss. Risks related to the use of options include possible illiquidity of the options markets; trading restrictions imposed by an exchange; movements in underlying security values; and, for written options, potential losses in excess of the fund’s initial investment. During the six months ended June 30, 2012, the fund’s exposure to options, based on underlying notional amounts, was generally less than 1% of net assets. Transactions in written options and related premiums received during the six months ended June 30, 2012, were as follows:
NOTE 4 - OTHER INVESTMENT TRANSACTIONS
Consistent with its investment objective, the fund engages in the following practices to manage exposure to certain risks and/or to enhance performance. The investment objective, policies, program, and risk factors of the fund are described more fully in the fund’s prospectus and Statement of Additional Information.
Restricted Securities The fund may invest in securities that are subject to legal or contractual restrictions on resale. Prompt sale of such securities at an acceptable price may be difficult and may involve substantial delays and additional costs.
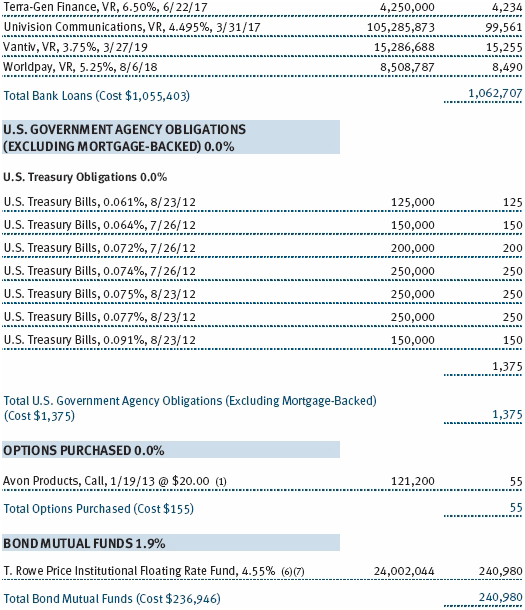
Bank Loans The fund may invest in bank loans, which represent an interest in amounts owed by a borrower to a syndication of lenders. Bank loans may involve multiple loans with the same borrower under a single credit agreement (each loan, a tranche), and each tranche may have different terms and associated risks. A bank or other financial institution typically acts as the agent and administers a bank loan in accordance with the associated credit agreement. Bank loans are generally noninvestment grade and often involve borrowers whose financial condition is troubled or uncertain and companies that are highly leveraged. The fund may buy and sell bank loans in the form of either loan assignments or loan participations. A loan assignment transfers all legal, beneficial, and economic rights to the buyer. Although loan assignments continue to be administered by the agent, the buyer acquires direct rights against the borrower. In many cases, a loan assignment requires the consent of both the borrower and the agent. In contrast, a loan participation generally entitles the buyer to receive the cash flows from principal, interest, and any fee payments that the seller is entitled to receive from the borrower; however, the seller continues to hold legal title to the loan. As a result, with loan participations, the buyer generally has no right to enforce compliance with the terms of the credit agreement against the borrower, and the buyer is subject to the credit risk of both the borrower and the seller. Bank loans often have extended settlement periods, during which the fund is subject to nonperformance by the counterparty. A portion of the fund’s bank loans may require additional principal to be funded at the borrowers’ discretion at a later date (unfunded commitments), and bank loans usually may be repaid any time at the option of the borrower. The fund reflects both the funded portion of the bank loan as well as any unfunded commitment on the loan in the Portfolio of Investments.
Counterparty Risk and Collateral The fund has entered into collateral agreements with certain counterparties to mitigate counterparty risk associated with certain over-the-counter (OTC) financial instruments, including swaps, forward currency exchange contracts, TBA purchase commitments, and OTC options (collectively, covered OTC instruments). Subject to certain minimum exposure requirements (which typically range from $100,000 to $500,000), collateral requirements generally are determined and transfers made based on the net aggregate unrealized gain or loss on all OTC instruments covered by a particular collateral agreement with a specified counterparty. Collateral, both pledged by the fund to a counterparty and pledged by a counterparty to the fund, is held in a segregated account by a third-party agent and can be in the form of cash or debt securities issued by the U.S. government or related agencies. Securities posted as collateral by the fund to a counterparty are so noted in the accompanying Portfolio of Investments and remain in the fund’s assets. Collateral pledged by counterparties to the fund is not included in the fund’s assets because the fund does not obtain effective control over those assets. As of June 30, 2012, no collateral was pledged by either the fund or counterparties for covered OTC instruments.
At any point in time, the fund’s risk of loss from counterparty credit risk on covered OTC instruments is the aggregate unrealized gain on appreciated covered OTC instruments in excess of collateral, if any, pledged by the counterparty to the fund. In accordance with the terms of the relevant derivatives agreements, counterparties to OTC derivatives may be able to terminate derivative contracts prior to maturity after the occurrence of certain stated events, such as a decline in net assets above a certain percentage or a failure by the fund to perform its obligations under the contract. Upon termination, all transactions would typically be liquidated and a net amount would be owed by or payable to the fund. Counterparty risk related to exchange-traded futures and options contracts is minimal because the exchange’s clearinghouse provides protection against counterparty defaults. Generally, for exchange-traded derivatives such as futures and options, each broker, in its sole discretion, may change margin requirements applicable to the fund. As of June 30, 2012, no collateral had been posted by the fund to the broker for exchange-traded derivatives.
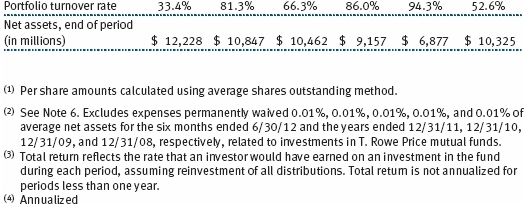
Other Purchases and sales of portfolio securities other than short-term securities aggregated $3,605,692,000 and $3,461,296,000, respectively, for the six months ended June 30, 2012.
NOTE 5 - FEDERAL INCOME TAXES
No provision for federal income taxes is required since the fund intends to continue to qualify as a regulated investment company under Subchapter M of the Internal Revenue Code and distribute to shareholders all of its taxable income and gains. Distributions determined in accordance with federal income tax regulations may differ in amount or character from net investment income and realized gains for financial reporting purposes. Financial reporting records are adjusted for permanent book/tax differences to reflect tax character but are not adjusted for temporary differences. The amount and character of tax-basis distributions and composition of net assets are finalized at fiscal year-end; accordingly, tax-basis balances have not been determined as of the date of this report.
The fund intends to retain realized gains to the extent of available capital loss carryforwards. As a result of the Regulated Investment Company Modernization Act of 2010, net capital losses realized on or after January 1, 2011 (effective date) may be carried forward indefinitely to offset future realized capital gains; however, post-effective losses must be used before pre-effective capital loss carryforwards with expiration dates. Accordingly, it is possible that all or a portion of the fund’s pre-effective capital loss carryforwards could expire unused. As of December 31, 2011, the fund had $78,301,000 of available capital loss carryforwards, which expire as follows: $71,408,000 in fiscal 2017 and $6,893,000 have no expiration.
At June 30, 2012, the cost of investments for federal income tax purposes was $11,501,530,000. Net unrealized gain aggregated $1,067,609,000 at period-end, of which $1,345,322,000 related to appreciated investments and $277,713,000 related to depreciated investments.
NOTE 6 - RELATED PARTY TRANSACTIONS
The fund is managed by T. Rowe Price Associates, Inc. (Price Associates), a wholly owned subsidiary of T. Rowe Price Group, Inc. (Price Group). The investment management agreement between the fund and Price Associates provides for an annual investment management fee, which is computed daily and paid monthly. The fee consists of an individual fund fee, equal to 0.30% of the fund’s average daily net assets, and a group fee. The group fee rate is calculated based on the combined net assets of certain mutual funds sponsored by Price Associates (the group) applied to a graduated fee schedule, with rates ranging from 0.48% for the first $1 billion of assets to 0.28% for assets in excess of $300 billion. The fund’s group fee is determined by applying the group fee rate to the fund’s average daily net assets. At June 30, 2012, the effective annual group fee rate was 0.30%.
In addition, the fund has entered into service agreements with Price Associates and two wholly owned subsidiaries of Price Associates (collectively, Price). Price Associates computes the daily share prices and provides certain other administrative services to the fund. T. Rowe Price Services, Inc., provides shareholder and administrative services in its capacity as the fund’s transfer and dividend disbursing agent. T. Rowe Price Retirement Plan Services, Inc., provides subaccounting and recordkeeping services for certain retirement accounts invested in the Investor Class. For the six months ended June 30, 2012, expenses incurred pursuant to these service agreements were $102,000 for Price Associates; $2,125,000 for T. Rowe Price Services, Inc.; and $878,000 for T. Rowe Price Retirement Plan Services, Inc. The total amount payable at period-end pursuant to these service agreements is reflected as Due to Affiliates in the accompanying financial statements.
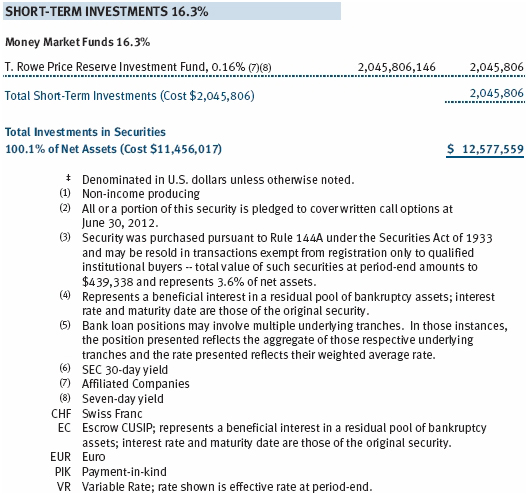
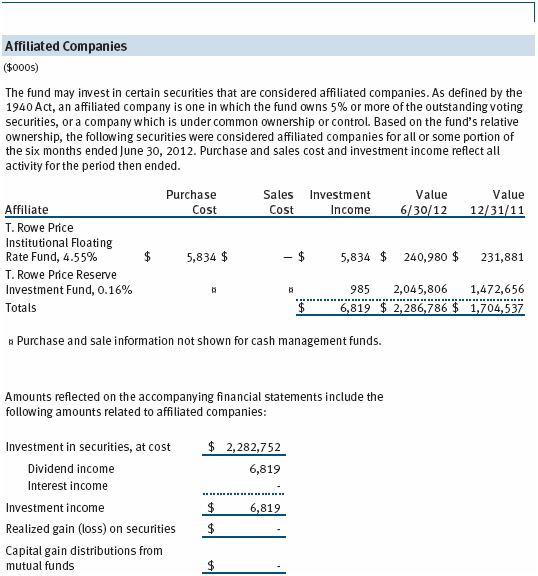
The fund may invest in the T. Rowe Price Reserve Investment Fund and the T. Rowe Price Government Reserve Investment Fund (collectively, the T. Rowe Price Reserve Investment Funds), open-end management investment companies managed by Price Associates and considered affiliates of the fund. The T. Rowe Price Reserve Investment Funds are offered as cash management options to mutual funds, trusts, and other accounts managed by Price Associates and/or its affiliates and are not available for direct purchase by members of the public. The T. Rowe Price Reserve Investment Funds pay no investment management fees.
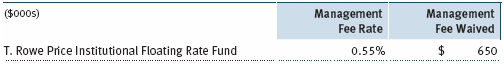
The fund may also invest in certain T. Rowe Price institutional funds (underlying institutional funds) as a means of gaining efficient and cost-effective exposure to certain markets. The underlying institutional funds are open-end management investment companies managed by Price Associates and are considered affiliates of the fund. Each underlying institutional fund pays an all-inclusive management and administrative fee to Price Associates. To ensure that the fund does not incur duplicate fees, Price Associates has agreed to permanently waive a portion of its management fee charged to the fund in an amount sufficient to fully offset the management fees paid by the underlying institutional funds related to fund assets invested therein. Accordingly, the accompanying Statement of Operations includes management fees permanently waived pursuant to this agreement. Annual fee rates and amounts waived within the accompanying Statement of Operations related to shares of the underlying institutional funds for the six months ended June 30, 2012, are as follows:
| Information on Proxy Voting Policies, Procedures, and Records |
A description of the policies and procedures used by T. Rowe Price funds and portfolios to determine how to vote proxies relating to portfolio securities is available in each fund’s Statement of Additional Information, which you may request by calling 1-800-225-5132 or by accessing the SEC’s website, sec.gov. The description of our proxy voting policies and procedures is also available on our website, troweprice.com. To access it, click on the words “Our Company” at the top of our corporate homepage. Then, when the next page appears, click on the words “Proxy Voting Policies” on the left side of the page.
Each fund’s most recent annual proxy voting record is available on our website and through the SEC’s website. To access it through our website, follow the directions above, then click on the words “Proxy Voting Records” on the right side of the Proxy Voting Policies page.
| How to Obtain Quarterly Portfolio Holdings |
The fund files a complete schedule of portfolio holdings with the Securities and Exchange Commission for the first and third quarters of each fiscal year on Form N-Q. The fund’s Form N-Q is available electronically on the SEC’s website (sec.gov); hard copies may be reviewed and copied at the SEC’s Public Reference Room, 100 F St. N.E., Washington, DC 20549. For more information on the Public Reference Room, call 1-800-SEC-0330.
| Approval of Investment Management Agreement |
On March 6, 2012, the fund’s Board of Trustees (Board), including a majority of the fund’s independent trustees, approved the continuation of the investment management agreement (Advisory Contract) between the fund and its investment advisor, T. Rowe Price Associates, Inc. (Advisor). In connection with its deliberations, the Board requested, and the Advisor provided, such information as the Board (with advice from independent legal counsel) deemed reasonably necessary. The Board considered a variety of factors in connection with its review of the Advisory Contract, also taking into account information provided by the Advisor during the course of the year, as discussed below:
Services Provided by the Advisor
The Board considered the nature, quality, and extent of the services provided to the fund by the Advisor. These services included, but were not limited to, directing the fund’s investments in accordance with its investment program and the overall management of the fund’s portfolio, as well as a variety of related activities such as financial, investment operations, and administrative services; compliance; maintaining the fund’s records and registrations; and shareholder communications. The Board also reviewed the background and experience of the Advisor’s senior management team and investment personnel involved in the management of the fund, as well as the Advisor’s compliance record. The Board concluded that it was satisfied with the nature, quality, and extent of the services provided by the Advisor.
Investment Performance of the Fund
The Board reviewed the fund’s average annual total returns over the three-month and 1-, 3-, 5-, and 10-year periods, as well as the fund’s year-by-year returns, and compared these returns with a wide variety of previously agreed upon comparable performance measures and market data, including those supplied by Lipper and Morningstar, which are independent providers of mutual fund data.
On the basis of this evaluation and the Board’s ongoing review of investment results, and factoring in the relative market conditions during certain of the performance periods, the Board concluded that the fund’s performance was satisfactory.
Costs, Benefits, Profits, and Economies of Scale
The Board reviewed detailed information regarding the revenues received by the Advisor under the Advisory Contract and other benefits that the Advisor (and its affiliates) may have realized from its relationship with the fund, including any research received under “soft dollar” agreements and commission-sharing arrangements with broker-dealers. The Board considered that the Advisor may receive some benefit from soft-dollar arrangements pursuant to which research is received from broker-dealers that execute the applicable fund’s portfolio transactions. The Board received information on the estimated costs incurred and profits realized by the Advisor from managing T. Rowe Price mutual funds. The Board also reviewed estimates of the profits realized from managing the fund in particular, and the Board concluded that the Advisor’s profits were reasonable in light of the services provided to the fund.
The Board also considered whether the fund benefits under the fee levels set forth in the Advisory Contract from any economies of scale realized by the Advisor. Under the Advisory Contract, the fund pays a fee to the Advisor for investment management services composed of two components—a group fee rate based on the combined average net assets of most of the T. Rowe Price mutual funds (including the fund) that declines at certain asset levels and an individual fund fee rate based on the fund’s average daily net assets—and the fund pays its own expenses of operations. The Board concluded that the advisory fee structure for the fund continued to provide for a reasonable sharing of benefits from any economies of scale with the fund’s investors.
Fees
The Board was provided with information regarding industry trends in management fees and expenses, and the Board reviewed the fund’s management fee rate, operating expenses, and total expense ratio (for the Investor Class and Advisor Class) in comparison to fees and expenses of other comparable funds based on information and data supplied by Lipper. The information provided to the Board indicated that the fund’s management fee rate was above the median for certain groups of comparable funds but at or below the median for other groups of comparable funds. The information also indicated that the total expense ratio (for the Investor Class) was at or below the median for comparable funds and the total expense ratio (for the Advisor Class) was below the median for comparable funds.
The Board also reviewed the fee schedules for institutional accounts and private accounts with similar mandates that are advised or subadvised by the Advisor and its affiliates. Management provided the Board with information about the Advisor’s responsibilities and services provided to institutional account clients, including information about how the requirements and economics of the institutional business are fundamentally different from those of the mutual fund business. The Board considered information showing that the mutual fund business is generally more complex from a business and compliance perspective than the institutional business, and that the Advisor generally performs significant additional services and assumes greater risk in managing the fund and other T. Rowe Price mutual funds than it does for institutional account clients.
On the basis of the information provided and the factors considered, the Board concluded that the fees paid by the fund under the Advisory Contract are reasonable.
Approval of the Advisory Contract
As noted, the Board approved the continuation of the Advisory Contract. No single factor was considered in isolation or to be determinative to the decision. Rather, the Board concluded, in light of a weighting and balancing of all factors considered, that it was in the best interests of the fund and its shareholders for the Board to approve the continuation of the Advisory Contract (including the fees to be charged for services thereunder). The independent trustees were advised throughout the process by independent legal counsel.
Item 2. Code of Ethics.
A code of ethics, as defined in Item 2 of Form N-CSR, applicable to its principal executive officer, principal financial officer, principal accounting officer or controller, or persons performing similar functions is filed as an exhibit to the registrant’s annual Form N-CSR. No substantive amendments were approved or waivers were granted to this code of ethics during the registrant’s most recent fiscal half-year.
Item 3. Audit Committee Financial Expert.
Disclosure required in registrant’s annual Form N-CSR.
Item 4. Principal Accountant Fees and Services.
Disclosure required in registrant’s annual Form N-CSR.
Item 5. Audit Committee of Listed Registrants.
Not applicable.
Item 6. Investments.
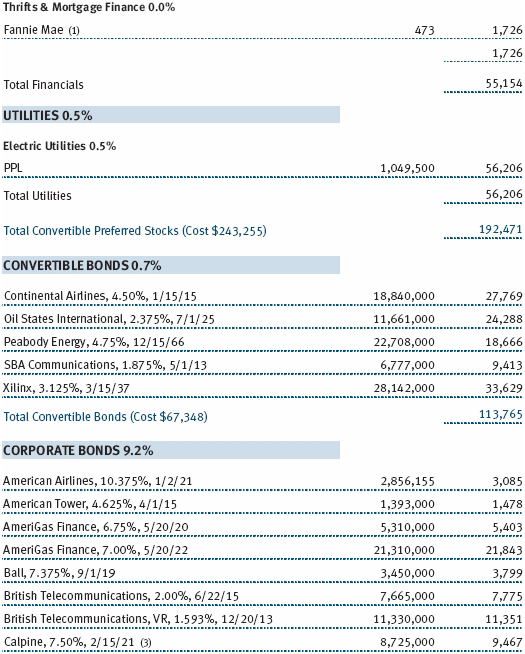
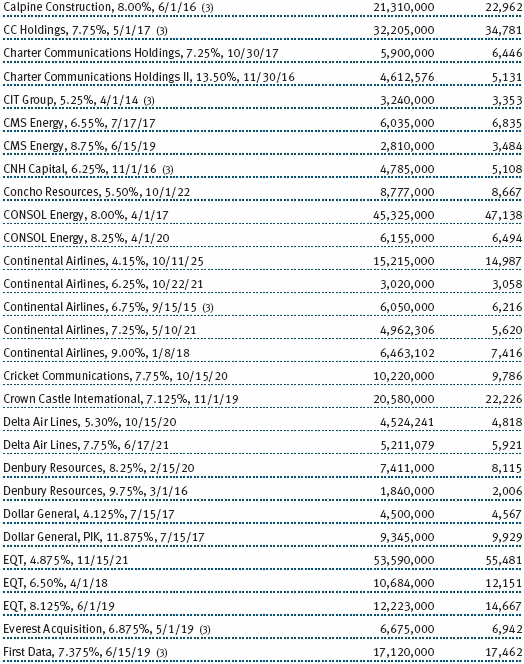
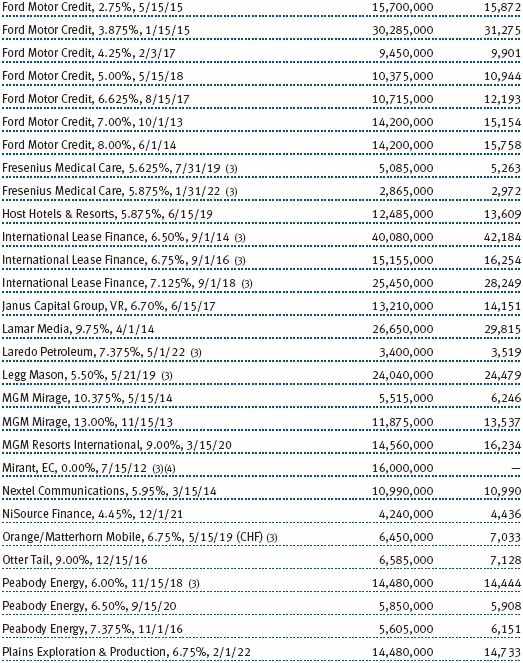
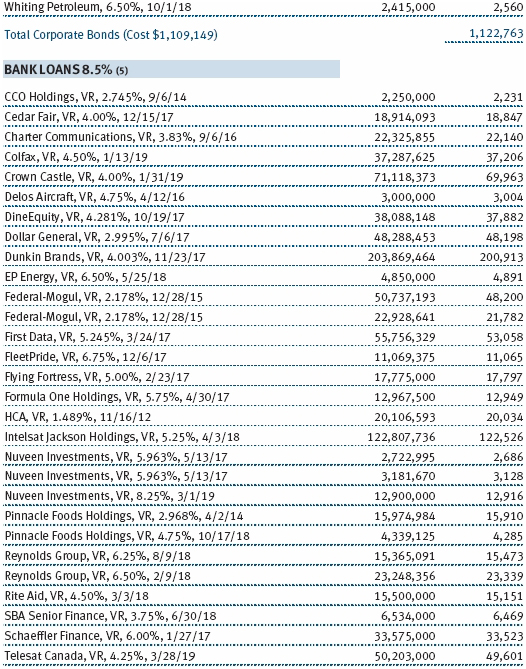
(a) Not applicable. The complete schedule of investments is included in Item 1 of this Form N-CSR.
(b) Not applicable.
Item 7. Disclosure of Proxy Voting Policies and Procedures for Closed-End Management Investment Companies.
Not applicable.
Item 8. Portfolio Managers of Closed-End Management Investment Companies.
Not applicable.
Item 9. Purchases of Equity Securities by Closed-End Management Investment Company and Affiliated Purchasers.
Not applicable.
Item 10. Submission of Matters to a Vote of Security Holders.
Not applicable.
Item 11. Controls and Procedures.
(a) The registrant’s principal executive officer and principal financial officer have evaluated the registrant’s disclosure controls and procedures within 90 days of this filing and have concluded that the registrant’s disclosure controls and procedures were effective, as of that date, in ensuring that information required to be disclosed by the registrant in this Form N-CSR was recorded, processed, summarized, and reported timely.
(b) The registrant’s principal executive officer and principal financial officer are aware of no change in the registrant’s internal control over financial reporting that occurred during the registrant’s second fiscal quarter covered by this report that has materially affected, or is reasonably likely to materially affect, the registrant’s internal control over financial reporting.
Item 12. Exhibits.
(a)(1) The registrant’s code of ethics pursuant to Item 2 of Form N-CSR is filed with the registrant’s annual Form N-CSR.
(2) Separate certifications by the registrant's principal executive officer and principal financial officer, pursuant to Section 302 of the Sarbanes-Oxley Act of 2002 and required by Rule 30a-2(a) under the Investment Company Act of 1940, are attached.
(3) Written solicitation to repurchase securities issued by closed-end companies: not applicable.
(b) A certification by the registrant's principal executive officer and principal financial officer, pursuant to Section 906 of the Sarbanes-Oxley Act of 2002 and required by Rule 30a-2(b) under the Investment Company Act of 1940, is attached.
SIGNATURES
Pursuant to the requirements of the Securities Exchange Act of 1934 and the Investment Company Act of 1940, the registrant has duly caused this report to be signed on its behalf by the undersigned, thereunto duly authorized.
T. Rowe Price Capital Appreciation Fund
| | By | /s/ Edward C. Bernard |
| | Edward C. Bernard |
| | Principal Executive Officer |
| |
| Date August 16, 2012 | | |
Pursuant to the requirements of the Securities Exchange Act of 1934 and the Investment Company Act of 1940, this report has been signed below by the following persons on behalf of the registrant and in the capacities and on the dates indicated.
| | By | /s/ Edward C. Bernard |
| | Edward C. Bernard |
| | Principal Executive Officer |
| |
| Date August 16, 2012 | | |
| |
| |
| By | /s/ Gregory K. Hinkle |
| | Gregory K. Hinkle |
| | Principal Financial Officer |
| |
| Date August 16, 2012 | | |