UNITED STATES
SECURITIES AND EXCHANGE COMMISSION
Washington, D.C. 20549
FORM N-CSR
CERTIFIED SHAREHOLDER REPORT OF REGISTERED MANAGEMENT
INVESTMENT COMPANIES
Investment Company Act File Number 811-04665
Commonwealth International Series Trust
(Exact name of registrant as specified in charter)
791 Town & Country Blvd
Houston, TX 77024-3925
(Address of principal executive offices) (Zip code)
CT Corporation System
155 Federal Street
Boston, MA 02110
(Name and address of agent for service)
Copies to:
John H. Lively
The Law Offices of John H. Lively & Associates, Inc.
A member firm of The 1940 Act Law GroupTM
2041 West 141st Terrace, Suite 119
Leawood, KS 66224
Registrant’s telephone number, including area code: (888) 345-1898
Date of fiscal year end: October 31
Date of reporting period: October 31, 2011
Item 1. Reports to Stockholders.
Commonwealth International
Series Trust
791 Town & Country Blvd, Suite 250
Houston, TX 77024-3925
888-345-1898
www.commonwealthfunds.com
INVESTMENT ADVISOR
FCA Corp
791 Town & Country Blvd, Suite 250
Houston, TX 77024-3925
713-781-2856
DISTRIBUTOR
UMB Distribution Services, LLC
803 West Michigan Street
Milwaukee, WI 53233
TRANSFER AGENT & ADMINISTRATOR
UMB Fund Services, Inc.
803 West Michigan Street
Milwaukee, WI 53233
CUSTODIAN BANK
Fifth Third Bank
Fifth Third Center
38 Fountain Square Plaza
Cincinnati, OH 45263
INDEPENDENT REGISTERED PUBLIC
ACCOUNTING FIRM
BBD, LLP
1835 Market Street, 26th Floor
Philadelphia, PA 19103
LEGAL COUNSEL
The Law Offices of John H. Lively & Associates, Inc.
A Member Firm of the 1940 Act Law GroupTM
2041 W. 141st Terrance, Suite 119
Leawood, KS 66224 | | 
Commonwealth Australia/New Zealand Fund
Commonwealth Japan Fund
Commonwealth Global Fund
Commonwealth Real Estate Securities Fund
ANNUAL REPORT
October 31, 2011 |
| | | |
| | | |
| This report is intended for the shareholders of the family of funds of the Commonwealth International Series Trust. It may not be distributed to prospective investors unless it is preceded or accompanied by the Funds’ current Prospectus. An additional Prospectus may be obtained at www.commonwealthfunds.com or from the principal underwriter of the Funds or your broker. | | |
| Table of Contents | | |
| | | |
| Shareholder Letter | | 2 |
| | | |
| Performance Overview | | |
Commonwealth Australia/New Zealand Fund | | 6 |
Commonwealth Japan Fund | | 8 |
Commonwealth Global Fund | | 10 |
Commonwealth Real Estate Securities Fund | | 12 |
| | | |
| Glossary of Terms | | 14 |
| Portfolio Composition | | 15 |
| Schedules of Investments | | 17 |
| Statements of Assets and Liabilities | | 24 |
| Statements of Operations | | 25 |
| Statements of Changes in Net Assets | | 26 |
| Financial Highlights | | 28 |
| | | |
| Notes to Financial Statements | | 32 |
| | | |
| Report of Independent Registered Public Accounting Firm | | 41 |
| | | |
| Additional Information | | 42 |
| | | |
| Trustees and Officers | | 44 |
| | | |
|
791 Town & Country Blvd, Suite 250, Houston, TX 77024-3925
888.345.1898
Commonwealth Australia/New Zealand Fund (CNZLX)
Commonwealth Japan Fund (CNJFX)
Commonwealth Global Fund (CNGLX)
Commonwealth Real Estate Securities Fund (CNREX)
www.commonwealthfunds.com
October 31, 2011
Dear Fellow Shareholders:
When the Egyptians created their twenty-four hour day, twelve hours were set aside for night time based on the positions of the stars and the day time was set to consist of only ten hours monitored by what was known as a “shadow clock”. The two absent hours remaining from this creative process were reserved and known as the twilight hours....one just before dawn and one immediately after sunset.
As we look back over the period of 2008 – 2011, we might conclude the economy of the United States has hopefully endured the darkest hours of the economic night and is perhaps entering the twilight of a promising new era.
From our view, history has demonstrated the United States is not an island unto itself and is not decoupled from other major economic powers of the world. For this new economic vista facing our country, we need our friends from foreign shores to be entering into more stable prosperous times as well for our country to be successful in the long term.
Galileo observed the time period for a swinging pendulum’s cycle does not vary regardless of the distance traveled. Outside forces can diminish its trajectory. To apply this analogy to our economy, it took considerable time to enter into the economic abyss we endured and it will take many months to regain the economic momentum lost. The problem is compounded by the lack of coordination of the international markets. The faltering of other markets may well be so powerful that our own recovery will be jeopardized.
Within this environment, FCA Corp manages the mutual funds comprising the Commonwealth International Series Trust. There are no secrets or special investments that weather difficult times without being affected. There are markets that perform better than others and currencies that strengthen while others decline.
The likes of tsunamis in Japan, earthquakes in New Zealand, credit crises in European countries, revolutions in northern Africa, political gamesmanship in the U.S., and questions of overall global growth must be addressed by investment strategies designed to navigate through these times and events.
Five-hundred years ago, the phrase was coined “knowledge is power”. This statement is absolutely true but is perhaps lacking in its complete definition. We think applicable, worthwhile powerful knowledge is actually developed by experiences. With over 20 years of international investing experience, FCA Corp has the basic intellectual comforts undergirding the investment processes for the various portfolios of the Commonwealth International Series Trust. There is no substitute for lessons learned through experience.
2
C O M M O N W E A L T H
INTERNATIONAL SERIES TRUST | ANNUAL REPORT 2011 |
| |
|
It is from this base that the Commonwealth International Series Trust expanded into the continent of Africa introducing the new Africa Fund which commenced operations on November 8, 2011. With the Australia/New Zealand, Japan, Global, Real Estate and now the Africa Funds, we feel the Commonwealth International Series Trust provides a broad approach to accessing many of the world’s markets. We believe that the market exposure provided by the mutual funds comprising the Commonwealth International Series Trust will allow our shareholders to participate in the economic recoveries that will take place on a global basis.
The following individual reports on each of the mutual funds in the Commonwealth International Series Trust are very important and we ask you to review them thoroughly.
In closing, as we reflect on our twentieth year as the investment advisor to the Trust, we would like to take this opportunity to thank you for your support and continued interest in our family of funds. We truly value our shareholders. If you have any questions, please feel free to contact us.
 | |  |
| Robert W. Scharar | | Wesley R. Yuhnke |
| President and Portfolio Manager | | Assistant Portfolio Manager |
| Commonwealth International Series Trust | | Commonwealth International Series Trust |
| | | |
| | |  |
| | | |
| | | Ronald Manning |
| | | Assistant Portfolio Manager |
| | | Commonwealth International Series Trust |
The views in the above discussion, along with discussion included under the “Performance Overview” for each Fund below, were those of the Funds’ investment advisor as of the date set forth above and may not reflect its views on the date this annual report is first published or anytime thereafter. These views are intended to assist shareholders in understanding their investment in the Funds and the performance of the Funds during the period covered by this report and do not constitute investment advice.
THE PERFORMANCE INFORMATION QUOTED IN THIS ANNUAL REPORT REPRESENTS PAST PERFORMANCE AND PAST PERFORMANCE DOES NOT GUARANTEE FUTURE RESULTS. INVESTMENT RETURN AND PRINCIPALVALUE OFAN INVESTMENT WILL FLUCTUATE SO THAT AN INVESTOR’S SHARES, WHEN REDEEMED, MAY BE WORTH MORE OR LESS THAN THEIR ORIGINAL COST. CURRENT PERFORMANCE MAY BE LOWER OR HIGHER THAN THE PERFORMANCE DATA QUOTED. AN INVESTOR SHOULD CONSIDER THE FUND’S INVESTMENT OBJECTIVES, RISKS, AND CHARGES AND EXPENSES CAREFULLY BEFORE INVESTING. THE FUND’S PROSPECTUS CONTAINS THISAND OTHER IMPORTANT INFORMATION. FOR INFORMATION ON THE FUND’S EXPENSE RATIO, PLEASE SEE THE FINANCIALHIGHLIGHTS TABLE FOUND WITHIN THIS REPORT. TO OBTAIN A PROSPECTUS AND OTHER INFORMATION ABOUT THE FUNDS, PLEASE VISIT WWW.COMMONWEALTHFUNDS.COM OR CALL 888-345-1898. PLEASE READ THE PROSPECTUS CAREFULLY BEFORE INVESTING.
3
C O M M O N W E A L T H
INTERNATIONAL SERIES TRUST | ANNUAL REPORT 2011 |
| |
|
Questions and Answers
To help shareholders better understand key attributes of the mutual funds (each a “Fund” and collectively the “Fund”) comprising the Commonwealth International Series Trust and their operations, the following Question and Answer section is provided.
Who is the advisor?
The Funds’ investment advisor is FCA Corp (“FCA”). FCA is an investment advisor that is registered with the U.S. Securities and Exchange Commission and has its principle place of business located at 791 Town & Country Blvd., Suite 250, Houston, Texas 77024-3925. The firm was founded 35 years ago and maintains a global perspective on the equity and fixed income marketplaces.
Why do our Funds include shares of foreign companies?
The Funds invest in companies outside the United States because FCA believes there are significant investment opportunities in select foreign markets. FCA also believe U.S. investors benefit from the diversification that having investments outside the United States can provide. International investing offers exposure to more companies and other nations’ economies. In 2011, over 50% of the value of equity markets was outside the United States, and the growth experienced by many of these foreign economies appeared to be attractive. FCA believes that for a U.S. investor, allocation of a portion of the investor’s portfolio to international securities can provide the potential for less risk and can achieve a more consistent long-term performance in the investor’s overall portfolio.1
How has international investing changed over the last decade?
International markets now comprise a significant portion of all equity value worldwide. As markets have blended through global commerce, capital has flowed from country to country following investment opportunities. Developed markets and emerging markets both require capital investments to provide the goods and services of their respective needs. During the last two decades in particular, statistical information has become more uniform thus more dependable. The trend appears to be in place for continued development of these distant countries and their markets long term. Their demand for investment capital continues as they provide opportunities for diversification and growth. The Funds seek to be participants in these developments. The challenge continues to be one of positioning portfolios for growth while seeking to protect against negative trends that might develop.
What are some of the factors influencing a Fund’s portfolio turnover?
Each Fund generally invests in equity securities with a long-term view and in debt securities to be held to maturity. The Funds’ portfolio securities are evaluated on their long-term prospects. A particular Fund may experience higher or lower turnover ratios in certain years. Factors influencing portfolio turnover include, but are not limited to the following: rebalancing portfolio securities to take advantage of long-term opportunities and/or to reallocate between fixed income and equity securities; investing new subscriptions; or selling securities to cover redemptions. Higher levels of portfolio activity by a Fund may result in higher transaction costs and/or more realized gains or losses, the impact of which is borne by the Fund’s shareholders. The turnover of a portfolio is not predictable because managers do not know when the portfolio transactions will be dictated. Under most circumstances, it is desirable to limit transactions because of the costs associated with trading although these are generally not the determining factor.
| 1 | Investing in international markets may involve additional risks, such as social and political instability, market illiquidity, exchange-rate fluctuations, a high level of volatility and limited regulation. |
We advise you to consider each Fund’s objectives, risks, charges and expenses carefully before investing in that Fund. The Prospectus contains information about those and other important matters relating to the Funds. Please read the Prospectus carefully before you invest.
4
C O M M O N W E A L T H
INTERNATIONAL SERIES TRUST | ANNUAL REPORT 2011 |
| |
|
How can the size of the Fund impact the Funds’ expense ratio?
The primary objective of investment management is to seek a reasonable return in keeping with the risks assumed. Obtaining this objective in global portfolios is historically more expensive than the costs associated with managing a portfolio comprised of domestic securities. Research of foreign markets, trading in different currencies, custody of assets, accurate evaluations of holdings and generally overall communications are all known to be more expensive when managing foreign portfolios. As with almost every mutual fund, size has an impact on the expense ratio of Funds. Typically, larger mutual funds can have lower expense ratios as there is an increased opportunity to spread out fixed and partially-fixed costs necessary to operate such mutual funds over a larger asset base. Generally, mutual fund expenses, including those of the Funds, are allocated on a daily basis among all shareholders. In addition, as a portfolio grows, it is self-evident that fixed costs as a percentage of the assets managed generally decline. In youthful portfolios or in highly specific investment objective portfolios, higher costs can be experienced during these growth of assets time periods. The Financial Highlights section of the accompanying financial statements provides supplemental data that includes current and historic expense information.
5
C O M M O N W E A L T H
INTERNATIONAL SERIES TRUST | ANNUAL REPORT 2011 |
| PERFORMANCE OVERVIEW – October 31, 2011 (Unaudited) |
| COMMONWEALTH AUSTRALIA/NEW ZEALAND FUND |
The Commonwealth Australia/New Zealand Fund’s net asset value (NAV) as of October 31, 2011 was $10.76 per share compared to $10.74 per share on October 31, 2010. For the twelve month period covered by this Annual Report, the Commonwealth Australia/New Zealand Fund returned 1.85%. This return figure reflects the 16.5 cents per share distribution made in December 2010. Our investments do not attempt to track any index, but rather we undertake investments on the basis of fundamental research. We also invest a portion of the Fund’s assets in fixed income investments and acknowledge this process may mitigate some meaningful comparisons to indexes that do not have such investments represented within them. During the twelve-month period New Zealand SmallCap Index1, the NZX 50 Free Float Total Return Index1 and the Australian All Ordinaries Index1, returned 10.28%, 7.42% and 5.14%, respectively. These indexes do not include any fixed income instruments. Additionally, the indexes are unmanaged, they are expressed in terms of U.S. dollars and they do not reflect the deduction of fees or taxes associated with a mutual fund such as investment management and fund accounting fees. The performance of the Fund reflects the deduction of fees for these services. Investors cannot invest directly in an index. |
| |
| The 6 percent appreciation of the New Zealand dollar versus the U.S. dollar positively impacted the fund’s returns during the year although the 7 percent decline of the Australian dollar negatively impacted the Fund’s returns. When measured in the respective local currency, New Zealand equities outperformed Australian equities. New Zealand small-cap equities generally outperformed relative to large-cap equities. Due to the allocation of the fund’s assets to the small-cap area, the Fund’s performance was correspondingly positively impacted. The Fund’s performance was unavoidably negatively impacted by the tragic mining accident in New Zealand at a mine owned and operated by Pike River Coal Co., Ltd*, which at the time of the accident represented 3.4% of the Fund’s portfolio. The holding, after the accidental event became worthless. In addition, New Zealand Oil & Gas Ltd.* was also a holding that was negatively impacted by this event. The company had an equity interest in Pike River Co., Ltd* and had also made loans to the company. The New Zealand Oil & Gas Ltd.* subsequently declined 40% in value. Both of these events and their affects on the portfolio are represented in the performance statistics of the year. South Port New Zealand, the Fund’s largest holding, had the largest positive impact on the fund’s performance as the company benefited from a robust period of increasing commodity prices coupled with strong demand for timber products for export to China. |
| |
| In New Zealand, the earthquakes in September 2010 and February 2011, as well as the associated aftershocks, significantly affected the economic environment. In addition to the considerable impact these events had on people’s lives, there was substantial damage to the regions infrastructure, as well as disruptions to economic activity. The New Zealand government’s working assumption is that there will be approximately NZ$20 billion of reconstruction required. This is equivalent to around 10 percent of GDP, which represents a very large stimulus in relative terms. As a comparison, the massive earthquake that struck Japan in March 2011 is estimated to have caused damage equivalent to around 3 to 4 percent of Japan’s annual GDP. |
| Investment Risks |
Equity securities (stocks) are more volatile and carry more risk than other forms of investments, including high-grade fixed income securities. The net asset values per share of a Fund will fluctuate as the value of these securities in the portfolio changes. |
| | |
The Fund’s investments in debt and/or fixed income securities also contain risk factors. The value of these securities tends to fluctuate inversely with changes in interest rates. Changes in an issuer’s financial strength or creditworthiness also can affect the value of the securities it issues. Convertible and preferred stocks, which have some characteristics of both equity and fixed income securities, also contain, to varying degrees depending on their structure, the associated risks of each. |
| | |
The Fund’s expenses, as with any mutual fund, detract from the Fund’s performance. The Fund’s asset levels have a direct effect on the expense indirectly paid by shareholders. To the extent the Fund’s assets decline and the expenses of the Fund rise or do not decrease proportionately, performance will be negatively impacted. |
| | |
International investing involves increased risk and volatility. An investment in this Fund entails the special risks of international investing, including currency exchange fluctuation, government regulations, and the potential for political and economic instability. Because the Fund invests primarily in the securities of, and depositary receipts represented by Australian and New Zealand issuers, the Fund is particularly susceptible to any economic, political, or regulatory developments affecting a particular issuer of those countries. |
| | |
By itself the Fund does not constitute a complete investment plan and should be considered a long-term investment for investors who can afford to weather change in the value of their investments. |
| | |
Investors should refer to the Fund’s Prospectus for a more complete description of risks associated with investing in and of the Fund. |
| | |
| * | Portfolio holdings will change due to ongoing management of the Funds. References to specific securities or sectors should not be construed as recommendations by the Trust, the Advisor or the Distributor. |
| 1 | For additional information, please refer to the Glossary of Terms following the Performance Overview section. |
6
C O M M O N W E A L T H
INTERNATIONAL SERIES TRUST | ANNUAL REPORT 2011 |
| PERFORMANCE OVERVIEW – October 31, 2011 (Unaudited) |
| COMMONWEALTH AUSTRALIA/NEW ZEALAND FUND |
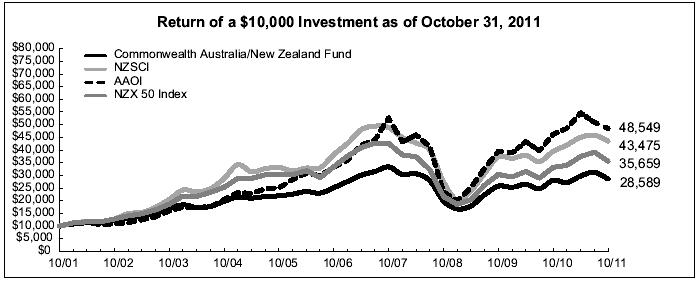
Comparison of Change in Value of a $10,000 Investment in the Commonwealth Australia/New Zealand Fund, the NZSCI, AAOI, and NZX 50 Index.
The above graph is a hypothetical $10,000 investment in the Commonwealth Australia/New Zealand Fund from 10/31/01 to 10/31/11, and represents the reinvestment of dividends and distributions in the Fund.
| | | Average Annual Total Return | | Average Annual Total Return | | Gross |
| | | as of September 30, 2011 | | as of October 31, 2011 | | Expense |
| | | 1 Year | | 5 Year | | 10 Year | | 1 Year | | 5 Year | | 10 Year | | Ratio1 |
Commonwealth Australia/New Zealand Fund | | -2.64 | % | | 1.82 | % | | 10.81 | % | | 1.85 | % | | 2.60 | % | | 11.08 | % | | 3.25 | % |
New Zealand SmallCap Index (“NZSCI”) | | 2.99 | % | | 1.22 | % | | 15.26 | % | | 10.28 | % | | 2.64 | % | | 15.83 | % | | — | |
Australian All Ordinaries Index (“AAOI”) | | -6.52 | % | | 6.37 | % | | 16.33 | % | | 5.14 | % | | 7.88 | % | | 17.12 | % | | — | |
NZX 50 Index | | 9.76 | % | | 1.77 | % | | 13.78 | % | | 7.42 | % | | 1.30 | % | | 13.56 | % | | — | |
| |
Past performance does not guarantee future results. The performance data quoted represents past performance and current returns may be lower or higher. The above graph and table do not reflect the deduction of taxes that a shareholder would pay on Fund distributions or the redemption of Fund shares. The investment return and principal value will fluctuate so that an investor’s shares, when redeemed may be worth more or less than the original cost. To obtain performance information current to the most recent month end, please call 888-345-1898. |
| | |
| 1 | The above expense ratio is from the Fund’s Prospectus dated March 1, 2011. Additional information pertaining to the Fund’s expense ratios as of October 31, 2011 can be found in the financial highlights. Excluding the indirect costs of investing in acquired funds, total fund operating expenses would be 3.24%. |
| | |
| The Fund’s performance is measured against the New Zealand SmallCap Index (“NZSCI”), a capitalization-weighted index of all New Zealand equities, excluding those in the NZX 50 Index, is considered to be reflective of the performance of the New Zealand small-cap equity market; the Australian All Ordinaries Index (“AAOI”), an index made up of the largest 500 companies as measured by market capitalization that are listed on the Australian Stock Exchange; and the NZX 50 Index, a total return index consisting of the top 50 companies by free float adjusted market capitalization that are listed on the New Zealand Stock Exchange. These indices are unmanaged, are expressed in terms of U.S. dollars, and do not reflect the deduction of fees or taxes with a mutual fund, such as investment management and fund accounting fees. The performance of the Fund reflects the deduction of fees for these services. Investors cannot invest directly in an index. |
| | |
You should carefully consider the investment objectives, risks, charges and expenses of the Fund before investing. This and other information can be found in the Fund’s Prospectus, which can be obtained from www.commonwealthfunds.com, by calling the Funds directly at 888-345-1898 or by contracting your investment representative. Please read it carefully before you invest or send money. |
| | |
| The Commonwealth Australia/New Zealand Fund was formerly known as Capstone New Zealand (2000) and subsequently the Commonwealth New Zealand Fund (2001). |
7
C O M M O N W E A L T H
INTERNATIONAL SERIES TRUST | ANNUAL REPORT 2011 |
| PERFORMANCE OVERVIEW – October 31, 2011 (Unaudited) |
| COMMONWEALTH JAPAN FUND |
The Commonwealth Japan Fund’s net asset value (NAV) as of October 31, 2011 was $2.70 per share compared to $2.80 per share on October 31, 2010. For the twelve month period covered by this Annual Report, the Commonwealth Japan Fund returned -3.57%. Our investments do not attempt to track any index, but rather we undertake investments on the basis of fundamental research. We also invest a portion of the Fund’s assets in fixed income investments and acknowledge this process may mitigate some meaningful comparisons to indexes that do not have such investments represented within them. The Tokyo Stock Price Index1 returned -0.58% for the same period. The index does not include any fixed income instruments. Additionally, the index is unmanaged, it is expressed in terms of U.S. dollars and it does not reflect the deduction of fees or taxes associated with a mutual fund such as investment management and fund accounting fees. The performance of the Fund reflects the deduction of fees for these services. Investors cannot invest directly in an index. |
| |
| Japan was hit by an unprecedented earthquake and tsunami on March 11, 2011. In the aftermath of the earthquake, production declined due to supply constraints caused primarily by the destruction of capital stock, disruptions in supply chains and a shortage of electric power. As a result, exports decreased and domestic demand became weak accentuated by deterioration in business and household sentiment. The supply constraints are, however, being solved more quickly than expected initially due to the strenuous efforts of many firms. Looking ahead, Japan’s economy is likely to continue to be under downward pressure seen mainly on the production side. However, as supply-chain constraints ease and production regains traction, the economy is expected to return to the moderate recovery path backed by an increase in exports reflecting the growth of the global economic recovery and by a rise in demand for restoring capital stock. |
| |
| While in many cases an economic downturn can be induced by a decline in demand, the economic contraction after the earthquake was due to constraints on the supply side including shortages in essential parts and power generation. Due to the nuclear power plant accident, the power generating capacities of the Tokyo Electric Power Company and Tohoku Electric Power Company* at one point had declined by 20 to 30 percent. The Fund’s performance therefore was negatively impacted by its holdings of electric power generating companies. In particular, Tohoku Electric Power Company’s* share price declined nearly 50 percent during the year. Also negatively impacting the Fund’s return was the Japanese government’s latest round of intervention in the currency markets which caused the Japanese Yen to decline over 3 percent versus the U.S. dollar in late October. |
| Investment Risks |
Equity securities (stocks) are more volatile and carry more risk than other forms of investments, including high-grade fixed income securities. The net asset values per share of a Fund will fluctuate as the value of these securities in the portfolio changes. |
| | |
The Fund’s investments in debt and/or fixed income securities also contain risk factors. The value of these securities tends to fluctuate inversely with changes in interest rates. Changes in an issuer’s financial strength or creditworthiness also can affect the value of the securities it issues. Convertible and preferred stocks, which have some characteristics of both equity and fixed income securities, also contain, to varying degrees depending on their structure, the associated risks of each. |
| | |
The Fund’s expenses, as with any mutual fund, detract from the Fund’s performance. The Fund’s asset levels have a direct effect on the expense indirectly paid by shareholders. To the extent the Fund’s assets decline and the expenses of the Fund rise or do not decrease proportionately, performance will be negatively impacted. |
| | |
International investing involves increased risk and volatility. An investment in this Fund entails the special risks of international investing, including currency exchange fluctuation, government regulations, and the potential for political and economic instability. Because the Fund invests primarily in the securities of, and depositary receipts represented by Japan issuers, the Fund is particularly susceptible to any economic, political, or regulatory developments affecting a particular issuer of that country. |
| | |
By itself the Fund does not constitute a complete investment plan and should be considered a long-term investment for investors who can afford to weather change in the value of their investments. |
| | |
Investors should refer to the Fund’s Prospectus for a more complete description of risks associated with investing in and of the Fund. |
| | |
| * | Portfolio holdings will change due to ongoing management of the Funds. References to specific securities or sectors should not be construed as recommendations by the Trust, the Advisor or the Distributor. |
| 1 | For additional information, please refer to the Glossary of Terms following the Performance Overview section. |
8
C O M M O N W E A L T H
INTERNATIONAL SERIES TRUST | ANNUAL REPORT 2011 |
| PERFORMANCE OVERVIEW – October 31, 2011 (Unaudited) |
| COMMONWEALTH JAPAN FUND |
Comparison of Change in Value of a $10,000 Investment in the Commonwealth Japan Fund and the TOPIX Index.
The above graph is a hypothetical $10,000 investment in the Commonwealth Japan Fund from 10/31/01 to 10/31/11, and represents the reinvestment of dividends and distributions in the Fund.
| | | Average Annual Total Return | | Average Annual Total Return | | | |
| | | as of September 30, 2011 | | as of October 31, 2011 | | Gross |
| | | | | | | | | | | | | | | | | | | | | Expense |
| | | 1 Year | | 5 Year | | 10 Year | | 1 Year | | 5 Year | | 10 Year | | Ratio1 |
Commonwealth Japan Fund | | 0.36 | % | | -5.80 | % | | -2.55 | % | | -3.57 | % | | -6.51 | % | | -2.71 | % | | 4.32 | % |
Tokyo Stock Price Index (“TOPIX”) | | 1.44 | % | | -4.64 | % | | 2.77 | % | | -0.58 | % | | -5.06 | % | | 2.63 | % | | — | |
| |
Past performance does not guarantee future results. The performance data quoted represents past performance and current returns may be lower or higher. The above graph and table do not reflect the deduction of taxes that a shareholder would pay on Fund distributions or the redemption of Fund shares. The investment return and principal value will fluctuate so that an investor’s shares, when redeemed may be worth more or less than the original cost. To obtain performance information current to the most recent month end, please call 888-345-1898. |
| | |
| 1 | The above expense ratio is from the Fund’s Prospectus dated March 1, 2011. Additional information pertaining to the Fund’s expense ratios as of October 31, 2011 can be found in the financial highlights. Excluding the indirect costs of investing in acquired funds, total fund operating expenses would be 4.31%. |
| | |
| The Fund’s performance is measured against the Tokyo Stock Price Index an unmanaged capitalization-weighted index of all the common stocks on the First Selection of the Tokyo Stock Exchange. This index is expressed in terms of U.S. dollars, and does not reflect the deduction of fees or taxes with a mutual fund, such as investment management and fund accounting fees. The performance of the Fund reflects the deduction of fees for these services. Investors cannot invest directly in an index. |
| | |
You should carefully consider the investment objectives, risks, charges and expenses of the Fund before investing. This and other information can be found in the Fund’s Prospectus, which can be obtained from www.commonwealthfunds.com, by calling the Funds directly at 888-345-1898 or by contracting your investment representative. Please read it carefully before you invest or send money. |
| | |
| The Commonwealth Japan Fund was formerly known as the Capstone Japan Fund (2000), established as a series of the Trust on July 10, 1989 under the name of the Capstone Nikko Japan Tilt Fund. |
9
C O M M O N W E A L T H
INTERNATIONAL SERIES TRUST | ANNUAL REPORT 2011 |
| PERFORMANCE OVERVIEW – October 31, 2011 (Unaudited) |
| COMMONWEALTH GLOBAL FUND |
The Commonwealth Global Fund’s net asset value (NAV) as of October 31, 2011 was $15.24 per share compared to $15.44 per share on October 31, 2010. For the twelve month period covered by this Annual Report, the Commonwealth Global Fund posted a -1.30% cumulative total return. Our investments do not attempt to track any index, but rather we undertake investments on the basis of fundamental research. We also invest a portion of the Fund’s assets in fixed income investments and acknowledge this process may mitigate some meaningful comparisons to indexes that do not have such investments represented within them. The MSCI World Index1 returned 2.30% for the same period. The index does not include any fixed income instruments. Additionally, the index is unmanaged, it is expressed in terms of U.S. dollars and it does not reflect the deduction of fees or taxes associated with a mutual fund such as investment management and fund accounting fees. The performance of the Fund reflects the deduction of fees for these services. Investors cannot invest directly in an index. |
| |
World economic confidence was hindered by the sovereign-debt credit-crisis in Europe and the potential impact the crisis might continually have on the banking industry. Many of the larger emerging market countries were forced to deal with inflation by tightening monetary policy which led to increased borrowing costs for corporations and therefore lower earnings. Japan’s economy appeared poised for recovery but was directly impacted by a severe earthquake which created a subsequent tsunami. The resulting damage to nuclear facilities created an additional crisis. While the U.S. market continued to face economic concerns of unemployment and a weak housing market, corporate earnings generally increased and equity returns exceeded 8% for the S&P 5001. |
| |
| The telecom and financial sectors held within the portfolio underperformed*. This was, in our view, due more to the specific region or country selection than to the sectors themselves. Financials did not escape unscathed due to the poor performance of many of the European bank holdings. |
| |
| We continue to note many companies valued at attractive historical fundamental discounts but the uncertainty of the global economy makes growth forecasting difficult. One positive we experienced during the last year which aided performance of the Fund was the acquisition of several of our holdings at attractive premiums. |
| |
| The Fund’s returns were impacted positively by solid stock returns in the information technology, energy and consumer staples sectors. These sectors’ outstanding performances were primarily driven by U.S. based companies The Fund’s investments in debt and fixed income securities including preferred stock was 6.0%. The Fund’s returns on the investments in both debt and preferred securities generally lagged the broader equity market returns. |
| Investment Risks |
Equity securities (stocks) are more volatile and carry more risk than other forms of investments, including high-grade fixed income securities. The net asset values per share of a Fund will fluctuate as the value of these securities in the portfolio changes. |
| | |
The Fund’s investments in debt and/or fixed income securities also contain risk factors. The value of these securities tends to fluctuate inversely with changes in interest rates. Changes in an issuer’s financial strength or creditworthiness also can affect the value of the securities it issues. Convertible and preferred stocks, which have some characteristics of both equity and fixed income securities, also contain, to varying degrees depending on their structure, the associated risks of each. |
| | |
The Fund’s expenses, as with any mutual fund, detract from the Fund’s performance. The Fund’s asset levels have a direct effect on the expense indirectly paid by shareholders. To the extent the Fund’s assets decline and the expenses of the Fund rise or do not decrease proportionately, performance will be negatively impacted. |
| | |
International investing involves increased risk and volatility. An investment in this Fund entails the special risks of international investing, including currency exchange fluctuation, government regulations, and the potential for political and economic instability. |
| | |
By itself the Fund does not constitute a complete investment plan and should be considered a long-term investment for investors who can afford to weather change in the value of their investments. |
| | |
Investors should refer to the Fund’s Prospectus for a more complete description of risks associated with investing in and of the Fund. |
| | |
| * | Portfolio holdings will change due to ongoing management of the Funds. References to specific securities or sectors should not be construed as recommendations by the Trust, the Advisor or the Distributor. |
| 1 | For additional information, please refer to the Glossary of Terms following the Performance Overview section. |
10
C O M M O N W E A L T H
INTERNATIONAL SERIES TRUST | ANNUAL REPORT 2011 |
| PERFORMANCE OVERVIEW – October 31, 2011 (Unaudited) |
| COMMONWEALTH GLOBAL FUND |
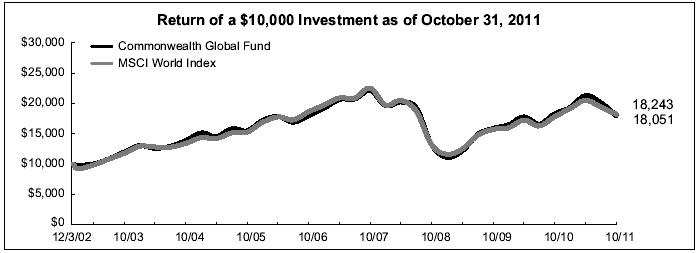
Comparison of Change in Value of a $10,000 Investment in the Commonwealth Global Fund and the MSCI World Index.
The above graph is a hypothetical $10,000 investment in the Commonwealth Global Fund from 12/3/02 (inception) to 10/31/11, and represents the reinvestment of dividends and distributions in the Fund.
| | | Average Annual Total Return | | Average Annual Total Return | | | |
| | | as of September 30, 2011 | | as of October 31, 2011 | | | |
| | | | | | | | | | | | | | | | | | | | | Gross |
| | | | | | | | | Inception | | | | | | | | Inception | | Expense |
| | | 1 Year | | 5 Year | | (12/03/02) | | 1 Year | | 5 Year | | (12/03/02) | | Ratio1 |
| Commonwealth Global Fund | | -7.32 | % | | -1.15 | % | | 5.73 | % | | -1.30 | % | | 0.06 | % | | 6.85 | % | | 3.03 | % |
| MSCI World Index | | -3.84 | % | | -1.68 | % | | 6.03 | % | | 2.30 | % | | -0.45 | % | | 7.15 | % | | — | |
| |
Past performance does not guarantee future results. The performance data quoted represents past performance and current returns may be lower or higher. The above graph and table do not reflect the deduction of taxes that a shareholder would pay on Fund distributions or the redemption of Fund shares. The investment return and principal value will fluctuate so that an investor’s shares, when redeemed may be worth more or less than the original cost. To obtain performance information current to the most recent month end, please call 888-345-1898. |
| | |
| 1 | The above expense ratio is from the Fund’s Prospectus dated March 1, 2011. Additional information pertaining to the Fund’s expense ratios as of October 31, 2011 can be found in the financial highlights. Excluding the indirect costs of investing in acquired funds, total fund operating expenses would be 3.03%. |
| | |
| The Fund’s performance is measured against the MSCI World Index, an unmanaged free float-adjusted market capitalization index that is designed to measure global developed market equity performance. Currently the MSCI World Index consists of the following 23 developed market country indices: Australia, Austria, Belgium, Canada, Denmark, Finland, France, Germany, Greece, Hong Kong, Ireland, Italy, Japan, Netherlands, New Zealand, Norway, Portugal, Singapore, Spain, Sweden, Switzerland, the United Kingdom and the United States. This performance of the index is expressed in terms of U.S. dollars, and does not reflect the deduction of fees or taxes with a mutual fund, such as investment management and fund accounting fees. The performance of the Fund reflects the deduction of fees for these services. Investors cannot invest directly in an index. |
| | |
You should carefully consider the investment objectives, risks, charges and expenses of the Fund before investing. This and other information can be found in the Fund’s Prospectus, which can be obtained from www.commonwealthfunds.com, by calling the Funds directly at 888-345-1898 or by contracting your investment representative. Please read it carefully before you invest or send money. |
11
C O M M O N W E A L T H
INTERNATIONAL SERIES TRUST | ANNUAL REPORT 2011 |
| PERFORMANCE OVERVIEW – October 31, 2011 (Unaudited) |
| COMMONWEALTH REAL ESTATE SECURITIES FUND |
| The Commonwealth Real Estate Securities Fund’s net asset value (NAV) as of October 31, 2011, was $9.72 per share compared to $10.09 per share on October 31, 2010. For the twelve month period covered by this Annual Report, the Commonwealth Real Estate Securities Fund posted a -3.67% cumulative total return. Our investments do not attempt to track any index, but rather we undertake investments on the basis of fundamental research. We also invest a portion of the Fund’s assets in fixed income investments and acknowledge this process may mitigate some meaningful comparisons to indexes that do not have such investments represented within them. Additionally, the index is unmanaged, it is expressed in terms of U.S. dollars and it does not reflect the deduction of fees or taxes associated with a mutual fund such as investment management and fund accounting fees. |
| |
| The commercial real estate market seems to have fundamentally improved during the last year. Prices and property values in many areas have held up well and the commercial sector has been aided by some increased building activity. Low interest rates certainly encourage activity across the country, yet many corporate entities continue to deleverage their balance sheets by paying off debt and building cash positions*. This process often restricts hiring and job creation which we view as vital to future growth of the real estate sector. |
| |
| The investment manager to the Fund, FCA Corp, invests for the longer term and regularly reviews all positions held. FCA Corp continues to buy value for the Fund and FCA Corp believes it has a diversified portfolio capable of benefiting from the future activity in the real estate sector. During the last year, it was difficult to see some of our positions challenged yet FCA Corp feels international markets will recover through time and that homebuilders should be held and not sold maintaining the long term view. Lodging is also of interest as well as some companies supporting and supplying the real estate sector. |
| |
| Our commitment is to remain vigilant and seek opportunities to benefit the portfolio. |
| Investment Risks |
Equity securities (stocks) are more volatile and carry more risk than other forms of investments, including high-grade fixed income securities. The net asset values per share of a Fund will fluctuate as the value of these securities in the portfolio changes. |
| | |
The Fund’s investments in debt and/or fixed income securities also contain risk factors. The value of these securities tends to fluctuate inversely with changes in interest rates. Changes in an issuer’s financial strength or creditworthiness also can affect the value of the securities it issues. Convertible and preferred stocks, which have some characteristics of both equity and fixed income securities, also contain, to varying degrees depending on their structure, the associated risks of each. |
| | |
The Fund’s expenses, as with any mutual fund, detract from the Fund’s performance. The Fund’s asset levels have a direct effect on the expense indirectly paid by shareholders. To the extent the Fund’s assets decline and the expenses of the Fund rise or do not decrease proportionately, performance will be negatively impacted. |
| | |
The Fund’s investments in REITs involves certain unique risks in addition to those risks associated with investing in the real estate industry in general. Equity REITs may be affected by changes in the value of the underlying property owned by the REITs, while mortgage REITs may be affected by the quality of any credit extended. |
| | |
Investments in the Fund are subject to the risks related to direct investment in real estate, such as real estate risk, regulatory risks, concentration risk, and diversification risk. |
| | |
By itself the Fund does not constitute a complete investment plan and should be considered a long-term investment for investors who can afford to weather change in the value of their investments. |
| | |
Investors should refer to the Fund’s Prospectus for a more complete description of risks associated with investing in and of the Fund. |
| | |
| * | Portfolio holdings will change due to ongoing management of the Funds. References to specific securities or sectors should not be construed as recommendations by the Trust, the Advisor or the Distributor. |
| 1 | For additional information, please refer to the Glossary of Terms following the Performance Overview section. |
12
C O M M O N W E A L T H
INTERNATIONAL SERIES TRUST | ANNUAL REPORT 2011 |
| PERFORMANCE OVERVIEW – October 31, 2011 (Unaudited) |
| COMMONWEALTH REAL ESTATE SECURITIES FUND |
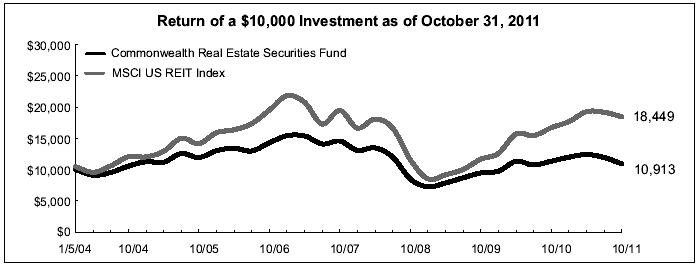
Comparison of Change in Value of a $10,000 Investment in the Commonwealth Real Estate Securities Fund and the MSCI US REIT Index.
The above graph is a hypothetical $10,000 investment in the Commonwealth Real Estate Securities Fund from 1/5/04 (inception) to 10/31/11, and represents the reinvestment of dividends and distributions in the Fund.
| | | Average Annual Total Return | | Average Annual Total Return | | | |
| | | as of September 30, 2011 | | as of October 31, 2011 | | | |
| | | | | | | | | | | | | | | | | | | | | Gross |
| | | | | | | | | Inception | | | | | | | | Inception | | Expense |
| | | 1 Year | | 5 Year | | (1/5/04) | | 1 Year | | 5 Year | | (1/5/04) | | Ratio1 |
Commonwealth Real Estate Securities Fund | | -13.36 | % | | -6.62 | % | | -0.51 | % | | -3.67 | % | | -5.23 | % | | 1.12 | % | | 3.29 | % |
| MSCI US REIT Index | | 1.26 | % | | -2.56 | % | | 6.37 | % | | 10.59 | % | | -1.11 | % | | 8.14 | % | | — | |
| |
Past performance does not guarantee future results. The performance data quoted represents past performance and current returns may be lower or higher. The above graph and table do not reflect the deduction of taxes that a shareholder would pay on Fund distributions or the redemption of Fund shares. The investment return and principal value will fluctuate so that an investor’s shares, when redeemed may be worth more or less than the original cost. To obtain performance information current to the most recent month end, please call 888-345-1898. |
| | |
| 1 | The above expense ratio is from the Fund’s Prospectus dated March 1, 2011. Additional information pertaining to the Fund’s expense ratios as of October 31, 2011 can be found in the financial highlights. Excluding the indirect costs of investing in acquired funds, total fund operating expenses would be 3.22%. |
| | |
| The Fund’s performance is measured against the MSCI US REIT Index which is an unmanaged free float-adjusted market capitalization weighted index that is comprised of equity REITs that are included in the MSCI US Investable Market 2500 Index, with the exception of specialty equity REITs that do not generate a majority of their revenue and income from real estate rental and leasing operations. The index represents approximately 85% of the US REIT universe. MSCI started calculating and maintaining the MSCI US REIT Index on June 20, 2005. Prior to this date the MSCI US REIT Index (then known as the Morgan Stanley REIT Index) was calculated and maintained by the AMEX. This index is expressed in terms of U.S. dollars, and does not reflect the deduction of fees or taxes with a mutual fund, such as investment management and fund accounting fees. The performance of the Fund reflects the deduction of fees for these services. Investors cannot invest directly in an index. |
| | |
You should carefully consider the investment objectives, risks, charges and expenses of the Fund before investing. This and other information can be found in the Fund’s Prospectus, which can be obtained from www.commonwealthfunds.com, by calling the Funds directly at 888-345-1898 or by contracting your investment representative. Please read it carefully before you invest or send money. |
13
C O M M O N W E A L T H
INTERNATIONAL SERIES TRUST | ANNUAL REPORT 2011 |
| |
|
Glossary of Terms
Australian All Ordinaries Index (“AAOI”) — is a capitalization-weighted index. The index is made up of the largest 500 companies as measured by market cap that are listed on the Australian Stock Exchange.
Gross Domestic Product (GDP) — is a measure of the market value of the goods and services produced by labor and property within the United States and/or other foreign countries.
MSCI World Index — is an unmanaged free float-adjusted market capitalization index that is designed to measure global developed market equity performance. Currently the MSCI World Index consists of the following 23 developed market country indices: Australia, Austria, Belgium, Canada, Denmark, Finland, France, Germany, Greece, Hong Kong, Ireland, Italy, Japan, Netherlands, New Zealand, Norway, Portugal, Singapore, Spain, Sweden, Switzerland, the United Kingdom and the United States.
MSCI US REIT Index — is an unmanaged free float-adjusted market capitalization weighted index that is comprised of equity REITs that are included in the MSCI US Investable Market 2500 Index, with the exception of specialty equity REITs that do not generate a majority of their revenue and income from real estate rental and leasing operations. The index represents approximately 85% of the US REIT universe. MSCI started calculating and maintaining the MSCI US REIT Index on June 20, 2005. Prior to this date the MSCI US REIT Index (then known as the Morgan Stanley REIT Index) was calculated and maintained by the AMEX.
NZX 50 Index — is a modified market capitalization weighted index. This index consists of the top 50 companies by free float adjusted market capitalization that are listed on the New Zealand Stock Exchange.
New Zealand SmallCap Index (“NZSCI”) — is a capitalization-weighted index of all New Zealand equities, excluding those in the NZX 50 Index, considered to be reflective of the performance of the New Zealand small-cap equity market.
Tokyo Stock Price Index (“TOPIX”) — is an unmanaged capitalization-weighted index of all companies listed on the First Section of the Tokyo Stock Exchange.
14
C O M M O N W E A L T H
INTERNATIONAL SERIES TRUST | ANNUAL REPORT 2011 |
| | |
| PORTFOLIO COMPOSITION – October 31, 2011* (Unaudited) |
| COMMONWEALTH AUSTRALIA/NEW ZEALAND FUND |
| Industry or | | Percent of Total |
| Security Type | | Investments |
| Commercial Services | | 21.6 | % |
| Mining | | 6.8 | % |
| Healthcare – Services | | 6.8 | % |
| Transportation | | 6.7 | % |
| Electric | | 6.3 | % |
| Retail | | 6.0 | % |
| Oil & Gas | | 5.4 | % |
| REITS | | 4.3 | % |
| Telecommunications | | 3.8 | % |
| Media | | 3.4 | % |
| Bonds – New Zealand | | 3.0 | % |
| Metal Fabricate/Hardware | | 2.8 | % |
| Engineering & Construction | | 2.8 | % |
| Home Furnishings | | 2.7 | % |
| Insurance | | 2.7 | % |
| Preferred Stocks | | 2.6 | % |
| Diversified Financial Services | | 2.5 | % |
| Building Materials | | 2.1 | % |
| Healthcare – Products | | 2.0 | % |
| Electrical Components & Equipment | | 1.3 | % |
| Bonds – Australia | | 1.1 | % |
| Chemicals | | 0.9 | % |
| Apparel | | 0.8 | % |
| Pharmaceuticals | | 0.7 | % |
| Agriculture | | 0.5 | % |
| Computers | | 0.4 | % |
| | | 100.0 | % |
| | | | |
| COMMONWEALTH JAPAN FUND |
| Industry or | | Percent of Total |
| Security Type | | Investments |
| Transportation | | 20.8 | % |
| Retail | | 10.1 | % |
| Real Estate | | 6.0 | % |
| Healthcare – Products | | 5.8 | % |
| Auto Parts & Equipment | | 5.0 | % |
| Machinery – Diversified | | 5.0 | % |
| Electronics | | 4.9 | % |
| Computers | | 4.8 | % |
| Electric | | 3.9 | % |
| Engineering & Construction | | 3.7 | % |
| Insurance | | 3.3 | % |
| Cosmetics/Personal Care | | 3.1 | % |
| Distribution/Wholesale | | 2.9 | % |
| Gas | | 2.9 | % |
| Banks | | 2.7 | % |
| Hand/Machine Tools | | 2.7 | % |
| Entertainment | | 2.7 | % |
| Toys/Games/Hobbies | | 2.3 | % |
| Internet | | 2.2 | % |
| Call Options | | 1.9 | % |
| Beverages | | 1.5 | % |
| Chemicals | | 1.4 | % |
| Metal Fabricate/Hardware | | 0.4 | % |
| | | 100.0 | % |
| | | | |
| COMMONWEALTH GLOBAL FUND |
| Country or | | Percent of Total |
| Security Type | | Investments |
| United States | | 34.8 | % |
| United Kingdom | | 12.8 | % |
| Short Term Investments | | 11.0 | % |
| Switzerland | | 6.2 | % |
| France | | 5.5 | % |
| Israel | | 4.8 | % |
| Spain | | 3.8 | % |
| Bermuda | | 3.2 | % |
| Mexico | | 2.6 | % |
| Netherlands | | 2.5 | % |
| Germany | | 2.5 | % |
| Guernsey | | 2.4 | % |
| Japan | | 2.3 | % |
| Canada | | 1.9 | % |
| India | | 1.5 | % |
| South Africa | | 1.2 | % |
| Brazil | | 1.0 | % |
| | | 100.0 | % |
| | | | |
| COMMONWEALTH REAL ESTATE SECURITIES FUND |
| Industry or | | Percent of Total |
| Security Type | | Investments |
| REITS – Office Property | | 13.6 | % |
| REITS – Apartments | | 11.1 | % |
| REITS – Hotels | | 8.2 | % |
| Lodging | | 7.7 | % |
| Building Materials | | 6.5 | % |
| Home Builders | | 6.3 | % |
| Real Estate | | 6.3 | % |
| REITS – Diversified | | 5.9 | % |
| REITS – Storage | | 4.6 | % |
| REITS – Warehouse/Industries | | 4.2 | % |
| Short-Term Investments | | 3.6 | % |
| Bonds | | 3.5 | % |
| Telecommunications | | 3.5 | % |
| REITS – Shopping Centers | | 3.4 | % |
| Exchange Traded Funds | | 3.1 | % |
| Retail | | 2.3 | % |
| Call Options | | 1.9 | % |
| REITS – Health Care | | 1.8 | % |
| REITS – Single Tenant | | 1.5 | % |
| Engineering & Construction | | 1.0 | % |
| | | 100.0 | % |
| * Portfolio composition is subject to change. |
15
C O M M O N W E A L T H
INTERNATIONAL SERIES TRUST | ANNUAL REPORT 2011 |
SCHEDULE OF INVESTMENTS – October 31, 2011
| COMMONWEALTH AUSTRALIA/NEW ZEALAND FUND |
| | | | | Shares | | | Value |
| AUSTRALIA (24.2%) | | | | | | | | | | |
| COMMON STOCKS (23.2%) | | | | | | | | | |
| APPAREL (0.8%) | | | | | | | | | |
| Billabong International, Ltd. | | | | 36,314 | | | $ | 161,589 | |
| BUILDING MATERIALS (0.6%) | | | | | | | | | |
| James Hardie Industries NV – ADR (1) | | | | 4,200 | | | 136,206 | |
| CHEMICALS (0.9%) | | | | | | | | | |
| Nufarm, Ltd. (1) | | | | 39,562 | | | 194,404 | |
| COMPUTERS (0.4%) | | | | | | | | | |
| Computershare, Ltd. | | | | 10,000 | | | 79,101 | |
| ELECTRIC (2.2%) | | | | | | | | | |
| AGL Energy, Ltd. | | | | 31,335 | | | 472,406 | |
| HEALTHCARE-PRODUCTS (1.1%) | | | | | | | | | |
| Cochlear, Ltd. | | | | 4,000 | | | 244,362 | |
| HEALTHCARE-SERVICES (1.4%) | | | | | | | | | |
| Sonic Healthcare Ltd. | | | | 25,628 | | | 295,869 | |
| INSURANCE (2.6%) | | | | | | | | | |
| QBE Insurance Group, Ltd. | | | | 36,237 | | | 556,174 | |
| MINING (6.6%) | | | | | | | | | |
| Orica Ltd. | | | | 12,604 | | | | 338,372 | |
| OZ Minerals, Ltd. | | | | 30,866 | | | | 363,844 | |
| PanAust, Ltd. (1) | | | | 210,000 | | | 702,779 | |
| | | | | | | | 1,404,995 | |
| OIL & GAS (2.8%) | | | | | | | | | |
| Eastern Star Gas, Ltd. (1) | | | | 400,000 | | | | 369,335 | |
| Woodside Petroleum, Ltd. | | | | 6,425 | | | 241,801 | |
| | | | | | | | 611,136 | |
| RETAIL (1.7%) | | | | | | | | | |
| Wesfarmers, Ltd. | | | | 10,812 | | | 363,703 | |
| TRANSPORTATION (2.1%) | | | | | | | | | |
| Asciano Group | | | | 280,000 | | | 442,149 | |
TOTAL COMMON STOCKS | | | | | | | | | |
(Cost $3,855,948) | | | | | | | 4,962,094 | |
| | | | Principal | | | | | |
| CORPORATE BONDS (1.0%) | | | | | | | | | |
| CBA Capital Australia, Ltd., 3.59%, | | | | | | | | | |
4/15/15 (2) (3) (4) | | | $ | 300,000 | | | 225,883 | |
TOTAL CORPORATE BONDS | | | | | | | | | |
(Cost $202,443) | | | | | | | 225,883 | |
TOTAL AUSTRALIA | | | | | | | | | |
(Cost $4,058,391) | | | | | | | 5,187,977 | |
| | | | | | | | | | |
| | | | Shares | | | | | |
| NEW ZEALAND (72.7%) | | | | | | | | | | |
| COMMON STOCKS (67.3%) | | | | | | | | | |
| AGRICULTURE (0.5%) | | | | | | | | | |
| PGG Wrightson, Ltd. (1) | | | | 309,340 | | | | 102,374 | |
| BUILDING MATERIALS (1.4%) | | | | | | | | | |
| Fletcher Building Ltd. | | | | 56,449 | | | 300,710 | |
| COAL (0.0%) | | | | | | | | | |
| Pike River Coal, Ltd. (1) (6) | | | | 1,145,295 | | | 0 | |
| COMMERCIAL SERVICES (20.9%) | | | | | | | | | |
| Guinness Peat Group PLC | | | | 495,906 | | | | 246,492 | |
| Mowbray Collectables, Ltd. (5) | | | | 821,593 | | | | 398,677 | |
| Northland Port Corp. (NZ), Ltd. | | | | 81,425 | | | | 92,193 | |
| Port of Tauranga, Ltd. | | | | 117,248 | | | | 917,501 | |
| South Port New Zealand, Ltd. | | | | 1,027,930 | | | 2,826,541 | |
| | | | | | | | 4,481,404 | |
| DIVERSIFIED FINANCIAL SERVICES (2.5%) | | | | | | | | | |
| Heartland New Zealand Ltd. (1) | | | | 1,252,765 | | | 525,211 | |
| ELECTRIC (3.9%) | | | | | | | | | |
| Infratil, Ltd. | | | | 557,777 | | | 831,607 | |
| ELECTRICAL COMPONENTS & EQUIPMENT (1.3%) | | | | | | | | | |
| Cavotec SA (1) | | | | 130,250 | | | 269,795 | |
| ENGINEERING & CONSTRUCTION (2.7%) | | | | | | | | | |
| Auckland International Airport Ltd. | | | | 307,229 | | | 579,796 | |
| HEALTHCARE-PRODUCTS (0.8%) | | | | | | | | | |
| Ebos Group Ltd. | | | | 30,000 | | | 166,995 | |
| HEALTHCARE-SERVICES (5.2%) | | | | | | | | | |
| Ryman Healthcare, Ltd. | | | | 455,000 | | | | 992,237 | |
| Wakefield Health Ltd. | | | | 30,000 | | | 116,460 | |
| | | | | | | | 1,108,697 | |
| HOME FURNISHINGS (2.6%) | | | | | | | | | |
| Scott Technology, Ltd. | | | | 450,619 | | | 567,687 | |
| MEDIA (3.3%) | | | | | | | | | |
| Sky Network Television, Ltd. | | | | 159,745 | | | 706,468 | |
| METAL FABRICATE/HARDWARE (2.7%) | | | | | | | | | |
| Methven, Ltd. | | | | 606,250 | | | 581,380 | |
| OIL & GAS (2.4%) | | | | | | | | | |
| New Zealand Oil & Gas, Ltd. | | | | 924,805 | | | 518,379 | |
See accompanying notes to financial statements.
16
C O M M O N W E A L T H
INTERNATIONAL SERIES TRUST | ANNUAL REPORT 2011 |
SCHEDULE OF INVESTMENTS – October 31, 2011
| COMMONWEALTH AUSTRALIA/NEW ZEALAND FUND |
| | | | Shares | | | Value |
| NEW ZEALAND (72.7%) – Continued | | | | | | | | | |
| COMMON STOCKS (67.3%) – Continued | | | | | | | | |
| PHARMACEUTICALS (0.7%) | | | | | | | | |
| Pharmacybrands, Ltd. (1) | | | 281,673 | | | $ | 150,291 | |
| REITS (4.2%) | | | | | | | | |
| Goodman Property Trust | | | 341,578 | | | | 269,678 | |
| Vital Healthcare Property Trust | | | 659,050 | | | 628,327 | |
| | | | | | | 898,005 | |
| RETAIL (4.1%) | | | | | | | | |
| Briscoe Group, Ltd. | | | 405,000 | | | | 457,397 | |
| Colonial Motor Co., Ltd. | | | 199,565 | | | 427,704 | |
| | | | | | | 885,101 | |
| TELECOMMUNICATIONS (3.7%) | | | | | | | | |
| TeamTalk, Ltd. | | | 445,094 | | | 797,023 | |
| TRANSPORTATION (4.4%) | | | | | | | | |
| Freightways, Ltd. | | | 173,540 | | | | 473,525 | |
| Mainfreight, Ltd. | | | 60,000 | | | 469,907 | |
| | | | | | | 943,432 | |
TOTAL COMMON STOCKS | | | | | | | | |
(Cost $12,121,248) | | | | | | 14,414,355 | |
| PREFERRED STOCKS (2.5%) | | | | | | | | |
| INVESTMENT COMPANIES (2.5%) | | | | | | | | |
| ASB Capital, Ltd., 3.80% (2) (3) | | | 954,218 | | | 530,836 | |
TOTAL PREFERRED STOCKS | | | | | | | | |
(Cost $686,799) | | | | | | 530,836 | |
| | | | | | | | | |
| | | Principal | | | | | |
| CORPORATE BONDS (2.9%) | | | | | | | | |
| Credit Agricole SA, 10.04%, | | | | | | | | |
12/29/49 (2) (3) (4) | | $ | 500,000 | | | | 250,712 | |
| Sky Network Television, Ltd., 3.60%, | | | | | | | | |
10/16/16 (2) (3) (4) | | | 500,000 | | | 370,002 | |
TOTAL CORPORATE BONDS | | | | | | | | |
(Cost $620,088) | | | | | | 620,714 | |
TOTAL NEW ZEALAND | | | | | | | | |
(Cost $13,428,135) | | | | | | 15,565,905 | |
| TOTAL INVESTMENTS (96.9%) | | | | | | | | |
| (Cost $17,486,526) | | | | | | | 20,753,882 | |
| OTHER ASSETS IN EXCESS OF LIABILITIES (3.1%) | | | | | | 658,357 | |
| NET ASSETS (100.0%) | | | | | | $ | 21,412,239 |
| |
| (1) | Non-income producing. |
| (2) | Variable, Floating, or Step Rate Security. The rate reflected in the Schedule of Investments is the rate in effect at 10/31/2011. |
| (3) | Callable. |
| (4) | Principal amount shown is in New Zealand Dollars; value shown in U.S. Dollars. |
| (5) | Affiliated Investment. See Note 5 of the Notes to Financial Statements. |
| (6) | Please refer to footnote *** under Note 3 of the Notes to Financial Statements for additional information. |
| ADR — American Depositary Receipt |
| PLC — Public Limited Company |
See accompanying notes to financial statements.
17
C O M M O N W E A L T H
INTERNATIONAL SERIES TRUST | ANNUAL REPORT 2011 |
SCHEDULE OF INVESTMENTS – October 31, 2011
| | | Shares | | | Value |
| COMMON STOCKS (102.0%) | | | | | | | | |
| AUTO PARTS & EQUIPMENT (5.3%) | | | | | | | | |
| NGK Spark Plug Co., Ltd. | | | 6,000 | | | $ | 74,564 | |
| Sumitomo Rubber Industries, Ltd. | | | 10,000 | | | 124,595 | |
| | | | | | | 199,159 | |
| BANKS (2.8%) | | | | | | | | |
| Sumitomo Mitsui Financial Group, Inc. | | | 3,800 | | | 105,940 | |
| BEVERAGES (1.6%) | | | | | | | | |
| Kirin Holdings Co., Ltd. | | | 5,000 | | | 61,271 | |
| CHEMICALS (1.5%) | | | | | | | | |
| JSR Corp. | | | 3,000 | | | 57,255 | |
| COMPUTERS (5.0%) | | | | | | | | |
| Fujitsu, Ltd. | | | 10,000 | | | | 53,407 | |
| INES Corp. | | | 5,000 | | | | 32,786 | |
| Melco Holdings, Inc. | | | 2,500 | | | | 69,693 | |
| Otsuka Corp. | | | 500 | | | 34,997 | |
| | | | | | | 190,883 | |
| COSMETICS/PERSONAL CARE (3.2%) | | | | | | | | |
| Unicharm Corp. | | | 2,700 | | | 121,275 | |
| DISTRIBUTION/WHOLESALE (3.1%) | | | | | | | | |
| Marubeni Corp. | | | 20,000 | | | 115,828 | |
| ELECTRIC (4.0%) | | | | | | | | |
| Hokkaido Electric Power Co., Inc. | | | 6,000 | | | | 75,578 | |
| Tohoku Electric Power Co., Inc. | | | 7,000 | | | 77,310 | |
| | | | | | | 152,888 | |
| ELECTRONICS (5.1%) | | | | | | | | |
| Hamamatsu Photonics K.K. | | | 1,500 | | | | 57,194 | |
| Hoya Corp. | | | 4,000 | | | | 87,748 | |
| Star Micronics Co., Ltd. | | | 5,000 | | | 49,616 | |
| | | | | | | 194,588 | |
| ENGINEERING & CONSTRUCTION (3.8%) | | | | | | | | |
| Kajima Corp. | | | 33,000 | | | | 105,338 | |
| Taihei Dengyo Kaisha, Ltd. | | | 6,000 | | | 39,700 | |
| | | | | | | 145,038 | |
| ENTERTAINMENT (2.8%) | | | | | | | | |
| Sankyo Co., Ltd. | | | 2,000 | | | 104,522 | |
| GAS (3.0%) | | | | | | | | |
| Toho Gas Co., Ltd. | | | 20,000 | | | 113,408 | |
| HAND/MACHINE TOOLS (2.8%) | | | | | | | | |
| Meidensha Corp. | | | 28,000 | | | | 105,507 | |
| HEALTHCARE-PRODUCTS (6.0%) | | | | | | | | |
| Asahi Intecc Co., Ltd. | | | 4,000 | | | | 101,710 | |
| Terumo Corp. | | | 2,500 | | | 126,923 | |
| | | | | | | 228,633 | |
| INSURANCE (3.4%) | | | | | | | | |
| T & D Holdings, Inc. | | | 4,000 | | | | 39,594 | |
| Tokio Marine Holdings, Inc. – ADR | | | 3,750 | | | 89,400 | |
| | | | | | | 128,994 | |
| INTERNET (2.3%) | | | | | | | | |
| DeNA Co., Ltd. | | | 2,000 | | | 86,939 | |
| MACHINERY-DIVERSIFIED (5.2%) | | | | | | | | |
| Fanuc, Ltd. | | | 1,000 | | | | 161,474 | |
| Torishima Pump Manufacturing Co., Ltd. | | | 2,500 | | | 34,575 | |
| | | | | | | 196,049 | |
| METAL FABRICATE/HARDWARE (0.4%) | | | | | | | | |
| Okano Valve Manufacturing Co. | | | 5,000 | | | 16,691 | |
| REAL ESTATE (6.2%) | | | | | | | | |
| Mitsui Fudosan Co., Ltd. | | | 3,000 | | | | 49,617 | |
| Sumitomo Realty & Development Co., Ltd. | | | 9,000 | | | 186,636 | |
| | | | | | | 236,253 | |
| RETAIL (10.5%) | | | | | | | | |
| ABC-Mart, Inc. | | | 2,000 | | | | 78,377 | |
| Nitori Co., Ltd. | | | 600 | | | | 57,389 | |
| Sugi Holdings Co., Ltd. | | | 2,500 | | | | 65,438 | |
| Sundrug Co., Ltd. | | | 3,000 | | | | 88,737 | |
| Yamada Denki Co., Ltd. | | | 1,500 | | | 108,106 | |
| | | | | | | 398,047 | |
| TOYS/GAMES/HOBBIES (2.4%) | | | | | | | | |
| Nintendo Co., Ltd. | | | 600 | | | 90,747 | |
| TRANSPORTATION (21.6%) | | | | | | | | |
| East Japan Railway Co. | | | 1,500 | | | | 91,087 | |
| Hankyu Hanshin Holdings, Inc. | | | 22,000 | | | | 93,040 | |
| Kawasaki Kisen Kaisha Ltd. | | | 30,000 | | | | 61,080 | |
| Keikyu Corp. | | | 13,000 | | | | 116,958 | |
| Keio Corp. | | | 18,000 | | | | 123,665 | |
| Kintetsu World Express, Inc. | | | 2,000 | | | | 60,921 | |
| Mitsui OSK Lines Ltd. | | | 18,000 | | | | 69,529 | |
See accompanying notes to financial statements.
18
C O M M O N W E A L T H
INTERNATIONAL SERIES TRUST | ANNUAL REPORT 2011 |
SCHEDULE OF INVESTMENTS – October 31, 2011
| | | Shares | | | Value |
| COMMON STOCKS (102.0%) – Continued | | | | | | | | |
| TRANSPORTATION (21.6%) – continued | | | | | | | | |
| Tobu Railway Co., Ltd. | | | 18,000 | | | $ | 86,174 | |
| Yamato Holdings Co., Ltd. | | | 7,000 | | | 116,035 | |
| | | | | | | 818,489 | |
TOTAL COMMON STOCKS | | | | | | | | |
(Cost $3,218,821) | | | | | | 3,868,374 | |
| CALL OPTIONS (1.9%) | | | | | | | | |
| Aflac, Inc., Strike Price: $43.00, | | | | | | | | |
Expiration 11/19/2011 (1) | | | 40 | | | | 12,640 | |
| iShares MSCI Japan Index Fund, | | | | | | | | |
Strike Price: $8.00, | | | | | | | | |
Expiration 1/19/2013 (1) | | | 150 | | | | 27,450 | |
| iShares MSCI Japan Index Fund, | | | | | | | | |
Strike Price: $8.00, | | | | | | | | |
Expiration 3/17/2012 (1) | | | 150 | | | | 24,000 | |
| iShares MSCI Japan Index Fund, | | | | | | | | |
Strike Price: $9.00, | | | | | | | | |
Expiration 1/21/2012 (1) | | | 150 | | | | 10,200 | |
| iShares MSCI Japan Index Fund, | | | | | | | | |
Strike Price: $13.00, | | | | | | | | |
Expiration 1/19/2013 (1) | | | 145 | | | 0 | |
TOTAL CALL OPTIONS | | | | | | | | |
(Cost $101,840) | | | | | | 74,290 | |
| TOTAL INVESTMENTS (103.9%) | | | | | | | | |
| (Cost $3,320,661) | | | | | | | 3,942,664 | |
| LIABILITIES IN EXCESS OF OTHER | | | | | | | | |
| ASSETS (-3.9%) | | | | | | (148,836 | ) |
| NET ASSETS (100.0%) | | | | | | $ | 3,793,828 | |
| (1) | Non-income producing |
| ADR — American Depositary Receipt |
See accompanying notes to financial statements.
19
C O M M O N W E A L T H
INTERNATIONAL SERIES TRUST | ANNUAL REPORT 2011 |
SCHEDULE OF INVESTMENTS – October 31, 2011
| | | Shares | | | Value |
| COMMON STOCKS (77.8%) | | | | | | | | |
| BERMUDA (3.0%) | | | | | | | | |
| Bunge, Ltd. | | | 6,500 | | | $ | 401,505 | |
| BRAZIL (1.0%) | | | | | | | | |
| Vale SA ADR | | | 5,000 | | | 127,050 | |
| CANADA (1.8%) | | | | | | | | |
| InterOil Corp. (1) | | | 5,000 | | | 237,550 | |
| FRANCE (5.2%) | | | | | | | | |
| Arkema SA ADR | | | 4,130 | | | | 281,047 | |
| BNP Paribas ADR | | | 6,000 | | | | 134,400 | |
| Total SA ADR | | | 5,200 | | | 271,960 | |
| | | | | | | 687,407 | |
| GERMANY (2.4%) | | | | | | | | |
| Siemens AG ADR | | | 3,000 | | | 314,910 | |
| GUERNSEY (2.3%) | | | | | | | | |
| Amdocs, Ltd. (1) | | | 10,000 | | | 300,200 | |
| INDIA (1.4%) | | | | | | | | |
| ICICI Bank Ltd. ADR | | | 5,000 | | | 185,800 | |
| ISRAEL (4.5%) | | | | | | | | |
| NICE Systems, Ltd. ADR (1) | | | 10,000 | | | | 357,600 | |
| Teva Pharmaceutical Industries, Ltd. ADR | | | 6,000 | | | 245,100 | |
| | | | | | | 602,700 | |
| JAPAN (2.2%) | | | | | | | | |
| Nidec Corp. ADR | | | 14,000 | | | 287,420 | |
| MEXICO (2.4%) | | | | | | | | |
| Grupo Televisa SA ADR | | | 15,000 | | | 319,950 | |
| NETHERLANDS (2.3%) | | | | | | | | |
| Unilever NV | | | 9,000 | | | 310,770 | |
| SOUTH AFRICA (1.1%) | | | | | | | | |
| Shoprite Holdings, Ltd. ADR | | | 5,000 | | | 148,750 | |
| SPAIN (3.6%) | | | | | | | | |
| Banco Bilbao Vizcaya Argentaria SA ADR | | | 317 | | | | 2,866 | |
| Banco Santander SA ADR | | | 27,450 | | | | 234,972 | |
| Repsol YPF SA ADR | | | 8,000 | | | 241,360 | |
| | | | | | | 479,198 | |
| SWITZERLAND (5.8%) | | | | | | | | |
| Nestle SA ADR | | | 7,750 | | | | 447,640 | |
| Roche Holding AG ADR | | | 8,000 | | | 327,200 | |
| | | | | | | 774,840 | |
| UNITED KINGDOM (12.0%) | | | | | | | | |
| Anglo American PLC ADR | | | 11,830 | | | | 217,080 | |
| BG Group PLC ADR | | | 2,000 | | | | 219,680 | |
| BP PLC ADR | | | 3,000 | | | | 132,540 | |
| Centrica PLC ADR | | | 3,000 | | | | 57,450 | |
| Diageo PLC ADR | | | 2,000 | | | | 165,760 | |
| Old Mutual PLC ADR | | | 15,000 | | | | 211,500 | |
| Prudential PLC ADR | | | 18,000 | | | | 372,060 | |
| Vodafone Group PLC ADR | | | 7,875 | | | 219,240 | |
| | | | | | | 1,595,310 | |
| UNITED STATES (26.8%) | | | | | | | | |
| AECOM Technology Corp. (1) | | | 10,000 | | | | 209,200 | |
| AGCO Corp. (1) | | | 5,000 | | | | 219,150 | |
| Apollo Group, Inc., Class A (1) | | | 5,000 | | | | 236,750 | |
| Chemed Corp. | | | 4,200 | | | | 249,312 | |
| Conmed Corp. (1) | | | 15,720 | | | | 412,964 | |
| DENTSPLY International, Inc. | | | 8,700 | | | | 321,552 | |
| KVH Industries, Inc. (1) | | | 30,000 | | | | 220,800 | |
| LifePoint Hospitals, Inc. (1) | | | 8,500 | | | | 328,610 | |
| Lufkin Industries, Inc. | | | 5,000 | | | | 295,450 | |
| Norfolk Southern Corp. | | | 6,000 | | | | 443,940 | |
| Northwest Natural Gas Co. | | | 5,000 | | | | 233,600 | |
| Pentair, Inc. | | | 10,760 | | | 386,822 | |
| | | | | | | 3,558,150 | |
TOTAL COMMON STOCKS | | | | | | | | |
(Cost $7,945,361) | | | | | | 10,331,510 | |
| PREFERRED STOCKS (4.5%) | | | | | | | | |
| UNITED STATES (4.5%) | | | | | | | | |
| Chesapeake Energy Corp., 4.65% (2) | | | 1,000 | | | | 96,690 | |
| HSBC USA, Inc., Series F, 3.50%, | | | | | | | | |
Callable 11/30/11 (3) (4) | | | 18,000 | | | | 307,620 | |
| HSBC USA, Inc., Series G, 4.00%, | | | | | | | | |
Callable 11/30/11 (3) (4) | | | 10,000 | | | 194,700 | |
TOTAL PREFERRED STOCKS | | | | | | | | |
(Cost $561,255) | | | | | | 599,010 | |
See accompanying notes to financial statements.
20
C O M M O N W E A L T H
INTERNATIONAL SERIES TRUST | ANNUAL REPORT 2011 |
SCHEDULE OF INVESTMENTS – October 31, 2011
| | | Principal | | | Value |
| CORPORATE BONDS (1.5%) | | | | | | | | |
| UNITED STATES (1.5%) | | | | | | | | |
| Toyota Motor Credit Corp., 4.75%, | | | | | | | | |
2/4/25, Callable 2/4/12 (3) (4) | | | $200,000 | | | $ | 200,567 | |
TOTAL CORPORATE BONDS | | | | | | | | |
(Cost $198,141) | | | | | | 200,567 | |
| | | | | | | | | |
| | | Shares | | | | | |
| SHORT-TERM INVESTMENTS (10.3%) | | | | | | | | |
| Fifth Third Bank Institutional Govt. | | | | | | | | |
Money Market Fund, 0.01% (5) | | | 1,372,919 | | | 1,372,919 | |
TOTAL SHORT-TERM INVESTMENTS | | | | | | | | |
(Cost $1,372,919) | | | | | | 1,372,919 | |
| TOTAL INVESTMENTS (94.1%) | | | | | | | | |
| (Cost $10,077,676) | | | | | | | 12,504,006 | |
| OTHER ASSETS IN EXCESS OF | | | | | | | | |
| LIABILITIES (5.9%) | | | | | | 781,417 | |
| NET ASSETS (100.0%) | | | | | | $ | 13,285,423 | |
| (1) | Non-income producing. |
| (2) | Convertible security. |
| (3) | Callable. |
| (4) | Variable, Floating, or Step Rate Security. The rate reflected in the Schedule of Investments is the rate in effect at 10/31/2011. |
| (5) | Rate disclosed is the seven day yield as of 10/31/2011. |
| ADR — American Depositary Receipt |
| PLC — Public Limited Company |
See accompanying notes to financial statements.
21
C O M M O N W E A L T H
INTERNATIONAL SERIES TRUST | ANNUAL REPORT 2011 |
SCHEDULE OF INVESTMENTS – October 31, 2011
| COMMONWEALTH REAL ESTATE SECURITIES FUND |
| | | Shares | | | Value |
| COMMON STOCKS (88.2%) | | | | | | | | |
| BUILDING MATERIALS (6.5%) | | | | | | | | |
| Cemex SAB de CV ADR (1) | | | 13,498 | | | $ | 58,986 | |
| James Hardie Industries NV – ADR (1) | | | 9,000 | | | | 291,870 | |
| Lafarge SA ADR | | | 5,000 | | | | 50,750 | |
| Pretoria Portland Cement Co., Ltd. ADR | | | 12,500 | | | 75,875 | |
| | | | | | | 477,481 | |
| ENGINEERING & CONSTRUCTION (1.0%) | | | | | | | | |
| Grupo Aeroportuario del Sureste SAB de CV ADR | | | 1,300 | | | 74,880 | |
| HOME BUILDERS (6.3%) | | | | | | | | |
| China Housing & Land Development, Inc. (1) | | | 40,000 | | | | 45,200 | |
| Desarrolladora Homex SAB de CV ADR (1) | | | 7,000 | | | | 104,720 | |
| KB Home | | | 10,000 | | | | 69,700 | |
| MDC Holdings, Inc. | | | 5,000 | | | | 112,000 | |
| Toll Brothers, Inc. (1) | | | 7,500 | | | 130,800 | |
| | | | | | | 462,420 | |
| LODGING (7.8%) | | | | | | | | |
| Gaylord Entertainment Co. (1) | | | 5,000 | | | | 116,950 | |
| Home Inns & Hotels Management, Inc. ADR (1) | | | 8,500 | | | | 290,360 | |
| Marriott International, Inc., Class A | | | 5,035 | | | 158,602 | |
| | | | | | | 565,912 | |
| REAL ESTATE (6.3%) | | | | | | | | |
| Alto Palermo SA ADR | | | 11,500 | | | | 172,270 | |
| Gafisa SA ADR | | | 12,000 | | | | 89,280 | |
| WP Carey & Co., LLC | | | 5,000 | | | 200,000 | |
| | | | | | | 461,550 | |
| REITS-APARTMENTS (11.2%) | | | | | | | | |
| AvalonBay Communities, Inc. | | | 1,547 | | | | 206,818 | |
| Campus Crest Communities, Inc. | | | 11,000 | | | | 125,730 | |
| Equity Residential | | | 6,000 | | | | 352,080 | |
| Essex Property Trust, Inc. | | | 900 | | | 128,484 | |
| | | | | | | 813,112 | |
| REITS-DIVERSIFIED (5.9%) | | | | | | | | |
| Vornado Realty Trust | | | 3,107 | | | | 257,291 | |
| Washington Real Estate Investment Trust | | | 6,000 | | | 173,760 | |
| | | | | | | 431,051 | |
| REITS-HEALTH CARE (1.8%) | | | | | | | | |
| Health Care REIT, Inc. | | | 2,500 | | | | 131,725 | |
| REITS-HOTELS (8.2%) | | | | | | | | |
| Host Hotels & Resorts, Inc. | | | 15,317 | | | | 218,574 | |
| LaSalle Hotel Properties | | | 12,000 | | | | 286,920 | |
| Pebblebrook Hotel Trust | | | 5,000 | | | 95,150 | |
| | | | | | | 600,644 | |
| REITS-OFFICE PROPERTY (13.7%) | | | | | | | | |
| Alexandria Real Estate Equities, Inc. | | | 2,500 | | | | 165,225 | |
| BioMed Realty Trust, Inc. | | | 9,000 | | | | 162,990 | |
| Boston Properties, Inc. | | | 2,500 | | | | 247,475 | |
| Corporate Office Properties Trust SBI MD | | | 4,000 | | | | 97,000 | |
| Douglas Emmett, Inc. | | | 6,000 | | | | 117,000 | |
| SL Green Realty Corp. | | | 3,000 | | | 206,970 | |
| | | | | | | 996,660 | |
| REITS-SHOPPING CENTERS (3.4%) | | | | | | | | |
| Acadia Realty Trust | | | 4,985 | | | | 103,289 | |
| Saul Centers, Inc. | | | 4,100 | | | 146,944 | |
| | | | | | | 250,233 | |
| REITS-SINGLE TENANT (1.5%) | | | | | | | | |
| National Retail Properties, Inc. | | | 4,000 | | | 109,000 | |
| REITS-STORAGE (4.6%) | | | | | | | | |
| Extra Space Storage, Inc. | | | 15,000 | | | 337,950 | |
| REITS-WAREHOUSE/INDUSTRIES (4.2%) | | | | | | | | |
| EastGroup Properties, Inc. | | | 3,000 | | | | 130,830 | |
| ProLogis | | | 5,955 | | | 177,221 | |
| | | | | | | 308,051 | |
| RETAIL (2.3%) | | | | | | | | |
| Kingfisher PLC ADR | | | 20,000 | | | 164,400 | |
| TELECOMMUNICATIONS (3.5%) | | | | | | | | |
| American Tower Corp., Class A (1) | | | 2,500 | | | | 137,750 | |
| SBA Communications Corp., Class A (1) | | | 3,000 | | | 114,270 | |
| | | | | | | 252,020 | |
TOTAL COMMON STOCKS | | | | | | | | |
(Cost $6,553,545) | | | | | | 6,437,089 | |
See accompanying notes to financial statements.
22
C O M M O N W E A L T H
INTERNATIONAL SERIES TRUST | ANNUAL REPORT 2011 |
SCHEDULE OF INVESTMENTS – October 31, 2011
| COMMONWEALTH REAL ESTATE SECURITIES FUND |
| | | Shares | | | Value |
| EXCHANGE TRADED FUNDS (3.1%) | | | | | | | | |
| Guggenheim China Real Estate ETF | | | 8,500 | | | $ | 135,490 | |
| SPDR Dow Jones International Real Estate ETF | | | 2,500 | | | 87,650 | |
TOTAL EXCHANGE TRADED FUNDS | | | | | | | | |
(Cost $246,853) | | | | | | 223,140 | |
| | | Principal | | | | | |
| CORPORATE BONDS (3.5%) | | | | | | | | |
| BUILDING MATERIALS (3.5%) | | | | | | | | |
| Hanson Australia Funding, Ltd., 5.25%, 3/15/13 (2) | | | $250,000 | | | 256,250 | |
TOTAL CORPORATE BONDS | | | | | | | | |
(Cost $250,343) | | | | | | 256,250 | |
| | | | | | | | | |
| | | Contracts | | | | | |
| CALL OPTIONS (1.9%) | | | | | | | | |
| Autodesk, Inc., Strike Price:$20.00, | | | | | | | | |
Expiration 1/19/2013 (1) | | | 70 | | | | 111,650 | |
| St. Joe Co. (The), Strike Price: | | | | | | | | |
$10.00, Expiration 1/19/2013 (1) | | | 50 | | | 25,050 | |
TOTAL CALL OPTIONS | | | | | | | | |
(Cost $149,440) | | | | | | 136,700 | |
| | | Shares | | | | | |
| SHORT-TERM INVESTMENTS (3.6%) | | | | | | | | |
| Fifth Third Bank Institutional Govt. | | | | | | | | |
Money Market Fund, 0.01% (3) | | | 260,452 | | | 260,452 | |
TOTAL SHORT-TERM INVESTMENTS | | | | | | | | |
(Cost $260,452) | | | | | | 260,452 | |
| TOTAL INVESTMENTS (100.3%) | | | | | | | | |
| (Cost $7,460,633) | | | | | | | 7,313,631 | |
| LIABILITIES IN EXCESS OF OTHER | | | | | | | | |
| ASSETS (-0.3%) | | | | | | (19,920 | ) |
| NET ASSETS (100.0%) | | | | | | $ | 7,293,711 | |
| (1) | Non-income producing. |
| (2) | Callable. |
| (3) | Rate disclosed is the seven day yield as of 10/31/2011. |
| ADR — American Depositary Receipt |
| PLC — Public Limited Company |
| REIT — Real Estate Investment Trusts |
| SPDR — Standard & Poor’s Depositary Receipt |
See accompanying notes to financial statements.
23
C O M M O N W E A L T H
INTERNATIONAL SERIES TRUST | ANNUAL REPORT 2011 |
| STATEMENTS OF ASSETS AND LIABILITIES – October 31, 2011 |
|
| | | Commonwealth | | | | | | | | | | Commonwealth |
| | | Australia/New | | Commonwealth | | Commonwealth | | Real Estate |
| | | Zealand Fund | | Japan Fund | | Global Fund | | Securities Fund |
| ASSETS: | | | | | | | | | | | | | | | | |
Investments, at value (Cost $16,728,208, $3,320,661, $10,077,676 and $7,460,633) | | | $20,355,205 | | | | $3,942,664 | | | | $12,504,006 | | | | $7,313,631 | |
Investments in affiliated companies, at value (Cost $758,318, $0, $0 and $0) | | | 398,677 | | | | — | | | | — | | | | — | |
Total Investments, at value (Cost $17,486,526, $3,320,661, $10,077,676 and $7,460,633) | | | 20,753,882 | | | | 3,942,664 | | | | 12,504,006 | | | | 7,313,631 | |
| Cash | | | — | | | | — | | | | 6 | | | | — | |
Foreign currency, at value (Cost $277,935, $0, $0 and $0) | | | 285,914 | | | | — | | | | — | | | | — | |
| Interest and dividends receivable | | | 131,496 | | | | 25,818 | | | | 31,112 | | | | 7,557 | |
| Receivable for shares of beneficial interest issued | | | 213,549 | | | | — | | | | 300 | | | | — | |
| Receivable for investments sold | | | 333,095 | | | | 1,459,131 | | | | 935,713 | | | | — | |
| Prepaid expenses | | | 12,705 | | | | 10,590 | | | | 13,646 | | | | 9,307 | |
Total Assets | | | 21,730,641 | | | | 5,438,203 | | | | 13,484,783 | | | | 7,330,495 | |
| LIABILITIES: | | | | | | | | | | | | | | | | |
| Due to custodian | | | 204,704 | | | | 1,597,047 | | | | — | | | | — | |
| Payable for investments purchased | | | — | | | | — | | | | 135,030 | | | | — | |
| Payable for shares of beneficial interest redeemed | | | 8,444 | | | | 14,766 | | | | — | | | | — | |
| Accrued expenses and other payables: | | | | | | | | | | | | | | | | |
Investment advisory | | | 13,254 | | | | 4,308 | | | | 8,378 | | | | 4,523 | |
Administration | | | 11,156 | | | | 3,673 | | | | 6,403 | | | | 3,560 | |
Distribution | | | 8,974 | | | | 2,941 | | | | 5,488 | | | | 2,941 | |
Accounting and transfer agent | | | 13,411 | | | | 7,888 | | | | 7,476 | | | | 5,656 | |
Trustee | | | 8,877 | | | | 2,964 | | | | 5,167 | | | | 2,792 | |
Compliance | | | 3,525 | | | | 1,160 | | | | 2,023 | | | | 1,125 | |
Custodian | | | 2,425 | | | | 723 | | | | 375 | | | | 326 | |
Other | | | 43,632 | | | | 8,905 | | | | 29,020 | | | | 15,861 | |
Total liabilities | | | 318,402 | | | | 1,644,375 | | | | 199,360 | | | | 36,784 | |
| NET ASSETS | | | $21,412,239 | | | | $3,793,828 | | | | $13,285,423 | | | | $7,293,711 | |
| | | | | | | | | | | | | | | | | |
NET ASSET VALUE, OFFERING PRICE &
REDEMPTION PRICE PER SHARE:(a) | | | | | | | | | | | | | | | | |
(1,990,498, 1,405,359, 871,515 and 750,430, shares of beneficial interest outstanding, respectively, par value $0.01, unlimited shares authorized) | | | $ 10.76 | | | | $ 2.70 | | | | $ 15.24 | | | | $ 9.72 | |
| | | | | | | | | | | | | | | | | |
| NET ASSETS CONSIST OF: | | | | | | | | | | | | | | | | |
| Paid-in-beneficial interest | | | $18,984,547 | | | | $4,048,451 | | | | $9,527,480 | | | | $8,148,443 | |
| Accumulated net investment income | | | 116,904 | | | | — | | | | — | | | | 7,413 | |
Accumulated net realized gains (losses) from investments, option contracts and foreign currency transactions | | | (961,289 | ) | | | (876,164 | ) | | | 1,331,613 | | | | (715,143 | ) |
Net unrealized appreciation/depreciation on investments, option contracts and foreign currency translations | | | 3,272,077 | | | | 621,541 | | | | 2,426,330 | | | | (147,002 | ) |
| NET ASSETS | | | $21,412,239 | | | | $3,793,828 | | | | $13,285,423 | | | | $7,293,711 | |
| (a) | | Subject to certain exceptions, a 2% redemption fee is imposed upon shares redeemed within 14 calendar days of their purchase. See Note 3 in the Notes to Financial Statements. |
| See accompanying notes to financial statements. |
|
| 24 |
C O M M O N W E A L T H
INTERNATIONAL SERIES TRUST | ANNUAL REPORT 2011 |
| STATEMENTS OF OPERATIONS – October 31, 2011 |
|
| | | Commonwealth | | | | | | | | | | Commonwealth |
| | | Australia/New | | Commonwealth | | Commonwealth | | Real Estate |
| | | Zealand Fund | | Japan Fund | | Global Fund | | Securities Fund |
| INVESTMENT INCOME: | | | | | | | | | | | | | | | | |
| Interest income | | | $ 70,701 | | | | $ 128 | | | | $ 9,658 | | | | $ 13,096 | |
| Dividend income, unaffiliated issuers | | | 1,014,817 | | | | 76,023 | | | | 446,162 | | | | 137,958 | |
| Dividend income, affiliated issuers | | | 8,440 | | | | — | | | | — | | | | — | |
| Foreign tax withholding | | | (121,179 | ) | | | (5,295 | ) | | | (49,224 | ) | | | (1,364 | ) |
Total Investment Income | | | 972,779 | | | | 70,856 | | | | 406,596 | | | | 149,690 | |
| EXPENSES: | | | | | | | | | | | | | | | | |
| Management fees (Note 4) | | | 170,622 | | | | 38,216 | | | | 114,180 | | | | 62,055 | |
| Legal fees | | | 49,003 | | | | 10,341 | | | | 33,162 | | | | 18,073 | |
| Administration fees | | | 131,793 | | | | 29,649 | | | | 88,107 | | | | 47,951 | |
| Accounting and transfer agent fees | | | 79,941 | | | | 49,809 | | | | 48,690 | | | | 37,625 | |
| Distribution fees | | | 56,921 | | | | 12,739 | | | | 38,103 | | | | 20,707 | |
| Custodian fees | | | 14,304 | | | | 3,985 | | | | 2,398 | | | | 2,318 | |
| Miscellaneous fees | | | 8,239 | | | | 1,910 | | | | 6,015 | | | | 3,497 | |
| Audit fees | | | 23,936 | | | | 5,221 | | | | 16,093 | | | | 8,750 | |
| Trustee fees and expenses | | | 35,233 | | | | 9,047 | | | | 23,351 | | | | 12,653 | |
| Consulting services fees | | | 11,737 | | | | 2,397 | | | | 8,425 | | | | 4,625 | |
| Compliance fees | | | 47,359 | | | | 10,356 | | | | 31,585 | | | | 17,200 | |
| Insurance fees | | | 18,876 | | | | 3,091 | | | | 12,605 | | | | 6,971 | |
| State registration and filing fees | | | 18,859 | | | | 16,030 | | | | 17,588 | | | | 16,838 | |
| Printing and postage fees | | | 31,693 | | | | 6,485 | | | | 22,965 | | | | 12,565 | |
| Interest expense | | | 1,179 | | | | 182 | | | | 661 | | | | — | |
Total Expenses | | | 699,695 | | | | 199,458 | | | | 463,928 | | | | 271,828 | |
| Net Investment Income (Loss) | | | 273,084 | | | | (128,602 | ) | | | (57,332 | ) | | | (122,138 | ) |
REALIZED/UNREALIZED GAIN (LOSS) ON INVESTMENTS, OPTION CONTRACTS AND FOREIGN CURRENCY TRANSACTIONS: | | | | | | | | | | | | | | | | |
Net realized gain (loss) on investments, unaffiliated issuers | | | 955,978 | | | | 55,343 | | | | 1,469,039 | | | | (57,660 | ) |
Net realized gain from option contracts | | | — | | | | — | | | | — | | | | 129,128 | |
Net realized gain on foreign currency transactions | | | 31,787 | | | | 10,753 | | | | — | | | | — | |
Net change in unrealized appreciation/depreciation on: | | | | | | | | | | | | | | | | |
Investments, unaffiliated issuers | | | (1,168,260 | ) | | | (213,076 | ) | | | (1,370,525 | ) | | | (125,750 | ) |
Investments, affiliated issuers | | | (71,080 | ) | | | — | | | | — | | | | — | |
Option contracts | | | — | | | | (27,550 | ) | | | — | | | | (18,057 | ) |
Foreign currency translations | | | (43,484 | ) | | | (1,867 | ) | | | — | | | | — | |
Net realized/unrealized gain (loss) from investments, option contracts and foreign currency transactions | | | (295,059 | ) | | | (176,397 | ) | | | 98,514 | | | | (72,339 | ) |
Net Increase (Decrease) In Net Assets Resulting From Operations | | | $ (21,975 | ) | | | $(304,999 | ) | | | $ 41,182 | | | | $ (194,477 | ) |
| | | | | | | | | | | | | | | | | |
| See accompanying notes to financial statements. |
|
| 25 |
C O M M O N W E A L T H
INTERNATIONAL SERIES TRUST | ANNUAL REPORT 2011 |
| STATEMENTS OF CHANGES IN NET ASSETS |
|
| | | Commonwealth | | Commonwealth |
| | | Australia/New Zealand Fund | | Japan Fund |
| | | Year Ended | | Year Ended | | Year Ended | | Year Ended |
| | | October 31, 2011 | | October 31, 2010 | | October 31, 2011 | | October 31, 2010 |
| OPERATIONS: | | | | | | | | | | | | | | | | |
Net investment income (loss) | | | $ 273,084 | | | | $ 257,742 | | | | $ (128,602 | ) | | | $ (105,499 | ) |
Net realized gain from investments | | | 955,978 | | | | 359,608 | | | | 55,343 | | | | 135,451 | |
Net realized gain (loss) from foreign currency transactions | | | 31,787 | | | | (7,603 | ) | | | 10,753 | | | | 2,969 | |
Net change in unrealized appreciation/depreciation on investments and foreign currency translations | | | (1,282,824 | ) | | | 1,604,651 | | | | (242,493 | ) | | | 143,753 | |
Change in net assets resulting from operations | | | (21,975 | ) | | | 2,214,398 | | | | (304,999 | ) | | | 176,674 | |
| | | | | | | | | | | | | | | | | |
| DISTRIBUTIONS TO SHAREHOLDERS: | | | | | | | | | | | | | | | | |
Net investment income: | | | (370,401 | ) | | | — | | | | — | | | | — | |
Change in net assets from distributions | | | (370,401 | ) | | | — | | | | — | | | | — | |
| | | | | | | | | | | | | | | | | |
| CAPITAL TRANSACTIONS: | | | | | | | | | | | | | | | | |
Proceeds from shares issued | | | 9,208,119 | | | | 7,053,608 | | | | 6,368,859 | | | | 1,824,761 | |
Dividends reinvested | | | 347,588 | | | | — | | | | — | | | | — | |
Cost of shares redeemed | | | (12,728,855 | ) | | | (13,268,204 | ) | | | (6,288,767 | ) | | | (2,416,751 | ) |
Redemption fees | | | 3,196 | | | | 26 | | | | 1,559 | | | | 34 | |
Change in net assets resulting from capital transactions | | | (3,169,952 | ) | | | (6,214,570 | ) | | | 81,651 | | | | (591,956 | ) |
Net decrease in net assets | | | (3,562,328 | ) | | | (4,000,172 | ) | | | (223,348 | ) | | | (415,282 | ) |
| | | | | | | | | | | | | | | | | |
| NET ASSETS: | | | | | | | | | | | | | | | | |
Beginning of year | | | 24,974,567 | | | | 28,974,739 | | | | 4,017,176 | | | | 4,432,458 | |
End of year | | | $ 21,412,239 | | | | $ 24,974,567 | | | | $ 3,793,828 | | | | $ 4,017,176 | |
Accumulated net investment income | | | $ 116,904 | | | | $ 81,934 | | | | $ — | | | | $ — | |
| | | | | | | | | | | | | | | | | |
| SHARE TRANSACTIONS: | | | | | | | | | | | | | | | | |
Issued | | | 837,765 | | | | 713,167 | | | | 2,200,096 | | | | 668,501 | |
Reinvested | | | 34,968 | | | | — | | | | — | | | | — | |
Redeemed | | | (1,207,361 | ) | | | (1,333,014 | ) | | | (2,230,009 | ) | | | (880,733 | ) |
Change in shares | | | (334,628 | ) | | | (619,847 | ) | | | (29,913 | ) | | | (212,232 | ) |
| See accompanying notes to financial statements. |
|
| 26 |
C O M M O N W E A L T H
INTERNATIONAL SERIES TRUST | ANNUAL REPORT 2011 |
| STATEMENTS OF CHANGES IN NET ASSETS |
|
| | Commonwealth | | Commonwealth |
| | Global Fund | | Real Estate Securities Fund |
| | | Year Ended | | Year Ended | | Year Ended | | Year Ended |
| | | October 31, 2011 | | October 31, 2010 | | October 31, 2011 | | October 31, 2010 |
| OPERATIONS: | | | | | | | | | | | | | | | | |
Net investment loss | | | $ (57,332 | ) | | | $ (132,819 | ) | | | $ (122,138 | ) | | | $ (78,741 | ) |
Net realized gain (loss) from investments | | | 1,469,039 | | | | 124,122 | | | | (57,660 | ) | | | (493,246 | ) |
Net realized gain (loss) from option contracts | | | — | | | | — | | | | 129,128 | | | | (46,254 | ) |
Net change in unrealized appreciation/depreciation on investments and option contracts | | | (1,370,525 | ) | | | 2,225,804 | | | | (143,807 | ) | | | 2,177,189 | |
Change in net assets resulting from operations | | | 41,182 | | | | 2,217,107 | | | | (194,477 | ) | | | 1,558,948 | |
| | | | | | | | | | | | | | | | | |
| CAPITAL TRANSACTIONS: | | | | | | | | | | | | | | | | |
Proceeds from shares issued | | | 631,685 | | | | 2,082,124 | | | | 599,412 | | | | 995,921 | |
Cost of shares redeemed | | | (3,963,349 | ) | | | (2,677,584 | ) | | | (2,174,861 | ) | | | (1,681,120 | ) |
Redemption fees | | | 1,731 | | | | 5 | | | | 997 | | | | — | |
Change in net assets resulting from capital transactions | | | (3,329,933 | ) | | | (595,455 | ) | | | (1,574,452 | ) | | | (685,199 | ) |
Net increase/(decrease) in net assets | | | (3,288,751 | ) | | | 1,621,652 | | | | (1,768,929 | ) | | | 873,749 | |
| | | | | | | | | | | | | | | | | |
| NET ASSETS: | | | | | | | | | | | | | | | | |
Beginning of year | | | 16,574,174 | | | | 14,952,522 | | | | 9,062,640 | | | | 8,188,891 | |
End of year | | | $13,285,423 | | | | $16,574,174 | | | | $ 7,293,711 | | | | $ 9,062,640 | |
Accumulated net investment income (loss) | | | $ �� — | | | | $ (41,225 | ) | | | $ 7,413 | | | | $ 7,590 | |
| | | | | | | | | | | | | | | | | |
| SHARE TRANSACTIONS: | | | | | | | | | | | | | | | | |
Issued | | | 38,001 | | | | 143,630 | | | | 56,916 | | | | 108,281 | |
Redeemed | | | (239,808 | ) | | | (186,434 | ) | | | (204,731 | ) | | | (182,185 | ) |
Change in shares | | | (201,807 | ) | | | (42,804 | ) | | | (147,815 | ) | | | (73,904 | ) |
| See accompanying notes to financial statements. |
|
| 27 |
C O M M O N W E A L T H
INTERNATIONAL SERIES TRUST | ANNUAL REPORT 2011 |
FINANCIAL HIGHLIGHTS
| COMMONWEALTH AUSTRALIA/NEW ZEALAND FUND |
Selected data for a share outstanding throughout the years indicated:
| | For the year | For the year | For the year | For the year | For the year |
| | ended | ended | ended | ended | ended |
| | 10/31/11 | 10/31/10 | 10/31/09 | 10/31/08 | 10/31/07 |
| |
|
|
|
|
|
Net Asset Value, Beginning of Year | | | $ 10.74 | | | | $ 9.84 | | | | $ 10.87 | | | | $ 20.34 | | | | $ 17.44 | |
| | | | | | | | | | | | | | | | | | | | | |
| Change in net assets from operations: | | | | | | | | | | | | | | | | | | | | |
Net investment income | | | 0.12 | | | | 0.08 | | | | 0.08 | (a) | | | 1.04 | | | | 0.19 | |
Net realized and unrealized gain (loss) from investments | | | 0.07 | (c) | | | 0.82 | | | | 1.95 | | | | (8.47 | ) | | | 5.00 | |
| Total from investment activities | | | 0.19 | | | | 0.90 | | | | 2.03 | | | | (7.43 | ) | | | 5.19 | |
| | | | | | | | | | | | | | | | | | | | | |
| Distributions | | | | | | | | | | | | | | | | | | | | |
Net investment income | | | (0.17 | ) | | | — | | | | (1.80 | ) | | | (0.60 | ) | | | (0.06 | ) |
Net realized gains | | | — | | | | — | | | | (1.26 | ) | | | (1.44 | ) | | | (2.23 | ) |
| Total distributions | | | (0.17 | ) | | | — | | | | (3.06 | ) | | | (2.04 | ) | | | (2.29 | ) |
| Redemption fees | | | — | (b) | | | — | (b) | | | — | (b) | | | — | | | | — | |
| Net Asset Value, End of Year | | | $ 10.76 | | | | $ 10.74 | | | | $ 9.84 | | | | $ 10.87 | | | | $ 20.34 | |
| | | | | | | | | | | | | | | | | | | | | |
| Total return | | | 1.85 | % | | | 9.15 | % | | | 29.09 | % | | | (40.25 | )% | | | 32.60 | % |
| Net assets at end of year (000’s) | | | $21,412 | | | | $24,975 | | | | $28,975 | | | | $19,964 | | | | $45,443 | |
| | | | | | | | | | | | | | | | | | | | | |
| Ratios/Supplemental Data: | | | | | | | | | | | | | | | | | | | | |
Ratio of net expenses to average net assets | | | 3.08 | % | | | 3.24 | % | | | 3.59 | % | | | 2.74 | % | | | 2.55 | % |
Ratio of net investment income to average net assets | | | 1.20 | % | | | 1.05 | % | | | 0.95 | % | | | 5.67 | % | | | 1.03 | % |
| Portfolio turnover rate | | | 22 | % | | | 12 | % | | | 34 | % | | | 21 | % | | | 21 | % |
| (a) | | Calculated using the average shares method. |
| (b) | | Value is less than $0.005 per share. |
| (c) | | The amount of net gain from securities (both realized and unrealized) per share, does note accord with the amounts reported in the Statements of Operations due to the timing of purchases and redemptions of Fund shares during the year. |
| See accompanying notes to financial statements. |
|
| 28 |
C O M M O N W E A L T H
INTERNATIONAL SERIES TRUST | ANNUAL REPORT 2011 |
FINANCIAL HIGHLIGHTS
Selected data for a share outstanding throughout the years indicated:
| | For the year | For the year | For the year | For the year | For the year |
| | ended | ended | ended | ended | ended |
| | 10/31/11 | 10/31/10 | 10/31/09 | 10/31/08 | 10/31/07 |
| |
|
|
|
|
|
| Net Asset Value, Beginning of Year | | | $ 2.80 | | | | $ 2.69 | | | | $ 2.47 | | | | $ 3.82 | | | | $ 4.33 | |
| | | | | | | | | | | | | | | | | | | | | |
| Change in net assets from operations: | | | | | | | | | | | | | | | | | | | | |
Net investment loss | | | (0.09 | ) | | | (0.07 | ) | | | (0.06 | )(a) | | | (0.04 | ) | | | (0.07 | ) |
Net realized and unrealized gain (loss) from investments | | | (0.01 | )(c) | | | 0.18 | | | | 0.28 | | | | (1.31 | ) | | | 0.11 | |
| Total from investment activities | | | (0.10 | ) | | | 0.11 | | | | 0.22 | | | | (1.35 | ) | | | 0.04 | |
| | | | | | | | | | | | | | | | | | | | | |
| Distributions | | | | | | | | | | | | | | | | | | | | |
Net investment income | | | — | | | | — | | | | — | | | | — | | | | — | |
Net realized gains | | | — | | | | — | | | | — | | | | — | | | | (0.55 | ) |
| Total distributions | | | — | | | | — | | | | — | | | | — | | | | (0.55 | ) |
| Redemption fees | | | — | (b) | | | — | (b) | | | — | (b) | | | — | | | | — | |
| Net Asset Value, End of Year | | | $ 2.70 | | | | $ 2.80 | | | | $ 2.69 | | | | $ 2.47 | | | | $ 3.82 | |
| | | | | | | | | | | | | | | | | | | | | |
| Total return | | | (3.57 | )% | | | 4.09 | % | | | 8.91 | % | | | (35.34 | )% | | | 1.02 | % |
| Net assets at end of year (000’s) | | | $3,794 | | | | $4,017 | | | | $4,432 | | | | $4,905 | | | | $8,121 | |
| | | | | | | | | | | | | | | | | | | | | |
| Ratios/Supplemental Data: | | | | | | | | | | | | | | | | | | | | |
Ratio of net expenses to average net assets | | | 3.91 | % | | | 4.24 | % | | | 4.56 | % | | | 3.33 | % | | | 3.19 | % |
Ratio of net investment loss to average net assets | | | (2.52 | )% | | | (2.45 | )% | | | (2.58 | )% | | | (1.36 | )% | | | (1.78 | )% |
| Portfolio turnover rate | | | 62 | % | | | 10 | % | | | 30 | % | | | 10 | % | | | 2 | % |
| (a) | | Calculated using the average shares method. |
| (b) | | Value is less than $0.005 per share. |
| (c) | | The amount of net gain from securities (both realized and unrealized) per share, does note accord with the amounts reported in the Statements of Operations due to the timing of purchases and redemptions of Fund shares during the year. |
| See accompanying notes to financial statements. |
|
| 29 |
C O M M O N W E A L T H
INTERNATIONAL SERIES TRUST | ANNUAL REPORT 2011 |
FINANCIAL HIGHLIGHTS
Selected data for a share outstanding throughout the years indicated:
| | | For the year | | For the year | | For the year | | For the year | | For the year |
| | | ended | | ended | | ended | | ended | | ended |
| | | 10/31/11 | | 10/31/10 | | 10/31/09 | | 10/31/08 | | 10/31/07 |
| Net Asset Value, Beginning of Year | | | $ | 15.44 | | | | $ | 13.40 | | | | $ | 11.16 | | | | $ | 19.97 | | | | $ | 17.07 | |
| Change in net assets from operations: | | | | | | | | | | | | | | | | | | | | | | | | | |
Net investment income (loss) | | | | (0.07 | ) | | | | (0.12 | ) | | | | (0.10 | )(a) | | | | (0.02 | ) | | | | 0.04 | |
Net realized and unrealized gain | | | | | | | | | | | | | | | | | | | | | | | | | |
(loss) from investments | | | | (0.13 | )(c) | | | | 2.16 | | | | | 2.34 | | | | | (7.60 | ) | | | | 3.77 | |
| Total from investment activities | | | | (0.20 | ) | | | | 2.04 | | | | | 2.24 | | | | | (7.62 | ) | | | | 3.81 | |
| | | | | | | | | | | | | | | | | | | | | | | | | | |
| Distributions | | | | | | | | | | | | | | | | | | | | | | | | | |
Net investment income | | | | — | | | | | — | | | | | — | | | | | (0.01 | ) | | | | — | |
Net realized gains | | | | — | | | | | — | | | | | — | | | | | (1.18 | ) | | | | (0.91 | ) |
| Total distributions | | | | — | | | | | — | | | | | — | | | | | (1.19 | ) | | | | (0.91 | ) |
| Redemption fees | | | | — | (b) | | | | — | (b) | | | | — | (b) | | | | — | | | | | — | |
| Net Asset Value, End of Year | | | $ | 15.24 | | | | $ | 15.44 | | | | $ | 13.40 | | | | $ | 11.16 | | | | $ | 19.97 | |
| Total return | | | | (1.30 | )% | | | | 15.22 | % | | | | 20.07 | % | | | | (40.36 | )% | | | | 23.13 | % |
| Net assets at end of year (000’s) | | | $ | 13,285 | | | | $ | 16,574 | | | | $ | 14,953 | | | | $ | 13,328 | | | | $ | 29,041 | |
| | | | | | | | | | | | | | | | | | | | | | | | | | |
| Ratios/Supplemental Data: | | | | | | | | | | | | | | | | | | | | | | | | | |
| Ratio of net expenses to | | | | | | | | | | | | | | | | | | | | | | | | | |
average net assets | | | | 3.05 | % | | | | 3.02 | % | | | | 3.40 | % | | | | 2.43 | % | | | | 2.34 | % |
| Ratio of net investment income (loss) | | | | | | | | | | | | | | | | | | | | | | | | | |
to average net assets | | | | (0.38 | )% | | | | (0.85 | )% | | | | (0.92 | )% | | | | (0.12 | )% | | | | 0.27 | % |
| Portfolio turnover rate | | | | 18 | % | | | | 10 | % | | | | 12 | % | | | | 7 | % | | | | 12 | % |
| (a) | | Calculated using the average shares method. |
| (b) | | Value is less than $0.005 per share. |
| (c) | | The amount of net gain from securities (both realized and unrealized) per share, does note accord with the amounts reported in the Statements of Operations due to the timing of purchases and redemptions of Fund shares during the year. |
| See accompanying notes to financial statements. |
|
| 30 |
C O M M O N W E A L T H
INTERNATIONAL SERIES TRUST | ANNUAL REPORT 2011 |
FINANCIAL HIGHLIGHTS
| COMMONWEALTH REAL ESTATE SECURITIES FUND |
Selected data for a share outstanding throughout the years indicated:
| | | For the year | | For the year | | For the year | | For the year | | For the year |
| | | ended | | ended | | ended | | ended | | ended |
| | | 10/31/11 | | 10/31/10 | | 10/31/09 | | 10/31/08 | | 10/31/07 |
| Net Asset Value, Beginning of Year | | | $ | 10.09 | | | | $ | 8.42 | | | | $ | 7.56 | | | | $ | 14.21 | | | | $ | 14.06 | |
| Change in net assets from operations: | | | | | | | | | | | | | | | | | | | | | | | | | |
Net investment income (loss) | | | | (0.16 | ) | | | | (0.09 | ) | | | | (0.01 | )(a) | | | | (0.08 | ) | | | | 0.06 | |
Net realized and unrealized gain | | | | | | | | | | | | | | | | | | | | | | | | | |
(loss) from investments | | | | (0.21 | )(c) | | | | 1.76 | | | | | 0.87 | | | | | (5.45 | ) | | | | 0.21 | |
| Total from investment activities | | | | (0.37 | ) | | | | 1.67 | | | | | 0.86 | | | | | (5.53 | ) | | | | 0.27 | |
| | | | | | | | | | | | | | | | | | | | | | | | | | |
| Distributions | | | | | | | | | | | | | | | | | | | | | | | | | |
Net investment income | | | | — | | | | | — | | | | | — | | | | | — | | | | | (0.09 | ) |
Net realized gains | | | | — | | | | | — | | | | | — | | | | | (0.95 | ) | | | | (0.03 | ) |
Return of capital | | | | — | | | | | — | | | | | — | | | | | (0.17 | ) | | | | — | |
| Total distributions | | | | — | | | | | — | | | | | — | | | | | (1.12 | ) | | | | (0.12 | ) |
| Redemption fees | | | | — | (b) | | | | — | | | | | — | | | | | — | | | | | — | |
| Net Asset Value, End of Year | | | $ | 9.72 | | | | $ | 10.09 | | | | $ | 8.42 | | | | $ | 7.56 | | | | $ | 14.21 | |
| Total return | | | | (3.67 | )% | | | | 19.83 | % | | | | 11.38 | % | | | | (41.65 | )% | | | | 1.91 | % |
| Net assets at end of year (000’s) | | | $ | 7,294 | | | | $ | 9,063 | | | | $ | 8,189 | | | | $ | 8,190 | | | | $ | 15,037 | |
| | | | | | | | | | | | | | | | | | | | | | | | | | |
| Ratios/Supplemental Data: | | | | | | | | | | | | | | | | | | | | | | | | | |
| Ratio of net expenses to | | | | | | | | | | | | | | | | | | | | | | | | | |
average net assets | | | | 3.29 | % | | | | 3.22 | % | | | | 3.71 | % | | | | 2.55 | % | | | | 2.49 | % |
| Ratio of net investment income (loss) | | | | | | | | | | | | | | | | | | | | | | | | | |
to average net assets | | | | (1.48 | )% | | | | (0.89 | )% | | | | (0.11 | )% | | | | (0.66 | )% | | | | 0.41 | % |
| Portfolio turnover rate | | | | 7 | % | | | | 21 | % | | | | 5 | % | | | | 13 | % | | | | 20 | % |
| (a) | | Calculated using the average shares method. |
| (b) | | Value is less than $0.005 per share. |
| (c) | | The amount of net gain from securities (both realized and unrealized) per share, does note accord with the amounts reported in the Statements of Operations due to the timing of purchases and redemptions of Fund shares during the year. |
| See accompanying notes to financial statements. |
|
| 31 |
 | | ANNUAL REPORT 2011 |
| NOTES TO FINANCIAL STATEMENTS – October 31, 2011 |
Note 1 – Organization
Commonwealth International Series Trust (the “Trust”) was organized as a Massachusetts business trust on May 8, 1986, and is registered under the Investment Company Act of 1940, as amended (the “1940 Act”), as a diversified open-end management investment company. The Trust currently consists of four diversified series: the Commonwealth Australia/New Zealand Fund (the “Australia/New Zealand Fund”), the Commonwealth Japan Fund (the “Japan Fund”), the Commonwealth Global Fund (the “Global Fund”) and the Commonwealth Real Estate Securities Fund (the “Real Estate Securities Fund”) (each a “Fund” and collectively the “Funds”).
Note 2 – Investment Objectives
Each Fund’s investment objective is to provide long-term capital appreciation and current income. Under normal market conditions, each Fund (other than the Global Fund) invests at least 80% of its assets in the country or asset class specified in its name (i.e., Japan, Australia/New Zealand or Real Estate).
Note 3 – Significant Accounting Policies
The following is a summary of significant accounting policies consistently followed by the Trust in the preparation of financial statements for the Funds. The policies are in conformity with accounting principles generally accepted in the United States of America (“GAAP”).
A) Valuation of Securities – Each Fund’s assets are valued normally on the basis of market quotations or official closing prices or, if there is no recent last sales price available, reference is made to the last current bid and ask quotation in the principal market in which the securities are normally traded. Equity securities that are traded on the NASDAQ National Market System, for which quotations are readily available, are valued at the official closing price. Debt securities are priced either by using a market quotation or an independent pricing service. The pricing service may use one or more pricing models. Generally, debt instruments with maturities of less than 60 days (short-term debt) are valued at amortized cost or original cost plus interest, which approximates current value. Investments in open-end investment companies are valued at net asset value. If Fund management determines that market quotations or official closing prices are not readily available or do not accurately reflect the fair value for a security, the fair value of the security or securities will be determined in accordance with procedures established by the Board of Trustees (the “Board”). Fair value prices are generally provided by an independent fair value pricing service. The Funds have instituted a policy whereby fair value prices provided by a pricing service will be utilized if certain conditions are met. For the year ended October 31, 2011, there were several instances where these conditions were met, and as a result, foreign securities in the Australia/New Zealand Fund and the Japan Fund were valued at fair value.
B) Fair Value Measurements – The Funds’ investments have been categorized by tiers dependent upon the various “inputs” used to determine the fair value of the Funds’ investments. These inputs are summarized in the three broad levels listed below:
| | • | | Level 1 – quoted prices in active markets for identical assets. |
| | • | | Level 2 – other significant observable inputs (including quoted prices for similar securities, interest rates, prepayments speeds, credit risk, etc.). |
| | • | | Level 3 – significant unobservable inputs (including the Fund’s own assumptions in determining the fair value of investments). |
The inputs or methodology used for valuing securities are not necessarily an indication of the risk associated with investing in those securities.
| | ANNUAL REPORT 2011 |
| NOTES TO FINANCIAL STATEMENTS – October 31, 2011 (Continued) |
The following is a summary of the inputs used to value the Funds’ net assets as of October 31, 2011:
| | Australia/New Zealand Fund |
| | | Level 1 | | Level 2*** | | Level 3 | | Total ** |
| Security Type | | | | | | | | | | | | |
Common Stocks* | | $ | — | | $ | 13,873,738 | | $ | — | | $ | 13,873,738 |
Building Materials | | | 136,206 | | | — | | | — | | | 136,206 |
Commercial Services | | | 3,317,411 | | | 1,163,993 | | | — | | | 4,481,404 |
Retail | | | 427,704 | | | 457,397 | | | — | | | 885,101 |
Corporate Bonds | | | 225,883 | | | 620,714 | | | — | | | 846,597 |
Preferred Stocks | | | — | | | 530,836 | | | — | | | 530,836 |
| Total | | $ | 4,107,204 | | $ | 16,646,678 | | $ | — | | $ | 20,753,882 |
| | Japan Fund |
| | | Level 1 | | Level 2 | | Level 3 | | Total ** |
| Security Type | | | | | | | | | | | | |
Common Stocks* | | $ | — | | $ | 3,778,974 | | $ | — | | $ | 3,778,974 |
Insurance | | | 89,400 | | | — | | | — | | | 89,400 |
Call Options | | | 74,290 | | | — | | | — | | | 74,290 |
| Total | | $ | 163,690 | | $ | 3,778,974 | | $ | — | | $ | 3,942,664 |
| | Global Fund |
| | | Level 1 | | Level 2 | | Level 3 | | Total ** |
| Security Type | | | | | | | | | | | | |
Common Stocks* | | $ | 10,331,510 | | $ | — | | $ | — | | $ | 10,331,510 |
Preferred Stocks | | | 502,320 | | | 96,690 | | | — | | | 599,010 |
Corporate Bonds | | | — | | | 200,567 | | | — | | | 200,567 |
Short Term Investment | | | 1,372,919 | | | — | | | — | | | 1,372,919 |
| Total | | $ | 12,206,749 | | $ | 297,257 | | $ | — | | $ | 12,504,006 |
| | Real Estate Fund |
| | | Level 1 | | Level 2 | | Level 3 | | Total ** |
| Security Type | | | | | | | | | | | | |
Common Stocks* | | $ | 6,437,089 | | $ | — | | $ | — | | $ | 6,437,089 |
Exchange Traded Funds | | | 223,140 | | | — | | | — | | | 223,140 |
Corporate Bonds | | | — | | | 256,250 | | | — | | | 256,250 |
Call Options | | | 136,700 | | | — | | | — | | | 136,700 |
Short Term Investments | | | 260,452 | | | — | | | — | | | 260,452 |
| Total | | $ | 7,057,381 | | $ | 256,250 | | $ | — | | $ | 7,313,631 |
| * | | All sub-categories within the security type represent their respective evaluation status unless otherwise shown. |
| ** | | There were no Level 3 securities held as of October 31, 2011. |
| *** | | After close of business November 19, 2010, the Pike River Coal Co., Ltd, experienced a catastrophic accident which led to a halted trading status the following business day, November 22, 2010. The Commonwealth Australia/New Zealand Fund held 1,145,295 shares (ticker: PRC) and 350,000 call options (ticker: PRCA) of the Pike River Coal Co., Ltd., on November 19, 2010 (representing 3.4% of the portfolio). From November 22 through October 31, 2011 both securities were fair valued at $0.00. Also, the value of certain equity securities listed or traded on foreign security exchanges may be valued by an independent fair value pricing service on any day when a significant change in value occurs. In the Australia/New Zealand Fund, the measure is based on a comparison to the iShares MSCI Australia Index Fund and in the Japan Fund it is based on a comparison between the S&P 500 Futures — Tokyo close to the U.S. close. As a result of such an event at October 31, 2011, these securities were fair valued by the service and categorized in Level 2. During the year ended October 31, 2011, these transactions represent the only significant transfers between each of the three categories. |
| | ANNUAL REPORT 2011 |
| NOTES TO FINANCIAL STATEMENTS – October 31, 2011 (Continued) |
C) Accounting Pronouncements and Tax Law Changes – On December 22, 2010, The Regulated Investment Company Modernization Act of 2010 (the “Modernization Act”) was signed into law. The Modernization Act is the first major piece of legislation affecting regulated investment companies (“RICs”) since 1986 and it modernizes several of the federal income and excise tax provisions related to RICs. Some highlights of the enacted provisions are as follows:
New capital losses may now be carried forward indefinitely, and retain the character of the original loss. Under pre-enactment law, capital losses could be carried forward for eight years, and carried forward as short-term capital losses, irrespective of the character of the original loss.
The Modernization Act contains simplification provisions, which are aimed at preventing disqualification of a RIC for “inadvertent” failures of the asset diversification and/or qualifying income tests. Additionally, the Modernization Act exempts RICs from the preferential dividend rule, and repealed the 60-day designation requirement for certain types of pay-through income and gains.
Finally, the Modernization Act contains several provisions aimed at preserving the character of distributions made by a fiscal year RIC during the portion of its taxable year ending after October 31 or December 31, reducing the circumstances under which a RIC might be required to file amended Forms 1099 to restate previously reported distributions.
The provisions related to the Modernization Act for qualification testing are effective for the October 31, 2011 taxable year. The effective date for changes in the treatment of capital losses is the October 31, 2012 taxable year.
In April 2011, FASB issued ASU No. 2011-03 “Reconsideration of Effective Control for Repurchase Agreements”. ASU 2011-03 amends FASB ASC Topic 860, Transfers and Servicing, specifically the criteria required to determine whether a repurchase agreement (repo) and similar agreements should be accounted for as sales of financial assets or secured borrowings with commitments. ASU No. 2011-03 changes the assessment of effective control by focusing on the transferor’s contractual rights and obligations and removing the criterion to assess its ability to exercise those rights or honor those obligations. This could result in changes to the way entities account for certain transactions including repurchase agreements, mortgage dollar rolls and reverse repurchase agreements. The ASU will become effective on a prospective basis for new transfers and modifications to existing transactions as of the beginning of the first interim or annual period beginning on or after December 15, 2011.
In May 2011, the Financial Accounting Standards Board (“FASB”) issued Accounting Standards Update (“ASU”) No. 2011-04 “Amendments to Achieve Common Fair Value Measurement and Disclosure Requirements in U.S. GAAP and the International Financial Reporting Standards (”IFRSs“)”. ASU No. 2011-04 amends FASB ASC Topic 820, Fair Value Measurements and Disclosures, to establish common requirements for measuring fair value and for disclosing information about fair value measurements in accordance with GAAP and IFRSs. ASU No. 2011-04 is effective for fiscal years beginning after December 15, 2011 and for interim periods within those fiscal years. Management is currently evaluating the impact these amendments may have on the Funds’ financial statements.
D) Currency Translation – For purposes of determining a Fund’s net asset value, all assets and liabilities initially expressed in foreign currency values are converted into U.S. dollar values at the prevailing market rate on each U.S. business day. The cost of securities is determined by using an exchange rate provided by an independent third party. Income is translated at approximate rates prevailing when accrued. The Funds do not isolate that portion of gains and losses on investments which is due to changes in foreign exchange rates from that which is due to changes in the market prices of the investments. Such fluctuations are included with the net realized and unrealized gains and losses from investments.
E) Allocations of Expenses – Expenses directly attributable to a Fund are charged directly to that Fund, while expenses which are attributable to more than one Fund, or the Trust, are allocated among the respective Funds based upon relative net assets or some other reasonable method.
F) Accounting for Investments – Security transactions are accounted for on the trade date. Realized gains and losses on security transactions are based on the identified cost basis for both financial statement and Federal income tax purposes. Dividend income and distributions to shareholders are recorded on the ex-dividend date or as soon as known if after the ex-dividend date. Discounts and premiums on bonds purchased are amortized over the life of the bonds (which may include maturity or call date). Interest income and estimated expenses are accrued daily.
G) Federal Income Taxes – It is each Fund’s policy is to comply with the requirements of Subchapter M of the Internal Revenue Code that are applicable to regulated investment companies and to distribute substantially all investment company taxable income and net capital gain to shareholders in a manner which results in no tax cost to the Funds. Therefore, no federal income tax provision is required.
Dividends or interest on foreign securities may be subject to the withholding of the country of domicile’s income tax by tax treaty provisions or otherwise. Generally, there are no foreign taxes applicable to the Funds’ capital gains realized on foreign securities in their country of domicile.
| | ANNUAL REPORT 2011 |
| NOTES TO FINANCIAL STATEMENTS – October 31, 2011 (Continued) |
Accounting for Uncertainty in Income Taxes (the “Income Tax Statement”) requires an evaluation of tax positions taken (or expected to be taken) in the course of preparing a Fund’s tax returns to determine whether these positions meet a “more-likely-than-not” standard that, based on the technical merits, have a more than fifty percent likelihood of being sustained by a taxing authority upon examination. A tax position that meets the “more-likely-than-not” recognition threshold is measured to determine the amount of benefit to recognize in the financial statements. The Funds recognize interest and penalties, if any, related to unrecognized tax benefits as income tax expense in the Statements of Operations.
The Income Tax Statement requires management of the Funds to analyze all open tax years, fiscal years 2008-2011 as defined by IRS statute of limitations for all major jurisdictions, including federal tax authorities and certain state tax authorities. As of and during the fiscal year October 31, 2011, the Funds did not have a liability for any unrecognized tax benefits. The Funds have no examinations in progress and are not aware of any tax positions for which it is reasonably possible that the total amounts of unrecognized tax benefits will significantly change in the next twelve months.
H) Distributions to Shareholders – The Funds distribute net investment income, if any, and net realized gains (net of any capital loss carryovers) annually. Income and capital gain distributions are determined in accordance with income tax regulations which may differ from GAAP. These differences are primarily due to differing treatments for foreign currency transactions and deferrals of certain losses.
I) Redemption Fees – Redemption fees are applicable to certain redemptions of shares within fourteen calendar days of purchase. The redemption fee is imposed to discourage abusive trading activity, which can have disruptive effects on the Funds’ portfolio management and can increase the Funds’ expenses. The redemption fees are intended to offset, at least partially, portfolio transaction and administrative costs associated with short-term trading. The shareholder will be charged a fee equal to 2.00% of the amount redeemed and will be charged when shares are sold, exchanged or involuntarily redeemed. In determining the applicability of the redemption fee, shares held for the longest period of time will be treated as being sold first and shares held for the shortest period of time as being sold last. For the year ended October 31, 2011, the Australia/New Zealand Fund, Japan Fund, Global Fund and Real Estate Securities Fund had contributions to capital due to redemption fees in the amount of $3,196, $1,559, $1,731 and $997, respectively.
J) Option Accounting Principles – When a Fund sells an option, the premium received is recorded as a liability. Each day the option contract liability is valued in accordance with the procedures for security valuation discussed above. When an offsetting option is purchased (a closing transaction) or the option contract expires, the Fund realizes a gain or loss and the liability related to such option contract is eliminated. When a call option is exercised, the Fund realizes a gain or loss from the sale of the underlying security and the proceeds of the sale are increased by the premiums originally received.
When a Fund purchases an option, the premium paid is recorded as an asset. Each day the option contract is valued in accordance with the procedures for security valuation discussed above. When an offsetting option is written (a closing transaction) or the option contract expires, the Fund realizes a gain or loss and the asset representing such option contract is eliminated. When a call option is exercised, the Fund purchases the underlying security and the cost basis of such purchase is increased by the premium originally paid.
K) Forward Currency Contracts – Forward currency transactions may be undertaken to hedge against possible variations in the foreign exchange rates between the U.S. dollar and foreign currencies. A forward currency contract is an agreement between two parties to buy or sell a currency at a set price on a future date. Forward contracts are marked-to-market daily and the change in the market value is recorded by the Fund as an unrealized gain or loss. When a contract is closed, the Fund records a realized gain or loss equal to the difference between the value of the contract at the time it was opened and the value at the time it was closed. The Funds could be exposed to risk if the counterparties are unable to meet the terms of the contracts or if the value of the currency changes unfavorably. Other risks of forward currency transactions include failing to achieve expected benefit, markets moving in a direction that the Funds did not expect, a Fund’s inability to be able to close out its position in the hedging instrument, and political and social unrest and the possibility of negative governmental actions. As of October 31, 2011, the Funds held no foreign currency contracts.
L) Repurchase Agreements – In connection with transactions in repurchase agreements, it is the Funds’ policy that their custodian bank takes possession of the underlying collateral securities, the fair value of which must be equal to the principal amount of the repurchase agreement including accrued interest throughout the term of the repurchase agreement. If the seller defaults and the fair value of the collateral declines, realization of the collateral value by the Funds may be delayed or limited.
M) Use of Estimates – The preparation of the financial statements in conformity with GAAP requires management to make estimates and assumptions that affect the reported amounts of assets and liabilities and the disclosure of contingent assets and liabilities at the date of the financial statements and the reported amounts of increases and decreases in net assets from operations during the reporting period. Actual results could differ from those estimates and these differences could be material.
| | ANNUAL REPORT 2011 |
| NOTES TO FINANCIAL STATEMENTS – October 31, 2011 (Continued) |
Note 4 – Related Party Transactions and Other Arrangements
A) Investment Advisor – The Trust, on behalf of each Fund, has retained FCA Corp (“FCA”) as the Funds’ investment advisor. Under each Fund’s Investment Advisory Agreement, FCA is paid a monthly fee based on the average daily net assets of each fund at the annual rate of 0.75%. Certain officers of the Trust are also officers of FCA.
B) Administration, Fund Accounting and Transfer Agent – UMB Fund Services, Inc. (“UMB”) serves as the administrator, transfer agent and fund accountant to the Funds. For these services UMB receives fees computed at an annual rate of the daily net assets of the Funds, subject to a minimum annual contractual fee. An officer of the Trust also is an employee of UMB, but is paid no fees directly by the Funds for serving as an officer of the Trust.
C) Distribution – UMB Distribution Services, LLC, serves as the principal underwriter for each Fund and receives an annual contractual fee. UMB Distribution Services, LLC is an affiliate of UMB.
Each Fund has adopted a Service and Distribution Plan (each a “Plan”) pursuant to Rule 12b-1 under the 1940 Act, whereby up to 0.35% of the Fund’s assets may be used to reimburse the Distributor for costs and expenses incurred in connection with the distribution and marketing of shares of the Fund and the servicing of Fund shareholders. Distribution and marketing expenses include, among other things, printing of prospectuses, marketing literature, and costs of personnel involved with the promotion and distribution of the Fund’s shares. These amounts are disclosed on the Statement of Operations under Distribution fees. While the plans permit each Fund to pay up to 0.35% of its average daily net assets to reimburse for certain expenses in connection with the distribution of its shares, the Board of Trustees has currently authorized each Fund to pay out only 0.25% under its Plan. If the Trustees’ intention changes on this matter, the Funds will amend or supplement their prospectus. Out of the foregoing amount, each Fund is permitted to pay up to an aggregate of 0.25% of its average daily net assets to reimburse for certain shareholder services.
D) Legal Counsel – The Law Offices of John H. Lively and Associates, Inc., a member firm of The 1940 Act Law GroupTM, serves as legal counsel to the Trust. John H. Lively, Secretary of the Trust, is the owner of The Law Offices of John H. Lively & Associates, Inc., but he receives no special compensation from the Trust or the Funds for serving as an officer of the Trust.
Note 5 – Investments in Affiliates
The Global Fund may invest a portion of its assets in the remaining three funds in the Trust. The Funds are considered to be affiliated under the 1940 Act because they have the same investment advisor. When computing both the advisory fee and the Rule 12b-1 fee for the Global Fund, average daily net assets are reduced by Fund assets invested in the affiliated funds. There were no affiliated holdings for the Global Fund during the year.
A company is considered an affiliate of a Fund under the 1940 Act if the Fund’s holdings in that company represent 5% or more of the outstanding voting shares of that company. The Commonwealth Australia/New Zealand Fund’s holding below is considered an affiliate of the Fund. Further detail on this holding as of the year ended October 31, 2011 appears below:
| | | | | | | | | Fair | | | | | | Change in | | Fair | | | | Realized |
| | | Percentage | | Shares | | Shares | | Value | | Cost of | | Cost of | | Appreciation/ | | Value | | Dividend | | Gain |
| Security Held | | of Ownership | | 10/31/10 | | 10/31/11 | | 10/31/10 | | Purchases | | Sales | | Depreciation | | 10/31/11 | | Income | | (Loss) |
Mowbray Collectables Ltd. | | 7.36% | | 821,593 | | 821,593 | | $469,757 | | — | | — | | ($71,080) | | $398,677 | | $8,440 | | $— |
Note 6 – Purchases and Sales of Securities
Purchases and sales of investment securities (excluding short-term securities) by the Funds for the year ended October 31, 2011 were as follows:
| | | Purchases | | Sales |
| Australia/New Zealand Fund | | $ | 4,863,117 | | | $ | 7,039,630 |
| Japan Fund | | | 2,653,810 | | | | 2,607,244 |
| Global Fund | | | 2,687,764 | | | | 7,739,166 |
| Real Estate Securities Fund | | | 508,101 | | | | 1,017,339 |
| | ANNUAL REPORT 2011 |
| NOTES TO FINANCIAL STATEMENTS – October 31, 2011 (Continued) |
Note 7 – Financial Instruments with Off-Balance Sheet Risk
In the ordinary course of trading activities, certain of the Funds trade and hold certain fair-valued derivative contracts. Such contracts include forward currency contracts, where the Funds would be obligated to buy currency at specified prices, and written put and call options, where the Funds would be obligated to purchase or sell securities at specified prices (i.e., the options are exercised by the counterparties). The maximum payout for the put option contracts is limited to the number of contracts written and the related strike prices, respectively. The maximum payout for the written call option contracts is limited only by how high the underlying securities strike price rises. Maximum payout amounts could be offset by the subsequent sale, if any, of assets obtained via the execution of a payout event.
The financial instruments contain varying degrees of off-balance sheet risk whereby changes in the market value of securities underlying the financial instruments may be in excess of the amounts recognized in the Statement of Assets and Liabilities. A Fund, as writer of an option, bears the market risk of an unfavorable change in the price of the security underlying the written option. The risk associated with purchasing an option is that the Fund pays a premium whether or not the option is exercised. Additionally, the Funds bear the risk of loss of premium and change in market value should the counterparty not perform under the contract. A call option gives the holder the right to buy the underlying stock from the writer at a specified price within a fixed period of time. Therefore, the securities held by the Fund against which options are written may not be traded and are held in escrow by the custodian.
Written option activity for the year ended October 31, 2011 was as follows:
| Commonwealth Real Estate Securities Fund | Number of Options | | Amount of Proceeds |
| Options outstanding at October 31, 2010 | | 360 | | | | $ | 96,974 | |
| Options written | | 92 | | | | | 13,063 | |
| Options expired | | (35 | ) | | | | (16,858 | ) |
| Options exercised | | (287 | ) | | | | (42,006 | ) |
| Options covered | | (130 | ) | | | | (51,173 | ) |
| Options outstanding at October 31, 2011 | | 0 | | | | $ | 0 | |
At October 31, 2011, the Commonwealth Funds had no outstanding written options.
Note 8 – Derivatives
The Funds’ use of derivatives for the year ended October 31, 2011 was limited to option and foreign exchange contracts. Following is a summary of how these derivatives are treated in the financial statements and their impact on the Funds.
| Fund/Financial | | Location of Gain (Loss) on | | Amount of | | Amount of |
| Instrument Type | | Derivatives Recognized in Income | | Realized Gain (Loss) | | Unrealized Gain (Loss) |
| Australia/New Zealand Fund | | | | | | | | | | |
Foreign Exchange Contracts | | Net realized gain on foreign currency transactions | | $ | 31,787 | | | $ | — | |
| | | Net change in unrealized appreciation/depreciation | | | | | | | | |
| | | on foreign currency translations | | | — | | | | (43,484 | ) |
| Japan Fund | | | | | | | | | | |
Foreign Exchange Contracts | | | | | | | | | | |
and Equity Contracts | | Net realized gain on foreign currency transactions | | | 10,753 | | | | — | |
| | | Net change in unrealized appreciation/depreciation on foreign currency translations | | | — | | | | (1,867 | ) |
| | | Net change in unrealized appreciation/depreciation on option contracts | | | — | | | | (27,550 | ) |
| Real Estate Securities Fund | | | | | | | | | | |
Equity Contracts | | Net realized gain from option contracts | | | 129,128 | | | | — | |
| | | Net change in unrealized appreciation/depreciation on option contracts | | | — | | | | (18,057 | ) |
| | ANNUAL REPORT 2011 |
| NOTES TO FINANCIAL STATEMENTS – October 31, 2011 (Continued) |
Note 9 – Tax Matters
As of October 31, 2011, the components of accumulated earnings (deficit) on a tax basis were as follows:
| | | Australia/New | | | | | | | | | | Real Estate |
| | | Zealand Fund | | Japan Fund | | Global Fund | | Securities Fund |
| Undistributed ordinary income | | $ | 231,578 | | | $ | — | | | $ | — | | | $ | — | |
| Undistributed long-term capital gains | | | — | | | | — | | | | 1,332,662 | | | | — | |
| Tax accumulated earnings | | | 231,578 | | | | — | | | | 1,332,662 | | | | — | |
| Accumulated capital and other losses | | | (959,213 | ) | | | (876,164 | ) | | | — | | | | (669,431 | ) |
| Unrealized appreciation (depreciation) on investments | | | 3,150,606 | | | | 622,003 | | | | 2,425,281 | | | | (185,301 | ) |
Unrealized appreciation (depreciation) on foreign currency | | | 4,721 | | | | (462 | ) | | | — | | | | — | |
| Total accumulated earnings (deficit) | | $ | 2,427,692 | | | $ | (254,623 | ) | | $ | 3,757,943 | | | $ | (854,732 | ) |
At October 31, 2011, the gross unrealized appreciation (depreciation) on investments and cost of securities on a tax basis for federal income tax purposes were as follows:
| | | Australia/New | | | | | | | | | | Real Estate |
| | | Zealand Fund | | Japan Fund | | Global Fund | | Securities Fund |
| Gross unrealized appreciation | | $ | 5,791,888 | | | $ | 1,030,283 | | | $ | 2,681,922 | | | $ | 1,074,759 | |
| Gross unrealized depreciation | | | (2,641,282 | ) | | | (408,280 | ) | | | (256,641 | ) | | | (1,260,060 | ) |
Net unrealized appreciation on foreign currency translations | | | 4,721 | | | | (462 | ) | | | — | | | | — | |
| Net unrealized appreciation (depreciation) | | $ | 3,155,327 | | | $ | 621,541 | | | $ | 2,425,281 | | | $ | (185,301 | ) |
| Cost of investments | | $ | 17,603,276 | | | $ | 3,320,661 | | | $ | 10,078,725 | | | $ | 7,498,932 | |
The difference between cost amounts for financial statement and federal income tax purposes is due primarily to wash sale loss deferrals, and passive foreign investment companies (“PFICs”).
The tax character of distributions paid during the tax years ended October 31, 2011 and 2010 were as follows:
| | | Australia/New | | | | | | | | | | | | | | | | | | Real Estate |
| | | Zealand Fund | | Japan Fund | | Global Fund | | Securities Fund |
| | | Year Ended | | Year Ended | | Year Ended | | Year Ended | | Year Ended | | Year Ended | | Year Ended | | Year Ended |
| | | October 31, | | October 31, | | October 31, | | October 31, | | October 31, | | October 31, | | October 31, | | October 31, |
| | | 2011 | | 2010 | | 2011 | | 2010 | | 2011 | | 2010 | | 2011 | | 2010 |
Distributions paid from: | | | | | | | | | | | | | | | | | | | | | | | | | | | | | | | | |
Ordinary Income | | | $370,401 | | | | $— | | | | $— | | | | $— | | | | $— | | | | $— | | | | $— | | | | $— | |
Net long-term capital gains | | | — | | | | — | | | | — | | | | — | | | | — | | | | — | | | | — | | | | — | |
Total distributions paid | | | $370,401 | | | | $— | | | | $— | | | | $— | | | | $— | | | | $— | | | | $— | | | | $— | |
| | ANNUAL REPORT 2011 |
| NOTES TO FINANCIAL STATEMENTS – October 31, 2011 (Continued) |
As of October 31, 2011, the following funds had net capital loss carryforwards which are available to offset future net capital gains, if any:
| | | Australia/New | | | | | | | | | | Real Estate |
| | | Zealand Fund | | Japan Fund | | Global Fund | | Securities Fund |
| For losses expiring October 31, | | | | | | | | | | | | | | | | |
2016 | | $ | — | | | $ | 54,096 | | | $ | — | | | $ | 175,591 | |
2017 | | | 959,213 | | | | 822,068 | | | | — | | | | — | |
2018 | | | — | | | | — | | | | — | | | | 493,840 | |
| | | $ | 959,213 | | | $ | 876,164 | | | $ | — | | | $ | 669,431 | |
Capital loss carryovers are available to offset future realized capital gains and thereby reduce further taxable gain distributions. During the year ended October 31, 2011, the Australia/New Zealand Fund, Japan Fund, Global Fund and Real Estate Securities Fund utilized $847,837, $55,343, $88,477 and $71,404, respectively, of their capital loss carryovers.
Note 10 – Revolving Credit Agreement
During a portion of the period covered by this Annual Report, the Trust had in place a Revolving Credit Agreement (the “Agreement”) with its custodian, Fifth Third Bank N.A. (the “Bank”). Pursuant to the terms of the Agreement, the Bank made available to the Trust, a line of credit facility under which the Bank may make loans to the Trust on behalf of the Funds from time to time. The Agreement provided a line of credit in an amount of up to $10,000,000 as a temporary measure for extraordinary or emergency purposes based on instructions received from an authorized representative of the Trust. The Trust shall not at any time incur borrowings with respect to the Funds such that the aggregate loans then outstanding under the line of credit facility would exceed $10,000,000. Such borrowings are also limited by the 1940 Act, which permits a Fund to borrow for temporary purposes only in an amount not exceeding 5% of the value of its total assets at the time when the loan is made. A loan shall be presumed to be for temporary purposes if it is repaid within 60 days and is not extended or renewed. Each Fund is also permitted, consistent with the 1940 Act, to borrow, and pledge its shares to secure such borrowings, provided, that immediately thereafter there is asset coverage of at least 300% for all borrowings by the Fund from a bank. Under the terms of the Agreement, any principal balance outstanding would bear interest at the Federal Funds Rate in effect at that time plus 1.50%.
The average amount of borrowings for the days on which the Funds borrowed and the average interest rate on those borrowings by the Funds during the year ended October 31, 2011 were as follows:
| | | Average Principal | | | Average Interest Rate | |
| Australia/New Zealand Fund | | $280,028 | | | | 1.67% | |
| Japan Fund | | 98,296 | | | | 1.61% | |
| Global Fund | | 389,319 | | | | 1.65% | |
During the year ended October 31, 2011 the Real Estate Securities Fund had no borrowings under the Agreement. Prior to October 31, 2011, the Agreement expired and the Trust was in the process of negotiating the renewal terms with the Bank. During the time that the Agreement had expired, the Bank has agreed to provide liquidity resources to the Trust at similar terms to the Agreement until a formal renewal was agreed upon. At the time that this Annual Report is being produced, the Bank has agreed to provide a new line of credit under substantially the same terms and conditions of the Agreement although the maximum amount of borrowings under the new line of credit will be reduced to $3,500,000.
Note 11 – Reclassification of Capital Accounts
The Funds have recorded reclassifications in their capital accounts. These reclassifications have no impact on the net asset value of the Funds and are designed generally to present undistributed net investment income and accumulated net realized gain (loss) on a tax basis which is considered to be more informative to the shareholder. As of October 31, 2011, the Funds recorded the following reclassifications to increase (decrease) the capital accounts listed below:
| | Australia/New | | | | | | | | | | Real Estate |
| | Zealand Fund | | Japan Fund | | Global Fund | | Securities Fund |
| Paid-in-beneficial interest | $ | (369 | ) | | $ | (117,849 | ) | | $ | (49,612 | ) | | $ | (121,961 | ) |
| Accumulated net investment income | | 132,287 | | | | 128,602 | | | | 98,557 | | | | 121,961 | |
| Accumulated net realized losses from investments, | | | | | | | | | | | | | | | |
written options and foreign currency transactions | | (131,918 | ) | | | (10,753 | ) | | | (48,945 | ) | | | — | |
| | ANNUAL REPORT 2011 |
| NOTES TO FINANCIAL STATEMENTS – October 31, 2011 (Continued) |
Note 12 – Contractual Obligations
Under the Funds organizational documents, its Trustees and Officers are indemnified against certain liabilities arising out of the performance of their duties to the Fund. In the normal course of business, the Funds enter into contracts that contain various representations and warranties and provide general indemnifications. The Funds’ maximum exposure under these arrangements is dependent on future claims against the Funds and is presently unknown.
Note 13 – Concentration of Market Risk
The Australia/New Zealand Fund has a majority of its investments in securities issued by Australian and New Zealand issuers and the Japan Fund invests primarily in securities of Japanese issuers. Investing in companies from specific geographic regions, such as Australia, New Zealand or Japan, may pose additional risks inherent to a region’s economic and political situation. These events will not necessarily affect the U.S. economy or similar issuers located in the U.S. In addition, many of the investments in Australia, New Zealand or Japan are denominated in foreign currencies. As a result, changes in the values of these currencies compared to the U.S. dollar may affect (positively or negatively) the value of the Funds’ investments. These events may happen separately from, and in response to, events that do not otherwise affect the values of the securities in the issuers’ home countries.
A large portion of investments held by the Real Estate Securities Fund are considered investments in the real estate sector of the market, which may include REITs. Investing in REITs involves certain unique risks in addition to those risks associated with investing in the real estate industry in general. Equity REITs may be affected by changes in the value of the underlying property owned by the REITs, while mortgage REITs may be affected by the quality of any credit extended. REITs are dependent upon management skills, are not diversified, are subject to heavy cash flow dependency, default by borrowers and self-liquidation. REITs are also subject to the possibilities of failing to qualify for tax-free pass through of income and maintaining their exemption from registration under the 1940 Act. Investing in a single market sector may be riskier than investing in a variety of market sectors.
Note 14 – Legal Matters
On October 22, 2010, Edward S. Weisfelner, as Trustee of the LP Creditor Trust (the “Plaintiff”), filed a suit in the Supreme Court of the State of New York in the county of New York against, among numerous other defendants, the Trust’s custodian (the “Custodian”) as a record holder of shares of Lyondell Chemical Company (“Lyondell”). Among the shares alleged to have been held by the Custodian were 10,000 shares for which the Commonwealth Global Fund (the “Global Fund”) was a beneficial shareholder. Neither the Trust, nor the Global Fund has been named or identified in this claim at the time this Annual Report was being produced. Generally, the Plaintiff’s claim alleges that a merger transaction, which closed on December 20, 2007, in which the Global Fund and the other shareholders of Lyondell disposed of their positions in Lyondell caused Lyondell to be insolvent and ultimately resulted in Lyondell filing for bankruptcy protection. Lyondell sought bankruptcy protection in cases filed on January 6, 2009 and April 24, 2009. The Plaintiff’s claim further alleges that, under various theories under state law, the transaction constituted a fraudulent transfer. The Plaintiff is seeking to set aside and recover the entire amount of the transfer, which is alleged to be approximately $5.9 billion. The Global Fund’s proceeds from the transaction amounted to $479,700. At the time that this Annual Report was being produced, the case remains in the preliminary stages. The complaint has been served on the Custodian and the Custodian has filed an initial response seeking to have the complaint against it dismissed. The Trust intends to participate in the defense of this case to the extent the Board of Trustees determines that such participation is in the best interest of the Global Fund’s shareholders.
Note 15 – Subsequent Events
On September 27, 2011, the Board of Trustees approved the establishment and designation of the Africa Fund which commenced operations on November 8, 2011. The Africa Fund seeks to provide long-term capital appreciation and current income.
| | ANNUAL REPORT 2011 |
| REPORT OF INDEPENDENT REGISTERED PUBLIC ACCOUNTING FIRM |

To the Shareholders and the Board of Trustees of
Commonwealth International Series Trust
We have audited the accompanying statements of assets and liabilities, including the schedules of investments, of Commonwealth Australia/New Zealand Fund, Commonwealth Japan Fund, Commonwealth Global Fund and Commonwealth Real Estate Securities Fund, each a series of shares of beneficial interest of Commonwealth International Series Trust, as of October 31, 2011, and the related statements of operations for the year then ended, the statements of changes in net assets for each of the two years in the period then ended and the financial highlights for each of the five years in the period then ended. These financial statements and financial highlights are the responsibility of the Funds’ management. Our responsibility is to express an opinion on these financial statements and financial highlights based on our audits.
We conducted our audits in accordance with the standards of the Public Company Accounting Oversight Board (United States). Those standards require that we plan and perform the audits to obtain reasonable assurance about whether the financial statements and financial highlights are free of material misstatement. An audit includes examining, on a test basis, evidence supporting the amounts and disclosures in the financial statements. Our procedures included confirmation of securities owned as of October 31, 2011, by correspondence with the custodian and brokers. An audit also includes assessing the accounting principles used and significant estimates made by management, as well as evaluating the overall financial statement presentation. We believe that our audits provide a reasonable basis for our opinion.
In our opinion, the financial statements and financial highlights referred to above present fairly, in all material respects, the financial position of Commonwealth Australia/New Zealand Fund, Commonwealth Japan Fund, Commonwealth Global Fund and Commonwealth Real Estate Securities Fund, as of October 31, 2011, the results of their operations for the year then ended, the changes in their net assets for each of the two years in the period then ended and their financial highlights for each of the five years in the period then ended, in conformity with accounting principles generally accepted in the United States of America.

BBD, LLP
Philadelphia, Pennsylvania
December 27, 2011
| | ANNUAL REPORT 2011 |
| ADDITIONAL INFORMATION – October 31, 2011 (Unadited) |
Table of Shareholder Expenses
As a shareholder of the Funds, you incur ongoing costs, including management fees, distribution and service fees, and other Fund expenses. This example is intended to help you understand your ongoing costs (in dollars) of investing in the Funds and compare these costs with the ongoing costs of investing in other mutual funds.
The example is based on an investment of $1,000 invested at the beginning of the period and held for the entire period from May 1, 2011 through October 31, 2011.
Actual Expenses
The table below provides information about actual account values and actual expenses. You may use the information below, together with the amount you invested, to estimate the expenses that you paid over the period. Simply divide your account value by $1,000 (for example, an $8,600 account value divided by $1,000 = 8.6), then multiply the result by the number in the table under the heading entitled “Expenses Paid During Period” to estimate the expenses you paid on your account during this period.
| | | Beginning | | Ending | | Expenses Paid | | Expense Ratio |
| | | Account Value | | Account Value | | During Period* | | During Period |
| | | 5/1/11 | | 10/31/11 | | 5/1/11 – 10/31/11 | | 5/1/11 – 10/31/11 |
| Australia/New Zealand Fund | | $ | 1,000.00 | | | $ | 961.60 | | | $ | 15.03 | | | | 3.04 | % |
| Japan Fund | | | 1,000.00 | | | | 974.70 | | | | 18.81 | | | | 3.78 | % |
| Global Fund | | | 1,000.00 | | | | 848.10 | | | | 13.97 | | | | 3.00 | % |
| Real Estate Securities Fund | | | 1,000.00 | | | | 879.60 | | | | 15.49 | | | | 3.27 | % |
Hypothetical Example for Comparison Purposes
The table below provides information about hypothetical account values and hypothetical expenses based on each Fund’s actual expense ratio and an assumed rate of return of 5% per year before expenses, which is not the Fund’s actual return. The hypothetical account values and expenses may not be used to estimate the actual ending account balance or expenses you paid for the period. You may use this information to compare this 5% hypothetical example with the 5% hypothetical examples that appear in the shareholder reports of other funds.
Please note that the expenses shown in the table are meant to highlight your ongoing costs only and do not reflect any transactional costs, such as sales charges (loads), or exchange fees. Therefore, the table is useful in comparing ongoing costs only, and will not help you determine the relative total costs of owning different funds. In addition, if these transactional costs were included, your costs would have been higher.
| | | Beginning | | Ending | | Expenses Paid | | Expense Ratio |
| | | Account Value | | Account Value | | During Period* | | During Period |
| | | 5/1/11 | | 10/31/11 | | 5/1/11 – 10/31/11 | | 5/1/11 – 10/31/11 |
| Australia/New Zealand Fund | | $ | 1,000.00 | | | $ | 1,009.85 | | | $ | 15.40 | | | | 3.04 | % |
| Japan Fund | | | 1,000.00 | | | | 1,006.15 | | | | 19.11 | | | | 3.78 | % |
| Global Fund | | | 1,000.00 | | | | 1,010.88 | | | | 15.20 | | | | 3.00 | % |
| Real Estate Securities Fund | | | 1,000.00 | | | | 1,008.72 | | | | 16.56 | | | | 3.27 | % |
* Expenses are equal to the average account value times the Fund’s annualized expense ratio multiplied by 184 (the number of days in the most recent fiscal half-year) divided by 365 (the number of days in the fiscal year) to reflect the one-half year period. |
TAX INFORMATION UNAUDITED
Pursuant to the foreign tax credit election under Section 853 of the Internal Revenue Code of 1986, the Australia/New Zealand Fund designates $1,023,256 of income derived from foreign sources and $116,875 of foreign taxes paid, for the year ended October 31, 2011.
Of the ordinary income distributions made by the Australia/New Zealand Fund during the year ended October 31, 2011, the proportionate share of income derived from foreign sources attributable to one share of stock, or the amount determined to be necessary, is $0.5141 and the proportionate share of foreign taxes attributable to one share of stock is $0.0587.
| | ANNUAL REPORT 2011 |
| ADDITIONAL INFORMATION – October 31, 2011 (Unaudited) (Continued) |
Qualified Dividend Income
Pursuant to Section 854 of the Internal Revenue Code of 1986, the Australia/New Zealand Fund designates income dividends of 100.00% as qualified dividend income paid during the fiscal year ended October 31, 2011.
The Global Fund designates $1,332,662 as long-term capital gains distributions for the fiscal year ended October 31, 2011.
Disclosure of Portfolio Holdings
The Funds file their complete schedule of portfolio holdings with the Securities and Exchange Commission (the “Commission”) for the first and third quarters of each fiscal year on Form N-Q. The Funds’ Forms N-Q is available on the Commission’s website at http://www.sec.gov. The Funds’ Forms N-Q may be reviewed and copied at the Commission’s Public Reference Room in Washington, DC. Information on the operation of the Commission’s Public Reference Room may be obtained by calling 800-SEC-0330.
Proxy Voting
A description of the policies and procedures that the Funds use to determine how to vote proxies relating to portfolio securities is available without charge, upon request, by calling 888-345-1898, and on the Commissions website at http://www.sec.gov.
Information regarding how the Funds voted proxies relating to portfolio securities during the most recent 12-month period ended June 30 is available without charge, upon request, by calling 888-345-1898, and on the Commission’s website at http://www.sec.gov.
C O M M O N W E A L T H
INTERNATIONAL SERIES TRUST | ANNUAL REPORT 2011 |
TRUSTEES AND OFFICERS – October 31, 2011 (Unaudited)
Overall responsibility for management of the Funds rests with the Board of Trustees. The names of the Trustees and Officers of the funds, their addresses, ages and principal occupations during the past five years are provided in the tables below. Trustees who are deemed “interested persons,” as defined in the 1940 Act, are included in the table titled, “Interested Trustees.” Trustees who are not “interested persons” are referred to as Independent Trustees. The Funds’ Statement of Additional information includes additional information about the Funds’ Trustees and is available, without charge and upon request, by calling 888-345-1898.
| | | | | | | | | | Number of | | |
| | | | | | Term of Office | | | | Portfolios in | | Other Directorships |
| | | | Position(s) | | and Length of | | Principal Occupation(s) | | Complex Overseen | | Held By |
| Name, Address and Age | | | With Fund | | Time Served | | for the Last Five Years | | by Trustee/Officer(3) | | Trustee/Officer |
| INTERESTED TRUSTEES: | | | | | | |
Robert Scharar(1)
791 Town & Country Blvd,
Suite 250
Houston, TX 77024-3925
Age 63 | | | President, Interested Trustee | | Indefinite until Successor elected and qualified; since 2000 | | Investment manager/Attorney/CPA; President, FCA Corp (investment advisor), 1975 to present. | | 5 | | See Below(2) |
| INDEPENDENT TRUSTEES: | | | | | | |
John Akard, Jr.
791 Town & Country Blvd,
Suite 250
Houston, TX 77024-3925
Age 45 | | | Independent Trustee | | Indefinite until Successor elected and qualified; since 2000 | | Owner, John Akard Jr. P.C. (and its predecessor) (law firm), 1996 to present; Of Counsel, Mason, Coplen & Banks, P.C. (law firm), 1999 to present. | | 5 | | None |
Kathleen Kelly
791 Town & Country Blvd,
Suite 250
Houston, TX 77024-3925 Age 59 | | | Independent Trustee | | Indefinite until Successor elected and qualified; since 2000 | | Honorary Consul, New Zealand Consulate, 1995 to present; Owner, International Protocol Advisors (consulting services), August 1992 to present. | | 5 | | None |
Jack Ewing
791 Town & Country Blvd,
Suite 250
Houston, TX 77024-3925
Age 72 | | | Independent Trustee | | Indefinite until Successor elected and qualified; since 2000 | | Adjunct Economics Professor, University of Houston-Downtown, 2005 to present; Adjunct Professor, Lonestar College, 2001 to present; Professor, Houston Community College, September 2000 to May 2011. | | 5 | | None |
| (1) | | Robert Scharar is considered an “Interested person” of the Funds’ as defined in the 1940 Act, as amended, because he is an officer of the Trust and an officer of the Trust’s investment advisor. |
| | | |
| (2) | | Mr. Scharar is also an officer, director and/or manager of the following companies: Blantyre Hotels, Ltd. (Malawi), NICO Holdings, Ltd. (Malawi), Africap, LLC, FCA Investment Company, First Commonwealth Holdings Corporation, First Commonwealth Mortgage Trust, Holly Mortgage Trust, Ivy Realty Trust, Scottsdale Canal Partners, LLC, Nashville Properties, Inc., subsidiary companies at some of the above, and other closely held entities. |
| | | |
| (3) | | The five (5) portfolios comprising the Trust include the four mutual funds covered by this annual report, as well as the Africa Fund, which commence operations after the period covered by this annual report. |
C O M M O N W E A L T H
INTERNATIONAL SERIES TRUST | ANNUAL REPORT 2011 |
TRUSTEES AND OFFICERS – October 31, 2011 (Unaudited)
| | | | | | | | | | Number of | | |
| | | | | | Term of Office | | | | Portfolios in | | Other Directorships |
| | | | Position(s) | | and Length of | | Principal Occupation(s) | | Complex Overseen | | Held By |
| Name, Address and Age | | | With Fund | | Time Served | | for the Last Five Years | | by Trustee/Officer | | Trustee/Officer |
| OFFICERS: | | | | | | | | | | | |
Terrance P. Gallagher
803 W. Michigan St.
Milwaukee, WI 53233
Age 53 | | | Treasurer | | Since 2010 | | Attorney/CPA, Executive Vice-President, UMB Fund Services, Inc. 2007 to present, Senior Vice-President, Director of Compliance, Unified Fund Services, 2005 – 2007 | | N/A | | N/A |
John H. Lively
2041 West 141st Terrace
Suite 119
Leawood, KS 66224
Age 42 | | | Secretary | | Since 2008 | | Attorney, The Law Offices of John H. Lively & Associates, Inc. (law firm), March 2010 to present; Attorney, Husch Blackwell Sanders LLP (law firm), March 2007 to February 2010; Managing Attorney, Raymond James Financial (financial services), September 2005 to March 2007 | | N/A | | N/A |
Bonnie Scott
791 Town & Country Blvd,
Suite 250
Houston, TX 77024-3925
Age 62 | | | Assistant Secretary | | Since 2003 | | Administrator, FCA Corp (investment advisor), 1998 to present. | | N/A | | N/A |
Stephen E. Fodo
2515 Golden Pond Drive
Kingwood, TX 77345
Age 69 | | | CCO | | Since 2004 | | Independent Consultant from January 2000 to present. Advisory Director, Ingenero Inc., Engineering and Consulting Services, from January 2002 to present; Chief Financial Officer, Organic Fuels Holdings Inc., October 2007 to December 2008; Adjunct Professor, University of Phoenix, July 2003 to October 2008. | | N/A | | N/A |
Item 2. Code of Ethics.
| | (a) | The Registrant has adopted a code of ethics (the “Code”) that applies to the Registrant’s principal executive officer, principal financial officer, principal accounting officer or controller, or persons performing similar functions. This Code is included as an Exhibit. |
| |
| | (b) | During the period covered by the report, with respect to the Registrant’s Code that applies to its principal executive officer, principal financial officer, principal accounting officer or controller, or persons performing similar functions; there have been no amendments to, nor any waivers granted from, a provision that relates to any element of the Code definition enumerated in paragraph (b) of this Item 2. |
Item 3. Audit Committee Financial Expert.
3(a)(1) The Registrant’s board of trustees has determined that the Registrant has a least one audit committee financial expert serving on its audit committee.
3(a)(2) The audit committee financial expert is John Akard, Jr., who is “independent” for purposes of this Item 3 of Form N-CSR.
Item 4. Principal Accountant Fees and Services.
The aggregate fees billed for professional services by BBD, LLP during the fiscal year 2011 and 2010 were as follows:
| (a) | Audit Fees for Registrant. |
| |
| | Fiscal year ended October 31, 2011 | $48,000 |
| | Fiscal year ended October 31, 2010 | $48,000 |
| |
| (b) | Audit-Related Fees for Registrant. These fees were billed by the Registrant’s independent auditors for assurance and related services that were reasonably related to the performance of the audit of the Registrant’s financial statements. |
| |
| | Fiscal year ended October 31, 2011 | $0 |
| | Fiscal year ended October 31, 2010 | $0 |
| |
| (c) | Tax Fees for Registrant. These fees were billed for professional services rendered by the Registrant’s independent auditors for tax compliance, tax advice and tax planning. |
| |
| | Fiscal year ended October 31, 2011 | $6,000 |
| | Fiscal year ended October 31, 2010 | $6,000 |
| |
| (d) | All Other Fees. |
| |
| | Fiscal year ended October 31, 2011 | $0 |
| | Fiscal year ended October 31, 2010 | $0 |
| |
| (e) | Audit Committee’s pre-approval policies and procedures. |
| | (1) | The audit committee has adopted pre-approval policies and procedures that require the audit committee to pre-approve all audit and non-audit services of the Registrant, including services provided to the Registrant’s investment adviser or any entity controlling, controlled by or under common control with the Registrant’s investment adviser that provides ongoing services to the Registrant with respect to any engagement that directly relates to the operations and financial reporting of the Registrant. |
| |
| | (2) | Services approved pursuant to paragraph (c)(7)(i)(C) of Rule 2-01 of Regulation S-X: 100% of these fees were approved by the Trust’s Audit Committee as required pursuant to paragraph (c)(7)(ii) of Rule 2-01 of Regulation S-X. |
| |
| (f) | None. |
| |
| (g) | During the last two fiscal years, there were no other non-audit services rendered by the Registrant’s independent auditors to the Registrant, its investment adviser or any entity controlling, controlled by or under the common control with the investment adviser that provides ongoing services to the Registrant. |
| |
| (h) | Not applicable. |
Item 5. Audit Committee of Listed Registrants.
Not applicable.
Item 6. Schedule of Investments.
| | (a) | Included as part of the report to shareholders filed under Item 1 of this Form N-CSR. |
| | (b) | Not applicable. |
Item 7. Disclosure of Proxy Voting Policies and Procedures for Closed-End Management Investment Companies.
Not applicable to open-end management investment companies.
Item 8. Portfolio Managers of Closed-End Management Investment Companies.
Not applicable to open-end management investment companies.
Item 9. Purchases of Equity Securities by Closed-End Management Investment Company and Affiliated Purchasers.
Not applicable to open-end management investment companies.
Item 10. Submission of Matters to a Vote of Security Holders.
None.
Item 11. Controls and Procedures.
| (a) | | The Registrant’s principal executive officer and principal financial officer have reviewed the Registrant’s disclosure controls and procedures (as defined in Rule 30a-3(c) under the Investment Company Act of 1940, as amended, (the “Act”)) as of a date within 90 days of the filing of this report, as required by Rule 30a-3(b) under the Act. Based on their review, such officers have concluded that the disclosure controls and procedures were effective in ensuring that information required to be disclosed in this report was appropriately recorded, processed, summarized and reported within the time periods specified by the Securities and Exchange Commission’s rules and forms. |
| | | |
| (b) | | There were no changes in the Registrant’s internal control over financial reporting (as defined in Rule 30a-3(d) under the Act (17 CFR 270.30a-3(d)) that occurred during the Registrant’s second fiscal quarter of the period covered by this report that materially affected, or were reasonably likely to materially affect, the Registrant’s internal control over financial reporting. |
Item 12. Exhibits.
| (a)(1) | Code of Ethics. The code of ethics that is the subject of the disclosure required by Item 2 is attached hereto. |
| | |
| (a)(2) | Certifications required pursuant to Section 30a-2(a) of the Act are attached hereto. |
| | |
| (a)(3) | Not applicable to open-end management investment companies. |
| | |
| (b) | Certifications pursuant to Section 30a-2(b) of the Act are furnished herewith. |
SIGNATURES
Pursuant to the requirements of the Securities Exchange Act of 1934 and the Investment Company Act of 1940, the Registrant has duly caused this report to be signed on its behalf by the undersigned, thereunto duly authorized.
Commonwealth International Series Trust
| /s/ Robert W. Scharar | |
| By: Robert W. Scharar | |
| President | |
| December 21, 2011 | |
Pursuant to the requirements of the Securities Exchange Act of 1934 and the Investment Company Act of 1940, this report has been signed below by the following persons on behalf of the Registrant and in the capacities and on the dates indicated.
| /s/ Robert W. Scharar | |
| By: Robert W. Scharar | |
| President | |
| (Principal Executive Officer) | |
| December 21, 2011 | |
| | |
| /s/ Terrance P. Gallagher | |
| By: Terrance P. Gallagher | |
| Treasurer | |
| (Principal Financial Officer) | |
| December 21, 2011 | |