UNITED STATES
SECURITIES AND EXCHANGE COMMISSION
Washington, D.C. 20549
FORM N-CSR
CERTIFIED SHAREHOLDER REPORT OF REGISTERED MANAGEMENT
INVESTMENT COMPANIES
Investment Company Act File Number 811-04665
Commonwealth International Series Trust
(Exact name of registrant as specified in charter)
791 Town & Country Blvd
Houston, TX 77024-3925
(Address of principal executive offices) (Zip code)
CT Corporation System
155 Federal Street
Boston, MA 02110
(Name and address of agent for service)
Copies to:
John H. Lively
The Law Offices of John H. Lively & Associates, Inc.
A member firm of The 1940 Act Law GroupTM
11300 Tomahawk Parkway, Suite 310
Leawood, KS 66211
Registrant’s telephone number, including area code: (888) 345-1898
Date of fiscal year end: October 31
Date of reporting period: October 31, 2013
| Item 1. Reports to Stockholders. |
The following is a copy of the report transmitted to shareholders pursuant to Rule 30e-1 under the Investment Company Act of 1940, as amended.
Commonwealth International
Series Trust
791 Town & Country Blvd, Suite 250
Houston, TX 77024-3925
888-345-1898
www.commonwealthfunds.com
INVESTMENT ADVISOR
FCA Corp
791 Town & Country Blvd, Suite 250
Houston, TX 77024-3925
713-781-2856
DISTRIBUTOR
UMB Distribution Services, LLC
803 West Michigan Street
Milwaukee, WI 53233
TRANSFER AGENT & ADMINISTRATOR
UMB Fund Services, Inc.
803 West Michigan Street
Milwaukee, WI 53233
CUSTODIAN BANK
Fifth Third Bank
Fifth Third Center
38 Fountain Square Plaza
Cincinnati, OH 45263
INDEPENDENT REGISTERED PUBLIC
ACCOUNTING FIRM
BBD, LLP
1835 Market Street, 26th Floor
Philadelphia, PA 19103
LEGAL COUNSEL
The Law Offices of John H. Lively & Associates, Inc.
A member firm of The 1940 Act Law GroupTM
11300 Tomahawk Creek Parkway, Ste. 310
Leawood, KS 66211 | |

Commonwealth Australia/New Zealand Fund
Africa Fund
Commonwealth Japan Fund
Commonwealth Global Fund
Commonwealth Real Estate Securities Fund
ANNUAL REPORT
October 31, 2013 |
| | | |
| This report is intended for the shareholders of the family of funds of the Commonwealth International Series Trust. It may not be distributed to prospective investors unless it is preceded or accompanied by a current prospectus. An additional prospectus may be obtained at www.commonwealthfunds.com or from the principal underwriter of the Commonwealth International Series Trust or your broker. | | |
| Table of Contents | | |
| | | |
| | | |
| Shareholder Letter | | 2 |
| | | |
| Performance Overview | | |
Commonwealth Australia/New Zealand Fund | | 6 |
Africa Fund | | 8 |
Commonwealth Japan Fund | | 10 |
Commonwealth Global Fund | | 12 |
Commonwealth Real Estate Securities Fund | | 14 |
| | | |
| Glossary of Terms | | 16 |
| Portfolio Composition | | 17 |
| Schedules of Investments | | 19 |
| Statements of Assets and Liabilities | | 28 |
| Statements of Operations | | 29 |
| Statements of Changes in Net Assets | | 30 |
| Financial Highlights | | 32 |
| | | |
| Notes to Financial Statements | | 37 |
| | | |
| Report of Independent Registered Public Accounting Firm | | 50 |
| | | |
| Additional Information | | 51 |
| | | |
| Trustees and Officers | | 53 |
| | | |
|
791 Town & Country Blvd, Suite 250, Houston, TX 77024-3925
Commonwealth Australia/New Zealand Fund (CNZLX)
Africa Fund (CAFRX)
Commonwealth Japan Fund (CNJFX)
Commonwealth Global Fund (CNGLX)
Commonwealth Real Estate Securities Fund (CNREX)
www.commonwealthfunds.com
October 31, 2013
Dear Fellow Shareholders:
Many quotations have been attributed to the venerableWinston Churchill. The following seems so appropriate for today:
“Politics is the ability to foretell what is going to happen tomorrow, next week, next month and next year.... and to have the ability afterwards to explain why it didn’t happen.”
Substitute “economics” for politics and you have what investors have been grappling with in interpreting where the markets are headed. In this light, investors have been digesting a wide array of economic and geopolitical developments in recent months. While economic growth has modestly continued despite the negative impact of the federal budget sequester, the Federal Reserve’s expected tapering of its bond buying program has prompted greater market volatility and bond yields have risen substantially. Emerging markets in particular have experienced movements as investors began to extract capital in anticipation of higher rates only to begin reinvestment anew when it became evident the tapering was not to be immediate.
There is concern that the ultimate reduction of Federal Reserve bond purchases will allow long-term interest rates to move higher, running the risk of curtailing any recovery. Already, mortgage rates have jumped and housing market data appear less robust than earlier in the year. Overseas, instability in Egypt and Syria has contributed to volatile oil prices, which if they remain at lofty prices, could undermine the reasonably positive trends in consumer spending. Fortunately, the Eurozone posted positive GDP growth in the second quarter after many months of contraction though the 17-nation currency-block continues to grapple with significant economic challenges.
While we at FCA Corp., the investment adviser to the Funds comprising the Commonwealth International Series Trust, cannot forecast with precision how economic or geopolitical events will unfold, we have confidence that a long-term investment program remains essential. FCACorp’s in-depth fundamental research, active investing and risk management strategies can serve investors well through challenging domestic and international markets.
2
C O M M O N W E A L T H
INTERNATIONAL SERIES TRUST | ANNUAL REPORT 2013 |
| |
|
As we reflect on our twenty-second year as the investment advisor to the Funds, we would like to thank you as shareholders for your support and continued interest in the Commonwealth family of funds.

| |  |
Robert W. Scharar | | Wesley R. Yuhnke |
President and Portfolio Manager | | Assistant Portfolio Manager |
Commonwealth International Series Trust | | Commonwealth International Series Trust |
| | | |
| | |  |
| | | |
| | | Ronald Manning |
| | | Assistant Portfolio Manager |
| | | Commonwealth International Series Trust |
The views in the above discussion, along with discussion included under the “Performance Overview” for each Fund below, were those of the Funds’ investment advisor as of the date set forth above and may not reflect its views on the date this annual report is first published or anytime thereafter. These views are intended to assist shareholders in understanding their investment in the Funds and the performance of the Funds during the period covered by this report and do not constitute investment advice.
THE PERFORMANCE INFORMATION QUOTED IN THIS ANNUAL REPORT REPRESENTS PAST PERFORMANCE AND PAST PERFORMANCE DOES NOT GUARANTEE FUTURE RESULTS. INVESTMENT RETURN AND PRINCIPAL VALUE OF AN INVESTMENT WILL FLUCTUATE SO THAT AN INVESTOR’S SHARES, WHEN REDEEMED, MAY BE WORTH MORE OR LESS THAN THEIR ORIGINAL COST. CURRENT PERFORMANCE MAY BE LOWER OR HIGHER THAN THE PERFORMANCE DATA QUOTED. AN INVESTOR SHOULD CONSIDER THE FUND’S INVESTMENT OBJECTIVES, RISKS, AND CHARGES AND EXPENSES CAREFULLY BEFORE INVESTING. THE FUNDS’PROSPECTUS CONTAINS THIS AND OTHER IMPORTANT INFORMATION. FOR INFORMATION ON EACH FUND’S EXPENSE RATIO, PLEASE SEE THE FINANCIAL HIGHLIGHTS TABLE FOUND WITHIN THIS REPORT. TO OBTAIN A PROSPECTUS AND OTHER INFORMATION ABOUT THE FUNDS, PLEASE VISIT WWW.COMMONWEALTHFUNDS.COM OR CALL 888-345-1898. PLEASE READ THE PROSPECTUS CAREFULLY BEFORE INVESTING.
3
C O M M O N W E A L T H
INTERNATIONAL SERIES TRUST | ANNUAL REPORT 2013 |
| |
|
Questions and Answers
To help shareholders better understand key attributes of the mutual funds (each a “Fund” and collectively the “Funds”) comprising the Commonwealth International Series Trust and their operations, the following Question and Answer section is provided.
Who is the Funds’ investment advisor?
The Funds’investment advisor is FCA Corp (“FCA”). FCA is an investment advisor that is registered with the U.S. Securities and Exchange Commission and has its principle place of business located at 791 Town & Country Blvd., Suite 250, Houston, Texas 77024-3925. The firm was founded 39 years ago and maintains a global perspective on the equity and fixed income marketplaces.
Why is investing outside the U.S. important?
The Funds invest in companies outside the United States because FCA believes there are significant investment opportunities in select foreign markets. FCA also believe U.S. investors benefit from the diversification that having investments outside the United States can provide. International investing offers exposure to more companies and other nations’ economies. In 2013, over 50% of the value of equity markets was outside the United States, and the growth experienced by many of these foreign economies appeared to be attractive. FCA believes that for a U.S. investor, allocation of a portion of the investor’s portfolio to international securities can provide the potential for less risk and can achieve a more consistent long-term performance in the investor’s overall portfolio.1
How has international investing changed over the last decade?
International markets now comprise a significant portion of all equity value worldwide. As markets have blended through global commerce, capital has flowed from country to country following investment opportunities. Developed markets and emerging markets both require capital investments to provide the goods and services of their respective needs. During the last two decades in particular, statistical information has become more uniform thus more dependable. The trend appears to be in place for continued development of these distant countries and their markets long term. Their demand for investment capital continues as they provide opportunities for diversification and growth. The Funds seek to be participants in these developments.
What are some of the factors influencing a Fund’s portfolio turnover?
Each Fund generally invests in equity securities with a long-term view and in debt securities to be held to maturity. The Funds’ portfolio securities are evaluated on their long-term prospects. A particular Fund may experience higher or lower turnover ratios in certain years. Factors influencing portfolio turnover include, but are not limited to the following: rebalancing portfolio securities to take advantage of long-term opportunities and/or to reallocate between fixed income and equity securities; investing new subscriptions; or selling securities to cover redemptions. Higher levels of portfolio activity by a Fund will result in higher transaction costs and/or more realized gains or losses, the impact of which is borne by the Fund’s shareholders. The turnover of a portfolio is not predictable because managers do not know when the portfolio transactions will be dictated. Under most circumstances, it is desirable to limit transactions because of the costs associated with trading although these are generally not the determining factor.
| 1 | Investing in international markets may involve additional risks, such as social and political instability, market illiquidity, exchange-rate fluctuations, a high level of volatility and limited regulation. |
You should consider each Fund’s objectives, risks, charges and expenses carefully before investing. The Prospectus contains information about those and other important matters relating to the Funds. Please read the Prospectus carefully before you invest.
4
C O M M O N W E A L T H
INTERNATIONAL SERIES TRUST | ANNUAL REPORT 2013 |
| |
|
How can the asset size of a Fund impact the Fund’s expense ratio?
Achieving each Fund’s objective with a portfolio comprised of international securities is historically more expensive than the costs associated with managing a portfolio comprised of domestic securities. Research of foreign markets, trading in different currencies, custody of assets, accurate evaluations of holdings and generally overall communications are all known to be more expensive when managing these types of portfolios. Additionally, as with almost every mutual fund, size has an impact on the expense ratio of Funds. Typically, larger mutual funds can have lower expense ratios as there is an increased opportunity to spread out fixed and partially-fixed costs necessary to operate such mutual funds over a larger asset base. Generally, mutual fund expenses, including those of the Funds, are allocated on a daily basis among all shareholders. In addition, as a portfolio grows, it is self-evident that fixed costs as a percentage of the assets managed generally decline. Whenever a new Fund is introduced or in highly specific investment objective portfolios, higher costs can be experienced during time periods of asset growth. The Financial Highlights section of the accompanying financial statements provides supplemental data that includes current and historic expense information, and where applicable, the advisor’s waiver of fees or voluntary contributions of expenses.
5
C O M M O N W E A L T H
INTERNATIONAL SERIES TRUST | ANNUAL REPORT 2013 |
| PERFORMANCE OVERVIEW – October 31, 2013 (Unaudited) |
| COMMONWEALTH AUSTRALIA/NEW ZEALAND FUND |
The Commonwealth Australia/New Zealand Fund’s net asset value (NAV) as of October 31, 2013 was $13.25 per share compared to $12.05 per share on October 31, 2012. For the twelve month period covered by this Annual Report, the Commonwealth Australia/New Zealand Fund returned 11.40%. This return figure includes the $0.16 per share dividend distribution made in December 2012.
In presenting comparative performance numbers on the Fund versus indexes, it is important to note that we do not make investment decisions with a view toward attempting to track any index. Rather, we invest based on fundamental research. Comparisons to indexes, which are not fundamentally based, may not appear as reasonable as we would prefer. We also invest a portion of the Fund’s assets in fixed income investments and, as a result, we would note that a comparison of the performance of the Fund to indexes may be less meaningful than a comparison of funds that do not incorporate such fixed income investments. In an attempt to present various aspects of the marketplace return, we provide three indexes for consideration. During the twelve-month period, the New Zealand SmallCap Index returned 20.01%, the NZX 50 Index returned 24.71% and the Australian All Ordinaries Index returned 15.33%. These indexes do not include any fixed income instruments. Additionally, you should note that the indexes are unmanaged, they are expressed in terms of U.S. dollars and they do not reflect the deduction of fees or taxes associated with a mutual fund such as investment management and fund accounting fees. The performance of the Fund reflects the deduction of fees for these services. In addition, investors cannot directly invest in an index.
From our view, the long term goal of owning the Australia/New Zealand Fund is to benefit from the ownership of companies domiciled and operating in both of these fine countries. Therefore, both countries are continuously represented in ownership. History shows that the returns of the respective marketplaces can vary significantly from one another. It is rare that both countries perform similarly. Nonetheless, the overriding goal of long term diversified ownership seeks to be maintained.
There are other considerations as well: |
| |
| – | The 0.5 percent appreciation of the New Zealand dollar versus the U.S. dollar positively impacted the Fund’s returns during the year while the 8.9 percent decline of the Australian dollar had a predictably negative effect. |
| |
| | When measured in the respective local currency, New Zealand equities outperformed Australian equities. New Zealand small-cap equities generally underperformed relative to large-cap equities. Due to the allocation of the Fund’s assets to the small-cap area, the Fund’s performance was negatively impacted. |
| |
| – | The Fund’s New Zealand holdings within the commercial services and transportation industries (particularly in the shipping and handling of goods through the port facilities) positively impacted the Fund’s performance, although South Port NZ, the Fund’s largest position returned less than the broader market. |
| – | Driven by the market appreciation of Ryman Healthcare, healthcare-services related investments in both Australia and New Zealand were solid contributors to the Fund’s overall performance and represented the second largest industry exposure in the portfolio. |
| |
| – | The Fund’s Australian mining and chemicals holdings had negative returns for the year with commensurate effects on total returns. |
| |
| – | The Fund’s commitment to fixed income investments (5.8% of total investments) is designed to provide a degree of stability to the portfolio while providing a modest income. During the period, these fixed income instruments outperformed the broader fixed income markets. |
| | |
| Investment Risks |
Equity securities (stocks) are more volatile and carry more risk than other forms of investments, including high-grade fixed income securities. The net asset values per share of a Fund will fluctuate as the value of these securities in the portfolio changes.
The Fund’s investments in debt and/or fixed income securities also contain risk factors. The value of these securities tends to fluctuate inversely with changes in interest rates. Changes in an issuer’s financial strength or creditworthiness also can affect the value of the securities it issues. Convertible and preferred stocks, which have some characteristics of both equity and fixed income securities, also contain, to varying degrees depending on their structure, the associated risks of each.
The Fund’s expenses, as with any mutual fund, detract from the Fund’s performance. The Fund’s asset levels have a direct effect on the expense indirectly paid by shareholders. To the extent the Fund’s assets decline and the expenses of the Fund rise or do not decrease proportionately, performance will be negatively impacted.
International investing involves increased risk and volatility. An investment in this Fund entails the special risks of international investing, including currency exchange fluctuation, government regulations, and the potential for political and economic instability. Because the Fund invests primarily in the securities of, and depositary receipts represented by Australian and New Zealand issuers, the Fund is particularly susceptible to any economic, political, or regulatory developments affecting a particular issuer of those countries.
By itself the Fund does not constitute a complete investment plan and should be considered a long-term investment for investors who can afford to weather change in the value of their investments.
Investors should refer to the Fund’s Prospectus for a more complete description of risks associated with investing in the Fund. |
| | |
| * | Portfolio holdings will change due to ongoing management of the Fund. References to specific securities or sectors should not be construed as recommendations by the Trust, the Advisor or the Distributor. |
| | |
| 1 | For additional information, please refer to the Glossary of Terms following the Performance Overview section. |
6
C O M M O N W E A L T H
INTERNATIONAL SERIES TRUST | ANNUAL REPORT 2013 |
| PERFORMANCE OVERVIEW – October 31, 2013 (Unaudited) |
| COMMONWEALTH AUSTRALIA/NEW ZEALAND FUND |
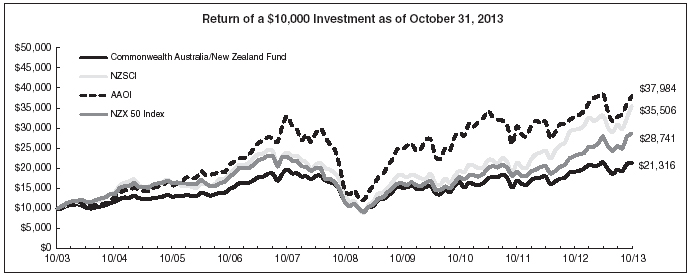
Comparison of Change in Value of a $10,000 Investment in the Commonwealth Australia/New Zealand Fund, the NZSCI, AAOI, and NZX 50 Index.
The above graph is a hypothetical $10,000 investment in the Commonwealth Australia/New Zealand Fund from 10/31/03 to 10/31/13, and represents the reinvestment of dividends and distributions in the Fund.
| | | Average Annual Total Return | | Average Annual Total Return | | Total Fund
Operating |
| | | as of September 30, 2013 | | as of October 31, 2013 | | Expense |
| | | 1 Year | | 5 Year | | 10 Year | | 1 Year | | 5 Year | | 10 Year | | Ratio1 |
| Commonwealth Australia/New Zealand Fund | | 11.16 | % | | 8.00 | % | | 8.44 | % | | 11.40 | % | | 12.62 | % | | 7.86 | % | | 3.32 | % |
| New Zealand SmallCap Index (“NZSCI”) | | 12.05 | % | | 14.00 | % | | 13.36 | % | | 20.01 | % | | 21.29 | % | | 13.51 | % | | — | |
| Australian All Ordinaries Index (“AAOI”) | | 12.68 | % | | 12.17 | % | | 14.51 | % | | 15.33 | % | | 20.89 | % | | 14.28 | % | | — | |
| NZX 50 Index | | 23.83 | % | | 13.76 | % | | 11.25 | % | | 24.71 | % | | 19.77 | % | | 11.13 | % | | — | |
| |
Past performance does not guarantee future results. The performance data quoted represents past performance and current returns may be lower or higher. The above graph and table do not reflect the deduction of taxes that a shareholder would pay on Fund distributions or the redemption of Fund shares. The investment return and principal value will fluctuate so that an investor’s shares, when redeemed may be worth more or less than the original cost. To obtain performance information current to the most recent month end, please call 888-345-1898. |
| | |
| 1 | The above expense ratio is from the Fund’s Prospectus dated February 28, 2013. Additional information pertaining to the Fund’s expense ratios as of October 31, 2013 can be found in the financial highlights. Excluding the indirect costs of investing in acquired funds, total fund operating expenses would be 3.32%. |
| | |
| The Fund’s performance is measured against the New Zealand SmallCap Index (“NZSCI”), a capitalization-weighted index of all New Zealand equities, excluding those in the NZX 50 Index, is considered to be reflective of the performance of the New Zealand small-cap equity market; the Australian All Ordinaries Index (“AAOI”), an index made up of the largest 500 companies as measured by market capitalization that are listed on the Australian Stock Exchange; and the NZX 50 Index, a total return index consisting of the top 50 companies by free float adjusted market capitalization that are listed on the New Zealand Stock Exchange. These indices are unmanaged, are expressed in terms of U.S. dollars, and do not reflect the deduction of fees or taxes with a mutual fund, such as investment management and fund accounting fees. The performance of the Fund reflects the deduction of fees for these services. Investors cannot invest directly in an index. |
| | |
You should carefully consider the investment objectives, risks, charges and expenses of the Fund before investing. This and other information can be found in the Fund’s Prospectus, which can be obtained from www.commonwealthfunds.com, by calling the Funds directly at 888-345-1898 or by contracting your investment representative. Please read it carefully before you invest or send money. |
| | |
| The Commonwealth Australia/New Zealand Fund was formerly known as Capstone New Zealand (2000) and subsequently the Commonwealth New Zealand Fund (2001). |
7
C O M M O N W E A L T H
INTERNATIONAL SERIES TRUST | ANNUAL REPORT 2013 |
| PERFORMANCE OVERVIEW – October 31, 2013 (Unaudited) |
| AFRICA FUND |
The Africa Fund’s net asset value (NAV) as of October 31, 2013 was $10.38 per share compared to $10.23 per share on October 31, 2012. For the period covered by this Annual Report, the Africa Fund posted a 3.02% cumulative total return. This return figure includes the $0.16 per share dividend distribution made in December 2012. Our investments do not attempt to track any indexes; rather, we make investment decisions on the basis of fundamental research. We also invest a portion of the Fund’s assets in fixed income investments and acknowledge this process may mitigate some meaningful comparisons to indexes that do not have such investments represented within them. The MSCI Emerging Markets Index and the Dow Jones Africa Titans 50 Index, returned 6.53% and 5.34%, respectively for the same period. These indexes do not include any fixed income instruments. Additionally, indexes are unmanaged, expressed in terms of U.S. dollars and do not reflect the deduction of fees or taxes associated with a mutual fund such as investment management and fund accounting fees. The performance of the Fund reflects the deduction of fees for these services. Investors cannot invest directly in an index.
For the period ended October 31, 2013, the Advisor contractually waived its advisory fee in the amount of $22,542 and voluntarily reimbursed Fund operating expenses in the amount of $88,266. The waived advisory fees are subject to recoupment. Please see accompanying notes to the financial statements for additional information.
We believe that Africa represents a unique, complicated continent with the potential to be both economically rewarding and punitive. We feel equities listed on African stock exchanges offer investors a way to participate in what is expected to be sizeable growth in the consumer consumption of goods and services and the economies in general. It takes time for governments to change and for the people of an emerging country to adjust. With the vast number of countries within the African continent, it is an exciting yet daunting task. Our portfolio selection includes using information we gather first hand through trips to the continent as we seek to monitor each investment and to make decisions we view as being in the best interests of the Fund. Because many U.S. investors share our vision for the African continent and have a desire to be informed beyond just financial aspects, we have constructed our website’s Africa section to provide a variety of information in response to this, and we invite you to visit the website at commonwealthfunds.com. |
| Investment Risks |
Equity securities (stocks) are more volatile and carry more risk than other forms of investments, including high-grade fixed income securities. The net asset values per share of a Fund will fluctuate as the value of these securities in the portfolio changes.
The Fund’s investments in debt and/or fixed income securities also contain risk factors. The value of these securities tends to fluctuate inversely with changes in interest rates. Changes in an issuer’s financial strength or creditworthiness also can affect the value of the securities it issues. Convertible and preferred stocks, which have some characteristics of both equity and fixed income securities, also contain, to varying degrees depending on their structure, the associated risks of each.
The Fund’s expenses, as with any mutual fund, detract from the Fund’s performance. The Fund’s asset levels have a direct effect on the expense indirectly paid by shareholders. To the extent the Fund’s assets decline and the expenses of the Fund rise or do not decrease proportionately, performance will be negatively impacted.
International investing involves increased risk and volatility. An investment in this Fund entails the special risks of international investing, including currency exchange fluctuation, government regulations, and the potential for political and economic instability. Because the Fund invests primarily in the securities of, and depositary receipts represented by African issuers, the Fund is particularly susceptible to any economic, political, or regulatory developments affecting a particular issuer of those countries.
By itself the Fund does not constitute a complete investment plan and should be considered a long-term investment for investors who can afford to weather change in the value of their investments.
Investors should refer to the Fund’s Prospectus for a more complete description of risks associated with investing in the Fund. |
| | |
| * | Portfolio holdings will change due to ongoing management of the Funds. References to specific securities or sectors should not be construed as recommendations by the Trust, the Advisor or the Distributor. |
| | |
| 1 | For additional information, please refer to the Glossary of Terms following the Performance Overview section. |
8
C O M M O N W E A L T H
INTERNATIONAL SERIES TRUST | ANNUAL REPORT 2013 |
| PERFORMANCE OVERVIEW – October 31, 2013 (Unaudited) |
| AFRICA FUND |
Comparison of Change in Value of a $10,000 Investment in the Africa Fund, the MSCIEM and DJAFKT.
The above graph is a hypothetical $10,000 investment in the Africa Fund from 11/07/11 (inception) to 10/31/13, and represents the reinvestment of dividends and distributions in the Fund.
| | | | | | | | | | | | | | | | | | | | Total Fund |
| | | Average Annual Total Return | | Average Annual Total Return | | | Total Fund | | | Operating |
| | | as of September 30, 2013 | | as of October 31, 2013 | | | Operating | | | Expense |
| | | | | | Inception | | | | | Inception | | | Expense | | | After Fee |
| | | 1 Year | | (11/07/11) | | 1 Year | | (11/07/11) | | | Ratio1 | | | Waiver Ratio1 |
| |
| Africa Fund | | -3.31 | % | | 0.80 | % | | 3.02 | % | | 2.68 | % | | | 8.36 | % | | | 7.11 | % |
| MSCI Emerging Markets Index (“MSCIEM”) | | 0.98 | % | | 2.51 | % | | 6.53 | % | | 4.88 | % | | | — | | | | — | |
| Dow Jones Africa Titans 50 Index (“DJAFKT”) | | 0.55 | % | | 6.63 | % | | 5.34 | % | | 8.59 | % | | | — | | | | — | |
| |
| | |
Past performance does not guarantee future results. The performance data quoted represents past performance and current returns may be lower or higher. The above graph and table do not reflect the deduction of taxes that a shareholder would pay on Fund distributions or the redemption of Fund shares. The investment return and principal value will fluctuate so that an investor’s shares, when redeemed may be worth more or less than the original cost. To obtain performance information current to the most recent month end, please call 888-345-1898. |
| | |
| 1 | The above expense ratios are from the Fund’s Prospectus dated February 28, 2013. FCA Corp has contractually agreed to waive the Management Fee of 1.25% through February 28, 2014. Please see Note 4 of the Notes to Financial Statements relating to additional voluntary expense reimbursements by FCA Corp. Additional information pertaining to the Fund’s expense ratios as of October 31, 2013 can be found in the financial highlights. |
| | |
| The Fund’s performance is measured against the MSCI Emerging Markets Index (“MSCIEM”), a free float-adjusted market capitalization index that is designed to measure equity market performance within global emerging markets; the Dow Jones Africa Titans 50 Index (“DJAFKT”), a float-adjusted market capitalization index that is designed to measure the stock performance of 50 leading companies that are headquartered or generate the majority of their revenues in Africa. The MSCI Emerging Markets Index currently consists of the following 21 emerging market country indices: Brazil, Chile, China, Colombia, Czech Republic, Egypt, Hungary, India, Indonesia, Korea, Malaysia, Mexico, Morocco, Peru, Philippines, Poland, Russia, South Africa, Taiwan, Thailand, and Turkey. These indices are unmanaged, are expressed in terms of U.S. dollars, and do not reflect the deduction of fees or taxes with a mutual fund, such as investment management and fund accounting fees. The performance of the Fund reflects the deduction of fees for these services. Investors cannot invest directly in an index. |
| | |
You should carefully consider the investment objectives, risks, charges and expenses of the Fund before investing. This and other information can be found in the Fund’s Prospectus, which can be obtained from www.commonwealthfunds.com, by calling the Funds directly at 888-345-1898 or by contracting your investment representative. Please read it carefully before you invest or send money. |
9
C O M M O N W E A L T H
INTERNATIONAL SERIES TRUST | ANNUAL REPORT 2013 |
| PERFORMANCE OVERVIEW – October 31, 2013 (Unaudited) |
| COMMONWEALTH JAPAN FUND |
The Commonwealth Japan Fund’s net asset value (NAV) as of October 31, 2013 was $3.08 per share compared to $2.54 per share on October 31, 2012. For the twelve month period covered by this Annual Report, the Commonwealth Japan Fund returned 21.26%. Our investments do not attempt to track any index, but rather we undertake investments on the basis of fundamental research. We also invest a portion of the Fund’s assets in fixed income investments and acknowledge this process may mitigate some meaningful comparisons to indexes that do not have such investments represented within them. The Tokyo Stock Price Index returned 33.19% for the same period. The index does not include any fixed income instruments. Additionally, the index is unmanaged, it is expressed in terms of U.S. dollars and it does not reflect the deduction of fees or taxes associated with a mutual fund such as investment management and fund accounting fees. The performance of the Fund reflects the deduction of fees for these services. Investors cannot invest directly in an index.
Japan’s economy registered growth of around 4% on an annualized basis in the first half of 2013. This growth was led by strong domestic demand; for example, (1) public investment continued to increase as positive effects of various economic measures came to take hold fully and (2) private consumption remained resilient, reflecting an improvement in consumer sentiment supported by the depreciation of the Yen and a rise in stock prices.
The Bank of Japan introduced the quantitative and qualitative monetary easing (or “QQE”) in April 2013, with a two year view for seeking to achieve the price stability target of +2% growth in the Consumer Price Index. The Bank of Japan announced its’ goal of doubling the monetary base within two years. In accomplish this, the Bank plan to purchase massive amounts of Japanese government bonds. In addition, in aiming to achieve the price stability target of +2%, the Bank made a commitment to continue with QQE as long as necessary to maintain the target in a stable manner. So far, QQE appears to have exerted positive influences on Japan’s economy as evidenced by the improving expectations of the financial markets and of individual firms and households.
The Tokyo Stock Price Index returned 60.88% in local currency terms over the last year. The decline in the exchange rate, a period in which the Yen depreciated almost 19% versus the dollar, reduced the return to US investors. While exports have been picking up at a somewhat slower pace, domestic demand, notably private consumption, has been firm, and positively impacted the Fund’s investments in the following industries: (1) auto parts & equipment; (2) leisure time; and (3) retail.
Business fixed investments overall grew for the third consecutive quarter. This reflected the improvements in corporate profits yet the recovery in the manufacturing sector was somewhat disappointing. Therefore, exports — which largely affect investments by these manufacturing firms — lacked resilience and decreased for the first time in three quarters. In this environment, the Fund’s investments in capital goods and transportation companies underperformed the broader market. |
| Investment Risks |
Equity securities (stocks) are more volatile and carry more risk than other forms of investments, including high-grade fixed income securities. The net asset values per share of a Fund will fluctuate as the value of these securities in the portfolio changes.
The Fund’s investments in debt and/or fixed income securities also contain risk factors. The value of these securities tends to fluctuate inversely with changes in interest rates. Changes in an issuer’s financial strength or creditworthiness also can affect the value of the securities it issues. Convertible and preferred stocks, which have some characteristics of both equity and fixed income securities, also contain, to varying degrees depending on their structure, the associated risks of each.
The Fund’s expenses, as with any mutual fund, detract from the Fund’s performance. The Fund’s asset levels have a direct effect on the expense indirectly paid by shareholders. To the extent the Fund’s assets decline and the expenses of the Fund rise or do not decrease proportionately, performance will be negatively impacted.
International investing involves increased risk and volatility. An investment in this Fund entails the special risks of international investing, including currency exchange fluctuation, government regulations, and the potential for political and economic instability. Because the Fund invests primarily in the securities of, and depositary receipts represented by Japanese issuers, the Fund is particularly susceptible to any economic, political, or regulatory developments affecting a particular issuer of those countries.
By itself the Fund does not constitute a complete investment plan and should be considered a long-term investment for investors who can afford to weather change in the value of their investments.
Investors should refer to the Fund’s Prospectus for a more complete description of risks associated with investing in the Fund. |
| | |
| * | Portfolio holdings will change due to ongoing management of the Fund. References to specific securities or sectors should not be construed as recommendations by the Trust, the Advisor or the Distributor. |
| | |
| 1 | For additional information, please refer to the Glossary of Terms following the Performance Overview section. |
10
C O M M O N W E A L T H
INTERNATIONAL SERIES TRUST | ANNUAL REPORT 2013 |
| PERFORMANCE OVERVIEW – October 31, 2013 (Unaudited) |
| COMMONWEALTH JAPAN FUND |
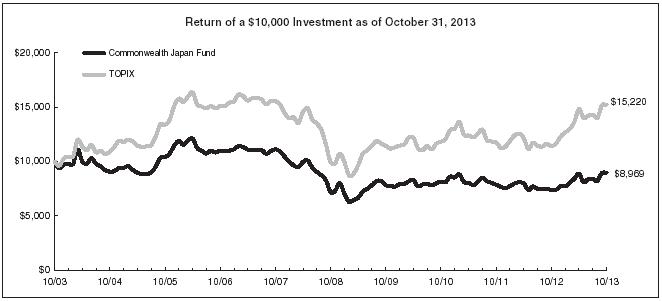
Comparison of Change in Value of a $10,000 Investment in the Commonwealth Japan Fund and the TOPIX Index.
The above graph is a hypothetical $10,000 investment in the Commonwealth Japan Fund from 10/31/03 to 10/31/13, and represents the reinvestment of dividends and distributions in the Fund.
| | | Average Annual Total Return | | Average Annual Total Return | | Total Fund
Operating |
| | | as of September 30, 2013 | | as of October 31, 2013 | | Expense |
| | | 1 Year | | 5 Year | | 10 Year | | 1 Year | | 5 Year | | 10 Year | | Ratio1 |
| Commonwealth Japan Fund | | 19.46 | % | | 1.57 | % | | -0.63 | % | | 21.26 | % | | 4.51 | % | | -1.08 | % | | 4.85 | % |
| Tokyo Stock Price Index (“TOPIX”) | | 30.48 | % | | 5.62 | % | | 4.66 | % | | 33.19 | % | | 8.87 | % | | 4.29 | % | | — | |
| |
Past performance does not guarantee future results. The performance data quoted represents past performance and current returns may be lower or higher. The above graph and table do not reflect the deduction of taxes that a shareholder would pay on Fund distributions or the redemption of Fund shares. The investment return and principal value will fluctuate so that an investor’s shares, when redeemed may be worth more or less than the original cost. To obtain performance information current to the most recent month end, please call 888-345-1898. |
| | |
| 1 | The above expense ratio is from the Fund’s Prospectus dated February 28, 2013. Additional information pertaining to the Fund’s expense ratios as of October 31, 2013 can be found in the financial highlights. Excluding the indirect costs of investing in acquired funds, total fund operating expenses would be 4.84%. |
| | |
| The Fund’s performance is measured against the Tokyo Stock Price Index an unmanaged capitalization-weighted index of all the common stocks on the First Selection of the Tokyo Stock Exchange. This index is expressed in terms of U.S. dollars, and does not reflect the deduction of fees or taxes with a mutual fund, such as investment management and fund accounting fees. The performance of the Fund reflects the deduction of fees for these services. Investors cannot invest directly in an index. |
| | |
You should carefully consider the investment objectives, risks, charges and expenses of the Fund before investing. This and other information can be found in the Fund’s Prospectus, which can be obtained from www.commonwealthfunds.com, by calling the Funds directly at 888-345-1898 or by contracting your investment representative. Please read it carefully before you invest or send money. |
| | |
| The Commonwealth Japan Fund was formerly known as the Capstone Japan Fund (2000), established as a series of the Trust on July 10, 1989 under the name of the Capstone Nikko Japan Tilt Fund. |
11
C O M M O N W E A L T H
INTERNATIONAL SERIES TRUST | ANNUAL REPORT 2013 |
| PERFORMANCE OVERVIEW – October 31, 2013 (Unaudited) |
| COMMONWEALTH GLOBAL FUND |
| The Commonwealth Global Fund’s net asset value (NAV) as of October 31, 2013 was $17.00 per share compared to $14.13 per share on October 31, 2012. For the twelve month period covered by this Annual Report, the Commonwealth Global Fund posted a 20.31% cumulative total return. Our investments do not attempt to track any index, but rather we undertake investments on the basis of fundamental research.We also invest a portion of the Fund’s assets in fixed income investments and acknowledge this process may mitigate some meaningful comparisons to indexes that do not have such investments represented within them. The MSCI World Index returned 26.48% for the same period. The index does not include any fixed income instruments. Additionally, the index is unmanaged, it is expressed in terms of U.S. dollars and it does not reflect the deduction of fees or taxes associated with a mutual fund such as investment management and fund accounting fees. The performance of the Fund reflects the deduction of fees for these services. Investors cannot invest directly in an index. |
| |
In review of the year, it is fair to conclude that “uncertainty” has been the underlying concern of all markets domestic or international. Governments and their respective peoples have had to deal with the events of the year which included, but were not limited to: “The Arab Spring”, the endless turmoil of the Euro-zone countries, threats of nuclear development (Iran) and changes in various degrees within the political leadership of the United States, France, Japan and China. As each country strives to adjust, economic policies can become very fluid, varied in application and undependable. Indeed, risk is everywhere and very hard to quantify. However, to address these concerns, our approach is to intensely analyze and determine the most appropriate risk-adjusted investments to be held in the portfolio. During this most recent time period, in light of these unpredictable circumstances, the Commonwealth Global Fund’s management maintained the portfolio in a more reserved, protected position which in retrospect was not the most beneficial for the greatest total return relative growth. Nonetheless, the risks assumed were less and the investments more secure, from our view. We believe progress has been made.
The ownership of the financial sector was beneficial and was the best performing sector of the Fund. Other areas of promise such as transportation experienced disappointing returns as rail road companies carried less coal due to the switch of coal powered electric-generation plants to natural gas as the primary source to be used to create electricity. This produced the obvious effect of significantly lower transportation tonnage of coal nationwide and this trend is continuing at present. This does not diminish our belief in the rails and their excellent competitive long range economies of scale fundamentals. It simply means that some of the dynamics are changing in this very important industry. |
| |
| During the last year, the United States continued to deserve an increased flow of capital into its markets as earnings improved for the international yet domestically domiciled companies. Corporate America showed a resiliency that will be continuously challenged. As we look at the year and beyond, diversification across markets remains a guiding key to continued portfolio management. |
| Investment Risks |
Equity securities (stocks) are more volatile and carry more risk than other forms of investments, including high-grade fixed income securities. The net asset values per share of a Fund will fluctuate as the value of these securities in the portfolio changes.
The Fund’s investments in debt and/or fixed income securities also contain risk factors. The value of these securities tends to fluctuate inversely with changes in interest rates. Changes in an issuer’s financial strength or creditworthiness also can affect the value of the securities it issues. Convertible and preferred stocks, which have some characteristics of both equity and fixed income securities, also contain, to varying degrees depending on their structure, the associated risks of each. |
| | |
The Fund’s expenses, as with any mutual fund, detract from the Fund’s performance. The Fund’s asset levels have a direct effect on the expense indirectly paid by shareholders. To the extent the Fund’s assets decline and the expenses of the Fund rise or do not decrease proportionately, performance will be negatively impacted. |
| | |
International investing involves increased risk and volatility. An investment in this Fund entails the special risks of international investing, including currency exchange fluctuation, government regulations, and the potential for political and economic instability. |
| | |
By itself the Fund does not constitute a complete investment plan and should be considered a long-term investment for investors who can afford to weather change in the value of their investments. |
| | |
Investors should refer to the Fund’s Prospectus for a more complete description of risks associated with investing in the Fund. |
| | |
| * | Portfolio holdings will change due to ongoing management of the Fund. References to specific securities or sectors should not be construed as recommendations by the Trust, the Advisor or the Distributor. |
| | |
| 1 | For additional information, please refer to the Glossary of Terms following the Performance Overview section. |
12
C O M M O N W E A L T H
INTERNATIONAL SERIES TRUST | ANNUAL REPORT 2013 |
| PERFORMANCE OVERVIEW – October 31, 2013 (Unaudited) |
| COMMONWEALTH GLOBAL FUND |
Comparison of Change in Value of a $10,000 Investment in the Commonwealth Global Fund and the MSCI World Index.
The above graph is a hypothetical $10,000 investment in the Commonwealth Global Fund from 10/31/03 to 10/31/13, and represents the reinvestment of dividends and distributions in the Fund.
| | | Average Annual Total Return | | Average Annual Total Return | | Total Fund
Operating |
| | | as of September 30, 2013 | | as of October 31, 2013 | | Expense |
| | | 1 Year | | 5 Year | | 10 Year | | 1 Year | | 5 Year | | 10 Year | | Ratio1 |
| Commonwealth Global Fund | | 14.30 | % | | 5.11 | % | | 6.89 | % | | 20.31 | % | | 11.20 | % | | 6.48 | % | | 3.33 | % |
| MSCI World Index | | 20.90 | % | | 8.46 | % | | 8.16 | % | | 26.48 | % | | 13.99 | % | | 7.95 | % | | — | |
| |
| | |
Past performance does not guarantee future results. The performance data quoted represents past performance and current returns may be lower or higher. The above graph and table do not reflect the deduction of taxes that a shareholder would pay on Fund distributions or the redemption of Fund shares. The investment return and principal value will fluctuate so that an investor’s shares, when redeemed may be worth more or less than the original cost. To obtain performance information current to the most recent month end, please call 888-345-1898. |
| | |
| 1 | The above expense ratio is from the Fund’s Prospectus dated February 28, 2013. Additional information pertaining to the Fund’s expense ratios as of October 31, 2013 can be found in the financial highlights. Excluding the indirect costs of investing in acquired funds, total fund operating expenses would be 3.31%. |
| | |
| The Fund’s performance is measured against the MSCI World Index, an unmanaged free float-adjusted market capitalization index that is designed to measure global developed market equity performance. Currently the MSCI World Index consists of the following 23 developed market country indices: Australia, Austria, Belgium, Canada, Denmark, Finland, France, Germany, Hong Kong, Ireland, Israel, Italy, Japan, Netherlands, New Zealand, Norway, Portugal, Singapore, Spain, Sweden, Switzerland, the United Kingdom and the United States. This performance of the index is expressed in terms of U.S. dollars, and does not reflect the deduction of fees or taxes with a mutual fund, such as investment management and fund accounting fees. The performance of the Fund reflects the deduction of fees for these services. Investors cannot invest directly in an index. |
| | |
You should carefully consider the investment objectives, risks, charges and expenses of the Fund before investing. This and other information can be found in the Fund’s Prospectus, which can be obtained from www.commonwealthfunds.com, by calling the Funds directly at 888-345-1898 or by contracting your investment representative. Please read it carefully before you invest or send money. |
13
C O M M O N W E A L T H
INTERNATIONAL SERIES TRUST | ANNUAL REPORT 2013 |
| PERFORMANCE OVERVIEW – October 31, 2013 (Unaudited) |
| COMMONWEALTH REAL ESTATE SECURITIES FUND |
| The Commonwealth Real Estate Securities Fund’s net asset value (NAV) as of October 31, 2013, was $12.55 per share compared to $11.27 per share on October 31, 2012. For the twelve month period covered by this Annual Report, the Commonwealth Real Estate Securities Fund posted 11.36% cumulative total return. The MSCI US REIT Index returned 11.42% for the same period. Our investments do not attempt to track any index, but rather we undertake investments on the basis of fundamental research. We also invest a portion of the Fund’s assets in fixed income investments and acknowledge this process may mitigate some meaningful comparisons to indexes that do not have such investments represented within them. Additionally, the index is unmanaged, it is expressed in terms of U.S. dollars and it does not reflect the deduction of fees or taxes associated with a mutual fund such as investment management and fund accounting fees. The performance returns of the Fund do reflect the deduction of fees for these services. |
| |
| Information on the various Real Estate interests throughout the Global/Domestic universe seems to remain at best confusingly constructive. As always, investors are generally optimistic and in the case of the international and domestic companies, they have expressed their optimism, even if unfounded, through new ownership of companies. |
| |
Internationally and domestically, the price movements of equities are from a very low base and large appreciation numbers can be seen with even the hint of modest improvements in fundamentals. The Commonwealth Real Estate Fund has stayed the course of ownership allowing time to heal many markets as the invisible hand of capitalism works its magic providing modest improvements in basic markets which have led to some appreciation of assets.
The Fund’s investments in hotels, lodging and building materials industries had a positive impact on the performance, whereas home builders trailed the broader market.
The commercial real estate market seems to have fundamentally improved during the last year. Prices and property values in many areas have held up and the commercial sector has been aided by some increased building activity. Low interest rates certainly encourage activity across the country, yet many corporate entities continue to deleverage their balance sheets by paying off debt and building cash positions. This process often restricts hiring and job creation which we continue to view as vital to future growth of the real estate sector. At present, we do not see reasons to be making material changes and believe the practice of holding the course longer term is the best process to follow.
The U.S. economy is on a recovery path, albeit at a moderate pace, against the background of progress in households’ balance-sheet adjustments and an improvement in the housing market. Speculation among investors about an earlier-than-expected reduction by the Federal Reserve in the pace of its asset purchases became heightened in late May 2013. This triggered instability within many global financial markets, as evidenced by the simultaneous declines in stock prices, bond prices, and in the value of currencies in many emerging economies. |
| The Fund’s investments in Real Estate Investment Trusts (REITs), in particular hotels, had a positive impact on the fund’s performance. Apartment REITs and building materials companies, having outperformed the prior year, mostly underperformed the MSCI US REIT Index in the current reporting period. |
| | |
| | |
| Investment Risks |
Equity securities (stocks) are more volatile and carry more risk than other forms of investments, including high-grade fixed income securities. The net asset values per share of a Fund will fluctuate as the value of these securities in the portfolio changes.
The Fund’s investments in debt and/or fixed income securities also contain risk factors. The value of these securities tends to fluctuate inversely with changes in interest rates. Changes in an issuer’s financial strength or creditworthiness also can affect the value of the securities it issues. Convertible and preferred stocks, which have some characteristics of both equity and fixed income securities, also contain, to varying degrees depending on their structure, the associated risks of each. |
| | |
The Fund’s expenses, as with any mutual fund, detract from the Fund’s performance. The Fund’s asset levels have a direct effect on the expense indirectly paid by shareholders. To the extent the Fund’s assets decline and the expenses of the Fund rise or do not decrease proportionately, performance will be negatively impacted. |
| | |
The Fund’s investments in REITs involves certain unique risks in addition to those risks associated with investing in the real estate industry in general. Equity REITs may be affected by changes in the value of the underlying property owned by the REITs, while mortgage REITs may be affected by the quality of any credit extended. |
| | |
Investments in the Fund are subject to the risks related to direct investment in real estate, such as real estate risk, regulatory risks, concentration risk, and diversification risk. |
| | |
By itself the Fund does not constitute a complete investment plan and should be considered a long-term investment for investors who can afford to weather change in the value of their investments. |
| | |
Investors should refer to the Fund’s Prospectus for a more complete description of risks associated with investing in the Fund. |
| | |
| * | Portfolio holdings will change due to ongoing management of the Fund. References to specific securities or sectors should not be construed as recommendations by the Trust, the Advisor or the Distributor. |
| | |
| 1 | For additional information, please refer to the Glossary of Terms following the Performance Overview section. |
14
C O M M O N W E A L T H
INTERNATIONAL SERIES TRUST | ANNUAL REPORT 2013 |
| PERFORMANCE OVERVIEW – October 31, 2013 (Unaudited) |
| COMMONWEALTH REAL ESTATE SECURITIES FUND |
Comparison of Change in Value of a $10,000 Investment in the Commonwealth Real Estate Securities Fund and the MSCI US REIT Index.
The above graph is a hypothetical $10,000 investment in the Commonwealth Real Estate Securities Fund from 1/5/04 (inception) to 10/31/13, and represents the reinvestment of dividends and distributions in the Fund.
| | | Average Annual Total Return | | Average Annual Total Return | | Total Fund |
| | | as of September 30, 2013 | | as of October 31, 2013 | | Operating |
| | | | | | | | | Inception | | | | | | | | Inception | | Expense |
| | | 1 Year | | 5 Year | | (1/5/04) | | 1 Year | | 5 Year | | (1/5/04) | | Ratio1 |
| Commonwealth Real Estate Securities Fund | | 8.03 | % | | 3.45 | % | | 3.21 | % | | 11.36 | % | | 10.67 | % | | 3.55 | % | | 3.53 | % |
| MSCI US REIT Index | | 5.75 | % | | 5.87 | % | | 8.73 | % | | 11.42 | % | | 15.30 | % | | 9.13 | % | | — | |
| |
Past performance does not guarantee future results. The performance data quoted represents past performance and current returns may be lower or higher. The above graph and table do not reflect the deduction of taxes that a shareholder would pay on Fund distributions or the redemption of Fund shares. The investment return and principal value will fluctuate so that an investor’s shares, when redeemed may be worth more or less than the original cost. To obtain performance information current to the most recent month end, please call 888-345-1898. |
| | |
| 1 | The above expense ratio is from the Fund’s Prospectus dated February 28, 2013. Additional information pertaining to the Fund’s expense ratios as of October 31, 2013 can be found in the financial highlights. Excluding the indirect costs of investing in acquired funds, total fund operating expenses would be 3.53%. |
| | |
| The Fund’s performance is measured against the MSCI US REIT Index which is an unmanaged free float-adjusted market capitalization weighted index that is comprised of equity REITs that are included in the MSCI US Investable Market 2500 Index, with the exception of specialty equity REITs that do not generate a majority of their revenue and income from real estate rental and leasing operations. The index represents approximately 85% of the US REIT universe. MSCI started calculating and maintaining the MSCI US REIT Index on June 20, 2005. Prior to this date the MSCI US REIT Index (then known as the Morgan Stanley REIT Index) was calculated and maintained by the AMEX. This index is expressed in terms of U.S. dollars, and does not reflect the deduction of fees or taxes with a mutual fund, such as investment management and fund accounting fees. The performance of the Fund reflects the deduction of fees for these services. Investors cannot invest directly in an index. |
| | |
You should carefully consider the investment objectives, risks, charges and expenses of the Fund before investing. This and other information can be found in the Fund’s Prospectus, which can be obtained from www.commonwealthfunds.com, by calling the Funds directly at 888-345-1898 or by contracting your investment representative. Please read it carefully before you invest or send money. |
15
C O M M O N W E A L T H
INTERNATIONAL SERIES TRUST | ANNUAL REPORT 2013 |
| |
|
Glossary of Terms
Australian All Ordinaries Index (“AAOI”) — is a capitalization-weighted index. The index is made up of the largest 500 companies as measured by market cap that are listed on the Australian Stock Exchange.
Consumer Price Index (“CPI”) — is a measure of changes in the price level of a market basket of consumer goods and services purchased by households.
Dow Jones Africa Titans 50 Index (“DJAFKT”) — a float-adjusted market capitalization index that is designed to measure the stock performance of 50 leading companies that are headquartered or generate the majority of their revenues in Africa.
Gross Domestic Product (GDP) — is a measure of the market value of the goods and services produced by labor and property within the United States and/or other foreign countries.
MSCI Emerging Markets Index (“MSCIEM”) — is a float-adjusted market capitalization index that is designed to measure equity market performance within global emerging markets. The Emerging Markets Index currently consists of the following 21 emerging market country indices: Brazil, Chile, China, Colombia, Czech Republic, Egypt, Hungary, India, Indonesia, Korea, Malaysia, Mexico, Morocco, Peru, Philippines, Poland, Russia, South Africa, Taiwan, Thailand, and Turkey.
MSCI US REIT Index — is an unmanaged free float-adjusted market capitalization weighted index that is comprised of equity REITs that are included in the MSCI US Investable Market 2500 Index, with the exception of specialty equity REITs that do not generate a majority of their revenue and income from real estate rental and leasing operations. The index represents approximately 85% of the US REIT universe. MSCI started calculating and maintaining the MSCI US REIT Index on June 20, 2005. Prior to this date the MSCI US REIT Index (then known as the Morgan Stanley REIT Index) was calculated and maintained by the AMEX.
MSCI World Index — is an unmanaged free float-adjusted market capitalization index that is designed to measure global developed market equity performance. Currently the MSCI World Index consists of the following 23 developed market country indices: Australia, Austria, Belgium, Canada, Denmark, Finland, France, Germany, Hong Kong, Ireland, Israel, Italy, Japan, Netherlands, New Zealand, Norway, Portugal, Singapore, Spain, Sweden, Switzerland, the United Kingdom and the United States.
New Zealand SmallCap Index (“NZSCI”) — is a capitalization-weighted index of all New Zealand equities, excluding those in the NZX 50 Index, considered to be reflective of the performance of the New Zealand small-cap equity market.
NZX 50 Index — is a modified market capitalization weighted index. This index consists of the top 50 companies by free float adjusted market capitalization that are listed on the New Zealand Stock Exchange.
Tokyo Stock Price Index (“TOPIX”) — is an unmanaged capitalization-weighted index of all companies listed on the First Section of the Tokyo Stock Exchange.
16
C O M M O N W E A L T H
INTERNATIONAL SERIES TRUST | ANNUAL REPORT 2013 |
| | |
| PORTFOLIO COMPOSITION – October 31, 2013* (Unaudited) |
| COMMONWEALTH AUSTRALIA/NEW ZEALAND FUND |
| Industry or | | Percent of Total |
| Security Type | | Investments |
| |
| Commercial Services | | 18.2 | % |
| Healthcare – Services | | 13.6 | % |
| Electric | | 7.7 | % |
| Oil & Gas | | 7.6 | % |
| Retail | | 7.1 | % |
| Transportation | | 6.6 | % |
| Telecommunications | | 5.7 | % |
| Diversified Financial Services | | 4.0 | % |
| REITs | | 4.0 | % |
| Home Furnishings | | 3.9 | % |
| Media | | 3.5 | % |
| Mining | | 3.4 | % |
| Electrical Components & Equipment | | 2.9 | % |
| Preferred Stocks | | 2.8 | % |
| Insurance | | 2.3 | % |
| Bonds – New Zealand | | 2.2 | % |
| Healthcare – Products | | 2.1 | % |
| Chemicals | | 1.1 | % |
| Bonds – Australia | | 1.0 | % |
| Food | | 0.3 | % |
| Short-Term Investments | | 0.0 | % |
| |
| | | 100.0 | % |
| AFRICA FUND |
| Country or | | Percent of Total |
| Security Type | | Investments |
| |
| South Africa | | 55.5 | % |
| Exchange Traded Funds – Africa Region | | 12.6 | % |
| Exchange Traded Funds – South Africa | | 11.7 | % |
| Short-Term Investments | | 10.5 | % |
| Egypt | | 3.2 | % |
| Exchange Traded Funds – Nigeria | | 2.6 | % |
| United Kingdom | | 2.5 | % |
| Sovereign Bonds – South Africa | | 1.0 | % |
| Guernsey | | 0.4 | % |
| |
| | | 100.0 | % |
| COMMONWEALTH JAPAN FUND |
| Industry or | | Percent of Total |
| Security Type | | Investments |
| |
| Transportation | | 24.7 | % |
| Healthcare – Products | | 7.2 | % |
| Short-Term Investments | | 7.2 | % |
| Real Estate | | 6.5 | % |
| Auto Parts & Equipment | | 6.2 | % |
| Insurance | | 5.1 | % |
| Engineering & Construction | | 4.5 | % |
| Retail | | 4.3 | % |
| Distribution/Wholesale | | 3.7 | % |
| Machinery – Diversified | | 3.5 | % |
| Beverages | | 3.5 | % |
| Electronics | | 3.4 | % |
| Cosmetics/Personal Care | | 2.9 | % |
| Hand/Machine Tools | | 2.3 | % |
| Banks | | 2.3 | % |
| Computers | | 2.2 | % |
| Entertainment | | 2.1 | % |
| Electric | | 1.9 | % |
| REITs | | 1.9 | % |
| Leisure Time | | 1.6 | % |
| Chemicals | | 1.3 | % |
| Food | | 1.0 | % |
| Diversified Financial Services | | 0.7 | % |
| |
| | | 100.0 | % |
| COMMONWEALTH GLOBAL FUND |
| Country or | | Percent of Total |
| Security Type | | Investments |
| |
| United States | | 34.8 | % |
| Switzerland | | 11.5 | % |
| United Kingdom | | 9.5 | % |
| Short-Term Investments | | 8.0 | % |
| France | | 4.9 | % |
| Israel | | 3.8 | % |
| Preferred Stocks | | 3.5 | % |
| Bermuda | | 3.3 | % |
| Canada | | 3.1 | % |
| Mexico | | 2.9 | % |
| Guernsey | | 2.4 | % |
| Germany | | 2.4 | % |
| Netherlands | | 2.2 | % |
| Japan | | 2.1 | % |
| Spain | | 1.8 | % |
| Brazil | | 1.2 | % |
| South Africa | | 1.1 | % |
| Singapore | | 0.7 | % |
| South Korea | | 0.6 | % |
| Call Options | | 0.2 | % |
| |
| | | 100.0 | % |
17
C O M M O N W E A L T H
INTERNATIONAL SERIES TRUST | ANNUAL REPORT 2013 |
| | |
| PORTFOLIO COMPOSITION – October 31, 2013* (Unaudited) |
| COMMONWEALTH REAL ESTATE SECURITIES FUND |
| Industry or | | Percent of Total |
| Security Type | | Investments |
| |
| REITS-Office Property | | 12.4 | % |
| Building Materials | | 10.9 | % |
| Lodging | | 10.9 | % |
| REITS-Hotels | | 9.2 | % |
| REITS-Apartments | | 8.6 | % |
| Real Estate | | 8.3 | % |
| Telecommunications | | 5.5 | % |
| REITS-Storage | | 5.1 | % |
| Home Builders | | 5.0 | % |
| REITS-Diversified | | 4.3 | % |
| REITS-Shopping Centers | | 3.9 | % |
| Retail | | 2.9 | % |
| Engineering & Construction | | 2.8 | % |
| REITS-Warehouse/Industries | | 2.3 | % |
| Exchange Traded Funds | | 2.2 | % |
| REITS-Health Care | | 1.9 | % |
| Savings & Loans | | 1.9 | % |
| REITS-Single Tenant | | 1.6 | % |
| Short-Term Investments | | 0.4 | % |
| |
| | | 100.0 | % |
| * Portfolio composition is subject to change. | | | |
18
C O M M O N W E A L T H
INTERNATIONAL SERIES TRUST | ANNUAL REPORT 2013 |
SCHEDULES OF INVESTMENTS – October 31, 2013
| COMMONWEALTH AUSTRALIA/NEW ZEALAND FUND |
| | | Shares | | | Value |
| | | | | | |
| AUSTRALIA (20.4%) | | | | | | | | |
| COMMON STOCKS (19.4%) | | | | | | | | |
| CHEMICALS (1.1%) | | | | | | | | |
| Nufarm, Ltd. | | | 55,308 | | | $ | 255,630 | |
| | | | | | | | |
| COMMERCIAL SERVICES (0.4%) | | | | | | | | |
| Silver Chef, Ltd. | | | 2,146 | | | | 16,612 | |
| Slater & Gordon, Ltd. | | | 20,208 | | | | 73,918 | |
| | | | | | | | |
| | | | | | | | 90,530 | |
| | | | | | | | |
| DIVERSIFIED FINANCIAL SERVICES (0.3%) | | | | | | | | |
| FlexiGroup, Ltd. | | | 15,000 | | | | 66,635 | |
| | | | | | | | |
| ELECTRIC (2.5%) | | | | | | | | |
| AGL Energy, Ltd. | | | 34,025 | | | | 502,978 | |
| ERM Power, Ltd. | | | 30,634 | | | | 82,521 | |
| | | | | | | | |
| | | | | | | | 585,499 | |
| | | | | | | | |
| HEALTHCARE-PRODUCTS (0.9%) | | | | | | | | |
| Cochlear, Ltd. | | | 4,000 | | | | 222,684 | |
| | | | | | | | |
| HEALTHCARE-SERVICES (1.7%) | | | | | | | | |
| Sonic Healthcare, Ltd. | | | 26,324 | | | | 401,578 | |
| | | | | | | | |
| INSURANCE (2.3%) | | | | | | | | |
| QBE Insurance Group, Ltd. | | | 38,954 | | | | 544,914 | |
| | | | | | | | |
| MINING (3.3%) | | | | | | | | |
| Orica, Ltd. | | | 13,622 | | | | 271,281 | |
| OZ Minerals, Ltd. | | | 30,866 | | | | 105,609 | |
| PanAust, Ltd. | | | 216,232 | | | | 412,844 | |
| | | | | | | | |
| | | | | | | | 789,734 | |
| | | | | | | | |
| OIL & GAS (2.7%) | | | | | | | | |
| Santos, Ltd. | | | 28,828 | | | | 413,347 | |
| Woodside Petroleum, Ltd. | | | 6,518 | | | | 239,157 | |
| | | | | | | | |
| | | | | | | | 652,504 | |
| | | | | | | | |
| RETAIL (2.0%) | | | | | | | | |
| Wesfarmers, Ltd. | | | 11,874 | | | | 482,255 | |
| | | | | | | | |
| TRANSPORTATION (2.2%) | | | | | | | | |
| Asciano Group | | | 93,333 | | | | 513,420 | |
| | | | | | | | |
TOTAL COMMON STOCKS | | | | | | | | |
(Cost $3,862,001) | | | | | | | 4,605,383 | |
| | | | | | | | |
| | | | | | | | | |
| | | Principal | | | | | |
| | | | | | | | |
| CORPORATE BONDS (1.0%) | | | | | | | | |
| CBA Capital Australia, Ltd., 3.43%, | | | | | | | | |
4/15/15 (1) (2) (3) | | | NZ$300,000 | | | | 242,215 | |
| | | | | | | | |
TOTAL CORPORATE BONDS | | | | | | | | |
(Cost $201,986) | | | | | | | 242,215 | |
| | | | | | | | |
TOTAL AUSTRALIA | | | | | | | | |
(Cost $4,063,987) | | | | | | | 4,847,598 | |
| | | | | | | | |
|
| | | | | | | | | |
| | Shares | | | | | | | | | | | | | | |
| NEW ZEALAND (77.5%) | | | | | | | | |
| COMMON STOCKS (72.7%) | | | | | | | | |
| COAL (0.0%) | | | | | | | | |
| Pike River Coal, Ltd. (4) (5) | | | 1,145,295 | | | | — | |
| | | | | | | | |
| COMMERCIAL SERVICES (17.4%) | | | | | | | | |
| Guinness Peat Group PLC (5) | | | 495,906 | | | | 241,666 | |
| Mowbray Collectables, Ltd. (4) (6) | | | 821,593 | | | | 339,305 | |
| Northland Port Corp. (NZ), Ltd. | | | 81,425 | | | | 191,675 | |
| Port of Tauranga, Ltd. | | | 50,000 | | | | 569,918 | |
| South Port New Zealand, Ltd. | | | 1,027,930 | | | | 2,801,825 | |
| | | | | | | | |
| | | | | | | | 4,144,389 | |
| | | | | | | | |
| DIVERSIFIED FINANCIAL SERVICES (3.7%) | | | | | | | | |
| Heartland New Zealand, Ltd. | | | 1,252,765 | | | | 869,185 | |
| | | | | | | | |
| ELECTRIC (5.1%) | | | | | | | | |
| Contact Energy, Ltd. | | | 90,000 | | | | 390,270 | |
| Infratil, Ltd. | | | 216,613 | | | | 447,289 | |
| TrustPower, Ltd. | | | 65,000 | | | | 370,447 | |
| | | | | | | | |
| | | | | | | | 1,208,006 | |
| | | | | | | | |
| ELECTRICAL COMPONENTS & EQUIPMENT (2.8%) | | | | | | | | |
| Cavotec SA | | | 130,250 | | | | 669,330 | |
| | | | | | | | |
| FOOD (0.3%) | | | | | | | | |
| Sanford, Ltd. | | | 20,000 | | | | 75,493 | |
| | | | | | | | |
| HEALTHCARE-PRODUCTS (1.1%) | | | | | | | | |
| Ebos Group, Ltd. | | | 33,389 | | | | 267,509 | |
| | | | | | | | |
| HEALTHCARE-SERVICES (11.6%) | | | | | | | | |
| Metlifecare, Ltd. | | | 171,484 | | | | 577,893 | |
| Ryman Healthcare, Ltd. | | | 350,000 | | | | 2,182,621 | |
| | | | | | | | |
| | | | | | | | 2,760,514 | |
| | | | | | | | |
| HOME FURNISHINGS (3.8%) | | | | | | | | |
| Scott Technology, Ltd. (4) | | | 497,396 | | | | 903,833 | |
| | | | | | | | |
| MEDIA (3.4%) | | | | | | | | |
| Sky Network Television, Ltd. | | | 159,745 | | | | 818,055 | |
| | | | | | | | |
| OIL & GAS (4.7%) | | | | | | | | |
| New Zealand Oil & Gas, Ltd. | | | 962,531 | | | | 667,817 | |
| New Zealand Refining Co., Ltd./The | | | 235,157 | | | | 437,023 | |
| | | | | | | | |
| | | | | | | | 1,104,840 | |
| | | | | | | | |
| REITS (3.9%) | | | | | | | | |
| Goodman Property Trust | | | 376,216 | | | | 320,065 | |
| Vital Healthcare Property Trust | | | 572,941 | | | | 610,468 | |
| | | | | | | | |
| | | | | | | | 930,533 | |
| | | | | | | | |
| RETAIL (5.0%) | | | | | | | | |
| Briscoe Group, Ltd. | | | 183,520 | | | | 360,765 | |
| Colonial Motor Co., Ltd. (4) | | | 199,565 | | | | 815,930 | |
| | | | | | | | |
| | | | | | | | 1,176,695 | |
| | | | | | | | |
| See accompanying notes to financial statements. |
|
| 19 |
C O M M O N W E A L T H
INTERNATIONAL SERIES TRUST | ANNUAL REPORT 2013 |
SCHEDULES OF INVESTMENTS – October 31, 2013
| COMMONWEALTH AUSTRALIA/NEW ZEALAND FUND |
| | | Shares | | | Value |
| | | | | | |
| NEW ZEALAND (77.5%) - Continued | | | | | | | | |
| COMMON STOCKS (72.7%) - Continued | | | | | | | | |
| TELECOMMUNICATIONS (5.6%) | | | | | | | | |
| Chorus, Ltd. | | | 226,311 | | | $ | 495,353 | |
| TeamTalk, Ltd. | | | 415,473 | | | | 830,466 | |
| | | | | | | | |
| | | | | | | | 1,325,819 | |
| | | | | | | | |
| TRANSPORTATION (4.3%) | | | | | | | | |
| Freightways, Ltd. | | | 173,540 | | | | 626,390 | |
| Mainfreight, Ltd. | | | 40,000 | | | | 383,249 | |
| | | | | | | | |
| | | | | | | | 1,009,639 | |
| | | | | | | | |
TOTAL COMMON STOCKS (Cost $11,660,666) | | | | | | | 17,263,840 | |
| | | | | | | | |
| PREFERRED STOCKS (2.7%) | | | | | | | | |
| INVESTMENT COMPANIES (2.7%) | | | | | | | | |
| ASB Capital, Ltd., 3.68% (1) (2) | | | 954,218 | | | | 639,981 | |
| | | | | | | | |
TOTAL PREFERRED STOCKS (Cost $686,799) | | | | | | | 639,981 | |
| | | | | | | | |
| | |
Principal | | | | | |
| | | | | | | | |
| CORPORATE BONDS (2.1%) | | | | | | | | |
| Credit Agricole SA, 5.04%, 12/29/49 (1) (2) (3) | | | NZ$890,000 | | | | 507,228 | |
| | | | | | | | |
TOTAL CORPORATE BONDS (Cost $463,084) | | | | | | | 507,228 | |
| | | | | | | | |
TOTAL NEW ZEALAND (Cost $12,810,549) | | | | | | | 18,411,049 | |
| | | | | | | | |
| | |
Shares | | | | | |
| | | | | | | | |
| SHORT-TERM INVESTMENTS (0.0%) | | | | | | | | |
| Federated Government Obligations Fund, 0.01% (7) | | | 6,088 | | | | 6,088 | |
| | | | | | | | |
TOTAL SHORT-TERM INVESTMENTS (Cost $6,088) | | | | | | | 6,088 | |
| | | | | | | | |
| TOTAL INVESTMENTS (97.9%) (Cost $16,880,624) | | | | | | | 23,264,735 | |
| OTHER ASSETS IN EXCESS OF LIABILITIES (2.1%) | | | | | | | 501,620 | |
| | | | | | | | |
| NET ASSETS (100.0%) | | | | | | $ | 23,766,355 | |
| | | | | | | | |
| (1) | | Variable, Floating, or Step Rate Security. The rate reflected in the Schedule of Investments is the rate in effect at October 31, 2013. |
| (2) | | Callable. |
| (3) | | Principal amount shown is in New Zealand Dollars (NZ$); value shown in U.S. Dollars. |
| (4) | | Security is being fair valued in accordance with the Trust’s fair valuation policies. |
| (5) | | Non-income producing. |
| (6) | | Affiliated Issuer. See Note 5 of the Notes to Financial Statements. |
| (7) | | Rate disclosed is the seven day yield as of October 31, 2013. |
| PLC — Public Limited Company |
| See accompanying notes to financial statements. |
|
| 20 |
C O M M O N W E A L T H
INTERNATIONAL SERIES TRUST | ANNUAL REPORT 2013 |
SCHEDULES OF INVESTMENTS – October 31, 2013
| | | Shares | | | Value |
| | | | | | |
| COMMON STOCKS (61.1%) | | | | | | | | |
| EGYPT (3.2%) | | | | | | | | |
| Global Telecom Holding GDR (1) | | | 20,000 | | | $ | 67,600 | |
| | | | | | | | |
| GUERNSEY (0.4%) | | | | | | | | |
| Agriterra, Ltd. (1) | | | 210,000 | | | | 7,811 | |
| | | | | | | | |
| SOUTH AFRICA (55.0%) | | | | | | | | |
| African Bank Investments, Ltd. | | | 10,145 | | | | 17,180 | |
| Anglo American Platinum, Ltd. (1) | | | 800 | | | | 32,365 | |
| AngloGold Ashanti, Ltd. ADR | | | 1,000 | | | | 15,100 | |
| Astral Foods, Ltd. | | | 4,000 | | | | 40,244 | |
| Barloworld, Ltd. | | | 3,300 | | | | 29,585 | |
| Bidvest Group, Ltd. | | | 1,400 | | | | 37,335 | |
| Capitec Bank Holdings, Ltd. | | | 2,850 | | | | 60,754 | |
| Clientele, Ltd. | | | 25,000 | | | | 32,624 | |
| Coronation Fund Managers, Ltd. | | | 6,500 | | | | 53,029 | |
| Discovery Holdings, Ltd. | | | 9,000 | | | | 76,204 | |
| FirstRand, Ltd. | | | 9,800 | | | | 35,144 | |
| Gold Fields, Ltd. ADR | | | 5,000 | | | | 23,000 | |
| Grindrod, Ltd. | | | 35,000 | | | | 84,198 | |
| Howden Africa Holdings, Ltd. | | | 11,000 | | | | 44,926 | |
| Imperial Holdings, Ltd. ADR | | | 1,200 | | | | 25,716 | |
| Invicta Holdings, Ltd. | | | 3,000 | | | | 29,854 | |
| JD Group, Ltd. | | | 9,200 | | | | 28,318 | |
| Kagiso Media, Ltd. | | | 16,000 | | | | 44,228 | |
| MTN Group, Ltd. ADR | | | 2,600 | | | | 51,636 | |
| Nedbank Group, Ltd. | | | 2,000 | | | | 43,432 | |
| Pinnacle Technology Holdings, Ltd. | | | 15,000 | | | | 36,698 | |
| PSG Group, Ltd. | | | 5,200 | | | | 42,734 | |
| RCL Foods, Ltd. (1) | | | 18,000 | | | | 30,661 | |
| Sasol, Ltd. ADR | | | 1,600 | | | | 81,632 | |
| Shoprite Holdings, Ltd. ADR | | | 900 | | | | 33,147 | |
| Standard Bank Group, Ltd. ADR | | | 2,800 | | | | 35,784 | |
| Steinhoff International Holdings, Ltd. | | | 13,222 | | | | 51,116 | |
| Wilson Bayly Holmes-Ovcon, Ltd. | | | 2,200 | | | | 38,568 | |
| | | | | | | | |
| | | | | | | | 1,155,212 | |
| | | | | | | | |
| UNITED KINGDOM (2.5%) | | | | | | | | |
| SABMiller PLC ADR | | | 500 | | | | 26,125 | |
| Tullow Oil PLC ADR | | | 3,500 | | | | 26,250 | |
| | | | | | | | |
| | | | | | | | 52,375 | |
| | | | | | | | |
TOTAL COMMON STOCKS (Cost $1,250,466) | | | | | | | 1,282,998 | |
| | | | | | | | |
| EXCHANGE TRADED FUNDS (26.7%) | | | | | | | | |
| Global X Nigeria Index ETF (1) | | | 3,500 | | | | 53,095 | |
| iShares MSCI South Africa Index Fund | | | 3,700 | | | | 242,794 | |
| Market Vectors Africa Index ETF | | | 8,340 | | | | 263,127 | |
| | | | | | | | |
TOTAL EXCHANGE TRADED FUNDS (Cost $533,633) | | | | | | | 559,016 | |
| | | | | | | | |
| | |
Principal | | | | | |
| | | | | | | | |
| SOVEREIGN BONDS (1.0%) | | | | | | | | |
| SOUTH AFRICA (1.0%) | | | | | | | | |
South Africa Government Bond,
8.00%, 12/21/18 (2) | | | R200,000 | | | | 20,939 | |
| | | | | | | | |
TOTAL SOVEREIGN BONDS (Cost $26,551) | | | | | | | 20,939 | |
| | | | | | | | |
| | |
Shares | | | | | |
| | | | | | | | |
| SHORT-TERM INVESTMENTS (10.4%) | | | | | | | | |
| Federated Government Obligations Fund, 0.01% (3) | | | 218,104 | | | | 218,104 | |
| | | | | | | | |
TOTAL SHORT-TERM INVESTMENTS (Cost $218,104) | | | | | | | 218,104 | |
| | | | | | | | |
| TOTAL INVESTMENTS (99.2%) (Cost $2,028,754) | | | | | | | 2,081,057 | |
| OTHER ASSETS IN EXCESS OF LIABILITIES (0.8%) | | | | | | | 17,701 | |
| | | | | | | | |
| NET ASSETS (100.0%) | | | | | | $ | 2,098,758 | |
| | | | | | | | |
| (1) | | Non-income producing. |
| (2) | | Principal amount shown in South African Rand; value shown in U.S. Dollars. |
| (3) | | Rate disclosed is the seven day yield as of October 31, 2013. |
| ADR — American Depositary Receipt |
| GDR — Global Depositary Receipt |
| PLC — Public Limited Company |
| See accompanying notes to financial statements. |
|
| 21 |
C O M M O N W E A L T H
INTERNATIONAL SERIES TRUST | ANNUAL REPORT 2013 |
SCHEDULES OF INVESTMENTS – October 31, 2013
| | | Shares | | | Value |
| | | | | | |
| COMMON STOCKS (92.6%) | | | | | | | | |
| AUTO PARTS & EQUIPMENT (6.2%) | | | | | | | | |
| NGK Spark Plug Co., Ltd. | | | 6,000 | | | $ | 136,378 | |
| Sumitomo Rubber Industries, Ltd. | | | 10,000 | | | | 138,513 | |
| | | | | | | | |
| | | | | | | | 274,891 | |
| | | | | | | | |
| BANKS (2.3%) | | | | | | | | |
| Mizuho Financial Group, Inc. | | | 30,000 | | | | 62,545 | |
| Nishi-Nippon City Bank, Ltd. | | | 15,000 | | | | 40,425 | |
| | | | | | | | |
| | | | | | | | 102,970 | |
| | | | | | | | |
| BEVERAGES (3.5%) | | | | | | | | |
| Coca-Cola West Co., Ltd. | | | 4,000 | | | | 80,993 | |
| Kirin Holdings Co., Ltd. | | | 5,000 | | | | 72,816 | |
| | | | | | | | |
| | | | | | | | 153,809 | |
| | | | | | | | |
| CHEMICALS (1.3%) | | | | | | | | |
| JSR Corp. | | | 3,000 | | | | 56,809 | |
| | | | | | | | |
| COMPUTERS (2.2%) | | | | | | | | |
| INES Corp. | | | 5,000 | | | | 33,052 | |
| Otsuka Corp. | | | 500 | | | | 64,731 | |
| | | | | | | | |
| | | | | | | | 97,783 | |
| | | | | | | | |
| COSMETICS/PERSONAL CARE (2.9%) | | | | | | | | |
| Unicharm Corp. | | | 2,000 | | | | 127,937 | |
| | | | | | | | |
| DISTRIBUTION/WHOLESALE (3.7%) | | | | | | | | |
| Marubeni Corp. | | | 16,000 | | | | 124,804 | |
| Yamae Hisano Co., Ltd. | | | 4,000 | | | | 38,442 | |
| | | | | | | | |
| | | | | | | | 163,246 | |
| | | | | | | | |
| DIVERSIFIED FINANCIAL SERVICES (0.7%) | | | | | | | | |
| Kyushu Leasing Service Co., Ltd. (3) | | | 13,000 | | | | 31,201 | |
| | | | | | | | |
| ELECTRIC (1.9%) | | | | | | | | |
| Tohoku Electric Power Co., Inc. (1) | | | 7,000 | | | | 84,359 | |
| | | | | | | | |
| ELECTRONICS (3.4%) | | | | | | | | |
| Hamamatsu Photonics K.K. | | | 1,500 | | | | 55,985 | |
| Hoya Corp. | | | 4,000 | | | | 95,718 | |
| | | | | | | | |
| | | | | | | | 151,703 | |
| | | | | | | | |
| ENGINEERING & CONSTRUCTION (4.5%) | | | | | | | | |
| Kajima Corp. | | | 33,000 | | | | 139,276 | |
| Taihei Dengyo Kaisha, Ltd. | | | 6,000 | | | | 42,164 | |
| Takada Corp. (1) | | | 6,000 | | | | 16,658 | |
| | | | | | | | |
| | | | | | | | 198,098 | |
| | | | | | | | |
| ENTERTAINMENT (2.1%) | | | | | | | | |
| Sankyo Co., Ltd. | | | 2,000 | | | | 94,783 | |
| | | | | | | | |
| FOOD (1.0%) | | | | | | | | |
| Maxvalu Kyushu Co., Ltd. | | | 3,000 | | | | 44,178 | |
| | | | | | | | |
| HAND/MACHINE TOOLS (2.3%) | | | | | | | | |
| Meidensha Corp. | | | 28,000 | | | | 104,221 | |
| | | | | | | | |
| HEALTHCARE-PRODUCTS (7.2%) | | | | | | | | |
| Asahi Intecc Co., Ltd. | | | 3,000 | | | | 201,058 | |
| Terumo Corp. | | | 2,500 | | | | 120,512 | |
| | | | | | | | |
| | | | | | | | 321,570 | |
| | | | | | | | |
| INSURANCE (5.1%) | | | | | | | | |
| Dai-ichi Life Insurance Co., Ltd. | | | 11,000 | | | | 156,168 | |
| T & D Holdings, Inc. | | | 6,000 | | | | 71,697 | |
| | | | | | | | |
| | | | | | | | 227,865 | |
| | | | | | | | |
| LEISURE TIME (1.6%) | | | | | | | | |
| Shimano, Inc. | | | 800 | | | | 69,969 | |
| | | | | | | | |
| MACHINERY-DIVERSIFIED (3.5%) | | | | | | | | |
| Fanuc, Ltd. | | | 700 | | | | 111,909 | |
| Torishima Pump Manufacturing Co., Ltd. | | | 5,000 | | | | 44,340 | |
| | | | | | | | |
| | | | | | | | 156,249 | |
| | | | | | | | |
| REAL ESTATE (6.4%) | | | | | | | | |
| Mitsui Fudosan Co., Ltd. | | | 3,000 | | | | 98,698 | |
| Sumitomo Realty & Development Co., Ltd. | | | 4,000 | | | | 188,142 | |
| | | | | | | | |
| | | | | | | | 286,840 | |
| | | | | | | | |
| REITS (1.9%) | | | | | | | | |
| Fukuoka REIT Corp. | | | 10 | | | | 82,477 | |
| | | | | | | | |
| RETAIL (4.2%) | | | | | | | | |
| Sugi Holdings Co., Ltd. | | | 2,500 | | | | 104,368 | |
| TOTAL MEDICAL SERVICE Co., Ltd. | | | 2,600 | | | | 84,613 | |
| | | | | | | | |
| | | | | | | | 188,981 | |
| | | | | | | | |
| See accompanying notes to financial statements. |
|
| 22 |
C O M M O N W E A L T H
INTERNATIONAL SERIES TRUST | ANNUAL REPORT 2013 |
SCHEDULES OF INVESTMENTS – October 31, 2013
| | | Shares | | | Value |
| | | | | | |
| COMMON STOCKS (92.6%) - Continued | | | | | | | | |
| TRANSPORTATION (24.7%) | | | | | | | | |
| Daiichi Koutsu Sangyo Co., Ltd. | | | 2,500 | | | $ | 20,975 | |
| East Japan Railway Co. | | | 1,500 | | | | 129,818 | |
| Hankyu Hanshin Holdings, Inc. | | | 22,000 | | | | 123,055 | |
| Kawasaki Kisen Kaisha, Ltd. | | | 30,000 | | | | 68,341 | |
| Keikyu Corp. | | | 13,000 | | | | 122,028 | |
| Keio Corp. | | | 18,000 | | | | 124,296 | |
| Kintetsu World Express, Inc. | | | 2,000 | | | | 76,070 | |
| Mitsui OSK Lines, Ltd. (1) | | | 18,000 | | | | 75,786 | |
| Nippon Express Co., Ltd. | | | 15,000 | | | | 75,053 | |
| Nishi-Nippon Railroad Co., Ltd. | | | 10,000 | | | | 38,239 | |
| Tobu Railway Co., Ltd. | | | 18,000 | | | | 92,993 | |
| Yamato Holdings Co., Ltd. | | | 7,000 | | | | 149,924 | |
| | | | | | | | |
| | | | | | | | 1,096,578 | |
| | | | | | | | |
TOTAL COMMON STOCKS (Cost $2,807,700) | | | | | | | 4,116,517 | |
| | | | | | | | |
| SHORT-TERM INVESTMENTS (7.2%) | | | | | | | | |
| Federated Government Obligations Fund, 0.01% (2) | | | 320,205 | | | | 320,205 | |
| | | | | | | | |
TOTAL SHORT-TERM INVESTMENTS (Cost $320,205) | | | | | | | 320,205 | |
| | | | | | | | |
| TOTAL INVESTMENTS (99.8%) (Cost $3,127,905) | | | | | | | 4,436,722 | |
| OTHER ASSETS IN EXCESS OF LIABILITIES (0.2%) | | | | | | | 7,327 | |
| | | | | | | | |
| NET ASSETS (100.0%) | | | | | | $ | 4,444,049 | |
| | | | | | | | |
| (1) | | | Non-income producing. |
| (2) | | | Rate disclosed is the seven day yield as of October 31, 2013. |
| (3) | | | Security is being fair valued in accordance with the Trust’s fair valuation policies. |
| REIT — Real Estate Investment Trusts |
| See accompanying notes to financial statements. |
|
| 23 |
C O M M O N W E A L T H
INTERNATIONAL SERIES TRUST | ANNUAL REPORT 2013 |
SCHEDULES OF INVESTMENTS – October 31, 2013
| | | Shares | | | Value |
| | | | | | |
| COMMON STOCKS (88.9%) | | | | | | | | |
| BERMUDA (3.3%) | | | | | | | | |
| Bunge, Ltd. | | | 6,500 | | | $ | 533,845 | |
| | | | | | | | |
| BRAZIL (1.2%) | | | | | | | | |
| Vale SA ADR | | | 12,000 | | | | 192,120 | |
| | | | | | | | |
| CANADA (3.1%) | | | | | | | | |
| Enbridge, Inc. | | | 5,000 | | | | 216,950 | |
| InterOil Corp. (1) | | | 4,000 | | | | 277,800 | |
| | | | | | | | |
| | | | | | | | 494,750 | |
| | | | | | | | |
| FRANCE (4.9%) | | | | | | | | |
| Arkema SA ADR | | | 4,130 | | | | 468,755 | |
| Total SA ADR | | | 5,200 | | | | 318,136 | |
| | | | | | | | |
| | | | | | | | 786,891 | |
| | | | | | | | |
| GERMANY (2.4%) | | | | | | | | |
| Siemens AG ADR | | | 3,000 | | | | 384,030 | |
| | | | | | | | |
| GUERNSEY (2.4%) | | | | | | | | |
| Amdocs, Ltd. | | | 10,000 | | | | 384,500 | |
| | | | | | | | |
| ISRAEL (3.9%) | | | | | | | | |
| NICE Systems, Ltd. ADR | | | 10,000 | | | | 391,800 | |
| Teva Pharmaceutical Industries, Ltd. ADR | | | 6,000 | | | | 222,540 | |
| | | | | | | | |
| | | | | | | | 614,340 | |
| | | | | | | | |
| JAPAN (2.1%) | | | | | | | | |
| Nidec Corp. ADR | | | 14,000 | | | | 341,320 | |
| | | | | | | | |
| MEXICO (2.9%) | | | | | | | | |
| Grupo Televisa SA ADR | | | 15,000 | | | | 456,600 | |
| | | | | | | | |
| NETHERLANDS (2.2%) | | | | | | | | |
| Unilever NV | | | 9,000 | | | | 357,480 | |
| | | | | | | | |
| SINGAPORE (0.7%) | | | | | | | | |
| DBS Group Holdings, Ltd. ADR | | | 2,000 | | | | 108,000 | |
| | | | | | | | |
| SOUTH AFRICA (1.2%) | | | | | | | | |
| Shoprite Holdings, Ltd. ADR | | | 5,000 | | | | 184,150 | |
| | | | | | | | |
| SOUTH KOREA (0.7%) | | | | | | | | |
| POSCO ADR | | | 1,400 | | | | 104,244 | |
| | | | | | | | |
| SPAIN (1.8%) | | | | | | | | |
| Banco Santander SA ADR | | | 32,631 | | | | 290,742 | |
| | | | | | | | |
| SWITZERLAND (11.5%) | | | | | | | | |
| Nestle SA ADR | | | 7,750 | | | | 561,178 | |
| Pentair, Inc. | | | 10,760 | | | | 721,888 | |
| Roche Holding AG ADR | | | 8,000 | | | | 554,720 | |
| | | | | | | | |
| | | | | | | | 1,837,786 | |
| | | | | | | | |
| UNITED KINGDOM (9.6%) | | | | | | | | |
| BG Group PLC ADR | | | 10,000 | | | | 204,600 | |
| Centrica PLC ADR | | | 7,000 | | | | 159,600 | |
| Diageo PLC ADR | | | 2,000 | | | | 255,180 | |
| InterContinental Hotels Group PLC ADR | | | 9,333 | | | | 273,924 | |
| Old Mutual PLC ADR | | | 13,125 | | | | 343,822 | |
| Vodafone Group PLC ADR | | | 7,875 | | | | 289,958 | |
| | | | | | | | |
| | | | | | | | 1,527,084 | |
| | | | | | | | |
| UNITED STATES (35.0%) | | | | | | | | |
| AECOM Technology Corp. (1) | | | 10,000 | | | | 317,800 | |
| AGCO Corp. | | | 5,000 | | | | 291,900 | |
| Chemed Corp. | | | 4,200 | | | | 284,844 | |
| Conmed Corp. | | | 15,720 | | | | 570,164 | |
| DENTSPLY International, Inc. | | | 8,700 | | | | 409,770 | |
| Huntington Bancshares, Inc. | | | 20,000 | | | | 176,000 | |
| Integrated Silicon Solution, Inc. (1) | | | 22,000 | | | | 237,160 | |
| ITC Holdings Corp. | | | 2,000 | | | | 201,180 | |
| Johnson Controls, Inc. | | | 6,000 | | | | 276,900 | |
| KVH Industries, Inc. (1) | | | 30,000 | | | | 412,200 | |
| LifePoint Hospitals, Inc. (1) | | | 4,500 | | | | 232,380 | |
| Miller Industries, Inc. | | | 14,000 | | | | 262,360 | |
| National Oilwell Varco, Inc. | | | 3,000 | | | | 243,540 | |
| New York Community Bancorp, Inc. | | | 10,000 | | | | 162,100 | |
| Norfolk Southern Corp. | | | 4,000 | | | | 344,080 | |
| Northwest Natural Gas Co. | | | 5,000 | | | | 217,150 | |
| Starwood Hotels & Resorts Worldwide, Inc. | | | 5,000 | | | | 368,100 | |
| Tenneco, Inc. (1) | | | 6,000 | | | | 318,420 | |
| Ultra Petroleum Corp. (1) | | | 5,000 | | | | 91,800 | |
| Wells Fargo & Co. | | | 4,000 | | | | 170,760 | |
| | | | | | | | |
| | | | | | | | 5,588,608 | |
| | | | | | | | |
TOTAL COMMON STOCKS (Cost $9,058,874) | | | | | | | 14,186,490 | |
| | | | | | | | |
| See accompanying notes to financial statements. |
|
| 24 |
C O M M O N W E A L T H
INTERNATIONAL SERIES TRUST | ANNUAL REPORT 2013 |
SCHEDULES OF INVESTMENTS – October 31, 2013
| | | Shares | | | Value |
| | | | | | |
| PREFERRED STOCKS (3.5%) | | | | | | | | |
| UNITED STATES (3.5%) | | | | | | | | |
HSBC USA, Inc., Series F, 3.50%,
Callable 12/2/13 (2) (3) | | | 18,000 | | | $ | 351,720 | |
HSBC USA, Inc., Series G, 4.00%,
Callable 12/2/13 (2) (3) | | | 10,000 | | | | 208,000 | |
| | | | | | | | |
TOTAL PREFERRED STOCKS (Cost $467,195) | | | | | | | 559,720 | |
| | | | | | | | |
| | |
Contracts | | | | | |
| | | | | | | | |
| CALL OPTION (0.2%) | | | | | | | | |
| UNITED STATES (0.2%) | | | | | | | | |
eBay, Inc., Strike Price: $45.00,
Expiration 1/18/2014 (1) | | | 40 | | | | 32,320 | |
| | | | | | | | |
TOTAL CALL OPTIONS (Premium $27,080) | | | | | | | 32,320 | |
| | | | | | | | |
| | |
Shares | | | | | |
| | | | | | | | |
| SHORT-TERM INVESTMENTS (8.0%) | | | | | | | | |
| Federated Government Obligations Fund, 0.01% (4) | | | 1,283,110 | | | | 1,283,110 | |
| | | | | | | | |
TOTAL SHORT-TERM INVESTMENTS (Cost $1,283,110) | | | | | | | 1,283,110 | |
| | | | | | | | |
| TOTAL INVESTMENTS (100.6%) (Cost $10,836,259) | | | | | | | 16,061,640 | |
| LIABILITIES IN EXCESS OF OTHER ASSETS (-0.6%) | | | | | | | (102,612 | ) |
| | | | | | | | |
| NET ASSETS (100.0%) | | | | | | $ | 15,959,028 | |
| | | | | | | | |
| (1) | | Non-income producing. |
| (2) | | Callable. |
| (3) | | Variable, Floating, or Step Rate Security. The rate reflected in the Schedule of Investments is the rate in effect at October 31, 2013. |
| (4) | | Rate disclosed is the seven day yield as of October 31, 2013. |
| ADR — American Depositary Receipt |
| PLC — Public Limited Company |
| See accompanying notes to financial statements. |
|
| 25 |
C O M M O N W E A L T H
INTERNATIONAL SERIES TRUST | ANNUAL REPORT 2013 |
SCHEDULES OF INVESTMENTS – October 31, 2013
| COMMONWEALTH REAL ESTATE SECURITIES FUND |
| | | Shares | | | Value |
| | | | | | |
| COMMON STOCKS (98.1%) | | | | | | | | |
| BUILDING MATERIALS (11.0%) | | | | | | | | |
| Cemex SAB de CV ADR (1) | | | 24,598 | | | $ | 260,247 | |
| CRH PLC ADR | | | 3,000 | | | | 73,440 | |
| James Hardie Industries NV – ADR | | | 8,000 | | | | 416,640 | |
| Lafarge SA ADR | | | 5,000 | | | | 86,400 | |
| PPC, Ltd. ADR | | | 12,500 | | | | 78,750 | |
| | | | | | | | |
| | | | | | | | 915,477 | |
| | | | | | | | |
| ENGINEERING & CONSTRUCTION (2.9%) | | | | | | | | |
| Grupo Aeroportuario del Sureste SAB de CV ADR | | | 1,300 | | | | 154,713 | |
| Kajima Corp. ADR | | | 2,000 | | | | 84,599 | |
| | | | | | | | |
| | | | | | | | 239,312 | |
| | | | | | | | |
| HOME BUILDERS (5.0%) | | | | | | | | |
| China Housing & Land Development, Inc. (1) | | | 40,000 | | | | 107,600 | |
| Desarrolladora Homex SAB de CV ADR (1) | | | 13,000 | | | | 17,160 | |
| MDC Holdings, Inc. | | | 5,000 | | | | 145,950 | |
| Toll Brothers, Inc. (1) | | | 4,500 | | | | 147,960 | |
| | | | | | | | |
| | | | | | | | 418,670 | |
| | | | | | | | |
| LODGING (10.9%) | | | | | | | | |
| Home Inns & Hotels Management, Inc. ADR (1) | | | 8,500 | | | | 296,140 | |
| InterContinental Hotels Group PLC ADR | | | 5,866 | | | | 172,167 | |
| Marriott International, Inc., Class A | | | 5,035 | | | | 226,978 | |
| Ryman Hospitality Properties | | | 5,924 | | | | 218,655 | |
| | | | | | | | |
| | | | | | | | 913,940 | |
| | | | | | | | |
| REAL ESTATE (8.4%) | | | | | | | | |
| Alto Palermo SA ADR | | | 11,500 | | | | 264,500 | |
| Gafisa SA ADR (1) | | | 12,000 | | | | 32,280 | |
| IRSA Inversiones y Representaciones SA ADR | | | 6,000 | | | | 68,700 | |
| WP Carey & Co., LLC | | | 5,000 | | | | 333,050 | |
| | | | | | | | |
| | | | | | | | 698,530 | |
| | | | | | | | |
| REITS-APARTMENTS (8.6%) | | | | | | | | |
| AvalonBay Communities, Inc. | | | 1,347 | | | | 168,442 | |
| Campus Crest Communities, Inc. | | | 11,000 | | | | 110,110 | |
| Equity Residential | | | 5,700 | | | | 298,452 | |
| Essex Property Trust, Inc. | | | 900 | | | | 144,900 | |
| | | | | | | | |
| | | | | | | | 721,904 | |
| | | | | | | | |
| REITS-DIVERSIFIED (4.3%) | | | | | | | | |
| Vornado Realty Trust | | | 2,307 | | | | 205,462 | |
| Washington Real Estate Investment Trust | | | 6,000 | | | | 157,260 | |
| | | | | | | | |
| | | | | | | | 362,722 | |
| | | | | | | | |
| REITS-HEALTH CARE (1.9%) | | | | | | | | |
| Health Care REIT, Inc. | | | 2,500 | | | | 162,125 | |
| | | | | | | | |
| REITS-HOTELS (9.3%) | | | | | | | | |
| Host Hotels & Resorts, Inc. | | | 15,317 | | | | 284,130 | |
| LaSalle Hotel Properties | | | 11,000 | | | | 341,550 | |
| Pebblebrook Hotel Trust | | | 5,000 | | | | 151,000 | |
| | | | | | | | |
| | | | | | | | 776,680 | |
| | | | | | | | |
| REITS-OFFICE PROPERTY (12.5%) | | | | | | | | |
| Alexandria Real Estate Equities, Inc. | | | 2,000 | | | | 131,560 | |
| BioMed Realty Trust, Inc. | | | 6,000 | | | | 119,520 | |
| Boston Properties, Inc. | | | 2,500 | | | | 258,750 | |
| Corporate Office Properties Trust SBI MD | | | 4,000 | | | | 98,400 | |
| Douglas Emmett, Inc. | | | 6,000 | | | | 149,580 | |
| SL Green Realty Corp. | | | 3,000 | | | | 283,710 | |
| | | | | | | | |
| | | | | | | | 1,041,520 | |
| | | | | | | | |
| REITS-SHOPPING CENTERS (3.9%) | | | | | | | | |
| Acadia Realty Trust | | | 4,985 | | | | 132,950 | |
| Saul Centers, Inc. | | | 4,100 | | | | 192,700 | |
| | | | | | | | |
| | | | | | | | 325,650 | |
| | | | | | | | |
| REITS-SINGLE TENANT (1.6%) | | | | | | | | |
| National Retail Properties, Inc. | | | 4,000 | | | | 137,600 | |
| | | | | | | | |
| REITS-STORAGE (5.2%) | | | | | | | | |
| Extra Space Storage, Inc. | | | 9,400 | | | | 432,306 | |
| | | | | | | | |
| REITS-WAREHOUSE/INDUSTRIES (2.3%) | | | | | | | | |
| EastGroup Properties, Inc. | | | 3,000 | | | | 190,980 | |
| | | | | | | | |
| RETAIL (2.9%) | | | | | | | | |
| Kingfisher PLC ADR | | | 20,000 | | | | 242,400 | |
| | | | | | | | |
| SAVINGS & LOANS (1.9%) | | | | | | | | |
| Harleysville Savings Financial Corp. | | | 8,675 | | | | 159,186 | |
| | | | | | | | |
| See accompanying notes to financial statements. |
|
| 26 |
C O M M O N W E A L T H
INTERNATIONAL SERIES TRUST | ANNUAL REPORT 2013 |
SCHEDULES OF INVESTMENTS – October 31, 2013
| COMMONWEALTH REAL ESTATE SECURITIES FUND |
| | | Shares | | | Value |
| | | | | | |
| COMMON STOCKS (98.1%) - Continued | | | | | | | | |
| TELECOMMUNICATIONS (5.5%) | | | | | | | | |
| American Tower Corp., Class A | | | 2,500 | | | $ | 198,375 | |
| SBA Communications Corp., Class A (1) | | | 3,000 | | | | 262,410 | |
| | | | | | | | |
| | | | | | | | 460,785 | |
| | | | | | | | |
TOTAL COMMON STOCKS (Cost $6,208,259) | | | | | | | 8,199,787 | |
| | | | | | | | |
| EXCHANGE TRADED FUNDS (2.2%) | | | | | | | | |
| Guggenheim China Real Estate ETF | | | 8,500 | | | | 183,600 | |
| | | | | | | | |
TOTAL EXCHANGE TRADED FUNDS (Cost $144,153) | | | | | | | 183,600 | |
| | | | | | | | |
| SHORT-TERM INVESTMENTS (0.4%) | | | | | | | | |
| Federated Government Obligations Fund, 0.01% (2) | | | 37,043 | | | | 37,043 | |
| | | | | | | | |
TOTAL SHORT-TERM INVESTMENTS (Cost $37,043) | | | | | | | 37,043 | |
| | | | | | | | |
| TOTAL INVESTMENTS (100.7%) (Cost $6,389,455) | | | | | | | 8,420,430 | |
| LIABILITIES IN EXCESS OF OTHER ASSETS (-0.7%) | | | | | | | (58,519 | ) |
| | | | | | | | |
| NET ASSETS (100.0%) | | | | | | $ | 8,361,911 | |
| | | | | | | | |
| (1) Non-income producing. |
| (2) Rate disclosed is the seven day yield as of October 31, 2013. |
| ADR — American Depositary Receipt |
| PLC — Public Limited Company |
| REIT — Real Estate Investment Trusts |
| See accompanying notes to financial statements. |
|
| 27 |
C O M M O N W E A L T H
INTERNATIONAL SERIES TRUST | ANNUAL REPORT 2013 |
| STATEMENTS OF ASSETS AND LIABILITIES – October 31, 2013 |
|
| | | Commonwealth | | | | | | | | | | | | | | | | | Commonwealth |
| | | Australia/New | | | | | | | Commonwealth | | Commonwealth | | Real Estate |
| | | Zealand Fund | | Africa Fund | | Japan Fund | | Global Fund | | Securities Fund |
| | | | | | | | | | | |
| ASSETS: | | | | | | | | | | | | | | | | | | | | | | | | | |
Investments in unaffiliated issuers, at value (Cost $16,122,306, $2,028,754, $3,127,905, $10,836,259 and $6,389,455) | | | $ | 22,925,430 | | | | $ | 2,081,057 | | | | $ | 4,436,722 | | | | $ | 16,061,640 | | | | $ | 8,420,430 | |
Investments in affiliated issuers, at value (Cost $758,318, $0, $0, $0 and $0) | | | | 339,305 | | | | | — | | | | | — | | | | | — | | | | | — | |
| | | | | | | | | | | | | | | | | | | | | |
Total Investments, at value (Cost $16,880,624, $2,028,754, $3,127,905, $10,836,259 and $6,389,455) | | | | 23,264,735 | | | | | 2,081,057 | | | | | 4,436,722 | | | | | 16,061,640 | | | | | 8,420,430 | |
Foreign currency, at value (Cost $460,210, $16,173, $0, $0 and $0) | | | | 455,621 | | | | | 14,857 | | | | | — | | | | | — | | | | | — | |
| Interest and dividends receivable | | | | 139,458 | | | | | 582 | | | | | 18,627 | | | | | 48,074 | | | | | 4,527 | |
Receivable for shares of beneficial interest issued | | | | 600 | | | | | 600 | | | | | 600 | | | | | 600 | | | | | 600 | |
| Due from advisor | | | | — | | | | | 7,038 | | | | | — | | | | | — | | | | | — | |
| Prepaid expenses | | | | 30,806 | | | | | 7,446 | | | | | 13,871 | | | | | 27,822 | | | | | 15,457 | |
| | | | | | | | | | | | | | | | | | | | | |
Total Assets | | | | 23,891,220 | | | | | 2,111,580 | | | | | 4,469,820 | | | | | 16,138,136 | | | | | 8,441,014 | |
| | | | | | | | | | | | | | | | | | | | | |
| LIABILITIES: | | | | | | | | | | | | | | | | | | | | | | | | | |
Payable for options written (Premiums received $0, $0, $0, $99,988 and $36,689) | | | | — | | | | | — | | | | | — | | | | | 96,030 | | | | | 35,950 | |
Payable for shares of beneficial interest redeemed | | | | 5,723 | | | | | — | | | | | — | | | | | — | | | | | — | |
| Accrued expenses and other payables: | | | | | | | | | | | | | | | | | | | | | | | | | |
Management fees | | | | 15,951 | | | | | — | | | | | 2,679 | | | | | 9,985 | | | | | 5,298 | |
Administration | | | | 14,395 | | | | | 1,185 | | | | | 2,397 | | | | | 8,891 | | | | | 4,728 | |
Distribution | | | | 10,235 | | | | | 844 | | | | | 1,777 | | | | | 17,426 | | | | | 6,708 | |
Accounting and transfer agent | | | | 13,733 | | | | | 5,435 | | | | | 7,953 | | | | | 7,644 | | | | | 5,553 | |
Trustee | | | | 9,339 | | | | | 768 | | | | | 1,555 | | | | | 5,769 | | | | | 3,068 | |
Compliance | | | | 3,467 | | | | | 285 | | | | | 641 | | | | | 2,245 | | | | | 1,196 | |
Custodian | | | | 4,187 | | | | | 387 | | | | | 840 | | | | | 1,707 | | | | | 962 | |
Other | | | | 47,835 | | | | | 3,918 | | | | | 7,929 | | | | | 29,411 | | | | | 15,640 | |
| | | | | | | | | | | | | | | | | | | | | |
Total Liabilities | | | | 124,865 | | | | | 12,822 | | | | | 25,771 | | | | | 179,108 | | | | | 79,103 | |
| | | | | | | | | | | | | | | | | | | | | |
| NET ASSETS | | | $ | 23,766,355 | | | | $ | 2,098,758 | | | | $ | 4,444,049 | | | | $ | 15,959,028 | | | | $ | 8,361,911 | |
| | | | | | | | | | | | | | | | | | | | | |
NET ASSET VALUE, OFFERING PRICE & REDEMPTION PRICE PER SHARE:(a) | | | | | | | | | | | | | | | | | | | | | | | | | |
(1,793,659, 202,237, 1,444,571, 938,744 and 666,164, shares of beneficial interest outstanding, respectively.) | | | $ | 13.25 | | | | $ | 10.38 | | | | $ | 3.08 | | | | $ | 17.00 | | | | $ | 12.55 | |
| | | | | | | | | | | | | | | | | | | | | |
| NET ASSETS CONSIST OF: | | | | | | | | | | | | | | | | | | | | | | | | | |
| Paid-in-beneficial interest | | | $ | 16,639,343 | | | | $ | 2,026,949 | | | | $ | 4,017,748 | | | | $ | 10,221,597 | | | | $ | 7,177,509 | |
| Accumulated net investment income (loss) | | | | 339,703 | | | | | 27,914 | | | | | (116,555 | ) | | | | (90,445 | ) | | | | (70,834 | ) |
Accumulated net realized gains (losses) from investments, option contracts and foreign currency transactions | | | | 407,498 | | | | | (7,088 | ) | | | | (765,972 | ) | | | | 598,537 | | | | | (776,478 | ) |
Net unrealized appreciation on investments, option contracts and foreign currency translations | | | | 6,379,811 | | | | | 50,983 | | | | | 1,308,828 | | | | | 5,229,339 | | | | | 2,031,714 | |
| | | | | | | | | | | | | | | | | | | | | |
| NET ASSETS | | | $ | 23,766,355 | | | | $ | 2,098,758 | | | | $ | 4,444,049 | | | | $ | 15,959,028 | | | | $ | 8,361,911 | |
| | | | | | | | | | | | | | | | | | | | | |
| (a) | | Subject to certain exceptions, a 2% redemption fee is imposed upon shares redeemed within 14 calendar days of their purchase. See Note 3 in the Notes to the Financial Statements. Par value $0.01, unlimited shares authorized. |
| See accompanying notes to financial statements. |
|
| 28 |
C O M M O N W E A L T H
INTERNATIONAL SERIES TRUST | ANNUAL REPORT 2013 |
| STATEMENTS OF OPERATIONS – Year Ended October 31, 2013 |
|
| | | Commonwealth | | | | | | | | | | | | | | | | | Commonwealth |
| | | Australia/ | | | | | | | Commonwealth | | Commonwealth | | Real Estate |
| | | New Zealand Fund | | Africa Fund | | Japan Fund | | Global Fund | | Securities Fund |
| | | | | | | | | | | |
| INVESTMENT INCOME: | | | | | | | | | | | | | | | | | | | | | | | | | |
| Interest income | | | $ | 68,385 | | | | $ | 1,798 | | | | $ | 20 | | | | $ | 88 | | | | $ | 4,824 | |
| Dividend income, unaffiliated issuers | | | | 1,218,828 | | | | | 43,355 | | | | | 63,255 | | | | | 353,565 | | | | | 256,562 | |
| Dividend income, affiliated issuers | | | | 15,397 | | | | | — | | | | | — | | | | | — | | | | | — | |
| Foreign tax withholding | | | | (159,087 | ) | | | | (3,980 | ) | | | | (4,332 | ) | | | | (15,027 | ) | | | | (523 | ) |
| | | | | | | | | | | | | | | | | | | | | |
Total Investment Income | | | | 1,143,523 | | | | | 41,173 | | | | | 58,943 | | | | | 338,626 | | | | | 260,863 | |
| | | | | | | | | | | | | | | | | | | | | |
| EXPENSES: | | | | | | | | | | | | | | | | | | | | | | | | | |
| Management fees (Note 4) | | | | 180,333 | | | | | 22,542 | | | | | 32,414 | | | | | 109,849 | | | | | 62,160 | |
| Legal fees | | | | 53,693 | | | | | 3,918 | | | | | 9,695 | | | | | 33,639 | | | | | 18,584 | |
| Administration fees | | | | 171,532 | | | | | 12,857 | | | | | 30,662 | | | | | 104,101 | | | | | 58,940 | |
| Accounting and transfer agent fees | | | | 87,927 | | | | | 30,951 | | | | | 53,190 | | | | | 45,907 | | | | | 34,716 | |
| Distribution fees | | | | 60,111 | | | | | 4,508 | | | | | 10,805 | | | | | 36,616 | | | | | 20,720 | |
| Custodian fees | | | | 15,110 | | | | | 1,560 | | | | | 3,024 | | | | | 4,253 | | | | | 2,606 | |
| Miscellaneous fees | | | | 15,966 | | | | | 2,959 | | | | | 5,756 | | | | | 9,654 | | | | | 5,534 | |
| Audit fees | | | | 30,752 | | | | | 2,531 | | | | | 5,120 | | | | | 18,996 | | | | | 10,101 | |
| Trustee fees and expenses | | | | 37,467 | | | | | 3,016 | | | | | 6,534 | | | | | 22,515 | | | | | 12,467 | |
| Consulting services fees | | | | 2,716 | | | | | 203 | | | | | 490 | | | | | 1,654 | | | | | 937 | |
| Compliance fees | | | | 48,860 | | | | | 3,695 | | | | | 8,885 | | | | | 29,801 | | | | | 16,883 | |
| Insurance fees | | | | 19,413 | | | | | 1,177 | | | | | 3,622 | | | | | 12,061 | | | | | 6,928 | |
| State registration and filing fees | | | | 17,547 | | | | | 18,873 | | | | | 16,754 | | | | | 17,706 | | | | | 19,374 | |
| Printing and postage fees | | | | 20,605 | | | | | 2,018 | | | | | 3,154 | | | | | 11,319 | | | | | 6,251 | |
| Interest expense | | | | 79 | | | | | — | | | | | 146 | | | | | — | | | | | — | |
| | | | | | | | | | | | | | | | | | | | | |
Total Expenses | | | | 762,111 | | | | | 110,808 | | | | | 190,251 | | | | | 458,071 | | | | | 276,201 | |
| | | | | | | | | | | | | | | | | | | | | |
Waiver of fees and reimbursement of expenses (Note 4) | | | | — | | | | | (110,808 | ) | | | | — | | | | | — | | | | | — | |
| | | | | | | | | | | | | | | | | | | | | |
| Net expenses | | | | 762,111 | | | | | — | | | | | 190,251 | | | | | 458,071 | | | | | 276,201 | |
| | | | | | | | | | | | | | | | | | | | | |
| Net Investment Income (Loss) | | | | 381,412 | | | | | 41,173 | | | | | (131,308 | ) | | | | (119,445 | ) | | | | (15,338 | ) |
| | | | | | | | | | | | | | | | | | | | | |
REALIZED/UNREALIZED GAIN ON INVESTMENTS, OPTION CONTRACTS AND FOREIGN CURRENCY TRANSLATIONS: | | | | | | | | | | | | | | | | | | | | | | | | | |
Net realized gain (loss) on investments, unaffiliated issuers | | | | 622,218 | | | | | (7,088 | ) | | | | 38,711 | | | | | 584,130 | | | | | 25,646 | |
| Net realized gain (loss) from option contracts | | | | — | | | | | — | | | | | (12,976 | ) | | | | 34,753 | | | | | 43,426 | |
| Net realized gain from rights | | | | 4,491 | | | | | — | | | | | — | | | | | — | | | | | — | |
Net realized gain (loss) on foreign currency transactions | | | | (30,983 | ) | | | | 1,740 | | | | | (17,147 | ) | | | | — | | | | | — | |
Net change in unrealized appreciation/depreciation on: | | | | | | | | | | | | | | | | | | | | | | | | | |
Investments, unaffiliated issuers | | | | 1,573,515 | | | | | 24,270 | | | | | 874,923 | | | | | 2,216,182 | | | | | 805,741 | |
Investments, affiliated issuers | | | | 35,249 | | | | | — | | | | | — | | | | | — | | | | | — | |
Option contracts | | | | — | | | | | — | | | | | 22,225 | | | | | 9,198 | | | | | 26,729 | |
Rights | | | | — | | | | | (1,232 | ) | | | | — | | | | | — | | | | | — | |
Foreign currency translations | | | | 1,017 | | | | | (2,374 | ) | | | | 628 | | | | | — | | | | | — | |
| | | | | | | | | | | | | | | | | | | | | |
Net realized/unrealized gain from investments, option contracts, rights and foreign currency translations | | | | 2,205,507 | | | | | 15,316 | | | | | 906,364 | | | | | 2,844,263 | | | | | 901,542 | |
| | | | | | | | | | | | | | | | | | | | | |
Net Increase In Net Assets Resulting From Operations | | | $ | 2,586,919 | | | | $ | 56,489 | | | | $ | 775,056 | | | | $ | 2,724,818 | | | | $ | 886,204 | |
| | | | | | | | | | | | | | | | | | | | | |
| See accompanying notes to financial statements. |
|
| 29 |
C O M M O N W E A L T H
INTERNATIONAL SERIES TRUST | ANNUAL REPORT 2013 |
| STATEMENTS OF CHANGES IN NET ASSETS |
|
| | | Commonwealth | | | | | | | | | | |
| | | Australia/New Zealand Fund | | Africa Fund |
| | | | | |
| | | Year Ended | | Year Ended | | Year Ended | | Period Ended |
| | | October 31, 2013 | | October 31, 2012 | | October 31, 2013 | | October 31, 2012(a) |
| | | | | | | | | |
| OPERATIONS: | | | | | | | | | | | | | | | | | | | | |
Net investment income (loss) | | | $ | 381,412 | | | | $ | 262,838 | | | | $ | 41,173 | | | | $ | 10,377 | |
Net realized gain (loss) from investments | | | | 622,218 | | | | | 879,348 | | | | | (7,088 | ) | | | | — | |
Net realized gain (loss) from option contracts | | | | — | | | | | — | | | | | — | | | | | — | |
Net realized gain from rights | | | | 4,491 | | | | | 17,003 | | | | | — | | | | | — | |
Net realized gain (loss) from foreign currency transactions | | | | (30,983 | ) | | | | (2,300 | ) | | | | 1,740 | | | | | (5,517 | ) |
Net change in unrealized appreciation (depreciation) on investments, option contracts, rights and foreign currency translations | | | | 1,609,781 | | | | | 1,497,953 | | | | | 20,664 | | | | | 30,319 | |
| | | | | | | | | | | | | | | | | |
Change in net assets resulting from operations | | | | 2,586,919 | | | | | 2,654,842 | | | | | 56,489 | | | | | 35,179 | |
| | | | | | | | | | | | | | | | | |
| DISTRIBUTIONS TO SHAREHOLDERS: | | | | | | | | | | | | | | | | | | | | |
Net investment income | | | | (310,746 | ) | | | | (231,695 | ) | | | | (23,882 | ) | | | | — | |
Net realized gains | | | | — | | | | | — | | | | | — | | | | | — | |
| | | | | | | | | | | | | | | | | |
Change in net assets from distributions | | | | (310,746 | ) | | | | (231,695 | ) | | | | (23,882 | ) | | | | — | |
| | | | | | | | | | | | | | | | | |
| CAPITAL TRANSACTIONS: | | | | | | | | | | | | | | | | | | | | |
Proceeds from shares issued | | | | 5,593,414 | | | | | 3,723,251 | | | | | 1,010,351 | | | | | 1,373,853 | |
Dividends reinvested | | | | 293,827 | | | | | 218,231 | | | | | 23,784 | | | | | — | |
Cost of shares redeemed | | | | (6,744,671 | ) | | | | (5,429,542 | ) | | | | (324,033 | ) | | | | (52,993 | ) |
Redemption fees | | | | 259 | | | | | 27 | | | | | 10 | | | | | — | |
| | | | | | | | | | | | | | | | | |
Change in net assets resulting from shares of beneficial interest transactions | | | | (857,171 | ) | | | | (1,488,033 | ) | | | | 710,112 | | | | | 1,320,860 | |
| | | | | | | | | | | | | | | | | |
Change in net assets | | | | 1,419,002 | | | | | 935,114 | | | | | 742,719 | | | | | 1,356,039 | |
| NET ASSETS: | | | | | | | | | | | | | | | | | | | | |
Beginning of period | | | | 22,347,353 | | | | | 21,412,239 | | | | | 1,356,039 | | | | | — | |
| | | | | | | | | | | | | | | | | |
End of period | | | $ | 23,766,355 | | | | $ | 22,347,353 | | | | $ | 2,098,758 | | | | $ | 1,356,039 | |
| | | | | | | | | | | | | | | | | |
Accumulated net investment income (loss) | | | $ | 339,703 | | | | $ | 263,831 | | | | $ | 27,914 | | | | $ | 8,883 | |
| | | | | | | | | | | | | | | | | |
| SHARE TRANSACTIONS: | | | | | | | | | | | | | | | | | | | | |
Issued | | | | 441,193 | | | | | 347,614 | | | | | 99,797 | | | | | 138,021 | |
Reinvested | | | | 23,811 | | | | | 22,110 | | | | | 2,267 | | | | | — | |
Redeemed | | | | (525,991 | ) | | | | (505,576 | ) | | | | (32,362 | ) | | | | (5,486 | ) |
| | | | | | | | | | | | | | | | | |
Change in shares | | | | (60,987 | ) | | | | (135,852 | ) | | | | 69,702 | | | | | 132,535 | |
| | | | | | | | | | | | | | | | | |
| (a) | | Reflects operations for the period from November 7, 2011 (inception date) to October 31, 2012. |
| See accompanying notes to financial statements. |
|
| 30 |
C O M M O N W E A L T H
INTERNATIONAL SERIES TRUST | ANNUAL REPORT 2013 |
| STATEMENTS OF CHANGES IN NET ASSETS |
|
| Commonwealth | | Commonwealth | | Commonwealth |
| Japan Fund | | Global Fund | | Real Estate Securities Fund |
| | | | | |
| Year Ended | | Year Ended | | Year Ended | | Year Ended | | Year Ended | | Year Ended |
| October 31, 2013 | | October 31, 2012 | | October 31, 2013 | | October 31, 2012 | | October 31, 2013 | | October 31, 2012 |
| | | | | | | | | | | |
| | | | | | | | | | | | | | | | | | | | | | | | | | | | | |
| | $ | (131,308 | ) | | | $ | (115,774 | ) | | | $ | (119,445 | ) | | | $ | (112,945 | ) | | | $ | (15,338 | ) | | | $ | (91,397 | ) |
| | | 38,711 | | | | | 123,173 | | | | | 584,130 | | | | | (19,297 | ) | | | | 25,646 | | | | | (132,284 | ) |
| | | (12,976 | ) | | | | (38,716 | ) | | | | 34,753 | | | | | — | | | | | 43,426 | | | | | — | |
| | | — | | | | | — | | | | | — | | | | | — | | | | | — | | | | | — | |
| | | (17,147 | ) | | | | 7,014 | | | | | — | | | | | — | | | | | — | | | | | — | |
| | | | | | | | | | | | | | | | | | | | | | | | | | | | | |
| | | 897,776 | | | | | (210,489 | ) | | | | 2,225,380 | | | | | 577,629 | | | | | 832,470 | | | | | 1,346,246 | |
| | | | | | | | | | | | | | | | | | | | | | | |
| | | 775,056 | | | | | (234,792 | ) | | | | 2,724,818 | | | | | 445,387 | | | | | 886,204 | | | | | 1,122,565 | |
| | | | | | | | | | | | | | | | | | | | | | | |
| | | | | | | | | | | | | | | | | | | | | | | | | | | | | |
| | | — | | | | | — | | | | | — | | | | | — | | | | | — | | | | | — | |
| | | — | | | | | — | | | | | — | | | | | (1,332,683 | ) | | | | — | | | | | — | |
| | | | | | | | | | | | | | | | | | | | | | | |
| | | — | | | | | — | | | | | — | | | | | (1,332,683 | ) | | | | — | | | | | — | |
| | | | | | | | | | | | | | | | | | | | | | | |
| | | | | | | | | | | | | | | | | | | | | | | | | | | | | |
| | | 2,350,149 | | | | | 1,092,483 | | | | | 1,226,946 | | | | | 916,081 | | | | | 891,528 | | | | | 278,311 | |
| | | — | | | | | — | | | | | — | | | | | 1,305,051 | | | | | — | | | | | — | |
| | | (2,698,114 | ) | | | | (634,582 | ) | | | | (1,304,026 | ) | | | | (1,307,983 | ) | | | | (1,239,436 | ) | | | | (871,009 | ) |
| | | 3 | | | | | 18 | | | | | 4 | | | | | 10 | | | | | 26 | | | | | 11 | |
| | | | | | | | | | | | | | | | | | | | | | | |
| | | | | | | | | | | | | | | | | | | | | | | | | | | | | |
| | | (347,962 | ) | | | | 457,919 | | | | | (77,076 | ) | | | | 913,159 | | | | | (347,882 | ) | | | | (592,687 | ) |
| | | | | | | | | | | | | | | | | | | | | | | |
| | | 427,094 | | | | | 223,127 | | | | | 2,647,742 | | | | | 25,863 | | | | | 538,322 | | | | | 529,878 | |
| | | | | | | | | | | | | | | | | | | | | | | | | | | | | |
| | | 4,016,955 | | | | | 3,793,828 | | | | | 13,311,286 | | | | | 13,285,423 | | | | | 7,823,589 | | | | | 7,293,711 | |
| | | | | | | | | | | | | | | | | | | | | | | |
| | $ | 4,444,049 | | | | $ | 4,016,955 | | | | $ | 15,959,028 | | | | $ | 13,311,286 | | | | $ | 8,361,911 | | | | $ | 7,823,589 | |
| | | | | | | | | | | | | | | | | | | | | | | |
| | $ | (116,555 | ) | | | $ | (93,196 | ) | | | $ | (90,445 | ) | | | $ | (71,600 | ) | | | $ | (70,834 | ) | | | $ | (73,336 | ) |
| | | | | | | | | | | | | | | | | | | | | | | |
| | | | | | | | | | | | | | | | | | | | | | | | | | | | | |
| | | 824,264 | | | | | 417,917 | | | | | 80,691 | | | | | 65,767 | | | | | 74,384 | | | | | 26,926 | |
| | | — | | | | | — | | | | | — | | | | | 98,607 | | | | | — | | | | | — | |
| | | (961,246 | ) | | | | (241,723 | ) | | | | (84,299 | ) | | | | (93,537 | ) | | | | (102,417 | ) | | | | (83,159 | ) |
| | | | | | | | | | | | | | | | | | | | | | | |
| | | (136,982 | ) | | | | 176,194 | | | | | (3,608 | ) | | | | 70,837 | | | | | (28,033 | ) | | | | (56,233 | ) |
| | | | | | | | | | | | | | | | | | | | | | | |
| See accompanying notes to financial statements. |
|
| 31 |
C O M M O N W E A L T H
INTERNATIONAL SERIES TRUST | ANNUAL REPORT 2013 |
FINANCIAL HIGHLIGHTS
| COMMONWEALTH AUSTRALIA/NEW ZEALAND FUND |
Selected data for a share outstanding throughout each of the years indicated:
| | | For the year | | For the year | | For the year | | For the year | | For the year |
| | | ended | | ended | | ended | | ended | | ended |
| | | 10/31/13 | | 10/31/12 | | 10/31/11 | | 10/31/10 | | 10/31/09 |
| | | | | | | | | | | |
| Net Asset Value, Beginning of Year | | | $ | 12.05 | | | | $ | 10.76 | | | | $ | 10.74 | | | | $ | 9.84 | | | | $ | 10.87 | |
| | | | | | | | | | | | | | | | | | | | | |
| Change in net assets from operations: | | | | | | | | | | | | | | | | | | | | | | | | | |
Net investment income | | | | 0.21 | | | | | 0.14 | | | | | 0.12 | | | | | 0.08 | | | | | 0.08 | (a) |
Net realized and unrealized gain from investments | | | | 1.15 | | | | | 1.27 | | | | | 0.07 | (b) | | | | 0.82 | | | | | 1.95 | |
| | | | | | | | | | | | | | | | | | | | | |
| Total from investment activities | | | | 1.36 | | | | | 1.41 | | | | | 0.19 | | | | | 0.90 | | | | | 2.03 | |
| | | | | | | | | | | | | | | | | | | | | |
| Distributions | | | | | | | | | | | | | | | | | | | | | | | | | |
Net investment income | | | | (0.16 | ) | | | | (0.12 | ) | | | | (0.17 | ) | | | | — | | | | | (1.80 | ) |
Net realized gains | | | | — | | | | | — | | | | | — | | | | | — | | | | | (1.26 | ) |
| | | | | | | | | | | | | | | | | | | | | |
| Total distributions | | | | (0.16 | ) | | | | (0.12 | ) | | | | (0.17 | ) | �� | | | — | | | | | (3.06 | ) |
| | | | | | | | | | | | | | | | | | | | | |
| Redemption fees | | | | — | (c) | | | | — | (c) | | | | — | (c) | | | | — | (c) | | | | — | (c) |
| | | | | | | | | | | | | | | | | | | | | |
| Net Asset Value, End of Year | | | $ | 13.25 | | | | $ | 12.05 | | | | $ | 10.76 | | | | $ | 10.74 | | | | $ | 9.84 | |
| | | | | | | | | | | | | | | | | | | | | |
| Total return | | | | 11.40 | % | | | | 13.31 | % | | | | 1.85 | % | | | | 9.15 | % | | | | 29.09 | % |
| | | | | | | | | | | | | | | | | | | | | |
| Net assets at end of year (000’s) | | | $ | 23,766 | | | | $ | 22,347 | | | | $ | 21,412 | | | | $ | 24,975 | | | | $ | 28,975 | |
| Ratios/Supplemental Data: | | | | | | | | | | | | | | | | | | | | | | | | | |
Ratio of net expenses to average net assets | | | | 3.17 | % | | | | 3.32 | % | | | | 3.08 | % | | | | 3.24 | % | | | | 3.59 | % |
Ratio of net investment income to average net assets | | | | 1.59 | % | | | | 1.26 | % | | | | 1.20 | % | | | | 1.05 | % | | | | 0.95 | % |
| Portfolio turnover rate | | | | 18 | % | | | | 8 | % | | | | 22 | % | | | | 12 | % | | | | 34 | % |
| (a) | | Calculated using the average shares method. |
| (b) | | The amount of net gain from securities (both realized and unrealized) per share, does not accord with the amounts reported in the Statements of Operations due to the timing of purchases and redemptions of Fund shares during the year. |
| (c) | | Value is less than $0.005 per share. |
| See accompanying notes to financial statements. |
|
| 32 |
C O M M O N W E A L T H
INTERNATIONAL SERIES TRUST | ANNUAL REPORT 2013 |
FINANCIAL HIGHLIGHTS
Selected data for a share outstanding throughout each of the periods indicated:
| | | For the year | | | | |
| | | ended | | For the period |
| | | 10/31/13 | | ended 10/31/12(a) |
| | | | | |
| Net Asset Value, Beginning of Period | | | $10.23 | | | | $10.00 | |
| | | | | | | | | |
| Change in net assets from operations: | | | | | | | | |
Net investment income | | | 0.22 | | | | 0.08 | |
Net realized and unrealized gain from investments | | | 0.09 | | | | 0.15 | |
| | | | | | | | | |
| Total from investment activities | | | 0.31 | | | | 0.23 | |
| | | | | | | | | |
| Distributions | | | | | | | | |
Net investment income | | | (0.16 | ) | | | — | |
| | | | | | | | | |
| Total distributions | | | (0.16 | ) | | | — | |
| | | | | | | | | |
| Redemption fees | | | — | (b) | | | — | |
| | | | | | | | | |
| Net Asset Value, End of Period | | | $10.38 | | | | $10.23 | |
| | | | | | | | | |
| Total return | | | 3.02 | % | | | 2.30 | %(c) |
| | | | | | | | | |
| Net assets at end of year (000’s) | | | $2,099 | | | | $1,356 | |
| Ratios/Supplemental Data: | | | | | | | | |
| Ratio of net expenses to average net assets | | | — | %(d) | | | 0.70 | %(e)(f) |
| Ratio of gross expenses before reimbursement | | | 6.13 | % | | | 8.32 | %(e) |
| Ratio of net investment income to average net assets | | | 2.28 | % | | | 1.32 | %(e) |
| Portfolio turnover rate | | | 7 | % | | | — | %(c) |
| (a) | Reflects operations for the period from November 7, 2011 (inception date) to October 31, 2012. |
| (b) | Value is less than $0.005 per share. |
| (c) | Not annualized for periods less than one year. |
| (d) | The ratio of net expenses are the combined result of $22,542 in contractual waivers representing (1.25)% and $88,266 in voluntary reimbursements representing (4.88)%. Please refer to Note 4, Related Party Transactions and Other Arrangements, in the Notes to Financial Statements. |
| (e) | Annualized for periods less than one year. |
| (f) | The ratio of net expenses are the combined result of $9,801 in contractual waivers representing (1.25)% and $49,962 in voluntary reimbursements representing (6.37)%. Please refer to Note 4, Related Party Transactions and Other Arrangements, in the Notes to Financial Statements. |
| See accompanying notes to financial statements. |
|
| 33 |
C O M M O N W E A L T H
INTERNATIONAL SERIES TRUST | ANNUAL REPORT 2013 |
FINANCIAL HIGHLIGHTS
Selected data for a share outstanding throughout each of the years indicated:
| | | For the year | | For the year | | For the year | | For the year | | For the year |
| | | ended | | ended | | ended | | ended | | ended |
| | | 10/31/13 | | 10/31/12 | | 10/31/11 | | 10/31/10 | | 10/31/09 |
| | | | | | | | | | | |
| Net Asset Value, Beginning of Year | | | $ 2.54 | | | | $ 2.70 | | | | $ 2.80 | | | | $ 2.69 | | | | $ 2.47 | |
| | | | | | | | | | | | | | | | | | | | | |
| Change in net assets from operations: | | | | | | | | | | | | | | | | | | | | |
Net investment loss | | | (0.10 | ) | | | (0.07 | ) | | | (0.09 | ) | | | (0.07 | ) | | | (0.06 | )(a) |
Net realized and unrealized gain (loss) from investments | | | 0.64 | | | | (0.09 | ) | | | (0.01 | )(b) | | | 0.18 | | | | 0.28 | |
| | | | | | | | | | | | | | | | | | | | | |
| Total from investment activities | | | 0.54 | | | | (0.16 | ) | | | (0.10 | ) | | | 0.11 | | | | 0.22 | |
| | | | | | | | | | | | | | | | | | | | | |
| Redemption fees | | | — | (c) | | | — | (c) | | | — | (c) | | | — | (c) | | | — | (c) |
| | | | | | | | | | | | | | | | | | | | | |
| Net Asset Value, End of Year | | | $ 3.08 | | | | $ 2.54 | | | | $ 2.70 | | | | $ 2.80 | | | | $ 2.69 | |
| | | | | | | | | | | | | | | | | | | | | |
| Total return | | | 21.26 | % | | | (5.93 | )% | | | (3.57 | )% | | | 4.09 | % | | | 8.91 | % |
| | | | | | | | | | | | | | | | | | | | | |
| Net assets at end of year (000’s) | | | $4,444 | | | | $4,017 | | | | $3,794 | | | | $4,017 | | | | $4,432 | |
| Ratios/Supplemental Data: | | | | | | | | | | | | | | | | | | | | |
Ratio of net expenses to average net assets | | | 4.40 | % | | | 4.84 | % | | | 3.91 | % | | | 4.24 | % | | | 4.56 | % |
Ratio of net investment loss to average net assets | | | (3.03 | )% | | | (3.01 | )% | | | (2.52 | )% | | | (2.45 | )% | | | (2.58 | )% |
| Portfolio turnover rate | | | 23 | % | | | 20 | % | | | 62 | % | | | 10 | % | | | 30 | % |
| (a) | Calculated using the average shares method. |
| (b) | The amount of net loss from securities (both realized and unrealized) per share, does not accord with the amounts reported in the Statements of Operations due to the timing of purchases and redemptions of Fund shares during the year. |
| (c) | Value is less than $0.005 per share. |
| See accompanying notes to financial statements. |
|
| 34 |
C O M M O N W E A L T H
INTERNATIONAL SERIES TRUST | ANNUAL REPORT 2013 |
FINANCIAL HIGHLIGHTS
Selected data for a share outstanding throughout each of the years indicated:
| | | For the year | | For the year | | For the year | | For the year | | For the year |
| | | ended | | ended | | ended | | ended | | ended |
| | | 10/31/13 | | 10/31/12 | | 10/31/11 | | 10/31/10 | | 10/31/09 |
| | | | | | | | | | | |
| Net Asset Value, Beginning of Year | | | $ 14.13 | | | | $ 15.24 | | | | $ 15.44 | | | | $ 13.40 | | | | $ 11.16 | |
| | | | | | | | | | | | | | | | | | | | | |
| Change in net assets from operations: | | | | | | | | | | | | | | | | | | | | |
Net investment loss | | | (0.12 | ) | | | (0.12 | ) | | | (0.07 | ) | | | (0.12 | ) | | | (0.10 | )(a) |
Net realized and unrealized gain (loss) from investments | | | 2.99 | | | | 0.54 | | | | (0.13 | )(b) | | | 2.16 | | | | 2.34 | |
| | | | | | | | | | | | | | | | | | | | | |
| Total from investment activities | | | 2.87 | | | | 0.42 | | | | (0.20 | ) | | | 2.04 | | | | 2.24 | |
| | | | | | | | | | | | | | | | | | | | | |
Net realized gains | | | — | | | | (1.53 | ) | | | — | | | | — | | | | — | |
| | | | | | | | | | | | | | | | | | | | | |
| Total distributions | | | — | | | | (1.53 | ) | | | — | | | | — | | | | — | |
| | | | | | | | | | | | | | | | | | | | | |
| Redemption fees | | | — | (c) | | | — | (c) | | | — | (c) | | | — | (c) | | | — | (c) |
| | | | | | | | | | | | | | | | | | | | | |
| Net Asset Value, End of Year | | | $ 17.00 | | | | $ 14.13 | | | | $ 15.24 | | | | $ 15.44 | | | | $ 13.40 | |
| | | | | | | | | | | | | | | | | | | | | |
| Total return | | | 20.31 | % | | | 3.47 | % | | | (1.30 | )% | | | 15.22 | % | | | 20.07 | % |
| | | | | | | | | | | | | | | | | | | | | |
| Net assets at end of year (000’s) | | | $15,959 | | | | $13,311 | | | | $13,285 | | | | $16,574 | | | | $14,953 | |
| Ratios/Supplemental Data: | | | | | | | | | | | | | | | | | | | | |
Ratio of net expenses to average net assets | | | 3.12 | % | | | 3.31 | % | | | 3.05 | % | | | 3.02 | % | | | 3.40 | % |
Ratio of net investment loss to average net assets | | | (0.81 | )% | | | (0.85 | )% | | | (0.38 | )% | | | (0.85 | )% | | | (0.92 | )% |
| Portfolio turnover rate | | | 14 | % | | | 11 | % | | | 18 | % | | | 10 | % | | | 12 | % |
| (a) | Calculated using the average shares method. |
| (b) | The amount of net loss from securities (both realized and unrealized) per share, does not accord with the amounts reported in the Statements of Operations due to the timing of purchases and redemptions of Fund shares during the year. |
| (c) | Value is less than $0.005 per share. |
| See accompanying notes to financial statements. |
|
| 35 |
C O M M O N W E A L T H
INTERNATIONAL SERIES TRUST | ANNUAL REPORT 2013 |
FINANCIAL HIGHLIGHTS
| COMMONWEALTH REAL ESTATE SECURITIES FUND |
Selected data for a share outstanding throughout each of the years indicated:
| | | For the year | | For the year | | For the year | | For the year | | For the year |
| | | ended | | ended | | ended | | ended | | ended |
| | | 10/31/13 | | 10/31/12 | | 10/31/11 | | 10/31/10 | | 10/31/09 |
| | | | | | | | | | | |
| Net Asset Value, Beginning of Year | | | $11.27 | | | | $ 9.72 | | | | $10.09 | | | | $ 8.42 | | | | $ 7.56 | |
| | | | | | | | | | | | | | | | | | | | | |
| Change in net assets from operations: | | | | | | | | | | | | | | | | | | | | |
Net investment loss | | | (0.02 | ) | | | (0.13 | ) | | | (0.16 | ) | | | (0.09 | ) | | | (0.01 | )(a) |
Net realized and unrealized gain (loss) from investments | | | 1.30 | | | | 1.68 | | | | (0.21 | )(b) | | | 1.76 | | | | 0.87 | |
| | | | | | | | | | | | | | | | | | | | | |
| Total from investment activities | | | 1.28 | | | | 1.55 | | | | (0.37 | ) | | | 1.67 | | | | 0.86 | |
| | | | | | | | | | | | | | | | | | | | | |
| Redemption fees | | | — | (c) | | | — | (c) | | | — | (c) | | | — | | | | — | |
| | | | | | | | | | | | | | | | | | | | | |
| Net Asset Value, End of Year | | | $12.55 | | | | $11.27 | | | | $ 9.72 | | | | $10.09 | | | | $ 8.42 | |
| | | | | | | | | | | | | | | | | | | | | |
| Total return | | | 11.36 | % | | | 15.95 | % | | | (3.67 | )% | | | 19.83 | % | | | 11.38 | % |
| | | | | | | | | | | | | | | | | | | | | |
| Net assets at end of year (000’s) | | | $8,362 | | | | $7,824 | | | | $7,294 | | | | $9,063 | | | | $8,189 | |
| Ratios/Supplemental Data: | | | | | | | | | | | | | | | | | | | | |
Ratio of net expenses to average net assets | | | 3.33 | % | | | 3.53 | % | | | 3.29 | % | | | 3.22 | % | | | 3.71 | % |
Ratio of net investment loss to average net assets | | | (0.18 | )% | | | (1.20 | )% | | | (1.48 | )% | | | (0.89 | )% | | | (0.11 | )% |
| Portfolio turnover rate | | | 4 | % | | | 5 | % | | | 7 | % | | | 21 | % | | | 5 | % |
| (a) | Calculated using the average shares method. |
| (b) | The amount of net gain from securities (both realized and unrealized) per share, does not accord with the amounts reported in the Statements of Operations due to the timing of purchases and redemptions of Fund shares during the year. |
| (c) | Value is less than $0.005 per share. |
| See accompanying notes to financial statements. |
|
| 36 |
C O M M O N W E A L T H
INTERNATIONAL SERIES TRUST | ANNUAL REPORT 2013 |
| NOTES TO FINANCIAL STATEMENTS – October 31, 2013 |
| |
Note 1 - Organization
Commonwealth International Series Trust (the “Trust”) was organized as a Massachusetts business trust on May 8, 1986, and is registered under the Investment Company Act of 1940, as amended (the “Act”), as a diversified open-end management investment company. The Trust currently consists of .ve diversified series: the Commonwealth Australia/New Zealand Fund (the “Australia/New Zealand Fund”), the Africa Fund (the “Africa Fund”), the Commonwealth Japan Fund (the “Japan Fund”), the Commonwealth Global Fund (the “Global Fund”) and the Commonwealth Real Estate Securities Fund (the “Real Estate Securities Fund”) (each a “Fund” and collectively the “Funds”).
Note 2 - Investment Objectives
Each Fund’s investment objective is to provide long-term capital appreciation and current income. Under normal market conditions, each Fund (other than the Global Fund) invests at least 80% of its assets in the country or asset class specified in its name (i.e. Australia/New Zealand, Africa, Japan or Real Estate).
Note 3 - Significant Accounting Policies
The following is a summary of significant accounting policies consistently followed by the Trust in the preparation of financial statements for the Funds. The policies are in conformity with accounting principles generally accepted in the United States of America (“GAAP”).
A) Valuation of Securities - Each Fund’s assets are valued normally on the basis of market quotations or official closing prices or, if there is no recent last sales price available, reference is made to the last current bid and ask quotation in the principal market in which the securities are normally traded. Equity securities that are traded on the NASDAQ National Market System, for which quotations are readily available, are valued at the official closing price. Debt securities are priced either by using a market quotation or an independent pricing service. The pricing service may use one or more pricing models. Generally, debt instruments with maturities of less than 60 days (short-term debt) are valued at amortized cost or original cost plus interest, which approximates current value. Investments in open-end investment companies are valued at net asset value. If Fund management determines that market quotations or official closing prices are not readily available or do not accurately reflect the fair value for a security, the fair value of the security or securities will be determined in accordance with procedures established by the Board of Trustees (the “Board”). Fair value prices are generally provided by an independent fair value pricing service. The Funds have instituted a policy whereby the value of certain equity securities listed or traded on foreign security exchanges may be valued by an independent fair value pricing service on any day when certain conditions are met. The Australia/New Zealand Fund, Africa Fund and Japan Fund have retained an independent fair value pricing service to assist in the fair valuing of these foreign securities. The service utilizes statistical data based on historical performance of securities, markets, and other data in developing factors used to estimate a fair value. In the Australia/New Zealand Fund and Japan Fund, the measure is based on a comparison between the S&P 500 Futures, Tokyo close to NewYork close. In the Africa Fund, the measure is based on a comparison between the S&P 500 Futures, London close to New York close.
B) Fair Value Measurements - The Funds’ investments have been categorized by tiers dependent upon the various “inputs” used to determine the fair value of the Funds’ investments. These inputs are summarized in the three broad levels listed below:
| • | | Level 1 - quoted prices in active markets for identical assets. |
| • | | Level 2 - other significant observable inputs (including quoted prices for similar securities, interest rates, prepayments speeds, credit risk, etc.). |
| • | | Level 3 - significant unobservable inputs (including management’s own assumptions in determining the fair value of investments). |
The Funds have adopted Accounting Standards Update No. 2011-04, Fair Value Measurements (Topic 820) - Amendments to Achieve Common Fair Value Measurement and Disclosure Requirements in U.S. GAAP and International Financial Reporting Standards (’’IFRS’’) which amends Fair Value Measurements and Disclosures to establish common requirements for measuring fair value and for disclosing information about fair value measurements in accordance with U.S. GAAP and IFRS. Enhanced disclosure is required to detail any transfers into and out of Level 1 and Level 2 measurements and Level 2 and Level 3 measurements and the reason for the transfers.
C O M M O N W E A L T H
INTERNATIONAL SERIES TRUST | ANNUAL REPORT 2013 |
| NOTES TO FINANCIAL STATEMENTS – October 31, 2013 (Continued) |
| |
A description of the valuation techniques applied to the Funds’ major categories of assets and liabilities measured at fair value on a recurring basis follows:
Common stocks, preferred stocks, exchange traded funds and short term investments. Securities traded on a national exchange (or reported on the NASDAQ national market) are stated at the last reported sales price on the day of valuation. To the extent these securities are actively traded and valuation adjustments are not applied, they are generally categorized in Level 1 of the fair value hierarchy. Investments in other open-end registered investment companies are valued at net asset value. Short term investments may be valued using amortized cost which approximates fair value. Securities traded on inactive markets, valued by reference to similar instruments or whose inputs are observable and timely would be categorized in Level 2 of the fair value hierarchy.
Corporate and Sovereign Bonds. The fair value of corporate bonds may be estimated using recently executed transactions, market price quotations (where observable), bond spreads, and/or credit default swap spreads adjusted for any basis difference between cash and derivative instruments. Domestically held corporate bonds are generally categorized in Level 2 of the fair value hierarchy; in instances where prices, spreads, or any of the other aforementioned key inputs are unobservable, they would be categorized in Level 3 of the fair value hierarchy.
Written/Purchased options. Listed derivatives that are actively traded are valued based on quoted prices from the exchange and are generally categorized in Level 1 of the fair value hierarchy.
The inputs or methodology used for valuing securities are not necessarily an indication of the risk associated with investing in those securities.
C O M M O N W E A L T H
INTERNATIONAL SERIES TRUST | ANNUAL REPORT 2013 |
| NOTES TO FINANCIAL STATEMENTS – October 31, 2013 (Continued) |
| |
The following is a summary of the inputs used to value the Funds’ net assets as of October 31, 2013:
| | | Australia/New Zealand Fund |
| | | |
| | | | Level 1 | | | Level 2 | | | Level 3 | | | Total** | |
| | | |
| Security Type | | | | | | | | | | | | | | | | | |
Common Stocks* | | | $ | 19,810,155 | | | $ | 2,059,068 | | | $ | — | | | $ | 21,869,223 | |
Preferred Stocks* | | | | 639,981 | | | | — | | | | — | | | | 639,981 | |
Corporate Bonds | | | | 749,443 | | | | — | | | | — | | | | 749,443 | |
Short Term Investments | | | | 6,088 | | | | — | | | | — | | | | 6,088 | |
| | | |
| Total | | | $ | 21,205,667 | | | $ | 2,059,068 | | | $ | — | | | $ | 23,264,735 | |
| | | |
| | | | | | | | | | | | | | | | | | |
| | | Africa Fund |
| | | |
| | | | Level 1 | | | Level 2 | | | Level 3 | | | Total** | |
| | | |
| Security Type | | | | | | | | | | | | | | | | | |
Common Stocks* | | | $ | 1,282,998 | | | $ | — | | | $ | — | | | $ | 1,282,998 | |
Exchange Traded Funds | | | | 559,016 | | | | — | | | | — | | | | 559,016 | |
Sovereign Bonds | | | | 20,939 | | | | — | | | | — | | | | 20,939 | |
Short Term Investments | | | | 218,104 | | | | — | | | | — | | | | 218,104 | |
| | | |
| Total | | | $ | 2,081,057 | | | $ | — | | | $ | — | | | $ | 2,081,057 | |
| | | |
| | | | | | | | | | | | | | | | | | |
| | | Japan Fund |
| | | |
| | | | Level 1 | | | Level 2 | | | Level 3 | | | Total** | |
| | | |
| Security Type | | | | | | | | | | | | | | | | | |
Common Stocks* | | | $ | 4,085,316 | | | $ | 31,201 | | | $ | — | | | $ | 4,116,517 | |
Short Term Investments | | | | 320,205 | | | | — | | | | — | | | | 320,205 | |
| | | |
| Total | | | $ | 4,405,521 | | | $ | 31,201 | | | $ | — | | | $ | 4,436,722 | |
| | | |
| | | | | | | | | | | | | | | | | | |
| | | Global Fund |
| | | |
| | | | Level 1 | | | Level 2 | | | Level 3 | | | Total** | |
| | | |
| Security Type | | | | | | | | | | | | | | | | | |
Common Stocks* | | | $ | 14,186,490 | | | $ | — | | | $ | — | | | $ | 14,186,490 | |
Preferred Stocks* | | | | 559,720 | | | | — | | | | — | | | | 559,720 | |
Call Options | | | | 32,320 | | | | — | | | | — | | | | 32,320 | |
Short Term Investments | | | | 1,283,110 | | | | — | | | | — | | | | 1,283,110 | |
| | | |
| Total | | | $ | 16,061,640 | | | $ | — | | | $ | — | | | $ | 16,061,640 | |
| | | |
| | | | | | | | | | | | | | | | | | |
| | | Real Estate Securities Fund |
| | | |
| | | | Level 1 | | | Level 2 | | | Level 3 | | | Total** | |
| | | |
| Security Type | | | | | | | | | | | | | | | | | |
Common Stocks* | | | $ | 8,115,188 | | | $ | — | | | $ | — | | | $ | 8,115,188 | |
Engineering & Construction | | | | — | | | | 84,599 | | | | — | | | | 84,599 | |
Exchange Traded Funds | | | | 183,600 | | | | — | | | | — | | | | 183,600 | |
Short Term Investments | | | | 37,043 | | | | — | | | | — | | | | 37,043 | |
| | | |
| Total | | | $ | 8,335,831 | | | $ | 84,599 | | | $ | — | | | $ | 8,420,430 | |
| | | |
| * | | All sub-categories within Common Stocks and Preferred Stocks represent Level 1 evaluation status. For a detailed breakout by industry or country, please refer to the Schedules of Investments. |
| ** | | There were no Level 3 securities held as of October 31, 2013. |
39
C O M M O N W E A L T H
INTERNATIONAL SERIES TRUST | ANNUAL REPORT 2013 |
| NOTES TO FINANCIAL STATEMENTS – October 31, 2013 (Continued) |
| |
The following is a summary of other financial instruments that are derivative instruments not reflected in the Schedules of Investments, such as futures, written options, forwards and swap contracts, which are shown below at the net unrealized appreciation/depreciation on the investments. Please refer to Note 7 — Financial Instruments with Off-Balance Sheet Risk for additional information.
| | | Unrealized Appreciation on Other Financial Instruments |
| | | |
| Fund | | | Level 1 | | | Level 2 | | | Level 3 | | | Total | |
| |
| Global Fund | | | | | | | | | | | | | | | | | |
Written Options | | | $ | — | | | $ | 3,958 | | | $ | — | | | $ | 3,958 | |
| Real Estate Securities Fund | | | | | | | | | | | | | | | | | |
Written Options | | | $ | — | | | $ | 739 | | | $ | — | | | $ | 739 | |
| | | |
It is the Funds’ policy to recognize transfers into and out of all Levels at the end of the reporting period. As described in Note 3 – Significant Accounting Policies under A) Valuation of Securities, certain equity securities listed or traded on foreign exchanges may be valued by an independent fair value pricing service on any day when certain conditions are met. During the year ended October 31, 2013, there were several instances where these conditions were met, and as a result, foreign securities in the Australia/New Zealand Fund, Africa Fund and the Japan Fund were fair valued. On October 31, 2012 and October 31, 2013, conditions were not met requiring securities to be fair valued and therefore, categorized in Level 1.
The Commonwealth Australia/New Zealand Fund and Commonwealth Japan Fund held certain equity securities at October 31, 2012, which received a last trade price and were categorized as a Level 1. In the absence of trading activity on October 31, 2013, these securities were valued at the last trade price and categorized as Level 2. The Commonwealth Global Fund held an American Depositary Receipt at October 31, 2012. As a result of no trading activity, the 3rd party pricing service provided an evaluated price on October 31, 2012 and the security was categorized as Level 2. On October 31, 2013, the American Depositary Receipt received a last trade price and was categorized as a Level 1. The Commonwealth Real Estate Securities Fund held an American Depositary Receipt at October 31, 2012, which received a last trade price and was categorized as a Level 1. As a result of no trading activity, the 3rd party pricing service provided an evaluated price on October 31, 2013 and the security was categorized as Level 2. The following is a reconciliation of transfers between category levels from October 31, 2012 to October 31, 2013:
| | | Australia/ | | | | | | | | | | | | Real Estate |
| | | New Zealand Fund | | Japan Fund | | Global Fund | | Securities Fund |
| | | |
| Transfers into Level 1 | | | $ | — | | | | $ | — | | | | $ | 343,822 | | | | $ | — | |
| Transfers out of Level 1 | | | $ | (2,059,068 | ) | | | $ | (31,201 | ) | | | $ | — | | | | $ | (84,599 | ) |
| | | | | | | | | | | | | | | | | |
| Net Transfers in (out) of Level 1 | | | $ | (2,059,068 | ) | | | $ | (31,201 | ) | | | $ | 343,822 | | | | $ | (84,599 | ) |
| | | | | | | | | | | | | | | | | |
| | | | | | | | | | | | | | | | | | | | | |
| Transfers into Level 2 | | | $ | 2,059,068 | | | | $ | 31,201 | | | | $ | — | | | | $ | 84,599 | |
| Transfers out of Level 2 | | | $ | — | | | | $ | — | | | | $ | (343,822 | ) | | | $ | — | |
| | | | | | | | | | | | | | | | | |
| Net Transfers in (out) of Level 2 | | | $ | 2,059,068 | | | | $ | 31,201 | | | | $ | (343,822 | ) | | | $ | 84,599 | |
| | | | | | | | | | | | | | | | | |
C) Currency Translation – For purposes of determining each Fund’s net asset value, all assets and liabilities initially expressed in foreign currency values are converted into U.S. dollar values at the prevailing market rate on each U.S. business day. The cost of securities is determined by using an exchange rate provided by an independent third party. Income is translated at approximate rates prevailing when accrued. The Funds do not isolate that portion of gains and losses on investments which is due to changes in foreign exchange rates from that which is due to changes in the market prices of the investments. Such fluctuations are included with the net realized and unrealized gains and losses from investments.
D) Allocations of Expenses – Expenses directly attributable to a Fund are charged directly to that Fund, while expenses which are attributable to more than one Fund, or the Trust, are allocated among the respective Funds based upon relative net assets or some other reasonable method.
E) Accounting for Investments – Security transactions are accounted for on the trade date. Realized gains and losses on security transactions are based on the identified cost basis for both financial statement and Federal income tax purposes. Dividend income and distributions to shareholders are recorded on the ex-dividend date or as soon as known if after the ex-dividend date. Discounts and premiums on bonds purchased are amortized over the life of the bonds (which may include maturity or call date). Interest income and estimated expenses are accrued daily.
F) Federal Income Taxes – It is each Fund’s policy to comply with the requirements of SubchapterMof the Internal Revenue Code that are applicable to regulated investment companies and to distribute substantially all investment company taxable income and net capital gain to shareholders in a manner which results in no tax cost to the Funds. Therefore, no federal income tax provision is required.
40
C O M M O N W E A L T H
INTERNATIONAL SERIES TRUST | ANNUAL REPORT 2013 |
| NOTES TO FINANCIAL STATEMENTS – October 31, 2013 (Continued) |
| |
Dividends or interest on foreign securities may be subject to the withholding of the country of domicile’s income tax by tax treaty provisions or otherwise. Generally, there are no foreign taxes applicable to the Funds’ capital gains realized on foreign securities in their country of domicile.
Accounting for Uncertainty in Income Taxes (the “Income Tax Statement”) requires an evaluation of tax positions taken (or expected to be taken) in the course of preparing a Fund’s tax returns to determine whether these positions meet a “more-likely-than-not” standard that, based on the technical merits, have a more than fifty percent likelihood of being sustained by a taxing authority upon examination. A tax position that meets the “more-likely-than-not” recognition threshold is measured to determine the amount of benefit to recognize in the financial statements. The Funds recognize interest and penalties, if any, related to unrecognized tax benefits as income tax expense in the Statements of Operations.
The Income Tax Statement requires management of the Funds to analyze all open tax years, fiscal years 2010 – 2013 as defined by IRS statute of limitations for all major jurisdictions, including federal tax authorities and certain state tax authorities. As of and during the year ended October 31, 2013, the Funds did not have a liability for any unrecognized tax benefits. The Funds have no examinations in progress and are not aware of any tax positions for which it is reasonably possible that the total amounts of unrecognized tax benefits will significantly change in the next twelve months.
G) Distributions to Shareholders – The Funds distribute net investment income, if any, and net realized gains (net of any capital loss carryovers) annually. Income and capital gain distributions are determined in accordance with income tax regulations which may differ from GAAP. These differences are primarily due to differing treatments for foreign currency transactions and deferrals of certain losses.
H) Redemption Fees – Redemption fees are applicable to certain redemptions of shares within fourteen calendar days of purchase. The redemption fee is imposed to discourage abusive trading activity, which can have disruptive effects on the Funds’ portfolio management and can increase the Funds’ expenses. The redemption fees are intended to offset, at least partially, portfolio transaction and administrative costs associated with short-term trading. The shareholder will be charged a fee equal to 2.00% of the amount redeemed and will be charged when shares are sold, exchanged or involuntarily redeemed. In determining the applicability of the redemption fee, shares held for the longest period of time will be treated as being sold first and shares held for the shortest period of time as being sold last. For the year ended October 31, 2013, the Australia/New Zealand Fund, Africa Fund, Japan Fund, Global Fund, and Real Estate Fund had contributions to capital due to redemption fees in the amount of $259, $10, $3, $4 and $26, respectively.
I) Option Accounting Principles – A Fund may purchase or write put or call options on futures contracts, individual securities, currencies or stock indices to hedge against fluctuations in securities prices and currency exchange rates and to adjust its risk exposure relative to the benchmark. The Fund may use these derivatives for any purpose consistent with its investment objective, such as hedging, obtaining market exposure, and generating premium income.
When a Fund writes an option, the premium received is recorded as a liability. Each day the option contract liability is valued in accordance with the procedures for security valuation discussed above. When an offsetting option is purchased (a closing transaction) or the option contract expires, the Fund realizes a gain or loss and the liability related to such option contract is eliminated. When a call option is exercised, the Fund realizes a gain or loss from the sale of the underlying security and the proceeds of the sale are increased by the premiums originally received.
When a Fund purchases an option, the premium paid is recorded as an asset. Each day the option contract is valued in accordance with the procedures for security valuation discussed above. When an offsetting option is written (a closing transaction) or the option contract expires, the Fund realizes a gain or loss and the asset representing such option contract is eliminated. When a call option is exercised, the Fund purchases the underlying security and the cost basis of such purchase is increased by the premium originally paid.
J) Forward Currency Contracts – Forward currency transactions may be undertaken to hedge against possible variations in the foreign exchange rates between the U.S. dollar and foreign currencies. A forward currency contract is an agreement between two parties to buy or sell a currency at a set price on a future date. Forward contracts are marked-to-market daily and the change in the market value is recorded by the Fund as an unrealized gain or loss. When a contract is closed, the Fund records a realized gain or loss equal to the difference between the value of the contract at the time it was opened and the value at the time it was closed. The Funds could be exposed to risk if the counterparties are unable to meet the terms of the contracts or if the value of the currency changes unfavorably. Other risks of forward currency transactions include failing to achieve expected benefit, markets moving in a direction that the Funds did not expect, a Fund’s inability to be able to close out its position in the hedging instrument, and political and social unrest and the possibility of negative governmental actions. As of October 31, 2013, the Funds held no foreign currency contracts.
41
C O M M O N W E A L T H
INTERNATIONAL SERIES TRUST | ANNUAL REPORT 2013 |
| NOTES TO FINANCIAL STATEMENTS – October 31, 2013 (Continued) |
| |
K) Repurchase Agreements – In connection with transactions in repurchase agreements, it is the Funds’ policy that their custodian bank takes possession of the underlying collateral securities, the fair value of which must be equal to the principal amount of the repurchase agreement including accrued interest throughout the term of the repurchase agreement. If the seller defaults and the fair value of the collateral declines, realization of the collateral value by the Funds may be delayed or limited.
L) Use of Estimates – The preparation of the financial statements in conformity with GAAP requires management to make estimates and assumptions that affect the reported amounts of assets and liabilities and the disclosure of contingent assets and liabilities at the date of the financial statements and the reported amounts of increases and decreases in net assets from operations during the reporting period. Actual results could differ from those estimates and these differences could be material.
Note 4 – Related Party Transactions and Other Arrangements
A) Investment Advisor – The Trust, on behalf of each Fund, has retained FCA Corp. as the Funds’ investment advisor (the “Advisor”). Under each Fund’s Investment Advisory Agreement, the Advisor is paid a monthly fee (the “Management Fee”), calculated daily and payable monthly, equal to an annual rate of 0.75% of the average net assets of each Fund other than the Africa Fund for which it receives 1.25% of the average daily net assets of the Fund. The Advisor has contractually agreed to waive the Management Fee of 1.25% for the Africa Fund through February 28, 2014. The Advisor may not terminate this arrangement prior to February 28, 2014 unless the investment advisory agreement is terminated. The Africa Fund has agreed to repay the Advisor for amounts waived by the Advisor pursuant to the fee waiver agreement to the extent that such repayment occurs within three years of the date of any such waiver and such repayment does not cause the Africa Fund’s total fund operating expenses to exceed 3.30%. For the year ended October 31, 2013, the Advisor waived Management Fees in the Africa Fund in the amount of $22,542 which is subject to recoupment. For the year ended October 31, 2013, the Advisor chose to voluntarily reimburse beyond its contractual agreement in the Africa Fund in the amount of $88,266, an amount which is not subject to recoupment. As of October 31, 2013, the Africa Fund has $9,801 subject to recoupment through October 31, 2015 and an additional $22,542 through October 31, 2016.
Certain officers of the Trust are also officers of FCA.
B) Administration, Fund Accounting and Transfer Agent – UMB Fund Services, Inc. (“UMB”) serves as the administrator, transfer agent and fund accountant to the Funds. For these services UMB receives fees computed at an annual rate of the daily net assets of the Funds, subject to a minimum annual contractual fee. An officer of the Trust also is an employee of UMB, but is paid no fees directly by the Funds for serving as an officer of the Trust.
C) Distribution – UMB Distribution Services, LLC, serves as the principal underwriter for the shares of each Fund of the Trust and receives an annual contractual fee. UMB Distribution Services, LLC is an affiliate of UMB.
Each Fund has adopted a Service and Distribution Plan (each a “Plan”) pursuant to Rule 12b-1 under the Act, whereby up to 0.35% of the Fund’s assets may be used to reimburse the Distributor for costs and expenses incurred in connection with the distribution and marketing of shares of the Fund and the servicing of Fund shareholders. Distribution and marketing expenses include, among other things, printing of prospectuses, marketing literature, and costs of personnel involved with the promotion and distribution of the Fund’s shares. These amounts are disclosed on the Statements of Operations under Distribution fees. While the plans permit each Fund to pay up to 0.35% of its average daily net assets to reimburse for certain expenses in connection with the distribution of its shares, the Board of Trustees has currently authorized each Fund to pay out only 0.25% under its Plan. If the Trustees’ intention changes on this matter, the Funds will amend or supplement their prospectus. Out of the foregoing amount, each Fund is permitted to pay up to an aggregate of 0.25% of its average daily net assets to reimburse for certain shareholder services.
D) Legal Counsel – The Law Offices of John H. Lively and Associates, Inc., a member firm of The 1940 Act Law GroupTM, serves as legal counsel to the Trust. John H. Lively, Secretary of the Trust, is the owner of the Law Offices of John H. Lively &Associates, Inc., but he receives no special compensation from the Trust or the Funds for serving as an officer of the Trust.
42
C O M M O N W E A L T H
INTERNATIONAL SERIES TRUST | ANNUAL REPORT 2013 |
| NOTES TO FINANCIAL STATEMENTS – October 31, 2013 (Continued) |
| |
Note 5 – Investments in Affiliated Issuers
A company is considered an affiliate of a Fund under the 1940 Act if the Fund’s holdings in that company represent 5% or more of the outstanding voting shares of that company. The Australia/New Zealand Fund’s holding below is shown in its Schedule of Investments. Further detail on this holding during the year ended October 31, 2013 appears below:
| | | | | | | | | | | | | | | Change in | | | | | | Realized |
| | | Percentage of | | Shares | | Shares | | Value | | Cost of | | Cost of | | Appreciation/ | | Value | | Dividend | | Gain |
| Security Held | | Ownership | | 10/31/12 | | 10/31/13 | | 10/31/12 | | Purchases | | Sales | | Depreciation | | 10/31/13 | | Income | | (Loss) |
| |
| Mowbray Collectables Ltd. | | 7.36% | | 821,593 | | 821,593 | | $304,056 | | — | | — | | $35,249 | | $339,305 | | $15,397 | | $— |
| |
Note 6 – Purchases and Sales of Securities
Purchases and sales of investment securities (excluding short-term securities) by the Funds for the year ended October 31, 2013 were as follows:
| | | Purchases | | Sales | |
| |
| Australia/New Zealand Fund | | $ | 4,054,019 | | $ | 4,454,439 | |
| Africa Fund | | | 712,000 | | | 113,123 | |
| Japan Fund | | | 921,071 | | | 1,406,950 | |
| Global Fund | | | 1,962,015 | | | 2,436,960 | |
| Real Estate Securities Fund | | | 298,590 | | | 432,177 | |
| |
Note 7 – Financial Instruments with Off-Balance Sheet Risk
In the ordinary course of trading activities, certain of the Funds trade and hold certain fair-valued derivative contracts. Such contracts include forward currency contracts, where the Funds would be obligated to buy currency at specified prices, and written put and call options, where the Funds would be obligated to purchase or sell securities at specified prices (i.e., the options are exercised by the counterparties). The maximum payout for the put option contracts is limited to the number of contracts written and the related strike prices, respectively. The maximum payout for the written call option contracts is limited only by how high the underlying securities strike price rises. Maximum payout amounts could be offset by the subsequent sale, if any, of assets obtained via the execution of a payout event.
The financial instruments contain varying degrees of off-balance sheet risk whereby changes in the market value of securities underlying the financial instruments may be in excess of the amounts recognized in the Statements of Assets and Liabilities. A Fund, as writer of an option, bears the market risk of an unfavorable change in the price of the security underlying the written option. The risk associated with purchasing an option is that the Fund pays a premium whether or not the option is exercised. Additionally, each Fund bears the risk of loss of premium and change in market value should the counterparty not perform under the contract. A call option gives the holder the right to buy the underlying stock from the writer at a specified price within a fixed period of time. Therefore, the securities held by the Fund against which options are written may not be traded and are held in escrow by the custodian.
The following is a summary of the Commonwealth Global Fund’s & Commonwealth Real Estate Securities Fund’s written option activity:
| | | Global Fund | | Real Estate Securities Fund |
| |
| | | Number of | | Premiums | | Number of | | Premiums |
| Contracts | | Contracts | | Received | | Contracts | | Received |
| |
| Outstanding @ 10/31/2012 | | | — | | | $ | — | | | | — | | | $ | — | |
| Options written | | | 250 | | | | 123,288 | | | | 225 | | | | 50,099 | |
| Options expired | | | — | | | | — | | | | (45 | ) | | | (13,410 | ) |
| Options exercised | | | — | | | | — | | | | — | | | | — | |
| Options closed | | | (100 | ) | | | (23,300 | ) | | | — | | | | — | |
| | | |
| Outstanding @ 10/31/2013 | | | 150 | | | $ | 99,988 | | | | 180 | | | $ | 36,689 | |
| | | |
43
C O M M O N W E A L T H
INTERNATIONAL SERIES TRUST | ANNUAL REPORT 2013 |
| NOTES TO FINANCIAL STATEMENTS – October 31, 2013 (Continued) |
| |
At October 31, 2013, the Global Fund had the following outstanding written options:
| | | | | | | | | | | | | | | | | | | Unrealized |
| | | | | Expiration | | Exercise | | Number of | | | | | | Appreciation/ |
| Contracts | | Type | | Date | | Price | | Contracts | | Value | | (Depreciation) |
| |
| Interoil Corp. | | Call | | 1/18/2014 | | $ | 105.00 | | | | 40 | | | $ | 4,280 | | | $ | 32,249 | |
| Starwood Hotels and Resorts | | Call | | 1/17/2015 | | | 67.50 | | | | 50 | | | | 52,750 | | | | (15,350 | ) |
| Tenneco Inc. | | Call | | 1/18/2014 | | | 48.00 | | | | 60 | | | | 39,000 | | | | (12,941 | ) |
| | | | | | | | | | | |
| Total | | | | | | | | | | | 150 | | | $ | 96,030 | | | $ | 3,958 | |
| | | | | | | | | | | |
At October 31, 2013, the Real Estate Securities Fund had the following outstanding written options:
| | | | | | | | | | | | | | | | | | | Unrealized |
| | | | | Expiration | | Exercise | | Number of | | | | | | Appreciation/ |
| Contracts | | Type | | Date | | Price | | Contracts | | Value | | (Depreciation) |
| |
| Home Inns & Hotels Management, Inc. | | Call | | 3/22/2014 | | $ | 40.00 | | | | 85 | | | $ | 18,275 | | | $ | (3,995 | ) |
| MDC Holdings, Inc. | | Call | | 3/22/2014 | | | 32.00 | | | | 50 | | | | 8,000 | | | | 4,149 | |
| Toll Brothers, Inc. | | Call | | 3/22/2014 | | | 35.00 | | | | 45 | | | | 9,675 | | | | 585 | |
| | | | | | | | | | | |
| Total | | | | | | | | | | | 180 | | | $ | 35,950 | | | $ | 739 | |
| | | | | | | | | | | |
44
C O M M O N W E A L T H
INTERNATIONAL SERIES TRUST | ANNUAL REPORT 2013 |
| NOTES TO FINANCIAL STATEMENTS – October 31, 2013 (Continued) |
| |
Note 8 – Derivatives
The Funds’ use of derivatives for the year ended October 31, 2013 was limited to options, foreign exchange contracts and rights issuances. The derivative instruments outstanding as of October 31, 2013, as disclosed in the Statements of Assets and Liabilities, and the amounts of realized and changes in unrealized gains and losses on derivative instruments during the period, as disclosed in the Statements of Operations, serve as indicators of the volume of derivative activity for the Funds. Following is a summary of how these derivatives are treated in the financial statements and their impact on the Funds.
| | | Statements of Assets and Liabilities | | Statements of Operations |
| | | | | |
| | | Location of | | | | | | | | Amount of | | Amount of |
| | | Asset/Liability | | | | | | Location of Gain (Loss) on | | Realized | | Unrealized |
| Fund/Financial Instrument Type | | Derivatives | | Value | | Derivatives Recognized | | Gain (Loss) | | Gain (Loss) |
| |
| Australia/New Zealand Fund | | | | | | | | | | | | | | | | |
Rights Issuances | | | | | | | | Net realized gain from rights | | $ | 4,491 | | | $ | — | |
| | | | | | | | | | | | | | | | | |
| Africa Fund | | | | | | | | | | | | | | | | |
Rights Issuances | | | | | | | | Net change in unrealized | | | | | | | | |
| | | | | | | | | appreciation/(depreciation) | | | | | | | | |
| | | | | | | | | on rights | | | — | | | | (1,232 | ) |
| | | | | | | | | | | | | | | | | |
| Japan Fund | | | | | | | | | | | | | | | | |
Equity Contracts | | | | | | | | Net realized loss from | | | | | | | | |
| | | | | | | | | option contracts | | | (12,976 | ) | | | — | |
| | | | | | | | | Net change in unrealized | | | | | | | | |
| | | | | | | | | appreciation/(depreciation) on | | | | | | | | |
| | | | | | | | | option contracts | | | — | | | | 22,225 | |
| | | | | | | | | | | | | | | | | |
| Global Fund | | | | | | | | | | | | | | | | |
Equity Contracts | | Investments, at value | | | | | | Net realized gain from | | | | | | | | |
| | | (Purchase options) | | $ | 32,320 | | | option contracts | | | 34,753 | | | | — | |
| | | Payable for options written | | | | | | Net change in unrealized | | | | | | | | |
| | | (Written options) | | | | | | appreciation/(depreciation) on | | | | | | | | |
| | | | | | (96,030 | ) | | option contracts | | | — | | | | 9,198 | |
| | | | | | | | | | | | | | | | | |
| Real Estate Securities Fund | | | | | | | | | | | | | | | | |
Equity Contracts | | Payable for options written | | | | | | Net realized gain from | | | | | | | | |
| | | (Written options) | | | (35,950 | ) | | option contracts | | | 43,426 | | | | — | |
| | | | | | | | | Net change in unrealized | | | | | | | | |
| | | | | | | | | appreciation/(depreciation) on | | | | | | | | |
| | | | | | | | | option contracts | | | — | | | | 26,729 | |
45
C O M M O N W E A L T H
INTERNATIONAL SERIES TRUST | ANNUAL REPORT 2013 |
| NOTES TO FINANCIAL STATEMENTS – October 31, 2013 (Continued) |
| |
Note 9 – Tax Matters
As of October 31, 2013, the components of accumulated earnings (deficit) on a tax basis were as follows:
| | | Australia/New | | | | | | | | | | | | | | Real Estate |
| | | Zealand Fund | | Africa Fund | | Japan Fund | | Global Fund | | Securities Fund |
| |
Undistributed ordinary income | | $ | 386,570 | | | $ | 27,914 | | | $ | — | | | $ | — | | | $ | — | |
Accumulated undistributed long-term capital gains | | | 409,574 | | | | — | | | | — | | | | 598,544 | | | | — | |
| | | |
Tax accumulated earnings | | | 796,144 | | | | 27,914 | | | | — | | | | 598,544 | | | | — | |
Accumulated capital and other losses | | | — | | | | (7,088 | ) | | | (872,142 | ) | | | (90,445 | ) | | | (820,788 | ) |
Unrealized appreciation on investments | | | 6,335,168 | | | | 52,303 | | | | 1,298,432 | | | | 5,225,374 | | | | 2,004,451 | |
Unrealized appreciation on options written | | | — | | | | — | | | | — | | | | 3,958 | | | | 739 | |
Unrealized appreciation (depreciation) on foreign currency translations | | | (4,300 | ) | | | (1,320 | ) | | | 11 | | | | — | | | | — | |
| | | |
Total accumulated earnings | | $ | 7,127,012 | | | $ | 71,809 | | | $ | 426,301 | | | $ | 5,737,431 | | | $ | 1,184,402 | |
| | | |
At October 31, 2013, the gross unrealized appreciation (depreciation) on investments and cost of securities on a tax basis for federal income tax purposes were as follows:
| | | Australia/New | | | | | | | | | | | | | | Real Estate |
| | | Zealand Fund | | Africa Fund | | Japan Fund | | Global Fund | | Securities Fund |
| |
| Gross unrealized appreciation | | $ | 8,167,456 | | | $ | 168,784 | | | $ | 1,411,765 | | | $ | 5,299,371 | | | $ | 2,667,757 | |
| Gross unrealized depreciation | | | (1,832,288 | ) | | | (116,481 | ) | | | (113,333 | ) | | | (73,997 | ) | | | (663,306 | ) |
| | | |
| Net unrealized appreciation | | $ | 6,335,168 | | | $ | 52,303 | | | $ | 1,298,432 | | | $ | 5,225,374 | | | $ | 2,004,451 | |
| | | |
| Cost of investments | | $ | 16,929,567 | | | $ | 2,028,754 | | | $ | 3,138,290 | | | $ | 10,836,266 | | | $ | 6,415,979 | |
| | | |
The difference between cost amounts for financial statement and federal income tax purposes is due primarily to wash sale loss deferrals, partnership adjustments and passive foreign investment companies (“PFICs”).
The tax character of distributions paid during the tax periods ended October 31, 2013 and 2012 were as follows:
| | | Australia/New | | | | | | | | | | | | | | | | | | | | | | | | | | Real Estate |
| | | Zealand Fund | | Africa Fund | | Japan Fund | | Global Fund | | Securities Fund |
| |
| | | | | | | | | | | | | | | Period | | | | | | | | | | | | | | | | | | | | | | | | |
| | | Year Ended | | Year Ended | | Year Ended | | Ended | | Year Ended | | Year Ended | | Year Ended | | Year Ended | | Year Ended | | Year Ended |
| | | October 31, | | October 31, | | October 31, | | October 31, | | October 31, | | October 31, | | October 31, | | October 31, | | October 31, | | October 31, |
| | | 2013 | | 2012 | | 2013 | | 2012 | | 2013 | | 2012 | | 2013 | | 2012 | | 2013 | | 2012 |
| |
| Distributions paid from: | | | | | | | | | | | | | | | | | | | | | | | | | | | | | | | | | | | | | | | | |
Ordinary Income | | | $310,746 | | | | $231,695 | | | | $23,882 | | | | $— | | | | $— | | | | $— | | | | $— | | | $ | — | | | | $— | | | | $— | |
Net long-term | | | | | | | | | | | | | | | | | | | | | | | | | | | | | | | | | | | | | | | | |
capital gains | | | — | | | | — | | | | — | | | | — | | | | — | | | | — | | | | — | | | | 1,332,683 | | | | — | | | | — | |
| | | |
| Total distributions paid | | | $310,746 | | | | $231,695 | | | | $23,882 | | | | $— | | | | $— | | | | $— | | | | $— | | | $ | 1,332,683 | | | | $— | | | | $— | |
| | | |
46
C O M M O N W E A L T H
INTERNATIONAL SERIES TRUST | ANNUAL REPORT 2013 |
| NOTES TO FINANCIAL STATEMENTS – October 31, 2013 (Continued) |
| |
As of October 31, 2013, the following Funds had net capital loss carryforwards which are available to offset future net capital gains, if any:
| | | Africa Fund | | Japan Fund | | Real Estate Securities Fund | |
| |
| | | Short-term | | Long-term | | Short-term | | Short-term | | Long-term | |
| |
| For losses expiring October 31, | | | | | | | | | | | | | | | | | | | | | | | | | | |
2016 | | | $ | — | | | | $ | — | | | | $ | — | | | | $ | 169,716 | | | | $ | — | | |
2017 | | | | — | | | | | — | | | | | 765,972 | | | | | — | | | | | — | | |
2018 | | | | — | | | | | — | | | | | — | | | | | 493,840 | | | | | — | | |
| Non-Expiring | | | | 5,905 | | | | | 1,183 | | | | | — | | | | | — | | | | | 86,398 | | |
| | | |
| | | | $ | 5,905 | | | | $ | 1,183 | | | | $ | 765,972 | | | | $ | 663,556 | | | | $ | 86,398 | | |
| | | |
Capital loss carryovers are available to offset future realized capital gains and thereby reduce further taxable gain distributions. During the year ended October 31, 2013, the Australia/New Zealand Fund, Japan Fund, Global Fund and Real Estate Securities Fund utilized $180,946, $25,735, $20,337 and $70,175, respectively, of their capital loss carryovers.
As of October 31, 2013, the Japan, Global and Real Estate Securities Funds, respectively, had $106,170, $90,445 and $70,834 of qualified late-year ordinary losses, which are deferred until fiscal year 2014 for tax purposes. Net late-year losses incurred after December 31, and within the taxable year are deemed to arise on the first day of the Funds’ next taxable year.
Note 10 – Revolving Credit Agreement
The Trust has in place an Amended and Restated Revolving Credit Agreement (the “Agreement”) with its custodian, Fifth Third Bank N.A. (the “Bank”). Pursuant to the terms of the Agreement, the Bank makes available to the Trust, a line of credit facility under which the Bank may make loans to the Trust, on behalf of the Funds, from time to time. The Agreement provides a line of credit in an amount of up to $3,500,000 for the Trust with respect to all of the Funds. The Agreement further limits the amount that any Fund may borrow to the lesser of 1/3 of the value of its net assets taken at market value, at the time of the borrowing, including the amount borrowed, or 5% of the Fund’s total assets valued at costs, excluding the amount borrowed. Under the terms of the Agreement, any principal balance outstanding would bear interest at the Federal Funds Rate in effect at that time plus 1.50%. Effective August 1, 2013, the agreement includes a commitment fee of 0.10% per annum (computed on the basis of a year of 360 days for the actual number of days elapsed) on the average daily unused portion of the Facility and a non-refundable up-front fee in an amount equal to 0.10% of the Facility.
The average amount of borrowings for the days which the Funds borrowed and the average interest rate on those borrowings by the Funds during the year ended October 31, 2013 were as follows:
| | | Average Principal | | Average Interest Rate |
| |
| Australia/New Zealand Fund | | $358,688 | | 1.58% |
| Japan Fund | | $148,598 | | 1.60% |
During the year ended October 31, 2013 the Australia/New Zealand Fund and Japan fund paid $79 and $146 in interest on borrowings, respectively. There were no borrowings outstanding under the Agreement as of October 31, 2013. It is the Custodian’s policy to utilize the line of credit for draws greater than $50,000.
47
C O M M O N W E A L T H
INTERNATIONAL SERIES TRUST | ANNUAL REPORT 2013 |
| NOTES TO FINANCIAL STATEMENTS – October 31, 2013 (Continued) |
| |
Note 11 – Reclassification of Capital Accounts
The Funds have recorded reclassifications in their capital accounts. These reclassifications have no impact on the net asset value of the Funds and are designed generally to present undistributed net investment income and accumulated net realized gain (loss) on a tax basis which is considered to be more informative to the shareholder. As of October 31, 2013, the Funds recorded the following reclassifications to increase (decrease) the capital accounts listed below:
| | | Australia/New | | | | | | | | | | | | | | Real Estate |
| | | Zealand Fund | | Africa Fund | | Japan Fund | | Global Fund | | Securities Fund |
| |
| Paid-in-beneficial interest | | $ | — | | | $ | — | | | $ | (125,096 | ) | | $ | (100,600 | ) | | $ | (19,717 | ) |
| Accumulated net investment income (loss) | | | 5,206 | | | | 1,740 | | | | 107,949 | | | | 100,600 | | | | 17,840 | |
| Accumulated net realized gains (losses) from | | | | | | | | | | | | | | | | | | | | |
investments, option contracts, rights and | | | | | | | | | | | | | | | | | | | | |
foreign currency transactions | | | (5,206 | ) | | | (1,740 | ) | | | 17,147 | | | | — | | | | 1,877 | |
| |
Note 12 – Contractual Obligations
Under the Funds’ organizational documents, its Trustees and Officers are indemnified against certain liabilities arising out of the performance of their duties to the Funds. In the normal course of business, the Funds enter into contracts that contain various representations and warranties and provide general indemnifications. The Funds’ maximum exposure under these arrangements is dependent on future claims against the Funds and is presently unknown.
Note 13 – Concentration of Market Risk
The Australia/New Zealand Fund has a majority of its investments in securities issued by Australian and New Zealand issuers, the Africa Fund invests primarily in securities issued by African issuers and the Japan Fund invests primarily in securities of Japanese issuers. Investing in companies from specific geographic regions, such as Australia, New Zealand, Africa or Japan, may pose additional risks inherent to a region’s economic and political situation. These events will not necessarily affect the U.S. economy or similar issuers located in the U.S. In addition, many of the investments in Australia, New Zealand, Africa or Japan are denominated in foreign currencies. As a result, changes in the values of these currencies compared to the U.S. dollar may affect (positively or negatively) the value of the Funds’ investments. These events may happen separately from, and in response to, events that do not otherwise affect the values of the securities in the issuers’ home countries.
The Africa Fund may be exposed to additional risks by focusing its investments on issuers in African countries that other funds invested in securities of issuers in a broader region may not be exposed to. The Fund is highly dependent on the state of economics of countries throughout Africa and, in particular Sub-Saharan countries. Changes in economics, tax policies, inflation rates, governmental instability, war or other political or economic factors may affect (positively or negatively) the Fund’s investments.
A large portion of investments held by the Real Estate Securities Fund are considered investments in the real estate sector of the market, which may include REITs. Investing in REITs involves certain unique risks in addition to those risks associated with investing in the real estate industry in general. Equity REITs may be affected by changes in the value of the underlying property owned by the REITs, while mortgage REITs may be affected by the quality of any credit extended. REITs are dependent upon management skills, are not diversified, are subject to heavy cash flow dependency, default by borrowers and self-liquidation. REITs are also subject to the possibilities of failing to qualify for tax-free pass through of income and maintaining their exemption from registration under the 1940 Act. Investing in a single market sector may be riskier than investing in a variety of market sectors.
48
C O M M O N W E A L T H
INTERNATIONAL SERIES TRUST | ANNUAL REPORT 2013 |
| NOTES TO FINANCIAL STATEMENTS – October 31, 2013 (Continued) |
| |
Note 14 – Legal Matters
On October 22, 2010, Edward S. Weisfelner, as Trustee of the LB Creditor Trust (the “Plaintiff”), filed a suit in the Supreme Court of the State of New York in the County of New York against, among numerous other defendants, the Trust’s custodian (the “Custodian”) as a record holder of shares of Lyondell Chemical Company (“Lyondell”). The action was removed to the United States District Court for the Southern District of New York and then referred to the United States Bankruptcy Court for the Southern District of New York. Among the shares alleged to have been held by the Custodian were 10,000 shares for which the Commonwealth Global Fund (the “Global Fund”) was a beneficial shareholder. On December 19, 2011, the Plaintiff filed a Second Amended Complaint in the U.S. Bankruptcy Court, Southern District of New York, naming the Global Fund as a defendant. Generally, the Plaintiff’s claim alleges that a merger transaction, which closed on December 20, 2007, in which the Global Fund and the other shareholders of Lyondell disposed of their positions in Lyondell caused Lyondell to be insolvent and ultimately resulted in Lyondell filing for bankruptcy protection. Lyondell sought bankruptcy protection in cases filed on January 6, 2009 and April 24, 2009. The Plaintiff’s claim further alleges that, under various theories under state law, the transaction constituted a fraudulent transfer. The Plaintiff is seeking to set aside and recover the entire amount of the transfer, which is alleged to be approximately $5.9 billion. The Global Fund’s proceeds from the transaction amounted to $479,700. As of this date, the suit has only involved preliminary procedural filings, including Motions to Dismiss the Complaint. To date, the Trust has joined in the response with several other defendants in the case seeking to dismiss the claims. The Court has not yet rendered a decision as to the motion to dismiss. The Trust expects to continue participating in the defense of this case, albeit as a direct defendant.
Note 15 – Subsequent Events
Within the financial statements, the Funds are required to recognize the effects of all subsequent events that provide additional evidence about conditions that existed as of the date of the Statements of Assets and Liabilities. For non-recognized subsequent events that must be disclosed to keep the financial statements from being misleading, the Funds are required to disclose the nature of the event as well as an estimate of its financial effect, on a statement that such an estimate cannot be made. Management has evaluated subsequent events through the issuances of these financial statements and has noted no such events.
Note 16 – New Accounting Pronouncements
In January 2013, the Financial Accounting Standards Board issued ASU No. 2013-01 Clarifying the Scope of Disclosures about Offsetting Assets and Liabilities. This update gives additional clarification to the Financial Accounting Standards Board issued ASU No. 2011-11 Disclosures about Offsetting Assets and Liabilities. The amendments in this ASU require an entity to disclose information about offsetting and related arrangements to enable users of its financial statements to understand the effect of those arrangements on its financial position. The ASU is effective for annual reporting periods beginning on or after January 1, 2013, and interim periods within those annual periods. The guidance requires retrospective application for all comparative periods presented. Management is currently evaluating the impact ASU 2013-01 and ASU 2011-11 will have on the Funds’ financial statement disclosures.
49
C O M M O N W E A L T H
INTERNATIONAL SERIES TRUST | ANNUAL REPORT 2013 |
| REPORT OF INDEPENDENT REGISTERED PUBLIC ACCOUNTING FIRM |
| |

| To the Shareholders and the Board of Trustees of |
| Commonwealth International Series Trust |
| |
| We have audited the accompanying statements of assets and liabilities of Commonwealth Australia/New Zealand Fund, Commonwealth Japan Fund, Commonwealth Global Fund and Commonwealth Real Estate Securities Fund, each a series of shares of beneficial interest of Commonwealth International Series Trust, including the schedules of investments, as of October 31, 2013, and the related statements of operations for the year then ended, the statements of changes in net assets for each of the two years in the period then ended and the financial highlights for each of the five years in the period then ended. We have also audited the accompanying statement of assets and liabilities of Africa Fund, a series of shares of beneficial interest of Commonwealth International Series Trust, including the schedule of investments, as of October 31, 2013, and the related statement of operations for the year then ended, and the statements of changes in net assets and the financial highlights for the year then ended and for the period November 7, 2011 (commencement of operations) through October 31, 2012. These financial statements and financial highlights are the responsibility of the Funds’ management. Our responsibility is to express an opinion on these financial statements and financial highlights based on our audits. |
| |
| We conducted our audits in accordance with the standards of the Public Company Accounting Oversight Board (United States). Those standards require that we plan and perform the audits to obtain reasonable assurance about whether the financial statements and financial highlights are free of material misstatement. An audit includes examining, on a test basis, evidence supporting the amounts and disclosures in the financial statements. Our procedures included confirmation of securities owned as of October 31, 2013, by correspondence with the custodian and broker. An audit also includes assessing the accounting principles used and significant estimates made by management, as well as evaluating the overall financial statement presentation. We believe that our audits provide a reasonable basis for our opinion. |
| |
| In our opinion, the financial statements and financial highlights referred to above present fairly, in all material respects, the financial position of Commonwealth Australia/New Zealand Fund, Africa Fund, Commonwealth Japan Fund, Commonwealth Global Fund and Commonwealth Real Estate Securities Fund, as of October 31, 2013, the results of their operations for the year then ended and the changes in their net assets and their financial highlights for each of the periods presented above, in conformity with accounting principles generally accepted in the United States of America. |
| | |  |
| | | BBD, LLP |
| | | |
| Philadelphia, Pennsylvania | | |
| December 26, 2013 | | |
50
C O M M O N W E A L T H
INTERNATIONAL SERIES TRUST | ANNUAL REPORT 2013 |
| ADDITIONAL INFORMATION – October 31, 2013 (Unaudited) |
| |
| Table of Shareholder Expenses |
| |
| As a shareholder of the Funds, you incur ongoing costs, including management fees, distribution and service fees, and other Fund expenses. This example is intended to help you understand your ongoing costs (in dollars) of investing in the Funds and compare these costs with the ongoing costs of investing in other mutual funds. |
| |
| The example is based on an investment of $1,000 invested at the beginning of the period and held for the entire period from May 1, 2013 through October 31, 2013. |
| |
| Actual Expenses |
| |
| The table below provides information about actual account values and actual expenses. You may use the information below, together with the amount you invested, to estimate the expenses that you paid over the period. Simply divide your account value by $1,000 (for example, an $8,600 account value divided by $1,000 = 8.6), then multiply the result by the number in the table under the heading entitled “Expenses Paid During Period” to estimate the expenses you paid on your account during this period. |
| | | Beginning | | Ending | | Expense Paid | | Expense Ratio |
| | | Account Value | | Account Value | | During Period* | | During Period* |
| | | 5/1/13 | | 10/31/13 | | 5/1/13 – 10/31/13 | | 5/1/13 – 10/31/13 |
| |
| Australia/New Zealand Fund | | $ | 1,000.00 | | | $ | 991.00 | | | $ | 15.71 | | | | 3.13 | % |
| Africa Fund | | | 1,000.00 | | | | 1,016.70 | | | | — | | | | — | |
| Japan Fund | | | 1,000.00 | | | | 1,009.80 | | | | 21.83 | | | | 4.31 | % |
| Global Fund | | | 1,000.00 | | | | 1,091.10 | | | | 16.34 | | | | 3.10 | % |
| Real Estate Securities Fund | | | 1,000.00 | | | | 1,000.80 | | | | 16.54 | | | | 3.28 | % |
| |
| Hypothetical Example for Comparison Purposes |
| |
| The table below provides information about hypothetical account values and hypothetical expenses based on each Fund’s actual expense ratio and an assumed rate of return of 5% per year before expenses, which is not the Fund’s actual return. The hypothetical account values and expenses may not be used to estimate the actual ending account balance or expenses you paid for the period. You may use this information to compare this 5% hypothetical example with the 5% hypothetical examples that appear in the shareholder reports of other funds. |
| |
| Please note that the expenses shown in the table are meant to highlight your ongoing costs only and do not reflect any transactional costs, such as sales charges (loads), or exchange fees. Therefore, the table is useful in comparing ongoing costs only, and will not help you determine the relative total costs of owning different funds. In addition, if these transactional costs were included, your costs would have been higher. |
| | | Beginning | | Ending | | Expense Paid | | Expense Ratio |
| | | Account Value | | Account Value | | During Period* | | During Period* |
| | | 5/1/13 | | 10/31/13 | | 5/1/13 – 10/31/13 | | 5/1/13 – 10/31/13 |
| |
| Australia/New Zealand Fund | | $ | 1,000.00 | | | $ | 1,009.20 | | | $ | 15.85 | | | | 3.13 | % |
| Africa Fund | | | 1,000.00 | | | | 1,025.00 | | | | — | | | | — | |
| Japan Fund | | | 1,000.00 | | | | 1,003.20 | | | | 21.76 | | | | 4.31 | % |
| Global Fund | | | 1,000.00 | | | | 1,009.40 | | | | 15.70 | | | | 3.10 | % |
| Real Estate Securities Fund | | | 1,000.00 | | | | 1,008.50 | | | | 16.61 | | | | 3.28 | % |
| |
| * Expenses are equal to the average account value times the Fund’s annualized expense ratio multiplied by 184 (the number of days in the most recent fiscal half-year) divided by 365 (the number of days in the fiscal year) to reflect the one-half year period. |
| |
| TAX INFORMATION UNAUDITED |
| |
| Pursuant to the foreign tax credit election under Section 853 of the Internal Revenue Code of 1986, the Australia/New Zealand Fund designates $514,998 of income derived from foreign sources and $158,824 of foreign taxes paid, for the year ended October 31, 2013. |
| |
| Of the ordinary income distributions made by the Australia/New Zealand Fund during the year ended October 31, 2013, the proportionate share of income derived from foreign sources attributable to one share of stock, or the amount determined to be necessary, is $0.2871 and the proportionate share of foreign taxes attributable to one share of stock is $0.0885. |
C O M M O N W E A L T H
INTERNATIONAL SERIES TRUST | ANNUAL REPORT 2013 |
| ADDITIONAL INFORMATION – October 31, 2013 (Unaudited) – (Continued) |
| |
| Qualified Dividend Income |
| |
| Pursuant to Section 854 of the Internal Revenue Code of 1986, the Australia/New Zealand and Africa Funds, respectively, designate income dividends of 100.00% and 90.92% as qualified dividend income paid during the fiscal year ended October 31, 2013. |
| |
| Disclosure of Portfolio Holdings |
| |
| The Funds file their complete schedule of portfolio holdings with the Securities and Exchange Commission (the “Commission”) for the first and third quarters of each fiscal year on Form N-Q. The Funds’ Forms N-Q are available on the Commission’s website at http://www.sec.gov. The Funds’ Forms N-Q may be reviewed and copied at the Commission’s Public Reference Room in Washington, DC. Information on the operation of the Commission’s Public Reference Room may be obtained by calling 800-SEC-0330. |
| |
| Proxy Voting |
| |
| A description of the policies and procedures that the Funds use to determine how to vote proxies relating to portfolio securities is available without charge, upon request, by calling 888-345-1898, and on the Commissions website at http://www.sec.gov. |
| |
| Information regarding how the Funds voted proxies relating to portfolio securities during the most recent 12-month period ended June 30 is available without charge, upon request, by calling 888-345-1898, and on the Commission’s website at http://www.sec.gov. |
C O M M O N W E A L T H
INTERNATIONAL SERIES TRUST | ANNUAL REPORT 2013 |
| TRUSTEES AND OFFICERS – October 31, 2013 (Unaudited) |
| |
Overall responsibility for management of the Funds rests with the Board of Trustees. The names of the Trustees and Officers of the Funds, their addresses, ages and principal occupations during the past five years are provided in the tables below. Trustees who are deemed “interested persons,” as defined in the 1940 Act, are included in the table titled, “Interested Trustees.” Trustees who are not “interested persons” are referred to as Independent Trustees. The Funds’ Statement of Additional information includes additional information about the Funds’ Trustees and is available, without charge and upon request, by calling 888-345-1898.
| | | | | | | | | Number of | | | Other |
| | | | | Term of Office | | | | Portfolios in | | | Directorships |
| | | Position(s) | | and Length of | | Principal Occupation(s) | | Complex Overseen | | | Held By |
| Name, Address and Age | | With Fund | | Time Served | | for the Last Five Years | | by Trustee/Officer(3) | | | Trustee/Officer |
| |
| INTERESTED TRUSTEES: | | | | | | | | | | | |
| |
| Robert Scharar(1) | | President, | | Indefinite until | | Investment manager/Attorney/CPA; | | 5 | | | See Below(2) |
| 791 Town & Country Blvd, | | Interested | | Successor | | President, FCA Corp (investment | | | | | |
| Suite 250 | | Trustee | | elected and | | advisor), 1975 to present. | | | | | |
| Houston, TX 77024-3925 | | | | qualified; | | | | | | | |
| Age 65 | | | | since 2000 | | | | | | | |
| |
| INDEPENDENT TRUSTEES: | | | | | | | | | | | |
| |
| John Akard, Jr. | | Independent | | Indefinite until | | Owner, John Akard Jr. P.C. (and its | | 5 | | | None |
| 791 Town & Country Blvd, | | Trustee | | Successor | | predecessor) (law firm), 1996 to | | | | | |
| Suite 250 | | | | elected and | | present; Of Counsel, Coplen & | | | | | |
| Houston, TX 77024-3925 | | | | qualified; | | Banks, P.C. (law firm), 1999 to | | | | | |
| Age 47 | | | | since 2000 | | present. | | | | | |
| |
| Kathleen Kelly | | Independent | | Indefinite until | | Honorary Consul, New Zealand | | 5 | | | None |
| 791 Town & Country Blvd, | | Trustee | | Successor | | Consulate, 1995 to present; Owner, | | | | | |
| Suite 250 | | | | elected and | | International Protocol Advisors | | | | | |
| Houston, TX 77024-3925 | | | | qualified; | | (consulting services), August 1992 | | | | | |
| Age 61 | | | | since 2000 | | to present. | | | | | |
| |
| Jack Ewing | | Independent | | Indefinite until | | Adjunct Economics Professor, | | 5 | | | None |
| 791 Town & Country Blvd, | | Trustee | | Successor | | University of Houston-Downtown, | | | | | |
| Suite 250 | | | | elected and | | 2005 to present; Adjunct Professor, | | | | | |
| Houston, TX 77024-3925 | | | | qualified; | | Lonestar College, 2001 to present; | | | | | |
| Age 74 | | | | since 2000 | | Professor, Houston Community | | | | | |
| | | | | | | College, September 2000 to | | | | | |
| | | | | | | May 2011. | | | | | |
| |
| (1) | | Robert Scharar is considered an “Interested person” of the Funds’ as defined in the 1940 Act, as amended, because he is an officer of the Trust and an officer of the Trust’s investment advisor. |
| (2) | | Mr. Scharar is also an officer, director and/or manager of the following companies: NICO Holdings, Ltd. (Malawi), Africap, LLC, First Commonwealth Holdings Corporation, First Commonwealth Mortgage Trust, Holly Mortgage Trust, Ivy Realty Trust, Nashville Properties, Inc., subsidiary companies at some of the above, and other closely held entities. |
| (3) | | The five (5) portfolios comprising the Trust include the five mutual funds covered by this annual report. |
C O M M O N W E A L T H
INTERNATIONAL SERIES TRUST | ANNUAL REPORT 2013 |
| TRUSTEES AND OFFICERS – October 31, 2013 (Unaudited) |
| |
| | | | | | | | | Number of | | Other |
| | | | | Term of Office | | | | Portfolios in | | Directorships |
| | | Position(s) | | and Length of | | Principal Occupation(s) | | Complex Overseen | | Held By |
| Name, Address and Age | | With Fund | | Time Served | | for the Last Five Years | | by Trustee/Officer | | Trustee/Officer |
| |
| OFFICERS: | | | | | | | | | | |
| |
| Terrance P. Gallagher | | Treasurer | | Since 2010 | | Attorney/CPA, Executive | | N/A | | N/A |
| 803 W. Michigan St. | | | | | | Vice-President, UMB Fund Services, | | | | |
| Milwaukee, WI 53233 | | | | | | Inc. 2007 to present, Senior | | | | |
| Age 55 | | | | | | Vice-President, Director of | | | | |
| | | | | | | Compliance, Unified Fund Services, | | | | |
| | | | | | | 2005 – 2007 | | | | |
| |
| John H. Lively | | Secretary | | Since 2008 | | Attorney, The Law Offices of John | | N/A | | N/A |
| Parkway, Ste. 310 | | | | | | H. Lively & Associates, Inc. (law | | | | |
| Leawood, KS 66211 | | | | | | firm), March 2010 to present; | | | | |
| Age 44 | | | | | | Attorney, Husch Blackwell Sanders | | | | |
| | | | | | | LLP (law firm), March 2007 to | | | | |
| | | | | | | February 2010; Managing Attorney, | | | | |
| | | | | | | Raymond James Financial (financial | | | | |
| | | | | | | services), September 2005 to | | | | |
| | | | | | | March 2007 | | | | |
| |
| Bonnie Scott | | Assistant | | Since 2003 | | Administrator, FCA Corp | | N/A | | N/A |
| 791 Town & Country Blvd, | | Secretary | | | | (investment advisor), 1998 to | | | | |
| Suite 250 | | | | | | present. | | | | |
| Houston, TX 77024-3925 | | | | | | | | | | |
| Age 64 | | | | | | | | | | |
| |
| Stephen E. Fodo | | CCO | | Since 2004 | | Independent Consultant from | | N/A | | N/A |
| 2515 Golden Pond Drive | | | | | | January 2000 to present. Advisory | | | | |
| Kingwood, TX 77345 | | | | | | Director, Ingenero Inc., Engineering | | | | |
| Age 71 | | | | | | and Consulting Services, from | | | | |
| | | | | | | January 2002 to present; Chief | | | | |
| | | | | | | Financial Officer, Organic Fuels | | | | |
| | | | | | | Holdings Inc., October 2007 to | | | | |
| | | | | | | December 2008; Adjunct Professor, | | | | |
| | | | | | | University of Phoenix, July 2003 to | | | | |
| | | | | | | October 2008. | | | | |
| |
C O M M O N W E A L T H
INTERNATIONAL SERIES TRUST | ANNUAL REPORT 2013 |
C O M M O N W E A L T H
INTERNATIONAL SERIES TRUST | ANNUAL REPORT 2013 |
C O M M O N W E A L T H
INTERNATIONAL SERIES TRUST | ANNUAL REPORT 2013 |
| Item 2. Code of Ethics. |
| | | |
| | (a) | The Registrant has adopted a code of ethics (the “Code”) that applies to the Registrant’s principal executive officer and principal financial officer. This Code is included as an Exhibit. |
| | | |
| | (b) | During the period covered by the report, with respect to the Registrant’s Code that applies to its principal executive officer and principal financial officer, there have been no amendments to, nor any waivers granted from, a provision that relates to any element of the Code definition enumerated in paragraph (b) of this Item 2. |
| |
| Item 3. Audit Committee Financial Expert. |
3(a)(1) The Registrant’s board of trustees has determined that the Registrant has a least one audit committee financial expert serving on its audit committee.
3(a)(2) The audit committee financial expert is John Akard, Jr., who is “independent” for purposes of this Item 3 of Form N-CSR.
| Item 4. Principal Accountant Fees and Services. |
The aggregate fees billed for professional services by BBD, LLP during the fiscal year 2013 and 2012 were as follows:
(a) Audit Fees for Registrant.
| | Fiscal year ended October 31, 2013 | | | $60,000 |
| | Fiscal year ended October 31, 2012 | | | $60,000 |
(b) Audit-Related Fees for Registrant. These fees were billed by the Registrant’s independent auditors for assurance and related services that were reasonably related to the performance of the audit of the Registrant’s financial statements.
| | Fiscal year ended October 31, 2013 | | | $0 |
| | Fiscal year ended October 31, 2012 | | | $0 |
(c) Tax Fees for Registrant. These fees were billed for professional services rendered by the Registrant’s independent auditors for tax compliance, tax advice and tax planning.
| | Fiscal year ended October 31, 2013 | | | $7,500 |
| | Fiscal year ended October 31, 2012 | | | $7,500 |
(d) All Other Fees.
| | Fiscal year ended October 31, 2013 | | | $0 |
| | Fiscal year ended October 31, 2012 | | | $0 |
(e) Audit Committee’s pre-approval policies and procedures.
| | (1) | The audit committee has adopted pre-approval policies and procedures that require the audit committee to pre-approve all audit and non-audit services of the Registrant, including services provided to the Registrant’s investment adviser or any entity controlling, controlled by or under common control with the Registrant’s investment adviser that provides ongoing services to the Registrant with respect to any engagement that directly relates to the operations and financial reporting of the Registrant. |
| | | |
| | (2) | Services approved pursuant to paragraph (c)(7)(i)(C) of Rule 2-01 of Regulation S-X: 100% of these fees were approved by the Registrant’s Audit Committee as required pursuant to paragraph (c)(7)(ii) of Rule 2-01 of Regulation S-X. |
| (f) | None. |
| | |
| (g) | During the last two fiscal years, there were no other non-audit services rendered by the Registrant’s independent auditors to the Registrant, its investment adviser or any entity controlling, controlled by or under the common control with the investment adviser that provides ongoing services to the Registrant. |
| | |
| (h) | Not applicable. |
| Item 5. Audit Committee of Listed Registrants. |
Not applicable.
| Item 6. Schedule of Investments. |
| | (a) | Included as part of the report to shareholders filed under Item 1 of this Form N-CSR. |
| | (b) | Not applicable. |
Item 7. Disclosure of Proxy Voting Policies and Procedures for Closed-End Management Investment Companies.
Not applicable to open-end management investment companies.
Item 8. Portfolio Managers of Closed-End Management Investment Companies.
Not applicable to open-end management investment companies.
Item 9. Purchases of Equity Securities by Closed-End Management Investment Company and Affiliated Purchasers.
Not applicable to open-end management investment companies.
Item 10. Submission of Matters to a Vote of Security Holders.
None.
| Item 11. Controls and Procedures. |
| | | |
| (a) | | The Registrant’s principal executive officer and principal financial officer have reviewed the Registrant’s disclosure controls and procedures (as defined in Rule 30a-3(c) under the Investment Company Act of 1940, as amended, (the “Act”)) as of a date within 90 days of the filing of this report, as required by Rule 30a-3(b) under the Act. Based on their review, such officers have concluded that the disclosure controls and procedures were effective in ensuring that information required to be disclosed in this report was appropriately recorded, processed, summarized and reported within the time periods specified by the Securities and Exchange Commission’s rules and forms. |
| | | |
| (b) | | There were no changes in the Registrant’s internal control over financial reporting (as defined in Rule 30a-3(d) under the Act (17 CFR 270.30a-3(d)) that occurred during the Registrant’s second fiscal quarter of the period covered by this report that materially affected, or were reasonably likely to materially affect, the Registrant’s internal control over financial reporting. |
| | | |
| Item 12. Exhibits. |
| | | |
| (a) (1) | | Code of Ethics. The code of ethics that is the subject of the disclosure required by Item 2 is attached hereto. |
| | | |
| (a) (2) | | Certifications required pursuant to Section 30a-2(a) of the Act are attached hereto. |
| | | |
| (a) (3) | | Not applicable to open-end management investment companies. |
| | | |
| (b) | | Certifications pursuant to Section 30a-2(b) of the Act are furnished herewith. |
SIGNATURES
Pursuant to the requirements of the Securities Exchange Act of 1934 and the Investment Company Act of 1940, the Registrant has duly caused this report to be signed on its behalf by the undersigned, thereunto duly authorized.
Commonwealth International Series Trust
/s/ Robert W. Scharar
By: Robert W. Scharar
President
December 27, 2013
Pursuant to the requirements of the Securities Exchange Act of 1934 and the Investment Company Act of 1940, this report has been signed below by the following persons on behalf of the Registrant and in the capacities and on the dates indicated.
/s/ Robert W. Scharar
By: Robert W. Scharar
President
(Principal Executive Officer)
December 27, 2013
/s/ Terrance P. Gallagher
By: Terrance P. Gallagher
Treasurer
(Principal Financial Officer)
December 27, 2013