UNITED STATES
SECURITIES AND EXCHANGE COMMISSION
Washington, D.C. 20549
FORM N-CSR
CERTIFIED SHAREHOLDER REPORT OF REGISTERED
MANAGEMENT INVESTMENT COMPANIES
Investment Company Act file number: 811-04665
Commonwealth International Series Trust
(Exact name of registrant as specified in charter)
791 Town & Country Blvd.
Houston, TX 77024-3925
(Address of principal executive offices) (Zip code)
CT Corporation System
155 Federal Street
Boston, MA 02110
(Name and address of agent for service)
Registrant’s telephone number, including area code: (888) 345-1898
Date of fiscal year end: October 31
Date of reporting period: October 31, 2023
Item 1. Reports to Stockholders.
(a)
| Commonwealth International |
| Series Trust |
| 791 Town & Country Blvd., Suite 250 |
| Houston, TX 77024-3925 |
| 888-345-1898 |
| www.commonwealthfunds.com |
| |
| INVESTMENT ADVISOR |
| FCA Corp |
| 791 Town & Country Blvd., Suite 250 |
| Houston, TX 77024-3925 |
| |
| DISTRIBUTOR |
| Ultimus Fund Distributors, LLC |
| 225 Pictoria Drive, Suite 450 |
| Cincinnati, OH 45246 |
| |
| TRANSFER AGENT & ADMINISTRATOR |
| Ultimus Fund Solutions, LLC |
| 225 Pictoria Drive, Suite 450 |
| Cincinnati, OH 45246 |
| |
| CUSTODIAN BANK |
| Fifth Third Bank N.A. |
| Fifth Third Center |
| 38 Fountain Square Plaza |
| Cincinnati, OH 45263 |
| |
| INDEPENDENT REGISTERED PUBLIC |
| ACCOUNTING FIRM |
| Cohen & Company, Ltd. |
| 1835 Market Street, 3rd Floor |
| Philadelphia, PA 19103 |
| |
| LEGAL COUNSEL |
| Practus, LLP |
| 11300 Tomahawk Creek Parkway, Suite 310 |
| Leawood, KS 66211 |
| |
| This report is intended for the shareholders of the family of funds of the Commonwealth International Series Trust. It may not be distributed to prospective investors unless it is preceded or accompanied by the Funds’ current Prospectus. A Prospectus may be obtained at www.commonwealthfunds.com or from the principal underwriter of the Funds or your broker. |
| |
Distributed by Ultimus Fund Distributors, LLC
Member FINRA/SIPC |
| |
| Commonwealth-AR-23 |
| |
| |
| |
| |
| |
| |
| |
| |
| |
| |
| |
| |
| |
| |
| |

Commonwealth Australia/New Zealand Fund Africa Fund Commonwealth Japan Fund Commonwealth Global Fund Commonwealth Real Estate Securities Fund ANNUAL REPORT October 31, 2023 |
| |
| |
| |
| |
| |
| |
| |
| |
| |
| |
| |
| |
| |
| |
| |
Table of Contents
| Shareholder Letter | 1 |
| | |
| Performance Overview | |
| | |
| Commonwealth Australia/New Zealand Fund | 6 |
| Africa Fund | 8 |
| Commonwealth Japan Fund | 11 |
| Commonwealth Global Fund | 14 |
| Commonwealth Real Estate Securities Fund | 16 |
| | |
| Portfolio Composition | 18 |
| | |
| Schedules of Investments | 20 |
| | |
| Statements of Assets and Liabilities | 30 |
| | |
| Statements of Operations | 31 |
| | |
| Statements of Changes in Net Assets | 32 |
| | |
| Financial Highlights | 34 |
| | |
| Notes to Financial Statements | 39 |
| | |
| Report of Independent Registered Public Accounting Firm | 50 |
| | |
| Additional Information | 51 |
| | |
| Liquidity Risk Management Program | 54 |
| | |
| Trustees and Officers | 55 |
| | |
| Notice of Privacy Policy & Practices | 58 |

| Commonwealth Australia/New Zealand Fund (CNZLX) |
| Africa Fund (CAFRX) |
| Commonwealth Japan Fund (CNJFX) |
| Commonwealth Global Fund (CNGLX) |
| Commonwealth Real Estate Securities Fund (CNREX) |
| www.commonwealthfunds.com |
Dear Fellow Shareholders:
We are pleased to present the enclosed annual report for the twelve-months ended October 31, 2023 of the Commonwealth International Series Trust on behalf of its separate series: Commonwealth Australia/New Zealand Fund, Commonwealth Japan Fund, Commonwealth Global Fund, Commonwealth Real Estate Securities Fund and Africa Fund (each a “Fund” and together the “Funds”).
The global economy continues to recover slowly from the blows of the pandemic, Russia’s invasion of Ukraine, and the cost-of-living crisis. In retrospect, the resilience has been remarkable. Despite the disruption in energy and food markets caused by the war, and the unprecedented tightening of global monetary conditions to combat decades-high inflation, the global economy has slowed, but not stalled. Yet growth remains slow and uneven, with growing global divergences. The global economy is limping along, but not sprinting.
Global activity bottomed out at the end of last year while inflation is gradually being brought under control. But a full recovery toward pre pandemic levels appears increasingly out of reach, especially in emerging markets and developing economies.
Headline inflation in the U.S. continues to decelerate, from 7.7%, on a year-over-year basis, to 3.2% this year. As a result, projections are increasingly consistent with a “soft landing” scenario, bringing inflation down without a major downturn in activity, especially in the U.S., where the forecast increase in the unemployment rate is modest.
But important divergences are appearing. The slowdown is more pronounced in advanced economies than in emerging markets and developing ones. Within advanced economies, the U.S. surprised on the upside, with resilient consumption and investment while the Euro area activity was revised downward. Many emerging market economies proved quite resilient and surprised on the upside, with the notable exception of China, facing headwinds from its real estate crisis and weakening confidence.
Multiple global forces are at play. First, the recovery in services is almost complete. Over the past year, strong demand for services supported service-oriented economies—including important tourism destinations such as France and Spain—relative to manufacturing powerhouses such as China and Germany. High demand for labor-intensive services also translated into tighter labor markets, and higher and more persistent services inflation. But services activity is now weakening alongside a persistent manufacturing slowdown, suggesting services inflation is likely to decrease next year and labor markets activity will soften.
Second, part of the slowdown is the result of the tighter monetary policy necessary to bring inflation down. This is starting to bite, but the transmission is uneven across countries. Tighter credit conditions are weighing on housing markets, capital investment, and consumption, more so in countries with a higher share of adjustable-rate mortgages or where households are less willing, or able, to dip into their savings.
 | ANNUAL REPORT 2023 |
| | |
While some of the extreme risks, such as severe banking instability, have moderated since April, the balance remains tilted to the downside.
The real estate crisis could deepen further in China, an important risk for the global economy. The policy challenge is complex. Restoring confidence requires promptly restructuring struggling property developers, preserving financial stability, and addressing the strains in local public finance.
Commodity prices could become more volatile under renewed geopolitical tensions. Since June, oil prices have increased by about 25%, on the back of extended supply cuts from OPEC+ (the Organization of the Petroleum Exporting Countries plus selected nonmembers) countries. Food prices remain elevated and could be disrupted further by an escalation of the war in Ukraine, causing hardship for many low-income countries.
Finally, despite the tightening of monetary policy, financial conditions have eased in many countries. The danger is of a sharp repricing of risk, especially for emerging markets, that would appreciate further the US dollar, trigger capital outflows, and increase borrowing costs and debt distress.
Each of the Funds has exposure to international investments, with the three of the Funds (Commonwealth Australia/New Zealand Fund, Commonwealth Japan Fund and Africa Fund) having most of their respective investments in international markets, while the Commonwealth Global Fund has 57% of its investments in international markets, and the Commonwealth Real Estate Securities Fund has 28%.
While we cannot forecast with precision how economic or geopolitical events will unfold, we have confidence a long-term investment program remains essential. FCA Corp’s in-depth fundamental research, active investing and risk management strategies can serve investors well through challenging domestic and international markets.
Our investment theme gives our shareholders the ability to select the Funds for its specific attributes in addition to the targeted markets a Fund is designed to invest in. We continue to offer these differential characteristics among our Funds coupled with a fundamental-based approach to investment selections.
As we begin on our 33rd year as the investment advisor to the Funds, we would like to thank you as shareholders for your support and continued interest in the Commonwealth family of funds.
 |  |
| | |
| Robert W. Scharar | Wesley R. Yuhnke |
| President and Portfolio Manager | Assistant Portfolio Manager |
| Commonwealth International Series Trust | Commonwealth International Series Trust |
| ANNUAL REPORT 2023 |
| | |
The views in the above discussion, along with discussion included under the “Performance Overview” for each Fund below, were those of the Funds’ investment advisor as of the date set forth above and may not reflect its views on the date this annual report is first published or anytime thereafter. These views are intended to assist shareholders in understanding their investment in the Funds and the performance of the Funds during the period covered by this report and do not constitute investment advice.
THE PERFORMANCE INFORMATION QUOTED IN THIS ANNUAL REPORT REPRESENTS PAST PERFORMANCE AND PAST PERFORMANCE DOES NOT GUARANTEE FUTURE RESULTS. INVESTMENT RETURN AND PRINCIPAL VALUE OF AN INVESTMENT WILL FLUCTUATE SO THAT AN INVESTOR’S SHARES, WHEN REDEEMED, MAY BE WORTH MORE OR LESS THAN THEIR ORIGINAL COST. CURRENT PERFORMANCE MAY BE LOWER OR HIGHER THAN THE PERFORMANCE DATA QUOTED. AN INVESTOR SHOULD CONSIDER THE FUND’S INVESTMENT OBJECTIVES, RISKS, AND CHARGES AND EXPENSES CAREFULLY BEFORE INVESTING. THE FUND’S PROSPECTUS CONTAINS THIS AND OTHER IMPORTANT INFORMATION. FOR INFORMATION ON THE FUND’S EXPENSE RATIO, PLEASE SEE THE FINANCIAL HIGHLIGHTS TABLE FOUND WITHIN THIS REPORT. TO OBTAIN A PROSPECTUS AND OTHER INFORMATION ABOUT THE FUNDS, PLEASE VISIT WWW.COMMONWEALTHFUNDS.COM OR CALL 888-345-1898. PLEASE READ THE PROSPECTUS CAREFULLY BEFORE INVESTING.
| ANNUAL REPORT 2023 |
| | |
Questions and Answers
To help shareholders better understand key attributes of the mutual funds (each a “Fund” and collectively the “Funds”) comprising the Commonwealth International Series Trust and their operations, the following Question and Answer section is provided.
Who is the Advisor?
The Funds’ investment advisor is FCA Corp (“FCA”). FCA is an investment advisor that is registered with the U.S. Securities and Exchange Commission and has its principal place of business located at 791 Town & Country Blvd., Suite 250, Houston, Texas 77024-3925. The firm was founded in 1975 and maintains a global perspective on the equity and fixed income marketplaces.
Why is investing outside the U.S. important?
The Funds invest in companies outside the United States because FCA believes there are significant investment opportunities in select foreign markets. In our view, U.S. investors benefit from the diversification that having investments outside the United States can provide. International investing offers exposure to more companies and other nations’ economies, currencies, and growth prospects. Nearly half of the value of equity markets is outside the United States. The growth experienced by many of these foreign economies appears to be attractive. FCA believes that, for a U.S. investor, allocation of a portion of the investor’s portfolio to international securities can provide the potential for less risk and can achieve a more consistent long-term performance in the investor’s overall portfolio.
How has international investing changed over the last decade?
International markets now comprise a significant portion of all equity value worldwide. As markets have blended through global commerce, capital has flowed from country to country following investment opportunities. Developed markets and emerging markets both require capital investments to provide the goods and services that their consumers need. During the last decade in particular, accounting and economic statistical information has become more uniform and thus more dependable. The trend appears to be in place for continued development of these distant countries and their markets. Their demand for investment capital outside the U.S. continues, which provides opportunities for diversification and growth. The Funds seek to be participants in these opportunities.
What are some of the factors influencing a Fund’s portfolio turnover?
Each Fund generally invests in equity securities with a long-term view. The Funds’ portfolio securities are evaluated on their long-term prospects. A particular Fund may experience higher or lower turnover ratios in certain years. Factors influencing portfolio turnover include, but are not limited to the following: rebalancing portfolio securities to take advantage of long-term opportunities and/or to reallocate between fixed income and equity securities; investing new subscriptions; or selling securities to cover redemptions. Higher levels of portfolio activity by a Fund will result in higher transaction costs and/or more realized gains or losses, the impact of which is borne by the Fund’s shareholders. The turnover of a portfolio is not predictable because managers do not know when the portfolio transactions will occur. Under most circumstances, it is desirable to limit transactions because of the costs associated with trading, currency conversions, and custody fees, although these are generally not the determining factors.
| ANNUAL REPORT 2023 |
| | |
How can the size of the Fund impact the Funds’ expense ratio?
Achieving each Fund’s objective with a portfolio comprised of international securities is historically more expensive than managing a portfolio comprised of domestic securities. Research of foreign markets, trading in different currencies, custody of assets, accurate evaluations of holdings, income tax, securities regulatory compliance, and generally overall communications are all known to be more expensive when managing these types of portfolios. Additionally, as with almost every mutual fund, size has an impact on the expense ratio of Funds. Typically, larger mutual funds can have lower expense ratios as there is an increased opportunity to spread out fixed and partially-fixed costs necessary to operate such mutual funds over a larger asset base. Generally, mutual fund expenses, including those of the Funds, are allocated on a daily basis among all shareholders. In addition, as portfolio assets increase, it is self-evident that fixed costs as a percentage of the assets managed generally decline. The Financial Highlights section of the accompanying financial statements provides supplemental data that includes current and historic expense information, and where applicable, the advisor’s waiver of fees or voluntary expense reimbursements to help reduce these costs.
| ANNUAL REPORT 2023 |
| | |
| PERFORMANCE OVERVIEW – October 31, 2023 (Unaudited) |
| COMMONWEALTH AUSTRALIA/NEW ZEALAND FUND |
The Commonwealth Australia/New Zealand Fund’s net asset value (NAV) as of October 31, 2023 was $10.06 per share compared to $11.34 per share on October 31, 2022. For the twelve-month period covered by this Annual Report, the Commonwealth Australia/New Zealand Fund returned -10.80%. This return figure includes the $0.07 per share distribution made in December 2022. In presenting comparative performance numbers on the Fund versus indexes, it is important to note that investment decisions for the Fund are based upon fundamental research and not designed to track a specific index. Further, our investments in cash and cash equivalents within the Fund could distort comparisons with indexes that do not make such investments. To present various aspects of the marketplace return, we provide two indexes for consideration. During the twelve-month period, the NZX 50 Index returned -5.12% and the Australian All Ordinaries Index returned 3.40%. These indexes are unmanaged, expressed in terms of U.S. dollars and do not reflect the deduction of fees associated with ownership of a mutual fund, such as investment management and fund accounting fees, nor do they reflect the deduction of taxes associated with ownership of a mutual fund.
From our view, the long-term goal of owning the Australia/New Zealand Fund is to benefit from the ownership of companies domiciled and operating in both countries. Therefore, both countries are continuously represented in ownership. History shows that the returns of the respective marketplaces can vary significantly from one another. Rarely would the markets for each county perform the same. Nonetheless, the overriding goal of long-term diversified ownership seeks to be maintained.
There are other considerations that impacted performance during the period covered by this year’s report:
| - | The 0.20% appreciation of the New Zealand dollar versus the U.S. dollar had a predictably positive effect on the Fund’s returns. |
| - | The -0.81% decline of the Australian dollar versus the U.S. dollar had a predictably negative effect on the Fund’s returns. |
| - | The Fund’s holdings in the following securities had the largest positive impact on the Fund’s performance: Origin Energy Ltd., Infratil Ltd., Webjet Ltd., Cochlear Ltd., and Brambles Ltd. |
| - | The Fund’s holdings in the following securities had the largest negative impact on the Fund’s performance: Mainfreight Ltd., ikeGPS Group Ltd., South Port New Zealand Ltd., Freightways Group Ltd., and Pacific Edge Ltd. |
Investment Risks
Equity securities (stocks) are more volatile and carry more risk than other forms of investments, including high-grade fixed income securities. The net asset values per share of a Fund will fluctuate as the value of these securities in the portfolio changes.
The Fund’s expenses, as with any mutual fund, detract from the Fund’s performance. The Fund’s asset levels have a direct effect on the expenses indirectly paid by shareholders. To the extent the Fund’s assets decline and the expenses of the Fund rise or do not decrease proportionately, performance will be negatively impacted.
International investing involves increased risk and volatility. An investment in this Fund entails the special risks of international investing, including currency exchange fluctuation, government regulations, and the potential for political and economic instability. Because the Fund invests primarily in the securities of, and depositary receipts represented by Australian and New Zealand issuers, the Fund is particularly susceptible to any economic, political, or regulatory developments affecting a particular issuer of those countries.
By itself the Fund does not constitute a complete investment plan and should be considered a long-term investment for investors who can afford to weather change in the value of their investments.
Investors should refer to the Fund’s Prospectus for a more complete description of risks associated with investing in the Fund.
Portfolio holdings will change due to ongoing management of the Fund.
References to specific securities or sectors should not be construed as recommendations by the Trust, the Fund, the Fund’s investment advisor or the distributor.
| ANNUAL REPORT 2023 |
| | |
| PERFORMANCE OVERVIEW – October 31, 2023 (Unaudited) |
| COMMONWEALTH AUSTRALIA/NEW ZEALAND FUND |
Comparison of Change in Value of a $10,000 investment in the Commonwealth Australia/New Zealand Fund (the “Fund”), the AAOI and the NZX 50 Index.
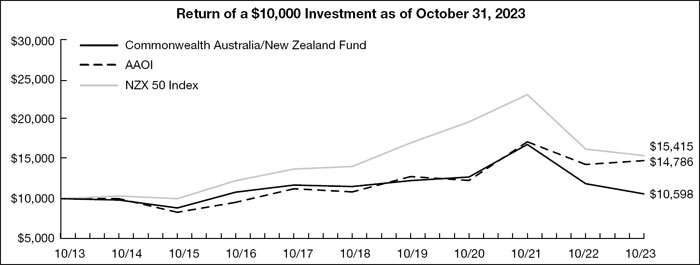
The above graph is a hypothetical $10,000 investment in the Fund from 10/31/13 to 10/31/23 and represents the reinvestment of dividends and distributions in the Fund.
| | | | | | | | | Total Fund |
| | | Average Annual Total Returns | | Operating |
| | | as of October 31, 2023 | | Expense |
| | | 1 Year | | 5 Year | | 10 Year | | Ratio(a) |
| Commonwealth Australia/New Zealand Fund | | (10.80)% | | (1.66)% | | 0.58% | | 2.60% |
| Australian All Ordinaries Index (“AAOI”) | | 3.40% | | 6.40% | | 3.99% | | — |
| NZX 50 Index | | (5.12)% | | 1.87% | | 4.42% | | — |
Past performance does not guarantee future results. The performance data quoted represents past performance and current returns which may be lower or higher. The above graph and table do not reflect the deduction of taxes that a shareholder would pay on Fund distributions or the redemption of Fund shares. The investment return and principal value will fluctuate so that an investor’s shares, when redeemed may be worth more or less than the original cost. To obtain performance information current to the most recent month end, please call 888-345-1898. The Fund’s performance reflects any fee waivers during the applicable periods. If such fee waivers had not occurred, the quoted performance would have been lower. Total returns for 1 year are not annualized.
| (a) | The above expense ratio is from the Fund’s Prospectus, dated February 28, 2023. Additional information pertaining to the Fund’s expense ratio as of October 31, 2023, can be found in the financial highlights. |
The Fund’s performance is measured against the Australian All Ordinaries Index (’‘AAOI’’), an index made up of the largest 500 companies as measured by market capitalization that are listed on the Australian Stock Exchange; and the NZX 50 Index, a total return index consisting of the top 50 companies by free float adjusted market capitalization that are listed on the New Zealand Stock Exchange. These indices are unmanaged, are expressed in terms of U.S. dollars, and do not reflect the deduction of fees or taxes with a mutual fund, such as investment management and fund accounting fees. The performance of the Fund reflects the deduction of fees for these services. Investors cannot invest directly in an index.
You should carefully consider the investment objectives, risks, charges and expenses of the Fund before investing. This and other information can be found in the Fund’s Prospectus, which can be obtained from www.commonwealthfunds.com, by calling the Funds directly at 888-345-1898 or by contacting your investment representative. Please read it carefully before you invest or send money.
| ANNUAL REPORT 2023 |
| | |
| PERFORMANCE OVERVIEW – October 31, 2023 (Unaudited) |
| AFRICA FUND |
The Africa Fund’s net asset value (NAV) as of October 31, 2023, was $6.74 per share compared to $7.12 per share on October 31, 2022. For the period covered by this Annual Report, the Africa Fund returned –4.41%. This return figure includes the $0.07 per share distribution made in December 2022. Investment decisions for the Fund are based upon fundamental research and not designed to track a specific index. Further, our investments in cash and cash equivalents within the Fund could distort comparisons with indexes that do not make such investments. The MSCI Emerging Markets Index and the Dow Jones Africa Titans 50 Index returned 10.80% and 1.95%, respectively for the same period. The indexes are unmanaged, expressed in terms of U.S. dollars and do not reflect the deduction of fees associated with ownership of a mutual fund such as investment management and fund accounting fees, nor do they reflect the deduction of taxes associated with ownership of a mutual fund. The performance of the Fund reflects the deduction of fees for these services. Investors cannot invest directly in an index.
There are other considerations that impacted performance during the period covered by this year’s report:
| - | For the period ended October 31, 2023, the Advisor limited the Fund operating expenses, which positively affected the Fund’s performance. Had the Advisor not capped the Fund’s operating expenses, performance would have been lower. Please see the accompanying notes to the financial statements for additional information. |
| - | The -1.47% decrease of the South African Rand versus the U.S. dollar had a predictable negative effect on the Fund’s performance. |
| - | The Fund’s holdings in the following securities had the largest positive impact on the Fund’s performance: Gold Fields Ltd. ADR, Naspers Ltd., Bid Corp Ltd., Bidvest Group Ltd., and Alexander Forbes Group Holdings Ltd. |
| - | The Fund’s holdings in the following securities had the largest negative impact on the Fund’s performance: Impala Platinum Holdings Ltd., Anglo American Platinum Ltd., Capitec Bank Holdings Ltd., Renergen Ltd., and Sibanye Stillwater Ltd. |
We believe that Africa represents a unique, complicated continent with the potential to be both economically rewarding and punitive. We feel equities listed on African stock exchanges offer investors a way to participate in what is expected to be sizeable growth in the consumer consumption of goods and services and the economies in general. It takes time for governments to change and for the people of an emerging country to adjust. With the vast number of countries within the African continent, it is an exciting yet daunting task. Our portfolio selection includes using information we gather first hand through trips to the continent as we seek to monitor each investment and to make decisions we view as being in the best interests of the Fund. The African
continent is not well understood by many US investors. In response we have included information on our website at Commonwealthfunds.com that will assist in the understanding of this unique and complex continent.
Investment Risks
Equity securities (stocks) are more volatile and carry more risk than other forms of investments, including high-grade fixed income securities. The net asset values per share of a Fund will fluctuate as the value of these securities in the portfolio changes.
The Fund’s expenses, as with any mutual fund, detract from the Fund’s performance. The Fund’s asset levels have a direct effect on the expenses indirectly paid by shareholders. To the extent the Fund’s assets decline and the expenses of the Fund rise or do not decrease proportionately, performance will be negatively impacted.
International investing involves increased risk and volatility. An investment in this Fund entails the special risks of international investing, including currency exchange fluctuation, government regulations, and the potential for political and economic instability. Because the Fund invests primarily in the securities of, and depositary receipts represented by African issuers, the Fund is particularly susceptible to any economic, political, or regulatory developments affecting a particular issuer of those countries.
By itself the Fund does not constitute a complete investment plan and should be considered a long-term investment for investors who can afford to weather change in the value of their investments.
Investors should refer to the Fund’s Prospectus for a more complete description of risks associated with investing in the Fund.
Portfolio holdings will change due to ongoing management of the Fund.
References to specific securities or sectors should not be construed as recommendations by the Trust, the Advisor or the Distributor.
| ANNUAL REPORT 2023 |
| | |
| PERFORMANCE OVERVIEW – October 31, 2023 (Unaudited) |
| AFRICA FUND |
Comparison of Change in Value of a $10,000 investment in the Africa Fund (the “Fund”), the MSCIEM and the DJAFKT.
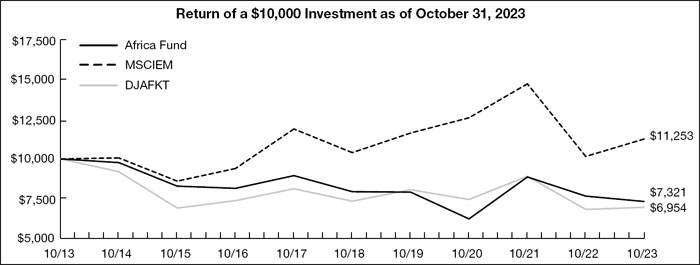
The above graph is a hypothetical $10,000 investment in the Fund from 10/31/13 to 10/31/23 and represents the reinvestment of dividends and distributions in the Fund.
| | | | | | | | | Total Fund |
| | | | | | | | | Operating |
| | | | | | | | | Expense |
| | | Average Annual Total Returns | | After Fee |
| | | as of October 31, 2023 | | Waiver |
| | | 1 Year | | 5 Year | | 10 Year | | Ratio(a) |
| Africa Fund | | (4.41)% | | (1.60)% | | (3.07)% | | 1.79% |
| MSCI Emerging Markets Index (“MSCIEM”) | | 10.80% | | 1.59% | | 1.19% | | — |
| Dow Jones Africa Titans 50 Index (“DJAFKT”) | | 1.95% | | (1.08)% | | (3.57)% | | — |
Past performance does not guarantee future results. The performance data quoted represents past performance and current returns which may be lower or higher. The above graph and table do not reflect the deduction of taxes that a shareholder would pay on Fund distributions or the redemption of Fund shares. The investment return and principal value will fluctuate so that an investor’s shares, when redeemed may be worth more or less than the original cost. To obtain performance information current to the most recent month end, please call 888-345-1898. The Fund’s performance reflects any fee waivers during the applicable periods. If such fee waivers had not occurred, the quoted performance would have been lower. Total returns for 1 year are not annualized.
| (a) | The above expense ratio is from the Fund’s Prospectus, dated February 28, 2023. FCA Corp has entered into a written expense limitation agreement under which it has agreed to limit the total expenses of the Fund (exclusive of interest, distribution fees pursuant to Rule 12b-1 Plans, taxes, acquired fund fees and expenses, brokerage commissions, extraordinary expenses and dividend expense on short sales) to an annual rate of 1.50% of the average daily net assets of the Fund. This expense limitation agreement may be terminated by FCA Corp or the Trust at any time after February 28, 2024. FCA Corp may recoup from the Fund any reduced fees and/or expenses reimbursed pursuant to this agreement if such recoupment does not cause the Fund to exceed the expense limitation in place at the time the fee was reduced and/or expenses were reimbursed and such recoupment is made within three years after the date in which FCA Corp incurred the expense. Excluding the indirect costs of investing in acquired funds, total fund operating expenses, before fee waiver, would have been 4.27%. Additional information pertaining to the Fund’s expense ratio as of October 31, 2023, can be found in the financial highlights. |
| ANNUAL REPORT 2023 |
| | |
| PERFORMANCE OVERVIEW – October 31, 2023 (Unaudited) |
| AFRICA FUND |
The Fund’s performance is measured against the MSCI Emerging Markets Index (’‘MSCIEM’’), a free float-adjusted market capitalization index that is designed to measure equity market performance within global emerging markets; and the Dow Jones Africa Titans 50 Index (’‘DJAFKT’’), a float-adjusted market capitalization index that is designed to measure the stock performance of 50 leading companies that are headquartered or generate the majority of their revenues in Africa. The MSCIEM currently consists of the following 27 emerging market country indices: Argentina, Brazil, Chile, China, Colombia, Czech Republic, Egypt, Greece, Hungary, India, Indonesia, Korea, Kuwait, Malaysia, Mexico, Pakistan, Peru, Philippines, Poland, Russia, Qatar, South Africa, Saudi Arabia, Taiwan, Thailand, Turkey and United Arab Emirates. These indices are unmanaged, are expressed in terms of U.S. dollars, and do not reflect the deduction of fees or taxes with a mutual fund, such as investment management and fund accounting fees. The performance of the Fund reflects the deduction of fees for these services. Investors cannot invest directly in an index.
You should carefully consider the investment objectives, risks, charges and expenses of the Fund before investing. This and other information can be found in the Fund’s Prospectus, which can be obtained from www.commonwealthfunds.com, by calling the Funds directly at 888-345-1898 or by contacting your investment representative. Please read it carefully before you invest or send money.
| ANNUAL REPORT 2023 |
| | |
| PERFORMANCE OVERVIEW – October 31, 2023 (Unaudited) |
| COMMONWEALTH JAPAN FUND |
The Commonwealth Japan Fund’s net asset value (NAV) as of October 31, 2023, was $3.42 per share compared to $3.03 per share on October 31, 2022. For the twelve-month period covered by this Annual Report, the Commonwealth Japan Fund returned 12.87%. Investment decisions for the Fund are based upon fundamental research and not designed to track a specific index. Further, our investments in cash and cash equivalents within the Fund could distort comparisons with indexes that do not make such investments. The Tokyo Stock Price Index returned 17.49% for the period ending October 31, 2023. The index is unmanaged, expressed in terms of U.S. dollars and does not reflect the deduction of fees associated with ownership of a mutual fund such as investment management and fund accounting fees, nor do they reflect the deduction of taxes associated with ownership of a mutual fund. The performance of the Fund reflects the deduction of fees for these services.
There are other considerations that impacted performance during the period covered by this year’s report:
| - | For the period ended October 31, 2023, the Advisor limited the Fund operating expenses, which positively affected the Fund’s performance had the Advisor not capped the Fund’s operating expenses, performance would have been lower. Please see the accompanying notes to the financial statements for additional information. |
| - | The 1.93% decline of the Japanese Yen versus the U.S. dollar during the year had a predictable negative effect on the Fund’s returns. |
| - | The Fund’s holdings in the following securities had the largest positive impact on the Fund’s performance: Kajima Corp., T&D Holdings, Inc., Yamae Group Holdings Co. Ltd., Dai-ichi Life Holdings, Inc., and Kansai Electric Power Co., Inc. |
| - | The Fund’s holdings in the following securities had the largest negative impact on the Fund’s performance: Takada Corp., Nidec Corp., Terumo Corp., Keikyu Corp., and Taiyo Yuden Co. Ltd. |
Investment Risks
Equity securities (stocks) are more volatile and carry more risk than other forms of investments, including high-grade fixed income securities. The net asset values per share of a Fund will fluctuate as the value of these securities in the portfolio changes.
The Fund’s expenses, as with any mutual fund, detract from the Fund’s performance. The Fund’s asset levels have a direct effect on the expenses indirectly paid by shareholders. To the extent the Fund’s assets decline and the expenses of the Fund rise or do not decrease proportionately, performance will be negatively impacted.
International investing involves increased risk and volatility. An investment in this Fund entails the special risks of international investing, including currency exchange fluctuation, government regulations, and the potential for political and economic instability. Because the Fund invests primarily in the securities of, and depositary receipts represented by Japanese issuers, the Fund is particularly susceptible to any economic, political, or regulatory developments affecting a particular issuer of those countries.
By itself the Fund does not constitute a complete investment plan and should be considered a long-term investment for investors who can afford to weather change in the value of their investments.
Investors should refer to the Fund’s Prospectus for a more complete description of risks associated with investing in the Fund.
Portfolio holdings will change due to ongoing management of the Fund.
References to specific securities or sectors should not be construed as recommendations by the Trust, the Advisor or the Distributor.
| ANNUAL REPORT 2023 |
| | |
| PERFORMANCE OVERVIEW – October 31, 2023 (Unaudited) |
| COMMONWEALTH JAPAN FUND |
Comparison of Change in Value of a $10,000 investment in the Commonwealth Japan Fund (the “Fund”) and the TOPIX.
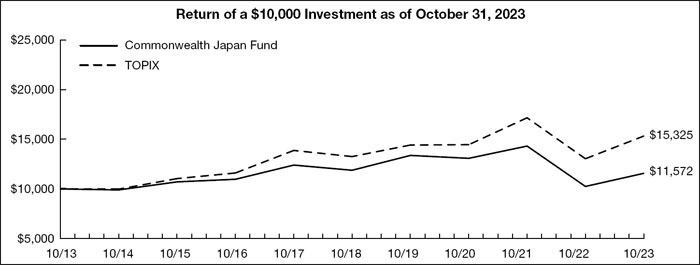
The above graph is a hypothetical $10,000 investment in the Fund from 10/31/13 to 10/31/23 and represents the reinvestment of dividends and distributions in the Fund.
| | | | | | | | | Total Fund |
| | | | | | | | | Operating |
| | | | | | | | | Expense |
| | | Average Annual Total Returns | | After Fee |
| | | as of October 31, 2023 | | Waiver |
| | | 1 Year | | 5 Year | | 10 Year | | Ratio(a) |
| Commonwealth Japan Fund | | 12.87% | | (0.53)% | | 1.47% | | 1.75% |
| Tokyo Stock Price Index (“TOPIX”) | | 17.49% | | 2.94% | | 4.36% | | — |
Past performance does not guarantee future results. The performance data quoted represents past performance and current returns which may be lower or higher. The above graph and table do not reflect the deduction of taxes that a shareholder would pay on Fund distributions or the redemption of Fund shares. The investment return and principal value will fluctuate so that an investor’s shares, when redeemed may be worth more or less than the original cost. To obtain performance information current to the most recent month end, please call 888-345-1898. The Fund’s performance reflects any fee waivers during the applicable periods. If such fee waivers had not occurred, the quoted performance would have been lower. Total returns for 1 year are not annualized.
| (a) | The above expense ratio is from the Fund’s Prospectus, dated February 28, 2023. FCA Corp has entered into a written expense limitation agreement under which it has agreed to limit the total expenses of the Fund (exclusive of interest, distribution fees pursuant to Rule 12b-1 Plans, taxes, acquired fund fees and expenses, brokerage commissions, extraordinary expenses and dividend expense on short sales) to an annual rate of 1.50% of the average daily net assets of the Fund. This expense limitation agreement may be terminated by FCA Corp or the Trust at any time after February 28, 2024. FCA Corp may recoup from the Fund any reduced fees and/or expenses reimbursed pursuant to this agreement if such recoupment does not cause the Fund to exceed the expense limitation in place at the time the fee was reduced and/or expenses were reimbursed and such recoupment is made within three years after the date in which FCA Corp incurred the expense. Excluding the indirect costs of investing in acquired funds, total fund operating expenses, before fee waiver, would have been 3.38%. Additional information pertaining to the Fund’s expense ratio as of October 31, 2023, can be found in the financial highlights. |
| ANNUAL REPORT 2023 |
| | |
| PERFORMANCE OVERVIEW – October 31, 2023 (Unaudited) |
| COMMONWEALTH JAPAN FUND |
The Fund’s performance is measured against the Tokyo Stock Price Index (“TOPIX”), an unmanaged capitalization-weighted index of all the companies stocks on the First Section of the Tokyo Stock Exchange. This index is expressed in terms of U.S. dollars, and does not reflect the deduction of fees or taxes with a mutual fund, such as investment management and fund accounting fees. The performance of the Fund reflects the deduction of fees for these services. Investors cannot invest directly in an index.
You should carefully consider the investment objectives, risks, charges and expenses of the Fund before investing. This and other information can be found in the Fund’s Prospectus, which can be obtained from www.commonwealthfunds.com, by calling the Funds directly at 888-345-1898 or by contacting your investment representative. Please read it carefully before you invest or send money.
| ANNUAL REPORT 2023 |
| | |
| PERFORMANCE OVERVIEW – October 31, 2023 (Unaudited) |
| COMMONWEALTH GLOBAL FUND |
The Commonwealth Global Fund’s net asset value (NAV) as of October 31, 2023, was $16.97 per share compared to $16.86 per share on October 31, 2022. For the twelve-month period covered by this Annual Report, the Commonwealth Global Fund returned 1.51%. This return figure includes the $0.15 per share distribution made in December 2022. Investment decisions for the Fund are based upon fundamental research and not designed to track a specific index. Further, our investments in cash and cash equivalents within the Fund could distort comparisons with indexes that do not make such investments. The MSCI World Index returned 11.05% for the period ending October 31, 2023. The index is unmanaged, expressed in terms of U.S. dollars and do not reflect the deduction of fees or taxes associated with ownership of a mutual fund such as investment management and fund accounting fees, nor does the index reflect the deduction of taxes associated with ownership of a mutual fund. The performance of the Fund reflects the deduction of fees for these services.
There are other considerations that impacted performance during the period covered by this year’s report:
| - | The following security holdings had the largest positive impact on the Fund’s performance: Group 1 Automotive, Inc., Miller Industries, Inc., Novo Nordisk A/S ADR., Microsoft Corp., and Siemens AG ADR. |
| - | The following securities had the largest negative impact on the Fund’s performance: KVHI Industries, Inc., Chevron Corp., Thermo Fisher Scientific, Inc., Nidec Corp. ADR., and Roche Holding AG ADR. |
Investment Risks
Equity securities (stocks) are more volatile and carry more risk than other forms of investments, including high-grade fixed income securities. The net asset values per share of a Fund will fluctuate as the value of these securities in the portfolio changes.
The Fund’s expenses, as with any mutual fund, detract from the Fund’s performance. The Fund’s asset levels have a direct effect on the expenses indirectly paid by shareholders. To the extent the Fund’s assets decline and the expenses of the Fund rise or do not decrease proportionately, performance will be negatively impacted.
International investing involves increased risk and volatility. An investment in this Fund entails the special risks of international investing, including currency exchange fluctuation, government regulations, and the potential for political and economic instability.
By itself the Fund does not constitute a complete investment plan and should be considered a long-term investment for investors who can afford to weather change in the value of their investments.
Investors should refer to the Fund’s Prospectus for a more complete description of risks associated with investing in the Fund.
Portfolio holdings will change due to ongoing management of the Fund.
References to specific securities or sectors should not be construed as recommendations by the Trust, the Advisor or the Distributor.
| ANNUAL REPORT 2023 |
| | |
| PERFORMANCE OVERVIEW – October 31, 2023 (Unaudited) |
| COMMONWEALTH GLOBAL FUND |
Comparison of Change in Value of a $10,000 investment in the Commonwealth Global Fund (the “Fund”) and the MSCI World Index.
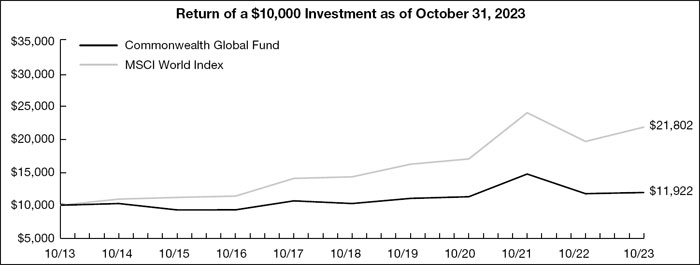
The above graph is a hypothetical $10,000 investment in the Fund from 10/31/13 to 10/31/23 and represents the reinvestment of dividends and distributions in the Fund.
| | | | | | | | | Total Fund |
| | | Average Annual Total Returns | | Operating |
| | | as of October 31, 2023 | | Expense |
| | | 1 Year | | 5 Year | | 10 Year | | Ratio(a) |
| Commonwealth Global Fund | | 1.51% | | 3.05% | | 1.77% | | 2.49% |
| MSCI World Index | | 11.05% | | 8.82% | | 8.11% | | — |
Past performance does not guarantee future results. The performance data quoted represents past performance and current returns which may be lower or higher. The above graph and table do not reflect the deduction of taxes that a shareholder would pay on Fund distributions or the redemption of Fund shares. The investment return and principal value will fluctuate so that an investor’s shares, when redeemed may be worth more or less than the original cost. To obtain performance information current to the most recent month end, please call 888-345-1898. The Fund’s performance reflects any fee waivers during the applicable periods. If such fee waivers had not occurred, the quoted performance would have been lower. Total returns for 1 year are not annualized.
| (a) | The above expense ratio is from the Fund’s Prospectus, dated February 28, 2023. Additional information pertaining to the Fund’s expense ratio as of October 31, 2023, can be found in the financial highlights. |
The Fund’s performance is measured against the MSCI World Index, an unmanaged free float-adjusted market capitalization index that is designed to measure global developed market equity performance. Currently the MSCI World Index consists of the following 23 developed market country indices: Australia, Austria, Belgium, Canada, Denmark, Finland, France, Germany, Hong Kong, Ireland, Israel, Italy, Japan, Netherlands, New Zealand, Norway, Portugal, Singapore, Spain, Sweden, Switzerland, the United Kingdom and the United States. The performance of the index is expressed in terms of U.S. dollars, and does not reflect the deduction of fees or taxes with a mutual fund, such as investment management and fund accounting fees. The performance of the Fund reflects the deduction of fees for these services. Investors cannot invest directly in an index.
You should carefully consider the investment objectives, risks, charges and expenses of the Fund before investing. This and other information can be found in the Fund’s Prospectus, which can be obtained from www.commonwealthfunds.com, by calling the Funds directly at 888-345-1898 or by contacting your investment representative. Please read it carefully before you invest or send money.
| ANNUAL REPORT 2023 |
| | |
| PERFORMANCE OVERVIEW – October 31, 2023 (Unaudited) |
| COMMONWEALTH REAL ESTATE SECURITIES FUND |
The Commonwealth Real Estate Securities Fund’s net asset value (NAV) as of October 31, 2023, was $17.86 per share compared to $17.68 per share on October 31, 2022. For the twelve-month period covered by this Annual Report, the Commonwealth Real Estate Securities Fund returned 1.61%. This return figure includes the $0.11 per share distribution made in December 2022. The MSCI US REIT Index returned -5.93% for the same period. The index is unmanaged, expressed in terms of U.S. dollars and do not reflect the deduction of fees or taxes associated with ownership of a mutual fund such as investment management and fund accounting fees, nor do they reflect the deduction of taxes associated with ownership of a mutual fund. The performance returns of the Fund do reflect the deduction of fees for these services. Investment decisions for the Fund are based upon fundamental research and not designed to track a specific index. Further, our investments in cash and cash equivalents within the Fund could distort comparisons with indexes that do not make such investments.
There are other considerations that impacted performance during the period covered by this year’s report:
| - | The Fund’s holdings in the following securities had the largest positive impact on the Fund’s performance: Tecnoglass, Inc., Lennox International, Inc., D.R. Horton, Inc., InterContinental Hotels Group PLC ADR, and Digital Realty Trust, Inc. |
| - | The Fund’s holdings in the following securities had the largest negative impact on the Fund’s performance: Extra Space Storage, Inc., SBA Communications Corp., Alexandria Real Estate Equites, Inc., WP Carey, Inc., and Hannon Armstrong Sustainable Infrastructure Capital, Inc. |
| - | The Fund’s outperformance compared to the MSCI US REIT Index may be in part explained by our strategy of not investing solely in REITs but also investing in real estate and related industries as well as international companies. Real estate and related industries include companies and industries whose fortunes are impacted by the real estate market beyond just owning the underlying real estate. |
Investment Risks
Equity securities (stocks) are more volatile and carry more risk than other forms of investments, including high-grade fixed income securities. The net asset values per share of a Fund will fluctuate as the value of these securities in the portfolio changes.
The Fund’s expenses, as with any mutual fund, detract from the Fund’s performance. The Fund’s asset levels have a direct effect on the expenses indirectly paid by shareholders. To the extent the Fund’s assets decline and the expenses of the Fund rise or do not decrease proportionately, performance will be negatively impacted.
The Fund’s investments in real estate investment trusts (“REITs”) involves certain unique risks in addition to those risks associated with investing in the real estate industry in general. Equity REITs may be affected by changes in the value of the underlying property owned by the REITs, while mortgage REITs may be affected by the quality of any credit extended.
Investments in the Fund are subject to the risks related to direct investment in real estate, such as real estate risk, regulatory risks, concentration risk, and diversification risk.
By itself the Fund does not constitute a complete investment plan and should be considered a long-term investment for investors who can afford to weather change in the value of their investments.
Investors should refer to the Fund’s Prospectus for a more complete description of risks associated with investing in the Fund.
Portfolio holdings will change due to ongoing management of the Fund.
References to specific securities or sectors should not be construed as recommendations by the Trust, the Advisor or the Distributor.
| ANNUAL REPORT 2023 |
| | |
| PERFORMANCE OVERVIEW – October 31, 2023 (Unaudited) |
| COMMONWEALTH REAL ESTATE SECURITIES FUND |
Comparison of Change in Value of a $10,000 investment in the Commonwealth Real Estate Securities Fund (the “Fund”) and the MSCI US REIT Index.
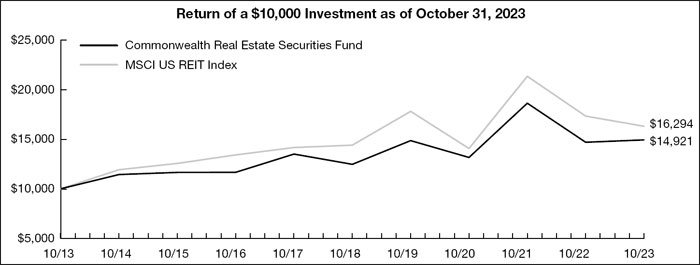
The above graph is a hypothetical $10,000 investment in the Fund from 10/31/13 to 10/31/23 and represents the reinvestment of dividends and distributions in the Fund.
| | | | | | | | | Total Fund |
| | | Average Annual Total Returns | | Operating |
| | | as of October 31, 2023 | | Expense |
| | | 1 Year | | 5 Year | | 10 Year | | Ratio(a) |
| Commonwealth Real Estate Securities Fund | | 1.61% | | 3.67% | | 4.08% | | 2.60% |
| MSCI US REIT Index | | (5.93)% | | 2.51% | | 5.00% | | — |
Past performance does not guarantee future results. The performance data quoted represents past performance and current returns which may be lower or higher. The above graph and table do not reflect the deduction of taxes that a shareholder would pay on Fund distributions or the redemption of Fund shares. The investment return and principal value will fluctuate so that an investor’s shares, when redeemed may be worth more or less than the original cost. To obtain performance information current to the most recent month end, please call 888-345-1898. The Fund’s performance reflects any fee waivers during the applicable periods. If such fee waivers had not occurred, the quoted performance would have been lower. Total returns for 1 year are not annualized.
| (a) | The above expense ratio is from the Fund’s Prospectus, dated February 28, 2023. Additional information pertaining to the Fund’s expense ratio as of October 31, 2023, can be found in the financial highlights. |
The Fund’s performance is measured against the MSCI US REIT Index which is an unmanaged free float-adjusted market capitalization weighted index that is comprised of equity REITs that are included in the MSCI USA Investable Market Index, with the exception of specialty equity REITs that do not generate a majority of their revenue and income from real estate rental and leasing operations. The index represents approximately 99% of the US REIT universe. This index is expressed in terms of U.S. dollars, and does not reflect the deduction of fees or taxes with a mutual fund, such as investment management and fund accounting fees. The performance of the Fund reflects the deduction of fees for these services. Investors cannot invest directly in an index.
You should carefully consider the investment objectives, risks, charges and expenses of the Fund before investing. This and other information can be found in the Fund’s Prospectus, which can be obtained from www.commonwealthfunds.com, by calling the Funds directly at 888-345-1898 or by contacting your investment representative. Please read it carefully before you invest or send money.
| | ANNUAL REPORT 2023 |
| |
| PORTFOLIO COMPOSITION – October 31, 2023* (Unaudited) |
| COMMONWEALTH AUSTRALIA/NEW ZEALAND FUND |
| Industry or | Percentage of Total |
| Security Type | Investments |
| Transport Operations & Services | 17.1% |
| Power Generation | 10.9% |
| Logistics Services | 8.4% |
| Health Care Services | 7.1% |
| Food & Drug Stores | 4.4% |
| Home Products Stores | 4.4% |
| Courier Services | 4.1% |
| Flow Control Equipment | 3.6% |
| Integrated Electric Utilities | 3.5% |
| Containers & Packaging | 3.5% |
| Medical Devices | 3.4% |
| Biotech | 3.4% |
| Wireless Telecommunications | 3.3% |
| Lodging | 2.9% |
| Measurement Instruments | 2.4% |
| Internet Media & Services | 2.0% |
| Multi Asset Class Owners & Developers | 2.0% |
| Gas Utilities | 1.9% |
| Real Estate Services | 1.9% |
| Environmental & Facilities Services | 1.6% |
| Packaged Food | 1.2% |
| Building Materials | 1.1% |
| Health Care Facilities | 1.1% |
| P&C Insurance | 1.0% |
| Alcoholic Beverages | 0.9% |
| Health Care Supply Chain | 0.8% |
| Retail REITs | 0.8% |
| Other Speciality Retail - Discretionary | 0.6% |
| Life Science & Diagnostics | 0.4% |
| Money Market Funds | 0.2% |
| IT Services | 0.1% |
| | 100.0% |
| AFRICA FUND |
| Country or | Percentage of Total |
| Security Type | Investments |
| South Africa | 90.0% |
| United Kingdom | 4.0% |
| Exchange Traded Funds - Nigeria | 3.0% |
| Egypt | 2.2% |
| Money Market Funds | 0.8% |
| | 100.0% |
| COMMONWEALTH JAPAN FUND |
| Industry or | Percentage of Total |
| Security Type | Investments |
| Medical Devices | 8.6% |
| Life Insurance | 8.2% |
| Transit Services | 7.8% |
| Personal Care Products | 5.0% |
| Commercial Finance | 4.6% |
| Automobiles | 4.0% |
| IT Services | 4.0% |
| Building Construction | 3.9% |
| Health Care Supplies | 3.9% |
| Electronics Components | 3.3% |
| Specialty Chemicals | 3.1% |
| Multi Asset Class Owners & Developers | 3.0% |
| Diversified Industrials | 2.9% |
| Consumer Electronics | 2.7% |
| Auto Parts | 2.7% |
| Commercial & Residential Building Equipment & Systems | 2.6% |
| Specialty Apparel Stores | 2.4% |
| Home Products Stores | 2.4% |
| Food & Beverage Wholesalers | 2.3% |
| Electrical Power Equipment | 2.2% |
| Courier Services | 2.1% |
| Basic & Diversified Chemicals | 2.0% |
| Food & Drug Stores | 1.8% |
| P&C Insurance | 1.8% |
| Alcoholic Beverages | 1.8% |
| Integrated Electric Utilities | 1.7% |
| Building Maintenance Services | 1.4% |
| Logistics Services | 1.4% |
| Infrastructure Construction | 1.4% |
| Factory Automation Equipment | 1.4% |
| Mass Merchants | 1.3% |
| Wireless Telecommunications | 1.1% |
| Exploration & Production | 0.9% |
| Money Market Funds | 0.3% |
| | 100.0% |
| * | Portfolio composition is subject to change. |
| | ANNUAL REPORT 2023 |
| | |
| PORTFOLIO COMPOSITION – October 31, 2023* (Unaudited) |
| COMMONWEALTH GLOBAL FUND |
| Country or | Percentage of Total |
| Security Type | Investments |
| United States | 52.2% |
| United Kingdom | 10.9% |
| Switzerland | 6.0% |
| Money Market Funds | 4.8% |
| Japan | 3.5% |
| Germany | 3.1% |
| India | 3.0% |
| Israel | 2.8% |
| Denmark | 2.6% |
| South Africa | 2.1% |
| Norway | 2.0% |
| France | 2.0% |
| Panama | 1.6% |
| Taiwan Province Of China | 1.2% |
| Mexico | 1.1% |
| Ireland | 1.1% |
| | 100.0% |
| COMMONWEALTH REAL ESTATE SECURITIES FUND |
| Industry or | Percentage of Total |
| Security Type | Investments |
| Building Materials | 11.1% |
| Homebuilding | 9.9% |
| Infrastructure REITs | 8.5% |
| Money Market Funds | 6.3% |
| Specialized REITs | 5.7% |
| Industrial REITs | 5.3% |
| Commercial & Residential Building Equipment & Systems | 5.1% |
| Cement & Aggregates | 4.8% |
| U.S. Government & Agencies | 4.8% |
| Data Center REITs | 4.6% |
| Home Products Stores | 4.0% |
| Hotels Resorts & Cruise Lines | 3.6% |
| Self-Storage REITs | 3.5% |
| Banks | 3.2% |
| Transport Operations & Services | 3.1% |
| Retail REITs | 2.7% |
| Timber REITs | 2.5% |
| Mortgage Finance | 2.2% |
| Multi Asset Class REITs | 1.9% |
| Building Construction | 1.8% |
| Industrial Machinery | 1.7% |
| Residential REITs | 1.4% |
| Residential Owners & Developers | 1.2% |
| Agricultural Producers | 1.1% |
| | 100.0% |
| * | Portfolio composition is subject to change. |
| | ANNUAL REPORT 2023 |
| |
| SCHEDULE OF INVESTMENTS – October 31, 2023 |
| Commonwealth Australia/New Zealand Fund |
| | | Shares | | | Fair Value | |
| COMMON STOCKS (99.57%) | | | | | | | | |
| AUSTRALIA (34.79%) | | | | | | | | |
| BIOTECH (3.36%) | | | | | | | | |
| CSL Ltd. | | | 2,500 | | | $ | 369,484 | |
| CONTAINERS & PACKAGING (3.45%) | | | | | | | | |
| Brambles Ltd. | | | 45,537 | | | | 380,045 | |
| ENVIRONMENTAL & FACILITIES SERVICES (1.60%) | | | | | | | | |
| Cleanaway Waste Management Ltd. | | | 123,329 | | | | 175,690 | |
| FOOD & DRUG STORES (3.25%) | | | | | | | | |
| Coles Group Ltd. | | | 36,872 | | | | 357,872 | |
| GAS UTILITIES (1.90%) | | | | | | | | |
| APA Group | | | 40,000 | | | | 209,680 | |
| HEALTH CARE FACILITIES (1.06%) | | | | | | | | |
| Ramsay Health Care Ltd. | | | 3,778 | | | | 116,983 | |
| HEALTH CARE SERVICES (4.39%) | | | | | | | | |
| Sonic Healthcare Ltd. | | | 26,382 | | | | 483,087 | |
| INTEGRATED ELECTRIC UTILITIES (3.47%) | | | | | | | | |
| Origin Energy Ltd. | | | 65,776 | | | | 381,561 | |
| INTERNET MEDIA & SERVICES (2.01%) | | | | | | | | |
| Webjet Ltd.(a) | | | 57,000 | | | | 221,504 | |
| IT SERVICES (0.08%) | | | | | | | | |
| Appen Ltd.(a) | | | 15,000 | | | | 8,629 | |
| LOGISTICS SERVICES (2.36%) | | | | | | | | |
| Qube Holdings Ltd. | | | 153,645 | | | | 260,541 | |
| MEDICAL DEVICES (2.78%) | | | | | | | | |
| Cochlear Ltd. | | | 2,000 | | | | 306,552 | |
| RETAIL REITS (0.77%) | | | | | | | | |
| Scentre Group Ltd. | | | 55,000 | | | | 85,207 | |
| TRANSPORT OPERATIONS & SERVICES (1.03%) | | | | | | | | |
| Transurban Group | | | 15,000 | | | | 112,929 | |
| WIRELESS TELECOMMUNICATIONS (3.28%) | | | | | | | | |
| Telstra Corp. Ltd. | | | 148,972 | | | | 361,243 | |
| TOTAL AUSTRALIA | | | | | | | 3,831,007 | |
| NEW ZEALAND (64.78%) | | | | | | | | |
| ALCOHOLIC BEVERAGES (0.93%) | | | | | | | | |
| Delegat Group Ltd. | | | 21,456 | | | | 101,846 | |
| BUILDING MATERIALS (1.14%) | | | | | | | | |
| Fletcher Building Ltd. | | | 50,000 | | | | 125,977 | |
| COURIER SERVICES (4.08%) | | | | | | | | |
| Freightways Ltd. | | | 103,540 | | | | 449,532 | |
| | | Shares | | | Fair Value | |
| COMMON STOCKS (99.57%) – Continued | | | | | | | | |
| NEW ZEALAND (64.78%) – Continued | | | | | | | | |
| FLOW CONTROL EQUIPMENT (3.59%) | | | | | | | | |
| Skellerup Holdings Ltd. | | | 150,000 | | | $ | 395,004 | |
| FOOD & DRUG STORES (1.17%) | | | | | | | | |
| Green Cross Health Ltd. | | | 181,796 | | | | 129,361 | |
| HEALTH CARE FACILITIES (2.73%) | | | | | | | | |
| Oceania Healthcare Ltd. | | | 457,544 | | | | 181,450 | |
| Summerset Group Holdings Ltd. | | | 20,842 | | | | 118,330 | |
| | | | | | | | 299,780 | |
| HEALTH CARE SUPPLY CHAIN (0.81%) | | | | | | | | |
| AFT Pharmaceuticals Ltd. | | | 46,000 | | | | 89,691 | |
| HOME PRODUCTS STORES (4.35%) | | | | | | | | |
| Briscoe Group Ltd. | | | 183,520 | | | | 479,915 | |
| LIFE SCIENCE & DIAGNOSTICS (0.42%) | | | | | | | | |
| Pacific Edge Ltd.(a) | | | 800,000 | | | | 46,587 | |
| LODGING (2.86%) | | | | | | | | |
| Millennium & Copthorne Hotels New Zealand Ltd. | | | 300,000 | | | | 314,937 | |
| LOGISTICS SERVICES (6.06%) | | | | | | | | |
| Mainfreight Ltd. | | | 20,000 | | | | 667,387 | |
| MEASUREMENT INSTRUMENTS (2.42%) | | | | | | | | |
| ikeGPS Group Ltd.(a) | | | 831,366 | | | | 266,537 | |
| MEDICAL DEVICES (0.65%) | | | | | | | | |
| Aroa Biosurgery Ltd.(a) | | | 145,000 | | | | 71,301 | |
| MULTI ASSET CLASS OWNERS & DEVELOPERS (1.98%) | | | | | | | | |
| Marsden Maritime Holdings Ltd. | | | 81,425 | | | | 218,206 | |
| OTHER SPECIALTY RETAIL - DISCRETIONARY (0.58%) | | | | | | | | |
| Comvita Ltd. | | | 35,694 | | | | 63,432 | |
| P&C INSURANCE (1.01%) | | | | | | | | |
| Tower Ltd. | | | 300,000 | | | | 111,752 | |
| PACKAGED FOOD (1.19%) | | | | | | | | |
| Sanford Ltd. | | | 60,000 | | | | 131,564 | |
| POWER GENERATION (10.88%) | | | | | | | | |
| Infratil Ltd. | | | 208,975 | | | | 1,196,280 | |
| REAL ESTATE SERVICES (1.89%) | | | | | | | | |
| Arvida Group Ltd. | | | 316,092 | | | | 208,480 | |
See accompanying notes to financial statements.
| | ANNUAL REPORT 2023 |
| | |
| SCHEDULE OF INVESTMENTS – October 31, 2023 |
| Commonwealth Australia/New Zealand Fund |
| | | Shares | | | Fair Value | |
| COMMON STOCKS (99.57%) – Continued | | | | | | | | |
| NEW ZEALAND (64.78%) – Continued | | | | | | | | |
| TRANSPORT OPERATIONS & SERVICES (16.04%) | | | | | | | | |
| Port of Tauranga Ltd. | | | 55,000 | | | $ | 163,522 | |
| South Port New Zealand Ltd. | | | 376,010 | | | | 1,601,011 | |
| | | | | | | | 1,764,533 | |
| TOTAL NEW ZEALAND | | | | | | | 7,132,102 | |
| TOTAL COMMON STOCKS | | | | | | | | |
| (COST $7,687,555) | | | | | | | 10,963,109 | |
| | | Shares | | | Fair Value | |
| MONEY MARKET FUNDS (0.21%) | | | | | | | | |
| Federated Hermes Government Obligations Fund, Institutional Class, 5.22%(b) | | | 23,104 | | | $ | 23,104 | |
| TOTAL MONEY MARKET FUNDS | | | | | | | | |
| (COST $23,104) | | | | | | | 23,104 | |
| TOTAL INVESTMENTS — (99.78%) | | | | | | | | |
| (COST $7,710,659) | | | | | | | 10,986,213 | |
| OTHER ASSETS IN EXCESS OF LIABILITIES (0.22%) | | | | | | | 24,072 | |
| NET ASSETS — 100.00% | | | | | | $ | 11,010,285 | |
| (a) | Non-income producing security. |
| (b) | Rate disclosed is the seven day effective yield as of October 31, 2023. |
REIT— Real Estate Investment Trust
See accompanying notes to financial statements.
| | ANNUAL REPORT 2023 |
| | |
| SCHEDULE OF INVESTMENTS – October 31, 2023 |
| Africa Fund |
| | | Shares | | | Fair Value | |
| COMMON STOCKS (93.19%) | | | | | | | | |
| EGYPT (2.17%) | | | | | | | | |
| BANKS (1.38%) | | | | | | | | |
| Commercial International Bank Egypt SAE - GDR | | | 34,571 | | | $ | 39,346 | |
| OTHER COMMERCIAL SUPPORT SERVICES (0.79%) | | | | | | | | |
| Integrated Diagnostics Holdings PLC(a) | | | 59,000 | | | | 22,591 | |
| TOTAL EGYPT | | | | | | | 61,937 | |
| SOUTH AFRICA (87.01%) | | | | | | | | |
| AGRICULTURAL PRODUCERS (5.06%) | | | | | | | | |
| Astral Foods Ltd. | | | 7,000 | | | | 54,904 | |
| Crookes Brothers Ltd.(a) | | | 10,000 | | | | 15,238 | |
| Oceana Group Ltd. | | | 20,000 | | | | 74,306 | |
| | | | | | | | 144,448 | |
| AUTOMOTIVE RETAILERS (6.85%) | | | | | | | | |
| Barloworld Ltd. | | | 7,900 | | | | 33,287 | |
| Bidvest Group Ltd. | | | 7,500 | | | | 106,109 | |
| Motus Holdings Ltd. | | | 11,400 | | | | 56,624 | |
| | | | | | | | 196,020 | |
| BANKS (16.83%) | | | | | | | | |
| Capitec Bank Holdings Ltd. | | | 3,000 | | | | 266,549 | |
| FirstRand Ltd. | | | 17,700 | | | | 58,348 | |
| Nedbank Group Ltd. | | | 6,000 | | | | 64,626 | |
| Standard Bank Group Ltd. - ADR | | | 9,400 | | | | 91,744 | |
| | | | | | | | 481,267 | |
| BASIC & DIVERSIFIED CHEMICALS (1.75%) | | | | | | | | |
| Sasol Ltd. - ADR | | | 4,000 | | | | 50,040 | |
| BUILDING CONSTRUCTION (2.19%) | | | | | | | | |
| Wilson Bayly Holmes-Ovcon Ltd.(a) | | | 9,900 | | | | 62,706 | |
| CABLE & SATELLITE (0.88%) | | | | | | | | |
| MultiChoice Group Ltd.(a) | | | 6,700 | | | | 25,079 | |
| COAL MINING (2.21%) | | | | | | | | |
| Exxaro Resources Ltd. | | | 6,300 | | | | 63,229 | |
| CONSUMER ELECTRONICS & APPLIANCE WHOLESALERS (1.46%) | | | | | | | | |
| DataTec Ltd. | | | 22,000 | | | | 41,648 | |
| FOOD & BEVERAGE WHOLESALERS (3.47%) | | | | | | | | |
| Bid Corp. Ltd. | | | 4,667 | | | | 99,096 | |
| FOOD & DRUG STORES (4.02%) | | | | | | | | |
| Shoprite Holdings Ltd. - ADR | | | 9,000 | | | | 114,750 | |
| INSTITUTIONAL BROKERAGE (1.11%) | | | | | | | | |
| Coronation Fund Managers Ltd. | | | 19,500 | | | | 31,617 | |
| INTERNET MEDIA & SERVICES (5.69%) | | | | | | | | |
| Naspers Ltd., N Shares(a) | | | 1,040 | | | | 162,584 | |
| | | Shares | | | Fair Value | |
| COMMON STOCKS (93.19%) – Continued | | | | | | | | |
| SOUTH AFRICA (87.01%) – Continued | | | | | | | | |
| LIFE & HEALTH INSURANCE (2.84%) | | | | | | | | |
| Momentum Metropolitan Holdings | | | 72,000 | | | $ | 81,072 | |
| LIFE INSURANCE (4.67%) | | | | | | | | |
| Clientele Ltd. | | | 90,000 | | | | 50,720 | |
| Discovery Ltd. | | | 12,000 | | | | 82,740 | |
| | | | | | | | 133,460 | |
| MARINE SHIPPING (3.26%) | | | | | | | | |
| Grindrod Ltd. | | | 160,000 | | | | 93,128 | |
| PAPER & PULP MILLS (1.40%) | | | | | | | | |
| Sappi Ltd. | | | 19,000 | | | | 39,989 | |
| PRECIOUS METALS (8.06%) | | | | | | | | |
| Anglo American Platinum Ltd. | | | 1,100 | | | | 36,751 | |
| Gold Fields Ltd. - ADR | | | 8,200 | | | | 106,764 | |
| Impala Platinum Holdings Ltd. | | | 12,500 | | | | 52,067 | |
| Sibanye Stillwater Ltd. | | | 27,000 | | | | 34,438 | |
| | | | | | | | 230,020 | |
| RENEWABLE ENERGY PROJECT DEVELOPERS (0.92%) | | | | | | | | |
| Renergen Ltd.(a) | | | 35,000 | | | | 26,330 | |
| SELF-STORAGE OWNERS & DEVELOPERS (1.58%) | | | | | | | | |
| Stor-Age Property REIT Ltd. | | | 70,000 | | | | 45,108 | |
| SPECIALTY & GENERIC PHARMACEUTICALS (1.85%) | | | | | | | | |
| Aspen Pharmacare Holdings Ltd. | | | 5,800 | | | | 52,751 | |
| SPECIALTY APPAREL STORES (1.97%) | | | | | | | | |
| Mr. Price Group Ltd. | | | 7,800 | | | | 56,393 | |
| WEALTH MANAGEMENT (3.81%) | | | | | | | | |
| Alexander Forbes Group Holdings Ltd. | | | 170,000 | | | | 58,265 | |
| PSG Konsult Ltd. | | | 65,000 | | | | 50,476 | |
| | | | | | | | 108,741 | |
| WIRELESS TELECOMMUNICATIONS (5.13%) | | | | | | | | |
| MTN Group Ltd. - ADR | | | 18,000 | | | | 88,380 | |
| Vodacom Group Ltd. | | | 10,700 | | | | 58,168 | |
| | | | | | | | 146,548 | |
| TOTAL SOUTH AFRICA | | | | | | | 2,486,024 | |
See accompanying notes to financial statements
| | ANNUAL REPORT 2023 |
| | |
| SCHEDULE OF INVESTMENTS – October 31, 2023 |
| Africa Fund |
| | | Shares | | | Fair Value | |
| COMMON STOCKS (93.19%) – Continued | | | | | | | | |
| UNITED KINGDOM (4.01%) | | | | | | | | |
| PRECIOUS METALS (4.01%) | | | | | | | | |
| AngloGold Ashanti PLC(a) | | | 3,000 | | | $ | 53,520 | |
| Endeavour Mining PLC | | | 3,000 | | | | 61,050 | |
| | | | | | | | 114,570 | |
| TOTAL UNITED KINGDOM | | | | | | | 114,570 | |
| TOTAL COMMON STOCKS | | | | | | | | |
| (COST $3,098,206) | | | | | | | 2,662,531 | |
| EXCHANGE-TRADED FUNDS (2.97%) | | | | | | | | |
| Global X MSCI Nigeria ETF | | | 11,100 | | | | 84,804 | |
| TOTAL EXCHANGE-TRADED FUNDS | | | | | | | | |
| (COST $169,505) | | | | | | | 84,804 | |
| | | Principal | | | | |
| | | Amount | | | Fair Value | |
| SOVEREIGN BONDS (2.63%) | | | | | | | | |
| SOUTH AFRICA (2.63%) | | | | | | | | |
| Republic of South Africa Government Bond, 6.25%, 3/08/2041 | | $ | 100,000 | | | $ | 75,240 | |
| TOTAL SOVEREIGN BONDS (COST $90,557) | | | | | | | 75,240 | |
| | | | | | | |
| | | Shares | | | | |
| MONEY MARKET FUNDS (0.83%) | | | | | | | | |
| Federated Hermes Government Obligations Fund, Institutional Class, 5.22%(b) | | | 23,667 | | | | 23,667 | |
| TOTAL MONEY MARKET FUNDS | | | | | | | | |
| (COST $23,667) | | | | | | | 23,667 | |
| TOTAL INVESTMENTS — (99.62%) | | | | | | | | |
| (COST $3,381,935) | | | | | | | 2,846,242 | |
| OTHER ASSETS IN EXCESS OF LIABILITIES (0.38%) | | | | | | | 10,832 | |
| NET ASSETS — 100.00% | | | | | | $ | 2,857,074 | |
| (a) | Non-income producing security. |
| (b) | Rate disclosed is the seven day effective yield as of October 31, 2023. |
ADR — American Depositary Receipt
GDR — Global Depositary Receipt
ETF — Exchange-Traded Fund
REIT— Real Estate Investment Trust
See accompanying notes to financial statements.
| | ANNUAL REPORT 2023 |
| | |
| SCHEDULE OF INVESTMENTS – October 31, 2023 |
| Commonwealth Japan Fund |
| | | Shares | | | Fair Value | |
| COMMON STOCKS (98.36%) | | | | | | | | |
| JAPAN (96.53%) | | | | | | | | |
| ALCOHOLIC BEVERAGES (1.77%) | | | | | | | | |
| Kirin Holdings Co. Ltd. | | | 7,000 | | | $ | 98,373 | |
| AUTO PARTS (2.63%) | | | | | | | | |
| Bridgestone Corp. - ADR | | | 4,000 | | | | 75,840 | |
| DENSO Corp. | | | 4,800 | | | | 70,878 | |
| | | | | | | | 146,718 | |
| AUTOMOBILES (3.94%) | | | | | | | | |
| Honda Motor Co. Ltd. - ADR | | | 2,000 | | | | 61,500 | |
| Toyota Motor Corp. - ADR | | | 900 | | | | 157,662 | |
| | | | | | | | 219,162 | |
| BASIC & DIVERSIFIED CHEMICALS (1.95%) | | | | | | | | |
| Mitsubishi Gas Chemical Co., Inc. | | | 8,000 | | | | 108,127 | |
| BUILDING CONSTRUCTION (3.82%) | | | | | | | | |
| Kajima Corp. | | | 12,850 | | | | 212,377 | |
| BUILDING MAINTENANCE SERVICES (1.41%) | | | | | | | | |
| Taihei Dengyo Kaisha Ltd. | | | 3,000 | | | | 78,532 | |
| COMMERCIAL & RESIDENTIAL BUILDING EQUIPMENT & SYSTEMS (2.59%) | | | | | | | | |
| Daikin Industries Ltd. | | | 1,000 | | | | 144,179 | |
| COMMERCIAL FINANCE (4.55%) | | | | | | | | |
| Kyushu Leasing Service Co. Ltd. | | | 13,000 | | | | 80,446 | |
| ORIX Corp. | | | 9,500 | | | | 172,770 | |
| | | | | | | | 253,216 | |
| CONSUMER ELECTRONICS (2.69%) | | | | | | | | |
| Sony Group Corp. - ADR | | | 1,800 | | | | 149,490 | |
| COURIER SERVICES (2.10%) | | | | | | | | |
| Yamato Holdings Co. Ltd. | | | 7,000 | | | | 116,592 | |
| DIVERSIFIED INDUSTRIALS (2.85%) | | | | | | | | |
| Hitachi Ltd. | | | 2,500 | | | | 158,467 | |
| ELECTRICAL POWER EQUIPMENT (2.14%) | | | | | | | | |
| Meidensha Corp. | | | 7,600 | | | | 119,068 | |
| ELECTRONICS COMPONENTS (3.25%) | | | | | | | | |
| Murata Manufacturing Co. Ltd. | | | 3,000 | | | | 51,388 | |
| Nidec Corp. | | | 1,700 | | | | 62,358 | |
| Taiyo Yuden Co. Ltd. | | | 3,000 | | | | 67,255 | |
| | | | | | | | 181,001 | |
| EXPLORATION & PRODUCTION (0.91%) | | | | | | | | |
| INPEX Corp. | | | 3,500 | | | | 50,396 | |
| FACTORY AUTOMATION EQUIPMENT (1.34%) | | | | | | | | |
| FANUC Corp. | | | 3,000 | | | | 74,449 | |
| | | Shares | | | Fair Value | |
| COMMON STOCKS (98.36%) – Continued | | | | | | | | |
| JAPAN (96.53%) – Continued | | | | | | | | |
| FOOD & BEVERAGE WHOLESALERS (2.23%) | | | | | | | | |
| Yamae Group Holdings Co. Ltd. | | | 5,200 | | | $ | 124,153 | |
| FOOD & DRUG STORES (1.82%) | | | | | | | | |
| Sugi Holdings Company Ltd. | | | 2,500 | | | | 101,196 | |
| HEALTH CARE SUPPLIES (3.81%) | | | | | | | | |
| Hoya Corp. | | | 2,200 | | | | 211,792 | |
| HOME PRODUCTS STORES (2.34%) | | | | | | | | |
| Nitori Holdings Co. Ltd. | | | 1,200 | | | | 129,954 | |
| INFRASTRUCTURE CONSTRUCTION (1.38%) | | | | | | | | |
| Takada Corp. | | | 12,000 | | | | 76,977 | |
| INTEGRATED ELECTRIC UTILITIES (1.73%) | | | | | | | | |
| Kansai Electric Power Co., Inc. (The) | | | 7,500 | | | | 96,029 | |
| IT SERVICES (3.93%) | | | | | | | | |
| INES Corp. | | | 10,000 | | | | 98,349 | |
| Otsuka Corp. | | | 3,000 | | | | 120,284 | |
| | | | | | | | 218,633 | |
| LIFE INSURANCE (6.25%) | | | | | | | | |
| Dai-ichi Life Holdings, Inc. | | | 8,000 | | | | 169,000 | |
| T&D Holdings, Inc. | | | 10,000 | | | | 178,392 | |
| | | | | | | | 347,392 | |
| LOGISTICS SERVICES (1.39%) | | | | | | | | |
| Nippon Express Holdings Co. Ltd. | | | 1,500 | | | | 77,093 | |
| MASS MERCHANTS (1.24%) | | | | | | | | |
| Aeon Kyushu Co. Ltd. | | | 4,500 | | | | 69,050 | |
| MEDICAL DEVICES (8.53%) | | | | | | | | |
| Asahi Intecc Co. Ltd. | | | 16,000 | | | | 268,843 | |
| Terumo Corp. | | | 7,500 | | | | 205,186 | |
| | | | | | | | 474,029 | |
| MULTI ASSET CLASS OWNERS & DEVELOPERS (2.97%) | | | | | | | | |
| Mitsui Fudosan Co. Ltd. | | | 3,000 | | | | 65,025 | |
| Sumitomo Realty & Development Co. Ltd. | | | 4,000 | | | | 100,375 | |
| | | | | | | | 165,400 | |
| P&C INSURANCE (1.79%) | | | | | | | | |
| Sompo Holdings, Inc. | | | 2,300 | | | | 99,636 | |
| PERSONAL CARE PRODUCTS (4.98%) | | | | | | | | |
| Kao Corp. | | | 2,000 | | | | 72,968 | |
| Unicharm Corp. | | | 6,000 | | | | 203,873 | |
| | | | | | | | 276,841 | |
| SPECIALTY APPAREL STORES (2.39%) | | | | | | | | |
| Fast Retailing Co. Ltd. | | | 600 | | | | 132,838 | |
See accompanying notes to financial statements.
| | ANNUAL REPORT 2023 |
| | |
| SCHEDULE OF INVESTMENTS – October 31, 2023 |
| Commonwealth Japan Fund |
| | | Shares | | | Fair Value | |
| COMMON STOCKS (98.36%) – Continued | | | | | | | | |
| JAPAN (96.53%) – Continued | | | | | | | | |
| SPECIALTY CHEMICALS (3.05%) | | | | | | | | |
| JSR Corp. | | | 3,000 | | | $ | 80,298 | |
| Shin-Etsu Chemical Co. Ltd. | | | 3,000 | | | | 89,710 | |
| | | | | | | | 170,008 | |
| TRANSIT SERVICES (7.68%) | | | | | | | | |
| Daiichi Koutsu Sangyo Co. Ltd. | | | 12,200 | | | | 69,388 | |
| East Japan Railway Co. | | | 1,500 | | | | 77,906 | |
| Hankyu Hanshin Holdings, Inc. | | | 4,400 | | | | 138,441 | |
| Keikyu Corp. | | | 6,500 | | | | 55,110 | |
| Tobu Railway Co. Ltd. | | | 3,600 | | | | 86,650 | |
| | | | | | | | 427,495 | |
| WIRELESS TELECOMMUNICATIONS (1.08%) | | | | | | | | |
| KDDI Corp. | | | 2,000 | | | | 59,829 | |
| TOTAL JAPAN | | | | | | | 5,368,492 | |
| UNITED STATES (1.83%) | | | | | | | | |
| LIFE INSURANCE (1.83%) | | | | | | | | |
| Aflac, Inc. | | | 1,300 | | | | 101,543 | |
| TOTAL COMMON STOCKS | | | | | | | | |
| (COST $3,945,555) | | | | | | | 5,470,035 | |
| | | Shares | | | Fair Value | |
| MONEY MARKET FUNDS (0.31%) | | | | | | | | |
| Federated Hermes Government Obligations | | | | | | | | |
| Fund, Institutional Class, 5.22%(a) | | | 17,143 | | | $ | 17,143 | |
| TOTAL MONEY MARKET FUNDS | | | | | | | | |
| (COST $17,143) | | | | | | | 17,143 | |
| TOTAL INVESTMENTS — (98.67%) | | | | | | | | |
| (COST $3,962,698) | | | | | | | 5,487,178 | |
| OTHER ASSETS IN EXCESS OF LIABILITIES (1.33%) | | | | | | | 73,749 | |
| NET ASSETS — 100.00% | | | | | | $ | 5,560,927 | |
| (a) | Rate disclosed is the seven day effective yield as of October 31, 2023. |
ADR — American Depositary Receipt
REIT— Real Estate Investment Trust
See accompanying notes to financial statements.
| | ANNUAL REPORT 2023 |
| | |
| SCHEDULE OF INVESTMENTS – October 31, 2023 |
| Commonwealth Global Fund |
| | | Shares | | | Fair Value | |
| COMMON STOCKS (97.50%) | | | | | | | | |
| DENMARK (2.65%) | | | | | | | | |
| LARGE PHARMACEUTICALS (2.65%) | | | | | | | | |
| Novo Nordisk A/S - ADR | | | 4,000 | | | $ | 386,280 | |
| FRANCE (2.01%) | | | | | | | | |
| BASIC & DIVERSIFIED CHEMICALS (2.01%) | | | | | | | | |
| Arkema SA - ADR | | | 3,130 | | | | 293,844 | |
| GERMANY (3.18%) | | | | | | | | |
| DIVERSIFIED INDUSTRIALS (3.18%) | | | | | | | | |
| Siemens AG - ADR | | | 7,000 | | | | 463,330 | |
| INDIA (3.10%) | | | | | | | | |
| BANKS (3.10%) | | | | | | | | |
| HDFC Bank Ltd. - ADR | | | 8,000 | | | | 452,400 | |
| IRELAND (1.11%) | | | | | | | | |
| BUILDING MATERIALS (1.11%) | | | | | | | | |
| James Hardie Industries PLC - ADR(a) | | | 6,500 | | | | 161,655 | |
| ISRAEL (2.86%) | | | | | | | | |
| APPLICATION SOFTWARE (2.86%) | | | | | | | | |
| NICE Ltd. - ADR(a) | | | 2,700 | | | | 416,745 | |
| JAPAN (3.59%) | | | | | | | | |
| CONSUMER ELECTRONICS (2.28%) | | | | | | | | |
| Sony Group Corp. - ADR | | | 4,000 | | | | 332,200 | |
| ELECTRONICS COMPONENTS (1.31%) | | | | | | | | |
| Nidec Corp. - ADR | | | 21,000 | | | | 191,730 | |
| TOTAL JAPAN | | | | | | | 523,930 | |
| MEXICO (1.14%) | | | | | | | | |
| WIRELESS TELECOMMUNICATIONS (1.14%) | | | | | | | | |
| America Movil S.A.B. de C.V., Class L - ADR | | | 10,000 | | | | 166,000 | |
| NORWAY (2.06%) | | | | | | | | |
| P&C INSURANCE (2.06%) | | | | | | | | |
| Gjensidige Forsikring ASA - ADR | | | 20,000 | | | | 300,398 | |
| PANAMA (1.68%) | | | | | | | | |
| AIRLINES (1.68%) | | | | | | | | |
| Copa Holdings, SA, Class A | | | 3,000 | | | | 244,950 | |
| SOUTH AFRICA (2.10%) | | | | | | | | |
| FOOD & DRUG STORES (2.10%) | | | | | | | | |
| Shoprite Holdings Ltd. - ADR | | | 24,000 | | | | 306,000 | |
| SWITZERLAND (6.16%) | | | | | | | | |
| LARGE PHARMACEUTICALS (2.66%) | | | | | | | | |
| Roche Holding AG - ADR | | | 12,000 | | | | 387,960 | |
| PACKAGED FOOD (3.50%) | | | | | | | | |
| Nestlé SA - ADR | | | 4,750 | | | | 511,860 | |
| TOTAL SWITZERLAND | | | | | | | 899,820 | |
| | | Shares | | | Fair Value | |
| COMMON STOCKS (97.50%) – Continued | | | | | | | | |
| TAIWAN PROVINCE OF CHINA (1.18%) | | | | | | | | |
| SEMICONDUCTOR MANUFACTURING (1.18%) | | | | | | | | |
| Taiwan Semiconductor Manufacturing Co., | | | | | | | | |
| Ltd. - ADR | | | 2,000 | | | $ | 172,620 | |
| UNITED KINGDOM (11.16%) | | | | | | | | |
| ALCOHOLIC BEVERAGES (2.95%) | | | | | | | | |
| Diageo PLC - ADR | | | 2,800 | | | | 429,800 | |
| INTEGRATED OILS (0.95%) | | | | | | | | |
| BP PLC - ADR | | | 3,800 | | | | 139,004 | |
| LARGE PHARMACEUTICALS (3.25%) | | | | | | | | |
| AstraZeneca PLC - ADR | | | 7,500 | | | | 474,225 | |
| PERSONAL CARE PRODUCTS (2.74%) | | | | | | | | |
| Haleon PLC - ADR | | | 8,500 | | | | 68,765 | |
| Unilever PLC - ADR | | | 7,000 | | | | 331,450 | |
| | | | | | | | 400,215 | |
| PUBLISHING (1.27%) | | | | | | | | |
| Pearson PLC - ADR | | | 16,000 | | | | 184,640 | |
| TOTAL UNITED KINGDOM | | | | | | | 1,627,884 | |
| UNITED STATES (53.52%) | | | | | | | | |
| AGRICULTURAL CHEMICALS (0.55%) | | | | | | | | |
| CF Industries Holdings, Inc. | | | 1,000 | | | | 79,780 | |
| APPLICATION SOFTWARE (0.91%) | | | | | | | | |
| Adobe, Inc.(a) | | | 250 | | | | 133,015 | |
| AUTO PARTS (4.49%) | | | | | | | | |
| Miller Industries, Inc. | | | 18,000 | | | | 654,660 | |
| AUTOMOTIVE RETAILERS (5.71%) | | | | | | | | |
| Group 1 Automotive, Inc. | | | 3,300 | | | | 832,689 | |
| COMMUNICATIONS EQUIPMENT (5.74%) | | | | | | | | |
| Apple, Inc. | | | 4,900 | | | | 836,773 | |
| COMPUTER HARDWARE & STORAGE (3.99%) | | | | | | | | |
| NetApp, Inc. | | | 8,000 | | | | 582,240 | |
| CONSTRUCTION & MINING MACHINERY (1.86%) | | | | | | | | |
| Caterpillar, Inc. | | | 1,200 | | | | 271,260 | |
| COURIER SERVICES (0.66%) | | | | | | | | |
| FedEx Corp. | | | 400 | | | | 96,040 | |
| DEFENSE (0.74%) | | | | | | | | |
| L3Harris Technologies, Inc. | | | 600 | | | | 107,646 | |
| DIVERSIFIED BANKS (2.00%) | | | | | | | | |
| JPMorgan Chase & Co. | | | 2,100 | | | | 292,026 | |
| HOUSEHOLD PRODUCTS (3.19%) | | | | | | | | |
| Procter & Gamble Co. (The) | | | 3,100 | | | | 465,093 | |
See accompanying notes to financial statements.
| | ANNUAL REPORT 2023 |
| |
| SCHEDULE OF INVESTMENTS – October 31, 2023 |
| Commonwealth Global Fund |
| | | Shares | | | Fair Value | |
| COMMON STOCKS (97.50%) – Continued | | | | | | | | |
| UNITED STATES (53.52%) – Continued | | | | | | | | |
| INFRASTRUCTURE SOFTWARE (3.48%) | | | | | | | | |
| Microsoft Corp. | | | 1,500 | | | $ | 507,165 | |
| INTEGRATED OIL & GAS (3.50%) | | | | | | | | |
| Chevron Corp. | | | 3,500 | | | | 510,055 | |
| LIFE SCIENCE & DIAGNOSTICS (4.12%) | | | | | | | | |
| Thermo Fisher Scientific, Inc. | | | 1,350 | | | | 600,440 | |
| MEDICAL EQUIPMENT (1.04%) | | | | | | | | |
| Dentsply Sirona, Inc. | | | 5,000 | | | | 152,050 | |
| OIL & GAS EQUIPMENT & SERVICES (1.03%) | | | | | | | | |
| Schlumberger Ltd. | | | 2,700 | | | | 150,282 | |
| OILFIELD SERVICES & EQUIPMENT (0.70%) | | | | | | | | |
| Natural Gas Services Group, Inc.(a) | | | 7,000 | | | | 102,760 | |
| ONLINE MARKETPLACE (1.37%) | | | | | | | | |
| Amazon.com, Inc.(a) | | | 1,500 | | | | 199,635 | |
| RAIL FREIGHT (3.14%) | | | | | | | | |
| Norfolk Southern Corp. | | | 2,400 | | | | 457,896 | |
| REFINING & MARKETING (0.78%) | | | | | | | | |
| Phillips 66 | | | 1,000 | | | | 114,070 | |
| SEMICONDUCTOR DEVICES (2.14%) | | | | | | | | |
| Skyworks Solutions, Inc. | | | 3,600 | | | | 312,264 | |
| VIDEO GAMES (1.36%) | | | | | | | | |
| Electronic Arts, Inc. | | | 1,600 | | | | 198,064 | |
| WASTE MANAGEMENT (1.02%) | | | | | | | | |
| Republic Services, Inc. | | | 1,000 | | | | 148,490 | |
| TOTAL UNITED STATES | | | | | | | 7,804,393 | |
| TOTAL COMMON STOCKS (COST $7,327,881) | | | | | | | 14,220,249 | |
| | | Shares | | | Fair Value | |
| MONEY MARKET FUNDS (4.94%) | | | | | | | | |
| Federated Hermes Government Obligations Fund, Institutional Class, 5.22%(b) | | | 720,232 | | | $ | 720,232 | |
| TOTAL MONEY MARKET FUNDS | | | | | | | | |
| (COST $720,232) | | | | | | | 720,232 | |
| TOTAL INVESTMENTS — (102.44%) | | | | | | | | |
| (COST $8,048,113) | | | | | | | 14,940,481 | |
| LIABILITIES IN EXCESS OF OTHER ASSETS (-2.44%) | | | | | | | (356,429 | ) |
| NET ASSETS — 100.00% | | | | | | $ | 14,584,052 | |
| (a) | Non-income producing security. |
| (b) | Rate disclosed is the seven day effective yield as of October 31, 2023. |
ADR — American Depositary Receipt
REIT— Real Estate Investment Trust
See accompanying notes to financial statements.
| | ANNUAL REPORT 2023 |
| | |
| SCHEDULE OF INVESTMENTS – October 31, 2023 |
| Commonwealth Real Estate Securities Fund |
| | | Shares | | | Fair Value | |
| COMMON STOCKS (91.80%) | | | | | | | | |
| AGRICULTURAL PRODUCERS (1.11%) | | | | | | | | |
| BrasilAgro - Company Brasileira de Propriedades Agricolas - ADR | | | 27,432 | | | $ | 132,771 | |
| BANKS (3.29%) | | | | | | | | |
| Harleysville Financial Corp. | | | 8,675 | | | | 174,368 | |
| Texas Capital Bancshares, Inc.(a) | | | 4,000 | | | | 220,240 | |
| | | | | | | | 394,608 | |
| BUILDING CONSTRUCTION (1.89%) | | | | | | | | |
| Kajima Corp. - ADR | | | 11,900 | | | | 195,755 | |
| Lendlease Group - ADR | | | 8,000 | | | | 30,960 | |
| | | | | | | | 226,715 | |
| BUILDING MATERIALS (11.50%) | | | | | | | | |
| James Hardie Industries PLC - ADR(a) | | | 25,000 | | | | 621,750 | |
| Tecnoglass, Inc. | | | 23,134 | | | | 756,019 | |
| | | | | | | | 1,377,769 | |
| CEMENT & AGGREGATES (4.99%) | | | | | | | | |
| Cemex S.A.B. de C.V. - ADR(a) | | | 30,000 | | | | 179,100 | |
| CRH PLC | | | 2,500 | | | | 133,925 | |
| Summit Materials, Inc., Class A(a) | | | 8,680 | | | | 285,572 | |
| | | | | | | | 598,597 | |
| COMMERCIAL & RESIDENTIAL BUILDING EQUIPMENT & SYSTEMS (5.26%) | | | | | | | | |
| Lennox International, Inc. | | | 1,700 | | | | 629,918 | |
| DATA CENTER REITS (4.72%) | | | | | | | | |
| Digital Realty Trust, Inc. | | | 3,368 | | | | 418,844 | |
| Equinix, Inc. | | | 200 | | | | 145,928 | |
| | | | | | | | 564,772 | |
| HOME PRODUCTS STORES (4.14%) | | | | | | | | |
| Lowe’s Cos., Inc. | | | 2,600 | | | | 495,482 | |
| HOMEBUILDING (10.17%) | | | | | | | | |
| D.R. Horton, Inc. | | | 5,000 | | | | 522,000 | |
| Lennar Corp., Class A | | | 4,000 | | | | 426,720 | |
| NVR, Inc.(a) | | | 50 | | | | 270,631 | |
| | | | | | | | 1,219,351 | |
| HOTELS RESORTS & CRUISE LINES (3.67%) | | | | | | | | |
| InterContinental Hotels Group PLC - ADR | | | 6,103 | | | | 440,209 | |
| INDUSTRIAL MACHINERY (1.70%) | | | | | | | | |
| Techtronic Industries Company Ltd. - ADR | | | 4,500 | | | | 204,120 | |
| INDUSTRIAL REITS (5.51%) | | | | | | | | |
| Hannon Armstrong Sustainable | | | | | | | | |
| Infrastructure Capital, Inc. | | | 15,200 | | | | 260,528 | |
| | | Shares | | | Fair Value | |
| COMMON STOCKS (91.80%) – Continued | | | | | | | | |
| INDUSTRIAL REITS (5.51%) – Continued | | | | | | | | |
| Prologis, Inc. | | | 2,000 | | | $ | 201,500 | |
| STAG Industrial, Inc. | | | 6,000 | | | | 199,320 | |
| | | | | | | | 661,348 | |
| INFRASTRUCTURE REITS (8.76%) | | | | | | | | |
| American Tower Corp., Class A | | | 2,500 | | | | 445,475 | |
| Crown Castle International Corp. | | | 2,000 | | | | 185,960 | |
| SBA Communications Corp., Class A | | | 2,000 | | | | 417,260 | |
| | | | | | | | 1,048,695 | |
| MORTGAGE FINANCE (2.24%) | | | | | | | | |
| Redwood Trust, Inc. | | | 20,000 | | | | 125,600 | |
| Starwood Property Trust, Inc. | | | 8,000 | | | | 142,000 | |
| | | | | | | | 267,600 | |
| MULTI ASSET CLASS REITS (2.00%) | | | | | | | | |
| WP Carey, Inc. | | | 4,470 | | | | 239,816 | |
| RESIDENTIAL OWNERS & DEVELOPERS (1.27%) | | | | | | | | |
| Cyrela Brazil Realty SA - ADR | | | 44,000 | | | | 152,240 | |
| RESIDENTIAL REITS (1.38%) | | | | | | | | |
| AvalonBay Communities, Inc. | | | 1,000 | | | | 165,740 | |
| RETAIL REITS (2.81%) | | | | | | | | |
| Kite Realty Group Trust | | | 9,000 | | | | 191,880 | |
| National Retail Properties, Inc. | | | 4,000 | | | | 145,320 | |
| | | | | | | | 337,200 | |
| SELF-STORAGE REITS (3.63%) | | | | | | | | |
| Extra Space Storage, Inc. | | | 2,500 | | | | 258,975 | |
| Global Self Storage, Inc. | | | 39,000 | | | | 176,280 | |
| | | | | | | | 435,255 | |
| SPECIALIZED REITS (5.87%) | | | | | | | | |
| Charter Hall Education Trust | | | 96,286 | | | | 145,370 | |
| Gladstone Land Corp. | | | 9,700 | | | | 132,502 | |
| Iron Mountain, Inc. | | | 7,200 | | | | 425,304 | |
| | | | | | | | 703,176 | |
| TIMBER REITS (2.63%) | | | | | | | | |
| PotlatchDeltic Corp. | | | 3,000 | | | | 128,550 | |
| Weyerhaeuser Co. | | | 6,500 | | | | 186,485 | |
| | | | | | | | 315,035 | |
| TRANSPORT OPERATIONS & SERVICES (3.26%) | | | | | | | | |
| Grupo Aeroportuario del Sureste S.A.B. de | | | | | | | | |
| C.V. - ADR | | | 1,800 | | | | 389,178 | |
| TOTAL COMMON STOCKS | | | | | | | | |
| (COST $6,287,772) | | | | | | | 10,999,595 | |
See accompanying notes to financial statements.
| | ANNUAL REPORT 2023 |
| | |
| SCHEDULE OF INVESTMENTS – October 31, 2023 |
| Commonwealth Real Estate Securities Fund |
| | | Principal | | | | |
| | | Amount | | | Fair Value | |
| U.S. GOVERNMENT & AGENCIES (4.93%) | | | | | | | | |
| Fannie Mae, 2.50%, 2/5/2024 | | $ | 300,000 | | | $ | 297,764 | |
| Federal Home Loan Bank, 2.88%, 9/13/2024 | | | 300,000 | | | | 293,485 | |
| TOTAL U.S. GOVERNMENT & AGENCIES | | | | | | | | |
| (COST $591,885) | | | | | | | 591,249 | |
| | | Shares | | | Fair Value | |
| MONEY MARKET FUNDS (6.47%) | | | | | | | | |
| Federated Hermes Government Obligations Fund, Institutional Class, 5.22%(b) | | | 774,943 | | | $ | 774,943 | |
| TOTAL MONEY MARKET FUNDS | | | | | | | | |
| (COST $774,943) | | | | | | | 774,943 | |
| TOTAL INVESTMENTS — (103.20%) | | | | | | | | |
| (COST $7,654,600) | | | | | | | 12,365,787 | |
| LIABILITIES IN EXCESS OF OTHER ASSETS (-3.20%) | | | | | | | (383,957 | ) |
| NET ASSETS — 100.00% | | | | | | $ | 11,981,830 | |
| (a) | Non-income producing security. |
| (b) | Rate disclosed is the seven day effective yield as of October 31, 2023. |
ADR — American Depositary Receipt
REIT— Real Estate Investment Trust
See accompanying notes to financial statements.
| ANNUAL REPORT 2023 |
| | |
| STATEMENTS OF ASSETS AND LIABILITIES – October 31, 2023 |
| | | Commonwealth | | | | | | | | | | | | Commonwealth | |
| | | Australia/New | | | | | | Commonwealth | | | Commonwealth | | | Real Estate | |
| | | Zealand Fund | | | Africa Fund | | | Japan Fund | | | Global Fund | | | Securities Fund | |
| ASSETS | | | | | | | | | | | | | | | | | | | | |
| Investments in securities at fair value (cost $7,710,659, $3,381,935, $3,962,698, $8,048,113 and $7,654,600) | | $ | 10,986,213 | | | $ | 2,846,242 | | | $ | 5,487,178 | | | $ | 14,940,481 | | | $ | 12,365,787 | |
| Cash | | | — | | | | — | | | | — | | | | — | | | | 3,208 | |
| Foreign currencies, at value (cost $7,585, $6,177, $92,533, $– and $–) | | | 7,562 | | | | 6,241 | | | | 85,798 | | | | — | | | | — | |
| Receivable for fund shares sold | | | — | | | | 25 | | | | — | | | | 100 | | | | 50,000 | |
| Receivable for investments sold | | | — | | | | — | | | | 61,365 | | | | — | | | | — | |
| Receivable from Advisor | | | — | | | | 6,736 | | | | 6,822 | | | | — | | | | — | |
| Dividends and interest receivable | | | 42,834 | | | | 1,166 | | | | 31,951 | | | | 11,767 | | | | 30,006 | |
| Tax reclaims receivable | | | — | | | | 3,548 | | | | 1,040 | | | | 19,637 | | | | — | |
| Prepaid expenses | | | 25,183 | | | | 9,644 | | | | 12,083 | | | | 23,119 | | | | 19,431 | |
| Total Assets | | | 11,061,792 | | | | 2,873,602 | | | | 5,686,237 | | | | 14,995,104 | | | | 12,468,432 | |
| LIABILITIES | | | | | | | | | | | | | | | | | | | | |
| Payable for investments purchased | | | — | | | | — | | | | 100,257 | | | | 354,060 | | | | 438,678 | |
| Payable to Advisor | | | 7,323 | | | | — | | | | — | | | | 9,526 | | | | 7,676 | |
| Distribution (12b-1) fees accrued | | | 3,564 | | | | 814 | | | | 2,162 | | | | 1,640 | | | | 3,113 | |
| Payable to Administrator | | | 6,904 | | | | 2,704 | | | | 4,009 | | | | 8,712 | | | | 7,191 | |
| Payable to trustees | | | 4,983 | | | | 1,275 | | | | 2,427 | | | | 6,579 | | | | 5,236 | |
| Other accrued expenses | | | 28,733 | | | | 11,735 | | | | 16,455 | | | | 30,535 | | | | 24,708 | |
| Total Liabilities | | | 51,507 | | | | 16,528 | | | | 125,310 | | | | 411,052 | | | | 486,602 | |
| NET ASSETS | | $ | 11,010,285 | | | $ | 2,857,074 | | | $ | 5,560,927 | | | $ | 14,584,052 | | | $ | 11,981,830 | |
| NET ASSETS CONSIST OF: | | | | | | | | | | | | | | | | | | | | |
| Paid-in capital | | | 7,902,915 | | | | 4,075,323 | | | | 4,232,137 | | | | 7,849,962 | | | | 7,283,303 | |
| Accumulated earnings (deficit) | | | 3,107,370 | | | | (1,218,249 | ) | | | 1,328,790 | | | | 6,734,090 | | | | 4,698,527 | |
| NET ASSETS | | $ | 11,010,285 | | | $ | 2,857,074 | | | $ | 5,560,927 | | | $ | 14,584,052 | | | $ | 11,981,830 | |
| Shares outstanding (unlimited number of shares authorized) | | | 1,094,060 | | | | 424,211 | | | | 1,623,971 | | | | 859,550 | | | | 671,045 | |
| Net asset value, offering and redemption price per share(a) | | $ | 10.06 | | | $ | 6.74 | | | $ | 3.42 | | | $ | 16.97 | | | $ | 17.86 | |
| (a) | Subject to certain exceptions, a 2% redemption fee is imposed upon shares redeemed within 14 calendar days of their purchase. See Note 3 in the Notes to Financial Statements. Par value $0.01, unlimited shares authorized. |
| See accompanying notes to financial statements. |
| ANNUAL REPORT 2023 |
| | |
| STATEMENTS OF OPERATIONS – For the year ended October 31, 2023 |
| | | Commonwealth | | | | | | | | | | | | Commonwealth | |
| | | Australia/New | | | | | | Commonwealth | | | Commonwealth | | | Real Estate | |
| | | Zealand Fund | | | Africa Fund | | | Japan Fund | | | Global Fund | | | Securities Fund | |
| INVESTMENT INCOME | | | | | | | | | | | | | | | | | | | | |
| Dividend income (net of foreign taxes withheld of $92,295, $23,746, $16,398, $26,571 and $8,013) | | $ | 409,440 | | | $ | 121,598 | | | $ | 101,726 | | | $ | 284,703 | | | $ | 359,106 | |
| Interest income | | | — | | | | 5,006 | | | | — | | | | — | | | | 6,946 | |
| Total investment income | | | 409,440 | | | | 126,604 | | | | 101,726 | | | | 284,703 | | | | 366,052 | |
| EXPENSES | | | | | | | | | | | | | | | | | | | | |
| Investment Advisor | | | 99,427 | | | | 23,011 | | | | 41,491 | | | | 119,088 | | | | 95,782 | |
| Administration | | | 70,754 | | | | 16,400 | | | | 29,656 | | | | 84,951 | | | | 68,279 | |
| Distribution (12b-1) | | | 33,142 | | | | 7,670 | | | | 13,830 | | | | 39,696 | | | | 31,927 | |
| Legal | | | 25,103 | | | | 5,742 | | | | 10,176 | | | | 29,598 | | | | 23,833 | |
| Audit and tax preparation | | | 21,183 | | | | 5,541 | | | | 9,307 | | | | 25,201 | | | | 20,419 | |
| Trustee | | | 21,053 | | | | 4,910 | | | | 9,242 | | | | 25,956 | | | | 20,838 | |
| Registration | | | 20,729 | | | | 15,525 | | | | 15,243 | | | | 15,009 | | | | 17,585 | |
| Insurance | | | 15,440 | | | | 3,299 | | | | 5,617 | | | | 16,741 | | | | 13,614 | |
| Transfer agent | | | 14,653 | | | | 14,653 | | | | 14,653 | | | | 14,653 | | | | 14,653 | |
| Chief Compliance Officer | | | 8,407 | | | | 1,945 | | | | 3,516 | | | | 10,123 | | | | 8,134 | |
| Pricing | | | 7,754 | | | | 7,489 | | | | 8,978 | | | | 1,102 | | | | 1,074 | |
| Custodian | | | 7,108 | | | | 2,581 | | | | 3,634 | | | | 3,060 | | | | 2,276 | |
| Printing | | | 6,611 | | | | 3,246 | | | | 4,301 | | | | 7,122 | | | | 6,123 | |
| Miscellaneous | | | 21,639 | | | | 22,265 | | | | 21,512 | | | | 21,546 | | | | 21,211 | |
| Total expenses | | | 373,003 | | | | 134,277 | | | | 191,156 | | | | 413,846 | | | | 345,748 | |
| Fees contractually waived and expenses reimbursed by Advisor | | | — | | | | (80,585 | ) | | | (94,303 | ) | | | — | | | | — | |
| Net operating expenses | | | 373,003 | | | | 53,692 | | | | 96,853 | | | | 413,846 | | | | 345,748 | |
| Net investment income (loss) | | | 36,437 | | | | 72,912 | | | | 4,873 | | | | (129,143 | ) | | | 20,304 | |
| NET REALIZED AND CHANGE IN UNREALIZED GAIN (LOSS) ON INVESTMENTS | | | | | | | | | | | | | | | | | | | | |
| Net realized gain (loss) on: | | | | | | | | | | | | | | | | | | | | |
| Investment securities transactions | | | (196,241 | ) | | | (77,543 | ) | | | (2,492 | ) | | | (53,302 | ) | | | (25,068 | ) |
| Foreign currency transactions | | | 31,920 | | | | (3,555 | ) | | | (147 | ) | | | 2 | | | | 163 | |
| Total net realized loss | | | (164,321 | ) | | | (81,098 | ) | | | (2,639 | ) | | | (53,300 | ) | | | (24,905 | ) |
| Net change in unrealized appreciation (depreciation) on: | | | | | | | | | | | | | | | | | | | | |
| Investment securities | | | (1,190,173 | ) | | | (139,799 | ) | | | 598,214 | | | | 447,419 | | | | 183,064 | |
| Foreign currency translations | | | (13,622 | ) | | | 222 | | | | (6,106 | ) | | | — | | | | — | |
| Total net change in unrealized appreciation (depreciation) | | | (1,203,795 | ) | | | (139,577 | ) | | | 592,108 | | | | 447,419 | | | | 183,064 | |
| Net realized and change in unrealized gain (loss) on investments | | | (1,368,116 | ) | | | (220,675 | ) | | | 589,469 | | | | 394,119 | | | | 158,159 | |
| Net increase (decrease) in net assets resulting from operations | | $ | (1,331,679 | ) | | $ | (147,763 | ) | | $ | 594,342 | | | $ | 264,976 | | | $ | 178,463 | |
See accompanying notes to financial statements.
| ANNUAL REPORT 2023 |
| | |
| STATEMENTS OF CHANGES IN NET ASSETS |
| | | Commonwealth | | | | | | | |
| | | Australia/New Zealand Fund | | | Africa Fund | |
| | | For the Year | | | For the Year | | | For the Year | | | For the Year | |
| | | Ended | | | Ended | | | Ended | | | Ended | |
| | | October 31, 2023 | | | October 31, 2022 | | | October 31, 2023 | | | October 31, 2022 | |
| INCREASE (DECREASE) IN NET ASSETS DUE TO: | | | | | | | | | | | | | | | | |
| OPERATIONS: | | | | | | | | | | | | | | | | |
| Net investment income (loss) | | $ | 36,437 | | | $ | (15,480 | ) | | $ | 72,912 | | | $ | 72,770 | |
| Net realized gain (loss) from investment securities and foreign currency transactions | | | (164,321 | ) | | | 10,753 | | | | (81,098 | ) | | | (115,836 | ) |
| Net change in unrealized appreciation (depreciation) from investment securities, foreign currency translations and purchased options contracts | | | (1,203,795 | ) | | | (5,675,771 | ) | | | (139,577 | ) | | | (462,577 | ) |
| Change in net assets resulting from operations | | | (1,331,679 | ) | | | (5,680,498 | ) | | | (147,763 | ) | | | (505,643 | ) |
| DISTRIBUTIONS TO SHAREHOLDERS FROM: | | | | | | | | | | | | | | | | |
| Earnings | | | (76,798 | ) | | | (1,185,183 | ) | | | (30,003 | ) | | | (56,372 | ) |
| CAPITAL TRANSACTIONS: | | | | | | | | | | | | | | | | |
| Proceeds from shares sold | | | 392,135 | | | | 954,305 | | | | 461,392 | | | | 765,272 | |
| Reinvestment of distributions | | | 75,262 | | | | 1,163,054 | | | | 29,112 | | | | 56,232 | |
| Amount paid for shares redeemed | | | (1,025,021 | ) | | | (2,392,940 | ) | | | (312,674 | ) | | | (356,896 | ) |
| Redemption fees | | | — | | | | — | | | | — | | | | 3 | |
| Change in net assets resulting from capital transactions | | | (557,624 | ) | | | (275,581 | ) | | | 177,830 | | | | 464,611 | |
| Net Increase (Decrease) in Net Assets | | | (1,966,101 | ) | | | (7,141,262 | ) | | | 64 | | | | (97,404 | ) |
| NET ASSETS: | | | | | | | | | | | | | | | | |
| Beginning of year | | | 12,976,386 | | | | 20,117,648 | | | | 2,857,010 | | | | 2,954,414 | |
| End of year | | $ | 11,010,285 | | | $ | 12,976,386 | | | $ | 2,857,074 | | | $ | 2,857,010 | |
| SHARE TRANSACTIONS: | | | | | | | | | | | | | | | | |
| Shares sold | | | 33,441 | | | | 67,401 | | | | 61,164 | | | | 85,278 | |
| Shares issued in reinvestment of distributions | | | 6,194 | | | | 78,691 | | | | 3,902 | | | | 6,833 | |
| Shares redeemed | | | (89,460 | ) | | | (173,605 | ) | | | (42,290 | ) | | | (42,594 | ) |
| Change in shares outstanding | | | (49,825 | ) | | | (27,513 | ) | | | 22,776 | | | | 49,517 | |
See accompanying notes to financial statements.
| ANNUAL REPORT 2023 |
| | |
| STATEMENTS OF CHANGES IN NET ASSETS |
| Commonwealth | | | Commonwealth | | | Commonwealth | |
| Japan Fund | | | Global Fund | | | Real Estate Securities Fund | |
| For the Year | | | For the Year | | | For the Year | | | For the Year | | | For the Year | | | For the Year | |
| Ended | | | Ended | | | Ended | | | Ended | | | Ended | | | Ended | |
| October 31, 2023 | | | October 31, 2022 | | | October 31, 2023 | | | October 31, 2022 | | | October 31, 2023 | | | October 31, 2022 | |
| | | | | | | | | | | | | | | | | | | | | | | |
| | | | | | | | | | | | | | | | | | | | | | | |
| $ | 4,873 | | | $ | (4,513 | ) | | $ | (129,143 | ) | | $ | (75,481 | ) | | $ | 20,304 | | | $ | (61,703 | ) |
| | (2,639 | ) | | | (85,729 | ) | | | (53,300 | ) | | | 222,837 | | | | (24,905 | ) | | | 70,284 | |
| | | | | | | | | | | | | | | | | | | | | | | |
| | 592,108 | | | | (1,803,783 | ) | | | 447,419 | | | | (3,974,886 | ) | | | 183,064 | | | | (3,438,719 | ) |
| | 594,342 | | | | (1,894,025 | ) | | | 264,976 | | | | (3,827,530 | ) | | | 178,463 | | | | (3,430,138 | ) |
| | | | | | | | | | | | | | | | | | | | | | | |
| | — | | | | (274,869 | ) | | | (128,817 | ) | | | — | | | | (70,458 | ) | | | (107,704 | ) |
| | | | | | | | | | | | | | | | | | | | | | | |
| | 988,911 | | | | 991,421 | | | | 245,983 | | | | 222,457 | | | | 397,875 | | | | 5,093,542 | |
| | — | | | | 274,316 | | | | 128,651 | | | | — | | | | 70,354 | | | | 107,565 | |
| | (667,912 | ) | | | (1,183,425 | ) | | | (751,439 | ) | | | (1,212,634 | ) | | | (214,276 | ) | | | (5,096,755 | ) |
| | — | | | | — | | | | — | | | | — | | | | — | | | | 598 | |
| | 320,999 | | | | 82,312 | | | | (376,805 | ) | | | (990,177 | ) | | | 253,953 | | | | 104,950 | |
| | 915,341 | | | | (2,086,582 | ) | | | (240,646 | ) | | | (4,817,707 | ) | | | 361,958 | | | | (3,432,892 | ) |
| | | | | | | | | | | | | | | | | | | | | | | |
| | 4,645,586 | | | | 6,732,168 | | | | 14,824,698 | | | | 19,642,405 | | | | 11,619,872 | | | | 15,052,764 | |
| $ | 5,560,927 | | | $ | 4,645,586 | | | $ | 14,584,052 | | | $ | 14,824,698 | | | $ | 11,981,830 | | | $ | 11,619,872 | |
| | | | | | | | | | | | | | | | | | | | | | | |
| | 286,774 | | | | 258,745 | | | | 13,897 | | | | 11,502 | | | | 21,282 | | | | 216,665 | |
| | — | | | | 66,260 | | | | 7,432 | | | | — | | | | 3,838 | | | | 4,709 | |
| | (196,935 | ) | | | (318,457 | ) | | | (41,160 | ) | | | (62,179 | ) | | | (11,224 | ) | | | (231,056 | ) |
| | 89,839 | | | | 6,548 | | | | (19,831 | ) | | | (50,677 | ) | | | 13,896 | | | | (9,682 | ) |
See accompanying notes to financial statements.
| ANNUAL REPORT 2023 |
| | |
| FINANCIAL HIGHLIGHTS |
| Commonwealth Australia/New Zealand Fund |
| Selected data for a share outstanding during each of the years indicated: |
| | | For the Year | | | For the Year | | | For the Year | | | For the Year | | | For the Year | |
| | | Ended | | | Ended | | | Ended | | | Ended | | | Ended | |
| | | October 31, | | | October 31, | | | October 31, | | | October 31, | | | October 31, | |
| | | 2023 | | | 2022 | | | 2021 | | | 2020(a) | | | 2019 | |
| | | | | | | | | | | | | | | | | | | | | |
| Net asset value, beginning of year | | $ | 11.34 | | | $ | 17.17 | | | $ | 12.92 | | | $ | 13.33 | | | $ | 12.85 | |
| Change in net assets from operations: | | | | | | | | | | | | | | | | | | | | |
| Net investment income (loss) | | | 0.03 | | | | (0.01 | ) | | | (0.05 | ) | | | 0.01 | | | | 0.10 | |
| Net realized and unrealized gain (loss) from investments | | | (1.24 | ) | | | (4.79 | ) | | | 4.32 | | | | 0.41 | | | | 0.68 | |
| Total from investment activities | | | (1.21 | ) | | | (4.80 | ) | | | 4.27 | | | | 0.42 | | | | 0.78 | |
| Distributions: | | | | | | | | | | | | | | | | | | | | |
| Net investment income | | | — | | | | (0.02 | ) | | | (0.02 | ) | | | (0.07 | ) | | | (0.08 | ) |
| Net realized gains | | | (0.07 | ) | | | (1.01 | ) | | | — | | | | (0.76 | ) | | | (0.22 | ) |
| Total distributions | | | (0.07 | ) | | | (1.03 | ) | | | (0.02 | ) | | | (0.83 | ) | | | (0.30 | ) |
| Redemption fees | | | — | | | | — | | | | — | (b) | | | — | | | | — | |
| Net asset value, end of year | | $ | 10.06 | | | $ | 11.34 | | | $ | 17.17 | | | $ | 12.92 | | | $ | 13.33 | |
| Total Return | | | (10.80 | )% | | | (29.37 | )% | | | 33.04 | % | | | 3.05 | % | | | 6.45 | % |
| Net assets, at end of year (000 omitted) | | $ | 11,010 | | | $ | 12,976 | | | $ | 20,118 | | | $ | 15,212 | | | $ | 16,266 | |
| Ratios and Supplemental Data: | | | | | | | | | | | | | | | | | | | | |
| Ratio of net expenses to average net assets | | | 2.81 | % | | | 2.60 | % | | | 2.41 | % | | | 2.60 | %(c) | | | 2.69 | % |
| Ratio of gross expenses before waivers and/or reimbursements | | | 2.81 | % | | | 2.60 | % | | | 2.41 | % | | | 2.70 | % | | | 2.69 | % |
| Ratio of net investment income (loss) to average net assets | | | 0.27 | % | | | (0.10 | )% | | | (0.35 | )% | | | 0.03 | % | | | 0.75 | % |
| Portfolio turnover rate | | | 6 | % | | | 8 | % | | | 20 | % | | | 4 | % | | | 6 | % |
| (a) | Includes adjustments in accordance with accounting principles generally accepted in the United States and, consequently, the net asset values for financial reporting purposes and the returns based upon those net asset values may differ from the net asset values and returns for shareholder transactions. |
| (b) | Rounds to less than $0.005 per share. |
| (c) | The ratio of net expenses include $13,438 in voluntary advisory waivers representing (0.10)%. For the period from May 12, 2020 to October 31, 2020, the Advisor voluntarily agreed to waive 0.20% of the Management Fee for the Fund. This voluntary waiver is not subject to recoupment. |
See accompanying notes to financial statements.
| ANNUAL REPORT 2023 |
| | |
| FINANCIAL HIGHLIGHTS |
| Africa Fund |
| Selected data for a share outstanding during each of the years indicated: |
| | | For the Year | | | For the Year | | | For the Year | | | For the Year | | | For the Year | |
| | | Ended | | | Ended | | | Ended | | | Ended | | | Ended | |
| | | October 31, | | | October 31, | | | October 31, | | | October 31, | | | October 31, | |
| | | 2023 | | | 2022 | | | 2021 | | | 2020 | | | 2019 | |
| | | | | | | | | | | | | | | | | | | | | |
| Net asset value, beginning of year | | $ | 7.12 | | | $ | 8.40 | | | $ | 6.04 | | | $ | 7.88 | | | $ | 7.95 | |
| Change in net assets from operations: | | | | | | | | | | | | | | | | | | | | |
| Net investment income | | | 0.17 | | | | 0.20 | | | | 0.13 | | | | 0.04 | | | | 0.26 | |
| Net realized and unrealized gain (loss) from investments | | | (0.48 | ) | | | (1.32 | ) | | | 2.41 | | | | (1.66 | ) | | | (0.29 | ) |
| Total from investment activities | | | (0.31 | ) | | | (1.12 | ) | | | 2.54 | | | | (1.62 | ) | | | (0.03 | ) |
| Distributions: | | | | | | | | | | | | | | | | | | | | |
| Net investment income | | | (0.07 | ) | | | (0.16 | ) | | | (0.18 | ) | | | (0.22 | ) | | | (0.04 | ) |
| Total distributions | | | (0.07 | ) | | | (0.16 | ) | | | (0.18 | ) | | | (0.22 | ) | | | (0.04 | ) |
| Redemption fees | | | — | | | | — | (a) | | | — | (a) | | | — | (a) | | | — | |
| Net asset value, end of year | | $ | 6.74 | | | $ | 7.12 | | | $ | 8.40 | | | $ | 6.04 | | | $ | 7.88 | |
| Total Return | | | (4.41 | )% | | | (13.59 | )% | | | 42.38 | % | | | (21.30 | )% | | | (0.36 | )% |
| Net assets, at end of year (000 omitted) | | $ | 2,857 | | | $ | 2,857 | | | $ | 2,954 | | | $ | 2,028 | | | $ | 2,632 | |
| Ratios and Supplemental Data: | | | | | | | | | | | | | | | | | | | | |
| Ratio of net expenses to average net assets | | | 1.75 | % | | | 1.75 | % | | | 1.75 | % | | | 1.75 | % | | | 1.75 | % |
| Ratio of gross expenses before waivers and/or reimbursements | | | 4.38 | % | | | 4.27 | % | | | 4.32 | % | | | 5.04 | % | | | 4.35 | % |
| Ratio of net investment income to average net assets | | | 2.38 | % | | | 2.27 | % | | | 1.56 | % | | | 0.69 | % | | | 3.14 | % |
| Portfolio turnover rate | | | 6 | % | | | 3 | % | | | 11 | % | | | 9 | % | | | 5 | % |
| (a) | Rounds to less than $0.005 per share. |
See accompanying notes to financial statements.
| ANNUAL REPORT 2023 |
| | |
| FINANCIAL HIGHLIGHTS |
| Commonwealth Japan Fund |
| Selected data for a share outstanding during each of the years indicated: |
| | | For the Year | | | For the Year | | | For the Year | | | For the Year | | | For the Year | |
| | | Ended | | | Ended | | | Ended | | | Ended | | | Ended | |
| | | October 31, | | | October 31, | | | October 31, | | | October 31, | | | October 31, | |
| | | 2023 | | | 2022 | | | 2021 | | | 2020 | | | 2019 | |
| | | | | | | | | | | | | | | | | | | | | |
| Net asset value, beginning of year | | $ | 3.03 | | | $ | 4.41 | | | $ | 4.03 | | | $ | 4.12 | | | $ | 3.66 | |
| Change in net assets from operations: | | | | | | | | | | | | | | | | | | | | |
| Net investment income (loss) | | | 0.01 | | | | (0.01 | ) | | | (0.02 | ) | | | (0.01 | ) | | | (0.01 | ) |
| Net realized and unrealized gain (loss) from investments | | | 0.38 | | | | (1.20 | ) | | | 0.40 | | | | (0.08 | ) | | | 0.47 | |
| Total from investment activities | | | 0.39 | | | | (1.21 | ) | | | 0.38 | | | | (0.09 | ) | | | 0.46 | |
| Distributions: | | | | | | | | | | | | | | | | | | | | |
| Net investment income | | | — | | | | (0.04 | ) | | | — | | | | — | | | | — | |
| Net realized gains | | | — | | | | (0.13 | ) | | | — | | | | — | | | | — | |
| Total distributions | | | — | | | | (0.17 | ) | | | — | | | | — | | | | — | |
| Redemption fees | | | — | | | | — | | | | — | | | | — | | | | — | (a) |
| Net asset value, end of year | | $ | 3.42 | | | $ | 3.03 | | | $ | 4.41 | | | $ | 4.03 | | | $ | 4.12 | |
| Total Return | | | 12.87 | % | | | (28.39 | )% | | | 9.43 | % | | | (2.18 | )% | | | 12.57 | % |
| Net assets, at end of year (000 omitted) | | $ | 5,561 | | | $ | 4,646 | | | $ | 6,732 | | | $ | 6,333 | | | $ | 6,492 | |
| Ratios and Supplemental Data: | | | | | | | | | | | | | | | | | | | | |
| Ratio of net expenses to average net assets | | | 1.75 | % | | | 1.75 | % | | | 1.75 | % | | | 1.75 | % | | | 1.75 | % |
| Ratio of gross expenses before waivers and/or reimbursements | | | 3.45 | % | | | 3.38 | % | | | 3.01 | % | | | 3.29 | % | | | 3.24 | % |
| Ratio of net investment income (loss) to average net assets | | | 0.09 | % | | | (0.08 | )% | | | (0.51 | )% | | | (0.34 | )% | | | (0.25 | )% |
| Portfolio turnover rate | | | 12 | % | | | 8 | % | | | 15 | % | | | 15 | % | | | 10 | % |
| (a) | Rounds to less than $0.005 per share. |
See accompanying notes to financial statements.
| ANNUAL REPORT 2023 |
| | |
| FINANCIAL HIGHLIGHTS |
| Commonwealth Global Fund |
| Selected data for a share outstanding during each of the years indicated: |
| | | For the Year | | | For the Year | | | For the Year | | | For the Year | | | For the Year | |
| | | Ended | | | Ended | | | Ended | | | Ended | | | Ended | |
| | | October 31, | | | October 31, | | | October 31, | | | October 31, | | | October 31, | |
| | | 2023 | | | 2022 | | | 2021 | | | 2020 | | | 2019 | |
| | | | | | | | | | | | | | | | | | | | | |
| Net asset value, beginning of year | | $ | 16.86 | | | $ | 21.12 | | | $ | 16.20 | | | $ | 15.84 | | | $ | 14.75 | |
| Change in net assets from operations: | | | | | | | | | | | | | | | | | | | | |
| Net investment loss | | | (0.15 | ) | | | (0.09 | ) | | | (0.11 | ) | | | (0.08 | ) | | | (0.02 | ) |
| Net realized and unrealized gain (loss) from investments | | | 0.41 | | | | (4.17 | ) | | | 5.03 | | | | 0.44 | | | | 1.13 | |
| Total from investment activities | | | 0.26 | | | | (4.26 | ) | | | 4.92 | | | | 0.36 | | | | 1.11 | |
| Distributions: | | | | | | | | | | | | | | | | | | | | |
| Net realized gains | | | (0.15 | ) | | | — | | | | — | | | | — | | | | (0.02 | ) |
| Total distributions | | | (0.15 | ) | | | — | | | | — | | | | — | | | | (0.02 | ) |
| Redemption fees | | | — | | | | — | | | | — | | | | — | (a) | | | — | |
| Net asset value, end of year | | $ | 16.97 | | | $ | 16.86 | | | $ | 21.12 | | | $ | 16.20 | | | $ | 15.84 | |
| Total Return | | | 1.51 | % | | | (20.17 | )% | | | 30.37 | % | | | 2.27 | % | | | 7.57 | % |
| Net assets, at end of year (000 omitted) | | $ | 14,584 | | | $ | 14,825 | | | $ | 19,642 | | | $ | 15,597 | | | $ | 15,993 | |
| Ratios and Supplemental Data: | | | | | | | | | | | | | | | | | | | | |
| Ratio of net expenses to average net assets | | | 2.61 | % | | | 2.49 | % | | | 2.33 | % | | | 2.47 | %(b) | | | 2.52 | % |
| Ratio of gross expenses before waivers and/or reimbursements | | | 2.61 | % | | | 2.49 | % | | | 2.33 | % | | | 2.56 | % | | | 2.52 | % |
| Ratio of net investment loss to average net assets | | | (0.81 | )% | | | (0.44 | )% | | | (0.54 | )% | | | (0.49 | )% | | | (0.15 | )% |
| Portfolio turnover rate | | | 9 | % | | | 7 | % | | | 6 | % | | | 8 | % | | | 8 | % |
| (a) | Rounds to less than $0.005 per share. |
| (b) | The ratio of net expenses include $14,458 in voluntary advisory waivers representing (0.09)%. For the period from May 12, 2020 to October 31, 2020, the Advisor voluntarily agreed to waive 0.20% of the Management Fee for the Fund. This voluntarily waiver is not subject to recoupment. |
See accompanying notes to financial statements.
| ANNUAL REPORT 2023 |
| | |
| FINANCIAL HIGHLIGHTS |
| Commonwealth Real Estate Securities Fund |
| Selected data for a share outstanding during each of the years indicated: |
| | | For the Year | | | For the Year | | | For the Year | | | For the Year | | | For the Year | |
| | | Ended | | | Ended | | | Ended | | | Ended | | | Ended | |
| | | October 31, | | | October 31, | | | October 31, | | | October 31, | | | October 31, | |
| | | 2023 | | | 2022 | | | 2021 | | | 2020 | | | 2019 | |
| | | | | | | | | | | | | | | | | | | | | |
| Net asset value, beginning of year | | $ | 17.68 | | | $ | 22.57 | | | $ | 15.95 | | | $ | 18.16 | | | $ | 15.35 | |
| Change in net assets from operations: | | | | | | | | | | | | | | | | | | | | |
| Net investment income (loss) | | | 0.04 | | | | (0.10 | ) | | | (0.14 | ) | | | (0.04 | ) | | | 0.05 | |
| Net realized and unrealized gain (loss) from investments | | | 0.25 | | | | (4.63 | ) | | | 6.76 | | | | (2.01 | ) | | | 2.87 | |
| Total from investment activities | | | 0.29 | | | | (4.73 | ) | | | 6.62 | | | | (2.05 | ) | | | 2.92 | |
| Distributions: | | | | | | | | | | | | | | | | | | | | |
| Net investment income | | | — | | | | — | | | | — | | | | (0.07 | ) | | | (0.04 | ) |
| Net realized gains | | | (0.11 | ) | | | (0.16 | ) | | | — | | | | (0.09 | ) | | | (0.07 | ) |
| Total distributions | | | (0.11 | ) | | | (0.16 | ) | | | — | | | | (0.16 | ) | | | (0.11 | ) |
| Redemption fees | | | — | | | | — | (a) | | | — | | | | — | (a) | | | — | |
| Net asset value, end of year | | $ | 17.86 | | | $ | 17.68 | | | $ | 22.57 | | | $ | 15.95 | | | $ | 18.16 | |
| Total Return | | | 1.61 | % | | | (21.11 | )% | | | 41.50 | % | | | (11.42 | )% | | | 19.17 | % |
| Net assets, at end of year (000 omitted) | | $ | 11,982 | | | $ | 11,620 | | | $ | 15,053 | | | $ | 10,790 | | | $ | 12,514 | |
| Ratios and Supplemental Data: | | | | | | | | | | | | | | | | | | | | |
| Ratio of net expenses to average net assets | | | 2.71 | % | | | 2.58 | % | | | 2.44 | % | | | 2.63 | %(b) | | | 2.61 | % |
| Ratio of gross expenses before waivers and/or reimbursements | | | 2.71 | % | | | 2.58 | % | | | 2.44 | % | | | 2.72 | % | | | 2.61 | % |
| Ratio of net investment income (loss) to average net assets | | | 0.16 | % | | | (0.45 | )% | | | (0.66 | )% | | | (0.22 | )% | | | 0.28 | % |
| Portfolio turnover rate | | | 14 | % | | | 34 | % | | | 9 | % | | | 11 | % | | | 11 | % |
| (a) | Rounds to less than $0.005 per share. |
| (b) | The ratio of net expenses include $10,164 in voluntary waivers representing (0.09)%. For the period from May 12, 2020 to October 31, 2020, the Advisor voluntarily agreed to waive 0.20% of the Management Fee for the Fund. This voluntarily waiver is not subject to recoupment. |
See accompanying notes to financial statements.
| ANNUAL REPORT 2023 |
| | |
| NOTES TO FINANCIAL STATEMENTS – October 31, 2023 |
Note 1 − Organization
Commonwealth International Series Trust (the ’‘Trust’’) was organized as a Massachusetts business trust on May 2, 1986, and is registered under the Investment Company Act of 1940, as amended (the ’’1940 Act’’), as an open-end management investment company. The Trust currently consists of five diversified series: the Commonwealth Australia/New Zealand Fund (the ’‘Australia/New Zealand Fund’’), the Africa Fund, the Commonwealth Japan Fund (the ’‘Japan Fund’’), the Commonwealth Global Fund (the ’‘Global Fund’’) and the Commonwealth Real Estate Securities Fund (the ’‘Real Estate Securities Fund’’) (each a ’‘Fund’’ and collectively the ’‘Funds’’).
Note 2 − Investment Objectives
Each Fund’s investment objective is to provide long-term capital appreciation and current income. Under normal market conditions, each Fund (other than the Global Fund) invests at least 80% of its assets in the country or asset class specified in its name (i.e., Australia/New Zealand, Africa, Japan or Real Estate).
Note 3 − Significant Accounting Policies
The Funds are investment companies and follow accounting and reporting guidance under Financial Accounting Standards Board Accounting Standards Codification (“ASC”) Topic 946, “Financial Services-Investment Companies.” The following is a summary of significant accounting policies followed by the Funds in the preparation of their financial statements. These policies are in conformity with generally accepted accounting principles in the United States of America (“GAAP”).
A) Valuation of Securities − Each Fund’s assets and liabilities are valued normally on the basis of market quotations or official closing prices or, if there is no recent last sales price available, reference is made to the last mean quotation in the principal market in which the securities are normally traded. Equity securities that are traded on the NASDAQ National Market System, for which quotations are readily available, are valued at the official closing price. Options are valued at the last quoted sales price. If there is no such reported sale on the valuation date, long positions are valued at the most recent bid price, and short positions are valued at the most recent ask price. Debt securities are priced either by using a market quotation or an independent pricing service. The pricing service may use one or more pricing models. Investments in open-end investment companies are valued at net asset value. In the event that market quotations are not readily available or are considered unreliable due to market or other events, securities are valued in good faith by FCA Corp (the “Advisor”) as “valuation designee” under the oversight of the Board of Trustees (the “Board”). Fair value prices are generally provided by an independent fair value pricing service. The Funds have instituted a policy whereby the value of certain equity securities listed or traded on foreign security exchanges may be valued by an independent fair value pricing service on any day when certain conditions are met (trigger). The Australia/New Zealand Fund, Africa Fund and Japan Fund have retained an independent fair value pricing service to assist in the fair valuing of these foreign securities. The service utilizes statistical data based on historical performance of securities, markets, and other data in developing factors used to estimate a fair value. For the Australia/New Zealand Fund and Japan Fund, the trigger is based on a comparison between the S&P 500® Futures Index at the time of Tokyo market close to the S&P 500® Futures Index at the time of the New York market close. For the Africa Fund, the trigger is based on a comparison between the S&P 500® Futures Index at the time of London market close to the S&P 500® Futures Index at the time of the New York market close.
| ANNUAL REPORT 2023 |
| | |
| NOTES TO FINANCIAL STATEMENTS – October 31, 2023 – (Continued) |
B) Fair Value Measurements − The Funds’ investments have been categorized by tiers dependent upon the various ’‘inputs’’ used to determine the fair value of the Funds’ investments. These inputs are summarized in the three broad levels listed below:
| ● | Level 1 − unadjusted quoted prices in active markets for identical investments and/or registered investment companies where the value per share is determined and published and is the basis for current transactions for identical assets or liabilities at the valuation date |
| ● | Level 2 − other significant observable inputs (including quoted prices for similar securities, interest rates, prepayments speeds, credit risk, etc.) |
| ● | Level 3 − significant unobservable inputs (including management’s own assumptions in determining the fair value of investments) |
A description of the valuation techniques applied to the Funds’ major categories of assets and liabilities measured at fair value on a recurring basis follows:
Common stocks, preferred stocks and exchange-traded funds – Securities traded on a national exchange (or reported on the NASDAQ national market) are stated at the last reported sales price on the day of valuation. Investments in other open-end registered investment companies, including money market funds, are valued at net asset value. To the extent these securities are actively traded and valuation adjustments are not applied, they are generally categorized in Level 1 of the fair value hierarchy. Securities traded on inactive markets, valued by reference to similar instruments or whose inputs are observable and timely would be categorized in Level 2 of the fair value hierarchy. To the extent certain conditions are met and the independent fair value pricing service uses a fair value factor for foreign equity securities, they will be classified as Level 2.
Corporate, Sovereign and U.S Government & Agency Bonds – The fair value of bonds may be estimated using recently executed transactions, market price quotations (where observable), bond spreads, and/or credit default swap spreads adjusted for any basis difference between cash and derivative instruments. Domestically held corporate bonds are generally categorized in Level 2 of the fair value hierarchy; in instances where prices, spreads, or any of the other aforementioned key inputs are unobservable, they would be categorized in Level 3 of the fair value hierarchy.
Written/Purchased Options – Listed derivatives that are actively traded are valued based on quoted prices from the exchange and are generally categorized in Level 1 of the fair value hierarchy. If there is no reported close price on the valuation date, long positions are valued at the most recent bid price and short positions are valued at the most recent ask price. In this instance, the securities would generally be categorized as Level 2.
The inputs or methodology used for valuing securities are not necessarily an indication of the risk associated with investing in those securities.
| ANNUAL REPORT 2023 |
| | |
| NOTES TO FINANCIAL STATEMENTS – October 31, 2023 – (Continued) |
The following is a summary of the inputs used to value the Funds’ investments as of October 31, 2023:
| | | Australia/New Zealand Fund | |
| | | Level 1 | | | Level 2 | | | Level 3 | | | Total | |
| Security Type | | | | | | | | | | | | | | | | |
| Common Stocks(a) | | $ | — | | | $ | 10,963,109 | | | $ | — | | | $ | 10,963,109 | |
| Money Market Funds | | | 23,104 | | | | — | | | | — | | | | 23,104 | |
| Total | | $ | 23,104 | | | $ | 10,963,109 | | | $ | — | | | $ | 10,986,213 | |
| | | | | | | | | | | | | | | | | |
| | | Africa Fund | |
| | | Level 1 | | | Level 2 | | | Level 3 | | | Total | |
| Security Type | | | | | | | | | | | | | | | | |
| Common Stocks(a) | | $ | 566,248 | | | $ | 2,096,283 | | | $ | — | | | $ | 2,662,531 | |
| Exchange-Traded Funds | | | 84,804 | | | | — | | | | — | | | | 84,804 | |
| Sovereign Bonds | | | — | | | | 75,240 | | | | — | | | | 75,240 | |
| Money Market Funds | | | 23,667 | | | | — | | | | — | | | | 23,667 | |
| Total | | $ | 674,719 | | | $ | 2,171,523 | | | $ | — | | | $ | 2,846,242 | |
| | | | | | | | | | | | | | | | | |
| | | Japan Fund | |
| | | Level 1 | | | Level 2 | | | Level 3 | | | Total | |
| Security Type | | | | | | | | | | | | | | | | |
| Common Stocks(a) | | $ | 546,035 | | | $ | 4,924,000 | | | $ | — | | | $ | 5,470,035 | |
| Money Market Funds | | | 17,143 | | | | — | | | | — | | | | 17,143 | |
| Total | | $ | 563,178 | | | $ | 4,924,000 | | | $ | — | | | $ | 5,487,178 | |
| | | | | | | | | | | | | | | | | |
| | | Global Fund | |
| | | Level 1 | | | Level 2 | | | Level 3 | | | Total | |
| Security Type | | | | | | | | | | | | | | | | |
| Common Stocks(a) | | $ | 14,220,249 | | | $ | — | | | $ | — | | | $ | 14,220,249 | |
| Money Market Funds | | | 720,232 | | | | — | | | | — | | | | 720,232 | |
| Total | | $ | 14,940,481 | | | $ | — | | | $ | — | | | $ | 14,940,481 | |
| | | | | | | | | | | | | | | | | |
| | | Real Estate Securities Fund | |
| | | Level 1 | | | Level 2 | | | Level 3 | | | Total | |
| Security Type | | | | | | | | | | | | | | | | |
| Common Stocks(a) | | $ | 10,825,227 | | | $ | 174,368 | | | $ | — | | | $ | 10,999,595 | |
| U.S. Government & Agencies | | | — | | | | 591,249 | | | | — | | | | 591,249 | |
| Money Market Funds | | | 774,943 | | | | — | | | | — | | | | 774,943 | |
| Total | | $ | 11,600,170 | | | $ | 765,617 | | | $ | — | | | $ | 12,365,787 | |
| (a) | For a detailed breakout by industry or country, please refer to the Schedules of Investments. All level 2 positions are classified as such resulting from fair value factor adjustments as of October 31, 2023 as described in the Note above. |
| ANNUAL REPORT 2023 |
| | |
| NOTES TO FINANCIAL STATEMENTS – October 31, 2023 – (Continued) |
C) Currency Translation − For purposes of determining each Fund’s net asset value, all assets and liabilities initially expressed in foreign currency values are converted into U.S. dollar values at the prevailing market rate on each U.S. business day. The cost of securities is determined by using an exchange rate provided by an independent third party. Income is translated at approximate rates prevailing when accrued. The Funds do not isolate that portion of gains and losses on investments which is due to changes in foreign exchange rates from that which is due to changes in the market prices of the investments. Such fluctuations are included with the net realized and unrealized gains and losses from investments.
D) Allocations of Expenses − Expenses directly attributable to a Fund are charged directly to that Fund, while expenses which are attributable to more than one Fund, or the Trust, are allocated among the respective Funds based upon relative net assets or some other reasonable method.
E) Accounting for Investments − Security transactions are accounted for on the trade date for financial reporting purposes. Realized gains and losses on security transactions are based on the identified cost basis for both financial statement and Federal income tax purposes. Dividend income and distributions to shareholders are recorded on the ex-dividend date or as soon as known if after the ex-dividend date. Dividend income from real estate investment trusts (REITs) and distributions from limited partnerships are recognized on the ex-date and included in dividend income. The calendar year-end classification of distributions received from REITs, which may include return of capital, during the fiscal year are reported subsequent to year end; accordingly, the Funds estimate the character of REIT distributions based on the most recent information available. Income or loss from limited partnerships is reclassified among the components of net assets upon receipt of K-1’s. Discounts and premiums on bonds purchased are amortized over the life of the bonds (which may include maturity or call date). Interest income and estimated expenses are accrued daily. Non-cash income, if any, is recorded at the fair market value of the securities received.
F) Federal Income Taxes − It is each Fund’s policy to comply with the requirements of Subchapter M of the Internal Revenue Code that are applicable to regulated investment companies and to distribute substantially all investment company taxable income and net capital gain to shareholders in a manner which results in no tax cost to the Funds. Therefore, no federal income tax provision is required.
Dividends or interest on foreign securities may be subject to the withholding of the country of domicile’s income tax by tax treaty provisions or otherwise. Generally, there are no foreign taxes applicable to the Funds’ capital gains realized on foreign securities in their country of domicile.
The Trust has evaluated tax positions taken or expected to be taken in the course of preparing each Fund’s tax returns to determine whether it is more-likely-than not (i.e., greater than 50-percent chance) that each tax position will be sustained upon examination by a taxing authority based on the technical merits of the position. A tax position that meets the more-likely-than-not recognition threshold is measured to determine the amount of benefit to recognize in the financial statements. Differences between tax positions taken in a tax return and amounts recognized in the financial statements will generally result in an increase in a liability for taxes payable (or a reduction of a tax refund receivable), including the recognition of any related interest and penalties as an operating expense. Tax positions taken in tax years remain subject to examination by tax authorities (generally three years plus the interim tax period since then for federal income tax purposes). The determination has been made that there are not any uncertain tax positions that would require the Funds to record a tax liability and, therefore, there is no impact to the Funds’ financial statements.
| ANNUAL REPORT 2023 |
| | |
| NOTES TO FINANCIAL STATEMENTS – October 31, 2023 – (Continued) |
G) Distributions to Shareholders − The Funds distribute net investment income, if any, and net realized gains (net of any capital loss carryforwards) annually. Income and capital gain distributions are determined in accordance with income tax regulations, which may differ from GAAP. These differences are primarily due to differing treatments for foreign currency transactions and deferrals of certain losses.
H) Redemption Fees − Redemption fees are applicable to certain redemptions of shares within fourteen calendar days of purchase. The redemption fee is imposed to discourage abusive trading activity, which can have disruptive effects on the Funds’ portfolio management and can increase the Funds’ expenses. The redemption fees are intended to offset, at least partially, portfolio transaction and administrative costs associated with short-term trading. The shareholder will be charged a fee equal to 2.00% of the amount redeemed and will be charged when shares are sold, exchanged or involuntarily redeemed. In determining the applicability of the redemption fee, shares held for the longest period of time will be treated as being sold first and shares held for the shortest period of time as being sold last. For the fiscal year ended October 31, 2023, the Funds had no redemption fees.
I) Option Accounting Principles − A Fund may purchase or write put or call options on futures contracts, individual securities, currencies or stock indices to hedge against fluctuations in securities prices and currency exchange rates and to adjust its risk exposure relative to the benchmark. The Fund may use these derivatives for any purpose consistent with its investment objective, such as hedging, obtaining market exposure, and generating premium income.
When a Fund writes an option, the premium received is recorded as a liability. Each day the option contract liability is valued in accordance with the procedures for security valuation discussed previously. When an offsetting option is purchased (a closing transaction) or the option contract expires, the Fund realizes a gain or loss and the liability related to such option contract is eliminated. When a call option is exercised, the Fund realizes a gain or loss from the sale of the underlying security and the proceeds of the sale are increased by the premiums originally received. For the fiscal year October 31, 2023, the Funds had no written options.
When a Fund purchases an option, the premium paid is recorded as an asset. Each day, the option contract is valued in accordance with the procedures for security valuation discussed previously. When an offsetting option is written (a closing transaction) or the option contract expires, the Fund realizes a gain or loss and the asset representing such option contract is eliminated. When a call option is exercised, the Fund purchases the underlying security and the cost basis of such purchase is increased by the premium originally paid. For the fiscal year October 31, 2023, the Funds had no purchased options.
J) Forward Currency Contracts − Forward currency transactions may be undertaken to hedge against possible variations in the foreign exchange rates between the U.S. dollar and foreign currencies. A forward currency contract is an agreement between two parties to buy or sell a currency at a set price on a future date. Forward contracts are marked-to-market daily and the change in the market value is recorded by the Fund as an unrealized gain or loss. When a contract is closed, the Fund records a realized gain or loss equal to the difference between the value of the contract at the time it was opened and the value at the time it was closed. The Funds could be exposed to risk if the counterparties are unable to meet the terms of the contracts or if the value of the currency changes unfavorably. Other risks of forward currency transactions include failing to achieve expected benefit, markets moving in a direction that the Funds did not expect, a Fund’s ability to close out its position in the hedging instrument, and political and social unrest and the possibility of negative governmental actions. During and as of the fiscal year ended October 31, 2023, the Funds held no foreign currency contracts.
| ANNUAL REPORT 2023 |
| | |
| NOTES TO FINANCIAL STATEMENTS – October 31, 2023 – (Continued) |
K) Use of Estimates − The preparation of the financial statements in conformity with GAAP requires management to make estimates and assumptions that affect the reported amounts of assets and liabilities and the disclosure of contingent assets and liabilities at the date of the financial statements and the reported amounts of increases and decreases in net assets from operations during the reporting period. Actual results could differ from those estimates and these differences could be material.
L) Regulatory Update − Tailored Shareholder Reports for Mutual Funds and Exchange - Traded Funds (“ETFs”) – Effective January 24, 2023, the SEC adopted rule and form amendments to require mutual funds and ETFs to transmit concise and visually engaging streamlined annual and semiannual reports to shareholders that highlight key information. Other information, including financial statements, will no longer appear in a streamlined shareholder report but must be available online, delivered free of charge upon request, and filed on a semiannual basis on Form N-CSR. The rule and form amendments have a compliance date of July 24, 2024. At this time, management is evaluating the impact of these amendments on the shareholder reports for the Funds.
Note 4 − Related Party Transactions and Other Arrangements
A) Investment Advisor − The Trust, on behalf of each Fund, has retained FCA Corp as the Funds’ investment advisor. Under each Fund’s Investment Advisory Agreement, the Advisor is paid a fee (the “Management Fee”), calculated daily and payable monthly, equal to an annual rate of 0.75% of the average net assets of each Fund.
The Advisor entered into an expense limitation agreement through February 28, 2024, under which it has agreed to limit the total expenses of the Africa Fund and the Japan Fund (exclusive of interest, distribution fees pursuant to Rule 12b-1 Plans, taxes, acquired fund fees and expenses, brokerage commissions, extraordinary expenses and dividend expense on short sales) to an annual rate of 1.50% and 1.50% of the average daily net assets of the Africa Fund and the Japan Fund, respectively. The Advisor may not terminate this arrangement prior to February 28, 2024, unless the investment advisory agreement is terminated. The Africa Fund and the Japan Fund each have agreed to repay the Advisor for amounts waived by the Advisor pursuant to the fee waiver agreement to the extent that such repayment occurs within three fiscal years of the date of any such waiver and such repayment does not cause the Africa Fund or the Japan Fund to exceed the expense limitation in place at the time the fee was waived. As of October 31, 2023, the Advisor may seek repayment of investment advisory fee waivers and expense reimbursements in the amounts as follows:
| Recoverable Through | | Africa Fund | | | Japan Fund | |
| October 31, 2024 | | $ | 72,998 | | | $ | 88,264 | |
| October 31, 2025 | | | 80,809 | | | | 91,747 | |
| October 31, 2026 | | | 80,585 | | | | 94,303 | |
Certain officers of the Trust are also officers of the Advisor.
B) Administration, Fund Accounting and Transfer Agent –Ultimus Fund Solutions, LLC (the “Administrator”) serves as the administrator, transfer agent and fund accountant to the Funds. For these services, the Administrator receives fees computed at an annual rate of the daily net assets of the Funds, subject to a minimum annual contractual fee. Certain officers of the Trust are also employees of the Administrator, but are paid no fees directly by the Funds for serving as an officer of the Trust.
C) Distribution – Ultimus Fund Distributors, LLC (the “Distributor”), an affiliate of the Administrator, serves as the principal underwriter for the shares of each Fund of the Trust and receives an annual contractual fee.
| ANNUAL REPORT 2023 |
| | |
| NOTES TO FINANCIAL STATEMENTS – October 31, 2023 – (Continued) |
Each Fund has adopted a Service and Distribution Plan (each a “Plan”) pursuant to Rule 12b-1 under the Act, whereby up to 0.35% of the Funds’ assets may be used to reimburse the Distributor for costs and expenses incurred in connection with the distribution and marketing of shares of the Funds and the servicing of the Funds’ shareholders. Distribution and marketing expenses include, among other things, printing of prospectuses, marketing literature, and costs of personnel involved with the promotion and distribution of the Funds’ shares. These amounts are disclosed on the Statements of Operations under Distribution (12b-1) fees. While the plans permit each Fund to pay up to 0.35% of its average daily net assets to reimburse for certain expenses in connection with the distribution of its shares, the Board has currently authorized each Fund to pay out only 0.25% under its Plan. If the Board’s intention changes on this matter, the Funds will amend or supplement their prospectus. Out of the foregoing amount, each Fund is permitted to pay up to an aggregate of 0.25% of its average daily net assets to reimburse for certain shareholder services.
D) Legal Counsel − Practus, LLP serves as legal counsel to the Trust. John H. Lively, Secretary of the Trust, is the managing partner of Practus, LLP, but he receives no special compensation from the Trust or the Funds for serving as an officer of the Trust.
Note 5 − Purchases and Sales of Securities
Purchases and sales of investment securities (excluding short-term securities) by the Funds for the fiscal year ended October 31, 2023, were as follows:
| | | Purchases | | | Sales | |
| Australia/New Zealand Fund | | $ | 954,211 | | | $ | 793,658 | |
| Africa Fund | | | 488,715 | | | | 174,779 | |
| Japan Fund | | | 939,033 | | | | 642,170 | |
| Global Fund | | | 1,363,954 | | | | 1,898,301 | |
| Real Estate Securities Fund | | | 1,633,377 | | | | 1,632,349 | |
There were no purchases or sales of long-term U.S. government obligations during the fiscal year ended October 31, 2023.
Note 6 − Financial Instruments with Off-Balance Sheet Risk
In the ordinary course of trading activities, certain of the Funds may trade and hold certain derivative contracts. Such contracts include forward currency contracts, where the Funds would be obligated to buy currency at specified prices, and written put and call options, where the Funds would be obligated to purchase or sell securities at specified prices (i.e., the options are exercised by the counterparties). The maximum payout for the put option contracts is limited to the number of contracts written and the related strike prices, respectively. The maximum payout for uncovered written call option contracts is limited only by how high the underlying rises above the strike price. Maximum payout amounts could be offset by the subsequent sale, if any, of assets obtained via the execution of a payout event.
These financial instruments contain varying degrees of off-balance sheet risk whereby changes in the market value of securities underlying the financial instruments may be in excess of the amounts recognized in the Statements of Assets and Liabilities. A Fund, as writer of an option, bears the market risk of an unfavorable change in the price of the security underlying the written option. The risk associated with purchasing an option is that the Fund pays a premium whether or not the option is exercised. Additionally, each Fund bears the risk of loss of premium and change in market value should the counterparty not perform
| ANNUAL REPORT 2023 |
| | |
| NOTES TO FINANCIAL STATEMENTS – October 31, 2023 – (Continued) |
under the contract. A call option gives the holder the right to buy the underlying stock from the writer at a specified price within a fixed period of time. Therefore, the securities held by the Fund against which options are written may not be traded and are held in escrow by the custodian. In the ordinary course of trading activities, certain of the Funds trade and hold certain fair-valued derivative contracts. Such contracts include forward currency contracts, where the Funds would be obligated to buy currency at specified prices, and written put and call options, where the Funds would be obligated to purchase or sell securities at specified prices (i.e., the options are exercised by the counterparties). The maximum payout for the put option contracts is limited to the number of contracts written and the related strike prices, respectively. The maximum payout for uncovered written call option contracts is limited only by how high the underlying security price rises above the strike price. Maximum payout amounts could be offset by the subsequent sale, if any, of assets obtained via the execution of a payout event.
Note 7 – Tax Matters
At October 31, 2023, the gross unrealized appreciation (depreciation) on investments, foreign currency translations and cost of securities on a tax basis for federal income tax purposes were as follows:
| | | Australia/New | | | | | | | | | | | | Real Estate | |
| | | Zealand Fund | | | Africa Fund | | | Japan Fund | | | Global Fund | | | Securities Fund | |
| Gross unrealized appreciation | | $ | 4,493,686 | | | $ | 367,622 | | | $ | 1,597,171 | | | $ | 6,904,835 | | | $ | 4,949,795 | |
| Gross unrealized depreciation | | | (1,221,226 | ) | | | (942,627 | ) | | | (190,225 | ) | | | (21,107 | ) | | | (238,608 | ) |
| Net unrealized appreciation (depreciation) on investments | | $ | 3,272,460 | | | $ | (575,005 | ) | | $ | 1,406,946 | | | $ | 6,883,728 | | | $ | 4,711,187 | |
| Tax cost of investments | | $ | 7,713,753 | | | $ | 3,421,247 | | | $ | 4,080,232 | | | $ | 8,056,753 | | | $ | 7,654,600 | |
The difference between cost amounts for financial statement and federal income tax purposes is due primarily to wash sale loss deferrals, straddle deferrals and passive foreign investment companies (’‘PFICs’’).
As of October 31, 2023, the components of accumulated earnings (deficit) on a tax basis were as follows:
| | | Australia/New | | | | | | | | | | | | Real Estate | |
| | | Zealand Fund | | | Africa Fund | | | Japan Fund | | | Global Fund | | | Securities Fund | |
| Undistributed ordinary income | | $ | 31,038 | | | $ | 99,103 | | | $ | 5,854 | | | $ | — | | | $ | — | |
| Undistributed long-term capital gains | | | — | | | | — | | | | — | | | | — | | | | — | |
| Tax accumulated earnings | | | 31,038 | | | | 99,103 | | | | 5,854 | | | | — | | | | — | |
| Accumulated capital and other losses | | | (196,242 | ) | | | (741,855 | ) | | | (76,564 | ) | | | (149,638 | ) | | | (12,660 | ) |
| Unrealized appreciation (depreciation) on investments | | | 3,272,460 | | | | (575,005 | ) | | | 1,406,946 | | | | 6,883,728 | | | | 4,711,187 | |
| Unrealized appreciation (depreciation) on foreign currency translations | | | 114 | | | | (492 | ) | | | (7,446 | ) | | | — | | | | — | |
| Total accumulated earnings (deficit) | | $ | 3,107,370 | | | $ | (1,218,249 | ) | | $ | 1,328,790 | | | $ | 6,734,090 | | | $ | 4,698,527 | |
| ANNUAL REPORT 2023 |
| | |
| NOTES TO FINANCIAL STATEMENTS – October 31, 2023 – (Continued) |
The tax character of distributions paid during the tax periods ended October 31, 2023 and 2022 were as follows:
| | | Australia/New | | | | | | | | | | | | | | | | | | | | | | | | | |
| | | Zealand Fund | | | Africa Fund | | | Japan Fund | | | Global Fund | | | Real Estate Fund | |
| | | Year | | | Year | | | Year | | | Year | | | Year | | | Year | | | Year | | | Year | | | Year | | | Year | |
| | | Ended | | | Ended | | | Ended | | | Ended | | | Ended | | | Ended | | | Ended | | | Ended | | | Ended | | | Ended | |
| | | October 31, | | | October 31, | | | October 31, | | | October 31, | | | October 31, | | | October 31, | | | October 31, | | | October 31, | | | October 31, | | | October 31, | |
| | | 2023 | | | 2022 | | | 2023 | | | 2022 | | | 2023 | | | 2022 | | | 2023 | | | 2022 | | | 2023 | | | 2022 | |
| Distributions paid from: | | | | | | | | | | | | | | | | | | | | | | | | | | | | | | | | | | | | | | | | |
| Ordinary income | | $ | 37 | | | $ | 22,002 | | | $ | 30,003 | | | $ | 56,372 | | | $ | — | | | $ | 66,305 | | | $ | — | | | $ | — | | | $ | — | | | $ | — | |
| Net long-term capital gains | | | 76,761 | | | | 1,163,181 | | | | — | | | | — | | | | — | | | | 208,564 | | | | 128,817 | | | | — | | | | 70,458 | | | | 107,704 | |
| Total distributions paid | | $ | 76,798 | | | $ | 1,185,183 | | | $ | 30,003 | | | $ | 56,372 | | | $ | — | | | $ | 274,869 | | | $ | 128,817 | | | $ | — | | | $ | 70,458 | | | $ | 107,704 | |
| | | | | | | | | | | | | | | | | | | | | | | | | | | | | | | | | | | | | | | | | |
| As of October 31, 2023, the following Funds had net capital loss carryforwards which are available to offset future net capital gains, if any: |
| | | | | | | | | | | | | | | | | | | | | | | | | | | | | | | | | | | | | | | | | |
| | | Australia/New | | | | | | | | | | | | | | | | | | | | | | | | | |
| | | Zealand Fund | | | Africa Fund | | | Japan Fund | | | Global Fund | | | Real Estate Fund | |
| | | Short-Term | | | Long-Term | | | Short-Term | | | Long-Term | | | Short-Term | | | Long-Term | | | Short-Term | | | Long-Term | | | Short-Term | | | Long-Term | |
| Non-Expiring | | $ | 34,059 | | | $ | 162,183 | | | $ | 16,130 | | | $ | 725,725 | | | $ | 37,512 | | | $ | 39,052 | | | $ | 53,302 | | | $ | — | | | $ | 12,660 | | | $ | — | |
Capital loss carryforwards are available to offset future realized capital gains and thereby reduce further taxable gain distributions.
As of October 31, 2023, the Global Fund had $96,336 of qualified late-year ordinary losses, which were deferred until fiscal year 2023 for tax purposes. Net late-year losses incurred after December 31 and within the taxable year are deemed to arise on the first day of the Funds’ next taxable year.
The Funds have recorded reclassifications in their capital accounts. These reclassifications have no impact on the net asset value of the Funds and are designed generally to present accumulated earnings (deficit) on a tax basis which is considered to be more informative to the shareholder. The permanent differences primarily relate to non-deductible excise tax, net operating losses, and taxable over distribution. As of October 31, 2023, the Funds recorded the following reclassifications to increase (decrease) the capital accounts listed below:
| | | Australia/New | | | | | | | | | | | | Real Estate | |
| | | Zealand Fund | | | Africa Fund | | | Japan Fund | | | Global Fund | | | Securities Fund | |
| Paid-in capital | | $ | — | | | $ | (240 | ) | | $ | — | | | $ | (83,248 | ) | | $ | (152,288 | ) |
| Accumulated earnings (deficit) | | | — | | | | 240 | | | | — | | | | 83,248 | | | | 152,288 | |
| | | $ | — | | | $ | — | | | $ | — | | | $ | — | | | $ | — | |
| ANNUAL REPORT 2023 |
| | |
| NOTES TO FINANCIAL STATEMENTS – October 31, 2023 – (Continued) |
Note 8 − Revolving Credit Agreement
The Trust has in place an Amended and Restated Revolving Credit Agreement (the “Agreement”) with its custodian, Fifth Third Bank N.A. (the “Bank”). Pursuant to the terms of the Agreement, the Bank makes available to the Trust, a line of credit facility under which the Bank may make loans to the Trust, on behalf of the Funds, from time to time. The Agreement provides a line of credit in an amount of up to $1,000,000 (the “Committed Amount”) for the Trust with respect to all of the Funds. The Agreement further limits the amount that any Fund may borrow subject to the requirements specified by the 1940 Act, which generally permits a fund to borrow and pledge its shares to secure such borrowing, provided, that immediately thereafter there is asset coverage of at least 300% for all borrowings by a fund from a bank. If borrowings exceed this 300% asset coverage requirement by reason of a decline in net assets of a fund, the fund will reduce its borrowings within three days to the extent necessary to comply with the 300% asset coverage requirement. The 1940 Act also permits a fund to borrow for temporary purposes only in an amount not exceeding 5% of the value of its total assets at the time when the loan is made. The terms of the agreement include a non-refundable commitment fee annually in an amount equal to $2,000. Any principal balance outstanding bears interest at the prime rate in effect at the time plus 0% and any amounts not drawn will be assessed unused fees at the rate of 0.275%.
The Funds did not utilize the line of credit for the fiscal year ended October 31, 2023.
Note 9 − Contractual Obligations
Under the Trust’s organizational documents, its Trustees and Officers are indemnified against certain liabilities arising out of the performance of their duties to the Funds. In the normal course of business, the Funds enter into contracts that contain various representations and warranties and provide general indemnifications. The Funds’ maximum exposure under these arrangements is dependent on future claims against the Funds and is presently unknown. Currently however, the Funds expect the risk of loss to be remote.
Note 10 − Concentration of Market Risk
The Australia/New Zealand Fund has a majority of its investments in securities issued by Australian and New Zealand issuers, the Africa Fund invests primarily in securities issued by African issuers and the Japan Fund invests primarily in securities of Japanese issuers. Investing in companies from specific geographic regions, such as Australia, New Zealand, Africa or Japan, may pose additional risks inherent to a region’s economic and political situation. These events will not necessarily affect the U.S. economy or similar issuers located in the U.S. In addition, many of the investments in Australia, New Zealand, Africa or Japan are denominated in foreign currencies. As a result, changes in the values of these currencies compared to the U.S. dollar may affect (positively or negatively) the value of the Funds’ investments. These events may happen separately from, and in response to, events that do not otherwise affect the values of the securities in the issuers’ home countries.
As of October 31, 2023, the Australia/New Zealand Fund held approximately 15% of its net assets in South Port New Zealand Ltd. Due to the large position, an increase or decrease in the value of this security may have a greater impact on the Australia/ New Zealand Fund’s net asset value and total return than if the Australia/New Zealand Fund did not focus as much in this particular security.
| ANNUAL REPORT 2023 |
| | |
| NOTES TO FINANCIAL STATEMENTS – October 31, 2023 – (Continued) |
The Africa Fund may be exposed to additional risks by focusing its investments on issuers in African countries to which other funds invested in securities of issuers in a broader region may not be exposed. The Africa Fund is highly dependent on the state of economics of countries throughout Africa and, Sub-Saharan countries. Changes in economics, tax policies, inflation rates, governmental instability, war or other political or economic factors may affect (positively or negatively) the Fund’s investments.
A large portion of investments held by the Real Estate Securities Fund are considered investments in the real estate sector of the market, which may include REITs. Investing in REITs involves certain unique risks in addition to those risks associated with investing in the real estate industry in general. Equity REITs may be affected by changes in the value of the underlying property owned by the REITs, while mortgage REITs may be affected by the quality of any credit extended. REITs are dependent upon management skills, are not diversified, are subject to heavy cash flow dependency, default by borrowers and self-liquidation. REITs are also subject to the possibilities of failing to qualify for tax-free pass through of income and maintaining their exemption from registration under the 1940 Act. Investing in a single market sector may be riskier than investing in a variety of market sectors.
Note 11 − Subsequent Events
Management of the Funds has evaluated the need for disclosures resulting from subsequent events through the date these financial statements were issued.
Subsequent to October 31, 2023, income and capital gain distributions were made to the shareholders of certain Commonwealth Funds, meeting the criteria of a subsequent event. The record date of the distributions were December 14, 2023, with an ex-dividend date of December 15, 2023 and a payable date of December 18, 2023.
| Fund Name | | Distribution Type | | Rate | | | Amount | |
| Australia/New Zealand Fund | | Income | | $ | 0.0282 | | | $ | 31,068 | |
| Africa Fund | | Income | | | 0.2312 | | | | 99,144 | |
| Japan Fund | | Income | | | 0.0038 | | | | 5,994 | |
| ANNUAL REPORT 2023 |
| | |
| REPORT OF INDEPENDENT REGISTERED PUBLIC ACCOUNTING FIRM |
To the Shareholders and Board of Trustees of
Commonwealth International Series Trust
Opinion on the Financial Statements
We have audited the accompanying statements of assets and liabilities, including the schedules of investments, of Commonwealth Australia/New Zealand Fund, Africa Fund, Commonwealth Japan Fund, Commonwealth Global Fund, and Commonwealth Real Estate Securities Fund (the “Funds”), each a series of Commonwealth International Series Trust as of October 31, 2023, and the related statements of operations and changes in net assets, the related notes, and the financial highlights for the year then ended (collectively referred to as the “financial statements”). In our opinion, the financial statements present fairly, in all material respects, the financial position of the Funds as of October 31, 2023, the results of their operations, changes in net assets, and the financial highlights for the year then ended, in conformity with accounting principles generally accepted in the United States of America.
The Funds’ financial statements and financial highlights for the years ended October 31, 2022, and prior, were audited by other auditors whose report dated December 22, 2022, expressed an unqualified opinion on those financial statements and financial highlights.
Basis for Opinion
These financial statements are the responsibility of the Funds’ management. Our responsibility is to express an opinion on the Funds’ financial statements based on our audits. We are a public accounting firm registered with the Public Company Accounting Oversight Board (United States) (“PCAOB”) and are required to be independent with respect to the Funds in accordance with the U.S. federal securities laws and the applicable rules and regulations of the Securities and Exchange Commission and the PCAOB.
We conducted our audits in accordance with the standards of the PCAOB. Those standards require that we plan and perform the audits to obtain reasonable assurance about whether the financial statements are free of material misstatement whether due to error or fraud.
Our audits included performing procedures to assess the risks of material misstatement of the financial statements, whether due to error or fraud, and performing procedures that respond to those risks. Such procedures included examining, on a test basis, evidence regarding the amounts and disclosures in the financial statements. Our procedures included confirmation of securities owned as of October 31, 2023, by correspondence with the custodian and brokers. Our audits also included evaluating the accounting principles used and significant estimates made by management, as well as evaluating the overall presentation of the financial statements. We believe that our audits provide a reasonable basis for our opinion.
We have served as the Funds’ auditor since 2023.

COHEN & COMPANY, LTD.
Philadelphia, Pennsylvania
December 22, 2023
| ANNUAL REPORT 2023 |
| | |
| ADDITIONAL INFORMATION – October 31, 2023 (Unaudited) |
Table of Shareholder Expenses
As a shareholder of the Funds, you incur ongoing costs, including management fees, distribution and service fees, and other Fund expenses. This example is intended to help you understand your ongoing costs (in dollars) of investing in the Funds and compare these costs with the ongoing costs of investing in other mutual funds.
The example is based on an investment of $1,000 invested at the beginning of the period and held for the entire period from May 1, 2023, through October 31, 2023.
Actual Expenses
The table below provides information about actual account values and actual expenses. You may use the information below, together with the amount you invested, to estimate the expenses that you paid over the period. Simply divide your account value by $1,000 (for example, an $8,600 account value divided by $1,000 = 8.6), then multiply the result by the number in the table under the heading entitled ’‘Expenses Paid During Period’’ to estimate the expenses you paid on your account during this period.
| | | Beginning | | | Ending | | | Expenses Paid | | | Expense Ratio |
| | | Account Value | | | Account Value | | | During Period* | | | During Period* |
| | | 5/1/23 | | | 10/31/23 | | | 5/1/23-10/31/23 | | | 5/1/23-10/31/23 |
| Australia/New Zealand Fund | | $ | 1,000.00 | | | $ | 836.20 | | | $ | 13.38 | | | 2.89% |
| Africa Fund | | | 1,000.00 | | | | 901.10 | | | | 8.39 | | | 1.75% |
| Japan Fund | | | 1,000.00 | | | | 974.40 | | | | 8.71 | | | 1.75% |
| Global Fund | | | 1,000.00 | | | | 914.30 | | | | 12.83 | | | 2.66% |
| Real Estate Securities Fund | | | 1,000.00 | | | | 926.30 | | | | 13.35 | | | 2.75% |
Hypothetical Example for Comparison Purposes
The table below provides information about hypothetical account values and hypothetical expenses based on each Fund’s actual expense ratio and an assumed rate of return of 5% per year before expenses, which is not the Fund’s actual return. The hypothetical account values and expenses may not be used to estimate the actual ending account balance or expenses you paid for the period. You may use this information to compare this 5% hypothetical example with the 5% hypothetical examples that appear in the shareholder reports of other funds.
Please note that the expenses shown in the table are meant to highlight your ongoing costs only and do not reflect any transactional costs, such as sales charges (loads), short-term redemption or exchange fees. Therefore, the table is useful in comparing ongoing costs only, and will not help you determine the relative total costs of owning different funds. In addition, if these transactional costs were included, your costs would have been higher.
| | | Beginning | | | Ending | | | Expenses Paid | | | Expense Ratio |
| | | Account Value | | | Account Value | | | During Period* | | | During Period* |
| | | 5/1/23 | | | 10/31/23 | | | 5/1/23-10/31/23 | | | 5/1/23-10/31/23 |
| Australia/New Zealand Fund | | $ | 1,000.00 | | | $ | 1,010.64 | | | $ | 14.65 | | | 2.89% |
| Africa Fund | | | 1,000.00 | | | | 1,016.38 | | | | 8.89 | | | 1.75% |
| Japan Fund | | | 1,000.00 | | | | 1,016.38 | | | | 8.89 | | | 1.75% |
| Global Fund | | | 1,000.00 | | | | 1,011.80 | | | | 13.49 | | | 2.66% |
| Real Estate Securities Fund | | | 1,000.00 | | | | 1,011.34 | | | | 13.94 | | | 2.75% |
| * | Expenses are equal to the average account value times the Fund’s annualized expense ratio multiplied by 184 (the number of days in the most recent fiscal half-year) divided by 365 (the number of days in the fiscal year) to reflect the one-half year period. |
| ANNUAL REPORT 2023 |
| | |
| ADDITIONAL INFORMATION – October 31, 2023 (Unaudited) – (Continued) |
Disclosure of Portfolio Holdings
The Funds file their complete schedule of portfolio holdings with the Securities and Exchange Commission (the ’‘Commission’’) for the first and third quarters of each fiscal year as an exhibit to its reports on Form N-PORT. The Funds’ Form N-PORT reports are available on the Commission’ website at http://www.sec.gov and on the Funds’ website at www.commonwealthfunds.com.
Proxy Voting
A description of the policies and procedures that the Funds use to determine how to vote proxies relating to portfolio securities is available without charge, upon request, by calling 888-345-1898, and on the Commissions website at http://www.sec.gov.
Information regarding how the Funds voted proxies relating to portfolio securities during the most recent 12-month period ended June 30 is available without charge, upon request, by calling 888-345-1898, and on the Commission’s website at http://www.sec.gov.
Additional Federal Income Tax Information
The Form 1099-DIV you receive in January 2024 will show the tax status of all distributions paid to your account in calendar year 2023. Shareholders are advised to consult their own tax adviser with respect to the tax consequences of their investment in the Fund. As required by the Internal Revenue Code and/or regulations, shareholders must be notified regarding the status of qualified dividend income for individuals and the dividends received deduction for corporations.
Qualified Dividend Income
The Australia/New Zealand Fund, Africa Fund and Japan Fund designates approximately 100%, 100% and 100%, respectively, or up to the maximum amount of such dividends allowable pursuant to the Internal Revenue Code, as qualified dividend income eligible for a reduced tax rate.
Qualified Business Income
Each of the Funds designate 0% of its ordinary income dividends, or up to the maximum amount of such dividends allowable pursuant to the Internal Revenue Code, as qualified business income.
Dividends Received Deduction
Corporate shareholders are generally entitled to take the dividends received deduction on the portion of the Fund’s dividend distribution that qualifies under the tax law. For each Funds’ calendar year 2023 ordinary income dividends, 0% qualifies for the corporate dividends received deduction.
For the year ended October 31, 2023, the Australia/New Zealand Fund, Global Fund and Real Estate Fund designated $76,761, $128,807 and $58,040, respectively, as 20% long-term capital gain distributions.
| ANNUAL REPORT 2023 |
| | |
| ADDITIONAL INFORMATION – October 31, 2023 (Unaudited) – (Continued) |
Foreign Tax Credit Pass Through
The Funds intend to elect to pass through to shareholders the income tax credit for taxes paid to foreign countries. The Japan Fund foreign source income per share was $0.067. The pass-through of the foreign tax credit will only affect those persons who are shareholders on the dividend record date in October 2023. These shareholders will receive more detailed information along with the 2023 Form 1099-DIV.
| ANNUAL REPORT 2023 |
| | |
| LIQUIDITY RISK MANAGEMENT PROGRAM (Unaudited) |
The Funds have adopted and implemented a written liquidity risk management program (the “Liquidity Program”) as required by Rule 22e-4 (the “Liquidity Rule”) under the Investment Company Act. The Liquidity Program is reasonably designed to assess and manage each Fund’s liquidity risk, taking into consideration, among other factors, the Fund’s investment strategy and liquidity of investments during both normal and reasonably foreseeable stressed conditions, including whether the investment strategy is appropriate for an open-end fund; the extent to which the strategy involves a relatively concentrated portfolio or large positions in particular issuers; its cash holdings and access to other funding sources (i.e., a line of credit); and its short and long-term cash flow projections. The Funds’ Board of Trustees approved the appointment of FCA Corp, the Funds’ investment adviser, as the administrator (the “Liquidity Administrator”) for the Liquidity Program. The Liquidity Administrator is responsible for the program’s administration and oversight and for reporting to the Board on at least an annual basis regarding the Liquidity Program’s operation and effectiveness.
In preparing its annual written report (the “Report”), the Liquidity Administrator considered the data it gathered in the twelve months ended July 31, 2023, and the overall operations of the Liquidity Program since its inception (the “Review Period”). The Report outlined the adequacy and effectiveness of the Liquidity Program during the Review Period and was reported to the Board at its meeting held on September 21, 2023. During the Review Period, none of the Funds experienced unusual stress and disruption to its operations related to purchase and redemption activity. Also, during the Review Period the Funds held adequate levels of cash, had access to lines of credit, and maintained investments in highly liquid investments in order to meet shareholder redemptions in accordance with applicable requirements. The Report concluded that (i) the Funds’ Liquidity Program is reasonably designed to prevent violations of the Liquidity Rule and (ii) the Funds’ Liquidity Program has been effectively implemented.
| ANNUAL REPORT 2023 |
| | |
| TRUSTEES AND OFFICERS – October 31, 2023 (Unaudited) |
The Board of Trustees provides overall supervision of the affairs of the Funds. The Chairman of the Board of Trustees is Mr. Jack Ewing, who is not an “interested person” of the Trust, within the meaning of the 1940 Act on the basis of his non-affiliation with the Funds or the Adviser, or its affiliated entities (an “Independent Trustee”). The Board of Trustees has considered the overall leadership structure of the Trust and has established committees designed to facilitate the governance of the Trust by the Trustees generally and the Board of Trustee’s role with respect to risk oversight specifically. The committees are responsible for certain aspects of risk oversight relating to financial statements, the valuation of the Trust’s assets, and compliance matters, as is more fully described below. The Board of Trustees also has frequent interaction with the service providers and Trust’s chief compliance officer (the “CCO”) with respect to risk oversight matters. The CCO reports directly to the Board generally with respect to the CCO’s role in managing the compliance risks of the Trust. The CCO may also report directly to a particular committee of the Board of Trustees depending on the subject matter. The Trust’s principal financial officer reports to the Audit Committee of the Board of Trustees on all financial matters affecting the Trust, including risks associated with financial reporting. Through the committee structure, the Trustees also interact with other officers and service providers of the Trust to monitor risks related to the Trust’s operations. The Board of Trustees has determined that its leadership structure is appropriate based on the size of the Trust, the Board of Trustee’s current responsibilities, each Trustee’s ability to participate in the oversight of the Trust and committee transparency.
The Trustees and Executive Officers, and their principal occupations for the last five years are listed below. Each Trustee and Executive Officer acts in that capacity for each Fund of the Trust. The address of each Trustee is c/o Commonwealth International Series Trust, 791 Town & Country Blvd., Suite 250, Houston, Texas 77024. The term of office for each Trustee is until the next meeting of Shareholders called for the purpose of electing Trustees and until the election and qualification of a successor, or until such Trustee sooner dies, resigns or is removed as provided in the governing documents of the Funds. Because the Funds do not hold an annual meeting of Shareholders, each Trustee will hold office for an indeterminate period.
The following table provides information regarding each Trustee who is an “interested person” of the Trust, as defined in the 1940 Act, and each officer of the Trust.
| Name, Address and Year of Birth | Position(s) Held
With the Fund | Term of Office/
Length of
Time Served | Principal Occupation(s)
During the Past 5 years | Number of
Portfolios in
the Fund Complex
Overseen by
Trustee(1) | Other
Directorships
held by Trustee |
Robert Scharar(2)
791 Town & Country Blvd.
Suite 250
Houston, TX 77024-3925
Birth year: 1948 | President, Interested Trustee | Indefinite until successor elected and qualified; since 2000. | Investment manager/Attorney/CPA; President, FCA Corp (investment Adviser), 1975 to present. | Five (5) | See Below(3) |
Wesley Yuhnke
791 Town & Country Blvd.
Suite 250
Houston, TX 77024-3925
Birth year: 1979 | Executive Vice President | Since 2013 | Portfolio manager, FCA Corp., 2002 – present. | N/A | N/A |
| | ANNUAL REPORT 2023 |
| | |
| TRUSTEES AND OFFICERS – October 31, 2023 (Unaudited) – (Continued) |
| Name, Address and Year of Birth | Position(s) Held
With the Fund | Term of Office/
Length of
Time Served | Principal Occupation(s)
During the Past 5 years | Number of
Portfolios in
the Fund Complex
Overseen by
Trustee(1) | Other
Directorships
held by Trustee |
Zachary P. Richmond
2 Easton Oval,
Suite 300
Columbus, Ohio 43219
Birth year: 1980 | Treasurer | Since 2015 | Assistant Vice President, Associate Director of Financial Administration, Ultimus Fund Solutions, LLC, December 2015 to present. | N/A | N/A |
John H. Lively
11300 Tomahawk Creek Parkway, Suite 310
Leawood, Kansas 66211
Birth year: 1969 | Secretary | Since 2008 | Attorney and Managing Partner, Practus, LLP (law firm), April 2018 to present; Attorney, The Law Offices of John H. Lively & Associates, Inc. (law firm) March 2010 to April 2018. | N/A | N/A |
William LeVay
791 Town & Country Blvd.
Suite 250
Houston, TX 77024-3925
Birth year: 1955 | Chief Compliance Officer | Since 2018 | Chief Compliance Officer, FCA Corp, December 2012 to present. | N/A | N/A |
| (1) | The “Fund Complex” consists of the Trust. |
| (2) | Robert Scharar is considered an “interested person” of the Funds as defined in the 1940 Act, as amended, because he is an officer of the Trust and an officer of the Trust’s investment adviser. |
| (3) | Mr. Scharar is also an officer, director and/or manager of the following companies: NICO Holdings, Ltd. (Malawi), NICO Capital (Malawi), Paratransit Insurance Company, Africap, LLC, First Commonwealth Holdings Corporation, First Commonwealth Mortgage Trust, Holly Mortgage Trust, subsidiary companies at some of the above, and other closely held entities. |
| | ANNUAL REPORT 2023 |
| | |
| TRUSTEES AND OFFICERS – October 31, 2023 (Unaudited) – (Continued) |
The following table provides information regarding each Trustee who is an Independent Trustee.
| Name, Address and Year of Birth | Position(s) Held
With the Fund | Term of Office/
Length of
Time Served | Principal Occupation(s)
During the Past 5 years | Number of
Portfolios in
the Fund Complex
Overseen by
Trustee(1) | Other
Directorships
held by Trustee |
John Akard, Jr.
791 Town & Country Blvd.
Suite 250
Houston, TX 77024-3925
Birth year: 1966 | Independent Trustee | Indefinite until successor elected and qualified; since 2000. | Attorney-CPA, Owner, John Akard Jr. P.C. (and its predecessor) (law firm), 1996 to present; Shareholder, 2014 to present, and of Counsel, 1999 to 2014, Coplen & Banks, P.C. (and its predecessor) (law firm). | Five (5) | None |
Kathleen Kelly
791 Town & Country Blvd.
Suite 250
Houston, TX 77024-3925
Birth year: 1952 | Independent Trustee | Indefinite until successor elected and qualified; since 2000. | Honorary Consul, New Zealand Consulate, 1995 to 2014; Owner, International Protocol Advisors (consulting services), August 1992 to 2018. | Five (5) | None |
Jack Ewing
791 Town & Country Blvd.
Suite 250
Houston, TX 77024-3925
Birth year: 1939 | Independent Trustee | Indefinite until successor elected and qualified; since 2000. | Adjunct Economics Professor, University of Houston - Downtown, 2005 to 2015. | Five (5) | None |
| (1) | The “Fund Complex” consists of the Trust. |
The Funds’ Statement of Additional Information (“SAI”) includes additional information about the Funds’ Trustees and is available, without charge and upon request, by calling 888-345-1898.
| | ANNUAL REPORT 2023 |
| | |
| NOTICE OF PRIVACY POLICY & PRACTICES (Unaudited) |
Commonwealth International Series Trust (the ’‘Trust’’) recognizes and respects the privacy expectations of our customers1. We provide this notice to you so that you will know what kinds of information we collect about our customers and the circumstances in which that information may be disclosed to third parties who are not affiliated with the Trust.
Collection of Customer Information
We collect nonpublic personal information about our customers from the following sources:
| ● | Account Applications and other forms, which may include a customer’s name, address, social security number, and information about a customer’s investment goals and risk tolerance; |
| ● | Account History, including information about the transactions and balances in a customer’s accounts; and |
| ● | Correspondence, including written, telephonic or electronic, between a customer and the Trust or service providers to the Trust. |
Disclosure of Customer Information
We may disclose all of the consumer information outlined above to third parties who are not affiliated with the Trust:
| ● | as permitted by law — for example with service providers who maintain or service shareholder accounts for the Trust or to a shareholder’s broker or agent; |
| ● | to perform marketing services on our behalf or pursuant to a joint marketing agreement with another financial institution. |
Security of Customer Information
We require service providers to the Trust:
| ● | to maintain policies and procedures designed to assure only appropriate access to, and use of information about customers of the Trust; and |
| ● | to maintain physical, electronic and procedural safeguards that comply with federal standards to guard nonpublic personal information of customers of the Trust. |
We will adhere to the policies and practices described in this notice regardless of whether you are a current or former customer of the Trust.
| 1 | For purposes of this notice, the terms ’‘customer’’ or ’‘customers’’ includes both individual shareholders of the Trust and individuals who provide nonpublic personal information to the Trust, but do not invest in Trust shares. |
[THIS PAGE INTENTIONALLY LEFT BLANK]
[THIS PAGE INTENTIONALLY LEFT BLANK]
[THIS PAGE INTENTIONALLY LEFT BLANK]
| Commonwealth International |
| Series Trust |
| 791 Town & Country Blvd., Suite 250 |
| Houston, TX 77024-3925 |
| 888-345-1898 |
| www.commonwealthfunds.com |
| |
| INVESTMENT ADVISOR |
| FCA Corp |
| 791 Town & Country Blvd., Suite 250 |
| Houston, TX 77024-3925 |
| |
| DISTRIBUTOR |
| Ultimus Fund Distributors, LLC |
| 225 Pictoria Drive, Suite 450 |
| Cincinnati, OH 45246 |
| |
| TRANSFER AGENT & ADMINISTRATOR |
| Ultimus Fund Solutions, LLC |
| 225 Pictoria Drive, Suite 450 |
| Cincinnati, OH 45246 |
| |
| CUSTODIAN BANK |
| Fifth Third Bank N.A. |
| Fifth Third Center |
| 38 Fountain Square Plaza |
| Cincinnati, OH 45263 |
| |
| INDEPENDENT REGISTERED PUBLIC |
| ACCOUNTING FIRM |
| Cohen & Company, Ltd. |
| 1835 Market Street, 3rd Floor |
| Philadelphia, PA 19103 |
| |
| LEGAL COUNSEL |
| Practus, LLP |
| 11300 Tomahawk Creek Parkway, Suite 310 |
| Leawood, KS 66211 |
| |
| This report is intended for the shareholders of the family of funds of the Commonwealth International Series Trust. It may not be distributed to prospective investors unless it is preceded or accompanied by the Funds’ current Prospectus. A Prospectus may be obtained at www.commonwealthfunds.com or from the principal underwriter of the Funds or your broker. |
| |
Distributed by Ultimus Fund Distributors, LLC
Member FINRA/SIPC |
| |
| Commonwealth-AR-23 |
(b) Not applicable
Item 2. Code of Ethics.
(a) The Registrant has adopted a code of ethics (the “Code”) that applies to the Registrant’s principal executive officer and principal financial officer. This Code is included as an Exhibit.
(b) During the period covered by the report, with respect to the Registrant’s Code that applies to its principal executive officer and principal financial officer, there have been no amendments to, nor any waivers granted from, a provision that relates to any element of the Code definition enumerated in paragraph (b) of this Item 2.
Item 3. Audit Committee Financial Expert.
(a)(1) The Registrant’s board of trustees has determined that the Registrant has a least one audit committee financial expert serving on its audit committee.
(a)(2) The audit committee financial expert is John Akard, Jr., who is “independent” for purposes of this Item 3 of Form N-CSR.
Item 4. Principal Accountant Fees and Services.
The aggregate fees billed for professional services by Cohen & Company, Ltd. during the fiscal year 2023 and BBD, LLP billed for professional services in fiscal year 2022, were as follows:
(a) Audit Fees for Registrant.
| | Fiscal year ended October 31, 2023 | | | $62,500 |
| | Fiscal year ended October 31, 2022 | | | $62,500 |
(b) Audit-Related Fees for Registrant. These fees were billed by the Registrant’s independent auditors for assurance and related services that were reasonably related to the performance of the audit of the Registrant’s financial statements.
| | Fiscal year ended October 31, 2023 | | | $0 |
| | Fiscal year ended October 31, 2022 | | | $0 |
(c) Tax Fees for Registrant. These fees were billed for professional services rendered by the Registrant’s independent auditors for tax compliance, tax advice and tax planning.
| | Fiscal year ended October 31, 2023 | | | $15,000 |
| | Fiscal year ended October 31, 2022 | | | $10,000 |
(d) All Other Fees.
| | Fiscal year ended October 31, 2023 | | | $0 |
| | Fiscal year ended October 31, 2022 | | | $0 |
(e) Audit Committee’s pre-approval policies and procedures.
| | (1) | | The audit committee has adopted pre-approval policies and procedures that require the audit committee to pre-approve all audit and non-audit services of the Registrant, including services provided to the Registrant’s investment adviser or any entity controlling, controlled by or under common control with the Registrant’s investment adviser that provides ongoing services to the Registrant with respect to any engagement that directly relates to the operations and financial reporting of the Registrant. |
| | | | |
| | (2) | | None of the services described in paragraphs (b) through (d) of Item 4 were pre-approved by the Audit Committee pursuant to paragraph (c)(7)(i)(C) of Rule 2-01 of Regulation S-X.. |
(f) None.
(g) The aggregate non-audit fees billed by the registrant's accountant for services rendered to the registrant, and rendered to the registrant's investment adviser (not including any sub-adviser whose role is primarily portfolio management and is subcontracted with or overseen by another investment adviser), and any entity controlling, controlled by, or under common control with the adviser that provides ongoing services to the registrant:
Registrant Adviser
FY 2023 $ 15,000 $ 0
FY 2022 $ 10,000 $ 0
(h) Not applicable
(i) Not applicable
(j) Not applicable
Item 5. Audit Committee of Listed Registrants.
Not applicable
Item 6. Schedule of Investments.
| | | | | (a) | | Included as part of the report to shareholders filed under Item 1 of this Form N-CSR. | |
| | | | | (b) | | Not applicable | |
Item 7. Disclosure of Proxy Voting Policies and Procedures for Closed-End Management Investment Companies.
Not applicable to open-end management investment companies.
Item 8. Portfolio Managers of Closed-End Management Investment Companies.
Not applicable to open-end management investment companies.
Item 9. Purchases of Equity Securities by Closed-End Management Investment Company and Affiliated Purchasers.
Not applicable to open-end management investment companies.
Item 10. Submission of Matters to a Vote of Security Holders.
None.
Item 11. Controls and Procedures.
| (a) | | The Registrant’s principal executive officer and principal financial officer have reviewed the Registrant’s disclosure controls and procedures (as defined in Rule 30a-3(c) under the Investment Company Act of 1940, as amended, (the “Act”)) as of a date within 90 days of the filing of this report, as required by Rule 30a-3(b) under the Act. Based on their review, such officers have concluded that the disclosure controls and procedures were effective in ensuring that information required to be disclosed in this report was appropriately recorded, processed, summarized and reported within the time periods specified by the Securities and Exchange Commission’s rules and forms. |
| | | |
| (b) | | There were no changes in the Registrant’s internal control over financial reporting (as defined in Rule 30a-3(d) under the Act (17 CFR 270.30a-3(d)) that occurred during the Registrant’s period covered by this report that materially affected, or were reasonably likely to materially affect, the Registrant’s internal control over financial reporting. |
Item 12. Disclosure of Securities Lending Activities for Closed-End Management Investment Companies.
Not applicable
Item 13. Exhibits.
SIGNATURES
Pursuant to the requirements of the Securities Exchange Act of 1934 and the Investment Company Act of 1940, the registrant has duly caused this report to be signed on its behalf by the undersigned, thereunto duly authorized.
(Registrant) Commonwealth International Series Trust
| By (Signature and Title) | /s/ Robert Scharar |
| | Robert Scharar, President | |
Pursuant to the requirements of the Securities Exchange Act of 1934 and the Investment Company Act of 1940, this report has been signed below by the following persons on behalf of the registrant and in the capacities and on the dates indicated.
| By (Signature and Title) | /s/ Robert Scharar | |
| | Robert Scharar, President |
| By (Signature and Title) | /s/ Zachary P. Richmond |
| | Zachary P. Richmond, Treasurer | |