united states
securities and exchange commission
washington, d.c. 20549
form n-csr
certified shareholder report of registered
management investment companies
| Investment Company Act file number | 811-04665 | |
Commonwealth International Series Trust
(Exact name of registrant as specified in charter)
791 Town & Country Blvd.,
Houston, TX 77024-3925
(Address of principal executive offices)
(Zip code)
CT Corporation System
155 Federal Street
Boston, MA 02110
(Name and address of agent for service)
| Registrant’s telephone number, including area code: | (888) 345-1898 | |
| Date of fiscal year end: | 10/31/2024 | |
| | | |
| Date of reporting period: | 10/31/2024 | |
Item 1. Reports to Stockholders.
Commonwealth Australia/New Zealand Fund
Annual Shareholder Report - October 31, 2024
This annual shareholder report contains important information about Commonwealth Australia/New Zealand Fund for the period of November 1, 2023 to October 31, 2024. You can find additional information about the Fund at https://funddocs.filepoint.com/commonwealth/. You can also request this information by contacting us at (888) 345-1898.
What were the Fund’s costs for the last year?
(based on a hypothetical $10,000 investment)
| Fund Name | Costs of a $10,000 investment | Costs paid as a percentage of a $10,000 investment |
|---|
| Commonwealth Australia/New Zealand Fund | $301 | 2.86% |
How did the Fund perform during the reporting period?
The Commonwealth Australia New Zealand Fund reported a net asset value (NAV) increase to $11.06 per share as of October 31, 2024, up from $10.06 per share a year earlier. This represents a 10.22% return, including a distribution of $0.0282 per share made in December 2023.
Contributors: The Fund's investments in the financial, industrial, and healthcare sectors were the primary contributors to positive returns. The appreciation of the New Zealand and Australian Dollars against the U.S. Dollar also favorably impacted the fund’s overall performance. The Fund’s holdings in the following five securities positively impacted its performance: Infratil Ltd, Freightways Group Ltd, Mainfreight Ltd, Brambles Ltd, and Tower Ltd.
Detractors: The Fund’s exposure to the consumer staples sector negatively affected returns. The leading detractors of performance were South Port New Zealand Ltd, Marsden Maritime Holdings, Green Cross Health Ltd, Comvita Ltd, and Delegat Group Ltd.
The portfolio, consisting of 36 equity positions (common stock and ADRs) and a money market fund, maintained a diversified strategy focused on assets with attractive fundamentals.
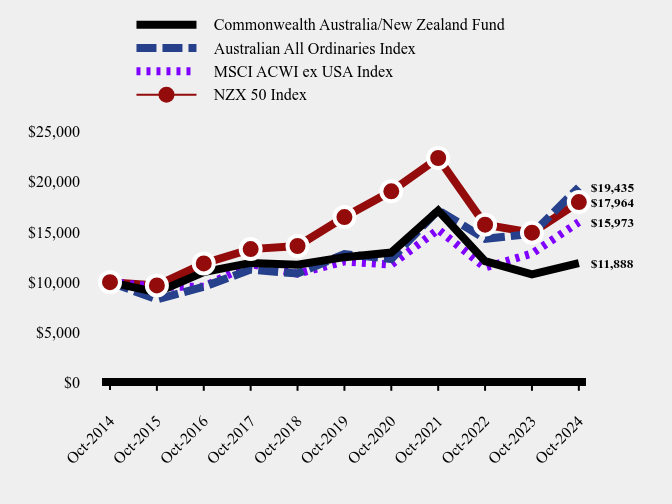
How has the Fund performed over the last ten years?
Total Return Based on $10,000 Investment
| Commonwealth Australia/New Zealand Fund | Australian All Ordinaries Index | MSCI ACWI ex USA Index | NZX 50 Index |
|---|
| Oct-2014 | $10,000 | $10,000 | $10,000 | $9,998 |
| Oct-2015 | $8,985 | $8,290 | $9,532 | $9,675 |
| Oct-2016 | $11,008 | $9,544 | $9,554 | $11,867 |
| Oct-2017 | $11,915 | $11,253 | $11,812 | $13,286 |
| Oct-2018 | $11,730 | $10,859 | $10,838 | $13,598 |
| Oct-2019 | $12,486 | $12,790 | $12,060 | $16,475 |
| Oct-2020 | $12,947 | $12,303 | $11,745 | $19,029 |
| Oct-2021 | $17,119 | $17,170 | $15,228 | $22,345 |
| Oct-2022 | $12,092 | $14,315 | $11,463 | $15,721 |
| Oct-2023 | $10,786 | $14,798 | $12,847 | $14,921 |
| Oct-2024 | $11,888 | $19,435 | $15,973 | $17,964 |
Average Annual Total Returns
| 1 Year | 5 Years | 10 Years |
|---|
| Commonwealth Australia/New Zealand Fund | 10.22% | -0.98% | 1.74% |
| Australian All Ordinaries Index | 31.41% | 8.72% | 6.87% |
| MSCI ACWI ex USA Index | 24.33% | 5.78% | 4.79% |
| NZX 50 Index | 20.41% | 1.75% | 6.03% |
The Fund's past performance is not a good predictor of how the Fund will perform in the future. The graph and table do not reflect the deduction of taxes that a shareholder would pay on fund distributions or redemption of fund shares.
What did the Fund invest in?
| Net Assets | $12,018,064 |
| Number of Portfolio Holdings | 37 |
| Advisory Fee | $89,975 |
| Portfolio Turnover | 8% |
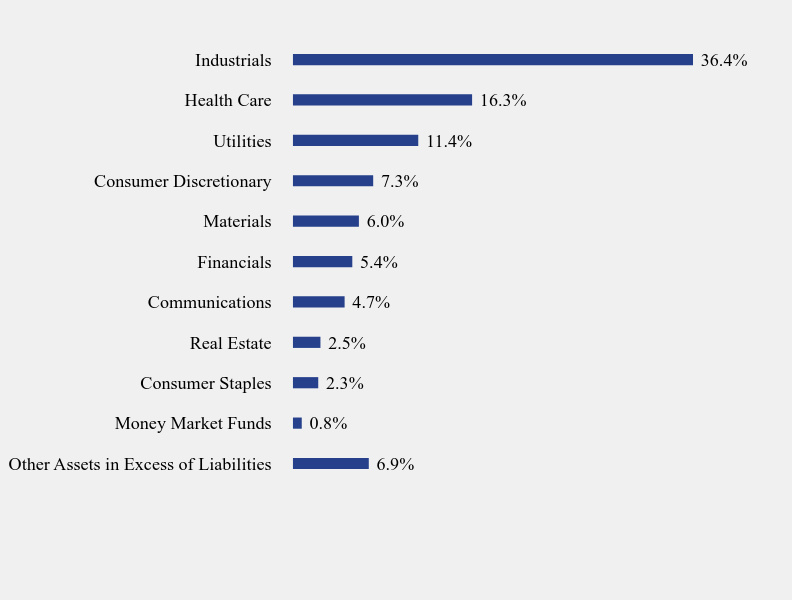
Sector Weighting (% of net assets)
| Value | Value |
|---|
| Other Assets in Excess of Liabilities | 6.9% |
| Money Market Funds | 0.8% |
| Consumer Staples | 2.3% |
| Real Estate | 2.5% |
| Communications | 4.7% |
| Financials | 5.4% |
| Materials | 6.0% |
| Consumer Discretionary | 7.3% |
| Utilities | 11.4% |
| Health Care | 16.3% |
| Industrials | 36.4% |
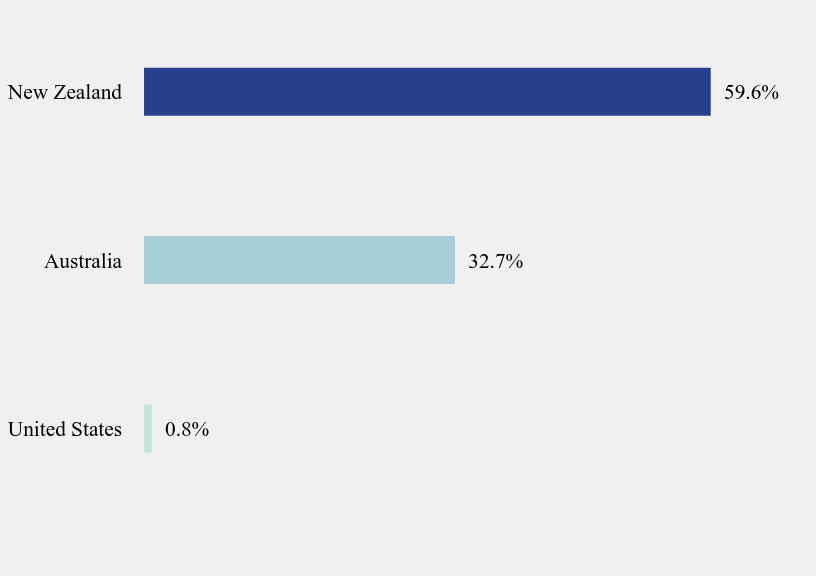
Country Weighting (% of net assets)
| Value | Value |
|---|
| United States | 0.8% |
| Australia | 32.7% |
| New Zealand | 59.6% |
Top 10 Holdings (% of net assets)
| Holding Name | % of Net Assets |
| South Port New Zealand Ltd. | 10.1% |
| Infratil Ltd. | 9.8% |
| Mainfreight Ltd. | 7.2% |
| Freightways Ltd. | 5.4% |
| Briscoe Group Ltd. | 4.7% |
| Brambles Ltd. | 4.6% |
| CSL Ltd. | 3.9% |
| Skellerup Holdings Ltd. | 3.7% |
| Telstra Corp. Ltd. | 3.2% |
| Qube Holdings Ltd. | 3.1% |
No material changes occurred during the year ended October 31, 2024.
Where can I find additional information about the Fund?
Additional information is available on the Fund's website (https://funddocs.filepoint.com/commonwealth/), including its:
Prospectus
Financial information
Holdings
Proxy voting information
Commonwealth Australia/New Zealand Fund - (CNZLX)
Annual Shareholder Report - October 31, 2024
Annual Shareholder Report - October 31, 2024
This annual shareholder report contains important information about Africa Fund for the period of November 1, 2023 to October 31, 2024. You can find additional information about the Fund at https://funddocs.filepoint.com/commonwealth/. You can also request this information by contacting us at (888) 345-1898.
What were the Fund’s costs for the last year?
(based on a hypothetical $10,000 investment)
| Fund Name | Costs of a $10,000 investment | Costs paid as a percentage of a $10,000 investment |
|---|
| Africa Fund | $207 | 1.75% |
How did the Fund perform during the reporting period?
The African Fund reported a net asset value (NAV) increase to $8.92 per share as of October 31, 2024, up from $6.74 per share a year earlier. This represents a 36.64% return, including a distribution of $0.2312 per share made in December 2023.
Contributors: Key positive drivers included investments in the financial, consumer discretionary, and industrial sectors. The Fund’s holdings in the following five securities positively impacted its performance: Capitec Bank Holdings Ltd, Naspers Ltd, Mr Price Group Ltd, Wilson Bayly Holmes, and Shoprite Holdings (ADR). The appreciation of the South African Rand against the U.S. dollar further bolstered returns.
Detractors: Exposure to the energy sector and specific investments, such as Endeavour Mining PLC, Sibanye Stillwater Ltd, Renergen Ltd, Global X MSCI Nigeria ETF, and Sasol Ltd ADR, detracted from the overall performance.
The Fund's portfolio, consisting of 38 equity positions (common stocks and ADRs), a South African Government bond, and a money market fund, maintained a diversified strategy focused on assets with attractive fundamentals.
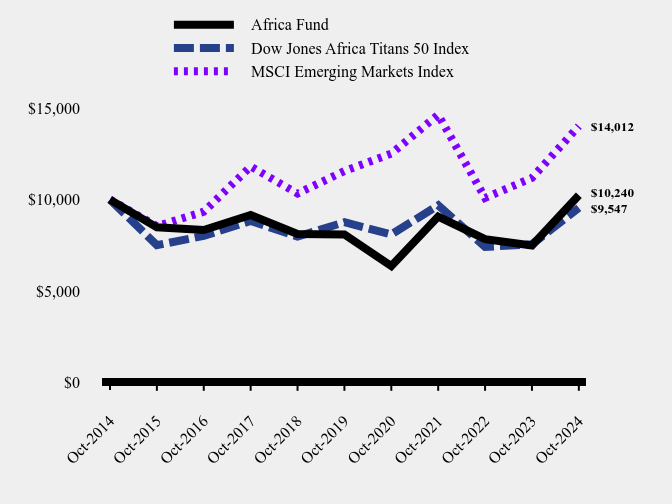
How has the Fund performed over the last ten years?
Total Return Based on $10,000 Investment
| Africa Fund | Dow Jones Africa Titans 50 Index | MSCI Emerging Markets Index |
|---|
| Oct-2014 | $10,000 | $10,000 | $10,000 |
| Oct-2015 | $8,484 | $7,510 | $8,547 |
| Oct-2016 | $8,342 | $8,020 | $9,339 |
| Oct-2017 | $9,162 | $8,833 | $11,809 |
| Oct-2018 | $8,126 | $7,982 | $10,331 |
| Oct-2019 | $8,097 | $8,764 | $11,556 |
| Oct-2020 | $6,372 | $8,098 | $12,509 |
| Oct-2021 | $9,073 | $9,685 | $14,631 |
| Oct-2022 | $7,840 | $7,416 | $10,091 |
| Oct-2023 | $7,495 | $7,561 | $11,181 |
| Oct-2024 | $10,240 | $9,547 | $14,012 |
Average Annual Total Returns
| 1 Year | 5 Years | 10 Years |
|---|
| Africa Fund | 36.64% | 4.81% | 0.24% |
| Dow Jones Africa Titans 50 Index | 26.26% | 1.72% | -0.46% |
| MSCI Emerging Markets Index | 25.31% | 3.93% | 3.43% |
The Fund's past performance is not a good predictor of how the Fund will perform in the future. The graph and table do not reflect the deduction of taxes that a shareholder would pay on fund distributions or redemption of fund shares.
What did the Fund invest in?
| Net Assets | $3,978,618 |
| Number of Portfolio Holdings | 40 |
| Advisory Fee (net of waivers) | $0 |
| Portfolio Turnover | 4% |
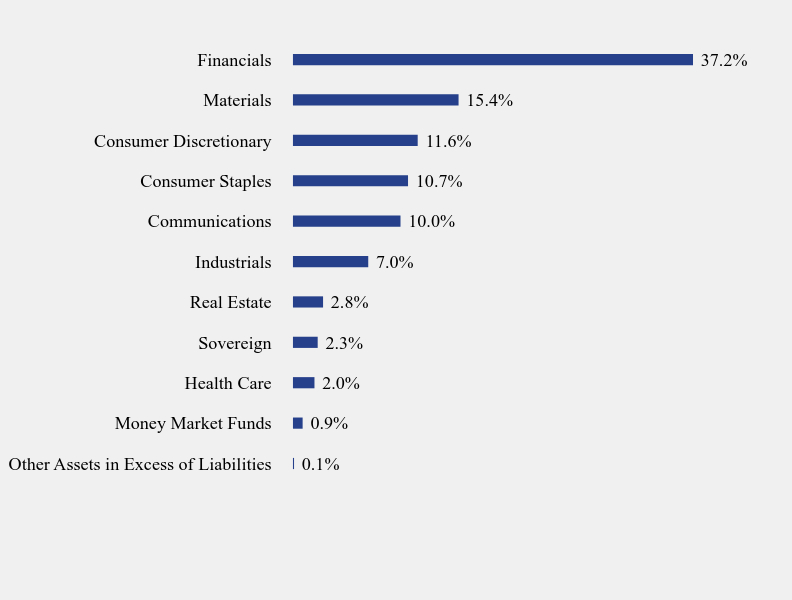
Sector Weighting (% of net assets)
| Value | Value |
|---|
| Other Assets in Excess of Liabilities | 0.1% |
| Money Market Funds | 0.9% |
| Health Care | 2.0% |
| Sovereign | 2.3% |
| Real Estate | 2.8% |
| Industrials | 7.0% |
| Communications | 10.0% |
| Consumer Staples | 10.7% |
| Consumer Discretionary | 11.6% |
| Materials | 15.4% |
| Financials | 37.2% |
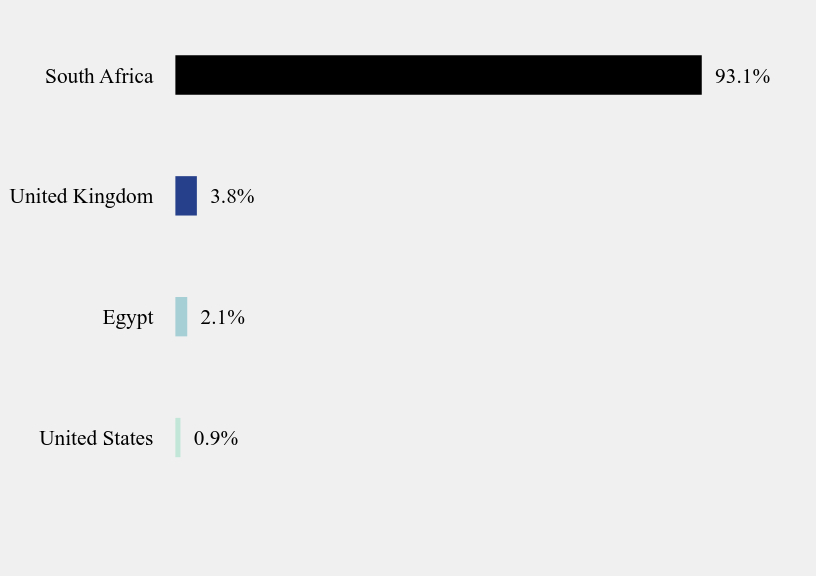
Country Weighting (% of net assets)
| Value | Value |
|---|
| United States | 0.9% |
| Egypt | 2.1% |
| United Kingdom | 3.8% |
| South Africa | 93.1% |
Top 10 Holdings (% of net assets)
| Holding Name | % of Net Assets |
| Capitec Bank Holdings Ltd. | 13.6% |
| Naspers Ltd., N Shares | 6.1% |
| Shoprite Holdings Ltd. | 3.9% |
| Gold Fields Ltd. | 3.4% |
| Standard Bank Group Ltd. | 3.3% |
| Grindrod Ltd. | 3.2% |
| Discovery Ltd. | 3.1% |
| Wilson Bayly Holmes-Ovcon Ltd. | 3.0% |
| Bidvest Group Ltd. | 3.0% |
| Momentum Metropolitan Holdings | 3.0% |
No material changes occurred during the year ended October 31, 2024.
Where can I find additional information about the Fund?
Additional information is available on the Fund's website (https://funddocs.filepoint.com/commonwealth/), including its:
Prospectus
Financial information
Holdings
Proxy voting information
Annual Shareholder Report - October 31, 2024
Annual Shareholder Report - October 31, 2024
This annual shareholder report contains important information about Commonwealth Japan Fund for the period of November 1, 2023 to October 31, 2024. You can find additional information about the Fund at https://funddocs.filepoint.com/commonwealth/. You can also request this information by contacting us at (888) 345-1898.
What were the Fund’s costs for the last year?
(based on a hypothetical $10,000 investment)
| Fund Name | Costs of a $10,000 investment | Costs paid as a percentage of a $10,000 investment |
|---|
| Commonwealth Japan Fund | $185 | 1.75% |
How did the Fund perform during the reporting period?
The Commonwealth Japan Fund reported a net asset value (NAV) increase to $3.79 per share as of October 31, 2024, up from $3.42 per share a year earlier. This represents a 10.93% return, including a distribution of $0.0038 per share made in December 2023.
Contributors: The Fund's gains were primarily due to investments in the industrial, financial, and healthcare sectors. The industrial sector, which covers construction, engineering, electrical equipment, and machinery manufacturing, was the strongest contributor. The Fund’s holdings in the following five securities positively impacted its performance: Hitachi Ltd, Terumo Corp, Meidensha Corp, Hoya Corp, and Fast Retailing Co Ltd.
Detractors: The Fund’s exposure to the energy and information technology sectors weighed on its overall performance, resulting in negative contributions. Specific detractors included holdings in Tobu Railway Co Ltd, Toyota Motor Corp (ADR), Tokyo Electron Ltd, Yamato Holdings Co Ltd, and Yamae Group Holdings Co Ltd. Additionally, the decline in the Japanese Yen against the U.S. dollar had a negative impact on the Fund's returns.
The portfolio, consisting of 45 equity holdings (common stock and ADRs), two investment-grade corporate bonds, and a money market fund, maintained a diversified strategy focused on assets with attractive fundamentals.
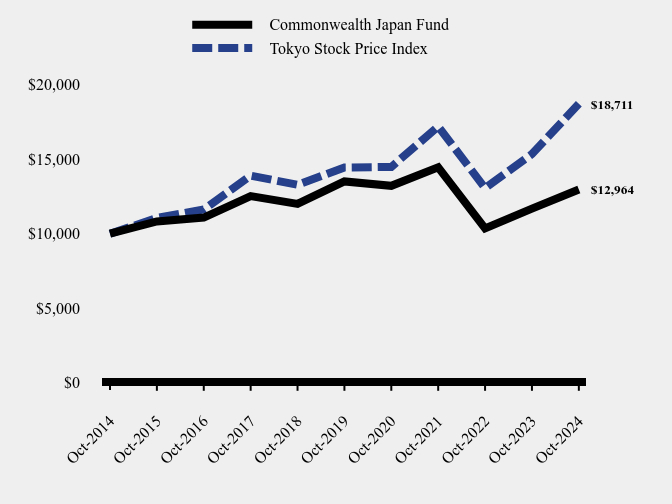
How has the Fund performed over the last ten years?
Total Return Based on $10,000 Investment
| Commonwealth Japan Fund | Tokyo Stock Price Index |
|---|
| Oct-2014 | $10,000 | $10,000 |
| Oct-2015 | $10,820 | $11,058 |
| Oct-2016 | $11,082 | $11,626 |
| Oct-2017 | $12,525 | $13,896 |
| Oct-2018 | $12,000 | $13,280 |
| Oct-2019 | $13,508 | $14,443 |
| Oct-2020 | $13,213 | $14,478 |
| Oct-2021 | $14,459 | $17,190 |
| Oct-2022 | $10,354 | $13,062 |
| Oct-2023 | $11,686 | $15,347 |
| Oct-2024 | $12,964 | $18,711 |
Average Annual Total Returns
| 1 Year | 5 Years | 10 Years |
|---|
| Commonwealth Japan Fund | 10.93% | -0.82% | 2.63% |
| Tokyo Stock Price Index | 21.92% | 5.31% | 6.47% |
The Fund's past performance is not a good predictor of how the Fund will perform in the future. The graph and table do not reflect the deduction of taxes that a shareholder would pay on fund distributions or redemption of fund shares.
What did the Fund invest in?
| Net Assets | $5,913,171 |
| Number of Portfolio Holdings | 48 |
| Advisory Fee (net of waivers) | $0 |
| Portfolio Turnover | 9% |
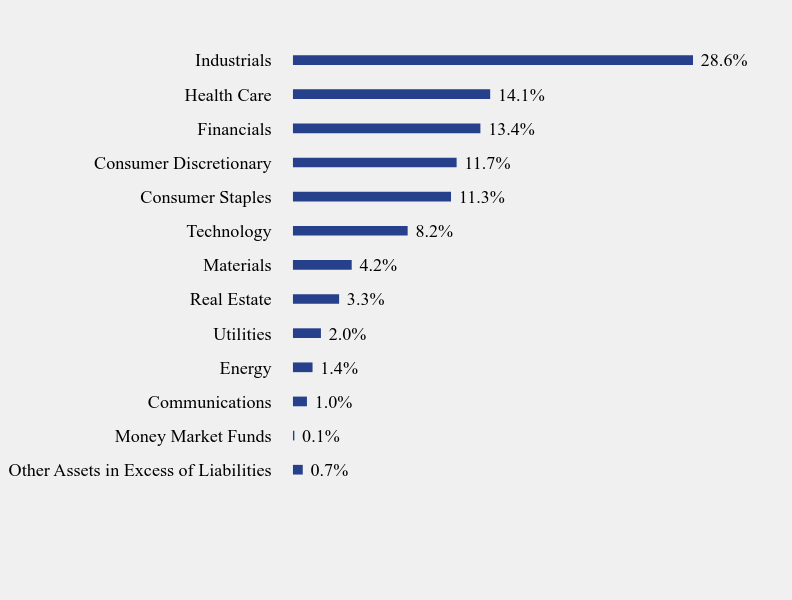
Sector Weighting (% of net assets)
| Value | Value |
|---|
| Other Assets in Excess of Liabilities | 0.7% |
| Money Market Funds | 0.1% |
| Communications | 1.0% |
| Energy | 1.4% |
| Utilities | 2.0% |
| Real Estate | 3.3% |
| Materials | 4.2% |
| Technology | 8.2% |
| Consumer Staples | 11.3% |
| Consumer Discretionary | 11.7% |
| Financials | 13.4% |
| Health Care | 14.1% |
| Industrials | 28.6% |
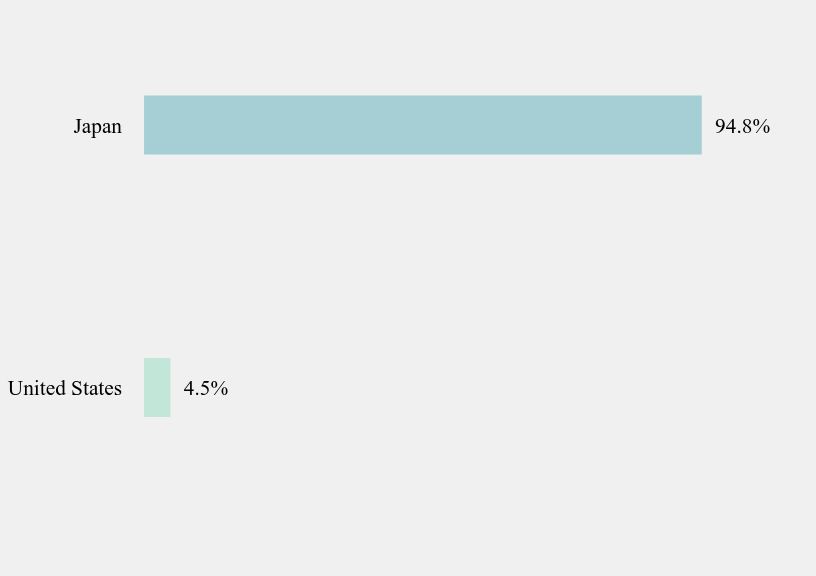
Country Weighting (% of net assets)
| Value | Value |
|---|
| United States | 4.5% |
| Japan | 94.8% |
Top 10 Holdings (% of net assets)
| Holding Name | % of Net Assets |
| Hitachi Ltd. | 5.3% |
| Hoya Corp. | 5.0% |
| Terumo Corp. | 4.8% |
| Asahi Intecc Co. Ltd. | 4.3% |
| Kajima Corp. | 3.8% |
| ORIX Corp. | 3.4% |
| Meidensha Corp. | 3.4% |
| Dai-ichi Life Holdings, Inc. | 3.4% |
| Unicharm Corp. | 3.3% |
| Fast Retailing Co. Ltd. | 3.2% |
No material changes occurred during the year ended October 31, 2024.
Where can I find additional information about the Fund?
Additional information is available on the Fund's website (https://funddocs.filepoint.com/commonwealth/), including its:
Prospectus
Financial information
Holdings
Proxy voting information
Commonwealth Japan Fund - (CNJFX)
Annual Shareholder Report - October 31, 2024
Annual Shareholder Report - October 31, 2024
This annual shareholder report contains important information about Commonwealth Global Fund for the period of November 1, 2023 to October 31, 2024. You can find additional information about the Fund at https://funddocs.filepoint.com/commonwealth/. You can also request this information by contacting us at (888) 345-1898.
What were the Fund’s costs for the last year?
(based on a hypothetical $10,000 investment)
| Fund Name | Costs of a $10,000 investment | Costs paid as a percentage of a $10,000 investment |
|---|
| Commonwealth Global Fund | $283 | 2.54% |
How did the Fund perform during the reporting period?
The Commonwealth Global Fund reported a net asset value (NAV) increase to $20.81 per share as of October 31, 2024, up from $16.97 per share a year earlier. This represents a 22.63% return.
Contributors: The Fund's primary drivers of positive returns were investments in the industrial, information technology, and consumer discretionary sectors. Geographically, investments in the United States, Germany, Taiwan, the United Kingdom, and South Africa contributed positively to the Fund’s performance. The Fund’s holdings in the following five securities positively impacted its performance: Miller Industries, NetApp Inc, Group 1 Automotive Inc, Apple Inc, and Siemens AG ADR.
Detractors: The Fund’s investments in France had a negative impact. The leading performance detractors were Diageo PLC ADR, Schlumberger Ltd, Nestle SA ADR, Bridgestone Group ADR, and Arkema ADR.
The portfolio, consisting of 45 equity positions (common stock and ADRs) and a money market fund, maintained a diversified strategy focused on assets with attractive fundamentals.
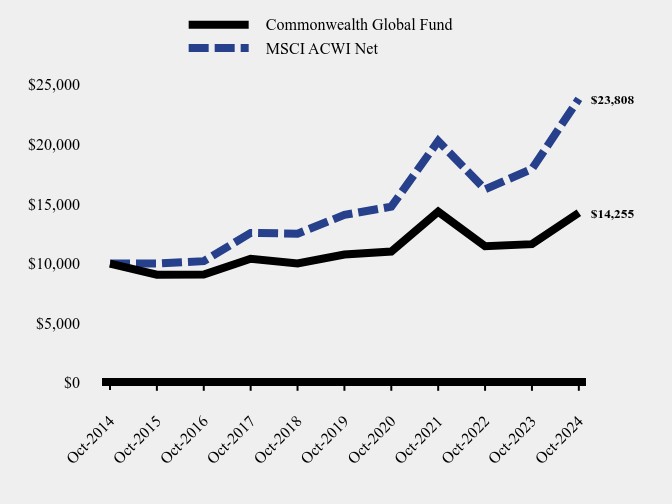
How has the Fund performed over the last ten years?
Total Return Based on $10,000 Investment
| Commonwealth Global Fund | MSCI ACWI Net |
|---|
| Oct-2014 | $10,000 | $10,000 |
| Oct-2015 | $9,058 | $9,997 |
| Oct-2016 | $9,071 | $10,201 |
| Oct-2017 | $10,395 | $12,568 |
| Oct-2018 | $10,001 | $12,503 |
| Oct-2019 | $10,759 | $14,078 |
| Oct-2020 | $11,004 | $14,766 |
| Oct-2021 | $14,345 | $20,270 |
| Oct-2022 | $11,452 | $16,225 |
| Oct-2023 | $11,624 | $17,929 |
| Oct-2024 | $14,255 | $23,808 |
Average Annual Total Returns
| 1 Year | 5 Years | 10 Years |
|---|
| Commonwealth Global Fund | 22.63% | 5.79% | 3.61% |
| MSCI ACWI Net | 32.79% | 11.08% | 9.06% |
The Fund's past performance is not a good predictor of how the Fund will perform in the future. The graph and table do not reflect the deduction of taxes that a shareholder would pay on fund distributions or redemption of fund shares.
What did the Fund invest in?
| Net Assets | $16,917,971 |
| Number of Portfolio Holdings | 46 |
| Advisory Fee | $126,432 |
| Portfolio Turnover | 4% |
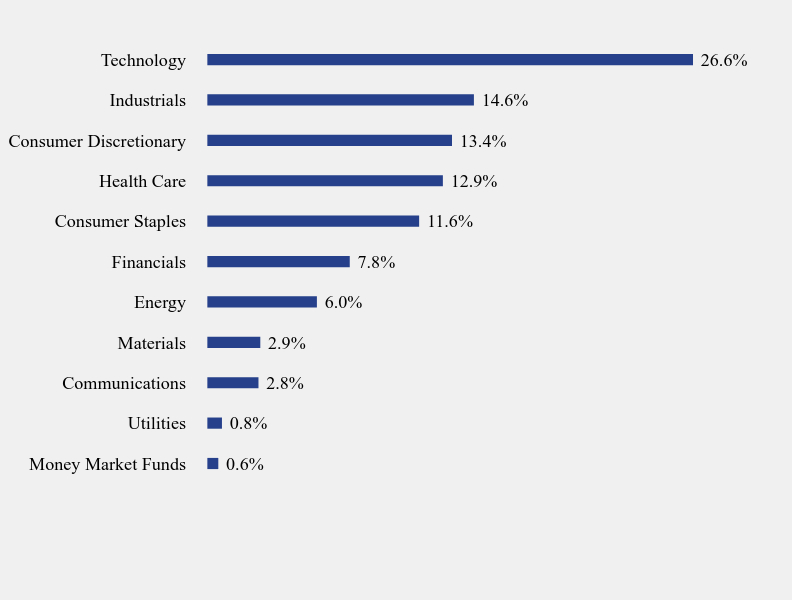
Sector Weighting (% of net assets)
| Value | Value |
|---|
| Money Market Funds | 0.6% |
| Utilities | 0.8% |
| Communications | 2.8% |
| Materials | 2.9% |
| Energy | 6.0% |
| Financials | 7.8% |
| Consumer Staples | 11.6% |
| Health Care | 12.9% |
| Consumer Discretionary | 13.4% |
| Industrials | 14.6% |
| Technology | 26.6% |
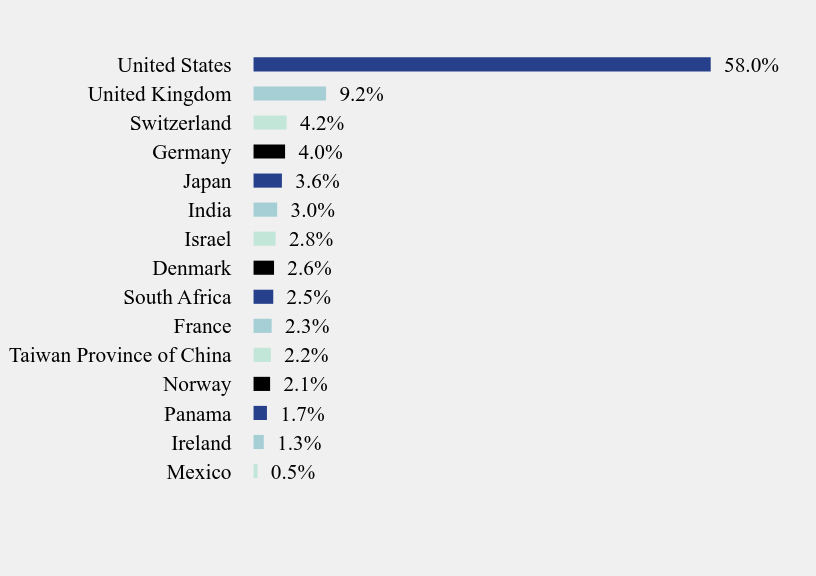
Country Weighting (% of net assets)
| Value | Value |
|---|
| Mexico | 0.5% |
| Ireland | 1.3% |
| Panama | 1.7% |
| Norway | 2.1% |
| Taiwan Province of China | 2.2% |
| France | 2.3% |
| South Africa | 2.5% |
| Denmark | 2.6% |
| Israel | 2.8% |
| India | 3.0% |
| Japan | 3.6% |
| Germany | 4.0% |
| Switzerland | 4.2% |
| United Kingdom | 9.2% |
| United States | 58.0% |
Top 10 Holdings (% of net assets)
| Holding Name | % of Net Assets |
| Group 1 Automotive, Inc. | 6.0% |
| Apple, Inc. | 6.0% |
| Miller Industries, Inc. | 5.4% |
| NetApp, Inc. | 4.8% |
| Thermo Fisher Scientific, Inc. | 4.4% |
| Siemens AG | 4.0% |
| Microsoft Corp. | 3.6% |
| Norfolk Southern Corp. | 3.6% |
| AstraZeneca PLC | 3.2% |
Chevron Corp. | 3.1% |
No material changes occurred during the year ended October 31, 2024.
Where can I find additional information about the Fund?
Additional information is available on the Fund's website (https://funddocs.filepoint.com/commonwealth/), including its:
Prospectus
Financial information
Holdings
Proxy voting information
Commonwealth Global Fund - (CNGLX)
Annual Shareholder Report - October 31, 2024
Commonwealth Real Estate Securities Fund
Annual Shareholder Report - October 31, 2024
This annual shareholder report contains important information about Commonwealth Real Estate Securities Fund for the period of November 1, 2023 to October 31, 2024. You can find additional information about the Fund at https://funddocs.filepoint.com/commonwealth/. You can also request this information by contacting us at (888) 345-1898.
What were the Fund’s costs for the last year?
(based on a hypothetical $10,000 investment)
| Fund Name | Costs of a $10,000 investment | Costs paid as a percentage of a $10,000 investment |
|---|
| Commonwealth Real Estate Securities Fund | $303 | 2.54% |
How did the Fund perform during the reporting period?
The Commonwealth Real Estate Securities Fund reported a net asset value (NAV) increase to $24.71 per share as of October 31, 2024, up from $17.86 per share a year earlier.
Contributors: The Fund's investments in the real estate sector, particularly specialty REITs, data center REITs, and infrastructure REITs, had a positive impact on the Fund’s return. The industrial and consumer discretionary sectors also positively impacted performance. The Fund’s holdings in the following five securities positively impacted its performance: Technoglass Inc, Iron Mountain Inc, Lennox International Inc, DR Horton Inc, and HA Sustainable Infrastructure Capital Inc.
Detractors: The Fund’s exposure to the consumer staples sector negatively affected its returns. Notable detractors included Cemex SAB de CV (sponsored ADR), BrasilAgro—CIA Bras de Prop Agricolas (sponsored ADR), and the 2033 3.375% United States Treasury bond.
The portfolio, consisting of 40 equity positions (common stock, ADRs, and REITs), four fixed-income positions of investment-grade bonds, and a money market fund, maintained a diversified strategy focused on assets with attractive fundamentals.
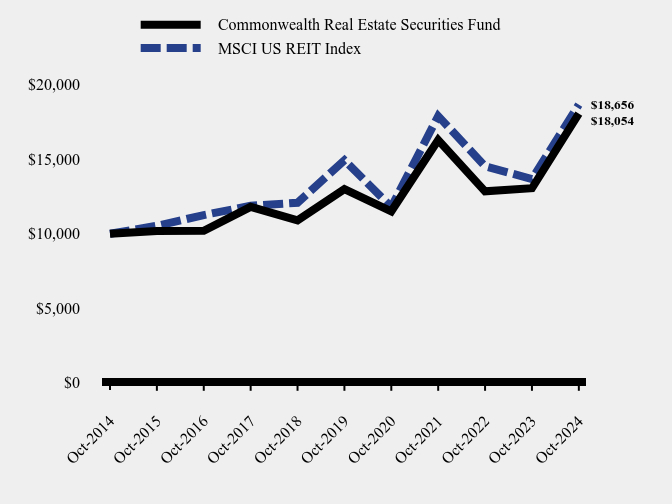
How has the Fund performed over the last ten years?
Total Return Based on $10,000 Investment
| Commonwealth Real Estate Securities Fund | MSCI US REIT Index |
|---|
| Oct-2014 | $10,000 | $10,000 |
| Oct-2015 | $10,188 | $10,532 |
| Oct-2016 | $10,196 | $11,250 |
| Oct-2017 | $11,802 | $11,875 |
| Oct-2018 | $10,898 | $12,075 |
| Oct-2019 | $12,987 | $14,929 |
| Oct-2020 | $11,504 | $11,793 |
| Oct-2021 | $16,279 | $17,889 |
| Oct-2022 | $12,843 | $14,530 |
| Oct-2023 | $13,049 | $13,671 |
| Oct-2024 | $18,054 | $18,656 |
Average Annual Total Returns
| 1 Year | 5 Years | 10 Years |
|---|
| Commonwealth Real Estate Securities Fund | 38.35% | 6.81% | 6.09% |
| MSCI US REIT Index | 36.48% | 4.56% | 6.43% |
The Fund's past performance is not a good predictor of how the Fund will perform in the future. The graph and table do not reflect the deduction of taxes that a shareholder would pay on fund distributions or redemption of fund shares.
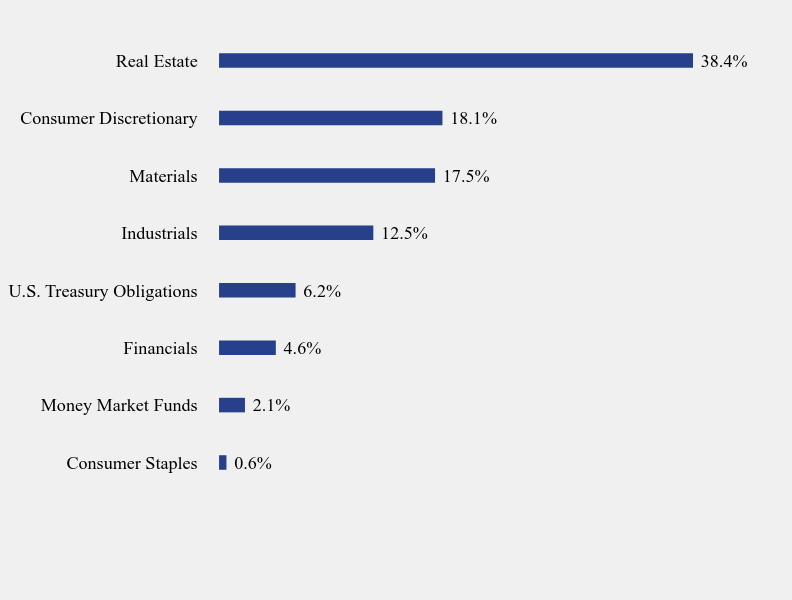
What did the Fund invest in?
| Net Assets | $16,831,887 |
| Number of Portfolio Holdings | 45 |
| Advisory Fee | $115,635 |
| Portfolio Turnover | 6% |
Sector Weighting (% of net assets)
| Value | Value |
|---|
| Consumer Staples | 0.6% |
| Money Market Funds | 2.1% |
| Financials | 4.6% |
| U.S. Treasury Obligations | 6.2% |
| Industrials | 12.5% |
| Materials | 17.5% |
| Consumer Discretionary | 18.1% |
| Real Estate | 38.4% |
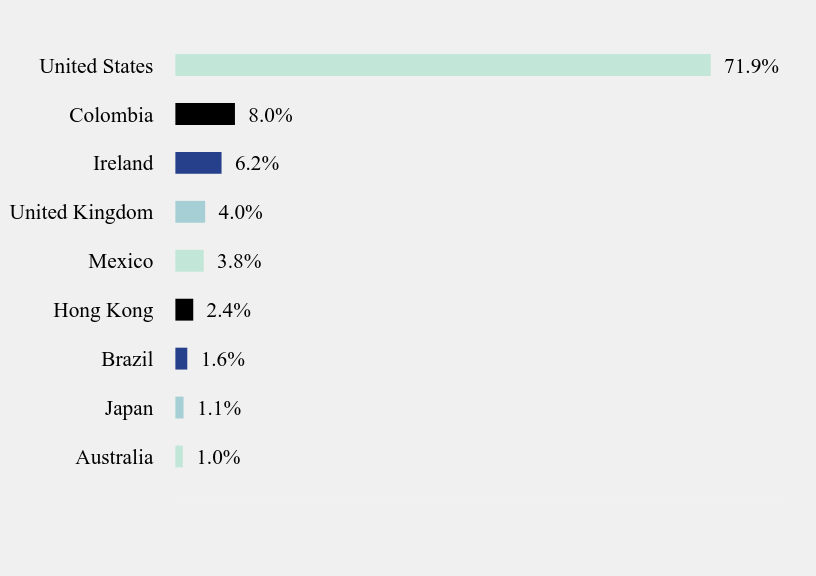
Country Weighting (% of net assets)
| Value | Value |
|---|
| Australia | 1.0% |
| Japan | 1.1% |
| Brazil | 1.6% |
| Hong Kong | 2.4% |
| Mexico | 3.8% |
| United Kingdom | 4.0% |
| Ireland | 6.2% |
| Colombia | 8.0% |
| United States | 71.9% |
Top 10 Holdings (% of net assets)
| Holding Name | % of Net Assets |
| Tecnoglass, Inc. | 8.0% |
| Lennox International, Inc. | 6.1% |
| Iron Mountain, Inc. | 5.3% |
| James Hardie Industries PLC | 4.8% |
| Lowe's Cos., Inc. | 4.1% |
| InterContinental Hotels Group PLC | 4.0% |
| D.R. Horton, Inc. | 4.0% |
| Digital Realty Trust, Inc. | 3.5% |
| Lennar Corp., Class A | 3.3% |
| American Tower Corp., Class A | 3.2% |
No material changes occurred during the year ended October 31, 2024.
Where can I find additional information about the Fund?
Additional information is available on the Fund's website (https://funddocs.filepoint.com/commonwealth/), including its:
Prospectus
Financial information
Holdings
Proxy voting information
Commonwealth Real Estate Securities Fund - (CNREX)
Annual Shareholder Report - October 31, 2024
Item 2. Code of Ethics.
| (a) | The registrant has, as of the end of the period covered by this report, adopted a code of ethics that applies to the registrant’s principal executive officer, principal financial officer, and principal accounting officer or controller, or persons performing similar functions, regardless of whether these individuals are employed by the registrant or a third party. |
| | |
| (b) | During the period covered by this report, there were no amendments to any provision of the code of ethics. |
| | |
| (c) | During the period covered by this report, there were no waivers or implicit waivers of a provision of the code of ethics. |
Item 3. Audit Committee Financial Expert.
| (a)(1) | The Registrant’s board of trustees has determined that the Registrant has a least one audit committee financial expert serving on its audit committee. |
| (a)(2) | The audit committee financial expert is John Akard, Jr., who is “independent” for purposes of this Item 3 of Form N-CSR. |
Item 4. Principal Accountant Fees and Services.
The aggregate fees billed for professional services by Cohen & Company, Ltd. during the fiscal year 2024 and fiscal year 2023, were as follows:
| (a) | Audit Fees. The aggregate fees billed for each of the last two fiscal years for professional services rendered by the registrant’s principal accountant for the audit of the registrant’s annual financial statements or services that are normally provided by the accountant in connection with statutory and regulatory filings or engagements for those fiscal years are as follows: |
| | | | FY 2024 | | $67,500 | |
| | | | FY 2023 | | $62,500 | |
| (b) | Audit-Related Fees. There were no fees billed in each of the last two fiscal years for assurances and related services by the principal accountant that are reasonably related to the performance of the audit of the registrant’s financial statements and are not reported under paragraph (a) of this item. |
| (c) | Tax Fees. The aggregate fees billed in each of the last two fiscal years for professional services rendered by the principal accountant for tax compliance are as follows: |
| | | FY 2024 | | $15,000 | |
| | | FY 2023 | | $15,000 | |
Preparation of Federal & State income tax returns, assistance with calculation of required income, capital gain and excise distributions and preparation of Federal excise tax returns.
| (d) | All Other Fees. The aggregate fees billed in each of the last two fiscal years for products and services provided by the registrant’s principal accountant, other than the services reported in paragraphs (a) through (c) of this item were $0 and $0 for the fiscal years ended October 31, 2024 and 2023 respectively. |
| | |
| (e)(1) | The audit committee does not have pre-approval policies and procedures. Instead, the audit committee or audit committee chairman approves on a case-by-case basis each audit or non-audit service before the principal accountant is engaged by the registrant. |
| | |
| (e)(2) | There were no services described in each of paragraphs (b) through (d) of this Item that were approved by the audit committee pursuant to paragraph (c)(7)(i)(C) of Rule 2-01 of Regulation S-X. |
| | |
| (f) | Not applicable. The percentage of hours expended on the principal accountant’s engagement to audit the registrant’s financial statements for the most recent fiscal year that were attributed to work performed by persons other than the principal accountant’s full-time, permanent employees was zero percent (0%). |
| | |
| (g) | All non-audit fees billed by the registrant’s principal accountant for services rendered to the registrant for the fiscal years ended October 31, 2024 and 2023 respectively are disclosed in (b)-(d) above. There were no audit or non-audit services performed by the registrant’s principal accountant for the registrant’s adviser. |
| | |
| (h) | Not applicable. |
| | |
| (i) | Not applicable. |
| | |
| (j) | Not applicable. |
Item 5. Audit Committee of Listed Registrants.
Not applicable.
Item 6. Investments.
The Registrant’s schedule of investments in unaffiliated issuers is included in the Financial Statements under Item 7 of this form.
Item 7. Financial Statements and Financial Highlights for Open-End Management Investment Companies.
| Commonwealth International |
| Series Trust |
| 791 Town & Country Blvd., Suite 250 |
| Houston, TX 77024-3925 |
| 888-345-1898 |
| www.commonwealthfunds.com |
| |
| INVESTMENT ADVISOR |
| FCA Corp |
| 791 Town & Country Blvd., Suite 250 |
| Houston, TX 77024-3925 |
| |
| DISTRIBUTOR |
| Ultimus Fund Distributors, LLC |
| 225 Pictoria Drive, Suite 450 |
| Cincinnati, OH 45246 |
| |
| TRANSFER AGENT & ADMINISTRATOR |
| Ultimus Fund Solutions, LLC |
| 225 Pictoria Drive, Suite 450 |
| Cincinnati, OH 45246 |
| |
| CUSTODIAN BANK |
| Fifth Third Bank N.A. |
| Fifth Third Center |
| 38 Fountain Square Plaza |
| Cincinnati, OH 45263 |
| |
| INDEPENDENT REGISTERED PUBLIC |
| ACCOUNTING FIRM |
| Cohen & Company, Ltd. |
| 1835 Market Street, 3rd Floor |
| Philadelphia, PA 19103 |
| |
| LEGAL COUNSEL |
| Practus, LLP |
| 11300 Tomahawk Creek Parkway, Suite 310 |
| Leawood, KS 66211 |
| |
| |
| This report is intended for the shareholders of the family of funds of the Commonwealth International Series Trust. It may not be distributed to prospective investors unless it is preceded or accompanied by the Funds’ current Prospectus. A Prospectus may be obtained at www.commonwealthfunds.com or from the principal underwriter of the Funds or your broker. |
| |
Distributed by Ultimus Fund Distributors, LLC
Member FINRA/SIPC |
|
| |
| |
| |
| |
| |
| |
| |
| |
| |
| |
| |
| |
| |
| |
| |
 Commonwealth Australia/New Zealand Fund Africa Fund Commonwealth Japan Fund Commonwealth Global Fund Commonwealth Real Estate Securities Fund FINANCIAL STATEMENTS October 31, 2024 |
| |
| |
| |
| |
| |
| |
| |
| |
| |
| |
| |
Table of Contents
| Schedules of Investments | | 3 |
| | | |
| Statements of Assets and Liabilities | | 13 |
| | | |
| Statements of Operations | | 14 |
| | | |
| Statements of Changes in Net Assets | | 16 |
| | | |
| Financial Highlights | | 18 |
| | | |
| Notes to Financial Statements | | 23 |
| | | |
| Report of Independent Registered Public Accounting Firm | | 35 |
 | FINANCIAL STATEMENTS 2024 |
| | |
| | |
| | |
Questions and Answers
To help shareholders better understand key attributes of the mutual funds (each a “Fund” and collectively the “Funds”) comprising the Commonwealth International Series Trust and their operations, the following Question and Answer section is provided.
Who is the Advisor?
The Funds’ investment advisor is FCA Corp (“FCA”). FCA is an investment advisor that is registered with the U.S. Securities and Exchange Commission and has its principal place of business located at 791 Town & Country Blvd., Suite 250, Houston, Texas 77024-3925. The firm was founded in 1975 and maintains a global perspective on the equity and fixed income marketplaces.
Why is investing outside the U.S. important?
The Funds invest in companies outside the United States because FCA believes there are significant investment opportunities in select foreign markets. In our view, U.S. investors benefit from the diversification that having investments outside the United States can provide. International investing offers exposure to more companies and other nations’ economies, currencies, and growth prospects. Nearly half of the value of equity markets is outside the United States. The growth experienced by many of these foreign economies appears to be attractive. FCA believes that, for a U.S. investor, allocation of a portion of the investor’s portfolio to international securities can provide the potential for less risk and can achieve a more consistent long-term performance in the investor’s overall portfolio.
How has international investing changed over the last decade?
International markets now comprise a significant portion of all equity value worldwide. As markets have blended through global commerce, capital has flowed from country to country following investment opportunities. Developed markets and emerging markets both require capital investments to provide the goods and services that their consumers need. During the last decade in particular, accounting and economic statistical information has become more uniform and thus more dependable. The trend appears to be in place for continued development of these distant countries and their markets. Their demand for investment capital outside the U.S. continues, which provides opportunities for diversification and growth. The Funds seek to be participants in these opportunities.
What are some of the factors influencing a Fund’s portfolio turnover?
Each Fund generally invests in equity securities with a long-term view. The Funds’ portfolio securities are evaluated on their long-term prospects. A particular Fund may experience higher or lower turnover ratios in certain years. Factors influencing portfolio turnover include, but are not limited to the following: rebalancing portfolio securities to take advantage of long-term opportunities and/or to reallocate between fixed income and equity securities; investing new subscriptions; or selling securities to cover redemptions. Higher levels of portfolio activity by a Fund will result in higher transaction costs and/or more realized gains or losses, the impact of which is borne by the Fund’s shareholders. The turnover of a portfolio is not predictable because managers do not know when the portfolio transactions will occur. Under most circumstances, it is desirable to limit transactions because of the costs associated with trading, currency conversions, and custody fees, although these are generally not the determining factors.
| FINANCIAL STATEMENTS 2024 |
| | |
| | |
| | |
How can the size of the Fund impact the Funds’ expense ratio?
Achieving each Fund’s objective with a portfolio comprised of international securities is historically more expensive than managing a portfolio comprised of domestic securities. Research of foreign markets, trading in different currencies, custody of assets, accurate evaluations of holdings, income tax, securities regulatory compliance, and generally overall communications are all known to be more expensive when managing these types of portfolios. Additionally, as with almost every mutual fund, size has an impact on the expense ratio of Funds. Typically, larger mutual funds can have lower expense ratios as there is an increased opportunity to spread out fixed and partially-fixed costs necessary to operate such mutual funds over a larger asset base. Generally, mutual fund expenses, including those of the Funds, are allocated on a daily basis among all shareholders. In addition, as portfolio assets increase, it is self-evident that fixed costs as a percentage of the assets managed generally decline. The Financial Highlights section of the accompanying financial statements provides supplemental data that includes current and historic expense information, and where applicable, the advisor’s waiver of fees or voluntary expense reimbursements to help reduce these costs.
| FINANCIAL STATEMENTS 2024 |
| |
| |
| SCHEDULE OF INVESTMENTS – October 31, 2024 |
| Commonwealth Australia/New Zealand Fund |
| | | Shares | | | Fair
Value | |
| COMMON STOCKS (92.33%) | | | | | | | | |
| AUSTRALIA (32.86%) | | | | | | | | |
| BIOTECH (3.91%) | | | | | | | | |
| CSL Ltd. | | | 2,500 | | | $ | 469,335 | |
| CONTAINERS & PACKAGING (4.62%) | | | | | | | | |
| Brambles Ltd. | | | 46,216 | | | | 556,377 | |
| DIVERSIFIED BANKS (1.90%) | | | | | | | | |
| Macquarie Group Ltd. | | | 1,509 | | | | 228,356 | |
| ENVIRONMENTAL & FACILITIES SERVICES (1.85%) | | | | | | | | |
| Cleanaway Waste Management Ltd. | | | 124,496 | | | | 222,871 | |
| GAS UTILITIES (1.63%) | | | | | | | | |
| APA Group | | | 42,839 | | | | 196,127 | |
| HEALTH CARE FACILITIES (0.84%) | | | | | | | | |
| Ramsay Health Care Ltd. | | | 3,816 | | | | 100,355 | |
| HEALTH CARE SERVICES (2.69%) | | | | | | | | |
| Sonic Healthcare Ltd. | | | 18,382 | | | | 323,860 | |
| INTERNET MEDIA & SERVICES (1.49%) | | | | | | | | |
| Webjet Group, Ltd.(a) | | | 57,000 | | | | 29,068 | |
| Webjet Ltd.(a) | | | 57,000 | | | | 149,675 | |
| | | | | | | | 178,743 | |
| LOGISTICS SERVICES (3.12%) | | | | | | | | |
| Qube Holdings Ltd. | | | 153,645 | | | | 374,691 | |
| MEDICAL DEVICES (2.70%) | | | | | | | | |
| Cochlear Ltd. | | | 1,750 | | | | 323,955 | |
| MINERAL & PRECIOUS STONE MINING (1.22%) | | | | | | | | |
| Lynas Rare Earth Ltd. - ADR(a) | | | 29,800 | | | | 146,616 | |
| P&C INSURANCE (1.54%) | | | | | | | | |
| QBE Insurance Group Ltd. | | | 16,434 | | | | 185,521 | |
| RETAIL REITS (1.08%) | | | | | | | | |
| Scentre Group Ltd. | | | 56,509 | | | | 129,541 | |
| TRANSPORT OPERATIONS & SERVICES (1.09%) | | | | | | | | |
| Transurban Group | | | 15,719 | | | | 130,986 | |
| WIRELESS TELECOMMUNICATIONS (3.18%) | | | | | | | | |
| Telstra Corp. Ltd. | | | 152,493 | | | | 381,711 | |
| TOTAL AUSTRALIA | | | | | | | 3,949,045 | |
| | | | | | | | | |
| NEW ZEALAND (59.47%) | | | | | | | | |
| ALCOHOLIC BEVERAGES (0.55%) | | | | | | | | |
| Delegat Group Ltd. | | | 21,456 | | | | 66,095 | |
| BUILDING MATERIALS (0.16%) | | | | | | | | |
| Fletcher Building Ltd.(a) | | | 11,135 | | | | 19,791 | |
| COURIER SERVICES (5.40%) | | | | | | | | |
| Freightways Ltd. | | | 103,540 | | | | 648,824 | |
| | | Shares | | | Fair
Value | |
| COMMON STOCKS (92.33%) – Continued | | | | | | | | |
| NEW ZEALAND (59.47%)) – Continued | | | | | | | | |
| FLOW CONTROL EQUIPMENT (3.66%) | | | | | | | | |
| Skellerup Holdings Ltd. | | | 150,000 | | | $ | 439,402 | |
| FOOD & DRUG STORES (0.66%) | | | | | | | | |
| Green Cross Health Ltd. | | | 181,796 | | | | 79,361 | |
| HEALTH CARE FACILITIES (4.33%) | | | | | | | | |
| Oceania Healthcare Ltd.(a) | | | 457,544 | | | | 212,715 | |
| Ryman Healthcare Ltd.(a) | | | 103,800 | | | | 307,159 | |
| | | | | | | | 519,874 | |
| HEALTH CARE SUPPLY CHAIN (0.73%) | | | | | | | | |
| AFT Pharmaceuticals Ltd. | | | 46,000 | | | | 88,096 | |
| HOME PRODUCTS STORES (4.67%) | | | | | | | | |
| Briscoe Group Ltd. | | | 183,520 | | | | 561,417 | |
| LIFE SCIENCE & DIAGNOSTICS (0.57%) | | | | | | | | |
| Pacific Edge Ltd.(a) | | | 800,000 | | | | 69,335 | |
| LODGING (2.63%) | | | | | | | | |
| Millennium & Copthorne Hotels New Zealand Ltd. | | | 300,000 | | | | 316,461 | |
| LOGISTICS SERVICES (7.13%) | | | | | | | | |
| Mainfreight Ltd. | | | 20,000 | | | | 856,613 | |
| MEASUREMENT INSTRUMENTS (2.39%) | | | | | | | | |
| ikeGPS Group Ltd.(a) | | | 831,366 | | | | 287,568 | |
| MEDICAL DEVICES (0.49%) | | | | | | | | |
| Aroa Biosurgery Ltd.(a) | | | 145,000 | | | | 58,645 | |
| MULTI ASSET CLASS OWNERS & DEVELOPERS (1.42%) | | | | | | | | |
| Marsden Maritime Holdings Ltd. | | | 81,425 | | | | 170,290 | |
| P&C INSURANCE (2.01%) | | | | | | | | |
| Tower Ltd. | | | 300,000 | | | | 241,271 | |
| PACKAGED FOOD (1.13%) | | | | | | | | |
| Sanford Ltd. | | | 60,000 | | | | 136,194 | |
| POWER GENERATION (9.80%) | | | | | | | | |
| Infratil Ltd. | | | 156,975 | | | | 1,177,979 | |
| TRANSPORT OPERATIONS & SERVICES (11.74%) | | | | | | | | |
| Port of Tauranga Ltd. | | | 55,000 | | | | 195,327 | |
| South Port New Zealand Ltd. | | | 376,010 | | | | 1,214,503 | |
| | | | | | | | 1,409,830 | |
| TOTAL NEW ZEALAND | | | | | | | 7,147,046 | |
| TOTAL COMMON STOCKS | | | | | | | | |
| (COST $6,905,698) | | | | | | | 11,096,091 | |
| See accompanying notes to financial statements. |
| |
3
| FINANCIAL STATEMENTS 2024 |
| |
| |
| SCHEDULE OF INVESTMENTS – October 31, 2024 |
| Commonwealth Australia/New Zealand Fund |
| | | Shares | | | Fair
Value | |
| MONEY MARKET FUNDS (0.75%) | | | | | | | | |
| Federated Hermes Government Obligations Fund, Institutional Class, 4.72%(b) | | | 90,552 | | | $ | 90,552 | |
| TOTAL MONEY MARKET FUNDS | | | | | | | | |
| (COST $90,552) | | | | | | | 90,552 | |
| | | | | | | | | |
| TOTAL INVESTMENTS — (93.08%) | | | | | | | | |
| (COST $6,996,250) | | | | | | | 11,186,643 | |
| Other Assets in Excess of Liabilities (6.92%) | | | | | | | 831,421 | |
| NET ASSETS — 100.00% | | | | | | $ | 12,018,064 | |
| (a) | Non-income producing security. |
| (b) | Rate disclosed is the seven day effective yield as of October 31, 2024. |
ADR — American Depositary Receipt
REIT — Real Estate Investment Trust
| See accompanying notes to financial statements. |
| |
4
| FINANCIAL STATEMENTS 2024 |
| |
| |
| SCHEDULE OF INVESTMENTS – October 31, 2024 |
| Africa Fund |
| | | Shares | | | Fair
Value | |
| COMMON STOCKS (96.70%) | | | | | | | | |
| EGYPT (2.08%) | | | | | | | | |
| BANKS (1.34%) | | | | | | | | |
| Commercial International Bank Egypt SAE - GDR | | | 34,571 | | | $ | 53,447 | |
| OTHER COMMERCIAL SUPPORT SERVICES (0.74%) | | | | | | | | |
| Integrated Diagnostics Holdings PLC(a) | | | 59,000 | | | | 29,382 | |
| TOTAL EGYPT | | | | | | | 82,829 | |
| | | | | | | | | |
| SOUTH AFRICA (90.85%) | | | | | | | | |
| AGRICULTURAL PRODUCERS (4.04%) | | | | | | | | |
| Astral Foods Ltd.(a) | | | 7,000 | | | | 68,187 | |
| Oceana Group Ltd. | | | 24,000 | | | | 92,504 | |
| | | | | | | | 160,691 | |
| AUTOMOTIVE RETAILERS (6.31%) | | | | | | | | |
| Barloworld Ltd. | | | 7,900 | | | | 37,027 | |
| Bidvest Group Ltd. | | | 7,500 | | | | 120,670 | |
| Motus Holdings Ltd. | | | 14,000 | | | | 93,698 | |
| | | | | | | | 251,395 | |
| BANKS (21.90%) | | | | | | | | |
| Capitec Bank Holdings Ltd. | | | 3,000 | | | | 539,564 | |
| FirstRand Ltd. | | | 23,200 | | | | 101,461 | |
| Nedbank Group Ltd. | | | 6,000 | | | | 101,090 | |
| Standard Bank Group Ltd. - ADR | | | 9,400 | | | | 129,532 | |
| | | | | | | | 871,647 | |
| BASIC & DIVERSIFIED CHEMICALS (0.57%) | | | | | | | | |
| Sasol Ltd. - ADR | | | 4,000 | | | | 22,840 | |
| BUILDING CONSTRUCTION (3.04%) | | | | | | | | |
| Wilson Bayly Holmes-Ovcon Ltd. | | | 9,900 | | | | 120,864 | |
| COAL MINING (2.03%) | | | | | | | | |
| Exxaro Resources Ltd. | | | 8,600 | | | | 80,807 | |
| CONSUMER ELEC & APPLC WHSLRS (2.39%) | | | | | | | | |
| DataTec Ltd. | | | 41,534 | | | | 95,085 | |
| FOOD & BEVERAGE WHOLESALERS (2.78%) | | | | | | | | |
| Bid Corp. Ltd. | | | 4,667 | | | | 110,430 | |
| FOOD & DRUG STORES (3.88%) | | | | | | | | |
| Shoprite Holdings Ltd. - ADR | | | 9,000 | | | | 154,575 | |
| INSTITUTIONAL BROKERAGE (1.11%) | | | | | | | | |
| Coronation Fund Managers Ltd. | | | 19,500 | | | | 44,288 | |
| INTERNET MEDIA & SERVICES (6.14%) | | | | | | | | |
| Naspers Ltd., N Shares | | | 1,040 | | | | 244,472 | |
| LIFE & HEALTH INSURANCE (2.96%) | | | | | | | | |
| Momentum Metropolitan Holdings | | | 72,000 | | | | 117,580 | |
| | | Shares | | | Fair
Value | |
| COMMON STOCKS (96.70%) – Continued | | | | | | | | |
| South Africa (90.85%) – Continued | | | | | | | | |
| LIFE INSURANCE (4.63%) | | | | | | | | |
| Clientele Ltd. | | | 90,000 | | | $ | 61,771 | |
| Discovery Ltd. | | | 12,000 | | | | 122,554 | |
| | | | | | | | 184,325 | |
| MARINE SHIPPING (3.22%) | | | | | | | | |
| Grindrod Ltd. | | | 160,000 | | | | 127,967 | |
| OTHER FINANCIAL SERVICES (1.74%) | | | | | | | | |
| Old Mutual Ltd. | | | 100,000 | | | | 69,032 | |
| PAPER & PULP MILLS (1.70%) | | | | | | | | |
| Sappi Ltd. | | | 25,000 | | | | 67,585 | |
| PRECIOUS METALS (7.32%) | | | | | | | | |
| Anglo American Platinum Ltd. | | | 1,100 | | | | 42,990 | |
| Gold Fields Ltd. - ADR | | | 8,200 | | | | 135,136 | |
| Impala Platinum Holdings Ltd.(a) | | | 12,500 | | | | 81,794 | |
| Sibanye Stillwater Ltd.(a) | | | 27,000 | | | | 31,044 | |
| | | | | | | 290,964 | |
| SELF-STORAGE OWNERS & DEVELOPERS (2.80%) | | | | | | | | |
| Stor-Age Property REIT Ltd. | | | 130,000 | | | | 111,421 | |
| SPECIALTY & GENERIC PHARMACEUTICALS (2.04%) | | | | | | | | |
| Aspen Pharmacare Holdings Ltd. | | | 8,000 | | | | 80,996 | |
| SPECIALTY APPAREL STORES (2.84%) | | | | | | | | |
| Mr. Price Group Ltd. | | | 7,800 | | | | 113,193 | |
| WEALTH MANAGEMENT (3.49%) | | | | | | | | |
| Alexander Forbes Group Holdings Ltd. | | | 170,000 | | | | 70,007 | |
| PSG Konsult Ltd. | | | 65,000 | | | | 68,910 | |
| | | | | | | | 138,917 | |
| WIRELESS TELECOMMUNICATIONS (3.92%) | | | | | | | | |
| MTN Group Ltd. - ADR | | | 18,000 | | | | 89,010 | |
| Vodacom Group Ltd. | | | 10,700 | | | | 66,763 | |
| | | | | | | | 155,773 | |
| TOTAL SOUTH AFRICA | | | | | | | 3,614,847 | |
| | | | | | | | | |
| UNITED KINGDOM (3.77%) | | | | | | | | |
| PRECIOUS METALS (3.77%) | | | | | | | | |
| AngloGold Ashanti PLC | | | 3,000 | | | | 83,400 | |
| Endeavour Mining PLC | | | 3,000 | | | | 66,797 | |
| TOTAL UNITED KINGDOM | | | | | | | 150,197 | |
| TOTAL COMMON STOCKS | | | | | | | | |
| (COST $3,185,652) | | | | | | | 3,847,873 | |
| See accompanying notes to financial statements. |
| |
5
| FINANCIAL STATEMENTS 2024 |
| |
| |
| SCHEDULE OF INVESTMENTS – October 31, 2024 |
| Africa Fund |
| | | Principal
Amount | | | Fair
Value | |
| SOVEREIGN BONDS (2.27%) | | | | | | | | |
| SOUTH AFRICA (2.27%) | | | | | | | | |
| Republic of South Africa Government Bond, 6.25%, 03-08-2041 | | $ | 100,000 | | | $ | 90,117 | |
| TOTAL SOVEREIGN BONDS | | | | | | | | |
| (COST $90,845) | | | | | | | 90,117 | |
| | | Shares | | | Fair
Value | |
| MONEY MARKET FUNDS (0.90%) | | | | | | | | |
| Federated Hermes Government Obligations Fund, Institutional Class, 4.72%(b) | | | 35,622 | | | $ | 35,622 | |
| TOTAL MONEY MARKET FUNDS | | | | | | | | |
| (COST $35,622) | | | | | | | 35,622 | |
| | | | | | | | | |
| TOTAL INVESTMENTS — (99.87%) | | | | | | | | |
| (COST $3,312,119) | | | | | | | 3,973,612 | |
| OTHER ASSETS IN EXCESS OF LIABILITIES (0.13%) | | | | | | | 5,006 | |
| NET ASSETS — 100.00% | | | | | | $ | 3,978,618 | |
| (a) | Non-income producing security. |
| (b) | Rate disclosed is the seven day effective yield as of October 31, 2024. |
ADR — American Depositary Receipt
GDR — Global Depositary Receipt
REIT — Real Estate Investment Trust
| See accompanying notes to financial statements. |
| |
6
| FINANCIAL STATEMENTS 2024 |
| |
| |
| SCHEDULE OF INVESTMENTS – October 31, 2024 |
| Commonwealth Japan Fund |
| | | Shares | | | Fair
Value | |
| COMMON STOCKS (94.75%) | | | | | | | | |
| JAPAN (94.75%) | | | | | | | | |
| ALCOHOLIC BEVERAGES (1.74%) | | | | | | | | |
| Kirin Holdings Co. Ltd. | | | 7,000 | | | $ | 103,058 | |
| AUTO PARTS (1.45%) | | | | | | | | |
| Bridgestone Corp. - ADR | | | 1,000 | | | | 17,820 | |
| DENSO Corp. | | | 4,800 | | | | 68,177 | |
| | | | | | | | 85,997 | |
| BASIC & DIVERSIFIED CHEMICALS (2.35%) | | | | | | | | |
| Mitsubishi Gas Chemical Co., Inc. | | | 8,000 | | | | 139,034 | |
| BUILDING CONSTRUCTION (3.75%) | | | | | | | | |
| Kajima Corp. | | | 12,850 | | | | 221,348 | |
| BUILDING MAINTENANCE SERVICES (1.71%) | | | | | | | | |
| Taihei Dengyo Kaisha Ltd. | | | 3,000 | | | | 100,879 | |
| COMMERCIAL & RESIDENTIAL BUILDING EQUIPMENT & SYSTEMS (2.03%) | | | | | | | | |
| Daikin Industries Ltd. | | | 1,000 | | | | 120,056 | |
| COMMERCIAL FINANCE (4.79%) | | | | | | | | |
| Kyushu Leasing Service Co. Ltd. | | | 13,000 | | | | 83,355 | |
| ORIX Corp. | | | 9,500 | | | | 200,164 | |
| | | | | | | | 283,519 | |
| COURIER SERVICES (1.26%) | | | | | | | | |
| Yamato Holdings Co. Ltd. | | | 7,000 | | | | 74,243 | |
| DIVERSIFIED INDUSTRIALS (5.31%) | | | | | | | | |
| Hitachi Ltd. | | | 12,500 | | | | 314,060 | |
| ELECTRICAL POWER EQUIPMENT (3.37%) | | | | | | | | |
| Meidensha Corp. | | | 7,600 | | | | 199,454 | |
| ELECTRONICS COMPONENTS (2.92%) | | | | | | | | |
| Murata Manufacturing Co. Ltd. | | | 3,000 | | | | 52,413 | |
| Nidec Corp. | | | 3,400 | | | | 67,731 | |
| Taiyo Yuden Co. Ltd. | | | 3,000 | | | | 52,469 | |
| | | | | | | | 172,613 | |
| EXPLORATION & PRODUCTION (1.36%) | | | | | | | | |
| INPEX Corp. | | | 6,100 | | | | 80,410 | |
| FACTORY AUTOMATION EQUIPMENT (1.35%) | | | | | | | | |
| FANUC Corp. | | | 3,000 | | | | 79,594 | |
| FOOD & BEVERAGE WHOLESALERS (1.12%) | | | | | | | | |
| Yamae Group Holdings Co. Ltd. | | | 5,200 | | | | 66,436 | |
| FOOD & DRUG STORES (2.16%) | | | | | | | | |
| Sugi Holdings Company Ltd. | | | 7,500 | | | | 128,049 | |
| HEALTH CARE SUPPLIES (4.98%) | | | | | | | | |
| Hoya Corp. | | | 2,200 | | | | 294,345 | |
| | | Shares | | | Fair
Value | |
| COMMON STOCKS (94.75%) – Continued | | | | | | | | |
| JAPAN (94.75%) – Continued | | | | | | | | |
| HOME PRODUCTS STORES (2.58%) | | | | | | | | |
| Nitori Holdings Co. Ltd. | | | 1,200 | | | $ | 152,825 | |
| INFRASTRUCTURE CONSTRUCTION (2.11%) | | | | | | | | |
| Takada Corp. | | | 12,000 | | | | 125,049 | |
| INTEGRATED ELECTRIC UTILITIES (2.03%) | | | | | | | | |
| Kansai Electric Power Co., Inc. (The) | | | 7,500 | | | | 120,278 | |
| IT SERVICES (3.99%) | | | | | | | | |
| INES Corp. | | | 10,000 | | | | 101,475 | |
| Otsuka Corp. | | | 6,000 | | | | 134,660 | |
| | | | | | | | 236,135 | |
| LIFE INSURANCE (6.08%) | | | | | | | | |
| Dai-ichi Life Holdings, Inc. | | | 8,000 | | | | 199,442 | |
| T&D Holdings, Inc. | | | 10,000 | | | | 159,622 | |
| | | | | | | | 359,064 | |
| LOGISTICS SERVICES (1.25%) | | | | | | | | |
| Nippon Express Holdings Co. Ltd. | | | 1,500 | | | | 73,953 | |
| MASS MERCHANTS (1.47%) | | | | | | | | |
| Aeon Kyushu Co. Ltd. | | | 4,500 | | | | 86,836 | |
| MEDICAL DEVICES (9.17%) | | | | | | | | |
| Asahi Intecc Co. Ltd. | | | 16,000 | | | | 256,377 | |
| Terumo Corp. | | | 15,000 | | | | 285,679 | |
| | | | | | | | 542,056 | |
| MULTI ASSET CLASS OWNERS & DEVELOPERS (3.31%) | | | | | | | | |
| Mitsui Fudosan Co. Ltd. | | | 9,000 | | | | 76,791 | |
| Sumitomo Realty & Development Co. Ltd. | | | 4,000 | | | | 118,655 | |
| | | | | | | | 195,446 | |
| P&C INSURANCE (2.50%) | | | | | | | | |
| Sompo Holdings, Inc. | | | 6,900 | | | | 147,929 | |
| PERSONAL CARE PRODUCTS (4.76%) | | | | | | | | |
| Kao Corp. | | | 2,000 | | | | 88,150 | |
| Unicharm Corp. | | | 6,000 | | | | 193,470 | |
| | | | | | | 281,620 | |
| SEMICONDUCTOR MANUFACTURING (1.24%) | | | | | | | | |
| Tokyo Electron Ltd. | | | 500 | | | | 73,576 | |
| SPECIALTY APPAREL STORES (3.25%) | | | | | | | | |
| Fast Retailing Co. Ltd. | | | 600 | | | | 191,832 | |
| SPECIALTY CHEMICALS (1.86%) | | | | | | | | |
| Shin-Etsu Chemical Co. Ltd. | | | 3,000 | | | | 109,932 | |
| See accompanying notes to financial statements. |
| |
7
| FINANCIAL STATEMENTS 2024 |
| |
| |
| SCHEDULE OF INVESTMENTS – October 31, 2024 |
| Commonwealth Japan Fund |
| | | Shares | | | Fair
Value | |
| COMMON STOCKS (94.75%) – Continued | | | | | | | | |
| JAPAN (94.75%) – Continued | | | | | | | | |
| TRANSIT SERVICES (6.45%) | | | | | | | | |
| Daiichi Koutsu Sangyo Co. Ltd. | | | 12,200 | | | $ | 61,923 | |
| East Japan Railway Co. | | | 4,500 | | | | 90,384 | |
| Hankyu Hanshin Holdings, Inc. | | | 4,400 | | | | 119,635 | |
| Keikyu Corp. | | | 6,500 | | | | 50,893 | |
| Tobu Railway Co. Ltd. | | | 3,600 | | | | 58,256 | |
| | | | | | | | 381,091 | |
| WIRELESS TELECOMMUNICATIONS (1.05%) | | | | | | | | |
| KDDI Corp. | | | 2,000 | | | | 62,359 | |
| TOTAL JAPAN | | | | | | | 5,603,076 | |
| TOTAL COMMON STOCKS | | | | | | | | |
| (COST $3,517,602) | | | | | | | 5,603,076 | |
| | | Principal
Amount | | | Fair
Value | |
| CORPORATE BONDS (4.40%) | | | | | | | | |
| UNITED STATES (4.40%) | | | | | | | | |
| American Honda Finance Corp, 1.80%, 1/13/2031 | | $ | 100,000 | | | $ | 83,737 | |
| Toyota Motor Credit Corp, 2.15%, 2/13/2030 | | | 200,000 | | | | 176,180 | |
| TOTAL CORPORATE BONDS | | | | | | | | |
| (COST $261,745) | | | | | | | 259,917 | |
| | | Shares | | | | |
| MONEY MARKET FUNDS (0.14%) | | | | | | | | |
| Federated Hermes Government Obligations Fund, Institutional Class, 4.72%(a) | | | 8,330 | | | | 8,330 | |
| TOTAL MONEY MARKET FUNDS | | | | | | | | |
| (COST $8,330) | | | | | | | 8,330 | |
| | | | | | | | | |
| TOTAL INVESTMENTS — (99.29%) | | | | | | | | |
| (COST $3,787,677) | | | | | | | 5,871,323 | |
| OTHER ASSETS IN EXCESS OF LIABILITIES (0.71%) | | | | | | | 41,848 | |
| NET ASSETS — 100.00% | | | | | | $ | 5,913,171 | |
| (a) | Rate disclosed is the seven day effective yield as of October 31, 2024. |
ADR — American Depositary Receipt
| See accompanying notes to financial statements. |
| |
8
| FINANCIAL STATEMENTS 2024 |
| |
| |
| SCHEDULE OF INVESTMENTS – October 31, 2024 |
| Commonwealth Global Fund |
| | | Shares | | | Fair
Value | |
| COMMON STOCKS (99.36%) | | | | | | | | |
| DENMARK (2.65%) | | | | | | | | |
| LARGE PHARMACEUTICALS (2.65%) | | | | | | | | |
| Novo Nordisk A/S - ADR | | | 4,000 | | | $ | 447,800 | |
| FRANCE (2.36%) | | | | | | | | |
| BASIC & DIVERSIFIED CHEMICALS (1.62%) | | | | | | | | |
| Arkema SA - ADR | | | 3,130 | | | | 273,625 | |
| INTEGRATED OILS (0.74%) | | | | | | | | |
| Total S.A. - ADR | | | 2,000 | | | | 125,120 | |
| TOTAL FRANCE | | | | | | | 398,745 | |
| | | | | | | | | |
| GERMANY (4.01%) | | | | | | | | |
| DIVERSIFIED INDUSTRIALS (4.01%) | | | | | | | | |
| Siemens AG - ADR | | | 7,000 | | | | 679,490 | |
| INDIA (2.98%) | | | | | | | | |
| BANKS (2.98%) | | | | | | | | |
| HDFC Bank Ltd. - ADR | | | 8,000 | | | | 504,240 | |
| IRELAND (1.23%) | | | | | | | | |
| BUILDING MATERIALS (1.23%) | | | | | | | | |
| James Hardie Industries PLC - ADR(a) | | | 6,500 | | | | 207,350 | |
| ISRAEL (2.76%) | | | | | | | | |
| APPLICATION SOFTWARE (2.76%) | | | | | | | | |
| NICE Ltd. - ADR(a) | | | 2,700 | | | | 468,990 | |
| JAPAN (3.63%) | | | | | | | | |
| AUTO PARTS (0.32%) | | | | | | | | |
| Bridgestone Corp. - ADR | | | 3,000 | | | | 53,460 | |
| CONSUMER ELECTRONICS (2.08%) | | | | | | | | |
| Sony Group Corp. - ADR | | | 20,000 | | | | 352,000 | |
| ELECTRONICS COMPONENTS (1.23%) | | | | | | | | |
| Nidec Corp. | | | 42,000 | | | | 208,740 | |
| TOTAL JAPAN | | | | | | | 614,200 | |
| | | | | | | | | |
| MEXICO (0.47%) | | | | | | | | |
| WIRELESS TELECOMMUNICATIONS (0.47%) | | | | | | | | |
| America Movil S.A.B. de C.V., Class L - ADR | | | 5,000 | | | | 78,700 | |
| NORWAY (2.11%) | | | | | | | | |
| P&C INSURANCE (2.11%) | | | | | | | | |
| Gjensidige Forsikring ASA - ADR | | | 20,000 | | | | 357,300 | |
| PANAMA (1.73%) | | | | | | | | |
| AIRLINES (1.73%) | | | | | | | | |
| Copa Holdings, SA, Class A | | | 3,000 | | | | 291,900 | |
| SOUTH AFRICA (2.44%) | | | | | | | | |
| FOOD & DRUG STORES (2.44%) | | | | | | | | |
| Shoprite Holdings Ltd. - ADR | | | 24,000 | | | | 412,200 | |
| | | Shares | | | Fair
Value | |
| COMMON STOCKS (99.36%) – Continued | | | | | | | | |
| SWITZERLAND (4.29%) | | | | | | | | |
| LARGE PHARMACEUTICALS (2.75%) | | | | | | | | |
| Roche Holding AG - ADR | | | 12,000 | | | $ | 465,720 | |
| PACKAGED FOOD (1.54%) | | | | | | | | |
| Nestlé SA - ADR | | | 2,750 | | | | 259,930 | |
| TOTAL SWITZERLAND | | | | | | | 725,650 | |
| | | | | | | | | |
| TAIWAN PROVINCE OF CHINA (2.25%) | | | | | | | | |
| SEMICONDUCTOR MANUFACTURING (2.25%) | | | | | | | | |
| Taiwan Semiconductor Manufacturing Co.,Ltd. - ADR | | | 2,000 | | | | 381,080 | |
| | | | | | | | | |
| UNITED KINGDOM (9.11%) | | | | | | | | |
| ALCOHOLIC BEVERAGES (2.05%) | | | | | | | | |
| Diageo PLC - ADR | | | 2,800 | | | | 347,648 | |
| LARGE PHARMACEUTICALS (3.16%) | | | | | | | | |
| AstraZeneca PLC - ADR | | | 7,500 | | | | 533,625 | |
| PERSONAL CARE PRODUCTS (2.52%) | | | | | | | | |
| Unilever PLC - ADR | | | 7,000 | | | | 426,370 | |
| PUBLISHING (1.38%) | | | | | | | | |
| Pearson PLC - ADR | | | 16,000 | | | | 233,600 | |
| TOTAL UNITED KINGDOM | | | | | | | 1,541,243 | |
| | | | | | | | | |
| UNITED STATES (57.34%) | | | | | | | | |
| APPLICATION SOFTWARE (1.13%) | | | | | | | | |
| Adobe, Inc.(a) | | | 400 | | | | 191,232 | |
| AUTO PARTS (5.43%) | | | | | | | | |
| Miller Industries, Inc. | | | 14,000 | | | | 918,960 | |
| AUTOMOTIVE RETAILERS (6.03%) | | | | | | | | |
| Group 1 Automotive, Inc. | | | 2,800 | | | | 1,020,096 | |
| COMMUNICATIONS EQUIPMENT (6.01%) | | | | | | | | |
| Apple, Inc. | | | 4,500 | | | | 1,016,595 | |
| COMPUTER HARDWARE & STORAGE (4.77%) | | | | | | | | |
| NetApp, Inc. | | | 7,000 | | | | 807,170 | |
| CONSTRUCTION & MINING MACHINERY (2.67%) | | | | | | | | |
| Caterpillar, Inc. | | | 1,200 | | | | 451,440 | |
| COURIER SERVICES (0.65%) | | | | | | | | |
| FedEx Corp. | | | 400 | | | | 109,540 | |
| DEFENSE (0.88%) | | | | | | | | |
| L3Harris Technologies, Inc. | | | 600 | | | | 148,482 | |
| DIVERSIFIED BANKS (2.75%) | | | | | | | | |
| JPMorgan Chase & Co. | | | 2,100 | | | | 466,032 | |
| HOUSEHOLD PRODUCTS (3.03%) | | | | | | | | |
| Procter & Gamble Co. (The) | | | 3,100 | | | | 512,058 | |
| See accompanying notes to financial statements. |
| |
9
| FINANCIAL STATEMENTS 2024 |
| |
| |
| SCHEDULE OF INVESTMENTS – October 31, 2024 |
| Commonwealth Global Fund |
| | | Shares | | | Fair
Value | |
| COMMON STOCKS (99.36%) – Continued | | | | | | | | |
| UNITED STATES (57.34%) – Continued | | | | | | | | |
| INFRASTRUCTURE SOFTWARE (4.48%) | | | | | | | | |
| Crowdstrike Holdings, Inc., Class A(a) | | | 500 | | | $ | 148,435 | |
| Microsoft Corp. | | | 1,500 | | | | 609,525 | |
| | | | | | | | 757,960 | |
| INTEGRATED ELECTRIC UTILITIES (0.78%) | | | | | | | | |
| American Electric Power Co., Inc. | | | 500 | | | | 49,375 | |
| Southern Co. (The) | | | 900 | | | | 81,927 | |
| | | | | | | | 131,302 | |
| INTEGRATED OIL & GAS (3.08%) | | | | | | | | |
| Chevron Corp. | | | 3,500 | | | | 520,870 | |
| LIFE SCIENCE & DIAGNOSTICS (4.36%) | | | | | | | | |
| Thermo Fisher Scientific, Inc. | | | 1,350 | | | | 737,532 | |
| OIL & GAS EQUIPMENT & SERVICES (0.64%) | | | | | | | | |
| Schlumberger Ltd. | | | 2,700 | | | | 108,189 | |
| OILFIELD SERVICES & EQUIPMENT (0.81%) | | | | | | | | |
| Natural Gas Services Group, Inc.(a) | | | 7,000 | | | | 136,990 | |
| ONLINE MARKETPLACE (1.65%) | | | | | | | | |
| Amazon.com, Inc.(a) | | | 1,500 | | | | 279,600 | |
| RAIL FREIGHT (3.55%) | | | | | | | | |
| Norfolk Southern Corp. | | | 2,400 | | | | 601,032 | |
| REFINING & MARKETING (0.72%) | | | | | | | | |
| Phillips 66 | | | 1,000 | | | | 121,820 | |
| SEMICONDUCTOR DEVICES (1.86%) | | | | | | | | |
| Skyworks Solutions, Inc. | | | 3,600 | | | | 315,288 | |
| VIDEO GAMES (0.89%) | | | | | | | | |
| Electronic Arts, Inc. | | | 1,000 | | | | 150,850 | |
| WASTE MANAGEMENT (1.17%) | | | | | | | | |
| Republic Services, Inc. | | | 1,000 | | | | 198,000 | |
| TOTAL UNITED STATES | | | | | | | 9,701,038 | |
| TOTAL COMMON STOCKS | | | | | | | | |
| (COST $7,110,531) | | | | | | | 16,809,926 | |
| | | Shares | | | Fair
Value | |
| MONEY MARKET FUNDS (0.61%) | | | | | | | | |
| Federated Hermes Government Obligations Fund, Institutional Class, 4.72%(b) | | | 102,455 | | | $ | 102,455 | |
| TOTAL MONEY MARKET FUNDS | | | | | | | | |
| (COST $102,455) | | | | | | | 102,455 | |
| | | | | | | | | |
| TOTAL INVESTMENTS — (99.97%) | | | | | | | | |
| (COST $7,212,986) | | | | | | | 16,912,381 | |
| OTHER ASSETS IN EXCESS OF LIABILITIES (0.03%) | | | | | | | 5,590 | |
| NET ASSETS — 100.00% | | | | | | $ | 16,917,971 | |
| (a) | Non-income producing security. |
| (b) | Rate disclosed is the seven day effective yield as of October 31, 2024. |
ADR — American Depositary Receipt
| See accompanying notes to financial statements. |
| |
10
| FINANCIAL STATEMENTS 2024 |
| |
| |
| SCHEDULE OF INVESTMENTS – October 31, 2024 |
| Commonwealth Real Estate Securities Fund |
| | | Shares | | | Fair
Value | |
| COMMON STOCKS (91.69%) | | | | | | | | |
| AGRICULTURAL PRODUCERS (0.67%) | | | | | | | | |
| BrasilAgro - Company Brasileira de Propriedades Agricolas - ADR | | | 27,432 | | | $ | 112,197 | |
| BANKS (1.15%) | | | | | | | | |
| Harleysville Financial Corp. | | | 8,675 | | | | 193,019 | |
| BUILDING CONSTRUCTION (1.17%) | | | | | | | | |
| Kajima Corp. - ADR | | | 11,900 | | | | 196,469 | |
| BUILDING MATERIALS (12.74%) | | | | | | | | |
| James Hardie Industries PLC - ADR(a) | | | 25,000 | | | | 797,500 | |
| Tecnoglass, Inc. | | | 19,634 | | | | 1,345,518 | |
| | | | | | | | 2,143,018 | |
| CEMENT & AGGREGATES (4.79%) | | | | | | | | |
| Cemex S.A.B. de C.V. - ADR | | | 30,000 | | | | 156,600 | |
| CRH PLC | | | 2,500 | | | | 238,575 | |
| Summit Materials, Inc., Class A(a) | | | 8,680 | | | | 411,519 | |
| | | | | | | | 806,694 | |
| COMMERCIAL & RESIDENTIAL BUILDING EQUIPMENT & SYSTEMS (6.09%) | | | | | | | | |
| Lennox International, Inc. | | | 1,700 | | | | 1,024,369 | |
| DATA CENTER REITS (4.64%) | | | | | | | | |
| Digital Realty Trust, Inc. | | | 3,368 | | | | 600,279 | |
| Equinix, Inc. | | | 200 | | | | 181,616 | |
| | | | | | | | 781,895 | |
| HOME PRODUCTS STORES (4.04%) | | | | | | | | |
| Lowe’s Cos., Inc. | | | 2,600 | | | | 680,758 | |
| HOMEBUILDING (9.98%) | | | | | | | | |
| D.R. Horton, Inc. | | | 4,000 | | | | 676,000 | |
| Lennar Corp., Class A | | | 3,200 | | | | 544,960 | |
| NVR, Inc.(a) | | | 50 | | | | 457,641 | |
| | | | | | | | 1,678,601 | |
| HOTEL REITS (0.89%) | | | | | | | | |
| Ryman Hospitality Properties, Inc. | | | 1,400 | | | | 149,870 | |
| HOTELS RESORTS & CRUISE LINES (4.04%) | | | | | | | | |
| InterContinental Hotels Group PLC - ADR | | | 6,103 | | | | 680,179 | |
| INDUSTRIAL MACHINERY (2.37%) | | | | | | | | |
| Techtronic Industries Company Ltd. - ADR | | | 5,500 | | | | 399,190 | |
| INDUSTRIAL REITS (5.83%) | | | | | | | | |
| Hannon Armstrong Sustainable Infrastructure Capital, Inc. | | | 15,200 | | | | 531,848 | |
| Prologis, Inc. | | | 2,000 | | | | 225,880 | |
| STAG Industrial, Inc. | | | 6,000 | | | | 223,680 | |
| | | | | | | | 981,408 | |
| | | Shares | | | Fair
Value | |
| COMMON STOCKS (91.69%) – Continued | | | | | | | | |
| INFRASTRUCTURE REITS (7.18%) | | | | | | | | |
| American Tower Corp., Class A | | | 2,500 | | | $ | 533,850 | |
| Crown Castle International Corp. | | | 2,000 | | | | 214,980 | |
| SBA Communications Corp., Class A | | | 2,000 | | | | 458,940 | |
| | | | | | | | 1,207,770 | |
| MORTGAGE FINANCE (3.35%) | | | | | | | | |
| Ladder Capital Corp. | | | 10,000 | | | | 114,100 | |
| Redwood Trust, Inc. | | | 40,000 | | | | 292,800 | |
| Starwood Property Trust, Inc. | | | 8,000 | | | | 157,920 | |
| | | | | | | | 564,820 | |
| MULTI ASSET CLASS REITS (1.49%) | | | | | | | | |
| WP Carey, Inc. | | | 4,470 | | | | 249,068 | |
| RESIDENTIAL OWNERS & DEVELOPERS (0.99%) | | | | | | | | |
| Cyrela Brazil Realty SA - ADR | | | 44,000 | | | | 165,880 | |
| RESIDENTIAL REITS (2.63%) | | | | | | | | |
| AvalonBay Communities, Inc. | | | 2,000 | | | | 443,220 | |
| RETAIL REITS (3.41%) | | | | | | | | |
| Kite Realty Group Trust | | | 9,000 | | | | 231,030 | |
| National Retail Properties, Inc. | | | 4,000 | | | | 173,760 | |
| Simon Property Group, Inc. | | | 1,000 | | | | 169,120 | |
| | | | | | | | 573,910 | |
| Self-Storage REITs (3.59%) | | | | | | | | |
| EXTRA SPACE STORAGE, INC. | | | 2,500 | | | | 408,250 | |
| Global Self Storage, Inc. | | | 39,000 | | | | 195,780 | |
| | | | | | | | 604,030 | |
| SPECIALIZED REITS (7.04%) | | | | | | | | |
| Charter Hall Education Trust | | | 99,140 | | | | 170,267 | |
| Gladstone Land Corp. | | | 9,700 | | | | 126,391 | |
| Iron Mountain, Inc. | | | 7,200 | | | | 890,855 | |
| | | | | | | | 1,187,513 | |
| TIMBER REITS (0.74%) | | | | | | | | |
| PotlatchDeltic Corp. | | | 3,000 | | | | 124,710 | |
| TRANSPORT OPERATIONS & SERVICES (2.87%) | | | | | | | | |
| Grupo Aeroportuario del Sureste S.A.B. de C.V. - ADR | | | 1,800 | | | | 484,704 | |
| TOTAL COMMON STOCKS | | | | | | | | |
| (COST $6,391,163) | | | | | | | 15,433,292 | |
| See accompanying notes to financial statements. |
| |
11
| FINANCIAL STATEMENTS 2024 |
| |
| |
| SCHEDULE OF INVESTMENTS – October 31, 2024 |
| Commonwealth Real Estate Securities Fund |
| | | Principal
Amount | | | Fair
Value | |
| U.S. GOVERNMENT & AGENCIES (6.14%) | | | | | | | | |
| Federal Home Loan Bank, 0.50%, 4/14/2025 | | $ | 300,000 | | | $ | 294,660 | |
| Federal National Mortgage Association, 0.88%, 8/5/2030 | | | 200,000 | | | | 165,830 | |
| United States Treasury Note, 2.88%, 5/31/2025 | | | 200,000 | | | | 198,235 | |
| United States Treasury Note, 3.38%, 5/15/2033 | | | 400,000 | | | | 374,765 | |
| TOTAL U.S. GOVERNMENT & AGENCIES | | | | | | | | |
| (COST $1,038,280) | | | | | | | 1,033,490 | |
| | | Shares | | | Fair
Value | |
| MONEY MARKET FUNDS (2.13%) | | | | | | | | |
| Federated Hermes Government Obligations Fund, Institutional Class, 4.72%(b) | | | 358,712 | | | $ | 358,712 | |
| TOTAL MONEY MARKET FUNDS | | | | | | | | |
| (COST $358,712) | | | | | | | 358,712 | |
| | | | | | | | | |
| TOTAL INVESTMENTS — (99.96%) | | | | | | | | |
| (COST $7,788,155) | | | | | | | 16,825,494 | |
| OTHER ASSETS IN EXCESS OF LIABILITIES (0.04%) | | | | | | | 6,393 | |
| NET ASSETS — 100.00% | | | | | | $ | 16,831,887 | |
| (a) | Non-income producing security. |
| (b) | Rate disclosed is the seven day effective yield as of October 31, 2024. |
ADR — American Depositary Receipt
REIT — Real Estate Investment Trust
| See accompanying notes to financial statements. |
| |
12
| FINANCIAL STATEMENTS 2024 |
| |
| |
| STATEMENTS OF ASSETS AND LIABILITIES – October 31, 2024 |
| | | Commonwealth
Australia/New
Zealand Fund | | | Africa Fund | | | Commonwealth
Japan Fund | | | Commonwealth
Global Fund | | | Commonwealth
Real Estate
Securities Fund | |
| ASSETS | | | | | | | | | | | | | | | | | | | | |
| Investments in securities at fair value (cost $6,996,250, $3,312,119, $3,787,677, $7,212,986 and $7,788,155) | | $ | 11,186,643 | | | $ | 3,973,612 | | | $ | 5,871,323 | | | $ | 16,912,381 | | | $ | 16,825,494 | |
| Foreign currencies, at value (cost $844,915, $6,561, $546, $– and $–) | | | 801,940 | | | | 6,572 | | | | 551 | | | | — | | | | — | |
| Receivable for fund shares sold | | | — | | | | — | | | | — | | | | 100 | | | | 250 | |
| Receivable from Advisor | | | — | | | | 4,839 | | | | 4,665 | | | | — | | | | — | |
| Dividends and interest receivable | | | 43,971 | | | | 1,254 | | | | 41,047 | | | | 5,415 | | | | 28,656 | |
| Tax reclaims receivable | | | — | | | | — | | | | 1,037 | | | | 22,691 | | | | — | |
| Prepaid expenses | | | 19,678 | | | | 5,446 | | | | 10,911 | | | | 16,462 | | | | 15,805 | |
| Total Assets | | | 12,052,232 | | | | 3,991,723 | | | | 5,929,534 | | | | 16,957,049 | | | | 16,870,205 | |
| LIABILITIES | | | | | | | | | | | | | | | | | | | | |
| Payable for fund shares redeemed | | | — | | | | 667 | | | | — | | | | — | | | | 2,447 | |
| Payable to Advisor | | | 7,849 | | | | — | | | | — | | | | 11,011 | | | | 10,989 | |
| Distribution (12b-1) fees accrued | | | 6,430 | | | | 2,151 | | | | 2,696 | | | | 4,520 | | | | 4,940 | |
| Payable to Administrator | | | 6,809 | | | | 2,509 | | | | 4,424 | | | | 9,805 | | | | 7,629 | |
| Payable to trustees | | | 4,480 | | | | 1,156 | | | | 2,414 | | | | 6,705 | | | | 5,745 | |
| Other accrued expenses | | | 8,600 | | | | 6,622 | | | | 6,829 | | | | 7,037 | | | | 6,568 | |
| Total Liabilities | | | 34,168 | | | | 13,105 | | | | 16,363 | | | | 39,078 | | | | 38,318 | |
| Commitments and contingent liabilities (Note 3) | | | | | | | | | | | | | | | | | | | | |
| NET ASSETS | | $ | 12,018,064 | | | $ | 3,978,618 | | | $ | 5,913,171 | | | $ | 16,917,971 | | | $ | 16,831,887 | |
| NET ASSETS CONSIST OF: | | | | | | | | | | | | | | | | | | | | |
| Paid-in capital | | | 7,786,487 | | | | 4,235,509 | | | | 4,002,351 | | | | 6,768,083 | | | | 7,505,565 | |
| Accumulated earnings (deficit) | | | 4,231,577 | | | | (256,891 | ) | | | 1,910,820 | | | | 10,149,888 | | | | 9,326,322 | |
| NET ASSETS | | $ | 12,018,064 | | | $ | 3,978,618 | | | $ | 5,913,171 | | | $ | 16,917,971 | | | $ | 16,831,887 | |
| Shares outstanding (unlimited number of shares authorized) | | | 1,086,370 | | | | 446,058 | | | | 1,561,985 | | | | 812,780 | | | | 681,051 | |
| Net asset value, offering and redemption price per share(a) | | $ | 11.06 | | | $ | 8.92 | | | $ | 3.79 | | | $ | 20.81 | | | $ | 24.71 | |
| (a) | Subject to certain exceptions, a 2% redemption fee is imposed upon shares redeemed within 14 calendar days of their purchase. See Note 3 in the Notes to Financial Statements. Par value $0.01, unlimited shares authorized. |
| See accompanying notes to financial statements. |
| |
13
| FINANCIAL STATEMENTS 2024 |
| |
| |
| STATEMENTS OF OPERATIONS – For the year ended October 31, 2024 |
| | | Commonwealth
Australia/New
Zealand Fund | | | Africa Fund | | | Commonwealth
Japan Fund | | | Commonwealth
Global Fund | | | Commonwealth
Real Estate
Securities Fund | |
| INVESTMENT INCOME | | | | | | | | | | | | | | | | | | | | |
| Dividend income (net of foreign taxes withheld of $69,652, $21,585, $19,174, $24,803 and $6,916) | | $ | 370,897 | | | $ | 135,754 | | | $ | 115,365 | | | $ | 307,370 | | | $ | 377,212 | |
| Interest income | | | — | | | | 6,544 | | | | 3,014 | | | | — | | | | 36,000 | |
| Non-cash income | | | 29,639 | | | | — | | | | — | | | | — | | | | — | |
| Total investment income | | | 400,536 | | | | 142,298 | | | | 118,379 | | | | 307,370 | | | | 413,212 | |
| EXPENSES | | | | | | | | | | | | | | | | | | | | |
| Investment Advisor | | | 89,975 | | | | 24,971 | | | | 45,594 | | | | 126,432 | | | | 115,635 | |
| Administration | | | 66,185 | | | | 18,906 | | | | 34,721 | | | | 93,008 | | | | 83,151 | |
| Distribution (12b-1) | | | 29,992 | | | | 8,324 | | | | 15,198 | | | | 42,144 | | | | 38,545 | |
| Registration | | | 22,470 | | | | 15,722 | | | | 11,600 | | | | 11,202 | | | | 12,269 | |
| Legal | | | 19,909 | | | | 5,515 | | | | 10,214 | | | | 27,787 | | | | 24,898 | |
| Audit and tax preparation | | | 18,553 | | | | 5,094 | | | | 9,430 | | | | 26,000 | | | | 23,511 | |
| Trustee | | | 18,110 | | | | 4,950 | | | | 9,298 | | | | 26,065 | | | | 23,577 | |
| Transfer agent | | | 15,614 | | | | 15,615 | | | | 15,615 | | | | 15,614 | | | | 15,615 | |
| Insurance | | | 12,954 | | | | 3,101 | | | | 6,096 | | | | 16,602 | | | | 13,333 | |
| Pricing | | | 7,550 | | | | 7,024 | | | | 8,850 | | | | 975 | | | | 1,160 | |
| Chief Compliance Officer | | | 6,991 | | | | 1,899 | | | | 3,533 | | | | 9,796 | | | | 8,813 | |
| Printing | | | 6,704 | | | | 3,299 | | | | 4,484 | | | | 7,436 | | | | 6,971 | |
| Custodian | | | 5,873 | | | | 2,002 | | | | 3,637 | | | | 2,694 | | | | 3,609 | |
| Interest expense | | | 69 | | | | — | | | | 232 | | | | — | | | | — | |
| Miscellaneous | | | 21,723 | | | | 23,356 | | | | 21,743 | | | | 22,337 | | | | 21,448 | |
| Total expenses | | | 342,672 | | | | 139,778 | | | | 200,245 | | | | 428,092 | | | | 392,535 | |
| Fees contractually waived and expenses reimbursed by Advisor | | | — | | | | (81,485 | ) | | | (93,739 | ) | | | — | | | | — | |
| Net operating expenses | | | 342,672 | | | | 58,293 | | | | 106,506 | | | | 428,092 | | | | 392,535 | |
| Net investment income (loss) | | | 57,864 | | | | 84,005 | | | | 11,873 | | | | (120,722 | ) | | | 20,677 | |
| NET REALIZED AND CHANGE IN UNREALIZED GAIN (LOSS) ON INVESTMENTS | | | | | | | | | | | | | | | | | | | | |
| Net realized gain (loss) on: | | | | | | | | | | | | | | | | | | | | |
| Investment securities transactions | | | 220,774 | | | | (223,531 | ) | | | 23,463 | | | | 600,845 | | | | 296,154 | |
| Foreign currency transactions | | | 5,198 | | | | 1,555 | | | | (11,098 | ) | | | — | | | | (259 | ) |
| Total net realized gain (loss) | | | 225,972 | | | | (221,976 | ) | | | 12,365 | | | | 600,845 | | | | 295,895 | |
| Net change in unrealized appreciation (depreciation) on: | | | | | | | | | | | | | | | | | | | | |
| Investment securities | | | 914,839 | | | | 1,197,186 | | | | 559,166 | | | | 2,807,027 | | | | 4,326,152 | |
| Foreign currency translations | | | (43,400 | ) | | | 503 | | | | 4,620 | | | | — | | | | — | |
| Total net change in unrealized appreciation (depreciation) | | | 871,439 | | | | 1,197,689 | | | | 563,786 | | | | 2,807,027 | | | | 4,326,152 | |
| Net realized and change in unrealized gain on investments | | | 1,097,411 | | | | 975,713 | | | | 576,151 | | | | 3,407,872 | | | | 4,622,047 | |
| Net increase in net assets resulting from operations | | $ | 1,155,275 | | | $ | 1,059,718 | | | $ | 588,024 | | | $ | 3,287,150 | | | $ | 4,642,724 | |
| See accompanying notes to financial statements. |
| |
14
[THIS PAGE INTENTIONALLY LEFT BLANK]
| FINANCIAL STATEMENTS 2024 |
| |
| |
| STATEMENTS OF CHANGES IN NET ASSETS |
| | | Commonwealth
Australia/New Zealand Fund | | | Africa Fund | |
| | | For the Year Ended
October 31,
2024 | | | For the Year Ended
October 31,
2023 | | | For the
Year Ended
October 31,
2024 | | | For the
Year Ended
October 31,
2023 | |
| INCREASE (DECREASE) IN NET ASSETS DUE TO: | | | | | | | | | | | | | | | | |
| OPERATIONS: | | | | | | | | | | | | | | | | |
| Net investment income | | $ | 57,864 | | | $ | 36,437 | | | $ | 84,005 | | | $ | 72,912 | |
| Net realized gain (loss) from investment securities and foreign currency transactions | | | 225,972 | | | | (164,321 | ) | | | (221,976 | ) | | | (81,098 | ) |
| Net change in unrealized appreciation (depreciation) from investment securities and foreign currency translations | | | 871,439 | | | | (1,203,795 | ) | | | 1,197,689 | | | | (139,577 | ) |
| Change in net assets resulting from operations | | | 1,155,275 | | | | (1,331,679 | ) | | | 1,059,718 | | | | (147,763 | ) |
| DISTRIBUTIONS TO SHAREHOLDERS FROM: | | | | | | | | | | | | | | | | |
| Earnings | | | (31,068 | ) | | | (76,798 | ) | | | (99,144 | ) | | | (30,003 | ) |
| CAPITAL TRANSACTIONS: | | | | | | | | | | | | | | | | |
| Proceeds from shares sold | | | 883,335 | | | | 392,135 | | | | 422,251 | | | | 461,392 | |
| Reinvestment of distributions | | | 30,410 | | | | 75,262 | | | | 93,340 | | | | 29,112 | |
| Amount paid for shares redeemed | | | (1,030,173 | ) | | | (1,025,021 | ) | | | (354,641 | ) | | | (312,674 | ) |
| Redemption fees | | | — | | | | — | | | | 20 | | | | — | |
| Change in net assets resulting from capital transactions | | | (116,428 | ) | | | (557,624 | ) | | | 160,970 | | | | 177,830 | |
| Net Increase (Decrease) in Net Assets | | | 1,007,779 | | | | (1,966,101 | ) | | | 1,121,544 | | | | 64 | |
| NET ASSETS: | | | | | | | | | | | | | | | | |
| Beginning of year | | | 11,010,285 | | | | 12,976,386 | | | | 2,857,074 | | | | 2,857,010 | |
| End of year | | $ | 12,018,064 | | | $ | 11,010,285 | | | $ | 3,978,618 | | | $ | 2,857,074 | |
| SHARE TRANSACTIONS: | | | | | | | | | | | | | | | | |
| Shares sold | | | 83,115 | | | | 33,441 | | | | 56,216 | | | | 61,164 | |
| Shares issued in reinvestment of distributions | | | 2,735 | | | | 6,194 | | | | 13,091 | | | | 3,902 | |
| Shares redeemed | | | (93,540 | ) | | | (89,460 | ) | | | (47,460 | ) | | | (42,290 | ) |
| Change in shares outstanding | | | (7,690 | ) | | | (49,825 | ) | | | 21,847 | | | | 22,776 | |
| See accompanying notes to financial statements. |
| |
16
| FINANCIAL STATEMENTS 2024 |
| |
| |
| STATEMENTS OF CHANGES IN NET ASSETS |
| Commonwealth | | | Commonwealth | | | Commonwealth | |
| Japan Fund | | | Global Fund | | | Real Estate Securities Fund | |
For the Year Ended
October 31,
2024 | | | For the
Year Ended
October 31,
2023 | | | For the
Year Ended
October 31,
2024 | | | For the
Year Ended
October 31,
2023 | | | For the
Year Ended
October 31,
2024 | | | For the
Year Ended
October 31,
2023 | |
| | | | | | | | | | | | | | | | | | | | | | | |
| | | | | | | | | | | | | | | | | | | | | | | |
| $ | 11,873 | | | $ | 4,873 | | | $ | (120,722 | ) | | $ | (129,143 | ) | | $ | 20,677 | | | $ | 20,304 | |
| | 12,365 | | | | (2,639 | ) | | | 600,845 | | | | (53,300 | ) | | | 295,895 | | | | (24,905 | ) |
| | 563,786 | | | | 592,108 | | | | 2,807,027 | | | | 447,419 | | | | 4,326,152 | | | | 183,064 | |
| | 588,024 | | | | 594,342 | | | | 3,287,150 | | | | 264,976 | | | | 4,642,724 | | | | 178,463 | |
| | | | | | | | | | | | | | | | | | | | | | | |
| | (5,994 | ) | | | — | | | | — | | | | (128,817 | ) | | | — | | | | (70,458 | ) |
| | | | | | | | | | | | | | | | | | | | | | | |
| | 576,702 | | | | 988,911 | | | | 56,946 | | | | 245,983 | | | | 1,206,279 | | | | 397,875 | |
| | 5,981 | | | | — | | | | — | | | | 128,651 | | | | — | | | | 70,354 | |
| | (812,469 | ) | | | (667,912 | ) | | | (1,010,177 | ) | | | (751,439 | ) | | | (999,153 | ) | | | (214,276 | ) |
| | — | | | | — | | | | — | | | | — | | | | 207 | | | | — | |
| | (229,786 | ) | | | 320,999 | | | | (953,231 | ) | | | (376,805 | ) | | | 207,333 | | | | 253,953 | |
| | 352,244 | | | | 915,341 | | | | 2,333,919 | | | | (240,646 | ) | | | 4,850,057 | | | | 361,958 | |
| | | | | | | | | | | | | | | | | | | | | | | |
| | 5,560,927 | | | | 4,645,586 | | | | 14,584,052 | | | | 14,824,698 | | | | 11,981,830 | | | | 11,619,872 | |
| $ | 5,913,171 | | | $ | 5,560,927 | | | $ | 16,917,971 | | | $ | 14,584,052 | | | $ | 16,831,887 | | | $ | 11,981,830 | |
| | | | | | | | | | | | | | | | | | | | | | | |
| | 151,727 | | | | 286,774 | | | | 2,859 | | | | 13,897 | | | | 52,993 | | | | 21,282 | |
| | 1,599 | | | | — | | | | — | | | | 7,432 | | | | — | | | | 3,838 | |
| | (215,312 | ) | | | (196,935 | ) | | | (49,629 | ) | | | (41,160 | ) | | | (42,987 | ) | | | (11,224 | ) |
| | (61,986 | ) | | | 89,839 | | | | (46,770 | ) | | | (19,831 | ) | | | 10,006 | | | | 13,896 | |
| See accompanying notes to financial statements. |
| |
17
| FINANCIAL STATEMENTS 2024 |
| |
| |
| FINANCIAL HIGHLIGHTS |
| Commonwealth Australia/New Zealand Fund |
Selected data for a share outstanding during each of the years indicated:
| | | For the Year
Ended
October 31,
2024 | | | For the Year
Ended
October 31,
2023 | | | For the Year
Ended
October 31,
2022 | | | For the Year
Ended
October 31,
2021 | | | For the Year
Ended
October 31,
2020(a) | |
| Net asset value, beginning of year | | $ | 10.06 | | | $ | 11.34 | | | $ | 17.17 | | | $ | 12.92 | | | $ | 13.33 | |
| Change in net assets from operations: | | | | | | | | | | | | | | | | | | | | |
| Net investment income (loss) | | | 0.05 | | | | 0.03 | | | | (0.01 | ) | | | (0.05 | ) | | | 0.01 | |
| Net realized and unrealized gain (loss) from investments | | | 0.98 | | | | (1.24 | ) | | | (4.79 | ) | | | 4.32 | | | | 0.41 | |
| Total from investment activities | | | 1.03 | | | | (1.21 | ) | | | (4.80 | ) | | | 4.27 | | | | 0.42 | |
| Distributions: | | | | | | | | | | | | | | | | | | | | |
| Net investment income | | | (0.03 | ) | | | — | | | | (0.02 | ) | | | (0.02 | ) | | | (0.07 | ) |
| Net realized gains | | | — | | | | (0.07 | ) | | | (1.01 | ) | | | — | | | | (0.76 | ) |
| Total distributions | | | (0.03 | ) | | | (0.07 | ) | | | (1.03 | ) | | | (0.02 | ) | | | (0.83 | ) |
| Redemption fees | | | — | | | | — | | | | — | | | | — | (b) | | | — | |
| Net asset value, end of year | | $ | 11.06 | | | $ | 10.06 | | | $ | 11.34 | | | $ | 17.17 | | | $ | 12.92 | |
| Total Return | | | 10.22 | % | | | (10.80 | )% | | | (29.37 | )% | | | 33.04 | % | | | 3.05 | % |
| Net assets, at end of year (000 omitted) | | $ | 12,018 | | | $ | 11,010 | | | $ | 12,976 | | | $ | 20,118 | | | $ | 15,212 | |
| Ratios and Supplemental Data: | | | | | | | | | | | | | | | | | | | | |
| Ratio of net expenses to average net assets | | | 2.86 | % | | | 2.81 | % | | | 2.60 | % | | | 2.41 | % | | | 2.60 | %(c) |
| Ratio of gross expenses before waivers and/or reimbursements | | | 2.86 | % | | | 2.81 | % | | | 2.60 | % | | | 2.41 | % | | | 2.70 | % |
| Ratio of net investment income (loss) to average net assets | | | 0.48 | % | | | 0.27 | % | | | (0.10 | )% | | | (0.35 | )% | | | 0.03 | % |
| Portfolio turnover rate | | | 8 | % | | | 6 | % | | | 8 | % | | | 20 | % | | | 4 | % |
| (a) | Includes adjustments in accordance with accounting principles generally accepted in the United States and, consequently, the net asset values for financial reporting purposes and the returns based upon those net asset values may differ from the net asset values and returns for shareholder transactions. |
| (b) | Rounds to less than $0.005 per share. |
| (c) | The ratio of net expenses include $13,438 in voluntary advisory waivers representing (0.10)%. For the period from May 12, 2020 to October 31, 2020, the Advisor voluntarily agreed to waive 0.20% of the Management Fee for the Fund. This voluntary waiver is not subject to recoupment. |
| See accompanying notes to financial statements. |
| |
18
| FINANCIAL STATEMENTS 2024 |
| |
| |
| FINANCIAL HIGHLIGHTS |
| Africa Fund |
Selected data for a share outstanding during each of the years indicated:
| | | For the Year
Ended
October 31,
2024 | | | For the Year
Ended
October 31,
2023 | | | For the Year
Ended
October 31,
2022 | | | For the Year
Ended
October 31,
2021 | | | For the Year
Ended
October 31,
2020 | |
| Net asset value, beginning of year | | $ | 6.74 | | | $ | 7.12 | | | $ | 8.40 | | | $ | 6.04 | | | $ | 7.88 | |
| Change in net assets from operations: | | | | | | | | | | | | | | | | | | | | |
| Net investment income | | | 0.19 | | | | 0.17 | | | | 0.20 | | | | 0.13 | | | | 0.04 | |
| Net realized and unrealized gain (loss) from investments | | | 2.22 | | | | (0.48 | ) | | | (1.32 | ) | | | 2.41 | | | | (1.66 | ) |
| Total from investment activities | | | 2.41 | | | | (0.31 | ) | | | (1.12 | ) | | | 2.54 | | | | (1.62 | ) |
| Distributions: | | | | | | | | | | | | | | | | | | | | |
| Net investment income | | | (0.23 | ) | | | (0.07 | ) | | | (0.16 | ) | | | (0.18 | ) | | | (0.22 | ) |
| Total distributions | | | (0.23 | ) | | | (0.07 | ) | | | (0.16 | ) | | | (0.18 | ) | | | (0.22 | ) |
| Redemption fees | | | — | (a) | | | — | | | | — | (a) | | | — | (a) | | | — | (a) |
| Net asset value, end of year | | $ | 8.92 | | | $ | 6.74 | | | $ | 7.12 | | | $ | 8.40 | | | $ | 6.04 | |
| Total Return | | | 36.64 | % | | | (4.41 | )% | | | (13.59 | )% | | | 42.38 | % | | | (21.30 | )% |
| Net assets, at end of year (000 omitted) | | $ | 3,979 | | | $ | 2,857 | | | $ | 2,857 | | | $ | 2,954 | | | $ | 2,028 | |
| Ratios and Supplemental Data: | | | | | | | | | | | | | | | | | | | | |
| Ratio of net expenses to average net assets | | | 1.75 | % | | | 1.75 | % | | | 1.75 | % | | | 1.75 | % | | | 1.75 | % |
| Ratio of gross expenses before waivers and/or reimbursements | | | 4.20 | % | | | 4.38 | % | | | 4.27 | % | | | 4.32 | % | | | 5.04 | % |
| Ratio of net investment income to average net assets | | | 2.52 | % | | | 2.38 | % | | | 2.27 | % | | | 1.56 | % | | | 0.69 | % |
| Portfolio turnover rate | | | 4 | % | | | 6 | % | | | 3 | % | | | 11 | % | | | 9 | % |
| (a) | Rounds to less than $0.005 per share. |
| See accompanying notes to financial statements. |
| |
19
| FINANCIAL STATEMENTS 2024 |
| |
| |
| FINANCIAL HIGHLIGHTS |
| Commonwealth Japan Fund |
Selected data for a share outstanding during each of the years indicated:
| | | For the Year
Ended
October 31,
2024 | | | For the Year
Ended
October 31,
2023 | | | For the Year
Ended
October 31,
2022 | | | For the Year
Ended
October 31,
2021 | | | For the Year
Ended
October 31,
2020 | |
| Net asset value, beginning of year | | $ | 3.42 | | | $ | 3.03 | | | $ | 4.41 | | | $ | 4.03 | | | $ | 4.12 | |
| Change in net assets from operations: | | | | | | | | | | | | | | | | | | | | |
| Net investment income (loss) | | | — | (a) | | | 0.01 | | | | (0.01 | ) | | | (0.02 | ) | | | (0.01 | ) |
| Net realized and unrealized gain (loss) from investments | | | 0.37 | | | | 0.38 | | | | (1.20 | ) | | | 0.40 | | | | (0.08 | ) |
| Total from investment activities | | | 0.37 | | | | 0.39 | | | | (1.21 | ) | | | 0.38 | | | | (0.09 | ) |
| Distributions: | | | | | | | | | | | | | | | | | | | | |
| Net investment income | | | — | (a) | | | — | | | | (0.04 | ) | | | — | | | | — | |
| Net realized gains | | | — | | | | — | | | | (0.13 | ) | | | — | | | | — | |
| Total distributions | | | — | | | | — | | | | (0.17 | ) | | | — | | | | — | |
| Net asset value, end of year | | $ | 3.79 | | | $ | 3.42 | | | $ | 3.03 | | | $ | 4.41 | | | $ | 4.03 | |
| Total Return | | | 10.93 | % | | | 12.87 | % | | | (28.39 | )% | | | 9.43 | % | | | (2.18 | )% |
| Net assets, at end of year (000 omitted) | | $ | 5,913 | | | $ | 5,561 | | | $ | 4,646 | | | $ | 6,732 | | | $ | 6,333 | |
| Ratios and Supplemental Data: | | | | | | | | | | | | | | | | | | | | |
| Ratio of net expenses to average net assets | | | 1.75 | % | | | 1.75 | % | | | 1.75 | % | | | 1.75 | % | | | 1.75 | % |
| Ratio of gross expenses before waivers and/or reimbursements | | | 3.29 | % | | | 3.45 | % | | | 3.38 | % | | | 3.01 | % | | | 3.29 | % |
| Ratio of net investment income (loss) to average net assets | | | 0.20 | % | | | 0.09 | % | | | (0.08 | )% | | | (0.51 | )% | | | (0.34 | )% |
| Portfolio turnover rate | | | 9 | % | | | 12 | % | | | 8 | % | | | 15 | % | | | 15 | % |
| (a) | Rounds to less than $0.005 per share. |
| See accompanying notes to financial statements. |
| |
20
| FINANCIAL STATEMENTS 2024 |
| |
| |
| FINANCIAL HIGHLIGHTS |
| Commonwealth Global Fund |
Selected data for a share outstanding during each of the years indicated:
| | | For the Year
Ended
October 31,
2024 | | | For the Year
Ended
October 31,
2023 | | | For the Year
Ended
October 31,
2022 | | | For the Year
Ended
October 31,
2021 | | | For the Year
Ended
October 31,
2020 | |
| Net asset value, beginning of year | | $ | 16.97 | | | $ | 16.86 | | | $ | 21.12 | | | $ | 16.20 | | | $ | 15.84 | |
| Change in net assets from operations: | | | | | | | | | | | | | | | | | | | | |
| Net investment loss | | | (0.15 | ) | | | (0.15 | ) | | | (0.09 | ) | | | (0.11 | ) | | | (0.08 | ) |
| Net realized and unrealized gain (loss) from investments | | | 3.99 | | | | 0.41 | | | | (4.17 | ) | | | 5.03 | | | | 0.44 | |
| Total from investment activities | | | 3.84 | | | | 0.26 | | | | (4.26 | ) | | | 4.92 | | | | 0.36 | |
| Distributions: | | | | | | | | | | | | | | | | | | | | |
| Net realized gains | | | — | | | | (0.15 | ) | | | — | | | | — | | | | — | |
| Total distributions | | | — | | | | (0.15 | ) | | | — | | | | — | | | | — | |
| Redemption fees | | | — | | | | — | | | | — | | | | — | | | | — | (a) |
| Net asset value, end of year | | $ | 20.81 | | | $ | 16.97 | | | $ | 16.86 | | | $ | 21.12 | | | $ | 16.20 | |
| Total Return | | | 22.63 | % | | | 1.51 | % | | | (20.17 | )% | | | 30.37 | % | | | 2.27 | % |
| Net assets, at end of year (000 omitted) | | $ | 16,918 | | | $ | 14,584 | | | $ | 14,825 | | | $ | 19,642 | | | $ | 15,597 | |
| Ratios and Supplemental Data: | | | | | | | | | | | | | | | | | | | | |
| Ratio of net expenses to average net assets | | | 2.54 | % | | | 2.61 | % | | | 2.49 | % | | | 2.33 | % | | | 2.47 | %(b) |
| Ratio of gross expenses before waivers and/or reimbursements | | | 2.54 | % | | | 2.61 | % | | | 2.49 | % | | | 2.33 | % | | | 2.56 | % |
| Ratio of net investment loss to average net assets | | | (0.72 | )% | | | (0.81 | )% | | | (0.44 | )% | | | (0.54 | )% | | | (0.49 | )% |
| Portfolio turnover rate | | | 4 | % | | | 9 | % | | | 7 | % | | | 6 | % | | | 8 | % |
| (a) | Rounds to less than $0.005 per share. |
| (b) | The ratio of net expenses include $14,458 in voluntary advisory waivers representing (0.09)%. For the period from May 12, 2020 to October 31, 2020, the Advisor voluntarily agreed to waive 0.20% of the Management Fee for the Fund. This voluntarily waiver is not subject to recoupment. |
| See accompanying notes to financial statements. |
| |
21
| FINANCIAL STATEMENTS 2024 |
| |
| |
| FINANCIAL HIGHLIGHTS |
| Commonwealth Real Estate Securities Fund |
Selected data for a share outstanding during each of the years indicated:
| | | For the Year
Ended
October 31,
2024 | | | For the Year
Ended
October 31,
2023 | | | For the Year
Ended
October 31,
2022 | | | For the Year
Ended
October 31,
2021 | | | For the Year
Ended
October 31,
2020 | |
| Net asset value, beginning of year | | $ | 17.86 | | | $ | 17.68 | | | $ | 22.57 | | | $ | 15.95 | | | $ | 18.16 | |
| Change in net assets from operations: | | | | | | | | | | | | | | | | | | | | |
| Net investment income (loss) | | | 0.03 | | | | 0.04 | | | | (0.10 | ) | | | (0.14 | ) | | | (0.04 | ) |
| Net realized and unrealized gain (loss) from investments | | | 6.82 | | | | 0.25 | | | | (4.63 | ) | | | 6.76 | | | | (2.01 | ) |
| Total from investment activities | | | 6.85 | | | | 0.29 | | | | (4.73 | ) | | | 6.62 | | | | (2.05 | ) |
| Distributions: | | | | | | | | | | | | | | | | | | | | |
| Net investment income | | | — | | | | — | | | | — | | | | — | | | | (0.07 | ) |
| Net realized gains | | | — | | | | (0.11 | ) | | | (0.16 | ) | | | — | | | | (0.09 | ) |
| Total distributions | | | — | | | | (0.11 | ) | | | (0.16 | ) | | | — | | | | (0.16 | ) |
| Redemption fees | | | — | (a) | | | — | | | | — | (a) | | | — | | | | — | (a) |
| Net asset value, end of year | | $ | 24.71 | | | $ | 17.86 | | | $ | 17.68 | | | $ | 22.57 | | | $ | 15.95 | |
| Total Return | | | 38.35 | % | | | 1.61 | % | | | (21.11 | )% | | | 41.50 | % | | | (11.42 | )% |
| Net assets, at end of year (000 omitted) | | $ | 16,832 | | | $ | 11,982 | | | $ | 11,620 | | | $ | 15,053 | | | $ | 10,790 | |
| Ratios and Supplemental Data: | | | | | | | | | | | | | | | | | | | | |
| Ratio of net expenses to average net assets | | | 2.54 | % | | | 2.71 | % | | | 2.58 | % | | | 2.44 | % | | | 2.63 | %(b) |
| Ratio of gross expenses before waivers and/or reimbursements | | | 2.54 | % | | | 2.71 | % | | | 2.58 | % | | | 2.44 | % | | | 2.72 | % |
| Ratio of net investment income (loss) to average net assets | | | 0.13 | % | | | 0.16 | % | | | (0.45 | )% | | | (0.66 | )% | | | (0.22 | )% |
| Portfolio turnover rate | | | 6 | % | | | 14 | % | | | 34 | % | | | 9 | % | | | 11 | % |
| (a) | Rounds to less than $0.005 per share. |
| (b) | The ratio of net expenses include $10,164 in voluntary waivers representing (0.09)%. For the period from May 12, 2020 to October 31, 2020, the Advisor voluntarily agreed to waive 0.20% of the Management Fee for the Fund. This voluntarily waiver is not subject to recoupment. |
| See accompanying notes to financial statements. |
| |
22
| FINANCIAL STATEMENTS 2024 |
| |
| |
| NOTES TO FINANCIAL STATEMENTS – October 31, 2024 |
Note 1 − Organization
Commonwealth International Series Trust (the ‘‘Trust’’) was organized as a Massachusetts business trust on May 2, 1986, and is registered under the Investment Company Act of 1940, as amended (the ‘‘1940 Act’’), as an open-end management investment company. The Trust currently consists of five diversified series: the Commonwealth Australia/New Zealand Fund (the ‘‘Australia/New Zealand Fund’’), the Africa Fund, the Commonwealth Japan Fund (the ‘‘Japan Fund’’), the Commonwealth Global Fund (the ‘‘Global Fund’’) and the Commonwealth Real Estate Securities Fund (the ‘‘Real Estate Securities Fund’’) (each a ‘‘Fund’’ and collectively the ‘‘Funds’’).
Note 2 − Investment Objectives
Each Fund’s investment objective is to provide long-term capital appreciation and current income. Under normal market conditions, each Fund (other than the Global Fund) invests at least 80% of its assets in the country or asset class specified in its name (i.e., Australia/New Zealand, Africa, Japan or Real Estate).
Note 3 − Significant Accounting Policies
The Funds are investment companies and follow accounting and reporting guidance under Financial Accounting Standards Board Accounting Standards Codification (“ASC”) Topic 946, “Financial Services-Investment Companies.” The following is a summary of significant accounting policies followed by the Funds in the preparation of their financial statements. These policies are in conformity with generally accepted accounting principles in the United States of America (“GAAP”).
A) Valuation of Securities − Each Fund’s assets and liabilities are valued normally on the basis of market quotations or official closing prices or, if there is no recent last sales price available, reference is made to the last mean quotation in the principal market in which the securities are normally traded. Equity securities that are traded on the NASDAQ National Market System, for which quotations are readily available, are valued at the official closing price. Options are valued at the last quoted sales price. If there is no such reported sale on the valuation date, long positions are valued at the most recent bid price, and short positions are valued at the most recent ask price. Debt securities are priced either by using a market quotation or an independent pricing service. The pricing service may use one or more pricing models. Investments in open-end investment companies are valued at net asset value. In the event that market quotations are not readily available or are considered unreliable due to market or other events, securities are valued in good faith by FCA Corp (the “Advisor”) as “valuation designee” under the oversight of the Board of Trustees (the “Board”). Fair value prices are generally provided by an independent fair value pricing service. The Funds have instituted a policy whereby the value of certain equity securities listed or traded on foreign security exchanges may be valued by an independent fair value pricing service on any day when certain conditions are met (trigger). The Australia/New Zealand Fund, Africa Fund and Japan Fund have retained an independent fair value pricing service to assist in the fair valuing of these foreign securities. The service utilizes statistical data based on historical performance of securities, markets, and other data in developing factors used to estimate a fair value. For the Australia/New Zealand Fund and Japan Fund, the trigger is based on a comparison between the S&P 500® Futures Index at the time of Tokyo market close to the S&P 500® Futures Index at the time of the New York market close. For the Africa Fund, the trigger is based on a comparison between the S&P 500® Futures Index at the time of London market close to the S&P 500® Futures Index at the time of the New York market close.
| FINANCIAL STATEMENTS 2024 |
| |
| |
| NOTES TO FINANCIAL STATEMENTS – October 31, 2024 – (Continued) |
B) Fair Value Measurements − The Funds’ investments have been categorized by tiers dependent upon the various ‘‘inputs’’ used to determine the fair value of the Funds’ investments. These inputs are summarized in the three broad levels listed below:
| ● | Level 1 − unadjusted quoted prices in active markets for identical investments and/or registered investment companies where the value per share is determined and published and is the basis for current transactions for identical assets or liabilities at the valuation date |
| ● | Level 2 − other significant observable inputs (including quoted prices for similar securities, interest rates, prepayments speeds, credit risk, etc.) |
| ● | Level 3 − significant unobservable inputs (including management’s own assumptions in determining the fair value of investments) |
A description of the valuation techniques applied to the Funds’ major categories of assets and liabilities measured at fair value on a recurring basis follows:
Common stocks, preferred stocks and exchange-traded funds - Securities traded on a national exchange (or reported on the NASDAQ national market) are stated at the last reported sales price on the day of valuation. Investments in other open-end registered investment companies, including money market funds, are valued at net asset value. To the extent these securities are actively traded and valuation adjustments are not applied, they are generally categorized in Level 1 of the fair value hierarchy. Securities traded on inactive markets, valued by reference to similar instruments or whose inputs are observable and timely would be categorized in Level 2 of the fair value hierarchy. To the extent certain conditions are met and the independent fair value pricing service uses a fair value factor for foreign equity securities, they will be classified as Level 2.
Corporate, Sovereign Bonds and U.S. Government & Agency Bonds - The fair value of bonds may be estimated using recently executed transactions, market price quotations (where observable), bond spreads, and/or credit default swap spreads adjusted for any basis difference between cash and derivative instruments. Domestically held corporate bonds and sovereign bonds are generally categorized in Level 2 of the fair value hierarchy; in instances where prices, spreads, or any of the other aforementioned key inputs are unobservable, they would be categorized in Level 3 of the fair value hierarchy.
Written/Purchased Options - Listed derivatives that are actively traded are valued based on quoted prices from the exchange and are generally categorized in Level 1 of the fair value hierarchy. If there is no reported close price on the valuation date, long positions are valued at the most recent bid price and short positions are valued at the most recent ask price. In this instance, the securities would generally be categorized as Level 2.
The inputs or methodology used for valuing securities are not necessarily an indication of the risk associated with investing in those securities.
| FINANCIAL STATEMENTS 2024 |
| |
| |
| NOTES TO FINANCIAL STATEMENTS – October 31, 2024 – (Continued) |
The following is a summary of the inputs used to value the Funds’ investments as of October 31, 2024:
| | | Australia/New Zealand Fund | |
| | | Level 1 | | | Level 2 | | | Level 3 | | | Total | |
| Security Type | | | | | | | | | | | | | | | | |
| Common Stocks(a) | | $ | 146,616 | | | $ | 10,949,475 | | | $ | — | | | $ | 11,096,091 | |
| Money Market Funds | | | 90,552 | | | | — | | | | — | | | | 90,552 | |
| Total | | $ | 237,168 | | | $ | 10,949,475 | | | $ | — | | | $ | 11,186,643 | |
| | | Africa Fund | |
| | | Level 1 | | | Level 2 | | | Level 3 | | | Total | |
| Security Type | | | | | | | | | | | | | | | | |
| Common Stocks(a) | | $ | 3,847,873 | | | $ | — | | | $ | — | | | $ | 3,847,873 | |
| Sovereign Bonds | | | — | | | | 90,117 | | | | — | | | | 90,117 | |
| Money Market Funds | | | 35,622 | | | | — | | | | — | | | | 35,622 | |
| Total | | $ | 3,883,495 | | | $ | 90,117 | | | $ | — | | | $ | 3,973,612 | |
| | | Japan Fund | |
| | | Level 1 | | | Level 2 | | | Level 3 | | | Total | |
| Security Type | | | | | | | | | | | | | | | | |
| Common Stocks(a) | | $ | 17,820 | | | $ | 5,585,256 | | | $ | — | | | $ | 5,603,076 | |
| Corporate Bonds | | | — | | | | 259,917 | | | | — | | | | 259,917 | |
| Money Market Funds | | | 8,330 | | | | — | | | | — | | | | 8,330 | |
| Total | | $ | 26,150 | | | $ | 5,845,173 | | | $ | — | | | $ | 5,871,323 | |
| | | Global Fund | |
| | | Level 1 | | | Level 2 | | | Level 3 | | | Total | |
| Security Type | | | | | | | | | | | | | | | | |
| Common Stocks(a) | | $ | 16,809,926 | | | $ | — | | | $ | — | | | $ | 16,809,926 | |
| Money Market Funds | | | 102,455 | | | | — | | | | — | | | | 102,455 | |
| Total | | $ | 16,912,381 | | | $ | — | | | $ | — | | | $ | 16,912,381 | |
| | | Real Estate Securities Fund | |
| | | Level 1 | | | Level 2 | | | Level 3 | | | Total | |
| Security Type | | | | | | | | | | | | | | | | |
| Common Stocks(a) | | $ | 15,433,292 | | | $ | — | | | $ | — | | | $ | 15,433,292 | |
| U.S. Government & Agencies | | | — | | | | 1,033,490 | | | | — | | | | 1,033,490 | |
| Money Market Funds | | | 358,712 | | | | — | | | | — | | | | 358,712 | |
| Total | | $ | 15,792,004 | | | $ | 1,033,490 | | | $ | — | | | $ | 16,825,494 | |
| (a) | For a detailed breakout by industry or country, please refer to the Schedules of Investments. All level 2 positions are classified as such from fair value factor adjustments as of October 31, 2024 as described in the Note above. |
| FINANCIAL STATEMENTS 2024 |
| |
| |
| NOTES TO FINANCIAL STATEMENTS – October 31, 2024 – (Continued) |
C) Currency Translation − For purposes of determining each Fund’s net asset value, all assets and liabilities initially expressed in foreign currency values are converted into U.S. dollar values at the prevailing market rate on each U.S. business day. The cost of securities is determined by using an exchange rate provided by an independent third party. Income is translated at approximate rates prevailing when accrued. The Funds do not isolate that portion of gains and losses on investments which is due to changes in foreign exchange rates from that which is due to changes in the market prices of the investments. Such fluctuations are included with the net realized and unrealized gains and losses from investments.
D) Allocations of Expenses − Expenses directly attributable to a Fund are charged directly to that Fund, while expenses which are attributable to more than one Fund, or the Trust, are allocated among the respective Funds based upon relative net assets or some other reasonable method.
E) Accounting for Investments − Security transactions are accounted for on the trade date for financial reporting purposes. Realized gains and losses on security transactions are based on the identified cost basis for both financial statement and Federal income tax purposes. Dividend income and distributions to shareholders are recorded on the ex-dividend date or as soon as known if after the ex-dividend date. Dividend income from real estate investment trusts (REITs) and distributions from limited partnerships are recognized on the ex-date and included in dividend income. The calendar year-end classification of distributions received from REITs, which may include return of capital, during the fiscal year are reported subsequent to year end; accordingly, the Funds estimate the character of REIT distributions based on the most recent information available. Income or loss from limited partnerships is reclassified among the components of net assets upon receipt of K-1’s. Discounts and premiums on bonds purchased are amortized over the life of the bonds using the effective interest method (which may include maturity or call date). Interest income and estimated expenses are accrued daily. Non-cash income, if any, is recorded at the fair market value of the securities received.
F) Federal Income Taxes − It is each Fund’s policy to comply with the requirements of Subchapter M of the Internal Revenue Code that are applicable to regulated investment companies and to distribute substantially all investment company taxable income and net capital gain to shareholders in a manner which results in no tax cost to the Funds. Therefore, no federal income tax provision is required.
Dividends or interest on foreign securities may be subject to the withholding of the country of domicile’s income tax by tax treaty provisions or otherwise. Generally, there are no foreign taxes applicable to the Funds’ capital gains realized on foreign securities in their country of domicile.
The Trust has evaluated tax positions taken or expected to be taken in the course of preparing each Fund’s tax returns to determine whether it is more-likely-than not (i.e., greater than 50-percent chance) that each tax position will be sustained upon examination by a taxing authority based on the technical merits of the position. A tax position that meets the more-likely-than-not recognition threshold is measured to determine the amount of benefit to recognize in the financial statements. Differences between tax positions taken in a tax return and amounts recognized in the financial statements will generally result in an increase in a liability for taxes payable (or a reduction of a tax refund receivable), including the recognition of any related interest and penalties as an operating expense. Tax positions taken in tax years remain subject to examination by tax authorities (generally three years plus the interim tax period since then for federal income tax purposes). The determination has been made that there are not any uncertain tax positions that would require the Funds to record a tax liability and, therefore, there is no impact to the Funds’ financial statements.
| FINANCIAL STATEMENTS 2024 |
| |
| |
| NOTES TO FINANCIAL STATEMENTS – October 31, 2024 – (Continued) |
G) Distributions to Shareholders − The Funds distribute net investment income, if any, and net realized gains (net of any capital loss carryforwards) annually. Income and capital gain distributions are determined in accordance with income tax regulations, which may differ from GAAP. These differences are primarily due to differing treatments for foreign currency transactions and deferrals of certain losses.
H) Redemption Fees − Redemption fees are applicable to certain redemptions of shares within fourteen calendar days of purchase. The redemption fee is imposed to discourage abusive trading activity, which can have disruptive effects on the Funds’ portfolio management and can increase the Funds’ expenses. The redemption fees are intended to offset, at least partially, portfolio transaction and administrative costs associated with short-term trading. The shareholder will be charged a fee equal to 2.00% of the amount redeemed and will be charged when shares are sold, exchanged or involuntarily redeemed. In determining the applicability of the redemption fee, shares held for the longest period of time will be treated as being sold first and shares held for the shortest period of time as being sold last. For the fiscal year ended October 31, 2024, the Africa Fund and Real Estate Fund had contributions to capital due to redemption fees in the amount of $20 and $207, respectively.
I) Option Accounting Principles − A Fund may purchase or write put or call options on futures contracts, individual securities, currencies or stock indices to hedge against fluctuations in securities prices and currency exchange rates and to adjust its risk exposure relative to the benchmark. The Fund may use these derivatives for any purpose consistent with its investment objective, such as hedging, obtaining market exposure, and generating premium income.
When a Fund writes an option, the premium received is recorded as a liability. Each day the option contract liability is valued in accordance with the procedures for security valuation discussed previously. When an offsetting option is purchased (a closing transaction) or the option contract expires, the Fund realizes a gain or loss and the liability related to such option contract is eliminated. When a call option is exercised, the Fund realizes a gain or loss from the sale of the underlying security and the proceeds of the sale are increased by the premiums originally received. During and as of the fiscal year ended October 31, 2024, the Funds had no written options.
When a Fund purchases an option, the premium paid is recorded as an asset. Each day, the option contract is valued in accordance with the procedures for security valuation discussed previously. When an offsetting option is written (a closing transaction) or the option contract expires, the Fund realizes a gain or loss and the asset representing such option contract is eliminated. When a call option is exercised, the Fund purchases the underlying security and the cost basis of such purchase is increased by the premium originally paid. During and as of the fiscal year ended October 31, 2024, the Funds had no purchased options.
J) Forward Currency Contracts − Forward currency contracts may be undertaken to hedge against possible variations in the foreign exchange rates between the U.S. dollar and foreign currencies. A forward currency contract is an agreement between two parties to buy or sell a currency at a set price on a future date. Forward contracts are marked-to-market daily and the change in the market value is recorded by the Fund as an unrealized gain or loss. When a contract is closed, the Fund records a realized gain or loss equal to the difference between the value of the contract at the time it was opened and the value at the time it was closed. The Funds could be exposed to risk if the counterparties are unable to meet the terms of the contracts or if the value of the currency changes unfavorably. Other risks of forward currency contracts include failing to achieve expected
| FINANCIAL STATEMENTS 2024 |
| |
| |
| NOTES TO FINANCIAL STATEMENTS – October 31, 2024 – (Continued) |
benefit, markets moving in a direction that the Funds did not expect, a Fund’s ability to close out its position in the hedging instrument, and political and social unrest and the possibility of negative governmental actions. During and as of the fiscal year ended October 31, 2024, the Funds held no forward currency contracts.
K) Use of Estimates − The preparation of the financial statements in conformity with GAAP requires management to make estimates and assumptions that affect the reported amounts of assets and liabilities and the disclosure of contingent assets and liabilities at the date of the financial statements and the reported amounts of increases and decreases in net assets from operations during the reporting period. Actual results could differ from those estimates and these differences could be material.
L) Regulatory Update − Tailored Shareholder Reports for Mutual Funds and Exchange - Traded Funds (“ETFs”) – Effective January 24, 2023, the SEC adopted rule and form amendments to require mutual funds and ETFs to transmit concise and visually engaging streamlined annual and semi-annual reports to shareholders that highlight key information. Other information, including financial statements, will appear in a streamlined shareholder report but must be available online, delivered free of charge upon request, and filed on a semi-annual basis on Form N-CSR.
Note 4 − Related Party Transactions and Other Arrangements
A) Investment Advisor − The Trust, on behalf of each Fund, has retained FCA Corp as the Funds’ investment advisor. Under each Fund’s Investment Advisory Agreement, the Advisor is paid a fee (the “Management Fee”), calculated daily and payable monthly, equal to an annual rate of 0.75% of the average net assets of each Fund.
The Advisor entered into an expense limitation agreement through February 28, 2025, under which it has agreed to limit the total expenses of the Africa Fund and the Japan Fund (exclusive of interest, distribution fees pursuant to Rule 12b-1 Plans, taxes, acquired fund fees and expenses, brokerage commissions, extraordinary expenses and dividend expense on short sales) to an annual rate of 1.50% and 1.50% of the average daily net assets of the Africa Fund and the Japan Fund, respectively. The Advisor may not terminate this arrangement prior to February 28, 2025, unless the investment advisory agreement is terminated. The Africa Fund and the Japan Fund each have agreed to repay the Advisor for amounts waived by the Advisor pursuant to the fee waiver agreement to the extent that such repayment occurs within three fiscal years of the date of any such waiver and such repayment does not cause the Africa Fund or the Japan Fund to exceed the expense limitation in place at the time the fee was waived. As of October 31, 2024, the Advisor may seek repayment of investment advisory fee waivers and expense reimbursements in the amounts as follows:
| Recoverable Through | | Africa Fund | | | Japan Fund | |
| October 31, 2025 | | $ | 80,809 | | | $ | 91,747 | |
| October 31, 2026 | | | 80,585 | | | | 94,303 | |
| October 31, 2027 | | | 81,485 | | | | 93,739 | |
Certain officers of the Trust are also officers of the Advisor.
B) Administration, Fund Accounting and Transfer Agent –Ultimus Fund Solutions, LLC (the “Administrator”) serves as the administrator, transfer agent and fund accountant to the Funds. For these services, the Administrator receives fees computed at an annual rate of the daily net assets of the Funds, subject to a minimum annual contractual fee. Certain officers of the Trust are also employees of the Administrator, but are paid no fees directly by the Funds for serving as an officer of the Trust.
| FINANCIAL STATEMENTS 2024 |
| |
| |
| NOTES TO FINANCIAL STATEMENTS – October 31, 2024 – (Continued) |
C) Distribution – Ultimus Fund Distributors, LLC (the “Distributor”), an affiliate of the Administrator, serves as the principal underwriter for the shares of each Fund of the Trust and receives an annual contractual fee.
Each Fund has adopted a Service and Distribution Plan (each a “Plan”) pursuant to Rule 12b-1 under the Act, whereby up to 0.35% of the Funds’ assets may be used to reimburse the Distributor for costs and expenses incurred in connection with the distribution and marketing of shares of the Funds and the servicing of the Funds’ shareholders. Distribution and marketing expenses include, among other things, printing of prospectuses, marketing literature, and costs of personnel involved with the promotion and distribution of the Funds’ shares. These amounts are disclosed on the Statements of Operations under Distribution (12b-1) fees. While the plans permit each Fund to pay up to 0.35% of its average daily net assets to reimburse for certain expenses in connection with the distribution of its shares, the Board has currently authorized each Fund to pay out only 0.25% under its Plan. If the Board’s intention changes on this matter, the Funds will amend or supplement their prospectus. Out of the foregoing amount, each Fund is permitted to pay up to an aggregate of 0.25% of its average daily net assets to reimburse for certain shareholder services.
D) Legal Counsel − Practus, LLP serves as legal counsel to the Trust. John H. Lively, Secretary of the Trust, is the managing partner of Practus, LLP, but he receives no special compensation from the Trust or the Funds for serving as an officer of the Trust.
Note 5 − Purchases and Sales of Securities
Purchases and sales of investment securities (excluding short-term securities) by the Funds for the fiscal year ended October 31, 2024, were as follows:
| | | Purchases | | | Sales | |
| Australia/New Zealand Fund | | $ | 881,154 | | | $ | 1,883,708 | |
| Africa Fund | | | 257,282 | | | | 115,810 | |
| Japan Fund | | | 550,897 | | | | 742,051 | |
| Global Fund | | | 737,892 | | | | 1,556,087 | |
| Real Estate Securities Fund | | | 1,498,803 | | | | 901,798 | |
The Real Estate Securities Fund had long-term purchases for U.S. Government Obligations in the amount of $740,495 during the fiscal year ended October 31, 2024. There were no sales for U.S. Government Obligations for any of the Funds during the fiscal year ended October 31, 2024.
Note 6 − Financial Instruments with Off-Balance Sheet Risk
In the ordinary course of trading activities, certain of the Funds may trade and hold certain derivative contracts. Such contracts include forward currency contracts, where the Funds would be obligated to buy currency at specified prices, and written put and call options, where the Funds would be obligated to purchase or sell securities at specified prices (i.e., the options are exercised by the counterparties). The maximum payout for the put option contracts is limited to the number of contracts written and the related strike prices, respectively. The maximum payout for uncovered written call option contracts is limited only by how high the underlying rises above the strike price. Maximum payout amounts could be offset by the subsequent sale, if any, of assets obtained via the execution of a payout event.
| FINANCIAL STATEMENTS 2024 |
| |
| |
| NOTES TO FINANCIAL STATEMENTS – October 31, 2024 – (Continued) |
These financial instruments contain varying degrees of off-balance sheet risk whereby changes in the market value of securities underlying the financial instruments may be in excess of the amounts recognized in the Statements of Assets and Liabilities. A Fund, as writer of an option, bears the market risk of an unfavorable change in the price of the security underlying the written option. The risk associated with purchasing an option is that the Fund pays a premium whether or not the option is exercised. Additionally, each Fund bears the risk of loss of premium and change in market value should the counterparty not perform under the contract. A call option gives the holder the right to buy the underlying stock from the writer at a specified price within a fixed period of time. Therefore, the securities held by the Fund against which options are written may not be traded and are held in escrow by the custodian. In the ordinary course of trading activities, certain of the Funds trade and hold certain fair-valued derivative contracts. Such contracts include forward currency contracts, where the Funds would be obligated to buy currency at specified prices, and written put and call options, where the Funds would be obligated to purchase or sell securities at specified prices (i.e., the options are exercised by the counterparties). The maximum payout for the put option contracts is limited to the number of contracts written and the related strike prices, respectively. The maximum payout for uncovered written call option contracts is limited only by how high the underlying security price rises above the strike price. Maximum payout amounts could be offset by the subsequent sale, if any, of assets obtained via the execution of a payout event.
Note 7 – Tax Matters
At October 31, 2024, the gross unrealized appreciation (depreciation) on investments, foreign currency translations and cost of securities on a tax basis for federal income tax purposes were as follows:
| | | Australia/New
Zealand Fund | | | Africa Fund | | | Japan Fund | | | Global Fund | | | Real Estate
Securities Fund | |
| Gross unrealized appreciation | | $ | 4,988,453 | | | $ | 963,654 | | | $ | 2,153,083 | | | $ | 9,728,333 | | | $ | 9,131,648 | |
| Gross unrealized depreciation | | | (871,530 | ) | | | (422,960 | ) | | | (220,247 | ) | | | (37,578 | ) | | | (94,389 | ) |
| Net unrealized appreciation (depreciation) on investments | | $ | 4,116,923 | | | $ | 540,694 | | | $ | 1,932,836 | | | $ | 9,690,755 | | | $ | 9,037,259 | |
| Tax cost of investments | | $ | 7,069,720 | | | $ | 3,432,918 | | | $ | 3,938,487 | | | $ | 7,221,626 | | | $ | 7,788,235 | |
The difference between cost amounts for financial statement and federal income tax purposes is due primarily to wash sale loss deferrals, straddle deferrals and passive foreign investment companies (‘PFICs’’).
As of October 31, 2024, the components of accumulated earnings (deficit) on a tax basis were as follows:
| | | Australia/New
Zealand Fund | | | Africa Fund | | | Japan Fund | | | Global Fund | | | Real Estate
Securities Fund | |
| Undistributed ordinary income | | $ | 123,034 | | | $ | 157,911 | | | $ | 33,911 | | | $ | — | | | $ | 5,569 | |
| Undistributed long-term capital gains | | | 34,907 | | | | — | | | | — | | | | 547,543 | | | | 283,494 | |
| Tax accumulated earnings | | | 157,941 | | | | 157,911 | | | | 33,911 | | | | 547,543 | | | | 289,063 | |
| Accumulated capital and other losses | | | — | | | | (955,507 | ) | | | (53,101 | ) | | | (88,410 | ) | | | — | |
| Unrealized appreciation (depreciation) on investments | | | 4,073,636 | | | | 540,705 | | | | 1,930,010 | | | | 9,690,755 | | | | 9,037,259 | |
| Unrealized appreciation (depreciation) on foreign currency translations | | | — | | | | — | | | | — | | | | — | | | | — | |
| Total accumulated earnings (deficit) | | $ | 4,231,577 | | | $ | (256,891 | ) | | $ | 1,910,820 | | | $ | 10,149,888 | | | $ | 9,326,322 | |
| FINANCIAL STATEMENTS 2024 |
| |
| |
| NOTES TO FINANCIAL STATEMENTS – October 31, 2024 – (Continued) |
The tax character of distributions paid during the tax years ended October 31, 2024 and 2023 were as follows:
| | | Australia/New
Zealand Fund | | | Africa Fund | | | Japan Fund | | | Global Fund | | | Real Estate Fund | |
| | | Year
Ended
October 31,
2024 | | | Year
Ended
October 31,
2023 | | | Year
Ended
October 31,
2024 | | | Year
Ended
October 31,
2023 | | | Year
Ended
October 31,
2024 | | | Year
Ended
October 31,
2023 | | | Year
Ended
October 31,
2024 | | | Year
Ended
October 31,
2023 | | | Year
Ended
October 31,
2024 | | | Year
Ended
October 31,
2023 | |
| Distributions paid from: | | | | | | | | | | | | | | | | | | | | | | | | | | | | | | | | | | | | | | | | |
| Ordinary income | | $ | 31,068 | | | $ | 37 | | | $ | 99,144 | | | $ | 30,003 | | | $ | 5,994 | | | $ | — | | | $ | — | | | $ | — | | | $ | — | | | $ | — | |
| Net long-term capital gains | | | — | | | | 76,761 | | | | — | | | | — | | | | — | | | | — | | | | — | | | | 128,817 | | | | — | | | | 70,458 | |
| Total distributions paid | | $ | 31,068 | | | $ | 76,798 | | | $ | 99,144 | | | $ | 30,003 | | | $ | 5,994 | | | $ | — | | | $ | — | | | $ | 128,817 | | | $ | — | | | $ | 70,458 | |
As of October 31, 2024, the following Funds had net capital loss carryforwards which are available to offset future net capital gains, if any:
| | | Australia/New
Zealand Fund | | | Africa Fund | | | Japan Fund | | | Global Fund | | | Real Estate Fund | |
| | | Short-Term | | | Long-Term | | | Short-Term | | | Long-Term | | | Short-Term | | | Long-Term | | | Short-Term | | | Long-Term | | | Short-Term | | | Long-Term | |
| For losses expiring October 31, Non-Expiring | | $ | — | | | $ | — | | | $ | 16,130 | | | $ | 939,377 | | | $ | 35,797 | | | $ | 17,304 | | | $ | — | | | $ | — | | | $ | — | | | $ | — | |
Capital loss carryforwards are available to offset future realized capital gains and thereby reduce further taxable gain distributions.
As of October 31, 2024, the Global Fund had $88,410 of qualified late-year ordinary losses, which were deferred until fiscal year 2024 for tax purposes. Net late-year losses incurred after October 31 and within the taxable year are deemed to arise on the first day of the Funds’ next taxable year.
The Funds have recorded reclassifications in their capital accounts. These reclassifications have no impact on the net asset value of the Funds and are designed generally to present accumulated earnings (deficit) on a tax basis which is considered to be more informative to the shareholder. The permanent differences primarily relate to non-deductible excise tax, net operating losses, and taxable over distribution. As of October 31, 2024, the Funds recorded the following reclassifications to increase (decrease) the capital accounts listed below:
| | Australia/New
Zealand Fund | | | Africa Fund | | | Japan Fund | | | Global Fund | | | Real Estate
Securities Fund | |
| Paid-in capital | | $ | — | | | $ | (784 | ) | | $ | — | | | $ | (128,648 | ) | | $ | 14,929 | |
| Accumulated earnings (deficit) | | | — | | | | 784 | | | | — | | | | 128,648 | | | | (14,929 | ) |
| FINANCIAL STATEMENTS 2024 |
| |
| |
| NOTES TO FINANCIAL STATEMENTS – October 31, 2024 – (Continued) |
Note 8− Revolving Credit Agreement
The Trust has in place an Amended and Restated Revolving Credit Agreement (the “Agreement”) with its custodian, Fifth Third Bank N.A. (the “Bank”). Pursuant to the terms of the Agreement, the Bank makes available to the Trust, a line of credit facility under which the Bank may make loans to the Trust, on behalf of the Funds, from time to time. The Agreement provides a line of credit in an amount of up to $1,000,000 (the “Committed Amount”) for the Trust with respect to all of the Funds. The Agreement further limits the amount that any Fund may borrow subject to the requirements specified by the 1940 Act, which generally permits a fund to borrow and pledge its shares to secure such borrowing, provided, that immediately thereafter there is asset coverage of at least 300% for all borrowings by a fund from a bank. If borrowings exceed this 300% asset coverage requirement by reason of a decline in net assets of a fund, the fund will reduce its borrowings within three days to the extent necessary to comply with the 300% asset coverage requirement. The 1940 Act also permits a fund to borrow for temporary purposes only in an amount not exceeding 5% of the value of its total assets at the time when the loan is made. The terms of the agreement include a non-refundable commitment fee annually in an amount equal to $2,000. Any principal balance outstanding bears interest at the prime rate in effect at the time plus 0% and any amounts not drawn will be assessed unused fees at the rate of 0.275%.
The average amount of borrowings for the days which the Funds borrowed and the average interest rate on those borrowings by the Funds during the fiscal year ended October 31, 2024, were as follows:
| | | Average Principal | | | Average Interest Rate | |
| Australia/New Zealand Fund | | $ | 56,667 | | | | 8.50 | % |
| Japan Fund | | | 163,870 | | | | 8.50 | % |
During the fiscal year ended October 31, 2024, the Australia/New Zealand Fund and Japan Fund paid $69, and $232, respectively, in interest on borrowings and overdrafts. There were no borrowings outstanding under the Agreement as of October 31, 2024. The Funds only utilize the line of credit for draws greater than $50,000.
Note 9 − Contractual Obligations
Under the Trust’s organizational documents, its Trustees and Officers are indemnified against certain liabilities arising out of the performance of their duties to the Funds. In the normal course of business, the Funds enter into contracts that contain various representations and warranties and provide general indemnifications. The Funds’ maximum exposure under these arrangements is dependent on future claims against the Funds and is presently unknown. Currently however, the Funds expect the risk of loss to be remote.
Note 10 − Concentration of Market Risk
The Australia/New Zealand Fund has a majority of its investments in securities issued by Australian and New Zealand issuers, the Africa Fund invests primarily in securities issued by African issuers and the Japan Fund invests primarily in securities of Japanese issuers. Investing in companies from specific geographic regions, such as Australia, New Zealand, Africa or Japan, may pose additional risks inherent to a region’s economic and political situation. These events will not necessarily affect the U.S. economy or similar issuers located in the U.S. In addition, many of the investments in Australia, New Zealand, Africa or
| FINANCIAL STATEMENTS 2024 |
| |
| |
| NOTES TO FINANCIAL STATEMENTS – October 31, 2024 – (Continued) |
Japan are denominated in foreign currencies. As a result, changes in the values of these currencies compared to the U.S. dollar may affect (positively or negatively) the value of the Funds’ investments. These events may happen separately from, and in response to, events that do not otherwise affect the values of the securities in the issuers’ home countries.
As of October 31, 2024, the Australia/New Zealand Fund held approximately 10% of its net assets in South Port New Zealand Ltd. Due to the large position, an increase or decrease in the value of this security may have a greater impact on the Australia/ New Zealand Fund’s net asset value and total return than if the Australia/New Zealand Fund did not focus as much in this particular security.
The Africa Fund may be exposed to additional risks by focusing its investments on issuers in African countries to which other funds invested in securities of issuers in a broader region may not be exposed. The Africa Fund is highly dependent on the state of economics of countries throughout Africa and, Sub-Saharan countries. Changes in economics, tax policies, inflation rates, governmental instability, war or other political or economic factors may affect (positively or negatively) the Fund’s investments.
A large portion of investments held by the Real Estate Securities Fund are considered investments in the real estate sector of the market, which may include REITs. Investing in REITs involves certain unique risks in addition to those risks associated with investing in the real estate industry in general. Equity REITs may be affected by changes in the value of the underlying property owned by the REITs, while mortgage REITs may be affected by the quality of any credit extended. REITs are dependent upon management skills, are not diversified, are subject to heavy cash flow dependency, default by borrowers and self-liquidation. REITs are also subject to the possibilities of failing to qualify for tax-free pass through of income and maintaining their exemption from registration under the 1940 Act. Investing in a single market sector may be riskier than investing in a variety of market sectors.
Note 11 − Subsequent Events
Management of the Funds has evaluated the need for disclosures resulting from subsequent events through the date these financial statements were issued.
Mr. Jack Ewing and Ms. Kathleen Kelly have each resigned as an Independent Trustee of the Trust, effective December 10, 2024. Additionally, on October 15, 2024, the Board selected Caroline Montalbano and Anthony Box, Jr. to fill the vacancies resulting from Mr. Ewing’s and Ms. Kelly’s retirement from the Board and for each to serve as an Independent Trustee of the Trust. Ms. Montalbano’s and Mr. Box’s service as Independent Trustees became effective concurrently with the effectiveness of Mr. Ewing and Ms. Kelly’s resignation on December 10, 2024. The Trustees were elected by shareholders at a meeting held on December 4, 2024. In addition, the Board of the Trust has elected Christina Doherty to serve as an Interested Trustee of the Trust effective on December 10, 2024. Two trustees of the Trust, Mr. Robert Scharar, an Interested Trustee, and Mr. John Akard, an Independent Trustee, will continue to serve on the Board.
| FINANCIAL STATEMENTS 2024 |
| |
| |
| NOTES TO FINANCIAL STATEMENTS – October 31, 2024 – (Continued) |
Subsequent to October 31, 2024, income and capital gain distributions were made to the shareholders of certain Commonwealth Funds, meeting the criteria of a subsequent event. The record date of the distributions were December 13, 2024, with an ex-dividend date of December 16, 2024 and a payable date of December 16, 2024.
| Fund Name | | Distribution Type | | Rate | | | Amount | |
| Australia/New Zealand Fund | | Income | | $ | 0.1172 | | | $ | 123,104 | |
| Australia/New Zealand Fund | | Long-Term Capital Gain | | | 0.0333 | | | | 34,977 | |
| Africa Fund | | Income | | | 0.3551 | | | | 157,934 | |
| Japan Fund | | Income | | | 0.0218 | | | | 34,024 | |
| Global Fund | | Long-Term Capital Gain | | | 0.6789 | | | | 547,611 | |
| Real Estate Securities Fund | | Income | | | 0.0083 | | | | 5,636 | |
| Real Estate Securities Fund | | Long-Term Capital Gain | | | 0.4176 | | | | 283,559 | |
| FINANCIAL STATEMENTS 2024 |
| |
| |
| REPORT OF INDEPENDENT REGISTERED PUBLIC ACCOUNTING FIRM |
To the Shareholders and Board of Trustees of
Commonwealth International Series Trust
Opinion on the Financial Statements
We have audited the accompanying statements of assets and liabilities, including the schedules of investments, of Commonwealth Australia/New Zealand Fund, Africa Fund, Commonwealth Japan Fund, Commonwealth Global Fund, and Commonwealth Real Estate Securities Fund (the “Funds”), each a series of Commonwealth International Series Trust, as of October 31, 2024, the related statements of operations for the year then ended, the statements of changes in net assets and the financial highlights for each of the two years in the period then ended, and the related notes (collectively referred to as the “financial statements”). In our opinion, the financial statements present fairly, in all material respects, the financial position of each of the Funds as of October 31, 2024, the results of their operations for the year then ended, and the changes in net assets and the financial highlights for each of the two years in the period then ended, in conformity with accounting principles generally accepted in the United States of America.
The Funds’ financial highlights for the years ended October 31, 2022, and prior, were audited by other auditors whose report dated December 22, 2022, expressed an unqualified opinion on those financial highlights.
Basis for Opinion
These financial statements are the responsibility of the Funds’ management. Our responsibility is to express an opinion on the Funds’ financial statements based on our audits. We are a public accounting firm registered with the Public Company Accounting Oversight Board (United States) (“PCAOB”) and are required to be independent with respect to the Funds in accordance with the U.S. federal securities laws and the applicable rules and regulations of the Securities and Exchange Commission and the PCAOB.
We conducted our audits in accordance with the standards of the PCAOB. Those standards require that we plan and perform the audit to obtain reasonable assurance about whether the financial statements are free of material misstatement whether due to error or fraud.
Our audits included performing procedures to assess the risks of material misstatement of the financial statements, whether due to error or fraud, and performing procedures that respond to those risks. Such procedures included examining, on a test basis, evidence regarding the amounts and disclosures in the financial statements. Our procedures included confirmation of securities owned as of October 31, 2024, by correspondence with the custodian. Our audits also included evaluating the accounting principles used and significant estimates made by management, as well as evaluating the overall presentation of the financial statements. We believe that our audits provide a reasonable basis for our opinion.
We have served as the Funds’ auditor since 2023.

COHEN & COMPANY, LTD.
Philadelphia, Pennsylvania
December 26, 2024
| FINANCIAL STATEMENTS 2024 |
| |
| |
| ADDITIONAL INFORMATION – October 31, 2024 (Unaudited) |
Disclosure of Portfolio Holdings
The Funds file their complete schedule of portfolio holdings with the Securities and Exchange Commission (the ‘‘Commission’’) for the first and third quarters of each fiscal year as an exhibit to its reports on Form N-PORT. The Funds’ Form N-PORT reports are available on the Commission’ website at http://www.sec.gov and on the Funds’ website at www.commonwealthfunds.com.
Proxy Voting
A description of the policies and procedures that the Funds use to determine how to vote proxies relating to portfolio securities is available without charge, upon request, by calling 888-345-1898, and on the Commissions website at http://www.sec.gov.
Information regarding how the Funds voted proxies relating to portfolio securities during the most recent 12-month period ended June 30 is available without charge, upon request, by calling 888-345-1898, and on the Commission’s website at http://www.sec.gov.
Additional Federal Income Tax Information
The Form 1099-DIV you receive in January 2025 will show the tax status of all distributions paid to your account in calendar year 2024. Shareholders are advised to consult their own tax adviser with respect to the tax consequences of their investment in the Fund. As required by the Internal Revenue Code and/or regulations, shareholders must be notified regarding the status of qualified dividend income for individuals and the dividends received deduction for corporations.
Qualified Dividend Income
The Australia/New Zealand Fund, Africa Fund and Japan Fund designates approximately 100%, 97% and 100%, respectively, or up to the maximum amount of such dividends allowable pursuant to the Internal Revenue Code, as qualified dividend income eligible for a reduced tax rate.
Qualified Business Income
Each of the Funds designate 0% of its ordinary income dividends, or up to the maximum amount of such dividends allowable pursuant to the Internal Revenue Code, as qualified business income.
Dividends Received Deduction
Corporate shareholders are generally entitled to take the dividends received deduction on the portion of the Fund’s dividend distribution that qualifies under the tax law. For each Funds’ calendar year 2024 ordinary income dividends, 0% qualifies for the corporate dividends received deduction.
For the year ended October 31, 2024, each Fund designated $0 as 20% long-term capital gain distributions.
Foreign Tax Credit Pass Through
The Funds intend to elect to pass through to shareholders the income tax credit for taxes paid to foreign countries. The Japan Fund foreign source income per share was $0.0823. The pass-through of the foreign tax credit will only affect those persons who are shareholders on the dividend record date in October 2024. These shareholders will receive more detailed information along with the 2024 Form 1099-DIV.
[THIS PAGE INTENTIONALLY LEFT BLANK]
| Commonwealth International |
| Series Trust |
| 791 Town & Country Blvd., Suite 250 |
| Houston, TX 77024-3925 |
| 888-345-1898 |
| www.commonwealthfunds.com |
| |
| INVESTMENT ADVISOR |
| FCA Corp |
| 791 Town & Country Blvd., Suite 250 |
| Houston, TX 77024-3925 |
| |
| DISTRIBUTOR |
| Ultimus Fund Distributors, LLC |
| 225 Pictoria Drive, Suite 450 |
| Cincinnati, OH 45246 |
| |
| TRANSFER AGENT & ADMINISTRATOR |
| Ultimus Fund Solutions, LLC |
| 225 Pictoria Drive, Suite 450 |
| Cincinnati, OH 45246 |
| |
| CUSTODIAN BANK |
| Fifth Third Bank N.A. |
| Fifth Third Center |
| 38 Fountain Square Plaza |
| Cincinnati, OH 45263 |
| |
| INDEPENDENT REGISTERED PUBLIC |
| ACCOUNTING FIRM |
| Cohen & Company, Ltd. |
| 1835 Market Street, 3rd Floor |
| Philadelphia, PA 19103 |
| |
| LEGAL COUNSEL |
| Practus, LLP |
| 11300 Tomahawk Creek Parkway, Suite 310 |
| Leawood, KS 66211 |
| |
| |
| This report is intended for the shareholders of the family of funds of the Commonwealth International Series Trust. It may not be distributed to prospective investors unless it is preceded or accompanied by the Funds’ current Prospectus. A Prospectus may be obtained at www.commonwealthfunds.com or from the principal underwriter of the Funds or your broker. |
| |
Distributed by Ultimus Fund Distributors, LLC
Member FINRA/SIPC |
Item 8. Changes in and Disagreements with Accountants for Open-End Management Investment Companies.
Not applicable.
Item 9. Proxy Disclosures for Open-End Management Investment Companies.
Not applicable.
Item 10. Remuneration Paid to Directors, Officers, and Others of Open-End Management Investment Companies.
Included under Item 7.
Item 11. Statement Regarding Basis for Approval of Investment Advisory Contract.
Not Applicable
Item 12. Disclosure of Proxy Voting Policies and Procedures for Closed-End Management Investment Companies.
Not applicable.
Item 13. Portfolio Managers of Closed-End Management Investment Companies.
Not applicable.
Item 14. Purchases of Equity Securities by Closed-End Management Investment Company and Affiliated Purchasers.
Not applicable.
Item 15. Submission of Matters to a Vote of Security Holders.
None.
Item 16. Controls and Procedures
| (a) | The registrant’s Principal Executive Officer and Principal Financial Officer have concluded that the registrant’s disclosure controls and procedures (as defined in Rule 30a-3(c) under the Act) are effective in design and operation and are sufficient to form the basis of the certifications required by Rule 30a-(2) under the Act, based on their evaluation of these disclosure controls and procedures as of a date within 90 days of this report on Form N-CSR. |
| (b) | There were no changes in the registrant’s internal control over financial reporting (as defined in Rule 30a-3(d) under the Act) during the period covered by this report that have materially affected, or are reasonably likely to materially affect, the registrant’s internal control over financial reporting. |
Item 17. Disclosure of Securities Lending Activities for Closed-End Management Investment Companies.
Not applicable.
Item 18. Recovery of Erroneously Awarded Compensation.
Item 19. Exhibits.
SIGNATURES
Pursuant to the requirements of the Securities Exchange Act of 1934 and the Investment Company Act of 1940, the registrant has duly caused this report to be signed on its behalf by the undersigned, thereunto duly authorized.
| Commonwealth International Series Trust | |
| By | /s/ Robert Scharar | |
| | Robert Scharar President and Principal Executive Officer | |
Pursuant to the requirements of the Securities Exchange Act of 1934 and the Investment Company Act of 1940, this report has been signed below by the following persons on behalf of the registrant and in the capacities and on the dates indicated.
| By | /s/ Robert Scharar | |
| | Robert Scharar President and Principal Executive Officer | |
| By | /s/ Zachary P. Richmond | |
| | Zachary P. Richmond Treasurer and Principal Financial Officer | |