| UNITED STATES |
| SECURITIES AND EXCHANGE COMMISSION |
| Washington, D.C. 20549 |
| CERTIFIED SHAREHOLDER REPORT OF REGISTERED MANAGEMENT |
| INVESTMENT COMPANIES |
| Investment Company Act file number | | 811-4688 |
| DREYFUS PREMIER VALUE EQUITY FUNDS |
| (Exact name of Registrant as specified in charter) |
| c/o The Dreyfus Corporation |
| 200 Park Avenue |
| New York, New York 10166 |
| (Address of principal executive offices) (Zip code) |
| |
| Mark N. Jacobs, Esq. |
| 200 Park Avenue |
| New York, New York 10166 |
| (Name and address of agent for service) |
Registrant's telephone number, including area code: (212) 922-6000
Date of fiscal year end: 10/31
Date of reporting period: 10/31/04
Item 1. Reports to Stockholders.
Dreyfus Premier Value Fund
| | ANNUAL REPORT October 31, 2004
|

The views expressed in this report reflect those of the portfolio manager only through the end of the period covered and do not necessarily represent the views of Dreyfus or any other person in the Dreyfus organization. Any such views are subject to change at any time based upon market or other conditions and Dreyfus disclaims any responsibility to update such views.These views may not be relied on as investment advice and, because investment decisions for a Dreyfus fund are based on numerous factors, may not be relied on as an indication of trading intent on behalf of any Dreyfus fund.
Not FDIC-Insured • Not Bank-Guaranteed • May Lose Value
| Contents |
| |
| | | THE FUND |
| |
|
| 2 | | Letter from the Chairman |
| 3 | | Discussion of Fund Performance |
| 6 | | Fund Performance |
| 8 | | Understanding Your Fund’s Expenses |
| 8 | | Comparing Your Fund’s Expenses |
| With Those of Other Funds |
| 9 | | Statement of Investments |
| 14 | | Statement of Financial Futures |
| 15 | | Statement of Assets and Liabilities |
| 16 | | Statement of Operations |
| 17 | | Statement of Changes in Net Assets |
| 19 | | Financial Highlights |
| 24 | | Notes to Financial Statements |
| 32 | | Report of Independent Registered |
| | | Public Accounting Firm |
| 33 | | Important Tax Information |
| 34 | | Board Members Information |
| 36 | | Officers of the Fund |
| FOR MORE INFORMATION |
|
| | | Back Cover |
| Dreyfus Premier |
| Value Fund |
The Fund

LETTER FROM THE CHAIRMAN
We are pleased to present this annual report for Dreyfus Premier Value Fund, covering the 12-month period from November 1, 2003, through October 31, 2004. Inside, you’ll find valuable information about how the fund was managed during the reporting period, including a discussion with the fund’s portfolio manager, Brian Ferguson, Chairman of The Boston Company Asset Management Large Cap Value Team.
The Federal Reserve Board has raised short-term interest rates three times since the beginning of the summer, the rate of corporate earnings growth appears to have slowed dramatically and high energy prices threaten to erode the rate of economic growth.Though these factors may suggest the U.S. economy is moving toward a new phase of the business cycle, we believe the current economic cycle still favors higher-quality stocks, which currently offer favorable relative and absolute valuations.
Of course, the specific investments that may be right for you in today’s economic and market environment depend on your current needs, future goals, tolerance for risk and the composition of your overall portfolio.As always, your financial advisor may be in the best position to recommend the specific asset classes and investments that will satisfy your financial needs most effectively.

The Dreyfus Corporation
November 15, 2004
|

DISCUSSION OF FUND PERFORMANCE
Brian Ferguson, Chairman, The Boston Company Asset Management Large Cap Value Team
How did Dreyfus Premier Value Fund perform relative to its benchmark?
For the 12-month period ended October 31, 2004, the fund’s Class A shares produced a total return of 11.43%, Class B shares produced a total return of 10.52%, Class C shares produced a total return of 10.47%, Class R shares produced a total return of 11.26% and Class T shares produced a total return of 10.66% .1 This compares with the performance of the fund’s benchmark, the Russell 1000 Value Index (the “Index”), which produced a total return of 15.45% for the same period.2
We attribute the fund’s gains to good results from the fund’s consumer discretionary and industrial holdings in an environment of stronger economic growth. However, the fund’s returns modestly trailed its benchmark, primarily due to our focus on large-cap stocks at a time in which smaller-cap stocks generally produced better returns.
What is the fund’s investment approach?
The fund seeks capital growth. To pursue this goal, it invests at least 80% of its assets in stocks.The fund focuses on larger, more-established companies that the fund’s manager believes are “undervalued,” but the fund can invest in companies of any size.The fund’s stock investments may include common stocks, preferred stocks and convertible securities of both U.S. and foreign issuers, including those purchased in initial public offerings. The fund expects to invest mainly in the stocks of U.S. issuers, but may invest up to 30% of its assets in foreign stocks.
In choosing stocks, the fund employs a “bottom-up” approach, primarily focusing on large companies with strong positions in their industries and a catalyst that can trigger a price increase (such as corporate restructuring or change in management).The portfolio manager uses fundamental analysis to create a broadly diversified portfolio,normally with a weighted
| | DISCUSSION OF FUND PERFORMANCE (continued)
|
average p/e ratio less than or equal to that of the S&P 500 Index and a long-term projected earnings growth rate greater than or equal to that of the S&P 500 Index.The manager selects stocks based on:
- value, or how a stock is priced relative to its perceived intrinsic worth;
- growth, in this case the sustainability or growth of earnings or cash flow; and
- financial profile, which measures the financial health of the company.
The fund typically sells a security when the portfolio manager believes that there has been a negative change in the fundamental factors surrounding the company, the company has been fully valued, the company has lost favor in the current market or economic environment, or a more attractive opportunity has been identified.
What other factors influenced the fund’s performance?
Although we choose stocks one company at a time, and not according to broader economic trends, stocks generally benefited during the reporting period from a stronger U.S. economy. However, the stock market’s strength was concentrated primarily among smaller-cap stocks that investors believed had greater growth potential than larger, better-established companies. Because the fund focused mainly on larger stocks, its returns trailed the Index.
Nonetheless, the fund scored a number of successes in the consumer discretionary sector. Gains in casino operator Mandalay Resort Group, cruise line Royal Caribbean Cruises and outdoor advertising company Lamar Advertising more than offset weakness in Home Depot, which was hurt by concerns that higher interest rates might constrain home building and renovation.
Strong industrial growth helped boost many of the fund’s industrial holdings, including railroad Norfolk Southern and construction machinery manufacturer Caterpillar, both of which benefited from rising demand for coal and other mining products. The fund also benefited from higher energy prices, which helped drive the performance of oil service companies BJ Services and Schlumberger, as well as exploration
and production companies such as XTO Energy. However, the fund had less exposure to energy stocks than the Index, and its returns from the sector lagged the averages.
Financial stocks represented the greatest detractor from the fund’s performance. Investments in global insurance firm American International Group, mortgage originator Fannie Mae and regional bank New York Community Bancorp were hurt by company-specific problems. In addition, the fund did not own shares of the Index holding AT&T Wireless, which rose on the strength of its buyout, further detracting from the fund’s relative performance.
What is the fund’s current strategy?
It was my pleasure to have assumed responsibility for managing the fund on October 5, 2004. Since then, I have begun to reposition the fund to better reflect our view of relative values in today’s marketplace. For example, I have started to reduce the number of holdings in the fund’s portfolio from 118 to a range between 70 and 100 stocks. My objective in this regard is to focus on investments in which I have a greater degree of confidence. In addition, I have begun to trim the fund’s exposure to the financial sector, redeploying those assets to consumer discretionary, industrial and technology stocks that I believe are attractively valued, financially strong and poised for growth.
| 1 | | Total return includes reinvestment of dividends and any capital gains paid and does not take into |
| | | consideration the maximum initial sales charges in the case of Class A and Class T shares or the |
| | | applicable contingent deferred sales charges imposed on redemptions in the case of Class B and |
| | | Class C shares. Had these charges been reflected, returns would have been lower. Past performance |
| | | is no guarantee of future results. Share price and investment return fluctuate such that upon |
| | | redemption, fund shares may be worth more or less than their original cost. |
| 2 | | SOURCE: LIPPER INC. — Reflects the reinvestment of dividends and, where applicable, |
| | | capital gain distributions.The Russell 1000 Value Index is an unmanaged index which measures |
| | | the performance of those Russell 1000 companies with lower price-to-book ratios and lower |
| | | forecasted growth values. |
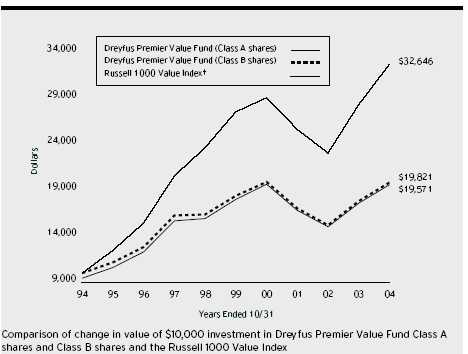
† Source: Lipper Inc.
Past performance is not predictive of future performance.
The above graph compares a $10,000 investment made in Class A shares and Class B shares of Dreyfus Premier Value Fund on 10/31/94 to a $10,000 investment made in the Russell 1000 Value Index (the “Index”) on that date.All dividends and capital gain distributions are reinvested. Performance for Class C, Class R and Class T shares will vary from the performance of both Class A and Class B shares shown above due to differences in charges and expenses. The fund’s performance shown in the line graph takes into account the maximum initial sales charge on Class A shares and all other applicable fees and expenses.The Index is an unmanaged index which measures the performance of those Russell 1000 companies with lower price-to-book ratios and lower forecasted growth values.The Index does not take into account charges, fees and other expenses. Further information relating to fund performance, including expense reimbursements, if applicable, is contained in the Financial Highlights section of the prospectus and elsewhere in this report.
| Average Annual Total Returns as of 10/31/04 | | | | | | |
| |
| | | Inception | | | | | | | | From |
| | | Date | | 1 Year | | 5 Years | | 10 Years | | Inception |
| |
| |
| |
| |
| |
|
| Class A shares | | | | | | | | | | |
| with maximum sales charge (5.75%) | | 5.04% | | 0.49% | | 6.95% | | |
| without sales charge | | | | 11.43% | | 1.69% | | 7.58% | | |
| Class B shares | | | | | | | | | | |
| with applicable redemption charge † | | | | 6.52% | | 0.52% | | 7.08% | | |
| without redemption | | | | 10.52% | | 0.85% | | 7.08% | | |
| Class C shares | | | | | | | | | | |
| with applicable redemption charge †† | | 9/1/95 | | 9.47% | | 0.81% | | — | | 6.07% |
| without redemption | | 9/1/95 | | 10.47% | | 0.81% | | — | | 6.07% |
| Class R shares | | 9/1/95 | | 11.26% | | 1.33% | | — | | 6.65% |
| Class T shares | | | | | | | | | | |
| with applicable sales charge (4.5%) | | 3/1/00 | | 5.67% | | — | | — | | 0.85% |
| without sales charge | | 3/1/00 | | 10.66% | | — | | — | | 1.85% |
Past performance is not predictive of future performance.The fund’s performance shown in the graph and table does not reflect the deduction of taxes that a shareholder would pay on fund distributions or the redemption of fund shares. Performance for Class B shares assumes the conversion of Class B shares to Class A shares at the end of the sixth year following the date of purchase.
| † | | The maximum contingent deferred sales charge for Class B shares is 4%.After six years Class B shares convert to |
| | | Class A shares. |
| †† | | The maximum contingent deferred sales charge for Class C shares is 1% for shares redeemed within one year of the |
| | | date of purchase. |
UNDERSTANDING YOUR FUND ’S EXPENSES (Unaudited)
As a mutual fund investor, you pay ongoing expenses, such as management fees and other expenses. Using the information below, you can estimate how these expenses affect your investment and compare them with the expenses of other funds.You also may pay one-time transaction expenses, including sales charges (loads) and redemption fees, which are not shown in this section and would have resulted in higher total expenses. For more information, see your fund’s prospectus or talk to your financial adviser.
Review your fund’s expenses
The table below shows the expenses you would have paid on a $1,000 investment in Dreyfus Premier Value Fund from May 1, 2004 to October 31, 2004. It also shows how much a $1,000 investment would be worth at the close of the period, assuming actual returns and expenses.
| Expenses and Value of a $1,000 Investment | | | | | | |
| assuming actual returns for the six months ended October 31, 2004 | | | | |
| | | Class A | | Class B | | Class C | | Class R | | Class T |
| |
| |
| |
| |
| |
|
| Expenses paid per $1,000 † | | $ 6.40 | | $ 10.74 | | $ 10.84 | | $ 6.76 | | $ 10.33 |
| Ending value (after expenses) | | $1,038.20 | | $1,034.40 | | $1,033.60 | | $1,038.00 | | $1,034.00 |
COMPARING YOUR FUND’S EXPENSES WITH THOSE OF OTHER FUNDS (Unaudited)
Using the SEC’s method to compare expenses
The Securities and Exchange Commission (SEC) has established guidelines to help investors assess fund expenses. Per these guidelines, the table below shows your fund’s expenses based on a $1,000 investment, assuming a hypothetical 5% annualized return. You can use this information to compare the ongoing expenses (but not transaction expenses or total cost) of investing in the fund with those of other funds.All mutual fund shareholder reports will provide this information to help you make this comparison. Please note that you cannot use this information to estimate your actual ending account balance and expenses paid during the period.
Expenses and Value of a $1,000 Investment assuming a hypothetical 5% annualized return for the six months ended October 31, 2004
| | | Class A | | Class B | | Class C | | Class R | | Class T |
| |
| |
| |
| |
| |
|
| Expenses paid per $1,000 † | | $ 6.34 | | $ 10.63 | | $ 10.74 | | $ 6.70 | | $ 10.23 |
| Ending value (after expenses) | | $1,018.85 | | $1,014.58 | | $1,014.48 | | $1,018.50 | | $1,014.98 |
- Expenses are equal to the fund’s annualized expense ratio of 1.25% for Class A, 2.10% for Class B, 2.12% for Class C, 1.32% for Class R and 2.02% for Class T; multiplied by the average account value over the period, multiplied by 184/366 (to reflect the one-half year period).
STATEMENT OF INVESTMENTS
October 31, 2004
|
| Common Stocks—96.5% | | Shares | | Value ($) | | |
| |
| |
| |
|
| Banking—13.3% | | | | | | |
| Bank of America | | 107,808 | | 4,828,721 | | |
| Bank of New York | | 20,600 | | 668,676 | | |
| First Horizon National | | 9,000 | | 389,520 | | |
| J.P. Morgan Chase & Co. | | 51,572 | | 1,990,679 | | |
| New York Community Bancorp | | 68,000 a | | 1,248,480 | | |
| North Fork Bancorporation | | 31,542 | | 1,391,002 | | |
| U.S. Bancorp | | 48,000 | | 1,373,280 | | |
| Wachovia | | 32,000 | | 1,574,720 | | |
| Washington Mutual | | 17,000 | | 658,070 | | |
| Wells Fargo | | 46,800 | | 2,794,896 | | |
| | | 16,918,044 | | |
| Consumer Discretionary—10.1% | | | | | | |
| Advance Auto Parts | | 17,000 b | | 665,040 | | |
| Clear Channel Communications | | 9,300 | | 310,620 | | |
| Comcast, Cl. A | | 44,691 b | | 1,318,385 | | |
| Corinthian Colleges | | 16,000 a,b | | 229,760 | | |
| Disney (Walt) | | 40,100 | | 1,011,322 | | |
| Eastman Kodak | | 15,000 | | 454,200 | | |
| Federated Department Stores | | 14,000 | | 706,300 | | |
| Gap | | 30,000 | | 599,400 | | |
| Hilton Hotels | | 36,000 | | 716,400 | | |
| Home Depot | | 19,000 | | 780,520 | | |
| Lamar Advertising | | 17,000 a,b | | 704,140 | | |
| Liberty Media | | 62,400 b | | 556,608 | | |
| Michaels Stores | | 24,000 | | 698,400 | | |
| JC Penney | | 12,000 a | | 415,080 | | |
| Royal Caribbean Cruises | | 16,000 a | | 745,600 | | |
| Time Warner | | 108,000 b | | 1,797,120 | | |
| Viacom, Cl. B | | 31,800 | | 1,160,382 | | |
| | | 12,869,277 | | |
| Consumer Staples—4.7% | | | | | | |
| Altria Group | | 45,800 | | 2,219,468 | | |
| Dean Foods | | 19,000 a,b | | 567,150 | | |
| General Mills | | 9,000 | | 398,250 | | |
| Kellogg | | 15,000 | | 645,000 | | |
| Kimberly-Clark | | 8,000 | | 477,360 | | |
| |
| |
| | | The Fund | | | | 9 |
S T A T E M E N T O F I N V E S T M E N T S (continued)
| Common Stocks (continued) | | Shares | | Value ($) |
| |
| |
|
| Consumer Staples (continued) | | | | |
| PepsiCo | | 17,700 | | 877,566 |
| Smithfield Foods | | 30,000 b | | 726,900 |
| | | | | 5,911,694 |
| Energy—11.1% | | | | |
| Anadarko Petroleum | | 14,000 | | 944,300 |
| BP, ADR | | 12,000 | | 699,000 |
| ChevronTexaco | | 48,000 | | 2,546,880 |
| ConocoPhillips | | 16,000 | | 1,348,960 |
| Exxon Mobil | | 159,260 | | 7,838,777 |
| Schlumberger | | 12,000 | | 755,280 |
| | | | | 14,133,197 |
| Financial—18.4% | | | | |
| American Express | | 13,500 | | 716,445 |
| American International Group | | 22,927 | | 1,391,898 |
| Axis Capital Holdings | | 38,400 | | 962,304 |
| Capital One Financial | | 10,000 | | 737,600 |
| CIT Group | | 19,000 | | 767,600 |
| Citigroup | | 128,301 | | 5,692,715 |
| Countrywide Financial | | 24,798 | | 791,800 |
| Developers Diversified Realty | | 13,000 a | | 543,400 |
| Doral Financial | | 12,000 a | | 503,760 |
| Federal Home Loan Mortgage | | 12,100 | | 805,860 |
| Federal National Mortgage Association | | 21,300 | | 1,494,195 |
| Fidelity National Financial | | 28,600 | | 1,079,364 |
| Fifth Third Bancorp | | 12,000 | | 590,280 |
| Goldman Sachs Group | | 10,000 | | 983,800 |
| Knight Trading Group | | 31,500 b | | 327,285 |
| MBNA | | 26,500 | | 679,195 |
| Merrill Lynch | | 34,000 a | | 1,833,960 |
| Morgan Stanley | | 31,600 | | 1,614,444 |
| Reinsurance Group of America | | 17,000 | | 732,360 |
| Willis Group Holdings | | 32,400 | | 1,164,780 |
| | | | | 23,413,045 |
| Health Care—6.2% | | | | |
| Becton, Dickinson & Co. | | 13,000 | | 682,500 |
| Bristol-Myers Squibb | | 30,000 | | 702,900 |
| DaVita | | 25,500 b | | 755,310 |
| |
| 10 | | | | |
| Common Stocks (continued) | | Shares | | Value ($) |
| |
| |
|
| Health Care (continued) | | | | |
| Fisher Scientific International | | 15,000 b | | 860,400 |
| Hospira | | 24,000 b | | 765,840 |
| IVAX | | 51,250 b | | 927,625 |
| Merck & Co. | | 21,700 | | 679,427 |
| Novartis, ADR | | 16,000 | | 768,160 |
| PacifiCare Health Systems | | 19,000 b | | 676,780 |
| Schering-Plough | | 36,000 | | 651,960 |
| Thermo Electron | | 12,800 b | | 371,200 |
| | | | | 7,842,102 |
| Industrials—12.0% | | | | |
| AMR | | 37,000 b | | 285,640 |
| Caterpillar | | 9,000 | | 724,860 |
| Cooper Industries, Cl. A | | 12,000 | | 766,800 |
| Deere & Co. | | 13,000 | | 777,140 |
| General Electric | | 192,000 | | 6,551,040 |
| Grainger (W.W.) | | 13,000 a | | 761,670 |
| Illinois Tool Works | | 9,000 | | 830,520 |
| Manpower | | 14,000 | | 633,500 |
| Norfolk Southern | | 30,000 | | 1,018,500 |
| Republic Services | | 27,000 | | 831,600 |
| Rockwell Collins | | 14,000 | | 496,580 |
| Tyco International | | 25,000 | | 778,750 |
| United Technologies | | 9,000 | | 835,380 |
| | | 15,291,980 |
| Information Technology—6.8% | | | | |
| Agilent Technologies | | 13,000 a,b | | 325,780 |
| Amdocs | | 29,000 b | | 729,350 |
| Computer Sciences | | 15,000 b | | 745,050 |
| Hewlett-Packard | | 82,280 | | 1,535,345 |
| Intel | | 13,000 | | 289,380 |
| International Business Machines | | 21,800 | | 1,956,550 |
| Lucent Technologies | | 102,000 a,b | | 362,100 |
| Microsoft | | 54,000 | | 1,511,460 |
| Motorola | | 22,900 | | 395,254 |
| SunGard Data Systems | | 28,000 b | | 741,720 |
| | | | | 8,591,989 |
| |
| |
| | | The Fund | | 11 |
S T A T E M E N T O F I N V E S T M E N T S (continued)
| Common Stocks (continued) | | Shares | | Value ($) |
| |
| |
|
| Materials—6.1% | | | | |
| Air Products & Chemicals | | 14,000 | | 744,520 |
| Alcoa | | 18,300 a | | 594,750 |
| du Pont (EI) de Nemours | | 23,100 | | 990,297 |
| International Paper | | 15,100 | | 581,501 |
| Olin | | 23,000 | | 430,100 |
| PPG Industries | | 10,000 | | 637,500 |
| Placer Dome | | 37,000 a | | 786,250 |
| Praxair | | 26,000 | | 1,097,200 |
| Sigma-Aldrich | | 7,000 a | | 389,480 |
| Sonoco Products | | 31,000 | | 826,150 |
| Weyerhaeuser | | 10,800 | | 676,512 |
| | | | | 7,754,260 |
| Telecommunication Services—4.1% | | | | |
| BellSouth | | 23,800 | | 634,746 |
| SBC Communications | | 54,996 | | 1,389,199 |
| Sprint (FON Group) | | 29,500 | | 618,025 |
| Verizon Communications | | 65,000 | | 2,541,500 |
| | | | | 5,183,470 |
| Utilities—3.7% | | | | |
| Consolidated Edison | | 15,000 | | 651,750 |
| Dominion Resources | | 10,000 | | 643,200 |
| Exelon | | 16,200 | | 641,844 |
| FPL Group | | 10,000 | | 689,000 |
| KeySpan | | 11,000 | | 439,450 |
| PG&E | | 29,000 a,b | | 929,160 |
| Southern | | 22,000 | | 694,980 |
| | | | | 4,689,384 |
| Total Common Stocks | | | | |
| (cost $98,361,190) | | | | 122,598,442 |
| |
| |
|
| | | Principal | | |
| Short-Term Investments—3.5% | | Amount ($) | | Value ($) |
| |
| |
|
| U.S. Treasury Bills: | | | | |
| 1.50%, 11/4/2004 | | 3,615,000 | | 3,614,494 |
| 1.40%, 11/12/2004 | | 713,000 c | | 712,643 |
| 1.66%, 11/26/2004 | | 151,000 | | 150,823 |
| Total Short-Term Investments | | | | |
| (cost $4,478,068) | | | | 4,477,960 |
| |
| 12 | | | | |
| Investment of Cash Collateral | | | | |
| for Securities Loaned—5.3% | | Shares | | Value ($) |
| |
| |
|
| Registered Investment Company; | | | | |
| Dreyfus Institutional Cash Advantage Fund | | | | |
| (cost $6,721,264) | | | | 6,721,264 d | | 6,721,264 |
| |
| |
| |
|
| |
| Total Investments (cost $109,560,522) | | 105.3% | | 133,797,666 |
| |
| Liabilities, Less Cash and Receivables | | (5.3%) | | (6,718,284) |
| |
| Net Assets | | | | 100.0% | | 127,079,382 |
| |
| a | | All or a portion of these securities are on loan.At October 31, 2004, the total market value of the securities on loan |
| | | is $6,479,571 and the total market value of the collateral held by the fund is $6,721,264. | | |
| b | | Non-income producing. | | | | | | |
| c | | Partially held by a broker in a segregated account as collateral for open financial futures positions. |
| d | | Investment in affiliated money market mutual fund. | | | | |
| |
| |
| |
|
| |
| |
| |
| Portfolio Summary (Unaudited) † | | | | |
| |
| | | | | Value (%) | | | | Value (%) |
| |
| |
| |
| |
|
| Financial | | 18.4 | | Information Technology | | 6.8 |
| Banking | | 13.3 | | Health Care | | 6.2 |
| Industrials | | 12.0 | | Materials | | 6.1 |
| Energy | | 11.1 | | Other | | 21.3 |
| Consumer Discretionary | | 10.1 | | | | 105.3 |
| |
| † | | Based on net assets. | | | | | | |
| See notes to financial statements. | | | | |
| STATEMENT OF FINANCIAL FUTURES |
| October 31, 2004 |
| | | | | Market Value | | | | Unrealized |
| | | | | Covered by | | | | Appreciation |
| | | Contracts | | Contracts ($) | | Expiration | | at 10/31/2004 ($) |
| |
| |
| |
| |
|
| |
| Financial Futures Long | | | | | | | | |
| Standard & Poor’s 500 | | 11 | | 3,108,325 | | December 2004 | | 10,313 |
See notes to financial statements.
|
| STATEMENT OF ASSETS AND LIABILITIES |
| October 31, 2004 |
| | | | | | | | | Cost | | Value |
| |
| |
| |
| |
| |
|
| Assets ($): | | | | | | | | | | |
| Investments in securities—See Statement of | | | | | | |
| Investments (including securities on loan, | | | | | | |
| valued at $6,479,571)—Note 1(c): | | | | | | | | |
| Unaffiliated issuers | | | | 102,839,258 | | 127,076,402 |
| Affiliated issuers | | | | 6,721,264 | | 6,721,264 |
| Cash | | | | | | | | | | 96,180 |
| Dividends and interest receivable | | | | | | | | 224,541 |
| Receivable for shares of Beneficial Interest subscribed | | | | | | 11,312 |
| Receivable for futures variation margin—Note 4 | | | | | | 7,425 |
| Prepaid expenses | | | | | | | | | | 24,034 |
| | | | | | | | | | | 134,161,158 |
| |
| |
| |
| |
| |
|
| Liabilities ($): | | | | | | | | | | |
| Due to The Dreyfus Corporation and affiliates—Note 3(c) | | | | | | 128,721 |
| Liability for securities on loan—Note 1(c) | | | | | | 6,721,264 |
| Payable for shares of Beneficial Interest redeemed | | | | | | 153,868 |
| Accrued expenses | | | | | | | | | | 77,923 |
| | | | | | | | | | | 7,081,776 |
| |
| |
| |
| |
| |
|
| Net Assets ($) | | | | | | | | | | 127,079,382 |
| |
| |
| |
| |
| |
|
| Composition of Net Assets ($): | | | | | | | | |
| Paid-in capital | | | | | | | | | | 104,824,960 |
| Accumulated undistributed investment income—net | | | | | | 1,025,440 |
| Accumulated net realized gain (loss) on investments | | | | | | (3,018,475) |
| Accumulated net unrealized appreciation (depreciation) | | | | | | |
| on investments (including $10,313 net unrealized | | | | | | |
| appreciation on financial futures) | | | | | | | | 24,247,457 |
| |
| |
| |
| |
|
| Net Assets ($) | | | | | | | | | | 127,079,382 |
| |
| |
| |
| |
| |
|
| |
| |
| Net Asset Value Per Share | | | | | | | | |
| | | Class A | | Class B | | Class C | | Class R | | Class T |
| |
| |
| |
| |
| |
|
| Net Assets ($) | | 118,301,215 | | 7,354,941 | | 1,237,342 | | 24,639 | | 161,245 |
| Shares Outstanding | | 6,309,071 | | 414,433 | | 70,668 | | 1,347 | | 8,824 |
| |
| |
| |
| |
| |
|
| Net Asset Value | | | | | | | | | | |
| Per Share ($) | | 18.75 | | 17.75 | | 17.51 | | 18.29 | | 18.27 |
| |
| See notes to financial statements. | | | | | | | | |
| STATEMENT OF OPERATIONS |
| Year Ended October 31, 2004 |
| Investment Income ($): | | |
| Income: | | |
| Cash dividends (net of $2,781 foreign taxes withheld at source) | | 2,685,516 |
| Interest | | 56,907 |
| Income on securities lending | | 2,293 |
| Total Income | | 2,744,716 |
| Expenses: | | |
| Management fee—Note 3(a) | | 966,102 |
| Shareholder servicing costs—Note 3(c) | | 495,420 |
| Distribution fees—Note 3(b) | | 70,983 |
| Registration fees | | 56,228 |
| Professional fees | | 55,007 |
| Prospectus and shareholders’ reports | | 18,677 |
| Custodian fees—Note 3(c) | | 16,018 |
| Trustees’ fees and expenses—Note 3(d) | | 14,814 |
| Loan commitment fees—Note 2 | | 1,014 |
| Interest expense—Note 2 | | 29 |
| Miscellaneous | | 9,647 |
| Total Expenses | | 1,703,939 |
| Less—reduction in custody fees | | |
| due to earnings credits—Note 1(c) | | (116) |
| Net Expenses | | 1,703,823 |
| Investment Income—Net | | 1,040,893 |
| |
|
| Realized and Unrealized Gain (Loss) on Investments—Note 4 ($): |
| Net realized gain (loss) on investments | | 7,287,627 |
| Net realized gain (loss) on financial futures | | 149,160 |
| Net Realized Gain (Loss) | | 7,436,787 |
| Net unrealized appreciation (depreciation) on investments | | |
| (including $4,415 net unrealized appreciation on financial futures) | | 5,432,068 |
| Net Realized and Unrealized Gain (Loss) on Investments | | 12,868,855 |
| Net Increase in Net Assets Resulting from Operations | | 13,909,748 |
See notes to financial statements.
|
STATEMENT OF CHANGES IN NET ASSETS
| | | Year Ended October 31, |
| |
|
| | | 2004 | | 2003 |
| |
| |
|
| Operations ($): | | | | |
| Investment income—net | | 1,040,893 | | 810,047 |
| Net realized gain (loss) on investments | | 7,436,787 | | (4,607,249) |
| Net unrealized appreciation | | | | |
| (depreciation) on investments | | 5,432,068 | | 22,375,855 |
| Net Increase (Decrease) in Net Assets | | | | |
| Resulting from Operations | | 13,909,748 | | 18,578,653 |
| |
| |
|
| Dividends to Shareholders from ($): | | | | |
| Investment income—net: | | | | |
| Class A shares | | (810,983) | | (860,419) |
| Class C shares | | — | | (880) |
| Class R shares | | (95) | | (52) |
| Class T shares | | — | | (61) |
| Total Dividends | | (811,078) | | (861,412) |
| |
| |
|
| Beneficial Interest Transactions ($): | | | | |
| Net proceeds from shares sold: | | | | |
| Class A shares | | 6,040,481 | | 4,322,990 |
| Class B shares | | 1,174,281 | | 1,397,706 |
| Class C shares | | 245,911 | | 169,865 |
| Class R shares | | 7,334 | | 5,952 |
| Class T shares | | 72,875 | | 96,501 |
| Dividends reinvested: | | | | |
| Class A shares | | 748,775 | | 788,483 |
| Class C shares | | — | | 414 |
| Class R shares | | 91 | | 52 |
| Class T shares | | — | | 61 |
| Cost of shares redeemed: | | | | |
| Class A shares | | (16,486,755) | | (12,753,414) |
| Class B shares | | (3,256,142) | | (2,858,681) |
| Class C shares | | (219,183) | | (417,423) |
| Class R shares | | (25) | | (5) |
| Class T shares | | (6,147) | | (64,566) |
| Increase (Decrease) in Net Assets from | | | | |
| Beneficial Interest Transactions | | (11,678,504) | | (9,312,065) |
| Total Increase (Decrease) in Net Assets | | 1,420,166 | | 8,405,176 |
| |
| |
|
| Net Assets ($): | | | | |
| Beginning of Period | | 125,659,216 | | 117,254,040 |
| End of Period | | 127,079,382 | | 125,659,216 |
| Undistributed investment income—net | | 1,025,440 | | 805,396 |
| | | | | The Fund 17 |
STATEMENT OF CHANGES IN NET ASSETS (continued)
|
| | | Year Ended October 31, |
| |
|
| | | 2004 | | 2003 |
| |
| |
|
| Capital Share Transactions: | | | | |
| Class A a | | | | |
| Shares sold | | 331,665 | | 282,949 |
| Shares issued for dividends reinvested | | 42,137 | | 53,566 |
| Shares redeemed | | (904,803) | | (845,160) |
| Net Increase (Decrease) in Shares Outstanding | | (531,001) | | (508,645) |
| |
| |
|
| Class B a | | | | |
| Shares sold | | 68,340 | | 96,625 |
| Shares redeemed | | (188,678) | | (197,571) |
| Net Increase (Decrease) in Shares Outstanding | | (120,338) | | (100,946) |
| |
| |
|
| Class C | | | | |
| Shares sold | | 14,388 | | 11,839 |
| Shares issued for dividends reinvested | | — | | 30 |
| Shares redeemed | | (12,846) | | (29,416) |
| Net Increase (Decrease) in Shares Outstanding | | 1,542 | | (17,547) |
| |
| |
|
| Class R | | | | |
| Shares sold | | 412 | | 405 |
| Shares issued for dividends reinvested | | 5 | | 3 |
| Shares redeemed | | (1) | | — |
| Net Increase (Decrease) in Shares Outstanding | | 416 | | 408 |
| |
| |
|
| Class T | | | | |
| Shares sold | | 4,016 | | 6,406 |
| Shares issued for dividends reinvested | | — | | 4 |
| Shares redeemed | | (348) | | (4,297) |
| Net Increase (Decrease) in Shares Outstanding | | 3,668 | | 2,113 |
a During the period ended October 31, 2004, 65,053 Class B shares representing $1,120,787 were automatically converted to 61,832 Class A shares and during the period ended October 31, 2003, 54,027 Class B shares representing $775,619 were automatically converted to 51,421 Class A shares.
See notes to financial statements.
The following tables describe the performance for each share class for the fiscal periods indicated.All information (except portfolio turnover rate) reflects financial results for a single fund share.Total return shows how much your investment in the fund would have increased (or decreased) during each period, assuming you had reinvested all dividends and distributions.These figures have been derived from the fund’s financial statements.
| | | | | Year Ended October 31, | | |
| |
| |
| |
|
| Class A Shares | | 2004 | | 2003 | | 2002 | | 2001 | | 2000 |
| |
| |
| |
| |
| |
|
| Per Share Data ($): | | | | | | | | | | |
| Net asset value, beginning of period | | 16.94 | | 14.59 | | 17.22 | | 21.85 | | 22.00 |
| Investment Operations: | | | | | | | | | | |
| Investment income—net a | | .16 | | .12 | | .12 | | .13 | | .10 |
| Net realized and unrealized | | | | | | | | | | |
| gain (loss) on investments | | 1.77 | | 2.35 | | (1.83) | | (3.08) | | 1.74 |
| Total from Investment Operations | | 1.93 | | 2.47 | | (1.71) | | (2.95) | | 1.84 |
| Distributions: | | | | | | | | | | |
| Dividends from investment income—net | | (.12) | | (.12) | | (.13) | | (.11) | | (.11) |
| Dividends from net realized | | | | | | | | | | |
| gain on investments | | — | | — | | (.79) | | (1.57) | | (1.88) |
| Total Distributions | | (.12) | | (.12) | | (.92) | | (1.68) | | (1.99) |
| Net asset value, end of period | | 18.75 | | 16.94 | | 14.59 | | 17.22 | | 21.85 |
| |
| |
| |
| |
| |
|
| Total Return (%) b | | 11.43 | | 17.04 | | (10.74) | | (14.32) | | 9.00 |
| |
| |
| |
| |
| |
|
| Ratios/Supplemental Data (%): | | | | | | | | | | |
| Ratio of total expenses | | | | | | | | | | |
| to average net assets | | 1.26 | | 1.26 | | 1.28 | | 1.20 | | 1.20 |
| Ratio of net expenses | | | | | | | | | | |
| to average net assets | | 1.26 | | 1.26 | | 1.28 | | 1.20 | | 1.20 |
| Ratio of net investment income | | | | | | | | | | |
| to average net assets | | .87 | | .76 | | .69 | | .66 | | .50 |
| Portfolio Turnover Rate | | 51.24 | | 59.66 | | 57.49 | | 91.91 | | 150.24 |
| |
| |
| |
| |
| |
|
| Net Assets, end of period ($ x 1,000) | | 118,301 | | 115,872 | | 107,217 | | 132,810 | | 164,534 |
| a | | Based on average shares outstanding at each month end. |
| b | | Exclusive of sales charge. |
See notes to financial statements.
|
FINANCIAL HIGHLIGHTS (continued)
|
| | | | | | | Year Ended October 31, | | |
| | | |
| |
| |
|
| Class B Shares | | 2004 | | 2003 | | 2002 | | 2001 | | 2000 |
| |
| |
| |
| |
| |
|
| Per Share Data ($): | | | | | | | | | | |
| Net asset value, beginning of period | | 16.06 | | 13.84 | | 16.40 | | 20.93 | | 21.21 |
| Investment Operations: | | | | | | | | | | |
| Investment income (loss)—net a | | .00b | | (.01) | | (.02) | | (.03) | | (.04) |
| Net realized and unrealized | | | | | | | | | | |
| gain (loss) on investments | | 1.69 | | 2.23 | | (1.75) | | (2.93) | | 1.64 |
| Total from Investment Operations | | 1.69 | | 2.22 | | (1.77) | | (2.96) | | 1.60 |
| Distributions: | | | | | | | | | | |
| Dividends from investment income—net | | — | | — | | (.00)b | | — | | — |
| Dividends from net realized | | | | | | | | | | |
| gain on investments | | — | | — | | (.79) | | (1.57) | | (1.88) |
| Total Distributions | | — | | — | | (.79) | | (1.57) | | (1.88) |
| Net asset value, end of period | | 17.75 | | 16.06 | | 13.84 | | 16.40 | | 20.93 |
| |
| |
| |
| |
| |
|
| Total Return (%) c | | 10.52 | | 16.04 | | (11.48) | | (15.02) | | 8.12 |
| |
| |
| |
| |
| |
|
| Ratios/Supplemental Data (%): | | | | | | | | | | |
| Ratio of total expenses | | | | | | | | | | |
| to average net assets | | 2.12 | | 2.12 | | 2.10 | | 2.02 | | 1.99 |
| Ratio of net expenses | | | | | | | | | | |
| to average net assets | | 2.12 | | 2.12 | | 2.10 | | 2.02 | | 1.99 |
| Ratio of net investment income | | | | | | | | | | |
| (loss) to average net assets | | .01 | | (.10) | | (.13) | | (.16) | | (.23) |
| Portfolio Turnover Rate | | 51.24 | | 59.66 | | 57.49 | | 91.91 | | 150.24 |
| |
| |
| |
| |
| |
|
| Net Assets, end of period ($ x 1,000) | | 7,355 | | 8,591 | | 8,801 | | 10,575 | | 11,936 |
| |
| a | | Based on average shares outstanding at each month end. | | | | | | | | |
| b | | Amount represents less than $.01 per share. | | | | | | | | |
| c | | Exclusive of sales charge. | | | | | | | | | | |
| See notes to financial statements. | | | | | | | | | | |
| | | | | | | Year Ended October 31, | | |
| | | |
| |
| |
|
| Class C Shares | | 2004 | | 2003 | | 2002 | | 2001 | | 2000 |
| |
| |
| |
| |
| |
|
| Per Share Data ($): | | | | | | | | | | |
| Net asset value, beginning of period | | 15.85 | | 13.68 | | 16.22 | | 20.75 | | 21.06 |
| Investment Operations: | | | | | | | | | | |
| Investment (loss)—net a | | (.00)b | | (.02) | | (.02) | | (.04) | | (.11) |
| Net realized and unrealized | | | | | | | | | | |
| gain (loss) on investments | | 1.66 | | 2.20 | | (1.72) | | (2.89) | | 1.68 |
| Total from Investment Operations | | 1.66 | | 2.18 | | (1.74) | | (2.93) | | 1.57 |
| Distributions: | | | | | | | | | | |
| Dividends from investment income—net | | — | | (.01) | | (.01) | | (.03) | | — |
| Dividends from net realized | | | | | | | | | | |
| gain on investments | | — | | — | | (.79) | | (1.57) | | (1.88) |
| Total Distributions | | — | | (.01) | | (.80) | | (1.60) | | (1.88) |
| Net asset value, end of period | | 17.51 | | 15.85 | | 13.68 | | 16.22 | | 20.75 |
| |
| |
| |
| |
| |
|
| Total Return (%) c | | 10.47 | | 15.95 | | (11.48) | | (14.99) | | 8.02 |
| |
| |
| |
| |
| |
|
| Ratios/Supplemental Data (%): | | | | | | | | | | |
| Ratio of total expenses | | | | | | | | | | |
| to average net assets | | 2.13 | | 2.16 | | 2.11 | | 2.04 | | 2.03 |
| Ratio of net expenses | | | | | | | | | | |
| to average net assets | | 2.13 | | 2.16 | | 2.11 | | 2.04 | | 2.03 |
| Ratio of net investment (loss) | | | | | | | | | | |
| to average net assets | | (.00)d | | (.13) | | (.15) | | (.20) | | (.59) |
| Portfolio Turnover Rate | | 51.24 | | 59.66 | | 57.49 | | 91.91 | | 150.24 |
| |
| |
| |
| |
| |
|
| Net Assets, end of period ($ x 1,000) | | 1,237 | | 1,096 | | 1,185 | | 1,243 | | 714 |
| |
| a | | Based on average shares outstanding at each month end. | | | | | | | | |
| b | | Amount represents less than $.01 per share. | | | | | | | | |
| c | | Exclusive of sales charge. | | | | | | | | | | |
| d | | Amount represents less than .01%. | | | | | | | | | | |
| See notes to financial statements. | | | | | | | | | | |
FINANCIAL HIGHLIGHTS (continued)
|
| | | | | Year Ended October 31, | | |
| |
| |
| |
|
| Class R Shares | | 2004 | | 2003 | | 2002 | | 2001 | | 2000 |
| |
| |
| |
| |
| |
|
| Per Share Data ($): | | | | | | | | | | |
| Net asset value, beginning of period | | 16.53 | | 14.26 | | 16.78 | | 21.55 | | 21.70 |
| Investment Operations: | | | | | | | | | | |
| Investment income (loss)—net a | | .13 | | .06 | | .07 | | (.05) | | .05 |
| Net realized and unrealized | | | | | | | | | | |
| gain (loss) on investments | | 1.73 | | 2.30 | | (1.80) | | (3.01) | | 1.75 |
| Total from Investment Operations | | 1.86 | | 2.36 | | (1.73) | | (3.06) | | 1.80 |
| Distributions: | | | | | | | | | | |
| Dividends from investment income—net | | (.10) | | (.09) | | — | | (.14) | | (.07) |
| Dividends from net realized | | | | | | | | | | |
| gain on investments | | — | | — | | (.79) | | (1.57) | | (1.88) |
| Total Distributions | | (.10) | | (.09) | | (.79) | | (1.71) | | (1.95) |
| Net asset value, end of period | | 18.29 | | 16.53 | | 14.26 | | 16.78 | | 21.55 |
| |
| |
| |
| |
| |
|
| Total Return (%) | | 11.26 | | 16.64 | | (10.97) | | (15.15) | | 8.97 |
| |
| |
| |
| |
| |
|
| Ratios/Supplemental Data (%): | | | | | | | | | | |
| Ratio of total expenses | | | | | | | | | | |
| to average net assets | | 1.40 | | 1.59 | | 1.56 | | 2.13 | | 1.37 |
| Ratio of net expenses | | | | | | | | | | |
| to average net assets | | 1.40 | | 1.59 | | 1.56 | | 2.13 | | 1.37 |
| Ratio of net investment income | | | | | | | | | | |
| (loss) to average net assets | | .74 | | .42 | | .41 | | (.27) | | .26 |
| Portfolio Turnover Rate | | 51.24 | | 59.66 | | 57.49 | | 91.91 | | 150.24 |
| |
| |
| |
| |
| |
|
| Net Assets, end of period ($ x 1,000) | | 25 | | 15 | | 7 | | 7 | | 6 |
| |
| a Based on average shares outstanding at each month end. | | | | | | | | |
| See notes to financial statements. | | | | | | | | | | |
| | | | | | | Year Ended October 31, | | |
| | | |
| |
| |
|
| Class T Shares | | 2004 | | 2003 | | 2002 | | 2001 | | 2000 a |
| |
| |
| |
| |
| |
|
| Per Share Data ($): | | | | | | | | | | |
| Net asset value, beginning of period | | 16.51 | | 14.32 | | 17.05 | | 21.77 | | 19.15 |
| Investment Operations: | | | | | | | | | | |
| Investment income (loss)—net b | | .03 | | (.07) | | (.07) | | (.02) | | (.02) |
| Net realized and unrealized | | | | | | | | | | |
| gain (loss) on investments | | 1.73 | | 2.28 | | (1.79) | | (3.08) | | 2.64 |
| Total from Investment Operations | | 1.76 | | 2.21 | | (1.86) | | (3.10) | | 2.62 |
| Distributions: | | | | | | | | | | |
| Dividends from investment income—net | | — | | (.02) | | (.08) | | (.05) | | — |
| Dividends from net realized | | | | | | | | | | |
| gain on investments | | — | | — | | (.79) | | (1.57) | | — |
| Total Distributions | | — | | (.02) | | (.87) | | (1.62) | | — |
| Net asset value, end of period | | 18.27 | | 16.51 | | 14.32 | | 17.05 | | 21.77 |
| |
| |
| |
| |
| |
|
| Total Return (%) c | | 10.66 | | 15.45 | | (11.69) | | (15.08) | | 13.68d |
| |
| |
| |
| |
| |
|
| Ratios/Supplemental Data (%): | | | | | | | | | | |
| Ratio of total expenses | | | | | | | | | | |
| to average net assets | | 1.95 | | 2.48 | | 2.38 | | 1.92 | | 1.17d |
| Ratio of net expenses | | | | | | | | | | |
| to average net assets | | 1.95 | | 2.48 | | 2.38 | | 1.92 | | 1.17d |
| Ratio of net investment income | | | | | | | | | | |
| (loss) to average net assets | | .19 | | (.48) | | (.41) | | (.11) | | (.09)d |
| Portfolio Turnover Rate | | 51.24 | | 59.66 | | 57.49 | | 91.91 | | 150.24 |
| |
| |
| |
| |
| |
|
| Net Assets, end of period ($ x 1,000) | | 161 | | 85 | | 44 | | 21 | | 1 |
| |
| a | | From March 1, 2000 (commencement of initial offering) to October 31, 2000. | | | | |
| b | | Based on average shares outstanding at each month end. | | | | | | | | |
| c | | Exclusive of sales charge. | | | | | | | | | | |
| d | | Not annualized. | | | | | | | | | | |
| See notes to financial statements. | | | | | | | | | | |
NOTES TO FINANCIAL STATEMENTS
NOTE 1—Significant Accounting Policies:
Dreyfus Premier Value Fund (the “fund”) is a separate non-diversified series of Dreyfus Premier Value Equity Funds (the “Company”), which is registered under the Investment Company Act of 1940, as amended (the “Act”), as an open-end management investment company and operates as a series company, currently offering two series including the fund. The fund’s investment objective is capital growth. The Dreyfus Corporation (the “Manager” or “Dreyfus”) serves as the fund’s investment adviser. The Manager is a wholly-owned subsidiary of Mellon Financial Corporation (“Mellon Financial”).
Dreyfus Service Corporation (the “Distributor”), a wholly-owned subsidiary of the Manager, is the distributor of the fund’s shares.The fund is authorized to issue an unlimited number of $.001 par value shares of Beneficial Interest in the following classes of shares: Class A, Class B, Class C, Class R and Class T. Class A and Class T shares are subject to a sales charge imposed at the time of purchase. Class B shares are subject to a contingent deferred sales charge (“CDSC”) imposed on Class B share redemptions made within six years of purchase and automatically convert to Class A shares after six years. Class C shares are subject to a CDSC imposed on Class C shares redeemed within one year of purchase and Class R shares are sold at net asset value per share only to institutional investors. Other differences between the classes include the services offered to and the expenses borne by each class and certain voting rights. Income, expenses (other expenses attributable to a specific class), and realized and unrealized gains or losses on investments are allocated to each class of shares based on its relative net assets.
The Company accounts separately for the assets, liabilities and operations of each series. Expenses directly attributable to each series are charged to that series’ operations; expenses which are applicable to all series are allocated among them on a pro rata basis.
The fund’s financial statements are prepared in accordance with U.S. generally accepted accounting principles, which may require the use of management estimates and assumptions. Actual results could differ from those estimates.
The fund enters into contracts that contain a variety of indemnifications. The fund’s maximum exposure under these arrangements is unknown.The fund does not anticipate recognizing any loss related to these arrangements.
(a) Portfolio valuation: Investments in securities are valued at the last sales price on the securities exchange or national securities market on which such securities are primarily traded. Securities listed on the National Market System for which market quotations are available are valued at the official closing price or, if there is no official closing price that day, at the last sales price. Securities not listed on an exchange or the national securities market, or securities for which there were no transactions, are valued at the average of the most recent bid and asked prices, except for open short positions, where the asked price is used for valuation purposes. Bid price is used when no asked price is avail-able.When market quotations or official closing prices are not readily available, or are determined not to reflect accurately fair value, such as when the value of a security has been significantly affected by events after the close of the exchange or market on which the security is principally traded (for example, a foreign exchange or market), but before the fund calculates its net asset value, the fund may value these investments at fair value as determined in accordance with the procedures approved by the Board of Directors. Fair valuing of securities may be determined with the assistance of a pricing service using calculations based on indices of domestic securities and other appropriate indicators, such as prices of relevant ADR’s and futures contracts. For other securities that are fair valued by the Board of Directors, certain factors may be considered such as: fundamental analytical data, the nature and duration of restrictions on disposition, an evaluation of the forces that influence the market in which the securities are purchased and sold, and public trading in similar securities of the issuer or comparable issuers. Financial futures are valued at the last sales price. Investments denominated in foreign currencies are translated to U.S. dollars at the prevailing rates of exchange. Forward currency exchange contracts are valued at the forward rate.
NOTES TO FINANCIAL STATEMENTS (continued)
|
(b) Foreign currency transactions: The fund does not isolate that portion of the results of operations resulting from changes in foreign exchange rates on investments from the fluctuations arising from changes in market prices of securities held. Such fluctuations are included with the net realized and unrealized gain or loss on investments.
Net realized foreign exchange gains or losses arise from sales and maturities of short-term securities, sales of foreign currencies, currency gains or losses realized on securities transactions and the difference between the amounts of dividends, interest and foreign withholding taxes recorded on the fund’s books and the U.S. dollar equivalent of the amounts actually received or paid. Net unrealized foreign exchange gains and losses arise from changes in the value of assets and liabilities other than investments in securities, resulting from changes in exchange rates. Such gains and losses are included with net realized and unrealized gain or loss on investments.
(c) Securities transactions and investment income: Securities transactions are recorded on a trade date basis. Realized gain and loss from securities transactions are recorded on the identified cost basis. Dividend income is recognized on the ex-dividend date and interest income, including, where applicable, accretion of discount and amortization of premium on investments, is recognized on the accrual basis.
The fund has an arrangement with the custodian bank whereby the fund receives earnings credits from the custodian when positive cash balances are maintained, which are used to offset custody fees. For financial reporting purposes, the fund includes net earnings credits as an expense offset in the Statement of Operations.
Pursuant to a securities lending agreement with Mellon Bank, N.A., an affiliate of the Manager, the fund may lend securities to qualified institutions.At origination, all loans are secured by collateral of at least 102% of the value of U.S. securities loaned and 105% of the value of foreign securities loaned. Collateral equivalent to at least 100% of the market value of securities on loan will be maintained at all times. Cash collateral is invested in certain money market mutual funds
managed by the Manager. The fund will be entitled to receive all income on securities loaned, in addition to income earned as a result of the leading transaction.Although each security loaned is fully collateralized, the fund would bear the risk of delay in recovery of, or loss of rights in, the securities loaned should a borrower fail to return the securities in a timely manner.
(d) Affiliated issuers: Investments in other investment companies advised by the Manager are defined as “affiliated “ in the Act.
(e) Dividends to shareholders: Dividends are recorded on the ex-dividend date. Dividends from investment income-net and dividends from net realized capital gain, if any, are normally declared and paid annually, but the fund may make distributions on a more frequent basis to comply with the distribution requirements of the Internal Revenue Code of 1986, as amended (the “Code”).To the extent that net realized capital gain can be offset by capital loss carryovers, it is the policy of the fund not to distribute such gain. Income and capital gain distributions are determined in accordance with income tax regulations, which may differ from U.S. generally accepted accounting principles.
(f) Federal income taxes: It is the policy of the fund to continue to qualify as a regulated investment company, if such qualification is in the best interests of its shareholders, by complying with the applicable provisions of the Code, and to make distributions of taxable income sufficient to relieve it from substantially all federal income and excise taxes.
At October 31, 2004, the components of accumulated earnings on a tax basis were as follows: undistributed ordinary income $1,025,440, accumulated capital losses $2,795,140 and unrealized appreciation $24,024,122.
The accumulated capital loss carryover is available to be applied against future net securities profits, if any, realized subsequent to October 31, 2004. If not applied, the carryover expires in fiscal 2011.
The tax character of distributions paid to shareholders during the fiscal periods ended October 31, 2004 and October 31, 2003, were as follows: ordinary income $811,078 and $861,412, respectively.
NOTES TO FINANCIAL STATEMENTS (continued)
|
During the period ended October 31, 2004, as a result of permanent book to tax differences primarily due to the tax treatment for real estate investment trusts, the fund decreased accumulated undistributed investment income-net by $9,771 and increased accumulated net realized gain (loss) on investments by the same amount. Net assets were not affected by this reclassification.
NOTE 2—Bank Line of Credit:
|
The fund participates with other Dreyfus-managed funds in a $350 million redemption credit facility (the “Facility”) to be utilized for temporary or emergency purposes, including the financing of redemptions. In connection therewith, the fund has agreed to pay commitment fees on its pro rata portion of the Facility. Interest is charged to the fund based on prevailing market rates in effect at the time of borrowings.
The average daily amount of borrowings outstanding under the Facility during the period ended October 31, 2004 was approximately $1,900, with a related weighted average annualized interest rate of 1.47% .
NOTE 3—Management Fee and Other Transactions With Affiliates:
(a) Pursuant to a management agreement with the Manager, the management fee is computed at the annual rate of .75 of 1% of the value of the fund’s average daily net assets and is payable monthly.
During the period ended October 31, 2004, the Distributor retained $27,556 and $41 from commissions earned on sales of the fund’s Class A and Class T shares, respectively, and $16,025 from contingent deferred sales charges on redemptions of the fund’s Class B shares.
(b) Under a Distribution Plan (the “Plan”) adopted pursuant to Rule 12b-1 under the Act, Class B, Class C and Class T shares pay the Distributor for distributing their shares at an annual rate of .75 of 1% of the value of the average daily net assets of Class B and Class C shares, and .25 of 1% of the value of the average daily net assets of Class T shares. During the period ended October 31, 2004, Class B, Class C and
Class T shares were charged $61,826, $8,876 and $281, respectively, pursuant to the Plan.
(c) Under the Shareholder Services Plan, Class A, Class B, Class C and Class T shares pay the Distributor at an annual rate of .25 of 1% of the value of their average daily net assets for the provision of certain services. The services provided may include personal services relating to shareholder accounts, such as answering shareholder inquiries regarding the fund and providing reports and other information, and services related to the maintenance of shareholder accounts. The Distributor may make payments to Service Agents (a securities dealer, financial institution or other industry professional) in respect of these services. The Distributor determines the amounts to be paid to Service Agents. During the period ended October 31, 2004, Class A, Class B, Class C and Class T shares were charged $298,135, $20,609, $2,958 and $281, respectively, pursuant to the Shareholder Services Plan.
The fund compensates Dreyfus Transfer,Inc.,a wholly-owned subsidiary of the Manager, under a transfer agency agreement for providing personnel and facilities to perform transfer agency services for the fund. During the period ended October 31, 2004, the fund was charged $98,371 pursuant to the transfer agency agreement.
The fund compensates Mellon Bank, N.A., an affiliate of the Manager, under a custody agreement for providing custodial services for the fund. During the period ended October 31, 2004, the fund was charged $16,018 pursuant to the custody agreement.
The components of Due to The Dreyfus Corporation and affiliates in the Statement of Assets and Liabilities consist of: management fees $80,338, Rule 12b-1 distribution plan fees $5,463, shareholder services plan fees $26,774, custodian fees $2,298 and transfer agency per account fees $13,848.
(d) Each Board member also serves as a Board member of other funds within the Dreyfus complex. Annual retainer fees and attendance fees are allocated to each fund based on net assets.
NOTES TO FINANCIAL STATEMENTS (continued)
|
(e) During the period ended October 31, 2004, the fund incurred total brokerage commissions of $226,673, of which $30 was paid to Harborside Plus Inc., a wholly-owned subsidiary of Mellon Financial Corporation.
NOTE 4—Securities Transactions:
|
The aggregate amount of purchases and sales of investment securities, excluding short-term securities and financial futures, during the period ended October 31, 2004, amounted to $63,323,101 and $75,837,438, respectively.
The fund may invest in financial futures contracts in order to gain exposure to or protect against changes in the market.The fund is exposed to market risk as a result of changes in the value of the underlying financial instruments. Investments in financial futures require the fund to “mark to market” on a daily basis, which reflects the change in the market value of the contract at the close of each day’s trading.Accordingly, variation margin payments are received or made to reflect daily unrealized gains or losses.When the contracts are closed, the fund recognizes a realized gain or loss.These investments require initial margin deposits with a broker, which consist of cash or cash equivalents.The amount of these deposits is determined by the exchange or Board of Trade on which the contract is traded and is subject to change. Contracts open at October 31, 2004, are set forth in the Statement of Financial Futures.
At October 31, 2004, the cost of investments for federal income tax purposes was $109,773,544; accordingly, accumulated net unrealized appreciation on investments was $24,024,122, consisting of $26,605,620 gross unrealized appreciation and $2,581,498 gross unrealized depreciation.
Two class actions have been filed against Mellon Financial,Mellon Bank, N.A., Dreyfus, Founders Asset Management LLC and the directors of all or substantially all of the Dreyfus Funds, on behalf of a purported class and derivatively on behalf of said funds, alleging violations of the
Investment Company Act of 1940, the Investment Advisers Act of 1940, and the common law. The complaints alleged, among other things, (i) that 12b-1 fees and directed brokerage were improperly used to pay brokers to recommend Dreyfus funds over other funds, (ii) that such payments were not disclosed to investors, (iii) that economies of scale and soft-dollar benefits were not passed on to investors, and (iv) that 12b-1 fees charged to certain funds that were closed to new investors were also improper.The complaints sought compensatory and punitive damages, rescission of the advisory contracts and an accounting and restitution of any unlawful fees, as well as an award of attorneys’ fees and litigation expenses. On April 22, 2004, the actions were consolidated under the caption In re Dreyfus Mutual Funds Fee Litigation, and a consolidated amended complaint was filed on September 13,2004.While adding new parties and claims under state and federal law, the allegations in the consolidated amended complaint essentially track the allegations in the prior complaints pertaining to 12b-1 fees, directed brokerage, soft dollars and revenue sharing. Dreyfus and the funds believe the allegations to be totally without merit and intend to defend the action vigorously.
Additional lawsuits arising out of these circumstances and presenting similar allegations and requests for relief may be filed against the defendants in the future. Neither Dreyfus nor the Dreyfus funds believe that any of the pending actions will have a material adverse effect on the Dreyfus funds or Dreyfus’ ability to perform its contracts with the Dreyfus funds.
On December 8, 2004, the fund’s Board of Directors approved an Agreement and Plan of Reorganization, subject to the approval of shareholders, under which all of the fund’s assets will be transferred in a tax-free reorganization to Dreyfus Premier Strategic Value Fund.
REPORT OF INDEPENDENT REGISTERED PUBLIC ACCOUNTING FIRM
Shareholders and Board of Trustees
Dreyfus Premier Value Fund
|
We have audited the accompanying statement of assets and liabilities, including the statements of investments and financial futures, of Dreyfus Premier Value Fund (one of the funds comprising Dreyfus Premier Value Equity Funds) as of October 31, 2004, and the related statement of operations for the year then ended, the statement of changes in net assets for each of the two years in the period then ended, and the financial highlights for each of the periods indicated therein.These financial statements and financial highlights are the responsibility of the Fund’s management. Our responsibility is to express an opinion on these financial statements and financial highlights based on our audits.
We conducted our audits in accordance with the standards of the Public Company Accounting Oversight Board (United States).Those standards require that we plan and perform the audit to obtain reasonable assurance about whether the financial statements and financial highlights are free of material misstatement. An audit includes examining, on a test basis, evidence supporting the amounts and disclosures in the financial statements and financial highlights. Our procedures included verification by examination of securities held by the custodian as of October 31, 2004 and confirmation of securities not held by the custodian by correspondence with others. An audit also includes assessing the accounting principles used and significant estimates made by management, as well as evaluating the overall financial statement presentation.We believe that our audits provide a reasonable basis for our opinion.
In our opinion, the financial statements and financial highlights referred to above present fairly, in all material respects, the financial position of Dreyfus Premier Value Fund at October 31, 2004, the results of its operations for the year then ended, the changes in its net assets for each of the two years in the period then ended, and the financial highlights for each of the indicated periods, in conformity with U.S. generally accepted accounting principles.

New York, New York
December 13, 2004
|
IMPORTANT TAX INFORMATION (Unaudited)
In accordance with federal tax law, the fund hereby designates 100% of the ordinary dividends paid during the fiscal year ended October 31, 2004 as qualifying for the corporate dividends received deduction. For the fiscal year ended October 31, 2004, certain dividends paid by the fund may be subject to a maximum tax rate of 15%, as provided for by the Jobs and Growth Tax Relief Reconciliation Act of 2003. Of the distributions paid during the fiscal year, $811,078 represents the maximum amount that may be considered qualified dividend income. Shareholders will receive notification in January 2005 of the percentage applicable to the preparation of their 2004 income tax returns.
BOARD MEMBERS INFORMATION (Unaudited)
Joseph S. DiMartino (61)
Chairman of the Board (1995)
|
Principal Occupation During Past 5 Years:
• Corporate Director and Trustee
|
Other Board Memberships and Affiliations:
|
- The Muscular Dystrophy Association, Director
- Levcor International, Inc., an apparel fabric processor, Director
- Century Business Services, Inc., a provider of outsourcing functions for small and medium size companies, Director
- The Newark Group, a provider of a national market of paper recovery facilities, paperboard mills and paperboard converting plants, Director
- Azimuth Trust, an institutional asset management firm, Member of Board of Managers and Advisory Board
No. of Portfolios for which Board Member Serves: 186
David W. Burke (68)
Board Member (1994)
|
Principal Occupation During Past 5 Years:
• Corporate Director and Trustee
|
Other Board Memberships and Affiliations:
|
- John F. Kennedy Library Foundation, Director
- U.S.S. Constitution Museum, Director
No. of Portfolios for which Board Member Serves: 83
|
Diane Dunst (65)
Board Member (1990)
|
Principal Occupation During Past 5 Years:
• President, Huntting House Antiques
|
No. of Portfolios for which Board Member Serves: 11
|
Rosalind Gersten Jacobs (79)
Board Member (1994)
|
Principal Occupation During Past 5 Years:
• Merchandise and marketing consultant
|
No. of Portfolios for which Board Member Serves: 33
|
Jay I. Meltzer (76)
Board Member (1991)
|
Principal Occupation During Past 5 Years:
|
- Physician, Internist and Specialist in Clinical Hypertension
- Clinical Professor of Medicine at Columbia University & College of Physicians and Surgeons
- Adjunct Clinical Professor of Medicine at Cornell Medical College
No. of Portfolios for which Board Member Serves: 11
———————
Daniel Rose (75) Board Member (1992)
Principal Occupation During Past 5 Years:
|
- Chairman and Chief Executive Officer of Rose Associates, Inc., a New York based real estate development and management firm
Other Board Memberships and Affiliations:
|
- Baltic-American Enterprise Fund,Vice Chairman and Director
- Harlem Educational Activities Fund, Inc., Chairman
- Housing Committee of the Real Estate Board of New York, Inc., Director
No. of Portfolios for which Board Member Serves: 21 ———————
Warren B. Rudman (74) Board Member (1993)
Principal Occupation During Past 5 Years:
|
- Of Counsel to (from January 1993 to December 31, 2003, Partner in) the law firm Paul, Weiss, Rifkind,Wharton & Garrison LLP
Other Board Memberships and Affiliations:
|
- Collins & Aikman Corporation, Director
- Allied Waste Corporation, Director
- Raytheon Company, Director
- Boston Scientific, Director
No. of Portfolios for which Board Member Serves: 20 ———————
Sander Vanocur (76) Board Member (1992)
Principal Occupation During Past 5 Years:
• President, Old Owl Communications
|
No. of Portfolios for which Board Member Serves: 21 ———————
Once elected all Board Members serve for an indefinite term.The address of the Board Members and Officers is in c/o The Dreyfus Corporation, 200 Park Avenue, New York, New York 10166.Additional information about the Board Members is available in the fund’s Statement of Additional Information which can be obtained from Dreyfus free of charge by calling this toll free number: 1-800-554-4611.
OFFICERS OF THE FUND (Unaudited)
STEPHEN E. CANTER, President since March 2000.
Chairman of the Board, Chief Executive Officer and Chief Operating Officer of the Manager, and an officer of 93 investment companies (comprised of 186 portfolios) managed by the Manager. Mr. Canter also is a Board member and, where applicable, an Executive Committee Member of the other investment management subsidiaries of Mellon Financial Corporation, each of which is an affiliate of the Manager. He is 59 years old and has been an employee of the Manager since May 1995.
STEPHEN R. BYERS, Executive Vice President since November 2002.
Chief Investment Officer,Vice Chairman and a director of the Manager, and an officer of 93 investment companies (comprised of 186 portfolios) managed by the Manager. Mr. Byers also is an officer, director or an Executive Committee Member of certain other investment management subsidiaries of Mellon Financial Corporation, each of which is an affiliate of the Manager. He is 51 years old and has been an employee of the Manager since January 2000. Prior to joining the Manager, he served as an Executive Vice President-Capital Markets, Chief Financial Officer and Treasurer at Gruntal & Co., L.L.C.
MARK N. JACOBS, Vice President since March 2000.
Executive Vice President, Secretary and General Counsel of the Manager, and an officer of 94 investment companies (comprised of 202 portfolios) managed by the Manager. He is 58 years old and has been an employee of the Manager since June 1977.
JOHN B. HAMMALIAN, Secretary since March 2000.
Associate General Counsel of the Manager, and an officer of 36 investment companies (comprised of 45 portfolios) managed by the Manager. He is 41 years old and has been an employee of the Manager since February 1991.
STEVEN F. NEWMAN, Assistant Secretary since March 2000.
Associate General Counsel and Assistant Secretary of the Manager, and an officer of 94 investment companies (comprised of 202 portfolios) managed by the Manager. He is 55 years old and has been an employee of the Manager since July 1980.
MICHAEL A. ROSENBERG, Assistant Secretary since March 2000.
Associate General Counsel of the Manager, and an officer of 91 investment companies (comprised of 195 portfolios) managed by the Manager. He is 44 years old and has been an employee of the Manager since October 1991.
JAMES WINDELS, Treasurer since November 2001.
Director – Mutual Fund Accounting of the Manager, and an officer of 94 investment companies (comprised of 202 portfolios) managed by the Manager. He is 46 years old and has been an employee of the Manager since April 1985.
RICHARD CASSARO, Assistant Treasurer since December 2003.
Senior Accounting Manager – Equity Funds of the Manager, and an officer of 26 investment companies (comprised of 101 portfolios) managed by the Manager. He is 44 years old and has been an employee of the Manager since September 1982.
KENNETH J. SANDGREN, Assistant Treasurer since November 2001.
Mutual Funds Tax Director of the Manager, and an officer of 94 investment companies (comprised of 202 portfolios) managed by the Manager. He is 50 years old and has been an employee of the Manager since June 1993.
ROBERT SVAGNA, Assistant Treasurer since December 2002.
Senior Accounting Manager – Equity Funds of the Manager, and an officer of 27 investment companies (comprised of 106 portfolios) managed by the Manager. He is 37 years old and has been an employee of the Manager since November 1990.
JOSEPH W. CONNOLLY, Chief Compliance Officer since October 2004.
Chief Compliance Officer of the Manager and The Dreyfus Family of Funds (94 investment companies, comprising 202 portfolios). From November 2001 through March 2004, Mr. Connolly was first Vice-President, Mutual Fund Servicing for Mellon Global Securities Services. In that capacity, Mr. Connolly was responsible for managing Mellon’s Custody, Fund Accounting and Fund Administration services to third-party mutual fund clients. He is 47 years old and has served in various capacities with the Manager since 1980, including manager of the firm’s Fund Accounting Department from 1997 through October 2001.
WILLIAM GERMENIS, Anti-Money Laundering Compliance Officer since August 2002.
Vice President and Anti-Money Laundering Compliance Officer of the Distributor, and the Anti-Money Laundering Compliance Officer of 89 investment companies (comprised of 197 portfolios) managed by the Manager. He is 33 years old and has been an employee of the Distributor since October 1998.
| For More | | Information |
| |
|
| |
| Dreyfus Premier | | Transfer Agent & |
| Value Fund | | Dividend Disbursing Agent |
| 200 Park Avenue | | |
| | | Dreyfus Transfer, Inc. |
| New York, NY 10166 | | |
| | | 200 Park Avenue |
| Manager | | New York, NY 10166 |
| The Dreyfus Corporation | | Distributor |
| 200 Park Avenue | | |
| | | Dreyfus Service Corporation |
| New York, NY 10166 | | |
| | | 200 Park Avenue |
| Custodian | | New York, NY 10166 |
| Mellon Bank, N.A. | | |
| One Mellon Bank Center | | |
| Pittsburgh, PA 15258 | | |
Telephone Call your financial representative or 1-800-554-4611
| Mail | | The Dreyfus Premier Family of Funds |
| | | 144 Glenn Curtiss Boulevard, Uniondale, NY 11556-0144 |
The fund files its complete schedule of portfolio holdings with the Securities and Exchange Commission (“SEC”) for the first and third quarters of each fiscal year on Form N-Q. The fund’s Forms N-Q are available on the SEC’s website at http://www.sec.gov and may be reviewed and copied at the SEC’s Public Reference Room in Washington, DC. Information on the operation of the Public Reference Room may be obtained by calling 1-800-SEC-0330.
A description of the policies and procedures that the fund uses to determine how to vote proxies relating to portfolio securities, and information regarding how the fund voted these proxies for the 12-month period ended June 30, 2004, is available through the fund’s website at http://www.dreyfus.com and on the SEC’s website at http://www.sec.gov. The description of the policies and procedures is also available without charge, upon request, by calling 1-800-645-6561.
®
© 2004 Dreyfus Service Corporation 0037AR1004
Dreyfus Premier International Opportunities Fund
| | ANNUAL REPORT October 31, 2004
|

The views expressed in this report reflect those of the portfolio manager only through the end of the period covered and do not necessarily represent the views of Dreyfus or any other person in the Dreyfus organization. Any such views are subject to change at any time based upon market or other conditions and Dreyfus disclaims any responsibility to update such views.These views may not be relied on as investment advice and, because investment decisions for a Dreyfus fund are based on numerous factors, may not be relied on as an indication of trading intent on behalf of any Dreyfus fund.
Not FDIC-Insured • Not Bank-Guaranteed • May Lose Value
| Contents |
| |
| | | THE FUND |
| |
|
| 2 | | Letter from the Chairman |
| 3 | | Discussion of Fund Performance |
| 6 | | Fund Performance |
| 8 | | Understanding Your Fund’s Expenses |
| 8 | | Comparing Your Fund’s Expenses |
| With Those of Other Funds |
| 9 | | Statement of Investments |
| 16 | | Statement of Assets and Liabilities |
| 17 | | Statement of Operations |
| 18 | | Statement of Changes in Net Assets |
| 20 | | Financial Highlights |
| 25 | | Notes to Financial Statements |
| 33 | | Report of Independent Registered |
| | | Public Accounting Firm |
| 34 | | Important Tax Information |
| 35 | | Board Members Information |
| 37 | | Officers of the Fund |
| FOR MORE INFORMATION |
|
| | | Back Cover |
Dreyfus Premier
International Opportunities Fund
The Fund

LETTER FROM THE CHAIRMAN
We are pleased to present this annual report for Dreyfus Premier International Opportunities Fund, covering the 12-month period from November 1, 2003, through October 31, 2004. Inside, you’ll find valuable information about how the fund was managed during the reporting period, including a discussion with the fund’s portfolio manager, D. Kirk Henry.
The global equity markets have remained within a relatively narrow trading range so far in 2004 due to uncertainties related to the potential impact of higher commodity prices, persistent geopolitical tension, a weaker U.S.dollar and the sustainability of China’s tremendous economic expansion.Yet, these factors also have produced what we believe to be attractive valuations among individual stocks in both developed and developing markets, suggesting that improvements in global economic conditions could lead to higher stock prices.
Of course, the specific international investments that may be right for you depend on your current needs, future goals, tolerance for risk and the composition of your overall portfolio.As always, your financial advisor may be in the best position to recommend the specific investments that will satisfy your need for global diversification most effectively.
Thank you for your continued confidence and support.
The Dreyfus Corporation
November 15, 2004
|

DISCUSSION OF FUND PERFORMANCE
D. Kirk Henry, Senior Portfolio Manager
How did Dreyfus Premier International Opportunities Fund perform relative to its benchmark?
For the 12-month period ended October 31, 2004, the fund produced total returns of 19.41% for Class A shares, 18.60% for Class B shares, 18.67% for Class C shares, 20.62% for Class R shares and 19.41% for ClassT shares.1This compares with a 19.67% return for the fund’s current benchmark, the Morgan Stanley Capital International All Country World ex United States Free Index, for the same period.2
We attribute the fund and market’s overall performance to solid global economic growth driven by U.S. consumption and unprecedented expansion in China. As a result, corporate earnings rose sharply, balance sheet strength improved and there was a marked resurgence in merger-and-acquisition activity.The fund’s returns modestly trailed its benchmark due to its higher weight in consumer staples and less exposure to energy, as well as lagging returns from German consumer discretionary holdings.
What is the fund’s investment approach?
The fund seeks long-term capital growth.To pursue this goal, the fund ordinarily invests most of its assets in equity securities of companies located throughout the world, including emerging market countries. At least 80% of the fund’s assets will be invested in stocks. The fund normally can be expected to invest up to 35% of its total assets in the stocks of emerging market companies.
The fund’s investment approach is value-oriented, research-driven and risk-adverse. In selecting stocks, we seek to identify potential investments through extensive quantitative and fundamental research. Emphasizing individual stock selection rather than economic and industry trends, the fund focuses on three key factors: value; business health; and business momentum.
DISCUSSION OF FUND PERFORMANCE (continued)
|
The fund employs strict risk control guidelines with respect to portfolio, country and sector diversification. Under normal market conditions:
- no single issue, at the time of purchase, will account for more than 5% of the portfolio or 5% of the outstanding common stock of the issuer;
- the fund will be invested in at least 12 to 15 countries, and country weightings will deviate from the weightings of the fund’s bench- mark index only within specific percentage ranges established by the portfolio manager; and
- the weighting in any one sector will be no more than the greater of 10 percentage points above the weighting of that sector in the benchmark or 30% of the portfolio.
What other factors influenced the fund’s performance?
Most international stock markets rallied sharply during the reporting period, due largely to U.S. consumer spending, and resilient economic growth in China, which triggered a strong rebound in industrial production and commodity prices. Buoyant exports and lower operating costs led to solid earnings growth in Japan. European companies used the profit recovery to reduce debt and execute strategic acquisitions.
The fund’s performance received especially strong contributions from its holdings in Japan, France, India, the Netherlands and South Korea. In Japan, consumer and corporate finance stocks such as Credit Saison, AIFUL and SFCG rose sharply, fueled by higher employment rates, which, in turn, led to improved lending volumes and lower loan loss delinquencies.The fund’s performance also was bolstered by its holdings in Sanofi-Aventis, the large French pharmaceutical firm created by a merger during the reporting period.
In India, an area we have favored for some time now, the stock price of Mahanagar Telephone Nigam (MTNL), a major telecommunications company, rebounded after it was announced that the new government would raise foreign ownership levels in the telecom sector.The fund also scored successes with several of its holdings in the Netherlands, includ-
ing Fortis, the bank and insurance company, and Hunter Douglas, the window treatment firm. Finally, strong exports to China, where the local industrial production is expanding rapidly, helped boost the performance of POSCO, the South Korean iron and steel manufacturer.
On the other hand,the fund’s returns were hindered by its limited exposure to energy stocks and a higher weight in consumer staples.While the fund’s energy companies rose steadily with oil prices, the overall impact was limited by a slightly lower weight in the sector relative to the index. In addition, the fund’s exposure to selected German consumer discretionary stocks, including Volkswagen and KarstadtQuelle, the department store and catalog retailer, also held back performance, primarily due to the country’s high unemployment and struggling economy.
What is the fund’s current strategy?
As of the end of the reporting period, we have taken profits and trimmed the fund’s exposure to richly priced energy companies and mining stocks that are vulnerable to specific metal price risk.We have redeployed those assets to more attractively valued investments, including France Telecom, Vodafone, select information technology companies, and European consumer stocks that appear to have been oversold by investors.
| 1 | | Total return includes reinvestment of dividends and any capital gains paid, and does not take into |
| | | consideration the maximum initial sales charges in the case of Class A and Class T shares, or the |
| | | applicable contingent deferred sales charges imposed on redemptions in the case of Class B and |
| | | Class C shares. Had these charges been reflected, returns would have been lower. Past performance |
| | | is no guarantee of future results. Share price and investment return fluctuate such that upon |
| | | redemption, fund shares may be worth more or less than their original cost. Return figures |
| | | provided reflect the absorption of fund expenses by The Dreyfus Corporation pursuant to an |
| | | agreement in effect through October 31, 2005, at which time it may be extended, terminated or |
| | | modified. Had these expenses not been absorbed, the fund’s returns would have been lower. |
| 2 | | SOURCE: LIPPER INC. — Reflects reinvestment of gross dividends and, where applicable, |
| | | capital gain distributions.The Morgan Stanley Capital International All Country World ex U.S. |
| | | Free Index is a free floated-adjusted market capitalization-weighted index that is designed to track |
| | | the performance of both developed and emerging market countries, excluding the United States. |
FUND PERFORMANCE
† Source: Lipper Inc.
Past performance is not predictive of future performance.
The above graph compares a $10,000 investment made in each of the Class A, Class B, Class C and Class R shares of Dreyfus Premier International Opportunities Fund on 3/31/98 (inception date) to a $10,000 investment made in the Morgan Stanley Capital International All Country World ex U.S. Free Index (the “Index”) on that date.All dividends and capital gain distributions are reinvested. Performance for Class T shares will vary from the performance of Class A, Class B, Class C and Class R shares shown above due to differences in charges and expenses.
The fund’s performance shown in the line graph takes into account the maximum initial sales charge on Class A shares and all other applicable fees and expenses on all classes.The Index is a free float-adjusted market capitalization-weighted index that is designed to track the performance of both developed and emerging market countries, excluding the United States.The Index does not take into account charges, fees and other expenses. Further information relating to fund performance, including expense reimbursements, if applicable, is contained in the Financial Highlights section of the prospectus and elsewhere in this report.
| Average Annual Total Returns as of 10/31/04 | | | | |
| |
| | | Inception | | | | | | From |
| | | Date | | 1 Year | | 5 Years | | Inception |
| |
| |
| |
| |
|
| Class A shares | | | | | | | | |
| with maximum sales charge (5.75%) | | 3/31/98 | | 12.58% | | 2.05% | | 3.45% |
| without sales charge | | 3/31/98 | | 19.41% | | 3.27% | | 4.38% |
| Class B shares | | | | | | | | |
| with applicable redemption charge † | | 3/31/98 | | 14.60% | | 2.07% | | 3.60% |
| without redemption | | 3/31/98 | | 18.60% | | 2.42% | | 3.60% |
| Class C shares | | | | | | | | |
| with applicable redemption charge †† | | 3/31/98 | | 17.67% | | 2.45% | | 3.56% |
| without redemption | | 3/31/98 | | 18.67% | | 2.45% | | 3.56% |
| Class R shares | | 3/31/98 | | 20.62% | | 3.72% | | 4.80% |
| Class T shares | | | | | | | | |
| with applicable sales charge (4.5%) | | 3/1/00 | | 14.08% | | — | | 2.63% |
| without sales charge | | 3/1/00 | | 19.41% | | — | | 3.65% |
Past performance is not predictive of future performance.The fund’s performance shown in the graph and table does not reflect the deduction of taxes that a shareholder would pay on fund distributions or the redemption of fund shares. Performance for Class B shares assumes the conversion of Class B shares to Class A shares at the end of the sixth year following the date of purchase.
| † | | The maximum contingent deferred sales charge for Class B shares is 4%.After six years Class B shares convert to |
| | | Class A shares. |
| †† | | The maximum contingent deferred sales charge for Class C shares is 1% for shares redeemed within one year of the |
| | | date of purchase. |
UNDERSTANDING YOUR FUND ’ S EXPENSES (Unaudited)
As a mutual fund investor, you pay ongoing expenses, such as management fees and other expenses. Using the information below, you can estimate how these expenses affect your investment and compare them with the expenses of other funds.You also may pay one-time transaction expenses, including sales charges (loads) and redemption fees, which are not shown in this section and would have resulted in higher total expenses. For more information, see your fund’s prospectus or talk to your financial adviser.
Review your fund’s expenses
The table below shows the expenses you would have paid on a $1,000 investment in Dreyfus Premier International Opportunities Fund from May 1, 2004 to October 31, 2004. It also shows how much a $1,000 investment would be worth at the close of the period, assuming actual returns and expenses.
| Expenses and Value of a $1,000 Investment | | | | | | |
| assuming actual returns for the six months ended October 31, 2004 | | | | |
| | | Class A | | Class B | | Class C | | Class R | | Class T |
| |
| |
| |
| |
| |
|
| Expenses paid per $1,000 † | | $ 10.37 | | $ 14.23 | | $ 14.23 | | $ 9.08 | | $ 11.67 |
| Ending value (after expenses) | | $1,063.00 | | $1,058.90 | | $1,059.00 | | $1,065.20 | | $1,063.40 |
COMPARING YOUR FUND’S EXPENSES WITH THOSE OF OTHER FUNDS ( U n a u d i t e d )
Using the SEC’s method to compare expenses
The Securities and Exchange Commission (SEC) has established guidelines to help investors assess fund expenses. Per these guidelines, the table below shows your fund’s expenses based on a $1,000 investment, assuming a hypothetical 5% annualized return. You can use this information to compare the ongoing expenses (but not transaction expenses or total cost) of investing in the fund with those of other funds.All mutual fund shareholder reports will provide this information to help you make this comparison. Please note that you cannot use this information to estimate your actual ending account balance and expenses paid during the period.
Expenses and Value of a $1,000 Investment assuming a hypothetical 5% annualized return for the six months ended October 31, 2004
| | | Class A | | Class B | | Class C | | Class R | | Class T |
| |
| |
| |
| |
| |
|
| Expenses paid per $1,000 † | | $ 10.13 | | $ 13.90 | | $ 13.90 | | $ 8.87 | | $ 11.39 |
| Ending value (after expenses) | | $1,015.08 | | $1,011.31 | | $1,011.31 | | $1,016.34 | | $1,013.83 |
- Expenses are equal to the fund’s annualized expense ratio of 2.00% for Class A, 2.75% for Class B, 2.75% for Class C, 1.75% for Class R and 2.25% for Class T; multiplied by the average account value over the period, multiplied by 184/366 (to reflect the one-half year period).
STATEMENT OF INVESTMENTS
October 31, 2004
|
| Common Stocks—95.1% | | Shares | | Value ($) | | |
| |
| |
| |
|
| Australia—1.2% | | | | | | |
| Amcor | | 13,551 | | 77,329 | | |
| National Australia Bank | | 6,359 | | 134,449 | | |
| | | | | 211,778 | | |
| Belgium—1.0% | | | | | | |
| Fortis | | 6,650 | | 169,655 | | |
| Brazil—1.0% | | | | | | |
| Banco Itau, ADR | | 30 | | 1,815 | | |
| Petroleo Brasileiro, ADR | | 2,600 | | 92,326 | | |
| Telecomunicacoes Brasileiras, ADR | | 3,324 | | 87,621 | | |
| | | | | 181,762 | | |
| Canada—3.6% | | | | | | |
| CP Railway | | 6,700 | | 189,019 | | |
| Quebecor World | | 7,150 | | 149,425 | | |
| Royal Bank of Canada | | 1,800 | | 93,564 | | |
| Sobeys | | 7,600 | | 197,836 | | |
| | | | | 629,844 | | |
| China—.8% | | | | | | |
| China Telecom, Cl. H | | 167,000 | | 53,642 | | |
| Huadian Power International, Cl. H | | 255,400 | | 82,038 | | |
| | | | | 135,680 | | |
| Croatia—.1% | | | | | | |
| Pliva, GDR | | 1,100 a | | 16,610 | | |
| Denmark—.4% | | | | | | |
| Danske Bank | | 2,750 | | 77,013 | | |
| Finland—1.9% | | | | | | |
| M-real, CL. B | | 8,900 | | 55,200 | | |
| Nokia | | 1,900 | | 29,375 | | |
| Nokia, ADR | | 4,359 | | 67,216 | | |
| Sampo | | 5,850 | | 69,872 | | |
| UPM-Kymmene | | 5,500 | | 109,018 | | |
| | | | | 330,681 | | |
| France—8.0% | | | | | | |
| BNP Paribas | | 2,030 | | 138,495 | | |
| Carrefour | | 3,880 | | 170,337 | | |
| France Telecom | | 7,750 b | | 222,396 | | |
| Sanofi-Aventis | | 2,100 | | 153,878 | | |
| Schneider Electric | | 1,470 | | 97,563 | | |
| |
| | | The Fund | | | | 9 |
STATEMENT OF INVESTMENTS (continued)
| Common Stocks (continued) | | Shares | | Value ($) |
| |
| |
|
| France (continued) | | | | |
| Societe Nationale d’Etude et de | | | | |
| Construction de Moteurs d’Avion | | 3,840 | | 82,007 |
| Thomson | | 7,170 | | 162,658 |
| Total | | 1,085 | | 226,162 |
| Valeo | | 3,750 | | 138,830 |
| | | | | 1,392,326 |
| Germany—5.8% | | | | |
| Deutsche Bank | | 1,640 | | 124,974 |
| Deutsche Boerse | | 1,300 | | 65,085 |
| Deutsche Lufthansa | | 9,188 b | | 121,491 |
| Deutsche Post | | 9,330 | | 182,905 |
| Deutsche Postbank | | 1,800 | | 71,771 |
| E.ON | | 1,614 | | 132,095 |
| Heidelberger Druckmaschinen | | 1,990 b | | 57,284 |
| KarstadtQuelle | | 5,650 | | 64,232 |
| Medion | | 1,860 | | 32,420 |
| Volkswagen | | 3,490 | | 155,759 |
| | | | | 1,008,016 |
| Greece—.4% | | | | |
| Hellenic Telecommunications Organization | | 4,580 | | 71,103 |
| Hong Kong—1.2% | | | | |
| Bank of East Asia | | 27,442 | | 78,627 |
| China Mobile (Hong Kong) | | 34,500 | | 99,958 |
| Citic Pacific | | 10,100 | | 25,824 |
| MTR | | 4,451 | | 6,663 |
| | | | | 211,072 |
| Hungary—.4% | | | | |
| Magyar Tavkozlesi | | 16,500 | | 69,215 |
| India—1.4% | | | | |
| Hindalco Industries, GDR | | 2,600 a | | 67,080 |
| Mahanagar Telephone Nigam, ADR | | 9,600 | | 75,840 |
| Reliance Industries, GDR | | 4,300 a,b | | 106,425 |
| | | | | 249,345 |
| Indonesia—.4% | | | | |
| PT Gudang Garam | | 50,100 | | 70,311 |
| Ireland—1.3% | | | | |
| Bank of Ireland | | 16,970 | | 233,288 |
| |
| 10 | | | | |
| Common Stocks (continued) | | Shares | | Value ($) |
| |
| |
|
| Italy—3.8% | | | | |
| Banche Popolari Unite Scrl | | 2,335 | | 41,625 |
| Benetton Group | | 4,800 | | 55,551 |
| Eni | | 7,505 | | 170,834 |
| Finmeccanica | | 190,160 | | 151,499 |
| SanPaolo IMI | | 4,070 | | 51,735 |
| UniCredito Italiano | | 37,200 | | 200,275 |
| | | | | 671,519 |
| Japan—21.3% | | | | |
| AIFUL | | 1,100 | | 109,896 |
| ALPS ELECTRIC | | 8,000 | | 96,468 |
| CANON | | 3,000 | | 148,159 |
| Credit Saison | | 5,100 | | 163,258 |
| DENTSU | | 26 | | 69,726 |
| FUNAI ELECTRIC | | 500 | | 65,439 |
| Fuji Heavy Industries | | 16,600 | | 80,727 |
| Fuji Photo Film | | 4,500 | | 153,824 |
| HONDA MOTOR | | 3,500 | | 169,216 |
| KDDI | | 18 | | 86,685 |
| Kao | | 4,800 | | 110,821 |
| Kuraray | | 10,000 | | 78,187 |
| LAWSON | | 2,700 | | 90,255 |
| MABUCHI MOTOR | | 1,700 | | 126,336 |
| MINEBEA | | 26,500 | | 112,606 |
| MURATA MANUFACTURING | | 1,900 | | 90,604 |
| Matsumotokiyoshi | | 3,600 | | 90,595 |
| NIPPON TELEGRAPH AND TELEPHONE | | 16 | | 67,989 |
| Nippon Express | | 32,000 | | 154,410 |
| OLYMPUS | | 2,500 | | 48,513 |
| RINNAI | | 4,200 | | 114,419 |
| ROHM | | 1,200 | | 123,286 |
| SFCG | | 300 | | 63,116 |
| SKYLARK | | 6,900 | | 114,414 |
| SOHGO SECURITY SERVICES | | 5,300 | | 72,368 |
| SUMITOMO CHEMICAL | | 20,600 | | 99,985 |
| Sekisui House | | 10,000 | | 103,305 |
| 77 Bank | | 19,000 | | 113,211 |
STATEMENT OF INVESTMENTS (continued)
| Common Stocks (continued) | | Shares | | Value ($) |
| |
| |
|
| Japan (continued) | | | | |
| Shin-Etsu Chemical | | 4,400 | | 167,441 |
| Shinsei Bank | | 1,000 | | 6,516 |
| Shiseido | | 6,500 | | 84,887 |
| Sumitomo Bakelite | | 12,700 | | 74,833 |
| Sumitomo Mitsui Financial | | 9 | | 58,555 |
| TDK | | 600 | | 41,700 |
| Takeda Pharmaceutical | | 3,450 | | 166,799 |
| Toyota Motor | | 2,200 | | 85,798 |
| Yamaha Motor | | 8,000 | | 121,851 |
| | | | | 3,726,198 |
| Malaysia—.5% | | | | |
| Sime Darby | | 58,300 | | 87,450 |
| Mexico—1.7% | | | | |
| Cemex, ADR | | 2,995 | | 86,795 |
| Coca-Cola Femsa, ADR | | 5,100 | | 102,612 |
| Kimberly-Clark de Mexico, Cl. A | | 5,300 | | 15,863 |
| Telefonos de Mexico, ADR | | 2,560 | | 87,655 |
| | | | | 292,925 |
| Netherlands—5.4% | | | | |
| ABN AMRO | | 4,059 | | 97,325 |
| Aegon | | 13,064 | | 143,339 |
| Akzo Nobel | | 2,024 | | 76,329 |
| DSM | | 1,100 | | 60,009 |
| Heineken | | 4,397 | | 138,548 |
| Koninklijke (Royal) Philips Electronics | | 4,410 | | 104,613 |
| Koninklijke (Royal) Philips Electronics | | | | |
| (New York Shares) | | 1,670 | | 39,779 |
| Royal Dutch Petroleum | | 2,700 | | 147,053 |
| Wolters Kluwer | | 7,118 | | 130,075 |
| | | | | 937,070 |
| New Zealand—.1% | | | | |
| Carter Holt Harvey | | 14,250 | | 20,959 |
| Norway—.2% | | | | |
| Norsk Hydro | | 350 | | 25,779 |
| Common Stocks (continued) | | Shares | | Value ($) |
| |
| |
|
| Singapore—1.1% | | | | |
| DBS | | 16,600 | | 155,690 |
| Singapore Technologies Engineering | | 32,100 | | 40,335 |
| | | | | 196,025 |
| South Africa—2.1% | | | | |
| Anglo American | | 3,560 | | 78,054 |
| Nampak | | 40,400 | | 98,006 |
| Nedcor | | 10,879 | | 118,680 |
| Old Mutual | | 31,900 | | 67,511 |
| | | | | 362,251 |
| South Korea—3.5% | | | | |
| Hyundai Motor, GDR | | 3,000 a | | 71,250 |
| KT, ADR | | 6,100 | | 112,606 |
| Kookmin Bank, ADR | | 2,350 b | | 79,030 |
| Korea Electric Power, ADR | | 10,160 | | 116,637 |
| POSCO, ADR | | 1,600 | | 59,824 |
| SK Telecom, ADR | | 4,400 | | 86,812 |
| Samsung Electronics, GDR | | 390 | | 76,440 |
| | | | | 602,599 |
| Spain—2.3% | | | | |
| Banco de Sabadell | | 3,110 | | 66,894 |
| Endesa | | 8,740 | | 177,822 |
| Repsol YPF | | 800 | | 17,382 |
| Repsol YPF, ADR | | 6,120 | | 132,620 |
| | | | | 394,718 |
| Sweden—.9% | | | | |
| Electrolux, Cl. B | | 8,700 | | 161,646 |
| Switzerland—6.3% | | | | |
| Clariant | | 6,485 | | 87,965 |
| Julius Baer, Cl. B | | 270 | | 75,735 |
| Lonza | | 2,500 | | 122,457 |
| Nestle | | 950 | | 225,310 |
| Novartis | | 5,160 | | 246,702 |
| Swiss Re | | 2,260 | | 139,086 |
STATEMENT OF INVESTMENTS (continued)
| Common Stocks (continued) | | Shares | | Value ($) |
| |
| |
|
| Switzerland (continued) | | | | |
| UBS | | 1,760 | | 127,177 |
| Zurich Financial Services | | 540 | | 77,091 |
| | | | | 1,101,523 |
| Taiwan—1.3% | | | | |
| Compal Electronics, GDR | | 24,417 | | 109,876 |
| United Microelectronics, ADR | | 35,351 b | | 123,729 |
| | | | | 233,605 |
| United Kingdom—15.7% | | | | |
| BAA | | 9,300 | | 97,940 |
| BAE Systems | | 29,345 | | 128,384 |
| BOC | | 5,254 | | 84,612 |
| BT | | 47,300 | | 161,337 |
| Barclays | | 9,831 | | 96,040 |
| Bunzl | | 14,753 | | 111,818 |
| Cadbury Schweppes | | 15,848 | | 131,685 |
| Centrica | | 18,000 | | 79,576 |
| Diageo | | 13,338 | | 178,428 |
| easyJet | | 21,000 b | | 60,736 |
| GKN | | 42,450 | | 166,620 |
| GlaxoSmithKline | | 12,600 | | 265,386 |
| Lloyds TSB | | 13,869 | | 109,766 |
| Marks & Spencer | | 11,300 | | 74,493 |
| Rexam | | 8,400 | | 66,404 |
| Rio Tinto | | 7,053 | | 184,428 |
| Royal Bank of Scotland | | 6,556 | | 193,223 |
| Sainsbury (J) | | 21,159 | | 100,147 |
| Scottish & Southern Energy | | 1,807 | | 27,690 |
| Shell Transport & Trading | | 28,233 | | 222,282 |
| Unilever | | 15,490 | | 130,559 |
| Vodafone | | 23,100 | | 59,174 |
| | | | | 2,730,728 |
| Total Common Stocks | | | | |
| (cost $13,969,571) | | | | 16,602,694 |
| | | | | | | Principal | | |
| Short-Term Investments—2.3% | | Amount ($) | | Value ($) |
| |
| |
|
| U.S. Treasury Bills; | | | | | | |
| 1.50%, 11/4/2004 | | | | 201,000 | | 200,972 |
| 1.64%, 11/18/2004 | | | | 201,000 | | 200,845 |
| Total Short-Term Investments | | | | |
| (cost $401,819) | | | | | | 401,817 |
| |
| |
| |
|
| |
| Total Investments (cost $14,371,390) | | 97.4% | | 17,004,511 |
| |
| Cash and Receivables (Net) | | 2.6% | | 449,728 |
| |
| Net Assets | | | | 100.0% | | 17,454,239 |
| |
| ADR—American Depository Receipts | | | | |
| GDR—Global Depository Receipts | | | | |
| a | | Securities exempt from registration under Rule 144A of the Securities Act of 1933.These securities may be resold |
| | | in transactions exempt from registration, normally to qualified institutional buyers.These securities have been |
| | | determined to be liquid by the Board of Trustees. At October 31, 2004, these securities amounted to $261,365 or |
| | | 1.5% of net assets. | | | | | | |
| b | | Non-income producing. | | | | | | |
| |
| |
| |
| |
|
| |
| |
| |
| |
| Portfolio Summary (Unaudited) † | | | | |
| |
| | | | | Value (%) | | | | Value (%) |
| |
| |
| |
| |
|
| Banking | | 11.8 | | Healthcare | | 4.0 |
| Financial Services | | 6.9 | | Electronic components | | 3.8 |
| Telecommunications | | 6.8 | | Utilities | | 3.5 |
| Chemicals | | 6.7 | | Beverages & Tobacco | | 3.5 |
| Food & Household Products | | 6.5 | | Other | | 34.3 |
| Automobiles | | 4.9 | | | | |
| Energy | | 4.7 | | | | 97.4 |
| |
| † | | Based on net assets. | | | | | | |
| See notes to financial statements. | | | | | | |
STATEMENT OF ASSETS AND LIABILITIES
October 31, 2004
| | | | | | | | | Cost | | Value |
| |
| |
| |
| |
| |
|
| Assets ($): | | | | | | | | | | |
| Investments in securities—See Statement of Investments | | 14,371,390 | | 17,004,511 |
| Cash | | | | | | | | | | 30,252 |
| Cash denominated in foreign currencies | | | | 389,188 | | 399,430 |
| Receivable for investment securities sold | | | | | | 113,595 |
| Dividends receivable | | | | | | | | 39,531 |
| Receivable for shares of Beneficial Interest subscribed | | | | | | 21,542 |
| Net unrealized appreciation on forward | | | | | | |
| currency exchange contracts—Note 4 | | | | | | 43 |
| Prepaid expenses | | | | | | | | | | 26,130 |
| | | | | | | | | | | 17,635,034 |
| |
| |
| |
| |
| |
|
| Liabilities ($): | | | | | | | | | | |
| Due to The Dreyfus Corporation and affiliates—Note 3(c) | | | | | | 12,769 |
| Payable for investment securities purchased | | | | | | 63,529 |
| Payable for shares of Beneficial Interest redeemed | | | | | | 45,233 |
| Accrued expenses | | | | | | | | | | 59,264 |
| | | | | | | | | | | 180,795 |
| |
| |
| |
| |
| |
|
| Net Assets ($) | | | | | | | | | | 17,454,239 |
| |
| |
| |
| |
| |
|
| Composition of Net Assets ($): | | | | | | | | |
| Paid-in capital | | | | | | | | | | 14,550,790 |
| Accumulated undistributed investment income—net | | | | | | 38,773 |
| Accumulated net realized gain (loss) on investments | | | | | | 220,020 |
| Accumulated net unrealized appreciation (depreciation) | | | | | | |
| on investments and foreign currency transactions | | | | | | 2,644,656 |
| |
| |
| |
|
| Net Assets ($) | | | | | | | | | | 17,454,239 |
| |
| |
| |
| |
| |
|
| |
| |
| Net Asset Value Per Share | | | | | | | | |
| | | Class A | | Class B | | Class C | | Class R | | Class T |
| |
| |
| |
| |
| |
|
| Net Assets ($) | | 7,798,692 | | 3,493,569 | | 5,961,217 | | 28,681 | | 172,080 |
| Shares Outstanding | | 563,177 | | 262,651 | | 448,520 | | 2,041 | | 12,360 |
| |
| |
| |
| |
| |
|
| Net Asset Value | | | | | | | | | | |
| Per Share ($) | | 13.85 | | 13.30 | | 13.29 | | 14.05 | | 13.92 |
| |
| See notes to financial statements. | | | | | | | | |
STATEMENT OF OPERATIONS
Year Ended October 31, 2004
|
| Investment Income ($): | | |
| Income: | | |
| Cash dividends (net of $46,422 foreign taxes withheld at source) | | 380,354 |
| Interest | | 5,763 |
| Total Income | | 386,117 |
| Expenses: | | |
| Management fee—Note 3(a) | | 153,873 |
| Shareholder servicing costs—Note 3(c) | | 82,402 |
| Custodian fees | | 79,492 |
| Registration fees | | 66,321 |
| Distribution fees—Note 3(b) | | 63,135 |
| Prospectus and shareholders’ reports | | 31,228 |
| Auditing fees | | 23,235 |
| Trustees’ fees and expenses—Note 3(d) | | 2,453 |
| Legal fees | | 1,625 |
| Loan commitment fees—Note 2 | | 107 |
| Miscellaneous | | 11,641 |
| Total Expenses | | 515,512 |
| Less—reduction in management fee due to | | |
| undertaking—Note 3(a) | | (144,754) |
| Less—reduction in custody fees due to | | |
| earnings credits—Note 1(c) | | (362) |
| Net Expenses | | 370,396 |
| Investment Income—Net | | 15,721 |
| |
|
| Realized and Unrealized Gain (Loss) on Investments—Note 4 ($): |
| Net realized gain (loss) on investments and foreign currency transactions | | 1,434,921 |
| Net realized gain (loss) on forward currency exchange contracts | | (8,315) |
| Net Realized Gain (Loss) | | 1,426,606 |
| Net unrealized appreciation (depreciation) on investments | | |
| and foreign currency transactions | | 987,696 |
| Net Realized and Unrealized Gain (Loss) on Investments | | 2,414,302 |
| Net Increase in Net Assets Resulting from Operations | | 2,430,023 |
See notes to financial statements.
|
STATEMENT OF CHANGES IN NET ASSETS
| | | Year Ended October 31, |
| |
|
| | | 2004 | | 2003 |
| |
| |
|
| Operations ($): | | | | |
| Investment income—net | | 15,721 | | 44,985 |
| Net realized gain (loss) on investments | | 1,426,606 | | (373,258) |
| Net unrealized appreciation | | | | |
| (depreciation) on investments | | 987,696 | | 2,616,609 |
| Net Increase (Decrease) in Net Assets | | | | |
| Resulting from Operations | | 2,430,023 | | 2,288,336 |
| |
| |
|
| Dividends to Shareholders from ($): | | | | |
| Investment income—net: | | | | |
| Class A shares | | (50,384) | | (59,889) |
| Class B shares | | (11,801) | | (18,053) |
| Class C shares | | (22,186) | | (20,906) |
| Class R shares | | (324) | | (6,701) |
| Class T shares | | (1,435) | | (369) |
| Total Dividends | | (86,130) | | (105,918) |
| |
| |
|
| Beneficial Interest Transactions ($): | | | | |
| Net proceeds from shares sold: | | | | |
| Class A shares | | 3,979,138 | | 11,578,164 |
| Class B shares | | 1,245,498 | | 3,593,944 |
| Class C shares | | 2,478,238 | | 2,473,249 |
| Class R shares | | 34,000 | | — |
| Class T shares | | 91,819 | | 877,761 |
| Dividends reinvested: | | | | |
| Class A shares | | 35,183 | | 23,852 |
| Class B shares | | 8,466 | | 13,802 |
| Class C shares | | 9,166 | | 9,041 |
| Class R shares | | 324 | | 323 |
| Class T shares | | 1,435 | | 369 |
| Cost of shares redeemed: | | | | |
| Class A shares | | (1,989,102) | | (11,792,371) |
| Class B shares | | (784,763) | | (3,185,577) |
| Class C shares | | (744,443) | | (1,122,391) |
| Class R shares | | (507,407) | | (49,662) |
| Class T shares | | (65,993) | | (802,041) |
| Increase (Decrease) in Net Assets | | | | |
| from Beneficial Interest Transactions | | 3,791,559 | | 1,618,463 |
| Total Increase (Decrease) in Net Assets | | 6,135,452 | | 3,800,881 |
| |
| |
|
| Net Assets ($): | | | | |
| Beginning of Period | | 11,318,787 | | 7,517,906 |
| End of Period | | 17,454,239 | | 11,318,787 |
| Undistributed investment income—net | | 38,773 | | 78,243 |
| |
| 18 | | | | |
| | | Year Ended October 31, |
| |
|
| | | 2004 | | 2003 |
| |
| |
|
| Capital Share Transactions: | | | | |
| Class A a | | | | |
| Shares sold | | 306,480 | | 1,188,196 |
| Shares issued for dividends reinvested | | 2,886 | | 2,560 |
| Shares redeemed | | (152,015) | | (1,194,815) |
| Net Increase (Decrease) in Shares Outstanding | | 157,351 | | (4,059) |
| |
| |
|
| Class B a | | | | |
| Shares sold | | 101,089 | | 395,578 |
| Shares issued for dividends reinvested | | 718 | | 1,532 |
| Shares redeemed | | (62,173) | | (351,150) |
| Net Increase (Decrease) in Shares Outstanding | | 39,634 | | 45,960 |
| |
| |
|
| Class C | | | | |
| Shares sold | | 199,933 | | 256,526 |
| Shares issued for dividends reinvested | | 779 | | 1,004 |
| Shares redeemed | | (58,978) | | (119,380) |
| Net Increase (Decrease) in Shares Outstanding | | 141,734 | | 138,150 |
| |
| |
|
| Class R | | | | |
| Shares sold | | 2,574 | | — |
| Shares issued for dividends reinvested | | 26 | | 35 |
| Shares redeemed | | (41,706) | | (5,130) |
| Net Increase (Decrease) in Shares Outstanding | | (39,106) | | (5,095) |
| |
| |
|
| Class T | | | | |
| Shares sold | | 7,115 | | 93,227 |
| Shares issued for dividends reinvested | | 117 | | 51 |
| Shares redeemed | | (5,009) | | (85,417) |
| Net Increase (Decrease) in Shares Outstanding | | 2,223 | | 7,861 |
a During the period ended October 31, 2004, 7,082 Class B shares representing $90,552 were automatically converted to 6,826 Class A shares and during the period ended October 31, 2003, 2,780 Class B shares representing $28,985 were automatically converted to 2,684 Class A shares.
See notes to financial statements.
The following tables describe the performance for each share class for the fiscal periods indicated.All information (except portfolio turnover rate) reflects financial results for a single fund share.Total return shows how much your investment in the fund would have increased (or decreased) during each period, assuming you had reinvested all dividends and distributions.These figures have been derived from the fund’s financial statements.
| | | | | | | Year Ended October 31, | | |
| | | |
| |
| |
|
| Class A Shares | | 2004 | | 2003 | | 2002 | | 2001 | | 2000 |
| |
| |
| |
| |
| |
|
| Per Share Data ($): | | | | | | | | | | |
| Net asset value, beginning of period | | 11.70 | | 9.47 | | 10.35 | | 12.96 | | 13.98 |
| Investment Operations: | | | | | | | | | | |
| Investment income—net a | | .07 | | .09 | | .06 | | .04 | | .03 |
| Net realized and unrealized | | | | | | | | | | |
| gain (loss) on investments | | 2.20 | | 2.27 | | (.94) | | (1.63) | | (.10) |
| Total from Investment Operations | | 2.27 | | 2.36 | | (.88) | | (1.59) | | (.07) |
| Distributions: | | | | | | | | | | |
| Dividends from investment income—net | | (.12) | | (.13) | | — | | — | | (.04) |
| Dividends from net realized | | | | | | | | | | |
| gain on investments | | — | | — | | — | | (1.02) | | (.91) |
| Total Distributions | | (.12) | | (.13) | | — | | (1.02) | | (.95) |
| Net asset value, end of period | | 13.85 | | 11.70 | | 9.47 | | 10.35 | | 12.96 |
| |
| |
| |
| |
| |
|
| Total Return (%) b | | 19.41 | | 25.23 | | (8.50) | | (13.57) | | (.69) |
| |
| |
| |
| |
| |
|
| Ratios/Supplemental Data (%): | | | | | | | | | | |
| Ratio of total expenses | | | | | | | | | | |
| to average net assets | | 2.93 | | 3.61�� | | 3.47 | | 3.69 | | 3.16 |
| Ratio of net expenses | | | | | | | | | | |
| to average net assets | | 2.00 | | 2.00 | | 2.00 | | 2.00 | | 2.00 |
| Ratio of net investment income | | | | | | | | | | |
| to average net assets | | .53 | | .92 | | .52 | | .35 | | .24 |
| Portfolio Turnover Rate | | 44.10 | | 78.42 | | 65.83 | | 49.65 | | 42.16 |
| |
| |
| |
| |
| |
|
| Net Assets, end of period ($ x 1,000) | | 7,799 | | 4,747 | | 3,882 | | 3,724 | | 4,121 |
| |
| a | | Based on average shares outstanding at each month end. | | | | | | | | |
| b | | Exclusive of sales charge. | | | | | | | | | | |
| See notes to financial statements. | | | | | | | | | | |
| | | | | | | Year Ended October 31, | | |
| | | |
| |
| |
|
| Class B Shares | | 2004 | | 2003 | | 2002 | | 2001 | | 2000 |
| |
| |
| |
| |
| |
|
| Per Share Data ($): | | | | | | | | | | |
| Net asset value, beginning of period | | 11.26 | | 9.17 | | 10.11 | | 12.78 | | 13.86 |
| Investment Operations: | | | | | | | | | | |
| Investment income (loss)—net a | | (.03) | | .00b | | (.03) | | (.05) | | (.07) |
| Net realized and unrealized | | | | | | | | | | |
| gain (loss) on investments | | 2.12 | | 2.18 | | (.91) | | (1.60) | | (.10) |
| Total from Investment Operations | | 2.09 | | 2.18 | | (.94) | | (1.65) | | (.17) |
| Distributions: | | | | | | | | | | |
| Dividends from investment income—net | | (.05) | | (.09) | | — | | — | | — |
| Dividends from net realized | | | | | | | | | | |
| gain on investments | | — | | — | | — | | (1.02) | | (.91) |
| Total Distributions | | (.05) | | (.09) | | — | | (1.02) | | (.91) |
| Net asset value, end of period | | 13.30 | | 11.26 | | 9.17 | | 10.11 | | 12.78 |
| |
| |
| |
| |
| |
|
| Total Return (%) c | | 18.60 | | 23.99 | | (9.30) | | (14.28) | | (1.42) |
| |
| |
| |
| |
| |
|
| Ratios/Supplemental Data (%): | | | | | | | | | | |
| Ratio of total expenses | | | | | | | | | | |
| to average net assets | | 3.68 | | 4.37 | | 4.24 | | 4.47 | | 3.89 |
| Ratio of net expenses | | | | | | | | | | |
| to average net assets | | 2.75 | | 2.75 | | 2.75 | | 2.75 | | 2.75 |
| Ratio of net investment income | | | | | | | | | | |
| (loss) to average net assets | | (.26) | | .01 | | (.34) | | (.45) | | (.52) |
| Portfolio Turnover Rate | | 44.10 | | 78.42 | | 65.83 | | 49.65 | | 42.16 |
| |
| |
| |
| |
| |
|
| Net Assets, end of period ($ x 1,000) | | 3,494 | | 2,512 | | 1,624 | | 809 | | 799 |
| |
| a | | Based on average shares outstanding at each month end. | | | | | | | | |
| b | | Amount represents less than $.01 per share. | | | | | | | | |
| c | | Exclusive of sales charge. | | | | | | | | | | |
| See notes to financial statements. | | | | | | | | | | |
FINANCIAL HIGHLIGHTS (continued)
|
| | | | | | | Year Ended October 31, | | |
| | | |
| |
| |
|
| Class C Shares | | 2004 | | 2003 | | 2002 | | 2001 | | 2000 |
| |
| |
| |
| |
| |
|
| Per Share Data ($): | | | | | | | | | | |
| Net asset value, beginning of period | | 11.26 | | 9.19 | | 10.12 | | 12.79 | | 13.87 |
| Investment Operations: | | | | | | | | | | |
| Investment (loss)—net a | | (.03) | | (.00)b | | (.04) | | (.05) | | (.06) |
| Net realized and unrealized | | | | | | | | | | |
| gain (loss) on investments | | 2.12 | | 2.17 | | (.89) | | (1.60) | | (.11) |
| Total from Investment Operations | | 2.09 | | 2.17 | | (.93) | | (1.65) | | (.17) |
| Distributions: | | | | | | | | | | |
| Dividends from investment income—net | | (.06) | | (.10) | | — | | — | | — |
| Dividends from net realized | | | | | | | | | | |
| gain on investments | | — | | — | | — | | (1.02) | | (.91) |
| Total Distributions | | (.06) | | (.10) | | — | | (1.02) | | (.91) |
| Net asset value, end of period | | 13.29 | | 11.26 | | 9.19 | | 10.12 | | 12.79 |
| |
| |
| |
| |
| |
|
| Total Return (%) c | | 18.67 | | 23.92 | | (9.19) | | (14.27) | | (1.42) |
| |
| |
| |
| |
| |
|
| Ratios/Supplemental Data (%): | | | | | | | | | | |
| Ratio of total expenses | | | | | | | | | | |
| to average net assets | | 3.69 | | 4.37 | | 4.29 | | 4.43 | | 3.92 |
| Ratio of net expenses | | | | | | | | | | |
| to average net assets | | 2.75 | | 2.75 | | 2.75 | | 2.75 | | 2.75 |
| Ratio of net investment (loss) | | | | | | | | | | |
| to average net assets | | (.25) | | (.04) | | (.43) | | (.44) | | (.47) |
| Portfolio Turnover Rate | | 44.10 | | 78.42 | | 65.83 | | 49.65 | | 42.16 |
| |
| |
| |
| |
| |
|
| Net Assets, end of period ($ x 1,000) | | 5,961 | | 3,455 | | 1,549 | | 556 | | 677 |
| |
| a | | Based on average shares outstanding at each month end. | | | | | | | | |
| b | | Amount represents less than $.01 per share. | | | | | | | | |
| c | | Exclusive of sales charge. | | | | | | | | | | |
| See notes to financial statements. | | | | | | | | | | |
| | | | | Year Ended October 31, | | |
| |
| |
| |
|
| Class R Shares | | 2004 | | 2003 | | 2002 | | 2001 | | 2000 |
| |
| |
| |
| |
| |
|
| Per Share Data ($): | | | | | | | | | | |
| Net asset value, beginning of period | | 11.80 | | 9.55 | | 10.41 | | 13.00 | | 14.01 |
| Investment Operations: | | | | | | | | | | |
| Investment income (loss)—net a | | (.01) | | .09 | | .08 | | .07 | | .07 |
| Net realized and unrealized | | | | | | | | | | |
| gain (loss) on investments | | 2.42 | | 2.32 | | (.94) | | (1.64) | | (.10) |
| Total from Investment Operations | | 2.41 | | 2.41 | | (.86) | | (1.57) | | (.03) |
| Distributions: | | | | | | | | | | |
| Dividends from investment income—net | | (.16) | | (.16) | | — | | — | | (.07) |
| Dividends from net realized | | | | | | | | | | |
| gain on investments | | — | | — | | — | | (1.02) | | (.91) |
| Total Distributions | | (.16) | | (.16) | | — | | (1.02) | | (.98) |
| Net asset value, end of period | | 14.05 | | 11.80 | | 9.55 | | 10.41 | | 13.00 |
| |
| |
| |
| |
| |
|
| Total Return (%) | | 20.62 | | 25.72 | | (8.26) | | (13.36) | | (.39) |
| |
| |
| |
| |
| |
|
| Ratios/Supplemental Data (%): | | | | | | | | | | |
| Ratio of total expenses | | | | | | | | | | |
| to average net assets | | 2.61 | | 3.37 | | 3.21 | | 3.43 | | 2.91 |
| Ratio of net expenses | | | | | | | | | | |
| to average net assets | | 1.75 | | 1.75 | | 1.75 | | 1.75 | | 1.75 |
| Ratio of net investment income | | | | | | | | | | |
| (loss) to average net assets | | (.12) | | .94 | | .73 | | .55 | | .48 |
| Portfolio Turnover Rate | | 44.10 | | 78.42 | | 65.83 | | 49.65 | | 42.16 |
| |
| |
| |
| |
| |
|
| Net Assets, end of period ($ x 1,000) | | 29 | | 485 | | 442 | | 881 | | 1,147 |
| |
| a Based on average shares outstanding at each month end. | | | | | | | | |
| See notes to financial statements. | | | | | | | | | | |
FINANCIAL HIGHLIGHTS (continued)
|
| | | | | | | Year Ended October 31, | | |
| | | |
| |
| |
|
| Class T Shares | | 2004 | | 2003 | | 2002 | | 2001 | | 2000 a |
| |
| |
| |
| |
| |
|
| Per Share Data ($): | | | | | | | | | | |
| Net asset value, beginning of period | | 11.77 | | 9.39 | | 10.29 | | 12.91 | | 13.06 |
| Investment Operations: | | | | | | | | | | |
| Investment income (loss)—net b | | .03 | | .07 | | (.04) | | .00c | | .05 |
| Net realized and unrealized | | | | | | | | | | |
| gain (loss) on investments | | 2.24 | | 2.45 | | (.86) | | (1.60) | | (.20) |
| Total from Investment Operations | | 2.27 | | 2.52 | | (.90) | | (1.60) | | (.15) |
| Distributions: | | | | | | | | | | |
| Dividends from investment income—net | | (.12) | | (.14) | | — | | — | | — |
| Dividends from net realized | | | | | | | | | | |
| gain on investments | | — | | — | | — | | (1.02) | | — |
| Total Distributions | | (.12) | | (.14) | | — | | (1.02) | | — |
| Net asset value, end of period | | 13.92 | | 11.77 | | 9.39 | | 10.29 | | 12.91 |
| |
| |
| |
| |
| |
|
| Total Return (%) d | | 19.41 | | 27.18 | | (8.75) | | (13.70) | | (1.15)e |
| |
| |
| |
| |
| |
|
| Ratios/Supplemental Data (%): | | | | | | | | | | |
| Ratio of total expenses | | | | | | | | | | |
| to average net assets | | 3.80 | | 4.44 | | 5.21 | | 3.95 | | 2.36e |
| Ratio of net expenses | | | | | | | | | | |
| to average net assets | | 2.25 | | 2.25 | | 2.25 | | 2.25 | | 1.51e |
| Ratio of net investment income | | | | | | | | | | |
| (loss) to average net assets | | .24 | | .61 | | (.41) | | .04 | | .35e |
| Portfolio Turnover Rate | | 44.10 | | 78.42 | | 65.83 | | 49.65 | | 42.16 |
| |
| |
| |
| |
| |
|
| Net Assets, end of period ($ x 1,000) | | 172 | | 119 | | 21 | | 1 | | 1 |
| a | | From March 1, 2000 (commencement of initial offering) to October 31, 2000. | | | | |
| b | | Based on average shares outstanding at each month end. | | | | | | | | |
| c | | Amount represents less than $.01 per share. | | | | | | | | |
| d | | Exclusive of sales charge. | | | | | | | | | | |
| e | | Not annualized. | | | | | | | | | | |
| See notes to financial statements. | | | | | | | | | | |
NOTES TO FINANCIAL STATEMENTS
NOTE 1—Significant Accounting Policies:
Dreyfus Premier International Opportunities Fund (the “fund”) is a separate non-diversified series of Dreyfus Premier Value Equity Funds (the “Company”), which is registered under the Investment Company Act of 1940, as amended (the “Act”), as an open-end management investment company and operates as a series company, currently offering two series, including the fund.The fund’s investment objective is long-term capital growth.The Dreyfus Corporation (the “Manager” or “Dreyfus”) serves as the fund’s investment adviser.The Manager is a wholly-owned subsidiary of Mellon Financial Corporation (“Mellon Financial”).
Dreyfus Service Corporation (the “Distributor”), a wholly-owned subsidiary of the Manager, is the distributor of the fund’s shares.The fund is authorized to issue an unlimited number of $.001 par value shares of Beneficial Interest in each of the following classes of shares: Class A, Class B, Class C, Class R and Class T. Class A and Class T shares are subject to a sales charge imposed at the time of purchase. Class B shares are subject to a contingent deferred sales charge (“CDSC”) imposed on Class B share redemptions made within six years of purchase and automatically convert to Class A shares after six years. Class C shares are subject to a CDSC imposed on Class C shares redeemed within one year of purchase and Class R shares are sold at net asset value per share only to institutional investors. Other differences between the classes include the services offered to and the expenses borne by each class and certain voting rights. Income, expenses (other than expenses attributable to a specific class), and realized and unrealized gains or losses on investments are allocated to each class of shares based on its relative net assets.
The Company accounts separately for the assets, liabilities and operations of each series. Expenses directly attributable to each series are charged to that series’ operations; expenses which are applicable to all series are allocated among them on a pro rata basis.
The fund’s financial statements are prepared in accordance with U.S. generally accepted accounting principles, which may require the use of management estimates and assumptions. Actual results could differ from those estimates.
The Fund 25
NOTES TO FINANCIAL STATEMENTS (continued)
|
The fund enters into contracts that contain a variety of indemnifications. The fund’s maximum exposure under these arrangements is unknown.The fund does not anticipate recognizing any loss related to these arrangements.
(a) Portfolio valuation: Investments in securities are valued at the last sales price on the securities exchange or national securities market on which such securities are primarily traded. Securities listed on the National Market System for which market quotations are available are valued at the official closing price or, if there is no official closing price that day, at the last sales price. Securities not listed on an exchange or the national securities market, or securities for which there were no transactions, are valued at the average of the most recent bid and asked prices, except for open short positions, where the asked price is used for valuation purposes. Bid price is used when no asked price is avail-able.When market quotations or official closing prices are not readily available, or are determined not to reflect accurately fair value, such as when the value of a security has been significantly affected by events after the close of the exchange or market on which the security is principally traded (for example, a foreign exchange or market), but before the fund calculates its net asset value, the fund may value these investments at fair value as determined in accordance with the procedures approved by the Board of Directors. Fair valuing of securities may be determined with the assistance of a pricing service using calculations based on indices of domestic securities and other appropriate indicators, such as prices of relevant ADR’s and futures contracts. For other securities that are fair valued by the Board of Directors, certain factors may be considered such as: fundamental analytical data, the nature and duration of restrictions on disposition, an evaluation of the forces that influence the market in which the securities are purchased and sold, and public trading in similar securities of the issuer or comparable issuers. Financial futures are valued at the last sales price. Investments denominated in foreign currencies are translated to U.S. dollars at the prevailing rates of exchange. Forward currency exchange contracts are valued at the forward rate.
(b) Foreign currency transactions: The fund does not isolate that portion of the results of operations resulting from changes in foreign exchange rates on investments from the fluctuations arising from changes in market prices of securities held. Such fluctuations are included with the net realized and unrealized gain or loss on investments.
Net realized foreign exchange gains or losses arise from sales and maturities of short-term securities, sales of foreign currencies, currency gains or losses realized on securities transactions and the difference between the amounts of dividends, interest and foreign withholding taxes recorded on the fund’s books and the U.S. dollar equivalent of the amounts actually received or paid. Net unrealized foreign exchange gains and losses arise from changes in the value of assets and liabilities other than investments in securities, resulting from changes in exchange rates. Such gains and losses are included with net realized and unrealized gain or loss on investments.
(c) Securities transactions and investment income: Securities transactions are recorded on a trade date basis. Realized gain and loss from securities transactions are recorded on the identified cost basis. Dividend income is recognized on the ex-dividend date and interest income, including, where applicable, accretion of discount and amortization of premium on investments, is recognized on the accrual basis.
The fund has an arrangement with the custodian bank whereby the fund receives earnings credits from the custodian when positive cash balances are maintained, which are used to offset custody fees. For financial reporting purposes, the fund includes net earnings credits as an expense offset in the Statement of Operations.
(d) Dividends to shareholders: Dividends are recorded on the ex-dividend date. Dividends from investment income-net and dividends from net realized capital gain, if any, are normally declared and paid annually, but the fund may make distributions on a more frequent basis to comply with the distribution requirements of the Internal Revenue Code of 1986, as amended (the “Code”).To the extent that net real-
NOTES TO FINANCIAL STATEMENTS (continued)
|
ized capital gain can be offset by capital loss carryovers, it is the policy of the fund not to distribute such gain. Income and capital gain distributions are determined in accordance with income tax regulations, which may differ from U.S. generally accepted accounting principles.
(e) Federal income taxes: It is the policy of the fund to continue to qualify as a regulated investment company, if such qualification is in the best interests of its shareholders, by complying with the applicable provisions of the Code, and to make distributions of taxable income sufficient to relieve it from substantially all federal income and excise taxes.
At October 31, 2004, the components of accumulated earnings on a tax basis were as follows: undistributed ordinary income $47,628, undistributed capital gains $455,609 and unrealized appreciation $2,400,212.
The tax character of distributions paid to shareholders during the fiscal periods ended October 31, 2004 and October 31, 2003, were as follows: ordinary income $86,130 and $105,918, respectively.
During the period ended October 31, 2004, as a result of permanent book to tax differences primarily due to the tax treatment for foreign currency exchange gains and losses and passive foreign investment companies, the fund increased accumulated undistributed investment income-net by $30,939, decreased accumulated net realized gain (loss) on investments by $39,794 and increased paid-in capital by $8,855. Net assets were not affected by this reclassification.
NOTE 2—Bank Line of Credit:
|
The fund participates with other Dreyfus-managed funds in a $350 million redemption credit facility (the “Facility”) to be utilized for temporary or emergency purposes, including the financing of redemptions. In connection therewith, the fund has agreed to pay commitment fees on its pro rata portion of the Facility. Interest is charged to the fund based on prevailing market rates in effect at the time of borrowings. During the period ended October 31, 2004, the fund did not borrow under the Facility.
NOTE 3—Management Fee and Other Transactions With Affiliates:
(a) Pursuant to a management agreement (“Agreement”) with the Manager, the management fee is computed at the annual rate of 1% of the value of the fund’s average daily net assets and is payable monthly. The Manager has undertaken from November 1, 2003 through October 31, 2005, that, if the aggregate expenses of the fund exclusive of taxes, brokerage fees, interest on borrowings, Rule 12b-1 distribution plan fees, shareholder services plan fees, commitment fees and extraordinary expenses, exceed an annual rate of 1.75% of the value of the fund’s average daily net assets, the fund may deduct from the payment to be made to the Manager under the Agreement, or the Manager will bear such excess expenses. The reduction in management fee, pursuant to the undertaking, amounted to $144,754 during the period ended October 31, 2004.
During the period ended October 31, 2004, the Distributor retained $4,474 from commissions earned on sales of the fund’s Class A shares and $8,325 and $984 from contingent deferred sales charges on redemptions of the fund’s Class B and Class C shares, respectively.
(b) Under the Distribution Plan (the “Plan”) adopted pursuant to Rule 12b-1 under the Act, Class B, Class C and Class T shares pay the Distributor for distributing their shares at an annual rate of .75 of 1% of the value of the average daily net assets of Class B and Class C shares and .25 of 1% of the value of the average daily net assets of Class T shares. During the period ended October 31, 2004, Class B, Class C and Class T shares were charged $24,616, $38,122 and $397, respectively, pursuant to the Plan.
(c) Under the Shareholder Services Plan, Class A, Class B, Class C and Class T shares pay the Distributor at an annual rate of .25 of 1% of the value of their average daily net assets for the provision of certain ser-
NOTES TO FINANCIAL STATEMENTS (continued)
|
vices.The services provided may include personal services relating to shareholder accounts, such as answering shareholder inquiries regarding the fund and providing reports and other information, and services related to the maintenance of shareholder accounts. The Distributor may make payments to Service Agents (a securities dealer, financial institution or other industry professional) in respect of these services. The Distributor determines the amounts to be paid to Service Agents. During the period ended October 31, 2004, Class A, Class B, Class C and Class T shares were charged $17,036, $8,205, $12,708 and $397, respectively, pursuant to the Shareholder Services Plan.
The fund compensates Dreyfus Transfer,Inc.,a wholly-owned subsidiary of the Manager, under a transfer agency agreement for providing personnel and facilities to perform transfer agency services for the fund. During the period ended October 31, 2004, the fund was charged $15,631 pursuant to the transfer agency agreement.
The components of Due to The Dreyfus Corporation and affiliates in the Statement of Assets and Liabilities consist of: management fees $14,594, Rule 12b-1 distribution plan fees $5,953, shareholder services plan fees $3,643, transfer agency per account fees $2,506, which are offset against an expense reimbursement currently in effect in the amount of $13,927.
(d) Each Board member also serves as a Board member of other funds within the Dreyfus complex. Annual retainer fees and attendance fees are allocated to each fund based on net assets.
NOTE 4—Securities Transactions:
|
The aggregate amount of purchases and sales of investment securities, excluding short-term securities and forward currency exchange contracts, during the period ended October 31, 2004, amounted to $9,987,514 and $6,422,042, respectively.
The fund enters into forward currency exchange contracts in order to hedge its exposure to changes in foreign currency exchange rates on
its foreign portfolio holdings and to settle foreign currency transac-tions.When executing forward currency exchange contracts, the fund is obligated to buy or sell a foreign currency at a specified rate on a certain date in the future. With respect to sales of forward currency exchange contracts, the fund would incur a loss if the value of the contract increases between the date the forward contract is opened and the date the forward contract is closed.The fund realizes a gain if the value of the contract decreases between those dates. With respect to purchases of forward currency exchange contracts, the fund would incur a loss if the value of the contract decreases between the date the forward contract is opened and the date the forward contract is closed. The fund realizes a gain if the value of the contract increases between those dates. The fund is also exposed to credit risk associated with counter party nonperformance on these forward currency exchange contracts which is typically limited to the unrealized gains on each open contract. The following summarizes open forward currency exchange contracts at October 31, 2004:
| | | Foreign | | | | | | |
| Forward Currency | | Currency | | | | | | Unrealized |
| Exchange Contracts | | Amounts | | Cost ($) | | Value ($) | | Appreciation ($) |
| |
| |
| |
| |
|
| Purchases: | | | | | | | | |
| Indonesian Rupiah, | | | | | | | | |
| expiring 11/2/2004 | | 62,174,285 | | 6,832 | | 6,843 | | 11 |
| Japanese Yen, | | | | | | | | |
| expiring 11/1/2004 | | 526,145 | | 4,952 | | 4,968 | | 16 |
| Japanese Yen, | | | | | | | | |
| expiring 11/2/2004 | | 527,152 | | 4,966 | | 4,978 | | 12 |
| Sales: | | | | Proceeds ($) | | | | |
| Mexican Peso, | | | | | | | | |
| expiring 11/1/2004 | | 63,474 | | 5,504 | | 5,500 | | 4 |
| Total | | | | | | | | 43 |
At October 31, 2004, the cost of investments for federal income tax purposes was $14,615,834; accordingly, accumulated net unrealized appreciation on investments was $2,388,677, consisting of $2,871,682 gross unrealized appreciation and $483,005 gross unrealized depreciation.
NOTES TO FINANCIAL STATEMENTS (continued)
|
Two class actions have been filed against Mellon Financial, Mellon Bank, N.A., Dreyfus, Founders Asset Management LLC and the directors of all or substantially all of the Dreyfus Funds, on behalf of a purported class and derivatively on behalf of said funds, alleging violations of the Investment Company Act of 1940, the Investment Advisers Act of 1940, and the common law. The complaints alleged, among other things, (i) that 12b-1 fees and directed brokerage were improperly used to pay brokers to recommend Dreyfus funds over other funds, (ii) that such payments were not disclosed to investors, (iii) that economies of scale and soft-dollar benefits were not passed on to investors, and (iv) that 12b-1 fees charged to certain funds that were closed to new investors were also improper. The complaints sought compensatory and punitive damages, rescission of the advisory contracts and an accounting and restitution of any unlawful fees, as well as an award of attorneys’ fees and litigation expenses. On April 22, 2004, the actions were consolidated under the caption In re Dreyfus Mutual Funds Fee Litigation, and a consolidated amended complaint was filed on September 13, 2004.While adding new parties and claims under state and federal law, the allegations in the consolidated amended complaint essentially track the allegations in the prior complaints pertaining to 12b-1 fees, directed brokerage, soft dollars and revenue sharing. Dreyfus and the funds believe the allegations to be totally without merit and intend to defend the action vigorously.
Additional lawsuits arising out of these circumstances and presenting similar allegations and requests for relief may be filed against the defendants in the future. Neither Dreyfus nor the Dreyfus funds believe that any of the pending actions will have a material adverse effect on the Dreyfus funds or Dreyfus’ ability to perform its contracts with the Dreyfus funds.
REPORT OF INDEPENDENT REGISTERED PUBLIC ACCOUNTING FIRM
Shareholders and Board of Trustees
Dreyfus Premier International Opportunities Fund
We have audited the accompanying statement of assets and liabilities, including the statement of investments, of Dreyfus Premier International Opportunities Fund (one of the funds comprising Dreyfus Premier Value Equity Funds) as of October 31, 2004, and the related statement of operations for the year then ended, the statement of changes in net assets for each of the two years in the period then ended, and financial highlights for each of the periods indicated therein.These financial statements and financial highlights are the responsibility of the Fund’s management. Our responsibility is to express an opinion on these financial statements and financial highlights based on our audits.
We conducted our audits in accordance with the standards of the Public Company Accounting Oversight Board (United States).Those standards require that we plan and perform the audit to obtain reasonable assurance about whether the financial statements and financial highlights are free of material misstatement. An audit includes examining, on a test basis, evidence supporting the amounts and disclosures in the financial statements and financial highlights. Our procedures included confirmation of securities owned as of October 31, 2004 by correspondence with the custodian and others.An audit also includes assessing the accounting principles used and significant estimates made by management, as well as evaluating the overall financial statement presentation.We believe that our audits provide a reasonable basis for our opinion.
In our opinion, the financial statements and financial highlights referred to above present fairly, in all material respects, the financial position of Dreyfus Premier International Opportunities Fund at October 31,2004, the results of its operations for the year then ended, the changes in its net assets for each of the two years in the period then ended, and the financial highlights for each of the indicated periods, in conformity with U.S. generally accepted accounting principles.

| | New York, New York
December 13, 2004
|
IMPORTANT TAX INFORMATION (Unaudited)
In accordance with federal tax law, the fund elects to provide each shareholder with their portion of the fund’s foreign taxes paid and the income sourced from foreign countries. Accordingly, the fund hereby makes the following designations regarding its fiscal year ended October 31, 2004:
—the total amount of taxes paid to foreign countries was $46,422
—the total amount of income sourced from foreign countries was $86,575
As required by federal tax law rules, shareholders will receive notification of their proportionate share of foreign taxes paid and foreign sourced income for the 2004 calendar year with Form 1099-DIV which will be mailed by January 31, 2005.
For the fiscal year ended October 31, 2004, certain dividends paid by the fund may be subject to a maximum tax rate of 15%, as provided for by the Jobs and Growth Tax Relief Reconciliation Act of 2003. Of the distributions paid during the fiscal year, $86,130 represents the maximum amount that may be considered qualified dividend income.
BOARD MEMBERS INFORMATION (Unaudited)
Joseph S. DiMartino (61) Chairman of the Board (1995)
Principal Occupation During Past 5 Years:
• Corporate Director and Trustee
Other Board Memberships and Affiliations:
- The Muscular Dystrophy Association, Director
- Levcor International, Inc., an apparel fabric processor, Director
- Century Business Services, Inc., a provider of outsourcing functions for small and medium size companies, Director
- The Newark Group, a provider of a national market of paper recovery facilities, paperboard mills and paperboard converting plants, Director
- Azimuth Trust, an institutional asset management firm, Member of Board of Managers and Advisory Board
No. of Portfolios for which Board Member Serves: 186
David W. Burke (68)
Board Member (1994)
|
Principal Occupation During Past 5 Years:
• Corporate Director and Trustee
Other Board Memberships and Affiliations:
- John F. Kennedy Library Foundation, Director
- U.S.S. Constitution Museum, Director
No. of Portfolios for which Board Member Serves: 83
Diane Dunst (65)
Board Member (1990)
|
Principal Occupation During Past 5 Years:
• President, Huntting House Antiques
No. of Portfolios for which Board Member Serves: 11
———————
Rosalind Gersten Jacobs (79) Board Member (1994)
Principal Occupation During Past 5 Years:
• Merchandise and marketing consultant
No. of Portfolios for which Board Member Serves: 33
BOARD MEMBERS INFORMATION (Unaudited) (continued)
Jay I. Meltzer (76)
Board Member (1991)
|
Principal Occupation During Past 5 Years:
|
- Physician, Internist and Specialist in Clinical Hypertension
- Clinical Professor of Medicine at Columbia University & College of Physicians and Surgeons
- Adjunct Clinical Professor of Medicine at Cornell Medical College
No. of Portfolios for which Board Member Serves: 11 ———————
Daniel Rose (75) Board Member (1992)
Principal Occupation During Past 5 Years:
|
- Chairman and Chief Executive Officer of Rose Associates, Inc., a New York based real estate development and management firm
Other Board Memberships and Affiliations:
|
- Baltic-American Enterprise Fund,Vice Chairman and Director
- Harlem Educational Activities Fund, Inc., Chairman
- Housing Committee of the Real Estate Board of New York, Inc., Director
No. of Portfolios for which Board Member Serves: 21 ———————
Warren B. Rudman (74) Board Member (1993)
Principal Occupation During Past 5 Years:
|
- Of Counsel to (from January 1993 to December 31, 2003, Partner in) the law firm Paul, Weiss, Rifkind,Wharton & Garrison LLP
Other Board Memberships and Affiliations:
|
- Collins & Aikman Corporation, Director
- Allied Waste Corporation, Director
- Raytheon Company, Director
- Boston Scientific, Director
No. of Portfolios for which Board Member Serves: 20 ———————
Sander Vanocur (76) Board Member (1992)
Principal Occupation During Past 5 Years:
• President, Old Owl Communications
|
No. of Portfolios for which Board Member Serves: 21 ———————
Once elected all Board Members serve for an indefinite term.The address of the Board Members and Officers is in c/o The Dreyfus Corporation, 200 Park Avenue, New York, New York 10166.Additional information about the Board Members is available in the fund’s Statement of Additional Information which can be obtained from Dreyfus free of charge by calling this toll free number: 1-800-554-4611.
36
OFFICERS OF THE FUND (Unaudited)
STEPHEN E. CANTER, President since March 2000.
Chairman of the Board, Chief Executive Officer and Chief Operating Officer of the Manager, and an officer of 93 investment companies (comprised of 186 portfolios) managed by the Manager. Mr. Canter also is a Board member and, where applicable, an Executive Committee Member of the other investment management subsidiaries of Mellon Financial Corporation, each of which is an affiliate of the Manager. He is 59 years old and has been an employee of the Manager since May 1995.
STEPHEN R. BYERS, Executive Vice President since November 2002.
Chief Investment Officer,Vice Chairman and a director of the Manager, and an officer of 93 investment companies (comprised of 186 portfolios) managed by the Manager. Mr. Byers also is an officer, director or an Executive Committee Member of certain other investment management subsidiaries of Mellon Financial Corporation, each of which is an affiliate of the Manager. He is 51 years old and has been an employee of the Manager since January 2000. Prior to joining the Manager, he served as an Executive Vice President-Capital Markets, Chief Financial Officer and Treasurer at Gruntal & Co., L.L.C.
MARK N. JACOBS, Vice President since March 2000.
Executive Vice President, Secretary and General Counsel of the Manager, and an officer of 94 investment companies (comprised of 202 portfolios) managed by the Manager. He is 58 years old and has been an employee of the Manager since June 1977.
JOHN B. HAMMALIAN, Secretary since March 2000.
Associate General Counsel of the Manager, and an officer of 36 investment companies (comprised of 45 portfolios) managed by the Manager. He is 41 years old and has been an employee of the Manager since February 1991.
STEVEN F. NEWMAN, Assistant Secretary since March 2000.
Associate General Counsel and Assistant Secretary of the Manager, and an officer of 94 investment companies (comprised of 202 portfolios) managed by the Manager. He is 55 years old and has been an employee of the Manager since July 1980.
MICHAEL A. ROSENBERG, Assistant Secretary since March 2000.
Associate General Counsel of the Manager, and an officer of 91 investment companies (comprised of 195 portfolios) managed by the Manager. He is 44 years old and has been an employee of the Manager since October 1991.
JAMES WINDELS, Treasurer since November 2001.
Director – Mutual Fund Accounting of the Manager, and an officer of 94 investment companies (comprised of 202 portfolios) managed by the Manager. He is 46 years old and has been an employee of the Manager since April 1985.
RICHARD CASSARO, Assistant Treasurer since December 2003.
Senior Accounting Manager – Equity Funds of the Manager, and an officer of 26 investment companies (comprised of 101 portfolios) managed by the Manager. He is 44 years old and has been an employee of the Manager since September 1982.
KENNETH J. SANDGREN, Assistant Treasurer since November 2001.
Mutual Funds Tax Director of the Manager, and an officer of 94 investment companies (comprised of 202 portfolios) managed by the Manager. He is 50 years old and has been an employee of the Manager since June 1993.
OFFICERS OF THE FUND (Unaudited) (continued)
|
ROBERT SVAGNA, Assistant Treasurer since December 2002.
Senior Accounting Manager – Equity Funds of the Manager, and an officer of 27 investment companies (comprised of 106 portfolios) managed by the Manager. He is 37 years old and has been an employee of the Manager since November 1990.
JOSEPH W. CONNOLLY, Chief Compliance Officer since October 2004.
Chief Compliance Officer of the Manager and The Dreyfus Family of Funds (94 investment companies, comprising 202 portfolios). From November 2001 through March 2004, Mr. Connolly was first Vice-President, Mutual Fund Servicing for Mellon Global Securities Services. In that capacity, Mr. Connolly was responsible for managing Mellon’s Custody, Fund Accounting and Fund Administration services to third-party mutual fund clients. He is 47 years old and has served in various capacities with the Manager since 1980, including manager of the firm’s Fund Accounting Department from 1997 through October 2001.
WILLIAM GERMENIS, Anti-Money Laundering Compliance Officer since August 2002.
Vice President and Anti-Money Laundering Compliance Officer of the Distributor, and the Anti-Money Laundering Compliance Officer of 89 investment companies (comprised of 197 portfolios) managed by the Manager. He is 33 years old and has been an employee of the Distributor since October 1998.
NOTES
| For More | | Information |
| |
|
| |
| Dreyfus Premier | | Transfer Agent & |
| International | | | | Dividend Disbursing Agent |
| Opportunities Fund | | |
| | | | | Dreyfus Transfer, Inc. |
| 200 Park Avenue | | |
| | | | | 200 Park Avenue |
| New York, NY | | 10166 | | |
| | | | | New York, NY 10166 |
| |
| Manager | | | | Distributor |
| The Dreyfus Corporation | | |
| | | | | Dreyfus Service Corporation |
| 200 Park Avenue | | |
| | | | | 200 Park Avenue |
| New York, NY | | 10166 | | |
| | | | | New York, NY 10166 |
| Custodian | | | | |
| The Bank of New York | | |
| One Wall Street | | |
| New York, NY | | 10286 | | |
Telephone Call your financial representative or 1-800-554-4611
| Mail | | The Dreyfus Premier Family of Funds |
| | | 144 Glenn Curtiss Boulevard, Uniondale, NY 11556-0144 |
The fund files its complete schedule of portfolio holdings with the Securities and Exchange Commission (“SEC”) for the first and third quarters of each fiscal year on Form N-Q. The fund’s Forms N-Q are available on the SEC’s website at http://www.sec.gov and may be reviewed and copied at the SEC’s Public Reference Room in Washington, DC. Information on the operation of the Public Reference Room may be obtained by calling 1-800-SEC-0330.
A description of the policies and procedures that the fund uses to determine how to vote proxies relating to portfolio securities, and information regarding how the fund voted these proxies for the 12-month period ended June 30, 2004, is available through the fund’s website at http://www.dreyfus.com and on the SEC’s website at http://www.sec.gov. The description of the policies and procedures is also available without charge, upon request, by calling 1-800-645-6561.
®
© 2004 Dreyfus Service Corporation 0173AR1004
Item 2. Code of Ethics.
The Registrant has adopted a code of ethics that applies to the Registrant's principal executive officer, principal financial officer, principal accounting officer or controller, or persons performing similar functions. There have been no amendments to, or waivers in connection with, the Code of Ethics during the period covered by this Report.
Item 3. Audit Committee Financial Expert.
The Registrant's Board has determined that Joseph S. DiMartino, a member of the Audit Committee of the Board, is an audit committee financial expert as defined by the Securities and Exchange Commission (the "SEC"). Joseph S. DiMartino is "independent" as defined by the SEC for purposes of audit committee financial expert determinations.
Item 4. Principal Accountant Fees and Services
(a) Audit Fees. The aggregate fees billed for each of the last two fiscal years (the "Reporting Periods") for professional services rendered by the Registrant's principal accountant (the "Auditor") for the audit of the Registrant's annual financial statements, or services that are normally provided by the Auditor in connection with the statutory and regulatory filings or engagements for the Reporting Periods, were $42,000.00 in 2003 and $44,100.00 in 2004.
(b)Audit-Related Fees. The aggregate fees billed in the Reporting Periods for assurance and related services by the Auditor that are reasonably related to the performance of the audit of the Registrant's financial statements and are not reported under paragraph (a) of this Item 4 were $4,500.00 in 2003 and $4,500.00 in 2004. These services consisted of (i) security counts required by Rule 17f-2 under the Investment Company Act of 1940, as amended.
The aggregate fees billed in the Reporting Periods for non-audit assurance and related services by the Auditor to the Registrant's investment adviser (not including any sub-investment adviser whose role is primarily portfolio management and is subcontracted with or overseen by another investment adviser), and any entity controlling, controlled by or under common control with the investment adviser that provides ongoing services to the Registrant ("Service Affiliates"), that were reasonably related to the performance of the annual audit of the Service Affiliate, which required pre-approval by the Audit Committee were $125,000.00 in 2003 and $178,500.00 in 2004.
Note: For the second paragraph in each of (b) through (d) of this Item 4, certain of such services were not pre-approved prior to May 6, 2003, when such services were required to be pre-approved. On and after May 6, 2003, 100% of all services provided by the Auditor were pre-approved as required. For comparative purposes, the fees shown assume that all such services were pre-approved, including services that were not pre-approved prior to the compliance date of the pre-approval requirement.
(c) Tax Fees. The aggregate fees billed in the Reporting Periods for professional services rendered by the Auditor for tax compliance, tax advice and tax planning ("Tax Services") were $6,781.00 in 2003 and $6,136.00 in 2004. [These services consisted of (i) review or preparation of U.S. federal, state, local and excise tax returns; (ii) U.S. federal, state and local tax planning, advice and assistance regarding statutory,
regulatory or administrative developments, (iii) tax advice regarding tax qualification matters and/or treatment of various financial instruments held or proposed to be acquired or held, and (iv) determination of Passive Foreign Investment Companies.]
The aggregate fees billed in the Reporting Periods for Tax Services by the Auditor to Service Affiliates which required pre-approval by the Audit Committee were $0.00 in 2003 and $0.00 in 2004.
(d) All Other Fees. The aggregate fees billed in the Reporting Periods for products and services provided by the Auditor, other than the services reported in paragraphs (a) through (c) of this Item, were $0.00 in 2003 and $376.00 in 2004. These services consisted of a review of the Registrant's anti-money laundering program.
The aggregate fees billed in the Reporting Periods for Non-Audit Services by the Auditor to Service Affiliates, other than the services reported in paragraphs (b) and (c) of this Item, which required pre-approval by the Audit Committee were $0.00 in 2003 and $0.00 in 2004.
Audit Committee Pre-Approval Policies and Procedures. The Registrant's Audit Committee has established policies and procedures (the "Policy") for pre-approval (within specified fee limits) of the Auditor's engagements for non-audit services to the Registrant and Service Affiliates without specific case-by-case consideration. Pre-approval considerations include whether the proposed services are compatible with maintaining the Auditor's independence. Pre-approvals pursuant to the Policy are considered annually.
Non-Audit Fees. The aggregate non-audit fees billed by the Auditor for services rendered to the Registrant, and rendered to Service Affiliates, for the Reporting Periods were $315,642.00 in 2003 and $635,655.00 in 2004.
Auditor Independence. The Registrant's Audit Committee has considered whether the provision of non-audit services that were rendered to Service Affiliates which were not pre-approved (not requiring pre-approval) is compatible with maintaining the Auditor's independence.
| Item 5. | | Audit Committee of Listed Registrants. |
| | | Not applicable. |
| Item 6. | | Schedule of Investments. |
| | | Not applicable. |
| Item 7. | | Disclosure of Proxy Voting Policies and Procedures for Closed-End Management |
| | | Investment Companies. |
| | | Not applicable. |
| Item 8. | | Purchases of Equity Securities by Closed-End Management Investment Companies and |
| | | Affiliated Purchasers. |
| | | Not applicable. |
| Item 9. | | Submission of Matters to a Vote of Security Holders. |
The Registrant has a Nominating Committee (the "Committee"), which is responsible for selecting and nominating persons for election or appointment by the Registrant's Board as Board members. The
Committee has adopted a Nominating Committee Charter (the "Charter"). Pursuant to the Charter, the Committee will consider recommendations for nominees from shareholders submitted to the Secretary of the Registrant, c/o The Dreyfus Corporation Legal Department, 200 Park Avenue, 8th Floor West, New York, New York 10166. A nomination submission must include information regarding the recommended nominee as specified in the Charter. This information includes all information relating to a recommended nominee that is required to be disclosed in solicitations or proxy statements for the election of Board members, as well as information sufficient to evaluate the factors to be considered by the Committee, including character and integrity, business and professional experience, and whether the person has the ability to apply sound and independent business judgment and would act in the interests of the Registrant and its shareholders.
Nomination submissions are required to be accompanied by a written consent of the individual to stand for election if nominated by the Board and to serve if elected by the shareholders, and such additional information must be provided regarding the recommended nominee as reasonably requested by the Committee.
Item 10. Controls and Procedures.
(a) The Registrant's principal executive and principal financial officers have concluded, based on their evaluation of the Registrant's disclosure controls and procedures as of a date within 90 days of the filing date of this report, that the Registrant's disclosure controls and procedures are reasonably designed to ensure that information required to be disclosed by the Registrant on Form N-CSR is recorded, processed, summarized and reported within the required time periods and that information required to be disclosed by the Registrant in the reports that it files or submits on Form N-CSR is accumulated and communicated to the Registrant's management, including its principal executive and principal financial officers, as appropriate to allow timely decisions regarding required disclosure.
(b) There were no changes to the Registrant's internal control over financial reporting that occurred during the Registrant's most recently ended fiscal half-year that have materially affected, or are reasonably likely to materially affect, the Registrant's internal control over financial reporting.
Item 11. Exhibits.
| (a)(1) | | Code of ethics referred to in Item 2. |
| (a)(2) | | Certifications of principal executive and principal financial officers as required by Rule 30a-2(a) |
| under the Investment Company Act of 1940. |
| (a)(3) | | Not applicable. |
| (b) | | Certification of principal executive and principal financial officers as required by Rule 30a-2(b) |
| under the Investment Company Act of 1940. |
Pursuant to the requirements of the Securities Exchange Act of 1934 and the Investment Company Act of 1940, the Registrant has duly caused this Report to be signed on its behalf by the undersigned, thereunto duly authorized.
DREYFUS PREMIER VALUE EQUITY FUNDS
| By: | | /s/ Stephen E. Canter |
| | | Stephen E. Canter |
| | | President |
| |
| Date: | | December 28, 2004 |
| |
| Pursuant to the requirements of the Securities Exchange Act of 1934 and the Investment Company Act of |
| 1940, this Report has been signed below by the following persons on behalf of the Registrant and in the |
| capacities and on the dates indicated. |
| |
| By: | | /s/ Stephen E. Canter |
| | | Stephen E. Canter |
| | | Chief Executive Officer |
| |
| Date: | | December 28, 2004 |
| |
| By: | | /s/ James Windels |
| | | James Windels |
| | | Chief Financial Officer |
| |
| Date: | | December 28, 2004 |
| |
| EXHIBIT INDEX |
| |
| | | (a)(1) | | Code of ethics referred to in Item 2. |
| |
| | | (a)(2) | | Certifications of principal executive and principal financial officers as required by Rule 30a- |
| | | 2(a) under the Investment Company Act of 1940. (EX-99.CERT) |
| |
| | | (b) | | Certification of principal executive and principal financial officers as required by Rule 30a- |
| | | 2(b) under the Investment Company Act of 1940. (EX-99.906CERT) |