| | | UNITED STATES |
| | | SECURITIES AND EXCHANGE COMMISSION |
| | | Washington, D.C. 20549 |
| |
| |
| | | FORM N-CSR |
| |
| CERTIFIED SHAREHOLDER REPORT OF REGISTERED MANAGEMENT |
| | | INVESTMENT COMPANIES |
| |
| Investment Company Act file number 811-4688 |
| |
| | | DREYFUS PREMIER VALUE EQUITY FUNDS |
| | | (Exact name of Registrant as specified in charter) |
| |
| |
| | | c/o The Dreyfus Corporation |
| | | 200 Park Avenue |
| | | New York, New York 10166 |
| | | (Address of principal executive offices) (Zip code) |
| |
| | | Mark N. Jacobs, Esq. |
| | | 200 Park Avenue |
| | | New York, New York 10166 |
| | | (Name and address of agent for service) |
| |
| Registrant's telephone number, including area code: (212) 922-6000 |
| |
| Date of fiscal year end: | | 10/31 |
| |
| Date of reporting period: | | 10/31/05 |
FORM N-CSR
Item 1. Reports to Stockholders.
| Dreyfus Premier |
| International |
| Opportunities Fund |
ANNUAL REPORT October 31, 2005

Save time. Save paper. View your next shareholder report online as soon as it's available. Log into www.dreyfus.com and sign up for Dreyfus eCommunications. It's simple and only takes a few minutes.
The views expressed in this report reflect those of the portfolio manager only through the end of the period covered and do not necessarily represent the views of Dreyfus or any other person in the Dreyfus organization. Any such views are subject to change at any time based upon market or other conditions and Dreyfus disclaims any responsibility to update such views.These views may not be relied on as investment advice and, because investment decisions for a Dreyfus fund are based on numerous factors, may not be relied on as an indication of trading intent on behalf of any Dreyfus fund.
Not FDIC-Insured • Not Bank-Guaranteed • May Lose Value
| | | Contents |
| |
| | | THE FUND |
| |
|
| 2 | | Letter from the Chairman |
| 3 | | Discussion of Fund Performance |
| 6 | | Fund Performance |
| 8 | | Understanding Your Fund's Expenses |
| 8 | | Comparing Your Fund's Expenses |
| | | With Those of Other Funds |
| 9 | | Statement of Investments |
| 15 | | Statement of Assets and Liabilities |
| 16 | | Statement of Operations |
| 17 | | Statement of Changes in Net Assets |
| 20 | | Financial Highlights |
| 25 | | Notes to Financial Statements |
| 33 | | Report of Independent Registered |
| | | Public Accounting Firm |
| 34 | | Important Tax Information |
| 35 | | Information About the Review and Approval |
| | | of the Fund's Management Agreement |
| 40 | | Board Members Information |
| 42 | | Officers of the Fund |
| | | FOR MORE INFORMATION |
| |
|
| | | Back Cover |
| Dreyfus Premier |
| International Opportunities Fund |
The Fund

LETTER FROM THE CHAIRMAN
Dear Shareholder:
We are pleased to present this annual report for Dreyfus Premier International Opportunities Fund, covering the 12-month period from November 1, 2004, through October 31, 2005. Inside, you'll find valuable information about how the fund was managed during the reporting period, including a discussion with the fund's portfolio manager, D. Kirk Henry.
The global economy once again demonstrated its resiliency over the past year, expanding at a steady pace despite the headwinds of soaring energy prices, higher U.S. interest rates and the dislocations caused by a series of natural disasters. Unlike the U.S. stock market, which traded within a relatively narrow range for much of 2005, international stocks rallied amid improving business conditions in many regions, particularly the emerging markets of Asia, Latin America and Eastern Europe. However, a strengthening U.S. dollar relative to other major currencies eroded some of those returns for U.S. investors.
As the end of 2005 approaches, investors' reactions to changes in the economic outlook for the United States and China, as well as the effects of higher fuel and commodity prices on inflation, may set the tone for the international markets in 2006. As always, we encourage you to talk to your financial advisor, who can help you diversify your portfolio in a way that allows you to participate in the longer-term gains of the world's financial markets while providing a measure of protection from shorter-term volatility.
Thank you for your continued confidence and support.
Sincerely,

| | Stephen E. Canter
Chairman and Chief Executive Officer
The Dreyfus Corporation
November 15, 2005
|
2

DISCUSSION OF FUND PERFORMANCE
D. Kirk Henry, Senior Portfolio Manager
How did Dreyfus Premier International Opportunities Fund perform relative to its benchmark?
For the 12-month period ended October 31, 2005, the fund produced total returns of 14.42% for Class A shares, 13.50% for Class B shares, 13.51% for Class C shares, 14.79% for Class R shares and 13.88% for Class T shares.1 This compares with a 20.57% return for the fund's current benchmark, the Morgan Stanley Capital International All Country World ex United States Index (the "Index"), for the same period.2
We attribute the international stock market's overall performance to steady global economic growth and improved corporate earnings, which helped support higher stock prices for many international companies during the reporting period. The fund's returns underper-formed its benchmark, primarily due to our emphasis on Japanese information technology stocks as well as the fund's limited exposure to energy stocks, which posted some of the market's stronger gains.
What other factors influenced the fund's performance?
Improving corporate earnings, strong employment data and low inflation and interest rates helped international stock markets post generally positive returns during the reporting period. Economic recoveries in Europe continued to gain momentum as a result of corporate restructuring efforts that benefited companies in Germany, France and Italy. However, these returns moderated during the first half of 2005 when investors became concerned that corporate earnings and global economic growth might have peaked. The United Kingdom reported less impressive gains, due in large part to a slowdown in consumer spending.
The Fund 3
DISCUSSION OF FUND PERFORMANCE (continued)
In Asia, China's unprecedented industrial growth fueled rising demand for products and services needed to help build its infrastructure. As a result, exporters to China fared well, including Japan. However, the fund's relative performance was hindered due to stock selection within Japan.The fund's overweight position in Japan was a positive allocation decision, where returns were greater than the benchmark during this reporting period. Our stock selection in Japan was negative, though, primarily due to information technology stocks, which suffered due to increased competition from Chinese companies.
What's more, the fund had less exposure to Japanese banks, where reforms in the country's financial system and a long-awaited economic recovery helped propel bank stock prices higher later in the reporting period.
The fund's relative performance also was hurt by its underweight position to energy stocks versus the benchmark, which performed especially well due to rising oil and natural gas prices. Because we believed that many of these stocks had grown too expensive to meet our valuation criteria, we found relatively few opportunities among energy companies.
On the other hand, the fund enjoyed stronger results in the emerging markets, where steady global economic growth triggered increased demand for developing countries' exports of oil, iron and other natural resources. Greater export activity benefited U.K.-based Rio Tinto, a global metals and mining firm. Defense contractor BAE Systems and
4
drug producer GlaxoSmithKline also fared well due to a shift in investor sentiment toward companies with records of consistent earnings growth under a variety of economic conditions.
November 15, 2005
| | | Investing in foreign companies involves special risks, including changes in currency rates, |
| | | political, economic and social instability, a lack of comprehensive company information, |
| | | differing auditing and legal standards, and less market liquidity. An investment in this |
| | | fund should be considered only as a supplement to an overall investment program. |
| 1 | | Total return includes reinvestment of dividends and any capital gains paid, and does not take into |
| | | consideration the maximum initial sales charges in the case of Class A and Class T shares, or the |
| | | applicable contingent deferred sales charges imposed on redemptions in the case of Class B and |
| | | Class C shares. Had these charges been reflected, returns would have been lower. Past performance |
| | | is no guarantee of future results. Share price and investment return fluctuate such that upon |
| | | redemption, fund shares may be worth more or less than their original cost. Return figures |
| | | provided reflect the absorption of certain fund expenses by The Dreyfus Corporation pursuant to |
| | | an agreement in effect through October 31, 2006, at which time it may be extended, terminated |
| | | or modified. Had these expenses not been absorbed, the fund's returns would have been lower. |
| 2 | | SOURCE: LIPPER INC. — Reflects reinvestment of gross dividends and, where applicable, |
| | | capital gain distributions.The Morgan Stanley Capital International All Country World ex U.S. |
| | | Index is a float-adjusted market capitalization-weighted index that is designed to track the |
| | | performance of both developed and emerging market countries, excluding the United States. |
The Fund 5
FUND PERFORMANCE
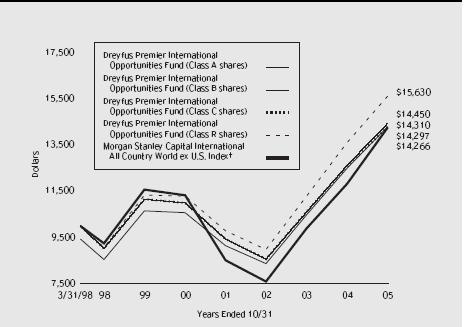
Comparison of change in value of $10,000 investment in Dreyfus Premier International Opportunities Fund Class A shares, Class B shares, Class C shares and Class R shares and the Morgan Stanley Capital International All Country World ex U.S. Index
| † Source: Lipper Inc. |
| Past performance is not predictive of future performance. |
| The above graph compares a $10,000 investment made in each of the Class A, Class B, Class C and Class R shares |
| of Dreyfus Premier International Opportunities Fund on 3/31/98 (inception date) to a $10,000 investment made in |
| the Morgan Stanley Capital International All Country World ex U.S. Index (the "Index") on that date. All dividends |
| and capital gain distributions are reinvested. Performance for Class T shares will vary from the performance of Class A, |
| Class B, Class C and Class R shares shown above due to differences in charges and expenses. |
| The fund's performance shown in the line graph takes into account the maximum initial sales charge on Class A shares |
| and all other applicable fees and expenses on all classes.The Index is a float-adjusted market capitalization-weighted |
| index that is designed to track the performance of both developed and emerging market countries, excluding the United |
| States.The Index does not take into account charges, fees and other expenses. Further information relating to fund |
| performance, including expense reimbursements, if applicable, is contained in the Financial Highlights section of the |
| prospectus and elsewhere in this report. |
| Average Annual Total Returns as of 10/31/05 | | | | |
| |
| | | Inception | | | | | | From |
| | | Date | | 1 Year | | 5 Years | | Inception |
| |
| |
| |
| |
|
| Class A shares | | | | | | | | |
| with maximum sales charge (5.75%) | | 3/31/98 | | 7.87% | | 4.98% | | 4.84% |
| without sales charge | | 3/31/98 | | 14.42% | | 6.23% | | 5.65% |
| Class B shares | | | | | | | | |
| with applicable redemption charge † | | 3/31/98 | | 9.50% | | 5.02% | | 4.97% |
| without redemption | | 3/31/98 | | 13.50% | | 5.35% | | 4.97% |
| Class C shares | | | | | | | | |
| with applicable redemption charge †† | | 3/31/98 | | 12.51% | | 5.38% | | 4.82% |
| without redemption | | 3/31/98 | | 13.51% | | 5.38% | | 4.82% |
| Class R shares | | 3/31/98 | | 14.79% | | 6.71% | | 6.06% |
| Class T shares | | | | | | | | |
| with applicable sales charge (4.5%) | | 3/1/00 | | 8.72% | | 5.40% | | 4.53% |
| without sales charge | | 3/1/00 | | 13.88% | | 6.38% | | 5.39% |
Past performance is not predictive of future performance.The fund's performance shown in the graph and table does not reflect the deduction of taxes that a shareholder would pay on fund distributions or the redemption of fund shares. Performance for Class B shares assumes the conversion of Class B shares to Class A shares at the end of the sixth year following the date of purchase.
| † | | The maximum contingent deferred sales charge for Class B shares is 4%. After six years Class B shares convert to |
| | | Class A shares. |
| †† | | The maximum contingent deferred sales charge for Class C shares is 1% for shares redeemed within one year of the |
| | | date of purchase. |
The Fund 7
UNDERSTANDING YOUR FUND'S EXPENSES (Unaudited)
As a mutual fund investor, you pay ongoing expenses, such as management fees and other expenses. Using the information below, you can estimate how these expenses affect your investment and compare them with the expenses of other funds.You also may pay one-time transaction expenses, including sales charges (loads) and redemption fees, which are not shown in this section and would have resulted in higher total expenses. For more information, see your fund's prospectus or talk to your financial adviser.
Review your fund's expenses
The table below shows the expenses you would have paid on a $1,000 investment in Dreyfus Premier International Opportunities Fund from May 1, 2005 to October 31, 2005. It also shows how much a $1,000 investment would be worth at the close of the period, assuming actual returns and expenses.
| Expenses and Value of a $1,000 Investment | | | | | | |
| assuming actual returns for the six months ended October 31, 2005 | | | | |
| | | Class A | | Class B | | Class C | | Class R | | Class T |
| |
| |
| |
| |
| |
|
| Expenses paid per $1,000 † | | $ 10.31 | | $ 14.50 | | $ 14.29 | | $ 8.45 | | $ 12.59 |
| Ending value (after expenses) | | $1,065.90 | | $1,062.10 | | $1,062.10 | | $1,068.40 | | $1,064.30 |
| | COMPARING YOUR FUND'S EXPENSES
WITH THOSE OF OTHER FUNDS (Unaudited)
|
Using the SEC's method to compare expenses
The Securities and Exchange Commission (SEC) has established guidelines to help investors assess fund expenses. Per these guidelines, the table below shows your fund's expenses based on a $1,000 investment, assuming a hypothetical 5% annualized return. You can use this information to compare the ongoing expenses (but not transaction expenses or total cost) of investing in the fund with those of other funds.All mutual fund shareholder reports will provide this information to help you make this comparison. Please note that you cannot use this information to estimate your actual ending account balance and expenses paid during the period.
| Expenses and Value of a $1,000 Investment | | | | | | |
| assuming a hypothetical 5% annualized return for the six months ended October 31, 2005 |
| | | Class A | | Class B | | Class C | | Class R | | Class T |
| |
| |
| |
| |
| |
|
| Expenses paid per $1,000 † | | $ 10.06 | | $ 14.14 | | $ 13.94 | | $ 8.24 | | $ 12.28 |
| Ending value (after expenses) | | $1,015.22 | | $1,011.14 | | $1,011.34 | | $1,017.04 | | $1,013.01 |
† Expenses are equal to the fund's annualized expense ratio of 1.98% for Class A, 2.79% for Class B, 2.75% for Class C, 1.62% for Class R and 2.42% for Class T; multiplied by the average account value over the period, multiplied by 184/365 (to reflect the one-half year period).
STATEMENT OF INVESTMENTS
October 31, 2005
|
| Common Stocks—98.6% | | Shares | | Value ($) |
| |
| |
|
| Australia—1.6% | | | | |
| Amcor | | 26,135 | | 130,409 |
| National Australia Bank | | 6,564 | | 162,047 |
| | | | | 292,456 |
| Belgium—.8% | | | | |
| Fortis | | 5,450 | | 155,221 |
| Brazil—1.2% | | | | |
| Petroleo Brasileiro, ADR | | 2,120 | | 135,468 |
| Telecomunicacoes Brasileiras, ADR | | 2,584 | | 86,099 |
| | | | | 221,567 |
| Canada—3.0% | | | | |
| Alcan | | 2,620 | | 83,028 |
| Canadian Imperial Bank of Commerce | | 1,570 | | 95,843 |
| Quebecor World | | 12,130 | | 179,176 |
| Sobeys | | 3,530 | | 124,611 |
| Torstar, Cl. B | | 3,910 | | 73,691 |
| | | | | 556,349 |
| China—.9% | | | | |
| China Telecom, Cl. H | | 296,000 | | 96,414 |
| Huadian Power International, Cl. H | | 306,400 | | 76,679 |
| | | | | 173,093 |
| Finland—1.4% | | | | |
| M-real, Cl. B | | 19,100 | | 90,932 |
| Nokia | | 700 | | 11,651 |
| Nokia, ADR | | 3,809 | | 64,067 |
| UPM-Kymmene | | 4,548 | | 87,972 |
| | | | | 254,622 |
| France—8.4% | | | | |
| BNP Paribas | | 2,070 | | 157,008 |
| Carrefour | | 5,510 | | 245,142 |
| Credit Agricole | | 5,270 | | 154,519 |
| France Telecom | | 9,073 | | 235,886 |
| Lafarge SA | | 540 | | 44,423 |
| Sanofi-Aventis | | 2,180 | | 174,632 |
| Thomson | | 6,385 | | 120,443 |
| Total | | 1,163 | | 292,044 |
| Valeo | | 4,007 | | 150,162 |
| | | | | 1,574,259 |
The Fund 9
STATEMENT OF INVESTMENTS (continued)
| Common Stocks (continued) | | Shares | | Value ($) |
| |
| |
|
| Germany—7.3% | | | | |
| Allianz | | 780 | | 109,851 |
| Deutsche Bank | | 2,235 | | 209,405 |
| Deutsche Lufthansa | | 8,138 | | 109,107 |
| Deutsche Post | | 9,356 | | 209,135 |
| Deutsche Telekom | | 8,150 | | 144,159 |
| E.ON | | 1,614 | | 146,305 |
| Hannover Rueckversicherung | | 2,530 | | 91,323 |
| Heidelberger Druckmaschinen | | 2,190 | | 69,596 |
| Infineon Technologies | | 11,310 a | | 105,791 |
| Medion | | 1,860 | | 25,562 |
| Schering | | 740 | | 45,542 |
| Volkswagen | | 1,970 | | 107,632 |
| | | | | 1,373,408 |
| Greece—.1% | | | | |
| Public Power | | 910 | | 19,316 |
| Hong Kong—1.4% | | | | |
| Bank of East Asia | | 44,128 | | 128,650 |
| Citic Pacific | | 14,100 | | 36,560 |
| Denway Motors | | 324,000 | | 97,175 |
| | | | | 262,385 |
| Hungary—.5% | | | | |
| Magyar Telekom | | 19,400 | | 90,893 |
| India—1.3% | | | | |
| Hindalco Industries, GDR | | 26,000 b | | 65,520 |
| Mahanagar Telephone Nigam, ADR | | 10,200 | | 60,690 |
| Reliance Industries, GDR | | 3,600 b | | 120,780 |
| | | | | 246,990 |
| Indonesia—.3% | | | | |
| Gudang Garam | | 64,400 | | 64,893 |
| Ireland—1.2% | | | | |
| Bank of Ireland | | 15,280 | | 232,895 |
| Italy—3.3% | | | | |
| Banco Popolare di Verona e Novara Scrl | | 3,380 | | 62,421 |
| Benetton Group | | 6,730 | | 71,546 |
| ENI | | 7,705 | | 206,603 |
| Common Stocks (continued) | | Shares | | Value ($) |
| |
| |
|
| Italy (continued) | | | | |
| Finmeccanica | | 2,600 | | 47,299 |
| UniCredito Italiano | | 42,430 | | 236,983 |
| | | | | 624,852 |
| Japan—23.1% | | | | |
| Aeon | | 7,900 | | 162,936 |
| Alps Electric | | 2,100 | | 33,170 |
| Astellas Pharma | | 2,400 | | 85,593 |
| Canon | | 3,600 | | 187,788 |
| Dentsu | | 42 | | 113,333 |
| East Japan Railway | | 5 | | 29,648 |
| Fuji Heavy Industries | | 19,600 | | 98,029 |
| Fuji Photo Film | | 4,100 | | 129,309 |
| Funai Electric | | 1,400 | | 114,055 |
| JS Group | | 5,900 | | 100,036 |
| Kao | | 6,400 | | 152,623 |
| KDDI | | 39 | | 222,541 |
| Kuraray | | 9,300 | | 88,153 |
| Mabuchi Motor | | 3,000 | | 145,920 |
| Matsumotokiyoshi | | 700 | | 20,994 |
| Minebea | | 19,500 | | 75,912 |
| Mitsubishi UFJ Financial Group | | 11 | | 137,069 |
| Murata Manufacturing | | 900 | | 44,627 |
| Nippon Express | | 44,000 | | 239,350 |
| Nippon Paper Group | | 15 | | 51,175 |
| Nissan Motor | | 13,600 | | 141,183 |
| ORIX | | 700 | | 130,357 |
| Ricoh | | 7,800 | | 123,269 |
| Rinnai | | 4,900 | | 116,642 |
| Rohm | | 2,200 | | 177,339 |
| Sekisui Chemical | | 8,000 | | 50,393 |
| Sekisui House | | 12,000 | | 149,014 |
| 77 Bank | | 19,000 | | 151,033 |
| Shin-Etsu Chemical | | 3,200 | | 152,348 |
| Skylark | | 7,300 | | 120,260 |
| Sohgo Security Services | | 2,399 | | 39,480 |
The Fund 11
STATEMENT OF INVESTMENTS (continued)
| Common Stocks (continued) | | Shares | | Value ($) |
| |
| |
|
| Japan (continued) | | | | |
| Sumitomo Bakelite | | 9,000 | | 59,554 |
| Sumitomo Chemical | | 11,500 | | 67,696 |
| Sumitomo Mitsui Financial Group | | 31 | | 285,051 |
| Takefuji | | 2,620 | | 182,600 |
| TDK | | 800 | | 53,693 |
| Toyoda Gosei | | 5,300 | | 98,836 |
| | | | | 4,331,009 |
| Malaysia—.6% | | | | |
| Sime Darby | | 67,200 | | 110,368 |
| Mexico—1.8% | | | | |
| Cemex, ADR | | 1,112 | | 57,902 |
| Coca-Cola Femsa, ADR | | 5,100 | | 131,121 |
| Telefonos de Mexico, ADR | | 7,120 | | 143,682 |
| | | | | 332,705 |
| Netherlands—6.0% | | | | |
| ABN AMRO Holding | | 5,612 | | 132,781 |
| Aegon | | 9,505 | | 143,050 |
| Heineken | | 6,077 | | 192,610 |
| Koninklijke Philips Electronics | | 6,890 | | 180,122 |
| Koninklijke Philips Electronics (New York Shares) | | 670 | | 17,527 |
| Royal Dutch Shell, Cl. A | | 7,730 | | 238,512 |
| VNU | | 2,470 | | 78,583 |
| Wolters Kluwer | | 7,581 | | 140,640 |
| | | | | 1,123,825 |
| Portugal—.6% | | | | |
| Energias de Portugal | | 40,617 | | 114,951 |
| Singapore—1.6% | | | | |
| DBS Group Holdings | | 20,850 | | 188,304 |
| United Overseas Bank | | 14,600 | | 118,930 |
| | | | | 307,234 |
| South Africa—3.2% | | | | |
| Anglo American | | 7,402 | | 218,858 |
| Nampak | | 33,668 | | 77,965 |
| Nedbank Group | | 8,886 | | 113,143 |
| Old Mutual | | 41,900 | | 97,737 |
| Sappi | | 10,600 | | 102,448 |
| | | | | 610,151 |
12
| Common Stocks (continued) | | Shares | | Value ($) |
| |
| |
|
| South Korea—3.8% | | | | |
| Hyundai Motor, GDR | | 2,750 b | | 101,200 |
| Kookmin Bank, ADR | | 2,350 | | 137,287 |
| Korea Electric Power, ADR | | 6,360 | | 103,859 |
| KT, ADR | | 5,600 | | 120,680 |
| Samsung Electronics, GDR | | 470 b | | 125,490 |
| SK Telecom, ADR | | 6,100 | | 123,281 |
| | | | | 711,797 |
| Spain—2.0% | | | | |
| Banco Sabadell | | 2,540 | | 67,103 |
| Endesa | | 3,890 | | 96,796 |
| Repsol YPF | | 1,100 | | 32,767 |
| Repsol YPF, ADR | | 6,120 | | 182,437 |
| | | | | 379,103 |
| Sweden—.9% | | | | |
| Svenska Cellulosa, Cl. B | | 5,140 | | 173,481 |
| Switzerland—6.0% | | | | |
| Ciba Specialty Chemicals | | 3,393 | | 194,935 |
| Clariant | | 6,280 | | 83,805 |
| Lonza Group | | 510 | | 29,399 |
| Nestle | | 646 | | 191,855 |
| Novartis | | 3,910 | | 210,380 |
| Swiss Reinsurance | | 3,000 | | 202,615 |
| UBS | | 2,470 | | 209,745 |
| | | | | 1,122,734 |
| Taiwan—1.1% | | | | |
| Compal Electronics, GDR | | 26,094 b | | 117,423 |
| United Microelectronics, ADR | | 30,717 | | 89,694 |
| | | | | 207,117 |
| United Kingdom—15.2% | | | | |
| BAA | | 9,516 | | 103,363 |
| BAE Systems | | 8,845 | | 51,757 |
| Barclays | | 18,555 | | 183,969 |
| Boots Group | | 12,208 | | 133,144 |
| BP | | 21,260 | | 234,879 |
| BT Group | | 36,235 | | 136,648 |
| Centrica | | 39,690 | | 167,772 |
| Diageo | | 12,101 | | 178,897 |
The Fund 13
STATEMENT OF INVESTMENTS (continued)
| Common Stocks (continued) | | Shares | | Value ($) |
| |
| |
|
| United Kingdom (continued) | | | | |
| GKN | | 21,658 | | 106,696 |
| GlaxoSmithKline | | 12,342 | | 320,998 |
| HSBC Holdings | | 10,277 | | 161,666 |
| Marks & Spencer Group | | 17,331 | | 128,108 |
| Rexam | | 7,750 | | 66,068 |
| Royal Bank of Scotland Group | | 10,278 | | 284,604 |
| Sainsbury (J) | | 19,506 | | 96,354 |
| Unilever | | 16,790 | | 170,334 |
| Vodafone Group | | 122,268 | | 320,925 |
| | | | | 2,846,182 |
| |
| |
|
| Total Investments (cost $15,884,103) | | 98.6% | | 18,513,856 |
| Cash and Receivables (Net) | | 1.4% | | 271,880 |
| Net Assets | | 100.0% | | 18,785,736 |
| ADR—American Depository Receipts. |
| GDR—Global Depository Receipts. |
| a Non-income producing. |
| b Securities exempt from registration under Rule 144A of the Securities Act of 1933.These securities may be resold in |
| transactions exempt from registration, normally to qualified institutional buyers. At October 31, 2005, these securities |
| amounted to $530,413 or 2.8% of net assets. |
| Portfolio Summary (Unaudited) † | | | | |
| |
| | | Value (%) | | | | Value (%) |
| |
| |
| |
|
| Banking | | 15.2 | | Electronic Components | | 3.6 |
| Telecommunications | | 8.0 | | Automobiles | | 3.5 |
| Financial Services | | 7.2 | | Chemicals | | 3.4 |
| Food & Household Products | | 5.9 | | Forest Products & Paper | | 3.4 |
| Energy | | 5.7 | | Other | | 34.7 |
| Healthcare | | 4.2 | | | | |
| Utilities | | 3.8 | | | | 98.6 |
† Based on net assets.
See notes to financial statements.
|
14
| | STATEMENT OF ASSETS AND LIABILITIES
October 31, 2005
|
| | | Cost | | Value |
| |
| |
|
| Assets ($): | | | | |
| Investments in securities—See Statement of Investments | | 15,884,103 | | 18,513,856 |
| Cash denominated in foreign currencies | | 371,130 | | 367,846 |
| Receivable for investment securities sold | | | | 57,623 |
| Dividends receivable | | | | 32,123 |
| Receivable for shares of Beneficial Interest subscribed | | | | 16,118 |
| Unrealized appreciation on forward | | | | |
| currency exchange contracts—Note 4 | | | | 212 |
| Prepaid expenses | | | | 19,188 |
| | | | | 19,006,966 |
| |
| |
|
| Liabilities ($): | | | | |
| Due to The Dreyfus Corporation and affiliates—Note 3(c) | | | | 24,482 |
| Cash overdraft due to Custodian | | | | 63,065 |
| Payable for investment securities purchased | | | | 41,910 |
| Payable for shares of Beneficial Interest redeemed | | | | 29,426 |
| Accrued expenses | | | | 62,311 |
| Unrealized depreciation on forward | | | | |
| currency exchange contracts—Note 4 | | | | 36 |
| | | | | 221,230 |
| |
| |
|
| Net Assets ($) | | | | 18,785,736 |
| |
| |
|
| Composition of Net Assets ($): | | | | |
| Paid-in capital | | | | 13,931,472 |
| Accumulated undistributed investment income—net | | | | 19,916 |
| Accumulated net realized gain (loss) on investments | | | | 2,208,753 |
| Accumulated net unrealized appreciation (depreciation) | | | | |
| on investments and foreign currency transactions | | | | 2,625,595 |
| |
| |
|
| Net Assets ($) | | | | 18,785,736 |
| Net Asset Value Per Share | | | | | | | | |
| | | Class A | | Class B | | Class C | | Class R | | Class T |
| |
| |
| |
| |
| |
|
| Net Assets ($) | | 9,133,014 | | 3,425,322 | | 5,824,168 | | 124,196 | | 279,036 |
| Shares Outstanding | | 594,038 | | 232,763 | | 395,919 | | 7,950 | | 18,134 |
| |
| |
| |
| |
| |
|
| Net Asset Value | | | | | | | | | | |
| Per Share ($) | | 15.37 | | 14.72 | | 14.71 | | 15.62 | | 15.39 |
See notes to financial statements.
The Fund 15
STATEMENT OF OPERATIONS
Year Ended October 31, 2005
|
| Investment Income ($): | | |
| Income: | | |
| Cash dividends (net of $46,705 foreign taxes withheld at source) | | 463,639 |
| Interest | | 13,213 |
| Total Income | | 476,852 |
| Expenses: | | |
| Management fee—Note 3(a) | | 193,146 |
| Custodian fees | | 92,326 |
| Shareholder servicing costs—Note 3(c) | | 80,713 |
| Distribution fees—Note 3(b) | | 74,562 |
| Registration fees | | 54,700 |
| Prospectus and shareholders' reports | | 28,735 |
| Professional fees | | 27,447 |
| Trustees' fees and expenses—Note 3(d) | | 2,792 |
| Loan commitment fees—Note 2 | | 145 |
| Miscellaneous | | 15,590 |
| Total Expenses | | 570,156 |
| Less—reduction in management fee due to | | |
| undertaking—Note 3(a) | | (109,538) |
| Less—reduction in custody fees due to | | |
| earnings credits—Note 1(c) | | (1,111) |
| Net Expenses | | 459,507 |
| Investment Income—Net | | 17,345 |
| |
|
| Realized and Unrealized Gain (Loss) on Investments—Note 4 ($): |
| Net realized gain (loss) on investments and foreign currency transactions | | 2,460,081 |
| Net realized gain (loss) on forward currency exchange contracts | | (3,499) |
| Net Realized Gain (Loss) | | 2,456,582 |
| Net unrealized appreciation (depreciation) | | |
| on investments and foreign currency transactions | | (19,061) |
| Net Realized and Unrealized Gain (Loss) on Investments | | 2,437,521 |
| Net Increase in Net Assets Resulting from Operations | | 2,454,866 |
See notes to financial statements.
STATEMENT OF CHANGES IN NET ASSETS
| | | Year Ended October 31, |
| |
|
| | | 2005 | | 2004 |
| |
| |
|
| Operations ($): | | | | |
| Investment income—net | | 17,345 | | 15,721 |
| Net realized gain (loss) on investments | | 2,456,582 | | 1,426,606 |
| Net unrealized appreciation | | | | |
| (depreciation) on investments | | (19,061) | | 987,696 |
| Net Increase (Decrease) in Net Assets | | |
| Resulting from Operations | | 2,454,866 | | 2,430,023 |
| |
| |
|
| Dividends to Shareholders from ($): | | | | |
| Investment income—net: | | | | |
| Class A shares | | (46,738) | | (50,384) |
| Class B shares | | — | | (11,801) |
| Class C shares | | — | | (22,186) |
| Class R shares | | (245) | | (324) |
| Class T shares | | (1,137) | | (1,435) |
| Net realized gain on investments: | | | | |
| Class A shares | | (202,341) | | — |
| Class B shares | | (94,024) | | — |
| Class C shares | | (153,796) | | — |
| Class R shares | | (724) | | — |
| Class T shares | | (5,046) | | — |
| Total Dividends | | (504,051) | | (86,130) |
| |
| |
|
| Beneficial Interest Transactions ($): | | | | |
| Net proceeds from shares sold: | | | | |
| Class A shares | | 3,771,560 | | 3,979,138 |
| Class B shares | | 898,036 | | 1,245,498 |
| Class C shares | | 1,597,701 | | 2,478,238 |
| Class R shares | | 88,215 | | 34,000 |
| Class T shares | | 215,341 | | 91,819 |
The Fund 17
STATEMENT OF CHANGES IN NET ASSETS (continued)
| | | Year Ended October 31, |
| |
|
| | | 2005 | | 2004 |
| |
| |
|
| Beneficial Interest Transactions ($) (continued): | | |
| Dividends reinvested: | | | | |
| Class A shares | | 168,645 | | 35,183 |
| Class B shares | | 65,813 | | 8,466 |
| Class C shares | | 55,899 | | 9,166 |
| Class R shares | | 970 | | 324 |
| Class T shares | | 6,183 | | 1,435 |
| Cost of shares redeemed: | | | | |
| Class A shares | | (3,532,855) | | (1,989,102) |
| Class B shares | | (1,398,888) | | (784,763) |
| Class C shares | | (2,419,918) | | (744,443) |
| Class R shares | | — | | (507,407) |
| Class T shares | | (136,020) | | (65,993) |
| Increase (Decrease) in Net Assets | | | | |
| from Beneficial Interest Transactions | | (619,318) | | 3,791,559 |
| Total Increase (Decrease) in Net Assets | | 1,331,497 | | 6,135,452 |
| |
| |
|
| Net Assets ($): | | | | |
| Beginning of Period | | 17,454,239 | | 11,318,787 |
| End of Period | | 18,785,736 | | 17,454,239 |
| Undistributed investment income—net | | 19,916 | | 38,773 |
| | | Year Ended October 31, |
| |
|
| | | 2005 | | 2004 |
| |
| |
|
| Capital Share Transactions: | | | | |
| Class A a | | | | |
| Shares sold | | 255,057 | | 306,480 |
| Shares issued for dividends reinvested | | 11,696 | | 2,886 |
| Shares redeemed | | (235,892) | | (152,015) |
| Net Increase (Decrease) in Shares Outstanding | | 30,861 | | 157,351 |
| |
| |
|
| Class B a | | | | |
| Shares sold | | 63,309 | | 101,089 |
| Shares issued for dividends reinvested | | 4,735 | | 718 |
| Shares redeemed | | (97,932) | | (62,173) |
| Net Increase (Decrease) in Shares Outstanding | | (29,888) | | 39,634 |
| |
| |
|
| Class C | | | | |
| Shares sold | | 111,933 | | 199,933 |
| Shares issued for dividends reinvested | | 4,024 | | 779 |
| Shares redeemed | | (168,558) | | (58,978) |
| Net Increase (Decrease) in Shares Outstanding | | (52,601) | | 141,734 |
| |
| |
|
| Class R | | | | |
| Shares sold | | 5,843 | | 2,574 |
| Shares issued for dividends reinvested | | 66 | | 26 |
| Shares redeemed | | — | | (41,706) |
| Net Increase (Decrease) in Shares Outstanding | | 5,909 | | (39,106) |
| |
| |
|
| Class T | | | | |
| Shares sold | | 14,463 | | 7,115 |
| Shares issued for dividends reinvested | | 426 | | 117 |
| Shares redeemed | | (9,115) | | (5,009) |
| Net Increase (Decrease) in Shares Outstanding | | 5,774 | | 2,223 |
a During the period ended October 31, 2005, 17,978 Class B shares representing $253,525 were automatically converted to 17,281 Class A shares and during the period ended October 31, 2004, 7,082 Class B shares representing $90,552 were automatically converted to 6,826 Class A shares.
See notes to financial statements.
The Fund 19
FINANCIAL HIGHLIGHTS
The following tables describe the performance for each share class for the fiscal periods indicated. All information (except portfolio turnover rate) reflects financial results for a single fund share.Total return shows how much your investment in the fund would have increased (or decreased) during each period, assuming you had reinvested all dividends and distributions.These figures have been derived from the fund's financial statements.
| | | | | Year Ended October 31, | | |
| |
| |
| |
|
| Class A Shares | | 2005 | | 2004 | | 2003 | | 2002 | | 2001 |
| |
| |
| |
| |
| |
|
| Per Share Data ($): | | | | | | | | | | |
| Net asset value, beginning of period | | 13.85 | | 11.70 | | 9.47 | | 10.35 | | 12.96 |
| Investment Operations: | | | | | | | | | | |
| Investment income—net a | | .07 | | .07 | | .09 | | .06 | | .04 |
| Net realized and unrealized | | | | | | | | | | |
| gain (loss) on investments | | 1.89 | | 2.20 | | 2.27 | | (.94) | | (1.63) |
| Total from Investment Operations | | 1.96 | | 2.27 | | 2.36 | | (.88) | | (1.59) |
| Distributions: | | | | | | | | | | |
| Dividends from investment income—net | | (.08) | | (.12) | | (.13) | | — | | — |
| Dividends from net realized | | | | | | | | | | |
| gain on investments | | (.36) | | — | | — | | — | | (1.02) |
| Total Distributions | | (.44) | | (.12) | | (.13) | | — | | (1.02) |
| Net asset value, end of period | | 15.37 | | 13.85 | | 11.70 | | 9.47 | | 10.35 |
| |
| |
| |
| |
| |
|
| Total Return (%) b | | 14.42 | | 19.41 | | 25.23 | | (8.50) | | (13.57) |
| |
| |
| |
| |
| |
|
| Ratios/Supplemental Data (%): | | | | | | | | | | |
| Ratio of total expenses | | | | | | | | | | |
| to average net assets | | 2.54 | | 2.93 | | 3.61 | | 3.47 | | 3.69 |
| Ratio of net expenses | | | | | | | | | | |
| to average net assets | | 1.97 | | 2.00 | | 2.00 | | 2.00 | | 2.00 |
| Ratio of net investment income | | | | | | | | | | |
| to average net assets | | .50 | | .53 | | .92 | | .52 | | .35 |
| Portfolio Turnover Rate | | 48.73 | | 44.10 | | 78.42 | | 65.83 | | 49.65 |
| |
| |
| |
| |
| |
|
| Net Assets, end of period ($ x 1,000) | | 9,133 | | 7,799 | | 4,747 | | 3,882 | | 3,724 |
| a | | Based on average shares outstanding at each month end. |
| b | | Exclusive of sales charge. |
| See notes to financial statements. |
20
| | | | | Year Ended October 31, | | |
| |
| |
| |
|
| Class B Shares | | 2005 | | 2004 | | 2003 | | 2002 | | 2001 |
| |
| |
| |
| |
| |
|
| Per Share Data ($): | | | | | | | | | | |
| Net asset value, beginning of period | | 13.30 | | 11.26 | | 9.17 | | 10.11 | | 12.78 |
| Investment Operations: | | | | | | | | | | |
| Investment income (loss)—net a | | (.04) | | (.03) | | .00b | | (.03) | | (.05) |
| Net realized and unrealized | | | | | | | | | | |
| gain (loss) on investments | | 1.82 | | 2.12 | | 2.18 | | (.91) | | (1.60) |
| Total from Investment Operations | | 1.78 | | 2.09 | | 2.18 | | (.94) | | (1.65) |
| Distributions: | | | | | | | | | | |
| Dividends from investment income—net | | — | | (.05) | | (.09) | | — | | — |
| Dividends from net realized | | | | | | | | | | |
| gain on investments | | (.36) | | — | | — | | — | | (1.02) |
| Total Distributions | | (.36) | | (.05) | | (.09) | | — | | (1.02) |
| Net asset value, end of period | | 14.72 | | 13.30 | | 11.26 | | 9.17 | | 10.11 |
| |
| |
| |
| |
| |
|
| Total Return (%) c | | 13.50 | | 18.60 | | 23.99 | | (9.30) | | (14.28) |
| |
| |
| |
| |
| |
|
| Ratios/Supplemental Data (%): | | | | | | | | | | |
| Ratio of total expenses | | | | | | | | | | |
| to average net assets | | 3.36 | | 3.68 | | 4.37 | | 4.24 | | 4.47 |
| Ratio of net expenses | | | | | | | | | | |
| to average net assets | | 2.79 | | 2.75 | | 2.75 | | 2.75 | | 2.75 |
| Ratio of net investment income | | | | | | | | | | |
| (loss) to average net assets | | (.31) | | (.26) | | .01 | | (.34) | | (.45) |
| Portfolio Turnover Rate | | 48.73 | | 44.10 | | 78.42 | | 65.83 | | 49.65 |
| |
| |
| |
| |
| |
|
| Net Assets, end of period ($ x 1,000) | | 3,425 | | 3,494 | | 2,512 | | 1,624 | | 809 |
| a | | Based on average shares outstanding at each month end. |
| b | | Amount represents less than $.01 per share. |
| c | | Exclusive of sales charge. |
| See notes to financial statements. |
The Fund 21
FINANCIAL HIGHLIGHTS (continued)
| | | | | Year Ended October 31, | | |
| |
| |
| |
|
| Class C Shares | | 2005 | | 2004 | | 2003 | | 2002 | | 2001 |
| |
| |
| |
| |
| |
|
| Per Share Data ($): | | | | | | | | | | |
| Net asset value, beginning of period | | 13.29 | | 11.26 | | 9.19 | | 10.12 | | 12.79 |
| Investment Operations: | | | | | | | | | | |
| Investment (loss)—net a | | (.04) | | (.03) | | (.00)b | | (.04) | | (.05) |
| Net realized and unrealized | | | | | | | | | | |
| gain (loss) on investments | | 1.82 | | 2.12 | | 2.17 | | (.89) | | (1.60) |
| Total from Investment Operations | | 1.78 | | 2.09 | | 2.17 | | (.93) | | (1.65) |
| Distributions: | | | | | | | | | | |
| Dividends from investment income—net | | — | | (.06) | | (.10) | | — | | — |
| Dividends from net realized | | | | | | | | | | |
| gain on investments | | (.36) | | — | | — | | — | | (1.02) |
| Total Distributions | | (.36) | | (.06) | | (.10) | | — | | (1.02) |
| Net asset value, end of period | | 14.71 | | 13.29 | | 11.26 | | 9.19 | | 10.12 |
| |
| |
| |
| |
| |
|
| Total Return (%) c | | 13.51 | | 18.67 | | 23.92 | | (9.19) | | (14.27) |
| |
| |
| |
| |
| |
|
| Ratios/Supplemental Data (%): | | | | | | | | | | |
| Ratio of total expenses | | | | | | | | | | |
| to average net assets | | 3.32 | | 3.69 | | 4.37 | | 4.29 | | 4.43 |
| Ratio of net expenses | | | | | | | | | | |
| to average net assets | | 2.75 | | 2.75 | | 2.75 | | 2.75 | | 2.75 |
| Ratio of net investment (loss) | | | | | | | | | | |
| to average net assets | | (.29) | | (.25) | | (.04) | | (.43) | | (.44) |
| Portfolio Turnover Rate | | 48.73 | | 44.10 | | 78.42 | | 65.83 | | 49.65 |
| |
| |
| |
| |
| |
|
| Net Assets, end of period ($ x 1,000) | | 5,824 | | 5,961 | | 3,455 | | 1,549 | | 556 |
| a | | Based on average shares outstanding at each month end. |
| b | | Amount represents less than $.01 per share. |
| c | | Exclusive of sales charge. |
| See notes to financial statements. |
22
| | | | | Year Ended October 31, | | |
| |
| |
| |
|
| Class R Shares | | 2005 | | 2004 | | 2003 | | 2002 | | 2001 |
| |
| |
| |
| |
| |
|
| Per Share Data ($): | | | | | | | | | | �� |
| Net asset value, beginning of period | | 14.05 | | 11.80 | | 9.55 | | 10.41 | | 13.00 |
| Investment Operations: | | | | | | | | | | |
| Investment income (loss)—net a | | .17 | | (.01) | | .09 | | .08 | | .07 |
| Net realized and unrealized | | | | | | | | | | |
| gain (loss) on investments | | 1.88 | | 2.42 | | 2.32 | | (.94) | | (1.64) |
| Total from Investment Operations | | 2.05 | | 2.41 | | 2.41 | | (.86) | | (1.57) |
| Distributions: | | | | | | | | | | |
| Dividends from investment income—net | | (.12) | | (.16) | | (.16) | | — | | — |
| Dividends from net realized | | | | | | | | | | |
| gain on investments | | (.36) | | — | | — | | — | | (1.02) |
| Total Distributions | | (.48) | | (.16) | | (.16) | | — | | (1.02) |
| Net asset value, end of period | | 15.62 | | 14.05 | | 11.80 | | 9.55 | | 10.41 |
| |
| |
| |
| |
| |
|
| Total Return (%) | | 14.79 | | 20.62 | | 25.72 | | (8.26) | | (13.36) |
| |
| |
| |
| |
| |
|
| Ratios/Supplemental Data (%): | | | | | | | | | | |
| Ratio of total expenses | | | | | | | | | | |
| to average net assets | | 2.21 | | 2.61 | | 3.37 | | 3.21 | | 3.43 |
| Ratio of net expenses | | | | | | | | | | |
| to average net assets | | 1.63 | | 1.75 | | 1.75 | | 1.75 | | 1.75 |
| Ratio of net investment income | | | | | | | | | | |
| (loss) to average net assets | | 1.09 | | (.12) | | .94 | | .73 | | .55 |
| Portfolio Turnover Rate | | 48.73 | | 44.10 | | 78.42 | | 65.83 | | 49.65 |
| |
| |
| |
| |
| |
|
| Net Assets, end of period ($ x 1,000) | | 124 | | 29 | | 485 | | 442 | | 881 |
a Based on average shares outstanding at each month end.
See notes to financial statements.
|
The Fund 23
FINANCIAL HIGHLIGHTS (continued)
| | | | | Year Ended October 31, | | |
| |
| |
| |
|
| Class T Shares | | 2005 | | 2004 | | 2003 | | 2002 | | 2001 |
| |
| |
| |
| |
| |
|
| Per Share Data ($): | | | | | | | | | | |
| Net asset value, beginning of period | | 13.92 | | 11.77 | | 9.39 | | 10.29 | | 12.91 |
| Investment Operations: | | | | | | | | | | |
| Investment income (loss)—net a | | .01 | | .03 | | .07 | | (.04) | | .00b |
| Net realized and unrealized | | | | | | | | | | |
| gain (loss) on investments | | 1.90 | | 2.24 | | 2.45 | | (.86) | | (1.60) |
| Total from Investment Operations | | 1.91 | | 2.27 | | 2.52 | | (.90) | | (1.60) |
| Distributions: | | | | | | | | | | |
| Dividends from investment income—net | | (.08) | | (.12) | | (.14) | | — | | — |
| Dividends from net realized | | | | | | | | | | |
| gain on investments | | (.36) | | — | | — | | — | | (1.02) |
| Total Distributions | | (.44) | | (.12) | | (.14) | | — | | (1.02) |
| Net asset value, end of period | | 15.39 | | 13.92 | | 11.77 | | 9.39 | | 10.29 |
| |
| |
| |
| |
| |
|
| Total Return (%) c | | 13.88 | | 19.41 | | 27.18 | | (8.75) | | (13.70) |
| |
| |
| |
| |
| |
|
| Ratios/Supplemental Data (%): | | | | | | | | | | |
| Ratio of total expenses | | | | | | | | | | |
| to average net assets | | 3.15 | | 3.80 | | 4.44 | | 5.21 | | 3.95 |
| Ratio of net expenses | | | | | | | | | | |
| to average net assets | | 2.49 | | 2.25 | | 2.25 | | 2.25 | | 2.25 |
| Ratio of net investment income | | | | | | | | | | |
| (loss) to average net assets | | .06 | | .24 | | .61 | | (.41) | | .04 |
| Portfolio Turnover Rate | | 48.73 | | 44.10 | | 78.42 | | 65.83 | | 49.65 |
| |
| |
| |
| |
| |
|
| Net Assets, end of period ($ x 1,000) | | 279 | | 172 | | 119 | | 21 | | 1 |
| a | | Based on average shares outstanding at each month end. |
| b | | Amount represents less than $.01 per share. |
| c | | Exclusive of sales charge. |
| See notes to financial statements. |
24
NOTES TO FINANCIAL STATEMENTS
NOTE 1—Significant Accounting Policies:
Dreyfus Premier International Opportunities Fund (the "fund") is a separate non-diversified series of Dreyfus Premier Value Equity Funds (the "Company"), which is registered under the Investment Company Act of 1940, as amended (the "Act"), as an open-end management investment company and operates as a series company, currently offering two series, including the fund.The fund's investment objective is long-term capital growth. The Dreyfus Corporation (the "Manager") serves as the fund's investment adviser.The Manager is a wholly-owned subsidiary of Mellon Financial Corporation ("Mellon Financial").
Dreyfus Service Corporation (the "Distributor"), a wholly-owned subsidiary of the Manager, is the distributor of the fund's shares.The fund is authorized to issue an unlimited number of $.001 par value shares of Beneficial Interest in each of the following classes of shares: Class A, Class B, Class C, Class R and Class T. Class A and Class T shares are subject to a sales charge imposed at the time of purchase. Class B shares are subject to a contingent deferred sales charge ("CDSC") imposed on Class B share redemptions made within six years of purchase and automatically convert to Class A shares after six years. Class C shares are subject to a CDSC imposed on Class C shares redeemed within one year of purchase and Class R shares are sold at net asset value per share only to institutional investors. Other differences between the classes include the services offered to and the expenses borne by each class and certain voting rights. Income, expenses (other than expenses attributable to a specific class), and realized and unrealized gains or losses on investments are allocated to each class of shares based on its relative net assets.
The Company accounts separately for the assets, liabilities and operations of each series. Expenses directly attributable to each series are charged to that series' operations; expenses which are applicable to all series are allocated among them on a pro rata basis.
The fund's financial statements are prepared in accordance with U.S. generally accepted accounting principles, which may require the use of management estimates and assumptions. Actual results could differ from those estimates.
The Fund 25
NOTES TO FINANCIAL STATEMENTS (continued)
The fund enters into contracts that contain a variety of indemnifications. The fund's maximum exposure under these arrangements is unknown.The fund does not anticipate recognizing any loss related to these arrangements.
(a) Portfolio valuation: Investments in securities are valued at the last sales price on the securities exchange or national securities market on which such securities are primarily traded. Securities listed on the National Market System for which market quotations are available are valued at the official closing price or, if there is no official closing price that day, at the last sales price. Securities not listed on an exchange or the national securities market, or securities for which there were no transactions, are valued at the average of the most recent bid and asked prices, except for open short positions, where the asked price is used for valuation purposes. Bid price is used when no asked price is available. Investments in registered investment companies are valued at their net asset value.When market quotations or official closing prices are not readily available, or are determined not to reflect accurately fair value, such as when the value of a security has been significantly affected by events after the close of the exchange or market on which the security is principally traded (for example, a foreign exchange or market), but before the fund calculates its net asset value, the fund may value these investments at fair value as determined in accordance with the procedures approved by the Board of Trustees. Fair valuing of securities may be determined with the assistance of a pricing service using calculations based on indices of domestic securities and other appropriate indicators, such as prices of relevant ADR's and futures contracts. For other securities that are fair valued by the Board of Trustees, certain factors may be considered such as: fundamental analytical data, the nature and duration of restrictions on disposition, an evaluation of the forces that influence the market in which the securities are purchased and sold, and public trading in similar securities of the issuer or comparable issuers.Financial futures are valued at the last sales price.Investments denominated in foreign currencies are translated to U.S. dollars at the prevailing rates of exchange. Forward currency exchange contracts are valued at the forward rate.
26
(b) Foreign currency transactions: The fund does not isolate that portion of the results of operations resulting from changes in foreign exchange rates on investments from the fluctuations arising from changes in market prices of securities held. Such fluctuations are included with the net realized and unrealized gain or loss on investments.
Net realized foreign exchange gains or losses arise from sales and maturities of short-term securities, sales of foreign currencies, currency gains or losses realized on securities transactions and the difference between the amounts of dividends, interest and foreign withholding taxes recorded on the fund's books and the U.S. dollar equivalent of the amounts actually received or paid. Net unrealized foreign exchange gains and losses arise from changes in the value of assets and liabilities other than investments in securities, resulting from changes in exchange rates. Such gains and losses are included with net realized and unrealized gain or loss on investments.
(c) Securities transactions and investment income: Securities transactions are recorded on a trade date basis. Realized gain and loss from securities transactions are recorded on the identified cost basis. Dividend income is recognized on the ex-dividend date and interest income, including, where applicable, accretion of discount and amortization of premium on investments, is recognized on the accrual basis.
The fund has an arrangement with the custodian bank whereby the fund receives earnings credits from the custodian when positive cash balances are maintained, which are used to offset custody fees. For financial reporting purposes, the fund includes net earnings credits as an expense offset in the Statement of Operations.
(d) Dividends to shareholders: Dividends are recorded on the ex-dividend date. Dividends from investment income-net and dividends from net realized capital gain, if any, are normally declared and paid annually, but the fund may make distributions on a more frequent basis to comply with the distribution requirements of the Internal Revenue
The Fund 27
NOTES TO FINANCIAL STATEMENTS (continued)
Code of 1986, as amended (the "Code").To the extent that net realized capital gain can be offset by capital loss carryovers, it is the policy of the fund not to distribute such gain. Income and capital gain distributions are determined in accordance with income tax regulations, which may differ from U.S. generally accepted accounting principles.
(e) Federal income taxes: It is the policy of the fund to continue to qualify as a regulated investment company, if such qualification is in the best interests of its shareholders, by complying with the applicable provisions of the Code, and to make distributions of taxable income sufficient to relieve it from substantially all federal income and excise taxes.
At October 31, 2005, the components of accumulated earnings on a tax basis were as follows: undistributed ordinary income $621,936, undistributed capital gains $1,773,991 and unrealized appreciation $2,458,337.
The tax character of distributions paid to shareholders during the fiscal periods ended October 31, 2005 and October 31, 2004, were as follows: ordinary income $48,120 and $86,130 and long-term capital gains $455,931 and $0, respectively.
During the period ended October 31, 2005, as a result of permanent book to tax differences, primarily due to the tax treatment for foreign currency exchange gains and losses and passive foreign investment companies, the fund increased accumulated undistributed investment income-net by $11,918 and decreased accumulated net realized gain (loss) on investments by the same amount. Net assets were not affected by this reclassification
NOTE 2—Bank Line of Credit:
The fund participates with other Dreyfus-managed funds in a $350 million redemption credit facility (the "Facility") to be utilized for temporary or emergency purposes, including the financing of redemptions. In connection therewith, the fund has agreed to pay commitment fees on its pro rata portion of the Facility. Interest is charged to the fund based on prevailing market rates in effect at the time of borrowing. During the period ended October 31, 2005, the fund did not borrow under the Facility.
28
NOTE 3—Management Fee and Other Transactions With Affiliates:
(a) Pursuant to a management agreement ("Agreement") with the Manager, the management fee is computed at the annual rate of 1% of the value of the fund's average daily net assets and is payable monthly. The Manager has undertaken from November 1, 2004 through October 31, 2006, that, if the aggregate expenses of the fund exclusive of taxes, brokerage fees, interest on borrowings, Rule 12b-1 distribution plan fees, shareholder services plan fees, commitment fees and extraordinary expenses, exceed an annual rate of 1.75% of the value of the fund's average daily net assets, the fund may deduct from the payment to be made to the Manager under the Agreement, or the Manager will bear such excess expenses. The reduction in management fee, pursuant to the undertaking, amounted to $109,538 during the period ended October 31, 2005.
During the period ended October 31, 2005, the Distributor retained $1,985 and $72 from commissions earned on sales the fund's Class A and Class T shares and $6,685 and $1,202 from contingent deferred sales charges on redemptions of the fund's Class B and Class C shares, respectively.
(b) Under the Distribution Plan (the "Plan") adopted pursuant to Rule 12b-1 under the Act, Class B, Class C and Class T shares pay the Distributor for distributing their shares at an annual rate of .75% of the value of the average daily net assets of Class B and Class C shares and .25% of the value of the average daily net assets of Class T shares. During the period ended October 31, 2005, Class B, Class C and Class T shares were charged $27,901, $45,974 and $687, respectively, pursuant to the Plan.
(c) Under the Shareholder Services Plan, Class A, Class B, Class C and Class T shares pay the Distributor at an annual rate of .25% of the value of their average daily net assets for the provision of certain services. The services provided may include personal services relating to shareholder accounts, such as answering shareholder inquiries regarding the
The Fund 29
NOTES TO FINANCIAL STATEMENTS (continued)
fund and providing reports and other information, and services related to the maintenance of shareholder accounts. The Distributor may make payments to Service Agents (a securities dealer, financial institution or other industry professional) in respect of these services. The Distributor determines the amounts to be paid to Service Agents. During the period ended October 31, 2005, Class A, Class B, Class C and Class T shares were charged $22,739, $9,300, $15,325 and $687, respectively, pursuant to the Shareholder Services Plan.
The fund compensates Dreyfus Transfer, Inc., a wholly-owned subsidiary of the Manager, under a transfer agency agreement for providing personnel and facilities to perform transfer agency services for the fund. During the period ended October 31, 2005, the fund was charged $16,928 pursuant to the transfer agency agreement.
During the period ended October 31, 2005, the fund was charged $3,143 for services performed by the Chief Compliance Officer.
The components of Due to The Dreyfus Corporation and affiliates in the Statement of Assets and Liabilities consist of: management fees $16,283, Rule 12b-1 distribution plan fees $6,097, shareholder services plan fees $4,044, transfer agency per account fees $2,860 and chief compliance officer fees $1,239, which are offset against an expense reimbursement currently in effect in the amount of $6,041.
(d) Each Board member also serves as a Board member of other funds within the Dreyfus complex. Annual retainer fees and attendance fees are allocated to each fund based on net assets.
NOTE 4—Securities Transactions:
The aggregate amount of purchases and sales of investment securities, excluding short-term securities and forward currency exchange contracts, during the period ended October 31, 2005, amounted to $9,052,561 and $9,586,271, respectively.
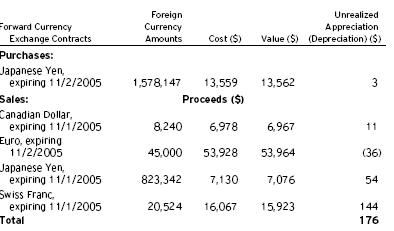
The fund enters into forward currency exchange contracts in order to hedge its exposure to changes in foreign currency exchange rates on its foreign portfolio holdings and to settle foreign currency transac-
30
tions.When executing forward currency exchange contracts, the fund is obligated to buy or sell a foreign currency at a specified rate on a certain date in the future. With respect to sales of forward currency exchange contracts, the fund would incur a loss if the value of the contract increases between the date the forward contract is opened and the date the forward contract is closed.The fund realizes a gain if the value of the contract decreases between those dates. With respect to purchases of forward currency exchange contracts, the fund would incur a loss if the value of the contract decreases between the date the forward contract is opened and the date the forward contract is closed. The fund realizes a gain if the value of the contract increases between those dates. The fund is also exposed to credit risk associated with counter party nonperformance on these forward currency exchange contracts which is typically limited to the unrealized gains on each open contract. The following summarizes open forward currency exchange contracts at October 31, 2005:
At October 31, 2005, the cost of investments for federal income tax purposes was $16,051,359; accordingly, accumulated net unrealized appreciation on investments was $2,462,497, consisting of $3,115,290 gross unrealized appreciation and $652,793 gross unrealized depreciation.
The Fund 31
NOTES TO FINANCIAL STATEMENTS (continued)
NOTE 5—Subsequent Event:
At a meeting of the fund's Board of Trustees held on November 2, 2005, the Board approved the liquidation of the fund and to distribute its net assets pro rata to fund shareholders.The anticipated date of liquidation of the fund is on December 15, 2005.
32
REPORT OF INDEPENDENT REGISTERED
PUBLIC ACCOUNTING FIRM
|
Shareholders and Board of Trustees
Dreyfus Premier International Opportunities Fund
|
We have audited the accompanying statement of assets and liabilities, including the statement of investments, of Dreyfus Premier International Opportunities Fund (one of the funds comprising Dreyfus Premier Value Equity Funds) as of October 31, 2005, and the related statement of operations for the year then ended, the statement of changes in net assets for each of the two years in the period then ended, and financial highlights for each of the years indicated therein.These financial statements and financial highlights are the responsibility of the Fund's management. Our responsibility is to express an opinion on these financial statements and financial highlights based on our audits.
We conducted our audits in accordance with the standards of the Public Company Accounting Oversight Board (United States).Those standards require that we plan and perform the audit to obtain reasonable assurance about whether the financial statements and financial highlights are free of material misstatement.We were not engaged to perform an audit of the Fund's internal control over financial reporting. Our audits included consideration of internal control over financial reporting as a basis for designing audit procedures that are appropriate in the circumstances, but not for the purpose of expressing an opinion on the effectiveness of the Fund's internal control over financial reporting. Accordingly, we express no such opinion.An audit also includes examining, on a test basis, evidence supporting the amounts and disclosures in the financial statements and financial highlights, assessing the accounting principles used and significant estimates made by management, and evaluating the overall financial statement presentation. Our procedures included confirmation of securities owned as of October 31, 2005 by correspondence with the custodian and others or by other appropriate auditing procedures where replies from others were not received. We believe that our audits provide a reasonable basis for our opinion.
In our opinion, the financial statements and financial highlights referred to above present fairly, in all material respects, the financial position of Dreyfus Premier International Opportunities Fund at October 31, 2005, the results of its operations for the year then ended, the changes in its net assets for each of the two years in the period then ended, and the financial highlights for each of the indicated years, in conformity with U.S. generally accepted accounting principles.

| | New York, New York
December 14, 2005
|
The Fund 33
IMPORTANT TAX INFORMATION (Unaudited)
In accordance with federal tax law, the fund elects to provide each shareholder with their portion of the fund's foreign taxes paid and the income sourced from foreign countries. Accordingly, the fund hereby makes the following designations regarding its fiscal year ended October 31, 2005:
—the total amount of taxes paid to foreign countries was $43,518
—the total amount of income sourced from foreign countries was $302,566
As required by federal tax law rules, shareholders will receive notification of their proportionate share of foreign taxes paid and foreign sourced income for the 2005 calendar year with Form 1099-DIV which will be mailed by January 31, 2006.
For the fiscal year ended October 31, 2005, certain dividends paid by the fund may be subject to a maximum tax rate of 15%, as provided for by the Jobs and Growth Tax Relief Reconciliation Act of 2003. Of the distributions paid during the fiscal year, $48,120 represents the maximum amount that may be considered qualified dividend income.Also, the fund designates $.3550 per share as a long-term capital gain distribution paid on December 21, 2004 and designates $4.623 per share as a long-term capital gain distribution paid on December 13, 2005.This includes the designation for long-term capital gains through the fund's liquidation on December 15, 2005.
34
INFORMATION ABOUT THE REVIEW AND APPROVAL
OF THE FUND'S MANAGEMENT AGREEMENT (Unaudited)
|
At a meeting of the Board of Trustees held on August 10, 2005, the Board considered the re-approval for an annual period of the fund's Management Agreement, pursuant to which the Manager provides the fund with investment advisory and administrative services. The Board members, none of whom are "interested persons" (as defined in the Investment Company Act of 1940, as amended) of the fund were assisted in their review by independent legal counsel and met with counsel in executive session separate from representatives of the Manager.
Analysis of Nature, Extent, and Quality of Services Provided to the Fund. The Board members received a presentation from representatives of the Manager regarding services provided to the fund and other funds in the Dreyfus fund complex, and discussed the nature, extent, and quality of the services provided to the fund pursuant to its Management Agreement.The Manager's representatives reviewed the fund's distribution of accounts and the relationships the Manager has with various intermediaries and the different needs of each.The Manager's representatives noted the diversity of distribution of the fund as well as among the funds in the Dreyfus fund complex, and the Manager's corresponding need for broad, deep, and diverse resources to be able to provide ongoing shareholder services to each of the fund's distribution channels. The Board members also reviewed the number of shareholder accounts in the fund, as well as the fund's asset size.
The Board members also considered the Manager's research and portfolio management capabilities and that the Manager also provides oversight of day-to-day fund operations, including fund accounting and administration and assistance in meeting legal and regulatory requirements. The Board members also considered the Manager's extensive administrative, accounting, and compliance infrastructure.
Comparative Analysis of the Fund's Performance, Management Fee, and Expense Ratio. The Board members reviewed the fund's performance, management fee, and expense ratio and placed significant emphasis on comparisons to a group of comparable funds,and to Lipper category averages, as applicable. The group of comparable funds was previously approved by the Board for this purpose, and was prepared using a Board-
The Fund 35
| | INFORMATION ABOUT THE REVIEW AND APPROVAL O F T H E
F U N D ' S M A N A G E M E N T A G R E E M E N T (Unaudited) (continued)
|
approved selection methodology that was based, in part, on selecting non-affiliated funds reported in the same Lipper category (the "International Multicap Value Funds" category) as the fund. The Board members discussed the results of the comparisons for various periods ended June 30, 2005.The Board members noted the fund's fourth quartile comparison group and Lipper category rankings for the 1-year period, third quartile comparison group and Lipper category rankings for the 3- and 5-year periods, and that the fund underperformed its comparison group and Lipper category averages for each such time period except the 5-year period with respect to the comparison group average.The Board members discussed the fund's performance with one of the fund's portfolio managers, and considered the portfolio manager's explanation of the reasons for the fund's underperformance for the 1-year and 3-year time peri-ods.The Board members noted that the fund's primary portfolio manager and his team were very experienced and had achieved a consistently strong long-term track record, and the Board members expressed their confidence in the manager and the team's portfolio management.
The Board members also noted the fund's management fee and expense ratio and reviewed the range of management fees and expense ratios for the funds in the comparison group. The Board members noted that the fund's management fee was near the median of the fees for the funds in the comparison group. The Board also noted the Manager's ongoing undertaking to limit the fund's total expense ratio to 1.75% annually, plus applicable share class distribution and servicing fees, and that the fund's total expense ratio was higher than both its comparison group average and Lipper category average.
The Board members reviewed the fees paid to the Manager or its affiliates by mutual funds managed by Dreyfus or its affiliates with similar investment objectives, policies, and strategies, and in the same Lipper category, as the fund (the "Similar Funds"). The Board members also reviewed the fees paid by institutional separate accounts managed by The Boston Company Asset Management ("TBCAM") and the fund's portfolio managers, with similar investment objectives, policies, and strategies as the fund (the "Separate Accounts" and, collectively with the Similar
36
Funds, the "Similar Accounts").The Manager's representatives explained the nature of the Similar Accounts and the differences, from the Manager's perspective, in management of the Separate Accounts as compared to management of the fund.The Manager's representatives noted that one Similar Fund had the same management fee as the fund and three Similar Funds had a lower management fee than the fund. With respect to Separate Accounts, the Manager's representatives advised the Board that each account is managed by TBCAM and reflected a fee schedule tied to TBCAM's internal cost structure and fee arrangements with the relevant institutional clients.The Board analyzed differences in fees paid to the Manager and discussed the relationship of the advisory fees paid in light of the Manager's performance and the services provided. The Board members considered the relevance of the fee information provided for the Similar Accounts managed by the Manager to evaluate the appropriateness and reasonableness of the fund's management fee.The Manager's representatives noted that there were no similarly managed wrap fee accounts managed by the Manager or its affiliates with similar investment objectives, policies, and strategies as the fund.
Analysis of Profitability and Economies of Scale. The Manager's representatives reviewed the dollar amount of expenses allocated and profit received by the Manager and the method used to determine such expenses and profit. The Board received and considered information prepared by an independent consulting firm regarding the Manager's approach to allocating costs to, and determining the profitability of, individual funds and the entire Dreyfus fund complex.The Manager's representatives stated that the methodology had also been reviewed by an independent registered public accounting firm which, like the consultant, found the methodology to be reasonable.The consulting firm also analyzed where any economies of scale might emerge in connection with the management of the fund.The Board members evaluated the analysis in light of the relevant circumstances for the fund, including the decline in fund assets, and the extent to which economies of scale would be realized as the fund grows and whether fee levels reflect these economies of scale for the benefit of fund investors. The Board
The Fund 37
INFORMATION ABOUT THE REVIEW AND APPROVAL O F T H E
F U N D ' S M A N A G E M E N T A G R E E M E N T (Unaudited) (continued)
|
noted that it appeared that the benefits of any economies of scale also would be appropriately shared with shareholders through increased investment in fund management and administration resources. The Board members also considered potential benefits to the Manager from acting as investment adviser and noted that the soft dollar arrangements in effect with respect to trading the fund's portfolio and that the associated soft dollar credits were earned by TBCAM and not the Manager.
It was noted that the Board members should consider the Manager's profitability with respect to the fund as part of their evaluation of whether the fee under the Management Agreement bears a reasonable relationship to the mix of services provided by the Manager, including the nature, extent, and quality of such services and that a discussion of economies of scale is predicated on increasing assets and that, if a fund's assets had been decreasing, the possibility that the Manager may have realized any economies of scale would be less.The Board members also discussed the profitability percentage ranges determined by appropriate court cases to be reasonable given the services rendered to investment companies. It was noted that the profitability percentage for managing the fund was not unreasonable given the fund's overall performance and generally superior service levels provided. The Board also noted the Manager's absorption of certain expenses of the fund over the past year and its effect on the profitability of the Manager.
At the conclusion of these discussions, each Board member expressed the opinion that he or she had been furnished with sufficient information to make an informed business decision with respect to continuation of the fund's Management Agreement. Based on their discussions and considerations as described above, the Board members made the following conclusions and determinations.
- The Board concluded that the nature, extent, and quality of the ser- vices provided by the Manager are adequate and appropriate.
- The Board generally was satisfied with the fund's longer-term perfor- mance, noting in particular the long-term track record of the fund's portfolio managers.
38
- The Board expressly considered the portfolio manager's consistently strong long-term performance record as a significant factor in re- approving the fund's management agreement.
- The Board concluded that the fee paid to the Manager by the fund was reasonable in light of comparative performance and expense and advisory fee information, costs of the services provided, and profits to be realized and benefits derived or to be derived by the Manager from its relationship with the fund.
- The Board determined that the economies of scale which may accrue to the Manager and its affiliates in connection with the management of the fund had been adequately considered by the Manager in con- nection with the management fee rate charged to the fund, and that, to the extent in the future it were to be determined that material economies of scale had not been shared with the fund, the Board would seek to have those economies of scale shared with the fund.
The Board members considered these conclusions and determinations, along with the information received on a routine and regular basis throughout the year, and, without any one factor being dispositive, the Board determined that re-approval of the fund's Management Agreement was in the best interests of the fund and its shareholders.
The Fund 39
BOARD MEMBERS INFORMATION (Unaudited)
| Joseph S. DiMartino (62) |
| Chairman of the Board (1995) |
| Principal Occupation During Past 5 Years: |
| • Corporate Director and Trustee |
| Other Board Memberships and Affiliations: |
| • The Muscular Dystrophy Association, Director |
| • Levcor International, Inc., an apparel fabric processor, Director |
| • Century Business Services, Inc., a provider of outsourcing functions for small and medium size |
| companies, Director |
| • The Newark Group, a provider of a national market of paper recovery facilities, paperboard |
| mills and paperboard converting plants, Director |
| • Azimuth Trust, an institutional asset management firm, Member of Board of Managers and |
| Advisory Board |
| • Sunair Services Corporation, engages in the design, manufacture and sale of high frequency |
| systems for long-range voice and data communications, as well as providing certain outdoor- |
| related services to homes and businesses, Director |
| No. of Portfolios for which Board Member Serves: 193 |
| ——————— |
| David W. Burke (69) |
| Board Member (1994) |
| Principal Occupation During Past 5 Years: |
| • Corporate Director and Trustee |
| Other Board Memberships and Affiliations: |
| • John F. Kennedy Library Foundation, Director |
| • U.S.S. Constitution Museum, Director |
| No. of Portfolios for which Board Member Serves: 84 |
| ——————— |
| Diane Dunst (66) |
| Board Member (1990) |
| Principal Occupation During Past 5 Years: |
| • President, Huntting House Antiques |
| No. of Portfolios for which Board Member Serves: 11 |
| ——————— |
| Jay I. Meltzer (77) |
| Board Member (1991) |
| Principal Occupation During Past 5 Years: |
| • Physician, Internist and Specialist in Clinical Hypertension |
| • Clinical Professor of Medicine at Columbia University & College of Physicians and Surgeons |
| • Faculty Associate, Center for Bioethics, Columbia |
| No. of Portfolios for which Board Member Serves: 11 |
40
| Daniel Rose (76) |
| Board Member (1992) |
| Principal Occupation During Past 5 Years: |
| • Chairman and Chief Executive Officer of Rose Associates, Inc., a New York based real estate |
| development and management firm |
| Other Board Memberships and Affiliations: |
| • Baltic-American Enterprise Fund,Vice Chairman and Director |
| • Harlem Educational Activities Fund, Inc., Chairman |
| • Housing Committee of the Real Estate Board of New York, Inc., Director |
| No. of Portfolios for which Board Member Serves: 22 |
| ——————— |
| Warren B. Rudman (75) |
| Board Member (1993) |
| Principal Occupation During Past 5 Years: |
| • Of Counsel to (from January 1993 to December 31, 2003, Partner in) the law firm Paul, |
| Weiss, Rifkind,Wharton & Garrison LLP |
| Other Board Memberships and Affiliations: |
| • Collins & Aikman Corporation, Director |
| • Allied Waste Corporation, Director |
| • Raytheon Company, Director |
| • Boston Scientific, Director |
| No. of Portfolios for which Board Member Serves: 20 |
| ——————— |
| Sander Vanocur (77) |
| Board Member (1992) |
| Principal Occupation During Past 5 Years: |
| • President, Old Owl Communications |
| No. of Portfolios for which Board Member Serves: 22 |
| ——————— |
| Once elected all Board Members serve for an indefinite term.The address of the Board Members and Officers is in c/o |
| The Dreyfus Corporation, 200 Park Avenue, New York, New York 10166. Additional information about the Board |
| Members is available in the fund's Statement of Additional Information which can be obtained from Dreyfus free of |
| charge by calling this toll free number: 1-800-554-4611. |
| Rosalind Gersten Jacobs, Emeritus Board Member |
The Fund 41
OFFICERS OF THE FUND (Unaudited)
STEPHEN E. CANTER, President since March 2000.
Chairman of the Board, Chief Executive Officer and Chief Operating Officer of the Manager, and an officer of 90 investment companies (comprised of 184 portfolios) managed by the Manager. Mr. Canter also is a Board member and, where applicable, an Executive Committee Member of the other investment management subsidiaries of Mellon Financial Corporation, each of which is an affiliate of the Manager. He is 60 years old and has been an employee of the Manager since May 1995.
STEPHEN R. BYERS, Executive Vice President since November 2002.
Chief Investment Officer,Vice Chairman and a director of the Manager, and an officer of 90 investment companies (comprised of 184 portfolios) managed by the Manager. Mr. Byers also is an officer, director or an Executive Committee Member of certain other investment management subsidiaries of Mellon Financial Corporation, each of which is an affiliate of the Manager. He is 52 years old and has been an employee of the Manager since January 2000.
MARK N. JACOBS, Vice President since March 2000.
Executive Vice President, Secretary and General Counsel of the Manager, and an officer of 91 investment companies (comprised of 200 portfolios) managed by the Manager. He is 59 years old and has been an employee of the Manager since June 1977.
MICHAEL A. ROSENBERG, Vice President and Secretary since August 2005.
Associate General Counsel of the Manager, and an officer of 91 investment companies (comprised of 200 portfolios) managed by the Manager. He is 45 years old and has been an employee of the Manager since October 1991.
JAMES BITETTO, Vice President and Assistant Secretary since August 2005.
Assistant General Counsel and Assistant Secretary of the Manager, and an officer of 91 investment companies (comprised of 200 portfolios) managed by the Manager. He is 39 years old and has been an employee of the Manager since December 1996.
JONI LACKS CHARATAN, Vice President and Assistant Secretary since August 2005.
Associate General Counsel of the Manager, and an officer of 91 investment companies (comprised of 200 portfolios) managed by the Manager. She is 49 years old and has been an employee of the Manager since October 1988.
JOSEPH M. CHIOFFI, Vice President and Assistant Secretary since August 2005.
Assistant General Counsel of the Manager, and an officer of 91 investment companies (comprised of 200 portfolios) managed by the Manager. He is 43 years old and has been an employee of the Manager since June 2000.
JANETTE E. FARRAGHER, Vice President and Assistant Secretary since August 2005.
Associate General Counsel of the Manager, and an officer of 91 investment companies (comprised of 200 portfolios) managed by the Manager. She is 42 years old and has been an employee of the Manager since February 1984.
JOHN B. HAMMALIAN, Vice President and Assistant Secretary since August 2005.
Associate General Counsel of the Manager, and an officer of 91 investment companies (comprised of 200 portfolios) managed by the Manager. He is 42 years old and has been an employee of the Manager since February 1991.
42
ROBERT R. MULLERY, Vice President and Assistant Secretary since August 2005.
Associate General Counsel of the Manager, and an officer of 91 investment companies (comprised of 200 portfolios) managed by the Manager. He is 53 years old and has been an employee of the Manager since May 1986.
JEFF PRUSNOFSKY, Vice President and Assistant Secretary since August 2005.
Associate General Counsel of the Manager, and an officer of 91 investment companies (comprised of 200 portfolios) managed by the Manager. He is 40 years old and has been an employee of the Manager since October 1990.
JAMES WINDELS, Treasurer since November 2001.
Director – Mutual Fund Accounting of the Manager, and an officer of 91 investment companies (comprised of 200 portfolios) managed by the Manager. He is 47 years old and has been an employee of the Manager since April 1985.
ERIK D. NAVILOFF, Assistant Treasurer since August 2005.
Senior Accounting Manager – Taxable Fixed Income Funds of the Manager, and an officer of 91 investment companies (comprised of 200 portfolios) managed by the Manager. He is 37 years old and has been an employee of the Manager since November 1992.
ROBERT ROBOL, Assistant Treasurer since August 2005.
Senior Accounting Manager – Money Market Funds of the Manager, and an officer of 91 investment companies (comprised of 200 portfolios) managed by the Manager. He is 41 years old and has been an employee of the Manager since October 1988.
ROBERT SVAGNA, Assistant Treasurer since December 2002.
Senior Accounting Manager – Equity Funds of the Manager, and an officer of 91 investment companies (comprised of 200 portfolios) managed by the Manager. He is 38 years old and has been an employee of the Manager since November 1990.
GAVIN C. REILLY, Assistant Treasurer since December 2005.
Tax Manager of the Investment Accounting and Support Department of the Manager, and an officer of 91 investment companies (comprised of 200 portfolios) managed by the Manager. He is 37 years old and has been an employee of the Manager since April 1991.
JOSEPH W. CONNOLLY, Chief Compliance Officer since October 2004.
Chief Compliance Officer of the Manager and The Dreyfus Family of Funds (91 investment companies, comprised of 200 portfolios). From November 2001 through March 2004, Mr. Connolly was first Vice-President, Mutual Fund Servicing for Mellon Global Securities Services. In that capacity, Mr. Connolly was responsible for managing Mellon's Custody, Fund Accounting and Fund Administration services to third-party mutual fund clients. He is 48 years old and has served in various capacities with the Manager since 1980, including manager of the firm's Fund Accounting Department from 1997 through October 2001.
WILLIAM GERMENIS, Anti-Money Laundering Compliance Officer since August 2002.
Vice President and Anti-Money Laundering Compliance Officer of the Distributor, and the Anti-Money Laundering Compliance Officer of 87 investment companies (comprised of 196 portfolios) managed by the Manager. He is 35 years old and has been an employee of the Distributor since October 1998.
The Fund 43
NOTES
| For More | | Information |
| |
|
| |
| Dreyfus Premier | | Transfer Agent & |
| International | | | | Dividend Disbursing Agent |
| Opportunities Fund | | |
| | | | | Dreyfus Transfer, Inc. |
| 200 Park Avenue | | |
| | | | | 200 Park Avenue |
| New York, NY | | 10166 | | |
| | | | | New York, NY 10166 |
| |
| Manager | | | | Distributor |
| The Dreyfus Corporation | | |
| | | | | Dreyfus Service Corporation |
| 200 Park Avenue | | |
| | | | | 200 Park Avenue |
| New York, NY | | 10166 | | |
| | | | | New York, NY 10166 |
| Custodian | | | | |
| The Bank of New York | | |
| One Wall Street | | |
| New York, NY | | 10286 | | |
Telephone Call your financial representative or 1-800-554-4611
| Mail | | The Dreyfus Premier Family of Funds |
| | | 144 Glenn Curtiss Boulevard, Uniondale, NY 11556-0144 |
The fund files its complete schedule of portfolio holdings with the Securities and Exchange Commission ("SEC") for the first and third quarters of each fiscal year on Form N-Q. The fund's Forms N-Q are available on the SEC's website at http://www.sec.gov and may be reviewed and copied at the SEC's Public Reference Room in Washington, DC. Information on the operation of the Public Reference Room may be obtained by calling 1-800-SEC-0330.
A description of the policies and procedures that the fund uses to determine how to vote proxies relating to portfolio securities, and information regarding how the fund voted these proxies for the 12-month period ended June 30, 2005, is available at http://www.dreyfus.com and on the SEC's website at http://www.sec.gov. The description of the policies and procedures is also available without charge, upon request, by calling 1-800-645-6561.

© 2005 Dreyfus Service Corporation 0173AR1005
| Dreyfus Premier |
| Value Fund |
ANNUAL REPORT October 31, 2005

Save time. Save paper. View your next shareholder report online as soon as it's available. Log into www.dreyfus.com and sign up for Dreyfus eCommunications. It's simple and only takes a few minutes.
The views expressed in this report reflect those of the portfolio manager only through the end of the period covered and do not necessarily represent the views of Dreyfus or any other person in the Dreyfus organization. Any such views are subject to change at any time based upon market or other conditions and Dreyfus disclaims any responsibility to update such views.These views may not be relied on as investment advice and, because investment decisions for a Dreyfus fund are based on numerous factors, may not be relied on as an indication of trading intent on behalf of any Dreyfus fund.
Not FDIC-Insured • Not Bank-Guaranteed • May Lose Value
| | | Contents |
| |
| | | THE FUND |
| |
|
| 2 | | Letter from the Chairman |
| 3 | | Discussion of Fund Performance |
| 6 | | Fund Performance |
| 8 | | Understanding Your Fund's Expenses |
| 8 | | Comparing Your Fund's Expenses |
| | | With Those of Other Funds |
| 9 | | Statement of Investments |
| 13 | | Statement of Assets and Liabilities |
| 14 | | Statement of Operations |
| 15 | | Statement of Changes in Net Assets |
| 17 | | Financial Highlights |
| 22 | | Notes to Financial Statements |
| 29 | | Report of Independent Registered |
| | | Public Accounting Firm |
| 30 | | Important Tax Information |
| 31 | | Information About the Review and Approval |
| | | of the Fund's Management Agreement |
| 36 | | Board Members Information |
| 38 | | Officers of the Fund |
| | | FOR MORE INFORMATION |
| |
|
| | | Back Cover |
| Dreyfus Premier |
| Value Fund |
The Fund

LETTER FROM THE CHAIRMAN
Dear Shareholder:
We are pleased to present this annual report for Dreyfus Premier Value Fund, covering the 12-month period from November 1, 2004, through October 31, 2005. Inside, you'll find valuable information about how the fund was managed during the reporting period, including a discussion with Brian Ferguson, Chairman of The Boston Company Asset Management U.S. Large Cap Value Equity Team that manages the fund.
Over the past year, the U.S. economy once again demonstrated its fortitude, expanding at a steady pace despite the headwinds of soaring energy prices, higher short-term interest rates and the Gulf Coast hurricanes. However, after rallying in the final weeks of 2004, the U.S. stock market traded within a relatively narrow range for much of 2005, when investors responded cautiously to uncertainty regarding future business conditions.While small- and midcap stocks generally produced higher returns than large-cap equities for the reporting period, we recently have seen signs of renewed strength among larger companies compared to smaller ones, and higher-quality over lower-quality stocks.
As the end of 2005 approaches, some economists have suggested that the U.S. economy and financial markets may be reaching an inflection point. Investors' reactions to a change in leadership at the Federal Reserve Board, coupled with the potential effects of higher fuel prices on consumer spending, may set the tone for the financial markets in 2006. As always, we encourage you to talk to your financial advisor, who can discuss with you these issues and the potential benefits of a long-term investment perspective.
Thank you for your continued confidence and support.
Sincerely,

| | Stephen E. Canter
Chairman and Chief Executive Officer
The Dreyfus Corporation
November 15, 2005
|
2

DISCUSSION OF FUND PERFORMANCE
Brian Ferguson, Chairman, The Boston Company Asset Management U.S. Large Cap Value Equity Team
How did Dreyfus Premier Value Fund perform relative to its benchmark?
For the 12-month period ended October 31, 2005, the fund's Class A shares produced a total return of 12.40%, Class B shares produced a total return of 11.38%, Class C shares produced a total return of 11.35%, Class R shares produced a total return of 12.45% and Class T shares produced a total return of 11.72% .1This compares with the performance of the fund's benchmark, the Russell 1000 Value Index (the "Index"), which produced a total return of 11.86% for the same period.2
Despite headwinds from rising interest rates and energy prices, U.S. stocks advanced over the reporting period as corporate earnings improved in a growing economy.The fund's returns were in line with the Index, primarily due to our security selection strategy in the health care and materials sectors.
What is the fund's investment approach?
The fund seeks capital growth.To pursue this goal, the fund invests at least 80% of its assets in stocks. The fund's stock investments may include common stocks, preferred stocks and convertible securities of both U.S. and foreign issuers, including those purchased in initial public offerings. The fund expects to invest mainly in the stocks of U.S. issuers, but may invest up to 30% of its assets in foreign stocks.
In choosing stocks,the Large Cap Equity Value Team employs a "bottom-up" approach, primarily focusing on large companies with strong positions in their industries and a catalyst that can trigger a price increase (such as corporate restructuring or change in management). We use fundamental analysis to create a broadly diversified value portfolio, normally with a weighted average p/e ratio less than or equal to that of
The Fund 3
DISCUSSION OF FUND PERFORMANCE (continued)
the S&P 500 Index and a long-term projected earnings growth rate greater than or equal to that of the Standard & Poor's 500 Composite Stock Price (S&P 500) Index.We select stocks based on:
- value, or how a stock is priced relative to its perceived intrinsic worth;
- growth, in this case the sustainability or growth of earnings or cash flow; and
- financial profile, which measures the financial health of the company.
The fund typically sells a security when we believe that there has been a negative change in the fundamental factors surrounding the company, the company has been fully valued, the company has lost favor in the current market or economic environment, or a more attractive opportunity has been identified.
What other factors influenced the fund's performance?
A growing economy and better-than-expected earnings generally supported U.S. stock prices. However, a majority of the market's gains occurred during the final weeks of 2004. Stocks produced more modest gains over the first 10 months of 2005, as investors grew increasingly concerned about the possible impact of rising interest rates and high fuel prices on consumer and business spending. Large-cap, value-oriented stocks performed well, as investors turned to companies with track records of consistent earnings under a variety of economic conditions.
The fund's health care holdings ranked among the main contributors to the fund's strong relative performance.The fund benefited from its relatively light exposure to major pharmaceutical manufacturers that were pressured by product safety issues and competition from generic drugs. Instead, we focused on companies within the health care sector, such as generic drug maker IVAX and prescription drug benefits manager Medco Health Solutions. In July, IVAX was sold due to its acquisition by Teva Pharmaceutical.
The materials sector also buoyed the fund's relative performance. Martin Marietta Materials, a large producer of construction aggregates, enjoyed rising demand for its products, especially in the
4
aftermath of the Gulf Coast hurricanes. Coal companies, such as Arch Coal, performed well in a favorable pricing environment, as coal became an increasingly attractive alternative to natural gas.
Although most energy companies posted impressive gains when oil and gas prices surged higher, the fund's energy holdings did not keep pace with the benchmark's energy component. The fund's relatively light exposure to energy stocks prevented it from participating fully in their rallies, and we tended to focus on integrated oil companies rather than the oil and gas refiners that led the sector's advance.
What is the fund's current strategy?
We remain committed to our bottom-up stock selection strategy. As of the end of the reporting period, we have identified opportunities among financial stocks, such as property and casualty insurance firms, that are starting to realize pricing power after a worse than expected hurricane season. Also, a few mega-cap financial stocks, we believe, are showing improving momentum, with attractive valuations and high dividend yields. Finally, we have maintained the fund's emphasis on technology companies that have strong business prospects and are attractively valued.
November 15, 2005
| 1 | | Total return includes reinvestment of dividends and any capital gains paid and does not take into |
| | | consideration the maximum initial sales charges in the case of Class A and Class T shares or the |
| | | applicable contingent deferred sales charges imposed on redemptions in the case of Class B and |
| | | Class C shares. Had these charges been reflected, returns would have been lower. Past performance |
| | | is no guarantee of future results. Share price and investment return fluctuate such that upon |
| | | redemption, fund shares may be worth more or less than their original cost. |
| | | Part of the fund's recent performance is attributable to positive returns from its initial public |
| | | offering (IPO) investments.There can be no guarantee that IPOs will have or continue to |
| | | have a positive effect on the fund's performance. |
| 2 | | SOURCE: LIPPER INC. — Reflects the reinvestment of dividends and, where applicable, |
| | | capital gain distributions.The Russell 1000 Value Index is an unmanaged index which measures |
| | | the performance of those Russell 1000 companies with lower price-to-book ratios and lower |
| | | forecasted growth values. |
The Fund 5
FUND PERFORMANCE
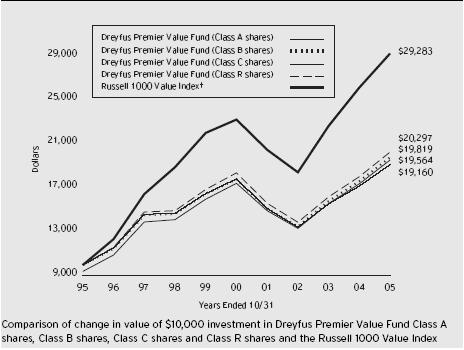
† Source: Lipper Inc.
Past performance is not predictive of future performance.
Part of the fund's recent performance is attributable to positive returns from its initial public offering (IPO) investments.There can be no guarantee that IPOs will have or continue to have a positive effect on the fund's performance.
The above graph compares a $10,000 investment made in each of the Class A, Class B, Class C and Class R shares of Dreyfus Premier Value Fund on 10/31/95 to a $10,000 investment made in the Russell 1000 Value Index (the "Index") on that date.All dividends and capital gain distributions are reinvested. Performance for Class T shares will vary from the performance of Class A, Class B, Class C and Class R shares shown above due to differences in charges and expenses. The fund's performance shown in the line graph takes into account the maximum initial sales charge on Class A shares and all other applicable fees and expenses.The Index is an unmanaged index which measures the performance of those Russell 1000 companies with lower price-to-book ratios and lower forecasted growth values.The Index does not take into account charges, fees and other expenses. Further information relating to fund performance, including expense reimbursements, if applicable, is contained in the Financial Highlights section of the prospectus and elsewhere in this report.
6
| Average Annual Total Returns as of 10/31/05 | | | | | | |
| |
| | | Inception | | | | | | | | From |
| | | Date | | 1 Year | | 5 Years | | 10 Years | | Inception |
| |
| |
| |
| |
| |
|
| Class A shares | | | | | | | | | | |
| with maximum sales charge (5.75%) | | 5.96% | | 1.11% | | 6.94% | | |
| without sales charge | | | | 12.40% | | 2.31% | | 7.58% | | |
| Class B shares | | | | | | | | | | |
| with applicable redemption charge † | | | | 7.38% | | 1.09% | | 7.08% | | |
| without redemption | | | | 11.38% | | 1.45% | | 7.08% | | |
| Class C shares | | | | | | | | | | |
| with applicable redemption charge †† | | 10.35% | | 1.43% | | 6.72% | | |
| without redemption | | | | 11.35% | | 1.43% | | 6.72% | | |
| Class R shares | | | | 12.45% | | 1.97% | | 7.34% | | |
| Class T shares | | | | | | | | | | |
| with applicable sales charge (4.5%) | | 3/1/00 | | 6.70% | | 0.44% | | — | | 2.69% |
| without sales charge | | 3/1/00 | | 11.72% | | 1.37% | | — | | 3.52% |
Past performance is not predictive of future performance.The fund's performance shown in the graph and table does not reflect the deduction of taxes that a shareholder would pay on fund distributions or the redemption of fund shares. Performance for Class B shares assumes the conversion of Class B shares to Class A shares at the end of the sixth year following the date of purchase.
| † | | The maximum contingent deferred sales charge for Class B shares is 4%. After six years Class B shares convert to |
| | | Class A shares. |
| †† | | The maximum contingent deferred sales charge for Class C shares is 1% for shares redeemed within one year of the |
| | | date of purchase. |
The Fund 7
UNDERSTANDING YOUR FUND'S EXPENSES (Unaudited)
As a mutual fund investor, you pay ongoing expenses, such as management fees and other expenses. Using the information below, you can estimate how these expenses affect your investment and compare them with the expenses of other funds.You also may pay one-time transaction expenses, including sales charges (loads) and redemption fees, which are not shown in this section and would have resulted in higher total expenses. For more information, see your fund's prospectus or talk to your financial adviser.
Review your fund's expenses
The table below shows the expenses you would have paid on a $1,000 investment in Dreyfus Premier Value Fund from May 1, 2005 to October 31, 2005. It also shows how much a $1,000 investment would be worth at the close of the period, assuming actual returns and expenses.
| Expenses and Value of a $1,000 Investment | | | | | | |
| assuming actual returns for the six months ended October 31, 2005 | | | | |
| | | Class A | | Class B | | Class C | | Class R | | Class T |
| |
| |
| |
| |
| |
|
| Expenses paid per $1,000 † | | $ 6.34 | | $ 10.92 | | $ 11.18 | | $ 6.39 | | $ 9.46 |
| Ending value (after expenses) | | $1,077.30 | | $1,072.10 | | $1,072.10 | | $1,077.10 | | $1,074.00 |
COMPARING YOUR FUND'S EXPENSES
WITH THOSE OF OTHER FUNDS (Unaudited)
|
Using the SEC's method to compare expenses
The Securities and Exchange Commission (SEC) has established guidelines to help investors assess fund expenses. Per these guidelines, the table below shows your fund's expenses based on a $1,000 investment, assuming a hypothetical 5% annualized return. You can use this information to compare the ongoing expenses (but not transaction expenses or total cost) of investing in the fund with those of other funds.All mutual fund shareholder reports will provide this information to help you make this comparison. Please note that you cannot use this information to estimate your actual ending account balance and expenses paid during the period.
| Expenses and Value of a $1,000 Investment | | | | | | |
| assuming a hypothetical 5% annualized return for the six months ended October 31, 2005 |
| | | Class A | | Class B | | Class C | | Class R | | Class T |
| |
| |
| |
| |
| |
|
| Expenses paid per $1,000 † | | $ 6.16 | | $ 10.61 | | $ 10.87 | | $ 6.21 | | $ 9.20 |
| Ending value (after expenses) | | $1,019.11 | | $1,014.67 | | $1,014.42 | | $1,019.06 | | $1,016.08 |
† Expenses are equal to the fund's annualized expense ratio of 1.21% for Class A, 2.09% for Class B, 2.14% for Class C, 1.22% for Class R and 1.81% for Class T; multiplied by the average account value over the period, multiplied by 184/365 (to reflect the one-half year period).
STATEMENT OF INVESTMENTS
October 31, 2005
|
| Common Stocks—99.3% | | Shares | | Value ($) |
| |
| |
|
| Aerospace & Defense—.5% | | | | |
| Empresa Brasileira de Aeronautica, ADR | | 15,900 | | 616,602 |
| Banking—10.6% | | | | |
| Bank of America | | 36,108 | | 1,579,363 |
| PHH | | 22,090 a | | 621,392 |
| JPMorgan Chase & Co. | | 107,272 | | 3,928,301 |
| SunTrust Banks | | 18,300 | | 1,326,384 |
| Wachovia | | 37,600 | | 1,899,552 |
| Washington Mutual | | 36,800 | | 1,457,280 |
| Wells Fargo & Co. | | 36,000 | | 2,167,200 |
| | | | | 12,979,472 |
| Basic Industries—3.9% | | | | |
| Air Products & Chemicals | | 8,400 | | 480,816 |
| Arch Coal | | 8,700 | | 670,509 |
| Bowater | | 15,200 | | 402,800 |
| Martin Marietta Materials | | 24,500 | | 1,933,295 |
| Mosaic | | 37,200 a | | 491,040 |
| 3M | | 11,200 | | 850,976 |
| | | | | 4,829,436 |
| Beverages & Tobacco—3.1% | | | | |
| Altria Group | | 50,000 | | 3,752,500 |
| Capital Goods—9.5% | | | | |
| Avery Dennison | | 11,600 | | 657,140 |
| Emerson Electric | | 24,800 | | 1,724,840 |
| Navistar International | | 44,700 a | | 1,230,144 |
| NCR | | 94,600 a | | 2,858,812 |
| Thermo Electron | | 35,800 a | | 1,080,802 |
| Tyco International | | 56,900 | | 1,501,591 |
| United Technologies | | 50,400 | | 2,584,512 |
| | | | | 11,637,841 |
| Consumer Durables—.9% | | | | |
| Johnson Controls | | 15,600 | | 1,061,580 |
| Consumer Non-Durables—4.1% | | | | |
| Campbell Soup | | 19,000 | | 552,900 |
| Colgate-Palmolive | | 46,100 | | 2,441,456 |
| Del Monte Foods | | 22,700 a | | 240,166 |
| General Mills | | 12,600 | | 608,076 |
The Fund 9
STATEMENT OF INVESTMENTS (continued)
| Common Stocks (continued) | | Shares | | | | Value ($) |
| |
| |
| |
|
| Consumer Non-Durables (continued) | | | | | | |
| Nike, Cl. B | | 7,300 | | | | 613,565 |
| Polo Ralph Lauren | | 11,700 | | | | 575,640 |
| | | | | | | 5,031,803 |
| Consumer Services—7.3% | | | | | | |
| Aramark, Cl. B | | 43,100 | | | | 1,095,602 |
| Brinker International | | 26,100 | | | | 994,932 |
| Cendant | | 26,700 | | | | 465,114 |
| Clear Channel Communications | | 71,000 | | | | 2,159,820 |
| CSK Auto | | 17,000 | | a | | 257,210 |
| Entercom Communications | | 15,400 | | a | | 444,598 |
| Liberty Global, Ser. C | | 15,500 | | a | | 367,660 |
| McDonald's | | 37,100 | | | | 1,172,360 |
| Omnicom Group | | 17,000 | | | | 1,410,320 |
| Viacom, Cl. B | | 18,400 | | | | 569,848 |
| | | | | | | 8,937,464 |
| Electronics-Semiconductors/Components—.1% | | | | |
| Freescale Semiconductor, Cl. A | | 7,300 | | a | | 172,937 |
| Energy—11.2% | | | | | | |
| Burlington Resources | | 10,300 | | | | 743,866 |
| Chevron | | 34,000 | | | | 1,940,380 |
| ConocoPhillips | | 40,300 | | | | 2,634,814 |
| Cooper Cameron | | 8,100 | | a | | 597,213 |
| Diamond Offshore Drilling | | 12,400 | | | | 700,104 |
| ENSCO International | | 14,400 | | | | 656,496 |
| Exxon Mobil | | 45,760 | | | | 2,568,966 |
| Grant Prideco | | 17,100 | | a | | 665,019 |
| Halliburton | | 11,000 | | | | 650,100 |
| Marathon Oil | | 25,800 | | | | 1,552,128 |
| Valero Energy | | 8,900 | | | | 936,636 |
| | | | | | | 13,645,722 |
| Financial—23.3% | | | | | | |
| American International Group | | 36,427 | | | | 2,360,470 |
| AON | | 17,900 | | | | 605,915 |
| Capital One Financial | | 10,900 | | | | 832,215 |
| Chubb | | 31,300 | | | | 2,909,961 |
| Citigroup | | 106,801 | | | | 4,889,350 |
10
| Common Stocks (continued) | | Shares | | Value ($) |
| |
| |
|
| Financial (continued) | | | | |
| E*Trade Financial | | 50,800 a | | 942,340 |
| Freddie Mac | | 25,300 | | 1,552,155 |
| Genworth Financial, Cl. A | | 78,670 | | 2,493,052 |
| Goldman Sachs Group | | 15,400 | | 1,946,098 |
| Janus Capital Group | | 28,500 | | 500,175 |
| Merrill Lynch & Co. | | 44,100 | | 2,855,034 |
| Morgan Stanley | | 16,100 | | 876,001 |
| PMI Group | | 51,100 | | 2,037,868 |
| PNC Financial Services Group | | 22,100 | | 1,341,691 |
| Radian Group | | 16,500 | | 859,650 |
| St. Paul Travelers Cos. | | 34,100 | | 1,535,523 |
| | | | | 28,537,498 |
| Health Care—3.2% | | | | |
| HCA | | 12,400 | | 597,556 |
| Medco Health Solutions | | 11,100 a | | 627,150 |
| Pfizer | | 36,500 | | 793,510 |
| WellPoint | | 11,100 a | | 828,948 |
| Wyeth | | 23,200 | | 1,033,792 |
| | | | | 3,880,956 |
| Insurance—1.4% | | | | |
| Endurance Specialty Holdings | | 25,800 | | 855,528 |
| Reinsurance Group of America | | 19,700 | | 901,275 |
| | | | | 1,756,803 |
| Merchandising—.5% | | | | |
| Estee Lauder Cos., Cl. A | | 19,300 | | 640,181 |
| Technology—9.8% | | | | |
| Advanced Micro Devices | | 40,200 a | | 933,444 |
| Automatic Data Processing | | 33,100 | | 1,544,446 |
| Ceridian | | 21,600 a | | 473,256 |
| EMC/Massachusetts | | 65,000 a | | 907,400 |
| Fairchild Semiconductor International | | 81,300 a | | 1,252,020 |
| Hewlett-Packard | | 55,700 | | 1,561,828 |
| International Business Machines | | 15,700 | | 1,285,516 |
| Lucent Technologies | | 169,800 a | | 483,930 |
| Microsoft | | 65,300 | | 1,678,210 |
| Motorola | | 24,400 | | 540,704 |
The Fund 11
STATEMENT OF INVESTMENTS (continued)
| Common Stocks (continued) | | Shares | | Value ($) |
| |
| |
|
| Technology (continued) | | | | |
| Solectron | | 165,600 a | | 584,568 |
| Tellabs | | 74,400 a | | 711,264 |
| | | | | 11,956,586 |
| Transportation—1.7% | | | | |
| Airtran Holdings | | 28,100 a | | 420,376 |
| Union Pacific | | 23,500 | | 1,625,730 |
| | | | | 2,046,106 |
| Utilities—8.2% | | | | |
| Alltel | | 17,700 | | 1,094,922 |
| Constellation Energy Group | | 11,200 | | 613,760 |
| Entergy | | 7,400 | | 523,328 |
| Exelon | | 16,900 | | 879,307 |
| Leap Wireless International | | 19,500 a | | 643,695 |
| NRG Energy | | 52,100 a | | 2,240,821 |
| PG & E | | 31,000 | | 1,127,780 |
| Reliant Resources | | 48,600 a | | 617,220 |
| SBC Communications | | 95,900 | | 2,287,215 |
| | | | | 10,028,048 |
| |
| |
|
| |
| Total Investments (cost $106,824,383) | | 99.3% | | 121,511,535 |
| Cash and Receivables (Net) | | .7% | | 824,343 |
| Net Assets | | 100.0% | | 122,335,878 |
ADR—American Depository Receipts.
a Non-income producing.
|
| Portfolio Summary † | | | | |
| |
| | | Value (%) | | | | Value (%) |
| |
| |
| |
|
| Financial | | 23.3 | | Utilities | | 8.2 |
| Energy | | 11.2 | | Consumer Services | | 7.3 |
| Banking | | 10.6 | | Consumer Non-Durables | | 4.1 |
| Technology | | 9.8 | | Other | | 15.3 |
| Capital Goods | | 9.5 | | | | 99.3 |
† Based on net assets.
See notes to financial statements.
|
12
| | STATEMENT OF ASSETS AND LIABILITIES
October 31, 2005
|
| | | Cost | | Value |
| |
| |
|
| Assets ($): | | | | |
| Investments in securities—See Statement of Investments | | 106,824,383 | | 121,511,535 |
| Receivable for investment securities sold | | | | 1,961,741 |
| Dividends receivable | | | | 102,144 |
| Receivable for shares of Beneficial Interest subscribed | | | | 94 |
| Prepaid expenses | | | | 34,254 |
| | | | | 123,609,768 |
| |
| |
|
| Liabilities ($): | | | | |
| Due to The Dreyfus Corporation and affiliates—Note 3(c) | | | | 123,633 |
| Cash overdraft due to Custodian | | | | 1,801 |
| Payable for investment securities purchased | | | | 952,763 |
| Payable for shares of Beneficial Interest redeemed | | | | 140,019 |
| Accrued expenses | | | | 55,674 |
| | | | | 1,273,890 |
| |
| |
|
| Net Assets ($) | | | | 122,335,878 |
| |
| |
|
| Composition of Net Assets ($): | | | | |
| Paid-in capital | | | | 86,181,279 |
| Accumulated undistributed investment income—net | | | | 819,056 |
| Accumulated net realized gain (loss) on investments | | | | 20,648,391 |
| Accumulated net unrealized appreciation | | | | |
| (depreciation) on investments | | | | 14,687,152 |
| |
| |
|
| Net Assets ($) | | | | 122,335,878 |
| Net Asset Value Per Share | | | | | | | | |
| | | Class A | | Class B | | Class C | | Class R | | Class T |
| |
| |
| |
| |
| |
|
| Net Assets ($) | | 115,459,416 | | 5,650,896 | | 1,049,194 | | 36,806 | | 139,566 |
| Shares Outstanding | | 5,524,937 | | 285,785 | | 53,824 | | 1,805 | | 6,868 |
| |
| |
| |
| |
| |
|
| Net Asset Value | | | | | | | | | | |
| Per Share ($) | | 20.90 | | 19.77 | | 19.49 | | 20.39 | | 20.32 |
See notes to financial statements.
The Fund 13
STATEMENT OF OPERATIONS
Year Ended October 31, 2005
|
| Investment Income ($): | | |
| Income: | | |
| Cash dividends | | 2,425,107 |
| Interest | | 8,422 |
| Income on securities lending | | 5,345 |
| Total Income | | 2,438,874 |
| Expenses: | | |
| Management fee—Note 3(a) | | 942,449 |
| Shareholder servicing costs—Note 3(c) | | 447,466 |
| Distribution fees—Note 3(b) | | 57,810 |
| Professional fees | | 46,701 |
| Registration fees | | 43,811 |
| Custodian fees—Note 3(c) | | 23,136 |
| Prospectus and shareholders' reports | | 21,321 |
| Trustees' fees and expenses—Note 3(d) | | 15,004 |
| Interest expense—Note 2 | | 1,116 |
| Loan commitment fees—Note 2 | | 1,015 |
| Miscellaneous | | 10,889 |
| Total Expenses | | 1,610,718 |
| Investment Income—Net | | 828,156 |
| |
|
| Realized and Unrealized Gain (Loss) on Investments—Note 4 ($): |
| Net realized gain (loss) on investments | | 23,654,166 |
| Net realized gain (loss) on financial futures | | 14,366 |
| Net Realized Gain (Loss) | | 23,668,532 |
| Net unrealized appreciation (depreciation) on investments | | |
| [including ($10,313) net unrealized (depreciation) on financial futures] | | (9,560,305) |
| Net Realized and Unrealized Gain (Loss) on Investments | | 14,108,227 |
| Net Increase in Net Assets Resulting from Operations | | 14,936,383 |
See notes to financial statements.
STATEMENT OF CHANGES IN NET ASSETS
| | | Year Ended October 31, |
| |
|
| | | 2005 | | 2004 |
| |
| |
|
| Operations ($): | | | | |
| Investment income—net | | 828,156 | | 1,040,893 |
| Net realized gain (loss) on investments | | 23,668,532 | | 7,436,787 |
| Net unrealized appreciation | | | | |
| (depreciation) on investments | | (9,560,305) | | 5,432,068 |
| Net Increase (Decrease) in Net Assets | | | | |
| Resulting from Operations | | 14,936,383 | | 13,909,748 |
| |
| |
|
| Dividends to Shareholders from ($): | | | | |
| Investment income—net: | | | | |
| Class A shares | | (1,034,886) | | (810,983) |
| Class C shares | | (483) | | — |
| Class R shares | | (234) | | (95) |
| Class T shares | | (603) | | — |
| Total Dividends | | (1,036,206) | | (811,078) |
| |
| |
|
| Beneficial Interest Transactions ($): | | | | |
| Net proceeds from shares sold: | | | | |
| Class A shares | | 4,032,093 | | 6,040,481 |
| Class B shares | | 666,685 | | 1,174,281 |
| Class C shares | | 201,732 | | 245,911 |
| Class R shares | | 8,777 | | 7,334 |
| Class T shares | | 51,219 | | 72,875 |
| Dividends reinvested: | | | | |
| Class A shares | | 938,531 | | 748,775 |
| Class C shares | | 242 | | — |
| Class R shares | | 227 | | 91 |
| Class T shares | | 592 | | — |
| Cost of shares redeemed: | | | | |
| Class A shares | | (20,822,423) | | (16,486,755) |
| Class B shares | | (3,116,097) | | (3,256,142) |
| Class C shares | | (516,078) | | (219,183) |
| Class R shares | | (10) | | (25) |
| Class T shares | | (89,171) | | (6,147) |
| Increase (Decrease) in Net Assets | | | | |
| from Beneficial Interest Transactions | | (18,643,681) | | (11,678,504) |
| Total Increase (Decrease) in Net Assets | | (4,743,504) | | 1,420,166 |
| |
| |
|
| Net Assets ($): | | | | |
| Beginning of Period | | 127,079,382 | | 125,659,216 |
| End of Period | | 122,335,878 | | 127,079,382 |
| Undistributed investment income—net | | 819,056 | | 1,025,440 |
The Fund 15
STATEMENT OF CHANGES IN NET ASSETS (continued)
| | | Year Ended October 31, |
| |
|
| | | 2005 | | 2004 |
| |
| |
|
| Capital Share Transactions: | | | | |
| Class A a | | | | |
| Shares sold | | 199,476 | | 331,665 |
| Shares issued for dividends reinvested | | 47,281 | | 42,137 |
| Shares redeemed | | (1,030,891) | | (904,803) |
| Net Increase (Decrease) in Shares Outstanding | | (784,134) | | (531,001) |
| |
| |
|
| Class B a | | | | |
| Shares sold | | 34,756 | | 68,340 |
| Shares redeemed | | (163,404) | | (188,678) |
| Net Increase (Decrease) in Shares Outstanding | | (128,648) | | (120,338) |
| |
| |
|
| Class C | | �� | | |
| Shares sold | | 10,634 | | 14,388 |
| Shares issued for dividends reinvested | | 13 | | — |
| Shares redeemed | | (27,491) | | (12,846) |
| Net Increase (Decrease) in Shares Outstanding | | (16,844) | | 1,542 |
| |
| |
|
| Class R | | | | |
| Shares sold | | 447 | | 412 |
| Shares issued for dividends reinvested | | 12 | | 5 |
| Shares redeemed | | (1) | | (1) |
| Net Increase (Decrease) in Shares Outstanding | | 458 | | 416 |
| |
| |
|
| Class T | | | | |
| Shares sold | | 2,645 | | 4,016 |
| Shares issued for dividends reinvested | | 30 | | — |
| Shares redeemed | | (4,631) | | (348) |
| Net Increase (Decrease) in Shares Outstanding | | (1,956) | | 3,668 |
a During the period ended October 31, 2005, 54,938 Class B shares representing $1,048,452 were automatically
converted to 52,190 Class A shares and during the period ended October 31, 2004, 65,053 Class B shares
representing $1,120,787 were automatically converted to 61,832 Class A shares.
See notes to financial statements.
|
FINANCIAL HIGHLIGHTS
The following tables describe the performance for each share class for the fiscal periods indicated.All information (except portfolio turnover rate) reflects financial results for a single fund share.Total return shows how much your investment in the fund would have increased (or decreased) during each period, assuming you had reinvested all dividends and distributions.These figures have been derived from the fund's financial statements.
| | | | | Year Ended October 31, | | |
| |
| |
| |
|
| Class A Shares | | 2005 | | 2004 | | 2003 | | 2002 | | 2001 |
| |
| |
| |
| |
| |
|
| Per Share Data ($): | | | | | | | | | | |
| Net asset value, beginning of period | | 18.75 | | 16.94 | | 14.59 | | 17.22 | | 21.85 |
| Investment Operations: | | | | | | | | | | |
| Investment income—net a | | .14 | | .16 | | .12 | | .12 | | .13 |
| Net realized and unrealized | | | | | | | | | | |
| gain (loss) on investments | | 2.18 | | 1.77 | | 2.35 | | (1.83) | | (3.08) |
| Total from Investment Operations | | 2.32 | | 1.93 | | 2.47 | | (1.71) | | (2.95) |
| Distributions: | | | | | | | | | | |
| Dividends from investment income—net | | (.17) | | (.12) | | (.12) | | (.13) | | (.11) |
| Dividends from net realized | | | | | | | | | | |
| gain on investments | | — | | — | | — | | (.79) | | (1.57) |
| Total Distributions | | (.17) | | (.12) | | (.12) | | (.92) | | (1.68) |
| Net asset value, end of period | | 20.90 | | 18.75 | | 16.94 | | 14.59 | | 17.22 |
| |
| |
| |
| |
| |
|
| Total Return (%) b | | 12.40 | | 11.43 | | 17.04 | | (10.74) | | (14.32) |
| |
| |
| |
| |
| |
|
| Ratios/Supplemental Data (%): | | | | | | | | | | |
| Ratio of total expenses | | | | | | | | | | |
| to average net assets | | 1.23 | | 1.26 | | 1.26 | | 1.28 | | 1.20 |
| Ratio of net investment income | | | | | | | | | | |
| to average net assets | | .71 | | .87 | | .76 | | .69 | | .66 |
| Portfolio Turnover Rate | | 154.96 | | 51.24 | | 59.66 | | 57.49 | | 91.91 |
| |
| |
| |
| |
| |
|
| Net Assets, end of period ($ x 1,000) | | 115,459 | | 118,301 | | 115,872 | | 107,217 | | 132,810 |
| a | | Based on average shares outstanding at each month end. |
| b | | Exclusive of sales charge. |
| See notes to financial statements. |
The Fund 17
FINANCIAL HIGHLIGHTS (continued)
| | | | | Year Ended October 31, | | |
| |
| |
| |
|
| Class B Shares | | 2005 | | 2004 | | 2003 | | 2002 | | 2001 |
| |
| |
| |
| |
| |
|
| Per Share Data ($): | | | | | | | | | | |
| Net asset value, beginning of period | | 17.75 | | 16.06 | | 13.84 | | 16.40 | | 20.93 |
| Investment Operations: | | | | | | | | | | |
| Investment income (loss)—net a | | (.03) | | .00b | | (.01) | | (.02) | | (.03) |
| Net realized and unrealized | | | | | | | | | | |
| gain (loss) on investments | | 2.05 | | 1.69 | | 2.23 | | (1.75) | | (2.93) |
| Total from Investment Operations | | 2.02 | | 1.69 | | 2.22 | | (1.77) | | (2.96) |
| Distributions: | | | | | | | | | | |
| Dividends from investment income—net | | — | | — | | — | | (.00)b | | — |
| Dividends from net realized | | | | | | | | | | |
| gain on investments | | — | | — | | — | | (.79) | | (1.57) |
| Total Distributions | | — | | — | | — | | (.79) | | (1.57) |
| Net asset value, end of period | | 19.77 | | 17.75 | | 16.06 | | 13.84 | | 16.40 |
| |
| |
| |
| |
| |
|
| Total Return (%) c | | 11.38 | | 10.52 | | 16.04 | | (11.48) | | (15.02) |
| |
| |
| |
| |
| |
|
| Ratios/Supplemental Data (%): | | | | | | | | | | |
| Ratio of total expenses | | | | | | | | | | |
| to average net assets | | 2.10 | | 2.12 | | 2.12 | | 2.10 | | 2.02 |
| Ratio of net investment income | | | | | | | | | | |
| (loss) to average net assets | | (.14) | | .01 | | (.10) | | (.13) | | (.16) |
| Portfolio Turnover Rate | | 154.96 | | 51.24 | | 59.66 | | 57.49 | | 91.91 |
| |
| |
| |
| |
| |
|
| Net Assets, end of period ($ x 1,000) | | 5,651 | | 7,355 | | 8,591 | | 8,801 | | 10,575 |
| a | | Based on average shares outstanding at each month end. |
| b | | Amount represents less than $.01 per share. |
| c | | Exclusive of sales charge. |
| See notes to financial statements. |
18
| | | | | Year Ended October 31, | | |
| |
| |
| |
|
| Class C Shares | | 2005 | | 2004 | | 2003 | | 2002 | | 2001 |
| |
| |
| |
| |
| |
|
| Per Share Data ($): | | | | | | | | | | |
| Net asset value, beginning of period | | 17.51 | | 15.85 | | 13.68 | | 16.22 | | 20.75 |
| Investment Operations: | | | | | | | | | | |
| Investment (loss)—net a | | (.03) | | (.00)b | | (.02) | | (.02) | | (.04) |
| Net realized and unrealized | | | | | | | | | | |
| gain (loss) on investments | | 2.02 | | 1.66 | | 2.20 | | (1.72) | | (2.89) |
| Total from Investment Operations | | 1.99 | | 1.66 | | 2.18 | | (1.74) | | (2.93) |
| Distributions: | | | | | | | | | | |
| Dividends from investment income—net | | (.01) | | — | | (.01) | | (.01) | | (.03) |
| Dividends from net realized | | | | | | | | | | |
| gain on investments | | — | | — | | — | | (.79) | | (1.57) |
| Total Distributions | | (.01) | | — | | (.01) | | (.80) | | (1.60) |
| Net asset value, end of period | | 19.49 | | 17.51 | | 15.85 | | 13.68 | | 16.22 |
| |
| |
| |
| |
| |
|
| Total Return (%) c | | 11.35 | | 10.47 | | 15.95 | | (11.48) | | (14.99) |
| |
| |
| |
| |
| |
|
| Ratios/Supplemental Data (%): | | | | | | | | | | |
| Ratio of total expenses | | | | | | | | | | |
| to average net assets | | 2.13 | | 2.13 | | 2.16 | | 2.11 | | 2.04 |
| Ratio of net investment (loss) | | | | | | | | | | |
| to average net assets | | (.17) | | (.00)d | | (.13) | | (.15) | | (.20) |
| Portfolio Turnover Rate | | 154.96 | | 51.24 | | 59.66 | | 57.49 | | 91.91 |
| |
| |
| |
| |
| |
|
| Net Assets, end of period ($ x 1,000) | | 1,049 | | 1,237 | | 1,096 | | 1,185 | | 1,243 |
| a | | Based on average shares outstanding at each month end. |
| b | | Amount represents less than $.01 per share. |
| c | | Exclusive of sales charge. |
| d | | Amount represents less than .01%. |
| See notes to financial statements. |
The Fund 19
FINANCIAL HIGHLIGHTS (continued)
| | | | | Year Ended October 31, | | |
| |
| |
| |
|
| Class R Shares | | 2005 | | 2004 | | 2003 | | 2002 | | 2001 |
| |
| |
| |
| |
| |
|
| Per Share Data ($): | | | | | | | | | | |
| Net asset value, beginning of period | | 18.29 | | 16.53 | | 14.26 | | 16.78 | | 21.55 |
| Investment Operations: | | | | | | | | | | |
| Investment income (loss)—net a | | .14 | | .13 | | .06 | | .07 | | (.05) |
| Net realized and unrealized | | | | | | | | | | |
| gain (loss) on investments | | 2.13 | | 1.73 | | 2.30 | | (1.80) | | (3.01) |
| Total from Investment Operations | | 2.27 | | 1.86 | | 2.36 | | (1.73) | | (3.06) |
| Distributions: | | | | | | | | | | |
| Dividends from investment income—net | | (.17) | | (.10) | | (.09) | | — | | (.14) |
| Dividends from net realized | | | | | | | | | | |
| gain on investments | | — | | — | | — | | (.79) | | (1.57) |
| Total Distributions | | (.17) | | (.10) | | (.09) | | (.79) | | (1.71) |
| Net asset value, end of period | | 20.39 | | 18.29 | | 16.53 | | 14.26 | | 16.78 |
| |
| |
| |
| |
| |
|
| Total Return (%) | | 12.45 | | 11.26 | | 16.64 | | (10.97) | | (15.15) |
| |
| |
| |
| |
| |
|
| Ratios/Supplemental Data (%): | | | | | | | | | | |
| Ratio of total expenses | | | | | | | | | | |
| to average net assets | | 1.17 | | 1.40 | | 1.59 | | 1.56 | | 2.13 |
| Ratio of net investment income | | | | | | | | | | |
| (loss) to average net assets | | .73 | | .74 | | .42 | | .41 | | (.27) |
| Portfolio Turnover Rate | | 154.96 | | 51.24 | | 59.66 | | 57.49 | | 91.91 |
| |
| |
| |
| |
| |
|
| Net Assets, end of period ($ x 1,000) | | 37 | | 25 | | 15 | | 7 | | 7 |
a Based on average shares outstanding at each month end.
See notes to financial statements.
|
20
| | | | | Year Ended October 31, | | |
| |
| |
| |
|
| Class T Shares | | 2005 | | 2004 | | 2003 | | 2002 | | 2001 |
| |
| |
| |
| |
| |
|
| Per Share Data ($): | | | | | | | | | | |
| Net asset value, beginning of period | | 18.27 | | 16.51 | | 14.32 | | 17.05 | | 21.77 |
| Investment Operations: | | | | | | | | | | |
| Investment income (loss)—net a | | .03 | | .03 | | (.07) | | (.07) | | (.02) |
| Net realized and unrealized | | | | | | | | | | |
| gain (loss) on investments | | 2.11 | | 1.73 | | 2.28 | | (1.79) | | (3.08) |
| Total from Investment Operations | | 2.14 | | 1.76 | | 2.21 | | (1.86) | | (3.10) |
| Distributions: | | | | | | | | | | |
| Dividends from investment income—net | | (.09) | | — | | (.02) | | (.08) | | (.05) |
| Dividends from net realized | | | | | | | | | | |
| gain on investments | | — | | — | | — | | (.79) | | (1.57) |
| Total Distributions | | (.09) | | — | | (.02) | | (.87) | | (1.62) |
| Net asset value, end of period | | 20.32 | | 18.27 | | 16.51 | | 14.32 | | 17.05 |
| |
| |
| |
| |
| |
|
| Total Return (%) b | | 11.72 | | 10.66 | | 15.45 | | (11.69) | | (15.08) |
| |
| |
| |
| |
| |
|
| Ratios/Supplemental Data (%): | | | | | | | | | | |
| Ratio of total expenses | | | | | | | | | | |
| to average net assets | | 1.83 | | 1.95 | | 2.48 | | 2.38 | | 1.92 |
| Ratio of net investment income | | | | | | | | | | |
| (loss) to average net assets | | .16 | | .19 | | (.48) | | (.41) | | (.11) |
| Portfolio Turnover Rate | | 154.96 | | 51.24 | | 59.66 | | 57.49 | | 91.91 |
| |
| |
| |
| |
| |
|
| Net Assets, end of period ($ x 1,000) | | 140 | | 161 | | 85 | | 44 | | 21 |
| a | | Based on average shares outstanding at each month end. |
| b | | Exclusive of sales charge. |
| See notes to financial statements. |
The Fund 21
NOTES TO FINANCIAL STATEMENTS
NOTE 1—Significant Accounting Policies:
Dreyfus Premier Value Fund (the "fund") is a separate non-diversified series of Dreyfus Premier Value Equity Funds (the "Company"), which is registered under the Investment Company Act of 1940, as amended (the "Act"), as an open-end management investment company and operates as a series company, currently offering two series including the fund. The fund's investment objective is capital growth. The Dreyfus Corporation (the "Manager") serves as the fund's investment adviser. The Manager is a wholly-owned subsidiary of Mellon Financial Corporation ("Mellon Financial").
Dreyfus Service Corporation (the "Distributor"), a wholly-owned subsidiary of the Manager, is the distributor of the fund's shares.The fund is authorized to issue an unlimited number of $.001 par value shares of Beneficial Interest in the following classes of shares: Class A, Class B, Class C, Class R and Class T. Class A and Class T shares are subject to a sales charge imposed at the time of purchase. Class B shares are subject to a contingent deferred sales charge ("CDSC") imposed on Class B share redemptions made within six years of purchase and automatically convert to Class A shares after six years. Class C shares are subject to a CDSC imposed on Class C shares redeemed within one year of purchase and Class R shares are sold at net asset value per share only to institutional investors. Other differences between the classes include the services offered to and the expenses borne by each class and certain voting rights. Income, expenses (other expenses attributable to a specific class), and realized and unrealized gains or losses on investments are allocated to each class of shares based on its relative net assets.
The Company accounts separately for the assets, liabilities and operations of each series. Expenses directly attributable to each series are charged to that series' operations; expenses which are applicable to all series are allocated among them on a pro rata basis.
The fund's financial statements are prepared in accordance with U.S. generally accepted accounting principles, which may require the use of management estimates and assumptions. Actual results could differ from those estimates.
22
The fund enters into contracts that contain a variety of indemnifications. The fund's maximum exposure under these arrangements is unknown.The fund does not anticipate recognizing any loss related to these arrangements.
(a) Portfolio valuation: Investments in securities are valued at the last sales price on the securities exchange or national securities market on which such securities are primarily traded. Securities listed on the National Market System for which market quotations are available are valued at the official closing price or, if there is no official closing price that day, at the last sales price. Securities not listed on an exchange or the national securities market, or securities for which there were no transactions, are valued at the average of the most recent bid and asked prices, except for open short positions, where the asked price is used for valuation purposes. Bid price is used when no asked price is available. Investment in registered investment companies are valued at their net asset value. When market quotations or official closing prices are not readily available, or are determined not to reflect accurately fair value, such as when the value of a security has been significantly affected by events after the close of the exchange or market on which the security is principally traded (for example, a foreign exchange or market), but before the fund calculates its net asset value, the fund may value these investments at fair value as determined in accordance with the procedures approved by the Board of Trustees. Fair valuing of securities may be determined with the assistance of a pricing service using calculations based on indices of domestic securities and other appropriate indicators, such as prices of relevant ADR's and futures contracts. For other securities that are fair valued by the Board of Trustees, certain factors may be considered such as: fundamental analytical data, the nature and duration of restrictions on disposition, an evaluation of the forces that influence the market in which the securities are purchased and sold, and public trading in similar securities of the issuer or comparable issuers. Financial futures are valued at the last sales price. Investments denominated in foreign currencies are translated to U.S. dollars at the prevailing rates of exchange. Forward currency exchange contracts are valued at the forward rate.
The Fund 23
NOTES TO FINANCIAL STATEMENTS (continued)
(b) Foreign currency transactions: The fund does not isolate that portion of the results of operations resulting from changes in foreign exchange rates on investments from the fluctuations arising from changes in market prices of securities held. Such fluctuations are included with the net realized and unrealized gain or loss on investments.
Net realized foreign exchange gains or losses arise from sales and maturities of short-term securities, sales of foreign currencies, currency gains or losses realized on securities transactions and the difference between the amounts of dividends, interest and foreign withholding taxes recorded on the fund's books and the U.S. dollar equivalent of the amounts actually received or paid. Net unrealized foreign exchange gains and losses arise from changes in the value of assets and liabilities other than investments in securities, resulting from changes in exchange rates. Such gains and losses are included with net realized and unrealized gain or loss on investments.
(c) Securities transactions and investment income: Securities transactions are recorded on a trade date basis. Realized gain and loss from securities transactions are recorded on the identified cost basis. Dividend income is recognized on the ex-dividend date and interest income, including, where applicable, accretion of discount and amortization of premium on investments, is recognized on the accrual basis.
The fund has an arrangement with the custodian bank whereby the fund receives earnings credits from the custodian when positive cash balances are maintained, which are used to offset custody fees. For financial reporting purposes, the fund includes net earnings credits, if any, as an expense offset in the Statement of Operations.
Pursuant to a securities lending agreement with Mellon Bank, N.A., an affiliate of the Manager, the fund may lend securities to qualified institutions.At origination, all loans are secured by collateral of at least 102% of the value of U.S. securities loaned and 105% of the value of foreign securities loaned. Collateral equivalent to at least 100% of the market value of securities on loan will be maintained at all times. Cash
24
collateral is invested in certain money market mutual funds managed by the Manager. The fund will be entitled to receive all income on securities loaned, in addition to income earned as a result of the leading transaction. Although each security loaned is fully collateralized, the fund would bear the risk of delay in recovery of, or loss of rights in, the securities loaned should a borrower fail to return the securities in a timely manner.
(d) Affiliated issuers: Investments in other investment companies advised by the Manager are defined as "affiliated " in the Act.
(e) Dividends to shareholders: Dividends are recorded on the ex-dividend date. Dividends from investment income-net and dividends from net realized capital gain, if any, are normally declared and paid annually, but the fund may make distributions on a more frequent basis to comply with the distribution requirements of the Internal Revenue Code of 1986, as amended (the "Code").To the extent that net realized capital gain can be offset by capital loss carryovers, it is the policy of the fund not to distribute such gain. Income and capital gain distributions are determined in accordance with income tax regulations, which may differ from U.S. generally accepted accounting principles.
(f) Federal income taxes: It is the policy of the fund to continue to qualify as a regulated investment company, if such qualification is in the best interests of its shareholders, by complying with the applicable provisions of the Code, and to make distributions of taxable income sufficient to relieve it from substantially all federal income and excise taxes.
At October 31, 2005, the components of accumulated earnings on a tax basis were as follows: undistributed ordinary income $6,051,691, undistributed capital gains $15,990,591 and unrealized appreciation $14,112,317.
The tax character of distributions paid to shareholders during the fiscal periods ended October 31, 2005 and October 31, 2004, were as follows: ordinary income $1,036,206 and $811,078, respectively.
The Fund 25
NOTES TO FINANCIAL STATEMENTS (continued)
During the period ended October 31, 2005, as a result of permanent book to tax differences, primarily due to the tax treatment for real estate investment trusts, the fund increased accumulated undistributed investment income-net by $1,666 and decreased accumulated net realized gain (loss) on investments by the same amount. Net assets were not affected by this reclassification.
NOTE 2—Bank Line of Credit:
The fund participates with other Dreyfus-managed funds in a $350 million redemption credit facility (the "Facility") to be utilized for temporary or emergency purposes, including the financing of redemptions. In connection therewith, the fund has agreed to pay commitment fees on its pro rata portion of the Facility. Interest is charged to the fund based on prevailing market rates in effect at the time of borrowing.
The average daily amount of borrowings outstanding under the Facility during the period ended October 31, 2005 was approximately $44,100, with a related weighted average annualized interest rate of 2.53% .
NOTE 3—Management Fee and Other Transactions With Affiliates:
(a) Pursuant to a management agreement with the Manager, the management fee is computed at the annual rate of .75% of the value of the fund's average daily net assets and is payable monthly.
During the period ended October 31, 2005, the Distributor retained $30,356 from commissions earned on sales of the fund's Class A shares, and $25,851 and $2 from contingent deferred sales charges on redemptions of the fund's Class B and Class C shares, respectively.
(b) Under a Distribution Plan (the "Plan") adopted pursuant to Rule 12b-1 under the Act, Class B, Class C and Class T shares pay the Distributor for distributing their shares at an annual rate of .75% of the value of the average daily net assets of Class B and Class C shares, and .25% of the value of the average daily net assets of Class T shares. During the period ended October 31, 2005, Class B, Class C and Class T shares were charged $49,201, $8,279 and $330, respectively, pursuant to the Plan.
26
(c) Under the Shareholder Services Plan, Class A, Class B, Class C and Class T shares pay the Distributor at an annual rate of .25% of the value of their average daily net assets for the provision of certain services. The services provided may include personal services relating to shareholder accounts, such as answering shareholder inquiries regarding the fund and providing reports and other information, and services related to the maintenance of shareholder accounts. The Distributor may make payments to Service Agents (a securities dealer, financial institution or other industry professional) in respect of these services. The Distributor determines the amounts to be paid to Service Agents. During the period ended October 31, 2005, Class A, Class B, Class C and Class T shares were charged $294,581, $16,401, $2,760 and $330, respectively, pursuant to the Shareholder Services Plan.
The fund compensates Dreyfus Transfer, Inc., a wholly-owned subsidiary of the Manager, under a transfer agency agreement for providing personnel and facilities to perform transfer agency services for the fund. During the period ended October 31, 2005, the fund was charged $87,597 pursuant to the transfer agency agreement.
The fund compensates Mellon Bank, N.A., an affiliate of the Manager, under a custody agreement for providing custodial services for the fund. During the period ended October 31, 2005, the fund was charged $23,136 pursuant to the custody agreement.
During the period ended October 31, 2005, the fund was charged $3,143 for services performed by the Chief Compliance Officer.
The components of Due to The Dreyfus Corporation and affiliates in the Statement of Assets and Liabilities consist of: management fees $77,182, Rule 12b-1 distribution plan fees $4,215, shareholder services plan fees $25,720, custodian fees $1,958, chief compliance officer fees $1,239 and transfer agency per account fees $13,319.
(d) Each Board member also serves as a Board member of other funds within the Dreyfus complex. Annual retainer fees and attendance fees are allocated to each fund based on net assets.
The Fund 27
NOTES TO FINANCIAL STATEMENTS (continued)
NOTE 4—Securities Transactions:
The aggregate amount of purchases and sales of investment securities, excluding short-term securities and financial futures, during the period ended October 31, 2005, amounted to $192,823,603 and $208,005,944, respectively.
The fund may invest in financial futures contracts in order to gain exposure to or protect against changes in the market.The fund is exposed to market risk as a result of changes in the value of the underlying financial instruments. Investments in financial futures require the fund to "mark to market" on a daily basis, which reflects the change in the market value of the contract at the close of each day's trading.Accordingly, variation margin payments are received or made to reflect daily unrealized gains or losses.When the contracts are closed, the fund recognizes a realized gain or loss.These investments require initial margin deposits with a broker, which consist of cash or cash equivalents.The amount of these deposits is determined by the exchange or Board of Trade on which the contract is traded and is subject to change. At October 31, 2005, there were no financial futures contracts outstanding.
At October 31, 2005, the cost of investments for federal income tax purposes was $107,399,218; accordingly, accumulated net unrealized appreciation on investments was $14,112,317, consisting of $17,116,925 gross unrealized appreciation and $3,004,608 gross unrealized depreciation.
28
REPORT OF INDEPENDENT REGISTERED
PUBLIC ACCOUNTING FIRM
|
| | Shareholders and Board of Trustees
Dreyfus Premier Value Fund
|
We have audited the accompanying statement of assets and liabilities, including the statement of investments, of Dreyfus Premier Value Fund (one of the funds comprising Dreyfus Premier Value Equity Funds) as of October 31, 2005, and the related statement of operations for the year then ended, the statement of changes in net assets for each of the two years in the period then ended, and financial highlights for each of the years indicated therein. These financial statements and financial highlights are the responsibility of the Fund's management. Our responsibility is to express an opinion on these financial statements and financial highlights based on our audits.
We conducted our audits in accordance with the standards of the Public Company Accounting Oversight Board (United States).Those standards require that we plan and perform the audit to obtain reasonable assurance about whether the financial statements and financial highlights are free of material misstatement.We were not engaged to perform an audit of the Fund's internal control over financial reporting. Our audits included consideration of internal control over financial reporting as a basis for designing audit procedures that are appropriate in the circumstances, but not for the purpose of expressing an opinion on the effectiveness of the Fund's internal control over financial reporting. Accordingly, we express no such opinion.An audit also includes examining, on a test basis, evidence supporting the amounts and disclosures in the financial statements and financial highlights, assessing the accounting principles used and significant estimates made by management, and evaluating the overall financial statement presentation. Our procedures included verification by examination of securities held by the custodian as of October 31, 2005 and confirmation of securities not held by the custodian by correspondence with others. We believe that our audits provide a reasonable basis for our opinion.
In our opinion, the financial statements and financial highlights referred to above present fairly, in all material respects, the financial position of Dreyfus Premier Value Fund at October 31, 2005, the results of its operations for the year then ended, the changes in its net assets for each of the two years in the period then ended, and the financial highlights for each of the indicated years, in conformity with U.S. generally accepted accounting principles.
| | New York, New York
December 14, 2005
|
The Fund 29
IMPORTANT TAX INFORMATION (Unaudited)
In accordance with federal tax law, the fund hereby designates 99.41% of the ordinary dividends paid during the fiscal year ended October 31, 2005 as qualifying for the corporate dividends received deduction. For the fiscal year ended October 31,2005,certain dividends paid by the fund may be subject to a maximum tax rate of 15%, as provided for by the Jobs and Growth Tax Relief Reconciliation Act of 2003. Of the distributions paid during the fiscal year, $1,036,206 represents the maximum amount that may be considered qualified dividend income. Shareholders will receive notification in January 2006 of the percentage applicable to the preparation of their 2005 income tax returns.
30
INFORMATION ABOUT THE REVIEW AND APPROVAL
OF THE FUND'S MANAGEMENT AGREEMENT (Unaudited)
|
At a meeting of the Board of Trustees held on August 10, 2005, the Board considered the re-approval for an annual period of the fund's Management Agreement, pursuant to which the Manager provides the fund with investment advisory and administrative services. The Board members, none of whom are "interested persons" (as defined in the Investment Company Act of 1940, as amended) of the fund were assisted in their review by independent legal counsel and met with counsel in executive session separate from representatives of the Manager.
Analysis of Nature, Extent, and Quality of Services Provided to the Fund. The Board members received a presentation from representatives of the Manager regarding services provided to the fund and other funds in the Dreyfus fund complex, and discussed the nature, extent, and quality of the services provided to the fund pursuant to its Management Agreement.The Manager's representatives reviewed the fund's distribution of accounts and the relationships the Manager has with various intermediaries and the different needs of each. The Manager's representatives noted the diversity of distribution of the fund as well as among the funds in the Dreyfus fund complex, and the Manager's corresponding need for broad, deep, and diverse resources to be able to provide ongoing shareholder services to each of the fund's distribution channels.The Board members also reviewed the number of shareholder accounts in the fund, as well as the fund's asset size.
The Board members also considered the Manager's research and portfolio management capabilities and that the Manager also provides oversight of day-to-day fund operations, including fund accounting and administration and assistance in meeting legal and regulatory requirements. The Board members also considered the Manager's extensive administrative, accounting, and compliance infrastructure.
Comparative Analysis of the Fund's Performance, Management Fee, and Expense Ratio. The Board members reviewed the fund's performance, management fee, and expense ratio and placed significant emphasis on comparisons to a group of comparable funds, and to Lipper category averages, as applicable.The group of comparable funds was previously
The Fund 31
| | INFORMATION ABOUT THE REVIEW AND APPROVAL
OF THE FUND'S MANAGEMENT AGREEMENT (Unaudited) (continued)
|
approved by the Board for this purpose, and was prepared using a Board-approved selection methodology that was based, in part, on selecting non-affiliated funds reported in the same Lipper category (the "Large Cap Value Funds" category) as the fund. The Board members discussed the results of the comparisons for various periods ended June 30, 2005.The Board members noted the fund's improved 1-year performance record, based on its improved comparison group and Lipper category total return rankings for the 1-year period.The Board members also noted the fund's high third quartile comparison group and Lipper category total return rankings for the 3-year period, and that the fund outperformed the comparison group and Lipper category averages for the 1-year period.The Board members discussed with a member of the Large Cap Value Team (the "Team") that manages the fund the relative performance results for the fund since the Team was appointed primary portfolio managers for the fund in October 2004 and noted, for the period ended June 30, 2005, the fund's improved relative performance since the Team was appointed to manage the fund.
The Board members discussed the fund's management fee and expense ratio and reviewed the range of management fees and expense ratios for the funds in the Comparison Group. The Board members noted that the fund's management fee was at the median of the fees for the funds in the Comparison Group and that the fund's total expense ratio was lower than the Comparison Group and Lipper category averages.
The Board members also reviewed the fees paid to the Manager or its affiliates by mutual funds managed by Dreyfus or its affiliates with similar investment objectives, policies, and strategies, and in the same Lipper category, as the fund (the "Similar Funds"). The Board members also reviewed the fees paid by institutional separate accounts managed by the Large Cap Value Team (of which the fund's portfolio managers are members) at The Boston Company Asset Management ("TBCAM"), an affiliate of the Manager, with similar investment objectives, policies, and strategies as the fund (the "Separate Accounts" and, collectively with the Similar Funds, the "Similar Accounts"). The Manager's representatives
32
explained the nature of the Similar Accounts and the differences,from the Manager's perspective, in management of the Separate Accounts as compared to managing and providing services to the fund. The Manager's representatives noted that two Similar Funds had the same management fee as the fund and one Similar Fund was a unitary fee fund with a fee that was higher than the fund's management fee.With respect to Separate Accounts, the Manager's representatives advised the Board that each account is managed by TBCAM and the Team and reflected a fee schedule tied to TBCAM's internal cost structure and negotiated rates with its institutional clients. The Board analyzed differences in fees paid to the Manager and discussed the relationship of the advisory fees paid in light of the Manager's performance and the services provided. The Board members considered the relevance of the fee information provided for the Similar Accounts managed by the Manager to evaluate the appropriateness and reasonableness of the fund's management fee.The Manager's representatives noted that there were no similarly managed wrap fee accounts managed by the Manager or its affiliates with similar investment objectives, policies, and strategies as the fund.
Analysis of Profitability and Economies of Scale. The Manager's representatives reviewed the dollar amount of expenses allocated and profit received by the Manager and the method used to determine such expenses and profit. The Board received and considered information prepared by an independent consulting firm regarding the Manager's approach to allocating costs to, and determining the profitability of, individual funds and the entire Dreyfus fund complex.The Manager's representatives stated that the methodology had also been reviewed by an independent registered public accounting firm which, like the consultant, found the methodology to be reasonable.The consulting firm also analyzed where any economies of scale might emerge in connection with the management of the fund.The Board members evaluated the analysis in light of the relevant circumstances for the fund, including the decline in fund assets, and the extent to which economies of scale would be realized as the fund grows and whether fee levels reflect
The Fund 33
| | INFORMATION ABOUT THE REVIEW AND APPROVAL
OF THE FUND'S MANAGEMENT AGREEMENT (Unaudited) (continued)
|
these economies of scale for the benefit of fund investors. The Board noted that it appeared that the benefits of any economies of scale also would be appropriately shared with shareholders through increased investment in fund management and administration resources. The Board members also considered potential benefits to the Manager from acting as investment adviser and the soft dollar arrangements in effect with respect to trading the fund's portfolio.
It was noted that the Board members should consider the Manager's profitability with respect to the fund as part of their evaluation of whether the fee under the Management Agreement bears a reasonable relationship to the mix of services provided by the Manager, including the nature, extent, and quality of such services and that a discussion of economies of scale is predicated on increasing assets and that, if a fund's assets had been decreasing, the possibility that the Manager may have realized any economies of scale would be less.The Board members also discussed the profitability percentage ranges determined by appropriate court cases to be reasonable given the services rendered to investment companies. It was noted that the profitability percentage for managing the fund was not unreasonable given the fund's overall performance and generally superior service levels provided.
At the conclusion of these discussions, each Board member expressed the opinion that he or she had been furnished with sufficient information to make an informed business decision with respect to continuation of the fund's Management Agreement. Based on their discussions and considerations as described above, the Board members made the following conclusions and determinations.
- The Board concluded that the nature, extent, and quality of the services provided by the Manager are adequate and appropriate.
- The Board generally was satisfied with the fund's overall performance.
34
- The Board expressly considered the appointment of the Team to manage the fund's portfolio in October 2004, the presentations made by Team members since the Team's appointment regarding the process in place for managing the fund, and the improvement in fund performance since that time as significant factors in reapproving the fund's management agreement.
- The Board concluded that the fee paid to the Manager by the fund was reasonable in light of comparative performance and expense and advisory fee information, costs of the services provided, and profits to be realized and benefits derived or to be derived by the Manager from its relationship with the fund.
- The Board determined that the economies of scale which may accrue to the Manager and its affiliates in connection with the management of the fund had been adequately considered by the Manager in connection with the management fee rate charged to the fund, and that, to the extent in the future it were to be determined that material economies of scale had not been shared with the fund, the Board would seek to have those economies of scale shared with the fund.
The Board members considered these conclusions and determinations, along with the information received on a routine and regular basis throughout the year, and, without any one factor being dispositive, the Board determined that re-approval of the fund's Management Agreement was in the best interests of the fund and its shareholders.
The Fund 35
BOARD MEMBERS INFORMATION (Unaudited)
| Joseph S. DiMartino (62) |
| Chairman of the Board (1995) |
| Principal Occupation During Past 5 Years: |
| • Corporate Director and Trustee |
| Other Board Memberships and Affiliations: |
| • The Muscular Dystrophy Association, Director |
| • Levcor International, Inc., an apparel fabric processor, Director |
| • Century Business Services, Inc., a provider of outsourcing functions for small and medium size |
| companies, Director |
| • The Newark Group, a provider of a national market of paper recovery facilities, paperboard |
| mills and paperboard converting plants, Director |
| • Azimuth Trust, an institutional asset management firm, Member of Board of Managers and |
| Advisory Board |
| • Sunair Services Corporation, engages in the design, manufacture and sale of high frequency |
| systems for long-range voice and data communications, as well as providing certain outdoor- |
| related services to homes and businesses, Director |
| No. of Portfolios for which Board Member Serves: 193 |
| ——————— |
| David W. Burke (69) |
| Board Member (1994) |
| Principal Occupation During Past 5 Years: |
| • Corporate Director and Trustee |
| Other Board Memberships and Affiliations: |
| • John F. Kennedy Library Foundation, Director |
| • U.S.S. Constitution Museum, Director |
| No. of Portfolios for which Board Member Serves: 84 |
| ——————— |
| Diane Dunst (66) |
| Board Member (1990) |
| Principal Occupation During Past 5 Years: |
| • President, Huntting House Antiques |
| No. of Portfolios for which Board Member Serves: 11 |
| ——————— |
| Jay I. Meltzer (77) |
| Board Member (1991) |
| Principal Occupation During Past 5 Years: |
| • Physician, Internist and Specialist in Clinical Hypertension |
| • Clinical Professor of Medicine at Columbia University & College of Physicians and Surgeons |
| • Faculty Associate, Center for Bioethics, Columbia |
| No. of Portfolios for which Board Member Serves: 11 |
36
| Daniel Rose (76) |
| Board Member (1992) |
| Principal Occupation During Past 5 Years: |
| • Chairman and Chief Executive Officer of Rose Associates, Inc., a New York based real estate |
| development and management firm |
| Other Board Memberships and Affiliations: |
| • Baltic-American Enterprise Fund,Vice Chairman and Director |
| • Harlem Educational Activities Fund, Inc., Chairman |
| • Housing Committee of the Real Estate Board of New York, Inc., Director |
| No. of Portfolios for which Board Member Serves: 22 |
| ——————— |
| Warren B. Rudman (75) |
| Board Member (1993) |
| Principal Occupation During Past 5 Years: |
| • Of Counsel to (from January 1993 to December 31, 2003, Partner in) the law firm Paul, |
| Weiss, Rifkind,Wharton & Garrison LLP |
| Other Board Memberships and Affiliations: |
| • Collins & Aikman Corporation, Director |
| • Allied Waste Corporation, Director |
| • Raytheon Company, Director |
| • Boston Scientific, Director |
| No. of Portfolios for which Board Member Serves: 20 |
| ——————— |
| Sander Vanocur (77) |
| Board Member (1992) |
| Principal Occupation During Past 5 Years: |
| • President, Old Owl Communications |
| No. of Portfolios for which Board Member Serves: 22 |
| ——————— |
| Once elected all Board Members serve for an indefinite term.The address of the Board Members and Officers is in c/o |
| The Dreyfus Corporation, 200 Park Avenue, New York, New York 10166. Additional information about the Board |
| Members is available in the fund's Statement of Additional Information which can be obtained from Dreyfus free of |
| charge by calling this toll free number: 1-800-554-4611. |
| Rosalind Gersten Jacobs, Emeritus Board Member |
The Fund 37
OFFICERS OF THE FUND (Unaudited)
STEPHEN E. CANTER, President since March 2000.
Chairman of the Board, Chief Executive Officer and Chief Operating Officer of the Manager, and an officer of 90 investment companies (comprised of 184 portfolios) managed by the Manager. Mr. Canter also is a Board member and, where applicable, an Executive Committee Member of the other investment management subsidiaries of Mellon Financial Corporation, each of which is an affiliate of the Manager. He is 60 years old and has been an employee of the Manager since May 1995.
STEPHEN R. BYERS, Executive Vice President since November 2002.
Chief Investment Officer,Vice Chairman and a director of the Manager, and an officer of 90 investment companies (comprised of 184 portfolios) managed by the Manager. Mr. Byers also is an officer, director or an Executive Committee Member of certain other investment management subsidiaries of Mellon Financial Corporation, each of which is an affiliate of the Manager. He is 52 years old and has been an employee of the Manager since January 2000.
MARK N. JACOBS, Vice President since March 2000.
Executive Vice President, Secretary and General Counsel of the Manager, and an officer of 91 investment companies (comprised of 200 portfolios) managed by the Manager. He is 59 years old and has been an employee of the Manager since June 1977.
MICHAEL A. ROSENBERG, Vice President and Secretary since August 2005.
Associate General Counsel of the Manager, and an officer of 91 investment companies (comprised of 200 portfolios) managed by the Manager. He is 45 years old and has been an employee of the Manager since October 1991.
JAMES BITETTO, Vice President and Assistant Secretary since August 2005.
Assistant General Counsel and Assistant Secretary of the Manager, and an officer of 91 investment companies (comprised of 200 portfolios) managed by the Manager. He is 39 years old and has been an employee of the Manager since December 1996.
JONI LACKS CHARATAN, Vice President and Assistant Secretary since August 2005.
Associate General Counsel of the Manager, and an officer of 91 investment companies (comprised of 200 portfolios) managed by the Manager. She is 49 years old and has been an employee of the Manager since October 1988.
JOSEPH M. CHIOFFI, Vice President and Assistant Secretary since August 2005.
Assistant General Counsel of the Manager, and an officer of 91 investment companies (comprised of 200 portfolios) managed by the Manager. He is 43 years old and has been an employee of the Manager since June 2000.
JANETTE E. FARRAGHER, Vice President and Assistant Secretary since August 2005.
Associate General Counsel of the Manager, and an officer of 91 investment companies (comprised of 200 portfolios) managed by the Manager. She is 42 years old and has been an employee of the Manager since February 1984.
JOHN B. HAMMALIAN, Vice President and Assistant Secretary since August 2005.
Associate General Counsel of the Manager, and an officer of 91 investment companies (comprised of 200 portfolios) managed by the Manager. He is 42 years old and has been an employee of the Manager since February 1991.
38
ROBERT R. MULLERY, Vice President and Assistant Secretary since August 2005.
Associate General Counsel of the Manager, and an officer of 91 investment companies (comprised of 200 portfolios) managed by the Manager. He is 53 years old and has been an employee of the Manager since May 1986.
JEFF PRUSNOFSKY, Vice President and Assistant Secretary since August 2005.
Associate General Counsel of the Manager, and an officer of 91 investment companies (comprised of 200 portfolios) managed by the Manager. He is 40 years old and has been an employee of the Manager since October 1990.
JAMES WINDELS, Treasurer since November 2001.
Director – Mutual Fund Accounting of the Manager, and an officer of 91 investment companies (comprised of 200 portfolios) managed by the Manager. He is 47 years old and has been an employee of the Manager since April 1985.
ERIK D. NAVILOFF, Assistant Treasurer since August 2005.
Senior Accounting Manager – Taxable Fixed Income Funds of the Manager, and an officer of 91 investment companies (comprised of 200 portfolios) managed by the Manager. He is 37 years old and has been an employee of the Manager since November 1992.
ROBERT ROBOL, Assistant Treasurer since August 2005.
Senior Accounting Manager – Money Market Funds of the Manager, and an officer of 91 investment companies (comprised of 200 portfolios) managed by the Manager. He is 41 years old and has been an employee of the Manager since October 1988.
ROBERT SVAGNA, Assistant Treasurer since December 2002.
Senior Accounting Manager – Equity Funds of the Manager, and an officer of 91 investment companies (comprised of 200 portfolios) managed by the Manager. He is 38 years old and has been an employee of the Manager since November 1990.
GAVIN C. REILLY, Assistant Treasurer since December 2005.
Tax Manager of the Investment Accounting and Support Department of the Manager, and an officer of 91 investment companies (comprised of 200 portfolios) managed by the Manager. He is 37 years old and has been an employee of the Manager since April 1991.
JOSEPH W. CONNOLLY, Chief Compliance Officer since October 2004.
Chief Compliance Officer of the Manager and The Dreyfus Family of Funds (91 investment companies, comprised of 200 portfolios). From November 2001 through March 2004, Mr. Connolly was first Vice-President, Mutual Fund Servicing for Mellon Global Securities Services. In that capacity, Mr. Connolly was responsible for managing Mellon's Custody, Fund Accounting and Fund Administration services to third-party mutual fund clients. He is 48 years old and has served in various capacities with the Manager since 1980, including manager of the firm's Fund Accounting Department from 1997 through October 2001.
WILLIAM GERMENIS, Anti-Money Laundering Compliance Officer since October 2002.
Vice President and Anti-Money Laundering Compliance Officer of the Distributor, and the Anti-Money Laundering Compliance Officer of 87 investment companies (comprised of 196 portfolios) managed by the Manager. He is 35 years old and has been an employee of the Distributor since October 1998.
The Fund 39
NOTES
| For More | | Information |
| |
|
| |
| Dreyfus Premier | | Transfer Agent & |
| Value Fund | | Dividend Disbursing Agent |
| 200 Park Avenue | | |
| | | Dreyfus Transfer, Inc. |
| New York, NY 10166 | | |
| | | 200 Park Avenue |
| Manager | | New York, NY 10166 |
| The Dreyfus Corporation | | Distributor |
| 200 Park Avenue | | |
| | | Dreyfus Service Corporation |
| New York, NY 10166 | | |
| | | 200 Park Avenue |
| Custodian | | New York, NY 10166 |
| Mellon Bank, N.A. | | |
| One Mellon Bank Center | | |
| Pittsburgh, PA 15258 | | |
Telephone Call your financial representative or 1-800-554-4611
| Mail | | The Dreyfus Premier Family of Funds |
| | | 144 Glenn Curtiss Boulevard, Uniondale, NY 11556-0144 |
The fund files its complete schedule of portfolio holdings with the Securities and Exchange Commission ("SEC") for the first and third quarters of each fiscal year on Form N-Q. The fund's Forms N-Q are available on the SEC's website at http://www.sec.gov and may be reviewed and copied at the SEC's Public Reference Room in Washington, DC. Information on the operation of the Public Reference Room may be obtained by calling 1-800-SEC-0330.
A description of the policies and procedures that the fund uses to determine how to vote proxies relating to portfolio securities, and information regarding how the fund voted these proxies for the 12-month period ended June 30, 2005, is available at http://www.dreyfus.com and on the SEC's website at http://www.sec.gov. The description of the policies and procedures is also available without charge, upon request, by calling 1-800-645-6561.

© 2005 Dreyfus Service Corporation 0037AR1005
Item 2. Code of Ethics.
The Registrant has adopted a code of ethics that applies to the Registrant's principal executive officer, principal financial officer, principal accounting officer or controller, or persons performing similar functions. There have been no amendments to, or waivers in connection with, the Code of Ethics during the period covered by this Report.
Item 3. Audit Committee Financial Expert.
The Registrant's Board has determined that Joseph S. DiMartino, a member of the Audit Committee of the Board, is an audit committee financial expert as defined by the Securities and Exchange Commission (the "SEC"). Joseph S. DiMartino is "independent" as defined by the SEC for purposes of audit committee financial expert determinations.
Item 4. Principal Accountant Fees and Services
(a) Audit Fees. The aggregate fees billed for each of the last two fiscal years (the "Reporting Periods") for professional services rendered by the Registrant's principal accountant (the "Auditor") for the audit of the Registrant's annual financial statements, or services that are normally provided by the Auditor in connection with the statutory and regulatory filings or engagements for the Reporting Periods, were $44,100 in 2004 and $47,805 in 2005.
(b) Audit-Related Fees. The aggregate fees billed in the Reporting Periods for assurance and related services by the Auditor that are reasonably related to the performance of the audit of the Registrant's financial statements and are not reported under paragraph (a) of this Item 4 were $4,500 in 2004 and $4,725 in 2005. These services consisted of security counts required by Rule 17f-2 under the Investment Company Act of 1940, as amended.
The aggregate fees billed in the Reporting Periods for non-audit assurance and related services by the Auditor to the Registrant's investment adviser (not including any sub-investment adviser whose role is primarily portfolio management and is subcontracted with or overseen by another investment adviser), and any entity controlling, controlled by or under common control with the investment adviser that provides ongoing services to the Registrant ("Service Affiliates"), that were reasonably related to the performance of the annual audit of the Service Affiliate, which required pre-approval by the Audit Committee were $178,500 in 2004 and $0 in 2005.
Note: For the second paragraph in each of (b) through (d) of this Item 4, certain of such services were not pre-approved prior to May 6, 2003, when such services were required to be pre-approved. On and after May 6, 2003, 100% of all services provided by the Auditor were pre-approved as required. For comparative purposes, the fees shown assume that all such services were pre-approved, including services that were not pre-approved prior to the compliance date of the pre-approval requirement.
(c) Tax Fees. The aggregate fees billed in the Reporting Periods for professional services rendered by the Auditor for tax compliance, tax advice and tax planning ("Tax Services") were $6,136 in 2004 and $6,149 in 2005. These services consisted of (i) review or preparation of U.S. federal, state, local and excise tax returns; (ii) U.S. federal, state and local tax planning, advice and assistance regarding statutory, regulatory or
administrative developments, (iii) tax advice regarding tax qualification matters and/or treatment of various financial instruments held or proposed to be acquired or held, and (iv) determination of Passive Foreign Investment Companies (as applicable).
The aggregate fees billed in the Reporting Periods for Tax Services by the Auditor to Service Affiliates which required pre-approval by the Audit Committee were $0 in 2004 and $0 in 2005.
(d) All Other Fees. The aggregate fees billed in the Reporting Periods for products and services provided by the Auditor, other than the services reported in paragraphs (a) through (c) of this Item, were $376 in 2004 and $330 in 2005. These services consisted of a review of the Registrant's anti-money laundering program.
The aggregate fees billed in the Reporting Periods for Non-Audit Services by the Auditor to Service Affiliates, other than the services reported in paragraphs (b) through (c) of this Item, which required pre-approval by the Audit Committee were $0 in 2004 and $0 in 2005.
Audit Committee Pre-Approval Policies and Procedures. The Registrant's Audit Committee has established policies and procedures (the "Policy") for pre-approval (within specified fee limits) of the Auditor's engagements for non-audit services to the Registrant and Service Affiliates without specific case-by-case consideration. Pre-approval considerations include whether the proposed services are compatible with maintaining the Auditor's independence. Pre-approvals pursuant to the Policy are considered annually.
Non-Audit Fees. The aggregate non-audit fees billed by the Auditor for services rendered to the Registrant, and rendered to Service Affiliates, for the Reporting Periods were $653,655 in 2004 and $755,822 in 2005.
Auditor Independence. The Registrant's Audit Committee has considered whether the provision of non-audit services that were rendered to Service Affiliates which were not pre-approved (not requiring pre-approval) is compatible with maintaining the Auditor's independence.
| Item 5. | | Audit Committee of Listed Registrants. |
| | | Not applicable. |
| Item 6. | | Schedule of Investments. |
| | | Not applicable. |
| Item 7. | | Disclosure of Proxy Voting Policies and Procedures for Closed-End Management |
| | | Investment Companies. |
| | | Not applicable. |
| Item 8. | | Portfolio Managers of Closed-End Management Investment Companies. |
| | | Not applicable. |
| Item 9. | | Purchases of Equity Securities by Closed-End Management Investment Companies and |
| | | Affiliated Purchasers. |
| | | Not applicable. |
| Item 10. | | Submission of Matters to a Vote of Security Holders. |
The Registrant has a Nominating Committee (the "Committee"), which is responsible for selecting and nominating persons for election or appointment by the Registrant's Board as Board members. The Committee has adopted a Nominating Committee Charter (the "Charter"). Pursuant to the Charter, the Committee will consider recommendations for nominees from shareholders submitted to the Secretary of the Registrant, c/o The Dreyfus Corporation Legal Department, 200 Park Avenue, 8th Floor East, New York, New York 10166. A nomination submission must include information regarding the recommended nominee as specified in the Charter. This information includes all information relating to a recommended nominee that is required to be disclosed in solicitations or proxy statements for the election of Board members, as well as information sufficient to evaluate the factors to be considered by the Committee, including character and integrity, business and professional experience, and whether the person has the ability to apply sound and independent business judgment and would act in the interests of the Registrant and its shareholders.
Nomination submissions are required to be accompanied by a written consent of the individual to stand for election if nominated by the Board and to serve if elected by the shareholders, and such additional information must be provided regarding the recommended nominee as reasonably requested by the Committee.
Item 11. Controls and Procedures.
(a) The Registrant's principal executive and principal financial officers have concluded, based on their evaluation of the Registrant's disclosure controls and procedures as of a date within 90 days of the filing date of this report, that the Registrant's disclosure controls and procedures are reasonably designed to ensure that information required to be disclosed by the Registrant on Form N-CSR is recorded, processed, summarized and reported within the required time periods and that information required to be disclosed by the Registrant in the reports that it files or submits on Form N-CSR is accumulated and communicated to the Registrant's management, including its principal executive and principal financial officers, as appropriate to allow timely decisions regarding required disclosure.
(b) There were no changes to the Registrant's internal control over financial reporting that occurred during the second fiscal quarter of the period covered by this report that have materially affected, or are reasonably likely to materially affect, the Registrant's internal control over financial reporting.
Item 12. Exhibits.
| (a)(1) | | Code of ethics referred to in Item 2. |
| (a)(2) | | Certifications of principal executive and principal financial officers as required by Rule 30a-2(a) |
| under the Investment Company Act of 1940. |
| (a)(3) | | Not applicable. |
| (b) | | Certification of principal executive and principal financial officers as required by Rule 30a-2(b) |
| under the Investment Company Act of 1940. |
SIGNATURES
Pursuant to the requirements of the Securities Exchange Act of 1934 and the Investment Company Act of 1940, the Registrant has duly caused this Report to be signed on its behalf by the undersigned, thereunto duly authorized.
| Dreyfus Premier Value Equity Funds |
| |
| |
| By: | | /s/ Stephen E. Canter |
| |
|
| | | Stephen E. Canter |
| | | President |
| |
| Date: | | December 28, 2005 |
Pursuant to the requirements of the Securities Exchange Act of 1934 and the Investment Company Act of 1940, this Report has been signed below by the following persons on behalf of the Registrant and in the capacities and on the dates indicated.
| By: | | /s/ Stephen E. Canter |
| |
|
| | | Stephen E. Canter |
| | | Chief Executive Officer |
| Date: | | December 28, 2005 |
| |
| By: | | /s/ James Windels |
| |
|
| James Windels |
| | | Chief Financial Officer |
| Date: | | December 28, 2005 |
EXHIBIT INDEX
| (a)(1) | | Code of ethics referred to in Item 2. |
| |
| (a)(2) | | Certifications of principal executive and principal financial officers as required by Rule 30a- |
| 2(a) under the Investment Company Act of 1940. (EX-99.CERT) |
| |
| (b) | | Certification of principal executive and principal financial officers as required by Rule 30a- |
| 2(b) under the Investment Company Act of 1940. (EX-99.906CERT) |