| | | UNITED STATES |
| | | SECURITIES AND EXCHANGE COMMISSION |
| | | Washington, D.C. 20549 |
| |
| |
| | | FORM N-CSR |
| |
| CERTIFIED SHAREHOLDER REPORT OF REGISTERED MANAGEMENT |
| | | INVESTMENT COMPANIES |
| |
| Investment Company Act file number 811-4688 |
| |
| | | DREYFUS PREMIER VALUE EQUITY FUNDS |
| | | (Exact name of Registrant as specified in charter) |
| |
| |
| | | c/o The Dreyfus Corporation |
| | | 200 Park Avenue |
| | | New York, New York 10166 |
| | | (Address of principal executive offices) (Zip code) |
| |
| | | Mark N. Jacobs, Esq. |
| | | 200 Park Avenue |
| | | New York, New York 10166 |
| | | (Name and address of agent for service) |
| |
| Registrant's telephone number, including area code: (212) 922-6000 |
| |
| Date of fiscal year end: | | 10/31 |
| |
| Date of reporting period: | | 10/31/06 |
FORM N-CSR
Item 1. Reports to Stockholders.
| | Dreyfus Premier
Value Fund
|
| | ANNUAL REPORT October 31, 2006
|

Save time. Save paper. View your next shareholder report
online as soon as it’s available. Log into www.dreyfus.com
and sign up for Dreyfus eCommunications. It’s simple and
only takes a few minutes.
|
The views expressed in this report reflect those of the portfolio
manager only through the end of the period covered and do not
necessarily represent the views of Dreyfus or any other person in
the Dreyfus organization. Any such views are subject to change at
any time based upon market or other conditions and Dreyfus dis-
claims any responsibility to update such views.These views may not
be relied on as investment advice and, because investment decisions
for a Dreyfus fund are based on numerous factors, may not be relied
on as an indication of trading intent on behalf of any Dreyfus fund.
|
Not FDIC-Insured • Not Bank-Guaranteed • May Lose Value
| | | Contents |
| |
| | | THE FUND |
| |
|
| 2 | | Letter from the Chairman |
| 3 | | Discussion of Fund Performance |
| 6 | | Fund Performance |
| 8 | | Understanding Your Fund’s Expenses |
| 8 | | Comparing Your Fund’s Expenses |
| | | With Those of Other Funds |
| 9 | | Statement of Investments |
| 13 | | Statement of Assets and Liabilities |
| 14 | | Statement of Operations |
| 15 | | Statement of Changes in Net Assets |
| 18 | | Financial Highlights |
| 23 | | Notes to Financial Statements |
| 32 | | Report of Independent Registered |
| | | Public Accounting Firm |
| 33 | | Important Tax Information |
| 34 | | Information About the Review and Approval |
| | | of the Fund’s Management Agreement |
| 39 | | Board Members Information |
| 41 | | Officers of the Fund |
| | | FOR MORE INFORMATION |
| |
|
| | | Back Cover |
| | Dreyfus Premier
Value Fund
|
The Fund

LETTER FROM THE CHAIRMAN
Dear Shareholder:
We are pleased to present this annual report for Dreyfus Premier Value Fund, covering the 12-month period from November 1, 2005, through October 31, 2006.
Although reports of slower economic growth and declining housing prices recently have raised economic concerns, we believe that neither a domestic recession nor a major shortfall in global growth is likely. Stimulative monetary policies over the last several years have left a legacy of ample financial liquidity worldwide,which should continue to support global economic growth. Indeed, while U.S. monetary policy has tightened to the borderline between a neutral policy and a restrictive policy, most foreign monetary policies have tightened only from stimulative to neutral, leaving room for further expansion.
The financial markets seem to concur with our view that a gradual economic slowdown is more likely than a recession, as evidenced by upward pressure on the price-earnings multiples of high-quality, large-capitalization stocks. Investors expecting generally slower profit growth have begun to favor companies with the ability to sustain profitability in a slower economic environment.This pattern is consistent with previous midcycle slowdowns.As always, we encourage you to discuss the implications of these and other matters with your financial adviser.
For information about how the fund performed during the reporting period, as well as market perspectives, we have provided a Discussion of Fund Performance given by the fund’s portfolio manager.
Thank you for your continued confidence and support.

DISCUSSION OF FUND PERFORMANCE
Brian C. Ferguson, Portfolio Manager
How did Dreyfus Premier Value Fund perform relative to its benchmark?
For the 12-month period ended October 31, 2006, the fund’s Class A shares produced a total return of 19.88%, Class B shares produced a total return of 18.89%,Class C shares produced a total return of 18.84%,Class R shares produced a total return of 20.12% and Class T shares produced a total return of 19.30% .1 This compares with the performance of the fund’s benchmark, the Russell 1000 Value Index (the “Index”), which produced a total return of 21.46% for the same period.2
While investors’ occasional concerns regarding the economy, inflation and interest rates prompted bouts of market weakness, stock prices generally rose over the reporting period due to a growing global economy and improved corporate earnings. The fund produced lower returns than its benchmark, primarily the result of its lack of exposure to real estate investment trusts (REITs), one of the market’s better performing industries for the reporting period. Returns were more favorable among the fund’s technology, telecommunications services, media and energy holdings.
What is the fund’s investment approach?
The fund seeks capital growth.To pursue this goal, the fund invests at least 80% of its assets in stocks, which may include common stocks, preferred stocks and convertible securities of both U.S. and foreign issuers, including those purchased in initial public offerings.The fund invests mainly in the stocks of U.S. issuers, but may invest up to 30% of its assets in foreign stocks. We employ a “bottom-up” approach to stock selection, choosing stocks based on their individual merits. Factors we consider include the value of the stock, the company’s growth prospects and the company’s financial profile.
DISCUSSION OF FUND PERFORMANCE (continued)
|
What other factors influenced the fund’s performance?
During the first half of the reporting period, U.S. economic growth generally remained strong, bolstered by healthy corporate earnings, low unemployment and subdued inflation.As a result, stock prices rose moderately, despite occasional concerns that rising short-term interest rates and higher energy prices might erode consumer confidence and reduce the rate of economic growth.
However, stock prices fell sharply in May after hawkish comments from members of the Federal Reserve Board caused investors to revise upward their expectations for short-term interest rates, sparking renewed concerns about the potentially adverse effects of higher borrowing costs and soaring energy prices on the economy. During this market downturn, large-cap stocks began to fare better than small-cap stocks as investors turned toward well-established businesses with track records of consistent earnings under a variety of economic conditions. Over the remainder of the reporting period, large-cap stocks generally continued to gain value as housing markets softened and employment gains moderated,marking the start of a new phase of the economic cycle and the apparent end to a long period of small-cap outperformance. In this environment, the fund produced a positive absolute return in each of the sectors in which it invests.
That said, the fund’s return modestly trailed the Index’s, which we attribute to its lack of exposure to REITs, a segment of the financials sector that posted especially positive returns during the reporting period.These stocks flourished as a growing number of investors added REIT components to their portfolios in an attempt to hedge against the possibility of an unanticipated acceleration of inflation.
On the other hand, the fund enjoyed better-than-average returns from its technology, telecommunications services, consumer discretionary and energy holdings. Within the technology area, Cisco Systems advanced sharply due to rising demand for the bandwidth, which led to strong router and advanced product sales. Hewlett Packard also gained value due to cost-cutting measures initiated by the company’s new president
and CEO. Among telecommunications companies, the fund achieved strong results from its holdings in AT&T, as the company benefited from synergies related to its merger with SBC Corporation. A lack of exposure to Sprint Nextel also aided the fund’s performance, as the company suffered due to integration issues from their recent merger.
Our stock selection strategy within the media industry proved beneficial, as we limited the fund’s exposure to traditional newspaper, radio and television companies,which lost revenue to Internet advertising.Instead, we focused on advertising agencies that tend to benefit regardless of the medium. Finally, robust gains among the fund’s energy stocks can be attributed to our emphasis on refineries, which benefited from favorable supply-and-demand dynamics.
What is the fund’s current strategy?
As of the end of the reporting period, we have focused on technology companies that we believe may benefit from greater demand for broadband applications that help reduce or manage Internet congestion. In fact, Cisco Systems and AT&T remain two of the fund’s larger holdings. Conversely, we have found relatively few investment opportunities among regional banks and utilities.
| 1 | | Total return includes reinvestment of dividends and any capital gains paid and does not take into |
| | | consideration the maximum initial sales charges in the case of Class A and Class T shares or the |
| | | applicable contingent deferred sales charges imposed on redemptions in the case of Class B and |
| | | Class C shares. Had these charges been reflected, returns would have been lower. Past performance |
| | | is no guarantee of future results. Share price and investment return fluctuate such that upon |
| | | redemption, fund shares may be worth more or less than their original cost. |
| | | Part of the fund’s recent performance is attributable to positive returns from its initial public |
| | | offering (IPO) investments. There can be no guarantee that IPOs will have or continue to |
| | | have a positive effect on fund performance. |
| 2 | | SOURCE: LIPPER INC. — Reflects the reinvestment of dividends and, where applicable, |
| | | capital gain distributions.The Russell 1000 Value Index is an unmanaged index which measures |
| | | the performance of those Russell 1000 companies with lower price-to-book ratios and lower |
| | | forecasted growth values. |
| † Source: Lipper Inc. |
| Past performance is not predictive of future performance. |
| Part of the fund’s recent performance is attributable to positive returns from its initial public offering (IPO) investments. |
| There can be no guarantee that IPOs will have or continue to have a positive effect on the fund’s performance. |
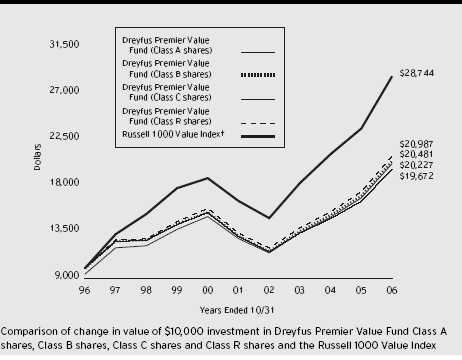
| The above graph compares a $10,000 investment made in each of the Class A, Class B, Class C and Class R shares |
| of Dreyfus Premier Value Fund on 10/31/96 to a $10,000 investment made in the Russell 1000 Value Index (the |
| “Index”) on that date. All dividends and capital gain distributions are reinvested. Performance for Class T shares will |
| vary from the performance of Class A, Class B, Class C and Class R shares shown above due to differences in charges |
| and expenses. |
| The fund’s performance shown in the line graph takes into account the maximum initial sales charge on Class A shares |
| and all other applicable fees and expenses.The Index is an unmanaged index which measures the performance of those |
| Russell 1000 companies with lower price-to-book ratios and lower forecasted growth values.The Index does not take into |
| account charges, fees and other expenses. Further information relating to fund performance, including expense |
| reimbursements, if applicable, is contained in the Financial Highlights section of the prospectus and elsewhere in this report. |
| Average Annual Total Returns as of 10/31/06 | | | | | | |
| |
| | | Inception | | | | | | | | From |
| | | Date | | 1 Year | | 5 Years | | 10 Years | | Inception |
| |
| |
| |
| |
| |
|
| Class A shares | | | | | | | | | | |
| with maximum sales charge (5.75%) | | 12.96% | | 8.13% | | 7.30% | | |
| without sales charge | | | | 19.88% | | 9.42% | | 7.94% | | |
| Class B shares | | | | | | | | | | |
| with applicable redemption charge † | | | | 14.97% | | 8.21% | | 7.43% | | |
| without redemption | | | | 18.89% | | 8.50% | | 7.43% | | |
| Class C shares | | | | | | | | | | |
| with applicable redemption charge †† | | 17.86% | | 8.45% | | 7.00% | | |
| without redemption | | | | 18.84% | | 8.45% | | 7.00% | | |
| Class R shares | | | | 20.12% | | 9.31% | | 7.70% | | |
| Class T shares | | | | | | | | | | |
| with applicable sales charge (4.5%) | | 3/1/00 | | 13.91% | | 7.51% | | — | | 5.02% |
| without sales charge | | 3/1/00 | | 19.30% | | 8.50% | | — | | 5.75% |
Past performance is not predictive of future performance.The fund’s performance shown in the graph and table does not reflect the deduction of taxes that a shareholder would pay on fund distributions or the redemption of fund shares. Performance for Class B shares assumes the conversion of Class B shares to Class A shares at the end of the sixth year following the date of purchase.
| † | | The maximum contingent deferred sales charge for Class B shares is 4%. After six years Class B shares convert to |
| | | Class A shares. |
| †† | | The maximum contingent deferred sales charge for Class C shares is 1% for shares redeemed within one year of the |
| | | date of purchase. |
U N D E R S TA N D I N G YO U R F U N D ’ S E X P E N S E S ( U n a u d i t e d )
As a mutual fund investor, you pay ongoing expenses, such as management fees and other expenses. Using the information below, you can estimate how these expenses affect your investment and compare them with the expenses of other funds.You also may pay one-time transaction expenses, including sales charges (loads) and redemption fees, which are not shown in this section and would have resulted in higher total expenses. For more information, see your fund’s prospectus or talk to your financial adviser.
Review your fund’s expenses
The table below shows the expenses you would have paid on a $1,000 investment in Dreyfus Premier Value Fund from May 1, 2006 to October 31, 2006. It also shows how much a $1,000 investment would be worth at the close of the period, assuming actual returns and expenses.
| Expenses and Value of a $1,000 Investment | | | | | | |
| assuming actual returns for the six months ended October 31, 2006 | | | | |
| | | Class A | | Class B | | Class C | | Class R | | Class T |
| |
| |
| |
| |
| |
|
| Expenses paid per $1,000 † | | $ 6.39 | | $ 10.89 | | $ 11.04 | | $ 5.36 | | $ 8.93 |
| Ending value (after expenses) | | $1,061.50 | | $1,056.80 | | $1,056.70 | | $1,062.90 | | $1,059.20 |
COMPARING YOUR FUND’S EXPENSES WITH THOSE OF OTHER FUNDS (Unaudited)
Using the SEC’s method to compare expenses
The Securities and Exchange Commission (SEC) has established guidelines to help investors assess fund expenses. Per these guidelines, the table below shows your fund’s expenses based on a $1,000 investment, assuming a hypothetical 5% annualized return. You can use this information to compare the ongoing expenses (but not transaction expenses or total cost) of investing in the fund with those of other funds.All mutual fund shareholder reports will provide this information to help you make this comparison. Please note that you cannot use this information to estimate your actual ending account balance and expenses paid during the period.
Expenses and Value of a $1,000 Investment assuming a hypothetical 5% annualized return for the six months ended October 31, 2006
| | | Class A | | Class B | | Class C | | Class R | | Class T |
| |
| |
| |
| |
| |
|
| Expenses paid per $1,000 † | | $ 6.26 | | $ 10.66 | | $ 10.82 | | $ 5.24 | | $ 8.74 |
| Ending value (after expenses) | | $1,019.00 | | $1,014.62 | | $1,014.47 | | $1,020.01 | | $1,016.53 |
† Expenses are equal to the fund’s annualized expense ratio of 1.23% for Class A, 2.10% for Class B, 2.13% for Class C, 1.03% for Class R and 1.72% for Class T; multiplied by the average account value over the period, multiplied by 184/365 (to reflect the one-half year period).
STATEMENT OF INVESTMENTS
October 31, 2006
|
| Common Stocks—98.7% | | Shares | | | | Value ($) |
| |
| |
| |
|
| Consumer Discretionary—8.8% | | | | | | |
| Clear Channel Communications | | 75,000 | | | | 2,613,750 |
| Gap | | 63,800 | | | | 1,341,076 |
| Johnson Controls | | 13,000 | | | | 1,060,020 |
| Liberty Global, Ser. C | | 38,073 | | a | | 968,196 |
| Marriott International, Cl. A | | 16,700 | | | | 697,559 |
| McDonald’s | | 27,700 | | | | 1,161,184 |
| News, Cl. A | | 42,200 | | | | 879,870 |
| Omnicom Group | | 19,700 | | | | 1,998,565 |
| OSI Restaurant Partners | | 13,700 | | | | 455,799 |
| | | | | | | 11,176,019 |
| Consumer Staples—7.8% | | | | | | |
| Altria Group | | 35,700 | | | | 2,903,481 |
| Clorox | | 10,100 | | | | 652,056 |
| Colgate-Palmolive | | 9,900 | | | | 633,303 |
| Dean Foods | | 29,900 | | a | | 1,252,511 |
| Kraft Foods, Cl. A | | 23,300 | | | | 801,520 |
| Procter & Gamble | | 48,900 | | | | 3,099,771 |
| Wal-Mart Stores | | 12,700 | | | | 625,856 |
| | | | | | | 9,968,498 |
| Energy—10.4% | | | | | | |
| Anadarko Petroleum | | 14,100 | | | | 654,522 |
| Cameron International | | 19,600 | | a | | 981,960 |
| Chesapeake Energy | | 42,300 | | | | 1,372,212 |
| Chevron | | 43,500 | | | | 2,923,200 |
| ConocoPhillips | | 49,900 | | | | 3,005,976 |
| Devon Energy | | 10,200 | | | | 681,768 |
| Halliburton | | 18,900 | | | | 611,415 |
| Marathon Oil | | 18,200 | | | | 1,572,480 |
| Valero Energy | | 27,400 | | | | 1,433,842 |
| | | | | | | 13,237,375 |
| Financial—20.5% | | | | | | |
| Bank of New York | | 30,900 | | | | 1,062,033 |
| Capital One Financial | | 32,100 | | | | 2,546,493 |
| CIT Group | | 12,900 | | | | 671,445 |
| Citigroup | | 38,300 | | | | 1,921,128 |
| Countrywide Financial | | 11,100 | | | | 423,132 |
The Fund 9
| | STATEMENT OF INVESTMENTS (continued)
|
| Common Stocks (continued) | | Shares | | Value ($) |
| |
| |
|
| Financial (continued) | | | | |
| Freddie Mac | | 38,800 | | 2,676,812 |
| Goldman Sachs Group | | 3,600 | | 683,244 |
| Janus Capital Group | | 31,100 | | 624,488 |
| JPMorgan Chase & Co. | | 80,472 | | 3,817,592 |
| Merrill Lynch & Co. | | 32,300 | | 2,823,666 |
| Morgan Stanley | | 17,300 | | 1,322,239 |
| PNC Financial Services Group | | 16,500 | | 1,155,495 |
| Realogy | | 9,100 a | | 234,598 |
| Sovereign Bancorp | | 13,000 | | 310,180 |
| SunTrust Banks | | 14,600 | | 1,153,254 |
| U.S. Bancorp | | 42,900 | | 1,451,736 |
| Wachovia | | 30,800 | | 1,709,400 |
| Washington Mutual | | 36,200 | | 1,531,260 |
| | | | | 26,118,195 |
| Health Care—9.0% | | | | |
| Abbott Laboratories | | 28,300 | | 1,344,533 |
| Advanced Medical Optics | | 12,800 a | | 522,880 |
| Amgen | | 8,600 a | | 652,826 |
| Baxter International | | 17,500 | | 804,475 |
| Bristol-Myers Squibb | | 19,900 | | 492,525 |
| Pfizer | | 96,100 | | 2,561,065 |
| Thermo Electron | | 44,100 a | | 1,890,567 |
| WellPoint | | 14,300 a | | 1,091,376 |
| Wyeth | | 41,000 | | 2,092,230 |
| | | | | 11,452,477 |
| Industrial—6.1% | | | | |
| 3M | | 17,000 | | 1,340,280 |
| Emerson Electric | | 7,600 | | 641,440 |
| Flowserve | | 6,400 a | | 339,200 |
| GATX | | 14,600 | | 636,122 |
| Lockheed Martin | | 7,900 | | 686,747 |
| Navistar International | | 37,200 a | | 1,031,556 |
| Tyco International | | 32,600 | | 959,418 |
| Union Pacific | | 9,100 | | 824,733 |
| US Airways Group | | 26,200 a | | 1,306,332 |
| | | | | 7,765,828 |
10
| Common Stocks (continued) | | Shares | | Value ($) |
| |
| |
|
| Information Technology—12.1% | | | | |
| Accenture, Cl. A | | 19,700 | | 648,327 |
| Automatic Data Processing | | 18,600 | | 919,584 |
| Cisco Systems | | 115,900 a | | 2,796,667 |
| Fiserv | | 19,100 a | | 943,540 |
| Hewlett-Packard | | 59,900 | | 2,320,526 |
| Intel | | 61,800 | | 1,318,812 |
| International Business Machines | | 10,500 | | 969,465 |
| Microsoft | | 65,400 | | 1,877,634 |
| NCR | | 35,200 a | | 1,461,504 |
| Sun Microsystems | | 247,500 a | | 1,343,925 |
| Take-Two Interactive Software | | 35,700 a | | 499,443 |
| Tellabs | | 36,400 a | | 383,656 |
| | | | | 15,483,083 |
| Insurance—11.3% | | | | |
| American International Group | | 28,727 | | 1,929,592 |
| AON | | 26,000 | | 904,540 |
| Chubb | | 50,500 | | 2,684,075 |
| Fidelity National Title Group, Cl. A | | 17,600 | | 387,376 |
| Genworth Financial, Cl. A | | 35,570 | | 1,189,461 |
| Lincoln National | | 20,000 | | 1,266,200 |
| MBIA | | 12,900 | | 800,058 |
| MetLife | | 21,900 | | 1,251,147 |
| MGIC Investment | | 22,400 | | 1,316,224 |
| PMI Group | | 46,200 | | 1,970,430 |
| UnumProvident | | 36,600 | | 723,948 |
| | | | | 14,423,051 |
| Materials—3.4% | | | | |
| Air Products & Chemicals | | 9,500 | | 661,865 |
| Alcoa | | 11,800 | | 341,138 |
| Arch Coal | | 9,400 | | 325,522 |
| Foundation Coal Holdings | | 7,900 | | 290,009 |
| Martin Marietta Materials | | 9,000 | | 792,000 |
| Mosaic | | 43,200 a | | 808,704 |
| Phelps Dodge | | 5,200 | | 521,976 |
| Smurfit-Stone Container | | 57,200 a | | 609,752 |
| | | | | 4,350,966 |
The Fund 11
| | STATEMENT OF INVESTMENTS (continued)
|
| Common Stocks (continued) | | Shares | | Value ($) |
| |
| |
|
| Telecommunication Services—4.8% | | | | |
| Alltel | | 8,800 | | 469,128 |
| AT & T | | 144,100 | | 4,935,425 |
| BellSouth | | 15,400 | | 694,540 |
| | | | | 6,099,093 |
| Utilities—4.5% | | | | |
| Constellation Energy Group | | 11,300 | | 705,120 |
| Entergy | | 7,000 | | 600,810 |
| Exelon | | 15,700 | | 973,086 |
| Mirant | | 14,000 a | | 413,980 |
| NRG Energy | | 45,300 a | | 2,181,195 |
| Questar | | 11,400 | | 928,872 |
| | | | | 5,803,063 |
| Total Common Stocks | | | | |
| (cost $105,005,331) | | | | 125,877,648 |
| |
| |
|
| |
| Other Investment—.6% | | | | |
| |
| |
|
| Registered Investment Company; | | | | |
| Dreyfus Institutional Preferred | | | | |
| Plus Money Market Fund | | | | |
| (cost $795,000) | | 795,000 b | | 795,000 |
| |
| |
|
| |
| Total Investments (cost $105,800,331) | | 99.3% | | 126,672,648 |
| Cash and Receivables (Net) | | .7% | | 913,599 |
| Net Assets | | 100.0% | | 127,586,247 |
| a | | Non-income producing security. |
| b | | Investment in affiliated money market mutual fund. |
| Portfolio Summary (Unaudited) † | | | | |
| |
| | | Value (%) | | | | Value (%) |
| |
| |
| |
|
| Financial | | 20.5 | | Industrial | | 6.1 |
| Information Technology | | 12.1 | | Telecommunication Services | | 4.8 |
| Insurance | | 11.3 | | Utilities | | 4.5 |
| Energy | | 10.4 | | Materials | | 3.4 |
| Health Care | | 9.0 | | Money Market Investment | | .6 |
| Consumer Discretionary | | 8.8 | | | | |
| Consumer Staples | | 7.8 | | | | 99.3 |
† Based on net assets.
See notes to financial statements.
12
STATEMENT OF ASSETS AND LIABILITIES
October 31, 2006
| | | | | | | | | Cost | | Value |
| |
| |
| |
| |
| |
|
| Assets ($): | | | | | | | | | | |
| Investments in securities—See Statement of Investments: | | | | |
| Unaffiliated issuers | | | | | | 105,005,331 | | 125,877,648 |
| Affiliated issuers | | | | | | | | 795,000 | | 795,000 |
| Receivable for investment securities sold | | | | | | 1,689,774 |
| Dividends receivable | | | | | | | | 167,870 |
| Receivable for shares of Beneficial Interest subscribed | | | | 15,207 |
| Prepaid expenses | | | | | | | | | | 29,101 |
| | | | | | | | | | | 128,574,600 |
| |
| |
| |
| |
| |
|
| Liabilities ($): | | | | | | | | | | |
| Due to The Dreyfus Corporation and affiliates—Note 3(c) | | | | 128,079 |
| Payable for investment securities purchased | | | | | | 785,192 |
| Cash overdraft due to Custodian | | | | | | | | 3,995 |
| Payable for shares of Beneficial Interest redeemed | | | | | | 1,360 |
| Accrued expenses | | | | | | | | | | 69,727 |
| | | | | | | | | | | 988,353 |
| |
| |
| |
| |
| |
|
| Net Assets ($) | | | | | | | | | | 127,586,247 |
| |
| |
| |
| |
| |
|
| Composition of Net Assets ($): | | | | | | | | |
| Paid-in capital | | | | | | | | | | 90,992,656 |
| Accumulated undistributed investment income—net | | | | | | 795,854 |
| Accumulated net realized gain (loss) on investments | | | | 14,925,420 |
| Accumulated net unrealized appreciation | | | | | | |
| (depreciation) on investments | | | | | | | | 20,872,317 |
| |
| |
| |
| |
|
| Net Assets ($) | | | | | | | | | | 127,586,247 |
| |
| |
| |
| |
| |
|
| |
| |
| Net Asset Value Per Share | | | | | | | | |
| | | Class A | | Class B | | Class C | | Class R | | Class T |
| |
| |
| |
| |
| |
|
| Net Assets ($) | | 122,788,252 | | 3,485,397 | | 1,081,705 | | 43,349 | | 187,544 |
| Shares Outstanding | | 5,927,913 | | 180,019 | | 56,863 | | 2,155.391 | | 9,360 |
| |
| |
| |
| |
| |
|
| Net Asset Value | | | | | | | | | | |
| Per Share ($) | | 20.71 | | 19.36 | | 19.02 | | 20.11 | | 20.04 |
See notes to financial statements.
The Fund 13
STATEMENT OF OPERATIONS
Year Ended October 31, 2006
|
| Investment Income ($): | | |
| Income: | | |
| Cash dividends (net of $1,092 foreign taxes withheld at source): | | |
| Unaffiliated issuers | | 2,361,470 |
| Affiliated issuers | | 15,967 |
| Income on securities lending | | 3,569 |
| Total Income | | 2,381,006 |
| Expenses: | | |
| Management fee—Note 3(a) | | 926,353 |
| Shareholder servicing costs—Note 3(c) | | 405,228 |
| Professional fees | | 59,526 |
| Registration fees | | 55,218 |
| Distribution fees—Note 3(b) | | 43,385 |
| Prospectus and shareholders’ reports | | 43,211 |
| Custodian fees—Note 3(c) | | 20,181 |
| Trustees’ fees and expenses—Note 3(d) | | 18,560 |
| Interest expense—Note 2 | | 4,031 |
| Loan commitment fees—Note 2 | | 971 |
| Miscellaneous | | 10,196 |
| Total Expenses | | 1,586,860 |
| Investment Income—Net | | 794,146 |
| |
|
| Realized and Unrealized Gain (Loss) on Investments—Note 4 ($): |
| Net realized gain (loss) on investments | | 15,496,397 |
| Net unrealized appreciation (depreciation) on investments | | 6,185,165 |
| Net Realized and Unrealized Gain (Loss) on Investments | | 21,681,562 |
| Net Increase in Net Assets Resulting from Operations | | 22,475,708 |
See notes to financial statements.
|
STATEMENT OF CHANGES IN NET ASSETS
| | | Year Ended October 31, |
| |
|
| | | 2006 | | 2005 |
| |
| |
|
| Operations ($): | | | | |
| Investment income—net | | 794,146 | | 828,156 |
| Net realized gain (loss) on investments | | 15,496,397 | | 23,668,532 |
| Net unrealized appreciation | | | | |
| (depreciation) on investments | | 6,185,165 | | (9,560,305) |
| Net Increase (Decrease) in Net Assets | | |
| Resulting from Operations | | 22,475,708 | | 14,936,383 |
| |
| |
|
| Dividends to Shareholders from ($): | | | | |
| Investment income—net: | | | | |
| Class A shares | | (819,168) | | (1,034,886) |
| Class C shares | | — | | (483) |
| Class R shares | | (330) | | (234) |
| Class T shares | | (274) | | (603) |
| Net realized gain on investments: | | | | |
| Class A shares | | (19,998,609) | | — |
| Class B shares | | (996,777) | | — |
| Class C shares | | (201,789) | | — |
| Class R shares | | (6,859) | | — |
| Class T shares | | (25,105) | | — |
| Total Dividends | | (22,048,911) | | (1,036,206) |
| |
| |
|
| Beneficial Interest Transactions ($): | | | | |
| Net proceeds from shares sold: | | | | |
| Class A shares | | 4,596,835 | | 4,032,093 |
| Class B shares | | 911,678 | | 666,685 |
| Class C shares | | 238,833 | | 201,732 |
| Class R shares | | 19,468 | | 8,777 |
| Class T shares | | 60,710 | | 51,219 |
STATEMENT OF CHANGES IN NET ASSETS (continued)
|
| | | Year Ended October 31, |
| |
|
| | | 2006 | | 2005 |
| |
| |
|
| Beneficial Interest Transactions ($) (continued): | | |
| Dividends reinvested: | | | | |
| Class A shares | | 18,887,481 | | 938,531 |
| Class B shares | | 688,669 | | — |
| Class C shares | | 113,358 | | 242 |
| Class R shares | | 7,026 | | 227 |
| Class T shares | | 24,679 | | 592 |
| Cost of shares redeemed: | | | | |
| Class A shares | | (16,761,555) | | (20,822,423) |
| Class B shares | | (3,603,865) | | (3,116,097) |
| Class C shares | | (296,410) | | (516,078) |
| Class R shares | | (20,568) | | (10) |
| Class T shares | | (42,767) | | (89,171) |
| Increase (Decrease) in Net Assets | | | | |
| from Beneficial Interest Transactions | | 4,823,572 | | (18,643,681) |
| Total Increase (Decrease) in Net Assets | | 5,250,369 | | (4,743,504) |
| |
| |
|
| Net Assets ($): | | | | |
| Beginning of Period | | 122,335,878 | | 127,079,382 |
| End of Period | | 127,586,247 | | 122,335,878 |
| Undistributed investment income—net | | 795,854 | | 819,056 |
| | | Year Ended October 31, |
| |
|
| | | 2006 | | 2005 |
| |
| |
|
| Capital Share Transactions: | | | | |
| Class A a | | | | |
| Shares sold | | 236,580 | | 199,476 |
| Shares issued for dividends reinvested | | 1,039,487 | | 47,281 |
| Shares redeemed | | (873,091) | | (1,030,891) |
| Net Increase (Decrease) in Shares Outstanding | | 402,976 | | (784,134) |
| |
| |
|
| Class B a | | | | |
| Shares sold | | 48,645 | | 34,756 |
| Shares issued for dividends reinvested | | 40,249 | | — |
| Shares redeemed | | (194,660) | | (163,404) |
| Net Increase (Decrease) in Shares Outstanding | | (105,766) | | (128,648) |
| |
| |
|
| Class C | | | | |
| Shares sold | | 13,114 | | 10,634 |
| Shares issued for dividends reinvested | | 6,740 | | 13 |
| Shares redeemed | | (16,815) | | (27,491) |
| Net Increase (Decrease) in Shares Outstanding | | 3,039 | | (16,844) |
| |
| |
|
| Class R | | | | |
| Shares sold | | 1,050 | | 447 |
| Shares issued for dividends reinvested | | 399 | | 12 |
| Shares redeemed | | (1,099) | | (1) |
| Net Increase (Decrease) in Shares Outstanding | | 350 | | 458 |
| |
| |
|
| Class T | | | | |
| Shares sold | | 3,307 | | 2,645 |
| Shares issued for dividends reinvested | | 1,398 | | 30 |
| Shares redeemed | | (2,213) | | (4,631) |
| Net Increase (Decrease) in Shares Outstanding | | 2,492 | | (1,956) |
a During the period ended October 31, 2006, 68,442 Class B shares representing $1,262,687 were automatically converted to 64,307 Class A shares and during the period ended October 31, 2005, 54,938 Class B shares representing $1,048,452 were automatically converted to 52,190 Class A shares.
See notes to financial statements.
The following tables describe the performance for each share class for the fiscal periods indicated.All information (except portfolio turnover rate) reflects financial results for a single fund share.Total return shows how much your investment in the fund would have increased (or decreased) during each period, assuming you had reinvested all dividends and distributions.These figures have been derived from the fund’s financial statements.
| | | | | Year Ended October 31, | | |
| |
| |
| |
|
| Class A Shares | | 2006 | | 2005 | | 2004 | | 2003 | | 2002 |
| |
| |
| |
| |
| |
|
| Per Share Data ($): | | | | | | | | | | |
| Net asset value, beginning of period | | 20.90 | | 18.75 | | 16.94 | | 14.59 | | 17.22 |
| Investment Operations: | | | | | | | | | | |
| Investment income—net a | | .13 | | .14 | | .16 | | .12 | | .12 |
| Net realized and unrealized | | | | | | | | | | |
| gain (loss) on investments | | 3.49 | | 2.18 | | 1.77 | | 2.35 | | (1.83) |
| Total from Investment Operations | | 3.62 | | 2.32 | | 1.93 | | 2.47 | | (1.71) |
| Distributions: | | | | | | | | | | |
| Dividends from investment income—net | | (.15) | | (.17) | | (.12) | | (.12) | | (.13) |
| Dividends from net realized | | | | | | | | | | |
| gain on investments | | (3.66) | | — | | — | | — | | (.79) |
| Total Distributions | | (3.81) | | (.17) | | (.12) | | (.12) | | (.92) |
| Net asset value, end of period | | 20.71 | | 20.90 | | 18.75 | | 16.94 | | 14.59 |
| |
| |
| |
| |
| |
|
| Total Return (%) b | | 19.88 | | 12.40 | | 11.43 | | 17.04 | | (10.74) |
| |
| |
| |
| |
| |
|
| Ratios/Supplemental Data (%): | | | | | | | | | | |
| Ratio of total expenses | | | | | | | | | | |
| to average net assets | | 1.24 | | 1.23 | | 1.26 | | 1.26 | | 1.28 |
| Ratio of net investment income | | | | | | | | | | |
| to average net assets | | .68 | | .71 | | .87 | | .76 | | .69 |
| Portfolio Turnover Rate | | 76.17 | | 154.96 | | 51.24 | | 59.66 | | 57.49 |
| |
| |
| |
| |
| |
|
| Net Assets, end of period ($ x 1,000) | | 122,788 | | 115,459 | | 118,301 | | 115,872 | | 107,217 |
| a | | Based on average shares outstanding at each month end. |
| b | | Exclusive of sales charge. |
| See notes to financial statements. |
| | | | | Year Ended October 31, | | |
| |
| |
| |
|
| Class B Shares | | 2006 | | 2005 | | 2004 | | 2003 | | 2002 |
| |
| |
| |
| |
| |
|
| Per Share Data ($): | | | | | | | | | | |
| Net asset value, beginning of period | | 19.77 | | 17.75 | | 16.06 | | 13.84 | | 16.40 |
| Investment Operations: | | | | | | | | | | |
| Investment income (loss)—net a | | (.03) | | (.03) | | .00b | | (.01) | | (.02) |
| Net realized and unrealized | | | | | | | | | | |
| gain (loss) on investments | | 3.28 | | 2.05 | | 1.69 | | 2.23 | | (1.75) |
| Total from Investment Operations | | 3.25 | | 2.02 | | 1.69 | | 2.22 | | (1.77) |
| Distributions: | | | | | | | | | | |
| Dividends from investment income—net | | — | | — | | — | | — | | (.00)b |
| Dividends from net realized | | | | | | | | | | |
| gain on investments | | (3.66) | | — | | — | | — | | (.79) |
| Total Distributions | | (3.66) | | — | | — | | — | | (.79) |
| Net asset value, end of period | | 19.36 | | 19.77 | | 17.75 | | 16.06 | | 13.84 |
| |
| |
| |
| |
| |
|
| Total Return (%) c | | 18.89 | | 11.38 | | 10.52 | | 16.04 | | (11.48) |
| |
| |
| |
| |
| |
|
| Ratios/Supplemental Data (%): | | | | | | | | | | |
| Ratio of total expenses | | | | | | | | | | |
| to average net assets | | 2.12 | | 2.10 | | 2.12 | | 2.12 | | 2.10 |
| Ratio of net investment income | | | | | | | | | | |
| (loss) to average net assets | | (.17) | | (.14) | | .01 | | (.10) | | (.13) |
| Portfolio Turnover Rate | | 76.17 | | 154.96 | | 51.24 | | 59.66 | | 57.49 |
| |
| |
| |
| |
| |
|
| Net Assets, end of period ($ x 1,000) | | 3,485 | | 5,651 | | 7,355 | | 8,591 | | 8,801 |
| a | | Based on average shares outstanding at each month end. |
| b | | Amount represents less than $.01 per share. |
| c | | Exclusive of sales charge. |
| See notes to financial statements. |
The Fund 19
| | FINANCIAL HIGHLIGHTS (continued)
|
| | | | | Year Ended October 31, | | |
| |
| |
| |
|
| Class C Shares | | 2006 | | 2005 | | 2004 | | 2003 | | 2002 |
| |
| |
| |
| |
| |
|
| Per Share Data ($): | | | | | | | | | | |
| Net asset value, beginning of period | | 19.49 | | 17.51 | | 15.85 | | 13.68 | | 16.22 |
| Investment Operations: | | | | | | | | | | |
| Investment (loss)—net a | | (.04) | | (.03) | | (.00)b | | (.02) | | (.02) |
| Net realized and unrealized | | | | | | | | | | |
| gain (loss) on investments | | 3.23 | | 2.02 | | 1.66 | | 2.20 | | (1.72) |
| Total from Investment Operations | | 3.19 | | 1.99 | | 1.66 | | 2.18 | | (1.74) |
| Distributions: | | | | | | | | | | |
| Dividends from investment income—net | | — | | (.01) | | — | | (.01) | | (.01) |
| Dividends from net realized | | | | | | | | | | |
| gain on investments | | (3.66) | | — | | — | | — | | (.79) |
| Total Distributions | | (3.66) | | (.01) | | — | | (.01) | | (.80) |
| Net asset value, end of period | | 19.02 | | 19.49 | | 17.51 | | 15.85 | | 13.68 |
| |
| |
| |
| |
| |
|
| Total Return (%) c | | 18.84 | | 11.35 | | 10.47 | | 15.95 | | (11.48) |
| |
| |
| |
| |
| |
|
| Ratios/Supplemental Data (%): | | | | | | | | | | |
| Ratio of total expenses | | | | | | | | | | |
| to average net assets | | 2.15 | | 2.13 | | 2.13 | | 2.16 | | 2.11 |
| Ratio of net investment (loss) | | | | | | | | | | |
| to average net assets | | (.21) | | (.17) | | (.00)d | | (.13) | | (.15) |
| Portfolio Turnover Rate | | 76.17 | | 154.96 | | 51.24 | | 59.66 | | 57.49 |
| |
| |
| |
| |
| |
|
| Net Assets, end of period ($ x 1,000) | | 1,082 | | 1,049 | | 1,237 | | 1,096 | | 1,185 |
| a | | Based on average shares outstanding at each month end. |
| b | | Amount represents less than $.01 per share. |
| c | | Exclusive of sales charge. |
| d | | Amount represents less than .01%. |
| See notes to financial statements. |
| | | | | Year Ended October 31, | | |
| |
| |
| |
|
| Class R Shares | | 2006 | | 2005 | | 2004 | | 2003 | | 2002 |
| |
| |
| |
| |
| |
|
| Per Share Data ($): | | | | | | | | | | |
| Net asset value, beginning of period | | 20.39 | | 18.29 | | 16.53 | | 14.26 | | 16.78 |
| Investment Operations: | | | | | | | | | | |
| Investment income—net a | | .15 | | .14 | | .13 | | .06 | | .07 |
| Net realized and unrealized | | | | | | | | | | |
| gain (loss) on investments | | 3.41 | | 2.13 | | 1.73 | | 2.30 | | (1.80) |
| Total from Investment Operations | | 3.56 | | 2.27 | | 1.86 | | 2.36 | | (1.73) |
| Distributions: | | | | | | | | | | |
| Dividends from investment income—net | | (.18) | | (.17) | | (.10) | | (.09) | | — |
| Dividends from net realized | | | | | | | | | | |
| gain on investments | | (3.66) | | — | | — | | — | | (.79) |
| Total Distributions | | (3.84) | | (.17) | | (.10) | | (.09) | | (.79) |
| Net asset value, end of period | | 20.11 | | 20.39 | | 18.29 | | 16.53 | | 14.26 |
| |
| |
| |
| |
| |
|
| Total Return (%) | | 20.12 | | 12.45 | | 11.26 | | 16.64 | | (10.97) |
| |
| |
| |
| |
| |
|
| Ratios/Supplemental Data (%): | | | | | | | | | | |
| Ratio of total expenses | | | | | | | | | | |
| to average net assets | | 1.08 | | 1.17 | | 1.40 | | 1.59 | | 1.56 |
| Ratio of net investment income | | | | | | | | | | |
| to average net assets | | .82 | | .73 | | .74 | | .42 | | .41 |
| Portfolio Turnover Rate | | 76.17 | | 154.96 | | 51.24 | | 59.66 | | 57.49 |
| |
| |
| |
| |
| |
|
| Net Assets, end of period ($ x 1,000) | | 43 | | 37 | | 25 | | 15 | | 7 |
| a Based on average shares outstanding at each month end. |
| See notes to financial statements. |
| | FINANCIAL HIGHLIGHTS (continued)
|
| | | | | Year Ended October 31, | | |
| |
| |
| |
|
| Class T Shares | | 2006 | | 2005 | | 2004 | | 2003 | | 2002 |
| |
| |
| |
| |
| |
|
| Per Share Data ($): | | | | | | | | | | |
| Net asset value, beginning of period | | 20.32 | | 18.27 | | 16.51 | | 14.32 | | 17.05 |
| Investment Operations: | | | | | | | | | | |
| Investment income (loss)—net a | | .03 | | .03 | | .03 | | (.07) | | (.07) |
| Net realized and unrealized | | | | | | | | | | |
| gain (loss) on investments | | 3.39 | | 2.11 | | 1.73 | | 2.28 | | (1.79) |
| Total from Investment Operations | | 3.42 | | 2.14 | | 1.76 | | 2.21 | | (1.86) |
| Distributions: | | | | | | | | | | |
| Dividends from investment income—net | | (.04) | | (.09) | | — | | (.02) | | (.08) |
| Dividends from net realized | | | | | | | | | | |
| gain on investments | | (3.66) | | — | | — | | — | | (.79) |
| Total Distributions | | (3.70) | | (.09) | | — | | (.02) | | (.87) |
| Net asset value, end of period | | 20.04 | | 20.32 | | 18.27 | | 16.51 | | 14.32 |
| |
| |
| |
| |
| |
|
| Total Return (%) b | | 19.30 | | 11.72 | | 10.66 | | 15.45 | | (11.69) |
| |
| |
| |
| |
| |
|
| Ratios/Supplemental Data (%): | | | | | | | | | | |
| Ratio of total expenses | | | | | | | | | | |
| to average net assets | | 1.78 | | 1.83 | | 1.95 | | 2.48 | | 2.38 |
| Ratio of net investment income | | | | | | | | | | |
| (loss) to average net assets | | .10 | | .16 | | .19 | | (.48) | | (.41) |
| Portfolio Turnover Rate | | 76.17 | | 154.96 | | 51.24 | | 59.66 | | 57.49 |
| |
| |
| |
| |
| |
|
| Net Assets, end of period ($ x 1,000) | | 188 | | 140 | | 161 | | 85 | | 44 |
| a | | Based on average shares outstanding at each month end. |
| b | | Exclusive of sales charge. |
| See notes to financial statements. |
NOTES TO FINANCIAL STATEMENTS
NOTE 1—Significant Accounting Policies:
Dreyfus Premier Value Fund (the “fund”) is a separate non-diversified series of Dreyfus Premier Value Equity Funds (the “Company”), which is registered under the Investment Company Act of 1940, as amended (the “Act”), as an open-end management investment company and operates as a series company, currently offering two series including the fund. The fund’s investment objective is capital growth. The Dreyfus Corporation (the “Manager” or “Dreyfus”) serves as the fund’s investment adviser. The Manager is a wholly-owned subsidiary of Mellon Financial Corporation (“Mellon Financial”).
Dreyfus Service Corporation (the “Distributor”), a wholly-owned subsidiary of the Manager, is the distributor of the fund’s shares.The fund is authorized to issue an unlimited number of $.001 par value shares of Beneficial Interest in the following classes of shares: Class A, Class B, Class C, Class R and Class T. Class A and Class T shares are subject to a sales charge imposed at the time of purchase. Class B shares are subject to a contingent deferred sales charge (“CDSC”) imposed on Class B share redemptions made within six years of purchase and automatically convert to Class A shares after six years. Class C shares are subject to a CDSC imposed on Class C shares redeemed within one year of purchase and Class R shares are sold at net asset value per share only to institutional investors. Other differences between the classes include the services offered to and the expenses borne by each class and certain voting rights. Income, expenses (other expenses attributable to a specific class), and realized and unrealized gains or losses on investments are allocated to each class of shares based on its relative net assets.
Effective March 1, 2006, Class A shares of the fund may be purchased at net asset value (“NAV”) without payment of a sales charge:
- By qualified investors who (i) purchase Class A shares directly through the Distributor, and (ii) have, or whose spouse or minor children have, beneficially owned shares and continuously maintained an open account directly through the Distributor in a Dreyfus-managed fund, including the fund, or a Founders-managed fund since on or before February 28, 2006.
The Fund 23
NOTES TO FINANCIAL STATEMENTS (continued)
|
- With the cash proceeds from an investor’s exercise of employment- related stock options, whether invested in the fund directly or indi- rectly through an exchange from a Dreyfus-managed money market fund, provided that the proceeds are processed through an entity that has entered into an agreement with the Distributor specifically relat- ing to processing stock options. Upon establishing the account in the fund or the Dreyfus-managed money market fund, the investor and the investor’s spouse and minor children become eligible to purchase Class A shares of the fund at NAV, whether or not using the proceeds of the employment-related stock options.
- By members of qualified affinity groups who purchase Class A shares directly through the Distributor, provided that the qualified affinity group has entered into an affinity agreement with the Distributor.
Effective March 1, 2006, Class A and Class T shares of the fund may be purchased at NAV without payment of a sales charge:
- For Dreyfus-sponsored IRA “Rollover Accounts” with the distrib- ution proceeds from qualified and non-qualified retirement plans or a Dreyfus-sponsored 403(b)(7) plan, provided that, in the case of a qualified or non-qualified retirement plan, the rollover is processed through an entity that has entered into an agreement with the Distributor specifically relating to processing rollovers. Upon estab- lishing the Dreyfus-sponsored IRA rollover account in the fund, the shareholder becomes eligible to make subsequent purchases of Class A or Class T shares of the fund at NAV in such account.
Effective June 1, 2006, the fund no longer offers Class B shares, except in connection with dividend reinvestment and permitted exchanges of Class B shares.
The Company accounts separately for the assets, liabilities and operations of each series. Expenses directly attributable to each series are charged to that series’ operations; expenses which are applicable to all series are allocated among them on a pro rata basis.
The fund’s financial statements are prepared in accordance with U.S. generally accepted accounting principles, which may require the use of management estimates and assumptions. Actual results could differ from those estimates.
The fund enters into contracts that contain a variety of indemnifications. The fund’s maximum exposure under these arrangements is unknown.The fund does not anticipate recognizing any loss related to these arrangements.
(a) Portfolio valuation: Investments in securities are valued at the last sales price on the securities exchange or national securities market on which such securities are primarily traded. Securities listed on the National Market System for which market quotations are available, are valued at the official closing price or, if there is no official closing price that day, at the last sales price. Securities not listed on an exchange or the national securities market, or securities for which there were no transactions, are valued at the average of the most recent bid and asked prices, except for open short positions, where the asked price is used for valuation purposes. Bid price is used when no asked price is available. Investment in registered investment companies are valued at their NAV.When market quotations or official closing prices are not readily available, or are determined not to reflect accurately fair value, such as when the value of a security has been significantly affected by events after the close of the exchange or market on which the security is principally traded (for example, a foreign exchange or market), but before the fund calculates its NAV, the fund may value these investments at fair value as determined in accordance with the procedures approved by the Board of Trustees. Fair valuing of securities may be determined with the assistance of a pricing service using calculations based on indices of domestic securities and other appropriate indicators, such as prices of relevant ADR’s and futures contracts. For other securities that are fair valued by the Board of Trustees, certain factors may be considered such as: fundamental analytical data, the nature and duration of restrictions on disposition, an evaluation of the forces that influence the market in which the securities are purchased and sold, and public trading in similar securities of the issuer or comparable issuers. Financial futures are valued at the last sales price. Investments denominated in foreign currencies are translated to U.S. dollars at the prevailing rates of exchange. Forward currency exchange contracts are valued at the forward rate.
The Fund 25
NOTES TO FINANCIAL STATEMENTS (continued)
|
On September 20, 2006, the FASB released Statement of Financial Accounting Standards No. 157 “Fair Value Measurements” (“FAS 157”). FAS 157 establishes an authoritative definition of fair value, sets out a framework for measuring fair value, and requires additional disclosures about fair-value measurements.The application of FAS 157 is required for fiscal years beginning after November 15, 2007 and interim periods within those fiscal years. Management does not believe that the application of this standard will have a material impact on the financial statements of the fund.
(b) Foreign currency transactions: The fund does not isolate that portion of the results of operations resulting from changes in foreign exchange rates on investments from the fluctuations arising from changes in market prices of securities held. Such fluctuations are included with the net realized and unrealized gain or loss on investments.
Net realized foreign exchange gains or losses arise from sales and maturities of short-term securities, sales of foreign currencies, currency gains or losses realized on securities transactions and the difference between the amounts of dividends, interest and foreign withholding taxes recorded on the fund’s books and the U.S. dollar equivalent of the amounts actually received or paid. Net unrealized foreign exchange gains and losses arise from changes in the value of assets and liabilities other than investments in securities, resulting from changes in exchange rates. Such gains and losses are included with net realized and unrealized gain or loss on investments.
(c) Securities transactions and investment income: Securities transactions are recorded on a trade date basis. Realized gain and loss from securities transactions are recorded on the identified cost basis. Dividend income is recognized on the ex-dividend date and interest income, including, where applicable, accretion of discount and amortization of premium on investments, is recognized on the accrual basis.
The fund has an arrangement with the custodian bank whereby the fund receives earnings credits from the custodian when positive cash balances are maintained, which are used to offset custody fees. For
financial reporting purposes, the fund includes net earnings credits, if any, as an expense offset in the Statement of Operations.
Pursuant to a securities lending agreement with Mellon Bank, N.A., an affiliate of the Manager, the fund may lend securities to qualified institutions.At origination, all loans are secured by collateral of at least 102% of the value of U.S. securities loaned and 105% of the value of foreign securities loaned. Collateral equivalent to at least 100% of the market value of securities on loan will be maintained at all times. Cash collateral is invested in certain money market mutual funds managed by the Manager. The fund will be entitled to receive all income on securities loaned, in addition to income earned as a result of the leading transaction. Although each security loaned is fully collateralized, the fund would bear the risk of delay in recovery of, or loss of rights in, the securities loaned should a borrower fail to return the securities in a timely manner.
(d) Affiliated issuers: Investments in other investment companies advised by the Manager are defined as “affiliated “ in the Act.
(e) Dividends to shareholders: Dividends are recorded on the ex-dividend date. Dividends from investment income-net and dividends from net realized capital gain, if any, are normally declared and paid annually, but the fund may make distributions on a more frequent basis to comply with the distribution requirements of the Internal Revenue Code of 1986, as amended (the “Code”).To the extent that net realized capital gain can be offset by capital loss carryovers, it is the policy of the fund not to distribute such gain. Income and capital gain distributions are determined in accordance with income tax regulations, which may differ from U.S. generally accepted accounting principles.
(f) Federal income taxes: It is the policy of the fund to continue to qualify as a regulated investment company, if such qualification is in the best interests of its shareholders, by complying with the applicable provisions of the Code, and to make distributions of taxable income sufficient to relieve it from substantially all federal income and excise taxes.
NOTES TO FINANCIAL STATEMENTS (continued)
|
On July 13, 2006, the Financial Accounting Standards Board (FASB) released FASB Interpretation No. 48 “Accounting for Uncertainty in Income Taxes” (FIN 48). FIN 48 provides guidance for how uncertain tax positions should be recognized, measured, presented and disclosed in the financial statements. FIN 48 requires the evaluation of tax positions taken or expected to be taken in the course of preparing the fund’s tax returns to determine whether the tax positions are “more-likely-than-not” of being sustained by the applicable tax authority.Tax positions not deemed to meet the more-likely-than-not threshold would be recorded as a tax benefit or expense in the current year. Adoption of FIN 48 is required for fiscal years beginning after December 15, 2006 and is to be applied to all open tax years as of the effective date. Management does not believe that the application of this standard will have a material impact on the financial statements of the fund.
At October 31, 2006, the components of accumulated earnings on a tax basis were as follows: undistributed ordinary income $5,571,414, undistributed capital gains $10,611,556 and unrealized appreciation $20,410,621.
The tax character of distributions paid to shareholders during the fiscal periods ended October 31, 2006 and October 31, 2005, were as follows: ordinary income $6,054,592 and $1,036,206 and long-term capital gains $15,994,319 and $0, respectively.
During the period ended October 31, 2006, as a result of permanent book to tax differences, primarily due to the tax treatment for limited partnership, the fund increased accumulated undistributed investment income-net by $2,424, increased accumulated net realized gain (loss) on investments by $9,771 and decreased paid-in capital by $12,195. Net assets were not affected by this reclassification.
NOTE 2—Bank Line of Credit:
|
The fund participates with other Dreyfus-managed funds in a $350 million redemption credit facility (the “Facility”) to be utilized for temporary or emergency purposes, including the financing of redemptions. In connection therewith, the fund has agreed to pay commitment fees
on its pro rata portion of the Facility. Interest is charged to the fund based on prevailing market rates in effect at the time of borrowings.
The average daily amount of borrowings outstanding under the Facility during the period ended October 31, 2006 was approximately $85,800, with a related weighted average annualized interest rate of 4.70% .
NOTE 3—Management Fee and Other Transactions With Affiliates:
(a) Pursuant to a management agreement with the Manager, the management fee is computed at the annual rate of .75% of the value of the fund’s average daily net assets and is payable monthly.
During the period ended October 31, 2006, the Distributor retained $6,121 and $1 from commissions earned on sales of the fund’s Class A and Class T shares, and $10,523 and $96 from CDSC on redemptions of the fund’s Class B and Class C shares.
(b) Under a Distribution Plan (the “Plan”) adopted pursuant to Rule 12b-1 under the Act, Class B, Class C and Class T shares pay the Distributor for distributing their shares at an annual rate of .75% of the value of the average daily net assets of Class B and Class C shares, and .25% of the value of the average daily net assets of Class T shares. During the period ended October 31, 2006, Class B, Class C and Class T shares were charged $35,289, $7,671 and $425, respectively, pursuant to the Plan.
(c) Under the Shareholder Services Plan, Class A, Class B, Class C and Class T shares pay the Distributor at an annual rate of .25% of the value of their average daily net assets for the provision of certain services. The services provided may include personal services relating to shareholder accounts, such as answering shareholder inquiries regarding the fund and providing reports and other information, and services related to the maintenance of shareholder accounts. The Distributor may make payments to Service Agents (a securities dealer, financial institution or other industry professional) in respect of these services. The Distributor determines the amounts to be paid to Service Agents.
NOTES TO FINANCIAL STATEMENTS (continued)
|
During the period ended October 31, 2006, Class A, Class B, Class C and Class T shares were charged $293,945, $11,763, $2,557 and $425, respectively, pursuant to the Shareholder Services Plan.
The fund compensates Dreyfus Transfer, Inc., a wholly-owned subsidiary of the Manager, under a transfer agency agreement for providing personnel and facilities to perform transfer agency services for the fund. During the period ended October 31, 2006, the fund was charged $72,248 pursuant to the transfer agency agreement.
The fund compensates Mellon Bank, N.A., an affiliate of the Manager, under a custody agreement for providing custodial services for the fund. During the period ended October 31, 2006, the fund was charged $20,181 pursuant to the custody agreement.
During the period ended October 31, 2006, the fund was charged $4,164 for services performed by the Chief Compliance Officer.
The components of Due to The Dreyfus Corporation and affiliates in the Statement of Assets and Liabilities consist of: management fees $80,310, Rule 12b-1 distribution plan fees $3,078, shareholder services plan fees $26,761, custodian fees $5,031, chief compliance officer fees $1,363 and transfer agency per account fees $11,536.
(d) Each Board member also serves as a Board member of other funds within the Dreyfus complex. Annual retainer fees and attendance fees are allocated to each fund based on net assets.
NOTE 4—Securities Transactions:
|
The aggregate amount of purchases and sales of investment securities, excluding short-term securities, during the period ended October 31, 2006, amounted to $93,702,718 and $110,977,419, respectively.
At October 31, 2006, the cost of investments for federal income tax purposes was $106,262,027; accordingly, accumulated net unrealized appreciation on investments was $20,410,621, consisting of $22,076,103 gross unrealized appreciation and $1,665,482 gross unrealized depreciation.
At a meeting of the Board of Trustees of the Company held on November 9, 2006, the Board approved, subject to shareholder approval, an Agreement and Plan of Reorganization (the “Agreement”) between the Company, on behalf of the fund and Advantage Funds, Inc., on behalf of Dreyfus Premier Strategic Value Fund (the “Acquiring Fund”). The Agreement provides for the transfer of the fund’s assets to the Acquiring Fund in a tax-free exchange for shares of the Acquiring Fund and the assumption by the Acquiring Fund of the fund’s stated liabilities, the distribution of shares of the Acquiring Fund to the fund’s shareholders and the subsequent termination of the fund (the “Reorganization”). It is currently contemplated that holders of fund shares as of December 15, 2006 will be asked to approve the Agreement on behalf of the fund at a special meeting of shareholders to be held on or about March 1, 2007. If the Agreement is approved the Reorganization is expected to become effective on or about March 16, 2007. In anticipation of the Reorganization, effective on or about November 17, 2006, the fund will be closed to any investments for new accounts.
The Fund 31
REPORT OF INDEPENDENT REGISTERED PUBLIC ACCOUNTING FIRM
Shareholders and Board of Trustees Dreyfus Premier Value Fund
We have audited the accompanying statement of assets and liabilities, including the statement of investments, of Dreyfus Premier Value Fund (one of the series comprising Dreyfus Premier Value Equity Funds) as of October 31, 2006, and the related statement of operations for the year then ended, the statement of changes in net assets for each of the two years in the period then ended, and the financial highlights for each of the years indicated therein. These financial statements and financial highlights are the responsibility of the Fund’s management. Our responsibility is to express an opinion on these financial statements based on our audits.
We conducted our audits in accordance with the standards of the Public Company Accounting Oversight Board (United States).Those standards require that we plan and perform the audit to obtain reasonable assurance about whether the financial statements and financial highlights are free of material misstatement.We were not engaged to perform an audit of the Fund’s internal control over financial reporting.Our audits included consideration of internal control over financial reporting as a basis for designing audit procedures that are appropriate in the circumstances,but not for the purpose of expressing an opinion on the effectiveness of the Fund’s internal control over financial reporting.Accordingly, we express no such opinion.An audit also includes examining, on a test basis, evidence supporting the amounts and disclosures in the financial statements and financial highlights, assessing the accounting principles used and significant estimates made by management, and evaluating the overall financial statement presentation. Our procedures included verification by examination of securities held by the custodian as of October 31, 2006 and confirmation of securities not held by the custodian by correspondence with oth-ers.We believe that our audits provide a reasonable basis for our opinion. In our opinion, the financial statements and financial highlights referred to above present fairly, in all material respects, the financial position of Dreyfus Premier Value Fund, at October 31, 2006, the results of its operations for the year then ended, the changes in its net assets for each of the two years in the period then ended, and the financial highlights for each of the indicated years, in conformity with U.S. generally accepted accounting principles.

New York, New York
December 13, 2006
|
IMPORTANT TAX INFORMATION (Unaudited)
For federal tax purposes, the fund hereby designates $2.7590 per share as a long-term capital gain distribution paid on December 13, 2005. The fund also hereby designates 33.10% of the ordinary dividends paid during the fiscal year ended October 31,2006 as qualifying for the corporate dividends received deduction. For the fiscal year ended October 31, 2006, certain dividends paid by the fund may be subject to a maximum tax rate of 15%,as provided for by the Jobs and Growth Tax Relief Reconciliation Act of 2003. Of the distributions paid during the fiscal year, $1,040,709 represents the maximum amount that may be considered qualified dividend income.Shareholders will receive notification in January 2007 of the percentage applicable to the preparation of their 2006 income tax returns.
INFORMATION ABOUT THE REVIEW AND APPROVAL OF THE FUND’S MANAGEMENT AGREEMENT (Unaudited)
At a Meeting of the fund’s Board of Trustees held on August 9, 2006, the Board considered the re-approval for an annual period of the fund’s Management Agreement, pursuant to which the Manager provides the fund with investment advisory and administrative services. The Board members, none of whom are “interested persons” (as defined in the Investment Company Act of 1940, as amended) of the fund, were assisted in their review by independent legal counsel and met with counsel in executive session separate from representatives of the Manager.
Analysis of Nature, Extent, and Quality of Services Provided to the Fund. The Board members received a presentation from representatives of the Manager regarding services provided to the fund and other funds in the Dreyfus fund complex, and discussed the nature, extent, and quality of the services provided to the fund pursuant to the fund’s Management Agreement. The Manager’s representatives reviewed the fund’s distribution of accounts and the relationships that the Manager has with various intermediaries and the different needs of each. The Manager’s representatives noted the diversity of distribution of the fund as well as among the funds in the Dreyfus fund complex generally, and the Manager’s corresponding need for broad, deep, and diverse resources to be able to provide ongoing shareholder services in each distribution channel.The Board also reviewed the number of shareholder accounts in the fund, as well as the fund’s asset size.
The Board members also considered the Manager’s research and portfolio management capabilities and that the Manager also provides oversight of day-to-day fund operations, including fund accounting and administration and assistance in meeting legal and regulatory requirements.The Board members also considered the Manager’s extensive administrative, accounting, and compliance infrastructure.
Comparative Analysis of the Fund’s Management Fee and Expense Ratio and Performance. The Board members reviewed reports prepared by Lipper, Inc., an independent provider of investment company data, which included information comparing the fund’s management
fee and expense ratio with a group of comparable funds (the “Expense Group”) and with a broader group of funds (the “Expense Universe”) that were selected by Lipper. Included in the fund’s reports were comparisons of contractual and actual management fee rates and total operating expenses.
The Board members also reviewed the reports prepared by Lipper that presented the fund’s performance for various periods ended June 30, 2006, and placed significant emphasis on comparisons of total return performance for the fund to the same group of funds as the fund’s Expense Group (the “Performance Group”) and to a group of funds that was broader than the fund’s Expense Universe (the “Performance Universe”) that also were selected by Lipper. The Manager furnished these reports to the Board along with a description of the methodology Lipper used to select the fund’s Expense Group and Expense Universe, and Performance Group and Performance Universe.The Manager also provided a comparison of the fund’s total returns to the returns of the fund’s benchmark index for the past 10 calendar years.
The Board reviewed the results of the Expense Group and Expense Universe comparisons for various periods ended June 30, 2006. The Board reviewed the range of management fees and expense ratios of the funds in the Expense Group and Expense Universe, and noted that the fund’s contractual and actual management fees were at or lower than the respective Expense Group medians and the actual management fee was slightly higher than the Expense Universe median.The Board also noted that the fund’s total expense ratio was lower than the Expense Group and Expense Universe medians.
With respect to the fund’s performance, the Board noted that the fund achieved first and second quintile (the first quintile reflecting the highest performance ranking group) total return rankings in the Performance Group and Performance Universe for the 1-year and 2-year periods, respectively. The Board also noted that the fund achieved total returns higher than the Performance Group median for the 5-year period and at the Performance Group median for the 10-year period.The Board noted
I N FO R M AT I O N A B O U T T H E R E V I E W A N D A P P R OVA L
O F T H E F U N D ’ S M A N A G E M E N T A G R E E M E N T ( U n a u d i t e d ) ( c o n t i n u e d )
the contributions of the fund’s primary portfolio manager, who was appointed to manage the fund on October 4, 2004, in achieving the reported total return results for the 1-year and 2-year periods.
Representatives of the Manager reviewed with the Board members the fees paid to the Manager or its affiliates by mutual funds managed by the Manager or its affiliates with similar investment objectives, policies, and strategies, and in the same Lipper category, as the fund (the “Similar Funds”).The Board members also reviewed the fees paid by institutional separate accounts managed by the Large Cap Value Team at The Boston Company Asset Management (“TBCAM”), an affiliate of the Manager, with similar investment objectives, policies, and strategies as the fund (the “Separate Accounts”)(collectively, the “Similar Accounts”).The Manager’s representatives explained the nature of the Similar Accounts and the differences, from the Manager’s perspective, in management of the Similar Accounts as compared to managing and providing services to the fund. The Manager’s representatives advised the Board that the fee schedules reflected for the Separate Accounts were tied to TBCAM’s internal cost structure and negotiated rates with its institutional clients. The Board analyzed differences in fees paid to the Manager and discussed the relationship of the advisory fees paid in light of the Manager’s performance and the services provided. The Board members considered the relevance of the fee information provided for the Similar Accounts managed by the Manager to evaluate the appropriateness and reasonableness of the fund’s management fee. The Manager’s representatives noted that there were no similarly managed wrap fee accounts managed by the Manager or its affiliates with similar investment objectives, policies, and strategies as the fund.
Analysis of Profitability and Economies of Scale. The Manager’s representatives reviewed the dollar amount of expenses allocated and profit received by the Manager for the fund and the method used to determine such expenses and profit.The Board previously had been provided with information prepared by an independent consulting firm regarding the Manager’s approach to allocating costs to, and determining the prof-
itability of, individual funds and the entire Dreyfus mutual fund com-plex.The Board also had been informed that the methodology had also been reviewed by an independent registered public accounting firm which, like the consultant, found the methodology to be reasonable. The consulting firm also analyzed where any economies of scale might emerge in connection with the management of a fund. The Board members evaluated the profitability analysis in light of the relevant circumstances for the fund, including any decline in fund assets from the prior year, and the extent to which economies of scale would be realized if the fund grows and whether fee levels reflect these economies of scale for the benefit of fund shareholders.The Board members also considered potential benefits to the Manager from acting as investment adviser to the fund and noted that the soft dollar arrangements in effect with respect to trading the fund’s portfolio.
It was noted that the Board members should consider the Manager’s profitability with respect to the fund as part of their evaluation of whether the fees under the Management Agreement bear a reasonable relationship to the mix of services provided by the Manager, including the nature, extent, and quality of such services and that a discussion of economies of scale is predicated on increasing assets and that, if a fund’s assets had been decreasing, the possibility that the Manager may have realized any economies of scale would be less. It was noted that the profitability percentage for managing the fund was within ranges determined by appropriate court cases to be reasonable given the services rendered and the fund’s overall performance and generally superior service levels provided.
At the conclusion of these discussions, each Board member expressed the opinion that he or she had been furnished with sufficient information to make an informed business decision with respect to continuation of the fund’s Management Agreement. Based on their discussions and considerations as described above, the fund’s Board made the following conclusions and determinations.
The Fund 37
I N FO R M AT I O N A B O U T T H E R E V I E W A N D A P P R OVA L
O F T H E F U N D ’ S M A N A G E M E N T A G R E E M E N T ( U n a u d i t e d ) ( c o n t i n u e d )
- The Board concluded that the nature,extent,and quality of the services provided by the Manager to the fund are adequate and appropriate.
- The Board was satisfied with the fund’s performance.
- The Board concluded that the fee paid to the Manager by the fund was reasonable in light of the services provided, comparative perfor- mance and expense and management fee information, costs of the services provided and profits to be realized and benefits derived or to be derived by the Manager from its relationship with the fund.
- The Board determined that the economies of scale which may accrue to Dreyfus and its affiliates in connection with the management of the fund had been adequately considered by Dreyfus in connection with the management fee rate charged to the fund, and that, to the extent in the future it were to be determined that material economies of scale had not been shared with the fund,the Board would seek to have those economies of scale shared with the fund.
The Board members considered these conclusions and determinations, along with the information received on a routine and regular basis throughout the year, and, without any one factor being dispositive, the Board determined that re-approval of the fund’s Management Agreement was in the best interests of the fund and its shareholders.
BOARD MEMBERS INFORMATION (Unaudited)
Joseph S. DiMartino (63) Chairman of the Board (1995)
Principal Occupation During Past 5 Years:
• Corporate Director and Trustee
Other Board Memberships and Affiliations:
- The Muscular Dystrophy Association, Director
- Century Business Services, Inc., a provider of outsourcing functions for small and medium size companies, Director
- The Newark Group, a provider of a national market of paper recovery facilities, paperboard mills and paperboard converting plants, Director
- Sunair Services Corporation, engaging in the design, manufacture and sale of high frequency systems for long-range voice and data communications, as well as providing certain outdoor- related services to homes and businesses, Director
No. of Portfolios for which Board Member Serves: 189
David W. Burke (70)
Board Member (1994)
|
Principal Occupation During Past 5 Years:
• Corporate Director and Trustee
Other Board Memberships and Affiliations:
- John F. Kennedy Library Foundation, Director
- U.S.S. Constitution Museum, Director
No. of Portfolios for which Board Member Serves: 80
Diane Dunst (67)
Board Member (1990)
|
Principal Occupation During Past 5 Years:
• President, Huntting House Antiques
No. of Portfolios for which Board Member Serves: 9
Jay I. Meltzer (78)
Board Member (1991)
|
Principal Occupation During Past 5 Years:
- Physician, Internist and Specialist in Clinical Hypertension
- Clinical Professor of Medicine at Columbia University & College of Physicians and Surgeons
- Faculty Associate, Center for Bioethics, Columbia
No. of Portfolios for which Board Member Serves: 9
BOARD MEMBERS INFORMATION (Unaudited) (continued)
Daniel Rose (77)
Board Member (1992)
|
Principal Occupation During Past 5 Years:
|
- Chairman and Chief Executive Officer of Rose Associates, Inc., a New York based real estate development and management firm
Other Board Memberships and Affiliations:
|
- Baltic-American Enterprise Fund,Vice Chairman and Director
- Harlem Educational Activities Fund, Inc., Chairman
- Housing Committee of the Real Estate Board of New York, Inc., Director
No. of Portfolios for which Board Member Serves: 18
Warren B. Rudman (76)
Board Member (1993)
|
Principal Occupation During Past 5 Years:
|
- Of Counsel to (from January 1993 to December 31, 2003, Partner in) the law firm Paul, Weiss, Rifkind,Wharton & Garrison LLP
Other Board Memberships and Affiliations:
|
- Collins & Aikman Corporation, Director
- Allied Waste Corporation, Director
- Raytheon Company, Director
- Boston Scientific, Director
No. of Portfolios for which Board Member Serves: 18
Sander Vanocur (78)
Board Member (1992)
|
Principal Occupation During Past 5 Years:
• President, Old Owl Communications
|
No. of Portfolios for which Board Member Serves: 18
———————
Once elected all Board Members serve for an indefinite term.The address of the Board Members and Officers is in c/o The Dreyfus Corporation, 200 Park Avenue, New York, New York 10166. Additional information about the Board Members is available in the fund’s Statement of Additional Information which can be obtained from Dreyfus free of charge by calling this toll free number: 1-800-554-4611.
Rosalind Gersten Jacobs, Emeritus Board Member
OFFICERS OF THE FUND (Unaudited)
| STEPHEN E. CANTER, President since | | JOSEPH M. CHIOFFI, Vice President and |
| March 2000. | | Assistant Secretary since August 2005. |
| Chairman of the Board and Chief Executive | | Associate General Counsel of the Manager, |
| Officer of the Manager, and an officer of 90 | | and an officer of 91 investment companies |
| investment companies (comprised of 189 | | (comprised of 205 portfolios) managed by the |
| portfolios) managed by the Manager. Mr. | | Manager. He is 44 years old and has been an |
| Canter also is a Board member and, where | | employee of the Manager since June 2000. |
| |
| applicable, an Executive Committee Member | | JANETTE E. FARRAGHER, Vice President |
| of the other investment management | | and Assistant Secretary since |
| subsidiaries of Mellon Financial Corporation, | | August 2005. |
| each of which is an affiliate of the Manager. | | |
| He is 61 years old and has been an employee | | Associate General Counsel of the Manager, |
| of the Manager since May 1995. | | and an officer of 91 investment companies |
| | | (comprised of 205 portfolios) managed by the |
| MARK N. JACOBS, Vice President since | | Manager. She is 43 years old and has been an |
| March 2000. | | employee of the Manager since February 1984. |
| |
| Executive Vice President, Secretary and | | JOHN B. HAMMALIAN, Vice President and |
| General Counsel of the Manager, and an | | Assistant Secretary since August 2005. |
| officer of 91 investment companies (comprised | | |
| of 205 portfolios) managed by the Manager. | | Associate General Counsel of the Manager, |
| He is 60 years old and has been an employee | | and an officer of 91 investment companies |
| of the Manager since June 1977. | | (comprised of 205 portfolios) managed by the |
| | | Manager. He is 43 years old and has been an |
| MICHAEL A. ROSENBERG, Vice President | | employee of the Manager since February 1991. |
| and Secretary since August 2005. | | |
| | | ROBERT R. MULLERY, Vice President and |
| Associate General Counsel of the Manager, | | Assistant Secretary since August 2005. |
| and an officer of 91 investment companies | | |
| (comprised of 205 portfolios) managed by the | | Associate General Counsel of the Manager, |
| Manager. He is 46 years old and has been an | | and an officer of 91 investment companies |
| employee of the Manager since October 1991. | | (comprised of 205 portfolios) managed by the |
| | | Manager. He is 54 years old and has been an |
| JAMES BITETTO, Vice President and | | employee of the Manager since May 1986. |
| Assistant Secretary since August 2005. | | |
| | | JEFF PRUSNOFSKY, Vice President and |
| Associate General Counsel and Assistant | | Assistant Secretary since August 2005. |
| Secretary of the Manager, and an officer of 91 | | |
| investment companies (comprised of 205 | | Associate General Counsel of the Manager, |
| portfolios) managed by the Manager. He is 40 | | and an officer of 91 investment companies |
| years old and has been an employee of the | | (comprised of 205 portfolios) managed by the |
| Manager since December 1996.�� | | Manager. He is 41 years old and has been an |
| | | employee of the Manager since October 1990. |
| JONI LACKS CHARATAN, Vice President | | |
| and Assistant Secretary since | | JAMES WINDELS, Treasurer since |
| August 2005. | | November 2001. |
| Associate General Counsel of the Manager, | | Director – Mutual Fund Accounting of the |
| and an officer of 91 investment companies | | Manager, and an officer of 91 investment |
| (comprised of 205 portfolios) managed by the | | companies (comprised of 205 portfolios) |
| Manager. She is 50 years old and has been an | | managed by the Manager. He is 48 years old |
| employee of the Manager since October 1988. | | and has been an employee of the Manager |
| | | since April 1985. |
The Fund 41
OFFICERS OF THE FUND (Unaudited) (continued)
| ERIK D. NAVILOFF, Assistant Treasurer | | JOSEPH W. CONNOLLY, Chief Compliance |
| since August 2005. | | Officer since October 2004. |
| Senior Accounting Manager – Taxable Fixed | | Chief Compliance Officer of the Manager and |
| Income Funds of the Manager, and an officer | | The Dreyfus Family of Funds (91 investment |
| of 91 investment companies (comprised of 205 | | companies, comprised of 205 portfolios). From |
| portfolios) managed by the Manager. He is 38 | | November 2001 through March 2004, Mr. |
| years old and has been an employee of the | | Connolly was first Vice-President, Mutual |
| Manager since November 1992. | | Fund Servicing for Mellon Global Securities |
| |
| ROBERT ROBOL, Assistant Treasurer | | Services. In that capacity, Mr. Connolly was |
| since August 2005. | | responsible for managing Mellon’s Custody, |
| | | Fund Accounting and Fund Administration |
| Senior Accounting Manager – Money Market | | services to third-party mutual fund clients. He |
| and Municipal Bond Funds of the Manager, | | is 49 years old and has served in various |
| and an officer of 91 investment companies | | capacities with the Manager since 1980, |
| (comprised of 205 portfolios) managed by the | | including manager of the firm’s Fund |
| Manager. He is 42 years old and has been an | | Accounting Department from 1997 through |
| employee of the Manager since October 1988. | | October 2001. |
| |
| ROBERT SVAGNA, Assistant Treasurer | | WILLIAM GERMENIS, Anti-Money |
| since December 2002. | | Laundering Compliance Officer since |
| Senior Accounting Manager – Equity Funds of | | October 2002. |
| the Manager, and an officer of 91 investment | | Vice President and Anti-Money Laundering |
| companies (comprised of 205 portfolios) | | Compliance Officer of the Distributor, and the |
| managed by the Manager. He is 39 years old | | Anti-Money Laundering Compliance Officer |
| and has been an employee of the Manager | | of 87 investment companies (comprised of 201 |
| since November 1990. | | portfolios) managed by the Manager. He is 36 |
| GAVIN C. REILLY, Assistant Treasurer | | years old and has been an employee of the |
| since December 2005. | | Distributor since October 1998. |
| Tax Manager of the Investment Accounting | | |
| and Support Department of the Manager, and | | |
| an officer of 91 investment companies | | |
| (comprised of 205 portfolios) managed by the | | |
| Manager. He is 38 years old and has been an | | |
| employee of the Manager since April 1991. | | |
42
NOTES
| For More | | Information |
| |
|
| |
| Dreyfus Premier | | Transfer Agent & |
| Value Fund | | Dividend Disbursing Agent |
| 200 Park Avenue | | |
| | | Dreyfus Transfer, Inc. |
| New York, NY 10166 | | |
| | | 200 Park Avenue |
| Manager | | New York, NY 10166 |
| The Dreyfus Corporation | | Distributor |
| 200 Park Avenue | | |
| | | Dreyfus Service Corporation |
| New York, NY 10166 | | |
| | | 200 Park Avenue |
| Custodian | | New York, NY 10166 |
| Mellon Bank, N.A. | | |
| One Mellon Bank Center | | |
| Pittsburgh, PA 15258 | | |
Telephone Call your financial representative or 1-800-554-4611
| Mail | | The Dreyfus Premier Family of Funds |
| | | 144 Glenn Curtiss Boulevard, Uniondale, NY 11556-0144 |
The fund files its complete schedule of portfolio holdings with the Securities and Exchange Commission (“SEC”) for the first and third quarters of each fiscal year on Form N-Q. The fund’s Forms N-Q are available on the SEC’s website at http://www.sec.gov and may be reviewed and copied at the SEC’s Public Reference Room in Washington, DC. Information on the operation of the Public Reference Room may be obtained by calling 1-202-551-8090.
A description of the policies and procedures that the fund uses to determine how to vote proxies relating to portfolio securities, and information regarding how the fund voted these proxies for the 12-month period ended June 30, 2006, is available at http://www.dreyfus.com and on the SEC’s website at http://www.sec.gov. The description of the policies and procedures is also available without charge, upon request, by calling 1-800-645-6561.
© 2006 Dreyfus Service Corporation

Item 2. Code of Ethics.
The Registrant has adopted a code of ethics that applies to the Registrant's principal executive officer, principal financial officer, principal accounting officer or controller, or persons performing similar functions. There have been no amendments to, or waivers in connection with, the Code of Ethics during the period covered by this Report.
Item 3. Audit Committee Financial Expert.
The Registrant's Board has determined that Joseph S. DiMartino, a member of the Audit Committee of the Board, is an audit committee financial expert as defined by the Securities and Exchange Commission (the "SEC"). Joseph S. DiMartino is "independent" as defined by the SEC for purposes of audit committee financial expert determinations.
Item 4. Principal Accountant Fees and Services
(a) Audit Fees. The aggregate fees billed for each of the last two fiscal years (the "Reporting Periods") for professional services rendered by the Registrant's principal accountant (the "Auditor") for the audit of the Registrant's annual financial statements, or services that are normally provided by the Auditor in connection with the statutory and regulatory filings or engagements for the Reporting Periods, were $47,805 in 2005 and $24,562 in 2006.
(b) Audit-Related Fees. The aggregate fees billed in the Reporting Periods for assurance and related services by the Auditor that are reasonably related to the performance of the audit of the Registrant's financial statements and are not reported under paragraph (a) of this Item 4 were $4,725 in 2005 and $5,122 in 2006. These services consisted of security counts required by Rule 17f-2 under the Investment Company Act of 1940, as amended.
The aggregate fees billed in the Reporting Periods for non-audit assurance and related services by the Auditor to the Registrant's investment adviser (not including any sub-investment adviser whose role is primarily portfolio management and is subcontracted with or overseen by another investment adviser), and any entity controlling, controlled by or under common control with the investment adviser that provides ongoing services to the Registrant ("Service Affiliates"), that were reasonably related to the performance of the annual audit of the Service Affiliate, which required pre-approval by the Audit Committee were $0 in 2005 and $0 in 2006.
Note: For the second paragraph in each of (b) through (d) of this Item 4, certain of such services were not pre-approved prior to May 6, 2003, when such services were required to be pre-approved. On and after May 6, 2003, 100% of all services provided by the Auditor were pre-approved as required. For comparative purposes, the fees shown assume that all such services were pre-approved, including services that were not pre-approved prior to the compliance date of the pre-approval requirement.
(c) Tax Fees. The aggregate fees billed in the Reporting Periods for professional services rendered by the Auditor for tax compliance, tax advice and tax planning ("Tax Services") were $6,149 in 2005 and $4,815 in 2006. These services consisted of (i) review or preparation of U.S. federal, state, local and excise tax returns; (ii) U.S. federal, state and local tax planning, advice and assistance regarding statutory, regulatory or
administrative developments, (iii) tax advice regarding tax qualification matters and/or treatment of various financial instruments held or proposed to be acquired or held, and (iv) determination of Passive Foreign Investment Companies (as applicable).
The aggregate fees billed in the Reporting Periods for Tax Services by the Auditor to Service Affiliates which required pre-approval by the Audit Committee were $0 in 2005 and $0 in 2006.
(d) All Other Fees. The aggregate fees billed in the Reporting Periods for products and services provided by the Auditor, other than the services reported in paragraphs (a) through (c) of this Item, were $330 in 2005 and $615 in 2006. These services consisted of a review of the Registrant's anti-money laundering program.
The aggregate fees billed in the Reporting Periods for Non-Audit Services by the Auditor to Service Affiliates, other than the services reported in paragraphs (b) through (c) of this Item, which required pre-approval by the Audit Committee were $0 in 2005 and $0 in 2006.
Audit Committee Pre-Approval Policies and Procedures. The Registrant's Audit Committee has established policies and procedures (the "Policy") for pre-approval (within specified fee limits) of the Auditor's engagements for non-audit services to the Registrant and Service Affiliates without specific case-by-case consideration. Pre-approval considerations include whether the proposed services are compatible with maintaining the Auditor's independence. Pre-approvals pursuant to the Policy are considered annually.
Non-Audit Fees. The aggregate non-audit fees billed by the Auditor for services rendered to the Registrant, and rendered to Service Affiliates, for the Reporting Periods were $755,822 in 2005 and $436,321 in 2006.
Auditor Independence. The Registrant's Audit Committee has considered whether the provision of non-audit services that were rendered to Service Affiliates which were not pre-approved (not requiring pre-approval) is compatible with maintaining the Auditor's independence.
Item 5. Audit Committee of Listed Registrants.
Not applicable.
Item 6. Schedule of Investments.
Not applicable.
Item 7. Disclosure of Proxy Voting Policies and Procedures for Closed-End Management
Investment Companies.
Not applicable.
Item 8. Portfolio Managers of Closed-End Management Investment Companies.
Not applicable.
Item 9. Purchases of Equity Securities by Closed-End Management Investment Companies and
Affiliated Purchasers.
Not applicable.
Item 10. Submission of Matters to a Vote of Security Holders.
|
The Registrant has a Nominating Committee (the "Committee"), which is responsible for selecting and nominating persons for election or appointment by the Registrant's Board as Board members. The Committee has adopted a Nominating Committee Charter (the "Charter"). Pursuant to the Charter, the Committee will consider recommendations for nominees from shareholders submitted to the Secretary of the Registrant, c/o The Dreyfus Corporation Legal Department, 200 Park Avenue, 8th Floor East, New York, New York 10166. A nomination submission must include information regarding the recommended nominee as specified in the Charter. This information includes all information relating to a recommended nominee that is required to be disclosed in solicitations or proxy statements for the election of Board members, as well as information sufficient to evaluate the factors to be considered by the Committee, including character and integrity, business and professional experience, and whether the person has the ability to apply sound and independent business judgment and would act in the interests of the Registrant and its shareholders.
Nomination submissions are required to be accompanied by a written consent of the individual to stand for election if nominated by the Board and to serve if elected by the shareholders, and such additional information must be provided regarding the recommended nominee as reasonably requested by the Committee.
Item 11. Controls and Procedures.
(a) The Registrant's principal executive and principal financial officers have concluded, based on their evaluation of the Registrant's disclosure controls and procedures as of a date within 90 days of the filing date of this report, that the Registrant's disclosure controls and procedures are reasonably designed to ensure that information required to be disclosed by the Registrant on Form N-CSR is recorded, processed, summarized and reported within the required time periods and that information required to be disclosed by the Registrant in the reports that it files or submits on Form N-CSR is accumulated and communicated to the Registrant's management, including its principal executive and principal financial officers, as appropriate to allow timely decisions regarding required disclosure.
(b) There were no changes to the Registrant's internal control over financial reporting that occurred during the second fiscal quarter of the period covered by this report that have materially affected, or are reasonably likely to materially affect, the Registrant's internal control over financial reporting.
Item 12. Exhibits.
(a)(1) Code of ethics referred to in Item 2.
(a)(2) Certifications of principal executive and principal financial officers as required by Rule 30a-2(a)
under the Investment Company Act of 1940.
(a)(3) Not applicable.
(b) Certification of principal executive and principal financial officers as required by Rule 30a-2(b)
under the Investment Company Act of 1940.
|
SIGNATURES
Pursuant to the requirements of the Securities Exchange Act of 1934 and the Investment Company Act of 1940, the Registrant has duly caused this Report to be signed on its behalf by the undersigned, thereunto duly authorized.
DREYFUS PREMIER VALUE EQUITY FUNDS
| By: | | /s/ Stephen E. Canter |
| |
|
| | | Stephen E. Canter |
| | | President |
| Date: | | December 28, 2006 |
Pursuant to the requirements of the Securities Exchange Act of 1934 and the Investment Company Act of 1940, this Report has been signed below by the following persons on behalf of the Registrant and in the capacities and on the dates indicated.
| By: | | /s/ Stephen E. Canter |
| |
|
| | | Stephen E. Canter |
| | | Chief Executive Officer |
| Date: | | December 28, 2006 |
| |
| |
| By: | | /s/ James Windels |
| |
|
| | | James Windels |
| | | Chief Financial Officer |
| Date: | | December 28, 2006 |
EXHIBIT INDEX
(a)(1) Code of ethics referred to in Item 2.
(a)(2) Certifications of principal executive and principal financial officers as required by Rule 30a-
2(a) under the Investment Company Act of 1940. (EX-99.CERT)
(b) Certification of principal executive and principal financial officers as required by Rule 30a-
2(b) under the Investment Company Act of 1940. (EX-99.906CERT)
|