UNITED STATES
SECURITIES AND EXCHANGE COMMISSION
Washington, D.C. 20549
FORM N-CSR
Certified Shareholder Report of
Registered Management Investment Companies
Investment Company Act File Number: 811-04692
Emerging Markets Growth Fund, Inc.
(Exact Name of Registrant as Specified in Charter)
6455 Irvine Center Drive
Irvine, California 92618
(Address of Principal Executive Offices)
Registrant's telephone number, including area code: (213) 486-9200
Date of fiscal year end: June 30
Date of reporting period: June 30, 2017
Courtney R. Taylor
Emerging Markets Growth Fund, Inc.
333 South Hope Street
Los Angeles, California 90071
(Name and Address of Agent for Service)
ITEM 1 – Reports to Stockholders
 | Emerging Markets Growth FundSM Annual report for the year ended June 30, 2017 |

Emerging Markets Growth Fund seeks long-term growth of capital and invests primarily in common stock and other equity securities of issuers in developing countries.
Fund results shown in this report are for past periods and are not predictive of results for future periods. The results shown are before taxes on fund distributions and sale of fund shares. Current and future results may be lower or higher than those shown. Share prices and returns will vary, so investors may lose money. Investing for short periods makes losses more likely. Investments are not FDIC-insured, nor are they deposits of or guaranteed by a bank or any other entity, so they may lose value. For current information and month-end results, please call (800) 421-4989.
Investing in developing markets involves risks, such as significant currency and price fluctuations, political instability, differing securities regulations and periods of illiquidity, which are detailed in the fund’s prospectus. Investments in developing markets have been more volatile than investments in developed markets, reflecting the greater uncertainties of investing in less established economies. Individuals investing in developing markets should have a long-term perspective and be able to tolerate potentially sharp declines in the value of their investments.
Contents
| 1 | Letter to investors | |
| 2 | 20 largest equity holdings | |
| 7 | Investment portfolio | |
| 15 | Financial statements | |
| 17 | Notes to financial statements |
Fellow investors:
Emerging markets stocks surged after several challenging years, bolstered by a major stimulus program in China, a rebound in commodity prices and strong earnings from technology-related companies. The value of Emerging Markets Growth Fund increased 25.43% with dividends reinvested for the 12 months ended June 30, 2017, while its benchmark, the unmanaged MSCI Emerging Markets Investable Market Index (IMI), rose 22.82%.*
Market review
Emerging markets led a worldwide rally in equities during the reporting period, fueled by outsized gains in the information technology and materials sectors. Shares of technology companies were driven higher by strong demand for internet services as well as increased orders for electronic components used in mobile devices and cloud computing systems. Materials companies rebounded as China’s stimulus measures and a broader recovery in the global economy spurred demand for industrial commodities such as iron ore, copper and aluminum.
By region, Asian countries produced the strongest returns. Chinese stocks soared 30.11%, helped by sustained government stimulus measures, healthy consumer spending and a red-hot property market. Moderate growth eased fears that the world’s second-largest economy was headed for a hard landing. Also driving
| * | Unless otherwise noted, country and sector returns are based on MSCI EM IMI indices, expressed in U.S. dollars, and assume the reinvestment of dividends. Results reflect dividends net of withholding taxes. |
Results at a glance
For periods ended June 30, 2017, with distributions reinvested
| Cumulative total returns | Average annual total returns | |||||||||||||||||||||||
| 6 months | 1 year | 3 years | 5 years | 10 years | Lifetime1 | |||||||||||||||||||
| Emerging Markets Growth Fund | 21.52 | % | 25.43 | % | 0.58 | % | 3.57 | % | 1.30 | % | 13.32 | % | ||||||||||||
| MSCI Emerging Markets IMI2,3 | 18.11 | 22.82 | 1.03 | 4.09 | 2.09 | 10.34 | 4 | |||||||||||||||||
| MSCI Emerging Markets Index3,5 | 18.43 | 23.75 | 1.07 | 3.96 | 1.91 | 10.28 | 4 | |||||||||||||||||
| 1 | Since May 30, 1986. |
| 2 | Returns for the MSCI Emerging Markets Investable Market Index (IMI) were calculated using the MSCI Emerging Markets Index with dividends gross of withholding taxes from January 1, 1988, to December 31, 2000, and with dividends net of withholding taxes from January 1, 2001, to November 30, 2007, and using the MSCI Emerging Markets IMI with dividends net of withholding taxes thereafter. |
| 3 | The indices are unmanaged and, therefore, have no expenses. Investors cannot invest directly in the index. Source: MSCI. |
| 4 | The MSCI Emerging Markets Index did not start until December 31, 1987. As a result, the International Finance Corporation (IFC) Global Composite Index was used in lieu of the MSCI Emerging Markets Index from May 30, 1986, to December 31, 1987. |
| 5 | Results reflect dividends gross of withholding taxes through December 31, 2000, and dividends net of withholding taxes thereafter. |
The total annual fund operating expense ratio is 0.85% as of the most recent fiscal year-end, and is 0.88% including “acquired fund” fees and expenses.
| Emerging Markets Growth Fund | 1 |
returns was the evolution of internet firms such as Alibaba and Tencent, whose robust sales during the period underscore China’s ongoing shift to a services-led economy.
South Korean and Taiwanese stocks climbed to new heights, propelled by rising exports of technology-related components used in smartphones and tablets. The MSCI Korea IMI surged 28.80%, while the MSCI Taiwan IMI increased 31.93%. Indian equities advanced 21.01% to trade at their highest level since 2008 amid moves to improve the country’s business climate, which would include the institution of a national sales tax. Prime Minister Narendra Modi’s party won key state elections in March, further solidifying his reform-minded agenda.
In Latin America, Brazilian stocks rose 18.15% but were volatile. After notching impressive gains on improving commodities prices and passage of a bill to curb public spending, stocks declined in May and June after allegations tied President Michel Temer to political bribes. The accusations raised concerns that his pro-business team would face difficulty in securing passage of major legislation to overhaul Brazil’s social security system, a reform seen as helping set the stage for economic growth.
Mexican stocks increased 11.38% during a tumultuous 12-month stretch. Stocks sold off during the first half of the reporting period, hurt by worries trade would slow with the U.S., its largest trading partner. However, sentiment gradually improved as investors became hopeful that trade officials for the U.S. and Mexico could amend the North American Free Trade Agreement on amicable terms. The Mexican peso swung back from sharp losses against the U.S. dollar, ending with an almost 1.93% gain.
20 largest equity holdings
| Percent of net assets as of 6/30/17 | Price change for the 12 months ended 6/30/17* | |||||||
| Samsung Electronics | 3.8 | % | 55.3 | % | ||||
| Alibaba Group | 3.7 | 77.2 | ||||||
| Taiwan Semiconductor Manufacturing | 3.4 | 35.5 | ||||||
| Naspers | 3.0 | 27.0 | ||||||
| AIA Group | 2.5 | 21.3 | ||||||
| Jiangsu Hengrui Medicine | 2.2 | 23.5 | ||||||
| Tencent | 2.1 | 57.0 | ||||||
| Bharti Airtel | 2.0 | 7.6 | ||||||
| Wynn Macau | 1.9 | 60.9 | ||||||
| China Overseas Land & Investment | 1.9 | –8.3 | ||||||
| Delta Electronics | 1.9 | 12.0 | ||||||
| América Móvil | 1.8 | 29.9 | ||||||
| Housing Development Finance | 1.7 | 33.9 | ||||||
| Elang Mahkota Teknologi | 1.5 | 16.3 | ||||||
| Vale | 1.5 | 102.2 | ||||||
| China Pacific Insurance Group | 1.4 | 19.7 | ||||||
| Longfor Properties | 1.4 | 65.1 | ||||||
| Savola Group | 1.3 | 38.2 | ||||||
| Astra International | 1.3 | 18.4 | ||||||
| Carlsberg | 1.3 | 12.6 | ||||||
| Total | 41.6 | % | ||||||
| * | The percent change is reflected in U.S. dollars. The actual gain or loss on the total position in the fund may differ from the percentage shown. |
Portfolio review
The choice of stocks in the materials sector contributed to returns on a relative basis. Shares of Brazilian miner Vale surged 102.2% even as iron prices began to fall from two-year highs. Vale bolstered its cash flow, swung to a 2016 profit, divested assets and reinstated its dividend. Shares of Mexico’s Cemex, one of the world’s largest providers of cement and building materials, climbed 52.7% on improving profits and debt reduction moves. Russian diamond producer Alrosa also rose.
Investments in China bolstered returns. Jiangsu Hengrui Medicine was a leading contributor. Shares gained 23.5% as the pharmaceutical firm projected strong revenue for the second half of 2017 and
| 2 | Emerging Markets Growth Fund |
Where the fund’s assets were invested
| Value of holdings | ||||||||||||||||||||||||
| Percent of net assets | MSCI EM IMI1 | 6/30/17 | ||||||||||||||||||||||
| 6/30/15 | 6/30/16 | 12/31/16 | 6/30/17 | 6/30/17 | (in thousands) | |||||||||||||||||||
| Asia-Pacific | ||||||||||||||||||||||||
| China | 27.4 | % | 21.9 | % | 21.7 | % | 24.3 | % | 26.9 | % | $ | 618,920 | ||||||||||||
| Hong Kong | 7.3 | 7.5 | 6.9 | 6.5 | — | 165,182 | ||||||||||||||||||
| India | 11.5 | 10.6 | 10.4 | 11.2 | 9.5 | 283,837 | ||||||||||||||||||
| Indonesia | 2.0 | 3.7 | 4.9 | 6.0 | 2.5 | 152,027 | ||||||||||||||||||
| Malaysia | 2.2 | 1.4 | .7 | .6 | 2.5 | 14,666 | ||||||||||||||||||
| Philippines | .5 | .4 | 1.3 | 1.7 | 1.2 | 44,178 | ||||||||||||||||||
| Singapore | .9 | 1.4 | 1.2 | 1.0 | — | 26,447 | ||||||||||||||||||
| South Korea | 4.3 | 5.3 | 3.7 | 5.6 | 15.7 | 143,502 | ||||||||||||||||||
| Taiwan | 5.8 | 7.2 | 8.1 | 7.9 | 13.2 | 201,369 | ||||||||||||||||||
| Thailand | 1.3 | .8 | .9 | 1.0 | 2.4 | 25,329 | ||||||||||||||||||
| 63.2 | 60.2 | 59.8 | 65.8 | 73.9 | 1,675,457 | |||||||||||||||||||
| Latin America | ||||||||||||||||||||||||
| Argentina | .9 | .6 | .2 | — | 2 | — | — | |||||||||||||||||
| Brazil | 6.4 | 8.6 | 9.4 | 4.9 | 6.3 | 125,085 | ||||||||||||||||||
| Chile | 1.1 | 1.4 | 1.4 | 1.1 | 1.1 | 27,842 | ||||||||||||||||||
| Colombia | — | — | — | — | .4 | — | ||||||||||||||||||
| Mexico | 4.8 | 4.4 | 4.1 | 3.7 | 3.6 | 93,772 | ||||||||||||||||||
| Peru | .1 | .6 | 1.3 | 1.3 | .3 | 32,289 | ||||||||||||||||||
| 13.3 | 15.6 | 16.4 | 11.0 | 11.7 | 278,988 | |||||||||||||||||||
| Eastern Europe and Middle East | ||||||||||||||||||||||||
| Czech Republic | — | — | — | — | .2 | — | ||||||||||||||||||
| Egypt | — | — | — | — | .2 | — | ||||||||||||||||||
| Greece | — | 2 | — | — | — | .4 | — | |||||||||||||||||
| Hungary | — | — | — | — | .3 | — | ||||||||||||||||||
| Israel | .1 | — | — | — | — | — | ||||||||||||||||||
| Oman | .4 | .2 | .3 | .1 | — | 1,752 | ||||||||||||||||||
| Pakistan | — | — | — | — | .2 | — | ||||||||||||||||||
| Poland | — | — | — | — | 1.3 | — | ||||||||||||||||||
| Qatar | — | — | — | — | .6 | — | ||||||||||||||||||
| Russia | 4.1 | 5.1 | 7.5 | 5.6 | 2.8 | 141,315 | ||||||||||||||||||
| Saudi Arabia | .8 | .9 | 1.1 | 1.3 | — | 32,600 | ||||||||||||||||||
| Turkey | .7 | 1.9 | 1.0 | .6 | 1.2 | 16,082 | ||||||||||||||||||
| United Arab Emirates | .9 | 1.1 | .5 | .4 | .7 | 10,835 | ||||||||||||||||||
| 7.0 | 9.2 | 10.4 | 8.0 | 7.9 | 202,584 | |||||||||||||||||||
| Africa | ||||||||||||||||||||||||
| South Africa | 3.2 | 4.6 | 5.5 | 6.4 | 6.4 | 163,590 | ||||||||||||||||||
| 3.2 | 4.6 | 5.5 | 6.4 | 6.4 | 163,590 | |||||||||||||||||||
| Other markets3 | ||||||||||||||||||||||||
| Australia | .8 | .4 | — | — | 2 | 477 | ||||||||||||||||||
| Austria | .4 | .2 | — | — | — | |||||||||||||||||||
| Canada | .9 | .5 | .3 | .2 | 4,441 | |||||||||||||||||||
| Denmark | — | .6 | 1.3 | 1.2 | 31,838 | |||||||||||||||||||
| France | — | — | — | — | 2 | 966 | ||||||||||||||||||
| Italy | .2 | .3 | .3 | .2 | 3,895 | |||||||||||||||||||
| Netherlands | — | 2 | — | — | — | — | ||||||||||||||||||
| Switzerland | .7 | .3 | .3 | .4 | 10,069 | |||||||||||||||||||
| United Kingdom | 1.9 | 2.1 | 1.0 | .8 | 19,317 | |||||||||||||||||||
| United States of America | 2.9 | 1.6 | 2.5 | 2.3 | 58,414 | |||||||||||||||||||
| 7.8 | 6.0 | 5.7 | 5.1 | 129,417 | ||||||||||||||||||||
| Multinational | .4 | .1 | .1 | — | 2 | 1,098 | ||||||||||||||||||
| Short-term securities and other assets less liabilities | 5.1 | 4.3 | 2.1 | 3.7 | 94,193 | |||||||||||||||||||
| Total net assets | 100.0 | % | 100.0 | % | 100.0 | % | 100.0 | % | 100.0 | %4 | $ | 2,545,327 | ||||||||||||
| 1 | A dash indicates that the market is not included in the index. Source: MSCI. |
| 2 | Amount less than 0.1%. |
| 3 | Includes investments in companies incorporated in the region that have significant operations in emerging markets. |
| 4 | Totals may not add to 100% due to rounding. |
| Emerging Markets Growth Fund | 3 |
voiced optimism that more of its drugs would be approved for sale. Shares of Alibaba Group and JD.com, China’s largest online retailers, gained 77.2% and 84.7%, respectively, on robust sales. Meanwhile, Longfor Properties was up 65.1% on continued strength in home sales and higher property prices in China.
Hong Kong-listed casinos Wynn Macau and Galaxy Entertainment contributed to portfolio results. Shares soared as business revived in Macau following a prolonged slump hurt by the Chinese government’s anti-corruption campaign. Newly opened properties in the gaming enclave also helped to lure casual gamblers.
Below-index weights in Korean technology giant Samsung Electronics and Chinese internet titan Tencent held back returns on a relative basis. Shares of both companies advanced amid ongoing strength in their respective businesses. Lack of investment in Taiwan’s Hon Hai Precision, a contract manufacturer for Apple, hindered results on a relative basis as well. Its shares soared on strong earnings.
Petrobras was another detractor. The Brazilian energy producer was affected by a decline in oil prices and a legal inquiry that temporarily halted its asset divestiture program. Petrobras, which already has raised cash by selling oil fields and pipelines, aims to cut its heavy debt load and regain its investment-grade credit rating. Also weighing on returns was Indian generic drug manufacturer Lupin, whose shares shed 28.3% on sluggish U.S. sales.
Outlook
Emerging markets have been regaining ground, benefiting from a pickup in global industrial production, a sustained stimulus program in China and a weaker U.S. dollar. Historically, a weak dollar has been supportive of prices for commodities and emerging markets equities.
Corporate profits are recovering, and in aggregate earnings for companies in developing countries are projected to increase at a double-digit rate this year and in 2018. Cash flows for companies are also improving and could lead to positive earnings revisions. In addition, valuations in emerging markets look more attractive relative to U.S. equities and certain developed countries on several measures, including price-to-earnings and price-to-book. On the whole, economic growth rates in the developing world vary by country but remain stronger than those in developed nations.
Given strong returns for developing country markets over the past 18 months, sentiment toward emerging markets
| 12 months ended 6/30/17 | 6 months ended 6/30/17 | |||||||||||||||
| Percent change in key markets* | Expressed in U.S. dollars | Expressed in local currency | Expressed in U.S. dollars | Expressed in local currency | ||||||||||||
| Asia-Pacific | ||||||||||||||||
| China IMI | 30.11 | % | 30.74 | % | 23.00 | % | 23.65 | % | ||||||||
| India IMI | 21.01 | 15.89 | 23.21 | 17.34 | ||||||||||||
| Indonesia IMI | 14.17 | 15.17 | 13.01 | 11.79 | ||||||||||||
| Malaysia IMI | 4.47 | 11.23 | 15.03 | 10.07 | ||||||||||||
| Philippines IMI | –6.20 | .60 | 12.64 | 14.34 | ||||||||||||
| South Korea IMI | 28.80 | 27.94 | 27.21 | 20.51 | ||||||||||||
| Taiwan IMI | 31.93 | 24.41 | 21.56 | 14.74 | ||||||||||||
| Thailand IMI | 16.88 | 12.99 | 9.74 | 4.10 | ||||||||||||
| Latin America | ||||||||||||||||
| Brazil IMI | 18.15 | 22.19 | 4.09 | 5.96 | ||||||||||||
| Chile IMI | 15.14 | 15.61 | 13.38 | 12.52 | ||||||||||||
| Colombia IMI | 7.79 | 13.20 | 6.92 | 8.81 | ||||||||||||
| Mexico IMI | 11.38 | 9.27 | 24.04 | 8.97 | ||||||||||||
| Peru IMI | 17.09 | 17.07 | 12.97 | 12.95 | ||||||||||||
| Eastern Europe and Middle East | ||||||||||||||||
| Czech Republic IMI | 12.66 | 5.81 | 16.28 | 3.93 | ||||||||||||
| Greece IMI | 54.29 | 50.28 | 33.67 | 23.61 | ||||||||||||
| Hungary IMI | 42.62 | 36.02 | 18.64 | 9.80 | ||||||||||||
| Poland IMI | 47.34 | 37.93 | 34.40 | 19.40 | ||||||||||||
| Russia IMI | 11.61 | 5.09 | –13.77 | –15.80 | ||||||||||||
| Turkey IMI | 7.74 | 31.97 | 30.76 | 30.95 | ||||||||||||
| United Arab Emirates IMI | 6.30 | 6.29 | 1.81 | 1.81 | ||||||||||||
| Qatar IMI | –3.23 | –2.73 | –9.55 | –9.08 | ||||||||||||
| Pakistan IMI | 18.36 | 18.50 | –5.30 | –4.88 | ||||||||||||
| Africa | ||||||||||||||||
| Egypt IMI | –4.50 | 94.87 | 6.51 | 6.45 | ||||||||||||
| South Africa IMI | 10.69 | –0.97 | 7.19 | 2.71 | ||||||||||||
| Emerging Markets Growth Fund | 25.43 | % | 21.52 | % | ||||||||||||
| * | The market indices, compiled by MSCI, reflect dividends net of withholding taxes and are unmanaged and therefore, have no expenses. Investors cannot invest directly in the indices. Source: MSCI. |
| 4 | Emerging Markets Growth Fund |
equities could become more risk averse depending on shifts in China’s economic policies and changes to global trade deals.
By sector, approximately 18% of the portfolio is invested in information technology stocks, including companies involved in e-commerce, internet services and semiconductors. Managers believe that sector growth looks promising due to increasing adoption of mobile phones, lower prices for smartphones and rising internet penetration rates.
Approximately 26% of the fund’s net assets consist of holdings in the consumer sectors, where managers seek to invest in companies poised to benefit from rising incomes in developing countries. These include businesses involved in the entertainment, automotive and food products industries. Financials constitute nearly 19% of the portfolio. Asian-based insurers selling financial products to the region’s growing middle class are one focus, while another is privately run banks in India that may benefit from the country’s solid growth rate and government initiatives to encourage digital banking.
We continue to believe the emerging markets universe offers a breadth of compelling investment opportunities and look forward to reporting to you again in another six months.
Sincerely,

Victor D. Kohn
President
August 21, 2017
About the fund and its adviser
Emerging Markets Growth Fund was organized in 1986 by the International Finance Corporation (IFC), an affiliate of the World Bank, as a vehicle for investing in the securities of companies based in developing countries. The premise behind the formation of the fund was that rapid growth in these countries could create very attractive investment opportunities. It also was felt that the availability of equity capital would stimulate the development of capital markets and encourage countries to liberalize their investment regulations.
Capital International, Inc., the fund’s investment adviser, is part of The Capital Group Companies,SM Inc., one of the world’s most experienced investment advisory organizations, with roots dating back to 1931. The fund has been managed by Capital International or an affiliate since 1986. Capital Group employs a research-driven approach to investing and has a global investment research network spanning three continents. This network of analysts and portfolio managers travel the world scrutinizing thousands of companies and keeping a close watch on industry trends and government actions.
Capital Group has devoted substantial resources to the task of evaluating and managing investments in developing countries. It is an intensive effort that combines company and industry analysis with broader political and macroeconomic views. We believe that our extensive worldwide research capabilities and integrated global investment process continue to provide Emerging Markets Growth Fund with a competitive edge.
| Emerging Markets Growth Fund | 5 |
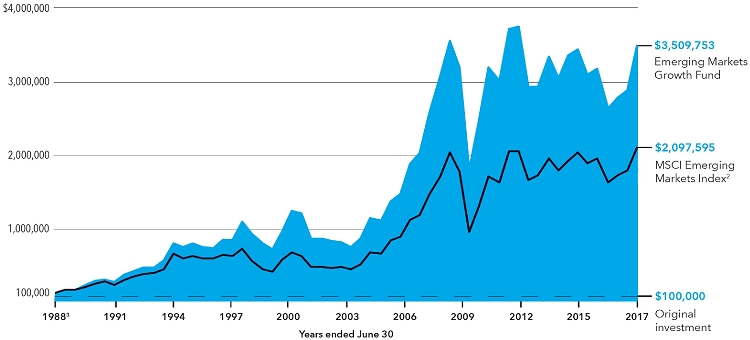
The value of a long-term investment
How a $100,000 investment has grown (for the period December 31, 1987, to June 30, 2017, with distributions reinvested)
This chart shows how a $100,0001 investment in Emerging Markets Growth Fund (EMGF) grew from December 31, 1987 —the inception of the MSCI Emerging Markets Index — through June 30, 2017, the end of the fund’s latest fiscal year.
| Total returns (with all distributions reinvested for periods ended June 30, 2017) |
| Cumulative total returns | Average annual total returns | |||||||
| 1 year | 25.43 | % | 25.43 | % | ||||
| 5 years | 19.19 | 3.57 | ||||||
| 10 years | 13.76 | 1.30 | ||||||
Results are for past periods and are not predictive of results for future periods. The results shown are before taxes on fund distributions and sale of fund shares. Current and future results may be lower or higher than those shown. Share prices and returns will vary, so investors may lose money. Investing for short periods makes losses more likely. For current information and month-end results, please call (800) 421-4989.
| 1 | The minimum initial investment for EMGF is $100,000. |
| 2 | Returns for the MSCI Emerging Markets Index were calculated using the MSCI Emerging Markets Index with gross dividends from December 31, 1987, to December 31, 2000, and with net dividends from January 1, 2001, to November 30, 2007, and using the MSCI EM IMI with net dividends thereafter. The indices are unmanaged and, therefore, have no expenses. Investors cannot invest directly in an index. Source: MSCI. |
| 3 | For the period December 31, 1987 (inception of the MSCI Emerging Markets Index), through June 30, 1988. EMGF began operations on May 30, 1986. |
| 6 | Emerging Markets Growth Fund |
| Investment portfolio June 30, 2017 |
Sector diversification
| Equity securities | Bonds, notes & other debt instruments | Percent of net assets | ||||||||||
| Financials | 18.9 | % | — | % | 18.9 | % | ||||||
| Consumer discretionary | 18.9 | — | 18.9 | |||||||||
| Information technology | 18.3 | — | 18.3 | |||||||||
| Health care | 7.0 | — | 7.0 | |||||||||
| Real estate | 6.8 | — | 6.8 | |||||||||
| Consumer staples | 6.6 | — | 6.6 | |||||||||
| Industrials | 6.6 | — | 6.6 | |||||||||
| Telecommunication services | 5.0 | — | 5.0 | |||||||||
| Materials | 4.1 | — | 4.1 | |||||||||
| Other | 2.2 | — | 2.2 | |||||||||
| Energy | 1.2 | — | 1.2 | |||||||||
| Utilities | 0.6 | — | 0.6 | |||||||||
| Government | — | .1 | .1 | |||||||||
| 96.2 | % | .1 | % | 96.3 | ||||||||
| Short-term securities | 3.4 | |||||||||||
| Other assets less liabilities | .3 | |||||||||||
| Net assets | 100.0 | % | ||||||||||
| Common stocks 94.9% | Shares | Value (000) | ||||||
| Asia-Pacific 65.8% | ||||||||
| China 24.3% | ||||||||
| AAC Technologies Holdings Inc. (Hong Kong) | 144,000 | $ | 1,800 | |||||
| Alibaba Group Holding Ltd. (ADR)1 | 675,280 | 95,147 | ||||||
| Beijing Enterprises Holdings Ltd. (Hong Kong) | 224,000 | 1,080 | ||||||
| China Everbright International Ltd. (Hong Kong) | 4,166,000 | 5,197 | ||||||
| China International Capital Corp. Ltd. (Hong Kong) | 450,400 | 665 | ||||||
| China Mengniu Dairy Co. (Hong Kong)1 | 11,902,600 | 23,325 | ||||||
| China Merchants Bank Co., Ltd. (Hong Kong) | 3,829,500 | 11,551 | ||||||
| China Overseas Grand Oceans Group, Ltd. (Hong Kong) | 4,515,100 | 2,412 | ||||||
| China Overseas Land & Investment Ltd. (Hong Kong) | 16,515,950 | 48,337 | ||||||
| China Pacific Insurance (Group) Co., Ltd. (Hong Kong) | 8,849,800 | 36,159 | ||||||
| China Resources Land Ltd. (Hong Kong) | 9,663,181 | 28,157 | ||||||
| China Unicom Ltd. (Hong Kong)1 | 4,106,000 | 6,101 | ||||||
| Ctrip.com International, Ltd. (ADR)1 | 272,046 | 14,652 | ||||||
| Fosun International Ltd. (Hong Kong) | 1,957,764 | 3,059 | ||||||
| Haitian International Holdings Ltd. (Hong Kong) | 4,207,803 | 11,803 | ||||||
| Hutchison China MediTech Ltd.1 | 46,718 | 2,198 | ||||||
| Hutchison China MediTech Ltd. (ADR)1 | 296,167 | 6,904 | ||||||
| IMAX China Holding, Inc. (Hong Kong)1 | 2,750,588 | 8,438 | ||||||
| JD.com, Inc. (ADR)1 | 669,000 | 26,238 | ||||||
| Emerging Markets Growth Fund | 7 |
| Common stocks (continued) | Shares | Value (000) | ||||||
| Asia-Pacific (continued) | ||||||||
| China (continued) | ||||||||
| Jiangsu Hengrui Medicine Co., Ltd. (Shanghai exchange) | 4,932,175 | $ | 36,805 | |||||
| Jiangsu Hengrui Medicine Co., Ltd. | 2,599,162 | 19,395 | ||||||
| Longfor Properties Co. Ltd. (Hong Kong) | 16,674,113 | 35,837 | ||||||
| Minth Group Ltd. (Hong Kong) | 4,655,000 | 19,735 | ||||||
| NetEase, Inc. (ADR) | 1,782 | 536 | ||||||
| New Oriental Education & Technology Group Inc. (ADR)1 | 328,000 | 23,121 | ||||||
| Shanghai Fosun Pharmaceutical (Group) Co., Ltd. (Hong Kong) | 7,630,500 | 29,565 | ||||||
| Shanghai Fudan-Zhangjiang Bio-Pharmaceutical Co., Ltd. (Hong Kong) | 2,679,000 | 1,568 | ||||||
| Shanghai Pharmaceutical (Group) Co., Ltd. (Hong Kong) | 5,978,100 | 17,802 | ||||||
| Shenzhen Inovance Technology Co., Ltd. | 2,489,441 | 9,378 | ||||||
| Sino Biopharmaceutical Ltd. (Hong Kong) | 7,934,033 | 7,012 | ||||||
| Tencent Holdings Ltd. (Hong Kong) | 1,529,300 | 54,689 | ||||||
| Weichai Power Co., Ltd. (Hong Kong) | 1,696,468 | 1,486 | ||||||
| Xin Point Holdings Ltd. (Hong Kong)1 | 18,999,000 | 8,371 | ||||||
| Yum China Holdings, Inc.1 | 517,300 | 20,397 | ||||||
| 618,920 | ||||||||
| Hong Kong 6.5% | ||||||||
| AIA Group Ltd. | 8,873,000 | 64,836 | ||||||
| Galaxy Entertainment Group Ltd. | 3,678,000 | 22,330 | ||||||
| Goodbaby International Holdings Ltd. | 11,185,000 | 4,642 | ||||||
| Jardine Matheson Holdings Ltd. | 43,700 | 2,805 | ||||||
| MGM China Holdings, Ltd. | 3,180,800 | 7,073 | ||||||
| Pacific Textiles Holdings Ltd. | 36 | — | ||||||
| Sands China Ltd. | 2,102,000 | 9,625 | ||||||
| VTech Holdings Ltd. | 319,400 | 5,060 | ||||||
| Wynn Macau, Ltd. | 20,893,034 | 48,811 | ||||||
| 165,182 | ||||||||
| India 11.2% | ||||||||
| Apollo Hospitals Enterprise Ltd.1 | 71,775 | 1,415 | ||||||
| Apollo Hospitals Enterprise Ltd. (GDR)1,2 | 188,500 | 3,717 | ||||||
| Bharat Electronics Ltd. | 1,583,700 | 3,958 | ||||||
| Bharti Airtel Ltd. | 8,678,587 | 50,981 | ||||||
| CRISIL Ltd. | 91,272 | 2,745 | ||||||
| Godrej Consumer Products Ltd.1 | 1,292,027 | 19,351 | ||||||
| HDFC Bank Ltd. | 951,105 | 24,482 | ||||||
| HDFC Bank Ltd. (ADR) | 200 | 18 | ||||||
| Housing Development Finance Corp. Ltd. | 1,704,648 | 42,590 | ||||||
| ICICI Bank Ltd. | 1,258,066 | 5,647 | ||||||
| ICICI Bank Ltd. (ADR) | 1,918,070 | 17,205 | ||||||
| IDFC Bank Ltd. | 13,811,605 | 11,688 | ||||||
| IndusInd Bank Ltd. | 1,208,592 | 27,654 | ||||||
| Info Edge (India) Ltd. | 635,899 | 10,174 | ||||||
| ITC Ltd. | 1,733,560 | 8,680 | ||||||
| Kotak Mahindra Bank Ltd. | 663,256 | 9,807 | ||||||
| Lupin Ltd. | 585,375 | 9,598 | ||||||
| 8 | Emerging Markets Growth Fund |
| Common stocks (continued) | Shares | Value (000) | ||||||
| Asia-Pacific (continued) | ||||||||
| India (continued) | ||||||||
| Maruti Suzuki India Ltd. | 54,863 | $ | 6,126 | |||||
| Nestlé India Ltd. | 48,392 | 5,044 | ||||||
| Piramal Healthcare Ltd. | 143,990 | 6,230 | ||||||
| Steel Authority of India Ltd.1 | 7,116,169 | 6,424 | ||||||
| TeamLease Services Ltd.1 | 286,074 | 5,948 | ||||||
| Torrent Power Ltd. | 1,584,518 | 4,355 | ||||||
| 283,837 | ||||||||
| Indonesia 6.0% | ||||||||
| Astra International Tbk PT | 48,148,100 | 32,162 | ||||||
| Bank Central Asia Tbk PT | 11,955,900 | 16,253 | ||||||
| Bank Mandiri (Persero) Tbk PT, Series B | 11,700,754 | 11,150 | ||||||
| Bank Rakyat Indonesia (Persero) Tbk PT | 12,830,700 | 14,637 | ||||||
| Elang Mahkota Teknologi Tbk PT | 44,422,400 | 38,331 | ||||||
| Matahari Department Store Tbk PT | 24,625,100 | 26,151 | ||||||
| Surya Citra Media Tbk PT | 68,798,700 | 13,343 | ||||||
| 152,027 | ||||||||
| Malaysia 0.6% | ||||||||
| Bumi Armada Bhd. | 18,924,488 | 3,351 | ||||||
| IHH Healthcare Bhd. | 3,716,480 | 4,978 | ||||||
| IJM Corp. Bhd. | 7,861,904 | 6,337 | ||||||
| 14,666 | ||||||||
| Philippines 1.7% | ||||||||
| International Container Terminal Services, Inc. | 12,285,848 | 23,812 | ||||||
| SM Investments Corp. | 704,221 | 11,206 | ||||||
| Universal Robina Corp. | 2,837,363 | 9,160 | ||||||
| 44,178 | ||||||||
| Singapore 1.0% | ||||||||
| Yoma Strategic Holdings Ltd. | 62,241,405 | 26,447 | ||||||
| South Korea 5.6% | ||||||||
| AMOREPACIFIC Corp. | 11,786 | 3,132 | ||||||
| BGFretail Co., Ltd. | 54,784 | 4,836 | ||||||
| Hankook Tire Co., Ltd. | 299,617 | 16,655 | ||||||
| Hyundai Motor Co. | 17,277 | 2,408 | ||||||
| NAVER Corp. | 819 | 600 | ||||||
| POSCO | 23,003 | 5,770 | ||||||
| S-1 Corp. | 20,250 | 1,717 | ||||||
| Samsung Electronics Co., Ltd. | 37,039 | 76,950 | ||||||
| Samsung Electronics Co., Ltd. (GDR)2 | 19,202 | 19,874 | ||||||
| Shinhan Financial Group Co., Ltd. | 268,295 | 11,560 | ||||||
| 143,502 | ||||||||
| Taiwan 7.9% | ||||||||
| Advantech Co., Ltd. | 574,181 | 4,068 | ||||||
| AirTAC International Group | 1,792,161 | 21,180 | ||||||
| CTCI Corp. | 6,396,600 | 10,892 | ||||||
| Delta Electronics, Inc. | 8,770,701 | 48,005 | ||||||
| Emerging Markets Growth Fund | 9 |
| Common stocks (continued) | Shares | Value (000) | ||||||
| Asia-Pacific (continued) | ||||||||
| Taiwan (continued) | ||||||||
| E.SUN Financial Holding Co., Ltd. | 758,000 | $ | 466 | |||||
| Ginko International Co., Ltd. | 734,000 | 5,610 | ||||||
| MediaTek Inc. | 2,334,000 | 19,987 | ||||||
| Taiwan Semiconductor Manufacturing Co., Ltd. | 12,772,094 | 87,540 | ||||||
| Vanguard International Semiconductor Corp. | 1,836,000 | 3,621 | ||||||
| 201,369 | ||||||||
| Thailand 1.0% | ||||||||
| Bangkok Bank PCL, nonvoting depository receipts | 2,553,804 | 13,908 | ||||||
| Central Pattana PCL | 4,232,100 | 8,627 | ||||||
| Thai Beverage PCL | 4,273,800 | 2,794 | ||||||
| 25,329 | ||||||||
| Total Asia-Pacific | 1,675,457 | |||||||
| Latin America 11.0% | ||||||||
| Argentina 0.0% | ||||||||
| Grupo Financiero Galicia SA, Class B | 5 | — | ||||||
| Brazil 4.9% | ||||||||
| CCR SA, ordinary nominative | 5,820,089 | 29,690 | ||||||
| Cielo SA, ordinary nominative | 454,400 | 3,374 | ||||||
| Hypermarcas SA, ordinary nominative | 2,852,400 | 23,936 | ||||||
| Itaú Unibanco Holding SA, preferred nominative (ADR) | 407,651 | 4,504 | ||||||
| Lojas Americanas SA, ordinary nominative | 1,171,727 | 4,297 | ||||||
| Lojas Americanas SA, preferred nominative | 1,248,100 | 5,275 | ||||||
| OdontoPrev SA, ordinary nominative | 269,800 | 949 | ||||||
| Petróleo Brasileiro SA (Petrobras), ordinary nominative (ADR)1 | 642,300 | 5,132 | ||||||
| Petróleo Brasileiro SA (Petrobras), preferred nominative (ADR)1 | 1,391,900 | 10,383 | ||||||
| Vale SA, Class A, preferred nominative | 1,677,200 | 13,624 | ||||||
| Vale SA, Class A, preferred nominative (ADR) | 2,935,100 | 23,921 | ||||||
| 125,085 | ||||||||
| Chile 1.1% | ||||||||
| Enel Américas SA | 9,689,523 | 1,838 | ||||||
| Enel Américas SA (ADR) | 908,791 | 8,570 | ||||||
| Enel Chile SA (ADR) | 148,556 | 817 | ||||||
| Inversiones La Construcción SA | 1,339,721 | 16,617 | ||||||
| 27,842 | ||||||||
| Mexico 3.7% | ||||||||
| América Móvil, SAB de CV, Series L (ADR) | 2,839,935 | 45,212 | ||||||
| Banco del Bajio, SA, Series O1 | 3,433,200 | 6,050 | ||||||
| CEMEX, SAB de CV, ordinary participation certificates, units (ADR)1 | 789,417 | 7,436 | ||||||
| Controladora Vuela Compañía de Aviación, SAB de CV, ordinary participation certificates, Class A1 | 677,200 | 991 | ||||||
| Fibra Uno Administración, SA de CV REIT | 12,684,334 | 24,056 | ||||||
| Fomento Económico Mexicano, SAB de CV | 363,200 | 3,577 | ||||||
| Grupo Comercial Chedraui, SAB de CV, Class B | 559,819 | 1,146 | ||||||
| Grupo Financiero Inbursa, SAB de CV | 3,105,400 | 5,304 | ||||||
| 93,772 | ||||||||
| 10 | Emerging Markets Growth Fund |
| Common stocks (continued) | Shares | Value (000) | ||||||
| Latin America (continued) | ||||||||
| Peru 1.3% | ||||||||
| Credicorp Ltd. | 175,428 | $ | 31,470 | |||||
| Graña y Montero SAA (ADR)1 | 251,282 | 819 | ||||||
| 32,289 | ||||||||
| Total Latin America | 278,988 | |||||||
| Eastern Europe and Middle East 6.6% | ||||||||
| Oman 0.1% | ||||||||
| bank muscat SAOG | 1,800,678 | 1,752 | ||||||
| Russia 5.6% | ||||||||
| Alrosa PJSC | 18,372,619 | 26,963 | ||||||
| Baring Vostok Private Equity Fund III, LP1,3,4,5,6 | 24,981,597 | 19,451 | ||||||
| Baring Vostok Private Equity Fund IV, LP3,5,6 | 22,192,132 | 14,412 | ||||||
| Baring Vostok Fund IV Supplemental Fund, LP3,5,6 | 39,302,641 | 20,779 | ||||||
| Global Ports Investments PLC (GDR)1 | 931,215 | 3,259 | ||||||
| Globaltrans Investment PLC (GDR) | 65,601 | 499 | ||||||
| Magnit PJSC | 9,050 | 1,409 | ||||||
| Magnit PJSC (GDR) | 9,070 | 308 | ||||||
| MegaFon PJSC (GDR) | 193,400 | 1,772 | ||||||
| Moscow Exchange MICEX-RTS PJSC | 6,930,361 | 12,260 | ||||||
| New Century Capital Partners, LP1,3,5 | 5,247,900 | 537 | ||||||
| Polyus PJSC1,2 | 34,210 | 2,304 | ||||||
| Rosneft Oil Co. PJSC (GDR) | 949,081 | 5,158 | ||||||
| Sberbank of Russia PJSC | 2,586,218 | 6,384 | ||||||
| Sberbank of Russia PJSC (ADR) | 1,647,500 | 17,052 | ||||||
| Sistema JSFC OJSC | 2,212,280 | 455 | ||||||
| Yandex NV, Class A1 | 316,825 | 8,313 | ||||||
| 141,315 | ||||||||
| Turkey 0.5% | ||||||||
| Akbank TAS | 4,755,197 | 13,245 | ||||||
| Aktaş Elektrik Ticaret AŞ1 | 4,273 | — | ||||||
| Türkiye Petrol Rafinerileri AŞ | 17,113 | 492 | ||||||
| 13,737 | ||||||||
| United Arab Emirates 0.4% | ||||||||
| DP World Ltd. | 519,209 | 10,835 | ||||||
| Total Eastern Europe and Middle East | 167,639 | |||||||
| Africa 6.4% | ||||||||
| South Africa 6.4% | ||||||||
| AngloGold Ashanti Ltd. | 48,780 | 477 | ||||||
| Barclays Africa Group Ltd. | 1,285,000 | 14,120 | ||||||
| Discovery Ltd. | 2,387,832 | 23,348 | ||||||
| JSE Ltd. | 746,803 | 6,993 | ||||||
| Mr Price Group Ltd. | 431,113 | 5,141 | ||||||
| Emerging Markets Growth Fund | 11 |
| Common stocks (continued) | Shares | Value (000) | ||||||
| Africa (continued) | ||||||||
| South Africa (continued) | ||||||||
| MTN Group Ltd. | 2,055,185 | $ | 17,924 | |||||
| Naspers Ltd., Class N | 399,062 | 77,631 | ||||||
| Shoprite Holdings Ltd. | 836,643 | 12,751 | ||||||
| Telkom SA SOC Ltd. | 1,106,315 | 5,205 | ||||||
| Total Africa | 163,590 | |||||||
| Other markets 5.1% | ||||||||
| Australia 0.0% | ||||||||
| Newcrest Mining Ltd. | 30,752 | 477 | ||||||
| Canada 0.2% | ||||||||
| First Quantum Minerals Ltd. | 525,001 | 4,441 | ||||||
| Denmark 1.2% | ||||||||
| Carlsberg A/S, Class B | 298,024 | 31,838 | ||||||
| France 0.0% | ||||||||
| Edenred SA | 37,065 | 966 | ||||||
| Italy 0.2% | ||||||||
| Tenaris SA (ADR) | 125,092 | 3,895 | ||||||
| Switzerland 0.4 | ||||||||
| Dufry AG1 | 61,457 | 10,069 | ||||||
| United Kingdom 0.8% | ||||||||
| British American Tobacco PLC | 13,800 | 941 | ||||||
| Lonmin PLC1 | 1,025,066 | 878 | ||||||
| PZ Cussons PLC | 1,473,820 | 6,569 | ||||||
| Sedibelo Platinum Mines Ltd.1 | 17,665,800 | 10,929 | ||||||
| 19,317 | ||||||||
| United States of America 2.3% | ||||||||
| Cobalt International Energy, Inc.1 | 118,083 | 292 | ||||||
| Ensco PLC, Class A | 436,300 | 2,251 | ||||||
| MercadoLibre, Inc. | 103,312 | 25,919 | ||||||
| Samsonite International SA | 7,173,300 | 29,952 | ||||||
| 58,414 | ||||||||
| Total other markets | 129,417 | |||||||
| Multinational 0.0% | ||||||||
| Capital International Private Equity Fund IV, LP1,3,4,5,6 | 50,842,740 | 285 | ||||||
| International Hospital Corp. Holding NV, Class A1,3,4 | 609,873 | 402 | ||||||
| Total Multinational | 687 | |||||||
| Total common stocks (cost: $1,751,124,000) | 2,415,778 | |||||||
| 12 | Emerging Markets Growth Fund |
| Warrants 1.3% | Shares | Value (000) | ||||||
| Eastern Europe and Middle East 1.3% | ||||||||
| Saudi Arabia 1.3% | ||||||||
| Savola Group Co., warrants, expire 20171,2 | 116,800 | $ | 1,569 | |||||
| Savola Group Co., warrants, expire 20201,2 | 231,092 | 31,031 | ||||||
| Total warrants (cost: $25,685,000) | 32,600 | |||||||
| Convertible preferred stocks 0.0% | ||||||||
| Multinational 0.0% | ||||||||
| International Hospital Corp. Holding NV, Series B, cumulative convertible preferred1,3,4 | 622,354 | 411 | ||||||
| Total convertible preferred stocks (cost: $3,504,000) | 411 | |||||||
| Bonds & notes 0.1% | Principal amount (000) | |||||||
| Eastern Europe and Middle East 0.1% | ||||||||
| Turkey 0.1% | ||||||||
| Turkey (Republic of) 11.00% 2022 | TRY | 8,080 | 2,345 | |||||
| Total bonds & notes (cost: $2,205,000) | 2,345 | |||||||
| Convertible bonds 0.0% | ||||||||
| Asia-Pacific 0.0% | ||||||||
| China 0.0% | ||||||||
| Fu Ji Food and Catering Services Holdings Ltd., 0.00% convertible notes, 20207 | CNY | 97,700 | — | |||||
| Total convertible bonds (cost: $0) | — | |||||||
| Short-term securities 3.4% | ||||||||
| Commercial paper 3.4% | ||||||||
| Canadian Imperial Bank of Commerce 1.02% due 7/3/20172 | $ | 27,400 | 27,398 | |||||
| General Electric Co. 1.08% due 7/3/2017 | 50,000 | 49,996 | ||||||
| Gotham Funding Corp. 1.191% due 7/11/20172 | 10,000 | 9,996 | ||||||
| Total short-term securities (cost: $87,392,000) | 87,390 | |||||||
| Total investment securities 99.7% (cost: $1,869,910,000) | 2,538,524 | |||||||
| Other assets less liabilities 0.3% | 6,803 | |||||||
| Net assets 100.0% | $ | 2,545,327 | ||||||
Forward currency contracts
The fund has entered into the over-the-counter (“OTC”) forward currency contracts as shown in the following table. The average month-end notional amount of open OTC forward currency contracts while held was $14,179,000.
| Unrealized | |||||||||
| Notional amount | (depreciation) | ||||||||
| Receive | Deliver | at 6/30/2017 | |||||||
| Settlement date | Counterparty | (000) | (000) | (000) | |||||
| Sales: | |||||||||
| Chinese yuan renminbi offshore | 1/12/2018 | Citibank N.A. | $15,358 | CNH109,390 | $ (558) | ||||
| Emerging Markets Growth Fund | 13 |
Investments in affiliates
If the fund owns more than 5% of the outstanding voting securities of an issuer, the fund’s investment in that issuer represents an investment in an affiliate as defined in the Investment Company Act of 1940. In addition, Capital International Private Equity Fund IV, LP is considered an affiliate since this issuer has the same investment adviser as the fund. A summary of the fund’s transactions in the securities of affiliated issuers during year ended June 30, 2017, is as follows:
| Dividend | Value of | |||||||||||||||||||||||
| and interest | affiliates at | |||||||||||||||||||||||
| Beginning | Ending | income | 6/30/2017 | |||||||||||||||||||||
| Issuer | shares | Additions | Reductions | shares | (000) | (000) | ||||||||||||||||||
| Baring Vostok Private Equity Fund III1,8 | 24,981,597 | — | — | 24,981,597 | $ | — | $ | 19,451 | ||||||||||||||||
| Capital International Private Equity Fund IV1,8 | 50,790,701 | 52,039 | — | 50,842,740 | — | 285 | ||||||||||||||||||
| International Hospital1 | 1,232,227 | — | — | 1,232,227 | — | 813 | ||||||||||||||||||
| Baring Vostok Private Equity Fund1,9 | 11,783,118 | — | 11,783,118 | — | — | — | ||||||||||||||||||
| Baring Vostok Capital Partners IV8,9 | 59,722,712 | 1,772,061 | — | 61,494,773 | 705 | — | ||||||||||||||||||
| Pan-African Investment Partners II1,9 | 3,800 | — | 3,800 | — | — | — | ||||||||||||||||||
| $ | 705 | $ | 20,549 | |||||||||||||||||||||
| 1 | Security did not produce income during the last 12 months. |
| 2 | Acquired in a transaction exempt from registration under Rule 144A or Section 4(2) of the Securities Act of 1933 (not including purchases of securities that were publicly offered in the primary local market but were not registered under U.S. securities laws). May be resold in the U.S. in transactions exempt from registration, normally to qualified institutional buyers. The total value of all such securities was $95,889,000, which represented 3.77% of the net assets of the fund. |
| 3 | Acquired through a private placement transaction exempt from registration under the Securities Act of 1933. May be subject to legal or contractual restrictions on resale. Further details on these holdings appear below. |
| 4 | This issuer represents investment in an affiliate as defined in the Investment Company Act of 1940. This definition includes, but is not limited to, issuers in which the fund owns more than 5% of the outstanding voting securities. Capital International Private Equity Fund IV, LP is also considered an affiliate since this issuer has the same investment adviser as the fund. |
| 5 | Cost and market value do not include prior distributions to the fund from income or proceeds realized from securities held by the private equity fund. Therefore, the cost and market value may not be indicative of the private equity fund’s performance. For private equity funds structured as limited partnerships, shares are not applicable and therefore the fund’s interest in the partnerships is reported. |
| 6 | Excludes an unfunded capital commitment representing an agreement which obligates the fund to meet capital calls in the future. Capital calls can only be made if and when certain requirements have been fulfilled; thus, the timing and the amount of such capital calls cannot readily be determined. (Note 3) |
| 7 | Scheduled interest and/or principal payment was not received. |
| 8 | For private equity funds structured as limited partnerships, shares are not applicable and therefore the fund’s interest in the partnerships is reported. |
| 9 | Unaffiliated issuer at 06/30/2017. |
| Percent | ||||||||||||
| Acquisition | Cost | Value | of net | |||||||||
| Private placement securities | date | (000) | (000) | assets | ||||||||
| Baring Vostok Fund IV Supplemental Fund, LP | 10/8/2007 | $ | 34,019 | $ | 20,779 | .82 | % | |||||
| Baring Vostok Private Equity Fund III, LP | 3/30/2005 | 19,026 | 19,451 | .76 | ||||||||
| Baring Vostok Private Equity Fund IV, LP | 4/25/2007 | 18,079 | 14,412 | .57 | ||||||||
| Capital International Private Equity Fund IV, LP | 3/29/2005 | 7,098 | 285 | .01 | ||||||||
| International Hospital Corp. Holding NV, Class A | 9/25/1997 | 8,011 | 402 | .01 | ||||||||
| International Hospital Corp. Holding NV, Series B, cumulative convertible preferred | 2/12/2007 | 3,504 | 411 | .02 | ||||||||
| New Century Capital Partners, LP | 12/7/1995 | — | 537 | .02 | ||||||||
| Total private placement securities | $ | 89,737 | $ | 56,277 | 2.21 | % | ||||||
Key to abbreviations
| ADR | — | American Depositary Receipts |
| CNH | — | Chinese yuan renminbi offshore |
| CNY | — | Chinese yuan |
| GDR | — | Global Depositary Receipts |
| TRY | — | Turkish lira |
See Notes to Financial Statements
| 14 | Emerging Markets Growth Fund |
Financial statements
Statement of assets and liabilities
| at June 30, 2017 | (dollars in thousands, except per-share amounts) |
| Assets: | ||||||||
| Investment securities, at value: | ||||||||
| Unaffiliated issuers (cost: $1,832,271) | $ | 2,517,975 | ||||||
| Affiliated issuers (cost: $37,639) | 20,549 | $ | 2,538,524 | |||||
| Cash | 242 | |||||||
| Restricted cash pledged on forward currency contracts | 530 | |||||||
| Cash denominated in non-U.S. currency (cost: $1,975) | 2,013 | |||||||
| Receivables for: | ||||||||
| Sales of investments | 3,259 | |||||||
| Sales of fund’s shares | 117 | |||||||
| Dividends and interest | 11,264 | |||||||
| Non-U.S. taxes | 2,061 | 16,701 | ||||||
| 2,558,010 | ||||||||
| Liabilities: | ||||||||
| Unrealized depreciation on open forward currency contracts | 558 | |||||||
| Payables for: | ||||||||
| Purchases of investments | 7,501 | |||||||
| Investment advisory services | 1,559 | |||||||
| Directors’ compensation | 2,078 | |||||||
| Repurchase of fund’s shares | 688 | |||||||
| Other accrued expenses | 299 | 12,125 | ||||||
| 12,683 | ||||||||
| Net assets at June 30, 2017: | ||||||||
| Equivalent to $7.34 per share on 346,771,659 shares of $0.01 par value capital stock outstanding (authorized capital stock – 2,000,000,000 shares) | $ | 2,545,327 | ||||||
| Net assets consist of: | ||||||||
| Capital paid in on shares of stock | $ | 2,176,400 | ||||||
| Distributions in excess of net investment income | (456 | ) | ||||||
| Accumulated net realized loss | (298,467 | ) | ||||||
| Net unrealized appreciation | 667,850 | |||||||
| Net assets at June 30, 2017 | $ | 2,545,327 |
See Notes to Financial Statements
| Emerging Markets Growth Fund | 15 |
Statement of operations
| for the year ended June 30, 2017 | (dollars in thousands) |
| Investment income: | ||||||||
| Income: | ||||||||
| Dividends (also includes $669 from affiliates) | $ | 54,126 | ||||||
| Interest (also includes $36 from affiliates) | 2,689 | $ | 56,815 | |||||
| Fees and expenses: | ||||||||
| Investment advisory services | 18,782 | |||||||
| Custodian | 886 | |||||||
| Registration statement and prospectus | 52 | |||||||
| Auditing and legal | 435 | |||||||
| Reports to shareholders | 33 | |||||||
| Directors’ compensation | 802 | |||||||
| Other | 466 | |||||||
| Total fees and expenses before expense reduction | 21,456 | |||||||
| Less custodian expense reduction | 5 | |||||||
| Total fees and expenses after expense reduction | 21,451 | |||||||
| Net investment income | 35,364 | |||||||
| Net realized gain and unrealized appreciation: | ||||||||
| Net realized gain (loss) on: | ||||||||
| Investments (includes $6,524 loss from affiliates) | 78,361 | |||||||
| Forward currency contracts | 230 | |||||||
| Currency transactions | (4,319 | ) | 74,272 | |||||
| Net unrealized appreciation (depreciation) on: | ||||||||
| Investments | 452,268 | |||||||
| Forward currency contracts | (558 | ) | ||||||
| Currency translations | 781 | 452,491 | ||||||
| Net realized gain and unrealized appreciation | 526,763 | |||||||
| Net increase in net assets resulting from operations | $ | 562,127 |
Statements of changes in net assets
(dollars in thousands)
| Year ended June 30 | ||||||||
| 2017 | 2016 | |||||||
| Operations: | ||||||||
| Net investment income | $ | 35,364 | $ | 51,396 | ||||
| Net realized gain (loss) | 74,272 | (247,691 | ) | |||||
| Net unrealized appreciation (depreciation) | 452,491 | (434,045 | ) | |||||
| Net increase (decrease) in net assets resulting from operations | 562,127 | (630,340 | ) | |||||
| Dividends from net investment income | (26,132 | ) | (105,314 | ) | ||||
| Capital share transactions: | ||||||||
| Proceeds from shares sold: 6,734,660 and 27,608,418 shares, respectively | 44,229 | 161,529 | ||||||
| Proceeds from shares issued in reinvestment of net investment income dividends: 1,930,310 and 12,044,439 shares, respectively | 11,447 | 67,449 | ||||||
| Capital shares issued in connection with merger: 0 and 56,285,214 shares, respectively | — | 345,592 | ||||||
| Cost of shares repurchased: 124,308,436 and 242,623,631 shares, respectively | (785,856 | ) | (1,392,796 | ) | ||||
| Cost of shares repurchased in connection with in-kind redemption: 0 and 56,909,781 shares, respectively | — | (327,510 | ) | |||||
| Net decrease in net assets resulting from capital share transactions | (730,180 | ) | (1,145,736 | ) | ||||
| Total decrease in net assets | (194,185 | ) | (1,881,390 | ) | ||||
| Net assets: | ||||||||
| Beginning of year | 2,739,512 | 4,620,902 | ||||||
| End of year (including distributions in excess of net investment income: $(456) and $(16,495), respectively) | $ | 2,545,327 | $ | 2,739,512 | ||||
See Notes to Financial Statements
| 16 | Emerging Markets Growth Fund |
Notes to financial statements
1. Organization
Emerging Markets Growth Fund, Inc. (the “fund”) is registered under the Investment Company Act of 1940 as an open-end, diversified management investment company. The fund seeks long-term growth of capital and invests primarily in common stock and other equity securities of issuers in developing countries.
2. Significant accounting policies
The fund is an investment company that applies the accounting and reporting guidance issued in Topic 946 by the U.S. Financial Accounting Standards Board. The fund’s financial statements have been prepared to comply with U.S. generally accepted accounting principles (“U.S. GAAP”). These principles require management to make estimates and assumptions that affect reported amounts and disclosures. Actual results could differ from those estimates. Subsequent events, if any, have been evaluated through the date of issuance in the preparation of the financial statements. The fund follows the significant accounting policies described below, as well as the valuation policies described in the next section on valuation.
Security transactions and related investment income — Security transactions are recorded by the fund as of the date the trades are executed with brokers. Realized gains and losses from security transactions are determined based on the specific identified cost of the securities. In the event a security is purchased with a delayed payment date, the fund will segregate liquid assets sufficient to meet its payment obligations. Dividend income is recognized on the ex-dividend date and interest income is recognized on an accrual basis. Market discounts, premiums and original issue discounts on fixed-income securities are amortized daily over the expected life of the security.
Dividends and distributions to shareholders — Dividends and distributions to shareholders are recorded on the ex-dividend date.
Currency translation — Assets and liabilities, including investment securities, denominated in currencies other than U.S. dollars are translated into U.S. dollars at the exchange rates supplied by one or more pricing vendors on the valuation date. Purchases and sales of investment securities and income and expenses are translated into U.S. dollars at the exchange rates on the dates of such transactions. The effects of changes in exchange rates on investment securities are included with the net realized gain or loss and net unrealized appreciation or depreciation on investments on the fund’s statement of operations. The realized gain or loss and unrealized appreciation or depreciation resulting from all other transactions denominated in currencies other than U.S. dollars are disclosed separately.
Shares issued and redeemed — The fund intends to issue shares in exchange for cash and redeem shares in cash, however, the investment adviser, at its discretion, may accept securities in exchange of fund shares or pay a redemption in whole or in part by a distribution of the fund’s portfolio securities. An issuance or redemption of shares “in-kind” is based upon the closing value of the securities as of the trade date. Realized gains/losses, if any, resulting from redemptions of shares in-kind are reflected separately in the statement of operations.
3. Valuation
Capital International, Inc. (“CII”), the fund’s investment adviser, values the fund’s investments at fair value as defined by U.S. GAAP. The net asset value of the fund is generally determined as of approximately 4:00 p.m. New York time each day the New York Stock Exchange is open.
Methods and inputs — The fund’s investment adviser uses the following methods and inputs to establish the fair value of the fund’s assets and liabilities. Use of particular methods and inputs may vary over time based on availability and relevance as market and economic conditions evolve.
Equity securities are generally valued at the official closing price of, or the last reported sale price on, the exchange or market on which such securities are traded, as of the close of business on the day the securities are being valued or, lacking any sales, at the last available bid price. Prices for each security are taken from the principal exchange or market on which the security trades.
| Emerging Markets Growth Fund | 17 |
Fixed-income securities, including short-term securities, are generally valued at prices obtained from one or more pricing vendors. Vendors value such securities based on one or more of the inputs described in the following table. The table provides examples of inputs that are commonly relevant for valuing particular classes of fixed-income securities in which the fund is authorized to invest. However, these classifications are not exclusive and any of the inputs may be used to value any other class of fixed-income security.
| Fixed income class | Examples of standard inputs | |
| All | Benchmark yields, transactions, bids, offers, quotations from dealers and trading systems, new issues, spreads and other relationships observed in the markets among comparable securities; and proprietary pricing models such as yield measures calculated using factors such as cash flows, financial or collateral performance and other reference data (collectively referred to as “standard inputs”) | |
| Corporate bonds & notes; convertible securities | Standard inputs and underlying equity of the issuer | |
| Bonds & notes of governments & government agencies | Standard inputs and interest rate volatilities |
When the fund’s investment adviser deems it appropriate to do so (such as when vendor prices are unavailable or not deemed to be representative), fixed-income securities will be valued in good faith at the mean quoted bid and ask prices that are reasonably and timely available (or bid prices, if ask prices are not available) or at prices for securities of comparable maturity, quality and type.
��
Securities with both fixed-income and equity characteristics, or equity securities traded principally among fixed-income dealers, are generally valued in the manner described for either equity or fixed-income securities, depending on which method is deemed most appropriate by the fund’s investment adviser. Forward currency contracts are valued at the mean of representative quoted bid and ask prices, generally based on prices supplied by one or more pricing vendors.
Securities and other assets for which representative market quotations are not readily available or are considered unreliable by the fund’s investment adviser are fair valued as determined in good faith under fair valuation guidelines adopted by authority of the fund’s board of directors as further described. The investment adviser follows fair valuation guidelines, consistent with U.S. Securities and Exchange Commission rules and guidance, to consider relevant principles and factors when making fair value determinations. The investment adviser considers relevant indications of value that are reasonably and timely available to it in determining the fair value to be assigned to a particular security, such as the type and cost of the security; contractual or legal restrictions on resale of the security; relevant financial or business developments of the issuer; actively traded similar or related securities; conversion or exchange rights on the security; related corporate actions; significant events occurring after the close of trading in the security; and changes in overall market conditions. In addition, the closing prices of equity securities that trade in markets outside U.S. time zones may be adjusted to reflect significant events that occur after the close of local trading but before the net asset value of the fund is determined. Fair valuations and valuations of investments that are not actively trading involve judgment and may differ materially from valuations that would have been used had greater market activity occurred.
Processes and structure — The fund’s board of directors has delegated authority to the fund’s investment adviser to make fair value determinations, subject to board oversight. The investment adviser has established a Joint Fair Valuation Committee (the “Fair Valuation Committee”) to administer, implement and oversee the fair valuation process, and to make fair value decisions. The Fair Valuation Committee regularly reviews its own fair value decisions, as well as decisions made under its standing instructions to the investment adviser’s valuation teams. The Fair Valuation Committee reviews changes in fair value measurements from period to period and may, as deemed appropriate, update the fair valuation guidelines to better reflect the results of back testing and address new or evolving issues. The Fair Valuation Committee reports any changes to the fair valuation guidelines to the audit committee with supplemental information to support the changes. The fund’s audit committee also regularly reviews reports that describe fair value determinations and methods.
The fund’s investment adviser has also established a Fixed-Income Pricing Review Group to administer and oversee the fixed-income valuation process, including the use of fixed-income pricing vendors. This group regularly reviews pricing vendor information and market data. Pricing decisions, processes and controls over security valuation are also subject to additional internal reviews, including an annual control self-evaluation program facilitated by the investment adviser’s compliance group.
| 18 | Emerging Markets Growth Fund |
Classifications — The fund’s investment adviser classifies the fund’s assets and liabilities into three levels based on the inputs used to value the assets or liabilities. Level 1 values are based on quoted prices in active markets for identical securities. Level 2 values are based on significant observable market inputs, such as quoted prices for similar securities and quoted prices in inactive markets. Certain securities trading outside the U.S. may transfer between Level 1 and Level 2 due to valuation adjustments resulting from significant market movements following the close of local trading. Level 3 values are based on significant unobservable inputs that reflect the investment adviser’s determination of assumptions that market participants might reasonably use in valuing the securities. The valuation levels are not necessarily an indication of the risk or liquidity associated with the underlying investment. For example, U.S. government securities are reflected as Level 2 because the inputs used to determine fair value may not always be quoted prices in an active market. The following tables present the fund’s valuation levels as of June 30, 2017 (dollars in thousands):
| Investment securities | ||||||||||||||||
| Level 11 | Level 21,2 | Level 32 | Total | |||||||||||||
| Assets: | ||||||||||||||||
| Common stocks: | ||||||||||||||||
| Asia-Pacific | $ | 1,647,258 | $ | 28,199 | $ | — | $ | 1,675,457 | ||||||||
| Latin America | 278,988 | — | — | 278,988 | ||||||||||||
| Eastern Europe and Middle East | 112,460 | — | 55,179 | 167,639 | ||||||||||||
| Africa | 163,590 | — | — | 163,590 | ||||||||||||
| Other markets | 118,488 | — | 10,929 | 129,417 | ||||||||||||
| Multinational | — | — | 687 | 687 | ||||||||||||
| Warrants | — | — | 32,600 | 32,600 | ||||||||||||
| Convertible preferred stocks | — | — | 411 | 411 | ||||||||||||
| Bonds & notes | — | 2,345 | — | 2,345 | ||||||||||||
| Short-term securities | — | 87,390 | — | 87,390 | ||||||||||||
| Total | $ | 2,320,784 | $ | 117,934 | $ | 99,806 | $ | 2,538,524 | ||||||||
| Other investments3 | ||||||||||||||||
| Level 1 | Level 2 | Level 3 | Total | |||||||||||||
| Liabilities: | ||||||||||||||||
| Unrealized depreciation on open forward currency contracts | $ | — | $ | (558 | ) | $ | — | $ | (558 | ) | ||||||
| 1 | Investment securities with a market value of $1,602,240,000, which represented 62.95% of the net assets of the fund, transferred from Level 2 to Level 1 since the prior fiscal year-end, primarily due to a lack of significant market movements following the close of local trading. |
| 2 | Level 2 and Level 3 include investment securities with an aggregate value of $128,005,000, which represented 5.03% of the net assets of the fund, that were fair valued under guidelines adopted by authority of the fund’s board of directors/trustees. |
| 3 | Forward currency contracts are not included in the investment portfolio. |
The following table reconciles the valuation of the fund’s Level 3 investment securities and related transactions during the year ended June 30, 2017 (dollars in thousands):
| Beginning | Gross | Net | Net | Gross | Ending | |||||||||||||||||||||||||||
| value at | transfers | realized | unrealized | transfers out | value at | |||||||||||||||||||||||||||
| 7/1/2016 | into Level 34 | Purchases | Sales | (loss) gain5 | appreciation5 | of Level 34 | 6/30/2017 | |||||||||||||||||||||||||
| Private equity funds | $ | 51,716 | $ | — | $ | 1,824 | $ | (9,682 | ) | $ | (5,760 | ) | $ | 17,366 | $ | — | $ | 55,464 | ||||||||||||||
| Other securities | 14,610 | 25,585 | 1,551 | (2,159 | ) | 1,026 | 3,877 | (148 | ) | 44,342 | ||||||||||||||||||||||
| Total | $ | 66,326 | $ | 25,585 | $ | 3,375 | $ | (11,841 | ) | $ | (4,734 | ) | $ | 21,243 | $ | (148 | ) | $ | 99,806 | |||||||||||||
| Net unrealized depreciation during the period on Level 3 investment securities held at June 30, 2017 (dollars in thousands): | $ | 16,404 | ||||||||||||||||||||||||||||||
| 4 | Transfers into and out of Level 3 are based on the beginning market value of the quarter in which they occurred. |
| 5 | Net realized gain (loss) and unrealized appreciation (depreciation) are included in the related amounts on investments in the statement of operations. |
The fund owns an interest in multiple private equity funds, which are considered alternative investments and are classified as Level 3 investment securities. The private equity funds are fair valued using the net asset value based on the fund’s financial statements adjusted for known company or market events, updated market pricing for underlying securities, and/or fund transactions (i.e., drawdowns and distributions) and may include other unobservable inputs.
| Emerging Markets Growth Fund | 19 |
The other unobservable inputs used in the fair value measurements of the fund’s private equity investments are directional adjustments based on relevant market data (such as significant movement of a country-specific exchange-traded fund or index after the financial statement date of the private equity fund).Significant increases (decreases) of these inputs could result in significantly higher (lower) fair valuation. There were no other unobservable inputs as of June 30, 2017.
The following table lists the characteristics of the alternative investments held by the fund as of June 30, 2017 (dollars in thousands):
| Investment type | Investment strategy | Fair value | Unfunded commitment* | Remaining life† | Redemption terms | |||||
| Private equity funds | Primarily private sector equity investments (i.e., expansion capital, buyouts) in emerging markets | $55,464 | $6,794 | ≤0 to 2 years | Redemptions are not permitted. These funds distribute proceeds from the liquidation of underlying assets of the funds. |
| * | Unfunded capital commitments represent agreements which obligate the fund to meet capital calls in the future. Payment would be made when a capital call is requested. Capital calls can only be made if and when certain requirements have been fulfilled; thus, the timing of such capital calls cannot readily be determined. |
| † | Represents the remaining life of the fund term or the estimated period of liquidation. |
4. Risk factors
Investing in the fund may involve certain risks including, but not limited to, those described below:
Market conditions — The prices of, and the income generated by, the common stocks and other securities held by the fund may decline – sometimes rapidly or unpredictably – due to various factors, including events or conditions affecting the general economy or particular industries; overall market changes; local, regional or global political, social or economic instability; governmental or governmental agency responses to economic conditions; and currency exchange rate, interest rate and commodity price fluctuations.
Issuer risks — The prices of, and the income generated by, securities held by the fund may decline in response to various factors directly related to the issuers of such securities, including reduced demand for an issuer’s goods or services, poor management performance and strategic initiatives such as mergers, acquisitions or dispositions and the market response to any such initiatives.
Investing in growth-oriented stocks — Growth-oriented common stocks and other equity-type securities (such as preferred stocks, convertible preferred stocks and convertible bonds) may involve larger price swings and greater potential for loss than other types of investments. These risks may be even greater in the case of smaller capitalization stocks.
Investing outside the U.S. — Securities of issuers domiciled outside the U.S., or with significant operations or revenues outside the U.S., may lose value because of adverse political, social, economic or market developments (including social instability, regional conflicts, terrorism and war) in the countries or regions in which the issuers operate or generate revenue. These securities may also lose value due to changes in foreign currency exchange rates against the U.S. dollar and/or currencies of other countries. Issuers of these securities may be more susceptible to actions of foreign governments, such as the imposition of price controls or punitive taxes, that could adversely impact the value of these securities. Securities markets in certain countries may be more volatile and/or less liquid than those in the U.S.. Investments outside the U.S. may also be subject to different accounting practices and different regulatory, legal and reporting standards and practices, and may be more difficult to value, than those in the U.S. In addition, the value of investments outside the U.S. may be reduced by foreign taxes, including foreign withholding taxes on interest and dividends. Further, there may be increased risks of delayed settlement of securities purchased or sold by the fund. The risks of investing outside the U.S. may be heightened in connection with investments in developing countries.
Investing in developing countries — Investing in countries with developing economies and/or markets may involve risks in addition to and greater than those generally associated with investing in the securities markets of developed countries. For instance, developing countries may have less developed legal and accounting systems than those in developed countries. The governments of these countries may be less stable and more likely to impose capital controls, nationalize a company or industry, place restrictions on foreign ownership and on withdrawing sale proceeds of securities from the country, and/or impose punitive taxes that could adversely affect the prices of securities. In addition, the economies of these countries may be dependent
| 20 | Emerging Markets Growth Fund |
on relatively few industries that are more susceptible to local and global changes. Securities markets in these countries can also be relatively small and have substantially lower trading volumes. As a result, securities issued in these countries may be more volatile and less liquid, and may be more difficult to value, than securities issued in countries with more developed economies and/or markets. Less certainty with respect to security valuations may lead to additional challenges and risks in calculating the fund’s net asset value. Additionally, there may be increased settlement risks for transactions in local securities.
Management — The investment adviser to the fund actively manages the fund’s investments. Consequently, the fund is subject to the risk that the methods and analyses employed by the investment adviser in this process may not produce the desired results. This could cause the fund to lose value or its investment results to lag relevant benchmarks or other funds with similar objectives.
5. Certain investment techniques
Forward currency contracts — The fund has entered into open over-the-counter (“OTC”) forward currency contracts, which represent agreements to exchange currencies on specific future dates at predetermined rates. The fund’s investment adviser uses forward currency contracts to manage the fund’s exposure to changes in exchange rates. Upon entering into these contracts, risks may arise from the potential inability of counterparties to meet the terms of their contracts and from possible movements in exchange rates
On a daily basis, forward currency contracts are valued and unrealized appreciation or depreciation for open forward currency contracts is recorded in the fund’s statement of assets and liabilities. Realized gains or losses are recorded at the time the forward currency contract is closed or offset by another contract with the same broker for the same settlement date and currency.
Closed forward currency contracts that have not reached their settlement date are included in the respective receivables or payables for closed forward currency contracts in the fund’s statement of assets and liabilities. Net realized gains or losses from closed forward currency contracts and net unrealized appreciation or depreciation from open forward currency contracts are recorded in the fund’s statement of operations and statements of changes in net assets. The average month-end notional amount of open OTC forward currency contracts while held was $14,179,000.
Collateral — The fund participates in a collateral program due to its use of forward currency contracts. The program calls for the fund to either receive or pledge highly liquid assets, such as cash or U.S. Treasury bills, as collateral based on the net gain or loss on unsettled forward currency contracts by counterparty. The purpose of the collateral is to cover potential losses that could occur in the event that either party cannot meet its contractual obligations.
Restricted cash — The fund held restricted cash in connection with investments in forward currency contracts. Restricted cash is held in a segregated account with the fund’s custodian and is reflected in the Statement of Assets and Liabilities.
Rights of offset — The fund has entered into enforceable master netting agreements with certain counterparties for forward currency contracts, where on any date amounts payable by each party to the other (in the same currency with respect to the same transaction) may be closed or offset by each party’s payment obligation. If an early termination date occurs under these agreements following an event of default or termination event, all obligations of each party to its counterparty are settled net through a single payment in a single currency (“close-out netting”). For financial reporting purposes, the fund does not offset the financial assets and financial liabilities that are subject to these master netting arrangements in the statement of assets and liabilities.
The following table presents the fund’s forward currency contracts by counterparty that are subject to master netting agreements but that are not offset in the fund’s statement of assets and liabilities. The net amount column shows the impact of offsetting on the fund’s statement of assets and liabilities as of June 30, 2017 (dollars in thousands) if close-out netting was exercised:
| Gross amounts not offset in the | ||||||||||||||||||||||
| Gross amounts | statement of assets and liabilities and | |||||||||||||||||||||
| recognized in the | subject to a master netting agreement | |||||||||||||||||||||
| statement of assets | Available | Non-cash | Cash | Net | ||||||||||||||||||
| Counterparty | and liabilities | to offset | collateral* | collateral | amount | |||||||||||||||||
| Liabilities: | ||||||||||||||||||||||
| Citibank | $ | (558 | ) | $ | — | $ | — | $ | 530 | $ | (28 | ) | ||||||||||
* Non-cash collateral is shown on a settlement basis.
| Emerging Markets Growth Fund | 21 |
6. Taxation and distributions
Federal income taxation — The fund complies with the requirements under Subchapter M of the Internal Revenue Code applicable to regulated investment companies and intends to distribute substantially all of its net taxable income and net capital gains each year. The fund is not subject to income taxes to the extent such distributions are made. Therefore, no federal income tax provision is required
As of and during the year ended June 30, 2017, the fund did not have a liability for any unrecognized tax benefits. The fund recognizes interest and penalties, if any, related to unrecognized tax benefits as income tax expense in the statement of operations. During the period, the fund did not incur any interest or penalties.
The fund is not subject to examination by U.S. federal tax authorities for tax years before 2013, by state authorities for tax years before 2012 and by tax authorities outside the U.S. for tax years before 2010.
Non-U.S. taxation — Dividend and interest income are recorded net of non-U.S. taxes paid. The fund may file withholding tax reclaims in certain jurisdictions to recover a portion of amounts previously withheld. As a result of rulings from European courts, the fund filed for additional reclaims related to prior years. These reclaims are recorded when the amount is known and there are no significant uncertainties on collectability. Gains realized by the fund on the sale of securities in certain countries, if any, may be subject to non-U.S. taxes. If applicable, the fund records an estimated deferred tax liability based on unrealized gains to provide for potential non-U.S. taxes payable upon the sale of these securities.
Distributions — Distributions paid to shareholders are based on net investment income and net realized gains determined on a tax basis, which may differ from net investment income and net realized gains for financial reporting purposes. These differences are due primarily to different treatment for items such as currency gains and losses; short-term capital gains and losses; capital losses related to sales of certain securities within 30 days of purchase; cost of investments sold and income on certain investments.
The fiscal year in which amounts are distributed may differ from the year in which the net investment income and net realized gains are recorded by the fund for financial reporting purposes. For the year ended June 30, 2017, the tax character of distributions paid to shareholders was ordinary income in the amount of $26,132,000. For the year ended June 30, 2016, the tax character of distributions paid to shareholders was ordinary income in the amount of $105,314,000.
During the year ended June 30, 2017, the fund reclassified $6,807,000 from accumulated net realized loss to undistributed net investment income to align financial reporting with tax reporting.
As of June 30, 2017, the tax basis components of distributable earnings, unrealized appreciation (depreciation) and cost of investment securities were as follows (dollars in thousands):
| Undistributed ordinary income | $ | 24,028 | ||
| Capital loss carryforward* | (283,948 | ) | ||
| Gross unrealized appreciation on investment securities | 820,535 | |||
| Gross unrealized depreciation on investment securities | (189,403 | ) | ||
| Net unrealized appreciation on investment securities | 631,132 | |||
| Cost of investment securities | 1,907,392 |
| * | The capital loss carryforward will be used to offset any capital gains realized by the fund in future years. The fund will not make distributions from capital gains while a capital loss carryforward remains. |
| 22 | Emerging Markets Growth Fund |
7. Fees and transactions with related parties
CII (the “Adviser”) is the fund’s investment adviser. American Funds Distributors,® Inc. (“AFD”), the fund’s principal underwriter, is affiliated with the Adviser. The Adviser and AFD are considered related parties to the fund.
Investment advisory services —The fund has an Investment Advisory and Service Agreement with the Adviser that provides for monthly management fees determined on the last business day of each calendar week and month. The Adviser is wholly owned by Capital Group International, Inc., which is indirectly wholly owned by The Capital Group Companies,SM Inc. These fees are based on a series of decreasing annual rates beginning with 0.90% on the first $400 million of the fund’s net assets and decreasing to 0.52% on such assets in excess of $20 billion. For the year ended June 30, 2017, the investment advisory services fee was $18,782,000, which was equivalent to an annualized rate of 0.74% of average daily net assets.
Distribution services — The fund has a principal underwriting agreement with AFD. AFD does not receive compensation for any sale of the fund’s shares.
Directors’ compensation — Directors who are unaffiliated with the Adviser may elect to defer the cash payment of part or all of their compensation. These deferred amounts, which remain as liabilities of the fund, are treated as if invested in shares of the fund or the American Funds. These amounts represent general, unsecured liabilities of the fund and vary according to the total returns of the selected funds. Directors’ compensation shown on the accompanying financial statements includes $351,000 in current fees (either paid in cash or deferred) and a net increase of $451,000 in the value of the deferred amounts.
Affiliated officers and directors — Officers and certain directors of the fund are or may be considered to be affiliated with the Adviser. No affiliated officers or directors received any compensation directly from the fund.
Interfund lending — Pursuant to an exemptive order issued by the SEC, the fund, along with other CII-managed funds (or funds managed by certain affiliates of CII), may participate in an interfund lending program. The program provides an alternate credit facility that permits the funds to lend or borrow cash for temporary purposes directly to or from one another, subject to the conditions of the exemptive order. The fund did not lend or borrow cash through the interfund lending program at any time during the year ended June 30, 2017.
8. Committed line of credit
The fund participates with other funds managed by CII (or funds managed by certain affiliates of CII) in a $1 billion credit facility (the “line of credit”) to be utilized for temporary purposes to support shareholder redemptions. The fund has agreed to pay commitment fees on its pro rata portion of the line of credit, which are reflected in other expenses in the fund’s statement of operations. The fund did not borrow on this line of credit at any time during the year ended June 30, 2017.
9. Investment transactions and other disclosures
The fund made purchases and sales of investment securities, excluding short-term securities, of $1,113,291,000 and $1,806,723,000, respectively, during the year ended June 30, 2017.
The fund receives an expense reduction in its custodian fee equal to the amount of interest calculated on certain cash balances held at the custodian bank. For the year ended June 30, 2017, the custodian fee of $886,000 was reduced by $5,000.
| Emerging Markets Growth Fund | 23 |
Financial highlights
| Year ended June 30 | ||||||||||||||||||||
| 2017 | 2016 | 20151 | 2014 | 2013 | ||||||||||||||||
| Net asset value, beginning of year | $ | 5.92 | $ | 6.94 | $ | 7.97 | $ | 7.45 | $ | 7.39 | ||||||||||
| Income (loss) from investment operations2: | ||||||||||||||||||||
| Net investment income | .09 | 3 | .08 | .08 | .07 | .12 | ||||||||||||||
| Net realized and unrealized gain (loss) on investments | 1.40 | (.93 | ) | (.71 | ) | .86 | .19 | |||||||||||||
| Total from investment operations | 1.49 | (.85 | ) | (.63 | ) | .93 | .31 | |||||||||||||
| Less dividends and distributions: | ||||||||||||||||||||
| Dividends from net investment income | (.07 | ) | (.17 | ) | (.14 | ) | (.10 | ) | (.21 | ) | ||||||||||
| Distributions from net realized gains | — | — | (.26 | ) | (.31 | ) | (.04 | ) | ||||||||||||
| Total dividends and distributions | (.07 | ) | (.17 | ) | (.40 | ) | (.41 | ) | (.25 | ) | ||||||||||
| Net asset value, end of year | $ | 7.34 | $ | 5.92 | $ | 6.94 | $ | 7.97 | $ | 7.45 | ||||||||||
| Total return | 25.43 | % | (12.09 | )% | (7.71 | )% | 12.69 | % | 3.95 | % | ||||||||||
| Ratios/Supplemental data: | ||||||||||||||||||||
| Net assets, end of year (in millions) | $ | 2,545 | $ | 2,740 | $ | 4,621 | $ | 6,526 | $ | 9,564 | ||||||||||
| Ratio of expenses to average net assets4 | .85 | % | .78 | % | .75 | % | .73 | % | .73 | % | ||||||||||
| Ratio of net investment income to average net assets | 1.40 | %3 | 1.44 | % | 1.12 | % | .88 | % | 1.55 | % | ||||||||||
| Portfolio turnover rate | 46 | % | 48 | %5 | 26 | % | 41 | % | 41 | % | ||||||||||
| 1 | Prior to October 31, 2014, the fund operated as an open-end interval fund, with monthly redemptions and weekly purchases. |
| 2 | Based on average shares outstanding. |
| 3 | For the year ended June 30, 2017, this reflects the impact of European Union tax reclaims received that resulted in a one-time increase to net investment income. If the reclaim had not occurred, the net investment income per share and ratio of net income to average net assets would have been lower by $.02 and .34 percentage points, respectively. |
| 4 | This ratio does not include acquired fund fees and expenses. |
| 5 | The portfolio turnover calculation has been adjusted to exclude the value of securities acquired in connection with the fund’s acquisition of the assets of the Capital Group Emerging Markets Equity Trust (US) on November 6, 2015. Should the calculation not have been subject to such adjustment, the fund’s portfolio turnover ratio would have been 58%. |
See Notes to Financial Statements
Report of Independent Registered Public Accounting Firm
To the Board of Directors and Shareholders of Emerging Markets Growth Fund, Inc.
In our opinion, the accompanying statement of assets and liabilities, including the investment portfolio, and the related statements of operations and of changes in net assets and the financial highlights present fairly, in all material respects, the financial position of Emerging Markets Growth Fund, Inc. (the “Fund”) at June 30, 2017, the results of its operations for the year then ended, the changes in its net assets for each of the two years in the period then ended and the financial highlights for each of the five years in the period then ended, in conformity with accounting principles generally accepted in the United States of America. These financial statements and financial highlights (hereafter referred to as “financial statements”) are the responsibility of the Fund’s management. Our responsibility is to express an opinion on these financial statements based on our audits. We conducted our audits of these financial statements in accordance with the standards of the Public Company Accounting Oversight Board (United States). Those standards require that we plan and perform the audit to obtain reasonable assurance about whether the financial statements are free of material misstatement. An audit includes examining, on a test basis, evidence supporting the amounts and disclosures in the financial statements, assessing the accounting principles used and significant estimates made by management, and evaluating the overall financial statement presentation. We believe that our audits, which included confirmation of securities at June 30, 2017, by correspondence with the custodian and brokers, provide a reasonable basis for our opinion.
PricewaterhouseCoopers LLP
Los Angeles, California
August 21, 2017
| 24 | Emerging Markets Growth Fund |
| Tax information | unaudited |
We are required to advise you of the federal tax status of certain distributions received by shareholders during the fiscal year. The fund hereby designates the following amounts for the fund’s fiscal year ended June 30, 2017:
| Foreign source income | $ | 0.11 per share | ||
| Qualified dividend income | $ | 23,994,000 |
Individual shareholders should refer to their Form 1099-DIV or other tax information, which will be mailed by February 15, 2018, to determine the calendar year amounts to be included on their 2017 tax returns. Shareholders should consult their tax advisors.
Expense example
As a shareholder of the fund, you incur ongoing costs, including investment advisory services fees and other expenses. This example is intended to help you understand your ongoing costs (in dollars) of investing in the fund so you can compare these costs with the ongoing costs of investing in other funds. The example is based on an investment of $1,000 invested at the beginning of the period and held for the entire six-month period (January 1, 2017, through June 30, 2017).
Actual expenses:
The first line of the table below provides information about actual account values and actual expenses. You may use the information in this line, together with the amount you invested, to estimate the expenses that you paid over the period. Simply divide your account value by $1,000 (for example, an $8,600 account value divided by $1,000 = 8.6), then multiply the result by the number in the first line under the heading entitled “Expenses paid during period” to estimate the expenses you paid on your account during this period.
Hypothetical example for comparison purposes:
The second line of the table below provides information about hypothetical account values and hypothetical expenses based on the fund’s actual expense ratio and an assumed rate of return of 5% per year before expenses, which is not the fund’s actual return. The hypothetical account values and expenses may not be used to estimate the actual ending account balance or expenses you paid for the period. You may use this information to compare the ongoing costs of investing in the fund and other funds. To do so, compare this 5% hypothetical example with the 5% hypothetical examples that appear in the shareholder reports of the other funds.
| Beginning account value 1/1/2017 | Ending account value 6/30/2017 | Expenses paid during period* | Annualized expense ratio | |||||||||||||
| Actual return | $ | 1,000.00 | $ | 1,215.23 | $ | 4.83 | .88 | % | ||||||||
| Hypothetical 5% return before expenses | 1,000.00 | 1,020.43 | 4.41 | .88 | ||||||||||||
| * | The “expenses paid during period” are equal to the “annualized expense ratio,” multiplied by the average account value over the period, multiplied by the number of days in the period, and divided by 365 (to reflect the six-month period). |
| Emerging Markets Growth Fund | 25 |
Approval of Investment Advisory and Service Agreement
Emerging Markets Growth Fund’s board has approved renewal of the fund’s Investment Advisory and Service Agreement (the “agreement”) with Capital International, Inc. (the “investment adviser”) through July 31, 2018. The board approved the agreement following the recommendation of the fund’s Contracts Committee (the “committee”), which is composed of all of the fund’s independent board members. The board and the committee determined that the fund’s advisory fee structure was fair and reasonable in relation to the services provided, and that approving the agreement was in the best interests of the fund and its shareholders.
In reaching this decision, the board and the committee took into account information furnished to them throughout the year and otherwise provided to them, as well as information prepared specifically in connection with their review of the agreement, and were advised by their independent counsel. They considered the following factors, among others, but did not identify any single issue or particular piece of information that, in isolation, was the controlling factor, and each board and committee member did not necessarily attribute the same weight to each factor.
1. Nature, extent and quality of services
The board and the committee considered the depth and quality of the investment adviser’s investment management process, including its global research capabilities; the experience, capability and integrity of its senior management and other personnel; the low turnover rates of its key personnel; the overall financial strength and stability of the investment adviser and the Capital Group organization; and the ongoing evolution of the investment adviser’s organizational structure designed to maintain and strengthen these qualities. The board and the committee also considered the nature, extent and quality of administrative, compliance and shareholder services provided by the investment adviser to the fund under the agreement and other agreements. The board and the committee concluded that the nature, extent and quality of the services provided by the investment adviser have benefited and should continue to benefit the fund and its shareholders.
2. Investment results
The board and the committee considered the investment results of the fund in light of its objective of providing long-term capital growth. They compared the fund’s investment results with those of other funds (including funds that currently form the basis of the Lipper index for the category in which the fund is included), and data such as relevant market and fund indexes over various periods through December 31, 2016. This report, including the letter to shareholders and related disclosures, contains certain information about the fund’s investment results. The board and the committee reviewed the fund’s investment results measured against various indexes, including the MSCI Emerging Markets IMI and the Lipper Emerging Markets Funds Average. The board and the committee noted that the fund had trailed the MSCI Index and Lipper Average over the three-year, five-year and 10-year periods. They further noted that the fund’s investment results were higher than the Lipper Average but lower than the MSCI Index for the one-year period. The board and the committee also noted that the fund’s performance has been in line with the Lipper Average for the lifetime of the fund. The board and the committee noted management’s assessment of the fund’s recent performance. The board and the committee concluded that although performance has lagged in certain recent periods, longer term performance has generally been satisfactory. The board and the committee concluded that the fund’s investment results have been satisfactory for renewal of the agreement, and that the investment adviser’s record in managing the fund indicated that its continued management should benefit the fund and its shareholders.
| 26 | Emerging Markets Growth Fund |
3. Advisory fees and total expenses
The board and the committee compared the advisory fees and total expense levels of the fund to those of other relevant funds. They observed that the fund’s advisory fees and expenses were in line with or lower than those of the other relevant funds included in the Lipper Emerging Markets Funds category. The board and the committee also considered the breakpoint discounts in the fund’s advisory fee structure that reduce the level of fees charged by the investment adviser to the fund as fund assets increase. In addition, they reviewed information regarding the effective advisory fees charged to non-mutual fund clients by the investment adviser and its affiliates. They noted that, to the extent there were differences between the advisory fees paid by the fund and the advisory fees paid by those clients, the differences appropriately reflected the investment, operational, regulatory and market differences between advising the fund and the other clients. The board and the committee concluded that the fund’s cost structure was fair and reasonable in relation to the services provided, and that the fund’s shareholders receive reasonable value in return for the advisory fees and other amounts paid to the investment adviser by the fund.
4. Ancillary benefits
The board and the committee considered a variety of other benefits that the investment adviser and its affiliates receive as a result of the investment adviser’s relationship with the fund, including fees for administrative services paid to Capital Group Private Client Services, a division of Capital Bank and Trust Company, an affiliate of the investment adviser, and possible ancillary benefits to the investment adviser and its affiliates in managing other investment vehicles and accounts. The board and the committee reviewed the investment adviser’s portfolio trading practices, noting the benefits the investment adviser receives from the research obtained with commissions from portfolio transactions made on behalf of the fund. The board and the committee took these ancillary benefits into account in evaluating the reasonableness of the advisory fees paid to the investment adviser by the fund.
5. Adviser financial information
The board and the committee reviewed information regarding the investment adviser’s costs of providing services to the fund, including personnel, systems and resources of investment, compliance, trading and other administrative operations. They considered the investment adviser’s costs and related cost allocation methodology as well as its willingness to invest in technology, infrastructure and staff to maintain and expand services and capabilities, respond to industry and regulatory developments, and attract and retain qualified personnel. They noted information regarding the compensation structure for the investment adviser’s investment professionals. The board and the committee also compared the investment adviser’s profitability and compensation data to the reported results and data of several large, publicly held investment management companies. The board and the committee noted the competitiveness and cyclicality of both the mutual fund industry and the capital markets, and the importance in that environment of the investment adviser’s long-term profitability for maintaining its independence, company culture and management continuity. They further considered the breakpoint discounts in the fund’s advisory fee structure. The board and the committee concluded that the fund’s advisory fee structure reflected a reasonable sharing of benefits between the investment adviser and fund shareholders.
| Emerging Markets Growth Fund | 27 |
Board of directors and other officers
Independent directors1
| Name, year of birth and position with fund | Year first elected a director of the fund2 | Principal occupation(s) during past five years | Number of portfolios in fund complex3 overseen by director | Other directorships4 held by director | ||||
| Joseph C. Berenato, 1946 | 2016 | Former Chairman and CEO, Ducommun Incorporated (aerospace components manufacturer) | 16 | None | ||||
| Richard G. Capen Jr., 1934 | 2016 | Corporate director and author | 10 | None | ||||
| Vanessa C. L. Chang, 1952 | 2016 | Director, EL & EL Investments (real estate) | 17 | Edison International; Sykes Enterprises; Transocean Ltd. | ||||
| H. Frederick Christie, 1933 | 2016 | Private investor | 10 | None | ||||
| Richard G. Newman,1934 Chairman of the Board (Independent and Non-Executive) | 2016 | Founder and Chairman Emeritus, AECOM Technology Corporation (global engineering, consulting and professional technical services) | 10 | None |
Interested director5
| Name, year of birth and position with fund | Year first elected a director or officer of the fund2 | Principal occupation(s) during past five years and positions held with affiliated entities of the fund | Number of portfolios in fund complex3 overseen by director | Other directorships4 held by director | ||||
| Paul F. Roye, 1953 Vice Chairman of the Board | 2016 | Director, Capital Research and Management Company;6 Senior Vice President and Senior Counsel — Fund Business Management Group, Capital Research and Management Company6 | 11 | None |
| 28 | Emerging Markets Growth Fund |
Other officers
| Name, year of birth and position with fund | Year first elected an officer of the fund2 | Principal occupation(s) during past five years and positions held with affiliated entities of the fund | ||
| Victor D. Kohn, 1957 President | 1996 | President and Director, Capital International, Inc.; Partner — Capital International Investors, Capital Research and Management Company;6 Partner — Capital International Investors, Capital Bank and Trust Company6 | ||
| Shaw B. Wagener, 1959 Senior Vice President | 1997 | Chairman of the Board, Capital International, Inc.; Partner — Capital International Investors, Capital Research and Management Company;6 Chairman of the Board, Capital Group International,Inc.;6 Director, Capital Group Private Markets, Inc.6 | ||
| Timothy W. McHale, 1978 Vice President | 2016 | Vice President and Senior Counsel — Fund Business Management Group, Capital Research and Management Company;6 Secretary, American Funds Distributors, Inc.6 | ||
| F. Chapman Taylor, 1959 Vice President | 2011 | Partner — Capital International Investors, Capital Research and Management Company6 | ||
| Courtney R. Taylor, 1975 Secretary | 2016 | Assistant Vice President — Fund Business Management Group, Capital Research and Management Company6 | ||
| Gregory F. Niland, 1971 Treasurer | 2016 | Vice President — Investment Operations, Capital Research and Management Company6 | ||
| Susan K. Countess, 1966 Assistant Secretary | 2016 | Associate — Fund Business Management Group, Capital Research and Management Company6 | ||
| Brian C. Janssen, 1972 Assistant Treasurer | 2015 | Vice President — Investment Operations, Capital Research and Management Company6 |
The fund’s statement of additional information (SAI) includes further details about fund directors. The address for all directors and officers of the fund is 333 South Hope Street, Los Angeles, CA 90071, Attention: Secretary.
The fund’s SAI, Proxy Voting Policy and Procedures, and proxy voting record for the 12 months ended June 30 are available free of charge on the U.S. Securities and Exchange Commission (SEC) website at sec.gov or upon request by calling (800) 421-4989.
The fund files a complete list of its portfolio holdings with the SEC for the first and third quarters of each fiscal year on Form N-Q. This filing is available free of charge on the SEC website or upon request by calling (800) 421-4989. You may also review or, for a fee, copy this filing at the SEC’s Public Reference Room in Washington, D.C. Information on the operation of the Public Reference Room may be obtained by calling (800) SEC-0330.
| 1 | The term independent director refers to a director who is not an “interested person” of the fund within the meaning of the Investment Company Act of 1940. |
| 2 | Directors and officers of the fund serve until their resignation, removal or retirement. |
| 3 | Funds managed by Capital International, Inc. or its affiliates. |
| 4 | This includes all directorships (other than those in the fund) that are held by each director as a director of a company with a class of securities registered pursuant to Section 12 of the Securities Exchange Act of 1934 or subject to the requirements of Section 15(d) of the Securities Exchange Act of 1934 or a company registered as an investment company under the 1940 Act. |
| 5 | The term interested director refers to a director who is an “interested person” within the meaning of the Investment Company Act of 1940, on the basis of their affiliation with the fund’s investment adviser, Capital International, Inc., or affiliated entities (including the fund’s principal underwriter). |
| 6 | Company affiliated with Capital International, Inc. |
| Emerging Markets Growth Fund | 29 |
Offices of the fund and of the investment adviser
Capital International, Inc.
11100 Santa Monica Boulevard
Los Angeles, CA 90025-3302
333 South Hope Street
Los Angeles, CA 90071-1406
400 South Hope Street
Los Angeles, CA 90071-2801
6455 Irvine Center Drive
Irvine, CA 92618-4518
Transfer agent for shareholder accounts
American Funds Service Company
6455 Irvine Center Drive
Irvine, CA 92618-4518
Custodian of assets
JPMorgan Chase Bank
270 Park Avenue
New York, NY 10017-2070
Counsel
Morgan, Lewis & Bockius LLP
300 South Grand Avenue, 22nd Floor
Los Angeles, CA 90071-3132
Independent registered public accounting firm
PricewaterhouseCoopers LLP
601 South Figueroa Street
Los Angeles, CA 90017-3874
Principal underwriter
American Funds Distributors, Inc.
333 South Hope Street
Los Angeles, CA 90071-1406
This report is for the information of shareholders of Emerging Markets Growth Fund, but it also may be used as sales literature when preceded or accompanied by the current prospectus, which gives details about charges, expenses, investment objectives and operating policies of the fund.
Investors should carefully consider investment objectives, risks, charges and expenses. This and other important information is in the prospectus, which can be obtained from Capital International by calling (800) 421-4989 and should be read carefully before investing.
MSCI has not approved, reviewed or produced this report, makes no express or implied warranties or representations and is not liable whatsoever for any data in the report. You may not redistribute the MSCI data or use it as a basis for other indices or investment products.

ITEM 2 – Code of Ethics
The Registrant has adopted a Code of Ethics that applies to its Principal Executive Officer and Principal Financial Officer. The Registrant undertakes to provide to any person without charge, upon request, a copy of the Code of Ethics. Such request can be made by calling 800/421-4989 or by writing to the Secretary of the Registrant, 333 South Hope Street, 55th Floor, Los Angeles, California 90071.
ITEM 3 – Audit Committee Financial Expert
The Registrant’s Board has determined that each member of the Registrant’s Audit Committee, Helmut Mader, Aje K. Saigal and David H. Zellner, is an “audit committee financial expert” and "independent," as such terms are defined in this Item. This designation will not increase each designee’s duties, obligations or liability as compared to his duties, obligations and liability as a member of the Audit Committee and of the Board, nor will it reduce the responsibility of the other Audit Committee members. The Board believes each member of the Audit Committee contributes significantly to the effective oversight of the Registrant’s financial statements and condition.
ITEM 4 – Principal Accountant Fees and Services
| Registrant: | ||
| a) Audit Fees: | ||
| 2016 | $146,000 | |
| 2017 | $146,000 | |
| b) Audit-Related Fees: | ||
| 2016 | None | |
| 2017 | None | |
| c) Tax Fees: | ||
| 2016 | $13,000 | |
| 2017 | $14,000 | |
| The tax fees consist of professional services relating to the preparation of the Registrant’s tax returns. | ||
| d) All Other Fees: | ||
| 2016 | None | |
| 2017 | None | |
| Adviser and affiliates (includes only fees for non-audit services billed to the adviser and affiliates for engagements that relate directly to the operations and financial reporting of the Registrant and were subject to the pre-approval policies described below): | ||
| a) Audit Fees: | ||
| Not Applicable | ||
| b) Audit-Related Fees: | ||
| 2016 | None | |
| 2017 | None | |
| The audit-related fees consist of assurance and related services relating to the examination of the Registrant’s transfer agent, principal underwriter and investment adviser conducted in accordance with Statement on Standards for Attestation Engagements Number 16 issued by the American Institute of Certified Public Accountants. | ||
| c) Tax Fees: | ||
| 2016 | None | |
| 2017 | None | |
| The tax fees consist of consulting services relating to the Registrant’s investments. | ||
| d) All Other Fees: | ||
| 2016 | None | |
| 2017 | None | |
| The other fees consist of subscription services related to an accounting research tool. | ||
| All audit and permissible non-audit services that the Registrant’s audit committee considers compatible with maintaining the independent registered public accounting firm’s independence are required to be pre-approved by the committee. The pre-approval requirement will extend to all non-audit services provided to the Registrant, the investment adviser, and any entity controlling, controlled by, or under common control with the investment adviser that provides ongoing services to the Registrant, if the engagement relates directly to the operations and financial reporting of the Registrant. The committee will not delegate its responsibility to pre-approve these services to the investment adviser. The committee may delegate to one or more committee members the authority to review and pre-approve audit and permissible non-audit services. Actions taken under any such delegation will be reported to the full committee at its next meeting. The pre-approval requirement is waived with respect to non-audit services if certain conditions are met. The pre-approval requirement was not waived for any of the non-audit services listed above provided to the Registrant, adviser and affiliates. | ||
| Aggregate non-audit fees paid to the Registrant’s auditors, including fees for all services billed to the Registrant, adviser and affiliates that provide ongoing services to the Registrant, were $13,000 for fiscal year 2016 and $743,000 for fiscal year 2017. The non-audit services represented by these amounts were brought to the attention of the committee and considered to be compatible with maintaining the auditors’ independence. | ||
ITEM 5 – Audit Committee of Listed Registrants
Not applicable to this Registrant, insofar as the Registrant is not a listed issuer as defined in Rule 10A-3 under the Securities Exchange Act of 1934.
ITEM 6 – Schedule of Investments
Not applicable, insofar as the schedule is included as part of the report to shareholders filed under Item 1 of this Form.
ITEM 7 – Disclosure of Proxy Voting Policies and Procedures for Closed-End Management Investment Companies
Not applicable to this Registrant, insofar as the Registrant is not a closed-end management investment company.
ITEM 8 – Portfolio Managers of Closed-End Management Investment Companies
Not applicable to this Registrant, insofar as the Registrant is not a closed-end management investment company.
ITEM 9 – Purchases of Equity Securities by Closed-End Management Investment Company and Affiliated Purchasers
Not applicable to this Registrant, insofar as the Registrant is not a closed-end management investment company.
ITEM 10 – Submission of Matters to a Vote of Security Holders
There have been no material changes to the procedures by which shareholders may recommend nominees to the Registrant’s board of directors since the Registrant last submitted a proxy statement to its shareholders. The procedures are as follows. The Registrant has a nominating committee comprised solely of persons who are not considered ‘‘interested persons’’ of the Registrant within the meaning of the Investment Company Act of 1940, as amended. The committee periodically reviews such issues as the board’s composition, responsibilities, committees, compensation and other relevant issues, and recommends any appropriate changes to the full board of directors. While the committee normally is able to identify from its own resources an ample number of qualified candidates, it will consider shareholder suggestions of persons to be considered as nominees to fill future vacancies on the board. Such suggestions must be sent in writing to the nominating committee of the Registrant, c/o the Registrant’s Secretary, and must be accompanied by complete biographical and occupational data on the prospective nominee, along with a written consent of the prospective nominee for consideration of his or her name by the nominating committee.
ITEM 11 – Controls and Procedures
| (a) | The Registrant’s Principal Executive Officer and Principal Financial Officer have concluded, based on their evaluation of the Registrant’s disclosure controls and procedures (as such term is defined in Rule 30a-3 under the Investment Company Act of 1940), that such controls and procedures are adequate and reasonably designed to achieve the purposes described in paragraph (c) of such rule. |
| (b) | There were no changes in the Registrant’s internal controls over financial reporting (as defined in Rule 30a-3(d) under the Investment Company Act of 1940) that occurred during the Registrant’s second fiscal quarter of the period covered by this report that has materially affected, or is reasonably likely to materially affect, the Registrant’s internal control over financial reporting. |
ITEM 12 – Exhibits
| (a)(1) | The Code of Ethics that is the subject of the disclosure required by Item 2 is attached as an exhibit hereto. |
| (a)(2) | The certifications required by Rule 30a-2 of the Investment Company Act of 1940 and Sections 302 and 906 of the Sarbanes-Oxley Act of 2002 are attached as exhibits hereto. |
SIGNATURES
Pursuant to the requirements of the Securities Exchange Act of 1934 and the Investment Company Act of 1940, the Registrant has duly caused this report to be signed on its behalf by the undersigned, thereunto duly authorized.
| EMERGING MARKETS GROWTH FUND, INC. | |
| By /s/ Victor D. Kohn | |
Victor D. Kohn, President and Principal Executive Officer | |
| Date: August 31, 2017 |
Pursuant to the requirements of the Securities Exchange Act of 1934 and the Investment Company Act of 1940, this report has been signed below by the following persons on behalf of the Registrant and in the capacities and on the dates indicated.
| By /s/ Victor D. Kohn |
Victor D. Kohn, President and Principal Executive Officer |
| Date: August 31, 2017 |
| By /s/ Gregory F. Niland |
Gregory F. Niland, Treasurer and Principal Financial Officer |
| Date: August 31, 2017 |