| UNITED STATES SECURITIES AND EXCHANGE COMMISSION | ||
| Washington, D.C. 20549 | ||
FORM N-CSR | ||
| CERTIFIED SHAREHOLDER REPORT OF REGISTERED MANAGEMENT INVESTMENT COMPANIES | ||
| Investment Company Act file number: | (811-04524) |
| Exact name of registrant as specified in charter: | Putnam Global Income Trust |
| Address of principal executive offices: | One Post Office Square, Boston, Massachusetts 02109 |
| Name and address of agent for service: | Robert T. Burns, Vice President One Post Office Square Boston, Massachusetts 02109 |
| Copy to: | John W. Gerstmayr, Esq. Ropes & Gray LLP 800 Boylston Street Boston, Massachusetts 02199-3600 |
| Registrant’s telephone number, including area code: | (617) 292-1000 |
| Date of fiscal year end: | October 31, 2014 |
| Date of reporting period: | November 1, 2013 — April 30, 2014 |
Item 1. Report to Stockholders: |
| The following is a copy of the report transmitted to stockholders pursuant to Rule 30e-1 under the Investment Company Act of 1940: | |||
Putnam
Global Income
Trust
Semiannual report
4 | 30 | 14
| Message from the Trustees | 1 | |
| About the fund | 2 | |
| Performance snapshot | 4 | |
| Interview with your fund’s portfolio manager | 5 | |
| Your fund’s performance | 11 | |
| Your fund’s expenses | 13 | |
| Terms and definitions | 15 | |
| Other information for shareholders | 16 | |
| Financial statements | 17 | |
| Shareholder meeting results | 76 | |
Consider these risks before investing: International investing involves currency, economic, and political risks. Emerging-market securities carry illiquidity and volatility risks. Lower-rated bonds may offer higher yields in return for more risk. Funds that invest in government securities are not guaranteed. Mortgage-backed securities are subject to prepayment risk and the risk that they may increase in value less when interest rates decline and decline in value more when interest rates rise. The fund invests in fewer issuers or concentrates its investments by region or sector, and involves more risk than a more broadly invested fund. The fund’s policy of concentrating on a limited group of industries and the fund’s non-diversified status, which means the fund may invest in fewer issuers, can increase the fund’s vulnerability to common economic forces and may result in greater losses and volatility. Bond investments are subject to interest-rate risk (the risk of bond prices falling if interest rates rise) and credit risk (the risk of an issuer defaulting on interest or principal payments). Interest-rate risk is greater for longer-term bonds, and credit risk is greater for below-investment-grade bonds. Risks associated with derivatives include increased investment exposure (which may be considered leverage) and, in the case of over-the-counter instruments, the potential inability to terminate or sell derivatives positions and the potential failure of the other party to the instrument to meet its obligations. Unlike bonds, funds that invest in bonds have fees and expenses. Bond prices may fall or fail to rise over time for several reasons, including general financial market conditions and factors related to a specific issuer or industry. You can lose money by investing in the fund.
Message from the Trustees
Dear Fellow Shareholder:
Global stock markets continue to advance, albeit at a slower pace than in 2013, as the recovery in economies around the world progresses.
In the United States, recent improvements in the vital areas of employment, manufacturing, and consumer sales appear to have returned the economy to its upward trajectory. Likewise, capital spending by businesses — a key variable needed to support continued economic expansion — has risen. This strength, along with the leadership transition at the Federal Reserve, has fueled debate about future monetary policy.
In this environment, we believe Putnam’s commitment to active fundamental research and new ways of thinking can serve the best interests of investors. We are pleased to report that this commitment has played a positive role in investment performance. Barron’s has ranked Putnam second among 55 fund families based on total return across asset classes for the five years ending in December 2013.
We also believe that it is worthwhile to meet with your financial advisor periodically to discuss the range of strategies that Putnam offers. Your advisor can help you assess your individual needs, time horizon, and risk tolerance — crucial considerations as you work toward your investment goals.
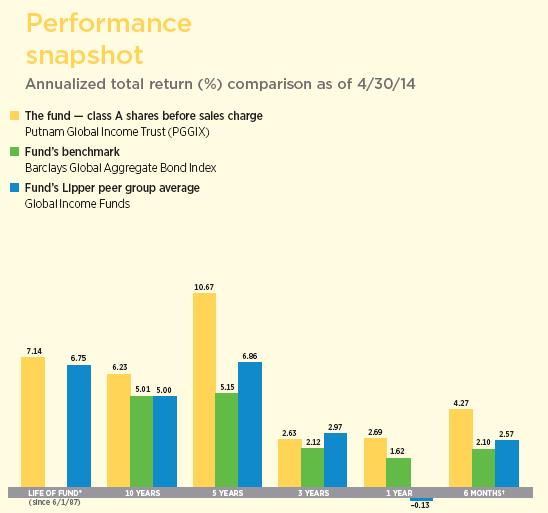
Current performance may be lower or higher than the quoted past performance, which cannot guarantee future results. Share price, principal value, and return will fluctuate, and you may have a gain or a loss when you sell your shares. Performance of class A shares assumes reinvestment of distributions and does not account for taxes. Fund returns in the bar chart do not reflect a sales charge of 4.00%; had they, returns would have been lower. See pages 5 and 11–13 for additional performance information. For a portion of the periods, the fund had expense limitations, without which returns would have been lower. To obtain the most recent month-end performance, visit putnam.com.
* The fund’s benchmark, the Barclays Global Aggregate Bond Index, was introduced on 12/31/89, which post-dates the inception of the fund’s class A shares.
† Returns for the six-month period are not annualized, but cumulative.
| 4 | Global Income Trust |
Interview with
your fund’s
portfolio manager

Bill, what was the environment like in global bond markets during the six months ended April 30, 2014?
The global business cycle remained on steady footing during the past six months, providing a generally benign backdrop for financial markets. However, divergences between emerging-market [EM] economies continued to expand, and rising global risks — particularly in Asia — increased the likelihood of greater market volatility. At the end of March, leading economic indicators in all of the largest developed markets were stronger than they were six months earlier, while only about 60% of emerging markets exhibited stronger leading indicators. According to Bloomberg’s Financial Condition Indexes, credit conditions in the United States and Europe reached their best levels since the 2007–2008 financial crisis, but hit new cycle lows in many developing markets and Asia. Global credit spreads — the yield premium offered over U.S. Treasuries — continued to narrow, particularly in peripheral eurozone countries.
In the United States, the Federal Reserve surprised investors at its December policy meeting by announcing the first reduction in its bond-buying program somewhat earlier than the market was anticipating. The Fed agreed to lower its $85-billion-per-month pace of purchases by $10 billion beginning in January, citing improving labor-market conditions as its rationale. Bond yields spiked
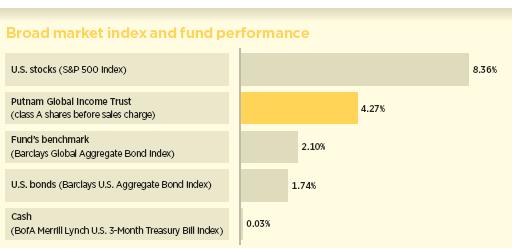
This comparison shows your fund’s performance in the context of broad market indexes for the six months ended 4/30/14. See pages 4 and 11–13 for additional fund performance information. Index descriptions can be found on page 16.
| Global Income Trust | 5 |
on the news, with the yield on the benchmark 10-year Treasury reaching 3.04% by the end of December.
In January, with the central bank beginning the process of reducing its bond-buying, lackluster U.S. economic data coupled with concern about EM currencies caused investors to assume a more risk-averse posture. Asset flows shifted toward the relative safety of U.S. Treasuries, pushing the yield on the 10-year note down to 2.67%, its lowest level since mid-November. By February, however, with EM stress abating, market participants were encouraged by the resiliency of U.S. stocks as well as lower Treasury yields. The bond markets were also buoyed by investors largely dismissing weak economic data as a function of severe weather affecting some of the country’s most densely populated regions, and by the fact that the crisis in Ukraine remained localized.
U.S. interest rates rose slightly in March only to decline marginally again in April, as the Fed reiterated that it is likely to keep its target for short-term interest rates close to zero for a “considerable time” after its bond purchases end.
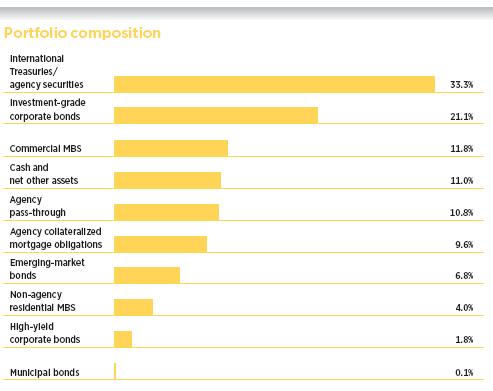
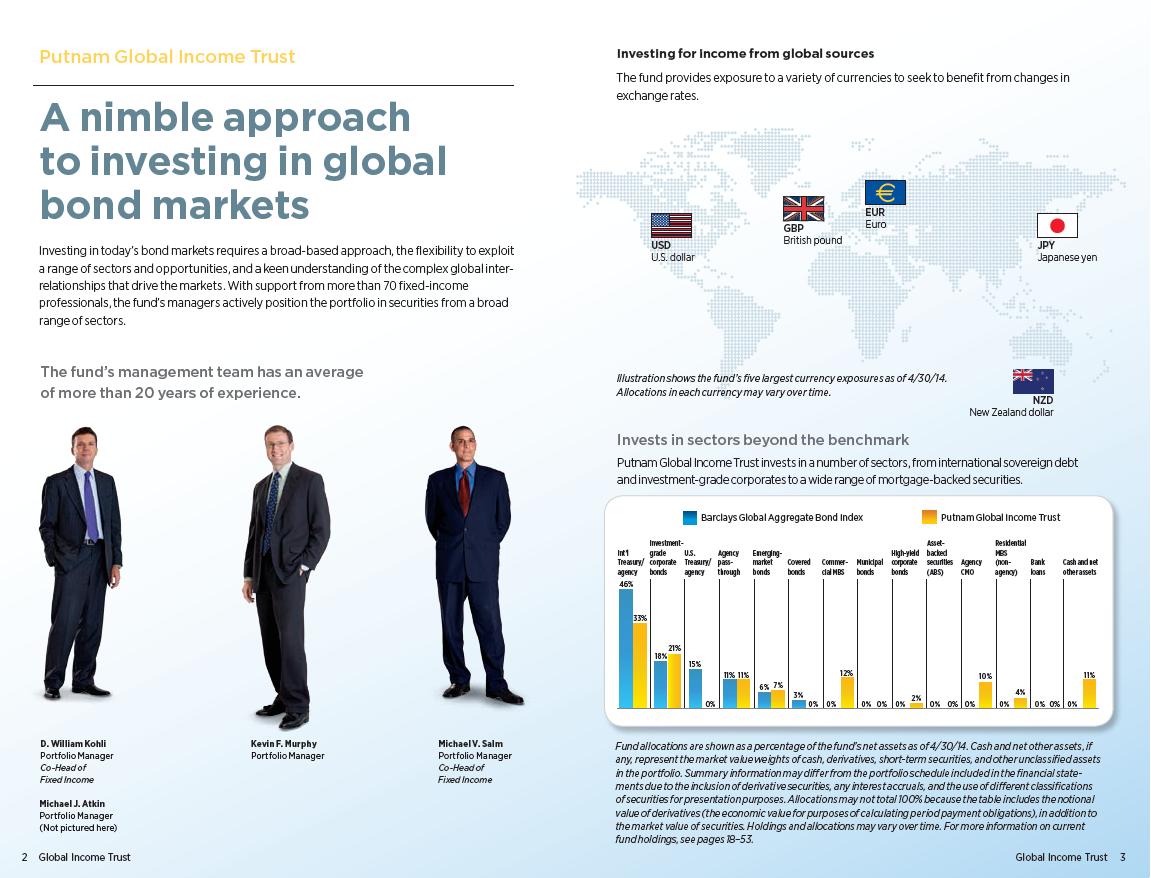
Allocations are shown as a percentage of the fund’s net assets as of 4/30/14. Cash and net other assets, if any, represent the market value weights of cash, derivatives, short-term securities, and other unclassified assets in the portfolio. Summary information may differ from the portfolio schedule included in the financial statements due to the inclusion of derivative securities, any interest accruals, the exclusion of as-of trades, if any, and the use of different classifications of securities for presentation purposes. Allocations may not total 100% because the table includes the notional value of derivatives (the economic value for purposes of calculating period payment obligations), in addition to the market value of securities. Holdings and allocations may vary over time.
| 6 | Global Income Trust |

The fund outpaced its benchmark and the average return of its Lipper peer group by considerable margins at net asset value. What factors fueled this solid relative performance?
Collectively, our credit holdings — both corporate and mortgage-related — were the biggest contributors to relative performance. Our positions in investment-grade and high-yield corporate bonds were aided by solid corporate fundamentals and consistent investor demand. In mortgage credit, our investments in commercial mortgage-backed securities [CMBS] were the primary contributors. Within CMBS, the fund benefited from solid security selection in subordinated “mezzanine” bonds rated BBB/ Baa, which offered higher yields at what we believed were acceptable risks. Allocations to non-agency residential mortgage-backed securities [RMBS] and interest-only CMBS also modestly helped relative performance.
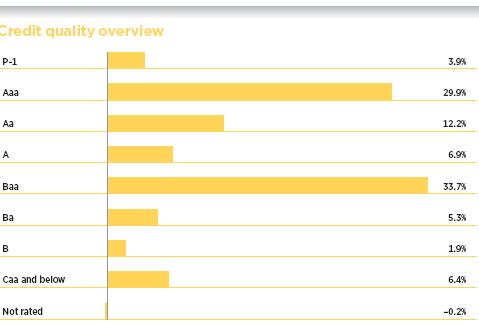
Credit qualities are shown as a percentage of the fund’s net assets as of 4/30/14. A bond rated Baa or higher (Prime-3 or higher, for short-term debt) is considered investment grade. The chart reflects Moody’s ratings; percentages may include bonds or derivatives not rated by Moody’s but rated by Standard & Poor’s (S&P) or, if unrated by S&P, by Fitch ratings, and then included in the closest equivalent Moody’s rating. To be announced (TBA) mortgage commitments, if any, are included based on their issuer ratings. Ratings and portfolio credit quality will vary over time.
Derivative instruments, including forward currency contracts, are only included to the extent of any unrealized gain or loss on such instruments and are shown in the not-rated category. Cash is also shown in the not-rated category. Derivative offset values are included in the not-rated category and may result in negative weights. The fund itself has not been rated by an independent rating agency.
| Global Income Trust | 7 |
Our prepayment strategies, which we implemented with securities such as interest-only and inverse interest-only collateralized mortgage obligations [CMOs], provided a further notable boost to the fund’s return. Lower policy risk coupled with mortgage rates that remained at elevated levels versus the past couple of years reduced the likelihood that the mortgages underlying our CMO holdings would be refinanced. As a result, slower prepayment speeds bolstered the securities’ values. Additionally, positioning the fund for higher mortgage rates worked well, as rates rose steadily during the final months of 2013.
How was the fund positioned with respect to interest-rate sensitivity versus the benchmark?
In the United States, the fund was defensively positioned for a rising-rate environment, as its duration was relatively short — particularly on the intermediate, 5- to 10-year portion of the Treasury yield curve — and was actually negative on an absolute basis. Rates in this portion of the curve are currently being dampened by Fed bond buying, and we believe they will begin to rise as the central bank continues to reduce its bond purchases. Outside the United States, we had overweight allocations in Spain, Greece, and Italy, along
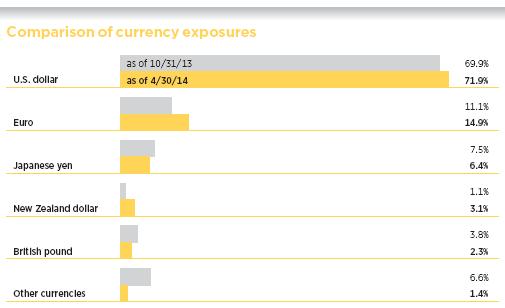
This chart shows how the fund’s top currency holdings have changed over the last six months. Allocations are shown as a percentage of the fund’s net assets. Holdings and allocations may vary over time.
| 8 | Global Income Trust |
with underweight allocations in Germany and France. This strategy worked well as rates in peripheral European countries declined and yield spreads tightened versus Germany and France. All told, the fund’s duration and yield-curve positioning meaningfully aided performance for the period, led by our non-U.S. strategy.
How did your currency strategy affect performance?
Beneficial exposure to the Japanese yen and Canadian dollar was more than offset by negative results from our positioning in the euro, the British pound sterling, and several other currencies. As a result, our currency strategy was a slight detractor.
How did you use derivatives during the period?
We used bond futures and interest-rate swaps to take tactical positions at various points along the yield curve. We also employed interest-rate swaps and “swaptions” — which give us the option to enter into a swap contract — to hedge the interest-rate risk associated with our CMO holdings. Additionally, we used total return swaps as a hedging tool and to help manage the fund’s sector exposure, as well as credit default swaps to hedge the fund’s credit risk. Lastly, we utilized currency forward contracts to hedge the foreign exchange risk associated with non-U.S. bonds and to implement our active currency strategy.
What is your outlook for the coming months, and how are you positioning the fund?
In our view, Treasury yields, particularly in the intermediate part of the yield curve, are likely to move higher in 2014 as the U.S. economy continues to strengthen. However, we don’t believe rates are likely to rise so quickly that the shift will undermine economic growth. What’s more, we expect to see an improving
ABOUT DERIVATIVES
Derivatives are an increasingly common type of investment instrument, the performance of which is derived from an underlying security, index, currency, or other area of the capital markets. Derivatives employed by the fund’s managers generally serve one of two main purposes: to implement a strategy that may be difficult or more expensive to invest in through traditional securities, or to hedge unwanted risk associated with a particular position.
For example, the fund’s managers might use currency forward contracts to capitalize on an anticipated change in exchange rates between two currencies. This approach would require a significantly smaller outlay of capital than purchasing traditional bonds denominated in the underlying currencies. In another example, the managers may identify a bond that they believe is undervalued relative to its risk of default, but may seek to reduce the interest-rate risk of that bond by using interest-rate swaps, a derivative through which two parties “swap” payments based on the movement of certain rates.
Like any other investment, derivatives may not appreciate in value and may lose money. Derivatives may amplify traditional investment risks through the creation of leverage and may be less liquid than traditional securities. And because derivatives typically represent contractual agreements between two financial institutions, derivatives entail “counterparty risk,” which is the risk that the other party is unable or unwilling to pay. Putnam monitors the counterparty risks we assume. For example, Putnam often enters into collateral agreements that require the counterparties to post collateral on a regular basis to cover their obligations to the fund. Counterparty risk for exchange-traded futures and centrally cleared swaps is mitigated by the daily exchange of margin and other safeguards against default through their respective clearinghouses.
| Global Income Trust | 9 |
U.S. growth trend reflected in Europe and in developing Asian countries.
In addition to weather, a significant inventory overhang was another factor in the weak economic readings we saw early this year, and we believe it will take some time for this surplus to work its way through the system. In 2013’s third quarter, gross domestic product [GDP] was much stronger than anticipated, and fourth-quarter 2013 GDP was firmer than originally forecast, leading manufacturers to expand their inventories. However, the weather-related slowdown in 2014’s first quarter, which contributed to an anemic 0.1% growth in GDP, left manufacturers with excess inventory. Consequently, when growth picks up, the economy won’t immediately need production to sustain inventories, meaning it likely won’t get the cyclical boost it otherwise would if inventories were at a more normal level, in our view.
Looking at the Fed, bond investors have been willing to give the central bank leeway to pursue a fairly aggressive stimulus policy. But this leeway is heavily dependent on maintaining low inflation, particularly in the area of wages. Currently, the Fed believes the non-accelerating inflation rate of unemployment [NAIRU] — the rate to which unemployment can fall without triggering wage inflation — is between 5.2% and 5.6%. However, our research suggests that the NAIRU may be significantly higher than this, primarily because of various structural problems hampering the labor participation rate, particularly in the younger demographic. As the unemployment rate moves downward, if wage inflation develops earlier than the Fed is anticipating, the central bank may begin reducing its stimulus efforts faster than the markets are currently forecasting, which could lead to increased yield-curve volatility. In order to position the portfolio for this potential risk, we have underweight exposure relative to the benchmark on the 2- to 5-year portion of the yield curve, since we believe that is the area of the curve that would be most affected by adjustments in Fed policy. Additionally, we will continue our efforts to minimize overall interest-rate risk in the portfolio.
As for other aspects of portfolio positioning, we plan to maintain our diversified exposure to mortgage, corporate, and sovereign credit via allocations to mezzanine CMBS, investment-grade bonds, and peripheral eurozone bonds, respectively. Concerning prepayment risk, we will continue to seek to capitalize on anticipated slower prepayment speeds through allocations to CMOs. Lastly, as of period-end, uncertainty regarding liquidity was dampening the returns of non-agency RMBS. We are, however, planning to maintain our RMBS positions because when this sector normalizes, our holdings may rebound.
Thanks for your time and for bringing us up to date, Bill.
The views expressed in this report are exclusively those of Putnam Management and are subject to change. They are not meant as investment advice.
Please note that the holdings discussed in this report may not have been held by the fund for the entire period. Portfolio composition is subject to review in accordance with the fund’s investment strategy and may vary in the future. Current and future portfolio holdings are subject to risk.
Portfolio Manager D. William Kohli is Co-Head of Fixed Income at Putnam. He has an M.B.A. from the Haas School of Business at the University of California, Berkeley, and a B.A. from the University of California, San Diego. Bill joined Putnam in 1994 and has been in the investment industry since 1986.
In addition to Bill, your fund’s portfolio managers are Michael J. Atkin, Kevin F. Murphy, and Michael V. Salm.
| 10 | Global Income Trust |
Your fund’s performance
This section shows your fund’s performance, price, and distribution information for periods ended April 30, 2014, the end of the first half of its current fiscal year. In accordance with regulatory requirements for mutual funds, we also include performance information as of the most recent calendar quarter-end and expense information taken from the fund’s current prospectus. Performance should always be considered in light of a fund’s investment strategy. Data represent past performance. Past performance does not guarantee future results. More recent returns may be less or more than those shown. Investment return and principal value will fluctuate, and you may have a gain or a loss when you sell your shares. Performance information does not reflect any deduction for taxes a shareholder may owe on fund distributions or on the redemption of fund shares. For the most recent month-end performance, please visit the Individual Investors section at putnam.com or call Putnam at 1-800-225-1581. Class R, R5, R6, and Y shares are not available to all investors. See the Terms and Definitions section in this report for definitions of the share classes offered by your fund.
Fund performance Total return for periods ended 4/30/14
| Class A | Class B | Class C | Class M | Class R | Class R5 | Class R6 | Class Y | |||||
| (inception dates) | (6/1/87) | (2/1/94) | (7/26/99) | (3/17/95) | (12/1/03) | (7/2/12) | (7/2/12) | (10/4/05) | ||||
| Before | After | Before | After | Net | Net | Net | Net | |||||
| sales | sales | Before | After | Before | After | sales | sales | asset | asset | asset | asset | |
| charge | charge | CDSC | CDSC | CDSC | CDSC | charge | charge | value | value | value | value | |
| Annual average | ||||||||||||
| (life of fund) | 7.14% | 6.97% | 6.87% | 6.87% | 6.33% | 6.33% | 6.84% | 6.70% | 6.87% | 7.22% | 7.23% | 7.22% |
| 10 years | 83.05 | 75.72 | 72.34 | 72.34 | 69.91 | 69.91 | 78.42 | 72.62 | 78.64 | 86.98 | 87.23 | 86.94 |
| Annual average | 6.23 | 5.80 | 5.59 | 5.59 | 5.44 | 5.44 | 5.96 | 5.61 | 5.97 | 6.46 | 6.47 | 6.46 |
| 5 years | 66.03 | 59.39 | 59.95 | 57.95 | 59.90 | 59.90 | 63.88 | 58.55 | 63.89 | 68.12 | 68.34 | 68.08 |
| Annual average | 10.67 | 9.77 | 9.85 | 9.57 | 9.84 | 9.84 | 10.38 | 9.66 | 10.38 | 10.95 | 10.98 | 10.94 |
| 3 years | 8.08 | 3.76 | 5.63 | 2.73 | 5.64 | 5.64 | 7.17 | 3.68 | 7.22 | 8.81 | 8.95 | 8.78 |
| Annual average | 2.63 | 1.24 | 1.84 | 0.90 | 1.84 | 1.84 | 2.33 | 1.21 | 2.35 | 2.85 | 2.90 | 2.85 |
| 1 year | 2.69 | –1.41 | 1.93 | –3.05 | 1.84 | 0.84 | 2.38 | –0.94 | 2.35 | 2.91 | 2.98 | 2.89 |
| 6 months | 4.27 | 0.10 | 3.90 | –1.10 | 3.89 | 2.89 | 4.11 | 0.72 | 4.15 | 4.42 | 4.36 | 4.33 |
Current performance may be lower or higher than the quoted past performance, which cannot guarantee future results. After-sales-charge returns for class A and M shares reflect the deduction of the maximum 4.00% and 3.25% sales charge, respectively, levied at the time of purchase. Class B share returns after contingent deferred sales charge (CDSC) reflect the applicable CDSC, which is 5% in the first year, declining over time to 1% in the sixth year, and is eliminated thereafter. Class C share returns after CDSC reflect a 1% CDSC for the first year that is eliminated thereafter. Class R, R5, R6, and Y shares have no initial sales charge or CDSC. Performance for class B, C, M, R, and Y shares before their inception is derived from the historical performance of class A shares, adjusted for the applicable sales charge (or CDSC) and the higher operating expenses for such shares, except for class Y shares, for which 12b-1 fees are not applicable. Performance for class R5 and R6 shares prior to their inception is derived from the historical performance of class Y shares and has not been adjusted for the lower investor servicing fees applicable to class R5 and R6 shares; had it, returns would have been higher.
For a portion of the periods, the fund had expense limitations, without which returns would have been lower.
Class B share performance reflects conversion to class A shares after eight years.
| Global Income Trust | 11 |
Comparative index returns For periods ended 4/30/14
| Barclays Global Aggregate | Lipper Global Income Funds | |
| Bond Index | category average* | |
| Annual average (life of fund) | —† | 6.75% |
| 10 years | 63.00% | 63.48 |
| Annual average | 5.01 | 5.00 |
| 5 years | 28.52 | 40.05 |
| Annual average | 5.15 | 6.86 |
| 3 years | 6.50 | 9.26 |
| Annual average | 2.12 | 2.97 |
| 1 year | 1.62 | –0.13 |
| 6 months | 2.10 | 2.57 |
Index and Lipper results should be compared with fund performance before sales charge, before CDSC, or at net asset value.
* Over the 6-month, 1-year, 3-year, 5-year, 10-year, and life-of-fund periods ended 4/30/14, there were 227, 204, 147, 118,77, and 2 funds, respectively, in this Lipper category.
† The fund’s benchmark, the Barclays Global Aggregate Bond Index, was introduced on 12/31/89, which post-dates the inception of the fund’s class A shares.
Fund price and distribution information For the six-month period ended 4/30/14
| Distributions | Class A | Class B | Class C | Class M | Class R | Class R5 | Class R6 | Class Y | ||
| Number | 6 | 6 | 6 | 6 | 6 | 6 | 6 | 6 | ||
| Income | $0.192 | $0.145 | $0.143 | $0.177 | $0.176 | $0.210 | $0.213 | $0.209 | ||
| Capital gains | — | — | — | — | — | — | — | — | ||
| Total | $0.192 | $0.145 | $0.143 | $0.177 | $0.176 | $0.210 | $0.213 | $0.209 | ||
| Before | After | Net | Net | Before | After | Net | Net | Net | Net | |
| sales | sales | asset | asset | sales | sales | asset | asset | asset | asset | |
| Share value | charge | charge | value | value | charge | charge | value | value | value | value |
| 10/31/13 | $12.57 | $13.09 | $12.51 | $12.51 | $12.45 | $12.87 | $12.54 | $12.56 | $12.57 | $12.57 |
| 4/30/14 | 12.91 | 13.45 | 12.85 | 12.85 | 12.78 | 13.21 | 12.88 | 12.90 | 12.90 | 12.90 |
| Before | After | Net | Net | Before | After | Net | Net | Net | Net | |
| Current rate | sales | sales | asset | asset | sales | sales | asset | asset | asset | asset |
| (end of period) | charge | charge | value | value | charge | charge | value | value | value | value |
| Current dividend rate 1 | 2.97% | 2.86% | 2.15% | 2.15% | 2.72% | 2.63% | 2.70% | 3.26% | 3.35% | 3.26% |
| Current 30-day SEC | ||||||||||
| yield 2 | N/A | 2.17 | 1.52 | 1.52 | N/A | 1.95 | 2.02 | 2.43 | 2.60 | 2.52 |
The classification of distributions, if any, is an estimate. Before-sales-charge share value and current dividend rate for class A and M shares, if applicable, do not take into account any sales charge levied at the time of purchase. After-sales-charge share value, current dividend rate, and current 30-day SEC yield, if applicable, are calculated assuming that the maximum sales charge (4.00% for class A shares and 3.25% for class M shares) was levied at the time of purchase. Final distribution information will appear on your year-end tax forms.
1 Most recent distribution, including any return of capital and excluding capital gains, annualized and divided by share price before or after sales charge at period-end.
2 Based only on investment income and calculated using the maximum offering price for each share class, in accordance with SEC guidelines.
| 12 | Global Income Trust |
Fund performance as of most recent calendar quarter
Total return for periods ended 3/31/14
| Class A | Class B | Class C | Class M | Class R | Class R5 | Class R6 | Class Y | |||||
| (inception dates) | (6/1/87) | (2/1/94) | (7/26/99) | (3/17/95) | (12/1/03) | (7/2/12) | (7/2/12) | (10/4/05) | ||||
| Before | After | Before | After | Net | Net | Net | Net | |||||
| sales | sales | Before | After | Before | After | sales | sales | asset | asset | asset | asset | |
| charge | charge | CDSC | CDSC | CDSC | CDSC | charge | charge | value | value | value | value | |
| Annual average | ||||||||||||
| (life of fund) | 7.13% | 6.97% | 6.86% | 6.86% | 6.33% | 6.33% | 6.83% | 6.70% | 6.86% | 7.22% | 7.22% | 7.22% |
| 10 years | 75.22 | 68.21 | 64.95 | 64.95 | 62.74 | 62.74 | 70.87 | 65.32 | 70.99 | 79.09 | 79.31 | 79.04 |
| Annual average | 5.77 | 5.34 | 5.13 | 5.13 | 4.99 | 4.99 | 5.50 | 5.16 | 5.51 | 6.00 | 6.01 | 6.00 |
| 5 years | 72.50 | 65.60 | 66.21 | 64.21 | 66.30 | 66.30 | 70.45 | 64.91 | 70.42 | 74.80 | 75.02 | 74.76 |
| Annual average | 11.52 | 10.61 | 10.70 | 10.43 | 10.71 | 10.71 | 11.26 | 10.52 | 11.25 | 11.82 | 11.85 | 11.81 |
| 3 years | 11.27 | 6.82 | 8.76 | 5.78 | 8.86 | 8.86 | 10.43 | 6.84 | 10.47 | 12.09 | 12.24 | 12.07 |
| Annual average | 3.62 | 2.22 | 2.84 | 1.89 | 2.87 | 2.87 | 3.36 | 2.23 | 3.38 | 3.88 | 3.92 | 3.87 |
| 1 year | 3.01 | –1.11 | 2.25 | –2.75 | 2.23 | 1.23 | 2.78 | –0.56 | 2.75 | 3.31 | 3.38 | 3.29 |
| 6 months | 4.87 | 0.68 | 4.52 | –0.48 | 4.50 | 3.50 | 4.80 | 1.39 | 4.75 | 5.02 | 5.05 | 5.02 |
See the discussion following the Fund performance table on page 11 for information about the calculation of fund performance.
Your fund’s expenses
As a mutual fund investor, you pay ongoing expenses, such as management fees, distribution fees (12b-1 fees), and other expenses. In the most recent six-month period, your fund’s expenses were limited; had expenses not been limited, they would have been higher. Using the following information, you can estimate how these expenses affect your investment and compare them with the expenses of other funds. You may also pay one-time transaction expenses, including sales charges (loads) and redemption fees, which are not shown in this section and would have resulted in higher total expenses. For more information, see your fund’s prospectus or talk to your financial representative.
Expense ratios
| Class A | Class B | Class C | Class M | Class R | Class R5 | Class R6 | Class Y | |
| Total annual operating expenses for | ||||||||
| the fiscal year ended 10/31/13 | 1.10% | 1.85% | 1.85% | 1.35% | 1.35% | 0.82% | 0.75% | 0.85% |
| Annualized expense ratio for the | ||||||||
| six-month period ended 4/30/14 | 1.13% | 1.88% | 1.88% | 1.38% | 1.38% | 0.86% | 0.79% | 0.88% |
Fiscal-year expense information in this table is taken from the most recent prospectus, is subject to change, and may differ from that shown for the annualized expense ratio and in the financial highlights of this report.
Expenses are shown as a percentage of average net assets.
| Global Income Trust | 13 |
Expenses per $1,000
The following table shows the expenses you would have paid on a $1,000 investment in the fund from November 1, 2013, to April 30, 2014. It also shows how much a $1,000 investment would be worth at the close of the period, assuming actual returns and expenses.
| Class A | Class B | Class C | Class M | Class R | Class R5 | Class R6 | Class Y | |
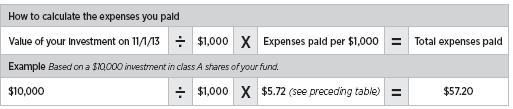
| Expenses paid per $1,000*† | $5.72 | $9.50 | $9.50 | $6.98 | $6.99 | $4.36 | $4.00 | $4.46 |
| Ending value (after expenses) | $1,042.70 | $1,039.00 | $1,038.90 | $1,041.10 | $1,041.50 | $1,044.20 | $1,043.60 | $1,043.30 |
* Expenses for each share class are calculated using the fund’s annualized expense ratio for each class, which represents the ongoing expenses as a percentage of average net assets for the six months ended 4/30/14. The expense ratio may differ for each share class.
† Expenses are calculated by multiplying the expense ratio by the average account value for the period; then multiplying the result by the number of days in the period; and then dividing that result by the number of days in the year.
Estimate the expenses you paid
To estimate the ongoing expenses you paid for the six months ended April 30, 2014, use the following calculation method. To find the value of your investment on November 1, 2013, call Putnam at 1-800-225-1581.
Compare expenses using the SEC’s method
The Securities and Exchange Commission (SEC) has established guidelines to help investors assess fund expenses. Per these guidelines, the following table shows your fund’s expenses based on a $1,000 investment, assuming a hypothetical 5% annualized return. You can use this information to compare the ongoing expenses (but not transaction expenses or total costs) of investing in the fund with those of other funds. All mutual fund shareholder reports will provide this information to help you make this comparison. Please note that you cannot use this information to estimate your actual ending account balance and expenses paid during the period.
| Class A | Class B | Class C | Class M | Class R | Class R5 | Class R6 | Class Y | |
| Expenses paid per $1,000*† | $5.66 | $9.39 | $9.39 | $6.90 | $6.90 | $4.31 | $3.96 | $4.41 |
| Ending value (after expenses) | $1,019.19 | $1,015.47 | $1,015.47 | $1,017.95 | $1,017.95 | $1,020.53 | $1,020.88 | $1,020.43 |
* Expenses for each share class are calculated using the fund’s annualized expense ratio for each class, which represents the ongoing expenses as a percentage of average net assets for the six months ended 4/30/14. The expense ratio may differ for each share class.
† Expenses are calculated by multiplying the expense ratio by the average account value for the six-month period; then multiplying the result by the number of days in the six-month period; and then dividing that result by the number of days in the year.
| 14 | Global Income Trust |
Terms and definitions
Important terms
Total return shows how the value of the fund’s shares changed over time, assuming you held the shares through the entire period and reinvested all distributions in the fund.
Before sales charge, or net asset value, is the price, or value, of one share of a mutual fund, without a sales charge. Before-sales-charge figures fluctuate with market conditions, and are calculated by dividing the net assets of each class of shares by the number of outstanding shares in the class.
After sales charge is the price of a mutual fund share plus the maximum sales charge levied at the time of purchase. After-sales-charge performance figures shown here assume the 4.00% maximum sales charge for class A shares and 3.25% for class M shares.
Contingent deferred sales charge (CDSC) is generally a charge applied at the time of the redemption of class B or C shares and assumes redemption at the end of the period. Your fund’s class B CDSC declines over time from a 5% maximum during the first year to 1% during the sixth year. After the sixth year, the CDSC no longer applies. The CDSC for class C shares is 1% for one year after purchase.
Share classes
Class A shares are generally subject to an initial sales charge and no CDSC (except on certain redemptions of shares bought without an initial sales charge).
Class B shares are not subject to an initial sales charge. They may be subject to a CDSC.
Class C shares are not subject to an initial sales charge and are subject to a CDSC only if the shares are redeemed during the first year.
Class M shares have a lower initial sales charge and a higher 12b-1 fee than class A shares and no CDSC (except on certain redemptions of shares bought without an initial sales charge).
Class R shares are not subject to an initial sales charge or CDSC and are available only to certain defined contribution plans.
Class R5 shares and class R6 shares are not subject to an initial sales charge or CDSC, and carry no 12b-1 fee. They are only available to employer-sponsored retirement plans.
Class Y shares are not subject to an initial sales charge or CDSC, and carry no 12b-1 fee. They are generally only available to corporate and institutional clients and clients in other approved programs.
Fixed-income terms
Current rate is the annual rate of return earned from dividends or interest of an investment. Current rate is expressed as a percentage of the price of a security, fund share, or principal investment.
Mortgage-backed security (MBS), also known as a mortgage “pass-through,” is a type of asset-backed security that is secured by a mortgage or collection of mortgages. The following are types of MBSs:
• Agency “pass-through” has its principal and interest backed by a U.S. government agency, such as the Federal National Mortgage Association (Fannie Mae), Government National Mortgage Association (Ginnie Mae), and Federal Home Loan Mortgage Corporation (Freddie Mac).
• Collateralized mortgage obligation (CMO) represents claims to specific cash flows from pools of home mortgages. The streams of principal and interest payments on the mortgages are distributed to the different classes of CMO interests in “tranches.” Each tranche may have different principal balances, coupon rates, prepayment risks, and maturity dates. A CMO is highly sensitive to changes in interest rates and any resulting change in the rate at which homeowners sell their properties, refinance, or otherwise prepay loans. CMOs are subject to prepayment, market, and liquidity risks.
• Interest-only (IO) security is a type of CMO in which the underlying asset is the interest portion of mortgage, Treasury, or bond payments.
• Non-agency residential mortgage-backed security (RMBS) is an MBS not backed by Fannie Mae, Ginnie Mae, or Freddie Mac. One type of RMBS is an Alt-A mortgage-backed security.
• Commercial mortgage-backed security (CMBS) is secured by the loan on a commercial property.
Yield curve is a graph that plots the yields of bonds with equal credit quality against their differing maturity dates, ranging from shortest to longest. It is used as a benchmark for other debt, such as mortgage or bank lending rates.
| Global Income Trust | 15 |
Comparative indexes
Barclays Global Aggregate Bond Index is an unmanaged index of global investment-grade fixed-income securities.
Barclays U.S. Aggregate Bond Index is an unmanaged index of U.S. investment-grade fixed-income securities.
BofA Merrill Lynch U.S. 3-Month Treasury Bill Index is an unmanaged index that seeks to measure the performance of U.S. Treasury bills available in the marketplace.
S&P 500 Index is an unmanaged index of common stock performance.
Indexes assume reinvestment of all distributions and do not account for fees. Securities and performance of a fund and an index will differ. You cannot invest directly in an index.
Lipper is a third-party industry-ranking entity that ranks mutual funds. Its rankings do not reflect sales charges. Lipper rankings are based on total return at net asset value relative to other funds that have similar current investment styles or objectives as determined by Lipper. Lipper may change a fund’s category assignment at its discretion. Lipper category averages reflect performance trends for funds within a category.
Other information for shareholders
Important notice regarding delivery of shareholder documents
In accordance with Securities and Exchange Commission (SEC) regulations, Putnam sends a single copy of annual and semiannual shareholder reports, prospectuses, and proxy statements to Putnam shareholders who share the same address, unless a shareholder requests otherwise. If you prefer to receive your own copy of these documents, please call Putnam at 1-800-225-1581, and Putnam will begin sending individual copies within 30 days.
Proxy voting
Putnam is committed to managing our mutual funds in the best interests of our shareholders. The Putnam funds’ proxy voting guidelines and procedures, as well as information regarding how your fund voted proxies relating to portfolio securities during the 12-month period ended June 30, 2013, are available in the Individual Investors section of putnam.com, and on the SEC’s website, www.sec.gov. If you have questions about finding forms on the SEC’s website, you may call the SEC at 1-800-SEC-0330. You may also obtain the Putnam funds’ proxy voting guidelines and procedures at no charge by calling Putnam’s Shareholder Services at 1-800-225-1581.
Fund portfolio holdings
The fund will file a complete schedule of its portfolio holdings with the SEC for the first and third quarters of each fiscal year on Form N-Q. Shareholders may obtain the fund’s Forms N-Q on the SEC’s website at www.sec.gov. In addition, the fund’s Forms N-Q may be reviewed and copied at the SEC’s Public Reference Room in Washington, D.C. You may call the SEC at 1-800-SEC-0330 for information about the SEC’s website or the operation of the Public Reference Room.
Trustee and employee fund ownership
Putnam employees and members of the Board of Trustees place their faith, confidence, and, most importantly, investment dollars in Putnam mutual funds. As of April 30, 2014, Putnam employees had approximately $458,000,000 and the Trustees had approximately $110,000,000 invested in Putnam mutual funds. These amounts include investments by the Trustees’ and employees’ immediate family members as well as investments through retirement and deferred compensation plans.
| 16 | Global Income Trust |
Financial statements
A guide to financial statements
These sections of the report, as well as the accompanying Notes, constitute the fund’s financial statements.
The fund’s portfolio lists all the fund’s investments and their values as of the last day of the reporting period. Holdings are organized by asset type and industry sector, country, or state to show areas of concentration and diversification.
Statement of assets and liabilities shows how the fund’s net assets and share price are determined. All investment and non-investment assets are added together. Any unpaid expenses and other liabilities are subtracted from this total. The result is divided by the number of shares to determine the net asset value per share, which is calculated separately for each class of shares. (For funds with preferred shares, the amount subtracted from total assets includes the liquidation preference of preferred shares.)
Statement of operations shows the fund’s net investment gain or loss. This is done by first adding up all the fund’s earnings — from dividends and interest income — and subtracting its operating expenses to determine net investment income (or loss). Then, any net gain or loss the fund realized on the sales of its holdings — as well as any unrealized gains or losses over the period — is added to or subtracted from the net investment result to determine the fund’s net gain or loss for the fiscal period.
Statement of changes in net assets shows how the fund’s net assets were affected by the fund’s net investment gain or loss, by distributions to shareholders, and by changes in the number of the fund’s shares. It lists distributions and their sources (net investment income or realized capital gains) over the current reporting period and the most recent fiscal year-end. The distributions listed here may not match the sources listed in the Statement of operations because the distributions are determined on a tax basis and may be paid in a different period from the one in which they were earned. Dividend sources are estimated at the time of declaration. Actual results may vary. Any non-taxable return of capital cannot be determined until final tax calculations are completed after the end of the fund’s fiscal year.
Financial highlights provide an overview of the fund’s investment results, per-share distributions, expense ratios, net investment income ratios, and portfolio turnover in one summary table, reflecting the five most recent reporting periods. In a semiannual report, the highlights table also includes the current reporting period.
| Global Income Trust | 17 |
The fund’s portfolio 4/30/14 (Unaudited)
| FOREIGN GOVERNMENT AND AGENCY | |||
| BONDS AND NOTES (35.6%)* | Principal amount/units | Value | |
| Argentina (Republic of) sr. unsec. bonds 8.28s, | |||
| 2033 (Argentina) | $238,346 | $189,366 | |
| Argentina (Republic of) sr. unsec. bonds 7s, 2017 (Argentina) | 25,000 | 22,750 | |
| Argentina (Republic of) sr. unsec. unsub. bonds 7s, | |||
| 2015 (Argentina) | 3,314,000 | 3,221,208 | |
| Argentina (Republic of) sr. unsec. unsub. notes Ser. NY, 8.28s, | |||
| 2033 (Argentina) | 1,584,303 | 1,279,325 | |
| Austria (Republic of) sr. unsec. unsub. bonds 3 1/2s, | |||
| 2021 (Austria) | EUR | 1,970,000 | 3,150,529 |
| Belgium (Government of) sr. unsec. unsub. bonds 4 1/4s, | |||
| 2022 (Belgium) | EUR | 4,110,000 | 6,863,960 |
| Brazil (Federal Republic of) sr. notes 5 7/8s, 2019 (Brazil) | $100,000 | 113,750 | |
| Brazil (Federal Republic of) sr. unsec. unsub. bonds 4 7/8s, | |||
| 2021 (Brazil) | 490,000 | 528,240 | |
| Brazil (Federal Republic of) unsec. notes 10s, 2021 (Brazil) | units | 790 | 328,763 |
| Canada (Government of) bonds 5s, 2037 (Canada) | CAD | 200,000 | 246,905 |
| Croatia (Republic of) 144A sr. unsec. notes 6 1/4s, | |||
| 2017 (Croatia) | $200,000 | 214,450 | |
| France (Government of) unsec. bonds 3 1/4s, 2021 (France) | EUR | 3,329,000 | 5,221,475 |
| Germany (Federal Republic of) unsec. bonds 2 1/2s, | |||
| 2044 (Germany) | EUR | 1,410,000 | 2,021,674 |
| Germany (Federal Republic of) unsec. bonds 1 3/4s, | |||
| 2022 (Germany) | EUR | 4,840,000 | 7,009,415 |
| Germany (Federal Republic of) unsec. bonds Ser. 2007, 4 1/4s, | |||
| 2017 (Germany) | EUR | 2,750,000 | 4,297,262 |
| Ghana (Republic of) 144A unsec. notes 8 1/2s, 2017 (Ghana) | $62,000 | 63,105 | |
| Ghana (Republic of) 144A unsec. notes 7 7/8s, 2023 (Ghana) | 168,573 | 156,351 | |
| Hellenic (Republic of) sr. unsec. unsub. bonds Ser. PSI, | |||
| stepped-coupon 2s (3s, 2/24/15), 2042 (Greece) †† | EUR | 151,502 | 133,987 |
| Hellenic (Republic of) sr. unsec. unsub. bonds Ser. PSI, | |||
| stepped-coupon 2s (3s, 2/24/15), 2041 (Greece) †† | EUR | 121,502 | 107,894 |
| Hellenic (Republic of) sr. unsec. unsub. bonds Ser. PSI, | |||
| stepped-coupon 2s (3s, 2/24/15), 2040 (Greece) †† | EUR | 157,502 | 140,297 |
| Hellenic (Republic of) sr. unsec. unsub. bonds Ser. PSI, | |||
| stepped-coupon 2s (3s, 2/24/15), 2039 (Greece) †† | EUR | 205,502 | 184,188 |
| Hellenic (Republic of) sr. unsec. unsub. bonds Ser. PSI, | |||
| stepped-coupon 2s (3s, 2/24/15), 2038 (Greece) †† | EUR | 615,502 | 553,876 |
| Hellenic (Republic of) sr. unsec. unsub. bonds Ser. PSI, | |||
| stepped-coupon 2s (3s, 2/24/15), 2037 (Greece) †† | EUR | 187,502 | 169,704 |
| Hellenic (Republic of) sr. unsec. unsub. bonds Ser. PSI, | |||
| stepped-coupon 2s (3s, 2/24/15), 2036 (Greece) †† | EUR | 319,502 | 291,825 |
| Hellenic (Republic of) sr. unsec. unsub. bonds Ser. PSI, | |||
| stepped-coupon 2s (3s, 2/24/15), 2035 (Greece) †† | EUR | 405,502 | 374,555 |
| Hellenic (Republic of) sr. unsec. unsub. bonds Ser. PSI, | |||
| stepped-coupon 2s (3s, 2/24/15), 2034 (Greece) †† | EUR | 289,502 | 270,521 |
| Hellenic (Republic of) sr. unsec. unsub. bonds Ser. PSI, | |||
| stepped-coupon 2s (3s, 2/24/15), 2033 (Greece) †† | EUR | 145,502 | 137,593 |
| Hellenic (Republic of) sr. unsec. unsub. bonds Ser. PSI, | |||
| stepped-coupon 2s (3s, 2/24/15), 2032 (Greece) †† | EUR | 275,503 | 263,754 |
| 18 | Global Income Trust |
| FOREIGN GOVERNMENT AND AGENCY | |||
| BONDS AND NOTES (35.6%)* cont. | Principal amount | Value | |
| Hellenic (Republic of) sr. unsec. unsub. bonds Ser. PSI, | |||
| stepped-coupon 2s (3s, 2/24/15), 2031 (Greece) †† | EUR | 97,503 | $94,745 |
| Hellenic (Republic of) sr. unsec. unsub. bonds Ser. PSI, | |||
| stepped-coupon 2s (3s, 2/24/15), 2030 (Greece) †† | EUR | 711,503 | 702,571 |
| Hellenic (Republic of) sr. unsec. unsub. bonds Ser. PSI, | |||
| stepped-coupon 2s (3s, 2/24/15), 2029 (Greece) †† | EUR | 115,503 | 116,014 |
| Hellenic (Republic of) sr. unsec. unsub. bonds Ser. PSI, | |||
| stepped-coupon 2s (3s, 2/24/15), 2028 (Greece) †† | EUR | 409,503 | 418,230 |
| Hellenic (Republic of) sr. unsec. unsub. bonds Ser. PSI, | |||
| stepped-coupon 2s (3s, 2/24/15), 2027 (Greece) †† | EUR | 121,503 | 126,156 |
| Hellenic (Republic of) sr. unsec. unsub. bonds Ser. PSI, | |||
| stepped-coupon 2s (3s, 2/24/15), 2026 (Greece) †† | EUR | 367,503 | 388,622 |
| Hellenic (Republic of) sr. unsec. unsub. bonds Ser. PSI, | |||
| stepped-coupon 2s (3s, 2/24/15), 2025 (Greece) †† | EUR | 1,101,503 | 1,184,041 |
| Hellenic (Republic of) sr. unsec. unsub. bonds Ser. PSI, | |||
| stepped-coupon 2s (3s, 2/24/15), 2024 (Greece) †† | EUR | 117,859 | 129,181 |
| Hellenic (Republic of) sr. unsec. unsub. bonds Ser. PSI, | |||
| stepped-coupon 2s (3s, 2/24/15), 2023 (Greece) †† | EUR | 462,011 | 515,424 |
| Hellenic (Republic of) unsec. bonds 4 3/4s, 2019 (Greece) | EUR | 699,000 | 962,171 |
| Hungary (Government of) sr. unsec. unsub. notes 5 3/8s, | |||
| 2024 (Hungary) | $470,000 | 487,038 | |
| Indonesia (Republic of) 144A sr. unsec. notes 3 3/8s, | |||
| 2023 (Indonesia) | 485,000 | 437,315 | |
| Ireland (Republic of) unsec. bonds 5s, 2020 (Ireland) | EUR | 1,070,000 | 1,766,616 |
| Italy (Republic of) sr. unsec. bonds 4 3/4s, 2023 (Italy) | EUR | 2,440,000 | 3,877,838 |
| Italy (Republic of) unsec. bonds 4 1/2s, 2023 (Italy) | EUR | 3,150,000 | 4,920,177 |
| Italy (Republic of) unsec. bonds 4 1/2s, 2018 (Italy) | EUR | 4,114,000 | 6,397,827 |
| Italy (Republic of) unsec. bonds 3 3/4s, 2016 (Italy) | EUR | 2,180,000 | 3,217,138 |
| Japan (Government of) 30 yr sr. unsec. unsub. bonds 2.3s, | |||
| 2040 (Japan) | JPY | 311,300,000 | 3,463,778 |
| Japan (Government of) 10 yr sr. unsec. unsub. bonds 1s, | |||
| 2021 (Japan) | JPY | 1,377,000,000 | 14,057,428 |
| Japan (Government of) 30 yr bonds Ser. 23, 2 1/2s, | |||
| 2036 (Japan) | JPY | 106,000,000 | 1,212,217 |
| Korea Development Bank sr. unsec. unsub. notes 4s, 2016 | |||
| (South Korea) | $250,000 | 265,752 | |
| Mexican (Government of) bonds Ser. M 10, 8s, 2015 (Mexico) | MXN | 36,810,000 | 2,992,238 |
| Ontario (Province of) bonds 4s, 2021 (Canada) | CAD | 1,690,000 | 1,671,667 |
| Poland (Republic of) sr. unsec. bonds 5s, 2022 (Poland) | $235,000 | 255,856 | |
| Poland (Republic of) unsec. bonds 5s, 2016 (Poland) | PLN | 4,460,000 | 1,531,822 |
| Russia (Federation of) 144A sr. notes 5 5/8s, 2042 (Russia) | $600,000 | 552,300 | |
| Russia (Federation of) 144A sr. unsec. unsub. bonds 7 1/2s, | |||
| 2030 (Russia) | 82,200 | 91,480 | |
| Russia (Federation of) 144A unsec. notes 3 1/4s, 2017 (Russia) | 200,000 | 201,610 | |
| South Africa (Republic of) sr. unsec. unsub. bonds 8s, 2018 | |||
| (South Africa) | ZAR | 14,180,000 | 1,358,991 |
| South Africa (Republic of) sr. unsec. unsub. notes 4.665s, 2024 | |||
| (South Africa) | $1,600,000 | 1,622,400 | |
| Spain (Kingdom of) sr. unsec. unsub. bonds 5.85s, 2022 (Spain) | EUR | 1,160,000 | 1,979,180 |
| Spain (Kingdom of) sr. unsec. bonds 4.4s, 2023 (Spain) | EUR | 12,230,000 | 19,006,071 |
| Global Income Trust | 19 |
| FOREIGN GOVERNMENT AND AGENCY | |||
| BONDS AND NOTES (35.6%)* cont. | Principal amount | Value | |
| Sweden (Government of) bonds Ser. 1054, 3 1/2s, | |||
| 2022 (Sweden) | SEK | 1,500,000 | $260,079 |
| Sweden (Government of) debs. Ser. 1041, 6 3/4s, | |||
| 2014 (Sweden) | SEK | 3,585,000 | 551,352 |
| Switzerland (Government of) bonds 2s, 2021 (Switzerland) | CHF | 600,000 | 756,187 |
| Ukraine (Government of) 144A sr. unsec. notes 9 1/4s, | |||
| 2017 (Ukraine) | $375,000 | 341,813 | |
| United Kingdom Treasury unsec. bonds 4s, 2060 | |||
| (United Kingdom) | GBP | 1,460,000 | 2,810,566 |
| United Kingdom Treasury unsec. bonds 3 3/4s, 2019 | |||
| (United Kingdom) | GBP | 350,000 | 645,247 |
| Total foreign government and agency bonds and notes (cost $112,533,700) | $118,925,860 | ||
| CORPORATE BONDS AND NOTES (26.6%)* | Principal amount | Value | |
| Basic materials (1.7%) | |||
| Ashland, Inc. company guaranty sr. unsec. unsub. notes | |||
| 4 3/4s, 2022 | $151,000 | $149,490 | |
| Celanese US Holdings, LLC sr. notes 5 7/8s, 2021 (Germany) | 160,000 | 175,200 | |
| CF Industries, Inc. company guaranty sr. unsec. unsub. notes | |||
| 7 1/8s, 2020 | 4,000 | 4,820 | |
| CF Industries, Inc. company guaranty sr. unsec. notes | |||
| 5 3/8s, 2044 | 420,000 | 440,746 | |
| CF Industries, Inc. company guaranty sr. unsec. notes | |||
| 5.15s, 2034 | 285,000 | 298,321 | |
| Cytec Industries, Inc. sr. unsec. unsub. notes 3 1/2s, 2023 | 175,000 | 168,268 | |
| Georgia-Pacific, LLC sr. unsec. unsub. notes 7 3/4s, 2029 | 120,000 | 160,053 | |
| Georgia-Pacific, LLC 144A company guaranty sr. | |||
| notes 5.4s, 2020 | 305,000 | 347,279 | |
| International Paper Co. sr. unsec. notes 8.7s, 2038 | 120,000 | 177,098 | |
| International Paper Co. sr. unsec. notes 7.95s, 2018 | 155,000 | 190,319 | |
| Methanex Corp. sr. unsec. unsub. notes 3 1/4s, 2019 (Canada) | 311,000 | 315,454 | |
| Mosaic Co. (The) sr. unsec. unsub. notes 5 5/8s, 2043 | 99,000 | 108,132 | |
| Mosaic Co. (The) sr. unsec. unsub. notes 5.45s, 2033 | 41,000 | 44,613 | |
| Mosaic Co. (The) sr. unsec. notes 3 3/4s, 2021 | 160,000 | 163,715 | |
| Packaging Corp. of America sr. unsec. unsub. notes 4 1/2s, 2023 | 160,000 | 168,491 | |
| Packaging Corp. of America sr. unsec. unsub. notes 3.9s, 2022 | 120,000 | 121,561 | |
| PPG Industries, Inc. sr. unsec. unsub. debs. 7.4s, 2019 | 260,000 | 317,847 | |
| Rock-Tenn Co. company guaranty sr. unsec. unsub. notes | |||
| 4.45s, 2019 | 105,000 | 113,583 | |
| Temple-Inland, Inc. sr. unsec. unsub. notes 6 5/8s, 2018 | 180,000 | 209,494 | |
| Union Carbide Corp. sr. unsec. unsub. bonds 7 3/4s, 2096 | 140,000 | 164,248 | |
| Westvaco Corp. company guaranty sr. unsec. unsub. notes | |||
| 7.95s, 2031 | 955,000 | 1,190,896 | |
| Weyerhaeuser Co. sr. unsec. unsub. notes 7 3/8s, 2032 R | 300,000 | 392,331 | |
| Xstrata Finance Canada, Ltd. 144A company guaranty sr. unsec. | |||
| notes 6s, 2041 (Canada) | 360,000 | 380,487 | |
| 5,802,446 | |||
| 20 Global Income Trust |
| CORPORATE BONDS AND NOTES (26.6%)* cont. | Principal amount | Value | |
| Capital goods (0.3%) | |||
| B/E Aerospace, Inc. sr. unsec. unsub. notes 5 1/4s, 2022 | $285,000 | $294,975 | |
| Crown Americas, LLC/Crown Americas Capital Corp. | |||
| IV company guaranty sr. unsec. notes 4 1/2s, 2023 | 105,000 | 100,275 | |
| Legrand France SA sr. unsec. unsub. debs 8 1/2s, 2025 (France) | 253,000 | 341,561 | |
| United Technologies Corp. sr. unsec. unsub. notes 4 1/2s, 2042 | 50,000 | 52,031 | |
| United Technologies Corp. sr. unsec. unsub. notes 3.1s, 2022 | 30,000 | 30,304 | |
| Waste Management, Inc. company guaranty sr. unsec. notes | |||
| 7 3/4s, 2032 | 105,000 | 146,823 | |
| 965,969 | |||
| Communication services (2.4%) | |||
| America Movil SAB de CV company guaranty sr. unsec. unsub. | |||
| notes 6 1/8s, 2040 (Mexico) | 100,000 | 114,471 | |
| America Movil SAB de CV company guaranty sr. unsec. unsub. | |||
| notes 2 3/8s, 2016 (Mexico) | 200,000 | 205,446 | |
| American Tower Corp. sr. unsec. notes 7s, 2017 R | 130,000 | 151,277 | |
| American Tower Corp. sr. unsec. unsub. notes 3.4s, 2019 R | 125,000 | 128,890 | |
| CenturyLink, Inc. sr. unsec. unsub. notes Ser. G, 6 7/8s, 2028 | 310,000 | 310,000 | |
| Comcast Corp. company guaranty sr. unsec. unsub. notes | |||
| 6 1/2s, 2035 | 75,000 | 94,331 | |
| Crown Castle Towers, LLC 144A company guaranty sr. notes | |||
| 4.883s, 2020 | 190,000 | 210,671 | |
| Koninklijke (Royal) KPN NV sr. unsec. unsub. bonds 8 3/8s, | |||
| 2030 (Netherlands) | 115,000 | 156,504 | |
| NBCUniversal Media, LLC sr. unsec. unsub. notes 6.4s, 2040 | 125,000 | 156,896 | |
| Orange SA sr. unsec. unsub. notes 5 3/8s, 2019 (France) | 555,000 | 628,795 | |
| Orange SA sr. unsec. unsub. notes 4 1/8s, 2021 (France) | 128,000 | 134,693 | |
| Qwest Corp. sr. unsec. notes 6 3/4s, 2021 | 518,000 | 587,529 | |
| Rogers Communications, Inc. company guaranty notes 6.8s, | |||
| 2018 (Canada) | 80,000 | 95,337 | |
| Rogers Communications, Inc. company guaranty sr. unsec. | |||
| unsub. notes 4 1/2s, 2043 (Canada) | 215,000 | 204,894 | |
| SBA Tower Trust 144A company guaranty sr. notes 5.101s, 2017 | 350,000 | 375,505 | |
| SES SA 144A company guaranty sr. unsec. notes 5.3s, | |||
| 2043 (France) | 270,000 | 279,386 | |
| TCI Communications, Inc. sr. unsec. unsub. notes 7 7/8s, 2026 | 580,000 | 772,049 | |
| Telecom Italia Capital SA company guaranty sr. unsec. unsub. | |||
| notes 6.175s, 2014 (Italy) | 153,000 | 153,918 | |
| Telefonica Emisiones SAU company guaranty sr. unsec. notes | |||
| 5.462s, 2021 (Spain) | 340,000 | 382,826 | |
| Telefonica Emisiones SAU company guaranty sr. unsec. notes | |||
| 4.57s, 2023 (Spain) | 150,000 | 156,882 | |
| Telefonica Emisiones SAU company guaranty sr. unsec. unsub. | |||
| notes 3.192s, 2018 (Spain) | 175,000 | 181,369 | |
| Time Warner Cable, Inc. company guaranty sr. unsec. unsub. | |||
| notes 8 3/4s, 2019 | 60,000 | 76,837 | |
| Time Warner Cable, Inc. company guaranty sr. notes 7.3s, 2038 | 105,000 | 139,526 | |
| Time Warner Cable, Inc. company guaranty sr. unsec. unsub. | |||
| notes 5 1/2s, 2041 | 525,000 | 578,671 | |
| Time Warner Entertainment Co. LP company guaranty sr. unsec. | |||
| bonds 8 3/8s, 2033 | 38,000 | 54,906 | |
| Global Income Trust | 21 |
| CORPORATE BONDS AND NOTES (26.6%)* cont. | Principal amount | Value | |
| Communication services cont. | |||
| Time Warner Entertainment Co. LP company guaranty sr. unsec. | |||
| bonds 8 3/8s, 2023 | $127,000 | $170,498 | |
| Verizon Communications, Inc. sr. unsec. unsub. notes | |||
| 7 3/4s, 2030 | 110,000 | 147,851 | |
| Verizon Communications, Inc. sr. unsec. unsub. notes 6.4s, 2033 | 350,000 | 422,445 | |
| Verizon Communications, Inc. sr. unsec. unsub. notes 5.9s, 2054 | 28,800 | 721,173 | |
| Verizon Communications, Inc. sr. unsec. unsub. notes | |||
| 5.05s, 2034 | 315,000 | 329,021 | |
| 8,122,597 | |||
| Consumer cyclicals (1.8%) | |||
| 21st Century Fox America, Inc. company guaranty sr. unsec. | |||
| notes 7.85s, 2039 | 115,000 | 158,199 | |
| 21st Century Fox America, Inc. company guaranty sr. unsec. | |||
| unsub. notes 6.2s, 2034 | 475,000 | 564,125 | |
| 21st Century Fox America, Inc. company guaranty sr. unsec. | |||
| unsub. notes 3s, 2022 | 71,000 | 69,059 | |
| Autonation, Inc. company guaranty sr. unsec. notes | |||
| 6 3/4s, 2018 | 85,000 | 97,750 | |
| CBS Corp. company guaranty sr. unsec. debs. 7 7/8s, 2030 | 170,000 | 227,295 | |
| Choice Hotels International, Inc. company guaranty sr. unsec. | |||
| unsub. notes 5.7s, 2020 | 160,000 | 170,400 | |
| D.R. Horton, Inc. company guaranty sr. unsec. notes | |||
| 5 3/4s, 2023 | 425,000 | 451,563 | |
| Dollar General Corp. sr. unsec. notes 3 1/4s, 2023 | 105,000 | 99,143 | |
| Expedia, Inc. company guaranty sr. unsec. unsub. notes | |||
| 5.95s, 2020 | 235,000 | 260,606 | |
| Ford Motor Co. sr. unsec. unsub. notes 7.45s, 2031 | 247,000 | 322,311 | |
| Ford Motor Co. sr. unsec. unsub. notes 7.4s, 2046 | 15,000 | 19,942 | |
| Ford Motor Credit Co., LLC sr. unsec. notes 4.207s, 2016 | 640,000 | 678,552 | |
| General Motors Financial Co., Inc. company guaranty sr. unsec. | |||
| notes 3 1/4s, 2018 | 171,000 | 172,710 | |
| General Motors Financial Co., Inc. company guaranty sr. unsec. | |||
| notes 2 3/4s, 2016 | 244,000 | 247,660 | |
| GLP Capital LP/GLP Financing II, Inc. 144A company guaranty | |||
| sr. unsec. notes 4 3/8s, 2018 | 30,000 | 31,050 | |
| Grupo Televisa, S.A.B. sr. unsec. unsub. notes 6 5/8s, | |||
| 2025 (Mexico) | 215,000 | 255,805 | |
| Grupo Televisa, S.A.B. sr. unsec. notes 6s, 2018 (Mexico) | 94,000 | 106,028 | |
| Host Hotels & Resorts LP sr. unsec. unsub. notes 6s, 2021 R | 61,000 | 69,801 | |
| Host Hotels & Resorts LP sr. unsec. unsub. notes 5 1/4s, 2022 R | 29,000 | 31,862 | |
| Hyatt Hotels Corp. sr. unsec. unsub. notes 3 3/8s, 2023 | 160,000 | 153,703 | |
| L Brands, Inc. company guaranty sr. unsec. notes 6 5/8s, 2021 | 145,000 | 162,219 | |
| L Brands, Inc. sr. unsec. notes 5 5/8s, 2022 | 220,000 | 231,550 | |
| Macy’s Retail Holdings, Inc. company guaranty sr. unsec. | |||
| notes 6.9s, 2029 | 175,000 | 214,268 | |
| Macy’s Retail Holdings, Inc. company guaranty sr. unsec. notes | |||
| 6.65s, 2024 | 105,000 | 127,435 | |
| Macy’s Retail Holdings, Inc. company guaranty sr. unsec. notes | |||
| 5 1/8s, 2042 | 30,000 | 31,472 | |
| Marriott International, Inc. sr. unsec. unsub. notes 3s, 2019 | 180,000 | 185,296 | |
| 22 Global Income Trust |
| CORPORATE BONDS AND NOTES (26.6%)* cont. | Principal amount | Value | |
| Consumer cyclicals cont. | |||
| O’Reilly Automotive, Inc. company guaranty sr. unsec. unsub. | |||
| notes 3.85s, 2023 | $150,000 | $150,021 | |
| Owens Corning company guaranty sr. unsec. notes 9s, 2019 | 15,000 | 18,829 | |
| QVC, Inc. 144A company guaranty sr. notes 4.85s, 2024 | 260,000 | 264,118 | |
| Time Warner, Inc. company guaranty sr. unsec. bonds 7.7s, 2032 | 215,000 | 295,932 | |
| TRW Automotive, Inc. 144A company guaranty sr. unsec. notes | |||
| 4.45s, 2023 | 65,000 | 66,300 | |
| 5,935,004 | |||
| Consumer staples (1.1%) | |||
| Altria Group, Inc. company guaranty sr. unsec. notes 10.2s, 2039 | 21,000 | 35,090 | |
| Altria Group, Inc. company guaranty sr. unsec. notes 9.7s, 2018 | 40,000 | 52,802 | |
| Altria Group, Inc. company guaranty sr. unsec. notes | |||
| 9 1/4s, 2019 | 29,000 | 38,459 | |
| Altria Group, Inc. company guaranty sr. unsec. bonds 4s, 2024 | 105,000 | 106,518 | |
| Altria Group, Inc. company guaranty sr. unsec. unsub. notes | |||
| 2.85s, 2022 | 385,000 | 365,898 | |
| Anheuser-Busch InBev Worldwide, Inc. company guaranty | |||
| sr. unsec. unsub. notes 8.2s, 2039 | 154,000 | 236,518 | |
| Bacardi, Ltd. 144A unsec. notes 4 1/2s, 2021 (Bermuda) | 230,000 | 245,876 | |
| Campbell Soup Co. sr. unsec. unsub. notes 8 7/8s, 2021 | 50,000 | 66,689 | |
| Corrections Corp. of America company guaranty sr. unsec. notes | |||
| 4 1/8s, 2020 R | 75,000 | 74,531 | |
| CVS Pass-Through Trust 144A sr. mtge. notes 7.507s, 2032 | 318,574 | 394,416 | |
| Delhaize Group SA company guaranty sr. unsec. notes 4 1/8s, | |||
| 2019 (Belgium) | 81,000 | 84,089 | |
| ERAC USA Finance, LLC 144A company guaranty sr. unsec. | |||
| notes 7s, 2037 | 85,000 | 109,989 | |
| ERAC USA Finance, LLC 144A sr. unsec. notes 4 1/2s, 2021 | 445,000 | 476,383 | |
| Kerry Group Financial Services 144A company guaranty | |||
| sr. unsec. notes 3.2s, 2023 (Ireland) | 377,000 | 353,516 | |
| Kraft Foods Group, Inc. sr. unsec. unsub. notes 6 1/2s, 2040 | 589,000 | 745,080 | |
| SABMiller Holdings, Inc. 144A company guaranty sr. unsec. | |||
| notes 4.95s, 2042 | 205,000 | 219,486 | |
| WPP Finance UK company guaranty sr. unsec. notes 8s, 2014 | |||
| (United Kingdom) | 200,000 | 205,271 | |
| 3,810,611 | |||
| Energy (1.7%) | |||
| Access Midstream Partners LP/ACMP Finance Corp. company | |||
| guaranty sr. unsec. notes 5 7/8s, 2021 | 110,000 | 117,150 | |
| Anadarko Finance Co. company guaranty sr. unsec. unsub. | |||
| notes Ser. B, 7 1/2s, 2031 | 455,000 | 606,107 | |
| Anadarko Petroleum Corp. sr. unsec. notes 6.45s, 2036 | 165,000 | 203,876 | |
| BG Energy Capital PLC 144A company guaranty sr. unsec. notes | |||
| 4s, 2021 (United Kingdom) | 200,000 | 209,202 | |
| BP Capital Markets PLC company guaranty sr. unsec. unsub. | |||
| notes 4 1/2s, 2020 (United Kingdom) | 140,000 | 154,377 | |
| Continental Resources, Inc. company guaranty sr. unsec. unsub. | |||
| notes 4 1/2s, 2023 | 120,000 | 125,850 | |
| Kerr-McGee Corp. company guaranty sr. unsec. unsub. notes | |||
| 7 7/8s, 2031 | 185,000 | 254,149 | |
| Global Income Trust | 23 |
| CORPORATE BONDS AND NOTES (26.6%)* cont. | Principal amount | Value | |
| Energy cont. | |||
| Lukoil International Finance BV 144A company guaranty | |||
| sr. unsec. notes 4.563s, 2023 (Russia) | $310,000 | $273,803 | |
| Marathon Petroleum Corp. sr. unsec. unsub. notes 6 1/2s, 2041 | 45,000 | 55,674 | |
| National JSC Naftogaz of Ukraine govt. guaranty unsec. notes | |||
| 9 1/2s, 2014 (Ukraine) | 330,000 | 298,650 | |
| Noble Holding International, Ltd. company guaranty sr. unsec. | |||
| notes 6.05s, 2041 | 160,000 | 176,589 | |
| Petrobras Global Finance BV company guaranty sr. unsec. | |||
| unsub. notes 6 1/4s, 2024 (Brazil) | 25,000 | 26,215 | |
| Petrobras International Finance Co. company guaranty sr. unsec. | |||
| notes 7 7/8s, 2019 (Brazil) | 55,000 | 63,686 | |
| Petrobras International Finance Co. company guaranty sr. unsec. | |||
| notes 5 3/8s, 2021 (Brazil) | 225,000 | 230,427 | |
| Petrobras International Finance Co. company guaranty sr. unsec. | |||
| notes 3 7/8s, 2016 (Brazil) | 185,000 | 190,481 | |
| Petroleos de Venezuela SA company guaranty sr. unsec. notes | |||
| 5 1/4s, 2017 (Venezuela) | 300,000 | 239,787 | |
| Petroleos de Venezuela SA company guaranty sr. unsec. unsub. | |||
| notes 5 3/8s, 2027 (Venezuela) | 30,000 | 17,475 | |
| Petroleos de Venezuela SA sr. unsec. notes 4.9s, | |||
| 2014 (Venezuela) | 110,000 | 106,421 | |
| Petroleos de Venezuela SA 144A company guaranty sr. notes | |||
| 8 1/2s, 2017 (Venezuela) | 140,000 | 126,000 | |
| Plains Exploration & Production Co. company guaranty | |||
| sr. unsec. notes 6 3/4s, 2022 | 422,000 | 471,058 | |
| Pride International, Inc. sr. unsec. notes 7 7/8s, 2040 | 425,000 | 620,547 | |
| Spectra Energy Capital, LLC company guaranty sr. unsec. notes | |||
| 5.65s, 2020 | 20,000 | 22,308 | |
| Spectra Energy Capital, LLC company guaranty sr. unsec. unsub. | |||
| notes 6.2s, 2018 | 75,000 | 85,723 | |
| Spectra Energy Partners LP sr. unsec. notes 4.6s, 2021 | 140,000 | 151,653 | |
| Statoil ASA company guaranty sr. unsec. notes 5.1s, | |||
| 2040 (Norway) | 165,000 | 184,795 | |
| Weatherford International, LLC company guaranty sr. unsec. | |||
| unsub. notes 6.8s, 2037 | 10,000 | 12,029 | |
| Weatherford International, Ltd. of Bermuda company guaranty | |||
| sr. unsec. notes 9 7/8s, 2039 (Bermuda) | 365,000 | 565,991 | |
| Weatherford International, Ltd. of Bermuda company guaranty | |||
| sr. unsec. notes 9 5/8s, 2019 (Bermuda) | 36,000 | 47,236 | |
| Williams Partners LP sr. unsec. notes 5.4s, 2044 | 45,000 | 47,109 | |
| Williams Partners LP sr. unsec. notes 4.3s, 2024 | 45,000 | 45,801 | |
| 5,730,169 | |||
| Financials (10.9%) | |||
| ABN Amro Bank NV 144A sr. unsec. notes 4 1/4s, | |||
| 2017 (Netherlands) | 812,000 | 872,047 | |
| Aflac, Inc. sr. unsec. notes 6.9s, 2039 | 295,000 | 392,095 | |
| Aflac, Inc. sr. unsec. notes 6.45s, 2040 | 108,000 | 136,327 | |
| American International Group, Inc. jr. sub. FRB bonds | |||
| 8.175s, 2058 | 414,000 | 553,725 | |
| Aon PLC company guaranty sr. unsec. unsub. notes 4 1/4s, 2042 | 545,000 | 511,449 | |
| 24 Global Income Trust |
| CORPORATE BONDS AND NOTES (26.6%)* cont. | Principal amount | Value | |
| Financials cont. | |||
| ARC Properties Operating Partnership LP/Clark Acquisition, LLC | |||
| 144A company guaranty sr. unsec. unsub. notes 4.6s, 2024 R | $465,000 | $472,232 | |
| Associates Corp. of North America sr. unsec. notes 6.95s, 2018 | 550,000 | 652,783 | |
| Assurant, Inc. sr. unsec. notes 6 3/4s, 2034 | 270,000 | 314,581 | |
| AXA SA 144A jr. unsec. sub. FRN notes 6.463s, perpetual | |||
| maturity (France) | 485,000 | 519,920 | |
| Banco do Brasil SA 144A unsec. sub. notes 5 7/8s, 2022 (Brazil) | 435,000 | 445,724 | |
| Barclays Bank PLC jr. sub. stock FRB bonds 6.278s, perpetual | |||
| maturity (United Kingdom) | 420,000 | 425,258 | |
| Barclays Bank PLC 144A sub. notes 10.179s, 2021 | |||
| (United Kingdom) | 216,000 | 293,280 | |
| BBVA International Preferred SAU bank guaranty jr. unsec. sub. | |||
| FRB bonds 5.919s, perpetual maturity (Spain) | 395,000 | 402,900 | |
| Bear Stearns Cos., LLC (The) sr. unsec. unsub. notes | |||
| 7 1/4s, 2018 | 230,000 | 273,551 | |
| Berkshire Hathaway Finance Corp. company guaranty sr. unsec. | |||
| unsub. notes 4.3s, 2043 | 335,000 | 326,195 | |
| BNP Paribas SA 144A jr. unsec. sub. FRN notes 7.195s, | |||
| perpetual maturity (France) | 300,000 | 336,000 | |
| BNP Paribas SA 144A jr. unsec. sub. FRN notes 5.186s, | |||
| perpetual maturity (France) | 593,000 | 608,566 | |
| BPCE SA 144A unsec. sub. notes 5.7s, 2023 (France) | 210,000 | 222,367 | |
| BPCE SA 144A unsec. sub. notes 5.15s, 2024 (France) | 215,000 | 218,143 | |
| Camden Property Trust sr. unsec. notes 4 7/8s, 2023 R | 585,000 | 636,636 | |
| CBL & Associates LP company guaranty sr. unsec. unsub. notes | |||
| 5 1/4s, 2023 R | 220,000 | 229,258 | |
| Citigroup, Inc. sr. unsec. notes 8 1/2s, 2019 | 5,000 | 6,370 | |
| Citigroup, Inc. jr. unsec. sub. FRB bonds 5.9s, perpetual maturity | 245,000 | 241,938 | |
| CNA Financial Corp. unsec. notes 6 1/2s, 2016 | 260,000 | 292,193 | |
| CNA Financial Corp. sr. unsec. unsub. notes 5 3/4s, 2021 | 80,000 | 92,709 | |
| Commerzbank AG 144A unsec. sub. notes 8 1/8s, | |||
| 2023 (Germany) | 320,000 | 373,600 | |
| Commonwealth Bank of Australia 144A sr. unsec. notes 5s, | |||
| 2019 (Australia) | 105,000 | 117,824 | |
| Credit Suisse AG 144A unsec. sub. notes 6 1/2s, | |||
| 2023 (Switzerland) | 340,000 | 380,130 | |
| Credit Suisse Group AG 144A jr. unsec. sub. FRN notes 7 1/2s, | |||
| perpetual maturity (Switzerland) | 200,000 | 217,500 | |
| DDR Corp. sr. unsec. unsub. notes 7 7/8s, 2020 R | 380,000 | 475,229 | |
| Duke Realty LP company guaranty sr. unsec. notes | |||
| 6 3/4s, 2020 R | 270,000 | 317,989 | |
| Duke Realty LP sr. unsec. unsub. notes 3 7/8s, 2021 R | 150,000 | 152,092 | |
| EPR Properties unsec. notes 5 1/4s, 2023 R | 285,000 | 294,044 | |
| Fifth Third Bancorp jr. unsec. sub. FRB bonds 5.1s, | |||
| perpetual maturity | 116,000 | 107,300 | |
| GE Capital Trust IV 144A unsec. sub. FRB bonds 4 5/8s, 2066 | EUR | 90,000 | 129,744 |
| General Electric Capital Corp. sr. unsec. notes 6 3/4s, 2032 | $830,000 | 1,081,576 | |
| Genworth Holdings, Inc. company guaranty jr. unsec. sub. FRB | |||
| bonds 6.15s, 2066 | 788,000 | 736,780 | |
| Goldman Sachs Group, Inc. (The) sr. notes 7 1/2s, 2019 | 195,000 | 236,731 | |
| Global Income Trust | 25 |
| CORPORATE BONDS AND NOTES (26.6%)* cont. | Principal amount | Value | |
| Financials cont. | |||
| Goldman Sachs Group, Inc. (The) sub. notes 6 3/4s, 2037 | $11,000 | $12,666 | |
| Hartford Financial Services Group, Inc. (The) jr. unsec. sub. FRB | |||
| bonds 8 1/8s, 2038 | 220,000 | 259,325 | |
| HBOS PLC 144A sr. unsec. sub. notes 6 3/4s, 2018 | |||
| (United Kingdom) | 229,000 | 260,813 | |
| HBOS PLC 144A unsec. sub. bonds 6s, 2033 (United Kingdom) | 300,000 | 320,133 | |
| Health Care REIT, Inc. sr. unsec. unsub. notes 3 3/4s, 2023 R | 165,000 | 164,776 | |
| HSBC Bank USA, NA unsec. sub. notes 7s, 2039 | 250,000 | 326,832 | |
| HSBC Capital Funding LP 144A bank guaranty jr. unsec. sub. | |||
| FRB bonds 10.176s, perpetual maturity (Jersey) | 570,000 | 832,200 | |
| HSBC Finance Capital Trust IX FRN notes 5.911s, 2035 | 200,000 | 207,500 | |
| HSBC Holdings PLC sr. unsec. notes 4 7/8s, 2022 | |||
| (United Kingdom) | 685,000 | 758,024 | |
| ING Bank NV 144A unsec. sub. notes 5.8s, 2023 (Netherlands) | 1,031,000 | 1,124,600 | |
| International Lease Finance Corp. sr. unsec. notes 6 1/4s, 2019 | 220,000 | 242,550 | |
| International Lease Finance Corp. sr. unsec. unsub. notes | |||
| 4 7/8s, 2015 | 390,000 | 402,675 | |
| JPMorgan Chase Capital XXIII company guaranty jr. unsec. sub. | |||
| FRN notes 1.236s, 2047 | 964,000 | 751,920 | |
| Liberty Mutual Group, Inc. 144A company guaranty jr. unsec. | |||
| sub. FRN notes 7s, 2037 | 265,000 | 282,225 | |
| Liberty Mutual Group, Inc. 144A company guaranty jr. unsec. | |||
| sub. bonds 7.8s, 2037 | 650,000 | 739,375 | |
| Lloyds Banking Group PLC jr. unsec. sub. FRB bonds 7 1/2s, | |||
| perpetual maturity (United Kingdom) | 212,000 | 221,540 | |
| Lloyds Banking Group PLC 144A jr. unsec. sub. FRN notes | |||
| 6.657s, perpetual maturity (United Kingdom) | 530,000 | 564,450 | |
| Massachusetts Mutual Life Insurance Co. 144A notes | |||
| 8 7/8s, 2039 | 435,000 | 670,035 | |
| MetLife Capital Trust IV 144A jr. unsec. sub. notes 7 7/8s, 2037 | 220,000 | 267,300 | |
| MetLife, Inc. jr. unsec. sub. notes 6.4s, 2036 | 125,000 | 135,625 | |
| Mid-America Apartments LP sr. unsec. notes 4.3s, 2023 R | 155,000 | 158,898 | |
| Morgan Stanley sr. unsec. notes Ser. MTN, 5 3/4s, 2016 | 100,000 | 110,712 | |
| MPT Operating Partnership LP/MPT Finance Corp. company | |||
| guaranty sr. unsec. notes 6 7/8s, 2021 R | 205,000 | 222,938 | |
| Nationwide Financial Services, Inc. notes 5 5/8s, 2015 | 35,000 | 36,112 | |
| Nationwide Mutual Insurance Co. 144A notes 9 3/8s, 2039 | 45,000 | 69,057 | |
| Nordea Bank AB 144A sub. notes 4 7/8s, 2021 (Sweden) | 815,000 | 866,182 | |
| OneAmerica Financial Partners, Inc. 144A bonds 7s, 2033 | 30,000 | 30,966 | |
| Primerica, Inc. sr. unsec. unsub. notes 4 3/4s, 2022 | 90,000 | 95,332 | |
| Progressive Corp. (The) jr. unsec. sub. FRN notes 6.7s, 2037 | 445,000 | 493,060 | |
| Prudential Financial, Inc. jr. unsec. sub. FRN notes 5 5/8s, 2043 | 90,000 | 92,813 | |
| Prudential Financial, Inc. jr. unsec. sub. FRN notes 5.2s, 2044 | 268,000 | 266,995 | |
| Prudential Financial, Inc. sr. unsec. notes 6 5/8s, 2040 | 85,000 | 110,223 | |
| Rabobank Nederland 144A jr. unsec. sub. FRN notes 11s, | |||
| perpetual maturity (Netherlands) | 865,000 | 1,152,613 | |
| Realty Income Corp. sr. unsec. notes 4.65s, 2023 R | 80,000 | 84,691 | |
| Royal Bank of Scotland Group PLC unsec. sub. notes 6.1s, 2023 | |||
| (United Kingdom) | 342,000 | 361,837 | |
| 26 Global Income Trust |
| CORPORATE BONDS AND NOTES (26.6%)* cont. | Principal amount | Value | |
| Financials cont. | |||
| Royal Bank of Scotland Group PLC unsec. sub. notes 6s, 2023 | |||
| (United Kingdom) | $88,000 | $91,931 | |
| Royal Bank of Scotland PLC (The) unsec. sub. FRN notes 9 1/2s, | |||
| 2022 (United Kingdom) | 820,000 | 960,425 | |
| Santander Issuances SAU 144A bank guaranty unsec. sub. notes | |||
| 5.911s, 2016 (Spain) | 600,000 | 635,491 | |
| Santander UK PLC 144A unsec. sub. notes 5s, 2023 | |||
| (United Kingdom) | 470,000 | 491,798 | |
| Sberbank of Russia Via SB Capital SA 144A sr. notes 6 1/8s, | |||
| 2022 (Russia) | 275,000 | 267,208 | |
| Sberbank of Russia Via SB Capital SA 144A sr. notes 4.95s, | |||
| 2017 (Russia) | 450,000 | 450,000 | |
| Shinhan Bank 144A sr. unsec. notes 4 3/8s, 2015 (South Korea) | 650,000 | 678,418 | |
| SL Green Realty Corp./SL Green Operating Partnership/ | |||
| Reckson Operating Partnership sr. unsec. unsub. | |||
| notes 5s, 2018 R | 270,000 | 293,204 | |
| Societe Generale SA 144A jr. unsec. sub. FRB bonds 7 7/8s, | |||
| perpetual maturity (France) | 200,000 | 208,250 | |
| Standard Chartered PLC 144A jr. unsec. sub. FRB bonds 7.014s, | |||
| perpetual maturity (United Kingdom) | 100,000 | 109,000 | |
| Standard Chartered PLC 144A unsec. sub. notes 3.95s, 2023 | |||
| (United Kingdom) | 330,000 | 320,036 | |
| State Street Capital Trust IV company guaranty jr. unsec. sub. | |||
| FRB bonds 1.233s, 2037 | 550,000 | 454,438 | |
| Tanger Properties, LP sr. unsec. notes 6 1/8s, 2020 R | 85,000 | 99,486 | |
| Teachers Insurance & Annuity Association of America 144A | |||
| notes 6.85s, 2039 | 210,000 | 278,322 | |
| Travelers Property Casuality Corp. sr. unsec. unsub. bonds | |||
| 7 3/4s, 2026 | 170,000 | 229,720 | |
| Vnesheconombank Via VEB Finance PLC 144A sr. unsec. unsub. | |||
| notes 6.8s, 2025 (Russia) | 500,000 | 462,150 | |
| VTB Bank OJSC Via VTB Capital SA sr. unsec. notes Ser. 6, | |||
| 6 1/4s, 2035 (Russia) | 100,000 | 100,750 | |
| VTB Bank OJSC Via VTB Capital SA 144A sr. unsec. notes | |||
| 6 7/8s, 2018 (Russia) | 699,000 | 699,000 | |
| VTB Bank OJSC Via VTB Capital SA 144A sr. unsec. notes | |||
| 6 1/4s, 2035 (Russia) | 100,000 | 100,750 | |
| Wachovia Bank NA sr. unsec. sub. notes 6.6s, 2038 | 930,000 | 1,240,673 | |
| Willis Group Holdings PLC company guaranty sr. unsec. unsub. | |||
| notes 5 3/4s, 2021 | 405,000 | 449,761 | |
| WP Carey, Inc. sr. unsec. unsub. notes 4.6s, 2024 | 725,000 | 741,299 | |
| ZFS Finance USA Trust V 144A FRB bonds 6 1/2s, 2037 | 300,000 | 320,250 | |
| 36,476,139 | |||
| Health care (0.4%) | |||
| Aetna, Inc. sr. unsec. unsub. notes 6 3/4s, 2037 | 200,000 | 262,890 | |
| Coventry Health Care, Inc. sr. unsec. notes 5.45s, 2021 | 250,000 | 289,512 | |
| Fresenius Medical Care US Finance II, Inc. 144A company | |||
| guaranty sr. unsec. notes 5 5/8s, 2019 | 120,000 | 130,500 | |
| Fresenius Medical Care US Finance, Inc. 144A company | |||
| guaranty sr. notes 5 3/4s, 2021 | 135,000 | 143,775 | |
| Mylan, Inc./PA company guaranty sr. unsec. notes 2.6s, 2018 | 120,000 | 121,693 | |
| Global Income Trust | 27 |
| CORPORATE BONDS AND NOTES (26.6%)* cont. | Principal amount | Value | |
| Health care cont. | |||
| Quest Diagnostics, Inc. company guaranty sr. unsec. notes | |||
| 6.95s, 2037 | $175,000 | $209,262 | |
| Quest Diagnostics, Inc. company guaranty sr. unsec. notes | |||
| 4 3/4s, 2020 | 28,000 | 30,210 | |
| 1,187,842 | |||
| Supra-Nation (2.1%) | |||
| Asian Development Bank sr. unsec. unsub. notes Ser. MTN, | |||
| 5 1/2s, 2016 (Supra-Nation) | AUD | 2,150,000 | 2,085,993 |
| European Investment Bank sr. unsec. unsub. bonds 5 5/8s, | |||
| 2032 (Luxembourg) | GBP | 1,900,000 | 4,044,402 |
| European Investment Bank sr. unsec. unsub. notes 4 1/8s, | |||
| 2024 (Luxembourg) | EUR | 450,000 | 751,485 |
| 6,881,880 | |||
| Technology (0.5%) | |||
| Apple, Inc. sr. unsec. unsub. notes 3.85s, 2043 | $322,000 | 292,539 | |
| Apple, Inc. sr. unsec. unsub. notes 3.45s, 2024 | 435,000 | 436,179 | |
| Apple, Inc. sr. unsec. unsub. notes 2.1s, 2019 | 95,000 | 95,312 | |
| Brocade Communications Systems, Inc. company guaranty | |||
| sr. notes 6 7/8s, 2020 | 145,000 | 155,150 | |
| Fidelity National Information Services, Inc. company guaranty | |||
| sr. unsec. unsub. notes 5s, 2022 | 230,000 | 240,784 | |
| Jabil Circuit, Inc. sr. unsec. notes 8 1/4s, 2018 | 100,000 | 119,250 | |
| SoftBank Corp. 144A sr. unsec. notes 4 1/2s, 2020 (Japan) | 225,000 | 225,563 | |
| 1,564,777 | |||
| Transportation (0.4%) | |||
| Burlington Northern Santa Fe, LLC sr. unsec. notes 5.4s, 2041 | 295,000 | 330,709 | |
| Burlington Northern Santa Fe, LLC sr. unsec. unsub. notes | |||
| 5 3/4s, 2040 | 10,000 | 11,712 | |
| Continental Airlines, Inc. pass-through certificates | |||
| Ser. 97-4A, 6.9s, 2018 | 56,053 | 60,397 | |
| Continental Airlines, Inc. pass-through certificates Ser. 98-1A, | |||
| 6.648s, 2017 | 77,344 | 83,145 | |
| Delta Air Lines, Inc. sr. notes Ser. A, 7 3/4s, 2019 | 112,729 | 131,752 | |
| Kansas City Southern de Mexico SA de CV sr. unsec. unsub. | |||
| notes 2.35s, 2020 | 39,000 | 37,029 | |
| Kansas City Southern Railway Co. (The) 144A sr. unsec. | |||
| notes 4.3s, 2043 | 76,000 | 70,549 | |
| Norfolk Southern Corp. sr. unsec. notes 6s, 2111 | 140,000 | 164,493 | |
| Southwest Airlines Co. pass-through certificates Ser. 07-1, | |||
| 6.15s, 2022 | 169,152 | 194,102 | |
| United AirLines, Inc. pass-through certificates Ser. 07-A, | |||
| 6.636s, 2022 | 34,611 | 38,073 | |
| 1,121,961 | |||
| Utilities and power (3.3%) | |||
| Arizona Public Services Co. sr. unsec. notes 4 1/2s, 2042 | 65,000 | 67,074 | |
| Beaver Valley Funding Corp. sr. bonds 9s, 2017 | 42,000 | 44,248 | |
| CMS Energy Corp. sr. unsec. notes 8 3/4s, 2019 | 405,000 | 519,204 | |
| Consolidated Edison Co. of New York sr. unsec. unsub. | |||
| notes 4.2s, 2042 | 65,000 | 63,424 | |
| Duke Energy Carolinas, LLC sr. mtge. notes 4 1/4s, 2041 | 165,000 | 164,932 | |
| EDP Finance BV 144A sr. unsec. unsub. notes 6s, | |||
| 2018 (Netherlands) | 335,000 | 363,475 | |
| 28 Global Income Trust |
| CORPORATE BONDS AND NOTES (26.6%)* cont. | Principal amount | Value | |
| Utilities and power cont. | |||
| EDP Finance BV 144A sr. unsec. notes 5 1/4s, | |||
| 2021 (Netherlands) | $360,000 | $374,731 | |
| El Paso Natural Gas Co., LLC sr. unsec. unsub. bonds | |||
| 8 3/8s, 2032 | 105,000 | 141,531 | |
| El Paso Pipeline Partners Operating Co., LP company guaranty | |||
| sr. unsec. notes 6 1/2s, 2020 | 95,000 | 110,299 | |
| Electricite de France (EDF) 144A sr. unsec. notes 6.95s, | |||
| 2039 (France) | 465,000 | 604,993 | |
| Electricite de France (EDF) 144A jr. unsec. sub. FRN notes | |||
| 5 5/8s, perpetual maturity (France) | 375,000 | 384,844 | |
| Electricite de France (EDF) 144A unsec. sub. FRN notes 5 1/4s, | |||
| perpetual maturity (France) | 1,114,000 | 1,133,495 | |
| Enel Finance International SA 144A company guaranty sr. unsec. | |||
| notes 5 1/8s, 2019 (Netherlands) | 175,000 | 193,403 | |
| Energy Transfer Partners LP sr. unsec. unsub. notes 6 1/2s, 2042 | 515,000 | 598,205 | |
| Energy Transfer Partners LP sr. unsec. unsub. notes 5.2s, 2022 | 210,000 | 230,163 | |
| Ente Nazionale Idrocarburi (ENI) SpA 144A sr. unsec. notes | |||
| 4.15s, 2020 (Italy) | 605,000 | 639,809 | |
| Enterprise Products Operating, LLC company guaranty sr. | |||
| unsec. unsub. notes 4.85s, 2042 | 125,000 | 126,895 | |
| Fortum OYJ sr. unsec. notes Ser. 14, Class EMTN, 4 1/2s, | |||
| 2016 (Finland) | EUR | 255,000 | 381,492 |
| Iberdrola International BV company guaranty sr. unsec. unsub. | |||
| notes 6 3/4s, 2036 (Spain) | $155,000 | 186,385 | |
| ITC Holdings Corp. 144A sr. unsec. notes 6.05s, 2018 | 125,000 | 139,872 | |
| Kinder Morgan Energy Partners LP sr. unsec. unsub. notes | |||
| 3 1/2s, 2021 | 40,000 | 39,908 | |
| Kinder Morgan, Inc./DE 144A sr. notes 5s, 2021 | 357,000 | 356,108 | |
| Korea Gas Corp. 144A sr. unsec. unsub. notes 6 1/4s, 2042 | |||
| (South Korea) | 370,000 | 460,267 | |
| Majapahit Holding BV 144A company guaranty sr. unsec. notes | |||
| 7 3/4s, 2020 (Indonesia) | 195,000 | 223,630 | |
| Oncor Electric Delivery Co., LLC sr. notes 4.1s, 2022 | 270,000 | 286,220 | |
| PPL WEM Holdings, Ltd. 144A sr. unsec. notes 5 3/8s, 2021 | |||
| (United Kingdom) | 640,000 | 705,580 | |
| Puget Sound Energy, Inc. jr. sub. FRN notes Ser. A, 6.974s, 2067 | 240,000 | 247,200 | |
| Teco Finance, Inc. company guaranty sr. unsec. unsub. notes | |||
| 6.572s, 2017 | 20,000 | 23,101 | |
| Texas-New Mexico Power Co. 144A 1st mtge. bonds Ser. A, | |||
| 9 1/2s, 2019 | 530,000 | 680,987 | |
| TransCanada PipeLines, Ltd. jr. unsec. sub. FRN notes 6.35s, | |||
| 2067 (Canada) | 340,000 | 353,175 | |
| West Penn Power Co. 144A sr. bonds 5.95s, 2017 | 170,000 | 193,000 | |
| Westar Energy, Inc. sr. mtge. bonds 8 5/8s, 2018 | 145,000 | 183,785 | |
| Westar Energy, Inc. sr. mtge. notes 4 1/8s, 2042 | 35,000 | 34,285 | |
| Wisconsin Energy Corp. jr. unsec. sub. FRN notes 6 1/4s, 2067 | 830,000 | 858,013 | |
| 11,113,733 | |||
| Total corporate bonds and notes (cost $82,736,514) | $88,713,128 | ||
| Global Income Trust 29 |
| MORTGAGE-BACKED SECURITIES (23.5%)* | Principal amount | Value | |
| Agency collateralized mortgage obligations (8.3%) | |||
| Federal Home Loan Mortgage Corp. | |||
| IFB Ser. 3182, Class SP, 27.991s, 2032 | $74,992 | $112,887 | |
| IFB Ser. 3408, Class EK, 25.181s, 2037 | 28,475 | 41,377 | |
| IFB Ser. 3072, Class SM, 23.239s, 2035 | 83,591 | 119,462 | |
| IFB Ser. 3072, Class SB, 23.092s, 2035 | 75,062 | 106,536 | |
| IFB Ser. 3249, Class PS, 21.773s, 2036 | 58,016 | 79,204 | |
| IFB Ser. 3065, Class DC, 19.403s, 2035 | 88,236 | 125,373 | |
| IFB Ser. 2990, Class LB, 16.557s, 2034 | 80,590 | 105,535 | |
| IFB Ser. 4218, Class SB, IO, 6.048s, 2041 | 2,244,038 | 401,481 | |
| IFB Ser. 4105, Class LS, IO, 5.998s, 2041 | 1,277,363 | 231,445 | |
| IFB Ser. 4240, Class SA, IO, 5.848s, 2043 | 1,854,175 | 425,793 | |
| IFB Ser. 271, Class S5, IO, 5.848s, 2042 | 4,253,946 | 931,274 | |
| IFB Ser. 14-326, Class S2, IO, 5.798s, 2044 | 4,866,621 | 1,147,206 | |
| IFB Ser. 311, Class S1, IO, 5.798s, 2043 | 4,694,681 | 1,001,483 | |
| IFB Ser. 14-327, Class S8, IO, 5.768s, 2044 | 703,073 | 154,254 | |
| IFB Ser. 314, Class AS, IO, 5.738s, 2043 | 1,671,217 | 366,954 | |
| Ser. 3632, Class CI, IO, 5s, 2038 | 69,234 | 6,492 | |
| Ser. 3626, Class DI, IO, 5s, 2037 | 16,224 | 264 | |
| Ser. 3707, Class PI, IO, 4 1/2s, 2025 | 540,179 | 51,765 | |
| Ser. 4193, Class PI, IO, 4s, 2043 | 2,550,523 | 449,527 | |
| Ser. 304, Class C53, IO, 4s, 2032 | 4,970,495 | 725,195 | |
| Ser. 4141, Class PI, IO, 3s, 2042 | 4,097,101 | 565,564 | |
| Ser. 4165, Class TI, IO, 3s, 2042 | 10,687,088 | 1,461,994 | |
| Ser. 13-4206, Class IP, IO, 3s, 2041 | 3,441,472 | 480,361 | |
| Ser. 13-4176, Class IA, IO, 2 1/2s, 2028 | 5,069,405 | 583,539 | |
| Ser. 3300, PO, zero %, 2037 | 8,856 | 7,861 | |
| FRB Ser. 3326, Class WF, zero %, 2035 | 2,805 | 2,398 | |
| Federal National Mortgage Association | |||
| IFB Ser. 06-8, Class HP, 24.008s, 2036 | 68,319 | 104,988 | |
| IFB Ser. 07-53, Class SP, 23.642s, 2037 | 71,961 | 106,061 | |
| IFB Ser. 05-75, Class GS, 19.793s, 2035 | 66,791 | 88,998 | |
| IFB Ser. 10-46, Class SB, IO, 6.298s, 2040 | 1,072,718 | 176,323 | |
| IFB Ser. 13-128, Class SA, IO, 5.848s, 2043 | 3,513,431 | 782,687 | |
| Ser. 13-98, Class SA, IO, 5.798s, 2043 | 1,974,861 | 426,373 | |
| IFB Ser. 13-102, Class SH, IO, 5.748s, 2043 | 2,029,319 | 442,189 | |
| Ser. 12-75, Class AI, IO, 4 1/2s, 2027 | 1,090,268 | 126,896 | |
| Ser. 418, Class C24, IO, 4s, 2043 | 2,563,030 | 602,712 | |
| Ser. 409, Class C16, IO, 4s, 2040 | 1,269,493 | 248,847 | |
| Ser. 418, Class C15, IO, 3 1/2s, 2043 | 2,658,217 | 608,690 | |
| Ser. 12-124, Class JI, 3 1/2s, 2042 | 2,746,269 | 437,700 | |
| Ser. 13-55, Class IK, IO, 3s, 2043 | 2,274,491 | 325,889 | |
| Ser. 13-35, Class IP, IO, 3s, 2042 | 5,939,868 | 676,124 | |
| Ser. 13-55, Class PI, IO, 3s, 2042 | 6,013,974 | 761,790 | |
| Ser. 13-23, Class PI, IO, 3s, 2041 | 7,904,232 | 813,187 | |
| Ser. 13-55, Class MI, IO, 3s, 2032 | 3,481,981 | 473,480 | |
| Ser. 03-W10, Class 1, IO, 1.092s, 2043 | 588,088 | 17,114 | |
| Ser. 07-64, Class LO, PO, zero %, 2037 | 15,400 | 13,538 | |
| 30 Global Income Trust |
| MORTGAGE-BACKED SECURITIES (23.5%)* cont. | Principal amount | Value | |
| Agency collateralized mortgage obligations cont. | |||
| Government National Mortgage Association | |||
| IFB Ser. 12-26, Class SP, IO, 6.498s, 2042 | $2,309,725 | $545,418 | |
| IFB Ser. 11-11, Class PS, IO, 6.448s, 2040 | 1,549,232 | 263,371 | |
| IFB Ser. 10-56, Class SC, IO, 6.348s, 2040 | 997,253 | 188,321 | |
| IFB Ser. 10-171, Class SB, IO, 6.298s, 2040 | 3,392,481 | 634,462 | |
| IFB Ser. 13-124, Class SC, IO, 6.048s, 2041 | 2,775,510 | 454,490 | |
| IFB Ser. 13-122, Class DS, IO, 5.998s, 2043 | 1,105,474 | 188,629 | |
| IFB Ser. 13-129, Class CS, IO, 5.998s, 2042 | 2,408,541 | 414,269 | |
| IFB Ser. 10-20, Class SC, IO, 5.998s, 2040 | 2,530,587 | 459,175 | |
| IFB Ser. 11-146, Class AS, IO, 5.948s, 2041 | 2,354,498 | 480,833 | |
| Ser. 14-58, Class SA, IO, 5.94s, 2044 | 3,194,000 | 507,495 | |
| IFB Ser. 10-151, Class SA, IO, 5.898s, 2040 | 1,112,109 | 200,791 | |
| Ser. 10-35, Class UI, IO, 5s, 2040 | 1,201,225 | 280,294 | |
| Ser. 10-9, Class UI, IO, 5s, 2040 | 1,471,478 | 338,448 | |
| Ser. 13-24, Class IC, IO, 4 1/2s, 2043 | 1,630,228 | 360,900 | |
| Ser. 11-18, Class PI, IO, 4 1/2s, 2040 | 83,079 | 14,888 | |
| Ser. 10-35, Class AI, IO, 4 1/2s, 2040 | 3,416,078 | 692,166 | |
| Ser. 10-35, Class QI, IO, 4 1/2s, 2040 | 6,146,036 | 1,238,456 | |
| Ser. 10-103, Class DI, IO, 4 1/2s, 2038 | 1,813,275 | 242,524 | |
| Ser. 13-24, Class PI, IO, 4s, 2042 | 1,154,498 | 218,281 | |
| Ser. 13-49, Class OI, IO, 3 1/2s, 2043 | 3,169,738 | 606,783 | |
| Ser. 13-27, Class PI, IO, 3 1/2s, 2042 | 2,251,624 | 392,548 | |
| Ser. 13-90, Class HI, IO, 3 1/2s, 2040 | 2,758,680 | 397,084 | |
| Ser. 13-53, Class PI, IO, 3s, 2041 | 5,588,262 | 776,377 | |
| Ser. 14-44, Class IC, IO, 3s, 2028 | 7,408,397 | 900,231 | |
| 27,715,044 | |||
| Commercial mortgage-backed securities (11.2%) | |||
| Banc of America Commercial Mortgage Trust | |||
| FRB Ser. 07-2, Class A2, 5.634s, 2049 F | 55,411 | 55,571 | |
| Ser. 06-6, Class AJ, 5.421s, 2045 | 1,555,000 | 1,584,035 | |
| Ser. 06-5, Class A2, 5.317s, 2047 | 1,034,133 | 1,039,287 | |
| Ser. 05-4, Class B, 5.118s, 2045 | 423,000 | 427,230 | |
| Banc of America Commercial Mortgage Trust 144A Ser. 07-5, | |||
| Class XW, IO, 0.531s, 2051 | 6,211,952 | 62,206 | |
| Banc of America Merrill Lynch Commercial Mortgage, Inc. 144A | |||
| Ser. 04-4, Class XC, IO, 0.932s, 2042 | 601,516 | 1,418 | |
| Bayview Commercial Asset Trust 144A | |||
| Ser. 06-CD1A, IO, zero %, 2023 | CAD | 2,623,362 | 24 |
| Ser. 07-CD1A, IO, zero %, 2021 | CAD | 2,719,511 | 1 |
| Bear Stearns Commercial Mortgage Securities Trust 144A | |||
| FRB Ser. 06-PW11, Class B, 5.607s, 2039 | $471,000 | 478,536 | |
| FRB Ser. 06-PW11, Class C, 5.607s, 2039 | 403,000 | 400,461 | |
| Ser. 06-PW14, Class X1, IO, 0.832s, 2038 | 5,397,546 | 83,014 | |
| CFCRE Commercial Mortgage Trust 144A FRB Ser. 11-C2, | |||
| Class E, 5.744s, 2047 | 329,000 | 332,556 | |
| Citigroup Commercial Mortgage Trust 144A | |||
| FRB Ser. 12-GC8, Class D, 5.04s, 2045 | 1,612,000 | 1,586,692 | |
| Ser. 06-C5, Class XC, IO, 0.735s, 2049 | 37,747,203 | 490,714 | |
| Global Income Trust | 31 |
| MORTGAGE-BACKED SECURITIES (23.5%)* cont. | Principal amount | Value | |
| Commercial mortgage-backed securities cont. | |||
| Citigroup/Deutsche Bank Commercial Mortgage Trust 144A | |||
| Ser. 07-CD4, Class XC, IO, 0.56s, 2049 | $5,951,244 | $44,634 | |
| Ser. 07-CD5, Class XS, IO, 0.071s, 2044 | 4,534,754 | 20,111 | |
| COMM Mortgage Trust | |||
| Ser. 07-C9, Class AJ, 5.65s, 2049 | 841,000 | 887,591 | |
| FRB Ser. 05-LP5, Class D, 5.257s, 2043 | 802,000 | 828,653 | |
| Ser. 12-CR1, Class XA, IO, 2.398s, 2045 | 3,195,247 | 374,850 | |
| Ser. 12-CR3, Class XA, IO, 2.193s, 2045 | 6,777,227 | 828,977 | |
| Ser. 14-UBS2, Class XA, IO, 1.609s, 2047 | 3,733,014 | 355,006 | |
| COMM Mortgage Trust 144A | |||
| FRB Ser. 13-CR8, Class AM, 3.965s, 2046 | 394,000 | 400,237 | |
| FRB Ser. 07-C9, Class AJFL, 0.84s, 2049 | 964,000 | 870,685 | |
| Credit Suisse Commercial Mortgage Trust 144A | |||
| Ser. 06-C4, Class AX, IO, 0.773s, 2039 | 8,255,623 | 100,553 | |
| Ser. 07-C2, Class AX, IO, 0.226s, 2049 | 8,832,107 | 45,195 | |
| Credit Suisse First Boston Mortgage Securities Corp. 144A | |||
| Ser. 98-C1, Class F, 6s, 2040 | 173,384 | 190,722 | |
| Ser. 02-CP5, Class M, 5 1/4s, 2035 | 38,636 | 1,554 | |
| Ser. 03-C3, Class AX, IO, 1.74s, 2038 | 127,543 | 5 | |
| DBRR Trust 144A FRB Ser. 13-EZ3, Class A, 1.636s, 2049 | 1,405,668 | 1,410,061 | |
| GE Capital Commercial Mortgage Corp. FRB Ser. 05-C1, Class B, | |||
| 4.846s, 2048 | 569,000 | 582,440 | |
| GE Capital Commercial Mortgage Corp. 144A Ser. 07-C1, | |||
| Class XC, IO, 0.16s, 2049 | 32,427,646 | 208,834 | |
| Greenwich Capital Commercial Funding Corp. FRB Ser. 05-GG3, | |||
| Class B, 4.894s, 2042 | 1,126,000 | 1,147,732 | |
| GS Mortgage Securities Trust | |||
| Ser. 06-GG6, Class A2, 5.506s, 2038 | 2,452 | 2,456 | |
| Ser. 05-GG4, Class AJ, 4.782s, 2039 | 1,000,000 | 1,015,597 | |
| Ser. 13-GC10, Class XA, IO, 1.902s, 2046 | 8,708,512 | 919,358 | |
| GS Mortgage Securities Trust 144A | |||
| Ser. 98-C1, Class F, 6s, 2030 | 7,284 | 7,284 | |
| FRB Ser. 13-GC10, Class E, 4.562s, 2046 F | 650,000 | 551,930 | |
| FRB Ser. GC10, Class D, 4.562s, 2046 | 983,000 | 894,432 | |
| JPMorgan Chase Commercial Mortgage Securities Trust | |||
| FRB Ser. 07-CB20, Class AJ, 6.282s, 2051 | 320,000 | 339,808 | |
| FRB Ser. 07-LD12, Class A3, 6.135s, 2051 | 681,665 | 683,696 | |
| FRB Ser. 06-LDP7, Class B, 6.025s, 2045 | 914,000 | 817,732 | |
| FRB Ser. 04-CB9, Class B, 5.964s, 2041 | 394,000 | 399,989 | |
| FRB Ser. 05-LDP2, Class B, 4.882s, 2042 | 406,000 | 419,601 | |
| FRB Ser. 13-C10, Class D, 4.299s, 2047 | 419,000 | 380,298 | |
| Ser. 13-C16, Class XA, IO, 1.545s, 2046 | 5,749,523 | 425,465 | |
| Ser. 06-LDP8, Class X, IO, 0.727s, 2045 | 1,981,148 | 22,288 | |
| Ser. 06-CB17, Class X, IO, 0.664s, 2043 | 21,810,172 | 257,687 | |
| Ser. 07-LDPX, Class X, IO, 0.494s, 2049 | 16,822,632 | 149,385 | |
| JPMorgan Chase Commercial Mortgage Securities Trust 144A | |||
| FRB Ser. 07-CB20, Class B, 6.382s, 2051 | 569,000 | 572,053 | |
| FRB Ser. 07-CB20, Class C, 6.382s, 2051 | 401,000 | 376,270 | |
| 32 Global Income Trust |
| MORTGAGE-BACKED SECURITIES (23.5%)* cont. | Principal amount | Value | |
| Commercial mortgage-backed securities cont. | |||
| JPMorgan Chase Commercial Mortgage Securities Trust 144A | |||
| FRB Ser. 12-C6, Class E, 5 3/8s, 2045 | $207,000 | $210,751 | |
| FRB Ser. 12-C8, Class D, 4.823s, 2045 | 2,300,000 | 2,307,865 | |
| FRB Ser. 12_LC9, Class D, 4.574s, 2047 | 474,000 | 465,292 | |
| Ser. 07-CB20, Class X1, IO, 0.206s, 2051 | 6,836,840 | 63,924 | |
| LB Commercial Conduit Mortgage Trust 144A Ser. 98-C4, | |||
| Class J, 5.6s, 2035 | 119,000 | 130,698 | |
| LB-UBS Commercial Mortgage Trust | |||
| Ser. 05-C7, Class C, 5.35s, 2040 | 763,000 | 785,280 | |
| Ser. 06-C7, Class A2, 5.3s, 2038 | 515,283 | 532,669 | |
| Ser. 04-C6, Class E, 5.177s, 2036 | 431,000 | 431,000 | |
| Ser. 04-C8, Class D, 4.946s, 2039 | 468,000 | 480,121 | |
| Ser. 05-C1, Class D, 4.856s, 2040 | 518,000 | 528,723 | |
| Ser. 07-C2, Class XW, IO, 0.738s, 2040 | 814,733 | 12,361 | |
| LB-UBS Commercial Mortgage Trust 144A | |||
| Ser. 06-C6, Class XCL, IO, 0.857s, 2039 | 25,155,209 | 390,686 | |
| Ser. 06-C7, Class XCL, IO, 0.85s, 2038 | 2,446,044 | 35,883 | |
| Ser. 06-C7, Class XW, IO, 0.85s, 2038 | 1,334,275 | 19,801 | |
| Ser. 05-C2, Class XCL, IO, 0.494s, 2040 | 3,415,856 | 7,119 | |
| Ser. 07-C2, Class XCL, IO, 0.172s, 2040 | 5,221,777 | 79,481 | |
| Merrill Lynch Mortgage Trust FRB Ser. 07-C1, Class A3, | |||
| 6.032s, 2050 | 386,749 | 396,852 | |
| Mezz Cap Commercial Mortgage Trust 144A Ser. 07-C5, Class X, | |||
| IO, 5.925s, 2049 | 101,338 | 5,766 | |
| ML-CFC Commercial Mortgage Trust | |||
| Ser. 06-4, Class AJ, 5.239s, 2049 | 230,000 | 232,588 | |
| FRB Ser. 06-4, Class A2FL, 0.273s, 2049 | 50,382 | 50,256 | |
| Morgan Stanley Capital I Trust | |||
| FRB Ser. 07-HQ12, Class A2, 5.777s, 2049 F | 118,404 | 118,540 | |
| FRB Ser. 07-HQ12, Class A2FX, 5.777s, 2049 | 806,627 | 818,808 | |
| Ser. 07-IQ14, Class A2, 5.61s, 2049 | 112,748 | 114,042 | |
| Ser. 07-HQ11, Class C, 5.558s, 2044 | 477,000 | 475,569 | |
| Morgan Stanley Capital I Trust 144A | |||
| FRB Ser. 04-RR, Class F7, 6s, 2039 | 242,616 | 232,002 | |
| FRB Ser. 05-HQ5, Class X1, IO, 0.463s, 2042 | 51,802,625 | 131,061 | |
| Morgan Stanley ReREMIC Trust 144A FRB Ser. 10-C30A, | |||
| Class A3B, 5.246s, 2043 | 642,091 | 642,123 | |
| UBS-Barclays Commercial Mortgage Trust 144A Ser. 12-C4, | |||
| Class XA, IO, 2.021s, 2045 | 3,210,875 | 356,873 | |
| Wachovia Bank Commercial Mortgage Trust | |||
| Ser. 06-C24, Class AJ, 5.658s, 2045 | 659,000 | 659,989 | |
| Ser. 07-C34, IO, 0.494s, 2046 | 1,980,017 | 23,958 | |
| Wachovia Bank Commercial Mortgage Trust 144A FRB | |||
| Ser. 05-C16, Class G, 5.703s, 2041 | 770,000 | 775,002 | |
| WF-RBS Commercial Mortgage Trust Ser. 13-C14, Class XA, IO, | |||
| 1.062s, 2046 | 10,841,499 | 631,734 | |
| Global Income Trust | 33 |
| MORTGAGE-BACKED SECURITIES (23.5%)* cont. | Principal amount | Value | |
| Commercial mortgage-backed securities cont. | |||
| WF-RBS Commercial Mortgage Trust 144A | |||
| FRB Ser. 11-C2, Class D, 5.647s, 2044 | $937,000 | $972,793 | |
| FRB Ser. 11-C4, Class E, 5.415s, 2044 | 794,000 | 805,179 | |
| Ser. 13-C12, Class XA, IO, 1.653s, 2048 | 4,872,927 | 429,851 | |
| 37,429,554 | |||
| Residential mortgage-backed securities (non-agency) (4.0%) | |||
| Barclays Capital, LLC Trust | |||
| Ser. 13-RR1, Class 9A4, 9.004s, 2036 | 550,000 | 556,875 | |
| FRB Ser. 12-RR10, Class 9A2, 2.654s, 2035 | 280,000 | 246,960 | |
| Ser. 13-RR1, Class 1A2, 2.425s, 2035 | 1,360,000 | 1,109,080 | |
| Barclays Capital, LLC Trust 144A FRB Ser. 12-RR11, Class 5A3, | |||
| 10.435s, 2037 | 314,007 | 193,428 | |
| Bear Stearns Asset Backed Securities, Inc. FRB Ser. 04-FR3, | |||
| Class M6, 5.029s, 2034 | 12,634 | 1,727 | |
| Countrywide Alternative Loan Trust | |||
| Ser. 05-20CB, Class 3A6, 5 1/2s, 2035 | 324,267 | 293,461 | |
| FRB Ser. 05-51, Class 1A1, 0.472s, 2035 | 668,797 | 570,150 | |
| Granite Mortgages PLC | |||
| FRB Ser. 03-2, Class 3C, 3.07s, 2043 (United Kingdom) | GBP | 121,603 | 214,553 |
| FRB Ser. 03-2, Class 2C1, 2.852s, 2043 (United Kingdom) | EUR | 327,000 | 474,985 |
| Harborview Mortgage Loan Trust FRB Ser. 05-10, Class 2A1A, | |||
| 0.462s, 2035 | $963,625 | 831,704 | |
| JPMorgan Resecuritization Trust 144A | |||
| FRB Ser. 09-11, Class 5A2, 2.621s, 2036 | 1,219,732 | 1,027,624 | |
| Ser. 14-1, Class 9A3, 0.444s, 2035 | 705,226 | 680,684 | |
| WAMU Mortgage Pass-Through Certificates | |||
| FRB Ser. 06-AR1, Class 2A1B, 1.196s, 2046 | 661,577 | 588,804 | |
| FRB Ser. 06-AR4, Class 1A1B, 1.066s, 2046 | 1,480,475 | 1,258,404 | |
| FRB Ser. 05-AR13, Class A1C3, 0.642s, 2045 | 3,549,895 | 3,058,235 | |
| FRB Ser. 05-AR9, Class A1C3, 0.632s, 2045 | 747,965 | 673,168 | |
| FRB Ser. 05-AR2, Class 2A1B, 0.522s, 2045 | 984,085 | 888,137 | |
| Wells Fargo Mortgage Loan Trust FRB Ser. 12-RR2, Class 1A2, | |||
| 0.324s, 2047 | 850,000 | 607,906 | |
| 13,275,885 | |||
| Total mortgage-backed securities (cost $74,201,249) | $78,420,483 | ||
| U.S. GOVERNMENT AND AGENCY | |||
| MORTGAGE OBLIGATIONS (11.4%)* | Principal amount | Value | |
| U.S. Government Guaranteed Mortgage Obligations (1.3%) | |||
| Government National Mortgage Association Pass-Through Certificates | |||
| 4 1/2s, TBA, May 1, 2044 | $3,000,000 | $3,252,656 | |
| 4s, TBA, May 1, 2044 | 1,000,000 | 1,058,438 | |
| 4,311,094 | |||
| U.S. Government Agency Mortgage Obligations (10.1%) | |||
| Federal Home Loan Mortgage Corporation Pass-Through Certificates | |||
| 6s, with due dates from July 1, 2021 to September 1, 2021 | 17,800 | 19,528 | |
| 5 1/2s, June 1, 2035 | 19,598 | 21,813 | |
| 5 1/2s, April 1, 2020 | 6,718 | 7,246 | |
| 3s, March 1, 2043 | 979,737 | 948,355 | |
| 34 Global Income Trust |
| U.S. GOVERNMENT AND AGENCY | |||
| MORTGAGE OBLIGATIONS (11.4%)* cont. | Principal amount | Value | |
| U.S. Government Agency Mortgage Obligations cont. | |||
| Federal National Mortgage Association Pass-Through Certificates | |||
| 7s, with due dates from March 1, 2033 to April 1, 2035 | $110,752 | $128,423 | |
| 6 1/2s, with due dates from September 1, 2036 to November 1, 2037 | 43,009 | 48,090 | |
| 6s, July 1, 2037 | 1,936 | 2,161 | |
| 6s, with due dates from May 1, 2021 to October 1, 2021 | 62,461 | 68,706 | |
| 5 1/2s, with due dates from February 1, 2018 to March 1, 2021 | 48,919 | 52,703 | |
| 5 1/2s, TBA, May 1, 2044 | 1,000,000 | 1,106,094 | |
| 5s, May 1, 2037 | 113,665 | 124,921 | |
| 5s, with due dates from May 1, 2020 to March 1, 2021 | 7,376 | 7,929 | |
| 4 1/2s, May 1, 2041 ## | 999,787 | 1,074,732 | |
| 4 1/2s, TBA, May 1, 2044 | 4,000,000 | 4,294,375 | |
| 4s, with due dates from May 1, 2019 to September 1, 2020 | 84,001 | 89,119 | |
| 4s, TBA, May 1, 2044 | 4,000,000 | 4,190,625 | |
| 3 1/2s, TBA, May 1, 2044 | 8,000,000 | 8,124,375 | |
| 3s, with due dates from January 1, 2043 to April 1, 2043 | 4,751,568 | 4,612,817 | |
| 3s, TBA, May 1, 2044 | 9,000,000 | 8,774,297 | |
| 33,696,309 | |||
| Total U.S. government and agency mortgage obligations (cost $37,625,394) | $38,007,403 | ||
| U.S. TREASURY OBLIGATIONS (—%)* | Principal amount | Value | |
| U.S. Treasury Bonds 3 5/8s, August 15, 2043 i | $110,000 | $113,614 | |
| Total U.S. treasury obligations (cost $113,614) | $113,614 | ||
| MUNICIPAL BONDS AND NOTES (0.1%)* | Principal amount | Value | |
| CA State G.O. Bonds (Build America Bonds), 7 1/2s, 4/1/34 | $100,000 | $138,205 | |
| IL State G.O. Bonds, 4.421s, 1/1/15 | 45,000 | 46,092 | |
| North TX, Tollway Auth. Rev. Bonds (Build America Bonds), | |||
| 6.718s, 1/1/49 | 95,000 | 128,985 | |
| OH State U. Rev. Bonds (Build America Bonds), 4.91s, 6/1/40 | 115,000 | 127,064 | |
| Total municipal bonds and notes (cost $355,665) | $440,346 | ||
| ||||
| PURCHASED SWAP OPTIONS OUTSTANDING (0.1%)* | ||||
| Counterparty | ||||
| Fixed right % to receive or (pay)/ | Expiration | Contract | ||
| Floating rate index/Maturity date | date/strike | amount | Value | |
| Bank of America N.A. | ||||
| 2.785/3 month USD-LIBOR-BBA/May-24 | May-14/2.785 | $9,355,500 | $46,403 | |
| (2.785)/3 month USD-LIBOR-BBA/May-24 | May-14/2.785 | 9,355,500 | 25,260 | |
| Barclays Bank PLC | ||||
| 1.80/6 month EUR-EURIBOR–Reuters/Jun-24 | Jun-14/1.80 | EUR | 6,205,000 | 86,774 |
| Credit Suisse International | ||||
| 2.79/3 month USD-LIBOR-BBA/May-24 | May-14/2.79 | $6,237,000 | 32,682 | |
| (2.79)/3 month USD-LIBOR-BBA/May-24 | May-14/2.79 | 6,237,000 | 15,779 | |
| Deutsche Bank AG | ||||
| 2.78/3 month USD-LIBOR-BBA/May-24 | May-14/2.78 | 3,742,200 | 17,551 | |
| (2.78)/3 month USD-LIBOR-BBA/May-24 | May-14/2.78 | 3,742,200 | 10,815 | |
| Global Income Trust | 35 |
| PURCHASED SWAP OPTIONS | ||||
| OUTSTANDING (0.1%)* cont. | ||||
| Counterparty | ||||
| Fixed right % to receive or (pay)/ | Expiration | Contract | ||
| Floating rate index/Maturity date | date/strike | amount | Value | |
| Goldman Sachs International | ||||
| 1.80/6 month EUR-EURIBOR–Reuters/Jun-24 | Jun-14/1.80 | EUR | 6,205,000 | $86,774 |
| 2.78375/3 month USD-LIBOR-BBA/May-24 | May-14/2.78375 | $6,237,000 | 30,499 | |
| (2.78375)/3 month USD-LIBOR-BBA/May-24 | May-14/2.78375 | 6,237,000 | 17,152 | |
| Total purchased swap options outstanding (cost $425,888) | $369,689 | |||
| PURCHASED OPTIONS | Expiration date/ | Contract | |
| OUTSTANDING (0.1%)* | strike price | amount | Value |
| Federal National Mortgage Association 30 yr 3.5s TBA | |||
| commitments (Put) | Jul-14/$101.00 | $8,000,000 | $72,240 |
| Federal National Mortgage Association 30 yr 3.5s TBA | |||
| commitments (Put) | Jul-14/100.56 | 8,000,000 | 57,280 |
| Federal National Mortgage Association 30 yr 3.5s TBA | |||
| commitments (Put) | Jul-14/100.38 | 8,000,000 | 51,680 |
| Federal National Mortgage Association 30 yr 3.5s TBA | |||
| commitments (Put) | Jul-14/100.19 | 8,000,000 | 46,560 |
| Federal National Mortgage Association 30 yr 3.5s TBA | |||
| commitments (Put) | Jul-14/100.00 | 8,000,000 | 41,920 |
| Total purchased options outstanding (cost $385,000) | $269,680 | ||
| SHORT-TERM INVESTMENTS (11.8%)* | Principal amount/shares | Value | |
| Putnam Short Term Investment Fund 0.06% L | 26,304,773 | $26,304,773 | |
| U.S. Treasury Bills with an effective yield of 0.12%, May 1, 2014 | $139,000 | 139,000 | |
| U.S. Treasury Bills with effective yields ranging from 0.11% | |||
| to 0.12%, August 21, 2014 # Δ § | 1,818,000 | 1,817,831 | |
| U.S. Treasury Bills with effective yields ranging from 0.10% | |||
| to 0.12%, July 24, 2014 # § | 2,412,000 | 2,411,916 | |
| U.S. Treasury Bills with effective yields ranging from 0.08% | |||
| to 0.13%, May 29, 2014 # Δ § | 8,672,000 | 8,671,356 | |
| Total short-term investments (cost $39,343,814) | $39,344,876 | ||
| TOTAL INVESTMENTS | |||
| Total investments (cost $347,720,838) | $364,605,079 | ||
Key to holding’s currency abbreviations
| AUD | Australian Dollar |
| CAD | Canadian Dollar |
| CHF | Swiss Franc |
| EUR | Euro |
| GBP | British Pound |
| HUF | Hungarian Forint |
| JPY | Japanese Yen |
| KRW | South Korean Won |
| MXN | Mexican Peso |
| MYR | Malaysian Ringgit |
| PLN | Polish Zloty |
| SEK | Swedish Krona |
| USD / $ | United States Dollar |
| 36 Global Income Trust |
| ZAR | South African Rand |
Key to holding’s abbreviations
bp Basis Points
EMTN Euro Medium Term Notes
FRB Floating Rate Bonds: the rate shown is the current interest rate at the close of the reporting period
FRN Floating Rate Notes: the rate shown is the current interest rate at the close of the reporting period
G.O. Bonds General Obligation Bonds
IFB Inverse Floating Rate Bonds, which are securities that pay interest rates that vary inversely to changes in the market interest rates. As interest rates rise, inverse floaters produce less current income. The rate shown is the current interest rate at the close of the reporting period.
IO Interest Only
JSC Joint Stock Company
MTN Medium Term Notes
OJSC Open Joint Stock Company
OTC Over-the-counter
PO Principal Only
TBA To Be Announced Commitments
Notes to the fund’s portfolio
Unless noted otherwise, the notes to the fund’s portfolio are for the close of the fund’s reporting period, which ran from November 1, 2013 through April 30, 2014 (the reporting period). Within the following notes to the portfolio, references to “ASC 820” represent Accounting Standards Codification 820 Fair Value Measurements and Disclosures and references to “OTC”, if any, represent over-the-counter.
* Percentages indicated are based on net assets of $334,025,465.
†† The interest rate and date shown parenthetically represent the new interest rate to be paid and the date the fund will begin accruing interest at this rate.
# This security, in part or in entirety, was pledged and segregated with the broker to cover margin requirements for futures contracts at the close of the reporting period.
Δ This security, in part or in entirety, was pledged and segregated with the custodian for collateral on certain derivative contracts at the close of the reporting period.
§ This security, in part or in entirety, was pledged and segregated with the custodian for collateral on the initial margin on certain centrally cleared derivative contracts at the close of the reporting period.
## Forward commitment, in part or in entirety (Note 1).
F Security is valued at fair value following procedures approved by the Trustees. Securities may be classified as Level 2 or Level 3 for ASC 820 based on the securities’ valuation inputs.
i Security was pledged, or purchased with cash that was pledged, to the fund for collateral on certain derivative contracts (Note 1).
L Affiliated company (Note 5). The rate quoted in the security description is the annualized 7-day yield of the fund at the close of the reporting period.
R Real Estate Investment Trust.
At the close of the reporting period, the fund maintained liquid assets totaling $194,229,479 to cover certain derivatives contracts and delayed delivery securities.
Debt obligations are considered secured unless otherwise indicated.
144A after the name of an issuer represents securities exempt from registration under Rule 144A under the Securities Act of 1933, as amended. These securities may be resold in transactions exempt from registration, normally to qualified institutional buyers.
See Note 1 to the financial statements regarding TBA’s.
The dates shown on debt obligations are the original maturity dates.
| Global Income Trust | 37 |
| DIVERSIFICATION BY COUNTRY ⌂ | ||||
Distribution of investments by country of risk at the close of the reporting period, excluding collateral received, if any (as a percentage of Portfolio Value):
| United States | 56.6% | Mexico | 1.0% | |
| Spain | 6.3 | Canada | 0.9 | |
| Italy | 5.3 | Russia | 0.9 | |
| Japan | 5.2 | Austria | 0.9 | |
| Germany | 3.8 | South Africa | 0.8 | |
| France | 3.0 | Ireland | 0.6 | |
| United Kingdom | 2.9 | Supra-Nation | 0.6 | |
| Greece | 2.0 | Brazil | 0.5 | |
| Belgium | 1.9 | Poland | 0.5 | |
| Luxembourg | 1.3 | Sweden | 0.5 | |
| Argentina | 1.3 | Other | 2.0 | |
| Netherlands | 1.2 | Total | 100.0% | |
⌂ Methodology differs from that used for purposes of complying with the fund’s policy regarding investments in securities of foreign issuers, as discussed further in the fund’s prospectus.
| FORWARD CURRENCY CONTRACTS at 4/30/14 (aggregate face value $149,526,079) (Unaudited) | ||||||
| Unrealized | ||||||
| Contract | Delivery | Aggregate | appreciation/ | |||
| Counterparty | Currency | type | date | Value | face value | (depreciation) |
| Bank of America N.A. | ||||||
| Australian Dollar | Sell | 7/17/14 | $733,792 | $728,534 | $(5,258) | |
| Chilean Peso | Buy | 7/17/14 | 10,390 | 10,625 | (235) | |
| Colombian Peso | Buy | 7/17/14 | 25,599 | 13,433 | 12,166 | |
| Euro | Buy | 6/18/14 | 1,766,184 | 1,752,376 | 13,808 | |
| Barclays Bank PLC | ||||||
| Australian Dollar | Buy | 7/17/14 | 235,109 | 233,314 | 1,795 | |
| British Pound | Buy | 6/18/14 | 6,299,643 | 6,237,691 | 61,952 | |
| Canadian Dollar | Sell | 7/17/14 | 893,679 | 887,528 | (6,151) | |
| Czech Koruna | Buy | 6/18/14 | 147,678 | 146,686 | 992 | |
| Euro | Sell | 6/18/14 | 34,680 | 43,578 | 8,898 | |
| Japanese Yen | Buy | 5/21/14 | 1,746,915 | 1,741,750 | 5,165 | |
| Mexican Peso | Buy | 7/17/14 | 231,667 | 231,083 | 584 | |
| New Zealand Dollar | Buy | 7/17/14 | 2,413,058 | 2,397,032 | 16,026 | |
| Norwegian Krone | Sell | 6/18/14 | 816,889 | 832,605 | 15,716 | |
| Polish Zloty | Sell | 6/18/14 | 1,142,508 | 1,131,007 | (11,501) | |
| Singapore Dollar | Sell | 5/21/14 | 257,397 | 253,060 | (4,337) | |
| South African Rand | Sell | 7/17/14 | 472,933 | 465,921 | (7,012) | |
| South Korean Won | Buy | 5/21/14 | 495,414 | 486,468 | 8,946 | |
| Swedish Krona | Sell | 6/18/14 | 1,722,770 | 1,700,676 | (22,094) | |
| Swiss Franc | Buy | 6/18/14 | 1,656,303 | 1,651,281 | 5,022 | |
| Turkish Lira | Buy | 6/18/14 | 240,981 | 236,194 | 4,787 | |
| Citibank, N.A. | ||||||
| Australian Dollar | Sell | 7/17/14 | 1,307,795 | 1,302,126 | (5,669) | |
| Brazilian Real | Sell | 7/2/14 | 329,891 | 315,907 | (13,984) | |
| 38 Global Income Trust |
| FORWARD CURRENCY CONTRACTS at 4/30/14 (aggregate face value $149,526,079) (Unaudited) cont. | ||||||
| Unrealized | ||||||
| Contract | Delivery | Aggregate | appreciation/ | |||
| Counterparty | Currency | type | date | Value | face value | (depreciation) |
| Citibank, N.A. cont. | ||||||
| Chilean Peso | Sell | 7/17/14 | $426,785 | $436,127 | $9,342 | |
| Danish Krone | Buy | 6/18/14 | 680,440 | 673,265 | 7,175 | |
| Euro | Sell | 6/18/14 | 19,926,582 | 19,777,215 | (149,367) | |
| Japanese Yen | Buy | 5/21/14 | 3,649,077 | 3,676,559 | (27,482) | |
| New Zealand Dollar | Buy | 7/17/14 | 1,596,426 | 1,583,051 | 13,375 | |
| Norwegian Krone | Sell | 6/18/14 | 783,806 | 779,696 | (4,110)�� | |
| Swiss Franc | Buy | 6/18/14 | 403,619 | 407,028 | (3,409) | |
| Thai Baht | Buy | 5/21/14 | 341,659 | 332,231 | 9,428 | |
| Credit Suisse International | ||||||
| Australian Dollar | Buy | 7/17/14 | 4,713 | 4,675 | 38 | |
| British Pound | Sell | 6/18/14 | 2,378,421 | 2,347,940 | (30,481) | |
| Canadian Dollar | Buy | 7/17/14 | 5,919 | 12,953 | (7,034) | |
| Euro | Buy | 6/18/14 | 929,424 | 923,165 | 6,259 | |
| Indian Rupee | Buy | 5/21/14 | 445,649 | 408,602 | 37,047 | |
| Japanese Yen | Sell | 5/21/14 | 7,052,674 | 7,083,774 | 31,100 | |
| New Zealand Dollar | Buy | 7/17/14 | 1,390,640 | 1,386,193 | 4,447 | |
| Norwegian Krone | Buy | 6/18/14 | 815,882 | 806,419 | 9,463 | |
| Norwegian Krone | Sell | 6/18/14 | 815,882 | 800,446 | (15,436) | |
| Singapore Dollar | Sell | 5/21/14 | 35,335 | 34,741 | (594) | |
| South African Rand | Sell | 7/17/14 | 1,092,769 | 1,077,090 | (15,679) | |
| South Korean Won | Buy | 5/21/14 | 2,346,588 | 2,245,702 | 100,886 | |
| Swedish Krona | Sell | 6/18/14 | 775,012 | 747,042 | (27,970) | |
| Swiss Franc | Sell | 6/18/14 | 324,509 | 313,917 | (10,592) | |
| Deutsche Bank AG | ||||||
| Australian Dollar | Buy | 7/17/14 | 1,442,817 | 1,430,980 | 11,837 | |
| British Pound | Buy | 6/18/14 | 832,583 | 827,606 | 4,977 | |
| Canadian Dollar | Sell | 7/17/14 | 8,652 | 8,575 | (77) | |
| Euro | Buy | 6/18/14 | 234,715 | 238,029 | (3,314) | |
| Japanese Yen | Sell | 5/21/14 | 417,043 | 418,489 | 1,446 | |
| New Zealand Dollar | Buy | 7/17/14 | 1,891,483 | 1,883,598 | 7,885 | |
| Norwegian Krone | Sell | 6/18/14 | 796,838 | 788,853 | (7,985) | |
| Swedish Krona | Sell | 6/18/14 | 27,999 | 17,457 | (10,542) | |
| Swiss Franc | Sell | 6/18/14 | 720,854 | 709,746 | (11,108) | |
| Goldman Sachs International | ||||||
| Australian Dollar | Sell | 7/17/14 | 201,932 | 200,528 | (1,404) | |
| British Pound | Buy | 6/18/14 | 986,676 | 969,700 | 16,976 | |
| Canadian Dollar | Buy | 7/17/14 | 830,567 | 825,519 | 5,048 | |
| Euro | Sell | 6/18/14 | 17,589,287 | 17,443,649 | (145,638) | |
| Japanese Yen | Sell | 5/21/14 | 1,033,094 | 1,028,134 | (4,960) | |
| HSBC Bank USA, National Association | ||||||
| Australian Dollar | Sell | 7/17/14 | 801,072 | 799,932 | (1,140) | |
| British Pound | Sell | 6/18/14 | 783,805 | 775,279 | (8,526) | |
| Global Income Trust 39 |
| FORWARD CURRENCY CONTRACTS at 4/30/14 (aggregate face value $149,526,079) (Unaudited) cont. | ||||||
| Unrealized | ||||||
| Contract | Delivery | Aggregate | appreciation/ | |||
| Counterparty | Currency | type | date | Value | face value | (depreciation) |
| HSBC Bank USA, National Association cont. | ||||||
| Euro | Sell | 6/18/14 | $617,443 | $611,936 | $(5,507) | |
| Japanese Yen | Buy | 5/21/14 | 5,250,154 | 5,273,046 | (22,892) | |
| Swedish Krona | Buy | 6/18/14 | 262,553 | 272,350 | (9,797) | |
| JPMorgan Chase Bank N.A. | ||||||
| Australian Dollar | Buy | 7/17/14 | 335,012 | 338,107 | (3,095) | |
| British Pound | Buy | 6/18/14 | 836,801 | 840,167 | (3,366) | |
| Canadian Dollar | Buy | 7/17/14 | 805,614 | 808,762 | (3,148) | |
| Euro | Buy | 6/18/14 | 3,179,324 | 3,164,400 | 14,924 | |
| Hungarian Forint | Sell | 6/18/14 | 477,907 | 466,095 | (11,812) | |
| Indian Rupee | Buy | 5/21/14 | 480,714 | 461,152 | 19,562 | |
| Japanese Yen | Buy | 5/21/14 | 297,525 | 290,442 | 7,083 | |
| Malaysian Ringgit | Buy | 5/21/14 | 208,123 | 202,530 | 5,593 | |
| Mexican Peso | Sell | 7/17/14 | 548,758 | 547,508 | (1,250) | |
| New Taiwan Dollar | Sell | 5/21/14 | 470,439 | 468,326 | (2,113) | |
| New Zealand Dollar | Buy | 7/17/14 | 1,057,973 | 1,048,949 | 9,024 | |
| Norwegian Krone | Sell | 6/18/14 | 643,851 | 639,209 | (4,642) | |
| Russian Ruble | Buy | 6/18/14 | 246,023 | 244,717 | 1,306 | |
| Swedish Krona | Buy | 6/18/14 | 805,732 | 814,372 | (8,640) | |
| Swedish Krona | Sell | 6/18/14 | 805,732 | 807,724 | 1,992 | |
| Swiss Franc | Buy | 6/18/14 | 340,536 | 345,368 | (4,832) | |
| Thai Baht | Buy | 5/21/14 | 12,380 | 19,502 | (7,122) | |
| Royal Bank of Scotland PLC (The) | ||||||
| British Pound | Sell | 6/18/14 | 7,184,040 | 7,100,055 | (83,985) | |
| Japanese Yen | Buy | 5/21/14 | 29,799 | 29,923 | (124) | |
| Japanese Yen | Sell | 5/21/14 | 29,799 | 29,795 | (4) | |
| State Street Bank and Trust Co. | ||||||
| Australian Dollar | Buy | 7/17/14 | 291,022 | 300,531 | (9,509) | |
| British Pound | Buy | 6/18/14 | 2,794,122 | 2,752,224 | 41,898 | |
| British Pound | Sell | 6/18/14 | 2,794,122 | 2,755,245 | (38,877) | |
| Canadian Dollar | Buy | 7/17/14 | 469,926 | 472,250 | (2,324) | |
| Chilean Peso | Buy | 7/17/14 | 786,649 | 812,925 | (26,276) | |
| Euro | Sell | 6/18/14 | 993,790 | 970,792 | (22,998) | |
| Israeli Shekel | Buy | 7/17/14 | 159,305 | 158,652 | 653 | |
| Japanese Yen | Sell | 5/21/14 | 692,904 | 690,922 | (1,982) | |
| New Taiwan Dollar | Sell | 5/21/14 | 470,551 | 468,238 | (2,313) | |
| New Zealand Dollar | Buy | 7/17/14 | 1,860,726 | 1,844,986 | 15,740 | |
| Norwegian Krone | Sell | 6/18/14 | 837,562 | 838,176 | 614 | |
| Singapore Dollar | Sell | 5/21/14 | 687,801 | 676,324 | (11,477) | |
| Swedish Krona | Sell | 6/18/14 | 763,687 | 750,975 | (12,712) | |
| Swiss Franc | Buy | 6/18/14 | 179,702 | 181,975 | (2,273) | |
| 40 Global Income Trust |
| FORWARD CURRENCY CONTRACTS at 4/30/14 (aggregate face value $149,526,079) (Unaudited) cont. | ||||||
| Unrealized | ||||||
| Contract | Delivery | Aggregate | appreciation/ | |||
| Counterparty | Currency | type | date | Value | face value | (depreciation) |
| UBS AG | ||||||
| Australian Dollar | Buy | 7/17/14 | $250,913 | $248,905 | $2,008 | |
| British Pound | Buy | 6/18/14 | 1,171,489 | 1,152,042 | 19,447 | |
| Canadian Dollar | Sell | 7/17/14 | 24,043 | 23,866 | (177) | |
| Euro | Buy | 6/18/14 | 205,999 | 204,398 | 1,601 | |
| Euro | Sell | 6/18/14 | 205,999 | 204,022 | (1,977) | |
| Japanese Yen | Sell | 5/21/14 | 609,289 | 609,974 | 685 | |
| Norwegian Krone | Sell | 6/18/14 | 752,823 | 745,289 | (7,534) | |
| Singapore Dollar | Sell | 5/21/14 | 255,403 | 251,138 | (4,265) | |
| Swedish Krona | Buy | 6/18/14 | 1,546,567 | 1,558,617 | (12,050) | |
| Swiss Franc | Sell | 6/18/14 | 788,369 | 781,400 | (6,969) | |
| WestPac Banking Corp. | ||||||
| Australian Dollar | Sell | 7/17/14 | 3,051 | 13,007 | 9,956 | |
| British Pound | Buy | 6/18/14 | 1,600,017 | 1,573,993 | 26,024 | |
| British Pound | Sell | 6/18/14 | 1,600,017 | 1,577,435 | (22,582) | |
| Canadian Dollar | Sell | 7/17/14 | 2,914,362 | 2,882,603 | (31,759) | |
| Euro | Buy | 6/18/14 | 1,012,240 | 1,011,195 | 1,045 | |
| Japanese Yen | Buy | 5/21/14 | 1,162,081 | 1,166,765 | (4,684) | |
| Total | $(346,415) | |||||
| FUTURES CONTRACTS OUTSTANDING at 4/30/14 (Unaudited) | |||||
| Unrealized | |||||
| Number of | Expiration | appreciation/ | |||
| contracts | Value | date | (depreciation) | ||
| Australian Government Treasury | |||||
| Bond 10 yr (Long) | 9 | $977,325 | Jun-14 | $18,955 | |
| Canadian Government Bond | |||||
| 10 yr (Long) | 13 | 1,553,287 | Jun-14 | 16,913 | |
| Euro-Bobl 5 yr (Short) | 47 | 8,200,885 | Jun-14 | (26,884) | |
| Euro-Bund 10 yr (Short) | 169 | 33,889,142 | Jun-14 | (312,069) | |
| Euro-Buxl 30 yr (Short) | 11 | 2,004,664 | Jun-14 | (39,408) | |
| Euro-Dollar 90 day (Short) | 214 | 53,088,050 | Sep-15 | 10,654 | |
| Euro-Schatz 2 yr (Long) | 96 | 14,711,674 | Jun-14 | (6,300) | |
| Japanese Government Bond | |||||
| 10 yr (Long) | 9 | 12,757,666 | Jun-14 | 13,165 | |
| Japanese Government Bond | |||||
| 10 yr (Short) | 14 | 19,845,258 | Jun-14 | (20,603) | |
| Japanese Government Bond | |||||
| 10 yr Mini (Long) | 27 | 3,827,036 | Jun-14 | 4,648 | |
| U.K. Gilt 10 yr (Long) | 37 | 6,892,400 | Jun-14 | 94,636 | |
| U.S. Treasury Bond 30 yr (Long) | 7 | 944,563 | Jun-14 | 25,143 | |
| U.S. Treasury Bond Ultra | |||||
| 30 yr (Long) | 42 | 6,185,813 | Jun-14 | 274,233 | |
| U.S. Treasury Note 2 yr (Long) | 75 | 16,490,625 | Jun-14 | 4,545 | |
| Global Income Trust | 41 |
| FUTURES CONTRACTS OUTSTANDING at 4/30/14 (Unaudited) cont. | |||||
| Unrealized | |||||
| Number of | Expiration | appreciation/ | |||
| contracts | Value | date | (depreciation) | ||
| U.S. Treasury Note 5 yr (Short) | 28 | $3,344,688 | Jun-14 | $2,064 | |
| U.S. Treasury Note 10 yr (Short) | 460 | 57,234,063 | Jun-14 | (234,186) | |
| Total | $(174,494) | ||||
| WRITTEN SWAP OPTIONS OUTSTANDING at 4/30/14 (premiums $809,322) (Unaudited) | |||
| Counterparty | |||
| Fixed Obligation % to receive or (pay)/ | Expiration | Contract | |
| Floating rate index/Maturity date | date/strike | amount | Value |
| Bank of America N.A. | |||
| (2.60)/3 month USD-LIBOR-BBA/Jan-25 | Jan-15/2.60 | $11,826,600 | $79,948 |
| JPMorgan Chase Bank N.A. | |||
| (6.00 Floor)/3 month USD-LIBOR-BBA/Mar-18 | Mar-18/6.00 | 3,723,000 | 651,804 |
| (2.60)/3 month USD-LIBOR-BBA/Feb-25 | Feb-15/2.60 | 5,913,300 | 40,624 |
| Total | $772,376 | ||
| WRITTEN OPTIONS OUTSTANDING at 4/30/14 (premiums $328,750) (Unaudited) | |||
| Expiration date/ | Contract | ||
| strike price | amount | Value | |
| Federal National Mortgage Association | |||
| 30 yr 3.5s TBA commitments (Put) | Jul-14/$99.00 | $16,000,000 | $46,560 |
| Federal National Mortgage Association | |||
| 30 yr 3.5s TBA commitments (Put) | Jul-14/100.00 | 8,000,000 | 41,920 |
| Federal National Mortgage Association | |||
| 30 yr 3.5s TBA commitments (Put) | Jul-14/99.56 | 8,000,000 | 32,560 |
| Federal National Mortgage Association | |||
| 30 yr 3.5s TBA commitments (Put) | Jul-14/99.38 | 8,000,000 | 29,120 |
| Federal National Mortgage Association | |||
| 30 yr 3.5s TBA commitments (Put) | Jul-14/99.19 | 8,000,000 | 26,080 |
| Federal National Mortgage Association | |||
| 30 yr 3.5s TBA commitments (Put) | Jul-14/98.56 | 8,000,000 | 17,840 |
| Federal National Mortgage Association | |||
| 30 yr 3.5s TBA commitments (Put) | Jul-14/98.38 | 8,000,000 | 15,840 |
| Federal National Mortgage Association | |||
| 30 yr 3.5s TBA commitments (Put) | Jul-14/98.19 | 8,000,000 | 14,160 |
| Federal National Mortgage Association | |||
| 30 yr 3.5s TBA commitments (Put) | Jul-14/98.00 | 8,000,000 | 12,560 |
| Total | $236,640 | ||
| FORWARD PREMIUM SWAP OPTION CONTRACTS OUTSTANDING at 4/30/14 (Unaudited) | |||
| Counterparty | Unrealized | ||
| Fixed right or obligation % to receive or (pay)/ | Expiration | Contract | appreciation/ |
| Floating rate index/Maturity date | date/strike | amount | (depreciation) |
| Goldman Sachs International | |||
| (1.56)/3 month USD-LIBOR-BBA/ | |||
| Oct-17 (Purchased) | Oct-14/1.56 | $43,925,000 | $(99,710) |
| 2.60/3 month USD-LIBOR-BBA/ | |||
| May-24 (Purchased) | May-14/2.60 | 14,235,200 | (4,982) |
| 42 Global Income Trust |
| FORWARD PREMIUM SWAP OPTION CONTRACTS OUTSTANDING at 4/30/14 (Unaudited) cont. | ||||
| Counterparty | Unrealized | |||
| Fixed right or obligation % to receive or (pay)/ | Expiration | Contract | appreciation/ | |
| Floating rate index/Maturity date | date/strike | amount | (depreciation) | |
| Goldman Sachs International cont. | ||||
| 1.575/3 month USD-LIBOR-BBA/ | ||||
| Jun-19 (Purchased) | Jun-14/1.575 | $17,873,729 | $(26,453) | |
| 1.03/6 month EUR-EURIBOR-Reuters/ | ||||
| Oct-17 (Written) | Oct-14/1.03 | EUR | 35,140,000 | 110,666 |
| JPMorgan Chase Bank N.A. | ||||
| (1.115)/3 month USD-LIBOR-BBA/ | ||||
| Oct-16 (Purchased) | Oct-14/1.115 | $17,570,000 | (26,355) | |
| 0.862/6 month EUR-EURIBOR-Reuters/ | ||||
| Oct-16 (Written) | Oct-14/0.862 | EUR | 13,178,000 | 23,036 |
| Total | $(23,798) | |||
| TBA SALE COMMITMENTS OUTSTANDING at 4/30/14 (proceeds receivable $2,108,398) (Unaudited) | ||||
| Principal | Settlement | |||
| Agency | amount | date | Value | |
| Federal National Mortgage Association, 4 1/2s, | ||||
| May 1, 2044 | $1,000,000 | 5/12/14 | $1,073,594 | |
| Federal National Mortgage Association, 4s, May 1, 2044 | 1,000,000 | 5/12/14 | 1,047,656 | |
| Total | $2,121,250 | |||
| OTC INTEREST RATE SWAP CONTRACTS OUTSTANDING at 4/30/14 (Unaudited) | |||||||
| Upfront | Payments | Payments | Unrealized | ||||
| Swap counterparty/ | premium | Termination | made by | received by | appreciation/ | ||
| Notional amount | received (paid) | date | fund per annum | fund per annum | (depreciation) | ||
| Bank of America N.A. | |||||||
| MYR | 5,495,000 | $— | 3/19/19 | 4.0275% | 3 month MYR- | $(280) | |
| KLIBOR-BNM | |||||||
| Credit Suisse International | |||||||
| AUD | 795,000 | — | 10/10/23 | 6 month AUD-BBR- | 4.49% | 19,771 | |
| BBSW | |||||||
| Deutsche Bank AG | |||||||
| MYR | 5,495,000 | — | 3/19/19 | 4.035% | 3 month MYR- | (853) | |
| KLIBOR-BNM | |||||||
| PLN | 5,586,000 | — | 3/17/24 | 4.1072% | 6 month PLN- | (34,446) | |
| WIBOR-WIBO | |||||||
| PLN | 2,785,000 | — | 3/18/24 | 4.12875% | 6 month PLN- | (18,795) | |
| WIBOR-WIBO | |||||||
| PLN | 2,458,000 | — | 3/27/24 | 4.045% | 6 month PLN- | (10,588) | |
| WIBOR-WIBO | |||||||
| Goldman Sachs International | |||||||
| CAD | 1,548,000 | — | 5/30/23 | 2.534% | 3 month CAD- | 8,044 | |
| BA-CDOR | |||||||
| CHF | 938,000 | — | 2/24/24 | 6 month CHF- | 1.36% | 23,712 | |
| LIBOR-BBA | |||||||
| EUR | 26,303,000 | — | 8/30/14 | 1 year EUR-EONIA- | 0.11% | (20,019) | |
| OIS-COMPOUND | |||||||
| Global Income Trust 43 |
| OTC INTEREST RATE SWAP CONTRACTS OUTSTANDING at 4/30/14 (Unaudited) cont. | |||||||
| Upfront | Payments | Payments | Unrealized | ||||
| Swap counterparty/ | premium | Termination | made by | received by | appreciation/ | ||
| Notional amount | received (paid) | date | fund per annum | fund per annum | (depreciation) | ||
| Goldman Sachs International cont. | |||||||
| EUR | 26,303,000 | $— | 8/30/14 | 0.309% | 3 month EUR- | $(57,448) | |
| EURIBOR- | |||||||
| REUTERS | |||||||
| EUR | 26,303,000 | — | 8/31/14 | 1 year EUR-EONIA- | 0.11% | (19,931) | |
| OIS-COMPOUND | |||||||
| EUR | 26,303,000 | — | 8/31/14 | 0.314% | 3 month EUR- | (59,393) | |
| EURIBOR- | |||||||
| REUTERS | |||||||
| EUR | 26,303,000 | — | 9/3/14 | 1 year EUR-EONIA- | 0.086% | (29,086) | |
| OIS-COMPOUND | |||||||
| EUR | 26,303,000 | — | 9/3/14 | 0.283% | 3 month EUR- | (48,468) | |
| EURIBOR- | |||||||
| REUTERS | |||||||
| JPY | 1,370,000,000 | — | 9/15/14 | 0.361% | 6 month JPY- | (11,184) | |
| LIBOR-BBA | |||||||
| JPY | 411,000,000 | — | 9/15/41 | 6 month JPY- | 1.768% | 9,836 | |
| LIBOR-BBA | |||||||
| KRW | 8,034,000,000 | — | 11/18/18 | 3 month KRW-CD- | 3.105% | 33,478 | |
| KSDA-BLOOMBERG | |||||||
| JPMorgan Chase Bank N.A. | |||||||
| CAD | 3,500,000 | — | 9/21/14 | 1.21561% | 3 month CAD- | 907 | |
| BA-CDOR | |||||||
| CAD | 1,100,000 | — | 9/21/41 | 3 month CAD-BA- | 2.78311% | (106,166) | |
| CDOR | |||||||
| CAD | 2,887,000 | — | 10/9/23 | 3 month CAD-BA- | 3.055% | 80,799 | |
| CDOR | |||||||
| CAD | 669,000 | — | 2/6/24 | 3 month CAD-BA- | 2.855% | 8,006 | |
| CDOR | |||||||
| HUF | 81,000,000 | — | 2/4/19 | 4.79% | 6 month | (17,916) | |
| HUF-BUBOR- | |||||||
| REUTERS | |||||||
| HUF | 162,000,000 | — | 2/5/19 | 4.7275% | 6 month | (33,647) | |
| HUF-BUBOR- | |||||||
| REUTERS | |||||||
| HUF | 225,000,000 | — | 2/11/19 | 4.41% | 6 month | (31,469) | |
| HUF-BUBOR- | |||||||
| REUTERS | |||||||
| JPY | 901,000,000 | — | 2/19/15 | 6 month JPY- | 0.705% | 45,208 | |
| LIBOR-BBA | |||||||
| JPY | 149,300,000 | — | 2/19/20 | 6 month JPY- | 1.3975% | 87,673 | |
| LIBOR-BBA | |||||||
| PLN | 1,070,000 | — | 2/4/19 | 6 month PLN- | 4.04% | 10,169 | |
| WIBOR-WIBO | |||||||
| PLN | 2,140,000 | — | 2/5/19 | 6 month PLN- | 3.9775% | 18,260 | |
| WIBOR-WIBO | |||||||
| PLN | 2,930,000 | — | 2/11/19 | 6 month PLN- | 3.805% | 17,029 | |
| WIBOR-WIBO | |||||||
| Total | $— | $(136,797) | |||||
| 44 Global Income Trust |
| CENTRALLY CLEARED INTEREST RATE SWAP CONTRACTS OUTSTANDING at 4/30/14 (Unaudited) | |||||||
| Upfront | Payments | Payments | Unrealized | ||||
| premium | Termination | made by | received by | appreciation/ | |||
| Notional amount | received (paid) | date | fund per annum | fund per annum | (depreciation) | ||
| JPY | 328,100,000 | $(59) | 11/19/43 | 1.75625% | 6 month JPY- | $12,763 | |
| LIBOR-BBA | |||||||
| JPY | 97,000,000 | (34) | 9/2/43 | 1.87875% | 6 month JPY- | (22,143) | |
| LIBOR-BBA | |||||||
| $47,118,800 E | 70,101 | 6/18/16 | 3 month USD- | 0.75% | (64,376) | ||
| LIBOR-BBA | |||||||
| 11,133,400 E | (28,450) | 6/18/19 | 3 month USD- | 2.00% | 57,121 | ||
| LIBOR-BBA | |||||||
| 24,604,900 E | 128,998 | 6/18/24 | 3 month USD- | 3.00% | (306,141) | ||
| LIBOR-BBA | |||||||
| 10,776,600 E | 266,954 | 6/18/44 | 3 month USD- | 3.75% | (327,591) | ||
| LIBOR-BBA | |||||||
| 2,912,900 E | (27) | 5/23/19 | 3 month USD- | 1.875% | (11,006) | ||
| LIBOR-BBA | |||||||
| 34,000,000 E | 282,551 | 6/18/21 | 3 month USD- | 2.50% | (59,251) | ||
| LIBOR-BBA | |||||||
| 35,966,000 E | (13,036) | 6/18/16 | 3 month USD- | 0.65% | 17,751 | ||
| LIBOR-BBA | |||||||
| 32,616,500 E | 135,491 | 6/18/19 | 3 month USD- | 1.90% | 43,121 | ||
| LIBOR-BBA | |||||||
| 7,879,000 E | 30,602 | 6/18/24 | 3 month USD- | 2.90% | 98,733 | ||
| LIBOR-BBA | |||||||
| 6,814,900 | (90) | 3/27/24 | 3 month USD- | 2.87% | (95,790) | ||
| LIBOR-BBA | |||||||
| 5,097,500 E | (72) | 5/23/24 | 3 month USD- | 2.845% | 31,339 | ||
| LIBOR-BBA | |||||||
| 2,563,300 E | (24) | 5/27/19 | 3 month USD- | 1.885% | (9,893) | ||
| LIBOR-BBA | |||||||
| 3,932,400 E | (55) | 5/27/24 | 3 month USD- | 2.86% | 27,802 | ||
| LIBOR-BBA | |||||||
| 32,800,000 E | 31,850 | 6/17/17 | 3 month USD- | 1.617% | (59,760) | ||
| LIBOR-BBA | |||||||
| 11,400,000 E | (107) | 6/15/19 | 3 month USD- | 2.61% | 28,906 | ||
| LIBOR-BBA | |||||||
| 11,400,000 E | (107) | 6/15/19 | 3 month USD- | 2.64% | 19,090 | ||
| LIBOR-BBA | |||||||
| EUR | 32,830,000 E | (227,421) | 6/18/16 | 6 month EUR- | 0.75% | 34,108 | |
| EURIBOR-REUTERS | |||||||
| EUR | 34,675,000 E | (1,693,367) | 6/18/19 | 6 month EUR- | 1.75% | 214,631 | |
| EURIBOR-REUTERS | |||||||
| EUR | 9,458,000 E | 661,829 | 6/18/24 | 6 month EUR- | 2.50% | (287,489) | |
| EURIBOR-REUTERS | |||||||
| EUR | 2,782,000 E | (356,405) | 6/18/44 | 6 month EUR- | 3.00% | 179,606 | |
| EURIBOR-REUTERS | |||||||
| EUR | 5,075,000 E | (28) | 2/18/24 | 6 month EUR- | 2.85% | (109,104) | |
| EURIBOR-REUTERS | |||||||
| Global Income Trust 45 |
| CENTRALLY CLEARED INTEREST RATE SWAP CONTRACTS OUTSTANDING at 4/30/14 (Unaudited) cont. | |||||||
| Upfront | Payments | Payments | Unrealized | ||||
| premium | Termination | made by | received by | appreciation/ | |||
| Notional amount | received (paid) | date | fund per annum | fund per annum | (depreciation) | ||
| GBP | 39,226,000 E | $96,645 | 6/18/16 | 6 month GBP- | 1.25% | $7,236 | |
| LIBOR-BBA | |||||||
| GBP | 12,202,000 E | (123,179) | 6/18/19 | 6 month GBP- | 2.25% | 30,798 | |
| LIBOR-BBA | |||||||
| JPY | 18,345,000 | (6) | 3/24/44 | 6 month JPY- | 1.80% | 120 | |
| LIBOR-BBA | |||||||
| JPY | 35,921,000 | (12) | 3/24/44 | 6 month JPY- | 1.79625% | (205) | |
| LIBOR-BBA | |||||||
| JPY | 996,900,000 | (39) | 3/14/19 | 6 month JPY- | 0.3175% | (3,577) | |
| LIBOR-BBA | |||||||
| JPY | 218,100,000 | (38) | 3/14/44 | 6 month JPY- | 1.795% | 701 | |
| LIBOR-BBA | |||||||
| JPY | 17,784,000 | (3) | 3/24/44 | 6 month JPY- | 1.80125% | 173 | |
| LIBOR-BBA | |||||||
| Total | $(737,538) | $(552,327) | |||||
E Extended effective date.
| OTC TOTAL RETURN SWAP CONTRACTS OUTSTANDING at 4/30/14 (Unaudited) | |||||||
| Upfront | Payments | Total return | Unrealized | ||||
| Swap counterparty/ | premium | Termination | received (paid) by | received by | appreciation/ | ||
| Notional amount | received (paid) | date | fund per annum | or paid by fund | (depreciation) | ||
| Bank of America N.A. | |||||||
| $654,469 | $— | 1/12/41 | 4.00% (1 month | Synthetic TRS Index | $1,471 | ||
| USD-LIBOR) | 4.00% 30 year Fannie | ||||||
| Mae pools | |||||||
| 1,165,266 | — | 1/12/41 | 4.50% (1 month | Synthetic TRS Index | 1,470 | ||
| USD-LIBOR) | 4.50% 30 year Fannie | ||||||
| Mae pools | |||||||
| Barclays Bank PLC | |||||||
| 126,667 | — | 1/12/40 | 5.00% (1 month | Synthetic MBX Index | 640 | ||
| USD-LIBOR) | 5.00% 30 year Fannie | ||||||
| Mae pools | |||||||
| 215,788 | — | 1/12/42 | 4.00% (1 month | Synthetic TRS Index | 417 | ||
| USD-LIBOR) | 4.00% 30 year Fannie | ||||||
| Mae pools | |||||||
| 7,078,133 | — | 1/12/41 | 4.00% (1 month | Synthetic TRS Index | 15,912 | ||
| USD-LIBOR) | 4.00% 30 year Fannie | ||||||
| Mae pools | |||||||
| 8,927,123 | — | 1/12/41 | 5.00% (1 month | Synthetic MBX Index | 46,477 | ||
| USD-LIBOR) | 5.00% 30 year Fannie | ||||||
| Mae pools | |||||||
| 5,599 | — | 1/12/38 | 6.50% (1 month | Synthetic TRS Index | 13 | ||
| USD-LIBOR) | 6.50% 30 year Fannie | ||||||
| Mae pools | |||||||
| 137,240 | — | 1/12/41 | 5.00% (1 month | Synthetic MBX Index | 715 | ||
| USD-LIBOR) | 5.00% 30 year Fannie | ||||||
| Mae pools | |||||||
| 46 Global Income Trust |
| OTC TOTAL RETURN SWAP CONTRACTS OUTSTANDING at 4/30/14 (Unaudited) cont. | ||||||
| Upfront | Payments | Total return | Unrealized | |||
| Swap counterparty/ | premium | Termination | received (paid) by | received by | appreciation/ | |
| Notional amount | received (paid) | date | fund per annum | or paid by fund | (depreciation) | |
| Barclays Bank PLC cont. | ||||||
| $590,870 | $— | 1/12/40 | 4.50% (1 month | Synthetic MBX Index | $1,814 | |
| USD-LIBOR) | 4.50% 30 year Fannie | |||||
| Mae pools | ||||||
| 77,407 | — | 1/12/40 | 5.00% (1 month | Synthetic MBX Index | 391 | |
| USD-LIBOR) | 5.00% 30 year Fannie | |||||
| Mae pools | ||||||
| 1,178,624 | — | 1/12/40 | 4.50% (1 month | Synthetic MBX Index | 3,618 | |
| USD-LIBOR) | 4.50% 30 year Fannie | |||||
| Mae pools | ||||||
| 3,175,077 | — | 1/12/41 | 5.00% (1 month | Synthetic MBX Index | 16,530 | |
| USD-LIBOR) | 5.00% 30 year Fannie | |||||
| Mae pools | ||||||
| 637,519 | — | 1/12/41 | 5.00% (1 month | Synthetic MBX Index | 3,319 | |
| USD-LIBOR) | 5.00% 30 year Fannie | |||||
| Mae pools | ||||||
| 110,993 | — | 1/12/40 | 5.00% (1 month | Synthetic MBX Index | 561 | |
| USD-LIBOR) | 5.00% 30 year Fannie | |||||
| Mae pools | ||||||
| 359,849 | — | 1/12/40 | 5.00% (1 month | Synthetic MBX Index | 1,817 | |
| USD-LIBOR) | 5.00% 30 year Fannie | |||||
| Mae pools | ||||||
| 261,010 | — | 1/12/40 | 5.00% (1 month | Synthetic MBX Index | 1,318 | |
| USD-LIBOR) | 5.00% 30 year Fannie | |||||
| Mae pools | ||||||
| 2,082,585 | — | 1/12/38 | (6.50%) 1 month | Synthetic MBX Index | (10,208) | |
| USD-LIBOR | 6.50% 30 year Fannie | |||||
| Mae pools | ||||||
| 106,674 | — | 1/12/39 | (6.00%) 1 month | Synthetic MBX Index | (445) | |
| USD-LIBOR | 6.00% 30 year Fannie | |||||
| Mae pools | ||||||
| 1,198,233 | — | 1/12/41 | (4.50%) 1 month | Synthetic TRS Index | (1,512) | |
| USD-LIBOR | 4.50% 30 year Fannie | |||||
| Mae pools | ||||||
| 343,836 | — | 1/12/39 | (5.50%) 1 month | Synthetic MBX Index | (1,290) | |
| USD-LIBOR | 5.50% 30 year Fannie | |||||
| Mae pools | ||||||
| 171,918 | — | 1/12/39 | (5.50%) 1 month | Synthetic MBX Index | (645) | |
| USD-LIBOR | 5.50% 30 year Fannie | |||||
| Mae pools | ||||||
| 171,918 | — | 1/12/39 | (5.50%) 1 month | Synthetic MBX Index | (645) | |
| USD-LIBOR | 5.50% 30 year Fannie | |||||
| Mae pools | ||||||
| 345,029 | — | 1/12/39 | (5.50%) 1 month | Synthetic MBX Index | (1,294) | |
| USD-LIBOR | 5.50% 30 year Fannie | |||||
| Mae pools | ||||||
| 895,983 | — | 1/12/39 | (5.50%) 1 month | Synthetic MBX Index | (3,361) | |
| USD-LIBOR | 5.50% 30 year Fannie | |||||
| Mae pools | ||||||
| Global Income Trust 47 |
| OTC TOTAL RETURN SWAP CONTRACTS OUTSTANDING at 4/30/14 (Unaudited) cont. | ||||||
| Upfront | Payments | Total return | Unrealized | |||
| Swap counterparty/ | premium | Termination | received (paid) by | received by | appreciation/ | |
| Notional amount | received (paid) | date | fund per annum | or paid by fund | (depreciation) | |
| Barclays Bank PLC cont. | ||||||
| $345,029 | $— | 1/12/39 | (5.50%) 1 month | Synthetic MBX Index | $(1,294) | |
| USD-LIBOR | 5.50% 30 year Fannie | |||||
| Mae pools | ||||||
| 1,268,906 | — | 1/12/41 | 4.00% (1 month | Synthetic TRS Index | 2,853 | |
| USD-LIBOR) | 4.00% 30 year Fannie | |||||
| Mae pools | ||||||
| 938,149 | — | 1/12/41 | 5.00% (1 month | Synthetic TRS Index | 992 | |
| USD-LIBOR) | 5.00% 30 year Ginnie | |||||
| Mae II pools | ||||||
| 301,373 | — | 1/12/41 | 5.00% (1 month | Synthetic MBX Index | 1,569 | |
| USD-LIBOR) | 5.00% 30 year Ginnie | |||||
| Mae II pools | ||||||
| 396,469 | — | 1/12/41 | 5.00% (1 month | Synthetic TRS Index | 419 | |
| USD-LIBOR) | 5.00% 30 year Ginnie | |||||
| Mae II pools | ||||||
| 533,832 | — | 1/12/38 | 6.50% (1 month | Synthetic TRS Index | 1,238 | |
| USD-LIBOR) | 6.50% 30 year Fannie | |||||
| Mae pools | ||||||
| 688,766 | — | 1/12/39 | (5.50%) 1 month | Synthetic MBX Index | (2,584) | |
| USD-LIBOR | 5.50% 30 year Fannie | |||||
| Mae pools | ||||||
| 867,490 | — | 1/12/41 | (5.00%) 1 month | Synthetic TRS Index | (103) | |
| USD-LIBOR | 5.00% 30 year Fannie | |||||
| Mae pools | ||||||
| 2,350,000 | — | 3/20/24 | (2.505%) | USA Non Revised | (10,895) | |
| Consumer Price | ||||||
| Index-Urban (CPI-U) | ||||||
| 11,302,000 | — | 3/20/16 | 1.795% | USA Non Revised | (31,239) | |
| Consumer Price | ||||||
| Index-Urban (CPI-U) | ||||||
| 1,831,000 | — | 3/21/24 | (2.505%) | USA Non Revised | (8,459) | |
| Consumer Price | ||||||
| Index-Urban (CPI-U) | ||||||
| Citibank, N.A. | ||||||
| 235,071 | — | 1/12/41 | 5.00% (1 month | Synthetic MBX Index | 1,224 | |
| USD-LIBOR) | 5.00% 30 year Fannie | |||||
| Mae pools | ||||||
| 7,028,000 | — | 2/3/16 | 1.795% | USA Non Revised | (26,165) | |
| Consumer Price | ||||||
| Index-Urban (CPI-U) | ||||||
| 1,947,181 | — | 1/12/41 | (4.50%) 1 month | Synthetic TRS Index | (2,457) | |
| USD-LIBOR | 4.50% 30 year Fannie | |||||
| Mae pools | ||||||
| 1,757,000 | — | 1/31/16 | 1.795% | USA Non Revised | (6,768) | |
| Consumer Price | ||||||
| Index-Urban (CPI-U) | ||||||
| 48 Global Income Trust |
| OTC TOTAL RETURN SWAP CONTRACTS OUTSTANDING at 4/30/14 (Unaudited) cont. | |||||||
| Upfront | Payments | Total return | Unrealized | ||||
| Swap counterparty/ | premium | Termination | received (paid) by | received by | appreciation/ | ||
| Notional amount | received (paid) | date | fund per annum | or paid by fund | (depreciation) | ||
| Citibank, N.A. cont. | |||||||
| $11,366,000 | $— | 3/27/16 | 1.7475% | USA Non Revised | $(37,337) | ||
| Consumer Price | |||||||
| Index-Urban (CPI-U) | |||||||
| 2,363,000 | — | 3/27/24 | (2.4825%) | USA Non Revised | (5,548) | ||
| Consumer Price | |||||||
| Index-Urban (CPI-U) | |||||||
| EUR | 4,580,000 | — | 2/21/19 | (1.235%) | Eurostat Eurozone | (22,760) | |
| HICP excluding | |||||||
| tobacco | |||||||
| EUR | 2,380,000 | — | 2/21/24 | 1.69% | Eurostat Eurozone | 24,896 | |
| HICP excluding | |||||||
| tobacco | |||||||
| Credit Suisse International | |||||||
| $1,055,966 | — | 1/12/41 | 4.50% (1 month | Synthetic MBX Index | 3,570 | ||
| USD-LIBOR) | 4.50% 30 year Ginnie | ||||||
| Mae II pools | |||||||
| 478,025 | — | 1/12/41 | (4.50%) 1 month | Synthetic TRS Index | (603) | ||
| USD-LIBOR | 4.50% 30 year Fannie | ||||||
| Mae pools | |||||||
| 2,185,137 | — | 1/12/41 | (4.50%) 1 month | Synthetic TRS Index | (2,757) | ||
| USD-LIBOR | 4.50% 30 year Fannie | ||||||
| Mae pools | |||||||
| 1,931,965 | — | 1/12/41 | (4.50%) 1 month | Synthetic TRS Index | (2,438) | ||
| USD-LIBOR | 4.50% 30 year Fannie | ||||||
| Mae pools | |||||||
| 1,910,833 | — | 1/12/41 | (4.50%) 1 month | Synthetic TRS Index | (2,411) | ||
| USD-LIBOR | 4.50% 30 year Fannie | ||||||
| Mae pools | |||||||
| 632,883 | — | 1/12/41 | (5.00%) 1 month | Synthetic TRS Index | (76) | ||
| USD-LIBOR | 5.00% 30 year Fannie | ||||||
| Mae pools | |||||||
| EUR | 1,340,000 | — | 3/27/19 | (1.1913%) | Eurostat Eurozone | (3,424) | |
| HICP excluding | |||||||
| tobacco | |||||||
| EUR | 4,580,000 | — | 2/20/19 | (1.2225%) | Eurostat Eurozone | (18,700) | |
| HICP excluding | |||||||
| tobacco | |||||||
| EUR | 2,380,000 | — | 2/20/24 | 1.68% | Eurostat Eurozone | 21,528 | |
| HICP excluding | |||||||
| tobacco | |||||||
| EUR | 1,340,000 | — | 3/24/19 | (1.1925%) | Eurostat Eurozone | (3,543) | |
| HICP excluding | |||||||
| tobacco | |||||||
| GBP | 1,130,000 | — | 3/20/19 | 3.05% | GBP Non-revised UK | (9,616) | |
| Retail Price Index | |||||||
| GBP | 1,130,000 | — | 3/25/19 | 3.0413% | GBP Non-revised UK | (10,474) | |
| Retail Price Index | |||||||
| Global Income Trust 49 |
| OTC TOTAL RETURN SWAP CONTRACTS OUTSTANDING at 4/30/14 (Unaudited) cont. | |||||||
| Upfront | Payments | Total return | Unrealized | ||||
| Swap counterparty/ | premium | Termination | received (paid) by | received by | appreciation/ | ||
| Notional amount | received (paid) | date | fund per annum | or paid by fund | (depreciation) | ||
| Goldman Sachs International | |||||||
| $224,603 | $— | 1/12/39 | 6.00% (1 month | Synthetic TRS Index | $286 | ||
| USD-LIBOR) | 6.00% 30 year Fannie | ||||||
| Mae pools | |||||||
| 38,012 | — | 1/12/38 | 6.50% (1 month | Synthetic TRS Index | 88 | ||
| USD-LIBOR) | 6.50% 30 year Fannie | ||||||
| Mae pools | |||||||
| 535,709 | — | 1/12/42 | 4.00% (1 month | Synthetic TRS Index | 1,036 | ||
| USD-LIBOR) | 4.00% 30 year Fannie | ||||||
| Mae pools | |||||||
| 535,709 | — | 1/12/42 | 4.00% (1 month | Synthetic TRS Index | 1,036 | ||
| USD-LIBOR) | 4.00% 30 year Fannie | ||||||
| Mae pools | |||||||
| 1,606,520 | — | 1/12/41 | 4.50% (1 month | Synthetic TRS Index | 2,027 | ||
| USD-LIBOR) | 4.50% 30 year Fannie | ||||||
| Mae pools | |||||||
| 1,779,076 | — | 1/12/41 | 4.00% (1 month | Synthetic TRS Index | 3,999 | ||
| USD-LIBOR) | 4.00% 30 year Fannie | ||||||
| Mae pools | |||||||
| 5,128,944 | — | 1/12/41 | 4.50% (1 month | Synthetic TRS Index | 6,472 | ||
| USD-LIBOR) | 4.50% 30 year Fannie | ||||||
| Mae pools | |||||||
| 694,367 | — | 1/12/40 | 4.00% (1 month | Synthetic TRS Index | 1,345 | ||
| USD-LIBOR) | 4.00% 30 year Fannie | ||||||
| Mae pools | |||||||
| 54,611 | — | 1/12/38 | (6.50%) 1 month | Synthetic MBX Index | (268) | ||
| USD-LIBOR | 6.50% 30 year Fannie | ||||||
| Mae pools | |||||||
| 65,514 | — | 1/12/38 | (6.50%) 1 month | Synthetic MBX Index | (321) | ||
| USD-LIBOR | 6.50% 30 year Fannie | ||||||
| Mae pools | |||||||
| 1,237,391 | — | 1/12/38 | (6.50%) 1 month | Synthetic MBX Index | (6,065) | ||
| USD-LIBOR | 6.50% 30 year Fannie | ||||||
| Mae pools | |||||||
| 1,512,829 | — | 1/12/42 | 4.00% (1 month | Synthetic TRS Index | 2,927 | ||
| USD-LIBOR) | 4.00% 30 year Fannie | ||||||
| Mae pools | |||||||
| 796,621 | — | 1/12/42 | 4.00% (1 month | Synthetic TRS Index | 1,541 | ||
| USD-LIBOR) | 4.00% 30 year Fannie | ||||||
| Mae pools | |||||||
| 12,861,000 | — | 3/3/19 | 2.13% | USA Non Revised | (16,977) | ||
| Consumer Price | |||||||
| Index-Urban (CPI-U) | |||||||
| JPMorgan Chase Bank N.A. | |||||||
| 1,750,646 | — | 1/12/41 | 4.50% (1 month | Synthetic TRS Index | 2,209 | ||
| USD-LIBOR) | 4.50% 30 year Fannie | ||||||
| Mae pools | |||||||
| Total | $— | $(74,944) | |||||
| 50 Global Income Trust |
| OTC CREDIT DEFAULT CONTRACTS OUTSTANDING at 4/30/14 (Unaudited) | |||||||
| Upfront | Payments | ||||||
| premium | Termi- | received | Unrealized | ||||
| Swap counterparty/ | received | Notional | nation | (paid) by fund | appreciation/ | ||
| Referenced debt* | Rating*** | (paid)** | amount | date | per annum | (depreciation) | |
| Bank of America N.A. | |||||||
| CMBX NA | BBB–/P | $2,666 | $39,000 | 5/11/63 | 300 bp | $2,599 | |
| BBB– Index | |||||||
| CMBX NA | BBB–/P | 5,303 | 88,000 | 5/11/63 | 300 bp | 5,154 | |
| BBB– Index | |||||||
| CMBX NA | BBB–/P | 10,865 | 176,000 | 5/11/63 | 300 bp | 10,566 | |
| BBB– Index | |||||||
| CMBX NA | BBB–/P | 10,317 | 181,000 | 5/11/63 | 300 bp | 10,009 | |
| BBB– Index | |||||||
| Barclays Bank PLC | |||||||
| CMBX NA | BBB–/P | 13,525 | 122,000 | 5/11/63 | 300 bp | 13,318 | |
| BBB– Index | |||||||
| Credit Suisse International | |||||||
| CMBX NA | BBB–/P | 690 | 89,000 | 5/11/63 | 300 bp | 539 | |
| BBB– Index | |||||||
| CMBX NA | BBB–/P | 8,994 | 113,000 | 5/11/63 | 300 bp | 8,802 | |
| BBB– Index | |||||||
| CMBX NA | BBB–/P | 1,382 | 119,000 | 5/11/63 | 300 bp | 1,179 | |
| BBB– Index | |||||||
| CMBX NA | BBB–/P | 15,705 | 139,000 | 5/11/63 | 300 bp | 15,469 | |
| BBB– Index | |||||||
| CMBX NA | BBB–/P | 11,537 | 149,000 | 5/11/63 | 300 bp | 11,283 | |
| BBB– Index | |||||||
| CMBX NA | BBB–/P | 11,968 | 150,000 | 5/11/63 | 300 bp | 11,714 | |
| BBB– Index | |||||||
| CMBX NA | BBB–/P | 9,867 | 150,000 | 5/11/63 | 300 bp | 9,612 | |
| BBB– Index | |||||||
| CMBX NA | BBB–/P | 4,625 | 152,000 | 5/11/63 | 300 bp | 4,367 | |
| BBB– Index | |||||||
| CMBX NA | BBB–/P | 2,678 | 152,000 | 5/11/63 | 300 bp | 2,420 | |
| BBB– Index | |||||||
| CMBX NA | BBB–/P | 2,397 | 156,000 | 5/11/63 | 300 bp | 2,132 | |
| BBB– Index | |||||||
| CMBX NA | BBB–/P | 13,039 | 179,000 | 5/11/63 | 300 bp | 12,735 | |
| BBB– Index | |||||||
| CMBX NA | BBB–/P | 19,852 | 259,000 | 5/11/63 | 300 bp | 19,411 | |
| BBB– Index | |||||||
| CMBX NA | BBB–/P | 12,926 | 315,000 | 5/11/63 | 300 bp | 12,391 | |
| BBB– Index | |||||||
| CMBX NA BB Index | — | (846) | 162,000 | 5/11/63 | (500 bp) | 541 | |
| CMBX NA BB Index | — | (2,096) | 120,000 | 5/11/63 | (500 bp) | (1,068) | |
| CMBX NA BB Index | — | (517) | 54,000 | 5/11/63 | (500 bp) | (25) | |
| CMBX NA BB Index | — | (493) | 54,000 | 5/11/63 | (500 bp) | (30) | |
| Global Income Trust | 51 |
| OTC CREDIT DEFAULT CONTRACTS OUTSTANDING at 4/30/14 (Unaudited) cont. | |||||||
| Upfront | Payments | ||||||
| premium | Termi- | received | Unrealized | ||||
| Swap counterparty/ | received | Notional | nation | (paid) by fund | appreciation/ | ||
| Referenced debt* | Rating*** | (paid)** | amount | date | per annum | (depreciation) | |
| Credit Suisse International cont. | |||||||
| CMBX NA BB Index | — | $(2,308) | $119,000 | 5/11/63 | (500 bp) | $(1,289) | |
| CMBX NA | BBB–/P | 48 | 1,000 | 5/11/63 | 300 bp | 46 | |
| BBB– Index | |||||||
| CMBX NA | BBB–/P | 2,617 | 110,000 | 5/11/63 | 300 bp | 2,430 | |
| BBB– Index | |||||||
| CMBX NA | — | (7,683) | 136,000 | 1/17/47 | (300 bp) | (4,365) | |
| BBB– Index | |||||||
| CMBX NA | — | (8,276) | 136,000 | 1/17/47 | (300 bp) | (4,958) | |
| BBB– Index | |||||||
| CMBX NA | — | (6,289) | 134,000 | 1/17/47 | (300 bp) | (3,019) | |
| BBB– Index | |||||||
| CMBX NA | — | (7,850) | 134,000 | 1/17/47 | (300 bp) | (4,580) | |
| BBB– Index | |||||||
| Goldman Sachs International | |||||||
| CMBX NA BB Index | — | (519) | 54,000 | 5/11/63 | (500 bp) | (56) | |
| Total | $124,124 | $137,327 | |||||
* Payments related to the referenced debt are made upon a credit default event.
** Upfront premium is based on the difference between the original spread on issue and the market spread on day of execution.
*** Ratings are presented for credit default contracts in which the fund has sold protection on the underlying referenced debt. Ratings for an underlying index represent the average of the ratings of all the securities included in that index. The Moody’s, Standard & Poor’s or Fitch ratings are believed to be the most recent ratings available at April 30, 2014. Securities rated by Putnam are indicated by “/P.”
| 52 Global Income Trust |
ASC 820 establishes a three-level hierarchy for disclosure of fair value measurements. The valuation hierarchy is based upon the transparency of inputs to the valuation of the fund’s investments. The three levels are defined as follows:
Level 1: Valuations based on quoted prices for identical securities in active markets.
Level 2: Valuations based on quoted prices in markets that are not active or for which all significant inputs are observable, either directly or indirectly.
Level 3: Valuations based on inputs that are unobservable and significant to the fair value measurement.
The following is a summary of the inputs used to value the fund’s net assets as of the close of the reporting period:
| Valuation inputs | |||
| Investments in securities: | Level 1 | Level 2 | Level 3 |
| Corporate bonds and notes | $— | $88,713,128 | $— |
| Foreign government and agency bonds and notes | — | 118,925,860 | — |
| Mortgage-backed securities | — | 78,420,483 | — |
| Municipal bonds and notes | — | 440,346 | — |
| Purchased options outstanding | — | 269,680 | — |
| Purchased swap options outstanding | — | 369,689 | — |
| U.S. government and agency mortgage obligations | — | 38,007,403 | — |
| U.S. treasury obligations | — | 113,614 | — |
| Short-term investments | 26,304,773 | 13,040,103 | — |
| Totals by level | $26,304,773 | $338,300,306 | $— |
| Valuation inputs | |||
| Other financial instruments: | Level 1 | Level 2 | Level 3 |
| Forward currency contracts | $— | $(346,415) | $— |
| Futures contracts | (174,494) | — | — |
| Written options outstanding | — | (236,640) | — |
| Written swap options outstanding | — | (772,376) | — |
| Forward premium swap option contracts | — | (23,798) | — |
| TBA sale commitments | — | (2,121,250) | — |
| Interest rate swap contracts | — | 48,414 | — |
| Total return swap contracts | — | (74,944) | — |
| Credit default contracts | — | 13,203 | — |
| Totals by level | $(174,494) | $(3,513,806) | $— |
The accompanying notes are an integral part of these financial statements.
| Global Income Trust | 53 |
Statement of assets and liabilities 4/30/14 (Unaudited)
| ASSETS | |
| Investment in securities, at value (Note 1): | |
| Unaffiliated issuers (identified cost $321,416,065) | $338,300,306 |
| Affiliated issuers (identified cost $26,304,773) (Note 5) | 26,304,773 |
| Foreign currency (cost $3,525) (Note 1) | 3,552 |
| Interest and other receivables | 3,956,941 |
| Receivable for shares of the fund sold | 1,729,691 |
| Receivable for investments sold | 18,113,905 |
| Receivable for sales of delayed delivery securities (Note 1) | 2,110,996 |
| Receivable for variation margin (Note 1) | 462,821 |
| Unrealized appreciation on forward premium swap option contracts (Note 1) | 133,702 |
| Unrealized appreciation on forward currency contracts (Note 1) | 611,741 |
| Unrealized appreciation on OTC swap contracts (Note 1) | 697,347 |
| Premium paid on OTC swap contracts (Note 1) | 36,877 |
| Prepaid assets | 62,694 |
| Total assets | 392,525,346 |
| LIABILITIES | |
| Payable to custodian | 799,859 |
| Payable for investments purchased | 17,287,359 |
| Payable for purchases of delayed delivery securities (Note 1) | 32,814,146 |
| Payable for shares of the fund repurchased | 690,575 |
| Payable for compensation of Manager (Note 2) | 155,680 |
| Payable for custodian fees (Note 2) | 31,707 |
| Payable for investor servicing fees (Note 2) | 36,507 |
| Payable for Trustee compensation and expenses (Note 2) | 123,851 |
| Payable for administrative services (Note 2) | 997 |
| Payable for distribution fees (Note 2) | 81,793 |
| Payable for variation margin (Note 1) | 978,157 |
| Unrealized depreciation on OTC swap contracts (Note 1) | 771,761 |
| Premium received on OTC swap contracts (Note 1) | 161,001 |
| Unrealized depreciation on forward currency contracts (Note 1) | 958,156 |
| Unrealized depreciation on forward premium swap option contracts (Note 1) | 157,500 |
| Written options outstanding, at value (premiums $1,138,072) (Notes 1 and 3) | 1,009,016 |
| TBA sale commitments, at value (proceeds receivable $2,108,398) (Note 1) | 2,121,250 |
| Collateral on certain derivative contracts, at value (Note 1) | 113,614 |
| Other accrued expenses | 206,952 |
| Total liabilities | 58,499,881 |
| Net assets | $334,025,465 |
| (Continued on next page) | |
| 54 Global Income Trust |
Statement of assets and liabilities (Continued)
| REPRESENTED BY | |
| Paid-in capital (Unlimited shares authorized) (Notes 1 and 4) | $326,047,499 |
| Undistributed net investment income (Note 1) | 1,583,484 |
| Accumulated net realized loss on investments and foreign currency transactions (Note 1) | (9,459,790) |
| Net unrealized appreciation of investments and assets and liabilities in foreign currencies | 15,854,272 |
| Total — Representing net assets applicable to capital shares outstanding | $334,025,465 |
| COMPUTATION OF NET ASSET VALUE AND OFFERING PRICE | |
| Net asset value and redemption price per class A share | |
| ($212,220,073 divided by 16,443,369 shares) | $12.91 |
| Offering price per class A share (100/96.00 of $12.91)* | $13.45 |
| Net asset value and offering price per class B share ($8,632,973 divided by 672,033 shares)** | $12.85 |
| Net asset value and offering price per class C share ($29,481,220 divided by 2,293,900 shares)** | $12.85 |
| Net asset value and redemption price per class M share ($11,608,756 divided by 908,176 shares) | $12.78 |
| Offering price per class M share (100/96.75 of $12.78)† | $13.21 |
| Net asset value, offering price and redemption price per class R share | |
| ($6,194,669 divided by 480,898 shares) | $12.88 |
| Net asset value, offering price and redemption price per class R5 share | |
| ($11,010 divided by 853 shares) ‡ | $12.90 |
| Net asset value, offering price and redemption price per class R6 share | |
| ($4,685,318 divided by 363,063 shares) | $12.90 |
| Net asset value, offering price and redemption price per class Y share | |
| ($61,191,446 divided by 4,742,228 shares) | $12.90 |
* On single retail sales of less than $100,000. On sales of $100,000 or more the offering price is reduced.
** Redemption price per share is equal to net asset value less any applicable contingent deferred sales charge.
† On single retail sales of less than $50,000. On sales of $50,000 or more the offering price is reduced.
‡ Net asset value may not recalculate due to rounding of fractional shares.
The accompanying notes are an integral part of these financial statements.
| Global Income Trust 55 |
Statement of operations Six months ended 4/30/14 (Unaudited)
| INVESTMENT INCOME | |
| Interest (including interest income of $5,108 from investments in affiliated issuers) (Note 5) | $6,315,376 |
| EXPENSES | |
| Compensation of Manager (Note 2) | 833,427 |
| Investor servicing fees (Note 2) | 217,551 |
| Custodian fees (Note 2) | 46,409 |
| Trustee compensation and expenses (Note 2) | 11,133 |
| Distribution fees (Note 2) | 485,418 |
| Administrative services (Note 2) | 4,617 |
| Other | 257,450 |
| Fees waived and reimbursed by Manager (Note 2) | (11,921) |
| Total expenses | 1,844,084 |
| Expense reduction (Note 2) | (440) |
| Net expenses | 1,843,644 |
| Net investment income | 4,471,732 |
| Net realized gain on investments (Notes 1 and 3) | 3,964,052 |
| Net realized loss on swap contracts (Note 1) | (2,737,559) |
| Net realized loss on futures contracts (Note 1) | (1,955,114) |
| Net realized loss on foreign currency transactions (Note 1) | (2,346,071) |
| Net realized gain on written options (Notes 1 and 3) | 538,871 |
| Net unrealized appreciation of assets and liabilities in foreign currencies during the period | 1,137,712 |
| Net unrealized appreciation of investments, futures contracts, swap contracts, written options, | |
| and TBA sale commitments during the period | 9,873,279 |
| Net gain on investments | 8,475,170 |
| Net increase in net assets resulting from operations | $12,946,902 |
The accompanying notes are an integral part of these financial statements.
| 56 Global Income Trust |
Statement of changes in net assets
| INCREASE (DECREASE) IN NET ASSETS | Six months ended 4/30/14* | Year ended 10/31/13 |
| Operations: | ||
| Net investment income | $4,471,732 | $9,988,638 |
| Net realized gain (loss) on investments | ||
| and foreign currency transactions | (2,535,821) | 7,986,115 |
| Net unrealized appreciation (depreciation) of investments | ||
| and assets and liabilities in foreign currencies | 11,010,991 | (15,823,667) |
| Net increase in net assets resulting from operations | 12,946,902 | 2,151,086 |
| Distributions to shareholders (Note 1): | ||
| From ordinary income | ||
| Net investment income | ||
| Class A | (3,056,810) | (6,033,372) |
| Class B | (99,314) | (212,458) |
| Class C | (336,065) | (740,318) |
| Class M | (165,928) | (340,470) |
| Class R | (80,244) | (136,973) |
| Class R5 | (177) | (311) |
| Class R6 | (73,178) | (77,428) |
| Class Y | (785,230) | (1,615,804) |
| From return of capital | ||
| Class A | — | (653,480) |
| Class B | — | (23,011) |
| Class C | — | (80,185) |
| Class M | — | (36,876) |
| Class R | — | (14,836) |
| Class R5 | — | (34) |
| Class R6 | — | (8,386) |
| Class Y | — | (175,009) |
| Increase (decrease) from capital share transactions (Note 4) | 23,470,895 | (52,950,579) |
| Total increase (decrease) in net assets | 31,820,851 | (60,948,444) |
| NET ASSETS | ||
| Beginning of period | 302,204,614 | 363,153,058 |
| End of period (including undistributed net investment | ||
| income of $1,583,484 and $1,708,698, respectively) | $334,025,465 | $302,204,614 |
| *Unaudited | ||
The accompanying notes are an integral part of these financial statements.
| Global Income Trust | 57 |
Financial highlights (For a common share outstanding throughout the period)
| INVESTMENT OPERATIONS: | LESS DISTRIBUTIONS: | RATIOS AND SUPPLEMENTAL DATA: | |||||||||||||
| Ratio of | |||||||||||||||
| Net asset | Net realized | Ratio | net investment | ||||||||||||
| value, | and unrealized | Total from | From | Total return | Net assets, | of expenses | income (loss) | ||||||||
| beginning | Net investment | gain (loss) | investment | net investment | From | Total | Redemption | Non-recurring | Net asset value, | at net asset | end of period | to average | to average | Portfolio | |
| Period ended | of period | income (loss) a | on investments | operations | income | return of capital | distributions | fees | reimbursements | end of period | value (%) b | (in thousands) | net assets (%) c | net assets (%) | turnover (%) d |
| Class A | |||||||||||||||
| April 30, 2014** | $12.57 | .19 | .34 | .53 | (.19) | — | (.19) | — | — | $12.91 | 4.27* | $212,220 | .56*h | 1.48* | 78* |
| October 31, 2013 | 12.85 | .38 | (.27) | .11 | (.35) | (.04) | (.39) | — | — | 12.57 | .82 | 199,284 | 1.10 | 2.96 | 335 |
| October 31, 2012 | 12.58 | .36 | .38 | .74 | (.36) | (.11) | (.47) | — | — | 12.85 | 6.02 | 229,240 | 1.10 | 2.85 | 162 |
| October 31, 2011 | 13.15 | .47 | (.27) | .20 | (.77) | — | (.77) | — e | — e,f | 12.58 | 1.55 | 215,202 | 1.13 | 3.67 | 116 |
| October 31, 2010 | 13.24 | .80 | .82 | 1.62 | (1.71) | — | (1.71) | — e | — e,g | 13.15 | 13.63 | 157,631 | 1.14 h | 6.35 h | 79 |
| October 31, 2009 | 10.47 | .62 | 2.91 | 3.53 | (.76) | — | (.76) | — e | — e,i | 13.24 | 35.39 | 113,047 | 1.14 h | 5.57 h | 203 |
| Class B | |||||||||||||||
| April 30, 2014** | $12.51 | .14 | .35 | .49 | (.15) | — | (.15) | — | — | $12.85 | 3.90* | $8,633 | .94*h | 1.10* | 78* |
| October 31, 2013 | 12.80 | .28 | (.28) | — e | (.26) | (.03) | (.29) | — | — | 12.51 | (.01) | 9,002 | 1.85 | 2.21 | 335 |
| October 31, 2012 | 12.53 | .26 | .38 | .64 | (.28) | (.09) | (.37) | — | — | 12.80 | 5.24 | 11,109 | 1.85 | 2.10 | 162 |
| October 31, 2011 | 13.10 | .38 | (.28) | .10 | (.67) | — | (.67) | — e | — e,f | 12.53 | .81 | 11,499 | 1.88 | 2.94 | 116 |
| October 31, 2010 | 13.20 | .72 | .80 | 1.52 | (1.62) | — | (1.62) | — e | — e,g | 13.10 | 12.74 | 9,453 | 1.89 h | 5.67 h | 79 |
| October 31, 2009 | 10.44 | .52 | 2.92 | 3.44 | (.68) | — | (.68) | — e | — e,i | 13.20 | 34.38 | 8,144 | 1.89 h | 4.77 h | 203 |
| Class C | |||||||||||||||
| April 30, 2014** | $12.51 | .14 | .34 | .48 | (.14) | — | (.14) | — | — | $12.85 | 3.89* | $29,481 | .94*h | 1.11* | 78* |
| October 31, 2013 | 12.80 | .28 | (.28) | — e | (.26) | (.03) | (.29) | — | — | 12.51 | (.01) | 31,771 | 1.85 | 2.22 | 335 |
| October 31, 2012 | 12.53 | .26 | .38 | .64 | (.28) | (.09) | (.37) | — | — | 12.80 | 5.25 | 39,316 | 1.85 | 2.10 | 162 |
| October 31, 2011 | 13.10 | .35 | (.24) | .11 | (.68) | — | (.68) | — e | — e,f | 12.53 | .83 | 36,264 | 1.88 | 2.70 | 116 |
| October 31, 2010 | 13.20 | .68 | .85 | 1.53 | (1.63) | — | (1.63) | — e | — e,g | 13.10 | 12.80 | 13,700 | 1.89 h | 5.39 h | 79 |
| October 31, 2009 | 10.44 | .53 | 2.91 | 3.44 | (.68) | — | (.68) | — e | — e,i | 13.20 | 34.38 | 4,451 | 1.89 h | 4.82 h | 203 |
| Class M | |||||||||||||||
| April 30, 2014** | $12.45 | .17 | .34 | .51 | (.18) | — | (.18) | — | — | $12.78 | 4.11* | $11,609 | .69*h | 1.35* | 78* |
| October 31, 2013 | 12.74 | .34 | (.28) | .06 | (.32) | (.03) | (.35) | — | — | 12.45 | .50 | 12,457 | 1.35 | 2.71 | 335 |
| October 31, 2012 | 12.47 | .32 | .38 | .70 | (.33) | (.10) | (.43) | — | — | 12.74 | 5.80 | 14,969 | 1.35 | 2.60 | 162 |
| October 31, 2011 | 13.04 | .45 | (.28) | .17 | (.74) | — | (.74) | — e | — e,f | 12.47 | 1.30 | 16,403 | 1.38 | 3.51 | 116 |
| October 31, 2010 | 13.14 | .78 | .80 | 1.58 | (1.68) | — | (1.68) | — e | — e,g | 13.04 | 13.35 | 17,170 | 1.39 h | 6.21 h | 79 |
| October 31, 2009 | 10.40 | .58 | 2.89 | 3.47 | (.73) | — | (.73) | — e | — e,i | 13.14 | 35.00 | 18,789 | 1.39 h | 5.30 h | 203 |
| Class R | |||||||||||||||
| April 30, 2014** | $12.54 | .17 | .35 | .52 | (.18) | — | (.18) | — | — | $12.88 | 4.15* | $6,195 | .69*h | 1.36* | 78* |
| October 31, 2013 | 12.83 | .34 | (.28) | .06 | (.32) | (.03) | (.35) | — | — | 12.54 | .50 | 5,586 | 1.35 | 2.70 | 335 |
| October 31, 2012 | 12.56 | .33 | .37 | .70 | (.33) | (.10) | (.43) | — | — | 12.83 | 5.76 | 4,142 | 1.35 | 2.61 | 162 |
| October 31, 2011 | 13.14 | .44 | (.28) | .16 | (.74) | — | (.74) | — e | — e,f | 12.56 | 1.25 | 3,658 | 1.38 | 3.43 | 116 |
| October 31, 2010 | 13.23 | .75 | .84 | 1.59 | (1.68) | — | (1.68) | — e | — e,g | 13.14 | 13.39 | 2,264 | 1.39 h | 5.92 h | 79 |
| October 31, 2009 | 10.46 | .59 | 2.91 | 3.50 | (.73) | — | (.73) | — e | — e,i | 13.23 | 35.10 | 834 | 1.39 h | 5.31 h | 203 |
| Class R5 | |||||||||||||||
| April 30, 2014** | $12.56 | .21 | .34 | .55 | (.21) | — | (.21) | — | — | $12.90 | 4.42* | $11 | .43*h | 1.65* | 78* |
| October 31, 2013 | 12.85 | .42 | (.29) | .13 | (.38) | (.04) | (.42) | — | — | 12.56 | 1.02 | 11 | .82 | 3.27 | 335 |
| October 31, 2012† | 12.45 | .13 | .41 | .54 | (.11) | (.03) | (.14) | — | — | 12.85 | 4.34* | 10 | .27* | .99* | 162 |
| Class R6 | |||||||||||||||
| April 30, 2014** | $12.57 | .21 | .33 | .54 | (.21) | — | (.21) | — | — | $12.90 | 4.36* | $4,685 | .39*h | 1.65* | 78* |
| October 31, 2013 | 12.85 | .38 j | (.23) | .15 | (.39) | (.04) | (.43) | — | — | 12.57 | 1.19 | 4,025 | .75 | 3.00 j | 335 |
| October 31, 2012† | 12.45 | .13 | .41 | .54 | (.11) | (.03) | (.14) | — | — | 12.85 | 4.37* | 10 | .25* | 1.01* | 162 |
See notes to financial highlights at the end of this section.
The accompanying notes are an integral part of these financial statements.
| 58 Global Income Trust | Global Income Trust 59 |
Financial highlights (Continued)
| INVESTMENT OPERATIONS: | LESS DISTRIBUTIONS: | RATIOS AND SUPPLEMENTAL DATA: | |||||||||||||
| Ratio of | |||||||||||||||
| Net asset | Net realized | Ratio | net investment | ||||||||||||
| value, | and unrealized | Total from | From | Total return | Net assets, | of expenses | income (loss) | ||||||||
| beginning | Net investment | gain (loss) | investment | net investment | From | Total | Redemption | Non-recurring | Net asset value, | at net asset | end of period | to average | to average | Portfolio | |
| Period ended | of period | income (loss) a | on investments | operations | income | return of capital | distributions | fees | reimbursements | end of period | value (%) b | (in thousands) | net assets (%) c | net assets (%) | turnover (%) d |
| Class Y | |||||||||||||||
| April 30, 2014** | $12.57 | .20 | .34 | .54 | (.21) | — | (.21) | — | — | $12.90 | 4.33* | $61,191 | .44*h | 1.59* | 78* |
| October 31, 2013 | 12.86 | .41 | (.28) | .13 | (.38) | (.04) | (.42) | — | — | 12.57 | 1.00 | 40,069 | .85 | 3.22 | 335 |
| October 31, 2012 | 12.58 | .39 | .39 | .78 | (.38) | (.12) | (.50) | — | — | 12.86 | 6.40 | 64,357 | .85 | 3.11 | 162 |
| October 31, 2011 | 13.16 | .46 | (.24) | .22 | (.80) | — | (.80) | — e | — e,f | 12.58 | 1.74 | 72,631 | .88 | 3.53 | 116 |
| October 31, 2010 | 13.25 | .83 | .83 | 1.66 | (1.75) | — | (1.75) | — e | — e,g | 13.16 | 13.93 | 13,371 | .89 h | 6.54 h | 79 |
| October 31, 2009 | 10.48 | .64 | 2.92 | 3.56 | (.79) | — | (.79) | — e | — e,i | 13.25 | 35.69 | 5,218 | .89 h | 5.78 h | 203 |
* Not annualized.
** Unaudited.
† For the period July 3, 2012 (commencement of operations) to October 31, 2012.
a Per share net investment income (loss) has been determined on the basis of the weighted average number of shares outstanding during the period.
b Total return assumes dividend reinvestment and does not reflect the effect of sales charges.
c Includes amounts paid through expense offset arrangements (Note 2). Also excludes acquired fund fees, if any.
d Portfolio turnover excludes TBA purchase and sale commitments.
e Amount represents less than $0.01 per share.
f Reflects a non-recurring reimbursement related to restitution amounts in connection with a distribution plan approved by the Securities and Exchange Commission (the SEC) which amounted to less than $0.01 per share outstanding on July 21, 2011. Also reflects a non-recurring reimbursement related to short-term trading related lawsuits, which amounted to less than $0.01 per share outstanding on May 11, 2011.
g Reflects a non-recurring reimbursement pursuant to a settlement between the SEC and Prudential Securities, Inc. which amounted to less than $0.01 per share outstanding on March 30, 2010.
h Reflects an involuntary contractual expense limitation in effect during the period. As a result of such limitation, the expenses of each class reflect a reduction of the following amounts (Note 2):
| Percentage of | |
| average net assets | |
| April 30, 2014 | <0.01% |
| October 31, 2010 | 0.02 |
| October 31, 2009 | 0.32 |
i Reflects a non-recurring reimbursement pursuant to a settlement between the SEC and Millennium Partners, L.P., Millennium Management, L.L.C. and Millennium International Management, L.L.C. which amounted to less than $0.01 per share outstanding on June 23, 2009.
j The net investment income ratio and per share amount shown for the period ending October 31, 2013 may not correspond with the expected class specific differences for the period due to the timing of subscriptions into the class.
The accompanying notes are an integral part of these financial statements. The accompanying notes are an integral part of these financial statements.
| 60 Global Income Trust | Global Income Trust | 61 |
Notes to financial statements 4/30/14 (Unaudited)
Within the following Notes to financial statements, references to “State Street” represent State Street Bank and Trust Company, references to “the SEC” represent the Securities and Exchange Commission, references to “Putnam Management” represent Putnam Investment Management, LLC, the fund’s manager, an indirect wholly-owned subsidiary of Putnam Investments, LLC and references to “OTC”, if any, represent over-the-counter. Unless otherwise noted, the “reporting period” represents the period from November 1, 2013 through April 30, 2014.
Putnam Global Income Trust (the fund) is a Massachusetts business trust, which is registered under the Investment Company Act of 1940, as amended, as a non-diversified open-end management investment company. The investment objective of the fund is to seek high current income. Preservation of capital and long-term total return are secondary objectives, but only to the extent consistent with the objective of seeking high current income. The fund invests mainly in bonds and securitized debt instruments (such as mortgage-backed investments) that are obligations of companies and governments worldwide; that are investment-grade in quality; and that have intermediate- to long-term maturities (three years or longer). The fund may also invest in bonds that are below-investment-grade in quality (sometimes referred to as “junk bonds”). Putnam Management may consider, among other factors, credit, interest rate and prepayment risks, as well as general market conditions, when deciding whether to buy or sell investments.
The fund offers class A, class B, class C, class M, class R, class R5, class R6 and class Y shares. Class A and class M shares are sold with a maximum front-end sales charge of 4.00% and 3.25%, respectively, and generally do not pay a contingent deferred sales charge. Class B shares, which convert to class A shares after approximately eight years, do not pay a front-end sales charge and are subject to a contingent deferred sales charge if those shares are redeemed within six years of purchase. Class C shares have a one-year 1.00% contingent deferred sales charge and do not convert to class A shares. Class R shares, which are not available to all investors, are sold at net asset value. The expenses for class A, class B, class C, class M and class R shares may differ based on the distribution fee of each class, which is identified in Note 2. Class R5, class R6 and class Y shares, which are sold at net asset value, are generally subject to the same expenses as class A, class B, class C, class M and class R shares, but do not bear a distribution fee and in the case of class R5 and class R6 shares, bear a lower investor servicing fee, which is identified in Note 2. Class R5, class R6 and class Y shares are not available to all investors.
In the normal course of business, the fund enters into contracts that may include agreements to indemnify another party under given circumstances. The fund’s maximum exposure under these arrangements is unknown as this would involve future claims that may be, but have not yet been, made against the fund. However, the fund’s management team expects the risk of material loss to be remote.
Note 1: Significant accounting policies
The following is a summary of significant accounting policies consistently followed by the fund in the preparation of its financial statements. The preparation of financial statements is in conformity with accounting principles generally accepted in the United States of America and requires management to make estimates and assumptions that affect the reported amounts of assets and liabilities in the financial statements and the reported amounts of increases and decreases in net assets from operations. Actual results could differ from those estimates. Subsequent events after the Statement of assets and liabilities date through the date that the financial statements were issued have been evaluated in the preparation of the financial statements.
Investment income, realized and unrealized gains and losses and expenses of the fund are borne pro-rata based on the relative net assets of each class to the total net assets of the fund, except that each class bears expenses unique to that class (including the distribution fees applicable to such classes). Each class votes as a class only with respect to its own distribution plan or other matters on which a class vote is required by law or determined by the Trustees. If the fund were liquidated, shares of each class would receive their pro-rata share of the net assets of the fund. In addition, the Trustees declare separate dividends on each class of shares.
Security valuation Market quotations are not considered to be readily available for certain debt obligations and other investments; such investments are valued on the basis of valuations furnished by an independent pricing service approved by the Trustees or dealers selected by Putnam Management. Such services or dealers determine valuations for normal institutional-size trading units of such securities using methods based on market transactions for comparable securities and various relationships, generally recognized by institutional traders, between securities (which consider such factors as security prices, yields, maturities and ratings). These securities will generally be categorized as Level 2. Securities quoted in foreign currencies, if any, are translated into U.S. dollars at the current
| 62 Global Income Trust |
exchange rate. Short-term securities with remaining maturities of 60 days or less may be valued at amortized cost, which approximates fair value and are classified as Level 2 securities.
Investments in open-end investment companies (excluding exchange traded funds), if any, which can be classified as Level 1 or Level 2 securities, are valued based on their net asset value. The net asset value of such investment companies equals the total value of their assets less their liabilities and divided by the number of their outstanding shares.
To the extent a pricing service or dealer is unable to value a security or provides a valuation that Putnam Management does not believe accurately reflects the security’s fair value, the security will be valued at fair value by Putnam Management in accordance with policies and procedures approved by the Trustees. Certain investments, including certain restricted and illiquid securities and derivatives, are also valued at fair value following procedures approved by the Trustees. These valuations consider such factors as significant market or specific security events such as interest rate or credit quality changes, various relationships with other securities, discount rates, U.S. Treasury, U.S. swap and credit yields, index levels, convexity exposures and recovery rates. These securities are classified as Level 2 or as Level 3 depending on the priority of the significant inputs.
Such valuations and procedures are reviewed periodically by the Trustees. Certain securities may be valued on the basis of a price provided by a single source. The fair value of securities is generally determined as the amount that the fund could reasonably expect to realize from an orderly disposition of such securities over a reasonable period of time. By its nature, a fair value price is a good faith estimate of the value of a security in a current sale and does not reflect an actual market price, which may be different by a material amount.
Security transactions and related investment income Security transactions are recorded on the trade date (the date the order to buy or sell is executed). Gains or losses on securities sold are determined on the identified cost basis. Interest income, net of any applicable withholding taxes, is recorded on the accrual basis.
All premiums/discounts are amortized/accreted on a yield-to-maturity basis.
The fund earned certain fees in connection with its senior loan purchasing activities. These fees are treated as market discount and are amortized into income in the Statement of operations.
Securities purchased or sold on a forward commitment or delayed delivery basis may be settled a month or more after the trade date; interest income is accrued based on the terms of the securities. Losses may arise due to changes in the fair value of the underlying securities or if the counterparty does not perform under the contract.
Stripped securities The fund may invest in stripped securities which represent a participation in securities that may be structured in classes with rights to receive different portions of the interest and principal. Interest-only securities receive all of the interest and principal-only securities receive all of the principal. If the interest-only securities experience greater than anticipated prepayments of principal, the fund may fail to recoup fully its initial investment in these securities. Conversely, principal-only securities increase in value if prepayments are greater than anticipated and decline if prepayments are slower than anticipated. The fair value of these securities is highly sensitive to changes in interest rates.
Foreign currency translation The accounting records of the fund are maintained in U.S. dollars. The fair value of foreign securities, currency holdings, and other assets and liabilities is recorded in the books and records of the fund after translation to U.S. dollars based on the exchange rates on that day. The cost of each security is determined using historical exchange rates. Income and withholding taxes are translated at prevailing exchange rates when earned or incurred. The fund does not isolate that portion of realized or unrealized gains or losses resulting from changes in the foreign exchange rate on investments from fluctuations arising from changes in the market prices of the securities. Such gains and losses are included with the net realized and unrealized gain or loss on investments. Net realized gains and losses on foreign currency transactions represent net realized exchange gains or losses on closed forward currency contracts, disposition of foreign currencies, currency gains and losses realized between the trade and settlement dates on securities transactions and the difference between the amount of investment income and foreign withholding taxes recorded on the fund’s books and the U.S. dollar equivalent amounts actually received or paid. Net unrealized appreciation and depreciation of assets and liabilities in foreign currencies arise from changes in the value of open forward currency contracts and assets and liabilities other than investments at the period end, resulting from changes in the exchange rate.
Options contracts The fund uses options contracts to hedge duration and convexity, to isolate prepayment risk and to manage downside risks.
| Global Income Trust 63 |
The potential risk to the fund is that the change in value of options contracts may not correspond to the change in value of the hedged instruments. In addition, losses may arise from changes in the value of the underlying instruments if there is an illiquid secondary market for the contracts, if interest or exchange rates move unexpectedly or if the counterparty to the contract is unable to perform. Realized gains and losses on purchased options are included in realized gains and losses on investment securities. If a written call option is exercised, the premium originally received is recorded as an addition to sales proceeds. If a written put option is exercised, the premium originally received is recorded as a reduction to the cost of investments.
Exchange traded options are valued at the last sale price or, if no sales are reported, the last bid price for purchased options and the last ask price for written options. OTC traded options are valued using prices supplied by dealers.
Options on swaps are similar to options on securities except that the premium paid or received is to buy or grant the right to enter into a previously agreed upon interest rate or credit default contract. Forward premium swap option contracts include premiums that have extended settlement dates. The delayed settlement of the premiums is factored into the daily valuation of the option contracts. In the case of interest rate cap and floor contracts, in return for a premium, ongoing payments between two parties are based on interest rates exceeding a specified rate, in the case of a cap contract, or falling below a specified rate in the case of a floor contract.
Written option contracts outstanding at period end, if any, are listed after the fund’s portfolio.
Futures contracts The fund uses futures contracts to hedge interest rate risk and to gain exposure to interest rates.
The potential risk to the fund is that the change in value of futures contracts may not correspond to the change in value of the hedged instruments. In addition, losses may arise from changes in the value of the underlying instruments, if there is an illiquid secondary market for the contracts, if interest or exchange rates move unexpectedly or if the counterparty to the contract is unable to perform. With futures, there is minimal counterparty credit risk to the fund since futures are exchange traded and the exchange’s clearinghouse, as counterparty to all exchange traded futures, guarantees the futures against default. Risks may exceed amounts recognized on the Statement of assets and liabilities. When the contract is closed, the fund records a realized gain or loss equal to the difference between the value of the contract at the time it was opened and the value at the time it was closed.
Futures contracts are valued at the quoted daily settlement prices established by the exchange on which they trade. The fund and the broker agree to exchange an amount of cash equal to the daily fluctuation in the value of the futures contract. Such receipts or payments are known as “variation margin.”
Futures contracts outstanding at period end, if any, are listed after the fund’s portfolio.
Forward currency contracts The fund buys and sells forward currency contracts, which are agreements between two parties to buy and sell currencies at a set price on a future date. These contracts are used to hedge foreign exchange risk and to gain exposure on currency.
The U.S. dollar value of forward currency contracts is determined using current forward currency exchange rates supplied by a quotation service. The fair value of the contract will fluctuate with changes in currency exchange rates. The contract is marked to market daily and the change in fair value is recorded as an unrealized gain or loss. The fund records a realized gain or loss equal to the difference between the value of the contract at the time it was opened and the value at the time it was closed when the contract matures or by delivery of the currency. The fund could be exposed to risk if the value of the currency changes unfavorably, if the counterparties to the contracts are unable to meet the terms of their contracts or if the fund is unable to enter into a closing position. Risks may exceed amounts recognized on the Statement of assets and liabilities.
Forward currency contracts outstanding at period end, if any, are listed after the fund’s portfolio.
Interest rate swap contracts The fund entered into OTC and/or centrally cleared interest rate swap contracts, which are arrangements between two parties to exchange cash flows based on a notional principal amount, to hedge interest rate risk and to gain exposure on interest rates.
An OTC and centrally cleared interest rate swap can be purchased or sold with an upfront premium. For OTC interest rate swap contracts, an upfront payment received by the fund is recorded as a liability on the fund’s books. An upfront payment made by the fund is recorded as an asset on the fund’s books. OTC and centrally cleared interest rate swap contracts are marked to market daily based upon quotations from an independent pricing service or market makers. Any change is recorded as an unrealized gain or loss on OTC interest rate swaps. Daily fluctuations in the value of centrally cleared interest rate swaps are settled through a central clearing agent and are recorded in variation margin on the Statement of assets and liabilities and recorded as unrealized gain or loss. Payments, including upfront premiums, received or made are recorded as realized gains or losses at the reset date
| 64 Global Income Trust |
or the closing of the contract. Certain OTC and centrally cleared interest rate swap contracts may include extended effective dates. Payments related to these swap contracts are accrued based on the terms of the contract.
The fund could be exposed to credit or market risk due to unfavorable changes in the fluctuation of interest rates or if the counterparty defaults, in the case of OTC interest rate contracts, or the central clearing agency or a clearing member defaults, in the case of centrally cleared interest rate swap contracts, on its respective obligation to perform under the contract. The fund’s maximum risk of loss from counterparty risk or central clearing risk is the fair value of the contract. This risk may be mitigated for OTC interest rate swap contracts by having a master netting arrangement between the fund and the counterparty and for centrally cleared interest rate swap contracts through the daily exchange of variation margin. There is minimal counterparty risk with respect to centrally cleared interest rate swap contracts due to the clearinghouse guarantee fund and other resources that are available in the event of a clearing member default. Risk of loss may exceed amounts recognized on the Statement of assets and liabilities.
OTC and centrally cleared interest rate swap contracts outstanding, including their respective notional amounts at period end, if any, are listed after the fund’s portfolio.
Total return swap contracts The fund entered into OTC total return swap contracts, which are arrangements to exchange a market linked return for a periodic payment, both based on a notional principal amount, to hedge sector exposure, to manage exposure to specific sectors or industries, to gain exposure to specific sectors or industries, to gain exposure to rates of inflation in specific regions or countries and to hedge inflation in specific regions or countries.
To the extent that the total return of the security, index or other financial measure underlying the transaction exceeds or falls short of the offsetting interest rate obligation, the fund will receive a payment from or make a payment to the counterparty. OTC total return swap contracts are marked to market daily based upon quotations from an independent pricing service or market makers and the change, if any, is recorded as an unrealized gain or loss. Payments received or made are recorded as realized gains or losses. Certain OTC total return swap contracts may include extended effective dates. Payments related to these swap contracts are accrued based on the terms of the contract. The fund could be exposed to credit or market risk due to unfavorable changes in the fluctuation of interest rates or in the price of the underlying security or index, the possibility that there is no liquid market for these agreements or that the counterparty may default on its obligation to perform. The fund’s maximum risk of loss from counterparty risk is the fair value of the contract. This risk may be mitigated by having a master netting arrangement between the fund and the counterparty. Risk of loss may exceed amounts recognized on the Statement of assets and liabilities.
OTC total return swap contracts outstanding, including their respective notional amounts at period end, if any, are listed after the fund’s portfolio.
Credit default contracts The fund entered into OTC and/or centrally cleared credit default contracts to hedge credit risk and to hedge market risk.
In OTC and centrally cleared credit default contracts, the protection buyer typically makes a periodic stream of payments to a counterparty, the protection seller, in exchange for the right to receive a contingent payment upon the occurrence of a credit event on the reference obligation or all other equally ranked obligations of the reference entity. Credit events are contract specific but may include bankruptcy, failure to pay, restructuring and obligation acceleration. For OTC credit default contracts, an upfront payment received by the fund is recorded as a liability on the fund’s books. An upfront payment made by the fund is recorded as an asset on the fund’s books. Centrally cleared credit default contracts provide the same rights to the protection buyer and seller except the payments between parties, including upfront premiums, are settled through a central clearing agent through variation margin payments. Upfront and periodic payments received or paid by the fund for OTC and centrally cleared credit default contracts are recorded as realized gains or losses at the reset date or close of the contract. The OTC and centrally cleared credit default contracts are marked to market daily based upon quotations from an independent pricing service or market makers. Any change in value of OTC credit default contracts is recorded as an unrealized gain or loss. Daily fluctuations in the value of centrally cleared credit default contracts are recorded in variation margin on the Statement of assets and liabilities and recorded as unrealized gain or loss. Upon the occurrence of a credit event, the difference between the par value and fair value of the reference obligation, net of any proportional amount of the upfront payment, is recorded as a realized gain or loss.
In addition to bearing the risk that the credit event will occur, the fund could be exposed to market risk due to unfavorable changes in interest rates or in the price of the underlying security or index or the possibility that the fund may be unable to close out its position at the same time or at the same price as if it had purchased the underlying
| Global Income Trust 65 |
reference obligations. In certain circumstances, the fund may enter into offsetting OTC and centrally cleared credit default contracts which would mitigate its risk of loss. Risks of loss may exceed amounts recognized on the Statement of assets and liabilities. The fund’s maximum risk of loss from counterparty risk, either as the protection seller or as the protection buyer, is the fair value of the contract. This risk may be mitigated for OTC credit default contracts by having a master netting arrangement between the fund and the counterparty and for centrally cleared credit default contracts through the daily exchange of variation margin. Counterparty risk is further mitigated with respect to centrally cleared credit default swap contracts due to the clearinghouse guarantee fund and other resources that are available in the event of a clearing member default. Where the fund is a seller of protection, the maximum potential amount of future payments the fund may be required to make is equal to the notional amount.
OTC and centrally cleared credit default contracts outstanding, including their respective notional amounts at period end, if any, are listed after the fund’s portfolio.
Master agreements The fund is a party to ISDA (International Swaps and Derivatives Association, Inc.) Master Agreements (Master Agreements) with certain counterparties that govern OTC derivative and foreign exchange contracts entered into from time to time. The Master Agreements may contain provisions regarding, among other things, the parties’ general obligations, representations, agreements, collateral requirements, events of default and early termination. With respect to certain counterparties, in accordance with the terms of the Master Agreements, collateral posted to the fund is held in a segregated account by the fund’s custodian and with respect to those amounts which can be sold or repledged, are presented in the fund’s portfolio. Collateral posted to the fund which cannot be sold or repledged totaled $154,366 at the close of the reporting period.
Collateral pledged by the fund is segregated by the fund’s custodian and identified in the fund’s portfolio. Collateral can be in the form of cash or debt securities issued by the U.S. Government or related agencies or other securities as agreed to by the fund and the applicable counterparty. Collateral requirements are determined based on the fund’s net position with each counterparty.
Termination events applicable to the fund may occur upon a decline in the fund’s net assets below a specified threshold over a certain period of time. Termination events applicable to counterparties may occur upon a decline in the counterparty’s long-term and short-term credit ratings below a specified level. In each case, upon occurrence, the other party may elect to terminate early and cause settlement of all derivative and foreign exchange contracts outstanding, including the payment of any losses and costs resulting from such early termination, as reasonably determined by the terminating party. Any decision by one or more of the fund’s counterparties to elect early termination could impact the fund’s future derivative activity.
At the close of the reporting period, the fund had a net liability position of $1,278,938 on open derivative contracts subject to the Master Agreements. Collateral posted by the fund at period end for these agreements totaled $850,993 and may include amounts related to unsettled agreements.
TBA purchase commitments The fund may enter into TBA (to be announced) commitments to purchase securities for a fixed unit price at a future date beyond customary settlement time. Although the unit price has been established, the principal value has not been finalized. However, it is anticipated that the amount of the commitments will not significantly differ from the principal amount. The fund holds, and maintains until settlement date, cash or high-grade debt obligations in an amount sufficient to meet the purchase price, or the fund may enter into offsetting contracts for the forward sale of other securities it owns. Income on the securities will not be earned until settlement date. TBA purchase commitments may be considered securities themselves, and involve a risk of loss if the value of the security to be purchased declines prior to the settlement date, which risk is in addition to the risk of decline in the value of the fund’s other assets. Unsettled TBA purchase commitments are valued at their fair value according to the procedures described under “Security valuation” above. The contract is marked to market daily and the change in fair value is recorded by the fund as an unrealized gain or loss. Based on market circumstances, Putnam Management will determine whether to take delivery of the underlying securities or to dispose of the TBA commitments prior to settlement.
TBA sale commitments The fund may enter into TBA sale commitments to hedge its portfolio positions or to sell mortgage-backed securities it owns under delayed delivery arrangements. Proceeds of TBA sale commitments are not received until the contractual settlement date. During the time a TBA sale commitment is outstanding, equivalent deliverable securities, or an offsetting TBA purchase commitment deliverable on or before the sale commitment date, are held as “cover” for the transaction.
| 66 Global Income Trust |
Unsettled TBA sale commitments are valued at their fair value according to the procedures described under “Security valuation” above. The contract is marked to market daily and the change in fair value is recorded by the fund as an unrealized gain or loss. If the TBA sale commitment is closed through the acquisition of an offsetting TBA purchase commitment, the fund realizes a gain or loss. If the fund delivers securities under the commitment, the fund realizes a gain or a loss from the sale of the securities based upon the unit price established at the date the commitment was entered into. Based on market circumstances, Putnam Management will determine whether to deliver the underlying securities or to dispose of the TBA commitments prior to settlement. TBA sale commitments outstanding at period end, if any, are listed after the fund’s portfolio.
Interfund lending The fund, along with other Putnam funds, may participate in an interfund lending program pursuant to an exemptive order issued by the SEC. This program allows the fund to borrow from or lend to other Putnam funds that permit such transactions. Interfund lending transactions are subject to each fund’s investment policies and borrowing and lending limits. Interest earned or paid on the interfund lending transaction will be based on the average of certain current market rates. During the reporting period, the fund did not utilize the program.
Line of credit The fund participates, along with other Putnam funds, in a $315 million unsecured committed line of credit and a $185 million unsecured uncommitted line of credit, both provided by State Street. Borrowings may be made for temporary or emergency purposes, including the funding of shareholder redemption requests and trade settlements. Interest is charged to the fund based on the fund’s borrowing at a rate equal to the Federal Funds rate plus 1.25% for the committed line of credit and the Federal Funds rate plus 1.30% for the uncommitted line of credit. A closing fee equal to 0.02% of the committed line of credit and $50,000 for the uncommitted line of credit has been paid by the participating funds. In addition, a commitment fee of 0.11% per annum on any unutilized portion of the committed line of credit is allocated to the participating funds based on their relative net assets and paid quarterly. During the reporting period, the fund had no borrowings against these arrangements.
Federal taxes It is the policy of the fund to distribute all of its taxable income within the prescribed time period and otherwise comply with the provisions of the Internal Revenue Code of 1986, as amended (the Code), applicable to regulated investment companies. It is also the intention of the fund to distribute an amount sufficient to avoid imposition of any excise tax under Section 4982 of the Code.
The fund is subject to the provisions of Accounting Standards Codification 740 Income Taxes (ASC 740). ASC 740 sets forth a minimum threshold for financial statement recognition of the benefit of a tax position taken or expected to be taken in a tax return. The fund did not have a liability to record for any unrecognized tax benefits in the accompanying financial statements. No provision has been made for federal taxes on income, capital gains or unrealized appreciation on securities held nor for excise tax on income and capital gains. Each of the fund’s federal tax returns for the prior three fiscal years remains subject to examination by the Internal Revenue Service.
The fund may also be subject to taxes imposed by governments of countries in which it invests. Such taxes are generally based on either income or gains earned or repatriated. The fund accrues and applies such taxes to net investment income, net realized gains and net unrealized gains as income and/or capital gains are earned. In some cases, the fund may be entitled to reclaim all or a portion of such taxes, and such reclaim amounts, if any, are reflected as an asset on the fund’s books. In many cases, however, the fund may not receive such amounts for an extended period of time, depending on the country of investment.
At October 31, 2013, the fund had a capital loss carryover of $6,737,475 available to the extent allowed by the Code to offset future net capital gain, if any. The amounts of the carryovers and the expiration dates are:
| Loss carryover | |||
| Short-term | Long-term | Total | Expiration |
| $3,606,825 | $651,228 | $4,258,053 | * |
| 2,479,422 | N/A | 2,479,422 | October 31, 2017 |
* Under the Regulated Investment Company Modernization Act of 2010, the fund will be permitted to carry forward capital losses incurred in taxable years beginning after December 22, 2010 for an unlimited period. However, any losses incurred will be required to be utilized prior to the losses incurred in pre-enactment tax years. As a result of this ordering rule, pre-enactment capital loss carryforwards may be more likely to expire unused. Additionally, post-enactment capital losses that are carried forward will retain their character as either short-term or long-term capital losses rather than being considered all short-term as under previous law.
| Global Income Trust 67 |
The aggregate identified cost on a tax basis is $348,699,619, resulting in gross unrealized appreciation and depreciation of $21,561,543 and $5,656,083, respectively, or net unrealized appreciation of $15,905,460.
Distributions to shareholders Distributions to shareholders from net investment income are recorded by the fund on the ex-dividend date. Distributions from capital gains, if any, are recorded on the ex-dividend date and paid at least annually. The amount and character of income and gains to be distributed are determined in accordance with income tax regulations, which may differ from generally accepted accounting principles. Dividend sources are estimated at the time of declaration. Actual results may vary. Any non-taxable return of capital cannot be determined until final tax calculations are completed after the end of the fund’s fiscal year. Reclassifications are made to the fund’s capital accounts to reflect income and gains available for distribution (or available capital loss carryovers) under income tax regulations.
Note 2: Management fee, administrative services and other transactions
The fund pays Putnam Management a management fee (based on the fund’s average net assets and computed and paid monthly) at annual rates that may vary based on the average of the aggregate net assets of most open-end funds, as defined in the fund’s management contract, sponsored by Putnam Management. Such annual rates may vary as follows:
| 0.700% | of the first $5 billion, | 0.500% | of the next $50 billion, | |
| 0.650% | of the next $5 billion, | 0.480% | of the next $50 billion, | |
| 0.600% | of the next $10 billion, | 0.470% | of the next $100 billion and | |
| 0.550% | of the next $10 billion, | 0.465% | of any excess thereafter. | |
The fund’s shareholders approved the fund’s current management contract with Putnam Management effective February 27, 2014. Shareholders were asked to approve the fund’s management contract following the death on October 8, 2013 of The Honourable Paul G. Desmarais, who had controlled directly and indirectly a majority of the voting shares of Power Corporation of Canada, the ultimate parent company of Putnam Management. The substantive terms of the management contract, including terms relating to fees, are identical to the terms of the fund’s previous management contract and reflect the rates provided in the table above.
Putnam Management has contractually agreed, through June 30, 2014, to waive fees or reimburse the fund’s expenses to the extent necessary to limit the cumulative expenses of the fund, exclusive of brokerage, interest, taxes, investment-related expenses, extraordinary expenses, acquired fund fees and expenses and payments under the fund’s investor servicing contract, investment management contract and distribution plans, on a fiscal year-to-date basis to an annual rate of 0.20% of the fund’s average net assets over such fiscal year-to-date period. During the reporting period, the fund’s expenses were reduced by $11,921 as a result of this limit.
Putnam Investments Limited (PIL), an affiliate of Putnam Management, is authorized by the Trustees to manage a separate portion of the assets of the fund as determined by Putnam Management from time to time. Putnam Management pays a quarterly sub-management fee to PIL for its services at an annual rate of 0.40% of the average net assets of the portion of the fund managed by PIL.
The fund reimburses Putnam Management an allocated amount for the compensation and related expenses of certain officers of the fund and their staff who provide administrative services to the fund. The aggregate amount of all such reimbursements is determined annually by the Trustees.
Custodial functions for the fund’s assets are provided by State Street. Custody fees are based on the fund’s asset level, the number of its security holdings and transaction volumes.
Putnam Investor Services, Inc., an affiliate of Putnam Management, provides investor servicing agent functions to the fund. Putnam Investor Services, Inc. received fees for investor servicing (except for Class R5 and R6 shares) based on the fund’s retail asset level, the number of shareholder accounts in the fund and the level of defined contribution plan assets in the fund. Class R5 shares pay a monthly fee based on the average net assets of class R5 shares at an annual rate of 0.12%. Class R6 shares pay a monthly fee based on the average net assets of class R6 shares at an annual rate of 0.05%. Investor servicing fees will not exceed an annual rate of 0.32% of the fund’s
| 68 Global Income Trust |
average net assets. During the reporting period, the expenses for each class of shares related to investor servicing fees were as follows:
| Class A | $143,452 | Class R5 | 6 | |
| Class B | 6,161 | Class R6 | 1,082 | |
| Class C | 21,225 | Class Y | 33,116 | |
| Class M | 8,410 | Total | $217,551 | |
| Class R | 4,099 | |||
The fund has entered into expense offset arrangements with Putnam Investor Services, Inc. and State Street whereby Putnam Investor Services, Inc.’s and State Street’s fees are reduced by credits allowed on cash balances. For the reporting period, the fund’s expenses were reduced by $440 under the expense offset arrangements.
Each independent Trustee of the fund receives an annual Trustee fee, of which $195, as a quarterly retainer, has been allocated to the fund, and an additional fee for each Trustees meeting attended. Trustees also are reimbursed for expenses they incur relating to their services as Trustees.
The fund has adopted a Trustee Fee Deferral Plan (the Deferral Plan) which allows the Trustees to defer the receipt of all or a portion of Trustees fees payable on or after July 1, 1995. The deferred fees remain invested in certain Putnam funds until distribution in accordance with the Deferral Plan.
The fund has adopted an unfunded noncontributory defined benefit pension plan (the Pension Plan) covering all Trustees of the fund who have served as a Trustee for at least five years and were first elected prior to 2004. Benefits under the Pension Plan are equal to 50% of the Trustee’s average annual attendance and retainer fees for the three years ended December 31, 2005. The retirement benefit is payable during a Trustee’s lifetime, beginning the year following retirement, for the number of years of service through December 31, 2006. Pension expense for the fund is included in Trustee compensation and expenses in the Statement of operations. Accrued pension liability is included in Payable for Trustee compensation and expenses in the Statement of assets and liabilities. The Trustees have terminated the Pension Plan with respect to any Trustee first elected after 2003.
The fund has adopted distribution plans (the Plans) with respect to its class A, class B, class C, class M and class R shares pursuant to Rule 12b–1 under the Investment Company Act of 1940. The purpose of the Plans is to compensate Putnam Retail Management Limited Partnership, an indirect wholly-owned subsidiary of Putnam Investments, LLC, for services provided and expenses incurred in distributing shares of the fund. The Plans provide for payments by the fund to Putnam Retail Management Limited Partnership at an annual rate of up to 0.35%, 1.00%, 1.00%, 1.00% and 1.00% of the average net assets attributable to class A, class B, class C, class M and class R shares, respectively. The Trustees have approved payment by the fund at an annual rate of 0.25%, 1.00%, 1.00%, 0.50% and 0.50% of the average net assets attributable to class A, class B, class C, class M and class R shares, respectively. During the reporting period, the class specific expenses related to distribution fees were as follows:
| Class A | $250,604 | Class M | 29,351 | |
| Class B | 43,008 | Class R | 14,313 | |
| Class C | 148,142 | Total | $485,418 | |
For the reporting period, Putnam Retail Management Limited Partnership, acting as underwriter, received net commissions of $10,862 and $81 from the sale of class A and class M shares, respectively, and received $1,165 and $516 in contingent deferred sales charges from redemptions of class B and class C shares, respectively.
A deferred sales charge of up to 1.00% and 0.40% is assessed on certain redemptions of class A and class M shares, respectively. For the reporting period, Putnam Retail Management Limited Partnership, acting as underwriter, received $15 and no monies on class A and class M redemptions, respectively.
Note 3: Purchases and sales of securities
During the reporting period, cost of purchases and proceeds from sales of investment securities other than short-term investments and TBA commitments aggregated $226,868,564 and $220,196,089, respectively. There were no purchases or proceeds from sales of long-term U.S. government securities.
| Global Income Trust 69 |
Written option transactions during the reporting period are summarized as follows:
| Written swap | Written | Written option | |||
| option contract | swap option | contract | Written option | ||
| amounts | premiums | amounts | premiums | ||
| Written options outstanding | |||||
| at the beginning of the | USD | 45,960,000 | $496,444 | — | $— |
| reporting period | EUR | — | $— | — | $— |
| Options opened | USD | 112,595,929 | 977,561 | 80,000,000 | 328,750 |
| EUR | 122,462,000 | 71,636 | — | — | |
| Options exercised | USD | — | — | — | — |
| EUR | — | — | — | — | |
| Options expired | USD | — | — | — | — |
| EUR | — | — | — | — | |
| Options closed | USD | (137,093,029) | (664,683) | — | — |
| EUR | (74,144,000) | (71,636) | — | — | |
| Written options outstanding | |||||
| at the end of the | USD | 21,462,900 | $809,322 | 80,000,000 | $328,750 |
| reporting period | EUR | 48,318,000 | $— | — | $— |
Note 4: Capital shares
At the close of the reporting period, there was an unlimited number of shares of beneficial interest authorized. Transactions in capital shares were as follows:
| Six months ended 4/30/14 | Year ended 10/31/13 | |||
| Class A | Shares | Amount | Shares | Amount |
| Shares sold | 2,716,806 | $34,455,579 | 4,261,894 | $54,357,290 |
| Shares issued in connection with | ||||
| reinvestment of distributions | 222,843 | 2,827,058 | 475,017 | 6,026,644 |
| 2,939,649 | 37,282,637 | 4,736,911 | 60,383,934 | |
| Shares repurchased | (2,353,996) | (29,807,559) | (6,712,131) | (85,179,431) |
| Net increase (decrease) | 585,653 | $7,475,078 | (1,975,220) | $(24,795,497) |
| Six months ended 4/30/14 | Year ended 10/31/13 | |||
| Class B | Shares | Amount | Shares | Amount |
| Shares sold | 33,368 | $424,204 | 122,001 | $1,551,555 |
| Shares issued in connection with | ||||
| reinvestment of distributions | 7,205 | 90,921 | 16,871 | 213,146 |
| 40,573 | 515,125 | 138,872 | 1,764,701 | |
| Shares repurchased | (88,190) | (1,111,868) | (287,294) | (3,627,673) |
| Net decrease | (47,617) | $(596,743) | (148,422) | $(1,862,972) |
| Six months ended 4/30/14 | Year ended 10/31/13 | |||
| Class C | Shares | Amount | Shares | Amount |
| Shares sold | 234,487 | $2,975,345 | 610,133 | $7,754,780 |
| Shares issued in connection with | ||||
| reinvestment of distributions | 22,872 | 288,741 | 54,454 | 688,048 |
| 257,359 | 3,264,086 | 664,587 | 8,442,828 | |
| Shares repurchased | (502,442) | (6,336,135) | (1,196,791) | (15,147,669) |
| Net decrease | (245,083) | $(3,072,049) | (532,204) | $(6,704,841) |
| 70 Global Income Trust |
| Six months ended 4/30/14 | Year ended 10/31/13 | |||
| Class M | Shares | Amount | Shares | Amount |
| Shares sold | 5,764 | $72,342 | 28,068 | $354,011 |
| Shares issued in connection with | ||||
| reinvestment of distributions | 2,931 | 36,806 | 6,607 | 83,029 |
| 8,695 | 109,148 | 34,675 | 437,040 | |
| Shares repurchased | (101,166) | (1,265,363) | (209,081) | (2,641,557) |
| Net decrease | (92,471) | $(1,156,215) | (174,406) | $(2,204,517) |
| Six months ended 4/30/14 | Year ended 10/31/13 | |||
| Class R | Shares | Amount | Shares | Amount |
| Shares sold | 112,914 | $1,432,746 | 262,354 | $3,348,411 |
| Shares issued in connection with | ||||
| reinvestment of distributions | 4,319 | 54,670 | 8,211 | 103,915 |
| 117,233 | 1,487,416 | 270,565 | 3,452,326 | |
| Shares repurchased | (81,672) | (1,034,156) | (147,965) | (1,878,387) |
| Net increase | 35,561 | $453,260 | 122,600 | $1,573,939 |
| Six months ended 4/30/14 | Year ended 10/31/13 | |||
| Class R5 | Shares | Amount | Shares | Amount |
| Shares sold | — | $— | — | $— |
| Shares issued in connection with | ||||
| reinvestment of distributions | 14 | 177 | 27 | 345 |
| 14 | 177 | 27 | 345 | |
| Shares repurchased | — | — | — | — |
| Net increase | 14 | $177 | 27 | $345 |
| Six months ended 4/30/14 | Year ended 10/31/13 | |||
| Class R6 | Shares | Amount | Shares | Amount |
| Shares sold | 62,942 | $795,457 | 378,940 | $4,867,378 |
| Shares issued in connection with | ||||
| reinvestment of distributions | 5,769 | 73,178 | 6,827 | 85,814 |
| 68,711 | 868,635 | 385,767 | 4,953,192 | |
| Shares repurchased | (25,929) | (328,145) | (66,298) | (828,879) |
| Net increase | 42,782 | $540,490 | 319,469 | $4,124,313 |
| Six months ended 4/30/14 | Year ended 10/31/13 | |||
| Class Y | Shares | Amount | Shares | Amount |
| Shares sold | 2,171,014 | $27,671,143 | 1,919,287 | $24,558,955 |
| Shares issued in connection with | ||||
| reinvestment of distributions | 42,203 | 535,520 | 93,944 | 1,194,335 |
| 2,213,217 | 28,206,663 | 2,013,231 | 25,753,290 | |
| Shares repurchased | (659,854) | (8,379,766) | (3,830,680) | (48,834,639) |
| Net increase (decrease) | 1,553,363 | $19,826,897 | (1,817,449) | $(23,081,349) |
| Global Income Trust | 71 |
At the close of the reporting period, Putnam Investments, LLC owned the following shares of the fund:
| Shares owned | Percentage of ownership | Value | |
| Class R5 | 853 | 100.00% | $11,010 |
| Class R6 | 854 | 0.24 | 11,017 |
Note 5: Affiliated transactions
Transactions during the reporting period with Putnam Short Term Investment Fund, which is under common ownership and control, were as follows:
| Fair value at the | Fair value at | ||||
| beginning of | the end of | ||||
| the reporting | Investment | the reporting | |||
| Name of affiliate | period | Purchase cost | Sale proceeds | income | period |
| Putnam Short Term | |||||
| Investment Fund* | $3,129,550 | $69,549,468 | $46,374,245 | $5,108 | $26,304,773 |
* Management fees charged to Putnam Short Term Investment Fund have been waived by Putnam Management.
Note 6: Senior loan commitments
Senior loans are purchased or sold on a when-issued or delayed delivery basis and may be settled a month or more after the trade date, which from time to time can delay the actual investment of available cash balances; interest income is accrued based on the terms of the securities. Senior loans can be acquired through an agent, by assignment from another holder of the loan, or as a participation interest in another holder’s portion of the loan. When the fund invests in a loan or participation, the fund is subject to the risk that an intermediate participant between the fund and the borrower will fail to meet its obligations to the fund, in addition to the risk that the borrower under the loan may default on its obligations.
Note 7: Market, credit and other risks
In the normal course of business, the fund trades financial instruments and enters into financial transactions where risk of potential loss exists due to changes in the market (market risk) or failure of the contracting party to the transaction to perform (credit risk). The fund may be exposed to additional credit risk that an institution or other entity with which the fund has unsettled or open transactions will default. Investments in foreign securities involve certain risks, including those related to economic instability, unfavorable political developments, and currency fluctuations. The fund may invest in higher yielding, lower rated bonds that may have a higher rate of default. The fund may invest a significant portion of its assets in securitized debt instruments, including mortgage-backed and asset-backed investments. The yields and values of these investments are sensitive to changes in interest rates, the rate of principal payments on the underlying assets and the market’s perception of the issuers. The market for these investments may be volatile and limited, which may make them difficult to buy or sell.
Note 8: Summary of derivative activity
The volume of activity for the reporting period for any derivative type that was held during the period is listed below and was as follows based on an average of the holdings at the end of each fiscal quarter:
| Purchased TBA commitment option contracts (contract amount) | $18,000,000 |
| Purchased swap option contracts (contract amount) | $123,500,000 |
| Written TBA commitment option contracts (contract amount) (Note 3) | $34,300,000 |
| Written swap option contracts (contract amount) (Note 3) | $101,300,000 |
| Futures contracts (number of contracts) | 1,000 |
| Forward currency contracts (contract amount) | $367,300,000 |
| OTC interest rate swap contracts (notional) | $444,400,000 |
| Centrally cleared interest rate swap contracts (notional) | $690,200,000 |
| OTC total return swap contracts (notional) | $123,000,000 |
| OTC credit default contracts (notional) | $4,000,000 |
| 72 Global Income Trust |
The following is a summary of the fair value of derivative instruments as of the close of the reporting period:
Fair value of derivative instruments as of the close of the reporting period
| Asset derivatives | Liability derivatives | |||
| Derivatives not | ||||
| accounted for as | Statement of | Statement of | ||
| hedging instruments | assets and | assets and | ||
| under ASC 815 | liabilities location | Fair value | liabilities location | Fair value |
| Credit contracts | Receivables | $18,028 | Payables | $4,825 |
| Foreign exchange | ||||
| contracts | Receivables | 611,741 | Payables | 958,156 |
| Investments, | ||||
| Receivables, Net | Payables, Net | |||
| assets — Unrealized | assets — Unrealized | |||
| Interest rate contracts | appreciation | 4,944,002* | depreciation | 5,538,471* |
| Total | $5,573,771 | $6,501,452 | ||
* Includes cumulative appreciation/depreciation of futures contracts and centrally cleared swaps as reported in the fund’s portfolio. Only current day’s variation margin is reported within the Statement of assets and liabilities.
The following is a summary of realized and change in unrealized gains or losses of derivative instruments on the Statement of operations for the reporting period (see Note 1):
Amount of realized gain or (loss) on derivatives recognized in net gain or (loss) on investments
| Derivatives not accounted | Forward | ||||
| for as hedging instruments | currency | ||||
| under ASC 815 | Options | Futures | contracts | Swaps | Total |
| Credit contracts | $— | $— | $— | $(33,844) | $(33,844) |
| Foreign exchange | |||||
| contracts | — | — | (2,348,026) | — | $(2,348,026) |
| Interest rate contracts | (188,912) | (1,955,114) | — | (2,703,715) | $(4,847,741) |
| Total | $(188,912) | $(1,955,114) | $(2,348,026) | $(2,737,559) | $(7,229,611) |
Change in unrealized appreciation or (depreciation) on derivatives recognized in net gain or (loss) on investments
| Derivatives not accounted | Forward | ||||
| for as hedging instruments | currency | ||||
| under ASC 815 | Options | Futures | contracts | Swaps | Total |
| Credit contracts | $— | $— | $— | $176,276 | $176,276 |
| Foreign exchange | |||||
| contracts | — | — | 1,133,018 | — | $1,133,018 |
| Interest rate contracts | (28,907) | 758,997 | — | 2,868,683 | $3,598,773 |
| Total | $(28,907) | $758,997 | $1,133,018 | $3,044,959 | $4,908,067 |
| Global Income Trust | 73 |
Note 9: Offsetting of financial and derivative assets and liabilities
The following table summarizes any derivatives, repurchase agreements and reverse repurchase agreements, at the end of the reporting period, that are subject to an enforceable master netting agreement or similar agreement. For securities lending transactions or borrowing transactions associated with securities sold short, see Note 1, if any. For financial reporting purposes, the fund does not offset financial assets and financial liabilities that are subject to the master netting agreements in the Statement of assets and liabilities.
| Bank of America N. A. | Barclays Bank PLC | Barclays Capital Inc. (clearing broker) | Citibank, N. A. | Credit Suisse International | Deutsche Bank AG | Goldman Sachs International | HSBC Bank USA, National Association | JPMorgan Chase Bank N. A. | Merrill Lynch, Pierce, Fenner & Smith, Inc. | Royal Bank of Scotland PLC (The) | State Street Bank and Trust Co. | UBS AG | WestPac Banking Corp. | Total | |
| Assets: | |||||||||||||||
| OTC Interest rate swap contracts*# | $— | $— | $— | $— | $19,771 | $— | $75,070 | $— | $268,051 | $— | $— | $— | $— | $— | $362,892 |
| Centrally cleared interest rate swap contracts§ | — | — | 440,197 | — | — | — | — | — | — | — | — | — | — | — | 440,197 |
| OTC Total return swap contracts*# | 2,941 | 100,613 | — | 26,120 | 25,098 | — | 20,757 | — | 2,209 | — | — | — | — | — | 177,738 |
| OTC Credit default contracts*# | — | — | — | — | 17,565 | — | 463 | — | — | — | — | — | — | — | 18,028 |
| Futures contracts§ | — | — | — | — | — | — | — | — | — | 22,624 | — | — | — | — | 22,624 |
| Forward currency contracts# | 25,974 | 129,883 | — | 39,320 | 189,240 | 26,145 | 22,024 | — | 59,484 | — | — | 58,905 | 23,741 | 37,025 | 611,741 |
| Forward premium swap option contracts# | — | — | — | — | — | — | 110,666 | — | 23,036 | — | — | — | — | — | 133,702 |
| Purchased swap options**# | 71,663 | 86,774 | — | — | 48,461 | 28,366 | 134,425 | — | — | — | — | — | — | — | 369,689 |
| Purchased options**# | — | — | — | — | — | — | — | — | 269,680 | — | — | — | — | — | 269,680 |
| Total Assets | $100,578 | $317,270 | $440,197 | $65,440 | $300,135 | $54,511 | $363,405 | $— | $622,460 | $22,624 | $— | $58,905 | $23,741 | $37,025 | $2,406,291 |
| Liabilities: | |||||||||||||||
| OTC Interest rate swap contracts*# | $280 | $— | $— | $— | $— | $64,682 | $245,529 | $— | $189,198 | $— | $— | $— | $— | $— | $499,689 |
| Centrally cleared interest rate swap contracts§ | — | — | 715,349 | — | — | — | — | — | — | — | — | — | — | — | 715,349 |
| OTC Total return swap contracts*# | — | 73,974 | — | 101,035 | 54,042 | — | 23,631 | — | — | — | — | — | — | — | 252,682 |
| OTC Credit default contracts*# | 823 | 207 | — | — | 3,795 | — | — | — | — | — | — | — | — | — | 4,825 |
| Futures contracts§ | — | — | — | — | — | — | — | — | — | 262,808 | — | — | — | — | 262,808 |
| Forward currency contracts# | 5,493 | 51,095 | — | 204,021 | 107,786 | 33,026 | 152,002 | 47,862 | 50,020 | — | 84,113 | 130,741 | 32,972 | 59,025 | 958,156 |
| Forward premium swap option contracts# | — | — | — | — | — | — | 131,145 | — | 26,355 | — | — | — | — | — | 157,500 |
| Written swap options# | 79,948 | — | — | — | — | — | — | — | 692,428 | — | — | — | — | — | 772,376 |
| Written options# | — | — | — | — | — | — | — | — | 236,640 | — | — | — | — | — | 236,640 |
| Total Liabilities | $86,544 | $125,276 | $715,349 | $305,056 | $165,623 | $97,708 | $552,307 | $47,862 | $1,194,641 | $262,808 | $84,113 | $130,741 | $32,972 | $59,025 | $3,860,025 |
| Total Financial and Derivative Net Assets | $14,034 | $191,994 | $(275,152) | $(239,616) | $134,512 | $(43,197) | $(188,902) | $(47,862) | $(572,181) | $(240,184) | $(84,113) | $(71,836) | $(9,231) | $(22,000) | $(1,453,734) |
| Total collateral received (pledged)##† | $— | $113,614 | $— | $(130,000) | $134,512 | $— | $(188,902) | $— | $(520,000) | $— | $— | $— | $— | $— | $(590,776) |
| Net amount | $14,034 | $78,380 | $(275,152) | $(109,616) | $— | $(43,197) | $— | $(47,862) | $(52,181) | $(240,184) | $(84,113) | $(71,836) | $(9,231) | $(22,000) | $(862,958) |
* Excludes premiums, if any. Included in unrealized appreciation and depreciation on OTC swap contracts on the Statement of assets and liabilities.
** Included with Investments in securities on the Statement of assets and liabilities.
† Additional collateral may be required from certain brokers based on individual agreements.
# Covered by master netting agreement. (Note 1)
## Any over-collateralization of total financial and derivative net assets is not shown. Collateral may include amounts related to unsettled agreements.
§ Includes current day’s variation margin only as reported on the Statement of assets and liabilities, which is not collateralized. Cumulative appreciation/(depreciation) for futures contracts and centrally cleared swap contracts is represented in the tables listed after the fund’s portfolio.
| 74 Global Income Trust | Global Income Trust | 75 |
Shareholder meeting results (Unaudited)
February 27, 2014 special meeting
At the meeting, each of the nominees for Trustees was elected as follows:
| Votes for | Votes withheld | |
| Liaquat Ahamed | 15,617,405 | 576,121 |
| Ravi Akhoury | 15,613,510 | 580,016 |
| Barbara M. Baumann | 15,690,242 | 503,284 |
| Jameson A. Baxter | 15,637,895 | 555,631 |
| Charles B. Curtis | 15,606,957 | 586,569 |
| Robert J. Darretta | 15,641,288 | 552,238 |
| Katinka Domotorffy | 15,629,258 | 564,268 |
| John A. Hill | 15,623,229 | 570,296 |
| Paul L. Joskow | 15,631,179 | 562,347 |
| Kenneth R. Leibler | 15,638,251 | 555,275 |
| Robert E. Patterson | 15,635,755 | 557,771 |
| George Putnam, III | 15,638,327 | 555,198 |
| Robert L. Reynolds | 15,634,472 | 559,054 |
| W. Thomas Stephens | 15,620,299 | 573,227 |
A proposal to approve a new management contract between the fund and Putnam Management was approved as follows:
| Votes | Votes | Broker | |
| for | against | Abstentions | non-votes |
| 12,343,174 | 329,809 | 547,464 | 2,973,079 |
March 27, 2014 special meeting
A proposal to adopt an Amended and Restated Declaration of Trust, with respect to which the February 27, 2014 meeting had been adjourned, was approved as follows:
| Votes | Votes | Broker | |
| for | against | Abstentions | non-votes |
| 12,532,580 | 1,234,191 | 656,273 | 2,674,337 |
All tabulations are rounded to the nearest whole number.
| 76 Global Income Trust |
Fund information
Founded over 75 years ago, Putnam Investments was built around the concept that a balance between risk and reward is the hallmark of a well-rounded financial program. We manage over 100 funds across income, value, blend, growth, asset allocation, absolute return, and global sector categories.
| Investment Manager | Trustees | Robert T. Burns |
| Putnam Investment | Jameson A. Baxter, Chair | Vice President and |
| Management, LLC | Liaquat Ahamed | Chief Legal Officer |
| One Post Office Square | Ravi Akhoury | |
| Boston, MA 02109 | Barbara M. Baumann | Robert R. Leveille |
| Charles B. Curtis | Vice President and | |
| Investment Sub-Manager | Robert J. Darretta | Chief Compliance Officer |
| Putnam Investments Limited | Katinka Domotorffy | |
| 57–59 St James’s Street | John A. Hill | Michael J. Higgins |
| London, England SW1A 1LD | Paul L. Joskow | Vice President, Treasurer, |
| Kenneth R. Leibler | and Clerk | |
| Marketing Services | Robert E. Patterson | |
| Putnam Retail Management | George Putnam, III | Janet C. Smith |
| One Post Office Square | Robert L. Reynolds | Vice President, |
| Boston, MA 02109 | W. Thomas Stephens | Principal Accounting Officer, |
| and Assistant Treasurer | ||
| Custodian | Robert L. Reynolds | |
| State Street Bank | President | Susan G. Malloy |
| and Trust Company | Vice President and | |
| Jonathan S. Horwitz | Assistant Treasurer | |
| Legal Counsel | Executive Vice President, | |
| Ropes & Gray LLP | Principal Executive Officer, and | James P. Pappas |
| Compliance Liaison | Vice President | |
| Steven D. Krichmar | Mark C. Trenchard | |
| Vice President and | Vice President and | |
| Principal Financial Officer | BSA Compliance Officer | |
| Nancy E. Florek | ||
| Vice President, Director of | ||
| Proxy Voting and Corporate | ||
| Governance, Assistant Clerk, | ||
| and Associate Treasurer |
This report is for the information of shareholders of Putnam Global Income Trust. It may also be used as sales literature when preceded or accompanied by the current prospectus, the most recent copy of Putnam’s Quarterly Performance Summary, and Putnam’s Quarterly Ranking Summary. For more recent performance, please visit putnam.com. Investors should carefully consider the investment objectives, risks, charges, and expenses of a fund, which are described in its prospectus. For this and other information or to request a prospectus or summary prospectus, call 1-800-225-1581 toll free. Please read the prospectus carefully before investing. The fund’s Statement of Additional Information contains additional information about the fund’s Trustees and is available without charge upon request by calling 1-800-225-1581.
| Item 2. Code of Ethics: |
| Not applicable |
| Item 3. Audit Committee Financial Expert: |
| Not applicable |
| Item 4. Principal Accountant Fees and Services: |
| Not applicable |
| Item 5. Audit Committee of Listed Registrants |
| Not applicable |
| Item 6. Schedule of Investments: |
| The registrant’s schedule of investments in unaffiliated issuers is included in the report to shareholders in Item 1 above. |
| Item 7. Disclosure of Proxy Voting Policies and Procedures For Closed-End Management Investment Companies: |
| Not applicable |
| Item 8. Portfolio Managers of Closed-End Investment Companies |
| Not Applicable |
| Item 9. Purchases of Equity Securities by Closed-End Management Investment Companies and Affiliated Purchasers: |
| Not applicable |
| Item 10. Submission of Matters to a Vote of Security Holders: |
| Not applicable |
| Item 11. Controls and Procedures: |
| (a) The registrant’s principal executive officer and principal financial officer have concluded, based on their evaluation of the effectiveness of the design and operation of the registrant’s disclosure controls and procedures as of a date within 90 days of the filing date of this report, that the design and operation of such procedures are generally effective to provide reasonable assurance that information required to be disclosed by the registrant in this report is recorded, processed, summarized and reported within the time periods specified in the Commission’s rules and forms. |
| (b) Changes in internal control over financial reporting: Not applicable |
| Item 12. Exhibits: |
| (a)(1) Not applicable |
| (a)(2) Separate certifications for the principal executive officer and principal financial officer of the registrant as required by Rule 30a-2(a) under the Investment Company Act of 1940, as amended, are filed herewith. |
| (b) The certifications required by Rule 30a-2(b) under the Investment Company Act of 1940, as amended, are filed herewith. |
| Putnam Global Income Trust |
| By (Signature and Title): |
| /s/Janet C. Smith Janet C. Smith Principal Accounting Officer |
| Date: June 26, 2014 |
| Pursuant to the requirements of the Securities Exchange Act of 1934 and the Investment Company Act of 1940, this report has been signed below by the following persons on behalf of the registrant and in the capacities and on the dates indicated. |
| By (Signature and Title): |
| /s/Jonathan S. Horwitz Jonathan S. Horwitz Principal Executive Officer |
| Date: June 26, 2014 |
| By (Signature and Title): |
| /s/Steven D. Krichmar Steven D. Krichmar Principal Financial Officer |
| Date: June 26, 2014 |