| UNITED STATES SECURITIES AND EXCHANGE COMMISSION | ||
| Washington, D.C. 20549 | ||
FORM N-CSR | ||
| CERTIFIED SHAREHOLDER REPORT OF REGISTERED MANAGEMENT INVESTMENT COMPANIES | ||
| Investment Company Act file number: | (811-04524) |
| Exact name of registrant as specified in charter: | Putnam Global Income Trust |
| Address of principal executive offices: | One Post Office Square, Boston, Massachusetts 02109 |
| Name and address of agent for service: | Robert T. Burns, Vice President One Post Office Square Boston, Massachusetts 02109 |
| Copy to: | Bryan Chegwidden, Esq. Ropes & Gray LLP 1211 Avenue of the Americas New York, New York 10036 |
| Registrant’s telephone number, including area code: | (617) 292-1000 |
| Date of fiscal year end: | October 31, 2015 |
| Date of reporting period: | November 1, 2014 – April 30, 2015 |
Item 1. Report to Stockholders: |
| The following is a copy of the report transmitted to stockholders pursuant to Rule 30e-1 under the Investment Company Act of 1940: | |||

Putnam
Global Income
Trust
Semiannual report
4 | 30 | 15
Message from the Trustees | 1 |
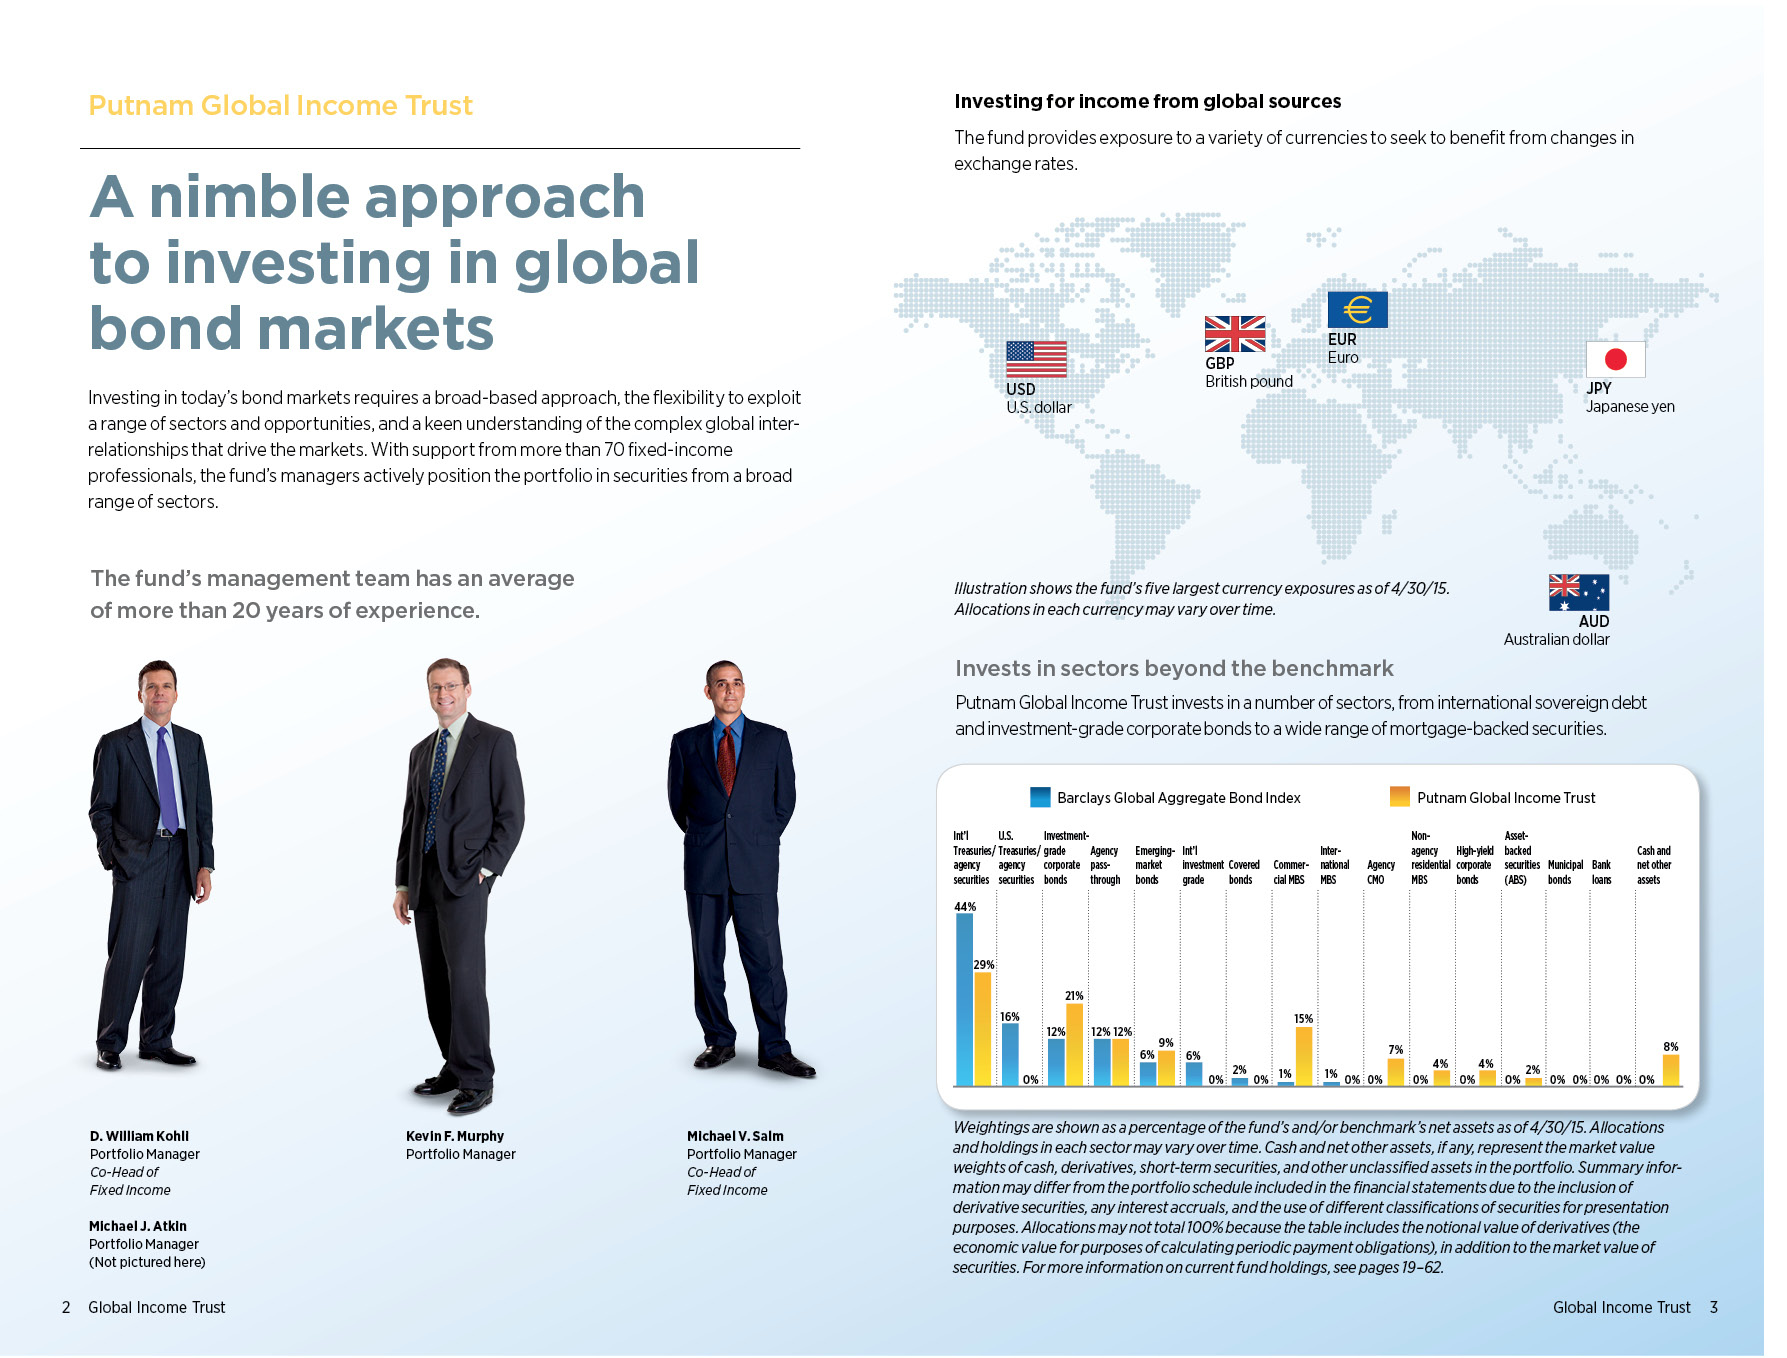
About the fund | 2 |
Performance snapshot | 4 |
Interview with your fund’s portfolio manager | 5 |
Your fund’s performance | 12 |
Your fund’s expenses | 14 |
Terms and definitions | 16 |
Other information for shareholders | 17 |
Financial statements | 18 |
Consider these risks before investing: International investing involves currency, economic, and political risks. Emerging-market securities carry illiquidity and volatility risks. Lower-rated bonds may offer higher yields in return for more risk. Funds that invest in government securities are not guaranteed. Mortgage-backed securities are subject to prepayment risk and the risk that they may increase in value less when interest rates decline and decline in value more when interest rates rise. The fund invests in fewer issuers or concentrates its investments by region or sector, and involves more risk than a more broadly invested fund. The fund’s policy of concentrating on a limited group of industries and the fund’s non-diversified status, which means the fund may invest in fewer issuers, can increase the fund’s vulnerability to common economic forces and may result in greater losses and volatility. Bond investments are subject to interest-rate risk (the risk of bond prices falling if interest rates rise) and credit risk (the risk of an issuer defaulting on interest or principal payments). Interest-rate risk is greater for longer-term bonds, and credit risk is greater for below-investment-grade bonds. Risks associated with derivatives include increased investment exposure (which may be considered leverage) and, in the case of over-the-counter instruments, the potential inability to terminate or sell derivatives positions and the potential failure of the other party to the instrument to meet its obligations. Unlike bonds, funds that invest in bonds have fees and expenses. The value of bonds in the fund’s portfolio may fall or fail to rise over extended periods of time for a variety of reasons, including general financial market conditions, changing market perceptions of the risk of default, changes in government intervention, and factors related to a specific issuer or industry. These factors may also lead to periods of high volatility and reduced liquidity in the bond markets. You can lose money by investing in the fund.
Message from the Trustees
Dear Fellow Shareholder:
With the midway point of 2015 at hand, we note the sixth anniversary of the beginning of the U.S. economic expansion as dated by the National Bureau of Economic Research, which tracks the ups and downs of U.S. business cycles. It has also been six years since the beginning of the current bull market in U.S. stocks.
Both the expansion and the bull market are longer than average, and both appear to owe their longevity, to some degree, to the extraordinary policy measures undertaken by the Federal Reserve. Recently, however, the Fed has been preparing markets for a shift toward tighter monetary policy. Short-term interest rates could increase for the first time since 2006.
While higher interest rates can be a reflection of solid economic conditions, they can also pose a risk to fixed-income investments, and can have a less direct impact on stocks. International markets, which have performed well in early 2015, would also feel the effects of higher rates in the world’s largest economy. In the following pages, your fund’s portfolio manager provides a market outlook in addition to an update on your fund’s performance.
With the possibility that markets could begin to move in different directions, it might be a prudent time to consult your financial advisor to determine whether any adjustments or additions to your portfolio are warranted.
As the owner of a Putnam fund, you have put your investment in the hands of professional managers who pursue a consistent strategy and have experience in navigating changing market conditions. They, and we, share a deep conviction that an active approach based on fundamental research can play a valuable role in your portfolio.
As always, thank you for investing with Putnam.
Respectfully yours,

Robert L. Reynolds
President and Chief Executive Officer
Putnam Investments

Jameson A. Baxter
Chair, Board of Trustees
June 9, 2015

Performance
snapshot
Annualized total return (%) comparison as of 4/30/15
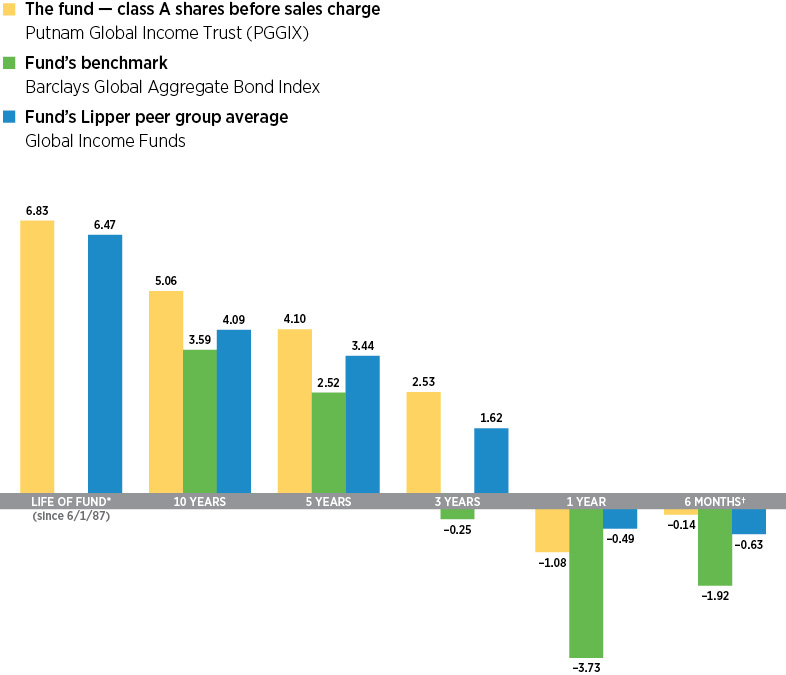
Current performance may be lower or higher than the quoted past performance, which cannot guarantee future results. Share price, principal value, and return will fluctuate, and you may have a gain or a loss when you sell your shares. Performance of class A shares assumes reinvestment of distributions and does not account for taxes. Fund returns in the bar chart do not reflect a sales charge of 4.00%; had they, returns would have been lower. See pages 5 and 12–14 for additional performance information. For a portion of the periods, the fund had expense limitations, without which returns would have been lower. To obtain the most recent month-end performance, visit putnam.com.
*The fund’s benchmark, the Barclays Global Aggregate Bond Index, was introduced on 12/31/89, which post-dates the inception of the fund’s class A shares.
†Returns for the six-month period are not annualized, but cumulative.
4 Global Income Trust
Interview with your fund’s portfolio manager
|
D. William Kohli |

Bill, what was the environment like in global bond markets during the six months ended April 30, 2015?
The period was punctuated by episodes of interest-rate volatility, but rates generally moved lower. We were not surprised to see some degree of rate volatility, given that the Federal Reserve ended its bond-buying program immediately prior to the period. In doing so, the Fed removed a major source of demand for intermediate-maturity U.S. Treasuries and agency mortgage-backed securities. Additionally, in January, the European Central Bank [ECB] officially announced its version of quantitative easing, with the goal of stimulating eurozone economies and fending off deflation in the region.
January was a pivotal month during the period, as the combination of a stock market pullback, weaker-than-expected U.S. economic data, and doubts about the efficacy of the ECB’s stimulus program fueled investors’ appetite for government bonds. Against this backdrop, the yield on the benchmark 10-year U.S. Treasury fell to 1.64%, its low for the period. In February, concern that the U.S. central bank might start raising rates in June hampered Treasuries, causing prices to fall and yields to rise. During March, however, dovish comments by Fed Chair Janet Yellen reassured investors that

Broad market index and fund performance
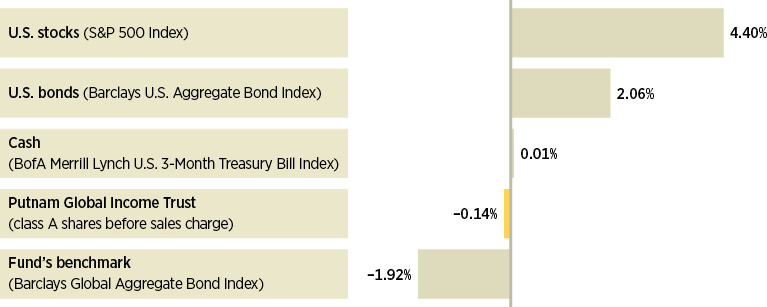
This comparison shows your fund’s performance in the context of broad market indexes for the six months ended 4/30/15. See pages 4 and 12–14 for additional fund performance information. Index descriptions can be found on page 17.
Global Income Trust 5
the central bank is likely to take a deliberate approach when it begins raising rates, which helped Treasuries modestly rebound. In late April, however, Treasury yields rose once again as a selloff in German government bonds highlighted concerns about elevated bond valuations and dampened investor demand for securities considered to be global safe havens.
The U.S. dollar declined in April, interrupting its steady march higher since last summer. It was pulled down in part by an anemic 0.2% growth rate for U.S. gross domestic product [GDP] in 2015’s first quarter. The weak GDP reading gave investors pause regarding the Fed’s interest-rate policy, leading to speculation that an increase in the federal funds rate could be pushed further into the future, creating a possible headwind to dollar strength.
Crude oil prices, after bottoming at just over $47 per barrel in mid-March, rose and ended the period at $59.63 on the New York Mercantile Exchange. Signs that U.S.
Portfolio composition
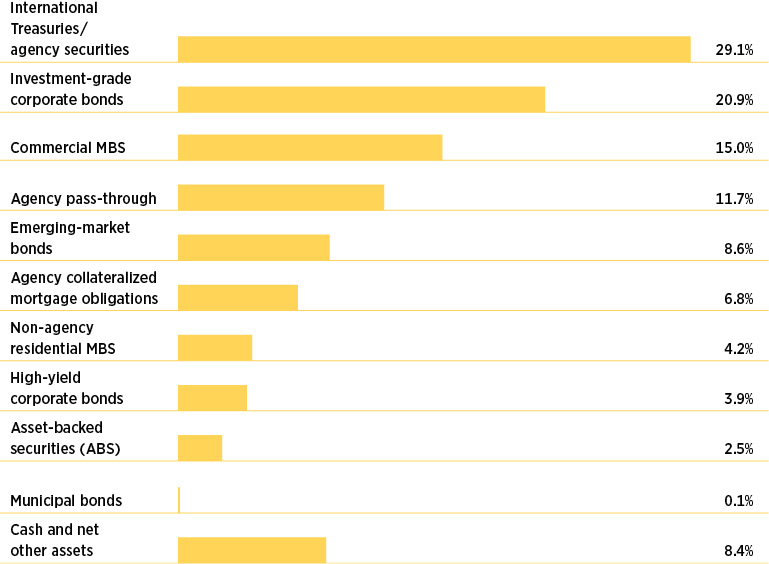
Allocations are shown as a percentage of the fund’s net assets as of 4/30/15. Cash and net other assets, if any, represent the market value weights of cash, derivatives, short-term securities, and other unclassified assets in the portfolio. Summary information may differ from the portfolio schedule included in the financial statements due to the inclusion of derivative securities, any interest accruals, and the use of different classifications of securities for presentation purposes. Allocations may not total 100% because the table includes the notional value of derivatives (the economic value for purposes of calculating period payment obligations), in addition to the market value of securities. Holdings and allocations may vary over time.
6 Global Income Trust
“Although first-quarter GDP growth
was disappointing, we remain positive
on the U.S. economic recovery.”
Bill Kohli
oil production may be peaking and global energy demand may be rising, coupled with a weaker U.S. dollar, buoyed the commodity’s price.
The fund posted a negative absolute return at net asset value, but outpaced its benchmark and the average return of its Lipper peer group. What factors aided relative performance?
Relative to the benchmark, our active currency strategy was a major contributor, led by underweight exposure to the euro, which weakened versus the U.S. dollar until this pattern reversed in April. An underweight to the Japanese yen toward the beginning of the period also helped.
Credit quality overview
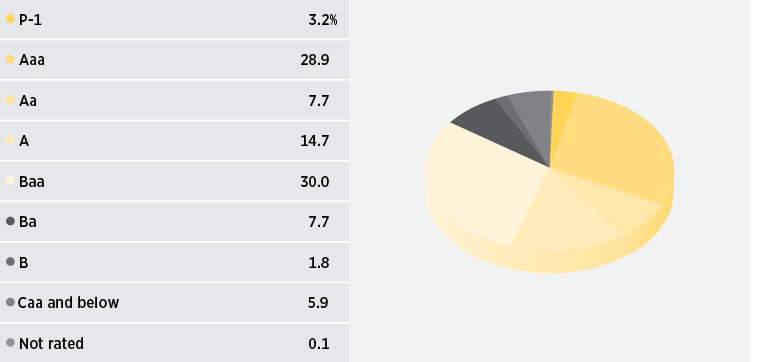
Credit qualities are shown as a percentage of the fund’s net assets as of 4/30/15. A bond rated Baa or higher (Prime-3 or higher, for short-term debt) is considered investment grade. The chart reflects Moody’s ratings; percentages may include bonds or derivatives not rated by Moody’s but rated by Standard & Poor’s (S&P) or, if unrated by S&P, by Fitch ratings, and then included in the closest equivalent Moody’s rating based on analysis of these agencies’ respective ratings criteria. Moody’s ratings are used in recognition of its prominence among rating agencies and breadth of coverage of rated securities. To-be-announced (TBA) mortgage commitments, if any, are included based on their issuer ratings. Ratings may vary over time.
Derivative instruments, including forward currency contracts, are only included to the extent of any unrealized gain or loss on such instruments and are shown in the not-rated category. Cash is also shown in the not-rated category. Derivative offset values are included in the not-rated category and may result in negative weights. The fund itself has not been rated by an independent rating agency.
Global Income Trust 7
Our mortgage credit investments, specifically positions in subordinated mezzanine commercial mortgage-backed securities [CMBS], also modestly contributed. Mezzanine CMBS benefited from supportive commercial real estate fundamentals, a generally improving U.S. economy, and persistent investor demand for higher-yielding bonds.
Various tactical trades that were designed to benefit from the difference between current mortgage rates and Treasury yields also moderately aided the fund’s relative performance.
Holdings of emerging-market debt, principally in Russia and Argentina, provided a further modest boost to performance. Rising oil prices toward the end of the period bolstered the returns of our investments in both of these markets. Russian debt also benefited from a February cease-fire in Ukraine, along with the fact that economic sanctions against the country did not become more burdensome.
Comparison of currency exposures
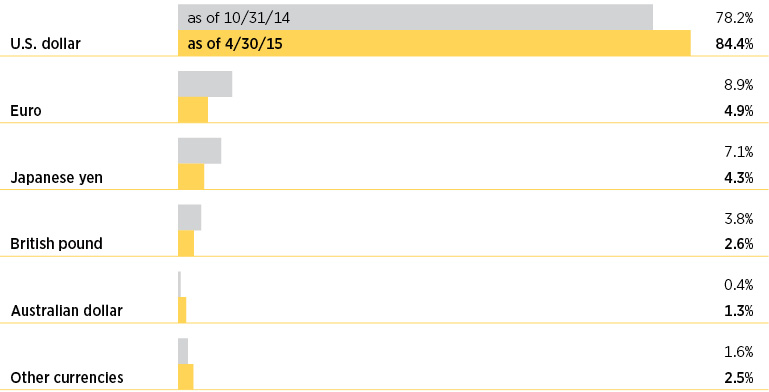
This chart shows how the fund’s top currency holdings have changed over the last six months. Allocations are shown as a percentage of the fund’s net assets. Holdings and allocations may vary over time.
8 Global Income Trust
Which strategies didn’t work as well this past six months?
The fund’s interest-rate and yield-curve positioning in the United States and Europe was the primary detractor versus the benchmark. In the United States, we continued our strategy of seeking to avoid directional interest-rate risk by keeping the portfolio’s duration — a key measure of interest-rate sensitivity — shorter than that of the benchmark. Unfortunately, because rates fell significantly in January, and trended lower for the period as a whole, this positioning worked against the fund’s performance.
In Europe, performance was hampered by our duration adjustments relative to German government bond yields. The fund was positioned with a relatively short duration in Germany as the country’s rates declined. Then we shifted to a long-duration position in April to hedge against risk in Greece. Unfortunately, German yields rose slightly in April, dampening the fund’s performance. In addition, our exposure to Greece detracted as Greek yields rose. Increasing uncertainty about Greece’s prospects for accessing new financing and its desire to remain within the European Union weighed on the country’s bonds.
Within corporate credit, our allocation to investment-grade bonds slightly dampened relative performance, primarily during the period’s first half when underperformance in the energy sector weighed on credit markets.
How did you use derivatives during the period?
We used bond futures and interest-rate swaps to take tactical positions at various points along the yield curve, and to hedge the risk associated with the fund’s curve positioning. We also employed interest-rate swaps to help manage the fund’s duration and yield-curve positioning, and to gain exposure to interest rates in various countries. We used options for similar reasons, and to also help manage
ABOUT DERIVATIVES
Derivatives are an increasingly common type of investment instrument, the performance of which is derived from an underlying security, index, currency, or other area of the capital markets. Derivatives employed by the fund’s managers generally serve one of two main purposes: to implement a strategy that may be difficult or more expensive to invest in through traditional securities, or to hedge unwanted risk associated with a particular position.
For example, the fund’s managers might use currency forward contracts to capitalize on an anticipated change in exchange rates between two currencies. This approach would require a significantly smaller outlay of capital than purchasing traditional bonds denominated in the underlying currencies. In another example, the managers may identify a bond that they believe is undervalued relative to its risk of default, but may seek to reduce the interest-rate risk of that bond by using interest-rate swaps, a derivative through which two parties “swap” payments based on the movement of certain rates.
Like any other investment, derivatives may not appreciate in value and may lose money. Derivatives may amplify traditional investment risks through the creation of leverage and may be less liquid than traditional securities. And because derivatives typically represent contractual agreements between two financial institutions, derivatives entail “counterparty risk,” which is the risk that the other party is unable or unwilling to pay. Putnam monitors the counterparty risks we assume. For example, Putnam often enters into collateral agreements that require the counterparties to post collateral on a regular basis to cover their obligations to the fund. Counterparty risk for exchange-traded futures and centrally cleared swaps is mitigated by the daily exchange of margin and other safeguards against default through their respective clearinghouses.
Global Income Trust 9
various downside risks. Additionally, we utilized total return swaps as a hedging tool, and to help manage the portfolio’s sector exposure, as well as its inflation risk. We employed credit default swaps to hedge the fund’s credit and market risk, and to access specific securities in various market sectors. Lastly, we used currency forward contracts to hedge the foreign exchange risk associated with non-U.S. bonds and to efficiently gain exposure to foreign currencies.
What is your outlook for the coming months, and how are you positioning the fund?
Although first-quarter GDP growth was disappointing, we remain positive on the U.S. economic recovery. We believe the first quarter slowdown was largely the result of weaker-than-expected consumer spending despite lower oil and gas prices, along with harsh winter weather in many parts of the country.
During the past year, rising hourly wages and lower gasoline prices benefited lower-wage workers, which we thought would bolster personal consumption expenditures. However, rather than spending more, these consumers increased their savings. Quite recently, though, data suggest this trend may be reversing to some degree, in keeping with our fundamental view. According to the Commerce Department, personal spending increased slightly in February and March, after being down in December and January. At the same time, the personal savings rate reached 5.7% in February, its highest level since the end of 2012, but declined to 5.3% in March. In our view, as the effects of an unseasonably cold winter in the East and Midwest dissipate, we think consumer spending will rise.
We continue to believe that the Fed is likely to begin raising its target for short-term interest rates sometime in 2015. However, as of period-end, inflation remained stubbornly below the central bank’s 2% target. As a result, we think the first increase won’t occur until the Fed sees enough consistent data to persuade it that the U.S. recovery is accelerating.
Globally, we believe economies are currently in one of the most disparate growth cycles since the mid- to late-1990s. Capital is flowing from the eurozone and elsewhere into the United States, as investors seek to capitalize on opportunities in stocks, high-yield bonds, mortgage-backed securities, and government debt. As a result, developing markets are under pressure since many of those economies require capital inflows to maintain their fiscal and monetary programs. Because of this trend, we’re not enthusiastic about near-term prospects in emerging markets overall, although we continue to find what we believe are attractive country-specific investment opportunities.
Within this environment, we plan to maintain our diversified mortgage, corporate, and sovereign credit exposure primarily through allocations to mezzanine CMBS, investment-grade corporate bonds, and peripheral European sovereign bonds, respectively. As for prepayment risk, we expect to retain our holdings of government-agency interest-only collateralized mortgage obligations. We should note that we are cognizant of a risk emanating from a new Federal Housing Administration policy that reduces the mortgage insurance premiums charged to certain borrowers. While we acknowledge that this policy could accelerate refinancing to some extent, we believe it is unlikely to have a major impact on the overall pace of residential refinancing. What’s more, we continue to find prepayment risk attractive, given the potential for higher interest rates as the U.S. economic recovery matures. We’re also excited about ongoing opportunities we see in the foreign-exchange market. Many of the fundamental drivers of currency
10 Global Income Trust
performance, such as divergent trends in U.S. and foreign economic growth and monetary policies, appear to be gaining momentum, in our view.
Thanks for your time and for bringing us up to date, Bill.
The views expressed in this report are exclusively those of Putnam Management and are subject to change. They are not meant as investment advice.
Please note that the holdings discussed in this report may not have been held by the fund for the entire period. Portfolio composition is subject to review in accordance with the fund’s investment strategy and may vary in the future. Current and future portfolio holdings are subject to risk.
Portfolio Manager D. William Kohli is Co-Head of Fixed Income at Putnam. He has an M.B.A. from the Haas School of Business at the University of California, Berkeley, and a B.A. from the University of California, San Diego. Bill joined Putnam in 1994 and has been in the investment industry since 1986.
In addition to Bill, your fund’s portfolio managers are Michael J. Atkin, Kevin F. Murphy, and Michael V. Salm.
IN THE NEWS
There seems to be momentum in the U.S. equities market, which is now in its third-longest bull run since 1928. Inflation, as measured by the Consumer Price Index, was –0.1% before seasonal adjustment for the 12 months ended March 31, 2015, according to the Bureau of Labor Statistics. Low inflation and a resilient U.S. economy generally provide a supportive environment for equities. However, investors appear to be more cautious than celebratory. Uncertainties include the timing of the Federal Reserve’s decision to implement the first hike in short-term interest rates since 2006 and whether the strong dollar could continue to worsen the trade balance, which could in turn reduce gross domestic product. In March, exports grew by less than 1%, according to the Bureau of Economic Analysis, compared with a 7.7% jump in imports in the same month. For now, the S&P 500 Index continues to hover around the 2100 mark. Investors should keep in mind that equities tend to perform well when short-term rates are rising from low levels. The reason is, in part, because rising rates typically signal an improving economy.
Global Income Trust 11
Your fund’s performance |
This section shows your fund’s performance, price, and distribution information for periods ended April 30, 2015, the end of the first half of its current fiscal year. In accordance with regulatory requirements for mutual funds, we also include performance information as of the most recent calendar quarter-end and expense information taken from the fund’s current prospectus. Performance should always be considered in light of a fund’s investment strategy. Data represent past performance. Past performance does not guarantee future results. More recent returns may be less or more than those shown. Investment return and principal value will fluctuate, and you may have a gain or a loss when you sell your shares. Performance information does not reflect any deduction for taxes a shareholder may owe on fund distributions or on the redemption of fund shares. For the most recent month-end performance, please visit the Individual Investors section at putnam.com or call Putnam at 1-800-225-1581. Class R, R5, R6, and Y shares are not available to all investors. See the Terms and Definitions section in this report for definitions of the share classes offered by your fund. |
Fund performance Total return for periods ended 4/30/15
Class A | Class B | Class C | Class M | Class R | Class R5 | Class R6 | Class Y | |||||
(inception dates) | (6/1/87) | (2/1/94) | (7/26/99) | (3/17/95) | (12/1/03) | (7/2/12) | (7/2/12) | (10/4/05) | ||||
Before sales charge | After sales charge | Before CDSC | After CDSC | Before CDSC | After CDSC | Before sales charge | After sales charge | Net | Net | Net | Net | |
Annual average | ||||||||||||
(life of fund) | 6.83% | 6.67% | 6.58% | 6.58% | 6.03% | 6.03% | 6.53% | 6.41% | 6.56% | 6.93% | 6.93% | 6.92% |
10 years | 63.88 | 57.32 | 54.28 | 54.28 | 52.17 | 52.17 | 59.84 | 54.64 | 59.84 | 68.13 | 68.34 | 67.95 |
Annual average | 5.06 | 4.64 | 4.43 | 4.43 | 4.29 | 4.29 | 4.80 | 4.46 | 4.80 | 5.33 | 5.35 | 5.32 |
5 years | 22.26 | 17.37 | 17.77 | 15.79 | 17.81 | 17.81 | 20.69 | 16.76 | 20.77 | 24.03 | 24.18 | 23.89 |
Annual average | 4.10 | 3.25 | 3.32 | 2.98 | 3.33 | 3.33 | 3.83 | 3.15 | 3.85 | 4.40 | 4.43 | 4.38 |
3 years | 7.77 | 3.46 | 5.40 | 2.45 | 5.48 | 5.48 | 7.01 | 3.54 | 7.05 | 8.74 | 8.88 | 8.62 |
Annual average | 2.53 | 1.14 | 1.77 | 0.81 | 1.79 | 1.79 | 2.29 | 1.17 | 2.30 | 2.83 | 2.88 | 2.80 |
1 year | –1.08 | –5.03 | –1.82 | –6.62 | –1.74 | –2.70 | –1.28 | –4.48 | –1.27 | –0.65 | –0.65 | –0.73 |
6 months | –0.14 | –4.14 | –0.51 | –5.43 | –0.51 | –1.50 | –0.28 | –3.52 | –0.28 | 0.07 | 0.03 | –0.01 |
Current performance may be lower or higher than the quoted past performance, which cannot guarantee future results. After-sales-charge returns for class A and M shares reflect the deduction of the maximum 4.00% and 3.25% sales charge, respectively, levied at the time of purchase. Class B share returns after contingent deferred sales charge (CDSC) reflect the applicable CDSC, which is 5% in the first year, declining over time to 1% in the sixth year, and is eliminated thereafter. Class C share returns after CDSC reflect a 1% CDSC for the first year that is eliminated thereafter. Class R, R5, R6, and Y shares have no initial sales charge or CDSC. Performance for class B, C, M, R, and Y shares before their inception is derived from the historical performance of class A shares, adjusted for the applicable sales charge (or CDSC) and the higher operating expenses for such shares, except for class Y shares, for which 12b-1 fees are not applicable. Performance for class R5 and R6 shares prior to their inception is derived from the historical performance of class Y shares and has not been adjusted for the lower investor servicing fees applicable to class R5 and R6 shares; had it, returns would have been higher.
For a portion of the periods, the fund had expense limitations, without which returns would have been lower.
Class B share performance reflects conversion to class A shares after eight years.
12 Global Income Trust
Comparative index returns For periods ended 4/30/15
Barclays Global Aggregate Bond Index | Lipper Global Income Funds category average* | |
Annual average (life of fund) | —† | 6.47% |
10 years | 42.25% | 49.97 |
Annual average | 3.59 | 4.09 |
5 years | 13.25 | 18.68 |
Annual average | 2.52 | 3.44 |
3 years | –0.74 | 5.08 |
Annual average | –0.25 | 1.62 |
1 year | –3.73 | –0.49 |
6 months | –1.92 | –0.63 |
Index and Lipper results should be compared with fund performance before sales charge, before CDSC, or at net asset value.
*Over the 6-month, 1-year, 3-year, 5-year, 10-year, and life-of-fund periods ended 4/30/15, there were 217, 213, 160, 120, 74, and 2 funds, respectively, in this Lipper category.
†The fund’s benchmark, the Barclays Global Aggregate Bond Index, was introduced on 12/31/89, which post-dates the inception of the fund’s class A shares.
Fund price and distribution information For the six-month period ended 4/30/15
Distributions | Class A | Class B | Class C | Class M | Class R | Class R5 | Class R6 | Class Y | ||
Number | 6 | 6 | 6 | 6 | 6 | 6 | 6 | 6 | ||
Income | $0.192 | $0.146 | $0.146 | $0.175 | $0.175 | $0.209 | $0.214 | $0.208 | ||
Capital gains | — | — | — | — | — | — | — | — | ||
Total | $0.192 | $0.146 | $0.146 | $0.175 | $0.175 | $0.209 | $0.214 | $0.208 | ||
Share value | Before | After sales charge | Net asset | Net asset | Before | After sales charge | Net asset | Net asset | Net asset | Net asset |
10/31/14 | $12.60 | $13.13 | $12.54 | $12.55 | $12.48 | $12.90 | $12.58 | $12.60 | $12.60 | $12.60 |
4/30/15 | 12.39 | 12.91 | 12.33 | 12.34 | 12.27 | 12.68 | 12.37 | 12.40 | 12.39 | 12.39 |
Current rate (end of period) | Before | After | Net asset | Net asset | Before | After | Net asset | Net asset | Net asset | Net asset |
Current dividend rate 1 | 3.10% | 2.97% | 2.34% | 2.33% | 2.84% | 2.74% | 2.72% | 3.39% | 3.49% | 3.39% |
Current 30-day SEC yield 2 | N/A | 2.22 | 1.56 | 1.56 | N/A | 1.99 | 2.05 | 2.54 | 2.65 | 2.56 |
The classification of distributions, if any, is an estimate. Before-sales-charge share value and current dividend rate for class A and M shares, if applicable, do not take into account any sales charge levied at the time of purchase. After-sales-charge share value, current dividend rate, and current 30-day SEC yield, if applicable, are calculated assuming that the maximum sales charge (4.00% for class A shares and 3.25% for class M shares) was levied at the time of purchase. Final distribution information will appear on your year-end tax forms.
1Most recent distribution, including any return of capital and excluding capital gains, annualized and divided by share price before or after sales charge at period-end.
2Based only on investment income and calculated using the maximum offering price for each share class, in accordance with SEC guidelines.
Global Income Trust 13
Fund performance as of most recent calendar quarter Total return for periods ended 3/31/15
Class A | Class B | Class C | Class M | Class R | Class R5 | Class R6 | Class Y | |||||
(inception dates) | (6/1/87) | (2/1/94) | (7/26/99) | (3/17/95) | (12/1/03) | (7/2/12) | (7/2/12) | (10/4/05) | ||||
Before sales charge | After sales charge | Before CDSC | After CDSC | Before CDSC | After CDSC | Before sales charge | After sales charge | Net | Net | Net | Net | |
Annual average | ||||||||||||
(life of fund) | 6.85% | 6.70% | 6.60% | 6.60% | 6.06% | 6.06% | 6.56% | 6.43% | 6.59% | 6.95% | 6.95% | 6.95% |
10 years | 65.89 | 59.25 | 56.29 | 56.29 | 54.05 | 54.05 | 61.81 | 56.55 | 61.81 | 70.15 | 70.35 | 69.96 |
Annual average | 5.19 | 4.76 | 4.57 | 4.57 | 4.42 | 4.42 | 4.93 | 4.58 | 4.93 | 5.46 | 5.47 | 5.45 |
5 years | 23.98 | 19.02 | 19.43 | 17.43 | 19.48 | 19.48 | 22.40 | 18.42 | 22.50 | 25.78 | 25.92 | 25.64 |
Annual average | 4.39 | 3.54 | 3.61 | 3.27 | 3.62 | 3.62 | 4.13 | 3.44 | 4.14 | 4.69 | 4.72 | 4.67 |
3 years | 8.57 | 4.23 | 6.19 | 3.22 | 6.18 | 6.18 | 7.82 | 4.31 | 7.85 | 9.55 | 9.68 | 9.43 |
Annual average | 2.78 | 1.39 | 2.02 | 1.06 | 2.02 | 2.02 | 2.54 | 1.42 | 2.55 | 3.09 | 3.13 | 3.05 |
1 year | –0.30 | –4.29 | –1.06 | –5.89 | –1.05 | –2.01 | –0.57 | –3.81 | –0.56 | 0.05 | 0.04 | –0.04 |
6 months | –1.31 | –5.26 | –1.68 | –6.54 | –1.60 | –2.58 | –1.38 | –4.59 | –1.36 | –1.02 | –1.07 | –1.11 |
See the discussion following the fund performance table on page 12 for information about the calculation of fund performance.
Your fund’s expenses |
As a mutual fund investor, you pay ongoing expenses, such as management fees, distribution fees (12b-1 fees), and other expenses. Using the following information, you can estimate how these expenses affect your investment and compare them with the expenses of other funds. You may also pay one-time transaction expenses, including sales charges (loads) and redemption fees, which are not shown in this section and would have resulted in higher total expenses. For more information, see your fund’s prospectus or talk to your financial representative. |
Expense ratios
Class A | Class B | Class C | Class M | Class R | Class R5 | Class R6 | Class Y | |
Total annual operating expenses for the fiscal year ended 10/31/14 | 1.09% | 1.84% | 1.84% | 1.34% | 1.34% | 0.82% | 0.75% | 0.84% |
Annualized expense ratio for the six-month period ended 4/30/15 | 1.09% | 1.84% | 1.84% | 1.34% | 1.34% | 0.81% | 0.74% | 0.84% |
Fiscal-year expense information in this table is taken from the most recent prospectus, is subject to change, and may differ from that shown for the annualized expense ratio and in the financial highlights of this report.
Expenses are shown as a percentage of average net assets.
14 Global Income Trust
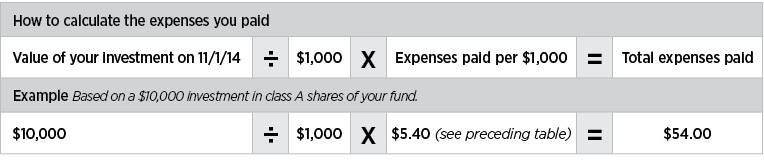
Expenses per $1,000
The following table shows the expenses you would have paid on a $1,000 investment in the fund from November 1, 2014, to April 30, 2015. It also shows how much a $1,000 investment would be worth at the close of the period, assuming actual returns and expenses.
Class A | Class B | Class C | Class M | Class R | Class R5 | Class R6 | Class Y | |
Expenses paid per $1,000*† | $5.40 | $9.10 | $9.10 | $6.64 | $6.64 | $4.02 | $3.67 | $4.17 |
Ending value (after expenses) | $998.60 | $994.90 | $994.90 | $997.20 | $997.20 | $1,000.70 | $1,000.30 | $999.90 |
*Expenses for each share class are calculated using the fund’s annualized expense ratio for each class, which represents the ongoing expenses as a percentage of average net assets for the six months ended 4/30/15. The expense ratio may differ for each share class.
†Expenses are calculated by multiplying the expense ratio by the average account value for the period; then multiplying the result by the number of days in the period; and then dividing that result by the number of days in the year.
Estimate the expenses you paid |
To estimate the ongoing expenses you paid for the six months ended April 30, 2015, use the following calculation method. To find the value of your investment on November 1, 2014, call Putnam at 1-800-225-1581. |
|
Compare expenses using the SEC’s method
The Securities and Exchange Commission (SEC) has established guidelines to help investors assess fund expenses. Per these guidelines, the following table shows your fund’s expenses based on a $1,000 investment, assuming a hypothetical 5% annualized return. You can use this information to compare the ongoing expenses (but not transaction expenses or total costs) of investing in the fund with those of other funds. All mutual fund shareholder reports will provide this information to help you make this comparison. Please note that you cannot use this information to estimate your actual ending account balance and expenses paid during the period.
Class A | Class B | Class C | Class M | Class R | Class R5 | Class R6 | Class Y | |
Expenses paid per $1,000*† | $5.46 | $9.20 | $9.20 | $6.71 | $6.71 | $4.06 | $3.71 | $4.21 |
Ending value (after expenses) | $1,019.39 | $1,015.67 | $1,015.67 | $1,018.15 | $1,018.15 | $1,020.78 | $1,021.12 | $1,020.63 |
*Expenses for each share class are calculated using the fund’s annualized expense ratio for each class, which represents the ongoing expenses as a percentage of average net assets for the six months ended 4/30/15. The expense ratio may differ for each share class.
†Expenses are calculated by multiplying the expense ratio by the average account value for the six-month period; then multiplying the result by the number of days in the six-month period; and then dividing that result by the number of days in the year.
Global Income Trust 15
Terms and definitions
Important terms
Total return shows how the value of the fund’s shares changed over time, assuming you held the shares through the entire period and reinvested all distributions in the fund.
Before sales charge, or net asset value, is the price, or value, of one share of a mutual fund, without a sales charge. Before-sales-charge figures fluctuate with market conditions, and are calculated by dividing the net assets of each class of shares by the number of outstanding shares in the class.
After sales charge is the price of a mutual fund share plus the maximum sales charge levied at the time of purchase. After-sales-charge performance figures shown here assume the 4.00% maximum sales charge for class A shares and 3.25% for class M shares.
Contingent deferred sales charge (CDSC) is generally a charge applied at the time of the redemption of class B or C shares and assumes redemption at the end of the period. Your fund’s class B CDSC declines over time from a 5% maximum during the first year to 1% during the sixth year. After the sixth year, the CDSC no longer applies. The CDSC for class C shares is 1% for one year after purchase.
Share classes
Class A shares are generally subject to an initial sales charge and no CDSC (except on certain redemptions of shares bought without an initial sales charge).
Class B shares are not subject to an initial sales charge and may be subject to a CDSC.
Class C shares are not subject to an initial sales charge and are subject to a CDSC only if the shares are redeemed during the first year.
Class M shares have a lower initial sales charge and a higher 12b-1 fee than class A shares and no CDSC (except on certain redemptions of shares bought without an initial sales charge).
Class R shares are not subject to an initial sales charge or CDSC and are available only to employer-sponsored retirement plans.
Class R5 and R6 shares are not subject to an initial sales charge or CDSC, and carry no 12b-1 fee. They are only available to employer-sponsored retirement plans.
Class Y shares are not subject to an initial sales charge or CDSC, and carry no 12b-1 fee. They are generally only available to corporate and institutional clients and clients in other approved programs.
Fixed-income terms
Current rate is the annual rate of return earned from dividends or interest of an investment. Current rate is expressed as a percentage of the price of a security, fund share, or principal investment.
Mortgage-backed security (MBS), also known as a mortgage “pass-through,” is a type of asset-backed security that is secured by a mortgage or collection of mortgages. The following are types of MBSs:
•Agency “pass-through” has its principal and interest backed by a U.S. government agency, such as the Federal National Mortgage Association (Fannie Mae), Government National Mortgage Association (Ginnie Mae), and Federal Home Loan Mortgage Corporation (Freddie Mac).
•Collateralized mortgage obligation (CMO) represents claims to specific cash flows from pools of home mortgages. The streams of principal and interest payments on the mortgages are distributed to the different classes of CMO interests in “tranches.” Each tranche may have different principal balances, coupon rates, prepayment risks, and maturity dates. A CMO is highly sensitive to changes in interest rates and any resulting change in the rate at which homeowners sell their properties, refinance, or otherwise prepay loans. CMOs are subject to prepayment, market, and liquidity risks.
•Interest-only (IO) security is a type of CMO in which the underlying asset is the interest portion of mortgage, Treasury, or bond payments.
•Non-agency residential mortgage-backed security (RMBS) is an MBS not backed by Fannie Mae, Ginnie Mae, or Freddie Mac. One type of RMBS is an Alt-A mortgage-backed security.
•Commercial mortgage-backed security (CMBS) is secured by the loan on a commercial property.
Yield curve is a graph that plots the yields of bonds with equal credit quality against their differing maturity dates, ranging from shortest to longest. It is used as a benchmark for other debt, such as mortgage or bank lending rates.
16 Global Income Trust
Comparative indexes
Barclays Global Aggregate Bond Index is an unmanaged index of global investment-grade fixed-income securities.
Barclays U.S. Aggregate Bond Index is an unmanaged index of U.S. investment-grade fixed-income securities.
BofA Merrill Lynch U.S. 3-Month Treasury Bill Index is an unmanaged index that seeks to measure the performance of U.S. Treasury bills available in the marketplace.
S&P 500 Index is an unmanaged index of common stock performance.
Indexes assume reinvestment of all distributions and do not account for fees. Securities and performance of a fund and an index will differ. You cannot invest directly in an index.
Lipper is a third-party industry-ranking entity that ranks mutual funds. Its rankings do not reflect sales charges. Lipper rankings are based on total return at net asset value relative to other funds that have similar current investment styles or objectives as determined by Lipper. Lipper may change a fund’s category assignment at its discretion. Lipper category averages reflect performance trends for funds within a category.
Other information for shareholders
Important notice regarding delivery of shareholder documents
In accordance with Securities and Exchange Commission (SEC) regulations, Putnam sends a single copy of annual and semiannual shareholder reports, prospectuses, and proxy statements to Putnam shareholders who share the same address, unless a shareholder requests otherwise. If you prefer to receive your own copy of these documents, please call Putnam at 1-800-225-1581, and Putnam will begin sending individual copies within 30 days.
Proxy voting
Putnam is committed to managing our mutual funds in the best interests of our shareholders. The Putnam funds’ proxy voting guidelines and procedures, as well as information regarding how your fund voted proxies relating to portfolio securities during the 12-month period ended June 30, 2014, are available in the Individual Investors section of putnam.com, and on the SEC’s website, www.sec.gov. If you have questions about finding forms on the SEC’s website, you may call the SEC at 1-800-SEC-0330. You may also obtain the Putnam funds’ proxy voting guidelines and procedures at no charge by calling Putnam’s Shareholder Services at 1-800-225-1581.
Fund portfolio holdings
The fund will file a complete schedule of its portfolio holdings with the SEC for the first and third quarters of each fiscal year on Form N-Q. Shareholders may obtain the fund’s Form N-Q on the SEC’s website at www.sec.gov. In addition, the fund’s Form N-Q may be reviewed and copied at the SEC’s Public Reference Room in Washington, D.C. You may call the SEC at 1-800-SEC-0330 for information about the SEC’s website or the operation of the Public Reference Room.
Trustee and employee fund ownership
Putnam employees and members of the Board of Trustees place their faith, confidence, and, most importantly, investment dollars in Putnam mutual funds. As of April 30, 2015, Putnam employees had approximately $498,000,000 and the Trustees had approximately $142,000,000 invested in Putnam mutual funds. These amounts include investments by the Trustees’ and employees’ immediate family members as well as investments through retirement and deferred compensation plans.
Global Income Trust 17
Financial statements
A guide to financial statements
These sections of the report, as well as the accompanying Notes, constitute the fund’s financial statements.
The fund’s portfolio lists all the fund’s investments and their values as of the last day of the reporting period. Holdings are organized by asset type and industry sector, country, or state to show areas of concentration and diversification.
Statement of assets and liabilities shows how the fund’s net assets and share price are determined. All investment and non-investment assets are added together. Any unpaid expenses and other liabilities are subtracted from this total. The result is divided by the number of shares to determine the net asset value per share, which is calculated separately for each class of shares. (For funds with preferred shares, the amount subtracted from total assets includes the liquidation preference of preferred shares.)
Statement of operations shows the fund’s net investment gain or loss. This is done by first adding up all the fund’s earnings — from dividends and interest income — and subtracting its operating expenses to determine net investment income (or loss). Then, any net gain or loss the fund realized on the sales of its holdings — as well as any unrealized gains or losses over the period — is added to or subtracted from the net investment result to determine the fund’s net gain or loss for the fiscal period.
Statement of changes in net assets shows how the fund’s net assets were affected by the fund’s net investment gain or loss, by distributions to shareholders, and by changes in the number of the fund’s shares. It lists distributions and their sources (net investment income or realized capital gains) over the current reporting period and the most recent fiscal year-end. The distributions listed here may not match the sources listed in the Statement of operations because the distributions are determined on a tax basis and may be paid in a different period from the one in which they were earned. Dividend sources are estimated at the time of declaration. Actual results may vary. Any non-taxable return of capital cannot be determined until final tax calculations are completed after the end of the fund’s fiscal year.
Financial highlights provide an overview of the fund’s investment results, per-share distributions, expense ratios, net investment income ratios, and portfolio turnover in one summary table, reflecting the five most recent reporting periods. In a semiannual report, the highlights table also includes the current reporting period.
18 Global Income Trust
The fund’s portfolio 4/30/15 (Unaudited)
FOREIGN GOVERNMENT AND AGENCY | Principal | Value | ||
Argentina (Republic of) sr. unsec. bonds 8.28s, 2033 (Argentina) (In default) † | $399,581 | $398,582 | ||
Argentina (Republic of) sr. unsec. bonds 7s, 2017 (Argentina) | 25,000 | 23,975 | ||
Argentina (Republic of) sr. unsec. unsub. bonds 7s, 2015 (Argentina) | 3,314,000 | 3,254,613 | ||
Argentina (Republic of) sr. unsec. unsub. notes Ser. LOC, 8.28s, 2033 (Argentina) | 1,518,407 | 1,374,158 | ||
Argentina (Republic of) sr. unsec. unsub. notes Ser. NY, 8.28s, 2033 (Argentina) (In default) † | 1,369,791 | 1,397,187 | ||
Austria (Republic of) sr. unsec. unsub. bonds 3 1/2s, 2021 (Austria) | EUR | 1,970,000 | 2,673,682 | |
Belgium (Government of) sr. unsec. unsub. bonds 4 1/4s, 2022 (Belgium) | EUR | 1,420,000 | 2,050,825 | |
Belgium (Government of) unsec. bonds Ser. 60, 4 1/4s, 2041 (Belgium) | EUR | 330,000 | 620,581 | |
Brazil (Federal Republic of) sr. notes 5 7/8s, 2019 (Brazil) | $100,000 | 111,250 | ||
Brazil (Federal Republic of) sr. unsec. unsub. bonds 4 7/8s, 2021 (Brazil) | 490,000 | 521,709 | ||
Brazil (Federal Republic of) unsec. notes 10s, 2021 (Brazil) (units) | BRL | 790 | 242,761 | |
Canada (Government of) sr. unsec. bonds 3 1/2s, 2045 (Canada) | CAD | 440,000 | 471,039 | |
Canada (Government of) unsec. bonds 1 1/4s, 2018 (Canada) | CAD | 960,000 | 810,744 | |
Colombia (Republic of) sr. unsec. unsub. bonds 5s, 2045 (Colombia) | $450,000 | 455,625 | ||
Croatia (Republic of) 144A sr. unsec. notes 6 1/4s, 2017 (Croatia) | 200,000 | 211,500 | ||
Denmark (Kingdom of) unsec. bonds 4 1/2s, 2039 (Denmark) | DKK | 570,000 | 153,327 | |
Denmark (Kingdom of) unsec. bonds 1 3/4s, 2025 (Denmark) | DKK | 3,020,000 | 513,014 | |
France (Government of) unsec. bonds 4 1/2s, 2041 (France) | EUR | 830,000 | 1,608,283 | |
France (Government of) unsec. bonds 4s, 2055 (France) | EUR | 150,000 | 298,757 | |
France (Government of) unsec. bonds 3 1/4s, 2021 (France) | EUR | 4,180,000 | 5,596,732 | |
France (Government of) unsec. bonds 1/2s, 2025 (France) | EUR | 1,170,000 | 1,295,736 | |
Germany (Federal Republic of) unsec. bonds 2 1/2s, 2044 (Germany) | EUR | 1,340,000 | 2,147,302 | |
Germany (Federal Republic of) unsec. bonds 1 3/4s, 2022 (Germany) | EUR | 4,840,000 | 6,053,105 | |
Germany (Federal Republic of) unsec. bonds 1/2s, 2025 (Germany) | EUR | 420,000 | 477,855 | |
Ghana (Republic of) 144A unsec. notes 8 1/2s, 2017 (Ghana) | $62,000 | 64,486 | ||
Ghana (Republic of) 144A unsec. notes 7 7/8s, 2023 (Ghana) | 168,573 | 163,305 | ||
Hellenic (Republic of) sr. unsec. bonds 4 3/4s, 2019 (Greece) | EUR | 1,530,000 | 1,249,129 | |
Hellenic (Republic of) sr. unsec. notes 3 3/8s, 2017 (Greece) | EUR | 1,767,000 | 1,443,296 | |
Hellenic (Republic of) sr. unsec. unsub. bonds Ser. PSI, stepped-coupon 3s (3.65s, 2/24/20), 2038 (Greece) †† | EUR | 317,294 | 189,630 | |
Hellenic (Republic of) sr. unsec. unsub. bonds Ser. PSI, stepped-coupon 3s (3.65s, 2/24/20), 2037 (Greece) †† | EUR | 28,208 | 16,914 | |
Hellenic (Republic of) sr. unsec. unsub. bonds Ser. PSI, stepped-coupon 3s (3.65s, 2/24/20), 2036 (Greece) †† | EUR | 304,883 | 182,144 |
Global Income Trust 19
FOREIGN GOVERNMENT AND AGENCY | Principal | Value | ||
Hellenic (Republic of) sr. unsec. unsub. bonds Ser. PSI, stepped-coupon 3s (3.65s, 2/24/20), 2035 (Greece) †† | EUR | 209,696 | $125,035 | |
Hellenic (Republic of) sr. unsec. unsub. bonds Ser. PSI, stepped-coupon 3s (3.65s, 2/24/20), 2034 (Greece) †† | EUR | 156,727 | 93,439 | |
Hellenic (Republic of) sr. unsec. unsub. bonds Ser. PSI, stepped-coupon 3s (3.65s, 2/24/20), 2033 (Greece) †† | EUR | 123,946 | 74,022 | |
Hellenic (Republic of) sr. unsec. unsub. bonds Ser. PSI, stepped-coupon 3s (3.65s, 2/24/20), 2032 (Greece) †† | EUR | 140,182 | 84,053 | |
Hellenic (Republic of) sr. unsec. unsub. bonds Ser. PSI, stepped-coupon 3s (3.65s, 2/24/20), 2031 (Greece) †† | EUR | 81,475 | 48,886 | |
Hellenic (Republic of) sr. unsec. unsub. bonds Ser. PSI, stepped-coupon 3s (3.65s, 2/24/20), 2030 (Greece) †† | EUR | 794,541 | 476,141 | |
Hellenic (Republic of) sr. unsec. unsub. bonds Ser. PSI, stepped-coupon 3s (3.65s, 2/24/20), 2029 (Greece) †† | EUR | 244,903 | 147,392 | |
Hellenic (Republic of) sr. unsec. unsub. bonds Ser. PSI, stepped-coupon 3s (3.65s, 2/24/20), 2028 (Greece) †† | EUR | 757,185 | 455,565 | |
Hellenic (Republic of) sr. unsec. unsub. bonds Ser. PSI, stepped-coupon 3s (3.65s, 2/24/20), 2027 (Greece) †† | EUR | 397,416 | 241,638 | |
Hellenic (Republic of) sr. unsec. unsub. bonds Ser. PSI, stepped-coupon 3s (3.65s, 2/24/20), 2026 (Greece) †† | EUR | 665,365 | 411,894 | |
Hellenic (Republic of) sr. unsec. unsub. bonds Ser. PSI, stepped-coupon 3s (3.65s, 2/24/20), 2025 (Greece) †† | EUR | 1,422,812 | 914,485 | |
Hellenic (Republic of) sr. unsec. unsub. bonds Ser. PSI, stepped-coupon 3s (3.65s, 2/24/20), 2024 (Greece) †† | EUR | 498,058 | 325,217 | |
Hellenic (Republic of) sr. unsec. unsub. bonds Ser. PSI, stepped-coupon 3s (3.65s, 2/24/20), 2023 (Greece) †† | EUR | 767,884 | 503,536 | |
Hungary (Government of) sr. unsec. unsub. notes 5 3/8s, 2024 (Hungary) | $470,000 | 528,092 | ||
Indonesia (Republic of) 144A sr. unsec. notes 5 1/8s, 2045 (Indonesia) | 200,000 | 207,000 | ||
Indonesia (Republic of) 144A sr. unsec. notes 3 3/8s, 2023 (Indonesia) | 285,000 | 278,958 | ||
Ireland (Republic of) unsec. bonds 5s, 2020 (Ireland) | EUR | 930,000 | 1,304,833 | |
Italy (Republic of) sr. unsec. bonds 4 3/4s, 2044 (Italy) | EUR | 820,000 | 1,358,830 | |
Italy (Republic of) sr. unsec. bonds 4 3/4s, 2023 (Italy) | EUR | 1,950,000 | 2,769,921 | |
Italy (Republic of) sr. unsec. bonds 2 1/2s, 2024 (Italy) | EUR | 1,060,000 | 1,298,065 | |
Italy (Republic of) sr. unsec. unsub. bonds 5 1/4s, 2017 (Italy) | EUR | 2,120,000 | 2,648,500 | |
Italy (Republic of) unsec. bonds 4 1/2s, 2023 (Italy) | EUR | 1,750,000 | 2,443,540 | |
Japan (Government of) 10 yr sr. unsec. unsub. bonds 1s, 2021 (Japan) | JPY | 1,377,000,000 | 12,184,968 | |
Japan (Government of) 20 yr sr. unsec. unsub. bonds Ser. 125, 2.2s, 2031 (Japan) | JPY | 308,000,000 | 3,118,232 | |
Japan (Government of) 30 yr sr. unsec. unsub. bonds Ser. 32, 2.3s, 2040 (Japan) | JPY | 407,000,000 | 4,154,673 | |
Japan (Government of) 40 yr sr. unsec. unsub. bonds Ser. 4, 2.2s, 2051 (Japan) | JPY | 230,000,000 | 2,332,843 | |
Mexican (Government of) unsec. bonds 8s, 2020 (Mexico) | MXN | 23,397,000 | 1,706,512 | |
Netherlands (Government of) unsec. bonds 3 3/4s, 2042 (Netherlands) | EUR | 290,000 | 550,016 | |
Netherlands (Government of) unsec. bonds 2 1/4s, 2022 (Netherlands) | EUR | 1,290,000 | 1,653,291 |
20 Global Income Trust
FOREIGN GOVERNMENT AND AGENCY | Principal | Value | ||
Norway (Government of) unsec. bonds Ser. 476, 3s, 2024 (Norway) | NOK | 1,760,000 | $262,612 | |
Ontario (Province of) bonds 4s, 2021 (Canada) | CAD | 1,690,000 | 1,582,125 | |
Panama (Republic of) sr. unsec. unsub. bonds 3 3/4s, 2025 (Panama) | $200,000 | 202,500 | ||
Poland (Republic of) sr. unsec. bonds 5s, 2022 (Poland) | 235,000 | 268,076 | ||
Poland (Republic of) unsec. bonds 3 1/4s, 2019 (Poland) | PLN | 6,285,000 | 1,825,898 | |
Russia (Federation of) 144A sr. notes 5 5/8s, 2042 (Russia) | $600,000 | 574,500 | ||
South Africa (Republic of) sr. unsec. unsub. bonds 8s, 2018 (South Africa) | ZAR | 14,180,000 | 1,220,931 | |
South Africa (Republic of) sr. unsec. unsub. notes 4.665s, 2024 (South Africa) | $1,600,000 | 1,677,664 | ||
Spain (Kingdom of) sr. unsec. bonds 5 1/2s, 2017 (Spain) | EUR | 770,000 | 968,189 | |
Spain (Kingdom of) sr. unsec. bonds 5.15s, 2044 (Spain) | EUR | 350,000 | 614,272 | |
Spain (Kingdom of) sr. unsec. unsub. bonds 4.65s, 2025 (Spain) | EUR | 440,000 | 638,770 | |
Spain (Kingdom of) sr. unsec. bonds 4.4s, 2023 (Spain) | EUR | 1,830,000 | 2,557,300 | |
Spain (Kingdom of) sr. unsec. unsub. bonds 4s, 2020 (Spain) | EUR | 490,000 | 638,753 | |
Sweden (Government of) bonds Ser. 1054, 3 1/2s, 2022 (Sweden) | SEK | 6,310,000 | 930,158 | |
Switzerland (Government of) bonds 2s, 2021 (Switzerland) | CHF | 600,000 | 734,296 | |
Turkey (Republic of) sr. unsec. notes 4 7/8s, 2043 (Turkey) | $1,000,000 | 965,000 | ||
Ukraine (Government of) 144A sr. unsec. notes 9 1/4s, 2017 (Ukraine) | 375,000 | 170,625 | ||
United Kingdom Treasury unsec. bonds 4s, 2060 (United Kingdom) | GBP | 1,560,000 | 3,385,221 | |
United Kingdom Treasury unsec. bonds 3 3/4s, 2019 (United Kingdom) | GBP | 920,000 | 1,566,482 | |
United Kingdom Treasury unsec. bonds 1s, 2017 (United Kingdom) | GBP | 1,050,000 | 1,623,032 | |
United Mexican States sr. unsec. unsub. notes Ser. MTN, 4 3/4s, 2044 (Mexico) | $440,000 | 453,864 | ||
Total foreign government and agency bonds and notes (cost $108,379,265) |
| |||
CORPORATE BONDS AND NOTES (29.2%)* | Principal | Value | ||
Basic materials (1.8%) | ||||
Celanese US Holdings, LLC sr. notes 5 7/8s, 2021 (Germany) | $160,000 | $175,600 | ||
Cemex Finance, LLC 144A company guaranty sr. notes 9 3/8s, 2022 (Mexico) | 200,000 | 228,700 | ||
CF Industries, Inc. company guaranty sr. unsec. notes 5 3/8s, 2044 | 420,000 | 456,304 | ||
CF Industries, Inc. company guaranty sr. unsec. notes 5.15s, 2034 | 285,000 | 304,717 | ||
CF Industries, Inc. company guaranty sr. unsec. unsub. notes 7 1/8s, 2020 | 4,000 | 4,809 | ||
Cytec Industries, Inc. sr. unsec. unsub. notes 3 1/2s, 2023 | 175,000 | 176,393 | ||
Eastman Chemical Co. sr. unsec. unsub. notes 3.8s, 2025 | 305,000 | 314,775 | ||
Georgia-Pacific, LLC sr. unsec. unsub. notes 7 3/4s, 2029 | 120,000 | 167,167 | ||
Georgia-Pacific, LLC 144A company guaranty sr. notes 5.4s, 2020 | 305,000 | 346,371 |
Global Income Trust 21
CORPORATE BONDS AND NOTES (29.2%)* cont. | Principal | Value | ||
Basic materials cont. | ||||
Glencore Finance Canada, Ltd. 144A company guaranty sr. unsec. notes 6s, 2041 (Canada) | $360,000 | $384,314 | ||
Glencore Funding, LLC 144A company guaranty sr. unsec. unsub. notes 4 5/8s, 2024 | 465,000 | 485,175 | ||
Glencore Funding, LLC 144A company guaranty sr. unsec. unsub. notes 4s, 2025 | 230,000 | 225,629 | ||
Glencore Funding, LLC 144A company guaranty sr. unsec. unsub. notes 2 7/8s, 2020 | 230,000 | 229,812 | ||
International Paper Co. sr. unsec. notes 8.7s, 2038 | 120,000 | 172,109 | ||
Mosaic Co. (The) sr. unsec. notes 3 3/4s, 2021 | 160,000 | 169,719 | ||
Mosaic Co. (The) sr. unsec. unsub. notes 5 5/8s, 2043 | 99,000 | 114,907 | ||
Mosaic Co. (The) sr. unsec. unsub. notes 5.45s, 2033 | 41,000 | 46,264 | ||
Packaging Corp. of America sr. unsec. unsub. notes 4 1/2s, 2023 | 160,000 | 170,644 | ||
Packaging Corp. of America sr. unsec. unsub. notes 3.9s, 2022 | 120,000 | 123,824 | ||
Rock-Tenn Co. company guaranty sr. unsec. unsub. notes 4.45s, 2019 | 105,000 | 112,246 | ||
Rockwood Specialties Group, Inc. company guaranty sr. unsec. notes 4 5/8s, 2020 | 160,000 | 166,800 | ||
Temple-Inland, Inc. sr. unsec. unsub. notes 6 5/8s, 2018 | 180,000 | 200,651 | ||
Union Carbide Corp. sr. unsec. unsub. bonds 7 3/4s, 2096 | 140,000 | 182,721 | ||
Westvaco Corp. company guaranty sr. unsec. unsub. notes 8.2s, 2030 | 90,000 | 124,963 | ||
Westvaco Corp. company guaranty sr. unsec. unsub. notes 7.95s, 2031 | 66,000 | 87,580 | ||
Weyerhaeuser Co. sr. unsec. unsub. notes 7 3/8s, 2032 R | 300,000 | 394,763 | ||
5,566,957 | ||||
Capital goods (0.2%) | ||||
Crown Americas, LLC/Crown Americas Capital Corp. IV company guaranty sr. unsec. notes 4 1/2s, 2023 | 105,000 | 105,525 | ||
Delphi Corp. company guaranty sr. unsec. unsub. notes 5s, 2023 | 120,000 | 129,300 | ||
Legrand France SA sr. unsec. unsub. debs 8 1/2s, 2025 (France) | 253,000 | 354,803 | ||
589,628 | ||||
Communication services (2.0%) | ||||
America Movil SAB de CV company guaranty sr. unsec. unsub. notes 6 1/8s, 2040 (Mexico) | 100,000 | 122,430 | ||
America Movil SAB de CV company guaranty sr. unsec. unsub. notes 2 3/8s, 2016 (Mexico) | 200,000 | 203,469 | ||
American Tower Corp. sr. unsec. unsub. notes 3.4s, 2019 R | 125,000 | 129,519 | ||
AT&T, Inc. sr. unsec. notes 4 3/4s, 2046 | 40,000 | 39,105 | ||
AT&T, Inc. sr. unsec. unsub. notes 3.4s, 2025 | 40,000 | 39,577 | ||
Comcast Cable Communications Holdings, Inc. company guaranty sr. unsec. notes 9.455s, 2022 | 70,000 | 101,061 | ||
Comcast Corp. company guaranty sr. unsec. unsub. notes 6 1/2s, 2035 | 75,000 | 99,478 | ||
Crown Castle Towers, LLC 144A company guaranty sr. notes 4.883s, 2020 | 190,000 | 208,009 | ||
Koninklijke KPN NV sr. unsec. unsub. bonds 8 3/8s, 2030 (Netherlands) | 115,000 | 164,035 | ||
NBCUniversal Media, LLC sr. unsec. unsub. notes 6.4s, 2040 | 125,000 | 164,827 | ||
Qwest Corp. sr. unsec. notes 6 3/4s, 2021 | 90,000 | 103,275 |
22 Global Income Trust
CORPORATE BONDS AND NOTES (29.2%)* cont. | Principal | Value | ||
Communication services cont. | ||||
Rogers Communications, Inc. company guaranty sr. unsec. unsub. notes 4 1/2s, 2043 (Canada) | $215,000 | $213,896 | ||
SBA Tower Trust 144A company guaranty sr. notes 5.101s, 2017 | 350,000 | 368,469 | ||
SES SA 144A company guaranty sr. unsec. notes 5.3s, 2043 (France) | 270,000 | 293,229 | ||
TCI Communications, Inc. sr. unsec. unsub. notes 7 7/8s, 2026 | 580,000 | 813,438 | ||
Telecom Italia SpA 144A sr. unsec. notes 5.303s, 2024 (Italy) | 800,000 | 842,000 | ||
Telefonica Emisiones SAU company guaranty sr. unsec. notes 5.462s, 2021 (Spain) | 340,000 | 385,985 | ||
Telefonica Emisiones SAU company guaranty sr. unsec. notes 4.57s, 2023 (Spain) | 300,000 | 327,281 | ||
Verizon Communications, Inc. sr. unsec. unsub. notes 5.9s, 2054 | 28,800 | 772,128 | ||
Verizon Communications, Inc. sr. unsec. unsub. notes 5.05s, 2034 | 315,000 | 332,439 | ||
Verizon Communications, Inc. 144A sr. unsec. unsub. notes 4.522s, 2048 | 622,000 | 588,825 | ||
6,312,475 | ||||
Consumer cyclicals (2.9%) | ||||
21st Century Fox America, Inc. company guaranty sr. unsec. notes 7.85s, 2039 | 115,000 | 167,855 | ||
Autonation, Inc. company guaranty sr. unsec. unsub. notes 5 1/2s, 2020 | 194,000 | 214,128 | ||
Bed Bath & Beyond, Inc. sr. unsec. notes 5.165s, 2044 | 565,000 | 600,528 | ||
CBS Corp. company guaranty sr. unsec. debs. 7 7/8s, 2030 | 162,000 | 222,444 | ||
D.R. Horton, Inc. company guaranty sr. unsec. notes 5 3/4s, 2023 | 425,000 | 461,125 | ||
Dollar General Corp. sr. unsec. notes 3 1/4s, 2023 | 215,000 | 209,462 | ||
Expedia, Inc. company guaranty sr. unsec. unsub. notes 5.95s, 2020 | 235,000 | 263,924 | ||
Ford Motor Co. sr. unsec. unsub. notes 9.98s, 2047 | 1,110,000 | 1,752,814 | ||
Ford Motor Co. sr. unsec. unsub. notes 7.45s, 2031 | 122,000 | 165,616 | ||
Ford Motor Co. sr. unsec. unsub. notes 7.4s, 2046 | 15,000 | 21,426 | ||
Gannett Co., Inc. 144A company guaranty sr. unsec. notes 4 7/8s, 2021 | 205,000 | 210,638 | ||
General Motors Co. sr. unsec. unsub. notes 6 1/4s, 2043 | 265,000 | 316,282 | ||
General Motors Financial Co., Inc. company guaranty sr. unsec. notes 3 1/4s, 2018 | 171,000 | 174,885 | ||
General Motors Financial Co., Inc. company guaranty sr. unsec. notes 2 3/4s, 2016 | 244,000 | 247,081 | ||
GLP Capital LP/GLP Financing II, Inc. company guaranty sr. unsec. notes 4 3/8s, 2018 | 30,000 | 31,050 | ||
Grupo Televisa SAB sr. unsec. bonds 6 5/8s, 2040 (Mexico) | 215,000 | 260,860 | ||
Grupo Televisa SAB sr. unsec. unsub. notes 5s, 2045 (Mexico) | 250,000 | 254,698 | ||
Host Hotels & Resorts LP sr. unsec. unsub. notes 6s, 2021 R | 61,000 | 70,135 | ||
Host Hotels & Resorts LP sr. unsec. unsub. notes 5 1/4s, 2022 R | 29,000 | 32,073 | ||
Hyatt Hotels Corp. sr. unsec. unsub. notes 3 3/8s, 2023 | 160,000 | 160,005 | ||
INVISTA Finance, LLC 144A company guaranty sr. notes 4 1/4s, 2019 | 262,000 | 258,596 | ||
L Brands, Inc. company guaranty sr. unsec. notes 6 5/8s, 2021 | 145,000 | 165,663 | ||
L Brands, Inc. sr. unsec. notes 5 5/8s, 2022 | 220,000 | 240,350 |
Global Income Trust 23
CORPORATE BONDS AND NOTES (29.2%)* cont. | Principal | Value | ||
Consumer cyclicals cont. | ||||
Macy’s Retail Holdings, Inc. company guaranty sr. unsec. notes 6.9s, 2029 | $527,000 | $680,501 | ||
Macy’s Retail Holdings, Inc. company guaranty sr. unsec. notes 6.65s, 2024 | 105,000 | 130,469 | ||
Macy’s Retail Holdings, Inc. company guaranty sr. unsec. notes 5 1/8s, 2042 | 30,000 | 33,208 | ||
Macy’s Retail Holdings, Inc. company guaranty sr. unsec. unsub. notes 7s, 2028 | 68,000 | 87,175 | ||
O’Reilly Automotive, Inc. company guaranty sr. unsec. unsub. notes 3.85s, 2023 | 150,000 | 155,673 | ||
Owens Corning company guaranty sr. unsec. notes 9s, 2019 | 15,000 | 18,118 | ||
Priceline Group, Inc. (The) sr. unsec. unsub. notes 3.65s, 2025 | 116,000 | 118,209 | ||
QVC, Inc. company guaranty sr. notes 4.85s, 2024 | 260,000 | 267,455 | ||
Tiffany & Co. 144A sr. unsec. notes 4.9s, 2044 | 355,000 | 356,588 | ||
Time Warner, Inc. company guaranty sr. unsec. bonds 7.7s, 2032 | 215,000 | 299,565 | ||
TRW Automotive, Inc. 144A company guaranty sr. unsec. notes 4.45s, 2023 | 65,000 | 65,894 | ||
Vulcan Materials Co. sr. unsec. unsub. notes 4 1/2s, 2025 | 125,000 | 127,188 | ||
8,841,681 | ||||
Consumer staples (1.4%) | ||||
Altria Group, Inc. company guaranty sr. unsec. notes 10.2s, 2039 | 21,000 | 36,471 | ||
Anheuser-Busch InBev Worldwide, Inc. company guaranty sr. unsec. unsub. notes 8.2s, 2039 | 154,000 | 240,160 | ||
Bacardi, Ltd. 144A unsec. notes 4 1/2s, 2021 (Bermuda) | 230,000 | 248,770 | ||
Campbell Soup Co. sr. unsec. unsub. notes 8 7/8s, 2021 | 50,000 | 65,429 | ||
Corrections Corp. of America company guaranty sr. unsec. notes 4 1/8s, 2020 R | 75,000 | 75,750 | ||
CVS Pass-Through Trust sr. notes 6.036s, 2028 | 60,958 | 71,054 | ||
CVS Pass-Through Trust 144A sr. mtge. notes 7.507s, 2032 | 309,452 | 398,091 | ||
ERAC USA Finance, LLC 144A company guaranty sr. unsec. bonds 4 1/2s, 2045 | 15,000 | 14,803 | ||
ERAC USA Finance, LLC 144A company guaranty sr. unsec. notes 7s, 2037 | 85,000 | 111,353 | ||
ERAC USA Finance, LLC 144A company guaranty sr. unsec. notes 5 5/8s, 2042 | 726,000 | 838,722 | ||
ERAC USA Finance, LLC 144A company guaranty sr. unsec. notes 3.85s, 2024 | 277,000 | 286,276 | ||
Grupo Bimbo SAB de CV 144A sr. unsec. notes 4 7/8s, 2044 (Mexico) | 500,000 | 491,011 | ||
Grupo Bimbo SAB de CV 144A sr. unsec. notes 3 7/8s, 2024 (Mexico) | 550,000 | 563,059 | ||
Kraft Foods Group, Inc. sr. unsec. unsub. notes 6 1/2s, 2040 | 589,000 | 740,383 | ||
SABMiller Holdings, Inc. 144A company guaranty sr. unsec. notes 4.95s, 2042 | 205,000 | 224,618 | ||
4,405,950 | ||||
Energy (1.9%) | ||||
Anadarko Petroleum Corp. sr. unsec. notes 6.45s, 2036 | 165,000 | 203,887 | ||
BG Energy Capital PLC 144A company guaranty sr. unsec. notes 4s, 2021 (United Kingdom) | 200,000 | 215,980 | ||
California Resources Corp. company guaranty sr. unsec. notes 5s, 2020 | 340,000 | 321,300 |
24 Global Income Trust
CORPORATE BONDS AND NOTES (29.2%)* cont. | Principal | Value | ||
Energy cont. | ||||
Ecopetrol SA sr. unsec. unsub. bonds 4 1/8s, 2025 (Colombia) | $260,000 | $250,172 | ||
EQT Midstream Partners LP company guaranty sr. unsec. notes 4s, 2024 | 405,000 | 396,525 | ||
Freeport-McMoran Oil & Gas, LLC/FCX Oil & Gas, Inc. company guaranty sr. unsec. notes 6 3/4s, 2022 | 66,000 | 70,554 | ||
Freeport-McMoran Oil & Gas, LLC/FCX Oil & Gas, Inc. company guaranty sr. unsec. unsub. notes 6 7/8s, 2023 | 16,000 | 17,200 | ||
Kerr-McGee Corp. company guaranty sr. unsec. unsub. notes 7 7/8s, 2031 | 185,000 | 252,272 | ||
Lukoil International Finance BV 144A company guaranty sr. unsec. notes 4.563s, 2023 (Russia) | 310,000 | 278,690 | ||
Marathon Petroleum Corp. sr. unsec. unsub. notes 6 1/2s, 2041 | 45,000 | 55,020 | ||
Noble Holding International, Ltd. company guaranty sr. unsec. notes 6.05s, 2041 | 160,000 | 136,031 | ||
Pertamina Persero PT 144A sr. unsec. unsub. notes 4.3s, 2023 (Indonesia) | 200,000 | 198,500 | ||
Petrobras Global Finance BV company guaranty sr. unsec. notes 7 7/8s, 2019 (Brazil) | 55,000 | 59,760 | ||
Petrobras Global Finance BV company guaranty sr. unsec. notes 5 3/8s, 2021 (Brazil) | 225,000 | 215,955 | ||
Petrobras Global Finance BV company guaranty sr. unsec. notes 3 7/8s, 2016 (Brazil) | 185,000 | 185,300 | ||
Petroleos de Venezuela SA company guaranty sr. unsec. notes 5 1/4s, 2017 (Venezuela) | 350,000 | 200,375 | ||
Petroleos de Venezuela SA company guaranty sr. unsec. unsub. notes 5 3/8s, 2027 (Venezuela) | 30,000 | 12,225 | ||
Petroleos de Venezuela SA sr. unsec. notes 5 1/8s, 2016 (Venezuela) | 11,000 | 8,044 | ||
Petroleos de Venezuela SA 144A company guaranty sr. notes 8 1/2s, 2017 (Venezuela) | 701,000 | 541,523 | ||
Petroleos de Venezuela SA 144A company guaranty sr. unsec. notes 6s, 2026 (Venezuela) | 155,000 | 64,325 | ||
Petroleos Mexicanos 144A company guaranty sr. unsec. notes 4 1/2s, 2026 (Mexico) | 55,000 | 55,961 | ||
Petroleos Mexicanos 144A company guaranty sr. unsec. unsub. notes 5 5/8s, 2046 (Mexico) | 315,000 | 317,861 | ||
Pride International, Inc. sr. unsec. notes 7 7/8s, 2040 | 425,000 | 483,064 | ||
Spectra Energy Capital, LLC company guaranty sr. unsec. notes 5.65s, 2020 | 20,000 | 22,024 | ||
Spectra Energy Capital, LLC company guaranty sr. unsec. unsub. notes 6.2s, 2018 | 75,000 | 83,059 | ||
Statoil ASA company guaranty sr. unsec. notes 5.1s, 2040 (Norway) | 165,000 | 190,790 | ||
Weatherford International, LLC company guaranty sr. unsec. unsub. notes 6.8s, 2037 | 10,000 | 9,677 | ||
Weatherford International, Ltd./Bermuda company guaranty sr. unsec. notes 9 7/8s, 2039 (Bermuda) | 365,000 | 424,594 | ||
Williams Cos., Inc. (The) sr. unsec. notes 4.55s, 2024 | 675,000 | 663,538 | ||
Williams Partners LP sr. unsec. notes 5.4s, 2044 | 45,000 | 43,797 | ||
Williams Partners LP sr. unsec. notes 4.3s, 2024 | 45,000 | 45,980 | ||
6,023,983 |
Global Income Trust 25
CORPORATE BONDS AND NOTES (29.2%)* cont. | Principal | Value | ||
Financials (12.4%) | ||||
Aflac, Inc. sr. unsec. notes 6.9s, 2039 | $295,000 | $396,343 | ||
Aflac, Inc. sr. unsec. notes 6.45s, 2040 | 108,000 | 139,550 | ||
Air Lease Corp. sr. unsec. unsub. notes 3 3/4s, 2022 | 125,000 | 126,483 | ||
American Express Co. jr. unsec. sub. FRN Ser. C, 4.9s, perpetual maturity | 215,000 | 212,352 | ||
American International Group, Inc. jr. sub. FRB 8.175s, 2058 | 414,000 | 573,390 | ||
Aon PLC company guaranty sr. unsec. unsub. notes 4 1/4s, 2042 | 545,000 | 524,341 | ||
ARC Properties Operating Partnership LP/Clark Acquisition, LLC company guaranty sr. unsec. unsub. notes 4.6s, 2024 R | 465,000 | 456,281 | ||
Assurant, Inc. sr. unsec. notes 6 3/4s, 2034 | 270,000 | 336,099 | ||
AXA SA 144A jr. unsec. sub. FRN 6.463s, perpetual maturity (France) | 485,000 | 514,391 | ||
Baggot Securities, Ltd. 144A jr. sub. notes 10.24s, perpetual maturity (Ireland) | EUR | 710,000 | 836,399 | |
Banco Bilbao Vizcaya Argentaria SA jr. unsec. sub. FRB 9s, perpetual maturity (Spain) | $200,000 | 216,000 | ||
Banco do Brasil SA/Cayman 144A unsec. sub. notes 5 7/8s, 2022 (Brazil) | 435,000 | 441,241 | ||
Bank of America Corp. jr. unsec. sub. FRN Ser. AA, 6.1s, perpetual maturity | 368,000 | 374,440 | ||
Bank of America Corp. jr. unsec. sub. FRN Ser. Z, 6 1/2s, perpetual maturity | 460,000 | 488,750 | ||
Barclays PLC jr. unsec. sub. FRB 6 5/8s, perpetual maturity (United Kingdom) | 1,421,000 | 1,410,343 | ||
BBVA International Preferred SAU company guaranty jr. unsec. sub. FRB 5.919s, perpetual maturity (Spain) | 195,000 | 201,630 | ||
Berkshire Hathaway Finance Corp. company guaranty sr. unsec. unsub. notes 4.3s, 2043 | 335,000 | 356,986 | ||
BNP Paribas SA 144A jr. unsec. sub. FRN 7.195s, perpetual maturity (France) | 300,000 | 360,750 | ||
BPCE SA 144A unsec. sub. notes 5.7s, 2023 (France) | 210,000 | 229,233 | ||
BPCE SA 144A unsec. sub. notes 5.15s, 2024 (France) | 215,000 | 226,522 | ||
CBL & Associates LP company guaranty sr. unsec. unsub. notes 5 1/4s, 2023 R | 456,000 | 483,725 | ||
Citigroup, Inc. jr. unsec. sub. FRB Ser. P, 5.95s, perpetual maturity | 148,000 | 147,214 | ||
Citigroup, Inc. jr. unsec. sub. FRB Ser. B, 5.9s, perpetual maturity | 152,000 | 153,235 | ||
Citigroup, Inc. jr. unsec. sub. FRN 5 7/8s, perpetual maturity | 88,000 | 88,660 | ||
Commerzbank AG 144A unsec. sub. notes 8 1/8s, 2023 (Germany) | 320,000 | 386,400 | ||
Commonwealth Bank of Australia 144A sr. unsec. notes 5s, 2019 (Australia) | 105,000 | 117,696 | ||
Cooperatieve Centrale Raiffeisen-Boerenleenbank BA/Netherlands 144A jr. unsec. sub. FRN 11s, perpetual maturity (Netherlands) | 865,000 | 1,111,525 | ||
Credit Agricole SA 144A jr. unsec. sub. FRN 7 7/8s, perpetual maturity (France) | 735,000 | 785,956 | ||
Credit Suisse Group AG 144A jr. unsec. sub. FRN 7 1/2s, perpetual maturity (Switzerland) | 200,000 | 214,000 | ||
Credit Suisse Group AG 144A unsec. sub. notes 6 1/2s, 2023 (Switzerland) | 340,000 | 389,114 |
26 Global Income Trust
CORPORATE BONDS AND NOTES (29.2%)* cont. | Principal | Value | ||
Financials cont. | ||||
DDR Corp. sr. unsec. unsub. notes 7 7/8s, 2020 R | $380,000 | $470,796 | ||
Deutsche Bank AG unsec. sub. notes 4 1/2s, 2025 (Germany) | 447,000 | 438,438 | ||
Dresdner Funding Trust I 144A bonds 8.151s, 2031 | 1,000,000 | 1,251,250 | ||
Duke Realty LP sr. unsec. unsub. notes 3 7/8s, 2021 R | 150,000 | 158,137 | ||
EPR Properties unsec. notes 5 1/4s, 2023 R | 285,000 | 305,261 | ||
Fifth Third Bancorp jr. unsec. sub. FRB 5.1s, perpetual maturity | 116,000 | 110,432 | ||
GE Capital Trust IV 144A unsec. sub. FRB 4 5/8s, 2066 | EUR | 90,000 | 105,260 | |
General Electric Capital Corp. sr. unsec. notes 6 3/4s, 2032 | $830,000 | 1,141,495 | ||
Genworth Holdings, Inc. company guaranty jr. unsec. sub. FRB 6.15s, 2066 | 788,000 | 496,440 | ||
Goldman Sachs Group, Inc. (The) sr. notes 7 1/2s, 2019 | 195,000 | 231,341 | ||
Goldman Sachs Group, Inc. (The) sub. notes 6 3/4s, 2037 | 11,000 | 13,806 | ||
Hartford Financial Services Group, Inc. (The) jr. unsec. sub. FRB 8 1/8s, 2038 | 220,000 | 248,600 | ||
HBOS PLC 144A unsec. sub. bonds 6s, 2033 (United Kingdom) | 300,000 | 341,187 | ||
Healthcare Realty Trust, Inc. sr. unsec. unsub. notes 3 7/8s, 2025 R | 155,000 | 154,098 | ||
Hospitality Properties Trust sr. unsec. unsub. notes 4 1/2s, 2025 R | 160,000 | 162,735 | ||
HSBC Bank USA, NA unsec. sub. notes 7s, 2039 | 250,000 | 344,999 | ||
HSBC Capital Funding LP 144A company guaranty jr. unsec. sub. FRB 10.176s, perpetual maturity (Jersey) | 570,000 | 869,250 | ||
HSBC Holdings PLC jr. unsec. sub. FRB 6 3/8s, perpetual maturity (United Kingdom) | 200,000 | 206,800 | ||
ING Bank NV 144A unsec. sub. notes 5.8s, 2023 (Netherlands) | 1,031,000 | 1,162,566 | ||
ING Groep NV jr. unsec. sub. FRN 6s, perpetual maturity (Netherlands) | 655,000 | 655,000 | ||
International Lease Finance Corp. sr. unsec. notes 6 1/4s, 2019 | 220,000 | 243,650 | ||
Intesa Sanpaolo SpA 144A company guaranty unsec. sub. bonds 5.017s, 2024 (Italy) | 630,000 | 634,608 | ||
Liberty Mutual Group, Inc. 144A company guaranty jr. unsec. sub. bonds 7.8s, 2037 | 650,000 | 799,565 | ||
Liberty Mutual Group, Inc. 144A company guaranty jr. unsec. sub. FRN 7s, 2037 | 265,000 | 273,281 | ||
Lloyds Banking Group PLC jr. unsec. sub. FRB 7 1/2s, perpetual maturity (United Kingdom) | 212,000 | 226,310 | ||
Lloyds Banking Group PLC 144A jr. unsec. sub. FRN 6.657s, perpetual maturity (United Kingdom) | 530,000 | 605,525 | ||
Massachusetts Mutual Life Insurance Co. 144A notes 8 7/8s, 2039 | 635,000 | 1,003,123 | ||
MetLife Capital Trust IV 144A jr. unsec. sub. notes 7 7/8s, 2037 | 330,000 | 437,250 | ||
Mid-America Apartments LP sr. unsec. notes 4.3s, 2023 R | 155,000 | 164,297 | ||
Morgan Stanley sr. unsec. notes Ser. MTN, 5 3/4s, 2016 | 100,000 | 106,566 | ||
MPT Operating Partnership LP/MPT Finance Corp. company guaranty sr. unsec. notes 6 7/8s, 2021 R | 205,000 | 220,375 | ||
Nationwide Mutual Insurance Co. 144A notes 9 3/8s, 2039 | 45,000 | 70,454 | ||
Neuberger Berman Group, LLC/Neuberger Berman Finance Corp. 144A sr. unsec. notes 5 7/8s, 2022 | 62,000 | 66,728 | ||
Nordea Bank AB 144A sub. notes 4 7/8s, 2021 (Sweden) | 815,000 | 889,573 | ||
OneAmerica Financial Partners, Inc. 144A bonds 7s, 2033 | 30,000 | 33,270 |
Global Income Trust 27
CORPORATE BONDS AND NOTES (29.2%)* cont. | Principal | Value | ||
Financials cont. | ||||
Peachtree Corners Funding Trust 144A company guaranty sr. unsec. unsub. bonds 3.976s, 2025 | $100,000 | $101,255 | ||
Primerica, Inc. sr. unsec. unsub. notes 4 3/4s, 2022 | 90,000 | 98,088 | ||
Progressive Corp. (The) jr. unsec. sub. FRN 6.7s, 2037 | 445,000 | 467,528 | ||
Prudential Financial, Inc. jr. unsec. sub. FRN 5 5/8s, 2043 | 90,000 | 96,075 | ||
Prudential Financial, Inc. jr. unsec. sub. FRN 5.2s, 2044 | 268,000 | 276,040 | ||
Prudential Financial, Inc. sr. unsec. notes 6 5/8s, 2040 | 85,000 | 110,900 | ||
Realty Income Corp. sr. unsec. notes 4.65s, 2023 R | 80,000 | 87,045 | ||
Royal Bank of Scotland Group PLC unsec. sub. notes 5 1/8s, 2024 (United Kingdom) | 430,000 | 444,122 | ||
Royal Bank of Scotland PLC (The) unsec. sub. FRN Ser. REGS, 9 1/2s, 2022 (United Kingdom) | 820,000 | 922,500 | ||
Santander Issuances SAU 144A company guaranty sr. unsec. unsub. notes 5.911s, 2016 (Spain) | 600,000 | 623,984 | ||
Santander UK PLC 144A unsec. sub. notes 5s, 2023 (United Kingdom) | 470,000 | 497,897 | ||
Sberbank of Russia Via SB Capital SA 144A sr. notes 6 1/8s, 2022 (Russia) | 275,000 | 265,375 | ||
Sberbank of Russia Via SB Capital SA 144A sr. notes 4.95s, 2017 (Russia) | 450,000 | 446,625 | ||
Shinhan Bank 144A sr. unsec. notes 4 3/8s, 2015 (South Korea) | 650,000 | 657,558 | ||
SL Green Realty Corp./SL Green Operating Partnership/ Reckson Operating Partnership sr. unsec. unsub. notes 5s, 2018 R | 270,000 | 290,431 | ||
Societe Generale SA 144A jr. unsec. sub. FRB 7 7/8s, perpetual maturity (France) | 200,000 | 208,000 | ||
Standard Chartered PLC unsec. sub. notes 5.7s, 2022 (United Kingdom) | 330,000 | 363,822 | ||
Standard Chartered PLC 144A jr. sub. FRB 7.014s, perpetual maturity (United Kingdom) | 100,000 | 113,500 | ||
State Street Capital Trust IV company guaranty jr. unsec. sub. FRB 1.271s, 2037 | 550,000 | 475,750 | ||
Teachers Insurance & Annuity Association of America 144A unsec. sub. notes 6.85s, 2039 | 210,000 | 283,336 | ||
TIERS Trust/United States 144A sr. bonds stepped-coupon zero % (8 1/8s, 3/15/18), 2046 †† | 520,000 | 543,400 | ||
Travelers Property Casualty Corp. sr. unsec. unsub. bonds 7 3/4s, 2026 | 170,000 | 220,319 | ||
Vnesheconombank Via VEB Finance PLC 144A sr. unsec. unsub. notes 6.8s, 2025 (Russia) | 500,000 | 465,000 | ||
VTB Bank OJSC Via VTB Capital SA sr. unsec. notes Ser. 6, 6 1/4s, 2035 (Russia) | 100,000 | 100,230 | ||
VTB Bank OJSC Via VTB Capital SA 144A sr. unsec. notes 6 7/8s, 2018 (Russia) | 699,000 | 700,748 | ||
VTB Bank OJSC Via VTB Capital SA 144A sr. unsec. notes 6 1/4s, 2035 (Russia) | 100,000 | 100,230 | ||
Wells Fargo Bank NA sr. unsec. sub. notes Ser. BKNT, 6.6s, 2038 | 930,000 | 1,283,078 | ||
Willis Group Holdings PLC company guaranty sr. unsec. unsub. notes 5 3/4s, 2021 | 405,000 | 454,883 |
28 Global Income Trust
CORPORATE BONDS AND NOTES (29.2%)* cont. | Principal | Value | ||
Financials cont. | ||||
WP Carey, Inc. sr. unsec. unsub. notes 4.6s, 2024 R | $725,000 | $749,928 | ||
ZFS Finance USA Trust V 144A FRB 6 1/2s, 2037 | 300,000 | 318,375 | ||
38,707,537 | ||||
Health care (0.5%) | ||||
Actavis Funding SCS company guaranty sr. unsec. unsub. notes 4 3/4s, 2045 (Luxembourg) | 58,000 | 58,634 | ||
Actavis Funding SCS company guaranty sr. unsec. unsub. notes 3.45s, 2022 (Luxembourg) | 58,000 | 58,932 | ||
Aetna, Inc. sr. unsec. unsub. notes 6 3/4s, 2037 | 200,000 | 271,794 | ||
Fresenius Medical Care US Finance II, Inc. 144A company guaranty sr. unsec. notes 5 5/8s, 2019 | 120,000 | 131,100 | ||
Fresenius Medical Care US Finance, Inc. 144A company guaranty sr. notes 5 3/4s, 2021 | 135,000 | 147,488 | ||
HCA, Inc. company guaranty sr. notes 5s, 2024 | 75,000 | 79,703 | ||
Medtronic PLC 144A sr. unsec. notes 4 3/8s, 2035 | 195,000 | 206,029 | ||
Medtronic PLC 144A sr. unsec. notes 3 1/2s, 2025 | 195,000 | 201,648 | ||
Omega Healthcare Investors, Inc. company guaranty sr. unsec. notes 4.95s, 2024 R | 100,000 | 104,500 | ||
Omega Healthcare Investors, Inc. 144A company guaranty sr. unsec. notes 4 1/2s, 2027 R | 180,000 | 176,400 | ||
Quest Diagnostics, Inc. company guaranty sr. unsec. notes 4 3/4s, 2020 | 28,000 | 30,865 | ||
1,467,093 | ||||
Supra-Nation (2.1%) | ||||
Asian Development Bank sr. unsec. unsub. notes Ser. MTN, 5 1/2s, 2016 (Supra-Nation) | AUD | 2,150,000 | 1,744,440 | |
European Investment Bank sr. unsec. unsub. bonds 5 5/8s, 2032 (Luxembourg) | GBP | 1,900,000 | 4,217,612 | |
European Investment Bank sr. unsec. unsub. notes Ser. EMTN, 4 1/8s, 2024 (Luxembourg) | EUR | 450,000 | 672,921 | |
6,634,973 | ||||
Technology (0.4%) | ||||
Apple, Inc. sr. unsec. unsub. notes 3.45s, 2024 | $435,000 | 456,511 | ||
Apple, Inc. sr. unsec. unsub. notes 2.1s, 2019 | 95,000 | 96,955 | ||
Fidelity National Information Services, Inc. company guaranty sr. unsec. unsub. notes 5s, 2022 | 230,000 | 243,153 | ||
Jabil Circuit, Inc. sr. unsec. notes 8 1/4s, 2018 | 100,000 | 115,750 | ||
Oracle Corp. sr. unsec. unsub. notes 4 1/8s, 2045 | 65,000 | 64,055 | ||
SoftBank Corp. 144A sr. unsec. notes 4 1/2s, 2020 (Japan) | 225,000 | 230,344 | ||
1,206,768 | ||||
Transportation (0.4%) | ||||
Burlington Northern Santa Fe, LLC sr. unsec. notes 5.4s, 2041 | 295,000 | 350,911 | ||
Burlington Northern Santa Fe, LLC sr. unsec. unsub. notes 5 3/4s, 2040 | 10,000 | 12,248 | ||
Continental Airlines, Inc. pass-through certificates Ser. 97-4A, 6.9s, 2018 | 37,009 | 39,230 | ||
Continental Airlines, Inc. pass-through certificates Ser. 98-1A, 6.648s, 2017 | 46,564 | 48,776 | ||
Delta Air Lines, Inc. sr. notes Ser. A, 7 3/4s, 2019 | 95,967 | 110,842 | ||
Norfolk Southern Corp. sr. unsec. notes 6s, 2111 | 140,000 | 173,361 |
Global Income Trust 29
CORPORATE BONDS AND NOTES (29.2%)* cont. | Principal | Value | ||
Transportation cont. | ||||
Southwest Airlines Co. pass-through certificates Ser. 07-1, 6.15s, 2022 | $161,195 | $186,180 | ||
United Airlines 2014-2 Class A Pass Through Trust sr. notes Ser. A, 3 3/4s, 2026 | 165,000 | 172,838 | ||
United AirLines, Inc. pass-through certificates Ser. 07-A, 6.636s, 2022 | 31,711 | 34,486 | ||
1,128,872 | ||||
Utilities and power (3.2%) | ||||
Beaver Valley II Funding Corp. sr. bonds 9s, 2017 | 20,000 | 21,600 | ||
Consolidated Edison Co. of New York, Inc. sr. unsec. unsub. notes 4.2s, 2042 | 65,000 | 67,336 | ||
EDP Finance BV 144A sr. unsec. notes 5 1/4s, 2021 (Netherlands) | 360,000 | 389,248 | ||
EDP Finance BV 144A sr. unsec. unsub. notes 6s, 2018 (Netherlands) | 335,000 | 364,547 | ||
El Paso Natural Gas Co., LLC sr. unsec. unsub. bonds 8 3/8s, 2032 | 105,000 | 131,085 | ||
El Paso Pipeline Partners Operating Co., LP company guaranty sr. unsec. notes 6 1/2s, 2020 | 95,000 | 109,825 | ||
Electricite de France (EDF) 144A jr. unsec. sub. FRN 5 5/8s, perpetual maturity (France) | 375,000 | 396,563 | ||
Electricite de France (EDF) 144A sr. unsec. notes 6.95s, 2039 (France) | 465,000 | 625,407 | ||
Electricite de France (EDF) 144A unsec. sub. FRN 5 1/4s, perpetual maturity (France) | 1,114,000 | 1,159,953 | ||
Enel Finance International SA 144A company guaranty sr. unsec. notes 5 1/8s, 2019 (Netherlands) | 175,000 | 194,968 | ||
Energy Transfer Partners LP sr. unsec. unsub. notes 6 1/2s, 2042 | 515,000 | 589,243 | ||
Energy Transfer Partners LP sr. unsec. unsub. notes 5.2s, 2022 | 210,000 | 229,225 | ||
Ente Nazionale Idrocarburi (ENI) SpA 144A sr. unsec. notes 4.15s, 2020 (Italy) | 605,000 | 636,509 | ||
Enterprise Products Operating, LLC company guaranty sr. unsec. unsub. notes 4.85s, 2042 | 125,000 | 130,155 | ||
FirstEnergy Transmission, LLC 144A sr. unsec. unsub. notes 5.45s, 2044 | 830,000 | 902,482 | ||
Fortum OYJ sr. unsec. notes Ser. 14, Class EMTN, 4 1/2s, 2016 (Finland) | EUR | 255,000 | 300,230 | |
Iberdrola International BV company guaranty sr. unsec. unsub. notes 6 3/4s, 2036 (Spain) | $155,000 | 198,792 | ||
ITC Holdings Corp. 144A sr. unsec. notes 6.05s, 2018 | 125,000 | 138,797 | ||
Kinder Morgan Energy Partners LP sr. unsec. unsub. notes 5.4s, 2044 | 312,000 | 306,980 | ||
Kinder Morgan Energy Partners LP sr. unsec. unsub. notes 3 1/2s, 2021 | 40,000 | 40,319 | ||
Korea Gas Corp. 144A sr. unsec. unsub. notes 6 1/4s, 2042 (South Korea) | 370,000 | 522,836 | ||
Oncor Electric Delivery Co., LLC sr. notes 4.1s, 2022 | 270,000 | 293,836 | ||
Puget Sound Energy, Inc. jr. sub. FRN Ser. A, 6.974s, 2067 | 240,000 | 242,400 | ||
Texas-New Mexico Power Co. 144A 1st mtge. bonds Ser. A, 9 1/2s, 2019 | 530,000 | 665,406 |
30 Global Income Trust
CORPORATE BONDS AND NOTES (29.2%)* cont. | Principal | Value | ||
Utilities and power cont. | ||||
TransCanada PipeLines, Ltd. jr. unsec. sub. FRN 6.35s, 2067 (Canada) | $340,000 | $328,100 | ||
West Penn Power Co. 144A sr. bonds 5.95s, 2017 | 170,000 | 188,347 | ||
Westar Energy, Inc. sr. mtge. notes 4 1/8s, 2042 | 35,000 | 36,637 | ||
Wisconsin Energy Corp. jr. unsec. sub. FRN 6 1/4s, 2067 | 830,000 | 823,775 | ||
10,034,601 | ||||
Total corporate bonds and notes (cost $86,242,628) |
| |||
MORTGAGE-BACKED SECURITIES (23.0%)* | Principal | Value | ||
Agency collateralized mortgage obligations (5.6%) | ||||
Federal Home Loan Mortgage Corporation | ||||
IFB Ser. 3182, Class SP, 27.874s, 2032 | $69,508 | $99,351 | ||
IFB Ser. 3408, Class EK, 25.063s, 2037 | 22,690 | 35,892 | ||
IFB Ser. 3072, Class SM, 23.131s, 2035 | 69,246 | 105,524 | ||
IFB Ser. 3072, Class SB, 22.984s, 2035 | 62,180 | 94,409 | ||
IFB Ser. 3249, Class PS, 21.676s, 2036 | 46,134 | 68,642 | ||
IFB Ser. 3065, Class DC, 19.316s, 2035 | 78,711 | 115,318 | ||
IFB Ser. 2990, Class LB, 16.482s, 2034 | 65,968 | 88,148 | ||
IFB Ser. 338, Class S2, IO, 5.869s, 2044 | 1,381,436 | 360,969 | ||
IFB Ser. 314, Class AS, IO, 5.709s, 2043 | 1,566,568 | 388,682 | ||
Ser. 3707, Class PI, IO, 4 1/2s, 2025 | 383,869 | 34,276 | ||
Ser. 4193, Class PI, IO, 4s, 2043 | 2,129,132 | 352,574 | ||
Ser. 304, Class C53, IO, 4s, 2032 | 4,205,817 | 685,969 | ||
Ser. 4369, Class IA, IO, 3 1/2s, 2044 | 2,618,829 | 445,508 | ||
Ser. 4141, Class PI, IO, 3s, 2042 | 3,582,918 | 444,389 | ||
Ser. 4165, Class TI, IO, 3s, 2042 | 9,468,948 | 1,123,017 | ||
Ser. 4206, Class IP, IO, 3s, 2041 | 3,120,323 | 378,495 | ||
Ser. 3300, PO, zero %, 2037 | 6,669 | 5,821 | ||
Ser. 3326, Class WF, zero %, 2035 | 2,592 | 2,178 | ||
Federal National Mortgage Association | ||||
IFB Ser. 06-8, Class HP, 23.902s, 2036 | 57,091 | 89,021 | ||
IFB Ser. 07-53, Class SP, 23.535s, 2037 | 57,269 | 88,597 | ||
IFB Ser. 05-75, Class GS, 19.706s, 2035 | 51,693 | 71,460 | ||
IFB Ser. 10-46, Class SB, IO, 6.269s, 2040 | 794,746 | 126,357 | ||
IFB Ser. 13-98, Class SA, IO, 5.769s, 2043 | 1,850,867 | 487,518 | ||
IFB Ser. 13-102, Class SH, IO, 5.719s, 2043 | 1,913,845 | 481,121 | ||
Ser. 15-4, Class IO, IO, 4 1/2s, 2045 | 1,528,245 | 297,396 | ||
Ser. 12-75, Class AI, IO, 4 1/2s, 2027 | 820,368 | 100,151 | ||
Ser. 418, Class C24, IO, 4s, 2043 | 2,211,213 | 427,507 | ||
Ser. 409, Class C16, IO, 4s, 2040 | 1,034,848 | 178,261 | ||
Ser. 418, Class C15, IO, 3 1/2s, 2043 | 2,393,137 | 472,420 | ||
Ser. 12-124, Class JI, IO, 3 1/2s, 2042 | 2,340,191 | 334,858 | ||
Ser. 13-55, Class IK, IO, 3s, 2043 | 2,044,771 | 260,074 | ||
Ser. 13-35, Class IP, IO, 3s, 2042 | 5,170,662 | 554,028 | ||
Ser. 13-55, Class PI, IO, 3s, 2042 | 5,229,405 | 571,731 | ||
Ser. 13-23, Class PI, IO, 3s, 2041 | 6,698,522 | 607,556 | ||
Ser. 14-28, Class AI, IO, 3s, 2040 | 3,821,622 | 489,645 |
Global Income Trust 31
MORTGAGE-BACKED SECURITIES (23.0%)* cont. | Principal | Value | ||
Agency collateralized mortgage obligations cont. | ||||
Federal National Mortgage Association | ||||
Ser. 13-55, Class MI, IO, 3s, 2032 | $3,143,531 | $376,564 | ||
FRB Ser. 03-W10, Class 1, IO, 0.955s, 2043 | 513,042 | 11,684 | ||
Ser. 07-64, Class LO, PO, zero %, 2037 | 11,418 | 10,607 | ||
Government National Mortgage Association | ||||
IFB Ser. 10-171, Class SB, IO, 6.268s, 2040 | 2,553,051 | 403,893 | ||
IFB Ser. 13-129, Class CS, IO, 5.969s, 2042 | 2,088,200 | 301,265 | ||
IFB Ser. 14-90, Class HS, IO, 5.919s, 2044 | 1,791,477 | 435,992 | ||
Ser. 10-35, Class UI, IO, 5s, 2040 | 950,115 | 192,103 | ||
Ser. 10-9, Class UI, IO, 5s, 2040 | 1,163,016 | 223,720 | ||
Ser. 13-24, Class IC, IO, 4 1/2s, 2043 | 1,309,002 | 219,847 | ||
Ser. 11-18, Class PI, IO, 4 1/2s, 2040 | 1,610,197 | 210,018 | ||
Ser. 10-35, Class AI, IO, 4 1/2s, 2040 | 2,726,551 | 433,712 | ||
Ser. 10-35, Class QI, IO, 4 1/2s, 2040 | 1,963,336 | 355,567 | ||
Ser. 10-103, Class DI, IO, 4 1/2s, 2038 | 2,051,008 | 146,501 | ||
Ser. 15-40, IO, 4s, 2045 | 2,094,769 | 505,782 | ||
Ser. 13-24, Class PI, IO, 4s, 2042 | 1,003,516 | 167,306 | ||
Ser. 13-49, Class OI, IO, 3 1/2s, 2043 | 2,799,712 | 484,434 | ||
Ser. 13-27, Class PI, IO, 3 1/2s, 2042 | 1,931,833 | 247,777 | ||
Ser. 14-102, Class IG, IO, 3 1/2s, 2041 | 2,814,700 | 404,444 | ||
Ser. 13-90, Class HI, IO, 3 1/2s, 2040 | 2,464,522 | 169,756 | ||
Ser. 13-53, Class PI, IO, 3s, 2041 | 4,983,891 | 526,050 | ||
Ser. 14-115, Class QI, IO, 3s, 2029 | 4,634,545 | 465,725 | ||
Ser. 14-44, Class IC, IO, 3s, 2028 | 6,149,424 | 663,575 | ||
17,423,185 | ||||
Commercial mortgage-backed securities (13.2%) | ||||
Banc of America Commercial Mortgage Trust | ||||
Ser. 07-2, Class A2, 5.634s, 2049 F | 45,549 | 45,692 | ||
Ser. 06-5, Class A2, 5.317s, 2047 | 123,201 | 123,193 | ||
Banc of America Commercial Mortgage Trust 144A FRB Ser. 07-5, Class XW, IO, 0.526s, 2051 | 5,543,145 | 44,556 | ||
Banc of America Merrill Lynch Commercial Mortgage, Inc. Ser. 05-4, Class B, 5.118s, 2045 | 423,000 | 427,230 | ||
Banc of America Merrill Lynch Commercial Mortgage, Inc. 144A FRB Ser. 04-4, Class XC, IO, 0.262s, 2042 | 194,664 | 420 | ||
Bayview Commercial Asset Trust 144A | ||||
Ser. 06-CD1A, IO, zero %, 2023 | CAD | 2,144,945 | 1 | |
Ser. 07-CD1A, IO, zero %, 2021 | CAD | 1,147,708 | 1 | |
Bear Stearns Commercial Mortgage Securities Trust 144A | ||||
FRB Ser. 06-PW11, Class B, 5.598s, 2039 | $959,000 | 961,877 | ||
FRB Ser. 06-PW11, Class C, 5.598s, 2039 | 403,000 | 403,476 | ||
FRB Ser. 06-PW14, Class X1, IO, 0.829s, 2038 F | 5,139,396 | 72,802 | ||
CD Mortgage Trust 144A FRB Ser. 07-CD5, Class XS, IO, 0.3s, 2044 | 3,960,701 | 13,670 | ||
CFCRE Commercial Mortgage Trust 144A | ||||
FRB Ser. 11-C2, Class E, 5.753s, 2047 | 329,000 | 362,232 | ||
FRB Ser. 11-C1, Class E, 5.721s, 2044 | 363,000 | 391,390 |
32 Global Income Trust
MORTGAGE-BACKED SECURITIES (23.0%)* cont. | Principal | Value | ||
Commercial mortgage-backed securities cont. | ||||
Citigroup Commercial Mortgage Trust | ||||
FRB Ser. 13-GC17, Class C, 5.261s, 2046 F | $447,000 | $493,920 | ||
Ser. 14-GC21, Class AS, 4.026s, 2047 | 749,000 | 801,565 | ||
Citigroup Commercial Mortgage Trust 144A FRB Ser. 06-C5, Class XC, IO, 0.736s, 2049 | 36,899,715 | 332,097 | ||
COMM Mortgage Pass-Through Certificates FRB Ser. 12-CR3, Class XA, IO, 2.321s, 2045 | 1,213,592 | 129,315 | ||
COMM Mortgage Trust | ||||
Ser. 07-C9, Class AJ, 5.65s, 2049 | 841,000 | 872,832 | ||
FRB Ser. 05-LP5, Class D, 5.195s, 2043 | 802,000 | 801,748 | ||
FRB Ser. 14-CR18, Class C, 4.897s, 2047 | 1,199,000 | 1,296,882 | ||
FRB Ser. 12-CR1, Class XA, IO, 2.284s, 2045 | 5,417,273 | 537,946 | ||
FRB Ser. 14-UBS6, Class XA, IO, 1.233s, 2047 | 10,555,498 | 745,925 | ||
FRB Ser. 13-CR13, Class XA, IO, 1.164s, 2023 | 9,372,977 | 503,048 | ||
COMM Mortgage Trust 144A | ||||
Ser. 13-LC13, Class E, 3.719s, 2046 | 489,000 | 379,466 | ||
FRB Ser. 07-C9, Class AJFL, 0.871s, 2049 | 1,722,000 | 1,672,406 | ||
Credit Suisse Commercial Mortgage Trust 144A | ||||
FRB Ser. 06-C4, Class AX, IO, 0.707s, 2039 | 7,544,603 | 48,293 | ||
FRB Ser. 07-C2, Class AX, IO, 0.219s, 2049 | 8,410,781 | 27,756 | ||
Credit Suisse First Boston Mortgage Securities Corp. 144A | ||||
Ser. 98-C1, Class F, 6s, 2040 | 136,722 | 148,001 | ||
FRB Ser. 03-C3, Class AX, IO, 2.047s, 2038 | 86,212 | 11 | ||
DBRR Trust 144A FRB Ser. 13-EZ3, Class A, 1.636s, 2049 | 312,927 | 314,394 | ||
GE Commercial Mortgage Corp. Trust 144A Ser. 07-C1, Class XC, IO, 0.386s, 2049 | 29,180,781 | 103,738 | ||
GS Mortgage Securities Corp. II | ||||
Ser. 05-GG4, Class AJ, 4.782s, 2039 | 215,583 | 215,691 | ||
FRB Ser. 13-GC10, Class XA, IO, 1.867s, 2046 F | 9,243,669 | 876,988 | ||
GS Mortgage Securities Corp. II 144A | ||||
FRB Ser. 13-GC10, Class D, 4.561s, 2046 | 983,000 | 979,225 | ||
FRB Ser. 13-GC10, Class E, 4.561s, 2046 | 650,000 | 562,406 | ||
GS Mortgage Securities Trust 144A FRB Ser. 12-GC6, Class D, 5.824s, 2045 | 971,000 | 1,036,999 | ||
JPMBB Commercial Mortgage Securities Trust FRB Ser. 13-C12, Class XA, IO, 1.005s, 2045 | 39,781,572 | 1,521,056 | ||
JPMorgan Chase Commercial Mortgage Securities Corp. 144A FRB Ser. 12-LC9, Class D, 4.569s, 2047 | 474,000 | 485,704 | ||
JPMorgan Chase Commercial Mortgage Securities Trust | ||||
FRB Ser. 07-CB20, Class AJ, 6.277s, 2051 | 487,000 | 510,839 | ||
FRB Ser. 07-LD12, Class A3, 6.136s, 2051 | 67,677 | 67,785 | ||
FRB Ser. 06-LDP7, Class B, 6.057s, 2045 | 914,000 | 612,948 | ||
Ser. 06-LDP8, Class AJ, 5.48s, 2045 | 1,820,000 | 1,862,988 | ||
FRB Ser. 05-LDP2, Class B, 4.882s, 2042 | 406,000 | 405,257 | ||
FRB Ser. 13-C10, Class C, 4.297s, 2047 | 758,000 | 782,418 | ||
FRB Ser. 13-C16, Class XA, IO, 1.522s, 2046 | 13,807,275 | 881,677 | ||
FRB Ser. 06-LDP8, Class X, IO, 0.718s, 2045 | 1,542,066 | 8,426 | ||
FRB Ser. 06-CB17, Class X, IO, 0.657s, 2043 | 20,525,396 | 130,480 | ||
FRB Ser. 07-LDPX, Class X, IO, 0.469s, 2049 | 14,003,066 | 150,099 |
Global Income Trust 33
MORTGAGE-BACKED SECURITIES (23.0%)* cont. | Principal | Value | ||
Commercial mortgage-backed securities cont. | ||||
JPMorgan Chase Commercial Mortgage Securities Trust 144A | ||||
FRB Ser. 07-CB20, Class C, 6.377s, 2051 | $401,000 | $384,306 | ||
FRB Ser. 12-C6, Class E, 5.381s, 2045 | 1,265,000 | 1,307,157 | ||
FRB Ser. 12-C8, Class D, 4.821s, 2045 | 1,932,000 | 2,013,056 | ||
FRB Ser. 07-CB20, Class X1, IO, 0.454s, 2051 | 6,579,483 | 45,366 | ||
LB Commercial Mortgage Trust 144A Ser. 98-C4, Class J, 5.6s, 2035 | 119,000 | 125,307 | ||
LB-UBS Commercial Mortgage Trust | ||||
Ser. 05-C7, Class C, 5.35s, 2040 | 763,000 | 764,129 | ||
Ser. 06-C7, Class A2, 5.3s, 2038 | 507,902 | 508,491 | ||
Ser. 04-C6, Class E, 5.177s, 2036 | 45,849 | 45,823 | ||
Ser. 04-C8, Class D, 4.946s, 2039 | 108,718 | 108,661 | ||
FRB Ser. 07-C2, Class XW, IO, 0.739s, 2040 | 796,549 | 8,210 | ||
LB-UBS Commercial Mortgage Trust 144A | ||||
FRB Ser. 06-C6, Class XCL, IO, 0.856s, 2039 | 24,756,219 | 206,046 | ||
FRB Ser. 06-C7, Class XCL, IO, 0.848s, 2038 | 2,392,763 | 20,458 | ||
FRB Ser. 06-C7, Class XW, IO, 0.848s, 2038 | 1,305,211 | 11,160 | ||
FRB Ser. 07-C2, Class XCL, IO, 0.739s, 2040 | 5,105,233 | 52,620 | ||
FRB Ser. 05-C2, Class XCL, IO, 0.226s, 2040 | 85,254 | 5 | ||
Merrill Lynch Mortgage Trust FRB Ser. 07-C1, Class A3, 6.029s, 2050 | 140,888 | 141,643 | ||
Mezz Cap Commercial Mortgage Trust 144A FRB Ser. 07-C5, Class X, IO, 5.926s, 2049 | 94,280 | 10,606 | ||
Morgan Stanley Capital I Trust | ||||
FRB Ser. 07-HQ12, Class A2, 5.861s, 2049 F | 44,991 | 45,131 | ||
FRB Ser. 07-HQ12, Class A2FX, 5.861s, 2049 | 306,499 | 305,966 | ||
Ser. 07-IQ14, Class A2, 5.61s, 2049 | 101,794 | 102,848 | ||
Ser. 07-HQ11, Class C, 5.558s, 2044 | 477,000 | 476,251 | ||
Morgan Stanley Capital I Trust 144A FRB Ser. 05-HQ5, Class X1, IO, 0.139s, 2042 F | 5,074,802 | 1,522 | ||
Morgan Stanley Capital I, Inc. 144A FRB Ser. 04-RR, Class F7, 6s, 2039 F | 232,322 | 219,991 | ||
Morgan Stanley Re-REMIC Trust 144A FRB Ser. 10-C30A, Class A3B, 5.246s, 2043 | 599,274 | 601,467 | ||
UBS-Barclays Commercial Mortgage Trust 144A FRB Ser. 12-C4, Class XA, IO, 1.99s, 2045 | 6,305,060 | 618,142 | ||
Wachovia Bank Commercial Mortgage Trust | ||||
FRB Ser. 06-C25, Class AJ, 5.896s, 2043 | 294,000 | 301,909 | ||
Ser. 06-C24, Class AJ, 5.658s, 2045 | 241,000 | 244,157 | ||
FRB Ser. 07-C34, IO, 0.463s, 2046 | 1,805,220 | 13,539 | ||
Wachovia Bank Commercial Mortgage Trust 144A | ||||
FRB Ser. 05-C17, Class F, 5.661s, 2042 | 425,249 | 424,322 | ||
FRB Ser. 05-C16, Class G, 5.39s, 2041 | 770,000 | 778,126 | ||
WF-RBS Commercial Mortgage Trust | ||||
Ser. 14-C19, Class C, 4.646s, 2047 | 1,380,000 | 1,466,802 | ||
Ser. 13-C18, Class AS, 4.387s, 2046 | 765,000 | 848,745 | ||
Ser. 13-UBS1, Class AS, 4.306s, 2046 | 476,000 | 524,961 | ||
FRB Ser. 13-C14, Class XA, IO, 1.043s, 2046 F | 10,756,178 | 561,563 |
34 Global Income Trust
MORTGAGE-BACKED SECURITIES (23.0%)* cont. | Principal | Value | ||
Commercial mortgage-backed securities cont. | ||||
WF-RBS Commercial Mortgage Trust 144A | ||||
FRB Ser. 11-C2, Class D, 5.648s, 2044 | $2,606,000 | $2,841,244 | ||
FRB Ser. 11-C4, Class E, 5.413s, 2044 | 527,000 | 561,336 | ||
FRB Ser. 12-C10, Class D, 4.606s, 2045 | 372,000 | 369,210 | ||
FRB Ser. 12-C10, Class XA, IO, 1.932s, 2045 F | 7,566,419 | 726,344 | ||
FRB Ser. 13-C12, Class XA, IO, 1.628s, 2048 | 1,947,475 | 151,617 | ||
41,085,106 | ||||
Residential mortgage-backed securities (non-agency) (4.2%) | ||||
BCAP, LLC 144A FRB Ser. 13-RR1, Class 9A4, 6.004s, 2036 | 550,000 | 556,325 | ||
BCAP, LLC Trust FRB Ser. 15-RR5, Class 2A3, 1.207s, 2046 F | 190,000 | 147,041 | ||
BCAP, LLC Trust 144A | ||||
FRB Ser. 12-RR10, Class 9A2, 2.705s, 2035 | 280,000 | 266,000 | ||
FRB Ser. 14-RR1, Class 2A2, 2.358s, 2036 | 1,000,000 | 870,000 | ||
Bear Stearns Asset Backed Securities I Trust FRB Ser. 04-FR3, Class M6, 5.049s, 2034 | 12,196 | 8,220 | ||
CSMC Trust 144A FRB Ser. 13-5R, Class 1A6, 0.398s, 2036 | 850,000 | 698,105 | ||
Granite Mortgages PLC | ||||
FRB Ser. 03-2, Class 3C, 3.07s, 2043 (United Kingdom) | GBP | 121,603 | 190,468 | |
FRB Ser. 03-2, Class 2C1, 2.852s, 2043 (United Kingdom) | EUR | 327,000 | 375,433 | |
Nomura Resecuritization Trust 144A FRB Ser. 14-3R, Class 3A9, 0.694s, 2035 | $1,539,000 | 1,328,311 | ||
RBSSP Resecuritization Trust 144A FRB Ser. 10-1, Class 3A2, 5.189s, 2035 | 640,000 | 624,384 | ||
WaMu Mortgage Pass-Through Certificates Trust | ||||
FRB Ser. 06-AR4, Class 1A1B, 1.068s, 2046 | 1,337,080 | 1,156,575 | ||
FRB Ser. 05-AR19, Class A1C3, 0.681s, 2045 | 1,682,026 | 1,484,388 | ||
FRB Ser. 05-AR13, Class A1C3, 0.671s, 2045 | 3,111,267 | 2,737,915 | ||
FRB Ser. 05-AR9, Class A1C3, 0.661s, 2045 | 1,155,353 | 1,062,925 | ||
FRB Ser. 05-AR2, Class 2A1B, 0.551s, 2045 | 860,592 | 782,110 | ||
Wells Fargo Mortgage Loan Trust 144A FRB Ser. 12-RR2, Class 1A2, 0.377s, 2047 | 850,000 | 629,000 | ||
12,917,200 | ||||
Total mortgage-backed securities (cost $69,728,406) |
| |||
U.S. GOVERNMENT AND AGENCY | Principal | Value | |
U.S. Government Guaranteed Mortgage Obligations (2.4%) | |||
Government National Mortgage Association Pass-Through Certificates | |||
4 1/2s, TBA, May 1, 2045 | $3,000,000 | $3,256,406 | |
4s, March 20, 2044 | 94,580 | 104,081 | |
3s, TBA, June 1, 2045 | 2,000,000 | 2,051,484 | |
3s, TBA, May 1, 2045 | 2,000,000 | 2,056,406 | |
7,468,377 | |||
U.S. Government Agency Mortgage Obligations (11.0%) | |||
Federal Home Loan Mortgage Corporation Pass-Through Certificates | |||
6s, with due dates from July 1, 2021 to September 1, 2021 | 12,706 | 13,922 | |
5 1/2s, June 1, 2035 | 15,119 | 17,180 | |
5 1/2s, April 1, 2020 | 5,722 | 6,184 | |
4 1/2s, May 1, 2044 | 563,023 | 628,103 |
Global Income Trust 35
U.S. GOVERNMENT AND AGENCY | Principal | Value | |
U.S. Government Agency Mortgage Obligations cont. | |||
Federal Home Loan Mortgage Corporation Pass-Through Certificates | |||
3 1/2s, with due dates from August 1, 2043 to February 1, 2044 | $2,657,277 | $2,797,274 | |
3s, March 1, 2043 | 849,517 | 866,176 | |
Federal National Mortgage Association Pass-Through Certificates | |||
7s, with due dates from March 1, 2033 to April 1, 2035 | 89,171 | 105,078 | |
6 1/2s, with due dates from September 1, 2036 to November 1, 2037 | 31,281 | 36,162 | |
6s, July 1, 2037 | 1,690 | 1,935 | |
6s, with due dates from May 1, 2021 to October 1, 2021 | 45,605 | 49,893 | |
5 1/2s, with due dates from February 1, 2018 to March 1, 2021 | 32,957 | 35,362 | |
5 1/2s, TBA, May 1, 2045 | 1,000,000 | 1,132,031 | |
5s, May 1, 2037 | 71,004 | 79,089 | |
5s, with due dates from May 1, 2020 to March 1, 2021 | 5,395 | 5,790 | |
4 1/2s, May 1, 2041 | 820,497 | 894,694 | |
4s, with due dates from May 1, 2044 to June 1, 2044 | 947,638 | 1,023,079 | |
4s, with due dates from May 1, 2019 to September 1, 2020 | 57,931 | 61,166 | |
4s, TBA, June 1, 2045 | 1,000,000 | 1,067,344 | |
4s, TBA, May 1, 2045 | 2,000,000 | 2,137,500 | |
3 1/2s, with due dates from July 1, 2043 to May 1, 2045 ## | 1,884,442 | 1,977,369 | |
3 1/2s, TBA, May 1, 2045 | 5,000,000 | 5,239,063 | |
3s, with due dates from February 1, 2043 to June 1, 2043 ## | 1,812,476 | 1,849,779 | |
3s, TBA, May 1, 2045 | 14,000,000 | 14,247,187 | |
34,271,360 | |||
Total U.S. government and agency mortgage obligations (cost $41,538,281) |
| ||
U.S. TREASURY OBLIGATIONS (—%)* | Principal | Value | |
U.S. Treasury Notes | |||
1.875%, November 30, 2021 i | $10,000 | $10,147 | |
1.000%, May 31, 2018 i | 91,000 | 91,475 | |
0.875%, September 15, 2016 i | 9,000 | 9,066 | |
Total U.S. treasury obligations (cost $110,688) |
| ||
ASSET-BACKED SECURITIES (2.5%)* | Principal | Value | ||
Station Place Securitization Trust 144A FRB Ser. 14-2, Class A, 1.055s, 2016 | $7,687,000 | $7,687,000 | ||
Total asset-backed securities (cost $7,687,000) |
| |||
PURCHASED SWAP OPTIONS OUTSTANDING (0.5%)* | Expiration date/strike | Contract amount | Value | |
Bank of America N.A. | ||||
(2.0875)/3 month USD-LIBOR-BBA/Jul-25 | Jul-15/2.0875 | $5,213,000 | $93,521 | |
(2.2125)/3 month USD-LIBOR-BBA/Jun-25 | Jun-15/2.2125 | 9,076,700 | 88,589 | |
(2.325)/3 month USD-LIBOR-BBA/Jun-25 | Jun-15/2.325 | 9,076,700 | 53,008 | |
1.9875/3 month USD-LIBOR-BBA/Jun-25 | Jun-15/1.9875 | 9,076,700 | 48,651 | |
(2.685)/3 month USD-LIBOR-BBA/Sep-25 | Sep-15/2.685 | 9,727,900 | 48,348 | |
1.925/3 month USD-LIBOR-BBA/May-25 | May-15/1.925 | 40,394,000 | 46,857 |
36 Global Income Trust
PURCHASED SWAP OPTIONS OUTSTANDING (0.5%)* cont. | Expiration date/strike | Contract amount | Value | |
Bank of America N.A. cont. | ||||
1.875/3 month USD-LIBOR-BBA/Jun-25 | Jun-15/1.875 | $9,076,700 | $28,773 | |
1.835/3 month USD-LIBOR-BBA/May-25 | May-15/1.835 | 40,394,000 | 19,389 | |
1.875/3 month USD-LIBOR-BBA/May-25 | May-15/1.875 | 7,035,100 | 7 | |
Barclays Bank PLC | ||||
(2.1625)/3 month USD-LIBOR-BBA/May-25 | May-15/2.1625 | 9,727,900 | 63,037 | |
Citibank, N.A. | ||||
2.20/3 month USD-LIBOR-BBA/May-25 | May-15/2.20 | 10,344,800 | 80,172 | |
2.043/3 month USD-LIBOR-BBA/May-25 | May-15/2.043 | 4,863,950 | 13,425 | |
1.4015/3 month USD-LIBOR-BBA/May-20 | May-15/1.4015 | 19,455,800 | 12,257 | |
1.3735/3 month USD-LIBOR-BBA/May-20 | May-15/1.3735 | 9,727,900 | 4,572 | |
1.294/3 month USD-LIBOR-BBA/May-20 | May-15/1.294 | 19,455,800 | 3,697 | |
1.266/3 month USD-LIBOR-BBA/May-20 | May-15/1.266 | 9,727,900 | 1,362 | |
Credit Suisse International | ||||
2.25/3 month USD-LIBOR-BBA/May-25 | May-15/2.25 | 17,638,600 | 199,140 | |
(2.915)/3 month USD-LIBOR-BBA/Apr-47 | Apr-17/2.915 | 2,333,000 | 171,126 | |
(3.315)/3 month USD-LIBOR-BBA/Apr-47 | Apr-17/3.315 | 2,333,000 | 104,728 | |
1.9425/3 month USD-LIBOR-BBA/May-25 | May-15/1.9425 | 53,858,600 | 80,249 | |
(2.3085)/3 month USD-LIBOR-BBA/May-25 | May-15/2.3085 | 9,727,900 | 20,234 | |
1.765/3 month USD-LIBOR-BBA/May-25 | May-15/1.765 | 18,764,600 | 6,005 | |
Goldman Sachs International | ||||
(2.1065)/3 month USD-LIBOR-BBA/May-25 | May-15/2.1065 | 19,455,800 | 152,726 | |
(2.82)/3 month USD-LIBOR-BBA/Jan-46 | Jan-16/2.82 | 3,752,875 | 150,153 | |
2.655/3 month USD-LIBOR-BBA/May-45 | May-15/2.655 | 2,431,975 | 77,945 | |
1.8755/3 month USD-LIBOR-BBA/May-25 | May-15/1.8755 | 19,455,800 | 9,339 | |
Total purchased swap options outstanding (cost $1,993,226) |
| |||
PURCHASED OPTIONS | Expiration date/strike | Contract amount | Value | |
Federal National Mortgage Association 30 yr 3.0s TBA commitments (Call) | Jul-15/$101.86 | $9,000,000 | $53,730 | |
Federal National Mortgage Association 30 yr 3.0s TBA commitments (Call) | Jul-15/103.42 | 9,000,000 | 14,490 | |
Total purchased options outstanding (cost $94,922) |
| |||
MUNICIPAL BONDS AND NOTES (0.1%)* | Principal | Value | ||
CA State G.O. Bonds (Build America Bonds), 7 1/2s, 4/1/34 | $100,000 | $147,477 | ||
North TX, Tollway Auth. Rev. Bonds (Build America Bonds), 6.718s, 1/1/49 | 95,000 | 137,578 | ||
OH State U. Rev. Bonds (Build America Bonds), 4.91s, 6/1/40 | 115,000 | 136,932 | ||
Total municipal bonds and notes (cost $310,649) |
| |||
Global Income Trust 37
SHORT-TERM INVESTMENTS (9.2%)* | Principal | Value | |
Putnam Short Term Investment Fund 0.07% L | Shares 17,821,691 | $17,821,691 | |
SSgA Prime Money Market Fund Class N 0.03% P | Shares 802,000 | 802,000 | |
U.S. Treasury Bills with an effective yield of 0.10%, July 23, 2015 § | $2,337,000 | 2,336,932 | |
U.S. Treasury Bills with an effective yield of 0.02%, August 27, 2015 | 147,000 | 146,991 | |
U.S. Treasury Bills with an effective yield of 0.02%, July 16, 2015 # Δ § | 2,650,000 | 2,649,971 | |
U.S. Treasury Bills with an effective yield of 0.01%, May 21, 2015 # Δ | 660,000 | 659,996 | |
U.S. Treasury Bills with an effective yield of 0.01%, May 14, 2015 # Δ | 200,000 | 200,000 | |
U.S. Treasury Bills with an effective yield of 0.01%, May 7, 2015 # § | 3,025,000 | 3,024,992 | |
U.S. Treasury Bills with effective yields ranging from 0.02% to 0.03%, August 6, 2015 # Δ § | 335,000 | 334,989 | |
U.S. Treasury Bills with effective yields ranging from less than 0.01% to 0.02%, July 9, 2015 # Δ § | 725,000 | 725,000 | |
Total short-term investments (cost $28,701,951) |
| ||
TOTAL INVESTMENTS | ||
Total investments (cost $344,787,016) | $344,024,604 |
Key to holding’s currency abbreviations
| AUD | Australian Dollar |
| BRL | Brazilian Real |
| CAD | Canadian Dollar |
| CHF | Swiss Franc | DKK | Danish Krone |
| EUR | Euro |
| GBP | British Pound |
| JPY | Japanese Yen |
| KRW | South Korean Won |
| MXN | Mexican Peso |
| NOK | Norwegian Krone |
| NZD | New Zealand Dollar |
| PLN | Polish Zloty |
| SEK | Swedish Krona |
| USD / $ | United States Dollar |
| ZAR | South African Rand |
| |
BKNT | Bank Note |
bp | Basis Points |
EMTN | Euro Medium Term Notes |
FRB | Floating Rate Bonds: the rate shown is the current interest rate at the close of the reporting period |
FRN | Floating Rate Notes: the rate shown is the current interest rate or yield at the close of the reporting period |
38 Global Income Trust
G.O. Bonds | General Obligation Bonds | |
IFB | Inverse Floating Rate Bonds, which are securities that pay interest rates that vary inversely to changes in the market interest rates. As interest rates rise, inverse floaters produce less current income. The rate shown is the current interest rate at the close of the reporting period. | |
IO | Interest Only | |
MTN | Medium Term Notes | |
OJSC | Open Joint Stock Company | |
OTC | Over-the-counter | |
PO | Principal Only | |
REGS | Securities sold under Regulation S may not be offered, sold or delivered within the United States except pursuant to an exemption from, or in a transaction not subject to, the registration requirements of the Securities Act of 1933. | |
TBA | To Be Announced Commitments |
Notes to the fund’s portfolio | |
Unless noted otherwise, the notes to the fund’s portfolio are for the close of the fund’s reporting period, which ran from November 1, 2014 through April 30, 2015 (the reporting period). Within the following notes to the portfolio, references to “ASC 820” represent Accounting Standards Codification 820 Fair Value Measurements and Disclosures and references to “OTC”, if any, represent over-the-counter. | |
* | Percentages indicated are based on net assets of $311,059,188. |
† | This security is non-income-producing. |
†† | The interest rate and date shown parenthetically represent the new interest rate to be paid and the date the fund will begin accruing interest at this rate. |
# | This security, in part or in entirety, was pledged and segregated with the broker to cover margin requirements for futures contracts at the close of the reporting period. |
Δ | This security, in part or in entirety, was pledged and segregated with the custodian for collateral on certain derivative contracts at the close of the reporting period. |
§ | This security, in part or in entirety, was pledged and segregated with the custodian for collateral on the initial margin on certain centrally cleared derivative contracts at the close of the reporting period. |
## | Forward commitment, in part or in entirety (Note 1). |
F | This security is valued at fair value following procedures approved by the Trustees. Securities may be classified as Level 2 or Level 3 for ASC 820 based on the securities’ valuation inputs (Note 1). |
i | This security was pledged, or purchased with cash that was pledged, to the fund for collateral on certain derivative contracts (Note 1). |
L | Affiliated company (Note 5). The rate quoted in the security description is the annualized 7-day yield of the fund at the close of the reporting period. |
P | This security was pledged, or purchased with cash that was pledged, to the fund for collateral on certain derivative contracts. The rate quoted in the security description is the annualized 7-day yield of the fund at the close of the reporting period (Note 1). |
R | Real Estate Investment Trust. |
At the close of the reporting period, the fund maintained liquid assets totaling $135,356,660 to cover certain derivative contracts and delayed delivery securities. | |
Debt obligations are considered secured unless otherwise indicated. | |
144A after the name of an issuer represents securities exempt from registration under Rule 144A under the Securities Act of 1933, as amended. These securities may be resold in transactions exempt from registration, normally to qualified institutional buyers. | |
See Note 1 to the financial statements regarding TBA commitments. | |
The dates shown on debt obligations are the original maturity dates. |
Global Income Trust 39
DIVERSIFICATION BY COUNTRY ⌂ | |
Distribution of investments by country of risk at the close of the reporting period, excluding collateral received, if any (as a percentage of Portfolio Value): |
United States | 58.6% |
Japan | 6.4 |
France | 4.1 |
Italy | 3.7 |
United Kingdom | 3.7 |
Germany | 2.8 |
Spain | 2.1 |
Greece | 2.0 |
Argentina | 1.9 |
Netherlands | 1.8 |
Luxembourg | 1.5 |
Mexico | 1.4 |
Canada | 1.1 |
Russia | 0.9 |
South Africa | 0.8 |
Austria | 0.8 |
Belgium | 0.8 |
Ireland | 0.6 |
Poland | 0.6 |
Sweden | 0.5 |
Brazil | 0.5 |
Supra-Nation | 0.5 |
Other | 2.9 |
Total | 100.0% |
⌂ Methodology differs from that used for purposes of complying with the fund’s policy regarding investments in securities of foreign issuers, as discussed further in the fund’s prospectus. |
| |||||||
Counterparty | Currency | Contract | Delivery | Value | Aggregate | Unrealized | |
| |||||||
Australian Dollar | Sell | 7/15/15 | $12,060 | $11,616 | $(444) | ||
British Pound | Buy | 6/17/15 | 407,726 | 412,659 | (4,933) | ||
Canadian Dollar | Sell | 7/15/15 | 1,266,418 | 1,206,687 | (59,731) | ||
Euro | Buy | 6/17/15 | 637,687 | 567,413 | 70,274 | ||
Japanese Yen | Buy | 5/20/15 | 398,340 | 404,643 | (6,303) | ||
Mexican Peso | Buy | 7/15/15 | 780,552 | 786,872 | (6,320) | ||
Norwegian Krone | Buy | 6/17/15 | 52,050 | 38,540 | 13,510 | ||
South Korean Won | Buy | 5/20/15 | 462,175 | 455,629 | 6,546 | ||
| |||||||
Australian Dollar | Buy | 7/15/15 | 760,647 | 751,010 | 9,637 | ||
British Pound | Buy | 6/17/15 | 421,843 | 396,839 | 25,004 | ||
Canadian Dollar | Sell | 7/15/15 | 3,097,115 | 2,945,903 | (151,212) | ||
Czech Koruna | Buy | 6/17/15 | 63,432 | 63,279 | 153 | ||
Euro | Sell | 6/17/15 | 1,003,266 | 1,001,279 | (1,987) | ||
Japanese Yen | Buy | 5/20/15 | 1,880,902 | 1,925,496 | (44,594) | ||
Mexican Peso | Buy | 7/15/15 | 806,804 | 818,151 | (11,347) | ||
New Zealand Dollar | Sell | 7/15/15 | 679,153 | 681,287 | 2,134 | ||
Norwegian Krone | Buy | 6/17/15 | 820,930 | 795,531 | 25,399 | ||
Singapore Dollar | Sell | 5/20/15 | 1,048,648 | 1,011,594 | (37,054) | ||
South African Rand | Sell | 7/15/15 | 1,097,606 | 1,084,903 | (12,703) | ||
South Korean Won | Sell | 5/20/15 | 1,286,675 | 1,260,566 | (26,109) | ||
Swedish Krona | Sell | 6/17/15 | 446,159 | 402,550 | (43,609) | ||
Swiss Franc | Buy | 6/17/15 | 1,413,197 | 1,386,513 | 26,684 | ||
Thai Baht | Sell | 5/20/15 | 208,391 | 209,174 | 783 | ||
40 Global Income Trust
| |||||||
Counterparty | Currency | Contract | Delivery | Value | Aggregate | Unrealized | |
| |||||||
Australian Dollar | Sell | 7/15/15 | $89,937 | $87,685 | $(2,252) | ||
Brazilian Real | Sell | 7/2/15 | 88,299 | 82,319 | (5,980) | ||
British Pound | Buy | 6/17/15 | 547,983 | 561,144 | (13,161) | ||
Canadian Dollar | Sell | 7/15/15 | 420,539 | 401,160 | (19,379) | ||
Chilean Peso | Buy | 7/15/15 | 33,180 | 33,420 | (240) | ||
Danish Krone | Sell | 6/17/15 | 430,308 | 442,124 | 11,816 | ||
Euro | Sell | 6/17/15 | 10,772,580 | 10,714,599 | (57,981) | ||
Japanese Yen | Sell | 5/20/15 | 10,707 | 18,851 | 8,144 | ||
Mexican Peso | Buy | 7/15/15 | 248,240 | 251,748 | (3,508) | ||
New Zealand Dollar | Buy | 7/15/15 | 43,205 | 42,253 | 952 | ||
Norwegian Krone | Buy | 6/17/15 | 161,032 | 106,423 | 54,609 | ||
Philippine Peso | Buy | 5/20/15 | 417,181 | 421,355 | (4,174) | ||
Swedish Krona | Sell | 6/17/15 | 406,706 | 388,418 | (18,288) | ||
Swiss Franc | Buy | 6/17/15 | 859,147 | 833,438 | 25,709 | ||
Thai Baht | Buy | 5/20/15 | 347,679 | 349,463 | (1,784) | ||
| |||||||
Australian Dollar | Buy | 7/15/15 | 403,892 | 424,075 | (20,183) | ||
British Pound | Sell | 6/17/15 | 4,600,077 | 4,582,114 | (17,963) | ||
Canadian Dollar | Buy | 7/15/15 | 301,638 | 315,531 | (13,893) | ||
Chinese Yuan (Onshore) | Buy | 5/20/15 | 789,688 | 796,766 | (7,078) | ||
Euro | Sell | 6/17/15 | 5,384,268 | 5,256,564 | (127,704) | ||
Indian Rupee | Buy | 5/20/15 | 889,840 | 902,140 | (12,300) | ||
Japanese Yen | Sell | 5/20/15 | 2,347,911 | 2,380,214 | 32,303 | ||
New Zealand Dollar | Sell | 7/15/15 | 329,646 | 346,396 | 16,750 | ||
Norwegian Krone | Sell | 6/17/15 | 165,303 | 161,329 | (3,974) | ||
Singapore Dollar | Sell | 5/20/15 | 818,897 | 794,685 | (24,212) | ||
South Korean Won | Buy | 5/20/15 | 785,406 | 770,947 | 14,459 | ||
Swedish Krona | Sell | 6/17/15 | 350,584 | 353,363 | 2,779 | ||
Swiss Franc | Sell | 6/17/15 | 239,290 | 242,779 | 3,489 | ||
| |||||||
Australian Dollar | Sell | 7/15/15 | 1,234,927 | 1,173,518 | (61,409) | ||
British Pound | Buy | 6/17/15 | 1,482,821 | 1,492,501 | (9,680) | ||
Canadian Dollar | Sell | 7/15/15 | 1,307,735 | 1,244,489 | (63,246) | ||
Euro | Sell | 6/17/15 | 9,245,324 | 9,163,548 | (81,776) | ||
Japanese Yen | Sell | 5/20/15 | 2,880,666 | 2,926,952 | 46,286 | ||
New Zealand Dollar | Buy | 7/15/15 | 876,986 | 855,978 | 21,008 | ||
Norwegian Krone | Buy | 6/17/15 | 73,711 | 71,944 | 1,767 | ||
Polish Zloty | Sell | 6/17/15 | 2,120,230 | 2,044,955 | (75,275) | ||
Swedish Krona | Sell | 6/17/15 | 8,563 | 8,547 | (16) | ||
Turkish Lira | Sell | 6/17/15 | 44,069 | 32,388 | (11,681) | ||
Global Income Trust 41
| |||||||
Counterparty | Currency | Contract | Delivery | Value | Aggregate | Unrealized | |
| |||||||
Australian Dollar | Sell | 7/15/15 | $448,348 | $431,168 | $(17,180) | ||
British Pound | Buy | 6/17/15 | 1,297,450 | 1,299,703 | (2,253) | ||
Canadian Dollar | Sell | 7/15/15 | 984,983 | 939,059 | (45,924) | ||
Euro | Sell | 6/17/15 | 7,370,465 | 7,389,645 | 19,180 | ||
Japanese Yen | Sell | 5/20/15 | 3,149,089 | 3,203,106 | 54,017 | ||
New Zealand Dollar | Buy | 7/15/15 | 676,803 | 660,575 | 16,228 | ||
Norwegian Krone | Sell | 6/17/15 | 338,060 | 329,622 | (8,438) | ||
South African Rand | Buy | 7/15/15 | 9,447 | 9,236 | 211 | ||
Swedish Krona | Sell | 6/17/15 | 94,194 | 94,010 | (184) | ||
| |||||||
Australian Dollar | Buy | 7/15/15 | 409,725 | 393,972 | 15,753 | ||
British Pound | Sell | 6/17/15 | 3,322,423 | 3,336,064 | 13,641 | ||
Canadian Dollar | Sell | 7/15/15 | 3,027,564 | 2,889,951 | (137,613) | ||
Chinese Yuan (Onshore) | Buy | 5/20/15 | 26,268 | 16,617 | 9,651 | ||
Euro | Sell | 6/17/15 | 8,088,592 | 8,139,015 | 50,423 | ||
Japanese Yen | Buy | 5/20/15 | 766,467 | 778,681 | (12,214) | ||
New Taiwan Dollar | Buy | 5/20/15 | 829,317 | 821,536 | 7,781 | ||
New Taiwan Dollar | Sell | 5/20/15 | 829,317 | 803,535 | (25,782) | ||
New Zealand Dollar | Buy | 7/15/15 | 436,068 | 425,480 | 10,588 | ||
Swedish Krona | Buy | 6/17/15 | 363,410 | 362,823 | 587 | ||
| |||||||
Australian Dollar | Buy | 7/15/15 | 795,487 | 775,794 | 19,693 | ||
British Pound | Buy | 6/17/15 | 189,208 | 181,566 | 7,642 | ||
Canadian Dollar | Sell | 7/15/15 | 544,655 | 506,785 | (37,870) | ||
Euro | Buy | 6/17/15 | 3,868,247 | 3,847,262 | 20,985 | ||
Indian Rupee | Buy | 5/20/15 | 9,615 | 10,159 | (544) | ||
Japanese Yen | Buy | 5/20/15 | 303,955 | 308,118 | (4,163) | ||
Malaysian Ringgit | Buy | 5/20/15 | 182,313 | 172,075 | 10,238 | ||
Mexican Peso | Sell | 7/15/15 | 156,129 | 158,285 | 2,156 | ||
New Zealand Dollar | Sell | 7/15/15 | 703,409 | 685,767 | (17,642) | ||
Norwegian Krone | Buy | 6/17/15 | 465,944 | 433,567 | 32,377 | ||
Philippine Peso | Buy | 5/20/15 | 417,179 | 421,448 | (4,269) | ||
Russian Ruble | Buy | 6/17/15 | 87,950 | 70,089 | 17,861 | ||
Singapore Dollar | Sell | 5/20/15 | 39,513 | 47,904 | 8,391 | ||
South African Rand | Buy | 7/15/15 | 204,103 | 201,891 | 2,212 | ||
South Korean Won | Sell | 5/20/15 | 213,385 | 192,609 | (20,776) | ||
Swedish Krona | Sell | 6/17/15 | 1,430,846 | 1,398,318 | (32,528) | ||
Swiss Franc | Sell | 6/17/15 | 537,732 | 534,612 | (3,120) | ||
42 Global Income Trust
| |||||||
Counterparty | Currency | Contract | Delivery | Value | Aggregate | Unrealized | |
| |||||||
Australian Dollar | Buy | 7/15/15 | $939,261 | $903,757 | $35,504 | ||
British Pound | Sell | 6/17/15 | 4,603,913 | 4,574,946 | (28,967) | ||
Canadian Dollar | Sell | 7/15/15 | 463,180 | 427,316 | (35,864) | ||
Euro | Sell | 6/17/15 | 11,354,766 | 11,386,300 | 31,534 | ||
New Zealand Dollar | Buy | 7/15/15 | 22,815 | 25,245 | (2,430) | ||
Norwegian Krone | Buy | 6/17/15 | 920,321 | 854,004 | 66,317 | ||
Singapore Dollar | Buy | 5/20/15 | 443,031 | 434,708 | 8,323 | ||
Swedish Krona | Sell | 6/17/15 | 17,919 | 7,048 | (10,871) | ||
| |||||||
Australian Dollar | Sell | 7/15/15 | 215,109 | 206,822 | (8,287) | ||
Brazilian Real | Buy | 7/2/15 | 676,544 | 672,089 | 4,455 | ||
British Pound | Buy | 6/17/15 | 6,018,296 | 6,069,282 | (50,986) | ||
Canadian Dollar | Buy | 7/15/15 | 98,449 | 117,151 | (18,702) | ||
Chilean Peso | Buy | 7/15/15 | 1,001 | 995 | 6 | ||
Euro | Buy | 6/17/15 | 8,704,931 | 8,244,039 | 460,892 | ||
Hungarian Forint | Buy | 6/17/15 | 799,744 | 792,431 | 7,313 | ||
Israeli Shekel | Sell | 7/15/15 | 22,952 | 22,354 | (598) | ||
Japanese Yen | Buy | 5/20/15 | 355,669 | 346,882 | 8,787 | ||
Malaysian Ringgit | Buy | 5/20/15 | 69,566 | 64,125 | 5,441 | ||
New Zealand Dollar | Buy | 7/15/15 | 203,064 | 198,214 | 4,850 | ||
Norwegian Krone | Sell | 6/17/15 | 248,233 | 239,719 | (8,514) | ||
Singapore Dollar | Sell | 5/20/15 | 65,578 | 48,078 | (17,500) | ||
Swedish Krona | Buy | 6/17/15 | 1,523,947 | 1,495,468 | 28,479 | ||
Swiss Franc | Buy | 6/17/15 | 1,083,408 | 1,060,500 | 22,908 | ||
Turkish Lira | Buy | 6/17/15 | 263,302 | 307,142 | (43,840) | ||
| |||||||
Australian Dollar | Buy | 7/15/15 | 480,587 | 479,567 | 1,020 | ||
British Pound | Sell | 6/17/15 | 2,733,161 | 2,652,773 | (80,388) | ||
Canadian Dollar | Sell | 7/15/15 | 375,165 | 357,794 | (17,371) | ||
Chilean Peso | Buy | 7/15/15 | 1,001 | 1,003 | (2) | ||
Euro | Buy | 6/17/15 | 956,079 | 978,592 | (22,513) | ||
Japanese Yen | Sell | 5/20/15 | 664,919 | 682,331 | 17,412 | ||
New Taiwan Dollar | Buy | 5/20/15 | 829,320 | 821,498 | 7,822 | ||
New Taiwan Dollar | Sell | 5/20/15 | 829,320 | 800,129 | (29,191) | ||
New Zealand Dollar | Buy | 7/15/15 | 872,439 | 851,461 | 20,978 | ||
Norwegian Krone | Buy | 6/17/15 | 840,323 | 778,383 | 61,940 | ||
Norwegian Krone | Sell | 6/17/15 | 827,018 | 798,343 | (28,675) | ||
Swedish Krona | Buy | 6/17/15 | 7,300 | 33,303 | (26,003) | ||
| |||||||
Australian Dollar | Buy | 7/15/15 | 403,024 | 404,609 | (1,585) | ||
British Pound | Buy | 6/17/15 | 1,883,641 | 1,886,806 | (3,165) | ||
Global Income Trust 43
| |||||||
Counterparty | Currency | Contract | Delivery | Value | Aggregate | Unrealized | |
| |||||||
Canadian Dollar | Buy | 7/15/15 | $153,592 | $146,651 | $6,941 | ||
Euro | Buy | 6/17/15 | 1,570,396 | 1,536,506 | 33,890 | ||
Japanese Yen | Sell | 5/20/15 | 2,934,977 | 2,935,956 | 979 | ||
New Zealand Dollar | Buy | 7/15/15 | 1,260,676 | 1,230,410 | 30,266 | ||
South Korean Won | Buy | 5/20/15 | 907,555 | 891,337 | 16,218 | ||
Total |
| ||||||
| |||||
Number of | Value | Expiration | Unrealized | ||
Australian Government Treasury Bond 10 yr (Long) | 15 | $1,534,346 | Jun-15 | $(11,588) | |
Canadian Government Bond 10 yr (Long) | 7 | 813,601 | Jun-15 | (10,061) | |
Euro-Bobl 5 yr (Short) | 54 | 7,809,646 | Jun-15 | 39,026 | |
Euro-Bund 10 yr (Long) | 204 | 35,893,918 | Jun-15 | (803,398) | |
Euro-Bund 10 yr (Short) | 43 | 7,565,875 | Jun-15 | (9,777) | |
Euro-Buxl 30 yr (Short) | 7 | 1,325,659 | Jun-15 | (34,289) | |
Euro-Schatz 2 yr (Long) | 10 | 1,248,328 | Jun-15 | 253 | |
Japanese Government Bond 10 yr (Long) | 13 | 16,101,926 | Jun-15 | 47,773 | |
Japanese Government Bond 10 yr Mini (Long) | 23 | 2,846,106 | Jun-15 | 11,288 | |
Japanese Government Bond 10 yr (Short) | 11 | 13,624,707 | Jun-15 | (67,294) | |
U.K. Gilt 10 yr (Long) | 33 | 5,983,367 | Jun-15 | (37,566) | |
U.S. Treasury Bond 30 yr (Short) | 5 | 797,969 | Jun-15 | 15,771 | |
U.S. Treasury Bond Ultra 30 yr (Long) | 54 | 8,883,000 | Jun-15 | (24,826) | |
U.S. Treasury Note 2 yr (Short) | 3 | 657,797 | Jun-15 | (1,693) | |
U.S. Treasury Note 5 yr (Short) | 89 | 10,691,820 | Jun-15 | (39,044) | |
U.S. Treasury Note 10 yr (Long) | 217 | 27,857,375 | Jun-15 | 249,482 | |
U.S. Treasury Note 10 yr (Short) | 117 | 15,019,875 | Jun-15 | (158,366) | |
Total |
| ||||
| |||||
Counterparty | Expiration | Contract | Value | ||
| |||||
2.275/3 month USD-LIBOR-BBA/May-25 | May-15/2.275 | $14,070,200 | $1,829 | ||
2.10/3 month USD-LIBOR-BBA/Jun-25 | Jun-15/2.10 | 9,076,700 | 33,039 | ||
2.955/3 month USD-LIBOR-BBA/Sep-25 | Sep-15/2.955 | 19,455,800 | 38,717 | ||
1.66/3 month USD-LIBOR-BBA/Jul-20 | Jul-15/1.66 | 10,426,000 | 74,650 | ||
44 Global Income Trust
| |||||
Counterparty | Expiration | Contract | Value | ||
| |||||
(2.10)/3 month USD-LIBOR-BBA/Jun-25 | Jun-15/2.10 | $9,076,700 | $79,421 | ||
(2.015)/3 month USD-LIBOR-BBA/May-25 | May-15/2.015 | 40,394,000 | 104,217 | ||
| |||||
2.3775/3 month USD-LIBOR-BBA/May-25 | May-15/2.3775 | 9,727,900 | 10,701 | ||
2.265/3 month USD-LIBOR-BBA/May-25 | May-15/2.265 | 9,727,900 | 29,378 | ||
| |||||
(1.481)/3 month USD-LIBOR-BBA/May-20 | May-15/1.481 | 9,727,900 | 12,938 | ||
(2.223)/3 month USD-LIBOR-BBA/May-25 | May-15/2.223 | 2,431,975 | 25,998 | ||
(1.509)/3 month USD-LIBOR-BBA/May-20 | May-15/1.509 | 19,455,800 | 32,880 | ||
| |||||
(1.865)/3 month USD-LIBOR-BBA/May-25 | May-15/1.865 | 9,382,300 | 7,693 | ||
(2.06)/3 month USD-LIBOR-BBA/May-25 | May-15/2.06 | 26,929,300 | 104,755 | ||
2.515/3 month USD-LIBOR-BBA/Apr-47 | Apr-17/2.515 | 2,333,000 | 260,659 | ||
| |||||
(2.35)/3 month USD-LIBOR-BBA/May-45 | May-15/2.35 | 2,431,975 | 8,804 | ||
(1.991)/3 month USD-LIBOR-BBA/May-25 | May-15/1.991 | 9,727,900 | 16,343 | ||
(2.5025)/3 month USD-LIBOR-BBA/May-45 | May-15/2.5025 | 2,431,975 | 30,375 | ||
(1.885)/3 month USD-LIBOR-BBA/Jan-46 | Jan-16/1.885 | 3,752,875 | 49,088 | ||
1.991/3 month USD-LIBOR-BBA/May-25 | May-15/1.991 | 9,727,900 | 150,102 | ||
| |||||
(6.00 Floor)/3 month USD-LIBOR-BBA/Mar-18 | Mar-18/6.00 | 3,723,000 | 555,784 | ||
Total |
| ||||
| ||||
Expiration date/strike price | Contract | Value | ||
Federal National Mortgage Association 30 yr 3.0s TBA commitments (Call) | Jul-15/$102.64 | $18,000,000 | $56,340 | |
Federal National Mortgage Association 30 yr 3.0s TBA commitments (Put) | Jul-15/99.86 | 5,000,000 | 16,350 | |
Total |
| |||
| ||||||
Counterparty | Expiration | Contract | Premium | Unrealized | ||
| ||||||
1.932/3 month USD-LIBOR-BBA/Jun-25 (Purchased) | Jun-15/1.932 | $10,150,000 | $(42,630) | $629 | ||
2.047/3 month USD-LIBOR-BBA/Jun-25 (Purchased) | Jun-15/2.047 | 10,150,000 | (74,095) | (1,908) | ||
(2.162)/3 month USD-LIBOR-BBA/Jun-25 (Written) | Jun-15/2.162 | 10,150,000 | 118,755 | 3,360 | ||
Global Income Trust 45
| ||||||
Counterparty | Expiration | Contract | Premium | Unrealized | ||
| ||||||
(2.155)/3 month USD-LIBOR-BBA/May-25 (Purchased) | May-15/2.155 | $6,809,530 | $(19,461) | $(1,975) | ||
| ||||||
2.117/3 month USD-LIBOR-BBA/Feb-27 (Purchased) | Feb-17/2.117 | 2,431,975 | (59,591) | 2,430 | ||
2.035/3 month USD-LIBOR-BBA/Feb-27 (Purchased) | Feb-17/2.035 | 2,431,975 | (61,794) | (5,713) | ||
(3.035)/3 month USD-LIBOR-BBA/Feb-27 (Purchased) | Feb-17/3.035 | 2,431,975 | (64,710) | (6,202) | ||
1.00/3 month USD-LIBOR-BBA/Apr-27 (Purchased) | Apr-17/1.00 | 4,764,600 | (31,504) | (7,766) | ||
(3.117)/3 month USD-LIBOR-BBA/Feb-27 (Purchased) | Feb-17/3.117 | 2,431,975 | (68,095) | (15,061) | ||
1.825/3 month USD-LIBOR-BBA/Jun-25 (Purchased) | Jun-15/1.825 | 9,382,300 | (40,344) | (17,076) | ||
1.00/3 month USD-LIBOR-BBA/Apr-27 (Purchased) | Apr-17/1.00 | 9,529,300 | (66,943) | (19,421) | ||
1.9425/3 month USD-LIBOR-BBA/Jun-25 (Purchased) | Jun-15/1.9425 | 9,382,300 | (69,429) | (28,522) | ||
(2.06)/3 month USD-LIBOR-BBA/Jun-25 (Written) | Jun-15/2.06 | 9,382,300 | 108,835 | 39,499 | ||
2.655/3 month USD-LIBOR-BBA/Feb-19 (Written) | Feb-17/2.655 | 10,652,100 | 70,570 | 22,582 | ||
2.56/3 month USD-LIBOR-BBA/Feb-19 (Written) | Feb-17/2.56 | 10,652,100 | 68,096 | 14,913 | ||
(1.00)/3 month USD-LIBOR-BBA/Apr-19 (Written) | Apr-17/1.00 | 19,058,600 | 60,988 | 8,233 | ||
(1.00)/3 month USD-LIBOR-BBA/Apr-19 (Written) | Apr-17/1.00 | 9,529,300 | 29,179 | 2,954 | ||
(1.56)/3 month USD-LIBOR-BBA/Feb-19 (Written) | Feb-17/1.56 | 10,652,100 | 61,327 | (5,326) | ||
(1.655)/3 month USD-LIBOR-BBA/Feb-19 (Written) | Feb-17/1.655 | 10,652,100 | 60,717 | (14,592) | ||
Total | $(20,129) |
| ||||
| ||||
Agency | Principal | Settlement | Value | |
Federal National Mortgage Association, 4s, May 1, 2045 | $1,000,000 | 5/13/15 | $1,068,750 | |
Federal National Mortgage Association, 3 1/2s, May 1, 2045 | 1,000,000 | 5/13/15 | 1,047,813 | |
Federal National Mortgage Association, 3s, May 1, 2045 | 1,000,000 | 5/13/15 | 1,017,656 | |
Government National Mortgage Association, 3s, May 1, 2045 | 2,000,000 | 5/20/15 | 2,056,406 | |
Total |
| |||
46 Global Income Trust
| |||||||
Swap counterparty/ | Upfront | Termination | Payments | Payments |
| ||
| |||||||
BRL | 4,597,190 | $— | 1/4/21 | 0.00% | Brazil Cetip Interbank Deposit Rate Over | $(11,437) | |
BRL | 15,581,594 | — | 1/2/17 | Brazil Cetip Interbank Deposit Rate Over | 0.00% | (11,895) | |
BRL | 6,013,694 | — | 1/4/21 | Brazil Cetip Interbank Deposit Rate Over | 0.00% | (33,504) | |
BRL | 3,533,612 | — | 1/4/21 | Brazil Cetip Interbank Deposit Rate Over | 0.00% | (19,137) | |
PLN | 5,586,000 | — | 3/17/24 | 4.1072% | 6 month PLN-WIBOR-WIBO | (219,848) | |
PLN | 2,785,000 | — | 3/18/24 | 4.12875% | 6 month PLN-WIBOR-WIBO | (110,919) | |
PLN | 2,458,000 | — | 3/27/24 | 4.045% | 6 month PLN-WIBOR-WIBO | (96,963) | |
ZAR | 10,592,000 | — | 1/26/25 | 3 month ZAR- | 7.09% | (47,064) | |
ZAR | 7,061,000 | — | 1/23/25 | 3 month ZAR- | 7.08% | (31,655) | |
| |||||||
JPY | 411,000,000 | — | 9/15/41 | 6 month JPY-LIBOR-BBA | 1.768% | 386,108 | |
KRW | 8,034,000,000 | — | 11/18/18 | 3 month KRW-CD-KSDA-BLOOMBERG | 3.105% | 314,329 | |
KRW | 981,000,000 | — | 11/6/19 | 3 month KRW-CD-KSDA-BLOOMBERG | 2.17% | 6,344 | |
| |||||||
BRL | 15,738,467 | — | 1/2/17 | Brazil Cetip Interbank Deposit Rate Over | 0.00% | (57,684) | |
BRL | 4,746,096 | — | 1/4/21 | 0.00% | Brazil Cetip Interbank Deposit Rate Over | 39,045 | |
PLN | 264,000 | — | 3/12/25 | 6 month PLN-WIBOR-WIBO | 2.4199% | 304 | |
ZAR | 7,326,000 | — | 1/22/25 | 3 month ZAR- | 7.14% | (30,275) | |
ZAR | 21,978,000 | — | 1/23/25 | 3 month ZAR- | 7.0633% | (100,642) | |
Total | $— |
| |||||
Global Income Trust 47
| |||||||
Notional amount | Upfront | Termination | Payments | Payments |
| ||
$10,426,000 | $93,696 | 2/19/25 | 3 month USD-LIBOR-BBA | 1.9575% | $(21,357) | ||
10,426,000 | (30,373) | 2/19/25 | 2.1575% | 3 month USD-LIBOR-BBA | (108,576) | ||
10,426,000 | (55,395) | 2/19/25 | 2.0575% | 3 month USD-LIBOR-BBA | (36,970) | ||
1,945,580 | (44,686) | 4/28/45 | 2.31% | 3 month USD-LIBOR-BBA | 49,444 | ||
JPY | 328,100,000 | (59) | 11/19/43 | 1.75625% | 6 month JPY-LIBOR-BBA | (312,855) | |
$7,505,750 | 21,668 | 1/6/25 | 2.28% | 3 month USD-LIBOR-BBA | (147,256) | ||
7,505,750 | 92,972 | 1/6/25 | 2.53% | 3 month USD-LIBOR-BBA | (250,254) | ||
5,213,000 | (70,705) | 4/15/25 | 3 month USD-LIBOR-BBA | 2.172% | (44,134) | ||
5,213,000 | 45,806 | 4/15/25 | 2.052% | 3 month USD-LIBOR-BBA | 77,039 | ||
1,235,000 E | (10) | 12/16/18 | 2.34% | 3 month USD-LIBOR-BBA | (30,140) | ||
9,375,000 E | (75) | 12/16/18 | 2.3795% | 3 month USD-LIBOR-BBA | (239,700) | ||
3,125,000 E | (25) | 12/16/18 | 2.337% | 3 month USD-LIBOR-BBA | (75,991) | ||
5,715,000 E | (46) | 12/16/18 | 2.0025% | 3 month USD-LIBOR-BBA | (82,685) | ||
10,002,000 E | (4,397) | 12/16/18 | 1.9525% | 3 month USD-LIBOR-BBA | (134,302) | ||
34,000,000 | 1,025,771 | 3/18/22 | 2.50% | 3 month USD-LIBOR-BBA | (495,241) | ||
1,390,000 E | 18,257 | 6/17/45 | 3 month USD-LIBOR-BBA | 2.50% | 4,739 | ||
31,708,100 E | 295,568 | 6/17/25 | 2.20% | 3 month USD-LIBOR-BBA | 186,969 | ||
23,771,000 E | (137,761) | 6/17/17 | 3 month USD-LIBOR-BBA | 1.15% | (22,757) | ||
9,770,000 E | 130,365 | 6/17/20 | 2.15% | 3 month USD-LIBOR-BBA | (110,339) | ||
2,561,000 E | (21) | 12/16/18 | 1.813% | 3 month USD-LIBOR-BBA | (22,762) | ||
51,924,500 E | 69,182 | 6/17/17 | 1.10% | 3 month USD-LIBOR-BBA | (130,365) | ||
6,410,000 E | (45,957) | 6/17/20 | 3 month USD-LIBOR-BBA | 1.80% | 3,086 | ||
5,445,000 | (44) | 4/20/20 | 1.4895% | 3 month USD-LIBOR-BBA | 21,621 | ||
48 Global Income Trust
CENTRALLY CLEARED INTEREST RATE SWAP CONTRACTS OUTSTANDING at 4/30/15 (Unaudited) cont. | |||||||
Notional amount | Upfront | Termination | Payments | Payments |
| ||
$9,883,000 | $(37) | 4/28/17 | 3 month USD-LIBOR-BBA | 0.7735% | $(8,554) | ||
1,860,000 | (63) | 5/1/45 | 3 month USD-LIBOR-BBA | 2.5385% | 3,071 | ||
2,102,000 | (71) | 5/1/45 | 3 month USD-LIBOR-BBA | 2.5395% | 3,933 | ||
1,415,000 | (5) | 5/1/17 | 0.82% | 3 month USD-LIBOR-BBA | 87 | ||
4,406,800 E | (55,921) | 6/17/45 | 2.38% | 3 month USD-LIBOR-BBA | 102,975 | ||
17,880,600 E | 733,253 | 6/17/20 | 2.40% | 3 month USD-LIBOR-BBA | 75,765 | ||
9,810,000 | (36) | 4/13/17 | 0.802% | 3 month USD-LIBOR-BBA | (2,157) | ||
760,000 | (10) | 4/13/25 | 2.007% | 3 month USD-LIBOR-BBA | 8,278 | ||
1,778,000 | (17) | 4/13/20 | 3 month USD-LIBOR-BBA | 1.522% | (3,596) | ||
7,515,000 | (99) | 4/13/25 | 2.0055% | 3 month USD-LIBOR-BBA | 76,390 | ||
2,546,000 | (87) | 4/13/45 | 3 month USD-LIBOR-BBA | 2.375% | (84,488) | ||
10,629,000 E | (86) | 12/16/18 | 3 month USD-LIBOR-BBA | 1.41% | (31,813) | ||
3,750,000 | (128) | 4/16/45 | 2.36037% | 3 month USD-LIBOR-BBA | 136,985 | ||
4,640,800 E | (26) | 4/20/19 | 3 month USD-LIBOR-BBA | 1.8325% | (11,776) | ||
1,181,600 E | (17) | 4/20/27 | 2.3675% | 3 month USD-LIBOR-BBA | 19,474 | ||
2,248,900 E | (12) | 4/20/19 | 3 month USD-LIBOR-BBA | 1.85% | (4,940) | ||
543,200 E | (8) | 4/20/27 | 2.415% | 3 month USD-LIBOR-BBA | 6,669 | ||
343,000 | (12) | 4/20/45 | 3 month USD-LIBOR-BBA | 2.416% | (8,432) | ||
2,477,000 | (33) | 4/20/25 | 2.00% | 3 month USD-LIBOR-BBA | 27,628 | ||
6,253,000 | (23) | 4/20/17 | 3 month USD-LIBOR-BBA | 0.7615% | (5,153) | ||
8,932,000 | (304) | 4/27/45 | 2.4005% | 3 month USD-LIBOR-BBA | 253,348 | ||
4,404,000 | (35) | 4/28/20 | 3 month USD-LIBOR-BBA | 1.488% | (19,987) | ||
8,621,000 | (114) | 4/28/25 | 2.005% | 3 month USD-LIBOR-BBA | 96,495 | ||
Global Income Trust 49
| |||||||
Notional amount | Upfront | Termination | Payments | Payments |
| ||
$2,804,000 | $(95) | 4/28/45 | 3 month USD-LIBOR-BBA | 2.3915% | $(85,457) | ||
2,501,000 | (33) | 5/1/25 | 2.14% | 3 month USD-LIBOR-BBA | (2,639) | ||
2,501,000 | (33) | 5/1/25 | 2.13894% | 3 month USD-LIBOR-BBA | (2,394) | ||
1,860,000 | (63) | 5/1/45 | 3 month USD-LIBOR-BBA | 2.54461% | 5,571 | ||
2,008,000 | (16) | 5/1/20 | 1.593% | 3 month USD-LIBOR-BBA | (799) | ||
AUD | 931,000 | (9) | 3/23/25 | 6 month AUD-BBR-BBSW | 2.765% | (13,056) | |
AUD | 1,257,000 | (13) | 3/30/25 | 2.77% | 6 month AUD-BBR-BBSW | 17,118 | |
AUD | 795,000 | (84,829) | 10/10/23 | 6 month AUD-BBR-BBSW | 4.49% | (6,607) | |
CAD | 918,000 | (10) | 3/20/25 | 1.7775% | 3 month CAD-BA-CDOR | 16,769 | |
CAD | 5,205,000 | (55) | 3/26/25 | 3 month CAD-BA-CDOR | 1.865% | (61,437) | |
CAD | 602,000 | (6) | 4/1/25 | 3 month CAD-BA-CDOR | 1.77% | (11,688) | |
CAD | 784,000 | (8) | 4/8/25 | 1.83% | 3 month CAD-BA-CDOR | 11,793 | |
CAD | 30,007,000 E | (90) | 6/17/17 | 0.92% | 3 month CAD-BA-CDOR | 76,588 | |
CAD | 12,335,000 E | (92) | 6/17/20 | 3 month CAD-BA-CDOR | 1.24% | (103,270) | |
CAD | 1,770,000 | (11) | 4/15/20 | 3 month CAD-BA-CDOR | 1.21% | (14,230) | |
CAD | 1,580,000 | (17) | 4/15/25 | 3 month CAD-BA-CDOR | 1.80% | (27,929) | |
CAD | 1,340,000 | (37) | 4/15/45 | 3 month CAD-BA-CDOR | 2.36% | (48,119) | |
CAD | 480,000 | (5) | 4/17/25 | 1.89% | 3 month CAD-BA-CDOR | 5,177 | |
CAD | 1,918,000 | (20) | 4/17/25 | 1.91875% | 3 month CAD-BA-CDOR | 16,426 | |
CAD | 1,702,000 | (18) | 4/17/25 | 1.89375% | 3 month CAD-BA-CDOR | 17,863 | |
CHF | 644,000 | (8) | 3/20/25 | 6 month CHF-LIBOR-BBA | 0.1775% | (2,148) | |
CHF | 442,000 | (6) | 3/23/25 | 6 month CHF-LIBOR-BBA | 0.1675% | (2,046) | |
CHF | 375,000 | (5) | 3/26/25 | 6 month CHF-LIBOR-BBA | 0.1525% | (2,386) | |
50 Global Income Trust
| |||||||
Notional amount | Upfront | Termination | Payments | Payments |
| ||
CHF | 1,862,000 | $(25) | 4/2/25 | 6 month CHF-LIBOR-BBA | 0.182% | $(6,321) | |
CHF | 698,000 | (10) | 4/10/25 | 0.16875% | 6 month CHF-LIBOR-BBA | 2,672 | |
CHF | 938,000 | (125,659) | 2/24/24 | 6 month CHF-LIBOR-BBA | 1.355% | (16,346) | |
CHF | 7,360,000 | (29) | 5/5/17 | 6 month CHF-LIBOR-BBA | 0.60875% | (3,176) | |
CHF | 1,450,000 | (20) | 5/5/25 | 6 month CHF-LIBOR-BBA | 0.22% | (28) | |
EUR | 6,607,000 E | (175,515) | 6/17/20 | 6 month EUR-EURIBOR-Telerate | 0.75% | (14,539) | |
EUR | 4,479,000 E | (464,038) | 6/17/25 | 6 month EUR-EURIBOR-Telerate | 1.50% | (59,342) | |
EUR | 1,126,000 E | (346,749) | 6/17/45 | 6 month EUR-EURIBOR-Telerate | 2.00% | (20,987) | |
EUR | 25,567,000 E | (224,676) | 6/17/17 | 6 month EUR-EURIBOR-Telerate | 0.50% | 7,914 | |
EUR | 2,900,000 E | 663,740 | 6/17/35 | 2.00% | 6 month EUR-EURIBOR-Telerate | 39,944 | |
GBP | 10,921,000 E | (580,729) | 6/17/20 | 6 month GBP-LIBOR-BBA | 2.25% | (18,942) | |
GBP | 9,465,000 E | 1,245,429 | 6/17/25 | 2.75% | 6 month GBP-LIBOR-BBA | 137,420 | |
GBP | 1,935,000 E | (562,709) | 6/17/45 | 6 month GBP-LIBOR-BBA | 3.00% | (30,303) | |
JPY | 18,345,000 | (6) | 3/24/44 | 6 month JPY-LIBOR-BBA | 1.80% | 18,339 | |
JPY | 35,921,000 | (12) | 3/24/44 | 6 month JPY-LIBOR-BBA | 1.79625% | 35,621 | |
JPY | 996,900,000 | (39) | 3/14/19 | 6 month JPY-LIBOR-BBA | 0.3175% | 41,058 | |
JPY | 218,100,000 | (38) | 3/14/44 | 1.795% | 6 month JPY-LIBOR-BBA | (216,501) | |
JPY | 17,784,000 | (3) | 3/24/44 | 6 month JPY-LIBOR-BBA | 1.80125% | 17,829 | |
JPY | 20,000,000 | (6) | 11/7/44 | 6 month JPY-LIBOR-BBA | 1.5025% | 7,852 | |
JPY | 120,000,000 | (36) | 11/7/44 | 6 month JPY-LIBOR-BBA | 1.495% | 45,117 | |
JPY | 627,000,000 | (45) | 11/7/19 | 0.2475% | 6 month JPY-LIBOR-BBA | (7,534) | |
JPY | 369,900,000 | (26) | 11/7/19 | 0.25% | 6 month JPY-LIBOR-BBA | (4,833) | |
JPY | 6,050,000 | (2) | 11/7/44 | 6 month JPY-LIBOR-BBA | 1.4975% | 2,308 | |
Global Income Trust 51
| |||||||
Notional amount | Upfront | Termination | Payments | Payments |
| ||
JPY | 149,300,000 | $(71,401) | 2/19/20 | 6 month JPY-LIBOR-BBA | 1.3975% | $(1,965) | |
JPY | 20,907,000 | (2) | 5/1/25 | 0.51% | 6 month JPY-LIBOR-BBA | 716 | |
NOK | 1,893,000 | (3) | 3/24/25 | 6 month NOK-NIBOR-NIBR | 1.765% | (7,288) | |
NOK | 1,867,000 | (3) | 3/24/25 | 6 month NOK-NIBOR-NIBR | 1.7625% | (7,244) | |
NOK | 3,648,000 | (6) | 4/7/25 | 1.865% | 6 month NOK-NIBOR-NIBR | 9,817 | |
NOK | 2,846,000 | (5) | 4/8/25 | 1.835% | 6 month NOK-NIBOR-NIBR | 8,694 | |
NOK | 1,512,000 | (2) | 4/10/25 | 1.825% | 6 month NOK-NIBOR-NIBR | 4,789 | |
NZD | 2,486,000 | (25) | 4/23/25 | 3 month NZD-BBR-FRA | 3.7275% | (20,649) | |
NZD | 880,000 | (9) | 4/8/25 | 3 month NZD-BBR-FRA | 3.675% | (10,203) | |
NZD | 5,550,000 | (56) | 4/9/25 | 3.675% | 3 month NZD-BBR-FRA | 64,162 | |
NZD | 892,000 | (9) | 4/10/25 | 3.7275% | 3 month NZD-BBR-FRA | 7,347 | |
NZD | 2,516,000 | (26) | 4/22/25 | 3 month NZD-BBR-FRA | 3.705% | (24,458) | |
SEK | 10,083,000 | (15) | 4/1/25 | 0.967% | 3 month SEK-STIBOR-SIDE | 7,832 | |
SEK | 30,082,000 | (46) | 4/2/25 | 0.975% | 3 month SEK-STIBOR-SIDE | 20,728 | |
SEK | 2,810,000 | (4) | 4/9/25 | 3 month SEK-STIBOR-SIDE | 0.9575% | (2,627) | |
SEK | 2,880,000 | (4) | 4/10/25 | 3 month SEK-STIBOR-SIDE | 0.93% | (3,619) | |
SEK | 2,101,000 | (3) | 4/13/25 | 3 month SEK-STIBOR-SIDE | 0.915% | (3,045) | |
JPY | 97,000,000 | (34) | 9/2/43 | 1.87875% | 6 month JPY-LIBOR-BBA | (114,059) | |
$7,596,400 | (100) | 1/9/25 | 3 month USD-LIBOR-BBA | 2.07% | 21,688 | ||
2,085,200 | 4,143 | 2/19/25 | 3 month USD-LIBOR-BBA | 2.15% | 18,334 | ||
1,042,600 | 2,384 | 2/19/25 | 3 month USD-LIBOR-BBA | 2.15% | 9,480 | ||
1,945,580 | (10,337) | 4/28/25 | 3 month USD-LIBOR-BBA | 2.045% | (24,952) | ||
Total | $1,347,595 |
| |||||
| |||||||
52 Global Income Trust
| |||||||
Notional amount | Upfront | Termination | Payments | Payments |
| ||
| |||||||
$553,077 | $— | 1/12/41 | 4.00% (1 month USD-LIBOR) | Synthetic TRS Index 4.00% 30 year Fannie Mae pools | $6,343 | ||
| |||||||
99,370 | — | 1/12/40 | 5.00% (1 month USD-LIBOR) | Synthetic MBX Index 5.00% 30 year Fannie Mae pools | 96 | ||
183,955 | — | 1/12/42 | 4.00% (1 month USD-LIBOR) | Synthetic TRS Index 4.00% 30 year Fannie Mae pools | 2,138 | ||
3,117,844 | — | 1/12/41 | 4.00% (1 month USD-LIBOR) | Synthetic TRS Index 4.00% 30 year Fannie Mae pools | 35,755 | ||
7,205,529 | — | 1/12/41 | 5.00% (1 month USD-LIBOR) | Synthetic MBX Index 5.00% 30 year Fannie Mae pools | 10,363 | ||
4,110 | — | 1/12/38 | 6.50% (1 month USD-LIBOR) | Synthetic TRS Index 6.50% 30 year Fannie Mae pools | 30 | ||
110,774 | — | 1/12/41 | 5.00% (1 month USD-LIBOR) | Synthetic MBX Index 5.00% 30 year Fannie Mae pools | 159 | ||
463,800 | — | 1/12/40 | 4.50% (1 month USD-LIBOR) | Synthetic MBX Index 4.50% 30 year Fannie Mae pools | (34) | ||
60,726 | — | 1/12/40 | 5.00% (1 month USD-LIBOR) | Synthetic MBX Index 5.00% 30 year Fannie Mae pools | 59 | ||
925,155 | — | 1/12/40 | 4.50% (1 month USD-LIBOR) | Synthetic MBX Index 4.50% 30 year Fannie Mae pools | (68) | ||
2,562,764 | — | 1/12/41 | 5.00% (1 month USD-LIBOR) | Synthetic MBX Index 5.00% 30 year Fannie Mae pools | 3,686 | ||
514,574 | — | 1/12/41 | 5.00% (1 month USD-LIBOR) | Synthetic MBX Index 5.00% 30 year Fannie Mae pools | 740 | ||
87,074 | — | 1/12/40 | 5.00% (1 month USD-LIBOR) | Synthetic MBX Index 5.00% 30 year Fannie Mae pools | 84 | ||
282,300 | — | 1/12/40 | 5.00% (1 month USD-LIBOR) | Synthetic MBX Index 5.00% 30 year Fannie Mae pools | 274 | ||
204,762 | — | 1/12/40 | 5.00% (1 month USD-LIBOR) | Synthetic MBX Index 5.00% 30 year Fannie Mae pools | 199 | ||
Global Income Trust 53
| |||||||
Notional amount | Upfront | Termination | Payments | Payments |
| ||
| |||||||
$1,528,828 | $— | 1/12/38 | (6.50%) 1 month USD-LIBOR | Synthetic MBX Index 6.50% 30 year Fannie Mae pools | $(7,942) | ||
77,039 | — | 1/12/39 | (6.00%) 1 month USD-LIBOR | Synthetic MBX Index 6.00% 30 year Fannie Mae pools | (224) | ||
248,312 | — | 1/12/39 | (5.50%) 1 month USD-LIBOR | Synthetic MBX Index 5.50% 30 year Fannie Mae pools | (539) | ||
124,156 | — | 1/12/39 | (5.50%) 1 month USD-LIBOR | Synthetic MBX Index 5.50% 30 year Fannie Mae pools | (269) | ||
124,156 | — | 1/12/39 | (5.50%) 1 month USD-LIBOR | Synthetic MBX Index 5.50% 30 year Fannie Mae pools | (269) | ||
249,174 | — | 1/12/39 | (5.50%) 1 month USD-LIBOR | Synthetic MBX Index 5.50% 30 year Fannie Mae pools | (541) | ||
647,062 | — | 1/12/39 | (5.50%) 1 month USD-LIBOR | Synthetic MBX Index 5.50% 30 year Fannie Mae pools | (1,404) | ||
249,174 | — | 1/12/39 | (5.50%) 1 month USD-LIBOR | Synthetic MBX Index 5.50% 30 year Fannie Mae pools | (541) | ||
1,072,324 | — | 1/12/41 | 4.00% (1 month USD-LIBOR) | Synthetic TRS Index 4.00% 30 year Fannie Mae pools | 12,297 | ||
746,365 | — | 1/12/41 | 5.00% (1 month USD-LIBOR) | Synthetic TRS Index 5.00% 30 year Ginnie Mae II pools | 6,854 | ||
243,253 | — | 1/12/41 | 5.00% (1 month USD-LIBOR) | Synthetic MBX Index 5.00% 30 year Fannie Mae pools | 350 | ||
315,420 | — | 1/12/41 | 5.00% (1 month USD-LIBOR) | Synthetic TRS Index 5.00% 30 year Ginnie Mae II pools | 2,896 | ||
391,887 | — | 1/12/38 | 6.50% (1 month USD-LIBOR) | Synthetic TRS Index 6.50% 30 year Fannie Mae pools | 2,866 | ||
497,414 | — | 1/12/39 | (5.50%) 1 month USD-LIBOR | Synthetic MBX Index 5.50% 30 year Fannie Mae pools | (1,079) | ||
700,195 | — | 1/12/41 | (5.00%) 1 month USD-LIBOR | Synthetic TRS Index 5.00% 30 year Fannie Mae pools | (7,523) | ||
54 Global Income Trust
| |||||||
Notional amount | Upfront | Termination | Payments | Payments |
| ||
| |||||||
$193,854 | $— | 1/12/41 | 5.00% (1 month USD-LIBOR) | Synthetic MBX Index 5.00% 30 year Fannie Mae pools | $279 | ||
299,449 | 1,310 | 1/12/38 | (6.50%) 1 month USD-LIBOR | Synthetic MBX Index 6.50% 30 year Fannie Mae pools | 749 | ||
| |||||||
189,737 | — | 1/12/41 | 5.00% (1 month USD-LIBOR) | Synthetic MBX Index 5.00% 30 year Fannie Mae pools | 273 | ||
| |||||||
841,909 | — | 1/12/41 | 4.50% (1 month USD-LIBOR) | Synthetic MBX Index 4.50% 30 year Ginnie Mae II pools | (62) | ||
510,831 | — | 1/12/41 | (5.00%) 1 month USD-LIBOR | Synthetic TRS Index 5.00% 30 year Fannie Mae pools | (5,488) | ||
1,271,369 | — | 1/12/41 | 4.00% (1 month USD-LIBOR) | Synthetic TRS Index 4.00% 30 year Fannie Mae pools | 14,580 | ||
965,400 | — | 1/12/44 | 3.50% (1 month USD-LIBOR) | Synthetic TRS Index 3.50% 30 year Fannie Mae pools | 12,325 | ||
482,700 | — | 1/12/44 | 3.50% (1 month USD-LIBOR) | Synthetic TRS Index 3.50% 30 year Fannie Mae pools | 6,162 | ||
1,041,920 | — | 1/12/43 | 3.50% (1 month USD-LIBOR) | Synthetic TRS Index 3.50% 30 year Fannie Mae pools | 12,161 | ||
| |||||||
162,208 | — | 1/12/39 | 6.00% (1 month USD-LIBOR) | Synthetic TRS Index 6.00% 30 year Fannie Mae pools | 1,321 | ||
27,904 | — | 1/12/38 | 6.50% (1 month USD-LIBOR) | Synthetic TRS Index 6.50% 30 year Fannie Mae pools | 204 | ||
456,681 | — | 1/12/42 | 4.00% (1 month USD-LIBOR) | Synthetic TRS Index 4.00% 30 year Fannie Mae pools | 5,308 | ||
456,681 | — | 1/12/42 | 4.00% (1 month USD-LIBOR) | Synthetic TRS Index 4.00% 30 year Fannie Mae pools | 5,308 | ||
1,503,457 | — | 1/12/41 | 4.00% (1 month USD-LIBOR) | Synthetic TRS Index 4.00% 30 year Fannie Mae pools | 17,241 | ||
568,302 | — | 1/12/40 | 4.00% (1 month USD-LIBOR) | Synthetic TRS Index 4.00% 30 year Fannie Mae pools | 6,252 | ||
Global Income Trust 55
| |||||||
Notional amount | Upfront | Termination | Payments | Payments |
| ||
| |||||||
$40,090 | $— | 1/12/38 | (6.50%) 1 month USD-LIBOR | Synthetic MBX Index 6.50% 30 year Fannie Mae pools | $(208) | ||
48,094 | — | 1/12/38 | (6.50%) 1 month USD-LIBOR | Synthetic MBX Index 6.50% 30 year Fannie Mae pools | (250) | ||
908,370 | — | 1/12/38 | (6.50%) 1 month USD-LIBOR | Synthetic MBX Index 6.50% 30 year Fannie Mae pools | (4,719) | ||
1,289,656 | — | 1/12/42 | 4.00% (1 month USD-LIBOR) | Synthetic TRS Index 4.00% 30 year Fannie Mae pools | 14,991 | ||
679,104 | — | 1/12/42 | 4.00% (1 month USD-LIBOR) | Synthetic TRS Index 4.00% 30 year Fannie Mae pools | 7,894 | ||
855,971 | — | 1/12/41 | 4.00% (1 month USD-LIBOR) | Synthetic TRS Index 4.00% 30 year Fannie Mae pools | 9,816 | ||
842,404 | — | 1/12/41 | (5.00%) 1 month USD-LIBOR | Synthetic TRS Index 5.00% 30 year Fannie Mae pools | (9,051) | ||
2,297,863 | — | 1/12/43 | 3.50% (1 month USD-LIBOR) | Synthetic TRS Index 3.50% 30 year Fannie Mae pools | 26,821 | ||
2,131,000 | — | 2/24/25 | (2.01%) | USA Non Revised Consumer Price Index-Urban (CPI-U) | 940 | ||
974,898 | — | 1/12/44 | 3.50% (1 month USD-LIBOR) | Synthetic TRS Index 3.50% 30 year Fannie Mae pools | 12,446 | ||
GBP | 1,234,000 | — | 2/20/25 | (2.895%) | GBP Non-revised UK Retail Price Index | (23,450) | |
| |||||||
$855,578 | — | 1/12/41 | 4.00% (1 month USD-LIBOR) | Synthetic TRS Index 4.00% 30 year Fannie Mae pools | 9,813 | ||
842,404 | — | 1/12/41 | (5.00%) 1 month USD-LIBOR | Synthetic TRS Index 5.00% 30 year Fannie Mae pools | (9,051) | ||
Total | $1,310 |
| |||||
56 Global Income Trust
| ||||||||
Swap counterparty/ | Rating*** | Upfront | Notional | Termi- | Payments | Unrealized | ||
| ||||||||
CMBX NA BBB– Index | BBB–/P | $10,317 | $181,000 | 5/11/63 | 300 bp | $12,380 | ||
CMBX NA BBB– Index | BBB–/P | 10,865 | 176,000 | 5/11/63 | 300 bp | 12,872 | ||
CMBX NA BBB– Index | BBB–/P | 5,303 | 88,000 | 5/11/63 | 300 bp | 6,306 | ||
CMBX NA BBB– Index | BBB–/P | 2,666 | 39,000 | 5/11/63 | 300 bp | 3,110 | ||
| ||||||||
CMBX NA BBB– Index | BBB–/P | 13,525 | 122,000 | 5/11/63 | 300 bp | 14,916 | ||
| ||||||||
CMBX NA BBB– Index | BBB–/P | 12,926 | 315,000 | 5/11/63 | 300 bp | 16,517 | ||
CMBX NA BBB– Index | BBB–/P | 13,039 | 179,000 | 5/11/63 | 300 bp | 15,080 | ||
CMBX NA BBB– Index | BBB–/P | 2,397 | 156,000 | 5/11/63 | 300 bp | 4,175 | ||
CMBX NA BBB– Index | BBB–/P | 4,625 | 152,000 | 5/11/63 | 300 bp | 6,358 | ||
CMBX NA BBB– Index | BBB–/P | 11,968 | 150,000 | 5/11/63 | 300 bp | 13,678 | ||
CMBX NA BBB– Index | BBB–/P | 9,867 | 150,000 | 5/11/63 | 300 bp | 11,577 | ||
CMBX NA BBB– Index | BBB–/P | 11,537 | 149,000 | 5/11/63 | 300 bp | 13,235 | ||
CMBX NA BBB– Index | BBB–/P | 10,883 | 142,000 | 5/11/63 | 300 bp | 12,501 | ||
CMBX NA BBB– Index | BBB–/P | 15,709 | 139,000 | 5/11/63 | 300 bp | 17,298 | ||
CMBX NA BBB– Index | BBB–/P | 1,382 | 119,000 | 5/11/63 | 300 bp | 2,738 | ||
CMBX NA BBB– Index | BBB–/P | 8,994 | 113,000 | 5/11/63 | 300 bp | 10,283 | ||
CMBX NA BBB– Index | BBB–/P | 690 | 89,000 | 5/11/63 | 300 bp | 1,705 | ||
CMBX NA BBB– Index | BBB–/P | (345) | 22,000 | 5/11/63 | 300 bp | (98) | ||
CMBX NA BBB– Index | — | 230 | 21,000 | 5/11/63 | (300 bp) | (9) | ||
CMBX NA BBB– Index | BBB–/P | 25 | 5,000 | 1/17/47 | 300 bp | (17) | ||
CMBX NA BBB– Index | BBB–/P | 150 | 17,000 | 1/17/47 | 300 bp | (1) | ||
Global Income Trust 57
| ||||||||
Swap counterparty/ | Rating*** | Upfront | Notional | Termi- | Payments | Unrealized | ||
| ||||||||
CMBX NA BBB– Index | BBB–/P | $54 | $19,000 | 1/17/47 | 300 bp | $(105) | ||
CMBX NA BBB– Index | BBB–/P | 61 | 19,000 | 1/17/47 | 300 bp | (99) | ||
CMBX NA BBB– Index | BBB–/P | 70 | 22,000 | 1/17/47 | 300 bp | (118) | ||
CMBX NA BBB– Index | BBB–/P | 70 | 22,000 | 1/17/47 | 300 bp | (118) | ||
CMBX NA BBB– Index | BBB–/P | 166 | 26,000 | 1/17/47 | 300 bp | (59) | ||
CMBX NA BBB– Index | BBB–/P | 129 | 26,000 | 1/17/47 | 300 bp | (96) | ||
CMBX NA BBB– Index | BBB–/P | 112 | 35,000 | 1/17/47 | 300 bp | (182) | ||
CMBX NA BBB– Index | BBB–/P | 75 | 35,000 | 1/17/47 | 300 bp | (219) | ||
CMBX NA BBB– Index | BBB–/P | 62 | 35,000 | 1/17/47 | 300 bp | (232) | ||
CMBX NA BBB– Index | BBB–/P | 95 | 38,000 | 1/17/47 | 300 bp | (224) | ||
CMBX NA BBB– Index | BBB–/P | 80 | 45,000 | 1/17/47 | 300 bp | (306) | ||
CMBX NA BBB– Index | BBB–/P | 353 | 99,000 | 1/17/47 | 300 bp | (479) | ||
CMBX NA BBB– Index | BBB–/P | 861 | 110,000 | 1/17/47 | 300 bp | (63) | ||
CMBX NA BBB– Index | BBB–/P | 783 | 110,000 | 1/17/47 | 300 bp | (141) | ||
CMBX NA BBB– Index | BBB–/P | 1 | 115,000 | 1/17/47 | 300 bp | (965) | ||
CMBX NA BB Index | — | 613 | 41,000 | 5/11/63 | (500 bp) | 218 | ||
CMBX NA BB Index | — | 1,060 | 53,000 | 5/11/63 | (500 bp) | 549 | ||
CMBX NA BB Index | — | (415) | 54,000 | 5/11/63 | (500 bp) | (935) | ||
CMBX NA BB Index | — | (517) | 54,000 | 5/11/63 | (500 bp) | (1,038) | ||
CMBX NA BB Index | — | (493) | 54,000 | 5/11/63 | (500 bp) | (1,013) | ||
CMBX NA BB Index | — | 1,345 | 76,000 | 5/11/63 | (500 bp) | 613 | ||
CMBX NA BB Index | — | 941 | 91,000 | 5/11/63 | (500 bp) | 64 | ||
CMBX NA BB Index | — | 1,624 | 105,000 | 5/11/63 | (500 bp) | 612 | ||
CMBX NA BB Index | — | 575 | 106,000 | 5/11/63 | (500 bp) | (446) | ||
CMBX NA BB Index | — | 2,826 | 107,000 | 5/11/63 | (500 bp) | 1,795 | ||
CMBX NA BB Index | — | (2,096) | 120,000 | 5/11/63 | (500 bp) | (3,252) | ||
58 Global Income Trust
| ||||||||
Swap counterparty/ | Rating*** | Upfront | Notional | Termi- | Payments | Unrealized | ||
| ||||||||
CMBX NA BB Index | — | $(448) | $123,000 | 5/11/63 | (500 bp) | $(1,633) | ||
CMBX NA BB Index | — | (846) | 162,000 | 5/11/63 | (500 bp) | (2,407) | ||
CMBX NA BB Index | — | (2,308) | 119,000 | 5/11/63 | (500 bp) | (3,454) | ||
CMBX NA BBB– Index | BBB–/P | (4,569) | 236,000 | 5/11/63 | 300 bp | (1,879) | ||
CMBX NA BBB– Index | BBB–/P | (1,627) | 162,000 | 5/11/63 | 300 bp | 219 | ||
CMBX NA BBB– Index | BBB–/P | 746 | 161,000 | 5/11/63 | 300 bp | 2,581 | ||
CMBX NA BBB– Index | BBB–/P | 602 | 130,000 | 5/11/63 | 300 bp | 2,084 | ||
CMBX NA BBB– Index | BBB–/P | (2,114) | 117,000 | 5/11/63 | 300 bp | (780) | ||
CMBX NA BBB– Index | BBB–/P | 81 | 116,000 | 5/11/63 | 300 bp | 1,403 | ||
CMBX NA BBB– Index | BBB–/P | 402 | 116,000 | 5/11/63 | 300 bp | 1,724 | ||
CMBX NA BBB– Index | BBB–/P | 1,323 | 111,000 | 5/11/63 | 300 bp | 2,588 | ||
CMBX NA BBB– Index | BBB–/P | 1,104 | 111,000 | 5/11/63 | 300 bp | 2,369 | ||
CMBX NA BBB– Index | BBB–/P | (1,020) | 109,000 | 5/11/63 | 300 bp | 222 | ||
CMBX NA BBB– Index | BBB–/P | (364) | 109,000 | 5/11/63 | 300 bp | 879 | ||
CMBX NA BBB– Index | BBB–/P | (364) | 109,000 | 5/11/63 | 300 bp | 878 | ||
CMBX NA BBB– Index | BBB–/P | (912) | 109,000 | 5/11/63 | 300 bp | 330 | ||
CMBX NA BBB– Index | BBB–/P | (1,082) | 108,000 | 5/11/63 | 300 bp | 149 | ||
CMBX NA BBB– Index | BBB–/P | 67 | 101,000 | 5/11/63 | 300 bp | 1,219 | ||
CMBX NA BBB– Index | BBB–/P | 589 | 97,000 | 5/11/63 | 300 bp | 1,695 | ||
CMBX NA BBB– Index | BBB–/P | (332) | 55,000 | 5/11/63 | 300 bp | 295 | ||
CMBX NA BBB– Index | BBB–/P | (525) | 55,000 | 5/11/63 | 300 bp | 102 | ||
CMBX NA BBB– Index | BBB–/P | 1,309 | 55,000 | 5/11/63 | 300 bp | 1,936 | ||
Global Income Trust 59
| ||||||||
Swap counterparty/ | Rating*** | Upfront | Notional | Termi- | Payments | Unrealized | ||
| ||||||||
CMBX NA BBB– Index | BBB–/P | $94 | $35,000 | 5/11/63 | 300 bp | $493 | ||
CMBX NA BBB– Index | BBB–/P | 48 | 1,000 | 5/11/63 | 300 bp | 59 | ||
| ||||||||
CMBX NA BBB– Index | BBB–/P | (692) | 100,000 | 5/11/63 | 300 bp | 448 | ||
CMBX NA BBB– Index | BBB–/P | 61 | 17,000 | 1/17/47 | 300 bp | (82) | ||
CMBX NA BBB– Index | BBB–/P | 61 | 17,000 | 1/17/47 | 300 bp | (82) | ||
CMBX NA BBB– Index | BBB–/P | 257 | 33,000 | 1/17/47 | 300 bp | (31) | ||
CMBX NA BBB– Index | BBB–/P | 141 | 33,000 | 1/17/47 | 300 bp | (136) | ||
CMBX NA BBB– Index | BBB–/P | 118 | 33,000 | 1/17/47 | 300 bp | (160) | ||
CMBX NA BBB– Index | BBB–/P | 118 | 33,000 | 1/17/47 | 300 bp | (160) | ||
CMBX NA BBB– Index | BBB–/P | 271 | 69,000 | 1/17/47 | 300 bp | (309) | ||
CMBX NA BBB– Index | BBB–/P | 83 | 77,000 | 1/17/47 | 300 bp | (564) | ||
CMBX NA BBB– Index | BBB–/P | 703 | 83,000 | 1/17/47 | 300 bp | (35) | ||
CMBX NA BB Index | — | 543 | 53,000 | 5/11/63 | (500 bp) | 33 | ||
CMBX NA BB Index | — | 1,198 | 53,000 | 5/11/63 | (500 bp) | 688 | ||
CMBX NA BB Index | — | (519) | 54,000 | 5/11/63 | (500 bp) | (1,039) | ||
CMBX NA BB Index | — | 70 | 58,000 | 5/11/63 | (500 bp) | (488) | ||
CMBX NA BB Index | — | (1,315) | 124,000 | 5/11/63 | (500 bp) | (2,509) | ||
CMBX NA BB Index | — | (80) | 40,000 | 1/17/47 | (500 bp) | 271 | ||
CMBX NA BBB– Index | BBB–/P | (1,950) | 117,000 | 5/11/63 | 300 bp | (616) | ||
CMBX NA BBB– Index | BBB–/P | (875) | 109,000 | 5/11/63 | 300 bp | 367 | ||
CMBX NA BBB– Index | BBB–/P | (437) | 109,000 | 5/11/63 | 300 bp | 805 | ||
CMBX NA BBB– Index | BBB–/P | (1,011) | 108,000 | 5/11/63 | 300 bp | 221 | ||
CMBX NA BBB– Index | BBB–/P | (1,083) | 108,000 | 5/11/63 | 300 bp | 148 | ||
60 Global Income Trust
| ||||||||
Swap counterparty/ | Rating*** | Upfront | Notional | Termi- | Payments | Unrealized | ||
| ||||||||
CMBX NA BBB– Index | BBB–/P | $(1,083) | $108,000 | 5/11/63 | 300 bp | $148 | ||
CMBX NA BBB– Index | BBB–/P | 1,188 | 104,000 | 5/11/63 | 300 bp | 2,374 | ||
CMBX NA BBB– Index | BBB–/P | 614 | 103,000 | 5/11/63 | 300 bp | 1,789 | ||
CMBX NA BBB– Index | BBB–/P | (600) | 55,000 | 5/11/63 | 300 bp | 27 | ||
Total | $140,823 |
| ||||||
| ||||||||
| ||||||||
| ||||||||
Global Income Trust 61
ASC 820 establishes a three-level hierarchy for disclosure of fair value measurements. The valuation hierarchy is based upon the transparency of inputs to the valuation of the fund’s investments. The three levels are defined as follows: | |
Level 1: Valuations based on quoted prices for identical securities in active markets. | |
Level 2: Valuations based on quoted prices in markets that are not active or for which all significant inputs are observable, either directly or indirectly. | |
Level 3: Valuations based on inputs that are unobservable and significant to the fair value measurement. | |
The following is a summary of the inputs used to value the fund’s net assets as of the close of the reporting period: |
Valuation inputs | ||||
Investments in securities: | Level 1 | Level 2 | Level 3 | |
Asset-backed securities | $— | $7,687,000 | $— | |
Corporate bonds and notes | — | 90,377,118 | 543,400 | |
Foreign government and agency bonds and notes | — | 101,371,091 | — | |
Mortgage-backed securities | — | 70,349,748 | 1,075,743 | |
Municipal bonds and notes | — | 421,987 | — | |
Purchased options outstanding | — | 68,220 | — | |
Purchased swap options outstanding | — | 1,577,310 | — | |
U.S. government and agency mortgage obligations | — | 41,739,737 | — | |
U.S. treasury obligations | — | 110,688 | — | |
Short-term investments | 18,623,691 | 10,078,871 | — | |
Totals by level | $18,623,691 | $323,781,770 | $1,619,143 | |
Valuation inputs | ||||
Other financial instruments: | Level 1 | Level 2 | Level 3 | |
Forward currency contracts | $— | $(247,350) | $— | |
Futures contracts | (834,309) | — | — | |
Written options outstanding | — | (72,690) | — | |
Written swap options outstanding | — | (1,627,371) | — | |
Forward premium swap option contracts | — | (28,962) | — | |
TBA sale commitments | — | (5,190,625) | — | |
Interest rate swap contracts | — | (2,971,272) | — | |
Total return swap contracts | — | 176,051 | — | |
Credit default contracts | — | 39,722 | — | |
Totals by level | $(834,309) | $(9,922,497) | $— | |
During the reporting period, transfers within the fair value hierarchy, if any, did not represent, in the aggregate, more than 1% of the fund’s net assets measured as of the end of the period. | ||||
At the start and close of the reporting period, Level 3 investments in securities represented less than 1% of the fund’s net assets and were not considered a significant portion of the fund’s portfolio. | ||||
The accompanying notes are an integral part of these financial statements.
62 Global Income Trust
Statement of assets and liabilities 4/30/15 (Unaudited) | ||
ASSETS | ||
Investment in securities, at value (Note 1): | ||
Unaffiliated issuers (identified cost $326,965,325) | $326,202,913 | |
Affiliated issuers (identified cost $17,821,691) (Note 5) | 17,821,691 | |
Cash | 2,355 | |
Foreign currency (cost $23,785) (Note 1) | 23,820�� | |
Interest and other receivables | 3,192,401 | |
Receivable for shares of the fund sold | 585,225 | |
Receivable for investments sold | 916,783 | |
Receivable for sales of delayed delivery securities (Note 1) | 2,122,891 | |
Receivable for variation margin (Note 1) | 1,785,154 | |
Unrealized appreciation on forward premium swap option contracts (Note 1) | 94,600 | |
Unrealized appreciation on forward currency contracts (Note 1) | 1,622,085 | |
Unrealized appreciation on OTC swap contracts (Note 1) | 1,203,327 | |
Premium paid on OTC swap contracts (Note 1) | 30,022 | |
Prepaid assets | 46,832 | |
Total assets | 355,650,099 | |
LIABILITIES | ||
Payable for investments purchased | 509,840 | |
Payable for purchases of delayed delivery securities (Note 1) | 30,189,051 | |
Payable for shares of the fund repurchased | 726,055 | |
Payable for compensation of Manager (Note 2) | 138,758 | |
Payable for custodian fees (Note 2) | 31,494 | |
Payable for investor servicing fees (Note 2) | 79,555 | |
Payable for Trustee compensation and expenses (Note 2) | 123,574 | |
Payable for administrative services (Note 2) | 984 | |
Payable for distribution fees (Note 2) | 71,531 | |
Payable for variation margin (Note 1) | 1,760,024 | |
Unrealized depreciation on OTC swap contracts (Note 1) | 870,314 | |
Premium received on OTC swap contracts (Note 1) | 172,155 | |
Unrealized depreciation on forward currency contracts (Note 1) | 1,869,435 | |
Unrealized depreciation on forward premium swap option contracts (Note 1) | 123,562 | |
Written options outstanding, at value (premiums $2,563,013) (Notes 1 and 3) | 1,700,061 | |
TBA sale commitments, at value (proceeds receivable $5,182,891) (Note 1) | 5,190,625 | |
Collateral on certain derivative contracts, at value (Note 1) | 912,688 | |
Other accrued expenses | 121,205 | |
Total liabilities | 44,590,911 | |
Net assets | $311,059,188 | |
(Continued on next page) |
The accompanying notes are an integral part of these financial statements.
Global Income Trust 63
Statement of assets and liabilities (Continued) | ||
REPRESENTED BY | ||
Paid-in capital (Unlimited shares authorized) (Notes 1 and 4) | $317,127,718 | |
Undistributed net investment income (Note 1) | 2,264,505 | |
Accumulated net realized loss on investments and foreign currency transactions (Note 1) | (6,019,696) | |
Net unrealized depreciation of investments and assets and liabilities in foreign currencies | (2,313,339) | |
Total — Representing net assets applicable to capital shares outstanding | $311,059,188 | |
COMPUTATION OF NET ASSET VALUE AND OFFERING PRICE | ||
Net asset value and redemption price per class A share ($174,062,779 divided by 14,046,527 shares) | $12.39 | |
Offering price per class A share (100/96.00 of $12.39)* | $12.91 | |
Net asset value and offering price per class B share ($7,072,744 divided by 573,482 shares)** | $12.33 | |
Net asset value and offering price per class C share ($27,618,479 divided by 2,238,504 shares)** | $12.34 | |
Net asset value and redemption price per class M share ($10,147,740 divided by 826,877 shares) | $12.27 | |
Offering price per class M share (100/96.75 of $12.27)† | $12.68 | |
Net asset value, offering price and redemption price per class R share ($5,213,979 divided by 421,519 shares) | $12.37 | |
Net asset value, offering price and redemption price per class R5 share ($24,498 divided by 1,976 shares) | $12.40 | |
Net asset value, offering price and redemption price per class R6 share ($4,336,659 divided by 350,006 shares) | $12.39 | |
Net asset value, offering price and redemption price per class Y share ($82,582,310 divided by 6,667,266 shares) | $12.39 | |
* | On single retail sales of less than $100,000. On sales of $100,000 or more the offering price is reduced. | |
** | Redemption price per share is equal to net asset value less any applicable contingent deferred sales charge. | |
† | On single retail sales of less than $50,000. On sales of $50,000 or more the offering price is reduced. | |
The accompanying notes are an integral part of these financial statements.
64 Global Income Trust
Statement of operations Six months ended 4/30/15 (Unaudited) | ||
INVESTMENT INCOME | ||
Interest (including interest income of $10,705 from investments in affiliated issuers) (Note 5) | $5,957,001 | |
EXPENSES | ||
Compensation of Manager (Note 2) | 894,432 | |
Investor servicing fees (Note 2) | 239,480 | |
Custodian fees (Note 2) | 49,112 | |
Trustee compensation and expenses (Note 2) | 5,115 | |
Distribution fees (Note 2) | 442,666 | |
Administrative services (Note 2) | 5,092 | |
Other | 194,337 | |
Total expenses | 1,830,234 | |
Expense reduction (Note 2) | (356) | |
Net expenses | 1,829,878 | |
Net investment income | 4,127,123 | |
Net realized gain on investments (Notes 1 and 3) | 1,518,864 | |
Net realized loss on swap contracts (Note 1) | (3,969,173) | |
Net realized gain on futures contracts (Note 1) | 1,029,414 | |
Net realized gain on foreign currency transactions (Note 1) | 7,468,857 | |
Net realized loss on written options (Notes 1 and 3) | (1,218,458) | |
Net unrealized depreciation of assets and liabilities in foreign currencies during the period | (1,263,219) | |
Net unrealized depreciation of investments, futures contracts, swap contracts, written options and TBA sale commitments during the period | (8,179,019) | |
Net loss on investments | (4,612,734) | |
Net decrease in net assets resulting from operations | $(485,611) |
The accompanying notes are an integral part of these financial statements.
Global Income Trust 65
Statement of changes in net assets | |||
INCREASE (DECREASE) IN NET ASSETS | Six months ended 4/30/15* | Year ended 10/31/14 | |
Operations: | |||
Net investment income | $4,127,123 | $9,085,578 | |
Net realized gain (loss) on investments and foreign currency transactions | 4,829,504 | (1,731,545) | |
Net unrealized appreciation (depreciation) of investments and assets and liabilities in foreign currencies | (9,442,238) | 2,285,618 | |
Net increase (decrease) in net assets resulting from operations | (485,611) | 9,639,651 | |
Distributions to shareholders (Note 1): | |||
From ordinary income | |||
Net investment income | |||
Class A | (2,728,103) | (5,908,621) | |
Class B | (87,986) | (191,793) | |
Class C | (341,642) | (678,804) | |
Class M | (148,018) | (321,934) | |
Class R | (82,824) | (165,487) | |
Class R5 | (406) | (513) | |
Class R6 | (77,311) | (152,391) | |
Class Y | (1,646,222) | (2,318,525) | |
Increase (decrease) from capital share transactions (Note 4) | (32,572,581) | 47,123,695 | |
Total increase (decrease) in net assets | (38,170,704) | 47,025,278 | |
NET ASSETS | |||
Beginning of period | 349,229,892 | 302,204,614 | |
End of period (including undistributed net investment income of $2,264,505 and $3,249,894, respectively) | $311,059,188 | $349,229,892 | |
* | Unaudited. | ||
The accompanying notes are an integral part of these financial statements.
66 Global Income Trust
This page left blank intentionally.
Global Income Trust 67
Financial highlights (For a common share outstanding throughout the period)
INVESTMENT OPERATIONS: | LESS DISTRIBUTIONS: | RATIOS AND SUPPLEMENTAL DATA: | |||||||||||||
Period ended | Net asset value, beginning of period | Net investment income (loss)a | Net realized and unrealized gain (loss) on investments | Total from investment operations | From | From | Total | Redemption | Non-recurring reimbursements | Net asset value, end of period | Total return at net asset value (%)b | Net assets, end of period (in thousands) | Ratio of expenses to average net assets (%)c | Ratio of net investment income (loss) to average net assets (%) | Portfolio turnover (%) |
Class A | |||||||||||||||
April 30, 2015** | $12.60 | .15 | (.17) | (.02) | (.19) | — | (.19) | — | — | $12.39 | (.14) * | $174,063 | .54* | 1.24* | 131*d |
October 31, 2014 | 12.57 | .36 | .05 | .41 | (.38) | — | (.38) | — | — | 12.60 | 3.30 | 171,481 | 1.09 | 2.84 | 295d |
October 31, 2013 | 12.85 | .38 | (.27) | .11 | (.35) | (.04) | (.39) | — | — | 12.57 | .82 | 199,284 | 1.10 | 2.96 | 335e |
October 31, 2012 | 12.58 | .36 | .38 | .74 | (.36) | (.11) | (.47) | — | — | 12.85 | 6.02 | 229,240 | 1.10 | 2.85 | 162e |
October 31, 2011 | 13.15 | .47 | (.27) | .20 | (.77) | — | (.77) | —f | —f,g | 12.58 | 1.55 | 215,202 | 1.13 | 3.67 | 116e |
October 31, 2010 | 13.24 | .80 | .82 | 1.62 | (1.71) | — | (1.71) | —f | —f,h | 13.15 | 13.63 | 157,631 | 1.14i | 6.35i | 79e |
Class B | |||||||||||||||
April 30, 2015** | $12.54 | .11 | (.17) | (.06) | (.15) | — | (.15) | — | — | $12.33 | (.51) * | $7,073 | .91* | .86* | 131*d |
October 31, 2014 | 12.51 | .26 | .06 | .32 | (.29) | — | (.29) | — | — | 12.54 | 2.54 | 7,884 | 1.84 | 2.08 | 295d |
October 31, 2013 | 12.80 | .28 | (.28) | —f | (.26) | (.03) | (.29) | — | — | 12.51 | (.01) | 9,002 | 1.85 | 2.21 | 335e |
October 31, 2012 | 12.53 | .26 | .38 | .64 | (.28) | (.09) | (.37) | — | — | 12.80 | 5.24 | 11,109 | 1.85 | 2.10 | 162e |
October 31, 2011 | 13.10 | .38 | (.28) | .10 | (.67) | — | (.67) | —f | —f,g | 12.53 | .81 | 11,499 | 1.88 | 2.94 | 116e |
October 31, 2010 | 13.20 | .72 | .80 | 1.52 | (1.62) | — | (1.62) | —f | —f,h | 13.10 | 12.74 | 9,453 | 1.89i | 5.67i | 79e |
Class C | |||||||||||||||
April 30, 2015** | $12.55 | .11 | (.17) | (.06) | (.15) | — | (.15) | — | — | $12.34 | (.51) * | $27,618 | .91* | .87* | 131*d |
October 31, 2014 | 12.51 | .26 | .07 | .33 | (.29) | — | (.29) | — | — | 12.55 | 2.61 | 30,175 | 1.84 | 2.08 | 295d |
October 31, 2013 | 12.80 | .28 | (.28) | —f | (.26) | (.03) | (.29) | — | — | 12.51 | (.01) | 31,771 | 1.85 | 2.22 | 335e |
October 31, 2012 | 12.53 | .26 | .38 | .64 | (.28) | (.09) | (.37) | — | — | 12.80 | 5.25 | 39,316 | 1.85 | 2.10 | 162e |
October 31, 2011 | 13.10 | .35 | (.24) | .11 | (.68) | — | (.68) | —f | —f,g | 12.53 | .83 | 36,264 | 1.88 | 2.70 | 116e |
October 31, 2010 | 13.20 | .68 | .85 | 1.53 | (1.63) | — | (1.63) | —f | —f,h | 13.10 | 12.80 | 13,700 | 1.89i | 5.39i | 79e |
Class M | |||||||||||||||
April 30, 2015** | $12.48 | .14 | (.17) | (.03) | (.18) | — | (.18) | — | — | $12.27 | (.28) * | $10,148 | .66* | 1.11* | 131*d |
October 31, 2014 | 12.45 | .33 | .05 | .38 | (.35) | — | (.35) | — | — | 12.48 | 3.07 | 10,911 | 1.34 | 2.58 | 295d |
October 31, 2013 | 12.74 | .34 | (.28) | .06 | (.32) | (.03) | (.35) | — | — | 12.45 | .50 | 12,457 | 1.35 | 2.71 | 335e |
October 31, 2012 | 12.47 | .32 | .38 | .70 | (.33) | (.10) | (.43) | — | — | 12.74 | 5.80 | 14,969 | 1.35 | 2.60 | 162e |
October 31, 2011 | 13.04 | .45 | (.28) | .17 | (.74) | — | (.74) | —f | —f,g | 12.47 | 1.30 | 16,403 | 1.38 | 3.51 | 116e |
October 31, 2010 | 13.14 | .78 | .80 | 1.58 | (1.68) | — | (1.68) | —f | —f,h | 13.04 | 13.35 | 17,170 | 1.39i | 6.21i | 79e |
Class R | |||||||||||||||
April 30, 2015** | $12.58 | .14 | (.17) | (.03) | (.18) | — | (.18) | — | — | $12.37 | (.28) * | $5,214 | .66* | 1.10* | 131*d |
October 31, 2014 | 12.54 | .33 | .06 | .39 | (.35) | — | (.35) | — | — | 12.58 | 3.12 | 6,072 | 1.34 | 2.58 | 295d |
October 31, 2013 | 12.83 | .34 | (.28) | .06 | (.32) | (.03) | (.35) | — | — | 12.54 | .50 | 5,586 | 1.35 | 2.70 | 335e |
October 31, 2012 | 12.56 | .33 | .37 | .70 | (.33) | (.10) | (.43) | — | — | 12.83 | 5.76 | 4,142 | 1.35 | 2.61 | 162e |
October 31, 2011 | 13.14 | .44 | (.28) | .16 | (.74) | — | (.74) | —f | —f,g | 12.56 | 1.25 | 3,658 | 1.38 | 3.43 | 116e |
October 31, 2010 | 13.23 | .75 | .84 | 1.59 | (1.68) | — | (1.68) | —f | —f,h | 13.14 | 13.39 | 2,264 | 1.39i | 5.92i | 79e |
Class R5 | |||||||||||||||
April 30, 2015** | $12.60 | .18 | (.17) | .01 | (.21) | — | (.21) | — | — | $12.40 | .07* | $24 | .40* | 1.40* | 131*d |
October 31, 2014 | 12.56 | .39 | .07 | .46 | (.42) | — | (.42) | — | — | 12.60 | 3.67 | 24 | .82 | 3.02 | 295d |
October 31, 2013 | 12.85 | .42 | (.29) | .13 | (.38) | (.04) | (.42) | — | — | 12.56 | 1.02 | 11 | .82 | 3.27 | 335e |
October 31, 2012† | 12.45 | .13 | .41 | .54 | (.11) | (.03) | (.14) | — | — | 12.85 | 4.34* | 10 | .27* | .99* | 162e |
Class R6 | |||||||||||||||
April 30, 2015** | $12.60 | .18 | (.18) | —f | (.21) | — | (.21) | — | — | $12.39 | .03* | $4,337 | .37* | 1.41* | 131*d |
October 31, 2014 | 12.57 | .40 | .06 | .46 | (.43) | — | (.43) | — | — | 12.60 | 3.64 | 4,736 | .75 | 3.15 | 295d |
October 31, 2013 | 12.85 | .38j | (.23) | .15 | (.39) | (.04) | (.43) | — | — | 12.57 | 1.19 | 4,025 | .75 | 3.00j | 335e |
October 31, 2012† | 12.45 | .13 | .41 | .54 | (.11) | (.03) | (.14) | — | — | 12.85 | 4.37* | 10 | .25* | 1.01* | 162e |
See notes to financial highlights at the end of this section.
The accompanying notes are an integral part of these financial statements.
68 | Global Income Trust | Global Income Trust | 69 |
Financial highlights (Continued)
INVESTMENT OPERATIONS: | LESS DISTRIBUTIONS: | RATIOS AND SUPPLEMENTAL DATA: | |||||||||||||
Period ended | Net asset value, beginning of period | Net investment income (loss)a | Net realized and unrealized gain (loss) on investments | Total from investment operations | From | From | Total | Redemption | Non-recurring reimbursements | Net asset value, end of period | Total return at net asset value (%)b | Net assets, end of period (in thousands) | Ratio of expenses to average net assets (%)c | Ratio of net investment income (loss) to average net assets (%) | Portfolio turnover (%) |
Class Y | |||||||||||||||
April 30, 2015** | $12.60 | .17 | (.17) | —f | (.21) | — | (.21) | — | — | $12.39 | (.01) * | $82,582 | .41* | 1.37* | 131*d |
October 31, 2014 | 12.57 | .38 | .07 | .45 | (.42) | — | (.42) | — | — | 12.60 | 3.58 | 117,947 | .84 | 2.97 | 295d |
October 31, 2013 | 12.86 | .41 | (.28) | .13 | (.38) | (.04) | (.42) | — | — | 12.57 | 1.00 | 40,069 | .85 | 3.22 | 335e |
October 31, 2012 | 12.58 | .39 | .39 | .78 | (.38) | (.12) | (.50) | — | — | 12.86 | 6.40 | 64,357 | .85 | 3.11 | 162e |
October 31, 2011 | 13.16 | .46 | (.24) | .22 | (.80) | — | (.80) | —f | —f,g | 12.58 | 1.74 | 72,631 | .88 | 3.53 | 116e |
October 31, 2010 | 13.25 | .83 | .83 | 1.66 | (1.75) | — | (1.75) | —f | —f,h | 13.16 | 13.93 | 13,371 | .89i | 6.54i | 79e |
* Not annualized.
** Unaudited.
† For the period July 3, 2012 (commencement of operations) to October 31, 2012.
a Per share net investment income (loss) has been determined on the basis of the weighted average number of shares outstanding during the period.
b Total return assumes dividend reinvestment and does not reflect the effect of sales charges.
c Includes amounts paid through expense offset and/or brokerage/service arrangements, if any (Note 2). Also excludes acquired fund fees and expenses, if any.
d Portfolio turnover includes TBA purchase and sale commitments.
e Portfolio turnover excludes TBA purchase and sale commitments. Including TBA purchase and sale commitments to conform with current year presentation, the portfolio turnover would have been the following:
Portfolio turnover % | |
October 31, 2013 | 673% |
October 31, 2012 | 328 |
October 31, 2011 | 319 |
October 31, 2010 | 161 |
f Amount represents less than $0.01 per share.
g Reflects a non-recurring reimbursement related to restitution amounts in connection with a distribution plan approved by the Securities and Exchange Commission (the SEC) which amounted to less than $0.01 per share outstanding on July 21, 2011. Also reflects a non-recurring reimbursement related to short-term trading related lawsuits, which amounted to less than $0.01 per share outstanding on May 11, 2011.
h Reflects a non-recurring reimbursement pursuant to a settlement between the SEC and Prudential Securities, Inc. which amounted to less than $0.01 per share outstanding on March 30, 2010.
i Reflects an involuntary contractual expense limitation in effect during the period. As a result of such limitation, the expenses of each class reflect a reduction of 0.02% of average net assets.
j The net investment income ratio and per share amount shown for the period ending October 31, 2013 may not correspond with the expected class specific differences for the period due to the timing of subscriptions into the class.
The accompanying notes are an integral part of these financial statements.
70 | Global Income Trust | Global Income Trust | 71 |
Notes to financial statements 4/30/15 (Unaudited)
Within the following Notes to financial statements, references to “State Street” represent State Street Bank and Trust Company, references to “the SEC” represent the Securities and Exchange Commission, references to “Putnam Management” represent Putnam Investment Management, LLC, the fund’s manager, an indirect wholly-owned subsidiary of Putnam Investments, LLC and references to “OTC”, if any, represent over-the-counter. Unless otherwise noted, the “reporting period” represents the period from November 1, 2014 through April 30, 2015.
Putnam Global Income Trust (the fund) is a Massachusetts business trust, which is registered under the Investment Company Act of 1940, as amended, as a non-diversified open-end management investment company. The goal of the fund is to seek high current income. Preservation of capital and long-term total return are secondary objectives, but only to the extent consistent with the objective of seeking high current income. The fund invests mainly in bonds and securitized debt instruments (such as mortgage-backed investments) that are obligations of companies and governments worldwide; that are investment-grade in quality; and that have intermediate- to long-term maturities (three years or longer). The fund may also invest in bonds that are below-investment-grade in quality (sometimes referred to as “junk bonds”). Putnam Management may consider, among other factors, credit, interest rate and prepayment risks, as well as general market conditions, when deciding whether to buy or sell investments.
The fund offers class A, class B, class C, class M, class R, class R5, class R6 and class Y shares. Class A and class M shares are sold with a maximum front-end sales charge of 4.00% and 3.25%, respectively, and generally do not pay a contingent deferred sales charge. Class B shares, which convert to class A shares after approximately eight years, do not pay a front-end sales charge and are subject to a contingent deferred sales charge if those shares are redeemed within six years of purchase. Class C shares have a one-year 1.00% contingent deferred sales charge and do not convert to class A shares. Class R shares, which are not available to all investors, are sold at net asset value. The expenses for class A, class B, class C, class M and class R shares may differ based on the distribution fee of each class, which is identified in Note 2. Class R5, class R6 and class Y shares, which are sold at net asset value, are generally subject to the same expenses as class A, class B, class C, class M and class R shares, but do not bear a distribution fee and in the case of class R5 and class R6 shares, bear a lower investor servicing fee, which is identified in Note 2. Class R5, class R6 and class Y shares are not available to all investors.
In the normal course of business, the fund enters into contracts that may include agreements to indemnify another party under given circumstances. The fund’s maximum exposure under these arrangements is unknown as this would involve future claims that may be, but have not yet been, made against the fund. However, the fund’s management team expects the risk of material loss to be remote.
Note 1: Significant accounting policies
The following is a summary of significant accounting policies consistently followed by the fund in the preparation of its financial statements. The preparation of financial statements is in conformity with accounting principles generally accepted in the United States of America and requires management to make estimates and assumptions that affect the reported amounts of assets and liabilities in the financial statements and the reported amounts of increases and decreases in net assets from operations. Actual results could differ from those estimates. Subsequent events after the Statement of assets and liabilities date through the date that the financial statements were issued have been evaluated in the preparation of the financial statements.
Investment income, realized and unrealized gains and losses and expenses of the fund are borne pro-rata based on the relative net assets of each class to the total net assets of the fund, except that each class bears expenses unique to that class (including the distribution fees applicable to such classes). Each class votes as a class only with respect to its own distribution plan or other matters on which a class vote is required by law or determined by the Trustees. If the fund were liquidated, shares of each class would receive their pro-rata share of the net assets of the fund. In addition, the Trustees declare separate dividends on each class of shares.
Security valuation Portfolio securities and other investments are valued using policies and procedures adopted by the Board of Trustees. The Trustees have formed a Pricing Committee to oversee the implementation of these procedures and have delegated responsibility for valuing the fund’s assets in accordance with these procedures to Putnam Management. Putnam Management has established an internal Valuation Committee that is responsible for making fair value determinations, evaluating the effectiveness of the pricing policies of the fund and reporting to the Pricing Committee.
Market quotations are not considered to be readily available for certain debt obligations and other investments; such investments are valued on the basis of valuations furnished by an independent pricing service approved
72 Global Income Trust
by the Trustees or dealers selected by Putnam Management. Such services or dealers determine valuations for normal institutional-size trading units of such securities using methods based on market transactions for comparable securities and various relationships, generally recognized by institutional traders, between securities (which consider such factors as security prices, yields, maturities and ratings). These securities will generally be categorized as Level 2. Securities quoted in foreign currencies, if any, are translated into U.S. dollars at the current exchange rate. Short-term securities with remaining maturities of 60 days or less may be valued at amortized cost, which approximates fair value, and are classified as Level 2 securities.
Investments in open-end investment companies (excluding exchange-traded funds), if any, which can be classified as Level 1 or Level 2 securities, are valued based on their net asset value. The net asset value of such investment companies equals the total value of their assets less their liabilities and divided by the number of their outstanding shares.
To the extent a pricing service or dealer is unable to value a security or provides a valuation that Putnam Management does not believe accurately reflects the security’s fair value, the security will be valued at fair value by Putnam Management in accordance with policies and procedures approved by the Trustees. Certain investments, including certain restricted and illiquid securities and derivatives, are also valued at fair value following procedures approved by the Trustees. These valuations consider such factors as significant market or specific security events such as interest rate or credit quality changes, various relationships with other securities, discount rates, U.S. Treasury, U.S. swap and credit yields, index levels, convexity exposures, recovery rates, sales and other multiples and resale restrictions. These securities are classified as Level 2 or as Level 3 depending on the priority of the significant inputs.
To assess the continuing appropriateness of fair valuations, the Valuation Committee reviews and affirms the reasonableness of such valuations on a regular basis after considering all relevant information that is reasonably available. Such valuations and procedures are reviewed periodically by the Trustees. Certain securities may be valued on the basis of a price provided by a single source. The fair value of securities is generally determined as the amount that the fund could reasonably expect to realize from an orderly disposition of such securities over a reasonable period of time. By its nature, a fair value price is a good faith estimate of the value of a security in a current sale and does not reflect an actual market price, which may be different by a material amount.
Security transactions and related investment income Security transactions are recorded on the trade date (the date the order to buy or sell is executed). Gains or losses on securities sold are determined on the identified cost basis.
Interest income, net of any applicable withholding taxes, is recorded on the accrual basis.
All premiums/discounts are amortized/accreted on a yield-to-maturity basis.
Securities purchased or sold on a forward commitment or delayed delivery basis may be settled at a future date beyond customary settlement time; interest income is accrued based on the terms of the securities. Losses may arise due to changes in the fair value of the underlying securities or if the counterparty does not perform under the contract.
Stripped securities The fund may invest in stripped securities which represent a participation in securities that may be structured in classes with rights to receive different portions of the interest and principal. Interest-only securities receive all of the interest and principal-only securities receive all of the principal. If the interest-only securities experience greater than anticipated prepayments of principal, the fund may fail to recoup fully its initial investment in these securities. Conversely, principal-only securities increase in value if prepayments are greater than anticipated and decline if prepayments are slower than anticipated. The fair value of these securities is highly sensitive to changes in interest rates.
Foreign currency translation The accounting records of the fund are maintained in U.S. dollars. The fair value of foreign securities, currency holdings, and other assets and liabilities is recorded in the books and records of the fund after translation to U.S. dollars based on the exchange rates on that day. The cost of each security is determined using historical exchange rates. Income and withholding taxes are translated at prevailing exchange rates when earned or incurred. The fund does not isolate that portion of realized or unrealized gains or losses resulting from changes in the foreign exchange rate on investments from fluctuations arising from changes in the market prices of the securities. Such gains and losses are included with the net realized and unrealized gain or loss on investments. Net realized gains and losses on foreign currency transactions represent net realized exchange gains or losses on closed forward currency contracts, disposition of foreign currencies, currency gains and losses realized between the trade and settlement dates on securities transactions and the difference between the amount of investment income and foreign withholding taxes recorded on the fund’s books and the U.S. dollar equivalent amounts actually received or paid. Net unrealized appreciation and depreciation of assets and liabilities in foreign
Global Income Trust 73
currencies arise from changes in the value of open forward currency contracts and assets and liabilities other than investments at the period end, resulting from changes in the exchange rate.
Options contracts The fund uses options contracts to hedge duration and convexity, to isolate prepayment risk and to manage downside risks.
The potential risk to the fund is that the change in value of options contracts may not correspond to the change in value of the hedged instruments. In addition, losses may arise from changes in the value of the underlying instruments if there is an illiquid secondary market for the contracts, if interest or exchange rates move unexpectedly or if the counterparty to the contract is unable to perform. Realized gains and losses on purchased options are included in realized gains and losses on investment securities. If a written call option is exercised, the premium originally received is recorded as an addition to sales proceeds. If a written put option is exercised, the premium originally received is recorded as a reduction to the cost of investments.
Exchange-traded options are valued at the last sale price or, if no sales are reported, the last bid price for purchased options and the last ask price for written options. OTC traded options are valued using prices supplied by dealers.
Options on swaps are similar to options on securities except that the premium paid or received is to buy or grant the right to enter into a previously agreed upon interest rate or credit default contract. Forward premium swap option contracts include premiums that have extended settlement dates. The delayed settlement of the premiums is factored into the daily valuation of the option contracts. In the case of interest rate cap and floor contracts, in return for a premium, ongoing payments between two parties are based on interest rates exceeding a specified rate, in the case of a cap contract, or falling below a specified rate in the case of a floor contract.
Written option contracts outstanding at period end, if any, are listed after the fund’s portfolio.
Futures contracts The fund uses futures contracts for hedging treasury term structure risk and for yield curve positioning.
The potential risk to the fund is that the change in value of futures contracts may not correspond to the change in value of the hedged instruments. In addition, losses may arise from changes in the value of the underlying instruments, if there is an illiquid secondary market for the contracts, if interest or exchange rates move unexpectedly or if the counterparty to the contract is unable to perform. With futures, there is minimal counterparty credit risk to the fund since futures are exchange traded and the exchange’s clearinghouse, as counterparty to all exchange traded futures, guarantees the futures against default. Risks may exceed amounts recognized on the Statement of assets and liabilities. When the contract is closed, the fund records a realized gain or loss equal to the difference between the value of the contract at the time it was opened and the value at the time it was closed.
Futures contracts are valued at the quoted daily settlement prices established by the exchange on which they trade. The fund and the broker agree to exchange an amount of cash equal to the daily fluctuation in the value of the futures contract. Such receipts or payments are known as “variation margin.”
Futures contracts outstanding at period end, if any, are listed after the fund’s portfolio.
Forward currency contracts The fund buys and sells forward currency contracts, which are agreements between two parties to buy and sell currencies at a set price on a future date. These contracts are used for hedging currency exposures and to gain exposure to currencies.
The U.S. dollar value of forward currency contracts is determined using current forward currency exchange rates supplied by a quotation service. The fair value of the contract will fluctuate with changes in currency exchange rates. The contract is marked to market daily and the change in fair value is recorded as an unrealized gain or loss. The fund records a realized gain or loss equal to the difference between the value of the contract at the time it was opened and the value at the time it was closed when the contract matures or by delivery of the currency. The fund could be exposed to risk if the value of the currency changes unfavorably, if the counterparties to the contracts are unable to meet the terms of their contracts or if the fund is unable to enter into a closing position. Risks may exceed amounts recognized on the Statement of assets and liabilities.
Forward currency contracts outstanding at period end, if any, are listed after the fund’s portfolio.
Interest rate swap contracts The fund entered into OTC and/or centrally cleared interest rate swap contracts, which are arrangements between two parties to exchange cash flows based on a notional principal amount, for hedging term structure risk, for yield curve positioning and for gaining exposure to rates in various countries.
An OTC and centrally cleared interest rate swap can be purchased or sold with an upfront premium. For OTC interest rate swap contracts, an upfront payment received by the fund is recorded as a liability on the fund’s books. An upfront payment made by the fund is recorded as an asset on the fund’s books. OTC and centrally cleared
74 Global Income Trust
interest rate swap contracts are marked to market daily based upon quotations from an independent pricing service or market makers. Any change is recorded as an unrealized gain or loss on OTC interest rate swaps. Daily fluctuations in the value of centrally cleared interest rate swaps are settled through a central clearing agent and are recorded in variation margin on the Statement of assets and liabilities and recorded as unrealized gain or loss. Payments, including upfront premiums, received or made are recorded as realized gains or losses at the reset date or the closing of the contract. Certain OTC and centrally cleared interest rate swap contracts may include extended effective dates. Payments related to these swap contracts are accrued based on the terms of the contract.
The fund could be exposed to credit or market risk due to unfavorable changes in the fluctuation of interest rates or if the counterparty defaults, in the case of OTC interest rate contracts, or the central clearing agency or a clearing member defaults, in the case of centrally cleared interest rate swap contracts, on its respective obligation to perform under the contract. The fund’s maximum risk of loss from counterparty risk or central clearing risk is the fair value of the contract. This risk may be mitigated for OTC interest rate swap contracts by having a master netting arrangement between the fund and the counterparty and for centrally cleared interest rate swap contracts through the daily exchange of variation margin. There is minimal counterparty risk with respect to centrally cleared interest rate swap contracts due to the clearinghouse guarantee fund and other resources that are available in the event of a clearing member default. Risk of loss may exceed amounts recognized on the Statement of assets and liabilities.
OTC and centrally cleared interest rate swap contracts outstanding, including their respective notional amounts at period end, if any, are listed after the fund’s portfolio.
Total return swap contracts The fund entered into OTC total return swap contracts, which are arrangements to exchange a market-linked return for a periodic payment, both based on a notional principal amount, to hedge sector exposure, for gaining exposure to specific sectors, for hedging inflation and for gaining exposure to inflation.
To the extent that the total return of the security, index or other financial measure underlying the transaction exceeds or falls short of the offsetting interest rate obligation, the fund will receive a payment from or make a payment to the counterparty. OTC total return swap contracts are marked to market daily based upon quotations from an independent pricing service or market makers and the change, if any, is recorded as an unrealized gain or loss. Payments received or made are recorded as realized gains or losses. Certain OTC total return swap contracts may include extended effective dates. Payments related to these swap contracts are accrued based on the terms of the contract. The fund could be exposed to credit or market risk due to unfavorable changes in the fluctuation of interest rates or in the price of the underlying security or index, the possibility that there is no liquid market for these agreements or that the counterparty may default on its obligation to perform. The fund’s maximum risk of loss from counterparty risk is the fair value of the contract. This risk may be mitigated by having a master netting arrangement between the fund and the counterparty. Risk of loss may exceed amounts recognized on the Statement of assets and liabilities.
OTC total return swap contracts outstanding, including their respective notional amounts at period end, if any, are listed after the fund’s portfolio.
Credit default contracts The fund entered into OTC and/or centrally cleared credit default contracts to hedge credit risk, for gaining liquid exposure to individual names, to hedge market risk and for gaining exposure to specific sectors.
In OTC and centrally cleared credit default contracts, the protection buyer typically makes a periodic stream of payments to a counterparty, the protection seller, in exchange for the right to receive a contingent payment upon the occurrence of a credit event on the reference obligation or all other equally ranked obligations of the reference entity. Credit events are contract specific but may include bankruptcy, failure to pay, restructuring and obligation acceleration. For OTC credit default contracts, an upfront payment received by the fund is recorded as a liability on the fund’s books. An upfront payment made by the fund is recorded as an asset on the fund’s books. Centrally cleared credit default contracts provide the same rights to the protection buyer and seller except the payments between parties, including upfront premiums, are settled through a central clearing agent through variation margin payments. Upfront and periodic payments received or paid by the fund for OTC and centrally cleared credit default contracts are recorded as realized gains or losses at the reset date or close of the contract. The OTC and centrally cleared credit default contracts are marked to market daily based upon quotations from an independent pricing service or market makers. Any change in value of OTC credit default contracts is recorded as an unrealized gain or loss. Daily fluctuations in the value of centrally cleared credit default contracts are recorded in variation margin on the Statement of assets and liabilities and recorded as unrealized gain or loss. Upon the occurrence of a credit event, the difference between the par value and fair value of the reference obligation, net of any proportional amount of the upfront payment, is recorded as a realized gain or loss.
Global Income Trust 75
In addition to bearing the risk that the credit event will occur, the fund could be exposed to market risk due to unfavorable changes in interest rates or in the price of the underlying security or index or the possibility that the fund may be unable to close out its position at the same time or at the same price as if it had purchased the underlying reference obligations. In certain circumstances, the fund may enter into offsetting OTC and centrally cleared credit default contracts which would mitigate its risk of loss. Risks of loss may exceed amounts recognized on the Statement of assets and liabilities. The fund’s maximum risk of loss from counterparty risk, either as the protection seller or as the protection buyer, is the fair value of the contract. This risk may be mitigated for OTC credit default contracts by having a master netting arrangement between the fund and the counterparty and for centrally cleared credit default contracts through the daily exchange of variation margin. Counterparty risk is further mitigated with respect to centrally cleared credit default swap contracts due to the clearinghouse guarantee fund and other resources that are available in the event of a clearing member default. Where the fund is a seller of protection, the maximum potential amount of future payments the fund may be required to make is equal to the notional amount.
OTC and centrally cleared credit default contracts outstanding, including their respective notional amounts at period end, if any, are listed after the fund’s portfolio.
TBA commitments The fund may enter into TBA (to be announced) commitments to purchase securities for a fixed unit price at a future date beyond customary settlement time. Although the unit price and par amount have been established, the actual securities have not been specified. However, it is anticipated that the amount of the commitments will not significantly differ from the principal amount. The fund holds, and maintains until settlement date, cash or high-grade debt obligations in an amount sufficient to meet the purchase price, or the fund may enter into offsetting contracts for the forward sale of other securities it owns. Income on the securities will not be earned until settlement date.
The fund may also enter into TBA sale commitments to hedge its portfolio positions, to sell mortgage-backed securities it owns under delayed delivery arrangements or to take a short position in mortgage-backed securities. Proceeds of TBA sale commitments are not received until the contractual settlement date. During the time a TBA sale commitment is outstanding, either equivalent deliverable securities or an offsetting TBA purchase commitment deliverable on or before the sale commitment date are held as “cover” for the transaction, or other liquid assets in an amount equal to the notional value of the TBA sale commitment are segregated. If the TBA sale commitment is closed through the acquisition of an offsetting TBA purchase commitment, the fund realizes a gain or loss. If the fund delivers securities under the commitment, the fund realizes a gain or a loss from the sale of the securities based upon the unit price established at the date the commitment was entered into.
TBA commitments, which are accounted for as purchase and sale transactions, may be considered securities themselves, and involve a risk of loss due to changes in the value of the security prior to the settlement date as well as the risk that the counterparty to the transaction will not perform its obligations. Counterparty risk is mitigated by having a master agreement between the fund and the counterparty.
Unsettled TBA commitments are valued at their fair value according to the procedures described under “Security valuation” above. The contract is marked to market daily and the change in fair value is recorded by the fund as an unrealized gain or loss. Based on market circumstances, Putnam Management will determine whether to take delivery of the underlying securities or to dispose of the TBA commitments prior to settlement.
TBA purchase commitments outstanding at period end, if any, are listed within the fund’s portfolio and TBA sale commitments outstanding at period end, if any, are listed after the fund’s portfolio.
Master agreements The fund is a party to ISDA (International Swaps and Derivatives Association, Inc.) Master Agreements that govern OTC derivative and foreign exchange contracts and Master Securities Forward Transaction Agreements that govern transactions involving mortgage-backed and other asset-backed securities that may result in delayed delivery (Master Agreements) with certain counterparties entered into from time to time. The Master Agreements may contain provisions regarding, among other things, the parties’ general obligations, representations, agreements, collateral requirements, events of default and early termination. With respect to certain counterparties, in accordance with the terms of the Master Agreements, collateral posted to the fund is held in a segregated account by the fund’s custodian and, with respect to those amounts which can be sold or repledged, are presented in the fund’s portfolio. Collateral posted to the fund which cannot be sold or repledged totaled $1,119,274 at the close of the reporting period.
76 Global Income Trust
Collateral pledged by the fund is segregated by the fund’s custodian and identified in the fund’s portfolio. Collateral can be in the form of cash or debt securities issued by the U.S. Government or related agencies or other securities as agreed to by the fund and the applicable counterparty. Collateral requirements are determined based on the fund’s net position with each counterparty.
With respect to ISDA Master Agreements, termination events applicable to the fund may occur upon a decline in the fund’s net assets below a specified threshold over a certain period of time. Termination events applicable to counterparties may occur upon a decline in the counterparty’s long-term or short-term credit ratings below a specified level. In each case, upon occurrence, the other party may elect to terminate early and cause settlement of all derivative and foreign exchange contracts outstanding, including the payment of any losses and costs resulting from such early termination, as reasonably determined by the terminating party. Any decision by one or more of the fund’s counterparties to elect early termination could impact the fund’s future derivative activity.
At the close of the reporting period, the fund had a net liability position of $1,870,029 on open derivative contracts subject to the Master Agreements. Collateral posted by the fund at period end for these agreements totaled $1,471,000 and may include amounts related to unsettled agreements.
Interfund lending The fund, along with other Putnam funds, may participate in an interfund lending program pursuant to an exemptive order issued by the SEC. This program allows the fund to borrow from or lend to other Putnam funds that permit such transactions. Interfund lending transactions are subject to each fund’s investment policies and borrowing and lending limits. Interest earned or paid on the interfund lending transaction will be based on the average of certain current market rates. During the reporting period, the fund did not utilize the program.
Lines of credit The fund participates, along with other Putnam funds, in a $392.5 million unsecured committed line of credit and a $235.5 million unsecured uncommitted line of credit, both provided by State Street. Borrowings may be made for temporary or emergency purposes, including the funding of shareholder redemption requests and trade settlements. Interest is charged to the fund based on the fund’s borrowing at a rate equal to the Federal Funds rate plus 1.25% for the committed line of credit and the Federal Funds rate plus 1.30% for the uncommitted line of credit. A closing fee equal to 0.04% of the committed line of credit and 0.04% of the uncommitted line of credit has been paid by the participating funds. In addition, a commitment fee of 0.11% per annum on any unutilized portion of the committed line of credit is allocated to the participating funds based on their relative net assets and paid quarterly. During the reporting period, the fund had no borrowings against these arrangements.
Federal taxes It is the policy of the fund to distribute all of its taxable income within the prescribed time period and otherwise comply with the provisions of the Internal Revenue Code of 1986, as amended (the Code), applicable to regulated investment companies. It is also the intention of the fund to distribute an amount sufficient to avoid imposition of any excise tax under Section 4982 of the Code.
The fund is subject to the provisions of Accounting Standards Codification 740 Income Taxes (ASC 740). ASC 740 sets forth a minimum threshold for financial statement recognition of the benefit of a tax position taken or expected to be taken in a tax return. The fund did not have a liability to record for any unrecognized tax benefits in the accompanying financial statements. No provision has been made for federal taxes on income, capital gains or unrealized appreciation on securities held nor for excise tax on income and capital gains. Each of the fund’s federal tax returns for the prior three fiscal years remains subject to examination by the Internal Revenue Service.
The fund may also be subject to taxes imposed by governments of countries in which it invests. Such taxes are generally based on either income or gains earned or repatriated. The fund accrues and applies such taxes to net investment income, net realized gains and net unrealized gains as income and/or capital gains are earned. In some cases, the fund may be entitled to reclaim all or a portion of such taxes, and such reclaim amounts, if any, are reflected as an asset on the fund’s books. In many cases, however, the fund may not receive such amounts for an extended period of time, depending on the country of investment.
Global Income Trust 77
At October 31, 2014, the fund had a capital loss carryover of $9,743,836 available to the extent allowed by the Code to offset future net capital gain, if any. The amounts of the carryovers and the expiration dates are:
Loss carryover | |||
Short-term | Long-term | Total | Expiration |
$6,736,225 | $528,189 | $7,264,414 | * |
2,479,422 | N/A | 2,479,422 | October 31, 2017 |
*Under the Regulated Investment Company Modernization Act of 2010, the fund will be permitted to carry forward capital losses incurred in taxable years beginning after December 22, 2010 for an unlimited period. However, any losses incurred will be required to be utilized prior to the losses incurred in pre-enactment tax years. As a result of this ordering rule, pre-enactment capital loss carryforwards may be more likely to expire unused. Additionally, post-enactment capital losses that are carried forward will retain their character as either short-term or long-term capital losses rather than being considered all short-term as under previous law.
The aggregate identified cost on a tax basis is $345,704,749, resulting in gross unrealized appreciation and depreciation of $12,940,467 and $14,620,612, respectively, or net unrealized depreciation of $1,680,145.
Distributions to shareholders Distributions to shareholders from net investment income are recorded by the fund on the ex-dividend date. Distributions from capital gains, if any, are recorded on the ex-dividend date and paid at least annually. The amount and character of income and gains to be distributed are determined in accordance with income tax regulations, which may differ from generally accepted accounting principles. Dividend sources are estimated at the time of declaration. Actual results may vary. Any non-taxable return of capital cannot be determined until final tax calculations are completed after the end of the fund’s fiscal year. Reclassifications are made to the fund’s capital accounts to reflect income and gains available for distribution (or available capital loss carryovers) under income tax regulations.
Note 2: Management fee, administrative services and other transactions
The fund pays Putnam Management a management fee (based on the fund’s average net assets and computed and paid monthly) at annual rates that may vary based on the average of the aggregate net assets of most open-end funds, as defined in the fund’s management contract, sponsored by Putnam Management. Such annual rates may vary as follows:
0.700% | of the first $5 billion, |
0.650% | of the next $5 billion, |
0.600% | of the next $10 billion, |
0.550% | of the next $10 billion, |
0.500% | of the next $50 billion, |
0.480% | of the next $50 billion, |
0.470% | of the next $100 billion and |
0.465% | of any excess thereafter. |
Putnam Management has contractually agreed, through June 30, 2015, to waive fees or reimburse the fund’s expenses to the extent necessary to limit the cumulative expenses of the fund, exclusive of brokerage, interest, taxes, investment-related expenses, extraordinary expenses, acquired fund fees and expenses and payments under the fund’s investor servicing contract, investment management contract and distribution plans, on a fiscal year-to-date basis to an annual rate of 0.20% of the fund’s average net assets over such fiscal year-to-date period. During the reporting period, the fund’s expenses were not reduced as a result of this limit.
Putnam Investments Limited (PIL), an affiliate of Putnam Management, is authorized by the Trustees to manage a separate portion of the assets of the fund as determined by Putnam Management from time to time. Putnam Management pays a quarterly sub-management fee to PIL for its services at an annual rate of 0.40% of the average net assets of the portion of the fund managed by PIL.
The fund reimburses Putnam Management an allocated amount for the compensation and related expenses of certain officers of the fund and their staff who provide administrative services to the fund. The aggregate amount of all such reimbursements is determined annually by the Trustees.
Custodial functions for the fund’s assets are provided by State Street. Custody fees are based on the fund’s asset level, the number of its security holdings and transaction volumes.
78 Global Income Trust
Putnam Investor Services, Inc., an affiliate of Putnam Management, provides investor servicing agent functions to the fund. Putnam Investor Services, Inc. received fees for investor servicing (except for class R5 and R6 shares) that included (1) a per account fee for each direct and underlying non-defined contribution account (“retail account”) of the fund and each of the other funds in its specified category, which was totaled and then allocated to each fund in the category based on its average daily net assets; (2) a specified rate of the fund’s assets attributable to defined contribution plan accounts; and (3) for the portion of the fund’s fiscal year beginning after January 1, 2015, a specified rate based on the average net assets in retail accounts. Putnam Investor Services has agreed that the aggregate investor servicing fees for each fund’s retail and defined contribution accounts will not exceed an annual rate of 0.320% of the fund’s average assets attributable to such accounts. Class R5 shares paid a monthly fee based on the average net assets of class R5 shares at an annual rate of 0.12%. Class R6 shares paid a monthly fee based on the average net assets of class R6 shares at an annual rate of 0.05%. During the reporting period, the expenses for each class of shares related to investor servicing fees were as follows:
Class A | $127,479 |
Class B | 5,425 |
Class C | 21,034 |
Class M | 7,563 |
Class R | 4,305 |
Class R5 | 14 |
Class R6 | 1,136 |
Class Y | 72,524 |
Total | $239,480 |
The fund has entered into expense offset arrangements with Putnam Investor Services, Inc. and State Street whereby Putnam Investor Services, Inc.’s and State Street’s fees are reduced by credits allowed on cash balances. For the reporting period, the fund’s expenses were reduced by $356 under the expense offset arrangements.
Each Independent Trustee of the fund receives an annual Trustee fee, of which $185, as a quarterly retainer, has been allocated to the fund, and an additional fee for each Trustees meeting attended. Trustees also are reimbursed for expenses they incur relating to their services as Trustees.
The fund has adopted a Trustee Fee Deferral Plan (the Deferral Plan) which allows the Trustees to defer the receipt of all or a portion of Trustees fees payable on or after July 1, 1995. The deferred fees remain invested in certain Putnam funds until distribution in accordance with the Deferral Plan.
The fund has adopted an unfunded noncontributory defined benefit pension plan (the Pension Plan) covering all Trustees of the fund who have served as a Trustee for at least five years and were first elected prior to 2004. Benefits under the Pension Plan are equal to 50% of the Trustee’s average annual attendance and retainer fees for the three years ended December 31, 2005. The retirement benefit is payable during a Trustee’s lifetime, beginning the year following retirement, for the number of years of service through December 31, 2006. Pension expense for the fund is included in Trustee compensation and expenses in the Statement of operations. Accrued pension liability is included in Payable for Trustee compensation and expenses in the Statement of assets and liabilities. The Trustees have terminated the Pension Plan with respect to any Trustee first elected after 2003.
The fund has adopted distribution plans (the Plans) with respect to its class A, class B, class C, class M and class R shares pursuant to Rule 12b–1 under the Investment Company Act of 1940. The purpose of the Plans is to compensate Putnam Retail Management Limited Partnership, an indirect wholly-owned subsidiary of Putnam Investments, LLC, for services provided and expenses incurred in distributing shares of the fund. The Plans provide for payments by the fund to Putnam Retail Management Limited Partnership at an annual rate of up to 0.35%, 1.00%, 1.00%, 1.00% and 1.00% of the average net assets attributable to class A, class B, class C, class M and class R shares, respectively. The Trustees have approved payment by the fund at an annual rate of 0.25%, 1.00%, 1.00%, 0.50% and 0.50% of the average net assets attributable to class A, class B, class C, class M and class R shares, respectively. During the reporting period, the class specific expenses related to distribution fees were as follows:
Class A | $219,468 |
Class B | 37,387 |
Class C | 144,923 |
Class M | 26,053 |
Class R | 14,835 |
Total | $442,666 |
Global Income Trust 79
For the reporting period, Putnam Retail Management Limited Partnership, acting as underwriter, received net commissions of $8,809 and $65 from the sale of class A and class M shares, respectively, and received $1,570 and $160 in contingent deferred sales charges from redemptions of class B and class C shares, respectively.
A deferred sales charge of up to 1.00% and 0.40% is assessed on certain redemptions of class A and class M shares, respectively. For the reporting period, Putnam Retail Management Limited Partnership, acting as underwriter, received $19 and no monies on class A and class M redemptions, respectively.
Note 3: Purchases and sales of securities
During the reporting period, the cost of purchases and the proceeds from sales, excluding short-term investments, were as follows:
Cost of purchases | Proceeds from sales | |
Investments in securities, including TBA commitments (Long-term) | $421,845,520 | $429,013,638 |
U.S. government securities (Long-term) | — | — |
Total | $421,845,520 | $429,013,638 |
Written option transactions during the reporting period are summarized as follows:
Written swap option contract amounts | Written swap option premiums | Written option contract amounts | Written option premiums | |
Written options outstanding at the beginning of the reporting period | $109,252,700 | $1,249,373 | $40,000,000 | $148,750 |
Options opened | 727,759,950 | 4,567,188 | 89,000,000 | 590,547 |
Options exercised | (44,511,300) | (294,387) | — | — |
Options expired | (95,124,150) | (472,562) | (44,000,000) | (227,812) |
Options closed | (382,637,500) | (2,578,318) | (62,000,000) | (419,766) |
Written options outstanding at the end of the reporting period | $314,739,700 | $2,471,294 | $23,000,000 | $91,719 |
Note 4: Capital shares
At the close of the reporting period, there were an unlimited number of shares of beneficial interest authorized. Transactions in capital shares were as follows:
Six months ended 4/30/15 | Year ended 10/31/14 | |||
Class A | Shares | Amount | Shares | Amount |
Shares sold | 1,891,066 | $23,676,002 | 4,413,251 | $56,303,781 |
Shares issued in connection with reinvestment of distributions | 198,960 | 2,482,057 | 425,621 | 5,434,427 |
2,090,026 | 26,158,059 | 4,838,872 | 61,738,208 | |
Shares repurchased | (1,651,321) | (20,634,406) | (7,088,766) | (90,985,210) |
Net increase (decrease) | 438,705 | $5,523,653 | (2,249,894) | $(29,247,002) |
80 Global Income Trust
Six months ended 4/30/15 | Year ended 10/31/14 | |||
Class B | Shares | Amount | Shares | Amount |
Shares sold | 14,245 | $177,428 | 58,465 | $746,113 |
Shares issued in connection with reinvestment of distributions | 6,512 | 80,871 | 13,829 | 175,668 |
20,757 | 258,299 | 72,294 | 921,781 | |
Shares repurchased | (75,843) | (942,501) | (163,376) | (2,076,157) |
Net decrease | (55,086) | $(684,202) | (91,082) | $(1,154,376) |
Six months ended 4/30/15 | Year ended 10/31/14 | |||
Class C | Shares | Amount | Shares | Amount |
Shares sold | 137,651 | $1,713,550 | 549,979 | $7,026,458 |
Shares issued in connection with reinvestment of distributions | 22,198 | 275,724 | 44,636 | 567,273 |
159,849 | 1,989,274 | 594,615 | 7,593,731 | |
Shares repurchased | (326,133) | (4,052,564) | (728,810) | (9,239,646) |
Net decrease | (166,284) | $(2,063,290) | (134,195) | $(1,645,915) |
Six months ended 4/30/15 | Year ended 10/31/14 | |||
Class M | Shares | Amount | Shares | Amount |
Shares sold | 12,152 | $150,385 | 15,894 | $201,452 |
Shares issued in connection with reinvestment of distributions | 2,563 | 31,675 | 5,630 | 71,168 |
14,715 | 182,060 | 21,524 | 272,620 | |
Shares repurchased | (62,049) | (768,587) | (147,960) | (1,862,433) |
Net decrease | (47,334) | $(586,527) | (126,436) | $(1,589,813) |
Six months ended 4/30/15 | Year ended 10/31/14 | |||
Class R | Shares | Amount | Shares | Amount |
Shares sold | 98,036 | $1,222,217 | 173,435 | $2,212,315 |
Shares issued in connection with reinvestment of distributions | 4,934 | 61,441 | 9,059 | 115,473 |
102,970 | 1,283,658 | 182,494 | 2,327,788 | |
Shares repurchased | (164,206) | (2,044,330) | (145,076) | (1,848,656) |
Net increase (decrease) | (61,236) | $(760,672) | 37,418 | $479,132 |
Six months ended 4/30/15 | Year ended 10/31/14 | |||
Class R5 | Shares | Amount | Shares | Amount |
Shares sold | 133 | $1,666 | 1,022 | $13,188 |
Shares issued in connection with reinvestment of distributions | 33 | 406 | 40 | 513 |
166 | 2,072 | 1,062 | 13,701 | |
Shares repurchased | (91) | (1,131) | — | — |
Net increase | 75 | $941 | 1,062 | $13,701 |
Global Income Trust 81
Six months ended 4/30/15 | Year ended 10/31/14 | |||
Class R6 | Shares | Amount | Shares | Amount |
Shares sold | 30,098 | $376,107 | 83,736 | $1,063,103 |
Shares issued in connection with reinvestment of distributions | 6,199 | 77,307 | 11,931 | 152,362 |
36,297 | 453,414 | 95,667 | 1,215,465 | |
Shares repurchased | (62,130) | (775,937) | (40,109) | (510,565) |
Net increase (decrease) | (25,833) | $(322,523) | 55,558 | $704,900 |
Six months ended 4/30/15 | Year ended 10/31/14 | |||
Class Y | Shares | Amount | Shares | Amount |
Shares sold | 1,720,502 | $21,508,300 | 7,420,058 | $95,484,059 |
Shares issued in connection with reinvestment of distributions | 98,960 | 1,234,080 | 119,124 | 1,521,931 |
1,819,462 | 22,742,380 | 7,539,182 | 97,005,990 | |
Shares repurchased | (4,515,474) | (56,422,341) | (1,364,769) | (17,442,922) |
Net increase (decrease) | (2,696,012) | $(33,679,961) | 6,174,413 | $79,563,068 |
At the close of the reporting period, Putnam Investments, LLC owned 882 class R5 shares of the fund (44.6% of class R5 shares outstanding), valued at $10,937.
Note 5: Affiliated transactions
Transactions during the reporting period with Putnam Money Market Liquidity Fund and Putnam Short Term Investment Fund, which are under common ownership or control, were as follows:
Name of affiliate | Fair value at the beginning of the reporting period | Purchase cost | Sale proceeds | Investment income | Fair value at the end of the reporting period |
Putnam Money Market Liquidity Fund* | $— | $3,318,955 | $3,318,955 | $371 | $— |
Putnam Short Term Investment Fund* | 33,891,737 | 74,556,127 | 90,626,173 | 10,334 | 17,821,691 |
Totals | $33,891,737 | $77,875,082 | $93,945,128 | $10,705 | $17,821,691 |
*Management fees charged to Putnam Money Market Liquidity Fund and Putnam Short Term Investment Fund have been waived by Putnam Management.
Note 6: Market, credit and other risks
In the normal course of business, the fund trades financial instruments and enters into financial transactions where risk of potential loss exists due to changes in the market (market risk) or failure of the contracting party to the transaction to perform (credit risk). The fund may be exposed to additional credit risk that an institution or other entity with which the fund has unsettled or open transactions will default. Investments in foreign securities involve certain risks, including those related to economic instability, unfavorable political developments, and currency fluctuations. The fund may invest in higher yielding, lower rated bonds that may have a higher rate of default. The
82 Global Income Trust
fund may invest a significant portion of its assets in securitized debt instruments, including mortgage-backed and asset-backed investments. The yields and values of these investments are sensitive to changes in interest rates, the rate of principal payments on the underlying assets and the market’s perception of the issuers. The market for these investments may be volatile and limited, which may make them difficult to buy or sell.
Note 7: Summary of derivative activity
The volume of activity for the reporting period for any derivative type that was held during the period is listed below and was as follows based on an average of the holdings at the end of each fiscal quarter:
Purchased TBA commitment option contracts (contract amount) | $24,300,000 |
Purchased swap option contracts (contract amount) | $299,400,000 |
Written TBA commitment option contracts (contract amount) (Note 3) | $43,000,000 |
Written swap option contracts (contract amount) (Note 3) | $214,900,000 |
Futures contracts (number of contracts) | 900 |
Forward currency contracts (contract amount) | $432,500,000 |
OTC interest rate swap contracts (notional) | $63,000,000 |
Centrally cleared interest rate swap contracts (notional) | $717,000,000 |
OTC total return swap contracts (notional) | $61,500,000 |
OTC credit default contracts (notional) | $7,900,000 |
The following is a summary of the fair value of derivative instruments as of the close of the reporting period:
Fair value of derivative instruments as of the close of the reporting period
Asset derivatives | Liability derivatives | |||
Derivatives not accounted for as hedging instruments under ASC 815 | Statement of | Fair value | Statement of | Fair value |
Credit contracts | Receivables | $65,384 | Payables | $25,662 |
Foreign exchange | Receivables | 1,622,085 | Payables | 1,869,435 |
Interest rate contracts | Investments, Receivables, Net assets — Unrealized appreciation | 7,228,285* | Payables, Net assets — Unrealized depreciation | 10,941,308* |
Total | $8,915,754 | $12,836,405 | ||
*Includes cumulative appreciation/depreciation of futures contracts and/or centrally cleared swaps as reported in the fund’s portfolio. Only current day’s variation margin is reported within the Statement of assets and liabilities.
Global Income Trust 83
The following is a summary of realized and change in unrealized gains or losses of derivative instruments on the Statement of operations for the reporting period (see Note 1):
Amount of realized gain or (loss) on derivatives recognized in net gain or (loss) on investments
Derivatives not accounted for as hedging instruments under ASC 815 | Options | Futures | Forward currency contracts | Swaps | Total |
Credit contracts | $— | $— | $— | $55,417 | $55,417 |
Foreign exchange | — | — | 7,583,684 | — | $7,583,684 |
Interest rate contracts | 156,994 | 1,029,414 | — | (4,024,590) | $(2,838,182) |
Total | $156,994 | $1,029,414 | $7,583,684 | $(3,969,173) | $4,800,919 |
Change in unrealized appreciation or (depreciation) on derivatives recognized in net gain or (loss) on investments
Derivatives not accounted for as hedging instruments under ASC 815 | Options | Futures | Forward currency contracts | Swaps | Total |
Credit contracts | $— | $— | $— | $28,313 | $28,313 |
Foreign exchange | — | — | (1,286,504) | — | $(1,286,504) |
Interest rate contracts | 531,459 | (998,397) | — | (44,204) | $(511,142) |
Total | $531,459 | $(998,397) | $(1,286,504) | $(15,891) | $(1,769,333) |
84 Global Income Trust
This page left blank intentionally.
Global Income Trust 85
Note 8: Offsetting of financial and derivative assets and liabilities
The following table summarizes any derivatives, repurchase agreements and reverse repurchase agreements, at the end of the reporting period, that are subject to an enforceable master netting agreement or similar agreement. For securities lending transactions or borrowing transactions associated with securities sold short, if any, see Note 1. For financial reporting purposes, the fund does not offset financial assets and financial liabilities that are subject to the master netting agreements in the Statement of assets and liabilities.
Bank of America N.A. | Barclays Bank PLC | Barclays Capital Inc. (clearing broker) | Citibank, N.A. | Credit Suisse International | Deutsche Bank AG | Goldman Sachs International | HSBC Bank USA, National Association | JPMorgan Chase Bank N.A. | Merrill Lynch, Pierce, Fenner & Smith, Inc. | Royal Bank of Scotland PLC (The) | State Street Bank and Trust Co. | UBS AG | WestPac Banking Corp. | Total | |
Assets: | |||||||||||||||
OTC Interest rate swap contracts*# | $— | $— | $— | $— | $— | $— | $706,781 | $— | $39,349 | $— | $— | $— | $— | $— | $746,130 |
Centrally cleared interest rate swap contracts§ | — | — | 1,691,528 | — | — | — | — | — | — | — | — | — | — | — | 1,691,528 |
OTC Total return swap contracts*# | 6,343 | 79,125 | — | 273 | 45,228 | — | 108,542 | — | 9,813 | — | — | — | — | — | 249,324 |
OTC Credit default contracts*# | 5,517 | 1,391 | — | — | 46,485 | — | 11,991 | — | — | — | — | — | — | — | 65,384 |
Futures contracts§ | — | — | — | — | — | — | — | — | — | 93,626 | — | — | — | — | 93,626 |
Forward currency contracts# | 90,330 | 89,794 | — | 101,230 | 69,780 | 69,061 | 89,636 | 108,424 | 121,555 | — | 141,678 | 543,131 | 109,172 | 88,294 | 1,622,085 |
Forward premium swap option contracts# | — | 3,989 | — | — | — | — | — | — | 90,611 | — | — | — | — | — | 94,600 |
Purchased swap options**# | 427,143 | 63,037 | — | 115,485 | 581,482 | — | 390,163 | — | — | — | — | — | — | — | 1,577,310 |
Purchased options**# | — | — | — | — | — | — | — | — | 68,220 | — | — | — | — | — | 68,220 |
Total Assets | $529,333 | $237,336 | $1,691,528 | $216,988 | $742,975 | $69,061 | $1,307,113 | $108,424 | $329,548 | $93,626 | $141,678 | $543,131 | $109,172 | $88,294 | $6,208,207 |
Liabilities: | |||||||||||||||
OTC Interest rate swap contracts*# | $— | $— | $— | $— | $— | $582,422 | $— | $— | $188,601 | $— | $— | $— | $— | $— | $771,023 |
Centrally cleared interest rate swap contracts§ | — | — | 1,464,523 | — | — | — | — | — | — | — | — | — | — | — | 1,464,523 |
OTC Total return swap contracts*# | — | 20,994 | — | — | 5,550 | — | 37,678 | — | 9,051 | — | — | — | — | — | 73,273 |
OTC Credit default contracts*# | — | — | — | — | 18,998 | — | 6,664 | — | — | — | — | — | — | — | 25,662 |
Futures contracts§ | — | — | — | — | — | — | — | — | — | 295,501 | — | — | — | — | 295,501 |
Forward currency contracts# | 77,731 | 328,615 | — | 126,747 | 227,307 | 303,083 | 73,979 | 175,609 | 120,912 | — | 78,132 | 148,427 | 204,143 | 4,750 | 1,869,435 |
Forward premium swap option contracts# | — | 1,908 | — | — | — | — | 1,975 | — | 119,679 | — | — | — | — | — | 123,562 |
Written swap options# | 331,873 | 40,079 | — | 71,816 | 373,107 | — | 254,712 | — | 555,784 | — | — | — | — | — | 1,627,371 |
Written options# | — | — | — | — | — | — | — | — | 72,690 | — | — | — | — | — | 72,690 |
Total Liabilities | $409,604 | $391,596 | $1,464,523 | $198,563 | $624,962 | $885,505 | $375,008 | $175,609 | $1,066,717 | $295,501 | $78,132 | $148,427 | $204,143 | $4,750 | $6,323,040 |
Total Financial and Derivative Net Assets | $119,729 | $(154,260) | $227,005 | $18,425 | $118,013 | $(816,444) | $932,105 | $(67,185) | $(737,169) | $(201,875) | $63,546 | $394,704 | $(94,971) | $83,544 | $(114,833) |
Total collateral received (pledged)†## | $— | $(121,000) | $— | $18,425 | $118,013 | $(610,000) | $932,105 | $110,688 | $(737,169) | $— | $63,546 | $— | $— | $— | |
Net amount | $119,729 | $(33,260) | $227,005 | $— | $— | $(206,444) | $— | $(177,873) | $— | $(201,875) | $— | $394,704 | $(94,971) | $83,544 |
* | Excludes premiums, if any. Included in unrealized appreciation and depreciation on OTC swap contracts on the Statement of assets and liabilities. |
** | Included with Investments in securities on the Statement of assets and liabilities. |
† | Additional collateral may be required from certain brokers based on individual agreements. |
# | Covered by master netting agreement (Note 1). |
## | Any over-collateralization of total financial and derivative net assets is not shown. Collateral may include amounts related to unsettled agreements. |
§ | Includes current day’s variation margin only as reported on the Statement of assets and liabilities, which is not collateralized. Cumulative appreciation/(depreciation) for futures contracts and centrally cleared swap contracts is represented in the tables listed after the fund’s portfolio. |
86 | Global Income Trust | Global Income Trust | 87 |
Services for shareholders
Investor services
Systematic investment plan Tell us how much you wish to invest regularly — weekly, semimonthly, or monthly — and the amount you choose will be transferred automatically from your checking or savings account. There’s no additional fee for this service, and you can suspend it at any time. This plan may be a great way to save for college expenses or to plan for your retirement.
Please note that regular investing does not guarantee a profit or protect against loss in a declining market. Before arranging a systematic investment plan, consider your financial ability to continue making purchases in periods when prices are low.
Systematic exchange You can make regular transfers from one Putnam fund to another Putnam fund. There are no additional fees for this service, and you can cancel or change your options at any time.
Dividends PLUS You can choose to have the dividend distributions from one of your Putnam funds automatically reinvested in another Putnam fund at no additional charge.
Free exchange privilege You can exchange money between Putnam funds free of charge, as long as they are the same class of shares. A signature guarantee is required if you are exchanging more than $500,000. The fund reserves the right to revise or terminate the exchange privilege.
Reinstatement privilege If you’ve sold Putnam shares or received a check for a dividend or capital gain, you may reinvest the proceeds with Putnam within 90 days of the transaction and they will be reinvested at the fund’s current net asset value — with no sales charge. However, reinstatement of class B shares may have special tax consequences. Ask your financial or tax representative for details.
Check-writing service You have ready access to many Putnam accounts. It’s as simple as writing a check, and there are no special fees or service charges. For more information about the check-writing service, call Putnam or visit our website.
Dollar cost averaging When you’re investing for long-term goals, it’s time, not timing, that counts. Investing on a systematic basis is a better strategy than trying to figure out when the markets will go up or down. This means investing the same amount of money regularly over a long period. This method of investing is called dollar cost averaging. When a fund’s share price declines, your investment dollars buy more shares at lower prices. When it increases, they buy fewer shares. Over time, you will pay a lower average price per share.
For more information
Visit the Individual Investors section at putnam.com A secure section of our website contains complete information on your account, including balances and transactions, updated daily. You may also conduct transactions, such as exchanges, additional investments, and address changes. Log on today to get your password.
Call us toll free at 1-800-225-1581 Ask a helpful Putnam representative or your financial advisor for details about any of these or other services, or see your prospectus.
88 Global Income Trust
Fund information
Founded over 75 years ago, Putnam Investments was built around the concept that a balance between risk and reward is the hallmark of a well-rounded financial program. We manage over 100 funds across income, value, blend, growth, asset allocation, absolute return, and global sector categories.
Investment Manager
Putnam Investment
Management, LLC
One Post Office Square
Boston, MA 02109
Investment Sub-Manager
Putnam Investments Limited
57–59 St James’s Street
London, England SW1A 1LD
Marketing Services
Putnam Retail Management
One Post Office Square
Boston, MA 02109
Custodian
State Street Bank
and Trust Company
Legal Counsel
Ropes & Gray LLP
Trustees
Jameson A. Baxter, Chair
Liaquat Ahamed
Ravi Akhoury
Barbara M. Baumann
Charles B. Curtis
Robert J. Darretta
Katinka Domotorffy
John A. Hill
Paul L. Joskow
Kenneth R. Leibler
Robert E. Patterson
George Putnam, III
Robert L. Reynolds
W. Thomas Stephens
Officers
Robert L. Reynolds
President
Jonathan S. Horwitz
Executive Vice President,
Principal Executive Officer, and
Compliance Liaison
Steven D. Krichmar
Vice President and
Principal Financial Officer
Robert T. Burns
Vice President and
Chief Legal Officer
Robert R. Leveille
Vice President and
Chief Compliance Officer
Michael J. Higgins
Vice President, Treasurer,
and Clerk
Janet C. Smith
Vice President,
Principal Accounting Officer,
and Assistant Treasurer
Susan G. Malloy
Vice President and
Assistant Treasurer
James P. Pappas
Vice President
Mark C. Trenchard
Vice President and
BSA Compliance Officer
Nancy E. Florek
Vice President, Director of
Proxy Voting and Corporate
Governance, Assistant Clerk,
and Associate Treasurer
This report is for the information of shareholders of Putnam Global Income Trust. It may also be used as sales literature when preceded or accompanied by the current prospectus, the most recent copy of Putnam’s Quarterly Performance Summary, and Putnam’s Quarterly Ranking Summary. For more recent performance, please visit putnam.com. Investors should carefully consider the investment objectives, risks, charges, and expenses of a fund, which are described in its prospectus. For this and other information or to request a prospectus or summary prospectus, call 1-800-225-1581 toll free. Please read the prospectus carefully before investing. The fund’s Statement of Additional Information contains additional information about the fund’s Trustees and is available without charge upon request by calling 1-800-225-1581.
| Item 2. Code of Ethics: |
| Not applicable |
| Item 3. Audit Committee Financial Expert: |
| Not applicable |
| Item 4. Principal Accountant Fees and Services: |
| Not applicable |
| Item 5. Audit Committee of Listed Registrants |
| Not applicable |
| Item 6. Schedule of Investments: |
| The registrant’s schedule of investments in unaffiliated issuers is included in the report to shareholders in Item 1 above. |
| Item 7. Disclosure of Proxy Voting Policies and Procedures For Closed-End Management Investment Companies: |
| Not applicable |
| Item 8. Portfolio Managers of Closed-End Investment Companies |
| Not Applicable |
| Item 9. Purchases of Equity Securities by Closed-End Management Investment Companies and Affiliated Purchasers: |
| Not applicable |
| Item 10. Submission of Matters to a Vote of Security Holders: |
| Not applicable |
| Item 11. Controls and Procedures: |
| (a) The registrant’s principal executive officer and principal financial officer have concluded, based on their evaluation of the effectiveness of the design and operation of the registrant’s disclosure controls and procedures as of a date within 90 days of the filing date of this report, that the design and operation of such procedures are generally effective to provide reasonable assurance that information required to be disclosed by the registrant in this report is recorded, processed, summarized and reported within the time periods specified in the Commission’s rules and forms. |
| (b) Changes in internal control over financial reporting: Not applicable |
| Item 12. Exhibits: |
| (a)(1) Not applicable |
| (a)(2) Separate certifications for the principal executive officer and principal financial officer of the registrant as required by Rule 30a-2(a) under the Investment Company Act of 1940, as amended, are filed herewith. |
| (b) The certifications required by Rule 30a-2(b) under the Investment Company Act of 1940, as amended, are filed herewith. |
| Putnam Global Income Trust |
| By (Signature and Title): |
| /s/ Janet C. Smith Janet C. Smith Principal Accounting Officer |
| Date: June 26, 2015 |
| Pursuant to the requirements of the Securities Exchange Act of 1934 and the Investment Company Act of 1940, this report has been signed below by the following persons on behalf of the registrant and in the capacities and on the dates indicated. |
| By (Signature and Title): |
| /s/ Jonathan S. Horwitz Jonathan S. Horwitz Principal Executive Officer |
| Date: June 26, 2015 |
| By (Signature and Title): |
| /s/ Steven D. Krichmar Steven D. Krichmar Principal Financial Officer |
| Date: June 26, 2015 |