| | |
| UNITED STATES
SECURITIES AND EXCHANGE COMMISSION |
| | |
| CERTIFIED SHAREHOLDER REPORT OF REGISTERED
MANAGEMENT INVESTMENT COMPANIES
|
| | |
| Investment Company Act file number: | (811-04524) |
| | |
| Exact name of registrant as specified in charter: | Putnam Global Income Trust |
| | |
| Address of principal executive offices: | One Post Office Square, Boston, Massachusetts 02109 |
| | |
| Name and address of agent for service: | Robert T. Burns, Vice President
One Post Office Square
Boston, Massachusetts 02109 |
| | |
| Copy to: | Bryan Chegwidden, Esq.
Ropes & Gray LLP
1211 Avenue of the Americas
New York, New York 10036 |
| | |
| Registrant's telephone number, including area code: | (617) 292-1000 |
| | |
| Date of fiscal year end: | October 31, 2017 |
| | |
| Date of reporting period: | November 1, 2016 — April 30, 2017 |
| | |
|
Item 1. Report to Stockholders: | |
| | |
| The following is a copy of the report transmitted to stockholders pursuant to Rule 30e-1 under the Investment Company Act of 1940: | |

Putnam
Global Income
Trust
Semiannual report
4 | 30 | 17
Consider these risks before investing: International investing involves currency, economic, and political risks. Emerging-market securities carry illiquidity and volatility risks. Lower-rated bonds may offer higher yields in return for more risk. Funds that invest in government securities are not guaranteed. Mortgage-backed investments carry the risk that they may increase in value when interest rates decline and decline in value when interest rates rise. The fund invests in fewer issuers or concentrates its investments by region or sector, and involves more risk than a more broadly invested fund. The fund’s policy of concentrating on a limited group of industries and the fund’s non-diversified status, which means the fund may invest in fewer issuers, can increase the fund’s vulnerability to common economic forces and may result in greater losses and volatility. Bond investments are subject to interest-rate risk (the risk of bond prices falling if interest rates rise) and credit risk (the risk of an issuer defaulting on interest or principal payments). Interest-rate risk is greater for longer-term bonds, and credit risk is greater for below-investment-grade bonds. Risks associated with derivatives include increased investment exposure (which may be considered leverage) and, in the case of over-the-counter instruments, the potential inability to terminate or sell derivatives positions and the potential failure of the other party to the instrument to meet its obligations. Unlike bonds, funds that invest in bonds have fees and expenses. Bond prices may fall or fail to rise over extended periods of time for a variety of reasons, including general financial market conditions, changing market perceptions (including perceptions about the risk of default and expectations about monetary policy or interest rates), changes in government intervention in the financial markets, and factors related to a specific issuer or industry. These and other factors may also lead to periods of high volatility and reduced liquidity in the bond markets. You can lose money by investing in the fund.
Message from the Trustees
June 8, 2017
Dear Fellow Shareholder:
An impressive level of investor optimism has helped to fuel financial markets through most of 2017’s first half. Global stock and bond markets have generally fared well, with many stock market indexes achieving new record highs with relatively low volatility. At the same time, however, investors worldwide are monitoring a number of macroeconomic and political risks that could disrupt the positive momentum.
While calm markets are generally welcome, we believe investors should continue to remember time-tested strategies: maintain a well-diversified portfolio, keep a long-term view, and do not overreact to short-term market fluctuations. We also believe it is a good idea to speak regularly with your financial advisor to help ensure that your portfolio is aligned with your goals. In the following pages, you will find an overview of your fund’s performance for the reporting period as well as an outlook for the coming months.
We would also like to take this opportunity to announce the arrival of Catharine Bond Hill and Manoj P. Singh to your fund’s Board of Trustees. Dr. Hill and Mr. Singh bring extensive professional and directorship experience to their role as Trustees, and we are pleased to welcome them.
Thank you for investing with Putnam.


Investing in today’s bond markets requires a broad-based approach, the flexibility to exploit a range of sectors and opportunities, and a keen understanding of the complex global interrelationships that drive the markets. With support from more than 90 fixed-income professionals, the fund’s managers actively position the portfolio in securities from a broad range of sectors.
The fund’s management team has an average of more than 25 years of experience.
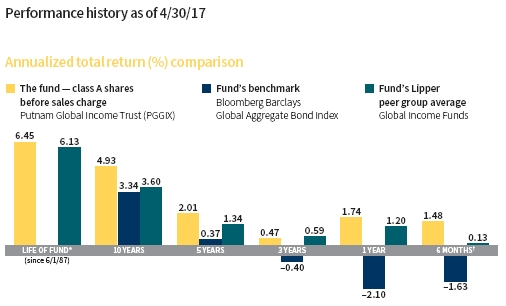
Putnam Global Income Trust invests in a number of sectors, from international sovereign debt and investment-grade corporate bonds to a wide range of mortgage-backed securities.

Allocations are shown as a percentage of the fund’s and/or benchmark’s net assets as of 4/30/17. Cash and net other assets, if any, represent the market value weights of cash, derivatives, short-term securities, and other unclassified assets in the portfolio. Summary information may differ from the portfolio schedule included in the financial statements due to the inclusion of derivative securities, any interest accruals, the use of different classifications of securities for presentation purposes, and rounding. Allocations may not total 100% because the table includes the notional value of certain derivatives (the economic value for purposes of calculating periodic payment obligations), in addition to the market value of securities. Holdings and allocations may vary over time. For more information on current fund holdings, see pages 19–57.
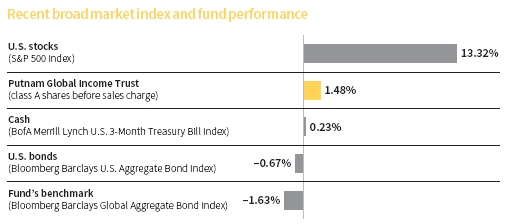
Current performance may be lower or higher than the quoted past performance, which cannot guarantee future results. Share price, principal value, and return will fluctuate, and you may have a gain or a loss when you sell your shares. Performance of class A shares assumes reinvestment of distributions and does not account for taxes. Fund returns in the bar chart do not reflect a sales charge of 4.00%; had they, returns would have been lower. See below and pages 11–13 for additional performance information. For a portion of the periods, the fund had expense limitations, without which returns would have been lower. To obtain the most recent month-end performance, visit putnam.com.
* The fund’s benchmark, the Bloomberg Barclays Global Aggregate Bond Index, was introduced on 12/31/89, which post-dates the inception of the fund’s class A shares.
† Returns for the six-month period are not annualized, but cumulative.
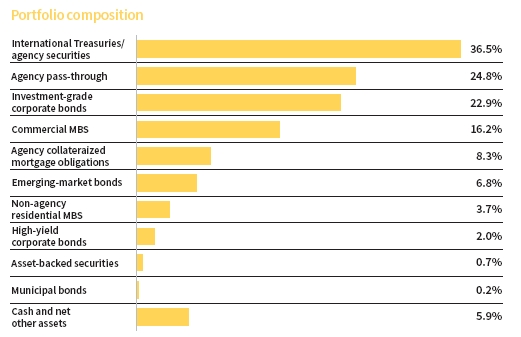
This comparison shows your fund’s performance in the context of broad market indexes for the six months ended 4/30/17. See above and pages 11–13 for additional fund performance information. Index descriptions can be found on page 16.


Bill is Chief Investment Officer, Fixed Income, at Putnam. He has an M.B.A. from the Haas School of Business, University of California, Berkeley, and a B.A. from the University of California, San Diego. Bill joined Putnam in 1994 and has been in the investment industry since 1988.
In addition to Bill, your fund’s portfolio managers are Michael J. Atkin; Robert L. Davis, CFA; Michael V. Salm; and Paul D. Scanlon, CFA.
Bill, what was the fund’s investment environment like during the six-month reporting period ended April 30, 2017?
In the months immediately after the U.S. presidential election, investors were optimistic about the potential for tax cuts and increases in infrastructure and defense spending under the incoming Trump administration. Treasury yields rose sharply during this time, with the yield on the 10-year note reaching 2.60% in mid-December, reflecting investor expectations for higher inflation and potentially expansionary fiscal policy under the new administration.
In March, however, a failed effort to repeal the Affordable Care Act [ACA] triggered uncertainty about the administration’s ability to get its tax-reform and fiscal-stimulus plans passed by Congress. A second attempt at an ACA repeal-and-replace bill was approved by the U.S. House of Representatives in April, but faces an uncertain outcome when it is taken up by the U.S. Senate.
After posting solid growth in the second half of 2016, the U.S. economy registered disappointing results in 2017’s first quarter, repeating a pattern that we’ve seen over the past two years. U.S. gross domestic product [GDP] grew
Allocations are shown as a percentage of the fund’s net assets as of 4/30/17. Cash and net other assets, if any, represent the market value weights of cash, derivatives, short-term securities, and other unclassified assets in the portfolio. Summary information may differ from the portfolio schedule included in the financial statements due to the inclusion of derivative securities, any interest accruals, the use of different classifications of securities for presentation purposes, and rounding. Allocations may not total 100% because the table includes the notional value of certain derivatives (the economic value for purposes of calculating periodic payment obligations), in addition to the market value of securities. Holdings and allocations may vary over time.

at a 0.7% annual rate in January through March, the slowest pace of expansion in three years, according to the Commerce Department. Consumers sharply reduced spending on big-ticket items, such as automobiles. At the same time, there were signs of underlying strength in the data. For example, final sales to domestic purchasers — a key measure of the health of domestic demand — rose at a 2.2% annual rate. In our view, transitory factors likely suppressed consumer spending in the first quarter, and we believe GDP may pick up in the second quarter.
The Federal Reserve increased its target for short-term interest rates by a quarter percentage point twice during the period, raising the federal funds rate to a range of 0.75% to 1%. The Fed issued a fairly upbeat statement at its early May policy meeting, saying that it expected economic growth to rebound after a soft first quarter. The central bank signaled that it is likely to continue gradually raising short-term rates this year if its growth forecast appears to be on track.
Overseas, the 19-country eurozone economy grew at a steady pace in the first three months of 2017, and its jobless rate declined to 9.5%, the lowest level since 2009. In early May, the European Union raised its 2017 economic growth forecast to a 1.7% annual rate, saying the bloc’s revival is strengthening despite geopolitical risks that could undermine its fifth year of recovery.
Within this environment, credit spreads continued to grind tighter, reflecting persistent investor demand for credit risk, as market volatility remained low and corporate earnings growth was positive overall.
The fund outpaced its benchmark and the average return of its Lipper peer group. Which holdings and strategies fueled its relative performance?
Our interest-rate and yield-curve positioning in the United States and overseas was the biggest contributor to performance. We continued our efforts to de-emphasize interest-rate risk by keeping the portfolio’s duration — a key measure of interest-rate sensitivity — meaningfully shorter than that of the benchmark for much of the period. This strategy was particularly helpful in November when Treasury yields rose sharply across the yield curve in response to the U.S. presidential election outcome. Internationally, rates also rose in Europe, particularly in the United Kingdom, so our lower-than-benchmark duration positioning aided performance there as well.
Our mortgage-credit strategies also notably contributed versus the benchmark, led by holdings of mezzanine commercial mortgage-backed securities [CMBS]. Early in the period, our positions in CMBS that were issued before the 2008 financial crisis performed particularly well. However, gains from the sector were pared in February when headlines concerning retail store closures prompted some investors to express a bearish view on certain parts of the CMBS market due to the sector’s exposure to retail properties. Although we agree that retailers face challenges amid evolving shopper preferences and a shift from traditional brick-and-mortar to online commerce, we believe the CMBS held by the fund have enough credit protection to withstand the changes that are occurring in retail.
Elsewhere within mortgage credit, non-agency residential mortgage-backed securities [RMBS] also aided the fund’s relative performance. Our investments in agency credit risk-transfer securities [CRTS] performed well, as a combination of relatively high yields and high-quality collateral continued to attract investors to this
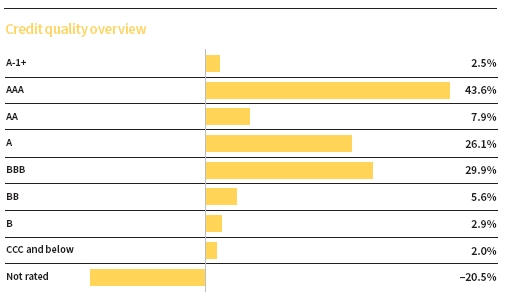
Credit qualities are shown as a percentage of the fund’s net assets as of 4/30/17. A bond rated BBB or higher (A-3 or higher, for short-term debt) is considered investment grade. This chart reflects the highest security rating provided by one or more of Standard & Poor’s, Moody’s, and Fitch. To-be-announced (TBA) mortgage commitments, if any, are included based on their issuer ratings. Ratings may vary over time.
Cash, derivative instruments, and net other assets are shown in the not-rated category. Payables and receivables for TBA mortgage commitments are included in the not-rated category and may result in negative weights. The fund itself has not been rated by an independent rating agency.
growing market. Furthermore, an increasing number of institutional investment managers are embracing CRTS as an easier way to access the mortgage market.
How did corporate credit influence performance?
An overweight allocation to investment-grade corporate credit, and a modest out-of-benchmark position in high-yield bonds, also aided relative results. Positive sentiment toward both sectors was fueled by investor expectations that economic growth could potentially accelerate if the Trump administration is successful at implementing tax cuts and more-robust fiscal policy. Relatively stable global oil prices also provided a tailwind.
Were there other parts of the portfolio that contributed versus the benchmark?
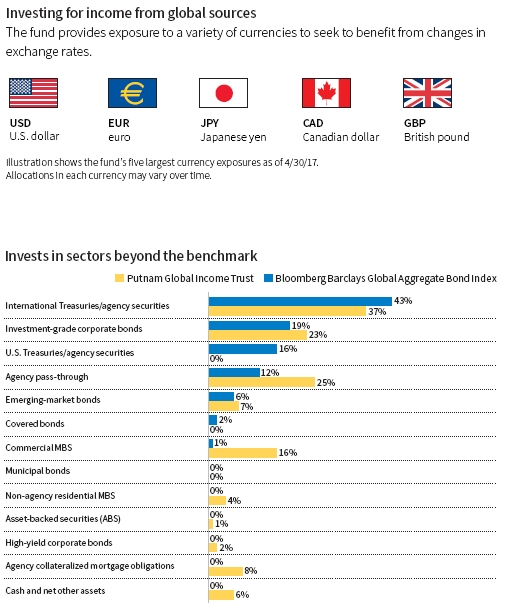
Our active currency strategy and our holdings of emerging-market [EM] bonds contributed about equally. Within active currency, underweight exposure to the Japanese yen and the euro bolstered results, as both of these currencies weakened significantly versus the U.S. dollar during the final two months of 2016.
In EM debt, positions in Argentina, Brazil, and Mexico added the most, partly helped by stable oil prices and persistent investor demand for high-yielding securities. Our EM exposure also benefited from reduced fears that the Trump administration might take a more protectionist approach to foreign trade.
What detracted on a relative basis?
There were no notable relative detractors, as our prepayment strategies had a net neutral impact on results. On the positive side of our prepayment strategies, our holdings of interest-only collateralized mortgage obligations [IO CMOs] performed well amid consistent investor demand for the higher return potential offered by securities with greater risk. Additionally, after spiking early in the period, the yield on the 10-year Treasury stayed in a fairly narrow range for the remainder of the period, keeping mortgage refinancing activity subdued and prepayment speeds slow. Conversely, adverse results from a strategy that sought to
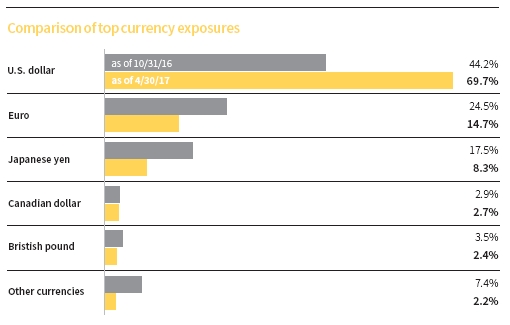
This chart shows how the fund’s top currency holdings have changed over the past six months. Allocations are shown as a percentage of the fund’s net assets. Holdings and allocations may vary over time.
exploit the yield differential between current mortgage rates and longer-term Treasury yields detracted from relative performance and negated the benefit of our IO CMO positions.

How did you use derivatives during the period?
We used bond futures and interest-rate swaps to take tactical positions at various points along the yield curve, and to hedge the risk associated with the fund’s curve positioning. We also employed interest-rate swaps to gain exposure to interest rates in various countries. Additionally, we utilized options to isolate the prepayment risks associated with our CMO holdings and to help manage the downside risk of these positions. We used total return swaps to help manage the fund’s sector and inflation exposure. Lastly, we employed currency forward contracts to hedge the foreign exchange risk associated with non-U.S. bonds and to efficiently gain exposure to foreign currencies.
What is your outlook for the coming months?
As we look at the world today, we see economic activity picking up and inflation levels beginning to rise. Higher commodity prices appear to be working their way into final prices, which is leading to fairly persistent pricing pressures in the United States and elsewhere. In our view, global economies appear to be normalizing, and we think this is particularly true in the United States. Given this normalization, we think the level of interest rates remains too low.
The declining U.S. unemployment rate suggests wage pressures could start to build as businesses compete for scarcer workers, though so far wage increases have been
ABOUT DERIVATIVES
Derivatives are an increasingly common type of investment instrument, the performance of which is derived from an underlying security, index, currency, or other area of the capital markets. Derivatives employed by the fund’s managers generally serve one of two main purposes: to implement a strategy that may be difficult or more expensive to invest in through traditional securities, or to hedge unwanted risk associated with a particular position.
For example, the fund’s managers might use currency forward contracts to capitalize on an anticipated change in exchange rates between two currencies. This approach would require a significantly smaller outlay of capital than purchasing traditional bonds denominated in the underlying currencies. In another example, the managers may identify a bond that they believe is undervalued relative to its risk of default, but may seek to reduce the interest-rate risk of that bond by using interest-rate swaps, a derivative through which two parties “swap” payments based on the movement of certain rates.
Like any other investment, derivatives may not appreciate in value and may lose money. Derivatives may amplify traditional investment risks through the creation of leverage and may be less liquid than traditional securities. And because derivatives typically represent contractual agreements between two financial institutions, derivatives entail “counterparty risk,” which is the risk that the other party is unable or unwilling to pay. Putnam monitors the counterparty risks we assume. For example, Putnam often enters into collateral agreements that require the counterparties to post collateral on a regular basis to cover their obligations to the fund. Counterparty risk for exchange-traded futures and centrally cleared swaps is mitigated by the daily exchange of margin and other safeguards against default through their respective clearinghouses.
modest. It also means, in our view, that the Fed is likely to raise interest rates for the second time this year at its next policy meeting in June, and then likely again in September.
Later this year, we also think the central bank is likely to communicate a plan for beginning the process of winding down its $4.5 trillion portfolio of U.S. Treasuries and mortgage-backed securities. The Fed has stated that its objective is to gently pull back the stimulus it pumped into the economy during and after the financial crisis now that it appears to be on more stable footing.
In Europe, the European Central Bank [ECB] left its monetary policy unchanged at its April meeting. In light of recent upside surprises in growth and inflation data, we think the ECB may soon be in a position to begin gradually reducing its highly accommodative policy. In the United Kingdom, Prime Minister Theresa May surprised the markets by calling for a June election, in an effort to garner greater support as the country transitions out of the European Union.
What implications does your outlook have for fund positioning?
We plan to continue seeking opportunities outside the benchmark, particularly in mortgage credit and prepayment-sensitive areas of the market that we believe offer relative value.
As of period-end, the fund’s duration was modestly shorter than that of the benchmark, reflecting diverse positioning across various countries. The fund had lower-than-benchmark duration in some of the largest developed-market economies, including the United States, Japan, the United Kingdom, Germany, and France. At the same time, we had above-benchmark duration in several other markets, including Canada, New Zealand, and Mexico.
Thanks for your time and for bringing us up to date, Bill.
The views expressed in this report are exclusively those of Putnam Management and are subject to change. They are not meant as investment advice.
Please note that the holdings discussed in this report may not have been held by the fund for the entire period. Portfolio composition is subject to review in accordance with the fund’s investment strategy and may vary in the future. Current and future portfolio holdings are subject to risk.
Your fund’s performance
This section shows your fund’s performance, price, and distribution information for periods ended April 30, 2017, the end of the first half of its current fiscal year. In accordance with regulatory requirements for mutual funds, we also include performance information as of the most recent calendar quarter-end and expense information taken from the fund’s current prospectus. Performance should always be considered in light of a fund’s investment strategy. Data represent past performance. Past performance does not guarantee future results. More recent returns may be less or more than those shown. Investment return and principal value will fluctuate, and you may have a gain or a loss when you sell your shares. Performance information does not reflect any deduction for taxes a shareholder may owe on fund distributions or on the redemption of fund shares. For the most recent month-end performance, please visit the Individual Investors section at putnam.com or call Putnam at 1-800-225-1581. Class R, R5, R6, and Y shares are not available to all investors. See the Terms and Definitions section in this report for definitions of the share classes offered by your fund.
Fund performance Total return for periods ended 4/30/17
| | | | | | | | | |
| | Annual | | | | | | | | |
| | average | | Annual | | Annual | | Annual | | |
| | (life of fund) | 10 years | average | 5 years | average | 3 years | average | 1 year | 6 months |
|
| Class A (6/1/87) | | | | | | | | | |
| Before sales charge | 6.45% | 61.79% | 4.93% | 10.49% | 2.01% | 1.42% | 0.47% | 1.74% | 1.48% |
|
| After sales charge | 6.30 | 55.32 | 4.50 | 6.07 | 1.18 | –2.64 | –0.89 | –2.33 | –2.58 |
|
| Class B (2/1/94) | | | | | | | | | |
| Before CDSC | 6.21 | 52.33 | 4.30 | 6.45 | 1.26 | –0.84 | –0.28 | 0.98 | 1.10 |
|
| After CDSC | 6.21 | 52.33 | 4.30 | 4.56 | 0.90 | –3.61 | –1.22 | –3.94 | –3.89 |
|
| Class C (7/26/99) | | | | | | | | | |
| Before CDSC | 5.65 | 50.10 | 4.15 | 6.46 | 1.26 | –0.82 | –0.27 | 0.98 | 1.10 |
|
| After CDSC | 5.65 | 50.10 | 4.15 | 6.46 | 1.26 | –0.82 | –0.27 | 0.00 | 0.10 |
|
| Class M (3/17/95) | | | | | | | | | |
| Before sales charge | 6.15 | 57.70 | 4.66 | 9.14 | 1.76 | 0.68 | 0.23 | 1.43 | 1.38 |
|
| After sales charge | 6.04 | 52.58 | 4.32 | 5.59 | 1.09 | –2.59 | –0.87 | –1.87 | –1.92 |
|
| Class R (12/1/03) | | | | | | | | | |
| Net asset value | 6.18 | 57.78 | 4.67 | 9.16 | 1.77 | 0.68 | 0.23 | 1.49 | 1.34 |
|
| Class R5 (7/2/12) | | | | | | | | | |
| Net asset value | 6.56 | 66.19 | 5.21 | 12.12 | 2.31 | 2.44 | 0.81 | 2.16 | 1.67 |
|
| Class R6 (7/2/12) | | | | | | | | | |
| Net asset value | 6.57 | 66.72 | 5.24 | 12.48 | 2.38 | 2.63 | 0.87 | 2.14 | 1.77 |
|
| Class Y (10/4/05) | | | | | | | | | |
| Net asset value | 6.55 | 65.89 | 5.19 | 11.92 | 2.28 | 2.28 | 0.75 | 2.08 | 1.69 |
Current performance may be lower or higher than the quoted past performance, which cannot guarantee future results. After-sales-charge returns for class A and M shares reflect the deduction of the maximum 4.00% and 3.25% sales charge, respectively, levied at the time of purchase. Class B share returns after contingent deferred sales charge (CDSC) reflect the applicable CDSC, which is 5% in the first year, declining over time to 1% in the sixth year, and is eliminated thereafter. Class C share returns after CDSC reflect a 1% CDSC for the first year that is eliminated thereafter. Class R, R5, R6, and Y shares have no initial sales charge or CDSC. Performance for class B, C, M, R, and Y shares before their inception is derived from the historical performance of class A shares, adjusted for the applicable sales charge (or CDSC) and the higher operating expenses for such shares, except for class Y shares, for which 12b-1 fees are not applicable. Performance for class R5 and R6 shares prior to their inception is derived from the historical performance of class Y shares and has not been adjusted for the lower investor servicing fees applicable to class R5 and R6 shares; had it, returns would have been higher.
For a portion of the periods, the fund had expense limitations, without which returns would have been lower.
Class B share performance reflects conversion to class A shares after eight years.
Comparative index returns For periods ended 4/30/17
| | | | | | | | | |
| | Annual | | | | | | | | |
| | average | | Annual | | Annual | | Annual | | |
| | (life of fund) | 10 years | average | 5 years | average | 3 years | average | 1 year | 6 months |
|
| Bloomberg Barclays | | | | | | | | | |
| Global Aggregate | —† | 38.84% | 3.34% | 1.88% | 0.37% | –1.18% | –0.40% | –2.10% | –1.63% |
| Bond Index | | | | | | | | | |
|
| Lipper Global Income | | | | | | | | | |
| Funds category | 6.13% | 43.38 | 3.60 | 7.18 | 1.34 | 1.90 | 0.59 | 1.20 | 0.13 |
| average* | | | | | | | | | |
Index and Lipper results should be compared with fund performance before sales charge, before CDSC, or at net asset value.
* Over the 6-month, 1-year, 3-year, 5-year, 10-year, and life-of-fund periods ended 4/30/17, there were 219, 214, 198, 157, 86, and 2 funds, respectively, in this Lipper category.
† The fund’s benchmark, the Bloomberg Barclays Global Aggregate Bond Index, was introduced on 12/31/89, which post-dates the inception of the fund’s class A shares.
Fund price and distribution information For the six-month period ended 4/30/17
| | | | | | | | | | |
| Distributions | Class A | Class B | Class C | Class M | Class R | Class R5 | Class R6 | Class Y |
|
| Number | 6 | 6 | 6 | 6 | 6 | 6 | 6 | 6 |
|
| Income | $0.192 | $0.148 | $0.148 | $0.179 | $0.157 | $0.214 | $0.216 | $0.207 |
|
| Capital gains | — | — | — | — | — | — | — | — |
|
| Total | $0.192 | $0.148 | $0.148 | $0.179 | $0.157 | $0.214 | $0.216 | $0.207 |
|
| | Before | After | Net | Net | Before | After | Net | Net | Net | Net |
| | sales | sales | asset | asset | sales | sales | asset | asset | asset | asset |
| Share value | charge | charge | value | value | charge | charge | value | value | value | value |
|
| 10/31/16 | $11.93 | $12.43 | $11.87 | $11.87 | $11.80 | $12.20 | $11.90 | $11.93 | $11.92 | $11.92 |
|
| 4/30/17 | 11.91 | 12.41 | 11.85 | 11.85 | 11.78 | 12.18 | 11.90 | 11.91 | 11.91 | 11.91 |
|
| Current rate | Before | After | Net | Net | Before | After | Net | Net | Net | Net |
| (end of | sales | sales | asset | asset | sales | sales | asset | asset | asset | asset |
| period) | charge | charge | value | value | charge | charge | value | value | value | value |
|
| Current | | | | | | | | | | |
| dividend rate1 | 3.22% | 3.09% | 2.53% | 2.53% | 3.06% | 2.96% | 3.03% | 3.53% | 3.63% | 3.43% |
|
| Current | | | | | | | | | | |
| 30-day | | | | | | | | | | |
| SEC yield2 | N/A | 1.89 | 1.23 | 1.23 | N/A | 1.67 | 1.72 | 2.33 | 2.39 | 2.22 |
The classification of distributions, if any, is an estimate. Before-sales-charge share value and current dividend rate for class A and M shares, if applicable, do not take into account any sales charge levied at the time of purchase. After-sales-charge share value, current dividend rate, and current 30-day SEC yield, if applicable, are calculated assuming that the maximum sales charge (4.00% for class A shares and 3.25% for class M shares) was levied at the time of purchase. Final distribution information will appear on your year-end tax forms.
1 Most recent distribution, including any return of capital and excluding capital gains, annualized and divided by share price before or after sales charge at period-end.
2 Based only on investment income and calculated using the maximum offering price for each share class, in accordance with SEC guidelines.
Fund performance as of most recent calendar quarter Total return for periods ended 3/31/17
| | | | | | | | | |
| | Annual | | | | | | | | |
| | average | | Annual | | Annual | | Annual | | |
| | (life of fund) | 10 years | average | 5 years | average | 3 years | average | 1 year | 6 months |
|
| Class A (6/1/87) | | | | | | | | | |
| Before sales charge | 6.43% | 62.37% | 4.97% | 10.28% | 1.98% | 1.27% | 0.42% | 3.10% | –1.68% |
|
| After sales charge | 6.29 | 55.88 | 4.54 | 5.87 | 1.15 | –2.78 | –0.94 | –1.03 | –5.61 |
|
| Class B (2/1/94) | | | | | | | | | |
| Before CDSC | 6.20 | 52.89 | 4.34 | 6.25 | 1.22 | –1.00 | –0.33 | 2.33 | –2.05 |
|
| After CDSC | 6.20 | 52.89 | 4.34 | 4.37 | 0.86 | –3.76 | –1.27 | –2.66 | –6.89 |
|
| Class C (7/26/99) | | | | | | | | | |
| Before CDSC | 5.64 | 50.77 | 4.19 | 6.26 | 1.22 | –0.97 | –0.32 | 2.43 | –1.97 |
|
| After CDSC | 5.64 | 50.77 | 4.19 | 6.26 | 1.22 | –0.97 | –0.32 | 1.43 | –2.94 |
|
| Class M (3/17/95) | | | | | | | | | |
| Before sales charge | 6.14 | 58.40 | 4.71 | 9.02 | 1.74 | 0.54 | 0.18 | 2.89 | –1.72 |
|
| After sales charge | 6.03 | 53.25 | 4.36 | 5.48 | 1.07 | –2.73 | –0.92 | –0.46 | –4.92 |
|
| Class R (12/1/03) | | | | | | | | | |
| Net asset value | 6.17 | 58.21 | 4.69 | 8.95 | 1.73 | 0.45 | 0.15 | 2.86 | –1.81 |
|
| Class R5 (7/2/12) | | | | | | | | | |
| Net asset value | 6.55 | 66.76 | 5.25 | 11.91 | 2.28 | 2.21 | 0.73 | 3.53 | –1.41 |
|
| Class R6 (7/2/12) | | | | | | | | | |
| Net asset value | 6.56 | 67.29 | 5.28 | 12.27 | 2.34 | 2.40 | 0.79 | 3.59 | –1.48 |
|
| Class Y (10/4/05) | | | | | | | | | |
| Net asset value | 6.54 | 66.48 | 5.23 | 11.72 | 2.24 | 2.06 | 0.68 | 3.45 | –1.47 |
See the discussion following the fund performance table on page 11 for information about the calculation of fund performance.
Your fund’s expenses
As a mutual fund investor, you pay ongoing expenses, such as management fees, distribution fees (12b-1 fees), and other expenses. Using the following information, you can estimate how these expenses affect your investment and compare them with the expenses of other funds. You may also pay one-time transaction expenses, including sales charges (loads) and redemption fees, which are not shown in this section and would have resulted in higher total expenses. For more information, see your fund’s prospectus or talk to your financial representative.
Expense ratios
| | | | | | | | |
| | Class A | Class B | Class C | Class M | Class R | Class R5 | Class R6 | Class Y |
|
| Total annual operating | | | | | | | | |
| expenses for the fiscal year | | | | | | | | |
| ended 10/31/16 | 1.21%* | 1.96%* | 1.96%* | 1.46%* | 1.46%* | 0.86% | 0.79% | 0.96%* |
|
| Annualized expense ratio | | | | | | | | |
| for the six-month period | | | | | | | | |
| ended 4/30/17 | 1.22% | 1.97% | 1.97% | 1.47% | 1.47% | 0.86% | 0.79% | 0.97% |
Fiscal-year expense information in this table is taken from the most recent prospectus, is subject to change, and may differ from that shown for the annualized expense ratio and in the financial highlights of this report.
Expenses are shown as a percentage of average net assets.
* Restated to reflect current fees resulting from a change to the fund’s investor servicing arrangements effective 9/1/16.
Expenses per $1,000
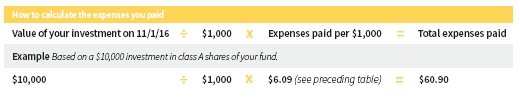
The following table shows the expenses you would have paid on a $1,000 investment in each class of the fund from 11/1/16 to 4/30/17. It also shows how much a $1,000 investment would be worth at the close of the period, assuming actual returns and expenses.
| | | | | | | | |
| | Class A | Class B | Class C | Class M | Class R | Class R5 | Class R6 | Class Y |
|
| Expenses paid per $1,000*† | $6.09 | $9.82 | $9.82 | $7.34 | $7.34 | $4.30 | $3.95 | $4.85 |
|
| Ending value (after expenses) | $1,014.80 | $1,011.00 | $1,011.00 | $1,013.80 | $1,013.40 | $1,016.70 | $1,017.70 | $1,016.90 |
* Expenses for each share class are calculated using the fund’s annualized expense ratio for each class, which represents the ongoing expenses as a percentage of average net assets for the six months ended 4/30/17. The expense ratio may differ for each share class.
† Expenses are calculated by multiplying the expense ratio by the average account value for the period; then multiplying the result by the number of days in the period; and then dividing that result by the number of days in the year.
Estimate the expenses you paid
To estimate the ongoing expenses you paid for the six months ended 4/30/17, use the following calculation method. To find the value of your investment on 11/1/16, call Putnam at 1-800-225-1581.
Compare expenses using the SEC’s method
The Securities and Exchange Commission (SEC) has established guidelines to help investors assess fund expenses. Per these guidelines, the following table shows your fund’s expenses based on a $1,000 investment, assuming a hypothetical 5% annualized return. You can use this information to compare the ongoing expenses (but not transaction expenses or total costs) of investing in the fund with those of other funds. All mutual fund shareholder reports will provide this information to help you make this comparison. Please note that you cannot use this information to estimate your actual ending account balance and expenses paid during the period.
| | | | | | | | |
| | Class A | Class B | Class C | Class M | Class R | Class R5 | Class R6 | Class Y |
|
| Expenses paid per $1,000*† | $6.11 | $9.84 | $9.84 | $7.35 | $7.35 | $4.31 | $3.96 | $4.86 |
|
| Ending value (after expenses) | $1,018.74 | $1,015.03 | $1,015.03 | $1,017.50 | $1,017.50 | $1,020.53 | $1,020.88 | $1,019.98 |
* Expenses for each share class are calculated using the fund’s annualized expense ratio for each class, which represents the ongoing expenses as a percentage of average net assets for the six months ended 4/30/17. The expense ratio may differ for each share class.
† Expenses are calculated by multiplying the expense ratio by the average account value for the six-month period; then multiplying the result by the number of days in the six-month period; and then dividing that result by the number of days in the year.
Terms and definitions
Important terms
Total return shows how the value of the fund’s shares changed over time, assuming you held the shares through the entire period and reinvested all distributions in the fund.
Before sales charge, or net asset value, is the price, or value, of one share of a mutual fund, without a sales charge. Before-sales-charge figures fluctuate with market conditions, and are calculated by dividing the net assets of each class of shares by the number of outstanding shares in the class.
After sales charge is the price of a mutual fund share plus the maximum sales charge levied at the time of purchase. After-sales-charge performance figures shown here assume the 4.00% maximum sales charge for class A shares and 3.25% for class M shares.
Contingent deferred sales charge (CDSC) is generally a charge applied at the time of the redemption of class B or C shares and assumes redemption at the end of the period. Your fund’s class B CDSC declines over time from a 5% maximum during the first year to 1% during the sixth year. After the sixth year, the CDSC no longer applies. The CDSC for class C shares is 1% for one year after purchase.
Share classes
Class A shares are generally subject to an initial sales charge and no CDSC (except on certain redemptions of shares bought without an initial sales charge).
Class B shares are closed to new investments and are only available by exchange from another Putnam fund or through dividend and/or capital gains reinvestment. They are not subject to an initial sales charge and may be subject to a CDSC.
Class C shares are not subject to an initial sales charge and are subject to a CDSC only if the shares are redeemed during the first year.
Class M shares have a lower initial sales charge and a higher 12b-1 fee than class A shares and no CDSC.
Class R shares are not subject to an initial sales charge or CDSC and are only available to employer-sponsored retirement plans.
Class R5 and R6 shares are not subject to an initial sales charge or CDSC, and carry no 12b-1 fee. They are only available to employer-sponsored retirement plans.
Class Y shares are not subject to an initial sales charge or CDSC, and carry no 12b-1 fee. They are generally only available to corporate and institutional clients and clients in other approved programs.
Fixed-income terms
Current rate is the annual rate of return earned from dividends or interest of an investment. Current rate is expressed as a percentage of the price of a security, fund share, or principal investment.
Mortgage-backed security (MBS), also known as a mortgage “pass-through,” is a type of asset-backed security that is secured by a mortgage or collection of mortgages. The following are types of MBSs:
• Agency “pass-through” has its principal and interest backed by a U.S. government agency, such as the Federal National Mortgage Association (Fannie Mae), Government National Mortgage Association (Ginnie Mae), and Federal Home Loan Mortgage Corporation (Freddie Mac).
• Collateralized mortgage obligation (CMO) represents claims to specific cash flows from pools of home mortgages. The streams of principal and interest payments on the mortgages are distributed to the different classes of CMO interests in “tranches.” Each tranche may have different principal balances, coupon rates, prepayment risks, and maturity dates.
A CMO is highly sensitive to changes in interest rates and any resulting change in the rate at which homeowners sell their properties, refinance, or otherwise prepay loans. CMOs are subject to prepayment, market, and liquidity risks.
• Interest-only (IO) security is a type of CMO in which the underlying asset is the interest portion of mortgage, Treasury, or bond payments.
• Non-agency residential mortgage-backed security (RMBS) is an MBS not backed by Fannie Mae, Ginnie Mae, or Freddie Mac. One type of RMBS is an Alt-A mortgage-backed security.
• Commercial mortgage-backed security (CMBS) is secured by the loan on a commercial property.
• Agency credit risk transfer security (CRTS) is backed by a reference pool of agency mortgages. Unlike regular agency pass-throughs, the principal invested in a CRTS is not backed by Fannie Mae or Freddie Mac. To compensate investors for this risk, CRTS offer a higher yield than conventional pass-through securities. Similar to CMBS, CRTS are structured into various tranches offering different levels of risk and yield based on the underlying reference pool.
Yield curve is a graph that plots the yields of bonds with equal credit quality against their differing maturity dates, ranging from shortest to longest. It is used as a benchmark for other debt, such as mortgage or bank lending rates.
Comparative indexes
Bloomberg Barclays Global Aggregate Bond Index is an unmanaged index of global investment-grade fixed-income securities.
Bloomberg Barclays U.S. Aggregate Bond Index is an unmanaged index of U.S. investment-grade fixed-income securities.
BofA Merrill Lynch U.S. 3-Month Treasury Bill Index is an unmanaged index that seeks to measure the performance of U.S. Treasury bills available in the marketplace.
S&P 500 Index is an unmanaged index of common stock performance.
Indexes assume reinvestment of all distributions and do not account for fees. Securities and performance of a fund and an index will differ. You cannot invest directly in an index.
Lipper is a third-party industry-ranking entity that ranks mutual funds. Its rankings do not reflect sales charges. Lipper rankings are based on total return at net asset value relative to other funds that have similar current investment styles or objectives as determined by Lipper. Lipper may change a fund’s category assignment at its discretion. Lipper category averages reflect performance trends for funds within a category.
Other information for shareholders
Important notice regarding delivery of shareholder documents
In accordance with Securities and Exchange Commission (SEC) regulations, Putnam sends a single copy of annual and semiannual shareholder reports, prospectuses, and proxy statements to Putnam shareholders who share the same address, unless a shareholder requests otherwise. If you prefer to receive your own copy of these documents, please call Putnam at 1-800-225-1581, and Putnam will begin sending individual copies within 30 days.
Proxy voting
Putnam is committed to managing our mutual funds in the best interests of our shareholders. The Putnam funds’ proxy voting guidelines and procedures, as well as information regarding how your fund voted proxies relating to portfolio securities during the 12-month period ended June 30, 2016, are available in the Individual Investors section of putnam.com, and on the SEC’s website, www.sec.gov. If you have questions about finding forms on the SEC’s website, you may call the SEC at 1-800-SEC-0330. You may also obtain the Putnam funds’ proxy voting guidelines and procedures at no charge by calling Putnam’s Shareholder Services at 1-800-225-1581.
Fund portfolio holdings
The fund will file a complete schedule of its portfolio holdings with the SEC for the first and third quarters of each fiscal year on Form N-Q. Shareholders may obtain the fund’s Form N-Q on the SEC’s website at www.sec.gov. In addition, the fund’s Form N-Q may be reviewed and copied at the SEC’s Public Reference Room in Washington, D.C. You may call the SEC at 1-800-SEC-0330 for information about the SEC’s website or the operation of the Public Reference Room.
Trustee and employee fund ownership
Putnam employees and members of the Board of Trustees place their faith, confidence, and, most importantly, investment dollars in Putnam mutual funds. As of April 30, 2017, Putnam employees had approximately $494,000,000 and the Trustees had approximately $139,000,000 invested in Putnam mutual funds. These amounts include investments by the Trustees’ and employees’ immediate family members as well as investments through retirement and deferred compensation plans.
Financial statements
These sections of the report, as well as the accompanying Notes, constitute the fund’s financial statements.
The fund’s portfolio lists all the fund’s investments and their values as of the last day of the reporting period. Holdings are organized by asset type and industry sector, country, or state to show areas of concentration and diversification.
Statement of assets and liabilities shows how the fund’s net assets and share price are determined. All investment and non-investment assets are added together. Any unpaid expenses and other liabilities are subtracted from this total. The result is divided by the number of shares to determine the net asset value per share, which is calculated separately for each class of shares. (For funds with preferred shares, the amount subtracted from total assets includes the liquidation preference of preferred shares.)
Statement of operations shows the fund’s net investment gain or loss. This is done by first adding up all the fund’s earnings — from dividends and interest income — and subtracting its operating expenses to determine net investment income (or loss). Then, any net gain or loss the fund realized on the sales of its holdings — as well as any unrealized gains or losses over the period — is added to or subtracted from the net investment result to determine the fund’s net gain or loss for the fiscal period.
Statement of changes in net assets shows how the fund’s net assets were affected by the fund’s net investment gain or loss, by distributions to shareholders, and by changes in the number of the fund’s shares. It lists distributions and their sources (net investment income or realized capital gains) over the current reporting period and the most recent fiscal year-end. The distributions listed here may not match the sources listed in the Statement of operations because the distributions are determined on a tax basis and may be paid in a different period from the one in which they were earned. Dividend sources are estimated at the time of declaration. Actual results may vary. Any non-taxable return of capital cannot be determined until final tax calculations are completed after the end of the fund’s fiscal year.
Financial highlights provide an overview of the fund’s investment results, per-share distributions, expense ratios, net investment income ratios, and portfolio turnover in one summary table, reflecting the five most recent reporting periods. In a semiannual report, the highlights table also includes the current reporting period.
The fund’s portfolio 4/30/17 (Unaudited)
| | | |
| U.S. GOVERNMENT AND AGENCY | | Principal | |
| MORTGAGE OBLIGATIONS (44.5%)* | | amount | Value |
|
| U.S. Government Guaranteed Mortgage Obligations (2.1%) | | | |
|
| Government National Mortgage Association Pass-Through Certificates | | |
|
| 3.50%, TBA, 5/1/47 | | $3,000,000 | $3,117,188 |
|
| 3.00%, TBA, 5/1/47 | | 2,000,000 | 2,026,875 |
|
| | | | 5,144,063 |
|
| U.S. Government Agency Mortgage Obligations (42.4%) | | | |
|
| Federal Home Loan Mortgage Corporation Ser. 2775, | | | |
| Class OE 4.50%, 4/15/19 i | | 123,139 | 126,515 |
|
| Federal National Mortgage Association Pass-Through Certificates | | | |
|
| 4.50%, TBA, 5/1/47 | | 1,000,000 | 1,076,094 |
|
| 4.00%, TBA, 5/1/47 | | 6,000,000 | 6,319,687 |
|
| 3.50%, TBA, 6/1/47 | | 38,000,000 | 38,997,500 |
|
| 3.50%, TBA, 5/1/47 | | 38,000,000 | 39,077,657 |
|
| 3.00%, TBA, 6/1/47 | | 2,000,000 | 1,994,531 |
|
| 3.00%, TBA, 5/1/47 | | 8,000,000 | 7,993,125 |
|
| 2.50%, TBA, 5/1/47 | | 9,000,000 | 8,666,719 |
|
| | | | 104,251,828 |
|
| Total U.S. government and agency mortgage obligations (cost $108,770,578) | $109,395,891 |
|
| |
| FOREIGN GOVERNMENT AND AGENCY | | Principal | |
| BONDS AND NOTES (37.8%)* | | amount | Value |
|
| Argentina (Republic of) sr. unsec. unsub. bonds 7.125%, | | | |
| 7/6/36 (Argentina) | | $275,000 | $278,300 |
|
| Argentina (Republic of) sr. unsec. unsub. notes 6.875%, | | | |
| 1/26/27 (Argentina) | | 780,000 | 824,070 |
|
| Australia (Government of) sr. unsec. bonds Ser. 133, 5.50%, | | | |
| 4/21/23 (Australia) | AUD | 690,000 | 610,675 |
|
| Australia (Government of) sr. unsec. bonds Ser. 144, 3.75%, | | | |
| 4/21/37 (Australia) | AUD | 200,000 | 161,347 |
|
| Australia (Government of) sr. unsec. bonds Ser. 149, 2.25%, | | | |
| 5/21/28 (Australia) | AUD | 670,000 | 480,449 |
|
| Australia (Government of) sr. unsec. notes Ser. 122, 5.25%, | | | |
| 3/15/19 (Australia) | AUD | 1,010,000 | 806,120 |
|
| Belgium (Kingdom of) sr. unsec. bonds Ser. 77, 1.00%, | | | |
| 6/22/26 (Belgium) | EUR | 620,000 | 698,396 |
|
| Belgium (Kingdom of) sr. unsec. unsub. notes Ser. 65, 4.25%, | | | |
| 9/28/22 (Belgium) | EUR | 530,000 | 715,957 |
|
| Belgium (Kingdom of) unsec. bonds Ser. 60, 4.25%, | | | |
| 3/28/41 (Belgium) | EUR | 330,000 | 555,523 |
|
| Brazil (Federal Republic of) sr. unsec. unsub. bonds 4.875%, | | | |
| 1/22/21 (Brazil) | | $490,000 | 518,175 |
|
| Brazil (Federal Republic of) sr. unsec. unsub. notes 5.875%, | | | |
| 1/15/19 (Brazil) | | 100,000 | 106,865 |
|
| Brazil (Federal Republic of) unsec. notes 10.00%, 1/1/21 | | | |
| (Brazil) (units) | BRL | 790 | 257,592 |
|
| Buenos Aires (Province of) 144A sr. unsec. unsub. notes 9.125%, | | | |
| 3/16/24 (Argentina) | | $848,000 | 962,449 |
|
| Canada (Government of) bonds 1.25%, 9/1/18 (Canada) | CAD | 960,000 | 708,686 |
|
| Canada (Government of) sr. unsec. bonds 3.50%, 12/1/45 (Canada) | CAD | 180,000 | 168,347 |
|
| Denmark (Kingdom of) unsec. bonds 4.50%, 11/15/39 (Denmark) | DKK | 740,000 | 183,221 |
|
| | | |
| FOREIGN GOVERNMENT AND AGENCY | | Principal | |
| BONDS AND NOTES (37.8%)* cont. | | amount | Value |
|
| Denmark (Kingdom of) unsec. bonds 1.75%, 11/15/25 (Denmark) | DKK | 2,550,000 | $419,196 |
|
| France (Government of) unsec. bonds 4.50%, 4/25/41 (France) | EUR | 830,000 | 1,416,203 |
|
| France (Government of) unsec. bonds 4.00%, 4/25/55 (France) | EUR | 150,000 | 252,641 |
|
| France (Government of) unsec. bonds 3.25%, 10/25/21 (France) | EUR | 3,410,000 | 4,298,099 |
|
| France (Government of) unsec. bonds 2.75%, 10/25/27 (France) | EUR | 250,000 | 323,114 |
|
| France (Government of) unsec. bonds 0.50%, 5/25/25 (France) | EUR | 1,490,000 | 1,623,706 |
|
| Germany (Federal Republic of) unsec. bonds 2.50%, | | | |
| 7/4/44 (Germany) | EUR | 1,460,000 | 2,124,331 |
|
| Germany (Federal Republic of) unsec. bonds 1.00%, | | | |
| 8/15/25 (Germany) | EUR | 1,000,000 | 1,173,198 |
|
| Germany (Federal Republic of) unsec. bonds 0.50%, | | | |
| 2/15/25 (Germany) | EUR | 420,000 | 475,179 |
|
| Hellenic (Republic of) sr. unsec. unsub. bonds Ser. PSI, | | | |
| stepped-coupon 3.00% (3.65%, 2/24/20), 2/24/33 (Greece) †† | EUR | 36,000 | 28,189 |
|
| Hellenic (Republic of) sr. unsec. unsub. bonds Ser. PSI, | | | |
| stepped-coupon 3.00% (3.65%, 2/24/20), 2/24/32 (Greece) †† | EUR | 286,000 | 227,349 |
|
| Hellenic (Republic of) sr. unsec. unsub. bonds Ser. PSI, | | | |
| stepped-coupon 3.00% (3.65%, 2/24/20), 2/24/30 (Greece) †† | EUR | 502,541 | 411,133 |
|
| Hellenic (Republic of) sr. unsec. unsub. bonds Ser. PSI, | | | |
| stepped-coupon 3.00% (3.65%, 2/24/20), 2/24/29 (Greece) †† | EUR | 987,903 | 821,856 |
|
| Hellenic (Republic of) sr. unsec. unsub. bonds Ser. PSI, | | | |
| stepped-coupon 3.00% (3.65%, 2/24/20), 2/24/28 (Greece) †† | EUR | 103,000 | 88,235 |
|
| Hellenic (Republic of) sr. unsec. unsub. bonds Ser. PSI, | | | |
| stepped-coupon 3.00% (3.65%, 2/24/20), 2/24/26 (Greece) †† | EUR | 137,000 | 122,767 |
|
| Hellenic (Republic of) sr. unsec. unsub. bonds Ser. PSI, | | | |
| stepped-coupon 3.00% (3.65%, 2/24/20), 2/24/25 (Greece) †† | EUR | 49,312 | 44,681 |
|
| Hellenic (Republic of) sr. unsec. unsub. bonds Ser. PSI, | | | |
| stepped-coupon 3.00% (3.65%, 2/24/20), 2/24/24 (Greece) †† | EUR | 209,000 | 192,301 |
|
| Hellenic (Republic of) sr. unsec. unsub. bonds Ser. PSI, | | | |
| stepped-coupon 3.00% (3.65%, 2/24/20), 2/24/23 (Greece) †† | EUR | 694,884 | 649,989 |
|
| Indonesia (Republic of) 144A sr. unsec. unsub. notes 3.375%, | | | |
| 4/15/23 (Indonesia) | | $1,235,000 | 1,238,088 |
|
| Ireland (Republic of) unsec. bonds 5.00%, 10/18/20 (Ireland) | EUR | 380,000 | 490,454 |
|
| Ireland (Republic of) unsec. notes 5.40%, 3/13/25 (Ireland) | EUR | 250,000 | 371,506 |
|
| Italy (Republic of) sr. unsec. bonds 6.50%, 11/1/27 (Italy) | EUR | 670,000 | 1,014,868 |
|
| Italy (Republic of) sr. unsec. bonds 4.75%, 9/1/44 (Italy) | EUR | 820,000 | 1,117,380 |
|
| Italy (Republic of) sr. unsec. bonds 2.50%, 12/1/24 (Italy) | EUR | 1,060,000 | 1,210,727 |
|
| Italy (Republic of) sr. unsec. unsub. bonds 4.75%, 8/1/23 (Italy) | EUR | 1,950,000 | 2,551,547 |
|
| Italy (Republic of) unsec. notes 0.30%, 10/15/18 (Italy) | EUR | 2,590,000 | 2,837,348 |
|
| Japan (Government of) 10 yr sr. unsec. unsub. notes Ser. 330, | | | |
| 0.80%, 9/20/23 (Japan) | JPY | 650,000,000 | 6,179,009 |
|
| Japan (Government of) 20 yr sr. unsec. bonds Ser. 95, 2.30%, | | | |
| 6/20/27 (Japan) | JPY | 500,000,000 | 5,517,874 |
|
| Japan (Government of) 20 yr sr. unsec. unsub. bonds Ser. 125, | | | |
| 2.20%, 3/20/31 (Japan) | JPY | 308,000,000 | 3,510,357 |
|
| Japan (Government of) 20 yr sr. unsec. unsub. bonds Ser. 156, | | | |
| 0.40%, 3/20/36 (Japan) | JPY | 120,000,000 | 1,054,805 |
|
| Japan (Government of) 20 yr sr. unsec. unsub. notes Ser. 318, | | | |
| 1.00%, 9/20/21 (Japan) | JPY | 1,377,000,000 | 12,984,255 |
|
| Japan (Government of) 20 yr sr. unsec. unsub. notes Ser. 41, 1.50%, | | | |
| 3/20/19 (Japan) | JPY | 370,000,000 | 3,425,939 |
|
| | | |
| FOREIGN GOVERNMENT AND AGENCY | | Principal | |
| BONDS AND NOTES (37.8%)* cont. | | amount | Value |
|
| Japan (Government of) 30 yr sr. unsec. unsub. bonds Ser. 32, | | | |
| 2.30%, 3/20/40 (Japan) | JPY | 407,000,000 | $4,932,887 |
|
| Japan (Government of) 40 yr sr. unsec. unsub. bonds Ser. 4, 2.20%, | | | |
| 3/20/51 (Japan) | JPY | 230,000,000 | 2,890,067 |
|
| Netherlands (Government of) unsec. bonds 3.75%, | | | |
| 1/15/42 (Netherlands) | EUR | 290,000 | 501,234 |
|
| Netherlands (Government of) unsec. bonds 2.25%, | | | |
| 7/15/22 (Netherlands) | EUR | 1,290,000 | 1,591,947 |
|
| New Zealand (Government of) sr. unsec. bonds Ser. 423, 5.50%, | | | |
| 4/15/23 (New Zealand) | NZD | 360,000 | 284,616 |
|
| Norway (Government of) unsec. bonds Ser. 476, 3.00%, | | | |
| 3/14/24 (Norway) | NOK | 1,760,000 | 227,287 |
|
| Ontario (Province of) unsec. bonds 4.00%, 6/2/21 (Canada) | CAD | 1,690,000 | 1,365,280 |
|
| Poland (Republic of) unsec. notes Ser. 0721, 1.75%, | | | |
| 7/25/21 (Poland) | PLN | 2,400,000 | 595,236 |
|
| Russia (Federation of) 144A sr. unsec. unsub. bonds 5.625%, | | | |
| 4/4/42 (Russia) | | $600,000 | $667,500 |
|
| South Africa (Republic of) unsec. bonds Ser. 2023, 7.75%, 2/28/23 | | | |
| (South Africa) | ZAR | 11,140,000 | 818,662 |
|
| Spain (Kingdom of) sr. unsec. bonds 5.15%, 10/31/44 (Spain) | EUR | 350,000 | 543,179 |
|
| Spain (Kingdom of) sr. unsec. bonds 5.15%, 10/31/28 (Spain) | EUR | 590,000 | 863,371 |
|
| Spain (Kingdom of) sr. unsec. bonds 4.40%, 10/31/23 (Spain) | EUR | 890,000 | 1,186,969 |
|
| Spain (Kingdom of) sr. unsec. unsub. bonds 4.65%, 7/30/25 (Spain) | EUR | 440,000 | 602,614 |
|
| Spain (Kingdom of) sr. unsec. unsub. bonds 4.00%, 4/30/20 (Spain) | EUR | 590,000 | 721,312 |
|
| Spain (Kingdom of) sr. unsec. unsub. bonds 2.90%, | | | |
| 10/31/46 (Spain) | EUR | 20,000 | 21,549 |
|
| Spain (Kingdom of) sr. unsec. unsub. notes 4.10%, 7/30/18 (Spain) | EUR | 630,000 | 723,580 |
|
| Sri Lanka (Republic of) 144A sr. unsec. unsub. bonds 6.85%, | | | |
| 11/3/25 (Sri Lanka) | | $200,000 | 210,523 |
|
| Sweden (Government of) unsec. bonds Ser. 1053, 3.50%, | | | |
| 3/30/39 (Sweden) | SEK | 270,000 | 41,379 |
|
| Sweden (Government of) unsec. bonds Ser. 1054, 3.50%, | | | |
| 6/1/22 (Sweden) | SEK | 6,120,000 | 817,345 |
|
| Switzerland (Government of) unsec. bonds 2.00%, | | | |
| 4/28/21 (Switzerland) | CHF | 600,000 | 668,322 |
|
| Turkey (Republic of) unsec. notes 11.00%, 3/2/22 (Turkey) | TRY | 576,000 | 164,759 |
|
| United Kingdom Treasury unsec. bonds 4.00%, 1/22/60 | | | |
| (United Kingdom) | GBP | 1,320,000 | 2,999,262 |
|
| United Kingdom Treasury unsec. bonds 3.75%, 9/7/19 | | | |
| (United Kingdom) | GBP | 920,000 | 1,294,941 |
|
| United Kingdom Treasury unsec. bonds 2.75%, 9/7/24 | | | |
| (United Kingdom) | GBP | 70,000 | 103,638 |
|
| United Kingdom Treasury unsec. notes 1.25%, 7/22/18 | | | |
| (United Kingdom) | GBP | 500,000 | 657,184 |
|
| United Mexican States sr. unsec. notes Ser. M 20, 10.00%, | | | |
| 12/5/24 (Mexico) | MXN | 12,310,000 | 789,230 |
|
| United Mexican States sr. unsec. unsub. notes Ser. MTN, 4.75%, | | | |
| 3/8/44 (Mexico) | | $440,000 | 435,539 |
|
| Total foreign government and agency bonds and notes (cost $98,250,433) | | $92,951,908 |
|
| | |
| | Principal | |
| CORPORATE BONDS AND NOTES (31.3%)* | amount | Value |
|
| Basic materials (1.6%) | | |
|
| Celanese US Holdings, LLC company guaranty sr. unsec. notes | | |
| 5.875%, 6/15/21 (Germany) | $160,000 | $179,333 |
|
| Celanese US Holdings, LLC company guaranty sr. unsec. unsub. | | |
| notes 4.625%, 11/15/22 (Germany) | 153,000 | 164,475 |
|
| Cemex Finance, LLC 144A company guaranty sr. notes 9.375%, | | |
| 10/12/22 (Mexico) | 200,000 | 215,250 |
|
| Eastman Chemical Co. sr. unsec. notes 3.80%, 3/15/25 | 229,000 | 235,875 |
|
| Georgia-Pacific, LLC sr. unsec. unsub. notes 7.75%, 11/15/29 | 120,000 | 167,157 |
|
| Georgia-Pacific, LLC 144A company guaranty sr. unsec. notes | | |
| 5.40%, 11/1/20 | 13,000 | 14,270 |
|
| Glencore Finance Canada, Ltd. 144A company guaranty sr. unsec. | | |
| unsub. notes 6.00%, 11/15/41 (Canada) | 234,000 | 259,494 |
|
| Glencore Funding, LLC 144A company guaranty sr. unsec. unsub. | | |
| notes 4.625%, 4/29/24 | 510,000 | 533,197 |
|
| Glencore Funding, LLC 144A company guaranty sr. unsec. unsub. | | |
| notes 4.00%, 4/16/25 | 187,000 | 187,370 |
|
| International Paper Co. sr. unsec. notes 8.70%, 6/15/38 | 6,000 | 8,657 |
|
| INVISTA Finance, LLC 144A company guaranty sr. notes | | |
| 4.25%, 10/15/19 | 262,000 | 269,205 |
|
| Westlake Chemical Corp. company guaranty sr. unsec. unsub. | | |
| notes 3.60%, 8/15/26 | 755,000 | 747,375 |
|
| WestRock MWV, LLC company guaranty sr. unsec. unsub. notes | | |
| 8.20%, 1/15/30 | 286,000 | 394,390 |
|
| WestRock MWV, LLC company guaranty sr. unsec. unsub. notes | | |
| 7.95%, 2/15/31 | 73,000 | 99,715 |
|
| WestRock RKT Co. company guaranty sr. unsec. unsub. notes | | |
| 4.45%, 3/1/19 | 105,000 | 109,268 |
|
| Weyerhaeuser Co. sr. unsec. unsub. notes 7.375%, 3/15/32 R | 195,000 | 261,888 |
|
| | | 3,846,919 |
|
| Capital goods (0.9%) | | |
|
| Crown Americas, LLC/Crown Americas Capital Corp. IV company | | |
| guaranty sr. unsec. notes 4.50%, 1/15/23 | 105,000 | 108,413 |
|
| Johnson Controls International PLC sr. unsec. unsub. bonds | | |
| 4.50%, 2/15/47 | 545,000 | 557,447 |
|
| L3 Technologies, Inc. company guaranty sr. unsec. bonds | | |
| 3.85%, 12/15/26 | 117,000 | 120,122 |
|
| Legrand France SA sr. unsec. unsub. notes 8.50%, 2/15/25 (France) | 253,000 | 330,813 |
|
| Rockwell Collins, Inc. sr. unsec. bonds 4.35%, 4/15/47 | 971,000 | 983,527 |
|
| | | 2,100,322 |
|
| Communication services (2.1%) | | |
|
| America Movil SAB de CV company guaranty sr. unsec. unsub. | | |
| notes 6.125%, 3/30/40 (Mexico) | 100,000 | 118,874 |
|
| American Tower Corp. sr. unsec. notes 4.00%, 6/1/25 R | 235,000 | 241,504 |
|
| American Tower Corp. sr. unsec. unsub. bonds 3.375%, 10/15/26 R | 322,000 | 313,623 |
|
| Charter Communications Operating, LLC/Charter | | |
| Communications Operating Capital Corp. company guaranty sr. | | |
| sub. bonds 6.484%, 10/23/45 | 622,000 | 730,460 |
|
| Charter Communications Operating, LLC/Charter | | |
| Communications Operating Capital Corp. company guaranty sr. | | |
| sub. notes 4.908%, 7/23/25 | 148,000 | 158,618 |
|
| | |
| | Principal | |
| CORPORATE BONDS AND NOTES (31.3%)* cont. | amount | Value |
|
| Communication services cont. | | |
|
| Charter Communications Operating, LLC/Charter | | |
| Communications Operating Capital 144A company guaranty | | |
| sr. bonds 5.375%, 5/1/47 | $240,000 | $245,557 |
|
| Comcast Cable Communications Holdings, Inc. company | | |
| guaranty sr. unsec. notes 9.455%, 11/15/22 | 70,000 | 94,315 |
|
| Comcast Corp. company guaranty sr. unsec. unsub. notes | | |
| 6.50%, 11/15/35 | 75,000 | 96,029 |
|
| Crown Castle International Corp. sr. unsec. notes 5.25%, 1/15/23 R | 192,000 | 212,455 |
|
| Crown Castle International Corp. sr. unsec. notes 4.75%, 5/15/47 R | 420,000 | 418,557 |
|
| Crown Castle Towers, LLC 144A company guaranty sr. notes | | |
| 4.883%, 8/15/20 | 190,000 | 202,606 |
|
| Koninklijke KPN NV sr. unsec. unsub. bonds 8.375%, | | |
| 10/1/30 (Netherlands) | 42,000 | 57,290 |
|
| NBCUniversal Media, LLC company guaranty sr. unsec. unsub. | | |
| notes 6.40%, 4/30/40 | 125,000 | 160,877 |
|
| Rogers Communications, Inc. company guaranty sr. unsec. unsub. | | |
| notes 4.50%, 3/15/43 (Canada) | 188,000 | 190,809 |
|
| Sprint Spectrum Co., LLC/Sprint Spectrum Co. II, LLC/ | | |
| Sprint Spectrum Co. III, LL 144A company guaranty sr. notes | | |
| 3.36%, 9/20/21 | 585,000 | 590,119 |
|
| Telecom Italia SpA 144A sr. unsec. notes 5.303%, 5/30/24 (Italy) | 600,000 | 621,000 |
|
| Verizon Communications, Inc. sr. unsec. unsub. notes 5.90%, | | |
| 2/15/54 (units) | 9,074 | 241,550 |
|
| Verizon Communications, Inc. sr. unsec. unsub. notes | | |
| 4.522%, 9/15/48 | 68,000 | 62,552 |
|
| Videotron Ltd./Videotron Ltee. 144A sr. unsec. bonds 5.125%, | | |
| 4/15/27 (Canada) | 390,000 | 397,683 |
|
| | | 5,154,478 |
|
| Conglomerates (0.1%) | | |
|
| General Electric Co. jr. unsec. sub. FRB Ser. D, 5.00%, | | |
| perpetual maturity | 346,000 | 367,556 |
|
| | | 367,556 |
|
| Consumer cyclicals (3.3%) | | |
|
| 21st Century Fox America, Inc. company guaranty sr. unsec. notes | | |
| 7.85%, 3/1/39 | 115,000 | 159,890 |
|
| Autonation, Inc. company guaranty sr. unsec. unsub. notes | | |
| 5.50%, 2/1/20 | 194,000 | 208,397 |
|
| CBS Corp. company guaranty sr. unsec. unsub. bonds | | |
| 2.90%, 1/15/27 | 567,000 | 534,665 |
|
| D.R. Horton, Inc. company guaranty sr. unsec. sub. notes | | |
| 5.75%, 8/15/23 | 425,000 | 481,313 |
|
| Expedia, Inc. company guaranty sr. unsec. unsub. notes | | |
| 5.00%, 2/15/26 | 115,000 | 123,598 |
|
| Ford Motor Co. sr. unsec. unsub. notes 9.98%, 2/15/47 | 630,000 | 969,428 |
|
| Ford Motor Co. sr. unsec. unsub. notes 7.45%, 7/16/31 | 122,000 | 153,892 |
|
| Ford Motor Co. sr. unsec. unsub. notes 7.40%, 11/1/46 | 15,000 | 19,051 |
|
| General Motors Co. sr. unsec. notes 6.25%, 10/2/43 | 265,000 | 289,507 |
|
| General Motors Financial Co., Inc. company guaranty sr. unsec. | | |
| notes 4.00%, 10/6/26 | 630,000 | 626,241 |
|
| General Motors Financial Co., Inc. company guaranty sr. unsec. | | |
| unsub. notes 4.30%, 7/13/25 | 222,000 | 225,998 |
|
| | |
| | Principal | |
| CORPORATE BONDS AND NOTES (31.3%)* cont. | amount | Value |
|
| Consumer cyclicals cont. | | |
|
| General Motors Financial Co., Inc. company guaranty sr. unsec. | | |
| unsub. notes 3.45%, 4/10/22 | $301,000 | $304,092 |
|
| Grupo Televisa SAB sr. unsec. unsub. bonds 6.625%, | | |
| 1/15/40 (Mexico) | 215,000 | 241,240 |
|
| Grupo Televisa SAB sr. unsec. unsub. notes 5.00%, 5/13/45 (Mexico) | 250,000 | 235,525 |
|
| Hilton Domestic Operating Co., Inc. 144A sr. unsec. sub. notes | | |
| 4.25%, 9/1/24 | 125,000 | 125,938 |
|
| Hilton Worldwide Finance, LLC/Hilton Worldwide Finance Corp. | | |
| 144A sr. unsec. bonds 4.875%, 4/1/27 | 655,000 | 671,375 |
|
| Host Hotels & Resorts LP sr. unsec. unsub. notes 6.00%, 10/1/21 R | 61,000 | 68,267 |
|
| Host Hotels & Resorts LP sr. unsec. unsub. notes 5.25%, 3/15/22 R | 29,000 | 31,545 |
|
| Hyatt Hotels Corp. sr. unsec. unsub. notes 3.375%, 7/15/23 | 160,000 | 162,688 |
|
| IHS Markit Ltd. 144A company guaranty notes 4.75%, 2/15/25 | | |
| (United Kingdom) | 120,000 | 125,400 |
|
| L Brands, Inc. company guaranty sr. unsec. sub. notes | | |
| 5.625%, 2/15/22 | 220,000 | 232,375 |
|
| Lear Corp. company guaranty sr. unsec. unsub. notes | | |
| 5.375%, 3/15/24 | 225,000 | 237,848 |
|
| O’Reilly Automotive, Inc. company guaranty sr. unsec. sub. notes | | |
| 3.55%, 3/15/26 | 220,000 | 221,038 |
|
| Omnicom Group, Inc. company guaranty sr. unsec. unsub. notes | | |
| 3.60%, 4/15/26 | 182,000 | 183,397 |
|
| Owens Corning company guaranty sr. unsec. sub. notes | | |
| 9.00%, 6/15/19 | 15,000 | 16,885 |
|
| Priceline Group, Inc. (The) sr. unsec. notes 3.65%, 3/15/25 | 116,000 | 118,302 |
|
| QVC, Inc. company guaranty sr. notes 4.85%, 4/1/24 | 238,000 | 242,562 |
|
| S&P Global, Inc. company guaranty sr. unsec. unsub. notes | | |
| 4.40%, 2/15/26 | 195,000 | 208,804 |
|
| Standard Industries, Inc. 144A sr. unsec. notes 5.00%, 2/15/27 | 335,000 | 338,350 |
|
| Time Warner, Inc. company guaranty sr. unsec. unsub. bonds | | |
| 3.80%, 2/15/27 | 95,000 | 94,583 |
|
| Time Warner, Inc. company guaranty sr. unsec. unsub. bonds | | |
| 2.95%, 7/15/26 | 160,000 | 150,114 |
|
| Vulcan Materials Co. sr. unsec. unsub. notes 4.50%, 4/1/25 | 125,000 | 132,399 |
|
| Wyndham Worldwide Corp. sr. unsec. unsub. bonds 4.50%, 4/1/27 | 275,000 | 280,561 |
|
| | | 8,215,268 |
|
| Consumer staples (2.1%) | | |
|
| Anheuser-Busch InBev Finance, Inc. company guaranty sr. unsec. | | |
| unsub. bonds 4.90%, 2/1/46 | 440,000 | 480,679 |
|
| Anheuser-Busch InBev Finance, Inc. company guaranty sr. unsec. | | |
| unsub. bonds 3.65%, 2/1/26 | 200,000 | 203,806 |
|
| Anheuser-Busch InBev Worldwide, Inc. company guaranty sr. | | |
| unsec. unsub. notes 8.20%, 1/15/39 | 154,000 | 235,680 |
|
| Bacardi, Ltd. 144A unsec. notes 4.50%, 1/15/21 (Bermuda) | 230,000 | 242,809 |
|
| Constellation Brands, Inc. company guaranty sr. unsec. unsub. | | |
| bonds 3.70%, 12/6/26 | 185,000 | 187,258 |
|
| CVS Pass-Through Trust sr. notes 6.036%, 12/10/28 | 54,768 | 62,195 |
|
| CVS Pass-Through Trust 144A sr. mtge. notes 7.507%, 1/10/32 | 289,026 | 360,491 |
|
| ERAC USA Finance, LLC 144A company guaranty sr. unsec. bonds | | |
| 4.50%, 2/15/45 | 15,000 | 14,307 |
|
| | |
| | Principal | |
| CORPORATE BONDS AND NOTES (31.3%)* cont. | amount | Value |
|
| Consumer staples cont. | | |
|
| ERAC USA Finance, LLC 144A company guaranty sr. unsec. notes | | |
| 7.00%, 10/15/37 | $85,000 | $106,837 |
|
| ERAC USA Finance, LLC 144A company guaranty sr. unsec. notes | | |
| 5.625%, 3/15/42 | 472,000 | 519,243 |
|
| ERAC USA Finance, LLC 144A company guaranty sr. unsec. notes | | |
| 3.85%, 11/15/24 | 277,000 | 284,028 |
|
| Grupo Bimbo SAB de CV 144A company guaranty sr. unsec. notes | | |
| 3.875%, 6/27/24 (Mexico) | 550,000 | 557,621 |
|
| Grupo Bimbo SAB de CV 144A company guaranty sr. unsec. unsub. | | |
| notes 4.875%, 6/27/44 (Mexico) | 500,000 | 480,207 |
|
| Kraft Heinz Co. (The) company guaranty sr. unsec. bonds | | |
| 4.375%, 6/1/46 | 231,000 | 219,782 |
|
| Kraft Heinz Co. (The) company guaranty sr. unsec. unsub. notes | | |
| 6.50%, 2/9/40 | 371,000 | 451,224 |
|
| Lamb Weston Holdings, Inc. 144A company guaranty sr. unsec. | | |
| unsub. notes 4.875%, 11/1/26 | 481,000 | 496,031 |
|
| Walgreens Boots Alliance, Inc. sr. unsec. bonds 3.45%, 6/1/26 | 231,000 | 227,216 |
|
| | | 5,129,414 |
|
| Energy (5.1%) | | |
|
| Anadarko Petroleum Corp. sr. unsec. notes 6.45%, 9/15/36 | 165,000 | 195,540 |
|
| Anadarko Petroleum Corp. sr. unsec. unsub. notes 5.55%, 3/15/26 | 10,000 | 11,161 |
|
| BP Capital Markets PLC company guaranty sr. unsec. bonds | | |
| 3.119%, 5/4/26 (United Kingdom) | 99,000 | 98,055 |
|
| Cenovus Energy, Inc. sr. unsec. bonds 6.75%, 11/15/39 (Canada) | 811,000 | 912,375 |
|
| Cenovus Energy, Inc. 144A sr. unsec. notes 4.25%, | | |
| 4/15/27 (Canada) | 345,000 | 342,206 |
|
| Concho Resources, Inc. company guaranty sr. unsec. notes | | |
| 4.375%, 1/15/25 | 560,000 | 567,000 |
|
| DCP Midstream Operating LP company guaranty sr. unsec. notes | | |
| 3.875%, 3/15/23 | 193,000 | 188,175 |
|
| Devon Energy Corp. sr. unsec. unsub. notes 3.25%, 5/15/22 | 132,000 | 132,475 |
|
| EQT Midstream Partners LP company guaranty sr. unsec. sub. | | |
| notes 4.00%, 8/1/24 | 405,000 | 411,321 |
|
| Kerr-McGee Corp. company guaranty sr. unsec. unsub. notes | | |
| 7.875%, 9/15/31 | 185,000 | 240,983 |
|
| Lukoil International Finance BV 144A company guaranty sr. unsec. | | |
| notes 4.563%, 4/24/23 (Russia) | 310,000 | 318,525 |
|
| Marathon Petroleum Corp. sr. unsec. unsub. notes 6.50%, 3/1/41 | 45,000 | 50,852 |
|
| MPLX LP sr. unsec. unsub. notes 4.125%, 3/1/27 | 315,000 | 319,071 |
|
| Nabors Industries, Inc. company guaranty sr. unsec. unsub. notes | | |
| 4.625%, 9/15/21 | 305,000 | 308,050 |
|
| Noble Holding International, Ltd. company guaranty sr. unsec. | | |
| unsub. notes 6.05%, 3/1/41 | 160,000 | 113,200 |
|
| Pertamina Persero PT 144A sr. unsec. unsub. notes 4.30%, | | |
| 5/20/23 (Indonesia) | 200,000 | 205,768 |
|
| Petrobras Global Finance BV company guaranty sr. unsec. unsub. | | |
| bonds 7.25%, 3/17/44 (Brazil) | 1,177,000 | 1,170,723 |
|
| Petrobras Global Finance BV company guaranty sr. unsec. unsub. | | |
| notes 6.85%, 6/5/15 (Brazil) | 361,000 | 321,471 |
|
| Petrobras Global Finance BV company guaranty sr. unsec. unsub. | | |
| notes 6.25%, 3/17/24 (Brazil) | 651,000 | 674,599 |
|
| | |
| | Principal | |
| CORPORATE BONDS AND NOTES (31.3%)* cont. | amount | Value |
|
| Energy cont. | | |
|
| Petrobras Global Finance BV company guaranty sr. unsec. unsub. | | |
| notes 5.375%, 1/27/21 (Brazil) | $225,000 | $231,154 |
|
| Petroleos de Venezuela SA company guaranty sr. unsec. unsub. | | |
| notes 5.375%, 4/12/27 (Venezuela) | 23,000 | 8,735 |
|
| Petroleos de Venezuela SA 144A company guaranty sr. unsec. | | |
| notes 6.00%, 11/15/26 (Venezuela) | 155,000 | 59,133 |
|
| Petroleos Mexicanos company guaranty sr. unsec. unsub. bonds | | |
| 5.625%, 1/23/46 (Mexico) | 315,000 | 280,429 |
|
| Petroleos Mexicanos company guaranty sr. unsec. unsub. notes | | |
| 5.50%, 1/21/21 (Mexico) | 625,000 | 665,126 |
|
| Petroleos Mexicanos company guaranty sr. unsec. unsub. notes | | |
| 4.50%, 1/23/26 (Mexico) | 1,281,000 | 1,242,570 |
|
| Pride International, LLC company guaranty sr. unsec. unsub. notes | | |
| 7.875%, 8/15/40 | 425,000 | 388,875 |
|
| Sabine Pass Liquefaction, LLC sr. notes 5.625%, 4/15/23 | 213,000 | 234,575 |
|
| Sabine Pass Liquefaction, LLC 144A sr. bonds 5.00%, 3/15/27 | 800,000 | 844,337 |
|
| Sabine Pass Liquefaction, LLC 144A sr. bonds 4.20%, 3/15/28 | 25,000 | 25,033 |
|
| Spectra Energy Capital, LLC company guaranty sr. unsec. notes | | |
| 5.65%, 3/1/20 | 20,000 | 21,541 |
|
| Spectra Energy Partners LP sr. unsec. notes 3.375%, 10/15/26 | 180,000 | 175,040 |
|
| Statoil ASA company guaranty sr. unsec. notes 5.10%, | | |
| 8/17/40 (Norway) | 165,000 | 187,340 |
|
| Transcanada Trust company guaranty jr. unsec. sub. FRB 5.30%, | | |
| 3/15/77 (Canada) | 595,000 | 600,206 |
|
| Valero Energy Partners LP sr. unsec. unsub. notes | | |
| 4.375%, 12/15/26 | 175,000 | 179,910 |
|
| Williams Partners LP sr. unsec. sub. notes 4.30%, 3/4/24 | 505,000 | 524,307 |
|
| Williams Partners LP sr. unsec. sub. notes 3.60%, 3/15/22 | 155,000 | 158,618 |
|
| Williams Partners LP/ACMP Finance Corp. sr. unsec. sub. notes | | |
| 4.875%, 3/15/24 | 208,000 | 215,800 |
|
| | | 12,624,279 |
|
| Financials (9.9%) | | |
|
| Aflac, Inc. sr. unsec. notes 6.45%, 8/15/40 | 29,000 | 38,365 |
|
| Air Lease Corp. sr. unsec. notes 3.75%, 2/1/22 | 125,000 | 129,411 |
|
| Ally Financial, Inc. sub. unsec. notes 5.75%, 11/20/25 | 425,000 | 435,094 |
|
| American Express Co. jr. unsec. sub. FRN Ser. C, 4.90%, | | |
| perpetual maturity | 215,000 | 217,688 |
|
| American International Group, Inc. jr. unsec. sub. FRB | | |
| 8.175%, 5/15/58 | 414,000 | 534,060 |
|
| Aon PLC company guaranty sr. unsec. unsub. notes | | |
| 4.25%, 12/12/42 | 545,000 | 507,012 |
|
| AXA SA 144A jr. unsec. sub. FRN 6.463%, perpetual | | |
| maturity (France) | 485,000 | 488,031 |
|
| Bank of America Corp. jr. unsec. sub. FRN Ser. Z, 6.50%, | | |
| perpetual maturity | 460,000 | 511,175 |
|
| BGC Partners, Inc. sr. unsec. notes 5.125%, 5/27/21 | 405,000 | 422,239 |
|
| BPCE SA 144A unsec. sub. notes 5.70%, 10/22/23 (France) | 210,000 | 227,307 |
|
| BPCE SA 144A unsec. sub. notes 5.15%, 7/21/24 (France) | 215,000 | 224,431 |
|
| Cantor Fitzgerald LP 144A unsec. notes 6.50%, 6/17/22 | 320,000 | 353,289 |
|
| Capital One Financial Corp. unsec. sub. notes 4.20%, 10/29/25 | 150,000 | 151,051 |
|
| | |
| | Principal | |
| CORPORATE BONDS AND NOTES (31.3%)* cont. | amount | Value |
|
| Financials cont. | | |
|
| CBRE Services, Inc. company guaranty sr. unsec. notes | | |
| 5.25%, 3/15/25 | $156,000 | $168,022 |
|
| CBRE Services, Inc. company guaranty sr. unsec. unsub. notes | | |
| 4.875%, 3/1/26 | 230,000 | 242,106 |
|
| Citigroup, Inc. jr. unsec. sub. FRB Ser. B, 5.90%, perpetual maturity | 152,000 | 159,600 |
|
| Citigroup, Inc. jr. unsec. sub. FRB Ser. P, 5.95%, perpetual maturity | 148,000 | 155,493 |
|
| Citigroup, Inc. jr. unsec. sub. FRN 5.875%, perpetual maturity | 59,000 | 61,286 |
|
| CNO Financial Group, Inc. sr. unsec. unsub. notes 5.25%, 5/30/25 | 220,000 | 227,150 |
|
| Commerzbank AG 144A unsec. sub. notes 8.125%, | | |
| 9/19/23 (Germany) | 320,000 | 378,231 |
|
| Cooperatieve Rabobank UA 144A jr. unsec. sub. FRN 11.00%, | | |
| perpetual maturity (Netherlands) | 790,000 | 922,325 |
|
| Credit Suisse Group AG 144A jr. unsec. sub. FRN 6.25%, perpetual | | |
| maturity (Switzerland) | 200,000 | 208,500 |
|
| Credit Suisse Group AG 144A sr. unsec. bonds 4.282%, | | |
| 1/9/28 (Switzerland) | 1,100,000 | 1,117,333 |
|
| Dresdner Funding Trust I 144A jr. unsec. sub. notes 8.151%, 6/30/31 | 1,000,000 | 1,187,500 |
|
| EPR Properties company guaranty sr. unsec. sub. notes | | |
| 5.25%, 7/15/23 R | 162,000 | 171,963 |
|
| Fifth Third Bancorp jr. unsec. sub. FRB 5.10%, perpetual maturity | 83,000 | 82,585 |
|
| GE Capital International Funding Co. Unlimited Co. company | | |
| guaranty sr. unsec. bonds 4.418%, 11/15/35 (Ireland) | 484,000 | 517,444 |
|
| Goldman Sachs Group, Inc. (The) sr. unsec. unsub. notes | | |
| 3.85%, 1/26/27 | 665,000 | 675,768 |
|
| Goldman Sachs Group, Inc. (The) unsec. sub. notes 6.75%, 10/1/37 | 11,000 | 13,720 |
|
| Hartford Financial Services Group, Inc. (The) jr. unsec. sub. FRB | | |
| 8.125%, 6/15/38 | 220,000 | 233,750 |
|
| Healthcare Realty Trust, Inc. sr. unsec. unsub. notes | | |
| 3.875%, 5/1/25 R | 155,000 | 154,595 |
|
| Hospitality Properties Trust sr. unsec. unsub. notes | | |
| 4.50%, 3/15/25 R | 148,000 | 149,627 |
|
| HSBC Bank USA, NA unsec. sub. notes 7.00%, 1/15/39 | 250,000 | 338,441 |
|
| HSBC Capital Funding LP 144A company guaranty jr. unsec. sub. | | |
| FRB 10.176%, perpetual maturity (Jersey) | 570,000 | 874,950 |
|
| ING Bank NV 144A unsec. sub. notes 5.80%, 9/25/23 (Netherlands) | 831,000 | 931,243 |
|
| International Lease Finance Corp. sr. unsec. unsub. notes | | |
| 6.25%, 5/15/19 | 142,000 | 152,828 |
|
| Liberty Mutual Group, Inc. 144A company guaranty jr. unsec. sub. | | |
| bonds 7.80%, 3/15/37 | 650,000 | 752,375 |
|
| Liberty Mutual Group, Inc. 144A company guaranty jr. unsec. sub. | | |
| FRN 4.036%, 3/15/37 | 172,000 | 164,432 |
|
| Lloyds Banking Group PLC unsec. sub. bonds 5.30%, 12/1/45 | | |
| (United Kingdom) | 342,000 | 368,296 |
|
| Lloyds Banking Group PLC 144A jr. unsec. sub. FRN 6.657%, | | |
| perpetual maturity (United Kingdom) | 530,000 | 581,622 |
|
| Massachusetts Mutual Life Insurance Co. 144A unsec. sub. notes | | |
| 8.875%, 6/1/39 | 635,000 | 1,030,900 |
|
| MetLife Capital Trust IV 144A jr. unsec. sub. notes 7.875%, 12/15/37 | 330,000 | 420,915 |
|
| Mid-America Apartments LP sr. unsec. notes 4.30%, 10/15/23 R | 155,000 | 164,726 |
|
| Mitsubishi UFJ Financial Group, Inc. sr. unsec. unsub. notes 3.85%, | | |
| 3/1/26 (Japan) | 240,000 | 249,180 |
|
| | |
| | Principal | |
| CORPORATE BONDS AND NOTES (31.3%)* cont. | amount | Value |
|
| Financials cont. | | |
|
| OneAmerica Financial Partners, Inc. 144A sr. unsec. notes | | |
| 7.00%, 10/15/33 | $30,000 | $37,799 |
|
| Peachtree Corners Funding Trust 144A company guaranty sr. | | |
| unsec. unsub. bonds 3.976%, 2/15/25 | 100,000 | 101,407 |
|
| Primerica, Inc. sr. unsec. notes 4.75%, 7/15/22 | 90,000 | 96,877 |
|
| Progressive Corp. (The) jr. unsec. sub. FRN 6.70%, 6/15/37 | 289,000 | 290,084 |
|
| Prudential Financial, Inc. jr. unsec. sub. FRN 5.625%, 6/15/43 | 90,000 | 97,875 |
|
| Prudential Financial, Inc. jr. unsec. sub. FRN 5.20%, 3/15/44 | 174,000 | 180,960 |
|
| Prudential Financial, Inc. sr. unsec. notes 6.625%, 6/21/40 | 85,000 | 111,810 |
|
| Royal Bank of Canada unsec. sub. notes Ser. GMTN, 4.65%, | | |
| 1/27/26 (Canada) | 159,000 | 169,796 |
|
| Santander Issuances SAU company guaranty unsec. sub. notes | | |
| 5.179%, 11/19/25 (Spain) | 200,000 | 209,201 |
|
| Santander UK PLC 144A unsec. sub. notes 5.00%, 11/7/23 | | |
| (United Kingdom) | 270,000 | 283,985 |
|
| Sberbank of Russia Via SB Capital SA 144A sr. unsec. notes 6.125%, | | |
| 2/7/22 (Russia) | 275,000 | 301,125 |
|
| State Street Corp. jr. unsec. sub. FRB 2.131%, 6/15/37 | 461,000 | 405,104 |
|
| Teachers Insurance & Annuity Association of America 144A unsec. | | |
| sub. notes 6.85%, 12/16/39 | 136,000 | 185,535 |
|
| TIERS Trust/United States 144A sr. bonds stepped-coupon zero % | | |
| (8.125%, 9/15/17), 3/15/46 †† | 520,000 | 574,600 |
|
| Toronto-Dominion Bank (The) unsec. sub. FRB 3.625%, | | |
| 9/15/31 (Canada) | 261,000 | 258,693 |
|
| Travelers Property Casualty Corp. company guaranty sr. unsec. | | |
| unsub. bonds 7.75%, 4/15/26 | 170,000 | 228,128 |
|
| UBS Group AG jr. unsec. sub. FRN 6.875%, perpetual | | |
| maturity (Switzerland) | 300,000 | 316,328 |
|
| UBS Group Funding Jersey, Ltd. 144A company guaranty sr. unsec. | | |
| notes 4.125%, 4/15/26 (Jersey) | 579,000 | 596,167 |
|
| VEREIT Operating Partnership LP company guaranty sr. unsec. | | |
| notes 4.60%, 2/6/24 R | 465,000 | 485,344 |
|
| Vnesheconombank Via VEB Finance PLC 144A sr. unsec. unsub. | | |
| notes 6.80%, 11/22/25 (Russia) | 500,000 | 557,702 |
|
| VTB Bank OJSC Via VTB Capital SA 144A sr. unsec. notes 6.875%, | | |
| 5/29/18 (Russia) | 699,000 | 731,853 |
|
| Wells Fargo Bank, NA unsec. sub. notes Ser. BKNT, 6.60%, 1/15/38 | 276,000 | 366,447 |
|
| WP Carey, Inc. sr. unsec. unsub. notes 4.60%, 4/1/24 R | 560,000 | 585,186 |
|
| ZFS Finance USA Trust V 144A jr. unsec. sub. FRB 6.50%, 5/9/37 | 300,000 | 300,240 |
|
| | | 24,568,305 |
|
| Health care (0.7%) | | |
|
| AbbVie, Inc. sr. unsec. notes 3.60%, 5/14/25 | 11,000 | 11,094 |
|
| Fresenius Medical Care US Finance II, Inc. 144A company guaranty | | |
| sr. unsec. sub. notes 5.625%, 7/31/19 | 120,000 | 128,100 |
|
| Fresenius Medical Care US Finance, Inc. 144A company guaranty | | |
| sr. unsec. unsub. notes 5.75%, 2/15/21 | 135,000 | 147,488 |
|
| HCA, Inc. company guaranty sr. bonds 5.25%, 6/15/26 | 110,000 | 117,288 |
|
| HCA, Inc. company guaranty sr. sub. notes 5.00%, 3/15/24 | 75,000 | 79,594 |
|
| Omega Healthcare Investors, Inc. company guaranty sr. unsec. | | |
| notes 4.50%, 4/1/27 R | 180,000 | 177,750 |
|
| | | |
| | | Principal | |
| CORPORATE BONDS AND NOTES (31.3%)* cont. | | amount | Value |
|
| Health care cont. | | | |
|
| Omega Healthcare Investors, Inc. company guaranty sr. unsec. | | | |
| unsub. notes 4.95%, 4/1/24 R | | $100,000 | $104,464 |
|
| Shire Acquisitions Investments Ireland DAC company guaranty sr. | | | |
| unsec. unsub. notes 3.20%, 9/23/26 (Ireland) | | 440,000 | 420,367 |
|
| Shire Acquisitions Investments Ireland DAC company guaranty sr. | | | |
| unsec. unsub. notes 2.875%, 9/23/23 (Ireland) | | 235,000 | 230,411 |
|
| Teva Pharmaceutical Finance Netherlands III BV company | | | |
| guaranty sr. unsec. unsub. bonds 3.15%, 10/1/26 (Netherlands) | | 355,000 | 330,540 |
|
| | | | 1,747,096 |
|
| Supra-Nation (1.8%) | | | |
|
| European Investment Bank sr. unsec. unsub. bonds 5.625%, | | | |
| 6/7/32 (Supra-Nation) | GBP | 1,900,000 | 3,703,879 |
|
| European Investment Bank sr. unsec. unsub. notes Ser. EMTN, | | | |
| 4.125%, 4/15/24 (Supra-Nation) | EUR | 450,000 | 626,488 |
|
| | | | 4,330,367 |
|
| Technology (1.0%) | | | |
|
| Apple, Inc. sr. unsec. notes 3.45%, 5/6/24 | | $166,000 | 173,555 |
|
| Broadcom Corp./Broadcom Cayman Finance, Ltd. 144A company | | | |
| guaranty sr. unsec. unsub. notes 3.875%, 1/15/27 | | 596,000 | 604,789 |
|
| Diamond 1 Finance Corp./Diamond 2 Finance Corp. 144A | | | |
| company guaranty sr. unsec. notes 7.125%, 6/15/24 | | 490,000 | 541,615 |
|
| Diamond 1 Finance Corp./Diamond 2 Finance Corp. 144A sr. bonds | | | |
| 8.35%, 7/15/46 | | 146,000 | 188,964 |
|
| Diamond 1 Finance Corp./Diamond 2 Finance Corp. 144A sr. notes | | | |
| 5.45%, 6/15/23 | | 742,000 | 800,743 |
|
| Jabil Circuit, Inc. sr. unsec. sub. notes 8.25%, 3/15/18 | | 100,000 | 105,529 |
|
| | | | 2,415,195 |
|
| Transportation (0.4%) | | | |
|
| Burlington Northern Santa Fe, LLC sr. unsec. unsub. notes | | | |
| 5.75%, 5/1/40 | | 10,000 | 12,253 |
|
| Continental Airlines, Inc. Pass Through Trust pass-through | | | |
| certificates Ser. 97-4, Class A, 6.90%, 1/2/18 | | 3,671 | 3,728 |
|
| Continental Airlines, Inc. Pass Through Trust pass-through | | | |
| certificates Ser. 98-1, Class A, 6.648%, 9/15/17 | | 6,431 | 6,528 |
|
| Delta Air Lines, Inc. sr. notes Ser. A, 7.75%, 12/17/19 | | 34,503 | 38,036 |
|
| Norfolk Southern Corp. sr. unsec. unsub. bonds 6.00%, 5/23/11 | | 140,000 | 162,337 |
|
| Penske Truck Leasing Co. Lp/PTL Finance Corp. 144A sr. unsec. | | | |
| bonds 3.40%, 11/15/26 | | 359,000 | 348,085 |
|
| Southwest Airlines Co. Pass Through Trust pass-through | | | |
| certificates Ser. 07-1, Class A, 6.15%, 8/1/22 | | 143,272 | 158,316 |
|
| United AirLines, Inc. Pass-Through Trust pass-through certificates | | | |
| Ser. 07-1, Class A, 6.636%, 7/2/22 | | 26,965 | 29,055 |
|
| United Airlines, Inc. Pass-Through Trust pass-through certificates | | | |
| Ser. 14-2, Class A, 3.75%, 9/3/26 | | 150,775 | 153,979 |
|
| | | | 912,317 |
|
| Utilities and power (2.3%) | | | |
|
| Beaver Valley II Funding Corp. sr. bonds 9.00%, 6/1/17 | | 2,000 | 2,012 |
|
| Boardwalk Pipelines LP company guaranty sr. unsec. unsub. FRB | | | |
| 4.45%, 7/15/27 | | 95,000 | 97,190 |
|
| Consolidated Edison Co. of New York, Inc. sr. unsec. unsub. notes | | | |
| 4.20%, 3/15/42 | | 41,000 | 41,955 |
|
| | |
| | Principal | |
| CORPORATE BONDS AND NOTES (31.3%)* cont. | amount | Value |
|
| Utilities and power cont. | | |
|
| El Paso Natural Gas Co., LLC company guaranty sr. unsec. unsub. | | |
| notes 8.375%, 6/15/32 | $105,000 | $135,174 |
|
| Emera US Finance LP company guaranty sr. unsec. notes | | |
| 3.55%, 6/15/26 | 263,000 | 260,978 |
|
| Enbridge, Inc. sr. unsec. unsub. bonds 4.25%, 12/1/26 (Canada) | 205,000 | 213,772 |
|
| Energy Transfer Equity LP sr. sub. notes 5.875%, 1/15/24 | 130,000 | 140,075 |
|
| Energy Transfer Partners LP sr. unsec. unsub. bonds | | |
| 4.20%, 4/15/27 | 25,000 | 25,171 |
|
| Energy Transfer Partners LP sr. unsec. unsub. notes 6.50%, 2/1/42 | 515,000 | 570,617 |
|
| Energy Transfer Partners LP sr. unsec. unsub. notes 5.20%, 2/1/22 | 210,000 | 227,333 |
|
| FirstEnergy Transmission, LLC 144A sr. unsec. unsub. notes | | |
| 5.45%, 7/15/44 | 830,000 | 919,738 |
|
| Great Plains Energy, Inc. sr. unsec. unsub. bonds 4.85%, 4/1/47 | 415,000 | 421,614 |
|
| Iberdrola International BV company guaranty sr. unsec. unsub. | | |
| bonds 6.75%, 7/15/36 (Spain) | 155,000 | 195,744 |
|
| ITC Holdings Corp. 144A sr. unsec. notes 6.05%, 1/31/18 | 125,000 | 128,650 |
|
| Kinder Morgan Energy Partners LP company guaranty sr. unsec. | | |
| notes 5.40%, 9/1/44 | 312,000 | 317,131 |
|
| Kinder Morgan Energy Partners LP company guaranty sr. unsec. | | |
| notes 3.50%, 3/1/21 | 40,000 | 40,899 |
|
| Puget Sound Energy, Inc. jr. unsec. sub. FRN Ser. A, 6.974%, 6/1/67 | 240,000 | 219,600 |
|
| Texas Gas Transmission, LLC 144A sr. unsec. notes 4.50%, 2/1/21 | 369,000 | 386,840 |
|
| Texas-New Mexico Power Co. 144A 1st sr. bonds Ser. A, | | |
| 9.50%, 4/1/19 | 530,000 | 600,567 |
|
| WEC Energy Group jr. unsec. sub. FRN 6.25%, 5/15/67 | 830,000 | 776,050 |
|
| | | 5,721,110 |
|
| Total corporate bonds and notes (cost $74,179,531) | | $77,132,626 |
|
| |
| | Principal | |
| MORTGAGE-BACKED SECURITIES (23.3%)* | amount | Value |
|
| Agency collateralized mortgage obligations (8.1%) | | |
|
| Federal Home Loan Mortgage Corporation | | |
|
| IFB Ser. 3408, Class EK, 21.792%, 4/15/37 | $15,169 | $23,436 |
|
| IFB Ser. 3072, Class SM, 20.15%, 11/15/35 | 47,710 | 69,445 |
|
| IFB Ser. 3249, Class PS, 18.993%, 12/15/36 | 28,698 | 40,334 |
|
| IFB Ser. 3065, Class DC, 16.877%, 3/15/35 | 64,716 | 93,858 |
|
| IFB Ser. 2990, Class LB, 14.404%, 6/15/34 | 42,385 | 50,916 |
|
| Ser. 3707, Class PI, IO, 4.50%, 7/15/25 | 186,817 | 13,888 |
|
| Ser. 4355, Class DI, IO, 4.00%, 3/15/44 | 2,000,084 | 247,210 |
|
| Ser. 4193, Class PI, IO, 4.00%, 3/15/43 | 1,446,877 | 229,844 |
|
| Structured Agency Credit Risk Debt FRN Ser. 15-DNA2, Class M2, | | |
| 3.591%, 12/25/27 | 248,228 | 254,697 |
|
| Ser. 4369, Class IA, IO, 3.50%, 7/15/44 | 1,881,408 | 312,618 |
|
| Ser. 4141, Class PI, IO, 3.00%, 12/15/42 | 2,651,115 | 311,480 |
|
| Ser. 4165, Class TI, IO, 3.00%, 12/15/42 | 6,602,875 | 663,589 |
|
| Ser. 4206, Class IP, IO, 3.00%, 12/15/41 | 2,173,895 | 212,054 |
|
| Ser. 3300, PO, zero %, 2/15/37 | 3,879 | 3,359 |
|
| Ser. 3326, Class WF, zero %, 10/15/35 | 1,810 | 1,360 |
|
| | |
| | Principal | |
| MORTGAGE-BACKED SECURITIES (23.3%)* cont. | amount | Value |
|
| Agency collateralized mortgage obligations cont. | | |
|
| Federal National Mortgage Association | | |
|
| IFB Ser. 06-8, Class HP, 20.935%, 3/25/36 | $38,524 | $61,180 |
|
| IFB Ser. 07-53, Class SP, 20.568%, 6/25/37 | 40,363 | 59,656 |
|
| IFB Ser. 05-75, Class GS, 17.278%, 8/25/35 | 31,002 | 40,544 |
|
| IFB Ser. 12-58, Class SM, IO, 5.509%, 6/25/42 | 1,519,524 | 285,013 |
|
| IFB Ser. 10-46, Class SB, IO, 5.459%, 5/25/40 | 441,351 | 78,210 |
|
| IFB Ser. 12-103, Class LS, IO, 5.009%, 9/25/42 | 2,306,947 | 388,799 |
|
| Ser. 421, Class C6, IO, 4.00%, 5/25/45 | 1,192,601 | 237,923 |
|
| Ser. 12-124, Class JI, IO, 3.50%, 11/25/42 | 1,577,719 | 209,111 |
|
| Ser. 13-55, Class IK, IO, 3.00%, 4/25/43 | 1,474,616 | 167,516 |
|
| Ser. 13-1, Class MI, IO, 3.00%, 1/25/43 | 1,646,133 | 152,596 |
|
| Ser. 13-35, Class IP, IO, 3.00%, 6/25/42 | 3,443,541 | 282,026 |
|
| Ser. 13-55, Class PI, IO, 3.00%, 5/25/42 | 3,428,830 | 298,342 |
|
| Ser. 13-23, Class PI, IO, 3.00%, 10/25/41 | 4,303,051 | 293,726 |
|
| Ser. 14-28, Class AI, IO, 3.00%, 3/25/40 | 2,780,761 | 301,713 |
|
| Connecticut Avenue Securities FRB Ser. 16-C05, Class 2M1, | | |
| 2.341%, 1/25/29 | 382,518 | 385,333 |
|
| Ser. 07-64, Class LO, PO, zero %, 7/25/37 | 5,635 | 5,190 |
|
| Government National Mortgage Association | | |
|
| Ser. 16-75, Class LI, IO, 6.00%, 1/20/40 | 1,744,150 | 409,875 |
|
| IFB Ser. 13-124, Class BS, IO, 5.657%, 8/20/38 | 3,142,509 | 416,382 |
|
| IFB Ser. 10-171, Class SB, IO, 5.456%, 12/16/40 | 1,365,549 | 247,874 |
|
| Ser. 14-76, IO, 5.00%, 5/20/44 | 938,763 | 192,960 |
|
| Ser. 14-25, Class QI, IO, 5.00%, 1/20/44 | 1,914,659 | 372,707 |
|
| Ser. 10-35, Class UI, IO, 5.00%, 3/20/40 | 314,011 | 66,203 |
|
| Ser. 10-9, Class UI, IO, 5.00%, 1/20/40 | 642,600 | 136,083 |
|
| Ser. 09-121, Class UI, IO, 5.00%, 12/20/39 | 204,405 | 42,950 |
|
| Ser. 15-80, Class IA, IO, 4.50%, 6/20/45 | 2,358,778 | 469,033 |
|
| Ser. 13-182, Class IQ, IO, 4.50%, 12/16/43 | 1,859,570 | 374,239 |
|
| Ser. 12-91, Class IN, IO, 4.50%, 5/20/42 | 2,930,144 | 571,671 |
|
| Ser. 11-18, Class PI, IO, 4.50%, 8/20/40 | 809,802 | 107,461 |
|
| Ser. 10-35, Class AI, IO, 4.50%, 3/20/40 | 1,506,126 | 293,213 |
|
| Ser. 10-35, Class QI, IO, 4.50%, 3/20/40 | 1,087,729 | 217,767 |
|
| Ser. 10-103, Class DI, IO, 4.50%, 12/20/38 | 485,183 | 22,964 |
|
| Ser. 16-19, Class PI, IO, 4.00%, 2/20/46 | 2,125,096 | 365,920 |
|
| Ser. 16-47, Class CI, IO, 4.00%, 9/20/45 | 4,335,915 | 665,476 |
|
| Ser. 17-57, Class AI, IO, 4.00%, 6/20/45 | 1,738,000 | 336,738 |
|
| Ser. 15-64, Class IG, IO, 4.00%, 5/20/45 | 2,195,057 | 446,123 |
|
| Ser. 15-40, IO, 4.00%, 3/20/45 | 1,603,915 | 340,506 |
|
| Ser. 14-116, Class IL, IO, 4.00%, 8/20/44 | 2,307,678 | 380,767 |
|
| Ser. 13-24, Class PI, IO, 4.00%, 11/20/42 | 648,625 | 103,993 |
|
| Ser. 15-94, Class NI, IO, 4.00%, 12/20/41 | 4,353,989 | 464,266 |
|
| Ser. 16-83, Class PI, IO, 3.50%, 6/20/45 | 3,253,649 | 531,497 |
|
| Ser. 13-27, Class PI, IO, 3.50%, 12/20/42 | 1,075,054 | 167,386 |
|
| Ser. 12-136, Class BI, IO, 3.50%, 11/20/42 | 1,688,189 | 327,846 |
|
| Ser. 14-102, Class IG, IO, 3.50%, 3/16/41 | 1,744,370 | 233,960 |
|
| Ser. 13-90, Class HI, IO, 3.50%, 4/20/40 | 1,637,664 | 116,749 |
|
| Ser. 15-124, Class NI, IO, 3.50%, 6/20/39 | 2,114,491 | 219,167 |
|
| Ser. 15-124, Class DI, IO, 3.50%, 1/20/38 | 1,349,121 | 171,152 |
|
| | | |
| | | Principal | |
| MORTGAGE-BACKED SECURITIES (23.3%)* cont. | | amount | Value |
|
| Agency collateralized mortgage obligations cont. | | | |
|
| Government National Mortgage Association | | | |
|
| Ser. 13-53, Class PI, IO, 3.00%, 4/20/41 | | $3,510,117 | $398,855 |
|
| Ser. 14-115, Class QI, IO, 3.00%, 3/20/29 | | 2,872,445 | 264,581 |
|
| Ser. 16-H23, Class NI, IO, 2.584%, 10/20/66 | | 4,714,764 | 647,337 |
|
| Ser. 15-H09, Class AI, IO, 2.362%, 4/20/65 | | 6,581,335 | 639,706 |
|
| Ser. 15-H26, Class DI, IO, 2.282%, 10/20/65 | | 3,125,560 | 341,936 |
|
| Ser. 15-H03, Class DI, IO, 2.252%, 1/20/65 | | 5,617,138 | 544,862 |
|
| Ser. 16-H16, Class EI, IO, 2.18%, 6/20/66 | | 3,879,389 | 493,846 |
|
| Ser. 16-H07, Class HI, IO, 2.111%, 2/20/66 | | 4,343,569 | 449,750 |
|
| Ser. 14-H21, Class AI, IO, 1.958%, 10/20/64 | | 3,271,821 | 308,860 |
|
| Ser. 15-H26, Class EI, IO, 1.719%, 10/20/65 | | 3,435,840 | 323,313 |
|
| Ser. 15-H25, Class AI, IO, 1.612%, 9/20/65 | | 3,481,761 | 281,326 |
|
| Ser. 14-H12, Class BI, IO, 1.545%, 5/20/64 | | 4,203,764 | 335,460 |
|
| Ser. 16-H25, Class GI, IO, 1.511%, 11/20/66 | | 4,837,982 | 298,020 |
|
| | | | 19,915,746 |
|
| Commercial mortgage-backed securities (11.5%) | | | |
|
| Banc of America Commercial Mortgage Trust 144A FRB Ser. 07-5, | | | |
| Class XW, IO, 0.478%, 2/10/51 | | 4,238,494 | 4,495 |
|
| Banc of America Merrill Lynch Commercial Mortgage, Inc. 144A | | | |
| FRB Ser. 04-4, Class XC, IO, 0.019%, 7/10/42 | | 31,904 | 6 |
|
| Bayview Commercial Asset Trust 144A | | | |
|
| Ser. 06-CD1A, IO, zero %, 7/25/23 | CAD | 1,602,555 | 1 |
|
| Ser. 07-CD1A, IO, zero %, 3/25/21 | CAD | 388,697 | 1 |
|
| Bear Stearns Commercial Mortgage Securities Trust 144A | | | |
|
| FRB Ser. 06-PW11, Class B, 5.328%, 3/11/39 | | $705,691 | 674,655 |
|
| FRB Ser. 06-PW11, Class C, 5.328%, 3/11/39 | | 403,000 | 203,761 |
|
| FRB Ser. 06-PW14, Class X1, IO, 0.534%, 12/11/38 | | 565,953 | 6,344 |
|
| CD Mortgage Trust 144A FRB Ser. 07-CD5, Class XS, IO, | | | |
| 0.208%, 11/15/44 | | 2,125,594 | 83 |
|
| CFCRE Commercial Mortgage Trust 144A | | | |
|
| FRB Ser. 11-C1, Class E, 6.281%, 4/15/44 | | 264,370 | 123,408 |
|
| FRB Ser. 11-C2, Class E, 5.945%, 12/15/47 | | 1,053,000 | 1,058,201 |
|
| Citigroup Commercial Mortgage Trust | | | |
|
| FRB Ser. 13-GC17, Class C, 5.259%, 11/10/46 | | 522,000 | 551,036 |
|
| Ser. 14-GC21, Class AS, 4.026%, 5/10/47 | | 749,000 | 778,997 |
|
| Citigroup Commercial Mortgage Trust 144A FRB Ser. 06-C5, | | | |
| Class XC, IO, 0.625%, 10/15/49 | | 5,118,844 | 12,285 |
|
| COBALT CMBS Commercial Mortgage Trust FRB Ser. 07-C3, | | | |
| Class AJ, 5.99%, 5/15/46 | | 461,000 | 461,943 |
|
| COMM Mortgage Pass-Through Certificates FRB Ser. 12-CR3, | | | |
| Class XA, IO, 2.229%, 10/15/45 | | 2,735,058 | 198,315 |
|
| COMM Mortgage Trust | | | |
|
| FRB Ser. 14-CR17, Class C, 4.895%, 5/10/47 | | 478,000 | 479,519 |
|
| FRB Ser. 14-CR18, Class C, 4.894%, 7/15/47 | | 886,000 | 919,402 |
|
| Ser. 12-CR2, Class AM, 3.791%, 8/15/45 | | 356,000 | 371,634 |
|
| FRB Ser. 12-CR1, Class XA, IO, 2.062%, 5/15/45 | | 2,762,313 | 213,736 |
|
| FRB Ser. 14-UBS6, Class XA, IO, 1.195%, 12/10/47 | | 10,362,271 | 550,237 |
|
| COMM Mortgage Trust 144A | | | |
|
| Ser. 13-LC13, Class AM, 4.557%, 8/10/46 | | 474,000 | 513,342 |
|
| Ser. 13-LC13, Class E, 3.719%, 8/10/46 | | 489,000 | 324,598 |
|
| | |
| | Principal | |
| MORTGAGE-BACKED SECURITIES (23.3%)* cont. | amount | Value |
|
| Commercial mortgage-backed securities cont. | | |
|
| Credit Suisse Commercial Mortgage Trust 144A FRB Ser. 07-C2, | | |
| Class AX, IO, 0.11%, 1/15/49 | $1,536,367 | $9 |
|
| Credit Suisse First Boston Mortgage Securities Corp. 144A | | |
|
| Ser. 98-C1, Class F, 6.00%, 5/17/40 | 35,541 | 36,099 |
|
| FRB Ser. 03-C3, Class AX, IO, 2.207%, 5/15/38 | 71,105 | 12 |
|
| Credit Suisse Mortgage Capital Certificates 144A FRB Ser. 06-C4, | | |
| Class AX, IO, 0.436%, 9/15/39 | 611,577 | 17 |
|
| CSAIL Commercial Mortgage Trust FRB Ser. 15-C1, Class C, | | |
| 4.443%, 4/15/50 | 285,000 | 286,408 |
|
| CSMC Trust FRB Ser. 16-NXSR, Class C, 4.51%, 12/15/49 | 808,000 | 817,513 |
|
| DBUBS Mortgage Trust 144A FRB Ser. 11-LC3A, Class D, | | |
| 5.51%, 8/10/44 | 1,220,000 | 1,259,162 |
|
| GE Commercial Mortgage Corp. Trust 144A FRB Ser. 07-C1, | | |
| Class XC, IO, 0.238%, 12/10/49 | 10,713,215 | 25,315 |
|
| GS Mortgage Securities Corp. II FRB Ser. 13-GC10, Class XA, IO, | | |
| 1.735%, 2/10/46 | 7,485,122 | 509,737 |
|
| GS Mortgage Securities Corp. II 144A | | |
|
| FRB Ser. 13-GC10, Class D, 4.557%, 2/10/46 | 421,000 | 400,455 |
|
| FRB Ser. 13-GC10, Class E, 4.557%, 2/10/46 | 650,000 | 505,375 |
|
| GS Mortgage Securities Trust FRB Ser. 13-GC12, Class C, | | |
| 4.179%, 6/10/46 | 476,000 | 464,052 |
|
| GS Mortgage Securities Trust 144A | | |
|
| FRB Ser. 12-GC6, Class D, 5.841%, 1/10/45 | 771,000 | 744,169 |
|
| FRB Ser. 11-GC3, Class D, 5.82%, 3/10/44 | 381,000 | 386,772 |
|
| JPMBB Commercial Mortgage Securities Trust | | |
|
| FRB Ser. 14-C19, Class C, 4.822%, 4/15/47 | 486,000 | 493,748 |
|
| FRB Ser. 13-C14, Class C, 4.709%, 8/15/46 | 333,000 | 340,842 |
|
| FRB Ser. 13-C12, Class XA, IO, 0.812%, 7/15/45 | 24,907,194 | 587,810 |
|
| JPMorgan Chase Commercial Mortgage Securities Trust | | |
|
| FRB Ser. 07-CB20, Class AJ, 6.37%, 2/12/51 | 52,000 | 53,274 |
|
| FRB Ser. 06-LDP7, Class B, 6.138%, 4/17/45 | 914,000 | 155,380 |
|
| Ser. 13-C10, Class AS, 3.372%, 12/15/47 | 133,000 | 134,545 |
|
| FRB Ser. 13-LC11, Class XA, IO, 1.566%, 4/15/46 | 5,366,863 | 317,396 |
|
| FRB Ser. 13-C16, Class XA, IO, 1.285%, 12/15/46 | 11,946,881 | 534,986 |
|
| FRB Ser. 06-CB17, Class X, IO, 0.852%, 12/12/43 | 2,001,619 | 13,945 |
|
| FRB Ser. 06-LDP8, Class X, IO, 0.536%, 5/15/45 | 529,717 | 18 |
|
| FRB Ser. 07-LDPX, Class X, IO, 0.318%, 1/15/49 | 3,406,173 | 32,766 |
|
| JPMorgan Chase Commercial Mortgage Securities Trust 144A | | |
|
| FRB Ser. 07-CB20, Class C, 6.47%, 2/12/51 | 401,000 | 352,880 |
|
| FRB Ser. 12-C6, Class E, 5.313%, 5/15/45 | 1,313,000 | 1,233,170 |
|
| FRB Ser. 12-C8, Class D, 4.807%, 10/15/45 | 1,260,000 | 1,224,594 |
|
| FRB Ser. 12-LC9, Class D, 4.535%, 12/15/47 | 251,000 | 252,431 |
|
| FRB Ser. 07-CB20, Class X1, IO, 0.45%, 2/12/51 | 4,253,774 | 2,538 |
|
| LB Commercial Mortgage Trust 144A Ser. 98-C4, Class J, | | |
| 5.60%, 10/15/35 | 117,019 | 119,324 |
|
| LB-UBS Commercial Mortgage Trust FRB Ser. 07-C2, Class XW, IO, | | |
| 0.474%, 2/15/40 | 84,103 | 8 |
|
| | |
| | Principal | |
| MORTGAGE-BACKED SECURITIES (23.3%)* cont. | amount | Value |
|
| Commercial mortgage-backed securities cont. | | |
|
| LB-UBS Commercial Mortgage Trust 144A | | |
|
| FRB Ser. 06-C6, Class XCL, IO, 0.628%, 9/15/39 | $3,751,227 | $23,445 |
|
| FRB Ser. 07-C2, Class XCL, IO, 0.474%, 2/15/40 | 539,030 | 52 |
|
| FRB Ser. 05-C2, Class XCL, IO, 0.195%, 4/15/40 | 46,837 | 3 |
|
| LSTAR Commercial Mortgage Trust 144A FRB Ser. 15-3, Class C, | | |
| 3.369%, 4/20/48 | 373,000 | 314,129 |
|
| Mezz Cap Commercial Mortgage Trust 144A FRB Ser. 07-C5, Class X, | | |
| IO, 5.608%, 12/15/49 | 52,970 | 318 |
|
| Morgan Stanley Bank of America Merrill Lynch Trust | | |
|
| FRB Ser. 14-C14, Class C, 4.99%, 2/15/47 | 605,000 | 629,151 |
|
| Ser. 12-C5, Class AS, 3.792%, 8/15/45 | 799,000 | 832,718 |
|
| Morgan Stanley Bank of America Merrill Lynch Trust 144A FRB | | |
| Ser. 12-C6, Class XA, IO, 2.126%, 11/15/45 | 7,534,913 | 467,165 |
|
| Morgan Stanley Capital I Trust | | |
|
| Ser. 07-HQ11, Class C, 5.558%, 2/12/44 | 477,000 | 145,485 |
|
| Ser. 07-HQ11, Class AJ, 5.508%, 2/12/44 | 251,832 | 250,951 |
|
| Morgan Stanley Capital I Trust 144A | | |
|
| FRB Ser. 04-RR, Class F7, 6.00%, 4/28/39 | 92,830 | 91,188 |
|
| FRB Ser. 11-C3, Class D, 5.327%, 7/15/49 | 582,000 | 598,412 |
|
| FRB Ser. 05-HQ5, Class X1, IO, 0.018%, 1/14/42 | 1,276,099 | 8,894 |
|
| UBS-Barclays Commercial Mortgage Trust 144A FRB Ser. 12-C4, | | |
| Class XA, IO, 1.893%, 12/10/45 | 3,892,734 | 270,483 |
|
| Wachovia Bank Commercial Mortgage Trust | | |
|
| FRB Ser. 05-C21, Class D, 5.471%, 10/15/44 | 357,000 | 354,535 |
|
| FRB Ser. 07-C34, IO, 0.463%, 5/15/46 | 1,099,760 | 1,650 |
|
| Wells Fargo Commercial Mortgage Trust FRB Ser. 13-LC12, Class C, | | |
| 4.431%, 7/15/46 | 363,000 | 371,168 |
|
| WF-RBS Commercial Mortgage Trust | | |
|
| Ser. 14-C19, Class C, 4.646%, 3/15/47 | 475,000 | 484,880 |
|
| Ser. 13-C18, Class AS, 4.387%, 12/15/46 | 787,000 | 844,349 |
|
| Ser. 13-UBS1, Class AS, 4.306%, 3/15/46 | 476,000 | 507,259 |
|
| Ser. 13-C11, Class AS, 3.311%, 3/15/45 | 299,000 | 304,092 |
|
| FRB Ser. 13-C14, Class XA, IO, 0.951%, 6/15/46 | 12,586,637 | 454,755 |
|
| WF-RBS Commercial Mortgage Trust 144A | | |
|
| FRB Ser. 11-C5, Class C, 5.861%, 11/15/44 | 183,000 | 201,157 |
|
| FRB Ser. 11-C5, Class E, 5.861%, 11/15/44 | 453,000 | 459,387 |
|
| FRB Ser. 11-C2, Class D, 5.788%, 2/15/44 | 417,000 | 431,720 |
|
| Ser. 11-C4, Class E, 5.265%, 6/15/44 | 861,000 | 819,242 |
|
| FRB Ser. 13-C15, Class D, 4.629%, 8/15/46 | 184,000 | 163,109 |
|
| FRB Ser. 12-C10, Class D, 4.601%, 12/15/45 | 298,000 | 264,568 |
|
| FRB Ser. 12-C10, Class XA, IO, 1.821%, 12/15/45 | 3,905,842 | 262,394 |
|
| FRB Ser. 13-C12, Class XA, IO, 1.515%, 3/15/48 | 1,287,777 | 67,811 |
|
| | | 28,355,219 |
|
| Residential mortgage-backed securities (non-agency) (3.7%) | | |
|
| BCAP, LLC Trust 144A FRB Ser. 14-RR1, Class 2A2, 2.86%, 1/26/36 | 1,000,000 | 872,660 |
|
| Bear Stearns Asset Backed Securities I Trust FRB Ser. 04-FR3, | | |
| Class M6, 5.866%, 9/25/34 | 12,196 | 5,777 |
|
| Citigroup Mortgage Loan Trust, Inc. FRB Ser. 05-2, Class 1A2A, | | |
| 3.144%, 5/25/35 | 708,983 | 719,618 |
|
| | |
| | Principal | |
| MORTGAGE-BACKED SECURITIES (23.3%)* cont. | amount | Value |
|
| Residential mortgage-backed securities (non-agency) cont. | | |
|
| Countrywide Alternative Loan Trust | | |
|
| FRB Ser. 06-OA10, Class 1A1, 1.622%, 8/25/46 | $397,434 | $354,209 |
|
| FRB Ser. 06-OA7, Class 1A2, 1.602%, 6/25/46 | 843,697 | 776,201 |
|
| FRB Ser. 06-OA10, Class 4A1, 1.181%, 8/25/46 | 739,792 | 658,415 |
|
| Federal National Mortgage Association | | |
|
| Connecticut Avenue Securities FRB Ser. 16-C03, Class 2M2, | | |
| 6.891%, 10/25/28 | 166,780 | 193,412 |
|
| Connecticut Avenue Securities FRB Ser. 15-C04, Class 2M2, | | |
| 6.541%, 4/25/28 | 735,000 | 821,322 |
|
| Connecticut Avenue Securities FRB Ser. 15-C03, Class 2M2, | | |
| 5.991%, 7/25/25 | 20,000 | 22,259 |
|
| Connecticut Avenue Securities FRB Ser. 15-C02, Class 1M2, | | |
| 4.991%, 5/25/25 | 27,649 | 29,941 |
|
| MASTR Adjustable Rate Mortgages Trust FRB Ser. 04-13, Class 3A7, | | |
| 3.048%, 11/21/34 | 226,927 | 231,323 |
|
| Merrill Lynch Mortgage Investors Trust FRB Ser. 05-A2, Class A2, | | |
| 2.974%, 2/25/35 | 228,689 | 230,475 |
|
| Morgan Stanley Resecuritization Trust 144A Ser. 15-R4, Class CB1, | | |
| 0.598%, 8/26/47 | 170,000 | 138,550 |
|
| Structured Asset Mortgage Investments II Trust FRB Ser. 07-AR1, | | |
| Class 2A1, 1.171%, 1/25/37 | 320,287 | 280,324 |
|
| WaMu Mortgage Pass-Through Certificates Trust | | |
|
| FRB Ser. 05-AR9, Class A1C3, 1.951%, 7/25/45 | 800,858 | 770,826 |
|
| FRB Ser. 05-AR1, Class A1B, 1.771%, 1/25/45 | 277,750 | 254,141 |
|
| FRB Ser. 05-AR19, Class A1C3, 1.491%, 12/25/45 | 634,731 | 602,867 |
|
| FRB Ser. 05-AR13, Class A1C3, 1.481%, 10/25/45 | 1,755,999 | 1,629,026 |
|
| FRB Ser. 05-AR2, Class 2A1B, 1.361%, 1/25/45 | 631,680 | 587,209 |
|
| | | 9,178,555 |
|
| Total mortgage-backed securities (cost $58,182,393) | | $57,449,520 |
|
| |
| | Principal | |
| ASSET-BACKED SECURITIES (0.7%)* | amount | Value |
|
| Station Place Securitization Trust 144A FRB Ser. 17-1, Class A, | | |
| 1.891%, 2/25/49 | $1,675,000 | $1,675,000 |
|
| Total asset-backed securities (cost $1,675,000) | | $1,675,000 |
|
| | | | |
| PURCHASED SWAP OPTIONS OUTSTANDING | | | | |
| (0.3%)* | | | | |
| Counterparty | | | | |
| Fixed right % to receive or (pay)/ | Expiration | | Contract | |
| Floating rate index/Maturity date | date/strike | | amount | Value |
|
| Bank of America N.A. | | | | |
| 1.54/3 month USD-LIBOR-BBA/Jun-18 | Jun-17/1.54 | | $18,595,500 | $20,641 |
|
| 1.495/3 month USD-LIBOR-BBA/Jul-18 | Jul-17/1.495 | | 18,595,500 | 12,087 |
|
| (1.495)/3 month USD-LIBOR-BBA/Jul-18 | Jul-17/1.495 | | 18,595,500 | 8,926 |
|
| 1.698/3 month USD-LIBOR-BBA/Jun-18 | Jun-17/1.698 | | 18,595,500 | 7,252 |
|
| Barclays Bank PLC | | | | |
| 2.62/3 month USD-LIBOR-BBA/May-37 | May-17/2.62 | | 6,198,500 | 135,623 |
|
| (0.51)/3 month GBP-LIBOR-BBA/Sep-18 | Sep-17/0.51 | GBP | 15,086,000 | 5,666 |
|
| | | | |
| PURCHASED SWAP OPTIONS OUTSTANDING | | | | |
| (0.3%)* cont. | | | | |
| Counterparty | | | | |
| Fixed right % to receive or (pay)/ | Expiration | | Contract | |
| Floating rate index/Maturity date | date/strike | | amount | Value |
|
| Citibank, N.A. | | | | |
| 2.25/3 month USD-LIBOR-BBA/Sep-27 | Sep-17/2.25 | | $12,397,000 | $161,783 |
|
| 2.368/3 month USD-LIBOR-BBA/Jun-27 | Jun-17/2.368 | | 9,297,750 | 119,011 |
|
| 1.6125/3 month USD-LIBOR-BBA/Aug-18 | Aug-17/1.6125 | | 24,794,000 | 32,480 |
|
| 2.062/3 month USD-LIBOR-BBA/May-27 | May-17/2.062 | | 24,794,000 | 21,819 |
|
| 1.954/3 month USD-LIBOR-BBA/May-27 | May-17/1.954 | | 9,297,750 | 3,161 |
|
| Goldman Sachs International | | | | |
| 1.884/3 month USD-LIBOR-BBA/Jul-18 | Jul-17/1.884 | | 18,595,500 | 26,034 |
|
| JPMorgan Chase Bank N.A. | | | | |
| 2.4427/3 month USD-LIBOR-BBA/May-27 | May-17/2.4427 | | 6,198,500 | 105,870 |
|
| 2.9498/3 month USD-LIBOR-BBA/May-27 | May-17/2.9498 | | 6,198,500 | 77,791 |
|
| (2.81025)/3 month USD-LIBOR-BBA/Oct-27 | Oct-17/2.81025 | | 12,397,000 | 51,943 |
|
| 0.843/6 month EUR-EURIBOR-Reuters/Jun-27 | Jun-17/0.843 | EUR | 2,124,800 | 20,507 |
|
| 1.999/3 month USD-LIBOR-BBA/Jul-27 | Jul-17/1.999 | | $6,198,500 | 19,773 |
|
| Total purchased swap options outstanding (cost $883,291) | | | $830,367 |
|
| | |
| | Principal | |
| MUNICIPAL BONDS AND NOTES (0.2%)* | amount | Value |
|
| CA State G.O. Bonds (Build America Bonds), 7.50%, 4/1/34 | $100,000 | $141,719 |
|
| North TX, Tollway Auth. Rev. Bonds (Build America Bonds), | | |
| 6.718%, 1/1/49 | 95,000 | 136,140 |
|
| OH State U. Rev. Bonds (Build America Bonds), 4.91%, 6/1/40 | 115,000 | 134,766 |
|
| Total municipal bonds and notes (cost $310,615) | | $412,625 |
|
| | | |
| | Expiration | | |
| | date/strike | Contract | |
| PURCHASED OPTIONS OUTSTANDING (0.1%)* | price | amount | Value |
|
| Federal National Mortgage Association 30 yr 3.50% TBA | | | |
| commitments (Put) | May-17/$100.95 | $5,000,000 | $5 |
|
| Federal National Mortgage Association 30 yr 3.50% TBA | | | |
| commitments (Put) | May-17/100.83 | 5,000,000 | 5 |
|
| Federal National Mortgage Association 30 yr 3.50% TBA | | | |
| commitments (Put) | May-17/100.71 | 5,000,000 | 5 |
|
| Federal National Mortgage Association 30 yr 3.00% TBA | | | |
| commitments (Call) | Jun-17/98.76 | 5,000,000 | 60,385 |
|
| Federal National Mortgage Association 30 yr 3.00% TBA | | | |
| commitments (Call) | Jun-17/98.63 | 5,000,000 | 65,190 |
|
| Federal National Mortgage Association 30 yr 3.00% TBA | | | |
| commitments (Call) | Jun-17/98.51 | 5,000,000 | 70,145 |
|
| Total purchased options outstanding (cost $239,063) | | | $195,735 |
|
| | | |
| | Principal amount/ | |
| SHORT-TERM INVESTMENTS (6.5%)* | | shares | Value |
|
| Putnam Short Term Investment Fund 0.87% L | Shares | 9,752,925 | $9,752,925 |
|
| U.S. Treasury Bills 0.773%, 7/13/17 #Ƥ | | $5,810,000 | 5,801,250 |
|
| U.S. Treasury Bills 0.523%, 5/18/17 | | 375,000 | 374,880 |
|
| Total short-term investments (cost $15,928,877) | | | $15,929,055 |
|
| |
| TOTAL INVESTMENTS | | | |
|
| Total investments (cost $358,419,781) | | | $355,972,727 |
|
Key to holding’s currency abbreviations
| |
| AUD | Australian Dollar |
| BRL | Brazilian Real |
| CAD | Canadian Dollar |
| CHF | Swiss Franc |
| DKK | Danish Krone |
| EUR | Euro |
| GBP | British Pound |
| HUF | Hungarian Forint |
| JPY | Japanese Yen |
| KRW | South Korean Won |
| MXN | Mexican Peso |
| MYR | Malaysian Ringgit |
| NOK | Norwegian Krone |
| NZD | New Zealand Dollar |
| PLN | Polish Zloty |
| SEK | Swedish Krona |
| THB | Thai Baht |
| TRY | Turkish Lira |
| USD/$ | United States Dollar |
| ZAR | South African Rand |
Key to holding’s abbreviations
| |
| BKNT | Bank Note |
| bp | Basis Points |
| DAC | Designated Activity Company |
| EMTN | Euro Medium Term Notes |
| FRB | Floating Rate Bonds: the rate shown is the current interest rate at the close of the reporting period |
| FRN | Floating Rate Notes: the rate shown is the current interest rate or yield at the close of the |
| | reporting period |
| GMTN | Global Medium Term Notes |
| G.O. Bonds | General Obligation Bonds |
| IFB | Inverse Floating Rate Bonds, which are securities that pay interest rates that vary inversely to |
| | changes in the market interest rates. As interest rates rise, inverse floaters produce less current |
| | income. The rate shown is the current interest rate at the close of the reporting period. |
| IO | Interest Only |
| MTN | Medium Term Notes |
| OJSC | Open Joint Stock Company |
| OTC | Over-the-counter |
| PO | Principal Only |
| TBA | To Be Announced Commitments |
Notes to the fund’s portfolio
Unless noted otherwise, the notes to the fund’s portfolio are for the close of the fund’s reporting period, which ran from November 1, 2016 through April 30, 2017 (the reporting period). Within the following notes to the portfolio, references to “ASC 820” represent Accounting Standards Codification 820 Fair Value Measurements and Disclosures and references to “OTC”, if any, represent over-the-counter.
* Percentages indicated are based on net assets of $246,047,117.
†† The interest rate and date shown parenthetically represent the new interest rate to be paid and the date the fund will begin accruing interest at this rate.
# This security, in part or in entirety, was pledged and segregated with the broker to cover margin requirements for futures contracts at the close of the reporting period.
∆ This security, in part or in entirety, was pledged and segregated with the custodian for collateral on certain derivative contracts at the close of the reporting period.
§ This security, in part or in entirety, was pledged and segregated with the custodian for collateral on the initial margin on certain centrally cleared derivative contracts at the close of the reporting period.
i This security was pledged, or purchased with cash that was pledged, to the fund for collateral on certain derivative contracts (Note 1).
L Affiliated company (Note 5). The rate quoted in the security description is the annualized 7-day yield of the fund at the close of the reporting period.
R Real Estate Investment Trust.
At the close of the reporting period, the fund maintained liquid assets totaling $127,439,728 to cover certain derivative contracts and delayed delivery securities.
Unless otherwise noted, the rates quoted in Short-term investments security descriptions represent the weighted average yield to maturity.
Debt obligations are considered secured unless otherwise indicated.
144A after the name of an issuer represents securities exempt from registration under Rule 144A of the Securities Act of 1933, as amended. These securities may be resold in transactions exempt from registration, normally to qualified institutional buyers.
See Note 1 to the financial statements regarding TBA commitments.
The dates shown on debt obligations are the original maturity dates.
|
| DIVERSIFICATION BY COUNTRY ⌂ |
|
Distribution of investments by country of risk at the close of the reporting period, excluding collateral received, if any (as a percentage of Portfolio Value):
| | | | |
| United States | 66.0% | | Brazil | 0.9% |
| |
|
| Japan | 11.4 | | Greece | 0.7 |
| |
|
| Italy | 2.6 | | Russia | 0.7 |
| |
|
| France | 2.6 | | Switzerland | 0.6 |
| |
|
| United Kingdom | 1.9 | | Argentina | 0.6 |
| |
|
| Canada | 1.6 | | Australia | 0.6 |
| |
|
| Mexico | 1.5 | | Ireland | 0.6 |
| |
|
| Spain | 1.4 | | Belgium | 0.6 |
| |
|
| Germany | 1.3 | | Other | 2.0 |
| |
|
| Netherlands | 1.2 | | Total | 100.0% |
| |
|
| Supra-Nation | 1.2 | | | |
⌂ Methodology differs from that used for purposes of complying with the fund’s policy regarding investments in securities of foreign issuers, as discussed further in the fund’s prospectus.
| | | | | | |
| FORWARD CURRENCY CONTRACTS at 4/30/17 (aggregate face value $116,542,359) (Unaudited) |
|
| | | | | | | Unrealized |
| | | Contract | Delivery | | Aggregate | appreciation/ |
| Counterparty | Currency | type | date | Value | face value | (depreciation) |
|
| Bank of America N. A. | | | | | |
|
| | Australian Dollar | Buy | 7/19/17 | $771,664 | $782,820 | $(11,156) |
|
| | Brazilian Real | Buy | 7/3/17 | 620,704 | 623,947 | (3,243) |
|
| | British Pound | Buy | 6/21/17 | 1,945,898 | 1,880,256 | 65,642 |
|
| | Canadian Dollar | Buy | 7/19/17 | 1,265,248 | 1,289,847 | (24,599) |
|
| | Chilean Peso | Buy | 7/19/17 | 1,217,996 | 1,227,153 | (9,157) |
|
| | Chilean Peso | Sell | 7/19/17 | 1,200,123 | 1,227,286 | 27,163 |
|
| | Czech Koruna | Buy | 6/21/17 | 158,878 | 152,884 | 5,994 |
|
| | Euro | Buy | 6/21/17 | 4,029,315 | 3,910,074 | 119,241 |
|
| | Hong Kong Dollar | Buy | 5/17/17 | 671,521 | 673,435 | (1,914) |
|
| | Hong Kong Dollar | Sell | 5/17/17 | 671,521 | 673,577 | 2,056 |
|
| | Indian Rupee | Buy | 5/17/17 | 659,518 | 625,695 | 33,823 |
|
| | Japanese Yen | Buy | 5/17/17 | 1,001,063 | 994,792 | 6,271 |
|
| | Mexican Peso | Buy | 7/19/17 | 14,488 | 21,452 | (6,964) |
|
| | New Zealand Dollar | Sell | 7/19/17 | 962,831 | 981,153 | 18,322 |
|
| | Norwegian Krone | Sell | 6/21/17 | 549,733 | 558,445 | 8,712 |
|
| | Singapore Dollar | Sell | 5/17/17 | 640,908 | 625,153 | (15,755) |
|
| | Swedish Krona | Buy | 6/21/17 | 641,658 | 629,752 | 11,906 |
|
| Barclays Bank PLC | | | | | | |
|
| | Australian Dollar | Sell | 7/19/17 | 7,179 | 4,562 | (2,617) |
|
| | British Pound | Buy | 6/21/17 | 550,320 | 519,004 | 31,316 |
|
| | Canadian Dollar | Buy | 7/19/17 | 607,210 | 618,427 | (11,217) |
|
| | Euro | Buy | 6/21/17 | 262,186 | 264,069 | (1,883) |
|
| | Japanese Yen | Sell | 5/17/17 | 528,008 | 511,571 | (16,437) |
|
| | New Zealand Dollar | Sell | 7/19/17 | 637,525 | 649,209 | 11,684 |
|
| | Swedish Krona | Buy | 6/21/17 | 642,246 | 630,143 | 12,103 |
|
| | Swiss Franc | Sell | 6/21/17 | 160,787 | 158,413 | (2,374) |
|
| Citibank, N.A. | | | | | | |
|
| | Australian Dollar | Buy | 7/19/17 | 431,784 | 441,918 | (10,134) |
|
| | Brazilian Real | Buy | 7/3/17 | 394,284 | 401,804 | (7,520) |
|
| | British Pound | Buy | 6/21/17 | 84,565 | 98,548 | (13,983) |
|
| | Canadian Dollar | Buy | 7/19/17 | 564,524 | 577,912 | (13,388) |
|
| | Danish Krone | Sell | 6/21/17 | 345,140 | 335,341 | (9,799) |
|
| | Euro | Buy | 6/21/17 | 31,995 | 17,516 | 14,479 |
|
| | Indonesian Rupiah | Buy | 5/17/17 | 621,981 | 615,885 | 6,096 |
|
| | Indonesian Rupiah | Sell | 5/17/17 | 621,981 | 620,302 | (1,679) |
|
| | Japanese Yen | Sell | 5/17/17 | 5,719,302 | 5,633,040 | (86,262) |
|
| | Mexican Peso | Sell | 7/19/17 | 144,696 | 144,908 | 212 |
|
| | New Zealand Dollar | Sell | 7/19/17 | 976,674 | 994,505 | 17,831 |
|
| | Norwegian Krone | Sell | 6/21/17 | 908,348 | 926,774 | 18,426 |
|
| | South African Rand | Sell | 7/19/17 | 1,129,272 | 1,113,074 | (16,198) |
|
| | Swedish Krona | Buy | 6/21/17 | 1,896,702 | 1,864,382 | 32,320 |
|
| | Swedish Krona | Sell | 6/21/17 | 1,891,707 | 1,886,913 | (4,794) |
|
| | Thai Baht | Buy | 5/17/17 | 393,052 | 388,260 | 4,792 |
| | | | | | |
| FORWARD CURRENCY CONTRACTS at 4/30/17 (aggregate face value $116,542,359) (Unaudited) cont. |
|
| | | | | | | Unrealized |
| | | Contract | Delivery | | Aggregate | appreciation/ |
| Counterparty | Currency | type | date | Value | face value | (depreciation) |
|
| Credit Suisse International | | | | | |
|
| | Australian Dollar | Sell | 7/19/17 | $506,416 | $509,841 | $3,425 |
|
| | Canadian Dollar | Buy | 7/19/17 | 611,317 | 618,642 | (7,325) |
|
| | Euro | Buy | 6/21/17 | 100,900 | 101,408 | (508) |
|
| | Hong Kong Dollar | Buy | 5/17/17 | 667,393 | 669,268 | (1,875) |
|
| | Hong Kong Dollar | Sell | 5/17/17 | 667,393 | 669,422 | 2,029 |
|
| | New Zealand Dollar | Sell | 7/19/17 | 902,663 | 919,406 | 16,743 |
|
| | Norwegian Krone | Sell | 6/21/17 | 620,633 | 627,273 | 6,640 |
|
| | Swedish Krona | Buy | 6/21/17 | 656,078 | 643,619 | 12,459 |
|
| Goldman Sachs International | | | | | |
|
| | Australian Dollar | Sell | 7/19/17 | 67,677 | 70,091 | 2,414 |
|
| | British Pound | Sell | 6/21/17 | 5,133,161 | 4,829,675 | (303,486) |
|
| | Canadian Dollar | Buy | 7/19/17 | 34,178 | 34,844 | (666) |
|
| | Euro | Sell | 6/21/17 | 11,967,389 | 11,615,342 | (352,047) |
|
| | Indian Rupee | Buy | 5/17/17 | 670,003 | 625,009 | 44,994 |
|
| | Japanese Yen | Sell | 5/17/17 | 11,433,622 | 11,247,994 | (185,628) |
|
| | New Zealand Dollar | Sell | 7/19/17 | 786,095 | 801,463 | 15,368 |
|
| | Norwegian Krone | Sell | 6/21/17 | 1,876,257 | 1,871,626 | (4,631) |
|
| | Russian Ruble | Buy | 6/21/17 | 160,007 | 152,074 | 7,933 |
|
| | South African Rand | Buy | 7/19/17 | 41,049 | 44,618 | (3,569) |
|
| | South Korean Won | Buy | 5/17/17 | 1,299,570 | 1,283,261 | 16,309 |
|
| | South Korean Won | Sell | 5/17/17 | 1,299,570 | 1,263,052 | (36,518) |
|
| | Swedish Krona | Buy | 6/21/17 | 1,223,733 | 1,201,855 | 21,878 |
|
| HSBC Bank USA, National Association | | | | | |
|
| | Canadian Dollar | Buy | 7/19/17 | 605,817 | 616,689 | (10,872) |
|
| | Euro | Buy | 6/21/17 | 1,163,292 | 1,139,796 | 23,496 |
|
| | Hong Kong Dollar | Buy | 5/17/17 | 666,608 | 668,500 | (1,892) |
|
| | Hong Kong Dollar | Sell | 5/17/17 | 666,608 | 668,620 | 2,012 |
|
| JPMorgan Chase Bank N.A. | | | | | |
|
| | Australian Dollar | Buy | 7/19/17 | 1,984,236 | 2,020,206 | (35,970) |
|
| | Brazilian Real | Buy | 7/3/17 | 280 | 285 | (5) |
|
| | British Pound | Sell | 6/21/17 | 332,553 | 337,218 | 4,665 |
|
| | Canadian Dollar | Sell | 7/19/17 | 169,643 | 173,426 | 3,783 |
|
| | Czech Koruna | Buy | 7/19/17 | 647,699 | 639,507 | 8,192 |
|
| | Czech Koruna | Sell | 7/19/17 | 647,699 | 630,375 | (17,324) |
|
| | Euro | Buy | 6/21/17 | 8,154,286 | 7,943,371 | 210,915 |
|
| | Euro | Buy | 7/19/17 | 642,710 | 628,537 | 14,173 |
|
| | Euro | Sell | 7/19/17 | 642,710 | 634,280 | (8,430) |
|
| | Hong Kong Dollar | Buy | 5/17/17 | 613,497 | 615,443 | (1,946) |
|
| | Hong Kong Dollar | Sell | 5/17/17 | 613,497 | 615,032 | 1,535 |
|
| | Indonesian Rupiah | Buy | 5/17/17 | 622,455 | 614,926 | 7,529 |
|
| | Indonesian Rupiah | Sell | 5/17/17 | 622,455 | 612,740 | (9,715) |
|
| | Japanese Yen | Sell | 5/17/17 | 2,773,843 | 2,719,730 | (54,113) |
|
| | New Zealand Dollar | Sell | 7/19/17 | 1,468,232 | 1,495,261 | 27,029 |
|
| | Norwegian Krone | Sell | 6/21/17 | 733,148 | 734,434 | 1,286 |
|
| | | | | | |
| FORWARD CURRENCY CONTRACTS at 4/30/17 (aggregate face value $116,542,359) (Unaudited) cont. |
|
| | | | | | | Unrealized |
| | | Contract | Delivery | | Aggregate | appreciation/ |
| Counterparty | Currency | type | date | Value | face value | (depreciation) |
|
| JPMorgan Chase Bank N.A. cont. | | | | | |
|
| | Singapore Dollar | Buy | 5/17/17 | $202,588 | $201,433 | $1,155 |
|
| | South Korean Won | Buy | 5/17/17 | 1,474,496 | 1,515,482 | (40,986) |
|
| | Swedish Krona | Sell | 6/21/17 | 176,110 | 169,144 | (6,966) |
|
| | Swiss Franc | Buy | 6/21/17 | 259,981 | 256,421 | 3,560 |
|
| Royal Bank of Scotland PLC (The) | | | | | |
|
| | British Pound | Buy | 6/21/17 | 648,244 | 610,231 | 38,013 |
|
| | Czech Koruna | Buy | 7/19/17 | 647,695 | 639,240 | 8,455 |
|
| | Czech Koruna | Sell | 7/19/17 | 647,695 | 630,994 | (16,701) |
|
| | Euro | Sell | 6/21/17 | 29,484 | 12,858 | (16,626) |
|
| | Euro | Buy | 7/19/17 | 642,929 | 628,735 | 14,194 |
|
| | Euro | Sell | 7/19/17 | 642,929 | 633,168 | (9,761) |
|
| | Japanese Yen | Sell | 5/17/17 | 625,133 | 622,526 | (2,607) |
|
| | New Zealand Dollar | Buy | 7/19/17 | 1,851 | 582 | 1,269 |
|
| | Norwegian Krone | Sell | 6/21/17 | 310,183 | 309,832 | (351) |
|
| | Swedish Krona | Buy | 6/21/17 | 322,963 | 308,219 | 14,744 |
|
| | Turkish Lira | Buy | 6/21/17 | 1,077,734 | 1,052,151 | 25,583 |
|
| State Street Bank and Trust Co. | | | | | |
|
| | Australian Dollar | Sell | 7/19/17 | 4,636 | 3,149 | (1,487) |
|
| | British Pound | Buy | 6/21/17 | 5,318 | 21,968 | (16,650) |
|
| | Euro | Buy | 6/21/17 | 474,685 | 471,934 | 2,751 |
|
| | Hungarian Forint | Buy | 6/21/17 | 212,584 | 210,866 | 1,718 |
|
| | Israeli Shekel | Buy | 7/19/17 | 73,881 | 73,677 | 204 |
|
| | Japanese Yen | Sell | 5/17/17 | 22,582 | 9,975 | (12,607) |
|
| | New Zealand Dollar | Sell | 7/19/17 | 293,236 | 295,772 | 2,536 |
|
| | Polish Zloty | Sell | 6/21/17 | 288,304 | 274,234 | (14,070) |
|
| | Singapore Dollar | Sell | 5/17/17 | 640,764 | 626,393 | (14,371) |
|
| | Swedish Krona | Buy | 6/21/17 | 367,683 | 353,980 | 13,703 |
|
| UBS AG | | | | | | |
|
| | Australian Dollar | Buy | 7/19/17 | 302,788 | 317,472 | (14,684) |
|
| | British Pound | Sell | 6/21/17 | 625,935 | 617,436 | (8,499) |
|
| | Canadian Dollar | Buy | 7/19/17 | 616,378 | 620,652 | (4,274) |
|
| | Euro | Buy | 6/21/17 | 56,564 | 68,804 | (12,240) |
|
| | Japanese Yen | Buy | 5/17/17 | 608,756 | 618,222 | (9,466) |
|
| | New Zealand Dollar | Sell | 7/19/17 | 1,197,817 | 1,216,623 | 18,806 |
|
| | Norwegian Krone | Buy | 6/21/17 | 613,982 | 624,186 | (10,204) |
|
| | Norwegian Krone | Sell | 6/21/17 | 616,228 | 615,154 | (1,074) |
|
| | Swedish Krona | Buy | 6/21/17 | 615,715 | 593,105 | 22,610 |
|
| | Turkish Lira | Buy | 6/21/17 | 627,362 | 604,741 | 22,621 |
|
| WestPac Banking Corp. | | | | | |
|
| | Australian Dollar | Sell | 7/19/17 | 439,039 | 438,177 | (862) |
|
| | Canadian Dollar | Buy | 7/19/17 | 5,647 | 5,011 | 636 |
|
| | Euro | Sell | 6/21/17 | 37,455 | 26,073 | (11,382) |
|
| | Japanese Yen | Sell | 5/17/17 | 308,757 | 307,930 | (827) |
|
| | New Zealand Dollar | Sell | 7/19/17 | 327,363 | 333,449 | 6,086 |
|
| Total | | | | | | $(432,448) |
|
| | | | | |
| FUTURES CONTRACTS OUTSTANDING at 4/30/17 (Unaudited) | | | |
|
| | | | | | Unrealized |
| | Number of | | | Expiration | appreciation/ |
| | contracts | Value | | date | (depreciation) |
|
| Canadian Government Bond | | | | | |
| 10 yr (Long) | 3 | $306,714 | | Jun-17 | $7,156 |
|
| Euro-Bobl 5 yr (Long) | 9 | 1,292,716 | | Jun-17 | 74 |
|
| Euro-Bund 10 yr (Long) | 11 | 1,938,496 | | Jun-17 | 10,754 |
|
| Euro-Bund 10 yr (Short) | 31 | 5,463,034 | | Jun-17 | (31,151) |
|
| Euro-Buxl 30 yr (Short) | 8 | 1,474,127 | | Jun-17 | (22,505) |
|
| Euro-OAT 10 yr (Short) | 8 | 1,305,765 | | Jun-17 | (41,054) |
|
| Euro-Schatz 2 yr (Short) | 24 | 2,934,312 | | Jun-17 | 1,503 |
|
| Japanese Government Bond | | | | | |
| 10 yr (Short) | 10 | 13,547,432 | | Jun-17 | (95,130) |
|
| U.K. Gilt 10 yr (Long) | 18 | 2,990,434 | | Jun-17 | 61,977 |
|
| U.S. Treasury Bond 30 yr (Short) | 12 | 1,835,625 | | Jun-17 | (46,524) |
|
| U.S. Treasury Bond Ultra 30 yr (Long) | 49 | 7,983,938 | | Jun-17 | 56,559 |
|
| U.S. Treasury Note 2 yr (Short) | 3 | 649,828 | | Jun-17 | (22) |
|
| U.S. Treasury Note 5 yr (Short) | 39 | 4,617,844 | | Jun-17 | (19,218) |
|
| U.S. Treasury Note 10 yr (Long) | 95 | 11,943,281 | | Jun-17 | 75,655 |
|
| U.S. Treasury Note 10 yr (Short) | 114 | 14,331,938 | | Jun-17 | (95,914) |
|
| U.S. Treasury Note Ultra 10 yr (Long) | 27 | 3,657,234 | | Jun-17 | 33,696 |
|
| Total | | | | | $(104,144) |
|
| | | |
| WRITTEN SWAP OPTIONS OUTSTANDING at 4/30/17 (premiums $1,496,793) (Unaudited) | |
|
| Counterparty | | | |
| Fixed Obligation % to receive or (pay)/ | Expiration | Contract | |
| Floating rate index/Maturity date | date/strike | amount | Value |
|
| Bank of America N.A. | | | |
|
| 2.082/3 month USD-LIBOR-BBA/Jul-20 | Jul-17/2.082 | $6,198,500 | $2,417 |
|
| (1.728)/3 month USD-LIBOR-BBA/Jul-20 | Jul-17/1.728 | 6,198,500 | 12,893 |
|
| (1.993)/3 month USD-LIBOR-BBA/Jun-18 | Jun-17/1.993 | 18,595,500 | 39,051 |
|
| Barclays Bank PLC | | | |
|
| 1.736/3 month USD-LIBOR-BBA/Sep-18 | Sep-17/1.736 | 18,592,000 | 5,578 |
|
| (2.905)/3 month USD-LIBOR-BBA/May-27 | May-17/2.905 | 6,198,500 | 57,708 |
|
| (2.40)/3 month USD-LIBOR-BBA/May-27 | May-17/2.40 | 6,198,500 | 82,005 |
|
| Citibank, N.A. | | | |
|
| 2.7055/3 month USD-LIBOR-BBA/Jun-27 | Jun-17/2.7055 | 9,297,750 | 1,488 |
|
| 2.51275/3 month USD-LIBOR-BBA/May-27 | May-17/2.51275 | 9,297,750 | 5,672 |
|
| (2.068)/3 month USD-LIBOR-BBA/Jun-27 | Jun-17/2.068 | 9,297,750 | 16,922 |
|
| (2.0625)/3 month USD-LIBOR-BBA/Aug-18 | Aug-17/2.0625 | 24,794,000 | 37,687 |
|
| (2.196)/3 month USD-LIBOR-BBA/May-27 | May-17/2.196 | 12,397,000 | 42,398 |
|
| (2.218)/3 month USD-LIBOR-BBA/Jun-27 | Jun-17/2.218 | 9,297,750 | 50,859 |
|
| (2.206)/3 month USD-LIBOR-BBA/Jun-27 | Jun-17/2.206 | 12,397,000 | 70,663 |
|
| Goldman Sachs International | | | |
|
| (1.674)/3 month USD-LIBOR-BBA/Jul-18 | Jul-17/1.674 | 18,595,500 | 9,298 |
|
| (1.779)/3 month USD-LIBOR-BBA/Jul-18 | Jul-17/1.779 | 18,595,500 | 16,178 |
| | | | |
| WRITTEN SWAP OPTIONS OUTSTANDING at 4/30/17 (premiums $1,496,793) (Unaudited) cont. | |
|
| Counterparty | | | | |
| Fixed Obligation % to receive or (pay)/ | Expiration | | Contract | |
| Floating rate index/Maturity date | date/strike | | amount | Value |
|
| JPMorgan Chase Bank N.A. | | | | |
|
| (1.799)/3 month USD-LIBOR-BBA/Jul-27 | Jul-17/1.799 | | $12,397,000 | $13,637 |
|
| (1.389)/6 month EUR-EURIBOR-Reuters/Jun-47 | Jun-17/1.389 | EUR | 818,000 | 17,874 |
|
| 2.534/3 month USD-LIBOR-BBA/Oct-27 | Oct-17/2.534 | | $6,198,500 | 62,853 |
|
| (6.00 Floor)/3 month USD-LIBOR-BBA/Mar-18 | Mar-18/6.00 | | 3,723,000 | 176,433 |
|
| (2.6657)/3 month USD-LIBOR-BBA/May-37 | May-17/2.6657 | | 6,198,500 | 181,739 |
|
| Total | | | | $903,353 |
|
| | | |
| WRITTEN OPTIONS OUTSTANDING at 4/30/17 (premiums $239,063) (Unaudited) | |
|
| | Expiration | Contract | |
| | date/strike price | amount | Value |
|
| Federal National Mortgage Association | | | |
| 30 yr 3.50% TBA commitments (Put) | May-17/$100.38 | $5,000,000 | $5 |
|
| Federal National Mortgage Association | | | |
| 30 yr 3.50% TBA commitments (Put) | May-17/100.26 | 5,000,000 | 5 |
|
| Federal National Mortgage Association | | | |
| 30 yr 3.50% TBA commitments (Put) | May-17/100.13 | 5,000,000 | 5 |
|
| Federal National Mortgage Association | | | |
| 30 yr 3.50% TBA commitments (Put) | May-17/99.81 | 5,000,000 | 5 |
|
| Federal National Mortgage Association | | | |
| 30 yr 3.50% TBA commitments (Put) | May-17/99.69 | 5,000,000 | 5 |
|
| Federal National Mortgage Association | | | |
| 30 yr 3.50% TBA commitments (Put) | May-17/99.56 | 5,000,000 | 5 |
|
| Federal National Mortgage Association | | | |
| 30 yr 3.00% TBA commitments (Call) | Jun-17/100.13 | 5,000,000 | 20,310 |
|
| Federal National Mortgage Association | | | |
| 30 yr 3.00% TBA commitments (Call) | Jun-17/100.01 | 5,000,000 | 22,890 |
|
| Federal National Mortgage Association | | | |
| 30 yr 3.00% TBA commitments (Call) | Jun-17/99.88 | 5,000,000 | 25,690 |
|
| Federal National Mortgage Association | | | |
| 30 yr 3.00% TBA commitments (Call) | Jun-17/99.45 | 5,000,000 | 37,195 |
|
| Federal National Mortgage Association | | | |
| 30 yr 3.00% TBA commitments (Call) | Jun-17/99.32 | 5,000,000 | 40,970 |
|
| Federal National Mortgage Association | | | |
| 30 yr 3.00% TBA commitments (Call) | Jun-17/99.20 | 5,000,000 | 44,945 |
|
| Total | | | $192,030 |
|
| | | | |
| FORWARD PREMIUM SWAP OPTION CONTRACTS OUTSTANDING at 4/30/17 (Unaudited) | |
|
| Counterparty | | | | |
| Fixed right or obligation % to receive | | Premium | Unrealized |
| or (pay)/ | Expiration | Contract | receivable/ | appreciation/ |
| Floating rate index/Maturity date | date/strike | amount | (payable) | (depreciation) |
|
| Bank of America N.A. | | | | |
|
| 2.5925/3 month USD-LIBOR-BBA/ | | | | |
| Jan-27 (Purchased) | Jan-19/2.5925 | $1,859,600 | $(65,551) | $3,422 |
|
| 2.785/3 month USD-LIBOR-BBA/ | | | | |
| Jan-47 (Purchased) | Jan-27/2.785 | 1,859,600 | (199,535) | 2,479 |
|
| | | | |
| FORWARD PREMIUM SWAP OPTION CONTRACTS OUTSTANDING at 4/30/17 (Unaudited) cont. | |
|
| Counterparty | | | | |
| Fixed right or obligation % to receive | | Premium | Unrealized |
| or (pay)/ | Expiration | Contract | receivable/ | appreciation/ |
| Floating rate index/Maturity date | date/strike | amount | (payable) | (depreciation) |
|
| Bank of America N.A. cont. | | | | |
|
| (2.785)/3 month USD-LIBOR-BBA/ | | | | |
| Jan-47 (Purchased) | Jan-27/2.785 | $1,859,600 | $(199,535) | $(16,074) |
|
| (2.5925)/3 month USD-LIBOR-BBA/ | | | | |
| Jan-27 (Purchased) | Jan-19/2.5925 | 1,859,600 | (65,551) | (20,753) |
|
| 2.7175/3 month USD-LIBOR-BBA/ | | | | |
| Jan-47 (Written) | Jan-19/2.7175 | 1,859,600 | 168,015 | 40,186 |
|
| (2.7175)/3 month USD-LIBOR-BBA/ | | | | |
| Jan-47 (Written) | Jan-19/2.7175 | 1,859,600 | 168,015 | (3,329) |
|
| Barclays Bank PLC | | | | |
|
| 2.43/3 month USD-LIBOR-BBA/ | | | | |
| Feb-22 (Purchased) | Feb-19/2.43 | 1,859,600 | (25,941) | 4,389 |
|
| (2.43)/3 month USD-LIBOR-BBA/ | | | | |
| Feb-22 (Purchased) | Feb-19/2.43 | 1,859,600 | (25,942) | (10,525) |
|
| Credit Suisse International | | | | |
|
| 2.165/3 month USD-LIBOR-BBA/ | | | | |
| May-27 (Purchased) | May-17/2.165 | 16,556,500 | (55,406) | (2,733) |
|
| (2.2725)/3 month USD-LIBOR-BBA/ | | | | |
| May-27 (Written) | May-17/2.2725 | 8,278,200 | 55,406 | (2,728) |
|
| Goldman Sachs International | | | | |
|
| 2.8175/3 month USD-LIBOR-BBA/ | | | | |
| Mar-47 (Purchased) | Mar-27/2.8175 | 371,900 | (46,952) | 2,938 |
|
| (2.8175)/3 month USD-LIBOR-BBA/ | | | | |
| Mar-47 (Purchased) | Mar-27/2.8175 | 371,900 | (46,952) | (2,507) |
|
| JPMorgan Chase Bank N.A. | | | | |
|
| 2.8325/3 month USD-LIBOR-BBA/ | | | | |
| Feb-52 (Purchased) | Feb-22/2.8325 | 1,859,600 | (259,647) | 22,817 |
|
| (2.8325)/3 month USD-LIBOR-BBA/ | | | | |
| Feb-52 (Purchased) | Feb-22/2.8325 | 1,859,600 | (259,647) | (43,310) |
|
| 2.79/3 month USD-LIBOR-BBA/ | | | | |
| Feb-49 (Written) | Feb-19/2.79 | 1,859,600 | 176,569 | 52,607 |
|
| (2.79)/3 month USD-LIBOR-BBA/ | | | | |
| Feb-49 (Written) | Feb-19/2.79 | 1,859,600 | 176,569 | (22,743) |
|
| Total | | | $(506,085) | $4,136 |
|
| | | | |
| TBA SALE COMMITMENTS OUTSTANDING at 4/30/17 (proceeds receivable $48,016,875) (Unaudited) |
|
| | Principal | | Settlement | |
| Agency | amount | | date | Value |
|
| Federal National Mortgage Association, 4.00%, 5/1/47 | $1,000,000 | | 5/11/17 | $1,053,281 |
|
| Federal National Mortgage Association, 3.50%, 5/1/47 | 38,000,000 | | 5/11/17 | 39,077,657 |
|
| Federal National Mortgage Association, 3.00%, 5/1/47 | 8,000,000 | | 5/11/17 | 7,993,125 |
|
| Total | | | | $48,124,063 |
|
| | | | | | | |
| OTC INTEREST RATE SWAP CONTRACTS OUTSTANDING at 4/30/17 (Unaudited) | |
|
| | | Upfront | | | Payments | Payments | Unrealized |
| Swap counterparty/ | premium | Termination | | made by | received by | appreciation/ |
| Notional amount | received (paid) | date | | fund per annum | fund per annum | (depreciation) |
|
| Goldman Sachs International | | | | | |
|
| KRW | 6,086,000,000 | $— | 12/9/21 | | 3 month KRW-CD- | 1.67% | $(6,724) |
| | | | | | KSDA-BLOOMBERG | | |
|
| JPMorgan Chase Bank N.A. | | | | | | |
|
| MXN | 18,821,000 | — | 1/1/26 | | 1 month MXN-TIIE- | 6.16% | (84,889) |
| | | | | | BANXICO | | |
|
| MXN | 21,780,000 | — | 10/6/21 | | 1 month MXN-TIIE- | 5.93% | (59,169) |
| | | | | | BANXICO | | |
|
| MXN | 8,802,000 | — | 10/8/21 | | 1 month MXN-TIIE- | 5.895% | (24,557) |
| | | | | | BANXICO | | |
|
| MXN | 9,124,000 | — | 10/26/21 | | 1 month MXN-TIIE- | 6.09% | (22,106) |
| | | | | | BANXICO | | |
|
| MYR | 3,770,000 | — | 11/14/21 | | 3 month MYR- | 4.08% | 13,259 |
| | | | | | KLIBOR-BNM | | |
|
| THB | 42,200,000 | — | 11/16/21 | | 6 month THB-SIBOR- 2.07% | 1,945 |
| | | | | | THFX6M | | |
|
| Total | | $— | | | | | $(182,241) |
|
| | | | | | |
| CENTRALLY CLEARED INTEREST RATE SWAP CONTRACTS OUTSTANDING at 4/30/17 (Unaudited) |
|
| | Upfront | | | Payments | Payments | Unrealized |
| | premium | Termination | | made by | received by | appreciation/ |
| Notional amount | received (paid) | date | | fund per annum | fund per annum | (depreciation) |
|
| $47,228,600 E | $7,202 | 6/21/19 | | 1.75% | 3 month USD- | $(97,456) |
| | | | | | LIBOR-BBA | |
|
| 26,405,600 E | 18,314 | 6/21/22 | | 2.20% | 3 month USD- | (274,656) |
| | | | | | LIBOR-BBA | |
|
| 24,545,300 E | 16,847 | 6/21/27 | | 2.50% | 3 month USD- | (480,686) |
| | | | | | LIBOR-BBA | |
|
| 2,543,000 E | 26,786 | 6/21/47 | | 2.70% | 3 month USD- | (69,502) |
| | | | | | LIBOR-BBA | |
|
| 2,918,000 E | (81,947) | 6/21/27 | | 3 month USD- | 2.65% | 17,051 |
| | | | | LIBOR-BBA | | |
|
| 1,733,000 E | 6,569 | 6/21/22 | | 2.30% | 3 month USD- | (20,951) |
| | | | | | LIBOR-BBA | |
|
| 9,297,800 | (9,421) | 4/19/27 | | 3 month USD- | 2.297% | 32,043 |
| | | | | LIBOR-BBA | | |
|
| 9,297,800 | 22,191 | 4/19/27 | | 2.435% | 3 month USD- | (136,573) |
| | | | | | LIBOR-BBA | |
|
| 1,689,000 | (22) | 4/4/27 | | 3 month USD- | 2.39859% | 24,257 |
| | | | | LIBOR-BBA | | |
|
| 714,000 | (11) | 4/5/27 | | 3 month USD- | 2.3365% | 6,177 |
| | | | | LIBOR-BBA | | |
|
| 2,134,000 | (28) | 4/11/27 | | 3 month USD- | 2.30% | 10,758 |
| | | | | LIBOR-BBA | | |
|
| 2,134,000 | (28) | 4/11/27 | | 3 month USD- | 2.2955% | 9,878 |
| | | | | LIBOR-BBA | | |
|
| 2,134,000 | (28) | 4/11/27 | | 3 month USD- | 2.286% | 8,025 |
| | | | | LIBOR-BBA | | |
|
| | | | | | | |
| CENTRALLY CLEARED INTEREST RATE SWAP CONTRACTS OUTSTANDING at 4/30/17 (Unaudited) cont. |
|
| | | Upfront | | | Payments | Payments | Unrealized |
| | | premium | Termination | | made by | received by | appreciation/ |
| Notional amount | received (paid) | date | | fund per annum | fund per annum | (depreciation) |
|
| | $1,343,000 | $(18) | 4/12/27 | | 2.332% | 3 month USD- | $(10,697) |
| | | | | | | LIBOR-BBA | |
|
| | 2,750,000 | (36) | 4/18/27 | | 3 month USD- | 2.24947% | 365 |
| | | | | | LIBOR-BBA | | |
|
| | 1,833,300 | (24) | 4/18/27 | | 2.26748% | 3 month USD- | (3,310) |
| | | | | | | LIBOR-BBA | |
|
| | 1,833,300 | (24) | 4/18/27 | | 3 month USD- | 2.26833% | 3,405 |
| | | | | | LIBOR-BBA | | |
|
| | 1,204,000 | (16) | 4/18/27 | | 3 month USD- | 2.217% | (3,415) |
| | | | | | LIBOR-BBA | | |
|
| | 1,294,000 | (17) | 4/19/27 | | 2.2205% | 3 month USD- | 3,261 |
| | | | | | | LIBOR-BBA | |
|
| | 1,887,000 | (25) | 4/19/27 | | 2.193% | 3 month USD- | 9,499 |
| | | | | | | LIBOR-BBA | |
|
| | 3,206,500 | (43) | 4/21/27 | | 2.16803% | 3 month USD- | 23,698 |
| | | | | | | LIBOR-BBA | |
|
| | 619,000 | (8) | 4/21/27 | | 2.162% | 3 month USD- | 4,916 |
| | | | | | | LIBOR-BBA | |
|
| | 1,880,000 | (25) | 4/24/27 | | 2.18336% | 3 month USD- | 11,518 |
| | | | | | | LIBOR-BBA | |
|
| | 1,820,000 | (24) | 4/24/27 | | 2.20876% | 3 month USD- | 6,924 |
| | | | | | | LIBOR-BBA | |
|
| | 2,594,000 | (34) | 4/25/27 | | 3 month USD- | 2.1825% | (16,257) |
| | | | | | LIBOR-BBA | | |
|
| | 6,403,000 | (52) | 4/26/22 | | 1.93% | 3 month USD- | (404) |
| | | | | | | LIBOR-BBA | |
|
| | 1,256,000 | (17) | 4/28/27 | | 2.3095% | 3 month USD- | (6,468) |
| | | | | | | LIBOR-BBA | |
|
| | 570,000 | (8) | 5/2/27 | | 3 month USD- | 2.2855% | 1,563 |
| | | | | | LIBOR-BBA | | |
|
| | 12,397,000 | 35,787 | 4/12/27 | | 3 month USD- | 2.43% | (173,903) |
| | | | | | LIBOR-BBA | | |
|
| AUD | 2,254,000 E | (6) | 2/13/20 | | 3 month AUD-BBR- | 2.388% | 2,922 |
| | | | | | BBSW | | |
|
| AUD | 2,257,000 E | (6) | 2/15/20 | | 3 month AUD-BBR- | 2.446% | 3,850 |
| | | | | | BBSW | | |
|
| AUD | 2,254,000 E | (6) | 2/15/20 | | 3 month AUD-BBR- | 2.475% | 4,318 |
| | | | | | BBSW | | |
|
| AUD | 2,257,000 E | (6) | 2/16/20 | | 3 month AUD-BBR- | 2.516% | 4,929 |
| | | | | | BBSW | | |
|
| AUD | 5,004,000 E | 6,892 | 6/28/22 | | 2.60% | 6 month AUD- | (15,864) |
| | | | | | | BBR-BBSW | |
|
| AUD | 1,199,000 E | (19,020) | 6/28/27 | | 6 month AUD-BBR- | 3.00% | (10,636) |
| | | | | | BBSW | | |
|
| AUD | 180,000 E | 519 | 6/28/27 | | 6 month AUD-BBR- | 3.001% | 1,790 |
| | | | | | BBSW | | |
|
| AUD | 1,520,000 E | (9,641) | 6/28/22 | | 6 month AUD-BBR- | 2.601% | (2,675) |
| | | | | | BBSW | | |
|
| | | | | | | |
| CENTRALLY CLEARED INTEREST RATE SWAP CONTRACTS OUTSTANDING at 4/30/17 (Unaudited) cont. |
| | | Upfront | | | Payments | Payments | Unrealized |
| | | premium | Termination | | made by | received by | appreciation/ |
| Notional amount | received (paid) | date | | fund per annum | fund per annum | (depreciation) |
|
| CAD | 8,531,000 E | $(34,919) | 6/21/22 | | 3 month CAD-BA- | 1.70% | $62,844 |
| | | | | | CDOR | | |
|
| CAD | 2,578,000 E | (21,262) | 6/21/27 | | 3 month CAD-BA- | 2.15% | 38,880 |
| | | | | | CDOR | | |
|
| CAD | 1,250,000 E | (6,781) | 6/21/27 | | 3 month CAD-BA- | 2.151% | 22,466 |
| | | | | | CDOR | | |
|
| CAD | 1,010,000 E | (4,559) | 6/21/47 | | 3 month CAD-BA- | 2.501% | 30,917 |
| | | | | | CDOR | | |
|
| CAD | 1,220,000 E | (3,705) | 6/21/22 | | 3 month CAD-BA- | 1.701% | 10,319 |
| | | | | | CDOR | | |
|
| CHF | 1,329,000 E | 23,558 | 6/21/27 | | 6 month CHF- | 0.10% | 16,391 |
| | | | | | LIBOR-BBA | | |
|
| CHF | 1,000 E | 10 | 6/21/22 | | 0.40% | 6 month CHF- | 5 |
| | | | | | | LIBOR-BBA | |
|
| EUR | 1,186,000 E | (25) | 1/24/32 | | 6 month EUR- | 1.665% | 186 |
| | | | | | EURIBOR-REUTERS | | |
|
| EUR | 2,376,000 E | (9) | 2/18/20 | | 1 day EUR- | 0.124% | 1,098 |
| | | | | | EURIBOR-REUTERS | | |
|
| EUR | 2,376,000 E | (9) | 2/18/20 | | 1 day EUR- | 0.104% | 570 |
| | | | | | EURIBOR-REUTERS | | |
|
| EUR | 2,744,000 E | (27) | 6/21/22 | | 0.40% | 6 month EUR- | (25,171) |
| | | | | | | EURIBOR- | |
| | | | | | | REUTERS | |
|
| EUR | 6,320,000 E | (160,407) | 6/21/27 | | 6 month EUR- | 1.00% | (40,481) |
| | | | | | EURIBOR-REUTERS | | |
|
| EUR | 9,504,000 E | (38) | 3/22/20 | | 0.028% | 1 day EUR- | (10,495) |
| | | | | | | EURIBOR- | |
| | | | | | | REUTERS | |
|
| EUR | 5,140,000 E | (41,321) | 6/21/22 | | 6 month EUR- | 0.401% | 6,058 |
| | | | | | EURIBOR-REUTERS | | |
|
| EUR | 6,400,000 E | (119,968) | 6/21/27 | | 6 month EUR- | 1.001% | 2,160 |
| | | | | | EURIBOR-REUTERS | | |
|
| EUR | 11,320,000 E | (8,720) | 6/21/19 | | 0.051% | 6 month EUR- | 8,198 |
| | | | | | | EURIBOR- | |
| | | | | | | REUTERS | |
|
| EUR | 110,000 E | (3,138) | 6/21/47 | | 6 month EUR- | 1.501% | (871) |
| | | | | | EURIBOR-REUTERS | | |
|
| EUR | 5,716,000 | (50) | 4/26/22 | | 0.21% | 6 month EUR- | (3,639) |
| | | | | | | EURIBOR- | |
| | | | | | | REUTERS | |
|
| GBP | 1,078,000 E | (20) | 1/19/32 | | 1.912% | 6 month GBP- | (34,346) |
| | | | | | | LIBOR-BBA | |
|
| GBP | 1,996,000 E | (9) | 2/11/20 | | 0.918% | 6 month GBP- | (4,368) |
| | | | | | | LIBOR-BBA | |
|
| GBP | 1,996,000 E | (9) | 2/14/20 | | 0.955% | 6 month GBP- | (5,288) |
| | | | | | | LIBOR-BBA | |
|
| GBP | 4,797,000 E | (45,759) | 6/21/22 | | 0.80% | 6 month GBP- | (40,683) |
| | | | | | | LIBOR-BBA | |
|
| | | | | | | |
| CENTRALLY CLEARED INTEREST RATE SWAP CONTRACTS OUTSTANDING at 4/30/17 (Unaudited) cont. |
|
| | | Upfront | | | Payments | Payments | Unrealized |
| | | premium | Termination | | made by | received by | appreciation/ |
| Notional amount | received (paid) | date | | fund per annum | fund per annum | (depreciation) |
|
| GBP | 706,000 E | $(8,701) | 6/21/27 | | 6 month GBP- | 1.25% | $(1,665) |
| | | | | | LIBOR-BBA | | |
|
| GBP | 1,330,000 E | (8,201) | 6/21/27 | | 1.251% | 6 month GBP- | (21,621) |
| | | | | | | LIBOR-BBA | |
|
| GBP | 1,810,000 E | 18,872 | 6/21/22 | | 6 month GBP- | 0.801% | 17,074 |
| | | | | | LIBOR-BBA | | |
|
| HUF | 171,200,000 | (8) | 2/28/27 | | 6 month HUF- | 2.65% | 8,198 |
| | | | | | BUBOR-NATIONAL | | |
| | | | | | BANK OF HUNGARY | | |
|
| HUF | 791,500,000 | (10) | 2/28/19 | | 0.715% | 6 month | (12,725) |
| | | | | | | HUF-BUBOR- | |
| | | | | | | NATIONAL BANK | |
| | | | | | | OF HUNGARY | |
|
| HUF | 490,490,000 | (6) | 3/1/19 | | 0.69% | 6 month | (6,977) |
| | | | | | | HUF-BUBOR- | |
| | | | | | | NATIONAL BANK | |
| | | | | | | OF HUNGARY | |
|
| HUF | 111,460,000 | (5) | 3/1/27 | | 6 month HUF- | 2.60% | 3,473 |
| | | | | | BUBOR-NATIONAL | | |
| | | | | | BANK OF HUNGARY | | |
|
| HUF | 374,560,000 | (5) | 3/20/19 | | 0.745% | 6 month | (6,471) |
| | | | | | | HUF-BUBOR- | |
| | | | | | | NATIONAL BANK | |
| | | | | | | OF HUNGARY | |
|
| HUF | 83,320,000 | (4) | 3/20/27 | | 6 month HUF- | 2.905% | 10,020 |
| | | | | | BUBOR-NATIONAL | | |
| | | | | | BANK OF HUNGARY | | |
|
| JPY | 97,000,000 | (34) | 9/2/43 | | 1.87875% | 6 month JPY- | (253,031) |
| | | | | | | LIBOR-BBA | |
|
| MXN | 8,980,000 | (6) | 12/3/26 | | 7.715% | 1 month MXN- | (9,173) |
| | | | | | | TIIE-BANXICO | |
|
| MXN | 6,330,000 | (4) | 12/24/26 | | 8.12% | 1 month MXN- | (16,118) |
| | | | | | | TIIE-BANXICO | |
|
| MXN | 6,240,000 | (4) | 1/7/27 | | 8.20% | 1 month MXN- | (17,950) |
| | | | | | | TIIE-BANXICO | |
|
| MXN | 9,870,000 | (10) | 3/9/32 | | 1 month MXN-TIIE- | 7.67% | (876) |
| | | | | | BANXICO | | |
|
| MXN | 4,805,000 | (5) | 3/12/32 | | 1 month MXN-TIIE- | 7.67% | (453) |
| | | | | | BANXICO | | |
|
| NOK | 107,000 E | 116 | 6/21/22 | | 1.75% | 6 month NOK- | (9) |
| | | | | | | NIBOR-NIBR | |
|
| NOK | 16,019,000 E | (8,133) | 6/21/27 | | 6 month NOK- | 2.10% | 19,206 |
| | | | | | NIBOR-NIBR | | |
|
| NZD | 5,333,000 E | (15) | 2/13/20 | | 3 month NZD- | 3.14% | 6,986 |
| | | | | | BBR-FRA | | |
|
| NZD | 6,768,000 E | (15,352) | 6/21/22 | | 3 month NZD- | 3.20% | 41,271 |
| | | | | | BBR-FRA | | |
|
| NZD | 5,612,000 E | (55,608) | 6/21/27 | | 3 month NZD- | 3.75% | 56,843 |
| | | | | | BBR-FRA | | |
|
| | | | | | | |
| CENTRALLY CLEARED INTEREST RATE SWAP CONTRACTS OUTSTANDING at 4/30/17 (Unaudited) cont. |
|
| | | Upfront | | | Payments | Payments | Unrealized |
| | | premium | Termination | | made by | received by | appreciation/ |
| Notional amount | received (paid) | date | | fund per annum | fund per annum | (depreciation) |
|
| NZD | 5,333,000 E | $(14) | 3/29/20 | | 3 month NZD- | 3.0475% | $2,062 |
| | | | | | BBR-FRA | | |
|
| SEK | 11,927,000 E | (17,865) | 6/21/22 | | 3 month SEK- | 0.55% | (3,862) |
| | | | | | STIBOR-SIDE | | |
|
| SEK | 20,314,000 E | (22,821) | 6/21/27 | | 3 month SEK- | 1.35% | 27,594 |
| | | | | | STIBOR-SIDE | | |
|
| SEK | 46,094,000 E | (20) | 3/22/20 | | 3 month SEK- | 0.513% | 13,084 |
| | | | | | STIBOR-SIDE | | |
|
| ZAR | 4,010,000 | (4) | 10/11/26 | | 8.32625% | 3 month ZAR- | (8,086) |
| | | | | | | JIBAR-SAFEX | |
|
| ZAR | 19,400,000 | (6) | 3/9/19 | | 3 month ZAR- | 7.305% | 3,124 |
| | | | | | JIBAR-SAFEX | | |
|
| ZAR | 39,240,000 | (12) | 3/24/19 | | 3 month ZAR- | 7.11% | (4,154) |
| | | | | | JIBAR-SAFEX | | |
|
| ZAR | 8,990,000 | (9) | 3/24/27 | | 7.785% | 3 month ZAR- | 8,463 |
| | | | | | | JIBAR-SAFEX | |
|
| Total | | $(524,475) | | | | | $(1,243,329) |
|
E Extended effective date.
| | | | | | |
| OTC TOTAL RETURN SWAP CONTRACTS OUTSTANDING at 4/30/17 (Unaudited) | |
|
| | Upfront | | | Payments | Total return | Unrealized |
| Swap counterparty/ | premium | Termination | | received (paid) by | received by | appreciation/ |
| Notional amount | received (paid) | date | | fund per annum | or paid by fund | (depreciation) |
|
| Bank of America N.A. | | | | | |
|
| $352,504 | $— | 1/12/41 | | 4.00% (1 month | Synthetic TRS Index | $(620) |
| | | | | USD-LIBOR) | 4.00% 30 year Fannie | |
| | | | | | Mae pools | |
|
| Barclays Bank PLC | | | | | |
|
| 118,371 | — | 1/12/42 | | 4.00% (1 month | Synthetic TRS Index | (98) |
| | | | | USD-LIBOR) | 4.00% 30 year Fannie | |
| | | | | | Mae pools | |
|
| 351,752 | — | 1/12/41 | | 4.00% (1 month | Synthetic TRS Index | (619) |
| | | | | USD-LIBOR) | 4.00% 30 year Fannie | |
| | | | | | Mae pools | |
|
| 2,425 | — | 1/12/38 | | 6.50% (1 month | Synthetic TRS Index | 3 |
| | | | | USD-LIBOR) | 6.50% 30 year Fannie | |
| | | | | | Mae pools | |
|
| 264,840 | — | 1/12/40 | | 4.50% (1 month | Synthetic MBX Index | 521 |
| | | | | USD-LIBOR) | 4.50% 30 year Fannie | |
| | | | | | Mae pools | |
|
| 191,203 | — | 1/12/40 | | 4.50% (1 month | Synthetic MBX Index | 376 |
| | | | | USD-LIBOR) | 4.50% 30 year Fannie | |
| | | | | | Mae pools | |
|
| 43,541 | — | 1/12/39 | | (6.00%) 1 month | Synthetic MBX Index | (146) |
| | | | | USD-LIBOR | 6.00% 30 year Fannie | |
| | | | | | Mae pools | |
|
| 421,912 | — | 1/12/41 | | 5.00% (1 month | Synthetic TRS Index | (387) |
| | | | | USD-LIBOR) | 5.00% 30 year Ginnie | |
| | | | | | Mae II pools | |
|
| | | | | | | |
| OTC TOTAL RETURN SWAP CONTRACTS OUTSTANDING at 4/30/17 (Unaudited) cont. | |
|
| | | Upfront | | | Payments | Total return | Unrealized |
| Swap counterparty/ | premium | Termination | | received (paid) by | received by | appreciation/ |
| Notional amount | received (paid) | date | | fund per annum | or paid by fund | (depreciation) |
|
| Barclays Bank PLC cont. | | | | |
|
| | $178,303 | $— | 1/12/41 | | 5.00% (1 month | Synthetic TRS Index | $(163) |
| | | | | | USD-LIBOR) | 5.00% 30 year Ginnie | |
| | | | | | | Mae II pools | |
|
| | 231,273 | — | 1/12/38 | | 6.50% (1 month | Synthetic TRS Index | 328 |
| | | | | | USD-LIBOR) | 6.50% 30 year Fannie | |
| | | | | | | Mae pools | |
|
| | 413,917 | — | 1/12/41 | | (5.00%) 1 month | Synthetic TRS Index | (459) |
| | | | | | USD-LIBOR | 5.00% 30 year Fannie | |
| | | | | | | Mae pools | |
|
| | 190,330 | — | 1/12/43 | | (3.50%) 1 month | Synthetic TRS Index | (241) |
| | | | | | USD-LIBOR | 3.50% 30 year Fannie | |
| | | | | | | Mae pools | |
|
| | 304,617 | — | 1/12/40 | | 5.00% (1 month | Synthetic MBX Index | 819 |
| | | | | | USD-LIBOR) | 5.00% 30 year Fannie | |
| | | | | | | Mae pools | |
|
| | 5,906,999 | — | 1/12/41 | | 5.00% (1 month | Synthetic MBX Index | 19,550 |
| | | | | | USD-LIBOR) | 5.00% 30 year Fannie | |
| | | | | | | Mae pools | |
|
| | 1,078,961 | — | 1/12/38 | | (6.50%) 1 month | Synthetic MBX Index | (4,058) |
| | | | | | USD-LIBOR | 6.50% 30 year Fannie | |
| | | | | | | Mae pools | |
|
| EUR | 1,446,000 | — | 9/15/17 | | (0.4975%) | Eurostat Eurozone | 5,576 |
| | | | | | | HICP excluding | |
| | | | | | | tobacco | |
|
| EUR | 723,000 | — | 9/15/17 | | (0.46%) | Eurostat Eurozone | 3,379 |
| | | | | | | HICP excluding | |
| | | | | | | tobacco | |
|
| EUR | 1,029,000 | — | 9/15/17 | | (0.435%) | Eurostat Eurozone | 5,380 |
| | | | | | | HICP excluding | |
| | | | | | | tobacco | |
|
| Citibank, N.A. | | | | | | |
|
| | $112,162 | — | 1/12/41 | | 5.00% (1 month | Synthetic MBX Index | 371 |
| | | | | | USD-LIBOR) | 5.00% 30 year Fannie | |
| | | | | | | Mae pools | |
|
| Credit Suisse International | | | | | |
|
| | 474,981 | — | 1/12/41 | | 4.50% (1 month | Synthetic MBX Index | (551) |
| | | | | | USD-LIBOR) | 4.50% 30 year Ginnie | |
| | | | | | | Mae II pools | |
|
| | 301,976 | — | 1/12/41 | | (5.00%) 1 month | Synthetic TRS Index | (335) |
| | | | | | USD-LIBOR | 5.00% 30 year Fannie | |
| | | | | | | Mae pools | |
|
| | 279,358 | — | 1/12/44 | | 3.50% (1 month | Synthetic TRS Index | 353 |
| | | | | | USD-LIBOR) | 3.50% 30 year Fannie | |
| | | | | | | Mae pools | |
|
| | 77,063 | — | 1/12/43 | | 3.50% (1 month | Synthetic TRS Index | 98 |
| | | | | | USD-LIBOR) | 3.50% 30 year Fannie | |
| | | | | | | Mae pools | |
|
| | | | | | |
| OTC TOTAL RETURN SWAP CONTRACTS OUTSTANDING at 4/30/17 (Unaudited) cont. | |
|
| | Upfront | | | Payments | Total return | Unrealized |
| Swap counterparty/ | premium | Termination | | received (paid) by | received by | appreciation/ |
| Notional amount | received (paid) | date | | fund per annum | or paid by fund | (depreciation) |
|
| Credit Suisse International cont. | | | | | |
|
| $668,972 | $— | 1/12/45 | | 4.00% (1 month | Synthetic TRS Index | $(1,072) |
| | | | | USD-LIBOR) | 4.00% 30 year Fannie | |
| | | | | | Mae pools | |
|
| 587,499 | — | 1/12/45 | | 4.00% (1 month | Synthetic TRS Index | (941) |
| | | | | USD-LIBOR) | 4.00% 30 year Fannie | |
| | | | | | Mae pools | |
|
| 588,397 | — | 1/12/45 | | 3.50% (1 month | Synthetic TRS Index | (539) |
| | | | | USD-LIBOR) | 3.50% 30 year Fannie | |
| | | | | | Mae pools | |
|
| 1,249,559 | — | 1/12/41 | | (4.00%) 1 month | Synthetic TRS Index | 2,199 |
| | | | | USD-LIBOR | 4.00% 30 year Fannie | |
| | | | | | Mae pools | |
|
| Goldman Sachs International | | | | | |
|
| 91,677 | — | 1/12/39 | | 6.00% (1 month | Synthetic TRS Index | 64 |
| | | | | USD-LIBOR) | 6.00% 30 year Fannie | |
| | | | | | Mae pools | |
|
| 16,468 | — | 1/12/38 | | 6.50% (1 month | Synthetic TRS Index | 23 |
| | | | | USD-LIBOR) | 6.50% 30 year Fannie | |
| | | | | | Mae pools | |
|
| 293,864 | — | 1/12/42 | | 4.00% (1 month | Synthetic TRS Index | (242) |
| | | | | USD-LIBOR) | 4.00% 30 year Fannie | |
| | | | | | Mae pools | |
|
| 293,864 | — | 1/12/42 | | 4.00% (1 month | Synthetic TRS Index | (242) |
| | | | | USD-LIBOR) | 4.00% 30 year Fannie | |
| | | | | | Mae pools | |
|
| 23,659 | — | 1/12/38 | | (6.50%) 1 month | Synthetic MBX Index | (89) |
| | | | | USD-LIBOR | 6.50% 30 year Fannie | |
| | | | | | Mae pools | |
|
| 28,383 | — | 1/12/38 | | (6.50%) 1 month | Synthetic MBX Index | (107) |
| | | | | USD-LIBOR | 6.50% 30 year Fannie | |
| | | | | | Mae pools | |
|
| 536,077 | — | 1/12/38 | | (6.50%) 1 month | Synthetic MBX Index | (2,016) |
| | | | | USD-LIBOR | 6.50% 30 year Fannie | |
| | | | | | Mae pools | |
|
| 829,863 | — | 1/12/42 | | 4.00% (1 month | Synthetic TRS Index | (684) |
| | | | | USD-LIBOR) | 4.00% 30 year Fannie | |
| | | | | | Mae pools | |
|
| 436,987 | — | 1/12/42 | | 4.00% (1 month | Synthetic TRS Index | (360) |
| | | | | USD-LIBOR) | 4.00% 30 year Fannie | |
| | | | | | Mae pools | |
|
| 497,983 | — | 1/12/41 | | (5.00%) 1 month | Synthetic TRS Index | (552) |
| | | | | USD-LIBOR | 5.00% 30 year Fannie | |
| | | | | | Mae pools | |
|
| 335,146 | — | 1/12/43 | | 3.50% (1 month | Synthetic TRS Index | 424 |
| | | | | USD-LIBOR) | 3.50% 30 year Fannie | |
| | | | | | Mae pools | |
|
| 699,325 | — | 1/12/44 | | 3.50% (1 month | Synthetic TRS Index | 885 |
| | | | | USD-LIBOR) | 3.50% 30 year Fannie | |
| | | | | | Mae pools | |
|
| | | | | | | |
| OTC TOTAL RETURN SWAP CONTRACTS OUTSTANDING at 4/30/17 (Unaudited) cont. | |
|
| | | Upfront | | | Payments | Total return | Unrealized |
| Swap counterparty/ | premium | Termination | | received (paid) by | received by | appreciation/ |
| Notional amount | received (paid) | date | | fund per annum | or paid by fund | (depreciation) |
|
| Goldman Sachs International cont. | | | | | |
|
| | $583,065 | $— | 1/12/45 | | 4.00% (1 month | Synthetic TRS Index | $(934) |
| | | | | | USD-LIBOR) | 4.00% 30 year Fannie | |
| | | | | | | Mae pools | |
|
| EUR | 5,206,000 | — | 8/10/17 | | (0.63%) | Eurostat Eurozone | 170 |
| | | | | | | HICP excluding | |
| | | | | | | tobacco | |
|
| EUR | 1,719,000 | — | 8/11/17 | | (0.63%) | Eurostat Eurozone | 56 |
| | | | | | | HICP excluding | |
| | | | | | | tobacco | |
|
| EUR | 1,446,000 | — | 8/31/17 | | (0.27%) | Eurostat Eurozone | 11,451 |
| | | | | | | HICP excluding | |
| | | | | | | tobacco | |
|
| EUR | 1,446,000 | — | 9/1/17 | | (0.37%) | Eurostat Eurozone | 9,608 |
| | | | | | | HICP excluding | |
| | | | | | | tobacco | |
|
| JPMorgan Chase Bank N.A. | | | | | |
|
| | $545,303 | — | 1/12/41 | | 4.00% (1 month | Synthetic TRS Index | (960) |
| | | | | | USD-LIBOR) | 4.00% 30 year Fannie | |
| | | | | | | Mae pools | |
|
| | 497,983 | — | 1/12/41 | | (5.00%) 1 month | Synthetic TRS Index | (552) |
| | | | | | USD-LIBOR | 5.00% 30 year Fannie | |
| | | | | | | Mae pools | |
|
| JPMorgan Securities LLC | | | | | |
|
| | 221,879 | — | 1/12/43 | | (3.50%) 1 month | Synthetic TRS Index | (281) |
| | | | | | USD-LIBOR | 3.50% 30 year Fannie | |
| | | | | | | Mae pools | |
|
| | 978,684 | — | 1/12/44 | | (3.50%) 1 month | Synthetic TRS Index | (1,238) |
| | | | | | USD-LIBOR | 3.50% 30 year Fannie | |
| | | | | | | Mae pools | |
|
| | 1,972,948 | — | 1/12/42 | | (4.00%) 1 month | Synthetic TRS Index | 1,627 |
| | | | | | USD-LIBOR | 4.00% 30 year Fannie | |
| | | | | | | Mae pools | |
|
| | 391,040 | (1,344) | 1/12/41 | | (5.00%) 1 month | Synthetic MBX Index | — |
| | | | | | USD-LIBOR | 5.00% 30 year Ginnie | |
| | | | | | | Mae II pools | |
|
| Total | | $(1,344) | | | | | $44,775 |
|
| | | | | | | |
| OTC CREDIT DEFAULT CONTRACTS OUTSTANDING at 4/30/17 (Unaudited) | | |
|
| | | Upfront | | | | Payments | |
| | | premium | | | Termi- | received | Unrealized |
| Swap counterparty/ | | received | Notional | | nation | (paid) by fund | appreciation/ |
| Referenced debt* | Rating*** | (paid)** | amount | | date | per annum | (depreciation) |
|
| Bank of America N.A. | | | | | | | |
|
| CMBX NA BBB– | BBB–/P | $2,666 | $39,000 | | 5/11/63 | 300 bp | $(1,671) |
| Index | | | | | | | |
|
| CMBX NA BBB– | BBB–/P | 5,303 | 88,000 | | 5/11/63 | 300 bp | (4,482) |
| Index | | | | | | | |
|
| CMBX NA BBB– | BBB–/P | 10,865 | 176,000 | | 5/11/63 | 300 bp | (8,706) |
| Index | | | | | | | |
| | | | | | | |
| OTC CREDIT DEFAULT CONTRACTS OUTSTANDING at 4/30/17 (Unaudited) cont. | | |
|
| | | Upfront | | | | Payments | |
| | | premium | | | Termi- | received | Unrealized |
| Swap counterparty/ | | received | Notional | | nation | (paid) by fund | appreciation/ |
| Referenced debt* | Rating*** | (paid)** | amount | | date | per annum | (depreciation) |
|
| Credit Suisse International | | | | | | |
|
| CMBX NA BB Index | — | $(842) | $6,000 | | 1/17/47 | (500 bp) | $137 |
|
| CMBX NA A Index | A/P | 17,943 | 341,000 | | 5/11/63 | 200 bp | 4,144 |
|
| CMBX NA A Index | A/P | 35,222 | 731,000 | | 5/11/63 | 200 bp | 5,641 |
|
| CMBX NA A Index | A/P | 40,288 | 828,000 | | 5/11/63 | 200 bp | 6,782 |
|
| CMBX NA BB Index | — | (25,805) | 1,462,000 | | 5/11/63 | (500 bp) | 248,892 |
|
| CMBX NA BB Index | — | (35,847) | 189,000 | | 1/17/47 | (500 bp) | (5,008) |
|
| CMBX NA BBB– | BBB–/P | 3,048 | 25,000 | | 5/11/63 | 300 bp | 268 |
| Index | | | | | | | |
|
| CMBX NA BBB– | BBB–/P | 3,020 | 27,000 | | 5/11/63 | 300 bp | 13 |
| Index | | | | | | | |
|
| CMBX NA BBB– | BBB–/P | 3,299 | 27,000 | | 5/11/63 | 300 bp | 297 |
| Index | | | | | | | |
|
| CMBX NA BBB– | BBB–/P | 5,345 | 63,000 | | 5/11/63 | 300 bp | (1,661) |
| Index | | | | | | | |
|
| CMBX NA BBB– | BBB–/P | 13,606 | 103,000 | | 5/11/63 | 300 bp | 2,152 |
| Index | | | | | | | |
|
| CMBX NA BBB– | BBB–/P | 12,509 | 159,000 | | 5/11/63 | 300 bp | (5,172) |
| Index | | | | | | | |
|
| CMBX NA BBB– | BBB–/P | 22,159 | 182,000 | | 5/11/63 | 300 bp | 1,921 |
| Index | | | | | | | |
|
| CMBX NA BBB– | BBB–/P | 29,617 | 204,000 | | 5/11/63 | 300 bp | 6,932 |
| Index | | | | | | | |
|
| CMBX NA BBB– | BBB–/P | 18,467 | 222,000 | | 5/11/63 | 300 bp | (6,219) |
| Index | | | | | | | |
|
| CMBX NA BBB– | BBB–/P | 15,027 | 307,000 | | 5/11/63 | 300 bp | (19,111) |
| Index | | | | | | | |
|
| CMBX NA BBB– | BBB–/P | 100,616 | 2,051,000 | | 5/11/63 | 300 bp | (127,453) |
| Index | | | | | | | |
|
| CMBX NA BBB– | BBB–/P | 23,081 | 292,000 | | 1/17/47 | 300 bp | (285) |
| Index | | | | | | | |
|
| Goldman Sachs International | | | | | | |
|
| CMBX NA BB Index | — | (48,592) | 475,000 | | 5/11/63 | (500 bp) | 40,692 |
|
| CMBX NA BB Index | — | (6,053) | 40,000 | | 1/17/47 | (500 bp) | 474 |
|
| CMBX NA A Index | A/P | 10,274 | 184,000 | | 5/11/63 | 200 bp | 2,828 |
|
| CMBX NA A Index | A/P | 9,804 | 199,000 | | 5/11/63 | 200 bp | 1,751 |
|
| CMBX NA A Index | A/P | 16,946 | 333,000 | | 5/11/63 | 200 bp | 3,471 |
|
| CMBX NA A Index | A/P | 18,006 | 346,000 | | 5/11/63 | 200 bp | 4,004 |
|
| CMBX NA A Index | A/P | 17,515 | 346,000 | | 5/11/63 | 200 bp | 3,514 |
|
| CMBX NA A Index | A/P | 17,515 | 346,000 | | 5/11/63 | 200 bp | 3,514 |
|
| CMBX NA A Index | A/P | 35,696 | 708,000 | | 1/17/47 | 200 bp | 11,860 |
|
| CMBX NA BB Index | — | (45,077) | 222,000 | | 1/17/47 | (500 bp) | (8,854) |
|
| CMBX NA BBB– | BBB–/P | 2,399 | 46,000 | | 5/11/63 | 300 bp | (2,716) |
| Index | | | | | | | |
|
| CMBX NA BBB– | BBB–/P | 6,093 | 77,000 | | 5/11/63 | 300 bp | (2,470) |
| Index | | | | | | | |
|
| | | | | | | |
| OTC CREDIT DEFAULT CONTRACTS OUTSTANDING at 4/30/17 (Unaudited) cont. | | |
| | | Upfront | | | | Payments | |
| | | premium | | | Termi- | received | Unrealized |
| Swap counterparty/ | | received | Notional | | nation | (paid) by fund | appreciation/ |
| Referenced debt* | Rating*** | (paid)** | amount | | date | per annum | (depreciation) |
|
| Goldman Sachs International cont. | | | | | |
|
| CMBX NA BBB– | BBB–/P | $10,491 | $154,000 | | 5/11/63 | 300 bp | $(6,633) |
| Index | | | | | | | |
|
| CMBX NA BBB– | BBB–/P | 21,307 | 175,000 | | 5/11/63 | 300 bp | 1,847 |
| Index | | | | | | | |
|
| CMBX NA BBB– | BBB–/P | 18,825 | 218,000 | | 5/11/63 | 300 bp | (5,417) |
| Index | | | | | | | |
|
| CMBX NA BBB– | BBB–/P | 48,302 | 515,000 | | 5/11/63 | 300 bp | (8,966) |
| Index | | | | | | | |
|
| CMBX NA BBB– | BBB–/P | 46,305 | 616,000 | | 5/11/63 | 300 bp | (22,194) |
| Index | | | | | | | |
|
| CMBX NA BBB– | — | (14,803) | 218,000 | | 1/17/47 | (300 bp) | 2,724 |
| Index | | | | | | | |
|
| CMBX NA BBB– | — | (3,519) | 51,000 | | 1/17/47 | (300 bp) | 581 |
| Index | | | | | | | |
|
| CMBX NA BBB– | — | (1,246) | 12,000 | | 1/17/47 | (300 bp) | (281) |
| Index | | | | | | | |
|
| CMBX NA BBB– | BBB–/P | 6,578 | 89,000 | | 1/17/47 | 300 bp | (577) |
| Index | | | | | | | |
|
| CMBX NA BBB– | BBB–/P | 16,952 | 199,000 | | 1/17/47 | 300 bp | 952 |
| Index | | | | | | | |
|
| CMBX NA BBB– | BBB–/P | 21,186 | 269,000 | | 1/17/47 | 300 bp | (441) |
| Index | | | | | | | |
|
| JPMorgan Securities LLC | | | | | | |
|
| CMBX NA A Index | A/P | 9,807 | 181,000 | | 5/11/63 | 200 bp | 2,482 |
|
| CMBX NA A Index | A/P | 9,756 | 183,000 | | 5/11/63 | 200 bp | 2,351 |
|
| CMBX NA A Index | A/P | 20,955 | 386,000 | | 5/11/63 | 200 bp | 5,335 |
|
| CMBX NA BB Index | — | (17,856) | 127,000 | | 5/11/63 | (500 bp) | 6,015 |
|
| CMBX NA BB Index | — | (12,630) | 95,000 | | 5/11/63 | (500 bp) | 5,226 |
|
| CMBX NA BB Index | — | (7,479) | 52,000 | | 5/11/63 | (500 bp) | 2,295 |
|
| CMBX NA BB Index | — | (20,201) | 118,000 | | 1/17/47 | (500 bp) | (947) |
|
| CMBX NA BBB– | BBB–/P | 1,752 | 12,000 | | 5/11/63 | 300 bp | 418 |
| Index | | | | | | | |
|
| CMBX NA BBB– | BBB–/P | 1,049 | 17,000 | | 5/11/63 | 300 bp | (842) |
| Index | | | | | | | |
|
| CMBX NA BBB– | BBB–/P | 2,837 | 25,000 | | 5/11/63 | 300 bp | 57 |
| Index | | | | | | | |
|
| CMBX NA BBB– | BBB–/P | 2,843 | 25,000 | | 5/11/63 | 300 bp | 63 |
| Index | | | | | | | |
|
| CMBX NA BBB– | BBB–/P | 3,178 | 26,000 | | 5/11/63 | 300 bp | 286 |
| Index | | | | | | | |
|
| CMBX NA BBB– | BBB–/P | 3,178 | 26,000 | | 5/11/63 | 300 bp | 286 |
| Index | | | | | | | |
|
| CMBX NA BBB– | BBB–/P | 2,241 | 35,000 | | 5/11/63 | 300 bp | (1,651) |
| Index | | | | | | | |
|
| CMBX NA BBB– | BBB–/P | 1,865 | 35,000 | | 5/11/63 | 300 bp | (2,027) |
| Index | | | | | | | |
|
| | | | | | | |
| OTC CREDIT DEFAULT CONTRACTS OUTSTANDING at 4/30/17 (Unaudited) cont. | | |
|
| | | Upfront | | | | Payments | |
| | | premium | | | Termi- | received | Unrealized |
| Swap counterparty/ | | received | Notional | | nation | (paid) by fund | appreciation/ |
| Referenced debt* | Rating*** | (paid)** | amount | | date | per annum | (depreciation) |
|
| JPMorgan Securities LLC cont. | | | | | | |
|
| CMBX NA BBB– | BBB–/P | $1,783 | $35,000 | | 5/11/63 | 300 bp | $(2,109) |
| Index | | | | | | | |
|
| CMBX NA BBB– | BBB–/P | 5,317 | 77,000 | | 5/11/63 | 300 bp | (3,246) |
| Index | | | | | | | |
|
| CMBX NA BBB– | BBB–/P | 10,154 | 82,000 | | 5/11/63 | 300 bp | 1,035 |
| Index | | | | | | | |
|
| CMBX NA BBB– | BBB–/P | 12,394 | 86,000 | | 5/11/63 | 300 bp | 2,830 |
| Index | | | | | | | |
|
| CMBX NA BBB– | BBB–/P | 14,850 | 102,000 | | 5/11/63 | 300 bp | 3,508 |
| Index | | | | | | | |
|
| CMBX NA BBB– | BBB–/P | 5,257 | 119,000 | | 5/11/63 | 300 bp | (7,976) |
| Index | | | | | | | |
|
| CMBX NA BBB– | BBB–/P | 29,457 | 199,000 | | 5/11/63 | 300 bp | 7,328 |
| Index | | | | | | | |
|
| CMBX NA BBB– | BBB–/P | 29,457 | 199,000 | | 5/11/63 | 300 bp | 7,328 |
| Index | | | | | | | |
|
| CMBX NA BBB– | BBB–/P | 18,909 | 231,000 | | 5/11/63 | 300 bp | (6,779) |
| Index | | | | | | | |
|
| CMBX NA BBB– | BBB–/P | 30,584 | 247,000 | | 5/11/63 | 300 bp | 3,118 |
| Index | | | | | | | |
|
| CMBX NA BBB– | BBB–/P | 31,054 | 396,000 | | 5/11/63 | 300 bp | (12,981) |
| Index | | | | | | | |
|
| CMBX NA BBB– | BBB–/P | 97,805 | 1,159,000 | | 5/11/63 | 300 bp | (31,076) |
| Index | | | | | | | |
|
| CMBX NA BBB– | — | (915) | 17,000 | | 1/17/47 | (300 bp) | 452 |
| Index | | | | | | | |
|
| CMBX NA BBB– | BBB–/P | 2,065 | 79,000 | | 1/17/47 | 300 bp | (4,286) |
| Index | | | | | | | |
|
| CMBX NA BBB– | BBB–/P | 4,980 | 90,000 | | 1/17/47 | 300 bp | (2,256) |
| Index | | | | | | | |
|
| CMBX NA BBB– | BBB–/P | 5,380 | 102,000 | | 1/17/47 | 300 bp | (2,821) |
| Index | | | | | | | |
|
| CMBX NA BBB– | BBB–/P | 15,352 | 156,000 | | 1/17/47 | 300 bp | 2,809 |
| Index | | | | | | | |
|
| CMBX NA BBB– | BBB–/P | 35,698 | 270,000 | | 1/17/47 | 300 bp | 13,990 |
| Index | | | | | | | |
|
| Total | | $855,367 | | | | | $105,289 |
|
* Payments related to the referenced debt are made upon a credit default event.
** Upfront premium is based on the difference between the original spread on issue and the market spread on day of execution.
*** Ratings are presented for credit default contracts in which the fund has sold protection on the underlying referenced debt. Ratings for an underlying index represent the average of the ratings of all the securities included in that index. The Moody’s, Standard & Poor’s or Fitch ratings are believed to be the most recent ratings available at April 30, 2017. Securities rated by Putnam are indicated by “/P.” The Putnam rating categories are comparable to the Standard & Poor’s classifications.
| | | | | | | |
| CENTRALLY CLEARED CREDIT DEFAULT CONTRACTS OUTSTANDING at 4/30/17 (Unaudited) | |
|
| | | Upfront | | | | Payments | |
| | | premium | | | Termi- | received | Unrealized |
| | | received | Notional | | nation | (paid) by fund | appreciation/ |
| Referenced debt* | Rating*** | (paid)** | amount | | date | per annum | (depreciation) |
|
| NA HY Series 28 | B+/P | $247,089 | $3,348,000 | | 6/20/22 | 500 bp | $(20,778) |
| Index | | | | | | | |
|
| Total | | $247,089 | | | | | $(20,778) |
|
* Payments related to the referenced debt are made upon a credit default event.
** Upfront premium is based on the difference between the original spread on issue and the market spread on day of execution.
*** Ratings are presented for credit default contracts in which the fund has sold protection on the underlying referenced debt. Ratings for an underlying index represent the average of the ratings of all the securities included in that index. The Moody’s, Standard & Poor’s or Fitch ratings are believed to be the most recent ratings available at April 30, 2017. Securities rated by Putnam are indicated by “/P.” The Putnam rating categories are comparable to the Standard & Poor’s classifications.
ASC 820 establishes a three-level hierarchy for disclosure of fair value measurements. The valuation hierarchy is based upon the transparency of inputs to the valuation of the fund’s investments. The three levels are defined as follows:
Level 1: Valuations based on quoted prices for identical securities in active markets.
Level 2: Valuations based on quoted prices in markets that are not active or for which all significant inputs are observable, either directly or indirectly.
Level 3: Valuations based on inputs that are unobservable and significant to the fair value measurement.
The following is a summary of the inputs used to value the fund’s net assets as of the close of the reporting period:
| | | | |
| | | | | Valuation inputs | |
|
| Investments in securities: | | Level 1 | Level 2 | Level 3 |
|
| Asset-backed securities | | $— | $1,675,000 | $— |
|
| Corporate bonds and notes | | — | 76,558,026 | 574,600 |
|
| Foreign government and agency bonds and notes | | — | 92,951,908 | — |
|
| Mortgage-backed securities | | — | 57,449,520 | — |
|
| Municipal bonds and notes | | — | 412,625 | — |
|
| Purchased options outstanding | | — | 195,735 | — |
|
| Purchased swap options outstanding | | — | 830,367 | — |
|
| U.S. government and agency mortgage obligations | | — | 109,395,891 | — |
|
| Short-term investments | | 9,752,925 | 6,176,130 | — |
|
| Totals by level | | $9,752,925 | $345,645,202 | $574,600 |
| |
| | | | | Valuation inputs | |
|
| Other financial instruments: | | Level 1 | Level 2 | Level 3 |
|
| Forward currency contracts | | $— | $(432,448) | $— |
|
| Futures contracts | | (104,144) | — | — |
|
| Written options outstanding | | — | (192,030) | — |
|
| Written swap options outstanding | | — | (903,353) | — |
|
| Forward premium swap option contracts | | — | 4,136 | — |
|
| TBA sale commitments | | — | (48,124,063) | — |
|
| Interest rate swap contracts | | — | (901,095) | — |
|
| Total return swap contracts | | — | 46,119 | — |
|
| Credit default contracts | | — | (1,017,945) | — |
|
| Totals by level | | $(104,144) | $(51,520,679) | $— |
During the reporting period, transfers within the fair value hierarchy, if any, did not represent, in the aggregate, more than 1% of the fund’s net assets measured as of the end of the period. Transfers are accounted for using the end of period pricing valuation method.
At the start and close of the reporting period, Level 3 investments in securities represented less than 1% of the fund’s net assets and were not considered a significant portion of the fund’s portfolio.
The accompanying notes are an integral part of these financial statements.
Statement of assets and liabilities 4/30/17 (Unaudited)
| |
| ASSETS | |
|
| Investment in securities, at value (Note 1): | |
| Unaffiliated issuers (identified cost $348,666,856) | $346,219,802 |
| Affiliated issuers (identified cost $9,752,925) (Note 5) | 9,752,925 |
|
| Cash | 87,335 |
|
| Interest and other receivables | 2,655,523 |
|
| Receivable for shares of the fund sold | 465,682 |
|
| Receivable for investments sold | 910,288 |
|
| Receivable for sales of delayed delivery securities (Note 1) | 44,105,139 |
|
| Receivable for variation margin (Note 1) | 321,005 |
|
| Unrealized appreciation on forward premium swap option contracts (Note 1) | 128,838 |
|
| Unrealized appreciation on forward currency contracts (Note 1) | 1,101,840 |
|
| Unrealized appreciation on OTC swap contracts (Note 1) | 501,068 |
|
| Premium paid on OTC swap contracts (Note 1) | 242,209 |
|
| Prepaid assets | 64,406 |
|
| Total assets | 406,556,060 |
|
| |
| LIABILITIES | |
|
| Payable to custodian | 6,984 |
|
| Payable for investments purchased | 1,287,389 |
|
| Payable for purchases of delayed delivery securities (Note 1) | 104,854,740 |
|
| Payable for shares of the fund repurchased | 726,581 |
|
| Payable for compensation of Manager (Note 2) | 110,347 |
|
| Payable for custodian fees (Note 2) | 68,087 |
|
| Payable for investor servicing fees (Note 2) | 91,567 |
|
| Payable for Trustee compensation and expenses (Note 2) | 177,741 |
|
| Payable for administrative services (Note 2) | 1,006 |
|
| Payable for distribution fees (Note 2) | 50,170 |
|
| Payable for variation margin (Note 1) | 380,835 |
|
| Unrealized depreciation on OTC swap contracts (Note 1) | 533,245 |
|
| Premium received on OTC swap contracts (Note 1) | 1,096,232 |
|
| Unrealized depreciation on forward currency contracts (Note 1) | 1,534,288 |
|
| Unrealized depreciation on forward premium swap option contracts (Note 1) | 124,702 |
|
| Written options outstanding, at value (premiums $1,735,856) (Notes 1 and 3) | 1,095,383 |
|
| TBA sale commitments, at value (proceeds receivable $48,016,875) (Note 1) | 48,124,063 |
|
| Collateral on certain derivative contracts, at value (Note 1) | 126,515 |
|
| Other accrued expenses | 119,068 |
|
| Total liabilities | 160,508,943 |
| | |
| Net assets | $246,047,117 |
|
(Continued on next page)
Statement of assets and liabilities cont.
| |
| REPRESENTED BY | |
|
| Paid-in capital (Unlimited shares authorized) (Notes 1 and 4) | $264,474,233 |
|
| Undistributed net investment income (Note 1) | 3,918,515 |
|
| Accumulated net realized loss on investments and foreign currency transactions (Note 1) | (18,607,903) |
|
| Net unrealized depreciation of investments and assets and liabilities in foreign currencies | (3,737,728) |
|
| Total — Representing net assets applicable to capital shares outstanding | $246,047,117 |
|
| |
| COMPUTATION OF NET ASSET VALUE AND OFFERING PRICE | |
|
| Net asset value and redemption price per class A share | |
| ($131,361,792 divided by 11,029,141 shares) | $11.91 |
|
| Offering price per class A share (100/96.00 of $11.91)* | $12.41 |
|
| Net asset value and offering price per class B share ($4,239,173 divided by 357,691 shares)** | $11.85 |
|
| Net asset value and offering price per class C share ($18,400,526 divided by 1,552,266 shares)** | $11.85 |
|
| Net asset value and redemption price per class M share ($7,960,722 divided by 675,535 shares) | $11.78 |
|
| Offering price per class M share (100/96.75 of $11.78)† | $12.18 |
|
| Net asset value, offering price and redemption price per class R share | |
| ($2,914,390 divided by 244,834 shares) | $11.90 |
|
| Net asset value, offering price and redemption price per class R5 share | |
| ($26,034 divided by 2,186 shares) | $11.91 |
|
| Net asset value, offering price and redemption price per class R6 share | |
| ($6,396,851 divided by 537,122 shares) | $11.91 |
|
| Net asset value, offering price and redemption price per class Y share | |
| ($74,747,629 divided by 6,278,261 shares) | $11.91 |
* On single retail sales of less than $100,000. On sales of $100,000 or more the offering price is reduced.
** Redemption price per share is equal to net asset value less any applicable contingent deferred sales charge.
† On single retail sales of less than $50,000. On sales of $50,000 or more the offering price is reduced.
The accompanying notes are an integral part of these financial statements.
Statement of operations Six months ended 4/30/17 (Unaudited)
| |
| INVESTMENT INCOME | |
|
| Interest (including interest income of $31,042 from investments in affiliated issuers) (Note 5) | $4,233,341 |
|
| Total investment income | 4,233,341 |
|
| |
| EXPENSES | |
|
| Compensation of Manager (Note 2) | 681,504 |
|
| Investor servicing fees (Note 2) | 278,655 |
|
| Custodian fees (Note 2) | 47,584 |
|
| Trustee compensation and expenses (Note 2) | 7,405 |
|
| Distribution fees (Note 2) | 326,393 |
|
| Administrative services (Note 2) | 4,583 |
|
| Other | 184,453 |
|
| Total expenses | 1,530,577 |
|
| Expense reduction (Note 2) | (306) |
|
| Net expenses | 1,530,271 |
| |
| Net investment income | 2,703,070 |
|
| Net realized loss on investments (Notes 1 and 3) | (3,127,906) |
|
| Net realized gain on swap contracts (Note 1) | 8,117,988 |
|
| Net realized loss on futures contracts (Note 1) | (2,905,195) |
|
| Net realized gain on foreign currency transactions (Note 1) | 456,859 |
|
| Net realized loss on written options (Notes 1 and 3) | (748,044) |
|
| Net unrealized appreciation of assets and liabilities in foreign currencies during the period | 533,213 |
|
| Net unrealized depreciation of investments, futures contracts, swap contracts, written options | |
| and TBA sale commitments during the period | (1,775,125) |
|
| Net gain on investments | 551,790 |
| |
| Net increase in net assets resulting from operations | $3,254,860 |
|
The accompanying notes are an integral part of these financial statements.
Statement of changes in net assets
| | |
| DECREASE IN NET ASSETS | Six months ended 4/30/17* | Year ended 10/31/16 |
|
| Operations | | |
|
| Net investment income | $2,703,070 | $6,757,643 |
|
| Net realized gain (loss) on investments | | |
| and foreign currency transactions | 1,793,702 | (5,772,867) |
|
| Net unrealized appreciation (depreciation) of investments | | |
| and assets and liabilities in foreign currencies | (1,241,912) | 7,449,284 |
|
| Net increase in net assets resulting from operations | 3,254,860 | 8,434,060 |
|
| Distributions to shareholders (Note 1): | | |
| From ordinary income | | |
| Net investment income | | |
|
| Class A | (2,259,910) | (4,995,135) |
|
| Class B | (56,057) | (134,575) |
|
| Class C | (243,764) | (551,718) |
|
| Class M | (124,362) | (265,872) |
|
| Class R | (67,833) | (309,354) |
|
| Class R5 | (448) | (915) |
|
| Class R6 | (114,658) | (222,137) |
|
| Class Y | (1,195,493) | (2,234,801) |
|
| Decrease from capital share transactions (Note 4) | (24,319,676) | (12,293,133) |
|
| Total decrease in net assets | (25,127,341) | (12,573,580) |
|
| |
| NET ASSETS | | |
|
| Beginning of period | 271,174,458 | 283,748,038 |
|
| End of period (including undistributed net investment | | |
| income of $3,918,515 and $5,277,970, respectively) | $246,047,117 | $271,174,458 |
* Unaudited.
The accompanying notes are an integral part of these financial statements.
Financial highlights (For a common share outstanding throughout the period)
| | | | | | | | | | | | | |
| | INVESTMENT OPERATIONS | LESS DISTRIBUTIONS | RATIOS AND SUPPLEMENTAL DATA |
| |
|
| | | | | | | | | | | | | Ratio of net | |
| | Net asset | | Net realized | | From | | | | | | Ratio | investment | |
| | value, | | and unrealized | Total from | net | From | | Net asset | Total return | Net assets, | of expenses | income (loss) | Portfolio |
| | beginning | Net investment | gain (loss) | investment | investment | return | Total | value, end | at net asset | end of period | to average | to average | turnover |
| Period ended | of period | income (loss)a | on investments | operations | income | of capital | distributions | of period | value (%)b | (in thousands) | net assets (%)c | net assets (%) | (%) |
|
| Class A | | | | | | | | | | | | | |
|
| April 30, 2017** | $11.93 | .13 | .04 | .17 | (.19) | — | (.19) | $11.91 | 1.48* | $131,362 | .60* | 1.07* | 353*e |
|
| October 31, 2016 | 11.93 | .30 | .08 | .38 | (.38) | — | (.38) | 11.93 | 3.27 | 148,868 | 1.16d | 2.50d | 551e |
|
| October 31, 2015 | 12.60 | .31 | (.60) | (.29) | (.38) | — | (.38) | 11.93 | (2.31) | 160,497 | 1.10 | 2.54 | 296e |
|
| October 31, 2014 | 12.57 | .36 | .05 | .41 | (.38) | — | (.38) | 12.60 | 3.30 | 171,481 | 1.09 | 2.84 | 295e |
|
| October 31, 2013 | 12.85 | .38 | (.27) | .11 | (.35) | (.04) | (.39) | 12.57 | .82 | 199,284 | 1.10 | 2.96 | 335f |
|
| October 31, 2012 | 12.58 | .36 | .38 | .74 | (.36) | (.11) | (.47) | 12.85 | 6.02 | 229,240 | 1.10 | 2.85 | 162f |
|
| Class B | | | | | | | | | | | | | |
|
| April 30, 2017** | $11.87 | .08 | .05 | .13 | (.15) | — | (.15) | $11.85 | 1.10* | $4,239 | .98* | .68* | 353*e |
|
| October 31, 2016 | 11.87 | .21 | .08 | .29 | (.29) | — | (.29) | 11.87 | 2.51 | 4,916 | 1.91d | 1.74d | 551e |
|
| October 31, 2015 | 12.54 | .22 | (.60) | (.38) | (.29) | — | (.29) | 11.87 | (3.05) | 6,060 | 1.85 | 1.78 | 296e |
|
| October 31, 2014 | 12.51 | .26 | .06 | .32 | (.29) | — | (.29) | 12.54 | 2.54 | 7,884 | 1.84 | 2.08 | 295e |
|
| October 31, 2013 | 12.80 | .28 | (.28) | —g | (.26) | (.03) | (.29) | 12.51 | (.01) | 9,002 | 1.85 | 2.21 | 335f |
|
| October 31, 2012 | 12.53 | .26 | .38 | .64 | (.28) | (.09) | (.37) | 12.80 | 5.24 | 11,109 | 1.85 | 2.10 | 162f |
|
| Class C | | | | | | | | | | | | | |
|
| April 30, 2017** | $11.87 | .08 | .05 | .13 | (.15) | — | (.15) | $11.85 | 1.10* | $18,401 | .98* | .70* | 353*e |
|
| October 31, 2016 | 11.88 | .21 | .08 | .29 | (.30) | — | (.30) | 11.87 | 2.43 | 21,570 | 1.91d | 1.74d | 551e |
|
| October 31, 2015 | 12.55 | .22 | (.60) | (.38) | (.29) | — | (.29) | 11.88 | (3.04) | 24,160 | 1.85 | 1.78 | 296e |
|
| October 31, 2014 | 12.51 | .26 | .07 | .33 | (.29) | — | (.29) | 12.55 | 2.61 | 30,175 | 1.84 | 2.08 | 295e |
|
| October 31, 2013 | 12.80 | .28 | (.28) | —g | (.26) | (.03) | (.29) | 12.51 | (.01) | 31,771 | 1.85 | 2.22 | 335f |
|
| October 31, 2012 | 12.53 | .26 | .38 | .64 | (.28) | (.09) | (.37) | 12.80 | 5.25 | 39,316 | 1.85 | 2.10 | 162f |
|
| Class M | | | | | | | | | | | | | |
|
| April 30, 2017** | $11.80 | .11 | .05 | .16 | (.18) | — | (.18) | $11.78 | 1.38* | $7,961 | .73* | .94* | 353*e |
|
| October 31, 2016 | 11.81 | .26 | .09 | .35 | (.36) | — | (.36) | 11.80 | 2.98 | 8,564 | 1.41d | 2.24d | 551e |
|
| October 31, 2015 | 12.48 | .28 | (.60) | (.32) | (.35) | — | (.35) | 11.81 | (2.58) | 9,406 | 1.35 | 2.28 | 296e |
|
| October 31, 2014 | 12.45 | .33 | .05 | .38 | (.35) | — | (.35) | 12.48 | 3.07 | 10,911 | 1.34 | 2.58 | 295e |
|
| October 31, 2013 | 12.74 | .34 | (.28) | .06 | (.32) | (.03) | (.35) | 12.45 | .50 | 12,457 | 1.35 | 2.71 | 335f |
|
| October 31, 2012 | 12.47 | .32 | .38 | .70 | (.33) | (.10) | (.43) | 12.74 | 5.80 | 14,969 | 1.35 | 2.60 | 162f |
|
| Class R | | | | | | | | | | | | | |
|
| April 30, 2017** | $11.90 | .11 | .05 | .16 | (.16) | — | (.16) | $11.90 | 1.34* | $2,914 | .73* | .96* | 353*e |
|
| October 31, 2016 | 11.91 | .27 | .08 | .35 | (.36) | — | (.36) | 11.90 | 2.98 | 13,875 | 1.41d | 2.26d | 551e |
|
| October 31, 2015 | 12.58 | .28 | (.60) | (.32) | (.35) | — | (.35) | 11.91 | (2.56) | 6,366 | 1.35 | 2.27 | 296e |
|
| October 31, 2014 | 12.54 | .33 | .06 | .39 | (.35) | — | (.35) | 12.58 | 3.12 | 6,072 | 1.34 | 2.58 | 295e |
|
| October 31, 2013 | 12.83 | .34 | (.28) | .06 | (.32) | (.03) | (.35) | 12.54 | .50 | 5,586 | 1.35 | 2.70 | 335f |
|
| October 31, 2012 | 12.56 | .33 | .37 | .70 | (.33) | (.10) | (.43) | 12.83 | 5.76 | 4,142 | 1.35 | 2.61 | 162f |
See notes to financial highlights at the end of this section.
The accompanying notes are an integral part of these financial statements.
| |
| 62 Global Income Trust | Global Income Trust 63 |
Financial highlights cont.
| | | | | | | | | | | | | |
| | INVESTMENT OPERATIONS | LESS DISTRIBUTIONS | RATIOS AND SUPPLEMENTAL DATA |
| |
|
| | | | | | | | | | | | | Ratio of net | |
| | Net asset | | Net realized | | From | | | | | | Ratio | investment | |
| | value, | | and unrealized | Total from | net | From | | Net asset | Total return | Net assets, | of expenses | income (loss) | Portfolio |
| | beginning | Net investment | gain (loss) | investment | investment | return | Total | value, end | at net asset | end of period | to average | to average | turnover |
| Period ended | of period | income (loss)a | on investments | operations | income | of capital | distributions | of period | value (%)b | (in thousands) | net assets (%)c | net assets (%) | (%) |
|
| Class R5 | | | | | | | | | | | | | |
|
| April 30, 2017** | $11.93 | .15 | .04 | .19 | (.21) | — | (.21) | $11.91 | 1.67* | $26 | .43* | 1.29* | 353*e |
|
| October 31, 2016 | 11.94 | .34 | .07 | .41 | (.42) | — | (.42) | 11.93 | 3.50 | 24 | .86d | 2.82d | 551e |
|
| October 31, 2015 | 12.60 | .35 | (.59) | (.24) | (.42) | — | (.42) | 11.94 | (1.94) | 41 | .83 | 2.84 | 296e |
|
| October 31, 2014 | 12.56 | .39 | .07 | .46 | (.42) | — | (.42) | 12.60 | 3.67 | 24 | .82 | 3.02 | 295e |
|
| October 31, 2013 | 12.85 | .42 | (.29) | .13 | (.38) | (.04) | (.42) | 12.56 | 1.02 | 11 | .82 | 3.27 | 335f |
|
| October 31, 2012† | 12.45 | .13 | .41 | .54 | (.11) | (.03) | (.14) | 12.85 | 4.34* | 10 | .27* | .99* | 162f |
|
| Class R6 | | | | | | | | | | | | | |
|
| April 30, 2017** | $11.92 | .15 | .06 | .21 | (.22) | — | (.22) | $11.91 | 1.77* | $6,397 | .39* | 1.30* | 353*e |
|
| October 31, 2016 | 11.93 | .34 | .08 | .42 | (.43) | — | (.43) | 11.92 | 3.59 | 6,445 | .79d | 2.88d | 551e |
|
| October 31, 2015 | 12.60 | .35 | (.59) | (.24) | (.43) | — | (.43) | 11.93 | (1.97) | 5,405 | .76 | 2.89 | 296e |
|
| October 31, 2014 | 12.57 | .40 | .06 | .46 | (.43) | — | (.43) | 12.60 | 3.64 | 4,736 | .75 | 3.15 | 295e |
|
| October 31, 2013 | 12.85 | .38h | (.23) | .15 | (.39) | (.04) | (.43) | 12.57 | 1.19 | 4,025 | .75 | 3.00h | 335f |
|
| October 31, 2012† | 12.45 | .13 | .41 | .54 | (.11) | (.03) | (.14) | 12.85 | 4.37* | 10 | .25* | 1.01* | 162f |
|
| Class Y | | | | | | | | | | | | | |
|
| April 30, 2017** | $11.92 | .14 | .06 | .20 | (.21) | — | (.21) | $11.91 | 1.69* | $74,748 | .48* | 1.21* | 353*e |
|
| October 31, 2016 | 11.93 | .33 | .07 | .40 | (.41) | — | (.41) | 11.92 | 3.44 | 66,913 | .91d | 2.75d | 551e |
|
| October 31, 2015 | 12.60 | .34 | (.59) | (.25) | (.42) | — | (.42) | 11.93 | (2.06) | 71,813 | .85 | 2.79 | 296e |
|
| October 31, 2014 | 12.57 | .38 | .07 | .45 | (.42) | — | (.42) | 12.60 | 3.58 | 117,947 | .84 | 2.97 | 295e |
|
| October 31, 2013 | 12.86 | .41 | (.28) | .13 | (.38) | (.04) | (.42) | 12.57 | 1.00 | 40,069 | .85 | 3.22 | 335f |
|
| October 31, 2012 | 12.58 | .39 | .39 | .78 | (.38) | (.12) | (.50) | 12.86 | 6.40 | 64,357 | .85 | 3.11 | 162f |
* Not annualized.
** Unaudited.
† For the period July 3, 2012 (commencement of operations) to October 31, 2012.
a Per share net investment income (loss) has been determined on the basis of the weighted average number of shares outstanding during the period.
b Total return assumes dividend reinvestment and does not reflect the effect of sales charges.
c Includes amounts paid through expense offset and/or brokerage/service arrangements, if any (Note 2). Also excludes acquired fund fees and expenses, if any.
d Reflects a voluntary waiver of certain fund expenses in effect during the period. As a result of such waiver, the expenses of each class reflect a reduction of less than 0.01% as a percentage of average net assets.
e Portfolio turnover includes TBA purchase and sale commitments.
f Portfolio turnover excludes TBA purchase and sale commitments. Including TBA purchase and sale commitments to conform with current year presentation, the portfolio turnover would have been the following:
| | | |
| | Portfolio turnover % | | |
| | |
| October 31, 2013 | 673% | | |
| | |
| October 31, 2012 | 328 | | |
| | |
g Amount represents less than $0.01 per share.
h The net investment income ratio and per share amount shown for the period ending October 31, 2013 may not correspond with the expected class specific differences for the period due to the timing of subscriptions into the class.
The accompanying notes are an integral part of these financial statements.
| |
| 64 Global Income Trust | Global Income Trust 65 |
Notes to financial statements 4/30/17 (Unaudited)
Within the following Notes to financial statements, references to “State Street” represent State Street Bank and Trust Company, references to “the SEC” represent the Securities and Exchange Commission, references to “Putnam Management” represent Putnam Investment Management, LLC, the fund’s manager, an indirect wholly-owned subsidiary of Putnam Investments, LLC and references to “OTC”, if any, represent over-the-counter. Unless otherwise noted, the “reporting period” represents the period from November 1, 2016 through April 30, 2017.
Putnam Global Income Trust (the fund) is a Massachusetts business trust, which is registered under the Investment Company Act of 1940, as amended, as a non-diversified open-end management investment company. The goal of the fund is to seek high current income. Preservation of capital and long-term total return are secondary objectives, but only to the extent consistent with the objective of seeking high current income. The fund invests mainly in bonds and securitized debt instruments (such as mortgage-backed investments) that are obligations of companies and governments worldwide; that are investment-grade in quality; and that have intermediate-to long-term maturities (three years or longer). Under normal circumstances, Putnam Management invests at least 80% of the fund’s net assets in investment-grade securities. This policy may be changed only after 60 days’ notice to shareholders. The fund may also invest in bonds that are below-investment-grade in quality (sometimes referred to as “junk bonds”). Putnam Management may consider, among other factors, credit, interest rate and prepayment risks, as well as general market conditions, when deciding whether to buy or sell investments. The fund typically uses to a significant extent derivatives, such as futures, options, certain foreign currency transactions and swap contracts, for both hedging and non-hedging purposes.
The fund offers class A, class B, class C, class M, class R, class R5, class R6 and class Y shares. The fund registered class T shares in February 2017, however, as of the date of this report, class T shares had not commenced operations and are not available for purchase. Effective April 1, 2017, purchases of class B shares are closed to new and existing investors except by exchange from class B shares of another Putnam fund or through dividend and/or capital gains reinvestment. Class A and class M shares are sold with a maximum front-end sales charge of 4.00% and 3.25%, respectively. Class A shares generally are not subject to a contingent deferred sales charge, and class M, class R, class R5, class R6 and class Y shares are not subject to a contingent deferred sales charge. Class B shares, which convert to class A shares after approximately eight years, are not subject to a front-end sales charge and are subject to a contingent deferred sales charge if those shares are redeemed within six years of purchase. Class C shares are subject to a one-year 1.00% contingent deferred sales charge and do not convert to class A shares. Class R shares, which are not available to all investors, are sold at net asset value. The expenses for class A, class B, class C, class M and class R shares may differ based on the distribution fee of each class, which is identified in Note 2. Class R5, class R6 and class Y shares, which are sold at net asset value, are generally subject to the same expenses as class A, class B, class C, class M and class R shares, but do not bear a distribution fee and in the case of class R5 and class R6 shares, bear a lower investor servicing fee, which is identified in Note 2. Class R5, class R6 and class Y shares are not available to all investors.
In the normal course of business, the fund enters into contracts that may include agreements to indemnify another party under given circumstances. The fund’s maximum exposure under these arrangements is unknown as this would involve future claims that may be, but have not yet been, made against the fund. However, the fund’s management team expects the risk of material loss to be remote.
The fund has entered into contractual arrangements with an investment adviser, administrator, distributor, shareholder servicing agent and custodian, who each provide services to the fund. Unless expressly stated otherwise, shareholders are not parties to, or intended beneficiaries of these contractual arrangements, and these contractual arrangements are not intended to create any shareholder right to enforce them against the service providers or to seek any remedy under them against the service providers, either directly or on behalf of the fund.
Under the fund’s Declaration of Trust, any claims asserted against or on behalf of the Putnam Funds, including claims against Trustees and Officers, must be brought in state and federal courts located within the Commonwealth of Massachusetts.
Note 1: Significant accounting policies
The following is a summary of significant accounting policies consistently followed by the fund in the preparation of its financial statements. The preparation of financial statements is in conformity with accounting principles generally accepted in the United States of America and requires management to make estimates and assumptions that affect the reported amounts of assets and liabilities in the financial statements and the reported amounts of increases and decreases in net assets from operations. Actual results could differ from those
estimates. Subsequent events after the Statement of assets and liabilities date through the date that the financial statements were issued have been evaluated in the preparation of the financial statements.
Investment income, realized and unrealized gains and losses and expenses of the fund are borne pro-rata based on the relative net assets of each class to the total net assets of the fund, except that each class bears expenses unique to that class (including the distribution fees applicable to such classes). Each class votes as a class only with respect to its own distribution plan or other matters on which a class vote is required by law or determined by the Trustees. If the fund were liquidated, shares of each class would receive their pro-rata share of the net assets of the fund. In addition, the Trustees declare separate dividends on each class of shares.
Security valuation Portfolio securities and other investments are valued using policies and procedures adopted by the Board of Trustees. The Trustees have formed a Pricing Committee to oversee the implementation of these procedures and have delegated responsibility for valuing the fund’s assets in accordance with these procedures to Putnam Management. Putnam Management has established an internal Valuation Committee that is responsible for making fair value determinations, evaluating the effectiveness of the pricing policies of the fund and reporting to the Pricing Committee.
Market quotations are not considered to be readily available for certain debt obligations (including short-term investments with remaining maturities of 60 days or less) and other investments; such investments are valued on the basis of valuations furnished by an independent pricing service approved by the Trustees or dealers selected by Putnam Management. Such services or dealers determine valuations for normal institutional-size trading units of such securities using methods based on market transactions for comparable securities and various relationships, generally recognized by institutional traders, between securities (which consider such factors as security prices, yields, maturities and ratings). These securities will generally be categorized as Level 2. Securities quoted in foreign currencies, if any, are translated into U.S. dollars at the current exchange rate.
Investments in open-end investment companies (excluding exchange-traded funds), if any, which can be classified as Level 1 or Level 2 securities, are valued based on their net asset value. The net asset value of such investment companies equals the total value of their assets less their liabilities and divided by the number of their outstanding shares.
To the extent a pricing service or dealer is unable to value a security or provides a valuation that Putnam Management does not believe accurately reflects the security’s fair value, the security will be valued at fair value by Putnam Management in accordance with policies and procedures approved by the Trustees. Certain investments, including certain restricted and illiquid securities and derivatives, are also valued at fair value following procedures approved by the Trustees. These valuations consider such factors as significant market or specific security events such as interest rate or credit quality changes, various relationships with other securities, discount rates, U.S. Treasury, U.S. swap and credit yields, index levels, convexity exposures, recovery rates, sales and other multiples and resale restrictions. These securities are classified as Level 2 or as Level 3 depending on the priority of the significant inputs.
To assess the continuing appropriateness of fair valuations, the Valuation Committee reviews and affirms the reasonableness of such valuations on a regular basis after considering all relevant information that is reasonably available. Such valuations and procedures are reviewed periodically by the Trustees. Certain securities may be valued on the basis of a price provided by a single source. The fair value of securities is generally determined as the amount that the fund could reasonably expect to realize from an orderly disposition of such securities over a reasonable period of time. By its nature, a fair value price is a good faith estimate of the value of a security in a current sale and does not reflect an actual market price, which may be different by a material amount.
Security transactions and related investment income Security transactions are recorded on the trade date (the date the order to buy or sell is executed). Gains or losses on securities sold are determined on the identified cost basis.
Interest income, net of any applicable withholding taxes, is recorded on the accrual basis.
All premiums/discounts are amortized/accreted on a yield-to-maturity basis.
Securities purchased or sold on a delayed delivery basis may be settled at a future date beyond customary settlement time; interest income is accrued based on the terms of the securities. Losses may arise due to changes in the fair value of the underlying securities or if the counterparty does not perform under the contract.
Stripped securities The fund may invest in stripped securities which represent a participation in securities that may be structured in classes with rights to receive different portions of the interest and principal. Interest-only securities receive all of the interest and principal-only securities receive all of the principal. If the interest-only
securities experience greater than anticipated prepayments of principal, the fund may fail to recoup fully its initial investment in these securities. Conversely, principal-only securities increase in value if prepayments are greater than anticipated and decline if prepayments are slower than anticipated. The fair value of these securities is highly sensitive to changes in interest rates.
Foreign currency translation The accounting records of the fund are maintained in U.S. dollars. The fair value of foreign securities, currency holdings, and other assets and liabilities is recorded in the books and records of the fund after translation to U.S. dollars based on the exchange rates on that day. The cost of each security is determined using historical exchange rates. Income and withholding taxes are translated at prevailing exchange rates when earned or incurred. The fund does not isolate that portion of realized or unrealized gains or losses resulting from changes in the foreign exchange rate on investments from fluctuations arising from changes in the market prices of the securities. Such gains and losses are included with the net realized and unrealized gain or loss on investments. Net realized gains and losses on foreign currency transactions represent net realized exchange gains or losses on closed forward currency contracts, disposition of foreign currencies, currency gains and losses realized between the trade and settlement dates on securities transactions and the difference between the amount of investment income and foreign withholding taxes recorded on the fund’s books and the U.S. dollar equivalent amounts actually received or paid. Net unrealized appreciation and depreciation of assets and liabilities in foreign currencies arise from changes in the value of open forward currency contracts and assets and liabilities other than investments at the period end, resulting from changes in the exchange rate.
Options contracts The fund uses options contracts to hedge duration and convexity, to isolate prepayment risk and to manage downside risks.
The potential risk to the fund is that the change in value of options contracts may not correspond to the change in value of the hedged instruments. In addition, losses may arise from changes in the value of the underlying instruments if there is an illiquid secondary market for the contracts, if interest or exchange rates move unexpectedly or if the counterparty to the contract is unable to perform. Realized gains and losses on purchased options are included in realized gains and losses on investment securities. If a written call option is exercised, the premium originally received is recorded as an addition to sales proceeds. If a written put option is exercised, the premium originally received is recorded as a reduction to the cost of investments.
Exchange-traded options are valued at the last sale price or, if no sales are reported, the last bid price for purchased options and the last ask price for written options. OTC traded options are valued using prices supplied by dealers.
Options on swaps are similar to options on securities except that the premium paid or received is to buy or grant the right to enter into a previously agreed upon interest rate or credit default contract. Forward premium swap option contracts include premiums that have extended settlement dates. The delayed settlement of the premiums is factored into the daily valuation of the option contracts. In the case of interest rate cap and floor contracts, in return for a premium, ongoing payments between two parties are based on interest rates exceeding a specified rate, in the case of a cap contract, or falling below a specified rate in the case of a floor contract.
Written option contracts outstanding at period end, if any, are listed after the fund’s portfolio.
Futures contracts The fund uses futures contracts for hedging treasury term structure risk and for yield curve positioning.
The potential risk to the fund is that the change in value of futures contracts may not correspond to the change in value of the hedged instruments. In addition, losses may arise from changes in the value of the underlying instruments, if there is an illiquid secondary market for the contracts, if interest or exchange rates move unexpectedly or if the counterparty to the contract is unable to perform. With futures, there is minimal counterparty credit risk to the fund since futures are exchange traded and the exchange’s clearinghouse, as counterparty to all exchange traded futures, guarantees the futures against default. Risks may exceed amounts recognized on the Statement of assets and liabilities. When the contract is closed, the fund records a realized gain or loss equal to the difference between the value of the contract at the time it was opened and the value at the time it was closed.
Futures contracts are valued at the quoted daily settlement prices established by the exchange on which they trade. The fund and the broker agree to exchange an amount of cash equal to the daily fluctuation in the value of the futures contract. Such receipts or payments are known as “variation margin.”
Futures contracts outstanding at period end, if any, are listed after the fund’s portfolio.
Forward currency contracts The fund buys and sells forward currency contracts, which are agreements between two parties to buy and sell currencies at a set price on a future date. These contracts are used for hedging currency exposures and to gain exposure to currencies.
The U.S. dollar value of forward currency contracts is determined using current forward currency exchange rates supplied by a quotation service. The fair value of the contract will fluctuate with changes in currency exchange rates. The contract is marked to market daily and the change in fair value is recorded as an unrealized gain or loss. The fund records a realized gain or loss equal to the difference between the value of the contract at the time it was opened and the value at the time it was closed when the contract matures or by delivery of the currency. The fund could be exposed to risk if the value of the currency changes unfavorably, if the counterparties to the contracts are unable to meet the terms of their contracts or if the fund is unable to enter into a closing position. Risks may exceed amounts recognized on the Statement of assets and liabilities.
Forward currency contracts outstanding at period end, if any, are listed after the fund’s portfolio.
Interest rate swap contracts The fund entered into OTC and/or centrally cleared interest rate swap contracts, which are arrangements between two parties to exchange cash flows based on a notional principal amount, for hedging term structure risk, for yield curve positioning and for gaining exposure to rates in various countries.
An OTC and centrally cleared interest rate swap can be purchased or sold with an upfront premium. For OTC interest rate swap contracts, an upfront payment received by the fund is recorded as a liability on the fund’s books. An upfront payment made by the fund is recorded as an asset on the fund’s books. OTC and centrally cleared interest rate swap contracts are marked to market daily based upon quotations from an independent pricing service or market makers. Any change is recorded as an unrealized gain or loss on OTC interest rate swaps. Daily fluctuations in the value of centrally cleared interest rate swaps are settled through a central clearing agent and are recorded in variation margin on the Statement of assets and liabilities and recorded as unrealized gain or loss. Payments, including upfront premiums, received or made are recorded as realized gains or losses at the reset date or the closing of the contract. Certain OTC and centrally cleared interest rate swap contracts may include extended effective dates. Payments related to these swap contracts are accrued based on the terms of the contract.
The fund could be exposed to credit or market risk due to unfavorable changes in the fluctuation of interest rates or if the counterparty defaults, in the case of OTC interest rate contracts, or the central clearing agency or a clearing member defaults, in the case of centrally cleared interest rate swap contracts, on its respective obligation to perform under the contract. The fund’s maximum risk of loss from counterparty risk or central clearing risk is the fair value of the contract. This risk may be mitigated for OTC interest rate swap contracts by having a master netting arrangement between the fund and the counterparty and for centrally cleared interest rate swap contracts through the daily exchange of variation margin. There is minimal counterparty risk with respect to centrally cleared interest rate swap contracts due to the clearinghouse guarantee fund and other resources that are available in the event of a clearing member default. Risk of loss may exceed amounts recognized on the Statement of assets and liabilities.
OTC and centrally cleared interest rate swap contracts outstanding, including their respective notional amounts at period end, if any, are listed after the fund’s portfolio.
Total return swap contracts The fund entered into OTC total return swap contracts, which are arrangements to exchange a market-linked return for a periodic payment, both based on a notional principal amount, to hedge sector exposure, for gaining exposure to specific sectors, for hedging inflation and for gaining exposure to inflation.
To the extent that the total return of the security, index or other financial measure underlying the transaction exceeds or falls short of the offsetting interest rate obligation, the fund will receive a payment from or make a payment to the counterparty. OTC total return swap contracts are marked to market daily based upon quotations from an independent pricing service or market makers and the change, if any, is recorded as an unrealized gain or loss. Payments received or made are recorded as realized gains or losses. Certain OTC total return swap contracts may include extended effective dates. Payments related to these swap contracts are accrued based on the terms of the contract. The fund could be exposed to credit or market risk due to unfavorable changes in the fluctuation of interest rates or in the price of the underlying security or index, the possibility that there is no liquid market for these agreements or that the counterparty may default on its obligation to perform. The fund’s maximum risk of loss from counterparty risk is the fair value of the contract. This risk may be mitigated by having a master netting arrangement between the fund and the counterparty. Risk of loss may exceed amounts recognized on the Statement of assets and liabilities.
OTC total return swap contracts outstanding, including their respective notional amounts at period end, if any, are listed after the fund’s portfolio.
Credit default contracts The fund entered into OTC and/or centrally cleared credit default contracts to hedge credit risk, for gaining liquid exposure to individual names, to hedge market risk and for gaining exposure to specific sectors.
In OTC and centrally cleared credit default contracts, the protection buyer typically makes a periodic stream of payments to a counterparty, the protection seller, in exchange for the right to receive a contingent payment upon the occurrence of a credit event on the reference obligation or all other equally ranked obligations of the reference entity. Credit events are contract specific but may include bankruptcy, failure to pay, restructuring and obligation acceleration. For OTC credit default contracts, an upfront payment received by the fund is recorded as a liability on the fund’s books. An upfront payment made by the fund is recorded as an asset on the fund’s books. Centrally cleared credit default contracts provide the same rights to the protection buyer and seller except the payments between parties, including upfront premiums, are settled through a central clearing agent through variation margin payments. Upfront and periodic payments received or paid by the fund for OTC and centrally cleared credit default contracts are recorded as realized gains or losses at the reset date or close of the contract. The OTC and centrally cleared credit default contracts are marked to market daily based upon quotations from an independent pricing service or market makers. Any change in value of OTC credit default contracts is recorded as an unrealized gain or loss. Daily fluctuations in the value of centrally cleared credit default contracts are recorded in variation margin on the Statement of assets and liabilities and recorded as unrealized gain or loss. Upon the occurrence of a credit event, the difference between the par value and fair value of the reference obligation, net of any proportional amount of the upfront payment, is recorded as a realized gain or loss.
In addition to bearing the risk that the credit event will occur, the fund could be exposed to market risk due to unfavorable changes in interest rates or in the price of the underlying security or index or the possibility that the fund may be unable to close out its position at the same time or at the same price as if it had purchased the underlying reference obligations. In certain circumstances, the fund may enter into offsetting OTC and centrally cleared credit default contracts which would mitigate its risk of loss. Risks of loss may exceed amounts recognized on the Statement of assets and liabilities. The fund’s maximum risk of loss from counterparty risk, either as the protection seller or as the protection buyer, is the fair value of the contract. This risk may be mitigated for OTC credit default contracts by having a master netting arrangement between the fund and the counterparty and for centrally cleared credit default contracts through the daily exchange of variation margin. Counterparty risk is further mitigated with respect to centrally cleared credit default swap contracts due to the clearinghouse guarantee fund and other resources that are available in the event of a clearing member default. Where the fund is a seller of protection, the maximum potential amount of future payments the fund may be required to make is equal to the notional amount.
OTC and centrally cleared credit default contracts outstanding, including their respective notional amounts at period end, if any, are listed after the fund’s portfolio.
TBA commitments The fund may enter into TBA (to be announced) commitments to purchase securities for a fixed unit price at a future date beyond customary settlement time. Although the unit price and par amount have been established, the actual securities have not been specified. However, it is anticipated that the amount of the commitments will not significantly differ from the principal amount. The fund holds, and maintains until settlement date, cash or high-grade debt obligations in an amount sufficient to meet the purchase price, or the fund may enter into offsetting contracts for the forward sale of other securities it owns. Income on the securities will not be earned until settlement date.
The fund may also enter into TBA sale commitments to hedge its portfolio positions, to sell mortgage-backed securities it owns under delayed delivery arrangements or to take a short position in mortgage-backed securities. Proceeds of TBA sale commitments are not received until the contractual settlement date. During the time a TBA sale commitment is outstanding, either equivalent deliverable securities or an offsetting TBA purchase commitment deliverable on or before the sale commitment date are held as “cover” for the transaction, or other liquid assets in an amount equal to the notional value of the TBA sale commitment are segregated. If the TBA sale commitment is closed through the acquisition of an offsetting TBA purchase commitment, the fund realizes a gain or loss. If the fund delivers securities under the commitment, the fund realizes a gain or a loss from the sale of the securities based upon the unit price established at the date the commitment was entered into.
TBA commitments, which are accounted for as purchase and sale transactions, may be considered securities themselves, and involve a risk of loss due to changes in the value of the security prior to the settlement date
as well as the risk that the counterparty to the transaction will not perform its obligations. Counterparty risk is mitigated by having a master agreement between the fund and the counterparty.
Unsettled TBA commitments are valued at their fair value according to the procedures described under “Security valuation” above. The contract is marked to market daily and the change in fair value is recorded by the fund as an unrealized gain or loss. Based on market circumstances, Putnam Management will determine whether to take delivery of the underlying securities or to dispose of the TBA commitments prior to settlement.
TBA purchase commitments outstanding at period end, if any, are listed within the fund’s portfolio and TBA sale commitments outstanding at period end, if any, are listed after the fund’s portfolio.
Master agreements The fund is a party to ISDA (International Swaps and Derivatives Association, Inc.) Master Agreements that govern OTC derivative and foreign exchange contracts and Master Securities Forward Transaction Agreements that govern transactions involving mortgage-backed and other asset-backed securities that may result in delayed delivery (Master Agreements) with certain counterparties entered into from time to time. The Master Agreements may contain provisions regarding, among other things, the parties’ general obligations, representations, agreements, collateral requirements, events of default and early termination. With respect to certain counterparties, in accordance with the terms of the Master Agreements, collateral posted to the fund is held in a segregated account by the fund’s custodian and, with respect to those amounts which can be sold or repledged, are presented in the fund’s portfolio.
Collateral pledged by the fund is segregated by the fund’s custodian and identified in the fund’s portfolio. Collateral can be in the form of cash or debt securities issued by the U.S. Government or related agencies or other securities as agreed to by the fund and the applicable counterparty. Collateral requirements are determined based on the fund’s net position with each counterparty.
With respect to ISDA Master Agreements, termination events applicable to the fund may occur upon a decline in the fund’s net assets below a specified threshold over a certain period of time. Termination events applicable to counterparties may occur upon a decline in the counterparty’s long-term or short-term credit ratings below a specified level. In each case, upon occurrence, the other party may elect to terminate early and cause settlement of all derivative and foreign exchange contracts outstanding, including the payment of any losses and costs resulting from such early termination, as reasonably determined by the terminating party. Any decision by one or more of the fund’s counterparties to elect early termination could impact the fund’s future derivative activity.
At the close of the reporting period, the fund had a net liability position of $1,732,383 on open derivative contracts subject to the Master Agreements. Collateral posted by the fund at period end for these agreements totaled $1,637,377 and may include amounts related to unsettled agreements.
Interfund lending The fund, along with other Putnam funds, may participate in an interfund lending program pursuant to an exemptive order issued by the SEC. This program allows the fund to borrow from or lend to other Putnam funds that permit such transactions. Interfund lending transactions are subject to each fund’s investment policies and borrowing and lending limits. Interest earned or paid on the interfund lending transaction will be based on the average of certain current market rates. During the reporting period, the fund did not utilize the program.
Lines of credit The fund participates, along with other Putnam funds, in a $317.5 million unsecured committed line of credit and a $235.5 million unsecured uncommitted line of credit, both provided by State Street. Borrowings may be made for temporary or emergency purposes, including the funding of shareholder redemption requests and trade settlements. Interest is charged to the fund based on the fund’s borrowing at a rate equal to the higher of (1) the Federal Funds rate and (2) the overnight LIBOR plus 1.25% for the committed line of credit and the Federal Funds rate plus 1.30% for the uncommitted line of credit. A closing fee equal to 0.04% of the committed line of credit plus a $25,000 flat fee and 0.04% of the uncommitted line of credit has been paid by the participating funds. In addition, a commitment fee of 0.21% per annum on any unutilized portion of the committed line of credit is allocated to the participating funds based on their relative net assets and paid quarterly. During the reporting period, the fund had no borrowings against these arrangements.
Federal taxes It is the policy of the fund to distribute all of its taxable income within the prescribed time period and otherwise comply with the provisions of the Internal Revenue Code of 1986, as amended (the Code), applicable to regulated investment companies. It is also the intention of the fund to distribute an amount sufficient to avoid imposition of any excise tax under Section 4982 of the Code.
The fund is subject to the provisions of Accounting Standards Codification 740 Income Taxes (ASC 740). ASC 740 sets forth a minimum threshold for financial statement recognition of the benefit of a tax position taken or
expected to be taken in a tax return. The fund did not have a liability to record for any unrecognized tax benefits in the accompanying financial statements. No provision has been made for federal taxes on income, capital gains or unrealized appreciation on securities held nor for excise tax on income and capital gains. Each of the fund’s federal tax returns for the prior three fiscal years remains subject to examination by the Internal Revenue Service.
The fund may also be subject to taxes imposed by governments of countries in which it invests. Such taxes are generally based on either income or gains earned or repatriated. The fund accrues and applies such taxes to net investment income, net realized gains and net unrealized gains as income and/or capital gains are earned. In some cases, the fund may be entitled to reclaim all or a portion of such taxes, and such reclaim amounts, if any, are reflected as an asset on the fund’s books. In many cases, however, the fund may not receive such amounts for an extended period of time, depending on the country of investment.
At October 31, 2016, the fund had a capital loss carryover of $18,818,173 available to the extent allowed by the Code to offset future net capital gain, if any. For any carryover, the amount of the carryover and that carryover’s expiration date is:
| | | |
| Loss carryover |
|
| Short-term | Long-term | Total | Expiration |
|
| $15,915,777 | $422,974 | $16,338,751 | * |
|
| 2,479,422 | N/A | 2,479,422 | October 31, 2017 |
* Under the Regulated Investment Company Modernization Act of 2010, the fund will be permitted to carry forward capital losses incurred in taxable years beginning after December 22, 2010 for an unlimited period. However, any losses incurred will be required to be utilized prior to the losses incurred in pre-enactment tax years. As a result of this ordering rule, pre-enactment capital loss carryforwards may be more likely to expire unused. Additionally, post-enactment capital losses that are carried forward will retain their character as either short-term or long-term capital losses rather than being considered all short-term as under previous law.
The aggregate identified cost on a tax basis is $361,071,927, resulting in gross unrealized appreciation and depreciation of $7,787,496 and $12,886,696, respectively, or net unrealized depreciation of $5,099,200.
Distributions to shareholders Distributions to shareholders from net investment income are recorded by the fund on the ex-dividend date. Distributions from capital gains, if any, are recorded on the ex-dividend date and paid at least annually. The amount and character of income and gains to be distributed are determined in accordance with income tax regulations, which may differ from generally accepted accounting principles. Dividend sources are estimated at the time of declaration. Actual results may vary. Any non-taxable return of capital cannot be determined until final tax calculations are completed after the end of the fund’s fiscal year. Reclassifications are made to the fund’s capital accounts to reflect income and gains available for distribution (or available capital loss carryovers) under income tax regulations.
Note 2: Management fee, administrative services and other transactions
The fund pays Putnam Management a management fee (based on the fund’s average net assets and computed and paid monthly) at annual rates that may vary based on the average of the aggregate net assets of all open-end mutual funds sponsored by Putnam Management (excluding net assets of funds that are invested in, or that are invested in by, other Putnam funds to the extent necessary to avoid “double counting” of those assets). Such annual rates may vary as follows:
| | | | |
| 0.700% | of the first $5 billion, | | 0.500% | of the next $50 billion, |
| |
|
| 0.650% | of the next $5 billion, | | 0.480% | of the next $50 billion, |
| |
|
| 0.600% | of the next $10 billion, | | 0.470% | of the next $100 billion and |
| |
|
| 0.550% | of the next $10 billion, | | 0.465% | of any excess thereafter. |
For the reporting period, the management fee represented an effective rate (excluding the impact from any expense waivers in effect) of 0.271% of the fund’s average net assets.
Putnam Management has contractually agreed, through February 28, 2018, to waive fees or reimburse the fund’s expenses to the extent necessary to limit the cumulative expenses of the fund, exclusive of brokerage, interest, taxes, investment-related expenses, extraordinary expenses, acquired fund fees and expenses and payments under the fund’s investor servicing contract, investment management contract and distribution plans, on a fiscal
year-to-date basis to an annual rate of 0.20% of the fund’s average net assets over such fiscal year-to-date period. During the reporting period, the fund’s expenses were not reduced as a result of this limit.
Putnam Investments Limited (PIL), an affiliate of Putnam Management, is authorized by the Trustees to manage a separate portion of the assets of the fund as determined by Putnam Management from time to time. PIL did not manage any portion of the assets of the fund during the reporting period. If Putnam Management were to engage the services of PIL, Putnam Management would pay a quarterly sub-management fee to PIL for its services at an annual rate of 0.40% of the average net assets of the portion of the fund managed by PIL.
The fund reimburses Putnam Management an allocated amount for the compensation and related expenses of certain officers of the fund and their staff who provide administrative services to the fund. The aggregate amount of all such reimbursements is determined annually by the Trustees.
Custodial functions for the fund’s assets are provided by State Street. Custody fees are based on the fund’s asset level, the number of its security holdings and transaction volumes.
Putnam Investor Services, Inc., an affiliate of Putnam Management, provides investor servicing agent functions to the fund. Putnam Investor Services, Inc. received fees for investor servicing for class A, class B, class C, class M, class R and class Y shares that included (1) a per account fee for each direct and underlying non-defined contribution account (“retail account”) of the fund; (2) a specified rate of the fund’s assets attributable to defined contribution plan accounts; and (3) a specified rate based on the average net assets in retail accounts. Putnam Investor Services, Inc. has agreed that the aggregate investor servicing fees for each fund’s retail and defined contribution accounts for these share classes will not exceed an annual rate of 0.25% of the fund’s average assets attributable to such accounts.
Class R5 shares paid a monthly fee based on the average net assets of class R5 shares at an annual rate of 0.12%.
Class R6 shares paid a monthly fee based on the average net assets of class R6 shares at an annual rate of 0.05%.
During the reporting period, the expenses for each class of shares related to investor servicing fees were as follows:
| | | | |
| Class A | $157,606 | | Class R5 | 15 |
| |
|
| Class B | 5,038 | | Class R6 | 1,560 |
| |
|
| Class C | 22,009 | | Class Y | 76,609 |
| |
|
| Class M | 9,166 | | Total | $278,655 |
| | |
| Class R | 6,652 | | | |
| | | |
The fund has entered into expense offset arrangements with Putnam Investor Services, Inc. and State Street whereby Putnam Investor Services, Inc.’s and State Street’s fees are reduced by credits allowed on cash balances. For the reporting period, the fund’s expenses were reduced by $306 under the expense offset arrangements.
Each Independent Trustee of the fund receives an annual Trustee fee, of which $186, as a quarterly retainer, has been allocated to the fund, and an additional fee for each Trustees meeting attended. Trustees also are reimbursed for expenses they incur relating to their services as Trustees.
The fund has adopted a Trustee Fee Deferral Plan (the Deferral Plan) which allows the Trustees to defer the receipt of all or a portion of Trustees fees payable on or after July 1, 1995. The deferred fees remain invested in certain Putnam funds until distribution in accordance with the Deferral Plan.
The fund has adopted an unfunded noncontributory defined benefit pension plan (the Pension Plan) covering all Trustees of the fund who have served as a Trustee for at least five years and were first elected prior to 2004. Benefits under the Pension Plan are equal to 50% of the Trustee’s average annual attendance and retainer fees for the three years ended December 31, 2005. The retirement benefit is payable during a Trustee’s lifetime, beginning the year following retirement, for the number of years of service through December 31, 2006. Pension expense for the fund is included in Trustee compensation and expenses in the Statement of operations. Accrued pension liability is included in Payable for Trustee compensation and expenses in the Statement of assets and liabilities. The Trustees have terminated the Pension Plan with respect to any Trustee first elected after 2003.
The fund has adopted distribution plans (the Plans) with respect to the following class shares pursuant to Rule 12b–1 under the Investment Company Act of 1940. The purpose of the Plans is to compensate Putnam Retail Management Limited Partnership, an indirect wholly-owned subsidiary of Putnam Investments, LLC, for services provided and expenses incurred in distributing shares of the fund. The Plans provide payments by the fund to
Putnam Retail Management Limited Partnership at an annual rate of up to the following amounts (“Maximum %”) of the average net assets attributable to each class. The Trustees have approved payment by the fund at the following annual rate (“Approved %”) of the average net assets attributable to each class. During the reporting period, the class-specific expenses related to distribution fees were as follows:
| | | |
| | Maximum % | Approved % | Amount |
|
| Class A | 0.35% | 0.25% | $172,806 |
|
| Class B | 1.00% | 1.00% | 22,122 |
|
| Class C | 1.00% | 1.00% | 96,615 |
|
| Class M | 1.00% | 0.50% | 20,115 |
|
| Class R | 1.00% | 0.50% | 14,735 |
|
| Total | | | $326,393 |
For the reporting period, Putnam Retail Management Limited Partnership, acting as underwriter, received net commissions of $4,364 and $43 from the sale of class A and class M shares, respectively, and received $891 and $461 in contingent deferred sales charges from redemptions of class B and class C shares, respectively.
A deferred sales charge of up to 1.00% is assessed on certain redemptions of class A shares. For the reporting period, Putnam Retail Management Limited Partnership, acting as underwriter, received $37 on class A redemptions.
Note 3: Purchases and sales of securities
During the reporting period, the cost of purchases and the proceeds from sales, excluding short-term investments, were as follows:
| | |
| | Cost of purchases | Proceeds from sales |
|
| Investments in securities, including TBA commitments (Long-term) | $1,050,850,345 | $1,070,086,479 |
|
| U.S. government securities (Long-term) | — | — |
|
| Total | $1,050,850,345 | $1,070,086,479 |
The fund may purchase or sell investments from or to other Putnam funds in the ordinary course of business, which can reduce the fund’s transaction costs, at prices determined in accordance with SEC requirements and policies approved by the Trustees. During the reporting period, purchases or sales of long-term securities from or to other Putnam funds, if any, did not represent more than 5% of the fund’s total cost of purchases and/or total proceeds from sales.
Written option transactions during the reporting period are summarized as follows:
| | | | | |
| | | Written swap | | | |
| | | option contract | Written swap | Written option | Written option |
| | | amounts | option premiums | contract amounts | premiums |
|
| Written options | USD | 127,567,000 | $801,697 | 56,000,000 | $286,562 |
| outstanding at the | EUR | — | $— | — | $— |
| beginning of the | | | | | |
| reporting period | | | | | |
|
| Options opened | USD | 1,026,690,300 | 2,973,113 | 105,064,100 | 477,501 |
| | EUR | 818,000 | 26,093 | 2,329,900 | 20,864 |
|
| Options exercised | USD | (55,786,600) | (223,878) | — | — |
| | EUR | — | — | — | — |
|
| Options expired | USD | (422,998,200) | (905,328) | — | — |
| | EUR | — | — | — | — |
|
| Options closed | USD | (445,287,400) | (1,174,904) | (101,064,100) | (525,000) |
| | EUR | — | — | (2,329,900) | (20,864) |
|
| Written options | USD | 230,185,100 | $1,470,700 | 60,000,000 | $239,063 |
| outstanding at the end of | EUR | 818,000 | $26,093 | — | $— |
| the reporting period | | | | | |
Note 4: Capital shares
At the close of the reporting period, there were an unlimited number of shares of beneficial interest authorized. Transactions in capital shares were as follows:
| | | | |
| | SIX MONTHS ENDED 4/30/17 | YEAR ENDED 10/31/16 |
| Class A | Shares | Amount | Shares | Amount |
|
| Shares sold | 891,711 | $10,489,449 | 2,062,239 | $24,524,846 |
|
| Shares issued in connection with | | | | |
| reinvestment of distributions | 176,405 | 2,070,559 | 376,113 | 4,477,195 |
|
| | 1,068,116 | 12,560,008 | 2,438,352 | 29,002,041 |
|
| Shares repurchased | (2,520,417) | (29,656,694) | (3,408,526) | (40,716,347) |
|
| Net decrease | (1,452,301) | $(17,096,686) | (970,174) | $(11,714,306) |
| |
| | SIX MONTHS ENDED 4/30/17 | YEAR ENDED 10/31/16 |
| Class B | Shares | Amount | Shares | Amount |
|
| Shares sold | 9,394 | $110,156 | 40,753 | $487,348 |
|
| Shares issued in connection with | | | | |
| reinvestment of distributions | 4,435 | 51,818 | 10,330 | 122,314 |
|
| | 13,829 | 161,974 | 51,083 | 609,662 |
|
| Shares repurchased | (70,365) | (824,382) | (147,249) | (1,751,155) |
|
| Net decrease | (56,536) | $(662,408) | (96,166) | $(1,141,493) |
| | | | |
| | SIX MONTHS ENDED 4/30/17 | YEAR ENDED 10/31/16 |
| Class C | Shares | Amount | Shares | Amount |
|
| Shares sold | 104,859 | $1,228,175 | 311,327 | $3,712,312 |
|
| Shares issued in connection with | | | | |
| reinvestment of distributions | 17,934 | 209,587 | 39,191 | 464,564 |
|
| | 122,793 | 1,437,762 | 350,518 | 4,176,876 |
|
| Shares repurchased | (387,578) | (4,531,469) | (567,680) | (6,738,879) |
|
| Net decrease | (264,785) | $(3,093,707) | (217,162) | $(2,562,003) |
| |
| | SIX MONTHS ENDED 4/30/17 | YEAR ENDED 10/31/16 |
| Class M | Shares | Amount | Shares | Amount |
|
| Shares sold | 6,408 | $74,647 | 5,400 | $63,636 |
|
| Shares issued in connection with | | | | |
| reinvestment of distributions | 2,229 | 25,890 | 5,204 | 61,308 |
|
| | 8,637 | 100,537 | 10,604 | 124,944 |
|
| Shares repurchased | (58,636) | (682,830) | (81,276) | (958,591) |
|
| Net decrease | (49,999) | $(582,293) | (70,672) | $(833,647) |
| |
| | SIX MONTHS ENDED 4/30/17 | YEAR ENDED 10/31/16 |
| Class R | Shares | Amount | Shares | Amount |
|
| Shares sold | 113,340 | $1,323,313 | 858,730 | $10,244,292 |
|
| Shares issued in connection with | | | | |
| reinvestment of distributions | 4,197 | 48,798 | 22,240 | 265,134 |
|
| | 117,537 | 1,372,111 | 880,970 | 10,509,426 |
|
| Shares repurchased | (1,038,714) | (12,070,230) | (249,535) | (2,963,675) |
|
| Net increase (decrease) | (921,177) | $(10,698,119) | 631,435 | $7,545,751 |
| |
| | SIX MONTHS ENDED 4/30/17 | YEAR ENDED 10/31/16 |
| Class R5 | Shares | Amount | Shares | Amount |
|
| Shares sold | 178 | $2,089 | 239 | $2,845 |
|
| Shares issued in connection with | | | | |
| reinvestment of distributions | 38 | 448 | 77 | 915 |
|
| | 216 | 2,537 | 316 | 3,760 |
|
| Shares repurchased | (23) | (263) | (1,729) | (20,323) |
|
| Net increase (decrease) | 193 | $2,274 | (1,413) | $(16,563) |
| |
| | SIX MONTHS ENDED 4/30/17 | YEAR ENDED 10/31/16 |
| Class R6 | Shares | Amount | Shares | Amount |
|
| Shares sold | 62,739 | $740,255 | 149,054 | $1,776,027 |
|
| Shares issued in connection with | | | | |
| reinvestment of distributions | 9,768 | 114,658 | 18,651 | 222,137 |
|
| | 72,507 | 854,913 | 167,705 | 1,998,164 |
|
| Shares repurchased | (75,853) | (891,893) | (80,255) | (953,673) |
|
| Net increase (decrease) | (3,346) | $(36,980) | 87,450 | $1,044,491 |
| | | | |
| | SIX MONTHS ENDED 4/30/17 | YEAR ENDED 10/31/16 |
| Class Y | Shares | Amount | Shares | Amount |
|
| Shares sold | 2,187,502 | $25,709,484 | 2,617,198 | $31,334,701 |
|
| Shares issued in connection with | | | | |
| reinvestment of distributions | 88,435 | 1,038,351 | 161,428 | 1,922,283 |
|
| | 2,275,937 | 26,747,835 | 2,778,626 | 33,256,984 |
|
| Shares repurchased | (1,609,779) | (18,899,592) | (3,187,960) | (37,872,347) |
|
| Net increase (decrease) | 666,158 | $7,848,243 | (409,334) | $(4,615,363) |
At the close of the reporting period, Putnam Investments, LLC owned 947 class R5 shares of the fund (43.32% of class R5 shares outstanding), valued at $11,279.
Note 5: Affiliated transactions
Transactions during the reporting period with any company which is under common ownership or control were as follows:
| | | | | |
| | Fair value at | | | | |
| | the beginning | | | | Fair value at |
| | of the | | | | the end of the |
| | reporting | | | Investment | reporting |
| Name of affiliate | period | Purchase cost | Sale proceeds | income | period |
|
| Putnam Short Term | | | | | |
| Investment Fund* | $9,296,839 | $43,038,509 | $42,582,423 | $31,042 | $9,752,925 |
|
| Totals | $9,296,839 | $43,038,509 | $42,582,423 | $31,042 | $9,752,925 |
* Management fees charged to Putnam Short Term Investment Fund have been waived by Putnam Management.
Note 6: Market, credit and other risks
In the normal course of business, the fund trades financial instruments and enters into financial transactions where risk of potential loss exists due to changes in the market (market risk) or failure of the contracting party to the transaction to perform (credit risk). The fund may be exposed to additional credit risk that an institution or other entity with which the fund has unsettled or open transactions will default. Investments in foreign securities involve certain risks, including those related to economic instability, unfavorable political developments, and currency fluctuations. The fund may invest in higher-yielding, lower-rated bonds that may have a higher rate of default. The fund may invest a significant portion of its assets in securitized debt instruments, including mortgage-backed and asset-backed investments. The yields and values of these investments are sensitive to changes in interest rates, the rate of principal payments on the underlying assets and the market’s perception of the issuers. The market for these investments may be volatile and limited, which may make them difficult to buy or sell.
Note 7: Summary of derivative activity
The volume of activity for the reporting period for any derivative type that was held during the period is listed below and was based on an average of the holdings at the end of each fiscal quarter:
| |
| Purchased TBA commitment option contracts (contract amount) | $21,100,000 |
|
| Purchased currency options (contract amount) | $3,200,000 |
|
| Purchased swap option contracts (contract amount) | $202,700,000 |
|
| Written TBA commitment option contracts (contract amount) (Note 3) | $42,300,000 |
|
| Written currency options (contract amount) (Note 3) | $3,200,000 |
|
| Written swap option contracts (contract amount) (Note 3) | $215,000,000 |
|
| Futures contracts (number of contracts) | 500 |
|
| Forward currency contracts (contract amount) | $304,700,000 |
|
| OTC interest rate swap contracts (notional) | $10,400,000 |
|
| Centrally cleared interest rate swap contracts (notional) | $344,300,000 |
|
| OTC total return swap contracts (notional) | $42,100,000 |
|
| OTC credit default contracts (notional) | $15,000,000 |
|
| Centrally cleared credit default contracts (notional) | $1,400,000 |
|
The following is a summary of the fair value of derivative instruments as of the close of the reporting period:
| | | | |
| Fair value of derivative instruments as of the close of the reporting period | |
|
| | ASSET DERIVATIVES | LIABILITY DERIVATIVES |
|
| Derivatives not | | | | |
| accounted for as | Statement of | | Statement of | |
| hedging instruments | assets and | | assets and | |
| under ASC 815 | liabilities location | Fair value | liabilities location | Fair value |
|
| | | | Payables, Net assets — | |
| Credit contracts | Receivables | $533,263 | Unrealized depreciation | $1,551,208* |
|
| Foreign exchange | | | | |
| contracts | Receivables | 1,101,840 | Payables | 1,534,288 |
|
| | Investments, | | | |
| | Receivables, Net | | | |
| | assets — Unrealized | | Payables, Net assets — | |
| Interest rate contracts | appreciation | 2,655,421* | Unrealized depreciation | 3,679,686* |
|
| Total | | $4,290,524 | | $6,765,182 |
* Includes cumulative appreciation/depreciation of futures contracts and/or centrally cleared swaps as reported in the fund’s portfolio. Only current day’s variation margin is reported within the Statement of assets and liabilities.
The following is a summary of realized and change in unrealized gains or losses of derivative instruments in the Statement of operations for the reporting period (Note 1):
| | | | | |
| Amount of realized gain or (loss) on derivatives recognized in net gain or (loss) on investments | |
|
| Derivatives not accounted | | | Forward | | |
| for as hedging instruments | | | currency | | |
| under ASC 815 | Options | Futures | contracts | Swaps | Total |
|
| Credit contracts | $— | $— | $— | $141,365 | $141,365 |
|
| Foreign exchange contracts | 142,524 | — | 465,031 | — | $607,555 |
|
| Interest rate contracts | (693,907) | (2,905,195) | — | 7,976,623 | $4,377,521 |
|
| Total | $(551,383) | $(2,905,195) | $465,031 | $8,117,988 | $5,126,441 |
| | | | | |
| Change in unrealized appreciation or (depreciation) on derivatives recognized in net gain or (loss) |
| on investments | | | | | |
|
| Derivatives not accounted | | | Forward | | |
| for as hedging instruments | | | currency | | |
| under ASC 815 | Options | Futures | contracts | Swaps | Total |
|
| Credit contracts | $— | $— | $— | $(48,489) | $(48,489) |
|
| Foreign exchange contracts | — | — | 507,759 | — | $507,759 |
|
| Interest rate contracts | 132,284 | 1,171,195 | — | (2,634,457) | $(1,330,978) |
|
| Total | $132,284 | $1,171,195 | $507,759 | $(2,682,946) | $(871,708) |
Note 8: Offsetting of financial and derivative assets and liabilities
The following table summarizes any derivatives, repurchase agreements and reverse repurchase agreements, at the end of the reporting period, that are subject to an enforceable master netting agreement or similar agreement. For securities lending transactions or borrowing transactions associated with securities sold short, if any, see Note 1. For financial reporting purposes, the fund does not offset financial assets and financial liabilities that are subject to the master netting agreements in the Statement of assets and liabilities.
| | | | | | | | | | | | | | | | | | | | | | | | | | | | | |
| | Bank of America N.A. | | Barclays Bank PLC | | Barclays Capital Inc. (clearing broker) | | Citibank, N.A. | | Credit Suisse International | | Goldman Sachs International | | HSBC Bank USA, National Association | | JPMorgan Chase Bank N.A. | | JPMorgan Securities LLC | | Merrill Lynch, Pierce, Fenner & Smith, Inc. | | Royal Bank of Scotland PLC (The) | | State Street Bank and Trust Co. | | UBS AG | | WestPac Banking Corp. | | Total |
|
| Assets: | | | | | | | | | | | | | | | | | | | | | | | | | | | | | |
|
| OTC Interest rate swap contracts*# | $— | | $— | | $— | | $— | | $— | | $— | | $— | | $15,204 | | $— | | $— | | $— | | $— | | $— | | $— | | $15,204 |
|
| Centrally cleared interest rate swap | | | | | | | | | | | | | | | | | | | | | | | | | | | | | |
| contracts§ | — | | — | | 291,683 | | — | | — | | — | | — | | — | | — | | — | | — | | — | | — | | — | | 291,683 |
|
| OTC Total return swap contracts*# | — | | 35,932 | | — | | 371 | | 2,650 | | 22,681 | | — | | — | | 2,971 | | — | | — | | — | | — | | — | | 64,605 |
|
| OTC Credit default contracts*# | — | | — | | — | | — | | 306,515 | | 154,626 | | — | | — | | 72,122 | | — | | — | | — | | — | | — | | 533,263 |
|
| Centrally cleared credit default | | | | | | | | | | | | | | | | | | | | | | | | | | | | | |
| contracts§ | — | | — | | — | | — | | — | | — | | — | | — | | — | | — | | — | | — | | — | | — | | — |
|
| Futures contracts§ | — | | — | | — | | — | | — | | — | | — | | — | | — | | 29,322 | | — | | — | | — | | — | | 29,322 |
|
| Forward currency contracts# | 299,130 | | 55,103 | | — | | 94,156 | | 41,296 | | 108,896 | | 25,508 | | 283,822 | | — | | — | | 102,258 | | 20,912 | | 64,037 | | 6,722 | | 1,101,840 |
|
| Forward premium swap option | | | | | | | | | | | | | | | | | | | | | | | | | | | | | |
| contracts# | 46,087 | | 4,389 | | — | | — | | — | | 2,938 | | — | | 75,424 | | — | | — | | — | | — | | — | | — | | 128,838 |
|
| Purchased swap options**# | 48,906 | | 141,289 | | — | | 338,254 | | — | | 26,034 | | — | | 275,884 | | — | | — | | — | | — | | — | | — | | 830,367 |
|
| Purchased options**# | — | | — | | — | | — | | — | | — | | — | | 195,735 | | — | | — | | — | | — | | — | | — | | 195,735 |
|
| Total Assets | $394,123 | | $236,713 | | $291,683 | | $432,781 | | $350,461 | | $315,175 | | $25,508 | | $846,069 | | $75,093 | | $29,322 | | $102,258 | | $20,912 | | $64,037 | | $6,722 | | $3,190,857 |
|
| Liabilities: | | | | | | | | | | | | | | | | | | | | | | | | | | | | | |
|
| OTC Interest rate swap contracts*# | $— | | $— | | $— | | $— | | $— | | $6,724 | | $— | | $190,721 | | $— | | $— | | $— | | $— | | $— | | $— | | $197,445 |
|
| Centrally cleared interest rate swap | | | | | | | | | | | | | | | | | | | | | | | | | | | | | |
| contracts§ | — | | — | | 345,174 | | — | | — | | — | | — | | — | | — | | — | | — | | — | | — | | — | | 345,174 |
|
| OTC Total return swap contracts*# | 620 | | 6,171 | | — | | — | | 3,438 | | 5,226 | | — | | 1,512 | | 1,519 | | — | | — | | — | | — | | — | | 18,486 |
|
| OTC Credit default contracts*# | 33,693 | | — | | — | | — | | 474,998 | | 339,867 | | — | | — | | 434,783 | | — | | — | | — | | — | | — | | 1,283,341 |
|
| Centrally cleared credit default | | | | | | | | | | | | | | | | | | | | | | | | | | | | | |
| contracts§ | — | | — | | 2,121 | | — | | — | | — | | — | | — | | — | | — | | — | | — | | — | | — | | 2,121 |
|
| Futures contracts§ | — | | — | | — | | — | | — | | — | | — | | — | | — | | 33,540 | | — | | — | | — | | — | | 33,540 |
|
| Forward currency contracts# | 72,788 | | 34,528 | | — | | 163,757 | | 9,708 | | 886,545 | | 12,764 | | 175,455 | | — | | — | | 46,046 | | 59,185 | | 60,441 | | 13,071 | | 1,534,288 |
|
| Forward premium swap option | | | | | | | | | | | | | | | | | | | | | | | | | | | | | |
| contracts# | 40,156 | | 10,525 | | — | | — | | 5,461 | | 2,507 | | — | | 66,053 | | — | | — | | — | | — | | — | | — | | 124,702 |
|
| Written swap options# | 54,361 | | 145,291 | | — | | 225,689 | | — | | 25,476 | | — | | 452,536 | | — | | — | | — | | — | | — | | — | | 903,353 |
|
| Written options# | — | | — | | — | | — | | — | | — | | — | | 192,030 | | — | | — | | — | | — | | — | | — | | 192,030 |
|
| Total Liabilities | $201,618 | | $196,515 | | $347,295 | | $389,446 | | $493,605 | | $1,266,345 | | $12,764 | | $1,078,307 | | $436,302 | | $33,540 | | $46,046 | | $59,185 | | $60,441 | | $13,071 | | $4,634,480 |
|
| Total Financial and Derivative | | | | | | | | | | | | | | | | | | | | | | | | | | | | | |
| Net Assets | $192,505 | | $40,198 | | $(55,612) | | $43,335 | | $(143,144) | | $(951,170) | | $12,744 | | $(232,238) | | $(361,209) | | $(4,218) | | $56,212 | | $(38,273) | | $3,596 | | $(6,349) | | $(1,443,623) |
|
| Total collateral received (pledged)†## | $126,515 | | $— | | $— | | $— | | $(143,144) | | $(951,170) | | $— | | $(213,658) | | $(299,520) | | $— | | $— | | $— | | $— | | $— | | |
|
| Net amount | $65,990 | | $40,198 | | $(55,612) | | $43,335 | | $— | | $— | | $12,744 | | $(18,580) | | $(61,689) | | $(4,218) | | $56,212 | | $(38,273) | | $3,596 | | $(6,349) | | |
| |
| 80 Global Income Trust | Global Income Trust 81 |
* Excludes premiums, if any. Included in unrealized appreciation and depreciation on OTC swap contracts on the Statement of assets and liabilities.
** Included with Investments in securities on the Statement of assets and liabilities.
† Additional collateral may be required from certain brokers based on individual agreements.
# Covered by master netting agreement (Note 1).
## Any over-collateralization of total financial and derivative net assets is not shown. Collateral may include amounts related to unsettled agreements.
§ Includes current day’s variation margin only as reported on the Statement of assets and liabilities, which is not collateralized. Cumulative appreciation/(depreciation) for futures contracts and centrally cleared swap contracts is represented in the tables listed after the fund’s portfolio.
Note 9: New pronouncements
In October 2016, the SEC adopted amendments to rules under the Investment Company Act of 1940 (“final rules”) intended to modernize the reporting and disclosure of information by registered investment companies. The final rules amend Regulation S-X and require funds to provide standardized, enhanced derivative disclosure in fund financial statements in a format designed for individual investors. The amendments to Regulation S-X also update the disclosures for other investments and investments in and advances to affiliates and amend the rules regarding the general form and content of fund financial statements. The compliance date for the amendments to Regulation S-X is August 1, 2017. Putnam Management have evaluated the amendments and their impact, if any, on the fund’s financial statements.
Putnam family of funds
The following is a list of Putnam’s open-end mutual funds offered to the public. Investors should carefully consider the investment objective, risks, charges, and expenses of a fund before investing. For a prospectus, or a summary prospectus if available, containing this and other information for any Putnam fund or product, contact your financial advisor or call Putnam Investor Services at 1-800-225-1581. Please read the prospectus carefully before investing.
| |
| Growth | Income |
| Growth Opportunities Fund | American Government Income Fund |
| International Growth Fund | Diversified Income Trust |
| Multi-Cap Growth Fund | Emerging Markets Income Fund |
| Small Cap Growth Fund | Floating Rate Income Fund |
| Global Income Trust |
| Blend | Government Money Market Fund* |
| Capital Opportunities Fund | High Yield Advantage Fund |
| Capital Spectrum Fund | High Yield Trust |
| Emerging Markets Equity Fund | Income Fund |
| Equity Spectrum Fund | Money Market Fund† |
| Europe Equity Fund | Short Duration Income Fund |
| Global Equity Fund | U.S. Government Income Trust |
| International Capital Opportunities Fund | |
| International Equity Fund | Tax-free Income |
| Investors Fund | AMT-Free Municipal Fund |
| Low Volatility Equity Fund | Intermediate-Term Municipal Income Fund |
| Multi-Cap Core Fund | Short-Term Municipal Income Fund |
| Research Fund | Tax Exempt Income Fund |
| Tax-Free High Yield Fund |
| Value | |
| Convertible Securities Fund | State tax-free income funds‡: |
| Equity Income Fund | Arizona, California, Massachusetts, Michigan, |
| Global Dividend Fund | Minnesota, New Jersey, New York, Ohio, |
| The Putnam Fund for Growth and Income | and Pennsylvania. |
| International Value Fund | |
| Multi-Cap Value Fund | |
| Small Cap Value Fund | |
| |
| Absolute Return | Retirement Income Fund Lifestyle 1 — a portfolio |
| Absolute Return 100 Fund® | with managed allocations to stocks, bonds, |
| Absolute Return 300 Fund® | and money market investments to generate |
| Absolute Return 500 Fund® | retirement income. |
| Absolute Return 700 Fund® | |
| RetirementReady® Funds — portfolios with |
| Global Sector | adjusting allocations to stocks, bonds, and |
| Global Consumer Fund | money market instruments, becoming more |
| Global Energy Fund | conservative over time. |
| Global Financials Fund | |
| Global Health Care Fund | RetirementReady® 2060 Fund |
| Global Industrials Fund | RetirementReady® 2055 Fund |
| Global Natural Resources Fund | RetirementReady® 2050 Fund |
| Global Sector Fund | RetirementReady® 2045 Fund |
| Global Technology Fund | RetirementReady® 2040 Fund |
| Global Telecommunications Fund | RetirementReady® 2035 Fund |
| Global Utilities Fund | RetirementReady® 2030 Fund |
| RetirementReady® 2025 Fund |
| Asset Allocation | RetirementReady® 2020 Fund |
| George Putnam Balanced Fund | |
| | |
| Global Asset Allocation Funds — four | |
| investment portfolios that spread your money | |
| across a variety of stocks, bonds, and money | |
| market instruments. | |
| | |
| Dynamic Asset Allocation Balanced Fund | |
| Dynamic Asset Allocation Conservative Fund | |
| Dynamic Asset Allocation Growth Fund | |
| Dynamic Risk Allocation Fund | |
* You could lose money by investing in the fund. Although the fund seeks to preserve the value of your investment at $1.00 per share, it cannot guarantee it will do so. An investment in the fund is not insured or guaranteed by the Federal Deposit Insurance Corporation or any other government agency. The fund’s sponsor has no legal obligation to provide financial support to the fund, and you should not expect that the sponsor will provide financial support to the fund at any time.
† You could lose money by investing in the fund. Although the fund seeks to preserve the value of your investment at $1.00 per share, it cannot guarantee it will do so. The fund may impose a fee upon sale of your shares or may temporarily suspend your ability to sell shares if the fund’s liquidity falls below required minimums because of market conditions or other factors. An investment in the fund is not insured or guaranteed by the Federal Deposit Insurance Corporation or any other government agency. The fund’s sponsor has no legal obligation to provide financial support to the fund, and you should not expect that the sponsor will provide financial support to the fund at any time.
‡ Not available in all states.
Check your account balances and the most recent month-end performance in the Individual Investors section at putnam.com.
Fund information
Founded over 75 years ago, Putnam Investments was built around the concept that a balance between risk and reward is the hallmark of a well-rounded financial program. We manage over 100 funds across income, value, blend, growth, asset allocation, absolute return, and global sector categories.
| | |
| Investment Manager | Trustees | James F. Clark |
| Putnam Investment | Jameson A. Baxter, Chair | Vice President and |
| Management, LLC | Kenneth R. Leibler, Vice Chair | Chief Compliance Officer |
| One Post Office Square | Liaquat Ahamed | |
| Boston, MA 02109 | Ravi Akhoury | Michael J. Higgins |
| | Barbara M. Baumann | Vice President, Treasurer, |
| Investment Sub-Advisor | Robert J. Darretta | and Clerk |
| Putnam Investments Limited | Katinka Domotorffy | |
| 57–59 St James’s Street | Catharine Bond Hill | Janet C. Smith |
| London, England SW1A 1LD | John A. Hill | Vice President, Principal Financial |
| Paul L. Joskow | Officer, |
| Marketing Services | Robert E. Patterson | Principal Accounting Officer, and |
| Putnam Retail Management | George Putnam, III | Assistant Treasurer |
| One Post Office Square | Robert L. Reynolds | |
| Boston, MA 02109 | Manoj P. Singh | Susan G. Malloy |
| | W. Thomas Stephens | Vice President and |
| Custodian | | Assistant Treasurer |
| State Street Bank | Officers | |
| and Trust Company | Robert L. Reynolds | Mark C. Trenchard |
| | President | Vice President and |
| Legal Counsel | | BSA Compliance Officer |
| Ropes & Gray LLP | Jonathan S. Horwitz | |
| Executive Vice President, | Nancy E. Florek |
| | Principal Executive Officer, and | Vice President, Director of |
| | Compliance Liaison | Proxy Voting and Corporate |
| | | Governance, Assistant Clerk, |
| | Robert T. Burns | and Associate Treasurer |
| | Vice President and | |
| | Chief Legal Officer | |
This report is for the information of shareholders of Putnam Global Income Trust. It may also be used as sales literature when preceded or accompanied by the current prospectus, the most recent copy of Putnam’s Quarterly Performance Summary, and Putnam’s Quarterly Ranking Summary. For more recent performance, please visit putnam.com. Investors should carefully consider the investment objectives, risks, charges, and expenses of a fund, which are described in its prospectus. For this and other information or to request a prospectus or summary prospectus, call 1-800-225-1581 toll free. Please read the prospectus carefully before investing. The fund’s Statement of Additional Information contains additional information about the fund’s Trustees and is available without charge upon request by calling 1-800-225-1581.
| |
| Item 3. Audit Committee Financial Expert: |
| |
| Item 4. Principal Accountant Fees and Services: |
| |
| Item 5. Audit Committee of Listed Registrants |
| |
| Item 6. Schedule of Investments: |
| |
| The registrant's schedule of investments in unaffiliated issuers is included in the report to shareholders in Item 1 above. |
| |
| Item 7. Disclosure of Proxy Voting Policies and Procedures For Closed-End Management Investment Companies: |
| |
| Item 8. Portfolio Managers of Closed-End Investment Companies |
| |
| Item 9. Purchases of Equity Securities by Closed-End Management Investment Companies and Affiliated Purchasers: |
| |
| Item 10. Submission of Matters to a Vote of Security Holders: |
| |
| Item 11. Controls and Procedures: |
| |
| (a) The registrant's principal executive officer and principal financial officer have concluded, based on their evaluation of the effectiveness of the design and operation of the registrant's disclosure controls and procedures as of a date within 90 days of the filing date of this report, that the design and operation of such procedures are generally effective to provide reasonable assurance that information required to be disclosed by the registrant in this report is recorded, processed, summarized and reported within the time periods specified in the Commission's rules and forms. |
| |
| (b) Changes in internal control over financial reporting: Not applicable |
| |
| (a)(2) Separate certifications for the principal executive officer and principal financial officer of the registrant as required by Rule 30a-2(a) under the Investment Company Act of 1940, as amended, are filed herewith. |
| |
| (b) The certifications required by Rule 30a-2(b) under the Investment Company Act of 1940, as amended, are filed herewith. |
| |
| Pursuant to the requirements of the Securities Exchange Act of 1934 and the Investment Company Act of 1940, the registrant has duly caused this report to be signed on its behalf by the undersigned, thereunto duly authorized. |
| |
| Putnam Global Income Trust |
| |
| By (Signature and Title): |
| |
| /s/ Janet C. Smith
Janet C. Smith
Principal Accounting Officer
|
| |
| Pursuant to the requirements of the Securities Exchange Act of 1934 and the Investment Company Act of 1940, this report has been signed below by the following persons on behalf of the registrant and in the capacities and on the dates indicated. |
| |
| By (Signature and Title): |
| |
| /s/ Jonathan S. Horwitz
Jonathan S. Horwitz
Principal Executive Officer
|
| |
| By (Signature and Title): |
| |
| /s/ Janet C. Smith
Janet C. Smith
Principal Financial Officer
|