UNITED STATES
SECURITIES AND EXCHANGE COMMISSION
Washington, D.C. 20549
FORM N-CSR
CERTIFIED SHAREHOLDER REPORT OF REGISTERED
MANAGEMENT INVESTMENT COMPANIES
Investment Company Act file number | 811-05084 |
|
Mutual of America Investment Corporation |
(Exact name of registrant as specified in charter) |
|
320 Park Avenue, New York, N.Y. | | 10022 |
(Address of principal executive offices) | | (Zip code) |
|
John R. Greed Executive Vice President and Treasurer Mutual of America Life Insurance Company 320 Park Avenue New York, NY 10022 |
(Name and address of agent for service) |
|
Registrant’s telephone number, including area code: | (212) 224-1600 | |
|
Date of fiscal year end: | December 31 | |
|
Date of reporting period: | December 31, 2005 | |
| | | | | | | | |
ITEM 1. REPORTS TO STOCKHOLDERS.
The Annual Report to Shareholders follows:
ANNUAL REPORTS OF
MUTUAL OF AMERICA INVESTMENT CORPORATION
AND
FIDELITY INVESTMENTS® VARIABLE INSURANCE
PRODUCT FUNDS
DECEMBER 31, 2005
This report is not to be construed as an offering for sale of any Variable Policy. No offering is made except in conjunction with a prospectus which must precede or accompany this report.
VOLUME I
CONTENTS
| Volume I | | Page | |
| Annual Report of Mutual of America Investment Corporation | |
|
| President's Message | | | 1 | | |
|
| Portfolio Management Discussions | | | 4 | | |
|
| Asset Allocations | | | 16 | | |
|
| Expense Example | | | 19 | | |
|
| Summary Portfolios of Investments in Securities: | |
|
| Equity Index Fund | | | 27 | | |
|
| All America Fund | | | 29 | | |
|
| Small Cap Value Fund | | | 32 | | |
|
| Small Cap Growth Fund | | | 33 | | |
|
| Mid Cap Value Fund | | | 34 | | |
|
| Mid-Cap Equity Index Fund | | | 35 | | |
|
| Aggressive Equity Fund | | | 37 | | |
|
| Composite Fund | | | 39 | | |
|
| Conservative Allocation Fund | | | 42 | | |
|
| Moderate Allocation Fund | | | 42 | | |
|
| Aggressive Allocation Fund | | | 42 | | |
|
| Short-Term Bond Fund | | | 43 | | |
|
| Mid-Term Bond Fund | | | 46 | | |
|
| Bond Fund | | | 48 | | |
|
| Statements of Assets and Liabilities | | | 51 | | |
|
| Statements of Operations | | | 56 | | |
|
| Statements of Changes in Net Assets | | | 59 | | |
|
| Financial Highlights | | | 62 | | |
|
| Notes to Financial Statements | | | 68 | | |
|
| Additional Information | | | 78 | | |
|
Annual Report of Fidelity Investments® Variable Insurance Products Funds: Equity-Income Portfolio
Annual Report of Fidelity Investments® Variable Insurance Products Funds: Asset ManagerSM Portfolio
Annual Report of Fidelity Investments® Variable Insurance Products Funds: Contrafund Portfolio
Annual Report of Fidelity Investments® Variable Insurance Products Funds: Mid Cap Portfolio
Annual Report of Vanguard Variable Insurance Fund: Diversified Value Portfolio
Annual Report of Vanguard Variable Insurance Fund: International Portfolio
Annual Report of DWS (formerly Scudder) Variable Series I: Bond Portfolio
Annual Report of DWS (formerly Scudder) Variable Series I: Capital Growth Portfolio
Annual Report of DWS (formerly Scudder) Variable Series I: International Portfolio
Annual Report of Oppenheimer Main Street Fund®/VA
Annual Report of VP Capital Appreciation Fund of American Century Variable Portfolios, Inc.
Annual Report of Calvert Social Balanced Portfolio of Calvert Variable Series, Inc.
MUTUAL OF AMERICA INVESTMENT CORPORATION
We are pleased to present to you the Mutual of America Investment Corporation ("the Investment Company") Annual Report for the year ended December 31, 2005. The report includes important information regarding the performance and financial position of the Investment Company's Funds during 2005.
Although 2005 was a very eventful year, those events did not have a large impact on the economy or the markets. While the Gulf Coast and Florida suffered severely with a spate of hurricanes, the net result for the economy is likely to be neutral to positive given the flow of money unleashed for the relief efforts. It is also true that energy prices went higher and have stayed higher than expected, and that the consumer will be somewhat hampered as a result going forward. The Federal Reserve has continued to raise short-term interest rates, although that has not discernibly slowed the economy or corporate profits. Likewise, the Iraq war remains a source of emotional, psychological, and financial concern for America.
However, the remarkable thing about the U.S. domestic equity and longer term fixed income markets during 2005 is that despite some ups and downs in prices, there was very little change. For instance, the yield on the 10-Year Treasury Note finished the year at 4.39%, only 17 basis points higher than its 4.22% close on the last day of 2004 a year earlier. Also note that this 2004 close was only 3 basis points lower than the year-end 2003 close. Similarly, the equity markets, as represented by the S&P 500 showed little change over the full year 2005, advancing only 3.0% on a price basis and generating a modest total return of 4.9%. And the difference between the year's low and high price was only 12%, providing limited opportunity to generate outsized returns without taking on a high degree of timin g and trading risk.
However, the one dramatic change that did occur in 2005 was a 133 basis point increase in the 2-Year Treasury note following a similar 125 basis point advance during 2004. This increase was driven by the steady, consistent 25 basis point hikes, from 1.00% to 4.25%, in the Fed Funds rate at each of the thirteen Federal Reserve Open Market Committee Meetings between June 2004 and December 2005. The Federal Reserve has added an additional increase early in 2006, so the Feds Fund Rate currently stands at 4.50%, resulting in the 2-Year Treasury note yielding more than the 10-Year Treasury note. This situation, referred to as an "inverted yield curve," has historic ally had a very high degree of correlation with subsequent economic slowdowns and recessions.
While it is not the intent of the Federal Reserve to create a recession, its rationale for engineering the rise in short rates over the past twenty months, besides moving back to "normal" from an unprecedented low Fed Funds rate, was to preclude the economy from overheating and, as a result, generating an acceleration in generalized inflation. The escalation in the price of oil and its derivatives put special emphasis on the potential for rising inflation. It is likely that the Federal Reserve did not expect longer term rates to remained essentially fixed as short rates rose, but rather to also increase, albeit at a slower pace. That didn't happen, at least to the degree that history would have suggested, and thus we have an inverted yield curve. The primary explanation for why long-term rates have not advanced is that a glut of global savings, especially in Asia, has prompted huge investments in U.S. bonds, the safest securities in the worl d, which also happened to offer the highest government yields in the developed markets, other than Australia and New Zealand.
With regards to the U.S. equity markets'muted advance, a variety of explanations have been offered, all of them reasonable and most of them representing a manifestation of "risk aversion." For instance, while corporate profits have continued to grow at double-digit rates for the past ten quarters, the price to earnings ratio of the equity market has continued to shrink, suggesting limited confidence in the sustainability of growth and the expectation that the cycle will end sooner rather than later, and perhaps abruptly and dramatically. The tendency of the market to focus on the problems rather than the strengths in the economy intimates fear as a greater motivator than greed. Some commentators have suggested this is the lingering effect of the bubble bursting in 2000. Thus, the constant expression of worry over high energy prices, the potential for a burst "housing bubble," the growing federal budget and trade deficits, and the persistent flow of bad news out of the Middle East. One can actually watch the markets respond to news as it is announced on an intra-day basis. While that is what markets always do to some extent, typical adjustments have tended to be incremental and generally moved in one direction or another for sustained periods. What we have been observing in this market cycle is a generalized lack of conviction in the sustainability of economic growth.
And yet, all the statistics make it evident that we are in the midst of a powerful economic expansion. The economy continues to grow at a very firm pace and corporate profits continue to advance at a double-digit rate and above expectations. Cash flow is up, balance sheets are very healthy, margins are at peak historical levels, employment continues to grow, incomes are rising, and consumers and businesses are spending. While short-term interest rates have continued to be raised by the Federal Reserve, markets have been very well prepared for the measured increases, and the economy has so far accommodated them well. Likewise, the dramatic increase in the nominal cost of energy has so far been well accommodated by consumers and businesses, the former by cutting back a bit and the latter by passing on the cost increases where they can.
1
Despite a generally healthy tone to the economy, equity and fixed income markets have remained within narrow trading ranges, as noted previously. One possible reason is that both economic and profit growth are much more likely to slow than to accelerate over the next 6-12 months; frankly, it's difficult to imagine things getting much better than they are. Another is the heightened concern about the potential for inflation as the result of higher energy costs. Markets always oscillate around the questions of growth on the one hand and inflation on the other. The last 3-4 months have been a period of increased uncertainty regarding both. And with Chairman Greenspan's retirement, there is an added uncertainty regarding the course that will be taken by his successor, Ben Bernanke. Thus, markets mark time until the outlook clarifies.
The question is: Will the Fed be successful in curbing any potential for secular inflation without throwing the economy into recession?
In our opinion, there is a good probability that it will be successful. Over the next few months, the types of evidence that would support that conclusion include: Continued growth of employment; continued moderate "core" inflation; continued subdued wage growth and on-going productivity growth; continued consumer spending advances; and continued growth in capital expenditures. If we get these types of results, confidence will increase that interest rate increases are near an end. As a result, markets should respond positively.
For the stock market, valuation has become fairly attractive, especially relative to cash, bonds and housing prices. A "soft landing" with prospects for a longer period of growth, albeit moderate, could yield some multiple expansion along with further profit growth. For fixed income markets, yields will probably not decline much but should hold at higher levels. It is even possible that longer-term bonds would stage a modest rally, exacerbating the yield curve inversion, but one that would not necessarily derail the recovery. Note that the banking system has very successfully navigated a significant flattening of the yield curve with only limited damage to net interest margins, and lower long-term rates would alleviate some of the recent pressure on mortgage rates.
The risk is that the Fed chokes off the recovery by continuing to raise short-term rates to too high a level. It will continue to raise rates until it is convinced inflation is not a problem. It is very likely that the Fed would risk tipping the economy into recession if it believed inflation was spreading much beyond commodities and early players in the intermediate supply chains, and especially if there was evidence suggesting that wages and salaries were beginning to accelerate. So far, wages and salaries have only moved up modestly in line with typical cyclical advances, benefits have actually moderated, productivity remains positive, and union labor remains limited in power. If the economic expansion can persist, even at a reduced pace, financial markets can continue to generate positive returns, although they may remain in single digit territory.
The total return performance for each of the Investment Company Funds is reflected below:
Total Returns — Year Ended December 31, 2005
| Equity Index Fund | | | + 4.81 | % | |
| All America Fund | | | + 3.71 | % | |
| Small Cap Value Fund* | | | + 7.61 | % | |
| Small Cap Growth Fund* | | | + 5.49 | % | |
| Mid Cap Value* | | | + 6.91 | % | |
| Mid-Cap Equity Index Fund | | | +12.50 | % | |
| Aggressive Equity Fund | | | + 5.73 | % | |
| Composite Fund | | | + 0.96 | % | |
| Conservative Allocation Fund | | | + 2.30 | % | |
| Moderate Allocation Fund Fund | | | + 4.35 | % | |
| Aggressive Allocation Fund | | | + 5.78 | % | |
| Money Market Fund | | | + 2.97 | % | |
| Short-Term Bond Fund | | | + 1.58 | % | |
| Mid-Term Bond Fund | | | + 0.77 | % | |
| Bond Fund | | | + 1.79 | % | |
* For the period July 1, 2005 (commencement of operations) to December 31, 2005.
The above total return performance figures do not reflect the deduction of respective Separate Account fees and expenses imposed by Mutual of America Life Insurance Company. All Fund performances presented throughout this report are historical, reflect the full reinvestment of dividends paid, and should not be considered indicative of future results.
2
On the pages immediately following are brief presentations and graphs for each Fund (except the Money Market Fund) which illustrate each Fund's respective:
• Historical total return achieved over specified periods, expressed as an average annual rate and as a cumulative rate;
• Equivalent in dollars of a $10,000 hypothetical investment at the beginning of each specified period; and
• Historical performance compared with an appropriate index.
Following that are graphical representations of the asset allocations of each Fund and an illustration of each Fund's operating expenses. The summarized portfolios of each Fund (other than the Money Market Fund) and financial statements are presented in the pages which then follow.
Thank you for your continued investment in our Funds.
Sincerely,

Manfred Altstadt
Chairman of the Board, President and Chief Executive Officer
Mutual of America Investment Corporation
3
EQUITY INDEX FUND
The Equity Index Fund's objective is to replicate the performance of the S&P 500 Index®, which consists of 500 stocks chosen for market size, liquidity and industry group representation. It is a market-weighted index of 500 stocks that are traded on the New York Stock Exchange, American Stock Exchange and NASDAQ, with each stock's weight in the Index proportionate to its market value. The weightings make each company's influence on the Index's performance directly proportional to that company's market value.
The S&P 500 had a total return of 4.91% for 2005. The Energy sector was the stellar performer with a positive return of over 29% during 2005 with oil rising to a new all-time high of $70 a barrel in the wake of Hurricane Katrina and coming back down to $60 by year's end. Telecom was the worst performing sector with a return of -9% due to competitive pressures from the cable and satellite industry for market share. As the year came to a close, there were still concerns as to whether consumer spending would slow down considerably and whether rising interest rates could hold off the threat of higher inflation.
The Fund's performance for the twelve months ended December 31, 2005 was 4.81%, in line with the benchmark return of 4.91%. Note that the Fund's performance includes expenses, such as transaction costs and management fees, which are not applicable to the benchmark.

| Equity Index Fund | |
| Period | | Growth | | Total Return | |
Ended
12/31/05 | | of
$10,000 | | Cumu-
lative | | Average
Annual | |
| 1 Year | | $ | 10,481 | | | | 4.81 | % | | | 4.81 | % | |
| 5 Years | | $ | 10,181 | | | | 1.81 | % | | | 0.36 | % | |
| 10 Years | | $ | 23,472 | | | | 134.72 | % | | | 8.91 | % | |
| S & P 500 Index | |
| Period | | Growth | | Total Return | |
Ended
12/31/05 | | of
$10,000 | | Cumu-
lative | | Average
Annual | |
| 1 Year | | $ | 10,491 | | | | 4.91 | % | | | 4.91 | % | |
| 5 Years | | $ | 10,275 | | | | 2.75 | % | | | 0.54 | % | |
| 10 Years | | $ | 23,841 | | | | 138.41 | % | | | 9.07 | % | |
The line representing the performance return of the Equity Index Fund includes expenses, such as transaction costs and management fees that reduce returns, while the performance return line of the Index does not.
4
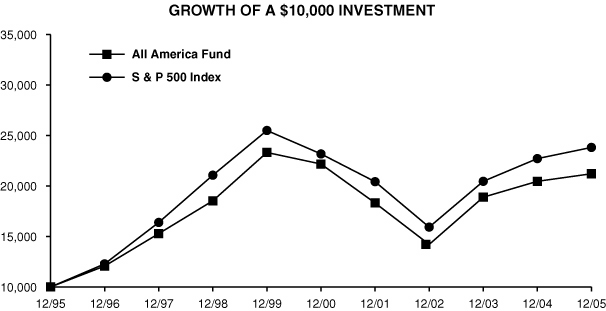
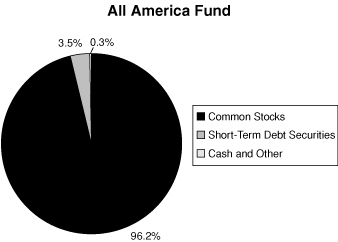
ALL AMERICA FUND
The investment objective of the All America Fund is to outperform the S&P 500 Index®. The Fund is approximately 60% invested in the 500 stocks that comprise the S&P 500 Index® with the remaining 40% actively managed using four different investment approaches. The actively managed portion of the fund is approximately equally distributed among large-cap growth, small-cap growth, large-cap value and small-cap value.
The U. S. equity markets performed better in the second half of 2005 than in the first six months of the year, and produced modest returns for the full year. For 2005, large-cap value stocks performed best while small-cap value, large-cap growth and small-cap growth stocks under-performed the S&P 500 for the period. Concerns relating to rising interest rates, higher energy prices, and possible inflation have kept the equity markets in a narrow trading range for most of 2005.
The Fund's return for the twelve months ending December 31, 2005 was 3.71% versus the benchmark return of 4.91%. Most of the Fund's modest underperformance came from the large-cap and small-cap growth component of the Fund as well as the recognition of the Fund's expenses. The large-cap component of the Fund was managed for the first seven months of the year by an independent sub-advisor, whose philosophy of highly volatile portfolios proved unsuitable in the low volatility market that existed in 2005. Mutual of America Capital Management Corporation assumed management of this component of the Fund on July 29, 2005. Stock selection, specifically in the Technology and Healthcare sectors, was the primary driver of the underperformance of the small-cap growth component of the Fund.
| All America Fund | |
| Period | | Growth | | Total Return | |
Ended
12/31/05 | | of
$10,000 | | Cumu-
lative | | Average
Annual | |
| 1 Year | | $ | 10,371 | | | | 3.71 | % | | | 3.71 | % | |
| 5 Years | | $ | 9,574 | | | | -4.26 | % | | | -0.87 | % | |
| 10 Years | | $ | 21,239 | | | | 112.39 | % | | | 7.82 | % | |
| S & P 500 INDEX | |
| Period | | Growth | | Total Return | |
Ended
12/31/05 | | of
$10,000 | | Cumu-
lative | | Average
Annual | |
| 1 Year | | $ | 10,491 | | | | 4.91 | % | | | 4.91 | % | |
| 5 Years | | $ | 10,275 | | | | 2.75 | % | | | 0.54 | % | |
| 10 Years | | $ | 23,841 | | | | 138.41 | % | | | 9.07 | % | |
The line representing the performance return of the All America Fund includes expenses, such as transaction costs and management fees that reduce returns, while the performance return line of the Index does not.
5
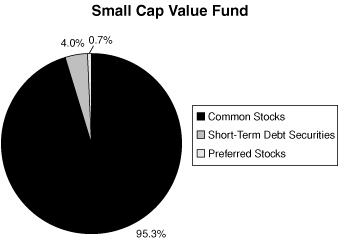
SMALL CAP VALUE FUND
The investment objective of the Small Cap Value Fund is to outperform the Russell 2000 Value® Index. The Fund generally invests in companies that are below $3 billion in market capitalization and have lower price to book characteristics. The inception date of the Fund was July 1, 2005.
For the inception period ending December 31, 2005 the best performing sectors within the benchmark were energy, technology, and materials and the worst performing sectors were consumer staples, utilities, and consumer discretionary.
For the inception period ending December 31, 2005 the Fund returned 7.61% versus a 3.14% return for the Russell 2000 Value® Index. Stock selection was the primary driver of better performance than the benchmark. Sectors contributing to stock selection included energy, materials, and producer durables, while sectors detracting from stock selection included healthcare, technology, and consumer staples.
Since the Fund has been in operation for less than a year, no graphical depiction of performance is being presented at this time.
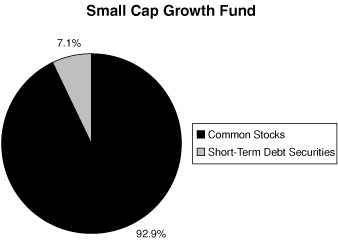
SMALL CAP GROWTH FUND
The investment objective of the Small Cap Growth Fund is capital appreciation. The Fund invests in growth stocks within the small capitalization marketplace. The inception date of the Fund was July 1, 2005. The Fund returned 5.49% during the period ended December 31, 2005.
The Fund underperformed its benchmark, the Russell 2000 Growth® Index, due to stock selection in the Technology and Healthcare sectors. The benchmark increased 7.55% from July 1, 2005 through the end of the year. The energy sector of the Index was the best performing sector for the period, returning approximately 51%. However, the sector had a difficult 4th quarter, declining 7%. Most equity returns in 2005 were quite dependent on energy and related sectors.
Since the Fund has been in operation for less than a year, no graphical depiction of performance is being presented at this time.
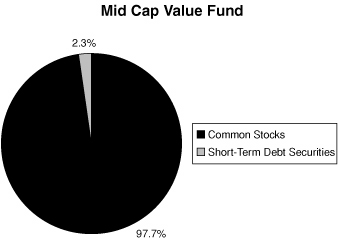
MID-CAP VALUE FUND
The investment objective of the Mid Cap Value Fund is to outperform the Russell Mid Cap Value® Index. The Fund generally invests in companies that are between $1 billion and $20 billion in market capitalization and have lower price to book characteristics. The inception date of the Fund was July 1, 2005.
During the inception period ending December 31, 2005, the best performing sectors within the benchmark were energy, technology, and materials and the worst performing sectors were consumer staples, transportation, and utilities.
For the inception period ending December 31, 2005, the Fund returned 6.91% versus a 6.17% return for the Russell Mid Cap Value Index. Stock selection was the primary driver of better performance than the benchmark. Sectors contributing to stock selection included consumer discretionary, transportation, consumer staples, while sectors detracting from stock selection included utilities, technology, and material processing.
Since the Fund has been in operation for less than a year, no graphical depiction of performance is being presented at this time.
6
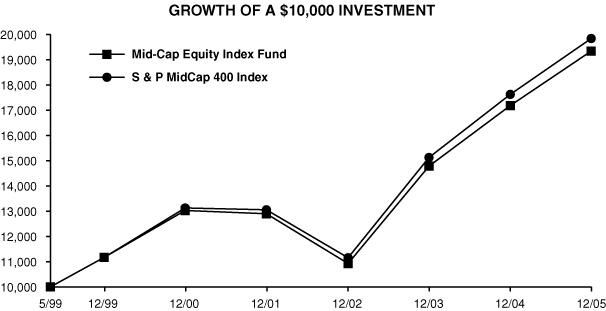
MID-CAP EQUITY INDEX FUND
The Mid-Cap Equity Index Fund invests in the 400 stocks that comprise the S&P 400 MidCap Index®. The index is a market-weighted index of 400 stocks traded on the New York Stock Exchange, American Stock Exchange and NASDAQ. The weightings make each company's influence on the index's performance directly proportional to that company's market value. The companies included in the index tend to be typical of this asset class, the medium-capitalized sector of the U.S. securities market.
The S&P MidCap 400 Index® continued to significantly outperform the S&P 500 Index® during 2005 with a return of 12.56% versus the S&P 500 return of 4.91%. For the fourth year in a row, the S&P 400 returned double-digit growth. Energy was the big story in 2005 with oil rising to an all-time high of $70 a barrel in the wake of Hurricane Katrina. It was also the top performing sector, with a 52% return for the year. Telecom was the only sector ending in negative territory, with a return of -10% due to competitive pressures from the cable and satellite industry for market share. As the year came to a close, there were still concerns as to whether consumer spending would slow down considerably and whether rising interest rates could hold off the threat of higher inflation.
The Fund's performance for the twelve month period ending December 31, 2005 was 12.50%, in line with the 12.56% return of the S&P MidCap 400 Index®. Note that the performance of the Fund includes expenses, such as transaction costs and management fees, which are not applicable to the benchmark.
| Mid-Cap Equity Index Fund | |
| Period | | Growth | | Total Return | |
Ended
12/31/05 | | of
$10,000 | | Cumu-
lative | | Average
Annual | |
| 1 Year | | $ | 11,250 | | | | 12.50 | % | | | 12.50 | % | |
| 5 Years | | $ | 14,835 | | | | 48.35 | % | | | 8.21 | % | |
Since 5/3/99
(Inception) | | $ | 19,343 | | | | 93.43 | % | | | 10.41 | % | |
| S & P MidCap 400 Index | |
| Period | | Growth | | Total Return | |
Ended
12/31/05 | | of
$10,000 | | Cumu-
lative | | Average
Annual | |
| 1 Year | | $ | 11,256 | | | | 12.56 | % | | | 12.56 | % | |
| 5 Years | | $ | 15,108 | | | | 51.08 | % | | | 8.60 | % | |
Since 5/3/99
(Inception) | | $ | 19,850 | | | | 98.50 | % | | | 10.84 | % | |
The line representing the performance return of the Mid-Cap Equity Index Fund includes expenses, such as transaction costs and management fees that reduce returns, while the performance return line of the Index does not.
7
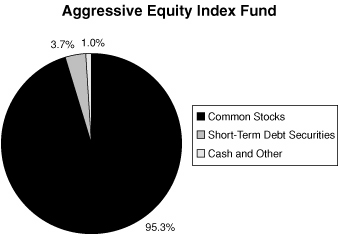
AGGRESSIVE EQUITY FUND
The objective of the Aggressive Equity Fund is to generate capital appreciation by investing in a combination of small-cap growth and value stocks, with the respective weightings to be determined by market conditions.
For the twelve months ended December 31, 2005, the small-cap Russell 2000® Index underperformed larger caps as measured by either the S&P 400 Index® or the S&P 500 Index®. For the year 2005, the best performing sectors for small-cap stocks were Energy and Utilities; the worst performer was Technology. All sectors, with the exception of Technology, contributed positively for the year, and overall value stocks outperformed growth stocks by a small margin in this segment of the m arket.
Over the twelve-month period ended December 31, 2005, the Fund returned 5.73% versus a 4.55% return for the Russell 2000 Index®. Stock selection was the primary driver of outperformance relative to the benchmark. Sectors contributing to the outperformance included Energy, Materials & Processing and Utilities. Sectors detracting from performance included Technology and Healthcare.

| Aggressive Equity Fund | |
| Period | | Growth | | Total Return | |
Ended
12/31/05 | | of
$10,000 | | Cumu-
lative | | Average
Annual | |
| 1 Year | | $ | 10,573 | | | | 5.73 | % | | | 5.73 | % | |
| 5 Years | | $ | 11,043 | | | | 10.43 | % | | | 2.00 | % | |
| 10 Years | | $ | 22,856 | | | | 128.56 | % | | | 8.62 | % | |
| Russell 2000 Index | |
| Period | | Growth | | Total Return | |
Ended
12/31/05 | | of
$10,000 | | Cumu-
lative | | Average
Annual | |
| 1 Year | | $ | 10,455 | | | | 4.55 | % | | | 4.55 | % | |
| 5 Years | | $ | 14,846 | | | | 48.46 | % | | | 8.22 | % | |
| 10 Years | | $ | 24,248 | | | | 142.48 | % | | | 9.26 | % | |
The line representing the performance return of the Aggressive Equity Fund includes expenses, such as transaction costs and management fees that reduce returns, while the performance return line of the Index does not.
8
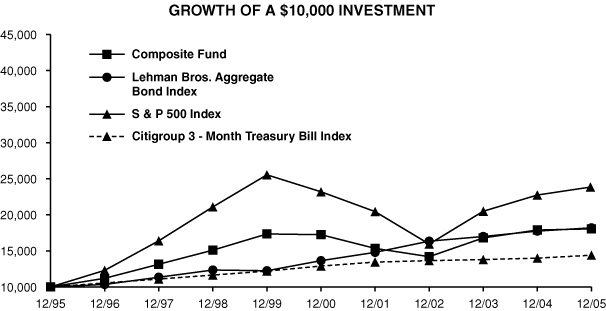
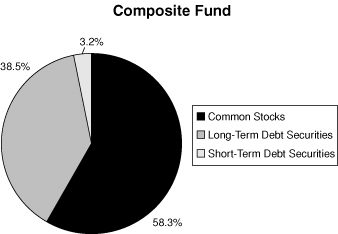
COMPOSITE FUND
The Composite Fund invests in a diversified portfolio of common stocks and fixed-income securities seeking appreciation and current income. The equity portion of the Fund invests in stocks within the S&P 500 Index®.
The S&P 500 showed little change over the full year 2005, advancing only 3.0% on a price basis and generating a modest total return of 4.9%. The largest contributor to performance was the energy sector, followed by materials and utilities, all benefiting from commodities inflation. Offsetting the risks that these inflationary forces would stimulate a more serious and sustained increase in the general price level was the Federal Reserve's steadfast campaign to raise short term interest rates, as well as the secular forces of globalization and productivity growth. Both economic and profit growth remained robust throughout the year, underscoring the meager returns generated in the aggregate by domestic stocks.
The shape of the yield curve flattened dramatically in 2005 as the Federal Reserve continued to raise short-term rates in an attempt to get back to a more "normal" relationship between short and long-term rates, as well as to head off any acceleration in the general price level in the face of dramatically increased energy prices, a strengthening domestic economic recovery, and signs of a global economic boom. Three-month Treasury Bill yields rose from 2.21% on December 31, 2004 to 4.07% on December 31, 2005 (an increase of 186 basis points), while the yield on the two-year notes rose from 3.07% to 4.40%(an increase of 133 basis points). At the same time, 10-Y ear Treasury bonds advanced only 17 basis points from 4.22% to 4.39%, essentially flat with the 2-Year Treasury.
For the twelve months ended December 31, 2005, the Composite Fund returned 0.96%, compared to the benchmark return of 3.92%, 40% of which is based on the Lehman Brothers Aggregate Bond Index® and 60% of which is based on the S&P 500 Index®. The Fund maintained a shorter duration in fixed-income investments than the Lehman Index during 2005, expecting long rates to rise along with short rates. This caused the Fund to return less than the Index. However, inflationary expectations might cause long rates to rise during 2006. Thus, a defensive interest rate posture will be maintained and the majority of corporate bond positions wi ll have maturities of less than five years.
| Composite Fund | |
| Period | | Growth | | Total Return | |
Ended
12/31/05 | | of
$10,000 | | Cumu-
lative | | Average
Annual | |
| 1 Year | | $ | 10,096 | | | | 0.96 | % | | | 0.96 | % | |
| 5 Years | | $ | 10,451 | | | | 4.51 | % | | | 0.89 | % | |
| 10 Years | | $ | 18,049 | | | | 80.49 | % | | | 6.08 | % | |
| S & P 500 Index | |
| Period | | Growth | | Total Return | |
Ended
12/31/05 | | of
$10,000 | | Cumu-
lative | | Average
Annual | |
| 1 Year | | $ | 10,491 | | | | 4.91 | % | | | 4.91 | % | |
| 5 Years | | $ | 10,275 | | | | 2.75 | % | | | 0.54 | % | |
| 10 Years | | $ | 23,841 | | | | 138.41 | % | | | 9.07 | % | |
| Lehman Bros. Aggregate Bond Index | |
| Period | | Growth | | Total Return | |
Ended
12/31/05 | | of
$10,000 | | Cumu-
lative | | Average
Annual | |
| 1 Year | | $ | 10,243 | | | | 2.43 | % | | | 2.43 | % | |
| 5 Years | | $ | 13,302 | | | | 33.02 | % | | | 5.87 | % | |
| 10 Years | | $ | 18,185 | | | | 81.85 | % | | | 6.16 | % | |
| Citigroup 3-Month T-Bill Index | |
| Period | | Growth | | Total Return | |
Ended
12/31/05 | | of
$10,000 | | Cumu-
lative | | Average
Annual | |
| 1 Year | | $ | 10,300 | | | | 3.00 | % | | | 3.00 | % | |
| 5 Years | | $ | 11,156 | | | | 11.56 | % | | | 2.21 | % | |
| 10 Years | | $ | 14,408 | | | | 44.08 | % | | | 3.72 | % | |
The line representing the performance return of the Composite Fund includes expenses, such as transaction costs and management fees that reduce returns, while the performance return lines of the Indices do not.
9
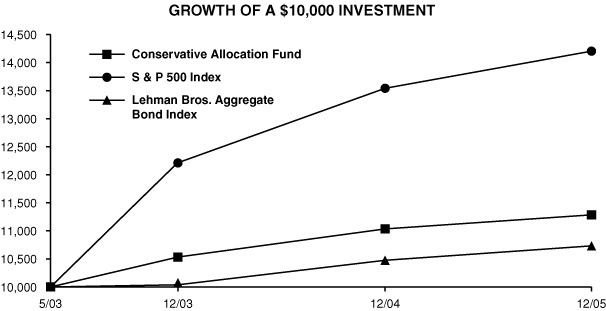
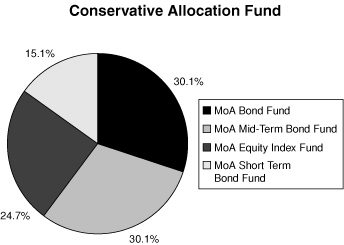
CONSERVATIVE ALLOCATION FUND
The objective of the Conservative Allocation Fund is current income and, to a lesser extent, capital appreciation. The Conservative Allocation Fund invests primarily in the fixed-income Funds of the Investment Company and also invests in an equity Fund of the Investment Company. The Fund's target allocation is approximately 75% of net assets in fixed-income Funds and approximately 25% of net assets in equity Funds. The Fund seeks to maintain approximately 30% of its net assets in the Bond Fund, approximately 30% in the Mid-Term Bond Fund, approximately 15% in the Short-Term Bond Fund and approximately 25% in the Equity Index Fund.
Performance for the Fund is compared to the Lehman Brothers Aggregate Bond Index® (75% weighting) and the S&P 500 Index® (25% weighting). For the twelve months ended December 31, 2005, the Fund returned 2.30% versus a 3.05% return in the benchmark. The underperformance of the Fund is attributable to the fact that the Short-Term Bond Fund and Mid-Term Bond Fund underperformed the benchmark's longer duration bond component as well as the recognition of the Fund's expenses.
| Conservative Allocation Fund | |
| Period | | Growth | | Total Return | |
Ended
12/31/05 | | of
$10,000 | | Cumu-
lative | | Average
Annual | |
| 1 Year | | $ | 10,230 | | | | 2.30 | % | | | 2.30 | % | |
Since 5/20/03
(Inception) | | $ | 11,283 | | | | 12.83 | % | | | 4.73 | % | |
| S & P 500 Index | |
| Period | | Growth | | Total Return | |
Ended
12/31/05 | | of
$10,000 | | Cumu-
lative | | Average
Annual | |
| 1 Year | | $ | 10,491 | | | | 4.91 | % | | | 4.91 | % | |
Since 5/20/03
(Inception) | | $ | 14,201 | | | | 42.01 | % | | | 14.36 | % | |
| Lehman Bros. Aggregate Bond Index | |
| Period | | Growth | | Total Return | |
Ended
12/31/05 | | of
$10,000 | | Cumu-
lative | | Average
Annual | |
| 1 Year | | $ | 10,243 | | | | 2.43 | % | | | 2.43 | % | |
Since 5/20/03
(Inception) | | $ | 10,727 | | | | 7.27 | % | | | 2.72 | % | |
The line representing the performance return of the Conservative Allocation Fund includes expenses, such as transaction costs and management fees in the underlying funds that reduce returns, while the performance return line of the Indices do not.
10
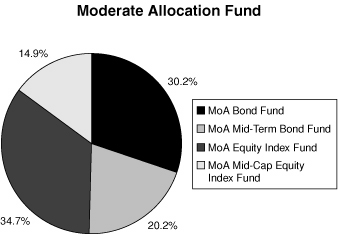
MODERATE ALLOCATION FUND
The objective of the Moderate Allocation Fund is capital appreciation and current income. The Moderate Allocation Fund invests in the equity and fixed-income Funds of the Investment Company. The Fund's target allocation is approximately 50% of net assets in equity Funds and approximately 50% of net assets in fixed-income Funds. The Fund seeks to maintain approximately 35% of its net assets in the Equity Index Fund, approximately 15% in the Mid-Cap Equity Index Fund, approximately 30% in the Bond Fund and approximately 20% in the Mid-Term Bond Fund.
Performance for the Fund is compared to the S&P 500 Index® (50% weighting) and the Lehman Brothers Aggregate Bond Index® (50% weighting). For the twelve months ending December 31, 2005, the Fund returned 4.35% versus a 3.67% return for the benchmark. The outperformance of the Fund was due largely to the Mid-Cap Equity Index Fund significantly outperforming the stock component of the benchmark, which focuses on large-cap stocks.

| Moderate Allocation Fund | |
| Period | | Growth | | Total Return | |
Ended
12/31/05 | | of
$10,000 | | Cumu-
lative | | Average
Annual | |
| 1 Year | | $ | 10,435 | | | | 4.35 | % | | | 4.35 | % | |
Since 5/20/03
(Inception) | | $ | 12,624 | | | | 26.24 | % | | | 9.32 | % | |
| S & P 500 Index | |
| Period | | Growth | | Total Return | |
Ended
12/31/05 | | of
$10,000 | | Cumu-
lative | | Average
Annual | |
| 1 Year | | $ | 10,491 | | | | 4.91 | % | | | 4.91 | % | |
Since 5/20/03
(Inception) | | $ | 14,201 | | | | 42.01 | % | | | 14.36 | % | |
| Lehman Bros. Aggregate Bond Index | |
| Period | | Growth | | Total Return | |
Ended
12/31/05 | | of
$10,000 | | Cumu-
lative | | Average
Annual | |
| 1 Year | | $ | 10,243 | | | | 2.43 | % | | | 2.43 | % | |
Since 5/20/03
(Inception) | | $ | 10,727 | | | | 7.27 | % | | | 2.72 | % | |
The line representing the performance return of the Moderate Allocation Fund includes expenses, such as transaction costs and management fees in the underlying funds that reduce returns, while the performance return line of the Indices do not.
11
AGGRESSIVE ALLOCATION FUND
The objective of the Aggressive Allocation Fund is capital appreciation and, to a lesser extent, current income. The Aggressive Allocation Fund invests in the equity and fixed income Funds of the Investment Company. The Fund's target allocation is approximately 75% of net assets in equity Funds and approximately 25% of net assets in fixed-income Funds. The Fund seeks to maintain approximately 45% of its net assets in the Equity Index Fund, approximately 20% in the Mid-Cap Equity Index Fund, approximately 10% in the Aggressive Equity Fund and approximately 25% in the Bond Fund.
Performance for the Fund is compared to the S&P 500 Index® (75% weighting) and the Lehman Brothers Aggregate Bond Index® (25% weighting). For the twelve months ending December 31, 2005, the Fund returned 5.78% versus a 4.29% return for the benchmark. The outperformance was mainly due to the Mid-Cap Index Fund and to a lesser extent the Aggressive Equity Fund outperforming the benchmark's stock component, which has a large-cap focus.
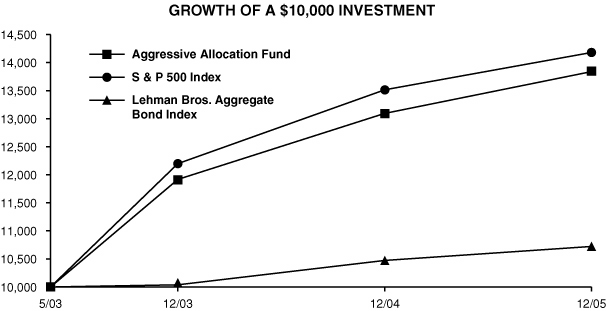
| Aggressive Allocation Fund | |
| Period | | Growth | | Total Return | |
Ended
12/31/05 | | of
$10,000 | | Cumu-
lative | | Average
Annual | |
| 1 Year | | $ | 10,578 | | | | 5.78 | % | | | 5.78 | % | |
Since 5/20/03
(Inception) | | $ | 13,867 | | | | 38.67 | % | | | 13.32 | % | |
| S & P 500 Index | |
| Period | | Growth | | Total Return | |
Ended
12/31/05 | | of
$10,000 | | Cumu-
lative | | Average
Annual | |
| 1 Year | | $ | 10,491 | | | | 4.91 | % | | | 4.91 | % | |
Since 5/20/03
(Inception) | | $ | 14,201 | | | | 42.01 | % | | | 14.36 | % | |
| Lehman Bros. Aggregate Bond Index | |
| Period | | Growth | | Total Return | |
Ended
12/31/05 | | of
$10,000 | | Cumu-
lative | | Average
Annual | |
| 1 Year | | $ | 10,243 | | | | 2.43 | % | | | 2.43 | % | |
Since 5/20/03
(Inception) | | $ | 10,727 | | | | 7.27 | % | | | 2.72 | % | |
The line representing the performance return of the Aggressive Allocation Fund includes expenses, such as transaction costs and management fees in the underlying funds that reduce returns, while the performance return line of the Indices do not.
12
MONEY MARKET FUND
The Money Market Fund's investment objective is to realize current income while maintaining liquidity, investment quality and stability of capital. Through investing in high-quality commercial paper issued by U.S. corporations and securities issued by the U.S. government and its agencies, the Fund returned 2.97% for the twelve months ended December 31, 2005. Short-term rates continued to move higher during 2005 as the Federal Open Market Committee raised the Federal funds rate eight times, bringing it to 4.25% from 2.25% at the beginning of the year. The seven-day effective yield as of February 14, 2006 was 4.36%. As with all performance reporting, this yield is not necessarily indicative of future annual yields. Neither the Federal Deposit Insurance Corporation nor any other U.S. Government agency insures or guarantees the Separate Account's investments in shares of the Money Market Fund.
SHORT-TERM BOND FUND
The Short-Term Bond Fund seeks a high level of return consistent with the preservation of capital through investment in publicly traded debt securities. The Fund primarily invests in corporate, U.S. Government agency and mortgage-backed securities, all of which normally yield more than U.S. Treasury issues. The Fund's strategy focuses on overweighting corporate and agency bonds, which yield more than competing index sectors.
Over the 12 month period ended December 31, 2005, the yield on two-year Treasury issues increased from 3.07% to 4.40%. Mortgage-backed securities, which make up 11% of the Fund, outperformed other securities with a similar duration. However, as these bonds mature, generally they will be replaced by corporate bonds.
The Fund's return was 1.58% for the twelve months ended December 31, 2005, compared to the Citigroup Government/Corporate 1-3 Year Bond Index return of 1.81% for the same period. The Fund modestly outperformed the benchmark on a pre-expense basis because it benefited from a shorter duration than that of the index as the Federal Reserve was raising short-term interest rates. The slight underperformance as reported here was entirely a result of expenses, such as transaction costs and management fees, which are not carried by the benchmark.

| Short-Term Bond Fund | |
| Period | | Growth | | Total Return | |
Ended
12/31/05 | | of
$10,000 | | Cumu-
lative | | Average
Annual | |
| 1 Year | | $ | 10,158 | | | | 1.58 | % | | | 1.58 | % | |
| 5 Years | | $ | 11,848 | | | | 18.48 | % | | | 3.45 | % | |
| 10 Years | | $ | 15,652 | | | | 56.52 | % | | | 4.58 | % | |
| Citigroup 1-3 Year Bond Index | |
| Period | | Growth | | Total Return | |
Ended
12/31/05 | | of
$10,000 | | Cumu-
lative | | Average
Annual | |
| 1 Year | | $ | 10,181 | | | | 1.81 | % | | | 1.81 | % | |
| 5 Years | | $ | 12,263 | | | | 22.63 | % | | | 4.17 | % | |
| 10 Years | | $ | 16,437 | | | | 64.37 | % | | | 5.10 | % | |
The line representing the performance return of the Short-Term Bond Fund includes expenses, such as transaction costs and management fees that reduce returns, while the performance return line of the Index does not.
13
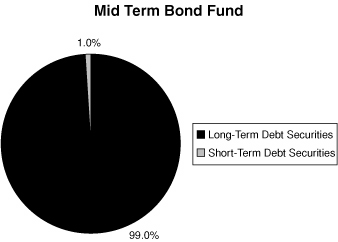
MID-TERM BOND FUND
The Mid-Term Bond Fund seeks a high level of return consistent with the preservation of capital through investment in publicly traded debt securities. The Fund primarily invests in corporate and U.S. Government agency securities, which normally yield more than U.S. Treasury issues.
The Fund continued to emphasize Agency issues and underweight Treasury and corporate bonds during 2005. So long as Agency yields remain similar to corporates, this position will be maintained. For the twelve months ended December 31, 2005, the Fund returned 0.77% compared to the Citigroup Government/Corporate 3-7 Year Bond Index, which returned 1.00%. The Fund modestly outperformed the benchmark on a pre-expense basis because its duration was shorter than that of the index when the Federal Reserve was raising short-term interest rates. The slight underperformance as reported above was entirely the result of expenses, such as transaction costs and management fees, which are not carried by the benchmark.
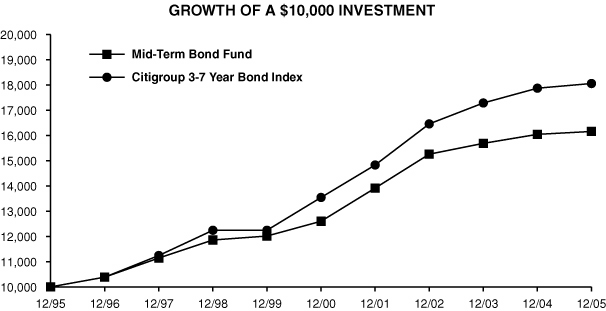
| Mid-Term Bond Fund | |
| Period | | Growth | | Total Return | |
Ended
12/31/05 | | of
$10,000 | | Cumu-
lative | | Average
Annual | |
| 1 Year | | $ | 10,077 | | | | 0.77 | % | | | 0.77 | % | |
| 5 Years | | $ | 12,825 | | | | 28.25 | % | | | 5.10 | % | |
| 10 Years | | $ | 16,167 | | | | 61.67 | % | | | 4.92 | % | |
| Citigroup 3-7 Year Bond Index | |
| Period | | Growth | | Total Return | |
Ended
12/31/05 | | of
$10,000 | | Cumu-
lative | | Average
Annual | |
| 1 Year | | $ | 10,100 | | | | 1.00 | % | | | 1.00 | % | |
| 5 Years | | $ | 13,325 | | | | 33.25 | % | | | 5.91 | % | |
| 10 Years | | $ | 18,056 | | | | 80.56 | % | | | 6.09 | % | |
The line representing the performance return of the Mid-Term Bond Fund includes expenses, such as transaction costs and management fees that reduce returns, while the performance return line of the Index does not.
14
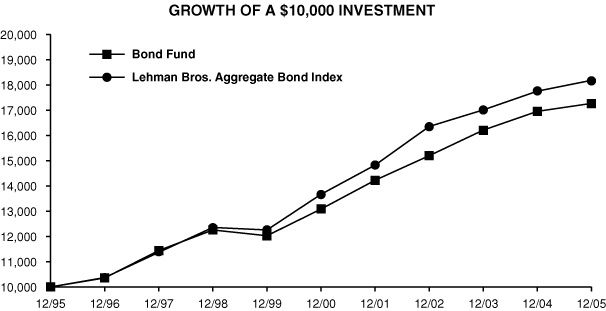
BOND FUND
The Bond Fund's primary investment objective is to provide as high a level of current income over time as is believed to be consistent with prudent investment risk by investing primarily in investment grade, publicly traded debt securities. A secondary objective is preservation of capital. The Fund primarily invests in corporate, U.S. Government agency and mortgage-backed securities, all of which normally yield more than U.S. Treasury issues.
The shape of the yield curve changed dramatically during 2005. Even though the Federal Reserve continued to raise short-term rates while energy prices escalated and signs of inflation became more apparent, long-term rates actually declined. Three-month Treasury Bill yields rose from 2.21% on December 31, 2004 to 4.07% at year end, while the yield on the two-year notes rose from 3.07% to 4.40%. At the same time, long Treasury rates declined from 4.83% to 4.54%.
The Bond Fund's return for the twelve months ended December 31, 2005 was 1.79%, compared to 2.43% for the Lehman Brothers Aggregate Bond Index. The Fund maintained a shorter duration than the Index throughout the year, anticipating long rates to rise along with short rates. However, as noted above, while short-term rates increased by over 100 basis points, long-term rates actually came down, causing the Fund to return less than the Index. However, inflationary expectations might cause long rates to rise during 2006. As such, a defensive interest rate posture will be maintained and the majority of corporate bond positions will have maturities of less than five years.
| Bond Fund | |
| Period | | Growth | | Total Return | |
Ended
12/31/05 | | of
$10,000 | | Cumu-
lative | | Average
Annual | |
| 1 Year | | $ | 10,179 | | | | 1.79 | % | | | 1.79 | % | |
| 5 Years | | $ | 13,192 | | | | 31.92 | % | | | 5.70 | % | |
| 10 Years | | $ | 17,261 | | | | 72.61 | % | | | 5.61 | % | |
| Lehman Bros. Aggregate Bond Index | |
| Period | | Growth | | Total Return | |
Ended
12/31/05 | | of
$10,000 | | Cumu-
lative | | Average
Annual | |
| 1 Year | | $ | 10,243 | | | | 2.43 | % | | | 2.43 | % | |
| 5 Years | | $ | 13,302 | | | | 33.02 | % | | | 5.87 | % | |
| 10 Years | | $ | 18,185 | | | | 81.85 | % | | | 6.16 | % | |
The line representing the performance return of the Bond Fund includes expenses, such as transaction costs and management fees that reduce returns, while the performance return lines of the Indices do not.
15
MUTUAL OF AMERICA INVESTMENT CORPORATION
ASSET ALLOCATIONS AS OF DECEMBER 31, 2005

16
MUTUAL OF AMERICA INVESTMENT CORPORATION
ASSET ALLOCATIONS AS OF DECEMBER 31, 2005 (Continued)


17
MUTUAL OF AMERICA INVESTMENT CORPORATION
ASSET ALLOCATIONS AS OF DECEMBER 31, 2005 (Continued)


18
MUTUAL OF AMERICA INVESTMENT CORPORATION
EXPENSE EXAMPLE
EXAMPLE
As a shareholder of one of the Mutual of America Investment Corporation Funds, you incur ongoing costs, including management fees and other Fund expenses. You do not incur transactional costs, such as sales charges (loads), redemption fees or exchange fees. Additionally, Mutual of America Capital Management Corporation, the Funds' Advisor, has contractually agreed to limit each Fund's total operating expenses to its investment management fees. This contractual obligation was in effect for 2005 and will continue through April 30, 2006. In addition, effective May 1, 2006, the Funds' Advisor will reduce the investment management fee it charges the Funds. Details about the Advisor's investment management fees are in footnotes 2 and 6 of the accompanying financial statements.
This Example is intended to help you understand your ongoing costs (in dollars) of investing in a Fund and to compare these costs with the ongoing costs of investing in other mutual funds. The Example is based on an investment of $1,000 invested at July 1, 2005 and held for the entire period ending December 31, 2005. See Footnote (1) on Page 23 for comparable amounts as if the contractual expense limitation described above was not in effect, and the reduced investment management fees were in effect, during the six months ended December 31, 2005.
ACTUAL EXPENSES
The first line of the tables below provides information about actual account values and actual expenses. You may use the information in this line, together with the amount you invested, to estimate the expenses that you paid over the period. Simply divide your account value by $1,000 (for example, an $8,600 account value divided by $1,000=8.6), then multiply the result by the number in the first line under the heading entitled "Expenses Paid During Period" to estimate the expenses you paid on your account during this period.
HYPOTHETICAL EXAMPLE FOR COMPARISON PURPOSES
The second line of the tables below provides information about hypothetical account values and hypothetical expenses based on each Fund's actual expense ratio and an assumed rate of return of 5% per year before expenses, which is not the Fund's actual return. The hypothetical account values and expenses may not be used to estimate the actual ending account balance or expenses you paid for the period. You may use this information to compare the ongoing costs of investing in the Fund with other funds. To do so, compare this 5% hypothetical example with the 5% hypothetical examples that appear in the shareholder reports of the other funds.
Please note that the second line of the table is useful in comparing ongoing costs only, and will not help you determine the relative total costs of owning other funds, which may also charge transactional costs, such as sales charges (loads), redemption fees or exchange fees.
Equity Index Fund
| | | Beginning
Account Value
July 1, 2005 | | Ending
Account Value
December 31, 2005 | | Expenses Paid
During Period*
July 1 –
December 31, 2005 | |
| Actual | | $ | 1,000.00 | | | $ | 1,057.13 | | | $ | 0.65 | | |
Hypothetical
(5% Return before Expenses) | | $ | 1,000.00 | | | $ | 1,024.26 | | | $ | 0.63 | | |
* Expenses are equal to the Fund's annual expense ratio of 0.125%, multiplied by the average account value over the period, multiplied by 184/365 (to reflect the one-half year period).
19
MUTUAL OF AMERICA INVESTMENT CORPORATION
EXPENSE EXAMPLE (Continued)
All America Fund
| | | Beginning
Account Value
July 1, 2005 | | Ending
Account Value
December 31, 2005 | | Expenses Paid
During Period*
July 1 –
December 31, 2005 | |
| Actual | | $ | 1,000.00 | | | $ | 1,059.14 | | | $ | 2.59 | | |
Hypothetical
(5% Return before Expenses) | | $ | 1,000.00 | | | $ | 1,022.33 | | | $ | 2.54 | | |
* Expenses are equal to the Fund's annual expense ratio of 0.50%, multiplied by the average account value over the period, multiplied by 184/365 (to reflect the one-half year period).
Small Cap Value Fund
| | | Beginning
Account Value
July 1, 2005 | | Ending
Account Value
December 31, 2005 | | Expenses Paid
During Period*
July 1 –
December 31, 2005 | |
| Actual | | $ | 1,000.00 | | | $ | 1,076.16 | | | $ | 4.38 | | |
Hypothetical
(5% Return before expenses) | | $ | 1,000.00 | | | $ | 1,020.52 | | | $ | 4.33 | | |
* Expenses are equal to the Fund's annual expense ratio of 0.85%, multiplied by the average account value over the period, multiplied by 184/365 (to reflect the one-half year period).
Small Cap Growth Fund
| | | Beginning
Account Value
July 1, 2005 | | Ending
Account Value
December 31, 2005 | | Expenses Paid
During Period*
July 1 –
December 31, 2005 | |
| Actual | | $ | 1,000.00 | | | $ | 1,055.03 | | | $ | 4.32 | | |
Hypothetical
(5% Return before expenses) | | $ | 1,000.00 | | | $ | 1,020.52 | | | $ | 4.33 | | |
* Expenses are equal to the Fund's annual expense ratio of 0.85%, multiplied by the average account value over the period, multiplied by 184/365 (to reflect the one-half year period).
Mid-Cap Value Fund
| | | Beginning
Account Value
July 1, 2005 | | Ending
Account Value
December 31, 2005 | | Expenses Paid
During Period*
July 1 –
December 31, 2005 | |
| Actual | | $ | 1,000.00 | | | $ | 1,069.12 | | | $ | 3.23 | | |
Hypothetical
(5% Return before expenses) | | $ | 1,000.00 | | | $ | 1,021.71 | | | $ | 3.15 | | |
* Expenses are equal to the Fund's annual expense ratio of 0.65%, multiplied by the average account value over the period, multiplied by 184/365 (to reflect the one-half year period).
20
MUTUAL OF AMERICA INVESTMENT CORPORATION
EXPENSE EXAMPLE (Continued)
Mid-Cap Equity Index Fund
| | | Beginning
Account Value
July 1, 2005 | | Ending
Account Value
December 31, 2005 | | Expenses Paid
During Period*
July 1 –
December 31, 2005 | |
| Actual | | $ | 1,000.00 | | | $ | 1,083.58 | | | $ | 0.65 | | |
Hypothetical
(5% Return before expenses) | | $ | 1,000.00 | | | $ | 1,024.26 | | | $ | 0.63 | | |
* Expenses are equal to the Fund's annual expense ratio of 0.125%, multiplied by the average account value over the period, multiplied by 184/365 (to reflect the one-half year period).
Aggressive Equity Fund
| | | Beginning
Account Value
July 1, 2005 | | Ending
Account Value
December 31, 2005 | | Expenses Paid
During Period*
July 1 –
December 31, 2005 | |
| Actual | | $ | 1,000.00 | | | $ | 1,067.31 | | | $ | 4.42 | | |
Hypothetical
(5% Return before expenses) | | $ | 1,000.00 | | | $ | 1,020.52 | | | $ | 4.33 | | |
* Expenses are equal to the Fund's annual expense ratio of 0.85%, multiplied by the average account value over the period, multiplied by 184/365 (to reflect the one-half year period).
Composite Fund
| | | Beginning
Account Value
July 1, 2005 | | Ending
Account Value
December 31, 2005 | | Expenses Paid
During Period*
July 1 –
December 31, 2005 | |
| Actual | | $ | 1,000.00 | | | $ | 1,029.75 | | | $ | 2.55 | | |
Hypothetical
(5% Return before Expenses) | | $ | 1,000.00 | | | $ | 1,022.33 | | | $ | 2.54 | | |
* Expenses are equal to the Fund's annual expense ratio of 0.50%, multiplied by the average account value over the period, multiplied by 184/365 (to reflect the one-half year period).
Conservative Allocation Fund
| | | Beginning
Account Value
July 1, 2005 | | Ending
Account Value
December 31, 2005 | | Expenses Paid
During Period*
July 1 –
December 31, 2005 | |
| Actual | | $ | 1,000.00 | | | $ | 1,014.66 | | | $ | 2.07 | | |
Hypothetical
(5% Return before Expenses) | | $ | 1,000.00 | | | $ | 1,022.80 | | | $ | 2.08 | | |
* Expenses are equal to the Fund's annual expense ratio of 0.41% (reflecting the proportional expense ratios of the underlying funds in which the Fund invests), multiplied by the average account value over the period, multiplied by 184/365 (to reflect the one-half year period).
21
MUTUAL OF AMERICA INVESTMENT CORPORATION
EXPENSE EXAMPLE (Continued)
Moderate Allocation Fund
| | | Beginning
Account Value
July 1, 2005 | | Ending
Account Value
December 31, 2005 | | Expenses Paid
During Period*
July 1 –
December 31, 2005 | |
| Actual | | $ | 1,000.00 | | | $ | 1,032.15 | | | $ | 1.60 | | |
Hypothetical
(5% Return before Expenses) | | $ | 1,000.00 | | | $ | 1,023.28 | | | $ | 1.60 | | |
* Expenses are equal to the Fund's annual expense ratio of 0.31% (reflecting the proportional expense ratios of the underlying funds in which the Fund invests), multiplied by the average account value over the period, multiplied by 184/365 (to reflect the one-half year period).
Aggressive Allocation Fund
| | | Beginning
Account Value
July 1, 2005 | | Ending
Account Value
December 31, 2005 | | Expenses Paid
During Period*
July 1 –
December 31, 2005 | |
| Actual | | $ | 1,000.00 | | | $ | 1,049.47 | | | $ | 1.51 | | |
Hypothetical
(5% Return before Expenses) | | $ | 1,000.00 | | | $ | 1,023.39 | | | $ | 1.49 | | |
* Expenses are equal to the Fund's annual expense ratio of 0.29% (reflecting the proportional expense ratios of the underlying funds in which the Fund invests), multiplied by the average account value over the period, multiplied by 184/365 (to reflect the one-half year period).
Money Market Fund
| | | Beginning
Account Value
July 1, 2005 | | Ending
Account Value
December 31, 2005 | | Expenses Paid
During Period*
July 1 –
December 31, 2005 | |
| Actual | | $ | 1,000.00 | | | $ | 1,017.22 | | | $ | 1.27 | | |
Hypothetical
(5% Return before Expenses) | | $ | 1,000.00 | | | $ | 1,023.62 | | | $ | 1.27 | | |
* Expenses are equal to the Fund's annual expense ratio of 0.25%, multiplied by the average account value over the period, multiplied by 184/365 (to reflect the one-half year period).
Short-Term Bond Fund
| | | Beginning
Account Value
July 1, 2005 | | Ending
Account Value
December 31, 2005 | | Expenses Paid
During Period*
July 1 –
December 31, 2005 | |
| Actual | | $ | 1,000.00 | | | $ | 1,007.83 | | | $ | 2.52 | | |
Hypothetical
(5% Return before Expenses) | | $ | 1,000.00 | | | $ | 1,022.33 | | | $ | 2.54 | | |
* Expenses are equal to the Fund's annual expense ratio of 0.50%, multiplied by the average account value over the period, multiplied by 184/365 (to reflect the one-half year period).
22
MUTUAL OF AMERICA INVESTMENT CORPORATION
EXPENSE EXAMPLE (Continued)
Mid-Term Bond Fund
| | | Beginning
Account Value
July 1, 2005 | | Ending
Account Value
December 31, 2005 | | Expenses Paid
During Period*
July 1 –
December 31, 2005 | |
| Actual | | $ | 1,000.00 | | | $ | 996.38 | | | $ | 2.50 | | |
Hypothetical
(5% Return before Expenses) | | $ | 1,000.00 | | | $ | 1,022.33 | | | $ | 2.54 | | |
* Expenses are equal to the Fund's annual expense ratio of 0.50%, multiplied by the average account value over the period, multiplied by 184/365 (to reflect the one-half year period).
Bond Fund
| | | Beginning
Account Value
July 1, 2005 | | Ending
Account Value
December 31, 2005 | | Expenses Paid
During Period*
July 1 –
December 31, 2005 | |
| Actual | | $ | 1,000.00 | | | $ | 1,000.23 | | | $ | 2.51 | | |
Hypothetical
(5% Return before Expenses) | | $ | 1,000.00 | | | $ | 1.022.33 | | | $ | 2.54 | | |
* Expenses are equal to the Fund's annual expense ratio of 0.50%, multiplied by the average account value over the period, multiplied by 184/365 (to reflect the one-half year period).
1. Effective, May 1, 2006, the Advisor will no longer limit the Funds' expenses to its investment management fees. Also effective on the same date, the Advisor will be lowering the investment management fees it charges the funds. Details about the Advisor's investment management fees are in footnotes 2 and 6 of the accompanying financial statements. The expense example tables below are based on an investment of $1,000 invested at July 1, 2005 and held for the entire period ending December 31, 2005 assuming the contractual expense limitation was not in effect, and the reduced investment management fees were in effect, during the six months ended December 31, 2005.
Equity Index Fund
| | | Beginning
Account Value
July 1, 2005 | | Ending
Account Value
December 31, 2005 | | Expenses Paid
During Period*
July 1 –
December 31, 2005 | |
| Actual | | $ | 1,000.00 | | | $ | 1,056.74 | | | $ | 1.02 | | |
Hypothetical
(5% Return before Expenses) | | $ | 1,000.00 | | | $ | 1,023.87 | | | $ | 1.02 | | |
* Expenses are equal to the Fund's annual expense ratio (before reimbursement) of 0.20%, multiplied by the average account value over the period, multiplied by 184/365 (to reflect the one-half year period).
All America Fund
| | | Beginning
Account Value
July 1, 2005 | | Ending
Account Value
December 31, 2005 | | Expenses Paid
During Period*
July 1 –
December 31, 2005 | |
| Actual | | $ | 1,000.00 | | | $ | 1,059.14 | | | $ | 2.82 | | |
Hypothetical
(5% Return before Expenses) | | $ | 1,000.00 | | | $ | 1,022.33 | | | $ | 2.77 | | |
* Expenses are equal to the Fund's annual expense ratio (before reimbursement) of 0.54%, multiplied by the average account value over the period, multiplied by 184/365 (to reflect the one-half year period).
23
MUTUAL OF AMERICA INVESTMENT CORPORATION
EXPENSE EXAMPLE (Continued)
Small Cap Value Fund
| | | Beginning
Account Value
July 1, 2005 | | Ending
Account Value
December 31, 2005 | | Expenses Paid
During Period*
July 1 –
December 31, 2005 | |
| Actual | | $ | 1,000.00 | | | $ | 1,076.04 | | | $ | 4.58 | | |
Hypothetical
(5% Return before expenses) | | $ | 1,000.00 | | | $ | 1,020.39 | | | $ | 4.46 | | |
* Expenses are equal to the Fund's annual expense ratio (before reimbursement) of 0.88%, multiplied by the average account value over the period, multiplied by 184/365 (to reflect the one-half year period).
Small Cap Growth Fund
| | | Beginning
Account Value
July 1, 2005 | | Ending
Account Value
December 31, 2005 | | Expenses Paid
During Period*
July 1 –
December 31, 2005 | |
| Actual | | $ | 1,000.00 | | | $ | 1,054.91 | | | $ | 4.53 | | |
Hypothetical
(5% Return before expenses) | | $ | 1,000.00 | | | $ | 1,020.39 | | | $ | 4.46 | | |
* Expenses are equal to the Fund's annual expense ratio (before reimbursement) of 0.88%, multiplied by the average account value over the period, multiplied by 184/365 (to reflect the one-half year period).
Mid-Cap Value Fund
| | | Beginning
Account Value
July 1, 2005 | | Ending
Account Value
December 31, 2005 | | Expenses Paid
During Period*
July 1 –
December 31, 2005 | |
| Actual | | $ | 1,000.00 | | | $ | 1,068.55 | | | $ | 3.59 | | |
Hypothetical
(5% Return before expenses) | | $ | 1,000.00 | | | $ | 1,021.35 | | | $ | 3.51 | | |
* Expenses are equal to the Fund's annual expense ratio (before reimbursement) of 0.69%, multiplied by the average account value over the period, multiplied by 184/365 (to reflect the one-half year period).
Mid-Cap Equity Index Fund
| | | Beginning
Account Value
July 1, 2005 | | Ending
Account Value
December 31, 2005 | | Expenses Paid
During Period*
July 1 –
December 31, 2005 | |
| Actual | | $ | 1,000.00 | | | $ | 1,083.15 | | | $ | 1.07 | | |
Hypothetical
(5% Return before expenses) | | $ | 1,000.00 | | | $ | 1,023.87 | | | $ | 1.02 | | |
* Expenses are equal to the Fund's annual expense ratio (before reimbursement) of 0.20%, multiplied by the average account value over the period, multiplied by 184/365 (to reflect the one-half year period).
Aggressive Equity Fund
| | | Beginning
Account Value
July 1, 2005 | | Ending
Account Value
December 31, 2005 | | Expenses Paid
During Period*
July 1 –
December 31, 2005 | |
| Actual | | $ | 1,000.00 | | | $ | 1,067.24 | | | $ | 4.51 | | |
Hypothetical
(5% Return before expenses) | | $ | 1,000.00 | | | $ | 1,020.44 | | | $ | 4.41 | | |
* Expenses are equal to the Fund's annual expense ratio (before reimbursement) of 0.87%, multiplied by the average account value over the period, multiplied by 184/365 (to reflect the one-half year period).
24
MUTUAL OF AMERICA INVESTMENT CORPORATION
EXPENSE EXAMPLE (Continued)
Composite Fund
| | | Beginning
Account Value
July 1, 2005 | | Ending
Account Value
December 31, 2005 | | Expenses Paid
During Period*
July 1 –
December 31, 2005 | |
| Actual | | $ | 1,000.00 | | | $ | 1,029.54 | | | $ | 2.77 | | |
Hypothetical
(5% Return before Expenses) | | $ | 1,000.00 | | | $ | 1,022.11 | | | $ | 2.76 | | |
* Expenses are equal to the Fund's annual expense ratio (before reimbursement) of 0.54%, multiplied by the average account value over the period, multiplied by 184/365 (to reflect the one-half year period).
Conservative Allocation Fund
| | | Beginning
Account Value
July 1, 2005 | | Ending
Account Value
December 31, 2005 | | Expenses Paid
During Period*
July 1 –
December 31, 2005 | |
| Actual | | $ | 1,000.00 | | | $ | 1,014.24 | | | $ | 2.49 | | |
Hypothetical
(5% Return before Expenses) | | $ | 1,000.00 | | | $ | 1,022.37 | | | $ | 2.50 | | |
* Expenses are equal to the Fund's annual expense ratio (before reimbursement) of 0.49% (reflecting the proportional expense ratios of the underlying funds in which the Fund invests), multiplied by the average account value over the period, multiplied by 184/365 (to reflect the one-half year period).
Moderate Allocation Fund
| | | Beginning
Account Value
July 1, 2005 | | Ending
Account Value
December 31, 2005 | | Expenses Paid
During Period*
July 1 –
December 31, 2005 | |
| Actual | | $ | 1,000.00 | | | $ | 1,031.96 | | | $ | 1.90 | | |
Hypothetical
(5% Return before Expenses) | | $ | 1,000.00 | | | $ | 1,022.99 | | | $ | 1.89 | | |
* Expenses are equal to the Fund's annual expense ratio (before reimbursement) of 0.37% (reflecting the proportional expense ratios of the underlying funds in which the Fund invests), multiplied by the average account value over the period, multiplied by 184/365 (to reflect the one-half year period).
Aggressive Allocation Fund
| | | Beginning
Account Value
July 1, 2005 | | Ending
Account Value
December 31, 2005 | | Expenses Paid
During Period*
July 1 –
December 31, 2005 | |
| Actual | | $ | 1,000.00 | | | $ | 1,049.28 | | | $ | 1.81 | | |
Hypothetical
(5% Return before Expenses) | | $ | 1,000.00 | | | $ | 1,023.09 | | | $ | 1.78 | | |
* Expenses are equal to the Fund's annual expense ratio (before reimbursement) of 0.35% (reflecting the proportional expense ratios of the underlying funds in which the Fund invests), multiplied by the average account value over the period, multiplied by 184/365 (to reflect the one-half year period).
Money Market Fund
| | | Beginning
Account Value
July 1, 2005 | | Ending
Account Value
December 31, 2005 | | Expenses Paid
During Period*
July 1 –
December 31, 2005 | |
| Actual | | $ | 1,000.00 | | | $ | 1,017.12 | | | $ | 1.37 | | |
Hypothetical
(5% Return before Expenses) | | $ | 1,000.00 | | | $ | 1,023.51 | | | $ | 1.38 | | |
* Expenses are equal to the Fund's annual expense ratio (before reimbursement) of 0.27%, multiplied by the average account value over the period, multiplied by 184/365 (to reflect the one-half year period).
25
MUTUAL OF AMERICA INVESTMENT CORPORATION
EXPENSE EXAMPLE (Continued)
Short-Term Bond Fund
| | | Beginning
Account Value
July 1, 2005 | | Ending
Account Value
December 31, 2005 | | Expenses Paid
During Period*
July 1 –
December 31, 2005 | |
| Actual | | $ | 1,000.00 | | | $ | 1,006.54 | | | $ | 3.82 | | |
Hypothetical
(5% Return before Expenses) | | $ | 1,000.00 | | | $ | 1,021.00 | | | $ | 3.85 | | |
* Expenses are equal to the Fund's annual expense ratio (before reimbursement) of 0.76%, multiplied by the average account value over the period, multiplied by 184/365 (to reflect the one-half year period).
Mid-Term Bond Fund
| | | Beginning
Account Value
July 1, 2005 | | Ending
Account Value
December 31, 2005 | | Expenses Paid
During Period*
July 1 –
December 31, 2005 | |
| Actual | | $ | 1,000.00 | | | $ | 996.10 | | | $ | 2.80 | | |
Hypothetical
(5% Return before Expenses) | | $ | 1,000.00 | | | $ | 1,022.03 | | | $ | 2.83 | | |
* Expenses are equal to the Fund's annual expense ratio (before reimbursement) of 0.56%, multiplied by the average account value over the period, multiplied by 184/365 (to reflect the one-half year period).
Bond Fund
| | | Beginning
Account Value
July 1, 2005 | | Ending
Account Value
December 31, 2005 | | Expenses Paid
During Period*
July 1 –
December 31, 2005 | |
| Actual | | $ | 1,000.00 | | | $ | 1,000.13 | | | $ | 2.62 | | |
Hypothetical
(5% Return before Expenses) | | $ | 1,000.00 | | | $ | 1,022.22 | | | $ | 2.65 | | |
* Expenses are equal to the Fund's annual expense ratio (before reimbursement) of 0.52%, multiplied by the average account value over the period, multiplied by 184/365 (to reflect the one-half year period).
26
MUTUAL OF AMERICA INVESTMENT CORPORATION (EQUITY INDEX FUND)
SUMMARY PORTFOLIO OF INVESTMENTS IN SECURITIES
December 31, 2005
| | | Shares | | Value | |
| COMMON STOCKS: | |
| BASIC MATERIALS (2.9%) | |
| Other Securities | | | 458,316 | | | $ | 20,907,187 | | |
| CONSUMER, CYCLICAL (10.4%) | |
| Comcast Corp. Cl A* | | | 136,686 | | | | 3,548,369 | | |
| Home Depot, Inc. | | | 133,714 | | | | 5,412,743 | | |
| Time Warner, Inc. | | | 293,489 | | | | 5,118,448 | | |
| Other Securities | | | 1,814,683 | | | | 61,430,757 | | |
| | | | 75,510,317 | | |
| CONSUMER, NON-CYCLICAL (9.3%) | |
| Altria Group, Inc. | | | 131,075 | | | | 9,793,924 | | |
| Coca-Cola Co. | | | 130,289 | | | | 5,251,950 | | |
| PepsiCo, Inc. | | | 104,438 | | | | 6,170,197 | | |
| Proctor & Gamble Co. | | | 210,978 | | | | 12,211,407 | | |
| Wal-Mart Stores, Inc. | | | 157,243 | | | | 7,358,972 | | |
| Other Securities | | | 756,527 | | | | 26,883,601 | | |
| | | | 67,670,051 | | |
| ENERGY (9.1%) | |
| ChevronTexaco Corp. | | | 141,311 | | | | 8,022,225 | | |
| ConocoPhillips | | | 87,341 | | | | 5,081,499 | | |
| Exxon Mobil Corp. | | | 391,670 | | | | 22,000,104 | | |
| Schlumberger, Ltd. | | | 37,080 | | | | 3,602,322 | | |
| Other Securities | | | 485,628 | | | | 27,506,971 | | |
| | | | 66,213,121 | | |
| FINANCIAL (20.8%) | |
| American Express Co. | | | 78,158 | | | | 4,022,011 | | |
| American Int'l. Group, Inc. | | | 163,381 | | | | 11,147,486 | | |
| Bank of America Corp. | | | 252,793 | | | | 11,666,397 | | |
| Citigroup, Inc. | | | 318,439 | | | | 15,453,845 | | |
| Goldman Sachs Group, Inc. | | | 28,376 | | | | 3,623,899 | | |
| J.P. Morgan Chase & Co. | | | 220,250 | | | | 8,741,722 | | |
| Merrill Lynch & Co., Inc. | | | 57,844 | | | | 3,917,774 | | |
| Morgan Stanley | | | 67,850 | | | | 3,849,809 | | |
| Wachovia Corp. | | | 97,784 | | | | 5,168,862 | | |
| Wells Fargo & Company | | | 105,260 | | | | 6,613,486 | | |
| Other Securities | | | 1,692,643 | | | | 76,643,930 | | |
| | | | 150,849,221 | | |
| HEALTHCARE (13.0%) | |
| Abbott Laboratories | | | 97,642 | | | | 3,850,024 | | |
| Amgen, Inc.* | | | 77,695 | | | | 6,127,028 | | |
| Johnson & Johnson | | | 187,258 | | | | 11,254,206 | | |
| Lilly (Eli) & Co. | | | 71,545 | | | | 4,048,732 | | |
| Medtronic, Inc. | | | 76,138 | | | | 4,383,265 | | |
| Merck & Co., Inc. | | | 137,638 | | | | 4,378,265 | | |
| Pfizer, Inc. | | | 463,995 | | | | 10,820,363 | | |
| UnitedHealth Group, Inc. | | | 85,782 | | | | 5,330,493 | | |
| Wyeth | | | 84,489 | | | | 3,892,408 | | |
| Other Securities | | | 939,422 | | | | 39,937,730 | | |
| | | | 94,022,514 | | |
* Non-income producing security.
| | | Shares | | Value | |
| COMMON STOCKS (CONTINUED): | |
| INDUSTRIAL (11.3%) | |
| 3M Company | | | 47,834 | | | $ | 3,707,135 | | |
| Boeing Co. | | | 50,814 | | | | 3,569,175 | | |
| General Electric Co. | | | 665,090 | | | | 23,311,405 | | |
| Tyco International, Ltd. | | | 126,712 | | | | 3,656,908 | | |
| United Parcel Service Cl B | | | 69,463 | | | | 5,220,144 | | |
| United Technologies Corp. | | | 64,119 | | | | 3,584,893 | | |
| Other Securities | | | 809,987 | | | | 38,895,617 | | |
| | | | 81,945,277 | | |
| TECHNOLOGY (14.8%) | |
| Apple Computer, Inc.* | | | 53,048 | | | | 3,813,621 | | |
| Cisco Systems, Inc.* | | | 386,644 | | | | 6,619,345 | | |
| Dell, Inc.* | | | 148,143 | | | | 4,442,809 | | |
| Hewlett-Packard Co. | | | 180,338 | | | | 5,163,077 | | |
| IBM Corp. | | | 99,423 | | | | 8,172,571 | | |
| Intel Corp. | | | 379,497 | | | | 9,472,245 | | |
| Microsoft Corp. | | | 576,228 | | | | 15,068,362 | | |
| Motorola, Inc. | | | 156,784 | | | | 3,541,751 | | |
| Qualcomm, Inc. | | | 103,494 | | | | 4,458,522 | | |
| Other Securities | | | 2,631,112 | | | | 46,229,130 | | |
| | | | 106,981,433 | | |
| TELECOMMUNICATIONS (2.9%) | |
| AT & T, Inc. | | | 245,889 | | | | 6,021,822 | | |
| Sprint Nextel Corp. | | | 185,970 | | | | 4,344,259 | | |
| Verizon Communications | | | 174,042 | | | | 5,242,145 | | |
| Other Securities | | | 265,643 | | | | 5,719,671 | | |
| | | | 21,327,897 | | |
| UTILITIES (3.3%) | |
| Other Securities | | | 641,567 | | | | 23,820,496 | | |
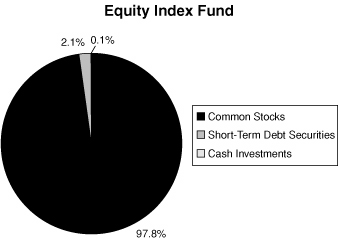
TOTAL COMMON STOCKS
(Cost: $615,527,933) 97.8% | | | | | | $ | 709,247,514 | | |
The accompanying notes are an integral part of these financial statements.
27
MUTUAL OF AMERICA INVESTMENT CORPORATION (EQUITY INDEX FUND)
SUMMARY PORTFOLIO OF INVESTMENTS IN SECURITIES (Continued)
December 31, 2005
| | | Rate | | Maturity | | Face
Amount | | Value | |
| SHORT-TERM DEBT SECURITIES: | |
| U.S. GOVERNMENT (0.1%) | |
| U.S. Treasury Bill (a) | | | 3.85 | % | | 02/09/06 | | $ | 800,000 | | | $ | 796,561 | | |
| U.S. Treasury Bill (a) | | | 3.87 | | | 03/30/06 | | | 200,000 | | | | 198,038 | | |
| | | | 994,599 | | |
| U.S. GOVERNMENT AGENCIES (2.0%) | |
| Federal Home Loan Bank | | | 3.35 | | | 01/03/06 | | | 14,500,000 | | | | 14,495,952 | | |
TOTAL SHORT-TERM DEBT SECURITIES
(Cost: $15,490,598) 2.1% | | | | | | | | | | | | | 15,490,551 | | |
TEMPORARY CASH INVESTMENTS**
(Cost $750,000) 0.1% | | | | | | | | | | | | | 750,000 | | |
TOTAL INVESTMENTS
(Cost: $631,768,531) 100.0% | | | | | | | | | | | | | 725,488,065 | | |
| OTHER NET ASSETS 0.0% (b) | | | | | | | | | | | | | 286,093 | | |
| NET ASSETS 100.0% | | | | | | | | | | | | $ | 725,774,158 | | |
(a) This security, or a portion thereof, has been segregated to cover initial margin requirements on open futures contracts.
(b) Less than 0.05%.
** The fund has an arrangement with its custodian bank, JPMorgan Chase Bank, whereby uninvested cash, subject to parameters set by the fund, is automatically invested in the fund's name by the bank in overnight commercial paper issued by J.P. Morgan Chase & Co. On the next business day, these funds (and earned interest) are automatically returned to the fund. The annual rate of interest earned on this temporary cash investment at December 31, 2005 was 3.79%.
The total value of non-income producing investments was $101,136,858, or 13.9%, of the Fund's total investments as of December 31, 2005.
FUTURES CONTRACTS OUTSTANDING AS OF DECEMBER 31, 2005:
| | | Expiration
Date | | Underlying Face
Amount at Value | | Unrealized
Gain (Loss) | |
| PURCHASED | |
| 50 S & P Stock Index Futures Contracts | | March 2005 | | $ | 15,685,000 | | | $ | (336,975 | ) | |
Face value of futures purchased and outstanding as a percentage of total investments in securities: 2.2%
The accompanying notes are an integral part of these financial statements.
28
MUTUAL OF AMERICA INVESTMENT CORPORATION (ALL AMERICA FUND)
SUMMARY PORTFOLIO OF INVESTMENTS IN SECURITIES
December 31, 2005
| | | Shares | | Value | |
| INDEXED ASSETS: | |
| COMMON STOCKS | |
| BASIC MATERIALS (1.6%) | |
| Other Securities | | | 139,503 | | | $ | 6,364,205 | | |
| CONSUMER, CYCLICAL (5.7%) | |
| Home Depot, Inc. | | | 40,702 | | | | 1,647,617 | | |
| Time Warner, Inc. | | | 89,337 | | | | 1,558,037 | | |
| Other Securities | | | 593,936 | | | | 19,778,646 | | |
| | | | 22,984,300 | | |
| CONSUMER, NON-CYCLICAL (5.1%) | |
| Altria Group, Inc. | | | 39,899 | | | | 2,981,253 | | |
| Coca-Cola Co. | | | 39,669 | | | | 1,599,057 | | |
| PepsiCo, Inc. | | | 31,791 | | | | 1,878,212 | | |
| Proctor & Gamble Co. | | | 64,221 | | | | 3,717,111 | | |
| Wal-Mart Stores, Inc. | | | 47,865 | | | | 2,240,082 | | |
| Other Securities | | | 230,257 | | | | 8,181,613 | | |
| | | | 20,597,328 | | |
| ENERGY (5.0%) | |
| ChevronTexaco Corp. | | | 43,023 | | | | 2,442,416 | | |
| ConocoPhillips | | | 26,594 | | | | 1,547,239 | | |
| Exxon Mobil Corp. | | | 119,224 | | | | 6,696,812 | | |
| Other Securities | | | 159,094 | | | | 9,467,922 | | |
| | | | 20,154,389 | | |
| FINANCIAL (11.3%) | |
| American Int'l. Group, Inc. | | | 49,733 | | | | 3,393,283 | | |
| Bank of America Corp. | | | 76,950 | | | | 3,551,242 | | |
| Citigroup, Inc. | | | 96,932 | | | | 4,704,110 | | |
| J.P. Morgan Chase & Co. | | | 67,043 | | | | 2,660,937 | | |
| Wachovia Corp. | | | 29,765 | | | | 1,573,378 | | |
| Wells Fargo & Company | | | 32,041 | | | | 2,013,136 | | |
| Other Securities | | | 585,886 | | | | 28,019,250 | | |
| | | | 45,915,336 | | |
* Non-income producing security
| | | Shares | | Value | |
| INDEXED ASSETS (CONTINUED): | |
| COMMON STOCKS (CONTINUED) | |
| HEALTHCARE (7.0%) | |
| Amgen, Inc.* | | | 23,650 | | | $ | 1,865,039 | | |
| Johnson & Johnson | | | 57,001 | | | | 3,425,760 | | |
| Pfizer, Inc. | | | 141,239 | | | | 3,293,693 | | |
| UnitedHealth Group, Inc. | | | 26,112 | | | | 1,622,600 | | |
| Other Securities | | | 428,230 | | | | 18,412,479 | | |
| | | | 28,619,571 | | |
| INDUSTRIAL (6.1%) | |
| General Electric Co. | | | 202,452 | | | | 7,095,943 | | |
| United Parcel Service Cl B | | | 21,154 | | | | 1,589,723 | | |
| Other Securities | | | 334,648 | | | | 16,257,115 | | |
| | | | 24,942,781 | | |
| TECHNOLOGY (8.0%) | |
| Cisco Systems, Inc.* | | | 117,694 | | | | 2,014,921 | | |
| Hewlett-Packard Co. | | | 54,895 | | | | 1,571,644 | | |
| IBM Corp. | | | 30,264 | | | | 2,487,701 | | |
| Intel Corp. | | | 115,518 | | | | 2,883,329 | | |
| Microsoft Corp. | | | 175,402 | | | | 4,586,762 | | |
| Qualcomm, Inc. | | | 31,503 | | | | 1,357,149 | | |
| Other Securities | | | 909,840 | | | | 17,662,601 | | |
| | | | 32,564,107 | | |
| TELECOMMUNICATIONS (1.6%) | |
| AT & T, Inc. | | | 74,848 | | | | 1,833,020 | | |
| Verizon Communications | | | 52,978 | | | | 1,595,697 | | |
| Other Securities | | | 137,470 | | | | 3,063,455 | | |
| | | | 6,492,172 | | |
| UTILITIES (1.8%) | |
| Other Securities | | | 195,283 | | | | 7,250,522 | | |
TOTAL INDEXED ASSETS-COMMON STOCKS
(Cost: $169,015,199) 53.2% | | | | | | $ | 215,884,711 | | |
The accompanying notes are an integral part of these financial statements.
29
MUTUAL OF AMERICA INVESTMENT CORPORATION (ALL AMERICA FUND)
SUMMARY PORTFOLIO OF INVESTMENTS IN SECURITIES (Continued)
December 31, 2005
| | | Rate | | Maturity | | Face
Amount | | Value | |
| INDEXED ASSETS: | |
| SHORT-TERM DEBT SECURITIES: | |
| U.S. GOVERNMENT (0.1%) | |
| U.S. Treasury Bill (a) | | | 3.82 | % | | 02/02/06 | | $ | 120,000 | | | $ | 119,571 | | |
| U.S. Treasury Bill (a) | | | 3.87 | | | 03/30/06 | | | 500,000 | | | | 495,096 | | |
| | | | 614,667 | | |
| U.S. GOVERNMENT AGENCIES (1.5%) | |
| Federal National Management Association | | | 3.25 | | | 01/03/06 | | | 6,060,000 | | | | 6,058,359 | | |
TOTAL SHORT-TERM DEBT SECURITIES
(Cost: $6,673,144) 1.6% | | | | | | | | | | | | | 6,673,026 | | |
TOTAL INDEXED ASSETS
(Cost: $175,688,343) 54.8% | | | | | | | | | | | | | 222,557,737 | | |
TEMPORARY CASH INVESTMENTS**
(Cost:$580,000) 0.1% | | | | | | | | | | | | $ | 580,000 | | |
(a) This security, or a portion thereof, has been segregated to cover initial margin requirements on open futures contracts.
** The fund has an arrangement with its custodian bank, JPMorgan Chase Bank, whereby uninvested cash, subject to parameters set by the fund, is automatically invested in the fund's name by the bank in overnight commercial paper issued by J.P. Morgan Chase & Co. On the next business day, these funds (and earned interest) are automatically returned to the fund. The annual rate of interest earned on this temporary cash investment at December 31, 2005 was 3.79%.
FUTURES CONTRACTS OUTSTANDING AS OF DECEMBER 31, 2005:
| | | Expiration
Date | | Underlying Face
Amount at Value | | Unrealized
Gain/(Loss) | |
| PURCHASED | |
| 26 S & P Stock Index Futures Contracts | | March 2005 | | $ | 8,156,200 | | | $ | (123,850 | ) | |
Face value of futures purchased and outstanding as a percentage of total investments in securities: 2.0%
The accompanying notes are an integral part of these financial statements.
30
MUTUAL OF AMERICA INVESTMENT CORPORATION (ALL AMERICA FUND)
SUMMARY PORTFOLIO OF INVESTMENTS IN SECURITIES (Continued)
December 31, 2005
| | | Shares | | Value | |
| ACTIVE ASSETS: | |
| COMMON STOCKS | |
| BASIC MATERIALS (1.5%) | |
| Other Securities | | | 164,508 | | | $ | 6,121,312 | | |
| CONSUMER, CYCLICAL (5.1%) | |
| Other Securities | | | 799,960 | | | | 20,531,108 | | |
| CONSUMER, NON-CYCLICAL (2.6%) | |
| Proctor & Gamble Co. | | | 40,450 | | | | 2,341,246 | | |
| Other Securities | | | 237,700 | | | | 8,050,333 | | |
| | | | 10,391,579 | | |
| ENERGY (3.6%) | |
| Exxon Mobil Corp. | | | 49,570 | | | | 2,784,347 | | |
| Halliburton Co. | | | 24,630 | | | | 1,526,075 | | |
| Range Resources Corp. | | | 61,758 | | | | 1,626,706 | | |
| Transocean, Inc.* | | | 22,210 | | | | 1,547,815 | | |
| Valero Energy Corp. | | | 27,280 | | | | 1,407,648 | | |
| Other Securities | | | 204,677 | | | | 5,931,952 | | |
| | | | 14,824,543 | | |
| FINANCIAL (9.8%) | |
| American Int'l. Group, Inc. | | | 20,699 | | | | 1,412,293 | | |
| Bank of America Corp. | | | 49,053 | | | | 2,263,796 | | |
| Citigroup, Inc. | | | 56,531 | | | | 2,743,449 | | |
| Merrill Lynch & Co., Inc. | | | 22,204 | | | | 1,503,877 | | |
| Wachovia Corp. | | | 26,323 | | | | 1,391,434 | | |
| Wells Fargo & Company | | | 31,205 | | | | 1,960,610 | | |
| Other Securities | | | 1,141,512 | | | | 28,587,238 | | |
| | | | 39,862,697 | | |
| HEALTHCARE (4.2%) | |
| Amgen, Inc.* | | | 19,800 | | | | 1,561,428 | | |
| Johnson & Johnson | | | 33,090 | | | | 1,988,709 | | |
* Non-income producing security
| | | Shares | | Value | |
| ACTIVE ASSETS (CONTINUED): | |
| COMMON STOCKS (CONTINUED) | |
| HEALTHCARE (CONTINUED) | |
| Pfizer, Inc. | | | 55,020 | | | $ | 1,283,066 | | |
| Other Securities | | | 393,585 | | | | 12,110,696 | | |
| | | | 16,943,899 | | |
| INDUSTRIAL (7.2%) | |
| General Electric Co. | | | 99,840 | | | | 3,499,392 | | |
| United Technologies Corp. | | | 27,620 | | | | 1,544,234 | | |
| Other Securities | | | 876,032 | | | | 24,468,253 | | |
| | | | 29,511,879 | | |
| TECHNOLOGY (6.8%) | |
| Intel Corp. | | | 57,330 | | | | 1,430,957 | | |
| Microsoft Corp. | | | 85,320 | | | | 2,231,118 | | |
| Other Securities | | | 1,277,382 | | | | 23,862,694 | | |
| | | | 27,524,769 | | |
| TELECOMMUNICATIONS (0.8%) | |
| Other Securities | | | 163,612 | | | | 3,285,234 | | |
| UTILITIES (1.4%) | |
| Other Securities | | | 175,047 | | | | 5,620,625 | | |
TOTAL ACTIVE ASSETS-COMMON STOCKS
(Cost: $160,520,201) 43.0% | | | | | | | 174,617,645 | | |
| PREFERRED STOCKS: | |
| FINANCIAL (0.1%) | |
| Quanta Capital Holdings | | | 13,420 | | | | 335,500 | | |
TOTAL PREFERRED STOCKS
(Cost: $335,500) 0.1% | | | | | | $ | 335,500 | | |
| | | Face
Rate | | Maturity | | Amount | | Value | |
| LONG-TERM DEBT SECURITIES: | |
| FINANCIAL (0.1%) | |
| GSC Capital Corp. | | | 7.25 | % | | 07/15/10 | | $ | 460,000 | | | $ | 460,000 | | |
TOTAL LONG-TERM DEBT SECURITIES
(Cost: $460,000) 0.1% | | | | | | | | | 460,000 | | |
| SHORT-TERM DEBT SECURITIES: | |
| COMMERCIAL PAPER (1.8%) | |
| Federal National Mortgage Association | | | 3.25 | | | 01/03/06 | | | 7,500,000 | | | | 7,497,969 | | |
TOTAL SHORT-TERM DEBT SECURITIES
(Cost: $7,497,969) 1.8% | | | | | | | | | 7,497,969 | | |
TOTAL ACTIVE ASSETS
(Cost: $168,813,670) 45.0% | | | | | | | | | 182,911,114 | | |
TEMPORARY CASH INVESTMENTS **
(Cost: $24,000) 0.0% (1) | | | | | | | | | 24,000 | | |
TOTAL INVESTMENTS
(Cost: $345,106,014) 99.9% | | | | | | | | | 406,072,851 | | |
| OTHER NET ASSETS 0.1% | | | | | | | | | 439,091 | | |
| NET ASSETS 100.0% | | | | | | | | $ | 406,511,942 | | |
(1) Less than 0.05%.
** The fund has an arrangement with its custodian bank, JPMorgan Chase Bank, whereby uninvested cash, subject to parameters set by the fund, is automatically invested in the fund's name by the bank in overnight commercial paper issued by J.P. Morgan Chase & Co. On the next business day, these funds (and earned interest) are automatically returned to the fund. The annual rate of interest earned on this temporary cash investment at December 31, 2005 was 3.79%.
The total value of non-income producing investments was $89,033,097, or 21.9%, of the Fund's total investments at December 31, 2005.
The accompanying notes are an integral part of these financial statements.
31
MUTUAL OF AMERICA INVESTMENT CORPORATION (SMALL CAP VALUE FUND)
SUMMARY PORTFOLIO OF INVESTMENTS IN SECURITIES
December 31, 2005
| | | Shares | | Value | |
| COMMON STOCKS: | |
| BASIC MATERIALS (7.5%) | |
| Commercial Metals Co. | | | 11,236 | | | $ | 421,799 | | |
| Longview Fibre Co. | | | 18,805 | | | | 391,332 | | |
| Lubrizol Corp. | | | 9,601 | | | | 416,971 | | |
| Oregon Steel Mills, Inc.* | | | 9,548 | | | | 280,902 | | |
| Other Securities | | | 41,455 | | | | 1,022,623 | | |
| | | | 2,533,627 | | |
| CONSUMER, CYCLICAL (8.6%) | |
| Audiovox Corp. Cl A* | | | 44,267 | | | | 613,541 | | |
| Crown Holdings, Inc.* | | | 46,470 | | | | 907,558 | | |
| Sunterra Corporation* | | | 23,698 | | | | 336,986 | | |
| Other Securities | | | 99,294 | | | | 1,044,207 | | |
| | | | 2,902,292 | | |
| CONSUMER, NON-CYCLICAL (3.7%) | |
| Chiquita Brands Intl., Inc. | | | 16,980 | | | | 339,770 | | |
| Longs Drug Stores Corp. | | | 14,140 | | | | 514,555 | | |
| Other Securities | | | 17,180 | | | | 400,426 | | |
| | | | 1,254,751 | | |
| ENERGY (5.4%) | |
| NS Group, Inc.* | | | 11,236 | | | | 469,777 | | |
| Range Resources Corp. | | | 24,708 | | | | 650,808 | | |
| Unisource Energy Corp. | | | 12,655 | | | | 394,836 | | |
| Other Securities | | | 10,563 | | | | 305,456 | | |
| | | | 1,820,877 | | |
| FINANCIAL (29.3%) | |
| Assured Guaranty Co.* | | | 19,698 | | | | 500,132 | | |
| Bank Mutual Corp. | | | 32,579 | | | | 345,337 | | |
| BankAtlantic Bancorp, Inc. Cl A | | | 32,707 | | | | 457,898 | | |
| Brookline Bankcorp | | | 33,310 | | | | 472,003 | | |
| Conseco, Inc.* | | | 15,805 | | | | 366,202 | | |
| Equity Inns, Inc. | | | 34,384 | | | | 465,903 | | |
| First Niagara Financial Grp. | | | 32,041 | | | | 463,633 | | |
| First State Bank Corporation | | | 16,149 | | | | 387,415 | | |
| Highwoods Properties, Inc. | | | 10,849 | | | | 308,654 | | |
| IShares Russell 200 Growth* | | | 4,620 | | | | 308,246 | | |
| KNBT Bancorp, Inc. | | | 25,300 | | | | 412,137 | | |
| LandAmerica Financial Group | | | 7,945 | | | | 495,768 | | |
| MAF Bancorp | | | 11,526 | | | | 476,945 | | |
| Mid-America Apt. Communities | | | 5,827 | | | | 282,610 | | |
| NewAlliance Bankshare | | | 31,289 | | | | 454,942 | | |
| PHH Corp.* | | | 16,041 | | | | 449,469 | | |
| Provident Financial Services | | | 27,009 | | | | 499,937 | | |
| Sterling Financial Corp. | | | 19,135 | | | | 477,992 | | |
| Taberna Realty Fin. Trust | | | 30,400 | | | | 364,800 | | |
| Other Securities | | | 131,201 | | | | 1,914,706 | | |
| | | | 9,904,729 | | |
* Non-income producing security
| | | Shares | | Value | |
| COMMON STOCKS (CONTINUED): | |
| HEALTHCARE (1.8%) | |
| Other Securities | | | 29,007 | | | $ | 611,628 | | |
| INDUSTRIAL (25.2%) | |
| Apogee Enterprises, Inc. | | | 34,955 | | | | 566,970 | | |
| Benchmark Electronics* | | | 9,010 | | | | 303,006 | | |
| Champion Enterprises, Inc.* | | | 54,245 | | | | 738,817 | | |
| Gardner Denver Machinery* | | | 10,580 | | | | 521,594 | | |
| General Cable Corp.* | | | 23,009 | | | | 453,277 | | |
| Kennametal, Inc. | | | 11,451 | | | | 584,459 | | |
| Kirby Corp.* | | | 9,505 | | | | 495,876 | | |
| RailAmerica, Inc.* | | | 53,933 | | | | 592,724 | | |
| Shaw Group, Inc.* | | | 11,955 | | | | 347,771 | | |
| Siligan Holdings, Inc. | | | 18,182 | | | | 656,734 | | |
| Texas Industries, Inc. | | | 6,268 | | | | 312,397 | | |
| Trinity Industries | | | 14,193 | | | | 625,486 | | |
| Universal Forest Products | | | 7,870 | | | | 434,818 | | |
| Other Securities | | | 137,538 | | | | 1,897,581 | | |
| | | | 8,531,510 | | |
| TECHNOLOGY (8.4%) | |
| Anixter International, Inc. | | | 9,988 | | | | 390,731 | | |
| Skyworks Solutions, Inc.* | | | 55,266 | | | | 281,304 | | |
| Other Securities | | | 138,138 | | | | 2,184,057 | | |
| | | | 2,856,092 | | |
| TELECOMMUNICATIONS (1.4%) | |
| Other Securities | | | 40,363 | | | | 495,319 | | |
| UTILITIES (3.7%) | |
| PNM Resources, Inc. | | | 14,881 | | | | 364,436 | | |
| Sierra Pacific Resources* | | | 30,052 | | | | 391,878 | | |
| Westar Energy, Inc. | | | 15,289 | | | | 328,714 | | |
| Other Securities | | | 9,419 | | | | 166,810 | | |
| | | | 1,251,838 | | |
TOTAL COMMON STOCKS
(Cost: $31,824,041) 95.0% | | | | | | | 32,162,663 | | |
| PREFERRED STOCKS: | |
| FINANCIAL (0.7%) | |
| Quanta Capital Holdings | | | 9,210 | | | | 230,250 | | |
TOTAL PREFERRED STOCKS
(Cost: $230,250) 0.7% | | | | | | $ | 230,250 | | |
| | | Rate | | Maturity | | Face
Amount | | Value | |
| SHORT-TERM DEBT SECURITIES: | |
| U.S. GOVERNMENT AGENCIES (4.0%) | |
| Federal National Mortgage Association | | | 3.25 | % | | 01/03/06 | | $ | 1,340,000 | | | $ | 1,339,758 | | |
TOTAL SHORT-TERM DEBT SECURITIES
(Cost: $1,339,758) 4.0% | | | | | | | | | 1,339,758 | | |
TOTAL INVESTMENTS
(Cost: $33,394,049) 99.7% | | | | | | | | | 33,732,671 | | |
| OTHER NET ASSETS 0.3% | | | | | | | | | 113,920 | | |
| NET ASSETS 100.0% | | | | | | | | $ | 33,846,591 | | |
The total value of non-income producing investments was $13,382,932, or 39.7%, of the Fund's total investments as of December 31, 2005.
The accompanying notes are an integral part of these financial statements.
32
MUTUAL OF AMERICA INVESTMENT CORPORATION (SMALL CAP GROWTH FUND)
SUMMARY PORTFOLIO OF INVESTMENTS IN SECURITIES
December 31, 2005
| | | Shares | | Value | |
| COMMON STOCKS: | |
| BASIC MATERIALS (0.6%) | |
| Other Securities | | | 3,832 | | | $ | 143,853 | | |
| CONSUMER, CYCLICAL (13.7%) | |
| Gamestop Corp.* | | | 14,451 | | | | 459,831 | | |
| Hibbett Sporting Goods, Inc.* | | | 11,349 | | | | 323,220 | | |
| Hudson Highland Group* | | | 10,782 | | | | 187,176 | | |
| P.F. Changs China Bistro, Inc. | | | 3,396 | | | | 168,543 | | |
| Payless Shoesource, Inc.* | | | 7,622 | | | | 191,312 | | |
| Pinnacle Entertainment, Inc.* | | | 9,006 | | | | 222,538 | | |
| Red Robin Gourmet Burgers* | | | 3,513 | | | | 179,022 | | |
| The Warnaco Group, Inc.* | | | 11,419 | | | | 305,116 | | |
| Wild Oaks Markets, Inc.* | | | 19,962 | | | | 241,141 | | |
| Wolverine World Wide, Inc. | | | 12,003 | | | | 269,587 | | |
| Other Securities | | | 47,596 | | | | 756,308 | | |
| | | | 3,303,794 | | |
| CONSUMER, NON-CYCLICAL (2.6%) | |
| Serologicals Corp.* | | | 10,443 | | | | 206,145 | | |
| Other Securities | | | 17,287 | | | | 420,610 | | |
| | | | 626,755 | | |
| ENERGY (6.4%) | |
| Holly Corp. | | | 3,241 | | | | 190,798 | | |
| NS Group, Inc.* | | | 8,953 | | | | 374,325 | | |
| Range Resources Corp. | | | 14,928 | | | | 393,204 | | |
| Todco Cl A | | | 8,391 | | | | 319,361 | | |
| Other Securities | | | 8,835 | | | | 270,704 | | |
| | | | 1,548,392 | | |
| FINANCIAL (15.1%) | |
| Choice Hotels Intl., Inc. | | | 6,600 | | | | 275,616 | | |
| IShares Russell 200 Growth | | | 4,100 | | | | 285,565 | | |
| IShares Russell Micropac | | | 4,100 | | | | 209,715 | | |
| La Salle Hotel Properties | | | 6,057 | | | | 222,413 | | |
| MoneyGram International, Inc. | | | 6,787 | | | | 177,005 | | |
| National Financial Partners | | | 5,717 | | | | 300,428 | | |
| Placer Sierra Banschares | | | 7,889 | | | | 218,604 | | |
| Platinum Underwriters Hldgs.* | | | 5,621 | | | | 174,644 | | |
| PrivateBancorp, Inc. | | | 6,244 | | | | 222,099 | | |
| Texas Regional Bancshares | | | 7,697 | | | | 217,825 | | |
| Other Securities | | | 53,331 | | | | 1,357,198 | | |
| | | | 3,661,112 | | |
* Non-income producing security
| | | Shares | | Value | |
| COMMON STOCKS (CONTINUED): | |
| HEALTHCARE (13.0%) | |
| Advanced Medical Optics, Inc.* | | | 4,545 | | | $ | 189,981 | | |
| Amedisys, Inc.* | | | 4,705 | | | | 198,739 | | |
| Amylin Pharmaceuticals, Inc.* | | | 5,323 | | | | 212,494 | | |
| CV Therapeutics, Inc.* | | | 7,186 | | | | 177,710 | | |
| United Surgical Partners, Inc. | | | 5,839 | | | | 187,724 | | |
| Ventana Medical Systems, Inc.* | | | 8,112 | | | | 343,544 | | |
| Viasys Healthcare, Inc.* | | | 6,861 | | | | 176,328 | | |
| Other Securities | | | 90,225 | | | | 1,668,361 | | |
| | | | 3,154,881 | | |
| INDUSTRIAL (17.6%) | |
| Actuant Corp. Cl A | | | 4,636 | | | | 258,689 | | |
| Cal Dive International, Inc.* | | | 9,302 | | | | 333,849 | | |
| Genesee & Wyoming, Inc. Cl A* | | | 5,685 | | | | 213,472 | | |
| HUB Group, Inc. Cl A* | | | 5,764 | | | | 203,757 | | |
| Hydril Company* | | | 3,832 | | | | 239,883 | | |
| Landstar System, Inc. | | | 7,658 | | | | 319,645 | | |
| Lincoln Electric Holdings | | | 5,811 | | | | 230,464 | | |
| Regal-Beloit Corp. | | | 12,302 | | | | 435,491 | | |
| Shaw Group, Inc.* | | | 8,239 | | | | 239,673 | | |
| Other Securities | | | 74,652 | | | | 1,797,234 | | |
| | | | 4,272,157 | | |
| TECHNOLOGY (21.9%) | |
| Medics Pharmaceutical Corp. | | | 12,520 | | | | 401,266 | | |
| Microsemi Corp.* | | | 14,553 | | | | 402,536 | | |
| Red Hat, Inc.* | | | 7,000 | | | | 190,680 | | |
| Secure Computing Corp.* | | | 20,867 | | | | 255,829 | | |
| Sonosite, Inc.* | | | 4,977 | | | | 174,245 | | |
| ValueClick , Inc.* | | | 12,222 | | | | 221,340 | | |
| Viasat, Inc.* | | | 10,029 | | | | 268,075 | | |
| Wabtech | | | 12,584 | | | | 338,510 | | |
| Other Securities | | | 224,268 | | | | 3,052,238 | | |
| | | | 5,304,719 | | |
| TELECOMMUNICATIONS (0.6%) | |
| Other Securities | | | 10,530 | | | | 146,367 | | |
| UTILITIES (1.1%) | |
| Other Securities | | | 10,738 | | | | 269,454 | | |
TOTAL COMMON STOCKS
(Cost: $21,455,601) 92.6% | | | | | | $ | 22,431,484 | | |
| | | Rate | | Maturity | | Face
Amount | | Value | |
| SHORT-TERM DEBT SECURITIES: | |
| COMMERCIAL PAPER (7.1%) | |
| Federal National Mortgage Association | | | 3.25 | % | | 01/03/06 | | $ | 1,720,000 | | | $ | 1,719,689 | | |
TOTAL SHORT-TERM DEBT SECURITIES
(Cost: $1,719,689) 7.1% | | | | | | | | | 1,719,689 | | |
TOTAL INVESTMENTS
(Cost: $23,175,290) 99.7% | | | | | | | | | 24,151,173 | | |
| OTHER NET ASSETS 0.3% | | | | | | | | | 77,469 | | |
| NET ASSETS 100.0% | | | | | | | | $ | 24,228,642 | | |
The total value of non-income producing investments was $14,658,780, or 60.7%, of the Fund's total investments as of December 31, 2005.
The accompanying notes are an integral part of these financial statements.
33
MUTUAL OF AMERICA INVESTMENT CORPORATION (MIDCAP VALUE FUND)
SUMMARY PORTFOLIO OF INVESTMENTS IN SECURITIES
December 31, 2005
| | | Shares | | Value | |
| COMMON STOCKS: | |
| BASIC MATERIALS (9.2%) | |
| Nucor Corp. | | | 1,585 | | | $ | 105,751 | | |
| PPG Industries, Inc. | | | 2,114 | | | | 122,401 | | |
| Phelps Dodge Corp. | | | 947 | | | | 136,245 | | |
| Sonoco Products Co. | | | 4,431 | | | | 130,271 | | |
| Vulcan Materials Co. | | | 1,819 | | | | 123,237 | | |
| Other Securities | | | 14,278 | | | | 415,769 | | |
| | | | 1,033,674 | | |
| CONSUMER, CYCLICAL (12.4%) | |
| Crown Holdings, Inc.* | | | 9,330 | | | | 182,215 | | |
| Johnson Controls, Inc. | | | 1,834 | | | | 133,717 | | |
| Penney (J.C.) Co., Inc. | | | 2,160 | | | | 120,096 | | |
| Polo Ralph Lauren Corp. | | | 2,612 | | | | 146,638 | | |
| Other Securities | | | 17,554 | | | | 810,749 | | |
| | | | 1,393,415 | | |
| CONSUMER, NON-CYCLICAL (6.4%) | |
| Archer-Daniels-Midland Co. | | | 4,291 | | | | 105,816 | | |
| Dean Foods Co.* | | | 2,861 | | | | 107,745 | | |
| Kroger Co.* | | | 6,421 | | | | 121,228 | | |
| RJ Reynolds Tobacco Hldgs. | | | 1,134 | | | | 108,104 | | |
| Other Securities | | | 11,580 | | | | 274,235 | | |
| | | | 717,128 | | |
| ENERGY (6.7%) | |
| Grant Prideco, Inc.* | | | 2,669 | | | | 117,756 | | |
| Kerr-McGee Corp. | | | 1,367 | | | | 124,205 | | |
| Noble Energy, Inc. | | | 2,954 | | | | 119,046 | | |
| Other Securities | | | 7,446 | | | | 382,452 | | |
| | | | 743,459 | | |
| FINANCIAL (27.4%) | |
| American Financial Group | | | 3,078 | | | | 117,918 | | |
Apartment Investment &
Mgmt. Co. | | | 2,954 | | | | 111,868 | | |
| Associated Banc-Corp. | | | 3,700 | | | | 120,435 | | |
| Bear Stearns Cos., Inc. | | | 1,274 | | | | 147,185 | | |
| CIT Group, Inc. | | | 2,176 | | | | 112,673 | | |
| Comerica, Inc. | | | 2,192 | | | | 124,418 | | |
| Developers Divers Rlty. | | | 2,922 | | | | 137,392 | | |
| Equity Office Properties | | | 4,618 | | | | 140,064 | | |
| Equity Residential | | | 3,918 | | | | 153,272 | | |
| First Tennessee Natl. Bank | | | 3,218 | | | | 123,700 | | |
| Genworth Financial, Inc. | | | 3,529 | | | | 122,033 | | |
* Non-income producing security
| | | Shares | | Value | |
| COMMON STOCKS (CONTINUED): | |
| FINANCIAL (CONTINUED) | |
| Huntington Bancshares, Inc. | | | 5,038 | | | $ | 119,653 | | |
| KeyCorp. | | | 4,229 | | | | 139,261 | | |
| M & T Bank Corp. | | | 979 | | | | 106,760 | | |
| North Fork Bancorp, Inc. | | | 4,929 | | | | 134,857 | | |
| Principal Financial Group Inc. | | | 3,483 | | | | 165,199 | | |
| StanCorp Financial Group, Inc. | | | 2,643 | | | | 132,018 | | |
| Vornado Realty Trust | | | 2,270 | | | | 189,477 | | |
| Zions Bancorporation | | | 1,741 | | | | 131,550 | | |
| Other Securities | | | 25,944 | | | | 541,792 | | |
| | | | 3,071,525 | | |
| HEALTHCARE (3.8%) | |
| CIGNA Corp. | | | 1,213 | | | | 135,492 | | |
| Other Securities | | | 10,274 | | | | 285,109 | | |
| | | | 420,601 | | |
| INDUSTRIAL (10.2%) | |
| Donnelley R.R. &Sons | | | 4,369 | | | | 149,463 | | |
| General Growth Pptys., Inc. | | | 2,316 | | | | 108,829 | | |
| Norfolk Southern | | | 3,187 | | | | 142,873 | | |
| Other Securities | | | 20,083 | | | | 745,778 | | |
| | | | 1,146,943 | | |
| TECHNOLOGY (9.0%) | |
| Xerox Corp.* | | | 8,085 | | | | 118,445 | | |
| Other Securities | | | 71,008 | | | | 887,180 | | |
| | | | 1,005,625 | | |
| TELECOMMUNICATIONS (1.3%) | |
| Other Securities | | | 6,840 | | | | 142,216 | | |
| UTILITIES (11.1%) | |
| American Electric Power, Inc. | | | 4,245 | | | | 157,447 | | |
| Edison International | | | 3,218 | | | | 140,337 | | |
| Energen Corp. | | | 3,218 | | | | 116,878 | | |
| PG & E Corp. | | | 3,047 | | | | 113,105 | | |
| PPL Corporation | | | 4,197 | | | | 123,392 | | |
| Pepco Holdings, Inc. | | | 5,287 | | | | 118,270 | | |
| Pinnacle West Capital Corp. | | | 2,813 | | | | 116,318 | | |
| Sempra Energy | | | 3,187 | | | | 142,905 | | |
| Teco Energy, Inc. | | | 7,075 | | | | 121,549 | | |
| Other Securities | | | 1,585 | | | | 91,296 | | |
| | | | 1,241,497 | | |
TOTAL COMMON STOCKS
(Cost: $10,470,978) 97.5% | | | | | | $ | 10,916,083 | | |
| | | Rate | | Maturity | | Face
Amount | | Value | |
| SHORT-TERM DEBT SECURITIES: | |
| U.S. GOVERNMENT AGENCIES (2.3%) | |
| Federal National Mortgage Association | | | 3.25 | % | | 01/03/06 | | $ | 260,000 | | | $ | 259,930 | | |
TOTAL SHORT-TERM DEBT SECURITIES
(Cost: $259,930) 2.3% | | | | | | | | | 259,930 | | |
TOTAL INVESTMENTS
(Cost: $10,730,908) 99.8% | | | | | | | | | 11,176,013 | | |
| OTHER NET ASSETS 0.2% | | | | | | | | | 27,640 | | |
| NET ASSETS 100.0% | | | | | | | | $ | 11,203,653 | | |
The total value of non-income producing investments was $2,178,381, or 19.5%, of the Fund's total investments as of December 31, 2005.
The accompanying notes are an integral part of these financial statements.
34
MUTUAL OF AMERICA INVESTMENT CORPORATION (MID-CAP EQUITY INDEX FUND)
SUMMARY PORTFOLIO OF INVESTMENTS IN SECURITIES
December 31, 2005
| | | Shares | | Value | |
| COMMON STOCKS: | |
| BASIC MATERIALS (5.3%) | |
| Arch Coal, Inc. | | | 19,668 | | | $ | 1,563,606 | | |
| Lyondell Chemical Co. | | | 62,312 | | | | 1,484,272 | | |
| Peabody Energy Corp. | | | 39,979 | | | | 3,295,069 | | |
| Other Securities | | | 454,829 | | | | 12,795,827 | | |
| | | | 19,138,774 | | |
| CONSUMER, CYCLICAL (14.0%) | |
| Abercrombie & Fitch Co. Cl A | | | 26,644 | | | | 1,736,656 | | |
| Advance Auto Parts* | | | 32,891 | | | | 1,429,443 | | |
| Chico's FAS, Inc.* | | | 55,025 | | | | 2,417,248 | | |
| Harman Intl. Inds | | | 20,026 | | | | 1,959,544 | | |
| Michaels Stores, Inc. | | | 40,644 | | | | 1,437,578 | | |
| Mohawk Industries, Inc.* | | | 16,067 | | | | 1,397,508 | | |
| Williams-Sonoma, Inc.* | | | 35,093 | | | | 1,514,263 | | |
| Other Securities | | | 1,288,124 | | | | 38,099,689 | | |
| | | | 49,991,929 | | |
| CONSUMER, NON-CYCLICAL (2.2%) | |
| Dean Foods Co.* | | | 40,925 | | | | 1,541,235 | | |
| Other Securities | | | 182,468 | | | | 6,175,932 | | |
| | | | 7,717,167 | | |
| ENERGY (7.1%) | |
| Cooper Cameron Corp.* | | | 34,283 | | | | 1,419,316 | | |
| ENSCO International, Inc. | | | 46,600 | | | | 2,066,710 | | |
| Grant Prideco, Inc.* | | | 39,092 | | | | 1,724,739 | | |
| NewField Exploration Company* | | | 38,685 | | | | 1,936,958 | | |
| Noble Energy, Inc. | | | 53,182 | | | | 2,143,235 | | |
| Patterson UTI Energy, Inc. | | | 52,540 | | | | 1,731,193 | | |
| Pioneer Natural Resources Co. | | | 39,079 | | | | 2,003,580 | | |
| Pride International, Inc.* | | | 48,174 | | | | 1,481,351 | | |
| Smith International, Inc. | | | 60,927 | | | | 2,261,001 | | |
| Other Securities | | | 223,342 | | | | 8,623,719 | | |
| | | | 25,391,802 | | |
| FINANCIAL (17.7%) | |
| Berkley (WR) Corp. | | | 34,096 | | | | 1,623,652 | | |
| Commerce Bancorp, Inc. ( N.J.) | | | 52,798 | | | | 1,816,779 | | |
| Developers Divers Rlty | | | 33,099 | | | | 1,556,315 | | |
| Everest RE Group* | | | 18,810 | | | | 1,887,584 | | |
| Fidelity Natl. Finl., Inc. | | | 52,760 | | | | 1,941,040 | | |
| Legg Mason, Inc. | | | 37,043 | | | | 4,433,676 | | |
| Mercantile Bankshares Corp. | | | 24,957 | | | | 1,408,573 | | |
| Old Republic Intl. Corp. | | | 55,710 | | | | 1,462,945 | | |
| Radian Group, Inc. | | | 25,244 | | | | 1,479,046 | | |
| Other Securities | | | 1,303,153 | | | | 45,427,950 | | |
| | | | 63,037,560 | | |
* Non-income producing security
| | | Shares | | Value | |
| COMMON STOCKS (CONTINUED): | |
| HEALTHCARE (10.6%) | |
| Barr Pharmaceuticals, Inc.* | | | 32,713 | | | $ | 2,037,693 | | |
| Health Net, Inc.* | | | 34,815 | | | | 1,794,712 | | |
| Ivax Corp.* | | | 66,580 | | | | 2,085,951 | | |
| Omnicare, Inc. | | | 36,305 | | | | 2,077,372 | | |
| Sepracor, Inc.* | | | 32,254 | | | | 1,664,306 | | |
| Varian Medical Systems, Inc.* | | | 39,994 | | | | 2,013,298 | | |
| Other Securities | | | 715,382 | | | | 26,349,936 | | |
| | | | 38,023,268 | | |
| INDUSTRIAL (13.8%) | |
| C.H. Robinson Worldwide, Inc. | | | 51,967 | | | | 1,924,338 | | |
| Expeditors Int'l Wash., Inc. | | | 32,421 | | | | 2,188,742 | | |
| Fastenal Co. | | | 37,660 | | | | 1,475,895 | | |
| Joy Global, Inc. | | | 36,946 | | | | 1,477,840 | | |
| Precision Castparts Corp. | | | 40,400 | | | | 2,093,123 | | |
| Republic Services, Inc. | | | 37,115 | | | | 1,393,668 | | |
| Other Securities | | | 1,090,085 | | | | 38,827,110 | | |
| | | | 49,380,716 | | |
| TECHNOLOGY (14.3%) | |
| Cadence Design Systems, Inc.* | | | 86,260 | | | | 1,459,519 | | |
| Cognizant Tech Solutions* | | | 42,016 | | | | 2,115,506 | | |
| Harris Corp. | | | 40,673 | | | | 1,749,346 | | |
| Lam Research Corp.* | | | 41,348 | | | | 1,475,297 | | |
| Microchip Technology, Inc. | | | 63,905 | | | | 2,054,545 | | |
| Sandisk Corp.* | | | 55,979 | | | | 3,516,601 | | |
| Other Securities | | | 2,035,309 | | | | 38,856,231 | | |
| | | | 51,227,045 | | |
| TELECOMMUNICATIONS (0.4%) | |
| Other Securities | | | 106,047 | | | | 1,386,816 | | |
| UTILITIES (7.4%) | |
| Questar Corp. | | | 25,929 | | | | 1,962,824 | | |
| Southwestern Energy Co.* | | | 48,712 | | | | 1,750,709 | | |
| Other Securities | | | 939,774 | | | | 22,728,169 | | |
| | | | 26,441,702 | | |
TOTAL COMMON STOCKS
(Cost: $274,490,267) 92.8% | | | | | | $ | 331,736,779 | | |
The accompanying notes are an integral part of these financial statements.
35
MUTUAL OF AMERICA INVESTMENT CORPORATION (MID-CAP EQUITY INDEX FUND)
SUMMARY PORTFOLIO OF INVESTMENTS IN SECURITIES (Continued)
December 31, 2005
| | | Rate | | Maturity | | Face
Amount | | Value | |
| SHORT-TERM DEBT SECURITIES: | |
| U.S. GOVERNMENT (0.3%) | |
| Other Securities | | | — | | | | — | | | $ | 1,000,000 | | | $ | 990,128 | | |
| U.S. GOVERNMENT AGENCIES (6.0%) | |
| Federal Home Loan Bank | | | 3.35 | % | | 01/03/06 | | | 21,430,000 | | | | 21,426,011 | | |
TOTAL SHORT-TERM DEBT SECURITIES
(Cost: $22,416,547) 6.3% | | | | | | | | | 22,416,139 | | |
TEMPORARY CASH INVESTMENTS**
(Cost: $500,000) 0.1% | | | | | | | | | 500,000 | | |
TOTAL INVESTMENTS
(Cost: $297,406,814) 99.2% | | | | | | | | | 354,652,918 | | |
| OTHER NET ASSETS 0.8% | | | | | | | | | 2,876,414 | | |
| NET ASSETS 100.0% | | | | | | | | $ | 357,529,332 | | |
** The fund has an arrangement with its custodian bank, JPMorgan Chase Bank, whereby uninvested cash, subject to parameters set by the fund, is automatically invested in the fund's name by the bank in overnight commercial paper issued by J.P. Morgan Chase & Co. On the next business day, these funds (and earned interest) are automatically returned to the fund. The annual rate of interest earned on this temporary cash investment at December 31, 2005 was 3.79%.
The total value of non-income producing investments was $127,674,208, or 36.0%, of the Fund's total investments as of December 31, 2005.
FUTURES CONTRACTS OUTSTANDING AS OF DECEMBER 30, 2005:
| | | Expiration
Date | | Underlying Face
Amount at Value | | Unrealized
Gain (Loss) | |
| PURCHASED | |
| 62 S & P Stock Index Futures Contracts | | March 2005 | | $ | 23,039,200 | | | $ | (368,000 | ) | |
Face value of futures purchased and outstanding as a percentage of total investments in securities: 6.4%
The accompanying notes are an integral part of these financial statements.
36
MUTUAL OF AMERICA INVESTMENT CORPORATION (AGGRESSIVE EQUITY FUND)
SUMMARY PORTFOLIO OF INVESTMENTS IN SECURITIES
December 31, 2005
| | | Shares | | Value | |
| COMMON STOCKS: | |
| BASIC MATERIALS (4.1%) | |
| Commercial Metals Co. | | | 77,730 | | | $ | 2,917,983 | | |
| Other Securities | | | 387,480 | | | | 10,193,787 | | |
| | | | 13,111,770 | | |
| CONSUMER, CYCLICAL (10.8%) | |
| Audiovox Corp. Cl A* | | | 212,272 | | | | 2,942,090 | | |
| Crown Holdings, Inc.* | | | 211,400 | | | | 4,128,641 | | |
| Gamestop Corp.* | | | 93,221 | | | | 2,966,292 | | |
| Hibbett Sporting Goods, Inc.* | | | 71,535 | | | | 2,037,317 | | |
| The Warnaco Group, Inc.* | | | 73,432 | | | | 1,962,103 | | |
| Wolverine World Wide, Inc. | | | 134,399 | | | | 3,018,602 | | |
| Other Securities | | | 1,205,553 | | | | 17,872,657 | | |
| | | | 34,927,702 | | |
| CONSUMER, NON-CYCLICAL (3.1%) | |
| Longs Drug Stores Corp. | | | 65,960 | | | | 2,400,283 | | |
| Other Securities | | | 339,108 | | | | 7,477,564 | | |
| | | | 9,877,847 | | |
| ENERGY (7.0%) | |
| NS Group, Inc.* | | | 112,235 | | | | 4,692,545 | | |
| Range Resources Corp. | | | 216,270 | | | | 5,696,551 | | |
| Todco Cl A | | | 63,890 | | | | 2,431,653 | | |
| Whittier Energy* | | | 302,200 | | | | 3,173,100 | | |
| Other Securities | | | 216,896 | | | | 6,748,768 | | |
| | | | 22,742,617 | | |
| FINANCIAL (23.5%) | |
| Assured Guaranty Co.* | | | 84,590 | | | | 2,147,740 | | |
| BankAtlantic Bancorp, Inc. Cl A | | | 157,840 | | | | 2,209,760 | | |
| Brookline Bankcorp | | | 161,240 | | | | 2,284,771 | | |
| Equity Inns, Inc. | | | 162,290 | | | | 2,199,030 | | |
| First Niagara Financial Grp. | | | 140,480 | | | | 2,032,746 | | |
| First State Bank Corporation | | | 107,700 | | | | 2,583,723 | | |
| IShares Russell 200 Growth | | | 31,300 | | | | 2,180,045 | | |
| LandAmerica Financial Group | | | 34,770 | | | | 2,169,648 | | |
| MAF Bancorp | | | 50,620 | | | | 2,094,655 | | |
| NewAlliance Bankshare | | | 147,590 | | | | 2,145,959 | | |
| PHH Corp.* | | | 77,810 | | | | 2,180,236 | | |
| Provident Financial Services | | | 118,590 | | | | 2,195,101 | | |
| Sterling Financial Corp. | | | 90,076 | | | | 2,250,098 | | |
| Taberna Realty Fin. Trust | | | 178,600 | | | | 2,143,200 | | |
| Other Securities | | | 2,098,122 | | | | 44,933,913 | | |
| | | | 75,750,625 | | |
| HEALTHCARE (7.2%) | |
| Advanced Medical Optics, Inc.* | | | 48,714 | | | | 2,036,244 | | |
| Ventana Medical Systems, Inc.* | | | 52,252 | | | | 2,212,871 | | |
| Other Securities | | | 894,198 | | | | 18,866,388 | | |
| | | | 23,115,503 | | |
* Non-income producing security.
| | | Shares | | Value | |
| COMMON STOCKS (CONTINUED): | |
| INDUSTRIAL (21.0%) | |
| Apogee Enterprises, Inc. | | | 153,220 | | | $ | 2,485,228 | | |
| Benchmark Electronics* | | | 65,158 | | | | 2,191,264 | | |
| Cal Dive International, Inc.* | | | 59,290 | | | | 2,127,918 | | |
| Champion Enterprises, Inc.* | | | 282,465 | | | | 3,847,172 | | |
| Gardner Denver Machinery* | | | 46,420 | | | | 2,288,506 | | |
| General Cable Corp.* | | | 110,460 | | | | 2,176,062 | | |
| Kennametal, Inc. | | | 50,140 | | | | 2,559,146 | | |
| Kirby Corp.* | | | 46,244 | | | | 2,412,548 | | |
| Landstar System, Inc. | | | 49,652 | | | | 2,072,474 | | |
| RailAmerica, Inc.* | | | 261,010 | | | | 2,868,500 | | |
| Regal-Beloit Corp. | | | 79,615 | | | | 2,818,371 | | |
| Shaw Group, Inc.* | | | 110,408 | | | | 3,211,769 | | |
| Siligan Holdings, Inc. | | | 89,000 | | | | 3,214,680 | | |
| Trinity Industries | | | 69,910 | | | | 3,080,934 | | |
| Universal Forest Products | | | 40,970 | | | | 2,263,593 | | |
| Other Securities | | | 1,274,749 | | | | 28,202,253 | | |
| | | | 67,820,418 | | |
| TECHNOLOGY (14.8%) | |
| Medics Pharmaceutical Corp. | | | 80,605 | | | | 2,583,390 | | |
| Microsemi Corp.* | | | 93,950 | | | | 2,598,656 | | |
| Wabtech | | | 81,190 | | | | 2,184,011 | | |
| Other Securities | | | 2,775,548 | | | | 40,566,696 | | |
| | | | 47,932,753 | | |
| TELECOMMUNICATIONS (1.1%) | |
| Other Securities | | | 265,735 | | | | 3,379,084 | | |
| UTILITIES (2.4%) | |
| PNM Resources, Inc. | | | 97,090 | | | | 2,377,733 | | |
| Sierra Pacific Resources* | | | 147,140 | | | | 1,918,706 | | |
| Other Securities | | | 157,024 | | | | 3,394,303 | | |
| | | | 7,690,742 | | |
TOTAL COMMON STOCKS
(Cost: $266,343,779) 95.0% | | | | | | | 306,349,061 | | |
| PREFERRED STOCKS: | |
| FINANCIAL (0.4%) | |
| Other Securities . | | | 48,020 | | | | 1,200,500 | | |
TOTAL PREFERRED STOCKS
(Cost: $1,200,500) 0.4% | | | | | | $ | 1,200,500 | | |
The accompanying notes are an integral part of these financial statements.
37
MUTUAL OF AMERICA INVESTMENT CORPORATION (AGGRESSIVE EQUITY FUND)
SUMMARY PORTFOLIO OF INVESTMENTS IN SECURITIES (Continued)
December 31, 2005
| | | Rate | | Maturity | | Face
Amount | | Value | |
| LONG-TERM DEBT SECURITIES: | |
| FINANCIAL (0.6%) | |
| Other Securities . | | | — | | | | — | | | $ | 1,890,000 | | | $ | 1,890,000 | | |
TOTAL LONG-TERM DEBT SECURITIES
(Cost: $1,890,000 ) 0.6% | | | | | | | | | | | | | 1,890,000 | | |
| SHORT-TERM DEBT SECURITIES: | |
| COMMERCIAL PAPER (3.7%) | |
| Federal Home Loan Bank | | | 3.35 | % | | 01/03/06 | | | 5,600,000 | | | | 5,598,958 | | |
| Federal National Mortgage Association | | | 3.25 | | | 01/03/06 | | | 6,420,000 | | | | 6,418,840 | | |
| | | | 12,017,798 | | |
TOTAL SHORT-TERM DEBT SECURITIES
(Cost: $12,017,798) 3.7% | | | | | | | | | | | | | 12,017,798 | | |
TEMPORARY CASH INVESTMENTS**
(Cost: $14,300) 0.0% (1) | | | | | | | | | | | | | 14,300 | | |
TOTAL INVESTMENTS
(Cost: $281,466,377) 99.7% | | | | | | | | | | | | | 321,471,659 | | |
| OTHER NET ASSETS 0.3% | | | | | | | | | | | | | 1,046,762 | | |
| NET ASSETS 100.0% | | | | | | | | | | | | $ | 322,518,421 | | |
(1) Less than 0.05%.
** The fund has an arrangement with its custodian bank, JPMorgan Chase Bank, whereby uninvested cash, subject to parameters set by the fund, is automatically invested in the fund's name by the bank in overnight commercial paper issued by J.P. Morgan Chase & Co. On the next business day, these funds (and earned interest) are automatically returned to the fund. The annual rate of interest earned on this temporary cash investment at December 31, 2005 was 3.79%.
The total value of non-income producing investments was $162,815,200, or 50.6% of the Fund's total investments as of December 31, 2005.
The accompanying notes are an integral part of these financial statements.
38
MUTUAL OF AMERICA INVESTMENT CORPORATION (COMPOSITE FUND)
SUMMARY PORTFOLIO OF INVESTMENTS IN SECURITIES
December 31, 2005
| | | Shares | | Value | |
| COMMON STOCKS: | |
| BASIC MATERIALS (1.6%) | |
| Phelps Dodge Corp. | | | 12,082 | | | $ | 1,738,237 | | |
| Other Securities | | | 42,042 | | | | 2,113,073 | | |
| | | | 3,851,310 | | |
| CONSUMER, CYCLICAL (7.0%) | |
| Best Buy Co., Inc. | | | 37,080 | | | | 1,612,238 | | |
| Kohl's Corp.* | | | 38,674 | | | | 1,879,556 | | |
| Omnicom Group, Inc. | | | 19,656 | | | | 1,673,315 | | |
| Penney (J.C.) Co., Inc. | | | 28,780 | | | | 1,600,168 | | |
| Starwood Hotels & Resorts | | | 24,465 | | | | 1,562,335 | | |
| Target Corp. | | | 34,468 | | | | 1,894,706 | | |
| Other Securities | | | 167,294 | | | | 5,942,492 | | |
| | | | 16,164,810 | | |
| CONSUMER, NON-CYCLICAL (5.1%) | |
| PepsiCo, Inc. | | | 31,469 | | | | 1,859,189 | | |
| Proctor & Gamble Co. | | | 63,135 | | | | 3,654,254 | | |
| Wal-Mart Stores, Inc. | | | 40,636 | | | | 1,901,765 | | |
| Other Securities | | | 116,433 | | | | 4,345,339 | | |
| | | | 11,760,547 | | |
| ENERGY (5.7%) | |
| Devon Energy Corp. | | | 29,865 | | | | 1,867,757 | | |
| Exxon Mobil Corp. | | | 77,545 | | | | 4,355,702 | | |
| Halliburton Co. | | | 40,146 | | | | 2,487,446 | | |
| Transocean, Inc.* | | | 33,754 | | | | 2,352,316 | | |
| Valero Energy Corp. | | | 41,570 | | | | 2,145,012 | | |
| | | | 13,208,233 | | |
| FINANCIAL (12.3%) | |
| American Int'l. Group, Inc. | | | 31,935 | | | | 2,178,925 | | |
| Bank of America Corp. | | | 75,497 | | | | 3,484,186 | | |
| Bear Stearns Cos., Inc. | | | 14,049 | | | | 1,623,081 | | |
| Capital One Financial Corp. | | | 19,029 | | | | 1,644,106 | | |
| Citigroup, Inc. | | | 87,866 | | | | 4,264,137 | | |
| Merrill Lynch & Co., Inc. | | | 34,304 | | | | 2,323,410 | | |
| North Fork Bancorp, Inc. | | | 64,374 | | | | 1,761,273 | | |
| Wachovia Corp. | | | 41,626 | | | | 2,200,350 | | |
| Wells Fargo & Company | | | 48,527 | | | | 3,048,951 | | |
| Other Securities | | | 87,869 | | | | 6,030,525 | | |
| | | | 28,558,944 | | |
* Non-income producing security.
| | | Shares | | Value | |
| COMMON STOCKS (CONTINUED): | |
| HEALTHCARE (6.8%) | |
| Aetna, Inc. | | | 17,932 | | | $ | 1,691,167 | | |
| Amgen, Inc.* | | | 30,590 | | | | 2,412,327 | | |
| Johnson & Johnson | | | 50,256 | | | | 3,020,385 | | |
| Pfizer, Inc. | | | 88,291 | | | | 2,058,946 | | |
| Wyeth | | | 42,439 | | | | 1,955,165 | | |
| Other Securities | | | 98,257 | | | | 4,687,759 | | |
| | | | 15,825,749 | | |
| INDUSTRIAL (6.7%) | |
| Boeing Co. | | | 21,491 | | | | 1,509,528 | | |
| General Electric Co. | | | 154,256 | | | | 5,406,672 | | |
| United Technologies Corp. | | | 42,494 | | | | 2,375,840 | | |
| Other Securities | | | 106,914 | | | | 6,359,740 | | |
| | | | 15,651,780 | | |
| TECHNOLOGY (9.1%) | |
| Dell, Inc.* | | | 56,008 | | | | 1,679,680 | | |
| IBM Corp. | | | 19,251 | | | | 1,582,432 | | |
| Intel Corp. | | | 85,829 | | | | 2,142,292 | | |
| Microsoft Corp. | | | 126,920 | | | | 3,318,957 | | |
| Texas Instruments, Inc. | | | 48,738 | | | | 1,563,028 | | |
| Other Securities | | | 502,688 | | | | 10,790,170 | | |
| | | | 21,076,559 | | |
| TELECOMMUNICATIONS (1.5%) | |
| Other Securities | | | 136,098 | | | | 3,590,959 | | |
| UTILITIES (2.3%) | |
| Exelon Corp. | | | 33,829 | | | | 1,797,673 | | |
| Other Securities | | | 61,631 | | | | 3,539,895 | | |
| | | | 5,337,568 | | |
TOTAL COMMON STOCKS
(Cost: $126,765,449 ) 58.1% | | | | | | $ | 135,026,459 | | |
The accompanying notes are an integral part of these financial statements.
39
MUTUAL OF AMERICA INVESTMENT CORPORATION (COMPOSITE FUND)
SUMMARY PORTFOLIO OF INVESTMENTS IN SECURITIES (Continued)
December 31, 2005
| | | Rating* | | Rate | | Maturity | | Face
Amount | | Value | |
| LONG-TERM DEBT SECURITIES: | |
| U.S. GOVERNMENT (1.6%) | |
| U.S. Treasury Strip | | AAA | | | 0.00 | % | | | 08/15/21 | | | $ | 7,000,000 | | | $ | 3,388,168 | | |
| Other Securities | | | | | — | | | | — | | | | 500,000 | | | | 484,629 | | |
| | | | 3,872,797 | | |
| U.S. GOVERNMENT AGENCIES (17.0%) | |
| MORTGAGE-BACKED OBLIGATIONS (14.9%) | |
| FHLMC | | AAA | | | 8.00 | | | | 07/15/06 | | | | 3,228 | | | | 3,223 | | |
| FHLMC | | AAA | | | 5.00 | | | | 06/15/17 | | | | 4,000,000 | | | | 3,987,896 | | |
| FHLMC | | AAA | | | 4.00 | | | | 10/15/26 | | | | 1,800,000 | | | | 1,737,232 | | |
| FNMA | | AAA | | | 7.50 | | | | 02/01/32 | | | | 51,169 | | | | 53,606 | | |
| FNMA | | AAA | | | 6.00 | | | | 05/01/32 | | | | 196,975 | | | | 199,183 | | |
| FNMA | | AAA | | | 7.50 | | | | 06/01/32 | | | | 65,058 | | | | 68,149 | | |
| FNMA | | AAA | | | 5.00 | | | | 06/01/33 | | | | 1,209,931 | | | | 1,176,562 | | |
| FNMA | | AAA | | | 5.00 | | | | 11/01/33 | | | | 1,664,376 | | | | 1,618,474 | | |
| FNMA | | AAA | | | 5.50 | | | | 05/01/34 | | | | 1,955,845 | | | | 1,938,565 | | |
| FNMA | | AAA | | | 6.00 | | | | 03/01/17 | | | | 47,845 | | | | 48,908 | | |
| FNMA | | AAA | | | 5.00 | | | | 04/01/18 | | | | 1,414,456 | | | | 1,401,355 | | |
| FNMA | | AAA | | | — | | | | — | | | | 16,853,413 | | | | 16,742,010 | | |
| GNMA (1) | | AAA | | | 6.27 | | | | 10/16/27 | | | | 3,000,000 | | | | 3,177,471 | | |
| GNMA (1) | | AAA | | | — | | | | — | | | | 237,843 | | | | 249,040 | | |
| Other Securities | | | | | — | | | | — | | | | 2,223,158 | | | | 2,192,052 | | |
| | | | 34,593,726 | | |
| NON-MORTGAGE-BACKED OBLIGATION (2.1%) | |
| FHLMC | | | | | 4.50 | | | | 01/15/13 | | | | 3,500,000 | | | | 3,437,980 | | |
| FNMA | | | | | — | | | | — | | | | 1,500,000 | | | | 1,432,498 | | |
| | | | 4,870,478 | | |
| BASIC MATERIALS (2.4%) | |
| Praxair, Inc. | | A- | | | 6.90 | | | | 11/01/06 | | | | 2,500,000 | | | | 2,538,897 | | |
| Other Securities | | | | | — | | | | — | | | | 3,000,000 | | | | 2,966,006 | | |
| | | | 5,504,903 | | |
| CONSUMER, CYCLICAL (2.7%) | |
| Target Corp. | | A+ | | | 5.38 | | | | 06/15/09 | | | | 1,000,000 | | | | 1,014,726 | | |
| Other Securities | | | | | — | | | | — | | | | 5,913,488 | | | | 5,230,606 | | |
| | | | 6,245,332 | | |
| CONSUMER, NON-CYCLICAL (1.1%) | |
| Wal-Mart Stores, Inc. | | AA | | | 6.88 | | | | 08/10/09 | | | | 1,000,000 | | | | 1,064,277 | | |
| Other Securities | | | | | — | | | | — | | | | 1,500,000 | | | | 1,457,354 | | |
| | | | 2,521,631 | | |
| ENERGY (0.5%) | |
| Other Securities | | | | | — | | | | — | | | | 1,250,000 | | | | 1,217,559 | | |
| FINANCIAL (8.8%) | |
| Bank of America Corp. | | AA- | | | 4.75 | | | | 10/15/06 | | | | 500,000 | | | | 499,834 | | |
| Berkley (WR) Corp. | | BBB+ | | | 8.70 | | | | 01/01/22 | | | | 1,500,000 | | | | 1,836,984 | | |
| GE Capital Corp. | | AAA | | | 5.45 | | | | 01/15/13 | | | | 2,000,000 | | | | 2,048,676 | | |
| Wells Fargo & Company | | AA- | | | 3.50 | | | | 04/04/08 | | | | 250,000 | | | | 242,920 | | |
| Other Securities | | | | | — | | | | — | | | | 17,200,785 | | | | 15,781,054 | | |
| | | | 20,409,468 | | |
The accompanying notes are an integral part of these financial statements.
40
MUTUAL OF AMERICA INVESTMENT CORPORATION (COMPOSITE FUND)
SUMMARY PORTFOLIO OF INVESTMENTS IN SECURITIES (Continued)
December 31, 2005
| | |
Rating* | |
Rate | |
Maturity | | Face
Amount | |
Value | |
| LONG-TERM DEBT SECURITIES: (Continued) | |
| HEALTHCARE (0.4%) | |
| Wyeth | | A | | | 5.50 | % | | | 03/15/13 | | | $ | 500,000 | | | $ | 506,884 | | |
| Other Securities | | | | | — | | | | — | | | | 500,000 | | | | 488,665 | | |
| | | | 995,549 | | |
| INDUSTRIAL (1.9%) | |
| Seariver Maritime | | AAA | | | 0.00 | | | | 09/01/12 | | | | 3,000,000 | | | | 2,174,244 | | |
| Other Securities | | | | | — | | | | — | | | | 2,250,000 | | | | 2,209,094 | | |
| | | | 4,383,338 | | |
| TECHNOLOGY (0.7%) | |
| Other Securities | | | | | — | | | | — | | | | 1,500,000 | | | | 1,535,692 | | |
| TELECOMMUNICATIONS (0.4%) | |
| Other Securities | | | | | — | | | | — | | | | 1,000,000 | | | | 989,747 | | |
| UTILITIES (0.8%) | |
| Other Securities | | | | | — | | | | — | | | | 2,000,000 | | | | 1,967,639 | | |
TOTAL LONG-TERM DEBT SECURITIES
(Cost: $91,479,984) 38.3% | | | | | | | | | | | | | | | | | 89,107,859 | | |
| SHORT-TERM DEBT SECURITIES: | |
| U.S. GOVERNMENT AGENCIES (3.2%) | |
| Federal Home Loan Bank | | | | | 3.35 | % | | | 01/03/06 | | | | 7,300,000 | | | | 7,298,641 | | |
TOTAL SHORT-TERM DEBT SECURITIES
(Cost: $7,298,641) 3.2% | | | | | | | | | | | | | | | | | 7,298,641 | | |
TEMPORARY CASH INVESTMENTS**
(Cost: $12,100 ) 0.0% (2) | | | | | | | | | | | | | | | | | 12,100 | | |
TOTAL INVESTMENTS
(Cost: $225,556,174) 99.6% | | | | | | | | | | | | | | | | | 231,445,059 | | |
| OTHER NET ASSETS 0.4% | | | | | | | | | | | | | | | | | 920,324 | | |
| NET ASSETS 100.0% | | | | | | | | | | | | | | | | $ | 232,365,383 | | |
* Ratings as per Standard & Poor's Corporation.
Abbreviations: FHLMC = Federal Home Loan Mortgage Corporation
FNMA = Federal National Mortgage Association
GNMA = Government National Mortgage Association
(1) U.S. Government guaranteed security.
(2) Less than 0.05%.
The total value of investments whose issuer has filed for Chapter XI bankruptcy law (or equivalent) protection was $49,199, or 0.02% of the Fund's total investments as of December 31, 2005.
** The fund has an arrangement with its custodian bank, JPMorgan Chase Bank, whereby uninvested cash, subject to parameters set by the fund, is automatically invested in the fund's name by the bank in overnight commercial paper issued by J.P. Morgan Chase & Co. On the next business day, these funds (and earned interest) are automatically returned to the fund. The annual rate of interest earned on this temporary cash investment at December 31, 2005 was 3.79%.
The total value of investments not rated or below-investment grade was $5,499,521, or 2.4% of the Fund's total investments as of December 31, 2005.
The total value of non-income producing investments was $17,879,322, or 7.7%, of the Fund's total investments as of December 31, 2005.
The accompanying notes are an integral part of these financial statements.
41
MUTUAL OF AMERICA INVESTMENT CORPORATION (CONSERVATIVE ALLOCATION FUND)
PORTFOLIO OF INVESTMENTS IN SECURITIES
December 31, 2005
| | | Shares | | Value | |
| COMMON STOCKS: | |
| DIVERSIFIED MUTUAL FUNDS (100%) | |
| Mutual of America Investment Corporation | |
| Bond Fund (30.1%) | | | 2,678,058 | | | $ | 3,364,217 | | |
| Mid-Term Bond Fund (30.1%) | | | 3,651,775 | | | | 3,363,792 | | |
| Equity Index Fund (24.7%) | | | 1,290,064 | | | | 2,759,932 | | |
| Short Term Bond Fund (15.1%) | | | 1,657,930 | | | | 1,682,805 | | |
TOTAL INVESTMENTS
(Cost: $11,348,079) 100.0% | | | | | | $ | 11,170,746 | | |
| OTHER NET ASSETS 0.0% | | | | | | | — | | |
| NET ASSETS 100.0% | | | | | | $ | 11,170,746 | | |
MUTUAL OF AMERICA INVESTMENT CORPORATION (MODERATE ALLOCATION FUND)
PORTFOLIO OF INVESTMENTS IN SECURITIES
December 31, 2005
| | | Shares | | Value | |
| COMMON STOCKS: | |
| DIVERSIFIED MUTUAL FUNDS (100%) | |
| Mutual of America Investment Corporation | |
| Equity Index Fund (34.7%) | | | 9,127,120 | | | $ | 19,526,342 | | |
| Bond Fund (30.2%) | | | 13,532,946 | | | | 17,000,290 | | |
| Mid-Term Bond Fund (20.2%) | | | 12,302,183 | | | | 11,332,021 | | |
| Mid-Cap Equity Index Fund (14.9%) | | | 5,471,830 | | | | 8,385,273 | | |
TOTAL INVESTMENTS
(Cost: $56,074,048) 100.0% | | | | | | $ | 56,243,926 | | |
| OTHER NET ASSETS 0.0% | | | | | | | — | | |
| NET ASSETS 100.0% | | | | | | $ | 56,243,926 | | |
MUTUAL OF AMERICA INVESTMENT CORPORATION (AGGRESSIVE ALLOCATION FUND)
PORTFOLIO OF INVESTMENTS IN SECURITIES
December 31, 2005
| | | Shares | | Value | |
| COMMON STOCKS: | |
| DIVERSIFIED MUTUAL FUNDS (100%) | |
| Mutual of America Investment Corporation | |
| Equity Index Fund (44.8%) | | | 9,952,466 | | | $ | 21,292,066 | | |
| Bond Fund (25.3%) | | | 9,563,026 | | | | 12,013,217 | | |
| Mid-Cap Equity Index Fund (19.9%) | | | 6,187,839 | | | | 9,482,517 | | |
| Aggressive Equity Fund (10.0%) | | | 2,585,976 | | | | 4,751,458 | | |
TOTAL INVESTMENTS
(Cost: $46,283,410) 100.0% | | | | | | $ | 47,539,258 | | |
| OTHER NET ASSETS 0.0% | | | | | | | — | | |
| NET ASSETS 100.0% | | | | | | $ | 47,539,258 | | |
The accompanying notes are an integral part of these financial statements.
42
MUTUAL OF AMERICA INVESTMENT CORPORATION (SHORT TERM BOND FUND)
SUMMARY PORTFOLIO OF INVESTMENTS IN SECURITIES
December 31, 2005
| | | Rating* | | Rate | | Maturity | | Face
Amount | | Value | |
| LONG-TERM DEBT SECURITIES: | |
| U.S. GOVERNMENT (19.5%) | |
| U.S. Treasury Note | | AAA | | | 2.75 | % | | | 07/31/06 | | | $ | 2,500,000 | | | $ | 2,476,465 | | |
| U.S. Treasury Note | | AAA | | | 3.00 | | | | 11/15/07 | | | | 1,500,000 | | | | 1,462,617 | | |
| U.S. Treasury Strip | | AAA | | | 0.00 | | | | 11/15/08 | | | | 4,000,000 | | | | 3,530,388 | | |
| | | | 7,469,470 | | |
| U.S. GOVERNMENT AGENCIES (53.2%) | |
| MORTGAGE-BACKED OBLIGATIONS (11.4%) | |
| FHLMC | | AAA | | | 6.50 | | | | 04/01/14 | | | | 216,322 | | | | 224,059 | | |
| FHLMC | | AAA | | | 4.50 | | | | 03/15/22 | | | | 1,100,494 | | | | 1,096,338 | | |
| FHLMC | | AAA | | | 4.00 | | | | 11/15/26 | | | | 475,050 | | | | 467,789 | | |
| FHLMC | | AAA | | | — | | | | — | | | | 600,465 | | | | 611,473 | | |
| FNMA | | AAA | | | 4.50 | | | | 10/25/17 | | | | 1,000,000 | | | | 993,078 | | |
| FNMA | | | | | — | | | | — | | | | 737,146 | | | | 744,609 | | |
| Other Securities | | | | | — | | | | — | | | | 230,595 | | | | 233,732 | | |
| | | | 4,371,078 | | |
| NON-MORTGAGE-BACKED OBLIGATION (41.8%) | |
| FFCB | | AAA | | | 2.88 | | | | 06/29/06 | | | | 1,000,000 | | | | 991,724 | | |
| FHLB | | AAA | | | 2.50 | | | | 03/15/06 | | | | 500,000 | | | | 497,885 | | |
| FHLB | | AAA | | | 2.88 | | | | 09/15/06 | | | | 2,800,000 | | | | 2,765,568 | | |
| FHLMC | | AAA | | | 2.75 | | | | 08/15/06 | | | | 1,000,000 | | | | 988,583 | | |
| FHLMC | | AAA | | | 2.38 | | | | 02/15/07 | | | | 2,000,000 | | | | 1,948,354 | | |
| FHLMC | | AAA | | | 3.88 | | | | 06/15/08 | | | | 3,750,000 | | | | 3,675,720 | | |
| FHLMC | | AAA | | | 3.63 | | | | 09/15/08 | | | | 1,500,000 | | | | 1,458,467 | | |
| FNMA | | AAA | | | 2.25 | | | | 05/15/06 | | | | 2,000,000 | | | | 1,982,952 | | |
| FNMA | | AAA | | | 2.63 | | | | 11/15/06 | | | | 1,000,000 | | | | 982,255 | | |
| FNMA | | AAA | | | 2.38 | | | | 02/15/07 | | | | 750,000 | | | | 730,475 | | |
| | | | 16,021,983 | | |
| BASIC MATERIALS (1.5%) | |
| International Paper Co. | | BBB | | | 3.80 | | | | 04/01/08 | | | | 200,000 | | | | 193,875 | | |
| Lubrizol Corp. | | BBB- | | | 5.88 | | | | 12/01/08 | | | | 200,000 | | | | 203,510 | | |
| Other Securities | | | | | — | | | | — | | | | 200,000 | | | | 193,013 | | |
| | | | 590,398 | | |
| CONSUMER, CYCLICAL (2.2%) | |
| Caterpillar Fin. Svc. | | A | | | 2.63 | | | | 01/30/07 | | | | 250,000 | | | | 244,245 | | |
| Other Securities | | | | | — | | | | — | | | | 590,000 | | | | 590,074 | | |
| | | | 834,319 | | |
| CONSUMER, NON-CYCLICAL (1.9%) | |
| General Mills, Inc. | | BBB+ | | | 3.88 | | | | 11/30/07 | | | | 200,000 | | | | 196,081 | | |
| Other Securities | | | | | — | | | | — | | | | 550,000 | | | | 536,923 | | |
| | | | 733,004 | | |
| ENERGY (2.3%) | |
| Cooper Cameron Corp. | | BBB+ | | | 2.65 | | | | 04/15/07 | | | | 200,000 | | | | 193,373 | | |
| Dominion Resources | | BBB | | | 4.13 | | | | 02/15/08 | | | | 200,000 | | | | 196,291 | | |
| Marathon Oil Corp. | | BBB+ | | | 5.38 | | | | 06/01/07 | | | | 200,000 | | | | 201,066 | | |
| Ocean Energy, Inc. | | BBB | | | 4.38 | | | | 10/01/07 | | | | 200,000 | | | | 197,733 | | |
| Other Securities | | | | | — | | | | — | | | | 100,000 | | | | 98,644 | | |
| | | | 887,107 | | |
The accompanying notes are an integral part of these financial statements.
43
MUTUAL OF AMERICA INVESTMENT CORPORATION (SHORT TERM BOND FUND)
SUMMARY PORTFOLIO OF INVESTMENTS IN SECURITIES (Continued)
December 31, 2005
| | | Rating* | | Rate | | Maturity | | Face
Amount | | Value | |
| LONG-TERM DEBT SECURITIES: (Continued) | |
| FINANCIAL (10.9%) | |
| American Express Co. | | A+ | | | 5.50 | % | | 09/12/06 | | $ | 200,000 | | | $ | 200,943 | | |
| American Honda Fin | | A+ | | | 3.85 | | | 11/06/08 | | | 200,000 | | | | 194,589 | | |
| Bank of New York, Inc. | | A+ | | | 3.90 | | | 09/01/07 | | | 200,000 | | | | 196,970 | | |
| Bank of Oklahoma | | BBB+ | | | 7.13 | | | 08/15/07 | | | 250,000 | | | | 258,705 | | |
| Capital One Bank | | BBB | | | 4.88 | | | 05/15/08 | | | 200,000 | | | | 199,186 | | |
| Deere Capital Corp. | | A- | | | 3.90 | | | 01/15/08 | | | 200,000 | | | | 196,083 | | |
| Fifth Third Bank | | AA- | | | 3.38 | | | 08/15/08 | | | 200,000 | | | | 192,732 | | |
| First Tennessee Bank | | A- | | | 5.75 | | | 12/01/08 | | | 200,000 | | | | 204,207 | | |
| GE Capital Corp. | | AAA | | | 2.75 | | | 09/25/06 | | | 250,000 | | | | 246,455 | | |
| Huntington National Bank | | A- | | | 3.13 | | | 05/15/08 | | | 200,000 | | | | 192,124 | | |
| Lehman Brothers Hlds. | | A+ | | | 3.50 | | | 08/07/08 | | | 200,000 | | | | 193,030 | | |
| National City Bank | | A+ | | | 3.38 | | | 10/15/07 | | | 250,000 | | | | 243,456 | | |
| Northern Trust Co. | | AA- | | | 2.88 | | | 12/15/06 | | | 200,000 | | | | 196,159 | | |
| Wachovia Corp. | | A+ | | | 3.50 | | | 08/15/08 | | | 200,000 | | | | 193,255 | | |
| Other Securities | | | | | ��� | | | | — | | | | 1,280,000 | | | | 1,264,872 | | |
| | | | 4,172,766 | | |
| HEALTHCARE (0.5%) | |
| UnitedHealth Group A 3.38 08/15/07 | | | 200,000 | | | | 195,466 | | |
| INDUSTRIAL (3.6%) | |
| Bunge, Ltd. | | BBB | | | 4.38 | | | | 12/15/08 | | | | 200,000 | | | | 196,549 | | |
| Comcast Cable Communications | | BBB+ | | | 6.20 | | | | 11/15/08 | | | | 200,000 | | | | 205,307 | | |
| Conoco Funding Co. | | A- | | | 5.45 | | | | 10/15/06 | | | | 200,000 | | | | 200,783 | | |
| Deluxe Corp. | | BBB+ | | | 3.50 | | | | 10/01/07 | | | | 250,000 | | | | 238,485 | | |
| Raytheon Co. | | BBB | | | 4.50 | | | | 11/15/07 | | | | 200,000 | | | | 198,277 | | |
| Other Securities | | | | | — | | | | — | | | | 320,000 | | | | 323,757 | | |
| | | | 1,363,158 | | |
| TECHNOLOGY (1.3%) | |
| Pitney Bowes, Inc. | | A+ | | | 5.75 | | | | 08/15/08 | | | | 200,000 | | | | 203,924 | | |
| Other Securities | | | | | — | | | | — | | | | 300,000 | | | | 296,550 | | |
| | | | 500,474 | | |
| UTILITIES (1.5%) | |
| DTE Energy Co. | | BBB- | | | 6.45 | | | | 06/01/06 | | | | 200,000 | | | | 201,281 | | |
| Telecom de Puerto Rico | | BBB+ | | | 6.80 | | | | 05/15/09 | | | | 200,000 | | | | 207,819 | | |
| Other Securities | | | | | — | | | | — | | | | 150,000 | | | | 145,126 | | |
| | | | 554,226 | | |
Total Long-Term Debt Securities
(Cost: $38,200,583) 98.4% | | | | | | | | | | | | | | | | | 37,693,449 | | |
The accompanying notes are an integral part of these financial statements.
44
MUTUAL OF AMERICA INVESTMENT CORPORATION (SHORT TERM BOND FUND)
SUMMARY PORTFOLIO OF INVESTMENTS IN SECURITIES (Continued)
December 31, 2005
| | | Rate | | Maturity | | Face
Amount | | Value | |
| SHORT-TERM DEBT SECURITIES: | |
| U.S. GOVERNMENT AGENCIES (1.4%) | |
| Federal National Mortgage Association | | | 4.23 | % | | 02/02/06 | | $ | 302,000 | | | $ | 300,825 | | |
| Federal National Mortgage Association | | | 3.25 | | | 01/03/06 | | | 260,000 | | | | 259,930 | | |
| | | | 560,755 | | |
Total Short-Term Debt Securities
(Cost: $560,755) 1.4% | | | | | | | | | 560,755 | | |
Total Investments
(Cost: $38,761,338) 99.8% | | | | | | | | | 38,254,204 | | |
| Other Net Assets 0.2% | | | | | | | | | 60,556 | | |
| Net Assets 100.0% | | | | | | | | $ | 38,314,760 | | |
* Ratings as per Standard & Poor's Corporation.
Abbreviations: FFCB = Federal Farm Credit Bank
FHLB = Federal Home Loan Bank
FHLMC = Federal Home Loan Mortgage Corporation
FNMA = Federal National Mortgage Association
GNMA = Government National Mortgage Association
The accompanying notes are an integral part of these financial statements.
45
MUTUAL OF AMERICA INVESTMENT CORPORATION (MID-TERM BOND FUND)
SUMMARY PORTFOLIO OF INVESTMENTS IN SECURITIES
December 31, 2005
| | | Rating* | | Rate | | Maturity | | Face
Amount | | Value | |
| LONG-TERM DEBT SECURITIES: | |
| U.S. GOVERNMENT (12.3%) | |
| U.S. Treasury Note | | AAA | | | 5.00 | % | | | 08/15/11 | | | $ | 3,000,000 | | | $ | 3,096,444 | | |
| U.S. Treasury Note | | AAA | | | 4.00 | | | | 11/15/12 | | | | 2,000,000 | | | | 1,956,954 | | |
| U.S. Treasury Strip | | AAA | | | 0.00 | | | | 11/15/12 | | | | 5,000,000 | | | | 3,705,385 | | |
| | | | 8,758,783 | | |
| U.S. GOVERNMENT AGENCIES (52.3%) | |
| MORTGAGE-BACKED OBLIGATIONS (4.3%) | |
| FHLMC | | AAA | | | 5.00 | | | | 06/15/17 | | | | 3,000,000 | | | | 2,990,922 | | |
| FHLMC | | AAA | | | — | | | | — | | | | 53,014 | | | | 55,365 | | |
| FNMA | | AAA | | | — | | | | — | | | | 23,789 | | | | 23,964 | | |
| | | | 3,070,251 | | |
| NON-MORTGAGE-BACKED OBLIGATION (48.0%) | |
| FHLB | | AAA | | | 2.75 | | | | 03/14/08 | | | | 4,750,000 | | | | 4,556,281 | | |
| FHLB | | AAA | | | 5.75 | | | | 05/15/12 | | | | 4,500,000 | | | | 4,738,464 | | |
| FHLMC | | AAA | | | 6.63 | | | | 09/15/09 | | | | 5,000,000 | | | | 5,312,210 | | |
| FHLMC | | AAA | | | 5.63 | | | | 03/15/11 | | | | 4,000,000 | | | | 4,157,756 | | |
| FNMA | | AAA | | | 3.25 | | | | 01/15/08 | | | | 5,000,000 | | | | 4,857,215 | | |
| FNMA | | AAA | | | 3.25 | | | | 02/15/09 | | | | 1,500,000 | | | | 1,436,718 | | |
| FNMA | | AAA | | | 6.63 | | | | 09/15/09 | | | | 5,500,000 | | | | 5,848,376 | | |
| FNMA | | AAA | | | 4.38 | | | | 09/15/12 | | | | 3,500,000 | | | | 3,419,896 | | |
| | | | 34,326,916 | | |
| BASIC MATERIALS (1.7%) | |
| Monsanto Co. | | A- | | | 4.00 | | | | 05/15/08 | | | | 500,000 | | | | 489,267 | | |
| Other Securities | | | | | — | | | | — | | | | 750,000 | | | | 758,314 | | |
| | | | 1,247,581 | | |
| CONSUMER, CYCLICAL (5.4%) | |
| Caterpillar Fin. Svc. | | A | | | 2.63 | | | | 01/30/07 | | | | 500,000 | | | | 488,490 | | |
| Cox Communications, Inc. Cl A | | BBB- | | | 3.88 | | | | 10/01/08 | | | | 500,000 | | | | 481,849 | | |
| Newell Rubbermaid | | BBB+ | | | 4.63 | | | | 12/15/09 | | | | 500,000 | | | | 488,921 | | |
| Target Corp. | | A+ | | | 5.38 | | | | 06/15/09 | | | | 1,000,000 | | | | 1,014,725 | | |
| Other Securities | | | | | — | | | | — | | | | 1,436,000 | | | | 1,397,664 | | |
| | | | 3,871,649 | | |
| CONSUMER, NON-CYCLICAL (3.8%) | |
| Campbell Soup Co. | | A | | | 5.50 | | | | 03/15/07 | | | | 500,000 | | | | 502,015 | | |
| Coca-Cola Enterprises | | A | | | 2.50 | | | | 09/15/06 | | | | 500,000 | | | | 491,353 | | |
| General Mills, Inc. | | BBB+ | | | 2.63 | | | | 10/24/06 | | | | 500,000 | | | | 489,618 | | |
| Kellogg Co. | | BBB+ | | | 2.88 | | | | 06/01/08 | | | | 500,000 | | | | 476,383 | | |
| Safeway, Inc. | | BBB- | | | 4.13 | | | | 11/01/08 | | | | 500,000 | | | | 484,160 | | |
| Other Securities | | | | | — | | | | — | | | | 250,000 | | | | 266,069 | | |
| | | | 2,709,598 | | |
| ENERGY (1.0%) | |
| Anadarko Petroleum | | BBB+ | | | 3.25 | | | | 05/01/08 | | | | 500,000 | | | | 481,510 | | |
| Other Securities | | | | | — | | | | — | | | | 250,000 | | | | 247,166 | | |
| | | | 728,676 | | |
| FINANCIAL (16.5%) | |
| American Honda Fin | | A+ | | | 3.85 | | | | 11/06/08 | | | | 500,000 | | | | 486,472 | | |
| Bank of America Corp. | | AA- | | | 4.75 | | | | 10/15/06 | | | | 500,000 | | | | 499,834 | | |
| Bank of Oklahoma | | BBB+ | | | 7.13 | | | | 08/15/07 | | | | 350,000 | | | | 362,187 | | |
| Berkshire Hathaway Financial | | AAA | | | 4.20 | | | | 12/15/10 | | | | 500,000 | | | | 484,064 | | |
| Colonial Properties LP | | BBB- | | | 4.80 | | | | 04/01/11 | | | | 300,000 | | | | 289,569 | | |
The accompanying notes are an integral part of these financial statements.
46
MUTUAL OF AMERICA INVESTMENT CORPORATION (MID-TERM BOND FUND)
SUMMARY PORTFOLIO OF INVESTMENTS IN SECURITIES (Continued)
December 31, 2005
| | | Rating* | | Rate | | Maturity | | Face
Amount | | Value | |
| LONG-TERM DEBT SECURITIES: (Continued) | |
| FINANCIAL (CONTINUED) | |
| Deere Capital Corp. | | A- | | | 3.90 | % | | | 01/15/08 | | | $ | 500,000 | | | $ | 490,209 | | |
| Ford Motor Credit Co. | | BB+ | | | 7.38 | | | | 10/28/09 | | | | 750,000 | | | | 665,165 | | |
| GE Capital Corp. | | AAA | | | 2.75 | | | | 09/25/06 | | | | 750,000 | | | | 739,364 | | |
| General Motors Acceptance Corp. | | BB | | | 6.75 | | | | 01/15/06 | | | | 500,000 | | | | 499,670 | | |
| Heller Financial, Inc. | | AAA | | | 6.38 | | | | 03/15/06 | | | | 500,000 | | | | 501,690 | | |
| Household Fin. Corp. | | A | | | 6.50 | | | | 01/24/06 | | | | 500,000 | | | | 500,498 | | |
| JP Morgan Chase Bank | | A+ | | | 5.63 | | | | 08/15/06 | | | | 500,000 | | | | 502,143 | | |
| Lehman Brothers Hlds. | | A+ | | | 4.00 | | | | 01/22/08 | | | | 500,000 | | | | 491,719 | | |
| Nationwide Rural Utilities Coop. Finance Corp. | | BBB- | | | 7.60 | | | | 11/20/28 | | | | 350,000 | | | | 397,754 | | |
| Roslyn Bancorp, Inc. | | BBB- | | | 7.50 | | | | 12/01/08 | | | | 500,000 | | | | 530,121 | | |
| SLM Corp. | | A | | | 4.00 | | | | 01/15/09 | | | | 500,000 | | | | 486,567 | | |
| Sprint Capital Corp. | | A- | | | 7.13 | | | | 01/30/06 | | | | 500,000 | | | | 500,800 | | |
| Textron Finance Corp. | | A- | | | 2.69 | | | | 10/03/06 | | | | 500,000 | | | | 492,455 | | |
| The CIT Group, Inc. | | A | | | 6.50 | | | | 02/07/06 | | | | 500,000 | | | | 500,838 | | |
| U S Bancorp | | A+ | | | 3.95 | | | | 08/23/07 | | | | 500,000 | | | | 493,521 | | |
| Other Securities | | | | | — | | | | — | | | | 1,900,000 | | | | 1,870,822 | | |
| | | | 11,785,462 | | |
| INDUSTRIAL (0.7%) | |
| Deluxe Corp. | | BBB+ | | | 3.50 | | | | 10/01/07 | | | | 500,000 | | | | 476,970 | | |
| TECHNOLOGY (1.4%) | |
| Hewlett-Packard Co. | | A- | | | 5.75 | | | | 12/15/06 | | | | 500,000 | | | | 504,180 | | |
| IBM Corp. | | A+ | | | 4.88 | | | | 10/01/06 | | | | 500,000 | | | | 500,411 | | |
| | | | 1,004,591 | | |
| TELECOMMUNICATIONS (1.1%) | |
| Verizon Global | | A+ | | | 4.00 | | | | 01/15/08 | | | | 500,000 | | | | 490,370 | | |
| Other Securities | | | | | — | | | | — | | | | 250,000 | | | | 249,687 | | |
| | | | 740,057 | | |
| UTILITIES (1.6%) | |
| Telecom de Puerto Rico | | BBB+ | | | 6.80 | | | | 05/15/09 | | | | 300,000 | | | | 311,728 | | |
| Virginia Elect.& Pwr | | BBB | | | 4.50 | | | | 12/15/10 | | | | 400,000 | | | | 390,007 | | |
| Other Securities | | | | | — | | | | — | | | | 500,000 | | | | 480,291 | | |
| | | | 1,182,026 | | |
Total Long-Term Debt Securities
(Cost: $71,677,109 ) 97.8% | | | | | | | | | | | | | | | | | 69,902,560 | | |
| SHORT-TERM DEBT SECURITIES: | |
| U.S. GOVERNMENT AGENCIES (1.0%) | |
| Federal National Mortgage Association | | | | | 3.25 | | | | 01/03/06 | | | | 680,000 | | | | 679,816 | | |
Total Short-Term Debt Securities
(Cost: $679,816 ) 1.0% | | | | | | | | | | | | | | | | | 679,816 | | |
Total Investments
(Cost: $72,356,925 ) 98.8% | | | | | | | | | | | | | | | | | 70,582,376 | | |
| Other Net Assets 1.2% | | | | | | | | | | | | | | | | | 860,878 | | |
| Net Assets 100.0% | | | | | | | | | | | | | | | | $ | 71,443,254 | | |
* Ratings as per Standard & Poor's Corporation.
Abbreviations: FHLB = Federal Home Loan Bank
FHLMC = Federal Home Loan Mortgage Corporation
FNMA = Federal National Mortgage Association
The total value of investments not rated or below-investment grade was $1,164,835, or 1.7% of the Fund's total investments as of December 31, 2005.
The accompanying notes are an integral part of these financial statements.
47
MUTUAL OF AMERICA INVESTMENT CORPORATION (BOND FUND)
SUMMARY PORTFOLIO OF INVESTMENTS IN SECURITIES
December 31, 2005
| | | Rating* | | Rate | | Maturity | | Face
Amount | | Value | |
| LONG-TERM DEBT SECURITIES: | |
| U.S. GOVERNMENT (4.3%) | |
| U.S. Treasury Strip | | AAA | | | 0.00 | % | | | 02/15/17 | | | $ | 15,000,000 | | | $ | 9,056,085 | | |
| U.S. Treasury Strip | | AAA | | | 0.00 | | | | 05/15/14 | | | | 10,000,000 | | | | 6,884,800 | | |
| | | | 15,940,885 | | |
| U.S. GOVERNMENT AGENCIES (43.8%) | |
| MORTGAGE-BACKED OBLIGATIONS (35.0%) | |
| FHLMC | | AAA | | | 8.00 | | | | 07/15/06 | | | | 6,456 | | | | 6,446 | | |
| FHLMC | | AAA | | | 4.00 | | | | 10/15/26 | | | | 9,000,000 | | | | 8,686,161 | | |
| FNMA | | AAA | | | 6.00 | | | | 05/01/32 | | | | 2,639,471 | | | | 2,669,059 | | |
| FNMA | | AAA | | | 6.50 | | | | 05/01/32 | | | | 3,130,980 | | | | 3,217,805 | | |
| FNMA | | AAA | | | 7.50 | | | | 06/01/32 | | | | 923,822 | | | | 967,714 | | |
| FNMA | | AAA | | | 6.00 | | | | 04/01/33 | | | | 3,598,682 | | | | 3,639,023 | | |
| FNMA | | AAA | | | 5.00 | | | | 06/01/33 | | | | 2,856,781 | | | | 2,777,994 | | |
| FNMA | | AAA | | | 5.50 | | | | 07/01/33 | | | | 4,789,923 | | | | 4,754,798 | | |
| FNMA | | AAA | | | 5.50 | | | | 09/01/33 | | | | 2,552,603 | | | | 2,533,884 | | |
| FNMA | | AAA | | | 5.50 | | | | 10/01/33 | | | | 3,028,945 | | | | 3,006,733 | | |
| FNMA | | AAA | | | 5.00 | | | | 11/01/33 | | | | 4,224,955 | | | | 4,108,435 | | |
| FNMA | | AAA | | | 5.00 | | | | 01/01/34 | | | | 3,164,217 | | | | 3,076,951 | | |
| FNMA | | AAA | | | 4.50 | | | | 05/01/34 | | | | 1,387,359 | | | | 1,309,563 | | |
| FNMA | | AAA | | | 4.50 | | | | 06/01/34 | | | | 2,681,381 | | | | 2,531,023 | | |
| FNMA | | AAA | | | 5.50 | | | | 07/01/34 | | | | 3,065,431 | | | | 3,038,348 | | |
| FNMA | | AAA | | | 5.50 | | | | 09/01/34 | | | | 2,401,253 | | | | 2,380,037 | | |
| FNMA | | AAA | | | 5.50 | | | | 10/01/34 | | | | 5,383,746 | | | | 5,336,180 | | |
| FNMA | | AAA | | | 5.00 | | | | 04/01/35 | | | | 2,597,727 | | | | 2,517,089 | | |
| FNMA | | AAA | | | 5.50 | | | | 08/01/35 | | | | 4,476,875 | | | | 4,433,973 | | |
| FNMA | | AAA | | | 5.00 | | | | 09/01/35 | | | | 5,952,518 | | | | 5,767,740 | | |
| FNMA | | AAA | | | 5.50 | | | | 11/01/35 | | | | 2,467,039 | | | | 2,443,397 | | |
| FNMA | | AAA | | | 5.00 | | | | 10/25/15 | | | | 5,000,000 | | | | 4,986,405 | | |
| FNMA | | AAA | | | 6.00 | | | | 03/01/17 | | | | 609,036 | | | | 622,563 | | |
| FNMA | | AAA | | | 5.00 | | | | 04/01/18 | | | | 757,744 | | | | 750,726 | | |
| FNMA | | AAA | | | 4.50 | | | | 05/01/18 | | | | 3,192,778 | | | | 3,113,971 | | |
| FNMA | | AAA | | | 4.00 | | | | 05/01/19 | | | | 2,996,225 | | | | 2,864,508 | | |
| FNMA | | AAA | | | 5.00 | | | | 09/01/20 | | | | 2,695,170 | | | | 2,666,485 | | |
| FNMA | | AAA | | | 5.00 | | | | 10/01/20 | | | | 3,437,166 | | | | 3,400,584 | | |
| FNMA | | AAA | | | — | | | | — | | | | 33,388,548 | | | | 33,208,626 | | |
| GNMA (1) | | AAA | | | 6.27 | | | | 10/16/27 | | | | 3,000,000 | | | | 3,177,471 | | |
| GNMA (1) | | AAA | | | — | | | | — | | | | 1,048,810 | | | | 1,097,812 | | |
| Other Securites | | | | | — | | | | — | | | | 3,990,321 | | | | 3,953,458 | | |
| | | | 129,044,962 | | |
| NON-MORTGAGE-BACKED OBLIGATION (8.8%) | |
| AID - Sri Lanka | | AAA | | | 6.59 | | | | 09/15/28 | | | | 4,000,000 | | | | 4,112,200 | | |
| FFCB | | AAA | | | 2.88 | | | | 06/29/06 | | | | 2,500,000 | | | | 2,479,310 | | |
| FFCB | | AAA | | | 4.15 | | | | 05/15/13 | | | | 10,000,000 | | | | 9,620,530 | | |
| FHLB | | AAA | | | 4.50 | | | | 11/15/12 | | | | 4,000,000 | | | | 3,937,464 | | |
| FHLMC | | AAA | | | 4.50 | | | | 01/15/13 | | | | 2,500,000 | | | | 2,455,700 | | |
| FHLMC | | AAA | | | 5.20 | | | | 03/05/19 | | | | 10,000,000 | | | | 9,759,130 | | |
| | | | 32,364,334 | | |
The accompanying notes are an integral part of these financial statements.
48
MUTUAL OF AMERICA INVESTMENT CORPORATION (BOND FUND)
SUMMARY PORTFOLIO OF INVESTMENTS IN SECURITIES (Continued)
December 31, 2005
| | |
Rating* | |
Rate | |
Maturity | | Face
Amount | |
Value | |
| LONG-TERM DEBT SECURITIES (CONTINUED): | |
| BASIC MATERIALS (6.0%) | |
| Intl. Flavors & Fragrances | | BBB+ | | | 6.45 | % | | | 05/15/06 | | | $ | 2,500,000 | | | $ | 2,511,938 | | |
| Lyondell Chemical Co. | | BB- | | | 10.25 | | | | 11/01/10 | | | | 5,000,000 | | | | 5,500,000 | | |
| PolyOne Corp. | | B+ | | | 7.50 | | | | 12/15/15 | | | | 3,750,000 | | | | 3,421,875 | | |
| Praxair, Inc. | | A- | | | 6.90 | | | | 11/01/06 | | | | 5,000,000 | | | | 5,077,795 | | |
| Other Securites | | | | | — | | | | — | | | | 5,500,000 | | | | 5,524,761 | | |
| | | | 22,036,369 | | |
| CONSUMER, CYCLICAL (8.0%) | |
| Kellwood, Co. | | BB | | | 7.88 | | | | 07/15/09 | | | | 4,000,000 | | | | 3,969,208 | | |
| Target Corp. | | A+ | | | 5.38 | | | | 06/15/09 | | | | 3,250,000 | | | | 3,297,860 | | |
| Other Securites | | | | | — | | | | — | | | | 23,776,720 | | | | 22,096,671 | | |
| | | | 29,363,739 | | |
| CONSUMER, NON-CYCLICAL (2.2%) | |
| Wal-Mart Stores, Inc. | | AA | | | 6.88 | | | | 08/10/09 | | | | 3,000,000 | | | | 3,192,831 | | |
| Other Securites | | | | | — | | | | — | | | | 5,000,000 | | | | 4,832,324 | | |
| | | | 8,025,155 | | |
| ENERGY (1.5%) | |
| Other Securites | | | | | — | | | | — | | | | 5,750,000 | | | | 5,589,934 | | |
| FINANCIAL (20.0%) | |
| Bank of America Alternative Loan Trust | | AAA | | | 5.75 | | | | 05/25/33 | | | | 3,500,000 | | | | 3,488,783 | | |
| Berkley (WR) Corp. | | BBB+ | | | 8.70 | | | | 01/01/22 | | | | 5,000,000 | | | | 6,123,280 | | |
| Deere Capital Corp. | | A- | | | 3.90 | | | | 01/15/08 | | | | 2,500,000 | | | | 2,451,043 | | |
| Executive Risk, Inc. | | A | | | 7.13 | | | | 12/15/07 | | | | 5,000,000 | | | | 5,193,330 | | |
| First Horizon Mortgage Trust | | AAA | | | 5.00 | | | | 06/25/33 | | | | 3,426,240 | | | | 3,401,859 | | |
| First Tennessee Natl. Bank | | BBB+ | | | 4.50 | | | | 05/15/13 | | | | 5,000,000 | | | | 4,770,585 | | |
| Ford Motor Credit Co. | | BB+ | | | 7.38 | | | | 10/28/09 | | | | 3,000,000 | | | | 2,660,658 | | |
| GE Capital Corp. | | AAA | | | 2.75 | | | | 09/25/06 | | | | 4,000,000 | | | | 3,943,276 | | |
| General Motor Accp. | | BB | | | 0.00 | | | | 12/01/12 | | | | 10,000,000 | | | | 5,689,440 | | |
| Simon Property Group Inc. | | BBB+ | | | 7.88 | | | | 03/15/16 | | | | 5,000,000 | | | | 5,848,230 | | |
| Other Securites | | | | | — | | | | — | | | | 30,750,000 | | | | 30,333,091 | | |
| | | | 73,903,575 | | |
| HEALTHCARE (1.1%) | |
| Other Securites | | | | | — | | | | — | | | | 4,250,000 | | | | 4,217,416 | | |
| INDUSTRIAL (4.4%) | |
| Seariver Maritime | | AAA | | | 0.00 | | | | 09/01/12 | | | | 10,000,000 | | | | 7,247,480 | | |
| Other Securites | | | | | — | | | | — | | | | 9,250,000 | | | | 9,131,834 | | |
| | | | 16,379,314 | | |
| TECHNOLOGY (0.6%) | |
| Other Securites | | | | | — | | | | — | | | | 2,000,000 | | | | 2,124,404 | | |
| TELECOMMUNICATIONS (1.1%) | |
| Other Securites | | | | | — | | | | — | | | | 4,000,000 | | | | 3,958,988 | | |
| UTILITIES (2.0%) | |
| Other Securites | | | | | — | | | | — | | | | 7,500,000 | | | | 7,351,012 | | |
Total Long-Term Debt Securities
(Cost: $354,810,678 ) 95.0% | | | | | | | | | | | | | | | | | 350,300,087 | | |
The accompanying notes are an integral part of these financial statements.
49
MUTUAL OF AMERICA INVESTMENT CORPORATION (BOND FUND)
SUMMARY PORTFOLIO OF INVESTMENTS IN SECURITIES (Continued)
December 31, 2005
| | | | |
Rate | |
Maturity | | Face
Amount | |
Value | |
| SHORT-TERM DEBT SECURITIES: | |
| COMMERCIAL PAPER (4.2%) | |
| Executive Jets Inc. | | | | | 4.15 | % | | 01/03/06 | | $ | 7,300,000 | | | $ | 7,297,475 | | |
| Hershey Foods | | | | | 4.00 | | | 01/03/06 | | | 5,722,000 | | | | 5,720,092 | | |
| Other Securites | | . | | | — | | | | — | | | | 2,520,000 | | | | 2,518,507 | | |
| | | | 15,536,074 | | |
Total Short-Term Debt Securities
(Cost: $15,536,074) 4.2% | | | | | | | | | | | | | | | 15,536,074 | | |
Temporary Cash Investments**
(Cost: $41,000) 0.0% (2) | | | | | | | | | | | | | | | 41,000 | | |
Total Investments
(Cost: $370,387,752) 99.2% | | | | | | | | | | | | | | | 365,877,161 | | |
| Other Net Assets 0.8% | | | | | | | | | | | | | | | 2,957,614 | | |
| Net Assets 100.0% | | | | | | | | | | | | | | $ | 368,834,775 | | |
* Ratings as per Standard & Poor's Corporation.
Abbreviations: FFCB = Federal Farm Credit Bank
FHLB = Federal Home Loan Bank
FHLMC = Federal Home Loan Mortgage Corporation
FNMA = Federal National Mortgage Association
GNMA = Government National Mortgage Association
(1) U.S. Government guaranteed security.
(2) Less than 0.05%.
The total value of investments whose issuer has filed for Chapter XI bankruptcy law (or equivalent) protection was $122,996, or 0.03% of the Fund's total investments as of June 30, 2005.
** The fund has an arrangement with its custodian bank, JPMorgan Chase Bank, whereby uninvested cash, subject to parameters set by the fund, is automatically invested in the fund's name by the bank in overnight commercial paper issued by J.P. Morgan Chase & Co. On the next business day, these funds (and earned interest) are automatically returned to the fund. The annual rate of interest earned on this temporary cash investment at December 31, 2005 was 3.79%.
The total value of investments not rated or below-investment grade was $25,085,970, or 6.9% of the Fund's total investments as of December 31, 2005.
The accompanying notes are an integral part of these financial statements.
50
MUTUAL OF AMERICA INVESTMENT CORPORATION
STATEMENTS OF ASSETS AND LIABILITIES
December 31, 2005
| | | Equity Index
Fund | | All America
Fund | | Small Cap
Value Fund | |
| ASSETS: | |
Investments at market value
(Cost:
Equity Index Fund — $631,768,531
All America Fund — $345,106,014
Small Cap Value Fund — $33,394,049)
(Notes 1 and 3) | | $ | 725,488,065 | | | $ | 406,072,851 | | | $ | 33,732,671 | | |
| Cash | | | 180,780 | | | | 16,659 | | | | 6,336 | | |
| Interest and dividends receivable | | | 950,486 | | | | 469,089 | | | | 43,711 | | |
| Receivable for securities sold | | | 114,398 | | | | 472,441 | | | | 63,873 | | |
| Receivable for daily variation margin on futures contracts | | | — | | | | — | | | | — | | |
| TOTAL ASSETS | | | 726,733,729 | | | | 407,031,040 | | | | 33,846,591 | | |
| LIABILITIES: | |
| Payable for securities purchased | | | 893,321 | | | | 484,648 | | | | — | | |
| Payable for daily variation margin on future contracts | | | 66,250 | | | | 34,450 | | | | — | | |
| TOTAL LIABILITIES | | | 959,571 | | | | 519,098 | | | | — | | |
| NET ASSETS | | $ | 725,774,158 | | | $ | 406,511,942 | | | $ | 33,846,591 | | |
| NUMBER OF SHARES OUTSTANDING (Note 4) | | | 339,245,640 | | | | 209,390,329 | | | | 31,714,079 | | |
| NET ASSET VALUES, offering and redemption price per share | | $ | 2.14 | | | $ | 1.94 | | | $ | 1.07 | | |
| COMPONENTS OF NET ASSETS: | |
| Paid-in capital | | $ | 630,699,692 | | | $ | 334,781,999 | | | $ | 33,256,411 | | |
| Accumulated undistributed net investment income (loss) | | | 1,341,393 | | | | 4,963,123 | | | | 6,414 | | |
Accumulated undistributed net realized gain (loss) on
investments and futures contracts | | | 350,515 | | | | 5,923,833 | | | | 245,144 | | |
Unrealized appreciation (depreciation) of investments
and futures contracts | | | 93,382,558 | | | | 60,842,987 | | | | 338,622 | | |
| NET ASSETS | | $ | 725,774,158 | | | $ | 406,511,942 | | | $ | 33,846,591 | | |
The accompanying notes are an integral part of these financial statements.
51
MUTUAL OF AMERICA INVESTMENT CORPORATION
STATEMENTS OF ASSETS AND LIABILITIES (Continued)
December 31, 2005
| | | Small Cap
Growth Fund | | Mid-Cap
Value Fund | | Mid-Cap
Equity Index
Fund | |
| ASSETS: | |
Investments at market value
(Cost:
Small Cap Growth Fund — $23,175,290
Mid-Cap Value Fund — $10,730,908
Mid-Cap Equity Index Fund — $297,406,814)
(Notes 1 and 3) | | $ | 24,151,173 | | | $ | 11,176,013 | | | $ | 354,652,918 | | |
| Cash | | | 5,328 | | | | 267,746 | | | | 322,083 | | |
| Interest and dividends receivable | | | 11,245 | | | | 19,800 | | | | 277,644 | | |
| Receivable for securities sold | | | 172,339 | | | | — | | | | 3,239,027 | | |
| Receivable for daily variation margin on futures contracts | | | — | | | | — | | | | 12,728 | | |
| TOTAL ASSETS | | | 24,340,085 | | | | 11,463,559 | | | | 358,504,400 | | |
| LIABILITIES: | |
| Payable for securities purchased | | | 111,443 | | | | 259,906 | | | | 975,068 | | |
| Payable for daily variation margin on future contracts | | | — | | | | — | | | | — | | |
| TOTAL LIABILITIES | | | 111,443 | | | | 259,906 | | | | 975,068 | | |
| NET ASSETS | | $ | 24,228,642 | | | $ | 11,203,653 | | | $ | 357,529,332 | | |
| NUMBER OF SHARES OUTSTANDING (Note 4) | | | 22,964,804 | | | | 10,540,041 | | | | 233,305,253 | | |
| NET ASSET VALUES, offering and redemption price per share | | $ | 1.06 | | | $ | 1.06 | | | $ | 1.53 | | |
| COMPONENTS OF NET ASSETS: | |
| Paid-in capital | | $ | 23,773,986 | | | $ | 10,752,767 | | | $ | 296,741,841 | | |
| Accumulated undistributed net investment income (loss) | | | — | | | | 5,993 | | | | 1,314,542 | | |
Accumulated undistributed net realized gain (loss)
on investments and futures contracts | | | (521,227 | ) | | | (212 | ) | | | 2,594,845 | | |
Unrealized appreciation (depreciation) of investments
and futures contracts | | | 975,883 | | | | 445,105 | | | | 56,878,104 | | |
| NET ASSETS | | $ | 24,228,642 | | | $ | 11,203,653 | | | $ | 357,529,332 | | |
The accompanying notes are an integral part of these financial statements.
52
MUTUAL OF AMERICA INVESTMENT CORPORATION
STATEMENTS OF ASSETS AND LIABILITIES (Continued)
December 31, 2005
| | | Aggressive
Equity
Fund | | Composite
Fund | | Conservative
Allocation
Fund | |
| ASSETS: | |
Investments at market value
(Cost:
Aggressive Equity Fund — $281,466,377
Composite Fund — $225,556,174
Conservative Allocation Fund — $11,348,079)
(Notes 1 and 3) | | $ | 321,471,659 | | | $ | 231,445,059 | | | $ | 11,170,746 | | |
| Cash | | | 6,771 | | | | 15,403 | | | | — | | |
| Interest and dividends receivable | | | 302,520 | | | | 904,921 | | | | — | | |
| Receivable for securities sold | | | 1,460,827 | | | | — | | | | — | | |
| TOTAL ASSETS | | | 323,241,777 | | | | 232,365,383 | | | | 11,170,746 | | |
| LIABILITIES: | |
| Payable for securities purchased | | | 723,356 | | | | — | | | | — | | |
| NET ASSETS | | $ | 322,518,421 | | | $ | 232,365,383 | | | $ | 11,170,746 | | |
| NUMBER OF SHARES OUTSTANDING (Note 4) | | | 175,529,648 | | | | 161,982,972 | | | | 11,134,470 | | |
| NET ASSET VALUES, offering and redemption price per share | | $ | 1.84 | | | $ | 1.43 | | | $ | 1.00 | | |
| COMPONENTS OF NET ASSETS: | |
| Paid-in capital | | $ | 262,105,592 | | | $ | 267,755,629 | | | $ | 11,353,531 | | |
| Accumulated undistributed net investment income (loss) | | | 815,386 | | | | 4,520,279 | | | | 17,184 | | |
Accumulated undistributed net realized gain (loss)
on investments and futures contracts | | | 19,592,162 | | | | (45,799,410 | ) | | | (22,636 | ) | |
Unrealized appreciation (depreciation) of investments
and futures contracts | | | 40,005,281 | | | | 5,888,885 | | | | (177,333 | ) | |
| NET ASSETS | | $ | 322,518,421 | | | $ | 232,365,383 | | | $ | 11,170,746 | | |
The accompanying notes are an integral part of these financial statements.
53
MUTUAL OF AMERICA INVESTMENT CORPORATION
STATEMENTS OF ASSETS AND LIABILITIES (Continued)
December 31, 2005
| | | Moderate
Allocation
Fund | | Aggressive
Allocation
Fund | | Money
Market
Fund | |
| ASSETS: | |
Investments at market value
(Cost:
Moderate Allocation Fund — $56,074,048
Aggressive Allocation Fund — $46,283,410
Money Market Fund — $129,701,179)
(Notes 1 and 3) | | $ | 56,243,926 | | | $ | 47,539,258 | | | $ | 129,700,384 | | |
| Cash | | | — | | | | — | | | | 2,371 | | |
| Interest and dividends receivable | | | — | | | | — | | | | — | | |
| Receivable for securities sold | | | — | | | | — | | | | — | | |
| NET ASSETS | | | 56,243,926 | | | | 47,539,258 | | | | 129,702,755 | | |
| LIABILITIES: | |
| Payable for securities purchased | | | — | | | | — | | | | — | | |
| NET ASSETS | | $ | 56,243,926 | | | $ | 47,539,258 | | | $ | 129,702,755 | | |
| NUMBER OF SHARES OUTSTANDING (Note 4) | | | 50,880,141 | | | | 39,032,769 | | | | 108,513,501 | | |
| NET ASSET VALUES, offering and redemption price per share | | $ | 1.11 | | | $ | 1.22 | | | $ | 1.20 | | |
| COMPONENTS OF NET ASSETS: | |
| Paid-in capital | | $ | 56,022,355 | | | $ | 46,274,474 | | | $ | 129,638,900 | | |
| Accumulated undistributed net investment income (loss) | | | 131,546 | | | | 82,155 | | | | 75,263 | | |
Accumulated undistributed net realized gain (loss)
on investments and futures contracts | | | (79,852 | ) | | | (73,179 | ) | | | (10,613 | ) | |
Unrealized appreciation (depreciation) of investments
and futures contracts | | | 169,877 | | | | 1,255,848 | | | | (795 | ) | |
| NET ASSETS | | $ | 56,243,926 | | | $ | 47,539,258 | | | $ | 129,702,755 | | |
The accompanying notes are an integral part of these financial statements.
54
MUTUAL OF AMERICA INVESTMENT CORPORATION
STATEMENTS OF ASSETS AND LIABILITIES (Continued)
December 31, 2005
| | | Short-Term
Bond Fund | | Mid-Term
Bond Fund | | Bond
Fund | |
| ASSETS: | |
Investments at market value
(Cost:
Short-Term Bond Fund — $38,761,338
Mid-Term Bond Fund — $72,356,925
Bond Fund — $370,387,752)
(Notes 1 and 3) | | $ | 38,254,204 | | | $ | 70,582,376 | | | $ | 365,877,161 | | |
| Cash | | | 7,812 | | | | 7,943 | | | | 86 | | |
| Interest and dividends receivable | | | 240,241 | | | | 852,935 | | | | 2,957,528 | | |
| Receivable for securities sold | | | 7,048 | | | | — | | | | — | | |
| NET ASSETS | | | 38,509,305 | | | | 71,443,254 | | | | 368,834,775 | | |
| LIABILITIES: | |
| Payable for securities purchased | | | 194,545 | | | | — | | | | — | | |
| NET ASSETS | | $ | 38,314,760 | | | $ | 71,443,254 | | | $ | 368,834,775 | | |
| NUMBER OF SHARES OUTSTANDING (Note 4) | | | 37,748,047 | | | | 77,559,677 | | | | 293,607,621 | | |
| NET ASSET VALUES, offering and redemption price per share | | $ | 1.02 | | | $ | 0.92 | | | $ | 1.26 | | |
| COMPONENTS OF NET ASSETS: | |
| Paid-in capital | | $ | 39,102,215 | | | $ | 73,508,365 | | | $ | 397,356,897 | | |
| Accumulated undistributed net investment income (loss) | | | 19,325 | | | | 48,373 | | | | 169,047 | | |
Accumulated undistributed net realized gain (loss)
on investments and futures contracts | | | (299,646 | ) | | | (338,934 | ) | | | (24,180,578 | ) | |
Unrealized appreciation (depreciation) of investments
and futures contracts | | | (507,134 | ) | | | (1,774,550 | ) | | | (4,510,591 | ) | |
| NET ASSETS | | $ | 38,314,760 | | | $ | 71,443,254 | | | $ | 368,834,775 | | |
The accompanying notes are an integral part of these financial statements.
55
MUTUAL OF AMERICA INVESTMENT CORPORATION
STATEMENTS OF OPERATIONS
For the Year Ended December 31, 2005
| | | Equity Index
Fund | | All America
Fund | | Small Cap
Value Fund(a) | | Small Cap
Growth Fund(a) | | Mid Cap
Value Fund(a) | |
| INVESTMENT INCOME AND EXPENSES: | |
| Income: | |
| Dividends | | $ | 12,994,439 | | | $ | 6,675,774 | | | $ | 230,714 | | | $ | 44,248 | | | $ | 83,194 | | |
| Interest | | | 505,647 | | | | 406,491 | | | | 43,927 | | | | 36,285 | | | | 12,124 | | |
| Total income | | | 13,500,086 | | | | 7,082,265 | | | | 274,641 | | | | 80,533 | | | | 95,318 | | |
| Expenses: | |
| Investment advisory fees (Note 2) | | | 892,369 | | | | 2,119,142 | | | | 113,540 | | | | 80,883 | | | | 24,741 | | |
| Accounting and recordkeeping expenses | | | 238,901 | | | | 142,628 | | | | 5,586 | | | | 3,998 | | | | 1,849 | | |
| Shareholders reports | | | 374,142 | | | | 223,370 | | | | 8,748 | | | | 6,262 | | | | 2,896 | | |
| Custodian expenses | | | 48,479 | | | | 99,096 | | | | 2,680 | | | | 4,464 | | | | 1,798 | | |
| Independent directors' fees and expenses | | | 51,241 | | | | 30,592 | | | | 1,198 | | | | 857 | | | | 396 | | |
| Audit | | | 41,568 | | | | 24,817 | | | | 972 | | | | 696 | | | | 322 | | |
| Licenses and other | | | 54,693 | | | | 53,701 | | | | 58 | | | | 41 | | | | 19 | | |
| Total expenses before reimbursement | | | 1,701,393 | | | | 2,693,346 | | | | 132,782 | | | | 97,201 | | | | 32,021 | | |
| Expense reimbursement (Note 2) | | | (809,024 | ) | | | (574,204 | ) | | | (19,242 | ) | | | (16,318 | ) | | | (7,280 | ) | |
| Net Expenses | | | 892,369 | | | | 2,119,142 | | | | 113,540 | | | | 80,883 | | | | 24,741 | | |
| Net Investment Income | | | 12,607,717 | | | | 4,963,123 | | | | 161,101 | | | | (350 | ) | | | 70,577 | | |
NET REALIZED AND UNREALIZED
GAIN (LOSS) ON INVESTMENTS AND
FUTURES CONTRACTS (NOTE 1): | |
Net realized gain (loss) on investments
and futures contracts: | |
| Net realized gain (loss) on investments | | | 15,761,167 | | | | 41,499,729 | | | | 371,282 | | | | (521,227 | ) | | | (212 | ) | |
Net realized gain (loss) on futures
contracts | | | 480,328 | | | | 498,500 | | | | — | | | | — | | | | — | | |
| | | | 16,241,495 | | | | 41,998,229 | | | | 371,282 | | | | (521,227 | ) | | | (212 | ) | |
Net unrealized appreciation
(depreciation) of investments
and futures contracts: | |
Net unrealized appreciation (depreciation)
of investments | | | 5,620,108 | | | | (32,318,408 | ) | | | 338,622 | | | | 975,883 | | | | 445,105 | | |
Net unrealized appreciation
(depreciation) of futures contracts | | | (535,725 | ) | | | (190,375 | ) | | | — | | | | — | | | | — | | |
| | | | 5,084,383 | | | | (32,508,783 | ) | | | 338,622 | | | | 975,883 | | | | 445,105 | | |
NET REALIZED AND UNREALIZED
GAIN (LOSS) ON INVESTMENTS AND
FUTURES CONTRACTS | | | 21,325,878 | | | | 9,489,446 | | | | 709,904 | | | | 454,656 | | | | 444,893 | | |
NET INCREASE (DECREASE) IN NET ASSETS
RESULTING FROM OPERATIONS | | $ | 33,933,595 | | | $ | 14,452,569 | | | $ | 871,005 | | | $ | 454,306 | | | $ | 515,470 | | |
(a) For the period July 1, 2005 (Date of Inception) to December 31, 2005.
The accompanying notes are an integral part of these financial statements.
56
MUTUAL OF AMERICA INVESTMENT CORPORATION
STATEMENTS OF OPERATIONS (Continued)
For the Year Ended December 31, 2005
| | | Mid-Cap
Equity Index
Fund | | Aggressive
Equity Fund | | Composite
Fund | | Conservative
Allocation
Fund | | Moderate
Allocation
Fund | |
| INVESTMENT INCOME AND EXPENSES: | |
| Income: | |
| Dividends | | $ | 4,088,190 | | | $ | 3,301,975 | | | $ | 2,485,965 | | | $ | 337,442 | | | $ | 1,516,270 | | |
| Interest | | | 723,711 | | | | 364,156 | | | | 4,706,812 | | | | — | | | | — | | |
| Total income | | | 4,811,901 | | | | 3,666,131 | | | | 7,192,777 | | | | 337,442 | | | | 1,516,270 | | |
| Expenses: | |
| Investment advisory fees (Note 2) | | | 400,492 | | | | 2,850,745 | | | | 1,205,775 | | | | — | (b) | | | — | (b) | |
| Accounting and recordkeeping expenses | | | 107,689 | | | | 114,915 | | | | 131,495 | | | | — | | | | — | | |
| Shareholders reports | | | 168,651 | | | | 179,968 | | | | 126,519 | | | | — | | | | — | | |
| Custodian expenses | | | 38,495 | | | | 53,718 | | | | 47,816 | | | | — | | | | — | | |
| Independent directors' fees and expenses | | | 23,097 | | | | 24,648 | | | | 17,328 | | | | — | | | | — | | |
| Audit | | | 18,738 | | | | 19,995 | | | | 14,057 | | | | — | | | | — | | |
| Licenses and other | | | 35,611 | | | | 1,184 | | | | 833 | | | | — | | | | — | | |
| Total expenses before reimbursement | | | 792,773 | | | | 3,245,173 | | | | 1,543,823 | | | | — | | | | — | | |
| Expense reimbursement (Note 2) | | | (392,281 | ) | | | (394,428 | ) | | | (338,048 | ) | | | — | | | | — | | |
| Net Expenses | | | 400,492 | | | | 2,850,745 | | | | 1,205,775 | | | | — | | | | — | | |
| Net Investment Income | | | 4,411,409 | | | | 815,386 | | | | 5,987,002 | | | | 337,442 | | | | 1,516,270 | | |
NET REALIZED AND UNREALIZED
GAIN (LOSS) ON INVESTMENTS AND
FUTURES CONTRACTS (Note 1): | |
Net realized gain (loss) on investments
and futures contracts: | |
| Net realized gain (loss) on investments | | | 19,047,452 | | | | 23,125,866 | | | | 5,338,875 | | | | 131,899 | | | | 1,121,198 | | |
Net realized gain (loss) on futures
contracts | | | 2,962,481 | | | | — | | | | — | | | | — | | | | — | | |
| | | | 22,009,933 | | | | 23,125,866 | | | | 5,338,875 | | | | 131,899 | | | | 1,121,198 | | |
Net unrealized appreciation
(depreciation) of investments
and futures contracts: | |
Net unrealized appreciation (depreciation)
of investments | | | 13,221,210 | | | | (5,916,719 | ) | | | (9,535,117 | ) | | | (218,500 | ) | | | (509,418 | ) | |
Net unrealized appreciation
(depreciation) of futures contracts | | | (774,350 | ) | | | — | | | | — | | | | — | | | | — | | |
| | | | 12,446,860 | | | | (5,916,719 | ) | | | (9,535,117 | ) | | | (218,500 | ) | | | (509,418 | ) | |
NET REALIZED AND UNREALIZED
GAIN (LOSS) ON INVESTMENTS AND
FUTURES CONTRACTS | | | 34,456,793 | | | | 17,209,147 | | | | (4,196,242 | ) | | | (86,601 | ) | | | 611,780 | | |
NET INCREASE (DECREASE) IN NET ASSETS
RESULTING FROM OPERATIONS | | $ | 38,868,202 | | | $ | 18,024,533 | | | $ | 1,790,760 | | | $ | 250,841 | | | $ | 2,128,050 | | |
(b) The Allocation Funds incur no other advisory or operating expenses other than those included in each of the underlying funds in which they invest.
The accompanying notes are an integral part of these financial statements.
57
MUTUAL OF AMERICA INVESTMENT CORPORATION
STATEMENTS OF OPERATIONS (Continued)
For the Year Ended December 31, 2005
| | | Aggressive
Allocation
Fund | | Money
Market
Fund | | Short-Term
Bond Fund | | Mid-Term
Bond Fund | | Bond
Fund | |
| INVESTMENT INCOME AND EXPENSES: | |
| Income: | |
| Dividends | | $ | 967,997 | | | $ | — | | | $ | — | | | $ | — | | | $ | — | | |
| Interest | | | — | | | | 2,910,524 | | | | 1,030,890 | | | | 2,719,427 | | | | 18,287,031 | | |
| Total income | | | 967,997 | | | | 2,910,524 | | | | 1,030,890 | | | | 2,719,427 | | | | 18,287,031 | | |
| Expenses: | |
| Investment advisory fees (Note 2) | | | — | (b) | | | 219,333 | | | | 166,397 | | | | 357,306 | | | | 1,901,711 | | |
| Accounting and recordkeeping expenses | | | — | | | | 34,353 | | | | 72,386 | | | | 56,325 | | | | 180,595 | | |
| Shareholders reports | | | — | | | | 53,801 | | | | 18,063 | | | | 37,385 | | | | 190,707 | | |
| Custodian expenses | | | — | | | | 20,391 | | | | 14,312 | | | | 8,276 | | | | 19,544 | | |
| Independent directors' fees and expenses | | | — | | | | 7,368 | | | | 2,474 | | | | 5,120 | | | | 26,119 | | |
| Audit | | | — | | | | 5,977 | | | | 2,007 | | | | 4,154 | | | | 21,188 | | |
| Licenses and other | | | — | | | | 354 | | | | 119 | | | | 246 | | | | 1,255 | | |
| Total expenses before reimbursement | | | — | | | | 341,577 | | | | 275,758 | | | | 468,812 | | | | 2,341,119 | | |
| Expense reimbursement (Note 2) | | | — | | | | (122,244 | ) | | | (109,361 | ) | | | (111,506 | ) | | | (439,408 | ) | |
| Net Expenses | | | — | | | | 219,333 | | | | 166,397 | | | | 357,306 | | | | 1,901,711 | | |
| Net Investment Income | | | 967,997 | | | | 2,691,191 | | | | 864,493 | | | | 2,362,121 | | | | 16,385,320 | | |
NET REALIZED AND UNREALIZED
GAIN (LOSS) ON INVESTMENTS AND
FUTURES CONTRACTS (Note 1) : | |
Net realized gain (loss) on investments
and futures contracts: | |
| Net realized gain (loss) on investments | | | 1,332,695 | | | | (4 | ) | | | (58,241 | ) | | | (338,934 | ) | | | (826,477 | ) | |
Net realized gain (loss) on futures
contracts | | | — | | | | — | | | | — | | | | — | | | | — | | |
| | | | 1,332,695 | | | | (4 | ) | | | (58,241 | ) | | | (338,934 | ) | | | (826,477 | ) | |
Net unrealized appreciation
(depreciation) of investments
and futures contracts: | |
Net unrealized appreciation (depreciation)
of investments | | | 81,434 | | | | (795 | ) | | | (261,643 | ) | | | (1,517,652 | ) | | | (8,811,420 | ) | |
Net unrealized appreciation
(depreciation) of futures contracts | | | — | | | | — | | | | — | | | | — | | | | — | | |
| | | | 81,434 | | | | (795 | ) | | | (261,643 | ) | | | (1,517,652 | ) | | | (8,811,420 | ) | |
NET REALIZED AND UNREALIZED
GAIN (LOSS) ON INVESTMENTS AND
FUTURES CONTRACTS | | | 1,414,129 | | | | (799 | ) | | | (319,884 | ) | | | (1,856,586 | ) | | | (9,637,897 | ) | |
NET INCREASE (DECREASE) IN NET ASSETS
RESULTING FROM OPERATIONS | | $ | 2,382,126 | | | $ | 2,690,392 | | | $ | 544,609 | | | $ | 505,535 | | | $ | 6,747,423 | | |
(b) The Allocation Funds incur no other advisory or operating expenses other than those included in each of the underlying funds in which they invest.
The accompanying notes are an integral part of these financial statements.
58
MUTUAL OF AMERICA INVESTMENT CORPORATION
STATEMENTS OF CHANGES IN NET ASSETS
For the Years Ended December 31,
| | | Equity Index Fund | | All America Fund | | Small Cap
Value Fund | | Small Cap
Growth Fund | |
| | | 2005 | | 2004 | | 2005 | | 2004 | | 2005(a) | | 2005(a) | |
| INCREASE (DECREASE) IN NET ASSETS: | |
| FROM OPERATIONS: | |
| Net investment income | | $ | 12,607,717 | | | $ | 12,363,328 | | | $ | 4,963,123 | | | $ | 5,381,044 | | | $ | 161,101 | | | $ | (350 | ) | |
Net realized gain (loss) on investments and
futures contracts | | | 16,241,495 | | | | 10,900,455 | | | | 41,998,229 | | | | 39,617,272 | | | | 371,282 | | | | (521,227 | ) | |
Unrealized appreciation (depreciation) of investments
and futures contracts | | | 5,084,383 | | | | 45,078,053 | | | | (32,508,783 | ) | | | (9,821,778 | ) | | | 338,622 | | | | 975,883 | | |
NET INCREASE (DECREASE) IN NET ASSETS
RESULTING FROM OPERATIONS | | | 33,933,595 | | | | 68,341,836 | | | | 14,452,569 | | | | 35,176,538 | | | | 871,005 | | | | 454,306 | | |
| DIVIDEND DISTRIBUTIONS (NOTE 5) | |
| From net investment income | | | (11,157,235 | ) | | | (12,302,210 | ) | | | (1,487,487 | ) | | | (5,385,057 | ) | | | (154,687 | ) | | | — | | |
| From capital gains | | | (14,754,098 | ) | | | (2,583,414 | ) | | | (33,401,686 | ) | | | (43,759,898 | ) | | | (126,138 | ) | | | — | | |
| Total distributions | | | (25,911,333 | ) | | | (14,885,624 | ) | | | (34,889,173 | ) | | | (49,144,955 | ) | | | (280,825 | ) | | | — | | |
| CAPITAL SHARE TRANSACTIONS (Note 4): | |
| Net proceeds from sale of shares | | | 72,178,177 | | | | 266,480,179 | | | | 9,541,654 | | | | 112,125,241 | | | | 40,058,358 | | | | 30,294,715 | | |
| Dividends reinvested | | | 25,911,333 | | | | 14,885,624 | | | | 34,889,172 | | | | 49,144,955 | | | | 280,825 | | | | — | | |
| Cost of shares redeemed | | | (102,155,792 | ) | | | (230,629,440 | ) | | | (75,212,021 | ) | | | (181,275,410 | ) | | | (7,082,772 | ) | | | (6,520,379 | ) | |
NET INCREASE (DECREASE) IN NET ASSETS
FROM CAPITAL SHARE TRANSACTIONS | | | (4,066,282 | ) | | | 50,736,363 | | | | (30,781,195 | ) | | | (20,005,214 | ) | | | 33,256,411 | | | | 23,774,336 | | |
| INCREASE (DECREASE) IN NET ASSETS | | | 3,955,980 | | | | 104,192,575 | | | | (51,217,799 | ) | | | (33,973,631 | ) | | | 33,846,591 | | | | 24,228,642 | | |
| NET ASSETS, BEGINNING OF PERIOD/YEAR | | | 721,818,178 | | | | 617,625,603 | | | | 457,729,741 | | | | 491,703,372 | | | | — | | | | — | | |
| NET ASSETS, END OF PERIOD/YEAR | | $ | 725,774,158 | | | $ | 721,818,178 | | | $ | 406,511,942 | | | $ | 457,729,741 | | | $ | 33,846,591 | | | $ | 24,228,642 | | |
| OTHER INFORMATION: | |
| Shares outstanding at the beginning of period/year | | | 341,035,099 | | | | 316,316,198 | | | | 223,626,559 | | | | 232,180,107 | | | | — | | | | — | | |
| Shares issued | | | 34,348,696 | | | | 132,943,667 | | | | 4,805,388 | | | | 53,041,602 | | | | 38,192,504 | | | | 29,215,716 | | |
| Shares issued as reinvestment of dividends | | | 12,098,877 | | | | 7,043,949 | | | | 17,922,112 | | | | 23,990,889 | | | | 260,950 | | | | — | | |
| Shares redeemed | | | (48,237,032 | ) | | | (115,268,715 | ) | | | (36,963,730 | ) | | | (85,586,039 | ) | | | (6,739,375 | ) | | | (6,250,912 | ) | |
| Net increase (decrease) | | | (1,789,459 | ) | | | 24,718,901 | | | | (14,236,230 | ) | | | (8,553,548 | ) | | | 31,714,079 | | | | 22,964,804 | | |
| Shares outstanding at the end of period/year | | | 339,245,640 | | | | 341,035,099 | | | | 209,390,329 | | | | 223,626,559 | | | | 31,714,079 | | | | 22,964,804 | | |
| | | Mid Cap
Value Fund | | Mid-Cap
Equity Index Fund | | Aggressive Equity Fund | |
| | | 2005(a) | | 2005 | | 2004 | | 2005 | | 2004 | |
| INCREASE (DECREASE) IN NET ASSETS: | |
| FROM OPERATIONS: | |
| Net investment income | | $ | 70,577 | | | $ | 4,411,409 | | | $ | 2,631,793 | | | $ | 815,386 | | | $ | (425,021 | ) | |
Net realized gain (loss) on investments and
futures contracts | | | (212 | ) | | | 22,009,933 | | | | 11,339,485 | | | | 23,125,866 | | | | 35,651,268 | | |
Unrealized appreciation (depreciation) of investments
and futures contracts | | | 445,105 | | | | 12,446,860 | | | | 23,747,740 | | | | (5,916,719 | ) | | | (17,518,525 | )) | |
NET INCREASE (DECREASE) IN NET ASSETS
RESULTING FROM OPERATIONS | | | 515,470 | | | | 38,868,202 | | | | 37,719,018 | | | | 18,024,533 | | | | 17,707,722 | | |
| DIVIDEND DISTRIBUTIONS (NOTE 5) | |
| From net investment income | | | (64,584 | ) | | | (4,436,689 | ) | | | (2,634,824 | ) | | | — | | | | — | | |
| From capital gains | | | — | | | | (19,851,398 | ) | | | (6,148,832 | ) | | | (3,277,393 | ) | | | (14,179,143 | ) | |
| Total distributions | | | (64,584 | ) | | | (24,288,087 | ) | | | (8,783,656 | ) | | | (3,277,393 | ) | | | (14,179,143 | ) | |
| CAPITAL SHARE TRANSACTIONS (NOTE 4): | |
| Net proceeds from sale of shares | | | 17,024,729 | | | | 65,055,325 | | | | 126,265,303 | | | | 14,648,472 | | | | 74,156,460 | | |
| Dividends reinvested | | | 64,584 | | | | 24,288,087 | | | | 8,783,656 | | | | 3,277,393 | | | | 14,179,143 | | |
| Cost of shares redeemed | | | (6,336,546 | ) | | | (41,392,768 | ) | | | (85,494,947 | ) | | | (83,952,504 | ) | | | (88,777,624 | ) | |
NET INCREASE (DECREASE) IN NET ASSETS
FROM CAPITAL SHARE TRANSACTIONS | | | 10,752,767 | | | | 47,950,644 | | | | 49,554,012 | | | | (66,026,639 | ) | | | (442,021 | ) | |
| INCREASE (DECREASE) IN NET ASSETS | | | 11,203,653 | | | | 62,530,759 | | | | 78,489,374 | | | | (51,279,499 | ) | | | 3,086,558 | | |
| NET ASSETS, BEGINNING OF PERIOD/YEAR | | | — | | | | 294,998,573 | | | | 216,509,199 | | | | 373,797,920 | | | | 370,711,362 | | |
| NET ASSETS, END OF PERIOD/YEAR | | $ | 11,203,653 | | | $ | 357,529,332 | | | $ | 294,998,573 | | | $ | 322,518,421 | | | $ | 373,797,920 | | |
| OTHER INFORMATION: | |
| Shares outstanding at the beginning of period/year | | | — | | | | 201,869,864 | | | | 167,002,741 | | | | 212,909,336 | | | | 214,148,480 | | |
| Shares issued | | | 16,588,121 | | | | 43,090,777 | | | | 92,750,786 | | | | 8,441,382 | | | | 44,202,487 | | |
| Shares issued as reinvestment of dividends | | | 60,408 | | | | 15,794,620 | | | | 6,104,563 | | | | 1,783,718 | | | | 8,076,219 | | |
| Shares redeemed | | | (6,108,488 | ) | | | (27,450,008 | ) | | | (63,988,226 | ) | | | (47,604,788 | ) | | | (53,517,850 | ) | |
| Net increase (decrease) | | | 10,540,041 | | | | 31,435,389 | | | | 34,867,123 | | | | (37,379,688 | ) | | | (1,239,144 | ) | |
| Shares outstanding at the end of period/year | | | 10,540,041 | | | | 233,305,253 | | | | 201,869,864 | | | | 175,529,648 | | | | 212,909,336 | | |
(a) For the period July 1, 2005 (Date of Inception) to December 31, 2005.
The accompanying notes are an integral part of these financial statements.
59
MUTUAL OF AMERICA INVESTMENT CORPORATION
STATEMENTS OF CHANGES IN NET ASSETS (Continued)
For the Years Ended December 31,
| | | Composite Fund | | Conservative
Allocation Fund | | Moderate
Allocation Fund | |
| | | 2005 | | 2004 | | 2005 | | 2004 | | 2005 | | 2004 | |
| INCREASE (DECREASE) IN NET ASSETS: | |
| FROM OPERATIONS: | |
| Net investment income (loss) | | $ | 5,987,002 | | | $ | 6,204,916 | | | $ | 337,442 | | | $ | 252,499 | | | $ | 1,516,270 | | | $ | 987,433 | | |
| Net realized gain (loss) on investments | | | 5,338,875 | | | | 6,286,697 | | | | 131,899 | | | | 10,466 | | | | 1,121,198 | | | | 937,822 | | |
| Unrealized appreciation (depreciation) of investments | | | (9,535,117 | ) | | | 2,938,167 | | | | (218,500 | ) | | | 62,408 | | | | (509,418 | ) | | | 382,614 | | |
NET INCREASE (DECREASE) IN NET ASSETS
RESULTING FROM OPERATIONS | | | 1,790,760 | | | | 15,429,780 | | | | 250,841 | | | | 325,373 | | | | 2,128,050 | | | | 2,307,869 | | |
| DIVIDEND DISTRIBUTIONS (NOTE 5) | |
| From net investment income | | | (5,978,084 | ) | | | (6,213,327 | ) | | | (316,515 | ) | | | (251,792 | ) | | | (1,434,825 | ) | | | (985,400 | ) | |
| From capital gains | | | — | | | | — | | | | (102,125 | ) | | | (67,084 | ) | | | (1,086,067 | ) | | | (1,032,891 | ) | |
| Total distributions | | | (5,978,084 | ) | | | (6,213,327 | ) | | | (418,640 | ) | | | (318,876 | ) | | | (2,520,892 | ) | | | (2,018,291 | ) | |
| CAPITAL SHARE TRANSACTIONS (NOTE 4): | |
| Net proceeds from sale of shares | | | 3,033,563 | | | | 8,131,915 | | | | 5,489,917 | | | | 10,483,014 | | | | 21,862,461 | | | | 46,027,147 | | |
| Dividends reinvested | | | 5,978,084 | | | | 6,213,327 | | | | 418,640 | | | | 318,876 | | | | 2,520,892 | | | | 2,018,291 | | |
| Cost of shares redeemed | | | (29,607,363 | ) | | | (25,046,841 | ) | | | (2,929,906 | ) | | | (5,341,171 | ) | | | (5,197,282 | ) | | | (25,703,974 | ) | |
NET INCREASE (DECREASE) IN NET ASSETS
FROM CAPITAL SHARE TRANSACTIONS | | | (20,595,716 | ) | | | (10,701,599 | ) | | | 2,978,651 | | | | 5,460,719 | | | | 19,186,071 | | | | 22,341,464 | | |
| INCREASE (DECREASE) IN NET ASSETS | | | (24,783,040 | ) | | | (1,485,146 | ) | | | 2,810,852 | | | | 5,467,216 | | | | 18,793,229 | | | | 22,631,042 | | |
| NET ASSETS, BEGINNING OF YEAR | | | 257,148,423 | | | | 258,633,569 | | | | 8,359,894 | | | | 2,892,678 | | | | 37,450,697 | | | | 14,819,655 | | |
| NET ASSETS, END OF YEAR | | $ | 232,365,383 | | | $ | 257,148,423 | | | $ | 11,170,746 | | | $ | 8,359,894 | | | $ | 56,243,926 | | | $ | 37,450,697 | | |
| OTHER INFORMATION: | |
| Shares outstanding at the beginning of year | | | 176,457,672 | | | | 184,087,307 | | | | 8,204,622 | | | | 2,857,375 | | | | 33,766,624 | | | | 13,680,002 | | |
| Shares issued | | | 2,056,025 | | | | 5,739,708 | | | | 5,367,888 | | | | 10,273,163 | | | | 19,296,576 | | | | 41,361,548 | | |
| Shares issued as reinvestment of dividends | | | 4,182,055 | | | | 4,391,212 | | | | 417,050 | | | | 322,695 | | | | 2,464,401 | | | | 1,877,391 | | |
| Shares redeemed | | | (20,712,780 | ) | | | (17,760,555 | ) | | | (2,855,090 | ) | | | (5,248,611 | ) | | | (4,647,460 | ) | | | (23,152,317 | ) | |
| Net increase (decrease) | | | (14,474,700 | ) | | | (7,629,635 | ) | | | 2,929,848 | | | | 5,347,247 | | | | 17,113,517 | | | | 20,086,622 | | |
| Shares outstanding at the end of year | | | 161,982,972 | | | | 176,457,672 | | | | 11,134,470 | | | | 8,204,622 | | | | 50,880,141 | | | | 33,766,624 | | |
| | | Aggressive
Allocation Fund | | Money Market Fund | | Short-Term
Bond Fund | |
| | | 2005 | | 2004 | | 2005 | | 2004 | | 2005 | | 2004 | |
| INCREASE (DECREASE) IN NET ASSETS: | |
| FROM OPERATIONS: | |
| Net investment income (loss) | | $ | 967,997 | | | $ | 591,931 | | | $ | 2,691,191 | | | $ | 823,870 | | | $ | 864,493 | | | $ | 765,941 | | |
| Net realized gain (loss) on investments | | | 1,332,695 | | | | 997,371 | | | | (4 | ) | | | (1,539 | ) | | | (58,241 | ) | | | (32,919 | ) | |
| Unrealized appreciation (depreciation) of investments | | | 81,434 | | | | 636,330 | | | | (795 | ) | | | 49 | | | | (261,643 | ) | | | (265,873 | ) | |
NET INCREASE (DECREASE) IN NET ASSETS
RESULTING FROM OPERATIONS | | | 2,382,126 | | | | 2,225,632 | | | | 2,690,392 | | | | 822,380 | | | | 544,609 | | | | 467,149 | | |
| DIVIDEND DISTRIBUTIONS (Note 5) | |
| From net investment income | | | (817,301 | ) | | | (591,931 | ) | | | (2,660,081 | ) | | | (826,630 | ) | | | (867,443 | ) | | | (767,960 | ) | |
| From capital gains | | | (1,474,545 | ) | | | (1,041,552 | ) | | | — | | | | — | | | | — | | | | — | | |
| Total distributions | | | (2,291,846 | ) | | | (1,633,483 | ) | | | (2,660,081 | ) | | | (826,630 | ) | | | (867,443 | ) | | | (767,960 | ) | |
| CAPITAL SHARE TRANSACTIONS (Note 4): | |
| Net proceeds from sale of shares | | | 20,218,460 | | | | 25,756,150 | | | | 102,597,545 | | | | 43,158,736 | | | | 14,292,185 | | | | 9,885,481 | | |
| Dividends reinvested | | | 2,291,846 | | | | 1,633,483 | | | | 2,660,081 | | | | 826,630 | | | | 867,443 | | | | 767,960 | | |
| Cost of shares redeemed | | | (4,709,581 | ) | | | (9,574,761 | ) | | | (54,072,408 | ) | | | (39,220,075 | ) | | | (8,095,897 | ) | | | (7,402,225 | ) | |
NET INCREASE (DECREASE) IN NET ASSETS
FROM CAPITAL SHARE TRANSACTIONS | | | 17,800,725 | | | | 17,814,872 | | | | 51,185,218 | | | | 4,765,291 | | | | 7,063,731 | | | | 3,251,216 | | |
| INCREASE (DECREASE) IN NET ASSETS | | | 17,891,005 | | | | 18,407,021 | | | | 51,215,529 | | | | 4,761,041 | | | | 6,740,897 | | | | 2,950,405 | | |
| NET ASSETS, BEGINNING OF YEAR | | | 29,648,253 | | | | 11,241,232 | | | | 78,487,226 | | | | 73,726,185 | | | | 31,573,863 | | | | 28,623,458 | | |
| NET ASSETS, END OF YEAR | | $ | 47,539,258 | | | $ | 29,648,253 | | | $ | 129,702,755 | | | $ | 78,487,226 | | | $ | 38,314,760 | | | $ | 31,573,863 | | |
| OTHER INFORMATION: | |
| Shares outstanding at the beginning of year | | | 24,504,532 | | | | 9,637,346 | | | | 66,233,088 | | | | 65,253,629 | | | | 30,881,978 | | | | 27,741,809 | | |
| Shares issued | | | 16,358,834 | | | | 21,533,345 | | | | 85,220,056 | | | | 36,282,977 | | | | 13,879,887 | | | | 9,499,013 | | |
| Shares issued as reinvestment of dividends | | | 2,022,596 | | | | 1,391,525 | | | | 2,225,659 | | | | 697,368 | | | | 854,219 | | | | 750,595 | | |
| Shares redeemed | | | (3,853,193 | ) | | | (8,057,684 | ) | | | (45,165,302 | ) | | | (33,000,886 | ) | | | (7,868,037 | ) | | | (7,109,439 | ) | |
| Net increase (decrease) | | | 14,528,237 | | | | 14,867,186 | | | | 42,280,413 | | | | 3,979,459 | | | | 6,866,069 | | | | 3,140,169 | | |
| Shares outstanding at the end of year | | | 39,032,769 | | | | 24,504,532 | | | | 108,513,501 | | | | 66,233,088 | | | | 37,748,047 | | | | 30,881,978 | | |
The accompanying notes are an integral part of these financial statements.
60
MUTUAL OF AMERICA INVESTMENT CORPORATION
STATEMENTS OF CHANGES IN NET ASSETS (Continued)
For the Years Ended December 31,
| | | Mid-Term
Bond Fund | |
Bond Fund | |
| | | 2005 | | 2004 | | 2005 | | 2004 | |
| INCREASE (DECREASE) IN NET ASSETS: | |
| FROM OPERATIONS: | |
| Net investment income (loss) | | $ | 2,362,121 | | | $ | 2,284,280 | | | $ | 16,385,320 | | | $ | 15,628,792 | | |
| Net realized gain (loss) on investments | | | (338,934 | ) | | | 227,112 | | | | (826,477 | ) | | | 762,481 | | |
| Unrealized appreciation (depreciation) of investments | | | (1,517,652 | ) | | | (889,302 | ) | | | (8,811,420 | ) | | | (304,025 | ) | |
| NET INCREASE (DECREASE) IN NET ASSETS RESULTING FROM OPERATIONS | | | 505,535 | | | | 1,622,090 | | | | 6,747,423 | | | | 16,087,248 | | |
| DIVIDEND DISTRIBUTIONS (NOTE 5) | |
| From net investment income | | | (2,313,748 | ) | | | (2,301,912 | ) | | | (16,217,492 | ) | | | (15,850,366 | ) | |
| From capital gains | | | — | | | | (288,913 | ) | | | — | | | | — | | |
| Total distributions | | | (2,313,748 | ) | | | (2,590,825 | ) | | | (16,217,492 | ) | | | (15,850,366 | ) | |
| CAPITAL SHARE TRANSACTIONS (NOTE 4): | |
| Net proceeds from sale of shares | | | 11,365,816 | | | | 28,518,548 | | | | 46,628,254 | | | | 71,651,883 | | |
| Dividends reinvested | | | 2,313,748 | | | | 2,590,825 | | | | 16,217,492 | | | | 15,850,366 | | |
| Cost of shares redeemed | | | (13,640,196 | ) | | | (31,569,505 | ) | | | (53,568,712 | ) | | | (67,561,068 | ) | |
| NET INCREASE (DECREASE) IN NET ASSETS FROM CAPITAL SHARE TRANSACTIONS | | | 39,368 | | | | (460,132 | ) | | | 9,277,034 | | | | (19,941,181 | ) | |
| INCREASE (DECREASE) IN NET ASSETS | | | (1,768,845 | ) | | | (1,428,867 | ) | | | (193,035 | ) | | | 20,178,063 | | |
| NET ASSETS, BEGINNING OF YEAR | | | 73,212,099 | | | | 74,640,966 | | | | 369,027,810 | | | | 348,849,747 | | |
| NET ASSETS, END OF YEAR | | $ | 71,443,254 | | | $ | 73,212,099 | | | $ | 368,834,775 | | | $ | 369,027,810 | | |
| OTHER INFORMATION: | |
| Shares outstanding at the beginning of year | | | 77,501,724 | | | | 77,940,160 | | | | 285,870,568 | | | | 270,545,154 | | |
| Shares issued | | | 12,004,896 | | | | 29,502,800 | | | | 35,969,954 | | | | 54,391,826 | | |
| Shares issued as reinvestment of dividends | | | 2,511,834 | | | | 2,740,255 | | | | 12,909,763 | | | | 12,273,170 | | |
| Shares redeemed | | | (14,458,777 | ) | | | (32,681,491 | ) | | | (41,142,664 | ) | | | (51,339,582 | ) | |
| Net increase (decrease) | | | 57,953 | | | | (438,436 | ) | | | 7,737,053 | | | | 15,325,414 | | |
| Shares outstanding at the end of year | | | 77,559,677 | | | | 77,501,724 | | | | 293,607,621 | | | | 285,870,568 | | |
The accompanying notes are an integral part of these financial statements.
61
MUTUAL OF AMERICA INVESTMENT CORPORATION
FINANCIAL HIGHLIGHTS
Income from investment operations and distributions per share for a Fund share outstanding throughout each of the five years ended December 31, (or since the Fund's inception date if in existence less than five years) and other supplementary data with respect to each Fund are presented below and in the pages following:
| | | Equity Index Fund | |
| | | Years Ended December 31, | |
| | | 2005 | | 2004 | | 2003 | | 2002 | | 2001 | |
| Net Asset Value, Beginning of Year | | $ | 2.12 | | | $ | 1.95 | | | $ | 1.54 | | | $ | 2.02 | | | $ | 2.37 | | |
Income (Loss) From Investment Operations:
Net Investment Income | | | 0.04 | | | | 0.05 | | | | 0.03 | | | | 0.03 | | | | 0.03 | | |
| Net Realized and Unrealized Gains (Losses) on Securities | | | 0.06 | | | | 0.17 | | | | 0.41 | | | | (0.48 | ) | | | (0.31 | ) | |
| Total From Investment Operations | | | 0.10 | | | | 0.22 | | | | 0.44 | | | | (0.45 | ) | | | (0.28 | ) | |
Less Dividend Distributions:
From Net Investment Income | | | (0.03 | ) | | | (0.04 | ) | | | (0.03 | ) | | | (0.03 | ) | | | (0.03 | ) | |
| From Capital Gains | | | (0.05 | ) | | | (0.01 | ) | | | — | | | | — | | | | (0.04 | ) | |
| Total Distributions | | | (0.08 | ) | | | (0.05 | ) | | | (0.03 | ) | | | (0.03 | ) | | | (0.07 | ) | |
| Net Asset Value, End of Year | | $ | 2.14 | | | $ | 2.12 | | | $ | 1.95 | | | $ | 1.54 | | | $ | 2.02 | | |
| Total Return (%)(b) | | | 4.81 | | | | 10.69 | | | | 28.32 | | | | (22.14 | ) | | | (12.17 | ) | |
| Net Assets, End of Year ($ millions) | | | 726 | | | | 722 | | | | 618 | | | | 390 | | | | 464 | | |
| Ratio of Net Investment Income to Average Net Assets (%) | | | 1.76 | | | | 1.91 | | | | 1.65 | | | | 1.49 | | | | 1.24 | | |
| Ratio of Expenses to Average Net Assets Before Expense Reimbursement (%) | | | 0.24 | | | | 0.22 | | | | 0.21 | | | | 0.20 | | | | 0.22 | | |
| Ratio of Expenses to Average Net Assets After Expense Reimbursement (%) | | | 0.13 | | | | 0.13 | | | | 0.13 | | | | 0.13 | | | | 0.13 | | |
| Portfolio Turnover Rate (%)(a) | | | 9.36 | | | | 4.87 | | | | 0.89 | | | | 7.36 | | | | 10.06 | | |
| | | All America Fund | |
| | | Years Ended December 31, | |
| | | 2005 | | 2004 | | 2003 | | 2002 | | 2001 | |
| Net Asset Value, Beginning of Year | | $ | 2.05 | | | $ | 2.12 | | | $ | 1.60 | | | $ | 2.09 | | | $ | 2.54 | | |
Income (Loss) From Investment Operations:
Net Investment Income | | | 0.01 | | | | 0.02 | | | | 0.01 | | | | 0.03 | | | | 0.02 | | |
| Net Realized and Unrealized Gains (Losses) on Securities | | | 0.06 | | | | 0.15 | | | | 0.52 | | | | (0.50 | ) | | | (0.46 | ) | |
| Total From Investment Operations | | | 0.07 | | | | 0.17 | | | | 0.53 | | | | (0.47 | ) | | | (0.44 | ) | |
Less Dividend Distributions:
From Net Investment Income | | | (0.01 | ) | | | (0.02 | ) | | | (0.01 | ) | | | (0.02 | ) | | | (0.01 | ) | |
| From Capital Gains | | | (0.17 | ) | | | (0.22 | ) | | | — | | | | — | | | | — | | |
| Total Distributions | | | (0.18 | ) | | | (0.24 | ) | | | (0.01 | ) | | | (0.02 | ) | | | (0.01 | ) | |
| Net Asset Value, End of Year | | $ | 1.94 | | | $ | 2.05 | | | $ | 2.12 | | | $ | 1.60 | | | $ | 2.09 | | |
| Total Return (%)(b) | | | 3.71 | | | | 8.23 | | | | 33.01 | | | | (22.38 | ) | | | (17.38 | ) | |
| Net Assets, End of Year ($ millions) | | | 407 | | | | 458 | | | | 492 | | | | 421 | | | | 604 | | |
| Ratio of Net Investment Income to Average Net Assets (%) | | | 1.17 | | | | 1.16 | | | | 0.84 | | | | 0.80 | | | | 0.70 | | |
| Ratio of Expenses to Average Net Assets Before Expense Reimbursement (%) | | | 0.64 | | | | 0.62 | | | | 0.61 | | | | 0.58 | | | | 0.59 | | |
| Ratio of Expenses to Average Net Assets After Expense Reimbursement (%) | | | 0.50 | | | | 0.50 | | | | 0.50 | | | | 0.50 | | | | 0.50 | | |
| Portfolio Turnover Rate (%)(a) | | | 48.00 | | | | 53.03 | | | | 76.73 | | | | 85.27 | | | | 75.93 | | |
(a) Portfolio turnover rate excludes all short-term securities.
(b) Total return would have been lower had non-investment advisory expenses not been reduced through expense reimbursement (Note 2).
The accompanying notes are an integral part of these financial statements.
62
MUTUAL OF AMERICA INVESTMENT CORPORATION
FINANCIAL HIGHLIGHTS (Continued)
| | | Small Cap
Value Fund | | Small Cap
Growth Fund | | Mid Cap
Value Fund | |
| | | Period
Ended
December 31,
2005(e) | | Period
Ended
December 31,
2005(e) | | Period
Ended
December 31,
2005(e) | |
| Net Asset Value, Beginning of Period | | $ | 1.00 | | | $ | 1.00 | | | $ | 1.00 | | |
Income From Investment Operations:
Net Investment Income | | | 0.01 | | | | — | | | | 0.01 | | |
| Net Realized and Unrealized Gains on Securities | | | 0.07 | | | | 0.06 | | | | 0.06 | | |
| Total From Investment Operations | | | 0.08 | | | | 0.06 | | | | 0.07 | | |
Less Dividend Distributions:
From Net Investment Income | | | (0.01 | ) | | | — | | | | (0.01 | ) | |
| From Capital Gains | | | — | | | | — | | | | — | | |
| Total Distributions | | | (0.01 | ) | | | — | | | | (0.01 | ) | |
| Net Asset Value, End of Period | | $ | 1.07 | | | $ | 1.06 | | | $ | 1.06 | | |
| Total Return (%) | | | 7.61 | (c) | | | 5.49 | (c) | | | 6.91 | (c) | |
| Net Assets, End of Period ($ millions) | | | 34 | | | | 24 | | | | 11 | | |
| Ratio of Net Investment Income to Average Net Assets (%) | | | 1.19 | (d) | | | 0.00 | (d) | | | 1.76 | (d) | |
| Ratio of Expenses to Average Net Assets Before Expense Reimbursement (%) | | | 0.96 | (d) | | | 0.95 | (d) | | | 0.75 | (d) | |
| Ratio of Expenses to Average Net Assets After Expense Reimbursement (%) | | | 0.84 | (d) | | | 0.83 | (d) | | | 0.62 | (d) | |
| Portfolio Turnover Rate (%)(a) | | | 32.67 | (c) | | | 64.38 | (c) | | | 14.39 | (c) | |
| | | Mid-Cap Equity Index Fund | |
| | | Years Ended December 31, | |
| | | 2005 | | 2004 | | 2003 | | 2002 | | 2001 | |
| Net Asset Value, Beginning of Year | | $ | 1.46 | | | $ | 1.30 | | | $ | 0.97 | | | $ | 1.16 | | | $ | 1.21 | | |
Income (Loss) From Investment Operations:
Net Investment Income | | | 0.02 | | | | 0.01 | | | | 0.01 | | | | 0.01 | | | | 0.01 | | |
| Net Realized and Unrealized Gains (Losses) on Securities | | | 0.16 | | | | 0.19 | | | | 0.33 | | | | (0.18 | ) | | | (0.03 | ) | |
| Total From Investment Operations | | | 0.18 | | | | 0.20 | | | | 0.34 | | | | (0.17 | ) | | | (0.02 | ) | |
Less Dividend Distributions:
From Net Investment Income | | | (0.02 | ) | | | (0.01 | ) | | | (0.01 | ) | | | — | | | | (0.01 | ) | |
| From Capital Gains | | | (0.09 | ) | | | (0.03 | ) | | | — | | | | (0.02 | ) | | | (0.02 | ) | |
| Total Distributions | | | (0.11 | ) | | | (0.04 | ) | | | (0.01 | ) | | | (0.02 | ) | | | (0.03 | ) | |
| Net Asset Value, End of Year | | $ | 1.53 | | | $ | 1.46 | | | $ | 1.30 | | | $ | 0.97 | | | $ | 1.16 | | |
| Total Return (%)(b) | | | 12.50 | | | | 16.28 | | | | 35.23 | | | | (15.24 | ) | | | (1.06 | ) | |
| Net Assets, End of Year ($ millions) | | | 358 | | | | 295 | | | | 217 | | | | 114 | | | | 112 | | |
| Ratio of Net Investment Income to Average Net Assets (%) | | | 1.37 | | | | 1.08 | | | | 1.06 | | | | 1.00 | | | | 1.13 | | |
| Ratio of Expenses to Average Net Assets Before Expense Reimbursement (%) | | | 0.25 | | | | 0.24 | | | | 0.22 | | | | 0.25 | | | | 0.25 | | |
| Ratio of Expenses to Average Net Assets After Expense Reimbursement (%) | | | 0.13 | | | | 0.13 | | | | 0.13 | | | | 0.13 | | | | 0.13 | | |
| Portfolio Turnover Rate (%)(a) | | | 18.65 | | | | 15.73 | | | | 7.87 | | | | 28.11 | | | | 34.78 | | |
(a) Portfolio turnover rate excludes all short-term securities.
(b) Total return would have been lower had non-investment advisory expenses not been reduced through expense reimbursement (Note 2).
(c) Not annualized.
(d) Annualized.
(e) Commenced operations July 1, 2005.
The accompanying notes are an integral part of these financial statements.
63
MUTUAL OF AMERICA INVESTMENT CORPORATION
FINANCIAL HIGHLIGHTS (Continued)
| | | Aggressive Equity Fund | |
| | | Years Ended December 31, | |
| | | 2005 | | 2004 | | 2003 | | 2002 | | 2001 | |
| Net Asset Value, Beginning of Year | | $ | 1.76 | | | $ | 1.73 | | | $ | 1.24 | | | $ | 1.56 | | | $ | 1.76 | | |
Income (Loss) From Investment Operations:
Net Investment Income (Loss) | | | 0.01 | | | | — | | | | (0.01 | ) | | | — | | | | — | | |
| Net Realized and Unrealized Gains (Losses) on Securities | | | 0.09 | | | | 0.10 | | | | 0.50 | | | | (0.32 | ) | | | (0.19 | ) | |
| Total From Investment Operations | | | 0.10 | | | | 0.10 | | | | 0.49 | | | | (0.32 | ) | | | (0.19 | ) | |
Less Dividend Distributions:
From Net Investment Income | | | — | | | | — | | | | — | | | | — | | | | (0.01 | ) | |
| From Capital Gains | | | (0.02 | ) | | | (0.07 | ) | | | — | | | | — | | | | — | | |
| Total Distributions | | | (0.02 | ) | | | (0.07 | ) | | | — | | | | — | | | | (0.01 | ) | |
| Net Asset Value, End of Year | | $ | 1.84 | | | $ | 1.76 | | | $ | 1.73 | | | $ | 1.24 | | | $ | 1.56 | | |
| Total Return (%)(b) | | | 5.73 | | | | 5.42 | | | | 39.37 | | | | (20.46 | ) | | | (10.62 | ) | |
| Net Assets, End of Year ($ millions) | | | 323 | | | | 374 | | | | 371 | | | | 238 | | | | 295 | | |
| Ratio of Net Investment Income to Average Net Assets (%) | | | 0.24 | | | | (0.12 | ) | | | (0.48 | ) | | | (0.13 | ) | | | 0.18 | | |
| Ratio of Expenses to Average Net Assets Before Expense Reimbursement (%) | | | 0.96 | | | | 0.95 | | | | 0.94 | | | | 0.92 | | | | 0.94 | | |
| Ratio of Expenses to Average Net Assets After Expense Reimbursement (%) | | | 0.85 | | | | 0.85 | | | | 0.85 | | | | 0.85 | | | | 0.85 | | |
| Portfolio Turnover Rate (%)(a) | | | 68.55 | | | | 144.47 | | | | 200.77 | | | | 204.53 | | | | 221.49 | | |
| | | Composite Fund | |
| | | Years Ended December 31, | |
| | | 2005 | | 2004 | | 2003 | | 2002 | | 2001 | |
| Net Asset Value, Beginning of Year | | $ | 1.46 | | | $ | 1.40 | | | $ | 1.22 | | | $ | 1.37 | | | $ | 1.60 | | |
Income (Loss) From Investment Operations:
Net Investment Income | | | 0.04 | | | | 0.04 | | | | 0.03 | | | | 0.02 | | | | 0.06 | | |
| Net Realized and Unrealized Gains (Losses) on Securities | | | (0.03 | ) | | | 0.06 | | | | 0.18 | | | | (0.13 | ) | | | (0.23 | ) | |
| Total From Investment Operations | | | 0.01 | | | | 0.10 | | | | 0.21 | | | | (0.11 | ) | | | (0.17 | ) | |
Less Dividend Distributions:
From Net Investment Income | | | (0.04 | ) | | | (0.04 | ) | | | (0.03 | ) | | | (0.02 | ) | | | (0.04 | ) | |
| From Capital Gains | | | — | | | | — | | | | — | | | | (0.02 | ) | | | (0.02 | ) | |
| Total Distributions | | | (0.04 | ) | | | (0.04 | ) | | | (0.03 | ) | | | (0.04 | ) | | | (0.06 | ) | |
| Net Asset Value, End of Year | | $ | 1.43 | | | $ | 1.46 | | | $ | 1.40 | | | $ | 1.22 | | | $ | 1.37 | | |
| Total Return (%)(b) | | | 0.96 | | | | 6.34 | | | | 18.23 | | | | (7.51 | ) | | | (11.00 | ) | |
| Net Assets, End of Year ($ millions) | | | 232 | | | | 257 | | | | 259 | | | | 225 | | | | 272 | | |
| Ratio of Net Investment Income to Average Net Assets (%) | | | 2.48 | | | | 2.46 | | | | 2.59 | | | | 3.37 | | | | 3.64 | | |
| Ratio of Expenses to Average Net Assets Before Expense Reimbursement (%) | | | 0.63 | | | | 0.61 | | | | 0.63 | | | | 0.58 | | | | 0.59 | | |
| Ratio of Expenses to Average Net Assets After Expense Reimbursement (%) | | | 0.50 | | | | 0.50 | | | | 0.50 | | | | 0.50 | | | | 0.50 | | |
| Portfolio Turnover Rate (%)(a) | | | 93.84 | | | | 94.56 | | | | 177.43 | | | | 204.99 | | | | 248.42 | | |
(a) Portfolio turnover rate excludes all short-term securities.
(b) Total return would have been lower had non-investment advisory expenses not been reduced through expense reimbursement (Note 2).
The accompanying notes are an integral part of these financial statements.
64
MUTUAL OF AMERICA INVESTMENT CORPORATION
FINANCIAL HIGHLIGHTS (Continued)
| | | Conservative Allocation Fund | | Moderate Allocation Fund | | Aggressive Allocation Fund | |
| | | Years Ended December 31, | | Years Ended December 31, | | Years Ended December 31, | |
| | | 2005 | | 2004 | | 2003(f) | | 2005 | | 2004 | | 2003(f) | | 2005 | | 2004 | | 2003(f) | |
Net Asset Value, Beginning of
Year/Period | | $ | 1.02 | | | $ | 1.01 | | | $ | 1.00 | | | $ | 1.11 | | | $ | 1.08 | | | $ | 1.00 | | | $ | 1.21 | | | $ | 1.17 | | | $ | 1.00 | | |
Income From Investment Operations:
Net Investment Income | | | 0.03 | | | | 0.03 | | | | 0.01 | | | | 0.03 | | | | 0.03 | | | | 0.01 | | | | 0.02 | | | | 0.02 | | | | 0.03 | | |
Net Realized and Unrealized
Gains on Securities | | | (0.01 | ) | | | 0.02 | | | | 0.05 | | | | 0.02 | | | | 0.06 | | | | 0.11 | | | | 0.05 | | | | 0.09 | | | | 0.17 | | |
| Total From Investment Operations | | | 0.02 | | | | 0.05 | | | | 0.06 | | | | 0.05 | | | | 0.09 | | | | 0.12 | | | | 0.07 | | | | 0.11 | | | | 0.20 | | |
Less Dividend Distributions:
From Net Investment Income | | | (0.03 | ) | | | (0.03 | ) | | | (0.01 | ) | | | (0.03 | ) | | | (0.03 | ) | | | (0.01 | ) | | | (0.02 | ) | | | (0.03 | ) | | | (0.01 | ) | |
| From Capital Gains | | | (0.01 | ) | | | (0.01 | ) | | | (0.04 | ) | | | (0.02 | ) | | | (0.03 | ) | | | (0.03 | ) | | | (0.04 | ) | | | (0.04 | ) | | | (0.02 | ) | |
| Total Distributions | | | (0.04 | ) | | | (0.04 | ) | | | (0.05 | ) | | | (0.05 | ) | | | (0.06 | ) | | | (0.04 | ) | | | (0.06 | ) | | | (0.07 | ) | | | (0.03 | ) | |
| Net Asset Value, End of Year/Period | | $ | 1.00 | | | $ | 1.02 | | | $ | 1.01 | | | $ | 1.11 | | | $ | 1.11 | | | $ | 1.08 | | | $ | 1.22 | | | $ | 1.21 | | | $ | 1.17 | | |
| Total Return (%) | | | 2.30 | | | | 4.72 | | | | 5.32 | (c) | | | 4.35 | | | | 8.27 | | | | 11.73 | (c) | | | 5.78 | | | | 9.92 | | | | 19.27 | (c) | |
Net Assets, End of Year/Period
($ millions) | | | 11 | | | | 8 | | | | 3 | | | | 56 | | | | 37 | | | | 15 | | | | 48 | | | | 30 | | | | 11 | | |
Ratio of Expenses to Average
Net Assets (%)(e) | | | 0.00 | | | | 0.00 | | | | 0.00 | (d) | | | 0.00 | | | | 0.00 | | | | 0.00 | (d) | | | 0.00 | | | | 0.00 | | | | 0.00 | (d) | |
Ratio of Net Investment Income to
Average Net Assets (%) | | | 3.39 | | | | 4.51 | | | | 8.59 | (d) | | | 3.28 | | | | 3.81 | | | | 8.85 | (d) | | | 2.58 | | | | 2.98 | | | | 6.48 | (d) | |
| Portfolio Turnover Rate (%)(a) | | | 8.39 | | | | 92.83 | | | | 66.44 | (c) | | | 14.09 | | | | 99.27 | | | | 18.44 | (c) | | | 14.96 | | | | 48.24 | | | | 26.92 | (c) | |
| | | Money Market Fund | |
| | | Years Ended December 31, | |
| | | 2005 | | 2004 | | 2003 | | 2002 | | 2001 | |
| Net Asset Value, Beginning of Year | | $ | 1.19 | | | $ | 1.18 | | | $ | 1.19 | | | $ | 1.19 | | | $ | 1.20 | | |
Income From Investment Operations:
Net Investment Income | | | 0.04 | | | | 0.02 | | | | 0.01 | | | | 0.02 | | | | 0.07 | | |
| Net Realized and Unrealized Gains or (Losses) on Securities | | | — | | | | — | | | | (0.01 | ) | | | — | | | | (0.01 | ) | |
| Total From Investment Operations | | | 0.04 | | | | 0.02 | | | | — | | | | 0.02 | | | | 0.06 | | |
Less: Dividend Distributions:
From Net Investment Income | | | (0.03 | ) | | | (0.01 | ) | | | (0.01 | ) | | | (0.02 | ) | | | (0.07 | ) | |
| Total Distributions | | | (0.03 | ) | | | (0.01 | ) | | | (0.01 | ) | | | (0.02 | ) | | | (0.07 | ) | |
| Net Asset Value, End of Year | | $ | 1.20 | | | $ | 1.19 | | | $ | 1.18 | | | $ | 1.19 | | | $ | 1.19 | | |
| Total Return (%)(b) | | | 2.97 | | | | 1.10 | | | | 0.84 | | | | 1.45 | | | | 3.94 | | |
| Net Assets, End of Year ($ millions) | | | 130 | | | | 78 | | | | 74 | | | | 93 | | | | 94 | | |
| Ratio of Net Investment Income to Average Net Assets (%) | | | 3.05 | | | | 1.12 | | | | 0.90 | | | | 1.48 | | | | 4.12 | | |
| Ratio of Expenses to Average Net Assets Before Expense Reimbursement (%) | | | 0.38 | | | | 0.38 | | | | 0.38 | | | | 0.33 | | | | 0.35 | | |
| Ratio of Expenses to Average Net Assets After Expense Reimbursement (%) | | | 0.25 | | | | 0.25 | | | | 0.25 | | | | 0.25 | | | | 0.25 | | |
| Portfolio Turnover Rate(a) | | | N/A | | | | N/A | | | | N/A | | | | N/A | | | | N/A | | |
(a) Portfolio turnover rate excludes all short-term securities.
(b) Total return would have been lower had non-investment advisory expenses not been reduced through expense reimbursement (Note 2).
(c) Not annualized.
(d) Annualized.
(e) Excludes expenses of the underlying funds.
(f) For the period May 20, 2003 (commencement of operations) through December 31, 2003.
N/A=Not Applicable.
The accompanying notes are an integral part of these financial statements.
65
MUTUAL OF AMERICA INVESTMENT CORPORATION
FINANCIAL HIGHLIGHTS (Continued)
| | | Short-Term Bond Fund | |
| | | Years Ended December 31, | |
| | | 2005 | | 2004 | | 2003 | | 2002 | | 2001 | |
| Net Asset Value, Beginning of Year | | $ | 1.02 | | | $ | 1.03 | | | $ | 1.05 | | | $ | 1.03 | | | $ | 1.01 | | |
Income From Investment Operations:
Net Investment Income | | | 0.02 | | | | 0.03 | | | | 0.04 | | | | 0.03 | | | | 0.06 | | |
| Net Realized and Unrealized Gains or (Losses) on Securities | | | — | | | | (0.01 | ) | | | (0.02 | ) | | | 0.02 | | | | 0.02 | | |
| Total From Investment Operations | | | 0.02 | | | | 0.02 | | | | 0.02 | | | | 0.05 | | | | 0.08 | | |
Less Dividend Distributions:
From Net Investment Income | | | (0.02 | ) | | | (0.03 | ) | | | (0.04 | ) | | | (0.03 | ) | | | (0.06 | ) | |
| From Capital Gains | | | — | | | | — | | | | — | | | | — | | | | — | | |
| Total Distributions | | | (0.02 | ) | | | (0.03 | ) | | | (0.04 | ) | | | (0.03 | ) | | | (0.06 | ) | |
| Net Asset Value, End of Year | | $ | 1.02 | | | $ | 1.02 | | | $ | 1.03 | | | $ | 1.05 | | | $ | 1.03 | | |
| Total Return (%)(b) | | | 1.58 | | | | 1.56 | | | | 1.74 | | | | 5.05 | | | | 7.45 | | |
| Net Assets, End of Year ($ millions) | | | 38 | | | | 32 | | | | 29 | | | | 38 | | | | 16 | | |
| Ratio of Net Investment Income to Average Net Assets (%) | | | 2.59 | | | | 2.57 | | | | 2.88 | | | | 4.19 | | | | 5.79 | | |
| Ratio of Expenses to Average Net Assets Before Expense Reimbursement (%) | | | 0.83 | | | | 0.83 | | | | 0.82 | | | | 0.79 | | | | 0.77 | | |
| Ratio of Expenses to Average Net Assets After Expense Reimbursement (%) | | | 0.50 | | | | 0.50 | | | | 0.50 | | | | 0.50 | | | | 0.50 | | |
| Portfolio Turnover Rate (%)(a) | | | 31.32 | | | | 31.87 | | | | 70.34 | | | | 38.75 | | | | 60.13 | | |
| | | Mid-Term Bond Fund | |
| | | Years Ended December 31, | |
| | | 2005 | | 2004 | | 2003 | | 2002 | | 2001 | |
| Net Asset Value, Beginning of Year | | $ | 0.94 | | | $ | 0.96 | | | $ | 0.98 | | | $ | 0.91 | | | $ | 0.85 | | |
Income From Investment Operations:
Net Investment Income | | | 0.03 | | | | 0.02 | | | | 0.03 | | | | 0.03 | | | | 0.03 | | |
| Net Realized and Unrealized Gains or (Losses) on Securities | | | (0.02 | ) | | | (0.01 | ) | | | — | | | | 0.07 | | | | 0.06 | | |
| Total From Investment Operations | | | 0.01 | | | | 0.01 | | | | 0.03 | | | | 0.10 | | | | 0.09 | | |
Less Dividend Distributions:
From Net Investment Income | | | (0.03 | ) | | | (0.03 | ) | | | (0.04 | ) | | | (0.03 | ) | | | (0.03 | ) | |
| From Capital Gains | | | — | | | | — | | | | (0.01 | ) | | | — | | | | — | | |
| Total Distributions | | | (0.03 | ) | | | (0.03 | ) | | | (0.05 | ) | | | (0.03 | ) | | | (0.03 | ) | |
| Net Asset Value, End of Year | | $ | 0.92 | | | $ | 0.94 | | | $ | 0.96 | | | $ | 0.98 | | | $ | 0.91 | | |
| Total Return (%)(b) | | | 0.77 | | | | 2.26 | | | | 2.76 | | | | 9.66 | | | | 10.44 | | |
| Net Assets, End of Year ($ millions) | | | 71 | | | | 73 | | | | 75 | | | | 88 | | | | 44 | | |
| Ratio of Net Investment Income to Average Net Assets (%) | | | 3.30 | | | | 3.25 | | | | 3.23 | | | | 4.11 | | | | 5.16 | | |
| Ratio of Expenses to Average Net Assets Before Expense Reimbursement (%) | | | 0.66 | | | | 0.65 | | | | 0.64 | | | | 0.62 | | | | 0.68 | | |
| Ratio of Expenses to Average Net Assets After Expense Reimbursement (%) | | | 0.50 | | | | 0.50 | | | | 0.50 | | | | 0.50 | | | | 0.50 | | |
| Portfolio Turnover Rate (%)(a) | | | 21.99 | | | | 27.23 | | | | 41.55 | | | | 106.79 | | | | 6.38 | | |
(a) Portfolio turnover rate excludes all short-term securities.
(b) Total return would have been lower had non-investment advisory expenses not been reduced through expense reimbursement (Note 2).
The accompanying notes are an integral part of these financial statements.
66
MUTUAL OF AMERICA INVESTMENT CORPORATION
FINANCIAL HIGHLIGHTS (Continued)
| | | Bond Fund | |
| | | Years Ended December 31, | |
| | | 2005 | | 2004 | | 2003 | | 2002 | | 2001 | |
| Net Asset Value, Beginning of Year | | $ | 1.29 | | | $ | 1.29 | | | $ | 1.27 | | | $ | 1.30 | | | $ | 1.31 | | |
Income From Investment Operations:
Net Investment Income | | | 0.06 | | | | 0.06 | | | | 0.07 | | | | 0.09 | | | | 0.13 | | |
| Net Realized and Unrealized Gains or (Losses) on Securities | | | (0.03 | ) | | | — | | | | 0.02 | | | | (0.01 | ) | | | (0.01 | ) | |
| Total From Investment Operations | | | 0.03 | | | | 0.06 | | | | 0.09 | | | | 0.08 | | | | 0.12 | | |
Less Dividend Distributions:
From Net Investment Income | | | (0.06 | ) | | | (0.06 | ) | | | (0.07 | ) | | | (0.08 | ) | | | (0.13 | ) | |
| From Capital Gains | | | — | | | | — | | | | — | | | | (0.03 | ) | | | — | | |
| Total Distributions | | | (0.06 | ) | | | (0.06 | ) | | | (0.07 | ) | | | (0.11 | ) | | | (0.13 | ) | |
| Net Asset Value, End of Year | | $ | 1.26 | | | $ | 1.29 | | | $ | 1.29 | | | $ | 1.27 | | | $ | 1.30 | | |
| Total Return (%)(b) | | | 1.79 | | | | 4.61 | | | | 6.73 | | | | 6.75 | | | | 8.73 | | |
| Net Assets, End of Year ($ millions) | | | 369 | | | | 369 | | | | 349 | | | | 437 | | | | 404 | | |
| Ratio of Net Investment Income to Average Net Assets (%) | | | 4.30 | | | | 4.44 | | | | 5.10 | | | | 6.38 | | | | 7.19 | | |
| Ratio of Expenses to Average Net Assets Before Expense Reimbursement (%) | | | 0.61 | | | | 0.59 | | | | 0.60 | | | | 0.57 | | | | 0.58 | | |
| Ratio of Expenses to Average Net Assets After Expense Reimbursement (%) | | | 0.50 | | | | 0.50 | | | | 0.50 | | | | 0.50 | | | | 0.50 | | |
| Portfolio Turnover Rate (%)(a) | | | 23.27 | | | | 35.12 | | | | 72.09 | | | | 76.91 | | | | 9.25 | | |
(a) Portfolio turnover rate excludes all short-term securities.
(b) Total return would have been lower had non-investment advisory expenses not been reduced through expense reimbursement (Note 2).
The accompanying notes are an integral part of these financial statements.
67
MUTUAL OF AMERICA INVESTMENT CORPORATION
NOTES TO FINANCIAL STATEMENTS
1. SIGNIFICANT ACCOUNTING POLICIES AND ORGANIZATION
Mutual of America Investment Corporation (the "Investment Company") is a diversified, open-end management investment company — a type of company commonly known as a "mutual fund". It is registered as such under the Investment Company Act of 1940 (the "Investment Company Act"). The Investment Company was formed on February 21, 1986 as a Maryland corporation and offers its shares exclusively to separate accounts of Mutual of America Life Insurance Company ("Mutual of America Life") and its affiliates. As a "series" type mutual fund, the Investment Company issues separate classes (or series) of capital stock, each of which represents a separate Fund of investments. At December 31, 2005, there were fifteen Funds: Equity Index Fund, All America Fund, Small Cap Value Fund, Small Cap Growth Fund, Mid Cap Value Fund, Mid-Cap Equity Index Fund, Aggressive Equity Fund, Composite Fund, Money Market Fund, Short-Term Bond Fund, Mid-Term Bond Fund, B ond Fund; a Conservative Allocation Fund, a Moderate Allocation Fund and an Aggressive Allocation Fund (collectively "Allocation Funds"). The Small Cap Value Fund, Small Cap Growth Fund and the Mid Cap Value Fund began operations on July 1, 2005. The Allocation Funds began operations on May 20, 2003.
Investment Company shares are issued to Mutual of America Life, and on a limited basis, to The American Life Insurance Company of New York, for allocation to their Separate Accounts as a funding medium for variable accumulation annuity contracts and variable life insurance policies. In addition, shares of selected equity and fixed income funds of the Investment Company are directly issued to one or more of the Investment Company's Allocation Funds.
The preparation of financial statements in accordance with accounting principles generally accepted in the United States of America may require management to make estimates and assumptions that affect the reported amounts of assets, liabilities, income, expenses and related disclosures. Actual results, however, may differ from those estimates.
The following is a summary of the significant accounting policies consistently followed by the Investment Company, which are in conformity with accounting principles generally accepted in the United States:
Security Valuation — Investment securities are valued as follows:
Equity securities are valued at the last sales price on the principal exchange on which the security is traded. If there is no trading volume for a particular valuation day, the last bid price is used. For any equity securities traded in the over-the-counter market, the security is valued at the last sale price, or if no sale, at the latest bid price available.
The Allocation Funds value their investments in the underlying Funds of the Investment Company at their respective net asset values.
Debt securities are valued on the basis of prices obtained from an independent pricing service. The pricing service may utilize various pricing methodologies that incorporate both dealer supplied valuations and analytical modeling techniques which consider factors such as yield, quality, coupon rate, maturity, issue type, broker quotes and trading characteristics to derive a valuation. In the rare instance when such a price is not available from an independent pricing service, a fair value is used, as determined in good faith by the Adviser, in accordance with procedures adopted by the Board of Directors of the Investment Company.
Short-term debt investments with a maturity of 60 days or less are valued at amortized cost, which approximates market value. Short-term debt securities which mature in more than 60 days are stated at market value.
Investment Transactions — Investment transactions are accounted for as of the trade date. Realized gains and losses on the sale of short and long-term debt securities are computed on the basis of amortized cost at the time of sale. Realized gains and losses on the sale of stock are based on the identified cost basis of the security, determined on the first-in, first-out ("FIFO") basis.
Equity-type funds with an indexed portfolio component may, in order to remain more fully invested in the equity markets while minimizing transaction costs, purchase stock index futures contracts. Initial cash margin deposits (represented by cash or Treasury bills) are made upon entering into futures contracts. (This initial margin, maintained in a segregated account, is equal to approximately 5%-6% of the contract amount, and does not involve the borrowing of funds to finance the transaction.) During the period the futures contract is outstanding, changes in the value of the contract are recognized as unrealized gains or losses by "marking-to-market" on a daily basis to reflect the market value of the contract at the end of each trading day. Futures contracts are valued at the settlement price established each day by the exchange on which traded. Depending upon whether unrealized gains or losses are incurred, variation margin payments are re ceived or made. When the contract is closed, a realized gain or loss from futures transactions is recorded, equal to the net variation margin received or paid over the period the contract was outstanding. The "Underlying Face Amount at Value" (appearing in the "Summary Portfolio of Investments in Securities")
68
MUTUAL OF AMERICA INVESTMENT CORPORATION
NOTES TO FINANCIAL STATEMENTS (Continued)
1. SIGNIFICANT ACCOUNTING POLICIES AND ORGANIZATION (CONTINUED)
representing the aggregate of outstanding contractual amounts under futures contracts reflects the extent of a Fund's exposure to off-balance sheet risk. The use of futures transactions involves the risk of imperfect correlation in the price movements of the contract and the underlying securities.
Each of the Allocation Funds invests in equity (stock) funds and fixed income (bond) funds and targets different percentages to these asset classes. The targets reflect three different approaches to asset allocation based on risk tolerance.
The Allocation Funds invest in the following underlying funds of the Investment Company in accordance with the percentage allocations noted:
| Conservative Allocation: | | Equity Index (25%), Bond (30%), | |
|
| | | Mid-Term Bond (30%), Short-Term Bond (15%). | |
|
| Moderate Allocation: | | Equity Index (35%), Bond (30%), | |
|
| | | Mid-Term Bond (20%), Mid-Cap Equity Index (15%). | |
|
| Aggressive Allocation: | | Equity Index (45%), Bond (25%), | |
|
| | | Mid-Cap Equity Index (20%), Aggressive Equity (10%). | |
|
Generally, rebalancing of the Allocation Funds' holdings are performed on a monthly basis.
Investment Income — Interest income, accretion of discount and amortization of premium are recorded daily on an accrual basis. A debt obligation may cease accrual of income and result in a reduction to interest income when the collection of all or a portion of current and past due interest is in doubt. Dividend income is recorded on the ex-dividend date. Foreign source tax withheld from dividends is recorded as a reduction from dividend income. Should reclamation efforts succeed, such amounts are recorded as income upon collection.
Distributions to Shareholders ("Dividends") — Distributions to shareholders are recorded on the ex-dividend date. It is the Investment Company's policy to make distributions of its net investment income and to distribute net realized gains, if any, on an annual basis, in accordance with Federal income tax regulations, which may differ from accounting principles generally accepted in the United States of America. Accordingly, periodic reclassifications (which do not impact the funds' net asset values) are made within the funds' capital accounts to reflect income and gains available for distribution under federal income tax regulations.
Federal Income Taxes — Each Fund in the Investment Company intends to comply with the requirements of the Internal Revenue Code applicable to regulated investment companies and to distribute substantially all of its taxable income to shareholders. Therefore, no Federal income or excise tax provision is required.
At December 31, 2005, the Funds had the following capital loss carryforwards to offset net capital gains, to the extent provided by Federal income tax regulations. In addition, the Small Cap Growth Fund, Composite Fund, Mid-Term Bond Fund and the Bond Fund generated post-October 2005 net capital losses of $24,992, $209,348, $176,167 and $451,742, respectively, which if unused will expire on December 31, 2014.
| Expiring on December 31, | | Equity
Index Fund | | All America
Fund | | Small Cap
Value Fund | | Small Cap
Growth Fund | | Mid Cap
Value Fund | |
| | 2006 | | | $ | 0 | | | $ | 0 | | | $ | 0 | | | $ | 0 | | | $ | 0 | | |
| | 2007 | | | | 0 | | | | 0 | | | | 0 | | | | 0 | | | | 0 | | |
| | 2008 | | | | 0 | | | | 0 | | | | 0 | | | | 0 | | | | 0 | | |
| | 2009 | | | | 0 | | | | 0 | | | | 0 | | | | 0 | | | | 0 | | |
| | 2010 | | | | 0 | | | | 0 | | | | 0 | | | | 0 | | | | 0 | | |
| | 2011 | | | | 0 | | | | 0 | | | | 0 | | | | 0 | | | | 0 | | |
| | 2012 | | | | 0 | | | | 0 | | | | 0 | | | | 0 | | | | 0 | | |
| | 2013 | | | | 0 | | | | 0 | | | | 0 | | | | 487,369 | | | | 0 | | |
| | Total | | | $ | 0 | | | $ | 0 | | | $ | 0 | | | $ | 487,369 | | | $ | 0 | | |
69
MUTUAL OF AMERICA INVESTMENT CORPORATION
NOTES TO FINANCIAL STATEMENTS (Continued)
1. SIGNIFICANT ACCOUNTING POLICIES AND ORGANIZATION (CONTINUED)
| Expiring on December 31, | | Mid-Cap
Equity Index
Fund | | Aggressive
Equity Fund | | Composite
Fund | | Conservative
Allocation
Fund | | Moderate
Allocation
Fund | |
| | 2006 | | | $ | 0 | | | $ | 0 | | | $ | 0 | | | $ | 0 | | | $ | 0 | | |
| | 2007 | | | | 0 | | | | 0 | | | | 0 | | | | 0 | | | | 0 | | |
| | 2008 | | | | 0 | | | | 0 | | | | 0 | | | | 0 | | | | 0 | | |
| | 2009 | | | | 0 | | | | 0 | | | | 24,794,693 | | | | 0 | | | | 0 | | |
| | 2010 | | | | 0 | | | | 0 | | | | 20,417,938 | | | | 0 | | | | 0 | | |
| | 2011 | | | | 0 | | | | 0 | | | | 0 | | | | 0 | | | | 0 | | |
| | 2012 | | | | 0 | | | | 0 | | | | 0 | | | | 0 | | | | 0 | | |
| | 2013 | | | | 0 | | | | 0 | | | | 0 | | | | 0 | | | | 0 | | |
| | Total | | | $ | 0 | | | $ | 0 | | | $ | 45,212,631 | | | $ | 0 | | | $ | 0 | | |
| Expiring on December 31, | | Aggressive
Allocation
Fund | | Money
Market
Fund | | Short-Term
Bond Fund | | Mid-Term
Bond Fund | | Bond Fund | |
| | 2006 | | | $ | 0 | | | $ | 2,238 | | | $ | 0 | | | $ | 0 | | | $ | 0 | | |
| | 2007 | | | | 0 | | | | 1,434 | | | | 73,348 | | | | 0 | | | | 0 | | |
| | 2008 | | | | 0 | | | | 5,103 | | | | 101 | | | | 0 | | | | 0 | | |
| | 2009 | | | | 0 | | | | 0 | | | | 0 | | | | 0 | | | | 0 | | |
| | 2010 | | | | 0 | | | | 295 | | | | 0 | | | | 0 | | | | 0 | | |
| | 2011 | | | | 0 | | | | 0 | | | | 111,136 | | | | 0 | | | | 23,117,159 | | |
| | 2012 | | | | 0 | | | | 1,539 | | | | 56,820 | | | | 0 | | | | 171,798 | | |
| | 2013 | | | | 0 | | | | 4 | | | | 58,241 | | | | 162,767 | | | | 439,879 | | |
| | Total | | | $ | 0 | | | $ | 10,613 | | | $ | 299,646 | | | $ | 162,767 | | | $ | 23,728,836 | | |
2. EXPENSES
The Investment Company has an Investment Advisory Agreement with Mutual of America Capital Management Corporation ("the Adviser"), an indirect wholly-owned subsidiary of Mutual of America Life. For providing investment management services to each of the Funds of the Investment Company, the Adviser receives a fee, calculated as a daily charge, at the annual rate of .125% of the value of the net assets of the Equity Index Fund and the Mid-Cap Equity Index Fund,.25% of the value of the net assets of the Money Market Fund, .50% of the value of the net assets of the All America Fund, Composite Fund, Short-Term Bond Fund, Mid-Term Bond Fund and Bond Fund, .65% of the value of the net assets of the Mid Cap Value Fund and .85% of the value of the net assets of the Aggressive Equity Fund, Small Cap Value Fund and Small Cap Growth Fund. The Adviser does not assess a fee for investment management to the Allocation Funds. However, shareholders in the Al location Funds will indirectly bear their pro-rata share of the investment management fees incurred by the underlying Funds in which they invest. See Note 6 for information regarding a reduction to the investment management fees, effective May 1, 2006.
Under a Sub-Advisory Agreement for the All America Fund, through July 27, 2005 the Adviser delegated investment advisory responsibilities to a subadviser responsible for providing management services for a portion of the Fund's assets. The Adviser (not the Fund) was responsible for compensation payable under such Sub-Advisory Agreement.
The Adviser contractually limits the expenses of each Fund, other than for brokers' commissions and other fees relating to portfolio transactions, to the amount of the advisory fee paid by the Funds to the Adviser. On December 30, 2005, the Adviser gave notice to the Investment Company that it will terminate its expense limitation policy effective May 1, 2006.
70
MUTUAL OF AMERICA INVESTMENT CORPORATION
NOTES TO FINANCIAL STATEMENTS (Continued)
3. PURCHASES AND SALES
The cost of investment purchases and proceeds from sales of investments, excluding short-term securities and futures contracts, for the year ended December 31, 2005 (for the period July 1, 2005 [commencement of operations] through December 31, 2005 for the Small Cap Value Fund, Small Cap Growth Fund and Mid Cap Value Fund) were as follows:
| | | Equity Index
Fund | | All America
Fund | | Small Cap
Value Fund | | Small Cap
Growth | | Mid Cap
Value Fund | |
| Cost of investment purchases | | $ | 65,209,063 | | | $ | 197,016,669 | | | $ | 40,750,523 | | | $ | 34,424,922 | | | $ | 11,650,120 | | |
| Proceeds from sales of investments | | $ | 65,783,456 | | | $ | 252,342,487 | | | $ | 9,067,514 | | | $ | 12,448,093 | | | $ | 1,161,712 | | |
| | | Mid-Cap
Equity Index
Fund | | Aggressive
Equity Fund | | Composite
Fund | | Conservative
Allocation
Fund | | Moderate
Allocation
Fund | |
| Cost of investment purchases | | $ | 91,689,700 | | | $ | 223,619,251 | | | $ | 221,262,131 | | | $ | 6,001,165 | | | $ | 25,540,573 | | |
| Proceeds from sales of investments | | $ | 55,726,980 | | | $ | 293,279,428 | | | $ | 246,006,421 | | | $ | 3,047,924 | | | $ | 6,505,196 | | |
| | | Aggressive
Allocation
Fund | | Money
Market
Fund | | Short-Term
Bond Fund | | Mid-Term
Bond Fund | | Bond
Fund | |
| Cost of investment purchases | | $ | 23,089,087 | | | $ | 0 | | | $ | 17,782,984 | | | $ | 17,104,642 | | | $ | 101,281,798 | | |
| Proceeds from sales of investments | | $ | 5,623,663 | | | $ | 0 | | | $ | 10,019,906 | | | $ | 15,329,356 | | | $ | 83,131,232 | | |
The cost of short-term security purchases for the Money Market Fund for the period was $2,501,679,863; net proceeds from sales and redemptions for the period were $2,452,377,783.
The components of net unrealized appreciation (depreciation) of investments for Federal income tax purposes and the cost of investments for Federal income tax purposes at December 31, 2005 for each of the funds were as follows. Differences with amounts reflected in the Statements of Assets and Liabilities arise principally from wash sales.
| | | Equity Index
Fund | | All America
Fund | | Small Cap
Value Fund | | Small Cap
Growth | | Mid Cap
Value Fund | |
| Unrealized Appreciation | | $ | 155,320,628 | | | $ | 84,937,532 | | | $ | 1,871,292 | | | $ | 1,602,864 | | | $ | 643,512 | | |
| Unrealized Depreciation | | | 65,264,141 | | | | 27,735,587 | | | | 1,582,525 | | | | 635,847 | | | | 203,909 | | |
| Net | | $ | 90,056,487 | | | $ | 57,201,945 | | | $ | 288,767 | | | $ | 967,017 | | | $ | 439,603 | | |
| Cost of Invesmtents | | $ | 635,431,578 | | | $ | 348,870,906 | | | $ | 33,443,904 | | | $ | 23,184,156 | | | $ | 10,736,410 | | |
| | | Mid-Cap
Equity Index
Fund | | Aggressive
Equity
Fund | | Composite
Fund | | Conservative
Allocation
Fund | | Moderate
Allocation
Fund | |
| Unrealized Appreciation | | $ | 74,229,275 | | | $ | 48,131,589 | | | $ | 12,220,874 | | | $ | 97,321 | | | $ | 1,316,439 | | |
| Unrealized Depreciation | | | 20,508,370 | | | | 8,431,530 | | | | 6,709,420 | | | | 311,169 | | | | 1,264,882 | | |
| Net | | $ | 53,720,905 | | | $ | 39,700,059 | | | $ | 5,511,454 | | | $ | (213,848 | ) | | $ | 51,557 | | |
| Cost of Invesmtents | | $ | 300,932,013 | | | $ | 281,771,600 | | | $ | 225,933,605 | | | $ | 11,384,594 | | | $ | 56,192,369 | | |
| | | Aggressive
Allocation
Fund | | Money
Market
Fund | | Short-Term
Bond Fund | | Mid-Term
Bond Fund | | Bond
Fund | |
| Unrealized Appreciation | | $ | 1,763,653 | | | $ | 0 | | | $ | 13,511 | | | $ | 56,382 | | | $ | 4,860,711 | | |
| Unrealized Depreciation | | | 580,984 | | | | 795 | | | | 520,645 | | | | 1,830,931 | | | | 9,371,302 | | |
| Net | | $ | 1,182,669 | | | $ | (795 | ) | | $ | (507,134 | ) | | $ | (1,774,549 | ) | | $ | (4,510,591 | ) | |
| Cost of Invesmtents | | $ | 46,356,589 | | | $ | 129,701,179 | | | $ | 38,761,338 | | | $ | 72,356,925 | | | $ | 370,387,752 | | |
71
MUTUAL OF AMERICA INVESTMENT CORPORATION
NOTES TO FINANCIAL STATEMENTS (Continued)
4. CAPITAL SHARE ACTIVITY
The Investment Company has registered an indefinite number of its capital shares pursuant to Rule 24f-2 under the Investment Company Act of 1940. As of December 31, 2005, shares authorized were allocated into the fifteen series of Funds as follows:
| | | Authorized No. of Shares | |
| Equity Index Fund | | | 500,000,000 | | |
| All America Fund | | | 500,000,000 | | |
| Small Cap Value Fund | | | 50,000,000 | | |
| Small Cap Growth Fund | | | 50,000,000 | | |
| Mid Cap Value Fund | | | 20,000,000 | | |
| Mid-Cap Equity Index Fund | | | 300,000,000 | | |
| Aggressive Equity Fund | | | 500,000,000 | | |
| Composite Fund | | | 300,000,000 | | |
| Conservative Allocation Fund | | | 100,000,000 | | |
| Moderate Allocation Fund | | | 100,000,000 | | |
| Aggressive Allocation Fund | | | 100,000,000 | | |
| Money Market Fund | | | 175,000,000 | | |
| Short-Term Bond Fund | | | 50,000,000 | | |
| Mid-Term Bond Fund | | | 125,000,000 | | |
| Bond Fund | | | 450,000,000 | | |
| Sub-Total | | | 3,320,000,000 | | |
| Shares to be allocated at the discretion of the Board of Directors | | | 180,000,000 | | |
| Total (See Note 6, "Subsequent Events") | | | 3,500,000,000 | | |
5. DIVIDENDS
On December 31, 2005, dividend distributions were declared and paid for each of the funds from net investment income and, as applicable, from net realized gains on investment transactions. Additionally, remaining required distributions relating to 2004 were made in accordance with Internal Revenue Sec. 855(a) and paid on September 15, 2005. Pursuant to shareholders' instructions, substantially all dividend distributions throughout 2005 and 2004 were immediately reinvested into their respective funds. The tax character of the distributions paid during 2005 and 2004 were as follows:
| | | Equity Index
Fund | | All America
Fund | | Small Cap
Value Fund | | Small Cap
Growth | | Mid Cap
Value Fund | |
| Ordinary Income (a) | | | |
| | 2005 | | | $ | 11,700,903 | | | $ | 2,609,110 | | | $ | 280,825 | | | $ | 0 | | | $ | 64,584 | | |
| | 2004 | | | $ | 12,302,210 | | | $ | 14,478,027 | | | | N/A | | | | N/A | | | | N/A | | |
| Long-Term Capital Gains (b) | | | |
| | 2005 | | | $ | 14,210,430 | | | $ | 32,280,063 | | | $ | 0 | | | $ | 0 | | | $ | 0 | | |
| | 2004 | | | $ | 2,583,414 | | | $ | 34,666,928 | | | | N/A | | | | N/A | | | | N/A | | |
| | | Mid-Cap
Equity Index
Fund | | Aggressive
Equity
Fund | | Composite
Equity Fund | | Conservative
Allocation
Fund | | Moderate
Allocation
Fund | |
| Ordinary Income (a) | | | |
| | 2005 | | | $ | 6,521,459 | | | $ | 0 | | | $ | 5,978,084 | | | $ | 350,757 | | | $ | 1,496,609 | | |
| | 2004 | | | $ | 2,781,048 | | | $ | 13,230,947 | | | $ | 6,213,327 | | | $ | 304,197 | | | $ | 1,870,967 | | |
| Long-Term Capital Gains (b) | | | |
| | 2005 | | | $ | 17,766,628 | | | $ | 3,277,393 | | | $ | 0 | | | $ | 67,883 | | | $ | 1,024,283 | | |
| | 2004 | | | $ | 6,002,608 | | | $ | 948,196 | | | $ | 0 | | | $ | 14,679 | | | $ | 147,324 | | |
72
MUTUAL OF AMERICA INVESTMENT CORPORATION
NOTES TO FINANCIAL STATEMENTS (Continued)
5. DIVIDENDS (CONTINUED)
| | | Aggressive
Allocation
Fund | | Money
Market
Fund | | Short-Term
Bond Fund | | Mid-Term
Bond Fund | | Bond
Fund | |
| Ordinary Income (a) | | | |
| | 2005 | | | $ | 954,523 | | | $ | 2,660,081 | | | $ | 867,443 | | | $ | 2,313,748 | | | $ | 16,217,492 | | |
| | 2004 | | | $ | 1,419,081 | | | $ | 826,630 | | | $ | 767,960 | | | $ | 2,396,579 | | | $ | 15,850,366 | | |
| Long-Term Capital Gains (b) | | | |
| | 2005 | | | $ | 1,337,323 | | | $ | 0 | | | $ | 0 | | | $ | 0 | | | $ | 0 | | |
| | 2004 | | | $ | 214,402 | | | $ | 0 | | | $ | 0 | | | $ | 194,246 | | | $ | 0 | | |
Notes:
No distribution paid during 2005 or 2004 constituted a return of capital for Federal income tax purposes.
(a) Includes distributions from Fund-level net short-term capital gains.
(b) To the extent reported, each Fund designates these amounts as capital gain dividends for Federal income tax purposes.
N/A — Not applicable; Fund was not in operation in 2004.
As of December 31, 2005, undistributed net income and undistributed accumulated gain (loss) on a tax basis were as follows:
| | | Equity
Index
Fund | | All America
Fund | | Small Cap
Value Fund | | Small Cap
Growth Fund | | Mid Cap
Value Fund | |
Accumulated undistributed net
investment income | | $ | 1,341,393 | | | $ | 7,238,393 | | | $ | 301,413 | | | $ | 0 | | | $ | 11,283 | | |
Accumulated net realized
gain/(loss) on investments and
futures contracts | | $ | 3,676,586 | | | $ | 7,289,605 | | | $ | 0 | | | $ | (512,361 | ) | | $ | 0 | | |
Net unrealized appreciation (depreciation)
of investments and futures contracts | | $ | 90,056,487 | | | $ | 57,201,945 | | | $ | 288,767 | | | $ | 967,017 | | | $ | 439,603 | | |
| | | Mid-Cap
Equity
Index Fund | | Aggressive
Equity Fund | | Composite
Fund | | Conservative
Allocation
Fund | | Moderate
Allocation
Fund | |
Accumulated undistributed net
investment income | | $ | 3,302,672 | | | $ | 815,386 | | | $ | 4,520,279 | | | $ | 17,184 | | | $ | 131,546 | | |
Accumulated net realized gain/(loss)
on investments and futures contracts | | $ | 3,763,914 | | | $ | 19,897,385 | | | $ | (45,421,979 | ) | | $ | 13,879 | | | $ | 38,469 | | |
Net unrealized appreciation
(depreciation) of investments
and futures contracts | | $ | 53,720,905 | | | $ | 39,700,059 | | | $ | 5,511,454 | | | $ | (213,848 | ) | | $ | 51,557 | | |
| | | Aggressive
Allocation
Fund | | Money
Market
Fund | | Short-Term
Bond Fund | | Mid-Term
Bond Fund | | Bond
Fund | |
Accumulated undistributed net
investment income | | $ | 82,115 | | | $ | 75,263 | | | $ | 19,325 | | | $ | 48,373 | | | $ | 169,047 | | |
Accumulated net realized gain/(loss)
on investments and futures contracts | | $ | 0 | | | $ | (10,613 | ) | | $ | (299,646 | ) | | $ | (338,934 | ) | | $ | (24,180,578 | ) | |
Net unrealized appreciation
(depreciation) of investments
and futures contracts | | $ | 1,182,669 | | | $ | (795 | ) | | $ | (507,134 | ) | | $ | (1,774,549 | ) | | $ | (4,510,591 | ) | |
The difference between the components of distributable earnings on a tax basis and the amounts reflected in the statements of changes in net assets are primarily due to wash sales, post-October losses and the Federal income tax treatment of futures contracts.
73
MUTUAL OF AMERICA INVESTMENT CORPORATION
NOTES TO FINANCIAL STATEMENTS (Continued)
5. DIVIDENDS (CONTINUED)
During the year ended December 31, 2005, each fund reclassified the following book to tax differences [increases (decreases)]:
| | | Equity
Index Fund | | All America
Fund | | Small Cap
Value Fund | | Small Cap
Growth Fund | | Mid Cap
Value Fund | |
Accumulated undistributed net
investment income | | $ | (528,382 | ) | | $ | 0 | | | $ | 0 | | | $ | 350 | | | $ | 0 | | |
Accumulated undistributed net realized
gains (loss) on investments and futures
contracts | | | 528,382 | | | | 0 | | | | 0 | | | | 0 | | | | 0 | | |
| Paid in capital | | $ | 0 | | | $ | 0 | | | $ | 0 | | | $ | (350 | ) | | $ | 0 | | |
| | | Mid-Cap
Equity
Index Fund | | Aggressive
Equity Fund | | Composite
Fund | | Conservative
Allocation
Fund | | Moderate
Allocation
Fund | |
Accumulated undistributed net
investment income | | $ | 0 | | | $ | 0 | | | $ | 0 | | | $ | (4,895 | ) | | $ | 27,493 | | |
Accumulated undistributed net realized
gains (loss) on investments and futures
contracts | | | 0 | | | | 0 | | | | 0 | | | | 4,895 | | | | (27,438 | ) | |
| Paid in capital | | $ | 0 | | | $ | 0 | | | $ | 0 | | | $ | 0 | | | $ | (55 | ) | |
| | | Aggressive
Allocation
Fund | | Money
Market
Fund | | Short-Term
Bond Fund | | Mid-Term
Bond Fund | | Bond
Fund | |
Accumulated undistributed net
investment income | | $ | (68,581 | ) | | $ | 0 | | | $ | 0 | | | $ | 0 | | | $ | 0 | | |
Accumulated undistributed net realized
gains (loss) on investments and futures
contracts | | | 68,581 | | | | 3,447 | | | | 0 | | | | 0 | | | | 0 | | |
| Paid in capital | | $ | 0 | | | $ | (3,447 | ) | | $ | 0 | | | $ | 0 | | | $ | 0 | | |
These reclassifications were made as a result of the differences arising from the disallowance of net operating losses, expiration of capital loss carryforwards, and other cumulative adjustments for Federal income tax purposes versus financial reporting purposes. Each Fund's net assets were not affected by these reclassifications.
6. SUBSEQUENT EVENTS
On February 22, 2006, the Adviser approved a reduction to its investment advisory fees for actively managed funds of 10 basis points and for indexed funds of five basis points, effective May 1, 2006. Thus, effective on that date, the annual advisory fees charged to the Funds will be as follows: .075% of the value of the net assets of the Equity Index Fund and the Mid-Cap Equity Index Fund, .15% of the value of the net assets of the Money Market Fund, .40% of the value of the net assets of the All America Fund, Composite Fund, Short-Term Bond Fund, Mid-Term Bond Fund and Bond Fund, .55% of the value of the net assets of the Mid Cap Value Fund and .75% of the value of the net assets of the Aggressive Equity Fund, Small Cap Value Fund and Small Cap Growth Fund.
On February 22, 2006, the Investment Company's Board of Directors increased to 4,000,000,000 the number of authorized shares to be allocated into the fifteen series of the Funds. Of those shares, 300,000,000 remain as unallocated shares. The Board also revised the allocation of shares of certain of the series of the Funds.
74
REPORT OF INDEPENDENT REGISTERED PUBLIC ACCOUNTING FIRM
The Board of Directors and Shareholders
of Mutual of America Investment Corporation:
We have audited the accompanying statements of assets and liabilities of Mutual of America Investment Corporation (comprised of: Equity Index Fund, All America Fund, Small Cap Value Fund, Small Cap Growth Fund, Mid Cap Value Fund, Mid-Cap Equity Index Fund, Aggressive Equity Fund, Composite Fund, Conservative Allocation Fund, Moderate Allocation Fund, Aggressive Allocation Fund, Money Market Fund, Short-Term Bond Fund, Mid-Term Bond Fund, and Bond Fund ("the Funds")), including the portfolios of investments in securities for the Conservative Allocation Fund, Moderate Allocation Fund and Aggressive Allocation Fund, and the summary portfolios of investments in securities for each of the other Funds other than the Money Market Fund, as of December 31, 2005, and the related statements of operations for the year or period then ended, the statements of changes in net assets for each of the years or period in the two-year period then ended, and the financial highlights for each of the years or periods in the four-year period then ended. These financial statements and financial highlights are the responsibility of the Funds' management. Our responsibility is to express an opinion on these financial statements and financial highlights based on our audits. The financial highlights for the year ended December 31, 2001 were audited by other auditors who have ceased operations. Those auditors expressed an unqualified opinion on those financial highlights in their report dated February 20, 2002.
We conducted our audits in accordance with the standards of the Public Company Accounting Oversight Board (United States). Those standards require that we plan and perform the audit to obtain reasonable assurance about whether the financial statements and financial highlights are free of material misstatement. An audit includes examining, on a test basis, evidence supporting the amounts and disclosures in the financial statements. Our procedures included confirmation of securities owned as of December 31, 2005, by correspondence with custodian and brokers or by other appropriate auditing procedures where replies from brokers were not received. An audit also includes assessing the accounting principles used and significant estimates made by management, as well as evaluating the overall financial statement presentation. We believe that our audits provide a reasonable basis for our opinion.
In our opinion, the financial statements and financial highlights referred to above present fairly, in all material respects, the assets and liabilities of the Funds as of December 31, 2005, and the results of their operations for the year or period then ended, the changes in their net assets for each of the years or period in the two-year period then ended, and the financial highlights for each of the years or periods in the four-year period then ended, in conformity with U.S. generally accepted accounting principles.

New York, New York
February 28, 2006
75
MUTUAL OF AMERICA INVESTMENT CORPORATION
Directors and Officers — unaudited
The tables below show information about the Directors and officers of the Investment Company. The address of each Director and officer is c/o Mutual of America Investment Corporation, 320 Park Avenue, New York, New York 10022. The Investment Company does not hold annual meetings of shareholders, and each Director has been elected by shareholders to serve until a successor is duly elected at a meeting of shareholders called for the purpose of electing directors. Each officer of the Investment Company has been elected by the Board of Directors to serve until a successor is duly elected. The Independent Directors do not serve as directors of any other fund that is affiliated with the Adviser or Mutual of America with the sole exception of Patrick J. Waide, Jr., who serves on the boards of Mutual of America Investment Corporation and Mutual of America Institutional Funds, Inc. The Interested Directors and officers of the Investment Company do no t receive compensation from the Investment Company for their service.
The Investment Company's Statement of Additional Information ("SAI"), filed with the Securities and Exchange Commission, contains additional information about the Investment Company's Directors and Officers. A copy of the latest SAI can be obtained, without charge, by writing to Mutual of America Investment Corporation at 320 Park Avenue, New York, NY 10022-6839 or by calling 1-800-468-3785 or through the following websites: http://www.mutualofamerica.com or http://www.sec.gov.
Independent Directors
| Name and Age | | Length of
Time Served | | Principal Occupation(s)
in Past Five Years | | Other Directorships
Held by Director | |
Peter J. Flanagan
age 75 | | since 1992 | | Consultant and President Emeritus, Life Insurance Council of New York, since 1998; prior thereto, President | | None | |
|
Robert J. McGuire
age 69 | | since 2/00 | | Attorney and Consultant, Morvillo, Abramowitz, Grand, Iason & Silberberg, P.C. (law firm), since January 1998; President, Police Athletic League; President, Kroll Associates (investigation and consulting) until 1997 | | Emigrant Savings Bank; GAM Funds, Inc.; Brazilian Equity Fund (special litigation committee); Police Athletic League; Volunteers of Legal Service; Office of the Appellate Defender; Trump Hotels & Casino Resorts; Trustee of Iona College | |
|
George Mertz
age 77 | | since 1989 | | Retired, since September 1994 | | None | |
|
Howard J. Nolan
age 68 | | since 1989 | | President & CEO, United Way of San Antonio & Bexar County | | None | |
|
Patrick J. Waide, Jr.
age 68 | | since 12/03 | | | | Trustee, School of Ethical Education; Director, American Federation for Aging Research; Mutual of America Institutional Funds, Inc. | |
|
76
Interested Directors
| Name, Position and Age | | Length of
Time Served | | Principal Occupation(s)
in Past Five Years | | Other Directorships
Held by Director | |
Manfred Altstadt
Chairman of the Board,
President and Chief
Executive Officer, age 55 | | since 1992 | | Senior Executive Vice President and Chief Financial Officer, Mutual of America, and Mutual of America Holding Company, Inc.; President and Chief Executive Officer, Mutual of America Capital Management Corporation; Senior Executive Vice President, Chief Financial Officer and Treasurer, Mutual of America Institutional Funds, Inc. | | Mutual of America; Mutual of America Securities Corporation; Mutual of America Holding Company, Inc.; Calvary Hospital; Calvary Fund; Calvary Holding Company; McQuade Children's Services, Army War College Foundation; Hazelden New York | |
|
Mr. Altstadt is an "interested person" as an officer of the Adviser and of affiliates of the Adviser.
Officers
| Name, Position and Age | | Length of
Time Served | | Principal Occupation(s)
in Past Five Years | | Other Directorships
Held by Director | |
Patrick A. Burns
Senior Executive Vice President and General Counsel, age 59 | | since 1986 | | Senior Executive Vice President and General Counsel, Mutual of America, Mutual of America Capital Management Corporation, Mutual of America Securities Corporation, Mutual of America Holding Company, Inc. and Mutual of America Institutional Funds, Inc. | | Mutual of America; Mutual of America Holding Company, Inc.; Irish American Legal and Education Research Foundation | |
|
John R. Greed
Executive Vice President, Chief Financial Officer and Treasurer, age 45 | | since 9/97 | | Executive Vice President and Treasurer, Mutual of America, Mutual of America Capital Management Corporation and Mutual of America Holding Company, Inc.; Chairman of the Board, President and Chief Executive Officer, Mutual of America Institutional Funds, Inc. | | None | |
|
Thomas L. Martin
Senior Vice President and Secretary, age 56 | | since 8/03 | | Senior Vice President and Associate General Counsel, Mutual of America | | None | |
|
77
MUTUAL OF AMERICA INVESTMENT CORPORATION
ADDITIONAL INFORMATION
Quarterly Portfolio Schedules
Included in this Annual Report are summary schedules of Mutual of America Investment Corporation's ("Investment Company") Fund portfolio holdings as of December 31, 2005 (except for the Money Market Fund). The Investment Company files complete schedules of Fund portfolio holdings (including the Money Market Fund) with the Securities and Exchange Commission ("SEC") for the first and third quarters of each fiscal year on Form N-Q and for the second and fourth quarters of each fiscal year on Form N-CSR. The Forms N-Q and N-CSR are available on the SEC's website at http://www.sec.gov. Additionally, the Forms N-Q and N-CSR may be reviewed and copied at the SEC's Public Reference Room in Washington, DC. Information on the operation of the Public Reference Room may be obtained by calling 1-800-SEC-0330.
Proxy Voting Policies and Procedures
A copy of the Investment Company's proxy voting policies and procedures can be obtained free of charge by calling 1-800-468-3785. It is also available on the SEC's website at http://www.sec.gov.
Information regarding how the Investment Company voted proxies relating to portfolio securities during the 12-month period ended June 30, 2005 is available without charge by calling 1-800-468-3785. It is also available on the SEC website.
Code of Ethics
The Investment Company has adopted a Code of Ethics that complies with Rule 17j-1 of the Investment Company Act of 1940 and with the requirements of the Sarbanes-Oxley Act of 2002. A copy of the Code of Ethics is available free of charge, upon request. To obtain a free copy of the Code of Ethics, please call (212) 224-1376 or write to:
Mr. Paul J. Costagliola
Chief Compliance Officer
Mutual of America Investment Corporation
320 Park Avenue
New York, NY 10022-6839
Supplemental Dividend Information — Unaudited
Dividends from the Money Market Fund, Mid-Term Bond Fund, Short-Term Bond Fund and Bond Fund do not qualify for the corporate dividends received deduction. The percentages of the ordinary dividends distributed in 2005 by the All America, Small Cap Value, Mid Cap Value, Mid-Cap Equity Index, Composite, Conservative Allocation, Moderate Allocation, and Aggressive Allocation Funds that qualify for the corporate dividends received deduction are 64.9%, 37.9%, 100.0%, 60.2%, 42.0%, 7.5%, 5.2% and 11.1%, respectively. One hundred percent of the Equity Index Fund's 2005 ordinary income dividend qualifies for the corporate dividends received deduction.
Important tax information: The Equity Index, All America, Mid-Cap Equity Index, Aggressive Equity, Conservative Allocation, Moderate Allocation, and Aggressive Allocation Funds designate $14,210,430, $32,280,062, $17,766,628, $3,277,393, $67,883, $1,024,283 and $1,337,323, respectively, of 2005 long-term capital gains dividends as qualifying for the 15% reduced rate on long-term capital gains.
78
MUTUAL OF AMERICA
LIFE INSURANCE COMPANY
320 PARK AVENUE
NEW YORK, NY 10022-6839
www.mutualofamerica.com
ANNUAL REPORTS OF
VANGUARD VARIABLE INSURANCE FUND
DWS (formerly SCUDDER) VARIABLE SERIES I
OPPENHEIMER MAIN STREET FUND®/VA
AMERICAN CENTURY VP CAPITAL APPRECIATION FUND
CALVERT SOCIAL BALANCED PORTFOLIO
DECEMBER 31, 2005
This report is not to be construed as an offering for sale of any Variable Policy. No offering is made except in conjunction with a prospectus which must precede or accompany this report.
VOLUME II
ITEM 2. CODE OF ETHICS.
Mutual of America Investment Corporation has adopted a Code of Ethics that applies to its principal executive and financial officers. The Code of Ethics was not amended during the period covered by this report.
The Annual Report to Shareholders includes information on how to obtain a copy of the Code of Ethics at no charge.
ITEM 3. AUDIT COMMITTEE FINANCIAL EXPERT.
(a) (1) Mutual of America Investment Corporation’s Board of Directors has determined that one audit committee financial expert serves on its Audit Committee.
(a) (2) The audit committee financial expert is Patrick J. Waide, Jr. He was Senior Vice-President, Administration at Sullivan & Company until March 1998; Director of the Drucker Foundation from 1996-1999 and President, Drucker Foundation in 1999. Mr. Waide is considered an independent director.
ITEM 4. PRINCIPAL ACCOUNTANT FEES AND SERVICES.
(a) Aggregate Audit Fees:
2005: $154,491
2004: $204,739
(b), (c), (d) There were no Audit-Related, Tax or Other Fees.
(e) All non-audit fees are pre-approved by the Audit Committee in advance.
(f), (g), (h) Not applicable.
ITEM 5. AUDIT COMMITTEE OF LISTED REGISTRANTS.
Not applicable.
ITEM 6. SCHEDULE OF INVESTMENTS.
Schedule I –Investments in Securities in Unaffiliated Issuers follows:
MUTUAL OF AMERICA INVESTMENT CORPORATION (EQUITY INDEX FUND)
PORTFOLIO OF INVESTMENTS IN SECURITIES
DECEMBER 31, 2005
| | Shares | | Value($) | |
COMMON STOCKS: | | | | | |
BASIC MATERIALS (2.9%) | | | | | |
Air Products & Chemicals, Inc. | | 13,968 | | 826,766 | |
Alcoa, Inc. | | 54,776 | | 1,619,726 | |
Allegheny Technologies, Inc. | | 5,353 | | 193,136 | |
Ball Corp. | | 6,549 | | 260,126 | |
Bemis Co. | | 6,628 | | 184,722 | |
Dow Chemical Co. | | 60,750 | | 2,662,065 | |
Du Pont (E.I.) de Nemours & Co. | | 57,870 | | 2,459,475 | |
Eastman Chemical Co. | | 5,129 | | 264,605 | |
Ecolab, Inc. | | 11,603 | | 420,841 | |
Engelhard Corp. | | 7,540 | | 227,331 | |
Freeport-McMoran Copper Cl B | | 11,585 | | 623,273 | |
Georgia-Pacific (Timber Group) | | 48 | | 2,303 | |
Hercules, Inc.* | | 7,098 | | 80,207 | |
International Paper Co. | | 30,875 | | 1,037,709 | |
Int’l. Flavors & Fragrances | | 5,087 | | 170,415 | |
Louisiana-Pacific Corp. | | 6,658 | | 182,895 | |
MeadWestvaco Corp. | | 11,422 | | 320,159 | |
Monsanto Co. | | 16,900 | | 1,310,257 | |
Newmont Mining Corp. Holding Co. | | 28,123 | | 1,501,768 | |
Nucor Corp. | | 9,795 | | 653,522 | |
PPG Industries, Inc. | | 10,514 | | 608,761 | |
Pactiv Corp.* | | 9,019 | | 198,418 | |
Phelps Dodge Corp. | | 6,392 | | 919,617 | |
Praxair, Inc. | | 20,291 | | 1,074,611 | |
Rohm & Haas Co. | | 9,065 | | 438,927 | |
Sealed Air Corp.* | | 5,123 | | 287,759 | |
Sigma-Aldrich Corp. | | 4,232 | | 267,843 | |
Temple-Inland, Inc. | | 7,065 | | 316,865 | |
United States Steel Group | | 7,137 | | 343,076 | |
Vulcan Materials Co. | | 6,410 | | 434,277 | |
Weyerhaeuser Co. | | 15,311 | | 1,015,732 | |
| | | | 20,907,187 | |
CONSUMER, CYCLICAL (10.4%) | | | | | |
Amazon.com, Inc.* | | 19,306 | | 910,278 | |
AutoZone, Inc.* | | 3,475 | | 318,831 | |
Autonation, Inc.* | | 11,396 | | 247,635 | |
Bed Bath & Beyond, Inc.* | | 18,686 | | 675,499 | |
Best Buy Co., Inc. | | 25,728 | | 1,118,653 | |
Big Lots, Inc.* | | 7,172 | | 86,136 | |
MUTUAL OF AMERICA INVESTMENT CORPORATION (EQUITY INDEX FUND)
PORTFOLIO OF INVESTMENTS IN SECURITIES
DECEMBER 31, 2005
| | Shares | | Value($) | |
COMMON STOCKS: | | | | | |
CONSUMER, CYCLICAL (Cont’d.) | | | | | |
Black & Decker Corp. | | 4,936 | | 429,235 | |
Brunswick Corp. | | 6,072 | | 246,888 | |
Carnival Corp. | | 27,270 | | 1,458,127 | |
Centex Corp. | | 8,041 | | 574,851 | |
Circuit City Group, Inc. | | 9,859 | | 222,715 | |
Clear Channel Communications* | | 34,023 | | 1,070,023 | |
Coach, Inc.* | | 23,923 | | 797,593 | |
Comcast Corp. Cl A* | | 136,686 | | 3,548,369 | |
Cooper Tire & Rubber Co. | | 3,860 | | 59,135 | |
D.R. Horton, Inc. | | 17,135 | | 612,234 | |
Dana Corp. | | 9,466 | | 67,966 | |
Darden Restaurants, Inc. | | 8,243 | | 320,488 | |
Dillard’s Inc. Cl A | | 3,877 | | 96,227 | |
Disney (Walt) Co. | | 121,082 | | 2,902,336 | |
Dollar General Corp. | | 19,930 | | 380,065 | |
Dow Jones & Co. | | 3,714 | | 131,810 | |
EW Scripps Co. Cl A | | 5,282 | | 253,642 | |
Eastman Kodak Co. | | 18,078 | | 423,025 | |
Family Dollar Stores, Inc. | | 9,773 | | 242,273 | |
Federated Dept Stores | | 17,135 | | 1,136,565 | |
Ford Motor Co. | | 116,928 | | 902,684 | |
Fortune Brands, Inc. | | 9,197 | | 717,550 | |
Gannett Co., Inc. | | 15,100 | | 914,607 | |
Gap, Inc. | | 36,128 | | 637,298 | |
General Motors Corp. | | 35,596 | | 691,274 | |
Genuine Parts Co. | | 10,924 | | 479,782 | |
Goodyear Tire & Rubber Co.* | | 11,104 | | 192,988 | |
Harley-Davidson, Inc. | | 17,286 | | 890,056 | |
Harrah’s Entertainment, Inc. | | 11,568 | | 824,683 | |
Hasbro, Inc. | | 11,235 | | 226,722 | |
Hilton Hotels Corp. | | 20,649 | | 497,847 | |
Home Depot, Inc. | | 133,714 | | 5,412,743 | |
International Game Technology | | 21,209 | | 652,813 | |
Interpublic Group of Cos., Inc. | | 27,100 | | 261,515 | |
Johnson Controls, Inc. | | 12,147 | | 885,638 | |
Jones Apparel Group, Inc. | | 7,354 | | 225,915 | |
KB Home | | 4,928 | | 358,068 | |
Knight-Ridder, Inc. | | 4,368 | | 276,494 | |
Kohl’s Corp.* | | 21,701 | | 1,054,669 | |
MUTUAL OF AMERICA INVESTMENT CORPORATION (EQUITY INDEX FUND)
PORTFOLIO OF INVESTMENTS IN SECURITIES
DECEMBER 31, 2005
| | Shares | | Value($) | |
COMMON STOCKS: | | | | | |
CONSUMER, CYCLICAL (Cont’d.) | | | | | |
Leggett & Platt | | 11,580 | | 265,877 | |
Lennar Corp. | | 8,646 | | 527,579 | |
Limited Brands, Inc. | | 21,912 | | 489,733 | |
Liz Claiborne, Inc. | | 6,713 | | 240,460 | |
Lowe’s Companies, Inc. | | 49,218 | | 3,280,872 | |
Marriott International, Inc. | | 10,362 | | 693,943 | |
Mattel, Inc. | | 25,418 | | 402,113 | |
Maytag Corp. | | 5,045 | | 94,947 | |
McDonald’s Corp. | | 79,221 | | 2,671,332 | |
McGraw-Hill Cos., Inc. | | 23,598 | | 1,218,365 | |
Meredith Corp. | | 2,631 | | 137,707 | |
NIKE, Inc. Cl B | | 11,966 | | 1,038,529 | |
New York Times Co. Cl A | | 9,133 | | 241,568 | |
Newell Rubbermaid, Inc. | | 17,341 | | 412,369 | |
News Corp, Inc. | | 153,166 | | 2,381,731 | |
Nordstrom, Inc. | | 13,760 | | 514,624 | |
Office Depot, Inc.* | | 19,441 | | 610,447 | |
OfficeMax, Inc. | | 4,456 | | 113,004 | |
Omnicom Group, Inc. | | 11,350 | | 966,225 | |
Penney (J.C.) Co., Inc. | | 14,618 | | 812,761 | |
Pulte Homes, Inc. | | 13,504 | | 531,517 | |
RadioShack Corp. | | 8,474 | | 178,208 | |
Reebok International, Ltd. | | 3,314 | | 192,974 | |
Sears Holding Corp.* | | 6,282 | | 725,759 | |
Sherwin-Williams Co. | | 7,066 | | 320,938 | |
Snap-On, Inc. | | 3,646 | | 136,944 | |
Stanley Works | | 4,579 | | 219,975 | |
Staples, Inc. | | 46,038 | | 1,045,523 | |
Starbucks Corp.* | | 48,372 | | 1,451,644 | |
Starwood Hotels & Resorts | | 13,800 | | 881,268 | |
TJX Companies, Inc. | | 28,998 | | 673,624 | |
Target Corp. | | 55,340 | | 3,042,040 | |
Tiffany & Co. | | 8,954 | | 342,849 | |
Time Warner, Inc. | | 293,489 | | 5,118,448 | |
Tribune Co. | | 16,480 | | 498,685 | |
Univision Communications, Inc. | | 14,074 | | 413,635 | |
V F Corp. | | 5,606 | | 310,236 | |
Viacom, Inc. Cl B* | | 97,277 | | 3,171,230 | |
Wendy’s International, Inc. | | 7,317 | | 404,337 | |
MUTUAL OF AMERICA INVESTMENT CORPORATION (EQUITY INDEX FUND)
PORTFOLIO OF INVESTMENTS IN SECURITIES
DECEMBER 31, 2005
| | Shares | | Value($) | |
COMMON STOCKS: | | | | | |
CONSUMER, CYCLICAL (Cont’d.) | | | | | |
Whirlpool Corp. | | 4,247 | | 355,729 | |
Yum! Brands, Inc. | | 17,817 | | 835,261 | |
eBay, Inc.* | | 71,939 | | 3,111,362 | |
| | | | 75,510,317 | |
CONSUMER, NON-CYCLICAL (9.3%) | | | | | |
Alberto-Culver Co. Cl A | | 4,752 | | 217,404 | |
Albertson’s, Inc. | | 23,213 | | 495,598 | |
Altria Group, Inc. | | 131,075 | | 9,793,924 | |
Anheuser-Busch Cos., Inc. | | 48,867 | | 2,099,326 | |
Archer-Daniels-Midland Co. | | 41,115 | | 1,013,896 | |
Avon Products, Inc. | | 28,854 | | 823,782 | |
Brown-Forman Corp. Cl B | | 5,229 | | 362,474 | |
CVS Corp. | | 51,250 | | 1,354,025 | |
Campbell Soup Co. | | 11,715 | | 348,756 | |
Clorox Co. | | 9,486 | | 539,659 | |
Coca-Cola Co. | | 130,289 | | 5,251,950 | |
Coca-Cola Enterprises, Inc. | | 19,076 | | 365,687 | |
Colgate-Palmolive Co. | | 32,609 | | 1,788,604 | |
ConAgra Foods, Inc. | | 32,663 | | 662,406 | |
Constellation Brands, Inc. Cl A | | 12,383 | | 324,806 | |
Costco Wholesale Corp. | | 29,716 | | 1,470,051 | |
General Mills, Inc. | | 22,363 | | 1,102,943 | |
Heinz (H.J.) Co. | | 21,066 | | 710,346 | |
Hershey Food Corp. | | 11,399 | | 629,795 | |
Kellogg Co. | | 16,166 | | 698,695 | |
Kimberly Clark Corp. | | 29,407 | | 1,754,128 | |
Kroger Co.* | | 45,627 | | 861,438 | |
McCormick & Co., Inc. | | 8,426 | | 260,532 | |
Molson Coors Brewing Co. | | 3,554 | | 238,082 | |
Pepsi Bottling Group, Inc. | | 8,630 | | 246,904 | |
PepsiCo, Inc. | | 104,438 | | 6,170,197 | |
Proctor & Gamble Co. | | 210,978 | | 12,211,407 | |
RJ Reynolds Tobacco Holdings | | 5,382 | | 513,066 | |
Safeway, Inc. | | 28,281 | | 669,128 | |
Sara Lee Corp. | | 47,809 | | 903,590 | |
Supervalu, Inc. | | 8,572 | | 278,419 | |
Sysco Corp. | | 39,045 | | 1,212,347 | |
Tyson Foods, Inc. | | 15,843 | | 270,915 | |
UST, Inc.* | | 10,296 | | 420,386 | |
MUTUAL OF AMERICA INVESTMENT CORPORATION (EQUITY INDEX FUND)
PORTFOLIO OF INVESTMENTS IN SECURITIES
DECEMBER 31, 2005
| | Shares | | Value($) | |
COMMON STOCKS: | | | | | |
CONSUMER, NON-CYCLICAL (Cont’d.) | | | | | |
Wal-Mart Stores, Inc. | | 157,243 | | 7,358,972 | |
Walgreen Co. | | 63,706 | | 2,819,628 | |
Whole Foods Market, Inc. | | 8,733 | | 675,847 | |
Wrigley (Wm.) Jr. Co. | | 11,294 | | 750,938 | |
| | | | 67,670,051 | |
ENERGY (9.1%) | | | | | |
Amerada Hess Corp. | | 5,036 | | 638,666 | |
Anadarko Petroleum | | 14,931 | | 1,414,712 | |
Apache Corp. | | 20,728 | | 1,420,283 | |
Ashland, Inc. | | 4,518 | | 261,592 | |
BJ Services Co. | | 20,290 | | 744,034 | |
Baker Hughes, Inc. | | 21,517 | | 1,307,803 | |
Burlington Resources, Inc. | | 23,796 | | 2,051,215 | |
ChevronTexaco Corp. | | 141,311 | | 8,022,225 | |
ConocoPhillips | | 87,341 | | 5,081,499 | |
Devon Energy Corp. | | 27,967 | | 1,749,056 | |
EOG Resources, Inc. | | 15,206 | | 1,115,664 | |
El Paso Corp. | | 41,502 | | 504,664 | |
Exxon Mobil Corp. | | 391,670 | | 22,000,104 | |
Halliburton Co. | | 32,281 | | 2,000,131 | |
Kerr-McGee Corp. | | 7,301 | | 663,369 | |
Kinder Morgan, Inc. | | 6,624 | | 609,077 | |
Marathon Oil Corp. | | 23,068 | | 1,406,456 | |
Murphy Oil Corp. | | 10,394 | | 561,172 | |
Nabors Industries, Ltd.* | | 9,946 | | 753,409 | |
National-Oilwell, Inc.* | | 10,971 | | 687,882 | |
Noble Corporation* | | 8,618 | | 607,914 | |
Occidental Petroleum | | 25,304 | | 2,021,284 | |
Rowan Cos., Inc. | | 6,881 | | 245,239 | |
Schlumberger, Ltd. | | 37,080 | | 3,602,322 | |
Sunoco, Inc. | | 8,573 | | 671,952 | |
Transocean, Inc.* | | 20,777 | | 1,447,949 | |
Valero Energy Corp. | | 38,587 | | 1,991,089 | |
Weatherford International, Ltd.* | | 21,882 | | 792,128 | |
Williams Cos., Inc. | | 36,069 | | 835,719 | |
XTO Energy, Inc. | | 22,861 | | 1,004,512 | |
| | | | 66,213,121 | |
MUTUAL OF AMERICA INVESTMENT CORPORATION (EQUITY INDEX FUND)
PORTFOLIO OF INVESTMENTS IN SECURITIES
DECEMBER 31, 2005
| | Shares | | Value($) | |
COMMON STOCKS: | | | | | |
FINANCIAL (20.8%) | | | | | |
Ace, Ltd.* | | 20,289 | | 1,084,244 | |
Aflac, Inc. | | 31,496 | | 1,462,044 | |
Allstate Corp. | | 40,829 | | 2,207,624 | |
AmSouth Bancorporation | | 21,940 | | 575,047 | |
Ambac Financial Group, Inc. | | 6,621 | | 510,214 | |
American Express Co. | | 78,158 | | 4,022,011 | |
American International Group, Inc. | | 163,381 | | 11,147,486 | |
Ameriprise Financial, Inc. | | 15,485 | | 634,885 | |
Aon Corp. | | 20,143 | | 724,141 | |
Apartment Investment & Mgmt. Co. | | 6,024 | | 228,129 | |
Archstone-Smith Trust | | 13,344 | | 558,980 | |
BB & T Corp. | | 34,135 | | 1,430,598 | |
Bank of America Corp. | | 252,793 | | 11,666,397 | |
Bank of New York Co., Inc. | | 48,481 | | 1,544,120 | |
Bear Stearns Cos., Inc. | | 7,133 | | 824,075 | |
CIT Group, Inc. | | 12,575 | | 651,133 | |
Capital One Financial Corp. | | 18,853 | | 1,628,899 | |
Charles Schwab Corp. | | 64,932 | | 952,552 | |
Chubb Corp. | | 12,583 | | 1,228,730 | |
Cincinnati Financial Corp. | | 10,997 | | 491,346 | |
Citigroup, Inc. | | 318,439 | | 15,453,845 | |
Comerica, Inc. | | 10,403 | | 590,474 | |
Compass Bancshares, Inc. | | 7,839 | | 378,545 | |
Countrywide Financial Corp. | | 37,590 | | 1,285,202 | |
E*Trade Financial Corp.* | | 25,749 | | 537,124 | |
Equity Office Properties | | 25,566 | | 775,417 | |
Equity Residential | | 18,139 | | 709,598 | |
Fannie Mae | | 60,925 | | 2,973,749 | |
Federated Investors, Inc. | | 5,330 | | 197,423 | |
Fifth Third Bancorp | | 34,925 | | 1,317,371 | |
First Tennessee National Bank | | 7,931 | | 304,868 | |
Franklin Resources, Inc. | | 9,344 | | 878,429 | |
Freddie Mac | | 43,495 | | 2,842,398 | |
Genworth Financial, Inc. | | 23,707 | | 819,788 | |
Golden West Financial Corp. | | 16,037 | | 1,058,442 | |
Goldman Sachs Group, Inc. | | 28,376 | | 3,623,899 | |
Hartford Financial Svc. Group, Inc. | | 18,907 | | 1,623,922 | |
Huntington Bancshares, Inc. | | 14,364 | | 341,145 | |
J.P. Morgan Chase & Co. | | 220,250 | | 8,741,722 | |
MUTUAL OF AMERICA INVESTMENT CORPORATION (EQUITY INDEX FUND)
PORTFOLIO OF INVESTMENTS IN SECURITIES
DECEMBER 31, 2005
| | Shares | | Value($) | |
COMMON STOCKS: | | | | | |
FINANCIAL (Cont’d.) | | | | | |
Janus Capital Group | | 13,577 | | 252,940 | |
Jefferson-Pilot Corp. | | 8,437 | | 480,318 | |
KeyCorp. | | 25,668 | | 845,247 | |
Lehman Brothers Holdings, Inc. | | 16,864 | | 2,161,459 | |
Lincoln National Corp. | | 10,905 | | 578,292 | |
Loews Corp. | | 8,535 | | 809,545 | |
M & T Bank Corp. | | 5,022 | | 547,649 | |
MBIA, Inc. | | 8,439 | | 507,690 | |
MBNA Corp. | | 79,002 | | 2,144,904 | |
MGIC Investment Corp. | | 5,711 | | 375,898 | |
Marsh & McLennan Cos., Inc. | | 34,286 | | 1,088,923 | |
Marshall & Ilsley Corp. | | 13,165 | | 566,622 | |
Mellon Financial Corp. | | 26,319 | | 901,426 | |
Merrill Lynch & Co., Inc. | | 57,844 | | 3,917,774 | |
MetLife, Inc. | | 47,667 | | 2,335,683 | |
Moody’s Corp. | | 15,619 | | 959,319 | |
Morgan Stanley | | 67,850 | | 3,849,809 | |
National City Corp. | | 34,692 | | 1,164,610 | |
North Fork Bancorp, Inc. | | 29,942 | | 819,213 | |
Northern Trust Corp. | | 11,677 | | 605,102 | |
PNC Financial Services Group | | 18,395 | | 1,137,363 | |
Plum Creek Timber Co. | | 11,585 | | 417,639 | |
Principal Financial Group, Inc. | | 17,634 | | 836,381 | |
Progressive Corp. of Ohio | | 12,416 | | 1,449,940 | |
Prologis Trust | | 15,327 | | 716,077 | |
Prudential Financial, Inc. | | 31,787 | | 2,326,491 | |
Public Storage, Inc. | | 5,204 | | 352,415 | |
Regions Financial Corp. | | 28,824 | | 984,628 | |
SLM Corporation | | 26,268 | | 1,447,104 | |
Safeco Corp. | | 7,776 | | 439,344 | |
Simon Property Group | | 11,736 | | 899,330 | |
Sovereign Bancorp, Inc. | | 22,481 | | 486,039 | |
St. Paul Travelers Co., Inc. | | 43,586 | | 1,946,987 | |
State Street Corp. | | 20,640 | | 1,144,282 | |
Suntrust Banks, Inc. | | 22,752 | | 1,655,436 | |
Synovus Financial Corp. | | 19,658 | | 530,963 | |
T. Rowe Price Group, Inc. | | 8,226 | | 592,519 | |
Torchmark Corp. | | 6,532 | | 363,179 | |
UNUM Provident Corp. | | 18,759 | | 426,767 | |
MUTUAL OF AMERICA INVESTMENT CORPORATION (EQUITY INDEX FUND)
PORTFOLIO OF INVESTMENTS IN SECURITIES
DECEMBER 31, 2005
| | Shares | | Value($) | |
COMMON STOCKS: | | | | | |
FINANCIAL (Cont’d.) | | | | | |
US Bancorp | | 114,330 | | 3,417,324 | |
Vornado Realty Trust | | 7,431 | | 620,266 | |
Wachovia Corp. | | 97,784 | | 5,168,862 | |
Washington Mutual, Inc. | | 62,109 | | 2,701,741 | |
Wells Fargo & Company | | 105,260 | | 6,613,486 | |
XL Capital Limited* | | 10,976 | | 739,563 | |
Zions Bancorporation | | 6,573 | | 496,656 | |
| | | | 150,849,221 | |
HEALTHCARE (13.0%) | | | | | |
Abbott Laboratories | | 97,642 | | 3,850,024 | |
Aetna, Inc. | | 18,003 | | 1,697,863 | |
Allergan, Inc. | | 8,284 | | 894,341 | |
Amerisource Bergen Corp. | | 13,126 | | 543,416 | |
Amgen, Inc.* | | 77,695 | | 6,127,028 | |
Applera Corp.-Applied Biosys | | 11,828 | | 314,152 | |
Bard (C.R.), Inc. | | 6,609 | | 435,665 | |
Bausch & Lomb, Inc. | | 3,385 | | 229,841 | |
Baxter International, Inc. | | 39,254 | | 1,477,913 | |
Becton Dickinson & Co. | | 15,865 | | 953,169 | |
Biogen Idec, Inc.* | | 21,364 | | 968,430 | |
Biomet, Inc. | | 15,678 | | 573,344 | |
Boston Scientific Corp.* | | 37,140 | | 909,559 | |
Bristol-Myers Squibb Co. | | 123,154 | | 2,830,079 | |
CIGNA Corp. | | 7,917 | | 884,329 | |
Cardinal Health, Inc. | | 26,955 | | 1,853,156 | |
Caremark Rx, Inc.* | | 28,311 | | 1,466,227 | |
Chiron Corp.* | | 6,885 | | 306,107 | |
Coventry Health Care* | | 10,226 | | 582,473 | |
Express Scripts, Inc.* | | 9,167 | | 768,195 | |
Forest Laboratories, Inc.* | | 21,263 | | 864,979 | |
Genzyme Corp. (Genl. Div.)* | | 16,254 | | 1,150,458 | |
Gilead Sciences, Inc.* | | 28,824 | | 1,517,007 | |
Guidant Corp. | | 20,885 | | 1,352,304 | |
HCA, Inc. | | 26,684 | | 1,347,542 | |
Health Management Associates | | 15,559 | | 341,676 | |
Hospira, Inc.* | | 10,125 | | 433,148 | |
Humana, Inc.* | | 10,247 | | 556,720 | |
IMS Health, Inc. | | 14,584 | | 363,433 | |
Johnson & Johnson | | 187,258 | | 11,254,206 | |
MUTUAL OF AMERICA INVESTMENT CORPORATION (EQUITY INDEX FUND)
PORTFOLIO OF INVESTMENTS IN SECURITIES
DECEMBER 31, 2005
| | Shares | | Value($) | |
COMMON STOCKS: | | | | | |
HEALTHCARE (Cont’d.) | | | | | |
King Pharmaceuticals, Inc.* | | 15,220 | | 257,522 | |
Laboratory Corp. of America* | | 8,367 | | 450,563 | |
Lilly (Eli) & Co. | | 71,545 | | 4,048,732 | |
Manor Care, Inc. | | 4,980 | | 198,055 | |
McKesson Corp. | | 19,366 | | 999,092 | |
Medco Health Solutions* | | 19,359 | | 1,080,232 | |
Medimmune, Inc.* | | 15,488 | | 542,390 | |
Medtronic, Inc. | | 76,138 | | 4,383,265 | |
Merck & Co., Inc. | | 137,638 | | 4,378,265 | |
Millipore Corp.* | | 3,278 | | 216,479 | |
Mylan Laboratories, Inc. | | 13,760 | | 274,650 | |
Patterson Cos., Inc.* | | 8,704 | | 290,714 | |
PerkinElmer, Inc. | | 8,233 | | 193,969 | |
Pfizer, Inc. | | 463,995 | | 10,820,363 | |
Quest Diagnostics, Inc. | | 10,431 | | 536,988 | |
Schering-Plough Corp. | | 93,027 | | 1,939,613 | |
St. Jude Medical, Inc.* | | 23,074 | | 1,158,315 | |
Stryker Corp. | | 18,354 | | 815,468 | |
Tenet Healthcare Corp.* | | 29,547 | | 226,330 | |
Thermo Electron Corp.* | | 10,208 | | 307,567 | |
UnitedHealth Group, Inc. | | 85,782 | | 5,330,493 | |
Waters Corp.* | | 6,966 | | 263,315 | |
Watson Pharmaceuticals, Inc.* | | 6,384 | | 207,544 | |
WellPoint, Inc.* | | 41,504 | | 3,311,604 | |
Wyeth | | 84,489 | | 3,892,408 | |
Zimmer Holdings, Inc.* | | 15,596 | | 1,051,794 | |
| | | | 94,022,514 | |
INDUSTRIAL (11.3%) | | | | | |
3M Company | | 47,834 | | 3,707,135 | |
Allied Waste Industries* | | 13,739 | | 120,079 | |
American Power Conversion | | 10,819 | | 238,018 | |
American Standard Cos., Inc. | | 11,512 | | 459,904 | |
Apollo Group, Inc. Cl A* | | 9,160 | | 553,814 | |
Avery Dennison Corp. | | 6,953 | | 384,292 | |
Block (H. & R.), Inc. | | 20,623 | | 506,295 | |
Boeing Co. | | 50,814 | | 3,569,175 | |
Burlington North Santa Fe | | 23,505 | | 1,664,624 | |
CSX Corp. | | 13,674 | | 694,229 | |
Caterpillar, Inc. | | 42,816 | | 2,473,480 | |
MUTUAL OF AMERICA INVESTMENT CORPORATION (EQUITY INDEX FUND)
PORTFOLIO OF INVESTMENTS IN SECURITIES
DECEMBER 31, 2005
| | Shares | | Value($) | |
COMMON STOCKS: | | | | | |
INDUSTRIAL (Cont’d.) | | | | | |
Cendant Corp. | | 64,480 | | 1,112,280 | |
Cintas Corp. | | 8,663 | | 356,742 | |
Cooper Industries, Ltd.* | | 5,767 | | 420,991 | |
Cummins, Inc. | | 2,947 | | 264,434 | |
Danaher Corp. | | 14,933 | | 832,963 | |
Deere & Co. | | 15,182 | | 1,034,046 | |
Donnelley R.R. &Sons | | 13,678 | | 467,924 | |
Dover Corp. | | 12,757 | | 516,531 | |
Eaton Corp. | | 9,316 | | 625,010 | |
Emerson Electric Co. | | 25,859 | | 1,931,667 | |
Equifax, Inc. | | 8,174 | | 310,775 | |
FedEx Corp. | | 19,075 | | 1,972,164 | |
Fisher Scientific International* | | 7,719 | | 477,497 | |
Fluor Corp. | | 5,465 | | 422,226 | |
General Dynamics Corp. | | 12,671 | | 1,445,128 | |
General Electric Co. | | 665,090 | | 23,311,404 | |
Goodrich Corporation | | 7,737 | | 317,991 | |
Grainger (W.W.), Inc. | | 4,785 | | 340,213 | |
Honeywell International, Inc. | | 53,048 | | 1,976,038 | |
ITT Industries, Inc. | | 5,819 | | 598,310 | |
Illinois Tool Works, Inc. | | 12,889 | | 1,134,103 | |
Ingersoll Rand Co.* | | 20,824 | | 840,665 | |
L-3 Communications Holdings, Inc. | | 7,562 | | 562,235 | |
Lockheed Martin Corp. | | 22,507 | | 1,432,120 | |
Masco Corp. | | 26,676 | | 805,348 | |
Monster Worldwide, Inc.* | | 7,749 | | 316,314 | |
Navistar International Corp.* | | 3,883 | | 111,131 | |
Norfolk Southern | | 25,582 | | 1,146,841 | |
Northrop Grumman Corp. | | 22,365 | | 1,344,136 | |
PACCAR, Inc. | | 10,656 | | 737,715 | |
Pall Corp. | | 7,842 | | 210,636 | |
Parker Hannifin Corp. | | 7,539 | | 497,272 | |
Pitney Bowes, Inc. | | 14,363 | | 606,837 | |
Raytheon Co. | | 28,119 | | 1,128,978 | |
Robert Half International, Inc. | | 10,720 | | 406,181 | |
Rockwell Automation, Inc. | | 11,276 | | 667,088 | |
Rockwell Collins | | 10,874 | | 505,315 | |
Ryder System, Inc. | | 4,030 | | 165,311 | |
Southwest Airlines Co. | | 43,911 | | 721,458 | |
MUTUAL OF AMERICA INVESTMENT CORPORATION (EQUITY INDEX FUND)
PORTFOLIO OF INVESTMENTS IN SECURITIES
DECEMBER 31, 2005
| | Shares | | Value($) | |
COMMON STOCKS: | | | | | |
INDUSTRIAL (Cont’d.) | | | | | |
Textron, Inc. | | 8,332 | | 641,397 | |
Tyco International, Ltd. | | 126,712 | | 3,656,908 | |
Union Pacific Corp. | | 16,677 | | 1,342,665 | |
United Parcel Service Cl B | | 69,463 | | 5,220,144 | |
United Technologies Corp. | | 64,119 | | 3,584,893 | |
Waste Management, Inc. | | 34,735 | | 1,054,207 | |
| | | | 81,945,277 | |
TECHNOLOGY (14.8%) | | | | | |
ADC Telecommunications, Inc.* | | 7,333 | | 163,819 | |
Adobe Systems, Inc.* | | 37,844 | | 1,398,714 | |
Advanced Micro Devices, Inc.* | | 25,434 | | 778,280 | |
Affiliated Computer Svcs.* | | 7,823 | | 462,965 | |
Agilent Technologies, Inc.* | | 25,877 | | 861,445 | |
Altera Corp.* | | 22,815 | | 422,762 | |
Analog Devices, Inc. | | 23,090 | | 828,238 | |
Andrew Corp.* | | 10,226 | | 109,725 | |
Apple Computer, Inc.* | | 53,048 | | 3,813,621 | |
Applied Materials, Inc. | | 102,128 | | 1,832,176 | |
Applied Micro Circuits Corp.* | | 18,805 | | 48,329 | |
Autodesk, Inc.* | | 14,528 | | 623,978 | |
Automatic Data Processing | | 36,294 | | 1,665,532 | |
Avaya, Inc.* | | 26,359 | | 281,251 | |
BMC Software, Inc.* | | 13,615 | | 278,971 | |
Broadcom Corp. Cl A* | | 18,204 | | 858,319 | |
Ciena Corp.* | | 36,380 | | 108,049 | |
Cisco Systems, Inc.* | | 386,644 | | 6,619,345 | |
Citrix Systems, Inc.* | | 11,100 | | 319,458 | |
Computer Associates International, Inc. | | 28,884 | | 814,240 | |
Computer Sciences Corp.* | | 11,645 | | 589,703 | |
Compuware Corp.* | | 24,388 | | 218,760 | |
Comverse Technology, Inc.* | | 12,715 | | 338,092 | |
Convergys Corp.* | | 8,812 | | 139,670 | |
Corning, Inc.* | | 95,926 | | 1,885,905 | |
Dell, Inc.* | | 148,143 | | 4,442,809 | |
EMC Corp.* | | 150,483 | | 2,049,578 | |
Electronic Arts, Inc.* | | 18,920 | | 989,705 | |
Electronic Data Systems Corp. | | 32,829 | | 789,209 | |
First Data Corp. | | 48,094 | | 2,068,523 | |
MUTUAL OF AMERICA INVESTMENT CORPORATION (EQUITY INDEX FUND)
PORTFOLIO OF INVESTMENTS IN SECURITIES
DECEMBER 31, 2005
| | Shares | | Value($) | |
COMMON STOCKS: | | | | | |
TECHNOLOGY (Cont’d.) | | | | | |
Fiserv, Inc.* | | 11,613 | | 502,495 | |
Freescale Semiconductor Cl A* | | 25,832 | | 650,191 | |
Gateway, Inc.* | | 16,676 | | 41,857 | |
Hewlett-Packard Co. | | 180,338 | | 5,163,077 | |
IBM Corp. | | 99,423 | | 8,172,571 | |
Intel Corp. | | 379,497 | | 9,472,245 | |
Intuit, Inc.* | | 11,138 | | 593,655 | |
JDS Uniphase Corp.* | | 104,011 | | 245,466 | |
Jabil Circuit, Inc.* | | 10,952 | | 406,210 | |
KLA Tencor Corp. | | 12,426 | | 612,975 | |
LSI Logic Corp.* | | 24,655 | | 197,240 | |
Lexmark International, Inc.* | | 7,305 | | 327,483 | |
Linear Technology Corp. | | 19,184 | | 691,967 | |
Lucent Technologies* | | 279,782 | | 744,220 | |
Maxim Integrated Products, Inc. | | 20,634 | | 747,776 | |
Mercury Interactive Corp.* | | 5,451 | | 151,483 | |
Micron Technology, Inc.* | | 38,900 | | 517,759 | |
Microsoft Corp. | | 576,228 | | 15,068,362 | |
Molex, Inc. Cl A | | 9,036 | | 234,484 | |
Motorola, Inc. | | 156,784 | | 3,541,751 | |
NCR Corp.* | | 11,557 | | 392,245 | |
NVIDIA Corporation* | | 10,775 | | 393,934 | |
National Semiconductor Corp. | | 21,633 | | 562,025 | |
Network Appliance, Inc.* | | 23,422 | | 632,394 | |
Novell, Inc.* | | 24,045 | | 212,317 | |
Novellus Systems, Inc.* | | 8,396 | | 202,512 | |
Oracle Corp.* | | 236,727 | | 2,890,437 | |
PMC Sierra, Inc.* | | 11,534 | | 88,927 | |
Parametric Technology Corp.* | | 17,141 | | 104,560 | |
Paychex, Inc. | | 20,993 | | 800,253 | |
QLogic Corp.* | | 5,072 | | 164,891 | |
Qualcomm, Inc. | | 103,494 | | 4,458,522 | |
Sabre Group Holdings, Inc. | | 8,260 | | 199,149 | |
Sanmina Corp.* | | 33,085 | | 140,942 | |
Scientific-Atlanta, Inc. | | 9,666 | | 416,315 | |
Siebel Systems, Inc. | | 33,304 | | 352,356 | |
Solectron Corp.* | | 57,507 | | 210,476 | |
Sun Microsystems, Inc.* | | 214,911 | | 900,477 | |
Symantec Corp.* | | 68,074 | | 1,191,295 | |
MUTUAL OF AMERICA INVESTMENT CORPORATION (EQUITY INDEX FUND)
PORTFOLIO OF INVESTMENTS IN SECURITIES
DECEMBER 31, 2005
| | Shares | | Value($) | |
COMMON STOCKS: | | | | | |
TECHNOLOGY (Cont’d.) | | | | | |
Symbol Technologies, Inc. | | 15,797 | | 202,518 | |
Tektronix, Inc. | | 5,249 | | 148,074 | |
Tellabs, Inc.* | | 28,228 | | 307,685 | |
Teradyne, Inc.* | | 12,394 | | 180,581 | |
Texas Instruments, Inc. | | 101,849 | | 3,266,297 | |
Unisys Corp.* | | 21,481 | | 125,234 | |
Xerox Corp.* | | 60,453 | | 885,636 | |
Xilinx, Inc. | | 21,934 | | 552,956 | |
Yahoo!, Inc.* | | 79,479 | | 3,113,987 | |
| | | | 106,981,433 | |
TELECOMMUNICATIONS (2.9%) | | | | | |
AT & T, Inc. | | 245,889 | | 6,021,822 | |
Alltel Corp. | | 24,103 | | 1,520,899 | |
BellSouth Corp. | | 115,103 | | 3,119,291 | |
CenturyTel, Inc. | | 8,245 | | 273,404 | |
Citizens Communications Co. | | 21,017 | | 257,038 | |
Qwest Communications International* | | 97,175 | | 549,039 | |
Sprint Nextel Corp. | | 185,970 | | 4,344,259 | |
Verizon Communications | | 174,042 | | 5,242,145 | |
| | | | 21,327,897 | |
UTILITIES (3.3%) | | | | | |
AES Corp.* | | 41,114 | | 650,835 | |
Allegheny Energy, Inc.* | | 10,251 | | 324,444 | |
Ameren Corp. | | 12,858 | | 658,844 | |
American Electric Power, Inc. | | 24,781 | | 919,127 | |
CINergy Corp. | | 12,554 | | 533,043 | |
CMS Energy Corp.* | | 13,854 | | 201,022 | |
Centerpoint Energy, Inc. | | 19,520 | | 250,832 | |
Consolidated Edison, Inc. | | 15,419 | | 714,362 | |
Constellation Energy Group | | 11,235 | | 647,136 | |
DTE Energy Co. | | 11,193 | | 483,426 | |
Dominion Resources, Inc. | | 21,859 | | 1,687,515 | |
Duke Energy Corp. | | 58,386 | | 1,602,696 | |
Dynergy, Inc.* | | 18,964 | | 91,786 | |
Edison International | | 20,508 | | 894,354 | |
Entergy Corp. | | 13,060 | | 896,569 | |
Exelon Corp. | | 41,999 | | 2,231,827 | |
FPL Group, Inc. | | 24,854 | | 1,032,932 | |
MUTUAL OF AMERICA INVESTMENT CORPORATION (EQUITY INDEX FUND)
PORTFOLIO OF INVESTMENTS IN SECURITIES
DECEMBER 31, 2005
| | Shares | | Value($) | |
COMMON STOCKS: | | | | | |
UTILITIES (Cont’d.) | | | | | |
FirstEnergy Corp. | | 20,762 | | 1,017,130 | |
Keyspan Corporation | | 10,975 | | 391,698 | |
NiSource, Inc. | | 17,160 | | 357,958 | |
Nicor, Inc. | | 2,781 | | 109,321 | |
PG & E Corp. | | 21,597 | | 801,681 | |
PPL Corporation | | 23,928 | | 703,483 | |
Peoples Energy Corp. | | 2,394 | | 83,958 | |
Pinnacle West Capital Corp. | | 6,232 | | 257,693 | |
Progress Energy, Inc. | | 15,841 | | 695,737 | |
Public Service Enterprise Group | | 15,780 | | 1,025,227 | |
Sempra Energy | | 16,183 | | 725,646 | |
Southern Co. | | 46,674 | | 1,611,653 | |
TXU Corp. | | 30,392 | | 1,525,374 | |
Teco Energy, Inc. | | 13,099 | | 225,041 | |
Xcel Energy, Inc. | | 25,360 | | 468,146 | |
| | | | 23,820,496 | |
| | | | | |
TOTAL COMMON STOCKS (Cost: $615,527,933) 97.8% | | | | 709,247,514 | |
*Non-income producing security.
MUTUAL OF AMERICA INVESTMENT CORPORATION (EQUITY INDEX FUND)
PORTFOLIO OF INVESTMENTS IN SECURITIES
DECEMBER 31, 2005
| | | | | | Face | | | |
| | Rate(%) | | Maturity | | Amount($) | | Value($) | |
SHORT-TERM DEBT SECURITIES: | | | | | | | | | |
U.S. GOVERNMENT (0.1%) | | | | | | | | | |
U.S. Treasury Bill (a) | | 3.85 | | 02/09/06 | | 800,000 | | 796,561 | |
U.S. Treasury Bill (a) | | 3.87 | | 03/30/06 | | 200,000 | | 198,038 | |
| | | | | | | | 994,599 | |
U.S. GOVERNMENT AGENCIES (2.0%) | | | | | | | | | |
Federal Home Loan Bank | | 3.35 | | 01/03/06 | | 14,500,000 | | 14,495,952 | |
| | | | | | | | | |
TOTAL SHORT-TERM DEBT SECURITIES (Cost: $15,490,598) 2.1% | | | | | | | | 15,490,551 | |
| | | | | | | | | |
TEMPORARY CASH INVESTMENTS** (Cost $750,000) 0.1% | | | | | | | | 750,000 | |
| | | | | | | | | |
TOTAL INVESTMENTS (Cost: $631,768,531) 100.0% | | | | | | | | 725,488,065 | |
| | | | | | | | | |
OTHER NET ASSETS0.0% (b) | | | | | | | | 286,093 | |
| | | | | | | | | |
NET ASSETS 100.0% | | | | | | | | $ | 725,774,158 | |
| | | | | | | | | | |
(a) This security, or a portion thereof, has been segregated to cover initial margin requirements on open futures contracts.
(b) Less than 0.05%.
**The fund has an arrangement with its custodian bank, JPMorgan Chase Bank, whereby uninvested cash, subject to parameters set by the fund, is automatically invested in the fund’s name by the bank in overnight commercial paper issued by J.P. Morgan Chase & Co. On the next business day, these funds (and earned interest) are automatically returned to the fund. The annual rate of interest earned on this temporary cash investment at December 30, 2005 was 3.79 %.
FUTURES CONTRACTS OUTSTANDING AS OF DECEMBER 31, 2005:
| | Expiration | | Underlying Face | | Unrealized | |
| | Date | | Amount at Value | | Gain(Loss) | |
| | | | | | | |
Purchased | | | | | | | |
| | | | | | | |
50 S & P Stock Index Futures Contracts | | March 2005 | | $ | 15,685,000 | | $ | (336,975 | ) |
| | | | | | | | | |
Face Value of futures purchased and outstanding as a percentage of total investments in securities: 2.2 %
MUTUAL OF AMERICA INVESTMENT CORPORATION (ALL AMERICA FUND)
PORTFOLIO OF INVESTMENTS IN SECURITIES
DECEMBER 31, 2005
| | Shares | | Value($) | |
INDEXED ASSETS: | | | | | |
COMMON STOCKS: | | | | | |
BASIC MATERIALS (1.6%) | | | | | |
Air Products & Chemicals, Inc. | | 4,252 | | 251,676 | |
Alcoa, Inc. | | 16,667 | | 492,843 | |
Allegheny Technologies, Inc. | | 1,629 | | 58,774 | |
Ball Corp. | | 1,993 | | 79,162 | |
Bemis Co. | | 2,017 | | 56,214 | |
Dow Chemical Co. | | 18,492 | | 810,319 | |
Du Pont (E.I.) de Nemours & Co. | | 17,615 | | 748,637 | |
Eastman Chemical Co. | | 1,556 | | 80,274 | |
Ecolab, Inc. | | 3,532 | | 128,106 | |
Engelhard Corp. | | 2,295 | | 69,194 | |
Freeport-McMoran Copper Cl B | | 3,526 | | 189,699 | |
Georgia-Pacific (Timber Group) | | 15 | | 720 | |
Hercules, Inc.* | | 2,154 | | 24,340 | |
International Paper Co. | | 9,398 | | 315,867 | |
International Flavors & Fragrances | | 1,549 | | 51,892 | |
Louisiana-Pacific Corp. | | 2,027 | | 55,682 | |
MeadWestvaco Corp. | | 3,477 | | 97,460 | |
Monsanto Co. | | 5,145 | | 398,892 | |
Newmont Mining Corp. Holding Co. | | 8,560 | | 457,104 | |
Nucor Corp. | | 2,985 | | 199,159 | |
PPG Industries, Inc. | | 3,200 | | 185,280 | |
Pactiv Corp.* | | 2,746 | | 60,412 | |
Phelps Dodge Corp. | | 1,946 | | 279,971 | |
Praxair, Inc. | | 6,176 | | 327,081 | |
Rohm & Haas Co. | | 2,759 | | 133,591 | |
Sealed Air Corp.* | | 1,559 | | 87,569 | |
Sigma-Aldrich Corp. | | 1,287 | | 81,454 | |
Temple-Inland, Inc. | | 2,159 | | 96,831 | |
United States Steel Group | | 2,172 | | 104,408 | |
Vulcan Materials Co. | | 1,954 | | 132,383 | |
Weyerhaeuser Co. | | 4,661 | | 309,211 | |
| | | | 6,364,205 | |
CONSUMER, CYCLICAL (5.7%) | | | | | |
Amazon.com, Inc.* | | 5,877 | | 277,101 | |
AutoZone, Inc.* | | 1,062 | | 97,439 | |
Autonation, Inc.* | | 3,469 | | 75,381 | |
Bed Bath & Beyond, Inc.* | | 5,688 | | 205,621 | |
Best Buy Co., Inc. | | 7,831 | | 340,492 | |
MUTUAL OF AMERICA INVESTMENT CORPORATION (ALL AMERICA FUND)
PORTFOLIO OF INVESTMENTS IN SECURITIES
DECEMBER 31, 2005
| | Shares | | Value($) | |
INDEXED ASSETS: | | | | | |
COMMON STOCKS: | | | | | |
CONSUMER, CYCLICAL (Cont’d.) | | | | | |
Big Lots, Inc.* | | 2,175 | | 26,122 | |
Black & Decker Corp. | | 1,502 | | 130,614 | |
Brunswick Corp. | | 1,848 | | 75,140 | |
Carnival Corp. | | 8,301 | | 443,854 | |
Centex Corp. | | 2,452 | | 175,293 | |
Circuit City Group, Inc. | | 3,001 | | 67,793 | |
Clear Channel Communications* | | 10,357 | | 325,728 | |
Coach, Inc.* | | 7,282 | | 242,782 | |
Comcast Corp. Cl A* | | 41,606 | | 1,080,092 | |
Cooper Tire & Rubber Co. | | 1,170 | | 17,924 | |
D.R. Horton, Inc. | | 5,215 | | 186,332 | |
Dana Corp. | | 2,873 | | 20,628 | |
Darden Restaurants, Inc. | | 2,509 | | 97,550 | |
Dillard’s, Inc. Cl A | | 1,181 | | 29,312 | |
Disney (Walt) Co. | | 36,857 | | 883,462 | |
Dollar General Corp. | | 6,067 | | 115,698 | |
Dow Jones & Co. | | 1,123 | | 39,855 | |
EW Scripps Co. Cl A | | 1,606 | | 77,120 | |
Eastman Kodak Co. | | 5,503 | | 128,770 | |
Family Dollar Stores, Inc. | | 2,967 | | 73,552 | |
Federated Dept Stores | | 5,216 | | 345,977 | |
Ford Motor Co. | | 35,593 | | 274,778 | |
Fortune Brands, Inc. | | 2,799 | | 218,378 | |
Gannett Co., Inc. | | 4,597 | | 278,440 | |
Gap, Inc. | | 10,997 | | 193,987 | |
General Motors Corp. | | 10,835 | | 210,416 | |
Genuine Parts Co. | | 3,325 | | 146,034 | |
Goodyear Tire & Rubber Co.* | | 3,380 | | 58,744 | |
Harley-Davidson, Inc. | | 5,262 | | 270,940 | |
Harrah’s Entertainment, Inc. | | 3,521 | | 251,012 | |
Hasbro, Inc. | | 3,420 | | 69,016 | |
Hilton Hotels Corp. | | 6,285 | | 151,531 | |
Home Depot, Inc. | | 40,702 | | 1,647,617 | |
International Game Technology | | 6,456 | | 198,716 | |
Interpublic Group of Cos., Inc. | | 8,249 | | 79,603 | |
Johnson Controls, Inc. | | 3,697 | | 269,548 | |
Jones Apparel Group, Inc. | | 2,238 | | 68,751 | |
KB Home | | 1,500 | | 108,990 | |
MUTUAL OF AMERICA INVESTMENT CORPORATION (ALL AMERICA FUND)
PORTFOLIO OF INVESTMENTS IN SECURITIES
DECEMBER 31, 2005
| | Shares | | Value($) | |
INDEXED ASSETS: | | | | | |
COMMON STOCKS: | | | | | |
CONSUMER, CYCLICAL (Cont’d.) | | | | | |
Knight-Ridder, Inc. | | 1,326 | | 83,936 | |
Kohl’s Corp.* | | 6,605 | | 321,003 | |
Leggett & Platt | | 3,525 | | 80,934 | |
Lennar Corp. | | 2,632 | | 160,605 | |
Limited Brands, Inc. | | 6,670 | | 149,075 | |
Liz Claiborne, Inc. | | 2,050 | | 73,431 | |
Lowe’s Companies, Inc. | | 14,982 | | 998,700 | |
Marriott International, Inc. | | 3,154 | | 211,223 | |
Mattel, Inc. | | 7,737 | | 122,399 | |
Maytag Corp. | | 1,535 | | 28,889 | |
McDonald’s Corp. | | 24,115 | | 813,158 | |
McGraw-Hill Cos., Inc. | | 7,183 | | 370,858 | |
Meredith Corp. | | 801 | | 41,924 | |
NIKE, Inc. Cl B | | 3,650 | | 316,784 | |
New York Times Co. Cl A | | 2,775 | | 73,399 | |
Newell Rubbermaid, Inc. | | 5,278 | | 125,511 | |
News Corp, Inc. | | 46,623 | | 724,988 | |
Nordstrom, Inc. | | 4,188 | | 156,631 | |
Office Depot, Inc.* | | 5,918 | | 185,825 | |
OfficeMax, Inc. | | 1,352 | | 34,287 | |
Omnicom Group, Inc. | | 3,455 | | 294,124 | |
Penney (J.C.) Co., Inc. | | 4,449 | | 247,364 | |
Pulte Homes, Inc. | | 4,110 | | 161,770 | |
RadioShack Corp. | | 2,579 | | 54,236 | |
Reebok International, Ltd. | | 1,004 | | 58,463 | |
Sears Holding Corp.* | | 1,912 | | 220,893 | |
Sherwin-Williams Co. | | 2,151 | | 97,698 | |
Snap-On, Inc. | | 1,104 | | 41,466 | |
Stanley Works | | 1,387 | | 66,631 | |
Staples, Inc. | | 14,014 | | 318,258 | |
Starbucks Corp.* | | 14,724 | | 441,867 | |
Starwood Hotels & Resorts | | 4,201 | | 268,276 | |
TJX Companies, Inc. | | 8,827 | | 205,051 | |
Target Corp. | | 16,846 | | 926,025 | |
Tiffany & Co. | | 2,721 | | 104,187 | |
Time Warner, Inc. | | 89,337 | | 1,558,037 | |
Tribune Co. | | 5,016 | | 151,784 | |
Univision Communications, Inc. | | 4,284 | | 125,907 | |
MUTUAL OF AMERICA INVESTMENT CORPORATION (ALL AMERICA FUND)
PORTFOLIO OF INVESTMENTS IN SECURITIES
DECEMBER 31, 2005
| | Shares | | Value($) | |
INDEXED ASSETS: | | | | | |
COMMON STOCKS: | | | | | |
CONSUMER, CYCLICAL (Cont’d.) | | | | | |
V F Corp. | | 1,707 | | 94,465 | |
Viacom, Inc. Cl B* | | 29,611 | | 965,319 | |
Wendy’s International, Inc. | | 2,228 | | 123,119 | |
Whirlpool Corp. | | 1,293 | | 108,302 | |
Yum! Brands, Inc. | | 5,424 | | 254,277 | |
eBay, Inc.* | | 21,898 | | 947,088 | |
| | | | 22,984,300 | |
CONSUMER, NON-CYCLICAL (5.1%) | | | | | |
Alberto-Culver Co. Cl A | | 1,440 | | 65,880 | |
Albertson’s, Inc. | | 7,066 | | 150,859 | |
Altria Group, Inc. | | 39,899 | | 2,981,253 | |
Anheuser-Busch Cos., Inc. | | 14,875 | | 639,030 | |
Archer-Daniels-Midland Co. | | 12,515 | | 308,620 | |
Avon Products, Inc. | | 8,783 | | 250,755 | |
Brown-Forman Corp. Cl B | | 1,585 | | 109,872 | |
CVS Corp. | | 15,600 | | 412,152 | |
Campbell Soup Co. | | 3,566 | | 106,160 | |
Clorox Co. | | 2,887 | | 164,241 | |
Coca-Cola Co. | | 39,669 | | 1,599,057 | |
Coca-Cola Enterprises, Inc. | | 5,806 | | 111,301 | |
Colgate-Palmolive Co. | | 9,924 | | 544,331 | |
ConAgra Foods, Inc. | | 9,943 | | 201,644 | |
Constellation Brands, Inc. Cl A | | 3,770 | | 98,887 | |
Costco Wholesale Corp. | | 9,045 | | 447,456 | |
General Mills, Inc. | | 6,807 | | 335,721 | |
Heinz (H.J.) Co. | | 6,412 | | 216,213 | |
Hershey Food Corp. | | 3,470 | | 191,718 | |
Kellogg Co. | | 4,921 | | 212,686 | |
Kimberly Clark Corp. | | 8,952 | | 533,987 | |
Kroger Co.* | | 13,889 | | 262,224 | |
McCormick & Co., Inc. | | 2,557 | | 79,062 | |
Molson Coors Brewing Co. | | 1,082 | | 72,483 | |
Pepsi Bottling Group, Inc. | | 2,627 | | 75,158 | |
PepsiCo, Inc. | | 31,791 | | 1,878,212 | |
Proctor & Gamble Co. | | 64,221 | | 3,717,111 | |
RJ Reynolds Tobacco Holdings | | 1,633 | | 155,674 | |
Safeway, Inc. | | 8,608 | | 203,665 | |
Sara Lee Corp. | | 14,553 | | 275,052 | |
MUTUAL OF AMERICA INVESTMENT CORPORATION (ALL AMERICA FUND)
PORTFOLIO OF INVESTMENTS IN SECURITIES
DECEMBER 31, 2005
| | Shares | | Value($) | |
INDEXED ASSETS: | | | | | |
COMMON STOCKS: | | | | | |
CONSUMER, NON-CYCLICAL (Cont’d.) | | | | | |
Supervalu, Inc. | | 2,609 | | 84,740 | |
Sysco Corp. | | 11,886 | | 369,060 | |
Tyson Foods, Inc. | | 4,822 | | 82,456 | |
UST, Inc.* | | 3,140 | | 128,206 | |
Wal-Mart Stores, Inc. | | 47,865 | | 2,240,082 | |
Walgreen Co. | | 19,392 | | 858,290 | |
Whole Foods Market, Inc. | | 2,658 | | 205,703 | |
Wrigley (Wm.) Jr. Co. | | 3,434 | | 228,327 | |
| | | | 20,597,328 | |
ENERGY (5.0%) | | | | | |
Amerada Hess Corp. | | 1,526 | | 193,527 | |
Anadarko Petroleum | | 4,545 | | 430,639 | |
Apache Corp. | | 6,309 | | 432,293 | |
Ashland, Inc. | | 1,375 | | 79,613 | |
BJ Services Co. | | 6,176 | | 226,474 | |
Baker Hughes, Inc. | | 6,550 | | 398,109 | |
Burlington Resources, Inc. | | 7,243 | | 624,347 | |
ChevronTexaco Corp. | | 43,023 | | 2,442,416 | |
ConocoPhillips | | 26,594 | | 1,547,239 | |
Devon Energy Corp. | | 8,513 | | 532,403 | |
EOG Resources, Inc. | | 4,629 | | 339,630 | |
El Paso Corp. | | 12,633 | | 153,617 | |
Exxon Mobil Corp. | | 119,224 | | 6,696,812 | |
Halliburton Co. | | 9,826 | | 608,819 | |
Kerr-McGee Corp. | | 2,223 | | 201,982 | |
Kinder Morgan, Inc. | | 2,009 | | 184,728 | |
Marathon Oil Corp. | | 7,022 | | 428,131 | |
Murphy Oil Corp. | | 3,164 | | 170,824 | |
Nabors Industries, Ltd.* | | 3,028 | | 229,371 | |
National-Oilwell, Inc.* | | 3,339 | | 209,355 | |
Noble Corporation* | | 2,623 | | 185,026 | |
Occidental Petroleum | | 7,703 | | 615,316 | |
Rowan Cos., Inc. | | 2,095 | | 74,666 | |
Schlumberger, Ltd. | | 11,287 | | 1,096,532 | |
Sunoco, Inc. | | 2,610 | | 204,572 | |
Transocean, Inc.* | | 6,324 | | 440,720 | |
Valero Energy Corp. | | 11,743 | | 605,939 | |
Weatherford International, Ltd.* | | 6,661 | | 241,128 | |
MUTUAL OF AMERICA INVESTMENT CORPORATION (ALL AMERICA FUND)
PORTFOLIO OF INVESTMENTS IN SECURITIES
DECEMBER 31, 2005
| | Shares | | Value($) | |
INDEXED ASSETS: | | | | | |
COMMON STOCKS: | | | | | |
ENERGY (Cont’d.) | | | | | |
Williams Cos., Inc. | | 10,979 | | 254,383 | |
XTO Energy, Inc. | | 6,959 | | 305,778 | |
| | | | 20,154,389 | |
FINANCIAL (11.3%) | | | | | |
Ace, Ltd.* | | 6,176 | | 330,045 | |
Aflac, Inc. | | 9,584 | | 444,889 | |
Allstate Corp. | | 12,429 | | 672,036 | |
AmSouth Bancorporation | | 6,679 | | 175,057 | |
Ambac Financial Group, Inc. | | 2,015 | | 155,276 | |
American Express Co. | | 23,791 | | 1,224,285 | |
American International Group, Inc. | | 49,733 | | 3,393,283 | |
Ameriprise Financial, Inc. | | 4,713 | | 193,233 | |
Aon Corp. | | 6,131 | | 220,409 | |
Apartment Investment & Mgmt. Co. | | 1,834 | | 69,454 | |
Archstone-Smith Trust | | 4,062 | | 170,157 | |
BB & T Corp. | | 10,390 | | 435,445 | |
Bank of America Corp. | | 76,950 | | 3,551,242 | |
Bank of New York Co., Inc. | | 14,758 | | 470,042 | |
Bear Stearns Cos., Inc. | | 2,171 | | 250,816 | |
CIT Group, Inc. | | 3,828 | | 198,214 | |
Capital One Financial Corp. | | 5,739 | | 495,850 | |
Charles Schwab Corp. | | 19,765 | | 289,953 | |
Chubb Corp. | | 3,830 | | 374,000 | |
Cincinnati Financial Corp. | | 3,339 | | 149,187 | |
Citigroup, Inc. | | 96,932 | | 4,704,110 | |
Comerica, Inc. | | 3,166 | | 179,702 | |
Compass Bancshares, Inc. | | 2,386 | | 115,220 | |
Countrywide Financial Corp. | | 11,442 | | 391,202 | |
E*Trade Financial Corp.* | | 7,838 | | 163,501 | |
Equity Office Properties | | 7,782 | | 236,028 | |
Equity Residential | | 5,521 | | 215,982 | |
Fannie Mae | | 18,546 | | 905,230 | |
Federated Investors, Inc. | | 1,618 | | 59,931 | |
Fifth Third Bancorp | | 10,624 | | 400,737 | |
First Tennessee National Bank | | 2,414 | | 92,794 | |
Franklin Resources, Inc. | | 2,836 | | 266,612 | |
Freddie Mac | | 13,239 | | 865,169 | |
Genworth Financial, Inc. | | 7,216 | | 249,529 | |
MUTUAL OF AMERICA INVESTMENT CORPORATION (ALL AMERICA FUND)
PORTFOLIO OF INVESTMENTS IN SECURITIES
DECEMBER 31, 2005
| | Shares | | Value($) | |
INDEXED ASSETS: | | | | | |
COMMON STOCKS: | | | | | |
FINANCIAL (Cont’d.) | | | | | |
Golden West Financial Corp. | | 4,882 | | 322,212 | |
Goldman Sachs Group, Inc. | | 8,638 | | 1,103,159 | |
Hartford Financial Service Group, Inc. | | 5,755 | | 494,297 | |
Huntington Bancshares, Inc. | | 4,372 | | 103,835 | |
J.P. Morgan Chase & Co. | | 67,043 | | 2,660,937 | |
Janus Capital Group | | 4,133 | | 76,998 | |
Jefferson-Pilot Corp. | | 2,575 | | 146,595 | |
KeyCorp. | | 7,820 | | 257,513 | |
Lehman Brothers Holdings, Inc. | | 5,133 | | 657,897 | |
Lincoln National Corp. | | 3,319 | | 176,007 | |
Loews Corp. | | 2,589 | | 245,567 | |
M & T Bank Corp. | | 1,529 | | 166,737 | |
MBIA, Inc. | | 2,561 | | 154,070 | |
MBNA Corp. | | 24,048 | | 652,903 | |
MGIC Investment Corp. | | 1,738 | | 114,395 | |
Marsh & McLennan Cos., Inc. | | 10,436 | | 331,447 | |
Marshall & Ilsley Corp. | | 4,008 | | 172,504 | |
Mellon Financial Corp. | | 8,012 | | 274,411 | |
Merrill Lynch & Co., Inc. | | 17,608 | | 1,192,590 | |
MetLife, Inc. | | 14,510 | | 710,990 | |
Moody’s Corp. | | 4,754 | | 291,991 | |
Morgan Stanley | | 20,654 | | 1,171,908 | |
National City Corp. | | 10,561 | | 354,533 | |
North Fork Bancorp, Inc. | | 9,114 | | 249,359 | |
Northern Trust Corp. | | 3,546 | | 183,754 | |
PNC Financial Services Group | | 5,600 | | 346,248 | |
Plum Creek Timber Co. | | 3,527 | | 127,148 | |
Principal Financial Group, Inc. | | 5,368 | | 254,604 | |
Progressive Corp. of Ohio | | 3,779 | | 441,312 | |
Prologis Trust | | 4,666 | | 217,996 | |
Prudential Financial, Inc. | | 9,676 | | 708,186 | |
Public Storage, Inc. | | 1,579 | | 106,930 | |
Regions Financial Corp. | | 8,774 | | 299,720 | |
SLM Corporation | | 7,995 | | 440,445 | |
Safeco Corp. | | 2,367 | | 133,736 | |
Simon Property Group | | 3,573 | | 273,799 | |
Sovereign Bancorp, Inc. | | 6,843 | | 147,946 | |
St. Paul Travelers Co., Inc. | | 13,267 | | 592,637 | |
MUTUAL OF AMERICA INVESTMENT CORPORATION (ALL AMERICA FUND)
PORTFOLIO OF INVESTMENTS IN SECURITIES
DECEMBER 31, 2005
| | Shares | | Value($) | |
INDEXED ASSETS: | | | | | |
COMMON STOCKS: | | | | | |
FINANCIAL (Cont’d.) | | | | | |
State Street Corp. | | 6,283 | | 348,330 | |
Suntrust Banks, Inc. | | 6,927 | | 504,009 | |
Synovus Financial Corp. | | 5,984 | | 161,628 | |
T. Rowe Price Group, Inc. | | 2,504 | | 180,363 | |
Torchmark Corp. | | 1,994 | | 110,866 | |
UNUM Provident Corp. | | 5,711 | | 129,925 | |
US Bancorp | | 34,802 | | 1,040,232 | |
Vornado Realty Trust | | 2,262 | | 188,809 | |
Wachovia Corp. | | 29,765 | | 1,573,378 | |
Washington Mutual, Inc. | | 18,906 | | 822,411 | |
Wells Fargo & Company | | 32,041 | | 2,013,136 | |
XL Capital Limited* | | 3,341 | | 225,117 | |
Zions Bancorporation | | 2,001 | | 151,196 | |
| | | | 45,915,336 | |
HEALTHCARE (7.0%) | | | | | |
Abbott Laboratories | | 29,722 | | 1,171,938 | |
Aetna, Inc. | | 5,480 | | 516,819 | |
Allergan, Inc. | | 2,522 | | 272,275 | |
Amerisource Bergen Corp. | | 3,996 | | 165,434 | |
Amgen, Inc.* | | 23,650 | | 1,865,039 | |
Applera Corp.-Applied Biosys | | 3,600 | | 95,616 | |
Bard (C.R.), Inc. | | 2,012 | | 132,631 | |
Bausch & Lomb, Inc. | | 1,027 | | 69,733 | |
Baxter International, Inc. | | 11,949 | | 449,880 | |
Becton Dickinson & Co. | | 4,829 | | 290,126 | |
Biogen Idec, Inc.* | | 6,503 | | 294,781 | |
Biomet, Inc. | | 4,768 | | 174,366 | |
Boston Scientific Corp.* | | 11,305 | | 276,859 | |
Bristol-Myers Squibb Co. | | 37,488 | | 861,474 | |
CIGNA Corp. | | 2,410 | | 269,197 | |
Cardinal Health, Inc. | | 8,205 | | 564,094 | |
Caremark Rx, Inc.* | | 8,618 | | 446,326 | |
Chiron Corp.* | | 2,096 | | 93,188 | |
Coventry Health Care* | | 3,113 | | 177,316 | |
Express Scripts, Inc.* | | 2,791 | | 233,886 | |
Forest Laboratories, Inc.* | | 6,472 | | 263,281 | |
Genzyme Corp. (Genl. Div.)* | | 4,948 | | 350,219 | |
Gilead Sciences, Inc.* | | 8,774 | | 461,776 | |
MUTUAL OF AMERICA INVESTMENT CORPORATION (ALL AMERICA FUND)
PORTFOLIO OF INVESTMENTS IN SECURITIES
DECEMBER 31, 2005
| | Shares | | Value($) | |
INDEXED ASSETS: | | | | | |
COMMON STOCKS: | | | | | |
HEALTHCARE (Cont’d.) | | | | | |
Guidant Corp. | | 6,358 | | 411,680 | |
HCA, Inc. | | 8,123 | | 410,211 | |
Health Management Associates | | 4,736 | | 104,003 | |
Hospira, Inc.* | | 3,082 | | 131,848 | |
Humana, Inc.* | | 3,119 | | 169,455 | |
IMS Health, Inc. | | 4,439 | | 110,620 | |
Johnson & Johnson | | 57,001 | | 3,425,760 | |
King Pharmaceuticals, Inc.* | | 4,633 | | 78,390 | |
Laboratory Corp. of America* | | 2,547 | | 137,156 | |
Lilly (Eli) & Co. | | 21,778 | | 1,232,417 | |
Manor Care, Inc. | | 1,510 | | 60,053 | |
McKesson Corp. | | 5,891 | | 303,917 | |
Medco Health Solutions* | | 5,893 | | 328,829 | |
Medimmune, Inc.* | | 4,706 | | 164,804 | |
Medtronic, Inc. | | 23,177 | | 1,334,300 | |
Merck & Co., Inc. | | 41,897 | | 1,332,744 | |
Millipore Corp.* | | 998 | | 65,908 | |
Mylan Laboratories, Inc. | | 4,188 | | 83,592 | |
Patterson Cos., Inc.* | | 2,649 | | 88,477 | |
PerkinElmer, Inc. | | 2,506 | | 59,041 | |
Pfizer, Inc. | | 141,239 | | 3,293,693 | |
Quest Diagnostics, Inc. | | 3,180 | | 163,706 | |
Schering-Plough Corp. | | 28,317 | | 590,409 | |
St. Jude Medical, Inc.* | | 7,024 | | 352,605 | |
Stryker Corp. | | 5,587 | | 248,230 | |
Tenet Healthcare Corp.* | | 8,994 | | 68,894 | |
Thermo Electron Corp.* | | 3,107 | | 93,614 | |
UnitedHealth Group, Inc. | | 26,112 | | 1,622,600 | |
Waters Corp.* | | 2,121 | | 80,174 | |
Watson Pharmaceuticals, Inc.* | | 1,943 | | 63,167 | |
WellPoint, Inc.* | | 12,633 | | 1,007,987 | |
Wyeth | | 25,718 | | 1,184,828 | |
Zimmer Holdings, Inc.* | | 4,748 | | 320,205 | |
| | | | 28,619,571 | |
INDUSTRIAL (6.1%) | | | | | |
3M Company | | 14,561 | | 1,128,477 | |
Allied Waste Industries, Inc.* | | 4,182 | | 36,551 | |
American Power Conversion | | 3,294 | | 72,468 | |
MUTUAL OF AMERICA INVESTMENT CORPORATION (ALL AMERICA FUND)
PORTFOLIO OF INVESTMENTS IN SECURITIES
DECEMBER 31, 2005
| | Shares | | Value($) | |
INDEXED ASSETS: | | | | | |
COMMON STOCKS: | | | | | |
INDUSTRIAL (Cont’d.) | | | | | |
American Standard Cos. | | 3,504 | | 139,985 | |
Apollo Group, Inc. Cl A* | | 2,795 | | 168,986 | |
Avery Dennison Corp. | | 2,110 | | 116,620 | |
Block (H. & R.), Inc. | | 6,277 | | 154,100 | |
Boeing Co. | | 15,468 | | 1,086,472 | |
Burlington North Santa Fe | | 7,155 | | 506,717 | |
CSX Corp. | | 4,163 | | 211,356 | |
Caterpillar, Inc. | | 13,033 | | 752,916 | |
Cendant Corp. | | 19,628 | | 338,583 | |
Cintas Corp. | | 2,637 | | 108,592 | |
Cooper Industries, Ltd.* | | 1,755 | | 128,115 | |
Cummins, Inc. | | 888 | | 79,680 | |
Danaher Corp. | | 4,539 | | 253,185 | |
Deere & Co. | | 4,622 | | 314,804 | |
Donnelley R.R. & Sons Co. | | 4,164 | | 142,450 | |
Dover Corp. | | 3,884 | | 157,263 | |
Eaton Corp. | | 2,836 | | 190,267 | |
Emerson Electric Co. | | 7,871 | | 587,964 | |
Equifax, Inc. | | 2,488 | | 94,594 | |
FedEx Corp. | | 5,806 | | 600,282 | |
Fisher Scientific International* | | 2,350 | | 145,371 | |
Fluor Corp. | | 1,657 | | 128,020 | |
General Dynamics Corp. | | 3,857 | | 439,891 | |
General Electric Co. | | 202,452 | | 7,095,943 | |
Goodrich Corporation | | 2,355 | | 96,791 | |
Grainger (W.W.), Inc. | | 1,457 | | 103,593 | |
Honeywell International, Inc. | | 16,148 | | 601,513 | |
ITT Industries, Inc. | | 1,772 | | 182,197 | |
Illinois Tool Works, Inc. | | 3,924 | | 345,273 | |
Ingersoll Rand Co.* | | 6,339 | | 255,905 | |
L-3 Communications Holdings, Inc | | 2,302 | | 171,154 | |
Lockheed Martin Corp. | | 6,851 | | 435,929 | |
Masco Corp. | | 8,120 | | 245,143 | |
Monster Worldwide, Inc.* | | 2,359 | | 96,294 | |
Navistar International Corp.* | | 1,179 | | 33,743 | |
Norfolk Southern | | 7,787 | | 349,091 | |
Northrop Grumman Corp. | | 6,808 | | 409,161 | |
PACCAR, Inc. | | 3,244 | | 224,582 | |
MUTUAL OF AMERICA INVESTMENT CORPORATION (ALL AMERICA FUND)
PORTFOLIO OF INVESTMENTS IN SECURITIES
DECEMBER 31, 2005
| | Shares | | Value($) | |
INDEXED ASSETS: | | | | | |
COMMON STOCKS: | | | | | |
INDUSTRIAL (Cont’d.) | | | | | |
Pall Corp. | | 2,387 | | 64,115 | |
Parker Hannifin Corp. | | 2,287 | | 150,851 | |
Pitney Bowes, Inc. | | 4,372 | | 184,717 | |
Raytheon Co. | | 8,560 | | 343,684 | |
Robert Half International, Inc. | | 3,263 | | 123,635 | |
Rockwell Automation, Inc. | | 3,432 | | 203,037 | |
Rockwell Collins | | 3,310 | | 153,816 | |
Ryder System, Inc. | | 1,226 | | 50,291 | |
Southwest Airlines Co. | | 13,367 | | 219,620 | |
Textron, Inc. | | 2,536 | | 195,221 | |
Tyco International, Ltd. | | 38,571 | | 1,113,159 | |
Union Pacific Corp. | | 5,077 | | 408,749 | |
United Parcel Service Cl B | | 21,154 | | 1,589,723 | |
United Technologies Corp. | | 19,518 | | 1,091,251 | |
Waste Management, Inc. | | 10,573 | | 320,891 | |
| | | | 24,942,781 | |
TECHNOLOGY (8.0%) | | | | | |
ADC Telecommunications, Inc.* | | 2,225 | | 49,707 | |
Adobe Systems, Inc.* | | 11,519 | | 425,742 | |
Advanced Micro Devices, Inc.* | | 7,742 | | 236,905 | |
Affiliated Computer Svcs.* | | 2,382 | | 140,967 | |
Agilent Technologies, Inc.* | | 7,877 | | 262,225 | |
Altera Corp.* | | 6,945 | | 128,691 | |
Analog Devices, Inc. | | 7,029 | | 252,130 | |
Andrew Corp.* | | 3,113 | | 33,402 | |
Apple Computer, Inc.* | | 16,148 | | 1,160,880 | |
Applied Materials, Inc. | | 31,088 | | 557,719 | |
Applied Micro Circuits Corp.* | | 5,724 | | 14,711 | |
Autodesk, Inc.* | | 4,422 | | 189,925 | |
Automatic Data Processing | | 11,048 | | 506,993 | |
Avaya, Inc.* | | 8,024 | | 85,616 | |
BMC Software, Inc.* | | 4,144 | | 84,911 | |
Broadcom Corp. Cl A* | | 5,541 | | 261,258 | |
Ciena Corp.* | | 11,074 | | 32,890 | |
Cisco Systems, Inc.* | | 117,694 | | 2,014,921 | |
Citrix Systems, Inc.* | | 3,379 | | 97,248 | |
Computer Associates International, Inc. | | 8,792 | | 247,846 | |
Computer Sciences Corp.* | | 3,545 | | 179,519 | |
MUTUAL OF AMERICA INVESTMENT CORPORATION (ALL AMERICA FUND)
PORTFOLIO OF INVESTMENTS IN SECURITIES
DECEMBER 31, 2005
| | Shares | | Value($) | |
INDEXED ASSETS: | | | | | |
COMMON STOCKS: | | | | | |
TECHNOLOGY (Cont’d.) | | | | | |
Compuware Corp.* | | 7,424 | | 66,593 | |
Comverse Technology, Inc.* | | 3,870 | | 102,903 | |
Convergys Corp.* | | 2,682 | | 42,510 | |
Corning, Inc.* | | 29,200 | | 574,072 | |
Dell, Inc.* | | 45,094 | | 1,352,369 | |
EMC Corp.* | | 45,806 | | 623,878 | |
Electronic Arts, Inc.* | | 5,759 | | 301,253 | |
Electronic Data Systems Corp. | | 9,993 | | 240,232 | |
First Data Corp. | | 14,640 | | 629,666 | |
Fiserv, Inc.* | | 3,535 | | 152,959 | |
Freescale Semiconductor Cl A* | | 7,864 | | 197,937 | |
Gateway, Inc.* | | 5,077 | | 12,743 | |
Hewlett-Packard Co. | | 54,895 | | 1,571,644 | |
IBM Corp. | | 30,264 | | 2,487,701 | |
Intel Corp. | | 115,518 | | 2,883,329 | |
Intuit, Inc.* | | 3,390 | | 180,687 | |
JDS Uniphase Corp.* | | 31,661 | | 74,720 | |
Jabil Circuit, Inc.* | | 3,334 | | 123,658 | |
KLA Tencor Corp. | | 3,774 | | 186,171 | |
LSI Logic Corp.* | | 7,505 | | 60,040 | |
Lexmark International, Inc.* | | 2,224 | | 99,702 | |
Linear Technology Corp. | | 5,840 | | 210,649 | |
Lucent Technologies* | | 85,165 | | 226,539 | |
Maxim Integrated Products, Inc. | | 6,281 | | 227,623 | |
Mercury Interactive Corp.* | | 1,654 | | 45,965 | |
Micron Technology, Inc.* | | 11,841 | | 157,604 | |
Microsoft Corp. | | 175,402 | | 4,586,762 | |
Molex, Inc. Cl A | | 2,751 | | 71,388 | |
Motorola, Inc. | | 47,724 | | 1,078,085 | |
NCR Corp.* | | 3,518 | | 119,401 | |
NVIDIA Corporation* | | 3,280 | | 119,917 | |
National Semiconductor Corp. | | 6,585 | | 171,078 | |
Network Appliance, Inc.* | | 7,129 | | 192,483 | |
Novell, Inc.* | | 7,320 | | 64,636 | |
Novellus Systems, Inc.* | | 2,556 | | 61,651 | |
Oracle Corp.* | | 72,050 | | 879,730 | |
PMC Sierra, Inc.* | | 3,511 | | 27,070 | |
Parametric Technology Corp.* | | 5,217 | | 31,824 | |
MUTUAL OF AMERICA INVESTMENT CORPORATION (ALL AMERICA FUND)
PORTFOLIO OF INVESTMENTS IN SECURITIES
DECEMBER 31, 2005
| | Shares | | Value($) | |
INDEXED ASSETS: | | | | | |
COMMON STOCKS: | | | | | |
TECHNOLOGY (Cont’d.) | | | | | |
Paychex, Inc. | | 6,390 | | 243,587 | |
QLogic Corp.* | | 1,544 | | 50,195 | |
Qualcomm, Inc. | | 31,503 | | 1,357,149 | |
Sabre Group Holdings, Inc. | | 2,505 | | 60,396 | |
Sanmina Corp.* | | 10,071 | | 42,902 | |
Scientific-Atlanta, Inc. | | 2,943 | | 126,755 | |
Siebel Systems, Inc. | | 10,138 | | 107,260 | |
Solectron Corp.* | | 17,505 | | 64,068 | |
Sun Microsystems, Inc.* | | 65,418 | | 274,101 | |
Symantec Corp.* | | 20,721 | | 362,617 | |
Symbol Technologies, Inc. | | 4,809 | | 61,651 | |
Tektronix, Inc. | | 1,598 | | 45,080 | |
Tellabs, Inc.* | | 8,592 | | 93,653 | |
Teradyne, Inc.* | | 3,773 | | 54,973 | |
Texas Instruments, Inc. | | 31,008 | | 994,427 | |
Unisys Corp.* | | 6,538 | | 38,117 | |
Xerox Corp.* | | 18,402 | | 269,589 | |
Xilinx, Inc. | | 6,677 | | 168,327 | |
Yahoo!, Inc.* | | 24,193 | | 947,882 | |
| | | | 32,564,107 | |
TELECOMMUNICATIONS (1.6%) | | | | | |
AT & T, Inc. | | 74,848 | | 1,833,020 | |
Alltel Corp. | | 7,337 | | 462,965 | |
BellSouth Corp. | | 35,037 | | 949,503 | |
CenturyTel, Inc. | | 2,510 | | 83,232 | |
Citizens Communications Co. | | 6,398 | | 78,248 | |
Qwest Communications International* | | 29,579 | | 167,121 | |
Sprint Nextel Corp. | | 56,609 | | 1,322,386 | |
Verizon Communications | | 52,978 | | 1,595,697 | |
| | | | 6,492,172 | |
UTILITIES (1.8%) | | | | | |
AES Corp.* | | 12,515 | | 198,112 | |
Allegheny Energy, Inc.* | | 3,121 | | 98,780 | |
Ameren Corp. | | 3,914 | | 200,553 | |
American Electric Power, Inc. | | 7,543 | | 279,770 | |
CINergy Corp. | | 3,821 | | 162,240 | |
CMS Energy Corp.* | | 4,217 | | 61,189 | |
Centerpoint Energy, Inc. | | 5,942 | | 76,355 | |
MUTUAL OF AMERICA INVESTMENT CORPORATION (ALL AMERICA FUND)
PORTFOLIO OF INVESTMENTS IN SECURITIES
DECEMBER 31, 2005
| | Shares | | Value($) | |
INDEXED ASSETS: | | | | | |
COMMON STOCKS: | | | | | |
UTILITIES (Cont’d.) | | | | | |
Consolidated Edison, Inc. | | 4,693 | | 217,427 | |
Constellation Energy Group | | 3,420 | | 196,992 | |
DTE Energy Co. | | 3,407 | | 147,148 | |
Dominion Resources, Inc. | | 6,654 | | 513,689 | |
Duke Energy Corp. | | 17,772 | | 487,841 | |
Dynergy, Inc.* | | 5,773 | | 27,941 | |
Edison International | | 6,243 | | 272,257 | |
Entergy Corp. | | 3,975 | | 272,884 | |
Exelon Corp. | | 12,784 | | 679,342 | |
FPL Group, Inc. | | 7,565 | | 314,401 | |
FirstEnergy Corp. | | 6,319 | | 309,568 | |
Keyspan Corporation | | 3,340 | | 119,205 | |
NiSource, Inc. | | 5,224 | | 108,973 | |
Nicor, Inc. | | 843 | | 33,138 | |
PG & E Corp. | | 6,574 | | 244,027 | |
PPL Corporation | | 7,283 | | 214,120 | |
Peoples Energy Corp. | | 728 | | 25,531 | |
Pinnacle West Capital Corp. | | 1,897 | | 78,441 | |
Progress Energy, Inc. | | 4,822 | | 211,782 | |
Public Svc. Enterprise Group | | 4,803 | | 312,051 | |
Sempra Energy | | 4,926 | | 220,882 | |
Southern Co. | | 14,207 | | 490,568 | |
TXU Corp. | | 9,251 | | 464,309 | |
Teco Energy, Inc. | | 3,988 | | 68,514 | |
Xcel Energy, Inc. | | 7,719 | | 142,492 | |
| | | | 7,250,522 | |
| | | | | |
TOTAL INDEXED ASSETS - COMMON STOCKS (Cost: $169,015,199) 53.2% | | | | 215,884,711 | |
* Non-income producing security.
MUTUAL OF AMERICA INVESTMENT CORPORATION (ALL AMERICA FUND)
PORTFOLIO OF INVESTMENTS IN SECURITIES
DECEMBER 31, 2005
| | | | | | Face | | | |
| | Rate(%) | | Maturity | | Amount($) | | Value($) | |
INDEXED ASSETS: | | | | | | | | | |
SHORT-TERM DEBT SECURITIES: | | | | | | | | | |
U.S. GOVERNMENT (0.1%) | | | | | | | | | |
U.S. Treasury Bill (a) | | 3.82 | | 02/02/06 | | 120,000 | | 119,571 | |
U.S. Treasury Bill (a) | | 3.87 | | 03/30/06 | | 500,000 | | 495,096 | |
| | | | | | | | 614,667 | |
U.S. GOVERNMENT AGENCIES (1.5%) | | | | | | | | | |
Federal National Management Association | | 3.25 | | 01/03/06 | | 6,060,000 | | 6,058,359 | |
| | | | | | | | | |
TOTAL SHORT-TERM DEBT SECURITIES (Cost: $6,673,144) 1.6% | | | | | | | | 6,673,026 | |
| | | | | | | | | |
TOTAL INDEXED ASSETS (Cost: $175,688,343) 54.8% | | | | | | | | 222,557,737 | |
| | | | | | | | | |
TEMPORARY CASH INVESTMENTS**(Cost:$580,000) 0.1% | | | | | | | | 580,000 | |
(a) This security, or a portion thereof, has been segregated to cover initial margin requirements on open futures contracts.
**The fund has an arrangement with its custodian bank, JPMorgan Chase Bank, whereby uninvested cash, subject to parameters set by the fund, is automatically invested in the fund’s name by the bank in overnight commercial paper issued by J.P. Morgan Chase & Co. On the next business day, these funds (and earned interest) are automatically returned to the fund. The annual rate of interest earned on this temporary cash investment at December 30, 2005 was 3.79 %.
FUTURES CONTRACTS OUTSTANDING AS OF DECEMBER 31, 2005:
| | Expiration | | Underlying Face | | Unrealized | |
| | Date | | Amount at Value | | Gain(Loss) | |
| | | | | | | |
Purchased | | | | | | | |
| | | | | | | |
26 S & P Stock Index Futures Contracts | | March 2005 | | $ | 8,156,200 | | $ | (123,850 | ) |
| | | | | | | | | |
Face Value of futures purchased and outstanding as a percentage of total investments in securities: 2.0 %
MUTUAL OF AMERICA INVESTMENT CORPORATION (ALL AMERICA FUND)
PORTFOLIO OF INVESTMENTS IN SECURITIES
DECEMBER 31, 2005
| | Shares | | Value($) | |
ACTIVE ASSETS: | | | | | |
COMMON STOCKS: | | | | | |
BASIC MATERIALS (1.5%) | | | | | |
Century Aluminum Company* | | 13,520 | | 354,359 | |
Commercial Metals Co. | | 22,100 | | 829,634 | |
Cytec Industries, Inc. | | 8,580 | | 408,665 | |
Dow Chemical Co. | | 19,830 | | 868,951 | |
Georgia Gulf Corp. | | 3,740 | | 113,771 | |
Glatfelter | | 16,950 | | 240,521 | |
Longview Fibre Co. | | 23,378 | | 486,496 | |
Lubrizol Corp. | | 11,940 | | 518,554 | |
Oregon Steel Mills, Inc.* | | 13,130 | | 386,285 | |
Phelps Dodge Corp. | | 7,530 | | 1,083,341 | |
Steel Dynamics, Inc. | | 6,700 | | 237,917 | |
U.S. Concrete, Inc.* | | 9,720 | | 92,146 | |
Vulcan Materials Co. | | 7,390 | | 500,672 | |
| | | | 6,121,312 | |
CONSUMER, CYCLICAL (5.1%) | | | | | |
A.C.More Arts & Crafts, Inc.* | | 8,900 | | 129,495 | |
Aaron Rents, Inc. | | 10,200 | | 215,016 | |
Audiovox Corp. Cl A* | | 59,366 | | 822,813 | |
Best Buy Co., Inc. | | 24,109 | | 1,048,259 | |
Carnival Corp. | | 13,490 | | 721,310 | |
Crown Holdings, Inc.* | | 60,042 | | 1,172,620 | |
Gamestop Corp.* | | 27,305 | | 868,845 | |
Guitar Center, Inc.* | | 4,290 | | 214,543 | |
Hibbett Sporting Goods, Inc.* | | 21,225 | | 604,488 | |
Home Depot, Inc. | | 23,160 | | 937,517 | |
Hot Topic, Inc.* | | 10,250 | | 146,062 | |
Hudson Highland Group* | | 20,472 | | 355,394 | |
Johnson Controls, Inc. | | 8,350 | | 608,798 | |
Kohl’s Corp.* | | 25,400 | | 1,234,440 | |
Landry’s Restaurant, Inc. | | 13,470 | | 359,784 | |
Lithia Motors, Inc. Cl A | | 6,875 | | 216,150 | |
Lone Star Steakhouse | | 8,310 | | 197,279 | |
Lowe’s Companies, Inc. | | 9,930 | | 661,934 | |
Omega Protein Corp.* | | 22,070 | | 148,090 | |
Omnicom Group, Inc. | | 12,912 | | 1,099,199 | |
P.F. Changs China Bistro, Inc. | | 6,410 | | 318,128 | |
Pacific Sunwear of California* | | 10,700 | | 266,644 | |
Payless Shoesource, Inc.* | | 14,300 | | 358,930 | |
MUTUAL OF AMERICA INVESTMENT CORPORATION (ALL AMERICA FUND)
PORTFOLIO OF INVESTMENTS IN SECURITIES
DECEMBER 31, 2005
| | Shares | | Value($) | |
ACTIVE ASSETS: | | | | | |
COMMON STOCKS: | | | | | |
CONSUMER, CYCLICAL (Cont'd.) | | | | | |
Penney (J.C.) Co., Inc. | | 17,910 | | 995,796 | |
Pinnacle Entertainment, Inc.* | | 16,676 | | 412,064 | |
Red Robin Gourmet Burgers* | | 6,137 | | 312,742 | |
Starwood Hotels & Resorts | | 15,840 | | 1,011,542 | |
Sunopta* | | 19,510 | | 102,623 | |
Sunterra Corporation* | | 31,755 | | 451,556 | |
Target Corp. | | 22,100 | | 1,214,837 | |
The Bombay Company, Inc.* | | 90,520 | | 267,939 | |
The Warnaco Group, Inc.* | | 21,508 | | 574,694 | |
Time Warner, Inc. | | 53,380 | | 930,947 | |
Wild Oaks Markets, Inc.* | | 37,590 | | 454,087 | |
Winnebago Industries, Inc. | | 6,900 | | 229,632 | |
Wolverine World Wide, Inc. | | 38,598 | | 866,911 | |
| | | | 20,531,108 | |
CONSUMER, NON-CYCLICAL (2.6%) | | | | | |
Alkermes, Inc.* | | 13,003 | | 248,617 | |
CVS Corp. | | 18,380 | | 485,600 | |
Chiquita Brands International, Inc. | | 22,677 | | 453,767 | |
Colgate-Palmolive Co. | | 12,520 | | 686,722 | |
Conmed Corp.* | | 11,215 | | 265,347 | |
General Mills, Inc. | | 8,300 | | 409,356 | |
Hershey Food Corp. | | 11,510 | | 635,927 | |
Hologic, Inc.* | | 5,800 | | 219,936 | |
Longs Drug Stores Corp. | | 18,710 | | 680,857 | |
MGI Pharma, Inc.* | | 21,034 | | 360,943 | |
PepsiCo, Inc. | | 20,300 | | 1,199,324 | |
Proctor & Gamble Co. | | 40,450 | | 2,341,246 | |
Safeway, Inc. | | 24,080 | | 569,733 | |
Serologicals Corp.* | | 19,241 | | 379,817 | |
Sovran Self-Storage, Inc. | | 2,750 | | 129,168 | |
Wal-Mart Stores, Inc. | | 25,990 | | 1,216,332 | |
Walter Industries, Inc. | | 2,190 | | 108,887 | |
| | | | 10,391,579 | |
ENERGY (3.6%) | | | | | |
CNX Gas Corp.* | | 17,650 | | 366,237 | |
Crosstex Energy, Inc. | | 3,280 | | 206,837 | |
Denbury Resources, Inc.* | | 14,790 | | 336,916 | |
Devon Energy Corp. | | 19,120 | | 1,195,765 | |
MUTUAL OF AMERICA INVESTMENT CORPORATION (ALL AMERICA FUND)
PORTFOLIO OF INVESTMENTS IN SECURITIES
DECEMBER 31, 2005
| | Shares | | Value($) | |
ACTIVE ASSETS: | | | | | |
COMMON STOCKS: | | | | | |
ENERGY (Cont'd.) | | | | | |
Exxon Mobil Corp. | | 49,570 | | 2,784,347 | |
Halliburton Co. | | 24,630 | | 1,526,075 | |
Holly Corp. | | 7,825 | | 460,658 | |
NS Group, Inc.* | | 32,140 | | 1,343,773 | |
Range Resources Corp. | | 61,758 | | 1,626,706 | |
Todco Cl A | | 18,605 | | 708,106 | |
Transocean, Inc.* | | 22,210 | | 1,547,815 | |
Unisource Energy Corp. | | 17,167 | | 535,610 | |
Valero Energy Corp. | | 27,280 | | 1,407,648 | |
Whittier Energy* | | 74,100 | | 778,050 | |
| | | | 14,824,543 | |
FINANCIAL (9.8%) | | | | | |
Acadia Realty Trust | | 10,640 | | 213,332 | |
Allstate Corp. | | 11,029 | | 596,338 | |
American Home Mortgage Investment Corp. | | 7,850 | | 255,674 | |
American International Group, Inc. | | 20,699 | | 1,412,293 | |
Amli Residential Properties | | 4,155 | | 158,098 | |
Argonaut Group, Inc.* | | 8,876 | | 290,867 | |
Assured Guaranty Co.* | | 24,038 | | 610,325 | |
Bank Mutual Corp. | | 40,487 | | 429,162 | |
Bank of America Corp. | | 49,053 | | 2,263,796 | |
BankAtlantic Bancorp, Inc. Cl A | | 44,144 | | 618,016 | |
Banner Corporation | | 8,273 | | 258,118 | |
Bear Stearns Cos., Inc. | | 9,226 | | 1,065,880 | |
Boykin Lodging Company* | | 8,180 | | 99,960 | |
Brookline Bankcorp | | 45,066 | | 638,585 | |
Capital One Financial Corp. | | 12,391 | | 1,070,582 | |
Ceres Group, Inc.* | | 13,700 | | 70,829 | |
Choice Hotels International, Inc. | | 12,558 | | 524,422 | |
Citigroup, Inc. | | 56,531 | | 2,743,449 | |
Columbia Banking System | | 10,599 | | 302,601 | |
Conseco, Inc.* | | 21,729 | | 503,461 | |
ECC Capital Corp. | | 51,210 | | 115,735 | |
Equity Inns, Inc. | | 45,461 | | 615,997 | |
First Financial Holdings, Inc. | | 8,630 | | 265,114 | |
First Niagara Financial Grp. | | 39,782 | | 575,646 | |
First State Bank Corporation | | 30,828 | | 739,564 | |
Getty Realty Corp. | | 7,162 | | 188,289 | |
MUTUAL OF AMERICA INVESTMENT CORPORATION (ALL AMERICA FUND)
PORTFOLIO OF INVESTMENTS IN SECURITIES
DECEMBER 31, 2005
| | Shares | | Value($) | |
ACTIVE ASSETS: | | | | | |
COMMON STOCKS: | | | | | |
FINANCIAL (Cont'd.) | | | | | |
Golden West Financial Corp. | | 10,035 | | 662,310 | |
Goldman Sachs Group, Inc. | | 5,232 | | 668,179 | |
Hartford Financial Service Group, Inc. | | 8,520 | | 731,783 | |
Highwoods Properties, Inc. | | 14,341 | | 408,001 | |
IShares Russell 200 Growth | | 9,200 | | 640,780 | |
IShares Russell 200 Growth* | | 6,820 | | 455,030 | |
IShares Russell Micropac | | 9,000 | | 460,350 | |
Iberia Bank Corp. | | 2,043 | | 104,213 | |
JER Investors Trust, Inc. | | 10,910 | | 184,924 | |
Jackson Hewitt Tax Service | | 3,950 | | 109,454 | |
KNBT Bancorp, Inc. | | 31,393 | | 511,392 | |
Knight Capital Group, Inc.* | | 12,650 | | 125,109 | |
La Salle Hotel Properties | | 11,625 | | 426,870 | |
LandAmerica Financial Group | | 9,827 | | 613,205 | |
Lazard, Ltd. Cl A* | | 6,900 | | 220,110 | |
MAF Bancorp | | 14,343 | | 593,513 | |
Max Re Capital, Ltd.* | | 9,050 | | 235,029 | |
Medical Properties Trust, Inc. | | 49,230 | | 481,469 | |
Merrill Lynch & Co., Inc. | | 22,204 | | 1,503,877 | |
Mid-America Apt. Communities | | 7,932 | | 384,702 | |
MoneyGram International, Inc. | | 12,800 | | 333,824 | |
Morgan Stanley | | 9,350 | | 530,519 | |
NASDAQ Stock Market, Inc.* | | 6,250 | | 219,875 | |
National Financial Partners | | 10,352 | | 543,998 | |
NewAlliance Bankshare | | 41,370 | | 601,520 | |
North Fork Bancorp, Inc. | | 41,399 | | 1,132,677 | |
PHH Corp.* | | 21,740 | | 609,155 | |
Pennsylvania REIT | | 8,022 | | 299,702 | |
Placer Sierra Banschares | | 15,030 | | 416,481 | |
Platinum Underwriters Holdings* | | 10,625 | | 330,119 | |
PrivateBancorp, Inc. | | 11,836 | | 421,007 | |
Provident Financial Services | | 33,584 | | 621,640 | |
Safeco Corp. | | 11,782 | | 665,683 | |
Santander Bancorp | | 12,899 | | 324,023 | |
Sterling Financial Corp. | | 25,503 | | 637,065 | |
Stewart Information Services | | 7,075 | | 344,340 | |
Summit Bancshares, Inc. (TX) | | 15,596 | | 280,416 | |
Sws Group, Inc. | | 15,363 | | 321,701 | |
MUTUAL OF AMERICA INVESTMENT CORPORATION (ALL AMERICA FUND)
PORTFOLIO OF INVESTMENTS IN SECURITIES
DECEMBER 31, 2005
| | Shares | | Value($) | |
ACTIVE ASSETS: | | | | | |
COMMON STOCKS: | | | | | |
FINANCIAL (Cont'd.) | | | | | |
Taberna Realty Financial Trust | | 50,000 | | 600,000 | |
Texas Regional Bancshares | | 14,441 | | 408,680 | |
Tower Group, Inc. | | 12,270 | | 269,695 | |
Vintage Wine Trust, Inc. | | 45,210 | | 452,100 | |
Wachovia Corp. | | 26,323 | | 1,391,434 | |
Wells Fargo & Company | | 31,205 | | 1,960,610 | |
| | | | 39,862,697 | |
HEALTHCARE (4.2%) | | | | | |
Abbott Laboratories | | 24,550 | | 968,006 | |
Adolor Corporation* | | 6,800 | | 99,280 | |
Advanced Medical Optics, Inc.* | | 14,115 | | 590,007 | |
Aetna, Inc. | | 11,740 | | 1,107,199 | |
Amedisys, Inc.* | | 8,880 | | 375,091 | |
Amgen, Inc.* | | 19,800 | | 1,561,428 | |
Amylin Pharmaceuticals, Inc.* | | 10,604 | | 423,312 | |
Arthrocare Corp.* | | 3,600 | | 151,704 | |
CV Therapeutics, Inc.* | | 12,573 | | 310,930 | |
Caliper Life Sciences, Inc.* | | 36,596 | | 215,184 | |
Caremark Rx, Inc.* | | 7,700 | | 398,783 | |
Conceptus, Inc.* | | 7,400 | | 93,388 | |
DJ Orthopedics, Inc.* | | 8,850 | | 244,083 | |
Digene Corp.* | | 17,500 | | 510,475 | |
Genesis HealthCare Corp.* | | 5,790 | | 211,451 | |
Genzyme Corp. (Genl. Div.)* | | 7,030 | | 497,583 | |
HCA, Inc. | | 10,280 | | 519,140 | |
Human Genome Sciences, Inc.* | | 24,900 | | 213,144 | |
Humana, Inc.* | | 4,765 | | 258,882 | |
Inspire Pharmaceuticals, Inc.* | | 18,245 | | 92,685 | |
Intuitive Surgical, Inc.* | | 1,400 | | 164,178 | |
Johnson & Johnson | | 33,090 | | 1,988,709 | |
Keryx Biopharmaceuticals, Inc. | | 7,300 | | 106,872 | |
Kyphon, Inc.* | | 3,700 | | 151,071 | |
Medimmune, Inc.* | | 5,120 | | 179,302 | |
Myogen, Inc.* | | 7,199 | | 216,690 | |
Nuvasive, Inc.* | | 9,000 | | 162,900 | |
OSI Pharmaceuticals, Inc.* | | 1,570 | | 72 | |
Pfizer, Inc. | | 55,020 | | 1,283,066 | |
Psychiatric Solutions* | | 3,600 | | 211,464 | |
MUTUAL OF AMERICA INVESTMENT CORPORATION (ALL AMERICA FUND)
PORTFOLIO OF INVESTMENTS IN SECURITIES
DECEMBER 31, 2005
| | Shares | | Value($) | |
ACTIVE ASSETS: | | | | | |
COMMON STOCKS: | | | | | |
HEALTHCARE (Cont'd.) | | | | | |
Senomyx, Inc.* | | 7,200 | | 87,264 | |
St. Jude Medical, Inc.* | | 3,780 | | 189,756 | |
Steris Corp. | | 8,700 | | 217,674 | |
Theravance, Inc.* | | 9,808 | | 220,876 | |
Thoratec Corp.* | | 9,100 | | 188,279 | |
United Surgical Partners, Inc. | | 11,131 | | 357,862 | |
Valeant Pharmaceuticals | | 7,460 | | 134,877 | |
Ventana Medical Systems, Inc.* | | 15,304 | | 648,124 | |
Viasys Healthcare, Inc.* | | 12,925 | | 332,172 | |
Wyeth | | 27,370 | | 1,260,936 | |
| | | | 16,943,899 | |
INDUSTRIAL (7.2%) | | | | | |
Actuant Corp. Cl A | | 8,770 | | 489,366 | |
Acuity Brands, Inc. | | 6,400 | | 203,520 | |
Agnico-Eagle Mines, Ltd. | | 26,357 | | 520,814 | |
Apogee Enterprises, Inc. | | 43,403 | | 703,997 | |
Aspect Medical Systems, Inc.* | | 4,250 | | 145,987 | |
Baker (Michael) Corp.* | | 7,090 | | 181,150 | |
Benchmark Electronics* | | 18,505 | | 622,323 | |
Boeing Co. | | 13,198 | | 927,028 | |
Cal Dive International, Inc.* | | 17,428 | | 625,491 | |
Caterpillar, Inc. | | 14,930 | | 862,506 | |
Champion Enterprises, Inc.* | | 79,874 | | 1,087,884 | |
Conexant Systems, Inc.* | | 79,440 | | 179,534 | |
Curtis Wright Corp. Cl B | | 10,305 | | 562,653 | |
Cymer, Inc.* | | 6,890 | | 244,664 | |
Diagnostic Products Corp. | | 4,300 | | 208,765 | |
Eagle Materials, Inc. | | 1,750 | | 214,130 | |
EastGroup Properties, Inc. | | 3,040 | | 137,286 | |
Eclipsys Corp.* | | 12,725 | | 240,884 | |
Filenet Corp.* | | 4,000 | | 103,400 | |
Fluor Corp. | | 11,599 | | 896,139 | |
Frozen Foods Express Ind.* | | 26,310 | | 290,199 | |
Gardner Denver Machinery* | | 13,147 | | 648,147 | |
General Cable Corp.* | | 30,897 | | 608,671 | |
General Electric Co. | | 99,840 | | 3,499,392 | |
Genesee & Wyoming, Inc. Cl A* | | 10,700 | | 401,785 | |
Genesis Microchip Corp.* | | 17,886 | | 323,558 | |
MUTUAL OF AMERICA INVESTMENT CORPORATION (ALL AMERICA FUND)
PORTFOLIO OF INVESTMENTS IN SECURITIES
DECEMBER 31, 2005
| | Shares | | Value($) | |
ACTIVE ASSETS: | | | | | |
COMMON STOCKS: | | | | | |
INDUSTRIAL (Cont'd.) | | | | | |
Granite Construction | | 5,974 | | 214,526 | |
HUB Group, Inc. Cl A* | | 10,875 | | 384,431 | |
Harmonic, Inc.* | | 21,425 | | 103,911 | |
Healthcare Services Group | | 11,080 | | 229,467 | |
Hydril Company* | | 7,227 | | 452,410 | |
ITT Industries, Inc. | | 7,970 | | 819,475 | |
Kennametal, Inc. | | 14,200 | | 724,768 | |
Kirby Corp.* | | 12,927 | | 674,402 | |
Komag, Inc.* | | 6,260 | | 216,972 | |
Labor Ready, Inc.* | | 8,830 | | 183,841 | |
Landstar System, Inc. | | 14,534 | | 606,649 | |
Lincoln Electric Holdings | | 11,095 | | 440,028 | |
Marinemax, Inc.* | | 7,400 | | 233,618 | |
Matrix Service Co.* | | 2,320 | | 22,829 | |
Moog, Inc. Cl A* | | 7,970 | | 226,189 | |
RailAmerica, Inc.* | | 72,951 | | 801,731 | |
Regal-Beloit Corp. | | 23,305 | | 824,997 | |
Shaw Group, Inc.* | | 31,631 | | 920,146 | |
Siligan Holdings, Inc. | | 24,884 | | 898,810 | |
Texas Industries, Inc. | | 8,620 | | 429,621 | |
Trico Marine Services, Inc.* | | 11,740 | | 305,240 | |
Trinity Industries | | 19,529 | | 860,643 | |
Tyco International, Ltd. | | 22,520 | | 649,927 | |
United Parcel Service Cl B | | 12,020 | | 903,303 | |
United Technologies Corp. | | 27,620 | | 1,544,234 | |
Universal Forest Products | | 11,451 | | 632,668 | |
Werner Enterprises, Inc. | | 14,100 | | 277,770 | |
| | | | 29,511,879 | |
TECHNOLOGY (6.8%) | | | | | |
3Com Corp.* | | 32,720 | | 117,792 | |
Activision, Inc.* | | 23,050 | | 316,707 | |
Adtran, Inc. | | 5,400 | | 160,596 | |
Akami Technologies* | | 10,500 | | 209,265 | |
Andrew Corp.* | | 43,450 | | 466,219 | |
Anixter International, Inc. | | 12,384 | | 484,462 | |
Ansys, Inc.* | | 5,200 | | 221,988 | |
Arris Group, Inc.* | | 15,350 | | 145,364 | |
Aspen Technology, Inc.* | | 28,200 | | 221,370 | |
MUTUAL OF AMERICA INVESTMENT CORPORATION (ALL AMERICA FUND)
PORTFOLIO OF INVESTMENTS IN SECURITIES
DECEMBER 31, 2005
| | Shares | | Value($) | |
ACTIVE ASSETS: | | | | | |
COMMON STOCKS: | | | | | |
TECHNOLOGY (Cont'd.) | | | | | |
Avocent Corp.* | | 8,606 | | 233,997 | |
BearingPoint, Inc.* | | 15,440 | | 121,358 | |
Broadcom Corp. Cl A* | | 20,890 | | 984,963 | |
Centillium Communications, Inc. | | 22,275 | | 77,962 | |
Checkpoint Systems* | | 8,010 | | 197,446 | |
Cisco Systems, Inc.* | | 47,490 | | 813,029 | |
Computer Programs & Systems | | 6,200 | | 256,866 | |
Corning, Inc.* | | 26,590 | | 522,759 | |
Credence Systems Corp.* | | 16,250 | | 113,100 | |
Dell, Inc.* | | 35,970 | | 1,078,740 | |
Digital Insight Corporation* | | 7,250 | | 232,145 | |
Digitas* | | 9,850 | | 123,322 | |
EMC Corp.* | | 45,780 | | 623,524 | |
Electronics For Imaging, Inc.* | | 14,180 | | 377,330 | |
Entegris, Inc.* | | 11,000 | | 103,620 | |
Fairchild Semiconductor International* | | 7,160 | | 121,076 | |
Freescale Semiconductor Cl A* | | 21,530 | | 541,910 | |
Hutchinson Tech* | | 8,060 | | 229,307 | |
IBM Corp. | | 12,430 | | 1,021,746 | |
IXYS Corporation* | | 7,333 | | 85,723 | |
Imation Corp. | | 7,910 | | 364,414 | |
Informatica Corp.* | | 13,750 | | 165,000 | |
Integrated Device Tech., Inc.* | | 23,244 | | 306,356 | |
Intel Corp. | | 57,330 | | 1,430,957 | |
Intrado, Inc.* | | 2,800 | | 64,456 | |
KLA Tencor Corp. | | 10,980 | | 541,643 | |
Lecroy Corp.* | | 23,080 | | 352,893 | |
Lexer Media, Inc.* | | 37,300 | | 306,233 | |
Lojack Corporation* | | 7,569 | | 182,640 | |
Maxim Integrated Products, Inc. | | 15,170 | | 549,761 | |
Medics Pharmaceutical Corp. | | 23,675 | | 758,784 | |
Microsemi Corp.* | | 27,550 | | 762,033 | |
Microsoft Corp. | | 85,320 | | 2,231,118 | |
Motorola, Inc. | | 21,010 | | 474,616 | |
Neustar, Inc. Cl A* | | 7,400 | | 225,626 | |
Oracle Corp.* | | 70,490 | | 860,683 | |
Palm, Inc.* | | 8,820 | | 280,476 | |
Parametric Technology Corp.* | | 50,364 | | 307,220 | |
MUTUAL OF AMERICA INVESTMENT CORPORATION (ALL AMERICA FUND)
PORTFOLIO OF INVESTMENTS IN SECURITIES
DECEMBER 31, 2005
| | Shares | | Value($) | |
ACTIVE ASSETS: | | | | | |
COMMON STOCKS: | | | | | |
TECHNOLOGY (Cont'd.) | | | | | |
Perot Systems Corp. Cl A* | | 12,955 | | 183,184 | |
Powerwave Technologies, Inc.* | | 9,096 | | 114,337 | |
Qualcomm, Inc. | | 18,360 | | 790,949 | |
Quest Software, Inc.* | | 8,575 | | 125,109 | |
RF Micro Devices* | | 47,610 | | 257,570 | |
Red Hat, Inc.* | | 13,225 | | 360,249 | |
SPSS, Inc.* | | 9,550 | | 295,382 | |
Secure Computing Corp.* | | 39,550 | | 484,883 | |
Sigmatel, Inc.* | | 4,480 | | 58,688 | |
Skyworks Solutions, Inc.* | | 68,599 | | 349,169 | |
Sonosite, Inc.* | | 9,490 | | 332,245 | |
Texas Instruments, Inc. | | 29,700 | | 952,479 | |
Tibco Software, Inc.* | | 35,600 | | 265,932 | |
ValueClick , Inc.* | | 23,050 | | 417,435 | |
Varian Semiconductor Equip.* | | 11,440 | | 502,559 | |
Viasat, Inc.* | | 18,416 | | 492,260 | |
Wabtech | | 23,735 | | 638,471 | |
Websense, Inc.* | | 4,321 | | 283,630 | |
aQuantive, Inc.* | | 9,970 | | 251,643 | |
| | | | 27,524,769 | |
TELECOMMUNICATIONS (0.8%) | | | | | |
BellSouth Corp. | | 23,680 | | 641,728 | |
CT Communications, Inc. | | 11,886 | | 144,296 | |
Sprint Nextel Corp. | | 38,441 | | 897,982 | |
Tekelec* | | 36,605 | | 508,810 | |
Valor Communications Group | | 26,920 | | 306,888 | |
Verizon Communications | | 26,080 | | 785,530 | |
| | | | 3,285,234 | |
UTILITIES (1.4%) | | | | | |
Avista Corp. | | 11,647 | | 206,268 | |
Constellation Energy Group | | 6,880 | | 396,288 | |
Dominion Resources, Inc. | | 11,610 | | 896,292 | |
EPIQ Systems, Inc.* | | 7,970 | | 147,764 | |
Exelon Corp. | | 21,690 | | 1,152,607 | |
FirstEnergy Corp. | | 8,730 | | 427,683 | |
PNM Resources, Inc. | | 27,479 | | 672,961 | |
Sempra Energy | | 12,630 | | 566,329 | |
Sierra Pacific Resources* | | 41,140 | | 536,466 | |
MUTUAL OF AMERICA INVESTMENT CORPORATION (ALL AMERICA FUND)
PORTFOLIO OF INVESTMENTS IN SECURITIES
DECEMBER 31, 2005
| | Shares | | Value($) | |
ACTIVE ASSETS: | | | | | |
COMMON STOCKS: | | | | | |
UTILITIES (Cont'd.) | | | | | |
Southwestern Energy Co.* | | 5,169 | | 185,774 | |
Westar Energy, Inc. | | 20,102 | | 432,193 | |
| | | | 5,620,625 | |
| | | | | |
TOTAL ACTIVE ASSETS-COMMON STOCKS (Cost: $160,520,201) 43.0% | | | | 174,617,645 | |
* Non-income producing security.
MUTUAL OF AMERICA INVESTMENT CORPORATION (ALL AMERICA FUND)
PORTFOLIO OF INVESTMENTS IN SECURITIES
DECEMBER 31, 2005
| | | | | | Shares | | Value($) | |
ACTIVE ASSETS: | | | | | | | | | |
PREFERRED STOCKS: | | | | | | | | | |
FINANCIAL (0.1%) | | | | | | | | | |
Quanta Capital Holdings | | | | | | 13,420 | | 335,500 | |
| | | | | | | | | |
TOTAL PREFERRED STOCKS (Cost: $335,500) 0.1% | | | | | | | | 335,500 | |
| | | | | | Face | | | |
| | Rate(%) | | Maturity | | Amount($) | | Value($) | |
LONG-TERM DEBT SECURITIES: | | | | | | | | | |
FINANCIAL (0.1%) | | | | | | | | | |
GSC Capital Corp. | | 7.25 | | 07/15/10 | | 460,000 | | 460,000 | |
| | | | | | | | | |
TOTAL LONG-TERM DEBT SECURITIES
(Cost: $460,000) 0.1% | | | | | | | | 460,000 | |
| | | | | | Face | | | |
| | Rate(%) | | Maturity | | Amount($) | | Value($) | |
SHORT-TERM DEBT SECURITIES: | | | | | | | | | |
COMMERCIAL PAPER (1.8%) | | | | | | | | | |
Federal National Mortgage Association | | 3.25 | | 01/03/06 | | 7,500,000 | | 7,497,969 | |
| | | | | | | | | |
TOTAL SHORT-TERM DEBT SECURITIES (Cost: $7,497,969) 1.8% | | | | | | | | 7,497,969 | |
| | | | | | | | | |
TOTAL ACTIVE ASSETS (Cost: $168,813,670) 45.0% | | | | | | | | 182,911,114 | |
| | | | | | | | | |
TEMPORARY CASH INVESTMENTS**
(Cost: $24,000) 0.0% (1) | | | | | | | | 24,000 | |
| | | | | | | | | |
TOTAL INVESTMENTS (Cost: $345,106,014) 99.9% | | | | | | | | 406,072,851 | |
| | | | | | | | | |
OTHER NET ASSETS0.1% (1) | | | | | | | | 439,091 | |
| | | | | | | | | |
NET ASSETS 100.0% | | | | | | | | $ | 406,511,942 | |
| | | | | | | | | | |
(1) Less than 0.05%.
**The fund has an arrangement with its custodian bank, JPMorgan Chase Bank, whereby uninvested cash, subject to parameters set by the fund, is automatically invested in the fund's name by the bank in overnight commercial paper issued by J.P. Morgan Chase & Co. On the next business day, these funds (and earned interest) are automatically returned to the fund. The annual rate of interest earned on this temporary cash investment at December 30, 2005 was 3.79%.
MUTUAL OF AMERICA INVESTMENT CORPORATION (SMALL CAP VALUE FUND)
PORTFOLIO OF INVESTMENTS IN SECURITIES
DECEMBER 31, 2005
| | Shares | | Value($) | |
COMMON STOCKS: | | | | | |
BASIC MATERIALS (7.5%) | | | | | |
Century Aluminum Company* | | 9,987 | | 261,759 | |
Commercial Metals Co. | | 11,236 | | 421,799 | |
Cytec Industries, Inc. | | 5,880 | | 280,064 | |
Georgia Gulf Corp. | | 2,720 | | 82,742 | |
Glatfelter | | 10,859 | | 154,089 | |
Longview Fibre Co. | | 18,805 | | 391,332 | |
Lubrizol Corp. | | 9,601 | | 416,971 | |
Oregon Steel Mills, Inc.* | | 9,548 | | 280,902 | |
Steel Dynamics, Inc. | | 4,999 | | 177,514 | |
U.S. Concrete, Inc.* | | 7,010 | | 66,455 | |
| | | | 2,533,627 | |
CONSUMER, CYCLICAL (8.6%) | | | | | |
Audiovox Corp. Cl A* | | 44,267 | | 613,541 | |
Crown Holdings, Inc.* | | 46,470 | | 907,558 | |
Landry’s Restaurant, Inc. | | 9,956 | | 265,925 | |
Lithia Motors, Inc. Cl A | | 5,569 | | 175,089 | |
Lone Star Steakhouse | | 6,128 | | 145,479 | |
Sunterra Corporation* | | 23,698 | | 336,986 | |
The Bombay Company, Inc.* | | 65,954 | | 195,224 | |
Wolverine World Wide, Inc. | | 11,687 | | 262,490 | |
| | | | 2,902,292 | |
CONSUMER, NON-CYCLICAL (3.7%) | | | | | |
Chiquita Brands International, Inc. | | 16,980 | | 339,770 | |
Conmed Corp.* | | 8,279 | | 195,881 | |
Longs Drug Stores Corp. | | 14,140 | | 514,555 | |
MGI Pharma, Inc.* | | 7,310 | | 125,440 | |
Walter Industries, Inc. | | 1,591 | | 79,105 | |
| | | | 1,254,751 | |
ENERGY (5.4%) | | | | | |
CNX Gas Corp.* | | 7,220 | | 149,815 | |
Holly Corp. | | 1,365 | | 80,358 | |
NS Group, Inc.* | | 11,236 | | 469,777 | |
Range Resources Corp. | | 24,708 | | 650,808 | |
Todco Cl A | | 1,978 | | 75,283 | |
Unisource Energy Corp. | | 12,655 | | 394,836 | |
| | | | 1,820,877 | |
FINANCIAL (29.3%) | | | | | |
American Home Mortgage Investment Corp. | | 5,903 | | 192,261 | |
Amli Residential Properties | | 2,820 | | 107,301 | |
MUTUAL OF AMERICA INVESTMENT CORPORATION (SMALL CAP VALUE FUND)
PORTFOLIO OF INVESTMENTS IN SECURITIES
DECEMBER 31, 2005
| | Shares | | Value($) | |
COMMON STOCKS: | | | | | |
FINANCIAL (Cont’d.) | | | | | |
Assured Guaranty Co.* | | 19,698 | | 500,132 | |
Bank Mutual Corp. | | 32,579 | | 345,337 | |
BankAtlantic Bancorp, Inc. Cl A | | 32,707 | | 457,898 | |
Brookline Bankcorp | | 33,310 | | 472,003 | |
Ceres Group, Inc.* | | 10,074 | | 52,083 | |
Conseco, Inc.* | | 15,805 | | 366,202 | |
ECC Capital Corp. | | 35,850 | | 81,021 | |
Equity Inns, Inc. | | 34,384 | | 465,903 | |
First Niagara Financial Group | | 32,041 | | 463,633 | |
First State Bank Corporation | | 16,149 | | 387,415 | |
Highwoods Properties, Inc. | | 10,849 | | 308,654 | |
IShares Russell 200 Growth* | | 4,620 | | 308,246 | |
Iberia Bank Corp. | | 1,628 | | 83,044 | |
JER Investors Trust, Inc. | | 7,967 | | 135,041 | |
KNBT Bancorp, Inc. | | 25,300 | | 412,137 | |
Knight Capital Group, Inc.* | | 10,182 | | 100,700 | |
LandAmerica Financial Group | | 7,945 | | 495,768 | |
MAF Bancorp | | 11,526 | | 476,945 | |
Medical Properties Trust, Inc. | | 26,128 | | 255,532 | |
Mid-America Apt. Communities | | 5,827 | | 282,610 | |
NewAlliance Bankshare | | 31,289 | | 454,942 | |
PHH Corp.* | | 16,041 | | 449,469 | |
Pennsylvania REIT | | 5,859 | | 218,892 | |
Provident Financial Services | | 27,009 | | 499,937 | |
Santander Bancorp | | 8,430 | | 211,762 | |
Sterling Financial Corp. | | 19,135 | | 477,992 | |
Stewart Information Services | | 4,850 | | 236,050 | |
Sws Group, Inc. | | 11,510 | | 241,019 | |
Taberna Realty Fin. Trust | | 30,400 | | 364,800 | |
| | | | 9,904,729 | |
HEALTHCARE (1.8%) | | | | | |
Advanced Medical Optics, Inc.* | | 4,365 | | 182,457 | |
Digene Corp.* | | 6,558 | | 191,297 | |
Genesis HealthCare Corp.* | | 4,644 | | 169,599 | |
Inspire Pharmaceuticals, Inc.* | | 13,440 | | 68,275 | |
| | | | 611,628 | |
INDUSTRIAL (25.2%) | | | | | |
Agnico-Eagle Mines, Ltd. | | 13,248 | | 261,780 | |
Apogee Enterprises, Inc. | | 34,955 | | 566,970 | |
MUTUAL OF AMERICA INVESTMENT CORPORATION (SMALL CAP VALUE FUND)
PORTFOLIO OF INVESTMENTS IN SECURITIES
DECEMBER 31, 2005
| | Shares | | Value($) | |
COMMON STOCKS: | | | | | |
INDUSTRIAL (Cont’d.) | | | | | |
Aspect Medical Systems, Inc.* | | 3,171 | | 108,924 | |
Baker (Michael) Corp.* | | 4,920 | | 125,706 | |
Benchmark Electronics* | | 9,010 | | 303,006 | |
Champion Enterprises, Inc.* | | 54,245 | | 738,817 | |
Conexant Systems, Inc.* | | 58,685 | | 132,628 | |
Curtis Wright Corp. Cl B | | 4,956 | | 270,598 | |
Cymer, Inc.* | | 1,763 | | 62,604 | |
Frozen Foods Express Ind.* | | 19,332 | | 213,232 | |
Gardner Denver Machinery* | | 10,580 | | 521,594 | |
General Cable Corp.* | | 23,009 | | 453,277 | |
Genesis Microchip Corp.* | | 8,268 | | 149,568 | |
Healthcare Services Group | | 8,268 | | 171,230 | |
Kennametal, Inc. | | 11,451 | | 584,459 | |
Kirby Corp.* | | 9,505 | | 495,876 | |
Komag, Inc.* | | 4,623 | | 160,233 | |
Matrix Service Co.* | | 1,660 | | 16,334 | |
RailAmerica, Inc.* | | 53,933 | | 592,724 | |
Shaw Group, Inc.* | | 11,955 | | 347,771 | |
Siligan Holdings, Inc. | | 18,182 | | 656,734 | |
Texas Industries, Inc. | | 6,268 | | 312,397 | |
Trico Marine Services, Inc.* | | 8,644 | | 224,744 | |
Trinity Industries | | 14,193 | | 625,486 | |
Universal Forest Products | | 7,870 | | 434,818 | |
| | | | 8,531,510 | |
TECHNOLOGY (8.4%) | | | | | |
3Com Corp.* | | 24,181 | | 87,052 | |
Andrew Corp.* | | 12,440 | | 133,481 | |
Anixter International, Inc. | | 9,988 | | 390,731 | |
BearingPoint, Inc.* | | 11,214 | | 88,142 | |
Checkpoint Systems* | | 5,827 | | 143,636 | |
Credence Systems Corp.* | | 11,816 | | 82,239 | |
Electronics For Imaging, Inc.* | | 10,451 | | 278,101 | |
Fairchild Semiconductor International* | | 5,204 | | 88,000 | |
Hutchinson Tech* | | 6,161 | | 175,280 | |
Imation Corp. | | 5,849 | | 269,463 | |
Integrated Device Tech., Inc.* | | 7,064 | | 93,104 | |
Lecroy Corp.* | | 8,429 | | 128,879 | |
Palm, Inc.* | | 6,677 | | 212,329 | |
Perot Systems Corp. Cl A* | | 9,687 | | 136,974 | |
MUTUAL OF AMERICA INVESTMENT CORPORATION (SMALL CAP VALUE FUND)
PORTFOLIO OF INVESTMENTS IN SECURITIES
DECEMBER 31, 2005
| | Shares | | Value($) | |
COMMON STOCKS: | | | | | |
TECHNOLOGY (Cont’d.) | | | | | |
Powerwave Technologies, Inc.* | | 6,623 | | 83,251 | |
Sigmatel, Inc.* | | 3,311 | | 43,374 | |
Skyworks Solutions, Inc.* | | 55,266 | | 281,304 | |
Varian Semiconductor Equip.* | | 3,204 | | 140,752 | |
| | | | 2,856,092 | |
TELECOMMUNICATIONS (1.4%) | | | | | |
CT Communications, Inc. | | 9,548 | | 115,913 | |
Tekelec* | | 11,246 | | 156,319 | |
Valor Communications Group | | 19,569 | | 223,087 | |
| | | | 495,319 | |
UTILITIES (3.7%) | | | | | |
Avista Corp. | | 9,419 | | 166,810 | |
PNM Resources, Inc. | | 14,881 | | 364,436 | |
Sierra Pacific Resources* | | 30,052 | | 391,878 | |
Westar Energy, Inc. | | 15,289 | | 328,714 | |
| | | | 1,251,838 | |
| | | | | |
TOTAL COMMON STOCKS (Cost: $31,824,041) 95.0% | | | | 32,162,663 | |
* Non-income producing security.
MUTUAL OF AMERICA INVESTMENT CORPORATION (SMALL CAP VALUE FUND)
PORTFOLIO OF INVESTMENTS IN SECURITIES
DECEMBER 31, 2005
| | | | | | Shares | | Value($) | |
PREFERRED STOCKS: | | | | | | | | | |
FINANCIAL (0.7%) | | | | | | | | | |
Quanta Capital Holdings | | | | | | 9,210 | | 230,250 | |
| | | | | | | | | |
TOTAL PREFERRED STOCKS (Cost: $230,250) 0.7% | | | | | | | | 230,250 | |
| | | | | | Face | | | |
| | Rate(%) | | Maturity | | Amount($) | | Value($) | |
SHORT-TERM DEBT SECURITIES: | | | | | | | | | |
U.S. GOVERNMENT AGENCIES (4.0%) | | | | | | | | | |
Federal National Mortgage Association | | 3.25 | | 01/03/06 | | 1,340,000 | | 1,339,758 | |
| | | | | | | | | |
TOTAL SHORT-TERM DEBT SECURITIES
(Cost: $1,339,758) 4.0% | | | | | | | | 1,339,758 | |
| | | | | | | | | |
TOTAL INVESTMENTS (Cost: $33,394,049) 99.7% | | | | | | | | 33,732,671 | |
| | | | | | | | | |
OTHER NET ASSETS0.3% | | | | | | | | 113,920 | |
| | | | | | | | | |
NET ASSETS 100.0% | | | | | | | | $ | 33,846,591 | |
| | | | | | | | | | |
MUTUAL OF AMERICA INVESTMENT CORPORATION (SMALL CAP GROWTH FUND)
PORTFOLIO OF INVESTMENTS IN SECURITIES
DECEMBER 31, 2005
| | Shares | | Value($) | |
COMMON STOCKS: | | | | | |
BASIC MATERIALS (0.6%) | | | | | |
Commercial Metals Co. | | 3,832 | | 143,853 | |
| | | | | |
CONSUMER, CYCLICAL (13.7%) | | | | | |
A.C.More Arts & Crafts, Inc.* | | 4,684 | | 68,152 | |
Aaron Rents, Inc. | | 5,408 | | 114,001 | |
Gamestop Corp.* | | 14,451 | | 459,831 | |
Guitar Center, Inc.* | | 2,230 | | 111,522 | |
Hibbett Sporting Goods, Inc.* | | 11,349 | | 323,220 | |
Hot Topic, Inc.* | | 5,413 | | 77,135 | |
Hudson Highland Group* | | 10,782 | | 187,176 | |
Omega Protein Corp.* | | 10,970 | | 73,609 | |
P.F. Changs China Bistro, Inc. | | 3,396 | | 168,543 | |
Pacific Sunwear of California* | | 5,652 | | 140,848 | |
Payless Shoesource, Inc.* | | 7,622 | | 191,312 | |
Pinnacle Entertainment, Inc.* | | 9,006 | | 222,538 | |
Red Robin Gourmet Burgers* | | 3,513 | | 179,022 | |
Sunopta* | | 9,620 | | 50,601 | |
The Warnaco Group, Inc.* | | 11,419 | | 305,116 | |
Wild Oaks Markets, Inc.* | | 19,962 | | 241,141 | |
Winnebago Industries, Inc. | | 3,619 | | 120,440 | |
Wolverine World Wide, Inc. | | 12,003 | | 269,587 | |
| | | | 3,303,794 | |
CONSUMER, NON-CYCLICAL (2.6%) | | | | | |
Alkermes, Inc.* | | 7,420 | | 141,870 | |
Hologic, Inc.* | | 3,193 | | 121,079 | |
MGI Pharma, Inc.* | | 5,227 | | 89,695 | |
Serologicals Corp.* | | 10,443 | | 206,145 | |
Sovran Self-Storage, Inc. | | 1,447 | | 67,966 | |
| | | | 626,755 | |
ENERGY (6.4%) | | | | | |
Crosstex Energy, Inc. | | 1,724 | | 108,715 | |
Denbury Resources, Inc.* | | 7,111 | | 161,989 | |
Holly Corp. | | 3,241 | | 190,798 | |
NS Group, Inc.* | | 8,953 | | 374,325 | |
Range Resources Corp. | | 14,928 | | 393,204 | |
Todco Cl A | | 8,391 | | 319,361 | |
| | | | 1,548,392 | |
MUTUAL OF AMERICA INVESTMENT CORPORATION (SMALL CAP GROWTH FUND)
PORTFOLIO OF INVESTMENTS IN SECURITIES
DECEMBER 31, 2005
| | Shares | | Value($) | |
COMMON STOCKS: | | | | | |
FINANCIAL (15.1%) | | | | | |
Acadia Realty Trust | | 5,642 | | 113,122 | |
Argonaut Group, Inc.* | | 4,651 | | 152,413 | |
Choice Hotels International, Inc. | | 6,600 | | 275,616 | |
First Financial Holdings, Inc. | | 4,524 | | 138,977 | |
First State Bank Corporation | | 5,726 | | 137,367 | |
Getty Realty Corp. | | 4,077 | | 107,184 | |
IShares Russell 200 Growth | | 4,100 | | 285,565 | |
IShares Russell Micropac | | 4,100 | | 209,715 | |
Jackson Hewitt Tax Service | | 2,076 | | 57,526 | |
La Salle Hotel Properties | | 6,057 | | 222,413 | |
Lazard, Ltd. Cl A* | | 3,619 | | 115,446 | |
Max Re Capital, Ltd.* | | 4,934 | | 128,136 | |
MoneyGram International, Inc. | | 6,787 | | 177,005 | |
NASDAQ Stock Market, Inc.* | | 3,257 | | 114,581 | |
National Financial Partners | | 5,717 | | 300,428 | |
Placer Sierra Banschares | | 7,889 | | 218,604 | |
Platinum Underwriters Holdings* | | 5,621 | | 174,644 | |
PrivateBancorp, Inc. | | 6,244 | | 222,099 | |
Summit Bancshares, Inc. (TX) | | 8,352 | | 150,169 | |
Texas Regional Bancshares | | 7,697 | | 217,825 | |
Tower Group, Inc. | | 6,473 | | 142,277 | |
| | | | 3,661,112 | |
HEALTHCARE (13.0%) | | | | | |
Adolor Corporation* | | 3,619 | | 52,837 | |
Advanced Medical Optics, Inc.* | | 4,545 | | 189,981 | |
Amedisys, Inc.* | | 4,705 | | 198,739 | |
Amylin Pharmaceuticals, Inc.* | | 5,323 | | 212,494 | |
Arthrocare Corp.* | | 1,884 | | 79,392 | |
CV Therapeutics, Inc.* | | 7,186 | | 177,710 | |
Caliper Life Sciences, Inc.* | | 18,171 | | 106,845 | |
Conceptus, Inc.* | | 3,939 | | 49,710 | |
DJ Orthopedics, Inc.* | | 4,780 | | 131,832 | |
Digene Corp.* | | 4,939 | | 144,071 | |
Human Genome Sciences, Inc.* | | 13,169 | | 112,727 | |
Intuitive Surgical, Inc.* | | 745 | | 87,366 | |
Keryx Biopharmaceuticals, Inc. | | 3,832 | | 56,100 | |
Kyphon, Inc.* | | 1,948 | | 79,537 | |
Myogen, Inc.* | | 3,821 | | 115,012 | |
Nuvasive, Inc.* | | 4,790 | | 86,699 | |
MUTUAL OF AMERICA INVESTMENT CORPORATION (SMALL CAP GROWTH FUND)
PORTFOLIO OF INVESTMENTS IN SECURITIES
DECEMBER 31, 2005
| | Shares | | Value($) | |
COMMON STOCKS: | | | | | |
HEALTHCARE (Cont’d.) | | | | | |
Psychiatric Solutions* | | 1,884 | | 110,666 | |
Senomyx, Inc.* | | 3,800 | | 46,056 | |
Steris Corp. | | 4,662 | | 116,643 | |
Theravance, Inc.* | | 5,151 | | 116,001 | |
Thoratec Corp.* | | 4,790 | | 99,105 | |
United Surgical Partners, Inc. | | 5,839 | | 187,724 | |
Valeant Pharmaceuticals | | 4,301 | | 77,762 | |
Ventana Medical Systems, Inc.* | | 8,112 | | 343,544 | |
Viasys Healthcare, Inc.* | | 6,861 | | 176,328 | |
| | | | 3,154,881 | |
INDUSTRIAL (17.6%) | | | | | |
Actuant Corp. Cl A | | 4,636 | | 258,689 | |
Acuity brands, Inc. | | 3,353 | | 106,625 | |
Agnico-Eagle Mines, Ltd. | | 4,524 | | 89,394 | |
Benchmark Electronics* | | 3,400 | | 114,342 | |
Cal Dive International, Inc.* | | 9,302 | | 333,849 | |
Champion Enterprises, Inc.* | | 7,117 | | 96,934 | |
Curtis Wright Corp. Cl B | | 2,081 | | 113,623 | |
Cymer, Inc.* | | 2,395 | | 85,046 | |
Diagnostic Products Corp. | | 2,267 | | 110,063 | |
Eagle Materials, Inc. | | 888 | | 108,656 | |
EastGroup Properties, Inc. | | 1,591 | | 71,850 | |
Eclipsys Corp.* | | 6,717 | | 127,153 | |
Filenet Corp.* | | 2,129 | | 55,035 | |
Genesee & Wyoming, Inc. Cl A* | | 5,685 | | 213,472 | |
Genesis Microchip Corp.* | | 3,547 | | 64,165 | |
Granite Construction | | 3,158 | | 113,404 | |
HUB Group, Inc. Cl A* | | 5,764 | | 203,757 | |
Harmonic, Inc.* | | 11,281 | | 54,713 | |
Hydril Company* | | 3,832 | | 239,883 | |
Labor Ready, Inc.* | | 4,635 | | 96,501 | |
Landstar System, Inc. | | 7,658 | | 319,645 | |
Lincoln Electric Holdings | | 5,811 | | 230,464 | |
Marinemax, Inc.* | | 3,939 | | 124,354 | |
Moog, Inc. Cl A* | | 4,178 | | 118,572 | |
Regal-Beloit Corp. | | 12,302 | | 435,491 | |
Shaw Group, Inc.* | | 8,239 | | 239,673 | |
Werner Enterprises, Inc. | | 7,452 | | 146,804 | |
| | | | 4,272,157 | |
MUTUAL OF AMERICA INVESTMENT CORPORATION (SMALL CAP GROWTH FUND)
PORTFOLIO OF INVESTMENTS IN SECURITIES
DECEMBER 31, 2005
| | Shares | | Value($) | |
COMMON STOCKS: | | | | | |
TECHNOLOGY (21.9%) | | | | | |
Activision, Inc.* | | 12,190 | | 167,491 | |
Adtran, Inc. | | 2,847 | | 84,670 | |
Akami Technologies* | | 5,500 | | 109,615 | |
Ansys, Inc.* | | 2,768 | | 118,166 | |
Arris Group, Inc.* | | 7,650 | | 72,446 | |
Aspen Technology, Inc.* | | 14,905 | | 117,004 | |
Avocent Corp.* | | 4,539 | | 123,415 | |
Centillium Communications, Inc. | | 11,739 | | 41,087 | |
Computer Programs & Systems | | 3,289 | | 136,263 | |
Digital Insight Corporation* | | 3,806 | | 121,868 | |
Digitas* | | 5,200 | | 65,104 | |
Entegris, Inc.* | | 5,802 | | 54,655 | |
IXYS Corporation* | | 3,876 | | 45,310 | |
Informatica Corp.* | | 7,292 | | 87,504 | |
Integrated Device Tech., Inc.* | | 7,250 | | 95,555 | |
Intrado, Inc.* | | 1,375 | | 31,653 | |
Lecroy Corp.* | | 6,127 | | 93,682 | |
Lexer Media, Inc.* | | 19,696 | | 161,704 | |
Lojack Corporation* | | 3,992 | | 96,327 | |
Medics Pharmaceutical Corp. | | 12,520 | | 401,266 | |
Microsemi Corp.* | | 14,553 | | 402,536 | |
Neustar, Inc. Cl A* | | 3,907 | | 119,124 | |
Parametric Technology Corp.* | | 26,639 | | 162,498 | |
Quest Software, Inc.* | | 4,551 | | 66,399 | |
RF Micro Devices* | | 25,184 | | 136,245 | |
Red Hat, Inc.* | | 7,000 | | 190,680 | |
SPSS, Inc.* | | 5,035 | | 155,733 | |
Secure Computing Corp.* | | 20,867 | | 255,829 | |
Sonosite, Inc.* | | 4,977 | | 174,245 | |
Tibco Software, Inc.* | | 17,700 | | 132,219 | |
ValueClick , Inc.* | | 12,222 | | 221,340 | |
Varian Semiconductor Equip.* | | 3,726 | | 163,683 | |
Viasat, Inc.* | | 10,029 | | 268,075 | |
Wabtech | | 12,584 | | 338,510 | |
Websense, Inc.* | | 2,448 | | 160,687 | |
aQuantive, Inc.* | | 5,235 | | 132,131 | |
| | | | 5,304,719 | |
MUTUAL OF AMERICA INVESTMENT CORPORATION (SMALL CAP GROWTH FUND)
PORTFOLIO OF INVESTMENTS IN SECURITIES
DECEMBER 31, 2005
| | Shares | | Value($) | |
COMMON STOCKS: | | | | | |
TELECOMMUNICATIONS (0.6%) | | | | | |
Tekelec* | | 10,530 | | 146,367 | |
| | | | | |
UTILITIES (1.1%) | | | | | |
EPIQ Systems, Inc.* | | 4,151 | | 76,960 | |
PNM Resources, Inc. | | 3,864 | | 94,629 | |
Southwestern Energy Co.* | | 2,723 | | 97,865 | |
| | | | 269,454 | |
| | | | | |
TOTAL COMMON STOCKS (Cost: $21,455,601) 92.6% | | | | 22,431,484 | |
| | Rate(%) | | Maturity | | Face
Amount($) | | Value($) | |
SHORT-TERM DEBT SECURITIES: | | | | | | | | | |
U.S. GOVERNMENT AGENCIES (7.1%) | | | | | | | | | |
Federal National Mortgage Association | | 3.25 | | 01/03/06 | | 1,720,000 | | 1,719,689 | |
| | | | | | | | | |
TOTAL SHORT-TERM DEBT SECURITIES
(Cost: $1,719,689) 7.1% | | | | | | | | 1,719,689 | |
| | | | | | | | | |
TOTAL INVESTMENTS (Cost: $23,175,290) 99.7% | | | | | | | | 24,151,173 | |
| | | | | | | | | |
OTHER NET ASSETS0.3% | | | | | | | | 77,469 | |
| | | | | | | | | |
NET ASSETS 100.0% | | | | | | | | $ | 24,228,642 | |
| | | | | | | | | | |
* Non-income producing security.
MUTUAL OF AMERICA INVESTMENT CORPORATION (MID CAP VALUE FUND)
PORTFOLIO OF INVESTMENTS IN SECURITIES
DECEMBER 31, 2005
| | Shares | | Value($) | |
COMMON STOCKS: | | | | | |
BASIC MATERIALS (9.2%) | | | | | |
Arch Coal, Inc. | | 823 | | 65,429 | |
Eastman Chemical Co. | | 1,694 | | 87,393 | |
Huntsman Corp.* | | 5,893 | | 101,477 | |
Lubrizol Corp. | | 1,313 | | 57,024 | |
Nucor Corp. | | 1,585 | | 105,751 | |
PPG Industries, Inc. | | 2,114 | | 122,401 | |
Phelps Dodge Corp. | | 947 | | 136,245 | |
Placer Dome, Inc. | | 4,555 | | 104,446 | |
Sonoco Products Co. | | 4,431 | | 130,271 | |
Vulcan Materials Co. | | 1,819 | | 123,237 | |
| | | | 1,033,674 | |
CONSUMER, CYCLICAL (12.4%) | | | | | |
Black & Decker Corp. | | 1,102 | | 95,830 | |
Borg-Warner, Inc. | | 761 | | 46,139 | |
Brunswick Corp. | | 1,420 | | 57,737 | |
Crown Holdings, Inc.* | | 9,330 | | 182,215 | |
Eastman Kodak Co. | | 3,078 | | 72,025 | |
Federated Dept. Stores | | 1,371 | | 90,938 | |
Harrah’s Entertainment, Inc. | | 1,009 | | 71,932 | |
Johnson Controls, Inc. | | 1,834 | | 133,717 | |
Mohawk Industries, Inc.* | | 1,009 | | 87,763 | |
Office Depot, Inc.* | | 2,643 | | 82,990 | |
Penney (J.C.) Co., Inc. | | 2,160 | | 120,096 | |
Polo Ralph Lauren Corp. | | 2,612 | | 146,638 | |
Rent-A-Center, Inc.* | | 2,471 | | 46,603 | |
Tiffany & Co. | | 1,463 | | 56,018 | |
Whirlpool Corp. | | 1,227 | | 102,774 | |
| | | | 1,393,415 | |
CONSUMER, NON-CYCLICAL (6.4%) | | | | | |
Albertson’s, Inc. | | 1,865 | | 39,818 | |
Archer-Daniels-Midland Co. | | 4,291 | | 105,816 | |
Clorox Co. | | 1,523 | | 86,643 | |
Coca-Cola Enterprises | | 3,715 | | 71,217 | |
Dean Foods Co.* | | 2,861 | | 107,745 | |
Kroger Co.* | | 6,421 | | 121,228 | |
RJ Reynolds Tobacco Holdings | | 1,134 | | 108,104 | |
Tyson Foods, Inc. | | 4,477 | | 76,557 | |
| | | | 717,128 | |
MUTUAL OF AMERICA INVESTMENT CORPORATION (MID CAP VALUE FUND)
PORTFOLIO OF INVESTMENTS IN SECURITIES
DECEMBER 31, 2005
| | Shares | | Value($) | |
COMMON STOCKS: | | | | | |
ENERGY (6.7%) | | | | | |
Amerada Hess Corp. | | 823 | | 104,373 | |
CNX Gas Corp.* | | 2,540 | | 52,705 | |
CONSOL Energy, Inc. | | 1,473 | | 96,010 | |
Grant Prideco, Inc.* | | 2,669 | | 117,756 | |
Kerr-McGee Corp. | | 1,367 | | 124,205 | |
Massey Energy Co. | | 1,321 | | 50,026 | |
Noble Energy, Inc. | | 2,954 | | 119,046 | |
Tesoro Petroleum Corp. | | 1,289 | | 79,338 | |
| | | | 743,459 | |
FINANCIAL (27.4%) | | | | | |
American Financial Group | | 3,078 | | 117,918 | |
Aon Corp. | | 2,689 | | 96,670 | |
Apartment Investment & Management Co. | | 2,954 | | 111,868 | |
Associated Banc-Corp. | | 3,700 | | 120,435 | |
Assurant, Inc. | | 1,569 | | 68,236 | |
Bear Stearns Cos., Inc. | | 1,274 | | 147,185 | |
CIT Group, Inc. | | 2,176 | | 112,673 | |
Comerica, Inc. | | 2,192 | | 124,418 | |
Developers Diversified Realty | | 2,922 | | 137,392 | |
E*Trade Financial Corp.* | | 3,778 | | 78,809 | |
Equity Office Properties | | 4,618 | | 140,064 | |
Equity Residential | | 3,918 | | 153,272 | |
First American Corp. | | 1,865 | | 84,485 | |
First Tennessee National Bank | | 3,218 | | 123,700 | |
Friedman, Billings, Ramsey Group | | 5,532 | | 54,767 | |
Genworth Financial, Inc. | | 3,529 | | 122,033 | |
Host Marriott Corp. | | 4,602 | | 87,208 | |
Hudson City Bancorp, Inc. | | 5,909 | | 71,617 | |
Huntington Bancshares, Inc. | | 5,038 | | 119,653 | |
KeyCorp. | | 4,229 | | 139,261 | |
M & T Bank Corp. | | 979 | | 106,760 | |
North Fork Bancorp, Inc. | | 4,929 | | 134,857 | |
Principal Financial Group, Inc. | | 3,483 | | 165,199 | |
StanCorp Financial Group, Inc. | | 2,643 | | 132,018 | |
Vornado Realty Trust | | 2,270 | | 189,477 | |
Zions Bancorporation | | 1,741 | | 131,550 | |
| | | | 3,071,525 | |
MUTUAL OF AMERICA INVESTMENT CORPORATION (MID CAP VALUE FUND)
PORTFOLIO OF INVESTMENTS IN SECURITIES
DECEMBER 31, 2005
| | Shares | | Value($) | |
COMMON STOCKS: | | | | | |
HEALTHCARE (3.8%) | | | | | |
Applera Corp.-Applied Biosys | | 3,218 | | 85,470 | |
CIGNA Corp. | | 1,213 | | 135,492 | |
King Pharmaceuticals, Inc.* | | 4,337 | | 73,382 | |
McKesson Corp. | | 1,585 | | 81,770 | |
Triad Hospitals, Inc.* | | 1,134 | | 44,487 | |
| | | | 420,601 | |
INDUSTRIAL (10.2%) | | | | | |
CSX Corp. | | 1,119 | | 56,812 | |
Champion Enterprises, Inc.* | | 7,200 | | 98,064 | |
Donnelley R.R. & Sons | | 4,369 | | 149,463 | |
Florida Rock Industries | | 1,880 | | 92,233 | |
General Growth Properties, Inc. | | 2,316 | | 108,829 | |
Lafarge Corp. | | 1,399 | | 76,973 | |
Mettler-Toledo International* | | 1,786 | | 98,587 | |
Norfolk Southern | | 3,187 | | 142,873 | |
Rinker Group, Ltd. | | 1,399 | | 84,010 | |
Textron, Inc. | | 1,213 | | 93,377 | |
Timken Co. | | 2,907 | | 93,082 | |
Yellow Roadway Corp.* | | 1,180 | | 52,640 | |
| | | | 1,146,943 | |
TECHNOLOGY (9.0%) | | | | | |
ADC Telecommunications, Inc.* | | 1,895 | | 42,334 | |
Andrew Corp.* | | 3,405 | | 36,536 | |
Arrow Electronics* | | 2,673 | | 85,616 | |
Computer Sciences Corp.* | | 1,614 | | 81,733 | |
Electronic Data Systems Corp. | | 3,995 | | 96,040 | |
Freescale Semiconductor Cl A* | | 3,202 | | 80,594 | |
Liberty Global, Inc.* | | 1,508 | | 33,930 | |
Liberty Global, Inc.* | | 1,508 | | 31,970 | |
Lucent Technologies* | | 31,120 | | 82,779 | |
NCR Corp.* | | 1,600 | | 54,304 | |
Siebel Systems, Inc. | | 7,340 | | 77,657 | |
Sybase, Inc.* | | 2,813 | | 61,492 | |
Telewest Global, Inc.* | | 2,426 | | 57,787 | |
Tellabs, Inc.* | | 5,909 | | 64,408 | |
Xerox Corp.* | | 8,085 | | 118,445 | |
| | | | 1,005,625 | |
MUTUAL OF AMERICA INVESTMENT CORPORATION (MID CAP VALUE FUND)
PORTFOLIO OF INVESTMENTS IN SECURITIES
DECEMBER 31, 2005
| | Shares | | Value($) | |
COMMON STOCKS: | | | | | |
TELECOMMUNICATIONS (1.3%) | | | | | |
CenturyTel, Inc. | | 2,798 | | 92,782 | |
Citizens Communications Co. | | 4,042 | | 49,434 | |
| | | | 142,216 | |
UTILITIES (11.1%) | | | | | |
American Electric Power, Inc. | | 4,245 | | 157,447 | |
Constellation Energy Group | | 1,585 | | 91,296 | |
Edison International | | 3,218 | | 140,337 | |
Energen Corp. | | 3,218 | | 116,878 | |
PG & E Corp. | | 3,047 | | 113,105 | |
PPL Corporation | | 4,197 | | 123,392 | |
Pepco Holdings, Inc. | | 5,287 | | 118,270 | |
Pinnacle West Capital Corp. | | 2,813 | | 116,318 | |
Sempra Energy | | 3,187 | | 142,905 | |
Teco Energy, Inc. | | 7,075 | | 121,549 | |
| | | | 1,241,497 | |
| | | | | |
TOTAL COMMON STOCKS (Cost: $10,470,978) 97.5% | | | | 10,916,083 | |
* Non-income producing security.
MUTUAL OF AMERICA INVESTMENT CORPORATION (MID CAP VALUE FUND)
PORTFOLIO OF INVESTMENTS IN SECURITIES
DECEMBER 31, 2005
| | Rate(%) | | Maturity | | Face
Amount($) | | Value($) | |
SHORT-TERM DEBT SECURITIES: | | | | | | | | | |
U.S. GOVERNMENT AGENCIES (2.3%) | | | | | | | | | |
Federal National Mortgage Association | | 3.25 | | 01/03/06 | | 260,000 | | 259,930 | |
| | | | | | | | | |
TOTAL SHORT-TERM DEBT SECURITIES
(Cost: $259,930) 2.3% | | | | | | | | 259,930 | |
| | | | | | | | | |
TOTAL INVESTMENTS (Cost: $10,730,908) 99.8% | | | | | | | | 11,176,013 | |
| | | | | | | | | |
OTHER NET ASSETS0.2% | | | | | | | | 27,640 | |
| | | | | | | | | |
NET ASSETS 100.0% | | | | | | | | $ | 11,203,653 | |
| | | | | | | | | | |
MUTUAL OF AMERICA INVESTMENT CORPORATION (MID-CAP EQUITY INDEX FUND)
PORTFOLIO OF INVESTMENTS IN SECURITIES
DECEMBER 31, 2005
| | Shares | | Value($) | |
COMMON STOCKS: | | | | | |
BASIC MATERIALS (5.3%) | | | | | |
Airgas, Inc. | | 20,373 | | 670,272 | |
Albemarle Corp. | | 11,623 | | 445,742 | |
Arch Coal, Inc. | | 19,668 | | 1,563,606 | |
Bowater, Inc. | | 17,003 | | 522,332 | |
Cabot Corp. | | 18,860 | | 675,188 | |
Chemtura Corp. | | 72,940 | | 926,338 | |
Cytec Industries, Inc. | | 12,059 | | 574,370 | |
FMC Corp.* | | 11,544 | | 613,794 | |
Ferro Corp. | | 12,740 | | 239,002 | |
Glatfelter | | 13,398 | | 190,118 | |
Longview Fibre Co. | | 15,530 | | 323,179 | |
Lubrizol Corp. | | 20,675 | | 897,915 | |
Lyondell Chemical Co. | | 62,312 | | 1,484,272 | |
Martin Marietta Materials, Inc. | | 14,096 | | 1,081,445 | |
Minerals Technologies, Inc. | | 6,106 | | 341,264 | |
Olin Corp. | | 21,807 | | 429,162 | |
Packaging Corp of America | | 19,067 | | 437,588 | |
Peabody Energy Corp. | | 39,979 | | 3,295,069 | |
Potlatch Corp.* | | 8,877 | | 452,549 | |
RPM International, Inc. | | 35,796 | | 621,777 | |
Scotts Co. Cl A | | 13,722 | | 620,783 | |
Sensient Technologies Corp. | | 14,309 | | 256,131 | |
Sonoco Products Co. | | 30,134 | | 885,940 | |
Steel Dynamics, Inc. | | 11,664 | | 414,189 | |
Valspar Corp. | | 30,789 | | 759,565 | |
Worthington Industries, Inc. | | 21,717 | | 417,184 | |
| | | | 19,138,774 | |
CONSUMER, CYCLICAL (14.0%) | | | | | |
99 Cent Only Stores* | | 14,591 | | 152,622 | |
Abercrombie & Fitch Co. Cl A | | 26,644 | | 1,736,656 | |
Advance Auto Parts* | | 32,891 | | 1,429,443 | |
Aeropostale, Inc.* | | 16,527 | | 434,660 | |
American Eagle Outfitters | | 39,998 | | 919,154 | |
American Greetings Corp. Cl A | | 19,981 | | 438,983 | |
Ann Taylor Stores Corp.* | | 22,103 | | 762,996 | |
Applebees International, Inc. | | 23,193 | | 523,930 | |
ArvinMeritor, Inc. | | 21,384 | | 307,716 | |
Bandag, Inc. | | 3,560 | | 151,905 | |
Barnes & Noble, Inc. | | 16,002 | | 682,805 | |
MUTUAL OF AMERICA INVESTMENT CORPORATION (MID-CAP EQUITY INDEX FUND)
PORTFOLIO OF INVESTMENTS IN SECURITIES
DECEMBER 31, 2005
| | Shares | | Value($) | |
COMMON STOCKS: | | | | | |
CONSUMER, CYCLICAL (Cont’d.) | | | | | |
Beazer Homes USA, Inc. | | 12,524 | | 912,248 | |
Belo Corporation | | 28,782 | | 616,223 | |
Blyth, Inc. | | 8,101 | | 169,716 | |
Bob Evans Farms, Inc. | | 10,888 | | 251,077 | |
Borders Group, Inc. | | 20,302 | | 439,944 | |
Borg-Warner, Inc. | | 17,333 | | 1,050,900 | |
Boyd Gaming Corp. | | 13,289 | | 633,354 | |
Brinker International, Inc. | | 26,149 | | 1,010,920 | |
CBRL Group, Inc. | | 14,216 | | 499,692 | |
Callaway Golf Co. | | 19,983 | | 276,565 | |
CarMax, Inc.* | | 31,831 | | 881,082 | |
Catalina Marketing Corp. | | 11,971 | | 303,465 | |
Cheesecake Factory, Inc.* | | 23,870 | | 892,499 | |
Chico’s FAS, Inc.* | | 55,025 | | 2,417,248 | |
Claire’s Stores, Inc. | | 30,213 | | 882,824 | |
Dollar Tree Stores* | | 32,346 | | 774,363 | |
Emmis Communications Cl A* | | 11,210 | | 223,191 | |
Entercom Communications* | | 11,592 | | 343,935 | |
Foot Locker, Inc. | | 47,448 | | 1,119,298 | |
Furniture Brands International, Inc. | | 15,463 | | 345,289 | |
GTECH Holdings Corp. | | 38,036 | | 1,207,263 | |
Gamestop Corp.* | | 17,372 | | 552,777 | |
Gentex Corp. | | 47,242 | | 921,219 | |
Harman International Industries, Inc. | | 20,026 | | 1,959,544 | |
Harte-Hanks, Inc. | | 17,263 | | 455,571 | |
Hovanian Enterprises, Inc.* | | 10,887 | | 540,431 | |
International Speedway Corp. | | 10,700 | | 512,530 | |
Lear Corp. | | 20,422 | | 581,210 | |
Lee Enterprises | | 13,826 | | 510,318 | |
Media General, Inc. Cl A | | 7,310 | | 370,617 | |
Michaels Stores, Inc. | | 40,644 | | 1,437,578 | |
Modine Manufacturing Co. | | 10,477 | | 341,445 | |
Mohawk Industries, Inc.* | | 16,067 | | 1,397,508 | |
O’Reilly Automotive, Inc.* | | 34,077 | | 1,090,805 | |
Outback Steakhouse, Inc. | | 19,976 | | 831,201 | |
Pacific Sunwear of California* | | 22,553 | | 562,021 | |
Payless Shoesource, Inc.* | | 20,859 | | 523,561 | |
PetSmart, Inc. | | 42,683 | | 1,095,246 | |
Pier 1 Imports, Inc. | | 26,360 | | 230,123 | |
MUTUAL OF AMERICA INVESTMENT CORPORATION (MID-CAP EQUITY INDEX FUND)
PORTFOLIO OF INVESTMENTS IN SECURITIES
DECEMBER 31, 2005
| | Shares | | Value($) | |
COMMON STOCKS: | | | | | |
CONSUMER, CYCLICAL (Cont’d.) | | | | | |
Polo Ralph Lauren Corp. | | 18,485 | | 1,037,748 | |
Reader’s Digest Assn. | | 29,957 | | 455,946 | |
Regis Corporation | | 13,760 | | 530,723 | |
Rent-A-Center, Inc.* | | 21,579 | | 406,980 | |
Ross Stores, Inc. | | 43,946 | | 1,270,039 | |
Ruby Tuesday, Inc. | | 19,034 | | 492,790 | |
Ryland Group, Inc. | | 14,214 | | 1,025,256 | |
Saks Incorporated* | | 42,257 | | 712,453 | |
Scholastic Corp.* | | 10,842 | | 309,105 | |
Thor Industries, Inc. | | 10,519 | | 421,496 | |
Timberland Company Cl A* | | 16,681 | | 542,967 | |
Toll Brothers, Inc.* | | 35,976 | | 1,246,209 | |
Tupperware Corp. | | 16,240 | | 363,776 | |
Urban Outfitters, Inc.* | | 33,550 | | 849,151 | |
Valassis Communication, Inc.* | | 14,468 | | 420,585 | |
Washington Post Co. Cl B | | 1,780 | | 1,361,700 | |
Westwood One, Inc. | | 19,943 | | 325,071 | |
Williams-Sonoma, Inc.* | | 35,093 | | 1,514,263 | |
| | | | 49,991,929 | |
CONSUMER, NON-CYCLICAL (2.2%) | | | | | |
BJ’s Wholesale Club, Inc.* | | 20,565 | | 607,901 | |
Church & Dwight | | 19,558 | | 646,001 | |
Dean Foods Co.* | | 40,925 | | 1,541,235 | |
Energizer Holdings, Inc.* | | 19,858 | | 988,730 | |
Hormel Foods Corp. | | 22,192 | | 725,235 | |
J.M. Smucker Co. | | 17,748 | | 780,912 | |
Lancaster Colony Corp. | | 7,742 | | 286,841 | |
PepsiAmericas, Inc. | | 18,687 | | 434,660 | |
Ruddick Corp. | | 10,583 | | 225,206 | |
Smithfield Foods, Inc.* | | 30,062 | | 919,897 | |
Tootsie Roll Inds., Inc. | | 7,648 | | 221,257 | |
Universal Corp. | | 7,825 | | 339,292 | |
| | | | 7,717,167 | |
ENERGY (7.1%) | | | | | |
Cooper Cameron Corp.* | | 34,283 | | 1,419,316 | |
Denbury Resources, Inc.* | | 34,830 | | 793,427 | |
ENSCO International, Inc. | | 46,600 | | 2,066,710 | |
FMC Technologies, Inc.* | | 20,934 | | 898,487 | |
Forest Oil Corp.* | | 16,618 | | 757,282 | |
MUTUAL OF AMERICA INVESTMENT CORPORATION (MID-CAP EQUITY INDEX FUND)
PORTFOLIO OF INVESTMENTS IN SECURITIES
DECEMBER 31, 2005
| | Shares | | Value($) | |
COMMON STOCKS: | | | | | |
ENERGY (Cont’d.) | | | | | |
Grant Prideco, Inc.* | | 39,092 | | 1,724,739 | |
Hanover Compressor Co.* | | 27,918 | | 393,923 | |
Helmerich & Payne, Inc. | | 15,814 | | 979,045 | |
NewField Exploration Company* | | 38,685 | | 1,936,958 | |
Noble Energy, Inc. | | 53,182 | | 2,143,235 | |
Overseas Shipholding Group | | 8,995 | | 453,258 | |
Patterson UTI Energy, Inc. | | 52,540 | | 1,731,193 | |
Pioneer Natural Resources Co. | | 39,079 | | 2,003,580 | |
Plains Exploration & Prod. Co. | | 23,837 | | 947,044 | |
Pogo Producing Co. | | 18,215 | | 907,289 | |
Pride International, Inc.* | | 48,174 | | 1,481,351 | |
Quicksilver Resources* | | 20,321 | | 853,685 | |
Smith International, Inc. | | 60,927 | | 2,261,001 | |
Tidewater, Inc. | | 18,391 | | 817,664 | |
Western Gas Resources | | 17,469 | | 822,615 | |
| | | | 25,391,802 | |
FINANCIAL (17.7%) | | | | | |
AMB Property Corp. | | 25,983 | | 1,277,584 | |
AmerUs Group Co. | | 11,752 | | 665,986 | |
American Financial Group | | 14,148 | | 542,010 | |
Americredit Corp.* | | 41,904 | | 1,074,000 | |
Associated Banc-Corp. | | 41,493 | | 1,350,597 | |
Astoria Financial Corp. | | 26,857 | | 789,596 | |
Bank of Hawaii Corp. | | 15,603 | | 804,179 | |
Berkley (WR) Corp. | | 34,096 | | 1,623,652 | |
Brown & Brown, Inc. | | 33,811 | | 1,032,588 | |
Cathay General Bancorp | | 15,254 | | 548,229 | |
City National Corp. | | 12,640 | | 915,642 | |
Colonial BancGroup, Inc. | | 46,883 | | 1,116,753 | |
Commerce Bancorp, Inc. NJ | | 52,798 | | 1,816,779 | |
Cullen Frost Bankers, Inc. | | 14,347 | | 770,147 | |
Developers Diversified Realty | | 33,099 | | 1,556,315 | |
Eaton Vance Corp. | | 39,690 | | 1,085,918 | |
Edwards (A.G.), Inc. | | 23,320 | | 1,092,775 | |
Everest RE Group* | | 18,810 | | 1,887,584 | |
Fidelity National Financial, Inc. | | 52,760 | | 1,941,040 | |
First American Corp. | | 29,100 | | 1,318,230 | |
Firstmerit Corp. | | 25,273 | | 654,823 | |
GATX Corp. | | 15,386 | | 555,127 | |
MUTUAL OF AMERICA INVESTMENT CORPORATION (MID-CAP EQUITY INDEX FUND)
PORTFOLIO OF INVESTMENTS IN SECURITIES
DECEMBER 31, 2005
| | Shares | | Value($) | |
COMMON STOCKS: | | | | | |
FINANCIAL (Cont’d.) | | | | | |
Gallagher (Arthur J.) & Co. | | 28,945 | | 893,822 | |
Greater Bay Bancorp | | 15,344 | | 393,113 | |
HCC Insurance Holdings, Inc. | | 32,167 | | 954,717 | |
Hanover Insurance Group | | 16,326 | | 681,937 | |
Highwoods Properties, Inc. | | 16,428 | | 467,377 | |
Horace Mann Educators Corp. | | 13,063 | | 247,674 | |
Hospitality Properties Trust | | 21,867 | | 876,867 | |
Independence Community Bank | | 22,443 | | 891,660 | |
Indymac Bancorp, Inc. | | 19,518 | | 761,592 | |
Investors Financial Services | | 19,757 | | 727,650 | |
Jefferies Group | | 15,011 | | 675,195 | |
Labranche & Co.* | | 18,432 | | 186,348 | |
Legg Mason, Inc. | | 37,043 | | 4,433,676 | |
Leucadia National | | 24,975 | | 1,185,314 | |
Liberty Property Trust | | 26,830 | | 1,149,666 | |
Macerich Co. | | 18,224 | | 1,223,559 | |
Mack-Cali Realty Corp. | | 18,818 | | 812,938 | |
Mercantile Bankshares Corp. | | 24,957 | | 1,408,573 | |
Mercury General Corporation | | 10,799 | | 628,718 | |
MoneyGram International, Inc. | | 25,896 | | 675,368 | |
New Plan Excel Realty Trust | | 31,690 | | 734,574 | |
New York Community Bancorp | | 72,008 | | 1,189,572 | |
Ohio Casualty Corp. | | 19,342 | | 547,765 | |
Old Republic International Corp. | | 55,710 | | 1,462,945 | |
PMI Group, Inc. | | 27,228 | | 1,118,254 | |
Protective Life Corp. | | 21,190 | | 927,486 | |
Radian Group, Inc. | | 25,244 | | 1,479,046 | |
Raymond James Financial, Inc. | | 17,297 | | 651,578 | |
Rayonier, Inc. | | 23,062 | | 919,021 | |
Regency Centers Corp. | | 20,636 | | 1,216,492 | |
SEI Investments | | 19,310 | | 714,470 | |
SVB Financial Group* | | 10,790 | | 505,404 | |
StanCorp Financial Group, Inc. | | 16,594 | | 828,870 | |
TCF Financial | | 34,566 | | 938,121 | |
Texas Regional Bancshares | | 12,546 | | 355,052 | |
United Dominion Realty Tr, Inc. | | 41,710 | | 977,682 | |
Unitrin, Inc. | | 13,821 | | 622,636 | |
Waddell & Reed Financial, Inc. | | 25,462 | | 533,938 | |
Washington Federal, Inc. | | 26,436 | | 607,764 | |
MUTUAL OF AMERICA INVESTMENT CORPORATION (MID-CAP EQUITY INDEX FUND)
PORTFOLIO OF INVESTMENTS IN SECURITIES
DECEMBER 31, 2005
| | Shares | | Value($) | |
COMMON STOCKS: | | | | | |
FINANCIAL (Cont’d.) | | | | | |
Webster Financial Corp. | | 16,360 | | 767,284 | |
Weingarten Realty Investors | | 24,438 | | 924,001 | |
Westamerica Bancorp | | 9,760 | | 517,963 | |
Wilmington Trust Corp. | | 20,620 | | 802,324 | |
| | | | 63,037,560 | |
HEALTHCARE (10.6%) | | | | | |
Advanced Medical Optics, Inc.* | | 20,286 | | 847,955 | |
Apria Healthcare Group, Inc.* | | 15,078 | | 363,531 | |
Barr Pharmaceuticals, Inc.* | | 32,713 | | 2,037,693 | |
Beckman Coulter, Inc. | | 18,896 | | 1,075,182 | |
Cephalon, Inc.* | | 17,662 | | 1,143,438 | |
Charles River Laboratories, Inc. | | 21,989 | | 931,674 | |
Community Health Systems, Inc.* | | 26,916 | | 1,031,959 | |
Covance, Inc.* | | 19,023 | | 923,567 | |
Cytyc Corp.* | | 34,646 | | 978,057 | |
Dentsply International, Inc. | | 23,907 | | 1,283,567 | |
Edwards Lifesciences Corp.* | | 18,162 | | 755,721 | |
Gen-Probe, Inc.* | | 15,453 | | 753,952 | |
Health Net, Inc.* | | 34,815 | | 1,794,712 | |
Hillenbrand Industries, Inc. | | 18,580 | | 918,038 | |
Inamed Corp.* | | 11,056 | | 969,390 | |
Intuitive Surgical, Inc.* | | 10,785 | | 1,264,757 | |
Invitrogen Corp.* | | 16,069 | | 1,070,838 | |
Ivax Corp.* | | 66,580 | | 2,085,951 | |
Lifepoint Hospitals, Inc.* | | 17,358 | | 650,925 | |
Lincare Holdings, Inc.* | | 29,565 | | 1,239,069 | |
Millennium Pharmaceuticals, Inc. | | 94,392 | | 915,602 | |
Omnicare, Inc. | | 36,305 | | 2,077,372 | |
Par Pharmaceutical Cos., Inc.* | | 10,412 | | 326,312 | |
Protein Design Labs BioPharma, Inc.* | | 34,308 | | 975,033 | |
Perrigo Co. | | 25,277 | | 376,880 | |
Renal Care Group, Inc.* | | 20,775 | | 982,865 | |
Schein (Henry), Inc.* | | 26,502 | | 1,156,547 | |
Sepracor, Inc.* | | 32,254 | | 1,664,306 | |
Steris Corp. | | 20,785 | | 520,041 | |
Techne Corp.* | | 11,819 | | 663,637 | |
Triad Hospitals, Inc.* | | 26,190 | | 1,027,434 | |
Universal Health Services Cl B | | 16,593 | | 775,557 | |
VCA Antech, Inc.* | | 25,130 | | 708,666 | |
MUTUAL OF AMERICA INVESTMENT CORPORATION (MID-CAP EQUITY INDEX FUND)
PORTFOLIO OF INVESTMENTS IN SECURITIES
DECEMBER 31, 2005
| | Shares | | Value($) | |
COMMON STOCKS: | | | | | |
HEALTHCARE (Cont’d.) | | | | | |
Valeant Pharmaceuticals | | 28,165 | | 509,223 | |
Varian Medical Systems, Inc.* | | 39,994 | | 2,013,298 | |
Varian, Inc.* | | 9,464 | | 376,573 | |
Vertex Pharmaceutical* | | 30,139 | | 833,946 | |
| | | | 38,023,268 | |
INDUSTRIAL (13.8%) | | | | | |
ADESA, Inc. | | 27,233 | | 665,030 | |
AGCO Corp.* | | 27,519 | | 455,990 | |
Affymetrix, Inc.* | | 20,416 | | 974,864 | |
AirTran Holdings, Inc.* | | 26,700 | | 428,001 | |
Alaska Air Group, Inc.* | | 10,126 | | 361,701 | |
Alexander & Baldwin, Inc. | | 13,349 | | 724,050 | |
Alliant TechSystems, Inc.* | | 11,142 | | 848,686 | |
Ametek, Inc. | | 21,339 | | 907,761 | |
Banta Corp. | | 7,291 | | 363,092 | |
C.H. Robinson Worldwide, Inc. | | 51,967 | | 1,924,338 | |
CNF, Inc. | | 15,868 | | 886,863 | |
Career Education Corp.* | | 29,789 | | 1,004,485 | |
Carlisle Companies, Inc. | | 9,273 | | 641,228 | |
ChoicePoint, Inc.* | | 27,267 | | 1,213,654 | |
Copart, Inc.* | | 21,184 | | 488,503 | |
Corinthian Colleges, Inc.* | | 27,797 | | 327,449 | |
Corporate Executive Board Co. | | 12,016 | | 1,077,835 | |
Crane Co. | | 15,162 | | 534,764 | |
DeVry, Inc.* | | 17,799 | | 355,980 | |
Deluxe Corp. | | 15,412 | | 464,518 | |
Donaldson Company, Inc. | | 20,748 | | 659,786 | |
Dun & Bradstreet* | | 20,185 | | 1,351,588 | |
Dycom Industries, Inc.* | | 12,207 | | 268,554 | |
Education Management Corp.* | | 20,339 | | 681,560 | |
Expeditors International, Wash., Inc. | | 32,421 | | 2,188,742 | |
Fastenal Co. | | 37,660 | | 1,475,895 | |
Federal Signal Corp. | | 14,625 | | 219,521 | |
Flowserve Corporation* | | 16,806 | | 664,845 | |
Graco, Inc. | | 20,840 | | 760,243 | |
Granite Construction | | 10,016 | | 359,675 | |
HNI Corporation | | 16,656 | | 914,914 | |
Harsco Corp. | | 12,694 | | 856,972 | |
Hubbell, Inc. Cl B | | 18,450 | | 832,464 | |
MUTUAL OF AMERICA INVESTMENT CORPORATION (MID-CAP EQUITY INDEX FUND)
PORTFOLIO OF INVESTMENTS IN SECURITIES
DECEMBER 31, 2005
| | Shares | | Value($) | |
COMMON STOCKS: | | | | | |
INDUSTRIAL (Cont’d.) | | | | | |
Hunt (JB) Transport Svcs., Inc. | | 37,619 | | 851,694 | |
ITT Educational Services, Inc. | | 11,553 | | 682,898 | |
Jacobs Engineering Group, Inc. | | 17,689 | | 1,200,552 | |
JetBlue Airways Corp.* | | 45,867 | | 705,434 | |
Joy Global, Inc. | | 36,946 | | 1,477,840 | |
Kelly Services, Inc. | | 5,878 | | 154,121 | |
Kennametal, Inc. | | 11,721 | | 598,240 | |
Korn/Ferry International* | | 12,813 | | 239,475 | |
Laureate Education, Inc.* | | 15,130 | | 794,476 | |
MSC Ind. Direct Co. Cl A | | 16,401 | | 659,648 | |
Manpower, Inc. | | 26,554 | | 1,234,761 | |
Martek Biosciences Corp.* | | 9,643 | | 237,314 | |
Miller (Herman), Inc. | | 20,994 | | 591,821 | |
Mine Safety Appliances Co. | | 8,018 | | 290,332 | |
Navigant Consulting Co.* | | 15,354 | | 337,481 | |
Nordson Corp. | | 9,929 | | 402,224 | |
Pentair, Inc. | | 30,764 | | 1,061,973 | |
Precision Castparts Corp. | | 40,400 | | 2,093,123 | |
Quanta Services, Inc.* | | 35,878 | | 472,513 | |
Republic Services, Inc. | | 37,115 | | 1,393,668 | |
Rollins, Inc. | | 8,931 | | 176,030 | |
SPX, Inc. | | 20,009 | | 915,812 | |
Sequa Corp. Cl A* | | 1,947 | | 134,440 | |
Sotheby’s Holdings* | | 13,632 | | 250,284 | |
Stericycle, Inc.* | | 13,415 | | 789,875 | |
Swift Transportation Co., Inc. | | 15,936 | | 323,501 | |
Tecumseh Products Co. Cl A* | | 5,627 | | 128,915 | |
Teleflex, Inc. | | 12,313 | | 800,099 | |
The Brink’s Company | | 17,860 | | 855,673 | |
Thomas & Betts Corp.* | | 16,102 | | 675,640 | |
Timken Co. | | 25,298 | | 810,042 | |
Trinity Industries | | 13,258 | | 584,280 | |
United Rentals* | | 20,354 | | 476,080 | |
Werner Enterprises, Inc. | | 15,690 | | 309,093 | |
Yellow Roadway Corp.* | | 17,660 | | 787,813 | |
| | | | 49,380,716 | |
TECHNOLOGY (14.3%) | | | | | |
3Com Corp.* | | 117,655 | | 423,558 | |
Activision, Inc.* | | 83,215 | | 1,143,374 | |
MUTUAL OF AMERICA INVESTMENT CORPORATION (MID-CAP EQUITY INDEX FUND)
PORTFOLIO OF INVESTMENTS IN SECURITIES
DECEMBER 31, 2005
| | Shares | | Value($) | |
COMMON STOCKS: | | | | | |
TECHNOLOGY (Cont’d.) | | | | | |
Acxiom Corp. | | 23,030 | | 529,690 | |
Adtran, Inc. | | 20,592 | | 612,406 | |
Advent Software, Inc.* | | 4,891 | | 141,399 | |
Alliance Data Systems* | | 20,840 | | 741,904 | |
Amphenol Corp. Cl A | | 27,023 | | 1,196,038 | |
Anteon International Corp.* | | 9,949 | | 540,728 | |
Arrow Electronics* | | 36,353 | | 1,164,387 | |
Atmel Corp.* | | 129,295 | | 399,522 | |
Avnet, Inc.* | | 44,365 | | 1,062,098 | |
Avocent Corp.* | | 14,872 | | 404,370 | |
BISYS Group, Inc.* | | 36,731 | | 514,601 | |
CDW Corp. | | 19,088 | | 1,098,896 | |
CSG Systems International, Inc.* | | 14,778 | | 329,845 | |
Cabot MicroElectronics Corp.* | | 7,386 | | 216,631 | |
Cadence Design Systems, Inc.* | | 86,260 | | 1,459,519 | |
Ceridian Corp.* | | 44,168 | | 1,097,575 | |
Certegy, Inc. | | 18,882 | | 765,854 | |
CheckFree Corp.* | | 27,568 | | 1,265,371 | |
Cognizant Tech Solutions* | | 42,016 | | 2,115,506 | |
CommScope, Inc.* | | 16,726 | | 336,694 | |
Credence Systems Corp.* | | 30,229 | | 210,394 | |
Cree , Inc.* | | 23,073 | | 582,363 | |
Cypress Semiconductor Corp.* | | 41,156 | | 586,473 | |
DST Systems, Inc.* | | 19,162 | | 1,147,995 | |
Diebold, Inc. | | 21,079 | | 801,002 | |
F5 Networks, Inc.* | | 11,986 | | 685,479 | |
Fair Isaac Corporation | | 19,879 | | 878,055 | |
Fairchild Semiconductor International* | | 36,520 | | 617,553 | |
Gartner, Inc.* | | 17,604 | | 227,092 | |
Harris Corp. | | 40,673 | | 1,749,346 | |
Henry (Jack) & Associates | | 22,751 | | 434,089 | |
Imation Corp. | | 10,429 | | 480,464 | |
Ingram Micro, Inc.* | | 35,250 | | 702,533 | |
Integrated Device Tech., Inc.* | | 60,697 | | 799,986 | |
International Rectifier* | | 21,517 | | 686,392 | |
Intersil Corp. Cl A | | 46,971 | | 1,168,638 | |
Kemet Corp.* | | 26,360 | | 186,365 | |
Lam Research Corp.* | | 41,348 | | 1,475,297 | |
Lattice Semiconductor Corp.* | | 34,545 | | 149,234 | |
MUTUAL OF AMERICA INVESTMENT CORPORATION (MID-CAP EQUITY INDEX FUND)
PORTFOLIO OF INVESTMENTS IN SECURITIES
DECEMBER 31, 2005
| | Shares | | Value($) | |
COMMON STOCKS: | | | | | |
TECHNOLOGY (Cont’d.) | | | | | |
MEMC Elect. Materials, Inc.* | | 50,216 | | 1,113,289 | |
MPS Group, Inc.* | | 30,755 | | 420,421 | |
Macrovision Corp.* | | 15,479 | | 258,964 | |
McAfee, Inc.* | | 51,008 | | 1,383,847 | |
McData Corporation Cl A* | | 46,513 | | 176,749 | |
Mentor Graphics Corp.* | | 24,073 | | 248,915 | |
Micrel, Inc.* | | 19,843 | | 230,179 | |
Microchip Technology, Inc. | | 63,905 | | 2,054,545 | |
National Instruments Corp. | | 16,844 | | 539,850 | |
Newport Corp.* | | 12,144 | | 164,430 | |
Plantronics, Inc. | | 14,407 | | 407,718 | |
Plexus Corp.* | | 13,245 | | 301,191 | |
Polycom, Inc.* | | 28,599 | | 437,565 | |
Powerwave Technologies, Inc.* | | 33,627 | | 422,691 | |
RF Micro Devices* | | 57,480 | | 310,967 | |
RSA Security, Inc.* | | 21,577 | | 242,310 | |
Reynolds & Reynolds Co. | | 15,550 | | 436,489 | |
SRA International, Inc. Cl A* | | 11,304 | | 345,224 | |
Sandisk Corp.* | | 55,979 | | 3,516,601 | |
Semtech Corp.* | | 22,148 | | 404,422 | |
Silicon Laboratories, Inc.* | | 13,627 | | 499,566 | |
Sybase, Inc.* | | 27,700 | | 605,522 | |
Synopsys, Inc.* | | 43,879 | | 880,213 | |
Tech Data Corp.* | | 17,168 | | 681,226 | |
Transaction Systems Architects | | 11,302 | | 325,385 | |
Triquint Semiconductor, Inc.* | | 42,567 | | 189,423 | |
Utstarcom, Inc.* | | 31,957 | | 257,573 | |
Vishay Intertechnology, Inc.* | | 55,980 | | 770,285 | |
Western Digital Corp.* | | 65,583 | | 1,220,500 | |
Wind River Systems* | | 22,729 | | 335,707 | |
Zebra Technologies Cl A* | | 21,390 | | 916,562 | |
| | | | 51,227,045 | |
TELECOMMUNICATIONS (0.4%) | | | | | |
Cincinnati Bell, Inc.* | | 74,848 | | 262,716 | |
Telephone & Data Systems, Inc. | | 31,199 | | 1,124,100 | |
| | | | 1,386,816 | |
UTILITIES (7.4%) | | | | | |
AGL Resources, Inc. | | 23,610 | | 821,864 | |
Alliant Energy Corp. | | 35,526 | | 996,149 | |
MUTUAL OF AMERICA INVESTMENT CORPORATION (MID-CAP EQUITY INDEX FUND)
PORTFOLIO OF INVESTMENTS IN SECURITIES
DECEMBER 31, 2005
| | Shares | | Value($) | |
COMMON STOCKS: | | | | | |
UTILITIES (Cont’d.) | | | | | |
Aqua America, Inc. | | 39,122 | | 1,067,639 | |
Aquila, Inc.* | | 113,531 | | 408,712 | |
Black Hills Corp. | | 10,072 | | 348,592 | |
DPL, Inc. | | 38,774 | | 1,008,512 | |
Duquesne Light Holdings, Inc. | | 23,707 | | 386,898 | |
Energy East Corporation | | 44,908 | | 1,023,902 | |
Equitable Resources, Inc. | | 36,751 | | 1,348,394 | |
Great Plains Energy, Inc. | | 22,711 | | 635,000 | |
Hawaiian Electric Inds. | | 24,614 | | 637,503 | |
IdaCorp, Inc. | | 12,869 | | 377,062 | |
MDU Resources Group | | 36,444 | | 1,193,177 | |
NSTAR | | 32,474 | | 932,004 | |
National Fuel Gas Co. | | 25,680 | | 800,959 | |
Northeast Utilities | | 45,628 | | 898,415 | |
OGE Energy Corp. | | 27,537 | | 737,716 | |
Oneok, Inc. | | 29,666 | | 790,006 | |
PNM Resources, Inc. | | 20,907 | | 512,012 | |
Pepco Holdings, Inc. | | 57,511 | | 1,286,521 | |
Puget Energy, Inc. | | 35,115 | | 717,048 | |
Questar Corp. | | 25,929 | | 1,962,824 | |
SCANA Corp. | | 34,808 | | 1,370,739 | |
Sierra Pacific Resources* | | 55,769 | | 727,228 | |
Southwestern Energy Co.* | | 48,712 | | 1,750,709 | |
Vectren Corporation | | 23,136 | | 628,374 | |
WGL Holdings, Inc. | | 14,806 | | 445,068 | |
WPS Resources | | 12,156 | | 672,348 | |
Westar Energy, Inc. | | 26,374 | | 567,041 | |
Wisconsin Energy Corp. | | 35,568 | | 1,389,286 | |
| | | | 26,441,702 | |
| | | | | |
TOTAL COMMON STOCKS (Cost: $274,490,267) 92.8% | | | | 331,736,779 | |
*Non-income producing security.
MUTUAL OF AMERICA INVESTMENT CORPORATION (MID-CAP EQUITY INDEX FUND)
PORTFOLIO OF INVESTMENTS IN SECURITIES
DECEMBER 31, 2005
| | Rate(%) | | Maturity | | Face
Amount($) | | Value($) | |
SHORT-TERM DEBT SECURITIES: | | | | | | | | | |
U.S. GOVERNMENT (0.3%) | | | | | | | | | |
U.S. Treasury Bill (a) | | 3.87 | | 03/30/06 | | 1,000,000 | | 990,128 | |
| | | | | | | | | |
U.S. GOVERNMENT AGENCIES (6.0%) | | | | | | | | | |
Federal Home Loan Bank | | 3.35 | | 01/03/06 | | 21,430,000 | | 21,426,011 | |
| | | | | | | | | |
TOTAL SHORT-TERM DEBT SECURITIES
(Cost: $22,416,547) 6.3% | | | | | | | | 22,416,139 | |
| | | | | | | | | |
TEMPORARY CASH INVESTMENTS**
(Cost: $500,000) 0.1% | | | | | | | | 500,000 | |
| | | | | | | | | |
TOTAL INVESTMENTS (Cost: $297,406,814) 99.2% | | | | | | | | 354,652,918 | |
| | | | | | | | | |
OTHER NET ASSETS0.8% | | | | | | | | 2,876,414 | |
| | | | | | | | | |
NET ASSETS 100.0% | | | | | | | | $ | 357,529,332 | |
| | | | | | | | | | |
(a) This security, or a portion thereof, has been segregated to cover initial margin requirements on open futures contracts.
** The fund has an arrangement with its custodian bank, JPMorgan Chase Bank, whereby uninvested cash, subject to parameters set by the fund, is automatically invested in the fund’s name by the bank in overnight commercial paper issued by J.P. Morgan Chase & Co. On the next business day, these funds (and earned interest) are automatically returned to the fund. The annual rate of interest earned on this temporary cash investment at December 30, 2005 was 3.79 %.
FUTURES CONTRACTS OUTSTANDING AS OF DECEMBER 31, 2005:
| | Expiration
Date | | Underlying Face
Amount at Value | | Unrealized
Gain(Loss) | |
| | | | | | | |
Purchased | | | | | | | |
| | | | | | | |
62 S & P Stock Index Futures Contracts | | March 2005 | | $ | 23,039,200 | | $ | (368,000 | ) |
| | | | | | | | | |
Face Value of futures purchased and outstanding as a percentage of total investments in securities: 6.5%
MUTUAL OF AMERICA INVESTMENT CORPORATION (AGGRESSIVE EQUITY FUND)
PORTFOLIO OF INVESTMENTS IN SECURITIES
DECEMBER 31, 2005
| | Shares | | Value($) | |
COMMON STOCKS: | | | | | |
BASIC MATERIALS (4.1%) | | | | | |
Century Aluminum Company* | | 48,430 | | 1,269,350 | |
Commercial Metals Co. | | 77,730 | | 2,917,983 | |
Cytec Industries, Inc. | | 30,730 | | 1,463,670 | |
Georgia Gulf Corp. | | 13,380 | | 407,020 | |
Glatfelter | | 60,630 | | 860,340 | |
Longview Fibre Co. | | 86,330 | | 1,796,527 | |
Lubrizol Corp. | | 42,220 | | 1,833,615 | |
Oregon Steel Mills, Inc.* | | 46,990 | | 1,382,446 | |
Steel Dynamics, Inc. | | 23,960 | | 850,820 | |
U.S. Concrete, Inc.* | | 34,810 | | 329,999 | |
| | | | 13,111,770 | |
CONSUMER, CYCLICAL (10.8%) | | | | | |
A.C.More Arts & Crafts, Inc.* | | 30,400 | | 442,320 | |
Aaron Rents, Inc. | | 34,700 | | 731,476 | |
Audiovox Corp. Cl A* | | 212,272 | | 2,942,090 | |
Crown Holdings, Inc.* | | 211,400 | | 4,128,641 | |
Gamestop Corp.* | | 93,221 | | 2,966,292 | |
Guitar Center, Inc.* | | 14,658 | | 733,047 | |
Hibbett Sporting Goods, Inc.* | | 71,535 | | 2,037,317 | |
Hot Topic, Inc.* | | 34,775 | | 495,544 | |
Hudson Highland Group* | | 69,800 | | 1,211,728 | |
Landry’s Restaurant, Inc. | | 48,190 | | 1,287,155 | |
Lithia Motors, Inc. Cl A | | 24,240 | | 762,106 | |
Lone Star Steakhouse | | 29,730 | | 705,790 | |
Omega Protein Corp.* | | 75,480 | | 506,471 | |
P.F. Changs China Bistro, Inc. | | 21,925 | | 1,088,138 | |
Pacific Sunwear of California* | | 36,500 | | 909,580 | |
Payless Shoesource, Inc.* | | 48,960 | | 1,228,896 | |
Pinnacle Entertainment, Inc.* | | 57,842 | | 1,429,276 | |
Red Robin Gourmet Burgers* | | 20,878 | | 1,063,943 | |
Sunopta* | | 67,670 | | 355,944 | |
Sunterra Corporation* | | 113,490 | | 1,613,828 | |
The Bombay Company, Inc.* | | 323,880 | | 958,685 | |
The Warnaco Group, Inc.* | | 73,432 | | 1,962,103 | |
Wild Oaks Markets, Inc.* | | 128,505 | | 1,552,340 | |
Winnebago Industries, Inc. | | 23,930 | | 796,390 | |
Wolverine World Wide, Inc. | | 134,399 | | 3,018,602 | |
| | | | 34,927,702 | |
MUTUAL OF AMERICA INVESTMENT CORPORATION (AGGRESSIVE EQUITY FUND)
PORTFOLIO OF INVESTMENTS IN SECURITIES
DECEMBER 31, 2005
| | Shares | | Value($) | |
COMMON STOCKS: | | | | | |
CONSUMER, NON-CYCLICAL (3.1%) | | | | | |
Alkermes, Inc.* | | 44,240 | | 845,869 | |
Chiquita Brands International, Inc. | | 80,200 | | 1,604,802 | |
Conmed Corp.* | | 40,110 | | 949,003 | |
Hologic, Inc.* | | 20,000 | | 758,400 | |
Longs Drug Stores Corp. | | 65,960 | | 2,400,283 | |
MGI Pharma, Inc.* | | 72,780 | | 1,248,905 | |
Serologicals Corp.* | | 65,813 | | 1,299,149 | |
Sovran Self-Storage, Inc. | | 8,125 | | 381,631 | |
Walter Industries, Inc. | | 7,840 | | 389,805 | |
| | | | 9,877,847 | |
ENERGY (7.0%) | | | | | |
CNX Gas Corp.* | | 67,070 | | 1,391,703 | |
Crosstex Energy, Inc. | | 11,400 | | 718,884 | |
Denbury Resources, Inc.* | | 50,216 | | 1,143,920 | |
Holly Corp. | | 26,820 | | 1,578,893 | |
NS Group, Inc.* | | 112,235 | | 4,692,545 | |
Range Resources Corp. | | 216,270 | | 5,696,551 | |
Todco Cl A | | 63,890 | | 2,431,653 | |
Unisource Energy Corp. | | 61,390 | | 1,915,368 | |
Whittier Energy* | | 302,200 | | 3,173,100 | |
| | | | 22,742,617 | |
FINANCIAL (23.5%) | | | | | |
Acadia Realty Trust | | 36,170 | | 725,209 | |
American Home Mortgage Investment Corp. | | 28,040 | | 913,263 | |
Amli Residential Properties | | 14,880 | | 566,184 | |
Argonaut Group, Inc.* | | 30,765 | | 1,008,169 | |
Assured Guaranty Co.* | | 84,590 | | 2,147,740 | |
Bank Mutual Corp. | | 142,970 | | 1,515,482 | |
BankAtlantic Bancorp, Inc. Cl A | | 157,840 | | 2,209,760 | |
Banner Corporation | | 30,430 | | 949,416 | |
Boykin Lodging Company* | | 30,090 | | 367,700 | |
Brookline Bankcorp | | 161,240 | | 2,284,771 | |
Ceres Group, Inc.* | | 49,010 | | 253,382 | |
Choice Hotels International, Inc. | | 43,580 | | 1,819,901 | |
Columbia Banking System | | 38,985 | | 1,113,022 | |
Conseco, Inc.* | | 77,770 | | 1,801,931 | |
ECC Capital Corp. | | 182,800 | | 413,128 | |
Equity Inns, Inc. | | 162,290 | | 2,199,030 | |
First Financial Holdings, Inc. | | 29,920 | | 919,142 | |
MUTUAL OF AMERICA INVESTMENT CORPORATION (AGGRESSIVE EQUITY FUND)
PORTFOLIO OF INVESTMENTS IN SECURITIES
DECEMBER 31, 2005
| | Shares | | Value($) | |
COMMON STOCKS: | | | | | |
FINANCIAL (Cont’d.) | | | | | |
First Niagara Financial Group | | 140,480 | | 2,032,746 | |
First State Bank Corporation | | 107,700 | | 2,583,723 | |
Getty Realty Corp. | | 24,261 | | 637,822 | |
Highwoods Properties, Inc. | | 51,170 | | 1,455,787 | |
IShares Russell 200 Growth | | 31,300 | | 2,180,045 | |
IShares Russell 200 Growth* | | 24,390 | | 1,627,301 | |
IShares Russell Micropac | | 30,900 | | 1,580,535 | |
Iberia Bank Corp. | | 7,212 | | 367,884 | |
JER Investors Trust, Inc. | | 39,040 | | 661,728 | |
Jackson Hewitt Tax Service | | 13,450 | | 372,700 | |
KNBT Bancorp, Inc. | | 110,800 | | 1,804,932 | |
Knight Capital Group Inc.* | | 44,730 | | 442,380 | |
La Salle Hotel Properties | | 39,175 | | 1,438,506 | |
LandAmerica Financial Group | | 34,770 | | 2,169,648 | |
Lazard, Ltd. Cl A* | | 23,700 | | 756,030 | |
MAF Bancorp | | 50,620 | | 2,094,655 | |
Max Re Capital, Ltd.* | | 30,545 | | 793,254 | |
Medical Properties Trust, Inc. | | 176,180 | | 1,723,040 | |
Mid-America Apt. Communities | | 28,390 | | 1,376,915 | |
MoneyGram International, Inc. | | 43,675 | | 1,139,044 | |
NASDAQ Stock Market, Inc.* | | 21,300 | | 749,334 | |
National Financial Partners | | 35,370 | | 1,858,694 | |
NewAlliance Bankshare | | 147,590 | | 2,145,959 | |
PHH Corp.* | | 77,810 | | 2,180,236 | |
Pennsylvania REIT | | 28,700 | | 1,072,232 | |
Placer Sierra Banschares | | 52,140 | | 1,444,799 | |
Platinum Underwriters Holdings* | | 35,440 | | 1,101,121 | |
PrivateBancorp, Inc. | | 40,447 | | 1,438,700 | |
Provident Financial Services | | 118,590 | | 2,195,101 | |
Santander Bancorp | | 45,565 | | 1,144,593 | |
Sterling Financial Corp. | | 90,076 | | 2,250,098 | |
Stewart Information Services | | 25,300 | | 1,231,351 | |
Summit Bancshares, Inc. (TX) | | 55,305 | | 994,384 | |
Sws Group, Inc. | | 54,270 | | 1,136,414 | |
Taberna Realty Fin. Trust | | 178,600 | | 2,143,200 | |
Texas Regional Bancshares | | 49,417 | | 1,398,501 | |
Tower Group, Inc. | | 41,870 | | 920,303 | |
Vintage Wine Trust, Inc. | | 189,970 | | 1,899,700 | |
| | | | 75,750,625 | |
MUTUAL OF AMERICA INVESTMENT CORPORATION (AGGRESSIVE EQUITY FUND)
PORTFOLIO OF INVESTMENTS IN SECURITIES
DECEMBER 31, 2005
| | Shares | | Value($) | |
COMMON STOCKS: | | | | | |
HEALTHCARE (7.2%) | | | | | |
Adolor Corporation* | | 23,300 | | 340,180 | |
Advanced Medical Optics, Inc.* | | 48,714 | | 2,036,244 | |
Amedisys, Inc.* | | 30,390 | | 1,283,674 | |
Amylin Pharmaceuticals, Inc.* | | 36,753 | | 1,467,180 | |
Arthrocare Corp.* | | 12,400 | | 522,536 | |
CV Therapeutics, Inc.* | | 42,768 | | 1,057,653 | |
Caliper Life Sciences, Inc.* | | 124,928 | | 734,577 | |
Conceptus, Inc.* | | 25,300 | | 319,286 | |
DJ Orthopedics, Inc.* | | 29,805 | | 822,022 | |
Digene Corp.* | | 60,240 | | 1,757,201 | |
Genesis HealthCare Corp.* | | 20,450 | | 746,834 | |
Human Genome Sciences, Inc.* | | 85,150 | | 728,884 | |
Inspire Pharmaceuticals, Inc.* | | 65,280 | | 331,622 | |
Intuitive Surgical, Inc.* | | 4,900 | | 574,623 | |
Keryx Biopharmaceuticals, Inc. | | 24,800 | | 363,072 | |
Kyphon, Inc.* | | 12,600 | | 514,458 | |
Myogen, Inc.* | | 24,666 | | 742,447 | |
Nuvasive, Inc.* | | 30,900 | | 559,290 | |
Psychiatric Solutions* | | 12,300 | | 722,502 | |
Senomyx, Inc.* | | 24,600 | | 298,152 | |
Steris Corp. | | 29,345 | | 734,212 | |
Theravance, Inc.* | | 34,045 | | 766,693 | |
Thoratec Corp.* | | 31,100 | | 643,459 | |
United Surgical Partners, Inc. | | 38,602 | | 1,241,054 | |
Valeant Pharmaceuticals | | 25,371 | | 458,708 | |
Ventana Medical Systems, Inc.* | | 52,252 | | 2,212,871 | |
Viasys Healthcare, Inc.* | | 44,205 | | 1,136,069 | |
| | | | 23,115,503 | |
INDUSTRIAL (21.0%) | | | | | |
Actuant Corp. Cl A | | 29,950 | | 1,671,210 | |
Acuity brands, Inc. | | 22,080 | | 702,144 | |
Agnico-Eagle Mines, Ltd. | | 92,833 | | 1,834,380 | |
Apogee Enterprises, Inc. | | 153,220 | | 2,485,228 | |
Aspect Medical Systems, Inc.* | | 15,170 | | 521,090 | |
Baker (Michael) Corp.* | | 25,360 | | 647,948 | |
Benchmark Electronics* | | 65,158 | | 2,191,264 | |
Cal Dive International, Inc.* | | 59,290 | | 2,127,918 | |
Champion Enterprises, Inc.* | | 282,465 | | 3,847,172 | |
Conexant Systems, Inc.* | | 284,220 | | 642,337 | |
MUTUAL OF AMERICA INVESTMENT CORPORATION (AGGRESSIVE EQUITY FUND)
PORTFOLIO OF INVESTMENTS IN SECURITIES
DECEMBER 31, 2005
| | Shares | | Value($) | |
COMMON STOCKS: | | | | | |
INDUSTRIAL (Cont’d.) | | | | | |
Curtis Wright Corp. Cl B | | 34,515 | | 1,884,519 | |
Cymer, Inc.* | | 23,860 | | 847,269 | |
Diagnostic Products Corp. | | 14,620 | | 709,801 | |
Eagle Materials, Inc. | | 5,925 | | 724,983 | |
EastGroup Properties, Inc. | | 9,200 | | 415,472 | |
Eclipsys Corp.* | | 43,575 | | 824,875 | |
Filenet Corp.* | | 13,600 | | 351,560 | |
Frozen Foods Express Ind.* | | 94,091 | | 1,037,824 | |
Gardner Denver Machinery* | | 46,420 | | 2,288,506 | |
General Cable Corp.* | | 110,460 | | 2,176,062 | |
Genesee & Wyoming, Inc. Cl A* | | 36,545 | | 1,372,265 | |
Genesis Microchip Corp.* | | 62,902 | | 1,137,897 | |
Granite Construction | | 20,374 | | 731,630 | |
HUB Group, Inc. Cl A* | | 36,980 | | 1,307,243 | |
Harmonic, Inc.* | | 73,075 | | 354,414 | |
Healthcare Services Group | | 39,600 | | 820,116 | |
Hydril Company* | | 24,585 | | 1,539,021 | |
Kennametal, Inc. | | 50,140 | | 2,559,146 | |
Kirby Corp.* | | 46,244 | | 2,412,548 | |
Komag, Inc.* | | 22,380 | | 775,691 | |
Labor Ready, Inc.* | | 30,624 | | 637,592 | |
Landstar System, Inc. | | 49,652 | | 2,072,474 | |
Lincoln Electric Holdings | | 38,405 | | 1,523,142 | |
Marinemax, Inc.* | | 25,400 | | 801,878 | |
Matrix Service Co.* | | 8,310 | | 81,770 | |
Moog, Inc. Cl A* | | 25,600 | | 726,528 | |
RailAmerica, Inc.* | | 261,010 | | 2,868,500 | |
Regal-Beloit Corp. | | 79,615 | | 2,818,371 | |
Shaw Group, Inc.* | | 110,408 | | 3,211,769 | |
Siligan Holdings, Inc. | | 89,000 | | 3,214,680 | |
Texas Industries, Inc. | | 30,850 | | 1,537,564 | |
Trico Marine Services, Inc.* | | 42,020 | | 1,092,520 | |
Trinity Industries | | 69,910 | | 3,080,934 | |
Universal Forest Products | | 40,970 | | 2,263,593 | |
Werner Enterprises, Inc. | | 48,100 | | 947,570 | |
| | | | 67,820,418 | |
TECHNOLOGY (14.8%) | | | | | |
3Com Corp.* | | 117,030 | | 421,308 | |
Activision, Inc.* | | 78,700 | | 1,081,338 | |
MUTUAL OF AMERICA INVESTMENT CORPORATION (AGGRESSIVE EQUITY FUND)
PORTFOLIO OF INVESTMENTS IN SECURITIES
DECEMBER 31, 2005
| | Shares | | Value($) | |
COMMON STOCKS: | | | | | |
TECHNOLOGY (Cont’d.) | | | | | |
Adtran, Inc. | | 18,450 | | 548,703 | |
Akami Technologies* | | 35,700 | | 711,501 | |
Andrew Corp.* | | 61,220 | | 656,891 | |
Anixter International, Inc. | | 43,710 | | 1,709,935 | |
Ansys, Inc.* | | 17,750 | | 757,748 | |
Arris Group, Inc.* | | 52,400 | | 496,228 | |
Aspen Technology, Inc.* | | 96,200 | | 755,170 | |
Avocent Corp.* | | 29,400 | | 799,386 | |
BearingPoint, Inc.* | | 55,250 | | 434,265 | |
Centillium Communications, Inc. | | 75,884 | | 265,594 | |
Checkpoint Systems* | | 28,670 | | 706,716 | |
Computer Programs & Systems | | 21,250 | | 880,388 | |
Credence Systems Corp.* | | 58,140 | | 404,654 | |
Digital Insight Corporation* | | 24,700 | | 790,894 | |
Digitas* | | 33,575 | | 420,359 | |
Electronics For Imaging, Inc.* | | 50,710 | | 1,349,393 | |
Entegris, Inc.* | | 37,600 | | 354,192 | |
Fairchild Semiconductor International* | | 25,620 | | 433,234 | |
Hutchinson Tech* | | 31,600 | | 899,020 | |
IXYS Corporation* | | 25,018 | | 292,460 | |
Imation Corp. | | 28,280 | | 1,302,860 | |
Informatica Corp.* | | 46,900 | | 562,800 | |
Integrated Device Tech., Inc.* | | 81,027 | | 1,067,936 | |
Intrado, Inc.* | | 9,500 | | 218,690 | |
Lecroy Corp.* | | 80,615 | | 1,232,603 | |
Lexer Media, Inc.* | | 127,400 | | 1,045,954 | |
Lojack Corporation* | | 25,883 | | 624,557 | |
Medics Pharmaceutical Corp. | | 80,605 | | 2,583,390 | |
Microsemi Corp.* | | 93,950 | | 2,598,656 | |
Neustar, Inc. Cl A* | | 25,100 | | 765,299 | |
Palm, Inc.* | | 34,610 | | 1,100,598 | |
Parametric Technology Corp.* | | 171,796 | | 1,047,956 | |
Perot Systems Corp. Cl A* | | 46,290 | | 654,541 | |
Powerwave Technologies, Inc.* | | 32,560 | | 409,279 | |
Quest Software, Inc.* | | 29,300 | | 427,487 | |
RF Micro Devices* | | 162,450 | | 878,855 | |
Red Hat, Inc.* | | 45,150 | | 1,229,886 | |
SPSS, Inc.* | | 32,650 | | 1,009,865 | |
Secure Computing Corp.* | | 134,900 | | 1,653,873 | |
MUTUAL OF AMERICA INVESTMENT CORPORATION (AGGRESSIVE EQUITY FUND)
PORTFOLIO OF INVESTMENTS IN SECURITIES
DECEMBER 31, 2005
| | Shares | | Value($) | |
COMMON STOCKS: | | | | | |
TECHNOLOGY (Cont’d.) | | | | | |
Sigmatel, Inc.* | | 16,020 | | 209,862 | |
Skyworks Solutions, Inc.* | | 242,620 | | 1,234,936 | |
Sonosite, Inc.* | | 32,910 | | 1,152,179 | |
Tibco Software, Inc.* | | 121,300 | | 906,111 | |
ValueClick , Inc.* | | 78,800 | | 1,427,068 | |
Varian Semiconductor Equip.* | | 39,640 | | 1,741,385 | |
Viasat, Inc.* | | 62,654 | | 1,674,741 | |
Wabtech | | 81,190 | | 2,184,011 | |
Websense, Inc.* | | 14,627 | | 960,116 | |
aQuantive, Inc.* | | 33,989 | | 857,882 | |
| | | | 47,932,753 | |
TELECOMMUNICATIONS (1.1%) | | | | | |
CT Communications, Inc. | | 41,950 | | 509,273 | |
Tekelec* | | 127,465 | | 1,771,763 | |
Valor Communications Group | | 96,320 | | 1,098,048 | |
| | | | 3,379,084 | |
UTILITIES (2.4%) | | | | | |
Avista Corp. | | 41,150 | | 728,767 | |
EPIQ Systems, Inc.* | | 27,110 | | 502,619 | |
PNM Resources, Inc. | | 97,090 | | 2,377,733 | |
Sierra Pacific Resources* | | 147,140 | | 1,918,706 | |
Southwestern Energy Co.* | | 17,624 | | 633,407 | |
Westar Energy, Inc. | | 71,140 | | 1,529,510 | |
| | | | 7,690,742 | |
| | | | | |
TOTAL COMMON STOCKS (Cost: $266,343,779) 95.0% | | | | 306,349,061 | |
*Non-income producing security.
MUTUAL OF AMERICA INVESTMENT CORPORATION (AGGRESSIVE EQUITY FUND)
PORTFOLIO OF INVESTMENTS IN SECURITIES
DECEMBER 31, 2005
| | Shares | | Value($) | |
PREFERRED STOCKS: | | | | | |
FINANCIAL (0.4%) | | | | | |
Quanta Capital Holdings | | 48,020 | | 1,200,500 | |
| | | | | |
TOTAL PREFERRED STOCKS (Cost: $1,200,500) 0.4% | | | | 1,200,500 | |
| | | | | | Face | | | |
| | Rate(%) | | Maturity | | Amount($) | | Value($) | |
LONG-TERM DEBT SECURITIES: | | | | | | | | | |
FINANCIAL (0.6%) | | | | | | | | | |
GSC Capital Corp. | | 7.25 | | 07/15/10 | | 1,890,000 | | 1,890,000 | |
| | | | | | | | | |
TOTAL LONG-TERM DEBT SECURITIES
(Cost: $1,890,000) 0.6% | | | | | | | | 1,890,000 | |
| | | | | | Face | | | |
| | Rate(%) | | Maturity | | Amount($) | | Value($) | |
SHORT-TERM DEBT SECURITIES: | | | | | | | | | |
U.S. GOVERNMENT AGENCIES (3.7%) | | | | | | | | | |
Federal Home Loan Bank | | 3.35 | | 01/03/06 | | 5,600,000 | | 5,598,958 | |
Federal National Mortgage Association | | 3.25 | | 01/03/06 | | 6,420,000 | | 6,418,840 | |
| | | | | | | | 12,017,798 | |
| | | | | | | | | |
TOTAL SHORT-TERM DEBT SECURITIES
(Cost: $12,017,798) 3.7% | | | | | | | | 12,017,798 | |
| | | | | | | | | |
TEMPORARY CASH INVESTMENTS**
(Cost: $14,300) 0.0% (1) | | | | | | | | 14,300 | |
| | | | | | | | | |
TOTAL INVESTMENTS (Cost: $281,466,377) 99.7% | | | | | | | | 321,471,659 | |
| | | | | | | | | |
OTHER NET ASSETS0.3% | | | | | | | | 1,046,762 | |
| | | | | | | | | |
NET ASSETS 100.0% | | | | | | | | $ | 322,518,421 | |
| | | | | | | | | | |
(1) Less than 0.05 %.
**The fund has an arrangement with its custodian bank, JPMorgan Chase Bank, whereby uninvested cash, subject to parameters set by the fund, is automatically invested in the fund’s name by the bank in overnight commercial paper issued by J.P. Morgan Chase & Co. On the next business day, these funds (and earned interest) are automatically returned to the fund. The annual rate of interest earned on this temporary cash investment at December 30, 2005 was 3.79 %.
MUTUAL OF AMERICA INVESTMENT CORPORATION (COMPOSITE FUND)
PORTFOLIO OF INVESTMENTS IN SECURITIES
DECEMBER 31, 2005
| | Shares | | Value($) | |
COMMON STOCKS: | | | | | |
BASIC MATERIALS (1.6%) | | | | | |
Dow Chemical Co. | | 30,726 | | 1,346,413 | |
Phelps Dodge Corp. | | 12,082 | | 1,738,237 | |
Vulcan Materials Co. | | 11,316 | | 766,660 | |
| | | | 3,851,310 | |
CONSUMER, CYCLICAL (7.0%) | | | | | |
Best Buy Co., Inc. | | 37,080 | | 1,612,238 | |
Carnival Corp. | | 20,349 | | 1,088,061 | |
Home Depot, Inc. | | 34,958 | | 1,415,100 | |
Johnson Controls, Inc. | | 13,369 | | 974,734 | |
Kohl’s Corp.* | | 38,674 | | 1,879,556 | |
Lowe’s Companies, Inc. | | 15,130 | | 1,008,566 | |
Omnicom Group, Inc. | | 19,656 | | 1,673,315 | |
Penney (J.C.) Co., Inc. | | 28,780 | | 1,600,168 | |
Starwood Hotels & Resorts | | 24,465 | | 1,562,335 | |
Target Corp. | | 34,468 | | 1,894,706 | |
Time Warner, Inc. | | 83,488 | | 1,456,031 | |
| | | | 16,164,810 | |
CONSUMER, NON-CYCLICAL (5.1%) | | | | | |
CVS Corp. | | 28,517 | | 753,419 | |
Colgate-Palmolive Co. | | 19,449 | | 1,066,778 | |
General Mills, Inc. | | 12,950 | | 638,694 | |
Hershey Food Corp. | | 18,136 | | 1,002,014 | |
PepsiCo, Inc. | | 31,469 | | 1,859,189 | |
Proctor & Gamble Co. | | 63,135 | | 3,654,254 | |
Safeway, Inc. | | 37,381 | | 884,434 | |
Wal-Mart Stores, Inc. | | 40,636 | | 1,901,765 | |
| | | | 11,760,547 | |
ENERGY (5.7%) | | | | | |
Devon Energy Corp. | | 29,865 | | 1,867,757 | |
Exxon Mobil Corp. | | 77,545 | | 4,355,702 | |
Halliburton Co. | | 40,146 | | 2,487,446 | |
Transocean, Inc.* | | 33,754 | | 2,352,316 | |
Valero Energy Corp. | | 41,570 | | 2,145,012 | |
| | | | 13,208,233 | |
FINANCIAL (12.3%) | | | | | |
Allstate Corp. | | 18,141 | | 980,884 | |
American International Group, Inc. | | 31,935 | | 2,178,925 | |
Bank of America Corp. | | 75,497 | | 3,484,186 | |
Bear Stearns Cos., Inc. | | 14,049 | | 1,623,081 | |
MUTUAL OF AMERICA INVESTMENT CORPORATION (COMPOSITE FUND)
PORTFOLIO OF INVESTMENTS IN SECURITIES
DECEMBER 31, 2005
| | Shares | | Value($) | |
COMMON STOCKS: | | | | | |
FINANCIAL (Cont’d.) | | | | | |
Capital One Financial Corp. | | 19,029 | | 1,644,106 | |
Citigroup, Inc. | | 87,866 | | 4,264,137 | |
Golden West Financial Corp. | | 15,476 | | 1,021,416 | |
Goldman Sachs Group, Inc. | | 8,050 | | 1,028,066 | |
Hartford Financial Services Group, Inc. | | 13,143 | | 1,128,852 | |
Merrill Lynch & Co., Inc. | | 34,304 | | 2,323,410 | |
Morgan Stanley | | 14,471 | | 821,085 | |
North Fork Bancorp, Inc. | | 64,374 | | 1,761,273 | |
Safeco Corp. | | 18,588 | | 1,050,222 | |
Wachovia Corp. | | 41,626 | | 2,200,350 | |
Wells Fargo & Company | | 48,527 | | 3,048,951 | |
| | | | 28,558,944 | |
HEALTHCARE (6.8%) | | | | | |
Abbott Laboratories | | 38,212 | | 1,506,699 | |
Aetna, Inc. | | 17,932 | | 1,691,167 | |
Amgen, Inc.* | | 30,590 | | 2,412,327 | |
Caremark Rx, Inc.* | | 12,211 | | 632,408 | |
Genzyme Corp. (Genl. Div.)* | | 11,181 | | 791,391 | |
HCA, Inc. | | 16,287 | | 822,494 | |
Humana, Inc.* | | 7,016 | | 381,179 | |
Johnson & Johnson | | 50,256 | | 3,020,385 | |
Medimmune, Inc.* | | 7,680 | | 268,954 | |
Pfizer, Inc. | | 88,291 | | 2,058,946 | |
St. Jude Medical, Inc.* | | 5,670 | | 284,634 | |
Wyeth | | 42,439 | | 1,955,165 | |
| | | | 15,825,749 | |
INDUSTRIAL (6.7%) | | | | | |
Boeing Co. | | 21,491 | | 1,509,528 | |
Caterpillar, Inc. | | 22,991 | | 1,328,190 | |
Fluor Corp. | | 18,181 | | 1,404,664 | |
General Electric Co. | | 154,256 | | 5,406,672 | |
ITT Industries, Inc. | | 12,182 | | 1,252,553 | |
Tyco International, Ltd. | | 35,660 | | 1,029,148 | |
United Parcel Service Cl B | | 17,900 | | 1,345,185 | |
United Technologies Corp. | | 42,494 | | 2,375,840 | |
| | | | 15,651,780 | |
TECHNOLOGY (9.1%) | | | | | |
Andrew Corp.* | | 42,284 | | 453,707 | |
Broadcom Corp. Cl A* | | 31,851 | | 1,501,775 | |
MUTUAL OF AMERICA INVESTMENT CORPORATION (COMPOSITE FUND)
PORTFOLIO OF INVESTMENTS IN SECURITIES
DECEMBER 31, 2005
| | Shares | | Value($) | |
COMMON STOCKS: | | | | | |
TECHNOLOGY (Cont’d.) | | | | | |
Cisco Systems, Inc.* | | 74,523 | | 1,275,834 | |
Corning, Inc.* | | 43,179 | | 848,899 | |
Dell, Inc.* | | 56,008 | | 1,679,680 | |
EMC Corp.* | | 72,450 | | 986,769 | |
Freescale Semiconductor Cl A* | | 32,973 | | 829,930 | |
IBM Corp. | | 19,251 | | 1,582,432 | |
Intel Corp. | | 85,829 | | 2,142,292 | |
KLA Tencor Corp. | | 16,939 | | 835,601 | |
Maxim Integrated Products, Inc. | | 22,794 | | 826,055 | |
Microsoft Corp. | | 126,920 | | 3,318,957 | |
Motorola, Inc. | | 30,254 | | 683,438 | |
Oracle Corp.* | | 106,467 | | 1,299,962 | |
Qualcomm, Inc. | | 28,974 | | 1,248,200 | |
Texas Instruments, Inc. | | 48,738 | | 1,563,028 | |
| | | | 21,076,559 | |
TELECOMMUNICATIONS (1.5%) | | | | | |
BellSouth Corp. | | 37,297 | | 1,010,749 | |
Sprint Nextel Corp. | | 58,532 | | 1,367,308 | |
Verizon Communications | | 40,269 | | 1,212,902 | |
| | | | 3,590,959 | |
UTILITIES (2.3%) | | | | | |
Constellation Energy Group | | 10,868 | | 625,997 | |
Dominion Resources, Inc. | | 17,984 | | 1,388,365 | |
Exelon Corp. | | 33,829 | | 1,797,673 | |
FirstEnergy Corp. | | 13,427 | | 657,789 | |
Sempra Energy | | 19,352 | | 867,744 | |
| | | | 5,337,568 | |
| | | | | |
TOTAL COMMON STOCKS (Cost: $126,765,449) 58.1% | | | | 135,026,459 | |
* Non-income producing security.
MUTUAL OF AMERICA INVESTMENT CORPORATION (COMPOSITE FUND)
PORTFOLIO OF INVESTMENTS IN SECURITIES
DECEMBER 31, 2005
| | | | | | | | Face | | | |
| | Rating* | | Rate(%) | | Maturity | | Amount($) | | Value($) | |
LONG-TERM DEBT SECURITIES: | | | | | | | | | | | |
U.S. GOVERNMENT (1.6%) | | | | | | | | | | | |
U.S. Treasury Note | | AAA | | 3.88 | | 02/15/13 | | 500,000 | | 484,629 | |
U.S. Treasury Strip | | AAA | | 0.00 | | 08/15/21 | | 7,000,000 | | 3,388,168 | |
| | | | | | | | | | 3,872,797 | |
U.S. GOVERNMENT AGENCIES (17.0%) | | | | | | | | | | | |
MORTGAGE-BACKED OBLIGATIONS (14.9%) | | | | | | | | | | | |
FHLMC | | AAA | | 8.00 | | 07/15/06 | | 3,228 | | 3,223 | |
FHLMC | | AAA | | 5.00 | | 06/15/17 | | 4,000,000 | | 3,987,896 | |
FHLMC | | AAA | | 4.00 | | 10/15/26 | | 1,800,000 | | 1,737,232 | |
FNMA | | AAA | | 8.00 | | 03/01/31 | | 51,513 | | 55,026 | |
FNMA | | AAA | | 7.50 | | 06/01/31 | | 56,535 | | 59,249 | |
FNMA | | AAA | | 7.00 | | 09/01/31 | | 83,140 | | 86,790 | |
FNMA | | AAA | | 7.00 | | 11/01/31 | | 145,618 | | 152,010 | |
FNMA | | AAA | | 7.50 | | 02/01/32 | | 51,169 | | 53,606 | |
FNMA | | AAA | | 6.00 | | 03/01/32 | | 88,000 | | 89,037 | |
FNMA | | AAA | | 6.50 | | 04/01/32 | | 207,735 | | 213,496 | |
FNMA | | AAA | | 6.00 | | 04/01/32 | | 206,713 | | 209,030 | |
FNMA | | AAA | | 6.00 | | 04/01/32 | | 178,437 | | 180,437 | |
FNMA | | AAA | | 7.00 | | 04/01/32 | | 78,521 | | 81,941 | |
FNMA | | AAA | | 7.50 | | 04/01/32 | | 71,020 | | 74,394 | |
FNMA | | AAA | | 8.00 | | 04/01/32 | | 21,384 | | 22,838 | |
FNMA | | AAA | | 8.00 | | 04/01/32 | | 20,525 | | 21,923 | |
FNMA | | AAA | | 6.00 | | 05/01/32 | | 196,975 | | 199,183 | |
FNMA | | AAA | | 6.50 | | 05/01/32 | | 234,583 | | 241,088 | |
FNMA | | AAA | | 6.50 | | 05/01/32 | | 230,219 | | 236,603 | |
FNMA | | AAA | | 7.50 | | 06/01/32 | | 65,058 | | 68,149 | |
FNMA | | AAA | | 7.00 | | 06/01/32 | | 38,327 | | 39,996 | |
FNMA | | AAA | | 6.50 | | 07/01/32 | | 93,812 | | 96,414 | |
FNMA | | AAA | | 6.00 | | 04/01/33 | | 630,069 | | 637,132 | |
FNMA | | AAA | | 6.00 | | 05/01/33 | | 299,235 | | 302,359 | |
FNMA | | AAA | | 5.00 | | 06/01/33 | | 1,209,931 | | 1,176,562 | |
FNMA | | AAA | | 5.50 | | 07/01/33 | | 839,919 | | 833,760 | |
FNMA | | AAA | | 5.50 | | 09/01/33 | | 729,315 | | 723,967 | |
FNMA | | AAA | | 5.50 | | 10/01/33 | | 1,056,609 | | 1,048,860 | |
FNMA | | AAA | | 5.00 | | 11/01/33 | | 1,664,376 | | 1,618,474 | |
FNMA | | AAA | | 5.00 | | 03/01/34 | | 358,295 | | 348,414 | |
FNMA | | AAA | | 5.50 | | 03/01/34 | | 281,454 | | 279,390 | |
FNMA | | AAA | | 5.00 | | 04/01/34 | | 415,387 | | 403,296 | |
FNMA | | AAA | | 5.50 | | 05/01/34 | | 1,955,845 | | 1,938,565 | |
MUTUAL OF AMERICA INVESTMENT CORPORATION (COMPOSITE FUND)
PORTFOLIO OF INVESTMENTS IN SECURITIES
DECEMBER 31, 2005
| | | | | | | | Face | | | |
| | Rating* | | Rate(%) | | Maturity | | Amount($) | | Value($) | |
LONG-TERM DEBT SECURITIES: | | | | | | | | | | | |
U.S. GOVERNMENT AGENCIES (Cont’d.) | | | | | | | | | | | |
MORTGAGE-BACKED OBLIGATIONS (Cont’d.) | | | | | | | | | | | |
FNMA | | AAA | | 4.50 | | 06/01/34 | | 658,585 | | 621,655 | |
FNMA | | AAA | | 6.00 | | 06/01/34 | | 424,859 | | 428,876 | |
FNMA | | AAA | | 5.50 | | 07/01/34 | | 766,358 | | 759,587 | |
FNMA | | AAA | | 6.50 | | 07/01/34 | | 323,658 | | 332,044 | |
FNMA | | AAA | | 6.00 | | 09/01/34 | | 222,817 | | 224,923 | |
FNMA | | AAA | | 5.50 | | 09/01/34 | | 615,706 | | 610,266 | |
FNMA | | AAA | | 5.50 | | 10/01/34 | | 409,165 | | 405,550 | |
FNMA | | AAA | | 6.00 | | 10/01/34 | | 383,684 | | 387,312 | |
FNMA | | AAA | | 6.00 | | 11/01/34 | | 480,379 | | 484,921 | |
FNMA | | AAA | | 5.50 | | 02/01/35 | | 511,031 | | 506,516 | |
FNMA | | AAA | | 5.12 | | 02/01/35 | | 433,577 | | 429,423 | |
FNMA | | AAA | | 5.50 | | 04/01/35 | | 600,378 | | 594,625 | |
FNMA | | AAA | | 5.00 | | 04/01/35 | | 750,455 | | 727,159 | |
FNMA | | AAA | | 5.50 | | 08/01/35 | | 241,732 | | 239,415 | |
FNMA | | AAA | | 5.00 | | 09/01/35 | | 496,043 | | 480,645 | |
FNMA | | AAA | | 5.00 | | 10/25/15 | | 1,000,000 | | 997,281 | |
FNMA | | AAA | | 6.50 | | 09/01/16 | | 75,848 | | 78,028 | |
FNMA | | AAA | | 6.00 | | 03/01/17 | | 47,845 | | 48,908 | |
FNMA | | AAA | | 6.50 | | 03/01/17 | | 115,222 | | 118,383 | |
FNMA | | AAA | | 5.50 | | 04/01/17 | | 110,865 | | 111,631 | |
FNMA | | AAA | | 5.50 | | 05/01/17 | | 90,171 | | 90,794 | |
FNMA | | AAA | | 6.50 | | 05/01/17 | | 70,403 | | 72,334 | |
FNMA | | AAA | | 5.50 | | 05/01/17 | | 56,202 | | 56,591 | |
FNMA | | AAA | | 6.50 | | 06/01/17 | | 105,566 | | 108,462 | |
FNMA | | AAA | | 5.50 | | 06/01/17 | | 53,529 | | 53,899 | |
FNMA | | AAA | | 5.00 | | 04/01/18 | | 1,414,456 | | 1,401,355 | |
FNMA | | AAA | | 4.50 | | 05/01/18 | | 672,164 | | 655,573 | |
FNMA | | AAA | | 5.00 | | 09/01/18 | | 701,560 | | 695,062 | |
FNMA | | AAA | | 4.50 | | 12/01/18 | | 562,237 | | 548,359 | |
FNMA | | AAA | | 4.50 | | 02/01/19 | | 276,790 | | 269,750 | |
FNMA | | AAA | | 4.50 | | 05/01/19 | | 641,278 | | 624,969 | |
FNMA | | AAA | | 4.00 | | 05/01/19 | | 365,393 | | 349,330 | |
FNMA | | AAA | | 4.50 | | 06/01/19 | | 444,555 | | 433,249 | |
GNMA (1) | | AAA | | 6.50 | | 04/15/31 | | 30,303 | | 31,672 | |
GNMA (1) | | AAA | | 7.00 | | 05/15/31 | | 25,978 | | 27,275 | |
GNMA (1) | | AAA | | 7.00 | | 09/15/31 | | 34,024 | | 35,722 | |
GNMA (1) | | AAA | | 7.00 | | 09/15/31 | | 8,133 | | 8,539 | |
MUTUAL OF AMERICA INVESTMENT CORPORATION (COMPOSITE FUND)
PORTFOLIO OF INVESTMENTS IN SECURITIES
DECEMBER 31, 2005
| | | | | | | | Face | | | |
| | Rating* | | Rate(%) | | Maturity | | Amount($) | | Value($) | |
LONG-TERM DEBT SECURITIES: | | | | | | | | | | | |
U.S. GOVERNMENT AGENCIES (Cont’d.) | | | | | | | | | | | |
MORTGAGE-BACKED OBLIGATIONS (Cont’d.) | | | | | | | | | | | |
GNMA (1) | | AAA | | 6.50 | | 10/15/31 | | 37,892 | | 39,605 | |
GNMA (1) | | AAA | | 6.50 | | 12/15/31 | | 29,853 | | 31,202 | |
GNMA (1) | | AAA | | 6.50 | | 05/15/32 | | 41,740 | | 43,615 | |
GNMA (1) | | AAA | | 7.00 | | 05/15/32 | | 29,919 | | 31,410 | |
GNMA (1) | | AAA | | 6.27 | | 10/16/27 | | 3,000,000 | | 3,177,471 | |
| | | | | | | | | | 34,593,726 | |
NON-MORTGAGE-BACKED OBLIGATION (2.1%) | | | | | | | | | | | |
FHLMC | | AAA | | 4.50 | | 01/15/13 | | 3,500,000 | | 3,437,980 | |
FNMA | | AAA | | 3.25 | | 02/15/09 | | 500,000 | | 478,906 | |
FNMA | | AAA | | 4.13 | | 04/15/14 | | 1,000,000 | | 953,592 | |
| | | | | | | | | | 4,870,478 | |
BASIC MATERIALS (2.4%) | | | | | | | | | | | |
International Paper Co. | | BBB | | 4.25 | | 01/15/09 | | 500,000 | | 485,263 | |
Lyondell Chemical Co. | | BB- | | 10.25 | | 11/01/10 | | 500,000 | | 550,000 | |
Monsanto Co. | | A- | | 4.00 | | 05/15/08 | | 500,000 | | 489,267 | |
PolyOne Corp. | | B+ | | 7.50 | | 12/15/15 | | 1,000,000 | | 912,500 | |
Praxair, Inc. | | A- | | 6.90 | | 11/01/06 | | 2,500,000 | | 2,538,897 | |
Worthington Industries, Inc. | | BBB | | 6.70 | | 12/01/09 | | 500,000 | | 528,976 | |
| | | | | | | | | | 5,504,903 | |
CONSUMER, CYCLICAL (2.7%) | | | | | | | | | | | |
Belo Corporation | | BBB | | 8.00 | | 11/01/08 | | 500,000 | | 531,147 | |
Coors Brewing Co. | | BBB | | 6.38 | | 05/15/12 | | 500,000 | | 529,840 | |
Cox Communications, Inc. Cl A | | BBB- | | 3.88 | | 10/01/08 | | 500,000 | | 481,848 | |
Daimlerchrysler | | BBB | | 4.05 | | 06/04/08 | | 250,000 | | 243,374 | |
Dow Jones & Co. | | A- | | 3.88 | | 02/15/08 | | 250,000 | | 245,069 | |
Fruit of the Loom (2) | | NR | | 7.00 | | 03/15/11 | | 525,420 | | 49,185 | |
Fruit of the Loom (2) | | NR | | 7.38 | | 11/15/23 | | 138,068 | | 14 | |
Kellwood, Co. | | BB | | 7.88 | | 07/15/09 | | 750,000 | | 744,226 | |
May Dept Stores Co. | | BBB | | 4.80 | | 07/15/09 | | 500,000 | | 493,027 | |
Newell Rubbermaid | | BBB+ | | 4.63 | | 12/15/09 | | 500,000 | | 488,922 | |
Pulte Homes, Inc. | | BBB- | | 4.88 | | 07/15/09 | | 250,000 | | 244,897 | |
Quebecor World, Inc. | | BB | | 4.88 | | 11/15/08 | | 500,000 | | 474,977 | |
Scholastic Corp. | | BBB- | | 5.00 | | 04/15/13 | | 500,000 | | 460,037 | |
Stanley Works | | A | | 3.50 | | 11/01/07 | | 250,000 | | 244,043 | |
Target Corp. | | A+ | | 5.38 | | 06/15/09 | | 1,000,000 | | 1,014,726 | |
| | | | | | | | | | 6,245,332 | |
MUTUAL OF AMERICA INVESTMENT CORPORATION (COMPOSITE FUND)
PORTFOLIO OF INVESTMENTS IN SECURITIES
DECEMBER 31, 2005
| | | | | | | | Face | | | |
| | Rating* | | Rate(%) | | Maturity | | Amount($) | | Value($) | |
LONG-TERM DEBT SECURITIES: | | | | | | | | | | | |
CONSUMER, NON-CYCLICAL (1.1%) | | | | | | | | | | | |
Coca-Cola Enterprises | | A | | 2.50 | | 09/15/06 | | 500,000 | | 491,353 | |
General Mills, Inc. | | BBB+ | | 2.63 | | 10/24/06 | | 500,000 | | 489,618 | |
Kellogg Co. | | BBB+ | | 2.88 | | 06/01/08 | | 500,000 | | 476,383 | |
Wal-Mart Stores, Inc. | | AA | | 6.88 | | 08/10/09 | | 1,000,000 | | 1,064,277 | |
| | | | | | | | | | 2,521,631 | |
ENERGY (0.5%) | | | | | | | | | | | |
Anadarko Petroleum | | BBB+ | | 3.25 | | 05/01/08 | | 500,000 | | 481,511 | |
Cooper Cameron Corp. | | BBB+ | | 2.65 | | 04/15/07 | | 250,000 | | 241,716 | |
Ocean Energy, Inc. | | BBB | | 4.38 | | 10/01/07 | | 500,000 | | 494,332 | |
| | | | | | | | | | 1,217,559 | |
FINANCIAL (8.8%) | | | | | | | | | | | |
American Express Credit Corp. | | A+ | | 3.00 | | 05/16/08 | | 250,000 | | 239,590 | |
American Honda Finance | | A+ | | 3.85 | | 11/06/08 | | 500,000 | | 486,472 | |
Bank of America Corp. | | AA- | | 4.75 | | 10/15/06 | | 500,000 | | 499,834 | |
Bear Stearns Cos., Inc. | | A | | 3.00 | | 03/30/06 | | 500,000 | | 498,056 | |
Berkley (WR) Corp. | | BBB+ | | 8.70 | | 01/01/22 | | 1,500,000 | | 1,836,984 | |
Berkshire Hathaway Financial | | AAA | | 4.20 | | 12/15/10 | | 500,000 | | 484,064 | |
Brandywine Realty Trust | | BBB- | | 4.50 | | 11/01/09 | | 500,000 | | 481,670 | |
CIT Group, Inc. | | A | | 2.88 | | 09/29/06 | | 500,000 | | 493,056 | |
Capital One Bank | | BBB | | 5.75 | | 09/15/10 | | 250,000 | | 255,962 | |
CenterPoint PPTS | | BBB | | 5.25 | | 07/15/11 | | 500,000 | | 494,335 | |
Colonial Realty LP | | BBB- | | 4.80 | | 04/01/11 | | 250,000 | | 241,307 | |
Deere Capital Corp. | | A- | | 3.90 | | 01/15/08 | | 500,000 | | 490,209 | |
Developers Divers Rlty | | BBB | | 5.00 | | 05/03/10 | | 250,000 | | 246,318 | |
First Horizon Mortgage Trust | | AAA | | 5.00 | | 06/25/33 | | 1,200,785 | | 1,192,240 | |
Fairfax Financial Holdings | | BB | | 8.25 | | 10/01/15 | | 500,000 | | 459,373 | |
First Tennessee National Bank | | BBB+ | | 4.50 | | 05/15/13 | | 1,500,000 | | 1,431,175 | |
FleetBoston Financial Group | | AA- | | 3.85 | | 02/15/08 | | 250,000 | | 245,063 | |
Ford Motor Credit Co. | | BB+ | | 7.38 | | 10/28/09 | | 1,000,000 | | 886,886 | |
GE Capital Corp. | | AAA | | 5.45 | | 01/15/13 | | 2,000,000 | | 2,048,676 | |
General Motor Acceptance Corp. | | BB | | 0.00 | | 12/01/12 | | 2,500,000 | | 1,422,360 | |
Goldman Sachs Group, Inc. | | A+ | | 3.88 | | 01/15/09 | | 500,000 | | 485,378 | |
JP Morgan Chase Bank | | A+ | | 5.63 | | 08/15/06 | | 500,000 | | 502,143 | |
Lehman Brothers Holdings | | A+ | | 4.00 | | 01/22/08 | | 500,000 | | 491,719 | |
Markel Corp. | | BBB- | | 6.80 | | 02/15/13 | | 250,000 | | 262,953 | |
Markel Corp. | | BBB- | | 7.00 | | 05/15/08 | | 250,000 | | 259,199 | |
National City Bank | | A+ | | 3.38 | | 10/15/07 | | 500,000 | | 486,912 | |
National Rural Utilities Coop. Finance Corp. | | A+ | | 3.88 | | 02/15/08 | | 250,000 | | 244,616 | |
MUTUAL OF AMERICA INVESTMENT CORPORATION (COMPOSITE FUND)
PORTFOLIO OF INVESTMENTS IN SECURITIES
DECEMBER 31, 2005
| | | | | | | | Face | | | |
| | Rating* | | Rate(%) | | Maturity | | Amount($) | | Value($) | |
LONG-TERM DEBT SECURITIES: | | | | | | | | | | | |
FINANCIAL (Cont’d.) | | | | | | | | | | | |
Northern Trust Co. | | AA- | | 2.88 | | 12/15/06 | | 1,000,000 | | 980,795 | |
Roslyn Bancorp, Inc. | | BBB- | | 7.50 | | 12/01/08 | | 250,000 | | 265,060 | |
SLM Corp. | | A | | 4.00 | | 01/15/09 | | 500,000 | | 486,567 | |
Shurgard Storage Centers, Inc. | | BBB- | | 7.75 | | 02/22/11 | | 250,000 | | 273,802 | |
Textron Finance Corp. | | A- | | 2.69 | | 10/03/06 | | 500,000 | | 492,454 | |
Union Planters Bank | | A+ | | 5.13 | | 06/15/07 | | 500,000 | | 501,320 | |
Wells Fargo & Company | | AA- | | 3.50 | | 04/04/08 | | 250,000 | | 242,920 | |
| | | | | | | | | | 20,409,468 | |
HEALTHCARE (0.4%) | | | | | | | | | | | |
UnitedHealth Group | | A | | 3.38 | | 08/15/07 | | 500,000 | | 488,665 | |
Wyeth | | A | | 5.50 | | 03/15/13 | | 500,000 | | 506,884 | |
| | | | | | | | | | 995,549 | |
INDUSTRIAL (1.9%) | | | | | | | | | | | |
Bunge, Ltd. | | BBB | | 5.35 | | 04/15/14 | | 500,000 | | 494,547 | |
Comcast Cable Communications | | BBB+ | | 6.20 | | 11/15/08 | | 500,000 | | 513,268 | |
Deluxe Corp. | | BBB+ | | 3.50 | | 10/01/07 | | 500,000 | | 476,970 | |
Donnelley R.R. & Sons | | A- | | 4.95 | | 04/01/14 | | 500,000 | | 466,833 | |
Lafarge Corp. | | BBB | | 6.50 | | 07/15/08 | | 250,000 | | 257,476 | |
Seariver Maritime | | AAA | | 0.00 | | 09/01/12 | | 3,000,000 | | 2,174,244 | |
| | | | | | | | | | 4,383,338 | |
TECHNOLOGY (0.7%) | | | | | | | | | | | |
Arrow Electronics | | BBB- | | 6.88 | | 06/01/18 | | 500,000 | | 531,101 | |
Hewlett-Packard Co. | | A- | | 5.75 | | 12/15/06 | | 500,000 | | 504,180 | |
IBM Corp. | | A+ | | 4.88 | | 10/01/06 | | 500,000 | | 500,411 | |
| | | | | | | | | | 1,535,692 | |
TELECOMMUNICATIONS (0.4%) | | | | | | | | | | | |
Nextel Communications, Inc. | | A- | | 5.25 | | 01/15/10 | | 500,000 | | 499,376 | |
Verizon Global | | A+ | | 4.00 | | 01/15/08 | | 500,000 | | 490,371 | |
| | | | | | | | | | 989,747 | |
UTILITIES (0.8%) | | | | | | | | | | | |
Kinder Morgan | | BBB | | 5.15 | | 03/01/15 | | 500,000 | | 485,756 | |
Pepco Holdings, Inc. | | BBB | | 4.00 | | 05/15/10 | | 500,000 | | 474,827 | |
Telecom de Puerto Rico | | BBB+ | | 6.80 | | 05/15/09 | | 500,000 | | 519,546 | |
Virginia Electric & Power Co. | | BBB | | 4.50 | | 12/15/10 | | 500,000 | | 487,510 | |
| | | | | | | | | | 1,967,639 | |
TOTAL LONG-TERM DEBT SECURITIES (Cost: $91,479,984) 38.3% | | | | | | 89,107,859 | |
* Ratings as per Standard & Poor’s Corporation.
MUTUAL OF AMERICA INVESTMENT CORPORATION (COMPOSITE FUND)
PORTFOLIO OF INVESTMENTS IN SECURITIES
DECEMBER 31, 2005
| | | | | | Face | | | |
| | Rate(%) | | Maturity | | Amount($) | | Value($) | |
SHORT-TERM DEBT SECURITIES: | | | | | | | | | |
U.S. GOVERNMENT AGENCIES (3.2%) | | | | | | | | | |
Federal Home Loan Bank | | 3.35 | | 01/03/06 | | 7,300,000 | | 7,298,641 | |
| | | | | | | | | |
TOTAL SHORT-TERM DEBT SECURITIES
(Cost: $7,298,641) 3.2% | | | | | | | | 7,298,641 | |
| | | | | | | | | |
TEMPORARY CASH INVESTMENTS**
(Cost: $12,100) 0.0% (3) | | | | | | | | 12,100 | |
| | | | | | | | | |
TOTAL INVESTMENTS (Cost: $225,556,174) 99.6% | | | | | | | | 231,445,059 | |
| | | | | | | | | |
OTHER NET ASSETS0.4% | | | | | | | | 920,324 | |
| | | | | | | | | |
NET ASSETS 100.0% | | | | | | | | $ | 232,365,383 | |
| | | | | | | | | | |
Abbreviations: | FHLMC = Federal Home Loan Mortgage Corporation |
| FNMA = Federal National Mortgage Association |
| GNMA = Government National Mortgage Association |
| NR = Issue not rated by S&P/Moody’s |
(1) U.S. Government guaranteed security.
(2) Issuer has filed for Chapter XI bankruptcy law (or equivalent) protection; issue is non-income producing and carried at fair value.
(3) Less than 0.05%.
**The fund has an arrangement with its custodian bank, JPMorgan Chase Bank, whereby uninvested cash, subject to parameters set by the fund, is automatically invested in the fund’s name by the bank in overnight commercial paper issued by J.P. Morgan Chase & Co. On the next business day, these funds (and earned interest) are automatically returned to the fund. The annual rate of interest earned on this temporary cash investment at December 31, 2005 was 3.79 %.
The total value of investments not rated or below-investment grade as a percentage of the Fund’s total investments as
December 30, 2005 is 2.4 %.
MUTUAL OF AMERICA INVESTMENT CORPORATION (CONSERVATIVE ALLOCATION FUND)
PORTFOLIO OF INVESTMENTS IN SECURITIES
DECEMBER 31, 2005
| | Shares | | Value($) | |
COMMON STOCKS: | | | | | |
DIVERSIFIED MUTUAL FUNDS (100.0%) | | | | | |
Mutual of America Investment Corporation | | | | | |
Bond Fund (30.1%) | | 2,678,058 | | 3,364,217 | |
Mid-Term Bond Fund (30.1%) | | 3,651,775 | | 3,363,792 | |
Equity Index Fund (24.7%) | | 1,290,064 | | 2,759,932 | |
Short Term Bond Fund (15.1%) | | 1,657,930 | | 1,682,805 | |
| | | | | |
TOTAL INVESTMENTS (Cost: $11,348,079) 100.0% | | | | 11,170,746 | |
| | | | | |
OTHER NET ASSETS0.0% | | | | — | |
| | | | | |
NET ASSETS 100.0% | | | | $ | 11,170,746 | |
| | | | | | |
MUTUAL OF AMERICA INVESTMENT CORPORATION (MODERATE ALLOCATION FUND)
PORTFOLIO OF INVESTMENTS IN SECURITIES
DECEMBER 31, 2005
| | Shares | | Value($) | |
COMMON STOCKS: | | | | | |
DIVERSIFIED MUTUAL FUNDS (100.0%) | | | | | |
Mutual of America Investment Corporation | | | | | |
Equity Index Fund (34.7%) | | 9,127,120 | | 19,526,342 | |
Bond Fund (30.2%) | | 13,532,946 | | 17,000,290 | |
Mid-Term Bond Fund (20.2%) | | 12,302,183 | | 11,332,021 | |
Mid-Cap Equity Index Fund (14.9%) | | 5,471,830 | | 8,385,273 | |
| | | | | |
TOTAL INVESTMENTS (Cost: $56,074,048) 100.0% | | | | $ | 56,243,926 | |
| | | | | |
OTHER NET ASSETS0.0% | | | | — | |
| | | | | |
NET ASSETS 100.0% | | | | $ | 56,243,926 | |
MUTUAL OF AMERICA INVESTMENT CORPORATION (AGGRESSIVE ALLOCATION FUND)
PORTFOLIO OF INVESTMENTS IN SECURITIES
DECEMBER 31, 2005
| | Shares | | Value($) | |
COMMON STOCKS: | | | | | |
DIVERSIFIED MUTUAL FUNDS (100.0%) | | | | | |
Mutual of America Investment Corporation | | | | | |
Equity Index Fund (44.8%) | | 9,952,466 | | 21,292,066 | |
Bond Fund (25.3%) | | 9,563,026 | | 12,013,217 | |
Mid-Cap Equity Index Fund (19.9%) | | 6,187,839 | | 9,482,517 | |
Aggressive Equity Fund (10.0%) | | 2,585,976 | | 4,751,458 | |
| | | | | |
TOTAL INVESTMENTS (Cost: $46,283,410) 100.0% | | | | $ | 47,539,258 | |
| | | | | |
OTHER NET ASSETS0.0% | | | | — | |
| | | | | |
NET ASSETS 100.0% | �� | | | $ | 47,539,258 | |
MUTUAL OF AMERICA INVESTMENT CORPORATION (MONEY MARKET FUND)
PORTFOLIO OF INVESTMENTS IN SECURITIES
DECEMBER 31, 2005
| | Rating* | | Rate(%) | | Maturity | | Face
Amount($) | | Value($) | |
SHORT-TERM DEBT SECURITIES: | | | | | | | | | | | |
U.S. GOVERNMENT AGENCIES | | | | | | | | | | | |
DISCOUNT NOTES (38.0%) | | | | | | | | | | | |
FHLMC | | AAA | | 4.03 | | 01/03/06 | | 4,215,000 | | 4,213,577 | |
FHLMC | | AAA | | 4.05 | | 01/03/06 | | 3,655,000 | | 3,653,761 | |
FHLMC | | AAA | | 4.02 | | 01/03/06 | | 806,000 | | 805,728 | |
FHLMC | | AAA | | 4.13 | | 01/03/06 | | 667,000 | | 666,770 | |
FHLMC | | AAA | | 4.09 | | 01/09/06 | | 161,000 | | 160,835 | |
FHLMC | | AAA | | 4.11 | | 01/10/06 | | 3,320,000 | | 3,316,218 | |
FHLMC | | AAA | | 4.18 | | 01/24/06 | | 265,000 | | 264,259 | |
FHLMC | | AAA | | 4.20 | | 02/01/06 | | 2,772,000 | | 2,761,616 | |
FHLMC | | AAA | | 4.20 | | 02/01/06 | | 1,826,000 | | 1,819,164 | |
FHLMC | | AAA | | 4.25 | | 02/06/06 | | 806,000 | | 802,471 | |
FHLMC | | AAA | | 4.25 | | 02/07/06 | | 2,600,000 | | 2,588,313 | |
FNMA | | AAA | | 4.03 | | 01/04/06 | | 10,705,000 | | 10,700,180 | |
FNMA | | AAA | | 4.04 | | 01/04/06 | | 1,415,000 | | 1,414,361 | |
FNMA | | AAA | | 4.09 | | 01/11/06 | | 1,450,000 | | 1,448,181 | |
FNMA | | AAA | | 4.20 | | 01/25/06 | | 1,000,000 | | 997,075 | |
FNMA | | AAA | | 4.22 | | 01/26/06 | | 250,000 | | 249,236 | |
FNMA | | AAA | | 4.25 | | 02/01/06 | | 305,000 | | 303,845 | |
FNMA | | AAA | | 4.23 | | 02/02/06 | | 2,682,000 | | 2,671,572 | |
FNMA | | AAA | | 4.20 | | 02/02/06 | | 1,496,000 | | 1,490,223 | |
FNMA | | AAA | | 4.23 | | 02/24/06 | | 2,300,000 | | 2,285,135 | |
FNMA | | AAA | | 4.23 | | 03/01/06 | | 3,357,000 | | 3,332,939 | |
FNMA | | AAA | | 4.27 | | 03/08/06 | | 3,375,000 | | 3,347,753 | |
| | | | | | | | | | 49,293,212 | |
| | | | | | | | | | | |
COMMERCIAL PAPER (62.0%) | | | | | | | | | | | |
7-Eleven, Inc. | | A1+/P1 | | 4.25 | | 01/03/06 | | 2,000,000 | | 1,999,290 | |
7-Eleven, Inc. | | A1+/P1 | | 4.25 | | 01/19/06 | | 1,600,000 | | 1,596,406 | |
Alabama Power Company | | A1/P1 | | 4.25 | | 01/18/06 | | 2,400,000 | | 2,394,898 | |
Alabama Power Company | | A1/P1 | | 4.26 | | 01/18/06 | | 850,000 | | 848,188 | |
Alabama Power Company | | A1/P1 | | 4.21 | | 01/10/06 | | 377,000 | | 376,558 | |
American Express Credit Corp. | | A1/P1 | | 4.13 | | 01/06/06 | | 1,421,000 | | 1,420,016 | |
American Express Credit Corp. | | A1/P1 | | 4.14 | | 01/13/06 | | 1,480,000 | | 1,477,775 | |
American Express Credit Corp. | | A1/P1 | | 4.13 | | 01/03/06 | | 700,000 | | 699,757 | |
American Express Credit Corp. | | A1/P1 | | 4.26 | | 01/31/06 | | 124,000 | | 123,545 | |
Anheuser-Busch Co. | | A1/P1 | | 4.00 | | 01/03/06 | | 2,741,000 | | 2,740,086 | |
Becton Dickinson & Co. | | A1/P1 | | 4.24 | | 01/05/06 | | 1,650,000 | | 1,649,027 | |
Becton Dickinson & Co. | | A1/P1 | | 4.25 | | 01/27/06 | | 1,350,000 | | 1,345,688 | |
MUTUAL OF AMERICA INVESTMENT CORPORATION (MONEY MARKET FUND)
PORTFOLIO OF INVESTMENTS IN SECURITIES
DECEMBER 31, 2005
| | Rating* | | Rate(%) | | Maturity | | Face
Amount($) | | Value($) | |
SHORT-TERM DEBT SECURITIES: | | | | | | | | | | | |
COMMERCIAL PAPER (Cont’d.) | | | | | | | | | | | |
Caterpillar, Inc. | | A1/P1 | | 4.25 | | 01/09/06 | | 3,600,000 | | 3,596,174 | |
Colgate-Palmolive Corp | | A1+/P1 | | 4.18 | | 01/26/06 | | 3,000,000 | | 2,990,942 | |
Executive Jets Inc. | | A1+/P1 | | 4.20 | | 01/17/06 | | 3,600,000 | | 3,592,838 | |
Gannett Co., Inc. | | A1/P1 | | 4.25 | | 01/27/06 | | 3,600,000 | | 3,588,501 | |
General Electric Capital Corp. | | A1+/P1 | | 4.18 | | 01/17/06 | | 1,000,000 | | 998,016 | |
General Electric Capital Corp. | | A1+/P1 | | 4.28 | | 02/03/06 | | 1,000,000 | | 995,945 | |
General Electric Capital Corp. | | A1+/P1 | | 4.32 | | 02/10/06 | | 1,000,000 | | 995,069 | |
General Electric Capital Corp. | | A1+/P1 | | 4.14 | | 01/06/06 | | 600,000 | | 599,583 | |
Hershey Foods | | A1/P1 | | 4.24 | | 02/13/06 | | 2,300,000 | | 2,288,079 | |
Hershey Foods | | A1/P1 | | 4.00 | | 01/03/06 | | 1,000,000 | | 999,667 | |
IBM Capital, Inc. | | A1/P1 | | 4.25 | | 01/25/06 | | 3,600,000 | | 3,589,363 | |
Kimberly Clark Worldwide | | A1+/P1 | | 4.12 | | 01/03/06 | | 3,600,000 | | 3,598,763 | |
Medtronic, Inc. | | A1+/P1 | | 4.25 | | 01/18/06 | | 3,300,000 | | 3,292,976 | |
Medtronic, Inc. | | A1+/P1 | | 4.25 | | 01/17/06 | | 300,000 | | 299,397 | |
National Rural Utilities | | A1/P1 | | 4.26 | | 01/19/06 | | 2,800,000 | | 2,793,693 | |
National Rural Utilities | | A1/P1 | | 4.23 | | 01/06/06 | | 800,000 | | 799,434 | |
National Rural Utilities | | A1/P1 | | 4.30 | | 01/24/06 | | 100,000 | | 99,713 | |
Nestle Capital Corp. | | A1+/P1 | | 4.28 | | 02/10/06 | | 1,700,000 | | 1,691,696 | |
Nestle Capital Corp. | | A1+/P1 | | 4.12 | | 01/13/06 | | 1,000,000 | | 998,504 | |
Nestle Capital Corp. | | A1+/P1 | | 4.18 | | 01/27/06 | | 900,000 | | 897,171 | |
New Jersey Natural Gas Co. | | A1/P1 | | 4.25 | | 01/04/06 | | 2,046,000 | | 2,045,033 | |
New Jersey Natural Gas Co. | | A1/P1 | | 4.19 | | 01/03/06 | | 600,000 | | 599,790 | |
New Jersey Natural Gas Co. | | A1/P1 | | 4.25 | | 01/03/06 | | 450,000 | | 449,840 | |
New Jersey Natural Gas Co. | | A1/P1 | | 4.24 | | 01/10/06 | | 395,000 | | 394,534 | |
New Jersey Natural Gas Co. | | A1/P1 | | 4.40 | | 01/04/06 | | 250,000 | | 249,878 | |
New York Times Co. | | A1/P1 | | 4.36 | | 02/28/06 | | 3,600,000 | | 3,574,245 | |
Novartis Finance Co. | | A1+/P1 | | 4.15 | | 01/05/06 | | 3,600,000 | | 3,597,925 | |
Procter & Gamble Co. | | A1+/P1 | | 4.20 | | 01/04/06 | | 3,100,000 | | 3,098,548 | |
Procter & Gamble Co. | | A1+/P1 | | 4.15 | | 01/17/06 | | 500,000 | | 499,016 | |
Sherwin Williams | | A1/P1 | | 4.26 | | 01/03/06 | | 1,300,000 | | 1,299,538 | |
Sherwin Williams | | A1/P1 | | 4.30 | | 01/03/06 | | 250,000 | | 249,910 | |
Siemens Capital Corp. | | A1+/P1 | | 4.11 | | 01/04/06 | | 1,275,000 | | 1,274,414 | |
Siemens Capital Corp. | | A1+/P1 | | 4.15 | | 01/12/06 | | 400,000 | | 399,444 | |
Washington Gas Light Co. | | A1/P1 | | 4.30 | | 02/10/06 | | 2,600,000 | | 2,587,241 | |
Washington Gas Light Co. | | A1/P1 | | 4.18 | | 01/10/06 | | 1,000,000 | | 998,835 | |
XTRA, Inc. | | A1+/P1 | | 4.28 | | 01/18/06 | | 1,700,000 | | 1,696,357 | |
XTRA, Inc. | | A1+/P1 | | 4.32 | | 01/20/06 | | 900,000 | | 897,837 | |
MUTUAL OF AMERICA INVESTMENT CORPORATION (MONEY MARKET FUND)
PORTFOLIO OF INVESTMENTS IN SECURITIES
DECEMBER 31, 2005
| | Rating* | | Rate(%) | | Maturity | | Face
Amount($) | | Value($) | |
SHORT-TERM DEBT SECURITIES: | | | | | | | | | | | |
COMMERCIAL PAPER (Cont’d.) | | | | | | | | | | | |
XTRA, Inc. | | A1+/P1 | | 4.27 | | 01/10/06 | | 619,000 | | 618,264 | |
XTRA, Inc. | | A1+/P1 | | 4.22 | | 01/04/06 | | 500,000 | | 499,765 | |
| | | | | | | | | | 80,407,172 | |
TOTAL INVESTMENTS (Cost: $129,701,179) 100.0% | | | | | | | | | | 129,700,384 | |
| | | | | | | | | | | |
OTHER NET ASSETS0.0% (1) | | | | | | | | | | 2,371 | |
| | | | | | | | | | | |
NET ASSETS 100.0% | | | | | | | | | | $ | 129,702,755 | |
| | | | | | | | | | | | |
(1) Less than 0.05%.
* The ratings are provided by Standard & Poor’s Corporation/Moody’s Investor Service, Inc.
Abbreviations: FHLMC = Federal Home Loan Mortgage Corporation
FNMA = Federal National Mortgage Association
MUTUAL OF AMERICA INVESTMENT CORPORATION (SHORT TERM BOND FUND)
PORTFOLIO OF INVESTMENTS IN SECURITIES
DECEMBER 31, 2005
| | | | | | | | Face | | | |
| | Rating* | | Rate(%) | | Maturity | | Amount($) | | Value($) | |
LONG-TERM DEBT SECURITIES: | | | | | | | | | | | |
U.S. GOVERNMENT (19.5%) | | | | | | | | | | | |
U.S. Treasury Note | | AAA | | 2.75 | | 07/31/06 | | 2,500,000 | | 2,476,465 | |
U.S. Treasury Note | | AAA | | 3.00 | | 11/15/07 | | 1,500,000 | | 1,462,617 | |
U.S. Treasury Strip | | AAA | | 0.00 | | 11/15/08 | | 4,000,000 | | 3,530,388 | |
| | | | | | | | | | 7,469,470 | |
U.S. GOVERNMENT AGENCIES (53.2%) | | | | | | | | | | | |
MORTGAGE-BACKED OBLIGATIONS (11.4%) | | | | | | | | | | | |
FHLMC | | AAA | | 8.50 | | 06/01/06 | | 12,494 | | 12,644 | |
FHLMC | | AAA | | 7.50 | | 02/15/07 | | 8,275 | | 8,262 | |
FHLMC | | AAA | | 7.00 | | 03/15/07 | | 8,167 | | 8,154 | |
FHLMC | | AAA | | 7.75 | | 05/01/08 | | 59,615 | | 61,197 | |
FHLMC | | AAA | | 6.00 | | 10/01/08 | | 84,646 | | 86,029 | |
FHLMC | | AAA | | 5.50 | | 04/01/09 | | 62,356 | | 62,774 | |
FHLMC | | AAA | | 5.50 | | 06/01/09 | | 67,172 | | 67,735 | |
FHLMC | | AAA | | 8.25 | | 10/01/09 | | 10,852 | | 10,845 | |
FHLMC | | AAA | | 6.50 | | 11/01/09 | | 18,619 | | 19,122 | |
FHLMC | | AAA | | 7.50 | | 07/01/10 | | 3,908 | | 4,006 | |
FHLMC | | AAA | | 6.00 | | 11/01/10 | | 47,863 | | 48,824 | |
FHLMC | | AAA | | 7.00 | | 02/01/14 | | 49,786 | | 52,142 | |
FHLMC | | AAA | | 6.50 | | 04/01/14 | | 216,322 | | 224,059 | |
FHLMC | | AAA | | 8.00 | | 05/01/14 | | 8,834 | | 9,013 | |
FHLMC | | AAA | | 6.00 | | 07/01/16 | | 17,366 | | 17,831 | |
FHLMC | | AAA | | 8.50 | | 09/01/17 | | 9,838 | | 10,076 | |
FHLMC | | AAA | | 8.00 | | 09/01/18 | | 39,700 | | 40,860 | |
FHLMC | | AAA | | 6.00 | | 02/01/19 | | 53,876 | | 54,924 | |
FHLMC | | AAA | | 7.50 | | 03/15/21 | | 37,099 | | 37,035 | |
FHLMC | | AAA | | 4.50 | | 03/15/22 | | 1,100,494 | | 1,096,338 | |
FHLMC | | AAA | | 4.00 | | 11/15/26 | | 475,050 | | 467,789 | |
FNMA | | AAA | | 7.50 | | 07/01/06 | | 777 | | 780 | |
FNMA | | AAA | | 7.75 | | 03/01/08 | | 12,369 | | 12,507 | |
FNMA | | AAA | | 8.00 | | 04/01/08 | | 13,105 | | 13,539 | |
FNMA | | AAA | | 6.00 | | 09/01/08 | | 37,210 | | 37,779 | |
FNMA | | AAA | | 7.50 | | 09/01/08 | | 16,324 | | 16,630 | |
FNMA | | AAA | | 5.50 | | 11/01/08 | | 43,652 | | 44,021 | |
FNMA | | AAA | | 5.50 | | 12/01/08 | | 10,395 | | 10,483 | |
FNMA | | AAA | | 7.50 | | 01/01/09 | | 4,308 | | 4,308 | |
FNMA | | AAA | | 5.50 | | 02/01/09 | | 27,832 | | 28,067 | |
FNMA | | AAA | | 6.00 | | 07/01/09 | | 44,619 | | 45,301 | |
FNMA | | AAA | | 8.50 | | 12/01/09 | | 20,232 | | 21,145 | |
MUTUAL OF AMERICA INVESTMENT CORPORATION (SHORT TERM BOND FUND)
PORTFOLIO OF INVESTMENTS IN SECURITIES
DECEMBER 31, 2005
| | | | | | | | Face | | | |
| | Rating* | | Rate(%) | | Maturity | | Amount($) | | Value($) | |
LONG-TERM DEBT SECURITIES: | | | | | | | | | | | |
U.S. GOVERNMENT AGENCIES (Cont’d.) | | | | | | | | | | | |
MORTGAGE-BACKED OBLIGATIONS (Cont’d.) | | | | | | | | | | | |
FNMA | | AAA | | 8.25 | | 01/01/10 | | 20,150 | | 20,344 | |
FNMA | | AAA | | 6.00 | | 01/01/11 | | 24,280 | | 24,651 | |
FNMA | | AAA | | 6.00 | | 09/01/12 | | 78,090 | | 79,774 | |
FNMA | | AAA | | 6.50 | | 08/01/13 | | 47,627 | | 48,863 | |
FNMA | | AAA | | 8.75 | | 09/01/16 | | 26,314 | | 26,609 | |
FNMA | | AAA | | 8.00 | | 06/01/17 | | 4,768 | | 4,807 | |
FNMA | | AAA | | 4.50 | | 10/25/17 | | 1,000,000 | | 993,078 | |
FNMA | | AAA | | 6.50 | | 01/25/23 | | 48,787 | | 49,045 | |
FNMA | | AAA | | 6.50 | | 12/25/23 | | 156,307 | | 157,573 | |
FNMA | | AAA | | 4.00 | | 11/25/26 | | 100,000 | | 98,383 | |
GNMA (1) | | AAA | | 7.50 | | 07/15/07 | | 16,402 | | 16,702 | |
GNMA (1) | | AAA | | 7.00 | | 08/15/07 | | 39,637 | | 40,190 | |
GNMA (1) | | AAA | | 7.50 | | 05/20/08 | | 20,440 | | 20,953 | |
GNMA (1) | | AAA | | 6.00 | | 11/15/08 | | 45,622 | | 46,376 | |
GNMA (1) | | AAA | | 6.00 | | 06/15/09 | | 23,816 | | 24,341 | |
GNMA (1) | | AAA | | 9.00 | | 03/15/10 | | 11,309 | | 12,014 | |
Residential Funding Mtge. Sec. | | AAA | | 5.00 | | 02/25/33 | | 73,367 | | 73,156 | |
| | | | | | | | | | 4,371,078 | |
NON-MORTGAGE-BACKED OBLIGATION (41.8%) | | | | | | | | | | | |
FFCB | | AAA | | 2.88 | | 06/29/06 | | 1,000,000 | | 991,724 | |
FHLB | | AAA | | 2.50 | | 03/15/06 | | 500,000 | | 497,885 | |
FHLB | | AAA | | 2.88 | | 09/15/06 | | 2,800,000 | | 2,765,568 | |
FHLMC | | AAA | | 2.75 | | 08/15/06 | | 1,000,000 | | 988,583 | |
FHLMC | | AAA | | 2.38 | | 02/15/07 | | 2,000,000 | | 1,948,354 | |
FHLMC | | AAA | | 3.88 | | 06/15/08 | | 3,750,000 | | 3,675,720 | |
FHLMC | | AAA | | 3.63 | | 09/15/08 | | 1,500,000 | | 1,458,467 | |
FNMA | | AAA | | 2.25 | | 05/15/06 | | 2,000,000 | | 1,982,952 | |
FNMA | | AAA | | 2.63 | | 11/15/06 | | 1,000,000 | | 982,255 | |
FNMA | | AAA | | 2.38 | | 02/15/07 | | 750,000 | | 730,475 | |
| | | | | | | | | | 16,021,983 | |
BASIC MATERIALS (1.5%) | | | | | | | | | | | |
International Paper Co. | | BBB | | 3.80 | | 04/01/08 | | 200,000 | | 193,875 | |
Lubrizol Corp. | | BBB- | | 5.88 | | 12/01/08 | | 200,000 | | 203,510 | |
Monsanto Co. | | A- | | 4.00 | | 05/15/08 | | 100,000 | | 97,854 | |
Praxair, Inc. | | A- | | 2.75 | | 06/15/08 | | 100,000 | | 95,159 | |
| | | | | | | | | | 590,398 | |
MUTUAL OF AMERICA INVESTMENT CORPORATION (SHORT TERM BOND FUND)
PORTFOLIO OF INVESTMENTS IN SECURITIES
DECEMBER 31, 2005
| | | | | | | | Face | | | |
| | Rating* | | Rate(%) | | Maturity | | Amount($) | | Value($) | |
LONG-TERM DEBT SECURITIES: | | | | | | | | | | | |
CONSUMER, CYCLICAL (2.2%) | | | | | | | | | | | |
Belo Corporation | | BBB | | 8.00 | | 11/01/08 | | 150,000 | | 159,344 | |
Caterpillar Fin. Svc. | | A | | 2.63 | | 01/30/07 | | 250,000 | | 244,245 | |
Daimlerchrysler | | BBB | | 4.05 | | 06/04/08 | | 150,000 | | 146,024 | |
Dow Jones & Co. | | A- | | 3.88 | | 02/15/08 | | 150,000 | | 147,041 | |
May Dept Stores Co. | | BBB | | 3.95 | | 07/15/07 | | 140,000 | | 137,665 | |
| | | | | | | | | | 834,319 | |
CONSUMER, NON-CYCLICAL (1.9%) | | | | | | | | | | | |
CVS Corp. | | A- | | 5.63 | | 03/15/06 | | 150,000 | | 150,174 | |
Coca-Cola Enterprises | | A | | 2.50 | | 09/15/06 | | 100,000 | | 98,271 | |
General Mills, Inc. | | BBB+ | | 3.88 | | 11/30/07 | | 200,000 | | 196,081 | |
General Mills, Inc. | | BBB+ | | 2.63 | | 10/24/06 | | 100,000 | | 97,924 | |
Kellogg Co. | | BBB+ | | 2.88 | | 06/01/08 | | 200,000 | | 190,554 | |
| | | | | | | | | | 733,004 | |
ENERGY (2.3%) | | | | | | | | | | | |
Cooper Cameron Corp. | | BBB+ | | 2.65 | | 04/15/07 | | 200,000 | | 193,373 | |
Devon Energy | | BBB | | 2.75 | | 08/01/06 | | 100,000 | | 98,644 | |
Dominion Resources | | BBB | | 4.13 | | 02/15/08 | | 200,000 | | 196,291 | |
Marathon Oil Corp. | | BBB+ | | 5.38 | | 06/01/07 | | 200,000 | | 201,066 | |
Ocean Energy, Inc. | | BBB | | 4.38 | | 10/01/07 | | 200,000 | | 197,733 | |
| | | | | | | | | | 887,107 | |
FINANCIAL (10.9%) | | | | | | | | | | | |
American Express Co. | | A+ | | 5.50 | | 09/12/06 | | 200,000 | | 200,943 | |
American Honda Fin | | A+ | | 3.85 | | 11/06/08 | | 200,000 | | 194,589 | |
Bank of America Corp. | | AA- | | 4.75 | | 10/15/06 | | 100,000 | | 99,967 | |
Bank of New York, Inc. | | A+ | | 3.90 | | 09/01/07 | | 200,000 | | 196,970 | |
Bank of Oklahoma | | BBB+ | | 7.13 | | 08/15/07 | | 250,000 | | 258,705 | |
Bear Stearns Cos., Inc. | | A | | 3.00 | | 03/30/06 | | 100,000 | | 99,611 | |
CIT Group, Inc. | | A | | 2.88 | | 09/29/06 | | 100,000 | | 98,611 | |
Capital One Bank | | BBB | | 4.88 | | 05/15/08 | | 200,000 | | 199,186 | |
Deere Capital Corp. | | A- | | 3.90 | | 01/15/08 | | 200,000 | | 196,083 | |
Fifth Third Bank | | AA- | | 3.38 | | 08/15/08 | | 200,000 | | 192,732 | |
First Tennessee Bank | | A- | | 5.75 | | 12/01/08 | | 200,000 | | 204,207 | |
GE Capital Corp. | | AAA | | 2.75 | | 09/25/06 | | 250,000 | | 246,455 | |
Huntington National Bank | | A- | | 3.13 | | 05/15/08 | | 200,000 | | 192,124 | |
IBM Corp. | | A+ | | 3.80 | | 02/01/08 | | 100,000 | | 97,940 | |
JP Morgan Chase Bank | | A+ | | 5.63 | | 08/15/06 | | 100,000 | | 100,429 | |
Lehman Brothers Holdings | | A+ | | 3.50 | | 08/07/08 | | 200,000 | | 193,030 | |
Merrill Lynch | | A+ | | 3.13 | | 07/15/08 | | 200,000 | | 191,604 | |
MUTUAL OF AMERICA INVESTMENT CORPORATION (SHORT TERM BOND FUND)
PORTFOLIO OF INVESTMENTS IN SECURITIES
DECEMBER 31, 2005
| | | | | | | | Face | | | |
| | Rating* | | Rate(%) | | Maturity | | Amount($) | | Value($) | |
LONG-TERM DEBT SECURITIES: | | | | | | | | | | | |
FINANCIAL (Cont’d.) | | | | | | | | | | | |
National City Bank | | A+ | | 3.38 | | 10/15/07 | | 250,000 | | 243,456 | |
National Rural Utilities Coop. Finance Corp. | | A+ | | 3.00 | | 02/15/06 | | 185,000 | | 184,680 | |
Northern Trust Co. | | AA- | | 2.88 | | 12/15/06 | | 200,000 | | 196,159 | |
Textron Finance Corp. | | A- | | 2.69 | | 10/03/06 | | 100,000 | | 98,491 | |
National Rural Utilities Coop. Finance Corp. | | AA- | | 2.85 | | 11/15/06 | | 150,000 | | 147,525 | |
Vornado Realty Trust | | BBB | | 5.63 | | 06/15/07 | | 145,000 | | 146,014 | |
Wachovia Corp. | | A+ | | 3.50 | | 08/15/08 | | 200,000 | | 193,255 | |
| | | | | | | | | | 4,172,766 | |
HEALTHCARE (0.5%) | | | | | | | | | | | |
UnitedHealth Group | | A | | 3.38 | | 08/15/07 | | 200,000 | | 195,466 | |
| | | | | | | | | | | |
INDUSTRIAL (3.6%) | | | | | | | | | | | |
Bunge, Ltd. | | BBB | | 4.38 | | 12/15/08 | | 200,000 | | 196,549 | |
Comcast Cable Communications | | BBB+ | | 6.20 | | 11/15/08 | | 200,000 | | 205,307 | |
Conoco Funding Co. | | A- | | 5.45 | | 10/15/06 | | 200,000 | | 200,783 | |
Deluxe Corp. | | BBB+ | | 3.50 | | 10/01/07 | | 250,000 | | 238,485 | |
General Dynamics Corp. | | A | | 2.13 | | 05/15/06 | | 100,000 | | 99,110 | |
Lafarge Corp. | | BBB | | 6.50 | | 07/15/08 | | 100,000 | | 102,990 | |
Raytheon Co. | | BBB | | 4.50 | | 11/15/07 | | 200,000 | | 198,277 | |
Union Pacific Corp. | | BBB | | 5.75 | | 10/15/07 | | 120,000 | | 121,657 | |
| | | | | | | | | | 1,363,158 | |
TECHNOLOGY (1.3%) | | | | | | | | | | | |
First Data Corp. | | A+ | | 3.38 | | 08/01/08 | | 100,000 | | 95,632 | |
Hewlett-Packard Co. | | A- | | 5.75 | | 12/15/06 | | 100,000 | | 100,836 | |
IBM Corp. | | A+ | | 4.88 | | 10/01/06 | | 100,000 | | 100,082 | |
Pitney Bowes, Inc. | | A+ | | 5.75 | | 08/15/08 | | 200,000 | | 203,924 | |
| | | | | | | | | | 500,474 | |
UTILITIES (1.5%) | | | | | | | | | | | |
DTE Energy Co. | | BBB- | | 6.45 | | 06/01/06 | | 200,000 | | 201,281 | |
Exelon Corp. | | A- | | 3.50 | | 05/01/08 | | 150,000 | | 145,126 | |
Telecom de Puerto Rico | | BBB+ | | 6.80 | | 05/15/09 | | 200,000 | | 207,819 | |
| | | | | | | | | | 554,226 | |
| | | | | | | | | | | |
TOTAL LONG-TERM DEBT SECURITIES (Cost: $38,200,583) 98.4% | | | | | | 37,693,449 | |
*Ratings as per Standard & Poor’s Corporation.
MUTUAL OF AMERICA INVESTMENT CORPORATION (SHORT TERM BOND FUND)
PORTFOLIO OF INVESTMENTS IN SECURITIES
DECEMBER 31, 2005
| | | | | | Face | | | |
| | Rate(%) | | Maturity | | Amount($) | | Value($) | |
SHORT-TERM DEBT SECURITIES: | | | | | | | | | |
U.S. GOVERNMENT AGENCIES (1.4%) | | | | | | | | | |
Federal National Mortgage Association | | 4.23 | | 02/02/06 | | 302,000 | | 300,825 | |
Federal National Mortgage Association | | 3.25 | | 01/03/06 | | 260,000 | | 259,930 | |
| | | | | | | | 560,755 | |
| | | | | | | | | |
TOTAL SHORT-TERM DEBT SECURITIES (Cost: $560,755) 1.4% | | | | | | | | 560,755 | |
| | | | | | | | | |
TOTAL INVESTMENTS (Cost: $38,761,338) 99.8% | | | | | | | | 38,254,204 | |
| | | | | | | | | |
OTHER NET ASSETS0.2% | | | | | | | | 60,556 | |
| | | | | | | | | |
NET ASSETS 100.0% | | | | | | | | $ | 38,314,760 | |
| | | | | | | | | | |
Abbreviations: | FFCB = Federal Farm Credit Bank |
| FHLB = Federal Home Loan Bank |
| FHLMC = Federal Home Loan Mortgage Corporation |
| FNMA = Federal National Mortgage Association |
| GNMA = Government National Mortgage Association |
(1) U.S. Government guaranteed security.
MUTUAL OF AMERICA INVESTMENT CORPORATION (MID-TERM BOND FUND)
PORTFOLIO OF INVESTMENTS IN SECURITIES
DECEMBER 31, 2005
| | | | | | | | Face | | | |
| | Rating* | | Rate(%) | | Maturity | | Amount($) | | Value($) | |
LONG-TERM DEBT SECURITIES: | | | | | | | | | | | |
U.S. GOVERNMENT (12.3%) | | | | | | | | | | | |
U.S. Treasury Note | | AAA | | 5.00 | | 08/15/11 | | 3,000,000 | | 3,096,444 | |
U.S. Treasury Note | | AAA | | 4.00 | | 11/15/12 | | 2,000,000 | | 1,956,954 | |
U.S. Treasury Strip | | AAA | | 0.00 | | 11/15/12 | | 5,000,000 | | 3,705,385 | |
| | | | | | | | | | 8,758,783 | |
U.S. GOVERNMENT AGENCIES (52.3%) | | | | | | | | | | | |
MORTGAGE-BACKED OBLIGATIONS (4.3%) | | | | | | | | | | | |
FHLMC | | AAA | | 8.00 | | 07/15/06 | | 3,228 | | 3,223 | |
FHLMC | | AAA | | 7.00 | | 02/01/14 | | 49,786 | | 52,142 | |
FHLMC | | AAA | | 5.00 | | 06/15/17 | | 3,000,000 | | 2,990,922 | |
FNMA | | AAA | | 7.00 | | 04/25/07 | | 23,789 | | 23,964 | |
| | | | | | | | | | 3,070,251 | |
NON-MORTGAGE-BACKED OBLIGATION (48.0%) | | | | | | | | | | | |
FHLB | | AAA | | 2.75 | | 03/14/08 | | 4,750,000 | | 4,556,281 | |
FHLB | | AAA | | 5.75 | | 05/15/12 | | 4,500,000 | | 4,738,464 | |
FHLMC | | AAA | | 6.63 | | 09/15/09 | | 5,000,000 | | 5,312,210 | |
FHLMC | | AAA | | 5.63 | | 03/15/11 | | 4,000,000 | | 4,157,756 | |
FNMA | | AAA | | 3.25 | | 01/15/08 | | 5,000,000 | | 4,857,215 | |
FNMA | | AAA | | 3.25 | | 02/15/09 | | 1,500,000 | | 1,436,718 | |
FNMA | | AAA | | 6.63 | | 09/15/09 | | 5,500,000 | | 5,848,376 | |
FNMA | | AAA | | 4.38 | | 09/15/12 | | 3,500,000 | | 3,419,896 | |
| | | | | | | | | | 34,326,916 | |
BASIC MATERIALS (1.7%) | | | | | | | | | | | |
International Paper Co. | | BBB | | 4.25 | | 01/15/09 | | 250,000 | | 242,632 | |
Intl. Flavors & Fragrances | | BBB+ | | 6.45 | | 05/15/06 | | 250,000 | | 251,194 | |
Monsanto Co. | | A- | | 4.00 | | 05/15/08 | | 500,000 | | 489,267 | |
Worthington Industries, Inc. | | BBB | | 6.70 | | 12/01/09 | | 250,000 | | 264,488 | |
| | | | | | | | | | 1,247,581 | |
CONSUMER, CYCLICAL (5.4%) | | | | | | | | | | | |
Caterpillar Fin. Svc. | | A | | 2.63 | | 01/30/07 | | 500,000 | | 488,490 | |
Cox Communications, Inc. Cl A | | BBB- | | 3.88 | | 10/01/08 | | 500,000 | | 481,849 | |
Daimlerchrysler | | BBB | | 4.05 | | 06/04/08 | | 250,000 | | 243,374 | |
Harman International Industries, Inc. | | BBB+ | | 7.13 | | 02/15/07 | | 186,000 | | 188,818 | |
May Dept Stores Co. | | BBB | | 4.80 | | 07/15/09 | | 250,000 | | 246,514 | |
Newell Rubbermaid | | BBB+ | | 4.63 | | 12/15/09 | | 500,000 | | 488,921 | |
Pulte Homes, Inc. | | BBB- | | 4.88 | | 07/15/09 | | 250,000 | | 244,897 | |
Scholastic Corp. | | BBB- | | 5.00 | | 04/15/13 | | 250,000 | | 230,018 | |
Stanley Works | | A | | 3.50 | | 11/01/07 | | 250,000 | | 244,043 | |
Target Corp. | | A+ | | 5.38 | | 06/15/09 | | 1,000,000 | | 1,014,725 | |
| | | | | | | | | | 3,871,649 | |
MUTUAL OF AMERICA INVESTMENT CORPORATION (MID-TERM BOND FUND)
PORTFOLIO OF INVESTMENTS IN SECURITIES
DECEMBER 31, 2005
| | | | | | | | Face | | | |
| | Rating* | | Rate(%) | | Maturity | | Amount($) | | Value($) | |
LONG-TERM DEBT SECURITIES: | | | | | | | | | | | |
CONSUMER, NON-CYCLICAL (3.8%) | | | | | | | | | | | |
Campbell Soup Co. | | A | | 5.50 | | 03/15/07 | | 500,000 | | 502,015 | |
Coca-Cola Enterprises | | A | | 2.50 | | 09/15/06 | | 500,000 | | 491,353 | |
General Mills, Inc. | | BBB+ | | 2.63 | | 10/24/06 | | 500,000 | | 489,618 | |
Kellogg Co. | | BBB+ | | 2.88 | | 06/01/08 | | 500,000 | | 476,383 | |
Safeway, Inc. | | BBB- | | 4.13 | | 11/01/08 | | 500,000 | | 484,160 | |
Wal-Mart Stores, Inc. | | AA | | 6.88 | | 08/10/09 | | 250,000 | | 266,069 | |
| | | | | | | | | | 2,709,598 | |
ENERGY (1.0%) | | | | | | | | | | | |
Anadarko Petroleum Corp. | | BBB+ | | 3.25 | | 05/01/08 | | 500,000 | | 481,510 | |
Ocean Energy, Inc. | | BBB | | 4.38 | | 10/01/07 | | 250,000 | | 247,166 | |
| | | | | | | | | | 728,676 | |
FINANCIAL (16.5%) | | | | | | | | | | | |
American Express Credit Corp. | | A+ | | 3.00 | | 05/16/08 | | 250,000 | | 239,590 | |
American Honda Finance | | A+ | | 3.85 | | 11/06/08 | | 500,000 | | 486,472 | |
Bank of America Corp. | | AA- | | 4.75 | | 10/15/06 | | 500,000 | | 499,834 | |
Bank of Oklahoma | | BBB+ | | 7.13 | | 08/15/07 | | 350,000 | | 362,187 | |
Berkshire Hathaway Financial | | AAA | | 4.20 | | 12/15/10 | | 500,000 | | 484,064 | |
Brandywine Realty Trust | | BBB- | | 4.50 | | 11/01/09 | | 250,000 | | 240,835 | |
Capital One Bank | | BBB | | 5.75 | | 09/15/10 | | 250,000 | | 255,962 | |
Colonial Properties LP | | BBB- | | 4.80 | | 04/01/11 | | 300,000 | | 289,569 | |
Deere Capital Corp. | | A- | | 3.90 | | 01/15/08 | | 500,000 | | 490,209 | |
Developers Diversified Realty | | BBB | | 5.00 | | 05/03/10 | | 250,000 | | 246,318 | |
FleetBoston Financial Group | | AA- | | 3.85 | | 02/15/08 | | 250,000 | | 245,063 | |
Ford Motor Credit Co. | | BB+ | | 7.38 | | 10/28/09 | | 750,000 | | 665,165 | |
GE Capital Corp. | | AAA | | 2.75 | | 09/25/06 | | 750,000 | | 739,364 | |
General Motors Acceptance Corp. | | BB | | 6.75 | | 01/15/06 | | 500,000 | | 499,670 | |
Heller Financial, Inc. | | AAA | | 6.38 | | 03/15/06 | | 500,000 | | 501,690 | |
Household Finance Corp. | | A | | 6.50 | | 01/24/06 | | 500,000 | | 500,498 | |
JP Morgan Chase Bank | | A+ | | 5.63 | | 08/15/06 | | 500,000 | | 502,143 | |
Lehman Brothers Holdings | | A+ | | 4.00 | | 01/22/08 | | 500,000 | | 491,719 | |
Markel Corp. | | BBB- | | 7.00 | | 05/15/08 | | 150,000 | | 155,519 | |
Nationwide Health Properties | | BBB- | | 7.60 | | 11/20/28 | | 350,000 | | 397,754 | |
National Rural Utilities Coop. Finance Corp. | | A+ | | 3.88 | | 02/15/08 | | 250,000 | | 244,615 | |
Roslyn Bancorp, Inc. | | BBB- | | 7.50 | | 12/01/08 | | 500,000 | | 530,121 | |
SLM Corp. | | A | | 4.00 | | 01/15/09 | | 500,000 | | 486,567 | |
Sprint Capital Corp. | | A- | | 7.13 | | 01/30/06 | | 500,000 | | 500,800 | |
Textron Finance Corp. | | A- | | 2.69 | | 10/03/06 | | 500,000 | | 492,455 | |
The CIT Group, Inc. | | A | | 6.50 | | 02/07/06 | | 500,000 | | 500,838 | |
MUTUAL OF AMERICA INVESTMENT CORPORATION (MID-TERM BOND FUND)
PORTFOLIO OF INVESTMENTS IN SECURITIES
DECEMBER 31, 2005
| | | | | | | | Face | | | |
| | Rating* | | Rate(%) | | Maturity | | Amount($) | | Value($) | |
LONG-TERM DEBT SECURITIES: | | | | | | | | | | | |
FINANCIAL (Cont’d.) | | | | | | | | | | | |
U S Bancorp | | A+ | | 3.95 | | 08/23/07 | | 500,000 | | 493,521 | |
Wells Fargo & Company | | AA- | | 3.50 | | 04/04/08 | | 250,000 | | 242,920 | |
| | | | | | | | | | 11,785,462 | |
INDUSTRIAL (0.7%) | | | | | | | | | | | |
Deluxe Corp. | | BBB+ | | 3.50 | | 10/01/07 | | 500,000 | | 476,970 | |
| | | | | | | | | | | |
TECHNOLOGY (1.4%) | | | | | | | | | | | |
Hewlett-Packard Co. | | A- | | 5.75 | | 12/15/06 | | 500,000 | | 504,180 | |
IBM Corp. | | A+ | | 4.88 | | 10/01/06 | | 500,000 | | 500,411 | |
| | | | | | | | | | 1,004,591 | |
TELECOMMUNICATIONS (1.1%) | | | | | | | | | | | |
Nextel Communications, Inc. | | A- | | 5.25 | | 01/15/10 | | 250,000 | | 249,687 | |
Verizon Global | | A+ | | 4.00 | | 01/15/08 | | 500,000 | | 490,370 | |
| | | | | | | | | | 740,057 | |
UTILITIES (1.6%) | | | | | | | | | | | |
Kinder Morgan | | BBB | | 5.15 | | 03/01/15 | | 250,000 | | 242,877 | |
Pepco Holdings, Inc. | | BBB | | 4.00 | | 05/15/10 | | 250,000 | | 237,414 | |
Telecom de Puerto Rico | | BBB+ | | 6.80 | | 05/15/09 | | 300,000 | | 311,728 | |
Virginia Electric & Power Co. | | BBB | | 4.50 | | 12/15/10 | | 400,000 | | 390,007 | |
| | | | | | | | | | 1,182,026 | |
| | | | | | | | | | | |
TOTAL LONG-TERM DEBT SECURITIES (Cost: $71,677,109) 97.8% | | | | | | 69,902,560 | |
*Ratings as per Standard & Poor’s Corporation.
MUTUAL OF AMERICA INVESTMENT CORPORATION (MID-TERM BOND FUND)
PORTFOLIO OF INVESTMENTS IN SECURITIES
DECEMBER 31, 2005
| | | | | | Face | | | |
| | Rate(%) | | Maturity | | Amount($) | | Value($) | |
SHORT-TERM DEBT SECURITIES: | | | | | | | | | |
U.S. GOVERNMENT AGENCIES (1.0%) | | | | | | | | | |
Federal National Mortgage Association | | 3.25 | | 01/03/06 | | 680,000 | | 679,816 | |
| | | | | | | | | |
TOTAL SHORT-TERM DEBT SECURITIES
(Cost: $679,816) 1.0% | | | | | | | | 679,816 | |
| | | | | | | | | |
TOTAL INVESTMENTS (Cost: $72,356,925) 98.8% | | | | | | | | 70,582,376 | |
| | | | | | | | | |
OTHER NET ASSETS 1.2% | | | | | | | | 860,878 | |
| | | | | | | | | |
NET ASSETS 100.0% | | | | | | | | $ | 71,443,254 | |
| | | | | | | | | | |
Abbreviations: | FHLB = Federal Home Loan Bank |
| FHLMC = Federal Home Loan Mortgage Corporation |
| FNMA = Federal National Mortgage Association |
The total value of investments not rated and or below-investment grade as a percentage of the Fund’s total
investments as of December 30, 2005 is 1.7 %.
MUTUAL OF AMERICA INVESTMENT CORPORATION (BOND FUND)
PORTFOLIO OF INVESTMENTS IN SECURITIES
DECEMBER 31, 2005
| | Rating* | | Rate(%) | | Maturity | | Face
Amount($) | | Value($) | |
LONG-TERM DEBT SECURITIES: | | | | | | | | | | | |
U.S. GOVERNMENT (4.3%) | | | | | | | | | | | |
U.S. Treasury Strip | | AAA | | 0.00 | | 05/15/14 | | 10,000,000 | | 6,884,800 | |
U.S. Treasury Strip | | AAA | | 0.00 | | 02/15/17 | | 15,000,000 | | 9,056,085 | |
| | | | | | | | | | 15,940,885 | |
U.S. GOVERNMENT AGENCIES (43.8%) | | | | | | | | | | | |
MORTGAGE-BACKED OBLIGATIONS (35.0%) | | | | | | | | | | | |
FHLMC | | AAA | | 8.00 | | 07/15/06 | | 6,456 | | 6,446 | |
FHLMC | | AAA | | 4.00 | | 10/15/26 | | 9,000,000 | | 8,686,161 | |
FNMA | | AAA | | 8.00 | | 03/01/31 | | 195,749 | | 209,099 | |
FNMA | | AAA | | 7.00 | | 09/01/31 | | 299,898 | | 313,063 | |
FNMA | | AAA | | 7.00 | | 11/01/31 | | 582,471 | | 608,041 | |
FNMA | | AAA | | 6.00 | | 04/01/32 | | 810,314 | | 819,397 | |
FNMA | | AAA | | 6.50 | | 04/01/32 | | 755,400 | | 776,348 | |
FNMA | | AAA | | 6.00 | | 04/01/32 | | 649,312 | | 656,591 | |
FNMA | | AAA | | 7.50 | | 04/01/32 | | 284,107 | | 297,605 | |
FNMA | | AAA | | 8.00 | | 04/01/32 | | 277,988 | | 296,893 | |
FNMA | | AAA | | 8.00 | | 04/01/32 | | 47,876 | | 51,135 | |
FNMA | | AAA | | 6.00 | | 05/01/32 | | 2,639,471 | | 2,669,059 | |
FNMA | | AAA | | 6.50 | | 05/01/32 | | 3,130,980 | | 3,217,805 | |
FNMA | | AAA | | 6.50 | | 05/01/32 | | 919,811 | | 945,318 | |
FNMA | | AAA | | 7.50 | | 06/01/32 | | 923,822 | | 967,714 | |
FNMA | | AAA | | 7.00 | | 06/01/32 | | 531,461 | | 554,613 | |
FNMA | | AAA | | 6.00 | | 04/01/33 | | 3,598,682 | | 3,639,023 | |
FNMA | | AAA | | 5.00 | | 06/01/33 | | 2,856,781 | | 2,777,994 | |
FNMA | | AAA | | 5.50 | | 07/01/33 | | 4,789,923 | | 4,754,798 | |
FNMA | | AAA | | 5.50 | | 09/01/33 | | 2,552,603 | | 2,533,884 | |
FNMA | | AAA | | 5.50 | | 10/01/33 | | 3,028,945 | | 3,006,733 | |
FNMA | | AAA | | 5.00 | | 11/01/33 | | 4,224,955 | | 4,108,435 | |
FNMA | | AAA | | 5.00 | | 01/01/34 | | 3,164,217 | | 3,076,951 | |
FNMA | | AAA | | 5.50 | | 03/01/34 | | 2,278,634 | | 2,261,925 | |
FNMA | | AAA | | 5.00 | | 03/01/34 | | 1,592,424 | | 1,548,507 | |
FNMA | | AAA | | 5.50 | | 03/01/34 | | 1,206,232 | | 1,197,387 | |
FNMA | | AAA | | 5.00 | | 04/01/34 | | 2,452,759 | | 2,381,366 | |
FNMA | | AAA | | 5.00 | | 04/01/34 | | 870,896 | | 845,547 | |
FNMA | | AAA | | 4.50 | | 05/01/34 | | 1,387,359 | | 1,309,563 | |
FNMA | | AAA | | 4.50 | | 06/01/34 | | 2,681,381 | | 2,531,023 | |
FNMA | | AAA | | 5.50 | | 07/01/34 | | 3,065,431 | | 3,038,348 | |
FNMA | | AAA | | 5.50 | | 09/01/34 | | 862,012 | | 854,396 | |
FNMA | | AAA | | 5.50 | | 09/01/34 | | 2,401,253 | | 2,380,037 | |
MUTUAL OF AMERICA INVESTMENT CORPORATION (BOND FUND)
PORTFOLIO OF INVESTMENTS IN SECURITIES
DECEMBER 31, 2005
| | Rating* | | Rate(%) | | Maturity | | Face
Amount($) | | Value($) | |
LONG-TERM DEBT SECURITIES: | | | | | | | | | | | |
U.S. GOVERNMENT AGENCIES (Cont’d.) | | | | | | | | | | | |
MORTGAGE-BACKED OBLIGATIONS (Cont’d.) | | | | | | | | | | | |
FNMA | | AAA | | 5.50 | | 10/01/34 | | 5,383,746 | | 5,336,180 | |
FNMA | | AAA | | 6.00 | | 11/01/34 | | 2,374,302 | | 2,396,751 | |
FNMA | | AAA | | 5.50 | | 02/01/35 | | 1,839,712 | | 1,823,458 | |
FNMA | | AAA | | 5.12 | | 02/01/35 | | 1,560,879 | | 1,545,921 | |
FNMA | | AAA | | 5.50 | | 04/01/35 | | 2,150,609 | | 2,130,000 | |
FNMA | | AAA | | 5.00 | | 04/01/35 | | 2,597,727 | | 2,517,089 | |
FNMA | | AAA | | 5.00 | | 06/01/35 | | 2,008,456 | | 1,946,109 | |
FNMA | | AAA | | 5.50 | | 08/01/35 | | 4,476,875 | | 4,433,973 | |
FNMA | | AAA | | 5.00 | | 09/01/35 | | 5,952,518 | | 5,767,740 | |
FNMA | | AAA | | 5.50 | | 11/01/35 | | 2,467,039 | | 2,443,397 | |
FNMA | | AAA | | 5.00 | | 10/25/15 | | 5,000,000 | | 4,986,405 | |
FNMA | | AAA | | 6.50 | | 09/01/16 | | 268,916 | | 276,643 | |
FNMA | | AAA | | 6.00 | | 03/01/17 | | 609,036 | | 622,563 | |
FNMA | | AAA | | 6.50 | | 03/01/17 | | 1,536,298 | | 1,578,440 | |
FNMA | | AAA | | 5.50 | | 04/01/17 | | 406,505 | | 409,315 | |
FNMA | | AAA | | 5.50 | | 05/01/17 | | 753,109 | | 758,315 | |
FNMA | | AAA | | 5.50 | | 05/01/17 | | 360,682 | | 363,175 | |
FNMA | | AAA | | 6.50 | | 05/01/17 | | 291,670 | | 299,670 | |
FNMA | | AAA | | 5.00 | | 04/01/18 | | 757,744 | | 750,726 | |
FNMA | | AAA | | 4.50 | | 05/01/18 | | 3,192,778 | | 3,113,971 | |
FNMA | | AAA | | 5.00 | | 09/01/18 | | 2,455,459 | | 2,432,716 | |
FNMA | | AAA | | 4.50 | | 12/01/18 | | 1,606,392 | | 1,566,741 | |
FNMA | | AAA | | 4.50 | | 02/01/19 | | 1,186,241 | | 1,156,073 | |
FNMA | | AAA | | 4.00 | | 05/01/19 | | 2,996,225 | | 2,864,508 | |
FNMA | | AAA | | 4.50 | | 05/01/19 | | 786,083 | | 766,091 | |
FNMA | | AAA | | 4.50 | | 06/01/19 | | 2,032,249 | | 1,980,565 | |
FNMA | | AAA | | 4.50 | | 06/01/19 | | 1,143,963 | | 1,114,870 | |
FNMA | | AAA | | 5.00 | | 09/01/20 | | 2,695,170 | | 2,666,485 | |
FNMA | | AAA | | 5.00 | | 10/01/20 | | 3,437,166 | | 3,400,584 | |
GNMA (1) | | AAA | | 6.50 | | 04/15/31 | | 113,130 | | 118,243 | |
GNMA (1) | | AAA | | 7.00 | | 09/15/31 | | 123,011 | | 129,149 | |
GNMA (1) | | AAA | | 7.00 | | 09/15/31 | | 111,543 | | 117,109 | |
GNMA (1) | | AAA | | 6.50 | | 12/15/31 | | 425,403 | | 444,631 | |
GNMA (1) | | AAA | | 6.50 | | 05/15/32 | | 159,371 | | 166,530 | |
GNMA (1) | | AAA | | 7.00 | | 05/15/32 | | 116,353 | | 122,150 | |
GNMA (1) | | AAA | | 6.27 | | 10/16/27 | | 3,000,000 | | 3,177,471 | |
| | | | | | | | | | 129,044,962 | |
MUTUAL OF AMERICA INVESTMENT CORPORATION (BOND FUND)
PORTFOLIO OF INVESTMENTS IN SECURITIES
DECEMBER 31, 2005
| | Rating* | | Rate(%) | | Maturity | | Face
Amount($) | | Value($) | |
LONG-TERM DEBT SECURITIES: | | | | | | | | | | | |
NON-MORTGAGE-BACKED OBLIGATION (8.8%) | | | | | | | | | | | |
AID - Sri Lanka | | AAA | | 6.59 | | 09/15/28 | | 4,000,000 | | 4,112,200 | |
FFCB | | AAA | | 2.88 | | 06/29/06 | | 2,500,000 | | 2,479,310 | |
FFCB | | AAA | | 4.15 | | 05/15/13 | | 10,000,000 | | 9,620,530 | |
FHLB | | AAA | | 4.50 | | 11/15/12 | | 4,000,000 | | 3,937,464 | |
FHLMC | | AAA | | 4.50 | | 01/15/13 | | 2,500,000 | | 2,455,700 | |
FHLMC | | AAA | | 5.20 | | 03/05/19 | | 10,000,000 | | 9,759,130 | |
| | | | | | | | | | 32,364,334 | |
BASIC MATERIALS (6.0%) | | | | | | | | | | | |
International Paper Co. | | BBB | | 4.25 | | 01/15/09 | | 2,000,000 | | 1,941,052 | |
International Flavors & Fragrances | | BBB+ | | 6.45 | | 05/15/06 | | 2,500,000 | | 2,511,938 | |
Lyondell Chemical Co. | | BB- | | 10.25 | | 11/01/10 | | 5,000,000 | | 5,500,000 | |
Monsanto Co. | | A- | | 4.00 | | 05/15/08 | | 1,500,000 | | 1,467,803 | |
PolyOne Corp. | | B+ | | 7.50 | | 12/15/15 | | 3,750,000 | | 3,421,875 | |
Praxair, Inc. | | A- | | 6.90 | | 11/01/06 | | 5,000,000 | | 5,077,795 | |
Worthington Industries, Inc. | | BBB | | 6.70 | | 12/01/09 | | 2,000,000 | | 2,115,906 | |
| | | | | | | | | | 22,036,369 | |
CONSUMER, CYCLICAL (8.0%) | | | | | | | | | | | |
Belo Corporation | | BBB | | 8.00 | | 11/01/08 | | 2,000,000 | | 2,124,588 | |
Centex Corp. | | BBB- | | 8.75 | | 03/01/07 | | 2,000,000 | | 2,067,250 | |
Coors Brewing Co. | | BBB | | 6.38 | | 05/15/12 | | 2,000,000 | | 2,119,360 | |
Cox Communications, Inc. Cl A | | BBB- | | 3.88 | | 10/01/08 | | 2,000,000 | | 1,927,394 | |
Daimlerchrysler | | BBB | | 4.05 | | 06/04/08 | | 1,000,000 | | 973,495 | |
Dow Jones & Co. | | A- | | 3.88 | | 02/15/08 | | 1,000,000 | | 980,275 | |
Fruit of the Loom (2) | | NR | | 7.00 | | 03/15/11 | | 1,313,550 | | 122,961 | |
Fruit of the Loom (2) | | NR | | 7.38 | | 11/15/23 | | 345,170 | | 35 | |
Harman International Industries, Inc. | | BBB+ | | 7.13 | | 02/15/07 | | 1,868,000 | | 1,896,306 | |
Kellwood, Co. | | BB | | 7.88 | | 07/15/09 | | 4,000,000 | | 3,969,208 | |
May Dept Stores Co. | | BBB | | 4.80 | | 07/15/09 | | 2,000,000 | | 1,972,108 | |
Newell Rubbermaid | | BBB+ | | 4.63 | | 12/15/09 | | 2,500,000 | | 2,444,608 | |
Pulte Homes, Inc. | | BBB- | | 4.88 | | 07/15/09 | | 2,000,000 | | 1,959,172 | |
Quebecor World, Inc. | | BB | | 4.88 | | 11/15/08 | | 1,500,000 | | 1,424,930 | |
Scholastic Corp. | | BBB- | | 5.00 | | 04/15/13 | | 2,000,000 | | 1,840,146 | |
Stanley Works | | A | | 3.50 | | 11/01/07 | | 250,000 | | 244,043 | |
Target Corp. | | A+ | | 5.38 | | 06/15/09 | | 3,250,000 | | 3,297,860 | |
| | | | | | | | | | 29,363,739 | |
CONSUMER, NON-CYCLICAL (2.2%) | | | | | | | | | | | |
General Mills, Inc. | | BBB+ | | 2.63 | | 10/24/06 | | 2,000,000 | | 1,958,470 | |
Kellogg Co. | | BBB+ | | 2.88 | | 06/01/08 | | 2,000,000 | | 1,905,534 | |
MUTUAL OF AMERICA INVESTMENT CORPORATION (BOND FUND)
PORTFOLIO OF INVESTMENTS IN SECURITIES
DECEMBER 31, 2005
| | Rating* | | Rate(%) | | Maturity | | Face
Amount($) | | Value($) | |
LONG-TERM DEBT SECURITIES: | | | | | | | | | | | |
CONSUMER, NON-CYCLICAL (Cont’d.) | | | | | | | | | | | |
Safeway, Inc. | | BBB- | | 4.13 | | 11/01/08 | | 1,000,000 | | 968,320 | |
Wal-Mart Stores, Inc. | | AA | | 6.88 | | 08/10/09 | | 3,000,000 | | 3,192,831 | |
| | | | | | | | | | 8,025,155 | |
ENERGY (1.5%) | | | | | | | | | | | |
Anadarko Petroleum Corp. | | BBB+ | | 3.25 | | 05/01/08 | | 2,000,000 | | 1,926,042 | |
Cooper Cameron Corp. | | BBB+ | | 2.65 | | 04/15/07 | | 2,000,000 | | 1,933,728 | |
Ocean Energy, Inc. | | BBB | | 4.38 | | 10/01/07 | | 1,750,000 | | 1,730,164 | |
| | | | | | | | | | 5,589,934 | |
FINANCIAL (20.0%) | | | | | | | | | | | |
American Honda Finance | | A+ | | 3.85 | | 11/06/08 | | 2,000,000 | | 1,945,888 | |
Banc of America Alternative Loan Trust | | AAA | | 5.75 | | 05/25/33 | | 3,500,000 | | 3,488,783 | |
Berkley (WR) Corp. | | BBB+ | | 8.70 | | 01/01/22 | | 5,000,000 | | 6,123,280 | |
Brandywine Realty Trust | | BBB- | | 4.50 | | 11/01/09 | | 2,000,000 | | 1,926,680 | |
Capital One Bank | | BBB | | 5.75 | | 09/15/10 | | 2,000,000 | | 2,047,694 | |
CenterPoint PPTS | | BBB | | 5.25 | | 07/15/11 | | 2,250,000 | | 2,224,508 | |
Colonial Properties Trust | | BBB- | | 4.80 | | 04/01/11 | | 1,500,000 | | 1,447,844 | |
Deere Capital Corp. | | A- | | 3.90 | | 01/15/08 | | 2,500,000 | | 2,451,043 | |
Developers Diversified Realty | | BBB | | 5.00 | | 05/03/10 | | 2,000,000 | | 1,970,540 | |
Executive Risk, Inc. | | A | | 7.13 | | 12/15/07 | | 5,000,000 | | 5,193,330 | |
First Horizon Mortgage Trust | | AAA | | 5.00 | | 06/25/33 | | 3,426,240 | | 3,401,859 | |
Fairfax Financial Holdings | | BB | | 8.25 | | 10/01/15 | | 2,500,000 | | 2,296,863 | |
First Tennessee National Bank | | BBB+ | | 4.50 | | 05/15/13 | | 5,000,000 | | 4,770,585 | |
Ford Motor Credit Co. | | BB+ | | 7.38 | | 10/28/09 | | 3,000,000 | | 2,660,658 | |
GE Capital Corp. | | AAA | | 2.75 | | 09/25/06 | | 4,000,000 | | 3,943,276 | |
General Motor Acceptance Corp. | | BB | | 0.00 | | 12/01/12 | | 10,000,000 | | 5,689,440 | |
Goldman Sachs Group, Inc. | | A+ | | 3.88 | | 01/15/09 | | 1,750,000 | | 1,698,825 | |
Lehman Brothers Holdings | | A+ | | 4.00 | | 01/22/08 | | 2,000,000 | | 1,966,876 | |
Markel Corp. | | BBB- | | 6.80 | | 02/15/13 | | 1,000,000 | | 1,051,811 | |
Markel Corp. | | BBB- | | 7.00 | | 05/15/08 | | 1,000,000 | | 1,036,794 | |
National City Bank | | A+ | | 3.38 | | 10/15/07 | | 2,250,000 | | 2,191,102 | |
National Rural Utilities Coop. Finance Corp. | | A+ | | 3.88 | | 02/15/08 | | 1,500,000 | | 1,467,696 | |
National Rural Utilities Coop. Finance Corp. | | BBB- | | 7.50 | | 12/01/08 | | 1,000,000 | | 1,060,241 | |
SLM Corp. | | A | | 4.00 | | 01/15/09 | | 2,250,000 | | 2,189,548 | |
Shurgard Storage Centers, Inc. | | BBB- | | 7.75 | | 02/22/11 | | 750,000 | | 821,405 | |
Simon Property Group, Inc. | | BBB+ | | 7.88 | | 03/15/16 | | 5,000,000 | | 5,848,230 | |
US Bank NA | | AA- | | 2.85 | | 11/15/06 | | 1,000,000 | | 983,498 | |
Union Planters Bank | | A+ | | 5.13 | | 06/15/07 | | 2,000,000 | | 2,005,278 | |
| | | | | | | | | | 73,903,575 | |
MUTUAL OF AMERICA INVESTMENT CORPORATION (BOND FUND)
PORTFOLIO OF INVESTMENTS IN SECURITIES
DECEMBER 31, 2005
| | Rating* | | Rate(%) | | Maturity | | Face
Amount($) | | Value($) | |
LONG-TERM DEBT SECURITIES: | | | | | | | | | | | |
HEALTHCARE (1.1%) | | | | | | | | | | | |
UnitedHealth Group | | A | | 3.38 | | 08/15/07 | | 2,500,000 | | 2,443,322 | |
Wyeth | | A | | 5.50 | | 03/15/13 | | 1,750,000 | | 1,774,094 | |
| | | | | | | | | | 4,217,416 | |
INDUSTRIAL (4.4%) | | | | | | | | | | | |
Bunge, Ltd. | | BBB | | 5.35 | | 04/15/14 | | 2,000,000 | | 1,978,188 | |
Comcast Cable Communications | | BBB+ | | 6.20 | | 11/15/08 | | 2,000,000 | | 2,053,073 | |
Deluxe Corp. | | BBB+ | | 3.50 | | 10/01/07 | | 1,500,000 | | 1,430,910 | |
Donnelley R.R. & Sons | | A- | | 4.95 | | 04/01/14 | | 2,000,000 | | 1,867,334 | |
Lafarge Corp. | | BBB | | 6.50 | | 07/15/08 | | 1,750,000 | | 1,802,329 | |
Seariver Maritime | | AAA | | 0.00 | | 09/01/12 | | 10,000,000 | | 7,247,480 | |
| | | | | | | | | | 16,379,314 | |
TECHNOLOGY (0.6%) | | | | | | | | | | | |
Arrow Electronics | | BBB- | | 6.88 | | 06/01/18 | | 2,000,000 | | 2,124,404 | |
| | | | | | | | | | | |
TELECOMMUNICATIONS (1.1%) | | | | | | | | | | | |
Nextel Communications, Inc. | | A- | | 5.25 | | 01/15/10 | | 2,000,000 | | 1,997,506 | |
Verizon Global | | A+ | | 4.00 | | 01/15/08 | | 2,000,000 | | 1,961,482 | |
| | | | | | | | | | 3,958,988 | |
UTILITIES (2.0%) | | | | | | | | | | | |
Kinder Morgan | | BBB | | 5.15 | | 03/01/15 | | 2,000,000 | | 1,943,026 | |
Pepco Holdings, Inc. | | BBB | | 4.00 | | 05/15/10 | | 2,000,000 | | 1,899,308 | |
Telecom de Puerto Rico | | BBB+ | | 6.80 | | 05/15/09 | | 1,500,000 | | 1,558,640 | |
Virginia Electric & Power Co. | | BBB | | 4.50 | | 12/15/10 | | 2,000,000 | | 1,950,038 | |
| | | | | | | | | | 7,351,012 | |
| | | | | | | | | | | |
TOTAL LONG-TERM DEBT SECURITIES (Cost: $354,810,678) 95.0% | | | | | | 350,300,087 | |
* Ratings as per Standard & Poor’s Corporation.
MUTUAL OF AMERICA INVESTMENT CORPORATION (BOND FUND)
PORTFOLIO OF INVESTMENTS IN SECURITIES
DECEMBER 31, 2005
| | Rate(%) | | Maturity | | Face
Amount($) | | Value($) | |
SHORT-TERM DEBT SECURITIES: | | | | | | | | | |
COMMERCIAL PAPER (4.2%) | | | | | | | | | |
Executive Jets Inc. | | 4.15 | | 01/03/06 | | 7,300,000 | | 7,297,475 | |
Hershey Foods | | 4.00 | | 01/03/06 | | 5,722,000 | | 5,720,092 | |
New Jersey Natural Gas | | 4.25 | | 01/04/06 | | 920,000 | | 919,565 | |
Washington Gas Light Co. | | 4.36 | | 01/05/06 | | 900,000 | | 899,455 | |
Washington Gas Light Co. | | 4.40 | | 01/06/06 | | 700,000 | | 699,487 | |
| | | | | | | | 15,536,074 | |
| | | | | | | | | |
TOTAL SHORT-TERM DEBT SECURITIES
(Cost: $15,536,074) 4.2% | | | | | | | | 15,536,074 | |
| | | | | | | | | |
TEMPORARY CASH INVESTMENTS**(Cost: $41,000)
0.0% (3) | | | | | | | | 41,000 | |
| | | | | | | | | |
TOTAL INVESTMENTS (Cost: $370,387,752) 99.2% | | | | | | | | 365,877,161 | |
| | | | | | | | | |
OTHER NET ASSETS0.8% | | | | | | | | 2,957,614 | |
| | | | | | | | | |
NET ASSETS 100.0% | | | | | | | | $ | 368,834,775 | |
| | | | | | | | | | |
Abbreviations: FFCB = Federal Farm Credit Bank
FHLB = Federal Home Loan Bank
FHLMC = Federal Home Loan Mortgage Corporation
FNMA = Federal National Mortgage Association
GNMA = Government National Mortgage Association
(1) U.S. Government guaranteed security.
(2) Issuer has filed for Chapter XI bankruptcy law (or equivalent) protection; issue is non-income producing and carried at fair value.
(3) Less than 0.05%.
** The fund has an arrangement with its custodian bank, JPMorgan Chase Bank, whereby uninvested cash, subject to parameters set by the fund, is automatically invested in the fund’s name by the bank in overnight commercial paper issued by J.P. Morgan Chase & Co. On the next business day, these funds (and earned interest) are automatically returned to the fund. The annual rate of interest earned on this temporary cash investment at December 30, 2005 was 3.79%.
The total value of investments not rated and or below-investment grade as a percentage of the Fund’s total investments as of December 30, 2005 is 6.9%.
ITEM 7. DISCLOSURE OF PROXY VOTING POLICIES AND PROCEDURES FOR CLOSED-END MANAGEMENT INVESTMENT COMPANIES.
Not applicable.
ITEM 8. PORTFOLIO MANAGERS OF CLOSED-END MANAGEMENT INVESTMENT COMPANIES.
Not applicable.
ITEM 9. PURCHASES OF EQUITY SECURITES BY CLOSED-END MANAGEMENT INVESTMENT COMPANY AND AFFILIATED PURCHASERS.
Not applicable.
ITEM 10. SUBMISSION OF MATTERS TO A VOTE OF SECURITY HOLDERS.
Not applicable.
ITEM 11. CONTROLS AND PROCEDURES.
(a) The registrant’s principal executive officer and principal financial officer have evaluated the registrant’s disclosure controls and procedures within 90 days of this filing and have concluded that the registrant’s disclosure controls and procedures were effective, as of that date, in ensuring that information required to be disclosed by the registrant in this Form N-CSR was recorded, processed, summarized, and reported in a timely and accurate manner.
(b) The registrant’s principal executive officer and principal financial officer are aware of no changes in the registrant’s internal control over financial reporting that occurred during the second fiscal quarter of the period covered by this report that has materially affected, or is likely to materially affect, the registrant’s internal control over financial reporting.
ITEM 12. EXHIBITS.
Attached hereto:
(a) | (1) | Not applicable | – The Annual Report to Shareholders includes information on how to obtain a copy of the Code of Ethics at no charge. |
| (2) | Exhibit 99.CERT | Certifications by the registrant’s principal executive officer and principal financial officer, pursuant to Section 302 of the Sarbanes-Oxley Act of 2002 and required by Rule 30a-2(a) under the Investment Company Act of 1940. |
| (3) | Not applicable. | |
(b) | | Exhibit 99.906CERT | Certifications pursuant to Section 906 of the Sarbanes-Oxley Act of 2002 and required by Rule 30a-2(b) under the Investment Company Act of 1940. |
| | | |
(c) | | Exhibit 99.REPT | Report of Independent Registered Public Accounting Firm |
SIGNATURES
Pursuant to the requirements of the Securities Exchange Act of 1934 and the Investment Company Act of 1940, the registrant has duly caused this report to be signed on its behalf by the undersigned, thereunto duly authorized.
Mutual of America Investment Corporation
By: | /s/ MANFRED ALTSTADT | |
| Manfred Altstadt |
| Chairman of the Board, |
| President and Chief Executive Officer of
Mutual of America Investment Corporation |
Date: February 28, 2006
Pursuant to the requirements of the Securities Exchange Act of 1934 and the Investment Company Act of 1940, this report has been signed below by the following persons on behalf of the registrant and in the capacities and on the dates indicated.
By: | /s/ MANFRED ALTSTADT | |
| Manfred Altstadt |
| Chairman of the Board, |
| President and Chief Executive Officer of |
| Mutual of America Investment Corporation |
Date: February 28, 2006
By: | /s/ JOHN R. GREED | |
| John R. Greed |
| Executive Vice President, |
| Chief Financial Officer and Treasurer of |
| Mutual of America Investment Corporation |
Date: February 28, 2006