UNITED STATES
SECURITIES AND EXCHANGE COMMISSION
Washington, D.C. 20549
FORM N-CSR
CERTIFIED SHAREHOLDER REPORT OF REGISTERED
MANAGEMENT INVESTMENT COMPANIES
Investment Company Act file number | 811-05084 |
|
Mutual of America Investment Corporation |
(Exact name of registrant as specified in charter) |
|
320 Park Avenue, New York, N.Y. | | 10022 |
(Address of principal executive offices) | | (Zip code) |
|
John R. Greed Senior Executive Vice President and Chief Financial Officer Mutual of America Life Insurance Company 320 Park Avenue New York, NY 10022 |
(Name and address of agent for service) |
|
Registrant’s telephone number, including area code: | (212) 224-1600 | |
|
Date of fiscal year end: | December 31 | |
|
Date of reporting period: | December 31, 2008 | |
| | | | | | | | |
ITEM 1. REPORTS TO STOCKHOLDERS.
The Annual Report to Shareholders follows:
ANNUAL REPORTS OF
MUTUAL OF AMERICA INVESTMENT CORPORATION
AND
FIDELITY INVESTMENTS® VARIABLE INSURANCE
PRODUCT FUNDS
DECEMBER 31, 2008
This report is not to be construed as an offering for sale of any Variable Policy. No offering is made except in conjunction with a prospectus which must precede or accompany this report.
VOLUME I
CONTENTS
| Volume I | | Page | |
| Annual Report of Mutual of America Investment Corporation | |
|
| President's Message | | | 1 | | |
|
| Portfolio Management Discussions | | | 4 | | |
|
| Asset Allocations | | | 26 | | |
|
| Expense Example | | | 30 | | |
|
| Summary Portfolios of Investments in Securities: | |
|
| Equity Index Fund | | | 37 | | |
|
| All America Fund | | | 39 | | |
|
| Small Cap Value Fund | | | 43 | | |
|
| Small Cap Growth Fund | | | 45 | | |
|
| Mid Cap Value Fund | | | 47 | | |
|
| Mid-Cap Equity Index Fund | | | 49 | | |
|
| International Fund | | | 51 | | |
|
| Composite Fund | | | 52 | | |
|
| Retirement Income Fund | | | 55 | | |
|
| 2010 Retirement Fund | | | 55 | | |
|
| 2015 Retirement Fund | | | 56 | | |
|
| 2020 Retirement Fund | | | 56 | | |
|
| 2025 Retirement Fund | | | 57 | | |
|
| 2030 Retirement Fund | | | 57 | | |
|
| 2035 Retirement Fund | | | 58 | | |
|
| 2040 Retirement Fund | | | 58 | | |
|
| 2045 Retirement Fund | | | 59 | | |
|
| Conservative Allocation Fund | | | 59 | | |
|
| Moderate Allocation Fund | | | 60 | | |
|
| Aggressive Allocation Fund | | | 60 | | |
|
| Money Market Fund | | | 61 | | |
|
| Mid-Term Bond Fund | | | 63 | | |
|
| Bond Fund | | | 66 | | |
|
| Statements of Assets and Liabilities | | | 70 | | |
|
| Statements of Operations | | | 74 | | |
|
| Statements of Changes in Net Assets | | | 78 | | |
|
| Financial Highlights | | | 86 | | |
|
| Notes to Financial Statements | | | 96 | | |
|
| Additional Information | | | 111 | | |
|
Annual Report of Fidelity Investments® Variable Insurance Products Funds: Equity-Income Portfolio
Annual Report of Fidelity Investments® Variable Insurance Products Funds: Asset ManagerSM Portfolio
Annual Report of Fidelity Investments® Variable Insurance Products Funds: Contrafund Portfolio
Annual Report of Fidelity Investments® Variable Insurance Products Funds: Mid Cap Portfolio
Volume II
Annual Report of Vanguard Variable Insurance Fund: Diversified Value Portfolio
Annual Report of Vanguard Variable Insurance Fund: International Portfolio
Annual Report of DWS Variable Series I: Bond Portfolio
Annual Report of DWS Variable Series I: Capital Growth Portfolio
Annual Report of DWS Variable Series I: International Portfolio
Annual Report of Oppenheimer Main Street Fund®/VA
Annual Report of VP Capital Appreciation Fund of American Century Variable Portfolios, Inc.
Annual Report of Calvert Social Balanced Portfolio of Calvert Variable Series, Inc.
MUTUAL OF AMERICA INVESTMENT CORPORATION
We are pleased to present to you the Mutual of America Investment Corporation (the "Investment Company") Annual Report for the year ended December 31, 2008. This Annual Report includes important information regarding the performance and financial positions of the Investment Company's funds during 2008.
The year 2008 will go down in history as one of the worst ever for almost every conceivable type of asset. Except for a handful of small equity markets around the world and the U.S. government securities market, negative returns, and generally of large magnitude, were the norm.
For equities, the U.S. Large Cap S&P 500® Index was down 37.0% on a total return basis. Russell Small Cap and Mid-Cap Indexes were down 33.8% and 41.5%, respectively. Outside the United States, equity returns declined by similar amounts in the larger European markets, Canada, Japan, Korea, and Brazil, but among even the smaller Western markets, and especially among the markets of less developed economies, returns were much worse. In Europe, Italy was down 48.7%; Belgium, 53.8%; and Ireland, 66.2%. In Asia, the Philippines declined 48.3%, and Indonesia fell 50.6%. And the Chinese (Shanghai) and Russian markets were down an astounding 70.1% and 72.4% for the year, respectively!
Bonds also had a very difficult year. In the U.S. market, the only sectors that had positive returns were U.S. Treasuries and U.S. agency securities, up 12.4% and 4.4%, respectively. Investment Grade Corporate bonds declined 3.1%, while High Yield Corporate bonds declined 26.2%. Foreign bond markets generally fared worse, especially among emerging markets.
Housing, of course, is another asset class that performed poorly. For the year, residential housing prices were down about 19% and are now down 25% from their peak in mid-2006. Commercial real estate prices have also come under pressure as the financial and economic crisis has deepened over the past five months.
And then there are commodities, which essentially collapsed in mid-2008 after generating huge returns over the previous few years. In 2008, the CRB Index, which tracks a variety of industrial and agricultural goods, declined by 36%, paced by mid-50% declines in oil and copper, but mediated by less serious drops in food stuffs. Gold, generally a haven from market tumult, only managed to eke out a 4.3% gain in a year marked by fear, panic and risk aversion.
The causes of this market turmoil have been fairly exhaustively documented in our periodic Economic and Market Perspectives and in the press. In summary, a housing bubble turned into a housing recession; the housing recession caused an implosion of the global financial system; the financial meltdown caused a decline in overall economic activity; and the financial crisis and the economic contraction are now feeding on each other in what economists, borrowing a concept from medicine, call a "negative feedback loop," characterized by a reduction of output in one system in response to a reduction in output of the other, and so on.
As a result, the United States economy, and nearly every other economy in the world, is in recession, the length and depth of which is the central issue of concern and debate. It has already been officially determined that the U.S. entered a recession in December 2007, and it is fairly widely agreed that our recession began before those in other economies. Thus, even if the U.S. economy were to begin recovery within the next six months, global recovery would not be likely at least until early 2010.
Unfortunately, at the present time a U.S. recovery is probably unlikely to begin at least before the end of this year. Most key economic statistics continue to show deterioration, including consumer spending, employment, industrial production, capital spending and exports.
At the same time, the financial crisis persists, despite the unprecedented actions already taken by policy makers throughout the world. All central banks, led by our Federal Reserve, have lowered benchmark interest rates dramatically. In addition, the Fed has instituted a large number of programs to provide "liquidity," or funding for day-to-day operations of various key components of the financial system, in order to keep the system as a whole functioning. The Fed, along with the U.S. Treasury, has facilitated the acquisition of several failing financial institutions by healthier ones, as it did with Bear Stearns and Wachovia, for example. And it has effectively taken over control of the key federal mortgage lending agencies, Fannie Mae and Freddie Mac, as well as American International Group, formerly the largest insurance company in the world.
And then there's the infamous Troubled Asset Relief Program — or T.A.R.P. — legislation passed by Congress that authorized the U.S. Treasury to inject an initial $350 billion into the banking system to shore it up, and has recently authorized the use of an additional $350 billion for actions as yet to be determined. Notwithstanding these dramatic and expensive responses, the U.S. Treasury has within the last two months had to provide emergency bailouts for Citibank and Bank of America, two of the largest banks in the world.
1
Fortunately, even more firepower is on the way. The new Obama administration is on the verge of announcing a comprehensive, wide-ranging fiscal plan proposing a variety of federal spending programs totaling $850 billion over the next two years. Most commentators believe the final bill will end up being much higher, but that eventually such government spending will be successful in mitigating the downside of the recession and in laying the groundwork for a recovery.
However hopeful, or convinced, we are that the will and creativity of our leaders, the wealth generating capacity of the U.S. economy over time, and the strength and fortitude of the American people, will ultimately triumph over our current woes, it will take time, and it will be painful. U.S. Gross Domestic Product, the broadest measure of economic growth, was just reported to have contracted 3.8% in the 4th Quarter of 2008, following a 0.5% contraction in the 3rd Quarter. Further contractions are likely in at least each of the next two quarters of 2009. Given such dire growth prospects, unemployment will likely rise from its current 7.2% to probably more that 10%. Many smaller banks will close their doors and many companies, large and small, will go bankrupt. Moody's projects that the corporate default rate, currently at 4.4% in the U.S., will hit 15% by the end of 2009, well above the previous peaks of 10-11% in the 1991 and 2002 recessio ns.
Under such circumstances, stock markets are unlikely to show any sustained advance, and will almost surely continue to show the type of volatility witnessed last year. In general, bull markets require at least a good chance of sustainable positive economic growth, and that is just not a reasonable expectation on any near term horizon at this time.
And yet, markets tend to anticipate the future. We probably saw the lows in stocks last November, unless the financial crisis and recession deepen further, or prove totally unresponsive to stimulus. And we will probably have to endure a series of rallies and retrenchments before the fundamentals sort themselves out and stabilize. This bear market has already witnessed two 18-23% advances since late October, only to see most of those gains given back.
But stocks will at some point begin a sustainable advance well before the news becomes positive. Investors are already looking for signs of such an inflexion point by looking at economic data as it is reported for signs that deterioration is slowing. For markets, less bad sometimes is good, especially when enough of the data seem to confirm that the worst of the declines are past. That day will come, and we're hoping it will arrive before the end of this year. Right now, unfortunately, too much is unknown while the data is still moving in the wrong direction.
In the meantime, the Investment Company has positioned its portfolios for the current environment with the objective of outperforming our benchmarks and our peers, as they did in many cases last year.
The total return performance for each of the Investment Company Funds is reflected below:
Total Returns — Year Ended December 31, 2008
| Equity Index Fund | | | -37.08 | % | |
| All America Fund | | | -35.49 | % | |
| Small Cap Value Fund | | | -27.76 | % | |
| Small Cap Growth Fund | | | -34.37 | % | |
| Mid Cap Value Fund | | | -32.64 | % | |
| Mid-Cap Equity Index Fund | | | -36.31 | % | |
| International Fund | | | -40.06 | % | |
| Composite Fund | | | -22.51 | % | |
| Retirement Income Fund | | | - 9.61 | % | |
| 2010 Retirement Fund | | | -17.45 | % | |
| 2015 Retirement Fund | | | -21.01 | % | |
| 2020 Retirement Fund | | | -24.81 | % | |
| 2025 Retirement Fund | | | -28.32 | % | |
| 2030 Retirement Fund | | | -29.95 | % | |
| 2035 Retirement Fund | | | -32.53 | % | |
| 2040 Retirement Fund | | | -32.75 | % | |
| 2045 Retirement Fund | | | -32.90 | % | |
| Conservative Allocation Fund | | | -10.19 | % | |
| Moderate Allocation Fund | | | -19.85 | % | |
2
| Aggressive Allocation Fund | | | -28.20 | % | |
| Money Market Fund | | | + 2.34 | % | |
| Mid-Term Bond Fund | | | + 1.84 | % | |
| Bond Fund | | | - 1.75 | % | |
The above total return performance figures do not reflect the deduction of respective Separate Account fees and expenses imposed by Mutual of America Life Insurance Company. All Fund performances presented throughout this report are historical, reflect the full reinvestment of dividends paid, and should not be considered indicative of future results.
On the pages immediately following are brief presentations and graphs for each Fund (except the Money Market Fund), which illustrate each Fund's respective:
• Historical total return achieved over specified periods, expressed as an average annual rate and as a cumulative rate;
• Equivalent in dollars of a $10,000 hypothetical investment at the beginning of each specified period; and
• Historical performance compared to an appropriate index.
Following those are graphical representations of the asset allocations of each Fund and an illustration of each Fund's operating expenses. The summarized portfolios of each Fund and financial statements are presented in the pages which then follow.
Thank you for your continued investment in our Funds.
Sincerely,

Manfred Altstadt
Chairman of the Board, President
and Chief Executive Officer
Mutual of America Investment Corporation
The views expressed in this Annual Report are subject to change at any time based on market and other conditions and should not be construed as a recommendation. This Report contains forward-looking statements, which speak only as of the date they were made and involve a number of risks and uncertainties that could cause actual results to differ materially from those expressed herein. Readers are cautioned not to place undue reliance on our forward-looking statements, as we assume no obligation to update these forward-looking statements. Readers assume any and all responsibility for any investment decision made as a result of the views expressed herein.
3
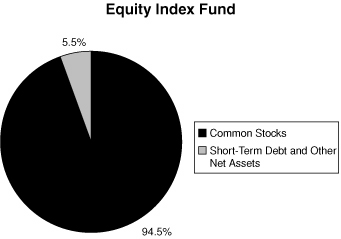
EQUITY INDEX FUND
The Equity Index Fund's objective is to replicate the performance of the S&P 500® Index (the "S&P 500"), which consists of 500 stocks chosen by Standard & Poor's for market size, liquidity and industry group representation. The S&P 500 is a market-weighted index of 500 stocks traded on the New York Stock Exchange, American Stock Exchange and Nasdaq, with each stock's weight in the index proportionate to its market value. The weightings make each company's influence on the S&P 500's performance directly proportional to that company's market value.
Overall, 2008 was an abysmal year for absolute returns. According to Standard & Poor's, the S&P 500 return of -37.00% marked the worst year for the index since 1937, when the market was down -38.59%. All ten sectors posted negative double digit returns with the Financial sector down 55.27%! Consumer Staples were the least hit with a negative 15.30% return. The fourth quarter of 2008 brought the most pain with a -22.56% return as the collapse of the financial industry leaders began in September.
The Equity Index Fund's performance for the year ended December 31, 2008, was -37.08%, in line with the benchmark return of -37.00%. Note that the Equity Index Fund's performance includes expenses, such as transaction costs and management fees, which are not applicable to the benchmark.

Equity Index Fund
| Period | | Growth | | Total Return | |
Ended
12/31/08 | | of
$10,000 | | Cumu-
lative | | Average
Annual | |
| 1 Year | | $ | 6,292 | | | | -37.08 | % | | | -37.08 | % | |
| 5 Years | | $ | 8,879 | | | | -11.21 | % | | | -2.35 | % | |
| 10 Years | | $ | 8,552 | | | | -14.48 | % | | | -1.55 | % | |
S & P 500 Index
| Period | | Growth | | Total Return | |
Ended
12/31/08 | | of
$10,000 | | Cumu-
lative | | Average
Annual | |
| 1 Year | | $ | 6,300 | | | | -37.00 | % | | | -37.00 | % | |
| 5 Years | | $ | 8,950 | | | | -10.50 | % | | | -2.19 | % | |
| 10 Years | | $ | 8,699 | | | | -13.01 | % | | | -1.38 | % | |
The line representing the performance return of the Equity Index Fund includes expenses, such as transaction costs and management fees that reduce returns, while the performance return line of the Index does not.
4
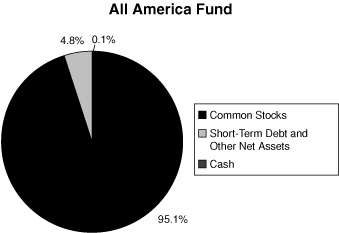
ALL AMERICA FUND
The investment objective of the All America Fund is to outperform the S&P 500® Index (the "S&P 500"). The All America Fund is approximately 60% invested in the 500 stocks that comprise the S&P 500, with the remaining 40% actively managed, using three different investment approaches. The actively managed portion of the All America Fund is approximately equally distributed between large cap stocks and small cap stocks, with the small cap stocks in turn equally distributed between small cap value and small cap growth stocks.
The year 2008 proved a difficult time for not only domestic equity markets, but global equity markets as well, as documented in the President's Letter. Only a handful of global equity indices had positive returns. In the U.S., the S&P 500® Index of large capitalization stocks declined by -37.00% , while the Russell 2000 (Small Cap) Growth® Index was down -38.54% and the Russell 2000 Value® Index was down -28.92% for the twelve month period ended December 31, 2008.
The All America Fund's return for the year ended December 31, 2008, was -35.49% versus the benchmark return of -37.00%. The indexed portion of the fund, representing 60% of the overall portfolio, performed in line with the S&P 500® index. The overperformance derived from results surpassing that of the S&P 500® Index by all three actively managed components of the Fund, specifically, Large Cap representing 20% of the Fund, and both Small Cap Value and Small Cap Growth, each representing 10% of the Fund.
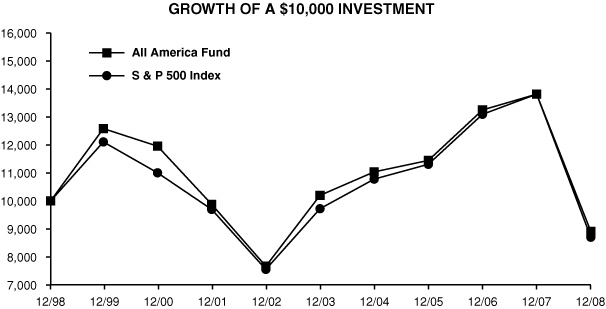
All America Fund
| Period | | Growth | | Total Return | |
Ended
12/31/08 | | of
$10,000 | | Cumu-
lative | | Average
Annual | |
| 1 Year | | $ | 6,451 | | | | -35.49 | % | | | -35.49 | % | |
| 5 Years | | $ | 8,739 | | | | -12.61 | % | | | -2.66 | % | |
| 10 Years | | $ | 8,909 | | | | -10.91 | % | | | -1.15 | % | |
S & P 500 Index
| Period | | Growth | | Total Return | |
Ended
12/31/08 | | of
$10,000 | | Cumu-
lative | | Average
Annual | |
| 1 Year | | $ | 6,300 | | | | -37.00 | % | | | -37.00 | % | |
| 5 Years | | $ | 8,950 | | | | -10.50 | % | | | -2.19 | % | |
| 10 Years | | $ | 8,699 | | | | -13.01 | % | | | -1.38 | % | |
The line representing the performance return of the All America Fund includes expenses, such as transaction costs and management fees that reduce returns, while the performance return line of the Index does not.
5
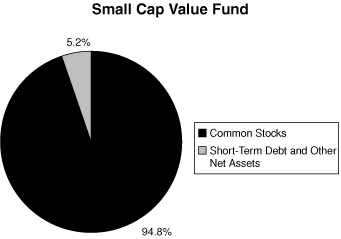
SMALL CAP VALUE FUND
The investment objective of the Small Cap Value Fund is to outperform the Russell 2000 Value® Index. The Small Cap Value Fund generally invests in companies that are below $3 billion in market capitalization and have lower price-to-book characteristics than the overall market.
For the year ended December 31, 2008, the Small Cap Value Fund returned -27.76% versus a -28.92% return for the Russell 2000 Value® Index. Stock selection was the primary driver of positive performance versus the benchmark. Sectors contributing to Fund performance included Finance, Consumer Cyclical and Consumer Staples, while sectors detracting from Fund performance included Basic Materials and Insurance.
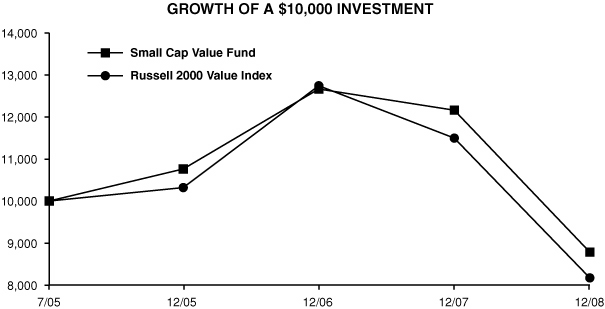
Small Cap Value Fund
| Period | | Growth | | Total Return | |
Ended
12/31/08 | | of
$10,000 | | Cumu-
lative | | Average
Annual | |
| 1 Year | | $ | 7,224 | | | | -27.76 | % | | | -27.76 | % | |
Since 7/1/05
(Inception) | | $ | 8,784 | | | | -12.16 | % | | | -3.64 | % | |
Russell 2000 Value Index
| Period | | Growth | | Total Return | |
Ended
12/31/08 | | of
$10,000 | | Cumu-
lative | | Average
Annual | |
| 1 Year | | $ | 7,108 | | | | -28.92 | % | | | -28.92 | % | |
Since 7/1/05
(Inception) | | $ | 8,171 | | | | -18.29 | % | | | -5.61 | % | |
The line representing the performance return of the Small Cap Value Fund includes expenses, such as transaction costs and management fees that reduce returns, while the performance return line of the Index does not.
6
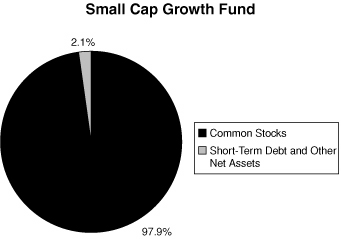
SMALL CAP GROWTH FUND
The investment objective of the Small Cap Growth Fund is capital appreciation. The Small Cap Growth Fund invests in growth stocks within the small capitalization marketplace. The Fund returned -34.37% during the year ended December 31, 2008. The Fund's benchmark, the Russell 2000 Growth® Index, returned -38.54% for the period.
The Small Cap Growth Fund's overperformance against its benchmark was due primarily to outperformance in the Financial, Consumer Discretionary and Industrial sectors. The Healthcare and Consumer Staples Sector underperformed the benchmark and detracted from the overall performance of the year. Also, we maintained a fairly defensive posture in our stock selection, which contributed to our overall outperformance for 2008. Stock selection, as opposed to sector allocation, continues to be the main factor in our returns.
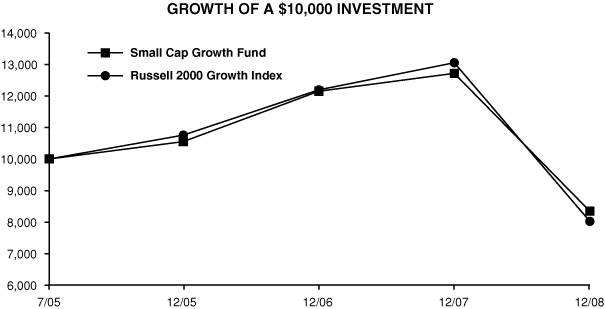
Small Cap Growth Fund
| Period | | Growth | | Total Return | |
Ended
12/31/08 | | of
$10,000 | | Cumu-
lative | | Average
Annual | |
| 1 Year | | $ | 6,563 | | | | -34.37 | % | | | -34.37 | % | |
Since 7/1/05
(Inception) | | $ | 8,345 | | | | -16.55 | % | | | -5.04 | % | |
Russell 2000 Growth Index
| Period | | Growth | | Total Return | |
Ended
12/31/08 | | of
$10,000 | | Cumu-
lative | | Average
Annual | |
| 1 Year | | $ | 6,146 | | | | -38.54 | % | | | -38.54 | % | |
Since 7/1/05
(Inception) | | $ | 8,022 | | | | -19.78 | % | | | -6.10 | % | |
The line representing the performance return of the Small Cap Growth Fund includes expenses, such as transaction costs and management fees that reduce returns, while the performance return line of the Index does not.
7
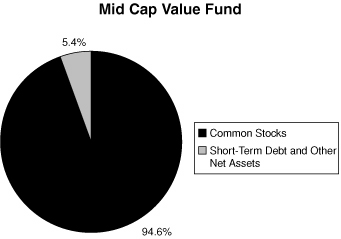
MID CAP VALUE FUND
The investment objective of the Mid Cap Value Fund is to outperform the Russell Mid Cap Value® Index. The Mid Cap Value Fund generally invests in companies that are between $1 billion and $20 billion in market capitalization and have lower price-to-book characteristics.
For the year ended December 31, 2008, the Mid Cap Value Fund returned -32.64% versus a -38.44% return for the Russell Mid Cap Value® Index. Stock selection was the primary driver of positive performance versus the benchmark. Sectors contributing to Mid Cap Value Fund performance included Finance and Retail, while sectors detracting from Mid Cap Value Fund performance included Consumer Staples and REITs.

Mid Cap Value Fund
| Period | | Growth | | Total Return | |
Ended
12/31/08 | | of
$10,000 | | Cumu-
lative | | Average
Annual | |
| 1 Year | | $ | 6,736 | | | | -32.64 | % | | | -32.64 | % | |
Since 7/1/05
(Inception) | | $ | 8,422 | | | | -15.78 | % | | | -4.78 | % | |
Russell Mid Cap Value Index
| Period | | Growth | | Total Return | |
Ended
12/31/08 | | of
$10,000 | | Cumu-
lative | | Average
Annual | |
| 1 Year | | $ | 6,156 | | | | -38.44 | % | | | -38.44 | % | |
Since 7/1/05
(Inception) | | $ | 7,723 | | | | -22.77 | % | | | -7.12 | % | |
The line representing the performance return of the Mid Cap Value Fund includes expenses, such as transaction costs and management fees that reduce returns, while the performance return line of the Index does not.
8
MID-CAP EQUITY INDEX FUND
The Mid-Cap Equity Index Fund invests in the 400 stocks that comprise the S&P MidCap 400® Index (the "S&P MidCap 400"). The S&P MidCap 400 is a market-weighted index of 400 stocks traded on the New York Stock Exchange, American Stock Exchange and Nasdaq. The weightings make each company's influence on the S&P MidCap 400's performance directly proportional to that company's market value. The companies included in the S&P MidCap 400 tend to be typical of this asset class, the medium-capitalized sector of the U.S. securities market.
The performance returns of 2008 were a disaster for all asset classes, with even the S&P MidCap 400 posting a -36.23% return, not far from its larger brethren, the S&P 500 at -37.00%. All ten sectors posted a negative double digit return with Energy leading the decline with -46.31%. Oil prices continued to drop from their peak of $145 a barrel in June 2008. Demand weakened as the global economy began to seize, leading to increases in inventory. The build out of global infrastructure slowed and consumers stopped spending. The mid-cap companies depend on these core sources to continue to grow and, as a result, the mid-cap index fell just as the large cap index was brutally hit by the capital market downturn. As 2009 begins, there is still uncertainty as to which direction the economy will head.
The Mid-Cap Equity Index Fund's performance for the year ended December 31, 2008, was -36.31%, in line with the -36.23% return of the S&P MidCap 400. Note that the performance of the Mid-Cap Equity Index Fund includes expenses, such as transaction costs and management fees, which are not applicable to the benchmark.
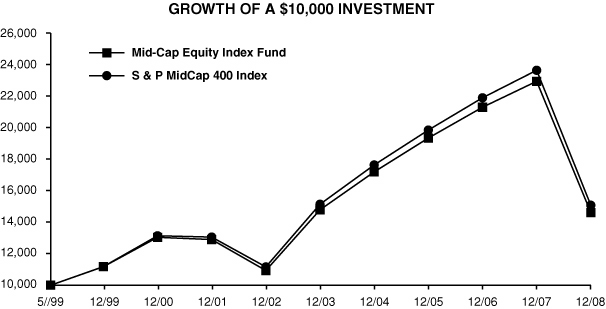
Mid-Cap Equity Index Fund
| Period | | Growth | | Total Return | |
Ended
12/31/08 | | of
$10,000 | | Cumu-
lative | | Average
Annual | |
| 1 Year | | $ | 6,369 | | | | -36.31 | % | | | -36.31 | % | |
| 5 Years | | $ | 9,883 | | | | -1.17 | % | | | -0.23 | % | |
Since 5/3/99
(Inception) | | $ | 14,614 | | | | 46.14 | % | | | 4.01 | % | |
S & P MidCap 400 Index
| Period | | Growth | | Total Return | |
Ended
12/31/08 | | of
$10,000 | | Cumu-
lative | | Average
Annual | |
| 1 Year | | $ | 6,377 | | | | -36.23 | % | | | -36.23 | % | |
| 5 Years | | $ | 9,959 | | | | -0.41 | % | | | -0.08 | % | |
Since 5/3/99
(Inception) | | $ | 15,079 | | | | 50.79 | % | | | 4.34 | % | |
The line representing the performance return of the Mid-Cap Equity Index Fund includes expenses, such as transaction costs and management fees that reduce returns, while the performance return line of the Index does not.
9
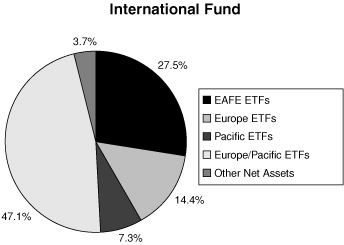
INTERNATIONAL FUND
The International Fund seeks capital appreciation by investing, directly or indirectly, in stocks of companies located outside of the United States that are reflected or contained in the Morgan Stanley Capital International, Inc. Europe, Australasia and Far East Index® (MSCI EAFE Index®). Currently the International Fund is invested exclusively in exchange traded funds that reflect or closely match the holdings in the MSCI EAFE Index®.
Performance for the International Fund is compared to the MSCI EAFE Index®. For the year ended December 31, 2008, the International Fund returned -40.06%, outperforming the -43.06% return of the benchmark. The Fund's outperformance against its benchmark was due to favorable management of cash inflows throughout the year.

International Fund
| Period | | Growth | | Total Return | |
Ended
12/31/08 | | of
$10,000 | | Cumu-
lative | | Average
Annual | |
| 1 Year | | $ | 5,994 | | | | -40.06 | % | | | -40.06 | % | |
Since 11/5/07
(Inception) | | $ | 5,819 | | | | -41.81 | % | | | -37.41 | % | |
MSCI EAFE Index
| Period | | Growth | | Total Return | |
Ended
12/31/08 | | of
$10,000 | | Cumu-
lative | | Average
Annual | |
| 1 Year | | $ | 5,694 | | | | -43.06 | % | | | -43.06 | % | |
Since 11/5/07
(Inception) | | $ | 5,540 | | | | -44.60 | % | | | -40.02 | % | |
The line representing the performance return of the International Fund includes expenses, such as transaction costs and management fees that reduce returns, while the performance return line of the Index does not.
10
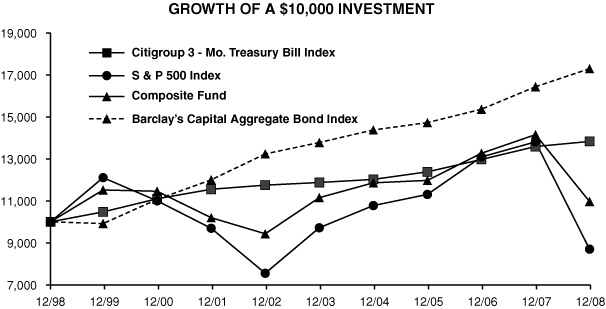
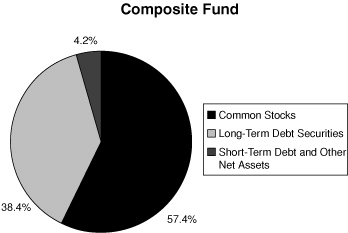
COMPOSITE FUND
The Composite Fund invests in a diversified portfolio of common stocks and fixed-income securities, seeking appreciation and current income. The equity portion of the Composite Fund invests in stocks within the S&P 500® Index.
The S&P 500 Index had a total return of -37.00% for the twelve months ended December 31, 2008. No sectors managed to generate positive total returns for the year as a whole. The worst performing sectors were Financials, Materials and Information Technology, which earned -55.27%, -45.68% and -43.01%, respectively. Only one sector, Consumer Staples, generated a return above -20%, coming in at -15.30%
The equity portion of the Composite Fund maintains sector weights within plus or minus 100 basis points of the S&P 500® Index and does not take positions in individual stocks with overweights of more than 200 basis points. This structural discipline produces a relatively low-risk portfolio that emphasizes stock selection based on strong fundamental analysis. For the twelve month period ending December 31, 2008, the equity portion of the Fund had a total return of -34.63% (before expenses), outperforming the S&P 500® Index by 237 basis points.
The Federal Reserve aggressively cut the federal funds rate throughout 2008. Starting the year at 4.25%, it was lowered to 2.00% by the end of the second quarter and then to a historic low range of 0.00%-0.25% by year's end. This seven-step process of reducing rates was part of the government's attempt to stimulate the economy and keep longer rates low.
The bond market became more focused on deflation as the government became increasingly involved in the credit markets in order to avoid instability and defaults. Nevertheless, credit spreads widened to unprecedented levels as traditional corporate bonds traded down to distress prices in a barely functioning market place.
The Fund emphasizes higher yielding corporate bonds and these were negatively affected, especially in the fourth quarter. The Fund ended the year with a shorter duration than the fixed-income component of its benchmark, which also hurt its performance.
The strategy of creating an extremely diversified credit portfolio with an intermediate maturity focus will be continued so long as inflation threatens to impair returns and economic concerns remain. The management focus will also continue to be on income, rather than capital gains, as compounded returns at favorable rates remains a primary objective.
For the year ended December 31, 2008, the Composite Fund returned -22.51% (after expenses) compared to the weighted benchmark return of -20.10%, 40% of which is based on the Barclay's Capital Aggregate Bond Index® and 60% of which is based on the S&P 500 Index®. This underperformance was the result of the significant underperformance of the fixed-income portion of the Fund offsetting the fairly strong overperformance of the equity portion of the Fund.
Composite Fund
| Period | | Growth | | Total Return | |
Ended
12/31/08 | | of
$10,000 | | Cumu-
lative | | Average
Annual | |
| 1 Year | | $ | 7,749 | | | | -22.51 | % | | | -22.51 | % | |
| 5 Years | | $ | 9,834 | | | | -1.66 | % | | | -0.33 | % | |
| 10 Years | | $ | 10,966 | | | | 9.66 | % | | | 0.93 | % | |
S & P 500 Index
| Period | | Growth | | Total Return | |
Ended
12/31/08 | | of
$10,000 | | Cumu-
lative | | Average
Annual | |
| 1 Year | | $ | 6,300 | | | | -37.00 | % | | | -37.00 | % | |
| 5 Years | | $ | 8,950 | | | | -10.50 | % | | | -2.19 | % | |
| 10 Years | | $ | 8,699 | | | | -13.01 | % | | | -1.38 | % | |
Barclay's Capital Aggregate Bond Index
| Period | | Growth | | Total Return | |
Ended
12/31/08 | | of
$10,000 | | Cumu-
lative | | Average
Annual | |
| 1 Year | | $ | 10,524 | | | | 5.24 | % | | | 5.24 | % | |
| 5 Years | | $ | 12,550 | | | | 25.50 | % | | | 4.65 | % | |
| 10 Years | | $ | 17,294 | | | | 72.94 | % | | | 5.63 | % | |
Citigroup 3 - Month T-Bill Index
| Period | | Growth | | Total Return | |
Ended
12/31/08 | | of
$10,000 | | Cumu-
lative | | Average
Annual | |
| 1 Year | | $ | 10,180 | | | | 1.80 | % | | | 1.80 | % | |
| 5 Years | | $ | 11,647 | | | | 16.47 | % | | | 3.10 | % | |
| 10 Years | | $ | 13,830 | | | | 38.30 | % | | | 3.30 | % | |
The line representing the performance return of the Composite Fund includes expenses, such as transaction costs and management fees that reduce returns, while the performance return lines of the Indices do not.
11
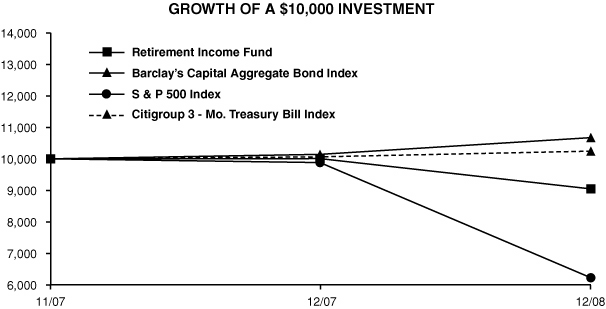
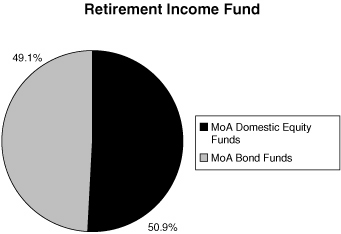
RETIREMENT INCOME FUND
The objective of the Retirement Income Fund is current income consistent with the preservation of capital and, to a lesser extent, capital appreciation. The Retirement Income Fund invests primarily in the fixed-income funds of the Investment Company and also invests in two equity funds of the Investment Company. The Fund's target allocation is approximately 75% of net assets in fixed-income funds (approximately 30% each in the Bond and Mid-Term Bond Funds and 15% in the Money Market Fund) and approximately 25% of net assets in equity funds (20% in the Equity Index Fund and 5% in the Mid-Cap Equity Index Fund).
Performance for the Retirement Income Fund is compared to the Barclay's Capital Aggregate Bond Index® (60% weighting), the Citigroup 3-Month Treasury Bill Index® (15% weighting) and the S&P 500® Index (25% weighting). For the year ended December 31, 2008, the Fund returned -9.61% versus a -5.84% return in the weighted benchmark. The underperformance of the Fund is mainly attributable to the Bond Fund and, to a lesser extent, the Mid-Term Bond Fund underperforming the Barclay's Capital Aggregate Bond Index®.
Retirement Income Fund
| Period | | Growth | | Total Return | |
Ended
12/31/08 | | of
$10,000 | | Cumu-
lative | | Average
Annual | |
| 1 Year | | $ | 9,039 | | | | -9.61 | % | | | -9.61 | % | |
Since 11/5/07
(Inception) | | $ | 9,046 | | | | -9.54 | % | | | -8.31 | % | |
S & P 500 Index
| Period | | Growth | | Total Return | |
Ended
12/31/08 | | of
$10,000 | | Cumu-
lative | | Average
Annual | |
| 1 Year | | $ | 6,300 | | | | -37.00 | % | | | -37.00 | % | |
Since 11/5/07
(Inception) | | $ | 6,225 | | | | -37.75 | % | | | -33.65 | % | |
Barclay's Capital Aggregate Bond Index
| Period | | Growth | | Total Return | |
Ended
12/31/08 | | of
$10,000 | | Cumu-
lative | | Average
Annual | |
| 1 Year | | $ | 10,524 | | | | 5.24 | % | | | 5.24 | % | |
Since 11/5/07
(Inception) | | $ | 10,673 | | | | 6.73 | % | | | 5.80 | % | |
Citigroup 3 - Month T-Bill Index
| Period | | Growth | | Total Return | |
Ended
12/31/08 | | of
$10,000 | | Cumu-
lative | | Average
Annual | |
| 1 Year | | $ | 10,180 | | | | 1.80 | % | | | 1.80 | % | |
Since 11/5/07
(Inception) | | $ | 10,244 | | | | 2.44 | % | | | 2.11 | % | |
The line representing the performance return of the Retirement Income Fund includes expenses, such as transaction costs and management fees (including those incurred by the underlying funds) that reduce returns, while the performance return lines of the Indices do not.
12
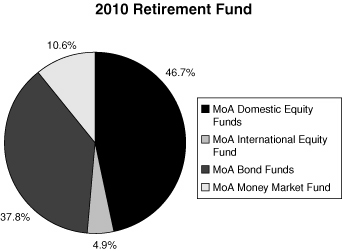
2010 RETIREMENT FUND
The objective of the 2010 Retirement Fund is current income and capital appreciation appropriate for the asset allocation associated with a target retirement in 2010. The 2010 Retirement Fund invests in funds of the Investment Company. The Fund's target allocation is approximately 55% of net assets in fixed-income funds (approximately 25% in the Bond Fund, 20% in the Mid-Term Bond Fund and 10% in the Money Market Fund) and approximately 45% of net assets in equity funds (25% in the Equity Index Fund, 15% in the Mid-Cap Equity Index Fund and 5% in the International Fund).
Performance for the 2010 Retirement Fund is compared to the Barclay's Capital Aggregate Bond Index® (45% weighting), the Citigroup 3-Month Treasury Bill Index® (10% weighting) and the S&P 500® Index (45% weighting). For the year ended December 31, 2008, the Fund returned -17.45% versus a -14.11% return in the weighted benchmark. The underperformance of the Fund is mainly attributable to the Bond Fund and, to a lesser extent, the Mid-Term Bond Fund underperforming the Barclay's Capital Aggregate Bond Index®.

2010 Retirement Fund
| Period | | Growth | | Total Return | |
Ended
12/31/08 | | of
$10,000 | | Cumu-
lative | | Average
Annual | |
| 1 Year | | $ | 8,255 | | | | -17.45 | % | | | -17.45 | % | |
Since 11/5/07
(Inception) | | $ | 8,200 | | | | -18.00 | % | | | -15.78 | % | |
S & P 500 Index
| Period | | Growth | | Total Return | |
Ended
12/31/08 | | of
$10,000 | | Cumu-
lative | | Average
Annual | |
| 1 Year | | $ | 6,300 | | | | -37.00 | % | | | -37.00 | % | |
Since 11/5/07
(Inception) | | $ | 6,225 | | | | -37.75 | % | | | -33.65 | % | |
Barclay's Capital Aggregate Bond Index
| Period | | Growth | | Total Return | |
Ended
12/31/08 | | of
$10,000 | | Cumu-
lative | | Average
Annual | |
| 1 Year | | $ | 10,524 | | | | 5.24 | % | | | 5.24 | % | |
Since 11/5/07
(Inception) | | $ | 10,673 | | | | 6.73 | % | | | 5.80 | % | |
Citigroup 3 - Month T-Bill Index
| Period | | Growth | | Total Return | |
Ended
12/31/08 | | of
$10,000 | | Cumu-
lative | | Average
Annual | |
| 1 Year | | $ | 10,180 | | | | 1.80 | % | | | 1.80 | % | |
Since 11/5/07
(Inception) | | $ | 10,244 | | | | 2.44 | % | | | 2.11 | % | |
The line representing the performance return of the 2010 Retirement Fund includes expenses, such as transaction costs and management fees (including those incurred by the underlying funds) that reduce returns, while the performance return lines of the Indices do not.
13
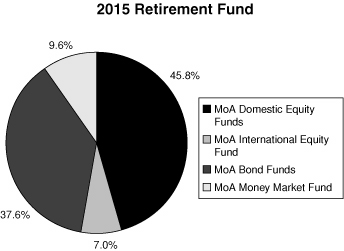
2015 RETIREMENT FUND
The objective of the 2015 Retirement Fund is current income and capital appreciation appropriate for the asset allocation associated with a target retirement in 2015. The 2015 Retirement Fund invests in funds of the Investment Company. The Fund's target allocation is approximately 55% of net assets in equity funds (approximately 30% in the Equity Index Fund, 12% in the Mid-Cap Equity Index Fund, 7% in the International Fund and 3% each in the Small Cap Growth and Small Cap Value Funds) and approximately 45% of net assets in fixed-income funds (25% in the Bond Fund, 11% in the Mid-Term Bond Fund and 9% in the Money Market Fund).
Performance for the 2015 Retirement Fund is compared to the S&P 500® Index (55% weighting), the Barclay's Capital Aggregate Bond Index® (36% weighting) and the Citigroup 3-Month Treasury Bill Index® (9% weighting). For the year ended December 31, 2008, the Fund returned -21.01% versus a -18.30% return in the weighted benchmark. The underperformance of the Fund is mainly attributable to the Bond Fund and, to a lesser extent, the Mid-Term Bond Fund underperforming the Barclay's Capital Aggregate Bond Index®.

2015 Retirement Fund
| Period | | Growth | | Total Return | |
Ended
12/31/08 | | of
$10,000 | | Cumu-
lative | | Average
Annual | |
| 1 Year | | $ | 7,899 | | | | -21.01 | % | | | -21.01 | % | |
Since 11/5/07
(Inception) | | $ | 7,807 | | | | -21.93 | % | | | -19.28 | % | |
S & P 500 Index
| Period | | Growth | | Total Return | |
Ended
12/31/08 | | of
$10,000 | | Cumu-
lative | | Average
Annual | |
| 1 Year | | $ | 6,300 | | | | -37.00 | % | | | -37.00 | % | |
Since 11/5/07
(Inception) | | $ | 6,225 | | | | -37.75 | % | | | -33.65 | % | |
Barclay's Capital Aggregate Bond Index
| Period | | Growth | | Total Return | |
Ended
12/31/08 | | of
$10,000 | | Cumu-
lative | | Average
Annual | |
| 1 Year | | $ | 10,524 | | | | 5.24 | % | | | 5.24 | % | |
Since 11/5/07
(Inception) | | $ | 10,673 | | | | 6.73 | % | | | 5.80 | % | |
Citigroup 3 - Month T-Bill Index
| Period | | Growth | | Total Return | |
Ended
12/31/08 | | of
$10,000 | | Cumu-
lative | | Average
Annual | |
| 1 Year | | $ | 10,180 | | | | 1.80 | % | | | 1.80 | % | |
Since 11/5/07
(Inception) | | $ | 10,244 | | | | 2.44 | % | | | 2.11 | % | |
The line representing the performance return of the 2015 Retirement Fund includes expenses, such as transaction costs and management fees (including those incurred by the underlying funds) that reduce returns, while the performance return lines of the Indices do not.
14
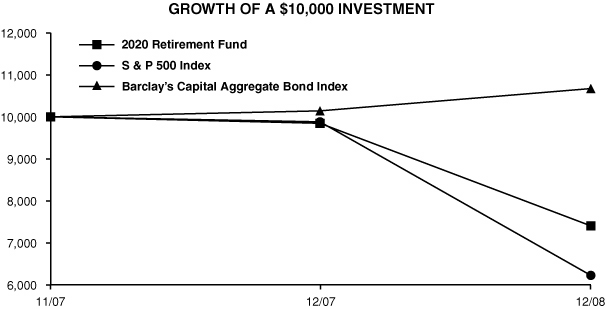
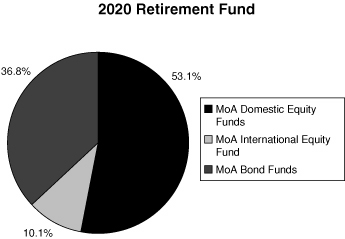
2020 RETIREMENT FUND
The objective of the 2020 Retirement Fund is current income and capital appreciation appropriate for the asset allocation associated with a target retirement in 2020. The 2020 Retirement Fund invests in funds of the Investment Company. The Fund's target allocation is approximately 65% of net assets in equity funds (approximately 35% in the Equity Index Fund, 12% in the Mid-Cap Equity Index Fund, 10% in the International Fund and 4% each in the Small Cap Growth and Small Cap Value Funds) and approximately 35% of net assets in fixed-income funds (24% in the Bond Fund and 11% in the Mid-Term Bond Fund).
Performance for the 2020 Retirement Fund is compared to the S&P 500® Index (65% weighting) and the Barclay's Capital Aggregate Bond Index® (35% weighting). For the year ended December 31, 2008, the Fund returned -24.81% versus a -22.22% return in the weighted benchmark. The underperformance of the Fund is mainly attributable to the Bond Fund and, to a lesser extent, the Mid-Term Bond Fund underperforming the Barclay's Capital Aggregate Bond Index®.
2020 Retirement Fund
| Period | | Growth | | Total Return | |
Ended
12/31/08 | | of
$10,000 | | Cumu-
lative | | Average
Annual | |
| 1 Year | | $ | 7,519 | | | | -24.81 | % | | | -24.81 | % | |
Since 11/5/07
(Inception) | | $ | 7,404 | | | | -25.96 | % | | | -22.90 | % | |
S & P 500 Index
| Period | | Growth | | Total Return | |
Ended
12/31/08 | | of
$10,000 | | Cumu-
lative | | Average
Annual | |
| 1 Year | | $ | 6,300 | | | | -37.00 | % | | | -37.00 | % | |
Since 11/5/07
(Inception) | | $ | 6,225 | | | | -37.75 | % | | | -33.65 | % | |
Barclay's Capital Aggregate Bond Index
| Period | | Growth | | Total Return | |
Ended
12/31/08 | | of
$10,000 | | Cumu-
lative | | Average
Annual | |
| 1 Year | | $ | 10,524 | | | | 5.24 | % | | | 5.24 | % | |
Since 11/5/07
(Inception) | | $ | 10,673 | | | | 6.73 | % | | | 5.80 | % | |
The line representing the performance return of the 2020 Retirement Fund includes expenses, such as transaction costs and management fees (including those incurred by the underlying funds) that reduce returns, while the performance return lines of the Indices do not.
15
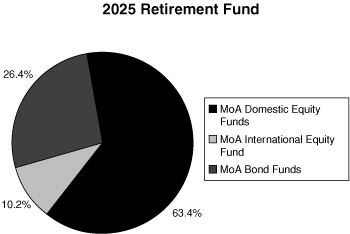
2025 RETIREMENT FUND
The objective of the 2025 Retirement Fund is current income and capital appreciation appropriate for the asset allocation associated with a target retirement in 2025. The 2025 Retirement Fund invests in funds of the Investment Company. The Fund's target allocation is approximately 75% of net assets in equity funds (approximately 40% in the Equity Index Fund, 15% in the Mid-Cap Equity Index Fund, 10% in the International Fund and 5% each in the Small Cap Growth and Small Cap Value Funds) and approximately 25% of net assets in fixed-income funds (20% in the Bond Fund and 5% in the Mid-Term Bond Fund).
Performance for the 2025 Retirement Fund is compared to the S&P 500® Index (75% weighting) and the Barclay's Capital Aggregate Bond Index® (25% weighting). For the year ended December 31, 2008, the Fund returned -28.32% versus a -26.44% return in the weighted benchmark. The underperformance of the Fund is mainly attributable to the Bond Fund underperforming the Barclay's Capital Aggregate Bond Index® and, to a lesser extent, the International Fund underperforming the S&P 500® Index.

2025 Retirement Fund
| Period | | Growth | | Total Return | |
Ended
12/31/08 | | of
$10,000 | | Cumu-
lative | | Average
Annual | |
| 1 Year | | $ | 7,168 | | | | -28.32 | % | | | -28.32 | % | |
Since 11/5/07
(Inception) | | $ | 7,029 | | | | -29.71 | % | | | -26.30 | % | |
S & P 500 Index
| Period | | Growth | | Total Return | |
Ended
12/31/08 | | of
$10,000 | | Cumu-
lative | | Average
Annual | |
| 1 Year | | $ | 6,300 | | | | -37.00 | % | | | -37.00 | % | |
Since 11/5/07
(Inception) | | $ | 6,225 | | | | -37.75 | % | | | -33.65 | % | |
Barclay's Capital Aggregate Bond Index
| Period | | Growth | | Total Return | |
Ended
12/31/08 | | of
$10,000 | | Cumu-
lative | | Average
Annual | |
| 1 Year | | $ | 10,524 | | | | 5.24 | % | | | 5.24 | % | |
Since 11/5/07
(Inception) | | $ | 10,673 | | | | 6.73 | % | | | 5.80 | % | |
The line representing the performance return of the 2025 Retirement Fund includes expenses, such as transaction costs and management fees (including those incurred by the underlying funds) that reduce returns, while the performance return lines of the Indices do not.
16
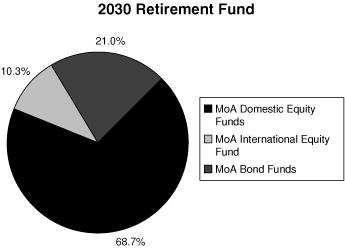
2030 RETIREMENT FUND
The objective of the 2030 Retirement Fund is current income and capital appreciation appropriate for the asset allocation associated with a target retirement in 2030. The 2030 Retirement Fund invests in funds of the Investment Company. The Fund's target allocation is approximately 80% of net assets in equity funds (approximately 40% in the Equity Index Fund, 18% in the Mid-Cap Equity Index Fund, 10% in the International Fund and 6% each in the Small Cap Growth and Small Cap Value Funds) and approximately 20% of net assets in the Bond Fund.
Performance for the 2030 Retirement Fund is compared to the S&P 500® Index (80% weighting) and the Barclay's Capital Aggregate Bond Index® (20% weighting). For the year ended December 31, 2008, the Fund returned -29.95% versus a -28.55% return in the weighted benchmark. The underperformance of the Fund is mainly attributable to the Bond Fund underperforming the Barclay's Capital Aggregate Bond Index® and, to a lesser extent, the International Fund underperforming the S&P 500® Index.

2030 Retirement Fund
| Period | | Growth | | Total Return | |
Ended
12/31/08 | | of
$10,000 | | Cumu-
lative | | Average
Annual | |
| 1 Year | | $ | 7,005 | | | | -29.95 | % | | | -29.95 | % | |
Since 11/5/07
(Inception) | | $ | 6,850 | | | | -31.50 | % | | | -27.92 | % | |
S & P 500 Index
| Period | | Growth | | Total Return | |
Ended
12/31/08 | | of
$10,000 | | Cumu-
lative | | Average
Annual | |
| 1 Year | | $ | 6,300 | | | | -37.00 | % | | | -37.00 | % | |
Since 11/5/07
(Inception) | | $ | 6,225 | | | | -37.75 | % | | | -33.65 | % | |
Barclay's Capital Aggregate Bond Index
| Period | | Growth | | Total Return | |
Ended
12/31/08 | | of
$10,000 | | Cumu-
lative | | Average
Annual | |
| 1 Year | | $ | 10,524 | | | | 5.24 | % | | | 5.24 | % | |
Since 11/5/07
(Inception) | | $ | 10,673 | | | | 6.73 | % | | | 5.80 | % | |
The line representing the performance return of the 2030 Retirement Fund includes expenses, such as transaction costs and management fees (including those incurred by the underlying funds) that reduce returns, while the performance return lines of the Indices do not.
17
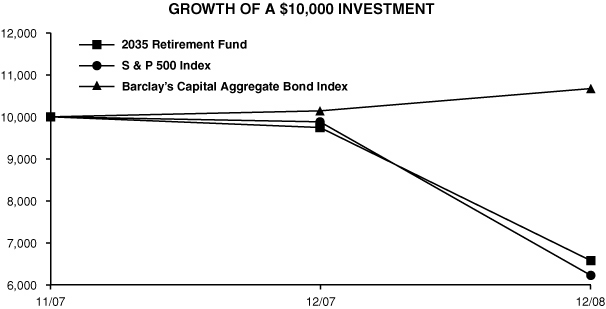
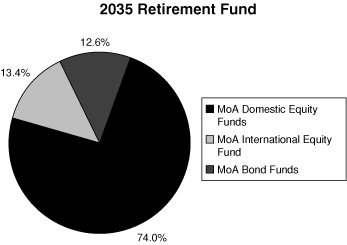
2035 RETIREMENT FUND
The objective of the 2035 Retirement Fund is current income and capital appreciation appropriate for the asset allocation associated with a target retirement in 2035. The 2035 Retirement Fund invests in funds of the Investment Company. The Fund's target allocation is approximately 88% of net assets in equity funds (approximately 40% in the Equity Index Fund, 21% in the Mid-Cap Equity Index Fund, 13% in the International Fund and 7% each in the Small Cap Growth and Small Cap Value Funds) and approximately 12% of net assets in the Bond Fund.
Performance for the 2035 Retirement Fund is compared to the S&P 500® Index (88% weighting) and the Barclay's Capital Aggregate Bond Index® (12% weighting). For the year ended December 31, 2008, the Fund returned -32.53% versus a -31.93% return in the weighted benchmark. The underperformance of the Fund is mainly attributable to the Bond Fund underperforming the Barclay's Capital Aggregate Bond Index® and, to a lesser extent, the International Fund underperforming the S&P 500® Index.
2035 Retirement Fund
| Period | | Growth | | Total Return | |
Ended
12/31/08 | | of
$10,000 | | Cumu-
lative | | Average
Annual | |
| 1 Year | | $ | 6,747 | | | | -32.53 | % | | | -32.53 | % | |
Since 11/5/07
(Inception) | | $ | 6,576 | | | | -34.24 | % | | | -30.42 | % | |
S & P 500 Index
| Period | | Growth | | Total Return | |
Ended
12/31/08 | | of
$10,000 | | Cumu-
lative | | Average
Annual | |
| 1 Year | | $ | 6,300 | | | | -37.00 | % | | | -37.00 | % | |
Since 11/5/07
(Inception) | | $ | 6,225 | | | | -37.75 | % | | | -33.65 | % | |
Barclay's Capital Aggregate Bond Index
| Period | | Growth | | Total Return | |
Ended
12/31/08 | | of
$10,000 | | Cumu-
lative | | Average
Annual | |
| 1 Year | | $ | 10,524 | | | | 5.24 | % | | | 5.24 | % | |
Since 11/5/07
(Inception) | | $ | 10,673 | | | | 6.73 | % | | | 5.80 | % | |
The line representing the performance return of the 2035 Retirement Fund includes expenses, such as transaction costs and management fees (including those incurred by the underlying funds) that reduce returns, while the performance return lines of the Indices do not.
18
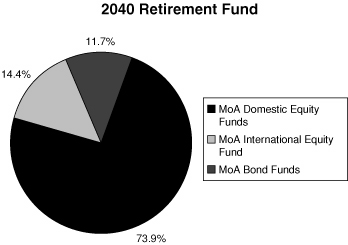
2040 RETIREMENT FUND
The objective of the 2040 Retirement Fund is current income and capital appreciation appropriate for the asset allocation associated with a target retirement in 2040. The 2040 Retirement Fund invests in funds of the Investment Company. The Fund's target allocation is approximately 89% of net assets in equity funds (approximately 35% in the Equity Index Fund, 24% in the Mid-Cap Equity Index Fund, 14% in the International Fund and 8% each in the Small Cap Growth and Small Cap Value Funds) and approximately 11% of net assets in the Bond Fund.
Performance for the 2040 Retirement Fund is compared to the S&P 500® Index (89% weighting) and the Barclay's Capital Aggregate Bond Index® (11% weighting). For the year ended December 31, 2008, the Fund returned -32.75%, in line with the -32.35% return in the weighted benchmark. The slight underperformance of the Fund is mainly attributable to the Bond Fund underperforming the Barclay's Capital Aggregate Bond Index® and the International Fund underperforming the S&P 500® Index.

2040 Retirement Fund
| Period | | Growth | | Total Return | |
Ended
12/31/08 | | of
$10,000 | | Cumu-
lative | | Average
Annual | |
| 1 Year | | $ | 6,725 | | | | -32.75 | % | | | -32.75 | % | |
Since 11/5/07
(Inception) | | $ | 6,545 | | | | -34.55 | % | | | -30.71 | % | |
S & P 500 Index
| Period | | Growth | | Total Return | |
Ended
12/31/08 | | of
$10,000 | | Cumu-
lative | | Average
Annual | |
| 1 Year | | $ | 6,300 | | | | -37.00 | % | | | -37.00 | % | |
Since 11/5/07
(Inception) | | $ | 6,225 | | | | -37.75 | % | | | -33.65 | % | |
Barclay's Capital Aggregate Bond Index
| Period | | Growth | | Total Return | |
Ended
12/31/08 | | of
$10,000 | | Cumu-
lative | | Average
Annual | |
| 1 Year | | $ | 10,524 | | | | 5.24 | % | | | 5.24 | % | |
Since 11/5/07
(Inception) | | $ | 10,673 | | | | 6.73 | % | | | 5.80 | % | |
The line representing the performance return of the 2040 Retirement Fund includes expenses, such as transaction costs and management fees (including those incurred by the underlying funds) that reduce returns, while the performance return lines of the Indices do not.
19
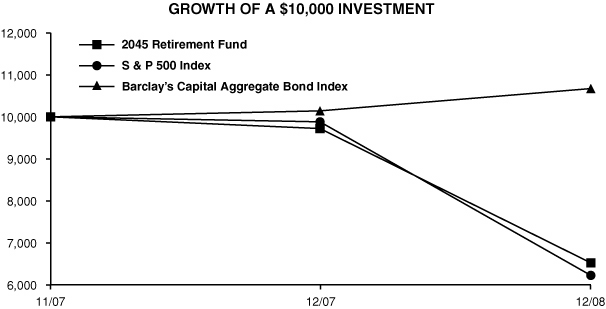
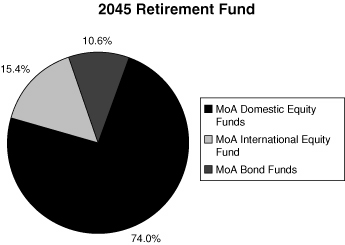
2045 RETIREMENT FUND
The objective of the 2045 Retirement Fund is current income and capital appreciation appropriate for the asset allocation associated with a target retirement in 2045. The 2045 Retirement Fund invests in funds of the Investment Company. The Fund's target allocation is approximately 90% of net assets in equity funds (approximately 35% in the Equity Index Fund, 20% in the Mid-Cap Equity Index Fund, 15% in the International Fund and 10% each in the Small Cap Growth and Small Cap Value Funds) and approximately 10% of net assets in the Bond Fund.
Performance for the 2045 Retirement Fund is compared to the S&P 500® Index (90% weighting) and the Barclay's Capital Aggregate Bond Index® (10% weighting). For the year ended December 31, 2008, the Fund returned -32.90%, in line with the -32.78% return in the weighted benchmark. The slight underperformance of the Fund is mainly attributable to the Bond Fund underperforming the Barclay's Capital Aggregate Bond Index® and the International Fund underperforming the S&P 500® Index.
2045 Retirement Fund
| Period | | Growth | | Total Return | |
Ended
12/31/08 | | of
$10,000 | | Cumu-
lative | | Average
Annual | |
| 1 Year | | $ | 6,710 | | | | -32.90 | % | | | -32.90 | % | |
Since 11/5/07
(Inception) | | $ | 6,523 | | | | -34.77 | % | | | -30.91 | % | |
S & P 500 Index
| Period | | Growth | | Total Return | |
Ended
12/31/08 | | of
$10,000 | | Cumu-
lative | | Average
Annual | |
| 1 Year | | $ | 6,300 | | | | -37.00 | % | | | -37.00 | % | |
Since 11/5/07
(Inception) | | $ | 6,225 | | | | -37.75 | % | | | -33.65 | % | |
Barclay's Capital Aggregate Bond Index
| Period | | Growth | | Total Return | |
Ended
12/31/08 | | of
$10,000 | | Cumu-
lative | | Average
Annual | |
| 1 Year | | $ | 10,524 | | | | 5.24 | % | | | 5.24 | % | |
Since 11/5/07
(Inception) | | $ | 10,673 | | | | 6.73 | % | | | 5.80 | % | |
The line representing the performance return of the 2045 Retirement Fund includes expenses, such as transaction costs and management fees (including those incurred by the underlying funds) that reduce returns, while the performance return lines of the Indices do not.
20
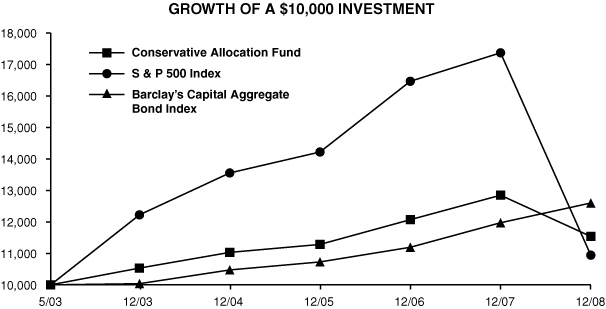
CONSERVATIVE ALLOCATION FUND
The objective of the Conservative Allocation Fund is current income and, to a lesser extent, capital appreciation. The Conservative Allocation Fund invests primarily in the fixed-income funds of the Investment Company and also invests in an equity fund of the Investment Company. The Conservative Allocation Fund's target allocation is approximately 75% of net assets in fixed-income funds (approximately 30% in the Bond Fund and approximately 45% in the Mid-Term Bond Fund) and approximately 25% of net assets in equity funds (the Equity Index Fund).
Performance for the Conservative Allocation Fund is compared to the Barclay's Capital Aggregate Bond Index® (75% weighting) and the S&P 500® Index (25% weighting). For the year ended December 31, 2008, the Conservative Allocation Fund returned -10.19% versus a -5.32% return in the weighted benchmark. The underperformance of the Fund is mainly attributable to the Bond Fund and, to a lesser extent, the Mid-Term Bond Fund underperforming the Barclay's Capital Aggregate Bond Index®.
Conservative Allocation Fund
| Period | | Growth | | Total Return | |
Ended
12/31/08 | | of
$10,000 | | Cumu-
lative | | Average
Annual | |
| 1 Year | | $ | 8,981 | | | | -10.19 | % | | | -10.19 | % | |
| 5 Years | | $ | 10,953 | | | | 9.53 | % | | | 1.84 | % | |
Since 5/20/03
(Inception) | | $ | 11,536 | | | | 15.36 | % | | | 2.58 | % | |
S & P 500 Index
| Period | | Growth | | Total Return | |
Ended
12/31/08 | | of
$10,000 | | Cumu-
lative | | Average
Annual | |
| 1 Year | | $ | 6,300 | | | | -37.00 | % | | | -37.00 | % | |
| 5 Years | | $ | 8,950 | | | | -10.50 | % | | | -2.19 | % | |
Since 5/20/03
(Inception) | | $ | 10,941 | | | | 9.41 | % | | | 1.61 | % | |
Barclay's Capital Aggregate Bond Index
| Period | | Growth | | Total Return | |
Ended
12/31/08 | | of
$10,000 | | Cumu-
lative | | Average
Annual | |
| 1 Year | | $ | 10,524 | | | | 5.24 | % | | | 5.24 | % | |
| 5 Years | | $ | 12,550 | | | | 25.50 | % | | | 4.65 | % | |
Since 5/20/03
(Inception) | | $ | 12,598 | | | | 25.98 | % | | | 4.20 | % | |
The line representing the performance return of the Conservative Allocation Fund includes expenses, such as transaction costs and management fees in the underlying funds that reduce returns, while the performance return lines of the Indices do not.
21
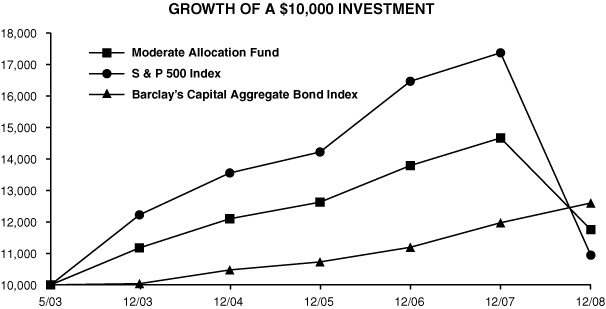
MODERATE ALLOCATION FUND
The objective of the Moderate Allocation Fund is capital appreciation and current income. The Moderate Allocation Fund invests in the equity and fixed-income funds of the Investment Company. The Moderate Allocation Fund's target allocation is approximately 50% of net assets in equity funds (approximately 35% of its net assets in the Equity Index Fund and approximately 15% of its net assets in the Mid-Cap Equity Index Fund) and approximately 50% of net assets in fixed-income funds (approximately 30% of its net assets in the Bond Fund and approximately 20% of its net assets in the Mid-Term Bond Fund).
Performance for the Moderate Allocation Fund is compared to the S&P 500® Index (50% weighting) and the Barclay's Capital Aggregate Bond Index® (50% weighting). For the year ended December 31, 2008, the Moderate Allocation Fund returned -19.85% versus a -15.88% return for the weighted benchmark. The underperformance of the Fund is mainly attributable to the Bond Fund and, to a lesser extent, the Mid-Term Bond Fund underperforming the Barclay's Capital Aggregate Bond Index®.
Moderate Allocation Fund
| Period | | Growth | | Total Return | |
Ended
12/31/08 | | of
$10,000 | | Cumu-
lative | | Average
Annual | |
| 1 Year | | $ | 8,015 | | | | -19.85 | % | | | -19.85 | % | |
| 5 Years | | $ | 10,517 | | | | 5.17 | % | | | 1.01 | % | |
Since 5/20/03
(Inception) | | $ | 11,751 | | | | 17.51 | % | | | 2.92 | % | |
S & P 500 Index
| Period | | Growth | | Total Return | |
Ended
12/31/08 | | of
$10,000 | | Cumu-
lative | | Average
Annual | |
| 1 Year | | $ | 6,300 | | | | -37.00 | % | | | -37.00 | % | |
| 5 Years | | $ | 8,950 | | | | -10.50 | % | | | -2.19 | % | |
Since 5/20/03
(Inception) | | $ | 10,941 | | | | 9.41 | % | | | 1.61 | % | |
Barclay's Capital Aggregate Bond Index
| Period | | Growth | | Total Return | |
Ended
12/31/08 | | of
$10,000 | | Cumu-
lative | | Average
Annual | |
| 1 Year | | $ | 10,524 | | | | 5.24 | % | | | 5.24 | % | |
| 5 Years | | $ | 12,550 | | | | 25.50 | % | | | 4.65 | % | |
Since 5/20/03
(Inception) | | $ | 12,598 | | | | 25.98 | % | | | 4.20 | % | |
The line representing the performance return of the Moderate Allocation Fund includes expenses, such as transaction costs and management fees in the underlying funds that reduce returns, while the performance return lines of the Indices do not.
22
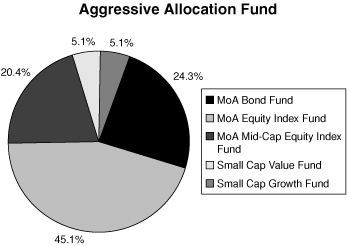
AGGRESSIVE ALLOCATION FUND
The objective of the Aggressive Allocation Fund is capital appreciation and, to a lesser extent, current income. The Aggressive Allocation Fund invests in the equity and fixed-income funds of the Investment Company. The Aggressive Allocation Fund's target allocation is approximately 75% of net assets in equity funds (approximately 45% of its net assets in the Equity Index Fund, approximately 20% of its net assets in the Mid-Cap Equity Index Fund, approximately 5% of its net assets in the Small Cap Value Fund and approximately 5% of its net assets in the Small Cap Growth Fund) and approximately 25% of net assets in the Bond Fund.
Performance for the Aggressive Allocation Fund is compared to the S&P 500 Index® (75% weighting) and the Barclay's Capital Aggregate Bond Index® (25% weighting). For the year ended December 31, 2008, the Aggressive Allocation Fund returned -28.20% versus a -26.44% return for the weighted benchmark. The underperformance of the Fund is mainly attributable to the Bond Fund and, to a lesser extent, the Mid-Term Bond Fund underperforming the Barclay's Capital Aggregate Bond Index®.

Aggressive Allocation Fund
| Period | | Growth | | Total Return | |
Ended
12/31/08 | | of
$10,000 | | Cumu-
lative | | Average
Annual | |
| 1 Year | | $ | 7,180 | | | | -28.20 | % | | | -28.20 | % | |
| 5 Years | | $ | 9,855 | | | | -1.45 | % | | | -0.29 | % | |
Since 5/20/03
(Inception) | | $ | 11,754 | | | | 17.54 | % | | | 2.92 | % | |
S & P 500 Index
| Period | | Growth | | Total Return | |
Ended
12/31/08 | | of
$10,000 | | Cumu-
lative | | Average
Annual | |
| 1 Year | | $ | 6,300 | | | | -37.00 | % | | | -37.00 | % | |
| 5 Years | | $ | 8,950 | | | | -10.50 | % | | | -2.19 | % | |
Since 5/20/03
(Inception) | | $ | 10,941 | | | | 9.41 | % | | | 1.61 | % | |
Barclay's Capital Aggregate Bond Index
| Period | | Growth | | Total Return | |
Ended
12/31/08 | | of
$10,000 | | Cumu-
lative | | Average
Annual | |
| 1 Year | | $ | 10,524 | | | | 5.24 | % | | | 5.24 | % | |
| 5 Years | | $ | 12,550 | | | | 25.50 | % | | | 4.65 | % | |
Since 5/20/03
(Inception) | | $ | 12,598 | | | | 25.98 | % | | | 4.20 | % | |
The line representing the performance return of the Aggressive Allocation Fund includes expenses, such as transaction costs and management fees in the underlying funds that reduce returns, while the performance return lines of the Indices do not.
23
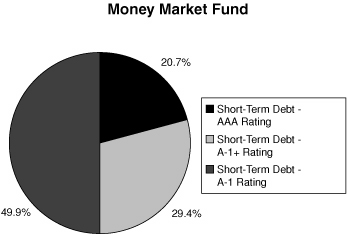
MONEY MARKET FUND
The Money Market Fund's investment objective is to realize current income while maintaining liquidity, investment quality and stability of capital through investing in high-quality commercial paper issued by U.S. corporations and securities issued by the U.S. government and its agencies. The Fund returned 2.34% for the year ended December 31, 2008, compared to a 1.80% return for the Citigroup 3 Month Treasury Bill Index. The Fund's overperformance compared to its benchmark is due to our efforts to extend the fund's weighted average maturity prior to the Fed's aggressive rate cuts.
The unprecedented events of 2008 have prompted the Federal Reserve and central banks around the world to take extraordinary measures to provide liquidity and restore confidence in the money markets. As a result, the Federal Reserve reduced the federal funds rate by 400 basis points during 2008, ending with a range of 0%-.25%. The seven-day effective yield as of February 17, 2009, was 0.02% As with all performance reporting, this yield is not necessarily indicative of future annual yields. Neither the Federal Deposit Insurance Corporation nor any other U.S. government agency insures or guarantees the Separate Account's investments in shares of the Money Market Fund.
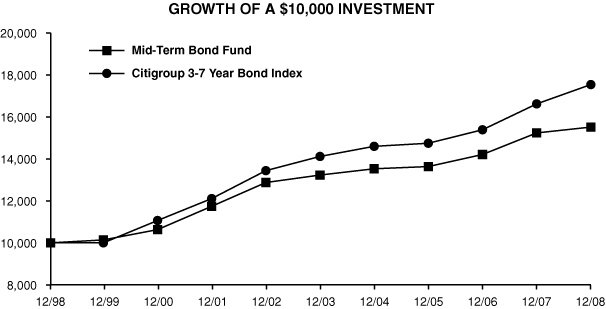
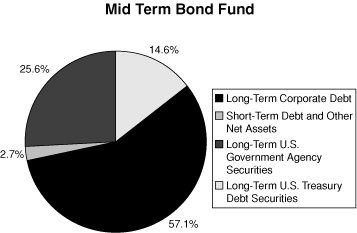
MID-TERM BOND FUND
The Mid-Term Bond Fund seeks a high level of return consistent with the preservation of capital through investment in publicly traded debt securities. The Mid-Term Bond Fund primarily invests in corporate and U.S. government agency securities, which normally yield more than U.S. Treasury issues.
Intermediate-term government rates declined substantially during the second half of 2008 in response to aggressive Federal Reserve easing. For example, five-year Treasury note yields declined from 3.33% on June 30th to 1.55% at year-end.
The Mid-Term Bond Fund maintained a shorter duration than its benchmark, the Citigroup Government/Corporate 3-7 Year Bond Index, due to concerns about inflation. This hurt performance since the Fund did not fully participate in the strong fourth quarter rally. The widening of corporate bonds' spreads also impeded returns since the Fund continues to emphasize higher yielding investment-grade securities in an extremely diversified portfolio. Credit diversification, along with shorter maturities, will continue to provide protection from event risk.
This portfolio strategy will be appropriate in an investment environment dominated by economic and inflationary concerns. Additionally, agency securities will become less dominant in the portfolio when fairly priced corporate securities become available.
For the year ended December 31, 2008, the Mid-Term Bond Fund returned 1.84% versus the 5.54% return for the Citigroup Government/Corporate 3-7 Year Bond Index. The Fund's underperformance compared to the benchmark was due to its shorter duration than the index and its underweighting of U.S. Treasuries.
Mid-Term Bond Fund
| Period | | Growth | | Total Return | |
Ended
12/31/08 | | of
$10,000 | | Cumu-
lative | | Average
Annual | |
| 1 Year | | $ | 10,184 | | | | 1.84 | % | | | 1.84 | % | |
| 5 Years | | $ | 11,727 | | | | 17.27 | % | | | 3.24 | % | |
| 10 Years | | $ | 15,512 | | | | 55.12 | % | | | 4.49 | % | |
Citigroup 3-7 Year Bond Index
| Period | | Growth | | Total Return | |
Ended
12/31/08 | | of
$10,000 | | Cumu-
lative | | Average
Annual | |
| 1 Year | | $ | 10,554 | | | | 5.54 | % | | | 5.54 | % | |
| 5 Years | | $ | 12,424 | | | | 24.24 | % | | | 4.44 | % | |
| 10 Years | | $ | 17,535 | | | | 75.35 | % | | | 5.77 | % | |
The line representing the performance return of the Mid-Term Bond Fund includes expenses, such as transaction costs and management fees that reduce returns, while the performance return line of the Index does not.
24
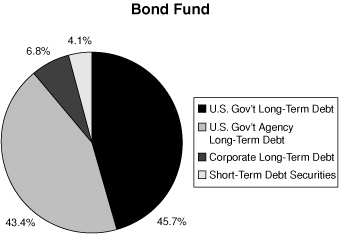
BOND FUND
The Bond Fund's primary investment objective is to provide as high a level of current income over time as is believed to be consistent with prudent investment risk by investing primarily in investment grade, publicly traded debt securities. A secondary objective is preservation of capital. The Bond Fund primarily invests in corporate, U.S. government agency and mortgage-backed securities, all of which normally yield more than U.S. Treasury issues.
The Federal Reserve aggressively cut the federal funds rate throughout 2008. Starting the year at 4.25%, it was lowered to 2.00% by the end of the second quarter and then to a historic low range of 0.00%-0.25% by year's end. This seven-step process of reducing rates was part of the government's attempt to stimulate the economy and keep longer rates low.
The bond market became more focused on deflation as the government became increasingly involved in the credit markets in order to avoid instability and defaults. Nevertheless, credit spreads widened to unprecedented levels as traditional corporate bonds traded down to distress prices in a barely functioning market place.
The Fund emphasizes higher yielding corporate bonds and these were negatively affected, especially in the fourth quarter. The Fund ended the year with a shorter duration than its benchmark, which also hurt its performance.
The strategy of creating an extremely diversified credit portfolio with an intermediate maturity focus will be continued so long as inflation threatens to impair returns and economic concerns remain. The management focus will also continue to be on income, rather than capital gains, as compounded returns at favorable rates remains a primary objective.
The Bond Fund's return for the year ended December 31, 2008, was -1.75%, compared to 5.24% for the Barclay's Capital Aggregate Bond Index®. The Fund's underperformance compared to the benchmark was due to its shorter duration than the index and its underweighting of U.S. Treasuries.

Bond Fund
| Period | | Growth | | Total Return | |
Ended
12/31/08 | | of
$10,000 | | Cumu-
lative | | Average
Annual | |
| 1 Year | | $ | 9,825 | | | | -1.75 | % | | | -1.75 | % | |
| 5 Years | | $ | 11,610 | | | | 16.10 | % | | | 3.03 | % | |
| 10 Years | | $ | 15,360 | | | | 53.60 | % | | | 4.39 | % | |
Barclay's Capital Aggregate Bond Index
| Period | | Growth | | Total Return | |
Ended
12/31/08 | | of
$10,000 | | Cumu-
lative | | Average
Annual | |
| 1 Year | | $ | 10,524 | | | | 5.24 | % | | | 5.24 | % | |
| 5 Years | | $ | 12,550 | | | | 25.50 | % | | | 4.65 | % | |
| 10 Years | | $ | 17,294 | | | | 72.94 | % | | | 5.63 | % | |
The line representing the performance return of the Bond Fund includes expenses, such as transaction costs and management fees that reduce returns, while the performance return line of the Index does not.
25
MUTUAL OF AMERICA INVESTMENT CORPORATION
ASSET ALLOCATIONS AS OF DECEMBER 31, 2008 (Unaudited)

26
MUTUAL OF AMERICA INVESTMENT CORPORATION
ASSET ALLOCATIONS AS OF DECEMBER 31, 2008 (Unaudited) (Continued)
27
MUTUAL OF AMERICA INVESTMENT CORPORATION
ASSET ALLOCATIONS AS OF DECEMBER 31, 2008 (Unaudited) (Continued)

28
MUTUAL OF AMERICA INVESTMENT CORPORATION
ASSET ALLOCATIONS AS OF DECEMBER 31, 2008 (Unaudited) (Continued)

29
MUTUAL OF AMERICA INVESTMENT CORPORATION
EXPENSE EXAMPLE (Unaudited)
EXAMPLE
As a shareholder of one of the Mutual of America Investment Corporation Funds, you incur ongoing costs, including management fees and other Fund expenses. You do not incur transactional costs, such as sales charges (loads), redemption fees or exchange fees.
This Example is intended to help you understand your ongoing costs (in dollars) of investing in a Fund and to compare these costs with the ongoing costs of investing in other mutual funds. The Example is based on an investment of $1,000 invested at July 1, 2008 and held for the entire period ending December 31, 2008.
ACTUAL EXPENSES
The first line of the tables below provides information about actual account values and actual expenses. You may use the information in this line, together with the amount you invested, to estimate the expenses that you paid over the period. Simply divide your account value by $1,000 (for example, an $8,600 account value divided by $1,000=8.6), then multiply the result by the number in the first line under the heading entitled "Expenses Paid During Period" to estimate the expenses you paid on your account during this period.
HYPOTHETICAL EXAMPLE FOR COMPARISON PURPOSES
The second line of the tables below provides information about hypothetical account values and hypothetical expenses based on each Fund's actual expense ratio and an assumed rate of return of 5% per year before expenses, which is not the Fund's actual return. The hypothetical account values and expenses may not be used to estimate the actual ending account balance or expenses you paid for the period. You may use this information to compare the ongoing costs of investing in the Fund with other funds. To do so, compare this 5% hypothetical example with the 5% hypothetical examples that appear in the shareholder reports of the other funds.
Please note that the second line of the table is useful in comparing ongoing costs only, and will not help you determine the relative total costs of owning other funds, which may also charge transactional costs, such as sales charges (loads), redemption fees or exchange fees.
Equity Index Fund
| | | Beginning
Account Value
July 1, 2008 | | Ending
Account Value
December 31, 2008 | | Expenses Paid
During Period*
July 1 –
December 31, 2008 | |
| Actual | | $ | 1,000.00 | | | $ | 715.06 | | | $ | 1.15 | | |
Hypothetical
(5% return before expenses) | | $ | 1,000.00 | | | $ | 1,023.44 | | | $ | 1.37 | | |
* Expenses are equal to the Fund's annualized expense ratio of 0.27%, multiplied by the average account value over the period, multiplied by 184/366 (to reflect the one-half year period).
All America Fund
| | | Beginning
Account Value
July 1, 2008 | | Ending
Account Value
December 31, 2008 | | Expenses Paid
During Period*
July 1 –
December 31, 2008 | |
| Actual | | $ | 1,000.00 | | | $ | 726.21 | | | $ | 2.33 | | |
Hypothetical
(5% return before expenses) | | $ | 1,000.00 | | | $ | 1,022.05 | | | $ | 2.75 | | |
* Expenses are equal to the Fund's annualized expense ratio of 0.54%, multiplied by the average account value over the period, multiplied by 184/366 (to reflect the one-half year period).
30
MUTUAL OF AMERICA INVESTMENT CORPORATION
EXPENSE EXAMPLE (Unaudited) (Continued)
Small Cap Value Fund
| | | Beginning
Account Value
July 1, 2008 | | Ending
Account Value
December 31, 2008 | | Expenses Paid
During Period*
July 1 –
December 31, 2008 | |
| Actual | | $ | 1,000.00 | | | $ | 794.45 | | | $ | 4.10 | | |
Hypothetical
(5% return before expenses) | | $ | 1,000.00 | | | $ | 1,020.14 | | | $ | 4.64 | | |
* Expenses are equal to the Fund's annualized expense ratio of 0.91%, multiplied by the average account value over the period, multiplied by 184/366 (to reflect the one-half year period).
Small Cap Growth Fund
| | | Beginning
Account Value
July 1, 2008 | | Ending
Account Value
December 31, 2008 | | Expenses Paid
During Period*
July 1 –
December 31, 2008 | |
| Actual | | $ | 1,000.00 | | | $ | 723.34 | | | $ | 3.93 | | |
Hypothetical
(5% return before expenses) | | $ | 1,000.00 | | | $ | 1,020.12 | | | $ | 4.65 | | |
* Expenses are equal to the Fund's annualized expense ratio of 0.92%, multiplied by the average account value over the period, multiplied by 184/366 (to reflect the one-half year period).
Mid Cap Value Fund
| | | Beginning
Account Value
July 1, 2008 | | Ending
Account Value
December 31, 2008 | | Expenses Paid
During Period*
July 1 –
December 31, 2008 | |
| Actual | | $ | 1,000.00 | | | $ | 712.74 | | | $ | 3.13 | | |
Hypothetical
(5% return before expenses) | | $ | 1,000.00 | | | $ | 1,021.05 | | | $ | 3.73 | | |
* Expenses are equal to the Fund's annualized expense ratio of 0.74%, multiplied by the average account value over the period, multiplied by 184/366 (to reflect the one-half year period).
Mid-Cap Equity Index Fund
| | | Beginning
Account Value
July 1, 2008 | | Ending
Account Value
December 31, 2008 | | Expenses Paid
During Period*
July 1 –
December 31, 2008 | |
| Actual | | $ | 1,000.00 | | | $ | 663.75 | | | $ | 1.03 | | |
Hypothetical
(5% return before expenses) | | $ | 1,000.00 | | | $ | 1,023.55 | | | $ | 1.27 | | |
* Expenses are equal to the Fund's annualized expense ratio of 0.25%, multiplied by the average account value over the period, multiplied by 184/366 (to reflect the one-half year period).
31
MUTUAL OF AMERICA INVESTMENT CORPORATION
EXPENSE EXAMPLE (Unaudited) (Continued)
International Fund
| | | Beginning
Account Value
July 1, 2008 | | Ending
Account Value
December 31, 2008 | | Expenses Paid
During Period*
July 1 –
December 31, 2008 | |
| Actual | | $ | 1,000.00 | | | $ | 671.39 | | | $ | 1.57 | | |
Hypothetical
(5% return before expenses) | | $ | 1,000.00 | | | $ | 1,022.88 | | | $ | 1.93 | | |
* Expenses are equal to the Fund's annualized expense ratio of 0.38%, (reflecting direct expenses and the proportional expense ratios of the underlying Exchange Traded Funds in which the Fund invests) multiplied by the average account value over the period, multiplied by 184/366 (to reflect the one-half year period).
Composite Fund
| | | Beginning
Account Value
July 1, 2008 | | Ending
Account Value
December 31, 2008 | | Expenses Paid
During Period*
July 1 –
December 31, 2008 | |
| Actual | | $ | 1,000.00 | | | $ | 825.20 | | | $ | 2.60 | | |
Hypothetical
(5% return before expenses) | | $ | 1,000.00 | | | $ | 1,021.90 | | | $ | 2.89 | | |
* Expenses are equal to the Fund's annualized expense ratio of 0.57%, multiplied by the average account value over the period, multiplied by 184/366 (to reflect the one-half year period).
Retirement Income Fund
| | | Beginning
Account Value
July 1, 2008 | | Ending
Account Value
December 31, 2008 | | Expenses Paid
During Period*
July 1 –
December 31, 2008 | |
| Actual | | $ | 1,000.00 | | | $ | 919.82 | | | $ | 2.36 | | |
Hypothetical
(5% return before expenses) | | $ | 1,000.00 | | | $ | 1,022.31 | | | $ | 2.49 | | |
* Expenses shown are equal to the Fund's annualized expense ratio of 0.49%, (reflecting direct investment management fees and the proportional expense ratios of the underlying funds in which the Fund invests) multiplied by the average account value over the period, multiplied by 184/366 (to reflect the one-half year period).
2010 Retirement Fund
| | | Beginning
Account Value
July 1, 2008 | | Ending
Account Value
December 31, 2008 | | Expenses Paid
During Period*
July 1 –
December 31, 2008 | |
| Actual | | $ | 1,000.00 | | | $ | 855.69 | | | $ | 2.09 | | |
Hypothetical
(5% return before expenses) | | $ | 1,000.00 | | | $ | 1,022.52 | | | $ | 2.29 | | |
* Expenses shown are equal to the Fund's annualized expense ratio of 0.45%, (reflecting direct investment management fees and the proportional expense ratios of the underlying funds in which the Fund invests) multiplied by the average account value over the period, multiplied by 184/366 (to reflect the one-half year period).
32
MUTUAL OF AMERICA INVESTMENT CORPORATION
EXPENSE EXAMPLE (Unaudited) (Continued)
2015 Retirement Fund
| | | Beginning
Account Value
July 1, 2008 | | Ending
Account Value
December 31, 2008 | | Expenses Paid
During Period*
July 1 –
December 31, 2008 | |
| Actual | | $ | 1,000.00 | | | $ | 833.55 | | | $ | 2.11 | | |
Hypothetical
(5% return before expenses) | | $ | 1,000.00 | | | $ | 1,022.46 | | | $ | 2.34 | | |
* Expenses shown are equal to the Fund's annualized expense ratio of 0.46%, (reflecting direct investment management fees and the proportional expense ratios of the underlying funds in which the Fund invests) multiplied by the average account value over the period, multiplied by 184/366 (to reflect the one-half year period).
2020 Retirement Fund
| | | Beginning
Account Value
July 1, 2008 | | Ending
Account Value
December 31, 2008 | | Expenses Paid
During Period*
July 1 –
December 31, 2008 | |
| Actual | | $ | 1,000.00 | | | $ | 801.27 | | | $ | 2.07 | | |
Hypothetical
(5% return before expenses) | | $ | 1,000.00 | | | $ | 1,022.46 | | | $ | 2.34 | | |
* Expenses shown are equal to the Fund's annualized expense ratio of 0.46%, (reflecting direct investment management fees and the proportional expense ratios of the underlying funds in which the Fund invests) multiplied by the average account value over the period, multiplied by 184/366 (to reflect the one-half year period).
2025 Retirement Fund
| | | Beginning
Account Value
July 1, 2008 | | Ending
Account Value
December 31, 2008 | | Expenses Paid
During Period*
July 1 –
December 31, 2008 | |
| Actual | | $ | 1,000.00 | | | $ | 772.39 | | | $ | 1.95 | | |
Hypothetical
(5% return before expenses) | | $ | 1,000.00 | | | $ | 1,022.57 | | | $ | 2.24 | | |
* Expenses shown are equal to the Fund's annualized expense ratio of 0.44%, (reflecting direct investment management fees and the proportional expense ratios of the underlying funds in which the Fund invests) multiplied by the average account value over the period, multiplied by 184/366 (to reflect the one-half year period).
33
MUTUAL OF AMERICA INVESTMENT CORPORATION
EXPENSE EXAMPLE (Unaudited) (Continued)
2030 Retirement Fund
| | | Beginning
Account Value
July 1, 2008 | | Ending
Account Value
December 31, 2008 | | Expenses Paid
During Period*
July 1 –
December 31, 2008 | |
| Actual | | $ | 1,000.00 | | | $ | 757.83 | | | $ | 1.93 | | |
Hypothetical
(5% return before expenses) | | $ | 1,000.00 | | | $ | 1,022.57 | | | $ | 2.24 | | |
* Expenses shown are equal to the Fund's annualized expense ratio of 0.44%, (reflecting direct investment management fees and the proportional expense ratios of the underlying funds in which the Fund invests) multiplied by the average account value over the period, multiplied by 184/366 (to reflect the one-half year period).
2035 Retirement Fund
| | | Beginning
Account Value
July 1, 2008 | | Ending
Account Value
December 31, 2008 | | Expenses Paid
During Period*
July 1, 2008 –
December 31, 2008 | |
| Actual | | $ | 1,000.00 | | | $ | 735.39 | | | $ | 1.86 | | |
Hypothetical
(5% return before expenses) | | $ | 1,000.00 | | | $ | 1,022.62 | | | $ | 2.19 | | |
* Expenses shown are equal to the Fund's annualized expense ratio of 0.43%, (reflecting direct investment management fees and the proportional expense ratios of the underlying funds in which the Fund invests) multiplied by the average account value over the period, multiplied by 184/366 (to reflect the one-half year period).
2040 Retirement Fund
| | | Beginning
Account Value
July 1, 2008 | | Ending
Account Value
December 31, 2008 | | Expenses Paid
During Period*
July 1, 2008 –
December 31, 2008 | |
| Actual | | $ | 1,000.00 | | | $ | 731.47 | | | $ | 1.90 | | |
Hypothetical
(5% return before expenses) | | $ | 1,000.00 | | | $ | 1,022.57 | | | $ | 2.24 | | |
* Expenses shown are equal to the Fund's annualized expense ratio of 0.44%, (reflecting direct investment management fees and the proportional expense ratios of the underlying funds in which the Fund invests) multiplied by the average account value over the period, multiplied by 184/366 (to reflect the one-half year period).
34
MUTUAL OF AMERICA INVESTMENT CORPORATION
EXPENSE EXAMPLE (Unaudited) (Continued)
2045 Retirement Fund
| | | Beginning
Account Value
July 1, 2008 | | Ending
Account Value
December 31, 2008 | | Expenses Paid
During Period*
July 1, 2008 –
December 31, 2008 | |
| Actual | | $ | 1,000.00 | | | $ | 732.36 | | | $ | 1.99 | | |
Hypothetical
(5% return before expenses) | | $ | 1,000.00 | | | $ | 1,022.46 | | | $ | 2.34 | | |
* Expenses shown are equal to the Fund's annualized expense ratio of 0.46%, (reflecting direct investment management fees and the proportional expense ratios of the underlying funds in which the Fund invests) multiplied by the average account value over the period, multiplied by 184/366 (to reflect the one-half year period).
Conservative Allocation Fund
| | | Beginning
Account Value
July 1, 2008 | | Ending
Account Value
December 31, 2008 | | Expenses Paid
During Period*
July 1, 2008 –
December 31, 2008 | |
| Actual | | $ | 1,000.00 | | | $ | 916.51 | | | $ | 2.31 | | |
Hypothetical
(5% return before expenses) | | $ | 1,000.00 | | | $ | 1,022.36 | | | $ | 2.44 | | |
* Expenses are equal to the Fund's annualized expense ratio of 0.48% (reflecting the proportional expense ratios of the underlying funds in which the Fund invests), multiplied by the average account value over the period, multiplied by 184/366 (to reflect the one-half year period).
Moderate Allocation Fund
| | | Beginning
Account Value
July 1, 2008 | | Ending
Account Value
December 31, 2008 | | Expenses Paid
During Period*
July 1, 2008 –
December 31, 2008 | |
| Actual | | $ | 1,000.00 | | | $ | 836.27 | | | $ | 1.89 | | |
Hypothetical
(5% return before expenses) | | $ | 1,000.00 | | | $ | 1,022.72 | | | $ | 2.08 | | |
* Expenses are equal to the Fund's annualized expense ratio of 0.41% (reflecting the proportional expense ratios of the underlying funds in which the Fund invests), multiplied by the average account value over the period, multiplied by 184/366 (to reflect the one-half year period).
Aggressive Allocation Fund
| | | Beginning
Account Value
July 1, 2008 | | Ending
Account Value
December 31, 2008 | | Expenses Paid
During Period*
July 1, 2008 –
December 31, 2008 | |
| Actual | | $ | 1,000.00 | | | $ | 770.66 | | | $ | 1.77 | | |
Hypothetical
(5% return before expenses) | | $ | 1,000.00 | | | $ | 1,022.77 | | | $ | 2.03 | | |
* Expenses are equal to the Fund's annualized expense ratio of 0.40% (reflecting the proportional expense ratios of the underlying funds in which the Fund invests), multiplied by the average account value over the period, multiplied by 184/366 (to reflect the one-half year period).
35
MUTUAL OF AMERICA INVESTMENT CORPORATION
EXPENSE EXAMPLE (Unaudited) (Continued)
Money Market Fund
| | | Beginning
Account Value
July 1, 2008 | | Ending
Account Value
December 31, 2008 | | Expenses Paid
During Period*
July 1, 2008 –
December 31, 2008 | |
| Actual | | $ | 1,000.00 | | | $ | 1,010.04 | | | $ | 1.62 | | |
Hypothetical
(5% return before expenses) | | $ | 1,000.00 | | | $ | 1,023.18 | | | $ | 1.63 | | |
* Expenses are equal to the Fund's annualized expense ratio of 0.32%, multiplied by the average account value over the period, multiplied by 184/366 (to reflect the one-half year period).
Mid-Term Bond Fund
| | | Beginning
Account Value
July 1, 2008 | | Ending
Account Value
December 31, 2008 | | Expenses Paid
During Period*
July 1, 2008 –
December 31, 2008 | |
| Actual | | $ | 1,000.00 | | | $ | 1,003.37 | | | $ | 2.91 | | |
Hypothetical
(5% return before expenses) | | $ | 1,000.00 | | | $ | 1,021.86 | | | $ | 2.94 | | |
* Expenses are equal to the Fund's annualized expense ratio of 0.58%, multiplied by the average account value over the period, multiplied by 184/366 (to reflect the one-half year period).
Bond Fund
| | | Beginning
Account Value
July 1, 2008 | | Ending
Account Value
December 31, 2008 | | Expenses Paid
During Period*
July 1, 2008 –
December 31, 2008 | |
| Actual | | $ | 1,000.00 | | | $ | 974.35 | | | $ | 2.86 | | |
Hypothetical
(5% return before expenses) | | $ | 1,000.00 | | | $ | 1,021.86 | | | $ | 2.93 | | |
* Expenses are equal to the Fund's annualized expense ratio of 0.58%, multiplied by the average account value over the period, multiplied by 184/366 (to reflect the one-half year period).
36
MUTUAL OF AMERICA INVESTMENT CORPORATION (EQUITY INDEX FUND)
SUMMARY PORTFOLIO OF INVESTMENTS IN SECURITIES
December 31, 2008
| | | Shares | | Value | |
| INDEXED ASSETS: | |
| COMMON STOCKS | |
| BASIC MATERIALS (2.8%) | |
| Monsanto Co. | | | 35,901 | | | $ | 2,525,635 | | |
| Other Securities | | | 462,384 | | | | 12,853,370 | | |
| | | | 15,379,005 | | |
| CONSUMER, CYCLICAL (7.9%) | |
| Comcast Corp. Cl A | | | 188,546 | | | | 3,182,656 | | |
| Disney (Walt) Co. | | | 121,355 | | | | 2,753,545 | | |
| Home Depot, Inc. | | | 111,052 | | | | 2,556,417 | | |
| McDonald's Corp. | | | 72,984 | | | | 4,538,875 | | |
| Other Securities | | | 1,822,559 | | | | 30,151,131 | | |
| | | | 43,182,624 | | |
| CONSUMER, NON-CYCLICAL (12.1%) | |
| Coca-Cola Co. | | | 130,297 | | | | 5,898,545 | | |
| CVS Caremark Corp. | | | 94,104 | | | | 2,704,549 | | |
| Kraft Foods, Inc. Cl A | | | 96,223 | | | | 2,583,588 | | |
| PepsiCo, Inc. | | | 101,686 | | | | 5,569,342 | | |
| Philip Morris Int'l., Inc. | | | 132,453 | | | | 5,763,030 | | |
| Proctor & Gamble Co. | | | 195,514 | | | | 12,086,676 | | |
| Wal-Mart Stores, Inc. | | | 146,387 | | | | 8,206,455 | | |
| Other Securities | | | 819,955 | | | | 23,393,502 | | |
| | | | 66,205,687 | | |
| ENERGY (12.6%) | |
| Chevron Corp. | | | 133,045 | | | | 9,841,339 | | |
| ConocoPhillips | | | 97,646 | | | | 5,058,063 | | |
| Exxon Mobil Corp. | | | 333,035 | | | | 26,586,185 | | |
| Occidental Petroleum Corp. | | | 53,005 | | | | 3,179,770 | | |
| Schlumberger Ltd. | | | 78,316 | | | | 3,315,116 | | |
| Other Securities | | | 766,720 | | | | 20,594,536 | | |
| | | | 68,575,009 | | |
| FINANCIAL (12.5%) | |
| Bank of America Corp. | | | 328,513 | | | | 4,625,463 | | |
| Goldman Sachs Group, Inc. | | | 28,977 | | | | 2,445,369 | | |
| JPMorgan Chase & Co. | | | 244,365 | | | | 7,704,829 | | |
| U.S. Bancorp | | | 114,923 | | | | 2,874,224 | | |
| Wells Fargo & Co. | | | 248,208 | | | | 7,317,172 | | |
| Other Securities | | | 2,589,206 | | | | 43,377,668 | | |
| | | | 68,344,725 | | |
| HEALTHCARE (14.0%) | |
| Abbott Laboratories | | | 101,624 | | | | 5,423,673 | | |
| Amgen, Inc.* | | | 69,381 | | | | 4,006,753 | | |
* Non-income producing security.
| | | Shares | | Value | |
| INDEXED ASSETS (CONTINUED): | |
| COMMON STOCKS (CONTINUED) | |
| HEALTHCARE (CONTINUED) | |
| Bristol-Myers Squibb Co. | | | 129,610 | | | $ | 3,013,433 | | |
| Gilead Sciences, Inc.* | | | 60,241 | | | | 3,080,725 | | |
| Johnson & Johnson | | | 181,657 | | | | 10,868,538 | | |
| Lilly (Eli) & Co. | | | 65,541 | | | | 2,639,336 | | |
| Merck & Co., Inc. | | | 138,421 | | | | 4,207,998 | | |
| Pfizer, Inc. | | | 441,476 | | | | 7,818,540 | | |
| Wyeth | | | 87,222 | | | | 3,271,697 | | |
| Other Securities | | | 1,020,648 | | | | 31,725,972 | | |
| | | | 76,056,665 | | |
| INDUSTRIAL (10.4%) | |
| 3M Co. | | | 45,369 | | | | 2,610,532 | | |
| General Electric Co. | | | 687,676 | | | | 11,140,351 | | |
| United Parcel Service, Inc. Cl B | | | 65,169 | | | | 3,594,722 | | |
| United Technologies Corp. | | | 62,251 | | | | 3,336,653 | | |
| Other Securities | | | 964,280 | | | | 36,283,954 | | |
| | | | 56,966,212 | | |
| TECHNOLOGY (14.5%) | |
| Apple, Inc.* | | | 58,194 | | | | 4,966,858 | | |
| Cisco Systems, Inc.* | | | 383,347 | | | | 6,248,556 | | |
| Google, Inc.* | | | 15,666 | | | | 4,819,645 | | |
| Hewlett-Packard Co. | | | 160,394 | | | | 5,820,698 | | |
| Int'l. Business Machines Corp. | | | 88,002 | | | | 7,406,248 | | |
| Intel Corp. | | | 364,158 | | | | 5,338,556 | | |
| Microsoft Corp. | | | 500,877 | | | | 9,737,049 | | |
| Oracle Corp.* | | | 256,629 | | | | 4,550,032 | | |
| QUALCOMM, Inc. | | | 108,387 | | | | 3,883,506 | | |
| Other Securities | | | 1,980,011 | | | | 26,022,278 | | |
| | | | 78,793,426 | | |
| TELECOMMUNICATIONS (3.6%) | |
| AT&T, Inc. | | | 385,830 | | | | 10,996,155 | | |
| Verizon Communications, Inc. | | | 185,973 | | | | 6,304,485 | | |
| Other Securities | | | 375,362 | | | | 2,413,164 | | |
| | | | 19,713,804 | | |
| UTILITIES (4.0%) | |
| Other Securities | | | 741,337 | | | | 21,822,916 | | |
TOTAL INDEXED ASSETS-COMMON STOCKS
(Cost: $625,064,783) 94.4% | | $ | 515,040,073 | | |
The accompanying notes are an integral part of these portfolio schedules.
37
MUTUAL OF AMERICA INVESTMENT CORPORATION (EQUITY INDEX FUND)
SUMMARY PORTFOLIO OF INVESTMENTS IN SECURITIES (Continued)
December 31, 2008
| | | Rating** | | Rate | | Maturity | | Face
Amount | | Value | |
| SHORT-TERM DEBT SECURITIES: | |
| U. S. GOVERNMENT (1.4%) | |
| U.S. Treasury Bill (1) | | AAA | | | 0.01 - 1.07 | % | | 01/02/09 - 04/30/09 | | $ | 7,600,000 | | | $ | 7,599,299 | | |
| COMMERCIAL PAPER (4.0%) | |
| NetJets, Inc.† | | A-1+ | | | 0.10 | | | 03/02/09 | | | 8,000,000 | | | | 7,998,645 | | |
| Toyota Motor Credit Corp. | | A-1+ | | | 0.40 | | | 01/21/09 - 01/22/09 | | | 7,750,000 | | | | 7,748,269 | | |
| Washington Post Co.† | | A-1 | | | 0.03 | | | 01/05/09 | | | 5,020,000 | | | | 5,019,983 | | |
| 7-Eleven, Inc.† | | A-1+ | | | 0.08 | | | 01/22/09 | | | 898,000 | | | | 897,958 | | |
| | | | 21,664,855 | | |
TOTAL SHORT-TERM DEBT SECURITIES
(Cost: $29,264,380) 5.4% | | | 29,264,154 | | |
TOTAL INVESTMENTS
(Cost: $654,329,163) 99.8% | | | 544,304,227 | | |
| OTHER NET ASSETS 0.2% | | | 880,606 | | |
| NET ASSETS 100.0% | | $ | 545,184,833 | | |
** Ratings as per Standard & Poors Corporation.
† Security exempt from registration under Rule 144A of the Securities Act of 1933. These securities may be resold in transactions exempt from registration, normally to qualified institutional buyers. At December 31, 2008, the aggregate value of these securities was $13,916,586, or 2.6% of the Fund's net assets.
(1) The security, or a portion thereof, has been segregated to cover initial margin requirements on open futures contracts.
"Other Securities" represent securities in the respective category that individually, or in the aggregate by issuer, do not exceed 1% of net assets.
FUTURES CONTRACTS OUTSTANDING AS OF DECEMBER 31, 2008:
| | | Expiration
Date | | Underlying Face
Amount at Value | | Unrealized
Gain(Loss) | |
| PURCHASED | |
| 129 S&P 500 Stock Index Futures Contracts | | March 2009 | | $ | 29,028,225 | | | $ | (9,213 | ) | |
Face value of futures purchased and outstanding as percentage of total investments in securities: 5.3%
The accompanying notes are an integral part of these portfolio schedules.
38
MUTUAL OF AMERICA INVESTMENT CORPORATION (ALL AMERICA FUND)
SUMMARY PORTFOLIO OF INVESTMENTS IN SECURITIES
December 31, 2008
| | | Shares | | Value | |
| INDEXED ASSETS: | |
| COMMON STOCKS | |
| BASIC MATERIALS (1.5%) | |
| Monsanto Co. | | | 7,771 | | | $ | 546,690 | | |
| Other Securities | | | 100,047 | | | | 2,781,756 | | |
| | | | 3,328,446 | | |
| CONSUMER, CYCLICAL (4.2%) | |
| Comcast Corp. Cl A | | | 40,829 | | | | 689,194 | | |
| McDonald's Corp. | | | 15,802 | | | | 982,726 | | |
| Other Securities | | | 444,586 | | | | 7,672,511 | | |
| | | | 9,344,431 | | |
| CONSUMER, NON-CYCLICAL (6.5%) | |
| Coca-Cola Co. | | | 28,209 | | | | 1,277,021 | | |
| CVS Caremark Corp. | | | 20,363 | | | | 585,233 | | |
| General Mills, Inc. | | | 4,737 | | | | 287,773 | | |
| Kraft Foods, Inc. Cl A | | | 20,829 | | | | 559,259 | | |
| PepsiCo, Inc. | | | 22,020 | | | | 1,206,035 | | |
| Philip Morris Int'l., Inc. | | | 28,682 | | | | 1,247,954 | | |
| Proctor & Gamble Co. | | | 42,331 | | | | 2,616,900 | | |
| Wal-Mart Stores, Inc. | | | 31,700 | | | | 1,777,102 | | |
| Other Securities | | | 172,737 | | | | 4,775,974 | | |
| | | | 14,333,251 | | |
| ENERGY (6.7%) | |
| Chevron Corp. | | | 28,807 | | | | 2,130,854 | | |
| ConocoPhillips | | | 21,137 | | | | 1,094,897 | | |
| Exxon Mobil Corp. | | | 72,118 | | | | 5,757,170 | | |
| Occidental Petroleum Corp. | | | 11,482 | | | | 688,805 | | |
| Schlumberger Ltd. | | | 16,959 | | | | 717,874 | | |
| Other Securities | | | 165,905 | | | | 4,456,090 | | |
| | | | 14,845,690 | | |
| FINANCIAL (6.7%) | |
| Bank of America Corp. | | | 71,139 | | | | 1,001,637 | | |
| Bank of New York Mellon Corp. | | | 16,270 | | | | 460,929 | | |
| JPMorgan Chase & Co. | | | 52,917 | | | | 1,668,473 | | |
| MetLife, Inc. | | | 11,251 | | | | 392,210 | | |
| U.S. Bancorp | | | 24,876 | | | | 622,149 | | |
| Wells Fargo & Co. | | | 53,730 | | | | 1,583,960 | | |
| Other Securities | | | 538,668 | | | | 9,062,361 | | |
| | | | 14,791,719 | | |
* Non-income producing security.
| | | Shares | | Value | |
| INDEXED ASSETS (CONTINUED): | |
| COMMON STOCKS (CONTINUED) | |
| HEALTHCARE (7.4%) | |
| Abbott Laboratories | | | 21,998 | | | $ | 1,174,033 | | |
| Gilead Sciences, Inc.* | | | 13,042 | | | | 666,968 | | |
| Johnson & Johnson | | | 39,338 | | | | 2,353,593 | | |
| Merck & Co., Inc. | | | 29,975 | | | | 911,240 | | |
| Pfizer, Inc. | | | 95,601 | | | | 1,693,094 | | |
| Other Securities | | | 296,980 | | | | 9,666,048 | | |
| | | | 16,464,976 | | |
| INDUSTRIAL (5.6%) | |
| General Electric Co. | | | 148,915 | | | | 2,412,423 | | |
| Lockheed Martin Corp. | | | 4,720 | | | | 396,858 | | |
| Rockwell Collins, Inc. | | | 2,250 | | | | 87,953 | | |
| United Parcel Service, Inc. Cl B | | | 14,110 | | | | 778,308 | | |
| United Technologies Corp. | | | 13,478 | | | | 722,421 | | |
| Other Securities | | | 211,596 | | | | 7,935,557 | | |
| | | | 12,333,520 | | |
| TECHNOLOGY (7.7%) | |
| Apple, Inc.* | | | 12,603 | | | | 1,075,666 | | |
| Cisco Systems, Inc.* | | | 83,013 | | | | 1,353,112 | | |
| Google, Inc.* | | | 3,392 | | | | 1,043,549 | | |
| Hewlett-Packard Co. | | | 34,723 | | | | 1,260,098 | | |
| Int'l. Business Machines Corp. | | | 19,047 | | | | 1,602,996 | | |
| Intel Corp. | | | 78,858 | | | | 1,156,058 | | |
| Microsoft Corp. | | | 108,464 | | | | 2,108,540 | | |
| Oracle Corp.* | | | 55,540 | | | | 984,724 | | |
| QUALCOMM, Inc. | | | 23,471 | | | | 840,966 | | |
| Other Securities | | | 428,513 | | | | 5,631,723 | | |
| | | | 17,057,432 | | |
| TELECOMMUNICATIONS (2.0%) | |
| AT&T, Inc. | | | 83,550 | | | | 2,381,175 | | |
| Verizon Communications, Inc. | | | 40,272 | | | | 1,365,221 | | |
| Other Securities | | | 80,974 | | | | 521,709 | | |
| | | | 4,268,105 | | |
| UTILITIES (2.1%) | |
| Other Securities | | | 160,456 | | | | 4,723,138 | | |
TOTAL INDEXED ASSETS-COMMON STOCKS
(Cost: $149,875,259) 50.4% | | $ | 111,490,708 | | |
The accompanying notes are an integral part of these portfolio schedules.
39
MUTUAL OF AMERICA INVESTMENT CORPORATION (ALL AMERICA FUND)
SUMMARY PORTFOLIO OF INVESTMENTS IN SECURITIES (Continued)
December 31, 2008
| | | Rating** | | Rate | | Maturity | | Face
Amount | | Value | |
| INDEXED ASSETS: | |
| SHORT-TERM DEBT SECURITIES: | |
| U.S. GOVERNMENT (1.0%) | |
| U.S. Treasury Bill (1) | | AAA | | | 0.01 - 1.07 | % | | 01/02/09 - 04/30/09 | | $ | 2,200,000 | | | $ | 2,199,638 | | |
| COMMERCIAL PAPER (2.2%) | |
| Rockwell Collins, Inc.† | | A-1 | | | 0.07 | | | 01/02/09 | | | 1,140,000 | | | | 1,139,998 | | |
| Toyota Motor Credit Corp. | | A-1+ | | | 0.40 | | | 01/21/09 | | | 3,800,000 | | | | 3,799,156 | | |
| | | | 4,939,154 | | |
TOTAL INDEXED ASSETS - SHORT-TERM DEBT SECURITIES
(Cost: $7,138,825) 3.2% | | | 7,138,792 | | |
TOTAL INDEXED ASSETS
(Cost: $157,014,084) 53.6% | | $ | 118,629,500 | | |
FUTURES CONTRACTS OUTSTANDING AS OF DECEMBER 31, 2008:
| | | Expiration
Date | | Underlying Face
Amount at Value | | Unrealized
Gain(Loss) | |
| PURCHASED | |
| 32 S&P 500 Stock Index Futures Contracts | | March 2009 | | $ | 7,200,800 | | | $ | (21,200 | ) | |
Face value of futures purchased and outstanding as percentage of total investments in securities: 3.2%
** Ratings as per Standard & Poors Corporation.
(1) The security, or a portion thereof, has been segregated to cover initial margin requirements on open futures contracts.
"Other Securities" represent securities in the respective category that individually, or in the aggregate by issuer, do not exceed 1% of net assets.
The accompanying notes are an integral part of these portfolio schedules.
40
MUTUAL OF AMERICA INVESTMENT CORPORATION (ALL AMERICA FUND)
SUMMARY PORTFOLIO OF INVESTMENTS IN SECURITIES (Continued)
December 31, 2008
| | | Shares | | Value | |
| ACTIVE ASSETS: | |
| COMMON STOCKS | |
| BASIC MATERIALS (1.7%) | |
| Crown Hldgs., Inc.* | | | 54,566 | | | $ | 1,047,667 | | |
| Monsanto Co. | | | 5,790 | | | | 407,327 | | |
| Other Securities | | | 218,875 | | | | 2,386,458 | | |
| | | | 3,841,452 | | |
| CONSUMER, CYCLICAL (4.0%) | |
| Comcast Corp. Cl A | | | 33,167 | | | | 559,859 | | |
| McDonald's Corp. | | | 15,316 | | | | 952,502 | | |
| Tupperware Brands Corp. | | | 45,669 | | | | 1,036,686 | | |
| Other Securities | | | 451,451 | | | | 6,350,594 | | |
| | | | 8,899,641 | | |
| CONSUMER, NON-CYCLICAL (4.1%) | |
| CVS Caremark Corp. | | | 18,871 | | | | 542,353 | | |
| General Mills, Inc. | | | 10,636 | | | | 646,137 | | |
| Kraft Foods, Inc. Cl A | | | 13,011 | | | | 349,345 | | |
| PepsiCo, Inc. | | | 15,709 | | | | 860,382 | | |
| Proctor & Gamble Co. | | | 23,331 | | | | 1,442,322 | | |
| Wal-Mart Stores, Inc. | | | 21,916 | | | | 1,228,611 | | |
| Other Securities | | | 174,977 | | | | 3,964,548 | | |
| | | | 9,033,698 | | |
| ENERGY (3.9%) | |
| Chevron Corp. | | | 11,280 | | | | 834,382 | | |
| ConocoPhillips | | | 8,948 | | | | 463,506 | | |
| Exxon Mobil Corp. | | | 32,795 | | | | 2,618,025 | | |
| Occidental Petroleum Corp. | | | 9,333 | | | | 559,887 | | |
| Schlumberger Ltd. | | | 7,884 | | | | 333,730 | | |
| Other Securities | | | 193,502 | | | | 3,709,135 | | |
| | | | 8,518,665 | | |
| FINANCIAL (9.0%) | |
| Bank of America Corp. | | | 26,165 | | | | 368,403 | | |
| Bank of New York Mellon Corp. | | | 16,262 | | | | 460,702 | | |
iShares Russell 2000 Growth
Index Fund | | | 18,850 | | | | 958,711 | | |
| JPMorgan Chase & Co. | | | 18,540 | | | | 584,566 | | |
| MetLife, Inc. | | | 14,434 | | | | 503,169 | | |
| SPDR KBW Regional Banking ETF | | | 30,765 | | | | 897,107 | | |
| U.S. Bancorp | | | 16,769 | | | | 419,393 | | |
| Wells Fargo & Co. | | | 34,744 | | | | 1,024,253 | | |
* Non-income producing security.
| | | Shares | | Value | |
| ACTIVE ASSETS (CONTINUED): | |
| COMMON STOCKS (CONTINUED) | |
| FINANCIAL (CONTINUED) | |
| Westamerica Bancorporation | | | 17,147 | | | $ | 877,069 | | |
| Other Securities | | | 983,864 | | | | 13,892,466 | | |
| | | | 19,985,839 | | |
| HEALTHCARE (6.6%) | |
| Abbott Laboratories | | | 23,573 | | | | 1,258,091 | | |
| Gilead Sciences, Inc.* | | | 21,372 | | | | 1,092,964 | | |
| Johnson & Johnson | | | 26,461 | | | | 1,583,162 | | |
| Merck & Co., Inc. | | | 9,862 | | | | 299,805 | | |
| Other Securities | | | 664,502 | | | | 10,435,908 | | |
| | | | 14,669,930 | | |
| INDUSTRIAL (6.3%) | |
| General Electric Co. | | | 74,207 | | | | 1,202,153 | | |
| Lockheed Martin Corp. | | | 6,516 | | | | 547,865 | | |
| United Parcel Service, Inc. Cl B | | | 11,211 | | | | 618,399 | | |
| United Technologies Corp. | | | 9,431 | | | | 505,502 | | |
| Other Securities | | | 546,857 | | | | 11,101,236 | | |
| | | | 13,975,155 | | |
| TECHNOLOGY (6.0%) | |
| Apple, Inc.* | | | 7,548 | | | | 644,222 | | |
| Cisco Systems, Inc.* | | | 38,027 | | | | 619,840 | | |
| Google, Inc.* | | | 1,048 | | | | 322,417 | | |
| Hewlett-Packard Co. | | | 20,181 | | | | 732,368 | | |
| Int'l. Business Machines Corp. | | | 9,261 | | | | 779,406 | | |
| Intel Corp. | | | 25,886 | | | | 379,489 | | |
| Microsoft Corp. | | | 48,069 | | | | 934,461 | | |
| Oracle Corp.* | | | 21,657 | | | | 383,979 | | |
| QUALCOMM, Inc. | | | 14,830 | | | | 531,359 | | |
| Other Securities | | | 602,788 | | | | 7,918,042 | | |
| | | | 13,245,583 | | |
| TELECOMMUNICATIONS (1.2%) | |
| AT&T, Inc. | | | 39,817 | | | | 1,134,785 | | |
| Other Securities | | | 104,057 | | | | 1,488,008 | | |
| | | | 2,622,793 | | |
| UTILITIES (2.0%) | |
| Other Securities | | | 165,105 | | | | 4,317,096 | | |
TOTAL ACTIVE ASSETS-COMMON STOCKS
(Cost: $124,430,840) 44.8% | | $ | 99,109,852 | | |
The accompanying notes are an integral part of these portfolio schedules.
41
MUTUAL OF AMERICA INVESTMENT CORPORATION (ALL AMERICA FUND)
SUMMARY PORTFOLIO OF INVESTMENTS IN SECURITIES (Continued)
December 31, 2008
| | | Rating** | | Rate | | Maturity | | Face
Amount | | Value | |
| ACTIVE ASSETS: | |
| LONG-TERM DEBT SECURITIES: | |
| FINANCIAL (0.0%) | |
| GSC Capital Corp.†(2) | | NR | | | 7.25 | % | | 07/15/10 | | $ | 460,000 | | | $ | — | | |
TOTAL ACTIVE ASSETS - LONG-TERM DEBT SECURITIES
(Cost: $460,000) 0.0% | | | — | | |
| ACTIVE ASSETS: | |
| SHORT-TERM DEBT SECURITIES: | |
| COMMERCIAL PAPER (1.6%) | |
| Rockwell Collins, Inc.† | | A-1 | | | 0.07 | | | 01/02/09 | | | 2,900,000 | | | | 2,899,994 | | |
| Washington Post Co.† | | A-1 | | | 0.03 | | | 01/05/09 | | | 700,000 | | | | 699,998 | | |
| | | | 3,599,992 | | |
TOTAL ACTIVE ASSETS - SHORT-TERM DEBT SECURITIES
(Cost: $3,599,992) 1.6% | | | 3,599,992 | | |
TOTAL ACTIVE ASSETS
(Cost: $128,490,832) 46.4% | | | 102,709,844 | | |
TEMPORARY CASH INVESTMENTS (3)
(Cost: $266,800) 0.1% | | | 266,800 | | |
TOTAL INVESTMENTS
(Cost: $285,771,716) 100.1% | | | 221,606,144 | | |
| OTHER NET ASSETS (0.1%) | | | (100,407 | ) | |
| NET ASSETS 100.0% | | $ | 221,505,737 | | |
Abbreviations: NR = Not Rated
** Ratings as per Standard & Poors Corporation.
† Security exempt from registration under Rule 144A of the Securities Act of 1933. These securities may be resold in transactions exempt from registration, normally to qualified institutional buyers. At December 31, 2008, the aggregate value of these securities was $5,435,336, or 2.5% of the Fund's net assets.
(2) Issuer has filed for Chapter XI bankruptcy law (or equivalent) protection; issue is non-income producing.
(3) The fund has an arrangement with its custodian bank, JP Morgan Chase Bank, whereby uninvested cash, subject to parameters set by the fund, is automatically invested in the fund's name by the bank in overnight commercial paper issued by J.P. Morgan Chase & Co. On the next business day, these funds (and earned interest) are automatically returned to the fund. The annual rate of interest earned on this temporary cash investment at December 31, 2008 was 0.10%.
"Other Securities" represent securities in the respective category that individually, or in the aggregate by issuer, do not exceed 1% of net assets.
The accompanying notes are an integral part of these portfolio schedules.
42
MUTUAL OF AMERICA INVESTMENT CORPORATION (SMALL CAP VALUE FUND)
SUMMARY PORTFOLIO OF INVESTMENTS IN SECURITIES
December 31, 2008
| | | Shares | | Value | |
| COMMON STOCKS: | |
| BASIC MATERIALS (7.7%) | |
| Crown Hldgs., Inc.* | | | 307,509 | | | $ | 5,904,173 | | |
| Silgan Hldgs., Inc. | | | 72,740 | | | | 3,477,699 | | |
| Other Securities | | | 886,597 | | | | 2,533,193 | | |
| | | | 11,915,065 | | |
| CONSUMER, CYCLICAL (6.9%) | |
| Dillard's, Inc. Cl A | | | 364,753 | | | | 1,448,069 | | |
| Rent-A-Center, Inc.* | | | 113,956 | | | | 2,011,323 | | |
| Tupperware Brands Corp. | | | 167,293 | | | | 3,797,551 | | |
| Wolverine World Wide, Inc. | | | 93,385 | | | | 1,964,820 | | |
| Other Securities | | | 265,676 | | | | 1,501,055 | | |
| | | | 10,722,818 | | |
| CONSUMER, NON-CYCLICAL (7.2%) | |
| American Italian Pasta Co. Cl A* | | | 204,187 | | | | 4,561,538 | | |
Great Atlantic & Pacific Tea
Co., Inc.* | | | 280,895 | | | | 1,761,212 | | |
| Vector Group Ltd. | | | 149,410 | | | | 2,034,964 | | |
| Other Securities | | | 73,728 | | | | 2,793,832 | | |
| | | | 11,151,546 | | |
| ENERGY (1.9%) | |
| Ellora Energy, Inc.† | | | 119,800 | | | | 1,437,600 | | |
| Other Securities | | | 155,195 | | | | 1,552,973 | | |
| | | | 2,990,573 | | |
| FINANCIAL (37.6%) | |
| Aspen Insurance Hldgs. Ltd. | | | 116,870 | | | | 2,834,098 | | |
| BancFirst Corp. | | | 27,328 | | | | 1,446,198 | | |
| Bank Mutual Corp. | | | 258,034 | | | | 2,977,712 | | |
| Brookline Bancorp, Inc. | | | 262,784 | | | | 2,798,650 | | |
| Ellington Financial LLC† | | | 123,900 | | | | 2,478,000 | | |
| First Niagara Financial Group, Inc. | | | 198,846 | | | | 3,215,340 | | |
| Glacier Bancorp, Inc. | | | 133,149 | | | | 2,532,494 | | |
| Highwoods Properties, Inc. | | | 80,296 | | | | 2,196,899 | | |
| iShares Russell 2000 Index Fund | | | 31,570 | | | | 1,555,454 | | |
iShares Russell 2000 Value
Index Fund | | | 31,890 | | | | 1,568,031 | | |
Meadowbrook Insurance
Group, Inc. | | | 276,483 | | | | 1,780,551 | | |
| MFA Mortgage Investment, Inc. | | | 290,507 | | | | 1,711,086 | | |
| National Penn Bancshares, Inc. | | | 185,548 | | | | 2,692,301 | | |
| NewAlliance Bancshares, Inc. | | | 216,271 | | | | 2,848,289 | | |
| PMA Capital Corp. Cl A* | | | 205,703 | | | | 1,456,377 | | |
| ProAssurance Corp.* | | | 45,656 | | | | 2,409,724 | | |
| Realty Income Corp. | | | 81,030 | | | | 1,875,845 | | |
* Non-income producing security.
| | | Shares | | Value | |
| COMMON STOCKS (CONTINUED): | |
| FINANCIAL (CONTINUED) | |
| S.Y. Bancorp, Inc. | | | 74,256 | | | $ | 2,042,040 | | |
| SeaBright Insurance Hldgs., Inc.* | | | 155,526 | | | | 1,825,875 | | |
| Senior Housing Pptys. Trust | | | 100,291 | | | | 1,797,215 | | |
| SPDR KBW Regional Banking ETF | | | 96,890 | | | | 2,825,312 | | |
| Trico Bancshares | | | 75,112 | | | | 1,875,547 | | |
| Westamerica Bancorporation | | | 53,045 | | | | 2,713,252 | | |
| Westfield Financial, Inc. | | | 140,435 | | | | 1,449,289 | | |
| Other Securities | | | 1,342,054 | | | | 5,571,105 | | |
| | | | 58,476,684 | | |
| HEALTHCARE (4.3%) | |
| Enzon Pharmaceuticals, Inc.* | | | 440,855 | | | | 2,570,185 | | |
| Other Securities | | | 666,907 | | | | 4,120,468 | | |
| | | | 6,690,653 | | |
| INDUSTRIAL (11.9%) | |
| Alaska Air Group, Inc.* | | | 134,880 | | | | 3,945,240 | | |
| CRA International, Inc.* | | | 53,352 | | | | 1,436,769 | | |
| Genesee & Wyoming, Inc. Cl A* | | | 57,184 | | | | 1,744,112 | | |
| Mueller Industries, Inc. | | | 174,672 | | | | 4,380,774 | | |
| Old Dominion Freight Line, Inc.* | | | 80,465 | | | | 2,290,034 | | |
| Perini Corp.* | | | 87,507 | | | | 2,045,914 | | |
| Other Securities | | | 579,396 | | | | 2,545,931 | | |
| | | | 18,388,774 | | |
| TECHNOLOGY (8.0%) | |
| Parametric Technology Corp.* | | | 133,934 | | | | 1,694,265 | | |
| Sybase, Inc.* | | | 64,461 | | | | 1,596,699 | | |
| Websense, Inc.* | | | 118,667 | | | | 1,776,445 | | |
| Other Securities | | | 828,015 | | | | 7,361,863 | | |
| | | | 12,429,272 | | |
| TELECOMMUNICATIONS (2.3%) | |
Iowa Telecommunications
Svcs., Inc. | | | 106,466 | | | | 1,520,334 | | |
| Other Securities | | | 177,732 | | | | 2,118,055 | | |
| | | | 3,638,389 | | |
| UTILITIES (7.0%) | |
| Avista Corp. | | | 123,693 | | | | 2,397,170 | | |
| Unisource Energy Corp. | | | 79,227 | | | | 2,326,105 | | |
| Westar Energy, Inc. | | | 102,400 | | | | 2,100,224 | | |
| Other Securities | | | 249,619 | | | | 4,045,713 | | |
| | | | 10,869,212 | | |
TOTAL COMMON STOCKS
(Cost: $190,455,820) 94.8% | | $ | 147,272,986 | | |
The accompanying notes are an integral part of these portfolio schedules.
43
MUTUAL OF AMERICA INVESTMENT CORPORATION (SMALL CAP VALUE FUND)
SUMMARY PORTFOLIO OF INVESTMENTS IN SECURITIES (Continued)
December 31, 2008
| | | Rating** | | Rate | | Maturity | | Face
Amount | | Value | |
| LONG-TERM DEBT SECURITIES: | |
| FINANCIAL (0.0%) | |
| GSC Capital Corp.†(1) | | NR | | | 7.25 | % | | 07/15/10 | | $ | 1,890,000 | | | $ | — | | |
TOTAL LONG-TERM DEBT SECURITIES
(Cost: $1,890,000) 0.0% | | | — | | |
| SHORT-TERM DEBT SECURITIES: | |
| U.S. GOVERNMENT AGENCIES (0.3%) | |
| FHLMCAAA0.0302/04/09420,000 | | | 419,988 | | |
| COMMERCIAL PAPER (4.7%) | |
| Danaher Corp. | | A-1 | | | 0.02 | | | 01/05/09 | | | 3,800,000 | | | | 3,799,992 | | |
| Hershey Co. | | A-1 | | | 1.15 | | | 01/12/09 | | | 1,000,000 | | | | 999,648 | | |
| Rockwell Collins, Inc.† | | A-1 | | | 0.07 | | | 01/02/09 | | | 1,000,000 | | | | 999,998 | | |
| Washington Post Co.† | | A-1 | | | 0.03 | | | 01/05/09 | | | 1,500,000 | | | | 1,499,995 | | |
| | | | 7,299,633 | | |
TOTAL SHORT-TERM DEBT SECURITIES
(Cost: $7,719,621) 5.0% | | | 7,719,621 | | |
TOTAL INVESTMENTS
(Cost: $200,065,441) 99.8% | | | 154,992,607 | | |
| OTHER NET ASSETS 0.2% | | | 338,939 | | |
| NET ASSETS 100.0% | | $ | 155,331,546 | | |
Abbreviations: FHLMC = Federal Home Loan Mortgage Corporation
** Ratings as per Standard & Poors Corporation.
† Security exempt from registration under Rule 144A of the Securities Act of 1933. These securities may be resold in transactions exempt from registration, normally to qualified institutional buyers. At December 31, 2008, the aggregate value of these securities was $6,489,645, or 4.2% of the Fund's net assets.
(1) Issuer has filed for Chapter XI bankruptcy law (or equivalent) protection; issue is non-income producing.
"Other Securities" represent securities in the respective category that individually, or in the aggregate by issuer, do not exceed 1% of net assets.
The accompanying notes are an integral part of these portfolio schedules.
44
MUTUAL OF AMERICA INVESTMENT CORPORATION (SMALL CAP GROWTH FUND)
SUMMARY PORTFOLIO OF INVESTMENTS IN SECURITIES
December 31, 2008
| | | Shares | | Value | |
| COMMON STOCKS: | |
| BASIC MATERIALS (2.4%) | |
| Royal Gold, Inc. | | | 50,590 | | | $ | 2,489,534 | | |
| Other Securities | | | 22,756 | | | | 1,087,964 | | |
| | | | 3,577,498 | | |
| CONSUMER, CYCLICAL (11.5%) | |
| California Pizza Kitchen, Inc.* | | | 160,330 | | | | 1,718,738 | | |
| Gymboree Corp.* | | | 51,269 | | | | 1,337,608 | | |
| Netflix, Inc.* | | | 66,883 | | | | 1,999,133 | | |
| Tupperware Brands Corp. | | | 85,275 | | | | 1,935,743 | | |
| WMS Industries, Inc.* | | | 83,506 | | | | 2,246,311 | | |
| Wolverine World Wide, Inc. | | | 68,811 | | | | 1,447,783 | | |
| Other Securities | | | 616,155 | | | | 6,248,364 | | |
| | | | 16,933,680 | | |
| CONSUMER, NON-CYCLICAL (2.5%) | |
| Ralcorp Hldgs., Inc.* | | | 29,833 | | | | 1,742,247 | | |
| Other Securities | | | 73,622 | | | | 1,880,300 | | |
| | | | 3,622,547 | | |
| ENERGY (5.0%) | |
| Concho Resources, Inc.* | | | 74,341 | | | | 1,696,462 | | |
| Penn Virginia Corp. | | | 54,826 | | | | 1,424,379 | | |
| Other Securities | | | 295,719 | | | | 4,184,584 | | |
| | | | 7,305,425 | | |
| FINANCIAL (13.7%) | |
| Glacier Bancorp, Inc. | | | 70,973 | | | | 1,349,906 | | |
iShares Russell 2000 Growth
Index Fund | | | 102,887 | | | | 5,232,830 | | |
| Realty Income Corp. | | | 78,317 | | | | 1,813,039 | | |
| Senior Housing Pptys. Trust | | | 84,605 | | | | 1,516,122 | | |
| SPDR KBW Regional Banking ETF | | | 71,363 | | | | 2,080,945 | | |
| Stifel Financial Corp.* | | | 52,599 | | | | 2,411,664 | | |
| Westamerica Bancorporation | | | 43,108 | | | | 2,204,974 | | |
| Other Securities | | | 178,582 | | | | 3,572,255 | | |
| | | | 20,181,735 | | |
| HEALTHCARE (23.0%) | |
| Abiomed, Inc.* | | | 106,147 | | | | 1,742,934 | | |
| Alexion Pharmaceuticals, Inc.* | | | 49,062 | | | | 1,775,554 | | |
| Almost Family, Inc.* | | | 33,261 | | | | 1,496,080 | | |
American Medical Systems
Hldgs., Inc.* | | | 153,576 | | | | 1,380,648 | | |
| Conmed Corp.* | | | 53,332 | | | | 1,276,768 | | |
| Enzon Pharmaceuticals, Inc.* | | | 308,291 | | | | 1,797,337 | | |
| Immucor, Inc.* | | | 67,529 | | | | 1,794,921 | | |
* Non-income producing security.
| | | Shares | | Value | |
| COMMON STOCKS (CONTINUED): | |
| HEALTHCARE (CONTINUED) | |
| Landauer, Inc. | | | 23,073 | | | $ | 1,691,251 | | |
| Magellan Health Svcs., Inc.* | | | 59,239 | | | | 2,319,799 | | |
| MedAssets, Inc.* | | | 110,125 | | | | 1,607,825 | | |
| Myriad Genetics, Inc.* | | | 24,937 | | | | 1,652,326 | | |
| OSI Pharmaceuticals, Inc.* | | | 33,316 | | | | 1,300,990 | | |
| STERIS Corp. | | | 56,760 | | | | 1,355,996 | | |
| Other Securities | | | 994,403 | | | | 12,647,177 | | |
| | | | 33,839,606 | | |
| INDUSTRIAL (20.3%) | |
| Astec Industries, Inc.* | | | 60,237 | | | | 1,887,225 | | |
| Exponent, Inc.* | | | 46,465 | | | | 1,397,667 | | |
| Genesee & Wyoming, Inc. Cl A* | | | 75,246 | | | | 2,295,003 | | |
| Huron Consulting Group, Inc.* | | | 46,196 | | | | 2,645,645 | | |
| JetBlue Airways Corp* | | | 276,594 | | | | 1,963,817 | | |
| Old Dominion Freight Line, Inc.* | | | 69,055 | | | | 1,965,305 | | |
| Stanley, Inc.* | | | 41,451 | | | | 1,501,355 | | |
| Sun Hydraulics Corp. | | | 71,277 | | | | 1,342,859 | | |
Watson Wyatt Worldwide,
Inc. Cl A | | | 27,132 | | | | 1,297,452 | | |
| Other Securities | | | 678,163 | | | | 13,539,161 | | |
| | | | 29,835,489 | | |
| TECHNOLOGY (15.6%) | |
| Data Domain, Inc.* | | | 90,844 | | | | 1,707,867 | | |
| Informatica Corp.* | | | 157,312 | | | | 2,159,894 | | |
| Microsemi Corp.* | | | 107,215 | | | | 1,355,198 | | |
| Parametric Technology Corp.* | | | 120,426 | | | | 1,523,389 | | |
| Sybase, Inc.* | | | 83,106 | | | | 2,058,536 | | |
| ViaSat, Inc.* | | | 78,621 | | | | 1,893,194 | | |
| Websense, Inc.* | | | 135,242 | | | | 2,024,573 | | |
| Other Securities | | | 830,900 | | | | 10,202,465 | | |
| | | | 22,925,116 | | |
| TELECOMMUNICATIONS (1.9%) | |
| Consolidated Comms. Hldgs., Inc. | | | 113,952 | | | | 1,353,750 | | |
| Syniverse Hldgs., Inc.* | | | 114,957 | | | | 1,372,587 | | |
| | | | 2,726,337 | | |
| UTILITIES (1.9%) | |
| Avista Corp. | | | 90,731 | | | | 1,758,367 | | |
| Other Securities | | | 33,644 | | | | 1,085,692 | | |
| | | | 2,844,059 | | |
TOTAL COMMON STOCKS
(Cost: $171,945,056) 97.8% | | $ | 143,791,492 | | |
The accompanying notes are an integral part of these portfolio schedules.
45
MUTUAL OF AMERICA INVESTMENT CORPORATION (SMALL CAP GROWTH FUND)
SUMMARY PORTFOLIO OF INVESTMENTS IN SECURITIES (Continued)
December 31, 2008
| | | Rating** | | Rate | | Maturity | | Face
Amount | | Value | |
| SHORT-TERM DEBT SECURITIES: | |
| COMMERCIAL PAPER (4.0%) | |
| Rockwell Collins, Inc.† | | A-1 | | | 0.07 | % | | 01/02/09 | | $ | 1,000,000 | | | $ | 999,998 | | |
| Toyota Motor Credit Corp. | | A-1+ | | | 0.45 | | | 01/13/09 | | | 4,000,000 | | | | 3,999,400 | | |
| Washington Post Co.† | | A-1 | | | 0.03 | | | 01/05/09 | | | 800,000 | | | | 799,997 | | |
| | | | 5,799,395 | | |
TOTAL SHORT-TERM DEBT SECURITIES
(Cost: $5,799,395) 4.0% | | | 5,799,395 | | |
TOTAL INVESTMENTS
(Cost: $177,744,451) 101.8% | | | 149,590,887 | | |
| OTHER NET ASSETS (1.8%) | | | (2,660,133 | ) | |
| NET ASSETS 100.0% | | $ | 146,930,754 | | |
** Ratings as per Standard & Poors Corporation.
† Security exempt from registration under Rule 144A of the Securities Act of 1933. These securities may be resold in transactions exempt from registration, normally to qualified institutional buyers. At December 31, 2008, the aggregate value of these securities was $1,799,995, or 1.2% of the Fund's net assets.
"Other Securities" represent securities in the respective category that individually, or in the aggregate by issuer, do not exceed 1% of net assets.
The accompanying notes are an integral part of these portfolio schedules.
46
MUTUAL OF AMERICA INVESTMENT CORPORATION (MID CAP VALUE FUND)
SUMMARY PORTFOLIO OF INVESTMENTS IN SECURITIES
December 31, 2008
| | | Shares | | Value | |
| COMMON STOCKS: | |
| BASIC MATERIALS (9.2%) | |
| Agnico-Eagle Mines Ltd. | | | 7,257 | | | $ | 372,502 | | |
| Crown Hldgs., Inc.* | | | 51,378 | | | | 986,460 | | |
| Lubrizol Corp. | | | 8,662 | | | | 315,210 | | |
| Sonoco Products Co. | | | 21,391 | | | | 495,416 | | |
| Other Securities | | | 46,725 | | | | 586,927 | | |
| | | | 2,756,515 | | |
| CONSUMER, CYCLICAL (8.1%) | |
| Johnson Controls, Inc. | | | 16,081 | | | | 292,031 | | |
| Polo Ralph Lauren Corp. | | | 6,287 | | | | 285,493 | | |
| V.F. Corp. | | | 9,831 | | | | 538,444 | | |
| Other Securities | | | 71,380 | | | | 1,293,399 | | |
| | | | 2,409,367 | | |
| CONSUMER, NON-CYCLICAL (8.8%) | |
| Clorox Co. | | | 5,345 | | | | 296,968 | | |
| Kroger Co. | | | 28,757 | | | | 759,472 | | |
| Vector Group Ltd. | | | 37,812 | | | | 514,999 | | |
| Other Securities | | | 40,920 | | | | 1,070,172 | | |
| | | | 2,641,611 | | |
| ENERGY (4.0%) | |
| CNX Gas Corp.* | | | 11,097 | | | | 302,948 | | |
| Range Resources Corp. | | | 14,211 | | | | 488,716 | | |
| Other Securities | | | 30,781 | | | | 419,616 | | |
| | | | 1,211,280 | | |
| FINANCIAL (28.5%) | |
| American Financial Group, Inc. | | | 22,287 | | | | 509,927 | | |
| Ameriprise Financial, Inc. | | | 15,376 | | | | 359,183 | | |
| Aon Corp. | | | 12,975 | | | | 592,698 | | |
| Associated Banc-Corp. | | | 25,911 | | | | 542,317 | | |
| BOK Financial Corp. | | | 11,721 | | | | 473,528 | | |
| Equity Residential | | | 16,783 | | | | 500,469 | | |
| Fulton Financial Corp. | | | 39,399 | | | | 379,018 | | |
iShares Russell Midcap
Index Fund | | | 4,810 | | | | 287,253 | | |
iShares Russell Midcap Value
Index Fd. | | | 10,180 | | | | 289,519 | | |
| Marsh & McLennan Cos., Inc. | | | 12,252 | | | | 297,356 | | |
| People's United Financial, Inc. | | | 40,023 | | | | 713,610 | | |
| SPDR KBW Regional Banking ETF | | | 16,100 | | | | 469,476 | | |
| StanCorp Financial Group, Inc. | | | 12,752 | | | | 532,651 | | |
| Vornado Realty Trust | | | 9,385 | | | | 566,385 | | |
| Other Securities | | | 145,188 | | | | 2,018,297 | | |
| | | | 8,531,687 | | |
* Non-income producing security.
| | | Shares | | Value | |
| COMMON STOCKS (CONTINUED): | |
| HEALTHCARE (4.7%) | |
| AmerisourceBergen Corp. | | | 8,717 | | | $ | 310,848 | | |
Laboratory Corp. of
America Hldgs.* | | | 4,550 | | | | 293,066 | | |
| Other Securities | | | 31,449 | | | | 799,042 | | |
| | | | 1,402,956 | | |
| INDUSTRIAL (7.6%) | |
| Alliant TechSystems, Inc.* | | | 6,437 | | | | 552,037 | | |
| CSX Corp. | | | 10,789 | | | | 350,319 | | |
| Donnelley (R.R.) & Sons Co. | | | 21,092 | | | | 286,429 | | |
| Lincoln Electric Hldgs., Inc. | | | 7,239 | | | | 368,682 | | |
| Precision Castparts Corp. | | | 5,791 | | | | 344,449 | | |
| Other Securities | | | 20,520 | | | | 359,958 | | |
| | | | 2,261,874 | | |
| TECHNOLOGY (7.3%) | |
| McAfee, Inc.* | | | 12,870 | | | | 444,916 | | |
| Mettler-Toledo Int'l., Inc.* | | | 4,944 | | | | 333,226 | | |
| Sybase, Inc.* | | | 12,501 | | | | 309,650 | | |
| Xerox Corp. | | | 36,231 | | | | 288,761 | | |
| Other Securities | | | 74,650 | | | | 805,795 | | |
| | | | 2,182,348 | | |
| TELECOMMUNICATIONS (1.7%) | |
| Embarq Corp. | | | 10,147 | | | | 364,886 | | |
| Other Securities | | | 36,355 | | | | 132,332 | | |
| | | | 497,218 | | |
| UTILITIES (14.7%) | |
| American Electric Power Co., Inc. | | | 16,061 | | | | 534,510 | | |
| Edison International | | | 18,275 | | | | 586,993 | | |
| Energen Corp. | | | 13,697 | | | | 401,733 | | |
| Entergy Corp. | | | 6,208 | | | | 516,071 | | |
| Pepco Hldgs., Inc. | | | 25,532 | | | | 453,448 | | |
| PG&E Corp. | | | 14,078 | | | | 544,959 | | |
| PPL Corp. | | | 12,669 | | | | 388,812 | | |
| Puget Energy, Inc. | | | 10,885 | | | | 296,834 | | |
| Sempra Energy | | | 16,093 | | | | 686,045 | | |
| | | | 4,409,405 | | |
TOTAL COMMON STOCKS
(Cost: $39,104,340) 94.6% | | $ | 28,304,261 | | |
The accompanying notes are an integral part of these portfolio schedules.
47
MUTUAL OF AMERICA INVESTMENT CORPORATION (MID CAP VALUE FUND)
SUMMARY PORTFOLIO OF INVESTMENTS IN SECURITIES (Continued)
December 31, 2008
| | | Rating** | | Rate | | Maturity | | Face
Amount | | Value | |
| SHORT-TERM DEBT SECURITIES: | |
| COMMERCIAL PAPER (5.0%) | |
| Toyota Motor Credit Corp. | | A-1+ | | | 0.40 | % | | 01/21/09 | | $ | 700,000 | | | $ | 699,844 | | |
| Unilever Capital Corp.† | | A-1 | | | 0.05 | | | 01/02/09 | | | 400,000 | | | | 399,999 | | |
| Washington Post Co.† | | A-1 | | | 0.03 | | | 01/05/09 | | | 400,000 | | | | 399,999 | | |
| | | | 1,499,842 | | |
TOTAL SHORT-TERM DEBT SECURITIES
(Cost: $1,499,842) 5.0% | | | 1,499,842 | | |
TOTAL INVESTMENTS
(Cost: $40,604,182) 99.6% | | | 29,804,103 | | |
| OTHER NET ASSETS 0.4% | | | 109,887 | | |
| NET ASSETS 100.0% | | $ | 29,913,990 | | |
** Ratings as per Standard & Poors Corporation.
† Security exempt from registration under Rule 144A of the Securities Act of 1933. These securities may be resold in transactions exempt from registration, normally to qualified institutional buyers. At December 31, 2008, the aggregate value of these securities was $799,998, or 2.7% of the Fund's net assets.
"Other Securities" represent securities in the respective category that individually, or in the aggregate by issuer, do not exceed 1% of net assets.
The accompanying notes are an integral part of these portfolio schedules.
48
MUTUAL OF AMERICA INVESTMENT CORPORATION (MID-CAP EQUITY INDEX FUND)
SUMMARY PORTFOLIO OF INVESTMENTS IN SECURITIES
December 31, 2008
| | | Shares | | Value | |
| INDEXED ASSETS: | |
| COMMON STOCKS | |
| BASIC MATERIALS (6.0%) | |
| Airgas, Inc. | | | 26,719 | | | $ | 1,041,774 | | |
| FMC Corp. | | | 24,431 | | | | 1,092,799 | | |
| Martin Marietta Materials, Inc | | | 13,669 | | | | 1,326,987 | | |
| Other Securities | | | 726,036 | | | | 11,360,378 | | |
| | | | 14,821,938 | | |
| CONSUMER, CYCLICAL (12.4%) | |
| Advance Auto Parts, Inc. | | | 31,254 | | | | 1,051,697 | | |
| DeVry, Inc. | | | 20,333 | | | | 1,167,318 | | |
| Dollar Tree, Inc.* | | | 29,910 | | | | 1,250,238 | | |
| O'Reilly Automotive, Inc.* | | | 44,400 | | | | 1,364,856 | | |
| Priceline.com, Inc.* | | | 13,397 | | | | 986,689 | | |
| Ross Stores, Inc. | | | 42,704 | | | | 1,269,590 | | |
| Strayer Education, Inc. | | | 4,697 | | | | 1,007,084 | | |
| Other Securities | | | 1,698,076 | | | | 22,626,460 | | |
| | | | 30,723,932 | | |
| CONSUMER, NON-CYCLICAL (4.0%) | |
| Church & Dwight Co., Inc. | | | 23,114 | | | | 1,297,158 | | |
| Energizer Hldgs., Inc.* | | | 19,246 | | | | 1,041,978 | | |
| Ralcorp Hldgs., Inc.* | | | 18,596 | | | | 1,086,006 | | |
| Other Securities | | | 258,179 | | | | 6,502,247 | | |
| | | | 9,927,389 | | |
| ENERGY (5.6%) | |
| FMC Technologies, Inc.* | | | 41,271 | | | | 983,488 | | |
| Other Securities | | | 753,669 | | | | 12,981,810 | | |
| | | | 13,965,298 | | |
| FINANCIAL (18.6%) | |
| Berkley (W.R.) Corp. | | | 45,770 | | | | 1,418,870 | | |
| Cullen/Frost Bankers, Inc. | | | 19,580 | | | | 992,314 | | |
| Everest Re Group Ltd. | | | 20,270 | | | | 1,543,358 | | |
| Federal Realty Investment Trust | | | 19,465 | | | | 1,208,387 | | |
| Fidelity Nat'l. Financial, Inc. Cl A | | | 69,909 | | | | 1,240,885 | | |
| HCC Insurance Hldgs., Inc. | | | 37,858 | | | | 1,012,702 | | |
| Health Care REIT, Inc. | | | 34,146 | | | | 1,440,961 | | |
New York Community
Bancorp, Inc. | | | 113,602 | | | | 1,358,680 | | |
| Regency Centers Corp. | | | 23,105 | | | | 1,079,004 | | |
| Reinsurance Grp. of America, Inc. | | | 23,950 | | | | 1,025,539 | | |
| Other Securities | | | 1,750,512 | | | | 33,894,132 | | |
| | | | 46,214,832 | | |
* Non-income producing security.
| | | Shares | | Value | |
| NDEXED ASSETS (CONTINUED): | |
| COMMON STOCKS (CONTINUED) | |
| HEALTHCARE (10.0%) | |
| Edwards Lifesciences Corp.* | | | 18,372 | | | $ | 1,009,541 | | |
| Endo Pharmaceuticals Hldgs., Inc.* | | | 38,641 | | | | 1,000,029 | | |
| Hologic, Inc.* | | | 84,570 | | | | 1,105,330 | | |
Pharmaceutical Product
Development, Inc. | | | 38,914 | | | | 1,128,895 | | |
| Schein (Henry), Inc.* | | | 29,492 | | | | 1,082,061 | | |
| Vertex Pharmaceuticals, Inc.* | | | 49,663 | | | | 1,508,762 | | |
| Other Securities | | | 747,484 | | | | 17,976,219 | | |
| | | | 24,810,837 | | |
| INDUSTRIAL (12.8%) | |
| Ametek, Inc. | | | 35,225 | | | | 1,064,147 | | |
| Quanta Services, Inc.* | | | 65,122 | | | | 1,289,416 | | |
| Roper Industries, Inc. | | | 29,610 | | | | 1,285,370 | | |
| URS Corp.* | | | 27,559 | | | | 1,123,580 | | |
| Other Securities | | | 1,258,045 | | | | 26,821,162 | | |
| | | | 31,583,675 | | |
| TECHNOLOGY (11.1%) | |
| Alliance Data Systems Corp.* | | | 21,302 | | | | 991,182 | | |
| SAIC, Inc.* | | | 66,912 | | | | 1,303,446 | | |
| Other Securities | | | 1,962,613 | | | | 25,070,581 | | |
| | | | 27,365,209 | | |
| TELECOMMUNICATIONS (0.5%) | |
| Telephone & Data Systems, Inc. | | | 35,135 | | | | 1,115,536 | | |
| Other Securities | | | 76,046 | | | | 146,769 | | |
| | | | 1,262,305 | | |
| UTILITIES (7.3%) | |
| Alliant Energy Corp. | | | 36,455 | | | | 1,063,757 | | |
| MDU Resources Group | | | 60,619 | | | | 1,308,154 | | |
| Northeast Utilities | | | 51,390 | | | | 1,236,443 | | |
| NSTAR | | | 35,253 | | | | 1,286,382 | | |
| Oneok, Inc. | | | 34,491 | | | | 1,004,378 | | |
| Puget Energy, Inc. | | | 42,802 | | | | 1,167,211 | | |
| Other Securities | | | 505,765 | | | | 10,953,857 | | |
| | | | 18,020,182 | | |
TOTAL INDEXED ASSETS-COMMON STOCKS
(Cost: $305,913,456) 88.3% | | $ | 218,695,597 | | |
The accompanying notes are an integral part of these portfolio schedules.
49
MUTUAL OF AMERICA INVESTMENT CORPORATION (MID-CAP EQUITY INDEX FUND)
SUMMARY PORTFOLIO OF INVESTMENTS IN SECURITIES (Continued)
December 31, 2008
| | | Rating** | | Rate | | Maturity | | Face
Amount | | Value | |
| SHORT-TERM DEBT SECURITIES: | |
| U.S. GOVERNMENT (2.1%) | |
| U.S. Treasury Bill (1) | | AAA | | | 0.01 - 1.07 | % | | 01/02/09 - 04/30/09 | | $ | 5,100,000 | | | $ | 5,099,526 | | |
| U.S. GOVERNMENT AGENCIES (1.6%) | |
| FHLB | | AAA | | | 0.03 | | | 02/02/09 | | | 3,900,000 | | | | 3,899,896 | | |
| COMMERCIAL PAPER (7.0%) | |
| American Express Credit Corp. | | A-1 | | | 0.01 | | | 01/02/09 | | | 5,000,000 | | | | 4,999,998 | | |
| NetJets, Inc.† | | A-1+ | | | 0.10 | | | 03/02/09 | | | 5,000,000 | | | | 4,999,153 | | |
| Siemens Capital Co. LLC† | | A-1+ | | | 0.10 | | | 03/13/09 | | | 2,377,000 | | | | 2,376,524 | | |
| Toyota Motor Credit Corp. | | A-1+ | | | 0.40 | | | 01/21/09 | | | 5,000,000 | | | | 4,998,889 | | |
| | | | 17,374,564 | | |
TOTAL SHORT-TERM DEBT SECURITIES
(Cost: $26,374,141) 10.7% | | | 26,373,986 | | |
TEMPORARY CASH INVESTMENTS (2)
(Cost: $28,800) 0.0% (3) | | | 28,800 | | |
TOTAL INVESTMENTS
(Cost: $332,316,397) 99.0% | | | 245,098,383 | | |
| OTHER NET ASSETS 1.0% | | | 2,426,253 | | |
| NET ASSETS 100.0% | | $ | 247,524,636 | | |
Abbreviations: FHLB = Federal Home Loan Bank
** Ratings as per Standard & Poors Corporation.
† Security exempt from registration under Rule 144A of the Securities Act of 1933. These securities may be resold in transactions exempt from registration, normally to qualified institutional buyers. At December 31, 2008, the aggregate value of these securities was $7,375,677, or 3.0% of the Fund's net assets.
(1) The security, or a portion thereof, has been segregated to cover initial margin requirements on open futures contracts.
(2) The fund has an arrangement with its custodian bank, JP Morgan Chase Bank, whereby uninvested cash, subject to parameters set by the fund, is automatically invested in the fund's name by the bank in overnight commercial paper issued by J.P. Morgan Chase & Co. On the next business day, these funds (and earned interest) are automatically returned to the fund. The annual rate of interest earned on this temporary cash investment at December 31, 2008 was 0.10%.
(3) Percentage is less than 0.05%.
FUTURES CONTRACTS OUTSTANDING AS OF DECEMBER 31, 2008:
| | | Expiration
Date | | Underlying Face
Amount at Value | | Unrealized
Gain(Loss) | |
| PURCHASED | |
| 100 S&P MidCap 400 Stock Index Futures Contracts | | March 2009 | | $ | 26,860,000 | | | $ | 495,125 | | |
Face value of futures purchased and outstanding as percentage of total investments in securities: 11.0%
"Other Securities" represent securities in the respective category that individually, or in the aggregate by issuer, do not exceed 1% of net assets.
The accompanying notes are an integral part of these portfolio schedules.
50
MUTUAL OF AMERICA INVESTMENT CORPORATION (INTERNATIONAL FUND)
PORTFOLIO OF INVESTMENTS IN SECURITIES
December 31, 2008
| | | Shares | | Value | |
| COMMON STOCKS: | |
| DIVERSIFIED MUTUAL FUNDS (96.3%) | |
| iShares MSCI EAFE Growth Index Fund | | | 22,760 | | | $ | 1,034,442 | | |
| iShares MSCI EAFE Index Fund | | | 29,225 | | | | 1,311,326 | | |
| iShares MSCI EAFE Value Index Fund | | | 25,510 | | | | 1,034,430 | | |
| Vanguard Europe Pacific ETF | | | 210,580 | | | | 5,784,632 | | |
| Vanguard European ETF | | | 46,010 | | | | 1,764,944 | | |
| Vanguard Pacific ETF | | | 20,517 | | | | 899,055 | | |
TOTAL INVESTMENTS
(Cost: $16,221,198) 96.3% | | | | | | | 11,828,829 | | |
| OTHER NET ASSETS 3.7% | | | | | | | 458,413 | | |
| NET ASSETS 100.0% | | | | | | $ | 12,287,242 | | |
The accompanying notes are an integral part of these portfolio schedules.
51
MUTUAL OF AMERICA INVESTMENT CORPORATION (COMPOSITE FUND)
SUMMARY PORTFOLIO OF INVESTMENTS IN SECURITIES
December 31, 2008
| | | Shares | | Value | |
| COMMON STOCKS: | |
| BASIC MATERIALS (1.3%) | |
| Other Securities | | | 60,629 | | | $ | 1,945,677 | | |
| CONSUMER, CYCLICAL (4.8%) | |
| Comcast Corp. Cl A | | | 61,236 | | | | 1,033,664 | | |
| Johnson Controls, Inc. | | | 35,628 | | | | 647,004 | | |
| McDonald's Corp. | | | 28,279 | | | | 1,758,671 | | |
| Staples, Inc. | | | 43,412 | | | | 777,943 | | |
| Other Securities | | | 128,015 | | | | 3,002,356 | | |
| | | | 7,219,638 | | |
| CONSUMER, NON-CYCLICAL (7.8%) | |
| CVS Caremark Corp. | | | 34,845 | | | | 1,001,445 | | |
| General Mills, Inc. | | | 19,638 | | | | 1,193,009 | | |
| PepsiCo, Inc. | | | 29,005 | | | | 1,588,604 | | |
| Proctor & Gamble Co. | | | 43,077 | | | | 2,663,020 | | |
| Wal-Mart Stores, Inc. | | | 40,465 | | | | 2,268,468 | | |
| Other Securities | | | 78,373 | | | | 3,058,869 | | |
| | | | 11,773,415 | | |
| ENERGY (8.2%) | |
| Chevron Corp. | | | 20,823 | | | | 1,540,277 | | |
| ConocoPhillips | | | 16,519 | | | | 855,684 | | |
| Exxon Mobil Corp. | | | 60,548 | | | | 4,833,547 | | |
| Noble Corp. | | | 13,731 | | | | 303,318 | | |
| Occidental Petroleum Corp. | | | 17,229 | | | | 1,033,568 | | |
| Other Securities | | | 124,511 | | | | 3,724,285 | | |
| | | | 12,290,679 | | |
| FINANCIAL (7.2%) | |
| Bank of New York Mellon Corp. | | | 30,025 | | | | 850,608 | | |
| JPMorgan Chase & Co. | | | 34,228 | | | | 1,079,209 | | |
| MetLife, Inc. | | | 26,650 | | | | 929,019 | | |
| U.S. Bancorp | | | 30,961 | | | | 774,335 | | |
| Wells Fargo & Co. | | | 64,147 | | | | 1,891,054 | | |
| Other Securities | | | 231,057 | | | | 5,321,142 | | |
| | | | 10,845,367 | | |
* Non-income producing security.
| | | Shares | | Value | |
| COMMON STOCKS (CONTINUED): | |
| HEALTHCARE (9.1%) | |
| Abbott Laboratories | | | 43,524 | | | $ | 2,322,876 | | |
| Celgene Corp.* | | | 16,931 | | | | 935,946 | | |
| Covidien Ltd. | | | 25,622 | | | | 928,541 | | |
| Gilead Sciences, Inc.* | | | 39,460 | | | | 2,017,984 | | |
| Johnson & Johnson | | | 48,854 | | | | 2,922,935 | | |
| Schering-Plough Corp. | | | 47,510 | | | | 809,095 | | |
| Other Securities | | | 96,100 | | | | 3,650,273 | | |
| | | | 13,587,650 | | |
| INDUSTRIAL (6.5%) | |
| General Electric Co. | | | 137,013 | | | | 2,219,611 | | |
| Lockheed Martin Corp. | | | 12,029 | | | | 1,011,398 | | |
| Northrop Grumman Corp. | | | 17,119 | | | | 771,040 | | |
| United Parcel Service, Inc. Cl B | | | 20,698 | | | | 1,141,702 | | |
| United Technologies Corp. | | | 17,412 | | | | 933,283 | | |
| Other Securities | | | 138,811 | | | | 3,683,081 | | |
| | | | 9,760,115 | | |
| TECHNOLOGY (8.4%) | |
| Apple, Inc.* | | | 13,938 | | | | 1,189,608 | | |
| Cisco Systems, Inc.* | | | 70,211 | | | | 1,144,439 | | |
| Hewlett-Packard Co. | | | 37,262 | | | | 1,352,238 | | |
| Int'l. Business Machines Corp. | | | 17,099 | | | | 1,439,052 | | |
| Microsoft Corp. | | | 88,753 | | | | 1,725,358 | | |
| QUALCOMM, Inc. | | | 27,381 | | | | 981,061 | | |
| Other Securities | | | 290,126 | | | | 4,805,269 | | |
| | | | 12,637,025 | | |
| TELECOMMUNICATIONS (1.8%) | |
| AT&T, Inc. | | | 73,514 | | | | 2,095,149 | | |
| Other Securities | | | 21,535 | | | | 631,406 | | |
| | | | 2,726,555 | | |
| UTILITIES (2.3%) | |
| Dominion Resources, Inc. | | | 22,626 | | | | 810,916 | | |
| Other Securities | | | 56,631 | | | | 2,608,069 | | |
| | | | 3,418,985 | | |
TOTAL COMMON STOCKS
(Cost: $106,756,232) 57.4% | | $ | 86,205,106 | | |
The accompanying notes are an integral part of these portfolio schedules.
52
MUTUAL OF AMERICA INVESTMENT CORPORATION (COMPOSITE FUND)
SUMMARY PORTFOLIO OF INVESTMENTS IN SECURITIES (Continued)
December 31, 2008
| | | Rating** | | Rate | | Maturity | | Face
Amount | |
Value | |
| LONG-TERM DEBT SECURITIES: | |
| U.S. GOVERNMENT AGENCIES (16.6%) | |
| MORTGAGE-BACKED OBLIGATIONS (16.6%) | |
| FHARM | | AAA | | | 5.26 - 5.45 | % | | 02/01/36 - 05/01/37 | | $ | 1,747,339 | | | $ | 1,774,165 | | |
| FHLMC | | AAA | | | 5.00 - 6.00 | | | 10/01/18 - 04/01/37 | | | 2,493,363 | | | | 2,559,896 | | |
| FNMA | | AAA | | | 4.00 - 8.00 | | | 09/01/16 - 06/01/48 | | | 19,998,571 | | | | 20,542,682 | | |
| Other Securities | | | | | | | | | | | 114,399 | | | | 120,450 | | |
| | | | 24,997,193 | | |
| CORPORATE DEBT (21.8%) | |
| BASIC MATERIALS (1.7%) | |
| Other Securities | | | | | | | | | | | 3,728,000 | | | | 2,481,336 | | |
| CONSUMER, CYCLICAL (3.5%) | |
| Johnson Controls, Inc. | | BBB | | | 4.88 | | | 09/15/13 | | | 500,000 | | | | 393,861 | | |
| Other Securities | | | | | | | | | | | 5,888,068 | | | | 4,861,681 | | |
| | | | 5,255,542 | | |
| CONSUMER, NON-CYCLICAL (1.2%) | |
| CVS Caremark Corp. | | BBB+ | | | 6.13 | | | 08/15/16 | | | 250,000 | | | | 242,208 | | |
| Other Securities | | | | | | | | | | | 1,750,000 | | | | 1,580,902 | | |
| | | | 1,823,110 | | |
| ENERGY (4.0%) | |
| Noble Corp. | | A- | | | 7.50 | | | 03/15/19 | | | 800,000 | | | | 989,206 | | |
| Seariver Maritime, Inc. | | AAA | | | 0.00 | | | 09/01/12 | | | 3,000,000 | | | | 2,569,396 | | |
| Other Securities | | | | | | | | | | | 2,850,000 | | | | 2,437,104 | | |
| | | | 5,995,706 | | |
| FINANCIAL (6.8%) | |
| Berkley (W.R.) Corp. | | BBB+ | | | 8.70 | | | 01/01/22 | | | 1,500,000 | | | | 1,607,671 | | |
| First Horizon National Corp. | | BBB- | | | 4.50 | | | 05/15/13 | | | 1,500,000 | | | | 1,041,893 | | |
| Ford Motor Credit Co. LLC | | CCC+ | | | 7.38 | | | 10/28/09 | | | 1,000,000 | | | | 878,221 | | |
| Other Securities | | | | | | | | | | | 9,826,975 | | | | 6,761,878 | | |
| | | | 10,289,663 | | |
| HEALTHCARE (1.1%) | |
| Other Securities | | | | | | | | | | | 1,750,000 | | | | 1,650,137 | | |
| INDUSTRIAL (1.1%) | |
| Other Securities | | | | | | | | | | | 1,900,000 | | | | 1,624,320 | | |
| TECHNOLOGY (0.6%) | |
| Other Securities | | | | | | | | | | | 1,000,000 | | | | 927,280 | | |
| TELECOMMUNICATIONS (0.3%) | |
| Other Securities | | | | | | | | | | | 500,000 | | | | 431,250 | | |
| UTILITIES (1.5%) | |
| Other Securities | | | | | | | | | | | 1,250,000 | | | | 2,215,208 | | |
TOTAL LONG-TERM DEBT SECURITIES
(Cost: $63,261,403) 38.4% | | | 57,690,745 | | |
The accompanying notes are an integral part of these portfolio schedules.
53
MUTUAL OF AMERICA INVESTMENT CORPORATION (COMPOSITE FUND)
SUMMARY PORTFOLIO OF INVESTMENTS IN SECURITIES (Continued)
December 31, 2008
| | | Rating** | | Rate | | Maturity | | Face
Amount | |
Value | |
| SHORT-TERM DEBT SECURITIES: | |
| COMMERCIAL PAPER (3.6%) | |
| American Express Credit Corp. | | A-1 | | | 0.01 | % | | 01/02/09 | | $ | 2,000,000 | | | $ | 1,999,999 | | |
| Danaher Corp. | | A-1 | | | 0.02 | | | 01/05/09 | | | 1,200,000 | | | | 1,199,997 | | |
| Rockwell Collins, Inc.† | | A-1 | | | 0.07 | | | 01/02/09 | | | 960,000 | | | | 959,998 | | |
| Toyota Motor Credit Corp. | | A-1+ | | | 0.40 | | | 01/21/09 | | | 1,190,000 | | | | 1,189,736 | | |
| | | | 5,349,730 | | |
TOTAL SHORT-TERM DEBT SECURITIES
(Cost: $5,349,730) 3.6% | | | 5,349,730 | | |
TOTAL INVESTMENTS
(Cost: $175,367,365) 99.4% | | | 149,245,581 | | |
| OTHER NET ASSETS 0.6% | | | 880,203 | | |
| NET ASSETS 100.0% | | $ | 150,125,784 | | |
Abbreviations: FHARM = Federal Home Adjustable Rate Mortgage
FHLMC = Federal Home Loan Mortgage Corporation
FNMA = Federal National Mortgage Association
** Ratings as per Standard & Poors Corporation.
† Security exempt from registration under Rule 144A of the Securities Act of 1933. These securities may be resold in transactions exempt from registration, normally to qualified institutional buyers. At December 31, 2008, the aggregate value of these securities was $1,930,145, or 1.3% of the Fund's net assets.
"Other Securities" represent securities in the respective category that individually, or in the aggregate by issuer, do not exceed 1% of net assets.
The accompanying notes are an integral part of these portfolio schedules.
54
MUTUAL OF AMERICA INVESTMENT CORPORATION (RETIREMENT INCOME FUND)
PORTFOLIO OF INVESTMENTS IN SECURITIES
December 31, 2008
| | | Shares | | Value | |
| COMMON STOCKS: | |
| DIVERSIFIED MUTUAL FUNDS (100.0%) | |
| Mutual of America Investment Corporation | |
| Bond Fund (30.4%) | | | 906,467 | | | $ | 1,067,407 | | |
| Equity Index Fund (18.5%) | | | 439,637 | | | | 650,568 | | |
| Mid-Cap Equity Index Fund (4.6%) | | | 175,565 | | | | 162,419 | | |
| Mid-Term Bond Fund (30.9%) | | | 1,159,481 | | | | 1,087,955 | | |
| Money Market Fund (15.6%) | | | 454,021 | | | | 548,584 | | |
TOTAL INVESTMENTS
(Cost: $3,881,924) 100.0% | | | | | | | 3,516,933 | | |
| OTHER NET ASSETS | | | | | | | — | | |
| NET ASSETS 100.0% | | | | | | $ | 3,516,933 | | |
MUTUAL OF AMERICA INVESTMENT CORPORATION (2010 RETIREMENT FUND)
PORTFOLIO OF INVESTMENTS IN SECURITIES
December 31, 2008
| | | Shares | | Value | |
| COMMON STOCKS: | |
| DIVERSIFIED MUTUAL FUNDS (100.0%) | |
| Mutual of America Investment Corporation | |
| Bond Fund (25.7%) | | | 1,807,380 | | | $ | 2,128,275 | | |
| Equity Index Fund (23.6%) | | | 1,321,312 | | | | 1,955,259 | | |
| International Fund (5.0%) | | | 739,224 | | | | 409,053 | | |
| Mid-Cap Equity Index Fund (14.2%) | | | 1,269,710 | | | | 1,174,632 | | |
| Mid-Term Bond Fund (20.9%) | | | 1,846,285 | | | | 1,732,392 | | |
| Money Market Fund (10.6%) | | | 724,247 | | | | 875,094 | | |
TOTAL INVESTMENTS
(Cost: $9,649,309) 100.0% | | | | | | | 8,274,705 | | |
| OTHER NET ASSETS | | | | | | | — | | |
| NET ASSETS 100.0% | | | | | | $ | 8,274,705 | | |
The accompanying notes are an integral part of these portfolio schedules.
55
MUTUAL OF AMERICA INVESTMENT CORPORATION (2015 RETIREMENT FUND)
PORTFOLIO OF INVESTMENTS IN SECURITIES
December 31, 2008
| | | Shares | | Value | |
| COMMON STOCKS: | |
| DIVERSIFIED MUTUAL FUNDS (100.0%) | |
| Mutual of America Investment Corporation | |
| Bond Fund (26.0%) | | | 4,411,815 | | | $ | 5,195,119 | | |
| Equity Index Fund (28.5%) | | | 3,865,037 | | | | 5,719,427 | | |
| International Fund (7.0%) | | | 2,529,236 | | | | 1,399,565 | | |
| Mid-Cap Equity Index Fund (11.5%) | | | 2,479,283 | | | | 2,293,629 | | |
| Mid-Term Bond Fund (11.6%) | | | 2,478,915 | | | | 2,325,996 | | |
| Money Market Fund (9.6%) | | | 1,589,271 | | | | 1,920,285 | | |
| Small Cap Growth Fund (2.8%) | | | 812,457 | | | | 568,483 | | |
| Small Cap Value Fund (3.0%) | | | 795,510 | | | | 594,588 | | |
TOTAL INVESTMENTS
(Cost: $24,153,563) 100.0% | | | | | | | 20,017,092 | | |
| OTHER NET ASSETS | | | | | | | — | | |
| NET ASSETS 100.0% | | | | | | $ | 20,017,092 | | |
MUTUAL OF AMERICA INVESTMENT CORPORATION (2020 RETIREMENT FUND)
PORTFOLIO OF INVESTMENTS IN SECURITIES
December 31, 2008
| | | Shares | | Value | |
| COMMON STOCKS: | |
| DIVERSIFIED MUTUAL FUNDS (100.0%) | |
| Mutual of America Investment Corporation | |
| Bond Fund (25.1%) | | | 4,411,065 | | | $ | 5,194,237 | | |
| Equity Index Fund (33.7%) | | | 4,706,492 | | | | 6,964,600 | | |
| International Fund (10.1%) | | | 3,774,428 | | | | 2,088,599 | | |
| Mid-Cap Equity Index Fund (11.6%) | | | 2,588,699 | | | | 2,394,852 | | |
| Mid-Term Bond Fund (11.7%) | | | 2,582,315 | | | | 2,423,017 | | |
| Small Cap Growth Fund (3.8%) | | | 1,132,742 | | | | 792,589 | | |
| Small Cap Value Fund (4.0%) | | | 1,107,596 | | | | 827,850 | | |
TOTAL INVESTMENTS
(Cost: $25,669,962) 100.0% | | | | | | | 20,685,744 | | |
| OTHER NET ASSETS | | | | | | | — | | |
| NET ASSETS 100.0% | | | | | | $ | 20,685,744 | | |
The accompanying notes are an integral part of these portfolio schedules.
56
MUTUAL OF AMERICA INVESTMENT CORPORATION (2025 RETIREMENT FUND)
PORTFOLIO OF INVESTMENTS IN SECURITIES
December 31, 2008
| | | Shares | | Value | |
| COMMON STOCKS: | |
| DIVERSIFIED MUTUAL FUNDS (100.0%) | |
| Mutual of America Investment Corporation | |
| Bond Fund (21.1%) | | | 2,648,706 | | | $ | 3,118,976 | | |
| Equity Index Fund (38.9%) | | | 3,894,135 | | | | 5,762,487 | | |
| International Fund (10.2%) | | | 2,731,058 | | | | 1,511,245 | | |
| Mid-Cap Equity Index Fund (14.6%) | | | 2,345,910 | | | | 2,170,244 | | |
| Mid-Term Bond Fund (5.4%) | | | 845,196 | | | | 793,057 | | |
| Small Cap Growth Fund (4.8%) | | | 1,025,996 | | | | 717,897 | | |
| Small Cap Value Fund (5.0%) | | | 1,001,415 | | | | 748,488 | | |
TOTAL INVESTMENTS
(Cost: $18,457,006) 100.0% | | | | | | | 14,822,394 | | |
| OTHER NET ASSETS | | | | | | | — | | |
| NET ASSETS 100.0% | | | | | | $ | 14,822,394 | | |
MUTUAL OF AMERICA INVESTMENT CORPORATION (2030 RETIREMENT FUND)
PORTFOLIO OF INVESTMENTS IN SECURITIES
December 31, 2008
| | | Shares | | Value | |
| COMMON STOCKS: | |
| DIVERSIFIED MUTUAL FUNDS (100.0%) | |
| Mutual of America Investment Corporation | |
| Bond Fund (21.1%) | | | 2,088,805 | | | $ | 2,459,666 | | |
| Equity Index Fund (39.0%) | | | 3,077,097 | | | | 4,553,444 | | |
| International Fund (10.2%) | | | 2,160,459 | | | | 1,195,501 | | |
| Mid-Cap Equity Index Fund (17.7%) | | | 2,227,355 | | | | 2,060,566 | | |
| Small Cap Growth Fund (5.9%) | | | 975,078 | | | | 682,270 | | |
| Small Cap Value Fund (6.1%) | | | 949,890 | | | | 709,976 | | |
TOTAL INVESTMENTS
(Cost: $14,711,346) 100.0% | | | | | | | 11,661,423 | | |
| OTHER NET ASSETS | | | | | | | — | | |
| NET ASSETS 100.0% | | | | | | $ | 11,661,423 | | |
The accompanying notes are an integral part of these portfolio schedules.
57
MUTUAL OF AMERICA INVESTMENT CORPORATION (2035 RETIREMENT FUND)
PORTFOLIO OF INVESTMENTS IN SECURITIES
December 31, 2008
| | | Shares | | Value | |
| COMMON STOCKS: | |
| DIVERSIFIED MUTUAL FUNDS (100.0%) | |
| Mutual of America Investment Corporation | |
| Bond Fund (12.7%) | | | 943,872 | | | $ | 1,111,453 | | |
| Equity Index Fund (39.2%) | | | 2,328,097 | | | | 3,445,085 | | |
| International Fund (13.4%) | | | 2,122,002 | | | | 1,174,221 | | |
| Mid-Cap Equity Index Fund (20.7%) | | | 1,968,007 | | | | 1,820,639 | | |
| Small Cap Growth Fund (6.9%) | | | 861,358 | | | | 602,699 | | |
| Small Cap Value Fund (7.1%) | | | 838,665 | | | | 626,843 | | |
TOTAL INVESTMENTS
(Cost: $11,265,677) 100.0% | | | | | | | 8,780,940 | | |
| OTHER NET ASSETS | | | | | | | — | | |
| NET ASSETS 100.0% | | | | | | $ | 8,780,940 | | |
MUTUAL OF AMERICA INVESTMENT CORPORATION (2040 RETIREMENT FUND)
PORTFOLIO OF INVESTMENTS IN SECURITIES
December 31, 2008
| | | Shares | | Value | |
| COMMON STOCKS: | |
| DIVERSIFIED MUTUAL FUNDS (100.0%) | |
| Mutual of America Investment Corporation | |
| Bond Fund (11.6%) | | | 612,574 | | | $ | 721,334 | | |
| Equity Index Fund (34.3%) | | | 1,437,114 | | | | 2,126,621 | | |
| International Fund (14.4%) | | | 1,615,931 | | | | 894,184 | | |
| Mid-Cap Equity Index Fund (23.7%) | | | 1,586,535 | | | | 1,467,732 | | |
| Small Cap Growth Fund (7.8%) | | | 693,683 | | | | 485,376 | | |
| Small Cap Value Fund (8.2%) | | | 676,257 | | | | 505,455 | | |
TOTAL INVESTMENTS
(Cost: $7,956,146) 100.0% | | | | | | | 6,200,702 | | |
| OTHER NET ASSETS | | | | | | | — | | |
| NET ASSETS 100.0% | | | | | | $ | 6,200,702 | | |
The accompanying notes are an integral part of these portfolio schedules.
58
MUTUAL OF AMERICA INVESTMENT CORPORATION (2045 RETIREMENT FUND)
PORTFOLIO OF INVESTMENTS IN SECURITIES
December 31, 2008
| | | Shares | | Value | |
| COMMON STOCKS: | |
| DIVERSIFIED MUTUAL FUNDS (100.0%) | |
| Mutual of America Investment Corporation | |
| Bond Fund (10.5%) | | | 613,434 | | | $ | 722,348 | | |
| Equity Index Fund (34.3%) | | | 1,589,622 | | | | 2,352,300 | | |
| International Fund (15.4%) | | | 1,913,168 | | | | 1,058,661 | | |
| Mid-Cap Equity Index Fund (19.8%) | | | 1,463,515 | | | | 1,353,924 | | |
| Small Cap Growth Fund (9.8%) | | | 959,703 | | | | 671,512 | | |
| Small Cap Value Fund (10.2%) | | | 935,805 | | | | 699,449 | | |
TOTAL INVESTMENTS
(Cost: $8,641,633) 100.0% | | | | | | | 6,858,194 | | |
| OTHER NET ASSETS | | | | | | | — | | |
| NET ASSETS 100.0% | | | | | | $ | 6,858,194 | | |
MUTUAL OF AMERICA INVESTMENT CORPORATION (CONSERVATIVE ALLOCATION FUND)
PORTFOLIO OF INVESTMENTS IN SECURITIES
December 31, 2008
| | | Shares | | Value | |
| COMMON STOCKS: | |
| DIVERSIFIED MUTUAL FUNDS (100.0%) | |
| Mutual of America Investment Corporation | |
| Bond Fund (29.8%) | | | 5,975,256 | | | $ | 7,036,145 | | |
| Equity Index Fund (25.6%) | | | 4,087,322 | | | | 6,048,361 | | |
| Mid-Term Bond Fund (44.6%) | | | 11,211,796 | | | | 10,520,162 | | |
TOTAL INVESTMENTS
(Cost: $26,834,350) 100.0% | | | | | | | 23,604,668 | | |
| OTHER NET ASSETS | | | | | | | — | | |
| NET ASSETS 100.0% | | | | | | $ | 23,604,668 | | |
The accompanying notes are an integral part of these portfolio schedules.
59
MUTUAL OF AMERICA INVESTMENT CORPORATION (MODERATE ALLOCATION FUND)
PORTFOLIO OF INVESTMENTS IN SECURITIES
December 31, 2008
| | | Shares | | Value | |
| COMMON STOCKS: | |
| DIVERSIFIED MUTUAL FUNDS (100.0%) | |
| Mutual of America Investment Corporation | |
| Bond Fund (29.5%) | | | 22,409,109 | | | $ | 26,387,778 | | |
| Equity Index Fund (35.5%) | | | 21,460,061 | | | | 31,756,298 | | |
| Mid-Cap Equity Index Fund (15.4%) | | | 14,945,308 | | | | 13,826,174 | | |
| Mid-Term Bond Fund (19.6%) | | | 18,687,826 | | | | 17,535,012 | | |
TOTAL INVESTMENTS
(Cost: $112,045,544) 100.0% | | | | | | | 89,505,262 | | |
| OTHER NET ASSETS | | | | | | | — | | |
| NET ASSETS 100.0% | | | | | | $ | 89,505,262 | | |
MUTUAL OF AMERICA INVESTMENT CORPORATION (AGGRESSIVE ALLOCATION FUND)
PORTFOLIO OF INVESTMENTS IN SECURITIES
December 31, 2008
| | | Shares | | Value | |
| COMMON STOCKS: | |
| DIVERSIFIED MUTUAL FUNDS (100.0%) | |
| Mutual of America Investment Corporation | |
| Bond Fund (24.3%) | | | 16,777,600 | | | $ | 19,756,412 | | |
| Equity Index Fund (45.1%) | | | 24,790,364 | | | | 36,684,434 | | |
| Mid-Cap Equity Index Fund (20.4%) | | | 17,903,584 | | | | 16,562,927 | | |
| Small Cap Growth Fund (5.1%) | | | 5,887,701 | | | | 4,119,672 | | |
| Small Cap Value Fund (5.1%) | | | 5,518,480 | | | | 4,124,677 | | |
TOTAL INVESTMENTS
(Cost: $112,985,924) 100.0% | | | | | | | 81,248,122 | | |
| OTHER NET ASSETS | | | | | | | — | | |
| NET ASSETS 100.0% | | | | | | $ | 81,248,122 | | |
The accompanying notes are an integral part of these portfolio schedules.
60
MUTUAL OF AMERICA INVESTMENT CORPORATION (MONEY MARKET FUND)
PORTFOLIO OF INVESTMENTS IN SECURITIES
December 31, 2008
| | | Rating* | | Rate | | Maturity | | Face
Amount | | Value | |
| SHORT-TERM DEBT SECURITIES: | |
| U.S. GOVERNMENT AGENCIES (20.7%) | |
| FHLB | | AAA | | | 1.95 | % | | 01/26/09 | | $ | 8,305,000 | | | $ | 8,314,436 | | |
| FHLB | | AAA | | | 2.10 | | | 01/05/09 | | | 2,029,000 | | | | 2,028,525 | | |
| FHLB | | AAA | | | 2.10 | | | 01/07/09 | | | 7,030,000 | | | | 7,027,529 | | |
| FHLB | | AAA | | | 2.10 | | | 01/08/09 | | | 4,744,000 | | | | 4,742,055 | | |
| FHLB | | AAA | | | 2.20 | | | 01/14/09 | | | 3,693,000 | | | | 3,695,943 | | |
| FHLB | | AAA | | | 2.24 | | | 01/16/09 | | | 1,488,000 | | | | 1,489,453 | | |
| FHLB | | AAA | | | 2.25 | | | 01/05/09 | | | 800,000 | | | | 799,799 | | |
| FHLMC | | AAA | | | 2.15 | | | 01/12/09 | | | 6,284,000 | | | | 6,287,457 | | |
| FHLMC | | AAA | | | 2.20 | | | 01/14/09 | | | 2,425,000 | | | | 2,427,212 | | |
| FNMA | | AAA | | | 0.20 | | | 03/19/09 | | | 105,000 | | | | 104,954 | | |
| FNMA | | AAA | | | 2.10 | | | 01/07/09 | | | 1,531,000 | | | | 1,530,462 | | |
| FNMA | | AAA | | | 2.20 | | | 01/12/09 | | | 2,000,000 | | | | 2,002,211 | | |
| FNMA | | AAA | | | 2.22 | | | 01/21/09 | | | 1,196,000 | | | | 1,197,377 | | |
| | | | 41,647,413 | | |
| COMMERCIAL PAPER (79.3%) | |
| American Express Credit Corp. | | A-1 | | | 1.95 | | | 01/02/09 | | | 2,500,000 | | | | 2,499,864 | | |
| American Express Credit Corp. | | A-1 | | | 1.75 | | | 02/03/09 | | | 210,000 | | | | 209,663 | | |
| American Express Credit Corp. | | A-1 | | | 2.00 | | | 02/02/09 | | | 2,500,000 | | | | 2,495,548 | | |
| AT&T, Inc.† | | A-1 | | | 1.00 | | | 02/06/09 | | | 1,700,000 | | | | 1,698,299 | | |
| AT&T, Inc.† | | A-1 | | | 2.40 | | | 01/05/09 | | | 3,500,000 | | | | 3,499,063 | | |
| Becton, Dickinson & Co. | | A-1+ | | | 1.00 | | | 01/16/09 | | | 5,150,000 | | | | 5,147,852 | | |
| Campbell Soup Co.† | | A-1 | | | 0.95 | | | 02/02/09 | | | 3,000,000 | | | | 2,997,465 | | |
| Campbell Soup Co.† | | A-1 | | | 1.00 | | | 01/16/09 | | | 2,044,000 | | | | 2,043,147 | | |
| Chevron Corp. | | A-1+ | | | 1.10 | | | 01/23/09 | | | 5,071,000 | | | | 5,067,587 | | |
| Chevron Funding Corp. | | A-1+ | | | 0.20 | | | 02/11/09 | | | 281,000 | | | | 280,936 | | |
| Coca-Cola Co. | | A-1 | | | 1.20 | | | 01/23/09 | | | 5,165,000 | | | | 5,161,207 | | |
| ConocoPhillips† | | A-1 | | | 0.75 | | | 01/30/09 | | | 4,100,000 | | | | 4,097,522 | | |
| ConocoPhillips† | | A-1 | | | 1.30 | | | 02/06/09 | | | 1,100,000 | | | | 1,098,569 | | |
| Danaher Corp. | | A-1 | | | 0.50 | | | 01/29/09 | | | 970,000 | | | | 969,623 | | |
| Danaher Corp. | | A-1 | | | 1.25 | | | 01/16/09 | | | 4,266,000 | | | | 4,263,776 | | |
| Deere & Co.† | | A-1 | | | 0.35 | | | 03/18/09 | | | 2,360,000 | | | | 2,358,233 | | |
| Deere & Co.† | | A-1 | | | 0.50 | | | 03/02/09 | | | 408,000 | | | | 407,654 | | |
| Deere & Co.† | | A-1 | | | 0.50 | | | 03/20/09 | | | 2,400,000 | | | | 2,397,367 | | |
| Eaton Corp.† | | A-1 | | | 1.30 | | | 01/23/09 | | | 1,900,000 | | | | 1,898,489 | | |
| Ecolab, Inc.† | | A-1 | | | 0.75 | | | 01/06/09 | | | 5,147,000 | | | | 5,146,464 | | |
| Eli Lilly & Co.† | | A-1+ | | | 1.35 | | | 01/12/09 | | | 5,000,000 | | | | 4,997,934 | | |
| Estee Lauder Cos.† | | A-1 | | | 1.10 | | | 02/12/09 | | | 1,400,000 | | | | 1,398,304 | | |
| GE Capital TLGP | | A-1+ | | | 1.60 | | | 01/20/09 | | | 1,991,000 | | | | 1,989,330 | | |
| GE Capital TLGP | | A-1+ | | | 1.65 | | | 01/13/09 | | | 2,286,000 | | | | 2,284,740 | | |
| GE Capital TLGP | | A-1+ | | | 1.65 | | | 01/16/09 | | | 643,000 | | | | 642,557 | | |
| GE Capital TLGP | | A-1+ | | | 1.65 | | | 01/20/09 | | | 140,000 | | | | 139,891 | | |
| Hershey Co. | | A-1 | | | 1.15 | | | 01/12/09 | | | 2,000,000 | | | | 1,999,296 | | |
| Hershey Co. | | A-1 | | | 1.15 | | | 01/20/09 | | | 3,175,000 | | | | 3,173,754 | | |
| Hewlett-Packard Co.† | | A-1 | | | 1.50 | | | 01/05/09 | | | 2,900,000 | | | | 2,899,516 | | |
| Hewlett-Packard Co.† | | A-1 | | | 2.10 | | | 01/02/09 | | | 2,148,000 | | | | 2,147,874 | | |
| Lowe's Cos., Inc. | | A-1 | | | 0.35 | | | 03/12/09 | | | 4,700,000 | | | | 4,696,755 | | |
| Lowe's Cos., Inc. | | A-1 | | | 0.35 | | | 03/16/09 | | | 458,000 | | | | 457,666 | | |
The accompanying notes are an integral part of these portfolio schedules.
61
MUTUAL OF AMERICA INVESTMENT CORPORATION (MONEY MARKET FUND)
PORTFOLIO OF INVESTMENTS IN SECURITIES (Continued)
December 31, 2008
| | | Rating* | | Rate | | Maturity | | Face
Amount | | Value | |
| SHORT-TERM DEBT SECURITIES: (Continued) | |
| COMMERCIAL PAPER (CONTINUED) | |
| Madison Gas & Electric | | A-1+ | | | 0.20 | % | | 01/30/09 | | $ | 4,400,000 | | | $ | 4,399,291 | | |
| Madison Gas & Electric | | A-1+ | | | 0.95 | | | 01/09/09 | | | 870,000 | | | | 869,816 | | |
| Medtronic, Inc.† | | A-1+ | | | 1.10 | | | 01/23/09 | | | 5,200,000 | | | | 5,196,500 | | |
| National Rural Utilities | | A-1 | | | 0.85 | | | 02/13/09 | | | 1,600,000 | | | | 1,598,375 | | |
| National Rural Utilities | | A-1 | | | 1.70 | | | 01/23/09 | | | 500,000 | | | | 499,480 | | |
| National Rural Utilities | | A-1 | | | 0.65 | | | 01/30/09 | | | 3,052,000 | | | | 3,050,401 | | |
| Nestle Capital Corp.† | | A-1+ | | | 0.75 | | | 02/02/09 | | | 5,000,000 | | | | 4,997,026 | | |
| NetJets, Inc.† | | A-1+ | | | 0.12 | | | 03/03/09 | | | 3,763,000 | | | | 3,762,223 | | |
| New Jersey Natural Gas | | A-1 | | | 1.25 | | | 01/16/09 | | | 5,200,000 | | | | 5,197,289 | | |
| NSTAR† | | A-1 | | | 2.40 | | | 01/05/09 | | | 4,074,000 | | | | 4,072,909 | | |
| NSTAR Electric Co. | | A-1 | | | 1.15 | | | 01/07/09 | | | 357,000 | | | | 356,931 | | |
| NSTAR Electric Co. | | A-1 | | | 2.00 | | | 01/05/09 | | | 1,100,000 | | | | 1,099,755 | | |
| Pfizer, Inc.† | | A-1+ | | | 1.00 | | | 01/23/09 | | | 5,000,000 | | | | 4,996,941 | | |
| Pitney Bowes, Inc.† | | A-1 | | | 1.80 | | | 01/05/09 | | | 3,000,000 | | | | 2,999,398 | | |
| Procter & Gamble Co.† | | A-1+ | | | 1.60 | | | 01/06/09 | | | 5,000,000 | | | | 4,998,886 | | |
| Rockwell Collins, Inc.† | | A-1 | | | 0.60 | | | 01/26/09 | | | 1,952,000 | | | | 1,951,186 | | |
| Rockwell Collins, Inc.† | | A-1 | | | 1.10 | | | 01/07/09 | | | 540,000 | | | | 539,901 | | |
| Rockwell Collins, Inc.† | | A-1 | | | 1.15 | | | 01/08/09 | | | 597,000 | | | | 596,866 | | |
| Siemens Capital Co. LLC† | | A-1+ | | | 0.10 | | | 03/13/09 | | | 2,923,000 | | | | 2,922,416 | | |
| Siemens Capital Co. LLC† | | A-1+ | | | 0.30 | | | 01/13/09 | | | 1,000,000 | | | | 999,900 | | |
| Toyota Motor Credit Corp. | | A-1+ | | | 1.05 | | | 02/24/09 | | | 175,000 | | | | 174,724 | | |
| Toyota Motor Credit Corp. | | A-1+ | | | 2.10 | | | 03/09/09 | | | 3,300,000 | | | | 3,286,892 | | |
| Toyota Motor Credit Corp. | | A-1+ | | | 2.10 | | | 02/02/09 | | | 700,000 | | | | 698,719 | | |
| Toyota Motor Credit Corp. | | A-1+ | | | 2.15 | | | 01/30/09 | | | 1,000,000 | | | | 998,265 | | |
| Toyota Motor Credit Corp. | | A-1+ | | | 2.30 | | | 01/05/09 | | | 183,000 | | | | 182,953 | | |
| Walgreen Co.† | | A-1 | | | 1.20 | | | 01/08/09 | | | 5,200,000 | | | | 5,198,784 | | |
| Walt Disney Co.† | | A-1 | | | 1.05 | | | 02/17/09 | | | 2,663,000 | | | | 2,660,356 | | |
| Washington Gas Light Co. | | A-1 | | | 1.65 | | | 01/06/09 | | | 4,269,000 | | | | 4,268,019 | | |
| Washington Gas Light Co. | | A-1 | | | 1.10 | | | 01/16/09 | | | 1,000,000 | | | | 999,541 | | |
| Washington Post Co.† | | A-1 | | | 0.15 | | | 01/23/09 | | | 5,200,000 | | | | 5,199,523 | | |
| | | | 159,339,211 | | |
TOTAL SHORT-TERM DEBT SECURITIES
(Cost: $200,937,136) 100.0% | | | 200,986,624 | | |
TOTAL INVESTMENTS
(Cost: $200,937,136) 100.0% | | | 200,986,624 | | |
| OTHER NET ASSETS 0.0% (1) | | | 3,058 | | |
| NET ASSETS 100.0% | | $ | 200,989,682 | | |
Abbreviations: FHLB = Federal Home Loan Bank
FHLMC = Federal Home Loan Mortgage Corporation
FNMA = Federal National Mortgage Association
* Ratings as per Standard & Poors Corporation.
† Security exempt from registration under Rule 144A of the Securities Act of 1933. These securities may be resold in transactions exempt from registration, normally to qualified institutional buyers. At December 31, 2008, the aggregate value of these securities was $90,178,715, or 44.9% of the Fund's net assets.
(1) Percentage is less than 0.05%.
The accompanying notes are an integral part of these portfolio schedules.
62
MUTUAL OF AMERICA INVESTMENT CORPORATION (MID-TERM BOND FUND)
SUMMARY PORTFOLIO OF INVESTMENTS IN SECURITIES
December 31, 2008
| | | Rating* | | Rate | | Maturity | | Face
Amount | | Value | |
| LONG-TERM DEBT SECURITIES: | |
| U.S. GOVERNMENT (14.6%) | |
| U.S. Treasury Note | | AAA | | | 3.13 | % | | 04/30/13 | | $ | 1,750,000 | | | $ | 1,894,239 | | |
| U.S. Treasury Strip | | AAA | | | 0.00 | | | 11/15/12 - 05/15/13 | | | 26,500,000 | | | | 24,860,157 | | |
| | | | 26,754,396 | | |
| U.S. GOVERNMENT AGENCIES (25.6%) | |
| MORTGAGE-BACKED OBLIGATIONS (1.9%) | |
| FHLMC | | AAA | | | 4.00 - 8.50 | | | 04/01/09 - 11/15/26 | | | 3,304,219 | | | | 3,388,164 | | |
| FNMA | | AAA | | | 4.00 - 8.50 | | | 02/01/09 - 11/25/26 | | | 116,351 | | | | 118,748 | | |
| Other Securities | | | | | | | | | | | 410 | | | | 429 | | |
| | | | 3,507,341 | | |
| NON-MORTGAGE-BACKED OBLIGATIONS (23.7%) | |
| FFCB | | AAA | | | 4.95 - 5.10 | | | 08/05/13 - 10/10/14 | | | 17,500,000 | | | | 19,648,355 | | |
| FHLB | | AAA | | | 3.00 - 5.75 | | | 04/15/09 - 05/15/12 | | | 6,700,000 | | | | 7,115,204 | | |
| FHLMC | | AAA | | | 5.00 - 6.63 | | | 09/15/09 - 07/15/14 | | | 11,250,000 | | | | 12,220,611 | | |
| FNMA | | AAA | | | 3.25 - 4.38 | | | 02/15/09 - 09/15/12 | | | 4,250,000 | | | | 4,413,979 | | |
| | | | 43,398,149 | | |
| CORPORATE DEBT (57.1%) | |
| BASIC MATERIALS (2.8%) | |
| Martin Marietta Materials, Inc | | BBB+ | | | 6.88 | | | 04/01/11 | | | 1,000,000 | | | | 955,011 | | |
| Other Securities | | | | | | | | | | | 4,643,000 | | | | 4,206,619 | | |
| | | | 5,161,630 | | |
| CONSUMER, CYCLICAL (7.9%) | |
| Best Buy Co., Inc.† | | BBB- | | | 6.75 | | | 07/15/13 | | | 1,000,000 | | | | 933,569 | | |
| Mattel, Inc. | | BBB- | | | 6.13 | | | 06/15/11 | | | 1,000,000 | | | | 954,792 | | |
| Newell Rubbermaid, Inc. | | BBB+ | | | 4.63 - 5.50 | | | 12/15/09 - 04/15/13 | | | 1,000,000 | | | | 924,460 | | |
| Target Corp. | | A+ | | | 5.38 | | | 06/15/09 | | | 1,000,000 | | | | 1,010,641 | | |
| Other Securities | | | | | | | | | | | 12,650,000 | | | | 10,780,823 | | |
| | | | 14,604,285 | | |
| CONSUMER, NON-CYCLICAL (5.6%) | |
| Anheuser-Busch Cos., Inc. | | BBB+ | | | 4.38 - 4.70 | | | 04/15/12 - 01/15/13 | | | 1,100,000 | | | | 1,026,185 | | |
| Brown-Forman Corp. | | A | | | 5.20 | | | 04/01/12 | | | 1,000,000 | | | | 989,530 | | |
| Clorox Co. | | BBB+ | | | 4.20 - 5.00 | | | 01/15/10 - 01/15/15 | | | 1,050,000 | | | | 1,020,189 | | |
| ConAgra Foods, Inc. | | BBB+ | | | 6.75 | | | 09/15/11 | | | 1,000,000 | | | | 1,010,855 | | |
| Hershey Co. | | A | | | 4.85 - 5.00 | | | 04/01/13 - 08/15/15 | | | 1,000,000 | | | | 983,488 | | |
| Other Securities | | | | | | | | | | | 5,750,000 | | | | 5,248,940 | | |
| | | | 10,279,187 | | |
| ENERGY (4.9%) | |
| Enbridge, Inc. | | A- | | | 5.80 | | | 06/15/14 | | | 1,065,000 | | | | 934,113 | | |
| Noble Corp. | | A- | | | 5.88 | | | 06/01/13 | | | 1,000,000 | | | | 974,578 | | |
| Smith International, Inc. | | BBB+ | | | 6.75 | | | 02/15/11 | | | 1,000,000 | | | | 1,006,759 | | |
| Other Securities | | | | | | | | | | | 6,750,000 | | | | 6,086,926 | | |
| | | | 9,002,376 | | |
| FINANCIAL (13.1%) | |
| American Express Credit Corp. | | A+ | | | 5.88 | | | 05/02/13 | | | 1,000,000 | | | | 959,974 | | |
| Fosters Finance Corp.† | | BBB | | | 4.88 - 6.88 | | | 06/15/11 - 10/01/14 | | | 1,000,000 | | | | 925,916 | | |
| Heinz (H.J.) Finance Co. | | BBB | | | 6.00 | | | 03/15/12 | | | 1,000,000 | | | | 1,007,627 | | |
| KeyCorp | | A- | | | 6.50 | | | 05/14/13 | | | 1,050,000 | | | | 967,981 | | |
| Nat'l. Rural Utilities Coop. | | A | | | 7.25 | | | 03/01/12 | | | 1,000,000 | | | | 1,029,624 | | |
The accompanying notes are an integral part of these portfolio schedules.
63
MUTUAL OF AMERICA INVESTMENT CORPORATION (MID-TERM BOND FUND)
SUMMARY PORTFOLIO OF INVESTMENTS IN SECURITIES (Continued)
December 31, 2008
| | | Rating* | | Rate | | Maturity | | Face
Amount | | Value | |
| LONG-TERM DEBT SECURITIES: (Continued) | |
| FINANCIAL (CONTINUED) | |
| Travelers Cos., Inc. | | A- | | | 5.38 | % | | 06/15/12 | | $ | 1,000,000 | | | $ | 997,820 | | |
| Other Securities | | | | | | | | | | | 22,578,000 | | | | 18,052,786 | | |
| | | | 23,941,728 | | |
| HEALTHCARE (5.5%) | |
| Blue Cross & Blue Shield of FL† | | A- | | | 8.25 | | | 11/15/11 | | | 1,000,000 | | | | 1,074,648 | | |
| Cardinal Health, Inc. | | BBB+ | | | 5.50 | | | 06/15/13 | | | 1,000,000 | | | | 945,345 | | |
| Humana, Inc. | | BBB | | | 6.45 | | | 06/01/16 | | | 1,415,000 | | | | 1,118,766 | | |
| McKesson Corp. | | BBB+ | | | 7.75 | | | 02/01/12 | | | 1,000,000 | | | | 1,117,911 | | |
| Other Securities | | | | | | | | | | | 6,160,000 | | | | 5,845,212 | | |
| | | | 10,101,882 | | |
| INDUSTRIAL (8.7%) | |
| Acuity Brands, Inc. | | BBB- | | | 8.38 | | | 08/01/10 | | | 1,000,000 | | | | 1,073,672 | | |
| Canadian Pacific Railway Co. | | BBB | | | 5.75 | | | 05/15/13 | | | 1,000,000 | | | | 925,462 | | |
| CSX Corp. | | BBB- | | | 5.30 - 6.25 | | | 02/15/14 - 04/01/15 | | | 1,000,000 | | | | 942,084 | | |
| Dun & Bradstreet Corp. | | A- | | | 5.50 - 6.00 | | | 03/15/11 - 04/01/13 | | | 1,500,000 | | | | 1,432,056 | | |
| Federal Express Corp. | | BBB | | | 9.65 | | | 06/15/12 | | | 1,000,000 | | | | 1,049,995 | | |
| Goodrich Corp. | | BBB+ | | | 7.63 | | | 12/15/12 | | | 1,000,000 | | | | 1,037,892 | | |
| Pall Corp.† | | BB+ | | | 6.00 | | | 08/01/12 | | | 1,000,000 | | | | 965,113 | | |
| Roper Industries, Inc. | | BBB- | | | 6.63 | | | 08/15/13 | | | 1,000,000 | | | | 1,002,837 | | |
| Ryder System, Inc. | | BBB+ | | | 6.00 - 7.20 | | | 03/01/13 - 09/01/15 | | | 1,500,000 | | | | 1,290,105 | | |
| Steelcase, Inc. | | BBB | | | 6.50 | | | 08/15/11 | | | 1,000,000 | | | | 941,726 | | |
| Union Pacific Corp. | | BBB | | | 4.88 - 6.13 | | | 01/15/12 - 01/15/15 | | | 1,000,000 | | | | 943,894 | | |
| Other Securities | | | | | | | | | | | 4,925,000 | | | | 4,321,989 | | |
| | | | 15,926,825 | | |
| TECHNOLOGY (2.1%) | |
| Computer Sciences Corp. | | A- | | | 7.38 | | | 06/15/11 | | | 950,000 | | | | 940,807 | | |
| Other Securities | | | | | | | | | | | 3,225,000 | | | | 2,941,539 | | |
| | | | 3,882,346 | | |
| TELECOMMUNICATIONS (0.7%) | |
| Verizon New England, Inc. | | A | | | 6.50 | | | 09/15/11 | | | 1,000,000 | | | | 992,677 | | |
| Other Securities | | | | | | | | | | | 250,000 | | | | 215,625 | | |
| | | | 1,208,302 | | |
| UTILITIES (5.8%) | |
| AGL Capital Corp. | | BBB+ | | | 6.38 - 7.13 | | | 01/14/11 - 07/15/16 | | | 1,500,000 | | | | 1,469,064 | | |
| Arizona Public Svc. Co. | | BBB- | | | 6.38 | | | 10/15/11 | | | 500,000 | | | | 470,662 | | |
| Arizona Public Svc. Co. | | BBB- | | | 6.50 | | | 03/01/12 | | | 500,000 | | | | 468,892 | | |
| PPL Energy Supply LLC | | BBB | | | 5.70 - 6.40 | | | 11/01/11 - 10/15/15 | | | 1,700,000 | | | | 1,576,368 | | |
| Progress Energy, Inc. | | BBB to A- | | | 5.95 - 6.85 | | | 03/01/09 - 04/15/12 | | | 1,100,000 | | | | 1,102,825 | | |
| Southwest Gas Corp. | | BBB- | | | 8.38 | | | 02/15/11 | | | 1,000,000 | | | | 1,011,279 | | |
| Virginia Electric & Power Co. | | | | | | | | | | | 5,150,000 | | | | 4,603,821 | | |
| | | | 10,702,911 | | |
TOTAL LONG-TERM DEBT SECURITIES
(Cost: $182,981,986) 97.3% | | | 178,471,358 | | |
The accompanying notes are an integral part of these portfolio schedules.
64
MUTUAL OF AMERICA INVESTMENT CORPORATION (MID-TERM BOND FUND)
SUMMARY PORTFOLIO OF INVESTMENTS IN SECURITIES (Continued)
December 31, 2008
| | | Rating* | | Rate | | Maturity | | Face
Amount | | Value | |
| SHORT-TERM DEBT SECURITIES: | |
| COMMERCIAL PAPER (1.4%) | |
| Northern Illinois Gas Co. | | A-1+ | | | 0.08 | % | | 01/08/09 | | $ | 1,000,000 | | | $ | 999,984 | | |
| Toyota Motor Credit Corp. | | A-1+ | | | 0.40 | | | 01/21/09 | | | 1,630,000 | | | | 1,629,638 | | |
| | | | 2,629,622 | | |
TOTAL SHORT-TERM DEBT SECURITIES
(Cost: $2,629,622) 1.4% | | | 2,629,622 | | |
TOTAL INVESTMENTS
(Cost: $185,611,608) 98.7% | | | 181,100,980 | | |
| OTHER NET ASSETS 1.3% | | | 2,318,294 | | |
| NET ASSETS 100.0% | | $ | 183,419,274 | | |
Abbreviations: FFCB = Federal Farm Credit Bank
FHLB = Federal Home Loan Bank
FHLMC = Federal Home Loan Mortgage Corporation
FNMA = Federal National Mortgage Association
* Ratings as per Standard & Poors Corporation.
† Security exempt from registration under Rule 144A of the Securities Act of 1933. These securities may be resold in transactions exempt from registration, normally to qualified institutional buyers. At December 31, 2008, the aggregate value of these securities was $7,067,985, or 3.9% of the Fund's net assets.
"Other Securities" represent securities in the respective category that individually, or in the aggregate by issuer, do not exceed 1% of net assets.
The accompanying notes are an integral part of these portfolio schedules.
65
MUTUAL OF AMERICA INVESTMENT CORPORATION (BOND FUND)
SUMMARY PORTFOLIO OF INVESTMENTS IN SECURITIES
December 31, 2008
| | | Rating* | | Rate | | Maturity | | Face
Amount | | Value | |
| LONG-TERM DEBT SECURITIES: | |
| U.S. GOVERNMENT (2.0%) | |
| U.S. Treasury Strip | | AAA | | | 0.00 | % | | 02/15/18 | | $ | 10,000,000 | | | $ | 7,686,690 | | |
| U.S. GOVERNMENT AGENCIES (42.5%) | |
| MORTGAGE-BACKED OBLIGATIONS (39.6%) | |
| FHARM | | AAA | | | 5.26 - 5.45 | | | 02/01/36 - 05/01/37 | | | 7,048,811 | | | | 7,155,339 | | |
| FHLMC | | AAA | | | 4.00 - 6.00 | | | 10/01/18 - 04/01/37 | | | 18,611,630 | | | | 19,124,870 | | |
| FNMA | | AAA | | | 4.00 - 8.00 | | | 09/01/16 - 06/01/48 | | | 114,255,918 | | | | 117,388,757 | | |
| GNMA (1) | | AAA | | | 6.27 - 7.00 | | | 10/16/27 - 05/15/32 | | | 3,416,477 | | | | 3,581,577 | | |
| | | | 147,250,543 | | |
| NON-MORTGAGE-BACKED OBLIGATIONS (2.9%) | |
| FNMA | | AAA | | | 0.00 | | | 10/09/19 | | | 20,000,000 | | | | 10,838,776 | | |
| CORPORATE DEBT (50.2%) | |
| BASIC MATERIALS (3.0%) | |
| International Paper Co. | | BBB | | | 4.25 | | | 01/15/09 | | | 2,000,000 | | | | 1,999,310 | | |
| Worthington Industries, Inc. | | BBB | | | 6.70 | | | 12/01/09 | | | 2,000,000 | | | | 2,042,302 | | |
| Other Securities | | | | | | | | | | | 14,750,000 | | | | 7,219,404 | | |
| | | | 11,261,016 | | |
| CONSUMER, CYCLICAL (8.8%) | |
| Ethan Allen Interiors, Inc. | | BBB- | | | 5.38 | | | 10/01/15 | | | 2,000,000 | | | | 1,895,586 | | |
| Fortune Brands, Inc. | | BBB | | | 4.88 - 5.38 | | | 12/01/13 - 01/15/16 | | | 2,400,000 | | | | 2,027,363 | | |
| Johnson Controls, Inc. | | BBB | | | 4.88 | | | 09/15/13 | | | 2,500,000 | | | | 1,969,303 | | |
| Kellwood Co. | | NR | | | 7.88 | | | 07/15/09 | | | 4,000,000 | | | | 2,600,000 | | |
| Macys Retail Hldgs., Inc.† | | BBB- | | | 4.80 | | | 07/15/09 | | | 2,000,000 | | | | 1,895,674 | | |
| Newell Rubbermaid, Inc. | | BBB+ | | | 4.63 | | | 12/15/09 | | | 2,500,000 | | | | 2,431,618 | | |
| Target Corp. | | A+ | | | 5.38 | | | 06/15/09 | | | 3,250,000 | | | | 3,284,583 | | |
| Other Securities | | | | | | | | | | | 20,345,170 | | | | 16,819,031 | | |
| | | | 32,923,158 | | |
| CONSUMER, NON-CYCLICAL (3.1%) | |
| Clorox Co. | | BBB+ | | | 5.00 | | | 03/01/13 | | | 2,000,000 | | | | 1,970,450 | | |
| CVS Caremark Corp. | | BBB+ | | | 6.13 | | | 08/15/16 | | | 2,000,000 | | | | 1,937,666 | | |
| Kroger Co. | | BBB- | | | 4.95 | | | 01/15/15 | | | 2,000,000 | | | | 1,904,132 | | |
| PepsiAmericas, Inc. | | A | | | 6.38 | | | 05/01/09 | | | 2,000,000 | | | | 2,009,516 | | |
| Sara Lee Corp. | | BBB+ | | | 6.25 | | | 09/15/11 | | | 2,000,000 | | | | 1,979,882 | | |
| Other Securities | | | | | | | | | | | 2,500,000 | | | | 1,881,849 | | |
| | | | 11,683,495 | | |
| ENERGY (5.8%) | |
| Noble Corp. | | A- | | | 7.50 | | | 03/15/19 | | | 2,000,000 | | | | 2,473,014 | | |
| Seariver Maritime, Inc. | | AAA | | | 0.00 | | | 09/01/12 | | | 10,000,000 | | | | 8,564,670 | | |
| Other Securities | | | | | | | | | | | 12,000,000 | | | | 10,415,284 | | |
| | | | 21,452,968 | | |
| FINANCIAL (15.7%) | |
| Berkley (W.R.) Corp. | | BBB+ | | | 8.70 | | | 01/01/22 | | | 5,000,000 | | | | 5,358,920 | | |
| Brandywine Realty Trust | | BBB- | | | 4.50 | | | 11/01/09 | | | 2,000,000 | | | | 1,875,574 | | |
| Capital One Bank | | A- | | | 5.75 | | | 09/15/10 | | | 2,000,000 | | | | 1,941,138 | | |
| Corporate Pptys. Investors† | | A- | | | 7.88 | | | 03/15/16 | | | 5,000,000 | | | | 3,487,785 | | |
| Fairfax Financial Hldgs. | | BB+ | | | 8.25 | | | 10/01/15 | | | 2,500,000 | | | | 1,950,000 | | |
| First Horizon National Corp. | | BBB- | | | 4.50 | | | 05/15/13 | | | 5,000,000 | | | | 3,472,975 | | |
| Ford Motor Credit Co. LLC | | CCC+ | | | 7.38 | | | 10/28/09 | | | 3,000,000 | | | | 2,634,663 | | |
The accompanying notes are an integral part of these portfolio schedules.
66
MUTUAL OF AMERICA INVESTMENT CORPORATION (BOND FUND)
SUMMARY PORTFOLIO OF INVESTMENTS IN SECURITIES (Continued)
December 31, 2008
| | | Rating* | | Rate | | Maturity | | Face
Amount | | Value | |
| LONG-TERM DEBT SECURITIES: (Continued) | |
| FINANCIAL (CONTINUED) | |
| Fosters Finance Corp.† | | BBB | | | 6.88 | % | | 06/15/11 | | $ | 2,000,000 | | | $ | 1,984,912 | | |
| GMAC LLC | | CC | | | 0.00 | | | 12/01/12 | | | 10,000,000 | | | | 1,894,900 | | |
| HCP, Inc. | | BBB | | | 4.88 - 5.65 | | | 09/15/10 - 12/15/13 | | | 4,000,000 | | | | 2,978,048 | | |
| Heinz (H.J.) Finance Co. | | BBB | | | 6.00 | | | 03/15/12 | | | 2,000,000 | | | | 2,015,254 | | |
| SLM Corp. | | BBB- | | | 4.00 | | | 01/15/09 | | | 2,250,000 | | | | 2,239,724 | | |
| Other Securities | | | | | | | | | | | 32,854,516 | | | | 26,462,874 | | |
| | | | 58,296,767 | | |
| HEALTHCARE (4.5%) | |
| Allergan, Inc. | | A | | | 5.75 | | | 04/01/16 | | | 2,000,000 | | | | 1,913,444 | | |
| Cardinal Health, Inc. | | BBB+ | | | 6.75 | | | 02/15/11 | | | 2,000,000 | | | | 1,990,252 | | |
| McKesson Corp. | | BBB+ | | | 7.75 | | | 02/01/12 | | | 1,750,000 | | | | 1,956,344 | | |
| WellPoint, Inc. | | A- | | | 4.25 | | | 12/15/09 | | | 2,000,000 | | | | 1,923,334 | | |
| Other Securities | | | | | | | | | | | 9,750,000 | | | | 8,777,171 | | |
| | | | 16,560,545 | | |
| INDUSTRIAL (3.5%) | |
| Goodrich Corp. | | BBB+ | | | 7.63 | | | 12/15/12 | | | 2,000,000 | | | | 2,075,784 | | |
| Steelcase, Inc. | | BBB | | | 6.50 | | | 08/15/11 | | | 2,000,000 | | | | 1,883,452 | | |
| Other Securities | | | | | | | | | | | 10,500,000 | | | | 8,865,767 | | |
| | | | 12,825,003 | | |
| TECHNOLOGY (1.1%) | |
| Cisco Systems, Inc. | | A+ | | | 5.25 | | | 02/22/11 | | | 2,000,000 | | | | 2,076,264 | | |
| Other Securities | | | | | | | | | | | 2,500,000 | | | | 2,065,058 | | |
| | | | 4,141,322 | | |
| TELECOMMUNICATIONS (1.5%) | |
| Alltel Corp. | | A | | | 7.00 | | | 03/15/16 | | | 2,000,000 | | | | 1,970,000 | | |
| Verizon Florida LLC | | A | | | 6.13 | | | 01/15/13 | | | 2,000,000 | | | | 1,906,104 | | |
| Other Securities | | | | | | | | | | | 2,000,000 | | | | 1,725,000 | | |
| | | | 5,601,104 | | |
| UTILITIES (3.2%) | |
| Arizona Public Svc. Co. | | BBB- | | | 6.50 | | | 03/01/12 | | | 2,000,000 | | | | 1,875,566 | | |
| Pepco Hldgs., Inc. | | BBB- | | | 4.00 | | | 05/15/10 | | | 2,000,000 | | | | 1,923,036 | | |
| Progress Energy, Inc. | | A- | | | 5.25 | | | 12/15/15 | | | 2,000,000 | | | | 2,028,956 | | |
| Virginia Electric & Power Co. | | A- | | | 4.50 | | | 12/15/10 | | | 2,000,000 | | | | 1,973,892 | | |
| Other Securities | | | | | | | | | | | 4,825,000 | | | | 4,277,257 | | |
| | | | 12,078,707 | | |
| SOVEREIGN DEBT (1.4%) | |
| Sri Lanka AID | | NR | | | 6.59 | | | 09/15/28 | | | 4,000,000 | | | | 5,063,760 | | |
TOTAL LONG-TERM DEBT SECURITIES
(Cost: $387,723,894) 96.1% | | | 357,663,854 | | |
The accompanying notes are an integral part of these portfolio schedules.
67
MUTUAL OF AMERICA INVESTMENT CORPORATION (BOND FUND)
SUMMARY PORTFOLIO OF INVESTMENTS IN SECURITIES (Continued)
December 31, 2008
| | | Rating* | | Rate | | Maturity | | Face
Amount | | Value | |
| SHORT-TERM DEBT SECURITIES: | |
| COMMERCIAL PAPER (2.8%) | |
| Danaher Corp. | | A-1 | | | 0.02 | % | | 01/05/09 | | $ | 5,000,000 | | | $ | 4,999,989 | | |
| Toyota Motor Credit Corp. | | A-1+ | | | 0.40 | | | 01/21/09 | | | 5,400,000 | | | | 5,398,800 | | |
| | | | 10,398,789 | | |
TOTAL SHORT-TERM DEBT SECURITIES
(Cost: $10,398,789) 2.8% | | | 10,398,789 | | |
TOTAL INVESTMENTS
(Cost: $398,122,683) 98.9% | | | 368,062,643 | | |
| OTHER NET ASSETS 1.1% | | | 4,038,766 | | |
| NET ASSETS 100.0% | | $ | 372,101,409 | | |
Abbreviations: FHARM = Federal Home Adjustable Rate Mortgage
FHLMC = Federal Home Loan Mortgage Corporation
FNMA = Federal National Mortgage Association
GMAC = General Motors Acceptance Corporation
GNMA = Government National Mortgage Association
NR = Not Rated
* Ratings as per Standard & Poors Corporation.
† Security exempt from registration under Rule 144A of the Securities Act of 1933. These securities may be resold in transactions exempt from registration, normally to qualified institutional buyers. At December 31, 2008, the aggregate value of these securities was $8,631,062, or 2.3% of the Fund's net assets.
(1) U.S. Government guaranteed security.
"Other Securities" represent securities in the respective category that individually, or in the aggregate by issuer, do not exceed 1% of net assets.
The accompanying notes are an integral part of these portfolio schedules.
68
(This page has been left blank intentionally.)
MUTUAL OF AMERICA INVESTMENT CORPORATION
STATEMENTS OF ASSETS AND LIABILITIES
December 31, 2008
| | | Equity Index
Fund | | All America
Fund | | Small Cap
Value Fund | | Small Cap
Growth Fund | | Mid Cap
Value Fund | | Mid-Cap
Equity Index
Fund | | International
Fund | |
| ASSETS: | |
Investments at market value
(Cost: Equity Index Fund — $654,329,163
All America Fund — $285,771,716
Small Cap Value Fund — $200,065,441
Small Cap Growth Fund — $177,744,451
Mid Cap Value Fund — $40,604,182
Mid-Cap Equity Index Fund — $332,316,397
International Fund — $16,221,198
Composite Fund — $175,367,365
Retirement Income Fund — $3,881,924
Retirement 2010 Fund — $9,649,309
Retirement 2015 Fund — $24,153,563
Retirement 2020 Fund — $25,669,962
Retirement 2025 Fund — $18,457,006)
(Notes 1 and 3) | | $ | 544,304,227 | | | $ | 221,606,144 | | | $ | 154,992,607 | | | $ | 149,590,887 | | | $ | 29,804,103 | | | $ | 245,098,383 | | | $ | 11,828,829 | | |
| Cash | | | — | | | | 86,218 | | | | 3,776 | | | | 168,579 | | | | 6,718 | | | | 65 | | | | 1,069,791 | | |
| Interest and dividends receivable | | | 1,142,176 | | | | 432,528 | | | | 335,226 | | | | 110,905 | | | | 103,169 | | | | 340,007 | | | | — | | |
| Receivable for securities sold | | | 448,917 | | | | 82,165 | | | | — | | | | 450,141 | | | | — | | | | 2,817,895 | | | | — | | |
| Receivable for daily variation margin on future contracts | | | 387,035 | | | | 97,952 | | | | — | | | | — | | | | — | | | | 590,940 | | | | — | | |
| TOTAL ASSETS | | | 546,282,355 | | | | 222,305,007 | | | | 155,331,609 | | | | 150,320,512 | | | | 29,913,990 | | | | 248,847,290 | | | | 12,898,620 | | |
| LIABILITIES: | |
| Due to custodian bank | | | 255,043 | | | | — | | | | — | | | | — | | | | — | | | | — | | | | — | | |
| Payable for securities purchased | | | 842,479 | | | | 799,270 | | | | 63 | | | | 3,389,758 | | | | — | | | | 1,322,654 | | | | 611,378 | | |
| TOTAL LIABILITIES | | | 1,097,522 | | | | 799,270 | | | | 63 | | | | 3,389,758 | | | | — | | | | 1,322,654 | | | | 611,378 | | |
| NET ASSETS | | $ | 545,184,833 | | | $ | 221,505,737 | | | $ | 155,331,546 | | | $ | 146,930,754 | | | $ | 29,913,990 | | | $ | 247,524,636 | | | $ | 12,287,242 | | |
| NUMBER OF SHARES OUTSTANDING (Note 4) | | | 368,420,865 | | | | 191,846,309 | | | | 207,820,402 | | | | 209,988,389 | | | | 37,860,539 | | | | 267,560,565 | | | | 22,203,777 | | |
| NET ASSET VALUES, offering and redemption price per share | | $ | 1.48 | | | $ | 1.15 | | | $ | 0.75 | | | $ | 0.70 | | | $ | 0.79 | | | $ | 0.93 | | | $ | 0.55 | | |
| COMPONENTS OF NET ASSETS: | |
| Paid-in capital | | $ | 674,824,533 | | | $ | 301,151,336 | | | $ | 230,026,303 | | | $ | 206,642,500 | | | $ | 41,798,449 | | | $ | 337,187,765 | | | $ | 16,675,826 | | |
| Accumulated undistributed net investment income (loss) | | | 1,927,434 | | | | 4,552,236 | | | | — | | | | — | | | | — | | | | 536,963 | | | | 3,785 | | |
Accumulated undistributed net realized gain(loss)
on investments and futures contracts | | | (21,532,985 | ) | | | (20,011,063 | ) | | | (29,621,923 | ) | | | (31,558,182 | ) | | | (1,084,380 | ) | | | (3,477,203 | ) | | | — | | |
Net unrealized appreciation (depreciation)
of investments and futures contracts | | | (110,034,149 | ) | | | (64,186,772 | ) | | | (45,072,834 | ) | | | (28,153,564 | ) | | | (10,800,079 | ) | | | (86,722,889 | ) | | | (4,392,369 | ) | |
| NET ASSETS | | $ | 545,184,833 | | | $ | 221,505,737 | | | $ | 155,331,546 | | | $ | 146,930,754 | | | $ | 29,913,990 | | | $ | 247,524,636 | | | $ | 12,287,242 | | |
The accompanying notes are an integral part of these financial statements.
70
| | | Composite
Fund | | Retirement
Income
Fund | | 2010
Retirement
Fund | | 2015
Retirement
Fund | | 2020
Retirement
Fund | | 2025
Retirement
Fund | |
| ASSETS: | |
Investments at market value
(Cost: Equity Index Fund — $654,329,163
All America Fund — $285,771,716
Small Cap Value Fund — $200,065,441
Small Cap Growth Fund — $177,744,451
Mid Cap Value Fund — $40,604,182
Mid-Cap Equity Index Fund — $332,316,397
International Fund — $16,221,198
Composite Fund — $175,367,365
Retirement Income Fund — $3,881,924
Retirement 2010 Fund — $9,649,309
Retirement 2015 Fund — $24,153,563
Retirement 2020 Fund — $25,669,962
Retirement 2025 Fund — $18,457,006)
(Notes 1 and 3) | | $ | 149,245,581 | | | $ | 3,516,933 | | | $ | 8,274,705 | | | $ | 20,017,092 | | | $ | 20,685,744 | | | $ | 14,822,394 | | |
| Cash | | | 23,716 | | | | — | | | | — | | | | — | | | | — | | | | — | | |
| Interest and dividends receivable | | | 833,318 | | | | — | | | | — | | | | — | | | | — | | | | — | | |
| Receivable for securities sold | | | 23,169 | | | | — | | | | — | | | | — | | | | — | | | | — | | |
| Receivable for daily variation margin on future contracts | | | — | | | | — | | | | — | | | | — | | | | — | | | | — | | |
| TOTAL ASSETS | | | 150,125,784 | | | | 3,516,933 | | | | 8,274,705 | | | | 20,017,092 | | | | 20,685,744 | | | | 14,822,394 | | |
| LIABILITIES: | |
| Due to custodian bank | | | — | | | | — | | | | — | | | | — | | | | — | | | | — | | |
| Payable for securities purchased | | | — | | | | — | | | | — | | | | — | | | | — | | | | — | | |
| TOTAL LIABILITIES | | | — | | | | — | | | | — | | | | — | | | | — | | | | — | | |
| NET ASSETS | | $ | 150,125,784 | | | $ | 3,516,933 | | | $ | 8,274,705 | | | $ | 20,017,092 | | | $ | 20,685,744 | | | $ | 14,822,394 | | |
| NUMBER OF SHARES OUTSTANDING (Note 4) | | | 124,623,815 | | | | 4,214,590 | | | | 11,114,476 | | | | 28,429,170 | | | | 31,210,997 | | | | 23,272,827 | | |
| NET ASSET VALUES, offering and redemption price per share | | $ | 1.20 | | | $ | 0.83 | | | $ | 0.74 | | | $ | 0.70 | | | $ | 0.66 | | | $ | 0.64 | | |
| COMPONENTS OF NET ASSETS: | |
| Paid-in capital | | $ | 211,699,178 | | | $ | 3,958,397 | | | $ | 9,848,024 | | | $ | 24,511,520 | | | $ | 25,954,174 | | | $ | 18,530,156 | | |
| Accumulated undistributed net investment income (loss) | | | 4,490,475 | | | | 3,557 | | | | 2,924 | | | | — | | | | — | | | | — | | |
Accumulated undistributed net realized gain(loss)
on investments and futures contracts | | | (39,942,085 | ) | | | (80,030 | ) | | | (201,639 | ) | | | (357,957 | ) | | | (284,212 | ) | | | (73,150 | ) | |
Net unrealized appreciation (depreciation)
of investments and futures contracts | | | (26,121,784 | ) | | | (364,991 | ) | | | (1,374,604 | ) | | | (4,136,471 | ) | | | (4,984,218 | ) | | | (3,634,612 | ) | |
| NET ASSETS | | $ | 150,125,784 | | | $ | 3,516,933 | | | $ | 8,274,705 | | | $ | 20,017,092 | | | $ | 20,685,744 | | | $ | 14,822,394 | | |
The accompanying notes are an integral part of these financial statements.
71
MUTUAL OF AMERICA INVESTMENT CORPORATION
STATEMENTS OF ASSETS AND LIABILITIES (Continued)
December 31, 2008
| | | 2030
Retirement
Fund | | 2035
Retirement
Fund | | 2040
Retirement
Fund | | 2045
Retirement
Fund | | Conservative
Allocation
Fund | |
| ASSETS: | |
Investments at market value
(Cost: Retirement 2030 Fund — $14,711,346
Retirement 2035 Fund — $11,265,677
Retirement 2040 Fund — $7,956,146
Retirement 2045 Fund — $8,641,633
Conservative Allocation Fund — $26,834,350
Moderate Allocation Fund — $112,045,544
Aggressive Allocation Fund — $112,985,924
Money Market Fund — $200,937,136
Mid-Term Bond Fund — $185,611,608
Bond Fund — $398,122,683)
(Notes 1 and 3) | | $ | 11,661,423 | | | $ | 8,780,940 | | | $ | 6,200,702 | | | $ | 6,858,194 | | | $ | 23,604,668 | | |
| Cash | | | — | | | | — | | | | — | | | | — | | | | — | | |
| Interest and dividends receivable | | | — | | | | — | | | | — | | | | — | | | | — | | |
| Receivable for securities sold | | | — | | | | — | | | | — | | | | — | | | | — | | |
| Receivable for daily variation margin on future contracts | | | — | | | | — | | | | — | | | | — | | | | — | | |
| TOTAL ASSETS | | | 11,661,423 | | | | 8,780,940 | | | | 6,200,702 | | | | 6,858,194 | | | | 23,604,668 | | |
| LIABILITIES: | |
| Due to custodian bank | | | — | | | | — | | | | — | | | | — | | | | — | | |
| Payable for securities purchased | | | — | | | | — | | | | — | | | | — | | | | — | | |
| TOTAL LIABILITIES | | | — | | | | — | | | | — | | | | — | | | | — | | |
| NET ASSETS | | $ | 11,661,423 | | | $ | 8,780,940 | | | $ | 6,200,702 | | | $ | 6,858,194 | | | $ | 23,604,668 | | |
| NUMBER OF SHARES OUTSTANDING (Note 4) | | | 18,754,328 | | | | 14,569,870 | | | | 10,465,972 | | | | 11,628,887 | | | | 26,598,668 | | |
| NET ASSET VALUES, offering and redemption price per share | | $ | 0.62 | | | $ | 0.60 | | | $ | 0.59 | | | $ | 0.59 | | | $ | 0.89 | | |
| COMPONENTS OF NET ASSETS: | |
| Paid-in capital | | $ | 14,890,364 | | | $ | 11,321,053 | | | $ | 8,017,711 | | | $ | 8,674,742 | | | $ | 27,206,642 | | |
| Accumulated undistributed net investment income (loss) | | | — | | | | — | | | | — | | | | — | | | | 1,633 | | |
Accumulated undistributed net realized gain(loss)
on investments and futures contracts | | | (179,018 | ) | | | (55,376 | ) | | | (61,565 | ) | | | (33,109 | ) | | | (373,925 | ) | |
Net unrealized appreciation (depreciation)
of investments and futures contracts | | | (3,049,923 | ) | | | (2,484,737 | ) | | | (1,755,444 | ) | | | (1,783,439 | ) | | | (3,229,682 | ) | |
| NET ASSETS | | $ | 11,661,423 | | | $ | 8,780,940 | | | $ | 6,200,702 | | | $ | 6,858,194 | | | $ | 23,604,668 | | |
The accompanying notes are an integral part of these financial statements.
72
| | | Moderate
Allocation
Fund | | Aggressive
Allocation
Fund | | Money
Market
Fund | | Mid-Term
Bond Fund | | Bond
Fund | |
| ASSETS: | |
Investments at market value
(Cost: Retirement 2030 Fund — $14,711,346
Retirement 2035 Fund — $11,265,677
Retirement 2040 Fund — $7,956,146
Retirement 2045 Fund — $8,641,633
Conservative Allocation Fund — $26,834,350
Moderate Allocation Fund — $112,045,544
Aggressive Allocation Fund — $112,985,924
Money Market Fund — $200,937,136
Mid-Term Bond Fund — $185,611,608
Bond Fund — $398,122,683)
(Notes 1 and 3) | | $ | 89,505,262 | | | $ | 81,248,122 | | | $ | 200,986,624 | | | $ | 181,100,980 | | | $ | 368,062,643 | | |
| Cash | | | — | | | | — | | | | 3,058 | | | | 7,923 | | | | 9,758 | | |
| Interest and dividends receivable | | | — | | | | — | | | | — | | | | 2,309,868 | | | | 3,937,222 | | |
| Receivable for securities sold | | | — | | | | — | | | | — | | | | 503 | | | | 91,786 | | |
| Receivable for daily variation margin on future contracts | | | — | | | | — | | | | — | | | | — | | | | — | | |
| TOTAL ASSETS | | | 89,505,262 | | | | 81,248,122 | | | | 200,989,682 | | | | 183,419,274 | | | | 372,101,409 | | |
| LIABILITIES: | |
| Due to custodian bank | | | — | | | | — | | | | — | | | | — | | | | — | | |
| Payable for securities purchased | | | — | | | | — | | | | — | | | | — | | | | — | | |
| TOTAL LIABILITIES | | | — | | | | — | | | | — | | | | — | | | | — | | |
| NET ASSETS | | $ | 89,505,262 | | | $ | 81,248,122 | | | $ | 200,989,682 | | | $ | 183,419,274 | | | $ | 372,101,409 | | |
| NUMBER OF SHARES OUTSTANDING (Note 4) | | | 102,039,836 | | | | 94,418,460 | | | | 166,343,903 | | | | 195,477,588 | | | | 315,997,008 | | |
| NET ASSET VALUES, offering and redemption price per share | | $ | 0.88 | | | $ | 0.86 | | | $ | 1.21 | | | $ | 0.94 | | | $ | 1.18 | | |
| COMPONENTS OF NET ASSETS: | |
| Paid-in capital | | $ | 113,173,836 | | | $ | 114,043,908 | | | $ | 200,836,744 | | | $ | 188,555,777 | | | $ | 425,815,268 | | |
| Accumulated undistributed net investment income (loss) | | | 7,603 | | | | — | | | | 85,967 | | | | 98,007 | | | | 203,066 | | |
Accumulated undistributed net realized gain(loss)
on investments and futures contracts | | | (1,135,895 | ) | | | (1,057,984 | ) | | | 17,483 | | | | (723,882 | ) | | | (23,856,885 | ) | |
Net unrealized appreciation (depreciation)
of investments and futures contracts | | | (22,540,282 | ) | | | (31,737,802 | ) | | | 49,488 | | | | (4,510,628 | ) | | | (30,060,040 | ) | |
| NET ASSETS | | $ | 89,505,262 | | | $ | 81,248,122 | | | $ | 200,989,682 | | | $ | 183,419,274 | | | $ | 372,101,409 | | |
The accompanying notes are an integral part of these financial statements.
73
MUTUAL OF AMERICA INVESTMENT CORPORATION
STATEMENTS OF OPERATIONS
For the Year Ended December 31, 2008
| | | Equity Index
Fund | | All America
Fund | | Small Cap
Value Fund | | Small Cap
Growth Fund | | Mid Cap
Value Fund | | Mid-Cap
Equity Index
Fund | | International
Fund | |
| INVESTMENT INCOME AND EXPENSES: | |
| INCOME: | |
| Dividends | | $ | 15,388,600 | | | $ | 6,503,679 | | | $ | 3,774,968 | | | $ | 1,200,471 | | | $ | 809,873 | | | $ | 5,053,004 | | | $ | 392,371 | | |
| Interest | | | 460,909 | | | | 246,136 | | | | 190,028 | | | | 208,236 | | | | 48,002 | | | | 457,807 | | | | — | | |
| Total income | | | 15,849,509 | | | | 6,749,815 | | | | 3,964,996 | | | | 1,408,707 | | | | 857,875 | | | | 5,510,811 | | | | 392,371 | | |
| EXPENSES: | |
| Investment advisory fees (Note 2) | | | 510,918 | | | | 1,224,347 | | | | 1,382,956 | | | | 1,382,544 | | | | 198,987 | | | | 239,653 | | | | 5,424 | | |
| Accounting and recordkeeping expenses | | | 373,114 | | | | 134,860 | | | | 90,303 | | | | 90,102 | | | | 18,399 | | | | 165,577 | | | | 2,916 | | |
| Shareholder reports | | | 50,124 | | | | 18,117 | | | | 12,131 | | | | 12,104 | | | | 2,472 | | | | 22,243 | | | | 392 | | |
| Custodian expenses | | | 41,251 | | | | 83,967 | | | | 20,953 | | | | 22,591 | | | | 12,470 | | | | 38,213 | | | | — | | |
| Independent directors' fees and expenses | | | 24,604 | | | | 19,791 | | | | 22,007 | | | | 21,957 | | | | 2,797 | | | | 23,272 | | | | 443 | | |
| Audit | | | 95,570 | | | | 34,543 | | | | 23,130 | | | | 23,079 | | | | 4,713 | | | | 42,411 | | | | 747 | | |
| Legal and Compliance | | | 142,918 | | | | 51,657 | | | | 34,590 | | | | 34,513 | | | | 7,048 | | | | 63,423 | | | | 1,117 | | |
| Administrative | | | 279,399 | | | | 100,987 | | | | 67,622 | | | | 67,471 | | | | 13,778 | | | | 123,989 | | | | 2,183 | | |
| Licenses | | | 47,138 | | | | 17,038 | | | | 11,409 | | | | 11,383 | | | | 2,324 | | | | 20,918 | | | | 368 | | |
| Other | | | 123,547 | | | | 44,655 | | | | 29,901 | | | | 29,836 | | | | 6,092 | | | | 54,828 | | | | 965 | | |
| Total Expenses | | | 1,688,583 | | | | 1,729,962 | | | | 1,695,002 | | | | 1,695,580 | | | | 269,080 | | | | 794,527 | | | | 14,555 | | |
| Net Investment Income (Loss) | | | 14,160,926 | | | | 5,019,853 | | | | 2,269,994 | | | | (286,873 | ) | | | 588,795 | | | | 4,716,284 | | | | 377,816 | | |
NET REALIZED AND UNREALIZED GAIN (LOSS) ON INVESTMENTS AND
FUTURES CONTRACTS (Note 1): | |
| Net realized gain (loss) on investments and futures contracts: | |
| Net realized gain (loss) on investments | | | (8,363,199 | ) | | | (12,741,818 | ) | | | (27,358,299 | ) | | | (31,351,111 | ) | | | (871,934 | ) | | | 13,814,947 | | | | — | | |
| Net realized gain (loss) on futures contracts | | | (10,796,231 | ) | | | (3,781,053 | ) | | | — | | | | — | | | | — | | | | (12,335,913 | ) | | | — | | |
| | | | (19,159,430 | ) | | | (16,522,871 | ) | | | (27,358,299 | ) | | | (31,351,111 | ) | | | (871,934 | ) | | | 1,479,034 | | | | — | | |
Net unrealized appreciation (depreciation) of investments and
futures contracts: | |
| Net unrealized appreciation (depreciation) of investments | | | (296,472,680 | ) | | | (116,441,100 | ) | | | (33,775,604 | ) | | | (43,716,710 | ) | | | (13,567,763 | ) | | | (141,283,446 | ) | | | (4,299,885 | ) | |
| Net unrealized appreciation (depreciation) of futures contracts | | | (169,963 | ) | | | (22,925 | ) | | | — | | | | — | | | | — | | | | 329,125 | | | | — | | |
| | | | (296,642,643 | ) | | | (116,464,025 | ) | | | (33,775,604 | ) | | | (43,716,710 | ) | | | (13,567,763 | ) | | | (140,954,321 | ) | | | (4,299,885 | ) | |
NET REALIZED AND UNREALIZED GAIN (LOSS) ON INVESTMENTS AND
FUTURES CONTRACTS | | | (315,802,073 | ) | | | (132,986,896 | ) | | | (61,133,903 | ) | | | (75,067,821 | ) | | | (14,439,697 | ) | | | (139,475,287 | ) | | | (4,299,885 | ) | |
| NET INCREASE (DECREASE) IN NET ASSETS RESULTING FROM OPERATIONS | | $ | (301,641,147 | ) | | $ | (127,967,043 | ) | | $ | (58,863,909 | ) | | $ | (75,354,694 | ) | | $ | (13,850,902 | ) | | $ | (134,759,003 | ) | | $ | (3,922,069 | ) | |
(a) The Retirement Funds incur no other expenses other than those included in each of the underlying funds in which they invest. The Allocation Funds incur no other advisory or operating expenses other than those included in each of the underlying funds in which they invest.
The accompanying notes are an integral part of these financial statements.
74
| | | Composite
Fund | | Retirement
Income
Fund | | 2010
Retirement
Fund | | 2015
Retirement
Fund | | 2020
Retirement
Fund | | 2025
Retirement
Fund | |
| INVESTMENT INCOME AND EXPENSES: | |
| INCOME: | |
| Dividends | | $ | 2,312,069 | | | $ | 132,861 | | | $ | 282,699 | | | $ | 646,318 | | | $ | 652,607 | | | $ | 426,045 | | |
| Interest | | | 4,406,648 | | | | — | | | | — | | | | — | | | | — | | | | — | | |
| Total income | | | 6,718,717 | | | | 132,861 | | | | 282,699 | | | | 646,318 | | | | 652,607 | | | | 426,045 | | |
| EXPENSES: | |
| Investment advisory fees (Note 2) | | | 749,004 | | | | 1,181 | (a) | | | 2,622 | (a) | | | 6,849 | (a) | | | 6,803 | (a) | | | 4,177 | (a) | |
| Accounting and recordkeeping expenses | | | 86,158 | | | | — | | | | — | | | | — | | | | — | | | | — | | |
| Shareholder reports | | | 11,574 | | | | — | | | | — | | | | — | | | | — | | | | — | | |
| Custodian expenses | | | 43,342 | | | | — | | | | — | | | | — | | | | — | | | | — | | |
| Independent directors' fees and expenses | | | 20,692 | | | | — | | | | — | | | | — | | | | — | | | | — | | |
| Audit | | | 22,069 | | | | — | | | | — | | | | — | | | | — | | | | — | | |
| Legal and Compliance | | | 33,002 | | | | — | | | | — | | | | — | | | | — | | | | — | | |
| Administrative | | | 64,518 | | | | — | | | | — | | | | — | | | | — | | | | — | | |
| Licenses | | | 10,885 | | | | — | | | | — | | | | — | | | | — | | | | — | | |
| Other | | | 28,529 | | | | — | | | | — | | | | — | | | | — | | | | — | | |
| Total Expenses | | | 1,069,773 | | | | 1,181 | | | | 2,622 | | | | 6,849 | | | | 6,803 | | | | 4,177 | | |
| Net Investment Income (Loss) | | | 5,648,944 | | | | 131,680 | | | | 280,077 | | | | 639,469 | | | | 645,804 | | | | 421,868 | | |
NET REALIZED AND UNREALIZED GAIN (LOSS) ON INVESTMENTS AND
FUTURES CONTRACTS (Note 1): | |
| Net realized gain (loss) on investments and futures contracts: | |
| Net realized gain (loss) on investments | | | (9,235,458 | ) | | | (79,114 | ) | | | (167,537 | ) | | | (289,133 | ) | | | (195,931 | ) | | | (6,721 | ) | |
| Net realized gain (loss) on futures contracts | | | — | | | | — | | | | — | | | | — | | | | — | | | | — | | |
| | | | (9,235,458 | ) | | | (79,114 | ) | | | (167,537 | ) | | | (289,133 | ) | | | (195,931 | ) | | | (6,721 | ) | |
Net unrealized appreciation (depreciation) of investments and
futures contracts: | |
| Net unrealized appreciation (depreciation) of investments | | | (42,402,859 | ) | | | (327,497 | ) | | | (1,293,761 | ) | | | (3,881,944 | ) | | | (4,757,207 | ) | | | (3,546,109 | ) | |
| Net unrealized appreciation (depreciation) of futures contracts | | | — | | | | — | | | | — | | | | — | | | | — | | | | — | | |
| | | | (42,402,859 | ) | | | (327,497 | ) | | | (1,293,761 | ) | | | (3,881,944 | ) | | | (4,757,207 | ) | | | (3,546,109 | ) | |
NET REALIZED AND UNREALIZED GAIN (LOSS) ON INVESTMENTS AND
FUTURES CONTRACTS | | | (51,638,317 | ) | | | (406,611 | ) | | | (1,461,298 | ) | | | (4,171,077 | ) | | | (4,953,138 | ) | | | (3,552,830 | ) | |
| NET INCREASE (DECREASE) IN NET ASSETS RESULTING FROM OPERATIONS | | $ | (45,989,373 | ) | | $ | (274,931 | ) | | $ | (1,181,221 | ) | | $ | (3,531,608 | ) | | $ | (4,307,334 | ) | | $ | (3,130,962 | ) | |
The accompanying notes are an integral part of these financial statements.
75
MUTUAL OF AMERICA INVESTMENT CORPORATION
STATEMENTS OF OPERATIONS (Continued)
For the Year Ended December 31, 2008
| | | 2030
Retirement
Fund | | 2035
Retirement
Fund | | 2040
Retirement
Fund | | 2045
Retirement
Fund | | Conservative
Allocation
Fund | |
| INVESTMENT INCOME AND EXPENSES: | |
| INCOME: | |
| Dividends | | $ | 319,981 | | | $ | 217,128 | | | $ | 149,547 | | | $ | 162,550 | | | $ | 934,058 | | |
| Interest | | | — | | | | — | | | | — | | | | — | | | | — | | |
| Total income | | | 319,981 | | | | 217,128 | | | | 149,547 | | | | 162,550 | | | | 934,058 | | |
| EXPENSES: | |
| Investment advisory fees (Note 2) | | | 3,424 | (a) | | | 2,536 | (a) | | | 1,759 | (a) | | | 1,780 | (a) | | | — | (a) | |
| Accounting and recordkeeping expenses | | | — | | | | — | | | | — | | | | — | | | | — | | |
| Shareholder reports | | | — | | | | — | | | | — | | | | — | | | | — | | |
| Custodian expenses | | | — | | | | — | | | | — | | | | — | | | | — | | |
| Independent directors' fees and expenses | | | — | | | | — | | | | — | | | | — | | | | — | | |
| Audit | | | — | | | | — | | | | — | | | | — | | | | — | | |
| Legal and Compliance | | | — | | | | — | | | | — | | | | — | | | | — | | |
| Administrative | | | — | | | | — | | | | — | | | | — | | | | — | | |
| Licenses | | | — | | | | — | | | | — | | | | — | | | | — | | |
| Other | | | — | | | | — | | | | — | | | | — | | | | — | | |
| Total Expenses | | | 3,424 | | | | 2,536 | | | | 1,759 | | | | 1,780 | | | | — | | |
| Net Investment Income (Loss) | | | 316,557 | | | | 214,592 | | | | 147,788 | | | | 160,770 | | | | 934,058 | | |
| NET REALIZED AND UNREALIZED GAIN (LOSS) ON INVESTMENTS AND FUTURES CONTRACTS (Note 1): | |
| Net realized gain (loss) on investments and futures contracts: | |
| Net realized gain (loss) on investments | | | (115,775 | ) | | | (1,667 | ) | | | (19,697 | ) | | | 7,615 | | | | (163,304 | ) | |
| Net realized gain (loss) on futures contracts | | | — | | | | — | | | | — | | | | — | | | | — | | |
| | | | (115,775 | ) | | | (1,667 | ) | | | (19,697 | ) | | | 7,615 | | | | (163,304 | ) | |
| Net unrealized appreciation (depreciation) of investments and futures contracts: | |
| Net unrealized appreciation (depreciation) of investments | | | (2,935,035 | ) | | | (2,396,416 | ) | | | (1,701,107 | ) | | | (1,744,199 | ) | | | (3,354,977 | ) | |
| Net unrealized appreciation (depreciation) of futures contracts | | | — | | | | — | | | | — | | | | — | | | | — | | |
| | | | (2,935,035 | ) | | | (2,396,416 | ) | | | (1,701,107 | ) | | | (1,744,199 | ) | | | (3,354,977 | ) | |
| NET REALIZED AND UNREALIZED GAIN (LOSS) ON INVESTMENTS AND FUTURES CONTRACTS | | | (3,050,810 | ) | | | (2,398,083 | ) | | | (1,720,804 | ) | | | (1,736,584 | ) | | | (3,518,281 | ) | |
| NET INCREASE (DECREASE) IN NET ASSETS RESULTING FROM OPERATIONS | | $ | (2,734,253 | ) | | $ | (2,183,491 | ) | | $ | (1,573,016 | ) | | $ | (1,575,814 | ) | | $ | (2,584,223 | ) | |
(a) The Retirement Funds incur no other expenses other than those included in each of the underlying funds in which they invest. The Allocation Funds incur no other advisory or operating expenses other than those included in each of the underlying funds in which they invest.
The accompanying notes are an integral part of these financial statements.
76
| | | Moderate
Allocation
Fund | | Aggressive
Allocation
Fund | | Money
Market
Fund | | Mid-Term
Bond Fund | | Bond
Fund | |
| INVESTMENT INCOME AND EXPENSES: | |
| INCOME: | |
| Dividends | | $ | 3,057,130 | | | $ | 2,258,800 | | | $ | — | | | $ | — | | | $ | — | | |
| Interest | | | — | | | | — | | | | 6,266,758 | | | | 8,398,111 | | | | 21,998,538 | | |
| Total income | | | 3,057,130 | | | | 2,258,800 | | | | 6,266,758 | | | | 8,398,111 | | | | 21,998,538 | | |
| EXPENSES: | |
| Investment advisory fees (Note 2) | | | — | (a) | | | — | (a) | | | 347,510 | | | | 698,015 | | | | 1,570,383 | | |
| Accounting and recordkeeping expenses | | | — | | | | — | | | | 119,527 | | | | 76,505 | | | | 195,314 | | |
| Shareholder reports | | | — | | | | — | | | | 16,057 | | | | 10,278 | | | | 26,238 | | |
| Custodian expenses | | | — | | | | — | | | | 23,023 | | | | 15,808 | | | | 23,396 | | |
| Independent directors' fees and expenses | | | — | | | | — | | | | 23,195 | | | | 19,773 | | | | 22,420 | | |
| Audit | | | — | | | | — | | | | 30,616 | | | | 19,596 | | | | 50,028 | | |
| Legal and Compliance | | | — | | | | — | | | | 45,784 | | | | 29,305 | | | | 74,813 | | |
| Administrative | | | — | | | | — | | | | 89,506 | | | | 57,289 | | | | 146,257 | | |
| Licenses | | | — | | | | — | | | | 15,101 | | | | 9,665 | | | | 24,675 | | |
| Other | | | — | | | | — | | | | 39,578 | | | | 25,332 | | | | 64,675 | | |
| Total Expenses | | | — | | | | — | | | | 749,897 | | | | 961,566 | | | | 2,198,199 | | |
| Net Investment Income (Loss) | | | 3,057,130 | | | | 2,258,800 | | | | 5,516,861 | | | | 7,436,545 | | | | 19,800,339 | | |
| NET REALIZED AND UNREALIZED GAIN (LOSS) ON INVESTMENTS AND FUTURES CONTRACTS (Note 1): | |
| Net realized gain (loss) on investments and futures contracts: | |
| Net realized gain (loss) on investments | | | (307,518 | ) | | | (669,111 | ) | | | 43,765 | | | | 928,917 | | | | 1,850,739 | | |
| Net realized gain (loss) on futures contracts | | | — | | | | — | | | | — | | | | — | | | | — | | |
| | | | (307,518 | ) | | | (669,111 | ) | | | 43,765 | | | | 928,917 | | | | 1,850,739 | | |
| Net unrealized appreciation (depreciation) of investments and futures contracts: | |
| Net unrealized appreciation (depreciation) of investments | | | (23,765,946 | ) | | | (32,032,538 | ) | | | 51,692 | | | | (6,837,197 | ) | | | (28,761,251 | ) | |
| Net unrealized appreciation (depreciation) of futures contracts | | | — | | | | — | | | | — | | | | — | | | | — | | |
| | | | (23,765,946 | ) | | | (32,032,538 | ) | | | 51,692 | | | | (6,837,197 | ) | | | (28,761,251 | ) | |
| NET REALIZED AND UNREALIZED GAIN (LOSS) ON INVESTMENTS AND FUTURES CONTRACTS | | | (24,073,464 | ) | | | (32,701,649 | ) | | | 95,457 | | | | (5,908,280 | ) | | | (26,910,512 | ) | |
| NET INCREASE (DECREASE) IN NET ASSETS RESULTING FROM OPERATIONS | | $ | (21,016,334 | ) | | $ | (30,442,849 | ) | | $ | 5,612,318 | | | $ | 1,528,265 | | | $ | (7,110,173 | ) | |
The accompanying notes are an integral part of these financial statements.
77
MUTUAL OF AMERICA INVESTMENT CORPORATION
STATEMENTS OF CHANGES IN NET ASSETS
For the Years Ended December 31,
| | | Equity Index Fund | | All America Fund | | Small Cap Value Fund | |
| | | 2008 | | 2007 | | 2008 | | 2007 | | 2008 | | 2007 | |
| INCREASE (DECREASE) IN NET ASSETS: | |
| FROM OPERATIONS: | |
| Net investment income (loss) | | $ | 14,160,926 | | | $ | 14,977,836 | | | $ | 5,019,853 | | | $ | 5,423,668 | | | $ | 2,269,994 | | | $ | 2,371,848 | | |
| Net realized gain (loss) on investments and futures contracts | | | (19,159,430 | ) | | | 15,747,647 | | | | (16,522,871 | ) | | | 43,912,978 | | | | (27,358,299 | ) | | | 16,521,416 | | |
| Unrealized appreciation (depreciation) of investments and futures contracts | | | (296,642,643 | ) | | | 10,895,770 | | | | (116,464,025 | ) | | | (31,001,640 | ) | | | (33,775,604 | ) | | | (27,094,797 | ) | |
| NET INCREASE (DECREASE) IN NET ASSETS RESULTING FROM OPERATIONS | | | (301,641,147 | ) | | | 41,621,253 | | | | (127,967,043 | ) | | | 18,335,006 | | | | (58,863,909 | ) | | | (8,201,533 | ) | |
| DIVIDEND DISTRIBUTIONS (Note 5) | |
| From net investment income | | | (12,175,938 | ) | | | (14,916,022 | ) | | | (4,037,987 | ) | | | (5,660,927 | ) | | | (2,230,467 | ) | | | (2,331,219 | ) | |
| From capital gains | | | (2,030,456 | ) | | | (13,667,824 | ) | | | (7,817,028 | ) | | | (37,949,306 | ) | | | (69,793 | ) | | | (20,476,164 | ) | |
| Return of capital | | | — | | | | — | | | | — | | | | — | | | | (1,636,549 | ) | | | — | | |
| Total distributions | | | (14,206,394 | ) | | | (28,583,846 | ) | | | (11,855,015 | ) | | | (43,610,233 | ) | | | (3,936,809 | ) | | | (22,807,383 | ) | |
| CAPITAL SHARE TRANSACTIONS (Note 4): | |
| Net proceeds from sale of shares | | | 103,893,527 | | | | 53,592,664 | | | | 3,668,944 | | | | 3,554,696 | | | | 16,844,741 | | | | 10,624,963 | | |
| Dividends reinvested | | | 14,206,394 | | | | 28,583,846 | | | | 11,855,015 | | | | 43,610,233 | | | | 3,936,809 | | | | 22,807,383 | | |
| Cost of shares redeemed | | | (73,484,080 | ) | | | (90,294,716 | ) | | | (43,202,561 | ) | | | (56,350,185 | ) | | | (17,238,254 | ) | | | (34,080,567 | ) | |
| NET INCREASE (DECREASE) IN NET ASSETS FROM CAPITAL SHARE TRANSACTIONS | | | 44,615,841 | | | | (8,118,206 | ) | | | (27,678,602 | ) | | | (9,185,256 | ) | | | 3,543,296 | | | | (648,221 | ) | |
| INCREASE (DECREASE) IN NET ASSETS | | | (271,231,700 | ) | | | 4,919,201 | | | | (167,500,660 | ) | | | (34,460,483 | ) | | | (59,257,422 | ) | | | (31,657,137 | ) | |
| NET ASSETS, BEGINNING OF PERIOD | | | 816,416,533 | | | | 811,497,332 | | | | 389,006,397 | | | | 423,466,880 | | | | 214,588,968 | | | | 246,246,105 | | |
| NET ASSETS, END OF PERIOD | | $ | 545,184,833 | | | $ | 816,416,533 | | | $ | 221,505,737 | | | $ | 389,006,397 | | | $ | 155,331,546 | | | $ | 214,588,968 | | |
| OTHER INFORMATION: | |
| Shares outstanding at the beginning of period | | | 338,454,776 | | | | 341,581,939 | | | | 209,312,795 | | | | 211,396,296 | | | | 202,162,033 | | | | 199,327,799 | | |
| Shares sold | | | 56,056,834 | | | | 21,547,757 | | | | 2,581,953 | | | | 1,713,879 | | | | 18,759,096 | | | | 8,414,630 | | |
| Shares issued as reinvestment of dividends | | | 9,158,871 | | | | 11,842,463 | | | | 7,367,377 | | | | 23,171,866 | | | | 5,243,599 | | | | 21,286,440 | | |
| Shares redeemed | | | (35,249,616 | ) | | | (36,517,383 | ) | | | (27,415,816 | ) | | | (26,969,246 | ) | | | (18,344,326 | ) | | | (26,866,836 | ) | |
| Net increase (decrease) | | | 29,966,089 | | | | (3,127,163 | ) | | | (17,466,486 | ) | | | (2,083,501 | ) | | | 5,658,369 | | | | 2,834,234 | | |
| Shares outstanding at the end of period | | | 368,420,865 | | | | 338,454,776 | | | | 191,846,309 | | | | 209,312,795 | | | | 207,820,402 | | | | 202,162,033 | | |
The accompanying notes are an integral part of these financial statements.
78
| | | Small Cap Growth Fund | | Mid Cap Value Fund | | Mid-Cap Equity Index Fund | |
| | | 2008 | | 2007 | | 2008 | | 2007 | | 2008 | | 2007 | |
| INCREASE (DECREASE) IN NET ASSETS: | |
| FROM OPERATIONS: | |
| Net investment income (loss) | | $ | (286,873 | ) | | $ | (597,383 | ) | | $ | 588,795 | | | $ | 680,602 | | | $ | 4,716,284 | | | $ | 5,935,307 | | |
| Net realized gain (loss) on investments and futures contracts | | | (31,351,111 | ) | | | 29,450,391 | | | | (871,934 | ) | | | (364,278 | ) | | | 1,479,034 | | | | 30,662,175 | | |
| Unrealized appreciation (depreciation) of investments and futures contracts | | | (43,716,710 | ) | | | (18,368,005 | ) | | | (13,567,763 | ) | | | (389,368 | ) | | | (140,954,321 | ) | | | (8,825,234 | ) | |
| NET INCREASE (DECREASE) IN NET ASSETS RESULTING FROM OPERATIONS | | | (75,354,694 | ) | | | 10,485,003 | | | | (13,850,902 | ) | | | (73,044 | ) | | | (134,759,003 | ) | | | 27,772,248 | | |
| DIVIDEND DISTRIBUTIONS (Note 5) | |
| From net investment income | | | — | | | | — | | | | (669,153 | ) | | | (538,793 | ) | | | (4,337,494 | ) | | | (5,805,833 | ) | |
| From capital gains | | | (3,537,395 | ) | | | (28,824,855 | ) | | | — | | | | (152,212 | ) | | | (7,042,607 | ) | | | (32,620,973 | ) | |
| Return of capital | | | — | | | | — | | | | — | | | | — | | | | — | | | | — | | |
| Total distributions | | | (3,537,395 | ) | | | (28,824,855 | ) | | | (669,153 | ) | | | (691,005 | ) | | | (11,380,101 | ) | | | (38,426,806 | ) | |
| CAPITAL SHARE TRANSACTIONS (Note 4): | |
| Net proceeds from sale of shares | | | 16,581,623 | | | | 12,131,672 | | | | 7,111,123 | | | | 18,440,535 | | | | 50,166,161 | | | | 48,973,638 | | |
| Dividends reinvested | | | 3,537,395 | | | | 28,824,855 | | | | 669,153 | | | | 691,005 | | | | 11,380,101 | | | | 38,426,806 | | |
| Cost of shares redeemed | | | (16,905,660 | ) | | | (23,535,716 | ) | | | (3,093,605 | ) | | | (11,767,508 | ) | | | (47,034,786 | ) | | | (54,583,949 | ) | |
| NET INCREASE (DECREASE) IN NET ASSETS FROM CAPITAL SHARE TRANSACTIONS | | | 3,213,358 | | | | 17,420,811 | | | | 4,686,671 | | | | 7,364,032 | | | | 14,511,476 | | | | 32,816,495 | | |
| INCREASE (DECREASE) IN NET ASSETS | | | (75,678,731 | ) | | | (919,041 | ) | | | (9,833,384 | ) | | | 6,599,983 | | | | (131,627,628 | ) | | | 22,161,937 | | |
| NET ASSETS, BEGINNING OF PERIOD | | | 222,609,485 | | | | 223,528,526 | | | | 39,747,374 | | | | 33,147,391 | | | | 379,152,264 | | | | 356,990,327 | | |
| NET ASSETS, END OF PERIOD | | $ | 146,930,754 | | | $ | 222,609,485 | | | $ | 29,913,990 | | | $ | 39,747,374 | | | $ | 247,524,636 | | | $ | 379,152,264 | | |
| OTHER INFORMATION: | |
| Shares outstanding at the beginning of period | | | 205,238,978 | | | | 188,200,676 | | | | 33,151,708 | | | | 27,416,448 | | | | 250,758,420 | | | | 229,128,404 | | |
| Shares sold | | | 19,410,862 | | | | 9,826,407 | | | | 6,789,917 | | | | 14,446,139 | | | | 42,267,347 | | | | 29,270,796 | | |
| Shares issued as reinvestment of dividends | | | 3,503,452 | | | | 26,195,977 | | | | 817,664 | | | | 574,103 | | | | 10,327,510 | | | | 25,024,133 | | |
| Shares redeemed | | | (18,164,903 | ) | | | (18,984,082 | ) | | | (2,898,750 | ) | | | (9,284,982 | ) | | | (35,792,712 | ) | | | (32,664,913 | ) | |
| Net increase (decrease) | | | 4,749,411 | | | | 17,038,302 | | | | 4,708,831 | | | | 5,735,260 | | | | 16,802,145 | | | | 21,630,016 | | |
| Shares outstanding at the end of period | | | 209,988,389 | | | | 205,238,978 | | | | 37,860,539 | | | | 33,151,708 | | | | 267,560,565 | | | | 250,758,420 | | |
The accompanying notes are an integral part of these financial statements.
79
MUTUAL OF AMERICA INVESTMENT CORPORATION
STATEMENTS OF CHANGES IN NET ASSETS (Continued)
| | | International Fund | | Composite Fund | | Retirement Income Fund | |
| | | For the
Year Ended
December 31, | | For the
Period Ended
December 31, | |
For the Year Ended December 31, | | For the
Year Ended
December 31, | | For the
Period Ended
December 31, | |
| | | 2008 | | 2007(a) | | 2008 | | 2007 | | 2008 | | 2007(a) | |
| INCREASE (DECREASE) IN NET ASSETS: | |
| FROM OPERATIONS: | |
| Net investment income (loss) | | $ | 377,816 | | | $ | 53,022 | | | $ | 5,648,944 | | | $ | 6,139,341 | | | $ | 131,680 | | | $ | 35,126 | | |
| Net realized gain (loss) on investments and futures contracts | | | — | | | | — | | | | (9,235,458 | ) | | | 9,595,580 | | | | (79,114 | ) | | | 6,806 | | |
| Unrealized appreciation (depreciation) of investments and futures contracts | | | (4,299,885 | ) | | | (92,484 | ) | | | (42,402,859 | ) | | | (1,192,668 | ) | | | (327,497 | ) | | | (37,494 | ) | |
| NET INCREASE (DECREASE) IN NET ASSETS RESULTING FROM OPERATIONS | | | (3,922,069 | ) | | | (39,462 | ) | | | (45,989,373 | ) | | | 14,542,253 | | | | (274,931 | ) | | | 4,438 | | |
| DIVIDEND DISTRIBUTIONS (Note 5) | |
| From net investment income | | | (377,242 | ) | | | (46,903 | ) | | | (5,645,651 | ) | | | (6,351,470 | ) | | | (126,674 | ) | | | (35,171 | ) | |
| From capital gains | | | (673 | ) | | | (2,235 | ) | | | — | | | | — | | | | (2,493 | ) | | | (6,633 | ) | |
| Total distributions | | | (377,915 | ) | | | (49,138 | ) | | | (5,645,651 | ) | | | (6,351,470 | ) | | | (129,167 | ) | | | (41,804 | ) | |
| CAPITAL SHARE TRANSACTIONS (Note 4): | |
| Net proceeds from sale of shares | | | 14,345,218 | | | | 3,690,570 | | | | 3,435,664 | | | | 4,356,484 | | | | 4,981,492 | | | | 1,058,787 | | |
| Dividends reinvested | | | 377,915 | | | | 49,138 | | | | 5,645,651 | | | | 6,351,470 | | | | 129,167 | | | | 41,804 | | |
| Cost of shares redeemed | | | (762,994 | ) | | | (1,024,021 | ) | | | (26,896,747 | ) | | | (28,668,469 | ) | | | (2,177,373 | ) | | | (75,480 | ) | |
| NET INCREASE (DECREASE) IN NET ASSETS FROM CAPITAL SHARE TRANSACTIONS | | | 13,960,139 | | | | 2,715,687 | | | | (17,815,432 | ) | | | (17,960,515 | ) | | | 2,933,286 | | | | 1,025,111 | | |
| INCREASE (DECREASE) IN NET ASSETS | | | 9,660,155 | | | | 2,627,087 | | | | (69,450,456 | ) | | | (9,769,732 | ) | | | 2,529,188 | | | | 987,745 | | |
| NET ASSETS, BEGINNING OF PERIOD | | | 2,627,087 | | | | — | | | | 219,576,240 | | | | 229,345,972 | | | | 987,745 | | | | — | | |
| NET ASSETS, END OF PERIOD | | $ | 12,287,242 | | | $ | 2,627,087 | | | $ | 150,125,784 | | | $ | 219,576,240 | | | $ | 3,516,933 | | | $ | 987,745 | | |
| OTHER INFORMATION: | |
| Shares outstanding at the beginning of period | | | 2,757,713 | | | | — | | | | 136,856,122 | | | | 148,173,743 | | | | 1,030,628 | | | | — | | |
| Shares sold | | | 19,777,925 | | | | 3,743,251 | | | | 2,360,210 | | | | 2,648,337 | | | | 5,359,642 | | | | 1,062,583 | | |
| Shares issued as reinvestment of dividends | | | 680,873 | | | | 51,581 | | | | 3,999,661 | | | | 3,977,871 | | | | 154,883 | | | | 43,619 | | |
| Shares redeemed | | | (1,012,734 | ) | | | (1,037,119 | ) | | | (18,592,178 | ) | | | (17,943,829 | ) | | | (2,330,563 | ) | | | (75,574 | ) | |
| Net increase (decrease) | | | 19,446,064 | | | | 2,757,713 | | | | (12,232,307 | ) | | | (11,317,621 | ) | | | 3,183,962 | | | | 1,030,628 | | |
| Shares outstanding at the end of period | | | 22,203,777 | | | | 2,757,713 | | | | 124,623,815 | | | | 136,856,122 | | | | 4,214,590 | | | | 1,030,628 | | |
(a) For the period November 5, 2007 (commencement of operations) to December 31, 2007.
The accompanying notes are an integral part of these financial statements.
80
| | | 2010 Retirement Fund | | 2015 Retirement Fund | | 2020 Retirement Fund | |
| | | For the
Year Ended
December 31, | | For the
Period Ended
December 31, | | For the
Year Ended
December 31, | | For the
Period Ended
December 31, | | For the
Year Ended
December 31, | | For the
Period Ended
December 31, | |
| | | 2008 | | 2007(a) | | 2008 | | 2007(a) | | 2008 | | 2007(a) | |
| INCREASE (DECREASE) IN NET ASSETS: | |
| FROM OPERATIONS: | |
| Net investment income (loss) | | $ | 280,077 | | | $ | 53,665 | | | $ | 639,469 | | | $ | 152,845 | | | $ | 645,804 | | | $ | 125,372 | | |
| Net realized gain (loss) on investments and futures contracts | | | (167,537 | ) | | | 23,783 | | | | (289,133 | ) | | | 105,533 | | | | (195,931 | ) | | | 109,561 | | |
| Unrealized appreciation (depreciation) of investments and futures contracts | | | (1,293,761 | ) | | | (80,843 | ) | | | (3,881,944 | ) | | | (254,527 | ) | | | (4,757,207 | ) | | | (227,011 | ) | |
| NET INCREASE (DECREASE) IN NET ASSETS RESULTING FROM OPERATIONS | | | (1,181,221 | ) | | | (3,395 | ) | | | (3,531,608 | ) | | | 3,851 | | | | (4,307,334 | ) | | | 7,922 | | |
| DIVIDEND DISTRIBUTIONS (Note 5) | |
| From net investment income | | | (278,681 | ) | | | (53,725 | ) | | | (636,760 | ) | | | (153,023 | ) | | | (644,535 | ) | | | (125,523 | ) | |
| From capital gains | | | (31,150 | ) | | | (25,147 | ) | | | (84,668 | ) | | | (105,924 | ) | | | (94,520 | ) | | | (110,978 | ) | |
| Total distributions | | | (309,831 | ) | | | (78,872 | ) | | | (721,428 | ) | | | (258,947 | ) | | | (739,055 | ) | | | (236,501 | ) | |
| CAPITAL SHARE TRANSACTIONS (Note 4): | |
| Net proceeds from sale of shares | | | 9,429,837 | | | | 2,093,936 | | | | 21,092,281 | | | | 5,589,450 | | | | 21,530,663 | | | | 5,053,600 | | |
| Dividends reinvested | | | 309,831 | | | | 78,872 | | | | 721,428 | | | | 258,947 | | | | 739,055 | | | | 236,501 | | |
| Cost of shares redeemed | | | (1,731,020 | ) | | | (333,432 | ) | | | (3,040,667 | ) | | | (96,215 | ) | | | (1,540,201 | ) | | | (58,906 | ) | |
| NET INCREASE (DECREASE) IN NET ASSETS FROM CAPITAL SHARE TRANSACTIONS | | | 8,008,648 | | | | 1,839,376 | | | | 18,773,042 | | | | 5,752,182 | | | | 20,729,517 | | | | 5,231,195 | | |
| INCREASE (DECREASE) IN NET ASSETS | | | 6,517,596 | | | | 1,757,109 | | | | 14,520,006 | | | | 5,497,086 | | | | 15,683,128 | | | | 5,002,616 | | |
| NET ASSETS, BEGINNING OF PERIOD | | | 1,757,109 | | | | — | | | | 5,497,086 | | | | — | | | | 5,002,616 | | | | — | | |
| NET ASSETS, END OF PERIOD | | $ | 8,274,705 | | | $ | 1,757,109 | | | $ | 20,017,092 | | | $ | 5,497,086 | | | $ | 20,685,744 | | | $ | 5,002,616 | | |
| OTHER INFORMATION: | |
| Shares outstanding at the beginning of period | | | 1,875,582 | | | | — | | | | 5,945,342 | | | | — | | | | 5,473,155 | | | | — | | |
| Shares sold | | | 10,829,314 | | | | 2,134,764 | | | | 25,213,864 | | | | 5,764,705 | | | | 26,603,617 | | | | 5,276,498 | | |
| Shares issued as reinvestment of dividends | | | 416,023 | | | | 84,190 | | | | 1,024,603 | | | | 280,063 | | | | 1,115,097 | | | | 258,748 | | |
| Shares redeemed | | | (2,006,443 | ) | | | (343,372 | ) | | | (3,754,639 | ) | | | (99,426 | ) | | | (1,980,872 | ) | | | (62,091 | ) | |
| Net increase (decrease) | | | 9,238,894 | | | | 1,875,582 | | | | 22,483,828 | | | | 5,945,342 | | | | 25,737,842 | | | | 5,473,155 | | |
| Shares outstanding at the end of period | | | 11,114,476 | | | | 1,875,582 | | | | 28,429,170 | | | | 5,945,342 | | | | 31,210,997 | | | | 5,473,155 | | |
The accompanying notes are an integral part of these financial statements.
81
MUTUAL OF AMERICA INVESTMENT CORPORATION
STATEMENTS OF CHANGES IN NET ASSETS (Continued)
| | | 2025 Retirement Fund | | 2030 Retirement Fund | | 2035 Retirement Fund | |
| | | For the
Year Ended
December 31,
2008 | | For the
Period Ended
December 31,
2007(a) | | For the
Year Ended
December 31,
2008 | | For the
Period Ended
December 31,
2007(a) | | For the
Year Ended
December 31,
2008 | | For the
Period Ended
December 31,
2007(a) | |
| INCREASE (DECREASE) IN NET ASSETS: | |
| FROM OPERATIONS: | |
| Net investment income (loss) | | $ | 421,868 | | | $ | 43,619 | | | $ | 316,557 | | | $ | 46,998 | | | $ | 214,592 | | | $ | 29,973 | | |
| Net realized gain (loss) on investments and futures contracts | | | (6,721 | ) | | | 53,027 | | | | (115,775 | ) | | | 70,509 | | | | (1,667 | ) | | | 57,609 | | |
| Unrealized appreciation (depreciation) of investments and futures contracts | | | (3,546,109 | ) | | | (88,503 | ) | | | (2,935,035 | ) | | | (114,888 | ) | | | (2,396,416 | ) | | | (88,321 | ) | |
| NET INCREASE (DECREASE) IN NET ASSETS RESULTING FROM OPERATIONS | | | (3,130,962 | ) | | | 8,143 | | | | (2,734,253 | ) | | | 2,619 | | | | (2,183,491 | ) | | | (739 | ) | |
| DIVIDEND DISTRIBUTIONS (Note 5) | |
| From net investment income | | | (420,538 | ) | | | (43,683 | ) | | | (315,142 | ) | | | (47,069 | ) | | | (213,304 | ) | | | (30,029 | ) | |
| From capital gains | | | (75,997 | ) | | | (53,089 | ) | | | (75,256 | ) | | | (70,174 | ) | | | (64,334 | ) | | | (57,721 | ) | |
| Total distributions | | | (496,535 | ) | | | (96,772 | ) | | | (390,398 | ) | | | (117,243 | ) | | | (277,638 | ) | | | (87,750 | ) | |
| CAPITAL SHARE TRANSACTIONS (Note 4): | |
| Net proceeds from sale of shares | | | 16,656,127 | | | | 1,952,908 | | | | 12,831,503 | | | | 2,282,875 | | | | 9,712,118 | | | | 1,644,557 | | |
| Dividends reinvested | | | 496,535 | | | | 96,772 | | | | 390,398 | | | | 117,243 | | | | 277,638 | | | | 87,750 | | |
| Cost of shares redeemed | | | (658,574 | ) | | | (5,248 | ) | | | (683,209 | ) | | | (38,112 | ) | | | (382,784 | ) | | | (8,721 | ) | |
| NET INCREASE (DECREASE) IN NET ASSETS FROM CAPITAL SHARE TRANSACTIONS | | | 16,494,088 | | | | 2,044,432 | | | | 12,538,692 | | | | 2,362,006 | | | | 9,606,972 | | | | 1,723,586 | | |
| INCREASE (DECREASE) IN NET ASSETS | | | 12,866,591 | | | | 1,955,803 | | | | 9,414,041 | | | | 2,247,382 | | | | 7,145,843 | | | | 1,635,097 | | |
| NET ASSETS, BEGINNING OF PERIOD | | | 1,955,803 | | | | — | | | | 2,247,382 | | | | — | | | | 1,635,097 | | | | — | | |
| NET ASSETS, END OF PERIOD | | $ | 14,822,394 | | | $ | 1,955,803 | | | $ | 11,661,423 | | | $ | 2,247,382 | | | $ | 8,780,940 | | | $ | 1,635,097 | | |
| OTHER INFORMATION: | |
| Shares outstanding at the beginning of period | | | 2,127,707 | | | | — | | | | 2,447,208 | | | | — | | | | 1,772,798 | | | | — | | |
| Shares sold | | | 21,217,245 | | | | 2,027,865 | | | | 16,625,894 | | | | 2,357,889 | | | | 12,838,265 | | | | 1,686,611 | | |
| Shares issued as reinvestment of dividends | | | 779,614 | | | | 105,278 | | | | 627,738 | | | | 127,668 | | | | 460,672 | | | | 95,140 | | |
| Shares redeemed | | | (851,739 | ) | | | (5,436 | ) | | | (946,512 | ) | | | (38,349 | ) | | | (501,865 | ) | | | (8,953 | ) | |
| Net increase (decrease) | | | 21,145,120 | | | | 2,127,707 | | | | 16,307,120 | | | | 2,447,208 | | | | 12,797,072 | | | | 1,772,798 | | |
| Shares outstanding at the end of period | | | 23,272,827 | | | | 2,127,707 | | | | 18,754,328 | | | | 2,447,208 | | | | 14,569,870 | | | | 1,772,798 | | |
(a) For the period November 5, 2007 (commencement of operations) to December 31, 2007.
The accompanying notes are an integral part of these financial statements.
82
| | | 2040 Retirement Fund | | 2045 Retirement Fund | |
| | | For the
Year Ended
December 31,
2008 | | For the
Period Ended
December 31,
2007(a) | | For the
Year Ended
December 31,
2008 | | For the
Period Ended
December 31,
2007(a) | |
| INCREASE (DECREASE) IN NET ASSETS: | |
| FROM OPERATIONS: | |
| Net investment income (loss) | | $ | 147,788 | | | $ | 16,867 | | | $ | 160,770 | | | $ | 11,757 | | |
| Net realized gain (loss) on investments and futures contracts | | | (19,697 | ) | | | 36,695 | | | | 7,615 | | | | 27,329 | | |
| Unrealized appreciation (depreciation) of investments and futures contracts | | | (1,701,107 | ) | | | (54,337 | ) | | | (1,744,199 | ) | | | (39,240 | ) | |
| NET INCREASE (DECREASE) IN NET ASSETS RESULTING FROM OPERATIONS | | | (1,573,016 | ) | | | (775 | ) | | | (1,575,814 | ) | | | (154 | ) | |
| DIVIDEND DISTRIBUTIONS (Note 5) | |
| From net investment income | | | (146,626 | ) | | | (16,898 | ) | | | (159,918 | ) | | | (11,770 | ) | |
| From capital gains | | | (49,245 | ) | | | (36,833 | ) | | | (47,012 | ) | | | (27,409 | ) | |
| Total distributions | | | (195,871 | ) | | | (53,731 | ) | | | (206,930 | ) | | | (39,179 | ) | |
| CAPITAL SHARE TRANSACTIONS (Note 4): | |
| Net proceeds from sale of shares | | | 7,117,308 | | | | 975,633 | | | | 7,953,125 | | | | 719,828 | | |
| Dividends reinvested | | | 195,871 | | | | 53,731 | | | | 206,930 | | | | 39,179 | | |
| Cost of shares redeemed | | | (307,469 | ) | | | (10,979 | ) | | | (215,752 | ) | | | (23,039 | ) | |
| NET INCREASE (DECREASE) IN NET ASSETS FROM CAPITAL SHARE TRANSACTIONS | | | 7,005,710 | | | | 1,018,385 | | | | 7,944,303 | | | | 735,968 | | |
| INCREASE (DECREASE) IN NET ASSETS | | | 5,236,823 | | | | 963,879 | | | | 6,161,559 | | | | 696,635 | | |
| NET ASSETS, BEGINNING OF PERIOD | | | 963,879 | | | | — | | | | 696,635 | | | | — | | |
| NET ASSETS, END OF PERIOD | | $ | 6,200,702 | | | $ | 963,879 | | | $ | 6,858,194 | | | $ | 696,635 | | |
| OTHER INFORMATION: | |
| Shares outstanding at the beginning of period | | | 1,059,583 | | | | — | | | | 768,742 | | | | — | | |
| Shares sold | | | 9,504,025 | | | | 1,011,979 | | | | 10,785,786 | | | | 748,996 | | |
| Shares issued as reinvestment of dividends | | | 330,604 | | | | 59,066 | | | | 350,863 | | | | 43,234 | | |
| Shares redeemed | | | (428,240 | ) | | | (11,462 | ) | | | (276,504 | ) | | | (23,488 | ) | |
| Net increase (decrease) | | | 9,406,389 | | | | 1,059,583 | | | | 10,860,145 | | | | 768,742 | | |
| Shares outstanding at the end of period | | | 10,465,972 | | | | 1,059,583 | | | | 11,628,887 | | | | 768,742 | | |
The accompanying notes are an integral part of these financial statements.
83
MUTUAL OF AMERICA INVESTMENT CORPORATION
STATEMENTS OF CHANGES IN NET ASSETS (Continued)
For the Years Ended December 31,
| | | Conservative Allocation Fund | | Moderate Allocation Fund | | Aggressive Allocation Fund | |
| | | 2008 | | 2007 | | 2008 | | 2007 | | 2008 | | 2007 | |
| INCREASE (DECREASE) IN NET ASSETS: | |
| FROM OPERATIONS: | |
| Net investment income (loss) | | $ | 934,058 | | | $ | 720,182 | | | $ | 3,057,130 | | | $ | 3,164,480 | | | $ | 2,258,800 | | | $ | 2,427,300 | | |
| Net realized gain (loss) on investments and futures contracts | | | (163,304 | ) | | | 239,814 | | | | (307,518 | ) | | | 3,062,629 | | | | (669,111 | ) | | | 4,483,138 | | |
| Unrealized appreciation (depreciation) of investments and futures contracts | | | (3,354,977 | ) | | | 35,853 | | | | (23,765,946 | ) | | | (1,030,361 | ) | | | (32,032,538 | ) | | | (2,814,164 | ) | |
| NET INCREASE (DECREASE) IN NET ASSETS RESULTING FROM OPERATIONS | | | (2,584,223 | ) | | | 995,849 | | | | (21,016,334 | ) | | | 5,196,748 | | | | (30,442,849 | ) | | | 4,096,274 | | |
| DIVIDEND DISTRIBUTIONS (Note 5) | |
| From net investment income | | | (925,302 | ) | | | (739,233 | ) | | | (3,001,341 | ) | | | (3,233,943 | ) | | | (2,202,966 | ) | | | (2,578,213 | ) | |
| From capital gains | | | (132,904 | ) | | | (198,022 | ) | | | (644,353 | ) | | | (3,025,085 | ) | | | (663,237 | ) | | | (4,772,012 | ) | |
| Total distributions | | | (1,058,206 | ) | | | (937,255 | ) | | | (3,645,694 | ) | | | (6,259,028 | ) | | | (2,866,203 | ) | | | (7,350,225 | ) | |
| CAPITAL SHARE TRANSACTIONS (Note 4): | |
| Net proceeds from sale of shares | | | 11,303,717 | | | | 7,741,299 | | | | 19,525,292 | | | | 26,527,910 | | | | 17,996,573 | | | | 28,496,967 | | |
| Dividends reinvested | | | 1,058,206 | | | | 937,255 | | | | 3,645,694 | | | | 6,259,028 | | | | 2,866,203 | | | | 7,350,225 | | |
| Cost of shares redeemed | | | (4,857,352 | ) | | | (2,025,549 | ) | | | (10,825,647 | ) | | | (6,217,556 | ) | | | (7,155,575 | ) | | | (4,365,065 | ) | |
| NET INCREASE (DECREASE) IN NET ASSETS FROM CAPITAL SHARE TRANSACTIONS | | | 7,504,571 | | | | 6,653,005 | | | | 12,345,339 | | | | 26,569,382 | | | | 13,707,201 | | | | 31,482,127 | | |
| INCREASE (DECREASE) IN NET ASSETS | | | 3,862,142 | | | | 6,711,599 | | | | (12,316,689 | ) | | | 25,507,102 | | | | (19,601,851 | ) | | | 28,228,176 | | |
| NET ASSETS, BEGINNING OF PERIOD | | | 19,742,526 | | | | 13,030,927 | | | | 101,821,951 | | | | 76,314,849 | | | | 100,849,973 | | | | 72,621,797 | | |
| NET ASSETS, END OF PERIOD | | $ | 23,604,668 | | | $ | 19,742,526 | | | $ | 89,505,262 | | | $ | 101,821,951 | | | $ | 81,248,122 | | | $ | 100,849,973 | | |
| OTHER INFORMATION: | |
| Shares outstanding at the beginning of period | | | 19,088,294 | | | | 12,771,880 | | | | 89,251,267 | | | | 66,772,504 | | | | 81,179,525 | | | | 57,189,062 | | |
| Shares sold | | | 11,325,847 | | | | 7,334,683 | | | | 18,870,607 | | | | 22,225,365 | | | | 16,464,294 | | | | 21,350,176 | | |
| Shares issued as reinvestment of dividends | | | 1,185,898 | | | | 905,708 | | | | 4,151,057 | | | | 5,484,316 | | | | 3,330,816 | | | | 5,913,189 | | |
| Shares redeemed | | | (5,001,371 | ) | | | (1,923,977 | ) | | | (10,233,095 | ) | | | (5,230,918 | ) | | | (6,556,175 | ) | | | (3,272,902 | ) | |
| Net increase (decrease) | | | 7,510,374 | | | | 6,316,414 | | | | 12,788,569 | | | | 22,478,763 | | | | 13,238,935 | | | | 23,990,463 | | |
| Shares outstanding at the end of period | | | 26,598,668 | | | | 19,088,294 | | | | 102,039,836 | | | | 89,251,267 | | | | 94,418,460 | | | | 81,179,525 | | |
The accompanying notes are an integral part of these financial statements.
84
| | | Money Market Fund | | Mid-Term Bond Fund | | Bond Fund | |
| | | 2008 | | 2007 | | 2008 | | 2007 | | 2008 | | 2007 | |
| INCREASE (DECREASE) IN NET ASSETS: | |
| FROM OPERATIONS: | |
| Net investment income (loss) | | $ | 5,516,861 | | | $ | 13,358,971 | | | $ | 7,436,545 | | | $ | 4,733,793 | | | $ | 19,800,339 | | | $ | 17,610,012 | | |
| Net realized gain (loss) on investments and futures contracts | | | 43,765 | | | | 1,629 | | | | 928,917 | | | | (409,798 | ) | | | 1,850,739 | | | | 1,411,716 | | |
| Unrealized appreciation (depreciation) of investments and futures contracts | | | 51,692 | | | | (1,863 | ) | | | (6,837,197 | ) | | | 3,496,636 | | | | (28,761,251 | ) | | | 1,587,003 | | |
| NET INCREASE (DECREASE) IN NET ASSETS RESULTING FROM OPERATIONS | | | 5,612,318 | | | | 13,358,737 | | | | 1,528,265 | | | | 7,820,631 | | | | (7,110,173 | ) | | | 20,608,731 | | |
| DIVIDEND DISTRIBUTIONS (Note 5) | |
| From net investment income | | | (5,622,687 | ) | | | (13,426,365 | ) | | | (7,408,865 | ) | | | (4,707,232 | ) | | | (19,789,048 | ) | | | (18,599,999 | ) | |
| From capital gains | | | (19,529 | ) | | | — | | | | — | | | | — | | | | — | | | | — | | |
| Total distributions | | | (5,642,216 | ) | | | (13,426,365 | ) | | | (7,408,865 | ) | | | (4,707,232 | ) | | | (19,789,048 | ) | | | (18,599,999 | ) | |
| CAPITAL SHARE TRANSACTIONS (Note 4): | |
| Net proceeds from sale of shares | | | 71,534,535 | | | | 155,572,427 | | | | 96,093,813 | | | | 21,007,091 | | | | 66,355,543 | | | | 54,103,838 | | |
| Dividends reinvested | | | 5,642,216 | | | | 13,426,365 | | | | 7,408,865 | | | | 4,707,232 | | | | 19,789,048 | | | | 18,599,999 | | |
| Cost of shares redeemed | | | (187,976,890 | ) | | | (95,800,914 | ) | | | (36,395,131 | ) | | | (13,712,430 | ) | | | (71,068,439 | ) | | | (34,277,922 | ) | |
| NET INCREASE (DECREASE) IN NET ASSETS FROM CAPITAL SHARE TRANSACTIONS | | | (110,800,139 | ) | | | 73,197,878 | | | | 67,107,547 | | | | 12,001,893 | | | | 15,076,152 | | | | 38,425,915 | | |
| INCREASE (DECREASE) IN NET ASSETS | | | (110,830,037 | ) | | | 73,130,250 | | | | 61,226,947 | | | | 15,115,292 | | | | (11,823,069 | ) | | | 40,434,647 | | |
| NET ASSETS, BEGINNING OF PERIOD | | | 311,819,719 | | | | 238,689,469 | | | | 122,192,327 | | | | 107,077,035 | | | | 383,924,478 | | | | 343,489,831 | | |
| NET ASSETS, END OF PERIOD | | $ | 200,989,682 | | | $ | 311,819,719 | | | $ | 183,419,274 | | | $ | 122,192,327 | | | $ | 372,101,409 | | | $ | 383,924,478 | | |
| OTHER INFORMATION: | |
| Shares outstanding at the beginning of period | | | 256,731,045 | | | | 197,536,255 | | | | 127,264,253 | | | | 114,968,714 | | | | 303,322,179 | | | | 273,438,407 | | |
| Shares sold | | | 58,191,033 | | | | 125,396,574 | | | | 97,850,958 | | | | 21,740,209 | | | | 52,211,307 | | | | 41,873,601 | | |
| Shares issued as reinvestment of dividends | | | 4,666,374 | | | | 11,047,840 | | | | 7,892,414 | | | | 4,902,255 | | | | 16,791,497 | | | | 14,673,181 | | |
| Shares redeemed | | | (153,244,549 | ) | | | (77,249,624 | ) | | | (37,530,037 | ) | | | (14,346,925 | ) | | | (56,327,975 | ) | | | (26,663,010 | ) | |
| Net increase (decrease) | | | (90,387,142 | ) | | | 59,194,790 | | | | 68,213,335 | | | | 12,295,539 | | | | 12,674,829 | | | | 29,883,772 | | |
| Shares outstanding at the end of period | | | 166,343,903 | | | | 256,731,045 | | | | 195,477,588 | | | | 127,264,253 | | | | 315,997,008 | | | | 303,322,179 | | |
The accompanying notes are an integral part of these financial statements.
85
MUTUAL OF AMERICA INVESTMENT CORPORATION
FINANCIAL HIGHLIGHTS
Income from investment operations and distributions per share for a Fund share outstanding throughout each of the five years ended December 31, 2008 (or since the Fund's inception date if in existence less than five years) and other supplementary data with respect to each Fund are presented below and in the pages following:
| | | Equity Index Fund | | All America Fund | |
| | | Years Ended December 31, | | Years Ended December 31, | |
| | | 2008 | | 2007 | | 2006 | | 2005 | | 2004 | | 2008 | | 2007 | | 2006 | | 2005 | | 2004 | |
| Net Asset Value, Beginning of Period | | $ | 2.41 | | | $ | 2.38 | | | $ | 2.14 | | | $ | 2.12 | | | $ | 1.95 | | | $ | 1.86 | | | $ | 2.00 | | | $ | 1.94 | | | $ | 2.05 | | | $ | 2.12 | | |
| INCOME (LOSS) FROM INVESTMENT OPERATIONS: | |
| Net Investment Income | | | 0.04 | | | | 0.05 | | | | 0.04 | | | | 0.04 | | | | 0.05 | | | | 0.03 | | | | 0.03 | | | | 0.02 | | | | 0.01 | | | | 0.02 | | |
| Net Realized and Unrealized Gains (Losses) on Investments and Futures Contracts | | | (0.93 | ) | | | 0.07 | | | | 0.30 | | | | 0.06 | | | | 0.17 | | | | (0.68 | ) | | | 0.06 | | | | 0.28 | | | | 0.06 | | | | 0.15 | | |
| Total From Investment Operations | | | (0.89 | ) | | | 0.12 | | | | 0.34 | | | | 0.10 | | | | 0.22 | | | | (0.65 | ) | | | 0.09 | | | | 0.30 | | | | 0.07 | | | | 0.17 | | |
Less: Dividend Distributions:
From Net Investment Income | | | (0.03 | ) | | | (0.05 | ) | | | (0.04 | ) | | | (0.03 | ) | | | (0.04 | ) | | | (0.02 | ) | | | (0.03 | ) | | | (0.03 | ) | | | (0.01 | ) | | | (0.02 | ) | |
| From Capital Gains | | | (0.01 | ) | | | (0.04 | ) | | | (0.06 | ) | | | (0.05 | ) | | | (0.01 | ) | | | (0.04 | ) | | | (0.20 | ) | | | (0.21 | ) | | | (0.17 | ) | | | (0.22 | ) | |
| From Return of Capital | | | — | | | | — | | | | — | | | | — | | | | — | | | | — | | | | — | | | | — | | | | — | | | | — | | |
| Total Distributions | | | (0.04 | ) | | | (0.09 | ) | | | (0.10 | ) | | | (0.08 | ) | | | (0.05 | ) | | | (0.06 | ) | | | (0.23 | ) | | | (0.24 | ) | | | (0.18 | ) | | | (0.24 | ) | |
| Net Asset Value, End of Period | | $ | 1.48 | | | $ | 2.41 | | | $ | 2.38 | | | $ | 2.14 | | | $ | 2.12 | | | $ | 1.15 | | | $ | 1.86 | | | $ | 2.00 | | | $ | 1.94 | | | $ | 2.05 | | |
| Total Return (%)(b) | | | (37.08 | ) | | | 5.22 | | | | 15.59 | | | | 4.81 | | | | 10.69 | | | | (35.49 | ) | | | 4.27 | | | | 15.74 | | | | 3.71 | | | | 8.23 | | |
| Net Assets, End of Period ($ millions) | | | 545 | | | | 816 | | | | 811 | | | | 726 | | | | 722 | | | | 222 | | | | 389 | | | | 423 | | | | 407 | | | | 458 | | |
| Ratio of Net Investment Income (Loss) to Average Net Assets (%) | | | 2.07 | | | | 1.82 | | | | 1.85 | | | | 1.76 | | | | 1.91 | | | | 1.64 | | | | 1.30 | | | | 1.36 | | | | 1.17 | | | | 1.16 | | |
| Ratio of Expenses to Average Net Assets Before Expense Reimbursement (%) | | | 0.25 | | | | 0.20 | | | | 0.17 | | | | 0.24 | | | | 0.22 | | | | 0.56 | | | | 0.55 | | | | 0.52 | | | | 0.64 | | | | 0.62 | | |
| Ratio of Expenses to Average Net Assets After Expense Reimbursement (%) | | | 0.25 | | | | 0.20 | | | | 0.14 | | | | 0.13 | | | | 0.13 | | | | 0.56 | | | | 0.55 | | | | 0.49 | | | | 0.50 | | | | 0.50 | | |
| Portfolio Turnover Rate (%)(a) | | | 4.70 | | | | 4.66 | | | | 4.91 | | | | 9.36 | | | | 4.87 | | | | 31.03 | | | | 29.24 | | | | 33.84 | | | | 48.00 | | | | 53.03 | | |
(a) Portfolio turnover rate excludes all short-term securities.
(b) Total return would have been lower had non-investment advisory expenses not been reduced through expense reimbursement in certain years (Note 2).
(c) Not annualized.
(d) Annualized.
(e) For the period July 1, 2005 (commencement of operations) through December 31, 2005.
(f) Allocation and Retirement Funds exclude expenses of the underlying funds.
(g) For the period November 5, 2007 (commencement of operations) through December 31, 2007.
N/A = Not Applicable
The accompanying notes are an integral part of these financial statements.
86
| | | Small Cap Value Fund | | Small Cap Growth Fund | |
| | | Year Ended December 31, | | Year Ended December 31, | |
| | | 2008 | | 2007 | | 2006 | | 2005(e) | | 2008 | | 2007 | | 2006 | | 2005(e) | |
| Net Asset Value, Beginning of Period | | $ | 1.06 | | | $ | 1.24 | | | $ | 1.07 | | | $ | 1.00 | | | $ | 1.08 | | | $ | 1.19 | | | $ | 1.06 | | | $ | 1.00 | | |
| INCOME (LOSS) FROM INVESTMENT OPERATIONS: | |
| Net Investment Income | | | 0.01 | | | | 0.01 | | | | 0.01 | | | | 0.01 | | | | — | | | | — | | | | — | | | | — | | |
| Net Realized and Unrealized Gains (Losses) on Investments and Futures Contracts | | | (0.30 | ) | | | (0.06 | ) | | | 0.18 | | | | 0.07 | | | | (0.36 | ) | | | 0.05 | | | | 0.16 | | | | 0.06 | | |
| Total From Investment Operations | | | (0.29 | ) | | | (0.05 | ) | | | 0.19 | | | | 0.08 | | | | (0.36 | ) | | | 0.05 | | | | 0.16 | | | | 0.06 | | |
Less: Dividend Distributions:
From Net Investment Income | | | (0.01 | ) | | | (0.01 | ) | | | (0.01 | ) | | | (0.01 | ) | | | — | | | | — | | | | — | | | | — | | |
| From Capital Gains | | | (0.00 | ) | | | (0.12 | ) | | | (0.01 | ) | | | — | | | | (0.02 | ) | | | (0.16 | ) | | | (0.03 | ) | | | — | | |
| From Return of Capital | | | (0.01 | ) | | | — | | | | — | | | | — | | | | — | | | | — | | | | — | | | | — | | |
| Total Distributions | | | (0.02 | ) | | | (0.13 | ) | | | (0.02 | ) | | | (0.01 | ) | | | (0.02 | ) | | | (0.16 | ) | | | (0.03 | ) | | | — | | |
| Net Asset Value, End of Period | | $ | 0.75 | | | $ | 1.06 | | | $ | 1.24 | | | $ | 1.07 | | | $ | 0.70 | | | $ | 1.08 | | | $ | 1.19 | | | $ | 1.06 | | |
| Total Return (%)(b) | | | (27.76 | ) | | | (3.99 | ) | | | 17.68 | | | | 7.61 | (c) | | | (34.37 | ) | | | 4.68 | | | | 15.14 | | | | 5.49 | (c) | |
| Net Assets, End of Period ($ millions) | | | 155 | | | | 215 | | | | 246 | | | | 34 | | | | 147 | | | | 223 | | | | 224 | | | | 24 | | |
| Ratio of Net Investment Income (Loss) to Average Net Assets (%) | | | 1.23 | | | | 0.96 | | | | 1.42 | | | | 1.19 | (d) | | | (0.16 | ) | | | (0.26 | ) | | | (0.20 | ) | | | 0.00 | (d) | |
| Ratio of Expenses to Average Net Assets Before Expense Reimbursement (%) | | | 0.92 | | | | 0.89 | | | | 0.81 | | | | 0.96 | (d) | | | 0.92 | | | | 0.89 | | | | 0.83 | | | | 0.95 | (d) | |
| Ratio of Expenses to Average Net Assets After Expense Reimbursement (%) | | | 0.92 | | | | 0.89 | | | | 0.80 | | | | 0.84 | (d) | | | 0.92 | | | | 0.89 | | | | 0.81 | | | | 0.83 | (d) | |
| Portfolio Turnover Rate (%)(a) | | | 59.64 | | | | 55.77 | | | | 62.55 | | | | 32.67 | (c) | | | 93.16 | | | | 94.06 | | | | 85.67 | | | | 64.38 | (c) | |
The accompanying notes are an integral part of these financial statements.
87
MUTUAL OF AMERICA INVESTMENT CORPORATION
FINANCIAL HIGHLIGHTS (Continued)
| | | Mid Cap Value Fund | | Mid-Cap Equity Index Fund | |
| | | Years Ended December 31, | | Years Ended December 31, | |
| | | 2008 | | 2007 | | 2006 | | 2005(e) | | 2008 | | 2007 | | 2006 | | 2005 | | 2004 | |
| Net Asset Value, Beginning of Period | | $ | 1.20 | | | $ | 1.21 | | | $ | 1.06 | | | $ | 1.00 | | | $ | 1.51 | | | $ | 1.56 | | | $ | 1.53 | | | $ | 1.46 | | | $ | 1.30 | | |
| INCOME (LOSS) FROM INVESTMENT OPERATIONS: | |
| Net Investment Income | | | 0.02 | | | | 0.02 | | | | 0.01 | | | | 0.01 | | | | 0.02 | | | | 0.03 | | | | 0.02 | | | | 0.02 | | | | 0.01 | | |
| Net Realized and Unrealized Gains (Losses) on Investments and Futures Contracts | | | (0.41 | ) | | | (0.01 | ) | | | 0.16 | | | | 0.06 | | | | (0.56 | ) | | | 0.09 | | | | 0.14 | | | | 0.16 | | | | 0.19 | | |
| Total From Investment Operations | | | (0.39 | ) | | | 0.01 | | | | 0.17 | | | | 0.07 | | | | (0.54 | ) | | | 0.12 | | | | 0.16 | | | | 0.18 | | | | 0.20 | | |
Less: Dividend Distributions:
From Net Investment Income | | | (0.02 | )(h) | | | (0.02 | ) | | | (0.01 | ) | | | (0.01 | ) | | | (0.02 | ) | | | (0.03 | ) | | | (0.03 | ) | | | (0.02 | ) | | | (0.01 | ) | |
| From Capital Gains | | | — | | | | — | | | | (0.01 | ) | | | — | | | | (0.02 | ) | | | (0.14 | ) | | | (0.10 | ) | | | (0.09 | ) | | | (0.03 | ) | |
| Total Distributions | | | (0.02 | ) | | | (0.02 | ) | | | (0.02 | ) | | | (0.01 | ) | | | (0.04 | ) | | | (0.17 | ) | | | (0.13 | ) | | | (0.11 | ) | | | (0.04 | ) | |
| Net Asset Value, End of Period | | $ | 0.79 | | | $ | 1.20 | | | $ | 1.21 | | | $ | 1.06 | | | $ | 0.93 | | | $ | 1.51 | | | $ | 1.56 | | | $ | 1.53 | | | $ | 1.46 | | |
| Total Return (%)(b) | | | (32.64 | ) | | | 0.88 | | | | 15.93 | | | | 6.91 | (c) | | | (36.31 | ) | | | 7.74 | | | | 10.10 | | | | 12.50 | | | | 16.28 | | |
| Net Assets, End of Period ($ millions) | | | 30 | | | | 40 | | | | 33 | | | | 11 | | | | 248 | | | | 379 | | | | 357 | | | | 358 | | | | 295 | | |
| Ratio of Net Investment Income (Loss) to Average Net Assets (%) | | | 1.62 | | | | 1.54 | | | | 1.69 | | | | 1.76 | (d) | | | 1.47 | | | | 1.52 | | | | 1.40 | | | | 1.37 | | | | 1.08 | | |
| Ratio of Expenses to Average Net Assets Before Expense Reimbursement (%) | | | 0.74 | | | | 0.75 | | | | 0.70 | | | | 0.75 | (d) | | | 0.25 | | | | 0.22 | | | | 0.17 | | | | 0.25 | | | | 0.24 | | |
| Ratio of Expenses to Average Net Assets After Expense Reimbursement (%) | | | 0.74 | | | | 0.75 | | | | 0.66 | | | | 0.62 | (d) | | | 0.25 | | | | 0.22 | | | | 0.14 | | | | 0.13 | | | | 0.13 | | |
| Portfolio Turnover Rate (%)(a) | | | 33.80 | | | | 27.24 | | | | 30.41 | | | | 14.39 | (c) | | | 22.66 | | | | 20.53 | | | | 16.02 | | | | 18.65 | | | | 15.73 | | |
(a) Portfolio turnover rate excludes all short-term securities.
(b) Total return would have been lower had non-investment advisory expenses not been reduced through expense reimbursement in certain years (Note 2).
(c) Not annualized.
(d) Annualized.
(e) For the period July 1, 2005 (commencement of operations) through December 31, 2005.
(f) Allocation and Retirement Funds exclude expenses of the underlying funds.
(g) For the period November 5, 2007 (commencement of operations) through December 31, 2007.
(h) Includes less than $0.005 of tax-basis return of capital distributions.
N/A = Not Applicable
The accompanying notes are an integral part of these financial statements.
88
| | | International Fund | | Composite Fund | |
| | | Year Ended
December 31, | | Period Ended
December 31, | | Years Ended December 31, | |
| | | 2008 | | 2007(g) | | 2008 | | 2007 | | 2006 | | 2005 | | 2004 | |
| Net Asset Value, Beginning of Period | | $ | 0.95 | | | $ | 1.00 | | | $ | 1.60 | | | $ | 1.55 | | | $ | 1.43 | | | $ | 1.46 | | | $ | 1.40 | | |
| INCOME (LOSS) FROM INVESTMENT OPERATIONS: | |
| Net Investment Income | | | 0.02 | | | | 0.02 | | | | 0.04 | | | | 0.05 | | | | 0.05 | | | | 0.04 | | | | 0.04 | | |
| Net Realized and Unrealized Gains (Losses) on Investments and Futures Contracts | | | (0.40 | ) | | | (0.05 | ) | | | (0.40 | ) | | | 0.05 | | | | 0.11 | | | | (0.03 | ) | | | 0.06 | | |
| Total From Investment Operations | | | (0.38 | ) | | | (0.03 | ) | | | (0.36 | ) | | | 0.10 | | | | 0.16 | | | | 0.01 | | | | 0.10 | | |
Less: Dividend Distributions:
From Net Investment Income | | | (0.02 | ) | | | (0.02 | ) | | | (0.04 | ) | | | (0.05 | ) | | | (0.04 | ) | | | (0.04 | ) | | | (0.04 | ) | |
| From Capital Gains | | | (0.00 | ) | | | — | | | | — | | | | — | | | | — | | | | — | | | | — | | |
| Total Distributions | | | (0.02 | ) | | | (0.02 | ) | | | (0.04 | ) | | | (0.05 | ) | | | (0.04 | ) | | | (0.04 | ) | | | (0.04 | ) | |
| Net Asset Value, End of Period | | $ | 0.55 | | | $ | 0.95 | | | $ | 1.20 | | | $ | 1.60 | | | $ | 1.55 | | | $ | 1.43 | | | $ | 1.46 | | |
| Total Return (%)(b) | | | (40.06 | ) | | | (2.93 | )(c) | | | (22.51 | ) | | | 6.69 | | | | 10.80 | | | | 0.96 | | | | 6.34 | | |
| Net Assets, End of Period ($ millions) | | | 12 | | | | 3 | | | | 150 | | | | 220 | | | | 229 | | | | 232 | | | | 257 | | |
| Ratio of Net Investment Income (Loss) to Average Net Assets (%) | | | 5.17 | | | | 3.38 | (c) | | | 3.01 | | | | 2.72 | | | | 2.70 | | | | 2.48 | | | | 2.46 | | |
| Ratio of Expenses to Average Net Assets Before Expense Reimbursement (%) | | | 0.20 | | | | 0.22 | (d) | | | 0.57 | | | | 0.55 | | | | 0.52 | | | | 0.63 | | | | 0.61 | | |
| Ratio of Expenses to Average Net Assets After Expense Reimbursement (%) | | | 0.20 | | | | 0.22 | (d) | | | 0.57 | | | | 0.55 | | | | 0.48 | | | | 0.50 | | | | 0.50 | | |
| Portfolio Turnover Rate (%)(a) | | | 0.00 | | | | — | | | | 37.98 | | | | 24.95 | | | | 26.77 | | | | 93.84 | | | | 94.56 | | |
The accompanying notes are an integral part of these financial statements.
89
MUTUAL OF AMERICA INVESTMENT CORPORATION
FINANCIAL HIGHLIGHTS (Continued)
| | | Retirement Income Fund | | 2010 Retirement Fund | | 2015 Retirement Fund | | 2020 Retirement Fund | |
| | | Year Ended
December 31, | | Period Ended
December 31, | | Year Ended
December 31, | | Period Ended
December 31, | | Year Ended
December 31, | | Period Ended
December 31, | | Year Ended
December 31, | | Period Ended
December 31, | |
| | | 2008 | | 2007(g) | | 2008 | | 2007(g) | | 2008 | | 2007(g) | | 2008 | | 2007(g) | |
| Net Asset Value, Beginning of Period | | $ | 0.96 | | | $ | 1.00 | | | $ | 0.94 | | | $ | 0.99 | | | $ | 0.92 | | | $ | 0.98 | | | $ | 0.91 | | | $ | 0.97 | | |
| INCOME (LOSS) FROM INVESTMENT OPERATIONS: | |
| Net Investment Income | | | 0.03 | | | | 0.04 | | | | 0.03 | | | | 0.03 | | | | 0.03 | | | | 0.03 | | | | 0.02 | | | | 0.02 | | |
| Net Realized and Unrealized Gains (Losses) on Investments and Futures Contracts | | | (0.13 | ) | | | (0.04 | ) | | | (0.20 | ) | | | (0.03 | ) | | | (0.22 | ) | | | (0.04 | ) | | | (0.25 | ) | | | (0.04 | ) | |
| Total From Investment Operations | | | (0.10 | ) | | | — | | | | (0.17 | ) | | | — | | | | (0.19 | ) | | | (0.01 | ) | | | (0.23 | ) | | | (0.02 | ) | |
Less: Dividend Distributions:
From Net Investment Income | | | (0.03 | ) | | | (0.03 | ) | | | (0.03 | ) | | | (0.03 | ) | | | (0.03 | )(h) | | | (0.03 | ) | | | (0.02 | )(h) | | | (0.02 | ) | |
| From Capital Gains | | | (0.00 | ) | | | (0.01 | ) | | | (0.00 | ) | | | (0.02 | ) | | | (0.00 | ) | | | (0.02 | ) | | | (0.00 | ) | | | (0.02 | ) | |
| Total Distributions | | | (0.03 | ) | | | (0.04 | ) | | | (0.03 | ) | | | (0.05 | ) | | | (0.03 | ) | | | (0.05 | ) | | | (0.02 | ) | | | (0.04 | ) | |
| Net Asset Value, End of Period | | $ | 0.83 | | | $ | 0.96 | | | $ | 0.74 | | | $ | 0.94 | | | $ | 0.70 | | | $ | 0.92 | | | $ | 0.66 | | | $ | 0.91 | | |
| Total Return (%)(b) | | | (9.61 | ) | | | 0.07 | (c) | | | (17.45 | ) | | | (0.68 | )(c) | | | (21.01 | ) | | | (1.18 | )(c) | | | (24.81 | ) | | | (1.54 | )(c) | |
| Net Assets, End of Period ($ millions) | | | 4 | | | | 1 | | | | 8 | | | | 2 | | | | 20 | | | | 5 | | | | 21 | | | | 5 | | |
| Ratio of Net Investment Income (Loss) to Average Net Assets (%) | | | 5.42 | | | | 6.12 | (c) | | | 5.36 | | | | 5.28 | (c) | | | 4.65 | | | | 5.39 | (c) | | | 4.73 | | | | 5.29 | (c) | |
| Ratio of Expenses to Average Net Assets Before Expense Reimbursement (%)(f) | | | 0.05 | | | | 0.05 | (d) | | | 0.05 | | | | 0.04 | (d) | | | 0.05 | | | | 0.04 | (d) | | | 0.05 | | | | 0.04 | (d) | |
| Ratio of Expenses to Average Net Assets After Expense Reimbursement (%)(f) | | | 0.05 | | | | 0.05 | (d) | | | 0.05 | | | | 0.04 | (d) | | | 0.05 | | | | 0.04 | (d) | | | 0.05 | | | | 0.04 | (d) | |
| Portfolio Turnover Rate (%)(a) | | | 82.92 | | | | 14.38 | (c) | | | 32.37 | | | | 32.49 | (c) | | | 21.47 | | | | 2.79 | (c) | | | 14.74 | | | | 2.51 | (c) | |
(a) Portfolio turnover rate excludes all short-term securities.
(b) Total return would have been lower had non-investment advisory expenses not been reduced through expense reimbursement in certain years (Note 2).
(c) Not annualized.
(d) Annualized.
(e) For the period July 1, 2005 (commencement of operations) through December 31, 2005.
(f) Allocation and Retirement Funds exclude expenses of the underlying funds.
(g) For the period November 5, 2007 (commencement of operations) through December 31, 2007.
(h) Includes less than $0.005 of tax-basis return of capital distributions.
N/A = Not Applicable
The accompanying notes are an integral part of these financial statements.
90
| | | 2025 Retirement Fund | | 2030 Retirement Fund | | 2035 Retirement Fund | |
| | | Year Ended
December 31, | | Period Ended
December 31, | | Year Ended
December 31, | | Period Ended
December 31, | | Year Ended
December 31, | | Period Ended
December 31, | |
| | | 2008 | | 2007(g) | | 2008 | | 2007(g) | | 2008 | | 2007(g) | |
| Net Asset Value, Beginning of Period | | $ | 0.92 | | | $ | 0.99 | | | $ | 0.92 | | | $ | 0.99 | | | $ | 0.92 | | | $ | 1.00 | | |
| INCOME (LOSS) FROM INVESTMENT OPERATIONS: | |
| Net Investment Income | | | 0.02 | | | | 0.02 | | | | 0.02 | | | | 0.02 | | | | 0.02 | | | | 0.02 | | |
| Net Realized and Unrealized Gains (Losses) on Investments and Futures Contracts | | | (0.28 | ) | | | (0.04 | ) | | | (0.30 | ) | | | (0.04 | ) | | | (0.32 | ) | | | (0.05 | ) | |
| Total From Investment Operations | | | (0.26 | ) | | | (0.02 | ) | | | (0.28 | ) | | | (0.02 | ) | | | (0.30 | ) | | | (0.03 | ) | |
Less: Dividend Distributions:
From Net Investment Income | | | (0.02 | )(h) | | �� | (0.02 | ) | | | (0.02 | )(h) | | | (0.02 | ) | | | (0.02 | )(h) | | | (0.02 | ) | |
| From Capital Gains | | | (0.00 | ) | | | (0.03 | ) | | | (0.00 | ) | | | (0.03 | ) | | | (0.00 | ) | | | (0.03 | ) | |
| Total Distributions | | | (0.02 | ) | | | (0.05 | ) | | | (0.02 | ) | | | (0.05 | ) | | | (0.02 | ) | | | (0.05 | ) | |
| Net Asset Value, End of Period | | $ | 0.64 | | | $ | 0.92 | | | $ | 0.62 | | | $ | 0.92 | | | $ | 0.60 | | | $ | 0.92 | | |
| Total Return (%)(b) | | | (28.32 | ) | | | (1.95 | )(c) | | | (29.95 | ) | | | (2.22 | )(c) | | | (32.53 | ) | | | (2.54 | )(c) | |
| Net Assets, End of Period ($ millions) | | | 15 | | | | 2 | | | | 12 | | | | 2 | | | | 9 | | | | 2 | | |
| Ratio of Net Investment Income (Loss) to Average Net Assets (%) | | | 5.06 | | | | 4.48 | (c) | | | 4.61 | | | | 4.82 | (c) | | | 4.21 | | | | 3.76 | (c) | |
| Ratio of Expenses to Average Net Assets Before Expense Reimbursement (%)(f) | | | 0.05 | | | | 0.04 | (d) | | | 0.05 | | | | 0.05 | (d) | | | 0.05 | | | | 0.05 | (d) | |
| Ratio of Expenses to Average Net Assets After Expense Reimbursement (%)(f) | | | 0.05 | | | | 0.04 | (d) | | | 0.05 | | | | 0.05 | (d) | | | 0.05 | | | | 0.05 | (d) | |
| Portfolio Turnover Rate (%)(a) | | | 10.06 | | | | 0.28 | (c) | | | 12.34 | | | | 4.11 | (c) | | | 7.62 | | | | 0.71 | (c) | |
The accompanying notes are an integral part of these financial statements.
91
MUTUAL OF AMERICA INVESTMENT CORPORATION
FINANCIAL HIGHLIGHTS (Continued)
| | | 2040 Retirement Fund | | 2045 Retirement Fund | | Conservative Allocation Fund | |
| | | Year Ended
December 31, | | Period Ended
December 31, | | Year Ended
December 31, | | Period Ended
December 31, | | Years Ended December 31, | |
| | | 2008 | | 2007(g) | | 2008 | | 2007(g) | | 2008 | | 2007 | | 2006 | | 2005 | | 2004 | |
| Net Asset Value, Beginning of Period | | $ | 0.91 | | | $ | 0.99 | | | $ | 0.91 | | | $ | 0.99 | | | $ | 1.03 | | | $ | 1.02 | | | $ | 1.00 | | | $ | 1.02 | | | $ | 1.01 | | |
| INCOME (LOSS) FROM INVESTMENT OPERATIONS: | |
| Net Investment Income | | | 0.02 | | | | 0.02 | | | | 0.02 | | | | 0.02 | | | | 0.04 | | | | 0.04 | | | | 0.04 | | | | 0.03 | | | | 0.03 | | |
| Net Realized and Unrealized Gains (Losses) on Investments and Futures Contracts | | | (0.32 | ) | | | (0.05 | ) | | | (0.32 | ) | | | (0.05 | ) | | | (0.14 | ) | | | 0.02 | | | | 0.03 | | | | (0.01 | ) | | | 0.02 | | |
| Total From Investment Operations | | | (0.30 | ) | | | (0.03 | ) | | | (0.30 | ) | | | (0.03 | ) | | | (0.10 | ) | | | 0.06 | | | | 0.07 | | | | 0.02 | | | | 0.05 | | |
Less: Dividend Distributions:
From Net Investment Income | | | (0.02 | )(h) | | | (0.02 | ) | | | (0.02 | )(h) | | | (0.02 | ) | | | (0.04 | ) | | | (0.04 | ) | | | (0.03 | ) | | | (0.03 | ) | | | (0.03 | ) | |
| From Capital Gains | | | (0.00 | ) | | | (0.03 | ) | | | (0.00 | ) | | | (0.03 | ) | | | (0.00 | ) | | | (0.01 | ) | | | (0.02 | ) | | | (0.01 | ) | | | (0.01 | ) | |
| Total Distributions | | | (0.02 | ) | | | (0.05 | ) | | | (0.02 | ) | | | (0.05 | ) | | | (0.04 | ) | | | (0.05 | ) | | | (0.05 | ) | | | (0.04 | ) | | | (0.04 | ) | |
| Net Asset Value, End of Period | | $ | 0.59 | | | $ | 0.91 | | | $ | 0.59 | | | $ | 0.91 | | | $ | 0.89 | | | $ | 1.03 | | | $ | 1.02 | | | $ | 1.00 | | | $ | 1.02 | | |
| Total Return (%)(b) | | | (32.75 | ) | | | (2.68 | )(c) | | | (32.90 | ) | | | (2.79 | )(c) | | | (10.19 | ) | | | 6.43 | | | | 6.96 | | | | 2.30 | | | | 4.72 | | |
| Net Assets, End of Period ($ millions) | | | 6 | | | | 1 | | | | 7 | | | | 1 | | | | 24 | | | | 20 | | | | 13 | | | | 11 | | | | 8 | | |
| Ratio of Net Investment Income to (Loss) Average Net Assets (%) | | | 4.20 | | | | 3.93 | (c) | | | 4.49 | | | | 4.17 | (c) | | | 4.04 | | | | 4.48 | | | | 4.11 | | | | 3.39 | | | | 4.51 | | |
| Ratio of Expenses to Average Net Assets Before Expense Reimbursement (%)(f) | | | 0.05 | | | | 0.05 | (d) | | | 0.05 | | | | 0.03 | (d) | | | 0.00 | | | | 0.00 | | | | 0.00 | | | | 0.00 | | | | 0.00 | | |
| Ratio of Expenses to Average Net Assets After Expense Reimbursement (%)(f) | | | 0.05 | | | | 0.05 | (d) | | | 0.05 | | | | 0.03 | (d) | | | 0.00 | | | | 0.00 | | | | 0.00 | | | | 0.00 | | | | 0.00 | | |
| Portfolio Turnover Rate (%)(a) | | | 7.79 | | | | 1.18 | (c) | | | 6.77 | | | | 6.34 | (c) | | | 38.30 | | | | 13.72 | | | | 49.05 | | | | 8.39 | | | | 92.83 | | |
(a) Portfolio turnover rate excludes all short-term securities.
(b) Total return would have been lower had non-investment advisory expenses not been reduced through expense reimbursement in certain years (Note 2).
(c) Not annualized.
(d) Annualized.
(e) For the period July 1, 2005 (commencement of operations) through December 31, 2005.
(f) Allocation and Retirement Funds exclude expenses of the underlying funds.
(g) For the period November 5, 2007 (commencement of operations) through December 31, 2007.
(h) Includes less than $0.005 of tax-basis return of capital distributions.
The accompanying notes are an integral part of these financial statements.
92
| | | Moderate Allocation Fund | | Aggressive Allocation Fund | |
| | | Years Ended December 31, | | Years Ended December 31, | |
| | | 2008 | | 2007 | | 2006 | | 2005 | | 2004 | | 2008 | | 2007 | | 2006 | | 2005 | | 2004 | |
| Net Asset Value, Beginning of Period | | $ | 1.14 | | | $ | 1.14 | | | $ | 1.11 | | | $ | 1.11 | | | $ | 1.08 | | | $ | 1.24 | | | $ | 1.27 | | | $ | 1.22 | | | $ | 1.21 | | | $ | 1.17 | | |
| INCOME (LOSS) FROM INVESTMENT OPERATIONS: | |
| Net Investment Income | | | 0.03 | | | | 0.04 | | | | 0.03 | | | | 0.03 | | | | 0.03 | | | | 0.02 | | | | 0.03 | | | | 0.03 | | | | 0.02 | | | | 0.02 | | |
| Net Realized and Unrealized Gains (Losses) on Investments and Futures Contracts | | | (0.25 | ) | | | 0.03 | | | | 0.06 | | | | 0.02 | | | | 0.06 | | | | (0.37 | ) | | | 0.04 | | | | 0.11 | | | | 0.05 | | | | 0.09 | | |
| Total From Investment Operations | | | (0.22 | ) | | | 0.07 | | | | 0.09 | | | | 0.05 | | | | 0.09 | | | | (0.35 | ) | | | 0.07 | | | | 0.14 | | | | 0.07 | | | | 0.11 | | |
Less: Dividend Distributions:
From Net Investment Income | | | (0.03 | ) | | | (0.04 | ) | | | (0.03 | ) | | | (0.03 | ) | | | (0.03 | ) | | | (0.02 | )(h) | | | (0.04 | )(h) | | | (0.03 | ) | | | (0.02 | ) | | | (0.03 | ) | |
| From Capital Gains | | | (0.01 | ) | | | (0.03 | ) | | | (0.03 | ) | | | (0.02 | ) | | | (0.03 | ) | | | (0.01 | ) | | | (0.06 | ) | | | (0.06 | ) | | | (0.04 | ) | | | (0.04 | ) | |
| Total Distributions | | | (0.04 | ) | | | (0.07 | ) | | | (0.06 | ) | | | (0.05 | ) | | | (0.06 | ) | | | (0.03 | ) | | | (0.10 | ) | | | (0.09 | ) | | | (0.06 | ) | | | (0.07 | ) | |
| Net Asset Value, End of Period | | $ | 0.88 | | | $ | 1.14 | | | $ | 1.14 | | | $ | 1.11 | | | $ | 1.11 | | | $ | 0.86 | | | $ | 1.24 | | | $ | 1.27 | | | $ | 1.22 | | | $ | 1.21 | | |
| Total Return (%)(b) | | | (19.85 | ) | | | 6.36 | | | | 9.20 | | | | 4.35 | | | | 8.27 | | | | (28.20 | ) | | | 5.52 | | | | 11.87 | | | | 5.78 | | | | 9.92 | | |
| Net Assets, End of Period ($ millions) | | | 90 | | | | 102 | | | | 76 | | | | 56 | | | | 37 | | | | 81 | | | | 101 | | | | 73 | | | | 48 | | | | 30 | | |
| Ratio of Net Investment Income to (Loss) Average Net Assets (%) | | | 3.14 | | | | 3.54 | | | | 3.30 | | | | 3.28 | | | | 3.81 | | | | 2.41 | | | | 2.75 | | | | 2.82 | | | | 2.58 | | | | 2.98 | | |
| Ratio of Expenses to Average Net Assets Before Expense Reimbursement (%)(f) | | | 0.00 | | | | 0.00 | | | | 0.00 | | | | 0.00 | | | | 0.00 | | | | 0.00 | | | | 0.00 | | | | 0.00 | | | | 0.00 | | | | 0.00 | | |
| Ratio of Expenses to Average Net Assets After Expense Reimbursement (%)(f) | | | 0.00 | | | | 0.00 | | | | 0.00 | | | | 0.00 | | | | 0.00 | | | | 0.00 | | | | 0.00 | | | | 0.00 | | | | 0.00 | | | | 0.00 | | |
| Portfolio Turnover Rate (%)(a) | | | 25.21 | | | | 12.35 | | | | 9.78 | | | | 14.09 | | | | 99.27 | | | | 20.56 | | | | 9.14 | | | | 6.75 | | | | 14.96 | | | | 48.24 | | |
The accompanying notes are an integral part of these financial statements.
93
MUTUAL OF AMERICA INVESTMENT CORPORATION
FINANCIAL HIGHLIGHTS (Continued)
| | | Money Market Fund | | Mid-Term Bond Fund | |
| | | Years Ended December 31, | | Years Ended December 31, | |
| | | 2008 | | 2007 | | 2006 | | 2005 | | 2004 | | 2008 | | 2007 | | 2006 | | 2005 | | 2004 | |
| Net Asset Value, Beginning of Period | | $ | 1.21 | | | $ | 1.21 | | | $ | 1.20 | | | $ | 1.19 | | | $ | 1.18 | | | $ | 0.96 | | | $ | 0.93 | | | $ | 0.92 | | | $ | 0.94 | | | $ | 0.96 | | |
| INCOME (LOSS) FROM INVESTMENT OPERATIONS: | |
| Net Investment Income | | | 0.03 | | | | 0.05 | | | | 0.05 | | | | 0.04 | | | | 0.02 | | | | 0.04 | | | | 0.04 | | | | 0.03 | | | | 0.03 | | | | 0.02 | | |
| Net Realized and Unrealized Gains (Losses) on Investments and Futures Contracts | | | 0.00 | | | | — | | | | — | | | | — | | | | — | | | | (0.02 | ) | | | 0.03 | | | | 0.01 | | | | (0.02 | ) | | | (0.01 | ) | |
| Total From Investment Operations | | | 0.03 | | | | 0.05 | | | | 0.05 | | | | 0.04 | | | | 0.02 | | | | 0.02 | | | | 0.07 | | | | 0.04 | | | | 0.01 | | | | 0.01 | | |
Less: Dividend Distributions:
From Net Investment Income | | | (0.03 | ) | | | (0.05 | ) | | | (0.04 | ) | | | (0.03 | ) | | | (0.01 | ) | | | (0.04 | ) | | | (0.04 | ) | | | (0.03 | ) | | | (0.03 | ) | | | (0.03 | ) | |
| From Capital Gains | | | — | | | | — | | | | — | | | | — | | | | — | | | | — | | | | — | | | | — | | | | — | | | | — | | |
| Total Distributions | | | (0.03 | ) | | | (0.05 | ) | | | (0.04 | ) | | | (0.03 | ) | | | (0.01 | ) | | | (0.04 | ) | | | (0.04 | ) | | | (0.03 | ) | | | (0.03 | ) | | | (0.03 | ) | |
| Net Asset Value, End of Period | | $ | 1.21 | | | $ | 1.21 | | | $ | 1.21 | | | $ | 1.20 | | | $ | 1.19 | | | $ | 0.94 | | | $ | 0.96 | | | $ | 0.93 | | | $ | 0.92 | | | $ | 0.94 | | |
| Total Return (%)(b) | | | 2.34 | | | | 5.03 | | | | 4.89 | | | | 2.97 | | | | 1.10 | | | | 1.84 | | | | 7.22 | | | | 4.22 | | | | 0.77 | | | | 2.26 | | |
| Net Assets, End of Period ($ millions) | | | 201 | | | | 312 | | | | 239 | | | | 130 | | | | 78 | | | | 183 | | | | 122 | | | | 107 | | | | 71 | | | | 73 | | |
| Ratio of Net Investment Income to Average Net Assets (%) | | | 2.38 | | | | 4.89 | | | | 4.83 | | | | 3.05 | | | | 1.12 | | | | 4.27 | | | | 4.28 | | | | 3.88 | | | | 3.30 | | | | 3.25 | | |
| Ratio of Expenses to Average Net Assets Before Expense Reimbursement (%) | | | 0.32 | | | | 0.28 | | | | 0.24 | | | | 0.38 | | | | 0.38 | | | | 0.55 | | | | 0.56 | | | | 0.50 | | | | 0.66 | | | | 0.65 | | |
| Ratio of Expenses to Average Net Assets After Expense Reimbursement (%) | | | 0.32 | | | | 0.28 | | | | 0.22 | | | | 0.25 | | | | 0.25 | | | | 0.55 | | | | 0.56 | | | | 0.47 | | | | 0.50 | | | | 0.50 | | |
| Portfolio Turnover Rate (%)(a) | | | N/A | | | | N/A | | | | N/A | | | | N/A | | | | N/A | | | | 34.95 | | | | 26.78 | | | | 30.91 | | | | 21.99 | | | | 27.23 | | |
(a) Portfolio turnover rate excludes all short-term securities.
(b) Total return would have been lower had non-investment advisory expenses not been reduced through expense reimbursement in certain years (Note 2).
(c) Not annualized.
(d) Annualized.
(e) For the period July 1, 2005 (commencement of operations) through December 31, 2005.
(f) Allocation and Retirement Funds exclude expenses of the underlying funds.
(g) For the period November 5, 2007 (commencement of operations) through December 31, 2007.
N/A = Not Applicable
The accompanying notes are an integral part of these financial statements.
94
| | | Bond Fund | |
| | | Years Ended December 31, | |
| | | 2008 | | 2007 | | 2006 | | 2005 | | 2004 | |
| Net Asset Value, Beginning of Period | | $ | 1.27 | | | $ | 1.26 | | | $ | 1.26 | | | $ | 1.29 | | | $ | 1.29 | | |
| INCOME (LOSS) FROM INVESTMENT OPERATIONS: | |
| Net Investment Income | | | 0.07 | | | | 0.06 | | | | 0.06 | | | | 0.06 | | | | 0.06 | | |
| Net Realized and Unrealized Gains (Losses) on Investments and Futures Contracts | | | (0.09 | ) | | | 0.01 | | | | — | | | | (0.03 | ) | | | — | | |
| Total From Investment Operations | | | (0.02 | ) | | | 0.07 | | | | 0.06 | | | | 0.03 | | | | 0.06 | | |
Less: Dividend Distributions:
From Net Investment Income | | | (0.07 | ) | | | (0.06 | ) | | | (0.06 | ) | | | (0.06 | ) | | | (0.06 | ) | |
| From Capital Gains | | | — | | | | — | | | | — | | | | — | | | | — | | |
| Total Distributions | | | (0.07 | ) | | | (0.06 | ) | | | (0.06 | ) | | | (0.06 | ) | | | (0.06 | ) | |
| Net Asset Value, End of Period | | $ | 1.18 | | | $ | 1.27 | | | $ | 1.26 | | | $ | 1.26 | | | $ | 1.29 | | |
| Total Return (%)(b) | | | (1.75 | ) | | | 5.90 | | | | 4.79 | | | | 1.79 | | | | 4.61 | | |
| Net Assets, End of Period ($ millions) | | | 372 | | | | 384 | | | | 343 | | | | 369 | | | | 369 | | |
| Ratio of Net Investment Income to Average Net Assets (%) | | | 5.05 | | | | 4.95 | | | | 4.84 | | | | 4.30 | | | | 4.44 | | |
| Ratio of Expenses to Average Net Assets Before Expense Reimbursement (%) | | | 0.56 | | | | 0.53 | | | | 0.50 | | | | 0.61 | | | | 0.59 | | |
| Ratio of Expenses to Average Net Assets After Expense Reimbursement (%) | | | 0.56 | | | | 0.53 | | | | 0.47 | | | | 0.50 | | | | 0.50 | | |
| Portfolio Turnover Rate (%)(a) | | | 23.76 | | | | 17.56 | | | | 19.03 | | | | 23.27 | | | | 35.12 | | |
The accompanying notes are an integral part of these financial statements.
95
MUTUAL OF AMERICA INVESTMENT CORPORATION
NOTES TO FINANCIAL STATEMENTS
1. SIGNIFICANT ACCOUNTING POLICIES AND ORGANIZATION
Mutual of America Investment Corporation (the "Investment Company") is a diversified, open-end management investment company — a type of company commonly known as a "mutual fund". It is registered as such under the Investment Company Act of 1940 (the "Investment Company Act"). The Investment Company was formed on February 21, 1986 as a Maryland corporation and principally offers its shares exclusively to separate accounts of Mutual of America Life Insurance Company ("Mutual of America Life") and its affiliates. As a "series" type mutual fund, the Investment Company issues separate classes (or series) of capital stock, each of which represents a separate Fund of investments. At December 31, 2008, there were 23 Funds: Equity Index Fund, All America Fund, Small Cap Value Fund, Small Cap Growth Fund, Mid Cap Value Fund, Mid-Cap Equity Index Fund, International Fund, Composite Fund, Money Market Fund, Mid-Term Bond Fund, Bond Fund; Retiremen t Income Fund, 2010 Retirement Fund, 2015 Retirement Fund, 2020 Retirement Fund, 2025 Retirement Fund, 2030 Retirement Fund, 2035 Retirement Fund, 2040 Retirement Fund and 2045 Retirement Fund (collectively, "Retirement Funds"); a Conservative Allocation Fund, a Moderate Allocation Fund and an Aggressive Allocation Fund (collectively "Allocation Funds"). The International Fund and the Retirement Funds began operations on November 5, 2007. The Small Cap Value Fund, Small Cap Growth Fund and the Mid Cap Value Fund began operations on July 1, 2005.
Investment Company shares are issued to Mutual of America Life, and on a limited basis, to Wilton Reassurance Life Company of New York (formerly The American Life Insurance Company of New York), for allocation to their Separate Accounts as a funding medium for variable accumulation annuity contracts and variable life insurance policies. In addition, shares of selected equity and fixed income funds of the Investment Company are directly issued to one or more of the Investment Company's Allocation Funds.
The preparation of financial statements in accordance with U.S. generally accepted accounting principles may require management to make estimates and assumptions that affect the reported amounts of assets, liabilities, income, expenses and related disclosures. Actual results, however, may differ from those estimates.
The following is a summary of the significant accounting policies consistently followed by the Investment Company, which are in conformity with U.S. generally accepted accounting principles:
Fair Value — Effective January 1, 2008, the Investment Company adopted Financial Accounting Standards Board ("FASB") Statement of Financial Accounting Standards No. 157, Fair Value Measurements ("SFAS 157"). SFAS 157 establishes a single definition of fair value, institutes a framework for measuring fair value and expands disclosures about fair value measurements. Fair value is an estimate of the price the Fund would receive upon selling a security in an orderly arms-length transaction. SFAS 157 establishes a three-level valuation hierarchy for measurement and disclosure of fair value. The valuation hierarchy is based upon the transparency of inputs used to measure fair value. The three levels are as follows:
• Level 1 — quoted prices in active markets for identical securities.
• Level 2 — other significant observable inputs (including yield, quality, coupon rate, maturity, issue type, quoted prices for similar securities, prepayment speeds, trading characteristics, etc.).
• Level 3 — significant unobservable inputs (including the Fund's own assumptions in determining the fair value of investments).
As of December 31, 2008, management determined that the fair value inputs for all equity securities, including shares of registered investment companies, were considered Level 1, with the exception of non-registered securities under Rule 144A of the Securities Act of 1933 which were considered Level 2. However, certain Rule 144A securities not actively traded were considered Level 3. Fair value inputs for all debt securities were considered Level 2. The inputs used for valuing securities are not necessarily an indication of the risk associated with investing in those securities.
96
MUTUAL OF AMERICA INVESTMENT CORPORATION
NOTES TO FINANCIAL STATEMENTS (Continued)
1. SIGNIFICANT ACCOUNTING POLICIES AND ORGANIZATION (CONTINUED)
The following is a summary of the inputs used to value the Funds' net assets as of December 31, 2008, by SFAS 157 valuation hierarchy:
| Fund | | Level 1 — Quoted
Prices | | Level 2 — Significant
Observable Inputs | | Level 3 — Significant
Unobservable Inputs | | Total | |
| Investments at Market Value: | |
| Equity Index Fund | | $ | 515,040,073 | | | $ | 29,264,154 | | | | — | | | $ | 544,304,227 | | |
| All America Fund | | $ | 209,905,213 | | | $ | 11,005,584 | | | $ | 695,347 | | | $ | 221,606,144 | | |
| Small Cap Value Fund | | $ | 143,283,334 | | | $ | 7,719,621 | | | $ | 3,989,652 | | | $ | 154,992,607 | | |
| Small Cap Growth Fund | | $ | 143,791,492 | | | $ | 5,799,395 | | | | — | | | $ | 149,590,887 | | |
| Mid Cap Value Fund | | $ | 28,304,261 | | | $ | 1,499,842 | | | | — | | | $ | 29,804,103 | | |
| Mid-Cap Equity Index Fund | | $ | 218,695,597 | | | $ | 26,402,786 | | | | — | | | $ | 245,098,383 | | |
| International Fund | | $ | 11,828,829 | | | | — | | | | — | | | $ | 11,828,829 | | |
| Composite Fund | | $ | 86,205,106 | | | $ | 63,040,475 | | | | — | | | $ | 149,245,581 | | |
| Retirement Income Fund | | $ | 3,516,933 | | | | — | | | | — | | | $ | 3,516,933 | | |
| 2010 Retirement Fund | | $ | 8,274,705 | | | | — | | | | — | | | $ | 8,274,705 | | |
| 2015 Retirement Fund | | $ | 20,017,092 | | | | — | | | | — | | | $ | 20,017,092 | | |
| 2020 Retirement Fund | | $ | 20,685,744 | | | | — | | | | — | | | $ | 20,685,744 | | |
| 2025 Retirement Fund | | $ | 14,822,394 | | | | — | | | | — | | | $ | 14,822,394 | | |
| 2030 Retirement Fund | | $ | 11,661,423 | | | | — | | | | — | | | $ | 11,661,423 | | |
| 2035 Retirement Fund | | $ | 8,780,940 | | | | — | | | | — | | | $ | 8,780,940 | | |
| 2040 Retirement Fund | | $ | 6,200,702 | | | | — | | | | — | | | $ | 6,200,702 | | |
| 2045 Retirement Fund | | $ | 6,858,194 | | | | — | | | | — | | | $ | 6,858,194 | | |
| Conservative Allocation Fund | | $ | 23,604,668 | | | | — | | | | — | | | $ | 23,604,668 | | |
| Moderate Allocation Fund | | $ | 89,505,262 | | | | — | | | | — | | | $ | 89,505,262 | | |
| Aggressive Allocation Fund | | $ | 81,248,122 | | | | — | | | | — | | | $ | 81,248,122 | | |
| Money Market Fund | | | — | | | $ | 200,986,624 | | | | — | | | $ | 200,986,624 | | |
| Mid-Term Bond Fund | | | — | | | $ | 181,100,980 | | | | — | | | $ | 181,100,980 | | |
| Bond Fund | | | — | | | $ | 368,062,643 | | | | — | | | $ | 368,062,643 | | |
| Other Financial Instruments:* | |
| Equity Index Fund | | $ | (9,213 | ) | | | — | | | | — | | | $ | (9,213 | ) | |
| All America Fund | | $ | (21,200 | ) | | | — | | | | — | | | $ | (21,200 | ) | |
| Mid-Cap Equity Index Fund | | $ | 495,125 | | | | — | | | | — | | | $ | 495,125 | | |
* Other financial instruments are derivative instruments not reflected in the Portfolio of Investments, such as futures, which are valued at the unrealized appreciation/depreciation on the instrument.
| | | Fair Value Measurement Using Signficant Unobservable
Inputs (Level 3) for the Year Ended December 31, 2008 | |
| | | Balance
December 31,
2007 | | Purchases/
(Sales) | | Unrealized
Gains
(Losses)(a) | | Transfer
In/(Out) of
Level 3 | | Balance
December 31,
2008 | |
| All America Fund | | $ | 1,473,487 | | | | | $ | (599,139 | ) | | $ | (179,001 | ) | | $ | 695,347 | | |
| Small Cap Value Fund | | $ | 6,658,540 | | | $ | 170,630 | | | $ | (2,839,518 | ) | | | | $ | 3,989,652 | | |
(a) Unrealized gains and losses on Level 3 securities are included in Net Unrealized Appreciation (Depreciation) of Investments in the Statements of Operations
Security Valuation — Investment securities are carried at fair value as follows:
Exchange-traded equity securities are valued at the last sales price on the principal exchange on which the security is traded. If there is no trading volume for a particular valuation day, the last bid price is used. For equity securities traded in the over-the-counter market, the security is valued at the last sale price, or if no sale, at the latest bid price available.
97
MUTUAL OF AMERICA INVESTMENT CORPORATION
NOTES TO FINANCIAL STATEMENTS (Continued)
1. SIGNIFICANT ACCOUNTING POLICIES AND ORGANIZATION (CONTINUED)
Short-term debt securities with a maturity of 60 days or less are valued at amortized cost, which approximates fair value for such securities.
Debt securities, including short-term debt securities maturing in excess of 60 days, are valued on the basis of prices obtained from an independent pricing source. The pricing source may utilize various pricing methodologies that incorporate both models (which consider factors such as yield, quality, coupon rate, maturity, issue type, quoted prices for similar securities, prepayment speeds and trading characteristics) and dealer-supplied valuations to derive a valuation.
In the rare instance when a price is not available from an independent pricing source or when prices are determined not to reflect fair value, such as when the value of a security has been significantly affected by events after the close of the market on which the security is principally traded but before the funds calculate their net asset value, a calculated fair value is used, as determined in good faith by the Adviser and reviewed by a Valuation Committee, in accordance with procedures adopted by the Board of Directors of the Investment Company.
The Retirement Funds and the Allocation Funds value their investments in the underlying Funds of the Investment Company at their respective net asset values.
Investment Transactions — Investment transactions are accounted for as of the trade date. Realized gains and losses on the sale of short and long-term debt securities are computed on the basis of amortized cost at the time of sale. Realized gains and losses on the sale of stock are based on the identified cost basis of the security, determined on the first-in, first-out ("FIFO") basis.
Equity-type funds with an indexed portfolio component may, in order to remain more fully invested in the equity markets while minimizing transaction costs, purchase stock index futures contracts. Initial cash margin deposits (represented by cash or Treasury bills) are made upon entering into futures contracts. (This initial margin, maintained in a segregated account, is equal to approximately 5%-6% of the contract amount, and does not involve the borrowing of funds to finance the transaction.) During the period the futures contract is outstanding, changes in the value of the contract are recognized as unrealized gains or losses by "marking-to-market" on a daily basis to reflect the market value of the contract at the end of each trading day. Futures contracts are valued at the settlement price established each day by the exchange on which traded. Depending upon whether unrealized gains or losses are incurred, variation margin payments are re ceived or made daily. When the contract is closed, a realized gain or loss from futures transactions is recorded, equal to the net variation margin received or paid over the period the contract was outstanding. The "Underlying Face Amount at Value" (appearing in the "Summary Portfolio of Investments in Securities") representing the aggregate of outstanding contractual amounts under futures contracts reflects the extent of a Fund's exposure to off-balance sheet risk. The use of futures transactions involves the risk of imperfect correlation in the price movements of the contract and the underlying securities.
Each of the Retirement Funds invests in equity (stock) funds and fixed income (bond) funds and targets different percentages to these asset classes. The targets reflect varying emphases on achieving capital appreciation and gains versus preserving capital and producing income, depending on the specific Fund's time horizon.
The Retirement Funds invest in the following underlying funds of the Investment Company in accordance with the percentage allocations noted:
| | | Equity
Index
Fund | | Mid-Cap
Equity
Index
Fund | | Small Cap
Growth
Fund | | Small Cap
Value
Fund | | International
Fund | | Bond
Fund | | Mid-Term
Bond
Fund | | Money
Market
Fund | |
| Retirement Income Fund | | | 20 | % | | | 5 | % | | | — | | | | — | | | | — | | | | 30 | % | | | 30 | % | | | 15 | % | |
| 2010 Retirement Fund | | | 25 | % | | | 15 | % | | | — | | | | — | | | | 5 | % | | | 25 | % | | | 20 | % | | | 10 | % | |
| 2015 Retirement Fund | | | 30 | % | | | 12 | % | | | 3 | % | | | 3 | % | | | 7 | % | | | 25 | % | | | 11 | % | | | 9 | % | |
| 2020 Retirement Fund | | | 35 | % | | | 12 | % | | | 4 | % | | | 4 | % | | | 10 | % | | | 24 | % | | | 11 | % | | | — | | |
| 2025 Retirement Fund | | | 40 | % | | | 15 | % | | | 5 | % | | | 5 | % | | | 10 | % | | | 20 | % | | | 5 | % | | | — | | |
| 2030 Retirement Fund | | | 40 | % | | | 18 | % | | | 6 | % | | | 6 | % | | | 10 | % | | | 20 | % | | | — | | | | — | | |
| 2035 Retirement Fund | | | 40 | % | | | 21 | % | | | 7 | % | | | 7 | % | | | 13 | % | | | 12 | % | | | — | | | | — | | |
| 2040 Retirement Fund | | | 35 | % | | | 24 | % | | | 8 | % | | | 8 | % | | | 14 | % | | | 11 | % | | | — | | | | — | | |
| 2045 Retirement Fund | | | 35 | % | | | 20 | % | | | 10 | % | | | 10 | % | | | 15 | % | | | 10 | % | | | — | | | | — | | |
98
MUTUAL OF AMERICA INVESTMENT CORPORATION
NOTES TO FINANCIAL STATEMENTS (Continued)
1. SIGNIFICANT ACCOUNTING POLICIES AND ORGANIZATION (CONTINUED)
Generally, rebalancing of the Retirement Funds' holdings are performed on a quarterly or other periodic basis and the mix of underlying Funds is reviewed annually.
The Allocation Funds invest in the following underlying Funds of the Investment Company in accordance with the percentage allocations noted:
| Conservative Allocation: | | Equity Index (25%), Bond (30%), | |
|
| | | Mid-Term Bond (45%). | |
|
| Moderate Allocation: | | Equity Index (35%), Bond (30%), | |
|
| | | Mid-Term Bond (20%), Mid-Cap Equity Index (15%). | |
|
| Aggressive Allocation: | | Equity Index (45%), Bond (25%), | |
|
| | | Mid-Cap Equity Index (20%), Small Cap Value (5%), Small Cap Growth (5%). | |
|
Generally, rebalancing of the Allocation Funds' holdings are performed on a monthly basis.
Investment Income — Interest income, accretion of discount and amortization of premium are recorded daily on an accrual basis using the effective interest method. A debt obligation may cease accrual of income and result in a reduction to interest income when the collection of all or a portion of current and past due interest is in doubt. Dividend income is recorded on the ex-dividend date. Foreign source tax withheld from dividends is recorded as a reduction from dividend income. Should reclamation efforts succeed, such amounts are recorded as income upon collection.
Distributions to Shareholders ("Dividends") — Distributions to shareholders are recorded on the ex-dividend date. It is the Investment Company's policy to make distributions of its net investment income twice a year and, on an annual basis, to distribute net realized gains, if any, in accordance with Federal income tax regulations, which may differ from U.S. generally accepted accounting principles. Accordingly, periodic reclassifications (which do not impact the funds' net asset values) are made within the funds' capital accounts to reflect income and gains available for distribution under Federal income tax regulations.
Federal Income Taxes — Each Fund in the Investment Company intends to comply with the requirements of the Internal Revenue Code applicable to regulated investment companies and to distribute substantially all of its taxable income to shareholders. Therefore, no Federal income or excise tax provision is required.
FASB Interpretation No. 48, Accounting for Uncertainty in Income Taxes ("FIN 48"), requires the evaluation of tax positions taken in the course of preparing a fund's tax return to determine whether it is "more-likely-than-not" that tax positions taken in the fund's tax return will be ultimately sustained. A tax liability and expense must be recorded in respect of any tax position that, in management's judgment, will not be fully realized.
As of December 31, 2008, management has evaluated the implications of FIN 48 and has concluded that it does not materially impact any of the Funds' financial statements. Tax returns for the years ended December 31, 2005 through 2008 for each Fund of the Investment Company remain subject to examination by the Internal Revenue Service and state tax authorities.
At December 31, 2008, the Funds had the following capital loss carryforwards to offset net capital gains, to the extent provided by Federal income tax regulations, which if unused expire on the dates noted. In addition, the Equity Index, All America, Small-Cap Value, Small-Cap Growth, Mid-Cap Equity Index, Composite, Aggressive Allocation, and Mid-Term Bond generated post-October 2008 net capital losses of $2,641,778, $6,618,769, $3,844,174, $15,247,075, $1,013,914, $2,422,095, $66,120, and $3,264 respectively, which if unused will expire on December 31, 2017.
| Expiring on December 31, | | Equity
Index Fund | | All America
Fund | | Small Cap
Value Fund | | Small Cap
Growth Fund | | Mid Cap
Value Fund | |
| 2009 | | $ | 0 | | | $ | 0 | | | $ | 0 | | | $ | 0 | | | $ | 0 | | |
| 2010 | | | 0 | | | | 0 | | | | 0 | | | | 0 | | | | 0 | | |
| 2011 | | | 0 | | | | 0 | | | | 0 | | | | 0 | | | | 0 | | |
| 2012 | | | 0 | | | | 0 | | | | 0 | | | | 0 | | | | 0 | | |
| 2013 | | | 0 | | | | 0 | | | | 0 | | | | 0 | | | | 0 | | |
| 2014 | | | 0 | | | | 0 | | | | 0 | | | | 0 | | | | 0 | | |
| 2015 | | | 0 | | | | 0 | | | | 0 | | | | 0 | | | | (129,927 | ) | |
| 2016 | | | (15,755,157 | ) | | | (8,802,799 | ) | | | (24,355,943 | ) | | | (15,945,123 | ) | | | (824,121 | ) | |
| Total | | $ | (15,755,157 | ) | | $ | (8,802,799 | ) | | $ | (24,355,943 | ) | | $ | (15,945,123 | ) | | $ | (954,048 | ) | |
99
MUTUAL OF AMERICA INVESTMENT CORPORATION
NOTES TO FINANCIAL STATEMENTS (Continued)
1. SIGNIFICANT ACCOUNTING POLICIES AND ORGANIZATION (CONTINUED)
| Expiring on December 31, | | Mid-Cap
Equity Index
Fund | | International
Fund | | Composite
Fund | | Retirement
Income Fund | | 2010
Retirement
Fund | |
| 2009 | | $ | 0 | | | $ | 0 | | | $ | 0 | | | $ | 0 | | | $ | 0 | | |
| 2010 | | | 0 | | | | 0 | | | | (9,970,637 | ) | | | 0 | | | | 0 | | |
| 2011 | | | 0 | | | | 0 | | | | (20,417,938 | ) | | | 0 | | | | 0 | | |
| 2012 | | | 0 | | | | 0 | | | | 0 | | | | 0 | | | | 0 | | |
| 2013 | | | 0 | | | | 0 | | | | 0 | | | | 0 | | | | 0 | | |
| 2014 | | | 0 | | | | 0 | | | | 0 | | | | 0 | | | | 0 | | |
| 2015 | | | 0 | | | | 0 | | | | 0 | | | | 0 | | | | 0 | | |
| 2016 | | | 0 | | | | 0 | | | | (6,800,156 | ) | | | (5,165 | ) | | | 0 | | |
| Total | | $ | 0 | | | $ | 0 | | | $ | (37,188,731 | ) | | $ | (5,165 | ) | | $ | 0 | | |
| Expiring on December 31, | | 2015
Retirement
Fund | | 2020
Retirement
Fund | | 2025
Retirement
Fund | | 2030
Retirement
Fund | | 2035
Retirement
Fund | |
| 2009 | | $ | 0 | | | $ | 0 | | | $ | 0 | | | $ | 0 | | | $ | 0 | | |
| 2010 | | | 0 | | | | 0 | | | | 0 | | | | 0 | | | | 0 | | |
| 2011 | | | 0 | | | | 0 | | | | 0 | | | | 0 | | | | 0 | | |
| 2012 | | | 0 | | | | 0 | | | | 0 | | | | 0 | | | | 0 | | |
| 2013 | | | 0 | | | | 0 | | | | 0 | | | | 0 | | | | 0 | | |
| 2014 | | | 0 | | | | 0 | | | | 0 | | | | 0 | | | | 0 | | |
| 2015 | | | 0 | | | | 0 | | | | 0 | | | | 0 | | | | 0 | | |
| 2016 | | | 0 | | | | 0 | | | | 0 | | | | 0 | | | | 0 | | |
| Total | | $ | 0 | | | $ | 0 | | | $ | 0 | | | $ | 0 | | | $ | 0 | | |
| Expiring on December 31, | | 2040
Retirement
Fund | | 2045
Retirement
Fund | | Conservative
Allocation
Fund | | Moderate
Allocation
Fund | | Aggressive
Allocation
Fund | |
| 2009 | | $ | 0 | | | $ | 0 | | | $ | 0 | | | $ | 0 | | | $ | 0 | | |
| 2010 | | | 0 | | | | 0 | | | | 0 | | | | 0 | | | | 0 | | |
| 2011 | | | 0 | | | | 0 | | | | 0 | | | | 0 | | | | 0 | | |
| 2012 | | | 0 | | | | 0 | | | | 0 | | | | 0 | | | | 0 | | |
| 2013 | | | 0 | | | | 0 | | | | 0 | | | | 0 | | | | 0 | | |
| 2014 | | | 0 | | | | 0 | | | | 0 | | | | 0 | | | | 0 | | |
| 2015 | | | 0 | | | | 0 | | | | 0 | | | | 0 | | | | 0 | | |
| 2016 | | | 0 | | | | 0 | | | | 0 | | | | 0 | | | | 0 | | |
| Total | | $ | 0 | | | $ | 0 | | | $ | 0 | | | $ | 0 | | | $ | 0 | | |
| Expiring on December 31, | | Money
Market Fund | | Mid-Term
Bond Fund | | Bond Fund | |
| 2009 | | $ | 0 | | | $ | 0 | | | $ | 0 | | |
| 2010 | | | 0 | | | | 0 | | | | 0 | | |
| 2011 | | | 0 | | | | 0 | | | | (19,938,423 | ) | |
| 2012 | | | 0 | | | | 0 | | | | (171,798 | ) | |
| 2013 | | | 0 | | | | 0 | | | | (439,879 | ) | |
| 2014 | | | 0 | | | | (310,818 | ) | | | (3,306,785 | ) | |
| 2015 | | | 0 | | | | (409,798 | ) | | | 0 | | |
| 2016 | | | 0 | | | | 0 | | | | 0 | | |
| Total | | $ | 0 | | | $ | (720,616 | ) | | $ | (23,856,885 | ) | |
100
MUTUAL OF AMERICA INVESTMENT CORPORATION
NOTES TO FINANCIAL STATEMENTS (Continued)
2. EXPENSES
The Investment Company has an Investment Advisory Agreement with Mutual of America Capital Management Corporation ("the Adviser"), an indirect wholly-owned subsidiary of Mutual of America Life. For providing investment management services to each of the Funds of the Investment Company, the Adviser receives a fee, calculated as a daily charge, at the annual rate of .05% of the value of the net assets of the Retirement Funds, .075% of the value of the net assets of the Equity Index Fund, the Mid-Cap Equity Index Fund and the International Fund, .15% of the value of the net assets of the Money Market Fund, .40% of the value of the net assets of the All America Fund, Composite Fund, Mid-Term Bond Fund and Bond Fund, .55% of the value of the net assets of the Mid Cap Value Fund and .75% of the value of the net assets of the Small Cap Value Fund and Small Cap Growth Fund. The Adviser does not assess a fee for investment management to the Allocatio n Funds. However, shareholders in the Allocation Funds (and the Retirement Funds) will indirectly bear their pro-rata share of the investment management fees incurred by the underlying Funds in which they invest.
Prior to May 1, 2006, the Adviser's investment management fee was .125% of the value of the net assets of the Equity Index Fund and the Mid-Cap Equity Index Fund, .25% of the value of the net assets of the Money Market Fund, .50% of the value of the net assets of the All America Fund, Composite Fund, Mid-Term Bond Fund and Bond Fund, .65% of the value of the net assets of the Mid Cap Value Fund and .85% of the value of the net assets of the Small Cap Value Fund and Small Cap Growth Fund.
Through April 30, 2006, the Adviser contractually limited the expenses of each Fund, other than for brokers commissions and other fees relating to portfolio transactions, to the amount of the advisory fee paid by the Funds to the Adviser. Effective May 1, 2006, the Adviser terminated its expense limitation policy and each Fund is charged with the full amount of its expenses. Investment company-wide expenses are allocated to each Fund based on its proportional share of net assets or equally, as appropriate.
Under a Sub-Advisory Agreement for the All America Fund, through July 27, 2005 the Adviser delegated investment advisory responsibilities to a subadviser responsible for providing management services for a portion of the Funds assets. The Adviser (not the Fund) was responsible for compensation payable under such Sub-Advisory Agreement.
3. INVESTMENTS
The cost of investment purchases and proceeds from sales of investments, excluding short-term securities and futures contracts, for the year ended December 31, 2008 were as follows:
| | | Equity Index
Fund | | All America
Fund | | Small Cap
Value Fund | | Small Cap
Growth | | Mid Cap
Value Fund | |
| Cost of investment purchases | | $ | 64,304,896 | | | $ | 92,029,113 | | | $ | 112,538,618 | | | $ | 168,734,766 | | | $ | 16,348,166 | | |
| Proceeds from sales of investments | | $ | 31,326,684 | | | $ | 121,951,898 | | | $ | 104,823,806 | | | $ | 165,345,548 | | | $ | 11,482,987 | | |
| | | Mid-Cap
Equity Index
Fund | | International
Fund | | Composite
Fund | | Retirement
Income
Fund | | 2010
Retirement
Fund | |
| Cost of investment purchases | | $ | 68,267,798 | | | $ | 13,681,878 | | | $ | 68,227,844 | | | $ | 4,929,956 | | | $ | 9,703,675 | | |
| Proceeds from sales of investments | | $ | 72,288,531 | | | $ | — | | | $ | 82,626,960 | | | $ | 1,989,182 | | | $ | 1,694,638 | | |
| | | 2015
Retirement
Fund | | 2020
Retirement
Fund | | 2025
Retirement
Fund | | 2030
Retirement
Fund | | 2035
Retirement
Fund | |
| Cost of investment purchases | | $ | 21,726,705 | | | $ | 22,739,257 | | | $ | 17,335,397 | | | $ | 13,388,075 | | | $ | 9,992,548 | | |
| Proceeds from sales of investments | | $ | 2,961,112 | | | $ | 2,023,142 | | | $ | 849,527 | | | $ | 860,737 | | | $ | 394,926 | | |
| | | 2040
Retirement
Fund | | 2045
Retirement
Fund | | Conservative
Allocation
Fund | | Moderate
Allocation
Fund | | Aggressive
Allocation
Fund | |
| Cost of investment purchases | | $ | 7,278,208 | | | $ | 8,185,283 | | | $ | 16,265,909 | | | $ | 36,891,481 | | | $ | 33,176,456 | | |
| Proceeds from sales of investments | | $ | 278,714 | | | $ | 246,397 | | | $ | 8,867,928 | | | $ | 24,695,496 | | | $ | 19,430,503 | | |
101
MUTUAL OF AMERICA INVESTMENT CORPORATION
NOTES TO FINANCIAL STATEMENTS (Continued)
3. INVESTMENTS (CONTINUED)
| | | Money
Market Fund | | Mid-Term
Bond Fund | | Bond
Fund | |
| Cost of investment purchases | | $ | — | | | $ | 124,422,928 | | | $ | 112,871,728 | | |
| Proceeds from sales of investments | | $ | — | | | $ | 58,460,901 | | | $ | 90,511,045 | | |
The cost of short-term security purchases for the Money Market Fund for the year ended December 31, 2008, was $2,721,294,894; net proceeds from sales for the year were $2,838,483,626.
The components of net unrealized appreciation (depreciation) of investments for Federal income tax purposes and the cost of investments for Federal income tax purposes at December 31, 2008 for each of the funds were as follows. Differences with amounts reflected in the Statements of Assets and Liabilities arise principally from wash sales and the treatment of distributions from Real Estate Investment Trusts (REITs).
| | | Equity
Index Fund | | All America
Fund | | Small Cap
Value Fund | | Small Cap
Growth | | Mid Cap
Value Fund | |
| Unrealized Appreciation | | $ | 77,630,933 | | | $ | 16,155,056 | | | $ | 6,808,157 | | | $ | 6,762,867 | | | $ | 449,951 | | |
| Unrealized Depreciation | | | (190,801,132 | ) | | | (84,931,327 | ) | | | (53,302,796 | ) | | | (35,282,416 | ) | | | (11,380,363 | ) | |
| Net | | $ | (113,170,199 | ) | | $ | (68,776,271 | ) | | $ | (46,494,639 | ) | | $ | (28,519,549 | ) | | $ | (10,930,412 | ) | |
| Tax Cost of Investments | | $ | 657,474,428 | | | $ | 290,382,414 | | | $ | 201,487,246 | | | $ | 178,110,436 | | | $ | 40,734,515 | | |
| | | Mid-Cap
Equity Index
Fund | | International
Fund | | Composite
Fund | | Retirement
Income
Fund | | 2010
Retirement
Fund | |
| Unrealized Appreciation | | $ | 13,364,583 | | | $ | 0 | | | $ | 4,398,899 | | | $ | 0 | | | $ | 0 | | |
| Unrealized Depreciation | | | (103,027,891 | ) | | | (4,392,369 | ) | | | (30,851,940 | ) | | | (439,857 | ) | | | (1,583,060 | ) | |
| Net | | $ | (89,663,308 | ) | | $ | (4,392,369 | ) | | $ | (26,453,041 | ) | | $ | (439,857 | ) | | $ | (1,583,060 | ) | |
| Tax Cost of Investments | | $ | 334,761,691 | | | $ | 16,221,198 | | | $ | 175,698,622 | | | $ | 3,956,790 | | | $ | 9,857,765 | | |
| | | 2015
Retirement
Fund | | 2020
Retirement
Fund | | 2025
Retirement
Fund | | 2030
Retirement
Fund | | 2035
Retirement
Fund | |
| Unrealized Appreciation | | $ | 0 | | | $ | 0 | | | $ | 0 | | | $ | 0 | | | $ | 0 | | |
| Unrealized Depreciation | | | (4,494,429 | ) | | | (5,268,430 | ) | | | (3,707,761 | ) | | | (3,228,941 | ) | | | (2,540,113 | ) | |
| Net | | $ | (4,494,429 | ) | | $ | (5,268,430 | ) | | $ | (3,707,761 | ) | | $ | (3,228,941 | ) | | $ | (2,540,113 | ) | |
| Tax Cost of Investments | | $ | 24,511,521 | | | $ | 25,954,174 | | | $ | 18,530,155 | | | $ | 14,890,364 | | | $ | (11,321,053 | ) | |
| | | 2040
Retirement
Fund | | 2045
Retirement
Fund | | Conservative
Allocation
Fund | | Moderate
Allocation
Fund | | Aggressive
Allocation
Fund | |
| Unrealized Appreciation | | $ | 0 | | | $ | 0 | | | $ | 0 | | | $ | 0 | | | $ | 0 | | |
| Unrealized Depreciation | | | (1,817,009 | ) | | | (1,816,548 | ) | | | (3,603,606 | ) | | | (23,676,178 | ) | | | (32,729,667 | ) | |
| Net | | $ | (1,817,009 | ) | | $ | (1,816,548 | ) | | $ | (3,603,606 | ) | | $ | (23,676,178 | ) | | $ | (32,729,667 | ) | |
| Tax Cost of Investments | | $ | 8,017,711 | | | $ | 8,674,742 | | | $ | 27,208,274 | | | $ | 113,181,440 | | | $ | 113,977,789 | | |
| | | Money
Market Fund | | Mid-Term
Bond Fund | | Bond
Fund | |
| Unrealized Appreciation | | $ | 49,812 | | | $ | 5,802,337 | | | $ | 6,634,058 | | |
| Unrealized Depreciation | | | (324 | ) | | | (10,312,968 | ) | | | (36,694,098 | ) | |
| Net | | $ | 49,488 | | | $ | (4,510,631 | ) | | $ | (30,060,040 | ) | |
| Tax Cost of Investments | | $ | 200,937,136 | | | $ | 185,611,611 | | | $ | 398,122,683 | | |
102
MUTUAL OF AMERICA INVESTMENT CORPORATION
NOTES TO FINANCIAL STATEMENTS (Continued)
3. INVESTMENTS (CONTINUED)
New Accounting Pronouncement — In March 2008, the FASB issued Statement of Financial Accounting Standards No. 161, Disclosures about Derivative Instruments and Hedging Activities — an amendment of FASB Statement No. 133 ("SFAS 161"), which is effective for fiscal years beginning after November 15, 2008. SFAS 161 requires entities that utilize derivative instruments to provide qualitative disclosures about their objectives and strategies for using such instruments, as well as any details of credit-risk-related contingent features contained within derivatives. SFAS 161 also requires entities to disclose additional information about the amounts and location of derivatives located within the financial statemen ts and the impact that hedges have on an entity's financial position, financial performance, and cash flows. Management is currently evaluating the impact of SFAS 161 on the disclosures about its use of derivatives.
4. CAPITAL SHARE ACTIVITY
The Investment Company has registered an indefinite number of its capital shares pursuant to Rule 24f-2 under the Investment Company Act of 1940. As of December 31, 2008, shares authorized were allocated into the 23 series of Funds as follows:
| | | Authorized No. of Shares | |
| Equity Index Fund | | | 500,000,000 | | |
| All America Fund | | | 400,000,000 | | |
| Small Cap Value Fund | | | 450,000,000 | | |
| Small Cap Growth Fund | | | 450,000,000 | | |
| Mid Cap Value Fund | | | 100,000,000 | | |
| Mid-Cap Equity Index Fund | | | 400,000,000 | | |
| International Fund | | | 30,000,000 | | |
| Composite Fund | | | 300,000,000 | | |
| Retirement Income Fund | | | 20,000,000 | | |
| 2010 Retirement Fund | | | 20,000,000 | | |
| 2015 Retirement Fund | | | 35,000,000 | | |
| 2020 Retirement Fund | | | 35,000,000 | | |
| 2025 Retirement Fund | | | 20,000,000 | | |
| 2030 Retirement Fund | | | 20,000,000 | | |
| 2035 Retirement Fund | | | 20,000,000 | | |
| 2040 Retirement Fund | | | 20,000,000 | | |
| 2045 Retirement Fund | | | 20,000,000 | | |
| Conservative Allocation Fund | | | 100,000,000 | | |
| Moderate Allocation Fund | | | 100,000,000 | | |
| Aggressive Allocation Fund | | | 100,000,000 | | |
| Money Market Fund | | | 350,000,000 | | |
| Mid-Term Bond Fund | | | 350,000,000 | | |
| Bond Fund | | | 450,000,000 | | |
| Sub-Total | | | 4,290,000,000 | | |
| Shares to be allocated at the discretion of the Board of Directors | | | 710,000,000 | | |
| Total | | | 5,000,000,000 | | |
5. DIVIDENDS
On December 31, 2008, dividend distributions were declared and paid for each of the funds from net investment income and, as applicable, from net realized gains on investment transactions. Additionally, remaining required distributions relating to 2007 were made in accordance with Internal Revenue Code Section 855(a) and paid on
103
MUTUAL OF AMERICA INVESTMENT CORPORATION
NOTES TO FINANCIAL STATEMENTS (Continued)
5. DIVIDENDS (CONTINUED)
August 27, 2008. Pursuant to shareholders' instructions, substantially all dividend distributions throughout 2008 and 2007 were immediately reinvested into their respective funds. The tax character of the distributions paid during 2008 and 2007 were as follows:
| | | Equity
Index Fund | | All America
Fund | | Small Cap
Value Fund | | Small Cap
Growth | | Mid Cap
Value Fund | |
| Ordinary Income (a) | | | |
| | 2008 | | | $ | 12,175,938 | | | $ | 4,037,987 | | | $ | 2,021,942 | | | $ | 0 | | | $ | 586,336 | | |
| | 2007 | | | $ | 15,219,165 | | | $ | 9,031,238 | | | $ | 17,063,247 | | | $ | 5,933,626 | | | $ | 620,328 | | |
| Long-Term Capital Gains (b) | | | |
| | 2008 | | | $ | 2,030,456 | | | $ | 7,817,028 | | | $ | 69,793 | | | $ | 3,537,395 | | | $ | 0 | | |
| | 2007 | | | $ | 13,364,681 | | | $ | 34,578,995 | | | $ | 5,744,136 | | | $ | 22,891,229 | | | $ | 70,677 | | |
| Return of Capital | | | |
| | 2008 | | | $ | 0 | | | $ | 0 | | | $ | 1,845,074 | | | $ | 0 | | | $ | 82,817 | | |
| | 2007 | | | $ | 0 | | | $ | 0 | | | $ | 0 | | | $ | 0 | | | $ | 0 | | |
| | | Mid-Cap
Equity
Index Fund | | International
Fund | | Composite
Fund | | Retirement
Fund | | 2010
Retirement
Fund | |
| Ordinary Income (a) | | | |
| | 2008 | | | $ | 4,707,574 | | | $ | 377,915 | | | $ | 5,645,651 | | | $ | 129,167 | | | $ | 281,959 | | |
| | 2007 | | | $ | 6,578,431 | | | $ | 48,458 | | | $ | 6,351,470 | | | $ | 35,280 | | | $ | 54,127 | | |
| Long-Term Capital Gains (b) | | | |
| | 2008 | | | $ | 6,672,527 | | | $ | 0 | | | $ | 0 | | | $ | 0 | | | $ | 27,872 | | |
| | 2007 | | | $ | 31,848,375 | | | $ | 680 | | | $ | 0 | | | $ | 6,524 | | | $ | 24,745 | | |
| | | 2015
Retirement
Fund | | 2020
Retirement
Fund | | 2025
Retirement
Fund | | 2030
Retirement
Fund | | 2035
Retirement
Fund | |
| Ordinary Income (a) | | | |
| | 2008 | | | $ | 641,889 | | | $ | 658,512 | | | $ | 423,664 | | | $ | 318,583 | | | $ | 216,139 | | |
| | 2007 | | | $ | 168,241 | | | $ | 143,704 | | | $ | 52,533 | | | $ | 59,297 | | | $ | 40,312 | | |
| Long-Term Capital Gains (b) | | | |
| | 2008 | | | $ | 65,864 | | | $ | 74,362 | | | $ | 64,571 | | | $ | 61,481 | | | $ | 52,057 | | |
| | 2007 | | | $ | 90,677 | | | $ | 92,440 | | | $ | 44,175 | | | $ | 57,946 | | | $ | 47,375 | | |
| Return of Capital | | | |
| | 2008 | | | $ | 13,675 | | | $ | 6,181 | | | $ | 8,300 | | | $ | 10,334 | | | $ | 9,442 | | |
| | 2007 | | | $ | 29 | | | $ | 357 | | | $ | 64 | | | $ | 0 | | | $ | 63 | | |
| | | 2040
Retirement
Fund | | 2045
Retirement
Equity Fund | | Conservative
Allocation
Fund | | Moderate
Allocation
Fund | | Aggressive
Allocation
Fund | |
| Ordinary Income (a) | | | |
| | 2008 | | | $ | 149,036 | | | $ | 161,860 | | | $ | 932,425 | | | $ | 3,065,729 | | | $ | 2,280,138 | | |
| | 2007 | | | $ | 23,732 | | | $ | 17,854 | | | $ | 741,026 | | | $ | 3,257,935 | | | $ | 3,038,713 | | |
| Long-Term Capital Gains (b) | | | |
| | 2008 | | | $ | 40,620 | | | $ | 39,541 | | | $ | 125,781 | | | $ | 579,965 | | | $ | 278,806 | | |
| | 2007 | | | $ | 29,830 | | | $ | 21,325 | | | $ | 196,229 | | | $ | 3,001,093 | | | $ | 3,957,312 | | |
| Return of Capital | | | |
| | 2008 | | | $ | 6,215 | | | $ | 5,529 | | | $ | 0 | | | $ | 0 | | | $ | 307,259 | | |
| | 2007 | | | $ | 169 | | | $ | 0 | | | $ | 0 | | | $ | 0 | | | $ | 354,200 | | |
104
MUTUAL OF AMERICA INVESTMENT CORPORATION
NOTES TO FINANCIAL STATEMENTS (Continued)
5. DIVIDENDS (CONTINUED)
| | | Money
Market Fund | | Mid-Term
Bond Fund | | Bond
Fund | |
| Ordinary Income (a) | | | |
| | 2008 | | | $ | 5,642,216 | | | $ | 7,408,865 | | | $ | 19,789,048 | | |
| | 2007 | | | $ | 13,426,365 | | | $ | 4,707,232 | | | $ | 18,599,999 | | |
| Long-Term Capital Gains (b) | | | |
| | 2008 | | | $ | 0 | | | $ | 0 | | | $ | 0 | | |
| | 2007 | | | $ | 0 | | | $ | 0 | | | $ | 0 | | |
Notes:
(a) Includes distributions from Fund-level net short-term capital gains.
(b) To the extent reported, each Fund designates these amounts as capital gain dividends for Federal income tax purposes.
Undistributed net income and gains (losses) — As of December 31, 2008, undistributed net income and undistributed accumulated gain (loss) on a tax basis were as follows:
| | | Equity Index
Fund | | All America
Fund | | Small Cap
Value Fund | | Small Cap
Growth Fund | | Mid Cap
Value Fund | |
Accumulated undistributed net
investment income | | $ | 1,927,435 | | | $ | 4,552,236 | | | $ | 0 | | | $ | 0 | | | $ | 0 | | |
Accumulated undistributed net realized
gain/(loss) on investments
and futures contracts | | $ | (18,396,935 | ) | | $ | (15,421,565 | ) | | $ | (28,200,118 | ) | | $ | (31,192,197 | ) | | $ | (954,048 | ) | |
Net unrealized appreciation
(depreciation) of investments
and futures contracts | | $ | (113,170,209 | ) | | $ | (68,776,270 | ) | | $ | (46,494,639 | ) | | $ | (28,519,549 | ) | | $ | (10,930,411 | ) | |
| | | Mid-Cap
Equity Index
Fund | | International
Fund | | Composite
Fund | | Retirement
Income
Fund | | 2010
Retirement
Fund | |
Accumulated undistributed net
investment income | | $ | 536,961 | | | $ | 3,787 | | | $ | 4,490,475 | | | $ | 3,557 | | | $ | 9,743 | | |
Accumulated undistributed net realized
gain/(loss) on investments
and futures contracts | | $ | (536,783 | ) | | $ | 0 | | | $ | (39,610,826 | ) | | $ | (5,165 | ) | | $ | 0 | | |
Net unrealized appreciation
(depreciation) of investments
and futures contracts | | $ | (89,663,308 | ) | | $ | (4,392,369 | ) | | $ | (26,453,041 | ) | | $ | (439,856 | ) | | $ | (1,583,062 | ) | |
| | | 2015
Retirement
Fund | | 2020
Retirement
Fund | | 2025
Retirement
Fund | | 2030
Retirement
Fund | | 2035
Retirement
Fund | |
Accumulated undistributed net
investment income | | $ | 0 | | | $ | 0 | | | $ | 0 | | | $ | 0 | | | $ | 0 | | |
Accumulated undistributed net realized
gain/(loss) on investments
and futures contracts | | $ | 0 | | | $ | 0 | | | $ | 0 | | | $ | 0 | | | $ | 0 | | |
Net unrealized appreciation
(depreciation) of investments
and futures contracts | | $ | (4,494,429 | ) | | $ | (5,268,430 | ) | | $ | (3,707,762 | ) | | $ | (3,228,940 | ) | | $ | (2,540,113 | ) | |
105
MUTUAL OF AMERICA INVESTMENT CORPORATION
NOTES TO FINANCIAL STATEMENTS (Continued)
5. DIVIDENDS (CONTINUED)
| | | 2040
Retirement
Fund | | 2045
Retirement
Fund | | Conservative
Allocation
Fund | | Moderate
Allocation
Fund | | Aggressive
Allocation
Fund | |
Accumulated undistributed net
investment income | | $ | 0 | | | $ | 0 | | | $ | 1,633 | | | $ | 7,603 | | | $ | 0 | | |
Accumulated undistributed net realized
gain/(loss) on investments
and futures contracts | | $ | 0 | | | $ | 0 | | | $ | 0 | | | $ | 0 | | | $ | (66,120 | ) | |
Net unrealized appreciation
(depreciation) of investments
and futures contracts | | $ | (1,817,009 | ) | | $ | (1,816,548 | ) | | $ | (3,603,607 | ) | | $ | (23,676,177 | ) | | $ | (32,729,666 | ) | |
| | | Money
Market Fund | | Mid-Term
Bond Fund | | Bond
Fund | |
Accumulated undistributed net
investment income | | $ | 103,451 | | | $ | 98,008 | | | $ | 203,066 | | |
Accumulated undistributed net realized
gain/(loss) on investments
and futures contracts | | $ | 0 | | | $ | (723,880 | ) | | $ | (23,856,885 | ) | |
Net unrealized appreciation
(depreciation) of investments
and futures contracts | | $ | 49,488 | | | $ | (4,510,631 | ) | | $ | (30,060,040 | ) | |
The difference between the components of distributable earnings on a tax basis and the amounts reflected in the statements of changes in net assets are primarily due to wash sales, post-October losses and the Federal income tax treatment of futures contracts.
Reclassifications — Periodically, the Funds may reclassify book to tax differences as a result of the differences arising from the accounting for REIT securities, non-deductible net operating loss, return of capital distributions and Fund distributions for Federal income tax purposes versus financial reporting purposes. Each Fund's net assets are not affected by these reclassifications.
During the year ended December 31, 2008, each Fund reclassified the following book to tax differences increases (decreases):
| | | Equity
Index Fund | | All America
Fund | | Small Cap
Value Fund | | Small Cap
Growth Fund | | Mid Cap
Value Fund | |
| Accumulated undistributed net investment income | | $ | (171,768 | ) | | $ | (467,760 | ) | | $ | 1,597,022 | | | $ | 286,873 | | | $ | 1,348 | | |
Accumulated undistributed net realized gains
(loss) on investments and futures contracts | | $ | 171,768 | | | $ | 467,875 | | | $ | 248,368 | | | $ | 50,496 | | | $ | 81,469 | | |
| Paid in capital | | $ | 0 | | | $ | (115 | ) | | $ | (1,845,390 | ) | | $ | (337,369 | ) | | $ | (82,817 | ) | |
| | | Mid-Cap
Equity Index
Fund | | International
Fund | | Composite
Fund | | Retirement
Income
Fund | | 2010
Retirement
Fund | |
| Accumulated undistributed net investment income | | $ | (443,527 | ) | | $ | (673 | ) | | $ | (13,503 | ) | | $ | (1,512 | ) | | $ | 1,186 | | |
Accumulated undistributed net realized gains
(loss) on investments and futures contracts | | $ | 443,527 | | | $ | 673 | | | $ | 13,503 | | | $ | 1,512 | | | $ | (1,186 | ) | |
| Paid in capital | | $ | 0 | | | $ | 0 | | | $ | 0 | | | $ | 0 | | | $ | 0 | | |
| | | 2015
Retirement
Fund | | 2020
Retirement
Fund | | 2025
Retirement
Fund | | 2030
Retirement
Fund | | 2035
Retirement
Fund | |
| Accumulated undistributed net investment income | | $ | (2,709 | ) | | $ | (1,269 | ) | | $ | (1,330 | ) | | $ | (1,415 | ) | | $ | (1,288 | ) | |
Accumulated undistributed net realized gains
(loss) on investments and futures contracts | | $ | 16,384 | | | $ | 7,450 | | | $ | 9,630 | | | $ | 11,749 | | | $ | 10,730 | | |
| Paid in capital | | $ | (13,675 | ) | | $ | (6,181 | ) | | $ | (8,300 | ) | | $ | (10,334 | ) | | $ | (9,442 | ) | |
106
MUTUAL OF AMERICA INVESTMENT CORPORATION
NOTES TO FINANCIAL STATEMENTS (Continued)
5. DIVIDENDS (CONTINUED)
| | | 2040
Retirement
Fund | | 2045
Retirement
Fund | | Conservative
Allocation
Fund | | Moderate
Allocation
Fund | | Aggressive
Allocation
Fund | |
| Accumulated undistributed net investment income | | $ | (1,162 | ) | | $ | (852 | ) | | $ | (7,123 | ) | | $ | (48,186 | ) | | $ | (55,834 | ) | |
Accumulated undistributed net realized gains
(loss) on investments and futures contracts | | $ | 7,377 | | | $ | 6,381 | | | $ | 7,123 | | | $ | 48,186 | | | $ | 363,093 | | |
| Paid in capital | | $ | (6,215 | ) | | $ | (5,529 | ) | | $ | 0 | | | $ | 0 | | | $ | (307,259 | ) | |
| | | Money
Market Fund | | Mid-Term
Bond Fund | | Bond
Fund | |
| Accumulated undistributed net investment income | | $ | 0 | | | $ | 0 | | | $ | 0 | | |
Accumulated undistributed net realized gains
(loss) on investments and futures contracts | | $ | 0 | | | $ | 0 | | | $ | 0 | | |
| Paid in capital | | $ | 0 | | | $ | 0 | | | $ | 0 | | |
These reclassifications were made as a result of the differences arising from the disallowance of net operating losses, expiration of capital loss carryforwards, distributions from REITs, distribution reclassifications and other cumulative adjustments for Federal income tax purposes versus financial reporting purposes.
107
REPORT OF INDEPENDENT REGISTERED PUBLIC ACCOUNTING FIRM
The Shareholders and Board of Directors
of Mutual of America Investment Corporation:
We have audited the accompanying statements of assets and liabilities of Mutual of America Investment Corporation (comprising of: Equity Index Fund, All America Fund, Small Cap Value Fund, Small Cap Growth Fund, Mid Cap Value Fund, Mid-Cap Equity Index Fund, International Fund, Composite Fund, Retirement Income Fund, 2010 Retirement Fund, 2015 Retirement Fund, 2020 Retirement Fund, 2025 Retirement Fund, 2030 Retirement Fund, 2035 Retirement Fund, 2040 Retirement Fund, 2045 Retirement Fund, Conservative Allocation Fund, Moderate Allocation Fund, Aggressive Allocation Fund, Money Market Fund, Mid-Term Bond Fund and Bond Fund, (collectively, the "Funds")), including the portfolios of investments in securities for the Conservative Allocation Fund, Moderate Allocation Fund, Aggressive Allocation Fund, Money Market Fund, International Fund, Retirement Income Fund, 2010 Retirement Fund, 2015 Retirement Fund, 2020 Retirement Fund, 2025 Retirement Fu nd, 2030 Retirement Fund, 2035 Retirement Fund, 2040 Retirement Fund and 2045 Retirement Fund, and the summary portfolios of investments in securities for each of the remaining Funds as of December 31, 2008, and the related statements of operations for the year then ended, the statements of changes in net assets for each of the years or period in the two-year period then ended, and the financial highlights for each of the years or period in the five-year period then ended. These financial statements and financial highlights are the responsibility of the Funds' management. Our responsibility is to express an opinion on these financial statements and financial highlights based on our audits.
We conducted our audits in accordance with the standards of the Public Company Accounting Oversight Board (United States). Those standards require that we plan and perform the audit to obtain reasonable assurance about whether the financial statements and financial highlights are free of material misstatement. An audit includes examining, on a test basis, evidence supporting the amounts and disclosures in the financial statements. Our procedures included confirmation of securities owned as of December 31, 2008, by correspondence with the custodian and brokers. An audit also includes assessing the accounting principles used and significant estimates made by management, as well as evaluating the overall financial statement presentation. We believe that our audits provide a reasonable basis for our opinion.
In our opinion, the financial statements and financial highlights referred to above present fairly, in all material respects, the financial position of each of the aforementioned Funds of Mutual of America Investment Corporation as of December 31, 2008, the results of their operations for the year then ended, the changes in their net assets for each of the years or period in the two-year period then ended, and the financial highlights for each of the years or period in the five-year period then ended, in conformity with U.S. generally accepted accounting principles.

February 27, 2009
108
MUTUAL OF AMERICA INVESTMENT CORPORATION
Directors and Officers — unaudited
The tables below show information about the Directors and officers of the Investment Company. The address of each Director and officer is c/o Mutual of America Investment Corporation, 320 Park Avenue, New York, New York 10022. The Investment Company does not hold annual meetings of shareholders, and each Director has been elected by shareholders to serve until a successor is duly elected at a meeting of shareholders called for the purpose of electing directors. Each officer of the Investment Company has been elected by the Board of Directors to serve until a successor is duly elected. The Independent Directors do not serve as directors of any other fund that is affiliated with the Adviser or Mutual of America with the sole exception of Patrick J. Waide, Jr., who serves on the boards of Mutual of America Investment Corporation and Mutual of America Institutional Funds, Inc. The Interested Directors and officers of the Investment Company do no t receive compensation from the Investment Company for their service.
The Investment Company's Statement of Additional Information ("SAI"), filed with the Securities and Exchange Commission, contains additional information about the Investment Company's Directors and Officers. A copy of the latest SAI can be obtained, without charge, by writing to Mutual of America Investment Corporation at 320 Park Avenue, New York, NY 10022-6839 or by calling 1-800-468-3785 or through the following websites: http://www.mutualofamerica.com or http://www.sec.gov.
Independent Directors
| Name and Age | | Length of
Time Served | | Principal Occupation(s)
in Past Five Years | | Other Directorships
Held by Director | |
Kevin M. Kearney
age 57 | | since May 2008 | | Partner, Wingate, Kearney & Cullen (law firm) | | Concern Worldwide, USA | |
|
George Mertz
age 80 | | since 1989 | | Retired, since September 1994 | | None | |
|
Howard J. Nolan
age 72 | | since 1989 | | President & CEO, United Way of San Antonio & Bexar County | | None | |
|
Margaret M. Smyth
age 45 | | since December 2007 | | Vice President, Controller, United Technologies Corporation; Vice President and Chief Accounting Officer, 3M Company; prior thereto, Managing Partner, Deloitte & Touche, 2002-2005 | | Trustee, Concern Worldwide (U.S.) Inc.; Fordham University Trustee Fellow; Executive Board Member, Financial Executives International Committee on Financial Reporting | |
|
Patrick J. Waide, Jr.
age 71 | | since 2003 | | | | John Simon Guggenheim Memorial Foundation; National Catholic Reporter; Mutual of America Institutional Funds, Inc. | |
|
109
Independent Directors
| Name and Age | | Length of
Time Served | | Principal Occupation(s)
in Past Five Years | | Other Directorships
Held by Director | |
Manfred Altstadt
Chairman of the Board, President and Chief Executive Officer, age 59 | | since 1992 | | Senior Executive Vice President and Chief Operating Officer, Mutual of America, and Mutual of America Holding Company, Inc. since 11/07, prior thereto, Senior Executive Vice President and Chief Financial Officer; Chairman of the Board, President and Chief Executive Officer, Mutual of America Investment Corporation; Chairman and Chief Executive Officer, Mutual of America Capital Management Corporation | | Mutual of America; Mutual of America Securities Corporation; Mutual of America Holding Company, Inc, Mutual of America Capital Management Corporation; Calvary Hospital; Calvary Fund; Calvary Holding Company; Army War College Foundation; Hazelden New York; Leader to Leader Institute | |
|
Mr. Altstadt is an "interested person" as an officer of the Adviser and of affiliates of the Adviser.
Officers
| Name, Position and Age | | Length of
Time Served | | Principal Occupation(s)
in Past Five Years | | Other Directorships
Held by Director | |
Patrick A. Burns
Senior Executive Vice President and General Counsel, age 62 | | since 1986 | | Senior Executive Vice President and General Counsel, Mutual of America, Mutual of America Capital Management Corporation, Mutual of America Securities Corporation, and Mutual of America Institutional Funds, Inc; Chairman, President and Chief Executive Officer, Mutual of America Holding Company, Inc. | | Mutual of America; Mutual of America Holding Company, Inc.; Irish American Legal and Education Research Foundation | |
|
John R. Greed
Senior Executive
Vice President, Chief Financial Officer and Treasurer, age 48 | | since 1997 | | Senior Executive Vice President and Chief Financial Officer, Mutual of America and Mutual of America Holding Company, Inc. since December 2007; prior thereto, Senior Executive Vice President and Treasurer; Senior Executive Vice President, Chief Financial Officer and Treasurer, Mutual of America Investment Corporation and Mutual of America Capital Management Corporation; Chairman of the Board, President and Chief Executive Officer, Mutual of America Institutional Funds, Inc. | | Mutual of America Holding Company, Inc. Mutual of America Institutional Funds, Inc. | |
|
Thomas L. Martin
Executive Vice President and Secretary, age 59 | | since 2003 | | Executive Vice President and Deputy General Counsel, Mutual of America since November 2008; prior thereto, Senior Vice President and Associate General Counsel | | None | |
|
110
MUTUAL OF AMERICA INVESTMENT CORPORATION
ADDITIONAL INFORMATION
Quarterly Portfolio Schedules
Included in this Annual Report are summary schedules of Mutual of America Investment Corporation's ("Investment Company") Fund portfolio holdings as of December 31, 2008. The Investment Company files complete schedules of Fund portfolio holdings with the Securities and Exchange Commission ("SEC") for the first and third quarters of each fiscal year on Form N-Q and for the second and fourth quarters of each fiscal year on Form N-CSR. The Forms N-Q and N-CSR are available on the SEC's website at http://www.sec.gov. Additionally, the Forms N-Q and N-CSR may be reviewed and copied at the SEC's Public Reference Room in Washington, DC. Information on the operation of the Public Reference Room may be obtained by calling 1-800-SEC-0330.
Proxy Voting Policies and Procedures
A copy of the Investment Company's proxy voting policies and procedures can be obtained free of charge by calling 1-800-468-3785. It is also available on the SEC's website at http://www.sec.gov.
Information regarding how the Investment Company voted proxies relating to portfolio securities during the 12-month period ended June 30, 2008 is available without charge by calling 1-800-468-3785. It is also available on the SEC website.
Annual Shareholder Meeting
On May 5, 2008, the Investment Company held an Annual Shareholder Meeting for the purpose of electing the full Board of Directors. All 2,277,470,933 of the outstanding shares were cast for the vote. The number and percentage of votes cast for each Board member were as follows:
| Name | | Number of
Shares Voted For | | Percentage of
Shares Voted For | | Number of
Shares Abstained | | Percentage of
Shares Abstained | |
| Manfred Altstadt | | | 2,225,824,070 | | | | 97.73 | % | | | 51,646,864 | | | | 2.27 | % | |
| Kevin M. Kearney | | | 2,225,674,539 | | | | 97.73 | % | | | 51,796,394 | | | | 2.27 | % | |
| George T. Mertz | | | 2,224,062,261 | | | | 97.65 | % | | | 53,408,673 | | | | 2.35 | % | |
| Howard J. Nolan | | | 2,224,185,610 | | | | 97.66 | % | | | 53,285,323 | | | | 2.34 | % | |
| Margaret M. Smyth | | | 2,227,212,602 | | | | 97.79 | % | | | 50,258,331 | | | | 2.21 | % | |
| Patrick J. Waide, Jr. | | | 2,225,867,260 | | | | 97.73 | % | | | 51,503,674 | | | | 2.27 | % | |
Code of Ethics
The Investment Company has adopted a Code of Ethics that complies with Rule 17j-1 of the Investment Company Act of 1940 and with the requirements of the Sarbanes-Oxley Act of 2002. A copy of the Code of Ethics is available free of charge, upon request. To obtain a free copy of the Code of Ethics, please call (212) 224-1568 or write to:
Ms. Kathryn Lu
Chief Compliance Officer
Mutual of America Institutional Funds, Inc.
320 Park Avenue
New York, NY 10022-6839
111
Supplemental Dividend Information — Unaudited
Dividends from the Money Market Fund, Mid-Term Bond Fund and Bond Fund do not qualify for the corporate dividends received deduction. The following are the percentages of the ordinary dividends distributed in 2008 by the other Investment Corporation Funds that qualify for the corporate dividends received deduction:
| | | Equity
Index Fund | | All America
Fund | | Small Cap
Value Fund | | Small Cap
Growth Fund | | Mid-Cap
Equity Index
Fund | |
| Ordinary dividend qualifying percentage | | | 100 | % | | | 88.5 | % | | | 100 | % | | | 0 | % | | | 90.3 | % | |
| | Mid Cap
Value Fund | | International | | Composite
Fund | | Retirement
Income Fund | | 2010
Retirement
Fund | |
| Ordinary dividend qualifying percentage | | | 100 | % | | | 0 | % | | | 30 | % | | | 12.8 | % | | | 21.1 | % | |
| | | 2015
Retirement
Fund | | 2020
Retirement
Fund | | 2025
Retirement
Fund | | 2030
Retirement
Fund | | 2035
Retirement
Fund | |
| Ordinary dividend qualifying percentage | | | 27.6 | % | | | 32.3 | % | | | 42.3 | % | | | 47.1 | % | | | 55.3 | % | |
| | | 2040
Retirement
Fund | | 2045
Retirement
Fund | | Conservative
Allocation
Fund | | Moderate
Allocation
Fund | | Aggressive
Allocation
Fund | |
| Ordinary dividend qualifying percentage | | | 54.9 | % | | | 55.6 | % | | | 14.4 | % | | | 30 | % | | | 51.8 | % | |
The following amounts of 2008 long-term capital gains dividends have been designated as qualifying for the 15% reduced rate on long-term capital gains.
| | | Equity
Index Fund | | All America
Fund | | Small Cap
Value Fund | | Small Cap
Growth Fund | | Mid-Cap
Value Fund | |
Dividends qualifying for reduced
long-term capital gains tax rate | | $ | 2,030,456 | | | $ | 7,817,028 | | | $ | 69,793 | | | $ | 3,537,395 | | | $ | 0 | | |
| | | Mid Cap
Equity Index | | International | | Composite
Fund | | Retirement
Income Fund | | 2010
Retirement
Fund | |
Dividends qualifying for reduced
long-term capital gains tax rate | | $ | 6,672,527 | | | $ | 0 | | | $ | 0 | | | $ | 0 | | | $ | 27,872 | | |
| | | 2015
Retirement
Fund | | 2020
Retirement
Fund | | 2025
Retirement
Fund | | 2030
Retirement
Fund | | 2035
Retirement
Fund | |
Dividends qualifying for reduced
long-term capital gains tax rate | | $ | 65,864 | | | $ | 74,362 | | | $ | 64,571 | | | $ | 61,481 | | | $ | 52,057 | | |
| | | 2040
Retirement
Fund | | 2045
Retirement
Fund | | Conservative
Allocation
Fund | | Moderate
Allocation
Fund | | Aggressive
Allocation
Fund | |
Dividends qualifying for reduced
long-term capital gains tax rate | | $ | 40,620 | | | $ | 39,541 | | | $ | 125,781 | | | $ | 579,965 | | | $ | 278,806 | | |
112
MUTUAL OF AMERICA
LIFE INSURANCE COMPANY
320 PARK AVENUE
NEW YORK, NY 10022-6839
www.mutualofamerica.com
ITEM 2. CODE OF ETHICS.
Mutual of America Investment Corporation has adopted a Code of Ethics that applies to its principal executive and financial officers, as well as all Access Persons as defined under Rule 17j-1 of the Investment Company Act of 1940. The Code consists of two sections. The first section, designated as Section A, is the Code of Ethics required under Rule 17j-1. Section A requires those subject to it to submit periodic reports detailing their securities holdings and transactions (subject to several exemptions contained in the rules) and requires pre-approval for certain securities transactions by such persons, including purchases and sales of reportable securities, investments in initial public offerings and private placements.
The second section, designated as Section B, is to assure compliance with the Code of Ethics requirements of Section 406 of the Sarbanes-Oxley Act of 2002. It applies specifically to the Corporation’s principal executive and financial officers.
The two sections are not mutually exclusive and must be observed independently by each person to whom they are intended to apply. Section A applies to all individuals while Section B applies to the individuals designated in Section B. Both Sections explicitly require those individuals subject to the provisions of the Code of Ethics to promptly report violations of the Code of Ethics to the Chief Compliance Officer.
There have been no amendments to Section A or B during the period covered by this report.
The Annual Report to Shareholders includes information on how to obtain a copy of the Code of Ethics at no charge.
ITEM 3. AUDIT COMMITTEE FINANCIAL EXPERT.
(a) (1) Mutual of America Investment Corporation’s Board of Directors has determined that one audit committee financial expert serves on its Audit Committee.
(a) (2) The audit committee financial expert is Patrick J. Waide, Jr. He was Senior Vice-President, Administration at Sullivan & C ompany until March 1998; Director of the Drucker Foundation from 1996-1999 and President, Drucker Foundation in 1999. Mr. Waide is considered an independent director.
ITEM 4. PRINCIPAL ACCOUNTANT FEES AND SERVICES.
(a) Aggregate Audit Fees:
2008: | | $ | 346,502 | |
2007: | | $ | 258,097 | |
(b), (c), (d) There were no Audit-Related, Tax or Other Fees.
(e) All non-audit fees are pre-approved by the Audit Committee in advance.
(f), (g), (h) Not applicable.
ITEM 5. AUDIT COMMITTEE OF LISTED REGISTRANTS.
Not applicable.
ITEM 6. INVESTMENTS.
(a) Schedule I — Portfolios of Investments in Securities follows for those Funds for which a summary portfolio is presented in the Annual Report to Shareholders:
MUTUAL OF AMERICA INVESTMENT CORPORATION (EQUITY INDEX FUND)
PORTFOLIO OF INVESTMENTS IN SECURITIES
December 31, 2008
| | Shares | | Value($) | |
INDEXED ASSETS: | | | | | |
COMMON STOCKS: | | | | | |
BASIC MATERIALS (2.8%) | | | | | |
Air Products & Chemicals, Inc. | | 13,732 | | 690,308 | |
AK Steel Hldg. Corp. | | 7,358 | | 68,577 | |
Alcoa, Inc. | | 52,453 | | 590,621 | |
Allegheny Technologies, Inc. | | 6,309 | | 161,069 | |
Ball Corp. | | 6,191 | | 257,484 | |
Bemis Co., Inc. | | 6,528 | | 154,583 | |
CF Industries Hldgs., Inc. | | 3,724 | | 183,072 | |
Dow Chemical Co. | | 60,512 | | 913,126 | |
Du Pont (E.I.) de Nemours & Co. | | 59,103 | | 1,495,306 | |
Eastman Chemical Co. | | 4,754 | | 150,749 | |
Ecolab, Inc. | | 10,983 | | 386,052 | |
Freeport-McMoRan Copper & Gold, Inc. | | 24,725 | | 604,279 | |
Int’l. Flavors & Fragrances, Inc. | | 5,150 | | 153,058 | |
International Paper Co. | | 28,016 | | 330,589 | |
MeadWestvaco Corp. | | 11,203 | | 125,362 | |
Monsanto Co. | | 35,901 | | 2,525,635 | |
Newmont Mining Corp. | | 29,775 | | 1,211,843 | |
Nucor Corp. | | 20,574 | | 950,519 | |
Owens-Illinois, Inc.* | | 10,823 | | 295,793 | |
Pactiv Corp.* | | 8,606 | | 214,117 | |
PPG Industries, Inc. | | 10,753 | | 456,250 | |
Praxair, Inc. | | 20,180 | | 1,197,885 | |
Rohm & Haas Co. | | 8,175 | | 505,133 | |
Sealed Air Corp. | | 10,329 | | 154,315 | |
Sigma-Aldrich Corp. | | 8,207 | | 346,664 | |
Titanium Metals Corp. | | 5,571 | | 49,080 | |
United States Steel Corp. | | 7,613 | | 283,204 | |
Vulcan Materials Co. | | 7,195 | | 500,628 | |
Weyerhaeuser Co. | | 13,842 | | 423,704 | |
| | | | 15,379,005 | |
CONSUMER, CYCLICAL (7.9%) | | | | | |
Abercrombie & Fitch Co. Cl A | | 5,701 | | 131,522 | |
Amazon.com, Inc.* | | 21,061 | | 1,080,008 | |
Apollo Group, Inc. Cl A* | | 6,976 | | 534,501 | |
AutoNation, Inc.* | | 7,071 | | 69,861 | |
AutoZone, Inc.* | | 2,506 | | 349,512 | |
Bed Bath & Beyond, Inc.* | | 17,009 | | 432,369 | |
Best Buy Co., Inc. | | 22,115 | | 621,653 | |
Big Lots, Inc.* | | 5,383 | | 78,000 | |
Black & Decker Corp. | | 3,932 | | 164,397 | |
Carnival Corp. | | 28,624 | | 696,136 | |
CBS Corp. Cl B | | 44,695 | | 366,052 | |
Centex Corp. | | 8,146 | | 86,673 | |
Coach, Inc.* | | 21,414 | | 444,769 | |
Comcast Corp. Cl A | | 188,546 | | 3,182,656 | |
D.R. Horton, Inc. | | 18,062 | | 127,698 | |
Darden Restaurants, Inc. | | 9,082 | | 255,931 | |
DIRECTV Group, Inc.* | | 35,757 | | 819,193 | |
Disney (Walt) Co. | | 121,355 | | 2,753,545 | |
Eastman Kodak Co. | | 17,605 | | 115,841 | |
Expedia, Inc.* | | 13,714 | | 113,003 | |
Family Dollar Stores, Inc. | | 9,147 | | 238,462 | |
Ford Motor Co.* | | 156,404 | | 358,165 | |
Fortune Brands, Inc. | | 9,819 | | 405,328 | |
GameStop Corp. Cl A* | | 10,722 | | 232,239 | |
Gannett Co., Inc. | | 14,935 | | 119,480 | |
Gap, Inc. | | 30,551 | | 409,078 | |
General Motors Corp. | | 39,968 | | 127,898 | |
Genuine Parts Co. | | 10,447 | | 395,523 | |
Goodyear Tire & Rubber Co.* | | 15,824 | | 94,469 | |
H&R Block, Inc. | | 22,201 | | 504,407 | |
Harley-Davidson, Inc. | | 15,262 | | 258,996 | |
Harman Int’l. Industries, Inc. | | 3,840 | | 64,243 | |
Hasbro, Inc. | | 8,116 | | 236,744 | |
Home Depot, Inc. | | 111,052 | | 2,556,417 | |
International Game Technology | | 19,294 | | 229,406 | |
Interpublic Group of Cos., Inc.* | | 31,275 | | 123,849 | |
Johnson Controls, Inc. | | 38,924 | | 706,860 | |
Jones Apparel Group, Inc. | | 5,481 | | 32,119 | |
KB Home | | 4,932 | | 67,174 | |
Kohl’s Corp.* | | 19,973 | | 723,023 | |
Leggett & Platt, Inc. | | 10,241 | | 155,561 | |
Lennar Corp. Cl A | | 9,270 | | 80,371 | |
Limited Brands, Inc. | | 17,715 | | 177,859 | |
Lowe’s Cos., Inc. | | 96,095 | | 2,067,964 | |
Macy’s, Inc | | 27,564 | | 285,287 | |
Marriott International, Inc. Cl A | | 19,210 | | 373,635 | |
Mattel, Inc. | | 23,467 | | 375,472 | |
McDonald’s Corp. | | 72,984 | | 4,538,875 | |
McGraw-Hill Cos., Inc. | | 20,599 | | 477,691 | |
Meredith Corp. | | 2,367 | | 40,523 | |
New York Times Co. Cl A | | 7,637 | | 55,979 | |
Newell Rubbermaid, Inc. | | 18,168 | | 177,683 | |
News Corp. Cl A | | 150,582 | | 1,368,790 | |
NIKE, Inc. Cl B | | 25,707 | | 1,311,057 | |
Nordstrom, Inc. | | 10,443 | | 138,996 | |
Office Depot, Inc.* | | 18,061 | | 53,822 | |
Omnicom Group, Inc. | | 20,348 | | 547,768 | |
Penney (J.C.) Co., Inc. | | 14,569 | | 287,009 | |
Polo Ralph Lauren Corp. | | 3,685 | | 167,336 | |
Pulte Homes, Inc. | | 14,005 | | 153,075 | |
RadioShack Corp. | | 8,195 | | 97,848 | |
Scripps Networks Interactive, Inc. Cl A | | 5,907 | | 129,954 | |
Sears Hldgs. Corp.* | | 3,641 | | 141,526 | |
Sherwin-Williams Co. | | 6,432 | | 384,312 | |
Snap-On, Inc. | | 3,764 | | 148,226 | |
Stanley Works | | 5,162 | | 176,024 | |
Staples, Inc. | | 46,733 | | 837,455 | |
Starbucks Corp.* | | 48,155 | | 455,546 | |
Starwood Hotels & Resorts Worldwide, Inc. | | 11,997 | | 214,746 | |
Target Corp. | | 49,301 | | 1,702,364 | |
Tiffany & Co. | | 8,060 | | 190,458 | |
Time Warner, Inc. | | 235,124 | | 2,365,347 | |
TJX Cos., Inc. | | 27,258 | | 560,697 | |
V.F. Corp. | | 5,768 | | 315,913 | |
Viacom, Inc. Cl B* | | 40,214 | | 766,479 | |
Washington Post Co. Cl B | | 394 | | 153,759 | |
Whirlpool Corp. | | 4,826 | | 199,555 | |
Wyndham Worldwide Corp. | | 11,609 | | 76,039 | |
Wynn Resorts Ltd.* | | 4,034 | | 170,477 | |
Yum! Brands, Inc. | | 30,284 | | 953,946 | |
| | | | 43,182,624 | |
CONSUMER, NON-CYCLICAL (12.1%) | | | | | |
Altria Group, Inc. | | 134,991 | | 2,032,964 | |
Archer-Daniels-Midland Co. | | 42,029 | | 1,211,696 | |
Avon Products, Inc. | | 27,922 | | 670,966 | |
Brown-Forman Corp. Cl B | | 6,425 | | 330,823 | |
Campbell Soup Co. | | 13,475 | | 404,385 | |
Clorox Co. | | 9,088 | | 504,929 | |
Coca-Cola Co. | | 130,297 | | 5,898,545 | |
Coca-Cola Enterprises, Inc. | | 20,800 | | 250,224 | |
Colgate-Palmolive Co. | | 33,055 | | 2,265,590 | |
ConAgra Foods, Inc. | | 29,289 | | 483,269 | |
Constellation Brands, Inc. Cl A* | | 12,744 | | 200,973 | |
Costco Wholesale Corp. | | 28,262 | | 1,483,755 | |
CVS Caremark Corp. | | 94,104 | | 2,704,549 | |
Dean Foods Co.* | | 10,085 | | 181,227 | |
Dr. Pepper Snapple Group, Inc.* | | 16,619 | | 270,059 | |
Estee Lauder Cos., Inc. Cl A | | 7,595 | | 235,141 | |
General Mills, Inc. | | 21,884 | | 1,329,453 | |
Heinz (H.J.) Co. | | 20,598 | | 774,485 | |
Hershey Co. | | 10,849 | | 376,894 | |
J.M. Smucker Co. | | 7,761 | | 336,517 | |
Kellogg Co. | | 16,497 | | 723,393 | |
Kimberly-Clark Corp. | | 27,089 | | 1,428,674 | |
Kraft Foods, Inc. Cl A | | 96,223 | | 2,583,588 | |
Kroger Co. | | 42,685 | | 1,127,311 | |
Lorillard, Inc. | | 11,004 | | 620,075 | |
McCormick & Co., Inc. | | 8,513 | | 271,224 | |
Molson Coors Brewing Co. Cl B | | 9,751 | | 477,019 | |
Pepsi Bottling Group, Inc. | | 8,851 | | 199,236 | |
PepsiCo, Inc. | | 101,686 | | 5,569,342 | |
Philip Morris Int’l., Inc. | | 132,453 | | 5,763,030 | |
Proctor & Gamble Co. | | 195,514 | | 12,086,676 | |
Reynolds American, Inc. | | 11,067 | | 446,111 | |
Safeway, Inc. | | 28,092 | | 667,747 | |
Sara Lee Corp. | | 46,283 | | 453,111 | |
Supervalu, Inc. | | 13,874 | | 202,560 | |
Sysco Corp. | | 39,227 | | 899,867 | |
Tyson Foods, Inc. Cl A | | 19,804 | | 173,483 | |
UST, Inc. | | 9,715 | | 674,027 | |
Wal-Mart Stores, Inc. | | 146,387 | | 8,206,455 | |
Walgreen Co. | | 64,836 | | 1,599,504 | |
Whole Foods Market, Inc. | | 9,196 | | 86,810 | |
| | | | 66,205,687 | |
ENERGY (12.6%) | | | | | |
Anadarko Petroleum Corp. | | 30,071 | | 1,159,237 | |
Apache Corp. | | 21,926 | | 1,634,145 | |
Baker Hughes, Inc. | | 20,134 | | 645,697 | |
BJ Services Co. | | 19,131 | | 223,259 | |
Cabot Oil & Gas Corp. | | 6,777 | | 176,202 | |
Cameron International Corp.* | | 14,387 | | 294,934 | |
Chesapeake Energy Corp. | | 35,434 | | 572,968 | |
Chevron Corp. | | 133,045 | | 9,841,339 | |
ConocoPhillips | | 97,646 | | 5,058,063 | |
Consol Energy, Inc. | | 11,863 | | 339,045 | |
Devon Energy Corp. | | 28,921 | | 1,900,399 | |
El Paso Corp. | | 45,909 | | 359,467 | |
ENSCO International, Inc. | | 9,292 | | 263,800 | |
EOG Resources, Inc. | | 16,377 | | 1,090,381 | |
Exxon Mobil Corp. | | 333,035 | | 26,586,185 | |
Halliburton Co. | | 58,516 | | 1,063,821 | |
Hess Corp. | | 18,592 | | 997,275 | |
Marathon Oil Corp. | | 46,195 | | 1,263,895 | |
Massey Energy Co. | | 5,578 | | 76,921 | |
Murphy Oil Corp. | | 12,486 | | 553,754 | |
Nabors Industries Ltd.* | | 18,665 | | 223,420 | |
National Oilwell Varco, Inc.* | | 27,323 | | 667,774 | |
Noble Corp. | | 17,313 | | 382,444 | |
Noble Energy, Inc. | | 11,315 | | 556,924 | |
Occidental Petroleum Corp. | | 53,005 | | 3,179,770 | |
Peabody Energy Corp. | | 17,497 | | 398,057 | |
Pioneer Natural Resources Co. | | 7,720 | | 124,910 | |
Range Resources Corp. | | 10,170 | | 349,746 | |
Rowan Cos., Inc. | | 7,403 | | 117,708 | |
Schlumberger Ltd. | | 78,316 | | 3,315,116 | |
Smith International, Inc. | | 14,322 | | 327,831 | |
Southwestern Energy Co.* | | 22,503 | | 651,912 | |
Spectra Energy Corp. | | 40,032 | | 630,104 | |
Sunoco, Inc. | | 7,653 | | 332,599 | |
Tesoro Corp. | | 9,065 | | 119,386 | |
Valero Energy Corp. | | 33,800 | | 731,432 | |
Weatherford Int’l. Ltd.* | | 44,639 | | 482,994 | |
Williams Cos., Inc. | | 37,914 | | 548,995 | |
XTO Energy, Inc. | | 37,797 | | 1,333,100 | |
| | | | 68,575,009 | |
FINANCIAL (12.5%) | | | | | |
Aflac, Inc. | | 30,565 | | 1,401,100 | |
Allstate Corp. | | 35,113 | | 1,150,302 | |
American Capital Strategies Ltd. | | 13,578 | | 43,993 | |
American Express Co. | | 76,059 | | 1,410,894 | |
American Int’l. Group, Inc. | | 177,105 | | 278,055 | |
Ameriprise Financial, Inc. | | 14,194 | | 331,572 | |
Aon Corp. | | 17,663 | | 806,846 | |
Apartment Investment & Co. Cl A | | 6,638 | | 76,669 | |
Assurant, Inc. | | 7,711 | | 231,330 | |
AvalonBay Communities, Inc. | | 5,051 | | 305,990 | |
Bank of America Corp. | | 328,513 | | 4,625,463 | |
Bank of New York Mellon Corp. | | 75,161 | | 2,129,311 | |
BB&T Corp. | | 36,172 | | 993,283 | |
Boston Properties, Inc. | | 7,916 | | 435,380 | |
Capital One Financial Corp. | | 25,659 | | 818,266 | |
CB Richard Ellis Group, Inc. Cl A* | | 14,600 | | 63,072 | |
Charles Schwab Corp. | | 61,263 | | 990,623 | |
Chubb Corp. | | 23,293 | | 1,187,943 | |
Cincinnati Financial Corp. | | 10,638 | | 309,247 | |
CIT Group, Inc. | | 18,737 | | 85,066 | |
Citigroup, Inc. | | 356,795 | | 2,394,094 | |
CME Group, Inc. | | 4,389 | | 913,395 | |
Comerica, Inc. | | 9,857 | | 195,661 | |
Developers Diversified Realty Corp. | | 7,874 | | 38,425 | |
Discover Financial Svcs. | | 31,421 | | 299,442 | |
E*Trade Financial Corp.* | | 37,165 | | 42,740 | |
Equity Residential | | 17,816 | | 531,273 | |
Federated Investors, Inc. Cl B | | 5,802 | | 98,402 | |
Fifth Third Bancorp | | 37,809 | | 312,302 | |
First Horizon National Corp. | | 13,441 | | 142,071 | |
Franklin Resources, Inc. | | 9,908 | | 631,932 | |
Genworth Financial, Inc. Cl A | | 28,446 | | 80,502 | |
Goldman Sachs Group, Inc. | | 28,977 | | 2,445,369 | |
Hartford Financial Svcs. Group, Inc. | | 19,726 | | 323,901 | |
HCP, Inc. | | 16,510 | | 458,483 | |
Host Hotels & Resorts, Inc. | | 34,257 | | 259,325 | |
Hudson City Bancorp, Inc. | | 34,149 | | 545,018 | |
Huntington Bancshares, Inc. | | 23,999 | | 183,832 | |
IntercontinentalExchange, Inc.* | | 4,735 | | 390,353 | |
Invesco Ltd. | | 25,185 | | 363,671 | |
Janus Capital Group, Inc. | | 10,335 | | 82,990 | |
JPMorgan Chase & Co. | | 244,365 | | 7,704,829 | |
KeyCorp | | 32,450 | | 276,474 | |
Kimco Realty Corp. | | 14,993 | | 274,072 | |
Legg Mason, Inc. | | 9,287 | | 203,478 | |
Leucadia National Corp.* | | 11,582 | | 229,324 | |
Lincoln National Corp. | | 16,753 | | 315,627 | |
Loews Corp. | | 23,741 | | 670,683 | |
M&T Bank Corp. | | 5,056 | | 290,265 | |
Marsh & McLennan Cos., Inc. | | 33,672 | | 817,219 | |
Marshall & Ilsley Corp. | | 17,055 | | 232,630 | |
MBIA, Inc.* | | 12,334 | | 50,199 | |
Merrill Lynch & Co., Inc. | | 104,922 | | 1,221,292 | |
MetLife, Inc. | | 52,060 | | 1,814,812 | |
Moody’s Corp. | | 12,711 | | 255,364 | |
Morgan Stanley | | 69,530 | | 1,115,261 | |
Nasdaq OMX Group, Inc.* | | 8,916 | | 220,314 | |
National City Corp. | | 134,095 | | 242,712 | |
Northern Trust Corp. | | 14,602 | | 761,348 | |
NYSE Euronext | | 17,343 | | 474,851 | |
People’s United Financial, Inc. | | 22,769 | | 405,971 | |
Plum Creek Timber Co., Inc. | | 10,926 | | 379,569 | |
PNC Financial Svcs. Grp., Inc. | | 22,793 | | 1,116,857 | |
Principal Financial Grp., Inc. | | 17,004 | | 383,780 | |
Progressive Corp. | | 44,235 | | 655,120 | |
ProLogis | | 17,410 | | 241,825 | |
Prudential Financial, Inc. | | 27,819 | | 841,803 | |
Public Storage | | 8,207 | | 652,457 | |
Regions Financial Corp. | | 45,357 | | 361,042 | |
Simon Property Group, Inc. | | 14,784 | | 785,474 | |
SLM Corp.* | | 30,594 | | 272,287 | |
Sovereign Bancorp, Inc.* | | 35,768 | | 106,589 | |
State Street Corp. | | 28,281 | | 1,112,292 | |
SunTrust Banks, Inc. | | 23,168 | | 684,383 | |
T. Rowe Price Group, Inc. | | 16,928 | | 599,928 | |
Torchmark Corp. | | 5,578 | | 249,337 | |
Travelers Cos., Inc. | | 38,288 | | 1,730,618 | |
U.S. Bancorp | | 114,923 | | 2,874,224 | |
Unum Group | | 21,691 | | 403,453 | |
Vornado Realty Trust | | 8,985 | | 542,245 | |
Wachovia Corp. | | 141,489 | | 783,849 | |
Wells Fargo & Co. | | 248,208 | | 7,317,172 | |
XL Capital Ltd. Cl A | | 21,716 | | 80,349 | |
Zions Bancorporation | | 7,579 | | 185,761 | |
| | | | 68,344,725 | |
HEALTHCARE (14.0%) | | | | | |
Abbott Laboratories | | 101,624 | | 5,423,673 | |
Aetna, Inc. | | 30,223 | | 861,356 | |
Allergan, Inc. | | 20,149 | | 812,408 | |
AmerisourceBergen Corp. | | 10,225 | | 364,624 | |
Amgen, Inc.* | | 69,381 | | 4,006,753 | |
Bard (C.R.), Inc. | | 6,502 | | 547,859 | |
Baxter International, Inc. | | 40,604 | | 2,175,968 | |
Becton, Dickinson & Co. | | 15,910 | | 1,088,085 | |
Biogen Idec, Inc.* | | 19,105 | | 909,971 | |
Boston Scientific Corp.* | | 98,437 | | 761,902 | |
Bristol-Myers Squibb Co. | | 129,610 | | 3,013,433 | |
Cardinal Health, Inc. | | 23,537 | | 811,320 | |
Celgene Corp.* | | 29,998 | | 1,658,289 | |
Cephalon, Inc.* | | 4,480 | | 345,139 | |
CIGNA Corp. | | 17,995 | | 303,216 | |
Coventry Health Care, Inc.* | | 9,761 | | 145,244 | |
Covidien Ltd. | | 32,970 | | 1,194,833 | |
DaVita, Inc.* | | 6,801 | | 337,126 | |
Dentsply International, Inc. | | 9,752 | | 275,396 | |
Express Scripts, Inc.* | | 16,199 | | 890,621 | |
Forest Laboratories, Inc.* | | 19,740 | | 502,778 | |
Genzyme Corp.* | | 17,714 | | 1,175,678 | |
Gilead Sciences, Inc.* | | 60,241 | | 3,080,725 | |
Hospira, Inc.* | | 10,461 | | 280,564 | |
Humana, Inc.* | | 11,049 | | 411,907 | |
IMS Health, Inc. | | 11,931 | | 180,874 | |
Intuitive Surgical, Inc.* | | 2,560 | | 325,094 | |
Johnson & Johnson | | 181,657 | | 10,868,538 | |
King Pharmaceuticals, Inc.* | | 16,137 | | 171,375 | |
Laboratory Corp. of America Hldgs.* | | 7,071 | | 455,443 | |
Life Technologies Corp.* | | 11,297 | | 263,333 | |
Lilly (Eli) & Co. | | 65,541 | | 2,639,336 | |
McKesson Corp. | | 18,064 | | 699,619 | |
Medco Health Solutions, Inc.* | | 32,621 | | 1,367,146 | |
Medtronic, Inc. | | 73,235 | | 2,301,044 | |
Merck & Co., Inc. | | 138,421 | | 4,207,998 | |
Millipore Corp.* | | 3,610 | | 185,987 | |
Mylan, Inc.* | | 19,991 | | 197,711 | |
Patterson Cos., Inc.* | | 5,966 | | 111,863 | |
PerkinElmer, Inc. | | 7,738 | | 107,636 | |
Pfizer, Inc. | | 441,476 | | 7,818,540 | |
Quest Diagnostics, Inc. | | 10,375 | | 538,566 | |
Schering-Plough Corp. | | 106,495 | | 1,813,610 | |
St. Jude Medical, Inc.* | | 22,541 | | 742,951 | |
Stryker Corp. | | 15,860 | | 633,607 | |
Tenet Healthcare Corp.* | | 27,434 | | 31,549 | |
Thermo Fisher Scientific, Inc.* | | 27,520 | | 937,606 | |
UnitedHealth Group, Inc. | | 79,108 | | 2,104,273 | |
Varian Medical Systems, Inc.* | | 8,137 | | 285,120 | |
Waters Corp.* | | 6,436 | | 235,879 | |
Watson Pharmaceuticals, Inc.* | | 6,860 | | 182,270 | |
WellPoint, Inc.* | | 33,328 | | 1,404,109 | |
Wyeth | | 87,222 | | 3,271,697 | |
Zimmer Hldgs., Inc.* | | 14,721 | | 595,023 | |
| | | | 76,056,665 | |
INDUSTRIAL (10.4%) | | | | | |
3M Co. | | 45,369 | | 2,610,532 | |
Avery Dennison Corp. | | 6,963 | | 227,899 | |
Boeing Co. | | 47,980 | | 2,047,307 | |
Burlington Northern Santa Fe Corp. | | 18,373 | | 1,391,020 | |
C.H. Robinson Worldwide, Inc. | | 11,082 | | 609,842 | |
Caterpillar, Inc. | | 39,485 | | 1,763,795 | |
Cintas Corp. | | 8,606 | | 199,917 | |
Cooper Industries Ltd. Cl A | | 11,355 | | 331,907 | |
CSX Corp. | | 25,843 | | 839,122 | |
Cummins, Inc. | | 13,194 | | 352,676 | |
Danaher Corp. | | 16,740 | | 947,651 | |
Deere & Co. | | 28,010 | | 1,073,343 | |
Donnelley (R.R.) & Sons Co. | | 13,421 | | 182,257 | |
Dover Corp. | | 12,175 | | 400,801 | |
Dun & Bradstreet Corp. | | 3,533 | | 272,748 | |
Eaton Corp. | | 10,801 | | 536,918 | |
Emerson Electric Co. | | 50,251 | | 1,839,689 | |
Equifax, Inc. | | 8,279 | | 219,559 | |
Expeditors Int’l. of Washington, Inc. | | 13,900 | | 462,453 | |
Fastenal Co. | | 8,463 | | 294,936 | |
FedEx Corp. | | 20,384 | | 1,307,634 | |
Flowserve Corp. | | 3,704 | | 190,756 | |
Fluor Corp. | | 11,883 | | 533,190 | |
General Dynamics Corp. | | 25,533 | | 1,470,445 | |
General Electric Co. | | 687,676 | | 11,140,351 | |
Goodrich Corp. | | 8,057 | | 298,270 | |
Grainger (W.W.), Inc. | | 4,239 | | 334,203 | |
Honeywell International, Inc. | | 47,566 | | 1,561,592 | |
Illinois Tool Works, Inc. | | 25,777 | | 903,484 | |
Ingersoll-Rand Co. Ltd. Cl A | | 20,871 | | 362,105 | |
ITT Corp. | | 11,905 | | 547,511 | |
Jacobs Engineering Group, Inc.* | | 8,048 | | 387,109 | |
L-3 Communications Hldgs., Inc. | | 7,818 | | 576,812 | |
Lockheed Martin Corp. | | 21,803 | | 1,833,196 | |
Manitowoc Co., Inc. | | 8,534 | | 73,904 | |
Masco Corp. | | 23,584 | | 262,490 | |
Monster Worldwide, Inc.* | | 8,074 | | 97,615 | |
Norfolk Southern Corp. | | 24,243 | | 1,140,633 | |
Northrop Grumman Corp. | | 21,415 | | 964,532 | |
PACCAR, Inc. | | 23,745 | | 679,107 | |
Pall Corp. | | 7,730 | | 219,764 | |
Parker Hannifin Corp. | | 10,556 | | 449,052 | |
Pitney Bowes, Inc. | | 13,501 | | 344,005 | |
Precision Castparts Corp. | | 9,134 | | 543,290 | |
Raytheon Co. | | 27,115 | | 1,383,950 | |
Republic Services, Inc. | | 21,037 | | 521,507 | |
Robert Half Int’l., Inc. | | 10,162 | | 211,573 | |
Rockwell Automation, Inc. | | 9,252 | | 298,284 | |
Rockwell Collins, Inc. | | 10,370 | | 405,363 | |
Ryder System, Inc. | | 3,644 | | 141,314 | |
Southwest Airlines Co. | | 48,492 | | 418,001 | |
Stericycle, Inc.* | | 5,601 | | 291,700 | |
Textron, Inc. | | 15,785 | | 218,938 | |
Tyco International Ltd. | | 30,978 | | 669,125 | |
Union Pacific Corp. | | 33,157 | | 1,584,905 | |
United Parcel Service, Inc. Cl B | | 65,169 | | 3,594,722 | |
United Technologies Corp. | | 62,251 | | 3,336,653 | |
Waste Management, Inc. | | 32,129 | | 1,064,755 | |
| | | | 56,966,212 | |
TECHNOLOGY (14.5%) | | | | | |
Adobe Systems, Inc.* | | 34,779 | | 740,445 | |
Advanced Micro Devices, Inc.* | | 40,028 | | 86,460 | |
Affiliated Computer Svcs., Inc. Cl A* | | 6,391 | | 293,666 | |
Agilent Technologies, Inc.* | | 22,915 | | 358,161 | |
Akamai Technologies, Inc.* | | 11,080 | | 167,197 | |
Altera Corp. | | 19,469 | | 325,327 | |
Amphenol Corp. Cl A | | 11,513 | | 276,082 | |
Analog Devices, Inc. | | 19,085 | | 362,997 | |
Apple, Inc.* | | 58,194 | | 4,966,858 | |
Applied Materials, Inc. | | 87,841 | | 889,829 | |
Autodesk, Inc.* | | 14,823 | | 291,272 | |
Automatic Data Processing, Inc. | | 33,252 | | 1,308,134 | |
BMC Software, Inc.* | | 12,285 | | 330,589 | |
Broadcom Corp. Cl A* | | 29,078 | | 493,454 | |
CA, Inc. | | 25,789 | | 477,870 | |
Ciena Corp.* | | 5,922 | | 39,677 | |
Cisco Systems, Inc.* | | 383,347 | | 6,248,556 | |
Citrix Systems, Inc.* | | 11,898 | | 280,436 | |
Cognizant Technology Solutions Inc. Cl A* | | 19,075 | | 344,495 | |
Computer Sciences Corp.* | | 9,914 | | 348,378 | |
Compuware Corp.* | | 16,163 | | 109,100 | |
Convergys Corp.* | | 8,004 | | 51,306 | |
Corning, Inc. | | 101,882 | | 970,935 | |
Dell, Inc.* | | 113,303 | | 1,160,223 | |
eBay, Inc.* | | 70,227 | | 980,369 | |
Electronic Arts, Inc.* | | 21,008 | | 336,968 | |
EMC Corp.* | | 133,613 | | 1,398,928 | |
Fidelity Nat’l. Information Svcs., Inc. | | 12,447 | | 202,513 | |
Fiserv, Inc.* | | 10,488 | | 381,449 | |
FLIR Systems, Inc.* | | 8,707 | | 267,131 | |
Google, Inc.* | | 15,666 | | 4,819,645 | |
Harris Corp. | | 8,821 | | 335,639 | |
Hewlett-Packard Co. | | 160,394 | | 5,820,698 | |
Int’l. Business Machines Corp. | | 88,002 | | 7,406,248 | |
Intel Corp. | | 364,158 | | 5,338,556 | |
Intuit, Inc.* | | 20,955 | | 498,519 | |
Jabil Circuit, Inc. | | 13,814 | | 93,245 | |
JDS Uniphase Corp.* | | 14,393 | | 52,534 | |
Juniper Networks, Inc.* | | 34,566 | | 605,251 | |
KLA-Tencor Corp. | | 11,060 | | 240,997 | |
Lexmark International, Inc. Cl A* | | 5,134 | | 138,105 | |
Linear Technology Corp. | | 14,517 | | 321,116 | |
LSI Corp.* | | 42,355 | | 139,348 | |
MasterCard, Inc. Cl A | | 4,738 | | 677,202 | |
McAfee, Inc.* | | 9,913 | | 342,692 | |
MEMC Electronic Materials, Inc.* | | 14,706 | | 210,002 | |
Microchip Technology, Inc. | | 11,915 | | 232,700 | |
Micron Technology, Inc.* | | 50,213 | | 132,562 | |
Microsoft Corp. | | 500,877 | | 9,737,049 | |
Molex, Inc. | | 9,228 | | 133,714 | |
Motorola, Inc. | | 148,383 | | 657,337 | |
National Semiconductor Corp. | | 12,785 | | 128,745 | |
NetApp, Inc.* | | 21,616 | | 301,976 | |
Novell, Inc.* | | 22,604 | | 87,930 | |
Novellus Systems, Inc.* | | 6,399 | | 78,964 | |
Nvidia Corp.* | | 35,162 | | 283,757 | |
Oracle Corp.* | | 256,629 | | 4,550,032 | |
Paychex, Inc. | | 21,023 | | 552,484 | |
QLogic Corp.* | | 8,382 | | 112,654 | |
QUALCOMM, Inc. | | 108,387 | | 3,883,506 | |
salesforce.com, inc.* | | 6,871 | | 219,941 | |
SanDisk Corp.* | | 14,814 | | 142,214 | |
Sun Microsystems, Inc.* | | 48,357 | | 184,724 | |
Symantec Corp.* | | 54,778 | | 740,599 | |
Tellabs, Inc.* | | 26,059 | | 107,363 | |
Teradata Corp.* | | 11,523 | | 170,886 | |
Teradyne, Inc.* | | 11,111 | | 46,888 | |
Texas Instruments, Inc. | | 84,937 | | 1,318,222 | |
Total System Services, Inc. | | 12,896 | | 180,544 | |
Tyco Electronics | | 29,981 | | 485,992 | |
VeriSign, Inc.* | | 12,710 | | 242,507 | |
Western Union Co. | | 46,850 | | 671,829 | |
Xerox Corp. | | 56,673 | | 451,684 | |
Xilinx, Inc. | | 17,933 | | 319,566 | |
Yahoo!, Inc.* | | 90,857 | | 1,108,455 | |
| | | | 78,793,426 | |
TELECOMMUNICATIONS (3.6%) | | | | | |
American Tower Corp. Cl A* | | 25,981 | | 761,763 | |
AT&T, Inc. | | 385,830 | | 10,996,155 | |
CenturyTel, Inc. | | 6,556 | | 179,175 | |
Embarq Corp. | | 9,308 | | 334,716 | |
Frontier Communications Corp. | | 20,406 | | 178,348 | |
Qwest Communications Int’l., Inc. | | 96,207 | | 350,193 | |
Sprint Nextel Corp.* | | 188,134 | | 344,285 | |
Verizon Communications, Inc. | | 185,973 | | 6,304,485 | |
Windstream Corp. | | 28,770 | | 264,684 | |
| | | | 19,713,804 | |
UTILITIES (4.0%) | | | | | |
AES Corp.* | | 44,046 | | 362,939 | |
Allegheny Energy, Inc. | | 11,071 | | 374,864 | |
Ameren Corp. | | 13,848 | | 460,584 | |
American Electric Power Co., Inc. | | 26,405 | | 878,758 | |
CenterPoint Energy, Inc. | | 22,551 | | 284,594 | |
CMS Energy Corp. | | 14,810 | | 149,729 | |
Consolidated Edison, Inc. | | 17,910 | | 697,236 | |
Constellation Energy Group, Inc. | | 11,686 | | 293,202 | |
Dominion Resources, Inc. | | 38,105 | | 1,365,683 | |
DTE Energy Co. | | 10,673 | | 380,706 | |
Duke Energy Corp. | | 82,841 | | 1,243,443 | |
Dynegy, Inc. Cl A* | | 33,112 | | 66,224 | |
Edison International | | 21,324 | | 684,927 | |
Entergy Corp. | | 12,397 | | 1,030,563 | |
Equitable Resources, Inc. | | 8,567 | | 287,423 | |
Exelon Corp. | | 43,100 | | 2,396,791 | |
FirstEnergy Corp. | | 19,950 | | 969,171 | |
FPL Group, Inc. | | 26,791 | | 1,348,391 | |
Integrys Energy Group, Inc. | | 5,003 | | 215,029 | |
Nicor, Inc. | | 2,961 | | 102,865 | |
NiSource, Inc. | | 17,955 | | 196,966 | |
Pepco Hldgs., Inc. | | 14,164 | | 251,553 | |
PG&E Corp. | | 23,634 | | 914,872 | |
Pinnacle West Capital Corp. | | 6,611 | | 212,411 | |
PPL Corp. | | 24,560 | | 753,746 | |
Progress Energy, Inc. | | 17,224 | | 686,376 | |
Public Svc. Enterprise Group, Inc. | | 33,158 | | 967,219 | |
Questar Corp. | | 11,365 | | 371,522 | |
SCANA Corp. | | 7,845 | | 279,282 | |
Sempra Energy | | 15,951 | | 679,991 | |
Southern Co. | | 50,741 | | 1,877,417 | |
TECO Energy, Inc. | | 13,931 | | 172,048 | |
Wisconsin Energy Corp. | | 7,647 | | 321,021 | |
Xcel Energy, Inc. | | 29,400 | | 545,370 | |
| | | | 21,822,916 | |
TOTAL INDEXED ASSETS - COMMON STOCKS
(Cost: $625,064,783) 94.4% | | | | $ | 515,040,073 | |
| | | | | | |
| | Rating** | | Rate(%) | | Maturity | | Face Amount($) | | Value($) | |
SHORT-TERM DEBT SECURITIES: | | | | | | | | | | | |
U. S. GOVERNMENT (1.4%) | | | | | | | | | | | |
U.S. Treasury Bill (1) | | AAA | | 0.01 | | 04/16/09 | | 500,000 | | 499,956 | |
U.S. Treasury Bill (1) | | AAA | | 0.01 | | 04/30/09 | | 2,600,000 | | 2,599,740 | |
U.S. Treasury Bill (1) | | AAA | | 0.09 | | 01/15/09 | | 500,000 | | 499,983 | |
U.S. Treasury Bill (1) | | AAA | | 0.30 | | 02/05/09 | | 1,000,000 | | 999,708 | |
U.S. Treasury Bill (1) | | AAA | | 1.07 | | 01/02/09 | | 3,000,000 | | 2,999,912 | |
| | | | | | | | | | 7,599,299 | |
COMMERCIAL PAPER (4.0%) | | | | | | | | | | | |
NetJets, Inc.† | | A-1+ | | 0.10 | | 03/02/09 | | 8,000,000 | | 7,998,645 | |
Toyota Motor Credit Corp. | | A-1+ | | 0.40 | | 01/21/09 | | 7,000,000 | | 6,998,444 | |
Toyota Motor Credit Corp. | | A-1+ | | 0.40 | | 01/22/09 | | 750,000 | | 749,825 | |
Washington Post Co.† | | A-1 | | 0.03 | | 01/05/09 | | 5,020,000 | | 5,019,983 | |
7-Eleven, Inc.† | | A-1+ | | 0.08 | | 01/22/09 | | 898,000 | | 897,958 | |
| | | | | | | | | | 21,664,855 | |
TOTAL SHORT-TERM DEBT SECURITIES
(Cost: $29,264,380) 5.4% | | | | | | | | | | 29,264,154 | |
| | | | | | | | | | | |
TOTAL INVESTMENTS
(Cost: $654,329,163) 99.8% | | | | | | | | | | 544,304,227 | |
| | | | | | | | | | | |
OTHER NET ASSETS 0.2% | | | | | | | | | | 880,606 | |
| | | | | | | | | | | |
NET ASSETS 100.0% | | | | | | | | | | $ | 545,184,833 | |
| | | | | | | | | | | | |
The accompanying notes are an integral part of these portfolio schedules.
MUTUAL OF AMERICA INVESTMENT CORPORATION (ALL AMERICA FUND)
PORTFOLIO OF INVESTMENTS IN SECURITIES
December 31, 2008
| | Shares | | Value($) | |
INDEXED ASSETS: | | | | | |
COMMON STOCKS: | | | | | |
BASIC MATERIALS (1.5%) | | | | | |
Air Products & Chemicals, Inc. | | 2,971 | | 149,352 | |
AK Steel Hldg. Corp. | | 1,587 | | 14,791 | |
Alcoa, Inc. | | 11,347 | | 127,767 | |
Allegheny Technologies, Inc. | | 1,365 | | 34,848 | |
Ball Corp. | | 1,341 | | 55,772 | |
Bemis Co., Inc. | | 1,409 | | 33,365 | |
CF Industries Hldgs., Inc. | | 798 | | 39,230 | |
Dow Chemical Co. | | 13,097 | | 197,634 | |
Du Pont (E.I.) de Nemours & Co. | | 12,794 | | 323,688 | |
Eastman Chemical Co. | | 1,029 | | 32,630 | |
Ecolab, Inc. | | 2,377 | | 83,552 | |
Freeport-McMoRan Copper & Gold, Inc. | | 5,354 | | 130,852 | |
Int’l. Flavors & Fragrances, Inc. | | 1,110 | | 32,989 | |
International Paper Co. | | 6,062 | | 71,532 | |
MeadWestvaco Corp. | | 2,413 | | 27,001 | |
Monsanto Co. | | 7,771 | | 546,690 | |
Newmont Mining Corp. | | 6,441 | | 262,149 | |
Nucor Corp. | | 4,451 | | 205,636 | |
Owens-Illinois, Inc.* | | 2,343 | | 64,034 | |
Pactiv Corp.* | | 1,863 | | 46,351 | |
PPG Industries, Inc. | | 2,328 | | 98,777 | |
Praxair, Inc. | | 4,372 | | 259,522 | |
Rohm & Haas Co. | | 1,771 | | 109,430 | |
Sealed Air Corp. | | 2,237 | | 33,421 | |
Sigma-Aldrich Corp. | | 1,779 | | 75,145 | |
Titanium Metals Corp. | | 1,202 | | 10,590 | |
United States Steel Corp. | | 1,648 | | 61,306 | |
Vulcan Materials Co. | | 1,562 | | 108,684 | |
Weyerhaeuser Co. | | 2,996 | | 91,708 | |
| | | | 3,328,446 | |
CONSUMER, CYCLICAL (4.2%) | | | | | |
Abercrombie & Fitch Co. Cl A | | 1,229 | | 28,353 | |
Amazon.com, Inc.* | | 4,560 | | 233,837 | |
Apollo Group, Inc. Cl A* | | 1,511 | | 115,773 | |
AutoNation, Inc.* | | 1,524 | | 15,057 | |
AutoZone, Inc.* | | 542 | | 75,593 | |
Bed Bath & Beyond, Inc.* | | 3,678 | | 93,495 | |
Best Buy Co., Inc. | | 4,789 | | 134,619 | |
Big Lots, Inc.* | | 1,159 | | 16,794 | |
Black & Decker Corp. | | 847 | | 35,413 | |
Carnival Corp. | | 6,196 | | 150,687 | |
CBS Corp. Cl B | | 9,640 | | 78,952 | |
Centex Corp. | | 1,763 | | 18,758 | |
Coach, Inc.* | | 4,635 | | 96,269 | |
Comcast Corp. Cl A | | 40,829 | | 689,194 | |
D.R. Horton, Inc. | | 3,906 | | 27,615 | |
Darden Restaurants, Inc. | | 1,967 | | 55,430 | |
DIRECTV Group, Inc.* | | 7,743 | | 177,392 | |
Disney (Walt) Co. | | 26,244 | | 595,476 | |
Eastman Kodak Co. | | 3,806 | | 25,043 | |
Expedia, Inc.* | | 2,970 | | 24,473 | |
Family Dollar Stores, Inc. | | 1,972 | | 51,410 | |
Ford Motor Co.* | | 33,869 | | 77,560 | |
Fortune Brands, Inc. | | 2,118 | | 87,431 | |
GameStop Corp. Cl A* | | 2,322 | | 50,295 | |
Gannett Co., Inc. | | 3,234 | | 25,872 | |
Gap, Inc. | | 6,611 | | 88,521 | |
General Motors Corp. | | 8,655 | | 27,696 | |
Genuine Parts Co. | | 2,260 | | 85,564 | |
Goodyear Tire & Rubber Co.* | | 3,421 | | 20,423 | |
H&R Block, Inc. | | 4,806 | | 109,192 | |
Harley-Davidson, Inc. | | 3,301 | | 56,018 | |
Harman Int’l. Industries, Inc. | | 828 | | 13,852 | |
Hasbro, Inc. | | 1,756 | | 51,223 | |
Home Depot, Inc. | | 24,038 | | 553,355 | |
International Game Technology | | 4,178 | | 49,676 | |
Interpublic Group of Cos., Inc.* | | 6,756 | | 26,754 | |
Johnson Controls, Inc. | | 8,424 | | 152,980 | |
Jones Apparel Group, Inc. | | 1,180 | | 6,915 | |
KB Home | | 1,063 | | 14,478 | |
Kohl’s Corp.* | | 4,320 | | 156,384 | |
Leggett & Platt, Inc. | | 2,215 | | 33,646 | |
Lennar Corp. Cl A | | 1,996 | | 17,305 | |
Limited Brands, Inc. | | 3,836 | | 38,513 | |
Lowe’s Cos., Inc. | | 20,780 | | 447,186 | |
Macy’s, Inc | | 5,963 | | 61,717 | |
Marriott International, Inc. Cl A | | 4,158 | | 80,873 | |
Mattel, Inc. | | 5,086 | | 81,376 | |
McDonald’s Corp. | | 15,802 | | 982,726 | |
McGraw-Hill Cos., Inc. | | 4,459 | | 103,404 | |
Meredith Corp. | | 512 | | 8,765 | |
New York Times Co. Cl A | | 1,646 | | 12,065 | |
Newell Rubbermaid, Inc. | | 3,930 | | 38,435 | |
News Corp. Cl A | | 32,608 | | 296,407 | |
NIKE, Inc. Cl B | | 5,562 | | 283,662 | |
Nordstrom, Inc. | | 2,257 | | 30,041 | |
Office Depot, Inc.* | | 3,895 | | 11,607 | |
Omnicom Group, Inc. | | 4,406 | | 118,610 | |
Penney (J.C.) Co., Inc. | | 3,150 | | 62,055 | |
Polo Ralph Lauren Corp. | | 803 | | 36,464 | |
Pulte Homes, Inc. | | 3,022 | | 33,030 | |
RadioShack Corp. | | 1,773 | | 21,170 | |
Scripps Networks Interactive, Inc. Cl A | | 1,270 | | 27,940 | |
Sears Hldgs. Corp.* | | 789 | | 30,668 | |
Sherwin-Williams Co. | | 1,394 | | 83,292 | |
Snap-On, Inc. | | 810 | | 31,898 | |
Stanley Works | | 1,111 | | 37,885 | |
Staples, Inc. | | 10,114 | | 181,243 | |
Starbucks Corp.* | | 10,428 | | 98,649 | |
Starwood Hotels & Resorts Worldwide, Inc. | | 2,595 | | 46,451 | |
Target Corp. | | 10,664 | | 368,228 | |
Tiffany & Co. | | 1,754 | | 41,447 | |
Time Warner, Inc. | | 50,863 | | 511,682 | |
TJX Cos., Inc. | | 5,903 | | 121,425 | |
V.F. Corp. | | 1,249 | | 68,408 | |
Viacom, Inc. Cl B* | | 8,699 | | 165,803 | |
Washington Post Co. Cl B | | 86 | | 33,562 | |
Whirlpool Corp. | | 1,042 | | 43,087 | |
Wyndham Worldwide Corp. | | 2,506 | | 16,414 | |
Wynn Resorts Ltd.* | | 873 | | 36,893 | |
Yum! Brands, Inc. | | 6,558 | | 206,577 | |
| | | | 9,344,431 | |
CONSUMER, NON-CYCLICAL (6.5%) | | | | | |
Altria Group, Inc. | | 29,212 | | 439,933 | |
Archer-Daniels-Midland Co. | | 9,099 | | 262,324 | |
Avon Products, Inc. | | 6,044 | | 145,237 | |
Brown-Forman Corp. Cl B | | 1,385 | | 71,314 | |
Campbell Soup Co. | | 2,917 | | 87,539 | |
Clorox Co. | | 1,967 | | 109,287 | |
Coca-Cola Co. | | 28,209 | | 1,277,021 | |
Coca-Cola Enterprises, Inc. | | 4,497 | | 54,099 | |
Colgate-Palmolive Co. | | 7,156 | | 490,472 | |
ConAgra Foods, Inc. | | 6,339 | | 104,594 | |
Constellation Brands, Inc. Cl A* | | 2,760 | | 43,525 | |
Costco Wholesale Corp. | | 6,120 | | 321,300 | |
CVS Caremark Corp. | | 20,363 | | 585,233 | |
Dean Foods Co.* | | 2,183 | | 39,229 | |
Dr. Pepper Snapple Group, Inc.* | | 3,597 | | 58,451 | |
Estee Lauder Cos., Inc. Cl A | | 1,643 | | 50,867 | |
General Mills, Inc. | | 4,737 | | 287,773 | |
Heinz (H.J.) Co. | | 4,458 | | 167,621 | |
Hershey Co. | | 2,351 | | 81,674 | |
J.M. Smucker Co. | | 1,676 | | 72,671 | |
Kellogg Co. | | 3,572 | | 156,632 | |
Kimberly-Clark Corp. | | 5,860 | | 309,056 | |
Kraft Foods, Inc. Cl A | | 20,829 | | 559,259 | |
Kroger Co. | | 9,245 | | 244,160 | |
Lorillard, Inc. | | 2,383 | | 134,282 | |
McCormick & Co., Inc. | | 1,843 | | 58,718 | |
Molson Coors Brewing Co. Cl B | | 2,110 | | 103,221 | |
Pepsi Bottling Group, Inc. | | 1,916 | | 43,129 | |
PepsiCo, Inc. | | 22,020 | | 1,206,035 | |
Philip Morris Int’l., Inc. | | 28,682 | | 1,247,954 | |
Proctor & Gamble Co. | | 42,331 | | 2,616,900 | |
Reynolds American, Inc. | | 2,405 | | 96,946 | |
Safeway, Inc. | | 6,078 | | 144,474 | |
Sara Lee Corp. | | 10,023 | | 98,125 | |
Supervalu, Inc. | | 2,999 | | 43,785 | |
Sysco Corp. | | 8,495 | | 194,875 | |
Tyson Foods, Inc. Cl A | | 4,283 | | 37,519 | |
UST, Inc. | | 2,104 | | 145,976 | |
Wal-Mart Stores, Inc. | | 31,700 | | 1,777,102 | |
Walgreen Co. | | 14,034 | | 346,219 | |
Whole Foods Market, Inc. | | 1,983 | | 18,720 | |
| | | | 14,333,251 | |
ENERGY (6.7%) | | | | | |
Anadarko Petroleum Corp. | | 6,508 | | 250,883 | |
Apache Corp. | | 4,745 | | 353,645 | |
Baker Hughes, Inc. | | 4,359 | | 139,793 | |
BJ Services Co. | | 4,139 | | 48,302 | |
Cabot Oil & Gas Corp. | | 1,462 | | 38,012 | |
Cameron International Corp.* | | 3,112 | | 63,796 | |
Chesapeake Energy Corp. | | 7,668 | | 123,992 | |
Chevron Corp. | | 28,807 | | 2,130,854 | |
ConocoPhillips | | 21,137 | | 1,094,897 | |
Consol Energy, Inc. | | 2,569 | | 73,422 | |
Devon Energy Corp. | | 6,264 | | 411,607 | |
El Paso Corp. | | 9,942 | | 77,846 | |
ENSCO International, Inc. | | 2,011 | | 57,092 | |
EOG Resources, Inc. | | 3,539 | | 235,627 | |
Exxon Mobil Corp. | | 72,118 | | 5,757,170 | |
Halliburton Co. | | 12,672 | | 230,377 | |
Hess Corp. | | 4,022 | | 215,740 | |
Marathon Oil Corp. | | 10,004 | | 273,709 | |
Massey Energy Co. | | 1,207 | | 16,645 | |
Murphy Oil Corp. | | 2,694 | | 119,479 | |
Nabors Industries Ltd.* | | 4,035 | | 48,299 | |
National Oilwell Varco, Inc.* | | 5,917 | | 144,611 | |
Noble Corp. | | 3,742 | | 82,661 | |
Noble Energy, Inc. | | 2,449 | | 120,540 | |
Occidental Petroleum Corp. | | 11,482 | | 688,805 | |
Peabody Energy Corp. | | 3,780 | | 85,995 | |
Pioneer Natural Resources Co. | | 1,669 | | 27,004 | |
Range Resources Corp. | | 2,194 | | 75,452 | |
Rowan Cos., Inc. | | 1,596 | | 25,376 | |
Schlumberger Ltd. | | 16,959 | | 717,874 | |
Smith International, Inc. | | 3,103 | | 71,028 | |
Southwestern Energy Co.* | | 4,868 | | 141,026 | |
Spectra Energy Corp. | | 8,663 | | 136,356 | |
Sunoco, Inc. | | 1,654 | | 71,883 | |
Tesoro Corp. | | 1,963 | | 25,853 | |
Valero Energy Corp. | | 7,316 | | 158,318 | |
Weatherford Int’l. Ltd.* | | 9,657 | | 104,489 | |
Williams Cos., Inc. | | 8,204 | | 118,794 | |
XTO Energy, Inc. | | 8,178 | | 288,438 | |
| | | | 14,845,690 | |
FINANCIAL (6.7%) | | | | | |
Aflac, Inc. | | 6,609 | | 302,957 | |
Allstate Corp. | | 7,599 | | 248,943 | |
American Capital Strategies Ltd. | | 2,923 | | 9,471 | |
American Express Co. | | 16,445 | | 305,055 | |
American Int’l. Group, Inc. | | 38,131 | | 59,866 | |
Ameriprise Financial, Inc. | | 3,063 | | 71,552 | |
Aon Corp. | | 3,825 | | 174,726 | |
Apartment Investment & Co. Cl A | | 1,436 | | 16,586 | |
Assurant, Inc. | | 1,675 | | 50,250 | |
AvalonBay Communities, Inc. | | 1,089 | | 65,972 | |
Bank of America Corp. | | 71,139 | | 1,001,637 | |
Bank of New York Mellon Corp. | | 16,270 | | 460,929 | |
BB&T Corp. | | 7,833 | | 215,094 | |
Boston Properties, Inc. | | 1,713 | | 94,215 | |
Capital One Financial Corp. | | 5,553 | | 177,085 | |
CB Richard Ellis Group, Inc. Cl A* | | 3,162 | | 13,660 | |
Charles Schwab Corp. | | 13,266 | | 214,511 | |
Chubb Corp. | | 5,043 | | 257,193 | |
Cincinnati Financial Corp. | | 2,294 | | 66,687 | |
CIT Group, Inc. | | 4,048 | | 18,378 | |
Citigroup, Inc. | | 77,263 | | 518,435 | |
CME Group, Inc. | | 949 | | 197,496 | |
Comerica, Inc. | | 2,126 | | 42,201 | |
Developers Diversified Realty Corp. | | 1,701 | | 8,301 | |
Discover Financial Svcs. | | 6,804 | | 64,842 | |
E*Trade Financial Corp.* | | 7,979 | | 9,176 | |
Equity Residential | | 3,857 | | 115,016 | |
Federated Investors, Inc. Cl B | | 1,256 | | 21,302 | |
Fifth Third Bancorp | | 8,188 | | 67,633 | |
First Horizon National Corp. | | 2,903 | | 30,689 | |
Franklin Resources, Inc. | | 2,150 | | 137,127 | |
Genworth Financial, Inc. Cl A | | 6,141 | | 17,379 | |
Goldman Sachs Group, Inc. | | 6,269 | | 529,041 | |
Hartford Financial Svcs. Group, Inc. | | 4,272 | | 70,146 | |
HCP, Inc. | | 3,582 | | 99,472 | |
Host Hotels & Resorts, Inc. | | 7,409 | | 56,086 | |
Hudson City Bancorp, Inc. | | 7,390 | | 117,944 | |
Huntington Bancshares, Inc. | | 5,190 | | 39,755 | |
IntercontinentalExchange, Inc.* | | 1,024 | | 84,419 | |
Invesco Ltd. | | 5,460 | | 78,842 | |
Janus Capital Group, Inc. | | 2,238 | | 17,971 | |
JPMorgan Chase & Co. | | 52,917 | | 1,668,473 | |
KeyCorp | | 7,018 | | 59,793 | |
Kimco Realty Corp. | | 3,247 | | 59,355 | |
Legg Mason, Inc. | | 2,004 | | 43,908 | |
Leucadia National Corp.* | | 2,503 | | 49,559 | |
Lincoln National Corp. | | 3,630 | | 68,389 | |
Loews Corp. | | 5,132 | | 144,979 | |
M&T Bank Corp. | | 1,091 | | 62,634 | |
Marsh & McLennan Cos., Inc. | | 7,289 | | 176,904 | |
Marshall & Ilsley Corp. | | 3,690 | | 50,332 | |
MBIA, Inc.* | | 2,671 | | 10,871 | |
Merrill Lynch & Co., Inc. | | 22,701 | | 264,240 | |
MetLife, Inc. | | 11,251 | | 392,210 | |
Moody’s Corp. | | 2,754 | | 55,328 | |
Morgan Stanley | | 15,057 | | 241,514 | |
Nasdaq OMX Group, Inc.* | | 1,930 | | 47,690 | |
National City Corp. | | 28,867 | | 52,249 | |
Northern Trust Corp. | | 3,162 | | 164,867 | |
NYSE Euronext | | 3,759 | | 102,921 | |
People’s United Financial, Inc. | | 4,931 | | 87,920 | |
Plum Creek Timber Co., Inc. | | 2,365 | | 82,160 | |
PNC Financial Svcs. Grp., Inc. | | 4,936 | | 241,864 | |
Principal Financial Grp., Inc. | | 3,677 | | 82,990 | |
Progressive Corp. | | 9,579 | | 141,865 | |
ProLogis | | 3,766 | | 52,310 | |
Prudential Financial, Inc. | | 6,011 | | 181,893 | |
Public Storage | | 1,768 | | 140,556 | |
Regions Financial Corp. | | 9,817 | | 78,143 | |
Simon Property Group, Inc. | | 3,202 | | 170,122 | |
SLM Corp.* | | 6,625 | | 58,963 | |
Sovereign Bancorp, Inc.* | | 7,719 | | 23,003 | |
State Street Corp. | | 6,124 | | 240,857 | |
SunTrust Banks, Inc. | | 5,021 | | 148,320 | |
T. Rowe Price Group, Inc. | | 3,664 | | 129,852 | |
Torchmark Corp. | | 1,206 | | 53,908 | |
Travelers Cos., Inc. | | 8,287 | | 374,572 | |
U.S. Bancorp | | 24,876 | | 622,149 | |
Unum Group | | 4,695 | | 87,327 | |
Vornado Realty Trust | | 1,948 | | 117,562 | |
Wachovia Corp. | | 30,639 | | 169,740 | |
Wells Fargo & Co. | | 53,730 | | 1,583,960 | |
XL Capital Ltd. Cl A | | 4,690 | | 17,353 | |
Zions Bancorporation | | 1,635 | | 40,074 | |
| | | | 14,791,719 | |
HEALTHCARE (7.4%) | | | | | |
Abbott Laboratories | | 21,998 | | 1,174,033 | |
Aetna, Inc. | | 6,537 | | 186,305 | |
Allergan, Inc. | | 4,360 | | 175,795 | |
AmerisourceBergen Corp. | | 2,215 | | 78,987 | |
Amgen, Inc.* | | 15,022 | | 867,521 | |
Bard (C.R.), Inc. | | 1,403 | | 118,217 | |
Baxter International, Inc. | | 8,793 | | 471,217 | |
Becton, Dickinson & Co. | | 3,441 | | 235,330 | |
Biogen Idec, Inc.* | | 4,136 | | 196,998 | |
Boston Scientific Corp.* | | 21,288 | | 164,769 | |
Bristol-Myers Squibb Co. | | 28,067 | | 652,558 | |
Cardinal Health, Inc. | | 5,099 | | 175,763 | |
Celgene Corp.* | | 6,496 | | 359,099 | |
Cephalon, Inc.* | | 977 | | 75,268 | |
CIGNA Corp. | | 3,897 | | 65,664 | |
Coventry Health Care, Inc.* | | 2,112 | | 31,427 | |
Covidien Ltd. | | 7,140 | | 258,754 | |
DaVita, Inc.* | | 1,475 | | 73,116 | |
Dentsply International, Inc. | | 2,112 | | 59,643 | |
Express Scripts, Inc.* | | 3,508 | | 192,870 | |
Forest Laboratories, Inc.* | | 4,273 | | 108,833 | |
Genzyme Corp.* | | 3,835 | | 254,529 | |
Gilead Sciences, Inc.* | | 13,042 | | 666,968 | |
Hospira, Inc.* | | 2,254 | | 60,452 | |
Humana, Inc.* | | 2,387 | | 88,987 | |
IMS Health, Inc. | | 2,570 | | 38,961 | |
Intuitive Surgical, Inc.* | | 549 | | 69,718 | |
Johnson & Johnson | | 39,338 | | 2,353,593 | |
King Pharmaceuticals, Inc.* | | 3,494 | | 37,106 | |
Laboratory Corp. of America Hldgs.* | | 1,531 | | 98,612 | |
Life Technologies Corp.* | | 2,447 | | 57,040 | |
Lilly (Eli) & Co. | | 14,185 | | 571,230 | |
McKesson Corp. | | 3,912 | | 151,512 | |
Medco Health Solutions, Inc.* | | 7,061 | | 295,927 | |
Medtronic, Inc. | | 15,854 | | 498,133 | |
Merck & Co., Inc. | | 29,975 | | 911,240 | |
Millipore Corp.* | | 780 | | 40,186 | |
Mylan, Inc.* | | 4,320 | | 42,725 | |
Patterson Cos., Inc.* | | 1,287 | | 24,131 | |
PerkinElmer, Inc. | | 1,675 | | 23,299 | |
Pfizer, Inc. | | 95,601 | | 1,693,094 | |
Quest Diagnostics, Inc. | | 2,246 | | 116,590 | |
Schering-Plough Corp. | | 23,047 | | 392,490 | |
St. Jude Medical, Inc.* | | 4,880 | | 160,845 | |
Stryker Corp. | | 3,434 | | 137,188 | |
Tenet Healthcare Corp.* | | 5,886 | | 6,769 | |
Thermo Fisher Scientific, Inc.* | | 5,958 | | 202,989 | |
UnitedHealth Group, Inc. | | 17,124 | | 455,498 | |
Varian Medical Systems, Inc.* | | 1,762 | | 61,740 | |
Waters Corp.* | | 1,398 | | 51,237 | |
Watson Pharmaceuticals, Inc.* | | 1,475 | | 39,191 | |
WellPoint, Inc.* | | 7,220 | | 304,179 | |
Wyeth | | 18,878 | | 708,114 | |
Zimmer Hldgs., Inc.* | | 3,180 | | 128,536 | |
| | | | 16,464,976 | |
INDUSTRIAL (5.6%) | | | | | |
3M Co. | | 9,825 | | 565,331 | |
Avery Dennison Corp. | | 1,505 | | 49,259 | |
Boeing Co. | | 10,390 | | 443,341 | |
Burlington Northern Santa Fe Corp. | | 3,983 | | 301,553 | |
C.H. Robinson Worldwide, Inc. | | 2,402 | | 132,182 | |
Caterpillar, Inc. | | 8,553 | | 382,063 | |
Cintas Corp. | | 1,866 | | 43,347 | |
Cooper Industries Ltd. Cl A | | 2,458 | | 71,847 | |
CSX Corp. | | 5,593 | | 181,605 | |
Cummins, Inc. | | 2,855 | | 76,314 | |
Danaher Corp. | | 3,625 | | 205,211 | |
Deere & Co. | | 6,054 | | 231,989 | |
Donnelley (R.R.) & Sons Co. | | 2,906 | | 39,463 | |
Dover Corp. | | 2,637 | | 86,810 | |
Dun & Bradstreet Corp. | | 764 | | 58,981 | |
Eaton Corp. | | 2,338 | | 116,222 | |
Emerson Electric Co. | | 10,875 | | 398,134 | |
Equifax, Inc. | | 1,791 | | 47,497 | |
Expeditors Int’l. of Washington, Inc. | | 3,011 | | 100,176 | |
Fastenal Co. | | 1,825 | | 63,601 | |
FedEx Corp. | | 4,413 | | 283,094 | |
Flowserve Corp. | | 810 | | 41,715 | |
Fluor Corp. | | 2,573 | | 115,451 | |
General Dynamics Corp. | | 5,527 | | 318,300 | |
General Electric Co. | | 148,915 | | 2,412,423 | |
Goodrich Corp. | | 1,745 | | 64,600 | |
Grainger (W.W.), Inc. | | 915 | | 72,139 | |
Honeywell International, Inc. | | 10,297 | | 338,051 | |
Illinois Tool Works, Inc. | | 5,580 | | 195,579 | |
Ingersoll-Rand Co. Ltd. Cl A | | 4,520 | | 78,422 | |
ITT Corp. | | 2,569 | | 118,148 | |
Jacobs Engineering Group, Inc.* | | 1,742 | | 83,790 | |
L-3 Communications Hldgs., Inc. | | 1,693 | | 124,910 | |
Lockheed Martin Corp. | | 4,720 | | 396,858 | |
Manitowoc Co., Inc. | | 1,839 | | 15,926 | |
Masco Corp. | | 5,103 | | 56,796 | |
Monster Worldwide, Inc.* | | 1,752 | | 21,182 | |
Norfolk Southern Corp. | | 5,250 | | 247,013 | |
Northrop Grumman Corp. | | 4,635 | | 208,760 | |
PACCAR, Inc. | | 5,133 | | 146,804 | |
Pall Corp. | | 1,674 | | 47,592 | |
Parker Hannifin Corp. | | 2,285 | | 97,204 | |
Pitney Bowes, Inc. | | 2,922 | | 74,453 | |
Precision Castparts Corp. | | 1,969 | | 117,116 | |
Raytheon Co. | | 5,871 | | 299,656 | |
Republic Services, Inc. | | 4,552 | | 112,844 | |
Robert Half Int’l., Inc. | | 2,203 | | 45,866 | |
Rockwell Automation, Inc. | | 2,006 | | 64,673 | |
Rockwell Collins, Inc. | | 2,250 | | 87,953 | |
Ryder System, Inc. | | 797 | | 30,908 | |
Southwest Airlines Co. | | 10,488 | | 90,407 | |
Stericycle, Inc.* | | 1,213 | | 63,173 | |
Textron, Inc. | | 3,418 | | 47,408 | |
Tyco International Ltd. | | 6,711 | | 144,958 | |
Union Pacific Corp. | | 7,180 | | 343,204 | |
United Parcel Service, Inc. Cl B | | 14,110 | | 778,308 | |
United Technologies Corp. | | 13,478 | | 722,421 | |
Waste Management, Inc. | | 6,955 | | 230,489 | |
| | | | 12,333,520 | |
TECHNOLOGY (7.7%) | | | | | |
Adobe Systems, Inc.* | | 7,528 | | 160,271 | |
Advanced Micro Devices, Inc.* | | 8,627 | | 18,634 | |
Affiliated Computer Svcs., Inc. Cl A* | | 1,383 | | 63,549 | |
Agilent Technologies, Inc.* | | 4,962 | | 77,556 | |
Akamai Technologies, Inc.* | | 2,389 | | 36,050 | |
Altera Corp. | | 4,216 | | 70,449 | |
Amphenol Corp. Cl A | | 2,496 | | 59,854 | |
Analog Devices, Inc. | | 4,129 | | 78,534 | |
Apple, Inc.* | | 12,603 | | 1,075,666 | |
Applied Materials, Inc. | | 19,022 | | 192,693 | |
Autodesk, Inc.* | | 3,208 | | 63,037 | |
Automatic Data Processing, Inc. | | 7,201 | | 283,287 | |
BMC Software, Inc.* | | 2,658 | | 71,527 | |
Broadcom Corp. Cl A* | | 6,297 | | 106,860 | |
CA, Inc. | | 5,585 | | 103,490 | |
Ciena Corp.* | | 1,275 | | 8,543 | |
Cisco Systems, Inc.* | | 83,013 | | 1,353,112 | |
Citrix Systems, Inc.* | | 2,576 | | 60,716 | |
Cognizant Technology Solutions Inc. Cl A* | | 4,128 | | 74,552 | |
Computer Sciences Corp.* | | 2,140 | | 75,200 | |
Compuware Corp.* | | 3,495 | | 23,591 | |
Convergys Corp.* | | 1,731 | | 11,096 | |
Corning, Inc. | | 22,037 | | 210,013 | |
Dell, Inc.* | | 24,535 | | 251,238 | |
eBay, Inc.* | | 15,208 | | 212,304 | |
Electronic Arts, Inc.* | | 4,549 | | 72,966 | |
EMC Corp.* | | 28,934 | | 302,939 | |
Fidelity Nat’l. Information Svcs., Inc. | | 2,694 | | 43,831 | |
Fiserv, Inc.* | | 2,271 | | 82,596 | |
FLIR Systems, Inc.* | | 1,885 | | 57,832 | |
Google, Inc.* | | 3,392 | | 1,043,549 | |
Harris Corp. | | 1,908 | | 72,599 | |
Hewlett-Packard Co. | | 34,723 | | 1,260,098 | |
Int’l. Business Machines Corp. | | 19,047 | | 1,602,996 | |
Intel Corp. | | 78,858 | | 1,156,058 | |
Intuit, Inc.* | | 4,534 | | 107,864 | |
Jabil Circuit, Inc. | | 2,987 | | 20,162 | |
JDS Uniphase Corp.* | | 3,117 | | 11,377 | |
Juniper Networks, Inc.* | | 7,485 | | 131,062 | |
KLA-Tencor Corp. | | 2,394 | | 52,165 | |
Lexmark International, Inc. Cl A* | | 1,112 | | 29,913 | |
Linear Technology Corp. | | 3,144 | | 69,545 | |
LSI Corp.* | | 9,146 | | 30,090 | |
MasterCard, Inc. Cl A | | 1,021 | | 145,932 | |
McAfee, Inc.* | | 2,129 | | 73,600 | |
MEMC Electronic Materials, Inc.* | | 3,189 | | 45,539 | |
Microchip Technology, Inc. | | 2,579 | | 50,368 | |
Micron Technology, Inc.* | | 10,829 | | 28,589 | |
Microsoft Corp. | | 108,464 | | 2,108,540 | |
Molex, Inc. | | 1,997 | | 28,937 | |
Motorola, Inc. | | 32,132 | | 142,345 | |
National Semiconductor Corp. | | 2,766 | | 27,854 | |
NetApp, Inc.* | | 4,681 | | 65,394 | |
Novell, Inc.* | | 4,895 | | 19,042 | |
Novellus Systems, Inc.* | | 1,385 | | 17,091 | |
Nvidia Corp.* | | 7,614 | | 61,445 | |
Oracle Corp.* | | 55,540 | | 984,724 | |
Paychex, Inc. | | 4,553 | | 119,653 | |
QLogic Corp.* | | 1,814 | | 24,380 | |
QUALCOMM, Inc. | | 23,471 | | 840,966 | |
salesforce.com, inc.* | | 1,488 | | 47,631 | |
SanDisk Corp.* | | 3,205 | | 30,768 | |
Sun Microsystems, Inc.* | | 10,472 | | 40,003 | |
Symantec Corp.* | | 11,854 | | 160,266 | |
Tellabs, Inc.* | | 5,643 | | 23,249 | |
Teradata Corp.* | | 2,495 | | 37,001 | |
Teradyne, Inc.* | | 2,400 | | 10,128 | |
Texas Instruments, Inc. | | 18,381 | | 285,273 | |
Total System Services, Inc. | | 2,791 | | 39,074 | |
Tyco Electronics | | 6,488 | | 105,170 | |
VeriSign, Inc.* | | 2,751 | | 52,489 | |
Western Union Co. | | 10,145 | | 145,479 | |
Xerox Corp. | | 12,272 | | 97,808 | |
Xilinx, Inc. | | 3,883 | | 69,195 | |
Yahoo!, Inc.* | | 19,675 | | 240,035 | |
| | | | 17,057,432 | |
TELECOMMUNICATIONS (2.0%) | | | | | |
American Tower Corp. Cl A* | | 5,624 | | 164,896 | |
AT&T, Inc. | | 83,550 | | 2,381,175 | |
CenturyTel, Inc. | | 1,420 | | 38,809 | |
Embarq Corp. | | 2,013 | | 72,387 | |
Frontier Communications Corp. | | 4,414 | | 38,578 | |
Qwest Communications Int’l., Inc. | | 20,770 | | 75,603 | |
Sprint Nextel Corp.* | | 40,503 | | 74,120 | |
Verizon Communications, Inc. | | 40,272 | | 1,365,221 | |
Windstream Corp. | | 6,230 | | 57,316 | |
| | | | 4,268,105 | |
UTILITIES (2.1%) | | | | | |
AES Corp.* | | 9,538 | | 78,593 | |
Allegheny Energy, Inc. | | 2,397 | | 81,162 | |
Ameren Corp. | | 2,998 | | 99,713 | |
American Electric Power Co., Inc. | | 5,722 | | 190,428 | |
CenterPoint Energy, Inc. | | 4,879 | | 61,573 | |
CMS Energy Corp. | | 3,207 | | 32,423 | |
Consolidated Edison, Inc. | | 3,880 | | 151,048 | |
Constellation Energy Group, Inc. | | 2,530 | | 63,478 | |
Dominion Resources, Inc. | | 8,242 | | 295,393 | |
DTE Energy Co. | | 2,305 | | 82,219 | |
Duke Energy Corp. | | 17,939 | | 269,264 | |
Dynegy, Inc. Cl A* | | 7,170 | | 14,340 | |
Edison International | | 4,619 | | 148,362 | |
Entergy Corp. | | 2,684 | | 223,121 | |
Equitable Resources, Inc. | | 1,849 | | 62,034 | |
Exelon Corp. | | 9,328 | | 518,730 | |
FirstEnergy Corp. | | 4,322 | | 209,963 | |
FPL Group, Inc. | | 5,795 | | 291,662 | |
Integrys Energy Group, Inc. | | 1,080 | | 46,418 | |
Nicor, Inc. | | 638 | | 22,164 | |
NiSource, Inc. | | 3,888 | | 42,651 | |
Pepco Hldgs., Inc. | | 3,065 | | 54,434 | |
PG&E Corp. | | 5,118 | | 198,118 | |
Pinnacle West Capital Corp. | | 1,422 | | 45,689 | |
PPL Corp. | | 5,317 | | 163,179 | |
Progress Energy, Inc. | | 3,730 | | 148,641 | |
Public Svc. Enterprise Group, Inc. | | 7,175 | | 209,295 | |
Questar Corp. | | 2,452 | | 80,156 | |
SCANA Corp. | | 1,698 | | 60,449 | |
Sempra Energy | | 3,454 | | 147,244 | |
Southern Co. | | 10,982 | | 406,334 | |
TECO Energy, Inc. | | 3,008 | | 37,149 | |
Wisconsin Energy Corp. | | 1,658 | | 69,603 | |
Xcel Energy, Inc. | | 6,367 | | 118,108 | |
| | | | 4,723,138 | |
TOTAL INDEXED ASSETS - COMMON STOCKS
(Cost: $149,875,259) 50.4% | | | | 111,490,708 | |
| | Rating** | | Rate(%) | | Maturity | | Face Amount($) | | Value($) | |
INDEXED ASSETS: | | | | | | | | | | | |
SHORT-TERM DEBT SECURITIES: | | | | | | | | | | | |
U.S. GOVERNMENT (1.0%) | | | | | | | | | | | |
U.S. Treasury Bill (1) | | AAA | | 0.01 | | 04/30/09 | | 500,000 | | 499,950 | |
U.S. Treasury Bill (1) | | AAA | | 0.30 | | 02/05/09 | | 1,000,000 | | 999,708 | |
U.S. Treasury Bill (1) | | AAA | | 1.07 | | 01/02/09 | | 700,000 | | 699,980 | |
| | | | | | | | | | 2,199,638 | |
COMMERCIAL PAPER (2.2%) | | | | | | | | | | | |
Rockwell Collins, Inc.† | | A-1 | | 0.07 | | 01/02/09 | | 1,140,000 | | 1,139,998 | |
Toyota Motor Credit Corp. | | A-1+ | | 0.40 | | 01/21/09 | | 3,800,000 | | 3,799,156 | |
| | | | | | | | | | 4,939,154 | |
TOTAL INDEXED ASSETS - SHORT-TERM DEBT SECURITIES
(Cost: $7,138,825) 3.2% | | | | 7,138,792 | |
| | | | | |
TOTAL INDEXED ASSETS
(Cost: $157,014,084) 53.6% | | | | 118,629,500 | |
| | Shares | | Value($) | |
ACTIVE ASSETS: | | | | | |
COMMON STOCKS: | | | | | |
BASIC MATERIALS (1.7%) | | | | | |
Ball Corp. | | 7,215 | | 300,072 | |
Crown Hldgs., Inc.* | | 54,566 | | 1,047,667 | |
Cytec Industries, Inc. | | 11,659 | | 247,404 | |
Dow Chemical Co. | | 14,783 | | 223,075 | |
Freeport-McMoRan Copper & Gold, Inc. | | 5,053 | | 123,495 | |
Horsehead Hldg. Corp.* | | 20,966 | | 98,540 | |
Louisiana-Pacific Corp. | | 39,165 | | 61,097 | |
Monsanto Co. | | 5,790 | | 407,327 | |
Royal Gold, Inc. | | 9,162 | | 450,862 | |
Silgan Hldgs., Inc. | | 17,331 | | 828,595 | |
Taseko Mines Ltd.* | | 93,541 | | 53,318 | |
| | | | 3,841,452 | |
CONSUMER, CYCLICAL (4.0%) | | | | | |
Aeropostale, Inc.* | | 13,186 | | 212,295 | |
Apollo Group, Inc. Cl A* | | 1,942 | | 148,796 | |
ArvinMeritor, Inc. | | 30,879 | | 88,005 | |
California Pizza Kitchen, Inc.* | | 29,019 | | 311,084 | |
Comcast Corp. Cl A | | 33,167 | | 559,859 | |
Corinthian Colleges, Inc.* | | 13,212 | | 216,280 | |
DeVry, Inc. | | 2,315 | | 132,904 | |
Dillard’s, Inc. Cl A | | 64,526 | | 256,168 | |
Family Dollar Stores, Inc. | | 10,582 | | 275,873 | |
Gymboree Corp.* | | 9,271 | | 241,880 | |
Home Depot, Inc. | | 6,555 | | 150,896 | |
Johnson Controls, Inc. | | 19,298 | | 350,452 | |
Landry’s Restaurants, Inc. | | 9,864 | | 114,422 | |
Leapfrog Enterprises, Inc.* | | 26,553 | | 92,936 | |
McDonald’s Corp. | | 15,316 | | 952,502 | |
Netflix, Inc.* | | 12,095 | | 361,520 | |
Omnicom Group, Inc. | | 9,340 | | 251,433 | |
P.F. Chang’s China Bistro, Inc.* | | 9,079 | | 190,114 | |
Pep Boys - Manny, Moe & Jack | | 38,571 | | 159,298 | |
Rent-A-Center, Inc.* | | 20,122 | | 355,153 | |
Sonic Corp.* | | 16,108 | | 196,034 | |
Staples, Inc. | | 23,512 | | 421,335 | |
Target Corp. | | 5,339 | | 184,356 | |
Time Warner, Inc. | | 26,455 | | 266,137 | |
TJX Cos., Inc. | | 4,425 | | 91,022 | |
Tupperware Brands Corp. | | 45,669 | | 1,036,686 | |
V.F. Corp. | | 4,700 | | 257,419 | |
WMS Industries, Inc.* | | 15,092 | | 405,975 | |
Wolverine World Wide, Inc. | | 29,411 | | 618,807 | |
| | | | 8,899,641 | |
CONSUMER, NON-CYCLICAL (4.1%) | | | | | |
American Italian Pasta Co. Cl A* | | 37,133 | | 829,551 | |
Campbell Soup Co. | | 9,760 | | 292,898 | |
Casey’s General Stores, Inc. | | 3,941 | | 89,737 | |
Chattem, Inc.* | | 4,623 | | 330,683 | |
Clorox Co. | | 4,841 | | 268,966 | |
Colgate-Palmolive Co. | | 3,786 | | 259,492 | |
CVS Caremark Corp. | | 18,871 | | 542,353 | |
Flowers Foods, Inc. | | 4,455 | | 108,524 | |
General Mills, Inc. | | 10,636 | | 646,137 | |
Great Atlantic & Pacific Tea Co., Inc.* | | 49,746 | | 311,907 | |
Heinz (H.J.) Co. | | 6,390 | | 240,264 | |
Kimberly-Clark Corp. | | 4,656 | | 245,557 | |
Kraft Foods, Inc. Cl A | | 13,011 | | 349,345 | |
PepsiCo, Inc. | | 15,709 | | 860,382 | |
Proctor & Gamble Co. | | 23,331 | | 1,442,322 | |
Ralcorp Hldgs., Inc.* | | 8,157 | | 476,369 | |
Vector Group Ltd. | | 37,489 | | 510,600 | |
Wal-Mart Stores, Inc. | | 21,916 | | 1,228,611 | |
| | | | 9,033,698 | |
ENERGY (3.9%) | | | | | |
Apache Corp. | | 3,145 | | 234,397 | |
Chevron Corp. | | 11,280 | | 834,382 | |
CNX Gas Corp.* | | 9,088 | | 248,102 | |
Concho Resources, Inc.* | | 13,425 | | 306,359 | |
ConocoPhillips | | 8,948 | | 463,506 | |
Consol Energy, Inc. | | 4,838 | | 138,270 | |
Devon Energy Corp. | | 4,431 | | 291,161 | |
Dresser-Rand Group, Inc.* | | 7,354 | | 126,857 | |
Dril-Quip, Inc.* | | 6,438 | | 132,043 | |
Ellora Energy, Inc.† | | 21,800 | | 261,600 | |
Exxon Mobil Corp. | | 32,795 | | 2,618,025 | |
Halliburton Co. | | 18,981 | | 345,075 | |
Noble Corp. | | 7,441 | | 164,372 | |
Occidental Petroleum Corp. | | 9,333 | | 559,887 | |
Penn Virginia Corp. | | 9,922 | | 257,774 | |
Pride International, Inc.* | | 7,875 | | 125,843 | |
Range Resources Corp. | | 5,352 | | 184,055 | |
Schlumberger Ltd. | | 7,884 | | 333,730 | |
Southwestern Energy Co.* | | 3,815 | | 110,521 | |
Superior Well Services, Inc.* | | 6,618 | | 66,180 | |
T-3 Energy Services, Inc.* | | 18,978 | | 179,152 | |
Trico Marine Services, Inc.* | | 13,617 | | 60,868 | |
Valero Energy Corp. | | 3,540 | | 76,606 | |
Willbros Group, Inc.* | | 11,389 | | 96,465 | |
Williams Cos., Inc. | | 11,624 | | 168,316 | |
XTO Energy, Inc. | | 3,831 | | 135,119 | |
| | | | 8,518,665 | |
FINANCIAL (9.0%) | | | | | |
Aflac, Inc. | | 5,238 | | 240,110 | |
Ashford Hospitality Trust, Inc. | | 77,374 | | 88,980 | |
Aspen Insurance Hldgs. Ltd. | | 21,261 | | 515,579 | |
BancFirst Corp. | | 4,836 | | 255,921 | |
Bank Mutual Corp. | | 45,670 | | 527,032 | |
Bank of America Corp. | | 26,165 | | 368,403 | |
Bank of New York Mellon Corp. | | 16,262 | | 460,702 | |
Brookline Bancorp, Inc. | | 46,408 | | 494,245 | |
Capital One Financial Corp. | | 10,531 | | 335,834 | |
CapLease, Inc. | | 8,342 | | 14,432 | |
Chubb Corp. | | 6,539 | | 333,489 | |
Citigroup, Inc. | | 27,585 | | 185,095 | |
CME Group, Inc. | | 1,089 | | 226,632 | |
Ellington Financial LLC† | | 21,000 | | 420,000 | |
Federated Investors, Inc. Cl B | | 9,067 | | 153,776 | |
FelCor Lodging Trust, Inc. | | 34,033 | | 62,621 | |
First Niagara Financial Group, Inc. | | 35,170 | | 568,699 | |
Glacier Bancorp, Inc. | | 36,361 | | 691,586 | |
Goldman Sachs Group, Inc. | | 3,813 | | 321,779 | |
Highwoods Properties, Inc. | | 14,605 | | 399,593 | |
IBERIABANK Corp. | | 4,653 | | 223,344 | |
iShares Russell 2000 Growth Index Fund | | 18,850 | | 958,711 | |
iShares Russell 2000 Index Fund | | 5,740 | | 282,810 | |
iShares Russell 2000 Value Index Fund | | 5,800 | | 285,186 | |
iShares Russell Microcap Index Fund | | 4,179 | | 133,101 | |
JPMorgan Chase & Co. | | 18,540 | | 584,566 | |
Marlin Business Svcs. Corp.* | | 26,616 | | 70,532 | |
Meadowbrook Insurance Group, Inc. | | 50,303 | | 323,951 | |
Medical Properties Trust, Inc. | | 19,472 | | 122,868 | |
MetLife, Inc. | | 14,434 | | 503,169 | |
MFA Mortgage Investment, Inc. | | 51,301 | | 302,163 | |
Mid-America Apt. Communities, Inc. | | 5,021 | | 186,580 | |
MSCI, Inc. Cl A* | | 5,640 | | 100,166 | |
Nara Bancorp, Inc. | | 12,473 | | 122,610 | |
National Penn Bancshares, Inc. | | 32,755 | | 475,275 | |
NewAlliance Bancshares, Inc. | | 52,959 | | 697,470 | |
Pennsylvania REIT | | 13,605 | | 101,357 | |
PMA Capital Corp. Cl A* | | 36,585 | | 259,022 | |
ProAssurance Corp.* | | 8,305 | | 438,338 | |
Progressive Corp. | | 17,289 | | 256,050 | |
ProLogis | | 7,927 | | 110,106 | |
Realty Income Corp. | | 28,799 | | 666,697 | |
S.Y. Bancorp, Inc. | | 13,152 | | 361,680 | |
SeaBright Insurance Hldgs., Inc.* | | 27,487 | | 322,697 | |
Senior Housing Pptys. Trust | | 33,524 | | 600,750 | |
SPDR KBW Regional Banking ETF | | 30,765 | | 897,107 | |
Stifel Financial Corp.* | | 9,505 | | 435,804 | |
T. Rowe Price Group, Inc. | | 9,907 | | 351,104 | |
Tower Group, Inc. | | 7,793 | | 219,841 | |
Trico Bancshares | | 13,531 | | 337,869 | |
U.S. Bancorp | | 16,769 | | 419,393 | |
Vintage Wine Trust, Inc.†*** | | 45,820 | | 13,746 | |
Wells Fargo & Co. | | 34,744 | | 1,024,253 | |
Westamerica Bancorporation | | 17,147 | | 877,069 | |
Westfield Financial, Inc. | | 24,801 | | 255,946 | |
| | | | 19,985,839 | |
HEALTHCARE (6.6%) | | | | | |
Abbott Laboratories | | 23,573 | | 1,258,091 | |
Abiomed, Inc.* | | 19,208 | | 315,395 | |
Acorda Therapeutics, Inc.* | | 6,125 | | 125,624 | |
Aetna, Inc. | | 5,560 | | 158,460 | |
Alexion Pharmaceuticals, Inc.* | | 8,862 | | 320,716 | |
Allscripts Healthcare Solution | | 19,040 | | 188,877 | |
Almost Family, Inc.* | | 6,022 | | 270,870 | |
Alnylam Pharmaceuticals, Inc.* | | 6,669 | | 164,924 | |
Alphatec Hldgs., Inc.* | | 107,246 | | 252,028 | |
American Medical Systems Hldgs., Inc.* | | 39,490 | | 355,015 | |
AmerisourceBergen Corp. | | 8,607 | | 306,926 | |
Animal Health Int’l., Inc.* | | 21,810 | | 46,455 | |
Auxilium Pharmaceuticals, Inc.* | | 4,256 | | 121,041 | |
Baxter International, Inc. | | 4,015 | | 215,164 | |
Celgene Corp.* | | 9,170 | | 506,918 | |
Cepheid* | | 5,510 | | 57,194 | |
Conceptus, Inc.* | | 28,627 | | 435,703 | |
Conmed Corp.* | | 14,145 | | 338,631 | |
Covidien Ltd. | | 13,873 | | 502,758 | |
Enzon Pharmaceuticals, Inc.* | | 133,795 | | 780,025 | |
ev3, Inc.* | | 18,127 | | 110,575 | |
Gilead Sciences, Inc.* | | 21,372 | | 1,092,964 | |
Immucor, Inc.* | | 12,199 | | 324,249 | |
Isis Pharmaceuticals, Inc.* | | 8,228 | | 116,673 | |
Johnson & Johnson | | 26,461 | | 1,583,162 | |
Laboratory Corp. of America Hldgs.* | | 4,729 | | 304,595 | |
Landauer, Inc. | | 4,165 | | 305,295 | |
Magellan Health Svcs., Inc.* | | 10,719 | | 419,756 | |
McKesson Corp. | | 6,982 | | 270,413 | |
MedAssets, Inc.* | | 19,934 | | 291,036 | |
Medco Health Solutions, Inc.* | | 3,385 | | 141,865 | |
Medtronic, Inc. | | 8,916 | | 280,141 | |
Merck & Co., Inc. | | 9,862 | | 299,805 | |
Myriad Genetics, Inc.* | | 4,511 | | 298,899 | |
Neogen Corp.* | | 9,110 | | 227,568 | |
Onyx Pharmaceuticals, Inc.* | | 5,822 | | 198,880 | |
OSI Pharmaceuticals, Inc.* | | 6,028 | | 235,393 | |
OSI Pharmaceuticals, Inc. - rights* | | 1,570 | | 1 | |
Owens & Minor, Inc. | | 5,840 | | 219,876 | |
Psychiatric Solutions, Inc.* | | 6,624 | | 184,478 | |
Schering-Plough Corp. | | 25,737 | | 438,301 | |
Seattle Genetics, Inc.* | | 18,921 | | 169,154 | |
Sepracor, Inc.* | | 9,220 | | 101,236 | |
STERIS Corp. | | 10,278 | | 245,541 | |
United Therapeutics Corp.* | | 1,427 | | 89,259 | |
| | | | 14,669,930 | |
INDUSTRIAL (6.3%) | | | | | |
Actuant Corp. Cl A | | 7,374 | | 140,253 | |
Aircastle Ltd. | | 31,902 | | 152,492 | |
Alaska Air Group, Inc.* | | 24,289 | | 710,453 | |
Astec Industries, Inc.* | | 10,883 | | 340,964 | |
AZZ, Inc.* | | 8,929 | | 224,118 | |
Belden, Inc. | | 7,475 | | 156,078 | |
Burlington Northern Santa Fe Corp. | | 3,887 | | 294,285 | |
Comfort Systems USA, Inc. | | 19,078 | | 203,371 | |
Cornell Cos., Inc.* | | 12,617 | | 234,550 | |
CRA International, Inc.* | | 9,426 | | 253,842 | |
Curtiss-Wright Corp. | | 6,204 | | 207,152 | |
Dollar Thrifty Automotive Grp.* | | 60,970 | | 66,457 | |
DXP Enterprises, Inc.* | | 10,249 | | 149,738 | |
Expeditors Int’l. of Washington, Inc. | | 7,490 | | 249,192 | |
Exponent, Inc.* | | 8,399 | | 252,642 | |
General Electric Co. | | 74,207 | | 1,202,153 | |
Genesee & Wyoming, Inc. Cl A* | | 24,589 | | 749,965 | |
Hub Group, Inc. Cl A* | | 7,811 | | 207,226 | |
Huron Consulting Group, Inc.* | | 8,358 | | 478,663 | |
Illinois Tool Works, Inc. | | 7,546 | | 264,487 | |
Insteel Industries, Inc. | | 15,522 | | 175,243 | |
ITT Corp. | | 8,356 | | 384,292 | |
JetBlue Airways Corp* | | 50,000 | | 355,000 | |
Lockheed Martin Corp. | | 6,516 | | 547,865 | |
Mueller Industries, Inc. | | 30,908 | | 775,173 | |
Northrop Grumman Corp. | | 9,273 | | 417,656 | |
Old Dominion Freight Line, Inc.* | | 26,717 | | 760,366 | |
Perini Corp.* | | 21,800 | | 509,684 | |
Powell Industries, Inc.* | | 4,205 | | 122,029 | |
RBC Bearings, Inc.* | | 5,655 | | 114,683 | |
Sauer-Danfoss, Inc. | | 6,344 | | 55,510 | |
Southwest Airlines Co. | | 28,769 | | 247,989 | |
Stanley, Inc.* | | 7,508 | | 271,940 | |
Sun Hydraulics Corp. | | 12,874 | | 242,546 | |
Teledyne Technologies, Inc.* | | 4,464 | | 198,871 | |
Tyco International Ltd. | | 13,742 | | 296,827 | |
Union Pacific Corp. | | 5,393 | | 257,785 | |
United Parcel Service, Inc. Cl B | | 11,211 | | 618,399 | |
United Technologies Corp. | | 9,431 | | 505,502 | |
Waste Connections, Inc.* | | 5,528 | | 174,519 | |
Watson Wyatt Worldwide, Inc. Cl A | | 4,900 | | 234,318 | |
Woodward Governor Co. | | 7,423 | | 170,877 | |
| | | | 13,975,155 | |
TECHNOLOGY (6.0%) | | | | | |
Anixter International, Inc.* | | 4,237 | | 127,618 | |
Ansys, Inc.* | | 7,648 | | 213,303 | |
Apple, Inc.* | | 7,548 | | 644,222 | |
Applied Materials, Inc. | | 22,803 | | 230,994 | |
Automatic Data Processing, Inc. | | 8,735 | | 343,635 | |
Broadcom Corp. Cl A* | | 8,404 | | 142,616 | |
Cisco Systems, Inc.* | | 38,027 | | 619,840 | |
Data Domain, Inc.* | | 29,243 | | 549,768 | |
EMC Corp.* | | 15,768 | | 165,091 | |
FormFactor, Inc.* | | 9,006 | | 131,488 | |
Forrester Research, Inc.* | | 3,075 | | 86,746 | |
Global Cash Access Hldgs., Inc.* | | 35,916 | | 79,734 | |
Google, Inc.* | | 1,048 | | 322,417 | |
Harmonic, Inc.* | | 31,572 | | 177,119 | |
Hewlett-Packard Co. | | 20,181 | | 732,368 | |
Informatica Corp.* | | 45,167 | | 620,143 | |
Int’l. Business Machines Corp. | | 9,261 | | 779,406 | |
Intel Corp. | | 25,886 | | 379,489 | |
L-1 Identity Solutions, Inc.* | | 20,828 | | 140,381 | |
Littelfuse, Inc.* | | 8,450 | | 140,270 | |
MEMC Electronic Materials, Inc.* | | 3,621 | | 51,708 | |
Microsemi Corp.* | | 24,627 | | 311,285 | |
Microsoft Corp. | | 48,069 | | 934,461 | |
MKS Instruments, Inc.* | | 19,734 | | 291,866 | |
Monolithic Power Systems, Inc.* | | 11,543 | | 145,557 | |
Omniture, Inc.* | | 13,940 | | 148,322 | |
Oracle Corp.* | | 21,657 | | 383,979 | |
Parametric Technology Corp.* | | 46,206 | | 584,506 | |
Plexus Corp.* | | 12,895 | | 218,570 | |
QUALCOMM, Inc. | | 14,830 | | 531,359 | |
Semtech Corp.* | | 22,161 | | 249,754 | |
Sybase, Inc.* | | 26,416 | | 654,324 | |
Symantec Corp.* | | 30,331 | | 410,075 | |
Tech Data Corp.* | | 4,999 | | 89,182 | |
Technitrol, Inc. | | 14,786 | | 51,455 | |
TIBCO Software, Inc.* | | 38,093 | | 197,703 | |
Trimble Navigation Ltd.* | | 6,650 | | 143,707 | |
ViaSat, Inc.* | | 14,209 | | 342,153 | |
Websense, Inc.* | | 45,460 | | 680,536 | |
Yahoo!, Inc.* | | 16,265 | | 198,433 | |
| | | | 13,245,583 | |
TELECOMMUNICATIONS (1.2%) | | | | | |
American Tower Corp. Cl A* | | 11,664 | | 341,988 | |
AT&T, Inc. | | 39,817 | | 1,134,785 | |
Consolidated Comms. Hldgs., Inc. | | 32,960 | | 391,565 | |
Iowa Telecommunications Svcs., Inc. | | 19,156 | | 273,548 | |
Syniverse Hldgs., Inc.* | | 40,277 | | 480,907 | |
| | | | 2,622,793 | |
UTILITIES (2.0%) | | | | | |
ALLETE, Inc. | | 6,073 | | 195,976 | |
Avista Corp. | | 38,872 | | 753,339 | |
Black Hills Corp. | | 6,281 | | 169,336 | |
Dominion Resources, Inc. | | 12,254 | | 439,183 | |
Edison International | | 3,437 | | 110,396 | |
Entergy Corp. | | 1,912 | | 158,945 | |
Exelon Corp. | | 5,085 | | 282,777 | |
FirstEnergy Corp. | | 5,230 | | 254,073 | |
FPL Group, Inc. | | 3,918 | | 197,193 | |
Northwest Natural Gas Co. | | 5,140 | | 227,342 | |
NV Energy, Inc. | | 17,985 | | 177,872 | |
PNM Resources, Inc. | | 15,941 | | 160,685 | |
Public Svc. Enterprise Group, Inc. | | 4,719 | | 137,653 | |
Sempra Energy | | 6,376 | | 271,809 | |
Unisource Energy Corp. | | 14,307 | | 420,054 | |
Westar Energy, Inc. | | 17,575 | | 360,463 | |
| | | | 4,317,096 | |
TOTAL ACTIVE ASSETS - COMMON STOCKS
(Cost: $124,430,840) 44.8% | | | | 99,109,852 | |
| | Rating** | | Rate(%) | | Maturity | | Face Amount($) | | Value($) | |
ACTIVE ASSETS: | | | | | | | | | | | |
LONG-TERM DEBT SECURITIES: | | | | | | | | | | | |
FINANCIAL (0.0%) | | | | | | | | | | | |
GSC Capital Corp.†(2) | | NR | | 7.25 | | 07/15/10 | | 460,000 | | 0 | |
| | | | | | | | | | | |
TOTAL ACTIVE ASSETS - LONG-TERM DEBT SECURITIES
(Cost: $460,000) 0.0% | | | | | | 0 | |
| | Rating** | | Rate(%) | | Maturity | | Face Amount($) | | Value($) | |
ACTIVE ASSETS: | | | | | | | | | | | |
SHORT-TERM DEBT SECURITIES: | | | | | | | | | | | |
COMMERCIAL PAPER (1.6%) | | | | | | | | | | | |
Rockwell Collins, Inc.† | | A-1 | | 0.07 | | 01/02/09 | | 2,900,000 | | 2,899,994 | |
Washington Post Co.† | | A-1 | | 0.03 | | 01/05/09 | | 700,000 | | 699,998 | |
| | | | | | | | | | 3,599,992 | |
TOTAL ACTIVE ASSETS - SHORT-TERM DEBT SECURITIES
(Cost: $3,599,992) 1.6% | | | | | | 3,599,992 | |
| | | | | | | | | | | |
TOTAL ACTIVE ASSETS
(Cost: $128,490,832) 46.4% | | | | | | 102,709,844 | |
| | | | | | | | | | | |
TEMPORARY CASH INVESTMENTS (3)
(Cost: $266,800) 0.1% | | | | | | 266,800 | |
| | | | | | | | | | | |
TOTAL INVESTMENTS
(Cost: $285,771,716) 100.1% | | | | | | | | | | 221,606,144 | |
| | | | | | | | | | | |
OTHER NET ASSETS (0.1%) | | | | | | | | | | (100,407 | ) |
| | | | | | | | | | | |
NET ASSETS 100.0% | | | | | | | | | | $ | 221,505,737 | |
| | | | | | | | | | | | |
The accompanying notes are an integral part of these portfolio schedules.
MUTUAL OF AMERICA INVESTMENT CORPORATION (SMALL CAP VALUE FUND)
PORTFOLIO OF INVESTMENTS IN SECURITIES
December 31, 2008
| | Shares | | Value($) | |
COMMON STOCKS: | | | | | |
BASIC MATERIALS (7.7%) | | | | | |
Crown Hldgs., Inc.* | | 307,509 | | 5,904,173 | |
Cytec Industries, Inc. | | 65,093 | | 1,381,273 | |
Horsehead Hldg. Corp.* | | 115,646 | | 543,536 | |
Louisiana-Pacific Corp. | | 208,126 | | 324,677 | |
Silgan Hldgs., Inc. | | 72,740 | | 3,477,699 | |
Taseko Mines Ltd.* | | 497,732 | | 283,707 | |
| | | | 11,915,065 | |
CONSUMER, CYCLICAL (6.9%) | | | | | |
Dillard’s, Inc. Cl A | | 364,753 | | 1,448,069 | |
Landry’s Restaurants, Inc. | | 54,058 | | 627,073 | |
Pep Boys - Manny, Moe & Jack | | 211,618 | | 873,982 | |
Rent-A-Center, Inc.* | | 113,956 | | 2,011,323 | |
Tupperware Brands Corp. | | 167,293 | | 3,797,551 | |
Wolverine World Wide, Inc. | | 93,385 | | 1,964,820 | |
| | | | 10,722,818 | |
CONSUMER, NON-CYCLICAL (7.2%) | | | | | |
American Italian Pasta Co. Cl A* | | 204,187 | | 4,561,538 | |
Casey’s General Stores, Inc. | | 22,308 | | 507,953 | |
Chattem, Inc.* | | 10,653 | | 762,009 | |
Flowers Foods, Inc. | | 25,174 | | 613,239 | |
Great Atlantic & Pacific Tea Co., Inc.* | | 280,895 | | 1,761,212 | |
Ralcorp Hldgs., Inc.* | | 15,593 | | 910,631 | |
Vector Group Ltd. | | 149,410 | | 2,034,964 | |
| | | | 11,151,546 | |
ENERGY (1.9%) | | | | | |
CNX Gas Corp.* | | 24,897 | | 679,688 | |
Ellora Energy, Inc.† | | 119,800 | | 1,437,600 | |
Superior Well Services, Inc.* | | 36,739 | | 367,390 | |
T-3 Energy Services, Inc.* | | 17,643 | | 166,550 | |
Trico Marine Services, Inc.* | | 75,916 | | 339,345 | |
| | | | 2,990,573 | |
FINANCIAL (37.6%) | | | | | |
Ashford Hospitality Trust, Inc. | | 415,444 | | 477,761 | |
Aspen Insurance Hldgs. Ltd. | | 116,870 | | 2,834,098 | |
BancFirst Corp. | | 27,328 | | 1,446,198 | |
Bank Mutual Corp. | | 258,034 | | 2,977,712 | |
Brookline Bancorp, Inc. | | 262,784 | | 2,798,650 | |
CapLease, Inc. | | 45,534 | | 78,774 | |
Ellington Financial LLC† | | 123,900 | | 2,478,000 | |
FelCor Lodging Trust, Inc. | | 181,679 | | 334,289 | |
First Niagara Financial Group, Inc. | | 198,846 | | 3,215,340 | |
Glacier Bancorp, Inc. | | 133,149 | | 2,532,494 | |
Highwoods Properties, Inc. | | 80,296 | | 2,196,899 | |
IBERIABANK Corp. | | 26,340 | | 1,264,320 | |
iShares Russell 2000 Index Fund | | 31,570 | | 1,555,454 | |
iShares Russell 2000 Value Index Fund | | 31,890 | | 1,568,031 | |
Marlin Business Svcs. Corp.* | | 145,828 | | 386,444 | |
Meadowbrook Insurance Group, Inc. | | 276,483 | | 1,780,551 | |
Medical Properties Trust, Inc. | | 106,922 | | 674,678 | |
MFA Mortgage Investment, Inc. | | 290,507 | | 1,711,086 | |
Mid-America Apt. Communities, Inc. | | 27,613 | | 1,026,099 | |
Nara Bancorp, Inc. | | 70,620 | | 694,195 | |
National Penn Bancshares, Inc. | | 185,548 | | 2,692,301 | |
NewAlliance Bancshares, Inc. | | 216,271 | | 2,848,289 | |
Pennsylvania REIT | | 75,234 | | 560,493 | |
PMA Capital Corp. Cl A* | | 205,703 | | 1,456,377 | |
ProAssurance Corp.* | | 45,656 | | 2,409,724 | |
Realty Income Corp. | | 81,030 | | 1,875,845 | |
S.Y. Bancorp, Inc. | | 74,256 | | 2,042,040 | |
SeaBright Insurance Hldgs., Inc.* | | 155,526 | | 1,825,875 | |
Senior Housing Pptys. Trust | | 100,291 | | 1,797,215 | |
SPDR KBW Regional Banking ETF | | 96,890 | | 2,825,312 | |
Trico Bancshares | | 75,112 | | 1,875,547 | |
Vintage Wine Trust, Inc.†*** | | 246,840 | | 74,052 | |
Westamerica Bancorporation | | 53,045 | | 2,713,252 | |
Westfield Financial, Inc. | | 140,435 | | 1,449,289 | |
| | | | 58,476,684 | |
HEALTHCARE (4.3%) | | | | | |
Alphatec Hldgs., Inc.* | | 314,986 | | 740,217 | |
American Medical Systems Hldgs., Inc.* | | 64,546 | | 580,269 | |
Animal Health Int’l., Inc.* | | 119,920 | | 255,430 | |
Conceptus, Inc.* | | 90,602 | | 1,378,962 | |
Conmed Corp.* | | 24,826 | | 594,334 | |
Enzon Pharmaceuticals, Inc.* | | 440,855 | | 2,570,185 | |
Sepracor, Inc.* | | 52,027 | | 571,256 | |
| | | | 6,690,653 | |
INDUSTRIAL (11.9%) | | | | | |
Aircastle Ltd. | | 180,718 | | 863,832 | |
Alaska Air Group, Inc.* | | 134,880 | | 3,945,240 | |
Cornell Cos., Inc.* | | 71,288 | | 1,325,244 | |
CRA International, Inc.* | | 53,352 | | 1,436,769 | |
Dollar Thrifty Automotive Grp.* | | 327,390 | | 356,855 | |
Genesee & Wyoming, Inc. Cl A* | | 57,184 | | 1,744,112 | |
Mueller Industries, Inc. | | 174,672 | | 4,380,774 | |
Old Dominion Freight Line, Inc.* | | 80,465 | | 2,290,034 | |
Perini Corp.* | | 87,507 | | 2,045,914 | |
| | | | 18,388,774 | |
TECHNOLOGY (8.0%) | | | | | |
Anixter International, Inc.* | | 23,853 | | 718,452 | |
Data Domain, Inc.* | | 71,562 | | 1,345,366 | |
Global Cash Access Hldgs., Inc.* | | 198,654 | | 441,012 | |
Informatica Corp.* | | 94,136 | | 1,292,487 | |
Littelfuse, Inc.* | | 17,444 | | 289,570 | |
Microsemi Corp.* | | 28,771 | | 363,665 | |
MKS Instruments, Inc.* | | 50,064 | | 740,447 | |
Parametric Technology Corp.* | | 133,934 | | 1,694,265 | |
Semtech Corp.* | | 28,600 | | 322,322 | |
Sybase, Inc.* | | 64,461 | | 1,596,699 | |
Tech Data Corp.* | | 28,219 | | 503,427 | |
Technitrol, Inc. | | 83,579 | | 290,855 | |
TIBCO Software, Inc.* | | 203,133 | | 1,054,260 | |
Websense, Inc.* | | 118,667 | | 1,776,445 | |
| | | | 12,429,272 | |
TELECOMMUNICATIONS (2.3%) | | | | | |
Consolidated Comms. Hldgs., Inc. | | 67,748 | | 804,846 | |
Iowa Telecommunications Svcs., Inc. | | 106,466 | | 1,520,334 | |
Syniverse Hldgs., Inc.* | | 109,984 | | 1,313,209 | |
| | | | 3,638,389 | |
UTILITIES (7.0%) | | | | | |
Avista Corp. | | 123,693 | | 2,397,170 | |
Black Hills Corp. | | 34,503 | | 930,201 | |
Northwest Natural Gas Co. | | 28,283 | | 1,250,957 | |
NV Energy, Inc. | | 98,539 | | 974,551 | |
PNM Resources, Inc. | | 88,294 | | 890,004 | |
Unisource Energy Corp. | | 79,227 | | 2,326,105 | |
Westar Energy, Inc. | | 102,400 | | 2,100,224 | |
| | | | 10,869,212 | |
TOTAL COMMON STOCKS
(Cost: $190,455,820) 94.8% | | | | 147,272,986 | |
| | Rating** | | Rate(%) | | Maturity | | Face Amount($) | | Value($) | |
LONG-TERM DEBT SECURITIES: | | | | | | | | | | | |
FINANCIAL (0.0%) | | | | | | | | | | | |
GSC Capital Corp.†(2) | | NR | | 7.25 | | 07/15/10 | | 1,890,000 | | 0 | |
| | | | | | | | | |
TOTAL LONG-TERM DEBT SECURITIES
(Cost: $1,890,000) 0.0% | | | | | | | | 0 | |
| | Rating** | | Rate(%) | | Maturity | | Face Amount($) | | Value($) | |
SHORT-TERM DEBT SECURITIES: | | | | | | | | | | | |
U.S. GOVERNMENT AGENCIES (0.3%) | | | | | | | | | | | |
FHLMC | | AAA | | 0.03 | | 02/04/09 | | 420,000 | | 419,988 | |
| | | | | | | | | | | |
COMMERCIAL PAPER (4.7%) | | | | | | | | | | | |
Danaher Corp. | | A-1 | | 0.02 | | 01/05/09 | | 3,800,000 | | 3,799,992 | |
Hershey Co. | | A-1 | | 1.15 | | 01/12/09 | | 1,000,000 | | 999,648 | |
Rockwell Collins, Inc.† | | A-1 | | 0.07 | | 01/02/09 | | 1,000,000 | | 999,998 | |
Washington Post Co.† | | A-1 | | 0.03 | | 01/05/09 | | 1,500,000 | | 1,499,995 | |
| | | | | | | | | | 7,299,633 | |
TOTAL SHORT-TERM DEBT SECURITIES
(Cost: $7,719,621) 5.0% | | | | | | | | 7,719,621 | |
| | | | | | | | | | | |
TOTAL INVESTMENTS
(Cost: $200,065,441) 99.8% | | | | | | | | | | 154,992,607 | |
| | | | | | | | | | | |
OTHER NET ASSETS 0.2% | | | | | | | | | | 338,939 | |
| | | | | | | | | | | |
NET ASSETS 100.0% | | | | | | | | | | $ | 155,331,546 | |
| | | | | | | | | | | | |
The accompanying notes are an integral part of these portfolio schedules.
MUTUAL OF AMERICA INVESTMENT CORPORATION (SMALL CAP GROWTH FUND)
PORTFOLIO OF INVESTMENTS IN SECURITIES
December 31, 2008
| | Shares | | Value($) | |
COMMON STOCKS: | | | | | |
BASIC MATERIALS (2.4%) | | | | | |
Royal Gold, Inc. | | 50,590 | | 2,489,534 | |
Silgan Hldgs., Inc. | | 22,756 | | 1,087,964 | |
| | | | 3,577,498 | |
CONSUMER, CYCLICAL (11.5%) | | | | | |
Aeropostale, Inc.* | | 72,957 | | 1,174,608 | |
ArvinMeritor, Inc. | | 171,076 | | 487,567 | |
California Pizza Kitchen, Inc.* | | 160,330 | | 1,718,738 | |
Corinthian Colleges, Inc.* | | 73,020 | | 1,195,337 | |
DeVry, Inc. | | 12,846 | | 737,489 | |
Gymboree Corp.* | | 51,269 | | 1,337,608 | |
Leapfrog Enterprises, Inc.* | | 146,785 | | 513,748 | |
Netflix, Inc.* | | 66,883 | | 1,999,133 | |
P.F. Chang’s China Bistro, Inc.* | | 50,428 | | 1,055,962 | |
Sonic Corp.* | | 89,043 | | 1,083,653 | |
Tupperware Brands Corp. | | 85,275 | | 1,935,743 | |
WMS Industries, Inc.* | | 83,506 | | 2,246,311 | |
Wolverine World Wide, Inc. | | 68,811 | | 1,447,783 | |
| | | | 16,933,680 | |
CONSUMER, NON-CYCLICAL (2.5%) | | | | | |
Chattem, Inc.* | | 15,154 | | 1,083,966 | |
Ralcorp Hldgs., Inc.* | | 29,833 | | 1,742,247 | |
Vector Group Ltd. | | 58,468 | | 796,334 | |
| | | | 3,622,547 | |
ENERGY (5.0%) | | | | | |
CNX Gas Corp.* | | 25,700 | | 701,610 | |
Concho Resources, Inc.* | | 74,341 | | 1,696,462 | |
Dresser-Rand Group, Inc.* | | 40,560 | | 699,660 | |
Dril-Quip, Inc.* | | 35,579 | | 729,725 | |
Penn Virginia Corp. | | 54,826 | | 1,424,379 | |
Pride International, Inc.* | | 43,500 | | 695,130 | |
T-3 Energy Services, Inc.* | | 87,362 | | 824,697 | |
Willbros Group, Inc.* | | 63,018 | | 533,762 | |
| | | | 7,305,425 | |
FINANCIAL (13.7%) | | | | | |
Glacier Bancorp, Inc. | | 70,973 | | 1,349,906 | |
iShares Russell 2000 Growth Index Fund | | 102,887 | | 5,232,830 | |
iShares Russell Microcap Index Fund | | 22,814 | | 726,626 | |
MSCI, Inc. Cl A* | | 31,199 | | 554,094 | |
NewAlliance Bancshares, Inc. | | 81,287 | | 1,070,550 | |
Realty Income Corp. | | 78,317 | | 1,813,039 | |
Senior Housing Pptys. Trust | | 84,605 | | 1,516,122 | |
SPDR KBW Regional Banking ETF | | 71,363 | | 2,080,945 | |
Stifel Financial Corp.* | | 52,599 | | 2,411,664 | |
Tower Group, Inc. | | 43,282 | | 1,220,985 | |
Westamerica Bancorporation | | 43,108 | | 2,204,974 | |
| | | | 20,181,735 | |
HEALTHCARE (23.0%) | | | | | |
Abiomed, Inc.* | | 106,147 | | 1,742,934 | |
Acorda Therapeutics, Inc.* | | 33,860 | | 694,469 | |
Alexion Pharmaceuticals, Inc.* | | 49,062 | | 1,775,554 | |
Allscripts Healthcare Solution | | 105,247 | | 1,044,050 | |
Almost Family, Inc.* | | 33,261 | | 1,496,080 | |
Alnylam Pharmaceuticals, Inc.* | | 36,819 | | 910,534 | |
Alphatec Hldgs., Inc.* | | 284,338 | | 668,194 | |
American Medical Systems Hldgs., Inc.* | | 153,576 | | 1,380,648 | |
Auxilium Pharmaceuticals, Inc.* | | 23,561 | | 670,075 | |
Cepheid* | | 30,600 | | 317,628 | |
Conceptus, Inc.* | | 70,016 | | 1,065,644 | |
Conmed Corp.* | | 53,332 | | 1,276,768 | |
Enzon Pharmaceuticals, Inc.* | | 308,291 | | 1,797,337 | |
ev3, Inc.* | | 100,238 | | 611,452 | |
Immucor, Inc.* | | 67,529 | | 1,794,921 | |
Isis Pharmaceuticals, Inc.* | | 45,520 | | 645,474 | |
Landauer, Inc. | | 23,073 | | 1,691,251 | |
Magellan Health Svcs., Inc.* | | 59,239 | | 2,319,799 | |
MedAssets, Inc.* | | 110,125 | | 1,607,825 | |
Myriad Genetics, Inc.* | | 24,937 | | 1,652,326 | |
Neogen Corp.* | | 50,308 | | 1,256,694 | |
Onyx Pharmaceuticals, Inc.* | | 32,240 | | 1,101,318 | |
OSI Pharmaceuticals, Inc.* | | 33,316 | | 1,300,990 | |
Owens & Minor, Inc. | | 32,214 | | 1,212,857 | |
Psychiatric Solutions, Inc.* | | 36,455 | | 1,015,272 | |
Seattle Genetics, Inc.* | | 105,089 | | 939,496 | |
STERIS Corp. | | 56,760 | | 1,355,996 | |
United Therapeutics Corp.* | | 7,898 | | 494,020 | |
| | | | 33,839,606 | |
INDUSTRIAL (20.3%) | | | | | |
Actuant Corp. Cl A | | 40,880 | | 777,538 | |
Astec Industries, Inc.* | | 60,237 | | 1,887,225 | |
AZZ, Inc.* | | 49,434 | | 1,240,793 | |
Belden, Inc. | | 41,455 | | 865,580 | |
Comfort Systems USA, Inc. | | 105,534 | | 1,124,992 | |
Curtiss-Wright Corp. | | 34,164 | | 1,140,736 | |
DXP Enterprises, Inc.* | | 56,619 | | 827,204 | |
Exponent, Inc.* | | 46,465 | | 1,397,667 | |
Genesee & Wyoming, Inc. Cl A* | | 75,246 | | 2,295,003 | |
Hub Group, Inc. Cl A* | | 43,241 | | 1,147,184 | |
Huron Consulting Group, Inc.* | | 46,196 | | 2,645,645 | |
Insteel Industries, Inc. | | 85,818 | | 968,885 | |
JetBlue Airways Corp* | | 276,594 | | 1,963,817 | |
Old Dominion Freight Line, Inc.* | | 69,055 | | 1,965,305 | |
Perini Corp.* | | 34,920 | | 816,430 | |
Powell Industries, Inc.* | | 23,293 | | 675,963 | |
RBC Bearings, Inc.* | | 31,341 | | 635,595 | |
Sauer-Danfoss, Inc. | | 35,151 | | 307,571 | |
Stanley, Inc.* | | 41,451 | | 1,501,355 | |
Sun Hydraulics Corp. | | 71,277 | | 1,342,859 | |
Teledyne Technologies, Inc.* | | 24,719 | | 1,101,231 | |
Waste Connections, Inc.* | | 30,569 | | 965,063 | |
Watson Wyatt Worldwide, Inc. Cl A | | 27,132 | | 1,297,452 | |
Woodward Governor Co. | | 41,025 | | 944,396 | |
| | | | 29,835,489 | |
TECHNOLOGY (15.6%) | | | | | |
Ansys, Inc.* | | 42,384 | | 1,182,090 | |
Data Domain, Inc.* | | 90,844 | | 1,707,867 | |
FormFactor, Inc.* | | 49,778 | | 726,759 | |
Forrester Research, Inc.* | | 16,950 | | 478,160 | |
Harmonic, Inc.* | | 174,603 | | 979,523 | |
Informatica Corp.* | | 157,312 | | 2,159,894 | |
L-1 Identity Solutions, Inc.* | | 115,073 | | 775,592 | |
Littelfuse, Inc.* | | 29,748 | | 493,817 | |
Microsemi Corp.* | | 107,215 | | 1,355,198 | |
MKS Instruments, Inc.* | | 59,967 | | 886,912 | |
Monolithic Power Systems, Inc.* | | 63,815 | | 804,707 | |
Omniture, Inc.* | | 76,966 | | 818,918 | |
Parametric Technology Corp.* | | 120,426 | | 1,523,389 | |
Plexus Corp.* | | 71,179 | | 1,206,484 | |
Semtech Corp.* | | 93,737 | | 1,056,416 | |
Sybase, Inc.* | | 83,106 | | 2,058,536 | |
Trimble Navigation Ltd.* | | 36,700 | | 793,087 | |
ViaSat, Inc.* | | 78,621 | | 1,893,194 | |
Websense, Inc.* | | 135,242 | | 2,024,573 | |
| | | | 22,925,116 | |
TELECOMMUNICATIONS (1.9%) | | | | | |
Consolidated Comms. Hldgs., Inc. | | 113,952 | | 1,353,750 | |
Syniverse Hldgs., Inc.* | | 114,957 | | 1,372,587 | |
| | | | 2,726,337 | |
UTILITIES (1.9%) | | | | | |
ALLETE, Inc. | | 33,644 | | 1,085,692 | |
Avista Corp. | | 90,731 | | 1,758,367 | |
| | | | 2,844,059 | |
TOTAL COMMON STOCKS
(Cost: $171,945,056) 97.8% | | | | 143,791,492 | |
| | Rating** | | Rate(%) | | Maturity | | Face Amount($) | | Value($) | |
SHORT-TERM DEBT SECURITIES: | | | | | | | | | | | |
COMMERCIAL PAPER (4.0%) | | | | | | | | | | | |
Rockwell Collins, Inc.† | | A-1 | | 0.07 | | 01/02/09 | | 1,000,000 | | 999,998 | |
Toyota Motor Credit Corp. | | A-1+ | | 0.45 | | 01/13/09 | | 4,000,000 | | 3,999,400 | |
Washington Post Co.† | | A-1 | | 0.03 | | 01/05/09 | | 800,000 | | 799,997 | |
| | | | | | | | | | 5,799,395 | |
TOTAL SHORT-TERM DEBT SECURITIES
(Cost: $5,799,395) 4.0% | | | | | | | 5,799,395 | |
| | | | | | | | | | | |
TOTAL INVESTMENTS
(Cost: $177,744,451) 101.8% | | | | | | | | | | 149,590,887 | |
| | | | | | | | | | | |
OTHER NET ASSETS (1.8%) | | | | | | | | | | (2,660,133 | ) |
| | | | | | | | | | | |
NET ASSETS 100.0% | | | | | | | | | | $ | 146,930,754 | |
| | | | | | | | | | | | |
The accompanying notes are an integral part of these portfolio schedules.
MUTUAL OF AMERICA INVESTMENT CORPORATION (MID CAP VALUE FUND)
PORTFOLIO OF INVESTMENTS IN SECURITIES
December 31, 2008
| | Shares | | Value($) | |
COMMON STOCKS: | | | | | |
BASIC MATERIALS (9.2%) | | | | | |
Agnico-Eagle Mines Ltd. | | 7,257 | | 372,502 | |
Crown Hldgs., Inc.* | | 51,378 | | 986,460 | |
Cytec Industries, Inc. | | 8,332 | | 176,805 | |
Eastman Chemical Co. | | 7,251 | | 229,929 | |
Louisiana-Pacific Corp. | | 17,461 | | 27,239 | |
Lubrizol Corp. | | 8,662 | | 315,210 | |
Sonoco Products Co. | | 21,391 | | 495,416 | |
Steel Dynamics, Inc. | | 13,681 | | 152,954 | |
| | | | 2,756,515 | |
CONSUMER, CYCLICAL (8.1%) | | | | | |
Black & Decker Corp. | | 4,570 | | 191,072 | |
Discovery Comms., Inc. Cl C* | | 5,662 | | 75,814 | |
Ford Motor Co.* | | 14,840 | | 33,984 | |
Fortune Brands, Inc. | | 5,235 | | 216,101 | |
Johnson Controls, Inc. | | 16,081 | | 292,031 | |
Mohawk Industries, Inc.* | | 4,857 | | 208,705 | |
Newell Rubbermaid, Inc. | | 11,011 | | 107,688 | |
Penney (J.C.) Co., Inc. | | 3,634 | | 71,590 | |
PetSmart, Inc. | | 9,646 | | 177,969 | |
Polo Ralph Lauren Corp. | | 6,287 | | 285,493 | |
Rent-A-Center, Inc.* | | 11,925 | | 210,476 | |
V.F. Corp. | | 9,831 | | 538,444 | |
| | | | 2,409,367 | |
CONSUMER, NON-CYCLICAL (8.8%) | | | | | |
Avon Products, Inc. | | 7,716 | | 185,415 | |
Clorox Co. | | 5,345 | | 296,968 | |
Coca-Cola Enterprises, Inc. | | 17,931 | | 215,710 | |
Heinz (H.J.) Co. | | 6,967 | | 261,959 | |
J.M. Smucker Co. | | 5,185 | | 224,822 | |
Kroger Co. | | 28,757 | | 759,472 | |
Ralcorp Hldgs., Inc.* | | 3,121 | | 182,266 | |
Vector Group Ltd. | | 37,812 | | 514,999 | |
| | | | 2,641,611 | |
ENERGY (4.0%) | | | | | |
CNX Gas Corp.* | | 11,097 | | 302,948 | |
Denbury Resources, Inc.* | | 13,460 | | 146,983 | |
Range Resources Corp. | | 14,211 | | 488,716 | |
Spectra Energy Corp. | | 17,321 | | 272,633 | |
| | | | 1,211,280 | |
FINANCIAL (28.5%) | | | | | |
American Financial Group, Inc. | | 22,287 | | 509,927 | |
Ameriprise Financial, Inc. | | 15,376 | | 359,183 | |
Annaly Capital Mgmt., Inc. | | 17,048 | | 270,552 | |
Aon Corp. | | 12,975 | | 592,698 | |
Apartment Investment & Co. Cl A | | 15,112 | | 174,544 | |
Associated Banc-Corp. | | 25,911 | | 542,317 | |
Assurant, Inc. | | 7,564 | | 226,920 | |
BOK Financial Corp. | | 11,721 | | 473,528 | |
Developers Diversified Realty Corp. | | 10,998 | | 53,670 | |
Discover Financial Svcs. | | 13,227 | | 126,053 | |
Equity Residential | | 16,783 | | 500,469 | |
Everest Re Group Ltd. | | 2,416 | | 183,954 | |
Fulton Financial Corp. | | 39,399 | | 379,018 | |
Genworth Financial, Inc. Cl A | | 17,034 | | 48,206 | |
Host Hotels & Resorts, Inc. | | 22,213 | | 168,152 | |
iShares Russell Midcap Index Fund | | 4,810 | | 287,253 | |
iShares Russell Midcap Value Index Fd. | | 10,180 | | 289,519 | |
M&T Bank Corp. | | 2,382 | | 136,751 | |
Marsh & McLennan Cos., Inc. | | 12,252 | | 297,356 | |
People’s United Financial, Inc. | | 40,023 | | 713,610 | |
Principal Financial Grp., Inc. | | 11,124 | | 251,069 | |
Progressive Corp. | | 17,732 | | 262,611 | |
ProLogis | | 8,338 | | 115,815 | |
SPDR KBW Regional Banking ETF | | 16,100 | | 469,476 | |
StanCorp Financial Group, Inc. | | 12,752 | | 532,651 | |
Vornado Realty Trust | | 9,385 | | 566,385 | |
| | | | 8,531,687 | |
HEALTHCARE (4.7%) | | | | | |
AmerisourceBergen Corp. | | 8,717 | | 310,848 | |
CIGNA Corp. | | 11,344 | | 191,146 | |
Hospira, Inc.* | | 9,214 | | 247,119 | |
Laboratory Corp. of America Hldgs.* | | 4,550 | | 293,066 | |
Varian Medical Systems, Inc.* | | 6,418 | | 224,887 | |
Vertex Pharmaceuticals, Inc.* | | 4,473 | | 135,890 | |
| | | | 1,402,956 | |
INDUSTRIAL (7.6%) | | | | | |
Alliant TechSystems, Inc.* | | 6,437 | | 552,037 | |
CSX Corp. | | 10,789 | | 350,319 | |
Donnelley (R.R.) & Sons Co. | | 21,092 | | 286,429 | |
ITT Corp. | | 4,899 | | 225,305 | |
Lincoln Electric Hldgs., Inc. | | 7,239 | | 368,682 | |
Precision Castparts Corp. | | 5,791 | | 344,449 | |
Southwest Airlines Co. | | 15,621 | | 134,653 | |
| | | | 2,261,874 | |
TECHNOLOGY (7.3%) | | | | | |
Amdocs Ltd.* | | 7,132 | | 130,444 | |
Computer Sciences Corp.* | | 5,034 | | 176,895 | |
Fidelity Nat’l. Information Svcs., Inc. | | 11,057 | | 179,897 | |
McAfee, Inc.* | | 12,870 | | 444,916 | |
Mettler-Toledo Int’l., Inc.* | | 4,944 | | 333,226 | |
Micron Technology, Inc.* | | 35,995 | | 95,027 | |
NCR Corp.* | | 7,716 | | 109,104 | |
Sybase, Inc.* | | 12,501 | | 309,650 | |
Teradata Corp.* | | 7,716 | | 114,428 | |
Xerox Corp. | | 36,231 | | 288,761 | |
| | | | 2,182,348 | |
TELECOMMUNICATIONS (1.7%) | | | | | |
Embarq Corp. | | 10,147 | | 364,886 | |
Qwest Communications Int’l., Inc. | | 36,355 | | 132,332 | |
| | | | 497,218 | |
UTILITIES (14.7%) | | | | | |
American Electric Power Co., Inc. | | 16,061 | | 534,510 | |
Edison International | | 18,275 | | 586,993 | |
Energen Corp. | | 13,697 | | 401,733 | |
Entergy Corp. | | 6,208 | | 516,071 | |
Pepco Hldgs., Inc. | | 25,532 | | 453,448 | |
PG&E Corp. | | 14,078 | | 544,959 | |
PPL Corp. | | 12,669 | | 388,812 | |
Puget Energy, Inc. | | 10,885 | | 296,834 | |
Sempra Energy | | 16,093 | | 686,045 | |
| | | | 4,409,405 | |
TOTAL COMMON STOCKS
(Cost: $39,104,340) 94.6% | | | | 28,304,261 | |
| | Rating** | | Rate(%) | | Maturity | | Face Amount($) | | Value($) | |
SHORT-TERM DEBT SECURITIES: | | | | | | | | | | | |
COMMERCIAL PAPER (5.0%) | | | | | | | | | | | |
Toyota Motor Credit Corp. | | A-1+ | | 0.40 | | 01/21/09 | | 700,000 | | 699,844 | |
Unilever Capital Corp.† | | A-1 | | 0.05 | | 01/02/09 | | 400,000 | | 399,999 | |
Washington Post Co.† | | A-1 | | 0.03 | | 01/05/09 | | 400,000 | | 399,999 | |
| | | | | | | | | | 1,499,842 | |
TOTAL SHORT-TERM DEBT SECURITIES
(Cost: $1,499,842) 5.0% | | | | | | | | 1,499,842 | |
| | | | | | | | | | | |
TOTAL INVESTMENTS
(Cost: $40,604,182) 99.6% | | | | | | | | | | 29,804,103 | |
| | | | | | | | | | | |
OTHER NET ASSETS 0.4% | | | | | | | | | | 109,887 | |
| | | | | | | | | | | |
NET ASSETS 100.0% | | | | | | | | | | $ | 29,913,990 | |
| | | | | | | | | | | | |
The accompanying notes are an integral part of these portfolio schedules.
MUTUAL OF AMERICA INVESTMENT CORPORATION (MID-CAP EQUITY INDEX FUND)
PORTFOLIO OF INVESTMENTS IN SECURITIES
December 31, 2008
| | Shares | | Value($) | |
INDEXED ASSETS: | | | | | |
COMMON STOCKS: | | | | | |
BASIC MATERIALS (6.0%) | | | | | |
Airgas, Inc. | | 26,719 | | 1,041,774 | |
Albemarle Corp. | | 30,106 | | 671,364 | |
AptarGroup, Inc. | | 22,283 | | 785,253 | |
Ashland, Inc. | | 21,835 | | 229,486 | |
Cabot Corp. | | 21,593 | | 330,373 | |
Carpenter Technology Corp. | | 14,550 | | 298,857 | |
Chemtura Corp. | | 80,036 | | 112,050 | |
Cliffs Natural Resources, Inc. | | 37,463 | | 959,427 | |
Commercial Metals Co. | | 37,561 | | 445,849 | |
Cytec Industries, Inc. | | 15,550 | | 329,971 | |
Ferro Corp. | | 14,438 | | 101,788 | |
FMC Corp. | | 24,431 | | 1,092,799 | |
Greif, Inc. Cl A | | 11,252 | | 376,154 | |
Louisiana-Pacific Corp. | | 30,002 | | 46,803 | |
Lubrizol Corp. | | 22,199 | | 807,822 | |
Martin Marietta Materials, Inc | | 13,669 | | 1,326,987 | |
Minerals Technologies, Inc. | | 6,186 | | 253,007 | |
Olin Corp. | | 25,376 | | 458,798 | |
Packaging Corp. of America | | 33,798 | | 454,921 | |
Reliance Steel & Aluminum Co. | | 21,048 | | 419,697 | |
RPM International, Inc. | | 42,485 | | 564,626 | |
Scotts Miracle-Gro Co. Cl A | | 14,457 | | 429,662 | |
Sensient Technologies Corp. | | 15,957 | | 381,053 | |
Sonoco Products Co. | | 32,916 | | 762,335 | |
Steel Dynamics, Inc. | | 53,373 | | 596,710 | |
Temple-Inland, Inc. | | 35,155 | | 168,744 | |
Terra Industries, Inc. | | 33,709 | | 561,929 | |
Valspar Corp. | | 32,936 | | 595,812 | |
Worthington Industries, Inc. | | 19,772 | | 217,887 | |
| | | | 14,821,938 | |
CONSUMER, CYCLICAL (12.4%) | | | | | |
99 Cents Only Stores* | | 15,467 | | 169,054 | |
Advance Auto Parts, Inc. | | 31,254 | | 1,051,697 | |
Aeropostale, Inc.* | | 22,054 | | 355,069 | |
American Eagle Outfitters, Inc. | | 68,046 | | 636,911 | |
American Greetings Corp. Cl A | | 14,989 | | 113,467 | |
AnnTaylor Stores Corp.* | | 18,858 | | 108,811 | |
ArvinMeritor, Inc. | | 24,362 | | 69,432 | |
Barnes & Noble, Inc. | | 12,165 | | 182,475 | |
Belo Corp. Cl A | | 29,012 | | 45,259 | |
Blyth, Inc. | | 7,987 | | 62,618 | |
Bob Evans Farms, Inc. | | 10,133 | | 207,017 | |
BorgWarner, Inc. | | 38,220 | | 832,049 | |
Boyd Gaming Corp. | | 18,840 | | 89,113 | |
Brink’s Home Security Hldgs., Inc.* | | 13,445 | | 294,714 | |
Brinker International, Inc. | | 33,613 | | 354,281 | |
Callaway Golf Co. | | 21,316 | | 198,026 | |
Career Education Corp.* | | 24,281 | | 435,601 | |
CarMax, Inc.* | | 72,755 | | 573,309 | |
Cheesecake Factory, Inc.* | | 19,710 | | 199,071 | |
Chico’s FAS, Inc.* | | 58,517 | | 244,601 | |
Chipotle Mexican Grill, Inc. Cl A* | | 10,887 | | 674,776 | |
Coldwater Creek, Inc.* | | 15,651 | | 44,605 | |
Collective Brands, Inc.* | | 21,038 | | 246,565 | |
Corinthian Colleges, Inc.* | | 28,251 | | 462,469 | |
DeVry, Inc. | | 20,333 | | 1,167,318 | |
Dick’s Sporting Goods, Inc.* | | 28,082 | | 396,237 | |
Dollar Tree, Inc.* | | 29,910 | | 1,250,238 | |
DreamWorks Animation SKG Cl A* | | 25,434 | | 642,463 | |
Foot Locker, Inc. | | 51,132 | | 375,309 | |
Furniture Brands Int’l., Inc. | | 13,690 | | 30,255 | |
Gentex Corp. | | 46,105 | | 407,107 | |
Guess?, Inc. | | 19,879 | | 305,143 | |
Hanesbrands, Inc.* | | 30,854 | | 393,389 | |
Harte-Hanks, Inc. | | 12,537 | | 78,231 | |
Hovnanian Enterprises, Inc. Cl A* | | 16,718 | | 28,755 | |
International Speedway Corp. Cl A | | 9,168 | | 263,397 | |
ITT Educational Svcs., Inc.* | | 10,344 | | 982,473 | |
J. Crew Group, Inc.* | | 17,117 | | 208,827 | |
Lamar Advertising Co. Cl A* | | 25,070 | | 314,879 | |
Life Time Fitness, Inc.* | | 11,534 | | 149,365 | |
LKQ Corp.* | | 46,684 | | 544,335 | |
Marvel Entertainment, Inc.* | | 16,188 | | 497,781 | |
Matthews International Corp. Cl A | | 10,089 | | 370,065 | |
MDC Hldgs., Inc. | | 12,138 | | 367,781 | |
Modine Manufacturing Co. | | 10,827 | | 52,727 | |
Mohawk Industries, Inc.* | | 18,516 | | 795,633 | |
Netflix, Inc.* | | 13,749 | | 410,958 | |
NVR, Inc.* | | 1,800 | | 821,250 | |
O’Reilly Automotive, Inc.* | | 44,400 | | 1,364,856 | |
Pacific Sunwear of California, Inc.* | | 21,681 | | 34,473 | |
PetSmart, Inc. | | 41,957 | | 774,107 | |
Phillips-Van Heusen Corp. | | 16,985 | | 341,908 | |
Priceline.com, Inc.* | | 13,397 | | 986,689 | |
Regis Corp. | | 14,259 | | 207,183 | |
Rent-A-Center, Inc.* | | 22,036 | | 388,935 | |
Ross Stores, Inc. | | 42,704 | | 1,269,590 | |
Ryland Group, Inc. | | 14,102 | | 249,182 | |
Saks, Inc.* | | 46,892 | | 205,387 | |
Scholastic Corp. | | 8,731 | | 118,567 | |
Scientific Games Corp. Cl A* | | 21,459 | | 376,391 | |
Service Corp. International | | 84,364 | | 419,289 | |
Sotheby’s | | 22,210 | | 197,447 | |
Strayer Education, Inc. | | 4,697 | | 1,007,084 | |
The Warnaco Group, Inc.* | | 15,389 | | 302,086 | |
Thor Industries, Inc. | | 11,711 | | 154,351 | |
Timberland Co. Cl A* | | 15,188 | | 175,421 | |
Toll Brothers, Inc.* | | 43,001 | | 921,511 | |
Tupperware Brands Corp. | | 20,461 | | 464,465 | |
Under Armour, Inc. Cl A* | | 12,039 | | 287,010 | |
Urban Outfitters, Inc.* | | 37,641 | | 563,862 | |
Wendy’s/Arby’s Group, Inc. | | 137,997 | | 681,705 | |
Wiley (John) & Sons, Inc. Cl A | | 14,132 | | 502,817 | |
Williams-Sonoma, Inc. | | 28,589 | | 224,710 | |
| | | | 30,723,932 | |
CONSUMER, NON-CYCLICAL (4.0%) | | | | | |
Alberto-Culver Co. | | 28,131 | | 689,491 | |
BJ’s Wholesale Club, Inc.* | | 19,410 | | 664,987 | |
Church & Dwight Co., Inc. | | 23,114 | | 1,297,158 | |
Corn Products Int’l., Inc. | | 24,585 | | 709,277 | |
Energizer Hldgs., Inc.* | | 19,246 | | 1,041,978 | |
Flowers Foods, Inc. | | 26,020 | | 633,847 | |
Hansen Natural Corp.* | | 24,407 | | 818,367 | |
Hormel Foods Corp. | | 23,139 | | 719,160 | |
Lancaster Colony Corp. | | 6,551 | | 224,699 | |
NBTY, Inc.* | | 18,095 | | 283,187 | |
PepsiAmericas, Inc. | | 18,911 | | 385,028 | |
Ralcorp Hldgs., Inc.* | | 18,596 | | 1,086,006 | |
Ruddick Corp. | | 12,917 | | 357,155 | |
Smithfield Foods, Inc.* | | 39,218 | | 551,797 | |
Tootsie Roll Industries, Inc. | | 8,548 | | 218,914 | |
Universal Corp. | | 8,247 | | 246,338 | |
| | | | 9,927,389 | |
ENERGY (5.6%) | | | | | |
Arch Coal, Inc. | | 47,153 | | 768,122 | |
Bill Barrett Corp.* | | 12,215 | | 258,103 | |
Cimarex Energy Co. | | 27,485 | | 736,048 | |
Comstock Resources, Inc.* | | 15,188 | | 717,633 | |
Denbury Resources, Inc.* | | 81,539 | | 890,406 | |
Encore Aquisition Co.* | | 17,415 | | 444,431 | |
Exterran Hldgs., Inc.* | | 21,358 | | 454,925 | |
FMC Technologies, Inc.* | | 41,271 | | 983,488 | |
Forest Oil Corp.* | | 32,056 | | 528,603 | |
Frontier Oil Corp. | | 34,294 | | 433,133 | |
Helix Energy Solutions Group* | | 30,316 | | 219,488 | |
Helmerich & Payne, Inc. | | 34,731 | | 790,130 | |
Mariner Energy, Inc.* | | 29,328 | | 299,146 | |
Newfield Exploration Co.* | | 43,649 | | 862,068 | |
Oceaneering Int’l., Inc.* | | 17,980 | | 523,937 | |
Overseas Shipholding Group, Inc. | | 8,324 | | 350,524 | |
Patriot Coal Corp.* | | 20,944 | | 130,900 | |
Patterson-UTI Energy, Inc. | | 51,033 | | 587,390 | |
Plains Exploration & Production Co.* | | 35,515 | | 825,369 | |
Pride International, Inc.* | | 57,124 | | 912,842 | |
Quicksilver Resources, Inc.* | | 36,902 | | 205,544 | |
Southern Union Co. | | 40,922 | | 533,623 | |
Superior Energy Services, Inc.* | | 25,589 | | 407,633 | |
Tidewater, Inc. | | 17,011 | | 685,033 | |
Unit Corp.* | | 15,598 | | 416,779 | |
| | | | 13,965,298 | |
FINANCIAL (18.6%) | | | | | |
Affiliated Managers Group, Inc.* | | 13,558 | | 568,351 | |
Alexandria Real Estate Equities, Inc. | | 10,637 | | 641,837 | |
AMB Property Corp | | 32,508 | | 761,337 | |
American Financial Group, Inc. | | 24,787 | | 567,127 | |
AmeriCredit Corp.* | | 38,381 | | 293,231 | |
Apollo Investment Corp. | | 46,942 | | 437,030 | |
Associated Banc-Corp. | | 42,153 | | 882,262 | |
Astoria Financial Corp. | | 26,578 | | 438,005 | |
BancorpSouth, Inc. | | 23,864 | | 557,463 | |
Bank of Hawaii Corp. | | 15,748 | | 711,337 | |
Berkley (W.R.) Corp. | | 45,770 | | 1,418,870 | |
BRE Properties, Inc. | | 16,864 | | 471,855 | |
Brown & Brown, Inc. | | 38,294 | | 800,345 | |
Camden Property Trust | | 17,579 | | 550,926 | |
Cathay General Bancorp | | 16,340 | | 388,075 | |
City National Corp. | | 13,356 | | 650,437 | |
Colonial BancGroup, Inc. | | 66,815 | | 138,307 | |
Commerce Bancshares, Inc. | | 21,771 | | 956,835 | |
Cousins Properties, Inc. | | 14,416 | | 199,662 | |
Cullen/Frost Bankers, Inc. | | 19,580 | | 992,314 | |
Duke Realty Corp. | | 48,639 | | 533,083 | |
Eaton Vance Corp. | | 38,299 | | 804,662 | |
Equity One, Inc. | | 10,882 | | 192,611 | |
Essex Property Trust, Inc. | | 8,844 | | 678,777 | |
Everest Re Group Ltd. | | 20,270 | | 1,543,358 | |
Federal Realty Investment Trust | | 19,465 | | 1,208,387 | |
Fidelity Nat’l. Financial, Inc. Cl A | | 69,909 | | 1,240,885 | |
First American Corp. | | 30,652 | | 885,536 | |
First Niagara Financial Group, Inc. | | 39,126 | | 632,667 | |
FirstMerit Corp. | | 26,726 | | 550,288 | |
Fulton Financial Corp. | | 57,754 | | 555,593 | |
Gallagher (Arthur J.) & Co. | | 31,356 | | 812,434 | |
Hanover Insurance Group, Inc. | | 16,860 | | 724,474 | |
HCC Insurance Hldgs., Inc. | | 37,858 | | 1,012,702 | |
Health Care REIT, Inc. | | 34,146 | | 1,440,961 | |
Highwoods Properties, Inc. | | 20,981 | | 574,040 | |
Horace Mann Educators Corp. | | 12,900 | | 118,551 | |
Hospitality Properties Trust | | 31,020 | | 461,267 | |
Jefferies Group, Inc. | | 39,927 | | 561,374 | |
Jones Lang LaSalle, Inc. | | 11,388 | | 315,448 | |
Liberty Property Trust | | 32,398 | | 739,646 | |
Mack-Cali Realty Corp. | | 21,744 | | 532,728 | |
Mercury General Corp. | | 11,749 | | 540,337 | |
Nationwide Health Pptys., Inc. | | 32,791 | | 941,758 | |
New York Community Bancorp, Inc. | | 113,602 | | 1,358,680 | |
Old Republic Int’l. Corp. | | 76,163 | | 907,863 | |
OMEGA Healthcare Investors, Inc.* | | 25,884 | | 413,367 | |
PacWest Bancorp | | 8,080 | | 217,352 | |
PMI Group, Inc. | | 22,900 | | 44,655 | |
Potlatch Corp. | | 13,044 | | 339,274 | |
Protective Life Corp. | | 23,073 | | 331,098 | |
Raymond James Financial, Inc. | | 31,836 | | 545,351 | |
Rayonier, Inc. | | 26,017 | | 815,633 | |
Realty Income Corp. | | 34,415 | | 796,707 | |
Regency Centers Corp. | | 23,105 | | 1,079,004 | |
Reinsurance Grp. of America, Inc. | | 23,950 | | 1,025,539 | |
SEI Investments Co. | | 44,034 | | 691,774 | |
SL Green Realty Corp | | 19,612 | | 507,951 | |
StanCorp Financial Group, Inc. | | 16,148 | | 674,502 | |
SVB Financial Group* | | 10,823 | | 283,887 | |
Synovus Financial Corp. | | 92,672 | | 769,178 | |
TCF Financial Corp. | | 38,032 | | 519,517 | |
The Macerich Co. | | 25,122 | | 456,216 | |
UDR, Inc. | | 44,948 | | 619,833 | |
Unitrin, Inc. | | 16,249 | | 259,009 | |
Valley National Bancorp* | | 44,821 | | 907,625 | |
Waddell & Reed Financial, Inc. Cl A | | 27,988 | | 432,694 | |
Washington Federal, Inc. | | 29,038 | | 434,408 | |
Webster Financial Corp. | | 17,402 | | 239,800 | |
Weingarten Realty Investors | | 25,575 | | 529,147 | |
Westamerica Bancorporation | | 9,537 | | 487,818 | |
Wilmington Trust Corp. | | 22,472 | | 499,777 | |
| | | | 46,214,832 | |
HEALTHCARE (10.0%) | | | | | |
Advanced Medical Optics, Inc.* | | 17,193 | | 113,646 | |
Affymetrix, Inc.* | | 23,176 | | 69,296 | |
Beckman Coulter, Inc. | | 20,685 | | 908,899 | |
Bio-Rad Laboratories, Inc. Cl A* | | 6,306 | | 474,905 | |
Cerner Corp.* | | 22,458 | | 863,510 | |
Charles River Laboratories Int’l., Inc.* | | 22,348 | | 585,518 | |
Community Health Systems, Inc.* | | 30,784 | | 448,831 | |
Covance, Inc.* | | 20,888 | | 961,475 | |
Edwards Lifesciences Corp.* | | 18,372 | | 1,009,541 | |
Endo Pharmaceuticals Hldgs., Inc.* | | 38,641 | | 1,000,029 | |
Gen-Probe, Inc.* | | 17,947 | | 768,849 | |
Health Management Associates, Inc. Cl A* | | 80,544 | | 144,174 | |
Health Net, Inc.* | | 34,224 | | 372,699 | |
Hill-Rom Hldgs., Inc. | | 20,632 | | 339,603 | |
Hologic, Inc.* | | 84,570 | | 1,105,330 | |
IDEXX Laboratories, Inc.* | | 19,658 | | 709,261 | |
Kindred Healthcare, Inc.* | | 9,890 | | 128,768 | |
Kinetic Concepts, Inc.* | | 18,489 | | 354,619 | |
LifePoint Hospitals, Inc.* | | 17,634 | | 402,761 | |
Lincare Hldgs., Inc.* | | 24,549 | | 661,105 | |
Masimo Corp.* | | 15,837 | | 472,418 | |
Medicis Pharmaceutical Corp. Cl A | | 18,720 | | 260,208 | |
Omnicare, Inc. | | 34,376 | | 954,278 | |
Perrigo Co. | | 25,627 | | 828,008 | |
Pharmaceutical Product Development, Inc. | | 38,914 | | 1,128,895 | |
Psychiatric Solutions, Inc.* | | 18,460 | | 514,111 | |
ResMed, Inc.* | | 24,982 | | 936,325 | |
Schein (Henry), Inc.* | | 29,492 | | 1,082,061 | |
Sepracor, Inc.* | | 35,934 | | 394,555 | |
STERIS Corp. | | 19,433 | | 464,254 | |
Techne Corp. | | 12,550 | | 809,726 | |
Teleflex, Inc. | | 13,108 | | 656,711 | |
Thoratec Corp.* | | 18,507 | | 601,292 | |
United Therapeutics Corp.* | | 7,667 | | 479,571 | |
Universal Health Svcs., Inc. Cl B | | 16,721 | | 628,208 | |
Valeant Pharmaceuticals Int’l.* | | 26,899 | | 615,987 | |
Varian, Inc.* | | 9,558 | | 320,289 | |
VCA Antech, Inc.* | | 27,934 | | 555,328 | |
Vertex Pharmaceuticals, Inc.* | | 49,663 | | 1,508,762 | |
WellCare Health Plans, Inc.* | | 13,766 | | 177,031 | |
| | | | 24,810,837 | |
INDUSTRIAL (12.8%) | | | | | |
AGCO Corp.* | | 30,281 | | 714,329 | |
AirTran Hldgs., Inc.* | | 38,693 | | 171,797 | |
Alaska Air Group, Inc.* | | 11,951 | | 349,567 | |
Alexander & Baldwin, Inc. | | 13,649 | | 342,044 | |
Alliant TechSystems, Inc.* | | 10,798 | | 926,036 | |
Ametek, Inc. | | 35,225 | | 1,064,147 | |
BE Aerospace, Inc.* | | 32,830 | | 252,463 | |
Bucyrus International, Inc. | | 24,708 | | 457,592 | |
Carlisle Cos., Inc. | | 20,135 | | 416,795 | |
Clean Harbors, Inc.* | | 6,656 | | 422,257 | |
Con-way, Inc. | | 15,125 | | 402,325 | |
Copart, Inc.* | | 20,906 | | 568,434 | |
Corporate Executive Board Co. | | 11,233 | | 247,800 | |
Corrections Corp. of America* | | 41,489 | | 678,760 | |
Crane Co. | | 15,994 | | 275,737 | |
Deluxe Corp. | | 16,878 | | 252,495 | |
Donaldson Co., Inc. | | 25,393 | | 854,474 | |
Dycom Industries, Inc.* | | 12,994 | | 106,811 | |
Federal Signal Corp. | | 15,653 | | 128,511 | |
FTI Consulting, Inc.* | | 16,773 | | 749,418 | |
GATX Corp. | | 16,074 | | 497,812 | |
Graco, Inc. | | 19,643 | | 466,128 | |
Granite Construction, Inc. | | 10,861 | | 477,124 | |
Harsco Corp. | | 27,565 | | 762,999 | |
HNI Corp. | | 14,599 | | 231,248 | |
Hubbell, Inc. Cl B | | 18,524 | | 605,364 | |
Hunt (J.B.) Transport Svcs., Inc. | | 27,034 | | 710,183 | |
IDEX Corp. | | 27,277 | | 658,740 | |
JetBlue Airways Corp* | | 60,479 | | 429,401 | |
Joy Global, Inc. | | 35,575 | | 814,312 | |
Kansas City Southern* | | 30,132 | | 574,015 | |
KBR, Inc. | | 53,319 | | 810,449 | |
Kelly Svcs., Inc. Cl A | | 9,064 | | 117,923 | |
Kennametal, Inc. | | 24,132 | | 535,489 | |
Korn/Ferry International* | | 14,770 | | 168,673 | |
Lincoln Electric Hldgs., Inc. | | 14,133 | | 719,794 | |
Manpower, Inc. | | 25,733 | | 874,665 | |
Miller (Herman), Inc. | | 17,702 | | 230,657 | |
Mine Safety Appliances Co. | | 9,804 | | 234,414 | |
MPS Group, Inc.* | | 30,471 | | 229,447 | |
MSC Industrial Direct Co., Inc. Cl A | | 14,792 | | 544,789 | |
Navigant Consulting, Inc.* | | 15,447 | | 245,144 | |
Nordson Corp. | | 11,257 | | 363,489 | |
Oshkosh Corp. | | 24,562 | | 218,356 | |
Pentair, Inc. | | 32,554 | | 770,553 | |
Quanta Services, Inc.* | | 65,122 | | 1,289,416 | |
Republic Services, Inc. | | 1 | | 25 | |
Rollins, Inc. | | 13,649 | | 246,774 | |
Roper Industries, Inc. | | 29,610 | | 1,285,370 | |
Shaw Group, Inc.* | | 27,568 | | 564,317 | |
SPX Corp. | | 17,963 | | 728,400 | |
Terex Corp.* | | 31,323 | | 542,514 | |
The Brink’s Co. | | 13,445 | | 361,402 | |
Thomas & Betts Corp.* | | 18,452 | | 443,217 | |
Timken Co. | | 28,044 | | 550,504 | |
Trinity Industries, Inc. | | 26,251 | | 413,716 | |
United Rentals, Inc.* | | 19,768 | | 180,284 | |
URS Corp.* | | 27,559 | | 1,123,580 | |
Wabtec Corp. | | 16,003 | | 636,119 | |
Waste Connections, Inc.* | | 26,311 | | 830,638 | |
Werner Enterprises, Inc. | | 14,066 | | 243,904 | |
Woodward Governor Co. | | 18,002 | | 414,406 | |
YRC Worldwide, Inc.* | | 19,557 | | 56,129 | |
| | | | 31,583,675 | |
TECHNOLOGY (11.1%) | | | | | |
3Com Corp.* | | 134,087 | | 305,718 | |
ACI Worldwide, Inc.* | | 11,522 | | 183,200 | |
Acxiom Corp. | | 22,419 | | 181,818 | |
ADC Telecommunications, Inc.* | | 38,861 | | 212,570 | |
Adtran, Inc. | | 18,081 | | 269,045 | |
Advent Software, Inc.* | | 5,510 | | 110,035 | |
Alliance Data Systems Corp.* | | 21,302 | | 991,182 | |
Ansys, Inc.* | | 29,606 | | 825,711 | |
Arrow Electronics, Inc.* | | 39,376 | | 741,844 | |
Atmel Corp.* | | 147,856 | | 462,789 | |
Avnet, Inc.* | | 49,724 | | 905,474 | |
Avocent Corp.* | | 14,785 | | 264,799 | |
Broadridge Financial Solutions, Inc. | | 46,670 | | 585,242 | |
Cadence Design Systems, Inc.* | | 85,900 | | 314,394 | |
CommScope, Inc.* | | 23,226 | | 360,932 | |
Cree, Inc.* | | 29,154 | | 462,674 | |
Diebold, Inc. | | 21,817 | | 612,840 | |
Digital River, Inc.* | | 12,242 | | 303,602 | |
DST Systems, Inc.* | | 13,428 | | 509,995 | |
F5 Networks, Inc.* | | 26,290 | | 600,989 | |
FactSet Research Systems, Inc. | | 13,915 | | 615,600 | |
Fair Isaac Corp. | | 16,001 | | 269,777 | |
Fairchild Semiconductor Int’l., Inc.* | | 40,971 | | 200,348 | |
Gartner, Inc.* | | 19,560 | | 348,755 | |
Global Payments, Inc. | | 26,469 | | 867,919 | |
Henry (Jack) & Associates, Inc. | | 27,895 | | 541,442 | |
Imation Corp. | | 9,950 | | 135,022 | |
Ingram Micro, Inc. Cl A* | | 54,409 | | 728,537 | |
Integrated Device Technology, Inc.* | | 55,791 | | 312,988 | |
International Rectifier Corp.* | | 24,055 | | 324,743 | |
Intersil Corp. Cl A | | 40,542 | | 372,581 | |
Lam Research Corp.* | | 41,241 | | 877,608 | |
Lender Processing Svcs., Inc. | | 27,671 | | 814,911 | |
Macrovision Solutions Corp.* | | 27,537 | | 348,343 | |
ManTech International Corp. Cl A* | | 6,895 | | 373,640 | |
Mentor Graphics Corp.* | | 30,484 | | 157,602 | |
Metavante Technologies, Inc.* | | 29,616 | | 477,114 | |
Mettler-Toledo Int’l., Inc.* | | 11,064 | | 745,714 | |
National Instruments Corp. | | 18,820 | | 458,455 | |
NCR Corp.* | | 52,084 | | 736,468 | |
NeuStar, Inc. Cl A* | | 26,027 | | 497,897 | |
Palm, Inc.* | | 36,228 | | 111,220 | |
Parametric Technology Corp.* | | 38,352 | | 485,153 | |
Plantronics, Inc. | | 16,129 | | 212,903 | |
Polycom, Inc.* | | 27,469 | | 371,106 | |
RF Micro Devices, Inc.* | | 86,846 | | 67,740 | |
SAIC, Inc.* | | 66,912 | | 1,303,446 | |
Semtech Corp.* | | 19,940 | | 224,724 | |
Silicon Laboratories, Inc.* | | 15,268 | | 378,341 | |
SRA International, Inc. Cl A* | | 13,894 | | 239,672 | |
Sybase, Inc.* | | 26,753 | | 662,672 | |
Synopsys, Inc.* | | 47,559 | | 880,793 | |
Tech Data Corp.* | | 16,509 | | 294,521 | |
Trimble Navigation Ltd.* | | 39,458 | | 852,687 | |
ValueClick, Inc.* | | 28,633 | | 195,850 | |
Vishay Intertechnology, Inc.* | | 61,574 | | 210,583 | |
Western Digital Corp.* | | 73,129 | | 837,327 | |
Wind River Systems, Inc.* | | 22,398 | | 202,254 | |
Zebra Technologies Corp. Cl A* | | 20,923 | | 423,900 | |
| | | | 27,365,209 | |
TELECOMMUNICATIONS (0.5%) | | | | | |
Cincinnati Bell, Inc.* | | 76,046 | | 146,769 | |
Telephone & Data Systems, Inc. | | 35,135 | | 1,115,536 | |
| | | | 1,262,305 | |
UTILITIES (7.3%) | | | | | |
AGL Resources, Inc. | | 25,342 | | 794,472 | |
Alliant Energy Corp. | | 36,455 | | 1,063,757 | |
Aqua America, Inc. | | 44,612 | | 918,561 | |
Black Hills Corp. | | 12,691 | | 342,149 | |
DPL, Inc. | | 38,274 | | 874,178 | |
Energen Corp. | | 23,668 | | 694,182 | |
Great Plains Energy, Inc. | | 39,250 | | 758,703 | |
Hawaiian Electric Industries, Inc. | | 29,748 | | 658,621 | |
IDACORP, Inc. | | 15,040 | | 442,928 | |
MDU Resources Group | | 60,619 | | 1,308,154 | |
National Fuel Gas Co. | | 26,116 | | 818,214 | |
Northeast Utilities | | 51,390 | | 1,236,443 | |
NSTAR | | 35,253 | | 1,286,382 | |
NV Energy, Inc. | | 77,284 | | 764,339 | |
OGE Energy Corp. | | 30,624 | | 789,487 | |
Oneok, Inc. | | 34,491 | | 1,004,378 | |
PNM Resources, Inc. | | 28,542 | | 287,703 | |
Puget Energy, Inc. | | 42,802 | | 1,167,211 | |
UGI Corp. | | 35,610 | | 869,596 | |
Vectren Corp. | | 26,728 | | 668,467 | |
Westar Energy, Inc. | | 35,742 | | 733,068 | |
WGL Hldgs., Inc. | | 16,494 | | 539,189 | |
| | | | 18,020,182 | |
TOTAL INDEXED ASSETS - COMMON STOCKS
(Cost: $305,913,456) 88.3% | | | | 218,695,597 | |
| | Rating** | | Rate(%) | | Maturity | | Face Amount($) | | Value($) | |
SHORT-TERM DEBT SECURITIES: | | | | | | | | | | | |
U.S. GOVERNMENT (2.1%) | | | | | | | | | | | |
U.S. Treasury Bill (1) | | AAA | | 0.01 | | 04/30/09 | | 2,000,000 | | 1,999,800 | |
U.S. Treasury Bill (1) | | AAA | | 0.30 | | 02/05/09 | | 700,000 | | 699,796 | |
U.S. Treasury Bill (1) | | AAA | | 1.07 | | 01/02/09 | | 2,400,000 | | 2,399,930 | |
| | | | | | | | | | 5,099,526 | |
U.S. GOVERNMENT AGENCIES (1.6%) FHLB | | AAA | | 0.03 | | 02/02/09 | | 3,900,000 | | 3,899,896 | |
| | | | | | | | | | | |
COMMERCIAL PAPER (7.0%) | | | | | | | | | | | |
American Express Credit Corp. | | A-1 | | 0.01 | | 01/02/09 | | 5,000,000 | | 4,999,998 | |
NetJets, Inc.† | | A-1+ | | 0.10 | | 03/02/09 | | 5,000,000 | | 4,999,153 | |
Siemens Capital Co. LLC† | | A-1+ | | 0.10 | | 03/13/09 | | 2,377,000 | | 2,376,524 | |
Toyota Motor Credit Corp. | | A-1+ | | 0.40 | | 01/21/09 | | 5,000,000 | | 4,998,889 | |
| | | | | | | | | | 17,374,564 | |
TOTAL SHORT-TERM DEBT SECURITIES (Cost: $26,374,141) 10.7% | | | | | | | | | | 26,373,986 | |
| | | | | | | | | | | |
TEMPORARY CASH INVESTMENTS (3)
(Cost: $28,800) 0.0% (4) | | | | | | | | | | 28,800 | |
| | | | | | | | | | | |
TOTAL INVESTMENTS
(Cost: $332,316,397) 99.0% | | | | | | | | | | 245,098,383 | |
| | | | | | | | | | | |
OTHER NET ASSETS 1.0% | | | | | | | | | | 2,426,253 | |
| | | | | | | | | | | |
NET ASSETS 100.0% | | | | | | | | | | $ | 247,524,636 | |
| | | | | | | | | | | | |
The accompanying notes are an integral part of these portfolio schedules.
MUTUAL OF AMERICA INVESTMENT CORPORATION (INTERNATIONAL FUND)
PORTFOLIO OF INVESTMENTS IN SECURITIES
December 31, 2008
| | Shares | | Value($) | |
COMMON STOCKS: | | | | | |
DIVERSIFIED MUTUAL FUNDS (96.3%) | | | | | |
iShares MSCI EAFE Growth Index Fund | | 22,760 | | 1,034,442 | |
iShares MSCI EAFE Index Fund | | 29,225 | | 1,311,326 | |
iShares MSCI EAFE Value Index Fund | | 25,510 | | 1,034,430 | |
Vanguard Europe Pacific ETF | | 210,580 | | 5,784,632 | |
Vanguard European ETF | | 46,010 | | 1,764,944 | |
Vanguard Pacific ETF | | 20,517 | | 899,055 | |
| | | | | |
TOTAL INVESTMENTS
(Cost: $16,221,198) 96.3% | | | | 11,828,829 | |
| | | | | |
OTHER NET ASSETS 3.7% | | | | 458,413 | |
| | | | | |
NET ASSETS 100.0% | | | | $ | 12,287,242 | |
| | | | | | |
The accompanying notes are an integral part of these portfolio schedules.
MUTUAL OF AMERICA INVESTMENT CORPORATION (COMPOSITE FUND)
PORTFOLIO OF INVESTMENTS IN SECURITIES
December 31, 2008
| | Shares | | Value($) | |
COMMON STOCKS: | | | | | |
BASIC MATERIALS (1.3%) | | | | | |
Ball Corp. | | 13,321 | | 554,020 | |
Dow Chemical Co. | | 27,293 | | 411,851 | |
Freeport-McMoRan Copper & Gold, Inc. | | 9,328 | | 227,976 | |
Monsanto Co. | | 10,687 | | 751,830 | |
| | | | 1,945,677 | |
CONSUMER, CYCLICAL (4.8%) | | | | | |
Apollo Group, Inc. Cl A* | | 3,595 | | 275,449 | |
Comcast Corp. Cl A | | 61,236 | | 1,033,664 | |
Family Dollar Stores, Inc. | | 19,529 | | 509,121 | |
Home Depot, Inc. | | 12,101 | | 278,565 | |
Johnson Controls, Inc. | | 35,628 | | 647,004 | |
McDonald’s Corp. | | 28,279 | | 1,758,671 | |
Omnicom Group, Inc. | | 17,244 | | 464,208 | |
Staples, Inc. | | 43,412 | | 777,943 | |
Target Corp. | | 9,858 | | 340,397 | |
Time Warner, Inc. | | 48,843 | | 491,361 | |
TJX Cos., Inc. | | 8,168 | | 168,016 | |
V.F. Corp. | | 8,677 | | 475,239 | |
| | | | 7,219,638 | |
CONSUMER, NON-CYCLICAL (7.8%) | | | | | |
Campbell Soup Co. | | 18,019 | | 540,750 | |
Clorox Co. | | 8,947 | | 497,095 | |
Colgate-Palmolive Co. | | 6,988 | | 478,958 | |
CVS Caremark Corp. | | 34,845 | | 1,001,445 | |
General Mills, Inc. | | 19,638 | | 1,193,009 | |
Heinz (H.J.) Co. | | 11,799 | | 443,642 | |
Kimberly-Clark Corp. | | 8,597 | | 453,406 | |
Kraft Foods, Inc. Cl A | | 24,023 | | 645,018 | |
PepsiCo, Inc. | | 29,005 | | 1,588,604 | |
Proctor & Gamble Co. | | 43,077 | | 2,663,020 | |
Wal-Mart Stores, Inc. | | 40,465 | | 2,268,468 | |
| | | | 11,773,415 | |
ENERGY (8.2%) | | | | | |
Apache Corp. | | 5,808 | | 432,870 | |
Chevron Corp. | | 20,823 | | 1,540,277 | |
ConocoPhillips | | 16,519 | | 855,684 | |
Consol Energy, Inc. | | 8,931 | | 255,248 | |
Devon Energy Corp. | | 8,181 | | 537,574 | |
Exxon Mobil Corp. | | 60,548 | | 4,833,547 | |
Halliburton Co. | | 35,045 | | 637,118 | |
Noble Corp. | | 13,731 | | 303,318 | |
Occidental Petroleum Corp. | | 17,229 | | 1,033,568 | |
Range Resources Corp. | | 9,880 | | 339,773 | |
Schlumberger Ltd. | | 14,553 | | 616,028 | |
Southwestern Energy Co.* | | 7,043 | | 204,036 | |
Valero Energy Corp. | | 6,536 | | 141,439 | |
Williams Cos., Inc. | | 21,462 | | 310,770 | |
XTO Energy, Inc. | | 7,072 | | 249,429 | |
| | | | 12,290,679 | |
FINANCIAL (7.2%) | | | | | |
Aflac, Inc. | | 9,670 | | 443,273 | |
Bank of America Corp. | | 48,307 | | 680,163 | |
Bank of New York Mellon Corp. | | 30,025 | | 850,608 | |
Capital One Financial Corp. | | 19,443 | | 620,037 | |
Chubb Corp. | | 12,072 | | 615,672 | |
Citigroup, Inc. | | 50,931 | | 341,747 | |
CME Group, Inc. | | 2,009 | | 418,093 | |
Federated Investors, Inc. Cl B | | 16,739 | | 283,893 | |
Goldman Sachs Group, Inc. | | 7,039 | | 594,021 | |
JPMorgan Chase & Co. | | 34,228 | | 1,079,209 | |
MetLife, Inc. | | 26,650 | | 929,019 | |
Progressive Corp. | | 31,922 | | 472,765 | |
ProLogis | | 14,635 | | 203,280 | |
T. Rowe Price Group, Inc. | | 18,290 | | 648,198 | |
U.S. Bancorp | | 30,961 | | 774,335 | |
Wells Fargo & Co. | | 64,147 | | 1,891,054 | |
| | | | 10,845,367 | |
HEALTHCARE (9.1%) | | | | | |
Abbott Laboratories | | 43,524 | | 2,322,876 | |
Aetna, Inc. | | 10,263 | | 292,496 | |
AmerisourceBergen Corp. | | 15,889 | | 566,602 | |
Baxter International, Inc. | | 7,408 | | 396,995 | |
Celgene Corp.* | | 16,931 | | 935,946 | |
Covidien Ltd. | | 25,622 | | 928,541 | |
Gilead Sciences, Inc.* | | 39,460 | | 2,017,984 | |
Johnson & Johnson | | 48,854 | | 2,922,935 | |
Laboratory Corp. of America Hldgs.* | | 8,730 | | 562,299 | |
McKesson Corp. | | 12,889 | | 499,191 | |
Medco Health Solutions, Inc.* | | 6,247 | | 261,812 | |
Medtronic, Inc. | | 16,459 | | 517,142 | |
Merck & Co., Inc. | | 18,215 | | 553,736 | |
Schering-Plough Corp. | | 47,510 | | 809,095 | |
| | | | 13,587,650 | |
INDUSTRIAL (6.5%) | | | | | |
Burlington Northern Santa Fe Corp. | | 7,178 | | 543,446 | |
Expeditors Int’l. of Washington, Inc. | | 13,829 | | 460,091 | |
General Electric Co. | | 137,013 | | 2,219,611 | |
Illinois Tool Works, Inc. | | 13,933 | | 488,352 | |
ITT Corp. | | 15,425 | | 709,396 | |
Lockheed Martin Corp. | | 12,029 | | 1,011,398 | |
Northrop Grumman Corp. | | 17,119 | | 771,040 | |
Southwest Airlines Co. | | 53,117 | | 457,869 | |
Tyco International Ltd. | | 25,374 | | 548,078 | |
Union Pacific Corp. | | 9,955 | | 475,849 | |
United Parcel Service, Inc. Cl B | | 20,698 | | 1,141,702 | |
United Technologies Corp. | | 17,412 | | 933,283 | |
| | | | 9,760,115 | |
TECHNOLOGY (8.4%) | | | | | |
Apple, Inc.* | | 13,938 | | 1,189,608 | |
Applied Materials, Inc. | | 42,102 | | 426,493 | |
Automatic Data Processing, Inc. | | 14,903 | | 586,284 | |
Broadcom Corp. Cl A* | | 15,515 | | 263,290 | |
Cisco Systems, Inc.* | | 70,211 | | 1,144,439 | |
EMC Corp.* | | 29,111 | | 304,792 | |
Google, Inc.* | | 1,930 | | 593,765 | |
Hewlett-Packard Co. | | 37,262 | | 1,352,238 | |
Int’l. Business Machines Corp. | | 17,099 | | 1,439,052 | |
Intel Corp. | | 47,794 | | 700,660 | |
MEMC Electronic Materials, Inc.* | | 6,684 | | 95,448 | |
Microsoft Corp. | | 88,753 | | 1,725,358 | |
Nortel Networks Corp.* | | 6,040 | | 1,570 | |
Oracle Corp.* | | 40,013 | | 709,430 | |
QUALCOMM, Inc. | | 27,381 | | 981,061 | |
Symantec Corp.* | | 56,002 | | 757,147 | |
Yahoo!, Inc.* | | 30,032 | | 366,390 | |
| | | | 12,637,025 | |
TELECOMMUNICATIONS (1.8%) | | | | | |
American Tower Corp. Cl A* | | 21,535 | | 631,406 | |
AT&T, Inc. | | 73,514 | | 2,095,149 | |
| | | | 2,726,555 | |
UTILITIES (2.3%) | | | | | |
Dominion Resources, Inc. | | 22,626 | | 810,916 | |
Edison International | | 6,344 | | 203,769 | |
Entergy Corp. | | 3,527 | | 293,200 | |
Exelon Corp. | | 9,387 | | 522,011 | |
FirstEnergy Corp. | | 9,655 | | 469,040 | |
FPL Group, Inc. | | 7,233 | | 364,037 | |
Public Svc. Enterprise Group, Inc. | | 8,712 | | 254,129 | |
Sempra Energy | | 11,773 | | 501,883 | |
| | | | 3,418,985 | |
TOTAL COMMON STOCKS
(Cost: $106,756,232) 57.4% | | | | 86,205,106 | |
| | Rating** | | Rate(%) | | Maturity | | Face Amount($) | | Value($) | |
LONG-TERM DEBT SECURITIES: | | | | | | | | | | | |
U.S. GOVERNMENT AGENCIES (16.6%) | | | | | | | | | | | |
MORTGAGE-BACKED OBLIGATIONS (16.6%) | | | | | | | | | | | |
FHARM | | AAA | | 5.26 | | 04/01/37 | | 716,058 | | 722,665 | |
FHARM | | AAA | | 5.28 | | 02/01/36 | | 414,734 | | 421,529 | |
FHARM | | AAA | | 5.45 | | 05/01/37 | | 616,547 | | 629,971 | |
FHLMC | | AAA | | 5.00 | | 02/01/26 | | 295,110 | | 303,157 | |
FHLMC | | AAA | | 5.43 | | 04/01/37 | | 563,857 | | 572,584 | |
FHLMC | | AAA | | 5.50 | | 10/01/18 | | 234,639 | | 242,703 | |
FHLMC | | AAA | | 5.50 | | 01/15/32 | | 190,000 | | 194,201 | |
FHLMC | | AAA | | 5.79 | | 03/01/37 | | 355,472 | | 362,414 | |
FHLMC | | AAA | | 6.00 | | 07/15/29 | | 358,483 | | 371,824 | |
FHLMC | | AAA | | 6.00 | | 03/15/32 | | 495,802 | | 513,013 | |
FNMA | | AAA | | 4.00 | | 05/01/19 | | 256,989 | | 261,200 | |
FNMA | | AAA | | 4.50 | | 05/01/18 | | 415,578 | | 427,451 | |
FNMA | | AAA | | 4.50 | | 02/01/19 | | 181,207 | | 185,932 | |
FNMA | | AAA | | 4.50 | | 06/01/19 | | 292,608 | | 300,236 | |
FNMA | | AAA | | 4.50 | | 06/01/34 | | 506,932 | | 515,025 | |
FNMA | | AAA | | 5.00 | | 04/01/18 | | 799,472 | | 825,312 | |
FNMA | | AAA | | 5.00 | | 06/01/33 | | 865,641 | | 886,102 | |
FNMA | | AAA | | 5.00 | | 09/01/33 | | 330,970 | | 338,793 | |
FNMA | | AAA | | 5.00 | | 11/01/33 | | 1,279,417 | | 1,309,653 | |
FNMA | | AAA | | 5.00 | | 03/01/34 | | 261,932 | | 268,123 | |
FNMA | | AAA | | 5.00 | | 04/01/34 | | 247,522 | | 253,218 | |
FNMA | | AAA | | 5.00 | | 04/01/35 | | 540,289 | | 552,384 | |
FNMA | | AAA | | 5.00 | | 09/01/35 | | 384,406 | | 393,011 | |
FNMA | | AAA | | 5.50 | | 04/01/17 | | 65,205 | | 67,507 | |
FNMA | | AAA | | 5.50 | | 05/01/17 | | 35,408 | | 36,658 | |
FNMA | | AAA | | 5.50 | | 06/01/17 | | 33,278 | | 34,452 | |
FNMA | | AAA | | 5.50 | | 07/01/33 | | 614,532 | | 631,458 | |
FNMA | | AAA | | 5.50 | | 09/01/33 | | 491,974 | | 505,524 | |
FNMA | | AAA | | 5.50 | | 10/01/33 | | 817,513 | | 840,029 | |
FNMA | | AAA | | 5.50 | | 03/01/34 | | 205,675 | | 211,340 | |
FNMA | | AAA | | 5.50 | | 05/01/34 | | 1,246,337 | | 1,279,886 | |
FNMA | | AAA | | 5.50 | | 07/01/34 | | 536,723 | | 551,171 | |
FNMA | | AAA | | 5.50 | | 09/01/34 | | 403,667 | | 414,533 | |
FNMA | | AAA | | 5.50 | | 10/01/34 | | 270,217 | | 277,491 | |
FNMA | | AAA | | 5.50 | | 02/01/35 | | 343,346 | | 352,588 | |
FNMA | | AAA | | 5.50 | | 02/01/35 | | 288,480 | | 296,065 | |
FNMA | | AAA | | 5.50 | | 04/01/35 | | 419,119 | | 430,139 | |
FNMA | | AAA | | 5.50 | | 08/01/35 | | 158,354 | | 162,517 | |
FNMA | | AAA | | 5.50 | | 06/01/37 | | 445,875 | | 457,573 | |
FNMA | | AAA | | 5.50 | | 08/01/37 | | 350,338 | | 359,529 | |
FNMA | | AAA | | 5.50 | | 06/01/48 | | 293,831 | | 293,831 | |
FNMA | | AAA | | 6.00 | | 03/01/17 | | 23,827 | | 24,809 | |
FNMA | | AAA | | 6.00 | | 05/01/23 | | 153,181 | | 158,392 | |
FNMA | | AAA | | 6.00 | | 03/01/32 | | 26,274 | | 27,174 | |
FNMA | | AAA | | 6.00 | | 04/01/32 | | 128,709 | | 132,999 | |
FNMA | | AAA | | 6.00 | | 04/01/32 | | 69,543 | | 71,860 | |
FNMA | | AAA | | 6.00 | | 05/01/32 | | 127,066 | | 131,301 | |
FNMA | | AAA | | 6.00 | | 04/01/33 | | 346,206 | | 357,743 | |
FNMA | | AAA | | 6.00 | | 05/01/33 | | 184,308 | | 190,334 | |
FNMA | | AAA | | 6.00 | | 06/01/34 | | 231,729 | | 239,126 | |
FNMA | | AAA | | 6.00 | | 09/01/34 | | 125,744 | | 129,757 | |
FNMA | | AAA | | 6.00 | | 10/01/34 | | 230,052 | | 237,394 | |
FNMA | | AAA | | 6.00 | | 11/01/34 | | 268,371 | | 276,936 | |
FNMA | | AAA | | 6.00 | | 12/01/36 | | 473,726 | | 488,254 | |
FNMA | | AAA | | 6.00 | | 01/01/37 | | 389,667 | | 401,618 | |
FNMA | | AAA | | 6.00 | | 04/01/37 | | 341,519 | | 346,612 | |
FNMA | | AAA | | 6.00 | | 05/01/37 | | 382,006 | | 387,702 | |
FNMA | | AAA | | 6.00 | | 06/01/37 | | 475,192 | | 482,277 | |
FNMA | | AAA | | 6.00 | | 02/25/47 | | 220,113 | | 223,827 | |
FNMA | | AAA | | 6.50 | | 09/01/16 | | 27,012 | | 28,105 | |
FNMA | | AAA | | 6.50 | | 03/01/17 | | 59,568 | | 61,894 | |
FNMA | | AAA | | 6.50 | | 05/01/17 | | 29,780 | | 30,943 | |
FNMA | | AAA | | 6.50 | | 06/01/17 | | 58,569 | | 60,856 | |
FNMA | | AAA | | 6.50 | | 04/01/32 | | 91,002 | | 94,955 | |
FNMA | | AAA | | 6.50 | | 05/01/32 | | 154,334 | | 161,038 | |
FNMA | | AAA | | 6.50 | | 05/01/32 | | 142,434 | | 148,621 | |
FNMA | | AAA | | 6.50 | | 07/01/32 | | 46,225 | | 48,233 | |
FNMA | | AAA | | 6.50 | | 07/01/34 | | 186,828 | | 194,593 | |
FNMA | | AAA | | 6.50 | | 09/01/36 | | 393,638 | | 403,120 | |
FNMA | | AAA | | 6.50 | | 05/01/37 | | 380,911 | | 396,067 | |
FNMA | | AAA | | 6.50 | | 09/01/37 | | 569,349 | | 592,003 | |
FNMA | | AAA | | 7.00 | | 09/01/31 | | 49,836 | | 52,733 | |
FNMA | | AAA | | 7.00 | | 11/01/31 | | 34,778 | | 36,801 | |
FNMA | | AAA | | 7.00 | | 04/01/32 | | 33,619 | | 35,576 | |
FNMA | | AAA | | 7.50 | | 06/01/31 | | 25,210 | | 26,689 | |
FNMA | | AAA | | 7.50 | | 02/01/32 | | 23,710 | | 25,120 | |
FNMA | | AAA | | 7.50 | | 04/01/32 | | 25,604 | | 27,128 | |
FNMA | | AAA | | 7.50 | | 06/01/32 | | 35,282 | | 37,382 | |
FNMA | | AAA | | 8.00 | | 03/01/31 | | 22,174 | | 23,552 | |
FNMA | | AAA | | 8.00 | | 04/01/32 | | 19,818 | | 21,054 | |
FNMA | | AAA | | 8.00 | | 04/01/32 | | 8,822 | | 9,373 | |
GNMA (5) | | AAA | | 6.50 | | 04/15/31 | | 12,894 | | 13,553 | |
GNMA (5) | | AAA | | 6.50 | | 10/15/31 | | 19,548 | | 20,547 | |
GNMA (5) | | AAA | | 6.50 | | 12/15/31 | | 16,474 | | 17,316 | |
GNMA (5) | | AAA | | 6.50 | | 05/15/32 | | 24,648 | | 25,907 | |
GNMA (5) | | AAA | | 7.00 | | 05/15/31 | | 13,006 | | 13,753 | |
GNMA (5) | | AAA | | 7.00 | | 09/15/31 | | 16,254 | | 17,187 | |
GNMA (5) | | AAA | | 7.00 | | 09/15/31 | | 2,566 | | 2,714 | |
GNMA (5) | | AAA | | 7.00 | | 05/15/32 | | 9,009 | | 9,473 | |
| | | | | | | | | | 24,997,193 | |
CORPORATE DEBT (21.8%) | | | | | | | | | | | |
BASIC MATERIALS (1.7%) | | | | | | | | | | | |
ARCO Chemical Co. | | D | | 10.25 | | 11/01/10 | | 500,000 | | 80,000 | |
International Paper Co. | | BBB | | 4.25 | | 01/15/09 | | 500,000 | | 499,828 | |
Lubrizol Corp. | | BBB | | 5.50 | | 10/01/14 | | 500,000 | | 454,547 | |
Martin Marietta Materials, Inc | | BBB+ | | 6.88 | | 04/01/11 | | 250,000 | | 238,753 | |
PolyOne Corp. | | B | | 7.50 | | 12/15/15 | | 1,000,000 | | 302,500 | |
Temple-Inland, Inc. | | BBB- | | 7.88 | | 05/01/12 | | 228,000 | | 199,531 | |
Vulcan Materials Co. | | BBB+ | | 7.00 | | 06/15/18 | | 250,000 | | 195,601 | |
Worthington Industries, Inc. | | BBB | | 6.70 | | 12/01/09 | | 500,000 | | 510,576 | |
| | | | | | | | | | 2,481,336 | |
CONSUMER, CYCLICAL (3.5%) | | | | | | | | | | | |
Black & Decker Corp. | | BBB | | 4.75 | | 11/01/14 | | 750,000 | | 655,163 | |
Ethan Allen Interiors, Inc. | | BBB- | | 5.38 | | 10/01/15 | | 500,000 | | 473,897 | |
Fortune Brands, Inc. | | BBB | | 4.88 | | 12/01/13 | | 500,000 | | 440,382 | |
Fruit of the Loom (2) | | NR | | 7.38 | | 11/15/23 | | 138,068 | | 14 | |
Home Depot, Inc. | | BBB+ | | 5.40 | | 03/01/16 | | 500,000 | | 447,460 | |
Johnson Controls, Inc. | | BBB | | 4.88 | | 09/15/13 | | 500,000 | | 393,861 | |
Kellwood Co. | | NR | | 7.88 | | 07/15/09 | | 750,000 | | 487,500 | |
Macys Retail Hldgs., Inc.† | | BBB- | | 4.80 | | 07/15/09 | | 500,000 | | 473,919 | |
Marriott International, Inc. | | BBB | | 5.63 | | 02/15/13 | | 500,000 | | 380,000 | |
Newell Rubbermaid, Inc. | | BBB+ | | 4.63 | | 12/15/09 | | 500,000 | | 486,324 | |
RadioShack Corp. | | BB | | 7.38 | | 05/15/11 | | 500,000 | | 435,000 | |
Scholastic Corp. | | BB | | 5.00 | | 04/15/13 | | 500,000 | | 385,000 | |
Whirlpool Corp. | | BBB | | 6.50 | | 06/15/16 | | 250,000 | | 197,022 | |
| | | | | | | | | | 5,255,542 | |
CONSUMER, NON-CYCLICAL (1.2%) | | | | | | | | | | | |
Bunge Ltd. Finance Corp. | | BBB- | | 5.35 | | 04/15/14 | | 500,000 | | 358,708 | |
CVS Caremark Corp. | | BBB+ | | 6.13 | | 08/15/16 | | 250,000 | | 242,208 | |
Kroger Co. | | BBB- | | 4.95 | | 01/15/15 | | 500,000 | | 476,033 | |
PepsiAmericas, Inc. | | A | | 6.38 | | 05/01/09 | | 250,000 | | 251,190 | |
Sara Lee Corp. | | BBB+ | | 6.25 | | 09/15/11 | | 500,000 | | 494,971 | |
| | | | | | | | | | 1,823,110 | |
ENERGY (4.0%) | | | | | | | | | | | |
Diamond Offshore Drilling | | A- | | 4.88 | | 07/01/15 | | 500,000 | | 459,174 | |
Enbridge, Inc. | | A- | | 5.80 | | 06/15/14 | | 100,000 | | 87,710 | |
Knight, Inc. | | BB | | 5.15 | | 03/01/15 | | 500,000 | | 372,500 | |
National Oilwell Varco, Inc. | | BBB+ | | 6.13 | | 08/15/15 | | 250,000 | | 217,155 | |
Noble Corp. | | A- | | 7.50 | | 03/15/19 | | 800,000 | | 989,206 | |
Premco Refining Group | | BBB | | 7.50 | | 06/15/15 | | 500,000 | | 450,208 | |
Seariver Maritime, Inc. | | AAA | | 0.00 | | 09/01/12 | | 3,000,000 | | 2,569,396 | |
Sunoco, Inc. | | BBB | | 4.88 | | 10/15/14 | | 500,000 | | 420,552 | |
Weatherford Int’l. Ltd. | | BBB+ | | 5.50 | | 02/15/16 | | 500,000 | | 429,805 | |
| | | | | | | | | | 5,995,706 | |
FINANCIAL (6.8%) | | | | | | | | | | | |
Berkley (W.R.) Corp. | | BBB+ | | 8.70 | | 01/01/22 | | 1,500,000 | | 1,607,671 | |
Brandywine Realty Trust | | BBB- | | 4.50 | | 11/01/09 | | 500,000 | | 468,894 | |
Capital One Bank | | A- | | 5.75 | | 09/15/10 | | 250,000 | | 242,642 | |
Colonial Realty LP | | BBB- | | 4.80 | | 04/01/11 | | 250,000 | | 199,300 | |
Developers Diversified Realty | | BBB- | | 5.00 | | 05/03/10 | | 250,000 | | 181,133 | |
Duke Realty LP | | BBB+ | | 4.63 | | 05/15/13 | | 250,000 | | 157,283 | |
Fairfax Financial Hldgs. | | BB+ | | 8.25 | | 10/01/15 | | 500,000 | | 390,000 | |
First Horizon Mtg. | | AAA | | 5.00 | | 06/25/33 | | 520,975 | | 515,444 | |
First Horizon National Corp. | | BBB- | | 4.50 | | 05/15/13 | | 1,500,000 | | 1,041,893 | |
First Industrial LP | | BBB- | | 6.88 | | 04/15/12 | | 250,000 | | 163,090 | |
Ford Motor Credit Co. LLC | | CCC+ | | 7.38 | | 10/28/09 | | 1,000,000 | | 878,221 | |
Fosters Finance Corp.† | | BBB | | 6.88 | | 06/15/11 | | 500,000 | | 496,228 | |
GATX Financial Corp. | | BBB+ | | 5.13 | | 04/15/10 | | 250,000 | | 234,179 | |
GMAC LLC | | CC | | 0.00 | | 12/01/12 | | 2,500,000 | | 473,725 | |
HCP, Inc. | | BBB | | 4.88 | | 09/15/10 | | 250,000 | | 222,866 | |
HCP, Inc. | | BBB | | 5.65 | | 12/15/13 | | 250,000 | | 149,390 | |
Health Care REIT, Inc. | | BBB- | | 8.00 | | 09/12/12 | | 159,000 | | 136,236 | |
Heinz (H.J.) Finance Co. | | BBB | | 6.00 | | 03/15/12 | | 500,000 | | 503,814 | |
Lincoln National Corp. | | A+ | | 5.65 | | 08/27/12 | | 500,000 | | 412,050 | |
Markel Corp. | | BBB | | 6.80 | | 02/15/13 | | 250,000 | | 220,885 | |
ProLogis | | BBB- | | 5.50 | | 04/01/12 | | 250,000 | | 150,625 | |
Regency Centers LP | | BBB+ | | 4.95 | | 04/15/14 | | 250,000 | | 172,562 | |
Shurgard Storage Centers | | A- | | 7.75 | | 02/22/11 | | 250,000 | | 251,071 | |
SLM Corp. | | BBB- | | 4.00 | | 01/15/09 | | 500,000 | | 497,717 | |
Vornado Realty LP | | BBB | | 5.60 | | 02/15/11 | | 250,000 | | 225,952 | |
Zions Bancorporation | | BBB | | 5.65 | | 05/15/14 | | 397,000 | | 296,792 | |
| | | | | | | | | | 10,289,663 | |
HEALTHCARE (1.1%) | | | | | | | | | | | |
Allergan, Inc. | | A | | 5.75 | | 04/01/16 | | 250,000 | | 239,181 | |
Laboratory Corp. of America | | BBB | | 5.63 | | 12/15/15 | | 500,000 | | 420,813 | |
WellPoint, Inc. | | A- | | 4.25 | | 12/15/09 | | 500,000 | | 480,834 | |
Wyeth | | A+ | | 5.50 | | 03/15/13 | | 500,000 | | 509,309 | |
| | | | | | | | | | 1,650,137 | |
INDUSTRIAL (1.1%) | | | | | | | | | | | |
Canadian Pacific Railway Co. | | BBB | | 5.75 | | 05/15/13 | | 150,000 | | 138,819 | |
CSX Corp. | | BBB- | | 5.30 | | 02/15/14 | | 250,000 | | 225,640 | |
Donnelley (R.R.) & Sons Co. | | BBB+ | | 4.95 | | 04/01/14 | | 500,000 | | 379,001 | |
Masco Corp. | | BBB | | 5.88 | | 07/15/12 | | 500,000 | | 409,997 | |
Steelcase, Inc. | | BBB | | 6.50 | | 08/15/11 | | 500,000 | | 470,863 | |
| | | | | | | | | | 1,624,320 | |
TECHNOLOGY (0.6%) | | | | | | | | | | | |
Arrow Electronics, Inc. | | BBB- | | 6.88 | | 06/01/18 | | 500,000 | | 408,214 | |
Cisco Systems, Inc. | | A+ | | 5.25 | | 02/22/11 | | 500,000 | | 519,066 | |
| | | | | | | | | | 927,280 | |
TELECOMMUNICATIONS (0.3%) | | | | | | | | | | | |
Nextel Communications, Inc. | | BB | | 5.25 | | 01/15/10 | | 500,000 | | 431,250 | |
| | | | | | | | | | | |
UTILITIES (1.5%) | | | | | | | | | | | |
Arizona Public Svc. Co. | | BBB- | | 6.50 | | 03/01/12 | | 250,000 | | 234,446 | |
Duke Energy Corp. | | A | | 4.50 | | 04/01/10 | | 500,000 | | 499,291 | |
Pepco Hldgs., Inc. | | BBB- | | 4.00 | | 05/15/10 | | 500,000 | | 480,759 | |
Progress Energy, Inc. | | A- | | 5.25 | | 12/15/15 | | 500,000 | | 507,239 | |
Virginia Electric & Power Co. | | A- | | 4.50 | | 12/15/10 | | 500,000 | | 493,473 | |
| | | | | | | | | | 2,215,208 | |
TOTAL LONG-TERM DEBT SECURITIES
(Cost: $63,261,403) 38.4% | | | | | | | | | | 57,690,745 | |
| | Rating** | | Rate(%) | | Maturity | | Face Amount($) | | Value($) | |
SHORT-TERM DEBT SECURITIES: | | | | | | | | | | | |
COMMERCIAL PAPER (3.6%) | | | | | | | | | | | �� |
American Express Credit Corp. | | A-1 | | 0.01 | | 01/02/09 | | 2,000,000 | | 1,999,999 | |
Danaher Corp. | | A-1 | | 0.02 | | 01/05/09 | | 1,200,000 | | 1,199,997 | |
Rockwell Collins, Inc.† | | A-1 | | 0.07 | | 01/02/09 | | 960,000 | | 959,998 | |
Toyota Motor Credit Corp. | | A-1+ | | 0.40 | | 01/21/09 | | 1,190,000 | | 1,189,736 | |
| | | | | | | | | | 5,349,730 | |
TOTAL SHORT-TERM DEBT SECURITIES
(Cost: $5,349,730) 3.6% | | | | | | | | | | 5,349,730 | |
| | | | | | | | | | | |
TOTAL INVESTMENTS
(Cost: $175,367,365) 99.4% | | | | | | | | | | 149,245,581 | |
| | | | | | | | | | | |
OTHER NET ASSETS 0.6% | | | | | | | | | | 880,203 | |
| | | | | | | | | | | |
NET ASSETS 100.0% | | | | | | | | | | $ | 150,125,784 | |
| | | | | | | | | | | | |
The accompanying notes are an integral part of these portfolio schedules.
MUTUAL OF AMERICA INVESTMENT CORPORATION (RETIREMENT INCOME FUND)
PORTFOLIO OF INVESTMENTS IN SECURITIES
December 31, 2008
| | Shares | | Value($) | |
COMMON STOCKS: | | | | | |
DIVERSIFIED MUTUAL FUNDS (100.0%) | | | | | |
Mutual of America Investment Corporation | | | | | |
Bond Fund (30.4%) | | 906,467 | | 1,067,407 | |
Equity Index Fund (18.5%) | | 439,637 | | 650,568 | |
Mid-Cap Equity Index Fund (4.6%) | | 175,565 | | 162,419 | |
Mid-Term Bond Fund (30.9%) | | 1,159,481 | | 1,087,955 | |
Money Market Fund (15.6%) | | 454,021 | | 548,584 | |
| | | | | |
TOTAL INVESTMENTS
(Cost: $3,881,924) 100.0% | | | | 3,516,933 | |
| | | | | |
OTHER NET ASSETS | | | | — | |
| | | | | |
NET ASSETS 100.0% | | | | $ | 3,516,933 | |
| | | | | | |
The accompanying notes are an integral part of these portfolio schedules.
MUTUAL OF AMERICA INVESTMENT CORPORATION (2010 RETIREMENT FUND)
PORTFOLIO OF INVESTMENTS IN SECURITIES
December 31, 2008
| | Shares | | Value($) | |
COMMON STOCKS: | | | | | |
DIVERSIFIED MUTUAL FUNDS (100.0%) | | | | | |
Mutual of America Investment Corporation | | | | | |
Bond Fund (25.7%) | | 1,807,380 | | 2,128,275 | |
Equity Index Fund (23.6%) | | 1,321,312 | | 1,955,259 | |
International Fund (5.0%) | | 739,224 | | 409,053 | |
Mid-Cap Equity Index Fund (14.2%) | | 1,269,710 | | 1,174,632 | |
Mid-Term Bond Fund (20.9%) | | 1,846,285 | | 1,732,392 | |
Money Market Fund (10.6%) | | 724,247 | | 875,094 | |
| | | | | |
TOTAL INVESTMENTS
(Cost: $9,649,309) 100.0% | | | | 8,274,705 | |
| | | | | |
OTHER NET ASSETS | | | | — | |
| | | | | |
NET ASSETS 100.0% | | | | $ | 8,274,705 | |
| | | | | | |
The accompanying notes are an integral part of these portfolio schedules.
MUTUAL OF AMERICA INVESTMENT CORPORATION (2015 RETIREMENT FUND)
PORTFOLIO OF INVESTMENTS IN SECURITIES
December 31, 2008
| | Shares | | Value($) | |
COMMON STOCKS: | | | | | |
DIVERSIFIED MUTUAL FUNDS (100.0%) | | | | | |
Mutual of America Investment Corporation | | | | | |
Bond Fund (26.0%) | | 4,411,815 | | 5,195,119 | |
Equity Index Fund (28.5%) | | 3,865,037 | | 5,719,427 | |
International Fund (7.0%) | | 2,529,236 | | 1,399,565 | |
Mid-Cap Equity Index Fund (11.5%) | | 2,479,283 | | 2,293,629 | |
Mid-Term Bond Fund (11.6%) | | 2,478,915 | | 2,325,996 | |
Money Market Fund (9.6%) | | 1,589,271 | | 1,920,285 | |
Small Cap Growth Fund (2.8%) | | 812,457 | | 568,483 | |
Small Cap Value Fund (3.0%) | | 795,510 | | 594,588 | |
| | | | | |
TOTAL INVESTMENTS
(Cost: $24,153,563) 100.0% | | | | 20,017,092 | |
| | | | | |
OTHER NET ASSETS | | | | — | |
| | | | | |
NET ASSETS 100.0% | | | | $ | 20,017,092 | |
| | | | | | |
The accompanying notes are an integral part of these portfolio schedules.
MUTUAL OF AMERICA INVESTMENT CORPORATION (2020 RETIREMENT FUND)
PORTFOLIO OF INVESTMENTS IN SECURITIES
December 31, 2008
| | Shares | | Value($) | |
COMMON STOCKS: | | | | | |
DIVERSIFIED MUTUAL FUNDS (100.0%) | | | | | |
Mutual of America Investment Corporation | | | | | |
Bond Fund (25.1%) | | 4,411,065 | | 5,194,237 | |
Equity Index Fund (33.7%) | | 4,706,492 | | 6,964,600 | |
International Fund (10.1%) | | 3,774,428 | | 2,088,599 | |
Mid-Cap Equity Index Fund (11.6%) | | 2,588,699 | | 2,394,852 | |
Mid-Term Bond Fund (11.7%) | | 2,582,315 | | 2,423,017 | |
Small Cap Growth Fund (3.8%) | | 1,132,742 | | 792,589 | |
Small Cap Value Fund (4.0%) | | 1,107,596 | | 827,850 | |
| | | | | |
TOTAL INVESTMENTS
(Cost: $25,669,962) 100.0% | | | | 20,685,744 | |
| | | | | |
OTHER NET ASSETS | | | | — | |
| | | | | |
NET ASSETS 100.0% | | | | $ | 20,685,744 | |
| | | | | | |
The accompanying notes are an integral part of these portfolio schedules.
MUTUAL OF AMERICA INVESTMENT CORPORATION (2025 RETIREMENT FUND)
PORTFOLIO OF INVESTMENTS IN SECURITIES
December 31, 2008
| | Shares | | Value($) | |
COMMON STOCKS: | | | | | |
DIVERSIFIED MUTUAL FUNDS (100.0%) | | | | | |
Mutual of America Investment Corporation | | | | | |
Bond Fund (21.1%) | | 2,648,706 | | 3,118,976 | |
Equity Index Fund (38.9%) | | 3,894,135 | | 5,762,487 | |
International Fund (10.2%) | | 2,731,058 | | 1,511,245 | |
Mid-Cap Equity Index Fund (14.6%) | | 2,345,910 | | 2,170,244 | |
Mid-Term Bond Fund (5.4%) | | 845,196 | | 793,057 | |
Small Cap Growth Fund (4.8%) | | 1,025,996 | | 717,897 | |
Small Cap Value Fund (5.0%) | | 1,001,415 | | 748,488 | |
| | | | | |
TOTAL INVESTMENTS
(Cost: $18,457,006) 100.0% | | | | 14,822,394 | |
| | | | | |
OTHER NET ASSETS | | | | — | |
| | | | | |
NET ASSETS 100.0% | | | | $ | 14,822,394 | |
| | | | | | |
The accompanying notes are an integral part of these portfolio schedules.
MUTUAL OF AMERICA INVESTMENT CORPORATION (2030 RETIREMENT FUND)
PORTFOLIO OF INVESTMENTS IN SECURITIES
December 31, 2008
| | Shares | | Value($) | |
COMMON STOCKS: | | | | | |
DIVERSIFIED MUTUAL FUNDS (100.0%) | | | | | |
Mutual of America Investment Corporation | | | | | |
Bond Fund (21.1%) | | 2,088,805 | | 2,459,666 | |
Equity Index Fund (39.0%) | | 3,077,097 | | 4,553,444 | |
International Fund (10.2%) | | 2,160,459 | | 1,195,501 | |
Mid-Cap Equity Index Fund (17.7%) | | 2,227,355 | | 2,060,566 | |
Small Cap Growth Fund (5.9%) | | 975,078 | | 682,270 | |
Small Cap Value Fund (6.1%) | | 949,890 | | 709,976 | |
| | | | | |
TOTAL INVESTMENTS
(Cost: $14,711,346) 100.0% | | | | 11,661,423 | |
| | | | | |
OTHER NET ASSETS | | | | — | |
| | | | | |
NET ASSETS 100.0% | | | | $ | 11,661,423 | |
| | | | | | |
The accompanying notes are an integral part of these portfolio schedules.
MUTUAL OF AMERICA INVESTMENT CORPORATION (2035 RETIREMENT FUND)
PORTFOLIO OF INVESTMENTS IN SECURITIES
December 31, 2008
| | Shares | | Value($) | |
COMMON STOCKS: | | | | | |
DIVERSIFIED MUTUAL FUNDS (100.0%) | | | | | |
Mutual of America Investment Corporation | | | | | |
Bond Fund (12.7%) | | 943,872 | | 1,111,453 | |
Equity Index Fund (39.2%) | | 2,328,097 | | 3,445,085 | |
International Fund (13.4%) | | 2,122,002 | | 1,174,221 | |
Mid-Cap Equity Index Fund (20.7%) | | 1,968,007 | | 1,820,639 | |
Small Cap Growth Fund (6.9%) | | 861,358 | | 602,699 | |
Small Cap Value Fund (7.1%) | | 838,665 | | 626,843 | |
| | | | | |
TOTAL INVESTMENTS
(Cost: $11,265,677) 100.0% | | | | 8,780,940 | |
| | | | | |
OTHER NET ASSETS | | | | — | |
| | | | | |
NET ASSETS 100.0% | | | | $ | 8,780,940 | |
| | | | | | |
The accompanying notes are an integral part of these portfolio schedules.
MUTUAL OF AMERICA INVESTMENT CORPORATION (2040 RETIREMENT FUND)
PORTFOLIO OF INVESTMENTS IN SECURITIES
December 31, 2008
| | Shares | | Value($) | |
COMMON STOCKS: | | | | | |
DIVERSIFIED MUTUAL FUNDS (100.0%) | | | | | |
Mutual of America Investment Corporation | | | | | |
Bond Fund (11.6%) | | 612,574 | | 721,334 | |
Equity Index Fund (34.3%) | | 1,437,114 | | 2,126,621 | |
International Fund (14.4%) | | 1,615,931 | | 894,184 | |
Mid-Cap Equity Index Fund (23.7%) | | 1,586,535 | | 1,467,732 | |
Small Cap Growth Fund (7.8%) | | 693,683 | | 485,376 | |
Small Cap Value Fund (8.2%) | | 676,257 | | 505,455 | |
| | | | | |
TOTAL INVESTMENTS
(Cost: $7,956,146) 100.0% | | | | 6,200,702 | |
| | | | | |
OTHER NET ASSETS | | | | — | |
| | | | | |
NET ASSETS 100.0% | | | | $ | 6,200,702 | |
| | | | | | |
The accompanying notes are an integral part of these portfolio schedules.
MUTUAL OF AMERICA INVESTMENT CORPORATION (2045 RETIREMENT FUND)
PORTFOLIO OF INVESTMENTS IN SECURITIES
December 31, 2008
| | Shares | | Value($) | |
COMMON STOCKS: | | | | | |
DIVERSIFIED MUTUAL FUNDS (100.0%) | | | | | |
Mutual of America Investment Corporation | | | | | |
Bond Fund (10.5%) | | 613,434 | | 722,348 | |
Equity Index Fund (34.3%) | | 1,589,622 | | 2,352,300 | |
International Fund (15.4%) | | 1,913,168 | | 1,058,661 | |
Mid-Cap Equity Index Fund (19.8%) | | 1,463,515 | | 1,353,924 | |
Small Cap Growth Fund (9.8%) | | 959,703 | | 671,512 | |
Small Cap Value Fund (10.2%) | | 935,805 | | 699,449 | |
| | | | | |
TOTAL INVESTMENTS
(Cost: $8,641,633) 100.0% | | | | 6,858,194 | |
| | | | | |
OTHER NET ASSETS | | | | — | |
| | | | | |
NET ASSETS 100.0% | | | | $ | 6,858,194 | |
| | | | | | |
The accompanying notes are an integral part of these portfolio schedules.
MUTUAL OF AMERICA INVESTMENT CORPORATION (CONSERVATIVE ALLOCATION FUND)
PORTFOLIO OF INVESTMENTS IN SECURITIES
December 31, 2008
| | Shares | | Value($) | |
COMMON STOCKS: | | | | | |
DIVERSIFIED MUTUAL FUNDS (100.0%) | | | | | |
Mutual of America Investment Corporation | | | | | |
Bond Fund (29.8%) | | 5,975,256 | | 7,036,145 | |
Equity Index Fund (25.6%) | | 4,087,322 | | 6,048,361 | |
Mid-Term Bond Fund (44.6%) | | 11,211,796 | | 10,520,162 | |
| | | | | |
TOTAL INVESTMENTS
(Cost: $26,834,350) 100.0% | | | | 23,604,668 | |
| | | | | |
OTHER NET ASSETS | | | | — | |
| | | | | |
NET ASSETS 100.0% | | | | $ | 23,604,668 | |
| | | | | | |
The accompanying notes are an integral part of these portfolio schedules.
MUTUAL OF AMERICA INVESTMENT CORPORATION (MODERATE ALLOCATION FUND)
PORTFOLIO OF INVESTMENTS IN SECURITIES
December 31, 2008
| | Shares | | Value($) | |
COMMON STOCKS: | | | | | |
DIVERSIFIED MUTUAL FUNDS (100.0%) | | | | | |
Mutual of America Investment Corporation | | | | | |
Bond Fund (29.5%) | | 22,409,109 | | 26,387,778 | |
Equity Index Fund (35.5%) | | 21,460,061 | | 31,756,298 | |
Mid-Cap Equity Index Fund (15.4%) | | 14,945,308 | | 13,826,174 | |
Mid-Term Bond Fund (19.6%) | | 18,687,826 | | 17,535,012 | |
| | | | | |
TOTAL INVESTMENTS
(Cost: $112,045,544) 100.0% | | | | 89,505,262 | |
| | | | | |
OTHER NET ASSETS | | | | — | |
| | | | | |
NET ASSETS 100.0% | | | | $ | 89,505,262 | |
| | | | | | |
The accompanying notes are an integral part of these portfolio schedules.
MUTUAL OF AMERICA INVESTMENT CORPORATION (AGGRESSIVE ALLOCATION FUND)
PORTFOLIO OF INVESTMENTS IN SECURITIES
December 31, 2008
| | Shares | | Value($) | |
COMMON STOCKS: | | | | | |
DIVERSIFIED MUTUAL FUNDS (100.0%) | | | | | |
Mutual of America Investment Corporation | | | | | |
Bond Fund (24.3%) | | 16,777,600 | | 19,756,412 | |
Equity Index Fund (45.1%) | | 24,790,364 | | 36,684,434 | |
Mid-Cap Equity Index Fund (20.4%) | | 17,903,584 | | 16,562,927 | |
Small Cap Growth Fund (5.1%) | | 5,887,701 | | 4,119,672 | |
Small Cap Value Fund (5.1%) | | 5,518,480 | | 4,124,677 | |
| | | | | |
TOTAL INVESTMENTS
(Cost: $112,985,924) 100.0% | | | | 81,248,122 | |
| | | | | |
OTHER NET ASSETS | | | | — | |
| | | | | |
NET ASSETS 100.0% | | | | $ | 81,248,122 | |
| | | | | | |
The accompanying notes are an integral part of these portfolio schedules.
MUTUAL OF AMERICA INVESTMENT CORPORATION (MONEY MARKET FUND)
PORTFOLIO OF INVESTMENTS IN SECURITIES
December 31, 2008
| | Rating** | | Rate(%) | | Maturity | | Face Amount($) | | Value($) | |
SHORT-TERM DEBT SECURITIES: | | | | | | | | | | | |
U.S. GOVERNMENT AGENCIES (20.7%) | | | | | | | | | | | |
FHLB | | AAA | | 1.95 | | 01/26/09 | | 8,305,000 | | 8,314,436 | |
FHLB | | AAA | | 2.10 | | 01/05/09 | | 2,029,000 | | 2,028,525 | |
FHLB | | AAA | | 2.10 | | 01/07/09 | | 7,030,000 | | 7,027,529 | |
FHLB | | AAA | | 2.10 | | 01/08/09 | | 4,744,000 | | 4,742,055 | |
FHLB | | AAA | | 2.20 | | 01/14/09 | | 3,693,000 | | 3,695,943 | |
FHLB | | AAA | | 2.24 | | 01/16/09 | | 1,488,000 | | 1,489,453 | |
FHLB | | AAA | | 2.25 | | 01/05/09 | | 800,000 | | 799,799 | |
FHLMC | | AAA | | 2.15 | | 01/12/09 | | 6,284,000 | | 6,287,457 | |
FHLMC | | AAA | | 2.20 | | 01/14/09 | | 2,425,000 | | 2,427,212 | |
FNMA | | AAA | | 0.20 | | 03/19/09 | | 105,000 | | 104,954 | |
FNMA | | AAA | | 2.10 | | 01/07/09 | | 1,531,000 | | 1,530,462 | |
FNMA | | AAA | | 2.20 | | 01/12/09 | | 2,000,000 | | 2,002,211 | |
FNMA | | AAA | | 2.22 | | 01/21/09 | | 1,196,000 | | 1,197,377 | |
| | | | | | | | | | 41,647,413 | |
COMMERCIAL PAPER (79.3%) | | | | | | | | | | | |
American Express Credit Corp. | | A-1 | | 1.95 | | 01/02/09 | | 2,500,000 | | 2,499,864 | |
American Express Credit Corp. | | A-1 | | 1.75 | | 02/03/09 | | 210,000 | | 209,663 | |
American Express Credit Corp. | | A-1 | | 2.00 | | 02/02/09 | | 2,500,000 | | 2,495,548 | |
AT&T, Inc.† | | A-1 | | 1.00 | | 02/06/09 | | 1,700,000 | | 1,698,299 | |
AT&T, Inc.† | | A-1 | | 2.40 | | 01/05/09 | | 3,500,000 | | 3,499,063 | |
Becton, Dickinson & Co. | | A-1+ | | 1.00 | | 01/16/09 | | 5,150,000 | | 5,147,852 | |
Campbell Soup Co.† | | A-1 | | 0.95 | | 02/02/09 | | 3,000,000 | | 2,997,465 | |
Campbell Soup Co.† | | A-1 | | 1.00 | | 01/16/09 | | 2,044,000 | | 2,043,147 | |
Chevron Corp. | | A-1+ | | 1.10 | | 01/23/09 | | 5,071,000 | | 5,067,587 | |
Chevron Funding Corp. | | A-1+ | | 0.20 | | 02/11/09 | | 281,000 | | 280,936 | |
Coca-Cola Co. | | A-1 | | 1.20 | | 01/23/09 | | 5,165,000 | | 5,161,207 | |
ConocoPhillips† | | A-1 | | 0.75 | | 01/30/09 | | 4,100,000 | | 4,097,522 | |
ConocoPhillips† | | A-1 | | 1.30 | | 02/06/09 | | 1,100,000 | | 1,098,569 | |
Danaher Corp. | | A-1 | | 0.50 | | 01/29/09 | | 970,000 | | 969,623 | |
Danaher Corp. | | A-1 | | 1.25 | | 01/16/09 | | 4,266,000 | | 4,263,776 | |
Deere & Co.† | | A-1 | | 0.35 | | 03/18/09 | | 2,360,000 | | 2,358,233 | |
Deere & Co.† | | A-1 | | 0.50 | | 03/02/09 | | 408,000 | | 407,654 | |
Deere & Co.† | | A-1 | | 0.50 | | 03/20/09 | | 2,400,000 | | 2,397,367 | |
Eaton Corp.† | | A-1 | | 1.30 | | 01/23/09 | | 1,900,000 | | 1,898,489 | |
Ecolab, Inc.† | | A-1 | | 0.75 | | 01/06/09 | | 5,147,000 | | 5,146,464 | |
Eli Lilly & Co.† | | A-1+ | | 1.35 | | 01/12/09 | | 5,000,000 | | 4,997,934 | |
Estee Lauder Cos.† | | A-1 | | 1.10 | | 02/12/09 | | 1,400,000 | | 1,398,304 | |
GE Capital TLGP | | A-1+ | | 1.60 | | 01/20/09 | | 1,991,000 | | 1,989,330 | |
GE Capital TLGP | | A-1+ | | 1.65 | | 01/13/09 | | 2,286,000 | | 2,284,740 | |
GE Capital TLGP | | A-1+ | | 1.65 | | 01/16/09 | | 643,000 | | 642,557 | |
GE Capital TLGP | | A-1+ | | 1.65 | | 01/20/09 | | 140,000 | | 139,891 | |
Hershey Co. | | A-1 | | 1.15 | | 01/12/09 | | 2,000,000 | | 1,999,296 | |
Hershey Co. | | A-1 | | 1.15 | | 01/20/09 | | 3,175,000 | | 3,173,754 | |
Hewlett-Packard Co.† | | A-1 | | 1.50 | | 01/05/09 | | 2,900,000 | | 2,899,516 | |
Hewlett-Packard Co.† | | A-1 | | 2.10 | | 01/02/09 | | 2,148,000 | | 2,147,874 | |
Lowe’s Cos., Inc. | | A-1 | | 0.35 | | 03/12/09 | | 4,700,000 | | 4,696,755 | |
Lowe’s Cos., Inc. | | A-1 | | 0.35 | | 03/16/09 | | 458,000 | | 457,666 | |
Madison Gas & Electric | | A-1+ | | 0.20 | | 01/30/09 | | 4,400,000 | | 4,399,291 | |
Madison Gas & Electric | | A-1+ | | 0.95 | | 01/09/09 | | 870,000 | | 869,816 | |
Medtronic, Inc.† | | A-1+ | | 1.10 | | 01/23/09 | | 5,200,000 | | 5,196,500 | |
National Rural Utilities | | A-1 | | 0.85 | | 02/13/09 | | 1,600,000 | | 1,598,375 | |
National Rural Utilities | | A-1 | | 1.70 | | 01/23/09 | | 500,000 | | 499,480 | |
National Rural Utilities | | A-1 | | 0.65 | | 01/30/09 | | 3,052,000 | | 3,050,401 | |
Nestle Capital Corp.† | | A-1+ | | 0.75 | | 02/02/09 | | 5,000,000 | | 4,997,026 | |
NetJets, Inc.† | | A-1+ | | 0.12 | | 03/03/09 | | 3,763,000 | | 3,762,223 | |
New Jersey Natural Gas | | A-1 | | 1.25 | | 01/16/09 | | 5,200,000 | | 5,197,289 | |
NSTAR† | | A-1 | | 2.40 | | 01/05/09 | | 4,074,000 | | 4,072,909 | |
NSTAR Electric Co. | | A-1 | | 1.15 | | 01/07/09 | | 357,000 | | 356,931 | |
NSTAR Electric Co. | | A-1 | | 2.00 | | 01/05/09 | | 1,100,000 | | 1,099,755 | |
Pfizer, Inc.† | | A-1+ | | 1.00 | | 01/23/09 | | 5,000,000 | | 4,996,941 | |
Pitney Bowes, Inc.† | | A-1 | | 1.80 | | 01/05/09 | | 3,000,000 | | 2,999,398 | |
Procter & Gamble Co.† | | A-1+ | | 1.60 | | 01/06/09 | | 5,000,000 | | 4,998,886 | |
Rockwell Collins, Inc.† | | A-1 | | 0.60 | | 01/26/09 | | 1,952,000 | | 1,951,186 | |
Rockwell Collins, Inc.† | | A-1 | | 1.10 | | 01/07/09 | | 540,000 | | 539,901 | |
Rockwell Collins, Inc.† | | A-1 | | 1.15 | | 01/08/09 | | 597,000 | | 596,866 | |
Siemens Capital Co. LLC† | | A-1+ | | 0.10 | | 03/13/09 | | 2,923,000 | | 2,922,416 | |
Siemens Capital Co. LLC† | | A-1+ | | 0.30 | | 01/13/09 | | 1,000,000 | | 999,900 | |
Toyota Motor Credit Corp. | | A-1+ | | 1.05 | | 02/24/09 | | 175,000 | | 174,724 | |
Toyota Motor Credit Corp. | | A-1+ | | 2.10 | | 03/09/09 | | 3,300,000 | | 3,286,892 | |
Toyota Motor Credit Corp. | | A-1+ | | 2.10 | | 02/02/09 | | 700,000 | | 698,719 | |
Toyota Motor Credit Corp. | | A-1+ | | 2.15 | | 01/30/09 | | 1,000,000 | | 998,265 | |
Toyota Motor Credit Corp. | | A-1+ | | 2.30 | | 01/05/09 | | 183,000 | | 182,953 | |
Walgreen Co.† | | A-1 | | 1.20 | | 01/08/09 | | 5,200,000 | | 5,198,784 | |
Walt Disney Co.† | | A-1 | | 1.05 | | 02/17/09 | | 2,663,000 | | 2,660,356 | |
Washington Gas Light Co. | | A-1 | | 1.65 | | 01/06/09 | | 4,269,000 | | 4,268,019 | |
Washington Gas Light Co. | | A-1 | | 1.10 | | 01/16/09 | | 1,000,000 | | 999,541 | |
Washington Post Co.† | | A-1 | | 0.15 | | 01/23/09 | | 5,200,000 | | 5,199,523 | |
| | | | | | | | | | 159,339,211 | |
TOTAL SHORT-TERM DEBT SECURITIES
(Cost: $200,937,136) 100.0% | | | | | | | | | | 200,986,624 | |
| | | | | | | | | | | |
TOTAL INVESTMENTS
(Cost: $200,937,136)100.0% | | | | | | | | | | 200,986,624 | |
| | | | | | | | | | | |
OTHER NET ASSETS 0.0% (4) | | | | | | | | | | 3,058 | |
| | | | | | | | | | | |
NET ASSETS 100.0% | | | | | | | | | | $ | 200,989,682 | |
| | | | | | | | | | | | |
The accompanying notes are an integral part of these portfolio schedules.
MUTUAL OF AMERICA INVESTMENT CORPORATION (MID-TERM BOND FUND)
PORTFOLIO OF INVESTMENTS IN SECURITIES
December 31, 2008
| | Rating** | | Rate(%) | | Maturity | | Face Amount($) | | Value($) | |
LONG-TERM DEBT SECURITIES: | | | | | | | | | | | |
U.S. GOVERNMENT (14.6%) | | | | | | | | | | | |
U.S. Treasury Note | | AAA | | 3.13 | | 04/30/13 | | 1,750,000 | | 1,894,239 | |
U.S. Treasury Strip | | AAA | | 0.00 | | 11/15/12 | | 5,000,000 | | 4,722,690 | |
U.S. Treasury Strip | | AAA | | 0.00 | | 02/15/13 | | 13,000,000 | | 12,187,872 | |
U.S. Treasury Strip | | AAA | | 0.00 | | 05/15/13 | | 8,500,000 | | 7,949,595 | |
| | | | | | | | | | 26,754,396 | |
U.S. GOVERNMENT AGENCIES (25.6%) | | | | | | | | | | | |
MORTGAGE-BACKED OBLIGATIONS (1.9%) | | | | | | | | | |
FHLMC | | AAA | | 4.00 | | 11/15/26 | | 112,957 | | 113,005 | |
FHLMC | | AAA | | 5.00 | | 06/15/17 | | 3,000,000 | | 3,074,778 | |
FHLMC | | AAA | | 5.50 | | 04/01/09 | | 1,975 | | 1,989 | |
FHLMC | | AAA | | 5.50 | | 06/01/09 | | 2,473 | | 2,522 | |
FHLMC | | AAA | | 6.00 | | 11/01/10 | | 7,812 | | 7,970 | |
FHLMC | | AAA | | 6.00 | | 07/01/16 | | 2,816 | | 2,907 | |
FHLMC | | AAA | | 6.00 | | 02/01/19 | | 17,917 | | 18,613 | |
FHLMC | | AAA | | 6.50 | | 11/01/09 | | 679 | | 694 | |
FHLMC | | AAA | | 6.50 | | 04/01/14 | | 88,512 | | 92,943 | |
FHLMC | | AAA | | 7.00 | | 02/01/14 | | 40,392 | | 42,280 | |
FHLMC | | AAA | | 7.50 | | 03/15/21 | | 18,257 | | 19,709 | |
FHLMC | | AAA | | 8.00 | | 09/01/18 | | 5,961 | | 5,983 | |
FHLMC | | AAA | | 8.50 | | 09/01/17 | | 4,468 | | 4,771 | |
FNMA | | AAA | | 4.00 | | 11/25/26 | | 10,055 | | 10,043 | |
FNMA | | AAA | | 5.50 | | 02/01/09 | | 326 | | 327 | |
FNMA | | AAA | | 6.00 | | 07/01/09 | | 635 | | 638 | |
FNMA | | AAA | | 6.00 | | 01/01/11 | | 489 | | 490 | |
FNMA | | AAA | | 6.00 | | 09/01/12 | | 21,372 | | 22,226 | |
FNMA | | AAA | | 6.50 | | 08/01/13 | | 17,967 | | 18,500 | |
FNMA | | AAA | | 6.50 | | 12/25/23 | | 61,976 | | 62,874 | |
FNMA | | AAA | | 8.00 | | 06/01/17 | | 891 | | 938 | |
FNMA | | AAA | | 8.50 | | 12/01/09 | | 2,641 | | 2,712 | |
GNMA(5) | | AAA | | 6.00 | | 06/15/09 | | 213 | | 219 | |
GNMA(5) | | AAA | | 9.00 | | 03/15/10 | | 197 | | 210 | |
| | | | | | | | | | 3,507,341 | |
NON-MORTGAGE-BACKED OBLIGATIONS (23.7%) | | | | | | | | | |
FFCB | | AAA | | 4.95 | | 10/10/14 | | 12,500,000 | | 14,080,020 | |
FFCB | | AAA | | 5.10 | | 08/05/13 | | 5,000,000 | | 5,568,335 | |
FHLB | | AAA | | 3.00 | | 04/15/09 | | 3,500,000 | | 3,526,894 | |
FHLB | | AAA | | 5.75 | | 05/15/12 | | 3,200,000 | | 3,588,310 | |
FHLMC | | AAA | | 5.00 | | 07/15/14 | | 5,500,000 | | 6,196,198 | |
FHLMC | | AAA | | 5.63 | | 03/15/11 | | 750,000 | | 817,418 | |
FHLMC | | AAA | | 6.63 | | 09/15/09 | | 5,000,000 | | 5,206,995 | |
FNMA | | AAA | | 3.25 | | 02/15/09 | | 500,000 | | 501,656 | |
FNMA | | AAA | | 4.25 | | 05/15/09 | | 2,000,000 | | 2,028,012 | |
FNMA | | AAA | | 4.38 | | 09/15/12 | | 1,750,000 | | 1,884,311 | |
| | | | | | | | | | 43,398,149 | |
CORPORATE DEBT (57.1%) | | | | | | | | | | | |
BASIC MATERIALS (2.8%) | | | | | | | | | | | |
Bemis Co., Inc. | | A | | 4.88 | | 04/01/12 | | 500,000 | | 451,477 | |
International Paper Co. | | BBB | | 4.25 | | 01/15/09 | | 250,000 | | 249,914 | |
Lubrizol Corp. | | BBB | | 5.50 | | 10/01/14 | | 500,000 | | 454,547 | |
Martin Marietta Materials, Inc | | BBB+ | | 6.88 | | 04/01/11 | | 1,000,000 | | 955,011 | |
Rohm & Haas Co. | | BBB | | 5.60 | | 03/15/13 | | 750,000 | | 724,168 | |
Sealed Air Corp.† | | BBB- | | 5.63 | | 07/15/13 | | 1,000,000 | | 826,304 | |
Sonoco Products Co. | | BBB+ | | 6.50 | | 11/15/13 | | 250,000 | | 234,760 | |
Temple-Inland, Inc. | | BBB- | | 7.88 | | 05/01/12 | | 143,000 | | 125,144 | |
Vulcan Materials Co. | | BBB+ | | 6.30 | | 06/15/13 | | 1,000,000 | | 885,017 | |
Worthington Industries, Inc. | | BBB | | 6.70 | | 12/01/09 | | 250,000 | | 255,288 | |
| | | | | | | | | | 5,161,630 | |
CONSUMER, CYCLICAL (7.9%) | | | | | | | | | | | |
AutoZone, Inc. | | BBB | | 6.50 | | 01/15/14 | | 1,000,000 | | 893,403 | |
Best Buy Co., Inc.† | | BBB- | | 6.75 | | 07/15/13 | | 1,000,000 | | 933,569 | |
Black & Decker Corp. | | BBB | | 4.75 | | 11/01/14 | | 500,000 | | 436,776 | |
Black & Decker Corp. | | BBB | | 5.75 | | 11/15/16 | | 500,000 | | 419,719 | |
Brinker International, Inc. | | BBB- | | 5.75 | | 06/01/14 | | 1,000,000 | | 788,204 | |
DaimlerChrysler N.A. LLC | | A- | | 5.75 | | 09/08/11 | | 1,000,000 | | 844,539 | |
Ethan Allen Interiors, Inc. | | BBB- | | 5.38 | | 10/01/15 | | 500,000 | | 473,897 | |
Fortune Brands, Inc. | | BBB | | 4.88 | | 12/01/13 | | 1,000,000 | | 880,763 | |
Home Depot, Inc. | | BBB+ | | 5.40 | | 03/01/16 | | 250,000 | | 223,730 | |
Johnson Controls, Inc. | | BBB | | 4.88 | | 09/15/13 | | 250,000 | | 196,930 | |
Johnson Controls, Inc. | | BBB | | 5.25 | | 01/15/11 | | 750,000 | | 689,208 | |
Kohl’s Corp. | | BBB+ | | 7.38 | | 10/15/11 | | 500,000 | | 490,379 | |
Leggett & Platt, Inc. | | A- | | 4.70 | | 04/01/13 | | 750,000 | | 673,827 | |
Macys Retail Hldgs., Inc.† | | BBB- | | 4.80 | | 07/15/09 | | 250,000 | | 236,959 | |
Marriott International, Inc. | | BBB | | 5.63 | | 02/15/13 | | 750,000 | | 570,000 | |
Mattel, Inc. | | BBB- | | 6.13 | | 06/15/11 | | 1,000,000 | | 954,792 | |
Newell Rubbermaid, Inc. | | BBB+ | | 4.63 | | 12/15/09 | | 500,000 | | 486,324 | |
Newell Rubbermaid, Inc. | | BBB+ | | 5.50 | | 04/15/13 | | 500,000 | | 438,136 | |
Nordstrom, Inc. | | A- | | 5.63 | | 01/15/09 | | 175,000 | | 175,116 | |
RadioShack Corp. | | BB | | 7.38 | | 05/15/11 | | 400,000 | | 348,000 | |
Scholastic Corp. | | BB | | 5.00 | | 04/15/13 | | 250,000 | | 192,500 | |
Stanley Works | | A | | 4.90 | | 11/01/12 | | 525,000 | | 513,738 | |
Starwood Hotels & Resorts | | BB+ | | 6.25 | | 02/15/13 | | 1,000,000 | | 690,000 | |
Target Corp. | | A+ | | 5.38 | | 06/15/09 | | 1,000,000 | | 1,010,641 | |
Wendy’s International, Inc. | | B+ | | 6.25 | | 11/15/11 | | 300,000 | | 253,500 | |
Whirlpool Corp. | | BBB | | 5.50 | | 03/01/13 | | 500,000 | | 395,591 | |
Whirlpool Corp. | | BBB | | 6.50 | | 06/15/16 | | 500,000 | | 394,044 | |
| | | | | | | | | | 14,604,285 | |
CONSUMER, NON-CYCLICAL (5.6%) | | | | | | | | | | | |
Anheuser-Busch Cos., Inc. | | BBB+ | | 4.38 | | 01/15/13 | | 1,000,000 | | 932,475 | |
Anheuser-Busch Cos., Inc. | | BBB+ | | 4.70 | | 04/15/12 | | 100,000 | | 93,710 | |
Brown-Forman Corp. | | A | | 5.20 | | 04/01/12 | | 1,000,000 | | 989,530 | |
Bunge Ltd. Finance Corp. | | BBB- | | 5.10 | | 07/15/15 | | 1,000,000 | | 727,428 | |
Cargill, Inc.† | | A | | 5.20 | | 01/22/13 | | 1,000,000 | | 916,095 | |
Clorox Co. | | BBB+ | | 4.20 | | 01/15/10 | | 250,000 | | 246,981 | |
Clorox Co. | | BBB+ | | 5.00 | | 03/01/13 | | 500,000 | | 492,613 | |
Clorox Co. | | BBB+ | | 5.00 | | 01/15/15 | | 300,000 | | 280,595 | |
Coca-Cola Bottling Co. | | BBB | | 6.38 | | 05/01/09 | | 200,000 | | 200,665 | |
ConAgra Foods, Inc. | | BBB+ | | 6.75 | | 09/15/11 | | 1,000,000 | | 1,010,855 | |
CVS Caremark Corp. | | BBB+ | | 6.13 | | 08/15/16 | | 500,000 | | 484,417 | |
Earthgrains Co. | | BBB+ | | 6.50 | | 04/15/09 | | 150,000 | | 151,538 | |
Hershey Co. | | A | | 4.85 | | 08/15/15 | | 500,000 | | 480,684 | |
Hershey Co. | | A | | 5.00 | | 04/01/13 | | 500,000 | | 502,804 | |
Kraft Foods, Inc. | | BBB+ | | 5.25 | | 10/01/13 | | 500,000 | | 487,698 | |
Kroger Co. | | BBB- | | 4.95 | | 01/15/15 | | 500,000 | | 476,033 | |
PepsiAmericas, Inc. | | A | | 6.38 | | 05/01/09 | | 150,000 | | 150,714 | |
Safeway, Inc. | | BBB | | 6.50 | | 03/01/11 | | 500,000 | | 501,473 | |
Sara Lee Corp. | | BBB+ | | 3.88 | | 06/15/13 | | 750,000 | | 647,904 | |
Sara Lee Corp. | | BBB+ | | 6.25 | | 09/15/11 | | 250,000 | | 247,485 | |
Wal-Mart Stores, Inc. | | AA | | 6.88 | | 08/10/09 | | 250,000 | | 257,490 | |
| | | | | | | | | | 10,279,187 | |
ENERGY (4.9%) | | | | | | | | | | | |
CenterPoint Energy Resources | | BBB | | 7.88 | | 04/01/13 | | 750,000 | | 694,721 | |
Diamond Offshore Drilling | | A- | | 4.88 | | 07/01/15 | | 500,000 | | 459,174 | |
Enbridge, Inc. | | A- | | 5.80 | | 06/15/14 | | 1,065,000 | | 934,113 | |
Halliburton Co. | | A | | 5.50 | | 10/15/10 | | 500,000 | | 510,691 | |
Knight, Inc. | | BB | | 5.15 | | 03/01/15 | | 250,000 | | 186,250 | |
Nabors Industries Ltd. | | BBB+ | | 5.38 | | 08/15/12 | | 750,000 | | 707,786 | |
National Oilwell Varco, Inc. | | BBB+ | | 6.13 | | 08/15/15 | | 1,000,000 | | 868,621 | |
Noble Corp. | | A- | | 5.88 | | 06/01/13 | | 1,000,000 | | 974,578 | |
Premco Refining Group | | BBB | | 7.50 | | 06/15/15 | | 500,000 | | 450,208 | |
Smith International, Inc. | | BBB+ | | 6.75 | | 02/15/11 | | 1,000,000 | | 1,006,759 | |
Sunoco, Inc. | | BBB | | 4.88 | | 10/15/14 | | 500,000 | | 420,552 | |
Valero Energy Corp. | | BBB | | 4.75 | | 06/15/13 | | 1,000,000 | | 918,832 | |
Weatherford Int’l. Ltd. | | BBB+ | | 5.15 | | 03/15/13 | | 500,000 | | 440,286 | |
Weatherford Int’l. Ltd. | | BBB+ | | 5.50 | | 02/15/16 | | 500,000 | | 429,805 | |
| | | | | | | | | | 9,002,376 | |
FINANCIAL (13.1%) | | | | | | | | | | | |
American Express Credit Corp. | | A+ | | 5.88 | | 05/02/13 | | 1,000,000 | | 959,974 | |
Bank of America Corp. | | A+ | | 5.38 | | 08/15/11 | | 250,000 | | 254,563 | |
Bank of America Corp. | | A | | 5.75 | | 08/15/16 | | 500,000 | | 467,309 | |
Berkshire Hathaway Finance | | AAA | | 4.20 | | 12/15/10 | | 500,000 | | 507,188 | |
Brandywine Realty Trust | | BBB- | | 4.50 | | 11/01/09 | | 250,000 | | 234,447 | |
Capital One Bank | | A- | | 5.75 | | 09/15/10 | | 250,000 | | 242,642 | |
CIT Group, Inc. | | BBB+ | | 5.80 | | 07/28/11 | | 250,000 | | 209,489 | |
Colonial Realty LP | | BBB- | | 4.80 | | 04/01/11 | | 300,000 | | 239,160 | |
Developers Diversified Realty | | BBB- | | 5.00 | | 05/03/10 | | 250,000 | | 181,133 | |
Duke Realty LP | | BBB+ | | 4.63 | | 05/15/13 | | 500,000 | | 314,566 | |
ERP Operating LP | | BBB+ | | 5.38 | | 08/01/16 | | 500,000 | | 352,351 | |
First Horizon National Corp. | | BBB- | | 4.50 | | 05/15/13 | | 125,000 | | 86,824 | |
First Industrial LP | | BBB- | | 6.88 | | 04/15/12 | | 750,000 | | 489,270 | |
First Tennessee Bank | | BBB+ | | 2.77 | | 05/18/09 | | 925,000 | | 899,495 | |
Ford Motor Credit Co. LLC | | CCC+ | | 7.38 | | 10/28/09 | | 750,000 | | 658,666 | |
Fosters Finance Corp.† | | BBB | | 4.88 | | 10/01/14 | | 500,000 | | 429,688 | |
Fosters Finance Corp.† | | BBB | | 6.88 | | 06/15/11 | | 500,000 | | 496,228 | |
GATX Financial Corp. | | BBB+ | | 5.13 | | 04/15/10 | | 250,000 | | 234,179 | |
General Electric Capital Corp. | | AAA | | 5.00 | | 01/08/16 | | 500,000 | | 484,206 | |
Harley-Davidson Funding† | | A | | 5.25 | | 12/15/12 | | 1,000,000 | | 697,773 | |
HCP, Inc. | | BBB | | 4.88 | | 09/15/10 | | 500,000 | | 445,732 | |
HCP, Inc. | | BBB | | 5.65 | | 12/15/13 | | 500,000 | | 298,780 | |
Health Care REIT, Inc. | | BBB- | | 8.00 | | 09/12/12 | | 500,000 | | 428,415 | |
Heinz (H.J.) Finance Co. | | BBB | | 6.00 | | 03/15/12 | | 1,000,000 | | 1,007,627 | |
HSBC Finance Corp. | | AA- | | 2.27 | | 01/10/10 | | 50,000 | | 44,200 | |
HSBC Finance Corp. | | AA- | | 4.84 | | 02/10/09 | | 20,000 | | 19,600 | |
HSBC Finance Corp. | | AA- | | 4.88 | | 01/10/10 | | 100,000 | | 88,417 | |
HSBC Finance Corp. | | AA- | | 5.03 | | 04/10/11 | | 20,000 | | 16,288 | |
HSBC Finance Corp. | | AA- | | 5.30 | | 07/10/09 | | 15,000 | | 13,802 | |
HSBC Finance Corp. | | AA- | | 5.82 | | 11/10/13 | | 40,000 | | 26,000 | |
HSBC Finance Corp. | | AA- | | 6.03 | | 11/10/13 | | 70,000 | | 45,500 | |
HSBC Finance Corp. | | AA- | | 6.16 | | 06/10/11 | | 10,000 | | 8,423 | |
HSBC Finance Corp. | | AA- | | 6.38 | | 11/10/13 | | 43,000 | | 27,950 | |
Jefferson-Pilot Corp. | | A+ | | 4.75 | | 01/30/14 | | 500,000 | | 371,730 | |
JPMorgan Chase & Co. | | A+ | | 5.60 | | 06/01/11 | | 250,000 | | 251,180 | |
JPMorgan Chase & Co. | | A+ | | 5.76 | | 06/28/09 | | 50,000 | | 50,413 | |
KeyCorp | | A- | | 6.50 | | 05/14/13 | | 1,050,000 | | 967,981 | |
Kimco Realty Corp. | | BBB+ | | 6.00 | | 11/30/12 | | 1,000,000 | | 773,577 | |
Lehman Brothers Hldgs. | | NR | | 5.75 | | 07/18/11 | | 250,000 | | 23,750 | |
Lincoln National Corp. | | A+ | | 5.65 | | 08/27/12 | | 400,000 | | 329,640 | |
Mack-Cali Realty LP | | BBB | | 5.80 | | 01/15/16 | | 1,000,000 | | 647,463 | |
MetLife, Inc. | | A | | 5.00 | | 11/24/13 | | 250,000 | | 228,654 | |
Morgan Stanley | | A | | 5.41 | | 02/01/11 | | 500,000 | | 395,665 | |
Nat’l. Rural Utilities Coop. | | A | | 7.25 | | 03/01/12 | | 1,000,000 | | 1,029,624 | |
Nationwide Health Pptys., Inc. | | BBB- | | 6.50 | | 07/15/11 | | 500,000 | | 453,861 | |
Nissan Motor Acceptance Corp.† | | BBB+ | | 5.63 | | 03/14/11 | | 500,000 | | 491,608 | |
ProLogis | | BBB- | | 5.50 | | 04/01/12 | | 500,000 | | 301,249 | |
Protective Life Corp. | | A | | 4.88 | | 11/01/14 | | 1,000,000 | | 797,272 | |
Protective Life Secured Trust | | AA | | 2.57 | | 05/10/10 | | 650,000 | | 415,604 | |
Regency Centers LP | | BBB+ | | 4.95 | | 04/15/14 | | 500,000 | | 345,123 | |
Simon Property Group LP | | A- | | 4.88 | | 08/15/10 | | 500,000 | | 442,355 | |
SLM Corp. | | BBB- | | 4.00 | | 01/15/09 | | 500,000 | | 497,717 | |
SLM Corp. | | BBB- | | 6.44 | | 06/15/12 | | 60,000 | | 39,814 | |
SLM Corp. | | BBB- | | 7.34 | | 12/15/09 | | 200,000 | | 160,776 | |
Southtrust Bank, N.A. | | AA | | 4.75 | | 03/01/13 | | 250,000 | | 234,091 | |
Textron Financial Corp. | | BBB | | 5.13 | | 02/03/11 | | 250,000 | | 188,159 | |
Textron Financial Corp. | | BBB | | 5.40 | | 04/28/13 | | 1,000,000 | | 697,697 | |
Travelers Cos., Inc. | | A- | | 5.38 | | 06/15/12 | | 1,000,000 | | 997,820 | |
Union Planters Corp. | | A | | 4.38 | | 12/01/10 | | 250,000 | | 234,777 | |
Vornado Realty LP | | BBB | | 5.60 | | 02/15/11 | | 500,000 | | 451,903 | |
Wachovia Bank, N.A. | | AA | | 5.60 | | 03/15/16 | | 500,000 | | 464,753 | |
Zions Bancorporation | | BBB | | 5.65 | | 05/15/14 | | 1,000,000 | | 747,587 | |
| | | | | | | | | | 23,941,728 | |
HEALTHCARE (5.5%) | | | | | | | | | | | |
Abbott Laboratories | | AA | | 5.60 | | 05/15/11 | | 500,000 | | 527,925 | |
Allergan, Inc. | | A | | 5.75 | | 04/01/16 | | 500,000 | | 478,361 | |
Baxter International, Inc. | | A+ | | 4.63 | | 03/15/15 | | 250,000 | | 251,198 | |
Beckman Coulter, Inc. | | BBB | | 6.88 | | 11/15/11 | | 925,000 | | 901,636 | |
Blue Cross & Blue Shield of FL† | | A- | | 8.25 | | 11/15/11 | | 1,000,000 | | 1,074,648 | |
Boston Scientific Corp. | | BB+ | | 4.25 | | 01/12/11 | | 500,000 | | 460,000 | |
Cardinal Health, Inc. | | BBB+ | | 5.50 | | 06/15/13 | | 1,000,000 | | 945,345 | |
Fisher Scientific Int’l., Inc. | | BBB | | 6.13 | | 07/01/15 | | 500,000 | | 440,625 | |
Humana, Inc. | | BBB | | 6.45 | | 06/01/16 | | 1,415,000 | | 1,118,766 | |
Laboratory Corp. of America | | BBB | | 5.50 | | 02/01/13 | | 285,000 | | 273,465 | |
Laboratory Corp. of America | | BBB | | 5.63 | | 12/15/15 | | 500,000 | | 420,813 | |
Lilly (Eli) & Co. | | AA | | 5.20 | | 03/15/17 | | 500,000 | | 507,756 | |
McKesson Corp. | | BBB+ | | 7.75 | | 02/01/12 | | 1,000,000 | | 1,117,911 | |
UnitedHealth Group, Inc. | | A- | | 5.25 | | 03/15/11 | | 250,000 | | 235,066 | |
UnitedHealth Group, Inc. | | A- | | 5.50 | | 11/15/12 | | 750,000 | | 683,460 | |
WellPoint, Inc. | | A- | | 4.25 | | 12/15/09 | | 200,000 | | 192,333 | |
WellPoint, Inc. | | A- | | 5.00 | | 01/15/11 | | 500,000 | | 472,574 | |
| | | | | | | | | | 10,101,882 | |
INDUSTRIAL (8.7%) | | | | | | | | | | | |
Acuity Brands, Inc. | | BBB- | | 8.38 | | 08/01/10 | | 1,000,000 | | 1,073,672 | |
Avery Dennison Corp. | | BBB | | 4.88 | | 01/15/13 | | 500,000 | | 448,219 | |
Burlington Northern Santa Fe | | BBB | | 4.30 | | 07/01/13 | | 500,000 | | 464,022 | |
Canadian Pacific Railway Co. | | BBB | | 5.75 | | 05/15/13 | | 1,000,000 | | 925,462 | |
CSX Corp. | | BBB- | | 5.30 | | 02/15/14 | | 500,000 | | 451,279 | |
CSX Corp. | | BBB- | | 6.25 | | 04/01/15 | | 500,000 | | 490,805 | |
Dun & Bradstreet Corp. | | A- | | 5.50 | | 03/15/11 | | 500,000 | | 487,509 | |
Dun & Bradstreet Corp. | | A- | | 6.00 | | 04/01/13 | | 1,000,000 | | 944,547 | |
Federal Express Corp. | | BBB | | 9.65 | | 06/15/12 | | 1,000,000 | | 1,049,995 | |
FedEx Corp. | | BBB | | 3.50 | | 04/01/09 | | 200,000 | | 199,313 | |
General Dynamics Corp. | | A | | 4.50 | | 08/15/10 | | 500,000 | | 510,629 | |
Goodrich Corp. | | BBB+ | | 7.63 | | 12/15/12 | | 1,000,000 | | 1,037,892 | |
Masco Corp. | | BBB | | 4.80 | | 06/15/15 | | 500,000 | | 337,995 | |
Masco Corp. | | BBB | | 5.88 | | 07/15/12 | | 300,000 | | 245,998 | |
Pall Corp.† | | BB+ | | 6.00 | | 08/01/12 | | 1,000,000 | | 965,113 | |
Precision Castparts Corp. | | BBB+ | | 5.60 | | 12/15/13 | | 750,000 | | 676,241 | |
Roper Industries, Inc. | | BBB- | | 6.63 | | 08/15/13 | | 1,000,000 | | 1,002,837 | |
Ryder System, Inc. | | BBB+ | | 6.00 | | 03/01/13 | | 500,000 | | 409,655 | |
Ryder System, Inc. | | BBB+ | | 7.20 | | 09/01/15 | | 1,000,000 | | 880,450 | |
Southwest Airlines Co. | | BBB+ | | 5.25 | | 10/01/14 | | 500,000 | | 377,193 | |
Steelcase, Inc. | | BBB | | 6.50 | | 08/15/11 | | 1,000,000 | | 941,726 | |
Tyco Int’l. Finance | | BBB+ | | 6.00 | | 11/15/13 | | 675,000 | | 633,363 | |
Union Pacific Corp. | | BBB | | 4.88 | | 01/15/15 | | 500,000 | | 457,020 | |
Union Pacific Corp. | | BBB | | 6.13 | | 01/15/12 | | 500,000 | | 486,874 | |
Waste Management, Inc. | | BBB | | 5.00 | | 03/15/14 | | 500,000 | | 429,016 | |
| | | | | | | | | | 15,926,825 | |
TECHNOLOGY (2.1%) | | | | | | | | | | | |
Arrow Electronics, Inc. | | BBB- | | 6.88 | | 07/01/13 | | 750,000 | | 678,143 | |
Cisco Systems, Inc. | | A+ | | 5.25 | | 02/22/11 | | 250,000 | | 259,533 | |
Computer Sciences Corp. | | A- | | 7.38 | | 06/15/11 | | 950,000 | | 940,807 | |
Intuit, Inc. | | BBB | | 5.40 | | 03/15/12 | | 725,000 | | 658,866 | |
Western Union Co. | | A- | | 5.40 | | 11/17/11 | | 500,000 | | 480,590 | |
Xerox Corp. | | BBB | | 6.88 | | 08/15/11 | | 1,000,000 | | 864,407 | |
| | | | | | | | | | 3,882,346 | |
TELECOMMUNICATIONS (0.7%) | | | | | | | | | | | |
Nextel Communications, Inc. | | BB | | 5.25 | | 01/15/10 | | 250,000 | | 215,625 | |
Verizon New England, Inc. | | A | | 6.50 | | 09/15/11 | | 1,000,000 | | 992,677 | |
| | | | | | | | | | 1,208,302 | |
UTILITIES (5.8%) | | | | | | | | | | | |
AGL Capital Corp. | | BBB+ | | 6.38 | | 07/15/16 | | 500,000 | | 455,189 | |
AGL Capital Corp. | | BBB+ | | 7.13 | | 01/14/11 | | 1,000,000 | | 1,013,875 | |
Arizona Public Svc. Co. | | BBB- | | 6.38 | | 10/15/11 | | 500,000 | | 470,662 | |
Arizona Public Svc. Co. | | BBB- | | 6.50 | | 03/01/12 | | 500,000 | | 468,892 | |
Atmos Energy Corp. | | BBB+ | | 4.95 | | 10/15/14 | | 1,000,000 | | 871,485 | |
Duke Energy Corp. | | A | | 4.50 | | 04/01/10 | | 500,000 | | 499,291 | |
Entergy New Orleans, Inc. | | BBB+ | | 5.25 | | 08/01/13 | | 1,000,000 | | 860,335 | |
Exelon Generation Co. LLC | | BBB | | 5.35 | | 01/15/14 | | 1,000,000 | | 913,390 | |
Pepco Hldgs., Inc. | | BBB- | | 4.00 | | 05/15/10 | | 250,000 | | 240,380 | |
PPL Energy Supply LLC | | BBB | | 5.70 | | 10/15/15 | | 600,000 | | 494,423 | |
PPL Energy Supply LLC | | BBB | | 6.40 | | 11/01/11 | | 1,100,000 | | 1,081,945 | |
Progress Energy, Inc. | | A- | | 5.95 | | 03/01/09 | | 200,000 | | 200,268 | |
Progress Energy, Inc. | | BBB | | 6.85 | | 04/15/12 | | 900,000 | | 902,557 | |
Southwest Gas Corp. | | BBB- | | 8.38 | | 02/15/11 | | 1,000,000 | | 1,011,279 | |
TransAlta Corp. | | BBB | | 5.75 | | 12/15/13 | | 1,000,000 | | 824,162 | |
Virginia Electric & Power Co. | | A- | | 4.50 | | 12/15/10 | | 400,000 | | 394,778 | |
| | | | | | | | | | 10,702,911 | |
TOTAL LONG-TERM DEBT SECURITIES
(Cost: $182,981,986) 97.3% | | | | | | | | | | 178,471,358 | |
| | Rating** | | Rate(%) | | Maturity | | Face Amount($) | | Value($) | |
SHORT-TERM DEBT SECURITIES: | | | | | | | | | | | |
COMMERCIAL PAPER (1.4%) | | | | | | | | | | | |
Northern Illinois Gas Co. | | A-1+ | | 0.08 | | 01/08/09 | | 1,000,000 | | 999,984 | |
Toyota Motor Credit Corp. | | A-1+ | | 0.40 | | 01/21/09 | | 1,630,000 | | 1,629,638 | |
| | | | | | | | | | 2,629,622 | |
TOTAL SHORT-TERM DEBT SECURITIES
(Cost: $2,629,622) 1.4% | | | | | | | | | | 2,629,622 | |
| | | | | | | | | | | |
TOTAL INVESTMENTS
(Cost: $185,611,608) 98.7% | | | | | | | | | | 181,100,980 | |
| | | | | | | | | | | |
OTHER NET ASSETS 1.3% | | | | | | | | | | 2,318,294 | |
| | | | | | | | | | | |
NET ASSETS 100.0% | | | | | | | | | | $ | 183,419,274 | |
| | | | | | | | | | | | |
The accompanying notes are an integral part of these portfolio schedules.
MUTUAL OF AMERICA INVESTMENT CORPORATION (BOND FUND)
PORTFOLIO OF INVESTMENTS IN SECURITIES
December 31, 2008
| | Rating** | | Rate(%) | | Maturity | | Face Amount($) | | Value($) | |
LONG-TERM DEBT SECURITIES: | | | | | | | | | | | |
U.S. GOVERNMENT (2.0%) | | | | | | | | | | | |
U.S. Treasury Strip | | AAA | | 0.00 | | 02/15/18 | | 10,000,000 | | 7,686,690 | |
| | | | | | | | | | | |
U.S. GOVERNMENT AGENCIES (42.5%) | | | | | | | | | |
MORTGAGE-BACKED OBLIGATIONS (39.6%) | | | | | | | | | |
FHARM | | AAA | | 5.26 | | 04/01/37 | | 2,953,740 | | 2,980,991 | |
FHARM | | AAA | | 5.28 | | 02/01/36 | | 1,834,399 | | 1,864,454 | |
FHARM | | AAA | | 5.45 | | 05/01/37 | | 2,260,673 | | 2,309,894 | |
FHLMC | | AAA | | 4.00 | | 10/15/26 | | 324,522 | | 325,187 | |
FHLMC | | AAA | | 5.00 | | 02/01/26 | | 1,106,663 | | 1,136,838 | |
FHLMC | | AAA | | 5.43 | | 04/01/37 | | 2,325,911 | | 2,361,911 | |
FHLMC | | AAA | | 5.50 | | 10/01/18 | | 1,020,171 | | 1,055,230 | |
FHLMC | | AAA | | 5.50 | | 12/15/20 | | 3,500,000 | | 3,582,394 | |
FHLMC | | AAA | | 5.50 | | 03/01/21 | | 1,078,617 | | 1,114,337 | |
FHLMC | | AAA | | 5.50 | | 07/15/31 | | 1,500,000 | | 1,537,946 | |
FHLMC | | AAA | | 5.50 | | 01/15/33 | | 2,121,829 | | 2,204,209 | |
FHLMC | | AAA | | 5.50 | | 01/15/35 | | 500,000 | | 515,591 | |
FHLMC | | AAA | | 5.79 | | 03/01/37 | | 1,599,624 | | 1,630,863 | |
FHLMC | | AAA | | 6.00 | | 07/15/29 | | 1,352,764 | | 1,403,109 | |
FHLMC | | AAA | | 6.00 | | 03/15/32 | | 2,181,528 | | 2,257,255 | |
FNMA | | AAA | | 4.00 | | 05/01/19 | | 2,107,310 | | 2,141,836 | |
FNMA | | AAA | | 4.50 | | 05/01/18 | | 1,973,994 | | 2,030,393 | |
FNMA | | AAA | | 4.50 | | 12/01/18 | | 1,025,378 | | 1,054,674 | |
FNMA | | AAA | | 4.50 | | 02/01/19 | | 776,603 | | 796,850 | |
FNMA | | AAA | | 4.50 | | 05/01/19 | | 506,742 | | 519,953 | |
FNMA | | AAA | | 4.50 | | 06/01/19 | | 1,337,635 | | 1,372,508 | |
FNMA | | AAA | | 4.50 | | 06/01/19 | | 696,645 | | 714,807 | |
FNMA | | AAA | | 4.50 | | 05/01/34 | | 1,049,791 | | 1,066,552 | |
FNMA | | AAA | | 4.50 | | 06/01/34 | | 2,063,936 | | 2,096,889 | |
FNMA | | AAA | | 5.00 | | 04/01/18 | | 428,288 | | 442,131 | |
FNMA | | AAA | | 5.00 | | 09/01/18 | | 1,487,230 | | 1,535,299 | |
FNMA | | AAA | | 5.00 | | 09/01/20 | | 1,550,507 | | 1,595,776 | |
FNMA | | AAA | | 5.00 | | 10/01/20 | | 2,189,528 | | 2,253,454 | |
FNMA | | AAA | | 5.00 | | 10/01/25 | | 1,648,002 | | 1,688,322 | |
FNMA | | AAA | | 5.00 | | 06/01/33 | | 2,043,876 | | 2,092,185 | |
FNMA | | AAA | | 5.00 | | 09/01/33 | | 1,749,802 | | 1,791,161 | |
FNMA | | AAA | | 5.00 | | 11/01/33 | | 3,247,752 | | 3,324,515 | |
FNMA | | AAA | | 5.00 | | 01/01/34 | | 2,393,044 | | 2,449,605 | |
FNMA | | AAA | | 5.00 | | 03/01/34 | | 1,164,142 | | 1,191,657 | |
FNMA | | AAA | | 5.00 | | 04/01/34 | | 1,461,559 | | 1,495,190 | |
FNMA | | AAA | | 5.00 | | 04/01/34 | | 574,118 | | 587,329 | |
FNMA | | AAA | | 5.00 | | 04/01/35 | | 1,870,230 | | 1,912,097 | |
FNMA | | AAA | | 5.00 | | 06/01/35 | | 1,467,815 | | 1,500,673 | |
FNMA | | AAA | | 5.00 | | 09/01/35 | | 4,612,873 | | 4,716,136 | |
FNMA | | AAA | | 5.50 | | 04/01/17 | | 239,086 | | 247,526 | |
FNMA | | AAA | | 5.50 | | 05/01/17 | | 474,466 | | 491,217 | |
FNMA | | AAA | | 5.50 | | 01/01/24 | | 1,244,511 | | 1,280,330 | |
FNMA | | AAA | | 5.50 | | 03/01/24 | | 2,868,658 | | 2,949,586 | |
FNMA | | AAA | | 5.50 | | 09/01/25 | | 1,326,503 | | 1,363,141 | |
FNMA | | AAA | | 5.50 | | 11/01/26 | | 1,675,460 | | 1,721,473 | |
FNMA | | AAA | | 5.50 | | 07/01/33 | | 3,504,572 | | 3,601,099 | |
FNMA | | AAA | | 5.50 | | 09/01/33 | | 1,721,908 | | 1,769,334 | |
FNMA | | AAA | | 5.50 | | 10/01/33 | | 2,343,536 | | 2,408,084 | |
FNMA | | AAA | | 5.50 | | 03/01/34 | | 1,638,528 | | 1,683,658 | |
FNMA | | AAA | | 5.50 | | 03/01/34 | | 881,464 | | 905,742 | |
FNMA | | AAA | | 5.50 | | 07/01/34 | | 2,146,893 | | 2,204,682 | |
FNMA | | AAA | | 5.50 | | 09/01/34 | | 1,574,301 | | 1,616,678 | |
FNMA | | AAA | | 5.50 | | 09/01/34 | | 619,071 | | 635,735 | |
FNMA | | AAA | | 5.50 | | 10/01/34 | | 3,555,489 | | 3,651,195 | |
FNMA | | AAA | | 5.50 | | 02/01/35 | | 1,236,044 | | 1,269,316 | |
FNMA | | AAA | | 5.50 | | 02/01/35 | | 1,038,529 | | 1,065,835 | |
FNMA | | AAA | | 5.50 | | 04/01/35 | | 1,501,322 | | 1,540,796 | |
FNMA | | AAA | | 5.50 | | 08/01/35 | | 2,932,714 | | 3,009,823 | |
FNMA | | AAA | | 5.50 | | 06/01/48 | | 1,665,042 | | 1,665,042 | |
FNMA | | AAA | | 6.00 | | 03/01/17 | | 303,300 | | 315,809 | |
FNMA | | AAA | | 6.00 | | 05/01/23 | | 1,507,471 | | 1,558,751 | |
FNMA | | AAA | | 6.00 | | 01/01/25 | | 845,099 | | 872,891 | |
FNMA | | AAA | | 6.00 | | 03/01/28 | | 1,803,148 | | 1,859,281 | |
FNMA | | AAA | | 6.00 | | 04/01/32 | | 504,541 | | 521,354 | |
FNMA | | AAA | | 6.00 | | 04/01/32 | | 253,058 | | 261,491 | |
FNMA | | AAA | | 6.00 | | 05/01/32 | | 1,702,691 | | 1,759,431 | |
FNMA | | AAA | | 6.00 | | 04/01/33 | | 1,977,381 | | 2,043,275 | |
FNMA | | AAA | | 6.00 | | 11/01/34 | | 1,326,438 | | 1,368,775 | |
FNMA | | AAA | | 6.00 | | 12/01/36 | | 1,831,209 | | 1,887,369 | |
FNMA | | AAA | | 6.00 | | 01/01/37 | | 1,892,096 | | 1,950,123 | |
FNMA | | AAA | | 6.00 | | 04/01/37 | | 1,707,597 | | 1,733,059 | |
FNMA | | AAA | | 6.00 | | 05/01/37 | | 1,716,879 | | 1,742,479 | |
FNMA | | AAA | | 6.00 | | 06/01/37 | | 1,995,805 | | 2,025,564 | |
FNMA | | AAA | | 6.00 | | 07/01/37 | | 1,829,087 | | 1,885,077 | |
FNMA | | AAA | | 6.00 | | 08/01/37 | | 2,734,236 | | 2,817,934 | |
FNMA | | AAA | | 6.00 | | 12/01/37 | | 1,450,861 | | 1,495,273 | |
FNMA | | AAA | | 6.00 | | 02/25/47 | | 1,607,705 | | 1,634,835 | |
FNMA | | AAA | | 6.50 | | 09/01/16 | | 95,772 | | 99,645 | |
FNMA | | AAA | | 6.50 | | 03/01/17 | | 794,244 | | 825,251 | |
FNMA | | AAA | | 6.50 | | 05/01/17 | | 123,376 | | 128,193 | |
FNMA | | AAA | | 6.50 | | 04/01/32 | | 330,917 | | 345,292 | |
FNMA | | AAA | | 6.50 | | 05/01/32 | | 1,937,108 | | 2,021,252 | |
FNMA | | AAA | | 6.50 | | 05/01/32 | | 605,151 | | 631,438 | |
FNMA | | AAA | | 6.50 | | 09/01/36 | | 1,457,920 | | 1,493,038 | |
FNMA | | AAA | | 6.50 | | 05/01/37 | | 1,714,102 | | 1,782,302 | |
FNMA | | AAA | | 6.50 | | 07/01/37 | | 1,249,419 | | 1,299,131 | |
FNMA | | AAA | | 6.50 | | 09/01/37 | | 2,171,963 | | 2,258,381 | |
FNMA | | AAA | | 6.50 | | 05/01/38 | | 2,004,972 | | 2,084,545 | |
FNMA | | AAA | | 7.00 | | 09/01/31 | | 179,765 | | 190,216 | |
FNMA | | AAA | | 7.00 | | 11/01/31 | | 139,114 | | 147,202 | |
FNMA | | AAA | | 7.50 | | 04/01/32 | | 102,426 | | 108,524 | |
FNMA | | AAA | | 7.50 | | 06/01/32 | | 501,005 | | 530,831 | |
FNMA | | AAA | | 8.00 | | 03/01/31 | | 84,262 | | 89,498 | |
FNMA | | AAA | | 8.00 | | 04/01/32 | | 114,684 | | 121,854 | |
FNMA | | AAA | | 8.00 | | 04/01/32 | | 46,227 | | 49,109 | |
GNMA (5) | | AAA | | 6.27 | | 10/16/27 | | 2,910,480 | | 3,049,121 | |
GNMA (5) | | AAA | | 6.50 | | 04/15/31 | | 48,137 | | 50,596 | |
GNMA (5) | | AAA | | 6.50 | | 12/15/31 | | 234,757 | | 246,749 | |
GNMA (5) | | AAA | | 6.50 | | 05/15/32 | | 94,112 | | 98,919 | |
GNMA (5) | | AAA | | 7.00 | | 09/15/31 | | 58,763 | | 62,139 | |
GNMA (5) | | AAA | | 7.00 | | 09/15/31 | | 35,193 | | 37,215 | |
GNMA (5) | | AAA | | 7.00 | | 05/15/32 | | 35,034 | | 36,838 | |
| | | | | | | | | | 147,250,543 | |
NON-MORTGAGE-BACKED OBLIGATIONS (2.9%) | | | | | | | | | |
FNMA | | AAA | | 0.00 | | 10/09/19 | | 20,000,000 | | 10,838,776 | |
| | | | | | | | | | | |
CORPORATE DEBT (50.2%) | | | | | | | | | | | |
BASIC MATERIALS (3.0%) | | | | | | | | | | | |
ARCO Chemical Co. | | D | | 10.25 | | 11/01/10 | | 5,000,000 | | 800,000 | |
International Paper Co. | | BBB | | 4.25 | | 01/15/09 | | 2,000,000 | | 1,999,310 | |
Lubrizol Corp. | | BBB | | 5.50 | | 10/01/14 | | 2,000,000 | | 1,818,186 | |
Martin Marietta Materials, Inc | | BBB+ | | 6.88 | | 04/01/11 | | 1,500,000 | | 1,432,517 | |
PolyOne Corp. | | B | | 7.50 | | 12/15/15 | | 3,750,000 | | 1,134,375 | |
Sonoco Products Co. | | BBB+ | | 6.50 | | 11/15/13 | | 500,000 | | 469,520 | |
Vulcan Materials Co. | | BBB+ | | 7.00 | | 06/15/18 | | 2,000,000 | | 1,564,806 | |
Worthington Industries, Inc. | | BBB | | 6.70 | | 12/01/09 | | 2,000,000 | | 2,042,302 | |
| | | | | | | | | | 11,261,016 | |
CONSUMER, CYCLICAL (8.8%) | | | | | | | | | | | |
Best Buy Co., Inc.† | | BBB- | | 6.75 | | 07/15/13 | | 500,000 | | 466,785 | |
Black & Decker Corp. | | BBB | | 4.75 | | 11/01/14 | | 2,000,000 | | 1,747,102 | |
Brinker International, Inc. | | BBB- | | 5.75 | | 06/01/14 | | 2,000,000 | | 1,576,408 | |
Ethan Allen Interiors, Inc. | | BBB- | | 5.38 | | 10/01/15 | | 2,000,000 | | 1,895,586 | |
Fortune Brands, Inc. | | BBB | | 4.88 | | 12/01/13 | | 500,000 | | 440,382 | |
Fortune Brands, Inc. | | BBB | | 5.38 | | 01/15/16 | | 1,900,000 | | 1,586,981 | |
Fruit of the Loom (2) | | NR | | 7.38 | | 11/15/23 | | 345,170 | | 35 | |
Home Depot, Inc. | | BBB+ | | 5.40 | | 03/01/16 | | 2,000,000 | | 1,789,840 | |
Johnson Controls, Inc. | | BBB | | 4.88 | | 09/15/13 | | 2,500,000 | | 1,969,303 | |
Kellwood Co. | | NR | | 7.88 | | 07/15/09 | | 4,000,000 | | 2,600,000 | |
Kohl’s Corp. | | BBB+ | | 6.30 | | 03/01/11 | | 1,500,000 | | 1,453,313 | |
Leggett & Platt, Inc. | | A- | | 4.70 | | 04/01/13 | | 2,000,000 | | 1,796,872 | |
Macys Retail Hldgs., Inc.† | | BBB- | | 4.80 | | 07/15/09 | | 2,000,000 | | 1,895,674 | |
Marriott International, Inc. | | BBB | | 5.63 | | 02/15/13 | | 2,000,000 | | 1,520,000 | |
Newell Rubbermaid, Inc. | | BBB+ | | 4.63 | | 12/15/09 | | 2,500,000 | | 2,431,618 | |
RadioShack Corp. | | BB | | 7.38 | | 05/15/11 | | 2,000,000 | | 1,740,000 | |
Scholastic Corp. | | BB | | 5.00 | | 04/15/13 | | 2,000,000 | | 1,540,000 | |
Starwood Hotels & Resorts | | BB+ | | 6.25 | | 02/15/13 | | 500,000 | | 345,000 | |
Target Corp. | | A+ | | 5.38 | | 06/15/09 | | 3,250,000 | | 3,284,583 | |
Wendy’s International, Inc. | | B+ | | 6.25 | | 11/15/11 | | 1,500,000 | | 1,267,500 | |
Whirlpool Corp. | | BBB | | 6.50 | | 06/15/16 | | 2,000,000 | | 1,576,176 | |
| | | | | | | | | | 32,923,158 | |
CONSUMER, NON-CYCLICAL (3.1%) | | | | | | | | | | | |
Bunge Ltd. Finance Corp. | | BBB- | | 5.35 | | 04/15/14 | | 2,000,000 | | 1,434,830 | |
Cargill, Inc.† | | A | | 5.00 | | 11/15/13 | | 500,000 | | 447,019 | |
Clorox Co. | | BBB+ | | 5.00 | | 03/01/13 | | 2,000,000 | | 1,970,450 | |
CVS Caremark Corp. | | BBB+ | | 6.13 | | 08/15/16 | | 2,000,000 | | 1,937,666 | |
Kroger Co. | | BBB- | | 4.95 | | 01/15/15 | | 2,000,000 | | 1,904,132 | |
PepsiAmericas, Inc. | | A | | 6.38 | | 05/01/09 | | 2,000,000 | | 2,009,516 | |
Sara Lee Corp. | | BBB+ | | 6.25 | | 09/15/11 | | 2,000,000 | | 1,979,882 | |
| | | | | | | | | | 11,683,495 | |
ENERGY (5.8%) | | | | | | | | | | | |
Diamond Offshore Drilling | | A- | | 4.88 | | 07/01/15 | | 2,000,000 | | 1,836,694 | |
Enbridge, Inc. | | A- | | 5.80 | | 06/15/14 | | 1,000,000 | | 877,101 | |
Knight, Inc. | | BB | | 5.15 | | 03/01/15 | | 2,000,000 | | 1,490,000 | |
Nabors Industries Ltd. | | BBB+ | | 5.38 | | 08/15/12 | | 1,000,000 | | 943,715 | |
National Oilwell Varco, Inc. | | BBB+ | | 6.13 | | 08/15/15 | | 2,000,000 | | 1,737,242 | |
Noble Corp. | | A- | | 7.50 | | 03/15/19 | | 2,000,000 | | 2,473,014 | |
Premco Refining Group | | BBB | | 7.50 | | 06/15/15 | | 2,000,000 | | 1,800,832 | |
Seariver Maritime, Inc. | | AAA | | 0.00 | | 09/01/12 | | 10,000,000 | | 8,564,670 | |
Weatherford Int’l. Ltd. | | BBB+ | | 5.15 | | 03/15/13 | | 500,000 | | 440,286 | |
Weatherford Int’l. Ltd. | | BBB+ | | 5.50 | | 02/15/16 | | 1,500,000 | | 1,289,414 | |
| | | | | | | | | | 21,452,968 | |
FINANCIAL (15.7%) | | | | | | | | | | | |
American Express Credit Corp. | | A+ | | 5.88 | | 05/02/13 | | 500,000 | | 479,987 | |
Berkley (W.R.) Corp. | | BBB+ | | 8.70 | | 01/01/22 | | 5,000,000 | | 5,358,920 | |
Brandywine Realty Trust | | BBB- | | 4.50 | | 11/01/09 | | 2,000,000 | | 1,875,574 | |
Capital One Bank | | A- | | 5.75 | | 09/15/10 | | 2,000,000 | | 1,941,138 | |
Colonial Realty LP | | BBB- | | 4.80 | | 04/01/11 | | 1,500,000 | | 1,195,799 | |
Corporate Pptys. Investors† | | A- | | 7.88 | | 03/15/16 | | 5,000,000 | | 3,487,785 | |
Developers Diversified Realty | | BBB- | | 5.00 | | 05/03/10 | | 2,000,000 | | 1,449,064 | |
Duke Realty LP | | BBB+ | | 4.63 | | 05/15/13 | | 2,000,000 | | 1,258,262 | |
Fairfax Financial Hldgs. | | BB+ | | 8.25 | | 10/01/15 | | 2,500,000 | | 1,950,000 | |
First Horizon Mtg. | | AAA | | 5.00 | | 06/25/33 | | 1,486,516 | | 1,470,733 | |
First Horizon National Corp. | | BBB- | | 4.50 | | 05/15/13 | | 5,000,000 | | 3,472,975 | |
First Industrial LP | | BBB- | | 6.88 | | 04/15/12 | | 2,000,000 | | 1,304,720 | |
Ford Motor Credit Co. LLC | | CCC+ | | 7.38 | | 10/28/09 | | 3,000,000 | | 2,634,663 | |
Fosters Finance Corp.† | | BBB | | 6.88 | | 06/15/11 | | 2,000,000 | | 1,984,912 | |
GATX Financial Corp. | | BBB+ | | 5.13 | | 04/15/10 | | 1,000,000 | | 936,714 | |
GMAC LLC | | CC | | 0.00 | | 12/01/12 | | 10,000,000 | | 1,894,900 | |
Harley-Davidson Funding† | | A | | 5.25 | | 12/15/12 | | 500,000 | | 348,887 | |
HCP, Inc. | | BBB | | 4.88 | | 09/15/10 | | 2,000,000 | | 1,782,928 | |
HCP, Inc. | | BBB | | 5.65 | | 12/15/13 | | 2,000,000 | | 1,195,120 | |
Health Care REIT, Inc. | | BBB- | | 8.00 | | 09/12/12 | | 2,000,000 | | 1,713,660 | |
Heinz (H.J.) Finance Co. | | BBB | | 6.00 | | 03/15/12 | | 2,000,000 | | 2,015,254 | |
HSBC Finance Corp. | | AA- | | 5.82 | | 11/10/13 | | 100,000 | | 65,000 | |
HSBC Finance Corp. | | AA- | | 6.52 | | 10/10/13 | | 70,000 | | 45,500 | |
KeyCorp | | A- | | 6.50 | | 05/14/13 | | 2,000,000 | | 1,843,774 | |
Kimco Realty Corp. | | BBB+ | | 6.00 | | 11/30/12 | | 1,000,000 | | 773,577 | |
Lincoln National Corp. | | A+ | | 5.65 | | 08/27/12 | | 2,000,000 | | 1,648,200 | |
Markel Corp. | | BBB | | 6.80 | | 02/15/13 | | 1,000,000 | | 883,540 | |
Nationwide Health Pptys., Inc. | | BBB- | | 6.50 | | 07/15/11 | | 2,000,000 | | 1,815,442 | |
ProLogis | | BBB- | | 5.50 | | 04/01/12 | | 2,000,000 | | 1,204,996 | |
Protective Life Corp. | | A | | 4.88 | | 11/01/14 | | 1,000,000 | | 797,272 | |
Protective Life Secured Trust | | AA | | 1.07 | | 08/10/14 | | 21,000 | | 12,775 | |
Protective Life Secured Trust | | AA | | 2.92 | | 10/10/14 | | 53,000 | | 33,166 | |
Protective Life Secured Trust | | AA | | 5.88 | | 12/10/14 | | 124,000 | | 75,950 | |
Regency Centers LP | | BBB+ | | 4.95 | | 04/15/14 | | 2,000,000 | | 1,380,492 | |
Shurgard Storage Centers | | A- | | 7.75 | | 02/22/11 | | 750,000 | | 753,212 | |
SLM Corp. | | BBB- | | 4.00 | | 01/15/09 | | 2,250,000 | | 2,239,724 | |
Southtrust Bank, N.A. | | AA | | 4.75 | | 03/01/13 | | 1,250,000 | | 1,170,456 | |
Travelers Cos., Inc. | | A- | | 5.38 | | 06/15/12 | | 500,000 | | 498,910 | |
Vornado Realty LP | | BBB | | 5.60 | | 02/15/11 | | 2,000,000 | | 1,807,612 | |
Zions Bancorporation | | BBB | | 5.65 | | 05/15/14 | | 2,000,000 | | 1,495,174 | |
| | | | | | | | | | 58,296,767 | |
HEALTHCARE (4.5%) | | | | | | | | | | | |
Allergan, Inc. | | A | | 5.75 | | 04/01/16 | | 2,000,000 | | 1,913,444 | |
Cardinal Health, Inc. | | BBB+ | | 6.75 | | 02/15/11 | | 2,000,000 | | 1,990,252 | |
Fisher Scientific Int’l., Inc. | | BBB | | 6.13 | | 07/01/15 | | 2,000,000 | | 1,762,500 | |
Humana, Inc. | | BBB | | 7.20 | | 06/15/18 | | 2,000,000 | | 1,608,376 | |
Laboratory Corp. of America | | BBB | | 5.50 | | 02/01/13 | | 1,000,000 | | 959,527 | |
Laboratory Corp. of America | | BBB | | 5.63 | | 12/15/15 | | 1,000,000 | | 841,626 | |
McKesson Corp. | | BBB+ | | 7.75 | | 02/01/12 | | 1,750,000 | | 1,956,344 | |
UnitedHealth Group, Inc. | | A- | | 5.50 | | 11/15/12 | | 2,000,000 | | 1,822,560 | |
WellPoint, Inc. | | A- | | 4.25 | | 12/15/09 | | 2,000,000 | | 1,923,334 | |
Wyeth | | A+ | | 5.50 | | 03/15/13 | | 1,750,000 | | 1,782,582 | |
| | | | | | | | | | 16,560,545 | |
INDUSTRIAL (3.5%) | | | | | | | | | | | |
Canadian Pacific Railway Co. | | BBB | | 5.75 | | 05/15/13 | | 500,000 | | 462,731 | |
CSX Corp. | | BBB- | | 5.30 | | 02/15/14 | | 2,000,000 | | 1,805,116 | |
Donnelley (R.R.) & Sons Co. | | BBB+ | | 4.95 | | 04/01/14 | | 2,000,000 | | 1,516,004 | |
Goodrich Corp. | | BBB+ | | 7.63 | | 12/15/12 | | 2,000,000 | | 2,075,784 | |
Masco Corp. | | BBB | | 5.88 | | 07/15/12 | | 2,000,000 | | 1,639,988 | |
Precision Castparts Corp. | | BBB+ | | 5.60 | | 12/15/13 | | 2,000,000 | | 1,803,310 | |
Ryder System, Inc. | | BBB+ | | 6.00 | | 03/01/13 | | 2,000,000 | | 1,638,618 | |
Steelcase, Inc. | | BBB | | 6.50 | | 08/15/11 | | 2,000,000 | | 1,883,452 | |
| | | | | | | | | | 12,825,003 | |
TECHNOLOGY (1.1%) | | | | | | | | | | | |
Arrow Electronics, Inc. | | BBB- | | 6.88 | | 06/01/18 | | 2,000,000 | | 1,632,854 | |
Cisco Systems, Inc. | | A+ | | 5.25 | | 02/22/11 | | 2,000,000 | | 2,076,264 | |
Xerox Corp. | | BBB | | 6.88 | | 08/15/11 | | 500,000 | | 432,204 | |
| | | | | | | | | | 4,141,322 | |
TELECOMMUNICATIONS (1.5%) | | | | | | | | | | | |
Alltel Corp. | | A | | 7.00 | | 03/15/16 | | 2,000,000 | | 1,970,000 | |
Nextel Communications, Inc. | | BB | | 5.25 | | 01/15/10 | | 2,000,000 | | 1,725,000 | |
Verizon Florida LLC | | A | | 6.13 | | 01/15/13 | | 2,000,000 | | 1,906,104 | |
| | | | | | | | | | 5,601,104 | |
UTILITIES (3.2%) | | | | | | | | | | | |
AGL Capital Corp. | | BBB+ | | 6.38 | | 07/15/16 | | 500,000 | | 455,189 | |
Arizona Public Svc. Co. | | BBB- | | 6.50 | | 03/01/12 | | 2,000,000 | | 1,875,566 | |
Duke Energy Corp. | | A | | 4.50 | | 04/01/10 | | 750,000 | | 748,936 | |
Entergy New Orleans, Inc. | | BBB+ | | 5.25 | | 08/01/13 | | 1,075,000 | | 924,860 | |
Entergy New Orleans, Inc. | | BBB+ | | 6.75 | | 10/15/17 | | 500,000 | | 440,514 | |
Pepco Hldgs., Inc. | | BBB- | | 4.00 | | 05/15/10 | | 2,000,000 | | 1,923,036 | |
PPL Energy Supply LLC | | BBB | | 5.40 | | 08/15/14 | | 2,000,000 | | 1,707,758 | |
Progress Energy, Inc. | | A- | | 5.25 | | 12/15/15 | | 2,000,000 | | 2,028,956 | |
Virginia Electric & Power Co. | | A- | | 4.50 | | 12/15/10 | | 2,000,000 | | 1,973,892 | |
| | | | | | | | | | 12,078,707 | |
SOVEREIGN DEBT (1.4%) | | | | | | | | | | | |
Sri Lanka AID | | NR | | 6.59 | | 09/15/28 | | 4,000,000 | | 5,063,760 | |
| | | | | | | | | | | |
TOTAL LONG-TERM DEBT SECURITIES
(Cost: $387,723,894) 96.1% | | | | | | | | 357,663,854 | |
| | Rating** | | Rate(%) | | Maturity | | Face Amount($) | | Value($) | |
SHORT-TERM DEBT SECURITIES: | | | | | | | | | | | |
COMMERCIAL PAPER (2.8%) | | | | | | | | | | | |
Danaher Corp. | | A-1 | | 0.02 | | 01/05/09 | | 5,000,000 | | 4,999,989 | |
Toyota Motor Credit Corp. | | A-1+ | | 0.40 | | 01/21/09 | | 5,400,000 | | 5,398,800 | |
| | | | | | | | | | 10,398,789 | |
TOTAL SHORT-TERM DEBT SECURITIES
(Cost: $10,398,789) 2.8% | | | | | | | | 10,398,789 | |
| | | | | | | | | | | |
TOTAL INVESTMENTS | | | | | | | | | | | |
(Cost: $398,122,683) 98.9% | | | | | | | | | | 368,062,643 | |
| | | | | | | | | | | |
OTHER NET ASSETS 1.1% | | | | | | | | | | 4,038,766 | |
| | | | | | | | | | | |
NET ASSETS 100.0% | | | | | | | | | | $ | 372,101,409 | |
| | | | | | | | | | | | |
The accompanying notes are an integral part of these portfolio schedules.
MUTUAL OF AMERICA INVESTMENT CORPORATION
FOOTNOTES TO PORTFOLIO OF INVESTMENTS IN SECURITIES
December 31, 2008
Abbreviations: | | FFCB = Federal Farm Credit Bank |
| | FHARM = Federal Home Adjustable Rate Mortgage |
| | FHLB = Federal Home Loan Bank |
| | FHLMC = Federal Home Loan Mortgage Corporation |
| | FNMA = Federal National Mortgage Association |
| | GMAC = General Motors Acceptance Corporation |
| | GNMA = Government National Mortgage Association |
| | NR = Not Rated |
* Non-income producing security.
** Ratings as per Standard & Poors Corporation.
*** This security was fair valued in accordance with procedures adopted by the Funds’ Board of Directors.
† Security exempt from registration under Rule 144A of the Securities Act of 1933. These securities may be resold in transactions exempt from registration, normally to qualified institutional buyers. At December 31, 2008, the aggregate values of these securities and their percentages of the respective Funds’ net assets were as follows:
| | Aggregate | | Percentage | |
| | Market | | of | |
Fund | | Value | | Net Assets | |
| | | | | |
EQUITY INDEX FUND | | $ | 13,916,586 | | 2.6 | % |
ALL AMERICA FUND | | $ | 5,435,336 | | 2.5 | % |
SMALL CAP VALUE FUND | | $ | 6,489,645 | | 4.2 | % |
SMALL CAP GROWTH FUND | | $ | 1,799,995 | | 1.2 | % |
MID CAP VALUE FUND | | $ | 799,998 | | 2.7 | % |
MID-CAP EQUITY INDEX FUND | | $ | 7,375,677 | | 3.0 | % |
COMPOSITE FUND | | $ | 1,930,145 | | 1.3 | % |
MONEY MARKET FUND | | $ | 90,178,715 | | 44.9 | % |
MID-TERM BOND FUND | | $ | 7,067,985 | | 3.9 | % |
BOND FUND | | $ | 8,631,062 | | 2.3 | % |
(1) | | This security, or a portion thereof, has been segregated to cover initial margin requirements on open futures contracts.Information on futures contracts outstanding in the Funds as of December 31, 2008, were as follows: |
| | | | | | | | | | | | | | Face Value | |
| | | | | | | | | | | | | | of Futures | |
| | | | | | | | | | Underlying | | | | as a % of | |
| | Number of | | | | Purchased (P) | | Expiration | | Face Amount | | Unrealized | | Total | |
Fund | | Contracts | | Contract Type | | or Sold (S) | | Date | | at Value | | Gain(Loss) | | Investments | |
| | | | | | | | | | | | | | | |
EQUITY INDEX FUND | | 129 | | S&P 500 Stock Index | | P | | March 2009 | | $ | 29,028,225 | | $ | (9,213 | ) | 5.3 | % |
ALL AMERICA FUND | | 32 | | S&P 500 Stock Index | | P | | March 2009 | | $ | 7,200,800 | | $ | (21,200 | ) | 3.2 | % |
MID-CAP EQUITY INDEX FUND | | 100 | | S&P MidCap 400 Stock Index | | P | | March 2009 | | $ | 26,860,000 | | $ | 495,125 | | 11.0 | % |
(2) | | Issuer has filed for Chapter XI bankruptcy law (or equivalent) protection; issue is non-income producing. |
(3) | | The fund has an arrangement with its custodian bank, JP Morgan Chase Bank, whereby uninvested cash, subject to parameters set by the fund, is automatically invested in the fund’s name by the bank in overnight commercial paper issued by J.P. Morgan Chase & Co. On the next business day, these funds (and earned interest) are automatically returned to the fund. The annual rate of interest earned on this temporary cash investment at December 31, 2008 was 0.10%. |
(4) | | Percentage is less than 0.05%. |
(5) | | U.S. Government guaranteed security. |
Fair Value—Effective January 1, 2008, the Investment Company adopted Financial Accounting Standards Board (“FASB”) Statement of Financial Accounting Standards No. 157, Fair Value Measurements (“SFAS 157”). SFAS 157 establishes a single definition of fair value, institutes a framework for measuring fair value and expands disclosures about fair value measurements. Fair value is an estimate of the price the Fund would receive upon selling a security in an orderly arms-length transaction. SFAS 157 establishes a three-level valuation hierarchy for measurement and disclosure of fair value. The valuation hierarchy is based upon the transparency of inputs used to measure fair value. The three levels are as follows:
· | | Level 1 – quoted prices in active markets for identical securities. |
· | | Level 2 –other significant observable inputs (including yield, quality, coupon rate, maturity, issue type, quoted prices for similar securities, prepayment speeds, trading characteristics, etc.). |
· | | Level 3 –significant unobservable inputs (including the Fund’s own assumptions in determining the fair value of investments). |
As of December 31, 2008, management determined that the fair value inputs for all equity securities, including shares of registered investment companies, were considered Level 1, with the exception of non-registered securities under Rule 144A of the Securities Act of 1933 which were considered Level 2. However, certain Rule 144A securities not actively traded were considered Level 3. Fair value inputs for all debt securities were considered Level 2. The inputs used for valuing securities are not necessarily an indication of the risk associated with investing in those securities.
The following is a summary of the inputs used to value the Funds’ net assets as of December 31, 2008, by SFAS 157 valuation hierarchy:
Fund | | Level 1 – Quoted
Prices | | Level 2 –
Significant
Observable
Inputs | | Level 3 –
Significant
Unobservable
Inputs | | Total | |
Investments at Market Value: | | | | | | | | | |
Equity Index Fund | | $ | 515,040,073 | | $ | 29,264,154 | | — | | $ | 544,304,227 | |
All America Fund | | $ | 209,905,213 | | $ | 11,005,584 | | 695,347 | | $ | 221,606,144 | |
Small Cap Value Fund | | $ | 143,283,334 | | $ | 7,719,621 | | 3,989,652 | | $ | 154,992,607 | |
Small Cap Growth Fund | | $ | 143,791,492 | | $ | 5,799,395 | | — | | $ | 149,590,887 | |
Mid Cap Value Fund | | $ | 28,304,261 | | $ | 1,499,842 | | — | | $ | 29,804,103 | |
Mid-Cap Equity Index Fund | | $ | 218,695,597 | | $ | 26,402,786 | | — | | $ | 245,098,383 | |
International Fund | | $ | 11,828,829 | | — | | — | | $ | 11,828,829 | |
Composite Fund | | $ | 86,205,106 | | $ | 63,040,475 | | — | | $ | 149,245,581 | |
Retirement Income Fund | | $ | 3,516,933 | | — | | — | | $ | 3,516,933 | |
2010 Retirement Fund | | $ | 8,274,705 | | — | | — | | $ | 8,274,705 | |
2015 Retirement Fund | | $ | 20,017,092 | | — | | — | | $ | 20,017,092 | |
2020 Retirement Fund | | $ | 20,685,744 | | — | | — | | $ | 20,685,744 | |
2025 Retirement Fund | | $ | 14,822,394 | | — | | — | | $ | 14,822,394 | |
2030 Retirement Fund | | $ | 11,661,423 | | — | | — | | $ | 11,661,423 | |
2035 Retirement Fund | | $ | 8,780,940 | | — | | — | | $ | 8,780,940 | |
2040 Retirement Fund | | $ | 6,200,702 | | — | | — | | $ | 6,200,702 | |
2045 Retirement Fund | | $ | 6,858,194 | | — | | — | | $ | 6,858,194 | |
Conservative Allocation Fund | | $ | 23,604,668 | | — | | — | | $ | 23,604,668 | |
Moderate Allocation Fund | | $ | 89,505,262 | | — | | — | | $ | 89,505,262 | |
Aggressive Allocation Fund | | $ | 81,248,122 | | — | | — | | $ | 81,248,122 | |
Money Market Fund | | — | | $ | 200,986,624 | | — | | $ | 200,986,624 | |
Mid-Term Bond Fund | | — | | $ | 181,100,980 | | — | | $ | 181,100,980 | |
Bond Fund | | — | | $ | 368,062,643 | | — | | $ | 368,062,643 | |
Other Financial Instruments:* | | | | | | | | | |
Equity Index Fund | | $ | (9,213 | ) | — | | — | | $ | (9,213 | ) |
All America Fund | | $ | (21,200 | ) | — | | — | | $ | (21,200 | ) |
Mid-Cap Equity Index Fund | | $ | 495,125 | | — | | — | | $ | 495,125 | |
* | | Other financial instruments are derivative instruments not reflected in the Portfolio of Investments, such as futures, which are valued at the unrealized appreciation/depreciation on the instrument. |
Fair Value Measurement Using Signficant Unobservable Inputs (Level 3)
for the Year Ended December 31, 2008
| | Balance
December 31,
2007 | | Purchases/
(Sales) | | Unrealized Gains
(Losses) (a) | | Transfer In/(Out)
of Level 3 | | Balance
December 31,
2008 | |
All America Fund | | $ | 1,473,487 | | — | | $ | (599,139 | ) | $ | (179,001 | ) | $ | 695,347 | |
Small Cap Value Fund | | $ | 6,658,540 | | $ | 170,630 | | $ | (2,839,518 | ) | — | | $ | 3,989,652 | |
| | | | | | | | | | | | | | | | |
(a) | | Unrealized gains and losses on Level 3 securities are included in Net Unrealized Appreciation (Depreciation) of Investments in the Statements of Operations |
Security Valuation — Investment securities are carried at fair value as follows:
Exchange-traded equity securities are valued at the last sales price on the principal exchange on which the security is traded. If there is no trading volume for a particular valuation day, the last bid price is used. For equity securities traded in the over-the-counter market, the security is valued at the last sale price, or if no sale, at the latest bid price available.
Short-term debt securities with a maturity of 60 days or less are valued at amortized cost, which approximates fair value for such securities.
Debt securities, including short-term debt securities maturing in excess of 60 days, are valued on the basis of prices obtained from an independent pricing source. The pricing source may utilize various pricing methodologies that incorporate both models (which consider factors such as yield, quality, coupon rate, maturity, issue type, quoted prices for similar securities, prepayment speeds and trading characteristics) and dealer supplied valuations to derive a valuation.
In the rare instance when a price is not available from an independent pricing source or when prices are determined not to reflect fair value, such as when the value of a security has been significantly affected by events after the close of the market on which the security is principally traded but before the Funds calculate their net asset value, a calculated fair value is used, as determined in good faith by the Adviser and reviewed by a Valuation Committee, in accordance with procedures adopted by the Board of Directors of the Investment Company.
Retirement Funds and the Allocation Funds value their investments in the underlying Funds of the Investment Company at their respective net asset values.
Investment Transactions — Investment transactions are accounted for as of the trade date. Realized gains and losses on the sale of short and long-term debt securities are computed on the basis of amortized cost at the time of sale. Realized gains and losses on the sale of common stock are based on the identified cost basis of the security determined on the first-in, first-out (“FIFO”) basis.
Equity-type funds with an indexed portfolio component may, in order to remain more fully invested in the equity markets while minimizing transaction costs, purchase stock index futures contracts. Initial cash margin deposits (represented by cash or Treasury bills) are made upon entering into futures contracts. (This initial margin, maintained in a segregated account, is equal to approximately 5%-6% of the contract amount, and does not involve the borrowing of funds to finance the transaction). During the period the futures contract is outstanding, changes in the value of the contract are recognized as unrealized gains or losses by “marking-to-market” on a daily basis to reflect the market value of the contract at the end of each trading day. Futures contracts are valued at the settlement price established each day by the exchange on which traded. Depending upon whether unrealized gains or losses are incurred, variation margin payments are received or made daily. When the contract is closed, a realized gain or loss from futures transactions is recorded, equal to the net variation margin received or paid over the period the contract was outstanding. The “Underlying Face Amount at Value” (appearing in Footnote 1), representing the aggregate of outstanding contractual amounts under futures contracts, reflects the extent of a Fund’s exposure to off-balance sheet risk. The use of futures transactions involves the risk of imperfect correlation in the price movements of the contract and the underlying securities.
Each of the Retirement Funds invests in equity (stock) funds and fixed income (bond) funds and targets different percentages to these asset classes. The targets reflect varying emphases on achieving capital appreciation and gains versus preserving capital and producing income, depending on the specific Fund’s time horizon.
The Retirement Funds invest in the following underlying funds of the Investment Company in accordance with the percentage allocations noted:
| | Equity Index
Fund | | Mid-Cap
Equity Index
Fund | | Small Cap
Growth Fund | | Small Cap Value
Fund | | International
Fund | | Bond Fund | | Mid-Term
Bond Fund | | Money
Market
Fund | |
Retirement Income Fund | | 20 | % | 5 | % | — | | — | | — | | 30 | % | 30 | % | 15 | % |
2010 Retirement Fund | | 25 | % | 15 | % | — | | — | | 5 | % | 25 | % | 20 | % | 10 | % |
2015 Retirement Fund | | 30 | % | 12 | % | 3 | % | 3 | % | 7 | % | 25 | % | 11 | % | 9 | % |
2020 Retirement Fund | | 35 | % | 12 | % | 4 | % | 4 | % | 10 | % | 24 | % | 11 | % | — | |
2025 Retirement Fund | | 40 | % | 15 | % | 5 | % | 5 | % | 10 | % | 20 | % | 5 | % | — | |
2030 Retirement Fund | | 40 | % | 18 | % | 6 | % | 6 | % | 10 | % | 20 | % | — | | — | |
2035 Retirement Fund | | 40 | % | 21 | % | 7 | % | 7 | % | 13 | % | 12 | % | — | | — | |
2040 Retirement Fund | | 35 | % | 24 | % | 8 | % | 8 | % | 14 | % | 11 | % | — | | — | |
2045 Retirement Fund | | 35 | % | 20 | % | 10 | % | 10 | % | 15 | % | 10 | % | — | | — | |
Generally, rebalancing of the Retirement Funds’ holdings are performed on a quarterly or other periodic basis and the mix of underlying Funds is reviewed annually.
The Allocation Funds invest in the following underlying Funds of the Investment Company in accordance with the percentage allocations noted:
Conservative Allocation: Equity Index (25%), Bond (30%), Mid-Term Bond (45%).
Moderate Allocation: Equity Index (35%), Bond (30%), Mid-Term Bond (20%), Mid-Cap Equity Index (15%).
Aggressive Allocation: Equity Index (45%), Bond (25%), Mid-Cap Equity Index (20%), Small Cap Value (5%), Small Cap Growth (5%).
Generally, rebalancing of the Allocation Funds’ holdings are performed on a monthly basis.
The components of net unrealized appreciation (depreciation) of investments for Federal income tax purposes and the cost of investments for Federal income tax purposes at December 31, 2008 for each of the funds were as follows. Differences with amounts reflected in the Statements of Assets and Liabilities arise principally from wash sales and the treatment of distributions from Real Estate Investment Trusts (REITs).
| | Equity Index | | All America | | Small Cap | | Small Cap | | Mid Cap | |
| | Fund | | Fund | | Value Fund | | Growth | | Value Fund | |
Unrealized Appreciation | | $ | 77,630,933 | | $ | 16,155,056 | | $ | 6,808,157 | | $ | 6,762,867 | | $ | 449,951 | |
Unrealized Depreciation | | (190,801,132 | ) | (84,931,327 | ) | (53,302,796 | ) | (35,282,416 | ) | (11,380,363 | ) |
Net | | $ | (113,170,199 | ) | $ | (68,776,271 | ) | $ | (46,494,639 | ) | $ | (28,519,549 | ) | $ | (10,930,412 | ) |
Cost of Invesmtents | | $ | 657,474,428 | | $ | 290,382,414 | | $ | 201,487,246 | | $ | 178,110,436 | | $ | 40,734,515 | |
| | Mid-Cap | | | | | | | | | |
| | Equity Index | | International | | Composite | | Retirement | | 2010 Retirement | |
| | Fund | | Fund | | Fund | | Income Fund | | Fund | |
Unrealized Appreciation | | $ | 13,364,583 | | $ | 0 | | $ | 4,398,899 | | $ | 0 | | $ | 0 | |
Unrealized Depreciation | | (103,027,891 | ) | (4,392,369 | ) | (30,851,940 | ) | (439,857 | ) | (1,583,060 | ) |
Net | | $ | (89,663,308 | ) | $ | (4,392,369 | ) | $ | (26,453,041 | ) | $ | (439,857 | ) | $ | (1,583,060 | ) |
Cost of Investments | | $ | 334,761,691 | | $ | 16,221,198 | | $ | 175,698,622 | | $ | 3,956,790 | | $ | 9,857,765 | |
| | 2015 | | | | 2025 | | 2030 | | | |
| | Retirement | | 2020 Retirement | | Retirement | | Retirement | | 2035 Retirement | |
| | Fund | | Fund | | Fund | | Fund | | Fund | |
Unrealized Appreciation | | $ | 0 | | $ | 0 | | $ | 0 | | $ | 0 | | $ | 0 | |
Unrealized Depreciation | | (4,494,429 | ) | (5,268,430 | ) | (3,707,761 | ) | (3,228,941 | ) | (2,540,113 | ) |
Net | | $ | (4,494,429 | ) | $ | (5,268,430 | ) | $ | (3,707,761 | ) | $ | (3,228,941 | ) | $ | (2,540,113 | ) |
Cost of Investments | | $ | 24,511,521 | | $ | 25,954,174 | | $ | 18,530,155 | | $ | 14,890,364 | | $ | (11,321,053 | ) |
| | 2040 | | | | Conservative | | Moderate | | Aggressive | |
| | Retirement | | 2045 Retirement | | Allocation | | Allocation | | Allocation | |
| | Fund | | Fund | | Fund | | Fund | | Fund | |
Unrealized Appreciation | | $ | 0 | | $ | 0 | | $ | 0 | | $ | 0 | | $ | 0 | |
Unrealized Depreciation | | (1,817,009 | ) | (1,816,548 | ) | (3,603,606 | ) | (23,676,178 | ) | (32,729,667 | ) |
Net | | $ | (1,817,009 | ) | $ | (1,816,548 | ) | $ | (3,603,606 | ) | $ | (23,676,178 | ) | $ | (32,729,667 | ) |
Cost of Investments | | $ | 8,017,711 | | $ | 8,674,742 | | $ | 27,208,274 | | $ | 113,181,440 | | $ | 113,977,789 | |
| | | | | | | | | | | |
| | Money | | | | | | | | | |
| | Market | | Mid-Term | | Bond | | | | | |
| | Fund | | Bond Fund | | Fund | | | | | |
Unrealized Appreciation | | $ | 49,812 | | $ | 5,802,337 | | $ | 6,634,058 | | | | | |
Unrealized Depreciation | | (324 | ) | (10,312,968 | ) | (36,694,098 | ) | | | | |
Net | | $ | 49,488 | | $ | (4,510,631 | ) | $ | (30,060,040 | ) | | | | |
Cost of Investments | | $ | 200,937,136 | | $ | 185,611,611 | | $ | 398,122,683 | | | | | |
New Accounting Pronouncement — In March 2008, the FASB issued Statement of Financial Accounting Standards No. 161, Disclosures about Derivative Instruments and Hedging Activities — an amendment of FASB Statement No. 133 (“SFAS 161”), which is effective for fiscal years beginning after November 15, 2008. SFAS 161 requires entities that utilize derivative instruments to provide qualitative disclosures about their objectives and strategies for using such instruments, as well as any details of credit-risk-related contingent features contained within derivatives. SFAS 161 requires entities to disclose additional information about the amounts and location of derivatives located within the financial statements and the impact that hedges have on an entity’s financial position, financial performance, and cash flows. Management is currently evaluating the Impact of SFAS 161 on the disclosures about its use of derivatives.
(b) Not applicable
ITEM 7. DISCLOSURE OF PROXY VOTING POLICIES AND PROCEDURES FOR CLOSED-END MANAGEMENT INVESTMENT COMPANIES.
Not applicable.
ITEM 8. PORTFOLIO MANAGERS OF CLOSED-END MANAGEMENT INVESTMENT COMPANIES.
Not applicable.
ITEM 9. PURCHASES OF EQUITY SECURITES BY CLOSED-END MANAGEMENT INVESTMENT COMPANY AND AFFILIATED PURCHASERS.
Not applicable.
ITEM 10. SUBMISSION OF MATTERS TO A VOTE OF SECURITY HOLDERS.
Not applicable.
ITEM 11. CONTROLS AND PROCEDURES.
(a) The registrant’s principal executive officer an d principal financial officer have evaluated the registrant’s disclosure controls and procedures within 90 days of this filing and have concluded that the registrant’s disclosure controls and procedures were effective, as of that date, in ensuring that information required to be disclosed by the
registrant in this Form N-CSR was recorded, processed, summarized, and reported in a timely and accurate manner.
(b) The registrant’s principal executive officer and principal financial officer are aware of no changes in the registrant’s internal control over financial reporting t hat occurred during the second fiscal quarter of the period covered by this report that has materially affected, or is likely to materially affect, the registrant’s internal control over financial reporting.
ITEM 12. EXHIBITS.
Attached hereto: | | |
| | |
(a) | (1) | Not applicable. | | |
| | | | |
| (2) | Exhibit 99.CERT | | Certifications by the registrant’s principal executive officer and principal financial officer, pursuant to Section 302 of the Sarbanes-Oxley Act of 2002 and required by Rule 30a-2(a) under the Investment Company Act of 1940. |
| | | | |
| (3) | Not applicable. | | |
| | | |
(b) | | Exhibit 99.906CERT | | Certifications pursuant to Section 906 of the Sarbanes-Oxley Act of 2002 and required by Rule 30a-2(b) under the Investment Company Act of 1940. |
| | | | |
| | Exhibit 99.REPT | | Report of Independent Registered Public Accounting Firm |
SIGNATURES
Pursuant to the requirements of the Securities Exchange Act of 1934 and the Investment Company Act of 1940, the registrant has duly caused this report to be signed on its behalf by the undersigned, thereunto duly authorized.
Mutual of America Investment Corporation
By: | /s/ MANFRED ALTSTADT | |
| Manfred Altstadt | |
| Chairman of the Board, | |
| President and Chief Executive Officer of | |
| Mutual of America Investment Corporation | |
| | |
Date: February 27, 2009 | |
Pursuant to the requirements of the Securities Exchange Act of 1934 and the Investment Company Act of 1940, this report has been signed below by the following persons on behalf of the registrant and in the capacities and on the dates indicated.
By: | /s/ MANFRED ALTSTADT | |
| Manfred Altstadt | |
| Chairman of the Board, | |
| President and Chief Executive Officer of | |
| Mutual of America Investment Corporation | |
| | |
Date: February 27, 2009 | |
| |
By: | /s/ JOHN R. GREED | |
| John R. Greed | |
| Senior Executive Vice President, | |
| Chief Financial Officer and Treasurer of | |
| Mutual of America Investment Corporation | |
| | |
Date: February 27, 2009 | |