UNITED STATES
SECURITIES AND EXCHANGE COMMISSION
Washington, D.C. 20549
FORM N-CSR
CERTIFIED SHAREHOLDER REPORT OF REGISTERED
MANAGEMENT INVESTMENT COMPANIES
Investment Company Act file number | 811-05084 |
|
Mutual of America Investment Corporation |
(Exact name of registrant as specified in charter) |
|
320 Park Avenue, New York, N.Y. | | 10022 |
(Address of principal executive offices) | | (Zip code) |
|
John R. Greed
Senior Executive Vice President and Chief Financial Officer
Mutual of America Life Insurance Company
320 Park Avenue
New York, NY 10022 |
(Name and address of agent for service) |
|
Registrant’s telephone number, including area code: | (212) 224-1600 | |
|
Date of fiscal year end: | December 31 | |
|
Date of reporting period: | December 31, 2009 | |
| | | | | | | | |
ITEM 1. REPORTS TO STOCKHOLDERS.
The Annual Report to Shareholders follows:
DECEMBER 31, 2009
Annual Reports of Investment Options Offered by
Mutual of America Life Insurance Company
This report is not to be construed as an offering for sale of any Variable Policy. No offering is made except in conjunction with a prospectus which must precede or accompany this report.


320 PARK AVENUE
NEW YORK NY 10022-6839
February 2010
Dear Contract Owner,
As a valued variable accumulation annuity contract owner, we are pleased to provide you with the annual fund reports for the investment options offered by your contract. Included in this booklet are the annual reports of the Mutual of America Investment Corporation Funds. If you are invested in other investment options, you will receive semi-annual reports for those funds in a separate booklet or booklets. The reports provide an update on each portfolio's performance as of December 31, 2009. Please note that portfolio performance does not take into account the fees charged by the contract. If these fees had been included, the fund's performance would have been lower. As always, past performance cannot predict or guarantee future returns.
Since 1945, Americans have turned to Mutual of America to help them plan for their retirement and meet their long-term financial objectives. Today, as in the past, Mutual of America remains financially strong, and is rated among the strongest companies in the life insurance industry by the major independent rating agencies.* We are committed to providing quality products and services to help participants build and preserve assets for a financially secure future.
We hope you find the enclosed information helpful. We appreciate and value your business and look forward to serving you in the future. If you have any questions, please call your local Mutual of America Regional Office or 1-800-468-3785.
Sincerely,
Mutual of America Life Insurance Company
* While these ratings do not apply to the safety or investment performance of the Separate Account investment alternatives, they do reflect upon Mutual of America's ability to fulfill its General Account (Interest Accumulation Account) obligations, which include annuity purchase rate guarantees and annuity benefit payouts, as well as life insurance and disability income payments.
DECEMBER 31, 2009
Annual Reports of Mutual of America
Investment Corporation
This report is not to be construed as an offering for sale of any Variable Policy. No offering is made except in conjunction with a prospectus which must precede or accompany this report.


(This page has been left blank intentionally.)
CONTENTS
| Volume I | | Page | |
| Annual Report of Mutual of America Investment Corporation | |
|
| President's Message | | | 1 | | |
|
| Portfolio Management Discussions | | | 5 | | |
|
| Asset Allocations | | | 27 | | |
|
| Expense Example | | | 31 | | |
|
| Summary Portfolios of Investments in Securities: | |
|
| Equity Index Fund | | | 38 | | |
|
| All America Fund | | | 40 | | |
|
| Small Cap Value Fund | | | 43 | | |
|
| Small Cap Growth Fund | | | 45 | | |
|
| Mid Cap Value Fund | | | 46 | | |
|
| Mid-Cap Equity Index Fund | | | 47 | | |
|
| International Fund | | | 49 | | |
|
| Composite Fund | | | 50 | | |
|
| Retirement Income Fund | | | 52 | | |
|
| 2010 Retirement Fund | | | 52 | | |
|
| 2015 Retirement Fund | | | 53 | | |
|
| 2020 Retirement Fund | | | 53 | | |
|
| 2025 Retirement Fund | | | 54 | | |
|
| 2030 Retirement Fund | | | 54 | | |
|
| 2035 Retirement Fund | | | 55 | | |
|
| 2040 Retirement Fund | | | 55 | | |
|
| 2045 Retirement Fund | | | 56 | | |
|
| Conservative Allocation Fund | | | 56 | | |
|
| Moderate Allocation Fund | | | 57 | | |
|
| Aggressive Allocation Fund | | | 57 | | |
|
| Money Market Fund | | | 58 | | |
|
| Mid-Term Bond Fund | | | 60 | | |
|
| Bond Fund | | | 62 | | |
|
| Statements of Assets and Liabilities | | | 66 | | |
|
| Statements of Operations | | | 70 | | |
|
| Statements of Changes in Net Assets | | | 74 | | |
|
| Financial Highlights | | | 82 | | |
|
| Notes to Financial Statements | | | 94 | | |
|
| Additional Information | | | 111 | | |
|
(This page has been left blank intentionally.)
MUTUAL OF AMERICA INVESTMENT CORPORATION
We are pleased to present the Mutual of America Investment Corporation (the "Investment Company") Annual Report. This Report includes important information regarding the performance and financial positions of the Investment Company's funds for the year ended December 31, 2009.
2009: Financial Markets Take Off
After plummeting 25% during the first two months of 2009, and 56% from its October 2007 peak, the S&P 500® advanced more than 50% through the remainder of last year for a full year total return of 26.46%. Most other equity markets around the world followed a similar pattern, although the magnitude of the advances from the market lows set in early March varied. Developed nations' (Europe, Japan, and the U.S.) stock markets were up for the year in the 20% to 30% range, while stock markets in developing nations, such as China, Brazil, Russia, India, Indonesia, and Korea, were up in the range of 50% to over 100%.
Corporate bonds, both investment grade and so-called "junk" bonds, also traced out a pattern similar to equities, as prices initially plummeted and yields rose through early March, and then reversed dramatically for the rest of the year. In the U.S., the corporate bond component of the Barclay's Capital Aggregate Index generated an 18.68% return for the year, its best return in 14 years. And the Barclay's Capital High Yield ("junk" bonds) index was up over 58% for the year, comparable to some of the developing nations' equity markets. Similarly, bond markets in developing nations advanced 34% in dollar terms for the year according to Barclay's Capital Emerging Market Index.
U.S. Treasuries, and sovereign bonds of developed nations in general, fared poorly in 2009 relative to other asset classes. High prices and low rates established in the depths of panic in late 2008 and early 2009 gave way to a greater willingness to take risk in equities and corporate bonds. In addition, concern about rising government deficits raised fears of inflation, encouraging the sale of longer term (3 to 30 years) government securities, which pushed yields up and prices and returns down.
Investors Step Back In ... Cautiously
Very few investors anticipated the magnitude of returns realized in 2009, especially early in the year. There are two market adages that seem apt as an explanation of this dramatic performance: "Don't fight the Federal Reserve" and "markets always climb a wall of worry."
In retrospect, the market takeoff from the March lows seems to have been ignited by a collective conclusion among investors that the unprecedented monetary and fiscal stimulus launched by the central banks and fiscal authorities around the world had helped prevent a total collapse of the global financial system and descent into global economic depression. In short, the world was too big and too important to fail.
In particular, the global banking system had to be preserved at all costs. Two key events took place in early 2009 that gave investors confidence that their worst fears would not be realized. First, there was the decision in late February/early March by U.S. authorities to not formally nationalize the U.S. banking system. This was followed by the Accounting Standards Board's clarification of the requirement that banks write down the value of toxic assets held on their balance sheets to market values.
With stock prices and valuations compressed to levels not seen since the late 1970s, and central banks promising liquidity support for an extended period, investors embraced greater risk by pouring money into stocks and bonds. Thus, "don't fight the Fed."
Consumers Face Numerous Challenges
However, the belief that the world was not coming to an end did not mean that the global economy was still not in deep trouble. Global trade had imploded, Gross Domestic Product (GDP) growth was down in all developed nations and slowed significantly in key developing countries, unemployment was rising everywhere, and lending came to a virtual halt.
In the United States, the residential housing industry, whose collapse sparked the financial and economic crisis, remained mired in recession, with delinquencies and foreclosures rising, housing prices continuing to fall, and housing starts and sales still declining after two years. Consumers were not spending because they had lost, or were afraid they were going to lose, their jobs and/or houses. Moreover, in general, they carried high debt loads, including mortgages and credit card debt. The commercial real estate market was also entering a downturn in delayed response to the economic slowdown and rising unemployment. In early April 2009, U.S. first quarter GDP was reported to have declined 6.4% on an annualized basis from the previous quarter. That followed declines of 5.4% in
1
the fourth quarter and 2.7% in the third quarter of 2008, respectively. Yet, markets continued their powerful advance. Thus, "markets climb a wall of worry."
Dire Outlook Begins to Lift
While the economic data through the spring and into summer of 2009 continued to be dire, there were increasing hints that the news was becoming "less bad." As noted in our publications on several occasions, markets tend to react less to what is going on at the moment and more to attempts to assess prospects in the future. The markets' behavior suggested that the global economy would soon begin to recover and grow again.
Corporate profit numbers, while still registering declines for the second and third quarters on a year-over-year basis, came in well ahead of expectations, supporting the notion that things were not as bad as previously thought and possibly were improving at an accelerating pace. Admittedly, these results were largely driven by severe cost-cutting measures, including layoffs, curtailed capital expenditures, inventory reductions, and even delayed payment of bills. Furthermore, revenues continued to fall, although, similar to profits, at a decelerating rate. Nonetheless, the market interpreted "not as bad as expected" in a positive light and continued to advance.
Similarly, in mid-October 2009, U.S. GDP was reported to have grown on an annualized basis for the first time in a year, registering an advance of 3.7% in the preliminary release. This number was ultimately revised down to 2.2%, but was still the first increase in four quarters. It is positive information such as this that sustains market rallies because economists respond by raising their GDP estimates and analysts become more aggressive in raising their earnings estimates.
This is exactly what happened during the last few months of 2009. U.S. economic data releases during this time frame were generally on the positive side. Production and trade showed improvement, inventories were scaled down to the level of current sales, inflation was well contained, and even home sales and retail sales showed unanticipated strength as the year drew to a close. Data from developing nations such as China, India, and Brazil, and resource-rich nations such as Australia and Canada, showed even more powerful signs of recovery, providing potential impetus to a U.S. recovery through the trade accounts.
Self-sustaining Recovery Still at Bay
However, several fundamental problems continue to undermine the potential for a strong, self-sustaining recovery in the U.S. First, unemployment remains very high, at 10%. It is true that the rate of layoffs declined dramatically over the past six months, and November actually posted the first month of job additions after 22 consecutive months of job reductions. Nevertheless, most commentators do not expect corporations to begin hiring at a rapid pace, but rather anticipate any U.S. recovery to follow the "jobless recovery" blueprint of the last two post-recession periods. Because consumer spending represents two-thirds of the U.S. economy, weakness there almost guarantees sub-par GDP growth for an extended period of time.
Second, the residential housing market remains troubled, with delinquencies and foreclosures on the rise and most government efforts to improve the problem inadequate to date. A slow recovery in employment, and therefore consumer income, will remain a headwind to home sales for an extended period of time.
Third, while the banking industry has been "saved," Congress seems determined to implement a new regime of regulations and penalties which may adversely impact potential rates of return on bank capital and could lead to reduced lending by the banking industry to the business sector, especially smaller businesses. This consequence would appear to be opposite of what is desired.
Largely because of these issues, the Federal Reserve, and most other central banks around the world, have stated or implied that they will continue their accommodative monetary policies through very low short-term lending rates and the maintenance of a variety of other liquidity programs. At the same time, they have begun to unwind those programs that no longer seem necessary to support markets and are studying how to most effectively withdraw from the remaining emergency programs so that markets can begin to function on their own again.
Markets Likely Kept in Check in 2010
The key issue of debate among economists and strategists now is not if, but when, will the Federal Reserve begin to raise interest rates, and at what pace will their program of tightening be executed. Although the Fed did raise the discount rate 0.25% on February 18, 2010, it has not indicated when and by how much it will raise the more important target Fed funds rate. In fact, at that time the Fed confirmed its expectation that the Fed funds rate will remain exceptionally low for "an extended period." This will remain an important uncertainty until the Fed acts. Current thinking on when this will occur ranges from as early as this June to not before mid- to late-2011.
2
The variables that will likely determine any Fed action will be the progress of economic recovery, especially job creation, as well as the behavior of inflation and inflation expectations over the short term. We think that job creation will remain tepid for a long time and inflation will remain well contained, largely because of wage cost control; and therefore, a rate-raising cycle by the Fed will likely be deferred until, at the earliest, late this year.
Given that scenario, and the uncertainties attached to it, as well as the magnitude of stock and corporate bond price advances witnessed over the past ten months, we believe that markets will generate much more modest returns in 2010 than in 2009. There also exists the possibility of a substantial correction along the way as fear emerges over the sustainability of recovery; concern about how rising interest rates might affect any recovery that has taken hold; and longer-term concerns over rising federal deficits, rising corporate and individual taxes, and the inflationary implications of both.
The total return performance for each of the Investment Company Funds is reflected below:
Total Returns — Year Ended December 31, 2009
| Equity Index Fund | | | +26.13 | % | |
| All America Fund | | | +25.31 | % | |
| Small Cap Value Fund | | | +29.28 | % | |
| Small Cap Growth Fund | | | +27.69 | % | |
| Mid Cap Value Fund | | | +25.22 | % | |
| Mid-Cap Equity Index Fund | | | +36.69 | % | |
| International Fund | | | +25.22 | % | |
| Composite Fund | | | +18.45 | % | |
| Retirement Income Fund | | | +16.25 | % | |
| 2010 Retirement Fund | | | +19.79 | % | |
| 2015 Retirement Fund | | | +21.27 | % | |
| 2020 Retirement Fund | | | +23.18 | % | |
| 2025 Retirement Fund | | | +25.10 | % | |
| 2030 Retirement Fund | | | +26.47 | % | |
| 2035 Retirement Fund | | | +27.05 | % | |
| 2040 Retirement Fund | | | +27.84 | % | |
| 2045 Retirement Fund | | | +27.55 | % | |
| Conservative Allocation Fund | | | +15.94 | % | |
| Moderate Allocation Fund | | | +21.27 | % | |
| Aggressive Allocation Fund | | | +25.64 | % | |
| Money Market Fund | | | - 0.08 | % | |
| Mid-Term Bond Fund | | | +11.22 | % | |
| Bond Fund | | | +14.61 | % | |
The above total return performance figures do not reflect the deduction of respective Separate Account fees and expenses imposed by Mutual of America Life Insurance Company. All Fund performances presented throughout this report are historical, reflect the full reinvestment of dividends paid, and should not be considered indicative of future results.
On the pages immediately following are brief presentations and graphs for each Fund (except the Money Market Fund), which illustrate each Fund's respective:
• Historical total return achieved over specified periods, expressed as an average annual rate and as a cumulative rate;
• Equivalent in dollars of a $10,000 hypothetical investment at the beginning of each specified period; and
• Historical performance compared to an appropriate index.
3
Following those are graphical representations of the asset allocations of each Fund and an illustration of each Fund's operating expenses. The summarized portfolios of each Fund and financial statements are presented in the pages which then follow.
Thank you for your continued investment in our Funds.
Sincerely,

Manfred Altstadt
Chairman of the Board, President
and Chief Executive Officer
Mutual of America Investment Corporation
The views expressed in this Annual Report are subject to change at any time based on market and other conditions and should not be construed as a recommendation. This Report contains forward-looking statements, which speak only as of the date they were made and involve a number of risks and uncertainties that could cause actual results to differ materially from those expressed herein. Readers are cautioned not to place undue reliance on our forward-looking statements, as we assume no obligation to update these forward-looking statements. Readers assume any and all responsibility for any investment decision made as a result of the views expressed herein.
4
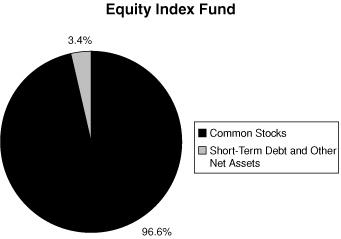
EQUITY INDEX FUND
The Equity Index Fund's objective is to replicate the performance of the S&P 500® Index (the "S&P 500"), which consists of 500 stocks chosen by Standard & Poor's for market size, liquidity and industry group representation. The S&P 500 is a market-weighted index of 500 stocks traded on the New York Stock Exchange, American Stock Exchange and Nasdaq, with each stock's weight in the index proportionate to its market value. The weightings make each company's influence on the S&P 500's performance directly proportional to that company's market value.
The S&P 500 ended 2009 up 26.46%, after being down 24.34% in the first two months of the year. The market was able to rebound over 63% from the March 6th low of 676, closing at a level of 1,159 on December 31, 2009. The financial sector rebounded over 140%, and the Consumer Discretionary, Technology, Industrials and Material sectors followed closely with total returns above 80% for the same time period. Although the year began with doom, March began a trend up for the remainder of the year. The second and third quarters both were up over 15%. The month of October was the only negative return for the second half of the year. Although the pace slowed going into the fourth quarter, the market was still up over 6%.
The Equity Index Fund's performance for the year ended December 31, 2009, was 26.13%, in line with the benchmark return of 26.46%. Note that the Equity Index Fund's performance includes expenses, such as transaction costs and management fees, which are not applicable to the benchmark.

| Equity Index Fund | |
| Period | | Growth | | Total Return | |
Ended
12/31/09 | | of
$10,000 | | Cumu-
lative | | Average
Annual | |
| 1 Year | | $ | 12,613 | | | | 26.13 | % | | | 26.13 | % | |
| 5 Years | | $ | 10,119 | | | | 1.19 | % | | | 0.24 | % | |
| 10 Years | | $ | 8,943 | | | | -10.57 | % | | | -1.11 | % | |
| S & P 500 Index | |
| Period | | Growth | | Total Return | |
Ended
12/31/09 | | of
$10,000 | | Cumu-
lative | | Average
Annual | |
| 1 Year | | $ | 12,646 | | | | 26.46 | % | | | 26.46 | % | |
| 5 Years | | $ | 10,208 | | | | 2.08 | % | | | 0.41 | % | |
| 10 Years | | $ | 9,088 | | | | -9.12 | % | | | -0.95 | % | |
The line representing the performance return of the Equity Index Fund includes expenses, such as transaction costs and management fees that reduce returns, while the performance return line of the Index does not.
5
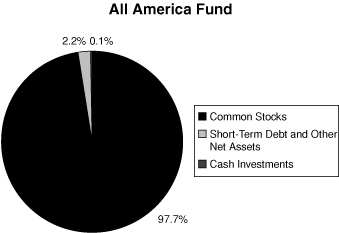
ALL AMERICA FUND
The investment objective of the All America Fund is to outperform the S&P 500® Index (the "S&P 500"). The All America Fund is approximately 60% invested in the 500 stocks that comprise the S&P 500, with the remaining 40% actively managed, using three different investment approaches. The actively managed portion of the All America Fund is close to being equally distributed between Large Cap stocks and Small Cap stocks, with the Small Cap stocks in turn equally distributed between Small Cap Value and Small Cap Growth stocks.
For the full year 2009, the S&P 500® Index of large capitalization stocks advanced by 26.46% on a total return basis, while the Russell 2000® Growth Index was up 34.47% and the Russell 2000® Value Index was up 20.58%.
The All America Fund's return for the year ended December 31, 2009, was 25.31% versus the benchmark return of 26.46%. The underperformance was attributable entirely to the underperformance of the actively managed Large Cap portion of the Fund, representing 20% of total assets. The indexed portion of the Fund, representing 60% of the overall portfolio, modestly outperformed the S&P 500, while the Small Cap Growth and Small Cap Value portions of the Fund, each representing 10% of total assets, both handsomely outperformed the S&P 500.
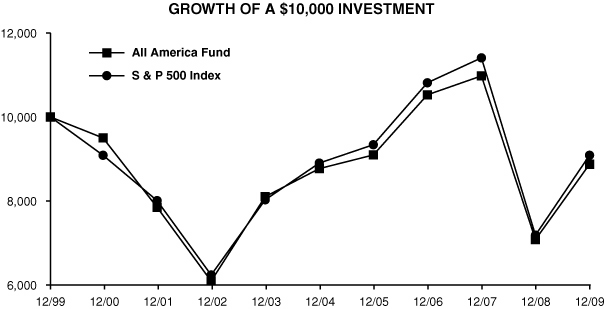
| All America Fund | |
| Period | | Growth | | Total Return | |
Ended
12/31/09 | | of
$10,000 | | Cumu-
lative | | Average
Annual | |
| 1 Year | | $ | 12,531 | | | | 25.31 | % | | | 25.31 | % | |
| 5 Years | | $ | 10,118 | | | | 1.18 | % | | | 0.24 | % | |
| 10 Years | | $ | 8,875 | | | | -11.25 | % | | | -1.19 | % | |
| S & P 500 INDEX | |
| Period | | Growth | | Total Return | |
Ended
12/31/09 | | of
$10,000 | | Cumu-
lative | | Average
Annual | |
| 1 Year | | $ | 12,646 | | | | 26.46 | % | | | 26.46 | % | |
| 5 Years | | $ | 10,208 | | | | 2.08 | % | | | 0.41 | % | |
| 10 Years | | $ | 9,088 | | | | -9.12 | % | | | -0.95 | % | |
The line representing the performance return of the All America Fund includes expenses, such as transaction costs and management fees that reduce returns, while the performance return line of the Indices do not.
6
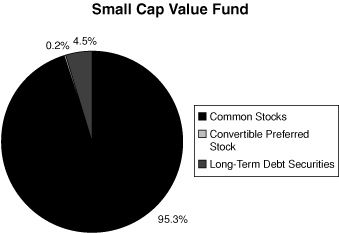
SMALL CAP VALUE FUND
The investment objective of the Small Cap Value Fund is to outperform the Russell 2000® Value Index. The Small Cap Value Fund generally invests in companies that are below $3 billion in market capitalization and have lower price-to-book characteristics than the overall market.
For the year ended December 31, 2009, the Small Cap Value Fund returned 29.28% versus a 20.58% return for the Russell 2000® Value Index. Stock selection was the primary driver of positive performance versus the benchmark. Sectors contributing to Fund performance included Finance, Basic Materials and Healthcare, while sectors detracting from Fund performance included Energy and Technology.
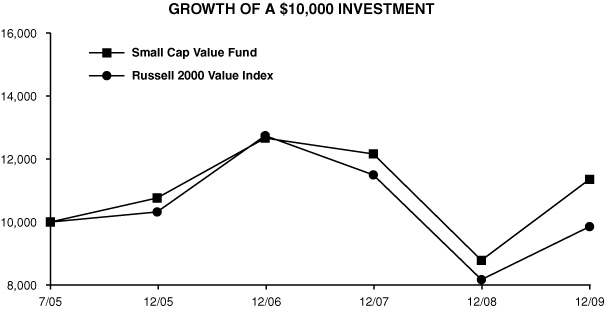
| Small Cap Value Fund | |
| Period | | Growth | | Total Return | |
Ended
12/31/09 | | of
$10,000 | | Cumu-
lative | | Average
Annual | |
| 1 Year | | $ | 12,928 | | | | 29.28 | % | | | 29.28 | % | |
Since 7/1/05
(Inception) | | $ | 11,356 | | | | 13.56 | % | | | 2.87 | % | |
| Russell 2000 Value Index | |
| Period | | Growth | | Total Return | |
Ended
12/31/09 | | of
$10,000 | | Cumu-
lative | | Average
Annual | |
| 1 Year | | $ | 12,058 | | | | 20.58 | % | | | 20.58 | % | |
Since 7/1/05
(Inception) | | $ | 9,853 | | | | -1.47 | % | | | -0.33 | % | |
The line representing the performance return of the Small Cap Value Fund includes expenses, such as transaction costs and management fees that reduce returns, while the performance return line of the Index does not.
7
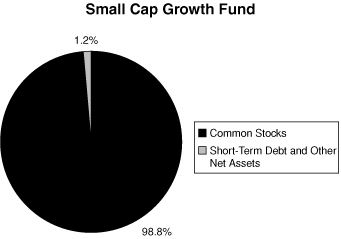
SMALL CAP GROWTH FUND
The investment objective of the Small Cap Growth Fund is capital appreciation. The Small Cap Growth Fund invests in growth stocks within the small capitalization marketplace. The Fund returned 27.69% during the year ended December 31, 2009. The Fund's benchmark, the Russell 2000® Growth Index, returned 34.47% for the period.
The Small Cap Growth Fund's underperformance against its benchmark was partially due to its lack of exposure to the micro-cap sector of the small capitalization marketplace. The best performing stocks were those that had the highest levels of volatility and beta. Additionally, single-digit-priced stock, more specifically those under $5, had some of the biggest price moves. Macroeconomic factors and the re-pricing of risk propelled the equity marketplace in 2009. The Healthcare and Industrial sectors underperformed the benchmark and our stock selection also detracted from these two areas for the calendar year. Energy and Telecommunication Services were our two best performing sectors, which benefited from stock selection. In sum, we remained focused on bottom-up stock selection in a year where fundamental investing was not in style.
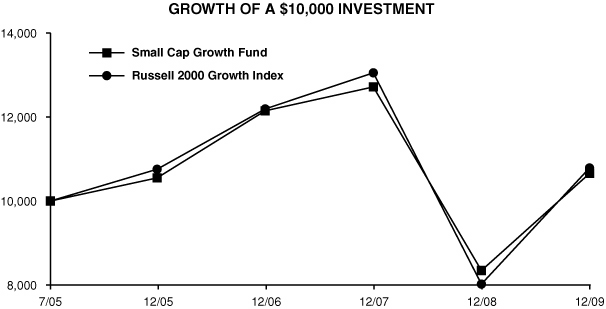
| Small Cap Growth Fund | |
| Period | | Growth | | Total Return | |
Ended
12/31/09 | | of
$10,000 | | Cumu-
lative | | Average
Annual | |
| 1 Year | | $ | 12,769 | | | | 27.69 | % | | | 27.69 | % | |
Since 7/1/05
(Inception) | | $ | 10,656 | | | | 6.56 | % | | | 1.42 | % | |
| Russell 2000 Growth Index | |
| Period | | Growth | | Total Return | |
Ended
12/31/09 | | of
$10,000 | | Cumu-
lative | | Average
Annual | |
| 1 Year | | $ | 13,447 | | | | 34.47 | % | | | 34.47 | % | |
Since 7/1/05
(Inception) | | $ | 10,787 | | | | 7.87 | % | | | 1.70 | % | |
The line representing the performance return of the Small Cap Growth Fund includes expenses, such as transaction costs and management fees that reduce returns, while the performance return line of the Index does not.
8
MID CAP VALUE FUND
The investment objective of the Mid Cap Value Fund is to outperform the Russell Midcap® Value Index. The Mid Cap Value Fund generally invests in companies that are between $1 billion and $20 billion in market capitalization and have lower price-to-book characteristics.
For the year ended December 31, 2009, the Mid Cap Value Fund returned 25.22% versus a 34.21% return for the Russell Midcap® Value Index. Adverse stock selection was the primary driver of negative performance versus the benchmark. Sectors contributing to Mid Cap Value Fund performance included Utilities and REITs while sectors detracting from Mid Cap Value Fund performance included Industrial and Retail.
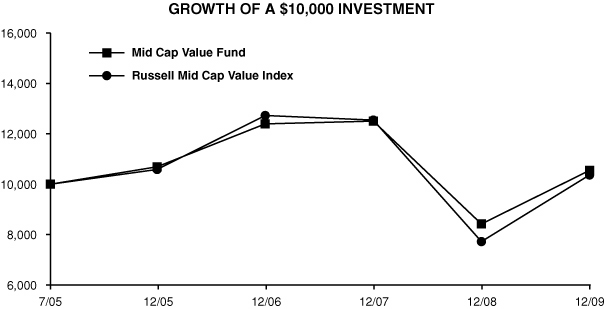
| Mid Cap Value Fund | |
| Period | | Growth | | Total Return | |
Ended
12/31/09 | | of
$10,000 | | Cumu-
lative | | Average
Annual | |
| 1 Year | | $ | 12,522 | | | | 25.22 | % | | | 25.22 | % | |
Since 7/1/05
(Inception) | | $ | 10,547 | | | | 5.47 | % | | | 1.20 | % | |
| Russell Mid Cap Value Index | |
| Period | | Growth | | Total Return | |
Ended
12/31/09 | | of
$10,000 | | Cumu-
lative | | Average
Annual | |
| 1 Year | | $ | 13,421 | | | | 34.21 | % | | | 34.21 | % | |
Since 7/1/05
(Inception) | | $ | 10,365 | | | | 3.65 | % | | | 0.80 | % | |
The line representing the performance return of the Mid Cap Value Fund includes expenses, such as transaction costs and management fees that reduce returns, while the performance return line of the Index does not.
9
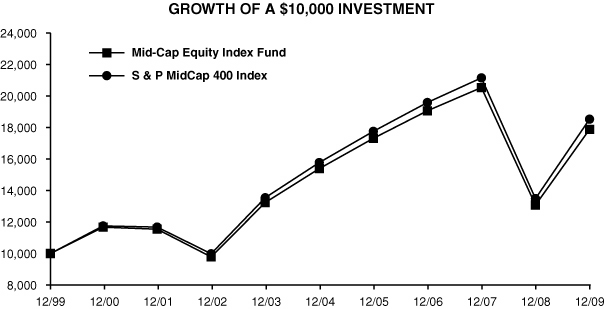
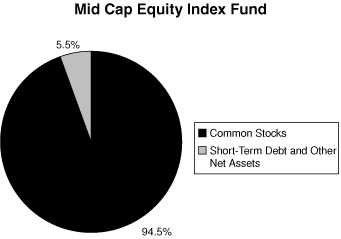
MID-CAP EQUITY INDEX FUND
The Mid-Cap Equity Index Fund invests in the 400 stocks that comprise the S&P MidCap 400® Index (the "S&P MidCap 400"). The S&P MidCap 400 is a market-weighted index of 400 stocks traded on the New York Stock Exchange, American Stock Exchange and Nasdaq. The weightings make each company's influence on the S&P MidCap 400's performance directly proportional to that company's market value. The companies included in the S&P MidCap 400 tend to be typical of this asset class, the medium-capitalized sector of the U.S. securities market.
The S&P MidCap 400 once again outperformed both the S&P 500® Index and the S&P 600® Index (small cap) during 2009 with a total return of 37.38%. The S&P MidCap 400 recovered over 78% from its March 6th low, continuing the strong upward trend through the remainder of the year. The Materials and Energy sectors were up over 100% as metal and oil prices reached new highs. Financials rebounded over 85% ending the full year up over 13%. The market continues to climb higher into 2010 toward the 900 level seen in 2007.
The Mid-Cap Equity Index Fund's performance for the year ended December 31, 2009, was 36.69%, below the 37.38% return of the S&P MidCap 400. Note that the performance of the Mid-Cap Equity Index Fund includes expenses, such as transaction costs and management fees, which are not applicable to the benchmark. Gross of fees, the total return of the account was 37.05%. The underperformance was attributable to the higher volatility of the account due to the use of future contracts to hedge temporary cash positions.
| Mid-Cap Equity Index Fund | |
| Period | | Growth | | Total Return | |
Ended
12/31/09 | | of
$10,000 | | Cumu-
lative | | Average
Annual | |
| 1 Year | | $ | 13,669 | | | | 36.69 | % | | | 36.69 | % | |
| 5 Years | | $ | 11,618 | | | | 16.18 | % | | | 3.05 | % | |
| 10 Years | | $ | 17,878 | | | | 78.78 | % | | | 5.98 | % | |
| S & P MidCap 400 Index | |
| Period | | Growth | | Total Return | |
Ended
12/31/09 | | of
$10,000 | | Cumu-
lative | | Average
Annual | |
| 1 Year | | $ | 13,738 | | | | 37.38 | % | | | 37.38 | % | |
| 5 Years | | $ | 11,746 | | | | 17.46 | % | | | 3.27 | % | |
| 10 Years | | $ | 18,528 | | | | 85.28 | % | | | 6.36 | % | |
The line representing the performance return of the Mid-Cap Equity Index Fund includes expenses, such as transaction costs and management fees that reduce returns, while the performance return line of the Index does not.
10
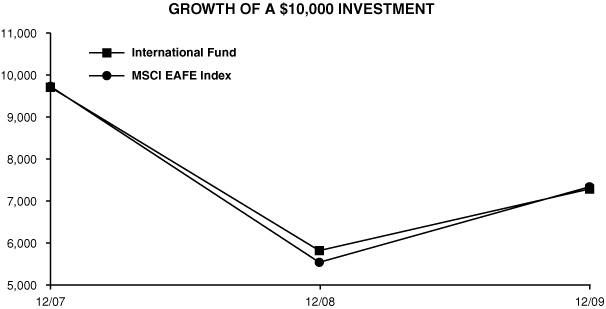
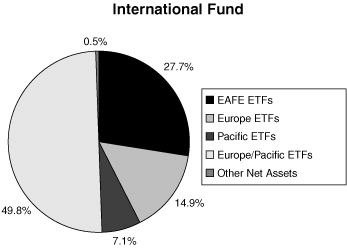
INTERNATIONAL FUND
The International Fund seeks capital appreciation by investing, directly or indirectly, in stocks of companies located outside of the United States that are reflected or contained in the Morgan Stanley Capital International, Inc. Europe, Australasia and Far East® Index (MSCI EAFE® Index). Currently the International Fund is invested exclusively in exchange traded funds that reflect or closely match the holdings in the MSCI EAFE® Index.
Performance for the International Fund is compared to the MSCI EAFE® Index. For the year ended December 31, 2009, the International Fund returned 25.22%, underperforming the 32.46% return of the benchmark. The Fund's cash position continued to create a drag on performance in the second and third quarters of 2009 as a result of the very strong performance of the International markets. During that six-month period the MSCI EAFE® Index rose 50%, while the Fund grew 47%.
| International Fund | |
| Period | | Growth | | Total Return | |
Ended
12/31/09 | | of
$10,000 | | Cumu-
lative | | Average
Annual | |
| 1 Year | | $ | 12,522 | | | | 25.22 | % | | | 25.22 | % | |
Since 11/5/07
(Inception) | | $ | 7,286 | | | | -27.14 | % | | | -13.66 | % | |
| MSCI EAFE Index | |
| Period | | Growth | | Total Return | |
Ended
12/31/09 | | of
$10,000 | | Cumu-
lative | | Average
Annual | |
| 1 Year | | $ | 13,246 | | | | 32.46 | % | | | 32.46 | % | |
Since 11/5/07
(Inception) | | $ | 7,338 | | | | -26.62 | % | | | -13.38 | % | |
The line representing the performance return of the International Fund includes expenses, such as transaction costs and management fees that reduce returns, while the performance return line of the Index does not.
11
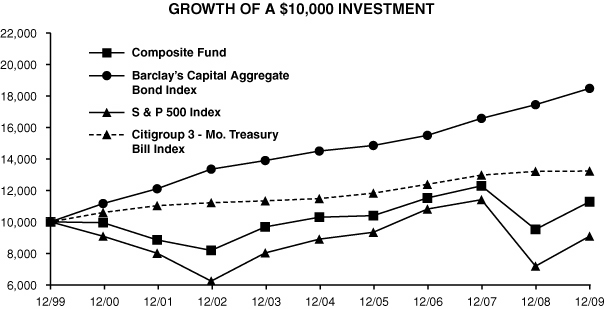
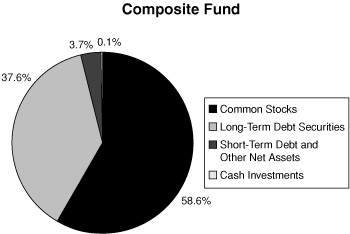
COMPOSITE FUND
The Composite Fund invests in a diversified portfolio of common stocks and fixed-income securities, seeking appreciation and current income. The equity portion of the Composite Fund invests in stocks within the S&P 500® Index.
For the year ended December 31, 2009, the equity portion of the Fund had a total return of 20.44% (before expenses), underperforming the S&P 500® Index by 602 basis points. The equity portion of the Composite Fund maintains sector weights within plus or minus 100 basis points of the S&P 500® Index and does not take positions in individual stocks with overweights of more than 200 basis points. This structural discipline produces a relatively low-risk portfolio that emphasizes stock selection based on strong fundamental analysis.
However, 2009 was a particularly difficult time for the type of conservative stock selection employed by the Fund. The strong stock market rally from the lows of early March was driven largely by stocks with characteristics far different from those the Fund normally seeks out. Specifically, the market gravitated toward lower quality, higher risk stocks characterized by small market capitalizations, high volatility, high leverage, low price and low returns on equity. These are generally the types of stocks the Fund attempts to avoid, as it did in 2009 to the detriment of performance over that time frame. Nevertheless, this philosophy of investment has served our clients well over the longer term. We began to see signs that the market is normalizing in late 2009 and early 2010, which should bode well for better performance in the current year.
The bond market remained focused on income as the Federal Reserve promoted low interest rates, especially in the money markets. As a result, higher yielding corporate bonds were in great demand. The risk premium attached to corporate credits diminished with each passing month, both as a result of enthusiasm about economic prospects and a lack of supply of new issues.
The Fund's strategy is to maintain a diversified portfolio of higher yielding corporate bonds while keeping its duration slightly short in order to guard against incipient inflation. This focus on income, rather than market volatility, enables the Fund to provide favorable compounded rates of return over meaningful time periods.
For the year ended December 31, 2009, the Composite Fund returned 18.45% (after expenses) compared to the weighted benchmark return of 18.25%, 40% of which is based on the Barclays Capital Aggregate Bond Index and 60% of which is based on the S&P 500® Index. The outperformance of the fixed-income portion of the Composite Fund more than offset the underperformance of the equity portion, despite its significantly lower proportion of the Fund overall.
| Composite Fund | |
| Period | | Growth | | Total Return | |
Ended
12/31/09 | | of
$10,000 | | Cumu-
lative | | Average
Annual | |
| 1 Year | | $ | 11,845 | | | | 18.45 | % | | | 18.45 | % | |
| 5 Years | | $ | 10,954 | | | | 9.54 | % | | | 1.84 | % | |
| 10 Years | | $ | 11,278 | | | | 12.78 | % | | | 1.21 | % | |
| S & P 500 Index | |
| Period | | Growth | | Total Return | |
Ended
12/31/09 | | of
$10,000 | | Cumu-
lative | | Average
Annual | |
| 1 Year | | $ | 12,646 | | | | 26.46 | % | | | 26.46 | % | |
| 5 Years | | $ | 10,208 | | | | 2.08 | % | | | 0.41 | % | |
| 10 Years | | $ | 9,088 | | | | -9.12 | % | | | -0.95 | % | |
| Barclay's Capital Aggregate Bond Index | |
| Period | | Growth | | Total Return | |
Ended
12/31/09 | | of
$10,000 | | Cumu-
lative | | Average
Annual | |
| 1 Year | | $ | 10,593 | | | | 5.93 | % | | | 5.93 | % | |
| 5 Years | | $ | 12,742 | | | | 27.42 | % | | | 4.97 | % | |
| 10 Years | | $ | 18,472 | | | | 84.72 | % | | | 6.33 | % | |
| Citigroup 3 - Month T-Bill Index | |
| Period | | Growth | | Total Return | |
Ended
12/31/09 | | of
$10,000 | | Cumu-
lative | | Average
Annual | |
| 1 Year | | $ | 10,016 | | | | 0.16 | % | | | 0.16 | % | |
| 5 Years | | $ | 11,523 | | | | 15.23 | % | | | 2.88 | % | |
| 10 Years | | $ | 13,225 | | | | 32.25 | % | | | 2.83 | % | |
The line representing the performance return of the Composite Fund includes expenses, such as transaction costs and management fees that reduce returns, while the performance return line of the Indices do not.
12
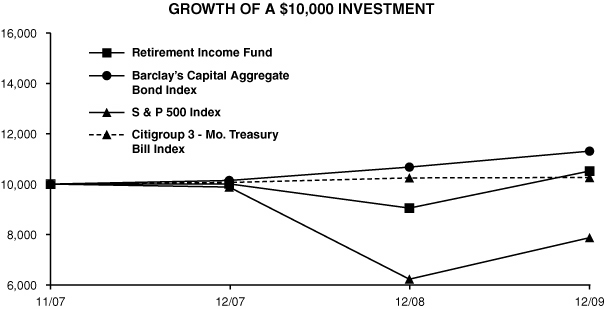
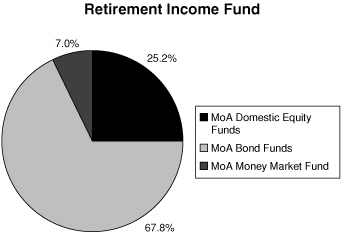
RETIREMENT INCOME FUND
The objective of the Retirement Income Fund is current income consistent with the preservation of capital and, to a lesser extent, capital appreciation. The Retirement Income Fund invests primarily in the fixed-income funds of the Investment Company and also invests in two equity funds of the Investment Company. The Fund's target allocation is approximately 75% of net assets in fixed-income funds (approximately 30% each in the Bond and Mid-Term Bond Funds and 15% in the Money Market Fund) and approximately 25% of net assets in equity funds (20% in the Equity Index Fund and 5% in the Mid-Cap Equity Index Fund).
Performance for the Retirement Income Fund is compared to the Barclays Capital Aggregate Bond Index (60% weighting), the Citigroup 3-Month Treasury Bill Index (15% weighting) and the S&P 500® Index (25% weighting). For the year ended December 31, 2009, the Fund returned 16.25% versus a 10.20% return in the weighted benchmark. The outperformance of the Fund is mainly attributable to the Bond Fund and the Mid-Term Bond Fund outperforming the Barclays Capital Aggregate Bond Index.
| Retirement Income Fund | |
| Period | | Growth | | Total Return | |
Ended
12/31/09 | | of
$10,000 | | Cumu-
lative | | Average
Annual | |
| 1 Year | | $ | 11,625 | | | | 16.25 | % | | | 16.25 | % | |
Since 11/5/07
(Inception) | | $ | 10,517 | | | | 5.17 | % | | | 2.36 | % | |
| S & P 500 Index | |
| Period | | Growth | | Total Return | |
Ended
12/31/09 | | of
$10,000 | | Cumu-
lative | | Average
Annual | |
| 1 Year | | $ | 12,646 | | | | 26.46 | % | | | 26.46 | % | |
Since 11/5/07
(Inception) | | $ | 7,872 | | | | -21.28 | % | | | -10.51 | % | |
| Barclay's Capital Aggregate Bond Index | |
| Period | | Growth | | Total Return | |
Ended
12/31/09 | | of
$10,000 | | Cumu-
lative | | Average
Annual | |
| 1 Year | | $ | 10,593 | | | | 5.93 | % | | | 5.93 | % | |
Since 11/5/07
(Inception) | | $ | 11,306 | | | | 13.06 | % | | | 5.86 | % | |
| Citigroup 3 - Month T-Bill Index | |
| Period | | Growth | | Total Return | |
Ended
12/31/09 | | of
$10,000 | | Cumu-
lative | | Average
Annual | |
| 1 Year | | $ | 10,016 | | | | 0.16 | % | | | 0.16 | % | |
Since 11/5/07
(Inception) | | $ | 10,261 | | | | 2.61 | % | | | 1.20 | % | |
The line representing the performance return of the Retirement Income Fund includes expenses, such as transaction costs and management fees that reduce returns, while the performance return line of the Indices do not.
13
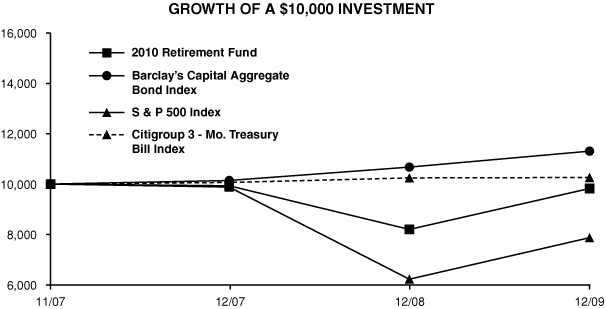
2010 RETIREMENT FUND
The objective of the 2010 Retirement Fund is current income and capital appreciation appropriate for the asset allocation associated with a target retirement in 2010. The 2010 Retirement Fund invests in funds of the Investment Company. The Fund's target allocation is approximately 57% of net assets in fixed-income funds (approximately 25% in the Bond Fund, 22% in the Mid-Term Bond Fund and 10% in the Money Market Fund) and approximately 43% of net assets in equity funds (25% in the Equity Index Fund, 14% in the Mid-Cap Equity Index Fund and 4% in the International Fund).
Performance for the 2010 Retirement Fund is compared to the Barclays Capital Aggregate Bond Index (47% weighting), the Citigroup 3-Month Treasury Bill Index (10% weighting) and the S&P 500® Index (43% weighting). For the year ended December 31, 2009, the Fund returned 19.79% versus a 14.18% return in the weighted benchmark. The outperformance of the Fund is mainly attributable to the Bond Fund and the Mid-Term Bond Fund outperforming the Barclays Capital Aggregate Bond Index, and the Mid-Cap Equity Index Fund outperforming the S&P 500® Index.
| 2010 Retirement Fund | |
| Period | | Growth | | Total Return | |
Ended
12/31/09 | | of
$10,000 | | Cumu-
lative | | Average
Annual | |
| 1 Year | | $ | 11,979 | | | | 19.79 | % | | | 19.79 | % | |
Since 11/5/07
(Inception) | | $ | 9,824 | | | | -1.76 | % | | | -0.82 | % | |
| S & P 500 Index | |
| Period | | Growth | | Total Return | |
Ended
12/31/09 | | of
$10,000 | | Cumu-
lative | | Average
Annual | |
| 1 Year | | $ | 12,646 | | | | 26.46 | % | | | 26.46 | % | |
Since 11/5/07
(Inception) | | $ | 7,872 | | | | -21.28 | % | | | -10.51 | % | |
| Barclay's Capital Aggregate Bond Index | |
| Period | | Growth | | Total Return | |
Ended
12/31/09 | | of
$10,000 | | Cumu-
lative | | Average
Annual | |
| 1 Year | | $ | 10,593 | | | | 5.93 | % | | | 5.93 | % | |
Since 11/5/07
(Inception) | | $ | 11,306 | | | | 13.06 | % | | | 5.86 | % | |
| Citigroup 3 - Month T-Bill Index | |
| Period | | Growth | | Total Return | |
Ended
12/31/09 | | of
$10,000 | | Cumu-
lative | | Average
Annual | |
| 1 Year | | $ | 10,016 | | | | 0.16 | % | | | 0.16 | % | |
Since 11/5/07
(Inception) | | $ | 10,261 | | | | 2.61 | % | | | 1.20 | % | |
The line representing the performance return of the 2010 Retirement Fund includes expenses, such as transaction costs and management fees that reduce returns, while the performance return line of the Indices do not.
14
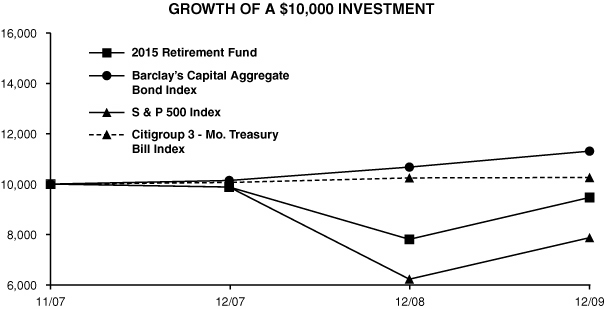
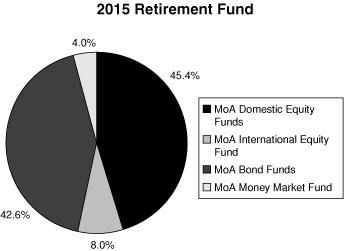
2015 RETIREMENT FUND
The objective of the 2015 Retirement Fund is current income and capital appreciation appropriate for the asset allocation associated with a target retirement in 2015. The 2015 Retirement Fund invests in funds of the Investment Company. The Fund's target allocation is approximately 53% of net assets in equity funds (approximately 30% in the Equity Index Fund, 11% in the Mid-Cap Equity Index Fund, 8% in the International Fund and 2% each in the Small Cap Growth and Small Cap Value Funds) and approximately 47% of net assets in fixed-income funds (25% in the Bond Fund, 13% in the Mid-Term Bond Fund and 9% in the Money Market Fund).
Performance for the 2015 Retirement Fund is compared to the S&P 500® Index (53% weighting), the Barclays Capital Aggregate Bond Index (38% weighting) and the Citigroup 3-Month Treasury Bill Index (9% weighting). For the year ended December 31, 2009, the Fund returned 21.27% versus a 16.29% return in the weighted benchmark. The outperformance of the Fund is mainly attributable to the Bond Fund and the Mid-Term Bond Fund outperforming the Barclays Capital Aggregate Bond Index, and the Mid-Cap Equity Index Fund outperforming the S&P 500® Index.
| 2015 Retirement Fund | |
| Period | | Growth | | Total Return | |
Ended
12/31/09 | | of
$10,000 | | Cumu-
lative | | Average
Annual | |
| 1 Year | | $ | 12,127 | | | | 21.27 | % | | | 21.27 | % | |
Since 11/5/07
(Inception) | | $ | 9,468 | | | | -5.32 | % | | | -2.50 | % | |
| S & P 500 Index | |
| Period | | Growth | | Total Return | |
Ended
12/31/09 | | of
$10,000 | | Cumu-
lative | | Average
Annual | |
| 1 Year | | $ | 12,646 | | | | 26.46 | % | | | 26.46 | % | |
Since 11/5/07
(Inception) | | $ | 7,872 | | | | -21.28 | % | | | -10.51 | % | |
| Barclay's Capital Aggregate Bond Index | |
| Period | | Growth | | Total Return | |
Ended
12/31/09 | | of
$10,000 | | Cumu-
lative | | Average
Annual | |
| 1 Year | | $ | 10,593 | | | | 5.93 | % | | | 5.93 | % | |
Since 11/5/07
(Inception) | | $ | 11,306 | | | | 13.06 | % | | | 5.86 | % | |
| Citigroup 3 - Month T-Bill Index | |
| Period | | Growth | | Total Return | |
Ended
12/31/09 | | of
$10,000 | | Cumu-
lative | | Average
Annual | |
| 1 Year | | $ | 10,016 | | | | 0.16 | % | | | 0.16 | % | |
Since 11/5/07
(Inception) | | $ | 10,261 | | | | 2.61 | % | | | 1.20 | % | |
The line representing the performance return of the 2015 Retirement Fund includes expenses, such as transaction costs and management fees that reduce returns, while the performance return line of the Indices do not.
15
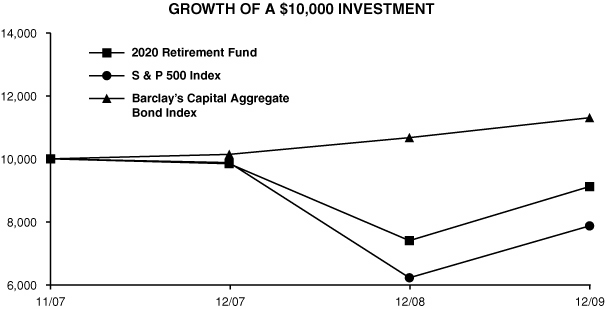
2020 RETIREMENT FUND
The objective of the 2020 Retirement Fund is current income and capital appreciation appropriate for the asset allocation associated with a target retirement in 2020. The 2020 Retirement Fund invests in funds of the Investment Company. The Fund's target allocation is approximately 63% of net assets in equity funds (approximately 35% in the Equity Index Fund, 11% in the Mid-Cap Equity Index Fund, 9% in the International Fund and 4% each in the Small Cap Growth and Small Cap Value Funds) and approximately 37% of net assets in fixed-income funds (24% in the Bond Fund and 13% in the Mid-Term Bond Fund).
Performance for the 2020 Retirement Fund is compared to the S&P 500® Index (63% weighting) and the Barclays Capital Aggregate Bond Index (37% weighting). For the year ended December 31, 2009, the Fund returned 23.18% versus an 18.86% return in the weighted benchmark. The outperformance of the Fund is mainly attributable to the Bond Fund and the Mid-Term Bond Fund outperforming the Barclays Capital Aggregate Bond Index, and the Mid-Cap Equity Index Fund outperforming the S&P 500® Index.
| 2020 Retirement Fund | |
| Period | | Growth | | Total Return | |
Ended
12/31/09 | | of
$10,000 | | Cumu-
lative | | Average
Annual | |
| 1 Year | | $ | 12,318 | | | | 23.18 | % | | | 23.18 | % | |
Since 11/5/07
(Inception) | | $ | 9,121 | | | | -8.79 | % | | | -4.18 | % | |
| S & P 500 Index | |
| Period | | Growth | | Total Return | |
Ended
12/31/09 | | of
$10,000 | | Cumu-
lative | | Average
Annual | |
| 1 Year | | $ | 12,646 | | | | 26.46 | % | | | 26.46 | % | |
Since 11/5/07
(Inception) | | $ | 7,872 | | | | -21.28 | % | | | -10.51 | % | |
| Barclay's Capital Aggregate Bond Index | |
| Period | | Growth | | Total Return | |
Ended
12/31/09 | | of
$10,000 | | Cumu-
lative | | Average
Annual | |
| 1 Year | | $ | 10,593 | | | | 5.93 | % | | | 5.93 | % | |
Since 11/5/07
(Inception) | | $ | 11,306 | | | | 13.06 | % | | | 5.86 | % | |
The line representing the performance return of the 2020 Retirement Fund includes expenses, such as transaction costs and management fees that reduce returns, while the performance return line of the Indices do not.
16
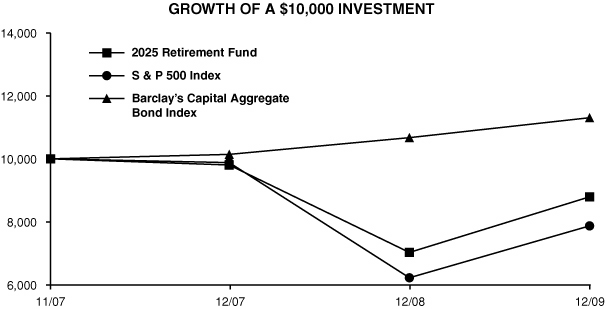
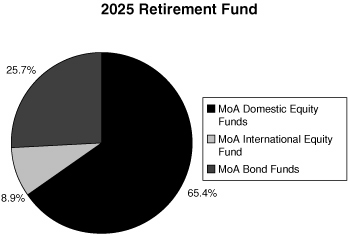
2025 RETIREMENT FUND
The objective of the 2025 Retirement Fund is current income and capital appreciation appropriate for the asset allocation associated with a target retirement in 2025. The 2025 Retirement Fund invests in funds of the Investment Company. The Fund's target allocation is approximately 74% of net assets in equity funds (approximately 40% in the Equity Index Fund, 15% in the Mid-Cap Equity Index Fund, 9% in the International Fund and 5% each in the Small Cap Growth and Small Cap Value Funds) and approximately 26% of net assets in fixed-income funds (20% in the Bond Fund and 6% in the Mid-Term Bond Fund).
Performance for the 2025 Retirement Fund is compared to the S&P 500® Index (74% weighting) and the Barclays Capital Aggregate Bond Index (26% weighting). For the year ended December 31, 2009, the Fund returned 25.10% versus a 21.12% return in the weighted benchmark. The outperformance of the Fund is mainly attributable to the Bond Fund outperforming the Barclays Capital Aggregate Bond Index, and the Mid-Cap Equity Index Fund outperforming the S&P 500® Index.
| 2025 Retirement Fund | |
| Period | | Growth | | Total Return | |
Ended
12/31/09 | | of
$10,000 | | Cumu-
lative | | Average
Annual | |
| 1 Year | | $ | 12,510 | | | | 25.10 | % | | | 25.10 | % | |
Since 11/5/07
(Inception) | | $ | 8,794 | | | | -12.06 | % | | | -5.79 | % | |
| S & P 500 Index | |
| Period | | Growth | | Total Return | |
Ended
12/31/09 | | of
$10,000 | | Cumu-
lative | | Average
Annual | |
| 1 Year | | $ | 12,646 | | | | 26.46 | % | | | 26.46 | % | |
Since 11/5/07
(Inception) | | $ | 7,872 | | | | -21.28 | % | | | -10.51 | % | |
| Barclay's Capital Aggregate Bond Index | |
| Period | | Growth | | Total Return | |
Ended
12/31/09 | | of
$10,000 | | Cumu-
lative | | Average
Annual | |
| 1 Year | | $ | 10,593 | | | | 5.93 | % | | | 5.93 | % | |
Since 11/5/07
(Inception) | | $ | 11,306 | | | | 13.06 | % | | | 5.86 | % | |
The line representing the performance return of the 2025 Retirement Fund includes expenses, such as transaction costs and management fees that reduce returns, while the performance return line of the Indices do not.
17
2030 RETIREMENT FUND
The objective of the 2030 Retirement Fund is current income and capital appreciation appropriate for the asset allocation associated with a target retirement in 2030. The 2030 Retirement Fund invests in funds of the Investment Company. The Fund's target allocation is approximately 80% of net assets in equity funds (approximately 40% in the Equity Index Fund, 18% in the Mid-Cap Equity Index Fund, 10% in the International Fund and 6% each in the Small Cap Growth and Small Cap Value Funds) and approximately 20% of net assets in the Bond Fund.
Performance for the 2030 Retirement Fund is compared to the S&P 500® Index (80% weighting) and the Barclays Capital Aggregate Bond Index (20% weighting). For the year ended December 31, 2009, the Fund returned 26.47% versus a 22.35% return in the weighted benchmark. The outperformance of the Fund is mainly attributable to the Bond Fund outperforming the Barclays Capital Aggregate Bond Index, and the Mid-Cap Equity Index Fund outperforming the S&P 500® Index.
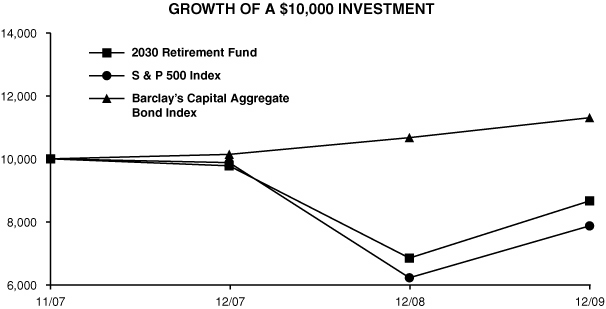
| 2030 Retirement Fund | |
| Period | | Growth | | Total Return | |
Ended
12/31/09 | | of
$10,000 | | Cumu-
lative | | Average
Annual | |
| 1 Year | | $ | 12,647 | | | | 26.47 | % | | | 26.47 | % | |
Since 11/5/07
(Inception) | | $ | 8,664 | | | | -13.36 | % | | | -6.44 | % | |
| S & P 500 Index | |
| Period | | Growth | | Total Return | |
Ended
12/31/09 | | of
$10,000 | | Cumu-
lative | | Average
Annual | |
| 1 Year | | $ | 12,646 | | | | 26.46 | % | | | 26.46 | % | |
Since 11/5/07
(Inception) | | $ | 7,872 | | | | -21.28 | % | | | -10.51 | % | |
| Barclay's Capital Aggregate Bond Index | |
| Period | | Growth | | Total Return | |
Ended
12/31/09 | | of
$10,000 | | Cumu-
lative | | Average
Annual | |
| 1 Year | | $ | 10,593 | | | | 5.93 | % | | | 5.93 | % | |
Since 11/5/07
(Inception) | | $ | 11,306 | | | | 13.06 | % | | | 5.86 | % | |
The line representing the performance return of the 2030 Retirement Fund includes expenses, such as transaction costs and management fees that reduce returns, while the performance return line of the Indices do not.
18
2035 RETIREMENT FUND
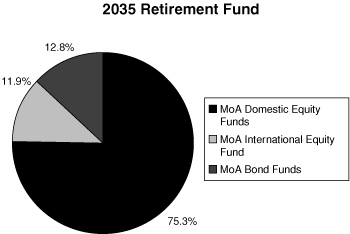
The objective of the 2035 Retirement Fund is current income and capital appreciation appropriate for the asset allocation associated with a target retirement in 2035. The 2035 Retirement Fund invests in funds of the Investment Company. The Fund's target allocation is approximately 87% of net assets in equity funds (approximately 40% in the Equity Index Fund, 21% in the Mid-Cap Equity Index Fund, 12% in the International Fund and 7% each in the Small Cap Growth and Small Cap Value Funds) and approximately 13% of net assets in the Bond Fund.
Performance for the 2035 Retirement Fund is compared to the S&P 500® Index (87% weighting) and the Barclays Capital Aggregate Bond Index (13% weighting). For the year ended December 31, 2009, the Fund returned 27.05% versus a 23.79% return in the weighted benchmark. The outperformance of the Fund is mainly attributable to the Mid-Cap Equity Index Fund outperforming the S&P 500® Index, and the Bond Fund outperforming the Barclays Capital Aggregate Bond Index.

| 2035 Retirement Fund | |
| Period | | Growth | | Total Return | |
Ended
12/31/09 | | of
$10,000 | | Cumu-
lative | | Average
Annual | |
| 1 Year | | $ | 12,705 | | | | 27.05 | % | | | 27.05 | % | |
Since 11/5/07
(Inception) | | $ | 8,356 | | | | -16.44 | % | | | -8.00 | % | |
| S & P 500 Index | |
| Period | | Growth | | Total Return | |
Ended
12/31/09 | | of
$10,000 | | Cumu-
lative | | Average
Annual | |
| 1 Year | | $ | 12,646 | | | | 26.46 | % | | | 26.46 | % | |
Since 11/5/07
(Inception) | | $ | 7,872 | | | | -21.28 | % | | | -10.51 | % | |
| Barclay's Capital Aggregate Bond Index | |
| Period | | Growth | | Total Return | |
Ended
12/31/09 | | of
$10,000 | | Cumu-
lative | | Average
Annual | |
| 1 Year | | $ | 10,593 | | | | 5.93 | % | | | 5.93 | % | |
Since 11/5/07
(Inception) | | $ | 11,306 | | | | 13.06 | % | | | 5.86 | % | |
The line representing the performance return of the 2035 Retirement Fund includes expenses, such as transaction costs and management fees that reduce returns, while the performance return line of the Indices do not.
19
2040 RETIREMENT FUND
The objective of the 2040 Retirement Fund is current income and capital appreciation appropriate for the asset allocation associated with a target retirement in 2040. The 2040 Retirement Fund invests in funds of the Investment Company. The Fund's target allocation is approximately 89% of net assets in equity funds (approximately 35% in the Equity Index Fund, 24% in the Mid-Cap Equity Index Fund, 14% in the International Fund and 8% each in the Small Cap Growth and Small Cap Value Funds) and approximately 11% of net assets in the Bond Fund.
Performance for the 2040 Retirement Fund is compared to the S&P 500® Index (89% weighting) and the Barclays Capital Aggregate Bond Index (11% weighting). For the year ended December 31, 2009, the Fund returned 27.84% versus a 24.20% return in the weighted benchmark. The outperformance of the Fund is mainly attributable to the Mid-Cap Equity Index Fund outperforming the S&P 500® Index, and the Bond Fund outperforming the Barclays Capital Aggregate Bond Index.

| 2040 Retirement Fund | |
| Period | | Growth | | Total Return | |
Ended
12/31/09 | | of
$10,000 | | Cumu-
lative | | Average
Annual | |
| 1 Year | | $ | 12,784 | | | | 27.84 | % | | | 27.84 | % | |
Since 11/5/07
(Inception) | | $ | 8,367 | | | | -16.33 | % | | | -7.94 | % | |
| S & P 500 Index | |
| Period | | Growth | | Total Return | |
Ended
12/31/09 | | of
$10,000 | | Cumu-
lative | | Average
Annual | |
| 1 Year | | $ | 12,646 | | | | 26.46 | % | | | 26.46 | % | |
Since 11/5/07
(Inception) | | $ | 7,872 | | | | -21.28 | % | | | -10.51 | % | |
| Barclay's Capital Aggregate Bond Index | |
| Period | | Growth | | Total Return | |
Ended
12/31/09 | | of
$10,000 | | Cumu-
lative | | Average
Annual | |
| 1 Year | | $ | 10,593 | | | | 5.93 | % | | | 5.93 | % | |
Since 11/5/07
(Inception) | | $ | 11,306 | | | | 13.06 | % | | | 5.86 | % | |
The line representing the performance return of the 2040 Retirement Fund includes expenses, such as transaction costs and management fees that reduce returns, while the performance return line of the Indices do not.
20
2045 RETIREMENT FUND
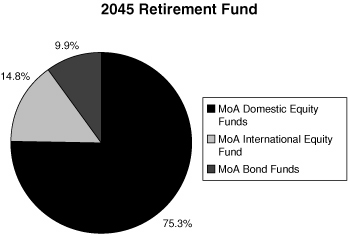
The objective of the 2045 Retirement Fund is current income and capital appreciation appropriate for the asset allocation associated with a target retirement in 2045. The 2045 Retirement Fund invests in funds of the Investment Company. The Fund's target allocation is approximately 90% of net assets in equity funds (approximately 35% in the Equity Index Fund, 20% in the Mid-Cap Equity Index Fund, 15% in the International Fund and 10% each in the Small Cap Growth and Small Cap Value Funds) and approximately 10% of net assets in the Bond Fund.
Performance for the 2045 Retirement Fund is compared to the S&P 500® Index (90% weighting) and the Barclays Capital Aggregate Bond Index (10% weighting). For the year ended December 31, 2009, the Fund returned 27.55% versus a 24.41% return in the weighted benchmark. The outperformance of the Fund is mainly attributable to the Mid-Cap Equity Index Fund outperforming the S&P 500® Index, and the Bond Fund outperforming the Barclays Capital Aggregate Bond Index.
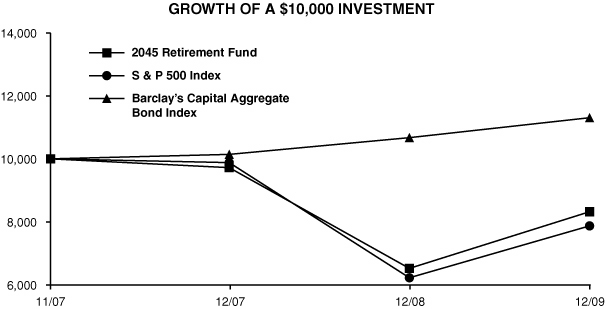
| 2045 Retirement Fund | |
| Period | | Growth | | Total Return | |
Ended
12/31/09 | | of
$10,000 | | Cumu-
lative | | Average
Annual | |
| 1 Year | | $ | 12,755 | | | | 27.55 | % | | | 27.55 | % | |
Since 11/5/07
(Inception) | | $ | 8,321 | | | | -16.79 | % | | | -8.17 | % | |
| S & P 500 Index | |
| Period | | Growth | | Total Return | |
Ended
12/31/09 | | of
$10,000 | | Cumu-
lative | | Average
Annual | |
| 1 Year | | $ | 12,646 | | | | 26.46 | % | | | 26.46 | % | |
Since 11/5/07
(Inception) | | $ | 7,872 | | | | -21.28 | % | | | -10.51 | % | |
| Barclay's Capital Aggregate Bond Index | |
| Period | | Growth | | Total Return | |
Ended
12/31/09 | | of
$10,000 | | Cumu-
lative | | Average
Annual | |
| 1 Year | | $ | 10,593 | | | | 5.93 | % | | | 5.93 | % | |
Since 11/5/07
(Inception) | | $ | 11,306 | | | | 13.06 | % | | | 5.86 | % | |
The line representing the performance return of the 2045 Retirement Fund includes expenses, such as transaction costs and management fees that reduce returns, while the performance return line of the Indices do not.
21
CONSERVATIVE ALLOCATION FUND
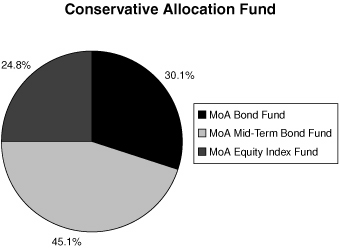
The objective of the Conservative Allocation Fund is current income and, to a lesser extent, capital appreciation. The Conservative Allocation Fund invests primarily in the fixed-income funds of the Investment Company and also invests in an equity fund of the Investment Company. The Conservative Allocation Fund's target allocation is approximately 75% of net assets in fixed-income funds (approximately 30% in the Bond Fund and approximately 45% in the Mid-Term Bond Fund) and approximately 25% of net assets in equity funds (the Equity Index Fund).
Performance for the Conservative Allocation Fund is compared to the Barclays Capital Aggregate Bond Index (75% weighting) and the S&P 500® Index (25% weighting). For the year ended December 31, 2009, the Conservative Allocation Fund returned 15.94% versus an 11.06% return in the weighted benchmark. The outperformance of the Fund is mainly attributable to the Bond Fund and the Mid-Term Bond Fund outperforming the Barclays Capital Aggregate Bond Index.
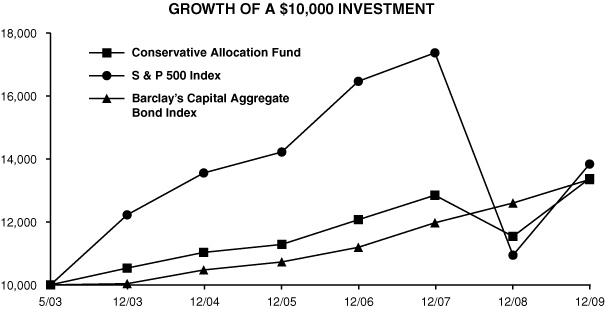
| Conservative Allocation Fund | |
| Period | | Growth | | Total Return | |
Ended
12/31/09 | | of
$10,000 | | Cumu-
lative | | Average
Annual | |
| 1 Year | | $ | 11,594 | | | | 15.94 | % | | | 15.94 | % | |
| 5 Years | | $ | 12,127 | | | | 21.27 | % | | | 3.93 | % | |
Since 5/20/03
(Inception) | | $ | 13,375 | | | | 33.75 | % | | | 4.49 | % | |
| S & P 500 Index | |
| Period | | Growth | | Total Return | |
Ended
12/31/09 | | of
$10,000 | | Cumu-
lative | | Average
Annual | |
| 1 Year | | $ | 12,646 | | | | 26.46 | % | | | 26.46 | % | |
| 5 Years | | $ | 10,208 | | | | 2.08 | % | | | 0.41 | % | |
Since 5/20/03
(Inception) | | $ | 13,835 | | | | 38.35 | % | | | 5.03 | % | |
| Barclay's Capital Aggregate Bond Index | |
| Period | | Growth | | Total Return | |
Ended
12/31/09 | | of
$10,000 | | Cumu-
lative | | Average
Annual | |
| 1 Year | | $ | 10,593 | | | | 5.93 | % | | | 5.93 | % | |
| 5 Years | | $ | 12,742 | | | | 27.42 | % | | | 4.97 | % | |
Since 5/20/03
(Inception) | | $ | 13,345 | | | | 33.45 | % | | | 4.46 | % | |
The line representing the performance return of the Conservative Allocation Fund includes expenses, such as transaction costs and management fees that reduce returns, while the performance return line of the Indices do not.
22
MODERATE ALLOCATION FUND
The objective of the Moderate Allocation Fund is capital appreciation and current income. The Moderate Allocation Fund invests in the equity and fixed-income funds of the Investment Company. The Moderate Allocation Fund's target allocation is approximately 50% of net assets in equity funds (approximately 35% of its net assets in the Equity Index Fund and approximately 15% of its net assets in the Mid-Cap Equity Index Fund) and approximately 50% of net assets in fixed-income funds (approximately 30% of its net assets in the Bond Fund and approximately 20% of its net assets in the Mid-Term Bond Fund).
Performance for the Moderate Allocation Fund is compared to the S&P 500® Index (50% weighting) and the Barclays Capital Aggregate Bond Index (50% weighting). For the year ended December 31, 2009, the Moderate Allocation Fund returned 21.27% versus a 16.20% return for the weighted benchmark. The outperformance of the Fund is mainly attributable to the Bond Fund and the Mid-Term Bond Fund outperforming the Barclays Capital Aggregate Bond Index, and the Mid-Cap Equity Index Fund outperforming the S&P 500® Index.
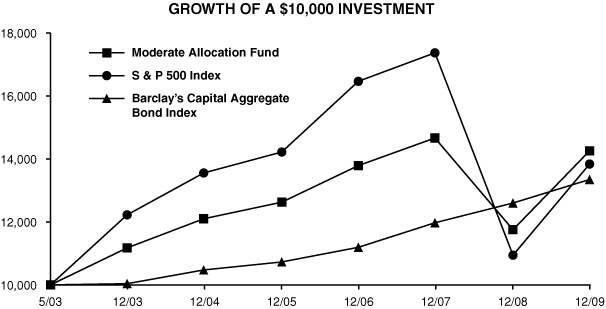
| Moderate Allocation Fund | |
| Period | | Growth | | Total Return | |
Ended
12/31/09 | | of
$10,000 | | Cumu-
lative | | Average
Annual | |
| 1 Year | | $ | 12,127 | | | | 21.27 | % | | | 21.27 | % | |
| 5 Years | | $ | 11,782 | | | | 17.82 | % | | | 3.33 | % | |
Since 5/20/03
(Inception) | | $ | 14,254 | | | | 42.54 | % | | | 5.51 | % | |
| S & P 500 Index | |
| Period | | Growth | | Total Return | |
Ended
12/31/09 | | of
$10,000 | | Cumu-
lative | | Average
Annual | |
| 1 Year | | $ | 12,646 | | | | 26.46 | % | | | 26.46 | % | |
| 5 Years | | $ | 10,208 | | | | 2.08 | % | | | 0.41 | % | |
Since 5/20/03
(Inception) | | $ | 13,835 | | | | 38.35 | % | | | 5.03 | % | |
| Barclay's Capital Aggregate Bond Index | |
| Period | | Growth | | Total Return | |
Ended
12/31/09 | | of
$10,000 | | Cumu-
lative | | Average
Annual | |
| 1 Year | | $ | 10,593 | | | | 5.93 | % | | | 5.93 | % | |
| 5 Years | | $ | 12,742 | | | | 27.42 | % | | | 4.97 | % | |
Since 5/20/03
(Inception) | | $ | 13,345 | | | | 33.45 | % | | | 4.46 | % | |
The line representing the performance return of the Moderate Allocation Fund includes expenses, such as transaction costs and management fees that reduce returns, while the performance return line of the Indices do not.
23
AGGRESSIVE ALLOCATION FUND
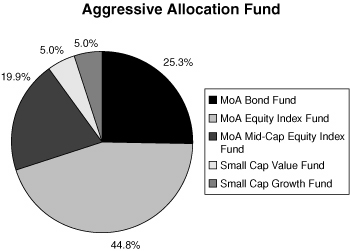
The objective of the Aggressive Allocation Fund is capital appreciation and, to a lesser extent, current income. The Aggressive Allocation Fund invests in the equity and fixed-income funds of the Investment Company. The Aggressive Allocation Fund's target allocation is approximately 75% of net assets in equity funds (approximately 45% of its net assets in the Equity Index Fund, approximately 20% of its net assets in the Mid-Cap Equity Index Fund, approximately 5% of its net assets in the Small Cap Value Fund and approximately 5% of its net assets in the Small Cap Growth Fund) and approximately 25% of net assets in the Bond Fund.
Performance for the Aggressive Allocation Fund is compared to the S&P 500® Index (75% weighting) and the Barclays Capital Aggregate Bond Index (25% weighting). For the year ended December 31, 2009, the Aggressive Allocation Fund returned 25.64% versus a 21.33% return for the weighted benchmark. The outperformance of the Fund is mainly attributable to the Mid-Cap Equity Index Fund outperforming the S&P 500® Index, and the Bond Fund outperforming the Barclays Capital Aggregate Bond Index.

| Aggressive Allocation Fund | |
| Period | | Growth | | Total Return | |
Ended
12/31/09 | | of
$10,000 | | Cumu-
lative | | Average
Annual | |
| 1 Year | | $ | 12,564 | | | | 25.64 | % | | | 25.64 | % | |
| 5 Years | | $ | 11,265 | | | | 12.65 | % | | | 2.41 | % | |
Since 5/20/03
(Inception) | | $ | 14,769 | | | | 47.69 | % | | | 6.07 | % | |
| S & P 500 Index | |
| Period | | Growth | | Total Return | |
Ended
12/31/09 | | of
$10,000 | | Cumu-
lative | | Average
Annual | |
| 1 Year | | $ | 12,646 | | | | 26.46 | % | | | 26.46 | % | |
| 5 Years | | $ | 10,208 | | | | 2.08 | % | | | 0.41 | % | |
Since 5/20/03
(Inception) | | $ | 13,835 | | | | 38.35 | % | | | 5.03 | % | |
| Barclay's Capital Aggregate Bond Index | |
| Period | | Growth | | Total Return | |
Ended
12/31/09 | | of
$10,000 | | Cumu-
lative | | Average
Annual | |
| 1 Year | | $ | 10,593 | | | | 5.93 | % | | | 5.93 | % | |
| 5 Years | | $ | 12,742 | | | | 27.42 | % | | | 4.97 | % | |
Since 5/20/03
(Inception) | | $ | 13,345 | | | | 33.45 | % | | | 4.46 | % | |
The line representing the performance return of the Aggressive Allocation Fund includes expenses, such as transaction costs and management fees that reduce returns, while the performance return line of the Indices do not.
24
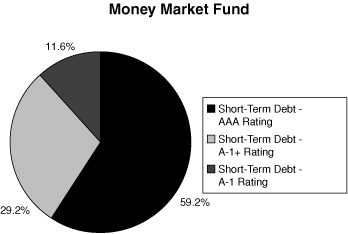
MONEY MARKET FUND
The Money Market Fund's investment objective is to realize current income while maintaining liquidity, investment quality and stability of capital through investing in high-quality commercial paper issued by U.S. corporations and securities issued by the U.S. government and its agencies. The Money Market Fund returned -0.08% for the year ended December 31, 2009, compared to a 0.16% return for the Citigroup 3-Month Treasury Bill Index. Note that the performance of the Money Market Fund includes expenses, such as transaction costs and management fees, which are not applicable to the benchmark.
The 2009 money market was characterized by extremely low interest rates and shrinking supply of eligible investments. The Federal Funds target rate remained at a historically low range of 0 to 25 basis points throughout the course of 2009 and is expected to persist in 2010. At the December 16th meeting, the Fed indicated that it will continue to keep rates "exceptionally low" for "an extended period."
The seven-day effective yield as of February 16, 2010, was -0.21%. As with all performance reporting, this yield is not necessarily indicative of future annual yields. Neither the Federal Deposit Insurance Corporation nor any other U.S. government agency insures or guarantees the Separate Account's investments in shares of the Money Market Fund.
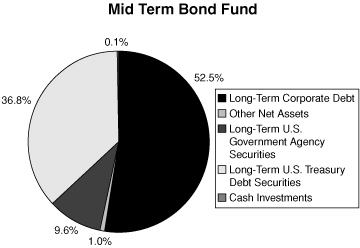
MID-TERM BOND FUND
The Mid-Term Bond Fund seeks a high level of return consistent with the preservation of capital through investment in publicly traded debt securities. The Mid-Term Bond Fund primarily invests in corporate and U.S. government agency securities, which normally yield more than U.S. Treasury issues.
The Mid-Term Bond Fund continued to overweight corporate issues and underweight Agencies and Treasuries during 2009. Agencies have been used as a source of funds and will continue to be sold as better opportunities in corporate bonds become available. The Mid-Term Bond Fund also maintains extreme diversification in its credit exposure in order to minimize event risk.
The Fund's duration is 90% of its market benchmark. This results in lower price volatility and protects against the effects of prospective inflation. While inflation is not a current problem, the government economic stimulus and debt monetization policies will cause an eventual rise in rates.
For the year ended December 31, 2009, the Mid-Term Bond Fund returned 11.22% versus a 5.89% return for the Citigroup Government/Corporate 3-7 Year Bond Index. The Mid-Term Bond Fund's emphasis on higher-yielding corporate issues was a major contributor to outperformance.
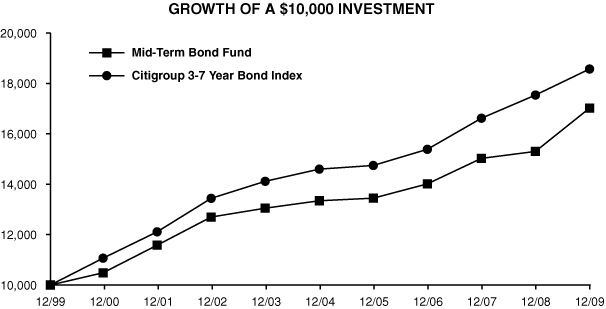
| Mid-Term Bond Fund | |
| Period | | Growth | | Total Return | |
Ended
12/31/09 | | of
$10,000 | | Cumu-
lative | | Average
Annual | |
| 1 Year | | $ | 11,122 | | | | 11.22 | % | | | 11.22 | % | |
| 5 Years | | $ | 12,755 | | | | 27.55 | % | | | 4.99 | % | |
| 10 Years | | $ | 17,018 | | | | 70.18 | % | | | 5.46 | % | |
| Citigroup 3-7 Year Bond Index | |
| Period | | Growth | | Total Return | |
Ended
12/31/09 | | of
$10,000 | | Cumu-
lative | | Average
Annual | |
| 1 Year | | $ | 10,589 | | | | 5.89 | % | | | 5.89 | % | |
| 5 Years | | $ | 12,721 | | | | 27.21 | % | | | 4.93 | % | |
| 10 Years | | $ | 18,570 | | | | 85.70 | % | | | 6.38 | % | |
The line representing the performance return of the Mid-Term Bond Fund includes expenses, such as transaction costs and management fees that reduce returns, while the performance return line of the Index does not.
25
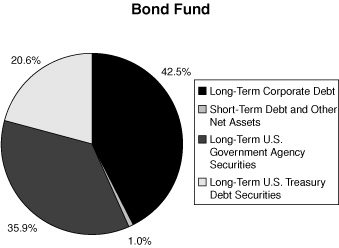
BOND FUND
The Bond Fund's primary investment objective is to provide as high a level of current income over time as is believed to be consistent with prudent investment risk by investing primarily in investment grade, publicly traded debt securities. A secondary objective is preservation of capital. The Bond Fund primarily invests in corporate, U.S. government agency and mortgage-backed securities, all of which normally yield more than U.S. Treasury issues.
The Federal Reserve continued to keep short-term rates very low during 2009 in order to try and stimulate the economy and reliquify the banking system. Other rates along the treasury yield curve maintained a steep configuration as the Federal Reserve aggressively intervened on a regular basis to try and force rates down in order to subsidize the mortgage market.
The corporate bond market also continued its positive response to the various government stimulus programs. Yield spreads between government and corporate bonds compressed aggressively during the final six months of 2009 as market participants became enthusiastic about economic prospects in 2010.
The Bond Fund's strategy was to maintain a slightly shorter duration than its benchmark, emphasize relatively short corporate bonds with high yields, establish extreme credit diversification, and take a market weight in mortgage-related securities. So long as inflation is perceived as a long-term threat, this strategy will be maintained in the Bond Fund.
The Bond Fund's return for the year ended December 31, 2009, was 14.61%, compared to 5.93% for the Barclays Capital Aggregate Bond Index. The Fund's emphasis on higher-yielding corporate issues was a major contributor to outperformance.
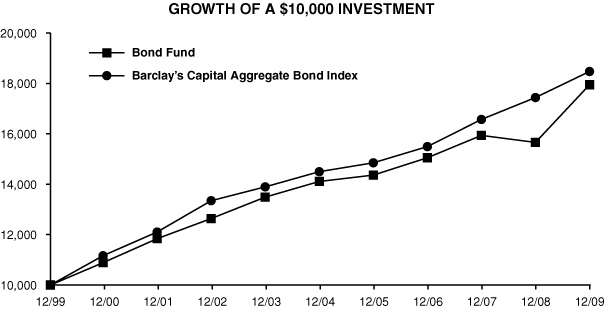
| Bond Fund | |
| Period | | Growth | | Total Return | |
Ended
12/31/09 | | of
$10,000 | | Cumu-
lative | | Average
Annual | |
| 1 Year | | $ | 11,461 | | | | 14.61 | % | | | 14.61 | % | |
| 5 Years | | $ | 12,720 | | | | 27.20 | % | | | 4.93 | % | |
| 10 Years | | $ | 17,997 | | | | 79.97 | % | | | 6.05 | % | |
| Barclay's Capital Aggregate Bond Index | |
| Period | | Growth | | Total Return | |
Ended
12/31/09 | | of
$10,000 | | Cumu-
lative | | Average
Annual | |
| 1 Year | | $ | 10,593 | | | | 5.93 | % | | | 5.93 | % | |
| 5 Years | | $ | 12,742 | | | | 27.42 | % | | | 4.97 | % | |
| 10 Years | | $ | 18,472 | | | | 84.72 | % | | | 6.33 | % | |
The line representing the performance return of the Bond Fund includes expenses, such as transaction costs and management fees that reduce returns, while the performance return line of the Index does not.
26
MUTUAL OF AMERICA INVESTMENT CORPORATION
ASSET ALLOCATIONS AS OF DECEMBER 31, 2009

27
MUTUAL OF AMERICA INVESTMENT CORPORATION
ASSET ALLOCATIONS AS OF DECEMBER 31, 2009 (Continued)


28
MUTUAL OF AMERICA INVESTMENT CORPORATION
ASSET ALLOCATIONS AS OF DECEMBER 31, 2009 (Continued)


29
MUTUAL OF AMERICA INVESTMENT CORPORATION
ASSET ALLOCATIONS AS OF DECEMBER 31, 2009 (Continued)

30
MUTUAL OF AMERICA INVESTMENT CORPORATION
EXPENSE EXAMPLE
EXAMPLE
As a shareholder of one of the Mutual of America Investment Corporation Funds, you incur ongoing costs, including management fees and other Fund expenses. You do not incur transactional costs, such as sales charges (loads), redemption fees or exchange fees.
This Example is intended to help you understand your ongoing costs (in dollars) of investing in a Fund and to compare these costs with the ongoing costs of investing in other mutual funds. The Example is based on an investment of $1,000 invested at July 1, 2009 and held for the entire period ending December 31, 2009.
ACTUAL EXPENSES
The first line of the tables below provides information about actual account values and actual expenses. You may use the information in this line, together with the amount you invested, to estimate the expenses that you paid over the period. Simply divide your account value by $1,000 (for example, an $8,600 account value divided by $1,000=8.6), then multiply the result by the number in the first line under the heading entitled "Expenses Paid During Period" to estimate the expenses you paid on your account during this period.
HYPOTHETICAL EXAMPLE FOR COMPARISON PURPOSES
The second line of the tables below provides information about hypothetical account values and hypothetical expenses based on each Fund's actual expense ratio and an assumed rate of return of 5% per year before expenses, which is not the Fund's actual return. The hypothetical account values and expenses may not be used to estimate the actual ending account balance or expenses you paid for the period. You may use this information to compare the ongoing costs of investing in the Fund with other funds. To do so, compare this 5% hypothetical example with the 5% hypothetical examples that appear in the shareholder reports of the other funds.
Please note that the second line of the table is useful in comparing ongoing costs only, and will not help you determine the relative total costs of owning other funds, which may also charge transactional costs, such as sales charges (loads), redemption fees or exchange fees.
| Equity Index Fund | |
| | | Beginning
Account Value
July 1, 2009 | | Ending
Account Value
December 31, 2009 | | Expenses Paid
During Period*
July 1 –
December 31, 2009 | |
| Actual | | $ | 1,000.00 | | | $ | 1,124.15 | | | $ | 1.39 | | |
Hypothetical
(5% return before expenses) | | $ | 1,000.00 | | | $ | 1,023.56 | | | $ | 1.33 | | |
* Expenses are equal to the Fund's annual expense ratio of 0.26%, multiplied by the average account value over the period, multiplied by 184/365 (to reflect the one-half year period).
| All America Fund | |
| | | Beginning
Account Value
July 1, 2009 | | Ending
Account Value
December 31, 2009 | | Expenses Paid
During Period*
July 1 –
December 31, 2009 | |
| Actual | | $ | 1,000.00 | | | $ | 1,120.46 | | | $ | 3.10 | | |
Hypothetical
(5% return before expenses) | | $ | 1,000.00 | | | $ | 1,021.91 | | | $ | 2.96 | | |
* Expenses are equal to the Fund's annual expense ratio of 0.58%, multiplied by the average account value over the period, multiplied by 184/365 (to reflect the one-half year period).
31
MUTUAL OF AMERICA INVESTMENT CORPORATION
EXPENSE EXAMPLE (Continued)
| Small Cap Value Fund | |
| | | Beginning
Account Value
July 1, 2009 | | Ending
Account Value
December 31, 2009 | | Expenses Paid
During Period*
July 1 –
December 31, 2009 | |
| Actual | | $ | 1,000.00 | | | $ | 1,138.21 | | | $ | 5.01 | | |
Hypothetical
(5% return before expenses) | | $ | 1,000.00 | | | $ | 1,020.11 | | | $ | 4.74 | | |
* Expenses are equal to the Fund's annual expense ratio of 0.93%, multiplied by the average account value over the period, multiplied by 184/365 (to reflect the one-half year period).
| Small Cap Growth Fund | |
| | | Beginning
Account Value
July 1, 2009 | | Ending
Account Value
December 31, 2009 | | Expenses Paid
During Period*
July 1 –
December 31, 2009 | |
| Actual | | $ | 1,000.00 | | | $ | 1,131.13 | | | $ | 4.99 | | |
Hypothetical
(5% return before expenses) | | $ | 1,000.00 | | | $ | 1,020.11 | | | $ | 4.74 | | |
* Expenses are equal to the Fund's annual expense ratio of 0.93%, multiplied by the average account value over the period, multiplied by 184/365 (to reflect the one-half year period).
| Mid Cap Value Fund | |
| | | Beginning
Account Value
July 1, 2009 | | Ending
Account Value
December 31, 2009 | | Expenses Paid
During Period*
July 1 –
December 31, 2009 | |
| Actual | | $ | 1,000.00 | | | $ | 1,120.05 | | | $ | 3.90 | | |
Hypothetical
(5% return before expenses) | | $ | 1,000.00 | | | $ | 1,021.14 | | | $ | 3.72 | | |
* Expenses are equal to the Fund's annual expense ratio of 0.73%, multiplied by the average account value over the period, multiplied by 184/365 (to reflect the one-half year period).
| Mid-Cap Equity Index Fund | |
| | | Beginning
Account Value
July 1, 2009 | | Ending
Account Value
December 31, 2009 | | Expenses Paid
During Period*
July 1 –
December 31, 2009 | |
| Actual | | $ | 1,000.00 | | | $ | 1,170.65 | | | $ | 1.42 | | |
Hypothetical
(5% return before expenses) | | $ | 1,000.00 | | | $ | 1,023.56 | | | $ | 1.33 | | |
* Expenses are equal to the Fund's annual expense ratio of 0.26%, multiplied by the average account value over the period, multiplied by 184/365 (to reflect the one-half year period).
32
MUTUAL OF AMERICA INVESTMENT CORPORATION
EXPENSE EXAMPLE (Continued)
| International Fund | |
| | | Beginning
Account Value
July 1, 2009 | | Ending
Account Value
December 31, 2009 | | Expenses Paid
During Period*
July 1 –
December 31, 2009 | |
| Actual | | $ | 1,000.00 | | | $ | 1,120.05 | | | $ | 2.51 | | |
Hypothetical
(5% return before expenses) | | $ | 1,000.00 | | | $ | 1,022.48 | | | $ | 2.40 | | |
* Expenses are equal to the Fund's annual expense ratio of 0.47% (reflecting direct expenses and the proportional expense ratios of the underlying funds in which the Fund invests), multiplied by the average account value over the period, multiplied by 184/365 (to reflect the one-half year period).
| Composite Fund | |
| | | Beginning
Account Value
July 1, 2009 | | Ending
Account Value
December 31, 2009 | | Expenses Paid
During Period*
July 1 –
December 31, 2009 | |
| Actual | | $ | 1,000.00 | | | $ | 1,089.10 | | | $ | 3.05 | | |
Hypothetical
(5% return before expenses) | | $ | 1,000.00 | | | $ | 1,021.91 | | | $ | 2.96 | | |
* Expenses are equal to the Fund's annual expense ratio of 0.58%, multiplied by the average account value over the period, multiplied by 184/365 (to reflect the one-half year period).
| Retirement Income Fund | |
| | | Beginning
Account Value
July 1, 2009 | | Ending
Account Value
December 31, 2009 | | Expenses Paid
During Period*
July 1 –
December 31, 2009 | |
| Actual | | $ | 1,000.00 | | | $ | 1,078.86 | | | $ | 2.78 | | |
Hypothetical
(5% return before expenses) | | $ | 1,000.00 | | | $ | 1,022.17 | | | $ | 2.70 | | |
* Expenses are equal to the Fund's annual expense ratio of .53% (reflecting direct investment management fees and the proportional expense ratios of the underlying funds in which the Fund invests ), multiplied by the average account value over the period, multiplied by 184/365 (to reflect the one-half year period).
| 2010 Retirement Fund | |
| | | Beginning
Account Value
July 1, 2009 | | Ending
Account Value
December 31, 2009 | | Expenses Paid
During Period*
July 1 –
December 31, 2009 | |
| Actual | | $ | 1,000.00 | | | $ | 1,095.30 | | | $ | 2.48 | | |
Hypothetical
(5% return before expenses) | | $ | 1,000.00 | | | $ | 1,022.48 | | | $ | 2.40 | | |
* Expenses are equal to the Fund's annual expense ratio of .47% (reflecting direct investment management fees and the proportional expense ratios of the underlying funds in which the Fund invests ), multiplied by the average account value over the period, multiplied by 184/365 (to reflect the one-half year period).
33
MUTUAL OF AMERICA INVESTMENT CORPORATION
EXPENSE EXAMPLE (Continued)
| 2015 Retirement Fund | |
| | | Beginning
Account Value
July 1, 2009 | | Ending
Account Value
December 31, 2009 | | Expenses Paid
During Period*
July 1 –
December 31, 2009 | |
| Actual | | $ | 1,000.00 | | | $ | 1,102.10 | | | $ | 2.49 | | |
Hypothetical
(5% return before expenses) | | $ | 1,000.00 | | | $ | 1,022.48 | | | $ | 2.40 | | |
* Expenses are equal to the Fund's annual expense ratio of .47% (reflecting direct investment management fees and the proportional expense ratios of the underlying funds in which the Fund invests ), multiplied by the average account value over the period, multiplied by 184/365 (to reflect the one-half year period).
| 2020 Retirement Fund | |
| | | Beginning
Account Value
July 1, 2009 | | Ending
Account Value
December 31, 2009 | | Expenses Paid
During Period*
July 1 –
December 31, 2009 | |
| Actual | | $ | 1,000.00 | | | $ | 1,110.81 | | | $ | 2.55 | | |
Hypothetical
(5% return before expenses) | | $ | 1,000.00 | | | $ | 1,022.42 | | | $ | 2.45 | | |
* Expenses are equal to the Fund's annual expense ratio of .48% (reflecting direct investment management fees and the proportional expense ratios of the underlying funds in which the Fund invests ), multiplied by the average account value over the period, multiplied by 184/365 (to reflect the one-half year period).
| 2025 Retirement Fund | |
| | | Beginning
Account Value
July 1, 2009 | | Ending
Account Value
December 31, 2009 | | Expenses Paid
During Period*
July 1 –
December 31, 2009 | |
| Actual | | $ | 1,000.00 | | | $ | 1,119.51 | | | $ | 2.46 | | |
Hypothetical
(5% return before expenses) | | $ | 1,000.00 | | | $ | 1,022.53 | | | $ | 2.35 | | |
* Expenses are equal to the Fund's annual expense ratio of .46% (reflecting direct investment management fees and the proportional expense ratios of the underlying funds in which the Fund invests ), multiplied by the average account value over the period, multiplied by 184/365 (to reflect the one-half year period).
| 2030 Retirement Fund | |
| | | Beginning
Account Value
July 1, 2009 | | Ending
Account Value
December 31, 2009 | | Expenses Paid
During Period*
July 1 –
December 31, 2009 | |
| Actual | | $ | 1,000.00 | | | $ | 1,125.67 | | | $ | 2.41 | | |
Hypothetical
(5% return before expenses) | | $ | 1,000.00 | | | $ | 1,022.58 | | | $ | 2.29 | | |
* Expenses are equal to the Fund's annual expense ratio of .45% (reflecting direct investment management fees and the proportional expense ratios of the underlying funds in which the Fund invests ), multiplied by the average account value over the period, multiplied by 184/365 (to reflect the one-half year period).
34
MUTUAL OF AMERICA INVESTMENT CORPORATION
EXPENSE EXAMPLE (Continued)
| 2035 Retirement Fund | |
| | | Beginning
Account Value
July 1, 2009 | | Ending
Account Value
December 31, 2009 | | Expenses Paid
During Period*
July 1 –
December 31, 2009 | |
| Actual | | $ | 1,000.00 | | | $ | 1,128.27 | | | $ | 2.36 | | |
Hypothetical
(5% return before expenses) | | $ | 1,000.00 | | | $ | 1,022.63 | | | $ | 2.24 | | |
* Expenses are equal to the Fund's annual expense ratio of .44% (reflecting direct investment management fees and the proportional expense ratios of the underlying funds in which the Fund invests ), multiplied by the average account value over the period, multiplied by 184/365 (to reflect the one-half year period).
| 2040 Retirement Fund | |
| | | Beginning
Account Value
July 1, 2009 | | Ending
Account Value
December 31, 2009 | | Expenses Paid
During Period*
July 1 –
December 31, 2009 | |
| Actual | | $ | 1,000.00 | | | $ | 1,131.80 | | | $ | 2.52 | | |
Hypothetical
(5% return before expenses) | | $ | 1,000.00 | | | $ | 1,022.48 | | | $ | 2.40 | | |
* Expenses are equal to the Fund's annual expense ratio of .47% (reflecting direct investment management fees and the proportional expense ratios of the underlying funds in which the Fund invests ), multiplied by the average account value over the period, multiplied by 184/365 (to reflect the one-half year period).
| 2045 Retirement Fund | |
| | | Beginning
Account Value
July 1, 2009 | | Ending
Account Value
December 31, 2009 | | Expenses Paid
During Period*
July 1 –
December 31, 2009 | |
| Actual | | $ | 1,000.00 | | | $ | 1,130.51 | | | $ | 2.52 | | |
Hypothetical
(5% return before expenses) | | $ | 1,000.00 | | | $ | 1,022.48 | | | $ | 2.40 | | |
* Expenses are equal to the Fund's annual expense ratio of .47% (reflecting direct investment management fees and the proportional expense ratios of the underlying funds in which the Fund invests ), multiplied by the average account value over the period, multiplied by 184/365 (to reflect the one-half year period).
| Conservative Allocation Fund | |
| | | Beginning
Account Value
July 1, 2009 | | Ending
Account Value
December 31, 2009 | | Expenses Paid
During Period*
July 1 –
December 31, 2009 | |
| Actual | | $ | 1,000.00 | | | $ | 1,077.41 | | | $ | 2.62 | | |
Hypothetical
(5% return before expenses) | | $ | 1,000.00 | | | $ | 1,022.32 | | | $ | 2.55 | | |
* Expenses are equal to the Fund's annual expense ratio of 0.50% (reflecting the proportional expense ratios of the underlying funds in which the Fund invests), multiplied by the average account value over the period, multiplied by 184/365 (to reflect the one-half year period).
35
MUTUAL OF AMERICA INVESTMENT CORPORATION
EXPENSE EXAMPLE (Continued)
| Moderate Allocation Fund | |
| | | Beginning
Account Value
July 1, 2009 | | Ending
Account Value
December 31, 2009 | | Expenses Paid
During Period*
July 1 –
December 31, 2009 | |
| Actual | | $ | 1,000.00 | | | $ | 1,102.10 | | | $ | 2.22 | | |
Hypothetical
(5% return before expenses) | | $ | 1,000.00 | | | $ | 1,022.73 | | | $ | 2.14 | | |
* Expenses are equal to the Fund's annual expense ratio of 0.42% (reflecting the proportional expense ratios of the underlying funds in which the Fund invests), multiplied by the average account value over the period, multiplied by 184/365 (to reflect the one-half year period).
| Aggressive Allocation Fund | |
| | | Beginning
Account Value
July 1, 2009 | | Ending
Account Value
December 31, 2009 | | Expenses Paid
During Period*
July 1 –
December 31, 2009 | |
| Actual | | $ | 1,000.00 | | | $ | 1,121.94 | | | $ | 2.19 | | |
Hypothetical
(5% return before expenses) | | $ | 1,000.00 | | | $ | 1,022.78 | | | $ | 2.09 | | |
* Expenses are equal to the Fund's annual expense ratio of 0.41% (reflecting the proportional expense ratios of the underlying funds in which the Fund invests), multiplied by the average account value over the period, multiplied by 184/365 (to reflect the one-half year period).
| Money Market Fund | |
| | | Beginning
Account Value
July 1, 2009 | | Ending
Account Value
December 31, 2009 | | Expenses Paid
During Period*
July 1 –
December 31, 2009 | |
| Actual | | $ | 1,000.00 | | | $ | 999.60 | | | $ | 1.66 | | |
Hypothetical
(5% return before expenses) | | $ | 1,000.00 | | | $ | 1,023.20 | | | $ | 1.68 | | |
* Expenses are equal to the Fund's annual expense ratio of 0.33%, multiplied by the average account value over the period, multiplied by 184/365 (to reflect the one-half year period).
| Mid Term Bond Fund | |
| | | Beginning
Account Value
July 1, 2009 | | Ending
Account Value
December 31, 2009 | | Expenses Paid
During Period*
July 1 –
December 31, 2009 | |
| Actual | | $ | 1,000.00 | | | $ | 1,055.07 | | | $ | 3.00 | | |
Hypothetical
(5% return before expenses) | | $ | 1,000.00 | | | $ | 1,021.91 | | | $ | 2.96 | | |
* Expenses are equal to the Fund's annual expense ratio of 0.58%, multiplied by the average account value over the period, multiplied by 184/365 (to reflect the one-half year period).
36
MUTUAL OF AMERICA INVESTMENT CORPORATION
EXPENSE EXAMPLE (Continued)
| Bond Fund | |
| | | Beginning
Account Value
July 1, 2009 | | Ending
Account Value
December 31, 2009 | | Expenses Paid
During Period*
July 1 –
December 31, 2009 | |
| Actual | | $ | 1,000.00 | | | $ | 1,071.16 | | | $ | 3.03 | | |
Hypothetical
(5% return before expenses) | | $ | 1,000.00 | | | $ | 1,021.91 | | | $ | 2.96 | | |
* Expenses are equal to the Fund's annual expense ratio of 0.58%, multiplied by the average account value over the period, multiplied by 184/365 (to reflect the one-half year period).
37
MUTUAL OF AMERICA INVESTMENT CORPORATION (EQUITY INDEX FUND)
SUMMARY PORTFOLIO OF INVESTMENTS IN SECURITIES
December 31, 2009
| | | Shares | | Value | |
| INDEXED ASSETS: | |
| COMMON STOCKS | |
| CONSUMER DISCRETIONARY (9.3%) | |
| Amazon.com, Inc.* | | | 24,946 | | | $ | 3,355,736 | | |
| Comcast Corp. Cl A | | | 212,861 | | | | 3,588,836 | | |
| Disney (Walt) Co. | | | 142,772 | | | | 4,604,397 | | |
| Home Depot, Inc. | | | 127,947 | | | | 3,701,507 | | |
| McDonald's Corp. | | | 80,451 | | | | 5,023,360 | | |
| Other Securities | | | 1,960,344 | | | | 50,883,542 | | |
| | | | 71,157,378 | | |
| CONSUMER STAPLES (11.1%) | |
| Altria Group, Inc. | | | 155,247 | | | | 3,047,499 | | |
| Coca-Cola Co. | | | 174,455 | | | | 9,943,935 | | |
| Colgate-Palmolive Co. | | | 37,750 | | | | 3,101,163 | | |
| CVS Caremark Corp. | | | 105,698 | | | | 3,404,533 | | |
| PepsiCo, Inc. | | | 118,947 | | | | 7,231,978 | | |
| Philip Morris Int'l., Inc. | | | 145,515 | | | | 7,012,368 | | |
| Proctor & Gamble Co. | | | 221,522 | | | | 13,430,879 | | |
| Wal-Mart Stores, Inc. | | | 159,906 | | | | 8,546,976 | | |
| Other Securities | | | 872,521 | | | | 29,493,237 | | |
| | | | 85,212,568 | | |
| ENERGY (11.1%) | |
| Chevron Corp. | | | 150,053 | | | | 11,552,580 | | |
| ConocoPhillips | | | 112,219 | | | | 5,731,024 | | |
| Exxon Mobil Corp. | | | 357,520 | | | | 24,379,287 | | |
| Occidental Petroleum Corp | | | 59,534 | | | | 4,843,091 | | |
| Schlumberger Ltd. | | | 89,391 | | | | 5,818,460 | | |
| Other Securities | | | 849,356 | | | | 32,970,952 | | |
| | | | 85,295,394 | | |
| FINANCIALS (13.8%) | |
| American Express Co. | | | 89,580 | | | | 3,629,782 | | |
| Bank of America Corp. | | | 735,918 | | | | 11,082,925 | | |
| Citigroup, Inc. | | | 1,425,998 | | | | 4,720,053 | | |
| Goldman Sachs Group, Inc. | | | 38,349 | | | | 6,474,845 | | |
| JPMorgan Chase & Co. | | | 291,901 | | | | 12,163,515 | | |
| U.S. Bancorp | | | 139,946 | | | | 3,150,185 | | |
| Wells Fargo & Co. | | | 371,013 | | | | 10,013,641 | | |
| Other Securities | | | 2,111,972 | | | | 54,850,995 | | |
| | | | 106,085,941 | | |
| HEALTH CARE (12.2%) | |
| Abbott Laboratories | | | 116,614 | | | | 6,295,990 | | |
| Amgen, Inc.* | | | 74,222 | | | | 4,198,739 | | |
| Bristol-Myers Squibb Co. | | | 127,849 | | | | 3,228,187 | | |
| | | Shares | | Value | |
| INDEXED ASSETS (CONTINUED): | |
| COMMON STOCKS (CONTINUED) | |
| HEALTH CARE (CONTINUED) | |
| Johnson & Johnson | | | 207,619 | | | $ | 13,372,740 | | |
| Medtronic, Inc. | | | 82,693 | | | | 3,636,838 | | |
| Merck & Co., Inc. | | | 226,765 | | | | 8,285,993 | | |
| Pfizer, Inc. | | | 601,241 | | | | 10,936,574 | | |
| Other Securities | | | 1,081,789 | | | | 43,879,610 | | |
| | | | 93,834,671 | | |
| INDUSTRIALS (9.9%) | |
| 3M Co. | | | 52,732 | | | | 4,359,354 | | |
| General Electric Co. | | | 801,149 | | | | 12,121,384 | | |
| United Parcel Service, Inc. Cl B | | | 74,328 | | | | 4,264,197 | | |
| United Technologies Corp. | | | 70,296 | | | | 4,879,245 | | |
| Other Securities | | | 1,071,501 | | | | 50,664,217 | | |
| | | | 76,288,397 | | |
| INFORMATION TECHNOLOGY (19.0%) | |
| Apple, Inc.* | | | 66,875 | | | | 14,101,263 | | |
| Cisco Systems, Inc.* | | | 429,161 | | | | 10,274,114 | | |
| Google, Inc.* | | | 17,948 | | | | 11,127,401 | | |
| Hewlett-Packard Co. | | | 174,790 | | | | 9,003,433 | | |
| Int'l. Business Machines Corp. | | | 98,341 | | | | 12,872,837 | | |
| Intel Corp. | | | 403,337 | | | | 8,228,075 | | |
| Microsoft Corp. | | | 570,740 | | | | 17,401,863 | | |
| Oracle Corp. | | | 275,410 | | | | 6,758,561 | | |
| QUALCOMM, Inc. | | | 124,779 | | | | 5,772,277 | | |
| Other Securities | | | 2,282,593 | | | | 50,438,368 | | |
| | | | 145,978,192 | | |
| MATERIALS (3.5%) | |
| Monsanto Co. | | | 41,003 | | | | 3,351,995 | | |
| Other Securities | | | 585,183 | | | | 23,378,578 | | |
| | | | 26,730,573 | | |
| TELECOMMUNICATION SERVICES (3.1%) | |
| AT&T, Inc. | | | 441,513 | | | | 12,375,609 | | |
| Verizon Communications, Inc | | | 213,187 | | | | 7,062,885 | | |
| Other Securities | | | 465,359 | | | | 4,081,077 | | |
| | | | 23,519,571 | | |
| UTILITIES (3.6%) | |
| Other Securities | | | 845,159 | | | | 27,558,249 | | |
TOTAL INDEXED ASSETS-COMMON STOCKS
(Cost: $709,726,697) 96.6% | | $ | 741,660,934 | | |
The accompanying notes are an integral part of these portfolio schedules.
38
MUTUAL OF AMERICA INVESTMENT CORPORATION (EQUITY INDEX FUND)
SUMMARY PORTFOLIO OF INVESTMENTS IN SECURITIES (Continued)
December 31, 2009
| | | Rating** | | Rate | | Maturity | | Face
Amount | | Value | |
| SHORT-TERM DEBT SECURITIES: | |
| U.S. GOVERNMENT (0.3%) | |
| U.S. Treasury Bill (1) | | AAA | | | 0.06 | % | | 02/11/10 | | $ | 2,400,000 | | | $ | 2,399,836 | | |
| U.S. GOVERNMENT AGENCIES (0.1%) | |
| FHLB | | AAA | | | 0.04 | | | 02/05/10 | | | 800,000 | | | | 799,969 | | |
| COMMERCIAL PAPER (2.9%) | |
| Abbott Laboratories† | | A-1+ | | | 0.05 | | | 01/04/10 | | | 8,900,000 | | | | 8,899,963 | | |
| Emerson Electric† | | A-1 | | | 0.08 | | | 01/20/10 | | | 3,100,000 | | | | 3,099,869 | | |
| Toyota Motor Credit Corp. | | A-1+ | | | 0.04 | | | 01/06/10 | | | 10,000,000 | | | | 9,999,944 | | |
| | | | 21,999,776 | | |
TOTAL SHORT-TERM DEBT SECURITIES
(Cost: $25,199,581) 3.3% | | | 25,199,581 | | |
TEMPORARY CASH INVESTMENTS (2)
(Cost: $71,000) 0.0% (3) | | | 71,000 | | |
TOTAL INVESTMENTS
(Cost: $734,997,278) 99.9% | | | 766,931,515 | | |
| OTHER NET ASSETS 0.1% | | | 703,528 | | |
| NET ASSETS 100.0% | | $ | 767,635,043 | | |
The accompanying notes are an integral part of these portfolio schedules.
39
MUTUAL OF AMERICA INVESTMENT CORPORATION (ALL AMERICA FUND)
SUMMARY PORTFOLIO OF INVESTMENTS IN SECURITIES
December 31, 2009
| | | Shares | | Value | |
| INDEXED ASSETS: | |
| COMMON STOCKS | |
| CONSUMER DISCRETIONARY (5.6%) | |
| Amazon.com, Inc.* | | | 4,983 | | | $ | 670,313 | | |
| Disney (Walt) Co. | | | 28,517 | | | | 919,673 | | |
| Home Depot, Inc. | | | 25,556 | | | | 739,335 | | |
| McDonald's Corp. | | | 16,070 | | | | 1,003,411 | | |
| Other Securities | | | 434,083 | | | | 10,880,287 | | |
| | | | 14,213,019 | | |
| CONSUMER STAPLES (6.6%) | |
| Coca-Cola Co. | | | 34,846 | | | | 1,986,222 | | |
| General Mills, Inc. | | | 4,935 | | | | 349,447 | | |
| PepsiCo, Inc. | | | 23,758 | | | | 1,444,486 | | |
| Philip Morris Int'l., Inc. | | | 29,066 | | | | 1,400,691 | | |
| Proctor & Gamble Co. | | | 44,246 | | | | 2,682,635 | | |
| Wal-Mart Stores, Inc. | | | 31,940 | | | | 1,707,193 | | |
| Other Securities | | | 229,005 | | | | 7,449,723 | | |
| | | | 17,020,397 | | |
| ENERGY (6.6%) | |
| Chevron Corp. | | | 29,972 | | | | 2,307,544 | | |
| ConocoPhillips | | | 22,414 | | | | 1,144,683 | | |
| Exxon Mobil Corp. | | | 71,411 | | | | 4,869,511 | | |
| Halliburton Co. | | | 13,611 | | | | 409,555 | | |
| Occidental Petroleum Corp. | | | 11,892 | | | | 967,414 | | |
| Schlumberger Ltd. | | | 17,855 | | | | 1,162,182 | | |
| Other Securities | | | 156,044 | | | | 6,176,394 | | |
| | | | 17,037,283 | | |
| FINANCIALS (8.3%) | |
| Bank of America Corp. | | | 146,992 | | | | 2,213,700 | | |
| Citigroup, Inc. | | | 284,828 | | | | 942,781 | | |
| CME Group, Inc. | | | 1,004 | | | | 337,294 | | |
| Goldman Sachs Group, Inc. | | | 7,660 | | | | 1,293,314 | | |
| JPMorgan Chase & Co. | | | 58,304 | | | | 2,429,528 | | |
| U.S. Bancorp | | | 27,953 | | | | 629,222 | | |
| Wells Fargo & Co. | | | 74,106 | | | | 2,000,121 | | |
| Other Securities | | | 438,720 | | | | 11,343,179 | | |
| | | | 21,189,139 | | |
| HEALTH CARE (7.3%) | |
| Abbott Laboratories | | | 23,292 | | | | 1,257,535 | | |
| Amgen, Inc.* | | | 14,825 | | | | 838,650 | | |
| Baxter International, Inc. | | | 9,133 | | | | 535,924 | | |
| Gilead Sciences, Inc.* | | | 13,653 | | | | 590,902 | | |
| Johnson & Johnson | | | 41,469 | | | | 2,671,018 | | |
| | | Shares | | Value | |
| INDEXED ASSETS (CONTINUED): | |
| COMMON STOCKS (CONTINUED) | |
| HEALTH CARE (CONTINUED) | |
| Medtronic, Inc. | | | 16,517 | | | $ | 726,418 | | |
| Merck & Co., Inc. | | | 45,294 | | | | 1,655,043 | | |
| Pfizer, Inc. | | | 120,092 | | | | 2,184,473 | | |
| Other Securities | | | 218,828 | | | | 8,282,463 | | |
| | | | 18,742,426 | | |
| INDUSTRIALS (6.0%) | |
| 3M Co. | | | 10,532 | | | | 870,680 | | |
| Boeing Co. | | | 11,084 | | | | 599,977 | | |
| General Electric Co. | | | 160,021 | | | | 2,421,118 | | |
| United Technologies Corp. | | | 14,041 | | | | 974,586 | | |
| Other Securities | | | 217,793 | | | | 10,371,942 | | |
| | | | 15,238,303 | | |
| INFORMATION TECHNOLOGY (11.4%) | |
| Apple, Inc.* | | | 13,358 | | | | 2,816,668 | | |
| Cisco Systems, Inc.* | | | 85,721 | | | | 2,052,161 | | |
| Google, Inc.* | | | 3,585 | | | | 2,222,628 | | |
| Hewlett-Packard Co. | | | 34,913 | | | | 1,798,369 | | |
| Int'l. Business Machines Corp. | | | 19,643 | | | | 2,571,269 | | |
| Intel Corp. | | | 80,563 | | | | 1,643,485 | | |
| Microsoft Corp. | | | 114,000 | | | | 3,475,855 | | |
| Oracle Corp. | | | 55,011 | | | | 1,349,970 | | |
| QUALCOMM, Inc. | | | 24,924 | | | | 1,152,984 | | |
| Texas Instruments, Inc. | | | 18,536 | | | | 483,048 | | |
| Other Securities | | | 437,406 | | | | 9,591,927 | | |
| | | | 29,158,364 | | |
| MATERIALS (2.1%) | |
| Monsanto Co. | | | 8,190 | | | | 669,533 | | |
| Other Securities | | | 116,886 | | | | 4,669,639 | | |
| | | | 5,339,172 | | |
| TELECOMMUNICATION SERVICES (1.8%) | |
| AT&T, Inc. | | | 88,188 | | | | 2,471,910 | | |
| Verizon Communications, Inc. | | | 42,582 | | | | 1,410,742 | | |
| Other Securities | | | 92,952 | | | | 815,138 | | |
| | | | 4,697,790 | | |
| UTILITIES (2.2%) | |
| Other Securities | | | 168,818 | | | | 5,504,671 | | |
TOTAL INDEXED ASSETS-COMMON STOCKS
(Cost: $158,924,227) 57.9% | | $ | 148,140,564 | | |
| | | Rating** | | Rate | | Maturity | | Face
Amount | | Value | |
| INDEXED ASSETS: | |
| SHORT-TERM DEBT SECURITIES: | |
| U.S. GOVERNMENT (0.2%) | |
| U.S. Treasury Bill (1) | | AAA | | | 0.10 | % | | 05/06/10 | | $ | 600,000 | | | $ | 599,786 | | |
| COMMERCIAL PAPER (1.9%) | |
| Abbott Laboratories† | | A-1+ | | | 0.05 | | | 01/04/10 | | | 4,770,000 | | | | 4,769,980 | | |
TOTAL INDEXED ASSETS-SHORT-TERM DEBT SECURITIES
(Cost: $5,369,772) 2.1% | | | 5,369,766 | | |
TOTAL INDEXED ASSETS
(Cost: $164,293,999) 60.0% | | $ | 153,510,330 | | |
The accompanying notes are an integral part of these portfolio schedules.
40
MUTUAL OF AMERICA INVESTMENT CORPORATION (ALL AMERICA FUND)
SUMMARY PORTFOLIO OF INVESTMENTS IN SECURITIES (Continued)
December 31, 2009
| | | Shares | | Value | |
| ACTIVE ASSETS: | |
| COMMON STOCKS | |
| CONSUMER DISCRETIONARY (4.1%) | |
| Amazon.com, Inc.* | | | 4,335 | | | $ | 583,144 | | |
| Disney (Walt) Co. | | | 15,987 | | | | 515,581 | | |
| Home Depot, Inc. | | | 5,711 | | | | 165,219 | | |
| McDonald's Corp. | | | 13,341 | | | | 833,012 | | |
| Tupperware Brands Corp. | | | 21,134 | | | | 984,210 | | |
| Other Securities | | | 352,920 | | | | 7,326,264 | | |
| | | | 10,407,430 | | |
| CONSUMER STAPLES (2.8%) | |
| General Mills, Inc. | | | 8,783 | | | | 621,924 | | |
| PepsiCo, Inc. | | | 15,220 | | | | 925,376 | | |
| Proctor & Gamble Co. | | | 14,495 | | | | 878,832 | | |
| Wal-Mart Stores, Inc. | | | 19,091 | | | | 1,020,414 | | |
| Other Securities | | | 165,528 | | | | 3,752,590 | | |
| | | | 7,199,136 | | |
| ENERGY (3.7%) | |
| Chevron Corp. | | | 9,827 | | | | 756,581 | | |
| ConocoPhillips | | | 7,795 | | | | 398,091 | | |
| Exxon Mobil Corp. | | | 28,567 | | | | 1,947,984 | | |
| Halliburton Co. | | | 16,535 | | | | 497,538 | | |
| Occidental Petroleum Corp. | | | 8,131 | | | | 661,457 | | |
| Schlumberger Ltd. | | | 6,869 | | | | 447,103 | | |
| Other Securities | | | 268,503 | | | | 4,636,027 | | |
| | | | 9,344,781 | | |
| FINANCIALS (6.4%) | |
| Bank of America Corp. | | | 58,218 | | | | 876,763 | | |
| Citigroup, Inc. | | | 106,440 | | | | 352,316 | | |
| CME Group, Inc. | | | 1,610 | | | | 540,880 | | |
| Goldman Sachs Group, Inc. | | | 3,998 | | | | 675,022 | | |
| JPMorgan Chase & Co. | | | 21,720 | | | | 905,072 | | |
| U.S. Bancorp | | | 17,584 | | | | 395,816 | | |
| Wells Fargo & Co. | | | 28,178 | | | | 760,524 | | |
| Other Securities | | | 774,890 | | | | 11,928,818 | | |
| | | | 16,435,211 | | |
| HEALTH CARE (5.3%) | |
| Abbott Laboratories | | | 20,534 | | | | 1,108,631 | | |
| Amgen, Inc.* | | | 2,752 | | | | 155,681 | | |
| Baxter International, Inc. | | | 9,754 | | | | 572,365 | | |
| Enzon Pharmaceuticals, Inc.* | | | 98,602 | | | | 1,038,279 | | |
| Gilead Sciences, Inc.* | | | 16,038 | | | | 694,125 | | |
| Johnson & Johnson | | | 23,050 | | | | 1,484,651 | | |
| Medtronic, Inc. | | | 7,768 | | | | 341,637 | | |
| Merck & Co., Inc. | | | 12,161 | | | | 444,363 | | |
| Other Securities | | | 459,789 | | | | 7,759,198 | | |
| | | | 13,598,930 | | |
| | | Shares | | Value | |
| ACTIVE ASSETS (CONTINUED): | |
| COMMON STOCKS (CONTINUED) | |
| INDUSTRIALS (4.9%) | |
| Boeing Co. | | | 11,219 | | | $ | 607,284 | | |
| General Electric Co. | | | 64,638 | | | | 977,973 | | |
| United Technologies Corp. | | | 8,216 | | | | 570,273 | | |
| Other Securities | | | 464,345 | | | | 10,456,693 | | |
| | | | 12,612,223 | | |
| INFORMATION TECHNOLOGY (8.0%) | |
| Apple, Inc.* | | | 6,576 | | | | 1,386,615 | | |
| Cisco Systems, Inc.* | | | 37,910 | | | | 907,565 | | |
| Google, Inc.* | | | 1,451 | | | | 899,591 | | |
| Hewlett-Packard Co. | | | 17,580 | | | | 905,546 | | |
| Int'l. Business Machines Corp. | | | 8,068 | | | | 1,056,101 | | |
| Microsoft Corp. | | | 38,074 | | | | 1,160,876 | | |
| Oracle Corp. | | | 28,629 | | | | 702,556 | | |
| QUALCOMM, Inc. | | | 12,918 | | | | 597,587 | | |
| Texas Instruments, Inc. | | | 15,922 | | | | 414,927 | | |
| Other Securities | | | 784,938 | | | | 12,366,481 | | |
| | | | 20,397,845 | | |
| MATERIALS (2.3%) | |
| Monsanto Co. | | | 5,045 | | | | 412,429 | | |
| Other Securities | | | 358,256 | | | | 5,436,390 | | |
| | | | 5,848,819 | | |
| TELECOMMUNICATION SERVICES (1.0%) | |
| AT&T, Inc. | | | 27,241 | | | | 763,565 | | |
| Other Securities | | | 106,859 | | | | 1,886,830 | | |
| | | | 2,650,395 | | |
| UTILITIES (1.3%) | |
| Other Securities | | | 108,089 | | | | 3,408,761 | | |
TOTAL ACTIVE ASSETS-COMMON STOCKS
(Cost: $94,184,004) 39.8% | | | 101,903,531 | | |
| ACTIVE ASSETS: | |
| CONVERTIBLE PREFERRED STOCKS | |
| ENERGY (0.0%) (3) | |
Energy XXI (Bermuda)
Ltd., 7.25% | | | 556 | | | | 55,600 | | |
TOTAL ACTIVE ASSETS-CONVERTIBLE
PREFERRED STOCKS
(Cost: $55,600) 0.0% (3) | | $ | 55,600 | | |
The accompanying notes are an integral part of these portfolio schedules.
41
MUTUAL OF AMERICA INVESTMENT CORPORATION (ALL AMERICA FUND)
SUMMARY PORTFOLIO OF INVESTMENTS IN SECURITIES (Continued)
December 31, 2009
| | | Rating** | | Rate | | Maturity | | Face
Amount | | Value | |
| ACTIVE ASSETS: | |
| LONG-TERM DEBT SECURITIES: | |
| FINANCIALS (0.0%) | |
| GSC Capital Corp.†(4) | | NR | | | 7.25 | % | | 07/15/10 | | $ | 460,000 | | | $ | 0 | | |
TOTAL LONG-TERM DEBT SECURITIES
(Cost: $460,000) 0.0% | | | 0 | | |
TOTAL ACTIVE ASSETS
(Cost: $94,699,604) 39.8% | | | 101,959,131 | | |
TEMPORARY CASH INVESTMENTS (2)
(Cost: $140,400) 0.1% | | | 140,400 | | |
TOTAL INVESTMENTS
(Cost: $259,134,003) 99.9% | | | 255,609,861 | | |
| OTHER NET ASSETS 0.1% | | | 311,506 | | |
| NET ASSETS 100.0% | | $ | 255,921,367 | | |
The accompanying notes are an integral part of these portfolio schedules.
42
MUTUAL OF AMERICA INVESTMENT CORPORATION (SMALL CAP VALUE FUND)
SUMMARY PORTFOLIO OF INVESTMENTS IN SECURITIES
December 31, 2009
| | | Shares | | Value | |
| COMMON STOCKS: | |
| CONSUMER DISCRETIONARY (6.8%) | |
| Dillard's, Inc. Cl A | | | 243,313 | | | $ | 4,489,125 | | |
| Rent-A-Center, Inc.* | | | 127,026 | | | | 2,250,901 | | |
| Tupperware Brands Corp. | | | 97,053 | | | | 4,519,758 | | |
| Other Securities | | | 191,353 | | | | 2,775,681 | | |
| | | | 14,035,465 | | |
| CONSUMER STAPLES (5.0%) | |
| American Italian Pasta Co. Cl A* | | | 170,887 | | | | 5,945,159 | | |
Great Atlantic & Pacific
Tea Co., Inc.* | | | 238,145 | | | | 2,807,730 | | |
| Other Securities | | | 112,962 | | | | 1,563,268 | | |
| | | | 10,316,157 | | |
| ENERGY (4.8%) | |
| MarkWest Energy Partners LP | | | 84,471 | | | | 2,472,466 | | |
| McMoRan Exploration Co.* | | | 332,620 | | | | 2,667,612 | | |
| Other Securities | | | 447,225 | | | | 4,622,723 | | |
| | | | 9,762,801 | | |
| FINANCIALS (28.6%) | |
| Ashford Hospitality Trust, Inc.* | | | 415,444 | | | | 1,927,660 | | |
| Aspen Insurance Hldgs. Ltd. | | | 92,870 | | | | 2,363,542 | | |
| Brookline Bancorp, Inc. | | | 247,394 | | | | 2,451,675 | | |
| Ellington Financial LLC†*** | | | 123,900 | | | | 2,478,000 | | |
| First Niagara Financial Group, Inc. | | | 137,256 | | | | 1,909,231 | | |
| Glacier Bancorp, Inc. | | | 133,149 | | | | 1,826,804 | | |
| Highwoods Properties, Inc. | | | 80,296 | | | | 2,677,872 | | |
Meadowbrook Insurance
Group, Inc. | | | 276,483 | | | | 2,045,974 | | |
| MFA Financial, Inc. | | | 248,787 | | | | 1,828,584 | | |
| NBH Hldgs. Co.†*** | | | 98,458 | | | | 1,993,775 | | |
| NewAlliance Bancshares, Inc. | | | 203,711 | | | | 2,446,569 | | |
| ProAssurance Corp.* | | | 45,656 | | | | 2,452,184 | | |
| SeaBright Insurance Hldgs., Inc.* | | | 198,956 | | | | 2,286,004 | | |
| Senior Housing Pptys. Trust | | | 100,291 | | | | 2,193,364 | | |
| Westamerica Bancorporation | | | 48,835 | | | | 2,703,994 | | |
| Other Securities | | | 2,389,345 | | | | 25,269,122 | | |
| | | | 58,854,354 | | |
| HEALTH CARE (5.0%) | |
| Enzon Pharmaceuticals, Inc.* | | | 440,855 | | | | 4,642,203 | | |
| Other Securities | | | 710,470 | | | | 5,529,122 | | |
| | | | 10,171,325 | | |
| INDUSTRIALS (16.7%) | |
| Actuant Corp. Cl A | | | 129,150 | | | | 2,393,150 | | |
| Alaska Air Group, Inc.* | | | 124,900 | | | | 4,316,544 | | |
| AZZ, Inc.* | | | 73,896 | | | | 2,416,399 | | |
| Encore Wire Corp. | | | 97,560 | | | | 2,055,589 | | |
| Genesee & Wyoming, Inc. Cl A* | | | 73,434 | | | | 2,396,886 | | |
| | | Shares | | Value | |
| COMMON STOCKS (CONTINUED): | |
| INDUSTRIALS (CONTINUED) | |
| Kaydon Corp. | | | 74,907 | | | $ | 2,678,674 | | |
| Mueller Industries, Inc. | | | 174,672 | | | | 4,338,852 | | |
| Old Dominion Freight Line, Inc.* | | | 80,465 | | | | 2,470,276 | | |
| Orion Marine Group, Inc.* | | | 111,235 | | | | 2,342,609 | | |
| Tutor Perini Corp.* | | | 125,207 | | | | 2,263,743 | | |
| Other Securities | | | 601,878 | | | | 6,684,470 | | |
| | | | 34,357,192 | | |
| INFORMATION TECHNOLOGY (9.2%) | |
| Coherent, Inc.* | | | 60,160 | | | | 1,788,557 | | |
| Global Cash Access Hldgs., Inc.* | | | 240,733 | | | | 1,803,090 | | |
| Sybase, Inc.* | | | 50,301 | | | | 2,183,063 | | |
| TIBCO Software, Inc.* | | | 203,133 | | | | 1,956,171 | | |
| Other Securities | | | 663,849 | | | | 11,143,771 | | |
| | | | 18,874,652 | | |
| MATERIALS (10.8%) | |
| Commercial Metals Co. | | | 169,390 | | | | 2,650,954 | | |
| Crown Hldgs., Inc.* | | | 247,799 | | | | 6,338,693 | | |
| Cytec Industries, Inc. | | | 65,093 | | | | 2,370,687 | | |
| Silgan Hldgs., Inc. | | | 72,740 | | | | 4,210,191 | | |
| Taseko Mines Ltd.* | | | 583,762 | | | | 2,463,476 | | |
| Walter Energy, Inc. | | | 33,170 | | | | 2,498,033 | | |
| Other Securities | | | 409,795 | | | | 1,596,666 | | |
| | | | 22,128,700 | | |
| TELECOMMUNICATION SERVICES (2.8%) | |
| Consolidated Comms. Hldgs., Inc. | | | 117,498 | | | | 2,056,215 | | |
| Syniverse Hldgs., Inc.* | | | 109,984 | | | | 1,922,520 | | |
| Other Securities | | | 106,466 | | | | 1,784,370 | | |
| | | | 5,763,105 | | |
| UTILITIES (5.6%) | |
| Avista Corp. | | | 123,693 | | | | 2,670,532 | | |
| Northwest Natural Gas Co. | | | 40,493 | | | | 1,823,805 | | |
| Unisource Energy Corp. | | | 79,227 | | | | 2,550,317 | | |
| Other Securities | | | 225,107 | | | | 4,381,999 | | |
| | | | 11,426,653 | | |
TOTAL COMMON STOCKS
(Cost: $183,653,309) 95.3% | | | 195,690,404 | | |
| CONVERTIBLE PREFERRED STOCKS: | |
| ENERGY (0.2%) | |
Energy XXI (Bermuda)
Ltd., 7.25% | | | 4,255 | | | | 425,500 | | |
TOTAL CONVERTIBLE PREFERRED STOCKS
(Cost: $425,500) 0.2% | | $ | 425,500 | | |
The accompanying notes are an integral part of these portfolio schedules.
43
MUTUAL OF AMERICA INVESTMENT CORPORATION (SMALL CAP VALUE FUND)
SUMMARY PORTFOLIO OF INVESTMENTS IN SECURITIES (Continued)
December 31, 2009
| | | Rating** | | Rate | | Maturity | | Face
Amount | | Value | |
| LONG-TERM DEBT SECURITIES: | |
| FINANCIALS (0.0%) | |
| GSC Capital Corp.†(4) | | NR | | | 7.25 | % | | 07/15/10 | | $ | 1,890,000 | | | $ | 0 | | |
TOTAL LONG-TERM DEBT SECURITIES
(Cost: $1,890,000) 0.0% | | | 0 | | |
| SHORT-TERM DEBT SECURITIES: | |
| COMMERCIAL PAPER (4.2%) | |
| Abbott Laboratories† | | A-1+ | | | 0.05 | | | 01/04/10 | | | 3,500,000 | | | | 3,499,985 | | |
| Toyota Motor Credit Corp. | | A-1+ | | | 0.04 | | | 01/06/10 | | | 5,200,000 | | | | 5,199,972 | | |
| | | | 8,699,957 | | |
TOTAL SHORT-TERM DEBT SECURITIES
(Cost: $8,699,957) 4.2% | | | 8,699,957 | | |
TOTAL INVESTMENTS
(Cost: $194,668,766) 99.7% | | | 204,815,861 | | |
| OTHER NET ASSETS 0.3% | | | 568,553 | | |
| NET ASSETS 100.0% | | $ | 205,384,414 | | |
The accompanying notes are an integral part of these portfolio schedules.
44
MUTUAL OF AMERICA INVESTMENT CORPORATION (SMALL CAP GROWTH FUND)
SUMMARY PORTFOLIO OF INVESTMENTS IN SECURITIES
December 31, 2009
| | | Shares | | Value | |
| COMMON STOCKS: | |
| CONSUMER DISCRETIONARY (13.6%) | |
| California Pizza Kitchen, Inc.* | | | 162,973 | | | $ | 2,191,987 | | |
| Deckers Outdoor Corp.* | | | 30,017 | | | | 3,053,329 | | |
| G-III Apparel Group Ltd.* | | | 94,106 | | | | 2,039,277 | | |
| Grand Canyon Education, Inc.* | | | 94,292 | | | | 1,792,491 | | |
| Gymboree Corp.* | | | 48,163 | | | | 2,094,609 | | |
| OfficeMax, Inc.* | | | 284,150 | | | | 3,605,864 | | |
| P.F. Chang's China Bistro, Inc.* | | | 40,853 | | | | 1,548,737 | | |
| Shutterfly, Inc.* | | | 98,631 | | | | 1,756,618 | | |
| Tupperware Brands Corp. | | | 64,272 | | | | 2,993,147 | | |
| Other Securities | | | 594,814 | | | | 5,233,666 | | |
| | | | 26,309,725 | | |
| CONSUMER STAPLES (2.7%) | |
| Chattem, Inc.* | | | 17,068 | | | | 1,592,444 | | |
| Pantry, Inc.* | | | 122,100 | | | | 1,659,339 | | |
| Other Securities | | | 183,556 | | | | 1,888,899 | | |
| | | | 5,140,682 | | |
| ENERGY (6.6%) | |
| Brigham Exploration Co.* | | | 317,822 | | | | 4,306,487 | | |
| Carrizo Oil and Gas, Inc.* | | | 70,669 | | | | 1,872,022 | | |
| McMoRan Exploration Co.* | | | 295,720 | | | | 2,371,674 | | |
| T-3 Energy Services, Inc.* | | | 61,476 | | | | 1,567,638 | | |
| Other Securities | | | 78,363 | | | | 2,690,322 | | |
| | | | 12,808,143 | | |
| FINANCIALS (6.2%) | |
iShares Russell 2000 Growth
Index Fund | | | 51,050 | | | | 3,474,974 | | |
| Senior Housing Pptys. Trust | | | 72,836 | | | | 1,592,923 | | |
| Stifel Financial Corp.* | | | 33,203 | | | | 1,966,946 | | |
| Other Securities | | | 202,269 | | | | 4,940,156 | | |
| | | | 11,974,999 | | |
| HEALTH CARE (21.3%) | |
| Abiomed, Inc.* | | | 214,271 | | | | 1,872,729 | | |
| Almost Family, Inc.* | | | 47,619 | | | | 1,882,379 | | |
| Alphatec Hldgs., Inc.* | | | 330,995 | | | | 1,767,513 | | |
| Enzon Pharmaceuticals, Inc.* | | | 311,998 | | | | 3,285,339 | | |
| Exelixis, Inc.* | | | 239,372 | | | | 1,764,172 | | |
| Genoptix, Inc.* | | | 51,414 | | | | 1,826,739 | | |
| Human Genome Sciences, Inc.* | | | 68,415 | | | | 2,093,499 | | |
| Magellan Health Svcs., Inc.* | | | 80,965 | | | | 3,297,704 | | |
| MedAssets, Inc.* | | | 88,391 | | | | 1,874,773 | | |
| | | Shares | | Value | |
| COMMON STOCKS (CONTINUED): | |
| HEALTH CARE (CONTINUED) | |
| Neogen Corp.* | | | 100,566 | | | $ | 2,374,363 | | |
| Steris Corp. | | | 77,339 | | | | 2,163,172 | | |
| Other Securities | | | 1,081,168 | | | | 17,245,790 | | |
| | | | 41,448,172 | | |
| INDUSTRIALS (12.1%) | |
| Genesee & Wyoming, Inc. Cl A* | | | 49,431 | | | | 1,613,428 | | |
| Graham Corp. | | | 96,932 | | | | 2,006,492 | | |
| Sun Hydraulics Corp. | | | 72,451 | | | | 1,901,839 | | |
| Teledyne Technologies, Inc.* | | | 51,198 | | | | 1,963,955 | | |
| Other Securities | | | 951,364 | | | | 15,937,971 | | |
| | | | 23,423,685 | | |
| INFORMATION TECHNOLOGY (29.0%) | |
| Ceragon Networks Ltd.* | | | 159,192 | | | | 1,868,914 | | |
| Commvault Systems, Inc.* | | | 70,341 | | | | 1,666,378 | | |
| DemandTec, Inc.* | | | 199,352 | | | | 1,748,317 | | |
| Global Cash Access Hldgs., Inc.* | | | 290,020 | | | | 2,172,250 | | |
| Informatica Corp.* | | | 77,409 | | | | 2,001,797 | | |
| Microsemi Corp.* | | | 96,813 | | | | 1,718,431 | | |
| Monolithic Power Systems, Inc.* | | | 64,866 | | | | 1,554,838 | | |
| Parametric Technology Corp.* | | | 143,113 | | | | 2,338,466 | | |
| Plexus Corp.* | | | 80,151 | | | | 2,284,304 | | |
| Semtech Corp.* | | | 95,282 | | | | 1,620,747 | | |
| Sourcefire, Inc.* | | | 111,799 | | | | 2,990,623 | | |
| Super Micro Computer, Inc.* | | | 141,348 | | | | 1,571,790 | | |
| Websense, Inc.* | | | 106,588 | | | | 1,861,026 | | |
| Other Securities | | | 2,309,861 | | | | 30,979,674 | | |
| | | | 56,377,555 | | |
| MATERIALS (4.5%) | |
| NewMarket Corp. | | | 15,729 | | | | 1,805,217 | | |
| Other Securities | | | 884,976 | | | | 6,955,765 | | |
| | | | 8,760,982 | | |
| TELECOMMUNICATION SERVICES (2.0%) | |
| Consolidated Comms. Hldgs., Inc. | | | 115,830 | | | | 2,027,025 | | |
| Syniverse Hldgs., Inc.* | | | 101,229 | | | | 1,769,483 | | |
| | | | 3,796,508 | | |
| UTILITIES (0.8%) | |
| Other Securities | | | 69,526 | | | | 1,501,066 | | |
TOTAL COMMON STOCKS
(Cost: $164,268,237) 98.8% | | $ | 191,541,517 | | |
| | | Rating** | | Rate | | Maturity | | Face
Amount | | Value | |
| SHORT-TERM DEBT SECURITIES: | |
| COMMERCIAL PAPER (0.8%) | |
| Abbott Laboratories† | | A-1+ | | | 0.05 | % | | 01/04/10 | | $ | 1,600,000 | | | $ | 1,599,993 | | |
TOTAL SHORT-TERM DEBT SECURITIES
(Cost: $1,599,993) 0.8% | | | 1,599,993 | | |
TOTAL INVESTMENTS
(Cost: $165,868,230) 99.6% | | | 193,141,510 | | |
| OTHER NET ASSETS 0.4% | | | 754,586 | | |
| NET ASSETS 100.0% | | $ | 193,896,096 | | |
The accompanying notes are an integral part of these portfolio schedules.
45
MUTUAL OF AMERICA INVESTMENT CORPORATION (MID CAP VALUE FUND)
SUMMARY PORTFOLIO OF INVESTMENTS IN SECURITIES
December 31, 2009
| | | Shares | | Value | |
| COMMON STOCKS: | |
| CONSUMER DISCRETIONARY (10.3%) | |
| CBS Corp. Cl B | | | 28,910 | | | $ | 406,186 | | |
| Polo Ralph Lauren Corp. | | | 6,287 | | | | 509,121 | | |
| V.F. Corp. | | | 9,831 | | | | 720,022 | | |
| Other Securities | | | 105,850 | | | | 2,683,641 | | |
| | | | 4,318,970 | | |
| CONSUMER STAPLES (5.8%) | |
| J.M. Smucker Co. | | | 6,705 | | | | 414,034 | | |
| Vector Group Ltd. | | | 39,702 | | | | 555,828 | | |
| Other Securities | | | 52,672 | | | | 1,455,727 | | |
| | | | 2,425,589 | | |
| ENERGY (8.9%) | |
| Arch Coal, Inc. | | | 17,840 | | | | 396,940 | | |
| Noble Energy, Inc. | | | 8,310 | | | | 591,838 | | |
| Pride International, Inc.* | | | 15,300 | | | | 488,223 | | |
| Range Resources Corp. | | | 14,211 | | | | 708,418 | | |
| Other Securities | | | 68,252 | | | | 1,537,668 | | |
| | | | 3,723,087 | | |
| FINANCIALS (22.6%) | |
| American Financial Group, Inc. | | | 22,287 | | | | 556,061 | | |
| Ameriprise Financial, Inc. | | | 15,376 | | | | 596,896 | | |
| Aon Corp. | | | 12,975 | | | | 497,462 | | |
| BOK Financial Corp. | | | 11,721 | | | | 556,982 | | |
| Equity Residential | | | 16,783 | | | | 566,930 | | |
| Host Hotels & Resorts, Inc.* | | | 34,058 | | | | 397,457 | | |
| People's United Financial, Inc. | | | 40,023 | | | | 668,384 | | |
| ProLogis | | | 32,068 | | | | 439,011 | | |
| Public Storage | | | 5,050 | | | | 411,323 | | |
| StanCorp Financial Group, Inc. | | | 12,752 | | | | 510,335 | | |
| Vornado Realty Trust | | | 9,723 | | | | 680,036 | | |
| Other Securities | | | 207,362 | | | | 3,631,839 | | |
| | | | 9,512,716 | | |
| HEALTH CARE (5.6%) | |
| AmerisourceBergen Corp. | | | 17,434 | | | | 454,504 | | |
| CIGNA Corp. | | | 11,344 | | | | 400,103 | | |
| Hospira, Inc.* | | | 9,214 | | | | 469,914 | | |
| Mettler-Toledo Int'l., Inc.* | | | 4,944 | | | | 519,071 | | |
| Other Securities | | | 13,350 | | | | 502,706 | | |
| | | | 2,346,298 | | |
| | | Shares | | Value | |
| COMMON STOCKS (CONTINUED): | |
| INDUSTRIALS (10.4%) | |
| Alliant TechSystems, Inc.* | | | 4,777 | | | $ | 421,666 | | |
| Donnelley (R.R.) & Sons Co. | | | 21,092 | | | | 469,719 | | |
| Joy Global, Inc. | | | 8,110 | | | | 418,395 | | |
| Kirby Corp.* | | | 13,650 | | | | 475,430 | | |
| Precision Castparts Corp. | | | 5,791 | | | | 639,037 | | |
| Other Securities | | | 59,939 | | | | 1,947,552 | | |
| | | | 4,371,799 | | |
| INFORMATION TECHNOLOGY (7.1%) | |
| SAIC, Inc.* | | | 20,560 | | | | 389,406 | | |
| Sybase, Inc.* | | | 12,501 | | | | 542,543 | | |
| Teradata Corp.* | | | 12,406 | | | | 389,921 | | |
| Other Securities | | | 111,264 | | | | 1,644,771 | | |
| | | | 2,966,641 | | |
| MATERIALS (10.5%) | |
| Agnico-Eagle Mines Ltd. | | | 7,257 | | | | 391,878 | | |
| Crown Hldgs., Inc.* | | | 51,378 | | | | 1,314,244 | | |
| Cytec Industries, Inc. | | | 13,332 | | | | 485,551 | | |
| Eastman Chemical Co. | | | 7,251 | | | | 436,800 | | |
| Lubrizol Corp. | | | 8,662 | | | | 631,893 | | |
| Sonoco Products Co. | | | 21,391 | | | | 625,687 | | |
| Other Securities | | | 16,741 | | | | 520,214 | | |
| | | | 4,406,267 | | |
| TELECOMMUNICATION SERVICES (2.1%) | |
| CenturyTel, Inc. | | | 13,901 | | | | 503,355 | | |
| Other Securities | | | 35,050 | | | | 385,200 | | |
| | | | 888,555 | | |
| UTILITIES (11.1%) | |
| American Electric Power Co., Inc. | | | 16,061 | | | | 558,762 | | |
| Edison International | | | 18,275 | | | | 635,605 | | |
| Energen Corp. | | | 13,697 | | | | 641,020 | | |
| Entergy Corp. | | | 6,208 | | | | 508,063 | | |
| Pepco Hldgs., Inc. | | | 25,532 | | | | 430,214 | | |
| PG&E Corp. | | | 14,078 | | | | 628,583 | | |
| PPL Corp. | | | 12,669 | | | | 409,335 | | |
| Sempra Energy | | | 9,843 | | | | 551,011 | | |
| Other Securities | | | 5,940 | | | | 309,415 | | |
| | | | 4,672,008 | | |
TOTAL COMMON STOCKS
(Cost: $41,586,532) 94.4% | | $ | 39,631,930 | | |
| | | Rating** | | Rate | | Maturity | | Face
Amount | | Value | |
| SHORT-TERM DEBT SECURITIES: | |
| COMMERCIAL PAPER (5.4%) | |
| Abbott Laboratories† | | A-1+ | | | 0.05 | % | | 01/04/10 | | $ | 670,000 | | | $ | 669,997 | | |
| Nestle Capital Corp.† | | A-1+ | | | 0.08 | | | 02/02/10 | | | 1,000,000 | | | | 999,929 | | |
| Toyota Motor Credit Corp. | | A-1+ | | | 0.04 | | | 01/06/10 | | | 600,000 | | | | 599,997 | | |
| | | | 2,269,923 | | |
TOTAL SHORT-TERM DEBT SECURITIES
(Cost: $2,269,923) 5.4% | | | 2,269,923 | | |
TOTAL INVESTMENTS
(Cost: $43,856,455) 99.8% | | | 41,901,853 | | |
| OTHER NET ASSETS 0.2% | | | 70,743 | | |
| NET ASSETS 100.0% | | $ | 41,972,596 | | |
The accompanying notes are an integral part of these portfolio schedules.
46
MUTUAL OF AMERICA INVESTMENT CORPORATION (MID-CAP EQUITY INDEX FUND)
SUMMARY PORTFOLIO OF INVESTMENTS IN SECURITIES
December 31, 2009
| | | Shares | | Value | |
| INDEXED ASSETS: | |
| COMMON STOCKS | |
| CONSUMER DISCRETIONARY (13.3%) | |
| Advance Auto Parts, Inc. | | | 37,346 | | | $ | 1,511,766 | | |
| BorgWarner, Inc. | | | 46,303 | | | | 1,538,186 | | |
| CarMax, Inc.* | | | 85,187 | | | | 2,065,785 | | |
| Dollar Tree, Inc.* | | | 34,791 | | | | 1,680,405 | | |
| NVR, Inc.* | | | 2,380 | | | | 1,691,490 | | |
| Urban Outfitters, Inc.* | | | 51,621 | | | | 1,806,219 | | |
| Other Securities | | | 1,774,412 | | | | 39,775,442 | | |
| | | | 50,069,293 | | |
| CONSUMER STAPLES (3.8%) | |
| Church & Dwight Co., Inc. | | | 28,051 | | | | 1,695,683 | | |
| Energizer Hldgs., Inc.* | | | 27,370 | | | | 1,677,234 | | |
| Other Securities | | | 327,471 | | | | 10,947,900 | | |
| | | | 14,320,817 | | |
| ENERGY (6.4%) | |
| Cimarex Energy Co. | | | 32,635 | | | | 1,728,676 | | |
| Helmerich & Payne, Inc. | | | 41,291 | | | | 1,646,685 | | |
| Newfield Exploration Co.* | | | 51,038 | | | | 2,461,568 | | |
Plains Exploration &
Production Co.* | | | 55,405 | | | | 1,532,502 | | |
| Pride International, Inc.* | | | 68,397 | | | | 2,182,548 | | |
| Other Securities | | | 610,447 | | | | 14,639,313 | | |
| | | | 24,191,292 | | |
| FINANCIALS (18.2%) | |
| AMB Property Corp. | | | 59,073 | | | | 1,509,315 | | |
| Everest Re Group Ltd. | | | 23,877 | | | | 2,045,781 | | |
| Federal Realty Investment Trust | | | 23,869 | | | | 1,616,409 | | |
| Liberty Property Trust | | | 44,544 | | | | 1,425,853 | | |
| Nationwide Health Pptys., Inc. | | | 45,110 | | | | 1,586,970 | | |
New York Community
Bancorp, Inc. | | | 163,888 | | | | 2,378,015 | | |
| SL Green Realty Corp | | | 31,103 | | | | 1,562,615 | | |
| Other Securities | | | 2,589,686 | | | | 56,296,952 | | |
| | | | 68,421,910 | | |
| HEALTH CARE (11.5%) | |
| Beckman Coulter, Inc. | | | 28,139 | | | | 1,841,416 | | |
| Cerner Corp.* | | | 26,569 | | | | 2,190,348 | | |
| Edwards Lifesciences Corp.* | | | 22,459 | | | | 1,950,564 | | |
| Hologic, Inc.* | | | 101,729 | | | | 1,475,071 | | |
| ResMed, Inc.* | | | 29,576 | | | | 1,545,938 | | |
| Schein (Henry), Inc.* | | | 35,538 | | | | 1,869,299 | | |
| | | Shares | | Value | |
| INDEXED ASSETS (CONTINUED): | |
| COMMON STOCKS (CONTINUED) | |
| HEALTH CARE (CONTINUED) | |
| Vertex Pharmaceuticals, Inc.* | | | 74,974 | | | $ | 3,212,641 | | |
| Other Securities | | | 958,109 | | | | 29,416,786 | | |
| | | | 43,502,063 | | |
| INDUSTRIALS (13.8%) | |
| AMETEK, Inc. | | | 42,179 | | | | 1,612,925 | | |
| Bucyrus International, Inc. | | | 30,599 | | | | 1,724,866 | | |
| Joy Global, Inc. | | | 40,571 | | | | 2,093,058 | | |
| Manpower, Inc. | | | 31,002 | | | | 1,692,089 | | |
| URS Corp.* | | | 33,123 | | | | 1,474,636 | | |
| Other Securities | | | 1,534,684 | | | | 43,482,636 | | |
| | | | 52,080,210 | | |
| INFORMATION TECHNOLOGY (14.4%) | |
| ANSYS, Inc.* | | | 34,541 | | | | 1,501,152 | | |
| Avnet, Inc.* | | | 59,628 | | | | 1,798,380 | | |
| Cree, Inc.* | | | 40,870 | | | | 2,303,842 | | |
| Equinix, Inc.* | | | 15,381 | | | | 1,632,693 | | |
| F5 Networks, Inc.* | | | 31,502 | | | | 1,668,976 | | |
| Global Payments, Inc. | | | 31,927 | | | | 1,719,588 | | |
| Lam Research Corp.* | | | 50,407 | | | | 1,976,458 | | |
| Lender Processing Svcs., Inc. | | | 38,335 | | | | 1,558,701 | | |
| Other Securities | | | 2,235,216 | | | | 40,219,746 | | |
| | | | 54,379,536 | | |
| MATERIALS (6.0%) | |
| Lubrizol Corp. | | | 27,553 | | | | 2,009,991 | | |
| Martin Marietta Materials, Inc. | | | 17,322 | | | | 1,548,760 | | |
| Steel Dynamics, Inc. | | | 85,101 | | | | 1,507,990 | | |
| Other Securities | | | 650,120 | | | | 17,640,081 | | |
| | | | 22,706,822 | | |
| TELECOMMUNICATION SERVICES (0.8%) | |
| Other Securities | | | 200,619 | | | | 2,965,842 | | |
| UTILITIES (6.4%) | |
| MDU Resources Group | | | 74,441 | | | | 1,756,808 | | |
| National Fuel Gas Co. | | | 31,706 | | | | 1,585,300 | | |
| NSTAR | | | 42,324 | | | | 1,557,523 | | |
| Oneok, Inc. | | | 41,551 | | | | 1,851,928 | | |
| Other Securities | | | 885,681 | | | | 17,198,220 | | |
| | | | 23,949,779 | | |
TOTAL INDEXED ASSETS-COMMON STOCKS
(Cost: $355,426,297) 94.6% | | $ | 356,587,564 | | |
The accompanying notes are an integral part of these portfolio schedules.
47
MUTUAL OF AMERICA INVESTMENT CORPORATION (MID-CAP EQUITY INDEX FUND)
SUMMARY PORTFOLIO OF INVESTMENTS IN SECURITIES (Continued)
December 31, 2009
| | | Rating** | | Rate | | Maturity | | Face
Amount | | Value | |
| SHORT-TERM DEBT SECURITIES: | |
| U.S. GOVERNMENT (0.6%) | |
| U.S. Treasury Bill (1) | | AAA | | | 0.05 - 0.10 | % | | 02/11/10 - 05/06/10 | | $ | 2,400,000 | | | $ | 2,399,730 | | |
| COMMERCIAL PAPER (4.7%) | |
| Abbott Laboratories† | | A-1+ | | | 0.05 | | | 01/04/10 | | | 9,500,000 | | | | 9,499,961 | | |
| Toyota Motor Credit Corp. | | A-1+ | | | 0.04 - 0.06 | | | 01/05/10 - 01/06/10 | | | 8,000,000 | | | | 7,999,949 | | |
| | | | 17,499,910 | | |
TOTAL SHORT-TERM DEBT SECURITIES
(Cost: $19,899,640) 5.3% | | | 19,899,640 | | |
TEMPORARY CASH INVESTMENTS (2)
(Cost: $187,800) 0.0% (3) | | | 187,800 | | |
TOTAL INVESTMENTS
(Cost: $375,513,737) 99.9% | | | 376,675,004 | | |
| OTHER NET ASSETS 0.1% | | | 527,476 | | |
| NET ASSETS 100.0% | | $ | 377,202,480 | | |
The accompanying notes are an integral part of these portfolio schedules.
48
MUTUAL OF AMERICA INVESTMENT CORPORATION (INTERNATIONAL FUND)
PORTFOLIO OF INVESTMENTS IN SECURITIES
December 31, 2009
| | | Shares | | Value | |
| COMMON STOCKS: | |
| FINANCIALS (99.5%) | |
| iShares MSCI EAFE Growth Index Fund | | | 53,300 | | | $ | 2,937,896 | | |
| iShares MSCI EAFE Index Fund | | | 59,600 | | | | 3,295,880 | | |
| iShares MSCI EAFE Value Index Fund | | | 58,300 | | | | 2,934,822 | | |
| Vanguard Europe Pacific ETF | | | 481,500 | | | | 16,467,300 | | |
| Vanguard European ETF | | | 101,600 | | | | 4,925,568 | | |
| Vanguard Pacific ETF | | | 46,000 | | | | 2,360,720 | | |
| | | | 32,922,186 | | |
TOTAL COMMON STOCKS
(Cost: $31,586,350) 99.5% | | | | | | $ | 32,922,186 | | |
| | | Rating** | | Rate | | Maturity | | Face
Amount | | Value | |
| SHORT-TERM DEBT SECURITIES: | |
| COMMERCIAL PAPER (7.3%) | |
| Abbott Laboratories† | | A-1+ | | | 0.05 | % | | 01/04/10 | | $ | 1,400,000 | | | $ | 1,399,994 | | |
| Washington Gas Light Co. | | A-1 | | | 0.05 | | | 01/04/10 | | | 1,000,000 | | | | 999,996 | | |
| | | | 2,399,990 | | |
TOTAL SHORT-TERM DEBT SECURITIES
(Cost: $2,399,990) 7.3% | | | 2,399,990 | | |
TOTAL INVESTMENTS
(Cost: $33,986,340) 106.8% | | | 35,322,176 | | |
| OTHER NET ASSETS -6.8% | | | (2,233,679 | ) | |
| NET ASSETS 100.0% | | $ | 33,088,497 | | |
The accompanying notes are an integral part of these portfolio schedules.
49
MUTUAL OF AMERICA INVESTMENT CORPORATION (COMPOSITE FUND)
SUMMARY PORTFOLIO OF INVESTMENTS IN SECURITIES
December 31, 2009
| | | Shares | | Value | |
| COMMON STOCKS: | |
| CONSUMER DISCRETIONARY (5.9%) | |
| Amazon.com, Inc.* | | | 8,442 | | | $ | 1,135,618 | | |
| Disney (Walt) Co. | | | 31,123 | | | | 1,003,717 | | |
| Home Depot, Inc. | | | 11,123 | | | | 321,788 | | |
| Johnson Controls, Inc. | | | 32,747 | | | | 892,028 | | |
| McDonald's Corp. | | | 25,993 | | | | 1,623,003 | | |
| V.F. Corp. | | | 11,744 | | | | 860,131 | | |
| Other Securities | | | 118,521 | | | | 3,938,792 | | |
| | | | 9,775,077 | | |
| CONSUMER STAPLES (6.2%) | |
| General Mills, Inc. | | | 17,113 | | | | 1,211,772 | | |
| PepsiCo, Inc. | | | 29,652 | | | | 1,802,842 | | |
| Proctor & Gamble Co. | | | 28,247 | | | | 1,712,616 | | |
| Wal-Mart Stores, Inc. | | | 37,193 | | | | 1,987,966 | | |
| Other Securities | | | 121,730 | | | | 3,551,308 | | |
| | | | 10,266,504 | | |
| ENERGY (7.3%) | |
| Chevron Corp. | | | 19,139 | | | | 1,473,512 | | |
| Exxon Mobil Corp. | | | 55,652 | | | | 3,794,907 | | |
| Halliburton Co. | | | 32,211 | | | | 969,229 | | |
| Occidental Petroleum Corp. | | | 15,836 | | | | 1,288,259 | | |
| Schlumberger Ltd. | | | 13,377 | | | | 870,709 | | |
| Other Securities | | | 78,233 | | | | 3,767,828 | | |
| | | | 12,164,444 | | |
| FINANCIALS (8.0%) | |
| Bank of America Corp. | | | 108,160 | | | | 1,628,890 | | |
| CME Group, Inc. | | | 3,134 | | | | 1,052,867 | | |
| Goldman Sachs Group, Inc. | | | 7,785 | | | | 1,314,419 | | |
| JPMorgan Chase & Co. | | | 42,293 | | | | 1,762,349 | | |
| Wells Fargo & Co. | | | 54,842 | | | | 1,480,186 | | |
| Other Securities | | | 386,029 | | | | 6,086,048 | | |
| | | | 13,324,759 | | |
| HEALTH CARE (7.8%) | |
| Abbott Laboratories | | | 40,004 | | | | 2,159,816 | | |
| Baxter International, Inc. | | | 18,987 | | | | 1,114,157 | | |
| Celgene Corp.* | | | 15,562 | | | | 866,492 | | |
| | | Shares | | Value | |
| COMMON STOCKS (CONTINUED): | |
| HEALTH CARE (CONTINUED) | |
| Gilead Sciences, Inc.* | | | 31,247 | | | $ | 1,352,370 | | |
| Johnson & Johnson | | | 44,903 | | | | 2,892,202 | | |
| Merck & Co., Inc. | | | 23,692 | | | | 865,706 | | |
| Other Securities | | | 82,741 | | | | 3,648,856 | | |
| | | | 12,899,599 | | |
| INDUSTRIALS (5.7%) | |
| Boeing Co. | | | 21,800 | | | | 1,180,034 | | |
| CSX Corp. | | | 13,238 | | | | 641,911 | | |
| General Electric Co. | | | 125,931 | | | | 1,905,336 | | |
| United Technologies Corp. | | | 16,004 | | | | 1,110,838 | | |
| Other Securities | | | 125,056 | | | | 4,667,609 | | |
| | | | 9,505,728 | | |
| INFORMATION TECHNOLOGY (11.9%) | |
| Apple, Inc.* | | | 12,812 | | | | 2,701,538 | | |
| Cisco Systems, Inc.* | | | 73,851 | | | | 1,767,993 | | |
| Google, Inc.* | | | 2,820 | | | | 1,748,344 | | |
| Hewlett-Packard Co. | | | 34,248 | | | | 1,764,114 | | |
| Int'l. Business Machines Corp. | | | 15,717 | | | | 2,057,355 | | |
| Microsoft Corp. | | | 74,184 | | | | 2,261,870 | | |
| Oracle Corp. | | | 55,783 | | | | 1,368,915 | | |
| QUALCOMM, Inc. | | | 25,168 | | | | 1,164,272 | | |
| Other Securities | | | 198,126 | | | | 4,997,499 | | |
| | | | 19,831,900 | | |
| MATERIALS (2.1%) | |
| Other Securities | | | 65,753 | | | | 3,421,564 | | |
| TELECOMMUNICATION SERVICES (1.7%) | |
| AT&T, Inc. | | | 53,078 | | | | 1,487,776 | | |
| Other Securities | | | 69,547 | | | | 1,249,958 | | |
| | | | 2,737,734 | | |
| UTILITIES (2.0%) | |
| Other Securities | | | 72,855 | | | | 3,334,888 | | |
TOTAL COMMON STOCKS
(Cost: $93,026,736) 58.6% | | $ | 97,262,197 | | |
| | | Rating** | | Rate | | Maturity | | Face
Amount | | Value | |
| LONG-TERM DEBT SECURITIES: | |
| U.S. GOVERNMENT (6.9%) | |
| U.S. Treasury Note | | AAA | | | 2.38 - 3.25 | % | | 10/31/14 - 05/15/19 | | $ | 6,500,000 | | | $ | 6,257,416 | | |
| U.S. Treasury Strip | | AAA | | | 0.00 | | | 11/15/21 | | | 8,900,000 | | | | 5,224,242 | | |
| | | | 11,481,658 | | |
| U.S. GOVERNMENT AGENCIES (12.7%) | |
| MORTGAGE-BACKED OBLIGATIONS (12.7%) | |
| FHARM | | AAA | | | 4.64 - 5.79 | | | 02/01/36 - 09/01/39 | | | 2,032,747 | | | | 2,143,216 | | |
| FHLMC | | AAA | | | 5.00 - 6.00 | | | 10/01/18 - 03/15/32 | | | 970,897 | | | | 1,026,467 | | |
| FNMA | | AAA | | | 4.00 - 8.00 | | | 09/01/16 - 12/25/49 | | | 16,315,158 | | | | 17,113,255 | | |
| Other Securities | | | | | | | | | | | 878,907 | | | | 915,509 | | |
| | | | 21,198,447 | | |
| CORPORATE DEBT (17.9%) | |
| CONSUMER DISCRETIONARY (2.4%) | |
| Home Depot, Inc. | | BBB+ | | | 5.40 | | | 03/01/16 | | | 500,000 | | | | 523,430 | | |
| Johnson Controls, Inc. | | BBB | | | 4.88 | | | 09/15/13 | | | 500,000 | | | | 514,278 | | |
| Other Securities | | | | | | | | | | | 3,138,068 | | | | 2,967,697 | | |
| | | | 4,005,405 | | |
The accompanying notes are an integral part of these portfolio schedules.
50
MUTUAL OF AMERICA INVESTMENT CORPORATION (COMPOSITE FUND)
SUMMARY PORTFOLIO OF INVESTMENTS IN SECURITIES (Continued)
December 31, 2009
| | | Rating** | | Rate | | Maturity | | Face
Amount | | Value | |
| LONG-TERM DEBT SECURITIES (CONTINUED): | |
| CONSUMER STAPLES (0.8%) | |
| Other Securities | | | | | | | | | | $ | 1,250,000 | | | $ | 1,327,504 | | |
| ENERGY (4.0%) | |
| Noble Corp. | | A- | | | 7.50 | % | | 03/15/19 | | | 800,000 | | | | 936,843 | | |
| Seariver Maritime, Inc. | | AAA | | | 0.00 | | | 09/01/12 | | | 3,000,000 | | | | 2,784,999 | | |
| Other Securities | | | | | | | | | | | 2,850,000 | | | | 2,879,153 | | |
| | | | 6,600,995 | | |
| FINANCIALS (5.8%) | |
| First Horizon National Corp. | | BB+ | | | 4.50 | | | 05/15/13 | | | 1,500,000 | | | | 1,355,621 | | |
| GMAC LLC | | CCC | | | 0.00 | | | 12/01/12 | | | 2,500,000 | | | | 1,868,750 | | |
| Other Securities | | | | | | | | | | | 6,397,000 | | | | 6,394,422 | | |
| | | | 9,618,793 | | |
| HEALTH CARE (0.8%) | |
| Other Securities | | | | | | | | | | | 1,250,000 | | | | 1,336,003 | | |
| INDUSTRIALS (1.1%) | |
| CSX Corp. | | BBB- | | | 6.25 | | | 04/01/15 | | | 250,000 | | | | 275,363 | | |
| Other Securities | | | | | | | | | | | 1,500,000 | | | | 1,522,220 | | |
| | | | 1,797,583 | | |
| INFORMATION TECHNOLOGY (0.3%) | |
| Other Securities | | | | | | | | | | | 500,000 | | | | 524,664 | | |
| MATERIALS (1.3%) | |
| PolyOne Corp. | | B- | | | 7.50 | | | 12/15/15 | | | 1,000,000 | | | | 895,000 | | |
| Other Securities | | | | | | | | | | | 1,228,000 | | | | 1,312,470 | | |
| | | | 2,207,470 | | |
| UTILITIES (1.4%) | |
| Other Securities | | | | | | | | | | | 2,250,000 | | | | 2,339,148 | | |
TOTAL LONG-TERM DEBT SECURITIES
(Cost: $61,286,708) 37.5% | | | 62,437,670 | | |
| SHORT-TERM DEBT SECURITIES: | |
| U.S. GOVERNMENT AGENCIES (0.1%) | |
| FHLB | | AAA | | | 0.10 | | | 02/17/10 | | | 100,000 | | | | 99,987 | | |
| COMMERCIAL PAPER (3.3%) | |
| Abbott Laboratories† | | A-1+ | | | 0.05 | | | 01/04/10 | | | 3,400,000 | | | | 3,399,986 | | |
| Toyota Motor Credit Corp. | | A-1+ | | | 0.17 | | | 02/16/10 | | | 2,000,000 | | | | 1,999,566 | | |
| | | | 5,399,552 | | |
TOTAL SHORT-TERM DEBT SECURITIES
(Cost: $5,499,539) 3.4% | | | 5,499,539 | | |
TEMPORARY CASH INVESTMENTS (2)
(Cost: $110,300) 0.1% | | | 110,300 | | |
TOTAL INVESTMENTS
(Cost: $159,923,283) 99.6% | | | 165,309,706 | | |
| OTHER NET ASSETS 0.4% | | | 671,390 | | |
| NET ASSETS 100.0% | | $ | 165,981,096 | | |
The accompanying notes are an integral part of these portfolio schedules.
51
MUTUAL OF AMERICA INVESTMENT CORPORATION (RETIREMENT INCOME FUND)
PORTFOLIO OF INVESTMENTS IN SECURITIES
December 31, 2009
| | | Shares | | Value | |
| COMMON STOCKS: | |
| DIVERSIFIED MUTUAL FUNDS (100.0%) | |
| Mutual of America Investment Corporation | |
| Bond Fund (29.9%) | | | 2,039,225 | | | $ | 2,643,945 | | |
| Equity Index Fund (20.2%) | | | 971,078 | | | | 1,783,243 | | |
| Mid-Cap Equity Index Fund (5.1%) | | | 362,796 | | | | 449,831 | | |
| Mid-Term Bond Fund (37.8%) | | | 3,363,839 | | | | 3,347,029 | | |
| Money Market Fund (7.0%) | | | 514,249 | | | | 620,396 | | |
TOTAL INVESTMENTS
(Cost: $8,401,052) 100.0% | | | | | | | 8,844,444 | | |
| OTHER NET ASSETS | | | | | | | — | | |
| NET ASSETS 100.0% | | | | | | $ | 8,844,444 | | |
MUTUAL OF AMERICA INVESTMENT CORPORATION (2010 RETIREMENT FUND)
PORTFOLIO OF INVESTMENTS IN SECURITIES
December 31, 2009
| | | Shares | | Value | |
| COMMON STOCKS: | |
| DIVERSIFIED MUTUAL FUNDS (100.0%) | |
| Mutual of America Investment Corporation | |
| Bond Fund (24.8%) | | | 2,801,085 | | | $ | 3,631,730 | | |
| Equity Index Fund (25.2%) | | | 2,001,654 | | | | 3,675,742 | | |
| International Fund (4.0%) | | | 865,882 | | | | 582,055 | | |
| Mid-Cap Equity Index Fund (14.2%) | | | 1,675,228 | | | | 2,077,113 | | |
| Mid-Term Bond Fund (26.8%) | | | 3,939,725 | | | | 3,920,038 | | |
| Money Market Fund (5.0%) | | | 605,543 | | | | 730,534 | | |
TOTAL INVESTMENTS
(Cost: $13,644,973) 100.0% | | | | | | | 14,617,212 | | |
| OTHER NET ASSETS | | | | | | | — | | |
| NET ASSETS 100.0% | | | | | | $ | 14,617,212 | | |
The accompanying notes are an integral part of these portfolio schedules.
52
MUTUAL OF AMERICA INVESTMENT CORPORATION (2015 RETIREMENT FUND)
PORTFOLIO OF INVESTMENTS IN SECURITIES
December 31, 2009
| | | Shares | | Value | |
| COMMON STOCKS: | |
| DIVERSIFIED MUTUAL FUNDS (100.0%) | |
| Mutual of America Investment Corporation | |
| Bond Fund (24.8%) | | | 8,435,967 | | | $ | 10,937,602 | | |
| Equity Index Fund (30.2%) | | | 7,232,190 | | | | 13,280,854 | | |
| International Fund (8.0%) | | | 5,214,309 | | | | 3,505,116 | | |
| Mid-Cap Equity Index Fund (11.1%) | | | 3,961,948 | | | | 4,912,415 | | |
| Mid-Term Bond Fund (17.9%) | | | 7,910,124 | | | | 7,870,597 | | |
| Money Market Fund (4.0%) | | | 1,458,887 | | | | 1,760,016 | | |
| Small Cap Growth Fund (2.0%) | | | 1,007,704 | | | | 900,360 | | |
| Small Cap Value Fund (2.0%) | | | 933,257 | | | | 892,274 | | |
TOTAL INVESTMENTS
(Cost: $41,068,911) 100.0% | | | | | | | 44,059,234 | | |
| OTHER NET ASSETS | | | | | | | — | | |
| NET ASSETS 100.0% | | | | | | $ | 44,059,234 | | |
MUTUAL OF AMERICA INVESTMENT CORPORATION (2020 RETIREMENT FUND)
PORTFOLIO OF INVESTMENTS IN SECURITIES
December 31, 2009
| | | Shares | | Value | |
| COMMON STOCKS: | |
| DIVERSIFIED MUTUAL FUNDS (100.0%) | |
| Mutual of America Investment Corporation | |
| Bond Fund (23.8%) | | | 9,118,628 | | | $ | 11,822,703 | | |
| Equity Index Fund (35.1%) | | | 9,502,717 | | | | 17,450,343 | | |
| International Fund (8.9%) | | | 6,606,764 | | | | 4,441,139 | | |
| Mid-Cap Equity Index Fund (11.2%) | | | 4,461,472 | | | | 5,531,775 | | |
| Mid-Term Bond Fund (12.9%) | | | 6,432,557 | | | | 6,400,414 | | |
| Small Cap Growth Fund (4.1%) | | | 2,269,429 | | | | 2,027,683 | | |
| Small Cap Value Fund (4.0%) | | | 2,101,694 | | | | 2,009,400 | | |
TOTAL INVESTMENTS
(Cost: $47,345,320) 100.0% | | | | | | | 49,683,457 | | |
| OTHER NET ASSETS | | | | | | | — | | |
| NET ASSETS 100.0% | | | | | | $ | 49,683,457 | | |
The accompanying notes are an integral part of these portfolio schedules.
53
MUTUAL OF AMERICA INVESTMENT CORPORATION (2025 RETIREMENT FUND)
PORTFOLIO OF INVESTMENTS IN SECURITIES
December 31, 2009
| | | Shares | | Value | |
| COMMON STOCKS: | |
| DIVERSIFIED MUTUAL FUNDS (100.0%) | |
| Mutual of America Investment Corporation | |
| Bond Fund (19.8%) | | | 6,408,543 | | | $ | 8,308,958 | | |
| Equity Index Fund (40.1%) | | | 9,160,790 | | | | 16,822,444 | | |
| International Fund (8.9%) | | | 5,572,581 | | | | 3,745,950 | | |
| Mid-Cap Equity Index Fund (15.2%) | | | 5,131,398 | | | | 6,362,416 | | |
| Mid-Term Bond Fund (5.9%) | | | 2,503,830 | | | | 2,491,319 | | |
| Small Cap Growth Fund (5.1%) | | | 2,392,730 | | | | 2,137,849 | | |
| Small Cap Value Fund (5.0%) | | | 2,215,831 | | | | 2,118,524 | | |
TOTAL INVESTMENTS
(Cost: $39,280,703) 100.0% | | | | | | | 41,987,460 | | |
| OTHER NET ASSETS | | | | | | | — | | |
| NET ASSETS 100.0% | | | | | | $ | 41,987,460 | | |
MUTUAL OF AMERICA INVESTMENT CORPORATION (2030 RETIREMENT FUND)
PORTFOLIO OF INVESTMENTS IN SECURITIES
December 31, 2009
| | | Shares | | Value | |
| COMMON STOCKS: | |
| DIVERSIFIED MUTUAL FUNDS (100.0%) | |
| Mutual of America Investment Corporation | |
| Bond Fund (19.8%) | | | 5,295,291 | | | $ | 6,865,578 | | |
| Equity Index Fund (40.0%) | | | 7,569,448 | | | | 13,900,180 | | |
| International Fund (9.9%) | | | 5,116,697 | | | | 3,439,500 | | |
| Mid-Cap Equity Index Fund (18.2%) | | | 5,087,510 | | | | 6,307,998 | | |
| Small Cap Growth Fund (6.1%) | | | 2,372,203 | | | | 2,119,508 | | |
| Small Cap Value Fund (6.0%) | | | 2,196,836 | | | | 2,100,364 | | |
TOTAL INVESTMENTS
(Cost: $32,279,136) 100.0% | | | | | | | 34,733,128 | | |
| OTHER NET ASSETS | | | | | | | — | | |
| NET ASSETS 100.0% | | | | | | $ | 34,733,128 | | |
The accompanying notes are an integral part of these portfolio schedules.
54
MUTUAL OF AMERICA INVESTMENT CORPORATION (2035 RETIREMENT FUND)
PORTFOLIO OF INVESTMENTS IN SECURITIES
December 31, 2009
| | | Shares | | Value | |
| COMMON STOCKS: | |
| DIVERSIFIED MUTUAL FUNDS (100.0%) | |
| Mutual of America Investment Corporation | |
| Bond Fund (12.8%) | | | 2,669,320 | | | $ | 3,460,891 | | |
| Equity Index Fund (40.0%) | | | 5,871,685 | | | | 10,782,487 | | |
| International Fund (11.9%) | | | 4,763,050 | | | | 3,201,774 | | |
| Mid-Cap Equity Index Fund (21.2%) | | | 4,604,418 | | | | 5,709,014 | | |
| Small Cap Growth Fund (7.1%) | | | 2,147,088 | | | | 1,918,374 | | |
| Small Cap Value Fund (7.0%) | | | 1,988,181 | | | | 1,900,872 | | |
TOTAL INVESTMENTS
(Cost: $25,039,085) 100.0% | | | | | | | 26,973,412 | | |
| OTHER NET ASSETS | | | | | | | — | | |
| NET ASSETS 100.0% | | | | | | $ | 26,973,412 | | |
MUTUAL OF AMERICA INVESTMENT CORPORATION (2040 RETIREMENT FUND)
PORTFOLIO OF INVESTMENTS IN SECURITIES
December 31, 2009
| | | Shares | | Value | |
| COMMON STOCKS: | |
| DIVERSIFIED MUTUAL FUNDS (100.0%) | |
| Mutual of America Investment Corporation | |
| Bond Fund (10.9%) | | | 1,888,404 | | | $ | 2,448,399 | | |
| Equity Index Fund (35.0%) | | | 4,294,849 | | | | 7,886,858 | | |
| International Fund (13.8%) | | | 4,644,674 | | | | 3,122,201 | | |
| Mid-Cap Equity Index Fund (24.2%) | | | 4,398,191 | | | | 5,453,313 | | |
| Small Cap Growth Fund (8.1%) | | | 2,050,758 | | | | 1,832,305 | | |
| Small Cap Value Fund (8.0%) | | | 1,899,183 | | | | 1,815,783 | | |
TOTAL INVESTMENTS
(Cost: $20,691,871) 100.0% | | | | | | | 22,558,859 | | |
| OTHER NET ASSETS | | | | | | | — | | |
| NET ASSETS 100.0% | | | | | | $ | 22,558,859 | | |
The accompanying notes are an integral part of these portfolio schedules.
55
MUTUAL OF AMERICA INVESTMENT CORPORATION (2045 RETIREMENT FUND)
PORTFOLIO OF INVESTMENTS IN SECURITIES
December 31, 2009
| | | Shares | | Value | |
| COMMON STOCKS: | |
| DIVERSIFIED MUTUAL FUNDS (100.0%) | |
| Mutual of America Investment Corporation | |
| Bond Fund (9.9%) | | | 1,900,376 | | | $ | 2,463,922 | | |
| Equity Index Fund (34.9%) | | | 4,754,751 | | | | 8,731,402 | | |
| International Fund (14.8%) | | | 5,509,725 | | | | 3,703,698 | | |
| Mid-Cap Equity Index Fund (20.1%) | | | 4,057,908 | | | | 5,031,396 | | |
| Small Cap Growth Fund (10.2%) | | | 2,838,260 | | | | 2,535,920 | | |
| Small Cap Value Fund (10.1%) | | | 2,628,323 | | | | 2,512,903 | | |
TOTAL INVESTMENTS
(Cost: $22,527,148) 100.0% | | | | | | | 24,979,241 | | |
| OTHER NET ASSETS | | | | | | | — | | |
| NET ASSETS 100.0% | | | | | | $ | 24,979,241 | | |
MUTUAL OF AMERICA INVESTMENT CORPORATION (CONSERVATIVE ALLOCATION FUND)
PORTFOLIO OF INVESTMENTS IN SECURITIES
December 31, 2009
| | | Shares | | Value | |
| COMMON STOCKS: | |
| DIVERSIFIED MUTUAL FUNDS (100.0%) | |
| Mutual of America Investment Corporation | |
| Bond Fund (30.1%) | | | 8,851,178 | | | $ | 11,475,942 | | |
| Equity Index Fund (24.8%) | | | 5,145,751 | | | | 9,449,416 | | |
| Mid-Term Bond Fund (45.1%) | | | 17,281,886 | | | | 17,195,529 | | |
TOTAL INVESTMENTS
(Cost: $37,316,969) 100.0% | | | | | | | 38,120,887 | | |
| OTHER NET ASSETS | | | | | | | — | | |
| NET ASSETS 100.0% | | | | | | $ | 38,120,887 | | |
The accompanying notes are an integral part of these portfolio schedules.
56
MUTUAL OF AMERICA INVESTMENT CORPORATION (MODERATE ALLOCATION FUND)
PORTFOLIO OF INVESTMENTS IN SECURITIES
December 31, 2009
| | | Shares | | Value | |
| COMMON STOCKS: | |
| DIVERSIFIED MUTUAL FUNDS (100.0%) | |
| Mutual of America Investment Corporation | |
| Bond Fund (30.2%) | | | 29,194,486 | | | $ | 37,851,935 | | |
| Equity Index Fund (34.9%) | | | 23,762,814 | | | | 43,636,914 | | |
| Mid-Cap Equity Index Fund (14.8%) | | | 14,992,661 | | | | 18,589,386 | | |
| Mid-Term Bond Fund (20.1%) | | | 25,334,574 | | | | 25,207,977 | | |
TOTAL INVESTMENTS
(Cost: $126,670,992) 100.0% | | | | | | | 125,286,212 | | |
| OTHER NET ASSETS | | | | | | | — | | |
| NET ASSETS 100.0% | | | | | | $ | 125,286,212 | | |
MUTUAL OF AMERICA INVESTMENT CORPORATION (AGGRESSIVE ALLOCATION FUND)
PORTFOLIO OF INVESTMENTS IN SECURITIES
December 31, 2009
| | | Shares | | Value | |
| COMMON STOCKS: | |
| DIVERSIFIED MUTUAL FUNDS (100.0%) | |
| Mutual of America Investment Corporation | |
| Bond Fund (25.3%) | | | 22,713,477 | | | $ | 29,449,022 | | |
| Equity Index Fund (44.8%) | | | 28,525,277 | | | | 52,382,478 | | |
| Mid-Cap Equity Index Fund (19.9%) | | | 18,664,311 | | | | 23,141,861 | | |
| Small Cap Growth Fund (5.0%) | | | 6,495,263 | | | | 5,803,368 | | |
| Small Cap Value Fund (5.0%) | | | 6,058,226 | | | | 5,792,185 | | |
TOTAL INVESTMENTS
(Cost: $124,430,837) 100.0% | | | | | | | 116,568,914 | | |
| OTHER NET ASSETS | | | | | | | — | | |
| NET ASSETS 100.0% | | | | | | $ | 116,568,914 | | |
The accompanying notes are an integral part of these portfolio schedules.
57
MUTUAL OF AMERICA INVESTMENT CORPORATION (MONEY MARKET FUND)
PORTFOLIO OF INVESTMENTS IN SECURITIES
December 31, 2009
| | | Rating** | | Rate | | Maturity | | Face
Amount | | Value | |
| SHORT-TERM DEBT SECURITIES: | |
| U.S. GOVERNMENT AGENCIES (59.2%) | |
| FHLB | | AAA | | | 0.02 | % | | 02/05/10 | | $ | 4,200,000 | | | $ | 4,199,918 | | |
| FHLB | | AAA | | | 0.09 | | | 01/27/10 | | | 8,127,000 | | | | 8,127,020 | | |
| FHLB | | AAA | | | 0.10 | | | 01/13/10 | | | 400,000 | | | | 399,987 | | |
| FHLB | | AAA | | | 0.10 | | | 01/20/10 | | | 690,000 | | | | 689,992 | | |
| FHLB | | AAA | | | 0.10 | | | 02/08/10 | | | 150,000 | | | | 149,998 | | |
| FHLB | | AAA | | | 0.10 | | | 02/12/10 | | | 2,200,000 | | | | 2,199,757 | | |
| FHLB | | AAA | | | 0.10 | | | 02/16/10 | | | 500,000 | | | | 499,936 | | |
| FHLB | | AAA | | | 0.10 | | | 02/17/10 | | | 400,000 | | | | 399,948 | | |
| FHLB | | AAA | | | 0.10 | | | 03/04/10 | | | 800,000 | | | | 799,915 | | |
| FHLB | | AAA | | | 0.10 | | | 03/05/10 | | | 800,000 | | | | 799,941 | | |
| FHLB | | AAA | | | 0.10 | | | 03/10/10 | | | 650,000 | | | | 649,843 | | |
| FHLB | | AAA | | | 0.10 | | | 03/17/10 | | | 9,242,000 | | | | 9,240,732 | | |
| FHLB | | AAA | | | 0.15 | | | 03/02/10 | | | 500,000 | | | | 499,896 | | |
| FHLMC | | AAA | | | 0.01 | | | 01/25/10 | | | 2,250,000 | | | | 2,249,985 | | |
| FHLMC | | AAA | | | 0.09 | | | 01/06/10 | | | 800,000 | | | | 799,990 | | |
| FHLMC | | AAA | | | 0.09 | | | 01/25/10 | | | 1,500,000 | | | | 1,499,972 | | |
| FHLMC | | AAA | | | 0.10 | | | 01/21/10 | | | 130,000 | | | | 129,993 | | |
| FHLMC | | AAA | | | 0.10 | | | 01/29/10 | | | 525,000 | | | | 524,959 | | |
| FHLMC | | AAA | | | 0.10 | | | 03/02/10 | | | 2,172,000 | | | | 2,171,890 | | |
| FHLMC | | AAA | | | 0.10 | | | 03/05/10 | | | 810,000 | | | | 809,912 | | |
| FHLMC | | AAA | | | 0.10 | | | 03/15/10 | | | 700,000 | | | | 699,883 | | |
| FHLMC | | AAA | | | 0.10 | | | 03/17/10 | | | 1,825,000 | | | | 1,824,727 | | |
| FHLMC | | AAA | | | 0.11 | | | 03/15/10 | | | 1,415,000 | | | | 1,414,764 | | |
| FHLMC | | AAA | | | 0.15 | | | 03/16/10 | | | 1,150,000 | | | | 1,149,842 | | |
| FHLMC | | AAA | | | 0.15 | | | 03/17/10 | | | 740,000 | | | | 739,890 | | |
| FNMA | | AAA | | | 0.09 | | | 01/20/10 | | | 1,100,000 | | | | 1,099,984 | | |
| FNMA | | AAA | | | 0.10 | | | 01/04/10 | | | 380,000 | | | | 379,997 | | |
| FNMA | | AAA | | | 0.10 | | | 01/06/10 | | | 600,000 | | | | 599,992 | | |
| FNMA | | AAA | | | 0.10 | | | 01/19/10 | | | 2,700,000 | | | | 2,699,865 | | |
| FNMA | | AAA | | | 0.10 | | | 01/20/10 | | | 315,000 | | | | 314,983 | | |
| FNMA | | AAA | | | 0.10 | | | 01/29/10 | | | 500,000 | | | | 499,961 | | |
| FNMA | | AAA | | | 0.10 | | | 02/01/10 | | | 110,000 | | | | 110,129 | | |
| FNMA | | AAA | | | 0.10 | | | 02/03/10 | | | 135,000 | | | | 134,995 | | |
| FNMA | | AAA | | | 0.10 | | | 02/10/10 | | | 285,000 | | | | 284,989 | | |
| FNMA | | AAA | | | 0.10 | | | 03/10/10 | | | 13,564,000 | | | | 13,561,889 | | |
| FNMA | | AAA | | | 0.10 | | | 03/17/10 | | | 400,000 | | | | 399,943 | | |
| FNMA | | AAA | | | 0.12 | | | 03/10/10 | | | 7,539,000 | | | | 7,537,758 | | |
| | | | 70,297,175 | | |
| COMMERCIAL PAPER (40.8%) | |
| Abbott Laboratories† | | A-1+ | | | 0.08 | | | 01/25/10 | | | 1,600,000 | | | | 1,599,917 | | |
| Abbott Laboratories† | | A-1+ | | | 0.10 | | | 01/26/10 | | | 500,000 | | | | 499,965 | | |
| Abbott Laboratories† | | A-1+ | | | 0.10 | | | 02/01/10 | | | 300,000 | | | | 299,974 | | |
| Abbott Laboratories† | | A-1+ | | | 0.11 | | | 02/08/10 | | | 300,000 | | | | 299,968 | | |
| Abbott Laboratories† | | A-1+ | | | 0.11 | | | 03/01/10 | | | 400,000 | | | | 399,945 | | |
| Becton, Dickinson & Co. | | A-1+ | | | 0.11 | | | 01/25/10 | | | 3,100,000 | | | | 3,099,773 | | |
| Chevron Funding Corp. | | A-1+ | | | 0.03 | | | 01/07/10 | | | 3,100,000 | | | | 3,099,985 | | |
| Coca-Cola Co.† | | A-1 | | | 0.11 | | | 01/13/10 | | | 840,000 | | | | 839,969 | | |
The accompanying notes are an integral part of these portfolio schedules.
58
MUTUAL OF AMERICA INVESTMENT CORPORATION (MONEY MARKET FUND)
PORTFOLIO OF INVESTMENTS IN SECURITIES (Continued)
December 31, 2009
| | | Rating** | | Rate | | Maturity | | Face
Amount | | Value | |
| SHORT-TERM DEBT SECURITIES: (CONTINUED) | |
| COMMERCIAL PAPER (CONTINUED) | |
| Coca-Cola Co.† | | A-1 | | | 0.10 | % | | 01/20/10 | | $ | 500,000 | | | $ | 499,974 | | |
| Coca-Cola Co.† | | A-1 | | | 0.12 | | | 02/03/10 | | | 2,000,000 | | | | 1,999,844 | | |
| Danaher Corp | | A-1 | | | 0.13 | | | 01/06/10 | | | 3,200,000 | | | | 3,199,942 | | |
| Florida Power & Light Co. | | A-1 | | | 0.11 | | | 01/05/10 | | | 3,100,000 | | | | 3,099,962 | | |
| General Electric Capital Corp. | | A-1+ | | | 0.02 | | | 01/15/10 | | | 1,400,000 | | | | 1,399,989 | | |
| General Electric Capital Svcs. | | A-1+ | | | 0.17 | | | 02/05/10 | | | 1,700,000 | | | | 1,699,719 | | |
| Johnson & Johnson† | | A-1+ | | | 0.09 | | | 02/01/10 | | | 3,100,000 | | | | 3,099,852 | | |
| Madison Gas & Electric | | A-1+ | | | 0.13 | | | 01/15/10 | | | 600,000 | | | | 599,970 | | |
| Microsoft Corp.† | | A-1+ | | | 0.09 | | | 01/26/10 | | | 3,150,000 | | | | 3,149,823 | | |
| Nestle Capital Corp.† | | A-1+ | | | 0.08 | | | 02/02/10 | | | 3,100,000 | | | | 3,099,809 | | |
| NetJets, Inc.† | | A-1+ | | | 0.12 | | | 02/05/10 | | | 3,100,000 | | | | 3,099,639 | | |
| Novartis Finance Corp.† | | A-1+ | | | 0.03 | | | 01/04/10 | | | 3,100,000 | | | | 3,099,992 | | |
| NSTAR Electric Co. | | A-1 | | | 0.11 | | | 01/07/10 | | | 1,000,000 | | | | 999,982 | | |
| Toyota Motor Credit Corp. | | A-1+ | | | 0.17 | | | 02/05/10 | | | 500,000 | | | | 499,917 | | |
| Toyota Motor Credit Corp. | | A-1+ | | | 0.18 | | | 02/16/10 | | | 1,150,000 | | | | 1,149,740 | | |
| Toyota Motor Credit Corp. | | A-1+ | | | 0.15 | | | 02/26/10 | | | 1,500,000 | | | | 1,499,650 | | |
| United Parcel Service, Inc.† | | A-1+ | | | 0.07 | | | 01/04/10 | | | 3,000,000 | | | | 2,999,983 | | |
| Washington Gas Light Co. | | A-1 | | | 0.12 | | | 01/05/10 | | | 2,000,000 | | | | 1,999,973 | | |
| Washington Gas Light Co. | | A-1 | | | 0.12 | | | 01/06/10 | | | 1,100,000 | | | | 1,099,982 | | |
| | | | 48,437,238 | | |
TOTAL SHORT-TERM DEBT SECURITIES
(Cost: $118,730,752) 100.0% | | | 118,734,413 | | |
TOTAL INVESTMENTS
(Cost: $118,730,752) 100.0% | | | 118,734,413 | | |
| OTHER NET ASSETS 0.0% (3) | | | 2,654 | | |
| NET ASSETS 100.0% | | $ | 118,737,067 | | |
The accompanying notes are an integral part of these portfolio schedules.
59
MUTUAL OF AMERICA INVESTMENT CORPORATION (MID-TERM BOND FUND)
SUMMARY PORTFOLIO OF INVESTMENTS IN SECURITIES
December 31, 2009
| | | Rating** | | Rate | | Maturity | | Face
Amount | | Value | |
| LONG-TERM DEBT SECURITIES: | |
| U.S. GOVERNMENT (36.8%) | |
| U.S. Treasury Note | | AAA | | | 1.00 - 3.25 | % | | 12/31/11 - 05/15/19 | | $ | 61,750,000 | | | $ | 61,469,315 | | |
| U.S. Treasury Strip | | AAA | | | 0.00 | | | 08/15/18 | | | 35,000,000 | | | | 24,828,750 | | |
| | | | 86,298,065 | | |
| U.S. GOVERNMENT AGENCIES (9.6%) | |
| MORTGAGE-BACKED OBLIGATIONS (1.4%) | |
| FHLMC | | AAA | | | 5.00 - 8.50 | | | 11/01/10 - 03/15/21 | | | 3,132,646 | | | | 3,272,663 | | |
| Other Securities | | | | | | | | | | | 57,383 | | | | 59,400 | | |
| | | | 3,332,063 | | |
| NON-MORTGAGE-BACKED OBLIGATIONS (8.2%) | |
| FFCB | | AAA | | | 4.95 - 5.10 | | | 08/05/13 - 10/10/14 | | | 17,500,000 | | | | 19,122,738 | | |
| CORPORATE DEBT (52.5%) | |
| CONSUMER DISCRETIONARY (5.8%) | |
| AutoZone, Inc. | | BBB | | | 6.50 | | | 01/15/14 | | | 1,000,000 | | | | 1,102,235 | | |
| Best Buy Co., Inc. | | BBB- | | | 6.75 | | | 07/15/13 | | | 1,000,000 | | | | 1,098,594 | | |
| DaimlerChrysler N.A. LLC | | A- | | | 5.75 | | | 09/08/11 | | | 1,000,000 | | | | 1,050,412 | | |
| Mattel, Inc. | | BBB- | | | 6.13 | | | 06/15/11 | | | 1,000,000 | | | | 1,054,346 | | |
| Other Securities | | | | | | | | | | | 9,017,000 | | | | 9,201,358 | | |
| | | | 13,506,945 | | |
| CONSUMER STAPLES (4.3%) | |
| Anheuser-Busch Cos., Inc. | | BBB+ | | | 4.38 - 4.70 | | | 04/15/12 - 01/15/13 | | | 1,100,000 | | | | 1,127,506 | | |
| Brown-Forman Corp. | | A | | | 5.20 | | | 04/01/12 | | | 1,000,000 | | | | 1,065,522 | | |
| Cargill, Inc.† | | A | | | 5.20 | | | 01/22/13 | | | 1,000,000 | | | | 1,060,343 | | |
| Clorox Co. | | BBB+ | | | 4.20 - 5.00 | | | 01/15/10 - 01/15/15 | | | 1,050,000 | | | | 1,103,106 | | |
| ConAgra Foods, Inc. | | BBB | | | 6.75 | | | 09/15/11 | | | 1,000,000 | | | | 1,079,674 | | |
| Hershey Co. | | A | | | 4.85 - 5.00 | | | 04/01/13 - 08/15/15 | | | 1,000,000 | | | | 1,053,801 | | |
| Kraft Foods, Inc. | | BBB+ | | | 5.25 - 5.63 | | | 10/01/13 - 11/01/11 | | | 1,000,000 | | | | 1,059,401 | | |
| Other Securities | | | | | | | | | | | 2,500,000 | | | | 2,625,307 | | |
| | | | 10,174,660 | | |
| ENERGY (4.8%) | |
| CenterPoint Energy Resources | | BBB | | | 7.75 - 7.88 | | | 02/15/11 - 04/01/13 | | | 1,170,000 | | | | 1,288,972 | | |
| Enbridge, Inc. | | A- | | | 5.80 | | | 06/15/14 | | | 1,065,000 | | | | 1,153,854 | | |
| Sunoco, Inc. | | BBB- | | | 4.88 - 9.63 | | | 10/15/14 - 04/15/15 | | | 1,000,000 | | | | 1,098,928 | | |
| Other Securities | | | | | | | | | | | 7,500,000 | | | | 7,729,317 | | |
| | | | 11,271,071 | | |
| FINANCIALS (14.8%) | |
| American Express Credit Corp. | | BBB+ | | | 5.88 | | | 05/02/13 | | | 1,000,000 | | | | 1,073,159 | | |
| Caterpillar Financial Services | | A | | | 6.13 | | | 02/17/14 | | | 1,000,000 | | | | 1,117,540 | | |
| General Electric Capital Corp. | | AA+ | | | 5.00 | | | 11/15/11 - 01/08/16 | | | 1,500,000 | | | | 1,561,964 | | |
| Heinz (H.J.) Finance Co. | | BBB | | | 6.00 | | | 03/15/12 | | | 1,000,000 | | | | 1,072,685 | | |
| KeyCorp | | BBB+ | | | 6.50 | | | 05/14/13 | | | 1,050,000 | | | | 1,083,745 | | |
| Kimco Realty Corp. | | BBB+ | | | 6.00 | | | 11/30/12 | | | 1,000,000 | | | | 1,054,733 | | |
| Nat'l. Rural Utilities Coop. | | A | | | 7.25 | | | 03/01/12 | | | 1,000,000 | | | | 1,099,238 | | |
| Travelers Cos., Inc. | | A- | | | 5.38 | | | 06/15/12 | | | 1,000,000 | | | | 1,058,710 | | |
| Other Securities | | | | | | | | | | | 25,785,000 | | | | 25,523,777 | | |
| | | | 34,645,551 | | |
| HEALTH CARE (4.7%) | |
| Blue Cross & Blue Shield of FL† | | A- | | | 8.25 | | | 11/15/11 | | | 1,000,000 | | | | 1,088,525 | | |
The accompanying notes are an integral part of these portfolio schedules.
60
MUTUAL OF AMERICA INVESTMENT CORPORATION (MID-TERM BOND FUND)
SUMMARY PORTFOLIO OF INVESTMENTS IN SECURITIES (Continued)
December 31, 2009
| | | Rating** | | Rate | | Maturity | | Face
Amount | | Value | |
| LONG-TERM DEBT SECURITIES (CONTINUED): | |
| HEALTH CARE (CONTINUED) | |
| Cardinal Health, Inc. | | BBB+ | | | 5.50 | % | | 06/15/13 | | $ | 1,000,000 | | | $ | 1,062,862 | | |
| Humana, Inc. | | BBB- | | | 6.45 | | | 06/01/16 | | | 1,415,000 | | | | 1,430,292 | | |
| McKesson Corp. | | BBB+ | | | 7.75 | | | 02/01/12 | | | 1,000,000 | | | | 1,102,336 | | |
| UnitedHealth Group, Inc. | | A- | | | 5.25 - 5.50 | | | 03/15/11 - 11/15/12 | | | 1,000,000 | | | | 1,059,806 | | |
| Other Securities | | | | | | | | | | | 4,960,000 | | | | 5,220,751 | | |
| | | | 10,964,572 | | |
| INDUSTRIALS (6.6%) | |
| CSX Corp. | | BBB- | | | 6.25 | | | 04/01/15 | | | 1,000,000 | | | | 1,101,451 | | |
| Dun & Bradstreet Corp. | | A- | | | 5.50 - 6.00 | | | 03/15/11 - 04/01/13 | | | 1,500,000 | | | | 1,550,283 | | |
| Federal Express Corp. | | BBB | | | 9.65 | | | 06/15/12 | | | 1,000,000 | | | | 1,157,023 | | |
| Goodrich Corp. | | BBB+ | | | 7.63 | | | 12/15/12 | | | 1,000,000 | | | | 1,119,799 | | |
| Roper Industries, Inc. | | BBB- | | | 6.63 | | | 08/15/13 | | | 1,000,000 | | | | 1,089,067 | | |
| Ryder System, Inc. | | BBB+ | | | 6.00 - 7.20 | | | 03/01/13 - 09/01/15 | | | 1,500,000 | | | | 1,613,384 | | |
| Union Pacific Corp. | | BBB | | | 4.88 - 6.13 | | | 01/15/12 - 01/15/15 | | | 1,000,000 | | | | 1,062,720 | | |
| Other Securities | | | | | | | | | | | 6,575,000 | | | | 6,719,063 | | |
| | | | 15,412,790 | | |
| INFORMATION TECHNOLOGY (2.3%) | |
| Xerox Corp. | | BBB | | | 6.88 | | | 08/15/11 | | | 1,000,000 | | | | 1,068,563 | | |
| Other Securities | | | | | | | | | | | 4,155,000 | | | | 4,401,820 | | |
| | | | 5,470,383 | | |
| MATERIALS (2.3%) | |
| Sealed Air Corp.† | | BB+ | | | 5.63 | | | 07/15/13 | | | 1,000,000 | | | | 1,057,362 | | |
| Vulcan Materials Co. | | BBB | | | 6.30 | | | 06/15/13 | | | 1,000,000 | | | | 1,069,595 | | |
| Other Securities | | | | | | | | | | | 3,143,000 | | | | 3,311,697 | | |
| | | | 5,438,654 | | |
| TELECOMMUNICATION SERVICES (0.9%) | |
| Verizon New England, Inc. | | A | | | 6.50 | | | 09/15/11 | | | 1,000,000 | | | | 1,065,857 | | |
| Other Securities | | | | | | | | | | | 900,000 | | | | 961,025 | | |
| | | | 2,026,882 | | |
| UTILITIES (6.0%) | |
| AGL Capital Corp. | | BBB+ | | | 6.38 - 7.13 | | | 01/14/11 - 07/15/16 | | | 1,500,000 | | | | 1,586,653 | | |
| Arizona Public Svc. Co. | | BBB- | | | 6.38 - 6.50 | | | 10/15/11 - 03/01/12 | | | 1,000,000 | | | | 1,072,686 | | |
| Black Hills Corp. | | BBB- | | | 9.00 | | | 05/15/14 | | | 2,000,000 | | | | 2,280,814 | | |
| Exelon Generation Co. LLC | | BBB | | | 5.35 | | | 01/15/14 | | | 1,000,000 | | | | 1,055,693 | | |
| PPL Energy Supply LLC | | BBB | | | 5.70 - 6.40 | | | 11/01/11 - 10/15/15 | | | 1,700,000 | | | | 1,806,028 | | |
| Southwest Gas Corp. | | NR | | | 8.38 | | | 02/15/11 | | | 1,000,000 | | | | 1,065,238 | | |
| TransAlta Corp. | | BBB | | | 5.75 | | | 12/15/13 | | | 1,000,000 | | | | 1,054,142 | | |
| Other Securities | | | | | | | | | | | 4,050,000 | | | | 4,230,944 | | |
| | | | 14,152,198 | | |
TOTAL LONG-TERM DEBT SECURITIES
(Cost: $226,265,440) 98.9% | | | 231,816,572 | | |
TEMPORARY CASH INVESTMENTS (2)
(Cost: $261,900) 0.1% | | | 261,900 | | |
TOTAL INVESTMENTS
(Cost: $226,527,340) 99.0% | | | 232,078,472 | | |
| OTHER NET ASSETS 1.0% | | | 2,343,976 | | |
| NET ASSETS 100.0% | | $ | 234,422,448 | | |
The accompanying notes are an integral part of these portfolio schedules.
61
MUTUAL OF AMERICA INVESTMENT CORPORATION (BOND FUND)
SUMMARY PORTFOLIO OF INVESTMENTS IN SECURITIES
December 31, 2009
| | | Rating** | | Rate | | Maturity | | Face
Amount | | Value | |
| LONG-TERM DEBT SECURITIES: | |
| U.S. GOVERNMENT (20.7%) | |
| U.S. Treasury Bond | | AAA | | | 3.50 - 4.25 | % | | 02/15/39 - 05/15/39 | | $ | 40,000,000 | | | $ | 37,048,747 | | |
| U.S. Treasury Note | | AAA | | | 1.00 - 3.25 | | | 12/31/11 - 05/15/19 | | | 65,000,000 | | | | 63,898,043 | | |
| | | | 100,946,790 | | |
| U.S. GOVERNMENT AGENCIES (35.8%) | |
| MORTGAGE-BACKED OBLIGATIONS (33.6%) | |
| FHARM | | AAA | | | 4.64 - 5.79 | | | 02/01/36 - 09/01/39 | | | 11,418,115 | | | | 12,027,523 | | |
| FHLMC | | AAA | | | 4.00 - 6.00 | | | 10/01/18 - 01/15/35 | | | 13,977,403 | | | | 14,653,668 | | |
| FNMA | | AAA | | | 4.00 - 8.00 | | | 09/01/16 - 12/25/49 | | | 124,824,147 | | | | 130,422,767 | | |
| GNMA (5) | | AAA | | | 4.50 - 7.00 | | | 02/20/21 - 11/15/39 | | | 4,355,701 | | | | 4,497,706 | | |
| Vendee Mortgage Trust (5) | | AAA | | | 5.25 | | | 01/15/32 | | | 2,421,102 | | | | 2,519,459 | | |
| | | | 164,121,123 | | |
| NON-MORTGAGE-BACKED OBLIGATIONS (2.2%) | |
| FNMA | | AAA | | | 0.00 | | | 10/09/19 | | | 20,000,000 | | | | 10,860,000 | | |
| CORPORATE DEBT (41.5%) | |
| CONSUMER DISCRETIONARY (5.1%) | |
| Fortune Brands, Inc. | | BBB- | | | 4.88 - 5.38 | | | 12/01/13 - 01/15/16 | | | 2,400,000 | | | | 2,401,881 | | |
| Home Depot, Inc. | | BBB+ | | | 5.40 | | | 03/01/16 | | | 2,000,000 | | | | 2,093,720 | | |
| Johnson Controls, Inc. | | BBB | | | 4.88 | | | 09/15/13 | | | 2,500,000 | | | | 2,571,390 | | |
| Whirlpool Corp. | | BBB- | | | 6.50 | | | 06/15/16 | | | 2,000,000 | | | | 2,080,050 | | |
| Other Securities | | | | | | | | | | | 15,954,170 | | | | 15,595,831 | | |
| | | | 24,742,872 | | |
| CONSUMER STAPLES (2.3%) | |
| Clorox Co. | | BBB+ | | | 5.00 | | | 03/01/13 | | | 2,000,000 | | | | 2,137,902 | | |
| CVS Caremark Corp. | | BBB+ | | | 6.13 | | | 08/15/16 | | | 2,000,000 | | | | 2,153,664 | | |
| Kraft Foods, Inc. | | BBB+ | | | 5.63 | | | 11/01/11 | | | 2,000,000 | | | | 2,124,130 | | |
| Kroger Co. | | BBB | | | 4.95 | | | 01/15/15 | | | 2,000,000 | | | | 2,099,390 | | |
| Sara Lee Corp. | | BBB+ | | | 6.25 | | | 09/15/11 | | | 2,000,000 | | | | 2,133,790 | | |
| Other Securities | | | | | | | | | | | 500,000 | | | | 530,844 | | |
| | | | 11,179,720 | | |
| ENERGY (5.3%) | |
| CenterPoint Energy Resources | | BBB | | | 7.75 | | | 02/15/11 | | | 2,000,000 | | | | 2,115,196 | | |
| Diamond Offshore Drilling, Inc. | | A- | | | 4.88 | | | 07/01/15 | | | 2,000,000 | | | | 2,111,208 | | |
| Noble Corp. | | A- | | | 7.50 | | | 03/15/19 | | | 2,000,000 | | | | 2,342,108 | | |
| Seariver Maritime, Inc. | | AAA | | | 0.00 | | | 09/01/12 | | | 10,000,000 | | | | 9,283,330 | | |
| Other Securities | | | | | | | | | | | 10,000,000 | | | | 10,109,478 | | |
| | | | 25,961,320 | | |
| FINANCIALS (15.8%) | |
| Allstate Corp. | | A- | | | 7.45 | | | 05/16/19 | | | 2,000,000 | | | | 2,323,644 | | |
| Berkley (W.R.) Corp. | | BBB+ | | | 7.38 | | | 09/15/19 | | | 2,000,000 | | | | 2,093,366 | | |
| Fairfax Financial Hldgs. | | BBB- | | | 8.25 | | | 10/01/15 | | | 2,500,000 | | | | 2,540,625 | | |
| First Horizon National Corp. | | BB+ | | | 4.50 | | | 05/15/13 | | | 5,000,000 | | | | 4,518,735 | | |
| Fosters Finance Corp.† | | BBB | | | 6.88 | | | 06/15/11 | | | 2,000,000 | | | | 2,123,174 | | |
| General Electric Capital Corp. | | AA+ | | | 5.00 | | | 11/15/11 | | | 2,000,000 | | | | 2,112,512 | | |
| GMAC LLC | | CCC | | | 0.00 | | | 12/01/12 | | | 10,000,000 | | | | 7,475,000 | | |
| HCP, Inc. | | BBB | | | 4.88 - 5.65 | | | 09/15/10 - 12/15/13 | | | 4,000,000 | | | | 4,044,232 | | |
| Heinz (H.J.) Finance Co. | | BBB | | | 6.00 | | | 03/15/12 | | | 2,000,000 | | | | 2,145,370 | | |
| JP Morgan Chase Bank NA | | A+ | | | 6.00 | | | 10/01/17 | | | 2,000,000 | | | | 2,141,348 | | |
| Manufacturers & Traders Tr. Co. | | A- | | | 8.00 | | | 10/01/10 | | | 2,000,000 | | | | 2,093,824 | | |
The accompanying notes are an integral part of these portfolio schedules.
62
MUTUAL OF AMERICA INVESTMENT CORPORATION (BOND FUND)
SUMMARY PORTFOLIO OF INVESTMENTS IN SECURITIES (Continued)
December 31, 2009
| | | Rating** | | Rate | | Maturity | | Face
Amount | | Value | |
| LONG-TERM DEBT SECURITIES (CONTINUED): | |
| FINANCIALS (CONTINUED) | |
| Retail Properties, Inc.† | | A- | | | 7.88 | % | | 03/15/16 | | $ | 5,000,000 | | | $ | 5,520,710 | | |
| Other Securities | | | | | | | | | | | 38,368,000 | | | | 38,118,548 | | |
| | | | 77,251,088 | | |
| HEALTH CARE (3.3%) | |
| Allergan, Inc. | | A | | | 5.75 | | | 04/01/16 | | | 2,000,000 | | | | 2,156,702 | | |
| Laboratory Corp. of America | | BBB+ | | | 5.50 - 5.63 | | | 02/01/13 - 12/15/15 | | | 2,000,000 | | | | 2,087,000 | | |
| UnitedHealth Group, Inc. | | A- | | | 5.50 | | | 11/15/12 | | | 2,000,000 | | | | 2,135,344 | | |
| Other Securities | | | | | | | | | | | 9,500,000 | | | | 9,864,788 | | |
| | | | 16,243,834 | | |
| INDUSTRIALS (3.0%) | |
| CSX Corp. | | BBB- | | | 6.25 | | | 04/01/15 | | | 2,000,000 | | | | 2,202,902 | | |
| Goodrich Corp. | | BBB+ | | | 7.63 | | | 12/15/12 | | | 2,000,000 | | | | 2,239,598 | | |
| Precision Castparts Corp. | | BBB+ | | | 5.60 | | | 12/15/13 | | | 2,000,000 | | | | 2,095,382 | | |
| Ryder System, Inc. | | BBB+ | | | 6.00 | | | 03/01/13 | | | 2,000,000 | | | | 2,102,482 | | |
| Other Securities | | | | | | | | | | | 6,000,000 | | | | 6,088,876 | | |
| | | | 14,729,240 | | |
| INFORMATION TECHNOLOGY (1.0%) | |
| Cisco Systems, Inc. | | A+ | | | 5.25 | | | 02/22/11 | | | 2,000,000 | | | | 2,098,654 | | |
| Other Securities | | | | | | | | | | | 2,500,000 | | | | 2,564,982 | | |
| | | | 4,663,636 | | |
| MATERIALS (2.0%) | |
| Lubrizol Corp. | | BBB | | | 5.50 | | | 10/01/14 | | | 2,000,000 | | | | 2,129,026 | | |
| PolyOne Corp. | | B- | | | 7.50 | | | 12/15/15 | | | 3,750,000 | | | | 3,356,250 | | |
| Vulcan Materials Co. | | BBB | | | 7.00 | | | 06/15/18 | | | 2,000,000 | | | | 2,181,370 | | |
| Other Securities | | BBB | | | 7.00 | | | 06/15/18 | | | 2,000,000 | | | | 2,104,617 | | |
| | | | 9,771,263 | | |
| TELECOMMUNICATION SERVICES (0.9%) | |
| Alltel Corp. | | A | | | 7.00 | | | 03/15/16 | | | 2,000,000 | | | | 2,256,704 | | |
| Verizon Florida LLC | | A | | | 6.13 | | | 01/15/13 | | | 2,000,000 | | | | 2,135,034 | | |
| | | | 4,391,738 | | |
| UTILITIES (2.8%) | |
| Arizona Public Svc. Co. | | BBB- | | | 6.50 | | | 03/01/12 | | | 2,000,000 | | | | 2,149,766 | | |
| PPL Energy Supply LLC | | BBB | | | 5.40 | | | 08/15/14 | | | 2,000,000 | | | | 2,095,844 | | |
| Progress Energy Enterprise | | A- | | | 5.25 | | | 12/15/15 | | | 2,000,000 | | | | 2,187,036 | | |
| Other Securities | | | | | | | | | | | 6,825,000 | | | | 6,980,162 | | |
| | | | 13,412,808 | | |
| SOVEREIGN DEBT (0.9%) | |
| Sri Lanka AID (5) | | NR | | | 6.59 | | | 09/15/28 | | | 3,899,114 | | | | 4,240,248 | | |
TOTAL LONG-TERM DEBT SECURITIES
(Cost: $473,803,756) 98.9% | | | 482,515,680 | | |
The accompanying notes are an integral part of these portfolio schedules.
63
MUTUAL OF AMERICA INVESTMENT CORPORATION (BOND FUND)
SUMMARY PORTFOLIO OF INVESTMENTS IN SECURITIES (Continued)
December 31, 2009
| | | Rating** | | Rate | | Maturity | | Face
Amount | | Value | |
| SHORT-TERM DEBT SECURITIES: | |
| COMMERCIAL PAPER (0.2%) | |
| Abbott Laboratories† | | A-1+ | | | 0.05 | % | | 01/04/10 | | $ | 900,000 | | | $ | 899,996 | | |
TOTAL SHORT-TERM DEBT SECURITIES
(Cost: $899,996) 0.2% | | | 899,996 | | |
TEMPORARY CASH INVESTMENTS (2)
(Cost: $31,100) 0.0% (3) | | | 31,100 | | |
TOTAL INVESTMENTS
(Cost: $474,734,852) 99.1% | | | 483,446,776 | | |
| OTHER NET ASSETS 0.9% | | | 4,180,063 | | |
| NET ASSETS 100.0% | | $ | 487,626,839 | | |
The accompanying notes are an integral part of these portfolio schedules.
64
MUTUAL OF AMERICA INVESTMENT CORPORATION
FOOTNOTES TO PORTFOLIOS OF INVESTMENTS IN SECURITIES
December 31, 2009
Abbreviations: FFCB = Federal Farm Credit Bank
FHARM = Federal Home Adjustable Rate Mortgage
FHLB = Federal Home Loan Bank
FHLMC = Federal Home Loan Mortgage Corporation
FNMA = Federal National Mortgage Association
GMAC = General Motors Acceptance Corporation
GNMA = Government National Mortgage Association
NR = Not Rated
"Other Securities" represent securities in the respective category that individually, or in the aggregate by issuer, do not exceed 1% of net assets.
* Non-income producing security.
** Ratings as per Standard & Poors Corporation.
*** This security is fair valued in accordance with procedures established by the Funds' Board of Directors.
† Security is exempt from registration under Rule 144A of the Securities Act of 1933. These securities may be resold in transactions exempt from registration, normally to qualified institutional buyers. At December 31, 2009, the aggregate values of these securities, and similar ones included in the Funds' "Other Securities" categories, and their percentages of the respective Funds' net assets were as follows:
| Fund | | Aggregate
Market
Value | | Percentage
of
Net Assets | |
| EQUITY INDEX FUND | | $ | 11,999,832 | | | | 1.6 | % | |
| ALL AMERICA FUND | | $ | 5,689,992 | | | | 2.2 | % | |
| SMALL CAP VALUE FUND | | $ | 8,840,310 | | | | 4.3 | % | |
| SMALL CAP GROWTH FUND | | $ | 1,599,993 | | | | 0.8 | % | |
| MID CAP VALUE FUND | | $ | 1,669,926 | | | | 4.0 | % | |
| MID-CAP EQUITY INDEX FUND | | $ | 9,499,961 | | | | 2.5 | % | |
| INTERNATIONAL FUND | | $ | 1,399,994 | | | | 4.2 | % | |
| COMPOSITE FUND | | $ | 3,930,780 | | | | 2.4 | % | |
| MONEY MARKET FUND | | $ | 24,988,654 | | | | 21.0 | % | |
| MID-TERM BOND FUND | | $ | 6,780,588 | | | | 2.9 | % | |
| BOND FUND | | $ | 9,585,833 | | | | 2.0 | % | |
(1) This security, or a portion thereof, has been segregated to cover initial margin requirements on open futures contracts. Information on futures contracts outstanding in the Funds as of December 31, 2009, were as follows:
| Fund | | Number of
Contracts | | Contract Type | | Purchased (P)
or Sold (S) | | Expiration
Date | | Underlying
Face Amount
at Value(a) | | Unrealized
Gain(Loss) | | Face Value
of Futures
as a %
of Total
Investments | |
| EQUITY INDEX FUND | | | 432 | | | E-mini S&P 500
Stock Index | | P | | March 2010 | | $ | 23,991,120 | | | $ | 117,782 | | | | 3.1 | % | |
| ALL AMERICA FUND | | | 54 | | | E-mini S&P 500
Stock Index | | P | | March 2010 | | $ | 2,998,890 | | | $ | 20,115 | | | | 1.2 | % | |
MID-CAP EQUITY
INDEX FUND | | | 268 | | | E-mini S&P MidCap
400 Stock Index | | P | | March 2010 | | $ | 19,427,320 | | | $ | 472,990 | | | | 5.2 | % | |
(a) Includes the cumulative appreciation (depreciation) of futures contracts, which is included in Net Unrealized Appreciaton (Depreciation) of Investments and Futures Contracts in the Components of Net Assets section of the Statement of Assets and Liabilities. The Receivable or Payable for Daily Variation on Futures Contracts in the Statements of Assets and Liabilities only includes the current day's variation margin payable or receivable.
(2) The fund has an arrangement with its custodian bank, JP Morgan Chase Bank, whereby uninvested cash, subject to parameters set by the fund, is automatically invested in the fund's name by the bank in overnight commercial paper issued by J.P. Morgan Chase & Co. On the next business day, these funds (and earned interest) are automatically returned to the fund. The annual rate of interest earned on this temporary cash investment at December 31, 2009 was 0.15%.
(3) Percentage is less than 0.05%.
(4) Issuer has filed for Chapter XI bankruptcy law (or equivalent) protection; issue is non-income producing.
(5) U.S. Government guaranteed security.
65
MUTUAL OF AMERICA INVESTMENT CORPORATION
STATEMENTS OF ASSETS AND LIABILITIES
December 31, 2009
| | | Equity Index
Fund | | All America
Fund | | Small Cap
Value Fund | | Small Cap
Growth Fund | | Mid Cap
Value Fund | | Mid-Cap
Equity Index
Fund | | International
Fund | |
| ASSETS: | |
Investments at market value
(Cost: Equity Index Fund — $734,997,278
All America Fund — $259,134,003
Small Cap Value Fund — $194,668,766
Small Cap Growth Fund — $165,868,230
Mid Cap Value Fund — $43,856,455
Mid-Cap Equity Index Fund — $375,513,737
International Fund $33,986,340
Composite Fund — $159,923,283
Retirement Income Fund — $8,401,052
Retirement 2010 Fund — $13,644,973
Retirement 2015 Fund — $41,068,911
Retirement 2020 Fund — $47,345,320
Retirement 2025 Fund — $39,280,703)
(Notes 1 and 3) | | $ | 766,931,515 | | | $ | 255,609,861 | | | $ | 204,815,861 | | | $ | 193,141,510 | | | $ | 41,901,853 | | | $ | 376,675,004 | | | $ | 35,322,176 | | |
| Cash | | | 41,107 | | | | 12,450 | | | | 81,467 | | | | 707,501 | | | | 6,215 | | | | 36 | | | | 729,289 | | |
| Interest and dividends receivable | | | 1,005,370 | | | | 314,650 | | | | 266,804 | | | | 47,085 | | | | 64,528 | | | | 347,992 | | | | — | | |
| Receivable for securities sold | | | — | | | | 34,482 | | | | 220,282 | | | | — | | | | — | | | | 1,042,983 | | | | — | | |
| TOTAL ASSETS | | | 767,977,992 | | | | 255,971,443 | | | | 205,384,414 | | | | 193,896,096 | | | | 41,972,596 | | | | 378,066,015 | | | | 36,051,465 | | |
| LIABILITIES: | |
| Payable for securities purchased | | | 96,709 | | | | 19,296 | | | | — | | | | — | | | | — | | | | 616,975 | | | | 2,676,127 | | |
| Payable for daily variation margin on future contracts | | | 246,240 | | | | 30,780 | | | | — | | | | — | | | | — | | | | 246,560 | | | | — | | |
| Other Liabilities | | | — | | | | — | | | | — | | | | — | | | | — | | | | — | | | | 286,841 | | |
| TOTAL LIABILITIES | | | 342,949 | | | | 50,076 | | | | — | | | | — | | | | — | | | | 863,535 | | | | 2,962,968 | | |
| NET ASSETS | | $ | 767,635,043 | | | $ | 255,921,367 | | | $ | 205,384,414 | | | $ | 193,896,096 | | | $ | 41,972,596 | | | $ | 377,202,480 | | | $ | 33,088,497 | | |
| NUMBER OF SHARES OUTSTANDING (Note 4) | | | 418,006,160 | | | | 180,351,927 | | | | 214,817,947 | | | | 217,012,966 | | | | 42,960,517 | | | | 304,220,329 | | | | 49,223,378 | | |
| NET ASSET VALUES, offering and redemption price per share | | $ | 1.84 | | | $ | 1.42 | | | $ | 0.96 | | | $ | 0.89 | | | $ | 0.98 | | | $ | 1.24 | | | $ | 0.67 | | |
| COMPONENTS OF NET ASSETS: | |
| Paid-in capital | | $ | 750,933,371 | | | $ | 287,855,530 | | | $ | 235,997,007 | | | $ | 211,493,385 | | | $ | 46,252,590 | | | $ | 375,627,383 | | | $ | 32,536,901 | | |
| Accumulated undistributed net investment income (loss) | | | 1,999,957 | | | | 3,215,664 | | | | — | | | | — | | | | — | | | | 565,311 | | | | — | | |
Accumulated undistributed net realized gain(loss)
on investments and futures contracts | | | (17,350,304 | ) | | | (31,645,800 | ) | | | (40,759,688 | ) | | | (44,870,569 | ) | | | (2,325,392 | ) | | | (624,471 | ) | | | (784,240 | ) | |
Net unrealized appreciation (depreciation)
of investments and futures contracts | | | 32,052,019 | | | | (3,504,027 | ) | | | 10,147,095 | | | | 27,273,280 | | | | (1,954,602 | ) | | | 1,634,257 | | | | 1,335,836 | | |
| NET ASSETS | | $ | 767,635,043 | | | $ | 255,921,367 | | | $ | 205,384,414 | | | $ | 193,896,096 | | | $ | 41,972,596 | | | $ | 377,202,480 | | | $ | 33,088,497 | | |
The accompanying notes are an integral part of these financial statements.
66
| | | Composite
Fund | | Retirement
Income
Fund | | 2010
Retirement
Fund | | 2015
Retirement
Fund | | 2020
Retirement
Fund | | 2025
Retirement
Fund | |
| ASSETS: | |
Investments at market value
(Cost: Equity Index Fund — $734,997,278
All America Fund — $259,134,003
Small Cap Value Fund — $194,668,766
Small Cap Growth Fund — $165,868,230
Mid Cap Value Fund — $43,856,455
Mid-Cap Equity Index Fund — $375,513,737
International Fund $33,986,340
Composite Fund — $159,923,283
Retirement Income Fund — $8,401,052
Retirement 2010 Fund — $13,644,973
Retirement 2015 Fund — $41,068,911
Retirement 2020 Fund — $47,345,320
Retirement 2025 Fund — $39,280,703)
(Notes 1 and 3) | | $ | 165,309,706 | | | $ | 8,844,444 | | | $ | 14,617,212 | | | $ | 44,059,234 | | | $ | 49,683,457 | | | $ | 41,987,460 | | |
| Cash | | | 45,384 | | | | — | | | | — | | | | — | | | | — | | | | — | | |
| Interest and dividends receivable | | | 619,224 | | | | — | | | | — | | | | — | | | | — | | | | — | | |
| Receivable for securities sold | | | 6,782 | | | | — | | | | — | | | | — | | | | — | | | | — | | |
| TOTAL ASSETS | | | 165,981,096 | | | | 8,844,444 | | | | 14,617,212 | | | | 44,059,234 | | | | 49,683,457 | | | | 41,987,460 | | |
| LIABILITIES: | |
| Payable for securities purchased | | | — | | | | — | | | | — | | | | — | | | | — | | | | — | | |
| Payable for daily variation margin on future contracts | | | — | | | | — | | | | — | | | | — | | | | — | | | | — | | |
| Other Liabilities | | | — | | | | — | | | | — | | | | — | | | | — | | | | — | | |
| TOTAL LIABILITIES | | | — | | | | — | | | | — | | | | — | | | | — | | | | — | | |
| NET ASSETS | | $ | 165,981,096 | | | $ | 8,844,444 | | | $ | 14,617,212 | | | $ | 44,059,234 | | | $ | 49,683,457 | | | $ | 41,987,460 | | |
| NUMBER OF SHARES OUTSTANDING (Note 4) | | | 119,708,439 | | | | 9,122,224 | | | | 16,871,361 | | | | 52,963,259 | | | | 62,378,472 | | | | 53,840,361 | | |
| NET ASSET VALUES, offering and redemption price per share | | $ | 1.39 | | | $ | 0.97 | | | $ | 0.87 | | | $ | 0.83 | | | $ | 0.80 | | | $ | 0.78 | | |
| COMPONENTS OF NET ASSETS: | |
| Paid-in capital | | $ | 196,091,567 | | | $ | 8,379,536 | | | $ | 14,595,002 | | | $ | 43,274,423 | | | $ | 49,068,427 | | | $ | 40,068,998 | | |
| Accumulated undistributed net investment income (loss) | | | 4,166,967 | | | | 261,549 | | | | — | | | | — | | | | — | | | | — | | |
Accumulated undistributed net realized gain(loss)
on investments and futures contracts | | | (39,663,861 | ) | | | (240,033 | ) | | | (950,029 | ) | | | (2,205,512 | ) | | | (1,723,107 | ) | | | (788,295 | ) | |
Net unrealized appreciation (depreciation)
of investments and futures contracts | | | 5,386,423 | | | | 443,392 | | | | 972,239 | | | | 2,990,323 | | | | 2,338,137 | | | | 2,706,757 | | |
| NET ASSETS | | $ | 165,981,096 | | | $ | 8,844,444 | | | $ | 14,617,212 | | | $ | 44,059,234 | | | $ | 49,683,457 | | | $ | 41,987,460 | | |
The accompanying notes are an integral part of these financial statements.
67
MUTUAL OF AMERICA INVESTMENT CORPORATION
STATEMENTS OF ASSETS AND LIABILITIES (Continued)
December 31, 2009
| | | 2030
Retirement
Fund | | 2035
Retirement
Fund | | 2040
Retirement
Fund | | 2045
Retirement
Fund | | Conservative
Allocation
Fund | |
| ASSETS: | |
Investments at market value
(Cost: Retirement 2030 Fund — $32,279,136
Retirement 2035 Fund — $25,039,085
Retirement 2040 Fund — $20,691,871
Retirement 2045 Fund — $22,527,148
Conservative Allocation Fund — $37,316,969
Moderate Allocation Fund — $126,670,992
Aggressive Allocation Fund — $124,430,837
Money Market Fund — ; $118,730,752
Mid-Term Bond Fund — $226,527,340
Bond Fund — $474,734,852)
(Notes 1 and 3) | | $ | 34,733,128 | | | $ | 26,973,412 | | | $ | 22,558,859 | | | $ | 24,979,241 | | | $ | 38,120,887 | | |
| Cash | | | — | | | | — | | | | — | | | | — | | | | — | | |
| Interest and dividends receivable | | | — | | | | — | | | | — | | | | — | | | | — | | |
| Receivable for securities sold | | | — | | | | — | | | | — | | | | — | | | | — | | |
| TOTAL ASSETS | | | 34,733,128 | | | | 26,973,412 | | | | 22,558,859 | | | | 24,979,241 | | | | 38,120,887 | | |
| LIABILITIES: | |
| Payable for securities purchased | | | — | | | | — | | | | — | | | | — | | | | — | | |
| Payable for daily variation margin on future contracts | | | — | | | | — | | | | — | | | | — | | | | — | | |
| Other Liabilities | | | — | | | | — | | | | — | | | | — | | | | — | | |
| TOTAL LIABILITIES | | | — | | | | — | | | | — | | | | — | | | | — | | |
| NET ASSETS | | $ | 34,733,128 | | | $ | 26,973,412 | | | $ | 22,558,859 | | | $ | 24,979,241 | | | $ | 38,120,887 | | |
| NUMBER OF SHARES OUTSTANDING (Note 4) | | | 45,047,756 | | | | 35,870,616 | | | | 30,313,753 | | | | 33,773,391 | | | | 38,492,999 | | |
| NET ASSET VALUES, offering and redemption price per share | | $ | 0.77 | | | $ | 0.75 | | | $ | 0.74 | | | $ | 0.74 | | | $ | 0.99 | | |
| COMPONENTS OF NET ASSETS: | |
| Paid-in capital | | $ | 33,068,019 | | | $ | 25,505,648 | | | $ | 21,004,461 | | | $ | 22,893,560 | | | $ | 38,767,190 | | |
| Accumulated undistributed net investment income (loss) | | | — | | | | — | | | | — | | | | — | | | | 1,382 | | |
Accumulated undistributed net realized gain(loss)
on investments and futures contracts | | | (788,883 | ) | | | (466,563 | ) | | | (312,591 | ) | | | (366,412 | ) | | | (1,451,602 | ) | |
Net unrealized appreciation (depreciation)
of investments and futures contracts | | | 2,453,992 | | | | 1,934,327 | | | | 1,866,989 | | | | 2,452,093 | | | | 803,917 | | |
| NET ASSETS | | $ | 34,733,128 | | | $ | 26,973,412 | | | $ | 22,558,859 | | | $ | 24,979,241 | | | $ | 38,120,887 | | |
The accompanying notes are an integral part of these financial statements.
68
| | | Moderate
Allocation
Fund | | Aggressive
Allocation
Fund | | Money
Market
Fund | | Mid-Term
Bond Fund | | Bond
Fund | |
| ASSETS: | |
Investments at market value
(Cost: Retirement 2030 Fund — $32,279,136
Retirement 2035 Fund — $25,039,085
Retirement 2040 Fund — $20,691,871
Retirement 2045 Fund — $22,527,148
Conservative Allocation Fund — $37,316,969
Moderate Allocation Fund — $126,670,992
Aggressive Allocation Fund — $124,430,837
Money Market Fund — ; $118,730,752
Mid-Term Bond Fund — $226,527,340
Bond Fund — $474,734,852)
(Notes 1 and 3) | | $ | 125,286,212 | | | $ | 116,568,914 | | | $ | 118,734,413 | | | $ | 232,078,472 | | | $ | 483,446,776 | | |
| Cash | | | — | | | | — | | | | 2,654 | | | | 31 | | | | 181,203 | | |
| Interest and dividends receivable | | | — | | | | — | | | | — | | | | 2,343,780 | | | | 3,925,469 | | |
| Receivable for securities sold | | | — | | | | — | | | | — | | | | 165 | | | | 73,391 | | |
| TOTAL ASSETS | | | 125,286,212 | | | | 116,568,914 | | | | 118,737,067 | | | | 234,422,448 | | | | 487,626,839 | | |
| LIABILITIES: | |
| Payable for securities purchased | | | — | | | | — | | | | — | | | | — | | | | — | | |
| Payable for daily variation margin on future contracts | | | — | | | | — | | | | — | | | | — | | | | — | | |
| Other Liabilities | | | — | | | | — | | | | — | | | | — | | | | — | | |
| TOTAL LIABILITIES | | | — | | | | — | | | | — | | | | — | | | | — | | |
| NET ASSETS | | $ | 125,286,212 | | | $ | 116,568,914 | | | $ | 118,737,067 | | | $ | 234,422,448 | | | $ | 487,626,839 | | |
| NUMBER OF SHARES OUTSTANDING (Note 4) | | | 121,209,452 | | | | 109,796,967 | | | | 98,421,821 | | | | 235,599,737 | | | | 376,097,392 | | |
| NET ASSET VALUES, offering and redemption price per share | | $ | 1.03 | | | $ | 1.06 | | | $ | 1.21 | | | $ | 1.00 | | | $ | 1.30 | | |
| COMPONENTS OF NET ASSETS: | |
| Paid-in capital | | $ | 131,792,894 | | | $ | 128,720,129 | | | $ | 118,735,648 | | | $ | 228,891,205 | | | $ | 505,909,110 | | |
| Accumulated undistributed net investment income (loss) | | | — | | | | 323,630 | | | | — | | | | (19,889 | ) | | | 162,638 | | |
Accumulated undistributed net realized gain(loss)
on investments and futures contracts | | | (5,121,902 | ) | | | (4,612,922 | ) | | | (2,242 | ) | | | — | | | | (27,156,833 | ) | |
Net unrealized appreciation (depreciation)
of investments and futures contracts | | | (1,384,780 | ) | | | (7,861,923 | ) | | | 3,661 | | | | 5,551,132 | | | | 8,711,924 | | |
| NET ASSETS | | $ | 125,286,212 | | | $ | 116,568,914 | | | $ | 118,737,067 | | | $ | 234,422,448 | | | $ | 487,626,839 | | |
The accompanying notes are an integral part of these financial statements.
69
MUTUAL OF AMERICA INVESTMENT CORPORATION
STATEMENTS OF OPERATIONS
For the Year Ended December 31, 2009
| | | Equity Index
Fund | | All America
Fund | | Small Cap
Value Fund | | Small Cap
Growth Fund | | Mid Cap
Value Fund | | Mid-Cap
Equity Index
Fund | | International
Fund | |
| INVESTMENT INCOME AND EXPENSES: | |
| INCOME: | |
| Dividends | | $ | 13,820,768 | | | $ | 4,549,464 | | | $ | 3,750,170 | | | $ | 1,049,942 | | | $ | 768,331 | | | $ | 4,879,479 | | | $ | 765,243 | | |
| Interest | | | 49,047 | | | | 13,068 | | | | 12,775 | | | | 9,784 | | | | 2,527 | | | | 31,792 | | | | 3 | | |
| Total income | | | 13,869,815 | | | | 4,562,532 | | | | 3,762,945 | | | | 1,059,726 | | | | 770,858 | | | | 4,911,271 | | | | 765,246 | | |
| EXPENSES: | |
| Investment advisory fees (Note 2) | | | 465,207 | | | | 893,996 | | | | 1,264,513 | | | | 1,188,156 | | | | 183,969 | | | | 221,074 | | | | 15,534 | | |
| Accounting and recordkeeping expenses | | | 347,574 | | | | 108,216 | | | | 89,667 | | | | 81,727 | | | | 16,792 | | | | 156,760 | | | | 10,055 | | |
| Shareholders reports | | | 68,369 | | | | 21,287 | | | | 17,638 | | | | 16,076 | | | | 3,303 | | | | 30,835 | | | | 1,978 | | |
| Custodian expenses | | | 42,723 | | | | 59,311 | | | | 13,719 | | | | 20,299 | | | | 7,199 | | | | 35,805 | | | | 4,737 | | |
| Independent directors' fees and expenses | | | 18,699 | | | | 16,153 | | | | 17,746 | | | | 17,211 | | | | 2,115 | | | | 17,746 | | | | 1,266 | | |
| Audit | | | 92,086 | | | | 28,671 | | | | 23,756 | | | | 21,653 | | | | 4,449 | | | | 41,532 | | | | 2,664 | | |
| Legal and Compliance | | | 133,481 | | | | 41,560 | | | | 34,435 | | | | 31,387 | | | | 6,449 | | | | 60,201 | | | | 3,861 | | |
| Administrative | | | 342,939 | | | | 106,775 | | | | 88,471 | | | | 80,638 | | | | 16,569 | | | | 154,669 | | | | 9,921 | | |
| Licenses | | | 39,520 | | | | 12,305 | | | | 10,195 | | | | 9,293 | | | | 1,909 | | | | 17,824 | | | | 1,143 | | |
| Other | | | 30,520 | | | | 9,503 | | | | 7,874 | | | | 7,177 | | | | 1,475 | | | | 13,765 | | | | 883 | | |
| Total expenses | | | 1,581,118 | | | | 1,297,777 | | | | 1,568,014 | | | | 1,473,617 | | | | 244,229 | | | | 750,211 | | | | 52,042 | | |
| Net Investment Income (Loss) | | | 12,288,697 | | | | 3,264,755 | | | | 2,194,931 | | | | (413,891 | ) | | | 526,629 | | | | 4,161,060 | | | | 713,204 | | |
NET REALIZED AND UNREALIZED GAIN (LOSS) ON INVESTMENTS AND
FUTURES CONTRACTS (Note 1): | |
| Net realized gain(loss) on: | |
| Investment securities | | | (2,727,846 | ) | | | (13,017,263 | ) | | | (11,306,654 | ) | | | (13,320,386 | ) | | | (1,261,680 | ) | | | (1,367,695 | ) | | | (784,240 | ) | |
| Futures contracts | | | 6,831,293 | | | | 1,333,436 | | | | — | | | | — | | | | — | | | | 7,307,510 | | | | — | | |
| | | | 4,103,447 | | | | (11,683,827 | ) | | | (11,306,654 | ) | | | (13,320,386 | ) | | | (1,261,680 | ) | | | 5,939,815 | | | | (784,240 | ) | |
| Change in net unrealized appreciation (depreciation) of: | |
| Investment securities | | | 141,959,173 | | | | 60,641,430 | | | | 55,219,929 | | | | 55,426,844 | | | | 8,845,477 | | | | 88,379,281 | | | | 5,728,205 | | |
| Futures contracts | | | 126,995 | | | | 41,315 | | | | — | | | | — | | | | — | | | | (22,135 | ) | | | — | | |
| | | | 142,086,168 | | | | 60,682,745 | | | | 55,219,929 | | | | 55,426,844 | | | | 8,845,477 | | | | 88,357,146 | | | | 5,728,205 | | |
NET REALIZED AND UNREALIZED GAIN (LOSS) ON INVESTMENTS AND
FUTURES CONTRACTS | | | 146,189,615 | | | | 48,998,918 | | | | 43,913,275 | | | | 42,106,458 | | | | 7,583,797 | | | | 94,296,961 | | | | 4,943,965 | | |
| NET INCREASE (DECREASE) IN NET ASSETS RESULTING FROM OPERATIONS | | $ | 158,478,312 | | | $ | 52,263,673 | | | $ | 46,108,206 | | | $ | 41,692,567 | | | $ | 8,110,426 | | | $ | 98,458,021 | | | $ | 5,657,169 | | |
(a) The Retirement Funds incur no operating expenses other than those included in each of the underlying funds in which they invest. The Allocation Funds incur no advisory or operating expenses other than those included in each
of the underlying funds in which they invest.
The accompanying notes are an integral part of these financial statements.
70
| | | Composite
Fund | | Retirement
Income
Fund | | 2010
Retirement
Fund | | 2015
Retirement
Fund | | 2020
Retirement
Fund | | 2025
Retirement
Fund | |
| INVESTMENT INCOME AND EXPENSES: | |
| INCOME: | |
| Dividends | | $ | 1,974,711 | | | $ | 261,575 | | | $ | 380,494 | | | $ | 1,067,106 | | | $ | 1,140,798 | | | $ | 841,249 | | |
| Interest | | | 3,076,346 | | | | — | | | | — | | | | — | | | | — | | | | — | | |
| Total income | | | 5,051,057 | | | | 261,575 | | | | 380,494 | | | | 1,067,106 | | | | 1,140,798 | | | | 841,249 | | |
| EXPENSES: | |
| Investment advisory fees (Note 2) | | | 608,282 | | | | 2,954 | (a) | | | 5,353 | (a) | | | 15,271 | (a) | | | 15,627 | (a) | | | 12,777 | (a) | |
| Accounting and recordkeeping expenses | | | 75,746 | | | | — | | | | — | | | | — | | | | — | | | | — | | |
| Shareholders reports | | | 14,899 | | | | — | | | | — | | | | — | | | | — | | | | — | | |
| Custodian expenses | | | 28,909 | | | | — | | | | — | | | | — | | | | — | | | | — | | |
| Independent directors' fees and expenses | | | 16,620 | | | | — | | | | — | | | | — | | | | — | | | | — | | |
| Audit | | | 20,068 | | | | — | | | | — | | | | — | | | | — | | | | — | | |
| Legal and Compliance | | | 29,089 | | | | — | | | | — | | | | — | | | | — | | | | — | | |
| Administrative | | | 74,735 | | | | — | | | | — | | | | — | | | | — | | | | — | | |
| Licenses | | | 8,612 | | | | — | | | | — | | | | — | | | | — | | | | — | | |
| Other | | | 6,651 | | | | — | | | | — | | | | — | | | | — | | | | — | | |
| Total expenses | | | 883,611 | | | | 2,954 | | | | 5,353 | | | | 15,271 | | | | 15,627 | | | | 12,777 | | |
| Net Investment Income (Loss) | | | 4,167,446 | | | | 258,621 | | | | 375,141 | | | | 1,051,835 | | | | 1,125,171 | | | | 828,472 | | |
NET REALIZED AND UNREALIZED GAIN (LOSS) ON INVESTMENTS AND
FUTURES CONTRACTS (Note 1): | |
| Net realized gain(loss) on: | |
| Investment securities | | | (9,692,893 | ) | | | (157,075 | ) | | | (728,238 | ) | | | (1,816,017 | ) | | | (1,349,890 | ) | | | (653,965 | ) | |
| Futures contracts | | | — | | | | — | | | | — | | | | — | | | | — | | | | — | | |
| | | | (9,692,893 | ) | | | (157,075 | ) | | | (728,238 | ) | | | (1,816,017 | ) | | | (1,349,890 | ) | | | (653,965 | ) | |
| Change in net unrealized appreciation (depreciation) of: | |
| Investment securities | | | 31,508,207 | | | | 808,383 | | | | 2,346,843 | | | | 7,126,794 | | | | 7,322,355 | | | | 6,341,369 | | |
| Futures contracts | | | — | | | | — | | | | — | | | | — | | | | — | | | | — | | |
| | | | 31,508,207 | | | | 808,383 | | | | 2,346,843 | | | | 7,126,794 | | | | 7,322,355 | | | | 6,341,369 | | |
NET REALIZED AND UNREALIZED GAIN (LOSS) ON INVESTMENTS AND
FUTURES CONTRACTS | | | 21,815,314 | | | | 651,308 | | | | 1,618,605 | | | | 5,310,777 | | | | 5,972,465 | | | | 5,687,404 | | |
| NET INCREASE (DECREASE) IN NET ASSETS RESULTING FROM OPERATIONS | | $ | 25,982,760 | | | $ | 909,929 | | | $ | 1,993,746 | | | $ | 6,362,612 | | | $ | 7,097,636 | | | $ | 6,515,876 | | |
The accompanying notes are an integral part of these financial statements.
71
MUTUAL OF AMERICA INVESTMENT CORPORATION
STATEMENTS OF OPERATIONS (Continued)
For the Year Ended December 31, 2009
| | | 2030
Retirement
Fund | | 2035
Retirement
Fund | | 2040
Retirement
Fund | | 2045
Retirement
Fund | | Conservative
Allocation
Fund | |
| INVESTMENT INCOME AND EXPENSES: | |
| INCOME: | |
| Dividends | | $ | 638,444 | | | $ | 443,782 | | | $ | 354,480 | | | $ | 384,747 | | | $ | 1,243,150 | | |
| Interest | | | — | | | | — | | | | — | | | | — | | | | — | | |
| Total income | | | 638,444 | | | | 443,782 | | | | 354,480 | | | | 384,747 | | | | 1,243,150 | | |
| EXPENSES: | |
| Investment advisory fees (Note 2) | | | 10,249 | (a) | | | 7,985 | (a) | | | 6,350 | (a) | | | 7,245 | (a) | | | — | (a) | |
| Accounting and recordkeeping expenses | | | — | | | | — | | | | — | | | | — | | | | — | | |
| Shareholders reports | | | — | | | | — | | | | — | | | | — | | | | — | | |
| Custodian expenses | | | — | | | | — | | | | — | | | | — | | | | — | | |
| Independent directors' fees and expenses | | | — | | | | — | | | | — | | | | — | | | | — | | |
| Audit | | | — | | | | — | | | | — | | | | — | | | | — | | |
| Legal and Compliance | | | — | | | | — | | | | — | | | | — | | | | — | | |
| Administrative | | | — | | | | — | | | | — | | | | — | | | | — | | |
| Licenses | | | — | | | | — | | | | — | | | | — | | | | — | | |
| Other | | | — | | | | — | | | | — | | | | — | | | | — | | |
| Total expenses | | | 10,249 | | | | 7,985 | | | | 6,350 | | | | 7,245 | | | | — | | |
| Net Investment Income (Loss) | | | 628,195 | | | | 435,797 | | | | 348,130 | | | | 377,502 | | | | 1,243,150 | | |
| NET REALIZED AND UNREALIZED GAIN (LOSS) ON INVESTMENTS AND FUTURES CONTRACTS (Note 1): | |
| Net realized gain(loss) on: | |
| Investment securities | | | (560,617 | ) | | | (361,974 | ) | | | (204,541 | ) | | | (290,738 | ) | | | (890,826 | ) | |
| Futures contracts | | | — | | | | — | | | | — | | | | — | | | | — | | |
| | | | (560,617 | ) | | | (361,974 | ) | | | (204,541 | ) | | | (290,738 | ) | | | (890,826 | ) | |
| Change in net unrealized appreciation (depreciation) of: | |
| Investment securities | | | 5,503,915 | | | | 4,419,064 | | | | 3,622,433 | | | | 4,235,532 | | | | 4,033,599 | | |
| Futures contracts | | | — | | | | — | | | | — | | | | — | | | | — | | |
| | | | 5,503,915 | | | | 4,419,064 | | | | 3,622,433 | | | | 4,235,532 | | | | 4,033,599 | | |
| NET REALIZED AND UNREALIZED GAIN (LOSS) ON INVESTMENTS AND FUTURES CONTRACTS | | | 4,943,298 | | | | 4,057,090 | | | | 3,417,892 | | | | 3,944,794 | | | | 3,142,773 | | |
| NET INCREASE (DECREASE) IN NET ASSETS RESULTING FROM OPERATIONS | | $ | 5,571,493 | | | $ | 4,492,887 | | | $ | 3,766,022 | | | $ | 4,322,296 | | | $ | 4,385,923 | | |
(a) The Retirement Funds incur no operating expenses other than those included in each of the underlying funds in which they invest. The Allocation Funds incur no advisory or operating expenses other than those included in each of the underlying funds in which they invest.
The accompanying notes are an integral part of these financial statements.
72
| | | Moderate
Allocation
Fund | | Aggressive
Allocation
Fund | | Money
Market
Fund | | Mid-Term
Bond Fund | | Bond
Fund | |
| INVESTMENT INCOME AND EXPENSES: | |
| INCOME: | |
| Dividends | | $ | 3,314,581 | | | $ | 2,280,953 | | | $ | — | | | $ | — | | | $ | — | | |
| Interest | | | — | | | | — | | | | 427,110 | | | | 9,805,234 | | | | 21,535,342 | | |
| Total income | | | 3,314,581 | | | | 2,280,953 | | | | 427,110 | | | | 9,805,234 | | | | 21,535,342 | | |
| EXPENSES: | |
| Investment advisory fees (Note 2) | | | — | (a) | | | — | (a) | | | 219,398 | | | | 827,873 | | | | 1,656,805 | | |
| Accounting and recordkeeping expenses | | | — | | | | — | | | | 77,587 | | | | 112,007 | | | | 230,192 | | |
| Shareholders reports | | | — | | | | — | | | | 15,262 | | | | 22,032 | | | | 45,280 | | |
| Custodian expenses | | | — | | | | — | | | | 14,780 | | | | 15,996 | | | | 29,945 | | |
| Independent directors' fees and expenses | | | — | | | | — | | | | 17,693 | | | | 18,068 | | | | 18,557 | | |
| Audit | | | — | | | | — | | | | 20,556 | | | | 29,675 | | | | 60,987 | | |
| Legal and Compliance | | | — | | | | — | | | | 29,797 | | | | 43,015 | | | | 88,402 | | |
| Administrative | | | — | | | | — | | | | 76,554 | | | | 110,514 | | | | 227,123 | | |
| Licenses | | | — | | | | — | | | | 8,822 | | | | 12,735 | | | | 26,173 | | |
| Other | | | — | | | | — | | | | 6,813 | | | | 9,835 | | | | 20,213 | | |
| Total expenses | | | — | | | | — | | | | 487,262 | | | | 1,201,750 | | | | 2,403,677 | | |
| Net Investment Income (Loss) | | | 3,314,581 | | | | 2,280,953 | | | | (60,152 | ) | | | 8,603,484 | | | | 19,131,665 | | |
| NET REALIZED AND UNREALIZED GAIN (LOSS) ON INVESTMENTS AND FUTURES CONTRACTS (Note 1): | |
| Net realized gain(loss) on: | |
| Investment securities | | | (3,867,311 | ) | | | (3,407,174 | ) | | | (2,242 | ) | | | 2,884,973 | | | | (3,299,948 | ) | |
| Futures contracts | | | — | | | | — | | | | — | | | | — | | | | — | | |
| | | | (3,867,311 | ) | | | (3,407,174 | ) | | | (2,242 | ) | | | 2,884,973 | | | | (3,299,948 | ) | |
| Change in net unrealized appreciation (depreciation) of: | |
| Investment securities | | | 21,155,502 | | | | 23,875,879 | | | | (45,827 | ) | | | 10,061,760 | | | | 38,771,964 | | |
| Futures contracts | | | — | | | | — | | | | — | | | | — | | | | — | | |
| | | | 21,155,502 | | | | 23,875,879 | | | | (45,827 | ) | | | 10,061,760 | | | | 38,771,964 | | |
| NET REALIZED AND UNREALIZED GAIN (LOSS) ON INVESTMENTS AND FUTURES CONTRACTS | | | 17,288,191 | | | | 20,468,705 | | | | (48,069 | ) | | | 12,946,733 | | | | 35,472,016 | | |
| NET INCREASE (DECREASE) IN NET ASSETS RESULTING FROM OPERATIONS | | $ | 20,602,772 | | | $ | 22,749,658 | | | $ | (108,221 | ) | | $ | 21,550,217 | | | $ | 54,603,681 | | |
The accompanying notes are an integral part of these financial statements.
73
MUTUAL OF AMERICA INVESTMENT CORPORATION
STATEMENTS OF CHANGES IN NET ASSETS
For the Years Ended December 31,
| | | Equity Index Fund | | All America Fund | | Small Cap Value Fund | |
| | | 2009 | | 2008 | | 2009 | | 2008 | | 2009 | | 2008 | |
| INCREASE (DECREASE) IN NET ASSETS: | |
| FROM OPERATIONS: | |
| Net investment income (loss) | | $ | 12,288,697 | | | $ | 14,160,926 | | | $ | 3,264,755 | | | $ | 5,019,853 | | | $ | 2,194,931 | | | $ | 2,269,994 | | |
| Net realized gain (loss) on investments and futures contracts | | | 4,103,447 | | | | (19,159,430 | ) | | | (11,683,827 | ) | | | (16,522,871 | ) | | | (11,306,654 | ) | | | (27,358,299 | ) | |
Change in net unrealized appreciation (depreciation) of investments and
futures contracts | | | 142,086,168 | | | | (296,642,643 | ) | | | 60,682,745 | | | | (116,464,025 | ) | | | 55,219,929 | | | | (33,775,604 | ) | |
| NET INCREASE (DECREASE) IN NET ASSETS RESULTING FROM OPERATIONS | | | 158,478,312 | | | | (301,641,147 | ) | | | 52,263,673 | | | | (127,967,043 | ) | | | 46,108,206 | | | | (58,863,909 | ) | |
| DIVIDEND DISTRIBUTIONS (Note 5) | |
| From net investment income | | | (12,136,940 | ) | | | (12,175,938 | ) | | | (4,552,237 | ) | | | (4,037,987 | ) | | | (2,026,043 | ) | | | (2,230,467 | ) | |
| From capital gains | | | — | | | | (2,030,456 | ) | | | — | | | | (7,817,028 | ) | | | — | | | | (69,793 | ) | |
| Return of capital | | | — | | | | — | | | | — | | | | — | | | | (147,499 | ) | | | (1,636,549 | ) | |
| Total distributions | | | (12,136,940 | ) | | | (14,206,394 | ) | | | (4,552,237 | ) | | | (11,855,015 | ) | | | (2,173,542 | ) | | | (3,936,809 | ) | |
| CAPITAL SHARE TRANSACTIONS (Note 4): | |
| Net proceeds from sale of shares | | | 131,586,187 | | | | 103,893,527 | | | | 16,036,349 | | | | 3,668,944 | | | | 25,084,409 | | | | 16,844,741 | | |
| Dividends reinvested | | | 12,136,940 | | | | 14,206,394 | | | | 4,552,237 | | | | 11,855,015 | | | | 2,173,542 | | | | 3,936,809 | | |
| Cost of shares redeemed | | | (67,614,289 | ) | | | (73,484,080 | ) | | | (33,884,392 | ) | | | (43,202,561 | ) | | | (21,139,747 | ) | | | (17,238,254 | ) | |
| NET INCREASE (DECREASE) IN NET ASSETS FROM CAPITAL SHARE TRANSACTIONS | | | 76,108,838 | | | | 44,615,841 | | | | (13,295,806 | ) | | | (27,678,602 | ) | | | 6,118,204 | | | | 3,543,296 | | |
| INCREASE (DECREASE) IN NET ASSETS | | | 222,450,210 | | | | (271,231,700 | ) | | | 34,415,630 | | | | (167,500,660 | ) | | | 50,052,868 | | | | (59,257,422 | ) | |
| NET ASSETS, BEGINNING OF PERIOD | | | 545,184,833 | | | | 816,416,533 | | | | 221,505,737 | | | | 389,006,397 | | | | 155,331,546 | | | | 214,588,968 | | |
| NET ASSETS, END OF PERIOD | | $ | 767,635,043 | | | $ | 545,184,833 | | | $ | 255,921,367 | | | $ | 221,505,737 | | | $ | 205,384,414 | | | $ | 155,331,546 | | |
| OTHER INFORMATION: | |
| Shares outstanding at the beginning of period | | | 368,420,865 | | | | 338,454,776 | | | | 191,846,309 | | | | 209,312,795 | | | | 207,820,402 | | | | 202,162,033 | | |
| Shares sold | | | 84,333,429 | | | | 56,056,834 | | | | 12,431,453 | | | | 2,581,953 | | | | 29,873,198 | | | | 18,759,096 | | |
| Shares issued as reinvestment of dividends | | | 6,714,675 | | | | 9,158,871 | | | | 3,592,572 | | | | 7,367,377 | | | | 2,273,375 | | | | 5,243,599 | | |
| Shares redeemed | | | (41,462,809 | ) | | | (35,249,616 | ) | | | (27,518,407 | ) | | | (27,415,816 | ) | | | (25,149,028 | ) | | | (18,344,326 | ) | |
| Net increase (decrease) | | | 49,585,295 | | | | 29,966,089 | | | | (11,494,382 | ) | | | (17,466,486 | ) | | | 6,997,545 | | | | 5,658,369 | | |
| Shares outstanding at the end of period | | | 418,006,160 | | | | 368,420,865 | | | | 180,351,927 | | | | 191,846,309 | | | | 214,817,947 | | | | 207,820,402 | | |
The accompanying notes are an integral part of these financial statements.
74
| | | Small Cap Growth Fund | | Mid Cap Value Fund | | Mid-Cap Equity Index Fund | |
| | | 2009 | | 2008 | | 2009 | | 2008 | | 2009 | | 2008 | |
| INCREASE (DECREASE) IN NET ASSETS: | |
| FROM OPERATIONS: | |
| Net investment income (loss) | | $ | (413,891 | ) | | $ | (286,873 | ) | | $ | 526,629 | | | $ | 588,795 | | | $ | 4,161,060 | | | $ | 4,716,284 | | |
| Net realized gain (loss) on investments and futures contracts | | | (13,320,386 | ) | | | (31,351,111 | ) | | | (1,261,680 | ) | | | (871,934 | ) | | | 5,939,815 | | | | 1,479,034 | | |
Change in net unrealized appreciation (depreciation) of investments and
futures contracts | | | 55,426,844 | | | | (43,716,710 | ) | | | 8,845,477 | | | | (13,567,763 | ) | | | 88,357,146 | | | | (140,954,321 | ) | |
| NET INCREASE (DECREASE) IN NET ASSETS RESULTING FROM OPERATIONS | | | 41,692,567 | | | | (75,354,694 | ) | | | 8,110,426 | | | | (13,850,902 | ) | | | 98,458,021 | | | | (134,759,003 | ) | |
| DIVIDEND DISTRIBUTIONS (Note 5) | |
| From net investment income | | | — | | | | — | | | | (505,962 | ) | | | (669,153 | ) | | | (3,808,316 | ) | | | (4,337,494 | ) | |
| From capital gains | | | — | | | | (3,537,395 | ) | | | — | | | | — | | | | (3,411,479 | ) | | | (7,042,607 | ) | |
| Return of capital | | | — | | | | — | | | | (20,110 | ) | | | — | | | | — | | | | — | | |
| Total distributions | | | — | | | | (3,537,395 | ) | | | (526,072 | ) | | | (669,153 | ) | | | (7,219,795 | ) | | | (11,380,101 | ) | |
| CAPITAL SHARE TRANSACTIONS (Note 4): | |
| Net proceeds from sale of shares | | | 24,697,625 | | | | 16,581,623 | | | | 8,799,815 | | | | 7,111,123 | | | | 76,415,175 | | | | 50,166,161 | | |
| Dividends reinvested | | | — | | | | 3,537,395 | | | | 526,072 | | | | 669,153 | | | | 7,219,795 | | | | 11,380,101 | | |
| Cost of shares redeemed | | | (19,424,850 | ) | | | (16,905,660 | ) | | | (4,851,635 | ) | | | (3,093,605 | ) | | | (45,195,352 | ) | | | (47,034,786 | ) | |
| NET INCREASE (DECREASE) IN NET ASSETS FROM CAPITAL SHARE TRANSACTIONS | | | 5,272,775 | | | | 3,213,358 | | | | 4,474,252 | | | | 4,686,671 | | | | 38,439,618 | | | | 14,511,476 | | |
| INCREASE (DECREASE) IN NET ASSETS | | | 46,965,342 | | | | (75,678,731 | ) | | | 12,058,606 | | | | (9,833,384 | ) | | | 129,677,844 | | | | (131,627,628 | ) | |
| NET ASSETS, BEGINNING OF PERIOD | | | 146,930,754 | | | | 222,609,485 | | | | 29,913,990 | | | | 39,747,374 | | | | 247,524,636 | | | | 379,152,264 | | |
| NET ASSETS, END OF PERIOD | | $ | 193,896,096 | | | $ | 146,930,754 | | | $ | 41,972,596 | | | $ | 29,913,990 | | | $ | 377,202,480 | | | $ | 247,524,636 | | |
| OTHER INFORMATION: | |
| Shares outstanding at the beginning of period | | | 209,988,389 | | | | 205,238,978 | | | | 37,860,539 | | | | 33,151,708 | | | | 267,560,565 | | | | 250,758,420 | | |
| Shares sold | | | 32,071,799 | | | | 19,410,862 | | | | 10,252,180 | | | | 6,789,917 | | | | 72,282,216 | | | | 42,267,347 | | |
| Shares issued as reinvestment of dividends | | | — | | | | 3,503,452 | | | | 547,291 | | | | 817,664 | | | | 5,908,130 | | | | 10,327,510 | | |
| Shares redeemed | | | (25,047,222 | ) | | | (18,164,903 | ) | | | (5,699,493 | ) | | | (2,898,750 | ) | | | (41,530,582 | ) | | | (35,792,712 | ) | |
| Net increase (decrease) | | | 7,024,577 | | | | 4,749,411 | | | | 5,099,978 | | | | 4,708,831 | | | | 36,659,764 | | | | 16,802,145 | | |
| Shares outstanding at the end of period | | | 217,012,966 | | | | 209,988,389 | | | | 42,960,517 | | | | 37,860,539 | | | | 304,220,329 | | | | 267,560,565 | | |
The accompanying notes are an integral part of these financial statements.
75
MUTUAL OF AMERICA INVESTMENT CORPORATION
STATEMENTS OF CHANGES IN NET ASSETS (Continued)
For the Years Ended December 31,
| | | International Fund | | Composite Fund | | Retirement Income Fund | |
| | | 2009 | | 2008 | | 2009 | | 2008 | | 2009 | | 2008 | |
| INCREASE (DECREASE) IN NET ASSETS: | |
| FROM OPERATIONS: | |
| Net investment income (loss) | | $ | 713,204 | | | $ | 377,816 | | | $ | 4,167,446 | | | $ | 5,648,944 | | | $ | 258,621 | | | $ | 131,680 | | |
| Net realized gain (loss) on investments and futures contracts | | | (784,240 | ) | | | — | | | | (9,692,893 | ) | | | (9,235,458 | ) | | | (157,075 | ) | | | (79,114 | ) | |
Change in net unrealized appreciation (depreciation) of investments and
futures contracts | | | 5,728,205 | | | | (4,299,885 | ) | | | 31,508,207 | | | | (42,402,859 | ) | | | 808,383 | | | | (327,497 | ) | |
| NET INCREASE (DECREASE) IN NET ASSETS RESULTING FROM OPERATIONS | | | 5,657,169 | | | | (3,922,069 | ) | | | 25,982,760 | | | | (45,989,373 | ) | | | 909,929 | | | | (274,931 | ) | |
| DIVIDEND DISTRIBUTIONS (Note 5) | |
| From net investment income | | | (716,989 | ) | | | (377,242 | ) | | | (4,490,474 | ) | | | (5,645,651 | ) | | | (3,557 | ) | | | (126,674 | ) | |
| From capital gains | | | — | | | | (673 | ) | | | — | | | | — | | | | — | | | | (2,493 | ) | |
| Return of capital | | | (279,706 | ) | | | — | | | | — | | | | — | | | | — | | | | — | | |
| Total distributions | | | (996,695 | ) | | | (377,915 | ) | | | (4,490,474 | ) | | | (5,645,651 | ) | | | (3,557 | ) | | | (129,167 | ) | |
| CAPITAL SHARE TRANSACTIONS (Note 4): | |
| Net proceeds from sale of shares | | | 18,501,183 | | | | 14,345,218 | | | | 14,470,419 | | | | 3,435,664 | | | | 7,251,235 | | | | 4,981,492 | | |
| Dividends reinvested | | | 709,854 | | | | 377,915 | | | | 4,490,474 | | | | 5,645,651 | | | | 3,557 | | | | 129,167 | | |
| Cost of shares redeemed | | | (3,070,256 | ) | | | (762,994 | ) | | | (24,597,867 | ) | | | (26,896,747 | ) | | | (2,833,653 | ) | | | (2,177,373 | ) | |
| NET INCREASE (DECREASE) IN NET ASSETS FROM CAPITAL SHARE TRANSACTIONS | | | 16,140,781 | | | | 13,960,139 | | | | (5,636,974 | ) | | | (17,815,432 | ) | | | 4,421,139 | | | | 2,933,286 | | |
| INCREASE (DECREASE) IN NET ASSETS | | | 20,801,255 | | | | 9,660,155 | | | | 15,855,312 | | | | (69,450,456 | ) | | | 5,327,511 | | | | 2,529,188 | | |
| NET ASSETS, BEGINNING OF PERIOD | | | 12,287,242 | | | | 2,627,087 | | | | 150,125,784 | | | | 219,576,240 | | | | 3,516,933 | | | | 987,745 | | |
| NET ASSETS, END OF PERIOD | | $ | 33,088,497 | | | $ | 12,287,242 | | | $ | 165,981,096 | | | $ | 150,125,784 | | | $ | 8,844,444 | | | $ | 3,516,933 | | |
| OTHER INFORMATION: | |
| Shares outstanding at the beginning of period | | | 22,203,777 | | | | 2,757,713 | | | | 124,623,815 | | | | 136,856,122 | | | | 4,214,590 | | | | 1,030,628 | | |
| Shares sold | | | 31,104,990 | | | | 19,777,925 | | | | 10,926,433 | | | | 2,360,210 | | | | 8,003,583 | | | | 5,359,642 | | |
| Shares issued as reinvestment of dividends | | | 1,055,262 | | | | 680,873 | | | | 3,492,246 | | | | 3,999,661 | | | | 3,866 | | | | 154,883 | | |
| Shares redeemed | | | (5,140,651 | ) | | | (1,012,734 | ) | | | (19,334,055 | ) | | | (18,592,178 | ) | | | (3,099,815 | ) | | | (2,330,563 | ) | |
| Net increase (decrease) | | | 27,019,601 | | | | 19,446,064 | | | | (4,915,376 | ) | | | (12,232,307 | ) | | | 4,907,634 | | | | 3,183,962 | | |
| Shares outstanding at the end of period | | | 49,223,378 | | | | 22,203,777 | | | | 119,708,439 | | | | 124,623,815 | | | | 9,122,224 | | | | 4,214,590 | | |
The accompanying notes are an integral part of these financial statements.
76
| | | 2010 Retirement Fund | | 2015 Retirement Fund | | 2020 Retirement Fund | |
| | | 2009 | | 2008 | | 2009 | | 2008 | | 2009 | | 2008 | |
| INCREASE (DECREASE) IN NET ASSETS: | |
| FROM OPERATIONS: | |
| Net investment income (loss) | | $ | 375,141 | | | $ | 280,077 | | | $ | 1,051,835 | | | $ | 639,469 | | | $ | 1,125,171 | | | $ | 645,804 | | |
| Net realized gain (loss) on investments and futures contracts | | | (728,238 | ) | | | (167,537 | ) | | | (1,816,017 | ) | | | (289,133 | ) | | | (1,349,890 | ) | | | (195,931 | ) | |
Change in net unrealized appreciation (depreciation) of investments and
futures contracts | | | 2,346,843 | | | | (1,293,761 | ) | | | 7,126,794 | | | | (3,881,944 | ) | | | 7,322,355 | | | | (4,757,207 | ) | |
| NET INCREASE (DECREASE) IN NET ASSETS RESULTING FROM OPERATIONS | | | 1,993,746 | | | | (1,181,221 | ) | | | 6,362,612 | | | | (3,531,608 | ) | | | 7,097,636 | | | | (4,307,334 | ) | |
| DIVIDEND DISTRIBUTIONS (Note 5) | |
| From net investment income | | | (347,066 | ) | | | (278,681 | ) | | | (974,899 | ) | | | (636,760 | ) | | | (1,093,278 | ) | | | (644,535 | ) | |
| From capital gains | | | (51,151 | ) | | | (31,150 | ) | | | (108,474 | ) | | | (84,668 | ) | | | (120,898 | ) | | | (94,520 | ) | |
| Return of capital | | | (16,645 | ) | | | — | | | | (54,360 | ) | | | — | | | | (978 | ) | | | — | | |
| Total distributions | | | (414,862 | ) | | | (309,831 | ) | | | (1,137,733 | ) | | | (721,428 | ) | | | (1,215,154 | ) | | | (739,055 | ) | |
| CAPITAL SHARE TRANSACTIONS (Note 4): | |
| Net proceeds from sale of shares | | | 8,873,325 | | | | 9,429,837 | | | | 27,583,963 | | | | 21,092,281 | | | | 29,189,086 | | | | 21,530,663 | | |
| Dividends reinvested | | | 414,862 | | | | 309,831 | | | | 1,137,733 | | | | 721,428 | | | | 1,215,154 | | | | 739,055 | | |
| Cost of shares redeemed | | | (4,524,564 | ) | | | (1,731,020 | ) | | | (9,904,433 | ) | | | (3,040,667 | ) | | | (7,289,009 | ) | | | (1,540,201 | ) | |
| NET INCREASE (DECREASE) IN NET ASSETS FROM CAPITAL SHARE TRANSACTIONS | | | 4,763,623 | | | | 8,008,648 | | | | 18,817,263 | | | | 18,773,042 | | | | 23,115,231 | | | | 20,729,517 | | |
| INCREASE (DECREASE) IN NET ASSETS | | | 6,342,507 | | | | 6,517,596 | | | | 24,042,142 | | | | 14,520,006 | | | | 28,997,713 | | | | 15,683,128 | | |
| NET ASSETS, BEGINNING OF PERIOD | | | 8,274,705 | | | | 1,757,109 | | | | 20,017,092 | | | | 5,497,086 | | | | 20,685,744 | | | | 5,002,616 | | |
| NET ASSETS, END OF PERIOD | | $ | 14,617,212 | | | $ | 8,274,705 | | | $ | 44,059,234 | | | $ | 20,017,092 | | | $ | 49,683,457 | | | $ | 20,685,744 | | |
| OTHER INFORMATION: | |
| Shares outstanding at the beginning of period | | | 11,114,476 | | | | 1,875,582 | | | | 28,429,170 | | | | 5,945,342 | | | | 31,210,997 | | | | 5,473,155 | | |
| Shares sold | | | 10,809,241 | | | | 10,829,314 | | | | 35,584,981 | | | | 25,213,864 | | | | 39,377,766 | | | | 26,603,617 | | |
| Shares issued as reinvestment of dividends | | | 479,268 | | | | 416,023 | | | | 1,367,660 | | | | 1,024,603 | | | | 1,525,648 | | | | 1,115,097 | | |
| Shares redeemed | | | (5,531,624 | ) | | | (2,006,443 | ) | | | (12,418,552 | ) | | | (3,754,639 | ) | | | (9,735,939 | ) | | | (1,980,872 | ) | |
| Net increase (decrease) | | | 5,756,885 | | | | 9,238,894 | | | | 24,534,089 | | | | 22,483,828 | | | | 31,167,475 | | | | 25,737,842 | | |
| Shares outstanding at the end of period | | | 16,871,361 | | | | 11,114,476 | | | | 52,963,259 | | | | 28,429,170 | | | | 62,378,472 | | | | 31,210,997 | | |
The accompanying notes are an integral part of these financial statements.
77
MUTUAL OF AMERICA INVESTMENT CORPORATION
STATEMENTS OF CHANGES IN NET ASSETS (Continued)
For the Years Ended December 31,
| | | 2025 Retirement Fund | | 2030 Retirement Fund | | 2035 Retirement Fund | |
| | | 2009 | | 2008 | | 2009 | | 2008 | | 2009 | | 2008 | |
| INCREASE (DECREASE) IN NET ASSETS: | |
| FROM OPERATIONS: | |
| Net investment income (loss) | | $ | 828,472 | | | $ | 421,868 | | | $ | 628,195 | | | $ | 316,557 | | | $ | 435,797 | | | $ | 214,592 | | |
| Net realized gain (loss) on investments and futures contracts | | | (653,965 | ) | | | (6,721 | ) | | | (560,617 | ) | | | (115,775 | ) | | | (361,974 | ) | | | (1,667 | ) | |
Change in net unrealized appreciation (depreciation) of investments and
futures contracts | | | 6,341,369 | | | | (3,546,109 | ) | | | 5,503,915 | | | | (2,935,035 | ) | | | 4,419,064 | | | | (2,396,416 | ) | |
| NET INCREASE (DECREASE) IN NET ASSETS RESULTING FROM OPERATIONS | | | 6,515,876 | | | | (3,130,962 | ) | | | 5,571,493 | | | | (2,734,253 | ) | | | 4,492,887 | | | | (2,183,491 | ) | |
| DIVIDEND DISTRIBUTIONS (Note 5) | |
| From net investment income | | | (801,582 | ) | | | (420,538 | ) | | | (603,408 | ) | | | (315,142 | ) | | | (417,357 | ) | | | (213,304 | ) | |
| From capital gains | | | (88,070 | ) | | | (75,997 | ) | | | (74,035 | ) | | | (75,256 | ) | | | (67,653 | ) | | | (64,334 | ) | |
| Return of capital | | | (5,210 | ) | | | — | | | | (3,475 | ) | | | — | | | | (340 | ) | | | — | | |
| Total distributions | | | (894,862 | ) | | | (496,535 | ) | | | (680,918 | ) | | | (390,398 | ) | | | (485,350 | ) | | | (277,638 | ) | |
| CAPITAL SHARE TRANSACTIONS (Note 4): | |
| Net proceeds from sale of shares | | | 25,813,392 | | | | 16,656,127 | | | | 21,345,134 | | | | 12,831,503 | | | | 16,136,587 | | | | 9,712,118 | | |
| Dividends reinvested | | | 894,862 | | | | 496,535 | | | | 680,918 | | | | 390,398 | | | | 485,350 | | | | 277,638 | | |
| Cost of shares redeemed | | | (5,164,202 | ) | | | (658,574 | ) | | | (3,844,922 | ) | | | (683,209 | ) | | | (2,437,002 | ) | | | (382,784 | ) | |
| NET INCREASE (DECREASE) IN NET ASSETS FROM CAPITAL SHARE TRANSACTIONS | | | 21,544,052 | | | | 16,494,088 | | | | 18,181,130 | | | | 12,538,692 | | | | 14,184,935 | | | | 9,606,972 | | |
| INCREASE (DECREASE) IN NET ASSETS | | | 27,165,066 | | | | 12,866,591 | | | | 23,071,705 | | | | 9,414,041 | | | | 18,192,472 | | | | 7,145,843 | | |
| NET ASSETS, BEGINNING OF PERIOD | | | 14,822,394 | | | | 1,955,803 | | | | 11,661,423 | | | | 2,247,382 | | | | 8,780,940 | | | | 1,635,097 | | |
| NET ASSETS, END OF PERIOD | | $ | 41,987,460 | | | $ | 14,822,394 | | | $ | 34,733,128 | | | $ | 11,661,423 | | | $ | 26,973,412 | | | $ | 8,780,940 | | |
| OTHER INFORMATION: | |
| Shares outstanding at the beginning of period | | | 23,272,827 | | | | 2,127,707 | | | | 18,754,328 | | | | 2,447,208 | | | | 14,569,870 | | | | 1,772,798 | | |
| Shares sold | | | 36,321,906 | | | | 21,217,245 | | | | 30,770,820 | | | | 16,625,894 | | | | 24,116,768 | | | | 12,838,265 | | |
| Shares issued as reinvestment of dividends | | | 1,147,478 | | | | 779,614 | | | | 883,129 | | | | 627,738 | | | | 645,443 | | | | 460,672 | | |
| Shares redeemed | | | (6,901,850 | ) | | | (851,739 | ) | | | (5,360,521 | ) | | | (946,512 | ) | | | (3,461,465 | ) | | | (501,865 | ) | |
| Net increase (decrease) | | | 30,567,534 | | | | 21,145,120 | | | | 26,293,428 | | | | 16,307,120 | | | | 21,300,746 | | | | 12,797,072 | | |
| Shares outstanding at the end of period | | | 53,840,361 | | | | 23,272,827 | | | | 45,047,756 | | | | 18,754,328 | | | | 35,870,616 | | | | 14,569,870 | | |
The accompanying notes are an integral part of these financial statements.
78
| | | 2040 Retirement Fund | | 2045 Retirement Fund | | Conservative Allocation Fund | |
| | | 2009 | | 2008 | | 2009 | | 2008 | | 2009 | | 2008 | |
| INCREASE (DECREASE) IN NET ASSETS: | |
| FROM OPERATIONS: | |
| Net investment income (loss) | | $ | 348,130 | | | $ | 147,788 | | | $ | 377,502 | | | $ | 160,770 | | | $ | 1,243,150 | | | $ | 934,058 | | |
| Net realized gain (loss) on investments and futures contracts | | | (204,541 | ) | | | (19,697 | ) | | | (290,738 | ) | | | 7,615 | | | | (890,826 | ) | | | (163,304 | ) | |
Change in net unrealized appreciation (depreciation) of investments and
futures contracts | | | 3,622,433 | | | | (1,701,107 | ) | | | 4,235,532 | | | | (1,744,199 | ) | | | 4,033,599 | | | | (3,354,977 | ) | |
| NET INCREASE (DECREASE) IN NET ASSETS RESULTING FROM OPERATIONS | | | 3,766,022 | | | | (1,573,016 | ) | | | 4,322,296 | | | | (1,575,814 | ) | | | 4,385,923 | | | | (2,584,223 | ) | |
| DIVIDEND DISTRIBUTIONS (Note 5) | |
| From net investment income | | | (333,402 | ) | | | (146,626 | ) | | | (362,960 | ) | | | (159,918 | ) | | | (1,243,401 | ) | | | (925,302 | ) | |
| From capital gains | | | (61,213 | ) | | | (49,245 | ) | | | (57,107 | ) | | | (47,012 | ) | | | (186,851 | ) | | | (132,904 | ) | |
| Return of capital | | | (131 | ) | | | — | | | | (1,040 | ) | | | — | | | | — | | | | — | | |
| Total distributions | | | (394,746 | ) | | | (195,871 | ) | | | (421,107 | ) | | | (206,930 | ) | | | (1,430,252 | ) | | | (1,058,206 | ) | |
| CAPITAL SHARE TRANSACTIONS (Note 4): | |
| Net proceeds from sale of shares | | | 14,505,770 | | | | 7,117,308 | | | | 16,895,737 | | | | 7,953,125 | | | | 15,100,574 | | | | 11,303,717 | | |
| Dividends reinvested | | | 394,746 | | | | 195,871 | | | | 421,107 | | | | 206,930 | | | | 1,430,252 | | | | 1,058,206 | | |
| Cost of shares redeemed | | | (1,913,635 | ) | | | (307,469 | ) | | | (3,096,986 | ) | | | (215,752 | ) | | | (4,970,278 | ) | | | (4,857,352 | ) | |
| NET INCREASE (DECREASE) IN NET ASSETS FROM CAPITAL SHARE TRANSACTIONS | | | 12,986,881 | | | | 7,005,710 | | | | 14,219,858 | | | | 7,944,303 | | | | 11,560,548 | | | | 7,504,571 | | |
| INCREASE (DECREASE) IN NET ASSETS | | | 16,358,157 | | | | 5,236,823 | | | | 18,121,047 | | | | 6,161,559 | | | | 14,516,219 | | | | 3,862,142 | | |
| NET ASSETS, BEGINNING OF PERIOD | | | 6,200,702 | | | | 963,879 | | | | 6,858,194 | | | | 696,635 | | | | 23,604,668 | | | | 19,742,526 | | |
| NET ASSETS, END OF PERIOD | | $ | 22,558,859 | | | $ | 6,200,702 | | | $ | 24,979,241 | | | $ | 6,858,194 | | | $ | 38,120,887 | | | $ | 23,604,668 | | |
| OTHER INFORMATION: | |
| Shares outstanding at the beginning of period | | | 10,465,972 | | | | 1,059,583 | | | | 11,628,887 | | | | 768,742 | | | | 26,598,668 | | | | 19,088,294 | | |
| Shares sold | | | 22,008,340 | | | | 9,504,025 | | | | 25,962,595 | | | | 10,785,786 | | | | 15,596,065 | | | | 11,325,847 | | |
| Shares issued as reinvestment of dividends | | | 530,445 | | | | 330,604 | | | | 569,361 | | | | 350,863 | | | | 1,444,239 | | | | 1,185,898 | | |
| Shares redeemed | | | (2,691,004 | ) | | | (428,240 | ) | | | (4,387,452 | ) | | | (276,504 | ) | | | (5,145,973 | ) | | | (5,001,371 | ) | |
| Net increase (decrease) | | | 19,847,781 | | | | 9,406,389 | | | | 22,144,504 | | | | 10,860,145 | | | | 11,894,331 | | | | 7,510,374 | | |
| Shares outstanding at the end of period | | | 30,313,753 | | | | 10,465,972 | | | | 33,773,391 | | | | 11,628,887 | | | | 38,492,999 | | | | 26,598,668 | | |
The accompanying notes are an integral part of these financial statements.
79
MUTUAL OF AMERICA INVESTMENT CORPORATION
STATEMENTS OF CHANGES IN NET ASSETS (Continued)
For the Years Ended December 31,
| | | Moderate Allocation Fund | | Aggressive Allocation Fund | | Money Market Fund | |
| | | 2009 | | 2008 | | 2009 | | 2008 | | 2009 | | 2008 | |
| INCREASE (DECREASE) IN NET ASSETS: | |
| FROM OPERATIONS: | |
| Net investment income (loss) | | $ | 3,314,581 | | | $ | 3,057,130 | | | $ | 2,280,953 | | | $ | 2,258,800 | | | $ | (60,152 | ) | | $ | 5,516,861 | | |
| Net realized gain (loss) on investments and futures contracts | | | (3,867,311 | ) | | | (307,518 | ) | | | (3,407,174 | ) | | | (669,111 | ) | | | (2,242 | ) | | | 43,765 | | |
Change in net unrealized appreciation (depreciation) of investments and
futures contracts | | | 21,155,502 | | | | (23,765,946 | ) | | | 23,875,879 | | | | (32,032,538 | ) | | | (45,827 | ) | | | 51,692 | | |
| NET INCREASE (DECREASE) IN NET ASSETS RESULTING FROM OPERATIONS | | | 20,602,772 | | | | (21,016,334 | ) | | | 22,749,658 | | | | (30,442,849 | ) | | | (108,221 | ) | | | 5,612,318 | | |
| DIVIDEND DISTRIBUTIONS (Note 5) | |
| From net investment income | | | (3,071,232 | ) | | | (3,001,341 | ) | | | (1,924,987 | ) | | | (2,202,966 | ) | | | (85,964 | ) | | | (5,622,687 | ) | |
| From capital gains | | | (369,648 | ) | | | (644,353 | ) | | | (180,100 | ) | | | (663,237 | ) | | | (17,483 | ) | | | (19,529 | ) | |
| Return of capital | | | (105,339 | ) | | | — | | | | — | | | | — | | | | — | | | | — | | |
| Total distributions | | | (3,546,219 | ) | | | (3,645,694 | ) | | | (2,105,087 | ) | | | (2,866,203 | ) | | | (103,447 | ) | | | (5,642,216 | ) | |
| CAPITAL SHARE TRANSACTIONS (Note 4): | |
| Net proceeds from sale of shares | | | 30,015,339 | | | | 19,525,292 | | | | 24,420,545 | | | | 17,996,573 | | | | 34,613,637 | | | | 71,534,535 | | |
| Dividends reinvested | | | 3,546,219 | | | | 3,645,694 | | | | 2,105,087 | | | | 2,866,203 | | | | 103,447 | | | | 5,642,216 | | |
| Cost of shares redeemed | | | (14,837,161 | ) | | | (10,825,647 | ) | | | (11,849,411 | ) | | | (7,155,575 | ) | | | (116,758,031 | ) | | | (187,976,890 | ) | |
| NET INCREASE (DECREASE) IN NET ASSETS FROM CAPITAL SHARE TRANSACTIONS | | | 18,724,397 | | | | 12,345,339 | | | | 14,676,221 | | | | 13,707,201 | | | | (82,040,947 | ) | | | (110,800,139 | ) | |
| INCREASE (DECREASE) IN NET ASSETS | | | 35,780,950 | | | | (12,316,689 | ) | | | 35,320,792 | | | | (19,601,851 | ) | | | (82,252,615 | ) | | | (110,830,037 | ) | |
| NET ASSETS, BEGINNING OF PERIOD | | | 89,505,262 | | | | 101,821,951 | | | | 81,248,122 | | | | 100,849,973 | | | | 200,989,682 | | | | 311,819,719 | | |
| NET ASSETS, END OF PERIOD | | $ | 125,286,212 | | | $ | 89,505,262 | | | $ | 116,568,914 | | | $ | 81,248,122 | | | $ | 118,737,067 | | | $ | 200,989,682 | | |
| OTHER INFORMATION: | |
| Shares outstanding at the beginning of period | | | 102,039,836 | | | | 89,251,267 | | | | 94,418,460 | | | | 81,179,525 | | | | 166,343,903 | | | | 256,731,045 | | |
| Shares sold | | | 30,987,848 | | | | 18,870,607 | | | | 25,537,227 | | | | 16,464,294 | | | | 28,648,847 | | | | 58,191,033 | | |
| Shares issued as reinvestment of dividends | | | 3,431,162 | | | | 4,151,057 | | | | 1,982,795 | | | | 3,330,816 | | | | 89,884 | | | | 4,666,374 | | |
| Shares redeemed | | | (15,249,394 | ) | | | (10,233,095 | ) | | | (12,141,515 | ) | | | (6,556,175 | ) | | | (96,660,813 | ) | | | (153,244,549 | ) | |
| Net increase (decrease) | | | 19,169,616 | | | | 12,788,569 | | | | 15,378,507 | | | | 13,238,935 | | | | (67,922,082 | ) | | | (90,387,142 | ) | |
| Shares outstanding at the end of period | | | 121,209,452 | | | | 102,039,836 | | | | 109,796,967 | | | | 94,418,460 | | | | 98,421,821 | | | | 166,343,903 | | |
The accompanying notes are an integral part of these financial statements.
80
| | | Mid-Term Bond Fund | | Bond Fund | |
| | | 2009 | | 2008 | | 2009 | | 2008 | |
| INCREASE (DECREASE) IN NET ASSETS: | |
| FROM OPERATIONS: | |
| Net investment income (loss) | | $ | 8,603,484 | | | $ | 7,436,545 | | | $ | 19,131,665 | | | $ | 19,800,339 | | |
| Net realized gain (loss) on investments and futures contracts | | | 2,884,973 | | | | 928,917 | | | | (3,299,948 | ) | | | 1,850,739 | | |
Change in net unrealized appreciation (depreciation) of investments and
futures contracts | | | 10,061,760 | | | | (6,837,197 | ) | | | 38,771,964 | | | | (28,761,251 | ) | |
| NET INCREASE (DECREASE) IN NET ASSETS RESULTING FROM OPERATIONS | | | 21,550,217 | | | | 1,528,265 | | | | 54,603,681 | | | | (7,110,173 | ) | |
| DIVIDEND DISTRIBUTIONS (Note 5) | |
| From net investment income | | | (8,815,591 | ) | | | (7,408,865 | ) | | | (19,172,093 | ) | | | (19,789,048 | ) | |
| From capital gains | | | (2,092,181 | ) | | | — | | | | — | | | | — | | |
| Return of capital | | | — | | | | — | | | | — | | | | — | | |
| Total distributions | | | (10,907,772 | ) | | | (7,408,865 | ) | | | (19,172,093 | ) | | | (19,789,048 | ) | |
| CAPITAL SHARE TRANSACTIONS (Note 4): | |
| Net proceeds from sale of shares | | | 61,709,976 | | | | 96,093,813 | | | | 118,066,876 | | | | 66,355,543 | | |
| Dividends reinvested | | | 10,907,772 | | | | 7,408,865 | | | | 19,172,093 | | | | 19,789,048 | | |
| Cost of shares redeemed | | | (32,257,019 | ) | | | (36,395,131 | ) | | | (57,145,127 | ) | | | (71,068,439 | ) | |
| NET INCREASE (DECREASE) IN NET ASSETS FROM CAPITAL SHARE TRANSACTIONS | | | 40,360,729 | | | | 67,107,547 | | | | 80,093,842 | | | | 15,076,152 | | |
| INCREASE (DECREASE) IN NET ASSETS | | | 51,003,174 | | | | 61,226,947 | | | | 115,525,430 | | | | (11,823,069 | ) | |
| NET ASSETS, BEGINNING OF PERIOD | | | 183,419,274 | | | | 122,192,327 | | | | 372,101,409 | | | | 383,924,478 | | |
| NET ASSETS, END OF PERIOD | | $ | 234,422,448 | | | $ | 183,419,274 | | | $ | 487,626,839 | | | $ | 372,101,409 | | |
| OTHER INFORMATION: | |
| Shares outstanding at the beginning of period | | | 195,477,588 | | | | 127,264,253 | | | | 315,997,008 | | | | 303,322,179 | | |
| Shares sold | | | 61,128,118 | | | | 97,850,958 | | | | 90,803,181 | | | | 52,211,307 | | |
| Shares issued as reinvestment of dividends | | | 10,961,345 | | | | 7,892,414 | | | | 14,786,835 | | | | 16,791,497 | | |
| Shares redeemed | | | (31,967,314 | ) | | | (37,530,037 | ) | | | (45,489,632 | ) | | | (56,327,975 | ) | |
| Net increase (decrease) | | | 40,122,149 | | | | 68,213,335 | | | | 60,100,384 | | | | 12,674,829 | | |
| Shares outstanding at the end of period | | | 235,599,737 | | | | 195,477,588 | | | | 376,097,392 | | | | 315,997,008 | | |
The accompanying notes are an integral part of these financial statements.
81
MUTUAL OF AMERICA INVESTMENT CORPORATION
FINANCIAL HIGHLIGHTS
Income from investment operations and distributions per share for a Fund share outstanding throughout the five years ended December 31, 2009 (or since the Fund's inception date if in existence less than five years) and other supplementary data with respect to each Fund are presented below and in the pages following:
| | | Equity Index Fund | | All America Fund | |
| | | Years Ended December 31, | | Years Ended December 31, | |
| | | 2009 | | 2008 | | 2007 | | 2006 | | 2005 | | 2009 | | 2008 | | 2007 | | 2006 | | 2005 | |
| Net Asset Value, Beginning of Period | | $ | 1.48 | | | $ | 2.41 | | | $ | 2.38 | | | $ | 2.14 | | | $ | 2.12 | | | $ | 1.15 | | | $ | 1.86 | | | $ | 2.00 | | | $ | 1.94 | | | $ | 2.05 | | |
| INCOME (LOSS) FROM INVESTMENT OPERATIONS: | |
| Net Investment Income | | | 0.03 | | | | 0.04 | | | | 0.05 | | | | 0.04 | | | | 0.04 | | | | 0.02 | | | | 0.03 | | | | 0.03 | | | | 0.02 | | | | 0.01 | | |
| Net Realized and Unrealized Gains (Losses) on Investments and Futures Contracts | | | 0.36 | | | | (0.93 | ) | | | 0.07 | | | | 0.30 | | | | 0.06 | | | | 0.28 | | | | (0.68 | ) | | | 0.06 | | | | 0.28 | | | | 0.06 | | |
| Total From Investment Operations | | | 0.39 | | | | (0.89 | ) | | | 0.12 | | | | 0.34 | | | | 0.10 | | | | 0.30 | | | | (0.65 | ) | | | 0.09 | | | | 0.30 | | | | 0.07 | | |
Less: Dividend Distributions:
From Net Investment Income | | | (0.03 | ) | | | (0.03 | ) | | | (0.05 | ) | | | (0.04 | ) | | | (0.03 | ) | | | (0.03 | ) | | | (0.02 | ) | | | (0.03 | ) | | | (0.03 | ) | | | (0.01 | ) | |
| From Capital Gains | | | — | | | | (0.01 | ) | | | (0.04 | ) | | | (0.06 | ) | | | (0.05 | ) | | | — | | | | (0.04 | ) | | | (0.20 | ) | | | (0.21 | ) | | | (0.17 | ) | |
| From Return of Capital | | | — | | | | — | | | | — | | | | — | | | | — | | | | — | | | | — | | | | — | | | | — | | | | — | | |
| Total Distributions | | | (0.03 | ) | | | (0.04 | ) | | | (0.09 | ) | | | (0.10 | ) | | | (0.08 | ) | | | (0.03 | ) | | | (0.06 | ) | | | (0.23 | ) | | | (0.24 | ) | | | (0.18 | ) | |
| Net Asset Value, End of Period | | $ | 1.84 | | | $ | 1.48 | | | $ | 2.41 | | | $ | 2.38 | | | $ | 2.14 | | | $ | 1.42 | | | $ | 1.15 | | | $ | 1.86 | | | $ | 2.00 | | | $ | 1.94 | | |
| Total Return (%)(b) | | | 26.13 | | | | (37.08 | ) | | | 5.22 | | | | 15.59 | | | | 4.81 | | | | 25.31 | | | | (35.49 | ) | | | 4.27 | | | | 15.74 | | | | 3.71 | | |
| Net Assets, End of Period ($ millions) | | | 768 | | | | 545 | | | | 816 | | | | 811 | | | | 726 | | | | 256 | | | | 222 | | | | 389 | | | | 423 | | | | 407 | | |
| Ratio of Net Investment Income (Loss) to Average Net Assets (%) | | | 1.98 | | | | 2.07 | | | | 1.82 | | | | 1.85 | | | | 1.76 | | | | 1.46 | | | | 1.64 | | | | 1.30 | | | | 1.36 | | | | 1.17 | | |
| Ratio of Expenses to Average Net Assets Before Expense Reimbursement (%) | | | 0.26 | | | | 0.25 | | | | 0.20 | | | | 0.17 | | | | 0.24 | | | | 0.58 | | | | 0.56 | | | | 0.55 | | | | 0.52 | | | | 0.64 | | |
| Ratio of Expenses to Average Net Assets After Expense Reimbursement (%) | | | 0.26 | | | | 0.25 | | | | 0.20 | | | | 0.14 | | | | 0.13 | | | | 0.58 | | | | 0.56 | | | | 0.55 | | | | 0.49 | | | | 0.50 | | |
| Portfolio Turnover Rate (%)(a) | | | 4.29 | | | | 4.70 | | | | 4.66 | | | | 4.91 | | | | 9.36 | | | | 35.15 | | | | 31.03 | | | | 29.24 | | | | 33.84 | | | | 48.00 | | |
(a) Portfolio turnover rate excludes all short-term securities.
(b) Total return would have been lower had non-investment advisory expenses not been reduced through expense reimbursement in certain years (Note 2).
(c) Not annualized.
(d) Annualized.
(e) For the period July 1, 2005 (commencement of operations) through December 31, 2005.
(f) Allocation and Retirement Funds exclude expenses of the underlying funds.
(g) For the period November 5, 2007 (commencement of operations) through December 31, 2007.
(h) Includes less than $0.005 of tax-basis return of capital distributions.
N/A = Not Applicable
The accompanying notes are an integral part of these financial statements.
82
| | | Small Cap Value Fund | |
| | | Years Ended December 31, | |
| | | 2009 | | 2008 | | 2007 | | 2006 | | 2005(e) | |
| Net Asset Value, Beginning of Period | | $ | 0.75 | | | $ | 1.06 | | | $ | 1.24 | | | $ | 1.07 | | | $ | 1.00 | | |
| INCOME (LOSS) FROM INVESTMENT OPERATIONS: | |
| Net Investment Income | | | 0.01 | | | | 0.01 | | | | 0.01 | | | | 0.01 | | | | 0.01 | | |
| Net Realized and Unrealized Gains (Losses) on Investments and Futures Contracts | | | 0.21 | | | | (0.30 | ) | | | (0.06 | ) | | | 0.18 | | | | 0.07 | | |
| Total From Investment Operations | | | 0.22 | | | | (0.29 | ) | | | (0.05 | ) | | | 0.19 | | | | 0.08 | | |
Less: Dividend Distributions:
From Net Investment Income | | | (0.01 | )(h) | | | (0.01 | ) | | | (0.01 | ) | | | (0.01 | ) | | | (0.01 | ) | |
| From Capital Gains | | | — | | | | — | | | | (0.12 | ) | | | (0.01 | ) | | | — | | |
| From Return of Capital | | | �� | | | | (0.01 | ) | | | — | | | | — | | | | — | | |
| Total Distributions | | | (0.01 | ) | | | (0.02 | ) | | | (0.13 | ) | | | (0.02 | ) | | | (0.01 | ) | |
| Net Asset Value, End of Period | | $ | 0.96 | | | $ | 0.75 | | | $ | 1.06 | | | $ | 1.24 | | | $ | 1.07 | | |
| Total Return (%)(b) | | | 29.28 | | | | (27.76 | ) | | | (3.99 | ) | | | 17.68 | | | | 7.61 | (c) | |
| Net Assets, End of Period ($ millions) | | | 205 | | | | 155 | | | | 215 | | | | 246 | | | | 34 | | |
| Ratio of Net Investment Income (Loss) to Average Net Assets (%) | | | 1.30 | | | | 1.23 | | | | 0.96 | | | | 1.42 | | | | 1.19 | (d) | |
| Ratio of Expenses to Average Net Assets Before Expense Reimbursement (%) | | | 0.93 | | | | 0.92 | | | | 0.89 | | | | 0.81 | | | | 0.96 | (d) | |
| Ratio of Expenses to Average Net Assets After Expense Reimbursement (%) | | | 0.93 | | | | 0.92 | | | | 0.89 | | | | 0.80 | | | | 0.84 | (d) | |
| Portfolio Turnover Rate (%)(a) | | | 39.03 | | | | 59.64 | | | | 55.77 | | | | 62.55 | | | | 32.67 | (c) | |
The accompanying notes are an integral part of these financial statements.
83
MUTUAL OF AMERICA INVESTMENT CORPORATION
FINANCIAL HIGHLIGHTS (Continued)
| | | Small Cap Growth Fund | | Mid Cap Value Fund | |
| | | Years Ended December 31, | | Years Ended December 31, | |
| | | 2009 | | 2008 | | 2007 | | 2006 | | 2005(e) | | 2009 | | 2008 | | 2007 | | 2006 | | 2005(e) | |
| Net Asset Value, Beginning of Period | | $ | 0.70 | | | $ | 1.08 | | | $ | 1.19 | | | $ | 1.06 | | | $ | 1.00 | | | $ | 0.79 | | | $ | 1.20 | | | $ | 1.21 | | | $ | 1.06 | | | $ | 1.00 | | |
| INCOME (LOSS) FROM INVESTMENT OPERATIONS: | |
| Net Investment Income | | | — | | | | — | | | | — | | | | — | | | | — | | | | 0.01 | | | | 0.02 | | | | 0.02 | | | | 0.01 | | | | 0.01 | | |
| Net Realized and Unrealized Gains (Losses) on Investments and Futures Contracts | | | 0.19 | | | | (0.36 | ) | | | 0.05 | | | | 0.16 | | | | 0.06 | | | | 0.19 | | | | (0.41 | ) | | | (0.01 | ) | | | 0.16 | | | | 0.06 | | |
| Total From Investment Operations | | | 0.19 | | | | (0.36 | ) | | | 0.05 | | | | 0.16 | | | | 0.06 | | | | 0.20 | | | | (0.39 | ) | | | 0.01 | | | | 0.17 | | | | 0.07 | | |
Less: Dividend Distributions:
From Net Investment Income | | | — | | | | — | | | | — | | | | — | | | | — | | | | (0.01 | )(h) | | | (0.02 | )(h) | | | (0.02 | ) | | | (0.01 | ) | | | (0.01 | ) | |
| From Capital Gains | | | — | | | | (0.02 | ) | | | (0.16 | ) | | | (0.03 | ) | | | — | | | | — | | | | — | | | | — | | | | (0.01 | ) | | | — | | |
| From Return of Capital | | | — | | | | — | | | | — | | | | — | | | | — | | | | — | | | | — | | | | — | | | | — | | | | — | | |
| Total Distributions | | | — | | | | (0.02 | ) | | | (0.16 | ) | | | (0.03 | ) | | | — | | | | (0.01 | ) | | | (0.02 | ) | | | (0.02 | ) | | | (0.02 | ) | | | (0.01 | ) | |
| Net Asset Value, End of Period | | $ | 0.89 | | | $ | 0.70 | | | $ | 1.08 | | | $ | 1.19 | | | $ | 1.06 | | | $ | 0.98 | | | $ | 0.79 | | | $ | 1.20 | | | $ | 1.21 | | | $ | 1.06 | | |
| Total Return (%)(b) | | | 27.69 | | | | (34.37 | ) | | | 4.68 | | | | 15.14 | | | | 5.49 | (c) | | | 25.22 | | | | (32.64 | ) | | | 0.88 | | | | 15.93 | | | | 6.91 | (c) | |
| Net Assets, End of Period ($ millions) | | | 194 | | | | 147 | | | | 223 | | | | 224 | | | | 24 | | | | 42 | | | | 30 | | | | 40 | | | | 33 | | | | 11 | | |
| Ratio of Net Investment Income (Loss) to Average Net Assets (%) | | | (0.26 | ) | | | (0.16 | ) | | | (0.26 | ) | | | (0.20 | ) | | | 0.00 | (d) | | | 1.57 | | | | 1.62 | | | | 1.54 | | | | 1.69 | | | | 1.76 | (d) | |
| Ratio of Expenses to Average Net Assets Before Expense Reimbursement (%) | | | 0.93 | | | | 0.92 | | | | 0.89 | | | | 0.83 | | | | 0.95 | (d) | | | 0.73 | | | | 0.74 | | | | 0.75 | | | | 0.70 | | | | 0.75 | (d) | |
| Ratio of Expenses to Average Net Assets After Expense Reimbursement (%) | | | 0.93 | | | | 0.92 | | | | 0.89 | | | | 0.81 | | | | 0.83 | (d) | | | 0.73 | | | | 0.74 | | | | 0.75 | | | | 0.66 | | | | 0.62 | (d) | |
| Portfolio Turnover Rate (%)(a) | | | 94.14 | | | | 93.16 | | | | 94.06 | | | | 85.67 | | | | 64.38 | (c) | | | 20.16 | | | | 33.80 | | | | 27.24 | | | | 30.41 | | | | 14.39 | (c) | |
(a) Portfolio turnover rate excludes all short-term securities.
(b) Total return would have been lower had non-investment advisory expenses not been reduced through expense reimbursement in certain years (Note 2).
(c) Not annualized.
(d) Annualized.
(e) For the period July 1, 2005 (commencement of operations) through December 31, 2005.
(f) Allocation and Retirement Funds exclude expenses of the underlying funds.
(g) For the period November 5, 2007 (commencement of operations) through December 31, 2007.
(h) Includes less than $0.005 of tax-basis return of capital distributions.
N/A = Not Applicable
The accompanying notes are an integral part of these financial statements.
84
| | | Mid-Cap Equity Index Fund | | International Fund | |
| | | Years Ended December 31, | | Years Ended
December 31, | | Period Ended
December 31, | |
| | | 2009 | | 2008 | | 2007 | | 2006 | | 2005 | | 2009 | | 2008 | | 2007(g) | |
| Net Asset Value, Beginning of Period | | $ | 0.93 | | | $ | 1.51 | | | $ | 1.56 | | | $ | 1.53 | | | $ | 1.46 | | | $ | 0.55 | | | $ | 0.95 | | | $ | 1.00 | | |
| INCOME (LOSS) FROM INVESTMENT OPERATIONS: | |
| Net Investment Income | | | 0.01 | | | | 0.02 | | | | 0.03 | | | | 0.02 | | | | 0.02 | | | | 0.01 | | | | 0.02 | | | | 0.02 | | |
| Net Realized and Unrealized Gains (Losses) on Investments and Futures Contracts | | | 0.32 | | | | (0.56 | ) | | | 0.09 | | | | 0.14 | | | | 0.16 | | | | 0.13 | | | | (0.40 | ) | | | (0.05 | ) | |
| Total From Investment Operations | | | 0.33 | | | | (0.54 | ) | | | 0.12 | | | | 0.16 | | | | 0.18 | | | | 0.14 | | | | (0.38 | ) | | | (0.03 | ) | |
Less: Dividend Distributions:
From Net Investment Income | | | (0.01 | ) | | | (0.02 | ) | | | (0.03 | ) | | | (0.03 | ) | | | (0.02 | ) | | | (0.01 | ) | | | (0.02 | ) | | | (0.02 | ) | |
| From Capital Gains | | | (0.01 | ) | | | (0.02 | ) | | | (0.14 | ) | | | (0.10 | ) | | | (0.09 | ) | | | — | | | | — | | | | — | | |
| From Return of Capital | | | — | | | | — | | | | — | | | | — | | | | — | | | | (0.01 | ) | | | — | | | | — | | |
| Total Distributions | | | (0.02 | ) | | | (0.04 | ) | | | (0.17 | ) | | | (0.13 | ) | | | (0.11 | ) | | | (0.02 | ) | | | (0.02 | ) | | | (0.02 | ) | |
| Net Asset Value, End of Period | | $ | 1.24 | | | $ | 0.93 | | | $ | 1.51 | | | $ | 1.56 | | | $ | 1.53 | | | $ | 0.67 | | | $ | 0.55 | | | $ | 0.95 | | |
| Total Return (%)(b) | | | 36.69 | | | | (36.31 | ) | | | 7.74 | | | | 10.10 | | | | 12.50 | | | | 25.22 | | | | (40.06 | ) | | | (2.93 | )(c) | |
| Net Assets, End of Period ($ millions) | | | 377 | | | | 248 | | | | 379 | | | | 357 | | | | 358 | | | | 33 | | | | 12 | | | | 3 | | |
| Ratio of Net Investment Income (Loss) to Average Net Assets (%) | | | 1.41 | | | | 1.47 | | | | 1.52 | | | | 1.40 | | | | 1.37 | | | | 3.45 | | | | 5.17 | | | | 3.38 | (c) | |
| Ratio of Expenses to Average Net Assets Before Expense Reimbursement (%) | | | 0.26 | | | | 0.25 | | | | 0.22 | | | | 0.17 | | | | 0.25 | | | | 0.25 | | | | 0.20 | | | | 0.22 | (d) | |
| Ratio of Expenses to Average Net Assets After Expense Reimbursement (%) | | | 0.26 | | | | 0.25 | | | | 0.22 | | | | 0.14 | | | | 0.13 | | | | 0.25 | | | | 0.20 | | | | 0.22 | (d) | |
| Portfolio Turnover Rate (%)(a) | | | 15.41 | | | | 22.66 | | | | 20.53 | | | | 16.02 | | | | 18.65 | | | | 4.95 | | | | 0.00 | | | | — | | |
The accompanying notes are an integral part of these financial statements.
85
MUTUAL OF AMERICA INVESTMENT CORPORATION
FINANCIAL HIGHLIGHTS (Continued)
| | | Composite Fund | | Retirement Income Fund | |
| | |
Years Ended December 31, | | Years Ended
December 31, | | Period Ended
December 31, | |
| | | 2009 | | 2008 | | 2007 | | 2006 | | 2005 | | 2009 | | 2008 | | 2007(g) | |
| Net Asset Value, Beginning of Period | | $ | 1.20 | | | $ | 1.60 | | | $ | 1.55 | | | $ | 1.43 | | | $ | 1.46 | | | $ | 0.83 | | | $ | 0.96 | | | $ | 1.00 | | |
| INCOME (LOSS) FROM INVESTMENT OPERATIONS: | |
| Net Investment Income | | | 0.04 | | | | 0.04 | | | | 0.05 | | | | 0.05 | | | | 0.04 | | | | 0.03 | | | | 0.03 | | | | 0.04 | | |
| Net Realized and Unrealized Gains (Losses) on Investments and Futures Contracts | | | 0.19 | | | | (0.40 | ) | | | 0.05 | | | | 0.11 | | | | (0.03 | ) | | | 0.11 | | | | (0.13 | ) | | | (0.04 | ) | |
| Total From Investment Operations | | | 0.23 | | | | (0.36 | ) | | | 0.10 | | | | 0.16 | | | | 0.01 | | | | 0.14 | | | | (0.10 | ) | | | — | | |
Less: Dividend Distributions:
From Net Investment Income | | | (0.04 | ) | | | (0.04 | ) | | | (0.05 | ) | | | (0.04 | ) | | | (0.04 | ) | | | — | | | | (0.03 | ) | | | (0.03 | ) | |
| From Capital Gains | | | — | | | | — | | | | — | | | | — | | | | — | | | | — | | | | — | | | | (0.01 | ) | |
| Total Distributions | | | (0.04 | ) | | | (0.04 | ) | | | (0.05 | ) | | | (0.04 | ) | | | (0.04 | ) | | | — | | | | (0.03 | ) | | | (0.04 | ) | |
| Net Asset Value, End of Period | | $ | 1.39 | | | $ | 1.20 | | | $ | 1.60 | | | $ | 1.55 | | | $ | 1.43 | | | $ | 0.97 | | | $ | 0.83 | | | $ | 0.96 | | |
| Total Return (%)(b) | | | 18.45 | | | | (22.51 | ) | | | 6.69 | | | | 10.80 | | | | 0.96 | | | | 16.25 | | | | (9.61 | ) | | | 0.07 | (c) | |
| Net Assets, End of Period ($ millions) | | | 166 | | | | 150 | | | | 220 | | | | 229 | | | | 232 | | | | 9 | | | �� | 4 | | | | 1 | | |
| Ratio of Net Investment Income (Loss) to Average Net Assets (%) | | | 2.74 | | | | 3.01 | | | | 2.72 | | | | 2.70 | | | | 2.48 | | | | 4.39 | | | | 5.42 | | | | 6.12 | (c) | |
| Ratio of Expenses to Average Net Assets Before Expense Reimbursement (%)(f) | | | 0.58 | | | | 0.57 | | | | 0.55 | | | | 0.52 | | | | 0.63 | | | | 0.05 | | | | 0.05 | | | | 0.05 | (d) | |
| Ratio of Expenses to Average Net Assets After Expense Reimbursement (%)(f) | | | 0.58 | | | | 0.57 | | | | 0.55 | | | | 0.48 | | | | 0.50 | | | | 0.05 | | | | 0.05 | | | | 0.05 | (d) | |
| Portfolio Turnover Rate (%)(a) | | | 31.73 | | | | 37.98 | | | | 24.95 | | | | 26.77 | | | | 93.84 | | | | 35.31 | | | | 82.92 | | | | 14.38 | (c) | |
(a) Portfolio turnover rate excludes all short-term securities.
(b) Total return would have been lower had non-investment advisory expenses not been reduced through expense reimbursement in certain years (Note 2).
(c) Not annualized.
(d) Annualized.
(e) For the period July 1, 2005 (commencement of operations) through December 31, 2005.
(f) Allocation and Retirement Funds exclude expenses of the underlying funds.
(g) For the period November 5, 2007 (commencement of operations) through December 31, 2007.
(h) Includes less than $0.005 of tax-basis return of capital distributions.
N/A = Not Applicable
The accompanying notes are an integral part of these financial statements.
86
| | | 2010 Retirement Fund | | 2015 Retirement Fund | | 2020 Retirement Fund | |
| | | Years Ended
December 31, | | Period Ended
December 31, | | Years Ended
December 31, | | Period Ended
December 31, | | Years Ended
December 31, | | Period Ended
December 31, | |
| | | 2009 | | 2008 | | 2007(g) | | 2009 | | 2008 | | 2007(g) | | 2009 | | 2008 | | 2007(g) | |
| Net Asset Value, Beginning of Period | | $ | 0.74 | | | $ | 0.94 | | | $ | 0.99 | | | $ | 0.70 | | | $ | 0.92 | | | $ | 0.98 | | | $ | 0.66 | | | $ | 0.91 | | | $ | 0.97 | | |
| INCOME (LOSS) FROM INVESTMENT OPERATIONS: | |
| Net Investment Income | | | 0.02 | | | | 0.03 | | | | 0.03 | | | | 0.02 | | | | 0.03 | | | | 0.03 | | | | 0.02 | | | | 0.02 | | | | 0.02 | | |
| Net Realized and Unrealized Gains (Losses) on Investments and Futures Contracts | | | 0.13 | | | | (0.20 | ) | | | (0.03 | ) | | | 0.13 | | | | (0.22 | ) | | | (0.04 | ) | | | 0.14 | | | | (0.25 | ) | | | (0.04 | ) | |
| Total From Investment Operations | | | 0.15 | | | | (0.17 | ) | | | — | | | | 0.15 | | | | (0.19 | ) | | | (0.01 | ) | | | 0.16 | | | | (0.23 | ) | | | (0.02 | ) | |
Less: Dividend Distributions:
From Net Investment Income | | | (0.02 | )(h) | | | (0.03 | ) | | | (0.03 | ) | | | (0.02 | )(h) | | | (0.03 | )(h) | | | (0.03 | ) | | | (0.02 | )(h) | | | (0.02 | )(h) | | | (0.02 | ) | |
| From Capital Gains | | | — | | | | — | | | | (0.02 | ) | | | — | | | | — | | | | (0.02 | ) | | | — | | | | — | | | | (0.02 | ) | |
| Total Distributions | | | (0.02 | ) | | | (0.03 | ) | | | (0.05 | ) | | | (0.02 | ) | | | (0.03 | ) | | | (0.05 | ) | | | (0.02 | ) | | | (0.02 | ) | | | (0.04 | ) | |
| Net Asset Value, End of Period | | $ | 0.87 | | | $ | 0.74 | | | $ | 0.94 | | | $ | 0.83 | | | $ | 0.70 | | | $ | 0.92 | | | $ | 0.80 | | | $ | 0.66 | | | $ | 0.91 | | |
| Total Return (%)(b) | | | 19.79 | | | | (17.45 | ) | | | (0.68 | )(c) | | | 21.27 | | | | (21.01 | ) | | | (1.18 | )(c) | | | 23.18 | | | | (24.81 | ) | | | (1.54 | )(c) | |
| Net Assets, End of Period ($ millions) | | | 15 | | | | 8 | | | | 2 | | | | 44 | | | | 20 | | | | 5 | | | | 50 | | | | 21 | | | | 5 | | |
| Ratio of Net Investment Income (Loss) to Average Net Assets (%) | | | 3.51 | | | | 5.36 | | | | 5.28 | (c) | | | 3.45 | | | | 4.65 | | | | 5.39 | (c) | | | 3.61 | | | | 4.73 | | | | 5.29 | (c) | |
| Ratio of Expenses to Average Net Assets Before Expense Reimbursement (%)(f) | | | 0.05 | | | | 0.05 | | | | 0.04 | (d) | | | 0.05 | | | | 0.05 | | | | 0.04 | (d) | | | 0.05 | | | | 0.05 | | | | 0.04 | (d) | |
| Ratio of Expenses to Average Net Assets After Expense Reimbursement (%)(f) | | | 0.05 | | | | 0.05 | | | | 0.04 | (d) | | | 0.05 | | | | 0.05 | | | | 0.04 | (d) | | | 0.05 | | | | 0.05 | | | | 0.04 | (d) | |
| Portfolio Turnover Rate (%)(a) | | | 38.17 | | | | 32.37 | | | | 32.49 | (c) | | | 26.96 | | | | 21.47 | | | | 2.79 | (c) | | | 13.70 | | | | 14.74 | | | | 2.51 | (c) | |
The accompanying notes are an integral part of these financial statements.
87
MUTUAL OF AMERICA INVESTMENT CORPORATION
FINANCIAL HIGHLIGHTS (Continued)
| | | 2025 Retirement Fund | | 2030 Retirement Fund | | 2035 Retirement Fund | |
| | | Years Ended
December 31, | | Period Ended
December 31, | | Years Ended
December 31, | | Period Ended
December 31, | | Years Ended
December 31, | | Period Ended
December 31, | |
| | | 2009 | | 2008 | | 2007(g) | | 2009 | | 2008 | | 2007(g) | | 2009 | | 2008 | | 2007(g) | |
| Net Asset Value, Beginning of Period | | $ | 0.64 | | | $ | 0.92 | | | $ | 0.99 | | | $ | 0.62 | | | $ | 0.92 | | | $ | 0.99 | | | $ | 0.60 | | | $ | 0.92 | | | $ | 1.00 | | |
| INCOME (LOSS) FROM INVESTMENT OPERATIONS: | |
| Net Investment Income | | | 0.02 | | | | 0.02 | | | | 0.02 | | | | 0.01 | | | | 0.02 | | | | 0.02 | | | | 0.01 | | | | 0.02 | | | | 0.02 | | |
Net Realized and Unrealized Gains (Losses) on Investments and
Futures Contracts | | | 0.14 | | | | (0.28 | ) | | | (0.04 | ) | | | 0.15 | | | | (0.30 | ) | | | (0.04 | ) | | | 0.15 | | | | (0.32 | ) | | | (0.05 | ) | |
| Total From Investment Operations | | | 0.16 | | | | (0.26 | ) | | | (0.02 | ) | | | 0.16 | | | | (0.28 | ) | | | (0.02 | ) | | | 0.16 | | | | (0.30 | ) | | | (0.03 | ) | |
Less: Dividend Distributions:
From Net Investment Income | | | (0.02 | )(h) | | | (0.02 | )(h) | | | (0.02 | ) | | | (0.01 | )(h) | | | (0.02 | )(h) | | | (0.02 | ) | | | (0.01 | )(h) | | | (0.02 | )(h) | | | (0.02 | ) | |
| From Capital Gains | | | — | | | | — | | | | (0.03 | ) | | | — | | | | — | | | | (0.03 | ) | | | — | | | | — | | | | (0.03 | ) | |
| Total Distributions | | | (0.02 | ) | | | (0.02 | ) | | | (0.05 | ) | | | (0.01 | ) | | | (0.02 | ) | | | (0.05 | ) | | | (0.01 | ) | | | (0.02 | ) | | | (0.05 | ) | |
| Net Asset Value, End of Period | | $ | 0.78 | | | $ | 0.64 | | | $ | 0.92 | | | $ | 0.77 | | | $ | 0.62 | | | $ | 0.92 | | | $ | 0.75 | | | $ | 0.60 | | | $ | 0.92 | | |
| Total Return (%)(b) | | | 25.10 | | | | (28.32 | ) | | | (1.95 | )(c) | | | 26.47 | | | | (29.95 | ) | | | (2.22 | )(c) | | | 27.05 | | | | (32.53 | ) | | | (2.54 | )(c) | |
| Net Assets, End of Period ($ millions) | | | 42 | | | | 15 | | | | 2 | | | | 35 | | | | 12 | | | | 2 | | | | 27 | | | | 9 | | | | 2 | | |
| Ratio of Net Investment Income (Loss) to Average Net Assets (%) | | | 3.25 | | | | 5.06 | | | | 4.48 | (c) | | | 3.07 | | | | 4.61 | | | | 4.82 | (c) | | | 2.74 | | | | 4.21 | | | | 3.76 | (c) | |
| Ratio of Expenses to Average Net Assets Before Expense Reimbursement (%)(f) | | | 0.05 | | | | 0.05 | | | | 0.04 | (d) | | | 0.05 | | | | 0.05 | | | | 0.05 | (d) | | | 0.05 | | | | 0.05 | | | | 0.05 | (d) | |
| Ratio of Expenses to Average Net Assets After Expense Reimbursement (%)(f) | | | 0.05 | | | | 0.05 | | | | 0.04 | (d) | | | 0.05 | | | | 0.05 | | | | 0.05 | (d) | | | 0.05 | | | | 0.05 | | | | 0.05 | (d) | |
| Portfolio Turnover Rate (%)(a) | | | 9.21 | | | | 10.06 | | | | 0.28 | (c) | | | 8.96 | | | | 12.34 | | | | 4.11 | (c) | | | 6.27 | | | | 7.62 | | | | 0.71 | (c) | |
(a) Portfolio turnover rate excludes all short-term securities.
(b) Total return would have been lower had non-investment advisory expenses not been reduced through expense reimbursement in certain years (Note 2).
(c) Not annualized.
(d) Annualized.
(e) For the period July 1, 2005 (commencement of operations) through December 31, 2005.
(f) Allocation and Retirement Funds exclude expenses of the underlying funds.
(g) For the period November 5, 2007 (commencement of operations) through December 31, 2007.
(h) Includes less than $0.005 of tax-basis return of capital distributions.
N/A = Not Applicable
The accompanying notes are an integral part of these financial statements.
88
| | | 2040 Retirement Fund | | 2045 Retirement Fund | |
| | | Years Ended
December 31, | | Period Ended
December 31, | | Years Ended
December 31, | | Period Ended
December 31, | |
| | | 2009 | | 2008 | | 2007(g) | | 2009 | | 2008 | | 2007(g) | |
| Net Asset Value, Beginning of Period | | $ | 0.59 | | | $ | 0.91 | | | $ | 0.99 | | | $ | 0.59 | | | $ | 0.91 | | | $ | 0.99 | | |
| INCOME (LOSS) FROM INVESTMENT OPERATIONS: | |
| Net Investment Income | | | 0.01 | | | | 0.02 | | | | 0.02 | | | | 0.01 | | | | 0.02 | | | | 0.02 | | |
Net Realized and Unrealized Gains (Losses) on Investments and
Futures Contracts | | | 0.15 | | | | (0.32 | ) | | | (0.05 | ) | | | 0.15 | | | | (0.32 | ) | | | (0.05 | ) | |
| Total From Investment Operations | | | 0.16 | | | | (0.30 | ) | | | (0.03 | ) | | | 0.16 | | | | (0.30 | ) | | | (0.03 | ) | |
Less: Dividend Distributions:
From Net Investment Income | | | (0.01 | )(h) | | | (0.02 | )(h) | | | (0.02 | ) | | | (0.01 | )(h) | | | (0.02 | )(h) | | | (0.02 | ) | |
| From Capital Gains | | | — | | | | — | | | | (0.03 | ) | | | — | | | | — | | | | (0.03 | ) | |
| Total Distributions | | | (0.01 | ) | | | (0.02 | ) | | | (0.05 | ) | | | (0.01 | ) | | | (0.02 | ) | | | (0.05 | ) | |
| Net Asset Value, End of Period | | $ | 0.74 | | | $ | 0.59 | | | $ | 0.91 | | | $ | 0.74 | | | $ | 0.59 | | | $ | 0.91 | | |
| Total Return (%)(b) | | | 27.84 | | | | (32.75 | ) | | | (2.68 | )(c) | | | 27.55 | | | | (32.90 | ) | | | (2.79 | )(c) | |
| Net Assets, End of Period ($ millions) | | | 23 | | | | 6 | | | | 1 | | | | 25 | | | | 7 | | | | 1 | | |
| Ratio of Net Investment Income (Loss) to Average Net Assets (%) | | | 2.75 | | | | 4.20 | | | | 3.93 | (c) | | | 2.61 | | | | 4.49 | | | | 4.17 | (c) | |
| Ratio of Expenses to Average Net Assets Before Expense Reimbursement (%)(f) | | | 0.05 | | | | 0.05 | | | | 0.05 | (d) | | | 0.05 | | | | 0.05 | | | | 0.03 | (d) | |
| Ratio of Expenses to Average Net Assets After Expense Reimbursement (%)(f) | | | 0.05 | | | | 0.05 | | | | 0.05 | (d) | | | 0.05 | | | | 0.05 | | | | 0.03 | (d) | |
| Portfolio Turnover Rate (%)(a) | | | 5.79 | | | | 7.79 | | | | 1.18 | (c) | | | 7.87 | | | | 6.77 | | | | 6.34 | (c) | |
The accompanying notes are an integral part of these financial statements.
89
MUTUAL OF AMERICA INVESTMENT CORPORATION
FINANCIAL HIGHLIGHTS (Continued)
| | | Conservative Allocation Fund | | Moderate Allocation Fund | |
| | | Years Ended December 31, | | Years Ended December 31, | |
| | | 2009 | | 2008 | | 2007 | | 2006 | | 2005 | | 2009 | | 2008 | | 2007 | | 2006 | | 2005 | |
| Net Asset Value, Beginning of Period | | $ | 0.89 | | | $ | 1.03 | | | $ | 1.02 | | | $ | 1.00 | | | $ | 1.02 | | | $ | 0.88 | | | $ | 1.14 | | | $ | 1.14 | | | $ | 1.11 | | | $ | 1.11 | | |
| INCOME (LOSS) FROM INVESTMENT OPERATIONS: | |
| Net Investment Income | | | 0.03 | | | | 0.04 | | | | 0.04 | | | | 0.04 | | | | 0.03 | | | | 0.03 | | | | 0.03 | | | | 0.04 | | | | 0.03 | | | | 0.03 | | |
| Net Realized and Unrealized Gains (Losses) on Investments and Futures Contracts | | | 0.11 | | | | (0.14 | ) | | | 0.02 | | | | 0.03 | | | | (0.01 | ) | | | 0.15 | | | | (0.25 | ) | | | 0.03 | | | | 0.06 | | | | 0.02 | | |
| Total From Investment Operations | | | 0.14 | | | | (0.10 | ) | | | 0.06 | | | | 0.07 | | | | 0.02 | | | | 0.18 | | | | (0.22 | ) | | | 0.07 | | | | 0.09 | | | | 0.05 | | |
Less: Dividend Distributions:
From Net Investment Income | | | (0.03 | ) | | | (0.04 | ) | | | (0.04 | ) | | | (0.03 | ) | | | (0.03 | ) | | | (0.03 | )(h) | | | (0.03 | ) | | | (0.04 | ) | | | (0.03 | ) | | | (0.03 | ) | |
| From Capital Gains | | | (0.01 | ) | | | — | | | | (0.01 | ) | | | (0.02 | ) | | | (0.01 | ) | | | — | | | | (0.01 | ) | | | (0.03 | ) | | | (0.03 | ) | | | (0.02 | ) | |
| Total Distributions | | | (0.04 | ) | | | (0.04 | ) | | | (0.05 | ) | | | (0.05 | ) | | | (0.04 | ) | | | (0.03 | ) | | | (0.04 | ) | | | (0.07 | ) | | | (0.06 | ) | | | (0.05 | ) | |
| Net Asset Value, End of Period | | $ | 0.99 | | | $ | 0.89 | | | $ | 1.03 | | | $ | 1.02 | | | $ | 1.00 | | | $ | 1.03 | | | $ | 0.88 | | | $ | 1.14 | | | $ | 1.14 | | | $ | 1.11 | | |
| Total Return (%)(b) | | | 15.94 | | | | (10.19 | ) | | | 6.43 | | | | 6.96 | | | | 2.30 | | | | 21.27 | | | | (19.85 | ) | | | 6.36 | | | | 9.20 | | | | 4.35 | | |
| Net Assets, End of Period ($ millions) | | | 38 | | | | 24 | | | | 20 | | | | 13 | | | | 11 | | | | 125 | | | | 90 | | | | 102 | | | | 76 | | | | 56 | | |
| Ratio of Net Investment Income (Loss) to Average Net Assets (%) | | | 4.24 | | | | 4.04 | | | | 4.48 | | | | 4.11 | | | | 3.39 | | | | 3.22 | | | | 3.14 | | | | 3.54 | | | | 3.30 | | | | 3.28 | | |
| Ratio of Expenses to Average Net Assets Before Expense Reimbursement (%)(f) | | | 0.00 | | | | 0.00 | | | | 0.00 | | | | 0.00 | | | | 0.00 | | | | 0.00 | | | | 0.00 | | | | 0.00 | | | | 0.00 | | | | 0.00 | | |
| Ratio of Expenses to Average Net Assets After Expense Reimbursement (%)(f) | | | 0.00 | | | | 0.00 | | | | 0.00 | | | | 0.00 | | | | 0.00 | | | | 0.00 | | | | 0.00 | | | | 0.00 | | | | 0.00 | | | | 0.00 | | |
| Portfolio Turnover Rate (%)(a) | | | 14.24 | | | | 38.30 | | | | 13.72 | | | | 49.05 | | | | 8.39 | | | | 15.29 | | | | 25.21 | | | | 12.35 | | | | 9.78 | | | | 14.09 | | |
(a) Portfolio turnover rate excludes all short-term securities.
(b) Total return would have been lower had non-investment advisory expenses not been reduced through expense reimbursement in certain years (Note 2).
(c) Not annualized.
(d) Annualized.
(e) For the period July 1, 2005 (commencement of operations) through December 31, 2005.
(f) Allocation and Retirement Funds exclude expenses of the underlying funds.
(g) For the period November 5, 2007 (commencement of operations) through December 31, 2007.
(h) Includes less than $0.005 of tax-basis return of capital distributions.
The accompanying notes are an integral part of these financial statements.
90
| | | Aggressive Allocation Fund | |
| | | Years Ended December 31, | |
| | | 2009 | | 2008 | | 2007 | | 2006 | | 2005 | |
| Net Asset Value, Beginning of Period | | $ | 0.86 | | | $ | 1.24 | | | $ | 1.27 | | | $ | 1.22 | | | $ | 1.21 | | |
| INCOME (LOSS) FROM INVESTMENT OPERATIONS: | |
| Net Investment Income | | | 0.02 | | | | 0.02 | | | | 0.03 | | | | 0.03 | | | | 0.02 | | |
| Net Realized and Unrealized Gains (Losses) on Investments and Futures Contracts | | | 0.20 | | | | (0.37 | ) | | | 0.04 | | | | 0.11 | | | | 0.05 | | |
| Total From Investment Operations | | | 0.22 | | | | (0.35 | ) | | | 0.07 | | | | 0.14 | | | | 0.07 | | |
Less: Dividend Distributions:
From Net Investment Income | | | (0.02 | ) | | | (0.02 | )(h) | | | (0.04 | )(h) | | | (0.03 | ) | | | (0.02 | ) | |
| From Capital Gains | | | — | | | | (0.01 | ) | | | (0.06 | ) | | | (0.06 | ) | | | (0.04 | ) | |
| Total Distributions | | | (0.02 | ) | | | (0.03 | ) | | | (0.10 | ) | | | (0.09 | ) | | | (0.06 | ) | |
| Net Asset Value, End of Period | | $ | 1.06 | | | $ | 0.86 | | | $ | 1.24 | | | $ | 1.27 | | | $ | 1.22 | | |
| Total Return (%)(b) | | | 25.64 | | | | (28.20 | ) | | | 5.52 | | | | 11.87 | | | | 5.78 | | |
| Net Assets, End of Period ($ millions) | | | 117 | | | | 81 | | | | 101 | | | | 73 | | | | 48 | | |
| Ratio of Net Investment Income (Loss) to Average Net Assets (%) | | | 2.44 | | | | 2.41 | | | | 2.75 | | | | 2.82 | | | | 2.58 | | |
| Ratio of Expenses to Average Net Assets Before Expense Reimbursement (%)(f) | | | 0.00 | | | | 0.00 | | | | 0.00 | | | | 0.00 | | | | 0.00 | | |
| Ratio of Expenses to Average Net Assets After Expense Reimbursement (%)(f) | | | 0.00 | | | | 0.00 | | | | 0.00 | | | | 0.00 | | | | 0.00 | | |
| Portfolio Turnover Rate (%)(a) | | | 11.70 | | | | 20.56 | | | | 9.14 | | | | 6.75 | | | | 14.96 | | |
The accompanying notes are an integral part of these financial statements.
91
MUTUAL OF AMERICA INVESTMENT CORPORATION
FINANCIAL HIGHLIGHTS (Continued)
| | | Money Market Fund | | Mid-Term Bond Fund | |
| | | Years Ended December 31, | | Years Ended December 31, | |
| | | 2009 | | 2008 | | 2007 | | 2006 | | 2005 | | 2009 | | 2008 | | 2007 | | 2006 | | 2005 | |
| Net Asset Value, Beginning of Period | | $ | 1.21 | | | $ | 1.21 | | | $ | 1.21 | | | $ | 1.20 | | | $ | 1.19 | | | $ | 0.94 | | | $ | 0.96 | | | $ | 0.93 | | | $ | 0.92 | | | $ | 0.94 | | |
| INCOME (LOSS) FROM INVESTMENT OPERATIONS: | |
| Net Investment Income | | | — | | | | 0.03 | | | | 0.05 | | | | 0.05 | | | | 0.04 | | | | 0.04 | | | | 0.04 | | | | 0.04 | | | | 0.03 | | | | 0.03 | | |
| Net Realized and Unrealized Gains (Losses) on Investments and Futures Contracts | | | — | | | | — | | | | — | | | | — | | | | — | | | | 0.07 | | | | (0.02 | ) | | | 0.03 | | | | 0.01 | | | | (0.02 | ) | |
| Total From Investment Operations | | | — | | | | 0.03 | | | | 0.05 | | | | 0.05 | | | | 0.04 | | | | 0.11 | | | | 0.02 | | | | 0.07 | | | | 0.04 | | | | 0.01 | | |
Less: Dividend Distributions:
From Net Investment Income | | | — | | | | (0.03 | ) | | | (0.05 | ) | | | (0.04 | ) | | | (0.03 | ) | | | (0.04 | ) | | | (0.04 | ) | | | (0.04 | ) | | | (0.03 | ) | | | (0.03 | ) | |
| From Capital Gains | | | — | | | | — | | | | — | | | | — | | | | — | | | | (0.01 | ) | | | — | | | | — | | | | — | | | | — | | |
| Total Distributions | | | — | | | | (0.03 | ) | | | (0.05 | ) | | | (0.04 | ) | | | (0.03 | ) | | | (0.05 | ) | | | (0.04 | ) | | | (0.04 | ) | | | (0.03 | ) | | | (0.03 | ) | |
| Net Asset Value, End of Period | | $ | 1.21 | | | $ | 1.21 | | | $ | 1.21 | | | $ | 1.21 | | | $ | 1.20 | | | $ | 1.00 | | | $ | 0.94 | | | $ | 0.96 | | | $ | 0.93 | | | $ | 0.92 | | |
| Total Return (%)(b) | | | (0.08 | ) | | | 2.34 | | | | 5.03 | | | | 4.89 | | | | 2.97 | | | | 11.22 | | | | 1.84 | | | | 7.22 | | | | 4.22 | | | | 0.77 | | |
| Net Assets, End of Period ($ millions) | | | 119 | | | | 201 | | | | 312 | | | | 239 | | | | 130 | | | | 234 | | | | 183 | | | | 122 | | | | 107 | | | | 71 | | |
| Ratio of Net Investment Income to Average Net Assets (%) | | | (0.04 | ) | | | 2.38 | | | | 4.89 | | | | 4.83 | | | | 3.05 | | | | 4.16 | | | | 4.27 | | | | 4.28 | | | | 3.88 | | | | 3.30 | | |
| Ratio of Expenses to Average Net Assets Before Expense Reimbursement (%) | | | 0.33 | | | | 0.32 | | | | 0.28 | | | | 0.24 | | | | 0.38 | | | | 0.58 | | | | 0.55 | | | | 0.56 | | | | 0.50 | | | | 0.66 | | |
| Ratio of Expenses to Average Net Assets After Expense Reimbursement (%) | | | 0.33 | | | | 0.32 | | | | 0.28 | | | | 0.22 | | | | 0.25 | | | | 0.58 | | | | 0.55 | | | | 0.56 | | | | 0.47 | | | | 0.50 | | |
| Portfolio Turnover Rate (%)(a) | | | N/A | | | | N/A | | | | N/A | | | | N/A | | | | N/A | | | | 30.76 | | | | 34.95 | | | | 26.78 | | | | 30.91 | | | | 21.99 | | |
(a) Portfolio turnover rate excludes all short-term securities.
(b) Total return would have been lower had non-investment advisory expenses not been reduced through expense reimbursement in certain years (Note 2).
(c) Not annualized.
(d) Annualized.
(e) For the period July 1, 2005 (commencement of operations) through December 31, 2005.
(f) Allocation and Retirement Funds exclude expenses of the underlying funds.
(g) For the period November 5, 2007 (commencement of operations) through December 31, 2007.
(h) Includes less than $0.005 of tax-basis return of capital distributions.
N/A = Not Applicable
The accompanying notes are an integral part of these financial statements.
92
| | | Bond Fund | |
| | | Years Ended December 31, | |
| | | 2009 | | 2008 | | 2007 | | 2006 | | 2005 | |
| Net Asset Value, Beginning of Period | | $ | 1.18 | | | $ | 1.27 | | | $ | 1.26 | | | $ | 1.26 | | | $ | 1.29 | | |
| INCOME (LOSS) FROM INVESTMENT OPERATIONS: | |
| Net Investment Income | | | 0.05 | | | | 0.07 | | | | 0.06 | | | | 0.06 | | | | 0.06 | | |
| Net Realized and Unrealized Gains (Losses) on Investments and Futures Contracts | | | 0.12 | | | | (0.09 | ) | | | 0.01 | | | | — | | | | (0.03 | ) | |
| Total From Investment Operations | | | 0.17 | | | | (0.02 | ) | | | 0.07 | | | | 0.06 | | | | 0.03 | | |
Less: Dividend Distributions:
From Net Investment Income | | | (0.05 | ) | | | (0.07 | ) | | | (0.06 | ) | | | (0.06 | ) | | | (0.06 | ) | |
| From Capital Gains | | | — | | | | — | | | | — | | | | — | | | | — | | |
| Total Distributions | | | (0.05 | ) | | | (0.07 | ) | | | (0.06 | ) | | | (0.06 | ) | | | (0.06 | ) | |
| Net Asset Value, End of Period | | $ | 1.30 | | | $ | 1.18 | | | $ | 1.27 | | | $ | 1.26 | | | $ | 1.26 | | |
| Total Return (%)(b) | | | 14.61 | | | | (1.75 | ) | | | 5.90 | | | | 4.79 | | | | 1.79 | | |
| Net Assets, End of Period ($ millions) | | | 488 | | | | 372 | | | | 384 | | | | 343 | | | | 369 | | |
| Ratio of Net Investment Income to Average Net Assets (%) | | | 4.62 | | | | 5.05 | | | | 4.95 | | | | 4.84 | | | | 4.30 | | |
| Ratio of Expenses to Average Net Assets Before Expense Reimbursement (%) | | | 0.58 | | | | 0.56 | | | | 0.53 | | | | 0.50 | | | | 0.61 | | |
| Ratio of Expenses to Average Net Assets After Expense Reimbursement (%) | | | 0.58 | | | | 0.56 | | | | 0.53 | | | | 0.47 | | | | 0.50 | | |
| Portfolio Turnover Rate (%)(a) | | | 46.27 | | | | 23.76 | | | | 17.56 | | | | 19.03 | | | | 23.27 | | |
The accompanying notes are an integral part of these financial statements.
93
MUTUAL OF AMERICA INVESTMENT CORPORATION
NOTES TO FINANCIAL STATEMENTS
1. SIGNIFICANT ACCOUNTING POLICIES AND ORGANIZATION
Mutual of America Investment Corporation (the "Investment Company") is a diversified, open-end management investment company — a type of company commonly known as a "mutual fund". It is registered as such under the Investment Company Act of 1940 (the "Investment Company Act"). The Investment Company was formed on February 21, 1986 as a Maryland corporation and principally offers its shares exclusively to separate accounts of Mutual of America Life Insurance Company ("Mutual of America Life") and its affiliates. As a "series" type mutual fund, the Investment Company issues separate classes (or series) of capital stock, each of which represents a separate Fund of investments. At December 31, 2009, there were 23 Funds (collectively, "the Funds"): Equity Index Fund, All America Fund, Small Cap Value Fund, Small Cap Growth Fund, Mid Cap Value Fund, Mid-Cap Equity Index Fund, International Fund, Composite Fund, Money Market Fund, Mid-Term Bon d Fund, Bond Fund; Retirement Income Fund, 2010 Retirement Fund, 2015 Retirement Fund, 2020 Retirement Fund, 2025 Retirement Fund, 2030 Retirement Fund, 2035 Retirement Fund, 2040 Retirement Fund and 2045 Retirement Fund (collectively, "Retirement Funds"); a Conservative Allocation Fund, a Moderate Allocation Fund and an Aggressive Allocation Fund (collectively "Allocation Funds"). The International Fund and the Retirement Funds began operations on November 5, 2007. The Small Cap Value Fund, Small Cap Growth Fund and the Mid Cap Value Fund began operations on July 1, 2005.
Investment Company shares are issued to Mutual of America Life, and on a limited basis, to Wilton Reassurance Life Company of New York (formerly The American Life Insurance Company of New York), for allocation to their Separate Accounts as a funding medium for variable accumulation annuity contracts and variable life insurance policies. In addition, shares of selected equity and fixed income funds of the Investment Company are directly issued to one or more of the Investment Company's Allocation Funds.
The preparation of financial statements in accordance with U.S. generally accepted accounting principles requires management to make estimates and assumptions that affect the reported amounts of assets, liabilities, income, expenses and related disclosures. Actual results, however, may differ from those estimates.
The following is a summary of the significant accounting policies consistently followed by the Investment Company, which are in conformity with U.S. generally accepted accounting principles ("GAAP"):
Fair Value — The Investment Company values its investments at fair value. Fair value is an estimate of the price the Fund would receive upon selling a security in an orderly arms-length transaction. Investments are categorized based on a three-level valuation hierarchy for measurement and disclosure of fair value. The valuation hierarchy is based upon the transparency of inputs used to measure fair value. The three levels are as follows:
• Level 1 — quoted prices in active markets for identical securities.
• Level 2 — other significant observable inputs (including yield, quality, coupon rate, maturity, issue type, quoted prices for similar securities, prepayment speeds, trading characteristics, etc.).
• Level 3 — significant unobservable inputs (including the Fund's own assumptions in determining the fair value of investments).
As of December 31, 2009, management determined that the fair value inputs for all equity securities, including shares of registered investment companies, were considered Level 1, with the exception of non-registered securities under Rule 144A of the Securities Act of 1933 which were considered Level 2. In addition, certain Rule 144A securities not actively traded were considered Level 3. Fair value inputs for all debt securities were considered Level 2. The inputs used for valuing securities are not necessarily an indication of the risk associated with investing in those securities.
94
MUTUAL OF AMERICA INVESTMENT CORPORATION
NOTES TO FINANCIAL STATEMENTS (Continued)
1. SIGNIFICANT ACCOUNTING POLICIES AND ORGANIZATION (CONTINUED)
The following is a summary of the inputs used to value the Funds' investments as of December 31, 2009, by fair value input hierarchy:
| Fund | | Level 1 — Quoted
Prices | | Level 2 — Significant
Observable Inputs | | Level 3 — Significant
Unobservable Inputs | | Total | |
Investments at Market Value:
(See Summary Portfolios of Investments
for More Details) | |
| Equity Index Fund | |
| Common Stock | | $ | 741,660,934 | | | | — | | | | — | | | $ | 741,660,934 | | |
| Short-Term Debt Securities | | | — | | | $ | 25,199,581 | | | | — | | | $ | 25,199,581 | | |
| Temporary Cash Investments | | | — | | | $ | 71,000 | | | | — | | | $ | 71,000 | | |
| | | $ | 741,660,934 | | | $ | 25,270,581 | | | | — | | | $ | 766,931,515 | | |
| All America Fund | |
| Common Stock-Indexed | | $ | 148,140,564 | | | | — | | | | — | | | $ | 148,140,564 | | |
| Common Stock-Active | | $ | 100,983,519 | | | $ | 158,050 | (1) | | $ | 761,962 | (2) | | $ | 101,903,531 | | |
| Convertible Preferred Stock | | | — | | | $ | 55,600 | | | | — | | | $ | 55,600 | | |
| Short-Term Debt Securities | | | — | | | $ | 5,369,766 | | | | — | | | $ | 5,369,766 | | |
| Temporary Cash Investments | | | — | | | $ | 140,400 | | | | — | | | $ | 140,400 | | |
| | | $ | 249,124,083 | | | $ | 5,723,816 | | | $ | 761,962 | | | $ | 255,609,861 | | |
| Small Cap Value Fund | |
| Common Stock | | $ | 190,350,079 | | | $ | 868,550 | (1) | | $ | 4,471,775 | (3) | | $ | 195,690,404 | | |
| Convertible Preferred Stock | | | — | | | $ | 425,500 | | | | — | | | $ | 425,500 | | |
| Short-Term Debt Securities | | | — | | | $ | 8,699,957 | | | | — | | | $ | 8,699,957 | | |
| | | $ | 190,350,079 | | | $ | 9,994,007 | | | $ | 4,471,775 | | | $ | 204,815,861 | | |
| Small Cap Growth Fund | |
| Common Stock | | $ | 191,541,517 | | | | — | | | | — | | | $ | 191,541,517 | | |
| Short-Term Debt Securities | | | — | | | $ | 1,599,993 | | | | — | | | $ | 1,599,993 | | |
| | | $ | 191,541,517 | | | $ | 1,599,993 | | | | — | | | $ | 193,141,510 | | |
| Mid Cap Value Fund | |
| Common Stock | | $ | 39,631,930 | | | | — | | | | — | | | $ | 39,631,930 | | |
| Short-Term Debt Securities | | | — | | | $ | 2,269,923 | | | | — | | | $ | 2,269,923 | | |
| | | $ | 39,631,930 | | | $ | 2,269,923 | | | | — | | | $ | 41,901,853 | | |
| Mid-Cap Equity Index Fund | |
| Common Stock | | $ | 356,587,564 | | | | — | | | | — | | | $ | 356,587,564 | | |
| Short-Term Debt Securities | | | — | | | $ | 19,899,640 | | | | — | | | $ | 19,899,640 | | |
| Temporary Cash Investments | | | — | | | $ | 187,800 | | | | — | | | $ | 187,800 | | |
| | | $ | 356,587,564 | | | $ | 20,087,440 | | | | — | | | $ | 376,675,004 | | |
| International Fund | |
| Common Stock | | $ | 32,922,186 | | | | — | | | | — | | | $ | 32,922,186 | | |
| Short-Term Debt Securities | | | — | | | $ | 2,399,990 | | | | — | | | $ | 2,399,990 | | |
| | | $ | 32,922,186 | | | $ | 2,399,990 | | | | — | | | $ | 35,322,176 | | |
| Composite Fund | |
| Common Stock | | $ | 97,262,197 | | | | — | | | | — | | | $ | 97,262,197 | | |
| U.S. Government Debt | | | — | | | $ | 11,481,658 | | | | — | | | $ | 11,481,658 | | |
U.S. Government Agency
Residential Mortgage-Backed
Obligations | | | — | | | $ | 21,198,447 | | | | — | | | $ | 21,198,447 | | |
| Corporate Long-Term Debt | | | — | | | $ | 29,757,565 | | | | — | | | $ | 29,757,565 | | |
| Short-Term Debt | | | — | | | $ | 5,499,539 | | | | — | | | $ | 5,499,539 | | |
| Temporary Cash Investments | | | — | | | $ | 110,300 | | | | — | | | $ | 110,300 | | |
| | | $ | 97,262,197 | | | $ | 68,047,509 | | | | — | | | $ | 165,309,706 | | |
| Retirement Income Fund | |
| Common Stock | | $ | 8,844,444 | | | | — | | | | — | | | $ | 8,844,444 | | |
95
MUTUAL OF AMERICA INVESTMENT CORPORATION
NOTES TO FINANCIAL STATEMENTS (Continued)
1. SIGNIFICANT ACCOUNTING POLICIES AND ORGANIZATION (CONTINUED)
| Fund | | Level 1 — Quoted
Prices | | Level 2 — Significant
Observable Inputs | | Level 3 — Significant
Unobservable Inputs | | Total | |
2010 Retirement Fund
Common Stock | | $ | 14,617,212 | | | | — | | | | — | | | $ | 14,617,212 | | |
2015 Retirement Fund
Common Stock | | $ | 44,059,234 | | | | — | | | | — | | | $ | 44,059,234 | | |
2020 Retirement Fund
Common Stock | | $ | 49,683,457 | | | | — | | | | — | | | $ | 49,683,457 | | |
2025 Retirement Fund
Common Stock | | $ | 41,987,460 | | | | — | | | | — | | | $ | 41,987,460 | | |
2030 Retirement Fund
Common Stock | | $ | 34,733,128 | | | | — | | | | — | | | $ | 34,733,128 | | |
2035 Retirement Fund
Common Stock | | $ | 26,973,412 | | | | — | | | | — | | | $ | 26,973,412 | | |
2040 Retirement Fund
Common Stock | | $ | 22,558,859 | | | | — | | | | — | | | $ | 22,558,859 | | |
2045 Retirement Fund
Common Stock | | $ | 24,979,241 | | | | — | | | | — | | | $ | 24,979,241 | | |
Conservative Allocation Fund
Common Stock | | $ | 38,120,887 | | | | — | | | | — | | | $ | 38,120,887 | | |
Moderate Allocation Fund
Common Stock | | $ | 125,286,212 | | | | — | | | | — | | | $ | 125,286,212 | | |
Aggressive Allocation Fund
Common Stock | | $ | 116,568,914 | | | | — | | | | — | | | $ | 116,568,914 | | |
| Money Market Fund | | | | | | | | | | | | | | | | | |
U.S. Government Agency
Short-Term Debt | | | — | | | $ | 70,297,175 | | | | — | | | $ | 70,297,175 | | |
| Commercial Paper | | | — | | | $ | 48,437,238 | | | | — | | | $ | 48,437,238 | | |
| | | | — | | | $ | 118,734,413 | | | | — | | | $ | 118,734,413 | | |
| Mid-Term Bond Fund | | | | | | | | | | | | | | | | | |
| U.S. Government Debt | | | — | | | $ | 86,298,065 | | | | — | | | $ | 86,298,065 | | |
U.S. Government Agency Residential
Mortgage-Backed Obligations | | | — | | | $ | 3,332,063 | | | | — | | | $ | 3,362,063 | | |
U.S. Government Agency
Non-Mortgage-Backed Obligations | | | — | | | $ | 19,122,738 | | | | — | | | $ | 19,122,738 | | |
| Corporate Debt | | | — | | | $ | 123,063,706 | | | | — | | | $ | 123,063,706 | | |
| Temporary Cash Investments | | | — | | | $ | 261,900 | | | | — | | | $ | 261,900 | | |
| | | | — | | | $ | 232,078,472 | | | | — | | | $ | 232,078,472 | | |
| Bond Fund | | | | | | | | | | | | | | | | | |
| U.S. Government Debt | | | — | | | $ | 100,946,790 | | | | — | | | $ | 100,946,790 | | |
U.S. Government Agency Residential
Mortgage-Backed Obligations | | | — | | | $ | 164,121,123 | | | | — | | | $ | 164,121,123 | | |
U.S. Government Agency
Non-Mortgage-Backed Obligations | | | — | | | $ | 10,860,000 | | | | — | | | $ | 10,860,000 | | |
| Long-Term Corporate Debt | | | — | | | $ | 202,347,519 | | | | — | | | $ | 202,347,519 | | |
| Sovereign Debt | | | — | | | $ | 4,240,248 | | | | — | | | $ | 4,240,248 | | |
| Short-Term Debt | | | — | | | $ | 899,996 | | | | — | | | $ | 899,996 | | |
| Temporary Cash Investments | | | — | | | $ | 31,100 | | | | — | | | $ | 31,100 | | |
| | | | — | | | $ | 483,446,776 | | | | — | | | $ | 483,446,776 | | |
| Other Financial Instruments:* | |
| Equity Index Fund | | $ | 117,782 | | | | — | | | | — | | | $ | 117,782 | | |
| All America Fund | | $ | 20,115 | | | | — | | | | — | | | $ | 20,115 | | |
| Mid-Cap Equity Index Fund | | $ | 472,990 | | | | — | | | | — | | | $ | 472,990 | | |
* Other financial instruments are derivative instruments not reflected in the Portfolio of Investments, such as futures, which are valued at the unrealized appreciation/depreciation on the instrument.
96
MUTUAL OF AMERICA INVESTMENT CORPORATION
NOTES TO FINANCIAL STATEMENTS (Continued)
1. SIGNIFICANT ACCOUNTING POLICIES AND ORGANIZATION (CONTINUED)
(1) Reflects one security included in "Other Securities" in the Energy section of the active asset segment of the All America Fund portfolio and in the Small Cap Value Fund portfolio, respectively.
(2) Reflects two securities included in "Other Securities" in the Financials section of the active asset segment of the All America Fund portfolio.
(3) Reflect securities issued by Ellington Financial and NBH Holdings included in the Financials section of the Small Cap Value Fund portfolio.
| | | Fair Value Measurement Using Significant Unobservable
Inputs (Level 3) for the Year Ended December 31, 2009 | |
Balance
December 31,
2008 | | Realized and
Unrealized
Gains
(Losses)(a) | | Net
Transfers
In/(Out) of
Level 3 | | Balance
December 31,
2009 | | Unrealized Gains/(Losses)
of Level 3 Assets Held as of
December 31, 2009 Included
in Statement of Operations | |
| All America Fund $695,347 | | | (13,746 | ) | | $ | 80,361 | | | $ | 761,962 | | | $ | 4,222 | | |
| Small Cap Value Fund $3,989,652 | | | (74,052 | ) | | $ | 556,175 | | | $ | 4,471,775 | | | $ | 24,615 | | |
(a) Unrealized gains and losses on Level 3 securities are included in Change in Net Unrealized Appreciation (Depreciation) of Investments in the Statements of Operations
In January 2010, the Financial Accounting Standards Board issued Accounting Standards Update ("ASU") No. 2010-06, "Improving Disclosures About Fair Value Measurements." The ASU clarifies existing disclosure regarding fair value measurements. Additionally, effective for interim and annual reporting periods beginning after December 15, 2009, the ASU requires entities to disclose significant transfers into and out of Level 1 and 2 fair value hierarchies and the reasons for those transfers. Effective for interim and annual reporting periods beginning after December 15, 2010, the ASU also requires entities to disclose information about purchases, sales, issuances and settlements of Level 3 securities on a gross basis, as opposed to the current net number. Management is currently evaluating the impa ct of ASU 2010-06 on the disclosures of fair value of the Funds' investments.
Security Valuation — Investment securities are carried at fair value as follows:
Exchange-traded equity securities are valued at the last sales price on the principal exchange on which the security is traded. If there is no trading volume for a particular valuation day, the last bid price is used. For equity securities traded in the over-the-counter market, the security is valued at the last sale price, or if no sale, at the latest bid price available.
Short-term debt securities with a maturity of 60 days or less are valued at amortized cost, which approximates fair value for such securities.
Debt securities, including short-term debt securities maturing in excess of 60 days, are valued on the basis of prices obtained from an independent pricing source. The pricing source may utilize various pricing methodologies that incorporate both models (which consider factors such as yield, quality, coupon rate, maturity, issue type, quoted prices for similar securities, prepayment speeds and trading characteristics) and dealer-supplied valuations to derive a valuation.
In the rare instance when a price is not available from an independent pricing source or when prices may not reflect fair value, such as when the price provided by the pricing source is not based on a recent trade, a calculated fair value is used, as determined in good faith by the Adviser and reviewed by a Valuation Committee, in accordance with procedures adopted by the Board of Directors of the Investment Company. The Advisor uses a market approach to calculate fair value for equity securities which are categorized as Level 3 above. The Adviser's valuation is primarily based on information regarding the specific equity issuer, such as financial statements, the relationship of per-share book value to the last trade price and operating information. The Adviser also considers industry-specific conditions and overall market conditions, to determine whether the last trade price reflects fair value or needs to be adjusted.
The Retirement Funds and the Allocation Funds value their investments in the underlying Funds of the Investment Company at their respective net asset values.
97
MUTUAL OF AMERICA INVESTMENT CORPORATION
NOTES TO FINANCIAL STATEMENTS (Continued)
1. SIGNIFICANT ACCOUNTING POLICIES AND ORGANIZATION (CONTINUED)
Investment Transactions — Investment transactions are accounted for as of the trade date. Realized gains and losses on the sale of short and long-term debt securities are computed on the basis of amortized cost at the time of sale. Realized gains and losses on the sale of stock are based on the identified cost basis of the security, determined on the first-in, first-out ("FIFO") basis.
Futures Contracts — The Equity Index Fund, Mid-Cap Equity Index Fund and a portion of the All America Fund each maintain indexed asset portfolios which are subject to equity price risk. In order to remain more fully invested in the equity markets while minimizing transaction costs, the funds purchase stock index futures contracts. An initial cash margin deposit (represented by cash or Treasury bills) is made upon entering into a futures contract and serves as collateral for the contract. This initial margin, maintained in a segregated account, is equal to approximately 5%-6% of the contract amount, and does not involve the borrowing of funds to finance the transaction. During the period the futures contract is outstanding, changes in the value of the contract are recognized as unrealized gains or losses by "marking-to-market" on a daily basis to reflect the m arket value of the contract at the end of each trading day. The accumulated unrealized gain or loss on the contract is included in Net Unrealized Appreciation (Depreciation) of Investments in the Components of Net Assets section of the Statement of Assets and Liabilities. Futures contracts are valued at the settlement price established each day by the exchange on which traded. Depending upon whether unrealized gains or losses are incurred, variation margin payments are received or made daily. The net change in unrealized appreciation or deprecation of futures contracts is recorded in the Statement of Operations. When the contract is closed, a realized gain or loss from futures transactions is recorded in the Statement of Operations, equal to the net variation margin received or paid over the period the contract was outstanding.
The "Underlying Face Amount at Value" (appearing in the "Notes to the Summary Portfolio of Investments in Securities") representing the aggregate of outstanding contractual amounts under futures contracts reflects the extent of a Fund's exposure to off-balance sheet risk. The use of futures transactions involves the risk of imperfect correlation in the price movements of the contract and the underlying securities. With futures contracts, there is minimal counterparty credit risk to the Fund since futures are exchange traded and the exchange's clearinghouse, as counterparty to all exchange traded futures, guarantees the futures against default.
During the year ended December 31, 2009, the Equity Index Fund, Mid-Cap Equity Index Fund and the All America Fund purchased futures contracts with total principal amounts of $236,684,125, $151,861,862 and $31,834,353, respectively.
Retirement Funds — Each of the Retirement Funds invests in equity (stock) funds and fixed income (bond) funds and targets different percentages to these asset classes. The targets reflect varying emphases on achieving capital appreciation and gains versus preserving capital and producing income, depending on the specific Fund's time horizon.
The Retirement Funds target their investments in the following underlying funds of the Investment Company in accordance with the percentage allocations noted:
| | | Equity
Index
Fund | | Mid-Cap
Equity
Index
Fund | | Small Cap
Growth
Fund | | Small Cap
Value
Fund | | International
Fund | | Bond
Fund | | Mid-Term
Bond
Fund | | Money
Market
Fund | |
| Retirement Income Fund | | | 20 | % | | | 5 | % | | | — | | | | — | | | | — | | | | 30 | % | | | 30 | % | | | 15 | % | |
| 2010 Retirement Fund | | | 25 | % | | | 14 | % | | | — | | | | — | | | | 4 | % | | | 25 | % | | | 22 | % | | | 10 | % | |
| 2015 Retirement Fund | | | 30 | % | | | 11 | % | | | 2 | % | | | 2 | % | | | 8 | % | | | 25 | % | | | 13 | % | | | 9 | % | |
| 2020 Retirement Fund | | | 35 | % | | | 11 | % | | | 4 | % | | | 4 | % | | | 9 | % | | | 24 | % | | | 13 | % | | | — | | |
| 2025 Retirement Fund | | | 40 | % | | | 15 | % | | | 5 | % | | | 5 | % | | | 9 | % | | | 20 | % | | | 6 | % | | | — | | |
| 2030 Retirement Fund | | | 40 | % | | | 18 | % | | | 6 | % | | | 6 | % | | | 10 | % | | | 20 | % | | | — | | | | — | | |
| 2035 Retirement Fund | | | 40 | % | | | 21 | % | | | 7 | % | | | 7 | % | | | 12 | % | | | 13 | % | | | — | | | | — | | |
| 2040 Retirement Fund | | | 35 | % | | | 24 | % | | | 8 | % | | | 8 | % | | | 14 | % | | | 11 | % | | | — | | | | — | | |
| 2045 Retirement Fund | | | 35 | % | | | 20 | % | | | 10 | % | | | 10 | % | | | 15 | % | | | 10 | % | | | — | | | | — | | |
Generally, rebalancing of the Retirement Funds' holdings is performed on a quarterly or other periodic basis and the mix of underlying Funds is reviewed annually.
98
MUTUAL OF AMERICA INVESTMENT CORPORATION
NOTES TO FINANCIAL STATEMENTS (Continued)
1. SIGNIFICANT ACCOUNTING POLICIES AND ORGANIZATION (CONTINUED)
Allocation Funds — The Allocation Funds target their investments in the following underlying Funds of the Investment Company in accordance with the percentage allocations noted:
| Conservative Allocation: | | Equity Index (25%), Bond (30%), | |
|
| | | Mid-Term Bond (45%). | |
|
| Moderate Allocation: | | Equity Index (35%), Bond (30%), | |
|
| | | Mid-Term Bond (20%), Mid-Cap Equity Index (15%). | |
|
| Aggressive Allocation: | | Equity Index (45%), Bond (25%), | |
|
| | | Mid-Cap Equity Index (20%), Small Cap Value (5%), Small Cap Growth (5%). | |
|
Generally, rebalancing of the Allocation Funds' holdings is performed on a monthly basis.
Investment Income — Interest income, accretion of discount and amortization of premium are recorded daily on an accrual basis using the effective interest method. A debt obligation may cease accrual of income and result in a reduction to interest income when the collection of all or a portion of current and past due interest is in doubt. Dividend income is recorded on the ex-dividend date. Foreign source tax withheld from dividends is recorded as a reduction from dividend income. Should reclamation efforts succeed, such amounts are recorded as income upon collection.
Distributions to Shareholders ("Dividends") — Distributions to shareholders are recorded on the ex-dividend date. It is the Investment Company's policy to make distributions of its net investment income twice a year and, on an annual basis, to distribute net realized gains, if any, in accordance with Federal income tax regulations, which may differ from U.S. generally accepted accounting principles. Accordingly, periodic reclassifications (which do not impact the funds' net asset values) are made within the funds' capital accounts to reflect income and gains available for distribution under Federal income tax regulations.
Federal Income Taxes — Each Fund in the Investment Company intends to comply with the requirements of the Internal Revenue Code applicable to regulated investment companies and to distribute substantially all of its taxable income to shareholders. Therefore, no Federal income or excise tax provision is required.
GAAP requires the evaluation of tax positions taken in the course of preparing a fund's tax return to determine whether it is "more-likely-than-not" that tax positions taken in the fund's tax return will be ultimately sustained, and, if not, a tax liability and expense is recorded.
As of December 31, 2009, management has evaluated the tax positions taken on the Funds' tax returns for all open tax years and has concluded that no tax provision is required in any of the Funds' financial statements. Each Fund's federal and state income, franchise and federal excise tax returns for tax years for which the applicable statutes of limitations have not expired are subject to examination by the Internal Revenue Service and state departments of revenue.
At December 31, 2009, the Funds had the following capital loss carryforwards to offset net capital gains, to the extent provided by Federal income tax regulations, which if unused expire on the dates noted. The Composite, Retirement Income and Mid-Term Bond Funds utilized the following respective amounts of its capital loss carryforward to offset net taxable gains realized in the year ended December 31, 2009: $9,970,637, $5,164 and $720,615. In addition, the Equity Index, All America, Small Cap Value, Composite, and Aggressive Allocation Funds generated post-October 2009 net capital losses of $112,643, $384,318, $1,179,500, $185,041, and $192,001 respectively, which if unused will expire on December 31, 2018.
| Expiring on December 31, | | Equity
Index Fund | | All America
Fund | | Small Cap
Value Fund | | Small Cap
Growth Fund | | Mid Cap
Value Fund | |
| 2009 | | $ | 0 | | | $ | 0 | | | $ | 0 | | | $ | 0 | | | $ | 0 | | |
| 2010 | | | 0 | | | | 0 | | | | 0 | | | | 0 | | | | 0 | | |
| 2011 | | | 0 | | | | 0 | | | | 0 | | | | 0 | | | | 0 | | |
| 2012 | | | 0 | | | | 0 | | | | 0 | | | | 0 | | | | 0 | | |
| 2013 | | | 0 | | | | 0 | | | | 0 | | | | 0 | | | | 0 | | |
| 2014 | | | 0 | | | | 0 | | | | 0 | | | | 0 | | | | 0 | | |
| 2015 | | | 0 | | | | 0 | | | | 0 | | | | 0 | | | | (129,927 | ) | |
| 2016 | | | (13,944,177 | ) | | | (8,802,799 | ) | | | (24,355,943 | ) | | | (15,945,123 | ) | | | (824,120 | ) | |
| 2017 | | | 0 | | | | (16,392,544 | ) | | | (15,058,092 | ) | | | (28,330,191 | ) | | | (1,374,534 | ) | |
| Total | | $ | (13,944,177 | ) | | $ | (25,195,343 | ) | | $ | (39,414,035 | ) | | $ | (44,275,314 | ) | | $ | (2,328,581 | ) | |
99
MUTUAL OF AMERICA INVESTMENT CORPORATION
NOTES TO FINANCIAL STATEMENTS (Continued)
1. SIGNIFICANT ACCOUNTING POLICIES AND ORGANIZATION (CONTINUED)
| Expiring on December 31, | | Mid-Cap
Equity Index
Fund | | International
Fund | | Composite
Fund | | Retirement
Income Fund | | 2010
Retirement
Fund | |
| 2009 | | $ | 0 | | | $ | 0 | | | $ | 0 | | | $ | 0 | | | $ | 0 | | |
| 2010 | | | 0 | | | | 0 | | | | (20,417,938 | ) | | | 0 | | | | 0 | | |
| 2011 | | | 0 | | | | 0 | | | | 0 | | | | 0 | | | | 0 | | |
| 2012 | | | 0 | | | | 0 | | | | 0 | | | | 0 | | | | 0 | | |
| 2013 | | | 0 | | | | 0 | | | | 0 | | | | 0 | | | | 0 | | |
| 2014 | | | 0 | | | | 0 | | | | 0 | | | | 0 | | | | 0 | | |
| 2015 | | | 0 | | | | 0 | | | | 0 | | | | 0 | | | | 0 | | |
| 2016 | | | 0 | | | | 0 | | | | (6,800,156 | ) | | | 0 | | | | 0 | | |
| 2017 | | | 0 | | | | (6,700 | ) | | | (11,795,277 | ) | | | 0 | | | | (84,827 | ) | |
| Total | | $ | 0 | | | $ | (6,700 | ) | | $ | (39,013,371 | ) | | $ | 0 | | | $ | (84,827 | ) | |
| Expiring on December 31, | | 2015
Retirement
Fund | | 2020
Retirement
Fund | | 2025
Retirement
Fund | | 2030
Retirement
Fund | | 2035
Retirement
Fund | |
| 2009 | | $ | 0 | | | $ | 0 | | | $ | 0 | | | $ | 0 | | | $ | 0 | | |
| 2010 | | | 0 | | | | 0 | | | | 0 | | | | 0 | | | | 0 | | |
| 2011 | | | 0 | | | | 0 | | | | 0 | | | | 0 | | | | 0 | | |
| 2012 | | | 0 | | | | 0 | | | | 0 | | | | 0 | | | | 0 | | |
| 2013 | | | 0 | | | | 0 | | | | 0 | | | | 0 | | | | 0 | | |
| 2014 | | | 0 | | | | 0 | | | | 0 | | | | 0 | | | | 0 | | |
| 2015 | | | 0 | | | | 0 | | | | 0 | | | | 0 | | | | 0 | | |
| 2016 | | | 0 | | | | 0 | | | | 0 | | | | 0 | | | | 0 | | |
| 2017 | | | (47,463 | ) | | | 0 | | | | 0 | | | | 0 | | | | 0 | | |
| Total | | $ | (47,463 | ) | | $ | 0 | | | $ | 0 | | | $ | 0 | | | $ | 0 | | |
| Expiring on December 31, | | 2040
Retirement
Fund | | 2045
Retirement
Fund | | Conservative
Allocation
Fund | | Moderate
Allocation
Fund | | Aggressive
Allocation
Fund | |
| 2009 | | $ | 0 | | | $ | 0 | | | $ | 0 | | | $ | 0 | | | $ | 0 | | |
| 2010 | | | 0 | | | | 0 | | | | 0 | | | | 0 | | | | 0 | | |
| 2011 | | | 0 | | | | 0 | | | | 0 | | | | 0 | | | | 0 | | |
| 2012 | | | 0 | | | | 0 | | | | 0 | | | | 0 | | | | 0 | | |
| 2013 | | | 0 | | | | 0 | | | | 0 | | | | 0 | | | | 0 | | |
| 2014 | | | 0 | | | | 0 | | | | 0 | | | | 0 | | | | 0 | | |
| 2015 | | | 0 | | | | 0 | | | | 0 | | | | 0 | | | | 0 | | |
| 2016 | | | 0 | | | | 0 | | | | 0 | | | | 0 | | | | 0 | | |
| 2017 | | | 0 | | | | 0 | | | | 0 | | | | (85,990 | ) | | | (919,709 | ) | |
| Total | | $ | 0 | | | $ | 0 | | | $ | 0 | | | $ | (85,990 | ) | | $ | (919,709 | ) | |
| Expiring on December 31, | | Money
Market Fund | | Mid-Term
Bond Fund | | Bond
Fund | |
| | | |
| 2009 | | $ | 0 | | | $ | 0 | | | $ | 0 | | | | | | | | | | |
| 2010 | | | 0 | | | | 0 | | | | 0 | | | | | | | | | | |
| 2011 | | | 0 | | | | 0 | | | | (19,938,423 | ) | | | | | | | | | |
| 2012 | | | 0 | | | | 0 | | | | (171,798 | ) | | | | | | | | | |
| 2013 | | | 0 | | | | 0 | | | | (439,879 | ) | | | | | | | | | |
| 2014 | | | 0 | | | | 0 | | | | (3,306,785 | ) | | | | | | | | | |
| 2015 | | | 0 | | | | 0 | | | �� | 0 | | | | | | | | | | |
| 2016 | | | 0 | | | | 0 | | | | 0 | | | | | | | | | | |
| 2017 | | | (2,242 | ) | | | 0 | | | | (3,299,948 | ) | | | | | | | | | |
| Total | | $ | (2,242 | ) | | $ | 0 | | | $ | (27,156,833 | ) | | | | | | | | | |
100
MUTUAL OF AMERICA INVESTMENT CORPORATION
NOTES TO FINANCIAL STATEMENTS (Continued)
2. EXPENSES
The Investment Company has an Investment Advisory Agreement with Mutual of America Capital Management Corporation ("the Adviser"), an indirect wholly-owned subsidiary of Mutual of America Life. For providing investment management services to each of the Funds of the Investment Company, the Adviser receives a fee, calculated as a daily charge, at the annual rate of .05% of the value of the net assets of the Retirement Funds, .075% of the value of the net assets of the Equity Index Fund, the Mid-Cap Equity Index Fund and the International Fund, .15% of the value of the net assets of the Money Market Fund, .40% of the value of the net assets of the All America Fund, Composite Fund, Mid-Term Bond Fund and Bond Fund, .55% of the value of the net assets of the Mid Cap Value Fund and .75% of the value of the net assets of the Small Cap Value Fund and Small Cap Growth Fund. The Adviser does not assess a fee for investment management to the Allocatio n Funds. However, shareholders in the Allocation Funds (and the Retirement Funds) will indirectly bear their pro-rata share of the investment management fees incurred by the underlying Funds in which they invest.
Prior to May 1, 2006, the Adviser's investment management fee was .125% of the value of the net assets of the Equity Index Fund and the Mid-Cap Equity Index Fund, .25% of the value of the net assets of the Money Market Fund, .50% of the value of the net assets of the All America Fund, Composite Fund, Mid-Term Bond Fund and Bond Fund, .65% of the value of the net assets of the Mid Cap Value Fund and .85% of the value of the net assets of the Small Cap Value Fund and Small Cap Growth Fund.
Through April 30, 2006, the Adviser contractually limited the expenses of each Fund, other than for brokers' commissions and other fees relating to portfolio transactions, to the amount of the advisory fee paid by the Funds to the Adviser. Effective May 1, 2006, the Adviser terminated its expense limitation policy and each Fund is charged with the full amount of its expenses. Investment company-wide expenses are allocated to each Fund based on its proportional share of net assets or equally, as appropriate.
Under a Sub-Advisory Agreement for the All America Fund, through July 27, 2005 the Adviser delegated investment advisory responsibilities to a subadviser responsible for providing management services for a portion of the Funds' assets. The Adviser (not the Fund) was responsible for compensation payable under such Sub-Advisory Agreement.
3. INVESTMENTS
The cost of investment purchases and proceeds from sales of investments, excluding short-term securities and futures contracts, for the year ended December 31, 2009 were as follows:
| | | Equity Index
Fund | | All America
Fund | | Small Cap
Value Fund | | Small Cap
Growth Fund | | Mid Cap
Value Fund | |
| Cost of investment purchases | | $ | 116,964,804 | | | $ | 75,085,987 | | | $ | 67,058,403 | | | $ | 148,251,254 | | | $ | 10,066,938 | | |
| Proceeds from sales of investments | | $ | 25,120,728 | | | $ | 82,385,125 | | | $ | 62,076,389 | | | $ | 142,607,424 | | | $ | 6,323,009 | | |
| | | Mid-Cap
Equity Index
Fund | | International
Fund | | Composite
Fund | | Retirement
Income
Fund | | 2010
Retirement
Fund | |
| Cost of investment purchases | | $ | 92,538,996 | | | $ | 17,148,920 | | | $ | 45,913,587 | | | $ | 6,778,497 | | | $ | 8,853,904 | | |
| Proceeds from sales of investments | | $ | 41,658,816 | | | $ | 999,528 | | | $ | 43,985,626 | | | $ | 2,068,365 | | | $ | 4,076,347 | | |
| | | 2015
Retirement
Fund | | 2020
Retirement
Fund | | 2025
Retirement
Fund | | 2030
Retirement
Fund | | 2035
Retirement
Fund | |
| Cost of investment purchases | | $ | 27,052,659 | | | $ | 27,412,715 | | | $ | 23,899,792 | | | $ | 20,017,694 | | | $ | 15,184,876 | | |
| Proceeds from sales of investments | | $ | 8,206,765 | | | $ | 4,281,667 | | | $ | 2,343,918 | | | $ | 1,833,950 | | | $ | 999,550 | | |
| | | 2040
Retirement
Fund | | 2045
Retirement
Fund | | Conservative
Allocation
Fund | | Moderate
Allocation
Fund | | Aggressive
Allocation
Fund | |
| Cost of investment purchases | | $ | 13,720,816 | | | $ | 15,354,420 | | | $ | 15,716,578 | | | $ | 34,605,412 | | | $ | 25,998,195 | | |
| Proceeds from sales of investments | | $ | 732,993 | | | $ | 1,134,048 | | | $ | 4,189,666 | | | $ | 15,718,617 | | | $ | 10,935,952 | | |
101
MUTUAL OF AMERICA INVESTMENT CORPORATION
NOTES TO FINANCIAL STATEMENTS (Continued)
3. INVESTMENTS (CONTINUED)
| | | Money
Market Fund | | Mid-Term
Bond Fund | | Bond
Fund | |
| Cost of investment purchases | | $ | — | | | $ | 100,202,452 | | | $ | 273,770,428 | | |
| Proceeds from sales of investments | | $ | — | | | $ | 43,640,891 | | | $ | 139,219,518 | | |
The cost of short-term security purchases for the Money Market Fund for the year ended December 31, 2009, was $1,719,905,503; net proceeds from sales for the year were $1,802,534,395.
The components of net unrealized appreciation (depreciation) of investments for Federal income tax purposes and the cost of investments for Federal income tax purposes at December 31, 2009 for each of the funds were as follows. Differences with amounts reflected in the Statements of Assets and Liabilities arise principally from wash sales and the treatment of distributions from Real Estate Investment Trusts (REITs).
| | | Equity
Index Fund | | All America
Fund | | Small Cap
Value Fund | | Small Cap
Growth Fund | | Mid Cap
Value Fund | |
| Unrealized Appreciation | | $ | 147,295,131 | | | $ | 34,616,809 | | | $ | 32,342,456 | | | $ | 35,460,514 | | | $ | 3,603,498 | | |
| Unrealized Depreciation | | | (118,536,593 | ) | | | (44,186.974 | ) | | | (22,361,514 | ) | | | (8,782,490 | ) | | | (5,554,912 | ) | |
| Net | | $ | 28,758,538 | | | $ | (9,570,165 | ) | | $ | 9,980,942 | | | $ | 26,678,024 | | | $ | (1,951,414 | ) | |
| Tax Cost of Investments | | $ | 738,172,977 | | | $ | 265,180,026 | | | $ | 194,834,919 | | | $ | 166,463,486 | | | $ | 43,853,267 | | |
| | | Mid-Cap
Equity Index
Fund | | International
Fund | | Composite
Fund | | Retirement
Income
Fund | | 2010
Retirement
Fund | |
| Unrealized Appreciation | | $ | 49,807,571 | | | $ | 1,335,836 | | | $ | 13,321,334 | | | $ | 444,964 | | | $ | 977,761 | | |
| Unrealized Depreciation | | | (51,376,752 | ) | | | (777,540 | ) | | | (8,400,361 | ) | | | (254,629 | ) | | | (870,724 | ) | |
| Net | | $ | (1,569,181 | ) | | $ | 558,296 | | | $ | 4,920,973 | | | $ | 190,335 | | | $ | 107,037 | | |
| Tax Cost of Investments | | $ | 378,244,185 | | | $ | 34,763,880 | | | $ | 160,388,733 | | | $ | 8,654,109 | | | $ | 14,510,175 | | |
| | | 2015
Retirement
Fund | | 2020
Retirement
Fund | | 2025
Retirement
Fund | | 2030
Retirement
Fund | | 2035
Retirement
Fund | |
| Unrealized Appreciation | | $ | 3,003,076 | | | $ | 2,359,776 | | | $ | 2,715,962 | | | $ | 2,453,992 | | | $ | 1,934,327 | | |
| Unrealized Depreciation | | | (2,170,802 | ) | | | (1,744,746 | ) | | | (797,500 | ) | | | (788,883 | ) | | | (466,563 | ) | |
| Net | | $ | 832,274 | | | $ | 615,030 | | | $ | 1,918,462 | | | $ | 1,665,109 | | | $ | 1,467,764 | | |
| Tax Cost of Investments | | $ | 43,226,960 | | | $ | 49,068,427 | | | $ | 40,068,998 | | | $ | 33,068,019 | | | $ | 25,505,648 | | |
| | | 2040
Retirement
Fund | | 2045
Retirement
Fund | | Conservative
Allocation
Fund | | Moderate
Allocation
Fund | | Aggressive
Allocation
Fund | |
| Unrealized Appreciation | | $ | 1,866,988 | | | $ | 2,452,093 | | | $ | 803,918 | | | $ | 1,696,520 | | | $ | 414,419 | | |
| Unrealized Depreciation | | | (312,591 | ) | | | (366,412 | ) | | | (1,459,806 | ) | | | (8,117,212 | ) | | | (11,777,554 | ) | |
| Net | | $ | 1,554,397 | | | $ | 2,085,681 | | | $ | (655,888 | ) | | $ | (6,420,692 | ) | | $ | (11,363,135 | ) | |
| Tax Cost of Investments | | $ | 21,004,462 | | | $ | 22,893,560 | | | $ | 38,776,775 | | | $ | 131,706,904 | | | $ | 127,932,049 | | |
| | | Money
Market Fund | | Mid-Term
Bond Fund | | Bond
Fund | |
| Unrealized Appreciation | | $ | 3,695 | | | $ | 8,239,352 | | | $ | 14,696,840 | | |
| Unrealized Depreciation | | | (34 | ) | | | (2,708,109 | ) | | | (5,984,916 | ) | |
| Net | | $ | 3,661 | | | $ | 5,531,243 | | | $ | 8,711,924 | | |
| Tax Cost of Investments | | $ | 118,730,752 | | | $ | 226,547,229 | | | $ | 474,734,852 | | |
102
MUTUAL OF AMERICA INVESTMENT CORPORATION
NOTES TO FINANCIAL STATEMENTS (Continued)
4. CAPITAL SHARE ACTIVITY
The Investment Company has registered an indefinite number of its capital shares pursuant to Rule 24f-2 under the Investment Company Act of 1940. As of December 31, 2009, shares authorized were allocated into the 23 series of Funds as follows:
| | | Authorized No. of Shares | |
| Equity Index Fund | | | 500,000,000 | | |
| All America Fund | | | 400,000,000 | | |
| Small Cap Value Fund | | | 350,000,000 | | |
| Small Cap Growth Fund | | | 350,000,000 | | |
| Mid Cap Value Fund | | | 100,000,000 | | |
| Mid-Cap Equity Index Fund | | | 400,000,000 | | |
| International Fund | | | 100,000,000 | | |
| Composite Fund | | | 200,000,000 | | |
| Retirement Income Fund | | | 50,000,000 | | |
| 2010 Retirement Fund | | | 50,000,000 | | |
| 2015 Retirement Fund | | | 100,000,000 | | |
| 2020 Retirement Fund | | | 100,000,000 | | |
| 2025 Retirement Fund | | | 100,000,000 | | |
| 2030 Retirement Fund | | | 100,000,000 | | |
| 2035 Retirement Fund | | | 100,000,000 | | |
| 2040 Retirement Fund | | | 100,000,000 | | |
| 2045 Retirement Fund | | | 100,000,000 | | |
| Conservative Allocation Fund | | | 100,000,000 | | |
| Moderate Allocation Fund | | | 200,000,000 | | |
| Aggressive Allocation Fund | | | 200,000,000 | | |
| Money Market Fund | | | 350,000,000 | | |
| Mid-Term Bond Fund | | | 350,000,000 | | |
| Bond Fund | | | 450,000,000 | | |
| Sub-Total | | | 4,850,000,000 | | |
| Shares to be allocated at the discretion of the Board of Directors | | | 150,000,000 | | |
| Total | | | 5,000,000,000 | | |
5. DIVIDENDS
On December 31, 2009, dividend distributions were declared and paid for each of the funds from net investment income and, as applicable, from net realized gains on investment transactions. Additionally, remaining required distributions relating to 2008 were made in accordance with Internal Revenue Sec. 855(a) and paid on August 10, 2009. Pursuant to shareholders' instructions, substantially all dividend distributions throughout 2009 and 2008 were immediately reinvested into their respective funds. The tax character of the distributions paid during 2009 and 2008 were as follows:
| | | Equity
Index Fund | | All America
Fund | | Small Cap
Value Fund | | Small Cap
Growth | | Mid Cap
Value Fund | |
| Ordinary Income (a) | |
| 2009 | | $ | 12,136,940 | | | $ | 4,552,237 | | | $ | 2,026,043 | | | $ | 0 | | | $ | 505,962 | | |
| 2008 | | $ | 12,175,938 | | | $ | 4,037,987 | | | $ | 2,021,942 | | | $ | 0 | | | $ | 586,336 | | |
| Long-Term Capital Gains (b) | |
| 2009 | | $ | 0 | | | $ | 0 | | | $ | 0 | | | $ | 0 | | | $ | 0 | | |
| 2008 | | $ | 2,030,456 | | | $ | 7,817,028 | | | $ | 69,793 | | | $ | 3,537,395 | | | $ | 0 | | |
| Return of Capital | |
| 2009 | | $ | 0 | | | $ | 0 | | | $ | 147,499 | | | $ | — | | | $ | 20,110 | | |
| 2008 | | $ | 0 | | | $ | 0 | | | $ | 1,845,074 | | | $ | 0 | | | $ | 82,817 | | |
103
MUTUAL OF AMERICA INVESTMENT CORPORATION
NOTES TO FINANCIAL STATEMENTS (Continued)
5. DIVIDENDS (CONTINUED)
| | | Mid-Cap
Equity
Index Fund | |
International
Fund | |
Composite
Fund | |
Retirement
Fund | | 2010
Retirement
Fund | |
| Ordinary Income (a) | |
| 2009 | | $ | 6,215,815 | | | $ | 716,989 | | | $ | 4,490,475 | | | $ | 3,557 | | | $ | 398,217 | | |
| 2008 | | $ | 4,707,574 | | | $ | 377,915 | | | $ | 5,645,651 | | | $ | 129,167 | | | $ | 281,959 | | |
| Long-Term Capital Gains (b) | |
| 2009 | | $ | 1,003,979 | | | $ | 0 | | | $ | 0 | | | $ | 0 | | | $ | 0 | | |
| 2008 | | $ | 6,672,527 | | | $ | 0 | | | $ | 0 | | | $ | 0 | | | $ | 27,872 | | |
| Return of Capital | |
| 2009 | | $ | 0 | | | $ | 279,706 | | | $ | 0 | | | $ | 0 | | | $ | 16,645 | | |
| 2008 | | $ | 0 | | | $ | 0 | | | $ | 0 | | | $ | 0 | | | $ | 0 | | |
| | | 2015
Retirement
Fund | | 2020
Retirement
Fund | | 2025
Retirement
Fund | | 2030
Retirement
Fund | | 2035
Retirement
Fund | |
| Ordinary Income (a) | |
| 2009 | | $ | 1,083,373 | | | $ | 1,160,492 | | | $ | 869,097 | | | $ | 668,472 | | | $ | 472,250 | | |
| 2008 | | $ | 641,889 | | | $ | 658,512 | | | $ | 423,664 | | | $ | 318,583 | | | $ | 216,139 | | |
| Long-Term Capital Gains (b) | |
| 2009 | | $ | 0 | | | $ | 53,684 | | | $ | 20,555 | | | $ | 8,971 | | | $ | 12,760 | | |
| 2008 | | $ | 65,864 | | | $ | 74,362 | | | $ | 64,571 | | | $ | 61,481 | | | $ | 52,057 | | |
| Return of Capital | |
| 2009 | | $ | 54,360 | | | $ | 978 | | | $ | 5,210 | | | $ | 3,475 | | | $ | 340 | | |
| 2008 | | $ | 13,675 | | | $ | 6,181 | | | $ | 8,300 | | | $ | 10,334 | | | $ | 9,442 | | |
| | | 2040
Retirement
Fund | | 2045
Retirement
Equity Fund | | Conservative
Allocation
Fund | | Moderate
Allocation
Fund | | Aggressive
Allocation
Fund | |
| Ordinary Income (a) | |
| 2009 | | $ | 382,954 | | | $ | 409,630 | | | $ | 1,243,401 | | | $ | 3,440,880 | | | $ | 2,105,087 | | |
| 2008 | | $ | 149,036 | | | $ | 161,860 | | | $ | 932,425 | | | $ | 3,065,729 | | | $ | 2,280,138 | | |
| Long-Term Capital Gains (b) | |
| 2009 | | $ | 11,661 | | | $ | 10,437 | | | $ | 186,851 | | | $ | 0 | | | $ | 0 | | |
| 2008 | | $ | 40,620 | | | $ | 39,541 | | | $ | 125,781 | | | $ | 579,965 | | | $ | 278,806 | | |
| Return of Capital | |
| 2009 | | $ | 131 | | | $ | 1,040 | | | $ | 0 | | | $ | 105,339 | | | $ | 0 | | |
| 2008 | | $ | 6,215 | | | $ | 5,529 | | | $ | 0 | | | $ | 0 | | | $ | 307,259 | | |
| | | Money
Market Fund | | Mid-Term
Bond Fund | | Bond
Fund | | | | | |
| Ordinary Income (a) | |
| 2009 | | $ | 103,447 | | | $ | 8,746,678 | | | $ | 19,172,093 | | | | | | | | | | |
| 2008 | | $ | 5,642,216 | | | $ | 7,408,865 | | | $ | 19,789,048 | | | | | | | | | | |
| Long-Term Capital Gains (b) | |
| 2009 | | $ | 0 | | | $ | 2,161,094 | | | $ | 0 | | | | | | | | | | |
| 2008 | | $ | 0 | | | $ | 0 | | | $ | 0 | | | | | | | | | | |
| Return of Capital | |
| 2009 | | $ | 0 | | | $ | 0 | | | $ | 0 | | | | | | | | | | |
| 2008 | | $ | 0 | | | $ | 0 | | | $ | 0 | | | | | | | | | | |
Notes:
(a) Includes distributions from Fund-level net short-term capital gains.
(b) To the extent reported, each Fund designates these amounts as capital gain dividends for Federal income tax purposes.
104
MUTUAL OF AMERICA INVESTMENT CORPORATION
NOTES TO FINANCIAL STATEMENTS (Continued)
5. DIVIDENDS (CONTINUED)
Undistributed net income and gains (losses) — As of December 31, 2009, undistributed net income and undistributed accumulated gain (loss) on a tax basis were as follows:
| | | Equity Index
Fund | | All America
Fund | | Small Cap
Value Fund | | Small Cap
Growth Fund | | Mid Cap
Value Fund | |
Accumulated undistributed net
investment income | | $ | 1,999,957 | | | $ | 3,215,663 | | | $ | 0 | | | $ | 0 | | | $ | 0 | | |
Accumulated undistributed net realized
gain/(loss) on investments
and futures contracts | | $ | (14,056,822 | ) | | $ | (25,579,661 | ) | | $ | (40,593,535 | ) | | $ | (44,275,313 | ) | | $ | (2,328,581 | ) | |
Net unrealized appreciation
(depreciation) of investments
and futures contracts | | $ | 28,758,538 | | | $ | (9,570,165 | ) | | $ | 9,980,942 | | | $ | 26,678,024 | | | $ | (1,951,414 | ) | |
| | | Mid-Cap
Equity Index
Fund | | International
Fund | | Composite
Fund | | Retirement
Income
Fund | | 2010
Retirement
Fund | |
Accumulated undistributed net
investment income | | $ | 1,962,017 | | | $ | 0 | | | $ | 4,166,967 | | | $ | 261,549 | | | $ | 0 | | |
Accumulated undistributed net realized
gain/(loss) on investments
and futures contracts | | $ | 1,182,262 | | | $ | (6,700 | ) | | $ | (39,198,412 | ) | | $ | 13,025 | | | $ | (84,827 | ) | |
Net unrealized appreciation
(depreciation) of investments
and futures contracts | | $ | (1,569,181 | ) | | $ | 558,296 | | | $ | 4,920,973 | | | $ | 190,335 | | | $ | 107,037 | | |
| | | 2015
Retirement
Fund | | 2020
Retirement
Fund | | 2025
Retirement
Fund | | 2030
Retirement
Fund | | 2035
Retirement
Fund | |
Accumulated undistributed net
investment income | | $ | 0 | | | $ | 0 | | | $ | 0 | | | $ | 0 | | | $ | 0 | | |
Accumulated undistributed net realized
gain/(loss) on investments
and futures contracts | | $ | (47,463 | ) | | $ | 0 | | | $ | 0 | | | $ | 0 | | | $ | 0 | | |
Net unrealized appreciation
(depreciation) of investments
and futures contracts | | $ | 832,274 | | | $ | 615,030 | | | $ | 1,918,462 | | | $ | 1,665,109 | | | $ | 1,467,764 | | |
| | | 2040
Retirement
Fund | | 2045
Retirement
Fund | | Conservative
Allocation
Fund | | Moderate
Allocation
Fund | | Aggressive
Allocation
Fund | |
Accumulated undistributed net
investment income | | $ | 0 | | | $ | 0 | | | $ | 1,380 | | | $ | 0 | | | $ | 323,630 | | |
Accumulated undistributed net realized
gain/(loss) on investments
and futures contracts | | $ | 0 | | | $ | 0 | | | $ | 8,204 | | | $ | (85,990 | ) | | $ | (1,111,710 | ) | |
Net unrealized appreciation
(depreciation) of investments
and futures contracts | | $ | 1,554,397 | | | $ | 2,085,681 | | | $ | (655,888 | ) | | $ | (6,420,692 | ) | | $ | (11,363,135 | ) | |
105
MUTUAL OF AMERICA INVESTMENT CORPORATION
NOTES TO FINANCIAL STATEMENTS (Continued)
5. DIVIDENDS (CONTINUED)
| | | Money
Market Fund | | Mid-Term
Bond Fund | | Bond
Fund | |
Accumulated undistributed net
investment income | | $ | 0 | | | $ | 0 | | | $ | 162,638 | | |
Accumulated undistributed net realized
gain/(loss) on investments
and futures contracts | | $ | (2,242 | ) | | $ | 0 | | | $ | (27,156,833 | ) | |
Net unrealized appreciation
(depreciation) of investments
and futures contracts | | $ | 3,661 | | | $ | 5,531,243 | | | $ | 8,711,924 | | |
The difference between the components of distributable earnings on a tax basis and the amounts reflected in the statements of assets and liabilities are primarily due to wash sales, post-October losses and the Federal income tax treatment of futures contracts.
Reclassifications — Periodically, the Funds may reclassify book to tax differences as a result of the differences arising from the accounting for REIT securities, non-deductible net operating loss, return of capital distributions and Fund distributions for Federal income tax purposes versus financial reporting purposes. Each Fund's net assets are not affected by these reclassifications.
During the year ended December 31, 2009, each Fund reclassified the following book to tax differences [increases (decreases)]:
| | | Equity
Index Fund | | All America
Fund | | Small Cap
Value Fund | | Small Cap
Growth Fund | | Mid Cap
Value Fund | |
| Accumulated undistributed net investment income | | $ | (79,235 | ) | | $ | (49,091 | ) | | $ | (21,390 | ) | | $ | 413,892 | | | $ | (557 | ) | |
Accumulated undistributed net realized gains
(loss) on investments and futures contracts | | $ | 79,235 | | | $ | 49,091 | | | $ | 168,889 | | | $ | 7,999 | | | $ | 20,667 | | |
| Paid in capital | | $ | 0 | | | $ | 0 | | | $ | (147,499 | ) | | $ | (421,891 | ) | | $ | (20,110 | ) | |
| | | Mid-Cap
Equity Index
Fund | | International
Fund | | Composite
Fund | | Retirement
Income
Fund | | 2010
Retirement
Fund | |
| Accumulated undistributed net investment income | | $ | (324,397 | ) | | $ | 279,706 | | | $ | (479 | ) | | $ | 2,928 | | | $ | (14,354 | ) | |
Accumulated undistributed net realized gains
(loss) on investments and futures contracts | | $ | 324,397 | | | $ | 0 | | | $ | 9,971,116 | | | $ | (2,928 | ) | | $ | 30,999 | | |
| Paid in capital | | $ | 0 | | | $ | (279,706 | ) | | $ | (9,970,637 | ) | | $ | 0 | | | $ | (16,645 | ) | |
| | | 2015
Retirement
Fund | | 2020
Retirement
Fund | | 2025
Retirement
Fund | | 2030
Retirement
Fund | | 2035
Retirement
Fund | |
| Accumulated undistributed net investment income | | $ | (22,576 | ) | | $ | (30,915 | ) | | $ | (21,680 | ) | | $ | (21,312 | ) | | $ | (18,100 | ) | |
Accumulated undistributed net realized gains
(loss) on investments and futures contracts | | $ | 76,936 | | | $ | 31,893 | | | $ | 26,890 | | | $ | 24,787 | | | $ | 18,440 | | |
| Paid in capital | | $ | (54,360 | ) | | $ | (978 | ) | | $ | (5,210 | ) | | $ | (3,475 | ) | | $ | (340 | ) | |
| | | 2040
Retirement
Fund | | 2045
Retirement
Fund | | Conservative
Allocation
Fund | | Moderate
Allocation
Fund | | Aggressive
Allocation
Fund | |
| Accumulated undistributed net investment income | | $ | (14,597 | ) | | $ | (13,502 | ) | | $ | 0 | | | $ | (145,613 | ) | | $ | (32,336 | ) | |
Accumulated undistributed net realized gains
(loss) on investments and futures contracts | | $ | 14,728 | | | $ | 14,542 | | | $ | 0 | | | $ | 250,952 | | | $ | 32,336 | | |
| Paid in capital | | $ | (131 | ) | | $ | (1,040 | ) | | $ | 0 | | | $ | (105,339 | ) | | $ | 0 | | |
106
MUTUAL OF AMERICA INVESTMENT CORPORATION
NOTES TO FINANCIAL STATEMENTS (Continued)
5. DIVIDENDS (CONTINUED)
| | | Money
Market Fund | | Mid-Term
Bond Fund | | Bond
Fund | |
| Accumulated undistributed net investment income | | $ | 60,153 | | | $ | 94,211 | | | $ | 0 | | |
Accumulated undistributed net realized gains
(loss) on investments and futures contracts | | $ | 0 | | | $ | (68,910 | ) | | $ | 0 | | |
| Paid in capital | | $ | (60,153 | ) | | $ | (25,301 | ) | | $ | 0 | | |
These reclassifications were made as a result of the differences arising from the disallowance of net operating losses, expiration of capital loss carryforwards, distributions from REITs, distribution reclassifications and other cumulative adjustments for Federal income tax purposes versus financial reporting purposes.
6. SUBSEQUENT EVENTS
Management has considered any events that occurred subsequent to December 31, 2009, the date of the Investment Company's financial statements, through February 26, 2010, the date of the issuance of the financial statements, to determine whether any of those events impacted the financial statements. Management determined that no events have occurred subsequent to the date of the Investment Company's financial statements that have significantly impacted the financial statements.
107
REPORT OF INDEPENDENT REGISTERED PUBLIC ACCOUNTING FIRM
The Shareholders and Board of Directors
of Mutual of America Investment Corporation:
We have audited the accompanying statement of assets and liabilities of Mutual of America Investment Corporation (comprised of: Equity Index Fund, All America Fund, Small Cap Value Fund, Small Cap Growth Fund, Mid Cap Value Fund, Mid-Cap Equity Index Fund, International Fund, Composite Fund, Retirement Income Fund, 2010 Retirement Fund, 2015 Retirement Fund, 2020 Retirement Fund, 2025 Retirement Fund, 2030 Retirement Fund, 2035 Retirement Fund, 2040 Retirement Fund, 2045 Retirement Fund, Conservative Allocation Fund, Moderate Allocation Fund, Aggressive Allocation Fund, Money Market Fund, Mid-Term Bond Fund and Bond Fund (collectively, the "Funds")), including the portfolios of investments in securities for the Conservative Allocation Fund, Moderate Allocation Fund, Aggressive Allocation Fund, Money Market Fund, International Fund, Retirement Income Fund, 2010 Retirement Fund, 2015 Retirement Fund, 2020 Retirement Fund, 2025 Retirement Fund, 2030 Retirement Fund, 2035 Retirement Fund, 2040 Retirement Fund and 2045 Retirement Fund, and the summary portfolios of investments in securities for each of the remaining Funds as of December 31, 2009, and the related statements of operations for the year then ended, the statements of changes in net assets for each of the years in the two-year period then ended, and the financial highlights for each of the years or period in the five-year period then ended. These financial statements and financial highlights are the responsibility of the Funds' management. Our responsibility is to express an opinion on these financial statements and financial highlights based on our audits.
We conducted our audits in accordance with the standards of the Public Company Accounting Oversight Board (United States). Those standards require that we plan and perform the audit to obtain reasonable assurance about whether the financial statements and financial highlights are free of material misstatement. An audit includes examining, on a test basis, evidence supporting the amounts and disclosures in the financial statements. Our procedures included confirmation of securities owned as of December 31, 2009, by correspondence with the custodian and brokers. An audit also includes assessing the accounting principles used and significant estimates made by management, as well as evaluating the overall financial statement presentation. We believe that our audits provide a reasonable basis for our opinion.
In our opinion, the financial statements and financial highlights referred to above present fairly, in all material respects, the financial position of each of the aforementioned Funds of Mutual of America Investment Corporation as of December 31, 2009, the results of their operations for the year then ended, the changes in their net assets for each of the years in the two-year period then ended, and the financial highlights for each of the years or period in the five-year period then ended, in conformity with U.S. generally accepted accounting principles.

February 26, 2010
108
MUTUAL OF AMERICA INVESTMENT CORPORATION
Directors and Officers — unaudited
The tables below show information about the Directors and officers of the Investment Company. The address of each Director and officer is c/o Mutual of America Investment Corporation, 320 Park Avenue, New York, New York 10022. The Investment Company does not hold annual meetings of shareholders, and each Director has been elected by shareholders to serve until a successor is duly elected at a meeting of shareholders called for the purpose of electing directors. Each officer of the Investment Company has been elected by the Board of Directors to serve until a successor is duly elected. The Independent Directors do not serve as directors of any other fund that is affiliated with the Adviser or Mutual of America with the sole exception of Patrick J. Waide, Jr., who serves on the boards of Mutual of America Investment Corporation and Mutual of America Institutional Funds, Inc. The Interested Directors and officers of the Investment Company do no t receive compensation from the Investment Company for their service.
The Investment Company's Statement of Additional Information ("SAI"), filed with the Securities and Exchange Commission, contains additional information about the Investment Company's Directors and Officers. A copy of the latest SAI can be obtained, without charge, by writing to Mutual of America Investment Corporation at 320 Park Avenue, New York, NY 10022-6839 or by calling 1-800-468-3785 or through the following websites: http://www.mutualofamerica.com or http://www.sec.gov.
Independent Directors
| Name and Age | | Length of
Time Served | | Principal Occupation(s)
in Past Five Years | | Other Directorships
Held by Director | |
Kevin M. Kearney
age 57 | | since May 2008 | | Partner, Wingate, Kearney & Cullen | | Concern Worldwide, USA | |
|
George Mertz
age 81 | | since 1989 | | Retired, since September 1994 | | None | |
|
Howard J. Nolan
age 73 | | since 1989 | | President & CEO, United Way of San Antonio & Bexar County | | None | |
|
Margaret M. Smyth
age 46 | | since December 2007 | | Vice President, Controller, United Technologies Corporation; prior thereto Vice President and Chief Accounting Officer, 3M Company; prior thereto, Managing Partner, Deloitte & Touche, 2002-2005 | | Trustee, Concern Worldwide (U.S.) Inc.; Trustee Fellow, Fordham University; Committee on Financial Reporting — Executive Board Member, Financial Executives International ; Global Preparers Group Member, International Accounting Standards Group | |
|
Patrick J. Waide, Jr.
age 72 | | since 2003 | | | | Trustee, John Simon Guggenheim Memorial Foundation; Director, The National Catholic Reporter Publishing Company; Director, Mutual of America Institutional Funds, Inc. | |
|
109
Independent Directors
| Name and Age | | Length of
Time Served | | Principal Occupation(s)
in Past Five Years | | Other Directorships
Held by Director | |
Manfred Altstadt
Chairman of the Board, President and Chief Executive Officer, age 60 | | since 1992 | | Senior Executive Vice President and Chief Operating Officer, Mutual of America, and Mutual of America Holding Company, Inc. since 11/07, prior thereto, Senior Executive Vice President and Chief Financial Officer; Chairman of the Board, President and Chief Executive Officer, Mutual of America Investment Corporation; Chairman and Chief Executive Officer, Mutual of America Capital Management Corporation | | Mutual of America; Mutual of America Securities Corporation; Mutual of America Holding Company, Inc, Mutual of America Capital Management Corporation; Calvary Hospital; Calvary Fund; Calvary Holding Company; Army War College Foundation; Hazelden New York; Leader to Leader Institute | |
|
Mr. Altstadt is an "interested person" as an officer of the Adviser and of affiliates of the Adviser.
Officers
| Name, Position and Age | | Length of
Time Served | | Principal Occupation(s)
in Past Five Years | | Other Directorships
Held by Director | |
James J. Roth
Executive Vice President and General Counsel, age 60 | | since May 2009 | | Senior Executive Vice President and General Counsel, Mutual of America, Mutual of America Capital Management Corporation, Mutual of America Securities Corporation, Mutual of America Investment Corporation, and Mutual of America Institutional Funds, Inc; Chairman, President and Chief Executive Officer, Mutual of America Holding Company, Inc. | | Mutual of America; Mutual of America Holding Company, Inc. | |
|
John R. Greed
Senior Executive Vice President, Chief Financial Officer and Treasurer, age 49 | | since 1997 | | Senior Executive Vice President and Chief Financial Officer, Mutual of America and Mutual of America Holding Company, Inc. since December 2007; prior thereto, Senior Executive Vice President and Treasurer; Senior Executive Vice President, Chief Financial Officer and Treasurer, Mutual of America Investment Corporation and Mutual of America Capital Management Corporation; Chairman of the Board, President and Chief Executive Officer, Mutual of America Institutional Funds, Inc. | | Mutual of America Holding Company, Inc. Mutual of America Institutional Funds, Inc. | |
|
Thomas L. Martin
Executive Vice President and Secretary, age 60 | | since 2003 | | Executive Vice President and Deputy General Counsel, Mutual of America since November 2008; prior thereto, Senior Vice President and Associate General Counsel | | None | |
|
110
MUTUAL OF AMERICA INVESTMENT CORPORATION
ADDITIONAL INFORMATION
Quarterly Portfolio Schedules
Included in this Annual Report are summary schedules of Mutual of America Investment Corporation's ("Investment Company") Fund portfolio holdings as of December 31, 2009. The Investment Company files complete schedules of Fund portfolio holdings with the Securities and Exchange Commission ("SEC") for the first and third quarters of each fiscal year on Form N-Q and for the second and fourth quarters of each fiscal year on Form N-CSR. The Forms N-Q and N-CSR are available on the SEC's website at http://www.sec.gov. Additionally, the Forms N-Q and N-CSR may be reviewed and copied at the SEC's Public Reference Room in Washington, DC. Information on the operation of the Public Reference Room may be obtained by calling 1-800-SEC-0330.
Proxy Voting Policies and Procedures
A copy of the Investment Company's proxy voting policies and procedures can be obtained free of charge by calling 1-800-468-3785. It is also available on the SEC's website at http://www.sec.gov.
Information regarding how the Investment Company voted proxies relating to portfolio securities during the 12-month period ended June 30, 2009 is available without charge by calling 1-800-468-3785. It is also available on the SEC website.
Supplemental Dividend Information — Unaudited
Dividends from the Small Cap Growth, International, Money Market, Mid-Term Bond and Bond Funds do not qualify for the corporate dividends received deduction. The following are the percentages of the ordinary dividends distributed in 2009 by the other Investment Corporation Funds that qualify for the corporate dividends received deduction:
| | | Equity
Index Fund | | All America
Fund | | Small Cap
Value Fund | | Mid-Cap
Equity Index
Fund | | Mid Cap
Value Fund | |
Ordinary dividend qualifying
percentage | | | 100 | % | | | 100 | % | | | 100 | % | | | 54.34 | % | | | 100 | % | |
| | | Composite
Fund | | Retirement
Income Fund | | 2010
Retirement
Fund | | 2015
Retirement
Fund | | 2020
Retirement
Fund | |
Ordinary dividend qualifying
percentage | | | 40.30 | % | | | 12.83 | % | | | 20.20 | % | | | 24.80 | % | | | 29.83 | % | |
| | | 2025
Retirement
Fund | | 2030
Retirement
Fund | | 2035
Retirement
Fund | | 2040
Retirement
Fund | | 2045
Retirement
Fund | |
Ordinary dividend qualifying
percentage | | | 40.40 | % | | | 43.30 | % | | | 53.50 | % | | | 48.40 | % | | | 49.54 | % | |
| | | Conservative
Allocation
Fund | | Moderate
Allocation
Fund | | Aggressive
Allocation
Fund | |
| |
| |
Ordinary dividend qualifying
percentage | | | 11.83 | % | | | 25.90 | % | | | 48.10 | % | | | | | | | | | |
111
Important tax information: The following amounts of 2009 long-term capital gains dividends have been designated as qualifying for the 15% reduced rate on long-term capital gains.
| | | Equity
Index Fund | | All America
Fund | | Small Cap
Value Fund | | Small Cap
Growth Fund | | Mid-Cap
Equity Index
Fund | |
Dividends qualifying for reduced
long-term capital gains tax rate | | $ | 0 | | | $ | 0 | | | $ | 0 | | | $ | 0 | | | $ | 1,003,979 | | |
| | | Mid Cap
Value Fund | | International | | Composite
Fund | | Retirement
Income
Fund | | 2010
Retirement
Fund | |
Dividends qualifying for reduced
long-term capital gains tax rate | | $ | 0 | | | $ | 0 | | | $ | 0 | | | $ | 0 | | | $ | 0 | | |
| | | 2015
Retirement
Fund | | 2020
Retirement
Fund | | 2025
Retirement
Fund | | 2030
Retirement
Fund | | 2035
Retirement
Fund | |
Dividends qualifying for reduced
long-term capital gains tax rate | | $ | 0 | | | $ | 53,684 | | | $ | 20,555 | | | $ | 8,971 | | | $ | 12,760 | | |
| | | 2040
Retirement
Fund | | 2045
Retirement
Fund | | Conservative
Allocation
Fund | | Moderate
Allocation
Fund | | Aggressive
Allocation
Fund | |
Dividends qualifying for reduced
long-term capital gains tax rate | | $ | 11,661 | | | $ | 10,437 | | | $ | 186,851 | | | $ | 0 | | | $ | 0 | | |
| | | Money
Market Fund | | Mid-Term
Bond Fund | | Bond Fund | | | | | |
Dividends qualifying for reduced
long-term capital gains tax rate | | $ | 0 | | | $ | 2,161,094 | | | $ | 0 | | | | | | | | | | |
112
MUTUAL OF AMERICA
LIFE INSURANCE COMPANY
320 PARK AVENUE
NEW YORK, NY 10022-6839
www.mutualofamerica.com

320 PARK AVENUE
NEW YORK NY 10022-6839
ADDRESS SERVICE REQUESTED

You can receive these and other important documents electronically. Sign up for eDocuments and we'll waive the monthly participant charge.
Find out more at mutualofamerica.com
or call 1-800-468-3785.
ITEM 2. CODE OF ETHICS.
Mutual of America Investment Corporation has adopted a Code of Ethics that applies to its principal executive and financial officers, as well as all Access Persons as defined under Rule 17j-1 of the Investment Company Act of 1940. The Code consists of two sections. The first section, designated as Section A, is the Code of Ethics required under Rule 17j-1. Section A requires those subject to it to submit periodic reports detailing their securities holdings and transactions (subject to several exemptions contained in the rules) and requires pre-approval for certain securities transactions by such persons, including purchases and sales of reportable securities, investments in initial public offerings and private placements.
The second section, designated as Section B, is to assure compliance with the Code of Ethics requirements of Section 406 of the Sarbanes-Oxley Act of 2002. It applies specifically to the Corporation’s principal executive and financial officers.
The two sections are not mutually exclusive and must be observed independently by each person to whom they are intended to apply. Section A applies to all individuals while Section B applies to the individuals designated in Section B. Both Sections explicitly require those individuals subject to the provisions of the Code of Ethics to promptly report violations of the Code of Ethics to the Chief Compliance Officer.
There have been no amendments to Section A or B during the period covered by this report.
The Annual Report to Shareholders includes information on how to obtain a copy of the Code of Ethics at no charge.
ITEM 3. AUDIT COMMITTEE FINANCIAL EXPERT.
(a) (1) Mutual of America Investment Corporation’s Board of Directors has determined that one audit committee financial expert serves on its Audit Committee.
(a) (2) The audit committee financial expert is Patrick J. Waide, Jr. He was Senior Vice-President, Administration at Sullivan & Company until March 1998; Director of the Drucker Foundation from 1996-1999 and President, Drucker Foundation in 1999. Mr. Waide is considered an independent director.
ITEM 4. PRINCIPAL ACCOUNTANT FEES AND SERVICES.
(a) Aggregate Audit Fees:
2009: $346,097
2008: $346,502
(b), (c), (d) There were no Audit-Related, Tax or Other Fees.
(e) All non-audit fees are pre-approved by the Audit Committee in advance.
(f), (g), (h) Not applicable.
ITEM 5. AUDIT COMMITTEE OF LISTED REGISTRANTS.
Not applicable.
ITEM 6. INVESTMENTS.
(a) Schedule I — Portfolios of Investments in Securities follows:
(b) Not applicable.
MUTUAL OF AMERICA INVESTMENT CORPORATION - EQUITY INDEX FUND
PORTFOLIO OF INVESTMENTS IN SECURITIES
December 31, 2009
| | Shares | | Value | |
INDEXED ASSETS: | | | | | |
COMMON STOCKS: | | | | | |
CONSUMER DISCRETIONARY (9.3%) | | | | | |
Abercrombie & Fitch Co. Cl A | | 6,747 | | 235,133 | |
Amazon.com, Inc.* | | 24,946 | | 3,355,736 | |
Apollo Group, Inc.* | | 9,462 | | 573,208 | |
AutoNation, Inc.* | | 6,822 | | 130,641 | |
AutoZone, Inc.* | | 2,238 | | 353,761 | |
Bed Bath & Beyond, Inc.* | | 19,764 | | 763,483 | |
Best Buy Co., Inc. | | 26,323 | | 1,038,706 | |
Big Lots, Inc.* | | 6,143 | | 178,024 | |
Black & Decker Corp. | | 4,534 | | 293,939 | |
Carnival Corp.* | | 33,977 | | 1,076,731 | |
CBS Corp. Cl B | | 50,649 | | 711,618 | |
Coach, Inc. | | 24,177 | | 883,186 | |
Comcast Corp. Cl A | | 212,861 | | 3,588,836 | |
D.R. Horton, Inc. | | 20,614 | | 224,074 | |
Darden Restaurants, Inc. | | 9,826 | | 344,598 | |
DeVry, Inc. | | 4,648 | | 263,681 | |
DIRECTV Group, Inc.* | | 70,878 | | 2,363,781 | |
Disney (Walt) Co. | | 142,772 | | 4,604,397 | |
Eastman Kodak Co.* | | 20,003 | | 84,413 | |
Expedia, Inc.* | | 15,888 | | 408,480 | |
Family Dollar Stores, Inc. | | 10,383 | | 288,959 | |
Ford Motor Co.* | | 241,464 | | 2,414,640 | |
Fortune Brands, Inc. | | 11,381 | | 491,659 | |
GameStop Corp. Cl A* | | 12,372 | | 271,442 | |
Gannett Co., Inc. | | 17,910 | | 265,964 | |
Gap, Inc. | | 36,459 | | 763,816 | |
Genuine Parts Co. | | 11,945 | | 453,432 | |
Goodyear Tire & Rubber Co.* | | 17,948 | | 253,067 | |
H&R Block, Inc. | | 24,852 | | 562,152 | |
Harley-Davidson, Inc. | | 17,492 | | 440,798 | |
Harman Int’l. Industries, Inc. | | 5,213 | | 183,915 | |
Hasbro, Inc. | | 9,339 | | 299,408 | |
Home Depot, Inc. | | 127,947 | | 3,701,507 | |
International Game Technology | | 21,885 | | 410,781 | |
Interpublic Group of Cos., Inc.* | | 36,182 | | 267,023 | |
Johnson Controls, Inc. | | 49,918 | | 1,359,766 | |
Kohl’s Corp.* | | 23,042 | | 1,242,655 | |
Leggett & Platt, Inc. | | 11,412 | | 232,805 | |
Lennar Corp. Cl A | | 12,201 | | 155,807 | |
Limited Brands, Inc. | | 20,054 | | 385,839 | |
Lowe’s Cos., Inc. | | 110,434 | | 2,583,051 | |
Macy’s, Inc | | 31,483 | | 527,655 | |
Marriott International, Inc. Cl A | | 19,012 | | 518,077 | |
Mattel, Inc. | | 27,149 | | 542,437 | |
McDonald's Corp. | | 80,451 | | 5,023,360 | |
McGraw-Hill Cos., Inc. | | 23,673 | | 793,282 | |
Meredith Corp. | | 2,765 | | 85,300 | |
New York Times Co. Cl A* | | 8,720 | | 107,779 | |
Newell Rubbermaid, Inc. | | 20,495 | | 307,630 | |
News Corp. Cl A | | 167,375 | | 2,291,364 | |
NIKE, Inc. Cl B | | 28,462 | | 1,880,484 | |
Nordstrom, Inc. | | 12,337 | | 463,624 | |
O'Reilly Automotive, Inc.* | | 10,260 | | 391,111 | |
Office Depot, Inc.* | | 20,530 | | 132,419 | |
Omnicom Group, Inc. | | 22,952 | | 898,571 | |
Penney (J.C.) Co., Inc. | | 17,636 | | 469,294 | |
Polo Ralph Lauren Corp. | | 4,279 | | 346,513 | |
Priceline.com, Inc.* | | 3,315 | | 724,328 | |
Pulte Homes, Inc.* | | 23,766 | | 237,660 | |
RadioShack Corp. | | 9,414 | | 183,573 | |
Ross Stores, Inc. | | 9,419 | | 402,285 | |
Scripps Networks Interactive, Inc. Cl A | | 6,722 | | 278,963 | |
Sears Hldgs. Corp.* | | 3,616 | | 301,755 | |
Sherwin-Williams Co. | | 7,102 | | 437,838 | |
Staples, Inc. | | 54,462 | | 1,339,221 | |
Starbucks Corp.* | | 53,063 | | 1,223,633 | |
Starwood Hotels & Resorts | | 14,049 | | 513,772 | |
Target Corp. | | 55,817 | | 2,699,868 | |
Tiffany & Co. | | 9,372 | | 402,996 | |
Time Warner Cable, Inc. | | 26,838 | | 1,110,825 | |
Time Warner, Inc. | | 88,236 | | 2,571,197 | |
TJX Cos., Inc. | | 31,418 | | 1,148,328 | |
V.F. Corp. | | 6,681 | | 489,316 | |
Viacom, Inc. Cl B* | | 45,773 | | 1,360,831 | |
Washington Post Co. Cl B | | 463 | | 203,535 | |
Whirlpool Corp. | | 5,532 | | 446,211 | |
Wyndham Worldwide Corp. | | 13,414 | | 270,560 | |
Wynn Resorts Ltd. | | 5,258 | | 306,173 | |
Yum! Brands, Inc. | | 34,907 | | 1,220,698 | |
| | | | 71,157,378 | |
CONSUMER STAPLES (11.1%) | | | | | |
Altria Group, Inc. | | 155,247 | | 3,047,499 | |
Archer-Daniels-Midland Co. | | 48,355 | | 1,513,995 | |
Avon Products, Inc. | | 32,011 | | 1,008,347 | |
Brown-Forman Corp. Cl B | | 8,257 | | 442,328 | |
Campbell Soup Co. | | 14,445 | | 488,241 | |
Clorox Co. | | 10,510 | | 641,110 | |
Coca-Cola Co. | | 174,455 | | 9,943,935 | |
Coca-Cola Enterprises, Inc. | | 23,798 | | 504,518 | |
Colgate-Palmolive Co. | | 37,750 | | 3,101,163 | |
ConAgra Foods, Inc. | | 33,308 | | 767,749 | |
Constellation Brands, Inc. Cl A* | | 14,790 | | 235,605 | |
Costco Wholesale Corp. | | 32,524 | | 1,924,445 | |
CVS Caremark Corp. | | 105,698 | | 3,404,533 | |
Dean Foods Co.* | | 13,427 | | 242,223 | |
Dr. Pepper Snapple Group, Inc. | | 19,114 | | 540,926 | |
Estee Lauder Cos., Inc. Cl A | | 8,963 | | 433,451 | |
General Mills, Inc. | | 24,709 | | 1,749,644 | |
Heinz (H.J.) Co. | | 23,987 | | 1,025,684 | |
Hershey Co. | | 12,612 | | 451,383 | |
Hormel Foods Corp. | | 5,229 | | 201,055 | |
J.M. Smucker Co. | | 8,915 | | 550,501 | |
Kellogg Co. | | 19,200 | | 1,021,440 | |
Kimberly-Clark Corp. | | 31,478 | | 2,005,463 | |
Kraft Foods, Inc. Cl A | | 110,602 | | 3,006,162 | |
Kroger Co. | | 49,464 | | 1,015,496 | |
Lorillard, Inc. | | 12,214 | | 979,929 | |
McCormick & Co., Inc. | | 9,841 | | 355,555 | |
Mead Johnson Nutrition Co.* | | 15,238 | | 660,263 | |
Molson Coors Brewing Co. Cl B | | 11,784 | | 532,165 | |
Pepsi Bottling Group, Inc. | | 10,896 | | 408,600 | |
PepsiCo, Inc. | | 118,947 | | 7,231,978 | |
Philip Morris Int’l., Inc. | | 145,515 | | 7,012,368 | |
Proctor & Gamble Co. | | 221,522 | | 13,430,879 | |
Reynolds American, Inc. | | 12,651 | | 670,123 | |
Safeway, Inc. | | 30,917 | | 658,223 | |
Sara Lee Corp. | | 52,884 | | 644,127 | |
SUPERVALU, Inc. | | 16,042 | | 203,894 | |
Sysco Corp. | | 45,281 | | 1,265,151 | |
Tyson Foods, Inc. Cl A | | 22,946 | | 281,547 | |
Wal-Mart Stores, Inc. | | 159,906 | | 8,546,976 | |
Walgreen Co. | | 75,475 | | 2,771,442 | |
Whole Foods Market, Inc.* | | 10,654 | | 292,452 | |
| | | | 85,212,568 | |
ENERGY (11.1%) | | | | | |
Anadarko Petroleum Corp. | | 37,058 | | 2,313,160 | |
Apache Corp. | | 25,209 | | 2,600,813 | |
Baker Hughes, Inc. | | 23,583 | | 954,640 | |
BJ Services Co. | | 22,316 | | 415,078 | |
Cabot Oil & Gas Corp. | | 7,641 | | 333,071 | |
Cameron International Corp.* | | 18,184 | | 760,091 | |
Chesapeake Energy Corp. | | 46,541 | | 1,204,481 | |
Chevron Corp. | | 150,053 | | 11,552,580 | |
ConocoPhillips | | 112,219 | | 5,731,024 | |
Consol Energy, Inc. | | 13,208 | | 657,758 | |
Denbury Resources, Inc.* | | 18,350 | | 271,580 | |
Devon Energy Corp. | | 32,820 | | 2,412,270 | |
Diamond Offshore Drilling, Inc. | | 5,230 | | 514,737 | |
El Paso Corp. | | 52,298 | | 514,089 | |
EOG Resources, Inc. | | 18,750 | | 1,824,375 | |
Exxon Mobil Corp. | | 357,520 | | 24,379,287 | |
FMC Technologies, Inc.* | | 9,145 | | 528,947 | |
Halliburton Co. | | 68,148 | | 2,050,573 | |
Hess Corp. | | 21,409 | | 1,295,245 | |
Marathon Oil Corp. | | 53,213 | | 1,661,310 | |
Massey Energy Co. | | 6,248 | | 262,478 | |
Murphy Oil Corp. | | 14,268 | | 773,326 | |
Nabors Industries Ltd.* | | 21,031 | | 460,369 | |
National Oilwell Varco, Inc. | | 32,190 | | 1,419,257 | |
Noble Energy, Inc. | | 12,974 | | 924,008 | |
Occidental Petroleum Corp. | | 59,534 | | 4,843,091 | |
Peabody Energy Corp. | | 20,062 | | 907,003 | |
Pioneer Natural Resources Co. | | 8,497 | | 409,300 | |
Range Resources Corp. | | 11,510 | | 573,774 | |
Rowan Cos., Inc.* | | 8,605 | | 194,817 | |
Schlumberger Ltd. | | 89,391 | | 5,818,460 | |
Smith International, Inc. | | 18,977 | | 515,605 | |
Southwestern Energy Co.* | | 24,928 | | 1,201,530 | |
Spectra Energy Corp. | | 48,693 | | 998,694 | |
Sunoco, Inc. | | 8,739 | | 228,088 | |
Tesoro Corp. | | 10,338 | | 140,080 | |
Valero Energy Corp. | | 41,978 | | 703,132 | |
Williams Cos., Inc. | | 43,648 | | 920,100 | |
XTO Energy, Inc. | | 43,567 | | 2,027,173 | |
| | | | 85,295,394 | |
FINANCIALS (13.8%) | | | | | |
Aflac, Inc. | | 35,203 | | 1,628,139 | |
Allstate Corp. | | 39,667 | | 1,191,597 | |
American Express Co. | | 89,580 | | 3,629,782 | |
American Int’l. Group, Inc.* | | 10,145 | | 304,147 | |
Ameriprise Financial, Inc. | | 19,095 | | 741,268 | |
Aon Corp. | | 20,695 | | 793,446 | |
Apartment Investment & Management Co. Cl A | | 8,750 | | 139,300 | |
Assurant, Inc. | | 8,867 | | 261,399 | |
AvalonBay Communities, Inc. | | 6,100 | | 500,871 | |
Bank of America Corp. | | 735,918 | | 11,082,925 | |
Bank of New York Mellon Corp. | | 89,794 | | 2,511,538 | |
BB&T Corp. | | 51,159 | | 1,297,904 | |
Boston Properties, Inc. | | 10,565 | | 708,595 | |
Capital One Financial Corp. | | 33,387 | | 1,280,058 | |
CB Richard Ellis Group, Inc. Cl A* | | 20,184 | | 273,897 | |
Charles Schwab Corp. | | 70,599 | | 1,328,673 | |
Chubb Corp. | | 25,716 | | 1,264,713 | |
Cincinnati Financial Corp. | | 12,267 | | 321,886 | |
Citigroup, Inc. | | 1,425,998 | | 4,720,053 | |
CME Group, Inc. | | 5,029 | | 1,689,493 | |
Comerica, Inc. | | 11,132 | | 329,173 | |
Discover Financial Svcs. | | 40,904 | | 601,698 | |
E*Trade Financial Corp.* | | 113,250 | | 198,188 | |
Equity Residential | | 20,589 | | 695,496 | |
Federated Investors, Inc. Cl B | | 6,486 | | 178,365 | |
Fifth Third Bancorp | | 59,302 | | 578,195 | |
First Horizon National Corp.* | | 16,672 | | 223,398 | |
Franklin Resources, Inc. | | 11,146 | | 1,174,231 | |
Genworth Financial, Inc. Cl A* | | 36,133 | | 410,110 | |
Goldman Sachs Group, Inc. | | 38,349 | | 6,474,845 | |
Hartford Financial Svcs. Group, Inc. | | 28,671 | | 666,887 | |
HCP, Inc. | | 22,144 | | 676,278 | |
Health Care REIT, Inc. | | 9,240 | | 409,517 | |
Host Hotels & Resorts, Inc.* | | 48,440 | | 565,298 | |
Hudson City Bancorp, Inc. | | 34,333 | | 471,392 | |
Huntington Bancshares, Inc. | | 53,893 | | 196,709 | |
IntercontinentalExchange, Inc.* | | 5,568 | | 625,286 | |
Invesco Ltd. | | 32,851 | | 771,670 | |
Janus Capital Group, Inc. | | 13,624 | | 183,243 | |
JPMorgan Chase & Co. | | 291,901 | | 12,163,515 | |
KeyCorp | | 66,089 | | 366,794 | |
Kimco Realty Corp. | | 29,801 | | 403,208 | |
Legg Mason, Inc. | | 12,233 | | 368,947 | |
Leucadia National Corp.* | | 14,142 | | 336,438 | |
Lincoln National Corp. | | 22,955 | | 571,120 | |
Loews Corp. | | 27,036 | | 982,759 | |
M&T Bank Corp. | | 6,085 | | 407,026 | |
Marsh & McLennan Cos., Inc. | | 39,760 | | 877,901 | |
Marshall & Ilsley Corp. | | 38,969 | | 212,381 | |
MetLife, Inc. | | 61,566 | | 2,176,358 | |
Moody’s Corp. | | 15,046 | | 403,233 | |
Morgan Stanley | | 102,180 | | 3,024,528 | |
Nasdaq OMX Group, Inc.* | | 11,114 | | 220,279 | |
Northern Trust Corp. | | 17,719 | | 928,476 | |
NYSE Euronext | | 19,791 | | 500,712 | |
People’s United Financial, Inc. | | 25,827 | | 431,311 | |
Plum Creek Timber Co., Inc. | | 12,309 | | 464,788 | |
PNC Financial Svcs. Grp., Inc. | | 33,736 | | 1,780,923 | |
Principal Financial Grp., Inc. | | 24,017 | | 577,369 | |
Progressive Corp.* | | 50,596 | | 910,222 | |
ProLogis | | 36,248 | | 496,235 | |
Prudential Financial, Inc. | | 34,619 | | 1,722,641 | |
Public Storage | | 10,286 | | 837,795 | |
Regions Financial Corp. | | 87,253 | | 461,568 | |
Simon Property Group, Inc. | | 21,466 | | 1,712,960 | |
SLM Corp.* | | 35,734 | | 402,722 | |
State Street Corp. | | 35,489 | | 1,545,191 | |
SunTrust Banks, Inc. | | 37,360 | | 758,034 | |
T. Rowe Price Group, Inc. | | 18,957 | | 1,009,460 | |
Torchmark Corp. | | 6,285 | | 276,226 | |
Travelers Cos., Inc. | | 41,185 | | 2,053,484 | |
U.S. Bancorp | | 139,946 | | 3,150,185 | |
Unum Group | | 25,116 | | 490,264 | |
Ventas, Inc. | | 11,859 | | 518,713 | |
Vornado Realty Trust | | 11,885 | | 831,248 | |
Wells Fargo & Co. | | 371,013 | | 10,013,641 | |
XL Capital Ltd. Cl A | | 25,476 | | 466,975 | |
Zions Bancorporation | | 10,183 | | 130,648 | |
| | | | 106,085,941 | |
HEALTH CARE (12.2%) | | | | | |
Abbott Laboratories | | 116,614 | | 6,295,990 | |
Aetna, Inc. | | 32,613 | | 1,033,832 | |
Allergan, Inc. | | 23,108 | | 1,456,035 | |
AmerisourceBergen Corp. | | 21,461 | | 559,488 | |
Amgen, Inc.* | | 74,222 | | 4,198,739 | |
Bard (C.R.), Inc. | | 7,775 | | 605,673 | |
Baxter International, Inc. | | 45,724 | | 2,683,084 | |
Becton, Dickinson & Co. | | 18,013 | | 1,420,505 | |
Biogen Idec, Inc.* | | 21,388 | | 1,144,258 | |
Boston Scientific Corp.* | | 111,932 | | 1,007,388 | |
Bristol-Myers Squibb Co. | | 127,849 | | 3,228,187 | |
Cardinal Health, Inc. | | 27,136 | | 874,865 | |
CareFusion Corp.* | | 12,926 | | 323,279 | |
Celgene Corp.* | | 31,286 | | 1,742,004 | |
Cephalon, Inc.* | | 5,583 | | 348,435 | |
CIGNA Corp. | | 20,755 | | 732,029 | |
Coventry Health Care, Inc.* | | 11,142 | | 270,639 | |
DaVita, Inc.* | | 7,670 | | 450,536 | |
Dentsply International, Inc. | | 11,449 | | 402,661 | |
Express Scripts, Inc.* | | 20,736 | | 1,792,627 | |
Forest Laboratories, Inc.* | | 22,549 | | 724,048 | |
Genzyme Corp.* | | 19,640 | | 962,556 | |
Gilead Sciences, Inc.* | | 68,358 | | 2,958,534 | |
Hospira, Inc.* | | 12,231 | | 623,781 | |
Humana, Inc.* | | 12,695 | | 557,184 | |
IMS Health, Inc. | | 13,703 | | 288,585 | |
Intuitive Surgical, Inc.* | | 2,884 | | 874,775 | |
Johnson & Johnson | | 207,619 | | 13,372,740 | |
King Pharmaceuticals, Inc.* | | 18,359 | | 225,265 | |
Laboratory Corp. of America Hldgs.* | | 7,976 | | 596,924 | |
Life Technologies Corp.* | | 13,259 | | 692,518 | |
Lilly (Eli) & Co. | | 75,430 | | 2,693,605 | |
McKesson Corp. | | 20,245 | | 1,265,313 | |
Medco Health Solutions, Inc.* | | 35,607 | | 2,275,643 | |
Medtronic, Inc. | | 82,693 | | 3,636,838 | |
Merck & Co., Inc. | | 226,765 | | 8,285,993 | |
Millipore Corp.* | | 4,185 | | 302,785 | |
Mylan, Inc.* | | 22,919 | | 422,397 | |
Patterson Cos., Inc.* | | 7,055 | | 197,399 | |
PerkinElmer, Inc. | | 8,843 | | 182,077 | |
Pfizer, Inc. | | 601,241 | | 10,936,574 | |
Quest Diagnostics, Inc. | | 11,683 | | 705,420 | |
St. Jude Medical, Inc.* | | 25,152 | | 925,091 | |
Stryker Corp. | | 21,310 | | 1,073,385 | |
Tenet Healthcare Corp.* | | 33,368 | | 179,854 | |
Thermo Fisher Scientific, Inc.* | | 30,931 | | 1,475,099 | |
UnitedHealth Group, Inc. | | 87,707 | | 2,673,309 | |
Varian Medical Systems, Inc.* | | 9,318 | | 436,548 | |
Waters Corp.* | | 7,167 | | 444,067 | |
Watson Pharmaceuticals, Inc.* | | 7,927 | | 313,988 | |
WellPoint, Inc.* | | 34,527 | | 2,012,579 | |
Zimmer Hldgs., Inc.* | | 16,064 | | 949,543 | |
| | | | 93,834,671 | |
INDUSTRIALS (9.9%) | | | | | |
3M Co. | | 52,732 | | 4,359,354 | |
Avery Dennison Corp. | | 8,409 | | 306,844 | |
Boeing Co. | | 55,492 | | 3,003,782 | |
Burlington Northern Santa Fe Corp. | | 19,653 | | 1,938,179 | |
Caterpillar, Inc. | | 47,021 | | 2,679,727 | |
Cintas Corp. | | 9,692 | | 252,477 | |
CSX Corp. | | 29,371 | | 1,424,200 | |
Cummins, Inc. | | 14,962 | | 686,157 | |
Danaher Corp. | | 19,366 | | 1,456,323 | |
Deere & Co. | | 31,203 | | 1,687,770 | |
Donnelley (R.R.) & Sons Co. | | 15,607 | | 347,568 | |
Dover Corp. | | 14,092 | | 586,368 | |
Dun & Bradstreet Corp. | | 3,929 | | 331,490 | |
Eaton Corp. | | 12,557 | | 798,876 | |
Emerson Electric Co. | | 56,365 | | 2,401,149 | |
Equifax, Inc. | | 9,395 | | 290,212 | |
Expeditors Int’l. of Wash. | | 15,790 | | 548,387 | |
Fastenal Co. | | 9,886 | | 411,653 | |
FedEx Corp. | | 23,297 | | 1,944,135 | |
First Solar, Inc.* | | 3,657 | | 495,158 | |
Flowserve Corp. | | 4,180 | | 395,135 | |
Fluor Corp. | | 13,343 | | 600,969 | |
General Dynamics Corp. | | 29,130 | | 1,985,792 | |
General Electric Co. | | 801,149 | | 12,121,384 | |
Goodrich Corp. | | 9,284 | | 596,497 | |
Grainger (W.W.), Inc. | | 4,763 | | 461,201 | |
Honeywell International, Inc. | | 57,574 | | 2,256,901 | |
Illinois Tool Works, Inc. | | 28,905 | | 1,387,151 | |
Iron Mountain, Inc.* | | 13,673 | | 311,197 | |
ITT Corp. | | 13,871 | | 689,944 | |
Jacobs Engineering Group, Inc.* | | 9,210 | | 346,388 | |
L-3 Communications Hldgs., Inc. | | 8,739 | | 759,856 | |
Lockheed Martin Corp. | | 23,926 | | 1,802,824 | |
Masco Corp. | | 27,358 | | 377,814 | |
Monster Worldwide, Inc.* | | 9,353 | | 162,742 | |
Norfolk Southern Corp. | | 27,576 | | 1,445,534 | |
Northrop Grumman Corp. | | 23,476 | | 1,311,135 | |
PACCAR, Inc. | | 26,952 | | 977,549 | |
Pall Corp. | | 8,728 | | 315,954 | |
Parker Hannifin Corp. | | 12,087 | | 651,248 | |
Pitney Bowes, Inc. | | 15,487 | | 352,484 | |
Precision Castparts Corp. | | 10,441 | | 1,152,164 | |
Quanta Services, Inc.* | | 15,623 | | 325,583 | |
Raytheon Co. | | 28,830 | | 1,485,322 | |
Republic Services, Inc. | | 24,316 | | 688,386 | |
Robert Half Int’l., Inc. | | 11,300 | | 302,049 | |
Robinson (C.H.) Worldwide, Inc. | | 12,425 | | 729,720 | |
Rockwell Automation, Inc. | | 10,721 | | 503,673 | |
Rockwell Collins, Inc. | | 11,771 | | 651,643 | |
Roper Industries, Inc. | | 6,797 | | 355,959 | |
Ryder System, Inc. | | 4,153 | | 170,979 | |
Snap-On, Inc. | | 4,311 | | 182,183 | |
Southwest Airlines Co. | | 56,311 | | 643,635 | |
Stanley Works | | 6,039 | | 311,069 | |
Stericycle, Inc.* | | 6,328 | | 349,116 | |
Textron, Inc. | | 20,549 | | 386,527 | |
Union Pacific Corp. | | 37,814 | | 2,416,315 | |
United Parcel Service, Inc. Cl B | | 74,328 | | 4,264,197 | |
United Technologies Corp. | | 70,296 | | 4,879,245 | |
Waste Management, Inc. | | 36,413 | | 1,231,124 | |
| | | | 76,288,397 | |
INFORMATION TECHNOLOGY (19.0%) | | | | | |
Adobe Systems, Inc.* | | 38,871 | | 1,429,675 | |
Advanced Micro Devices, Inc.* | | 42,485 | | 411,255 | |
Affiliated Computer Svcs., Inc. Cl A* | | 7,341 | | 438,184 | |
Agilent Technologies, Inc.* | | 25,939 | | 805,925 | |
Akamai Technologies, Inc.* | | 12,778 | | 323,667 | |
Altera Corp. | | 21,834 | | 494,103 | |
Amphenol Corp. Cl A | | 12,688 | | 585,932 | |
Analog Devices, Inc. | | 21,579 | | 681,465 | |
Apple, Inc.* | | 66,875 | | 14,101,263 | |
Applied Materials, Inc. | | 98,713 | | 1,376,059 | |
Autodesk, Inc.* | | 17,043 | | 433,063 | |
Automatic Data Processing, Inc. | | 37,852 | | 1,620,823 | |
BMC Software, Inc.* | | 13,719 | | 550,132 | |
Broadcom Corp. Cl A* | | 32,133 | | 1,010,583 | |
CA, Inc. | | 29,603 | | 664,883 | |
Cisco Systems, Inc.* | | 429,161 | | 10,274,114 | |
Citrix Systems, Inc.* | | 13,639 | | 567,519 | |
Cognizant Technology Solutions* | | 21,793 | | 987,223 | |
Computer Sciences Corp.* | | 11,509 | | 662,113 | |
Compuware Corp.* | | 17,155 | | 124,031 | |
Corning, Inc. | | 117,086 | | 2,260,931 | |
Dell, Inc.* | | 128,783 | | 1,849,324 | |
eBay, Inc.* | | 85,670 | | 2,016,672 | |
Electronic Arts, Inc.* | | 24,003 | | 426,053 | |
EMC Corp.* | | 149,794 | | 2,616,901 | |
Fidelity Nat’l. Information Svcs., Inc. | | 24,287 | | 569,287 | |
Fiserv, Inc.* | | 11,475 | | 556,308 | |
FLIR Systems, Inc.* | | 11,238 | | 367,707 | |
Google, Inc.* | | 17,948 | | 11,127,401 | |
Harris Corp. | | 9,880 | | 469,794 | |
Hewlett-Packard Co. | | 174,790 | | 9,003,433 | |
Int’l. Business Machines Corp. | | 98,341 | | 12,872,837 | |
Intel Corp. | | 403,337 | | 8,228,075 | |
Intuit, Inc.* | | 23,454 | | 720,272 | |
Jabil Circuit, Inc. | | 13,884 | | 241,165 | |
JDS Uniphase Corp.* | | 16,728 | | 138,006 | |
Juniper Networks, Inc.* | | 38,854 | | 1,036,236 | |
KLA-Tencor Corp. | | 12,714 | | 459,738 | |
Lexmark International, Inc. Cl A* | | 5,798 | | 150,632 | |
Linear Technology Corp. | | 16,713 | | 510,415 | |
LSI Corp.* | | 47,487 | | 285,397 | |
MasterCard, Inc. Cl A | | 7,059 | | 1,806,963 | |
McAfee, Inc.* | | 11,768 | | 477,428 | |
MEMC Electronic Materials, Inc.* | | 16,458 | | 224,158 | |
Microchip Technology, Inc. | | 13,768 | | 400,098 | |
Micron Technology, Inc.* | | 63,341 | | 668,881 | |
Microsoft Corp. | | 570,740 | | 17,401,863 | |
Molex, Inc. | | 10,055 | | 216,685 | |
Motorola, Inc.* | | 163,921 | | 1,272,027 | |
National Semiconductor Corp. | | 17,455 | | 268,109 | |
NetApp, Inc.* | | 25,886 | | 890,220 | |
Novell, Inc.* | | 26,310 | | 109,187 | |
Novellus Systems, Inc.* | | 7,277 | | 169,845 | |
Nvidia Corp.* | | 41,542 | | 776,005 | |
Oracle Corp. | | 275,410 | | 6,758,561 | |
Paychex, Inc. | | 24,125 | | 739,190 | |
QLogic Corp.* | | 8,608 | | 162,433 | |
QUALCOMM, Inc. | | 124,779 | | 5,772,277 | |
Red Hat, Inc.* | | 13,866 | | 428,459 | |
SAIC, Inc.* | | 23,498 | | 445,052 | |
Salesforce.com, inc.* | | 8,073 | | 595,545 | |
SanDisk Corp.* | | 17,094 | | 495,555 | |
Sun Microsystems, Inc.* | | 56,228 | | 526,856 | |
Symantec Corp.* | | 60,412 | | 1,080,771 | |
Tellabs, Inc.* | | 29,055 | | 165,032 | |
Teradata Corp.* | | 13,018 | | 409,156 | |
Teradyne, Inc.* | | 12,957 | | 139,029 | |
Texas Instruments, Inc. | | 92,801 | | 2,418,394 | |
Total System Services, Inc. | | 14,678 | | 253,489 | |
VeriSign, Inc.* | | 13,391 | | 324,598 | |
Visa, Inc. Cl A | | 32,836 | | 2,871,837 | |
Western Digital Corp.* | | 16,676 | | 736,245 | |
Western Union Co. | | 51,798 | | 976,392 | |
Xerox Corp. | | 65,232 | | 551,863 | |
Xilinx, Inc. | | 20,568 | | 515,434 | |
Yahoo!, Inc.* | | 88,317 | | 1,481,959 | |
| | | | 145,978,192 | |
MATERIALS (3.5%) | | | | | |
Air Products & Chemicals, Inc. | | 15,807 | | 1,281,315 | |
Airgas, Inc. | | 6,153 | | 292,883 | |
AK Steel Hldg. Corp. | | 8,176 | | 174,558 | |
Alcoa, Inc. | | 72,536 | | 1,169,280 | |
Allegheny Technologies, Inc. | | 7,198 | | 322,254 | |
Ball Corp. | | 7,064 | | 365,209 | |
Bemis Co., Inc. | | 8,231 | | 244,049 | |
CF Industries Hldgs., Inc. | | 3,687 | | 334,706 | |
Cliffs Natural Resources, Inc. | | 9,822 | | 452,696 | |
Dow Chemical Co. | | 85,893 | | 2,373,224 | |
Du Pont (E.I.) de Nemours & Co. | | 67,785 | | 2,282,321 | |
Eastman Chemical Co. | | 5,501 | | 331,380 | |
Ecolab, Inc. | | 17,799 | | 793,479 | |
FMC Corp. | | 5,426 | | 302,554 | |
Freeport-McMoRan Copper & Gold, Inc.* | | 32,012 | | 2,570,243 | |
Int’l. Flavors & Fragrances, Inc. | | 5,955 | | 244,989 | |
International Paper Co. | | 32,120 | | 860,174 | |
MeadWestvaco Corp. | | 12,901 | | 369,356 | |
Monsanto Co. | | 41,003 | | 3,351,995 | |
Newmont Mining Corp. | | 36,240 | | 1,714,514 | |
Nucor Corp. | | 23,397 | | 1,091,470 | |
Owens-Illinois, Inc.* | | 12,556 | | 412,716 | |
Pactiv Corp.* | | 10,040 | | 242,366 | |
PPG Industries, Inc. | | 12,570 | | 735,848 | |
Praxair, Inc. | | 23,064 | | 1,852,270 | |
Sealed Air Corp. | | 11,981 | | 261,905 | |
Sigma-Aldrich Corp. | | 9,132 | | 461,440 | |
Titanium Metals Corp.* | | 6,284 | | 78,676 | |
United States Steel Corp. | | 10,649 | | 586,973 | |
Vulcan Materials Co. | | 9,279 | | 488,725 | |
Weyerhaeuser Co. | | 15,925 | | 687,005 | |
| | | | 26,730,573 | |
TELECOMMUNICATION SERVICES (3.1%) | | | | | |
American Tower Corp. Cl A* | | 29,883 | | 1,291,244 | |
AT&T, Inc. | | 441,513 | | 12,375,609 | |
CenturyTel, Inc. | | 22,314 | | 807,990 | |
Frontier Communications Corp. | | 23,193 | | 181,137 | |
MetroPCS Communications, Inc.* | | 18,970 | | 144,741 | |
Qwest Communications Int’l., Inc. | | 111,305 | | 468,594 | |
Sprint Nextel Corp.* | | 227,376 | | 832,196 | |
Verizon Communications, Inc. | | 213,187 | | 7,062,885 | |
Windstream Corp. | | 32,318 | | 355,175 | |
| | | | 23,519,571 | |
UTILITIES (3.6%) | | | | | |
AES Corp.* | | 49,821 | | 663,118 | |
Allegheny Energy, Inc. | | 12,760 | | 299,605 | |
Ameren Corp. | | 17,753 | | 496,196 | |
American Electric Power Co., Inc. | | 35,886 | | 1,248,474 | |
CenterPoint Energy, Inc. | | 29,099 | | 422,226 | |
CMS Energy Corp. | | 16,990 | | 266,063 | |
Consolidated Edison, Inc. | | 21,041 | | 955,893 | |
Constellation Energy Group, Inc. | | 15,004 | | 527,691 | |
Dominion Resources, Inc. | | 44,654 | | 1,737,934 | |
DTE Energy Co. | | 12,280 | | 535,285 | |
Duke Energy Corp. | | 97,903 | | 1,684,911 | |
Edison International | | 24,686 | | 858,579 | |
Entergy Corp. | | 14,188 | | 1,161,146 | |
EQT Corp. | | 9,759 | | 428,615 | |
Exelon Corp. | | 49,506 | | 2,419,358 | |
FirstEnergy Corp. | | 22,918 | | 1,064,541 | |
FPL Group, Inc. | | 30,950 | | 1,634,779 | |
Integrys Energy Group, Inc. | | 5,758 | | 241,778 | |
Nicor, Inc. | | 3,397 | | 143,014 | |
NiSource, Inc. | | 20,551 | | 316,074 | |
Northeast Utilities | | 13,121 | | 338,391 | |
Pepco Hldgs., Inc. | | 16,600 | | 279,710 | |
PG&E Corp. | | 27,677 | | 1,235,778 | |
Pinnacle West Capital Corp. | | 7,652 | | 279,910 | |
PPL Corp. | | 28,100 | | 907,911 | |
Progress Energy Enterprise | | 20,925 | | 858,134 | |
Public Svc. Enterprise Group, Inc. | | 37,962 | | 1,262,237 | |
Questar Corp. | | 12,906 | | 536,502 | |
SCANA Corp. | | 8,255 | | 311,048 | |
Sempra Energy | | 18,546 | | 1,038,205 | |
Southern Co. | | 59,733 | | 1,990,304 | |
TECO Energy, Inc. | | 16,073 | | 260,704 | |
Wisconsin Energy Corp. | | 8,666 | | 431,827 | |
Xcel Energy, Inc. | | 34,039 | | 722,308 | |
| | | | 27,558,249 | |
TOTAL INDEXED ASSETS - COMMON STOCKS | | | | | |
(Cost: $709,726,697) 96.6% | | | | 741,660,934 | |
| | Rating** | | Rate(%) | | Maturity | | Face Amount | | Value | |
SHORT-TERM DEBT SECURITIES: | | | | | | | | | | | |
U.S. GOVERNMENT (0.3%) | | | | | | | | | | | |
U.S. Treasury Bill (1) | | AAA | | 0.06 | | 02/11/10 | | 2,400,000 | | 2,399,836 | |
U.S. GOVERNMENT AGENCIES (0.1%) | | | | | | | | | | | |
FHLB | | AAA | | 0.04 | | 02/05/10 | | 800,000 | | 799,969 | |
COMMERCIAL PAPER (2.9%) | | | | | | | | | | | |
Abbott Laboratories† | | A-1+ | | 0.05 | | 01/04/10 | | 8,900,000 | | 8,899,963 | |
Emerson Electric† | | A-1 | | 0.08 | | 01/20/10 | | 3,100,000 | | 3,099,869 | |
Toyota Motor Credit Corp. | | A-1+ | | 0.04 | | 01/06/10 | | 10,000,000 | | 9,999,944 | |
| | | | | | | | | | 21,999,776 | |
TOTAL SHORT-TERM DEBT SECURITIES | | | | | | | | | | | |
(Cost: $25,199,581) 3.3% | | | | | | | | | | 25,199,581 | |
| | | | | | | | | | | |
TEMPORARY CASH INVESTMENTS (2) | | | | | | | | | | | |
(Cost: $71,000) 0.0% (3) | | | | | | | | | | 71,000 | |
| | | | | | | | | | | |
TOTAL INVESTMENTS | | | | | | | | | | | |
(Cost: $734,997,278) 99.9% | | | | | | | | | | 766,931,515 | |
| | | | | | | | | | | |
OTHER NET ASSETS 0.1% | | | | | | | | | | 703,528 | |
| | | | | | | | | | | |
NET ASSETS 100.0% | | | | | | | | | | $ | 767,635,043 | |
| | | | | | | | | | | | |
The accompanying notes are an integral part of these portfolio schedules.
MUTUAL OF AMERICA INVESTMENT CORPORATION - ALL AMERICA FUND
PORTFOLIO OF INVESTMENTS IN SECURITIES
Dectember 31, 2009
| | Shares | | Value | |
INDEXED ASSETS: | | | | | |
COMMON STOCKS: | | | | | |
CONSUMER DISCRETIONARY (5.6%) | | | | | |
Abercrombie & Fitch Co. Cl A | | 1,347 | | 46,943 | |
Amazon.com, Inc.* | | 4,983 | | 670,313 | |
Apollo Group, Inc.* | | 1,890 | | 114,496 | |
AutoNation, Inc.* | | 1,363 | | 26,101 | |
AutoZone, Inc.* | | 447 | | 70,657 | |
Bed Bath & Beyond, Inc.* | | 3,947 | | 152,473 | |
Best Buy Co., Inc. | | 5,257 | | 207,441 | |
Big Lots, Inc.* | | 1,227 | | 35,558 | |
Black & Decker Corp. | | 905 | | 58,671 | |
Carnival Corp.* | | 6,786 | | 215,048 | |
CBS Corp. Cl B | | 10,117 | | 142,144 | |
Coach, Inc. | | 4,829 | | 176,403 | |
Comcast Corp. Cl A | | 42,517 | | 716,837 | |
D.R. Horton, Inc. | | 4,118 | | 44,763 | |
Darden Restaurants, Inc. | | 1,963 | | 68,842 | |
DeVry, Inc. | | 929 | | 52,702 | |
DIRECTV Group, Inc.* | | 14,157 | | 472,136 | |
Disney (Walt) Co. | | 28,517 | | 919,673 | |
Eastman Kodak Co.* | | 3,996 | | 16,863 | |
Expedia, Inc.* | | 3,173 | | 81,578 | |
Family Dollar Stores, Inc. | | 2,074 | | 57,719 | |
Ford Motor Co.* | | 48,230 | | 482,300 | |
Fortune Brands, Inc. | | 2,273 | | 98,194 | |
GameStop Corp. Cl A* | | 2,472 | | 54,236 | |
Gannett Co., Inc. | | 3,577 | | 53,118 | |
Gap, Inc. | | 7,282 | | 152,558 | |
Genuine Parts Co. | | 2,386 | | 90,573 | |
Goodyear Tire & Rubber Co.* | | 3,585 | | 50,549 | |
H&R Block, Inc. | | 4,964 | | 112,286 | |
Harley-Davidson, Inc. | | 3,494 | | 88,049 | |
Harman Int’l. Industries, Inc. | | 1,042 | | 36,762 | |
Hasbro, Inc. | | 1,866 | | 59,824 | |
Home Depot, Inc. | | 25,556 | | 739,335 | |
International Game Technology | | 4,372 | | 82,062 | |
Interpublic Group of Cos., Inc.* | | 7,227 | | 53,335 | |
Johnson Controls, Inc. | | 9,971 | | 271,610 | |
Kohl’s Corp.* | | 4,602 | | 248,186 | |
Leggett & Platt, Inc. | | 2,280 | | 46,512 | |
Lennar Corp. Cl A | | 2,437 | | 31,120 | |
Limited Brands, Inc. | | 4,006 | | 77,075 | |
Lowe’s Cos., Inc. | | 22,058 | | 515,937 | |
Macy’s, Inc | | 6,289 | | 105,404 | |
Marriott International, Inc. Cl A | | 3,797 | | 103,468 | |
Mattel, Inc. | | 5,422 | | 108,332 | |
McDonald’s Corp. | | 16,070 | | 1,003,411 | |
McGraw-Hill Cos., Inc. | | 4,729 | | 158,469 | |
Meredith Corp. | | 552 | | 17,029 | |
New York Times Co. Cl A* | | 1,741 | | 21,519 | |
Newell Rubbermaid, Inc. | | 4,094 | | 61,451 | |
News Corp. Cl A | | 33,432 | | 457,684 | |
NIKE, Inc. Cl B | | 5,685 | | 375,608 | |
Nordstrom, Inc. | | 2,465 | | 92,635 | |
O’Reilly Automotive, Inc.* | | 2,050 | | 78,146 | |
Office Depot, Inc.* | | 4,101 | | 26,451 | |
Omnicom Group, Inc. | | 4,585 | | 179,503 | |
Penney (J.C.) Co., Inc. | | 3,523 | | 93,747 | |
Polo Ralph Lauren Corp. | | 855 | | 69,238 | |
Priceline.com, Inc.* | | 662 | | 144,647 | |
Pulte Homes, Inc.* | | 4,747 | | 47,470 | |
RadioShack Corp. | | 1,881 | | 36,680 | |
Ross Stores, Inc. | | 1,881 | | 80,338 | |
Scripps Networks Interactive, Inc. Cl A | | 1,342 | | 55,693 | |
Sears Hldgs. Corp.* | | 723 | | 60,334 | |
Sherwin-Williams Co. | | 1,419 | | 87,481 | |
Staples, Inc. | | 10,878 | | 267,490 | |
Starbucks Corp.* | | 10,599 | | 244,413 | |
Starwood Hotels & Resorts | | 2,807 | | 102,652 | |
Target Corp. | | 11,149 | | 539,277 | |
Tiffany & Co. | | 1,871 | | 80,453 | |
Time Warner Cable, Inc. | | 5,360 | | 221,850 | |
Time Warner, Inc. | | 17,625 | | 513,593 | |
TJX Cos., Inc. | | 6,276 | | 229,388 | |
V.F. Corp. | | 1,335 | | 97,775 | |
Viacom, Inc. Cl B* | | 9,142 | | 271,792 | |
Washington Post Co. Cl B | | 92 | | 40,443 | |
Whirlpool Corp. | | 1,105 | | 89,129 | |
Wyndham Worldwide Corp. | | 2,680 | | 54,056 | |
Wynn Resorts Ltd. | | 1,050 | | 61,142 | |
Yum! Brands, Inc. | | 6,973 | | 243,846 | |
| | | | 14,213,019 | |
CONSUMER STAPLES (6.6%) | | | | | |
Altria Group, Inc. | | 31,009 | | 608,707 | |
Archer-Daniels-Midland Co. | | 9,658 | | 302,392 | |
Avon Products, Inc. | | 6,394 | | 201,411 | |
Brown-Forman Corp. Cl B | | 1,650 | | 88,391 | |
Campbell Soup Co. | | 2,886 | | 97,547 | |
Clorox Co. | | 2,099 | | 128,039 | |
Coca-Cola Co. | | 34,846 | | 1,986,222 | |
Coca-Cola Enterprises, Inc. | | 4,754 | | 100,785 | |
Colgate-Palmolive Co. | | 7,540 | | 619,411 | |
ConAgra Foods, Inc. | | 6,652 | | 153,329 | |
Constellation Brands, Inc. Cl A* | | 2,955 | | 47,073 | |
Costco Wholesale Corp. | | 6,497 | | 384,427 | |
CVS Caremark Corp. | | 21,112 | | 680,018 | |
Dean Foods Co.* | | 2,682 | | 48,383 | |
Dr. Pepper Snapple Group, Inc. | | 3,818 | | 108,049 | |
Estee Lauder Cos., Inc. Cl A | | 1,790 | | 86,564 | |
General Mills, Inc. | | 4,935 | | 349,447 | |
Heinz (H.J.) Co. | | 4,791 | | 204,863 | |
Hershey Co. | | 2,519 | | 90,155 | |
Hormel Foods Corp. | | 1,045 | | 40,180 | |
J.M. Smucker Co. | | 1,781 | | 109,977 | |
Kellogg Co. | | 3,835 | | 204,022 | |
Kimberly-Clark Corp. | | 6,287 | | 400,545 | |
Kraft Foods, Inc. Cl A | | 22,092 | | 600,461 | |
Kroger Co. | | 9,879 | | 202,816 | |
Lorillard, Inc. | | 2,440 | | 195,761 | |
McCormick & Co., Inc. | | 1,966 | | 71,032 | |
Mead Johnson Nutrition Co.* | | 3,043 | | 131,853 | |
Molson Coors Brewing Co. Cl B | | 2,354 | | 106,307 | |
Pepsi Bottling Group, Inc. | | 2,176 | | 81,600 | |
PepsiCo, Inc. | | 23,758 | | 1,444,486 | |
Philip Morris Int’l., Inc. | | 29,066 | | 1,400,691 | |
Proctor & Gamble Co. | | 44,246 | | 2,682,635 | |
Reynolds American, Inc. | | 2,527 | | 133,855 | |
Safeway, Inc. | | 6,176 | | 131,487 | |
Sara Lee Corp. | | 10,563 | | 128,657 | |
SUPERVALU, Inc. | | 3,204 | | 40,723 | |
Sysco Corp. | | 9,044 | | 252,689 | |
Tyson Foods, Inc. Cl A | | 4,584 | | 56,246 | |
Wal-Mart Stores, Inc. | | 31,940 | | 1,707,193 | |
Walgreen Co. | | 15,075 | | 553,554 | |
Whole Foods Market, Inc.* | | 2,128 | | 58,414 | |
| | | | 17,020,397 | |
ENERGY (6.6%) | | | | | |
Anadarko Petroleum Corp. | | 7,401 | | 461,970 | |
Apache Corp. | | 5,036 | | 519,564 | |
Baker Hughes, Inc. | | 4,710 | | 190,661 | |
BJ Services Co. | | 4,457 | | 82,900 | |
Cabot Oil & Gas Corp. | | 1,527 | | 66,562 | |
Cameron International Corp.* | | 3,632 | | 151,818 | |
Chesapeake Energy Corp. | | 9,296 | | 240,580 | |
Chevron Corp. | | 29,972 | | 2,307,544 | |
ConocoPhillips | | 22,414 | | 1,144,683 | |
Consol Energy, Inc. | | 2,638 | | 131,372 | |
Denbury Resources, Inc.* | | 3,666 | | 54,257 | |
Devon Energy Corp. | | 6,556 | | 481,866 | |
Diamond Offshore Drilling, Inc. | | 1,045 | | 102,849 | |
El Paso Corp. | | 10,446 | | 102,684 | |
EOG Resources, Inc. | | 3,746 | | 364,486 | |
Exxon Mobil Corp. | | 71,411 | | 4,869,511 | |
FMC Technologies, Inc.* | | 1,827 | | 105,674 | |
Halliburton Co. | | 13,611 | | 409,555 | |
Hess Corp. | | 4,277 | | 258,759 | |
Marathon Oil Corp. | | 10,629 | | 331,837 | |
Massey Energy Co. | | 1,248 | | 52,428 | |
Murphy Oil Corp. | | 2,850 | | 154,470 | |
Nabors Industries Ltd.* | | 4,201 | | 91,960 | |
National Oilwell Varco, Inc. | | 6,429 | | 283,455 | |
Noble Energy, Inc. | | 2,592 | | 184,602 | |
Occidental Petroleum Corp. | | 11,892 | | 967,414 | |
Peabody Energy Corp. | | 4,008 | | 181,202 | |
Pioneer Natural Resources Co. | | 1,698 | | 81,793 | |
Range Resources Corp. | | 2,299 | | 114,605 | |
Rowan Cos., Inc.* | | 1,718 | | 38,896 | |
Schlumberger Ltd. | | 17,855 | | 1,162,182 | |
Smith International, Inc. | | 3,790 | | 102,974 | |
Southwestern Energy Co.* | | 4,979 | | 239,988 | |
Spectra Energy Corp. | | 9,726 | | 199,480 | |
Sunoco, Inc. | | 1,746 | | 45,571 | |
Tesoro Corp. | | 2,065 | | 27,981 | |
Valero Energy Corp. | | 8,385 | | 140,449 | |
Williams Cos., Inc. | | 8,719 | | 183,797 | |
XTO Energy, Inc. | | 8,702 | | 404,904 | |
| | | | 17,037,283 | |
FINANCIALS (8.3%) | | | | | |
Aflac, Inc. | | 7,032 | | 325,230 | |
Allstate Corp. | | 7,924 | | 238,037 | |
American Express Co. | | 17,892 | | 724,984 | |
American Int’l. Group, Inc.* | | 2,026 | | 60,740 | |
Ameriprise Financial, Inc. | | 3,814 | | 148,059 | |
Aon Corp. | | 4,133 | | 158,459 | |
Apartment Investment & Management Co. Cl A | | 1,748 | | 27,828 | |
Assurant, Inc. | | 1,772 | | 52,239 | |
AvalonBay Communities, Inc. | | 1,218 | | 100,010 | |
Bank of America Corp. | | 146,992 | | 2,213,700 | |
Bank of New York Mellon Corp. | | 17,936 | | 501,670 | |
BB&T Corp. | | 10,219 | | 259,256 | |
Boston Properties, Inc. | | 2,110 | | 141,518 | |
Capital One Financial Corp. | | 6,669 | | 255,689 | |
CB Richard Ellis Group, Inc. Cl A* | | 4,032 | | 54,714 | |
Charles Schwab Corp. | | 14,102 | | 265,400 | |
Chubb Corp. | | 5,137 | | 252,638 | |
Cincinnati Financial Corp. | | 2,450 | | 64,288 | |
Citigroup, Inc. | | 284,828 | | 942,781 | |
CME Group, Inc. | | 1,004 | | 337,294 | |
Comerica, Inc. | | 2,224 | | 65,764 | |
Discover Financial Svcs. | | 8,170 | | 120,181 | |
E*Trade Financial Corp.* | | 22,621 | | 39,587 | |
Equity Residential | | 4,113 | | 138,937 | |
Federated Investors, Inc. Cl B | | 1,296 | | 35,640 | |
Fifth Third Bancorp | | 11,845 | | 115,489 | |
First Horizon National Corp.* | | 3,330 | | 44,627 | |
Franklin Resources, Inc. | | 2,227 | | 234,614 | |
Genworth Financial, Inc. Cl A* | | 7,218 | | 81,924 | |
Goldman Sachs Group, Inc. | | 7,660 | | 1,293,314 | |
Hartford Financial Svcs. Group, Inc. | | 5,727 | | 133,210 | |
HCP, Inc. | | 4,423 | | 135,078 | |
Health Care REIT, Inc. | | 1,845 | | 81,770 | |
Host Hotels & Resorts, Inc.* | | 9,656 | | 112,687 | |
Hudson City Bancorp, Inc. | | 6,858 | | 94,160 | |
Huntington Bancshares, Inc. | | 10,764 | | 39,289 | |
IntercontinentalExchange, Inc.* | | 1,112 | | 124,878 | |
Invesco Ltd. | | 6,561 | | 154,118 | |
Janus Capital Group, Inc. | | 2,722 | | 36,611 | |
JPMorgan Chase & Co. | | 58,304 | | 2,429,528 | |
KeyCorp | | 13,201 | | 73,266 | |
Kimco Realty Corp. | | 5,953 | | 80,544 | |
Legg Mason, Inc. | | 2,443 | | 73,681 | |
Leucadia National Corp.* | | 2,825 | | 67,207 | |
Lincoln National Corp. | | 4,585 | | 114,075 | |
Loews Corp. | | 5,401 | | 196,326 | |
M&T Bank Corp. | | 1,216 | | 81,338 | |
Marsh & McLennan Cos., Inc. | | 7,941 | | 175,337 | |
Marshall & Ilsley Corp. | | 7,783 | | 42,417 | |
MetLife, Inc. | | 12,298 | | 434,734 | |
Moody’s Corp. | | 3,005 | | 80,534 | |
Morgan Stanley | | 20,410 | | 604,136 | |
Nasdaq OMX Group, Inc.* | | 2,220 | | 44,000 | |
Northern Trust Corp. | | 3,540 | | 185,496 | |
NYSE Euronext | | 3,953 | | 100,011 | |
People’s United Financial, Inc. | | 5,159 | | 86,155 | |
Plum Creek Timber Co., Inc. | | 2,458 | | 92,814 | |
PNC Financial Svcs. Grp., Inc. | | 6,739 | | 355,752 | |
Principal Financial Grp., Inc. | | 4,798 | | 115,344 | |
Progressive Corp.* | | 10,106 | | 181,807 | |
ProLogis | | 7,240 | | 99,116 | |
Prudential Financial, Inc. | | 6,915 | | 344,090 | |
Public Storage | | 2,054 | | 167,298 | |
Regions Financial Corp. | | 17,428 | | 92,194 | |
Simon Property Group, Inc. | | 4,284 | | 341,866 | |
SLM Corp.* | | 7,137 | | 80,434 | |
State Street Corp. | | 7,089 | | 308,655 | |
SunTrust Banks, Inc. | | 7,463 | | 151,424 | |
T. Rowe Price Group, Inc. | | 3,787 | | 201,658 | |
Torchmark Corp. | | 1,255 | | 55,157 | |
Travelers Cos., Inc. | | 8,227 | | 410,198 | |
U.S. Bancorp | | 27,953 | | 629,222 | |
Unum Group | | 5,016 | | 97,912 | |
Ventas, Inc. | | 2,368 | | 103,576 | |
Vornado Realty Trust | | 2,372 | | 165,914 | |
Wells Fargo & Co. | | 74,106 | | 2,000,121 | |
XL Capital Ltd. Cl A | | 5,089 | | 93,281 | |
Zions Bancorporation | | 2,035 | | 26,109 | |
| | | | 21,189,139 | |
HEALTH CARE (7.3%) | | | | | |
Abbott Laboratories | | 23,292 | | 1,257,535 | |
Aetna, Inc. | | 6,514 | | 206,494 | |
Allergan, Inc. | | 4,616 | | 290,854 | |
AmerisourceBergen Corp. | | 4,287 | | 111,762 | |
Amgen, Inc.* | | 14,825 | | 838,650 | |
Bard (C.R.), Inc. | | 1,553 | | 120,979 | |
Baxter International, Inc. | | 9,133 | | 535,924 | |
Becton, Dickinson & Co. | | 3,598 | | 283,738 | |
Biogen Idec, Inc.* | | 4,272 | | 228,552 | |
Boston Scientific Corp.* | | 22,358 | | 201,222 | |
Bristol-Myers Squibb Co. | | 25,538 | | 644,835 | |
Cardinal Health, Inc. | | 5,420 | | 174,741 | |
CareFusion Corp.* | | 2,582 | | 64,576 | |
Celgene Corp.* | | 6,249 | | 347,944 | |
Cephalon, Inc.* | | 1,115 | | 69,587 | |
CIGNA Corp. | | 4,145 | | 146,194 | |
Coventry Health Care, Inc.* | | 2,226 | | 54,070 | |
DaVita, Inc.* | | 1,532 | | 89,990 | |
Dentsply International, Inc. | | 2,286 | | 80,399 | |
Express Scripts, Inc.* | | 4,141 | | 357,989 | |
Forest Laboratories, Inc.* | | 4,504 | | 144,623 | |
Genzyme Corp.* | | 3,923 | | 192,266 | |
Gilead Sciences, Inc.* | | 13,653 | | 590,902 | |
Hospira, Inc.* | | 2,443 | | 124,593 | |
Humana, Inc.* | | 2,536 | | 111,305 | |
IMS Health, Inc. | | 2,737 | | 57,641 | |
Intuitive Surgical, Inc.* | | 576 | | 174,712 | |
Johnson & Johnson | | 41,469 | | 2,671,018 | |
King Pharmaceuticals, Inc.* | | 3,667 | | 44,994 | |
Laboratory Corp. of America Hldgs.* | | 1,593 | | 119,220 | |
Life Technologies Corp.* | | 2,649 | | 138,357 | |
Lilly (Eli) & Co. | | 15,067 | | 538,043 | |
McKesson Corp. | | 4,043 | | 252,688 | |
Medco Health Solutions, Inc.* | | 7,112 | | 454,528 | |
Medtronic, Inc. | | 16,517 | | 726,418 | |
Merck & Co., Inc. | | 45,294 | | 1,655,043 | |
Millipore Corp.* | | 835 | | 60,412 | |
Mylan, Inc.* | | 4,578 | | 84,373 | |
Patterson Cos., Inc.* | | 1,409 | | 39,424 | |
PerkinElmer, Inc. | | 1,766 | | 36,362 | |
Pfizer, Inc. | | 120,092 | | 2,184,473 | |
Quest Diagnostics, Inc. | | 2,334 | | 140,927 | |
St. Jude Medical, Inc.* | | 5,024 | | 184,783 | |
Stryker Corp. | | 4,256 | | 214,375 | |
Tenet Healthcare Corp.* | | 6,664 | | 35,919 | |
Thermo Fisher Scientific, Inc.* | | 6,178 | | 294,629 | |
UnitedHealth Group, Inc. | | 17,518 | | 533,949 | |
Varian Medical Systems, Inc.* | | 1,862 | | 87,235 | |
Waters Corp.* | | 1,432 | | 88,727 | |
Watson Pharmaceuticals, Inc.* | | 1,584 | | 62,742 | |
WellPoint, Inc.* | | 6,897 | | 402,026 | |
Zimmer Hldgs., Inc.* | | 3,209 | | 189,684 | |
| | | | 18,742,426 | |
INDUSTRIALS (6.0%) | | | | | |
3M Co. | | 10,532 | | 870,680 | |
Avery Dennison Corp. | | 1,680 | | 61,303 | |
Boeing Co. | | 11,084 | | 599,977 | |
Burlington Northern Santa Fe Corp. | | 3,926 | | 387,182 | |
Caterpillar, Inc. | | 9,392 | | 535,250 | |
Cintas Corp. | | 1,936 | | 50,433 | |
CSX Corp. | | 5,867 | | 284,491 | |
Cummins, Inc. | | 2,989 | | 137,076 | |
Danaher Corp. | | 3,869 | | 290,949 | |
Deere & Co. | | 6,233 | | 337,143 | |
Donnelley (R.R.) & Sons Co. | | 3,117 | | 69,416 | |
Dover Corp. | | 2,814 | | 117,091 | |
Dun & Bradstreet Corp. | | 785 | | 66,230 | |
Eaton Corp. | | 2,508 | | 159,559 | |
Emerson Electric Co. | | 11,259 | | 479,633 | |
Equifax, Inc. | | 1,877 | | 57,981 | |
Expeditors Int’l. of Wash. | | 3,154 | | 109,538 | |
Fastenal Co. | | 1,975 | | 82,239 | |
FedEx Corp. | | 4,654 | | 388,376 | |
First Solar, Inc.* | | 730 | | 98,842 | |
Flowserve Corp. | | 835 | | 78,933 | |
Fluor Corp. | | 2,666 | | 120,077 | |
General Dynamics Corp. | | 5,818 | | 396,613 | |
General Electric Co. | | 160,021 | | 2,421,118 | |
Goodrich Corp. | | 1,855 | | 119,184 | |
Grainger (W.W.), Inc. | | 951 | | 92,085 | |
Honeywell International, Inc. | | 11,499 | | 450,761 | |
Illinois Tool Works, Inc. | | 5,774 | | 277,094 | |
Iron Mountain, Inc.* | | 2,731 | | 62,158 | |
ITT Corp. | | 2,770 | | 137,780 | |
Jacobs Engineering Group, Inc.* | | 1,840 | | 69,202 | |
L-3 Communications Hldgs., Inc. | | 1,746 | | 151,815 | |
Lockheed Martin Corp. | | 4,779 | | 360,098 | |
Masco Corp. | | 5,464 | | 75,458 | |
Monster Worldwide, Inc.* | | 1,869 | | 32,521 | |
Norfolk Southern Corp. | | 5,508 | | 288,729 | |
Northrop Grumman Corp. | | 4,690 | | 261,937 | |
PACCAR, Inc. | | 5,384 | | 195,278 | |
Pall Corp. | | 1,744 | | 63,133 | |
Parker Hannifin Corp. | | 2,414 | | 130,066 | |
Pitney Bowes, Inc. | | 3,094 | | 70,419 | |
Precision Castparts Corp. | | 2,086 | | 230,190 | |
Quanta Services, Inc.* | | 3,121 | | 65,042 | |
Raytheon Co. | | 5,759 | | 296,704 | |
Republic Services, Inc. | | 4,856 | | 137,473 | |
Robert Half Int’l., Inc. | | 2,257 | | 60,330 | |
Robinson (C.H.) Worldwide, Inc. | | 2,482 | | 145,768 | |
Rockwell Automation, Inc. | | 2,141 | | 100,584 | |
Rockwell Collins, Inc. | | 2,352 | | 130,207 | |
Roper Industries, Inc. | | 1,357 | | 71,066 | |
Ryder System, Inc. | | 830 | | 34,171 | |
Snap-On, Inc. | | 861 | | 36,386 | |
Southwest Airlines Co. | | 11,247 | | 128,553 | |
Stanley Works | | 1,206 | | 62,121 | |
Stericycle, Inc.* | | 1,264 | | 69,735 | |
Textron, Inc. | | 4,104 | | 77,196 | |
Union Pacific Corp. | | 7,553 | | 482,637 | |
United Parcel Service, Inc. Cl B | | 14,847 | | 851,772 | |
United Technologies Corp. | | 14,041 | | 974,586 | |
Waste Management, Inc. | | 7,274 | | 245,934 | |
| | | | 15,238,303 | |
INFORMATION TECHNOLOGY (11.4%) | | | | | |
Adobe Systems, Inc.* | | 7,765 | | 285,597 | |
Advanced Micro Devices, Inc.* | | 8,485 | | 82,135 | |
Affiliated Computer Svcs., Inc. Cl A* | | 1,467 | | 87,565 | |
Agilent Technologies, Inc.* | | 5,182 | | 161,005 | |
Akamai Technologies, Inc.* | | 2,553 | | 64,667 | |
Altera Corp. | | 4,362 | | 98,712 | |
Amphenol Corp. Cl A | | 2,535 | | 117,066 | |
Analog Devices, Inc. | | 4,311 | | 136,141 | |
Apple, Inc.* | | 13,358 | | 2,816,668 | |
Applied Materials, Inc. | | 19,717 | | 274,855 | |
Autodesk, Inc.* | | 3,404 | | 86,496 | |
Automatic Data Processing, Inc. | | 7,560 | | 323,719 | |
BMC Software, Inc.* | | 2,741 | | 109,914 | |
Broadcom Corp. Cl A* | | 6,419 | | 201,878 | |
CA, Inc. | | 5,913 | | 132,806 | |
Cisco Systems, Inc.* | | 85,721 | | 2,052,161 | |
Citrix Systems, Inc.* | | 2,725 | | 113,387 | |
Cognizant Technology Solutions* | | 4,353 | | 197,191 | |
Computer Sciences Corp.* | | 2,298 | | 132,204 | |
Compuware Corp.* | | 3,427 | | 24,777 | |
Corning, Inc. | | 23,387 | | 451,603 | |
Dell, Inc.* | | 25,723 | | 369,382 | |
eBay, Inc.* | | 17,111 | | 402,793 | |
Electronic Arts, Inc.* | | 4,795 | | 85,111 | |
EMC Corp.* | | 29,920 | | 522,702 | |
Fidelity Nat’l. Information Svcs., Inc. | | 4,852 | | 113,731 | |
Fiserv, Inc.* | | 2,292 | | 111,116 | |
FLIR Systems, Inc.* | | 2,245 | | 73,456 | |
Google, Inc.* | | 3,585 | | 2,222,628 | |
Harris Corp. | | 1,973 | | 93,816 | |
Hewlett-Packard Co. | | 34,913 | | 1,798,369 | |
Int’l. Business Machines Corp. | | 19,643 | | 2,571,269 | |
Intel Corp. | | 80,563 | | 1,643,485 | |
Intuit, Inc.* | | 4,685 | | 143,876 | |
Jabil Circuit, Inc. | | 2,773 | | 48,167 | |
JDS Uniphase Corp.* | | 3,341 | | 27,563 | |
Juniper Networks, Inc.* | | 7,761 | | 206,986 | |
KLA-Tencor Corp. | | 2,540 | | 91,846 | |
Lexmark International, Inc. Cl A* | | 1,158 | | 30,085 | |
Linear Technology Corp. | | 3,339 | | 101,973 | |
LSI Corp.* | | 9,485 | | 57,005 | |
MasterCard, Inc. Cl A | | 1,410 | | 360,932 | |
McAfee, Inc.* | | 2,351 | | 95,380 | |
MEMC Electronic Materials, Inc.* | | 3,288 | | 44,783 | |
Microchip Technology, Inc. | | 2,750 | | 79,915 | |
Micron Technology, Inc.* | | 12,652 | | 133,605 | |
Microsoft Corp. | | 114,000 | | 3,475,855 | |
Molex, Inc. | | 2,009 | | 43,294 | |
Motorola, Inc.* | | 32,742 | | 254,078 | |
National Semiconductor Corp. | | 3,487 | | 53,560 | |
NetApp, Inc.* | | 5,170 | | 177,796 | |
Novell, Inc.* | | 5,255 | | 21,808 | |
Novellus Systems, Inc.* | | 1,454 | | 33,936 | |
Nvidia Corp.* | | 8,297 | | 154,988 | |
Oracle Corp. | | 55,011 | | 1,349,970 | |
Paychex, Inc. | | 4,819 | | 147,654 | |
QLogic Corp.* | | 1,720 | | 32,456 | |
QUALCOMM, Inc. | | 24,924 | | 1,152,984 | |
Red Hat, Inc.* | | 2,770 | | 85,593 | |
SAIC, Inc.* | | 4,693 | | 88,885 | |
Salesforce.com, inc.* | | 1,613 | | 118,991 | |
SanDisk Corp.* | | 3,415 | | 99,001 | |
Sun Microsystems, Inc.* | | 11,231 | | 105,234 | |
Symantec Corp.* | | 12,067 | | 215,879 | |
Tellabs, Inc.* | | 5,804 | | 32,967 | |
Teradata Corp.* | | 2,600 | | 81,718 | |
Teradyne, Inc.* | | 2,589 | | 27,780 | |
Texas Instruments, Inc. | | 18,536 | | 483,048 | |
Total System Services, Inc. | | 2,932 | | 50,636 | |
VeriSign, Inc.* | | 2,675 | | 64,842 | |
Visa, Inc. Cl A | | 6,558 | | 573,563 | |
Western Digital Corp.* | | 3,331 | | 147,064 | |
Western Union Co. | | 10,347 | | 195,041 | |
Xerox Corp. | | 13,030 | | 110,234 | |
Xilinx, Inc. | | 4,109 | | 102,972 | |
Yahoo!, Inc.* | | 17,641 | | 296,016 | |
| | | | 29,158,364 | |
MATERIALS (2.1%) | | | | | |
Air Products & Chemicals, Inc. | | 3,158 | | 255,987 | |
Airgas, Inc. | | 1,228 | | 58,453 | |
AK Steel Hldg. Corp. | | 1,633 | | 34,865 | |
Alcoa, Inc. | | 14,489 | | 233,563 | |
Allegheny Technologies, Inc. | | 1,438 | | 64,379 | |
Ball Corp. | | 1,411 | | 72,949 | |
Bemis Co., Inc. | | 1,644 | | 48,745 | |
CF Industries Hldgs., Inc. | | 736 | | 66,814 | |
Cliffs Natural Resources, Inc. | | 1,961 | | 90,382 | |
Dow Chemical Co. | | 17,157 | | 474,048 | |
Du Pont (E.I.) de Nemours & Co. | | 13,540 | | 455,892 | |
Eastman Chemical Co. | | 1,098 | | 66,144 | |
Ecolab, Inc. | | 3,556 | | 158,526 | |
FMC Corp. | | 1,084 | | 60,444 | |
Freeport-McMoRan Copper & Gold, Inc.* | | 6,394 | | 513,374 | |
Int’l. Flavors & Fragrances, Inc. | | 1,189 | | 48,915 | |
International Paper Co. | | 6,416 | | 171,820 | |
MeadWestvaco Corp. | | 2,577 | | 73,780 | |
Monsanto Co. | | 8,190 | | 669,533 | |
Newmont Mining Corp. | | 7,239 | | 342,477 | |
Nucor Corp. | | 4,674 | | 218,042 | |
Owens-Illinois, Inc.* | | 2,508 | | 82,438 | |
Pactiv Corp.* | | 2,005 | | 48,401 | |
PPG Industries, Inc. | | 2,510 | | 146,935 | |
Praxair, Inc. | | 4,607 | | 369,988 | |
Sealed Air Corp. | | 2,393 | | 52,311 | |
Sigma-Aldrich Corp. | | 1,824 | | 92,167 | |
Titanium Metals Corp.* | | 1,256 | | 15,725 | |
United States Steel Corp. | | 2,127 | | 117,240 | |
Vulcan Materials Co. | | 1,854 | | 97,650 | |
Weyerhaeuser Co. | | 3,180 | | 137,185 | |
| | | | 5,339,172 | |
TELECOMMUNICATION SERVICES (1.8%) | | | | | |
American Tower Corp. Cl A* | | 5,968 | | 257,877 | |
AT&T, Inc. | | 88,188 | | 2,471,910 | |
CenturyTel, Inc. | | 4,457 | | 161,388 | |
Frontier Communications Corp. | | 4,633 | | 36,184 | |
MetroPCS Communications, Inc.* | | 3,790 | | 28,918 | |
Qwest Communications Int’l., Inc. | | 22,232 | | 93,597 | |
Sprint Nextel Corp.* | | 45,416 | | 166,223 | |
Verizon Communications, Inc. | | 42,582 | | 1,410,742 | |
Windstream Corp. | | 6,456 | | 70,951 | |
| | | | 4,697,790 | |
UTILITIES (2.2%) | | | | | |
AES Corp.* | | 9,952 | | 132,461 | |
Allegheny Energy, Inc. | | 2,549 | | 59,851 | |
Ameren Corp. | | 3,546 | | 99,111 | |
American Electric Power Co., Inc. | | 7,168 | | 249,375 | |
CenterPoint Energy, Inc. | | 5,812 | | 84,332 | |
CMS Energy Corp. | | 3,394 | | 53,150 | |
Consolidated Edison, Inc. | | 4,202 | | 190,897 | |
Constellation Energy Group, Inc. | | 2,997 | | 105,404 | |
Dominion Resources, Inc. | | 8,919 | | 347,127 | |
DTE Energy Co. | | 2,453 | | 106,926 | |
Duke Energy Corp. | | 19,555 | | 336,542 | |
Edison International | | 4,930 | | 171,465 | |
Entergy Corp. | | 2,834 | | 231,935 | |
EQT Corp. | | 1,950 | | 85,644 | |
Exelon Corp. | | 9,889 | | 483,275 | |
FirstEnergy Corp. | | 4,578 | | 212,648 | |
FPL Group, Inc. | | 6,182 | | 326,533 | |
Integrys Energy Group, Inc. | | 1,150 | | 48,288 | |
Nicor, Inc. | | 679 | | 28,586 | |
NiSource, Inc. | | 4,105 | | 63,135 | |
Northeast Utilities | | 2,621 | | 67,596 | |
Pepco Hldgs., Inc. | | 3,316 | | 55,875 | |
PG&E Corp. | | 5,529 | | 246,870 | |
Pinnacle West Capital Corp. | | 1,528 | | 55,894 | |
PPL Corp. | | 5,613 | | 181,356 | |
Progress Energy Enterprise | | 4,180 | | 171,422 | |
Public Svc. Enterprise Group, Inc. | | 7,583 | | 252,135 | |
Questar Corp. | | 2,578 | | 107,167 | |
SCANA Corp. | | 1,649 | | 62,134 | |
Sempra Energy | | 3,704 | | 207,350 | |
Southern Co. | | 11,932 | | 397,574 | |
TECO Energy, Inc. | | 3,211 | | 52,082 | |
Wisconsin Energy Corp. | | 1,731 | | 86,256 | |
Xcel Energy, Inc. | | 6,799 | | 144,275 | |
| | | | 5,504,671 | |
TOTAL INDEXED ASSETS - COMMON STOCKS | | | | | |
(Cost: $158,924,227) 57.9% | | | | 148,140,564 | |
| | Rating** | | Rate(%) | | Maturity | | Face Amount | | Value | |
INDEXED ASSETS: | | | | | | | | | | | |
SHORT-TERM DEBT SECURITIES: | | | | | | | | | | | |
U.S. GOVERNMENT (0.2%) | | | | | | | | | | | |
U.S. Treasury Bill (1) | | AAA | | 0.10 | | 05/06/10 | | 600,000 | | 599,786 | |
COMMERCIAL PAPER (1.9%) | | | | | | | | | | | |
Abbott Laboratories† | | A-1+ | | 0.05 | | 01/04/10 | | 4,770,000 | | 4,769,980 | |
TOTAL INDEXED ASSETS - SHORT-TERM DEBT SECURITIES | | | | | | | | | | | |
(Cost: $5,369,772) 2.1% | | | | | | | | | | 5,369,766 | |
| | | | | | | | | | | |
TOTAL INDEXED ASSETS | | | | | | | | | | | |
(Cost: $164,293,999) 60.0% | | | | | | | | | | 153,510,330 | |
| | Shares | | Value | |
ACTIVE ASSETS: | | | | | |
COMMON STOCKS: | | | | | |
CONSUMER DISCRETIONARY (4.1%) | | | | | |
Amazon.com, Inc.* | | 4,335 | | 583,144 | |
Apollo Group, Inc.* | | 3,278 | | 198,581 | |
California Pizza Kitchen, Inc.* | | 22,216 | | 298,805 | |
Carter's, Inc.* | | 6,575 | | 172,594 | |
Deckers Outdoor Corp.* | | 4,147 | | 421,833 | |
Dillard's, Inc. Cl A | | 30,943 | | 570,898 | |
Disney (Walt) Co. | | 15,987 | | 515,581 | |
Family Dollar Stores, Inc. | | 9,220 | | 256,593 | |
G-III Apparel Group Ltd.* | | 12,998 | | 281,667 | |
Grand Canyon Education, Inc.* | | 12,856 | | 244,393 | |
Gymboree Corp.* | | 6,581 | | 286,208 | |
Home Depot, Inc. | | 5,711 | | 165,219 | |
Johnson Controls, Inc. | | 16,811 | | 457,932 | |
Leapfrog Enterprises, Inc.* | | 13,417 | | 52,460 | |
McDonald's Corp. | | 13,341 | | 833,012 | |
OfficeMax, Inc.* | | 38,696 | | 491,052 | |
P.F. Chang's China Bistro, Inc.* | | 5,573 | | 211,272 | |
Pep Boys - Manny, Moe & Jack | | 16,490 | | 139,505 | |
Rent-A-Center, Inc.* | | 16,303 | | 288,889 | |
Shutterfly, Inc.* | | 13,454 | | 239,616 | |
Smith & Wesson Hldg. Corp.* | | 38,018 | | 155,494 | |
Sonic Corp.* | | 19,663 | | 198,006 | |
Staples, Inc. | | 14,149 | | 347,924 | |
Target Corp. | | 4,651 | | 224,969 | |
Time Warner Cable, Inc. | | 8,054 | | 333,355 | |
Time Warner, Inc. | | 7,682 | | 223,853 | |
TJX Cos., Inc. | | 3,856 | | 140,937 | |
Tupperware Brands Corp. | | 21,134 | | 984,210 | |
V.F. Corp. | | 6,031 | | 441,710 | |
Viacom, Inc. Cl B* | | 9,964 | | 296,230 | |
WMS Industries, Inc.* | | 3,448 | | 137,920 | |
Wolverine World Wide, Inc. | | 7,846 | | 213,568 | |
| | | | 10,407,430 | |
CONSUMER STAPLES (2.8%) | | | | | |
American Italian Pasta Co. Cl A* | | 21,787 | | 757,970 | |
Avon Products, Inc. | | 10,860 | | 342,090 | |
Campbell Soup Co. | | 8,443 | | 285,373 | |
Chattem, Inc.* | | 2,363 | | 220,468 | |
Constellation Brands, Inc. Cl A* | | 17,548 | | 279,540 | |
Darling International, Inc.* | | 16,685 | | 139,820 | |
Dr. Pepper Snapple Group, Inc. | | 13,798 | | 390,483 | |
General Mills, Inc. | | 8,783 | | 621,924 | |
Great Atlantic & Pacific Tea Co., Inc.* | | 30,286 | | 357,072 | |
Heinz (H.J.) Co. | | 6,922 | | 295,985 | |
Molson Coors Brewing Co. Cl B | | 5,692 | | 257,051 | |
Pantry, Inc.* | | 22,630 | | 307,542 | |
PepsiCo, Inc. | | 15,220 | | 925,376 | |
Proctor & Gamble Co. | | 14,495 | | 878,832 | |
Vector Group Ltd. | | 8,514 | | 119,196 | |
Wal-Mart Stores, Inc. | | 19,091 | | 1,020,414 | |
| | | | 7,199,136 | |
ENERGY (3.7%) | | | | | |
Apache Corp. | | 2,741 | | 282,789 | |
Arena Resources, Inc.* | | 3,906 | | 168,427 | |
Brigham Exploration Co.* | | 43,746 | | 592,758 | |
Carrizo Oil and Gas, Inc.* | | 9,627 | | 255,019 | |
Chevron Corp. | | 9,827 | | 756,581 | |
CNX Gas Corp.* | | 4,342 | | 128,176 | |
ConocoPhillips | | 7,795 | | 398,091 | |
Consol Energy, Inc. | | 4,216 | | 209,957 | |
Ellora Energy, Inc.† | | 21,800 | | 158,050 | |
Exxon Mobil Corp. | | 28,567 | | 1,947,984 | |
Halliburton Co. | | 16,535 | | 497,538 | |
ION Geophysical Corp.* | | 11,311 | | 66,961 | |
MarkWest Energy Partners LP | | 17,615 | | 515,591 | |
McMoRan Exploration Co.* | | 89,231 | | 715,633 | |
Noble Energy, Inc. | | 3,965 | | 282,387 | |
Occidental Petroleum Corp. | | 8,131 | | 661,457 | |
Range Resources Corp. | | 4,664 | | 232,500 | |
Schlumberger Ltd. | | 6,869 | | 447,103 | |
Southwestern Energy Co.* | | 3,324 | | 160,217 | |
Superior Well Services, Inc.* | | 4,743 | | 67,635 | |
T-3 Energy Services, Inc.* | | 14,111 | | 359,831 | |
Trico Marine Services, Inc.* | | 15,695 | | 71,255 | |
Williams Cos., Inc. | | 10,127 | | 213,477 | |
XTO Energy, Inc. | | 3,339 | | 155,364 | |
| | | | 9,344,781 | |
FINANCIALS (6.4%) | | | | | |
Aflac, Inc. | | 5,494 | | 254,098 | |
AmTrust Financial Svcs., Inc. | | 6,242 | | 73,780 | |
Ashford Hospitality Trust, Inc.* | | 65,198 | | 302,519 | |
Aspen Insurance Hldgs. Ltd. | | 11,833 | | 301,150 | |
BancFirst Corp. | | 3,094 | | 114,602 | |
Bank Mutual Corp. | | 32,380 | | 224,070 | |
Bank of America Corp. | | 58,218 | | 876,763 | |
Bank of Marin Bancorp | | 2,160 | | 70,330 | |
Bank of New York Mellon Corp. | | 11,535 | | 322,634 | |
Brookline Bancorp, Inc. | | 31,755 | | 314,692 | |
Bryn Mawr Bank Corp. | | 4,100 | | 61,869 | |
Chubb Corp. | | 6,858 | | 337,276 | |
Citigroup, Inc. | | 106,440 | | 352,316 | |
CME Group, Inc. | | 1,610 | | 540,880 | |
DiamondRock Hospitality Co. | | 21,896 | | 185,459 | |
Dime Community Bancshares | | 10,335 | | 121,126 | |
Ellington Financial LLC†*** | | 21,000 | | 420,000 | |
FBR Capital Markets Corp.* | | 15,313 | | 94,634 | |
First Financial Bancorp. | | 11,133 | | 162,096 | |
First Niagara Financial Group, Inc. | | 17,620 | | 245,094 | |
Forest City Enterprises, Inc. Cl A* | | 21,040 | | 247,851 | |
Franklin Resources, Inc. | | 3,506 | | 369,357 | |
Glacier Bancorp, Inc. | | 16,879 | | 231,580 | |
Goldman Sachs Group, Inc. | | 3,998 | | 675,022 | |
Highwoods Properties, Inc. | | 10,466 | | 349,041 | |
Hudson City Bancorp, Inc. | | 10,570 | | 145,126 | |
IBERIABANK Corp. | | 2,955 | | 159,009 | |
iShares Russell 2000 Growth Index Fund | | 7,025 | | 478,192 | |
JPMorgan Chase & Co. | | 21,720 | | 905,072 | |
Marlin Business Svcs. Corp.* | | 18,753 | | 148,711 | |
MB Financial, Inc. | | 4,510 | | 88,937 | |
Meadowbrook Insurance Group, Inc. | | 36,043 | | 266,718 | |
Medical Properties Trust, Inc. | | 7,877 | | 78,770 | |
MFA Financial, Inc. | | 32,509 | | 238,941 | |
Mid-America Apt. Communities, Inc. | | 3,599 | | 173,760 | |
National Retail Pptys., Inc. | | 9,339 | | 198,174 | |
NBH Hldgs. Co.†*** | | 16,887 | | 341,962 | |
NewAlliance Bancshares, Inc. | | 26,144 | | 313,989 | |
Northwest Bancshares, Inc. | | 11,123 | | 125,912 | |
Pennsylvania REIT | | 23,297 | | 197,093 | |
PHH Corp.* | | 12,742 | | 205,274 | |
PMA Capital Corp. Cl A* | | 26,214 | | 165,148 | |
ProAssurance Corp.* | | 5,952 | | 319,682 | |
Progressive Corp.* | | 18,129 | | 326,141 | |
ProLogis | | 8,312 | | 113,791 | |
PS Business Parks, Inc. | | 3,281 | | 164,214 | |
S.Y. Bancorp, Inc. | | 15,571 | | 332,441 | |
SeaBright Insurance Hldgs., Inc.* | | 25,564 | | 293,730 | |
Senior Housing Pptys. Trust | | 22,992 | | 502,835 | |
Signature Bank* | | 11,054 | | 352,623 | |
Stifel Financial Corp.* | | 4,530 | | 268,357 | |
T. Rowe Price Group, Inc. | | 5,451 | | 290,266 | |
Travelers Cos., Inc. | | 4,399 | | 219,334 | |
U.S. Bancorp | | 17,584 | | 395,816 | |
United Westen Bancorp, Inc. | | 47,045 | | 129,844 | |
Wells Fargo & Co. | | 28,178 | | 760,524 | |
Westamerica Bancorporation | | 6,267 | | 347,004 | |
Westfield Financial, Inc. | | 16,919 | | 139,582 | |
| | | | 16,435,211 | |
HEALTH CARE (5.3%) | | | | | |
Abbott Laboratories | | 20,534 | | 1,108,631 | |
Abiomed, Inc.* | | 33,662 | | 294,206 | |
Acorda Therapeutics, Inc.* | | 6,751 | | 170,260 | |
Allied Healthcare Int'l., Inc.* | | 28,294 | | 82,336 | |
Almost Family, Inc.* | | 6,544 | | 258,684 | |
Alnylam Pharmaceuticals, Inc.* | | 3,791 | | 66,797 | |
Alphatec Hldgs., Inc.* | | 85,503 | | 456,586 | |
American Medical Systems Hldgs., Inc.* | | 8,392 | | 161,882 | |
Amgen, Inc.* | | 2,752 | | 155,681 | |
Auxilium Pharmaceuticals, Inc.* | | 4,285 | | 128,464 | |
Baxter International, Inc. | | 9,754 | | 572,365 | |
Celgene Corp.* | | 7,989 | | 444,828 | |
Conceptus, Inc.* | | 19,673 | | 369,065 | |
Cyberonics, Inc.* | | 8,068 | | 164,910 | |
Emergent Biosolutions, Inc.* | | 9,504 | | 129,159 | |
Enzon Pharmaceuticals, Inc.* | | 98,602 | | 1,038,279 | |
ev3, Inc.* | | 13,718 | | 182,998 | |
Exelixis, Inc.* | | 32,632 | | 240,498 | |
Genoptix, Inc.* | | 7,011 | | 249,101 | |
Geron Corp.* | | 12,331 | | 68,437 | |
Gilead Sciences, Inc.* | | 16,038 | | 694,125 | |
Human Genome Sciences, Inc.* | | 9,537 | | 291,832 | |
Inspire Pharmaceuticals, Inc.* | | 19,432 | | 107,265 | |
Johnson & Johnson | | 23,050 | | 1,484,651 | |
Laboratory Corp. of America Hldgs.* | | 4,121 | | 308,416 | |
Magellan Health Svcs., Inc.* | | 11,142 | | 453,814 | |
McKesson Corp. | | 6,083 | | 380,188 | |
MedAssets, Inc.* | | 12,043 | | 255,432 | |
Medco Health Solutions, Inc.* | | 2,950 | | 188,535 | |
Medivation, Inc.* | | 5,015 | | 188,815 | |
Medtronic, Inc. | | 7,768 | | 341,637 | |
Merck & Co., Inc. | | 12,161 | | 444,363 | |
Mylan, Inc.* | | 8,752 | | 161,299 | |
Neogen Corp.* | | 13,707 | | 323,622 | |
Omnicell, Inc.* | | 16,586 | | 193,890 | |
Onyx Pharmaceuticals, Inc.* | | 6,016 | | 176,509 | |
Optimer Pharmaceuticals, Inc.* | | 6,336 | | 71,470 | |
OSI Pharmaceuticals, Inc. - rights* | | 1,570 | | 0 | |
Regeneron Pharmaceuticals, Inc.* | | 3,183 | | 76,965 | |
Salix Pharmaceuticals Ltd.* | | 7,025 | | 178,435 | |
Seattle Genetics, Inc.* | | 14,486 | | 147,178 | |
St. Jude Medical, Inc.* | | 4,965 | | 182,613 | |
Steris Corp. | | 10,649 | | 297,853 | |
UnitedHealth Group, Inc. | | 5,113 | | 155,844 | |
Varian, Inc.* | | 2,930 | | 151,012 | |
| | | | 13,598,930 | |
INDUSTRIALS (4.9%) | | | | | |
ACCO Brands Corp.* | | 18,665 | | 135,881 | |
Actuant Corp. Cl A | | 17,167 | | 318,105 | |
Aircastle Ltd. | | 22,859 | | 225,161 | |
Alaska Air Group, Inc.* | | 15,892 | | 549,228 | |
Astec Industries, Inc.* | | 6,873 | | 185,159 | |
AZZ, Inc.* | | 15,617 | | 510,676 | |
Belden, Inc. | | 5,034 | | 110,345 | |
Boeing Co. | | 11,219 | | 607,284 | |
Cornell Cos., Inc.* | | 9,041 | | 205,231 | |
CRA International, Inc.* | | 3,240 | | 86,346 | |
CSX Corp. | | 7,169 | | 347,625 | |
Cummins, Inc. | | 8,613 | | 394,992 | |
Deluxe Corp. | | 5,929 | | 87,690 | |
Encore Wire Corp. | | 12,811 | | 269,928 | |
Expeditors Int'l. of Wash. | | 11,126 | | 386,406 | |
FedEx Corp. | | 5,040 | | 420,588 | |
Flowserve Corp. | | 3,104 | | 293,421 | |
General Electric Co. | | 64,638 | | 977,973 | |
Genesee & Wyoming, Inc. Cl A* | | 16,163 | | 527,560 | |
Graham Corp. | | 13,335 | | 276,035 | |
Hub Group, Inc. Cl A* | | 6,860 | | 184,054 | |
Illinois Tool Works, Inc. | | 6,574 | | 315,486 | |
JetBlue Airways Corp* | | 16,422 | | 89,500 | |
Kaydon Corp. | | 9,838 | | 351,807 | |
Miller Industries, Inc.* | | 20,070 | | 227,795 | |
Mueller Industries, Inc. | | 22,146 | | 550,107 | |
Old Dominion Freight Line, Inc.* | | 16,957 | | 520,580 | |
Orion Marine Group, Inc.* | | 14,605 | | 307,581 | |
Powell Industries, Inc.* | | 4,642 | | 146,362 | |
RBC Bearings, Inc.* | | 6,550 | | 159,362 | |
Robbins & Myers, Inc. | | 8,306 | | 195,357 | |
Southwest Airlines Co. | | 25,060 | | 286,436 | |
Spherion Corp.* | | 53,345 | | 299,799 | |
Stanley, Inc.* | | 5,749 | | 157,580 | |
Sun Hydraulics Corp. | | 9,857 | | 258,746 | |
Teledyne Technologies, Inc.* | | 7,048 | | 270,361 | |
Tutor Perini Corp.* | | 27,939 | | 505,137 | |
Union Pacific Corp. | | 4,699 | | 300,266 | |
United Technologies Corp. | | 8,216 | | 570,273 | |
| | | | 12,612,223 | |
INFORMATION TECHNOLOGY (8.0%) | | | | | |
Adtran, Inc. | | 8,575 | | 193,366 | |
Advanced Energy Industries, Inc.* | | 9,525 | | 143,637 | |
Anixter International, Inc.* | | 4,212 | | 198,385 | |
Apple, Inc.* | | 6,576 | | 1,386,615 | |
Applied Materials, Inc. | | 19,864 | | 276,904 | |
Ariba, Inc.* | | 11,738 | | 146,960 | |
Autodesk, Inc.* | | 6,595 | | 167,579 | |
Automatic Data Processing, Inc. | | 7,639 | | 327,102 | |
BMC Software, Inc.* | | 4,931 | | 197,733 | |
Brooks Automation, Inc.* | | 21,625 | | 185,543 | |
Ceragon Networks Ltd.* | | 21,913 | | 257,259 | |
Cirrus Logic, Inc.* | | 18,286 | | 124,711 | |
Cisco Systems, Inc.* | | 37,910 | | 907,565 | |
Coherent, Inc.* | | 7,718 | | 229,456 | |
Commvault Systems, Inc.* | | 9,602 | | 227,471 | |
comScore, Inc.* | | 5,536 | | 97,157 | |
CyberSource Corp.* | | 5,742 | | 115,472 | |
DemandTec, Inc.* | | 36,438 | | 319,561 | |
EMC Corp.* | | 13,736 | | 239,968 | |
FormFactor, Inc.* | | 9,439 | | 205,393 | |
Forrester Research, Inc.* | | 5,913 | | 153,442 | |
Global Cash Access Hldgs., Inc.* | | 70,678 | | 529,378 | |
Google, Inc.* | | 1,451 | | 899,591 | |
Harmonic, Inc.* | | 22,875 | | 144,799 | |
Hewlett-Packard Co. | | 17,580 | | 905,546 | |
Informatica Corp.* | | 10,559 | | 273,056 | |
Int’l. Business Machines Corp. | | 8,068 | | 1,056,101 | |
Intevac, Inc.* | | 18,826 | | 215,934 | |
Lawson Software, Inc.* | | 27,805 | | 184,903 | |
LogMeIn, Inc.* | | 9,484 | | 189,206 | |
MasterCard, Inc. Cl A | | 456 | | 116,727 | |
Microsemi Corp.* | | 17,295 | | 306,986 | |
Microsoft Corp. | | 38,074 | | 1,160,876 | |
MKS Instruments, Inc.* | | 19,866 | | 345,867 | |
Monolithic Power Systems, Inc.* | | 8,838 | | 211,847 | |
Monotype Imaging Hldgs., Inc.* | | 16,072 | | 145,130 | |
Nvidia Corp.* | | 18,034 | | 336,875 | |
Oracle Corp. | | 28,629 | | 702,556 | |
Parametric Technology Corp.* | | 30,613 | | 500,216 | |
Plexus Corp.* | | 15,669 | | 446,567 | |
Polycom, Inc.* | | 5,307 | | 132,516 | |
QUALCOMM, Inc. | | 12,918 | | 597,587 | |
RightNow Technologies, Inc.* | | 4,429 | | 76,932 | |
Riverbed Technology, Inc.* | | 6,681 | | 153,463 | |
Rogers Corp.* | | 5,441 | | 164,917 | |
Salary.com, Inc.* | | 33,472 | | 78,659 | |
Salesforce.com, inc.* | | 5,480 | | 404,260 | |
Sapient Corp.* | | 14,104 | | 116,640 | |
ScanSource, Inc.* | | 4,958 | | 132,379 | |
Semtech Corp.* | | 25,344 | | 431,101 | |
Solera Hldgs., Inc. | | 5,724 | | 206,121 | |
Sourcefire, Inc.* | | 15,385 | | 411,549 | |
SuccessFactors, Inc.* | | 11,265 | | 186,774 | |
Super Micro Computer, Inc.* | | 19,797 | | 220,143 | |
Sybase, Inc.* | | 9,332 | | 405,009 | |
Synaptics, Inc.* | | 4,596 | | 140,867 | |
Tech Data Corp.* | | 1,971 | | 91,967 | |
Texas Instruments, Inc. | | 15,922 | | 414,927 | |
TIBCO Software, Inc.* | | 43,316 | | 417,133 | |
TNS, Inc.* | | 7,195 | | 184,840 | |
Virtusa Corp.* | | 14,923 | | 135,202 | |
Websense, Inc.* | | 23,512 | | 410,520 | |
Yahoo!, Inc.* | | 6,609 | | 110,899 | |
| | | | 20,397,845 | |
MATERIALS (2.3%) | | | | | |
Allied Nevada Gold Corp.* | | 10,316 | | 155,565 | |
Ball Corp. | | 6,286 | | 324,986 | |
Commercial Metals Co. | | 21,748 | | 340,356 | |
Crown Hldgs., Inc.* | | 31,526 | | 806,435 | |
Cytec Industries, Inc. | | 8,355 | | 304,289 | |
Dow Chemical Co. | | 12,878 | | 355,819 | |
Eastman Chemical Co. | | 5,150 | | 310,236 | |
Freeport-McMoRan Copper & Gold, Inc.* | | 4,403 | | 353,517 | |
Innophos Hldgs., Inc. | | 10,290 | | 236,567 | |
Louisiana-Pacific Corp.* | | 16,486 | | 115,072 | |
Monsanto Co. | | 5,045 | | 412,429 | |
NewMarket Corp. | | 2,182 | | 250,428 | |
Silgan Hldgs., Inc. | | 12,622 | | 730,561 | |
Taseko Mines Ltd.* | | 76,889 | | 324,472 | |
US Gold Corp.* | | 107,378 | | 266,297 | |
Vista Gold Corp.* | | 15,682 | | 38,421 | |
Walter Energy, Inc. | | 4,227 | | 318,335 | |
Zep, Inc. | | 11,838 | | 205,034 | |
| | | | 5,848,819 | |
TELECOMMUNICATION SERVICES (1.0%) | | | | | |
AT&T, Inc. | | 27,241 | | 763,565 | |
CenturyTel, Inc. | | 9,891 | | 358,153 | |
Consolidated Comms. Hldgs., Inc. | | 31,149 | | 545,108 | |
Iowa Telecommunications Svcs., Inc. | | 13,726 | | 230,048 | |
Syniverse Hldgs., Inc.* | | 27,892 | | 487,552 | |
Windstream Corp. | | 24,201 | | 265,969 | |
| | | | 2,650,395 | |
UTILITIES (1.3%) | | | | | |
Avista Corp. | | 25,595 | | 552,596 | |
Black Hills Corp. | | 4,501 | | 119,862 | |
Dominion Resources, Inc. | | 10,675 | | 415,471 | |
Edison International | | 2,995 | | 104,166 | |
Entergy Corp. | | 1,667 | | 136,427 | |
Exelon Corp. | | 4,430 | | 216,494 | |
FirstEnergy Corp. | | 4,557 | | 211,673 | |
FPL Group, Inc. | | 3,414 | | 180,327 | |
Idacorp, Inc. | | 7,158 | | 228,698 | |
Northwest Natural Gas Co. | | 5,314 | | 239,343 | |
PNM Resources, Inc. | | 17,863 | | 225,967 | |
Public Svc. Enterprise Group, Inc. | | 4,112 | | 136,724 | |
Sempra Energy | | 5,555 | | 310,969 | |
Unisource Energy Corp. | | 10,253 | | 330,044 | |
| | | | 3,408,761 | |
TOTAL ACTIVE ASSETS - COMMON STOCKS | | | | | |
(Cost: $94,184,004) 39.8% | | | | 101,903,531 | |
| | Shares | | Value | |
ACTIVE ASSETS: | | | | | |
CONVERTIBLE PREFERRED STOCKS: | | | | | |
ENERGY (0.0%) (3) | | | | | |
Energy XXI (Bermuda) Ltd., 7.25% | | 556 | | 55,600 | |
TOTAL ACTIVE ASSETS - CONVERTIBLE PREFERRED STOCKS | | | | | |
(Cost: $55,600) 0.0% (3) | | | | 55,600 | |
| | Rating** | | Rate(%) | | Maturity | | Face Amount | | Value | |
ACTIVE ASSETS: | | | | | | | | | | | |
LONG-TERM DEBT SECURITIES: | | | | | | | | | | | |
FINANCIALS (0.0%) | | | | | | | | | | | |
GSC Capital Corp.†(4) | | NR | | 7.25 | | 07/15/10 | | 460,000 | | 0 | |
TOTAL LONG-TERM DEBT SECURITIES | | | | | | | | | | | |
(Cost: $460,000) 0.0% | | | | | | | | | | 0 | |
| | | | | | | | | | | |
TOTAL ACTIVE ASSETS | | | | | | | | | | | |
(Cost: $94,699,604) 39.8% | | | | | | | | | | 101,959,131 | |
| | | | | | | | | | | |
TEMPORARY CASH INVESTMENTS (2) | | | | | | | | | | | |
(Cost: $140,400) 0.1% | | | | | | | | | | 140,400 | |
| | | | | | | | | | | |
TOTAL INVESTMENTS | | | | | | | | | | | |
(Cost: $259,134,003) 99.9% | | | | | | | | | | 255,609,861 | |
| | | | | | | | | | | |
OTHER NET ASSETS 0.1% | | | | | | | | | | 311,506 | |
| | | | | | | | | | | |
NET ASSETS 100.0% | | | | | | | | | | $ | 255,921,367 | |
| | | | | | | | | | | | |
The accompanying notes are an integral part of these portfolio schedules.
MUTUAL OF AMERICA INVESTMENT CORPORATION - SMALL CAP VALUE FUND
PORTFOLIO OF INVESTMENTS IN SECURITIES
December 31, 2009
| | Shares | | Value | |
COMMON STOCKS: | | | | | |
CONSUMER DISCRETIONARY (6.8%) | | | | | |
Dillard’s, Inc. Cl A | | 243,313 | | 4,489,125 | |
Pep Boys - Manny, Moe & Jack | | 129,688 | | 1,097,160 | |
Rent-A-Center, Inc.* | | 127,026 | | 2,250,901 | |
Tupperware Brands Corp. | | 97,053 | | 4,519,758 | |
Wolverine World Wide, Inc. | | 61,665 | | 1,678,521 | |
| | | | 14,035,465 | |
| | | | | |
CONSUMER STAPLES (5.0%) | | | | | |
American Italian Pasta Co. Cl A* | | 170,887 | | 5,945,159 | |
Great Atlantic & Pacific Tea Co., Inc.* | | 238,145 | | 2,807,730 | |
Pantry, Inc.* | | 44,390 | | 603,260 | |
Vector Group Ltd. | | 68,572 | | 960,008 | |
| | | | 10,316,157 | |
| | | | | |
ENERGY (4.8%) | | | | | |
CNX Gas Corp.* | | 33,807 | | 997,983 | |
Ellora Energy, Inc.† | | 119,800 | | 868,550 | |
ION Geophysical Corp.* | | 88,680 | | 524,986 | |
MarkWest Energy Partners LP | | 84,471 | | 2,472,466 | |
McMoRan Exploration Co.* | | 332,620 | | 2,667,612 | |
Superior Well Services, Inc.* | | 36,739 | | 523,898 | |
T-3 Energy Services, Inc.* | | 45,023 | | 1,148,087 | |
Trico Marine Services, Inc.* | | 123,176 | | 559,219 | |
| | | | 9,762,801 | |
| | | | | |
FINANCIALS (28.6%) | | | | | |
AmTrust Financial Svcs., Inc. | | 48,550 | | 573,861 | |
Ashford Hospitality Trust, Inc.* | | 415,444 | | 1,927,660 | |
Aspen Insurance Hldgs. Ltd. | | 92,870 | | 2,363,542 | |
BancFirst Corp. | | 24,088 | | 892,220 | |
Bank Mutual Corp. | | 252,304 | | 1,745,944 | |
Bank of Marin Bancorp | | 12,590 | | 409,930 | |
Brookline Bancorp, Inc. | | 247,394 | | 2,451,675 | |
Bryn Mawr Bank Corp. | | 31,250 | | 471,563 | |
DiamondRock Hospitality Co. | | 166,790 | | 1,412,711 | |
Dime Community Bancshares | | 79,010 | | 925,997 | |
Ellington Financial LLC†*** | | 123,900 | | 2,478,000 | |
FBR Capital Markets Corp.* | | 117,010 | | 723,122 | |
First Niagara Financial Group, Inc. | | 137,256 | | 1,909,231 | |
Forest City Enterprises, Inc. Cl A* | | 144,210 | | 1,698,794 | |
Glacier Bancorp, Inc. | | 133,149 | | 1,826,804 | |
Highwoods Properties, Inc. | | 80,296 | | 2,677,872 | |
IBERIABANK Corp. | | 23,020 | | 1,238,706 | |
Marlin Business Svcs. Corp.* | | 124,218 | | 985,049 | |
MB Financial, Inc. | | 34,370 | | 677,776 | |
Meadowbrook Insurance Group, Inc. | | 276,483 | | 2,045,974 | |
Medical Properties Trust, Inc. | | 61,392 | | 613,920 | |
MFA Financial, Inc. | | 248,787 | | 1,828,584 | |
Mid-America Apt. Communities, Inc. | | 27,613 | | 1,333,156 | |
National Retail Pptys., Inc. | | 71,380 | | 1,514,684 | |
NBH Hldgs. Co.†*** | | 98,458 | | 1,993,775 | |
NewAlliance Bancshares, Inc. | | 203,711 | | 2,446,569 | |
Northwest Bancshares, Inc. | | 85,098 | | 963,309 | |
Pennsylvania REIT | | 178,034 | | 1,506,168 | |
PHH Corp.* | | 97,380 | | 1,568,792 | |
PMA Capital Corp. Cl A* | | 205,703 | | 1,295,929 | |
ProAssurance Corp.* | | 45,656 | | 2,452,184 | |
S.Y. Bancorp, Inc. | | 67,746 | | 1,446,377 | |
SeaBright Insurance Hldgs., Inc.* | | 198,956 | | 2,286,004 | |
Senior Housing Pptys. Trust | | 100,291 | | 2,193,364 | |
Signature Bank* | | 36,507 | | 1,164,573 | |
United Westen Bancorp, Inc. | | 369,287 | | 1,019,232 | |
Westamerica Bancorporation | | 48,835 | | 2,703,994 | |
Westfield Financial, Inc. | | 131,795 | | 1,087,309 | |
| | | | 58,854,354 | |
| | | | | |
HEALTH CARE (5.0%) | | | | | |
Abiomed, Inc.* | | 33,482 | | 292,633 | |
Allied Healthcare Int’l., Inc.* | | 203,672 | | 592,686 | |
Alphatec Hldgs., Inc.* | | 318,168 | | 1,699,017 | |
American Medical Systems Hldgs., Inc.* | | 64,546 | | 1,245,092 | |
Conceptus, Inc.* | | 90,602 | | 1,699,694 | |
Enzon Pharmaceuticals, Inc.* | | 440,855 | | 4,642,203 | |
| | | | 10,171,325 | |
| | | | | |
INDUSTRIALS (16.7%) | | | | | |
Actuant Corp. Cl A | | 129,150 | | 2,393,150 | |
Aircastle Ltd. | | 180,718 | | 1,780,072 | |
Alaska Air Group, Inc.* | | 124,900 | | 4,316,544 | |
AZZ, Inc.* | | 73,896 | | 2,416,399 | |
Cornell Cos., Inc.* | | 71,288 | | 1,618,238 | |
CRA International, Inc.* | | 25,232 | | 672,433 | |
Encore Wire Corp. | | 97,560 | | 2,055,589 | |
Genesee & Wyoming, Inc. Cl A* | | 73,434 | | 2,396,886 | |
Kaydon Corp. | | 74,907 | | 2,678,674 | |
Miller Industries, Inc.* | | 137,740 | | 1,563,349 | |
Mueller Industries, Inc. | | 174,672 | | 4,338,852 | |
Old Dominion Freight Line, Inc.* | | 80,465 | | 2,470,276 | |
Orion Marine Group, Inc.* | | 111,235 | | 2,342,609 | |
Spherion Corp.* | | 186,900 | | 1,050,378 | |
Tutor Perini Corp.* | | 125,207 | | 2,263,743 | |
| | | | 34,357,192 | |
| | | | | |
INFORMATION TECHNOLOGY (9.2%) | | | | | |
Anixter International, Inc.* | | 32,803 | | 1,545,021 | |
Cirrus Logic, Inc.* | | 143,660 | | 979,761 | |
Coherent, Inc.* | | 60,160 | | 1,788,557 | |
DemandTec, Inc.* | | 70,792 | | 620,846 | |
Global Cash Access Hldgs., Inc.* | | 240,733 | | 1,803,090 | |
Microsemi Corp.* | | 32,170 | | 571,018 | |
MKS Instruments, Inc.* | | 77,214 | | 1,344,296 | |
Parametric Technology Corp.* | | 87,014 | | 1,421,809 | |
Plexus Corp.* | | 37,310 | | 1,063,335 | |
Semtech Corp.* | | 97,100 | | 1,651,671 | |
Sybase, Inc.* | | 50,301 | | 2,183,063 | |
Tech Data Corp.* | | 15,349 | | 716,184 | |
TIBCO Software, Inc.* | | 203,133 | | 1,956,171 | |
Websense, Inc.* | | 70,437 | | 1,229,830 | |
| | | | 18,874,652 | |
| | | | | |
MATERIALS (10.8%) | | | | | |
Commercial Metals Co. | | 169,390 | | 2,650,954 | |
Crown Hldgs., Inc.* | | 247,799 | | 6,338,693 | |
Cytec Industries, Inc. | | 65,093 | | 2,370,687 | |
Louisiana-Pacific Corp.* | | 129,656 | | 904,999 | |
Silgan Hldgs., Inc. | | 72,740 | | 4,210,191 | |
Taseko Mines Ltd.* | | 583,762 | | 2,463,476 | |
US Gold Corp.* | | 177,546 | | 440,314 | |
Vista Gold Corp.* | | 102,593 | | 251,353 | |
Walter Energy, Inc. | | 33,170 | | 2,498,033 | |
| | | | 22,128,700 | |
| | | | | |
TELECOMMUNICATION SERVICES (2.8%) | | | | | |
Consolidated Comms. Hldgs., Inc. | | 117,498 | | 2,056,215 | |
Iowa Telecommunications Svcs., Inc. | | 106,466 | | 1,784,370 | |
Syniverse Hldgs., Inc.* | | 109,984 | | 1,922,520 | |
| | | | 5,763,105 | |
| | | | | |
UTILITIES (5.6%) | | | | | |
Avista Corp. | | 123,693 | | 2,670,532 | |
Black Hills Corp. | | 34,503 | | 918,815 | |
Idacorp, Inc. | | 54,510 | | 1,741,595 | |
Northwest Natural Gas Co. | | 40,493 | | 1,823,805 | |
PNM Resources, Inc. | | 136,094 | | 1,721,589 | |
Unisource Energy Corp. | | 79,227 | | 2,550,317 | |
| | | | 11,426,653 | |
| | | | | |
TOTAL COMMON STOCKS
(Cost: $183,653,309) 95.3% | | | | 195,690,404 | |
| | | | | |
| | Shares | | Value | |
CONVERTIBLE PREFERRED STOCKS: | | | | | |
ENERGY (0.2%)
Energy XXI (Bermuda) Ltd., 7.25% | | 4,255 | | 425,500 | |
TOTAL CONVERTIBLE PREFERRED STOCKS
(Cost: $425,500) 0.2% | | | | 425,500 | |
| | | | | | | | | | | |
| | Rating** | | Rate(%) | | Maturity | | Face Amount | | Value | |
LONG-TERM DEBT SECURITIES: | | | | | | | | | | | |
FINANCIALS (0.0%)
GSC Capital Corp.†(4) | | NR | | 7.25 | | 07/15/10 | | 1,890,000 | | 0 | |
TOTAL LONG-TERM DEBT SECURITIES
(Cost: $1,890,000) 0.0% | | | | | | | | | | 0 | |
| | | | | | | | | | | |
| | Rating** | | Rate(%) | | Maturity | | Face Amount | | Value | |
SHORT-TERM DEBT SECURITIES: | | | | | | | | | | | |
COMMERCIAL PAPER (4.2%) | | | | | | | | | | | |
Abbott Laboratories† | | A-1+ | | 0.05 | | 01/04/10 | | 3,500,000 | | 3,499,985 | |
Toyota Motor Credit Corp. | | A-1+ | | 0.04 | | 01/06/10 | | 5,200,000 | | 5,199,972 | |
| | | | | | | | | | 8,699,957 | |
TOTAL SHORT-TERM DEBT SECURITIES
(Cost: $8,699,957) 4.2% | | | | | | | | 8,699,957 | |
| | | | | | | | | | | |
TOTAL INVESTMENTS
(Cost: $194,668,766) 99.7% | | | | | | | | | | 204,815,861 | |
| | | | | | | | | | | |
OTHER NET ASSETS 0.3% | | | | | | | | | | 568,553 | |
| | | | | | | | | | | |
NET ASSETS 100.0% | | | | | | | | | | $ | 205,384,414 | |
| | | | | | | | | | | | |
The accompanying notes are an integral part of these portfolio schedules.
MUTUAL OF AMERICA INVESTMENT CORPORATION - SMALL CAP GROWTH FUND
PORTFOLIO OF INVESTMENTS IN SECURITIES
December 31, 2009
| | Shares | | Value | |
COMMON STOCKS: | | | | | |
CONSUMER DISCRETIONARY (13.6%) | | | | | |
California Pizza Kitchen, Inc.* | | 162,973 | | 2,191,987 | |
Carter's, Inc.* | | 47,675 | | 1,251,469 | |
Deckers Outdoor Corp.* | | 30,017 | | 3,053,329 | |
G-III Apparel Group Ltd.* | | 94,106 | | 2,039,277 | |
Grand Canyon Education, Inc.* | | 94,292 | | 1,792,491 | |
Gymboree Corp.* | | 48,163 | | 2,094,609 | |
Leapfrog Enterprises, Inc.* | | 99,007 | | 387,117 | |
OfficeMax, Inc.* | | 284,150 | | 3,605,864 | |
P.F. Chang's China Bistro, Inc.* | | 40,853 | | 1,548,737 | |
Shutterfly, Inc.* | | 98,631 | | 1,756,618 | |
Smith & Wesson Hldg. Corp.* | | 278,867 | | 1,140,566 | |
Sonic Corp.* | | 144,206 | | 1,452,154 | |
Tupperware Brands Corp. | | 64,272 | | 2,993,147 | |
WMS Industries, Inc.* | | 25,059 | | 1,002,360 | |
| | | | 26,309,725 | |
| | | | | |
CONSUMER STAPLES (2.7%) | | | | | |
Chattem, Inc.* | | 17,068 | | 1,592,444 | |
Darling International, Inc.* | | 121,154 | | 1,015,271 | |
Pantry, Inc.* | | 122,100 | | 1,659,339 | |
Vector Group Ltd. | | 62,402 | | 873,628 | |
| | | | 5,140,682 | |
| | | | | |
| | | | | |
ENERGY (6.6%) | | | | | |
Arena Resources, Inc.* | | 28,638 | | 1,234,871 | |
Brigham Exploration Co.* | | 317,822 | | 4,306,487 | |
Carrizo Oil and Gas, Inc.* | | 70,669 | | 1,872,022 | |
MarkWest Energy Partners LP | | 49,725 | | 1,455,451 | |
McMoRan Exploration Co.* | | 295,720 | | 2,371,674 | |
T-3 Energy Services, Inc.* | | 61,476 | | 1,567,638 | |
| | | | 12,808,143 | |
| | | | | |
| | | | | |
FINANCIALS (6.2%) | | | | | |
First Financial Bancorp. | | 81,726 | | 1,189,931 | |
iShares Russell 2000 Growth Index Fund | | 51,050 | | 3,474,974 | |
PS Business Parks, Inc. | | 24,075 | | 1,204,954 | |
S.Y. Bancorp, Inc. | | 50,432 | | 1,076,723 | |
Senior Housing Pptys. Trust | | 72,836 | | 1,592,923 | |
Signature Bank* | | 46,036 | | 1,468,548 | |
Stifel Financial Corp.* | | 33,203 | | 1,966,946 | |
| | | | 11,974,999 | |
| | | | | |
| | | | | |
HEALTH CARE (21.3%) | | | | | |
Abiomed, Inc.* | | 214,271 | | 1,872,729 | |
Acorda Therapeutics, Inc.* | | 49,032 | | 1,236,587 | |
Almost Family, Inc.* | | 47,619 | | 1,882,379 | |
Alnylam Pharmaceuticals, Inc.* | | 27,845 | | 490,629 | |
Alphatec Hldgs., Inc.* | | 330,995 | | 1,767,513 | |
Auxilium Pharmaceuticals, Inc.* | | 31,467 | | 943,381 | |
Conceptus, Inc.* | | 60,144 | | 1,128,301 | |
Cyberonics, Inc.* | | 59,200 | | 1,210,048 | |
Emergent Biosolutions, Inc.* | | 69,729 | | 947,617 | |
Enzon Pharmaceuticals, Inc.* | | 311,998 | | 3,285,339 | |
ev3, Inc.* | | 100,577 | | 1,341,697 | |
Exelixis, Inc.* | | 239,372 | | 1,764,172 | |
Genoptix, Inc.* | | 51,414 | | 1,826,739 | |
Geron Corp.* | | 89,554 | | 497,025 | |
Human Genome Sciences, Inc.* | | 68,415 | | 2,093,499 | |
Inspire Pharmaceuticals, Inc.* | | 142,500 | | 786,600 | |
Magellan Health Svcs., Inc.* | | 80,965 | | 3,297,704 | |
MedAssets, Inc.* | | 88,391 | | 1,874,773 | |
Medivation, Inc.* | | 36,814 | | 1,386,047 | |
Neogen Corp.* | | 100,566 | | 2,374,363 | |
Omnicell, Inc.* | | 121,687 | | 1,422,521 | |
Onyx Pharmaceuticals, Inc.* | | 44,134 | | 1,294,892 | |
Optimer Pharmaceuticals, Inc.* | | 46,492 | | 524,430 | |
Regeneron Pharmaceuticals, Inc.* | | 23,282 | | 562,959 | |
Salix Pharmaceuticals Ltd.* | | 50,400 | | 1,280,160 | |
Seattle Genetics, Inc.* | | 106,821 | | 1,085,301 | |
Steris Corp. | | 77,339 | | 2,163,172 | |
Varian, Inc.* | | 21,490 | | 1,107,595 | |
| | | | 41,448,172 | |
| | | | | |
INDUSTRIALS (12.1%) | | | | | |
ACCO Brands Corp.* | | 133,964 | | 975,258 | |
Astec Industries, Inc.* | | 50,454 | | 1,359,231 | |
AZZ, Inc.* | | 43,591 | | 1,425,426 | |
Belden, Inc. | | 36,953 | | 810,010 | |
Deluxe Corp. | | 43,574 | | 644,459 | |
Genesee & Wyoming, Inc. Cl A* | | 49,431 | | 1,613,428 | |
Graham Corp. | | 96,932 | | 2,006,492 | |
Hub Group, Inc. Cl A* | | 50,281 | | 1,349,039 | |
JetBlue Airways Corp* | | 120,472 | | 656,572 | |
Old Dominion Freight Line, Inc.* | | 49,607 | | 1,522,935 | |
Powell Industries, Inc.* | | 33,717 | | 1,063,097 | |
RBC Bearings, Inc.* | | 48,100 | | 1,170,273 | |
Robbins & Myers, Inc. | | 60,251 | | 1,417,104 | |
Spherion Corp.* | | 153,946 | | 865,177 | |
Stanley, Inc.* | | 42,133 | | 1,154,866 | |
Sun Hydraulics Corp. | | 72,451 | | 1,901,839 | |
Teledyne Technologies, Inc.* | | 51,198 | | 1,963,955 | |
Tutor Perini Corp.* | | 84,321 | | 1,524,524 | |
| | | | 23,423,685 | |
| | | | | |
INFORMATION TECHNOLOGY (29.0%) | | | | | |
Adtran, Inc. | | 62,275 | | 1,404,301 | |
Advanced Energy Industries, Inc.* | | 69,275 | | 1,044,667 | |
Ariba, Inc.* | | 85,146 | | 1,066,028 | |
Brooks Automation, Inc.* | | 157,150 | | 1,348,347 | |
Ceragon Networks Ltd.* | | 159,192 | | 1,868,914 | |
Commvault Systems, Inc.* | | 70,341 | | 1,666,378 | |
comScore, Inc.* | | 40,611 | | 712,723 | |
CyberSource Corp.* | | 42,180 | | 848,240 | |
DemandTec, Inc.* | | 199,352 | | 1,748,317 | |
FormFactor, Inc.* | | 69,224 | | 1,506,314 | |
Forrester Research, Inc.* | | 43,307 | | 1,123,817 | |
Global Cash Access Hldgs., Inc.* | | 290,020 | | 2,172,250 | |
Harmonic, Inc.* | | 166,225 | | 1,052,204 | |
Informatica Corp.* | | 77,409 | | 2,001,797 | |
Intevac, Inc.* | | 116,338 | | 1,334,397 | |
Lawson Software, Inc.* | | 202,014 | | 1,343,393 | |
LogMeIn, Inc.* | | 68,968 | | 1,375,912 | |
Microsemi Corp.* | | 96,813 | | 1,718,431 | |
MKS Instruments, Inc.* | | 72,829 | | 1,267,953 | |
Monolithic Power Systems, Inc.* | | 64,866 | | 1,554,838 | |
Monotype Imaging Hldgs., Inc.* | | 116,745 | | 1,054,207 | |
Parametric Technology Corp.* | | 143,113 | | 2,338,466 | |
Plexus Corp.* | | 80,151 | | 2,284,304 | |
Polycom, Inc.* | | 38,925 | | 971,957 | |
RightNow Technologies, Inc.* | | 28,900 | | 501,993 | |
Riverbed Technology, Inc.* | | 49,042 | | 1,126,495 | |
Rogers Corp.* | | 39,913 | | 1,209,763 | |
Salary.com, Inc.* | | 243,131 | | 571,358 | |
Sapient Corp.* | | 103,450 | | 855,532 | |
ScanSource, Inc.* | | 36,380 | | 971,346 | |
Semtech Corp.* | | 95,282 | | 1,620,747 | |
Solera Hldgs., Inc. | | 41,942 | | 1,510,331 | |
Sourcefire, Inc.* | | 111,799 | | 2,990,623 | |
SuccessFactors, Inc.* | | 82,574 | | 1,369,077 | |
Super Micro Computer, Inc.* | | 141,348 | | 1,571,790 | |
Sybase, Inc.* | | 20,928 | | 908,275 | |
Synaptics, Inc.* | | 33,688 | | 1,032,537 | |
TIBCO Software, Inc.* | | 117,500 | | 1,131,525 | |
TNS, Inc.* | | 52,706 | | 1,354,017 | |
Virtusa Corp.* | | 108,495 | | 982,965 | |
Websense, Inc.* | | 106,588 | | 1,861,026 | |
| | | | 56,377,555 | |
| | | | | |
MATERIALS (4.5%) | | | | | |
Allied Nevada Gold Corp.* | | 75,750 | | 1,142,310 | |
Innophos Hldgs., Inc. | | 67,192 | | 1,544,744 | |
NewMarket Corp. | | 15,729 | | 1,805,217 | |
Silgan Hldgs., Inc. | | 23,130 | | 1,338,764 | |
US Gold Corp.* | | 621,532 | | 1,541,399 | |
Vista Gold Corp.* | | 20,036 | | 49,088 | |
Zep, Inc. | | 77,336 | | 1,339,460 | |
| | | | 8,760,982 | |
| | | | | |
TELECOMMUNICATION SERVICES (2.0%) | | | | | |
Consolidated Comms. Hldgs., Inc. | | 115,830 | | 2,027,025 | |
Syniverse Hldgs., Inc.* | | 101,229 | | 1,769,483 | |
| | | | 3,796,508 | |
| | | | | |
UTILITIES (0.8%)
Avista Corp. | | 69,526 | | 1,501,066 | |
| | | | | |
TOTAL COMMON STOCKS
(Cost: $164,268,237) 98.8% | | | | 191,541,517 | |
| | | | | | | | | | | |
| | Rating** | | Rate(%) | | Maturity | | Face Amount | | Value | |
SHORT-TERM DEBT SECURITIES: | | | | | | | | | | | |
COMMERCIAL PAPER (0.8%)
Abbott Laboratories† | | A-1+ | | 0.05 | | 01/04/10 | | 1,600,000 | | 1,599,993 | |
TOTAL SHORT-TERM DEBT SECURITIES
(Cost: $1,599,993) 0.8% | | | | | | | | | | 1,599,993 | |
| | | | | | | | | | | |
TOTAL INVESTMENTS
(Cost: $165,868,230) 99.6% | | | | | | | | | | 193,141,510 | |
| | | | | | | | | | | |
OTHER NET ASSETS 0.4% | | | | | | | | | | 754,586 | |
| | | | | | | | | | | |
NET ASSETS 100.0% | | | | | | | | | | $ | 193,896,096 | |
| | | | | | | | | | | | |
The accompanying notes are an integral part of these portfolio schedules.
MUTUAL OF AMERICA INVESTMENT CORPORATION - MID CAP VALUE FUND
PORTFOLIO OF INVESTMENTS IN SECURITIES
December 31, 2009
| | Shares | | Value | |
COMMON STOCKS: | | | | | |
CONSUMER DISCRETIONARY (10.3%) | | | | | |
Black & Decker Corp. | | 4,570 | | 296,273 | |
Burger King Hldgs., Inc. | | 17,480 | | 328,974 | |
CBS Corp. Cl B | | 28,910 | | 406,186 | |
Discovery Communications, Inc. Cl C* | | 5,662 | | 150,156 | |
DreamWorks Animation SKG Cl A* | | 6,790 | | 271,261 | |
Fortune Brands, Inc. | | 5,235 | | 226,152 | |
GameStop Corp. Cl A* | | 10,540 | | 231,248 | |
Mohawk Industries, Inc.* | | 4,857 | | 231,193 | |
Newell Rubbermaid, Inc. | | 25,511 | | 382,920 | |
Penney (J.C.) Co., Inc. | | 3,634 | | 96,701 | |
PetSmart, Inc. | | 9,646 | | 257,452 | |
Polo Ralph Lauren Corp. | | 6,287 | | 509,121 | |
Rent-A-Center, Inc.* | | 11,925 | | 211,311 | |
V.F. Corp. | | 9,831 | | 720,022 | |
| | | | 4,318,970 | |
| | | | | |
CONSUMER STAPLES (5.8%) | | | | | |
Avon Products, Inc. | | 12,116 | | 381,654 | |
Clorox Co. | | 5,345 | | 326,045 | |
Coca-Cola Enterprises, Inc. | | 17,931 | | 380,137 | |
J.M. Smucker Co. | | 6,705 | | 414,034 | |
Safeway, Inc. | | 17,280 | | 367,891 | |
Vector Group Ltd. | | 39,702 | | 555,828 | |
| | | | 2,425,589 | |
| | | | | |
ENERGY (8.9%) | | | | | |
Arch Coal, Inc. | | 17,840 | | 396,940 | |
CNX Gas Corp.* | | 11,097 | | 327,583 | |
Denbury Resources, Inc.* | | 21,020 | | 311,096 | |
Enterprise Products Partners LP | | 6,224 | | 195,496 | |
Noble Energy, Inc. | | 8,310 | | 591,838 | |
Plains Exploration & Production Co.* | | 12,590 | | 348,239 | |
Pride International, Inc.* | | 15,300 | | 488,223 | |
Range Resources Corp. | | 14,211 | | 708,418 | |
Spectra Energy Corp. | | 17,321 | | 355,254 | |
| | | | 3,723,087 | |
| | | | | |
FINANCIALS (22.6%) | | | | | |
American Financial Group, Inc. | | 22,287 | | 556,061 | |
Ameriprise Financial, Inc. | | 15,376 | | 596,896 | |
Annaly Capital Mgmt., Inc. | | 17,048 | | 295,783 | |
Aon Corp. | | 12,975 | | 497,462 | |
Associated Banc-Corp. | | 34,671 | | 381,728 | |
Assurant, Inc. | | 7,564 | | 222,987 | |
BOK Financial Corp. | | 11,721 | | 556,982 | |
Boston Properties, Inc. | | 5,770 | | 386,994 | |
Developers Diversified Realty Corp. | | 12,145 | | 112,463 | |
Discover Financial Svcs. | | 5,967 | | 87,775 | |
Equity Residential | | 16,783 | | 566,930 | |
Everest Re Group Ltd. | | 2,416 | | 207,003 | |
Fulton Financial Corp. | | 39,399 | | 343,559 | |
Genworth Financial, Inc. Cl A* | | 17,034 | | 193,336 | |
HCC Insurance Hldgs., Inc. | | 5,020 | | 140,409 | |
Host Hotels & Resorts, Inc.* | | 34,058 | | 397,457 | |
Marsh & McLennan Cos, Inc. | | 12,252 | | 270,524 | |
National Retail Pptys., Inc. | | 16,280 | | 345,462 | |
People’s United Financial, Inc. | | 40,023 | | 668,384 | |
Principal Financial Grp., Inc. | | 6,644 | | 159,722 | |
Progressive Corp.* | | 17,732 | | 318,999 | |
ProLogis | | 32,068 | | 439,011 | |
Public Storage | | 5,050 | | 411,323 | |
SPDR KBW | | 7,420 | | 165,095 | |
StanCorp Financial Group, Inc. | | 12,752 | | 510,335 | |
Vornado Realty Trust | | 9,723 | | 680,036 | |
| | | | 9,512,716 | |
| | | | | |
HEALTH CARE (5.6%) | | | | | |
AmerisourceBergen Corp. | | 17,434 | | 454,504 | |
CIGNA Corp. | | 11,344 | | 400,103 | |
Hospira, Inc.* | | 9,214 | | 469,914 | |
Laboratory Corp. of America Hldgs.* | | 4,550 | | 340,522 | |
Mettler-Toledo Int’l., Inc.* | | 4,944 | | 519,071 | |
Mylan, Inc.* | | 8,800 | | 162,184 | |
| | | | 2,346,298 | |
| | | | | |
INDUSTRIALS (10.4%) | | | | | |
Alliant TechSystems, Inc.* | | 4,777 | | 421,666 | |
Con-way, Inc. | | 7,320 | | 255,541 | |
Donnelley (R.R.) & Sons Co. | | 21,092 | | 469,719 | |
General Cable Corp.* | | 11,630 | | 342,155 | |
ITT Corp. | | 4,899 | | 243,676 | |
Joy Global, Inc. | | 8,110 | | 418,395 | |
Kirby Corp.* | | 13,650 | | 475,430 | |
L-3 Communications Hldgs., Inc. | | 3,310 | | 287,805 | |
Lincoln Electric Hldgs., Inc. | | 5,929 | | 316,964 | |
Precision Castparts Corp. | | 5,791 | | 639,037 | |
Shaw Group, Inc.* | | 11,230 | | 322,863 | |
Southwest Airlines Co. | | 15,621 | | 178,548 | |
| | | | 4,371,799 | |
| | | | | |
INFORMATION TECHNOLOGY (7.1%) | | | | | |
Amdocs Ltd.* | | 13,402 | | 382,359 | |
Lender Processing Svcs., Inc. | | 5,310 | | 215,905 | |
McAfee, Inc.* | | 4,540 | | 184,188 | |
Micron Technology, Inc.* | | 35,995 | | 380,107 | |
NCR Corp.* | | 15,786 | | 175,698 | |
SAIC, Inc.* | | 20,560 | | 389,406 | |
Sybase, Inc.* | | 12,501 | | 542,543 | |
Teradata Corp.* | | 12,406 | | 389,921 | |
Xerox Corp. | | 36,231 | | 306,514 | |
| | | | 2,966,641 | |
| | | | | |
MATERIALS (10.5%) | | | | | |
Agnico-Eagle Mines Ltd. | | 7,257 | | 391,878 | |
CF Industries Hldgs., Inc. | | 3,060 | | 277,787 | |
Crown Hldgs., Inc.* | | 51,378 | | 1,314,244 | |
Cytec Industries, Inc. | | 13,332 | | 485,551 | |
Eastman Chemical Co. | | 7,251 | | 436,800 | |
Lubrizol Corp. | | 8,662 | | 631,893 | |
Sonoco Products Co. | | 21,391 | | 625,687 | |
Steel Dynamics, Inc. | | 13,681 | | 242,427 | |
| | | | 4,406,267 | |
| | | | | |
TELECOMMUNICATION SERVICES (2.1%) | | | | | |
CenturyTel, Inc. | | 13,901 | | 503,355 | |
Windstream Corp. | | 35,050 | | 385,200 | |
| | | | 888,555 | |
UTILITIES (11.1%) | | | | | |
American Electric Power Co., Inc. | | 16,061 | | 558,762 | |
Edison International | | 18,275 | | 635,605 | |
Energen Corp. | | 13,697 | | 641,020 | |
Entergy Corp. | | 6,208 | | 508,063 | |
ITC Hldgs. Corp. | | 5,940 | | 309,415 | |
Pepco Hldgs., Inc. | | 25,532 | | 430,214 | |
PG&E Corp. | | 14,078 | | 628,583 | |
PPL Corp. | | 12,669 | | 409,335 | |
Sempra Energy | | 9,843 | | 551,011 | |
| | | | 4,672,008 | |
| | | | | |
TOTAL COMMON STOCKS
(Cost: $41,586,532) 94.4% | | | | 39,631,930 | |
| | Rating** | | Rate | | Maturity | | Face Amount | | Value | |
SHORT-TERM DEBT SECURITIES: | | | | | | | | | | | |
COMMERCIAL PAPER (5.4%) | | | | | | | | | | | |
Abbott Laboratories† | | A-1+ | | 0.05 | | 01/04/10 | | 670,000 | | 669,997 | |
Nestle Capital Corp.† | | A-1+ | | 0.08 | | 02/02/10 | | 1,000,000 | | 999,929 | |
Toyota Motor Credit Corp. | | A-1+ | | 0.04 | | 01/06/10 | | 600,000 | | 599,997 | |
| | | | | | | | | | 2,269,923 | |
TOTAL SHORT-TERM DEBT SECURITIES
(Cost: $2,269,923) 5.4% | | | | | | | | | | 2,269,923 | |
| | | | | | | | | | | |
TOTAL INVESTMENTS
(Cost: $43,856,455) 99.8% | | | | | | | | | | 41,901,853 | |
| | | | | | | | | | | |
OTHER NET ASSETS 0.2% | | | | | | | | | | 70,743 | |
| | | | | | | | | | | |
NET ASSETS 100.0% | | | | | | | | | | $ | 41,972,596 | |
| | | | | | | | | | | | |
The accompanying notes are an integral part of these portfolio schedules.
MUTUAL OF AMERICA INVESTMENT CORPORATION - MID-CAP EQUITY INDEX FUND
PORTFOLIO OF INVESTMENTS IN SECURITIES
December 31, 2009
| | Shares | | Value | |
INDEXED ASSETS: | | | | | |
COMMON STOCKS: | | | | | |
CONSUMER DISCRETIONARY (13.3%) | | | | | |
99 Cents Only Stores* | | 17,910 | | 234,084 | |
Aaron’s, Inc. | | 21,253 | | 589,346 | |
Advance Auto Parts, Inc. | | 37,346 | | 1,511,766 | |
Aeropostale, Inc.* | | 26,005 | | 885,470 | |
American Eagle Outfitters, Inc. | | 83,098 | | 1,411,004 | |
American Greetings Corp. Cl A | | 15,949 | | 347,529 | |
AnnTaylor Stores Corp.* | | 24,003 | | 327,401 | |
Barnes & Noble, Inc. | | 15,864 | | 302,526 | |
Bob Evans Farms, Inc. | | 11,821 | | 342,218 | |
BorgWarner, Inc. | | 46,303 | | 1,538,186 | |
Boyd Gaming Corp.* | | 21,088 | | 176,507 | |
Brink’s Home Security Hldgs., Inc.* | | 18,365 | | 599,434 | |
Brinker International, Inc. | | 38,390 | | 572,779 | |
Career Education Corp.* | | 28,072 | | 654,358 | |
CarMax, Inc.* | | 85,187 | | 2,065,785 | |
Cheesecake Factory, Inc.* | | 23,495 | | 507,257 | |
Chico’s FAS, Inc.* | | 71,595 | | 1,005,910 | |
Chipotle Mexican Grill, Inc. Cl A* | | 12,547 | | 1,106,144 | |
Coldwater Creek, Inc.* | | 23,216 | | 103,543 | |
Collective Brands, Inc.* | | 25,767 | | 586,715 | |
Corinthian Colleges, Inc.* | | 34,075 | | 469,213 | |
Dick’s Sporting Goods, Inc.* | | 34,618 | | 860,950 | |
Dollar Tree, Inc.* | | 34,791 | | 1,680,405 | |
DreamWorks Animation SKG Cl A* | | 29,673 | | 1,185,436 | |
Foot Locker, Inc. | | 61,486 | | 684,954 | |
Fossil, Inc.* | | 19,549 | | 656,064 | |
Gentex Corp. | | 55,248 | | 986,177 | |
Guess?, Inc. | | 23,595 | | 998,069 | |
Hanesbrands, Inc.* | | 37,751 | | 910,177 | |
Harte-Hanks, Inc. | | 15,113 | | 162,918 | |
International Speedway Corp. Cl A | | 12,119 | | 344,786 | |
ITT Educational Svcs., Inc.* | | 12,311 | | 1,181,364 | |
J. Crew Group, Inc.* | | 23,124 | | 1,034,568 | |
KB Home | | 30,716 | | 420,195 | |
Lamar Advertising Co. Cl A* | | 20,500 | | 637,345 | |
Life Time Fitness, Inc.* | | 16,384 | | 408,453 | |
LKQ Corp.* | | 55,616 | | 1,089,517 | |
Matthews International Corp. Cl A | | 11,998 | | 425,089 | |
MDC Hldgs., Inc. | | 14,967 | | 464,576 | |
Mohawk Industries, Inc.* | | 22,530 | | 1,072,428 | |
Netflix, Inc.* | | 17,116 | | 943,776 | |
NVR, Inc.* | | 2,380 | | 1,691,490 | |
Panera Bread Co. Cl A* | | 12,281 | | 822,459 | |
PetSmart, Inc. | | 49,181 | | 1,312,641 | |
Phillips-Van Heusen Corp. | | 20,643 | | 839,757 | |
Regis Corp. | | 23,031 | | 358,593 | |
Rent-A-Center, Inc.* | | 26,011 | | 460,915 | |
Ryland Group, Inc. | | 17,345 | | 341,697 | |
Saks, Inc.* | | 62,969 | | 413,077 | |
Scholastic Corp. | | 9,988 | | 297,942 | |
Scientific Games Corp. Cl A* | | 25,473 | | 370,632 | |
Service Corp. International | | 100,553 | | 823,529 | |
Sotheby’s | | 25,826 | | 580,568 | |
Strayer Education, Inc. | | 5,640 | | 1,198,444 | |
The Warnaco Group, Inc.* | | 18,511 | | 780,979 | |
Thor Industries, Inc. | | 13,593 | | 426,820 | |
Timberland Co. Cl A* | | 17,784 | | 318,867 | |
Toll Brothers, Inc.* | | 54,602 | | 1,027,064 | |
Tupperware Brands Corp. | | 26,190 | | 1,219,668 | |
Under Armour, Inc. Cl A* | | 14,961 | | 407,986 | |
Urban Outfitters, Inc.* | | 51,621 | | 1,806,219 | |
Wendy’s/Arby’s Group, Inc. | | 142,947 | | 670,421 | |
Wiley (John) & Sons, Inc. Cl A | | 16,859 | | 706,055 | |
Williams-Sonoma, Inc. | | 42,395 | | 880,968 | |
WMS Industries, Inc.* | | 20,702 | | 828,080 | |
| | | | 50,069,293 | |
| | | | | |
CONSUMER STAPLES (3.8%) | | | | | |
Alberto-Culver Co. | | 34,571 | | 1,012,585 | |
BJ’s Wholesale Club, Inc.* | | 21,853 | | 714,812 | |
Church & Dwight Co., Inc. | | 28,051 | | 1,695,683 | |
Corn Products Int’l., Inc. | | 29,648 | | 866,611 | |
Energizer Hldgs., Inc.* | | 27,370 | | 1,677,234 | |
Flowers Foods, Inc. | | 30,504 | | 724,775 | |
Green Mountain Coffee Roasters, Inc.* | | 13,781 | | 1,122,738 | |
Hansen Natural Corp.* | | 27,810 | | 1,067,904 | |
Lancaster Colony Corp. | | 7,713 | | 383,336 | |
NBTY, Inc.* | | 24,558 | | 1,069,255 | |
PepsiAmericas, Inc. | | 22,392 | | 655,190 | |
Ralcorp Hldgs., Inc.* | | 22,375 | | 1,336,011 | |
Ruddick Corp. | | 16,047 | | 412,889 | |
Smithfield Foods, Inc.* | | 56,063 | | 851,597 | |
Tootsie Roll Industries, Inc. | | 10,374 | | 284,040 | |
Universal Corp. | | 9,782 | | 446,157 | |
| | | | 14,320,817 | |
| | | | | |
ENERGY (6.4%) | | | | | |
Arch Coal, Inc. | | 63,480 | | 1,412,430 | |
Atwood Oceanics, Inc.* | | 22,675 | | 812,899 | |
Bill Barrett Corp.* | | 15,130 | | 470,694 | |
Cimarex Energy Co. | | 32,635 | | 1,728,676 | |
Comstock Resources, Inc.* | | 18,044 | | 732,045 | |
Encore Aquisition Co.* | | 21,869 | | 1,050,149 | |
Exterran Hldgs., Inc.* | | 25,167 | | 539,832 | |
Forest Oil Corp.* | | 44,241 | | 984,362 | |
Frontier Oil Corp. | | 41,466 | | 499,251 | |
Helix Energy Solutions Group* | | 35,964 | | 422,577 | |
Helmerich & Payne, Inc. | | 41,291 | | 1,646,685 | |
Mariner Energy, Inc.* | | 39,563 | | 459,326 | |
Newfield Exploration Co.* | | 51,038 | | 2,461,568 | |
Oceaneering Int’l., Inc.* | | 21,603 | | 1,264,208 | |
Overseas Shipholding Group, Inc. | | 9,173 | | 403,153 | |
Patriot Coal Corp.* | | 29,201 | | 451,447 | |
Patterson-UTI Energy, Inc. | | 60,415 | | 927,370 | |
Plains Exploration & Production Co.* | | 55,405 | | 1,532,502 | |
Pride International, Inc.* | | 68,397 | | 2,182,548 | |
Quicksilver Resources, Inc.* | | 46,799 | | 702,453 | |
Southern Union Co. | | 48,624 | | 1,103,765 | |
Superior Energy Services, Inc.* | | 30,606 | | 743,420 | |
Tidewater, Inc. | | 20,511 | | 983,502 | |
Unit Corp.* | | 15,916 | | 676,430 | |
| | | | 24,191,292 | |
| | | | | |
FINANCIALS (18.2%) | | | | | |
Affiliated Managers Group, Inc.* | | 16,567 | | 1,115,787 | |
Alexandria Real Estate Equities, Inc. | | 17,144 | | 1,102,188 | |
AMB Property Corp. | | 59,073 | | 1,509,315 | |
American Financial Group, Inc. | | 31,530 | | 786,674 | |
AmeriCredit Corp.* | | 38,249 | | 728,261 | |
Apollo Investment Corp. | | 69,031 | | 657,865 | |
Associated Banc-Corp. | | 49,526 | | 545,281 | |
Astoria Financial Corp. | | 30,888 | | 383,938 | |
BancorpSouth, Inc. | | 28,398 | | 666,217 | |
Bank of Hawaii Corp. | | 18,954 | | 891,975 | |
Berkley (W.R.) Corp. | | 54,335 | | 1,338,814 | |
BRE Properties, Inc. | | 21,435 | | 709,070 | |
Brown & Brown, Inc. | | 46,843 | | 841,769 | |
Camden Property Trust | | 25,472 | | 1,079,249 | |
Cathay General Bancorp | | 25,950 | | 195,923 | |
City National Corp. | | 16,800 | | 766,080 | |
Commerce Bancshares, Inc. | | 28,664 | | 1,109,870 | |
Corporate Office Pptys. Trust | | 23,043 | | 844,065 | |
Cousins Properties, Inc. | | 39,495 | | 301,347 | |
Cullen/Frost Bankers, Inc. | | 23,479 | | 1,173,950 | |
Duke Realty Corp. | | 88,588 | | 1,078,116 | |
Eaton Vance Corp. | | 46,634 | | 1,418,140 | |
Equity One, Inc. | | 13,120 | | 212,150 | |
Essex Property Trust, Inc. | | 11,474 | | 959,800 | |
Everest Re Group Ltd. | | 23,877 | | 2,045,781 | |
Federal Realty Investment Trust | | 23,869 | | 1,616,409 | |
Fidelity Nat’l. Financial, Inc. Cl A | | 92,133 | | 1,240,110 | |
First American Corp. | | 39,327 | | 1,302,117 | |
First Niagara Financial Group, Inc. | | 72,893 | | 1,013,942 | |
FirstMerit Corp. | | 33,349 | | 671,649 | |
Fulton Financial Corp. | | 68,965 | | 601,375 | |
Gallagher (Arthur J.) & Co. | | 40,512 | | 911,925 | |
Hanover Insurance Group, Inc. | | 19,910 | | 884,601 | |
HCC Insurance Hldgs., Inc. | | 44,251 | | 1,237,701 | |
Highwoods Properties, Inc. | | 28,031 | | 934,834 | |
Horace Mann Educators Corp. | | 15,546 | | 194,325 | |
Hospitality Properties Trust | | 49,285 | | 1,168,547 | |
International Bancshares Corp. | | 20,066 | | 379,849 | |
Jefferies Group, Inc.* | | 47,925 | | 1,137,260 | |
Jones Lang LaSalle, Inc. | | 16,573 | | 1,001,009 | |
Liberty Property Trust | | 44,544 | | 1,425,853 | |
Mack-Cali Realty Corp. | | 31,248 | | 1,080,243 | |
Mercury General Corp. | | 13,835 | | 543,162 | |
MSCI, Inc. Cl A* | | 42,063 | | 1,337,603 | |
Nationwide Health Pptys., Inc. | | 45,110 | | 1,586,970 | |
New York Community Bancorp, Inc. | | 163,888 | | 2,378,015 | |
NewAlliance Bancshares, Inc. | | 41,802 | | 502,042 | |
Old Republic Int’l. Corp. | | 94,783 | | 951,621 | |
OMEGA Healthcare Investors, Inc. | | 33,436 | | 650,330 | |
PacWest Bancorp | | 11,440 | | 230,516 | |
Potlatch Corp. | | 15,768 | | 502,684 | |
Protective Life Corp. | | 34,217 | | 566,291 | |
Raymond James Financial, Inc. | | 38,773 | | 921,634 | |
Rayonier, Inc. | | 31,839 | | 1,342,332 | |
Realty Income Corp. | | 41,124 | | 1,065,523 | |
Regency Centers Corp. | | 31,705 | | 1,111,577 | |
Reinsurance Grp. of America, Inc. | | 29,028 | | 1,383,184 | |
SEI Investments Co. | | 51,795 | | 907,448 | |
Senior Housing Pptys. Trust | | 50,251 | | 1,098,989 | |
SL Green Realty Corp | | 31,103 | | 1,562,615 | |
StanCorp Financial Group, Inc. | | 19,513 | | 780,910 | |
SVB Financial Group* | | 16,056 | | 669,375 | |
Synovus Financial Corp. | | 181,634 | | 372,350 | |
TCF Financial Corp. | | 43,521 | | 592,756 | |
The Macerich Co. | | 38,459 | | 1,382,602 | |
Trustmark Corp. | | 21,532 | | 485,331 | |
UDR, Inc. | | 60,411 | | 993,157 | |
Unitrin, Inc. | | 19,986 | | 440,691 | |
Valley National Bancorp | | 57,461 | | 811,924 | |
Waddell & Reed Financial, Inc. Cl A | | 33,856 | | 1,033,962 | |
Washington Federal, Inc. | | 44,002 | | 850,999 | |
Webster Financial Corp. | | 25,520 | | 302,922 | |
Weingarten Realty Investors | | 41,879 | | 828,785 | |
Westamerica Bancorporation | | 11,546 | | 639,302 | |
Wilmington Trust Corp. | | 26,818 | | 330,934 | |
| | | | 68,421,910 | |
| | | | | |
HEALTH CARE (11.5%) | | | | | |
Affymetrix, Inc.* | | 27,299 | | 159,426 | |
Beckman Coulter, Inc. | | 28,139 | | 1,841,416 | |
Bio-Rad Laboratories, Inc. Cl A* | | 7,654 | | 738,305 | |
Cerner Corp.* | | 26,569 | | 2,190,348 | |
Charles River Laboratories Int’l., Inc.* | | 25,959 | | 874,559 | |
Community Health Systems, Inc.* | | 36,730 | | 1,307,588 | |
Covance, Inc.* | | 25,279 | | 1,379,475 | |
Edwards Lifesciences Corp.* | | 22,459 | | 1,950,564 | |
Endo Pharmaceuticals Hldgs., Inc.* | | 46,365 | | 950,946 | |
Gen-Probe, Inc.* | | 19,250 | | 825,825 | |
Health Management Associates, Inc. Cl A* | | 99,017 | | 719,854 | |
Health Net, Inc.* | | 40,824 | | 950,791 | |
Hill-Rom Hldgs., Inc. | | 24,317 | | 583,365 | |
Hologic, Inc.* | | 101,729 | | 1,475,071 | |
IDEXX Laboratories, Inc.* | | 23,227 | | 1,241,251 | |
Immucor, Inc.* | | 27,946 | | 565,627 | |
Kindred Healthcare, Inc.* | | 15,369 | | 283,712 | |
Kinetic Concepts, Inc.* | | 24,189 | | 910,716 | |
LifePoint Hospitals, Inc.* | | 21,577 | | 701,468 | |
Lincare Hldgs., Inc.* | | 26,856 | | 996,895 | |
Masimo Corp.* | | 20,409 | | 620,842 | |
Medicis Pharmaceutical Corp. Cl A | | 23,609 | | 638,623 | |
Mettler-Toledo Int’l., Inc.* | | 13,477 | | 1,414,950 | |
Omnicare, Inc. | | 46,856 | | 1,132,978 | |
OSI Pharmaceuticals, Inc.* | | 23,174 | | 719,089 | |
Owens & Minor, Inc. | | 16,764 | | 719,679 | |
Perrigo Co. | | 32,297 | | 1,286,712 | |
Pharmaceutical Product Development, Inc. | | 45,340 | | 1,062,770 | |
Psychiatric Solutions, Inc.* | | 22,589 | | 477,531 | |
ResMed, Inc.* | | 29,576 | | 1,545,938 | |
Schein (Henry), Inc.* | | 35,538 | | 1,869,299 | |
Steris Corp. | | 23,035 | | 644,289 | |
Techne Corp. | | 14,697 | | 1,007,626 | |
Teleflex, Inc. | | 15,783 | | 850,546 | |
Thoratec Corp.* | | 22,845 | | 614,987 | |
United Therapeutics Corp.* | | 18,613 | | 979,974 | |
Universal Health Svcs., Inc. Cl B | | 38,528 | | 1,175,104 | |
Valeant Pharmaceuticals Int’l.* | | 26,350 | | 837,667 | |
Varian, Inc.* | | 11,411 | | 588,123 | |
VCA Antech, Inc.* | | 33,778 | | 841,748 | |
Vertex Pharmaceuticals, Inc.* | | 74,974 | | 3,212,641 | |
WellCare Health Plans, Inc.* | | 16,696 | | 613,745 | |
| | | | 43,502,063 | |
INDUSTRIALS (13.8%) | | | | | |
Aecom Technology Corp.* | | 44,522 | | 1,224,355 | |
AGCO Corp.* | | 36,060 | | 1,166,180 | |
AirTran Hldgs., Inc.* | | 54,101 | | 282,407 | |
Alaska Air Group, Inc.* | | 14,056 | | 485,775 | |
Alexander & Baldwin, Inc. | | 16,033 | | 548,810 | |
Alliant TechSystems, Inc.* | | 13,123 | | 1,158,367 | |
AMETEK, Inc. | | 42,179 | | 1,612,925 | |
BE Aerospace, Inc.* | | 40,047 | | 941,105 | |
Bucyrus International, Inc. | | 30,599 | | 1,724,866 | |
Carlisle Cos., Inc. | | 24,115 | | 826,180 | |
Clean Harbors, Inc.* | | 8,998 | | 536,371 | |
Con-way, Inc. | | 18,607 | | 649,570 | |
Copart, Inc.* | | 26,587 | | 973,882 | |
Corporate Executive Board Co. | | 13,144 | | 299,946 | |
Corrections Corp. of America* | | 46,179 | | 1,133,694 | |
Crane Co. | | 18,501 | | 566,501 | |
Deluxe Corp. | | 19,848 | | 293,552 | |
Donaldson Co., Inc. | | 30,500 | | 1,297,470 | |
Federal Signal Corp. | | 18,755 | | 112,905 | |
FTI Consulting, Inc.* | | 20,485 | | 966,073 | |
GATX Corp. | | 18,396 | | 528,885 | |
Graco, Inc. | | 23,787 | | 679,595 | |
Granite Construction, Inc. | | 13,361 | | 449,731 | |
Harsco Corp. | | 31,374 | | 1,011,184 | |
HNI Corp. | | 17,400 | | 480,762 | |
Hubbell, Inc. Cl B | | 23,236 | | 1,099,063 | |
Hunt (J.B.) Transport Svcs., Inc. | | 34,919 | | 1,126,836 | |
IDEX Corp. | | 31,760 | | 989,324 | |
JetBlue Airways Corp* | | 85,898 | | 468,144 | |
Joy Global, Inc. | | 40,571 | | 2,093,058 | |
Kansas City Southern* | | 37,542 | | 1,249,773 | |
KBR, Inc. | | 63,717 | | 1,210,623 | |
Kennametal, Inc. | | 31,953 | | 828,222 | |
Kirby Corp.* | | 21,252 | | 740,207 | |
Korn/Ferry International* | | 18,284 | | 301,686 | |
Landstar System, Inc. | | 19,969 | | 774,198 | |
Lennox International, Inc. | | 19,034 | | 743,087 | |
Lincoln Electric Hldgs., Inc. | | 16,731 | | 894,439 | |
Manpower, Inc. | | 31,002 | | 1,692,089 | |
Miller (Herman), Inc. | | 21,935 | | 350,521 | |
Mine Safety Appliances Co. | | 11,623 | | 308,358 | |
MPS Group, Inc.* | | 36,743 | | 504,849 | |
MSC Industrial Direct Co., Inc. Cl A | | 17,415 | | 818,505 | |
Navigant Consulting, Inc.* | | 19,486 | | 289,562 | |
Nordson Corp. | | 12,846 | | 785,918 | |
Oshkosh Corp. | | 34,829 | | 1,289,718 | |
Pentair, Inc. | | 39,729 | | 1,283,247 | |
Regal-Beloit Corp. | | 14,344 | | 745,027 | |
Rollins, Inc. | | 17,202 | | 331,655 | |
Shaw Group, Inc.* | | 33,267 | | 956,426 | |
SPX Corp. | | 19,563 | | 1,070,096 | |
Terex Corp.* | | 42,655 | | 844,996 | |
The Brink’s Co. | | 18,788 | | 457,300 | |
Thomas & Betts Corp.* | | 20,751 | | 742,678 | |
Timken Co. | | 31,824 | | 754,547 | |
Towers Watson & Co. Cl A* | | 16,680 | | 792,634 | |
Trinity Industries, Inc. | | 32,023 | | 558,481 | |
United Rentals, Inc.* | | 23,736 | | 232,850 | |
URS Corp.* | | 33,123 | | 1,474,636 | |
Valmont Industries, Inc. | | 7,927 | | 621,873 | |
Wabtec Corp. | | 18,346 | | 749,251 | |
Waste Connections, Inc.* | | 31,284 | | 1,043,009 | |
Werner Enterprises, Inc. | | 17,302 | | 342,407 | |
Woodward Governor Co. | | 22,112 | | 569,826 | |
| | | | 52,080,210 | |
| | | | | |
INFORMATION TECHNOLOGY (14.4%) | | | | | |
3Com Corp.* | | 154,810 | | 1,161,075 | |
ACI Worldwide, Inc.* | | 13,462 | | 230,873 | |
Acxiom Corp.* | | 31,003 | | 416,060 | |
ADC Telecommunications, Inc.* | | 38,119 | | 236,719 | |
Adtran, Inc. | | 22,338 | | 503,722 | |
Advent Software, Inc.* | | 6,017 | | 245,072 | |
Alliance Data Systems Corp.* | | 20,691 | | 1,336,432 | |
ANSYS, Inc.* | | 34,541 | | 1,501,152 | |
AOL, Inc.* | | 42,698 | | 994,009 | |
Arrow Electronics, Inc.* | | 47,598 | | 1,409,377 | |
Atmel Corp.* | | 177,496 | | 818,257 | |
Avnet, Inc.* | | 59,628 | | 1,798,380 | |
Broadridge Financial Solutions, Inc. | | 53,470 | | 1,206,283 | |
Cadence Design Systems, Inc.* | | 106,567 | | 638,336 | |
Ciena Corp.* | | 35,995 | | 390,186 | |
CommScope, Inc.* | | 37,631 | | 998,350 | |
Convergys Corp.* | | 46,739 | | 502,444 | |
Cree, Inc.* | | 40,870 | | 2,303,842 | |
Diebold, Inc. | | 26,008 | | 739,928 | |
Digital River, Inc.* | | 15,406 | | 415,808 | |
DST Systems, Inc.* | | 15,454 | | 673,022 | |
Equinix, Inc.* | | 15,381 | | 1,632,693 | |
F5 Networks, Inc.* | | 31,502 | | 1,668,976 | |
FactSet Research Systems, Inc. | | 16,737 | | 1,102,466 | |
Fair Isaac Corp. | | 18,462 | | 393,425 | |
Fairchild Semiconductor Int’l., Inc.* | | 49,268 | | 492,187 | |
Gartner, Inc.* | | 24,035 | | 433,591 | |
Global Payments, Inc. | | 31,927 | | 1,719,588 | |
Henry (Jack) & Associates, Inc. | | 33,637 | | 777,687 | |
Hewitt Associates, Inc. Cl A* | | 32,640 | | 1,379,366 | |
Informatica Corp.* | | 34,772 | | 899,204 | |
Ingram Micro, Inc. Cl A* | | 64,426 | | 1,124,234 | |
Integrated Device Technology, Inc.* | | 65,497 | | 423,766 | |
International Rectifier Corp.* | | 28,185 | | 623,452 | |
Intersil Corp. Cl A | | 48,733 | | 747,564 | |
Itron, Inc.* | | 15,592 | | 1,053,551 | |
Lam Research Corp.* | | 50,407 | | 1,976,458 | |
Lender Processing Svcs., Inc. | | 38,335 | | 1,558,701 | |
ManTech International Corp. Cl A* | | 8,721 | | 421,050 | |
Mentor Graphics Corp.* | | 38,229 | | 337,562 | |
MICROS Systems, Inc.* | | 31,464 | | 976,328 | |
National Instruments Corp. | | 22,505 | | 662,772 | |
NCR Corp.* | | 62,954 | | 700,678 | |
NeuStar, Inc. Cl A* | | 29,073 | | 669,842 | |
Palm, Inc.* | | 78,261 | | 785,740 | |
Parametric Technology Corp.* | | 45,674 | | 746,313 | |
Plantronics, Inc. | | 19,547 | | 507,831 | |
Polycom, Inc.* | | 32,950 | | 822,762 | |
Quest Software, Inc.* | | 24,693 | | 454,351 | |
RF Micro Devices, Inc.* | | 104,590 | | 498,894 | |
Rovi Corp.* | | 40,377 | | 1,286,815 | |
Semtech Corp.* | | 23,944 | | 407,287 | |
Silicon Laboratories, Inc.* | | 17,708 | | 856,005 | |
Solera Hldgs., Inc. | | 27,785 | | 1,000,538 | |
SRA International, Inc. Cl A* | | 16,661 | | 318,225 | |
Sybase, Inc.* | | 32,225 | | 1,398,565 | |
Synopsys, Inc.* | | 56,580 | | 1,260,602 | |
Tech Data Corp.* | | 20,034 | | 934,786 | |
Trimble Navigation Ltd.* | | 47,430 | | 1,195,236 | |
ValueClick, Inc.* | | 32,945 | | 333,403 | |
Vishay Intertechnology, Inc.* | | 74,162 | | 619,253 | |
Zebra Technologies Corp. Cl A* | | 23,218 | | 658,462 | |
| | | | 54,379,536 | |
| | | | | |
MATERIALS (6.0%) | | | | | |
Albemarle Corp. | | 36,318 | | 1,320,886 | |
AptarGroup, Inc. | | 26,816 | | 958,404 | |
Ashland, Inc. | | 29,772 | | 1,179,567 | |
Cabot Corp. | | 25,946 | | 680,564 | |
Carpenter Technology Corp. | | 17,229 | | 464,322 | |
Commercial Metals Co. | | 44,394 | | 694,766 | |
Cytec Industries, Inc. | | 19,574 | | 712,885 | |
Greif, Inc. Cl A | | 13,591 | | 733,642 | |
Louisiana-Pacific Corp.* | | 48,603 | | 339,249 | |
Lubrizol Corp. | | 27,553 | | 2,009,991 | |
Martin Marietta Materials, Inc. | | 17,322 | | 1,548,760 | |
Minerals Technologies, Inc. | | 7,435 | | 404,984 | |
Olin Corp. | | 31,120 | | 545,222 | |
Packaging Corp. of America | | 39,837 | | 916,649 | |
Reliance Steel & Aluminum Co. | | 25,493 | | 1,101,807 | |
RPM International, Inc. | | 51,236 | | 1,041,628 | |
Scotts Miracle-Gro Co. Cl A | | 18,024 | | 708,523 | |
Sensient Technologies Corp. | | 19,309 | | 507,827 | |
Silgan Hldgs., Inc. | | 10,615 | | 614,396 | |
Sonoco Products Co. | | 39,275 | | 1,148,794 | |
Steel Dynamics, Inc. | | 85,101 | | 1,507,990 | |
Temple-Inland, Inc. | | 41,572 | | 877,585 | |
Terra Industries, Inc. | | 40,075 | | 1,290,014 | |
Valspar Corp. | | 40,041 | | 1,086,713 | |
Worthington Industries, Inc. | | 23,845 | | 311,654 | |
| | | | 22,706,822 | |
| | | | | |
TELECOMMUNICATION SERVICES (0.8%) | | | | | |
Cincinnati Bell, Inc.* | | 79,337 | | 273,713 | |
Syniverse Hldgs., Inc.* | | 27,380 | | 478,602 | |
Telephone & Data Systems, Inc. | | 35,998 | | 1,221,052 | |
tw telecom inc* | | 57,904 | | 992,475 | |
| | | | 2,965,842 | |
| | | | | |
UTILITIES (6.4%) | | | | | |
AGL Resources, Inc. | | 30,444 | | 1,110,293 | |
Alliant Energy Corp. | | 42,949 | | 1,299,637 | |
Aqua America, Inc. | | 53,969 | | 944,997 | |
Atmos Energy Corp. | | 36,391 | | 1,069,895 | |
Black Hills Corp. | | 15,112 | | 402,433 | |
Cleco Corp. | | 23,709 | | 647,967 | |
DPL, Inc. | | 47,421 | | 1,308,820 | |
Dynegy, Inc. Cl A* | | 198,643 | | 359,544 | |
Energen Corp. | | 27,479 | | 1,286,017 | |
Great Plains Energy, Inc. | | 52,411 | | 1,016,249 | |
Hawaiian Electric Industries, Inc. | | 36,403 | | 760,823 | |
Idacorp, Inc. | | 18,487 | | 590,660 | |
MDU Resources Group | | 74,441 | | 1,756,808 | |
National Fuel Gas Co. | | 31,706 | | 1,585,300 | |
NSTAR | | 42,324 | | 1,557,523 | |
NV Energy, Inc. | | 92,741 | | 1,148,134 | |
OGE Energy Corp. | | 38,110 | | 1,405,878 | |
Oneok, Inc. | | 41,551 | | 1,851,928 | |
PNM Resources, Inc. | | 34,007 | | 430,189 | |
UGI Corp. | | 43,074 | | 1,041,960 | |
Vectren Corp. | | 31,914 | | 787,638 | |
Westar Energy, Inc. | | 42,841 | | 930,507 | |
WGL Hldgs., Inc. | | 19,576 | | 656,579 | |
| | | | 23,949,779 | |
| | | | | |
TOTAL INDEXED ASSETS - COMMON STOCKS
(Cost: $355,426,297) 94.6% | | | | 356,587,564 | |
| | Rating** | | Rate(%) | | Maturity | | Face Amount | | Value | |
SHORT-TERM DEBT SECURITIES: | | | | | | | | | | | |
U.S. GOVERNMENT (0.6%) | | | | | | | | | | | |
U.S. Treasury Bill (1) | | AAA | | 0.05 | | 02/11/10 | | 500,000 | | 499,972 | |
U.S. Treasury Bill (1) | | AAA | | 0.06 | | 02/11/10 | | 1,500,000 | | 1,499,897 | |
U.S. Treasury Bill (1) | | AAA | | 0.10 | | 05/06/10 | | 400,000 | | 399,861 | |
| | | | | | | | | | 2,399,730 | |
COMMERCIAL PAPER (4.7%) | | | | | | | | | | | |
Abbott Laboratories† | | A-1+ | | 0.05 | | 01/04/10 | | 9,500,000 | | 9,499,961 | |
Toyota Motor Credit Corp. | | A-1+ | | 0.04 | | 01/06/10 | | 2,000,000 | | 1,999,989 | |
Toyota Motor Credit Corp. | | A-1+ | | 0.06 | | 01/05/10 | | 6,000,000 | | 5,999,960 | |
| | | | | | | | | | 17,499,910 | |
TOTAL SHORT-TERM DEBT SECURITIES
(Cost: $19,899,640) 5.3% | | | | | | | | | | 19,899,640 | |
| | | | | | | | | | | |
TEMPORARY CASH INVESTMENTS (2)
(Cost: $187,800) 0.0% (3) | | | | | | | | | 187,800 | |
| | | | | | | | | | | |
TOTAL INVESTMENTS
(Cost: $375,513,737) 99.9% | | | | | | | | | | 376,675,004 | |
| | | | | | | | | | | |
OTHER NET ASSETS 0.1% | | | | | | | | | | 527,476 | |
| | | | | | | | | | | |
NET ASSETS 100.0% | | | | | | | | | | $ | 377,202,480 | |
| | | | | | | | | | | | |
The accompanying notes are an integral part of these portfolio schedules.
MUTUAL OF AMERICA INVESTMENT CORPORATION - INTERNATIONAL FUND
PORTFOLIO OF INVESTMENTS IN SECURITIES
December 31, 2009
| | Shares | | Value | |
COMMON STOCKS: | | | | | |
FINANCIALS (99.5%) | | | | | |
iShares MSCI EAFE Growth Index Fund | | 53,300 | | 2,937,896 | |
iShares MSCI EAFE Index Fund | | 59,600 | | 3,295,880 | |
iShares MSCI EAFE Value Index Fund | | 58,300 | | 2,934,822 | |
Vanguard Europe Pacific ETF | | 481,500 | | 16,467,300 | |
Vanguard European ETF | | 101,600 | | 4,925,568 | |
Vanguard Pacific ETF | | 46,000 | | 2,360,720 | |
| | | | 32,922,186 | |
TOTAL COMMON STOCKS
(Cost: $31,586,350) 99.5% | | | | 32,922,186 | |
| | Rating** | | Rate(%) | | Maturity | | Face Amount | | Value | |
SHORT-TERM DEBT SECURITIES: | | | | | | | | | | | |
COMMERCIAL PAPER (7.3%) | | | | | | | | | | | |
Abbott Laboratories† | | A-1+ | | 0.05 | | 01/04/10 | | 1,400,000 | | 1,399,994 | |
Washington Gas Light Co. | | A-1 | | 0.05 | | 01/04/10 | | 1,000,000 | | 999,996 | |
| | | | | | | | | | 2,399,990 | |
TOTAL SHORT-TERM DEBT SECURITIES
(Cost: $2,399,990) 7.3% | | | | | | | | | | 2,399,990 | |
| | | | | | | | | | | |
TOTAL INVESTMENTS
(Cost: $33,986,340) 106.8 % | | | | | | | | | | 35,322,176 | |
| | | | | | | | | | | |
OTHER NET ASSETS -6.8% | | | | | | | | | | (2,233,679 | ) |
| | | | | | | | | | | |
NET ASSETS 100.0% | | | | | | | | | | $ | 33,088,497 | |
| | | | | | | | | | | | |
The accompanying notes are an integral part of these portfolio schedules.
MUTUAL OF AMERICA INVESTMENT CORPORATION — COMPOSITE FUND
PORTFOLIO OF INVESTMENTS IN SECURITIES
December 31, 2009
| | Shares | | Value | |
COMMON STOCKS: | | | | | |
CONSUMER DISCRETIONARY (5.9%) | | | | | |
Amazon.com, Inc.* | | 8,442 | | 1,135,618 | |
Apollo Group, Inc.* | | 6,382 | | 386,622 | |
Disney (Walt) Co. | | 31,123 | | 1,003,717 | |
Family Dollar Stores, Inc. | | 17,951 | | 499,576 | |
Home Depot, Inc. | | 11,123 | | 321,788 | |
Johnson Controls, Inc. | | 32,747 | | 892,028 | |
McDonald’s Corp. | | 25,993 | | 1,623,003 | |
Staples, Inc. | | 27,574 | | 678,045 | |
Target Corp. | | 9,062 | | 438,329 | |
Time Warner Cable, Inc. | | 15,679 | | 648,954 | |
Time Warner, Inc. | | 14,965 | | 436,080 | |
TJX Cos., Inc. | | 7,509 | | 274,454 | |
V.F. Corp. | | 11,744 | | 860,131 | |
Viacom, Inc. Cl B* | | 19,399 | | 576,732 | |
| | | | 9,775,077 | |
CONSUMER STAPLES (6.2%) | | | | | |
Avon Products, Inc. | | 20,772 | | 654,318 | |
Campbell Soup Co. | | 16,436 | | 555,537 | |
Constellation Brands, Inc. Cl A* | | 34,162 | | 544,201 | |
Dr. Pepper Snapple Group, Inc. | | 26,374 | | 746,384 | |
General Mills, Inc. | | 17,113 | | 1,211,772 | |
Heinz (H.J.) Co. | | 13,475 | | 576,191 | |
Molson Coors Brewing Co. Cl B | | 10,511 | | 474,677 | |
PepsiCo, Inc. | | 29,652 | | 1,802,842 | |
Proctor & Gamble Co. | | 28,247 | | 1,712,616 | |
Wal-Mart Stores, Inc. | | 37,193 | | 1,987,966 | |
| | | | 10,266,504 | |
ENERGY (7.3%) | | | | | |
Apache Corp. | | 5,339 | | 550,825 | |
Chevron Corp. | | 19,139 | | 1,473,512 | |
ConocoPhillips | | 15,184 | | 775,447 | |
Consol Energy, Inc. | | 8,209 | | 408,808 | |
Exxon Mobil Corp. | | 55,652 | | 3,794,907 | |
Halliburton Co. | | 32,211 | | 969,229 | |
Noble Energy, Inc. | | 7,718 | | 549,676 | |
Occidental Petroleum Corp. | | 15,836 | | 1,288,259 | |
Range Resources Corp. | | 9,081 | | 452,688 | |
Schlumberger Ltd. | | 13,377 | | 870,709 | |
Southwestern Energy Co.* | | 6,474 | | 312,047 | |
Williams Cos., Inc. | | 19,727 | | 415,845 | |
XTO Energy, Inc. | | 6,501 | | 302,492 | |
| | | | 12,164,444 | |
FINANCIALS (8.0%) | | | | | |
Aflac, Inc. | | 10,695 | | 494,644 | |
Bank of America Corp. | | 108,160 | | 1,628,890 | |
Bank of New York Mellon Corp. | | 22,451 | | 627,954 | |
Chubb Corp. | | 13,352 | | 656,651 | |
Citigroup, Inc. | | 207,221 | | 685,902 | |
CME Group, Inc. | | 3,134 | | 1,052,867 | |
Franklin Resources, Inc. | | 6,822 | | 718,698 | |
Goldman Sachs Group, Inc. | | 7,785 | | 1,314,419 | |
Hudson City Bancorp, Inc. | | 20,577 | | 282,522 | |
JPMorgan Chase & Co. | | 42,293 | | 1,762,349 | |
Progressive Corp.* | | 35,305 | | 635,137 | |
ProLogis | | 16,187 | | 221,600 | |
T. Rowe Price Group, Inc. | | 10,616 | | 565,302 | |
Travelers Cos., Inc. | | 8,561 | | 426,851 | |
U.S. Bancorp | | 34,242 | | 770,787 | |
Wells Fargo & Co. | | 54,842 | | 1,480,186 | |
| | | | 13,324,759 | |
HEALTH CARE (7.8%) | | | | | |
Abbott Laboratories | | 40,004 | | 2,159,816 | |
Amgen, Inc.* | | 5,356 | | 302,989 | |
Baxter International, Inc. | | 18,987 | | 1,114,157 | |
Celgene Corp.* | | 15,562 | | 866,492 | |
Gilead Sciences, Inc.* | | 31,247 | | 1,352,370 | |
Johnson & Johnson | | 44,903 | | 2,892,202 | |
Laboratory Corp. of America Hldgs.* | | 8,025 | | 600,591 | |
McKesson Corp. | | 11,848 | | 740,500 | |
Medco Health Solutions, Inc.* | | 5,743 | | 367,035 | |
Medtronic, Inc. | | 15,128 | | 665,329 | |
Merck & Co., Inc. | | 23,692 | | 865,706 | |
Mylan, Inc.* | | 17,037 | | 313,992 | |
St. Jude Medical, Inc.* | | 9,665 | | 355,479 | |
UnitedHealth Group, Inc. | | 9,939 | | 302,941 | |
| | | | 12,899,599 | |
INDUSTRIALS (5.7%) | | | | | |
Boeing Co. | | 21,800 | | 1,180,034 | |
CSX Corp. | | 13,238 | | 641,911 | |
Cummins, Inc. | | 16,768 | | 768,980 | |
Expeditors Int’l. of Wash. | | 21,670 | | 752,599 | |
FedEx Corp. | | 9,795 | | 817,393 | |
Flowserve Corp. | | 6,043 | | 571,245 | |
General Electric Co. | | 125,931 | | 1,905,336 | |
Illinois Tool Works, Inc. | | 12,807 | | 614,608 | |
Southwest Airlines Co. | | 48,822 | | 558,035 | |
Union Pacific Corp. | | 9,151 | | 584,749 | |
United Technologies Corp. | | 16,004 | | 1,110,838 | |
| | | | 9,505,728 | |
INFORMATION TECHNOLOGY (11.9%) | | | | | |
Apple, Inc.* | | 12,812 | | 2,701,538 | |
Applied Materials, Inc. | | 38,697 | | 539,436 | |
Autodesk, Inc.* | | 12,839 | | 326,239 | |
Automatic Data Processing, Inc. | | 13,699 | | 586,591 | |
BMC Software, Inc.* | | 9,599 | | 384,920 | |
Cisco Systems, Inc.* | | 73,851 | | 1,767,993 | |
EMC Corp.* | | 26,757 | | 467,445 | |
Google, Inc.* | | 2,820 | | 1,748,344 | |
Hewlett-Packard Co. | | 34,248 | | 1,764,114 | |
Int’l. Business Machines Corp. | | 15,717 | | 2,057,355 | |
MasterCard, Inc. Cl A | | 886 | | 226,798 | |
Microsoft Corp. | | 74,184 | | 2,261,870 | |
Nortel Networks Corp.* | | 6,040 | | 139 | |
Nvidia Corp.* | | 35,055 | | 654,827 | |
Oracle Corp. | | 55,783 | | 1,368,915 | |
QUALCOMM, Inc. | | 25,168 | | 1,164,272 | |
Salesforce.com, inc.* | | 10,669 | | 787,052 | |
Texas Instruments, Inc. | | 30,998 | | 807,808 | |
Yahoo!, Inc.* | | 12,887 | | 216,244 | |
| | | | 19,831,900 | |
MATERIALS (2.1%) | | | | | |
Ball Corp. | | 12,244 | | 633,015 | |
Dow Chemical Co. | | 25,086 | | 693,126 | |
Eastman Chemical Co. | | 10,025 | | 603,906 | |
Freeport-McMoRan Copper & Gold, Inc.* | | 8,575 | | 688,487 | |
Monsanto Co. | | 9,823 | | 803,030 | |
| | | | 3,421,564 | |
TELECOMMUNICATION SERVICES (1.7%) | | | | | |
AT&T, Inc. | | 53,078 | | 1,487,776 | |
CenturyTel, Inc. | | 19,256 | | 697,260 | |
Windstream Corp. | | 50,291 | | 552,698 | |
| | | | 2,737,734 | |
UTILITIES (2.0%) | | | | | |
Dominion Resources, Inc. | | 20,797 | | 809,419 | |
Edison International | | 5,832 | | 202,837 | |
Entergy Corp. | | 3,243 | | 265,407 | |
Exelon Corp. | | 8,629 | | 421,699 | |
FirstEnergy Corp. | | 8,875 | | 412,244 | |
FPL Group, Inc. | | 6,649 | | 351,200 | |
Public Svc. Enterprise Group, Inc. | | 8,008 | | 266,266 | |
Sempra Energy | | 10,822 | | 605,816 | |
| | | | 3,334,888 | |
TOTAL COMMON STOCKS
(Cost: $93,026,736) 58.6% | | | | 97,262,197 | |
| | Rating** | | Rate(%) | | Maturity | | Face Amount | | Value | |
LONG-TERM DEBT SECURITIES: | | | | | | | | | | | |
U.S. GOVERNMENT (6.9%) | | | | | | | | | | | |
U.S. Treasury Note | | AAA | | 2.38 | | 10/31/14 | | 1,000,000 | | 989,140 | |
U.S. Treasury Note | | AAA | | 2.38 | | 03/31/16 | | 500,000 | | 478,360 | |
U.S. Treasury Note | | AAA | | 3.13 | | 05/15/19 | | 4,000,000 | | 3,788,119 | |
U.S. Treasury Note | | AAA | | 3.25 | | 07/31/16 | | 1,000,000 | | 1,001,797 | |
U.S. Treasury Strip | | AAA | | 0.00 | | 11/15/21 | | 8,900,000 | | 5,224,242 | |
| | | | | | | | | | 11,481,658 | |
U.S. GOVERNMENT AGENCIES (12.7%) | | | | | | | | | | | |
MORTGAGE-BACKED OBLIGATIONS (12.7%) | | | | | | | | | | | |
FHARM | | AAA | | 4.64 | | 09/01/39 | | 309,017 | | 322,110 | |
FHARM | | AAA | | 5.23 | | 04/01/37 | | 644,728 | | 677,744 | |
FHARM | | AAA | | 5.25 | | 02/01/36 | | 319,854 | | 336,915 | |
FHARM | | AAA | | 5.43 | | 05/01/37 | | 467,926 | | 496,597 | |
FHARM | | AAA | | 5.79 | | 03/01/37 | | 291,221 | | 309,850 | |
FHLMC | | AAA | | 5.00 | | 02/01/26 | | 236,859 | | 244,958 | |
FHLMC | | AAA | | 5.50 | | 10/01/18 | | 197,315 | | 210,350 | |
FHLMC | | AAA | | 5.50 | | 01/15/32 | | 190,000 | | 200,057 | |
FHLMC | | AAA | | 6.00 | | 03/15/32 | | 346,723 | | 371,102 | |
FNMA | | AAA | | 4.00 | | 05/01/19 | | 203,344 | | 207,814 | |
FNMA | | AAA | | 4.50 | | 05/01/18 | | 311,034 | | 324,191 | |
FNMA | | AAA | | 4.50 | | 06/01/34 | | 484,160 | | 486,480 | |
FNMA | | AAA | | 4.50 | | 12/01/35 | | 375,724 | | 376,820 | |
FNMA | | AAA | | 5.00 | | 04/01/18 | | 621,721 | | 655,021 | |
FNMA | | AAA | | 5.00 | | 06/01/33 | | 685,477 | | 706,292 | |
FNMA | | AAA | | 5.00 | | 09/01/33 | | 277,746 | | 286,180 | |
FNMA | | AAA | | 5.00 | | 11/01/33 | | 1,086,313 | | 1,119,299 | |
FNMA | | AAA | | 5.00 | | 11/01/33 | | 382,107 | | 393,709 | |
FNMA | | AAA | | 5.00 | | 03/01/34 | | 211,246 | | 217,660 | |
FNMA | | AAA | | 5.00 | | 04/01/34 | | 446,275 | | 459,896 | |
FNMA | | AAA | | 5.00 | | 04/01/34 | | 218,760 | | 225,197 | |
FNMA | | AAA | | 5.00 | | 09/01/35 | | 324,335 | | 333,473 | |
FNMA | | AAA | | 5.50 | | 04/01/17 | | 51,006 | | 54,311 | |
FNMA | | AAA | | 5.50 | | 05/01/17 | | 26,024 | | 27,710 | |
FNMA | | AAA | | 5.50 | | 06/01/17 | | 6,629 | | 7,059 | |
FNMA | | AAA | | 5.50 | | 07/01/33 | | 503,585 | | 529,289 | |
FNMA | | AAA | | 5.50 | | 10/01/33 | | 739,330 | | 777,067 | |
FNMA | | AAA | | 5.50 | | 03/01/34 | | 159,973 | | 168,138 | |
FNMA | | AAA | | 5.50 | | 05/01/34 | | 1,100,328 | | 1,156,491 | |
FNMA | | AAA | | 5.50 | | 07/01/34 | | 338,307 | | 355,575 | |
FNMA | | AAA | | 5.50 | | 09/01/34 | | 319,208 | | 335,501 | |
FNMA | | AAA | | 5.50 | | 10/01/34 | | 232,941 | | 244,830 | |
FNMA | | AAA | | 5.50 | | 02/01/35 | | 302,963 | | 318,427 | |
FNMA | | AAA | | 5.50 | | 02/01/35 | | 253,098 | | 265,858 | |
FNMA | | AAA | | 5.50 | | 04/01/35 | | 373,017 | | 391,824 | |
FNMA | | AAA | | 5.50 | | 08/01/35 | | 144,687 | | 151,981 | |
FNMA | | AAA | | 5.50 | | 08/01/37 | | 230,548 | | 241,596 | |
FNMA | | AAA | | 5.50 | | 11/01/38 | | 272,042 | | 284,440 | |
FNMA | | AAA | | 5.50 | | 06/01/48 | | 266,106 | | 276,154 | |
FNMA | | AAA | | 6.00 | | 03/01/17 | | 18,153 | | 19,455 | |
FNMA | | AAA | | 6.00 | | 05/01/23 | | 127,693 | | 137,151 | |
FNMA | | AAA | | 6.00 | | 03/01/32 | | 10,906 | | 11,670 | |
FNMA | | AAA | | 6.00 | | 04/01/32 | | 103,080 | | 110,166 | |
FNMA | | AAA | | 6.00 | | 04/01/32 | | 54,940 | | 58,718 | |
FNMA | | AAA | | 6.00 | | 05/01/32 | | 90,763 | | 97,002 | |
FNMA | | AAA | | 6.00 | | 04/01/33 | | 272,717 | | 291,466 | |
FNMA | | AAA | | 6.00 | | 05/01/33 | | 173,877 | | 185,722 | |
FNMA | | AAA | | 6.00 | | 06/01/34 | | 198,980 | | 212,225 | |
FNMA | | AAA | | 6.00 | | 09/01/34 | | 97,284 | | 103,760 | |
FNMA | | AAA | | 6.00 | | 10/01/34 | | 198,652 | | 211,875 | |
FNMA | | AAA | | 6.00 | | 11/01/34 | | 217,917 | | 232,422 | |
FNMA | | AAA | | 6.00 | | 12/01/36 | | 385,856 | | 409,851 | |
FNMA | | AAA | | 6.00 | | 01/01/37 | | 332,351 | | 353,019 | |
FNMA | | AAA | | 6.00 | | 04/01/37 | | 302,709 | | 320,021 | |
FNMA | | AAA | | 6.00 | | 05/01/37 | | 306,177 | | 323,686 | |
FNMA | | AAA | | 6.00 | | 06/01/37 | | 417,298 | | 441,163 | |
FNMA | | AAA | | 6.00 | | 02/25/47 | | 200,306 | | 209,633 | |
FNMA | | AAA | | 6.00 | | 12/25/49 | | 248,076 | | 262,728 | |
FNMA | | AAA | | 6.50 | | 09/01/16 | | 23,291 | | 25,285 | |
FNMA | | AAA | | 6.50 | | 03/01/17 | | 44,203 | | 47,987 | |
FNMA | | AAA | | 6.50 | | 05/01/17 | | 23,008 | | 24,978 | |
FNMA | | AAA | | 6.50 | | 06/01/17 | | 50,911 | | 55,269 | |
FNMA | | AAA | | 6.50 | | 04/01/32 | | 35,511 | | 38,374 | |
FNMA | | AAA | | 6.50 | | 05/01/32 | | 108,598 | | 117,354 | |
FNMA | | AAA | | 6.50 | | 05/01/32 | | 103,061 | | 111,371 | |
FNMA | | AAA | | 6.50 | | 07/01/32 | | 45,347 | | 49,003 | |
FNMA | | AAA | | 6.50 | | 07/01/34 | | 168,271 | | 181,155 | |
FNMA | | AAA | | 6.50 | | 05/01/37 | | 321,415 | | 344,567 | |
FNMA | | AAA | | 6.50 | | 09/01/37 | | 443,485 | | 475,430 | |
FNMA | | AAA | | 7.00 | | 09/01/31 | | 40,388 | | 44,992 | |
FNMA | | AAA | | 7.00 | | 11/01/31 | | 24,025 | | 26,764 | |
FNMA | | AAA | | 7.00 | | 04/01/32 | | 32,995 | | 36,414 | |
FNMA | | AAA | | 7.50 | | 06/01/31 | | 21,730 | | 24,520 | |
FNMA | | AAA | | 7.50 | | 02/01/32 | | 21,611 | | 24,388 | |
FNMA | | AAA | | 7.50 | | 04/01/32 | | 25,074 | | 28,296 | |
FNMA | | AAA | | 7.50 | | 06/01/32 | | 32,006 | | 36,118 | |
FNMA | | AAA | | 8.00 | | 03/01/31 | | 20,104 | | 23,050 | |
FNMA | | AAA | | 8.00 | | 04/01/32 | | 19,539 | | 22,402 | |
FNMA | | AAA | | 8.00 | | 04/01/32 | | 4,815 | | 5,522 | |
GNMA (5) | | AAA | | 5.00 | | 11/15/39 | | 349,585 | | 360,169 | |
GNMA (5) | | AAA | | 6.50 | | 04/15/31 | | 11,282 | | 12,184 | |
GNMA (5) | | AAA | | 6.50 | | 10/15/31 | | 15,351 | | 16,579 | |
GNMA (5) | | AAA | | 6.50 | | 12/15/31 | | 12,415 | | 13,408 | |
GNMA (5) | | AAA | | 6.50 | | 05/15/32 | | 17,780 | | 19,152 | |
GNMA (5) | | AAA | | 7.00 | | 05/15/31 | | 10,712 | | 11,931 | |
GNMA (5) | | AAA | | 7.00 | | 09/15/31 | | 13,438 | | 14,967 | |
GNMA (5) | | AAA | | 7.00 | | 09/15/31 | | 2,522 | | 2,809 | |
GNMA (5) | | AAA | | 7.00 | | 05/15/32 | | 5,621 | | 6,227 | |
Vendee Mortgage Trust (5) | | AAA | | 5.25 | | 01/15/32 | | 440,200 | | 458,083 | |
| | | | | | | | | | 21,198,447 | |
CORPORATE DEBT (17.9%) | | | | | | | | | | | |
CONSUMER DISCRETIONARY (2.4%) | | | | | | | | | | | |
Black & Decker Corp. | | BBB | | 4.75 | | 11/01/14 | | 750,000 | | 768,116 | |
Ethan Allen Interiors, Inc. | | B+ | | 5.38 | | 10/01/15 | | 500,000 | | 448,288 | |
Fortune Brands, Inc. | | BBB- | | 4.88 | | 12/01/13 | | 500,000 | | 510,716 | |
Fruit of the Loom (4) | | NR | | 7.38 | | 11/15/23 | | 138,068 | | 14 | |
Home Depot, Inc. | | BBB+ | | 5.40 | | 03/01/16 | | 500,000 | | 523,430 | |
Johnson Controls, Inc. | | BBB | | 4.88 | | 09/15/13 | | 500,000 | | 514,278 | |
Marriott International, Inc. | | BBB- | | 5.63 | | 02/15/13 | | 500,000 | | 513,057 | |
Scholastic Corp. | | BB- | | 5.00 | | 04/15/13 | | 500,000 | | 467,500 | |
Whirlpool Corp. | | BBB- | | 6.50 | | 06/15/16 | | 250,000 | | 260,006 | |
| | | | | | | | | | 4,005,405 | |
CONSUMER STAPLES (0.8%) | | | | | | | | | | | |
CVS Caremark Corp. | | BBB+ | | 6.13 | | 08/15/16 | | 250,000 | | 269,208 | |
Kroger Co. | | BBB | | 4.95 | | 01/15/15 | | 500,000 | | 524,848 | |
Sara Lee Corp. | | BBB+ | | 6.25 | | 09/15/11 | | 500,000 | | 533,448 | |
| | | | | | | | | | 1,327,504 | |
ENERGY (4.0%) | | | | | | | | | | | |
Diamond Offshore Drilling, Inc. | | A- | | 4.88 | | 07/01/15 | | 500,000 | | 527,802 | |
Enbridge, Inc. | | A- | | 5.80 | | 06/15/14 | | 100,000 | | 108,343 | |
Knight, Inc. | | BB | | 5.15 | | 03/01/15 | | 500,000 | | 480,000 | |
National Oilwell Varco, Inc. | | BBB+ | | 6.13 | | 08/15/15 | | 250,000 | | 250,893 | |
Noble Corp. | | A- | | 7.50 | | 03/15/19 | | 800,000 | | 936,843 | |
Premco Refining Group | | BBB | | 7.50 | | 06/15/15 | | 500,000 | | 496,326 | |
Seariver Maritime, Inc. | | AAA | | 0.00 | | 09/01/12 | | 3,000,000 | | 2,784,999 | |
Sunoco, Inc. | | BBB- | | 4.88 | | 10/15/14 | | 500,000 | | 503,882 | |
Weatherford Int’l. Ltd. | | BBB+ | | 5.50 | | 02/15/16 | | 500,000 | | 511,907 | |
| | | | | | | | | | 6,600,995 | |
FINANCIALS (5.8%) | | | | | | | | | | | |
Berkley (W.R.) Corp. | | BBB+ | | 7.38 | | 09/15/19 | | 250,000 | | 261,671 | |
Bunge Ltd. Finance Corp. | | BBB- | | 5.35 | | 04/15/14 | | 500,000 | | 511,135 | |
Capital One Bank | | BBB+ | | 5.75 | | 09/15/10 | | 250,000 | | 257,757 | |
Colonial Realty LP | | BB+ | | 4.80 | | 04/01/11 | | 250,000 | | 243,511 | |
Developers Diversified Realty | | BB | | 5.00 | | 05/03/10 | | 250,000 | | 249,994 | |
Duke Realty LP | | BBB | | 4.63 | | 05/15/13 | | 250,000 | | 241,092 | |
Fairfax Financial Hldgs. | | BBB- | | 8.25 | | 10/01/15 | | 500,000 | | 508,125 | |
First Horizon National Corp. | | BB+ | | 4.50 | | 05/15/13 | | 1,500,000 | | 1,355,621 | |
First Industrial LP | | BB | | 6.88 | | 04/15/12 | | 250,000 | | 231,849 | |
Fosters Finance Corp.† | | BBB | | 6.88 | | 06/15/11 | | 500,000 | | 530,794 | |
GATX Financial Corp. | | BBB+ | | 5.13 | | 04/15/10 | | 250,000 | | 251,814 | |
GMAC LLC | | CCC | | 0.00 | | 12/01/12 | | 2,500,000 | | 1,868,750 | |
HCP, Inc. | | BBB | | 4.88 | | 09/15/10 | | 250,000 | | 255,094 | |
HCP, Inc. | | BBB | | 5.65 | | 12/15/13 | | 250,000 | | 250,435 | |
Heinz (H.J.) Finance Co. | | BBB | | 6.00 | | 03/15/12 | | 500,000 | | 536,343 | |
Lincoln National Corp. | | A- | | 5.65 | | 08/27/12 | | 500,000 | | 517,469 | |
Markel Corp. | | BBB | | 6.80 | | 02/15/13 | | 250,000 | | 252,665 | |
ProLogis | | BBB- | | 5.50 | | 04/01/12 | | 250,000 | | 253,091 | |
Regency Centers LP | | BBB | | 4.95 | | 04/15/14 | | 250,000 | | 236,054 | |
Shurgard Storage Centers | | A- | | 7.75 | | 02/22/11 | | 250,000 | | 263,071 | |
Vornado Realty LP | | BBB | | 5.60 | | 02/15/11 | | 250,000 | | 253,246 | |
Zions Bancorporation | | BB+ | | 5.65 | | 05/15/14 | | 397,000 | | 289,212 | |
| | | | | | | | | | 9,618,793 | |
HEALTH CARE (0.8%) | | | | | | | | | | | |
Allergan, Inc. | | A | | 5.75 | | 04/01/16 | | 250,000 | | 269,588 | |
Laboratory Corp. of America | | BBB+ | | 5.63 | | 12/15/15 | | 500,000 | | 522,771 | |
Wyeth | | AA | | 5.50 | | 03/15/13 | | 500,000 | | 543,644 | |
| | | | | | | | | | 1,336,003 | |
INDUSTRIALS (1.1%) | | | | | | | | | | | |
CSX Corp. | | BBB- | | 6.25 | | 04/01/15 | | 250,000 | | 275,363 | |
Donnelley (R.R.) & Sons Co. | | BBB | | 4.95 | | 04/01/14 | | 500,000 | | 500,152 | |
Masco Corp. | | BBB | | 5.88 | | 07/15/12 | | 500,000 | | 510,764 | |
Steelcase, Inc. | | BBB | | 6.50 | | 08/15/11 | | 500,000 | | 511,304 | |
| | | | | | | | | | 1,797,583 | |
INFORMATION TECHNOLOGY (0.3%) | | | | | | | | | | | |
Cisco Systems, Inc. | | A+ | | 5.25 | | 02/22/11 | | 500,000 | | 524,664 | |
| | | | | | | | | | | |
MATERIALS (1.3%) | | | | | | | | | | | |
Lubrizol Corp. | | BBB | | 5.50 | | 10/01/14 | | 500,000 | | 532,257 | |
Martin Marietta Materials, Inc. | | BBB+ | | 6.88 | | 04/01/11 | | 250,000 | | 261,419 | |
PolyOne Corp. | | B- | | 7.50 | | 12/15/15 | | 1,000,000 | | 895,000 | |
Temple-Inland, Inc. | | BBB- | | 7.88 | | 05/01/12 | | 228,000 | | 246,123 | |
Vulcan Materials Co. | | BBB | | 7.00 | | 06/15/18 | | 250,000 | | 272,671 | |
| | | | | | | | | | 2,207,470 | |
UTILITIES (1.4%) | | | | | | | | | | | |
Arizona Public Svc. Co. | | BBB- | | 6.50 | | 03/01/12 | | 250,000 | | 268,721 | |
Duke Energy Corp. | | A | | 4.50 | | 04/01/10 | | 500,000 | | 504,756 | |
Pepco Hldgs., Inc. | | BBB- | | 4.00 | | 05/15/10 | | 500,000 | | 504,690 | |
Progress Energy Enterprise | | A- | | 5.25 | | 12/15/15 | | 500,000 | | 546,759 | |
Virginia Electric & Power Co. | | A- | | 4.50 | | 12/15/10 | | 500,000 | | 514,222 | |
| | | | | | | | | | 2,339,148 | |
TOTAL LONG-TERM DEBT SECURITIES
(Cost: $61,286,708) 37.5% | | | | | | | | | | 62,437,670 | |
| | Rating** | | Rate(%) | | Maturity | | Face Amount | | Value | |
SHORT-TERM DEBT SECURITIES: | | | | | | | | | | | |
U.S. GOVERNMENT AGENCIES (0.1%) | | | | | | | | | | | |
FHLB | | AAA | | 0.10 | | 02/17/10 | | 100,000 | | 99,987 | |
COMMERCIAL PAPER (3.3%) | | | | | | | | | | | |
Abbott Laboratories† | | A-1+ | | 0.05 | | 01/04/10 | | 3,400,000 | | 3,399,986 | |
Toyota Motor Credit Corp. | | A-1+ | | 0.17 | | 02/16/10 | | 2,000,000 | | 1,999,566 | |
| | | | | | | | | | 5,399,552 | |
TOTAL SHORT-TERM DEBT SECURITIES
(Cost: $5,499,539) 3.4% | | | | | | | | | | 5,499,539 | |
TEMPORARY CASH INVESTMENTS (2)
(Cost: $110,300) 0.1% | | | | | | | | | | 110,300 | |
| | | | | | | | | | | |
TOTAL INVESTMENTS
(Cost: $159,923,283) 99.6% | | | | | | | | | | 165,309,706 | |
| | | | | | | | | | | |
OTHER NET ASSETS 0.4% | | | | | | | | | | 671,390 | |
| | | | | | | | | | | |
NET ASSETS 100.0% | | | | | | | | | | $ | 165,981,096 | |
| | | | | | | | | | | | |
The accompanying notes are an integral part of these portfolio schedules.
MUTUAL OF AMERICA INVESTMENT CORPORATION - RETIREMENT INCOME FUND
PORTFOLIO OF INVESTMENTS IN SECURITIES
December 31, 2009
| | Shares | | Value($) | |
COMMON STOCKS: | | | | | |
DIVERSIFIED MUTUAL FUNDS (100.0%) | | | | | |
Mutual of America Investment Corporation | | | | | |
Bond Fund (29.9%) | | 2,039,225 | | 2,643,945 | |
Equity Index Fund (20.2%) | | 971,078 | | 1,783,243 | |
Mid-Cap Equity Index Fund (5.1%) | | 362,796 | | 449,831 | |
Mid-Term Bond Fund (37.8%) | | 3,363,839 | | 3,347,029 | |
Money Market Fund (7.0%) | | 514,249 | | 620,396 | |
TOTAL INVESTMENTS
(Cost: $8,401,052) 100.0% | | | | 8,844,444 | |
OTHER NET ASSETS | | | | — | |
| | | | | |
NET ASSETS 100.0% | | | | $ | 8,844,444 | |
| | | | | | |
The accompanying notes are an integral part of these portfolio schedules.
MUTUAL OF AMERICA INVESTMENT CORPORATION - 2010 RETIREMENT FUND
PORTFOLIO OF INVESTMENTS IN SECURITIES
December 31, 2009
| | Shares | | Value($) | |
COMMON STOCKS: | | | | | |
DIVERSIFIED MUTUAL FUNDS (100.0%) | | | | | |
Mutual of America Investment Corporation | | | | | |
Bond Fund (24.8%) | | 2,801,085 | | 3,631,730 | |
Equity Index Fund (25.2%) | | 2,001,654 | | 3,675,742 | |
International Fund (4.0%) | | 865,882 | | 582,055 | |
Mid-Cap Equity Index Fund (14.2%) | | 1,675,228 | | 2,077,113 | |
Mid-Term Bond Fund (26.8%) | | 3,939,725 | | 3,920,038 | |
Money Market Fund (5.0%) | | 605,543 | | 730,534 | |
TOTAL INVESTMENTS
(Cost: $13,644,973) 100.0% | | | | 14,617,212 | |
OTHER NET ASSETS | | | | — | |
| | | | | |
NET ASSETS 100.0% | | | | $ | 14,617,212 | |
| | | | | | |
The accompanying notes are an integral part of these portfolio schedules.
MUTUAL OF AMERICA INVESTMENT CORPORATION - 2015 RETIREMENT FUND
PORTFOLIO OF INVESTMENTS IN SECURITIES
December 31, 2009
| | Shares | | Value($) | |
COMMON STOCKS: | | | | | |
DIVERSIFIED MUTUAL FUNDS (100.0%) | | | | | |
Mutual of America Investment Corporation | | | | | |
Bond Fund (24.8%) | | 8,435,967 | | 10,937,602 | |
Equity Index Fund (30.2%) | | 7,232,190 | | 13,280,854 | |
International Fund (8.0%) | | 5,214,309 | | 3,505,116 | |
Mid-Cap Equity Index Fund (11.1%) | | 3,961,948 | | 4,912,415 | |
Mid-Term Bond Fund (17.9%) | | 7,910,124 | | 7,870,597 | |
Money Market Fund (4.0%) | | 1,458,887 | | 1,760,016 | |
Small Cap Growth Fund (2.0%) | | 1,007,704 | | 900,360 | |
Small Cap Value Fund (2.0%) | | 933,257 | | 892,274 | |
TOTAL INVESTMENTS
(Cost: $41,068,911) 100.0% | | | | 44,059,234 | |
OTHER NET ASSETS | | | | — | |
| | | | | |
NET ASSETS 100.0% | | | | $ | 44,059,234 | |
| | | | | | |
The accompanying notes are an integral part of these portfolio schedules.
MUTUAL OF AMERICA INVESTMENT CORPORATION - 2020 RETIREMENT FUND
PORTFOLIO OF INVESTMENTS IN SECURITIES
December 31, 2009
| | Shares | | Value($) | |
COMMON STOCKS: | | | | | |
DIVERSIFIED MUTUAL FUNDS (100.0%) | | | | | |
Mutual of America Investment Corporation | | | | | |
Bond Fund (23.8%) | | 9,118,628 | | 11,822,703 | |
Equity Index Fund (35.1%) | | 9,502,717 | | 17,450,343 | |
International Fund (8.9%) | | 6,606,764 | | 4,441,139 | |
Mid-Cap Equity Index Fund (11.2%) | | 4,461,472 | | 5,531,775 | |
Mid-Term Bond Fund (12.9%) | | 6,432,557 | | 6,400,414 | |
Small Cap Growth Fund (4.1%) | | 2,269,429 | | 2,027,683 | |
Small Cap Value Fund (4.0%) | | 2,101,694 | | 2,009,400 | |
TOTAL INVESTMENTS
(Cost: $47,345,320) 100.0% | | | | 49,683,457 | |
OTHER NET ASSETS | | | | — | |
| | | | | |
NET ASSETS 100.0% | | | | $ | 49,683,457 | |
| | | | | | |
The accompanying notes are an integral part of these portfolio schedules.
MUTUAL OF AMERICA INVESTMENT CORPORATION - 2025 RETIREMENT FUND
PORTFOLIO OF INVESTMENTS IN SECURITIES
December 31, 2009
| | Shares | | Value($) | |
COMMON STOCKS: | | | | | |
DIVERSIFIED MUTUAL FUNDS (100.0%) | | | | | |
Mutual of America Investment Corporation | | | | | |
Bond Fund (19.8%) | | 6,408,543 | | 8,308,958 | |
Equity Index Fund (40.1%) | | 9,160,790 | | 16,822,444 | |
International Fund (8.9%) | | 5,572,581 | | 3,745,950 | |
Mid-Cap Equity Index Fund (15.2%) | | 5,131,398 | | 6,362,416 | |
Mid-Term Bond Fund (5.9%) | | 2,503,830 | | 2,491,319 | |
Small Cap Growth Fund (5.1%) | | 2,392,730 | | 2,137,849 | |
Small Cap Value Fund (5.0%) | | 2,215,831 | | 2,118,524 | |
TOTAL INVESTMENTS
(Cost: $39,280,703) 100.0% | | | | 41,987,460 | |
OTHER NET ASSETS | | | | — | |
| | | | | |
NET ASSETS 100.0% | | | | $ | 41,987,460 | |
| | | | | | |
The accompanying notes are an integral part of these portfolio schedules.
MUTUAL OF AMERICA INVESTMENT CORPORATION - 2030 RETIREMENT FUND
PORTFOLIO OF INVESTMENTS IN SECURITIES
December 31, 2009
| | Shares | | Value($) | |
COMMON STOCKS: | | | | | |
DIVERSIFIED MUTUAL FUNDS (100.0%) | | | | | |
Mutual of America Investment Corporation | | | | | |
Bond Fund (19.8%) | | 5,295,291 | | 6,865,578 | |
Equity Index Fund (40.0%) | | 7,569,448 | | 13,900,180 | |
International Fund (9.9%) | | 5,116,697 | | 3,439,500 | |
Mid-Cap Equity Index Fund (18.2%) | | 5,087,510 | | 6,307,998 | |
Small Cap Growth Fund (6.1%) | | 2,372,203 | | 2,119,508 | |
Small Cap Value Fund (6.0%) | | 2,196,836 | | 2,100,364 | |
TOTAL INVESTMENTS
(Cost: $32,279,136) 100.0% | | | | 34,733,128 | |
OTHER NET ASSETS | | | | — | |
| | | | | |
NET ASSETS 100.0% | | | | $ | 34,733,128 | |
| | | | | | |
The accompanying notes are an integral part of these portfolio schedules.
MUTUAL OF AMERICA INVESTMENT CORPORATION - 2035 RETIREMENT FUND
PORTFOLIO OF INVESTMENTS IN SECURITIES
December 31, 2009
| | Shares | | Value($) | |
COMMON STOCKS: | | | | | |
DIVERSIFIED MUTUAL FUNDS (100.0%) | | | | | |
Mutual of America Investment Corporation | | | | | |
Bond Fund (12.8%) | | 2,669,320 | | 3,460,891 | |
Equity Index Fund (40.0%) | | 5,871,685 | | 10,782,487 | |
International Fund (11.9%) | | 4,763,050 | | 3,201,774 | |
Mid-Cap Equity Index Fund (21.2%) | | 4,604,418 | | 5,709,014 | |
Small Cap Growth Fund (7.1%) | | 2,147,088 | | 1,918,374 | |
Small Cap Value Fund (7.0%) | | 1,988,181 | | 1,900,872 | |
TOTAL INVESTMENTS
(Cost: $25,039,085) 100.0% | | | | 26,973,412 | |
OTHER NET ASSETS | | | | — | |
| | | | | |
NET ASSETS 100.0% | | | | $ | 26,973,412 | |
| | | | | | |
The accompanying notes are an integral part of these portfolio schedules.
MUTUAL OF AMERICA INVESTMENT CORPORATION - 2040 RETIREMENT FUND
PORTFOLIO OF INVESTMENTS IN SECURITIES
December 31, 2009
| | Shares | | Value($) | |
COMMON STOCKS: | | | | | |
DIVERSIFIED MUTUAL FUNDS (100.0%) | | | | | |
Mutual of America Investment Corporation | | | | | |
Bond Fund (10.9%) | | 1,888,404 | | 2,448,399 | |
Equity Index Fund (35.0%) | | 4,294,849 | | 7,886,858 | |
International Fund (13.8%) | | 4,644,674 | | 3,122,201 | |
Mid-Cap Equity Index Fund (24.2%) | | 4,398,191 | | 5,453,313 | |
Small Cap Growth Fund (8.1%) | | 2,050,758 | | 1,832,305 | |
Small Cap Value Fund (8.0%) | | 1,899,183 | | 1,815,783 | |
TOTAL INVESTMENTS
(Cost: $20,691,871) 100.0% | | | | 22,558,859 | |
OTHER NET ASSETS | | | | — | |
| | | | | |
NET ASSETS 100.0% | | | | $ | 22,558,859 | |
| | | | | | |
The accompanying notes are an integral part of these portfolio schedules.
MUTUAL OF AMERICA INVESTMENT CORPORATION - 2045 RETIREMENT FUND
PORTFOLIO OF INVESTMENTS IN SECURITIES
December 31, 2009
| | Shares | | Value($) | |
COMMON STOCKS: | | | | | |
DIVERSIFIED MUTUAL FUNDS (100.0%) | | | | | |
Mutual of America Investment Corporation | | | | | |
Bond Fund (9.9%) | | 1,900,376 | | 2,463,922 | |
Equity Index Fund (34.9%) | | 4,754,751 | | 8,731,402 | |
International Fund (14.8%) | | 5,509,725 | | 3,703,698 | |
Mid-Cap Equity Index Fund (20.1%) | | 4,057,908 | | 5,031,396 | |
Small Cap Growth Fund (10.2%) | | 2,838,260 | | 2,535,920 | |
Small Cap Value Fund (10.1%) | | 2,628,323 | | 2,512,903 | |
TOTAL INVESTMENTS
(Cost: $22,527,148) 100.0% | | | | 24,979,241 | |
OTHER NET ASSETS | | | | — | |
| | | | | |
NET ASSETS 100.0% | | | | $ | 24,979,241 | |
| | | | | | |
The accompanying notes are an integral part of these portfolio schedules.
MUTUAL OF AMERICA INVESTMENT CORPORATION - CONSERVATIVE ALLOCATION FUND
PORTFOLIO OF INVESTMENTS IN SECURITIES
December 31, 2009
| | Shares | | Value($) | |
COMMON STOCKS: | | | | | |
DIVERSIFIED MUTUAL FUNDS (100.0%) | | | | | |
Mutual of America Investment Corporation | | | | | |
Bond Fund (30.1%) | | 8,851,178 | | 11,475,942 | |
Equity Index Fund (24.8%) | | 5,145,751 | | 9,449,416 | |
Mid-Term Bond Fund (45.1%) | | 17,281,886 | | 17,195,529 | |
TOTAL INVESTMENTS
(Cost: $37,316,969) 100.0% | | | | 38,120,887 | |
OTHER NET ASSETS | | | | — | |
| | | | | |
NET ASSETS 100.0% | | | | $ | 38,120,887 | |
| | | | | | |
The accompanying notes are an integral part of these portfolio schedules.
MUTUAL OF AMERICA INVESTMENT CORPORATION - MODERATE ALLOCATION FUND
PORTFOLIO OF INVESTMENTS IN SECURITIES
December 31, 2009
| | Shares | | Value($) | |
COMMON STOCKS: | | | | | |
DIVERSIFIED MUTUAL FUNDS (100.0%) | | | | | |
Mutual of America Investment Corporation | | | | | |
Bond Fund (30.2%) | | 29,194,486 | | 37,851,935 | |
Equity Index Fund (34.9%) | | 23,762,814 | | 43,636,914 | |
Mid-Cap Equity Index Fund (14.8%) | | 14,992,661 | | 18,589,386 | |
Mid-Term Bond Fund (20.1%) | | 25,334,574 | | 25,207,977 | |
TOTAL INVESTMENTS
(Cost: $126,670,992) 100.0% | | | | 125,286,212 | |
OTHER NET ASSETS | | | | — | |
| | | | | |
NET ASSETS 100.0% | | | | $ | 125,286,212 | |
| | | | | | |
The accompanying notes are an integral part of these portfolio schedules.
MUTUAL OF AMERICA INVESTMENT CORPORATION - AGGRESSIVE ALLOCATION FUND
PORTFOLIO OF INVESTMENTS IN SECURITIES
December 31, 2009
| | Shares | | Value($) | |
COMMON STOCKS: | | | | | |
DIVERSIFIED MUTUAL FUNDS (100.0%) | | | | | |
Mutual of America Investment Corporation | | | | | |
Bond Fund (25.3%) | | 22,713,477 | | 29,449,022 | |
Equity Index Fund (44.8%) | | 28,525,277 | | 52,382,478 | |
Mid-Cap Equity Index Fund (19.9%) | | 18,664,311 | | 23,141,861 | |
Small Cap Growth Fund (5.0%) | | 6,495,263 | | 5,803,368 | |
Small Cap Value Fund (5.0%) | | 6,058,226 | | 5,792,185 | |
| | | | | |
TOTAL INVESTMENTS
(Cost: $124,430,837) 100.0% | | | | 116,568,914 | |
OTHER NET ASSETS | | | | — | |
| | | | | |
NET ASSETS 100.0% | | | | $ | 116,568,914 | |
| | | | | | |
The accompanying notes are an integral part of these portfolio schedules.
MUTUAL OF AMERICA INVESTMENT CORPORATION - MONEY MARKET FUND
PORTFOLIO OF INVESTMENTS IN SECURITIES
December 31, 2009
| | Rating** | | Rate(%) | | Maturity | | Face Amount | | Value | |
SHORT-TERM DEBT SECURITIES: | | | | | | | | | | | |
U.S. GOVERNMENT AGENCIES (59.2%) | | | | | | | | | | | |
FHLB | | AAA | | 0.02 | | 02/05/10 | | 4,200,000 | | 4,199,918 | |
FHLB | | AAA | | 0.09 | | 01/27/10 | | 8,127,000 | | 8,127,020 | |
FHLB | | AAA | | 0.10 | | 01/13/10 | | 400,000 | | 399,987 | |
FHLB | | AAA | | 0.10 | | 01/20/10 | | 690,000 | | 689,992 | |
FHLB | | AAA | | 0.10 | | 02/08/10 | | 150,000 | | 149,998 | |
FHLB | | AAA | | 0.10 | | 02/12/10 | | 2,200,000 | | 2,199,757 | |
FHLB | | AAA | | 0.10 | | 02/16/10 | | 500,000 | | 499,936 | |
FHLB | | AAA | | 0.10 | | 02/17/10 | | 400,000 | | 399,948 | |
FHLB | | AAA | | 0.10 | | 03/04/10 | | 800,000 | | 799,915 | |
FHLB | | AAA | | 0.10 | | 03/05/10 | | 800,000 | | 799,941 | |
FHLB | | AAA | | 0.10 | | 03/10/10 | | 650,000 | | 649,843 | |
FHLB | | AAA | | 0.10 | | 03/17/10 | | 9,242,000 | | 9,240,732 | |
FHLB | | AAA | | 0.15 | | 03/02/10 | | 500,000 | | 499,896 | |
FHLMC | | AAA | | 0.01 | | 01/25/10 | | 2,250,000 | | 2,249,985 | |
FHLMC | | AAA | | 0.09 | | 01/06/10 | | 800,000 | | 799,990 | |
FHLMC | | AAA | | 0.09 | | 01/25/10 | | 1,500,000 | | 1,499,972 | |
FHLMC | | AAA | | 0.10 | | 01/21/10 | | 130,000 | | 129,993 | |
FHLMC | | AAA | | 0.10 | | 01/29/10 | | 525,000 | | 524,959 | |
FHLMC | | AAA | | 0.10 | | 03/02/10 | | 2,172,000 | | 2,171,890 | |
FHLMC | | AAA | | 0.10 | | 03/05/10 | | 810,000 | | 809,912 | |
FHLMC | | AAA | | 0.10 | | 03/15/10 | | 700,000 | | 699,883 | |
FHLMC | | AAA | | 0.10 | | 03/17/10 | | 1,825,000 | | 1,824,727 | |
FHLMC | | AAA | | 0.11 | | 03/15/10 | | 1,415,000 | | 1,414,764 | |
FHLMC | | AAA | | 0.15 | | 03/16/10 | | 1,150,000 | | 1,149,842 | |
FHLMC | | AAA | | 0.15 | | 03/17/10 | | 740,000 | | 739,890 | |
FNMA | | AAA | | 0.09 | | 01/20/10 | | 1,100,000 | | 1,099,984 | |
FNMA | | AAA | | 0.10 | | 01/04/10 | | 380,000 | | 379,997 | |
FNMA | | AAA | | 0.10 | | 01/06/10 | | 600,000 | | 599,992 | |
FNMA | | AAA | | 0.10 | | 01/19/10 | | 2,700,000 | | 2,699,865 | |
FNMA | | AAA | | 0.10 | | 01/20/10 | | 315,000 | | 314,983 | |
FNMA | | AAA | | 0.10 | | 01/29/10 | | 500,000 | | 499,961 | |
FNMA | | AAA | | 0.10 | | 02/01/10 | | 110,000 | | 110,129 | |
FNMA | | AAA | | 0.10 | | 02/03/10 | | 135,000 | | 134,995 | |
FNMA | | AAA | | 0.10 | | 02/10/10 | | 285,000 | | 284,989 | |
FNMA | | AAA | | 0.10 | | 03/10/10 | | 13,564,000 | | 13,561,889 | |
FNMA | | AAA | | 0.10 | | 03/17/10 | | 400,000 | | 399,943 | |
FNMA | | AAA | | 0.12 | | 03/10/10 | | 7,539,000 | | 7,537,758 | |
| | | | | | | | | | 70,297,175 | |
COMMERCIAL PAPER (40.8%) | | | | | | | | | | | |
Abbott Laboratories† | | A-1+ | | 0.08 | | 01/25/10 | | 1,600,000 | | 1,599,917 | |
Abbott Laboratories† | | A-1+ | | 0.10 | | 01/26/10 | | 500,000 | | 499,965 | |
Abbott Laboratories† | | A-1+ | | 0.10 | | 02/01/10 | | 300,000 | | 299,974 | |
Abbott Laboratories† | | A-1+ | | 0.11 | | 02/08/10 | | 300,000 | | 299,968 | |
Abbott Laboratories† | | A-1+ | | 0.11 | | 03/01/10 | | 400,000 | | 399,945 | |
Becton, Dickinson & Co. | | A-1+ | | 0.11 | | 01/25/10 | | 3,100,000 | | 3,099,773 | |
Chevron Funding Corp. | | A-1+ | | 0.03 | | 01/07/10 | | 3,100,000 | | 3,099,985 | |
Coca-Cola Co.† | | A-1 | | 0.11 | | 01/13/10 | | 840,000 | | 839,969 | |
Coca-Cola Co.† | | A-1 | | 0.10 | | 01/20/10 | | 500,000 | | 499,974 | |
Coca-Cola Co.† | | A-1 | | 0.12 | | 02/03/10 | | 2,000,000 | | 1,999,844 | |
Danaher Corp | | A-1 | | 0.13 | | 01/06/10 | | 3,200,000 | | 3,199,942 | |
Florida Power & Light Co. | | A-1 | | 0.11 | | 01/05/10 | | 3,100,000 | | 3,099,962 | |
General Electric Capital Corp. | | A-1+ | | 0.02 | | 01/15/10 | | 1,400,000 | | 1,399,989 | |
General Electric Capital Svcs. | | A-1+ | | 0.17 | | 02/05/10 | | 1,700,000 | | 1,699,719 | |
Johnson & Johnson† | | A-1+ | | 0.09 | | 02/01/10 | | 3,100,000 | | 3,099,852 | |
Madison Gas & Electric | | A-1+ | | 0.13 | | 01/15/10 | | 600,000 | | 599,970 | |
Microsoft Corp.† | | A-1+ | | 0.09 | | 01/26/10 | | 3,150,000 | | 3,149,823 | |
Nestle Capital Corp.† | | A-1+ | | 0.08 | | 02/02/10 | | 3,100,000 | | 3,099,809 | |
NetJets, Inc.† | | A-1+ | | 0.12 | | 02/05/10 | | 3,100,000 | | 3,099,639 | |
Novartis Finance Corp.† | | A-1+ | | 0.03 | | 01/04/10 | | 3,100,000 | | 3,099,992 | |
NSTAR Electric Co. | | A-1 | | 0.11 | | 01/07/10 | | 1,000,000 | | 999,982 | |
Toyota Motor Credit Corp. | | A-1+ | | 0.17 | | 02/05/10 | | 500,000 | | 499,917 | |
Toyota Motor Credit Corp. | | A-1+ | | 0.18 | | 02/16/10 | | 1,150,000 | | 1,149,740 | |
Toyota Motor Credit Corp. | | A-1+ | | 0.15 | | 02/26/10 | | 1,500,000 | | 1,499,650 | |
United Parcel Service, Inc.† | | A-1+ | | 0.07 | | 01/04/10 | | 3,000,000 | | 2,999,983 | |
Washington Gas Light Co. | | A-1 | | 0.12 | | 01/05/10 | | 2,000,000 | | 1,999,973 | |
Washington Gas Light Co. | | A-1 | | 0.12 | | 01/06/10 | | 1,100,000 | | 1,099,982 | |
| | | | | | | | | | 48,437,238 | |
TOTAL SHORT-TERM DEBT SECURITIES
(Cost: $118,730,752) 100.0% | | | | | | | | | | 118,734,413 | |
| | | | | | | | | | | |
TOTAL INVESTMENTS
(Cost: $118,730,752) 100.0% | | | | | | | | | | 118,734,413 | |
| | | | | | | | | | | |
OTHER NET ASSETS 0.0% (3) | | | | | | | | | | 2,654 | |
| | | | | | | | | | | |
NET ASSETS 100.0% | | | | | | | | | | $ | 118,737,067 | |
| | | | | | | | | | | | |
The accompanying notes are an integral part of these portfolio schedules.
MUTUAL OF AMERICA INVESTMENT CORPORATION - MID-TERM BOND FUND
PORTFOLIO OF INVESTMENTS IN SECURITIES
December 31, 2009
| | Rating** | | Rate | | Maturity | | Face Amount | | Value | |
LONG-TERM DEBT SECURITIES: | | | | | | | | | | | |
U.S. GOVERNMENT (36.8%) | | | | | | | | | | | |
U.S. Treasury Note | | AAA | | 1.00 | | 12/31/11 | | 3,000,000 | | 2,991,564 | |
U.S. Treasury Note | | AAA | | 1.38 | | 09/15/12 | | 20,000,000 | | 19,906,235 | |
U.S. Treasury Note | | AAA | | 2.38 | | 10/31/14 | | 7,000,000 | | 6,923,980 | |
U.S. Treasury Note | | AAA | | 2.38 | | 03/31/16 | | 3,500,000 | | 3,348,517 | |
U.S. Treasury Note | | AAA | | 3.13 | | 04/30/13 | | 4,750,000 | | 4,948,906 | |
U.S. Treasury Note | | AAA | | 3.13 | | 05/15/19 | | 4,000,000 | | 3,788,124 | |
U.S. Treasury Note | | AAA | | 3.25 | | 05/31/16 | | 11,500,000 | | 11,547,617 | |
U.S. Treasury Note | | AAA | | 3.25 | | 07/31/16 | | 8,000,000 | | 8,014,372 | |
U.S. Treasury Strip | | AAA | | 0.00 | | 08/15/18 | | 35,000,000 | | 24,828,750 | |
| | | | | | | | | | 86,298,065 | |
U.S. GOVERNMENT AGENCIES (9.6%) | | | | | | | | | | | |
MORTGAGE-BACKED OBLIGATIONS (1.4%) | | | | | | | | | | | |
FHLMC | | AAA | | 5.00 | | 06/15/17 | | 3,000,000 | | 3,129,393 | |
FHLMC | | AAA | | 6.00 | | 11/01/10 | | 2,415 | | 2,431 | |
FHLMC | | AAA | | 6.00 | | 02/01/19 | | 16,542 | | 17,862 | |
FHLMC | | AAA | | 6.50 | | 04/01/14 | | 63,316 | | 68,088 | |
FHLMC | | AAA | | 7.00 | | 02/01/14 | | 28,057 | | 30,461 | |
FHLMC | | AAA | | 7.50 | | 03/15/21 | | 14,793 | | 16,139 | |
FHLMC | | AAA | | 8.00 | | 09/01/18 | | 3,449 | | 3,795 | |
FHLMC | | AAA | | 8.50 | | 09/01/17 | | 4,073 | | 4,494 | |
FNMA | | AAA | | 6.00 | | 01/01/11 | | 142 | | 146 | |
FNMA | | AAA | | 6.00 | | 09/01/12 | | 10,317 | | 11,015 | |
FNMA | | AAA | | 6.50 | | 08/01/13 | | 12,202 | | 12,859 | |
FNMA | | AAA | | 6.50 | | 12/25/23 | | 33,981 | | 34,574 | |
FNMA | | AAA | | 8.00 | | 06/01/17 | | 741 | | 806 | |
| | | | | | | | | | 3,332,063 | |
NON-MORTGAGE-BACKED OBLIGATIONS (8.2%) | | | | | | | | | | | |
FFCB | | AAA | | 4.95 | | 10/10/14 | | 12,500,000 | | 13,630,333 | |
FFCB | | AAA | | 5.10 | | 08/05/13 | | 5,000,000 | | 5,492,405 | |
| | | | | | | | | | 19,122,738 | |
CORPORATE DEBT (52.5%) | | | | | | | | | | | |
CONSUMER DISCRETIONARY (5.8%) | | | | | | | | | | | |
AutoZone, Inc. | | BBB | | 6.50 | | 01/15/14 | | 1,000,000 | | 1,102,235 | |
Best Buy Co., Inc. | | BBB- | | 6.75 | | 07/15/13 | | 1,000,000 | | 1,098,594 | |
Black & Decker Corp. | | BBB | | 4.75 | | 11/01/14 | | 500,000 | | 512,077 | |
Black & Decker Corp. | | BBB | | 5.75 | | 11/15/16 | | 500,000 | | 515,406 | |
Brinker International, Inc. | | BBB- | | 5.75 | | 06/01/14 | | 1,000,000 | | 980,567 | |
DaimlerChrysler N.A. LLC | | A- | | 5.75 | | 09/08/11 | | 1,000,000 | | 1,050,412 | |
Ethan Allen Interiors, Inc. | | B+ | | 5.38 | | 10/01/15 | | 500,000 | | 448,288 | |
Fortune Brands, Inc. | | BBB- | | 4.88 | | 12/01/13 | | 1,000,000 | | 1,021,431 | |
Home Depot, Inc. | | BBB+ | | 5.40 | | 03/01/16 | | 250,000 | | 261,715 | |
Johnson Controls, Inc. | | BBB | | 4.88 | | 09/15/13 | | 250,000 | | 257,139 | |
Johnson Controls, Inc. | | BBB | | 5.25 | | 01/15/11 | | 750,000 | | 787,054 | |
Kohl's Corp. | | BBB+ | | 7.38 | | 10/15/11 | | 500,000 | | 548,291 | |
Leggett & Platt, Inc. | | A- | | 4.70 | | 04/01/13 | | 750,000 | | 779,842 | |
Marriott International, Inc. | | BBB- | | 5.63 | | 02/15/13 | | 750,000 | | 769,585 | |
Mattel, Inc. | | BBB- | | 6.13 | | 06/15/11 | | 1,000,000 | | 1,054,346 | |
Newell Rubbermaid, Inc. | | BBB- | | 5.50 | | 04/15/13 | | 500,000 | | 517,052 | |
Scholastic Corp. | | BB- | | 5.00 | | 04/15/13 | | 250,000 | | 233,750 | |
Starwood Hotels & Resorts | | BB | | 6.25 | | 02/15/13 | | 217,000 | | 223,781 | |
Wendy's International, Inc. | | B- | | 6.25 | | 11/15/11 | | 300,000 | | 310,500 | |
Whirlpool Corp. | | BBB- | | 5.50 | | 03/01/13 | | 500,000 | | 514,867 | |
Whirlpool Corp. | | BBB- | | 6.50 | | 06/15/16 | | 500,000 | | 520,013 | |
| | | | | | | | | | 13,506,945 | |
CONSUMER STAPLES (4.3%) | | | | | | | | | | | |
Anheuser-Busch Cos., Inc. | | BBB+ | | 4.38 | | 01/15/13 | | 1,000,000 | | 1,023,216 | |
Anheuser-Busch Cos., Inc. | | BBB+ | | 4.70 | | 04/15/12 | | 100,000 | | 104,290 | |
Brown-Forman Corp. | | A | | 5.20 | | 04/01/12 | | 1,000,000 | | 1,065,522 | |
Cargill, Inc.† | | A | | 5.20 | | 01/22/13 | | 1,000,000 | | 1,060,343 | |
Clorox Co. | | BBB+ | | 4.20 | | 01/15/10 | | 250,000 | | 250,228 | |
Clorox Co. | | BBB+ | | 5.00 | | 03/01/13 | | 500,000 | | 534,476 | |
Clorox Co. | | BBB+ | | 5.00 | | 01/15/15 | | 300,000 | | 318,402 | |
ConAgra Foods, Inc. | | BBB | | 6.75 | | 09/15/11 | | 1,000,000 | | 1,079,674 | |
CVS Caremark Corp. | | BBB+ | | 6.13 | | 08/15/16 | | 500,000 | | 538,416 | |
Hershey Co. | | A | | 4.85 | | 08/15/15 | | 500,000 | | 524,152 | |
Hershey Co. | | A | | 5.00 | | 04/01/13 | | 500,000 | | 529,649 | |
Kraft Foods, Inc. | | BBB+ | | 5.25 | | 10/01/13 | | 500,000 | | 528,368 | |
Kraft Foods, Inc. | | BBB+ | | 5.63 | | 11/01/11 | | 500,000 | | 531,033 | |
Kroger Co. | | BBB | | 4.95 | | 01/15/15 | | 500,000 | | 524,848 | |
Safeway, Inc. | | BBB | | 6.50 | | 03/01/11 | | 500,000 | | 528,471 | |
Sara Lee Corp. | | BBB+ | | 3.88 | | 06/15/13 | | 750,000 | | 766,848 | |
Sara Lee Corp. | | BBB+ | | 6.25 | | 09/15/11 | | 250,000 | | 266,724 | |
| | | | | | | | | | 10,174,660 | |
ENERGY (4.8%) | | | | | | | | | | | |
CenterPoint Energy Resources | | BBB | | 7.75 | | 02/15/11 | | 420,000 | | 444,191 | |
CenterPoint Energy Resources | | BBB | | 7.88 | | 04/01/13 | | 750,000 | | 844,781 | |
Diamond Offshore Drilling, Inc. | | A- | | 4.88 | | 07/01/15 | | 500,000 | | 527,802 | |
Enbridge, Inc. | | A- | | 5.80 | | 06/15/14 | | 1,065,000 | | 1,153,854 | |
Halliburton Co. | | A | | 5.50 | | 10/15/10 | | 500,000 | | 520,343 | |
Knight, Inc. | | BB | | 5.15 | | 03/01/15 | | 250,000 | | 240,000 | |
Nabors Industries Ltd. | | BBB+ | | 5.38 | | 08/15/12 | | 750,000 | | 790,700 | |
National Oilwell Varco, Inc. | | BBB+ | | 6.13 | | 08/15/15 | | 1,000,000 | | 1,003,572 | |
Noble Corp. | | A- | | 5.88 | | 06/01/13 | | 1,000,000 | | 1,045,356 | |
Premco Refining Group | | BBB | | 7.50 | | 06/15/15 | | 500,000 | | 496,326 | |
Smith International, Inc. | | BBB+ | | 6.75 | | 02/15/11 | | 1,000,000 | | 1,046,223 | |
Sunoco, Inc. | | BBB- | | 4.88 | | 10/15/14 | | 500,000 | | 503,882 | |
Sunoco, Inc. | | BBB- | | 9.63 | | 04/15/15 | | 500,000 | | 595,046 | |
Valero Energy Corp. | | BBB | | 4.75 | | 06/15/13 | | 1,000,000 | | 1,023,474 | |
Weatherford Int'l. Ltd. | | BBB+ | | 5.15 | | 03/15/13 | | 500,000 | | 523,614 | |
Weatherford Int'l. Ltd. | | BBB+ | | 5.50 | | 02/15/16 | | 500,000 | | 511,907 | |
| | | | | | | | | | 11,271,071 | |
FINANCIALS (14.8%) | | | | | | | | | | | |
American Express Credit Corp. | | BBB+ | | 5.88 | | 05/02/13 | | 1,000,000 | | 1,073,159 | |
Bank of America Corp. | | A | | 5.38 | | 08/15/11 | | 250,000 | | 262,444 | |
Bank of America Corp. | | A- | | 5.75 | | 08/15/16 | | 500,000 | | 503,263 | |
Berkshire Hathaway Finance | | AAA | | 4.20 | | 12/15/10 | | 500,000 | | 517,640 | |
Bunge Ltd. Finance Corp. | | BBB- | | 5.10 | | 07/15/15 | | 1,000,000 | | 991,452 | |
Capital One Bank | | BBB+ | | 5.75 | | 09/15/10 | | 250,000 | | 257,757 | |
Caterpillar Financial Services | | A | | 6.13 | | 02/17/14 | | 1,000,000 | | 1,117,540 | |
Colonial Realty LP | | BB+ | | 4.80 | | 04/01/11 | | 300,000 | | 292,214 | |
Developers Diversified Realty | | BB | | 5.00 | | 05/03/10 | | 250,000 | | 249,994 | |
Duke Realty LP | | BBB | | 4.63 | | 05/15/13 | | 500,000 | | 482,184 | |
ERP Operating LP | | BBB+ | | 5.38 | | 08/01/16 | | 500,000 | | 491,582 | |
Fairfax Financial Hldgs. | | BBB- | | 8.25 | | 10/01/15 | | 742,000 | | 754,058 | |
First Horizon National Corp. | | BB+ | | 4.50 | | 05/15/13 | | 125,000 | | 112,968 | |
First Industrial LP | | BB | | 6.88 | | 04/15/12 | | 750,000 | | 695,548 | |
Fosters Finance Corp.† | | BBB | | 4.88 | | 10/01/14 | | 500,000 | | 510,236 | |
Fosters Finance Corp.† | | BBB | | 6.88 | | 06/15/11 | | 500,000 | | 530,794 | |
GATX Financial Corp. | | BBB+ | | 5.13 | | 04/15/10 | | 250,000 | | 251,814 | |
General Electric Capital Corp. | | AA+ | | 5.00 | | 11/15/11 | | 1,000,000 | | 1,056,256 | |
General Electric Capital Corp. | | AA+ | | 5.00 | | 01/08/16 | | 500,000 | | 505,708 | |
Harley-Davidson Funding† | | BBB | | 5.25 | | 12/15/12 | | 1,000,000 | | 1,022,217 | |
HCP, Inc. | | BBB | | 4.88 | | 09/15/10 | | 500,000 | | 510,188 | |
HCP, Inc. | | BBB | | 5.65 | | 12/15/13 | | 500,000 | | 500,870 | |
Heinz (H.J.) Finance Co. | | BBB | | 6.00 | | 03/15/12 | | 1,000,000 | | 1,072,685 | |
HSBC Finance Corp. | | A | | 0.00 | | 01/10/10 | | 100,000 | | 100,000 | |
HSBC Finance Corp. | | A | | 0.00 | | 01/10/10 | | 50,000 | | 50,000 | |
HSBC Finance Corp. | | A | | 0.01 | | 04/10/11 | | 20,000 | | 19,480 | |
HSBC Finance Corp. | | A | | 0.01 | | 06/10/11 | | 10,000 | | 9,783 | |
HSBC Finance Corp. | | A | | 2.18 | | 11/10/13 | | 40,000 | | 38,392 | |
HSBC Finance Corp. | | A | | 2.21 | | 11/10/13 | | 43,000 | | 41,319 | |
HSBC Finance Corp. | | A | | 2.39 | | 11/10/13 | | 70,000 | | 67,727 | |
Jefferson-Pilot Corp. | | A- | | 4.75 | | 01/30/14 | | 500,000 | | 496,721 | |
JPMorgan Chase & Co. | | A+ | | 5.60 | | 06/01/11 | | 250,000 | | 264,632 | |
KeyCorp | | BBB+ | | 6.50 | | 05/14/13 | | 1,050,000 | | 1,083,745 | |
Kimco Realty Corp. | | BBB+ | | 6.00 | | 11/30/12 | | 1,000,000 | | 1,054,733 | |
Lehman Brothers Hldgs. (4) | | NR | | 5.75 | | 07/18/11 | | 250,000 | | 48,750 | |
Lincoln National Corp. | | A- | | 5.65 | | 08/27/12 | | 400,000 | | 413,975 | |
Mack-Cali Realty LP | | BBB | | 5.80 | | 01/15/16 | | 1,000,000 | | 959,475 | |
Manufacturers & Traders Tr. Co. | | A- | | 8.00 | | 10/01/10 | | 1,000,000 | | 1,046,912 | |
Markel Corp. | | BBB | | 6.80 | | 02/15/13 | | 1,000,000 | | 1,010,660 | |
MetLife, Inc. | | A- | | 5.00 | | 11/24/13 | | 250,000 | | 263,181 | |
Morgan Stanley | | A | | 0.01 | | 02/01/11 | | 500,000 | | 495,280 | |
Nat’l. Rural Utilities Coop. | | A | | 7.25 | | 03/01/12 | | 1,000,000 | | 1,099,238 | |
National City Corp. | | A | | 4.00 | | 02/01/11 | | 1,000,000 | | 1,018,750 | |
Nationwide Health Pptys., Inc. | | BBB- | | 6.50 | | 07/15/11 | | 1,000,000 | | 1,039,753 | |
Nissan Motor Acceptance Corp.† | | BBB | | 5.63 | | 03/14/11 | | 500,000 | | 510,161 | |
ProLogis | | BBB- | | 5.50 | | 04/01/12 | | 1,000,000 | | 1,012,365 | |
Protective Life Corp. | | A- | | 4.88 | | 11/01/14 | | 1,000,000 | | 990,968 | |
Protective Life Secured Trust | | AA- | | 0.01 | | 05/10/10 | | 650,000 | | 648,473 | |
Prudential Financial, Inc. | | A | | 4.75 | | 09/17/15 | | 1,000,000 | | 1,014,015 | |
Regency Centers LP | | BBB | | 4.95 | | 04/15/14 | | 500,000 | | 472,108 | |
Simon Property Group LP | | A- | | 4.88 | | 08/15/10 | | 500,000 | | 510,108 | |
SLM Corp. | | BBB- | | 1.51 | | 06/15/12 | | 60,000 | | 47,206 | |
Southtrust Bank, N.A. | | AA- | | 4.75 | | 03/01/13 | | 250,000 | | 261,398 | |
Textron Financial Corp. | | BB+ | | 5.40 | | 04/28/13 | | 1,000,000 | | 999,526 | |
Travelers Cos., Inc. | | A- | | 5.38 | | 06/15/12 | | 1,000,000 | | 1,058,710 | |
Tyco Int’l. Finance | | BBB+ | | 6.00 | | 11/15/13 | | 675,000 | | 739,384 | |
Union Planters Corp. | | BBB | | 4.38 | | 12/01/10 | | 250,000 | | 249,628 | |
Vornado Realty LP | | BBB | | 5.60 | | 02/15/11 | | 500,000 | | 506,491 | |
Wachovia Bank, N.A. | | AA- | | 5.60 | | 03/15/16 | | 500,000 | | 511,440 | |
Zions Bancorporation | | BB+ | | 5.65 | | 05/15/14 | | 1,000,000 | | 728,493 | |
| | | | | | | | | | 34,645,551 | |
HEALTH CARE (4.7%) | | | | | | | | | | | |
Abbott Laboratories | | AA | | 5.60 | | 05/15/11 | | 500,000 | | 530,317 | |
Allergan, Inc. | | A | | 5.75 | | 04/01/16 | | 500,000 | | 539,176 | |
Baxter International, Inc. | | A+ | | 4.63 | | 03/15/15 | | 250,000 | | 265,031 | |
Beckman Coulter, Inc. | | BBB | | 6.88 | | 11/15/11 | | 925,000 | | 995,876 | |
Blue Cross & Blue Shield of FL† | | A- | | 8.25 | | 11/15/11 | | 1,000,000 | | 1,088,525 | |
Boston Scientific Corp. | | BBB- | | 4.25 | | 01/12/11 | | 500,000 | | 508,750 | |
Cardinal Health, Inc. | | BBB+ | | 5.50 | | 06/15/13 | | 1,000,000 | | 1,062,862 | |
Fisher Scientific Int’l., Inc. | | BBB+ | | 6.13 | | 07/01/15 | | 500,000 | | 515,625 | |
Humana, Inc. | | BBB- | | 6.45 | | 06/01/16 | | 1,415,000 | | 1,430,292 | |
Laboratory Corp. of America | | BBB+ | | 5.50 | | 02/01/13 | | 285,000 | | 296,816 | |
Laboratory Corp. of America | | BBB+ | | 5.63 | | 12/15/15 | | 500,000 | | 522,771 | |
Lilly (Eli) & Co. | | AA | | 5.20 | | 03/15/17 | | 500,000 | | 529,408 | |
McKesson Corp. | | BBB+ | | 7.75 | | 02/01/12 | | 1,000,000 | | 1,102,336 | |
UnitedHealth Group, Inc. | | A- | | 5.25 | | 03/15/11 | | 250,000 | | 259,052 | |
UnitedHealth Group, Inc. | | A- | | 5.50 | | 11/15/12 | | 750,000 | | 800,754 | |
WellPoint, Inc. | | A- | | 5.00 | | 01/15/11 | | 500,000 | | 516,981 | |
| | | | | | | | | | 10,964,572 | |
INDUSTRIALS (6.6%) | | | | | | | | | | | |
Avery Dennison Corp. | | BBB | | 4.88 | | 01/15/13 | | 500,000 | | 515,098 | |
Burlington Northern Santa Fe | | BBB | | 4.30 | | 07/01/13 | | 500,000 | | 525,431 | |
CSX Corp. | | BBB- | | 6.25 | | 04/01/15 | | 1,000,000 | | 1,101,451 | |
Dun & Bradstreet Corp. | | A- | | 5.50 | | 03/15/11 | | 500,000 | | 520,833 | |
Dun & Bradstreet Corp. | | A- | | 6.00 | | 04/01/13 | | 1,000,000 | | 1,029,450 | |
Federal Express Corp. | | BBB | | 9.65 | | 06/15/12 | | 1,000,000 | | 1,157,023 | |
General Dynamics Corp. | | A | | 4.50 | | 08/15/10 | | 500,000 | | 512,904 | |
Goodrich Corp. | | BBB+ | | 7.63 | | 12/15/12 | | 1,000,000 | | 1,119,799 | |
Masco Corp. | | BBB | | 4.80 | | 06/15/15 | | 500,000 | | 459,630 | |
Masco Corp. | | BBB | | 5.88 | | 07/15/12 | | 300,000 | | 306,458 | |
Pall Corp.† | | NR | | 6.00 | | 08/01/12 | | 1,000,000 | | 1,000,950 | |
Precision Castparts Corp. | | BBB+ | | 5.60 | | 12/15/13 | | 750,000 | | 785,768 | |
Roper Industries, Inc. | | BBB- | | 6.63 | | 08/15/13 | | 1,000,000 | | 1,089,067 | |
Ryder System, Inc. | | BBB+ | | 6.00 | | 03/01/13 | | 500,000 | | 525,621 | |
Ryder System, Inc. | | BBB+ | | 7.20 | | 09/01/15 | | 1,000,000 | | 1,087,763 | |
Southwest Airlines Co. | | BBB | | 5.25 | | 10/01/14 | | 500,000 | | 506,435 | |
Stanley Works | | A | | 4.90 | | 11/01/12 | | 525,000 | | 556,598 | |
Steelcase, Inc. | | BBB | | 6.50 | | 08/15/11 | | 1,000,000 | | 1,022,607 | |
Union Pacific Corp. | | BBB | | 4.88 | | 01/15/15 | | 500,000 | | 519,185 | |
Union Pacific Corp. | | BBB | | 6.13 | | 01/15/12 | | 500,000 | | 543,535 | |
Waste Management, Inc. | | BBB | | 5.00 | | 03/15/14 | | 500,000 | | 527,184 | |
| | | | | | | | | | 15,412,790 | |
INFORMATION TECHNOLOGY (2.3%) | | | | | | | | | | | |
Arrow Electronics, Inc. | | BBB- | | 6.88 | | 07/01/13 | | 750,000 | | 817,994 | |
Avnet, Inc. | | BBB- | | 6.00 | | 09/01/15 | | 980,000 | | 995,043 | |
Cisco Systems, Inc. | | A+ | | 5.25 | | 02/22/11 | | 250,000 | | 262,332 | |
Computer Sciences Corp. | | A- | | 7.38 | | 06/15/11 | | 950,000 | | 1,022,366 | |
Intuit, Inc. | | BBB | | 5.40 | | 03/15/12 | | 725,000 | | 770,243 | |
Western Union Co. | | A- | | 5.40 | | 11/17/11 | | 500,000 | | 533,842 | |
Xerox Corp. | | BBB | | 6.88 | | 08/15/11 | | 1,000,000 | | 1,068,563 | |
| | | | | | | | | | 5,470,383 | |
MATERIALS (2.3%) | | | | | | | | | | | |
Bemis Co., Inc. | | A | | 4.88 | | 04/01/12 | | 500,000 | | 519,775 | |
Lubrizol Corp. | | BBB | | 5.50 | | 10/01/14 | | 500,000 | | 532,257 | |
Martin Marietta Materials, Inc. | | BBB+ | | 6.88 | | 04/01/11 | | 1,000,000 | | 1,045,674 | |
Rohm & Haas Co. | | BBB- | | 5.60 | | 03/15/13 | | 750,000 | | 791,571 | |
Sealed Air Corp.† | | BB+ | | 5.63 | | 07/15/13 | | 1,000,000 | | 1,057,362 | |
Sonoco Products Co. | | BBB+ | | 6.50 | | 11/15/13 | | 250,000 | | 268,053 | |
Temple-Inland, Inc. | | BBB- | | 7.88 | | 05/01/12 | | 143,000 | | 154,367 | |
Vulcan Materials Co. | | BBB | | 6.30 | | 06/15/13 | | 1,000,000 | | 1,069,595 | |
| | | | | | | | | | 5,438,654 | |
TELECOMMUNICATION SERVICES (0.9%) | | | | | | | | | | | |
BellSouth Corp. | | A | | 4.75 | | 11/15/12 | | 900,000 | | 961,025 | |
Verizon New England, Inc. | | A | | 6.50 | | 09/15/11 | | 1,000,000 | | 1,065,857 | |
| | | | | | | | | | 2,026,882 | |
UTILITIES (6.0%) | | | | | | | | | | | |
AGL Capital Corp. | | BBB+ | | 6.38 | | 07/15/16 | | 500,000 | | 531,324 | |
AGL Capital Corp. | | BBB+ | | 7.13 | | 01/14/11 | | 1,000,000 | | 1,055,329 | |
Arizona Public Svc. Co. | | BBB- | | 6.38 | | 10/15/11 | | 500,000 | | 535,244 | |
Arizona Public Svc. Co. | | BBB- | | 6.50 | | 03/01/12 | | 500,000 | | 537,442 | |
Atmos Energy Corp. | | BBB+ | | 4.95 | | 10/15/14 | | 1,000,000 | | 1,047,817 | |
Black Hills Corp. | | BBB- | | 9.00 | | 05/15/14 | | 2,000,000 | | 2,280,814 | |
Duke Energy Corp. | | A | | 4.50 | | 04/01/10 | | 500,000 | | 504,756 | |
Entergy New Orleans, Inc. | | BBB+ | | 5.25 | | 08/01/13 | | 1,000,000 | | 1,037,706 | |
Exelon Generation Co. LLC | | BBB | | 5.35 | | 01/15/14 | | 1,000,000 | | 1,055,693 | |
Pepco Hldgs., Inc. | | BBB- | | 4.00 | | 05/15/10 | | 250,000 | | 252,345 | |
PPL Energy Supply LLC | | BBB | | 5.70 | | 10/15/15 | | 600,000 | | 624,054 | |
PPL Energy Supply LLC | | BBB | | 6.40 | | 11/01/11 | | 1,100,000 | | 1,181,974 | |
Progress Energy, Inc. | | BBB | | 6.85 | | 04/15/12 | | 900,000 | | 976,942 | |
Southwest Gas Corp. | | NR | | 8.38 | | 02/15/11 | | 1,000,000 | | 1,065,238 | |
TransAlta Corp. | | BBB | | 5.75 | | 12/15/13 | | 1,000,000 | | 1,054,142 | |
Virginia Electric & Power Co. | | A- | | 4.50 | | 12/15/10 | | 400,000 | | 411,378 | |
| | | | | | | | | | 14,152,198 | |
TOTAL LONG-TERM DEBT SECURITIES
(Cost: $226,265,440) 98.9% | | | | | | | | | | 231,816,572 | |
| | | | | | | | | | | |
TEMPORARY CASH INVESTMENTS (2)
(Cost: $261,900) 0.1% | | | | | | | | | | 261,900 | |
| | | | | | | | | | | |
TOTAL INVESTMENTS
(Cost: $226,527,340) 99.0% | | | | | | | | | | 232,078,472 | |
| | | | | | | | | | | |
OTHER NET ASSETS 1.0% | | | | | | | | | | 2,343,976 | |
| | | | | | | | | | | |
NET ASSETS 100.0% | | | | | | | | | | $ | 234,422,448 | |
| | | | | | | | | | | | |
The accompanying notes are an integral part of these portfolio schedules.
MUTUAL OF AMERICA INVESTMENT CORPORATION - BOND FUND
PORTFOLIO OF INVESTMENTS IN SECURITIES
December 31, 2009
| | Rating** | | Rate(%) | | Maturity | | Face Amount | | Value | |
LONG-TERM DEBT SECURITIES: | | | | | | | | | | | |
U.S. GOVERNMENT (20.7%) | | | | | | | | | | | |
U.S. Treasury Bond | | AAA | | 3.50 | | 02/15/39 | | 4,000,000 | | 3,276,248 | |
U.S. Treasury Bond | | AAA | | 4.25 | | 05/15/39 | | 36,000,000 | | 33,772,499 | |
U.S. Treasury Note | | AAA | | 1.00 | | 12/31/11 | | 19,000,000 | | 18,946,572 | |
U.S. Treasury Note | | AAA | | 2.38 | | 10/31/14 | | 25,000,000 | | 24,728,500 | |
U.S. Treasury Note | | AAA | | 2.38 | | 03/31/16 | | 12,000,000 | | 11,480,628 | |
U.S. Treasury Note | | AAA | | 3.13 | | 05/15/19 | | 5,000,000 | | 4,735,155 | |
U.S. Treasury Note | | AAA | | 3.25 | | 07/31/16 | | 4,000,000 | | 4,007,188 | |
| | | | | | | | | | 100,946,790 | |
U.S. GOVERNMENT AGENCIES (35.8%) | | | | | | | | | | | |
MORTGAGE-BACKED OBLIGATIONS (33.6%) | | | | | | | | | | | |
FHARM | | AAA | | 4.64 | | 09/01/39 | | 2,492,073 | | 2,597,662 | |
FHARM | | AAA | | 5.23 | | 04/01/37 | | 2,659,505 | | 2,795,695 | |
FHARM | | AAA | | 5.25 | | 02/01/36 | | 1,414,740 | | 1,490,201 | |
FHARM | | AAA | | 5.41 | | 04/01/37 | | 1,825,574 | | 1,928,786 | |
FHARM | | AAA | | 5.43 | | 05/01/37 | | 1,715,727 | | 1,820,856 | |
FHARM | | AAA | | 5.79 | | 03/01/37 | | 1,310,496 | | 1,394,323 | |
FHLMC | | AAA | | 4.00 | | 10/15/26 | | 118,526 | | 119,842 | |
FHLMC | | AAA | | 4.50 | | 03/01/34 | | 2,743,106 | | 2,757,965 | |
FHLMC | | AAA | | 5.00 | | 02/01/26 | | 888,222 | | 918,592 | |
FHLMC | | AAA | | 5.50 | | 10/01/18 | | 857,891 | | 914,567 | |
FHLMC | | AAA | | 5.50 | | 12/15/20 | | 3,500,000 | | 3,697,964 | |
FHLMC | | AAA | | 5.50 | | 03/01/21 | | 886,630 | | 944,929 | |
FHLMC | | AAA | | 5.50 | | 01/15/33 | | 1,596,131 | | 1,687,864 | |
FHLMC | | AAA | | 5.50 | | 01/15/35 | | 617,000 | | 643,132 | |
FHLMC | | AAA | | 6.00 | | 07/15/29 | | 1,244,315 | | 1,335,963 | |
FHLMC | | AAA | | 6.00 | | 03/15/32 | | 1,525,582 | | 1,632,850 | |
FNMA | | AAA | | 4.00 | | 05/01/19 | | 1,667,418 | | 1,704,075 | |
FNMA | | AAA | | 4.50 | | 05/01/18 | | 1,477,409 | | 1,539,905 | |
FNMA | | AAA | | 4.50 | | 05/01/19 | | 357,995 | | 372,243 | |
FNMA | | AAA | | 4.50 | | 06/01/19 | | 569,154 | | 591,807 | |
FNMA | | AAA | | 4.50 | | 07/01/29 | | 2,344,018 | | 2,375,749 | |
FNMA | | AAA | | 4.50 | | 08/01/33 | | 2,006,018 | | 2,014,377 | |
FNMA | | AAA | | 4.50 | | 10/01/33 | | 2,588,868 | | 2,604,509 | |
FNMA | | AAA | | 4.50 | | 10/01/33 | | 1,518,119 | | 1,527,291 | |
FNMA | | AAA | | 4.50 | | 05/01/34 | | 944,725 | | 949,252 | |
FNMA | | AAA | | 4.50 | | 06/01/34 | | 1,971,223 | | 1,980,669 | |
FNMA | | AAA | | 4.50 | | 07/01/34 | | 2,458,243 | | 2,470,023 | |
FNMA | | AAA | | 4.50 | | 01/01/35 | | 2,618,254 | | 2,629,164 | |
FNMA | | AAA | | 4.50 | | 12/01/35 | | 1,127,172 | | 1,130,460 | |
FNMA | | AAA | | 5.00 | | 04/01/18 | | 333,065 | | 350,904 | |
FNMA | | AAA | | 5.00 | | 09/01/18 | | 1,238,578 | | 1,304,917 | |
FNMA | | AAA | | 5.00 | | 09/01/20 | | 1,133,726 | | 1,191,615 | |
FNMA | | AAA | | 5.00 | | 10/01/20 | | 1,676,874 | | 1,762,497 | |
FNMA | | AAA | | 5.00 | | 10/01/25 | | 1,317,523 | | 1,366,089 | |
FNMA | | AAA | | 5.00 | | 06/01/33 | | 1,618,488 | | 1,667,634 | |
FNMA | | AAA | | 5.00 | | 09/01/33 | | 5,566,305 | | 5,735,325 | |
FNMA | | AAA | | 5.00 | | 11/01/33 | | 3,773,304 | | 3,887,880 | |
FNMA | | AAA | | 5.00 | | 11/01/33 | | 2,757,563 | | 2,841,296 | |
FNMA | | AAA | | 5.00 | | 01/01/34 | | 2,054,985 | | 2,117,385 | |
FNMA | | AAA | | 5.00 | | 03/01/34 | | 938,870 | | 967,379 | |
FNMA | | AAA | | 5.00 | | 04/01/34 | | 1,713,696 | | 1,766,000 | |
FNMA | | AAA | | 5.00 | | 04/01/34 | | 1,291,725 | | 1,329,737 | |
FNMA | | AAA | | 5.00 | | 04/01/34 | | 463,784 | | 477,432 | |
FNMA | | AAA | | 5.00 | | 04/01/35 | | 1,648,995 | | 1,695,459 | |
FNMA | | AAA | | 5.00 | | 06/01/35 | | 1,176,322 | | 1,209,467 | |
FNMA | | AAA | | 5.00 | | 09/01/35 | | 3,892,015 | | 4,001,680 | |
FNMA | | AAA | | 5.50 | | 04/01/17 | | 187,021 | | 199,142 | |
FNMA | | AAA | | 5.50 | | 05/01/17 | | 348,715 | | 371,316 | |
FNMA | | AAA | | 5.50 | | 01/01/24 | | 1,021,516 | | 1,082,496 | |
FNMA | | AAA | | 5.50 | | 03/01/24 | | 2,355,643 | | 2,492,440 | |
FNMA | | AAA | | 5.50 | | 09/01/25 | | 1,072,871 | | 1,134,306 | |
FNMA | | AAA | | 5.50 | | 11/01/26 | | 1,163,858 | | 1,228,874 | |
FNMA | | AAA | | 5.50 | | 01/01/27 | | 728,985 | | 769,708 | |
FNMA | | AAA | | 5.50 | | 07/01/33 | | 2,871,863 | | 3,018,448 | |
FNMA | | AAA | | 5.50 | | 09/01/33 | | 1,564,312 | | 1,644,158 | |
FNMA | | AAA | | 5.50 | | 10/01/33 | | 2,119,413 | | 2,227,592 | |
FNMA | | AAA | | 5.50 | | 03/01/34 | | 1,343,531 | | 1,412,108 | |
FNMA | | AAA | | 5.50 | | 03/01/34 | | 685,598 | | 720,592 | |
FNMA | | AAA | | 5.50 | | 07/01/34 | | 1,353,229 | | 1,422,301 | |
FNMA | | AAA | | 5.50 | | 09/01/34 | | 1,244,912 | | 1,308,455 | |
FNMA | | AAA | | 5.50 | | 09/01/34 | | 506,620 | | 532,479 | |
FNMA | | AAA | | 5.50 | | 10/01/34 | | 3,065,009 | | 3,221,453 | |
FNMA | | AAA | | 5.50 | | 02/01/35 | | 1,090,667 | | 1,146,337 | |
FNMA | | AAA | | 5.50 | | 02/01/35 | | 911,153 | | 957,090 | |
FNMA | | AAA | | 5.50 | | 04/01/35 | | 1,336,181 | | 1,403,548 | |
FNMA | | AAA | | 5.50 | | 08/01/35 | | 2,679,599 | | 2,814,697 | |
FNMA | | AAA | | 5.50 | | 02/25/37 | | 1,516,178 | | 1,596,148 | |
FNMA | | AAA | | 5.50 | | 11/01/38 | | 1,506,696 | | 1,575,361 | |
FNMA | | AAA | | 5.50 | | 06/01/48 | | 1,507,935 | | 1,564,874 | |
FNMA | | AAA | | 6.00 | | 03/01/17 | | 231,080 | | 247,646 | |
FNMA | | AAA | | 6.00 | | 05/01/23 | | 1,256,639 | | 1,349,718 | |
FNMA | | AAA | | 6.00 | | 01/01/25 | | 722,190 | | 774,716 | |
FNMA | | AAA | | 6.00 | | 03/01/28 | | 1,412,187 | | 1,505,670 | |
FNMA | | AAA | | 6.00 | | 04/01/32 | | 404,072 | | 431,852 | |
FNMA | | AAA | | 6.00 | | 04/01/32 | | 199,922 | | 213,667 | |
FNMA | | AAA | | 6.00 | | 05/01/32 | | 1,216,218 | | 1,299,833 | |
FNMA | | AAA | | 6.00 | | 04/01/33 | | 1,557,641 | | 1,664,729 | |
FNMA | | AAA | | 6.00 | | 11/01/34 | | 1,077,068 | | 1,148,761 | |
FNMA | | AAA | | 6.00 | | 12/01/36 | | 1,491,543 | | 1,584,299 | |
FNMA | | AAA | | 6.00 | | 01/01/37 | | 1,613,785 | | 1,714,143 | |
FNMA | | AAA | | 6.00 | | 03/01/37 | | 1,448,697 | | 1,531,545 | |
FNMA | | AAA | | 6.00 | | 04/01/37 | | 1,513,547 | | 1,600,103 | |
FNMA | | AAA | | 6.00 | | 05/01/37 | | 1,376,075 | | 1,454,770 | |
FNMA | | AAA | | 6.00 | | 06/01/37 | | 1,752,653 | | 1,852,884 | |
FNMA | | AAA | | 6.00 | | 07/01/37 | | 1,532,292 | | 1,625,426 | |
FNMA | | AAA | | 6.00 | | 08/01/37 | | 2,299,728 | | 2,439,507 | |
FNMA | | AAA | | 6.00 | | 12/01/37 | | 1,189,391 | | 1,261,683 | |
FNMA | | AAA | | 6.00 | | 02/25/47 | | 1,463,038 | | 1,531,161 | |
FNMA | | AAA | | 6.00 | | 12/25/49 | | 2,480,760 | | 2,627,281 | |
FNMA | | AAA | | 6.50 | | 09/01/16 | | 82,579 | | 89,648 | |
FNMA | | AAA | | 6.50 | | 03/01/17 | | 589,368 | | 639,822 | |
FNMA | | AAA | | 6.50 | | 05/01/17 | | 95,320 | | 103,480 | |
FNMA | | AAA | | 6.50 | | 04/01/32 | | 129,132 | | 139,544 | |
FNMA | | AAA | | 6.50 | | 05/01/32 | | 1,476,935 | | 1,596,013 | |
FNMA | | AAA | | 6.50 | | 05/01/32 | | 404,109 | | 436,690 | |
FNMA | | AAA | | 6.50 | | 09/01/36 | | 1,107,859 | | 1,181,947 | |
FNMA | | AAA | | 6.50 | | 05/01/37 | | 1,446,367 | | 1,550,550 | |
FNMA | | AAA | | 6.50 | | 07/01/37 | | 960,523 | | 1,029,710 | |
FNMA | | AAA | | 6.50 | | 09/01/37 | | 1,691,814 | | 1,813,677 | |
FNMA | | AAA | | 6.50 | | 05/01/38 | | 1,740,766 | | 1,866,058 | |
FNMA | | AAA | | 7.00 | | 09/01/31 | | 145,686 | | 162,292 | |
FNMA | | AAA | | 7.00 | | 11/01/31 | | 96,102 | | 107,056 | |
FNMA | | AAA | | 7.00 | | 01/25/44 | | 1,453,765 | | 1,603,049 | |
FNMA | | AAA | | 7.50 | | 04/01/32 | | 100,307 | | 113,194 | |
FNMA | | AAA | | 7.50 | | 06/01/32 | | 454,484 | | 512,878 | |
FNMA | | AAA | | 8.00 | | 03/01/31 | | 76,396 | | 87,588 | |
FNMA | | AAA | | 8.00 | | 04/01/32 | | 62,596 | | 71,780 | |
FNMA | | AAA | | 8.00 | | 04/01/32 | | 45,574 | | 52,254 | |
GNMA (5) | | AAA | | 4.50 | | 02/20/21 | | 1,966,123 | | 2,013,076 | |
GNMA (5) | | AAA | | 5.00 | | 11/15/39 | | 1,997,628 | | 2,058,110 | |
GNMA (5) | | AAA | | 6.50 | | 04/15/31 | | 42,119 | | 45,487 | |
GNMA (5) | | AAA | | 6.50 | | 12/15/31 | | 176,915 | | 191,063 | |
GNMA (5) | | AAA | | 6.50 | | 05/15/32 | | 67,887 | | 73,125 | |
GNMA (5) | | AAA | | 7.00 | | 09/15/31 | | 48,585 | | 54,111 | |
GNMA (5) | | AAA | | 7.00 | | 09/15/31 | | 34,583 | | 38,517 | |
GNMA (5) | | AAA | | 7.00 | | 05/15/32 | | 21,861 | | 24,217 | |
Vendee Mortgage Trust (5) | | AAA | | 5.25 | | 01/15/32 | | 2,421,102 | | 2,519,459 | |
| | | | | | | | | | 164,121,123 | |
NON-MORTGAGE-BACKED OBLIGATIONS (2.2%) | | | | | | | | | | | |
FNMA | | AAA | | 0.00 | | 10/09/19 | | 20,000,000 | | 10,860,000 | |
| | | | | | | | | | | |
CORPORATE DEBT (41.5%) | | | | | | | | | | | |
CONSUMER DISCRETIONARY (5.1%) | | | | | | | | | | | |
Best Buy Co., Inc. | | BBB- | | 6.75 | | 07/15/13 | | 500,000 | | 549,297 | |
Black & Decker Corp. | | BBB | | 4.75 | | 11/01/14 | | 2,000,000 | | 2,048,308 | |
Brinker International, Inc. | | BBB- | | 5.75 | | 06/01/14 | | 2,000,000 | | 1,961,134 | |
Ethan Allen Interiors, Inc. | | B+ | | 5.38 | | 10/01/15 | | 2,000,000 | | 1,793,152 | |
Fortune Brands, Inc. | | BBB- | | 4.88 | | 12/01/13 | | 500,000 | | 510,716 | |
Fortune Brands, Inc. | | BBB- | | 5.38 | | 01/15/16 | | 1,900,000 | | 1,891,165 | |
Fruit of the Loom (4) | | NR | | 7.38 | | 11/15/23 | | 345,170 | | 35 | |
Home Depot, Inc. | | BBB+ | | 5.40 | | 03/01/16 | | 2,000,000 | | 2,093,720 | |
Johnson Controls, Inc. | | BBB | | 4.88 | | 09/15/13 | | 2,500,000 | | 2,571,390 | |
Kohl’s Corp. | | BBB+ | | 6.30 | | 03/01/11 | | 1,500,000 | | 1,577,195 | |
Leggett & Platt, Inc. | | A- | | 4.70 | | 04/01/13 | | 2,000,000 | | 2,079,578 | |
Marriott International, Inc. | | BBB- | | 5.63 | | 02/15/13 | | 2,000,000 | | 2,052,226 | |
Scholastic Corp. | | BB- | | 5.00 | | 04/15/13 | | 2,000,000 | | 1,870,000 | |
Starwood Hotels & Resorts | | BB | | 6.25 | | 02/15/13 | | 109,000 | | 112,406 | |
Wendy’s International, Inc. | | B- | | 6.25 | | 11/15/11 | | 1,500,000 | | 1,552,500 | |
Whirlpool Corp. | | BBB- | | 6.50 | | 06/15/16 | | 2,000,000 | | 2,080,050 | |
| | | | | | | | | | 24,742,872 | |
CONSUMER STAPLES (2.3%) | | | | | | | | | | | |
Cargill, Inc.† | | A | | 5.00 | | 11/15/13 | | 500,000 | | 530,844 | |
Clorox Co. | | BBB+ | | 5.00 | | 03/01/13 | | 2,000,000 | | 2,137,902 | |
CVS Caremark Corp. | | BBB+ | | 6.13 | | 08/15/16 | | 2,000,000 | | 2,153,664 | |
Kraft Foods, Inc. | | BBB+ | | 5.63 | | 11/01/11 | | 2,000,000 | | 2,124,130 | |
Kroger Co. | | BBB | | 4.95 | | 01/15/15 | | 2,000,000 | | 2,099,390 | |
Sara Lee Corp. | | BBB+ | | 6.25 | | 09/15/11 | | 2,000,000 | | 2,133,790 | |
| | | | | | | | | | 11,179,720 | |
ENERGY (5.3%) | | | | | | | | | | | |
CenterPoint Energy Resources | | BBB | | 7.75 | | 02/15/11 | | 2,000,000 | | 2,115,196 | |
Diamond Offshore Drilling, Inc. | | A- | | 4.88 | | 07/01/15 | | 2,000,000 | | 2,111,208 | |
Enbridge, Inc. | | A- | | 5.80 | | 06/15/14 | | 1,000,000 | | 1,083,431 | |
Knight, Inc. | | BB | | 5.15 | | 03/01/15 | | 2,000,000 | | 1,920,000 | |
Nabors Industries Ltd. | | BBB+ | | 5.38 | | 08/15/12 | | 1,000,000 | | 1,054,266 | |
National Oilwell Varco, Inc. | | BBB+ | | 6.13 | | 08/15/15 | | 2,000,000 | | 2,007,144 | |
Noble Corp. | | A- | | 7.50 | | 03/15/19 | | 2,000,000 | | 2,342,108 | |
Premco Refining Group | | BBB | | 7.50 | | 06/15/15 | | 2,000,000 | | 1,985,302 | |
Seariver Maritime, Inc. | | AAA | | 0.00 | | 09/01/12 | | 10,000,000 | | 9,283,330 | |
Weatherford Int’l. Ltd. | | BBB+ | | 5.15 | | 03/15/13 | | 500,000 | | 523,614 | |
Weatherford Int’l. Ltd. | | BBB+ | | 5.50 | | 02/15/16 | | 1,500,000 | | 1,535,721 | |
| | | | | | | | | | 25,961,320 | |
FINANCIALS (15.8%) | | | | | | | | | | | |
Allstate Corp. | | A- | | 7.45 | | 05/16/19 | | 2,000,000 | | 2,323,644 | |
American Express Credit Corp. | | BBB+ | | 5.88 | | 05/02/13 | | 500,000 | | 536,580 | |
Berkley (W.R.) Corp. | | BBB+ | | 7.38 | | 09/15/19 | | 2,000,000 | | 2,093,366 | |
Bunge Ltd. Finance Corp. | | BBB- | | 5.35 | | 04/15/14 | | 2,000,000 | | 2,044,540 | |
Capital One Bank | | BBB+ | | 5.75 | | 09/15/10 | | 2,000,000 | | 2,062,056 | |
Colonial Realty LP | | BB+ | | 4.80 | | 04/01/11 | | 1,500,000 | | 1,461,068 | |
Developers Diversified Realty | | BB | | 5.00 | | 05/03/10 | | 2,000,000 | | 1,999,952 | |
Duke Realty LP | | BBB | | 4.63 | | 05/15/13 | | 2,000,000 | | 1,928,734 | |
Fairfax Financial Hldgs. | | BBB- | | 8.25 | | 10/01/15 | | 2,500,000 | | 2,540,625 | |
First Horizon National Corp. | | BB+ | | 4.50 | | 05/15/13 | | 5,000,000 | | 4,518,735 | |
First Industrial LP | | BB | | 6.88 | | 04/15/12 | | 2,000,000 | | 1,854,794 | |
Fosters Finance Corp.† | | BBB | | 6.88 | | 06/15/11 | | 2,000,000 | | 2,123,174 | |
GATX Financial Corp. | | BBB+ | | 5.13 | | 04/15/10 | | 1,000,000 | | 1,007,256 | |
General Electric Capital Corp. | | AA+ | | 5.00 | | 11/15/11 | | 2,000,000 | | 2,112,512 | |
GMAC LLC | | CCC | | 0.00 | | 12/01/12 | | 10,000,000 | | 7,475,000 | |
Harley-Davidson Funding† | | BBB | | 5.25 | | 12/15/12 | | 500,000 | | 511,109 | |
HCP, Inc. | | BBB | | 4.88 | | 09/15/10 | | 2,000,000 | | 2,040,752 | |
HCP, Inc. | | BBB | | 5.65 | | 12/15/13 | | 2,000,000 | | 2,003,480 | |
Heinz (H.J.) Finance Co. | | BBB | | 6.00 | | 03/15/12 | | 2,000,000 | | 2,145,370 | |
HSBC Finance Corp. | | A | | 2.18 | | 11/10/13 | | 100,000 | | 95,979 | |
HSBC Finance Corp. | | A | | 2.35 | | 10/10/13 | | 70,000 | | 67,320 | |
JP Morgan Chase Bank NA | | A+ | | 6.00 | | 10/01/17 | | 2,000,000 | | 2,141,348 | |
KeyCorp | | BBB+ | | 6.50 | | 05/14/13 | | 2,000,000 | | 2,064,276 | |
Kimco Realty Corp. | | BBB+ | | 6.00 | | 11/30/12 | | 1,000,000 | | 1,054,733 | |
Lincoln National Corp. | | A- | | 5.65 | | 08/27/12 | | 2,000,000 | | 2,069,874 | |
Manufacturers & Traders Tr. Co. | | A- | | 8.00 | | 10/01/10 | | 2,000,000 | | 2,093,824 | |
Markel Corp. | | BBB | | 6.80 | | 02/15/13 | | 2,000,000 | | 2,021,320 | |
National City Corp. | | A | | 4.00 | | 02/01/11 | | 2,000,000 | | 2,037,500 | |
Nationwide Health Pptys., Inc. | | BBB- | | 6.50 | | 07/15/11 | | 2,000,000 | | 2,079,506 | |
ProLogis | | BBB- | | 5.50 | | 04/01/12 | | 2,000,000 | | 2,024,730 | |
Protective Life Corp. | | A- | | 4.88 | | 11/01/14 | | 1,000,000 | | 990,968 | |
Protective Life Secured Trust | | AA- | | 1.71 | | 12/10/14 | | 124,000 | | 112,873 | |
Protective Life Secured Trust | | AA- | | 1.86 | | 10/10/14 | | 53,000 | | 48,639 | |
Protective Life Secured Trust | | AA- | | 1.96 | | 08/10/14 | | 21,000 | | 19,772 | |
Prudential Financial, Inc. | | A | | 4.75 | | 09/17/15 | | 2,000,000 | | 2,028,030 | |
Regency Centers LP | | BBB | | 4.95 | | 04/15/14 | | 2,000,000 | | 1,888,430 | |
Retail Properties, Inc.† | | A- | | 7.88 | | 03/15/16 | | 5,000,000 | | 5,520,710 | |
Shurgard Storage Centers | | A- | | 7.75 | | 02/22/11 | | 750,000 | | 789,213 | |
Southtrust Bank, N.A. | | AA- | | 4.75 | | 03/01/13 | | 1,250,000 | | 1,306,991 | |
Travelers Cos., Inc. | | A- | | 5.38 | | 06/15/12 | | 500,000 | | 529,355 | |
Vornado Realty LP | | BBB | | 5.60 | | 02/15/11 | | 2,000,000 | | 2,025,964 | |
Zions Bancorporation | | BB+ | | 5.65 | | 05/15/14 | | 2,000,000 | | 1,456,986 | |
| | | | | | | | | | 77,251,088 | |
HEALTH CARE (3.3%) | | | | | | | | | | | |
Allergan, Inc. | | A | | 5.75 | | 04/01/16 | | 2,000,000 | | 2,156,702 | |
CIGNA Corp. | | BBB | | 5.38 | | 03/15/17 | | 2,000,000 | | 1,924,970 | |
Fisher Scientific Int’l., Inc. | | BBB+ | | 6.13 | | 07/01/15 | | 2,000,000 | | 2,062,500 | |
Humana, Inc. | | BBB- | | 7.20 | | 06/15/18 | | 2,000,000 | | 2,045,476 | |
Laboratory Corp. of America | | BBB+ | | 5.50 | | 02/01/13 | | 1,000,000 | | 1,041,459 | |
Laboratory Corp. of America | | BBB+ | | 5.63 | | 12/15/15 | | 1,000,000 | | 1,045,541 | |
McKesson Corp. | | BBB+ | | 7.75 | | 02/01/12 | | 1,750,000 | | 1,929,088 | |
UnitedHealth Group, Inc. | | A- | | 5.50 | | 11/15/12 | | 2,000,000 | | 2,135,344 | |
Wyeth | | AA | | 5.50 | | 03/15/13 | | 1,750,000 | | 1,902,754 | |
| | | | | | | | | | 16,243,834 | |
INDUSTRIALS (3.0%) | | | | | | | | | | | |
CSX Corp. | | BBB- | | 6.25 | | 04/01/15 | | 2,000,000 | | 2,202,902 | |
Donnelley (R.R.) & Sons Co. | | BBB | | 4.95 | | 04/01/14 | | 2,000,000 | | 2,000,606 | |
Goodrich Corp. | | BBB+ | | 7.63 | | 12/15/12 | | 2,000,000 | | 2,239,598 | |
Masco Corp. | | BBB | | 5.88 | | 07/15/12 | | 2,000,000 | | 2,043,056 | |
Precision Castparts Corp. | | BBB+ | | 5.60 | | 12/15/13 | | 2,000,000 | | 2,095,382 | |
Ryder System, Inc. | | BBB+ | | 6.00 | | 03/01/13 | | 2,000,000 | | 2,102,482 | |
Steelcase, Inc. | | BBB | | 6.50 | | 08/15/11 | | 2,000,000 | | 2,045,214 | |
| | | | | | | | | | 14,729,240 | |
INFORMATION TECHNOLOGY (1.0%) | | | | | | | | | | | |
Avnet, Inc. | | BBB- | | 6.00 | | 09/01/15 | | 2,000,000 | | 2,030,700 | |
Cisco Systems, Inc. | | A+ | | 5.25 | | 02/22/11 | | 2,000,000 | | 2,098,654 | |
Xerox Corp. | | BBB | | 6.88 | | 08/15/11 | | 500,000 | | 534,282 | |
| | | | | | | | | | 4,663,636 | |
MATERIALS (2.0%) | | | | | | | | | | | |
Lubrizol Corp. | | BBB | | 5.50 | | 10/01/14 | | 2,000,000 | | 2,129,026 | |
Martin Marietta Materials, Inc. | | BBB+ | | 6.88 | | 04/01/11 | | 1,500,000 | | 1,568,511 | |
PolyOne Corp. | | B- | | 7.50 | | 12/15/15 | | 3,750,000 | | 3,356,250 | |
Sonoco Products Co. | | BBB+ | | 6.50 | | 11/15/13 | | 500,000 | | 536,106 | |
Vulcan Materials Co. | | BBB | | 7.00 | | 06/15/18 | | 2,000,000 | | 2,181,370 | |
| | | | | | | | | | 9,771,263 | |
TELECOMMUNICATION SERVICES (0.9%) | | | | | | | | | | | |
Alltel Corp. | | A | | 7.00 | | 03/15/16 | | 2,000,000 | | 2,256,704 | |
Verizon Florida LLC | | A | | 6.13 | | 01/15/13 | | 2,000,000 | | 2,135,034 | |
| | | | | | | | | | 4,391,738 | |
UTILITIES (2.8%) | | | | | | | | | | | |
AGL Capital Corp. | | BBB+ | | 6.38 | | 07/15/16 | | 500,000 | | 531,324 | |
Arizona Public Svc. Co. | | BBB- | | 6.50 | | 03/01/12 | | 2,000,000 | | 2,149,766 | |
Duke Energy Corp. | | A | | 4.50 | | 04/01/10 | | 750,000 | | 757,133 | |
Entergy New Orleans, Inc. | | BBB+ | | 5.25 | | 08/01/13 | | 1,075,000 | | 1,115,534 | |
Entergy New Orleans, Inc. | | BBB+ | | 6.75 | | 10/15/17 | | 500,000 | | 500,525 | |
Pepco Hldgs., Inc. | | BBB- | | 4.00 | | 05/15/10 | | 2,000,000 | | 2,018,758 | |
PPL Energy Supply LLC | | BBB | | 5.40 | | 08/15/14 | | 2,000,000 | | 2,095,844 | |
Progress Energy Enterprise | | A- | | 5.25 | | 12/15/15 | | 2,000,000 | | 2,187,036 | |
Virginia Electric & Power Co. | | A- | | 4.50 | | 12/15/10 | | 2,000,000 | | 2,056,888 | |
| | | | | | | | | | 13,412,808 | |
SOVEREIGN DEBT (0.9%) | | | | | | | | | | | |
Sri Lanka AID (5) | | NR | | 6.59 | | 09/15/28 | | 3,899,114 | | 4,240,248 | |
| | | | | | | | | | | |
TOTAL LONG-TERM DEBT SECURITIES
(Cost: $473,803,756) 98.9% | | | | | | | | | | 482,515,680 | |
| | Rating** | | Rate(%) | | Maturity | | Face Amount | | Value | |
SHORT-TERM DEBT SECURITIES: | | | | | | | | | | | |
COMMERCIAL PAPER (0.2%) | | | | | | | | | | | |
Abbott Laboratories† | | A-1+ | | 0.05 | | 01/04/10 | | 900,000 | | 899,996 | |
TOTAL SHORT-TERM DEBT SECURITIES
(Cost: $899,996) 0.2% | | | | | | | | | | 899,996 | |
| | | | | | | | | | | |
TEMPORARY CASH INVESTMENTS (2)
(Cost: $31,100) 0.0% (3) | | | | | | | | | | 31,100 | |
TOTAL INVESTMENTS
(Cost: $474,734,852) 99.1% | | | | | | | | | | 483,446,776 | |
| | | | | | | | | | | |
OTHER NET ASSETS 0.9% | | | | | | | | | | 4,180,063 | |
| | | | | | | | | | | |
NET ASSETS 100.0% | | | | | | | | | | $ | 487,626,839 | |
| | | | | | | | | | | | |
The accompanying notes are an integral part of these portfolio schedules.
MUTUAL OF AMERICA INVESTMENT CORPORATION
FOOTNOTES TO PORTFOLIOS OF INVESTMENTS IN SECURITIES
December 31, 2009
Abbreviations: | FFCB = Federal Farm Credit Bank |
| FHARM = Federal Home Adjustable Rate Mortgage |
| FHLB = Federal Home Loan Bank |
| FHLMC = Federal Home Loan Mortgage Corporation |
| FNMA = Federal National Mortgage Association |
| GMAC = General Motors Acceptance Corporation |
| GNMA = Government National Mortgage Association |
| NR = Not Rated |
“Other Securities” represent securities in the respective category that individually, or in the aggregate by issuer, do not exceed 1% of net assets.
* Non-income producing security.
** Ratings as per Standard & Poors Corporation.
*** This security is fair valued in accordance with procedures established by the Funds’ Board of Directors.
† Security is exempt from registration under Rule 144A of the Securities Act of 1933. These securities may be resold in transactions exempt from registration, normally to qualified institutional buyers. At December 31, 2009, the aggregate values of these securities and their percentages of the respective Funds’ net assets were as follows:
| | Aggregate | | Percentage | |
| | Market | | of | |
Fund | | Value | | Net Assets | |
| | | | | |
EQUITY INDEX FUND | | $ | 11,999,832 | | 1.6 | % |
ALL AMERICA FUND | | $ | 5,689,992 | | 2.2 | % |
SMALL CAP VALUE FUND | | $ | 8,840,310 | | 4.3 | % |
SMALL CAP GROWTH FUND | | $ | 1,599,993 | | 0.8 | % |
MID CAP VALUE FUND | | $ | 1,669,926 | | 4.0 | % |
MID-CAP EQUITY INDEX FUND | | $ | 9,499,961 | | 2.5 | % |
INTERNATIONAL FUND | | $ | 1,399,994 | | 4.2 | % |
COMPOSITE FUND | | $ | 3,930,780 | | 2.4 | % |
MONEY MARKET FUND | | $ | 24,988,654 | | 21.0 | % |
MID-TERM BOND FUND | | $ | 6,780,588 | | 2.9 | % |
BOND FUND | | $ | 9,585,833 | | 2.0 | % |
(1) | This security, or a portion thereof, has been segregated to cover initial margin requirements on open futures contracts. |
| Information on futures contracts outstanding in the Funds as of December 31, 2009, were as follows: |
| | | | | | | | | | | | | | Face Value | |
| | | | | | | | | | | | | | of Futures | |
| | | | | | | | | | Underlying | | | | as a % of | |
| | Number of | | | | Purchased (P) | | Expiration | | Face Amount | | Unrealized | | Total | |
Fund | | Contracts | | Contract Type | | or Sold (S) | | Date | | at Value(a) | | Gain(Loss) | | Investments | |
| | | | | | | | | | | | | | | |
EQUITY INDEX FUND | | 432 | | E-mini S&P 500 Stock Index | | P | | March 2010 | | $ | 23,991,120 | | $ | 117,782 | | 3.1 | % |
ALL AMERICA FUND | | 54 | | E-mini S&P 500 Stock Index | | P | | March 2010 | | $ | 2,998,890 | | $ | 20,115 | | 1.2 | % |
MID-CAP EQUITY INDEX FUND | | 268 | | E-mini S&P MidCap 400 Stock Index | | P | | March 2010 | | $ | 19,427,320 | | $ | 472,990 | | 5.2 | % |
(a) | Includes the cumulative appreciation(depreciation) of futures contracts. |
| |
(2) | The fund has an arrangement with its custodian bank, JP Morgan Chase Bank, whereby uninvested cash, subject to parameters set by the fund, is automatically invested in the fund’s name by the bank in overnight commercial paper issued by J.P. Morgan Chase & Co. On the next business day, these funds (and earned interest) are automatically returned to the fund. The annual rate of interest earned on this temporary cash investment at December 31, 2009 was 0.15%. |
(3) | Percentage is less than 0.05%. |
(4) | Issuer has filed for Chapter XI bankruptcy law (or equivalent) protection; issue is non-income producing. |
(5) | U.S. Government guaranteed security. |
Fair Value—The Investment Company values its investments at fair value. Fair value is an estimate of the price the Fund would receive upon selling a security in an orderly arms-length transaction. Investments are categorized based on a three-level valuation hierarchy for measurement and disclosure of fair value. The valuation hierarchy is based upon the transparency of inputs used to measure fair value. The three levels are as follows:
· Level 1 – quoted prices in active markets for identical securities.
· Level 2 - other significant observable inputs (including yield, quality, coupon rate, maturity, issue type, quoted prices for similar securities, prepayment speeds, trading characteristics, etc.).
· Level 3 – significant unobservable inputs (including the Fund’s own assumptions in determining the fair value of investments).
As of December 31, 2009, management determined that the fair value inputs for all equity securities, including shares of registered investment companies, were considered Level 1, with the exception of non-registered securities under Rule 144A of the Securities Act of 1933 which were considered Level 2. In addition, certain Rule 144A securities not actively traded were considered Level 3. Fair value inputs for all debt securities were considered Level 2. The inputs used for valuing securities are not necessarily an indication of the risk associated with investing in those securities.
The following is a summary of the inputs used to value the Funds’ investments as of December 31, 2009, by fair value input hierarchy:
Fund | | Level 1 – Quoted
Prices | | Level 2 – Significant
Observable Inputs | | Level 3 – Significant
Unobservable Inputs | | Total | |
Investments at Market Value: | | | | | | | | | |
(See Portfolios of Investments for More Details) | | | | | | | | | |
Equity Index Fund | | | | | | | | | |
Common Stock | | $ | 741,660,934 | | — | | — | | $ | 741,660,934 | |
Short-Term Debt Securities | | — | | $ | 25,199,581 | | — | | $ | 25,199,581 | |
Temporary Cash Investments | | — | | $ | 71,000 | | — | | $ | 71,000 | |
| | $ | 741,660,934 | | $ | 25,270,581 | | — | | $ | 766,931,515 | |
| | | | | | | | | |
All America Fund | | | | | | | | | |
Common Stock - Indexed | | $ | 148,140,564 | | — | | — | | $ | 148,140,564 | |
Common Stock - Active | | $ | 100,983,519 | | $ | 158,050 | (1) | $ | 761,962 | (2) | $ | 101,903,531 | |
Convertible Preferred Stock | | — | | $ | 55,600 | | — | | $ | 55,600 | |
Short-Term Debt Securities | | — | | $ | 5,369,766 | | — | | $ | 5,369,766 | |
Temporary Cash Investments | | — | | $ | 140,400 | | — | | $ | 140,400 | |
| | $ | 249,124,083 | | $ | 5,723,816 | | $ | 761,962 | | $ | 255,609,861 | |
| | | | | | | | | |
Small Cap Value Fund | | | | | | | | | |
Common Stock | | $ | 190,350,079 | | $ | 868,550 | (1) | $ | 4,471,775 | (2) | $ | 195,690,404 | |
Convertible Preferred Stock | | — | | $ | 425,500 | | — | | $ | 425,500 | |
Short-Term Debt Securities | | — | | $ | 8,699,957 | | — | | $ | 8,699,957 | |
| | $ | 190,350,079 | | $ | 9,994,007 | | $ | 4,471,775 | | $ | 204,815,861 | |
| | | | | | | | | |
Small Cap Growth Fund | | | | | | | | | |
Common Stock | | $ | 191,541,517 | | — | | — | | $ | 191,541,517 | |
Short-Term Debt Securities | | — | | $ | 1,599,993 | | — | | $ | 1,599,993 | |
| | $ | 191,541,517 | | $ | 1,599,993 | | — | | $ | 193,141,510 | |
| | | | | | | | | |
Mid Cap Value Fund | | | | | | | | | |
Common Stock | | $ | 39,631,930 | | — | | — | | $ | 39,631,930 | |
Short-Term Debt Securities | | — | | $ | 2,269,923 | | — | | $ | 2,269,923 | |
| | $ | 39,631,930 | | $ | 2,269,923 | | — | | $ | 41,901,853 | |
| | | | | | | | | |
Mid-Cap Equity Index Fund | | | | | | | | | |
Common Stock | | $ | 356,587,564 | | — | | — | | $ | 356,587,564 | |
Short-Term Debt Securities | | — | | $ | 19,899,640 | | — | | $ | 19,899,640 | |
Temporary Cash Investments | | — | | $ | 187,800 | | — | | $ | 187,800 | |
| | $ | 356,587,564 | | $ | 20,087,440 | | — | | $ | 376,675,004 | |
| | | | | | | | | |
International Fund | | | | | | | | | |
Common Stock | | $ | 32,922,186 | | — | | — | | $ | 32,922,186 | |
Short-Term Debt Securities | | — | | $ | 2,399,990 | | — | | $ | 2,399,990 | |
| | $ | 32,922,186 | | $ | 2,399,990 | | — | | $ | 35,322,176 | |
| | | | | | | | | |
Composite Fund | | | | | | | | | |
Common Stock | | $ | 97,262,197 | | — | | — | | $ | 97,262,197 | |
U.S. Government Debt | | — | | $ | 11,481,658 | | — | | $ | 11,481,658 | |
U.S. Government Agency Residential Mortgage-Backed Obligations | | — | | $ | 21,198,447 | | — | | $ | 21,198,447 | |
Corporate Long-Term Debt | | — | | $ | 29,757,565 | | — | | $ | 29,757,565 | |
Short-Term Debt | | — | | $ | 5,499,539 | | — | | $ | 5,499,539 | |
Temporary Cash Investments | | — | | $ | 110,300 | | — | | $ | 110,300 | |
| | $ | 97,262,197 | | $ | 68,047,509 | | — | | $ | 165,309,706 | |
| | | | | | | | | |
Retirement Income Fund | | | | | | | | | |
Common Stock | | $ | 8,844,444 | | — | | — | | $ | 8,844,444 | |
| | | | | | | | | |
2010 Retirement Fund | | | | | | | | | |
Common Stock | | $ | 14,617,212 | | — | | — | | $ | 14,617,212 | |
| | | | | | | | | |
2015 Retirement Fund | | | | | | | | | |
Common Stock | | $ | 44,059,234 | | — | | — | | $ | 44,059,234 | |
| | | | | | | | | |
2020 Retirement Fund | | | | | | | | | |
Common Stock | | $ | 49,683,457 | | — | | — | | $ | 49,683,457 | |
2025 Retirement Fund | | | | | | | | | |
Common Stock | | $ | 41,987,460 | | — | | — | | $ | 41,987,460 | |
| | | | | | | | | |
2030 Retirement Fund | | | | | | | | | |
Common Stock | | $ | 34,733,128 | | — | | — | | $ | 34,733,128 | |
| | | | | | | | | |
2035 Retirement Fund | | | | | | | | | |
Common Stock | | $ | 26,973,412 | | — | | — | | $ | 26,973,412 | |
| | | | | | | | | |
2040 Retirement Fund | | | | | | | | | |
Common Stock | | $ | 22,558,859 | | — | | — | | $ | 22,558,859 | |
| | | | | | | | | |
2045 Retirement Fund | | | | | | | | | |
Common Stock | | $ | 24,979,241 | | — | | — | | $ | 24,979,241 | |
| | | | | | | | | |
Conservative Allocation Fund | | | | | | | | | |
Common Stock | | $ | 38,120,887 | | — | | — | | $ | 38,120,887 | |
| | | | | | | | | |
Moderate Allocation Fund | | | | | | | | | |
Common Stock | | $ | 125,286,212 | | — | | — | | $ | 125,286,212 | |
| | | | | | | | | |
Aggressive Allocation Fund | | | | | | | | | |
Common Stock | | $ | 116,568,914 | | — | | — | | $ | 116,568,914 | |
| | | | | | | | | |
Money Market Fund | | | | | | | | | |
U.S. Government Agency Short-Term Debt | | — | | $ | 70,297,175 | | — | | $ | 70,297,175 | |
Commercial Paper | | — | | $ | 48,437,238 | | — | | $ | 48,437,238 | |
| | — | | $ | 118,734,413 | | — | | $ | 118,734,413 | |
| | | | | | | | | |
Mid-Term Bond Fund | | | | | | | | | |
U.S. Government Debt | | — | | $ | 86,298,065 | | — | | $ | 86,298,065 | |
U.S. Government Agency Residential Mortgage-Backed Obligations | | — | | $ | 3,332,063 | | — | | $ | 3,362,063 | |
U.S. Government Agency Non-Mortgage-Backed Obligations | | — | | $ | 19,122,738 | | — | | $ | 19,122,738 | |
Corporate Debt | | — | | $ | 123,063,706 | | — | | $ | 123,063,706 | |
Temporary Cash Investments | | — | | $ | 261,900 | | — | | $ | 261,900 | |
| | — | | $ | 232,078,472 | | — | | $ | 232,078,472 | |
| | | | | | | | | |
Bond Fund | | | | | | | | | |
U.S. Government Debt | | — | | $ | 100,946,790 | | — | | $ | 100,946,790 | |
U.S. Government Agency Residential Mortgage-Backed Obligations | | — | | $ | 164,121,123 | | — | | $ | 164,121,123 | |
U.S. Government Agency Non-Mortgage-Backed Obligations | | — | | $ | 10,860,000 | | — | | $ | 10,860,000 | |
Long-Term Corporate Debt | | — | | $ | 202,347,519 | | — | | $ | 202,347,519 | |
Sovereign Debt | | — | | $ | 4,240,248 | | — | | $ | 4,240,248 | |
Short-Term Debt | | — | | 899,996 | | — | | 899,996 | |
Temporary Cash Investments | | — | | $ | 31,100 | | — | | $ | 31,100 | |
| | — | | $ | 483,446,776 | | — | | $ | 483,446,776 | |
| | | | | | | | | |
Other Financial Instruments:* | | | | | | | | | |
Equity Index Fund | | $ | 117,782 | | — | | — | | $ | 117,782 | |
All America Fund | | $ | 20,115 | | — | | — | | $ | 20,115 | |
Mid-Cap Equity Index Fund | | $ | 472,990 | | — | | — | | $ | 472,990 | |
* Other financial instruments are derivative instruments not reflected in the Portfolio of Investments, such as futures, which are valued at the unrealized appreciation/depreciation on the instrument.
(1) Reflects security issued by Ellora Energy, Inc. included in the Energy section of the active asset segment of the All America Fund portfolio and in the Small Cap Value Fund portfolio, respectively.
(2) Reflects securities issued by Ellington Financial and NBH Holdings included in the Financials section of the active asset segment of the All America Fund portfolio and in the Small Cap Value Fund portfolio.
Fair Value Measurement Using Significant Unobservable Inputs (Level 3) for the Year Ended December 31, 2009
| | Balance | | Realized and
Unrealized | | Net Transfers | | Balance | |
| | December 31, | | Gains | | In/(Out) of | | December 31, | |
| | 2008 | | (Losses) | | Level 3 | | 2009 | |
All America Fund | | $ | 695,347 | | $ | (13,746 | ) | $ | 80,361 | | $ | 761,962 | |
Small Cap Value Fund | | $ | 3,989,652 | | $ | (74,052 | ) | $ | 556,175 | | $ | 4,471,775 | |
In January 2010, the Financial Accounting Standards Board issued Accounting Standards Update (“ASU”) No. 2010-06. “Improving Disclosures About Fair Value Measurements.” The ASU clarifies existing disclosure regarding fair value measurements. Additionally, effective for interim and annual reporting periods beginning after December 15, 2009, the ASU requires entities to disclose significant transfers into and out of Level 1 and 2 fair value hierarchies and the reasons for those transfers. Effective for interim and annual reporting periods beginning after December 15, 2010, the ASU also requires entities to disclose information about purchases, sales, issuances and settlements of Level 3 securities on a gross basis, as opposed to the current net number. Management is currently evaluating the impact of ASU 2010-06 on the disclosures of fair value of the Funds’ investments.
Security Valuation — Investment securities are carried at fair value as follows:
Exchange-traded equity securities are valued at the last sales price on the principal exchange on which the security is traded. If there is no trading volume for a particular valuation day, the last bid price is used. For equity securities traded in the over-the-counter market, the security is valued at the last sale price, or if no sale, at the latest bid price available.
Short-term debt securities with a maturity of 60 days or less are valued at amortized cost, which approximates fair value for such securities.
Debt securities, including short-term debt securities maturing in excess of 60 days, are valued on the basis of prices obtained from an independent pricing source. The pricing source may utilize various pricing methodologies that incorporate both models (which consider factors such as yield, quality, coupon rate, maturity, issue type, quoted prices for similar securities, prepayment speeds and trading characteristics) and dealer supplied
valuations to derive a valuation.
In the rare instance when a price is not available from an independent pricing source or when prices may not reflect fair value, such as when the pricing service price is not the result of a recent trade, a calculated fair value is used, as determined in good faith by the Adviser and reviewed by a Valuation Committee, in accordance with procedures adopted by the Board of Directors of the Investment Company. The Adviser uses a market approach to calculate fair value for equity securities, which are categorized as Level 3 above. The Adviser’s valuation is primarily based on information regarding the specific equity issuer, such as financial statements, the relationship of per-share book value to the last trade price and operating information. The Adviser also considers industry-specific conditions and overall market conditions, to determine whether the last trade price reflects fair value or needs to be adjusted.
Retirement Funds and the Allocation Funds value their investments in the underlying Funds of the Investment Company at their respective net asset values.
Investment Transactions — Investment transactions are accounted for as of the trade date. Realized gain and loss on the sale of short and long-term debt securities is computed on the basis of amortized cost at the time of sale. Realized gain and loss on the sale of common stock is based on the identified cost basis of the security determined on a first-in, first-out (“FIFO”) basis.
Futures Contracts - The Equity Index Fund, Mid-Cap Equity Index Fund and a portion of the All America Fund each maintain indexed asset portfolios which are subject to equity price risk. In order to remain more fully invested in the equity markets while minimizing transaction costs, the funds purchase stock index futures contracts. An initial cash margin deposit (represented by cash or Treasury bills) is made upon entering into a futures contract and serves as collateral for the contract. This initial margin, maintained in a segregated account, is equal to approximately 5%-6% of the contract amount, and does not involve the borrowing of funds to finance the transaction. During the period the futures contract is outstanding, changes in the value of the contract are recognized as unrealized gains or losses by “marking-to-market” on a daily basis to reflect the market value of the contract at the end of each trading day. The accumulated unrealized gain or loss on the contract is included in Net Unrealized Appreciation (Depreciation) of Investments in the Components of Net Assets section of the Statement of Assets and Liabilities. Futures contracts are valued at the settlement price established each day by the exchange on which traded. Depending upon whether unrealized gains or losses are incurred, variation margin payments are received or made daily. The net change in unrealized appreciation or deprecation of futures contracts is recorded in the Statement of Operations. When the contract is closed, a realized gain or loss from futures transactions is recorded in the Statement of Operations, equal to the net variation margin received or paid over the period the contract was outstanding. The “Underlying Face Amount at Value” (appearing in the “Notes to the Summary Portfolio of Investments in Securities”) representing the aggregate of outstanding contractual amounts under futures contracts reflects the extent of a Fund’s exposure to off-balance sheet risk. The use of futures transactions involves the risk of imperfect correlation in the price movements of the contract and the underlying securities. With futures contracts, there is minimal counterparty credit risk to the Fund since futures are exchange traded and the exchange’s clearinghouse, as counterparty to all exchange traded futures, guarantees the futures against default.
The components of net unrealized appreciation (depreciation) of investments for Federal income tax purposes and the cost of investments for Federal income tax purposes at December 31, 2009 for each of the funds were as follows.
| | Equity Index | | All America | | Small Cap | | Small Cap | | Mid Cap | |
| | Fund | | Fund | | Value Fund | | Growth Fund | | Value Fund | |
Unrealized Appreciation | | $ | 147,295,131 | | $ | 34,616,809 | | $ | 32,342,456 | | $ | 35,460,514 | | $ | 3,603,498 | |
Unrealized Depreciation | | (118,536,593 | ) | (44,186,974 | ) | (22,361,514 | ) | (8,782,490 | ) | (5,554,912 | ) |
Net | | $ | 28,758,538 | | $ | (9,570,165 | ) | $ | 9,980,942 | | $ | 26,678,024 | | $ | (1,951,414 | ) |
Tax Cost of Investments | | $ | 738,172,977 | | $ | 265,180,026 | | $ | 194,834,919 | | $ | 166,463,486 | | $ | 43,853,267 | |
| | Mid-Cap | | | | | | | | | |
| | Equity Index | | International | | Composite | | Retirement | | 2010 Retirement | |
| | Fund | | Fund | | Fund | | Income Fund | | Fund | |
Unrealized Appreciation | | $ | 49,807,571 | | $ | 1,335,836 | | $ | 13,321,334 | | $ | 444,964 | | $ | 977,761 | |
Unrealized Depreciation | | (51,376,752 | ) | (777,540 | ) | (8,400,361 | ) | (254,629 | ) | (870,724 | ) |
Net | | $ | (1,569,181 | ) | $ | 558,296 | | $ | 4,920,973 | | $ | 190,335 | | $ | 107,037 | |
Tax Cost of Investments | | $ | 378,244,185 | | $ | 34,763,880 | | $ | 160,388,733 | | $ | 8,654,109 | | $ | 14,510,175 | |
| | 2015 | | 2020 | | 2025 | | 2030 | | | |
| | Retirement | | Retirement | | Retirement | | Retirement | | 2035 Retirement | |
| | Fund | | Fund | | Fund | | Fund | | Fund | |
Unrealized Appreciation | | $ | 3,003,076 | | $ | 2,359,776 | | $ | 2,715,962 | | $ | 2,453,992 | | $ | 1,934,327 | |
Unrealized Depreciation | | (2,170,802 | ) | (1,744,746 | ) | (797,500 | ) | (788,883 | ) | (466,563 | ) |
Net | | $ | 832,274 | | $ | 615,030 | | $ | 1,918,462 | | $ | 1,665,109 | | $ | 1,467,764 | |
Tax Cost of Investments | | $ | 43,226,960 | | $ | 49,068,427 | | $ | 40,068,998 | | $ | 33,068,019 | | $ | 25,505,648 | |
| | 2040 | | 2045 | | Conservative | | Moderate | | Aggressive | |
| | Retirement | | Retirement | | Allocation | | Allocation | | Allocation | |
| | Fund | | Fund | | Fund | | Fund | | Fund | |
Unrealized Appreciation | | $ | 1,866,988 | | $ | 2,452,093 | | $ | 803,918 | | $ | 1,696,520 | | $ | 414,419 | |
Unrealized Depreciation | | (312,591 | ) | (366,412 | ) | (1,459,806 | ) | (8,117,212 | ) | (11,777,554 | ) |
Net | | $ | 1,554,397 | | $ | 2,085,681 | | $ | (655,888 | ) | $ | (6,420,692 | ) | $ | (11,363,135 | ) |
Tax Cost of Investments | | $ | 21,004,462 | | $ | 22,893,560 | | $ | 38,776,775 | | $ | 131,706,904 | | $ | 127,932,049 | |
| | Money | | | | | | | | | |
| | Market | | Mid-Term | | Bond | | | | | |
| | Fund | | Bond Fund | | Fund | | | | | |
Unrealized Appreciation | | $ | 3,695 | | $ | 8,239,352 | | $ | 14,696,840 | | | | | |
Unrealized Depreciation | | (34 | ) | (2,708,109 | ) | (5,984,916 | ) | | | | |
Net | | $ | 3,661 | | $ | 5,531,243 | | $ | 8,711,924 | | | | | |
Tax Cost of Investments | | $ | 118,730,752 | | $ | 226,547,229 | | $ | 474,734,852 | | | | | |
ITEM 7. DISCLOSURE OF PROXY VOTING POLICIES AND PROCEDURES FOR CLOSED-END MANAGEMENT INVESTMENT COMPANIES.
Not applicable.
ITEM 8. PORTFOLIO MANAGERS OF CLOSED-END MANAGEMENT INVESTMENT COMPANIES.
Not applicable.
ITEM 9. PURCHASES OF EQUITY SECURITES BY CLOSED-END MANAGEMENT INVESTMENT COMPANY AND AFFILIATED PURCHASERS.
Not applicable.
ITEM 10. SUBMISSIO N OF MATTERS TO A VOTE OF SECURITY HOLDERS.
Not applicable.
ITEM 11. CONTROLS AND PROCEDURES.
(a) The registrant’s principal executive officer and principal financial officer have evaluated the registrant’s disclosure controls and procedures within 90 days of this filing and have concluded that the registrant’s disclosure controls and procedures were effective, as of that date, in ensuring that information required to be disclosed by the registrant in this Form N-CSR was recorded, processed, summarized, and reported in a timely and accurate manner.
(b) The registrant’s principal executive officer and principal financial officer are aware of no changes in the registrant’s interna l control over financial reporting that occurred during the second fiscal quarter of the period covered by this report that has materially affected, or is likely to materially affect, the registrant’s internal control over financial reporting.
ITEM 12. EXHIBITS.
Attach ed hereto:
(a) (1) Not applicable.
(2) Exhibit 99.CERT | Certifications by the registrant’s principal executive officer and principal financial officer, pursuant to Section 302 of the Sarbanes-Oxley Act of 2002 and required by Rule 30a-2(a) under the Investment Company Act of 1940. |
(b) | Exhibit 99.906CERT | Certifications pursuant to Section 906 of the Sarbanes-Oxley Act of 2002 and required by Rule 30a-2(b) under the Investment Company Act of 1940. |
| | |
| Exhibit 99.REPT | Report of Independent Registered Public Accounting Firm |
SIGNATURES
Pursuant to the requirements of the Securities Exchange Act of 1934 and the Investment Company Act of 1940, the registrant has duly caused this report to be signed on its behalf by the undersigned, thereunto duly authorized.
| Mutual of America Investment Corporation | |
By: | /s/ MANFRED ALTSTADT | |
| Manfred Altstadt | |
| Chairman of the Board, | |
| President and Chief Executive Officer of | |
| Mutual of America Investment Corporation | |
Date: February 26, 2010
Pursuant to the requirements of the Securities Exchange Act of 1934 and the Investment Company Act of 1940, this report has been signed below by the following persons on behalf of the registrant and in the capacities and on the dates indicated.
By: | /s/ MANFRED ALTSTADT | |
| Manfred Altstadt | |
| Chairman of the Board, | |
| President and Chief Executive Officer of | |
| Mutual of America Investment Corporation | |
Date: February 26, 2010
By: | /s/ JOHN R. GREED | |
| John R. Greed | |
| Senior Executive Vice President, | |
| Chief Financial Officer and Treasurer of | |
| Mutual of America Investment Corporation | |
Date: February 26, 2010