UNITED STATES
SECURITIES AND EXCHANGE COMMISSION
Washington, D.C. 20549
FORM N-CSR
CERTIFIED SHAREHOLDER REPORT OF REGISTERED
MANAGEMENT INVESTMENT COMPANIES
Investment Company Act file number | 811-05084 |
|
Mutual of America Investment Corporation |
(Exact name of registrant as specified in charter) |
|
320 Park Avenue, New York, N.Y. | | 10022 |
(Address of principal executive offices) | | (Zip code) |
|
John R. Greed Senior Executive Vice President and Chief Financial Officer Mutual of America Life Insurance Company 320 Park Avenue New York, NY 10022 |
(Name and address of agent for service) |
|
Registrant’s telephone number, including area code: | (212) 224-1600 | |
|
Date of fiscal year end: | December 31 | |
|
Date of reporting period: | December 31, 2012 | |
| | | | | | | | |
ITEM 1. REPORTS TO STOCKHOLDERS.
The Annual Report to Shareholders follows:
Annual Reports of Investment Options Offered by
Mutual of America Life Insurance Company
This report is not to be construed as an offering for sale of any Variable Policy. No offering is made except in conjunction with a prospectus which must precede or accompany this report.


320 PARK AVENUE
NEW YORK NY 10022-6839
February 2013
Dear Contract Owner,
As a valued variable accumulation annuity contract owner, we are pleased to provide you with the annual fund reports for the investment options offered by your contract. Included in this booklet are the annual reports of the Mutual of America Investment Corporation Funds. If you have also selected other investment options, you will receive annual reports for those funds in a separate booklet or booklets. The reports provide an update on each portfolio's performance as of December 31, 2012. Please note that portfolio performance does not take into account the fees charged by the contract. If these fees had been included, the fund's performance would have been lower. As always, past performance cannot predict or guarantee future returns.
Mutual of America has specialized in providing retirement products and related services to organizations and their employees, as well as individuals, for over 65 years. As a mutual company, we do not have stockholders and are not publicly traded. We operate solely for the benefit of our customers, managing the Company for their long-term interest, rather than for the short-term demands of stockholders. Today, as in the past, Mutual of America remains financially strong and is rated among the strongest companies in the life insurance industry by the major independent rating agencies.*
Since 1945, Mutual of America has remained committed to its Mission to offer plan sponsors, plan participants and individuals carefully selected, quality products and services at a competitive price and the personal attention they need to help build and preserve assets for a financially secure future. Integrity, prudence, and reliability are the values that have guided us since our inception and that continue to serve us well.
We hope you find the enclosed information helpful. We appreciate and value your business and look forward to serving you in the future. If you have any questions, please call your local Mutual of America Regional Office or 1-800-468-3785.
Sincerely,
Mutual of America Life Insurance Company
* While these ratings do not apply to the safety or investment performance of the Separate Account investment funds available under Mutual of America's products, they do reflect the Company's ability to fulfill its General Account obligations, which include its obligations under the Interest Accumulation Account, annuity purchase rate guarantees and annuity benefit payouts, as well as life insurance and disability income payments. Third party ratings are subject to change.
Annual Reports of Mutual of America
Investment Corporation
This report is not to be construed as an offering for sale of any Variable Policy. No offering is made except in conjunction with a prospectus which must precede or accompany this report.


(This page has been left blank intentionally.)
CONTENTS
| | | Page | |
Annual Report of Mutual of America Investment Corporation | |
President's Message | | | 1 | | |
Portfolio Management Discussions | | | 4 | | |
Asset Allocations | | | 26 | | |
Expense Example | | | 30 | | |
Summary Portfolios or Portfolios of Investments in Securities: | | | |
Equity Index Fund | | | 37 | | |
| All America Fund | | | 38 | | |
Small Cap Value Fund | | | 40 | | |
Small Cap Growth Fund | | | 41 | | |
Mid Cap Value Fund | | | 42 | | |
Mid-Cap Equity Index Fund | | | 43 | | |
| International Fund | | | 44 | | |
| Composite Fund | | | 45 | | |
| Retirement Income Fund | | | 47 | | |
| 2010 Retirement Fund | | | 47 | | |
| 2015 Retirement Fund | | | 47 | | |
| 2020 Retirement Fund | | | 48 | | |
| 2025 Retirement Fund | | | 48 | | |
| 2030 Retirement Fund | | | 48 | | |
| 2035 Retirement Fund | | | 49 | | |
| 2040 Retirement Fund | | | 49 | | |
| 2045 Retirement Fund | | | 49 | | |
| 2050 Retirement Fund | | | 50 | | |
Conservative Allocation Fund | | | 50 | | |
Moderate Allocation Fund | | | 50 | | |
Aggressive Allocation Fund | | | 51 | | |
| Money Market Fund | | | 52 | | |
| Mid-Term Bond Fund | | | 53 | | |
| Bond Fund | | | 55 | | |
| Footnotes to Summary Portfolios of Investments in Securities | | | 57 | | |
| Statements of Assets and Liabilities | | | 58 | | |
| Statements of Operations | | | 62 | | |
| Statements of Changes in Net Assets | | | 66 | | |
| Financial Highlights | | | 74 | | |
| Notes to Financial Statements | | | 88 | | |
Report of Independent Registered Public Accounting Firm | | | 102 | | |
Additional Information | | | 103 | | |
(This page has been left blank intentionally.)
MUTUAL OF AMERICA INVESTMENT CORPORATION
We are pleased to present the Mutual of America Investment Corporation (the "Investment Company") Annual Report. This Report includes important information regarding the performance and financial position of the Investment Company's funds for the year ended December 31, 2012.
The Year in Review
In 2012, the economy and equity markets followed similar patterns to those in 2010 and 2011. Each year began with a continuation of a rally spawned by the announcement and implementation of a new, incremental, quantitative easing (QE) program by the Federal Reserve in mid- to late-summer of the prior year. That was followed by a downturn in the early spring caused by worries about outstanding and long-term macroeconomic issues, including the European sovereign debt crisis, deteriorating U.S. economic statistics, global economic implications of a Chinese growth slowdown and angst over high U.S. deficits and growing national debt, as well as extreme partisanship in Congress.
During the summer months, policy decisions were implemented regarding the European debt crisis (2010 and 2011) and the U.S. debt problem (2011), which effectively worked to calm fears. Then, in mid- to late summer, a new, more extensive QE program occurred in the form of government bond purchases — thus injecting more money into the economic system to stimulate lending, borrowing, spending and thus growth. Finally, near the end of each year, U.S. economic data became more positive than it had since the spring of those respective years.
Bond markets, as represented by U.S. Treasury securities, showed a similar pattern, responding to the QE programs with falling prices and rising yields as investors anticipated that the new stimulus would lead to accelerating growth and ultimately higher inflation. This trend would subsequently reverse though, with bond prices rising and interest rates falling, as the data continued to support low inflation and, at best, sluggish growth.
Issues in Europe and China Continue to Impact U.S.
However, 2012 witnessed some significant differences than the prior two years that may portend a brighter future for the global economy. The most significant was the mid-year announcement by Mario Draghi, the Chairman of the European Central Bank (ECB), that the ECB would do "whatever it takes" to resolve the European sovereign debt crisis. In September, he backed that promise with the initiation of an ECB quantitative easing program that was designed to be "open-ended," unlike those of the U.S. Federal Reserve, which had a definite limit in the amount of bonds that the Fed would buy. The almost immediate response was a rapid and dramatic decline in European sovereign bond yields, especially those of Spain, Italy and even Greece — a signal that the crisis phase had passed, at least for the time being.
In addition, serious discussions began regarding establishing a Eurozone-wide banking regulator, a comparable role played by the Federal Reserve in the U.S. At the same time, policy leaders began to float the idea of ultimately establishing some form of centralized administration of Eurozone-wide fiscal policy, with the implicit relinquishment of some individual sovereign independence. All of these actions signaled a firm commitment to the preservation of the European Union and its currency, the Euro. The fear of the consequences of the dissolution of the Eurozone and abandonment of the Euro had been the source of equity market corrections and dangerously rising sovereign yields in the most troubled Eurozone countries.
In the U.S., the Federal Reserve took the lead of the ECB and launched its own open-ended QE program. This suggested tacit cooperation, if not coordination, of monetary policy between these two globally important economic blocs. The Fed took the additional step of stating that QE would continue until the unemployment rate was down to at least 6.5%. This was the first time it used a specific target for the measure of success of the policy. However, the most significant observation is that although the Fed's QE policy has been and continues to consist of regular and large purchases of U.S. Treasury securities, the ECB has not had to buy a single Eurozone sovereign bond. Nevertheless, sovereign yields have dropped to levels that have encouraged private investors to purchase new sovereign debt issues of Spain, Italy, Portugal and even Greece. The verbal commitment of doing whatever it takes has proven sufficient to calm the markets and return them to functionality. In short, the sovereigns can fund themselves without bailouts from the ECB or the emergency backup fund.
Another issue during 2012 that had been of major concern to the markets was the slowdown in China. After peaking near 12% on an annualized basis approximately two years ago, China's Gross Domestic Product (GDP) growth decelerated to around 7.5% over the past two years as policy initiatives aimed at reducing rapidly rising inflation were put into effect. However, evidence over the past six months suggests that the growth slowdown has bottomed. Given that China's growth was the prime driver of global growth over the past decade, the risks to the global economy of a continued slowing in the Chinese economy would only exacerbate the other long-term issues we've discussed.
1
U.S. Economy Showing Signs of Improvement
In the U.S., the economic data is increasingly more positive than negative, especially in housing, consumer spending, bank lending and job creation. Unemployment fell from a peak of over 10% several years ago to 7.9% in January 2013 according to the Bureau of Labor Statistics. Similarly, claims for unemployment continued to drop after stalling over the past year. The number of jobs created has steadily, though very slowly, risen over that same time period, approaching levels that in the past have indicated self-sustaining recovery.
The -0.1% GDP report for the 4th quarter of 2012 was disappointing and below consensus, and was dragged down by slower export growth, lower inventories and a large drop in defense spending. However, on the positive side, personal consumer spending and residential investment were both strong, and capital spending, especially for equipment and software, was firm. Collectively, these positive contributions offset the negative factors. The inventory decline actually sets up a stronger first quarter, and the GDP deflator, a measure of inflation, rose only 0.6% at an annualized rate. Looking at real final demand, which excludes net exports, the economy grew approximately 1.5% in the 4th quarter, in line with the steady though sluggish average of the past couple of years.
The key exception to these positive indicators has been anemic manufacturing output. The culprits seem to have been a hesitancy by business leaders to commit to expansion — given the uncertainties over the presidential and congressional elections in November of last year — as well as the so-called "fiscal cliff," which was scheduled to hit with full force on January 1, 2013, with the expected impact of up to a 3.5% reduction in GDP growth.
The reelection of President Obama and the loss of seats by the Republicans in both houses of Congress proved nonproblematic for the markets. A potential replay of the partisan stalemate in the 2011 deficit/debt debate was ultimately avoided when the Republicans accepted President Obama's insistence on income tax increases for the rich (i.e., singles earning over $400,000 per year and couples earning over $450,000), and offered suspension of the debt ceiling and deferral of discussions on spending cuts for several months, choosing to defer the battle for another day.
All of these indicators of forward progress on longer-term macro issues and a turn in global economic prospects gave hope that the worst consequences of the 2008 financial crisis would ultimately be resolved. As a result, the markets rallied, reaching cycle highs through year-end and nearing all-time highs early in 2013.
Outlook for 2013 Cautiously Optimistic, with Caveats
At this moment (early February 2013), equity markets are probably extended and due for a modest pullback, but should continue to advance over the course of this year depending on the continued progress on issues discussed above. Of course, despite progress, any one of these issues — the European sovereign debt crisis and the U.S. deficit — could once again spiral into a problem because no final resolutions have yet occurred.
That said, if global growth continues to pick up even only modestly, markets should continue their advance for an extended period of time as corporate profits reaccelerate and confidence in continued progress on macro issues improves. Rising confidence in the future raises the possibility that the financial markets will accord a higher price/earnings (P/E) multiple to future earnings because growth would be viewed as sustainable. Given earnings per share expectations of $105 to $110 and the potential for modest expansion of the P/E multiple, stocks could see a solid positive return in 2013 despite the very strong 16% gain achieved in 2012.
Under these assumptions for growth, the odds are that bond yields would rise, although credit spreads could remain about the same because growth would support corporate credit worthiness. However, given the staggering amount of liquidity central banks have created over the past five years — with more to come — continued global expansion will sooner or later prompt fears of an inflationary spiral. That fear alone will drive rates up rapidly and substantially across the board while credit spreads will widen. But that's a problem for another day.
The total return performance (net of investment management and other operating expenses) for each of the Investment Company Funds is reflected below:
Total Returns — Year Ended December 31, 2012
Equity Index Fund | | | +15.94% | | |
All America Fund | | | +14.73% | | |
Small Cap Value Fund | | | +15.46% | | |
Small Cap Growth Fund | | | + 5.62% | | |
Mid Cap Value Fund | | | + 11.01% | | |
Mid-Cap Equity Index Fund | | | + 17.80% | | |
International Fund | | | +18.24% | | |
2
Total Returns — Year Ended December 31, 2012 (Continued)
| | Composite Fund | | | | + 11.65% | | |
| | Retirement Income Fund | | | | + 7.15% | | |
| | 2010 | Retirement Fund | | | + 9.69% | | |
| | 2015 | Retirement Fund | | | +10.59% | | |
| | 2020 | Retirement Fund | | | + 11.69% | | |
| | 2025 | Retirement Fund | | | +12.90% | | |
| | 2030 | Retirement Fund | | | +13.69% | | |
| | 2035 | Retirement Fund | | | +14.39% | | |
| | 2040 | Retirement Fund | | | +14.63% | | |
| | 2045 | Retirement Fund | | | +14.45% | | |
| | 2050 | Retirement Fund* | | | + 1.83% | | |
| | Conservative Allocation Fund | | | | + 7.44% | | |
| | Moderate Allocation Fund | | | | +10.90% | | |
| | Aggressive Allocation Fund | | | | +13.41% | | |
| | Money Market Fund | | | | - 0.17 | % | |
| | Mid-Term Bond Fund | | | | + 3.33% | | |
| | Bond Fund | | | | + 5.79% | | |
* For the period October 1, 2012 (commencement of operations) through December 31, 2012.
The above performance figures do not reflect the deduction of respective Separate Account fees and expenses imposed by Mutual of America Life Insurance Company. All Fund performances presented throughout this report are historical, reflect the full reinvestment of dividends paid, and should not be considered indicative of future results.
The pages which immediately follow include brief discussions of each Fund's performance for the year ended December 31, 2012, compared with its relevant index. Also presented are graphs and tables for each Fund (except for the Money Market Fund and the 2050 Retirement Fund) which illustrate each Fund's respective:
• Historical total return achieved over specific periods, expressed as an average annual rate and as a cumulative rate;
• Value in dollars of a $10,000 hypothetical investment at the beginning of each specified period; and
• Historical performance compared to an appropriate index.
Following the discussions and graphs are graphical representations of the asset allocations of each Fund and an illustration of each Fund's operating expenses. The summarized portfolios of each Fund and financial statements are presented in the pages which then follow.
Thank you for your continued investment in our Funds.
Sincerely,

John R. Greed
Chairman of the Board, President
and Chief Executive Officer
Mutual of America Investment Corporation
The views expressed in this Annual Report are subject to change at any time based on market and other conditions and should not be construed as a recommendation. This Report contains forward-looking statements, which speak only as of the date they were made and involve a number of risks and uncertainties that could cause actual results to differ materially from those expressed herein. Readers are cautioned not to place undue reliance on our forward-looking statements, as we assume no obligation to update these forward-looking statements. Readers assume any and all responsibility for any investment decision made as a result of the views expressed herein.
3
EQUITY INDEX FUND
The Equity Index Fund's objective is to replicate the performance of the S&P 500® Index (S&P 500), which consists of 500 stocks chosen by Standard & Poor's for market size, liquidity and industry group representation. The S&P 500 is a market-weighted index of 500 stocks traded on the New York Stock Exchange, American Stock Exchange and NASDAQ, with each stock's weight in the index proportionate to its market value. The weightings make each company's influence on the S&P 500's performance directly proportional to that company's market value.
The S&P 500 had an overall strong first half of 2012, returning 16% including dividends. The S&P 500 reached its high of 1465 on September 14, 2012. The market hovered between 1420 and 1460 for the next month and then began a correction in mid October of about 8 percent, reaching an intra-quarter low of 1343 on November 15, 2012. Concerns over sovereign defaults in Europe, the U.S. "fiscal cliff" and a potential slowdown in corporate earnings weighed on the market. Despite no resolution to fiscal concerns in Europe and minimal improvement to domestic economic conditions, the market recovered and rallied 6% into the end of 2012. Financials, Consumer Discretionary and Healthcare were the best performing sectors for the year, returning 26.3%, 21.9% and 15.2%, respectively. Utilities and Energy were the worst performing, with returns of -2.9% and 2.3% respectively.
The Equity Index Fund's performance for the year ended December 31, 2012, was 15.94%, in line with the benchmark return of 16.00%. Note that the Equity Index Fund's performance includes expenses, such as transaction costs and management fees, which are not applicable to the benchmark.

Equity Index Fund
Period | | Growth | | Total Return | |
Ended
12/31/12 | | of
$10,000 | | Cumu-
lative | | Average
Annual | |
| 1 Year | | $ | 11,593 | | | | 15.94 | % | | | 15.94 | % | |
| 5 Years | | $ | 10,750 | | | | 7.50 | % | | | 1.46 | % | |
| 10 Years | | $ | 19,466 | | | | 94.66 | % | | | 6.89 | % | |
S & P 500 Index
Period | | Growth | | Total Return | |
Ended
12/31/12 | | of
$10,000 | | Cumu-
lative | | Average
Annual | |
| 1 Year | | $ | 11,600 | | | | 16.00 | % | | | 16.00 | % | |
| 5 Years | | $ | 10,857 | | | | 8.57 | % | | | 1.66 | % | |
| 10 Years | | $ | 19,853 | | | | 98.53 | % | | | 7.10 | % | |
The line representing the performance return of the Equity Index Fund includes expenses, such as transaction costs and management fees that reduce returns, while the performance return line of the Index does not. Past performance is not indicative of future results.
4
ALL AMERICA FUND
The investment objective of the All America Fund is to outperform the S&P 500® Index (S&P 500). The All America Fund is approximately 60% invested in the 500 stocks that comprise the S&P 500, with the remaining 40% actively managed, using three different investment approaches. The actively managed portion of the All America Fund is close to being equally distributed between large cap stocks and small cap stocks, with the small cap stocks in turn equally distributed between small cap value and small cap growth stocks.
For the year ended December 31, 2012, the S&P 500 of large capitalization stocks increased by 16.00% on a total return basis, while the Russell 2000® Growth Index was up 14.59% and the Russell 2000® Value Index was up 18.05%.
The All America Fund's return for the year ended December 31, 2012, was 14.73% versus the benchmark return of 16.00%. The underperformance of the Fund was entirely the result of the underperformance of the Small Cap Growth component of the Fund. The Equity Index, Large Cap and Small Cap Value components each outperformed the benchmark.

All America Fund
Period | | Growth | | Total Return | |
Ended
12/31/12 | | of
$10,000 | | Cumu-
lative | | Average
Annual | |
| 1 Year | | $ | 11,475 | | | | 14.73 | % | | | 14.73 | % | |
| 5 Years | | $ | 10,950 | | | | 9.50 | % | | | 1.83 | % | |
| 10 Years | | $ | 19,731 | | | | 97.31 | % | | | 7.05 | % | |
S & P 500 Index
Period | | Growth | | Total Return | |
Ended
12/31/12 | | of
$10,000 | | Cumu-
lative | | Average
Annual | |
| 1 Year | | $ | 11,600 | | | | 16.00 | % | | | 16.00 | % | |
| 5 Years | | $ | 10,857 | | | | 8.57 | % | | | 1.66 | % | |
| 10 Years | | $ | 19,853 | | | | 98.53 | % | | | 7.10 | % | |
The line representing the performance return of the All America Fund includes expenses, such as transaction costs and management fees that reduce returns, while the performance return line of the Index does not. Past performance is not indicative of future results.
5
SMALL CAP VALUE FUND
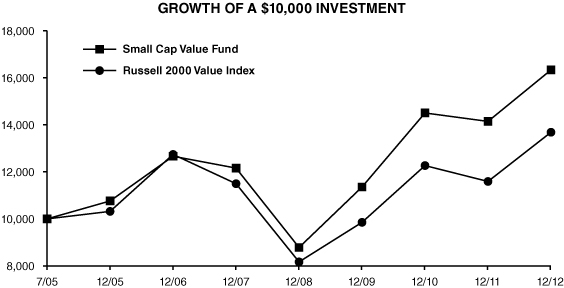
The investment objective of the Small Cap Value Fund is to outperform the Russell 2000® Value Index. The Small Cap Value Fund generally invests in companies that are below $3 billion in market capitalization and have lower price-to-book characteristics than the overall market.
For the year ended December 31, 2012, the Small Cap Value Fund returned 15.46% versus an 18.05% return for the Russell 2000 Value Index. Stock selection was the primary driver of negative performance versus the benchmark. Sectors contributing to Fund performance included Healthcare, Industrials and Utilities, while sectors detracting from Fund performance included Technology and Retail.
Small Cap Value Fund
Period | | Growth | | Total Return | |
Ended
12/31/12 | | of
$10,000 | | Cumu-
lative | | Average
Annual | |
| 1 Year | | $ | 11,547 | | | | 15.46 | % | | | 15.46 | % | |
| 5 Years | | $ | 13,433 | | | | 34.33 | % | | | 6.09 | % | |
Since 7/1/05
(Inception) | | $ | 16,334 | | | | 63.34 | % | | | 6.77 | % | |
Russell 2000 Value Index
Period | | Growth | | Total Return | |
Ended
12/31/12 | | of
$10,000 | | Cumu-
lative | | Average
Annual | |
| 1 Year | | $ | 11,805 | | | | 18.05 | % | | | 18.05 | % | |
| 5 Years | | $ | 11,903 | | | | 19.03 | % | | | 3.55 | % | |
Since 7/1/05
(Inception) | | $ | 13,684 | | | | 36.84 | % | | | 4.27 | % | |
The line representing the performance return of the Small Cap Value Fund includes expenses, such as transaction costs and management fees that reduce returns, while the performance return line of the Index does not. Past performance is not indicative of future results.
6
SMALL CAP GROWTH FUND
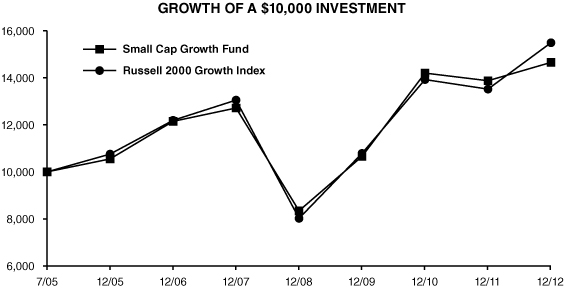
The investment objective of the Small Cap Growth Fund is capital appreciation. The Small Cap Growth Fund invests in growth stocks within the small capitalization marketplace. The Fund returned 5.62% during the year ended December 31, 2012. The Fund's benchmark, the Russell 2000® Growth Index, returned 14.59% for the period.
The year ended December 31, 2012, was a difficult one for active small cap growth managers with less than half outperforming their benchmark, the Russell 2000 Growth Index. Both the Technology and Healthcare sectors had particularly disappointing investment results relative to the returns shown by the benchmark. These two sectors combined accounted for more than half of the Fund's underperformance during the year. The Technology sector, which is usually a leading performer, lagged the benchmark in 2012 due to concerns about enterprise spending and capital expenditures. More specifically, we were particularly challenged in the internet software and services industry. The Healthcare sector was led by the biotechnology industry, which historically generates little profitability. We were too conservative with our stock selections in that industry.
Our best performance was in the Energy and Telecommunication sectors. With our bottom-up stock selection approach, we remain focused on companies that have sustainable top-line growth as opposed to those that have benefited from policy stimulus or margin expansion (reduced operating expenses).
Small Cap Growth Fund
Period | | Growth | | Total Return | |
Ended
12/31/12 | | of
$10,000 | | Cumu-
lative | | Average
Annual | |
| 1 Year | | $ | 10,563 | | | | 5.62 | % | | | 5.62 | % | |
| 5 Years | | $ | 11,525 | | | | 15.25 | % | | | 2.88 | % | |
Since 7/1/05
(Inception) | | $ | 14,655 | | | | 46.55 | % | | | 5.23 | % | |
Russell 2000 Growth Index
Period | | Growth | | Total Return | |
Ended
12/31/12 | | of
$10,000 | | Cumu-
lative | | Average
Annual | |
| 1 Year | | $ | 11,459 | | | | 14.59 | % | | | 14.59 | % | |
| 5 Years | | $ | 11,868 | | | | 18.68 | % | | | 3.49 | % | |
Since 7/1/05
(Inception) | | $ | 15,492 | | | | 54.92 | % | | | 6.01 | % | |
The line representing the performance return of the Small Cap Growth Fund includes expenses, such as transaction costs and management fees that reduce returns, while the performance return line of the Index does not. Past performance is not indicative of future results.
7
MID CAP VALUE FUND
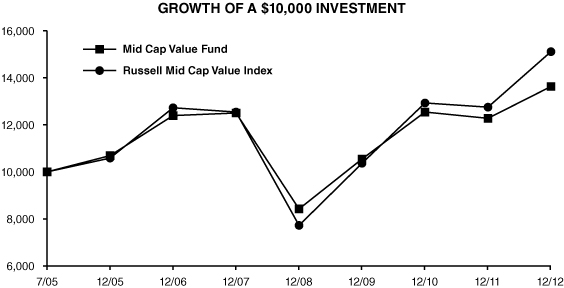
The investment objective of the Mid Cap Value Fund is to outperform the Russell Midcap® Value Index. The Mid Cap Value Fund generally invests in companies that are between $1 billion and $20 billion in market capitalization and have lower price-to-book characteristics.
For the year ended December 31, 2012, the Mid Cap Value Fund returned 11.01% versus an 18.51% return for the Russell Midcap Value Index. Adverse stock selection was the primary driver of performance versus the benchmark. Sectors contributing to Mid Cap Value Fund performance included Basic Materials and Consumer Cyclical while sectors detracting from Fund performance included Industrials and Technology.
Mid Cap Value Fund
Period | | Growth | | Total Return | |
Ended
12/31/12 | | of
$10,000 | | Cumu-
lative | | Average
Annual | |
| 1 Year | | $ | 11,101 | | | | 11.01 | % | | | 11.01 | % | |
| 5 Years | | $ | 10,901 | | | | 9.01 | % | | | 1.74 | % | |
Since 7/1/05
(Inception) | | $ | 13,630 | | | | 36.30 | % | | | 4.22 | % | |
Russell Mid Cap Value Index
Period | | Growth | | Total Return | |
Ended
12/31/12 | | of
$10,000 | | Cumu-
lative | | Average
Annual | |
| 1 Year | | $ | 11,851 | | | | 18.51 | % | | | 18.51 | % | |
| 5 Years | | $ | 12,045 | | | | 20.45 | % | | | 3.79 | % | |
Since 7/1/05
(Inception) | | $ | 15,112 | | | | 51.12 | % | | | 5.66 | % | |
The line representing the performance return of the Mid Cap Value Fund includes expenses, such as transaction costs and management fees that reduce returns, while the performance return line of the Index does not. Past performance is not indicative of future results.
8
MID-CAP EQUITY INDEX FUND
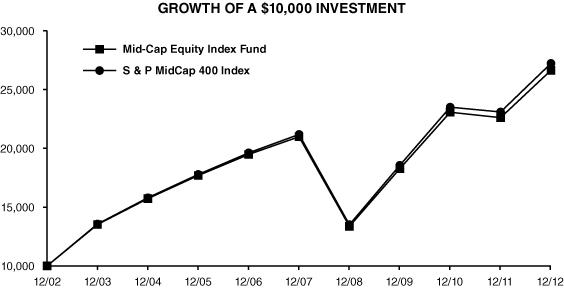
The Mid-Cap Equity Index Fund invests in the 400 stocks that comprise the S&P MidCap 400® Index (S&P MidCap 400). The S&P MidCap 400 is a market-weighted index of 400 stocks traded on the New York Stock Exchange, American Stock Exchange and NASDAQ. The weightings make each company's influence on the S&P MidCap 400's performance directly proportional to that company's market value. The companies included in the S&P MidCap 400 tend to be typical of this asset class, the medium-capitalized sector of the U.S. securities market.
The S&P MidCap 400 outperformed the S&P 500® for the full year in 2012. The outperformance occurred in the second half of the year when the S&P MidCap 400 returned 9.3% and the S&P 500 returned 6%. This was a reversal of the respective performance during 2011 and was driven by investor demand for growth and in anticipation of increased merger and acquisition activity in 2013. Within the S&P MidCap 400, the Healthcare sector was extremely strong, up 26.3%. Consumer Discretionary, Industrials and Materials also outperformed and were up 21.5%, 20.5% and 20%, respectively. As was the case with the S&P 500, Energy and Utilities were the worst performing sectors with returns of -1.4% and 1.7% respectively.
The Mid-Cap Equity Index Fund's performance for the year ended December 31, 2012, was 17.80%, in line with the 17.88% return of the S&P MidCap 400. Note that the performance of the Mid-Cap Equity Index Fund includes expenses, such as transaction costs and management fees, which are not applicable to the benchmark.
Mid-Cap Equity Index Fund
Period | | Growth | | Total Return | |
Ended
12/31/12 | | of
$10,000 | | Cumu-
lative | | Average
Annual | |
| 1 Year | | $ | 11,781 | | | | 17.80 | % | | | 17.80 | % | |
| 5 Years | | $ | 12,693 | | | | 26.93 | % | | | 4.89 | % | |
| 10 Years | | $ | 26,638 | | | | 166.38 | % | | | 10.31 | % | |
S & P MidCap 400 Index
Period | | Growth | | Total Return | |
Ended
12/31/12 | | of
$10,000 | | Cumu-
lative | | Average
Annual | |
| 1 Year | | $ | 11,788 | | | | 17.88 | % | | | 17.88 | % | |
| 5 Years | | $ | 12,851 | | | | 28.51 | % | | | 5.15 | % | |
| 10 Years | | $ | 27,224 | | | | 172.24 | % | | | 10.53 | % | |
The line representing the performance return of the Mid-Cap Equity Index Fund includes expenses, such as transaction costs and management fees that reduce returns, while the performance return line of the Index does not. Past performance is not indicative of future results.
9
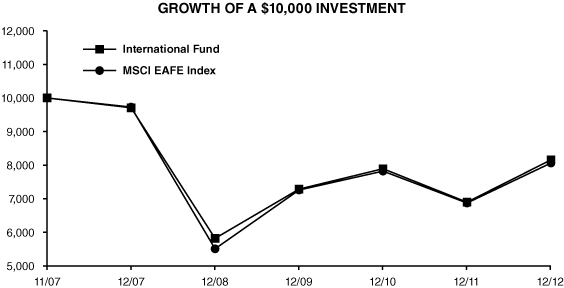
INTERNATIONAL FUND
The International Fund seeks capital appreciation by investing, directly or indirectly, in stocks of companies located outside of the United States that are reflected or contained in the Morgan Stanley Capital International, Inc. Europe, Australasia and Far East® Index (MSCI EAFE® Index). Currently the International Fund is invested exclusively in exchange traded funds that reflect or closely match the holdings in the MSCI EAFE Index.
For the year ended December 31, 2012, the International Fund returned 18.24%, outperforming the 17.32% return of the benchmark. The fund's benchmark closes earlier in the day than the actual market for the fund's investments. This time lag can result in both positive and negative performance differences. On the last business day of the period, the time lag resulted in the fund outperforming the benchmark.
International Fund
Period | | Growth | | Total Return | |
Ended
12/31/12 | | of
$10,000 | | Cumu-
lative | | Average
Annual | |
| 1 Year | | $ | 11,824 | | | | 18.24 | % | | | 18.24 | % | |
| 5 Years | | $ | 8,402 | | | | -15.98 | % | | | -3.42 | % | |
Since 11/5/07
(Inception) | | $ | 8,157 | | | | -18.43 | % | | | -3.88 | % | |
MSCI EAFE Index
Period | | Growth | | Total Return | |
Ended
12/31/12 | | of
$10,000 | | Cumu-
lative | | Average
Annual | |
| 1 Year | | $ | 11,732 | | | | 17.32 | % | | | 17.32 | % | |
| 5 Years | | $ | 8,286 | | | | -17.14 | % | | | -3.69 | % | |
Since 11/5/07
(Inception) | | $ | 8,063 | | | | -19.37 | % | | | -4.09 | % | |
The line representing the performance return of the International Fund includes expenses, such as transaction costs and management fees that reduce returns, while the performance return line of the Index does not. Past performance is not indicative of future results.
10
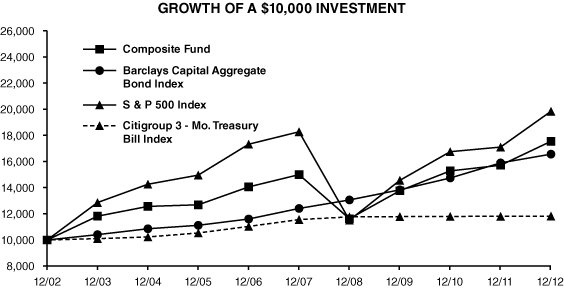
COMPOSITE FUND
The Composite Fund invests in a diversified portfolio of common stocks and fixed-income securities, seeking appreciation and current income. The equity portion of the Composite Fund invests in stocks within the S&P 500® Index (S&P 500).
For the year ended December 31, 2012, the equity portion of the Fund had a total return of 17.23% (before expenses), outperforming the S&P 500 Index by 123 basis points. The primary reason for the outperformance of this portion of the Fund was good stock selection, particularly in the Materials, Financials and Consumer Discretionary sectors.
The equity portion of the Composite Fund maintains sector weights within plus or minus 100 basis points of the S&P 500 Index and does not take positions in individual stocks with overweights of more than 200 basis points. This structural discipline produces a relatively low-risk portfolio that emphasizes stock selection based on strong fundamental analysis.
For the year ended December 31, 2012, the fixed income portion of the Fund had a total return of 5.53% (before expenses), outperforming the Barclays Capital Aggregate Bond Index by 132 basis points. The fixed income portion of the Fund focused on income and capital preservation.
The Federal Reserve maintained its interest rate policies and promised to retain them for some time into the future. These are designed to drive short-term rates to negligible levels and flatten the yield curve so that even long-term Treasury rates remain under three percent. As a result, income needs of market participants were focused on intermediate corporate bonds. This compressed the spread between Treasury and corporate bonds. We expect this to continue throughout the year.
The Fund's primary strategy is to maintain a diversified portfolio of higher-yielding corporate bonds while keeping the duration slightly short in order to guard against incipient inflation. The corporate bond holdings have relatively short maturities and each represents only a small percentage of the entire portfolio. The focus on income, rather than market volatility, will enable the Fund to provide favorable compounded rates of return over meaningful time periods.
For the year ended December 31, 2012, the Composite Fund returned 11.65% compared to the weighted benchmark return of 11.37%, 40% of which is based on the Barclays Capital Aggregate Bond Index and 60% of which is based on the S&P 500. Both components of the Fund contributed to its outperformance.
Composite Fund
Period | | Growth | | Total Return | |
Ended
12/31/12 | | of
$10,000 | | Cumu-
lative | | Average
Annual | |
| 1 Year | | $ | 11,166 | | | | 11.65 | % | | | 11.65 | % | |
| 5 Years | | $ | 11,699 | | | | 16.99 | % | | | 3.19 | % | |
| 10 Years | | $ | 17,555 | | | | 75.55 | % | | | 5.80 | % | |
S & P 500 Index
Period | | Growth | | Total Return | |
Ended
12/31/12 | | of
$10,000 | | Cumu-
lative | | Average
Annual | |
| 1 Year | | $ | 11,600 | | | | 16.00 | % | | | 16.00 | % | |
| 5 Years | | $ | 10,857 | | | | 8.57 | % | | | 1.66 | % | |
| 10 Years | | $ | 19,853 | | | | 98.53 | % | | | 7.10 | % | |
Barclays Capital Aggregate Bond Index
Period | | Growth | | Total Return | |
Ended
12/31/12 | | of
$10,000 | | Cumu-
lative | | Average
Annual | |
| 1 Year | | $ | 10,421 | | | | 4.21 | % | | | 4.21 | % | |
| 5 Years | | $ | 13,347 | | | | 33.47 | % | | | 5.95 | % | |
| 10 Years | | $ | 16,572 | | | | 65.72 | % | | | 5.18 | % | |
Citigroup 3 - Month T-Bill Index
Period | | Growth | | Total Return | |
Ended
12/31/12 | | of
$10,000 | | Cumu-
lative | | Average
Annual | |
| 1 Year | | $ | 10,007 | | | | 0.07 | % | | | 0.07 | % | |
| 5 Years | | $ | 10,224 | | | | 2.24 | % | | | 0.45 | % | |
| 10 Years | | $ | 11,823 | | | | 18.23 | % | | | 1.69 | % | |
The line representing the performance return of the Composite Fund includes expenses, such as transaction costs and management fees that reduce returns, while the performance return lines of the Indices do not. Past performance is not indicative of future results.
11
RETIREMENT INCOME FUND
The objective of the Retirement Income Fund is current income consistent with the preservation of capital and, to a lesser extent, capital appreciation. The Retirement Income Fund invests primarily in the fixed-income funds of the Investment Company and also invests in two equity funds of the Investment Company. The Fund's target allocation is approximately 75% of net assets in fixed-income funds (approximately 30% in the Bond, 40% in the Mid-Term Bond Funds and 5% in the Money Market Fund) and approximately 25% of net assets in equity funds (20% in the Equity Index Fund and 5% in the Mid-Cap Equity Index Fund).
Performance for the Retirement Income Fund is compared to the Barclays Capital Aggregate Bond Index (70% weighting), the Citigroup 3-Month Treasury Bill Index (5% weighting) and the S&P 500® Index (25% weighting). For the year ended December 31, 2012, the Fund returned 7.15% versus a 7.01% return in the weighted benchmark. The small outperformance of the Fund is mainly attributable to the outperformance of the Bond Fund relative to the Barclays Capital Aggregate Bond Index, and the performance of the Mid-Cap Equity Index as compared to the S&P 500 Index.

Retirement Income Fund
Period | | Growth | | Total Return | |
Ended
12/31/12 | | of
$10,000 | | Cumu-
lative | | Average
Annual | |
| 1 Year | | $ | 10,715 | | | | 7.15 | % | | | 7.15 | % | |
| 5 Years | | $ | 12,862 | | | | 28.62 | % | | | 5.16 | % | |
Since 11/5/07
(Inception) | | $ | 12,871 | | | | 28.71 | % | | | 5.01 | % | |
S & P 500 Index
Period | | Growth | | Total Return | |
Ended
12/31/12 | | of
$10,000 | | Cumu-
lative | | Average
Annual | |
| 1 Year | | $ | 11,600 | | | | 16.00 | % | | | 16.00 | % | |
| 5 Years | | $ | 10,857 | | | | 8.57 | % | | | 1.66 | % | |
Since 11/5/07
(Inception) | | $ | 10,653 | | | | 6.53 | % | | | 1.23 | % | |
Barclays Capital Aggregate Bond Index
Period | | Growth | | Total Return | |
Ended
12/31/12 | | of
$10,000 | | Cumu-
lative | | Average
Annual | |
| 1 Year | | $ | 10,421 | | | | 4.21 | % | | | 4.21 | % | |
| 5 Years | | $ | 13,347 | | | | 33.47 | % | | | 5.95 | % | |
Since 11/5/07
(Inception) | | $ | 13,537 | | | | 35.37 | % | | | 6.05 | % | |
Citigroup 3 - Month T-Bill Index
Period | | Growth | | Total Return | |
Ended
12/31/12 | | of
$10,000 | | Cumu-
lative | | Average
Annual | |
| 1 Year | | $ | 10,007 | | | | 0.07 | % | | | 0.07 | % | |
| 5 Years | | $ | 10,224 | | | | 2.24 | % | | | 0.45 | % | |
Since 11/5/07
(Inception) | | $ | 10,289 | | | | 2.89 | % | | | 0.55 | % | |
The line representing the performance return of the Retirement Income Fund includes expenses, such as direct management fees and expenses of the underlying funds in which the Fund invests, that reduce returns while the performance return lines of the Indices do not. Past performance is not indicative of future results.
12
2010 RETIREMENT FUND
The objective of the 2010 Retirement Fund is current income and capital appreciation appropriate for the asset allocation associated with a target retirement in 2010. The 2010 Retirement Fund invests in funds of the Investment Company. The Fund's target allocation is approximately 61% of net assets in fixed-income funds (approximately 25% in the Bond Fund, 31% in the Mid-Term Bond Fund and 5% in the Money Market Fund) and approximately 39% of net assets in equity funds (25% in the Equity Index Fund, 11% in the Mid-Cap Equity Index Fund and 3% in the International Fund).
Performance for the 2010 Retirement Fund is compared to the Barclays Capital Aggregate Bond Index (56% weighting), the Citigroup 3-Month Treasury Bill Index (5% weighting) and the S&P 500® Index (39% weighting). For the year ended December 31, 2012, the Fund returned 9.69% versus an 8.68% return in the weighted benchmark. The outperformance of the Fund is mainly attributable to the outperformance of the Bond Fund relative to the Barclays Capital Aggregate Bond Index, and the Mid-Cap Equity Index and International Funds relative to the S&P 500 Index.

2010 Retirement Fund
Period | | Growth | | Total Return | |
Ended
12/31/12 | | of
$10,000 | | Cumu-
lative | | Average
Annual | |
| 1 Year | | $ | 10,970 | | | | 9.69 | % | | | 9.69 | % | |
| 5 Years | | $ | 12,456 | | | | 24.56 | % | | | 4.49 | % | |
Since 11/5/07
(Inception) | | $ | 12,371 | | | | 23.71 | % | | | 4.21 | % | |
S & P 500 Index
Period | | Growth | | Total Return | |
Ended
12/31/12 | | of
$10,000 | | Cumu-
lative | | Average
Annual | |
| 1 Year | | $ | 11,600 | | | | 16.00 | % | | | 16.00 | % | |
| 5 Years | | $ | 10,857 | | | | 8.57 | % | | | 1.66 | % | |
Since 11/5/07
(Inception) | | $ | 10,653 | | | | 6.53 | % | | | 1.23 | % | |
Barclays Capital Aggregate Bond Index
Period | | Growth | | Total Return | |
Ended
12/31/12 | | of
$10,000 | | Cumu-
lative | | Average
Annual | |
| 1 Year | | $ | 10,421 | | | | 4.21 | % | | | 4.21 | % | |
| 5 Years | | $ | 13,347 | | | | 33.47 | % | | | 5.95 | % | |
Since 11/5/07
(Inception) | | $ | 13,537 | | | | 35.37 | % | | | 6.05 | % | |
Citigroup 3 - Month T-Bill Index
Period | | Growth | | Total Return | |
Ended
12/31/12 | | of
$10,000 | | Cumu-
lative | | Average
Annual | |
| 1 Year | | $ | 10,007 | | | | 0.07 | % | | | 0.07 | % | |
| 5 Years | | $ | 10,224 | | | | 2.24 | % | | | 0.45 | % | |
Since 11/5/07
(Inception) | | $ | 10,289 | | | | 2.89 | % | | | 0.55 | % | |
The line representing the performance return of the 2010 Retirement Fund includes expenses, such as direct management fees and expenses of the underlying funds in which the Fund invests, that reduce returns while the performance return lines of the Indices do not. Past performance is not indicative of future results.
13
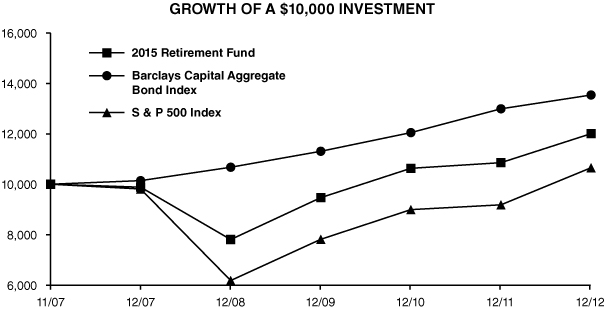
2015 RETIREMENT FUND
The objective of the 2015 Retirement Fund is current income and capital appreciation appropriate for the asset allocation associated with a target retirement in 2015. The 2015 Retirement Fund invests in funds of the Investment Company. The Fund's target allocation is approximately 49% of net assets in equity funds (approximately 28% in the Equity Index Fund, 11% in the Mid-Cap Equity Index Fund, 6% in the International Fund and 2% each in the Small Cap Growth and Small Cap Value Funds) and approximately 51% of net assets in fixed-income funds (25% in the Bond Fund and 26% in the Mid-Term Bond Fund).
Performance for the 2015 Retirement Fund is compared to the S&P 500® Index (49% weighting) and the Barclays Capital Aggregate Bond Index (51% weighting). For the year ended December 31, 2012, the Fund returned 10.59% versus a 10.08% return in the weighted benchmark. The small outperformance of the Fund is mainly attributable to the outperformance of the Bond Fund relative to the Barclays Capital Aggregate Bond Index, and the Mid-Cap Equity Index and International Funds relative to the S&P 500 Index.
2015 Retirement Fund
Period | | Growth | | Total Return | |
Ended
12/31/12 | | of
$10,000 | | Cumu-
lative | | Average
Annual | |
| 1 Year | | $ | 11,060 | | | | 10.59 | % | | | 10.59 | % | |
| 5 Years | | $ | 12,147 | | | | 21.47 | % | | | 3.96 | % | |
Since 11/5/07
(Inception) | | $ | 12,004 | | | | 20.04 | % | | | 3.60 | % | |
S & P 500 Index
Period | | Growth | | Total Return | |
Ended
12/31/12 | | of
$10,000 | | Cumu-
lative | | Average
Annual | |
| 1 Year | | $ | 11,600 | | | | 16.00 | % | | | 16.00 | % | |
| 5 Years | | $ | 10,857 | | | | 8.57 | % | | | 1.66 | % | |
Since 11/5/07
(Inception) | | $ | 10,653 | | | | 6.53 | % | | | 1.23 | % | |
Barclays Capital Aggregate Bond Index
Period | | Growth | | Total Return | |
Ended
12/31/12 | | of
$10,000 | | Cumu-
lative | | Average
Annual | |
| 1 Year | | $ | 10,421 | | | | 4.21 | % | | | 4.21 | % | |
| 5 Years | | $ | 13,347 | | | | 33.47 | % | | | 5.95 | % | |
Since 11/5/07
(Inception) | | $ | 13,537 | | | | 35.37 | % | | | 6.05 | % | |
The line representing the performance return of the 2015 Retirement Fund includes expenses, such as direct management fees and expenses of the underlying funds in which the Fund invests, that reduce returns while the performance return lines of the Indices do not. Past performance is not indicative of future results.
14
2020 RETIREMENT FUND
The objective of the 2020 Retirement Fund is current income and capital appreciation appropriate for the asset allocation associated with a target retirement in 2020. The 2020 Retirement Fund invests in funds of the Investment Company. The Fund's target allocation is approximately 59% of net assets in equity funds (approximately 33% in the Equity Index Fund, 11% in the Mid-Cap Equity Index Fund, 9% in the International Fund and 3% each in the Small Cap Growth and Small Cap Value Funds) and approximately 41% of net assets in fixed-income funds (25% in the Bond Fund and 16% in the Mid-Term Bond Fund).
Performance for the 2020 Retirement Fund is compared to the S&P 500® Index (59% weighting) and the Barclays Capital Aggregate Bond Index (41% weighting). For the year ended December 31, 2012, the Fund returned 11.69% versus an 11.26% return in the weighted benchmark. The small outperformance of the Fund is mainly attributable to the outperformance of the Bond Fund relative to the Barclays Capital Aggregate Bond Index, and the Mid-Cap Equity Index and International Funds relative to the S&P 500 Index.

2020 Retirement Fund
Period | | Growth | | Total Return | |
Ended
12/31/12 | | of
$10,000 | | Cumu-
lative | | Average
Annual | |
| 1 Year | | $ | 11,169 | | | | 11.69 | % | | | 11.69 | % | |
| 5 Years | | $ | 11,970 | | | | 19.70 | % | | | 3.66 | % | |
Since 11/5/07
(Inception) | | $ | 11,786 | | | | 17.86 | % | | | 3.23 | % | |
S & P 500 Index
Period | | Growth | | Total Return | |
Ended
12/31/12 | | of
$10,000 | | Cumu-
lative | | Average
Annual | |
| 1 Year | | $ | 11,600 | | | | 16.00 | % | | | 16.00 | % | |
| 5 Years | | $ | 10,857 | | | | 8.57 | % | | | 1.66 | % | |
Since 11/5/07
(Inception) | | $ | 10,653 | | | | 6.53 | % | | | 1.23 | % | |
Period | | Growth | | Total Return | |
Ended
12/31/12 | | of
$10,000 | | Cumu-
lative | | Average
Annual | |
| 1 Year | | $ | 10,421 | | | | 4.21 | % | | | 4.21 | % | |
| 5 Years | | $ | 13,347 | | | | 33.47 | % | | | 5.95 | % | |
Since 11/5/07
(Inception) | | $ | 13,537 | | | | 35.37 | % | | | 6.05 | % | |
Barclays Capital Aggregate Bond Index
The line representing the performance return of the 2020 Retirement Fund includes expenses, such as direct management fees and expenses of the underlying funds in which the Fund invests, that reduce returns while the performance return lines of the Indices do not. Past performance is not indicative of future results.
15
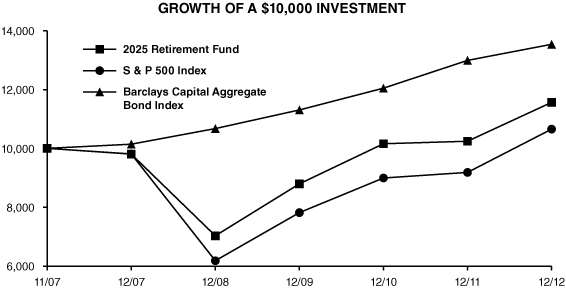
2025 RETIREMENT FUND
The objective of the 2025 Retirement Fund is current income and capital appreciation appropriate for the asset allocation associated with a target retirement in 2025. The 2025 Retirement Fund invests in funds of the Investment Company. The Fund's target allocation is approximately 69% of net assets in equity funds (approximately 37% in the Equity Index Fund, 15% in the Mid-Cap Equity Index Fund, 9% in the International Fund and 4% each in the Small Cap Growth and Small Cap Value Funds) and approximately 31% of net assets in fixed-income funds (23% in the Bond Fund and 8% in the Mid-Term Bond Fund).
Performance for the 2025 Retirement Fund is compared to the S&P 500® Index (69% weighting) and the Barclays Capital Aggregate Bond Index (31% weighting). For the year ended December 31, 2012, the Fund returned 12.90% versus a 12.42% return in the weighted benchmark. The small outperformance of the Fund is mainly attributable to the outperformance of the Bond Fund relative to the Barclays Capital Aggregate Bond Index, and the Mid-Cap Equity Index and International Funds relative to the S&P 500 Index.
2025 Retirement Fund
Period | | Growth | | Total Return | |
Ended
12/31/12 | | of
$10,000 | | Cumu-
lative | | Average
Annual | |
| 1 Year | | $ | 11,291 | | | | 12.90 | % | | | 12.90 | % | |
| 5 Years | | $ | 11,794 | | | | 17.94 | % | | | 3.35 | % | |
Since 11/5/07
(Inception) | | $ | 11,564 | | | | 15.64 | % | | | 2.85 | % | |
S & P 500 Index
Period | | Growth | | Total Return | |
Ended
12/31/12 | | of
$10,000 | | Cumu-
lative | | Average
Annual | |
| 1 Year | | $ | 11,600 | | | | 16.00 | % | | | 16.00 | % | |
| 5 Years | | $ | 10,857 | | | | 8.57 | % | | | 1.66 | % | |
Since 11/5/07
(Inception) | | $ | 10,653 | | | | 6.53 | % | | | 1.23 | % | |
Barclays Capital Aggregate Bond Index
Period | | Growth | | Total Return | |
Ended
12/31/12 | | of
$10,000 | | Cumu-
lative | | Average
Annual | |
| 1 Year | | $ | 10,421 | | | | 4.21 | % | | | 4.21 | % | |
| 5 Years | | $ | 13,347 | | | | 33.47 | % | | | 5.95 | % | |
Since 11/5/07
(Inception) | | $ | 13,537 | | | | 35.37 | % | | | 6.05 | % | |
The line representing the performance return of the 2025 Retirement Fund includes expenses, such as direct management fees and expenses of the underlying funds in which the Fund invests, that reduce returns while the performance return lines of the Indices do not. Past performance is not indicative of future results.
16
2030 RETIREMENT FUND
The objective of the 2030 Retirement Fund is current income and capital appreciation appropriate for the asset allocation associated with a target retirement in 2030. The 2030 Retirement Fund invests in funds of the Investment Company. The Fund's target allocation is approximately 77% of net assets in equity funds (approximately 40% in the Equity Index Fund, 17% in the Mid-Cap Equity Index Fund, 10% in the International Fund and 5% each in the Small Cap Growth and Small Cap Value Funds) and approximately 23% of net assets in the Bond Fund.
Performance for the 2030 Retirement Fund is compared to the S&P 500® Index (77% weighting) and the Barclays Capital Aggregate Bond Index (23% weighting). For the year ended December 31, 2012, the Fund returned 13.69% versus a 13.36% return in the weighted benchmark. The small outperformance of the Fund is mainly attributable to the outperformance of the Bond Fund relative to the Barclays Capital Aggregate Bond Index, and the Mid-Cap Equity Index and International Funds relative to the S&P 500 Index.
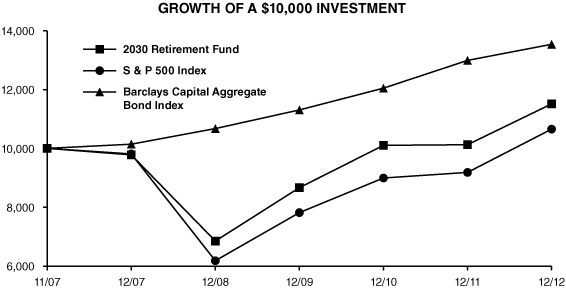
2030 Retirement Fund
Period | | Growth | | Total Return | |
Ended
12/31/12 | | of
$10,000 | | Cumu-
lative | | Average
Annual | |
| 1 Year | | $ | 11,370 | | | | 13.69 | % | | | 13.69 | % | |
| 5 Years | | $ | 11,772 | | | | 17.72 | % | | | 3.31 | % | |
Since 11/5/07
(Inception) | | $ | 11,511 | | | | 15.11 | % | | | 2.76 | % | |
S & P 500 Index
Period | | Growth | | Total Return | |
Ended
12/31/12 | | of
$10,000 | | Cumu-
lative | | Average
Annual | |
| 1 Year | | $ | 11,600 | | | | 16.00 | % | | | 16.00 | % | |
| 5 Years | | $ | 10,857 | | | | 8.57 | % | | | 1.66 | % | |
Since 11/5/07
(Inception) | | $ | 10,653 | | | | 6.53 | % | | | 1.23 | % | |
Barclays Capital Aggregate Bond Index
Period | | Growth | | Total Return | |
Ended
12/31/12 | | of
$10,000 | | Cumu-
lative | | Average
Annual | |
| 1 Year | | $ | 10,421 | | | | 4.21 | % | | | 4.21 | % | |
| 5 Years | | $ | 13,347 | | | | 33.47 | % | | | 5.95 | % | |
Since 11/5/07
(Inception) | | $ | 13,537 | | | | 35.37 | % | | | 6.05 | % | |
The line representing the performance return of the 2030 Retirement Fund includes expenses, such as direct management fees and expenses of the underlying funds in which the Fund invests, that reduce returns while the performance return lines of the Indices do not. Past performance is not indicative of future results.
17
2035 RETIREMENT FUND
The objective of the 2035 Retirement Fund is current income and capital appreciation appropriate for the asset allocation associated with a target retirement in 2035. The 2035 Retirement Fund invests in funds of the Investment Company. The Fund's target allocation is approximately 84% of net assets in equity funds (approximately 40% in the Equity Index Fund, 20% in the Mid-Cap Equity Index Fund, 12% in the International Fund and 6% each in the Small Cap Growth and Small Cap Value Funds) and approximately 16% of net assets in the Bond Fund.
Performance for the 2035 Retirement Fund is compared to the S&P 500® Index (84% weighting) and the Barclays Capital Aggregate Bond Index (16% weighting). For the year ended December 31, 2012, the Fund returned 14.39% versus a 14.17% return in the weighted benchmark. The small outperformance of the Fund is mainly attributable to the outperformance of the Mid-Cap Equity Index and International Funds relative to the S&P 500 Index, and the Bond Fund relative to the Barclays Capital Aggregate Bond Index.
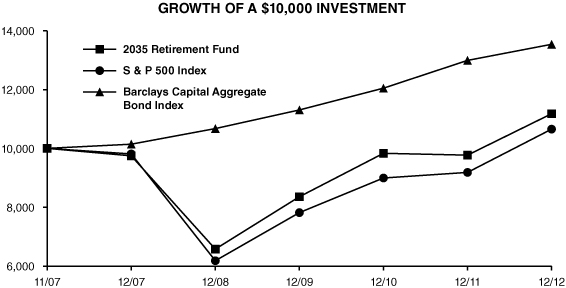
2035 Retirement Fund
Period | | Growth | | Total Return | |
Ended
12/31/12 | | of
$10,000 | | Cumu-
lative | | Average
Annual | |
| 1 Year | | $ | 11,440 | | | | 14.39 | % | | | 14.39 | % | |
| 5 Years | | $ | 11,468 | | | | 14.68 | % | | | 2.77 | % | |
Since 11/5/07
(Inception) | | $ | 11,177 | | | | 11.77 | % | | | 2.18 | % | |
S & P 500 Index
Period | | Growth | | Total Return | |
Ended
12/31/12 | | of
$10,000 | | Cumu-
lative | | Average
Annual | |
| 1 Year | | $ | 11,600 | | | | 16.00 | % | | | 16.00 | % | |
| 5 Years | | $ | 10,857 | | | | 8.57 | % | | | 1.66 | % | |
Since 11/5/07
(Inception) | | $ | 10,653 | | | | 6.53 | % | | | 1.23 | % | |
Barclays Capital Aggregate Bond Index
Period | | Growth | | Total Return | |
Ended
12/31/12 | | of
$10,000 | | Cumu-
lative | | Average
Annual | |
| 1 Year | | $ | 10,421 | | | | 4.21 | % | | | 4.21 | % | |
| 5 Years | | $ | 13,347 | | | | 33.47 | % | | | 5.95 | % | |
Since 11/5/07
(Inception) | | $ | 13,537 | | | | 35.37 | % | | | 6.05 | % | |
The line representing the performance return of the 2035 Retirement Fund includes expenses, such as direct management fees and expenses of the underlying funds in which the Fund invests, that reduce returns while the performance return lines of the Indices do not. Past performance is not indicative of future results.
18
2040 RETIREMENT FUND
The objective of the 2040 Retirement Fund is current income and capital appreciation appropriate for the asset allocation associated with a target retirement in 2040. The 2040 Retirement Fund invests in funds of the Investment Company. The Fund's target allocation is approximately 88% of net assets in equity funds (approximately 35% in the Equity Index Fund, 23% in the Mid-Cap Equity Index Fund, 14% in the International Fund and 8% each in the Small Cap Growth and Small Cap Value Funds) and approximately 12% of net assets in the Bond Fund.
Performance for the 2040 Retirement Fund is compared to the S&P 500® Index (88% weighting) and the Barclays Capital Aggregate Bond Index (12% weighting). For the year ended December 31, 2012, the Fund returned 14.63%, equal to the 14.63% return in the weighted benchmark. The Fund performed in line with the benchmark index mainly because the Mid-Cap Equity Index and International Funds outperformed the S&P 500 Index, while the Small Cap Growth and Value Funds underperformed the S&P 500 Index.

2040 Retirement Fund
Period | | Growth | | Total Return | |
Ended
12/31/12 | | of
$10,000 | | Cumu-
lative | | Average
Annual | |
| 1 Year | | $ | 11,464 | | | | 14.63 | % | | | 14.63 | % | |
| 5 Years | | $ | 11,526 | | | | 15.26 | % | | | 2.88 | % | |
Since 11/5/07
(Inception) | | $ | 11,217 | | | | 12.17 | % | | | 2.25 | % | |
S & P 500 Index
Period | | Growth | | Total Return | |
Ended
12/31/12 | | of
$10,000 | | Cumu-
lative | | Average
Annual | |
| 1 Year | | $ | 11,600 | | | | 16.00 | % | | | 16.00 | % | |
| 5 Years | | $ | 10,857 | | | | 8.57 | % | | | 1.66 | % | |
Since 11/5/07
(Inception) | | $ | 10,653 | | | | 6.53 | % | | | 1.23 | % | |
Barclays Capital Aggregate Bond Index
Period | | Growth | | Total Return | |
Ended
12/31/12 | | of
$10,000 | | Cumu-
lative | | Average
Annual | |
| 1 Year | | $ | 10,421 | | | | 4.21 | % | | | 4.21 | % | |
| 5 Years | | $ | 13,347 | | | | 33.47 | % | | | 5.95 | % | |
Since 11/5/07
(Inception) | | $ | 13,537 | | | | 35.37 | % | | | 6.05 | % | |
The line representing the performance return of the 2040 Retirement Fund includes expenses, such as direct management fees and expenses of the underlying funds in which the Fund invests, that reduce returns while the performance return lines of the Indices do not. Past performance is not indicative of future results.
19
2045 RETIREMENT FUND
The objective of the 2045 Retirement Fund is current income and capital appreciation appropriate for the asset allocation associated with a target retirement in 2045. The 2045 Retirement Fund invests in funds of the Investment Company. The Fund's target allocation is approximately 90% of net assets in equity funds (approximately 35% in the Equity Index Fund, 21% in the Mid-Cap Equity Index Fund, 16% in the International Fund and 9% each in the Small Cap Growth and Small Cap Value Funds) and approximately 10% of net assets in the Bond Fund.
Performance for the 2045 Retirement Fund is compared to the S&P 500® Index (90% weighting) and the Barclays Capital Aggregate Bond Index (10% weighting). For the year ended December 31, 2012, the Fund returned 14.45% versus a 14.86% return in the weighted benchmark. The underperformance of the Fund is mainly attributable to the Small Cap Growth and Value Funds underperforming the S&P 500 Index.

2045 Retirement Fund
Period | | Growth | | Total Return | |
Ended
12/31/12 | | of
$10,000 | | Cumu-
lative | | Average
Annual | |
| 1 Year | | $ | 11,446 | | | | 14.45 | % | | | 14.45 | % | |
| 5 Years | | $ | 11,452 | | | | 14.52 | % | | | 2.74 | % | |
Since 11/5/07
(Inception) | | $ | 11,132 | | | | 11.32 | % | | | 2.09 | % | |
S & P 500 Index
Period | | Growth | | Total Return | |
Ended
12/31/12 | | of
$10,000 | | Cumu-
lative | | Average
Annual | |
| 1 Year | | $ | 11,600 | | | | 16.00 | % | | | 16.00 | % | |
| 5 Years | | $ | 10,857 | | | | 8.57 | % | | | 1.66 | % | |
Since 11/5/07
(Inception) | | $ | 10,653 | | | | 6.53 | % | | | 1.23 | % | |
Barclays Capital Aggregate Bond Index
Period | | Growth | | Total Return | |
Ended
12/31/12 | | of
$10,000 | | Cumu-
lative | | Average
Annual | |
| 1 Year | | $ | 10,421 | | | | 4.21 | % | | | 4.21 | % | |
| 5 Years | | $ | 13,347 | | | | 33.47 | % | | | 5.95 | % | |
Since 11/5/07
(Inception) | | $ | 13,537 | | | | 35.37 | % | | | 6.05 | % | |
The line representing the performance return of the 2045 Retirement Fund includes expenses, such as direct management fees and expenses of the underlying funds in which the Fund invests, that reduce returns while the performance return lines of the Indices do not. Past performance is not indicative of future results.
20
2050 RETIREMENT FUND
The objective of the 2050 Retirement Fund is current income and capital appreciation appropriate for the asset allocation associated with a target retirement in 2050. The 2050 Retirement Fund invests in funds of the Investment Company. The Fund's target allocation is approximately 92% of net assets in equity funds (approximately 35% in the Equity Index Fund, 20% in the Mid-Cap Equity Index Fund, 17% in the International Fund and 10% each in the Small Cap Growth and Small Cap Value Funds) and approximately 8% of net assets in the Bond Fund.
Performance for the 2050 Retirement Fund is compared to the S&P 500® Index (92% weighting) and the Barclays Capital Aggregate Bond Index (8% weighting). For the period October 1, 2012 (commencement of operations), through December 31, 2012, the Fund returned 1.83% versus a -0.33% return in the weighted benchmark. The outperformance of the Fund is mainly attributable to the outperformance of the Mid-Cap Equity Index and International Funds relative to the S&P 500 Index.
Since the Fund has been in operation for less than six months, no graphical depiction of performance is being presented at this time.
CONSERVATIVE ALLOCATION FUND
The objective of the Conservative Allocation Fund is current income and, to a lesser extent, capital appreciation. The Conservative Allocation Fund invests primarily in the fixed-income funds of the Investment Company and also invests in an equity fund of the Investment Company. The Conservative Allocation Fund's target allocation is approximately 75% of net assets in fixed-income funds (approximately 30% in the Bond Fund and approximately 45% in the Mid-Term Bond Fund) and approximately 25% of net assets in equity funds (Equity Index Fund).
Performance for the Conservative Allocation Fund is compared to the Barclays Capital Aggregate Bond Index (75% weighting) and the S&P 500® Index (25% weighting). For the year ended December 31, 2012, the Conservative Allocation Fund returned 7.44% versus a 7.23% return in the weighted benchmark. The outperformance of the Fund is mainly attributable to the outperformance of the Bond Fund relative to the Barclays Capital Aggregate Bond Index.
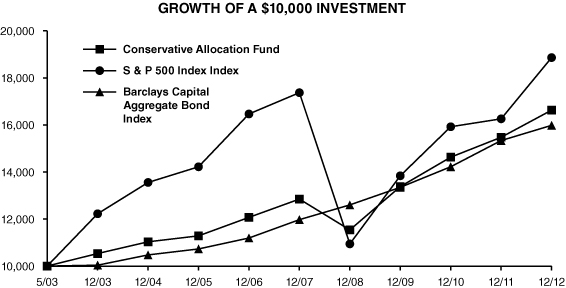
Conservative Allocation Fund
Period | | Growth | | Total Return | |
Ended
12/31/12 | | of
$10,000 | | Cumu-
lative | | Average
Annual | |
| 1 Year | | $ | 10,744 | | | | 7.44 | % | | | 7.44 | % | |
| 5 Years | | $ | 12,941 | | | | 29.41 | % | | | 5.30 | % | |
Since 5/20/03
(Inception) | | $ | 16,623 | | | | 66.23 | % | | | 5.43 | % | |
S & P 500 Index
Period | | Growth | | Total Return | |
Ended
12/31/12 | | of
$10,000 | | Cumu-
lative | | Average
Annual | |
| 1 Year | | $ | 11,600 | | | | 16.00 | % | | | 16.00 | % | |
| 5 Years | | $ | 10,857 | | | | 8.57 | % | | | 1.66 | % | |
Since 5/20/03
(Inception) | | $ | 18,856 | | | | 88.56 | % | | | 6.82 | % | |
Barclays Capital Aggregate Bond Index
Period | | Growth | | Total Return | |
Ended
12/31/12 | | of
$10,000 | | Cumu-
lative | | Average
Annual | |
| 1 Year | | $ | 10,421 | | | | 4.21 | % | | | 4.21 | % | |
| 5 Years | | $ | 13,347 | | | | 33.47 | % | | | 5.95 | % | |
Since 5/20/03
(Inception) | | $ | 15,978 | | | | 59.78 | % | | | 5.00 | % | |
The line representing the performance return of the Conservative Allocation Fund includes expenses, such as transaction costs and management fees of the underlying funds in which the Fund invests, that reduce returns, while the performance return lines of the Indicies do not. Past performance is not indicative of future results.
21
MODERATE ALLOCATION FUND
The objective of the Moderate Allocation Fund is capital appreciation and current income. The Moderate Allocation Fund invests in the equity and fixed-income funds of the Investment Company. The Moderate Allocation Fund's target allocation is approximately 50% of net assets in equity funds (approximately 35% of its net assets in the Equity Index Fund and approximately 15% of its net assets in the Mid-Cap Equity Index Fund) and approximately 50% of net assets in fixed-income funds (approximately 30% of its net assets in the Bond Fund and approximately 20% of its net assets in the Mid-Term Bond Fund).
Performance for the Moderate Allocation Fund is compared to the S&P 500® Index (50% weighting) and the Barclays Capital Aggregate Bond Index (50% weighting). For the year ended December 31, 2012, the Moderate Allocation Fund returned 10.90% versus a 10.20% return for the weighted benchmark. The outperformance of the Fund is mainly attributable to the outperformance of the Bond Fund relative to the Barclays Capital Aggregate Bond Index, and the Mid-Cap Equity Index Fund relative to the S&P 500 Index.
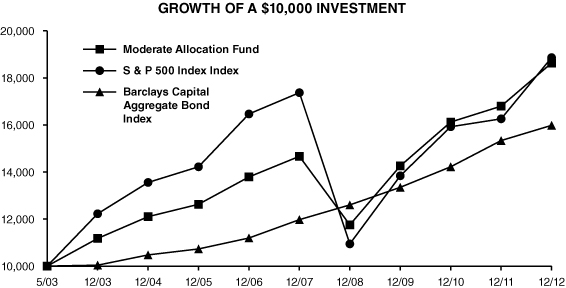
Moderate Allocation Fund
Period | | Growth | | Total Return | |
Ended
12/31/12 | | of
$10,000 | | Cumu-
lative | | Average
Annual | |
| 1 Year | | $ | 11,091 | | | | 10.90 | % | | | 10.90 | % | |
| 5 Years | | $ | 12,703 | | | | 27.03 | % | | | 4.91 | % | |
Since 5/20/03
(Inception) | | $ | 18,625 | | | | 86.25 | % | | | 6.69 | % | |
S & P 500 Index
Period | | Growth | | Total Return | |
Ended
12/31/12 | | of
$10,000 | | Cumu-
lative | | Average
Annual | |
| 1 Year | | $ | 11,600 | | | | 16.00 | % | | | 16.00 | % | |
| 5 Years | | $ | 10,857 | | | | 8.57 | % | | | 1.66 | % | |
Since 5/20/03
(Inception) | | $ | 18,856 | | | | 88.56 | % | | | 6.82 | % | |
Barclays Capital Aggregate Bond Index
Period | | Growth | | Total Return | |
Ended
12/31/12 | | of
$10,000 | | Cumu-
lative | | Average
Annual | |
| 1 Year | | $ | 10,421 | | | | 4.21 | % | | | 4.21 | % | |
| 5 Years | | $ | 13,347 | | | | 33.47 | % | | | 5.95 | % | |
Since 5/20/03
(Inception) | | $ | 15,978 | | | | 59.78 | % | | | 5.00 | % | |
The line representing the performance return of the Moderate Allocation Fund includes expenses, such as transaction costs and management fees of the underlying funds in which the Fund invests, that reduce returns while the performance return lines of the Indicies do not. Past performance is not indicative of future results.
22
AGGRESSIVE ALLOCATION FUND
The objective of the Aggressive Allocation Fund is capital appreciation and, to a lesser extent, current income. The Aggressive Allocation Fund invests in the equity and fixed-income funds of the Investment Company. The Aggressive Allocation Fund's target allocation is approximately 75% of net assets in equity funds (approximately 45% of its net assets in the Equity Index Fund, approximately 20% of its net assets in the Mid-Cap Equity Index Fund, approximately 5% of its net assets in the Small Cap Value Fund and approximately 5% of its net assets in the Small Cap Growth Fund) and approximately 25% of net assets in the Bond Fund.
Performance for the Aggressive Allocation Fund is compared to the S&P 500® Index (75% weighting) and the Barclays Capital Aggregate Bond Index (25% weighting). For the year ended December 31, 2012, the Aggressive Allocation Fund returned 13.41% versus a 13.12% return for the weighted benchmark. The small outperformance of the Fund is mainly attributable to the outperformance of the Mid-Cap Equity Index Fund relative to the S&P 500 Index, and the Bond Fund relative to the Barclays Capital Aggregate Bond Index.

Aggressive Allocation Fund
Period | | Growth | | Total Return | |
Ended
12/31/12 | | of
$10,000 | | Cumu-
lative | | Average
Annual | |
| 1 Year | | $ | 11,343 | | | | 13.41 | % | | | 13.41 | % | |
| 5 Years | | $ | 12,248 | | | | 22.48 | % | | | 4.15 | % | |
Since 5/20/03
(Inception) | | $ | 20,052 | | | | 100.52 | % | | | 7.51 | % | |
S & P 500 Index
Period | | Growth | | Total Return | |
Ended
12/31/12 | | of
$10,000 | | Cumu-
lative | | Average
Annual | |
| 1 Year | | $ | 11,600 | | | | 16.00 | % | | | 16.00 | % | |
| 5 Years | | $ | 10,857 | | | | 8.57 | % | | | 1.66 | % | |
Since 5/20/03
(Inception) | | $ | 18,856 | | | | 88.56 | % | | | 6.82 | % | |
Barclays Capital Aggregate Bond Index
Period | | Growth | | Total Return | |
Ended
12/31/12 | | of
$10,000 | | Cumu-
lative | | Average
Annual | |
| 1 Year | | $ | 10,421 | | | | 4.21 | % | | | 4.21 | % | |
| 5 Years | | $ | 13,347 | | | | 33.47 | % | | | 5.95 | % | |
Since 5/20/03
(Inception) | | $ | 15,978 | | | | 59.78 | % | | | 5.00 | % | |
The line representing the performance return of the Aggressive Allocation Fund includes expenses, such as transaction costs and management fees of the underlying funds in which the Fund invests, that reduce returns while the performance return lines of the Indicies do not. Past performance is not indicative of future results.
23
MONEY MARKET FUND
The Money Market Fund's investment objective is to realize current income while maintaining liquidity, investment quality and stability of capital through investing in high-quality commercial paper issued by U.S. corporations and securities issued by the U.S. government and its agencies. The Money Market Fund returned 0.13% before expenses and -0.17% after expenses for the year ended December 31, 2012, compared to a 0.07% return for the Citigroup 3-Month Treasury Bill Index. Note that the benchmark performance does not reflect any expenses.
The Federal Reserve maintained a near-zero interest rate policy throughout 2012. This caused money market returns to be extremely low by historical standards. In addition, the supply of eligible investments continued to decrease. The Fund's strategy continued to focus on quality, liquidity and maintaining a relatively short weighted average maturity.
The seven-day effective yield as of February 12, 2013, was -0.17%. As with all performance reporting, this yield is not necessarily indicative of future annual yields. Neither the Federal Deposit Insurance Corporation nor any other U.S. government agency insures or guarantees the Separate Account's investments in shares of the Money Market Fund.
MID-TERM BOND FUND
The Mid-Term Bond Fund seeks a high level of return consistent with the preservation of capital through investment in publicly traded debt securities. The Mid-Term Bond Fund primarily invests in corporate and U.S. government agency securities, which normally yield more than U.S. Treasury issues.
The Mid-Term Bond Fund emphasized corporate issues during 2012 in order to capture incremental income. The Fund will continue to focus on income, rather than market volatility, to achieve superior returns over market cycles. In addition, the Fund's corporate securities will remain highly diversified in order to shield the portfolio from any credit risk that might arise should the domestic economy weaken.
During 2012, the portfolio duration was extended slightly to 95% of the Barclays Capital Intermediate Government/Credit Bond Index. This will aid performance as long as the Federal Reserve maintains its low income policies. However, the Fund will remain in a position to maintain value if the government's monetary and fiscal policies begin to promote inflation. Even though official inflation numbers are relatively benign, anecdotal evidence suggests the opposite conclusion. At the very least, it is prudent to guard against the potential effects of the enormous debt burden that is being imposed by the federal government.
For the year ended December 31, 2012, the Mid-Term Bond Fund returned 3.92% before expenses and 3.33% after expenses, versus a 3.89% return for the Barclays Capital Intermediate Government/Credit Bond Index. The Fund's emphasis on higher-yielding corporate issues was a major contributor to its pre-expense outperformance.

Mid-Term Bond Fund
Period | | Growth | | Total Return | |
Ended
12/31/12 | | of
$10,000 | | Cumu-
lative | | Average
Annual | |
| 1 Year | | $ | 10,334 | | | | 3.33 | % | | | 3.33 | % | |
| 5 Years | | $ | 13,306 | | | | 33.06 | % | | | 5.89 | % | |
| 10 Years | | $ | 15,746 | | | | 57.46 | % | | | 4.66 | % | |
Barclays Capital Intermediate
Government/Credit Bond Index
Period | | Growth | | Total Return | |
Ended
12/31/12 | | of
$10,000 | | Cumu-
lative | | Average
Annual | |
| 1 Year | | $ | 10,389 | | | | 3.89 | % | | | 3.89 | % | |
| 5 Years | | $ | 12,870 | | | | 28.70 | % | | | 5.18 | % | |
| 10 Years | | $ | 15,706 | | | | 57.06 | % | | | 4.62 | % | |
The line representing the performance return of the Mid-Term Bond Fund includes expenses, such as transaction costs and management fees that reduce returns, while the performance return line of the Index does not. Past performance is not indicative of future results.
24
BOND FUND
The Bond Fund's primary investment objective is to provide as high a level of current income over time as is believed to be consistent with prudent investment risk by investing primarily in investment grade, publicly traded debt securities. A secondary objective is preservation of capital. The Bond Fund primarily invests in corporate, U.S. government agency and mortgage-backed securities, all of which normally yield more than U.S. Treasury issues.
The Federal Reserve continued to emphasize low short-term rates in order to stimulate the economy, re-liquefy the banking system and support the mortgage market. This has also reduced long-term rates to the three percent level as the government made massive purchases of longer-dated issues.
The corporate bond market performed well due to the decline in absolute yields as well as a continuing tightening of the spreads between government and corporate bonds. This was created by a supply/demand imbalance that left investors desperate for quality investments with reasonable income.
The Bond Fund's strategy was to maintain a slightly shorter duration than its benchmark, emphasize relatively short corporate bonds with high yields, establish extreme credit diversification and take a market weight in mortgage-related securities.
The Bond Fund's return for the year ended December 31, 2012, was 5.79%. This compares favorably to the Barclays Capital U.S. Aggregate Bond Index, which returned 4.21% for the period. The Fund's emphasis on higher-yielding corporate issues was a major contributor to its performance.
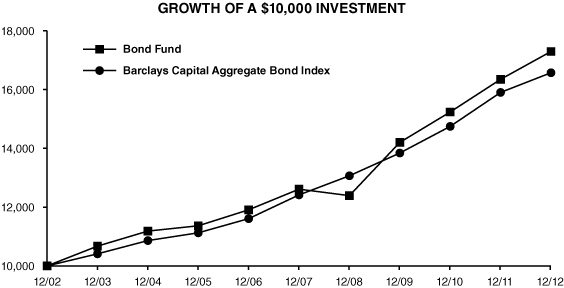
Bond Fund
Period | | Growth | | Total Return | |
Ended
12/31/12 | | of
$10,000 | | Cumu-
lative | | Average
Annual | |
| 1 Year | | $ | 10,580 | | | | 5.79 | % | | | 5.79 | % | |
| 5 Years | | $ | 13,713 | | | | 37.13 | % | | | 6.52 | % | |
| 10 Years | | $ | 17,345 | | | | 73.45 | % | | | 5.66 | % | |
Barclays Capital Aggregate Bond Index
Period | | Growth | | Total Return | |
Ended
12/31/12 | | of
$10,000 | | Cumu-
lative | | Average
Annual | |
| 1 Year | | $ | 10,421 | | | | 4.21 | % | | | 4.21 | % | |
| 5 Years | | $ | 13,347 | | | | 33.47 | % | | | 5.95 | % | |
| 10 Years | | $ | 16,572 | | | | 65.72 | % | | | 5.18 | % | |
The line representing the performance return of the Bond Fund includes expenses, such as transaction costs and management fees that reduce returns, while the performance return line of the Index does not. Past performance is not indicative of future results.
25
MUTUAL OF AMERICA INVESTMENT CORPORATION
ASSET ALLOCATIONS AS OF DECEMBER 31, 2012 (Unaudited)
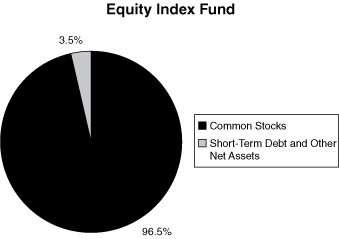
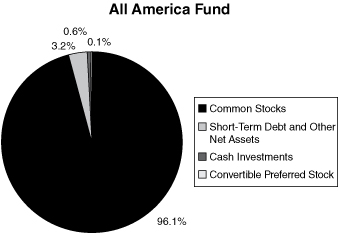
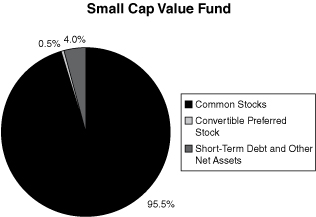
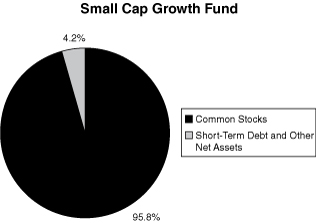
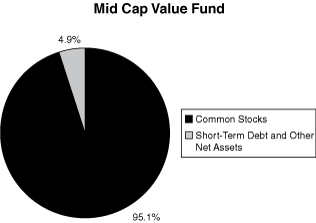
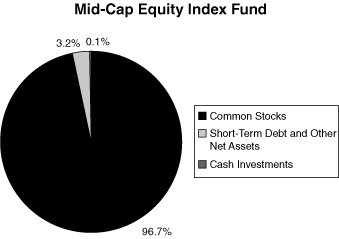
26
MUTUAL OF AMERICA INVESTMENT CORPORATION
ASSET ALLOCATIONS AS OF DECEMBER 31, 2012 (Unaudited) (Continued)

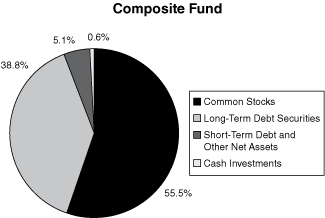
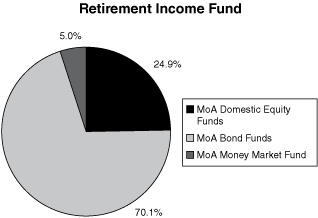


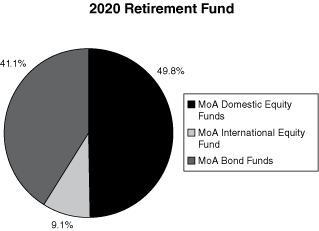
27
MUTUAL OF AMERICA INVESTMENT CORPORATION
ASSET ALLOCATIONS AS OF DECEMBER 31, 2012 (Unaudited) (Continued)
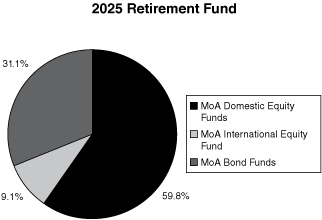
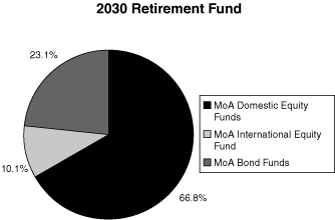
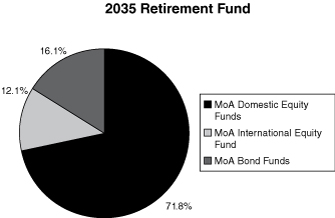

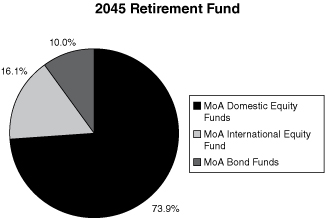
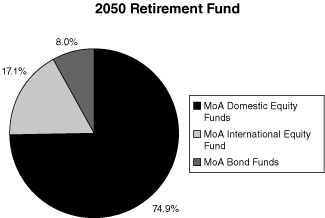
28
MUTUAL OF AMERICA INVESTMENT CORPORATION
ASSET ALLOCATIONS AS OF DECEMBER 31, 2012 (Unaudited) (Continued)
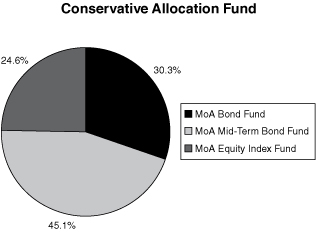
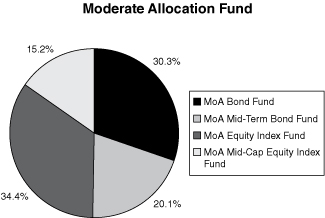
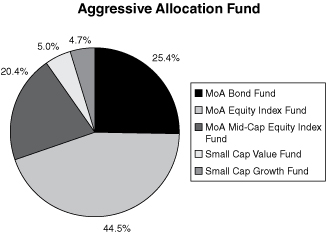
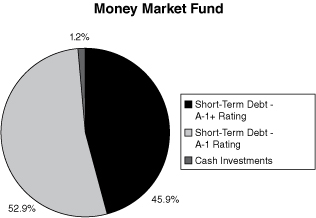

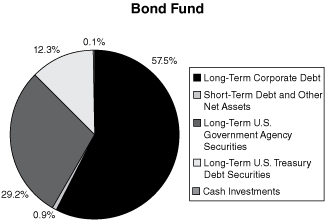
29
MUTUAL OF AMERICA INVESTMENT CORPORATION
EXPENSE EXAMPLE (Unaudited)
EXAMPLE
As a shareholder of one of the Mutual of America Investment Corporation Funds, you incur ongoing costs, including management fees and other Fund expenses. You do not incur transactional costs, such as sales charges (loads), redemption fees or exchange fees.
This Example is intended to help you understand your ongoing costs (in dollars) of investing in a Fund and to compare these costs with the ongoing costs of investing in other mutual funds. The Example is based on an investment of $1,000 invested at July 1, 2012 and held for the entire period ending December 31, 2012.
ACTUAL EXPENSES
The first line of the tables below provides information about actual account values and actual expenses. You may use the information in this line, together with the amount you invested, to estimate the expenses that you paid over the period. Simply divide your account value by $1,000 (for example, an $8,600 account value divided by $1,000=8.6), then multiply the result by the number in the first line under the heading entitled "Expenses Paid During Period" to estimate the expenses you paid on your account during this period.
HYPOTHETICAL EXAMPLE FOR COMPARISON PURPOSES
The second line of the tables below provides information about hypothetical account values and hypothetical expenses based on each Fund's actual expense ratio and an assumed rate of return of 5% per year before expenses, which is not the Fund's actual return. The hypothetical account values and expenses may not be used to estimate the actual ending account balance or expenses you paid for the period. You may use this information to compare the ongoing costs of investing in the Fund with other funds. To do so, compare this 5% hypothetical example with the 5% hypothetical examples that appear in the shareholder reports of the other funds.
Please note that the second line of the table is useful in comparing ongoing costs only, and will not help you determine the relative total costs of owning other funds, which may also charge transactional costs, such as sales charges (loads), redemption fees or exchange fees.
Equity Index Fund
| | | Beginning
Account Value
July 1, 2012 | | Ending
Account Value
December 31, 2012 | | Expenses Paid
During Period*
July 1 to
December 31, 2012 | |
Actual | | $ | 1,000.00 | | | $ | 1,077.19 | | | $ | 1.15 | | |
Hypothetical
(5% return before expenses) | | $ | 1,000.00 | | | $ | 1,023.70 | | | $ | 1.12 | | |
* Expenses are equal to the Fund's annual expense ratio of 0.22%, multiplied by the average account value over the period, multiplied by 184/366 (to reflect the one-half year period).
All America Fund
| | | Beginning
Account Value
July 1, 2012 | | Ending
Account Value
December 31, 2012 | | Expenses Paid
During Period*
July 1 to
December 31, 2012 | |
Actual | | $ | 1,000.00 | | | $ | 1,071.52 | | | $ | 2.86 | | |
Hypothetical
(5% return before expenses) | | $ | 1,000.00 | | | $ | 1,022.00 | | | $ | 2.80 | | |
* Expenses are equal to the Fund's annual expense ratio of 0.55%, multiplied by the average account value over the period, multiplied by 184/366 (to reflect the one-half year period).
30
MUTUAL OF AMERICA INVESTMENT CORPORATION
EXPENSE EXAMPLE (Unaudited) (Continued)
Small Cap Value Fund
| | | Beginning
Account Value
July 1, 2012 | | Ending
Account Value
December 31, 2012 | | Expenses Paid
During Period*
July 1 to
December 31, 2012 | |
Actual | | $ | 1,000.00 | | | $ | 1,074.94 | | | $ | 4.69 | | |
Hypothetical
(5% return before expenses) | | $ | 1,000.00 | | | $ | 1,020.21 | | | $ | 4.57 | | |
* Expenses are equal to the Fund's annual expense ratio of 0.90%, multiplied by the average account value over the period, multiplied by 184/366 (to reflect the one-half year period).
Small Cap Growth Fund
| | | Beginning
Account Value
July 1, 2012 | | Ending
Account Value
December 31, 2012 | | Expenses Paid
During Period*
July 1 to
December 31, 2012 | |
Actual | | $ | 1,000.00 | | | $ | 1,027.87 | | | $ | 4.59 | | |
Hypothetical
(5% return before expenses) | | $ | 1,000.00 | | | $ | 1,020.21 | | | $ | 4.57 | | |
* Expenses are equal to the Fund's annual expense ratio of 0.90%, multiplied by the average account value over the period, multiplied by 184/366 (to reflect the one-half year period).
Mid Cap Value Fund
| | | Beginning
Account Value
July 1, 2012 | | Ending
Account Value
December 31, 2012 | | Expenses Paid
During Period*
July 1 to
December 31, 2012 | |
Actual | | $ | 1,000.00 | | | $ | 1,053.91 | | | $ | 3.61 | | |
Hypothetical
(5% return before expenses) | | $ | 1,000.00 | | | $ | 1,021.23 | | | $ | 3.56 | | |
* Expenses are equal to the Fund's annual expense ratio of 0.70%, multiplied by the average account value over the period, multiplied by 184/366 (to reflect the one-half year period).
Mid-Cap Equity Index Fund
| | | Beginning
Account Value
July 1, 2012 | | Ending
Account Value
December 31, 2012 | | Expenses Paid
During Period*
July 1 to
December 31, 2012 | |
Actual | | $ | 1,000.00 | | | $ | 1,085.84 | | | $ | 1.15 | | |
Hypothetical
(5% return before expenses) | | $ | 1,000.00 | | | $ | 1,023.70 | | | $ | 1.12 | | |
* Expenses are equal to the Fund's annual expense ratio of 0.22%, multiplied by the average account value over the period, multiplied by 184/366 (to reflect the one-half year period).
31
MUTUAL OF AMERICA INVESTMENT CORPORATION
EXPENSE EXAMPLE (Unaudited) (Continued)
International Fund
| | | Beginning
Account Value
July 1, 2012 | | Ending
Account Value
December 31, 2012 | | Expenses Paid
During Period*
July 1 to
December 31, 2012 | |
Actual | | $ | 1,000.00 | | | $ | 1,087.88 | | | $ | 2.15 | | |
Hypothetical
(5% return before expenses) | | $ | 1,000.00 | | | $ | 1,022.72 | | | $ | 2.08 | | |
* Expenses are equal to the Fund's annual expense ratio of 0.41% (reflecting direct expenses and the proportional expense ratios of the underlying funds in which the Fund invests), multiplied by the average account value over the period, multiplied by 184/366 (to reflect the one-half year period).
Composite Fund
| | | Beginning
Account Value
July 1, 2012 | | Ending
Account Value
December 31, 2012 | | Expenses Paid
During Period*
July 1 to
December 31, 2012 | |
Actual | | $ | 1,000.00 | | | $ | 1,056.96 | | | $ | 2.84 | | |
Hypothetical
(5% return before expenses) | | $ | 1,000.00 | | | $ | 1,022.00 | | | $ | 2.80 | | |
* Expenses are equal to the Fund's annual expense ratio of 0.55%, multiplied by the average account value over the period, multiplied by 184/366 (to reflect the one-half year period).
Retirement Income Fund
| | | Beginning
Account Value
July 1, 2012 | | Ending
Account Value
December 31, 2012 | | Expenses Paid
During Period*
July 1 to
December 31, 2012 | |
Actual | | $ | 1,000.00 | | | $ | 1,035.33 | | | $ | 2.56 | | |
Hypothetical
(5% return before expenses) | | $ | 1,000.00 | | | $ | 1,022.26 | | | $ | 2.54 | | |
* Expenses are equal to the Fund's annual expense ratio of 0.50% (reflecting direct investment management fees and the proportional expense ratios of the underlying funds in which the Fund invests), multiplied by the average account value over the period, multiplied by 184/366 (to reflect the one-half year period).
2010 Retirement Fund
| | | Beginning
Account Value
July 1, 2012 | | Ending
Account Value
December 31, 2012 | | Expenses Paid
During Period*
July 1 to
December 31, 2012 | |
Actual | | $ | 1,000.00 | | | $ | 1,047.59 | | | $ | 2.26 | | |
Hypothetical
(5% return before expenses) | | $ | 1,000.00 | | | $ | 1,022.57 | | | $ | 2.24 | | |
* Expenses are equal to the Fund's annual expense ratio of 0.44% (reflecting direct investment management fees and the proportional expense ratios of the underlying funds in which the Fund invests), multiplied by the average account value over the period, multiplied by 184/366 (to reflect the one-half year period).
32
MUTUAL OF AMERICA INVESTMENT CORPORATION
EXPENSE EXAMPLE (Unaudited) (Continued)
2015 Retirement Fund
| | | Beginning
Account Value
July 1, 2012 | | Ending
Account Value
December 31, 2012 | | Expenses Paid
During Period*
July 1 to
December 31, 2012 | |
Actual | | $ | 1,000.00 | | | $ | 1,051.91 | | | $ | 2.27 | | |
Hypothetical
(5% return before expenses) | | $ | 1,000.00 | | | $ | 1,022.57 | | | $ | 2.24 | | |
* Expenses are equal to the Fund's annual expense ratio of 0.44% (reflecting direct investment management fees and the proportional expense ratios of the underlying funds in which the Fund invests), multiplied by the average account value over the period, multiplied by 184/366 (to reflect the one-half year period).
2020 Retirement Fund
| | | Beginning
Account Value
July 1, 2012 | | Ending
Account Value
December 31, 2012 | | Expenses Paid
During Period*
July 1 to
December 31, 2012 | |
Actual | | $ | 1,000.00 | | | $ | 1,057.15 | | | $ | 2.33 | | |
Hypothetical
(5% return before expenses) | | $ | 1,000.00 | | | $ | 1,022.52 | | | $ | 2.29 | | |
* Expenses are equal to the Fund's annual expense ratio of 0.45% (reflecting direct investment management fees and the proportional expense ratios of the underlying funds in which the Fund invests), multiplied by the average account value over the period, multiplied by 184/366 (to reflect the one-half year period).
2025 Retirement Fund
| | | Beginning
Account Value
July 1, 2012 | | Ending
Account Value
December 31, 2012 | | Expenses Paid
During Period*
July 1 to
December 31, 2012 | |
Actual | | $ | 1,000.00 | | | $ | 1,062.90 | | | $ | 2.23 | | |
Hypothetical
(5% return before expenses) | | $ | 1,000.00 | | | $ | 1,022.62 | | | $ | 2.19 | | |
* Expenses are equal to the Fund's annual expense ratio of 0.43% (reflecting direct investment management fees and the proportional expense ratios of the underlying funds in which the Fund invests), multiplied by the average account value over the period, multiplied by 184/366 (to reflect the one-half year period).
2030 Retirement Fund
| | | Beginning
Account Value
July 1, 2012 | | Ending
Account Value
December 31, 2012 | | Expenses Paid
During Period*
July 1 to
December 31, 2012 | |
Actual | | $ | 1,000.00 | | | $ | 1,066.63 | | | $ | 2.18 | | |
Hypothetical
(5% return before expenses) | | $ | 1,000.00 | | | $ | 1,022.67 | | | $ | 2.14 | | |
* Expenses are equal to the Fund's annual expense ratio of 0.42% (reflecting direct investment management fees and the proportional expense ratios of the underlying funds in which the Fund invests), multiplied by the average account value over the period, multiplied by 184/366 (to reflect the one-half year period).
33
MUTUAL OF AMERICA INVESTMENT CORPORATION
EXPENSE EXAMPLE (Unaudited) (Continued)
2035 Retirement Fund
| | | Beginning
Account Value
July 1, 2012 | | Ending
Account Value
December 31, 2012 | | Expenses Paid
During Period*
July 1 to
December 31, 2012 | |
Actual | | $ | 1,000.00 | | | $ | 1,069.92 | | | $ | 2.13 | | |
Hypothetical
(5% return before expenses) | | $ | 1,000.00 | | | $ | 1,022.72 | | | $ | 2.08 | | |
* Expenses are equal to the Fund's annual expense ratio of 0.41% (reflecting direct investment management fees and the proportional expense ratios of the underlying funds in which the Fund invests), multiplied by the average account value over the period, multiplied by 184/366 (to reflect the one-half year period).
2040 Retirement Fund
| | | Beginning
Account Value
July 1, 2012 | | Ending
Account Value
December 31, 2012 | | Expenses Paid
During Period*
July 1 to
December 31, 2012 | |
Actual | | $ | 1,000.00 | | | $ | 1,071.05 | | | $ | 2.19 | | |
Hypothetical
(5% return before expenses) | | $ | 1,000.00 | | | $ | 1,022.67 | | | $ | 2.14 | | |
* Expenses are equal to the Fund's annual expense ratio of 0.42% (reflecting direct investment management fees and the proportional expense ratios of the underlying funds in which the Fund invests), multiplied by the average account value over the period, multiplied by 184/366 (to reflect the one-half year period).
2045 Retirement Fund
| | | Beginning
Account Value
July 1, 2012 | | Ending
Account Value
December 31, 2012 | | Expenses Paid
During Period*
July 1 to
December 31, 2012 | |
Actual | | $ | 1,000.00 | | | $ | 1,070.21 | | | $ | 2.29 | | |
Hypothetical
(5% return before expenses) | | $ | 1,000.00 | | | $ | 1,022.57 | | | $ | 2.24 | | |
* Expenses are equal to the Fund's annual expense ratio of 0.44% (reflecting direct investment management fees and the proportional expense ratios of the underlying funds in which the Fund invests), multiplied by the average account value over the period, multiplied by 184/366 (to reflect the one-half year period).
2050 Retirement Fund
| | | Beginning
Account Value
July 1, 2012 | | Ending
Account Value
December 31, 2012 | | Expenses Paid
During Period*
July 1 to
December 31, 2012 | |
Actual | | $ | 1,000.00 | | | $ | 1,009.16 | | | $ | 2.32 | | |
Hypothetical
(5% return before expenses) | | $ | 1,000.00 | | | $ | 1,022.46 | | | $ | 2.34 | | |
* The Fund was not in operation during the entire period from July 1, 2012 through December 31, 2012. Expenses are equal to the Fund's annual expense ratio of 0.46% (reflecting direct investment management fees and the proportional expense ratios of the underlying funds in which the Fund invests), multiplied by the average account value over the period, multiplied by 184/366 (to reflect the one-half year period).
34
MUTUAL OF AMERICA INVESTMENT CORPORATION
EXPENSE EXAMPLE (Unaudited) (Continued)
Conservative Allocation Fund
| | | Beginning
Account Value
July 1, 2012 | | Ending
Account Value
December 31, 2012 | | Expenses Paid
During Period*
July 1 to
December 31, 2012 | |
Actual | | $ | 1,000.00 | | | $ | 1,036.74 | | | $ | 2.05 | | |
Hypothetical
(5% return before expenses) | | $ | 1,000.00 | | | $ | 1,022.77 | | | $ | 2.03 | | |
* Expenses are equal to the Fund's annual expense ratio of 0.40% (reflecting the proportional expense ratios of the underlying funds in which the Fund invests), multiplied by the average account value over the period, multiplied by 184/366 (to reflect the one-half year period).
Moderate Allocation Fund
| | | Beginning
Account Value
July 1, 2012 | | Ending
Account Value
December 31, 2012 | | Expenses Paid
During Period*
July 1 to
December 31, 2012 | |
Actual | | $ | 1,000.00 | | | $ | 1,053.39 | | | $ | 1.96 | | |
Hypothetical
(5% return before expenses) | | $ | 1,000.00 | | | $ | 1,022.88 | | | $ | 1.93 | | |
* Expenses are equal to the Fund's annual expense ratio of 0.38% (reflecting the proportional expense ratios of the underlying funds in which the Fund invests), multiplied by the average account value over the period, multiplied by 184/366 (to reflect the one-half year period).
Aggressive Allocation Fund
| | | Beginning
Account Value
July 1, 2012 | | Ending
Account Value
December 31, 2012 | | Expenses Paid
During Period*
July 1 to
December 31, 2012 | |
Actual | | $ | 1,000.00 | | | $ | 1,065.31 | | | $ | 1.92 | | |
Hypothetical
(5% return before expenses) | | $ | 1,000.00 | | | $ | 1,022.93 | | | $ | 1.88 | | |
* Expenses are equal to the Fund's annual expense ratio of 0.37% (reflecting the proportional expense ratios of the underlying funds in which the Fund invests), multiplied by the average account value over the period, multiplied by 184/366 (to reflect the one-half year period).
Money Market Fund
| | | Beginning
Account Value
July 1, 2012 | | Ending
Account Value
December 31, 2012 | | Expenses Paid
During Period*
July 1 to
December 31, 2012 | |
Actual | | $ | 1,000.00 | | | $ | 999.14 | | | $ | 1.51 | | |
Hypothetical
(5% return before expenses) | | $ | 1,000.00 | | | $ | 1,023.29 | | | $ | 1.53 | | |
* Expenses are equal to the Fund's annual expense ratio of 0.30%, multiplied by the average account value over the period, multiplied by 184/366 (to reflect the one-half year period).
35
MUTUAL OF AMERICA INVESTMENT CORPORATION
EXPENSE EXAMPLE (Unaudited) (Continued)
Mid-Term Bond Fund
| | | Beginning
Account Value
July 1, 2012 | | Ending
Account Value
December 31, 2012 | | Expenses Paid
During Period*
July 1 to
December 31, 2012 | |
Actual | | $ | 1,000.00 | | | $ | 1,016.60 | | | $ | 2.79 | | |
Hypothetical
(5% return before expenses) | | $ | 1,000.00 | | | $ | 1,022.00 | | | $ | 2.80 | | |
* Expenses are equal to the Fund's annual expense ratio of 0.55%, multiplied by the average account value over the period, multiplied by 184/366 (to reflect the one-half year period).
Bond Fund
| | | Beginning
Account Value
July 1, 2012 | | Ending
Account Value
December 31, 2012 | | Expenses Paid
During Period*
July 1 to
December 31, 2012 | |
Actual | | $ | 1,000.00 | | | $ | 1,028.70 | | | $ | 2.80 | | |
Hypothetical
(5% return before expenses) | | $ | 1,000.00 | | | $ | 1,022.00 | | | $ | 2.80 | | |
* Expenses are equal to the Fund's annual expense ratio of 0.55%, multiplied by the average account value over the period, multiplied by 184/366 (to reflect the one-half year period).
36
MUTUAL OF AMERICA INVESTMENT CORPORATION (EQUITY INDEX FUND)
SUMMARY PORTFOLIO OF INVESTMENTS IN SECURITIES
December 31, 2012
| | | Shares | | Value | |
INDEXED ASSETS: | |
COMMON STOCKS | |
CONSUMER DISCRETIONARY (11.1%) | |
Amazon.com, Inc.* | | | 30,413 | | | $ | 7,637,921 | | |
Comcast Corp. Cl A | | | 224,243 | | | | 8,382,203 | | |
Disney (Walt) Co. | | | 146,932 | | | | 7,315,744 | | |
Home Depot, Inc. | | | 127,422 | | | | 7,881,051 | | |
McDonald's Corp. | | | 84,213 | | | | 7,428,429 | | |
Other Securities | | | 2,162,972 | | | | 84,659,561 | | |
| | | | 123,304,909 | | |
CONSUMER STAPLES (10.2%) | |
Altria Group, Inc. | | | 170,216 | | | | 5,348,187 | | |
Coca-Cola Co. | | | 323,336 | | | | 11,720,930 | | |
CVS Caremark Corp. | | | 104,583 | | | | 5,056,588 | | |
PepsiCo, Inc. | | | 129,981 | | | | 8,894,600 | | |
Philip Morris Int'l., Inc. | | | 141,302 | | | | 11,818,499 | | |
Proctor & Gamble Co. | | | 229,250 | | | | 15,563,783 | | |
Wal-Mart Stores, Inc. | | | 140,008 | | | | 9,552,746 | | |
Other Securities | | | 1,020,228 | | | | 45,555,262 | | |
| | | | 113,510,595 | | |
ENERGY (10.6%) | |
Chevron Corp. | | | 163,568 | | | | 17,688,244 | | |
ConocoPhillips | | | 101,747 | | | | 5,900,309 | | |
Exxon Mobil Corp. | | | 385,191 | | | | 33,338,278 | | |
Occidental Petroleum Corp. | | | 67,526 | | | | 5,173,167 | | |
Schlumberger Ltd. | | | 112,031 | | | | 7,762,628 | | |
Other Securities | | | 1,070,261 | | | | 47,628,979 | | |
| | | | 117,491,605 | | |
FINANCIALS (14.9%) | |
American Express Co. | | | 81,644 | | | | 4,692,897 | | |
Bank of America Corp. | | | 902,925 | | | | 10,473,930 | | |
Berkshire Hathaway, Inc. Cl B* | | | 151,595 | | | | 13,598,072 | | |
Citigroup, Inc. | | | 244,654 | | | | 9,678,512 | | |
Goldman Sachs Group, Inc. | | | 36,782 | | | | 4,691,912 | | |
JPMorgan Chase & Co. | | | 313,596 | | | | 13,788,816 | | |
U.S. Bancorp | | | 157,609 | | | | 5,034,031 | | |
Wells Fargo & Co. | | | 409,067 | | | | 13,981,910 | | |
Other Securities | | | 2,539,301 | | | | 89,613,091 | | |
| | | | 165,553,171 | | |
HEALTH CARE (11.7%) | |
Abbott Laboratories | | | 132,286 | | | | 8,664,733 | | |
Amgen, Inc. | | | 64,988 | | | | 5,609,764 | | |
Bristol-Myers Squibb Co. | | | 139,014 | | | | 4,530,466 | | |
| | | Shares | | Value | |
| INDEXED ASSETS (CONTINUED): | |
COMMON STOCKS (CONTINUED) | |
HEALTH CARE (CONTINUED) | |
Gilead Sciences, Inc.* | | | 65,514 | | | $ | 4,812,003 | | |
Johnson & Johnson | | | 231,161 | | | | 16,204,386 | | |
Merck & Co., Inc. | | | 264,685 | | | | 10,836,204 | | |
Pfizer, Inc. | | | 622,595 | | | | 15,614,683 | | |
UnitedHealth Group, Inc. | | | 84,903 | | | | 4,605,139 | | |
Other Securities | | | 1,082,217 | | | | 58,343,341 | | |
| | | | 129,220,719 | | |
INDUSTRIALS (9.8%) | |
3M Co. | | | 53,085 | | | | 4,928,942 | | |
Caterpillar, Inc. | | | 56,262 | | | | 5,039,950 | | |
General Electric Co. | | | 900,808 | | | | 18,907,960 | | |
Union Pacific Corp. | | | 39,613 | | | | 4,980,146 | | |
United Technologies Corp. | | | 69,789 | | | | 5,723,396 | | |
Other Securities | | | 1,272,876 | | | | 68,668,363 | | |
| | | | 108,248,757 | | |
INFORMATION TECHNOLOGY (18.5%) | |
Apple, Inc. | | | 81,328 | | | | 43,350,259 | | |
Cisco Systems, Inc. | | | 452,098 | | | | 8,883,726 | | |
eBay, Inc.* | | | 98,068 | | | | 5,003,429 | | |
Google, Inc. Cl A* | | | 22,205 | | | | 15,751,561 | | |
Int'l. Business Machines Corp. | | | 89,033 | | | | 17,054,271 | | |
Intel Corp. | | | 417,262 | | | | 8,608,115 | | |
Microsoft Corp. | | | 637,244 | | | | 17,033,532 | | |
Oracle Corp. | | | 304,888 | | | | 10,158,868 | | |
QUALCOMM, Inc. | | | 144,795 | | | | 8,980,186 | | |
Visa, Inc. Cl A | | | 43,152 | | | | 6,540,980 | | |
Other Securities | | | 2,295,740 | | | | 63,242,616 | | |
| | | | 204,607,543 | | |
MATERIALS (3.5%) | |
Other Securities | | | 798,305 | | | | 38,473,028 | | |
TELECOMMUNICATION SERVICES (2.9%) | |
AT&T, Inc. | | | 477,196 | | | | 16,086,277 | | |
Verizon Communications, Inc. | | | 236,398 | | | | 10,228,941 | | |
Other Securities | | | 494,954 | | | | 6,300,880 | | |
| | | | 32,616,098 | | |
UTILITIES (3.3%) | |
Other Securities | | | 946,384 | | | | 36,537,129 | | |
TOTAL INDEXED ASSETS-COMMON STOCKS
(Cost: $822,824,420) 96.5% | | $ | 1,069,563,554 | | |
| | Rating** | | Rate | | Maturity | | Face
Amount | | Value | |
SHORT-TERM DEBT SECURITIES: | |
U.S. GOVERNMENT (0.9%) | |
U.S. Treasury Bill (1) | | A-1+ | | | 0.03 - 0.10 | % | | 02/14/13 - 04/04/13 | | $ | 10,100,000 | | | $ | 10,098,858 | | |
COMMERCIAL PAPER (2.4%) | |
Air Products & Chemicals† | | A-1 | | | 0.13 | | | 01/16/13 | | | 3,400,000 | | | | 3,399,816 | | |
General Electric Capital Corp. | | A-1+ | | | 0.12 | | | 03/18/13 | | | 10,000,000 | | | | 9,997,465 | | |
New Jersey Natural Gas | | A-1 | | | 0.11 | | | 01/14/13 | | | 1,300,000 | | | | 1,299,948 | | |
Toyota Motor Credit Corp. | | A-1+ | | | 0.15 - 0.16 | | | 02/15/13 - 02/22/13 | | | 9,000,000 | | | | 8,998,150 | | |
Washington Gas Light Co. | | A-1 | | | 0.13 | | | 01/02/13 | | | 3,100,000 | | | | 3,099,989 | | |
| | | | 26,795,368 | | |
TOTAL SHORT-TERM DEBT SECURITIES
(Cost: $36,894,226) 3.3% | | | 36,894,226 | | |
TEMPORARY CASH INVESTMENTS (2)
(Cost: $32,700) 0.0% (3) | | | 32,700 | | |
TOTAL INVESTMENTS
(Cost: $859,751,346) 99.8% | | | 1,106,490,480 | | |
OTHER NET ASSETS 0.2% | | | 2,096,585 | | |
NET ASSETS 100.0% | | $ | 1,108,587,065 | | |
The accompanying notes are an integral part of these portfolio schedules.
37
MUTUAL OF AMERICA INVESTMENT CORPORATION (ALL AMERICA FUND)
SUMMARY PORTFOLIO OF INVESTMENTS IN SECURITIES
December 31, 2012
| | | Shares | | Value | |
INDEXED ASSETS: | |
COMMON STOCKS | |
CONSUMER DISCRETIONARY (5.9%) | |
Amazon.com, Inc.* | | | 3,743 | | | $ | 940,017 | | |
Comcast Corp. Cl A | | | 27,683 | | | | 1,034,791 | | |
Disney (Walt) Co. | | | 18,111 | | | | 901,747 | | |
Ford Motor Co. | | | 39,164 | | | | 507,174 | | |
Home Depot, Inc. | | | 15,787 | | | | 976,426 | | |
Starbucks Corp. | | | 7,766 | | | | 416,413 | | |
Other Securities | | | 229,963 | | | | 10,421,415 | | |
| | | | 15,197,983 | | |
CONSUMER STAPLES (5.4%) | |
Coca-Cola Co. | | | 39,712 | | | | 1,439,560 | | |
PepsiCo, Inc. | | | 15,968 | | | | 1,092,690 | | |
Philip Morris Int'l., Inc. | | | 17,357 | | | | 1,451,739 | | |
Proctor & Gamble Co. | | | 28,159 | | | | 1,911,715 | | |
Wal-Mart Stores, Inc. | | | 17,212 | | | | 1,174,375 | | |
Other Securities | | | 159,367 | | | | 6,887,324 | | �� |
| | | | 13,957,403 | | |
ENERGY (5.6%) | |
Chevron Corp. | | | 20,131 | | | | 2,176,966 | | |
Exxon Mobil Corp. | | | 47,262 | | | | 4,090,521 | | |
Occidental Petroleum Corp. | | | 8,323 | | | | 637,625 | | |
Schlumberger Ltd. | | | 13,828 | | | | 958,142 | | |
Other Securities | | | 144,402 | | | | 6,596,550 | | |
| | | | 14,459,804 | | |
FINANCIALS (7.9%) | |
American Int'l. Group, Inc.* | | | 15,372 | | | | 542,632 | | |
Bank of America Corp. | | | 111,031 | | | | 1,287,960 | | |
Berkshire Hathaway, Inc. Cl B* | | | 18,622 | | | | 1,670,393 | | |
Capital One Financial Corp. | | | 6,055 | | | | 350,766 | | |
Citigroup, Inc. | | | 30,184 | | | | 1,194,079 | | |
Goldman Sachs Group, Inc. | | | 4,536 | | | | 578,612 | | |
JPMorgan Chase & Co. | | | 38,604 | | | | 1,697,418 | | |
Simon Property Group, Inc. | | | 3,138 | | | | 496,086 | | |
Wells Fargo & Co. | | | 50,464 | | | | 1,724,860 | | |
Other Securities | | | 318,025 | | | | 10,851,818 | | |
| | | | 20,394,624 | | |
HEALTH CARE (6.2%) | |
Abbott Laboratories | | | 16,331 | | | | 1,069,681 | | |
Gilead Sciences, Inc.* | | | 8,066 | | | | 592,448 | | |
| | | Shares | | Value | |
| INDEXED ASSETS (CONTINUED): | |
COMMON STOCKS (CONTINUED) | |
HEALTH CARE (CONTINUED) | |
Johnson & Johnson | | | 28,496 | | | $ | 1,997,570 | | |
Merck & Co., Inc. | | | 32,567 | | | | 1,333,293 | | |
Pfizer, Inc. | | | 76,543 | | | | 1,919,698 | | |
Other Securities | | | 168,705 | | | | 8,994,613 | | |
| | | | 15,907,303 | | |
INDUSTRIALS (5.2%) | |
Boeing Co. | | | 6,934 | | | | 522,546 | | |
Caterpillar, Inc. | | | 6,930 | | | | 620,789 | | |
General Electric Co. | | | 111,555 | | | | 2,341,539 | | |
Precision Castparts Corp. | | | 1,485 | | | | 281,289 | | |
Union Pacific Corp. | | | 4,882 | | | | 613,765 | | |
Other Securities | | | 163,659 | | | | 8,980,213 | | |
| | | | 13,360,141 | | |
INFORMATION TECHNOLOGY (9.8%) | |
Apple, Inc. | | | 9,998 | | | | 5,329,229 | | |
Cisco Systems, Inc. | | | 55,721 | | | | 1,094,918 | | |
EMC Corp.* | | | 21,880 | | | | 553,564 | | |
Google, Inc. Cl A* | | | 2,737 | | | | 1,941,546 | | |
Int'l. Business Machines Corp. | | | 10,929 | | | | 2,093,450 | | |
Intel Corp. | | | 51,451 | | | | 1,061,434 | | |
MasterCard, Inc. Cl A | | | 1,091 | | | | 535,986 | | |
Microsoft Corp. | | | 78,356 | | | | 2,094,456 | | |
Oracle Corp. | | | 37,424 | | | | 1,246,968 | | |
QUALCOMM, Inc. | | | 17,892 | | | | 1,109,662 | | |
Salesforce.com, inc.* | | | 1,352 | | | | 227,271 | | |
Other Securities | | | 276,527 | | | | 7,910,017 | | |
| | | | 25,198,501 | | |
MATERIALS (1.9%) | |
Other Securities | | | 98,426 | | | | 4,742,277 | | |
TELECOMMUNICATION SERVICES (1.6%) | |
AT&T, Inc. | | | 58,732 | | | | 1,979,856 | | |
Verizon Communications, Inc. | | | 29,234 | | | | 1,264,955 | | |
Other Securities | | | 60,839 | | | | 774,508 | | |
| | | | 4,019,319 | | |
UTILITIES (1.8%) | |
Other Securities | | | 116,545 | | | | 4,500,342 | | |
TOTAL INDEXED ASSETS-COMMON STOCKS
(Cost: $112,321,645) 51.3% | | $ | 131,737,697 | | |
| | | Rating** | | Rate | | Maturity | | Face
Amount | | Value | |
INDEXED ASSETS: | |
SHORT-TERM DEBT SECURITIES: | |
U.S. GOVERNMENT (0.4%) | |
U.S. Treasury Bill (1) | | A-1+ | | | 0.05 | % | | 03/21/13 | | $ | 1,000,000 | | | $ | 999,867 | | |
COMMERCIAL PAPER (0.9%) | |
General Electric Capital Corp. | | A-1+ | | | 0.12 | | | 03/13/13 - 03/18/13 | | | 2,300,000 | | | | 2,299,354 | | |
TOTAL INDEXED ASSETS-SHORT-TERM DEBT SECURITIES
(Cost: $3,299,333) 1.3% | | | 3,299,221 | | |
TOTAL INDEXED ASSETS
(Cost: $115,620,978) 52.6% | | $ | 135,036,918 | | |
The accompanying notes are an integral part of these portfolio schedules.
38
MUTUAL OF AMERICA INVESTMENT CORPORATION (ALL AMERICA FUND)
SUMMARY PORTFOLIO OF INVESTMENTS IN SECURITIES (Continued)
December 31, 2012
| | | Shares | | Value | |
ACTIVE ASSETS: | |
COMMON STOCKS | |
CONSUMER DISCRETIONARY (4.9%) | |
Amazon.com, Inc.* | | | 3,603 | | | $ | 904,857 | | |
Disney (Walt) Co. | | | 14,336 | | | | 713,789 | | |
Ford Motor Co. | | | 57,693 | | | | 747,124 | | |
Starbucks Corp. | | | 21,172 | | | | 1,135,243 | | |
Other Securities | | | 338,073 | | | | 9,012,054 | | |
| | | | 12,513,067 | | |
CONSUMER STAPLES (3.4%) | |
PepsiCo, Inc. | | | 9,829 | | | | 672,598 | | |
Philip Morris Int'l., Inc. | | | 13,570 | | | | 1,134,995 | | |
Proctor & Gamble Co. | | | 15,488 | | | | 1,051,480 | | |
Wal-Mart Stores, Inc. | | | 17,613 | | | | 1,201,735 | | |
Other Securities | | | 195,112 | | | | 4,697,684 | | |
| | | | 8,758,492 | | |
ENERGY (4.0%) | |
Chevron Corp. | | | 6,326 | | | | 684,094 | | |
Energy XXI (Bermuda) Ltd. | | | 27,537 | | | | 886,416 | | |
Exxon Mobil Corp. | | | 25,539 | | | | 2,210,400 | | |
McMoRan Exploration Co.* | | | 70,241 | | | | 1,127,368 | | |
Occidental Petroleum Corp. | | | 7,449 | | | | 570,668 | | |
Other Securities | | | 450,258 | | | | 4,781,860 | | |
| | | | 10,260,806 | | |
FINANCIALS (8.9%) | |
American Int'l. Group, Inc.* | | | 14,552 | | | | 513,686 | | |
Bank of America Corp. | | | 52,718 | | | | 611,529 | | |
Berkshire Hathaway, Inc. Cl B* | | | 5,917 | | | | 530,755 | | |
Capital One Financial Corp. | | | 14,184 | | | | 821,679 | | |
Citigroup, Inc. | | | 13,874 | | | | 548,855 | | |
Goldman Sachs Group, Inc. | | | 4,870 | | | | 621,217 | | |
JPMorgan Chase & Co. | | | 31,400 | | | | 1,380,658 | | |
Simon Property Group, Inc. | | | 5,117 | | | | 808,947 | | |
Wells Fargo & Co. | | | 38,762 | | | | 1,324,885 | | |
Other Securities | | | 719,527 | | | | 15,647,838 | | |
| | | | 22,810,049 | | |
HEALTH CARE (5.6%) | |
Abbott Laboratories | | | 4,072 | | | | 266,716 | | |
Gilead Sciences, Inc.* | | | 7,228 | | | | 530,897 | | |
Merck & Co., Inc. | | | 21,999 | | | | 900,639 | | |
Pfizer, Inc. | | | 51,541 | | | | 1,292,648 | | |
Other Securities | | | 498,972 | | | | 11,319,427 | | |
| | | | 14,310,327 | | |
| | | Shares | | Value | |
| ACTIVE ASSETS (CONTINUED): | |
COMMON STOCKS (CONTINUED) | |
INDUSTRIALS (5.9%) | |
Boeing Co. | | | 10,566 | | | $ | 796,254 | | |
Caterpillar, Inc. | | | 7,729 | | | | 692,364 | | |
General Electric Co. | | | 62,144 | | | | 1,304,403 | | |
Old Dominion Freight Line, Inc.* | | | 29,600 | | | | 1,014,688 | | |
Precision Castparts Corp. | | | 4,211 | | | | 797,648 | | |
Union Pacific Corp. | | | 3,758 | | | | 472,456 | | |
Other Securities | | | 250,139 | | | | 9,959,222 | | |
| | | | 15,037,035 | | |
INFORMATION TECHNOLOGY (7.4%) | |
Apple, Inc. | | | 5,401 | | | | 2,878,893 | | |
Cisco Systems, Inc. | | | 14,262 | | | | 280,248 | | |
EMC Corp.* | | | 15,865 | | | | 401,385 | | |
Google, Inc. Cl A* | | | 1,426 | | | | 1,011,562 | | |
Int'l. Business Machines Corp. | | | 5,392 | | | | 1,032,838 | | |
MasterCard, Inc. Cl A | | | 814 | | | | 399,902 | | |
Microsoft Corp. | | | 32,624 | | | | 872,040 | | |
Oracle Corp. | | | 20,533 | | | | 684,160 | | |
QUALCOMM, Inc. | | | 11,609 | | | | 719,990 | | |
Salesforce.com, inc.* | | | 4,512 | | | | 758,467 | | |
Other Securities | | | 435,926 | | | | 10,024,225 | | |
| | | | 19,063,710 | | |
MATERIALS (2.5%) | |
Other Securities | | | 288,938 | | | | 6,493,752 | | |
TELECOMMUNICATION SERVICES (0.8%) | |
AT&T, Inc. | | | 32,277 | | | | 1,088,058 | | |
Other Securities | | | 92,226 | | | | 869,191 | | |
| | | | 1,957,249 | | |
UTILITIES (1.4%) | |
Other Securities | | | 99,951 | | | | 3,665,472 | | |
TOTAL ACTIVE ASSETS-COMMON STOCKS
(Cost: $95,259,528) 44.8% | | $ | 114,869,959 | | |
ACTIVE ASSETS: | |
CONVERTIBLE PREFERRED STOCKS | |
ENERGY (0.1%) | |
Energy XXI (Bermuda)
Ltd., 7.25% | | | 556 | | | | 191,225 | | |
TOTAL ACTIVE ASSETS-CONVERTIBLE
PREFERRED STOCKS
(Cost: $55,600) 0.1% | | $ | 191,225 | | |
| | | Rating** | | Rate | | Maturity | | Face
Amount | | Value | |
ACTIVE ASSETS: | |
SHORT-TERM DEBT SECURITIES: | |
COMMERCIAL PAPER (1.6%) | |
General Electric Capital Corp. | | A-1+ | | | 0.12 | % | | 03/13/13 - 03/18/13 | | $ | 2,000,000 | | | $ | 1,999,436 | | |
Toyota Motor Credit Corp. | | A-1+ | | | 0.15 | | | 02/22/13 | | | 2,000,000 | | | | 1,999,593 | | |
| | | | 3,999,029 | | |
TOTAL ACTIVE ASSETS-SHORT-TERM DEBT SECURITIES
(Cost: $3,999,096) 1.6% | | | 3,999,029 | | |
TOTAL ACTIVE ASSETS
(Cost: $99,314,224) 46.5% | | | 119,060,213 | | |
TEMPORARY CASH INVESTMENTS (2)
(Cost: $1,489,000) 0.6% | | | 1,489,000 | | |
TOTAL INVESTMENTS
(Cost: $216,424,202) 99.7% | | | 255,586,131 | | |
OTHER NET ASSETS 0.3% | | | 651,959 | | |
NET ASSETS 100.0% | | $ | 256,238,090 | | |
The accompanying notes are an integral part of these portfolio schedules.
39
MUTUAL OF AMERICA INVESTMENT CORPORATION (SMALL CAP VALUE FUND)
SUMMARY PORTFOLIO OF INVESTMENTS IN SECURITIES
December 31, 2012
| | | Shares | | Value | |
COMMON STOCKS: | |
CONSUMER DISCRETIONARY (6.2%) | |
Bassett Furniture Industries, Inc. | | | 250,937 | | | $ | 3,129,184 | | |
Pep Boys - Manny, Moe & Jack | | | 274,091 | | | | 2,694,315 | | |
Rent-A-Center, Inc. | | | 73,658 | | | | 2,530,889 | | |
Shutterfly, Inc.* | | | 86,812 | | | | 2,593,074 | | |
Wolverine World Wide, Inc. | | | 84,192 | | | | 3,450,188 | | |
Other Securities | | | 472,280 | | | | 3,514,204 | | |
| | | | 17,911,854 | | |
CONSUMER STAPLES (2.9%) | |
Prestige Brands Hldgs., Inc.* | | | 170,630 | | | | 3,417,719 | | |
The Pantry, Inc.* | | | 186,980 | | | | 2,268,067 | | |
Other Securities | | | 183,626 | | | | 2,678,198 | | |
| | | | 8,363,984 | | |
ENERGY (6.2%) | |
Energy XXI (Bermuda) Ltd. | | | 170,518 | | | | 5,488,974 | | |
McMoRan Exploration Co.* | | | 514,326 | | | | 8,254,933 | | |
PBF Energy, Inc.* | | | 93,886 | | | | 2,727,388 | | |
Other Securities | | | 2,562,348 | | | | 1,533,073 | | |
| | | | 18,004,368 | | |
FINANCIALS (35.3%) | |
Brookline Bancorp, Inc. | | | 266,743 | | | | 2,267,316 | | |
Chesapeake Lodging Trust | | | 120,188 | | | | 2,509,525 | | |
Colonial Properties Trust | | | 140,135 | | | | 2,994,685 | | |
EastGroup Properties, Inc. | | | 51,570 | | | | 2,774,982 | | |
Ellington Financial LLC | | | 201,248 | | | | 4,520,030 | | |
Equity Lifestyle Properties, Inc. | | | 55,306 | | | | 3,721,541 | | |
Forest City Enterprises, Inc. Cl A* | | | 193,991 | | | | 3,132,955 | | |
Highwoods Properties, Inc. | | | 86,575 | | | | 2,895,934 | | |
Investors Bancorp, Inc. | | | 131,530 | | | | 2,338,603 | | |
Marlin Business Svcs. Corp. | | | 129,133 | | | | 2,590,408 | | |
National Retail Pptys., Inc. | | | 76,962 | | | | 2,401,214 | | |
PHH Corp.* | | | 104,995 | | | | 2,388,636 | | |
ProAssurance Corp. | | | 98,452 | | | | 4,153,690 | | |
SeaBright Hldgs., Inc. | | | 421,334 | | | | 4,664,167 | | |
Select Income REIT | | | 105,967 | | | | 2,624,803 | | |
Signature Bank* | | | 51,071 | | | | 3,643,405 | | |
SVB Financial Group* | | | 47,850 | | | | 2,678,165 | | |
Symetra Financial Corp. | | | 257,477 | | | | 3,342,051 | | |
Other Securities | | | 2,960,806 | | | | 46,828,576 | | |
| | | | 102,470,686 | | |
HEALTH CARE (5.3%) | |
Capital Senior Living Corp.* | | | 136,096 | | | | 2,543,634 | | |
Conceptus, Inc.* | | | 198,804 | | | | 4,176,872 | | |
QLT, Inc.* | | | 462,866 | | | | 3,638,127 | | |
Other Securities | | | 422,078 | | | | 5,014,961 | | |
| | | | 15,373,594 | | |
| | | Shares | | Value | |
| COMMON STOCKS (CONTINUED): | |
INDUSTRIALS (12.5%) | |
Actuant Corp. Cl A | | | 116,737 | | | $ | 3,258,130 | | |
Alaska Air Group, Inc.* | | | 80,066 | | | | 3,450,044 | | |
AZZ, Inc. | | | 104,766 | | | | 4,026,157 | | |
Encore Wire Corp. | | | 139,323 | | | | 4,222,880 | | |
Genesee & Wyoming, Inc. Cl A* | | | 57,567 | | | | 4,379,697 | | |
Miller Industries, Inc. | | | 181,808 | | | | 2,772,572 | | |
Mueller Industries, Inc. | | | 127,675 | | | | 6,387,580 | | |
Old Dominion Freight Line, Inc.* | | | 187,675 | | | | 6,433,499 | | |
Other Securities | | | 44,946 | | | | 1,463,442 | | |
| | | | 36,394,001 | | |
INFORMATION TECHNOLOGY (10.0%) | |
CommVault Systems, Inc.* | | | 43,379 | | | | 3,023,950 | | |
Richardson Electronics Ltd. | | | 385,634 | | | | 4,365,377 | | |
Other Securities | | | 1,117,077 | | | | 21,491,071 | | |
| | | | 28,880,398 | | |
MATERIALS (10.6%) | |
Boise, Inc. | | | 616,526 | | | | 4,901,382 | | |
Crown Hldgs., Inc.* | | | 133,733 | | | | 4,922,712 | | |
Innophos Hldgs., Inc. | | | 86,374 | | | | 4,016,391 | | |
Kaiser Aluminum Corp. | | | 79,388 | | | | 4,897,446 | | |
Silgan Hldgs., Inc. | | | 156,858 | | | | 6,523,724 | | |
Other Securities | | | 655,883 | | | | 5,591,770 | | |
| | | | 30,853,425 | | |
TELECOMMUNICATION SERVICES (0.6%) | |
Other Securities | | | 107,770 | | | | 1,715,698 | | |
UTILITIES (5.9%) | |
Avista Corp. | | | 133,367 | | | | 3,215,478 | | |
Idacorp, Inc. | | | 70,860 | | | | 3,071,781 | | |
PNM Resources, Inc. | | | 146,738 | | | | 3,009,596 | | |
UNS Energy Corp. | | | 85,423 | | | | 3,623,644 | | |
Other Securities | | | 108,886 | | | | 4,331,658 | | |
| | | | 17,252,157 | | |
TOTAL COMMON STOCKS
(Cost: $219,265,972) 95.5% | | $ | 277,220,165 | | |
CONVERTIBLE PREFERRED STOCKS: | |
ENERGY (0.5%) | |
Energy XXI (Bermuda)
Ltd., 7.25% | | | 4,255 | | | | 1,463,422 | | |
TOTAL CONVERTIBLE PREFERRED STOCKS
(Cost: $425,500) 0.5% | | $ | 1,463,422 | | |
| | | Rating** | | Rate | | Maturity | | Face
Amount | | Value | |
SHORT-TERM DEBT SECURITIES: | |
U.S. GOVERNMENT (0.3%) | |
U.S. Treasury Bill | | A-1+ | | | 0.03 | % | | 04/04/13 | | $ | 1,000,000 | | | $ | 999,923 | | |
COMMERCIAL PAPER (3.6%) | |
General Electric Capital Corp. | | A-1+ | | | 0.12 | | | 03/18/13 | | | 4,000,000 | | | | 3,998,987 | | |
Toyota Motor Credit Corp. | | A-1+ | | | 0.15 | | | 02/22/13 | | | 5,000,000 | | | | 4,998,915 | | |
Washington Gas Light Co. | | A-1 | | | 0.13 | | | 01/02/13 | | | 1,500,000 | | | | 1,499,995 | | |
| | | | 10,497,897 | | |
TOTAL SHORT-TERM DEBT SECURITIES
(Cost: $11,497,820) 3.9% | | | 11,497,820 | | |
TOTAL INVESTMENTS
(Cost: $231,189,292) 99.9% | | | 290,181,407 | | |
OTHER NET ASSETS 0.1% | | | 153,526 | | |
NET ASSETS 100.0% | | $ | 290,334,933 | | |
The accompanying notes are an integral part of these portfolio schedules.
40
MUTUAL OF AMERICA INVESTMENT CORPORATION (SMALL CAP GROWTH FUND)
SUMMARY PORTFOLIO OF INVESTMENTS IN SECURITIES
December 31, 2012
| | | Shares | | Value | |
COMMON STOCKS: | |
CONSUMER DISCRETIONARY (14.2%) | |
AFC Enterprises, Inc.* | | | 176,415 | | | $ | 4,609,724 | | |
American Axle & Mfg.
Hldgs., Inc.* | | | 253,328 | | | | 2,837,274 | | |
ANN, Inc.* | | | 70,746 | | | | 2,394,045 | | |
HSN, Inc. | | | 67,787 | | | | 3,733,708 | | |
Monro Muffler Brake, Inc. | | | 69,353 | | | | 2,425,274 | | |
Red Robin Gourmet
Burgers, Inc.* | | | 59,023 | | | | 2,082,922 | | |
Rent-A-Center, Inc. | | | 76,019 | | | | 2,612,013 | | |
Shutterfly, Inc.* | | | 94,884 | | | | 2,834,185 | | |
Other Securities | | | 569,662 | | | | 15,006,687 | | |
| | | | 38,535,832 | | |
CONSUMER STAPLES (4.4%) | |
Susser Hldgs. Corp.* | | | 66,765 | | | | 2,302,725 | | |
Other Securities | | | 347,500 | | | | 9,538,457 | | |
| | | | 11,841,182 | | |
ENERGY (5.6%) | |
Energy XXI (Bermuda) Ltd. | | | 104,372 | | | | 3,359,735 | | |
McMoRan Exploration Co.* | | | 184,367 | | | | 2,959,090 | | |
Oasis Petroleum, Inc.* | | | 71,032 | | | | 2,258,818 | | |
PBF Energy, Inc.* | | | 100,357 | | | | 2,915,371 | | |
Other Securities | | | 320,407 | | | | 3,795,566 | | |
| | | | 15,288,580 | | |
FINANCIALS (7.5%) | |
Colonial Properties Trust | | | 104,847 | | | | 2,240,580 | | |
Sabra Health Care REIT, Inc. | | | 101,553 | | | | 2,205,731 | | |
Other Securities | | | 560,492 | | | | 15,849,504 | | |
| | | | 20,295,815 | | |
HEALTH CARE (20.5%) | |
BioScrip, Inc.* | | | 234,083 | | | | 2,521,074 | | |
Cubist Pharmaceuticals, Inc.* | | | 64,193 | | | | 2,699,958 | | |
Cyberonics, Inc.* | | | 43,622 | | | | 2,291,464 | | |
HMS Hldgs. Corp.* | | | 90,051 | | | | 2,334,122 | | |
Neogen Corp.* | | | 45,734 | | | | 2,072,665 | | |
PAREXEL International Corp.* | | | 76,921 | | | | 2,276,092 | | |
Questcor Pharmaceuticals, Inc. | | | 82,922 | | | | 2,215,676 | | |
Other Securities | | | 2,210,465 | | | | 39,506,487 | | |
| | | | 55,917,538 | | |
INDUSTRIALS (18.8%) | |
Astronics Corp.* | | | 108,361 | | | | 2,479,300 | | |
Astronics Corp. Cl B* | | | 15,932 | | | | 345,724 | | |
| | | Shares | | Value | |
| COMMON STOCKS (CONTINUED): | |
INDUSTRIALS (CONTINUED) | |
AZZ, Inc. | | | 100,373 | | | $ | 3,857,334 | | |
Beacon Roofing Supply, Inc.* | | | 65,922 | | | | 2,193,884 | | |
CIRCOR International, Inc. | | | 53,491 | | | | 2,117,709 | | |
EnPro Industries, Inc.* | | | 49,764 | | | | 2,035,348 | | |
Genesee & Wyoming, Inc. Cl A* | | | 47,358 | | | | 3,602,997 | | |
Healthcare Svcs. Group, Inc. | | | 132,401 | | | | 3,075,675 | | |
Old Dominion Freight Line, Inc.* | | | 106,602 | | | | 3,654,317 | | |
On Assignment, Inc.* | | | 150,089 | | | | 3,043,805 | | |
Raven Industries, Inc. | | | 146,113 | | | | 3,851,539 | | |
Robbins & Myers, Inc. | | | 52,524 | | | | 3,122,552 | | |
Smith (A.O.) Corp. | | | 48,990 | | | | 3,089,799 | | |
Sun Hydraulics Corp. | | | 86,631 | | | | 2,259,336 | | |
Teledyne Technologies, Inc.* | | | 43,901 | | | | 2,856,638 | | |
The Advisory Board Co.* | | | 60,592 | | | | 2,835,100 | | |
Other Securities | | | 197,194 | | | | 6,701,443 | | |
| | | | 51,122,500 | | |
INFORMATION TECHNOLOGY (19.2%) | |
Cavium, Inc.* | | | 69,224 | | | | 2,160,481 | | |
Cirrus Logic, Inc.* | | | 81,127 | | | | 2,350,249 | | |
CommVault Systems, Inc.* | | | 74,275 | | | | 5,177,706 | | |
iGATE Corp.* | | | 134,067 | | | | 2,114,237 | | |
Imperva, Inc.* | | | 67,785 | | | | 2,137,261 | | |
Informatica Corp.* | | | 75,207 | | | | 2,280,276 | | |
LogMeIn, Inc.* | | | 101,639 | | | | 2,277,730 | | |
MAXIMUS, Inc. | | | 36,520 | | | | 2,308,794 | | |
Parametric Technology Corp.* | | | 99,208 | | | | 2,233,172 | | |
Sourcefire, Inc.* | | | 75,720 | | | | 3,575,498 | | |
WEX, Inc.* | | | 27,594 | | | | 2,079,760 | | |
Other Securities | | | 1,413,321 | | | | 23,512,151 | | |
| | | | 52,207,315 | | |
MATERIALS (4.3%) | |
Innophos Hldgs., Inc. | | | 59,487 | | | | 2,766,146 | | |
Other Securities | | | 590,921 | | | | 8,993,508 | | |
| | | | 11,759,654 | | |
TELECOMMUNICATION SERVICES (0.5%) | |
Other Securities | | | 87,850 | | | | 1,398,572 | | |
UTILITIES (0.8%) | |
Northwest Natural Gas Co. | | | 47,851 | | | | 2,115,014 | | |
TOTAL COMMON STOCKS
(Cost: $225,502,801) 95.8% | | $ | 260,482,002 | | |
| | Rating** | | Rate | | Maturity | | Face
Amount | | Value | |
SHORT-TERM DEBT SECURITIES: | |
U.S. GOVERNMENT (0.7%) | |
U.S. Treasury Bill | | A-1+ | | | 0.03 | % | | 04/04/13 | | $ | 2,000,000 | | | $ | 1,999,845 | | |
COMMERCIAL PAPER (3.5%) | |
General Electric Capital Corp. | | A-1+ | | | 0.12 | | | 03/18/13 | | | 3,000,000 | | | | 2,999,240 | | |
Toyota Motor Credit Corp. | | A-1+ | | | 0.14 - 0.16 | | | 02/14/13 - 02/15/13 | | | 5,800,000 | | | | 5,798,956 | | |
Washington Gas Light Co. | | A-1 | | | 0.13 | | | 01/02/13 | | | 800,000 | | | | 799,997 | | |
| | | | 9,598,193 | | |
TOTAL SHORT-TERM DEBT SECURITIES
(Cost: $11,598,038) 4.2% | | | 11,598,038 | | |
TOTAL INVESTMENTS
(Cost: $237,100,839) 100.0% | | | 272,080,040 | | |
OTHER NET ASSETS 0.0% (3) | | | 99,748 | | |
NET ASSETS 100.0% | | $ | 272,179,788 | | |
The accompanying notes are an integral part of these portfolio schedules.
41
MUTUAL OF AMERICA INVESTMENT CORPORATION (MID CAP VALUE FUND)
SUMMARY PORTFOLIO OF INVESTMENTS IN SECURITIES
December 31, 2012
| | | Shares | | Value | |
COMMON STOCKS: | |
CONSUMER DISCRETIONARY (7.5%) | |
Mohawk Industries, Inc.* | | | 8,280 | | | $ | 749,092 | | |
Newell Rubbermaid, Inc. | | | 25,777 | | | | 574,054 | | |
V.F. Corp. | | | 3,493 | | | | 527,338 | | |
Other Securities | | | 49,082 | | | | 2,111,853 | | |
| | | | 3,962,337 | | |
CONSUMER STAPLES (4.8%) | |
ConAgra Foods, Inc. | | | 31,403 | | | | 926,389 | | |
Dr. Pepper Snapple Group, Inc. | | | 17,601 | | | | 777,612 | | |
J.M. Smucker Co. | | | 6,775 | | | | 584,276 | | |
Other Securities | | | 17,220 | | | | 256,061 | | |
| | | | 2,544,338 | | |
ENERGY (9.7%) | |
Energy XXI (Bermuda) Ltd. | | | 33,997 | | | | 1,094,363 | | |
McMoRan Exploration Co.* | | | 83,913 | | | | 1,346,803 | | |
Noble Energy, Inc. | | | 11,367 | | | | 1,156,479 | | |
Range Resources Corp. | | | 10,221 | | | | 642,185 | | |
Other Securities | | | 27,197 | | | | 917,136 | | |
| | | | 5,156,966 | | |
FINANCIALS (27.9%) | |
American Financial Group, Inc. | | | 22,519 | | | | 889,951 | | |
Ameriprise Financial, Inc. | | | 15,536 | | | | 973,020 | | |
Aon PLC | | | 13,110 | | | | 729,047 | | |
BOK Financial Corp. | | | 11,843 | | | | 644,970 | | |
Brandywine Realty Trust | | | 42,060 | | | | 512,711 | | |
CBL & Associates Pptys., Inc. | | | 31,240 | | | | 662,600 | | |
Discover Financial Svcs. | | | 12,829 | | | | 494,558 | | |
Duke Realty Corp. | | | 35,710 | | | | 495,298 | | |
Everest Re Group Ltd. | | | 5,685 | | | | 625,066 | | |
Home Properties, Inc. | | | 10,070 | | | | 617,392 | | |
Host Hotels & Resorts, Inc. | | | 34,412 | | | | 539,236 | | |
Kilroy Realty Corp. | | | 10,800 | | | | 511,596 | | |
National Retail Pptys., Inc. | | | 16,449 | | | | 513,209 | | |
People's United Financial, Inc. | | | 40,439 | | | | 488,908 | | |
Vornado Realty Trust | | | 9,825 | | | | 786,786 | | |
Other Securities | | | 248,495 | | | | 5,394,122 | | |
| | | | 14,878,470 | | |
HEALTH CARE (6.9%) | |
AmerisourceBergen Corp. | | | 17,615 | | | | 760,616 | | |
CIGNA Corp. | | | 11,462 | | | | 612,759 | | |
Forest Laboratories, Inc.* | | | 14,473 | | | | 511,186 | | |
| | | Shares | | Value | |
| COMMON STOCKS (CONTINUED): | |
HEALTH CARE (CONTINUED) | |
Humana, Inc. | | | 8,584 | | | $ | 589,120 | | |
MEDNAX, Inc.* | | | 6,323 | | | | 502,805 | | |
Other Securities | | | 24,091 | | | | 712,870 | | |
| | | | 3,689,356 | | |
INDUSTRIALS (10.5%) | |
Joy Global, Inc. | | | 9,020 | | | | 575,296 | | |
Kirby Corp.* | | | 15,712 | | | | 972,416 | | |
Lincoln Electric Hldgs., Inc. | | | 11,981 | | | | 583,235 | | |
Old Dominion Freight Line, Inc.* | | | 21,480 | | | | 736,334 | | |
Triumph Group, Inc. | | | 8,040 | | | | 525,012 | | |
Other Securities | | | 47,734 | | | | 2,230,608 | | |
| | | | 5,622,901 | | |
INFORMATION TECHNOLOGY (10.0%) | |
Coherent, Inc.* | | | 9,787 | | | | 495,418 | | |
Informatica Corp.* | | | 19,387 | | | | 587,814 | | |
NCR Corp.* | | | 23,781 | | | | 605,940 | | |
Other Securities | | | 96,594 | | | | 3,626,001 | | |
| | | | 5,315,173 | | |
MATERIALS (7.5%) | |
Agnico-Eagle Mines Ltd. | | | 10,372 | | | | 544,115 | | |
Crown Hldgs., Inc.* | | | 42,242 | | | | 1,554,923 | | |
Cytec Industries, Inc. | | | 10,131 | | | | 697,317 | | |
Eastman Chemical Co. | | | 10,522 | | | | 716,022 | | |
Walter Energy, Inc. | | | 13,666 | | | | 490,336 | | |
| | | | 4,002,713 | | |
TELECOMMUNICATION SERVICES (0.6%) | |
Other Securities | | | 35,415 | | | | 293,236 | | |
UTILITIES (9.7%) | |
Ameren Corp. | | | 21,916 | | | | 673,260 | | |
Atmos Energy Corp. | | | 18,147 | | | | 637,323 | | |
Edison International | | | 18,465 | | | | 834,433 | | |
FirstEnergy Corp. | | | 13,882 | | | | 579,712 | | |
Great Plains Energy, Inc. | | | 27,493 | | | | 558,383 | | |
ITC Hldgs. Corp. | | | 9,659 | | | | 742,874 | | |
NV Energy, Inc. | | | 40,396 | | | | 732,783 | | |
Other Securities | | | 6,273 | | | | 399,904 | | |
| | | | 5,158,672 | | |
TOTAL COMMON STOCKS
(Cost: $44,839,472) 95.1% | | $ | 50,624,162 | | |
| | | Rating** | | Rate | | Maturity | | Face
Amount | | Value | |
SHORT-TERM DEBT SECURITIES: | |
U.S. GOVERNMENT (1.2%) | |
U.S. Treasury Bill | | A-1+ | | | 0.03 | % | | 04/04/13 | | $ | 650,000 | | | $ | 649,950 | | |
COMMERCIAL PAPER (3.5%) | |
General Electric Capital Corp. | | A-1+ | | | 0.12 | | | 03/13/13 | | | 1,200,000 | | | | 1,199,716 | | |
Toyota Motor Credit Corp. | | A-1+ | | | 0.13 | | | 01/23/13 | | | 650,000 | | | | 649,948 | | |
| | | | 1,849,664 | | |
TOTAL SHORT-TERM DEBT SECURITIES
(Cost: $2,499,614) 4.7% | | | 2,499,614 | | |
TOTAL INVESTMENTS
(Cost: $47,339,086) 99.8% | | | 53,123,776 | | |
OTHER NET ASSETS 0.2% | | | 91,394 | | |
NET ASSETS 100.0% | | $ | 53,215,170 | | |
The accompanying notes are an integral part of these portfolio schedules.
42
MUTUAL OF AMERICA INVESTMENT CORPORATION (MID-CAP EQUITY INDEX FUND)
SUMMARY PORTFOLIO OF INVESTMENTS IN SECURITIES
December 31, 2012
| | | Shares | | Value | |
INDEXED ASSETS: | |
COMMON STOCKS | |
CONSUMER DISCRETIONARY (12.9%) | |
Advance Auto Parts, Inc. | | | 37,204 | | | $ | 2,691,709 | | |
LKQ Corp.* | | | 144,433 | | | | 3,047,536 | | |
Mohawk Industries, Inc.* | | | 27,120 | | | | 2,453,546 | | |
Polaris Industries, Inc. | | | 31,331 | | | | 2,636,504 | | |
PVH Corp. | | | 35,321 | | | | 3,920,984 | | |
Toll Brothers, Inc.* | | | 76,745 | | | | 2,481,166 | | |
Tractor Supply Co. | | | 34,354 | | | | 3,035,519 | | |
Other Securities | | | 2,115,136 | | | | 58,728,307 | | |
| | | | 78,995,271 | | |
CONSUMER STAPLES (3.7%) | |
Church & Dwight Co., Inc. | | | 69,677 | | | | 3,732,597 | | |
Energizer Hldgs., Inc. | | | 30,971 | | | | 2,477,061 | | |
Green Mountain Coffee
Roasters, Inc.* | | | 60,287 | | | | 2,493,470 | | |
Ralcorp Hldgs., Inc.* | | | 27,198 | | | | 2,438,301 | | |
Other Securities | | | 426,920 | | | | 11,444,067 | | |
| | | | 22,585,496 | | |
ENERGY (5.9%) | |
Cimarex Energy Co. | | | 43,045 | | | | 2,484,988 | | |
HollyFrontier Corp. | | | 100,054 | | | | 4,657,514 | | |
Oceaneering Int'l., Inc. | | | 53,414 | | | | 2,873,139 | | |
Plains Exploration &
Production Co.* | | | 64,321 | | | | 3,019,228 | | |
Other Securities | | | 900,073 | | | | 22,874,334 | | |
| | | | 35,909,203 | | |
FINANCIALS (21.0%) | |
Affiliated Managers Group, Inc.* | | | 25,842 | | | | 3,363,336 | | |
Alleghany Corp.* | | | 8,458 | | | | 2,836,982 | | |
Camden Property Trust | | | 41,136 | | | | 2,805,887 | | |
Essex Property Trust, Inc. | | | 17,757 | | | | 2,604,064 | | |
Everest Re Group Ltd. | | | 25,391 | | | | 2,791,740 | | |
Federal Realty Investment Trust | | | 32,005 | | | | 3,329,160 | | |
New York Community
Bancorp, Inc. | | | 219,802 | | | | 2,879,406 | | |
Rayonier, Inc. | | | 60,605 | | | | 3,141,157 | | |
Realty Income Corp. | | | 66,028 | | | | 2,654,986 | | |
SL Green Realty Corp | | | 44,882 | | | | 3,440,205 | | |
The Macerich Co. | | | 67,386 | | | | 3,928,604 | | |
UDR, Inc. | | | 120,630 | | | | 2,868,581 | | |
Other Securities | | | 3,902,991 | | | | 91,859,640 | | |
| | | | 128,503,748 | | |
| | | Shares | | Value | |
| INDEXED ASSETS (CONTINUED): | |
COMMON STOCKS (CONTINUED) | |
HEALTH CARE (9.2%) | |
Hologic, Inc.* | | | 132,901 | | | $ | 2,662,007 | | |
IDEXX Laboratories, Inc.* | | | 27,014 | | | | 2,506,899 | | |
Mettler-Toledo Int'l., Inc.* | | | 15,184 | | | | 2,935,067 | | |
Regeneron Pharmaceuticals, Inc.* | | | 38,556 | | | | 6,595,774 | | |
ResMed, Inc. | | | 73,935 | | | | 3,073,478 | | |
Schein (Henry), Inc.* | | | 43,824 | | | | 3,526,079 | | |
Vertex Pharmaceuticals, Inc.* | | | 107,251 | | | | 4,498,107 | | |
Other Securities | | | 911,318 | | | | 30,060,460 | | |
| | | | 55,857,871 | | |
INDUSTRIALS (16.7%) | |
AMETEK, Inc. | | | 121,352 | | | | 4,559,195 | | |
B/E Aerospace, Inc.* | | | 50,595 | | | | 2,499,393 | | |
Hunt (J.B.) Transport Svcs., Inc. | | | 44,855 | | | | 2,678,292 | | |
Kansas City Southern | | | 53,909 | | | | 4,500,323 | | |
Other Securities | | | 2,328,998 | | | | 87,972,790 | | |
| | | | 102,209,993 | | |
INFORMATION TECHNOLOGY (15.0%) | |
Alliance Data Systems Corp.* | | | 24,609 | | | | 3,562,399 | | |
ANSYS, Inc.* | | | 46,145 | | | | 3,107,404 | | |
Equinix, Inc.* | | | 24,122 | | | | 4,973,956 | | |
Rackspace Hosting, Inc.* | | | 53,927 | | | | 4,005,158 | | |
Trimble Navigation Ltd.* | | | 61,951 | | | | 3,703,431 | | |
Other Securities | | | 3,444,169 | | | | 72,326,282 | | |
| | | | 91,678,630 | | |
MATERIALS (7.0%) | |
Albemarle Corp. | | | 44,465 | | | | 2,762,166 | | |
Ashland, Inc. | | | 35,862 | | | | 2,883,663 | | |
Rock-Tenn Co. Cl A | | | 35,127 | | | | 2,455,729 | | |
Royal Gold, Inc. | | | 32,792 | | | | 2,666,318 | | |
Valspar Corp. | | | 41,441 | | | | 2,585,918 | | |
Other Securities | | | 801,386 | | | | 29,143,148 | | |
| | | | 42,496,942 | | |
TELECOMMUNICATION SERVICES (0.5%) | |
Other Securities | | | 124,033 | | | | 2,997,316 | | |
UTILITIES (4.8%) | |
Alliant Energy Corp. | | | 55,539 | | | | 2,438,717 | | |
OGE Energy Corp. | | | 49,054 | | | | 2,762,231 | | |
Other Securities | | | 879,436 | | | | 23,757,439 | | |
| | | | 28,958,387 | | |
TOTAL INDEXED ASSETS-COMMON STOCKS
(Cost: $490,418,436) 96.7% | | $ | 590,192,857 | | |
| | | Rating** | | Rate | | Face
Maturity | | Amount | | Value | |
SHORT-TERM DEBT SECURITIES: | |
U.S. GOVERNMENT (0.7%) | |
U.S. Treasury Bill (1) | | A-1+ | | | 0.09 - 0.10 | % | | 01/10/13 - 02/21/13 | | $ | 4,300,000 | | | $ | 4,299,585 | | |
COMMERCIAL PAPER (2.4%) | |
General Electric Capital Corp. | | A-1+ | | | 0.12 | | | 03/18/13 | | | 4,000,000 | | | | 3,998,987 | | |
Toyota Motor Credit Corp. | | A-1+ | | | 0.15 - 0.16 | | | 02/15/13 - 02/22/13 | | | 7,800,000 | | | | 7,798,427 | | |
Washington Gas Light Co. | | A-1 | | | 0.13 | | | 01/02/13 | | | 2,600,000 | | | | 2,599,991 | | |
| | | | 14,397,405 | | |
TOTAL SHORT-TERM DEBT SECURITIES
(Cost: $18,696,990) 3.1% | | | 18,696,990 | | |
TEMPORARY CASH INVESTMENTS (2)
(Cost: $301,400) 0.1% | | | 301,400 | | |
TOTAL INVESTMENTS
(Cost: $509,416,826) 99.9% | | | 609,191,247 | | |
OTHER NET ASSETS 0.1% | | | 774,221 | | |
NET ASSETS 100.0% | | $ | 609,965,468 | | |
The accompanying notes are an integral part of these portfolio schedules.
43
MUTUAL OF AMERICA INVESTMENT CORPORATION (INTERNATIONAL FUND)
PORTFOLIO OF INVESTMENTS IN SECURITIES
December 31, 2012
| | | Shares | | Value | |
COMMON STOCKS: | |
FINANCIALS (99.5%) | |
iShares MSCI EAFE Growth Index Fund | | | 162,700 | | | $ | 9,768,508 | | |
iShares MSCI EAFE Index Fund | | | 220,600 | | | | 12,534,492 | | |
iShares MSCI EAFE Value Index Fund | | | 200,200 | | | | 9,739,730 | | |
Vanguard MSCI EAFE ETF | | | 1,584,800 | | | | 55,832,504 | | |
Vanguard MSCI Europe ETF | | | 350,300 | | | | 17,108,652 | | |
Vanguard MSCI Pacific ETF | | | 168,500 | | | | 8,996,215 | | |
| | | | | | | | 113,980,101 | | |
TOTAL COMMON STOCKS
(Cost: $108,021,891) 99.5% | | | 113,980,101 | | |
TOTAL INVESTMENTS
(Cost: $108,021,891) 99.5% | | | 113,980,101 | | |
OTHER NET ASSETS 0.5% | | | | | 567,858 | | |
NET ASSETS 100.0% | | | | $ | 114,547,959 | | |
The accompanying notes are an integral part of these portfolio schedules.
44
MUTUAL OF AMERICA INVESTMENT CORPORATION (COMPOSITE FUND)
SUMMARY PORTFOLIO OF INVESTMENTS IN SECURITIES
December 31, 2012
| | | Shares | | Value | |
COMMON STOCKS: | |
CONSUMER DISCRETIONARY (6.3%) | |
Amazon.com, Inc.* | | | 5,756 | | | $ | 1,445,562 | | |
Disney (Walt) Co. | | | 22,904 | | | | 1,140,390 | | |
Ford Motor Co. | | | 92,449 | | | | 1,197,215 | | |
Starbucks Corp. | | | 33,831 | | | | 1,814,018 | | |
Other Securities | | | 99,145 | | | | 5,093,638 | | |
| | | | 10,690,823 | | |
CONSUMER STAPLES (6.1%) | |
PepsiCo, Inc. | | | 15,726 | | | | 1,076,130 | | |
Philip Morris Int'l., Inc. | | | 21,598 | | | | 1,806,457 | | |
Proctor & Gamble Co. | | | 24,483 | | | | 1,662,151 | | |
Wal-Mart Stores, Inc. | | | 28,141 | | | | 1,920,060 | | |
Other Securities | | | 136,582 | | | | 3,912,006 | | |
| | | | 10,376,804 | | |
ENERGY (6.5%) | |
Chevron Corp. | | | 10,082 | | | | 1,090,267 | | |
Exxon Mobil Corp. | | | 40,801 | | | | 3,531,327 | | |
Halliburton Co. | | | 25,134 | | | | 871,898 | | |
National Oilwell Varco, Inc. | | | 11,306 | | | | 772,765 | | |
Noble Energy, Inc. | | | 9,679 | | | | 984,741 | | |
Occidental Petroleum Corp. | | | 11,903 | | | | 911,889 | | |
Other Securities | | | 37,682 | | | | 2,854,410 | | |
| | | | 11,017,297 | | |
FINANCIALS (8.9%) | |
Bank of America Corp. | | | 84,219 | | | | 976,940 | | |
Berkshire Hathaway, Inc. Cl B* | | | 9,503 | | | | 852,419 | | |
Capital One Financial Corp. | | | 22,847 | | | | 1,323,527 | | |
Citigroup, Inc. | | | 22,177 | | | | 877,322 | | |
Goldman Sachs Group, Inc. | | | 7,861 | | | | 1,002,749 | | |
JPMorgan Chase & Co. | | | 50,495 | | | | 2,220,265 | | |
Simon Property Group, Inc. | | | 8,180 | | | | 1,293,176 | | |
Wells Fargo & Co. | | | 62,372 | | | | 2,131,875 | | |
Other Securities | | | 136,960 | | | | 4,360,913 | | |
| | | | 15,039,186 | | |
HEALTH CARE (6.6%) | |
Forest Laboratories, Inc.* | | | 25,575 | | | | 903,309 | | |
Gilead Sciences, Inc.* | | | 11,463 | | | | 841,957 | | |
Merck & Co., Inc. | | | 35,136 | | | | 1,438,468 | | |
| | | Shares | | Value | |
| COMMON STOCKS (CONTINUED): | |
HEALTH CARE (CONTINUED) | |
Mylan, Inc.* | | | 34,259 | | | $ | 941,437 | | |
Pfizer, Inc. | | | 79,547 | | | | 1,995,039 | | |
Other Securities | | | 81,470 | | | | 5,018,349 | | |
| | | | 11,138,559 | | |
INDUSTRIALS (5.8%) | |
Boeing Co. | | | 16,880 | | | | 1,272,077 | | |
Caterpillar, Inc. | | | 12,290 | | | | 1,100,938 | | |
Cummins, Inc. | | | 8,572 | | | | 928,776 | | |
General Electric Co. | | | 99,279 | | | | 2,083,866 | | |
Precision Castparts Corp. | | | 6,731 | | | | 1,274,986 | | |
Roper Industries, Inc. | | | 8,877 | | | | 989,608 | | |
Other Securities | | | 30,340 | | | | 2,165,415 | | |
| | | | 9,815,666 | | |
INFORMATION TECHNOLOGY (10.1%) | |
Apple, Inc. | | | 8,636 | | | | 4,603,250 | | |
Google, Inc. Cl A* | | | 2,290 | | | | 1,624,457 | | |
Int'l. Business Machines Corp. | | | 8,626 | | | | 1,652,310 | | |
Microsoft Corp. | | | 52,135 | | | | 1,393,569 | | |
Oracle Corp. | | | 32,470 | | | | 1,081,900 | | |
QUALCOMM, Inc. | | | 18,564 | | | | 1,151,339 | | |
Salesforce.com, inc.* | | | 7,209 | | | | 1,211,833 | | |
Other Securities | | | 133,533 | | | | 4,570,049 | | |
| | | | 17,288,707 | | |
MATERIALS (2.1%) | |
Eastman Chemical Co. | | | 14,395 | | | | 979,580 | | |
Other Securities | | | 57,208 | | | | 2,585,392 | | |
| | | | 3,564,972 | | |
TELECOMMUNICATION SERVICES (1.5%) | |
AT&T, Inc. | | | 50,988 | | | | 1,718,805 | | |
CenturyLink, Inc. | | | 11,293 | | | | 441,782 | | |
Other Securities | | | 103,550 | | | | 443,194 | | |
| | | | 2,603,781 | | |
UTILITIES (1.6%) | |
Other Securities | | | 65,760 | | | | 2,787,492 | | |
TOTAL COMMON STOCKS
(Cost: $76,948,298) 55.5% | | $ | 94,323,287 | | |
| | | Rating** | | Rate | | Maturity | | Face
Amount | | Value | |
LONG-TERM DEBT SECURITIES: | |
U.S. GOVERNMENT (6.6%) | |
U.S. Treasury Note | | AA+ | | | 0.25 | % | | 05/31/14 - 07/15/15 | | $ | 1,300,000 | | | $ | 1,299,555 | | |
U.S. Treasury Strip | | AA+ | | | 0.00 | | | 08/15/21 - 08/15/29 | | | 12,850,000 | | | | 9,851,219 | | |
| | | | 11,150,774 | | |
U.S. GOVERNMENT AGENCIES (13.5%) | |
MORTGAGE-BACKED OBLIGATIONS (13.5%) | |
FHARM | | AA+ | | | 4.64 - 5.77 | | | 02/01/36 - 09/01/39 | | | 483,199 | | | | 517,372 | | |
FHLMC | | AA+ | | | 2.50 - 6.00 | | | 02/01/25 - 07/01/41 | | | 3,351,203 | | | | 3,581,585 | | |
FNMA | | AA+ | | | 3.50 - 8.00 | | | 09/01/16 - 12/25/49 | | | 12,700,239 | | | | 13,880,762 | | |
GNMA (4) | | AA+ | | | 3.50 - 7.00 | | | 10/15/24 - 08/20/42 | | | 4,151,159 | | | | 4,529,671 | | |
Other Securities | | | | | | | | | 327,911 | | | | 380,217 | | |
| | | | 22,889,607 | | |
The accompanying notes are an integral part of these portfolio schedules.
45
MUTUAL OF AMERICA INVESTMENT CORPORATION (COMPOSITE FUND)
SUMMARY PORTFOLIO OF INVESTMENTS IN SECURITIES (Continued)
December 31, 2012
| | | Rating** | | Rate | | Maturity | | Face
Amount | | Value | |
| LONG-TERM DEBT SECURITIES (CONTINUED): | |
CORPORATE DEBT (18.7%) | |
CONSUMER DISCRETIONARY (2.9%) | |
Other Securities | | | | | | | | $ | 4,600,000 | | | $ | 4,891,649 | | |
CONSUMER STAPLES (1.1%) | |
Other Securities | | | | | | | | | 1,675,000 | | | | 1,816,106 | | |
ENERGY (3.0%) | |
National Oilwell Varco, Inc. | | A- | | | 6.13 | % | | 08/15/15 | | | 250,000 | | | | 252,488 | | |
Noble Drilling Corp. | | BBB+ | | | 7.50 | | | 03/15/19 | | | 800,000 | | | | 967,184 | | |
Other Securities | | | | | | | | | 3,600,000 | | | | 3,871,883 | | |
| | | | 5,091,555 | | |
FINANCIALS (5.7%) | |
Bank of America Corp. | | A- | | | 3.70 | | | 09/01/15 | | | 250,000 | | | | 264,285 | | |
First Horizon National Corp. | | BB+ | | | 4.50 | | | 05/15/13 | | | 1,500,000 | | | | 1,517,982 | | |
Other Securities | | | | | | | | | 7,297,000 | | | | 7,876,400 | | |
| | | | 9,658,667 | | |
HEALTH CARE (1.5%) | |
Other Securities | | | | | | | | | 2,250,000 | | | | 2,483,896 | | |
INDUSTRIALS (1.6%) | |
Other Securities | | | | | | | | | 2,600,000 | | | | 2,744,473 | | |
INFORMATION TECHNOLOGY (0.1%) | |
Other Securities | | | | | | | | | 200,000 | | | | 211,180 | | |
MATERIALS (1.3%) | |
Geon Co. | | BB- | | | 7.50 | | | 12/15/15 | | | 1,000,000 | | | | 1,030,000 | | |
Other Securities | | | | | | | | | 1,150,000 | | | | 1,215,913 | | |
| | | | 2,245,913 | | |
TELECOMMUNICATION SERVICES (0.3%) | |
CenturyLink, Inc. | | BB | | | 5.00 | | | 02/15/15 | | | 500,000 | | | | 531,451 | | |
UTILITIES (1.2%) | |
Other Securities | | | | | | | | | 1,890,000 | | | | 1,997,460 | | |
TOTAL LONG-TERM DEBT SECURITIES
(Cost: $61,615,438) 38.8% | | | 65,712,731 | | |
SHORT-TERM DEBT SECURITIES: | |
COMMERCIAL PAPER (4.8%) | |
General Electric Capital Corp. | | A-1+ | | | 0.12 | | | 03/18/13 | | | 2,800,000 | | | | 2,799,282 | | |
Procter & Gamble Co.† | | A-1+ | | | 0.15 | | | 01/16/13 | | | 250,000 | | | | 249,984 | | |
Toyota Motor Credit Corp. | | A-1+ | | | 0.14 - 0.15 | | | 02/14/13 - 02/22/13 | | | 5,000,000 | | | | 4,999,099 | | |
| | | | 8,048,365 | | |
TOTAL SHORT-TERM DEBT SECURITIES
(Cost: $8,048,374) 4.8% | | | 8,048,365 | | |
TEMPORARY CASH INVESTMENTS (2)
(Cost: $934,600) 0.6% | | | 934,600 | | |
TOTAL INVESTMENTS
(Cost: $147,546,710) 99.7% | | | 169,018,983 | | |
OTHER NET ASSETS 0.3% | | | 578,050 | | |
NET ASSETS 100.0% | | $ | 169,597,033 | | |
The accompanying notes are an integral part of these portfolio schedules.
46
MUTUAL OF AMERICA INVESTMENT CORPORATION (RETIREMENT INCOME FUND)
PORTFOLIO OF INVESTMENTS IN SECURITIES
December 31, 2012
| | | Shares | | Value | |
COMMON STOCKS: | |
DIVERSIFIED MUTUAL FUNDS (100.0%) | |
Mutual of America Investment Corporation | |
Bond Fund (30.0%) | | | 6,393,146 | | | $ | 9,390,938 | | |
Equity Index Fund (19.9%) | | | 2,591,460 | | | | 6,210,784 | | |
Mid-Cap Equity Index Fund (5.0%) | | | 955,239 | | | | 1,557,655 | | |
Mid-Term Bond Fund (40.1%) | | | 11,467,988 | | | | 12,522,103 | | |
Money Market Fund (5.0%) | | | 1,300,960 | | | | 1,561,895 | | |
TOTAL INVESTMENTS
(Cost: $29,728,136) 100.0% | | $ | 31,243,375 | | |
OTHER NET ASSETS — 0.0% (3) | | | | | (128 | ) | |
NET ASSETS 100.0% | | | | $ | 31,243,247 | | |
MUTUAL OF AMERICA INVESTMENT CORPORATION (2010 RETIREMENT FUND)
PORTFOLIO OF INVESTMENTS IN SECURITIES
December 31, 2012
| | | Shares | | Value | |
COMMON STOCKS: | |
DIVERSIFIED MUTUAL FUNDS (100.0%) | |
Mutual of America Investment Corporation | |
Bond Fund (25.1%) | | | 3,660,382 | | | $ | 5,376,761 | | |
Equity Index Fund (24.9%) | | | 2,225,135 | | | | 5,332,836 | | |
International Fund (3.0%) | | | 916,323 | | | | 648,422 | | |
Mid-Cap Equity Index Fund (11.0%) | | | 1,443,628 | | | | 2,354,044 | | |
Mid-Term Bond Fund (31.0%) | | | 6,106,306 | | | | 6,667,585 | | |
Money Market Fund (5.0%) | | | 893,804 | | | | 1,073,075 | | |
TOTAL INVESTMENTS
(Cost: $19,885,714) 100.0% | | $ | 21,452,723 | | |
OTHER NET ASSETS — 0.0% (3) | | | | | (88 | ) | |
NET ASSETS 100.0% | | | | $ | 21,452,635 | | |
MUTUAL OF AMERICA INVESTMENT CORPORATION (2015 RETIREMENT FUND)
PORTFOLIO OF INVESTMENTS IN SECURITIES
December 31, 2012
| | | Shares | | Value | |
COMMON STOCKS: | |
DIVERSIFIED MUTUAL FUNDS (100.0%) | |
Mutual of America Investment Corporation | |
Bond Fund (25.1%) | | | 19,167,793 | | | $ | 28,155,705 | | |
Equity Index Fund (27.8%) | | | 13,051,120 | | | | 31,278,771 | | |
International Fund (6.1%) | | | 9,597,129 | | | | 6,791,255 | | |
Mid-Cap Equity Index Fund (11.0%) | | | 7,560,037 | | | | 12,327,737 | | |
Mid-Term Bond Fund (26.0%) | | | 26,818,584 | | | | 29,283,695 | | |
Small Cap Growth Fund (2.0%) | | | 1,839,521 | | | | 2,245,115 | | |
Small Cap Value Fund (2.0%) | | | 1,672,556 | | | | 2,255,427 | | |
TOTAL INVESTMENTS
(Cost: $101,086,700) 100.0% | | $ | 112,337,705 | | |
OTHER NET ASSETS — 0.0% (3) | | | | | (460 | ) | |
NET ASSETS 100.0% | | | | $ | 112,337,245 | | |
The accompanying notes are an integral part of these portfolio schedules.
47
MUTUAL OF AMERICA INVESTMENT CORPORATION (2020 RETIREMENT FUND)
PORTFOLIO OF INVESTMENTS IN SECURITIES
December 31, 2012
| | | Shares | | Value | |
COMMON STOCKS: | |
DIVERSIFIED MUTUAL FUNDS (100.0%) | |
Mutual of America Investment Corporation | |
Bond Fund (25.0%) | | | 28,849,093 | | | $ | 42,376,635 | | |
Equity Index Fund (32.8%) | | | 23,151,096 | | | | 55,484,727 | | |
International Fund (9.1%) | | | 21,666,342 | | | | 15,331,840 | | |
Mid-Cap Equity Index Fund (11.0%) | | | 11,378,696 | | | | 18,554,614 | | |
Mid-Term Bond Fund (16.1%) | | | 24,839,481 | | | | 27,122,676 | | |
Small Cap Growth Fund (3.0%) | | | 4,153,114 | | | | 5,068,830 | | |
Small Cap Value Fund (3.0%) | | | 3,776,052 | | | | 5,091,972 | | |
TOTAL INVESTMENTS
(Cost: $150,457,834) 100.0% | | $ | 169,031,294 | | |
OTHER NET ASSETS — 0.0% (3) | | | | | (693 | ) | |
NET ASSETS 100.0% | | | | $ | 169,030,601 | | |
MUTUAL OF AMERICA INVESTMENT CORPORATION (2025 RETIREMENT FUND)
PORTFOLIO OF INVESTMENTS IN SECURITIES
December 31, 2012
| | | Shares | | Value | |
COMMON STOCKS: | |
DIVERSIFIED MUTUAL FUNDS (100.0%) | |
Mutual of America Investment Corporation | |
Bond Fund (23.1%) | | | 25,416,163 | | | $ | 37,333,980 | | |
Equity Index Fund (36.8%) | | | 24,855,316 | | | | 59,569,121 | | |
International Fund (9.1%) | | | 20,747,235 | | | | 14,681,449 | | |
Mid-Cap Equity Index Fund (15.0%) | | | 14,857,728 | | | | 24,227,679 | | |
Mid-Term Bond Fund (8.0%) | | | 11,893,320 | | | | 12,986,531 | | |
Small Cap Growth Fund (4.0%) | | | 5,302,420 | | | | 6,471,546 | | |
Small Cap Value Fund (4.0%) | | | 4,821,065 | | | | 6,501,164 | | |
TOTAL INVESTMENTS
(Cost: $142,278,583) 100.0% | | $ | 161,771,470 | | |
OTHER NET ASSETS — 0.0% (3) | | | | | (663 | ) | |
NET ASSETS 100.0% | | | | $ | 161,770,807 | | |
MUTUAL OF AMERICA INVESTMENT CORPORATION (2030 RETIREMENT FUND)
PORTFOLIO OF INVESTMENTS IN SECURITIES
December 31, 2012
| | | Shares | | Value | |
COMMON STOCKS: | |
DIVERSIFIED MUTUAL FUNDS (100.0%) | |
Mutual of America Investment Corporation | |
Bond Fund (23.1%) | | | 20,944,508 | | | $ | 30,765,535 | | |
Equity Index Fund (39.8%) | | | 22,144,736 | | | | 53,072,850 | | |
International Fund (10.1%) | | | 18,996,322 | | | | 13,442,443 | | |
Mid-Cap Equity Index Fund (17.0%) | | | 13,877,060 | | | | 22,628,558 | | |
Small Cap Growth Fund (5.0%) | | | 5,462,548 | | | | 6,666,980 | | |
Small Cap Value Fund (5.0%) | | | 4,966,269 | | | | 6,696,970 | | |
TOTAL INVESTMENTS
(Cost: $115,735,566) 100.0% | | $ | 133,273,336 | | |
OTHER NET ASSETS — 0.0% (3) | | | | | (546 | ) | |
NET ASSETS 100.0% | | | | $ | 133,272,790 | | |
The accompanying notes are an integral part of these portfolio schedules.
48
MUTUAL OF AMERICA INVESTMENT CORPORATION (2035 RETIREMENT FUND)
PORTFOLIO OF INVESTMENTS IN SECURITIES
December 31, 2012
| | | Shares | | Value | |
COMMON STOCKS: | |
DIVERSIFIED MUTUAL FUNDS (100.0%) | |
Mutual of America Investment Corporation | |
Bond Fund (16.1%) | | | 11,664,761 | | | $ | 17,134,450 | | |
Equity Index Fund (39.8%) | | | 17,730,782 | | | | 42,494,213 | | |
International Fund (12.1%) | | | 18,251,579 | | | | 12,915,438 | | |
Mid-Cap Equity Index Fund (20.0%) | | | 13,071,709 | | | | 21,315,316 | | |
Small Cap Growth Fund (6.0%) | | | 5,248,311 | | | | 6,405,505 | | |
Small Cap Value Fund (6.0%) | | | 4,771,531 | | | | 6,434,366 | | |
TOTAL INVESTMENTS
(Cost: $92,092,566) 100.0% | | $ | 106,699,288 | | |
OTHER NET ASSETS — 0.0% (3) | | | | | (437 | ) | |
NET ASSETS 100.0% | | | | $ | 106,698,851 | | |
MUTUAL OF AMERICA INVESTMENT CORPORATION (2040 RETIREMENT FUND)
PORTFOLIO OF INVESTMENTS IN SECURITIES
December 31, 2012
| | | Shares | | Value | |
COMMON STOCKS: | |
DIVERSIFIED MUTUAL FUNDS (100.0%) | |
Mutual of America Investment Corporation | |
Bond Fund (12.0%) | | | 7,704,355 | | | $ | 11,316,981 | | |
Equity Index Fund (34.9%) | | | 13,662,133 | | | | 32,743,147 | | |
International Fund (14.1%) | | | 18,751,460 | | | | 13,269,170 | | |
Mid-Cap Equity Index Fund (23.0%) | | | 13,237,849 | | | | 21,586,232 | | |
Small Cap Growth Fund (8.0%) | | | 6,162,354 | | | | 7,521,085 | | |
Small Cap Value Fund (8.0%) | | | 5,602,572 | | | | 7,555,018 | | |
TOTAL INVESTMENTS
(Cost: $80,714,140) 100.0% | | $ | 93,991,633 | | |
OTHER NET ASSETS — 0.0% (3) | | | | | (385 | ) | |
NET ASSETS 100.0% | | | | $ | 93,991,248 | | |
MUTUAL OF AMERICA INVESTMENT CORPORATION (2045 RETIREMENT FUND)
PORTFOLIO OF INVESTMENTS IN SECURITIES
December 31, 2012
| | | Shares | | Value | |
COMMON STOCKS: | |
DIVERSIFIED MUTUAL FUNDS (100.0%) | |
Mutual of America Investment Corporation | |
Bond Fund (10.0%) | | | 8,080,848 | | | $ | 11,870,014 | | |
Equity Index Fund (34.9%) | | | 17,194,929 | | | | 41,209,968 | | |
International Fund (16.1%) | | | 26,972,457 | | | | 19,086,627 | | |
Mid-Cap Equity Index Fund (21.0%) | | | 15,212,109 | | | | 24,805,549 | | |
Small Cap Growth Fund (9.0%) | | | 8,725,252 | | | | 10,649,075 | | |
Small Cap Value Fund (9.0%) | | | 7,932,750 | | | | 10,697,242 | | |
TOTAL INVESTMENTS
(Cost: $102,022,522) 100.0% | | $ | 118,318,475 | | |
OTHER NET ASSETS — 0.0% (3) | | | | | (485 | ) | |
NET ASSETS 100.0% | | | | $ | 118,317,990 | | |
The accompanying notes are an integral part of these portfolio schedules.
49
MUTUAL OF AMERICA INVESTMENT CORPORATION (2050 RETIREMENT FUND)
PORTFOLIO OF INVESTMENTS IN SECURITIES
December 31, 2012
| | | Shares | | Value | |
COMMON STOCKS: | |
DIVERSIFIED MUTUAL FUNDS (100.0%) | |
Mutual of America Investment Corporation | |
Bond Fund (8.0%) | | | 115,525 | | | $ | 169,695 | | |
Equity Index Fund (34.9%) | | | 307,810 | | | | 737,707 | | |
International Fund (17.1%) | | | 512,298 | | | | 362,519 | | |
Mid-Cap Equity Index Fund (20.0%) | | | 259,278 | | | | 422,790 | | |
Small Cap Growth Fund (10.0%) | | | 173,600 | | | | 211,877 | | |
Small Cap Value Fund (10.0%) | | | 157,660 | | | | 212,603 | | |
TOTAL INVESTMENTS
(Cost: $2,080,019) 100.0% | | $ | 2,117,191 | | |
OTHER NET ASSETS — 0.0% (3) | | | | | (9 | ) | |
NET ASSETS 100.0% | | | | $ | 2,117,182 | | |
MUTUAL OF AMERICA INVESTMENT CORPORATION (CONSERVATIVE ALLOCATION FUND)
PORTFOLIO OF INVESTMENTS IN SECURITIES
December 31, 2012
| | | Shares | | Value | |
COMMON STOCKS: | |
DIVERSIFIED MUTUAL FUNDS (100.0%) | |
Mutual of America Investment Corporation | |
Bond Fund (30.3%) | | | 17,803,214 | | | $ | 26,151,266 | | |
Equity Index Fund (24.6%) | | | 8,851,114 | | | | 21,212,889 | | |
Mid-Term Bond Fund (45.1%) | | | 35,713,076 | | | | 38,995,751 | | |
TOTAL INVESTMENTS
(Cost: $79,794,318) 100.0% | | $ | 86,359,906 | | |
OTHER NET ASSETS | | | | | — | | |
NET ASSETS 100.0% | | | | $ | 86,359,906 | | |
MUTUAL OF AMERICA INVESTMENT CORPORATION (MODERATE ALLOCATION FUND)
PORTFOLIO OF INVESTMENTS IN SECURITIES
December 31, 2012
| | | Shares | | Value | |
COMMON STOCKS: | |
DIVERSIFIED MUTUAL FUNDS (100.0%) | |
Mutual of America Investment Corporation | |
Bond Fund (30.3%) | | | 46,473,212 | | | $ | 68,264,826 | | |
Equity Index Fund (34.4%) | | | 32,325,478 | | | | 77,472,372 | | |
Mid-Cap Equity Index Fund (15.2%) | | | 20,993,570 | | | | 34,233,059 | | |
Mid-Term Bond Fund (20.1%) | | | 41,427,042 | | | | 45,234,933 | | |
TOTAL INVESTMENTS
(Cost: $193,148,223) 100.0% | | $ | 225,205,190 | | |
OTHER NET ASSETS | | | | | — | | |
NET ASSETS 100.0% | | | | $ | 225,205,190 | | |
The accompanying notes are an integral part of these portfolio schedules.
50
MUTUAL OF AMERICA INVESTMENT CORPORATION (AGGRESSIVE ALLOCATION FUND)
PORTFOLIO OF INVESTMENTS IN SECURITIES
December 31, 2012
| | | Shares | | Value | |
COMMON STOCKS: | |
DIVERSIFIED MUTUAL FUNDS (100.0%) | |
Mutual of America Investment Corporation | |
Bond Fund (25.4%) | | | 32,332,875 | | | $ | 47,493,987 | | |
Equity Index Fund (44.5%) | | | 34,670,024 | | | | 83,091,393 | | |
Mid-Cap Equity Index Fund (20.4%) | | | 23,359,792 | | | | 38,091,527 | | |
Small Cap Growth Fund (4.7%) | | | 7,256,078 | | | | 8,855,963 | | |
Small Cap Value Fund (5.0%) | | | 6,959,101 | | | | 9,384,286 | | |
TOTAL INVESTMENTS
(Cost: $157,985,430) 100.0% | | $ | 186,917,156 | | |
OTHER NET ASSETS | | | | | — | | |
NET ASSETS 100.0% | | | | $ | 186,917,156 | | |
The accompanying notes are an integral part of these portfolio schedules.
51
MUTUAL OF AMERICA INVESTMENT CORPORATION (MONEY MARKET FUND)
PORTFOLIO OF INVESTMENTS IN SECURITIES
December 31, 2012
| | | Rating** | | Rate | | Maturity | | Face
Amount | | Value | |
SHORT-TERM DEBT SECURITIES: | |
U.S. GOVERNMENT (8.9%) | |
U.S. Treasury Bill | | A-1+ | | | 0.05 | % | | 03/28/13 | | $ | 8,000,000 | | | $ | 7,999,292 | | |
U.S. GOVERNMENT AGENCIES (22.7%) | |
FHLB | | A-1+ | | | 0.08 | | | 04/08/13 | | | 4,530,000 | | | | 4,529,024 | | |
FHLB | | A-1+ | | | 0.09 | | | 02/05/13 | | | 640,000 | | | | 639,944 | | |
FHLB | | A-1+ | | | 0.11 | | | 03/15/13 | | | 6,500,000 | | | | 6,498,550 | | |
FHLMC | | A-1+ | | | 0.09 | | | 04/03/13 | | | 739,000 | | | | 738,839 | | |
FHLMC | | A-1+ | | | 0.11 | | | 02/19/13 | | | 1,905,000 | | | | 1,904,715 | | |
FHLMC | | A-1+ | | | 0.11 | | | 03/04/13 | | | 1,101,000 | | | | 1,100,791 | | |
FNMA | | A-1+ | | | 0.11 | | | 03/13/13 | | | 5,000,000 | | | | 4,999,022 | | |
| | | | 20,410,885 | | |
COMMERCIAL PAPER (67.2%) | |
Air Products & Chemicals† | | A-1 | | | 0.13 | | | 01/14/13 | | | 500,000 | | | | 499,977 | | |
Air Products & Chemicals† | | A-1 | | | 0.13 | | | 01/16/13 | | | 1,600,000 | | | | 1,599,913 | | |
Air Products & Chemicals† | | A-1 | | | 0.15 | | | 01/02/13 | | | 1,600,000 | | | | 1,599,993 | | |
Baker Hughes, Inc.† | | A-1 | | | 0.14 | | | 02/19/13 | | | 2,950,000 | | | | 2,949,438 | | |
Baker Hughes, Inc.† | | A-1 | | | 0.15 | | | 01/07/13 | | | 750,000 | | | | 749,981 | | |
Coca-Cola Co.† | | A-1+ | | | 0.12 | | | 02/13/13 | | | 950,000 | | | | 949,864 | | |
Danaher Corp.† | | A-1 | | | 0.15 | | | 01/02/13 | | | 1,000,000 | | | | 999,996 | | |
Disney (Walt) Co.† | | A-1 | | | 0.12 | | | 02/15/13 | | | 3,700,000 | | | | 3,699,445 | | |
General Electric Capital Corp. | | A-1+ | | | 0.12 | | | 03/13/13 | | | 3,700,000 | | | | 3,699,013 | | |
Google, Inc.† | | A-1+ | | | 0.13 | | | 03/06/13 | | | 1,100,000 | | | | 1,099,789 | | |
Google, Inc.† | | A-1+ | | | 0.14 | | | 01/04/13 | | | 2,000,000 | | | | 1,999,977 | | |
Kimberly-Clark Worldwide† | | A-1 | | | 0.08 | | | 01/09/13 | | | 2,450,000 | | | | 2,449,956 | | |
Kimberly-Clark Worldwide† | | A-1 | | | 0.09 | | | 01/14/13 | | | 1,250,000 | | | | 1,249,959 | | |
National Rural Utilities | | A-1 | | | 0.14 | | | 02/07/13 | | | 3,700,000 | | | | 3,699,468 | | |
New Jersey Natural Gas | | A-1 | | | 0.14 | | | 01/07/13 | | | 3,800,000 | | | | 3,799,911 | | |
Praxair, Inc. | | A-1 | | | 0.10 | | | 01/04/13 | | | 3,700,000 | | | | 3,699,969 | | |
Precision Castparts Corp.† | | A-1 | | | 0.18 | | | 01/11/13 | | | 3,700,000 | | | | 3,699,815 | | |
Private Export Funding Corp.† | | A-1 | | | 0.16 | | | 01/15/13 | | | 2,000,000 | | | | 1,999,876 | | |
Rockwell Collins, Inc.† | | A-1 | | | 0.12 | | | 01/11/13 | | | 3,700,000 | | | | 3,699,877 | | |
Sysco Corp.† | | A-1 | | | 0.09 | | | 01/02/13 | | | 3,700,000 | | | | 3,699,991 | | |
Toyota Motor Credit Corp. | | A-1+ | | | 0.21 | | | 01/16/13 | | | 3,700,000 | | | | 3,699,676 | | |
Unilever Capital Corp.† | | A-1 | | | 0.16 | | | 02/04/13 | | | 3,700,000 | | | | 3,699,441 | | |
Wal-Mart Stores, Inc.† | | A-1+ | | | 0.11 | | | 01/24/13 | | | 1,400,000 | | | | 1,399,902 | | |
Washington Gas Light Co. | | A-1 | | | 0.15 | | | 01/10/13 | | | 300,000 | | | | 299,989 | | |
Washington Gas Light Co. | | A-1 | | | 0.15 | | | 01/16/13 | | | 3,500,000 | | | | 3,499,781 | | |
| | | | 60,444,997 | | |
TOTAL SHORT-TERM DEBT SECURITIES
(Cost: $88,854,791) 98.8% | | | 88,855,174 | | |
TEMPORARY CASH INVESTMENTS (2)
(Cost: $1,078,600) 1.2% | | | 1,078,600 | | |
TOTAL INVESTMENTS
(Cost: $89,933,391) 100.0% | | | 89,933,774 | | |
OTHER NET ASSETS (0.0%) (3) | | | (1,068 | ) | |
NET ASSETS 100.0% | | $ | 89,932,706 | | |
The accompanying notes are an integral part of these portfolio schedules.
52
MUTUAL OF AMERICA INVESTMENT CORPORATION (MID-TERM BOND FUND)
SUMMARY PORTFOLIO OF INVESTMENTS IN SECURITIES
December 31, 2012
| | | Rating** | | Rate | | Maturity | | Face
Amount | | Value | |
LONG-TERM DEBT SECURITIES: | |
U.S. GOVERNMENT (46.5%) | |
U.S. Treasury Note | | AA+ | | | 0.13 - 3.25 | % | | 12/31/14 - 12/31/19 | | $ | 103,500,000 | | | $ | 108,191,439 | | |
U.S. Treasury Strip | | AA+ | | | 0.00 | | | 08/15/17 - 08/15/18 | | | 75,000,000 | | | | 71,614,454 | | |
| | | | 179,805,893 | | |
U.S. GOVERNMENT AGENCIES (11.9%) | |
MORTGAGE-BACKED OBLIGATIONS (0.0%) (3) | |
FHLMC | | AA+ | | | 6.00 - 8.50 | | | 02/01/14 - 03/15/21 | | | 28,703 | | | | 30,576 | | |
FNMA | | AA+ | | | 6.50 - 8.00 | | | 08/01/13 - 06/01/17 | | | 1,214 | | | | 1,227 | | |
| | | | 31,803 | | |
NON-MORTGAGE-BACKED OBLIGATIONS (11.9%) | |
FFCB | | AA+ | | | 4.95 - 5.10 | | | 08/05/13 - 10/10/14 | | | 17,500,000 | | | | 18,677,200 | | |
FHLB | | AA+ | | | 1.38 | | | 05/28/14 | | | 17,000,000 | | | | 17,290,678 | | |
FNMA | | AA+ | | | 1.25 | | | 02/27/14 | | | 10,000,000 | | | | 10,133,370 | | |
| | | | 46,101,248 | | |
CORPORATE DEBT (40.5%) | |
CONSUMER DISCRETIONARY (3.3%) | |
AutoZone, Inc. | | BBB | | | 4.00 - 6.50 | | | 01/15/14 - 11/15/20 | | | 1,700,000 | | | | 1,814,908 | | |
Hyatt Hotels Corp. | | BBB | | | 3.88 | | | 08/15/16 | | | 1,525,000 | | | | 1,623,896 | | |
Hyatt Hotels Corp.† | | BBB | | | 5.75 | | | 08/15/15 | | | 200,000 | | | | 219,555 | | |
Kohl's Corp. | | BBB+ | | | 3.25 - 4.00 | | | 11/01/21 - 02/01/23 | | | 1,700,000 | | | | 1,737,263 | | |
Marriott International, Inc. | | BBB | | | 3.00 - 5.63 | | | 02/15/13 - 03/01/19 | | | 1,950,000 | | | | 1,989,077 | | |
Other Securities | | | | | | | | | 5,350,000 | | | | 5,564,688 | | |
| | | | 12,949,387 | | |
CONSUMER STAPLES (3.3%) | |
Avon Products, Inc. | | BBB- | | | 6.50 | | | 03/01/19 | | | 1,800,000 | | | | 1,941,899 | | |
Energizer Hldgs., Inc. | | BBB- | | | 4.70 | | | 05/19/21 | | | 1,700,000 | | | | 1,821,946 | | |
Flowers Foods, Inc. | | BBB- | | | 4.38 | | | 04/01/22 | | | 1,500,000 | | | | 1,537,665 | | |
Other Securities | | | | | | | | | 7,125,000 | | | | 7,423,287 | | |
| | | | 12,724,797 | | |
ENERGY (3.2%) | |
Energen Corp. | | BBB | | | 4.63 | | | 09/01/21 | | | 1,500,000 | | | | 1,562,850 | | |
Marathon Petroleum Corp. | | BBB | | | 3.50 | | | 03/01/16 | | | 1,500,000 | | | | 1,596,764 | | |
Murphy Oil Corp. | | BBB | | | 2.50 | | | 12/01/17 | | | 1,750,000 | | | | 1,760,792 | | |
Other Securities | | | | | | | | | 7,105,000 | | | | 7,503,487 | | |
| | | | 12,423,893 | | |
FINANCIALS (13.3%) | |
Aflac, Inc. | | A- | | | 2.65 | | | 02/15/17 | | | 1,500,000 | | | | 1,576,832 | | |
Hartford Financial Svcs. | | BBB | | | 4.00 - 5.50 | | | 10/15/16 - 10/15/17 | | | 1,850,000 | | | | 2,047,828 | | |
HCP, Inc. | | BBB+ | | | 5.65 - 6.00 | | | 12/15/13 - 01/30/17 | | | 1,750,000 | | | | 1,958,931 | | |
Health Care REIT, Inc. | | BBB- | | | 3.63 | | | 03/15/16 | | | 1,750,000 | | | | 1,847,951 | | |
Kemper Corp. | | BBB- | | | 6.00 | | | 11/30/15 | | | 1,500,000 | | | | 1,617,827 | | |
Morgan Stanley | | A- | | | 2.88 - 4.00 | | | 01/24/14 - 07/24/15 | | | 1,500,000 | | | | 1,554,687 | | |
Penske Truck Leasing Co. LP† | | BBB- | | | 3.38 - 3.75 | | | 05/11/17 - 03/15/18 | | | 1,790,000 | | | | 1,824,378 | | |
ProLogis LP | | BBB- | | | 6.63 | | | 05/15/18 | | | 1,500,000 | | | | 1,811,738 | | |
Raymond James Financial, Inc. | | BBB | | | 4.25 | | | 04/15/16 | | | 1,600,000 | | | | 1,682,206 | | |
Reckson Operating Partnership | | BBB- | | | 6.00 | | | 03/31/16 | | | 1,700,000 | | | | 1,863,936 | | |
Reinsurance Grp. of America, Inc. | | A- | | | 5.63 | | | 03/15/17 | | | 1,500,000 | | | | 1,694,295 | | |
Senior Housing Pptys. Trust | | BBB- | | | 4.30 | | | 01/15/16 | | | 1,650,000 | | | | 1,710,669 | | |
Simon Property Group LP | | A- | | | 2.80 | | | 01/30/17 | | | 1,500,000 | | | | 1,582,779 | | |
Ventas Realty LP/Capital Corp. | | BBB | | | 4.00 | | | 04/30/19 | | | 1,700,000 | | | | 1,827,401 | | |
Vornado Realty LP | | BBB | | | 4.25 | | | 04/01/15 | | | 1,500,000 | | | | 1,585,520 | | |
Other Securities | | | | | | | | | 23,830,000 | | | | 25,253,345 | | |
| | | | 51,440,323 | | |
The accompanying notes are an integral part of these portfolio schedules.
53
MUTUAL OF AMERICA INVESTMENT CORPORATION (MID-TERM BOND FUND)
SUMMARY PORTFOLIO OF INVESTMENTS IN SECURITIES (Continued)
December 31, 2012
| | | Rating** | | Rate | | Maturity | | Face
Amount | | Value | |
LONG-TERM DEBT SECURITIES: (CONTINUED) | |
HEALTH CARE (3.5%) | |
Biogen Idec, Inc. | | BBB+ | | | 6.88 | % | | 03/01/18 | | $ | 1,250,000 | | | $ | 1,548,331 | | |
CIGNA Corp. | | BBB | | | 2.75 | | | 11/15/16 | | | 1,750,000 | | | | 1,840,902 | | |
Humana, Inc. | | BBB | | | 6.45 | | | 06/01/16 | | | 1,415,000 | | | | 1,607,256 | | |
Laboratory Corp. of America | | BBB+ | | | 3.13 - 5.63 | | | 02/01/13 - 11/15/20 | | | 1,685,000 | | | | 1,822,045 | | |
PerkinElmer, Inc. | | BBB | | | 5.00 | | | 11/15/21 | | | 1,700,000 | | | | 1,884,807 | | |
Other Securities | | | | | | | | | 4,750,000 | | | | 5,012,411 | | |
| | | | 13,715,752 | | |
INDUSTRIALS (5.2%) | |
Dun & Bradstreet Corp. | | BBB+ | | | 3.25 | | | 12/01/17 | | | 1,750,000 | | | | 1,768,536 | | |
Equifax, Inc. | | BBB+ | | | 3.30 | | | 12/15/22 | | | 1,700,000 | | | | 1,686,301 | | |
Harsco Corp. | | BBB | | | 5.75 | | | 05/15/18 | | | 1,850,000 | | | | 2,058,092 | | |
Ryder System, Inc. | | BBB | | | 6.00 - 7.20 | | | 03/01/13 - 09/01/15 | | | 1,500,000 | | | | 1,649,064 | | |
URS Corp.† | | BBB- | | | 3.85 | | | 04/01/17 | | | 1,700,000 | | | | 1,751,236 | | |
Other Securities | | | | | | | | | 10,735,000 | | | | 11,331,188 | | |
| | | | 20,244,417 | | |
INFORMATION TECHNOLOGY (2.5%) | |
Arrow Electronics, Inc. | | BBB- | | | 6.88 | | | 07/01/13 - 06/01/18 | | | 1,450,000 | | | | 1,591,665 | | |
Avnet, Inc. | | BBB- | | | 5.88 - 6.00 | | | 03/15/14 - 09/01/15 | | | 1,730,000 | | | | 1,852,832 | | |
Ingram Micro, Inc. | | BBB- | | | 5.25 | | | 09/01/17 | | | 1,500,000 | | | | 1,628,991 | | |
Lexmark International, Inc. | | BBB- | | | 6.65 | | | 06/01/18 | | | 1,500,000 | | | | 1,640,790 | | |
Tech Data Corp. | | BBB- | | | 3.75 | | | 09/21/17 | | | 1,500,000 | | | | 1,538,711 | | |
Other Securities | | | | | | | | | 1,500,000 | | | | 1,532,571 | | |
| | | | 9,785,560 | | |
MATERIALS (3.1%) | |
Airgas, Inc. | | BBB | | | 3.25 | | | 10/01/15 | | | 1,500,000 | | | | 1,593,185 | | |
Freeport-McMoRan Copper & Gold | | BBB | | | 2.15 | | | 03/01/17 | | | 1,750,000 | | | | 1,759,294 | | |
Kinross Gold Corp. | | NR | | | 3.63 - 5.13 | | | 09/01/16 - 09/01/21 | | | 2,750,000 | | | | 2,804,420 | | |
Methanex Corp. | | BBB- | | | 3.25 | | | 12/15/19 | | | 1,750,000 | | | | 1,760,178 | | |
Other Securities | | | | | | | | | 3,850,000 | | | | 4,038,337 | | |
| | | | 11,955,414 | | |
TELECOMMUNICATION SERVICES (0.3%) | |
| Other Securities1,250,000 | | | 1,328,626 | | |
UTILITIES (2.8%) | |
Black Hills Corp. | | BBB- | | | 9.00 | | | 05/15/14 | | | 2,000,000 | | | | 2,202,070 | | |
Constellation Energy | | BBB- | | | 5.15 | | | 12/01/20 | | | 1,500,000 | | | | 1,714,680 | | |
Other Securities | | | | | | | | | 6,450,000 | | | | 6,844,017 | | |
| | | | 10,760,767 | | |
MUNICIPAL OBLIGATIONS (0.2%) | |
| Tennessee Valley Auth. StripNR0.0011/01/20900,000 | | | 769,456 | | |
TOTAL LONG-TERM DEBT SECURITIES
(Cost: $361,983,035) 99.1% | | | 384,037,336 | | |
TEMPORARY CASH INVESTMENTS (2)
(Cost: $697,600) 0.2% | | | 697,600 | | |
TOTAL INVESTMENTS
(Cost: $362,680,635) 99.3% | | | 384,734,936 | | |
OTHER NET ASSETS 0.7% | | | 2,581,298 | | |
NET ASSETS 100.0% | | $ | 387,316,234 | | |
The accompanying notes are an integral part of these portfolio schedules.
54
MUTUAL OF AMERICA INVESTMENT CORPORATION (BOND FUND)
SUMMARY PORTFOLIO OF INVESTMENTS IN SECURITIES
December 31, 2012
| | | Rating** | | Rate | | Maturity | | Face
Amount | | Value | |
LONG-TERM DEBT SECURITIES: | |
U.S. GOVERNMENT (12.3%) | |
U.S. Treasury Note | | AA+ | | | 0.13 - 2.13 | % | | 05/31/14 - 08/15/22 | | $ | 65,100,000 | | | $ | 65,157,440 | | |
U.S. Treasury Strip | | AA+ | | | 0.00 | | | 08/15/18 - 08/15/29 | | | 41,000,000 | | | | 27,367,139 | | |
| | | | 92,524,579 | | |
U.S. GOVERNMENT AGENCIES (29.1%) | |
MORTGAGE-BACKED OBLIGATIONS (26.8%) | |
FHARM | | AA+ | | | 2.90 - 5.77 | | | 02/01/36 - 04/01/42 | | | 4,216,665 | | | | 4,465,795 | | |
FHLMC | | AA+ | | | 2.50 - 6.00 | | | 03/01/21 - 08/01/42 | | | 30,609,207 | | | | 32,775,582 | | |
FNMA | | AA+ | | | 3.00 - 8.00 | | | 09/01/16 - 12/25/49 | | | 107,081,768 | | | | 116,799,873 | | |
GNMA (4) | | AA+ | | | 2.68 - 7.00 | | | 02/20/20 - 10/16/47 | | | 42,130,623 | | | | 45,962,237 | | |
Other Securities | | | | | | | | | 1,803,511 | | | | 2,091,194 | | |
| | | | 202,094,681 | | |
NON-MORTGAGE-BACKED OBLIGATIONS (2.3%) | |
FNMA | | AA+ | | | 0.00 | | | 10/09/19 | | | 20,000,000 | | | | 17,521,140 | | |
CORPORATE DEBT (57.0%) | |
CONSUMER DISCRETIONARY (7.9%) | |
Expedia, Inc. | | BBB- | | | 5.95 | | | 08/15/20 | | | 3,000,000 | | | | 3,337,806 | | |
Kohl's Corp. | | BBB+ | | | 3.25 - 4.00 | | | 11/01/21 - 02/01/23 | | | 3,500,000 | | | | 3,625,332 | | |
Newell Rubbermaid, Inc. | | BBB- | | | 4.70 | | | 08/15/20 | | | 3,000,000 | | | | 3,313,473 | | |
O'Reilly Automotive, Inc. | | BBB | | | 3.80 | | | 09/01/22 | | | 3,250,000 | | | | 3,381,580 | | |
Omnicom Group, Inc. | | BBB+ | | | 4.45 | | | 08/15/20 | | | 3,000,000 | | | | 3,338,208 | | |
Whirlpool Corp. | | BBB- | | | 4.85 - 6.50 | | | 06/15/16 - 06/15/21 | | | 3,000,000 | | | | 3,365,634 | | |
Other Securities | | | | | | | | | 37,000,000 | | | | 38,981,604 | | |
| | | | 59,343,637 | | |
CONSUMER STAPLES (3.8%) | |
Flowers Foods, Inc. | | BBB- | | | 4.38 | | | 04/01/22 | | | 3,500,000 | | | | 3,587,885 | | |
Ingredion, Inc. | | BBB | | | 4.63 | | | 11/01/20 | | | 3,225,000 | | | | 3,600,954 | | |
Other Securities | | | | | | | | | 20,244,000 | | | | 21,503,699 | | |
| | | | 28,692,538 | | |
ENERGY (5.1%) | |
Cameron International Corp. | | BBB+ | | | 4.50 | | | 06/01/21 | | | 3,000,000 | | | | 3,356,871 | | |
Energen Corp. | | BBB | | | 4.63 | | | 09/01/21 | | | 3,500,000 | | | | 3,646,650 | | |
Marathon Petroleum Corp. | | BBB | | | 5.13 | | | 03/01/21 | | | 3,000,000 | | | | 3,530,520 | | |
Murphy Oil Corp. | | BBB | | | 2.50 - 3.70 | | | 12/01/17 - 12/01/22 | | | 3,500,000 | | | | 3,499,146 | | |
Rowan Companies PLC | | BBB- | | | 4.88 | | | 06/01/22 | | | 3,500,000 | | | | 3,801,238 | | |
Other Securities | | | | | | | | | 18,775,000 | | | | 20,420,947 | | |
| | | | 38,255,372 | | |
FINANCIALS (19.0%) | |
Alleghany Corp. | | BBB | | | 5.63 | | | 09/15/20 | | | 3,000,000 | | | | 3,331,479 | | |
Capital One Financial Corp. | | BBB | | | 4.75 | | | 07/15/21 | | | 3,200,000 | | | | 3,690,118 | | |
First Horizon National Corp. | | BB+ | | | 4.50 | | | 05/15/13 | | | 5,000,000 | | | | 5,059,955 | | |
Genworth Financial, Inc. | | BBB- | | | 7.20 - 7.63 | | | 02/15/21 - 09/24/21 | | | 3,050,000 | | | | 3,324,640 | | |
Hartford Financial Svcs. | | BBB | | | 5.50 | | | 10/15/16 - 03/30/20 | | | 3,000,000 | | | | 3,400,447 | | |
HCP, Inc. | | BBB+ | | | 5.65 - 6.00 | | | 12/15/13 - 01/30/17 | | | 3,250,000 | | | | 3,527,916 | | |
Health Care REIT, Inc. | | BBB- | | | 3.63 - 6.13 | | | 03/15/16 - 04/15/20 | | | 3,250,000 | | | | 3,719,984 | | |
Marsh & McLennan Cos., Inc. | | BBB | | | 4.80 | | | 07/15/21 | | | 3,000,000 | | | | 3,375,732 | | |
Pacific LifeCorp.† | | BBB+ | | | 6.00 | | | 02/10/20 | | | 3,000,000 | | | | 3,348,807 | | |
ProLogis LP | | BBB- | | | 6.63 | | | 05/15/18 | | | 3,000,000 | | | | 3,623,475 | | |
Prudential Financial, Inc. | | | A | | | | 4.50 - 4.75 | | | 09/17/15 - 11/16/21 | | | 3,000,000 | | | | 3,316,937 | | |
Raymond James Financial, Inc. | | BBB | | | 4.25 | | | 04/15/16 | | | 3,150,000 | | | | 3,311,844 | | |
Reckson Operating Partnership | | BBB- | | | 6.00 | | | 03/31/16 | | | 3,200,000 | | | | 3,508,586 | | |
Reinsurance Grp. of America, Inc. | | A- | | | 5.00 | | | 06/01/21 | | | 3,000,000 | | | | 3,303,288 | | |
Retail Properties, Inc.† | | A- | | | 7.88 | | | 03/15/16 | | | 5,000,000 | | | | 5,981,510 | | |
The accompanying notes are an integral part of these portfolio schedules.
55
MUTUAL OF AMERICA INVESTMENT CORPORATION (BOND FUND)
SUMMARY PORTFOLIO OF INVESTMENTS IN SECURITIES (Continued)
December 31, 2012
| | | Rating** | | Rate | | Maturity | | Face
Amount | | Value | |
LONG-TERM DEBT SECURITIES: (CONTINUED) | |
FINANCIALS (CONTINUED) | |
Ventas Realty LP/Capital Corp. | | BBB | | | 3.25 - 4.75 | % | | 06/01/21 - 08/15/22 | | $ | 3,500,000 | | | $ | 3,770,979 | | |
Other Securities | | | | | | | | | 77,696,000 | | | | 83,166,984 | | |
| | | | 142,762,681 | | |
HEALTH CARE (4.8%) | |
CIGNA Corp. | | BBB | | | 2.75 - 5.38 | | | 11/15/16 - 03/15/17 | | | 3,000,000 | | | | 3,316,808 | | |
PerkinElmer, Inc. | | BBB | | | 5.00 | | | 11/15/21 | | | 3,500,000 | | | | 3,880,485 | | |
Other Securities | | | | | | | | | 25,850,000 | | | | 28,822,415 | | |
| | | | 36,019,708 | | |
INDUSTRIALS (5.2%) | |
Dun & Bradstreet Corp. | | BBB+ | | | 3.25 - 4.38 | | | 12/01/17 - 12/01/22 | | | 3,475,000 | | | | 3,522,500 | | |
Equifax, Inc. | | BBB+ | | | 3.30 | | | 12/15/22 | | | 3,500,000 | | | | 3,471,797 | | |
Flowserve Corp. | | BBB- | | | 3.50 | | | 09/15/22 | | | 3,500,000 | | | | 3,515,096 | | |
Harsco Corp. | | BBB | | | 5.75 | | | 05/15/18 | | | 3,000,000 | | | | 3,337,446 | | |
L-3 Communications Corp. | | BBB- | | | 4.75 | | | 07/15/20 | | | 3,000,000 | | | | 3,343,908 | | |
Pentair Ltd. | | BBB | | | 5.00 | | | 05/15/21 | | | 3,000,000 | | | | 3,388,815 | | |
URS Corp.† | | BBB- | | | 5.00 | | | 04/01/22 | | | 3,600,000 | | | | 3,706,081 | | |
Other Securities | | | | | | | | | 13,900,000 | | | | 14,605,713 | | |
| | | | 38,891,356 | | |
INFORMATION TECHNOLOGY (3.0%) | |
Arrow Electronics, Inc. | | BBB- | | | 6.88 | | | 06/01/18 | | | 2,900,000 | | | | 3,399,461 | | |
Motorola Solutions, Inc. | | BBB | | | 3.75 | | | 05/15/22 | | | 3,500,000 | | | | 3,575,999 | | |
Other Securities | | | | | | | | | 14,770,000 | | | | 15,890,253 | | |
| | | | 22,865,713 | | |
MATERIALS (4.4%) | |
Geon Co. | | BB- | | | 7.50 | | | 12/15/15 | | | 3,750,000 | | | | 3,862,500 | | |
Methanex Corp. | | BBB- | | | 3.25 - 5.25 | | | 12/15/19 - 03/01/22 | | | 3,500,000 | | | | 3,582,339 | | |
Other Securities | | | | | | | | | 24,500,000 | | | | 26,005,089 | | |
| | | | 33,449,928 | | |
TELECOMMUNICATION SERVICES (0.6%) | |
Other Securities | | | | | | | | | 4,000,000 | | | | 4,498,154 | | |
UTILITIES (3.2%) | |
Constellation Energy | | BBB- | | | 5.15 | | | 12/01/20 | | | 3,000,000 | | | | 3,429,360 | | |
National Fuel Gas Co. | | BBB | | | 4.90 | | | 12/01/21 | | | 3,000,000 | | | | 3,312,447 | | |
Other Securities | | | | | | | | | 16,900,000 | | | | 17,311,434 | | |
| | | | 24,053,241 | | |
SOVEREIGN DEBT (0.6%) | |
Sri Lanka AID | | NR | | | 6.59 | | | 09/15/28 | | | 3,554,103 | | | | 4,453,291 | | |
TOTAL LONG-TERM DEBT SECURITIES
(Cost: $704,869,509) 99.0% | | | 745,426,019 | | |
SHORT-TERM DEBT SECURITIES: | |
COMMERCIAL PAPER (0.3%) | |
Washington Gas Light Co. | | A-1 | | | 0.13 | | | 01/02/13 | | | 2,000,000 | | | | 1,999,993 | | |
TOTAL SHORT-TERM DEBT SECURITIES
(Cost: $1,999,993) 0.3% | | | 1,999,993 | | |
TEMPORARY CASH INVESTMENTS (2)
(Cost: $487,200) 0.1% | | | 487,200 | | |
TOTAL INVESTMENTS
(Cost: $707,356,702) 99.4% | | | 747,913,212 | | |
OTHER NET ASSETS 0.6% | | | 4,833,160 | | |
NET ASSETS 100.0% | | $ | 752,746,372 | | |
The accompanying notes are an integral part of these portfolio schedules.
56
MUTUAL OF AMERICA INVESTMENT CORPORATION
FOOTNOTES TO SUMMARY PORTFOLIO OF INVESTMENTS IN SECURITIES
December 31, 2012
Abbreviations: FFCB = Federal Farm Credit Bank
FHARM = Federal Home Adjustable Rate Mortgage
FHLB = Federal Home Loan Bank
FHLMC = Federal Home Loan Mortgage Corporation
FNMA = Federal National Mortgage Association
GNMA = Government National Mortgage Association
NR = Not Rated
"Other Securities" represent securities in the respective category that individually, or in the aggregate by issuer, do not exceed 1% of net assets.
* Non-income producing security.
** Ratings as per Standard & Poor's Corporation (unaudited).
† Security is exempt from registration under Rule 144A of the Securities Act of 1933. These securities may be resold in transactions exempt from registration, normally to qualified institutional buyers. At December 31, 2012, the aggregate values of these securities and their percentages of the respective Funds' net assets were as follows:
Fund | | Aggregate
Market
Value | | Percentage
of
Net Assets | |
EQUITY INDEX FUND | | $ | 3,399,816 | | | | 0.3 | % | |
COMPOSITE FUND | | $ | 973,141 | | | | 0.6 | % | |
MONEY MARKET FUND | | $ | 38,047,190 | | | | 42.3 | % | |
MID-TERM BOND FUND | | $ | 8,372,692 | | | | 2.2 | % | |
BOND FUND | | $ | 19,972,720 | | | | 2.7 | % | |
(1) This security, or a portion thereof, has been segregated to cover initial margin requirements on open futures contracts. Information on futures contracts outstanding in the Funds as of December 31, 2012, were as follows:
Fund | | Number of
Contracts | | Contract Type | | Purchased (P)
or Sold (S) | | Expiration
Date | | Underlying
Face Amount
at Value(a) | | Unrealized
Gain(Loss) | | Face Value
of Futures
as a %
of Total
Investments | |
EQUITY INDEX FUND | | | 515 | | | E-mini S&P 500
Stock Index | | | P | | | March 2013 | | $ | 36,567,575 | | | $ | (271,225 | ) | | | 3.3 | % | |
ALL AMERICA FUND | | | 45 | | | E-mini S&P 500
Stock Index | | | P | | | March 2013 | | $ | 3,195,225 | | | $ | (19,126 | ) | | | 1.3 | % | |
MID-CAP EQUITY
INDEX FUND | | | 188 | | | E-mini S&P MidCap
400 Stock Index | | | P | | | March 2013 | | $ | 19,140,280 | | | $ | (111,507 | ) | | | 3.1 | % | |
(a) Includes the cumulative appreciation(depreciation) of futures contracts, which is included in Net Unrealized Appreciation (Depreciation) of Investments and Futures Contracts in the Components of Net Assets section of the Statements of Assets and Liabilities. The Receivable or Payable for Daily Variation on Futures Contracts in the Statements of Assets and Liabilities only includes the current day's variation margin payable or receivable.
(2) The fund has an arrangement with its custodian bank, JP Morgan Chase Bank, whereby uninvested cash, subject to parameters set by the fund, is automatically invested in the fund's name by the bank in overnight commercial paper issued by J.P. Morgan Chase & Co. On the next business day, these funds (and earned interest) are automatically returned to the fund. The annual rate of interest earned on this temporary cash investment at December 31, 2012 was 0.15%.
(3) Percentage is less than 0.05%.
(4) U.S. Government guaranteed security.
57
MUTUAL OF AMERICA INVESTMENT CORPORATION
STATEMENTS OF ASSETS AND LIABILITIES
December 31, 2012
| | | Equity Index
Fund | | All America
Fund | | Small Cap
Value Fund | | Small Cap
Growth Fund | | Mid Cap
Value Fund | | Mid-Cap
Equity Index
Fund | | International
Fund | | Composite
Fund | | Retirement
Income
Fund | | 2010
Retirement
Fund | | 2015
Retirement
Fund | | 2020
Retirement
Fund | | 2025
Retirement
Fund | |
ASSETS: | |
Investments at fair value
(Cost: Equity Index Fund — $859,751,346
All America Fund — $216,424,202
Small Cap Value Fund — $231,189,292
Small Cap Growth Fund — $237,100,839
Mid Cap Value Fund — $47,339,086
Mid-Cap Equity Index Fund — $509,416,826
International Fund — $108,021,891
Composite Fund — $147,546,710
Retirement Income Fund — $29,728,136
Retirement 2010 Fund — $19,885,714
Retirement 2015 Fund — $101,086,700
Retirement 2020 Fund — $150,457,834
Retirement 2025 Fund — $142,278,583)
(Notes 1 and 3) | | $ | 1,106,490,480 | | | $ | 255,586,131 | | | $ | 290,181,407 | | | $ | 272,080,040 | | | $ | 53,123,776 | | | $ | 609,191,247 | | | $ | 113,980,101 | | | $ | 169,018,983 | | | $ | 31,243,375 | | | $ | 21,452,723 | | | $ | 112,337,705 | | | $ | 169,031,294 | | | $ | 161,771,470 | | |
Cash | | | 38 | | | | 326,133 | | | | 84,296 | | | | 46,330 | | | | 37,902 | | | | 24 | | | | 568,562 | | | | 202 | | | | — | | | | — | | | | — | | | | — | | | | — | | |
Interest and dividends receivable | | | 1,176,587 | | | | 253,003 | | | | 87,079 | | | | 70,151 | | | | 55,891 | | | | 343,237 | | | | — | | | | 574,450 | | | | — | | | | — | | | | — | | | | — | | | | — | | |
Receivable for securities sold | | | — | | | | — | | | | — | | | | — | | | | — | | | | — | | | | — | | | | 8,959 | | | | — | | | | — | | | | — | | | | — | | | | — | | |
Receivable for daily variation margin on future contracts | | | 926,775 | | | | 81,225 | | | | — | | | | — | | | | — | | | | 434,710 | | | | — | | | | — | | | | — | | | | — | | | | — | | | | — | | | | — | | |
TOTAL ASSETS | | | 1,108,593,880 | | | | 256,246,492 | | | | 290,352,782 | | | | 272,196,521 | | | | 53,217,569 | | | | 609,969,218 | | | | 114,548,663 | | | | 169,602,594 | | | | 31,243,375 | | | | 21,452,723 | | | | 112,337,705 | | | | 169,031,294 | | | | 161,771,470 | | |
LIABILITIES: | |
Payable for securities purchased | | | — | | | | — | | | | — | | | | — | | | | — | | | | — | | | | — | | | | — | | | | — | | | | — | | | | — | | | | — | | | | — | | |
Accrued expenses | | | 6,815 | | | | 8,402 | | | | 17,849 | | | | 16,733 | | | | 2,399 | | | | 3,750 | | | | 704 | | | | 5,561 | | | | 128 | | | | 88 | | | | 460 | | | | 693 | | | | 663 | | |
TOTAL LIABILITIES | | | 6,815 | | | | 8,402 | | | | 17,849 | | | | 16,733 | | | | 2,399 | | | | 3,750 | | | | 704 | | | | 5,561 | | | | 128 | | | | 88 | | | | 460 | | | | 693 | | | | 663 | | |
NET ASSETS | | $ | 1,108,587,065 | | | $ | 256,238,090 | | | $ | 290,334,933 | | | $ | 272,179,788 | | | $ | 53,215,170 | | | $ | 609,965,468 | | | $ | 114,547,959 | | | $ | 169,597,033 | | | $ | 31,243,247 | | | $ | 21,452,635 | | | $ | 112,337,245 | | | $ | 169,030,601 | | | $ | 161,770,807 | | |
NUMBER OF SHARES OUTSTANDING (Note 4) | | | 462,559,004 | | | | 138,745,627 | | | | 215,294,961 | | | | 223,008,469 | | | | 43,126,278 | | | | 374,064,073 | | | | 161,874,441 | | | | 103,273,971 | | | | 29,130,938 | | | | 21,461,692 | | | | 112,209,986 | | | | 171,582,429 | | | | 164,296,317 | | |
NET ASSET VALUES, offering and redemption price per share | | $ | 2.40 | | | $ | 1.85 | | | $ | 1.35 | | | $ | 1.22 | | | $ | 1.23 | | | $ | 1.63 | | | $ | 0.71 | | | $ | 1.64 | | | $ | 1.07 | | | $ | 1.00 | | | $ | 1.00 | | | $ | 0.99 | | | $ | 0.98 | | |
COMPONENTS OF NET ASSETS: | |
Paid-in capital | | $ | 842,275,967 | | | $ | 218,767,075 | | | $ | 233,806,195 | | | $ | 214,925,509 | | | $ | 45,806,810 | | | $ | 481,750,747 | | | $ | 107,584,645 | | | $ | 155,076,889 | | | $ | 29,188,958 | | | $ | 18,959,581 | | | $ | 97,682,182 | | | $ | 148,091,643 | | | $ | 139,413,283 | | |
Accumulated undistributed net investment income (loss) | | | 20,255,515 | | | | 3,679,239 | | | | 3,652,524 | | | | (187,166 | ) | | | 651,813 | | | | 7,797,145 | | | | 2,689,340 | | | | 3,658,494 | | | | — | | | | — | | | | (3 | ) | | | — | | | | — | | |
Accumulated undistributed net realized gain (loss)
on investments and futures contracts | | | (412,326 | ) | | | (5,351,027 | ) | | | (6,115,901 | ) | | | 22,462,244 | | | | 971,857 | | | | 20,754,662 | | | | (1,684,236 | ) | | | (10,610,623 | ) | | | 539,050 | | | | 926,045 | | | | 3,404,061 | | | | 2,365,498 | | | | 2,864,637 | | |
Net unrealized appreciation (depreciation)
of investments and futures contracts | | | 246,467,909 | | | | 39,142,803 | | | | 58,992,115 | | | | 34,979,201 | | | | 5,784,690 | | | | 99,662,914 | | | | 5,958,210 | | | | 21,472,273 | | | | 1,515,239 | | | | 1,567,009 | | | | 11,251,005 | | | | 18,573,460 | | | | 19,492,887 | | |
NET ASSETS | | $ | 1,108,587,065 | | | $ | 256,238,090 | | | $ | 290,334,933 | | | $ | 272,179,788 | | | $ | 53,215,170 | | | $ | 609,965,468 | | | $ | 114,547,959 | | | $ | 169,597,033 | | | $ | 31,243,247 | | | $ | 21,452,635 | | | $ | 112,337,245 | | | $ | 169,030,601 | | | $ | 161,770,807 | | |
The accompanying notes are an integral part of these financial statements.
58
The accompanying notes are an integral part of these financial statements.
59
MUTUAL OF AMERICA INVESTMENT CORPORATION
STATEMENTS OF ASSETS AND LIABILITIES (Continued)
December 31, 2012
| | | 2030
Retirement
Fund | | 2035
Retirement
Fund | | 2040
Retirement
Fund | | 2045
Retirement
Fund | | 2050
Retirement
Fund | | Conservative
Allocation
Fund | | Moderate
Allocation
Fund | | Aggressive
Allocation
Fund | | Money
Market
Fund | | Mid-Term
Bond Fund | | Bond Fund | |
ASSETS: | |
Investments at fair value
(Cost: Retirement 2030 Fund — $115,735,566
Retirement 2035 Fund — $92,092,566
Retirement 2040 Fund — $80,714,140
Retirement 2045 Fund — $102,022,522
Retirement 2050 Fund — $2,080,019
Conservative Allocation Fund — $79,794,318
Moderate Allocation Fund — $193,148,223
Aggressive Allocation Fund — $157,985,430
Money Market Fund — $89,933,391
Mid-Term Bond Fund — $362,680,635
Bond Fund — $707,356,702)
(Notes 1 and 3) | | $ | 133,273,336 | | | $ | 106,699,288 | | | $ | 93,991,633 | | | $ | 118,318,475 | | | $ | 2,117,191 | | | $ | 86,359,906 | | | $ | 225,205,190 | | | $ | 186,917,156 | | | $ | 89,933,774 | | | $ | 384,734,936 | | | $ | 747,913,212 | | |
Cash | | | — | | | | — | | | | — | | | | — | | | | — | | | | — | | | | — | | | | — | | | | 37 | | | | 11 | | | | 20 | | |
Interest and dividends receivable | | | — | | | | — | | | | — | | | | — | | | | — | | | | — | | | | — | | | | — | | | | — | | | | 2,593,921 | | | | 5,791,430 | | |
Receivable for securities sold | | | — | | | | — | | | | — | | | | — | | | | — | | | | — | | | | — | | | | — | | | | — | | | | 65 | | | | 113,722 | | |
Receivable for daily variation margin on future contracts | | | — | | | | — | | | | — | | | | — | | | | — | | | | — | | | | — | | | | — | | | | — | | | | — | | | | — | | |
TOTAL ASSETS | | | 133,273,336 | | | | 106,699,288 | | | | 93,991,633 | | | | 118,318,475 | | | | 2,117,191 | | | | 86,359,906 | | | | 225,205,190 | | | | 186,917,156 | | | | 89,933,811 | | | | 387,328,933 | | | | 753,818,384 | | |
LIABILITIES: | |
Payable for securities purchased | | | — | | | | — | | | | — | | | | — | | | | — | | | | — | | | | — | | | | — | | | | — | | | | — | | | | 1,047,331 | | |
Accrued expenses | | | 546 | | | | 437 | | | | 385 | | | | 485 | | | | 9 | | | | — | | | | — | | | | — | | | | 1,105 | | | | 12,699 | | | | 24,681 | | |
TOTAL LIABILITIES | | | 546 | | | | 437 | | | | 385 | | | | 485 | | | | 9 | | | | — | | | | — | | | | — | | | | 1,105 | | | | 12,699 | | | | 1,072,012 | | |
NET ASSETS | | $ | 133,272,790 | | | $ | 106,698,851 | | | $ | 93,991,248 | | | $ | 118,317,990 | | | $ | 2,117,182 | | | $ | 86,359,906 | | | $ | 225,205,190 | | | $ | 186,917,156 | | | $ | 89,932,706 | | | $ | 387,316,234 | | | $ | 752,746,372 | | |
NUMBER OF SHARES OUTSTANDING (Note 4) | | | 135,356,937 | | | | 110,190,376 | | | | 97,860,427 | | | | 123,735,275 | | | | 2,079,203 | | | | 74,926,086 | | | | 177,299,750 | | | | 135,535,587 | | | | 74,907,971 | | | | 354,712,016 | | | | 512,445,634 | | |
NET ASSET VALUES, offering and redemption price per share | | $ | 0.98 | | | $ | 0.97 | | | $ | 0.96 | | | $ | 0.96 | | | $ | 1.02 | | | $ | 1.15 | | | $ | 1.27 | | | $ | 1.38 | | | $ | 1.20 | | | $ | 1.09 | | | $ | 1.47 | | |
COMPONENTS OF NET ASSETS: | |
Paid-in capital | | $ | 113,843,979 | | | $ | 90,593,230 | | | $ | 79,458,956 | | | $ | 100,578,141 | | | $ | 2,079,718 | | | $ | 79,231,703 | | | $ | 198,006,699 | | | $ | 160,391,681 | | | $ | 89,932,323 | | | $ | 354,194,355 | | | $ | 687,164,035 | | |
| Accumulated undistributed net investment income (loss) | | | — | | | | — | | | | — | | | | — | | | | — | | | | 34,836 | | | | 52,765 | | | | 17,814 | | | | — | | | | 10,236,772 | | | | 23,755,259 | | |
Accumulated undistributed net realized gain (loss)
on investments and futures contracts | | | 1,891,041 | | | | 1,498,899 | | | | 1,254,799 | | | | 1,443,896 | | | | 292 | | | | 527,779 | | | | (4,911,241 | ) | | | (2,424,065 | ) | | | — | | | | 830,806 | | | | 1,270,568 | | |
Net unrealized appreciation (depreciation)
of investments and futures contracts | | | 17,537,770 | | | | 14,606,722 | | | | 13,277,493 | | | | 16,295,953 | | | | 37,172 | | | | 6,565,588 | | | | 32,056,967 | | | | 28,931,726 | | | | 383 | | | | 22,054,301 | | | | 40,556,510 | | |
NET ASSETS | | $ | 133,272,790 | | | $ | 106,698,851 | | | $ | 93,991,248 | | | $ | 118,317,990 | | | $ | 2,117,182 | | | $ | 86,359,906 | | | $ | 225,205,190 | | | $ | 186,917,156 | | | $ | 89,932,706 | | | $ | 387,316,234 | | | $ | 752,746,372 | | |
The accompanying notes are an integral part of these financial statements.
60
The accompanying notes are an integral part of these financial statements.
61
MUTUAL OF AMERICA INVESTMENT CORPORATION
STATEMENTS OF OPERATIONS
For the Year Ended December 31, 2012
| | | Equity Index
Fund | | All America
Fund | | Small Cap
Value Fund | | Small Cap
Growth Fund | | Mid Cap
Value Fund | | Mid-Cap
Equity Index
Fund | | International
Fund | | Composite
Fund | | Retirement
Income
Fund | | 2010
Retirement
Fund | | 2015
Retirement
Fund | | 2020
Retirement
Fund | | 2025
Retirement
Fund | |
INVESTMENT INCOME AND EXPENSES: | |
INCOME: | |
Dividends | | $ | 23,418,508 | | | $ | 5,361,030 | | | $ | 7,230,687 | | | $ | 2,326,328 | | | $ | 1,063,146 | | | $ | 9,798,173 | | | $ | 2,868,559 | (b) | | $ | 1,938,667 | | | $ | 6,496 | | | $ | 4,138 | | | $ | 18,315 | | | $ | 24,305 | | | $ | 17,924 | | |
Interest | | | 43,877 | | | | 9,403 | | | | 17,167 | | | | 14,848 | | | | 2,013 | | | | 21,188 | | | | 827 | | | | 2,644,823 | | | | — | | | | — | | | | — | | | | — | | | | — | | |
Total income | | | 23,462,385 | | | | 5,370,433 | | | | 7,247,854 | | | | 2,341,176 | | | | 1,065,159 | | | | 9,819,361 | | | | 2,869,386 | | | | 4,583,490 | | | | 6,496 | | | | 4,138 | | | | 18,315 | | | | 24,305 | | | | 17,924 | | |
EXPENSES: | |
Investment advisory fees (Note 2) | | | 783,984 | | | | 1,039,706 | | | | 2,120,272 | | | | 2,137,212 | | | | 285,459 | | | | 429,760 | | | | 63,278 | | | | 676,186 | | | | 13,039 | (a) | | | 10,548 | (a) | | | 51,143 | (a) | | | 71,531 | (a) | | | 66,343 | (a) | |
Accounting and recordkeeping expenses | | | 385,326 | | | | 75,391 | | | | 95,997 | | | | 95,170 | | | | 17,160 | | | | 203,726 | | | | 27,924 | | | | 49,412 | | | | — | | | | — | | | | — | | | | — | | | | — | | |
Shareholders reports | | | 185,586 | | | | 36,311 | | | | 46,235 | | | | 45,837 | | | | 8,265 | | | | 98,121 | | | | 13,449 | | �� | | 23,798 | | | | — | | | | — | | | | — | | | | — | | | | — | | |
Custodian expenses | | | 43,793 | | | | 69,492 | | | | 16,671 | | | | 32,539 | | | | 8,165 | | | | 36,604 | | | | 5,585 | | | | 29,610 | | | | — | | | | — | | | | — | | | | — | | | | — | | |
Independent directors' fees and expenses | | | 44,436 | | | | 35,997 | | | | 41,595 | | | | 41,354 | | | | 5,096 | | | | 43,460 | | | | 8,293 | | | | 36,519 | | | | — | | | | — | | | | — | | | | — | | | | — | | |
Audit | | | 128,044 | | | | 25,053 | | | | 31,900 | | | | 31,625 | | | | 5,703 | | | | 67,698 | | | | 9,278 | | | | 16,420 | | | | — | | | | — | | | | — | | | | — | | | | — | | |
Legal and Compliance | | | 191,367 | | | | 37,442 | | | | 47,675 | | | | 47,265 | | | | 8,522 | | | | 101,178 | | | | 13,868 | | | | 24,540 | | | | — | | | | — | | | | — | | | | — | | | | — | | |
Administrative | | | 429,283 | | | | 83,992 | | | | 106,948 | | | | 106,027 | | | | 19,118 | | | | 226,966 | | | | 31,109 | | | | 55,049 | | | | — | | | | — | | | | — | | | | — | | | | — | | |
Licenses | | | 56,209 | | | | 10,998 | | | | 14,004 | | | | 13,883 | | | | 2,503 | | | | 29,718 | | | | 4,073 | | | | 7,208 | | | | — | | | | — | | | | — | | | | — | | | | — | | |
Other | | | 44,004 | | | | 8,610 | | | | 10,963 | | | | 10,868 | | | | 1,960 | | | | 23,265 | | | | 3,189 | | | | 5,643 | | | | — | | | | — | | | | — | | | | — | | | | — | | |
Total expenses | | | 2,292,032 | | | | 1,422,992 | | | | 2,532,260 | | | | 2,561,780 | | | | 361,951 | | | | 1,260,496 | | | | 180,046 | | | | 924,385 | | | | 13,039 | | | | 10,548 | | | | 51,143 | | | | 71,531 | | | | 66,343 | | |
Net Investment Income (Loss) | | | 21,170,353 | | | | 3,947,441 | | | | 4,715,594 | | | | (220,604 | ) | | | 703,208 | | | | 8,558,865 | | | | 2,689,340 | | | | 3,659,105 | | | | (6,543 | ) | | | (6,410 | ) | | | (32,828 | ) | | | (47,226 | ) | | | (48,419 | ) | |
NET REALIZED AND UNREALIZED GAIN (LOSS) ON INVESTMENTS AND
FUTURES CONTRACTS (Note 1): | |
Net realized gain (loss) on: | |
Investment securities | | | 2,418,746 | | | | 10,714,017 | | | | 9,522,047 | | | | 23,128,237 | | | | 1,555,614 | | | | 19,099,986 | | | | 7,603 | | | | 6,660,921 | | | | 555,644 | | | | 1,532,453 | | | | 5,701,617 | | | | 4,534,309 | | | | 3,974,911 | | |
Futures contracts | | | 6,217,645 | | | | 489,283 | | | | — | | | | — | | | | — | | | | 2,640,861 | | | | — | | | | — | | | | — | | | | — | | | | — | | | | — | | | | — | | |
| | | | 8,636,391 | | | | 11,203,300 | | | | 9,522,047 | | | | 23,128,237 | | | | 1,555,614 | | | | 21,740,847 | | | | 7,603 | | | | 6,660,921 | | | | 555,644 | | | | 1,532,453 | | | | 5,701,617 | | | | 4,534,309 | | | | 3,974,911 | | |
Change in net unrealized appreciation (depreciation) of: | |
Investment securities | | | 121,090,299 | | | | 20,627,200 | | | | 25,862,098 | | | | (7,462,891 | ) | | | 3,273,963 | | | | 61,253,080 | | | | 12,017,697 | | | | 8,092,224 | | | | 1,185,276 | | | | 405,469 | | | | 4,314,404 | | | | 10,658,577 | | | | 11,481,411 | | |
Futures contracts | | | (253,521 | ) | | | (17,165 | ) | | | — | | | | — | | | | — | | | | (107,968 | ) | | | — | | | | — | | | | — | | | | — | | | | — | | | | — | | | | — | | |
| | | | 120,836,778 | | | | 20,610,035 | | | | 25,862,098 | | | | (7,462,891 | ) | | | 3,273,963 | | | | 61,145,112 | | | | 12,017,697 | | | | 8,092,224 | | | | 1,185,276 | | | | 405,469 | | | | 4,314,404 | | | | 10,658,577 | | | | 11,481,411 | | |
NET REALIZED AND UNREALIZED GAIN (LOSS) ON INVESTMENTS AND
FUTURES CONTRACTS | | | 129,473,169 | | | | 31,813,335 | | | | 35,384,145 | | | | 15,665,346 | | | | 4,829,577 | | | | 82,885,959 | | | | 12,025,300 | | | | 14,753,145 | | | | 1,740,920 | | | | 1,937,922 | | | | 10,016,021 | | | | 15,192,886 | | | | 15,456,322 | | |
NET INCREASE (DECREASE) IN NET ASSETS RESULTING FROM OPERATIONS | | $ | 150,643,522 | | | $ | 35,760,776 | | | $ | 40,099,739 | | | $ | 15,444,742 | | | $ | 5,532,785 | | | $ | 91,444,824 | | | $ | 14,714,640 | | | $ | 18,412,250 | | | $ | 1,734,377 | | | $ | 1,931,512 | | | $ | 9,983,193 | | | $ | 15,145,660 | | | $ | 15,407,903 | | |
(a) The Retirement Funds incur no operating expenses other than those included in each of the underlying funds in which they invest. The Allocation Funds incur no advisory or operating expenses other than those included in each of the underlying funds in which they invest.
(b) Net of foreign taxes of $182,282.
The accompanying notes are an integral part of these financial statements.
62
The accompanying notes are an integral part of these financial statements.
63
MUTUAL OF AMERICA INVESTMENT CORPORATION
STATEMENTS OF OPERATIONS (Continued)
For the Year Ended December 31, 2012
| | | 2030
Retirement
Fund | | 2035
Retirement
Fund | | 2040
Retirement
Fund | | 2045
Retirement
Fund | | 2050
Retirement
Fund(c) | | Conservative
Allocation
Fund | | Moderate
Allocation
Fund | | Aggressive
Allocation
Fund | | Money
Market
Fund | | Mid-Term
Bond Fund | | Bond Fund | |
INVESTMENT INCOME AND EXPENSES: | |
INCOME: | |
Dividends | | $ | 12,086 | | | $ | 8,328 | | | $ | 6,975 | | | $ | 8,894 | | | $ | — | | | $ | 22,060 | | | $ | 38,320 | | | $ | 17,814 | | | $ | — | | | $ | — | | | $ | — | | |
Interest | | | — | | | | — | | | | — | | | | — | | | | — | | | | — | | | | — | | | | — | | | | 119,559 | | | | 12,137,593 | | | | 27,405,569 | | |
Total income | | | 12,086 | | | | 8,328 | | | | 6,975 | | | | 8,894 | | | | — | | | | 22,060 | | | | 38,320 | | | | 17,814 | | | | 119,559 | | | | 12,137,593 | | | | 27,405,569 | | |
EXPENSES: | |
Investment advisory fees (Note 2) | | | 54,592 | (a) | | | 43,079 | (a) | | | 38,562 | (a) | | | 48,185 | (a) | | | 88 | (a) | | | — | (a) | | | — | (a) | | | — | (a) | | | 145,209 | | | | 1,395,470 | | | | 2,687,377 | | |
Accounting and recordkeeping expenses | | | — | | | | — | | | | — | | | | — | | | | — | | | | — | | | | — | | | | — | | | | 26,375 | | | | 121,613 | | | | 239,121 | | |
Shareholders reports | | | — | | | | — | | | | — | | | | — | | | | — | | | | — | | | | — | | | | — | | | | 12,703 | | | | 58,573 | | | | 115,169 | | |
Custodian expenses | | | — | | | | — | | | | — | | | | — | | | | — | | | | — | | | | — | | | | — | | | | 11,585 | | | | 13,235 | | | | 37,355 | | |
Independent directors' fees and expenses | | | — | | | | — | | | | — | | | | — | | | | — | | | | — | | | | — | | | | — | | | | 35,209 | | | | 44,006 | | | | 44,480 | | |
Audit | | | — | | | | — | | | | — | | | | — | | | | — | | | | — | | | | — | | | | — | | | | 8,764 | | | | 40,412 | | | | 79,460 | | |
Legal and Compliance | | | — | | | | — | | | | — | | | | — | | | | — | | | | — | | | | — | | | | — | | | | 13,099 | | | | 60,397 | | | | 118,757 | | |
Administrative | | | — | | | | — | | | | — | | | | — | | | | — | | | | — | | | | — | | | | — | | | | 29,384 | | | | 135,486 | | | | 266,400 | | |
Licenses | | | — | | | | — | | | | — | | | | — | | | | — | | | | — | | | | — | | | | — | | | | 3,847 | | | | 17,740 | | | | 34,882 | | |
Other | | | — | | | | — | | | | — | | | | — | | | | — | | | | — | | | | — | | | | — | | | | 3,012 | | | | 13,888 | | | | 27,308 | | |
Total expenses | | | 54,592 | | | | 43,079 | | | | 38,562 | | | | 48,185 | | | | 88 | | | | — | | | | — | | | | — | | | | 289,187 | | | | 1,900,820 | | | | 3,650,309 | | |
Net Investment Income (Loss) | | | (42,506 | ) | | | (34,751 | ) | | | (31,587 | ) | | | (39,291 | ) | | | (88 | ) | | | 22,060 | | | | 38,320 | | | | 17,814 | | | | (169,628 | ) | | | 10,236,773 | | | | 23,755,260 | | |
NET REALIZED AND UNREALIZED GAIN (LOSS) ON INVESTMENTS AND FUTURES CONTRACTS (Note 1): | |
Net realized gain(loss) on: | |
Investment securities | | | 2,913,099 | | | | 2,167,658 | | | | 1,690,530 | | | | 1,945,397 | | | | 380 | | | | 2,026,952 | | | | 2,470,199 | | | | 2,124,556 | | | | 697 | | | | 830,806 | | | | 8,488,978 | | |
Futures contracts | | | — | | | | — | | | | — | | | | — | | | | — | | | | — | | | | — | | | | — | | | | — | | | | — | | | | — | | |
| | | | 2,913,099 | | | | 2,167,658 | | | | 1,690,530 | | | | 1,945,397 | | | | 380 | | | | 2,026,952 | | | | 2,470,199 | | | | 2,124,556 | | | | 697 | | | | 830,806 | | | | 8,488,978 | | |
Change in net unrealized appreciation (depreciation) of: | |
Investment securities | | | 10,542,909 | | | | 8,933,297 | | | | 8,390,528 | | | | 10,443,095 | | | | 37,172 | | | | 3,223,789 | | | | 18,071,555 | | | | 19,427,143 | | | | 10,164 | | | | 268,254 | | | | 5,009,137 | | |
Futures contracts | | | — | | | | — | | | | — | | | | — | | | | — | | | | — | | | | — | | | | — | | | | — | | | | — | | | | — | | |
| | | | 10,542,909 | | | | 8,933,297 | | | | 8,390,528 | | | | 10,443,095 | | | | 37,172 | | | | 3,223,789 | | | | 18,071,555 | | | | 19,427,143 | | | | 10,164 | | | | 268,254 | | | | 5,009,137 | | |
NET REALIZED AND UNREALIZED GAIN (LOSS) ON INVESTMENTS AND FUTURES CONTRACTS | | | 13,456,008 | | | | 11,100,955 | | | | 10,081,058 | | | | 12,388,492 | | | | 37,552 | | | | 5,250,741 | | | | 20,541,754 | | | | 21,551,699 | | | | 10,861 | | | | 1,099,060 | | | | 13,498,115 | | |
NET INCREASE (DECREASE) IN NET ASSETS RESULTING FROM OPERATIONS | | $ | 13,413,502 | | | $ | 11,066,204 | | | $ | 10,049,471 | | | $ | 12,349,201 | | | $ | 37,464 | | | $ | 5,272,801 | | | $ | 20,580,074 | | | $ | 21,569,513 | | | $ | (158,767 | ) | | $ | 11,335,833 | | | $ | 37,253,375 | | |
(a) The Retirement Funds incur no operating expenses other than those included in each of the underlying funds in which they invest. The Allocation Funds incur no advisory or operating expenses other than those included in each of the underlying funds in which they invest.
(c) For the period October 1, 2012 (Commencement of Operations) to December 31, 2012.
The accompanying notes are an integral part of these financial statements.
64
The accompanying notes are an integral part of these financial statements.
65
MUTUAL OF AMERICA INVESTMENT CORPORATION
STATEMENTS OF CHANGES IN NET ASSETS
For the Years Ended December 31,
| | | Equity Index Fund | | All America Fund | | Small Cap Value Fund | | Small Cap Growth Fund | | Mid-Cap Value Fund | | Mid-Cap Equity Index Fund | |
| | | 2012 | | 2011 | | 2012 | | 2011 | | 2012 | | 2011 | | 2012 | | 2011 | | 2012 | | 2011 | | 2012 | | 2011 | |
INCREASE (DECREASE) IN NET ASSETS: | |
FROM OPERATIONS: | |
Net investment income (loss) | | $ | 21,170,353 | | | $ | 16,802,930 | | | $ | 3,947,441 | | | $ | 3,252,974 | | | $ | 4,715,594 | | | $ | 2,565,895 | | | $ | (220,604 | ) | | $ | (888,732 | ) | | $ | 703,208 | | | $ | 634,548 | | | $ | 8,558,865 | | | $ | 5,941,732 | | |
Net realized gain (loss) on investments and futures contracts | | | 8,636,391 | | | | 1,199,991 | | | | 11,203,300 | | | | 10,836,801 | | | | 9,522,047 | | | | 14,130,799 | | | | 23,128,237 | | | | 31,496,456 | | | | 1,555,614 | | | | 994,607 | | | | 21,740,847 | | | | 21,902,626 | | |
Change in net unrealized appreciation (depreciation) of investments and
futures contracts | | | 120,836,778 | | | | (377,096 | ) | | | 20,610,035 | | | | (13,294,248 | ) | | | 25,862,098 | | | | (23,731,915 | ) | | | (7,462,891 | ) | | | (38,320,121 | ) | | | 3,273,963 | | | | (2,666,651 | ) | | | 61,145,112 | | | | (40,405,479 | ) | |
NET INCREASE (DECREASE) IN NET ASSETS RESULTING FROM OPERATIONS | | | 150,643,522 | | | | 17,625,825 | | | | 35,760,776 | | | | 795,527 | | | | 40,099,739 | | | | (7,035,221 | ) | | | 15,444,742 | | | | (7,712,397 | ) | | | 5,532,785 | | | | (1,037,496 | ) | | | 91,444,824 | | | | (12,561,121 | ) | |
DIVIDEND DISTRIBUTIONS (Note 5) | |
From net investment income | | | (82,879 | ) | | | (18,904,206 | ) | | | — | | | | (6,317,474 | ) | | | — | | | | (2,548,887 | ) | | | — | | | | — | | | | — | | | | (628,396 | ) | | | — | | | | (6,190,609 | ) | |
From capital gains | | | — | | | | — | | | | — | | | | — | | | | — | | | | — | | | | (2,029,204 | ) | | | — | | | | — | | | | — | | | | (21,609,254 | ) | | | (8,969,464 | ) | |
Total distributions | | | (82,879 | ) | | | (18,904,206 | ) | | | — | | | | (6,317,474 | ) | | | — | | | | (2,548,887 | ) | | | (2,029,204 | ) | | | — | | | | — | | | | (628,396 | ) | | | (21,609,254 | ) | | | (15,160,073 | ) | |
CAPITAL SHARE TRANSACTIONS (Note 4): | |
Net proceeds from sale of shares | | | 128,222,096 | | | | 115,501,542 | | | | 4,607,747 | | | | 7,840,554 | | | | 19,621,802 | | | | 20,202,900 | | | | 19,735,745 | | | | 32,797,199 | | | | 4,057,048 | | | | 5,346,389 | | | | 65,051,670 | | | | 84,977,973 | | |
Dividends reinvested | | | 82,879 | | | | 18,904,206 | | | | — | | | | 6,317,474 | | | | — | | | | 2,548,887 | | | | 2,029,204 | | | | — | | | | — | | | | 628,396 | | | | 21,609,254 | | | | 15,160,073 | | |
Cost of shares redeemed | | | (98,936,936 | ) | | | (109,845,972 | ) | | | (34,381,245 | ) | | | (28,895,564 | ) | | | (28,901,746 | ) | | | (30,842,376 | ) | | | (34,429,438 | ) | | | (34,423,945 | ) | | | (7,343,207 | ) | | | (8,030,202 | ) | | | (51,854,450 | ) | | | (60,933,929 | ) | |
NET INCREASE (DECREASE) IN NET ASSETS FROM CAPITAL SHARE TRANSACTIONS | | | 29,368,039 | | | | 24,559,776 | | | | (29,773,498 | ) | | | (14,737,536 | ) | | | (9,279,944 | ) | | | (8,090,589 | ) | | | (12,664,489 | ) | | | (1,626,746 | ) | | | (3,286,159 | ) | | | (2,055,417 | ) | | | 34,806,474 | | | | 39,204,117 | | |
INCREASE (DECREASE) IN NET ASSETS | | | 179,928,682 | | | | 23,281,395 | | | | 5,987,278 | | | | (20,259,483 | ) | | | 30,819,795 | | | | (17,674,697 | ) | | | 751,049 | | | | (9,339,143 | ) | | | 2,246,626 | | | | (3,721,309 | ) | | | 104,642,044 | | | | 11,482,923 | | |
NET ASSETS, BEGINNING OF PERIOD | | | 928,658,383 | | | | 905,376,988 | | | | 250,250,812 | | | | 270,510,295 | | | | 259,515,138 | | | | 277,189,835 | | | | 271,428,739 | | | | 280,767,882 | | | | 50,968,544 | | | | 54,689,853 | | | | 505,323,424 | | | | 493,840,501 | | |
NET ASSETS, END OF PERIOD | | $ | 1,108,587,065 | | | $ | 928,658,383 | | | $ | 256,238,090 | | | $ | 250,250,812 | | | $ | 290,334,933 | | | $ | 259,515,138 | | | $ | 272,179,788 | | | $ | 271,428,739 | | | $ | 53,215,170 | | | $ | 50,968,544 | | | $ | 609,965,468 | | | $ | 505,323,424 | | |
ACCUMULATED UNDISTRIBUTED NET INVESTMENT INCOME (LOSS) | | $ | 20,255,515 | | | $ | (692,503 | ) | | $ | 3,679,239 | | | $ | (124,202 | ) | | $ | 3,652,524 | | | $ | — | | | $ | (187,166 | ) | | $ | — | | | $ | 651,813 | | | $ | — | | | $ | 7,797,145 | | | $ | — | | |
OTHER INFORMATION: | |
Shares outstanding at the beginning of period | | | 449,187,528 | | | | 436,979,517 | | | | 155,472,750 | | | | 164,065,152 | | | | 222,210,260 | | | | 229,217,197 | | | | 233,295,435 | | | | 235,799,898 | | | | 45,857,125 | | | | 47,569,341 | | | | 352,190,597 | | | | 326,716,727 | | |
Shares sold | | | 55,632,510 | | | | 54,523,607 | | | | 2,610,859 | | | | 4,571,499 | | | | 15,286,892 | | | | 16,565,987 | | | | 16,097,180 | | | | 26,887,842 | | | | 3,444,439 | | | | 4,561,657 | | | | 41,371,686 | | | | 54,650,356 | | |
Shares issued as reinvestment of dividends | | | 33,876 | | | | 9,209,608 | | | | — | | | | 4,099,118 | | | | — | | | | 2,173,743 | | | | 1,558,473 | | | | — | | | | — | | | | 561,926 | | | | 13,224,814 | | | | 11,117,003 | | |
Shares redeemed | | | (42,294,910 | ) | | | (51,525,204 | ) | | | (19,337,982 | ) | | | (17,263,019 | ) | | | (22,202,191 | ) | | | (25,746,667 | ) | | | (27,942,619 | ) | | | (29,392,305 | ) | | | (6,175,286 | ) | | | (6,835,799 | ) | | | (32,723,024 | ) | | | (40,293,489 | ) | |
Net increase (decrease) | | | 13,371,476 | | | | 12,208,011 | | | | (16,727,123 | ) | | | (8,592,402 | ) | | | (6,915,299 | ) | | | (7,006,937 | ) | | | (10,286,966 | ) | | | (2,504,463 | ) | | | (2,730,847 | ) | | | (1,712,216 | ) | | | 21,873,476 | | | | 25,473,870 | | |
Shares outstanding at the end of period | | | 462,559,004 | | | | 449,187,528 | | | | 138,745,627 | | | | 155,472,750 | | | | 215,294,961 | | | | 222,210,260 | | | | 223,008,469 | | | | 233,295,435 | | | | 43,126,278 | | | | 45,857,125 | | | | 374,064,073 | | | | 352,190,597 | | |
The accompanying notes are an integral part of these financial statements.
66
The accompanying notes are an integral part of these financial statements.
67
MUTUAL OF AMERICA INVESTMENT CORPORATION
STATEMENTS OF CHANGES IN NET ASSETS (Continued)
For the Years Ended December 31,
| | | International Fund | | Composite Fund | | Retirement Income Fund | | 2010 Retirement Fund | | 2015 Retirement Fund | | 2020 Retirement Fund | |
| | | 2012 | | 2011 | | 2012 | | 2011 | | 2012 | | 2011 | | 2012 | | 2011 | | 2012 | | 2011 | | 2012 | | 2011 | |
INCREASE (DECREASE) IN NET ASSETS: | |
FROM OPERATIONS: | |
Net investment income (loss) | | $ | 2,689,340 | | | $ | 2,157,164 | | | $ | 3,659,105 | | | $ | 3,683,548 | | | $ | (6,543 | ) | | $ | 605,283 | | | $ | (6,410 | ) | | $ | 507,104 | | | $ | (32,828 | ) | | $ | 2,165,457 | | | $ | (47,226 | ) | | $ | 2,761,452 | | |
Net realized gain (loss) on investments and futures contracts | | | 7,603 | | | | (41,804 | ) | | | 6,660,921 | | | | 2,281,819 | | | | 555,644 | | | | 708,815 | | | | 1,532,453 | | | | 953,249 | | | | 5,701,617 | | | | 890,433 | | | | 4,534,309 | | | | 197,700 | | |
Change in net unrealized appreciation (depreciation) of investments and
futures contracts | | | 12,017,697 | | | | (11,076,546 | ) | | | 8,092,224 | | | | (1,670,945 | ) | | | 1,185,276 | | | | (390,018 | ) | | | 405,469 | | | | (897,953 | ) | | | 4,314,404 | | | | (1,432,237 | ) | | | 10,658,577 | | | | (1,547,109 | ) | |
NET INCREASE (DECREASE) IN NET ASSETS RESULTING FROM OPERATIONS | | | 14,714,640 | | | | (8,961,186 | ) | | | 18,412,250 | | | | 4,294,422 | | | | 1,734,377 | | | | 924,080 | | | | 1,931,512 | | | | 562,400 | | | | 9,983,193 | | | | 1,623,653 | | | | 15,145,660 | | | | 1,412,043 | | |
DIVIDEND DISTRIBUTIONS (Note 5) | |
From net investment income | | | (21,570 | ) | | | (2,142,256 | ) | | | (26,332 | ) | | | (7,396,780 | ) | | | (598,298 | ) | | | (478,508 | ) | | | (501,103 | ) | | | (441,941 | ) | | | (2,132,730 | ) | | | (1,729,238 | ) | | | (2,712,014 | ) | | | (1,955,796 | ) | |
From capital gains | | | (73,270 | ) | | | (211,930 | ) | | | — | | | | — | | | | (555,974 | ) | | | (47,419 | ) | | | (711,769 | ) | | | (25,781 | ) | | | (705,161 | ) | | | (120,136 | ) | | | (463,425 | ) | | | (139,097 | ) | |
Total distributions | | | (94,840 | ) | | | (2,354,186 | ) | | | (26,332 | ) | | | (7,396,780 | ) | | | (1,154,272 | ) | | | (525,927 | ) | | | (1,212,872 | ) | | | (467,722 | ) | | | (2,837,891 | ) | | | (1,849,374 | ) | | | (3,175,439 | ) | | | (2,094,893 | ) | |
CAPITAL SHARE TRANSACTIONS (Note 4): | |
Net proceeds from sale of shares | | | 35,280,034 | | | | 21,481,303 | | | | 5,437,089 | | | | 8,108,962 | | | | 10,767,924 | | | | 9,779,827 | | | | 4,340,735 | | | | 6,037,036 | | | | 25,217,670 | | | | 20,326,509 | | | | 42,854,810 | | | | 33,106,062 | | |
Dividends reinvested | | | 94,840 | | | | 2,354,186 | | | | 26,332 | | | | 7,396,780 | | | | 1,154,272 | | | | 525,927 | | | | 1,212,872 | | | | 467,722 | | | | 2,837,891 | | | | 1,849,374 | | | | 3,175,439 | | | | 2,094,893 | | |
Cost of shares redeemed | | | (4,207,992 | ) | | | (4,866,870 | ) | | | (15,304,827 | ) | | | (18,027,578 | ) | | | (4,528,143 | ) | | | (5,580,493 | ) | | | (5,401,605 | ) | | | (5,194,258 | ) | | | (13,801,345 | ) | | | (9,140,521 | ) | | | (6,954,660 | ) | | | (6,988,453 | ) | |
NET INCREASE (DECREASE) IN NET ASSETS FROM CAPITAL SHARE TRANSACTIONS | | | 31,166,882 | | | | 18,968,619 | | | | (9,841,406 | ) | | | (2,521,836 | ) | | | 7,394,053 | | | | 4,725,261 | | | | 152,002 | | | | 1,310,500 | | | | 14,254,216 | | | | 13,035,362 | | | | 39,075,589 | | | | 28,212,502 | | |
INCREASE (DECREASE) IN NET ASSETS | | | 45,786,682 | | | | 7,653,247 | | | | 8,544,512 | | | | (5,624,194 | ) | | | 7,974,158 | | | | 5,123,414 | | | | 870,642 | | | | 1,405,178 | | | | 21,399,518 | | | | 12,809,641 | | | | 51,045,810 | | | | 27,529,652 | | |
NET ASSETS, BEGINNING OF PERIOD | | | 68,761,277 | | | | 61,108,030 | | | | 161,052,521 | | | | 166,676,715 | | | | 23,269,089 | | | | 18,145,675 | | | | 20,581,993 | | | | 19,176,815 | | | | 90,937,727 | | | | 78,128,086 | | | | 117,984,791 | | | | 90,455,139 | | |
NET ASSETS, END OF PERIOD | | $ | 114,547,959 | | | $ | 68,761,277 | | | $ | 169,597,033 | | | $ | 161,052,521 | | | $ | 31,243,247 | | | $ | 23,269,089 | | | $ | 21,452,635 | | | $ | 20,581,993 | | | $ | 112,337,245 | | | $ | 90,937,727 | | | $ | 169,030,601 | | | $ | 117,984,791 | | |
ACCUMULATED UNDISTRIBUTED NET INVESTMENT INCOME (LOSS) | | $ | 2,689,340 | | | $ | 21,570 | | | $ | 3,658,494 | | | $ | 25,801 | | | $ | — | | | $ | 598,298 | | | $ | — | | | $ | 501,103 | | | $ | (3 | ) | | $ | 2,132,728 | | | $ | — | | | $ | 2,712,014 | | |
OTHER INFORMATION: | |
Shares outstanding at the beginning of period | | | 114,779,271 | | | | 86,063,890 | | | | 109,476,608 | | | | 111,151,229 | | | | 22,240,340 | | | | 17,677,383 | | | | 21,291,136 | | | | 19,977,014 | | | | 97,748,763 | | | | 83,797,669 | | | | 131,001,202 | | | | 99,880,789 | | |
Shares sold | | | 53,370,157 | | | | 31,688,865 | | | | 3,423,758 | | | | 5,170,990 | | | | 10,009,508 | | | | 9,320,778 | | | | 4,310,243 | | | | 6,160,261 | | | | 25,650,359 | | | | 21,464,309 | | | | 44,583,171 | | | | 36,290,152 | | |
Shares issued as reinvestment of dividends | | | 139,262 | | | | 3,924,540 | | | | 15,920 | | | | 5,121,567 | | | | 1,079,456 | | | | 519,182 | | | | 1,217,701 | | | | 507,013 | | | | 2,841,787 | | | | 2,097,793 | | | | 3,226,026 | | | | 2,477,827 | | |
Shares redeemed | | | (6,414,249 | ) | | | (6,898,024 | ) | | | (9,642,315 | ) | | | (11,967,178 | ) | | | (4,198,366 | ) | | | (5,277,003 | ) | | | (5,357,388 | ) | | | (5,353,152 | ) | | | (14,030,923 | ) | | | (9,611,008 | ) | | | (7,227,970 | ) | | | (7,647,566 | ) | |
Net increase (decrease) | | | 47,095,170 | | | | 28,715,381 | | | | (6,202,637 | ) | | | (1,674,621 | ) | | | 6,890,598 | | | | 4,562,957 | | | | 170,556 | | | | 1,314,122 | | | | 14,461,223 | | | | 13,951,094 | | | | 40,581,227 | | | | 31,120,413 | | |
Shares outstanding at the end of period | | | 161,874,441 | | | | 114,779,271 | | | | 103,273,971 | | | | 109,476,608 | | | | 29,130,938 | | | | 22,240,340 | | | | 21,461,692 | | | | 21,291,136 | | | | 112,209,986 | | | | 97,748,763 | | | | 171,582,429 | | | | 131,001,202 | | |
The accompanying notes are an integral part of these financial statements.
68
The accompanying notes are an integral part of these financial statements.
69
MUTUAL OF AMERICA INVESTMENT CORPORATION
STATEMENTS OF CHANGES IN NET ASSETS (Continued)
For the Years Ended December 31,
| | | 2025 Retirement Fund | | 2030 Retirement Fund | | 2035 Retirement Fund | | 2040 Retirement Fund | | 2045 Retirement Fund | | 2050
Retirement
Fund | |
| | | 2012 | | 2011 | | 2012 | | 2011 | | 2012 | | 2011 | | 2012 | | 2011 | | 2012 | | 2011 | | 2012(a) | |
INCREASE (DECREASE) IN NET ASSETS: | |
FROM OPERATIONS: | |
Net investment income (loss) | | $ | (48,419 | ) | | $ | 2,357,359 | | | $ | (42,506 | ) | | $ | 1,837,878 | | | $ | (34,751 | ) | | $ | 1,302,656 | | | $ | (31,587 | ) | | $ | 1,126,355 | | | $ | (39,291 | ) | | $ | 1,343,257 | | | $ | (88 | ) | |
Net realized gain (loss) on investments and futures contracts | | | 3,974,911 | | | | 268,218 | | | | 2,913,099 | | | | 248,287 | | | | 2,167,658 | | | | 242,917 | | | | 1,690,530 | | | | 280,637 | | | | 1,945,397 | | | | 244,723 | | | | 380 | | |
Change in net unrealized appreciation (depreciation) of investments and
futures contracts | | | 11,481,411 | | | | (2,097,902 | ) | | | 10,542,909 | | | | (2,104,574 | ) | | | 8,933,297 | | | | (1,957,978 | ) | | | 8,390,528 | | | | (2,194,412 | ) | | | 10,443,095 | | | | (2,672,642 | ) | | | 37,172 | | |
NET INCREASE (DECREASE) IN NET ASSETS RESULTING FROM OPERATIONS | | | 15,407,903 | | | | 527,675 | | | | 13,413,502 | | | | (18,409 | ) | | | 11,066,204 | | | | (412,405 | ) | | | 10,049,471 | | | | (787,420 | ) | | | 12,349,201 | | | | (1,084,662 | ) | | | 37,464 | | |
DIVIDEND DISTRIBUTIONS (Note 5) | |
From net investment income | | | (2,312,037 | ) | | | (1,518,829 | ) | | | (1,804,778 | ) | | | (1,162,444 | ) | | | (1,281,243 | ) | | | (836,651 | ) | | | (1,115,985 | ) | | | (707,075 | ) | | | (1,327,885 | ) | | | (801,800 | ) | | | — | | |
From capital gains | | | (386,258 | ) | | | (201,103 | ) | | | (338,408 | ) | | | (195,986 | ) | | | (310,979 | ) | | | (173,801 | ) | | | (321,679 | ) | | | (182,882 | ) | | | (317,477 | ) | | | (173,340 | ) | | | — | | |
Total distributions | | | (2,698,295 | ) | | | (1,719,932 | ) | | | (2,143,186 | ) | | | (1,358,430 | ) | | | (1,592,222 | ) | | | (1,010,452 | ) | | | (1,437,664 | ) | | | (889,957 | ) | | | (1,645,362 | ) | | | (975,140 | ) | | | — | | |
CAPITAL SHARE TRANSACTIONS (Note 4): | |
Net proceeds from sale of shares | | | 41,210,498 | | | | 32,624,713 | | | | 33,543,178 | | | | 27,048,601 | | | | 28,916,022 | | | | 19,402,632 | | | | 24,156,040 | | | | 18,677,607 | | | | 32,120,162 | | | | 24,785,755 | | | | 2,086,003 | | |
Dividends reinvested | | | 2,698,295 | | | | 1,719,932 | | | | 2,143,186 | | | | 1,358,430 | | | | 1,592,222 | | | | 1,010,452 | | | | 1,437,664 | | | | 889,957 | | | | 1,645,362 | | | | 975,140 | | | | — | | |
Cost of shares redeemed | | | (4,336,584 | ) | | | (4,182,066 | ) | | | (3,918,647 | ) | | | (4,198,317 | ) | | | (2,335,351 | ) | | | (2,779,132 | ) | | | (2,286,360 | ) | | | (2,449,742 | ) | | | (1,673,152 | ) | | | (1,987,479 | ) | | | (6,285 | ) | |
NET INCREASE (DECREASE) IN NET ASSETS FROM CAPITAL SHARE TRANSACTIONS | | | 39,572,209 | | | | 30,162,579 | | | | 31,767,717 | | | | 24,208,714 | | | | 28,172,893 | | | | 17,633,952 | | | | 23,307,344 | | | | 17,117,822 | | | | 32,092,372 | | | | 23,773,416 | | | | 2,079,718 | | |
INCREASE (DECREASE) IN NET ASSETS | | | 52,281,817 | | | | 28,970,322 | | | | 43,038,033 | | | | 22,831,875 | | | | 37,646,875 | | | | 16,211,095 | | | | 31,919,151 | | | | 15,440,445 | | | | 42,796,211 | | | | 21,713,614 | | | | 2,117,182 | | |
NET ASSETS, BEGINNING OF PERIOD | | | 109,488,990 | | | | 80,518,668 | | | | 90,234,757 | | | | 67,402,882 | | | | 69,051,976 | | | | 52,840,881 | | | | 62,072,097 | | | | 46,631,652 | | | | 75,521,779 | | | | 53,808,165 | | | | — | | |
NET ASSETS, END OF PERIOD | | $ | 161,770,807 | | | $ | 109,488,990 | | | $ | 133,272,790 | | | $ | 90,234,757 | | | $ | 106,698,851 | | | $ | 69,051,976 | | | $ | 93,991,248 | | | $ | 62,072,097 | | | $ | 118,317,990 | | | $ | 75,521,779 | | | $ | 2,117,182 | | |
ACCUMULATED UNDISTRIBUTED NET INVESTMENT INCOME (LOSS) | | $ | — | | | $ | 2,312,037 | | | $ | — | | | $ | 1,804,778 | | | $ | — | | | $ | 1,281,243 | | | $ | — | | | $ | 1,115,985 | | | $ | — | | | $ | 1,327,885 | | | $ | — | | |
OTHER INFORMATION: | |
Shares outstanding at the beginning of period | | | 123,168,724 | | | | 89,584,434 | | | | 102,295,614 | | | | 75,141,561 | | | | 80,186,050 | | | | 59,862,854 | | | | 72,819,703 | | | | 53,059,793 | | | | 89,009,683 | | | | 61,484,646 | | | | — | | |
Shares sold | | | 42,953,140 | | | | 36,123,268 | | | | 35,035,650 | | | | 30,143,771 | | | | 30,858,066 | | | | 22,163,711 | | | | 26,018,178 | | | | 21,357,545 | | | | 34,831,930 | | | | 28,528,576 | | | | 2,085,610 | | |
Shares issued as reinvestment of dividends | | | 2,738,074 | | | | 2,084,433 | | | | 2,173,456 | | | | 1,669,841 | | | | 1,641,133 | | | | 1,279,489 | | | | 1,496,046 | | | | 1,139,502 | | | | 1,717,895 | | | | 1,254,688 | | | | — | | |
Shares redeemed | | | (4,563,621 | ) | | | (4,623,411 | ) | | | (4,147,783 | ) | | | (4,659,559 | ) | | | (2,494,873 | ) | | | (3,120,004 | ) | | | (2,473,500 | ) | | | (2,737,137 | ) | | | (1,824,233 | ) | | | (2,258,227 | ) | | | (6,407 | ) | |
Net increase (decrease) | | | 41,127,593 | | | | 33,584,290 | | | | 33,061,323 | | | | 27,154,053 | | | | 30,004,326 | | | | 20,323,196 | | | | 25,040,724 | | | | 19,759,910 | | | | 34,725,592 | | | | 27,525,037 | | | | 2,079,203 | | |
Shares outstanding at the end of period | | | 164,296,317 | | | | 123,168,724 | | | | 135,356,937 | | | | 102,295,614 | | | | 110,190,376 | | | | 80,186,050 | | | | 97,860,427 | | | | 72,819,703 | | | | 123,735,275 | | | | 89,009,683 | | | | 2,079,203 | | |
(a) For the period October 1, 2012 (commencement of operations) to December 31, 2012.
The accompanying notes are an integral part of these financial statements.
70
The accompanying notes are an integral part of these financial statements.
71
MUTUAL OF AMERICA INVESTMENT CORPORATION
STATEMENTS OF CHANGES IN NET ASSETS (Continued)
For the Years Ended December 31,
| | | Conservative Allocation Fund | | Moderate Allocation Fund | | Aggressive Allocation Fund | | Money Market Fund | | Mid-Term Bond Fund | | Bond Fund | |
| | | 2012 | | 2011 | | 2012 | | 2011 | | 2012 | | 2011 | | 2012 | | 2011 | | 2012 | | 2011 | | 2012 | | 2011 | |
INCREASE (DECREASE) IN NET ASSETS: | |
FROM OPERATIONS: | |
Net investment income (loss) | | $ | 22,060 | | | $ | 1,915,996 | | | $ | 38,320 | | | $ | 4,627,842 | | | $ | 17,814 | | | $ | 3,305,812 | | | $ | (169,628 | ) | | $ | (177,791 | ) | | $ | 10,236,773 | | | $ | 10,029,013 | | | $ | 23,755,260 | | | $ | 22,608,804 | | |
Net realized gain (loss) on investments and futures contracts | | | 2,026,952 | | | | 876,682 | | | | 2,470,199 | | | | 1,092,571 | | | | 2,124,556 | | | | 784,096 | | | | 697 | | | | 479 | | | | 830,806 | | | | 844,782 | | | | 8,488,978 | | | | 5,779,208 | | |
Change in net unrealized appreciation (depreciation) of investments and
futures contracts | | | 3,223,789 | | | | 362,228 | | | | 18,071,555 | | | | 1,173,084 | | | | 19,427,143 | | | | (732,789 | ) | | | 10,164 | | | | (11,870 | ) | | | 268,254 | | | | 9,872,731 | | | | 5,009,137 | | | | 15,778,546 | | |
NET INCREASE (DECREASE) IN NET ASSETS RESULTING FROM OPERATIONS | | | 5,272,801 | | | | 3,154,906 | | | | 20,580,074 | | | | 6,893,497 | | | | 21,569,513 | | | | 3,357,119 | | | | (158,767 | ) | | | (189,182 | ) | | | 11,335,833 | | | | 20,746,526 | | | | 37,253,375 | | | | 44,166,558 | | |
DIVIDEND DISTRIBUTIONS (Note 5) | |
From net investment income | | | (1,854,503 | ) | | | (1,565,125 | ) | | | (4,454,203 | ) | | | (4,054,555 | ) | | | (3,143,042 | ) | | | (3,017,256 | ) | | | — | | | | — | | | | (140,268 | ) | | | (10,100,703 | ) | | | (187,178 | ) | | | (22,722,570 | ) | |
From capital gains | | | (770,637 | ) | | | (19,438 | ) | | | (1,816,656 | ) | | | (304,510 | ) | | | (511,903 | ) | | | — | | | | — | | | | — | | | | (844,782 | ) | | | — | | | | — | | | | — | | |
Total distributions | | | (2,625,140 | ) | | | (1,584,563 | ) | | | (6,270,859 | ) | | | (4,359,065 | ) | | | (3,654,945 | ) | | | (3,017,256 | ) | | | — | | | | — | | | | (985,050 | ) | | | (10,100,703 | ) | | | (187,178 | ) | | | (22,722,570 | ) | |
CAPITAL SHARE TRANSACTIONS (Note 4): | |
Net proceeds from sale of shares | | | 21,853,650 | | | | 17,507,346 | | | | 32,492,851 | | | | 25,085,892 | | | | 18,298,271 | | | | 15,471,781 | | | | 11,061,565 | | | | 10,887,817 | | | | 76,269,600 | | | | 86,254,417 | | | | 133,212,776 | | | | 110,796,918 | | |
Dividends reinvested | | | 2,625,140 | | | | 1,584,563 | | | | 6,270,859 | | | | 4,359,065 | | | | 3,654,945 | | | | 3,017,256 | | | | — | | | | — | | | | 985,050 | | | | 10,100,703 | | | | 187,178 | | | | 22,722,570 | | |
Cost of shares redeemed | | | (6,841,171 | ) | | | (6,320,201 | ) | | | (9,891,750 | ) | | | (12,642,498 | ) | | | (11,239,182 | ) | | | (7,944,371 | ) | | | (21,561,315 | ) | | | (18,925,022 | ) | | | (38,621,808 | ) | | | (66,520,582 | ) | | | (52,819,070 | ) | | | (117,046,903 | ) | |
NET INCREASE (DECREASE) IN NET ASSETS FROM CAPITAL SHARE TRANSACTIONS | | | 17,637,619 | | | | 12,771,708 | | | | 28,871,960 | | | | 16,802,459 | | | | 10,714,034 | | | | 10,544,666 | | | | (10,499,750 | ) | | | (8,037,205 | ) | | | 38,632,842 | | | | 29,834,538 | | | | 80,580,884 | | | | 16,472,585 | | |
INCREASE (DECREASE) IN NET ASSETS | | | 20,285,280 | | | | 14,342,051 | | | | 43,181,175 | | | | 19,336,891 | | | | 28,628,602 | | | | 10,884,529 | | | | (10,658,517 | ) | | | (8,226,387 | ) | | | 48,983,625 | | | | 40,480,361 | | | | 117,647,081 | | | | 37,916,573 | | |
NET ASSETS, BEGINNING OF PERIOD | | | 66,074,626 | | | | 51,732,575 | | | | 182,024,015 | | | | 162,687,124 | | | | 158,288,554 | | | | 147,404,025 | | | | 100,591,223 | | | | 108,817,610 | | | | 338,332,609 | | | | 297,852,248 | | | | 635,099,291 | | | | 597,182,718 | | |
NET ASSETS, END OF PERIOD | | $ | 86,359,906 | | | $ | 66,074,626 | | | $ | 225,205,190 | | | $ | 182,024,015 | | | $ | 186,917,156 | | | $ | 158,288,554 | | | $ | 89,932,706 | | | $ | 100,591,223 | | | $ | 387,316,234 | | | $ | 338,332,609 | | | $ | 752,746,372 | | | $ | 635,099,291 | | |
ACCUMULATED UNDISTRIBUTED NET INVESTMENT INCOME (LOSS) | | $ | 34,836 | | | $ | 1,854,505 | | | $ | 52,765 | | | $ | 4,454,203 | | | $ | 17,814 | | | $ | 3,143,042 | | | $ | — | | | $ | — | | | $ | 10,236,772 | | | $ | 140,267 | | | $ | 23,755,259 | | | $ | 187,178 | | |
OTHER INFORMATION: | |
Shares outstanding at the beginning of period | | | 59,597,939 | | | | 47,977,563 | | | | 154,321,854 | | | | 139,889,356 | | | | 127,613,673 | | | | 119,017,515 | | | | 83,650,118 | | | | 90,330,033 | | | | 319,283,521 | | | | 289,925,398 | | | | 457,267,817 | | | | 444,790,076 | | |
Shares sold | | | 18,992,460 | | | | 15,902,834 | | | | 25,939,236 | | | | 21,227,945 | | | | 13,651,647 | | | | 12,279,281 | | | | 9,206,365 | | | | 9,059,065 | | | | 70,450,344 | | | | 82,259,549 | | | | 92,161,939 | | | | 79,248,176 | | |
Shares issued as reinvestment of dividends | | | 2,283,401 | | | | 1,476,269 | | | | 4,941,217 | | | | 3,917,722 | | | | 2,637,646 | | | | 2,645,970 | | | | — | | | | — | | | | 909,078 | | | | 9,537,207 | | | | 129,380 | | | | 16,371,590 | | |
Shares redeemed | | | (5,947,714 | ) | | | (5,758,727 | ) | | | (7,902,557 | ) | | | (10,713,169 | ) | | | (8,367,379 | ) | | | (6,329,093 | ) | | | (17,948,512 | ) | | | (15,738,980 | ) | | | (35,930,927 | ) | | | (62,438,633 | ) | | | (37,113,502 | ) | | | (83,142,025 | ) | |
Net increase (decrease) | | | 15,328,147 | | | | 11,620,376 | | | | 22,977,896 | | | | 14,432,498 | | | | 7,921,914 | | | | 8,596,158 | | | | (8,742,147 | ) | | | (6,679,915 | ) | | | 35,428,495 | | | | 29,358,123 | | | | 55,177,817 | | | | 12,477,741 | | |
Shares outstanding at the end of period | | | 74,926,086 | | | | 59,597,939 | | | | 177,299,750 | | | | 154,321,854 | | | | 135,535,587 | | | | 127,613,673 | | | | 74,907,971 | | | | 83,650,118 | | | | 354,712,016 | | | | 319,283,521 | | | | 512,445,634 | | | | 457,267,817 | | |
The accompanying notes are an integral part of these financial statements.
72
The accompanying notes are an integral part of these financial statements.
73
MUTUAL OF AMERICA INVESTMENT CORPORATION
FINANCIAL HIGHLIGHTS
Income from investment operations and distributions per share for a Fund share outstanding throughout the five years ended December 31, 2012 (or since the Fund's inception date if in existence less than five years) and other supplementary data with respect to each Fund are presented below and in the pages following:
| | | Equity Index Fund | | All America Fund | | Small Cap Value Fund | |
| | | Years Ended December 31, | | Years Ended December 31, | | Years Ended December 31, | |
| | | 2012 | | 2011 | | 2010 | | 2009 | | 2008 | | 2012 | | 2011 | | 2010 | | 2009 | | 2008 | | 2012 | | 2011 | | 2010 | | 2009 | | 2008 | |
Net Asset Value, Beginning of Period | | $ | 2.07 | | | $ | 2.07 | | | $ | 1.84 | | | $ | 1.48 | | | $ | 2.41 | | | $ | 1.61 | | | $ | 1.65 | | | $ | 1.42 | | | $ | 1.15 | | | $ | 1.86 | | | $ | 1.17 | | | $ | 1.21 | | | $ | 0.96 | | | $ | 0.75 | | | $ | 1.06 | | |
INCOME (LOSS) FROM INVESTMENT OPERATIONS: | |
Net Investment Income (Loss) | | | 0.05 | | | | 0.04 | | | | 0.03 | | | | 0.03 | | | | 0.04 | | | | 0.03 | | | | 0.02 | | | | 0.02 | | | | 0.02 | | | | 0.03 | | | | 0.02 | | | | 0.01 | | | | 0.01 | | | | 0.01 | | | | 0.01 | | |
Net Realized and Unrealized Gains (Losses) on Investments and Futures Contracts | | | 0.28 | | | | — | (f) | | | 0.23 | | | | 0.36 | | | | (0.93 | ) | | | 0.21 | | | | (0.02 | ) | | | 0.23 | | | | 0.28 | | | | (0.68 | ) | | | 0.16 | | | | (0.04 | ) | | | 0.25 | | | | 0.21 | | | | (0.30 | ) | |
Total From Investment Operations | | | 0.33 | | | | 0.04 | | | | 0.26 | | | | 0.39 | | | | (0.89 | ) | | | 0.24 | | | | — | | | | 0.25 | | | | 0.30 | | | | (0.65 | ) | | | 0.18 | | | | (0.03 | ) | | | 0.26 | | | | 0.22 | | | | (0.29 | ) | |
Less: Dividend Distributions:
From Net Investment Income | | | — | (f) | | | (0.04 | ) | | | (0.03 | ) | | | (0.03 | ) | | | (0.03 | ) | | | — | | | | (0.04 | ) | | | (0.02 | ) | | | (0.03 | ) | | | (0.02 | ) | | | — | | | | (0.01 | ) | | | (0.01 | ) | | | (0.01 | ) | | | (0.01 | ) | |
| From Capital Gains | | | — | | | | — | | | | — | | | | — | | | | (0.01 | ) | | | — | | | | — | | | | — | | | | — | | | | (0.04 | ) | | | — | | | | — | | | | — | | | | — | | | | — | (f) | |
| From Return of Capital | | | — | | | | — | | | | — | | | | — | | | | — | | | | — | | | | — | | | | — | | | | — | | | | — | | | | — | | | | — | | | | — | | | | — | (f) | | | (0.01 | ) | |
| Total Distributions | | | — | | | | (0.04 | ) | | | (0.03 | ) | | | (0.03 | ) | | | (0.04 | ) | | | — | | | | (0.04 | ) | | | (0.02 | ) | | | (0.03 | ) | | | (0.06 | ) | | | — | | | | (0.01 | ) | | | (0.01 | ) | | | (0.01 | ) | | | (0.02 | ) | |
Net Asset Value, End of Period | | $ | 2.40 | | | $ | 2.07 | | | $ | 2.07 | | | $ | 1.84 | | | $ | 1.48 | | | $ | 1.85 | | | $ | 1.61 | | | $ | 1.65 | | | $ | 1.42 | | | $ | 1.15 | | | $ | 1.35 | | | $ | 1.17 | | | $ | 1.21 | | | $ | 0.96 | | | $ | 0.75 | | |
Total Return (%) | | | 15.94 | | | | 1.88 | | | | 14.68 | | | | 26.13 | | | | (37.08 | ) | | | 14.73 | | | | 0.24 | | | | 17.78 | | | | 25.31 | | | | (35.49 | ) | | | 15.46 | | | | (2.46 | ) | | | 27.72 | | | | 29.28 | | | | (27.76 | ) | |
Net Assets, End of Period ($ millions) | | | 1,109 | | | | 929 | | | | 905 | | | | 768 | | | | 545 | | | | 256 | | | | 250 | | | | 271 | | | | 256 | | | | 222 | | | | 290 | | | | 260 | | | | 277 | | | | 205 | | | | 155 | | |
Ratio of Net Investment Income (Loss) to Average Net Assets (%) | | | 2.03 | | | | 1.81 | | | | 1.76 | | | | 1.98 | | | | 2.07 | | | | 1.52 | | | | 1.24 | | | | 1.21 | | | | 1.46 | | | | 1.64 | | | | 1.67 | | | | 0.92 | | | | 0.99 | | | | 1.30 | | | | 1.23 | | |
Ratio of Expenses to Average Net Assets Before Expense Reimbursement (%) | | | 0.22 | | | | 0.23 | | | | 0.25 | | | | 0.26 | | | | 0.25 | | | | 0.55 | | | | 0.56 | | | | 0.57 | | | | 0.58 | | | | 0.56 | | | | 0.90 | | | | 0.90 | | | | 0.92 | | | | 0.93 | | | | 0.92 | | |
Ratio of Expenses to Average Net Assets After Expense Reimbursement (%) | | | 0.22 | | | | 0.23 | | | | 0.25 | | | | 0.26 | | | | 0.25 | | | | 0.55 | | | | 0.56 | | | | 0.57 | | | | 0.58 | | | | 0.56 | | | | 0.90 | | | | 0.90 | | | | 0.92 | | | | 0.93 | | | | 0.92 | | |
Portfolio Turnover Rate (%)(a) | | | 6.45 | | | | 5.26 | | | | 4.50 | | | | 4.29 | | | | 4.70 | | | | 17.37 | | | | 24.67 | | | | 22.71 | | | | 35.15 | | | | 31.03 | | | | 24.71 | | | | 23.34 | | | | 35.34 | | | | 39.03 | | | | 59.64 | | |
(a) Portfolio turnover rate excludes all short-term securities.
(b) Not annualized.
(c) Annualized.
(d) Allocation and Retirement Funds exclude expenses of the underlying funds.
(e) For the period October 1, 2012 (commencement of operations) through December 31, 2012.
(f) Amount is less than $0.005 per share.
NA = Not Applicable
The accompanying notes are an integral part of these financial statements.
74
The accompanying notes are an integral part of these financial statements.
75
MUTUAL OF AMERICA INVESTMENT CORPORATION
FINANCIAL HIGHLIGHTS (Continued)
| | | Small Cap Growth Fund | | Mid Cap Value Fund | | Mid-Cap Equity Index Fund | | International Fund | |
| | | Years Ended December 31, | | Years Ended December 31, | | Years Ended December 31, | | Years Ended December 31, | |
| | | 2012 | | 2011 | | 2010 | | 2009 | | 2008 | | 2012 | | 2011 | | 2010 | | 2009 | | 2008 | | 2012 | | 2011 | | 2010 | | 2009 | | 2008 | | 2012 | | 2011 | | 2010 | | 2009 | | 2008 | |
Net Asset Value, Beginning of Period | | $ | 1.16 | | | $ | 1.19 | | | $ | 0.89 | | | $ | 0.70 | | | $ | 1.08 | | | $ | 1.11 | | | $ | 1.15 | | | $ | 0.98 | | | $ | 0.79 | | | $ | 1.20 | | | $ | 1.43 | | | $ | 1.51 | | | $ | 1.24 | | | $ | 0.93 | | | $ | 1.51 | | | $ | 0.60 | | | $ | 0.71 | | | $ | 0.67 | | | $ | 0.55 | | | $ | 0.95 | | |
INCOME (LOSS) FROM INVESTMENT OPERATIONS: | |
| Net Investment Income (Loss) | | | — | (f) | | | — | (f) | | | — | (f) | | | — | (f) | | | — | (f) | | | 0.02 | | | | 0.01 | | | | 0.01 | | | | 0.01 | | | | 0.02 | | | | 0.02 | | | | 0.02 | | | | 0.01 | | | | 0.01 | | | | 0.02 | | | | 0.02 | | | | 0.02 | | | | 0.02 | | | | 0.01 | | | | 0.02 | | |
Net Realized and Unrealized Gains (Losses) on Investments and Futures Contracts | | | 0.07 | | | | (0.03 | ) | | | 0.30 | | | | 0.19 | | | | (0.36 | ) | | | 0.10 | | | | (0.04 | ) | | | 0.17 | | | | 0.19 | | | | (0.41 | ) | | | 0.24 | | | | (0.05 | ) | | | 0.31 | | | | 0.32 | | | | (0.56 | ) | | | 0.09 | | | | (0.11 | ) | | | 0.04 | | | | 0.13 | | | | (0.40 | ) | |
Total From Investment Operations | | | 0.07 | | | | (0.03 | ) | | | 0.30 | | | | 0.19 | | | | (0.36 | ) | | | 0.12 | | | | (0.03 | ) | | | 0.18 | | | | 0.20 | | | | (0.39 | ) | | | 0.26 | | | | (0.03 | ) | | | 0.32 | | | | 0.33 | | | | (0.54 | ) | | | 0.11 | | | | (0.09 | ) | | | 0.06 | | | | 0.14 | | | | (0.38 | ) | |
Less: Dividend Distributions:
From Net Investment Income | | | — | | | | — | | | | — | | | | — | | | | — | | | | — | | | | (0.01 | ) | | | (0.01 | ) | | | (0.01 | ) | | | (0.02 | ) | | | — | | | | (0.02 | ) | | | (0.01 | ) | | | (0.01 | ) | | | (0.02 | ) | | | — | (f) | | | (0.02 | ) | | | (0.02 | ) | | | (0.01 | ) | | | (0.02 | ) | |
From Capital Gains | | | (0.01 | ) | | | — | | | | — | | | | — | | | | (0.02 | ) | | | — | | | | — | | | | — | | | | — | | | | — | | | | (0.06 | ) | | | (0.03 | ) | | | (0.04 | ) | | | (0.01 | ) | | | (0.02 | ) | | | — | (f) | | | — | (f) | | | — | | | | — | | | | — | (f) | |
| From Return of Capital | | | — | | | | — | | | | — | | | | — | | | | — | | | | — | | | | — | | | | — | | | | — | (f) | | | — | (f) | | | — | | | | — | | | | — | | | | — | | | | — | | | | — | | | | — | | | | — | | | | (0.01 | ) | | | — | | |
Total Distributions | | | (0.01 | ) | | | — | | | | — | | | | — | | | | (0.02 | ) | | | — | | | | (0.01 | ) | | | (0.01 | ) | | | (0.01 | ) | | | (0.02 | ) | | | (0.06 | ) | | | (0.05 | ) | | | (0.05 | ) | | | (0.02 | ) | | | (0.04 | ) | | | — | | | | (0.02 | ) | | | (0.02 | ) | | | (0.02 | ) | | | (0.02 | ) | |
Net Asset Value, End of Period | | $ | 1.22 | | | $ | 1.16 | | | $ | 1.19 | | | $ | 0.89 | | | $ | 0.70 | | | $ | 1.23 | | | $ | 1.11 | | | $ | 1.15 | | | $ | 0.98 | | | $ | 0.79 | | | $ | 1.63 | | | $ | 1.43 | | | $ | 1.51 | | | $ | 1.24 | | | $ | 0.93 | | | $ | 0.71 | | | $ | 0.60 | | | $ | 0.71 | | | $ | 0.67 | | | $ | 0.55 | | |
Total Return (%) | | | 5.62 | | | | (2.28 | ) | | | 33.27 | | | | 27.69 | | | | (34.37 | ) | | | 11.01 | | | | (2.12 | ) | | | 18.94 | | | | 25.22 | | | | (32.64 | ) | | | 17.80 | | | | (1.99 | ) | | | 26.28 | | | | 36.69 | | | | (36.31 | ) | | | 18.24 | | | | (12.60 | ) | | | 8.32 | | | | 25.22 | | | | (40.06 | ) | |
Net Assets, End of Period ($ millions) | | | 272 | | | | 271 | | | | 281 | | | | 194 | | | | 147 | | | | 53 | | | | 51 | | | | 55 | | | | 42 | | | | 30 | | | | 610 | | | | 505 | | | | 494 | | | | 377 | | | | 248 | | | | 115 | | | | 69 | | | | 61 | | | | 33 | | | | 12 | | |
Ratio of Net Investment Income (Loss) to Average Net Assets (%) | | | (0.08 | ) | | | (0.31 | ) | | | (0.26 | ) | | | (0.26 | ) | | | (0.16 | ) | | | 1.36 | | | | 1.19 | | | | 1.25 | | | | 1.57 | | | | 1.62 | | | | 1.50 | | | | 1.14 | | | | 1.16 | | | | 1.41 | | | | 1.47 | | | | 3.20 | | | | 3.24 | | | | 3.48 | | | | 3.45 | | | | 5.17 | | |
Ratio of Expenses to Average Net Assets Before Expense Reimbursement (%) | | | 0.90 | | | | 0.90 | | | | 0.92 | | | | 0.93 | | | | 0.92 | | | | 0.70 | | | | 0.70 | | | | 0.72 | | | | 0.73 | | | | 0.74 | | | | 0.22 | | | | 0.23 | | | | 0.25 | | | | 0.26 | | | | 0.25 | | | | 0.21 | | | | 0.23 | | | | 0.24 | | | | 0.25 | | | | 0.20 | | |
Ratio of Expenses to Average Net Assets After Expense Reimbursement (%) | | | 0.90 | | | | 0.90 | | | | 0.92 | | | | 0.93 | | | | 0.92 | | | | 0.70 | | | | 0.70 | | | | 0.72 | | | | 0.73 | | | | 0.74 | | | | 0.22 | | | | 0.23 | | | | 0.25 | | | | 0.26 | | | | 0.25 | | | | 0.21 | | | | 0.23 | | | | 0.24 | | | | 0.25 | | | | 0.20 | | |
Portfolio Turnover Rate (%)(a) | | | 66.69 | | | | 59.53 | | | | 50.73 | | | | 94.14 | | | | 93.16 | | | | 29.05 | | | | 12.99 | | | | 29.88 | | | | 20.16 | | | | 33.80 | | | | 12.98 | | | | 15.98 | | | | 13.29 | | | | 15.41 | | | | 22.66 | | | | 0.28 | | | | 1.44 | | | | 9.17 | | | | 4.95 | | | | — | | |
(a) Portfolio turnover rate excludes all short-term securities.
(b) Not annualized.
(c) Annualized.
(d) Allocation and Retirement Funds exclude expenses of the underlying funds.
(e) For the period October 1, 2012 (commencement of operations) through December 31, 2012.
(f) Amount is less than $0.005 per share.
NA = Not Applicable
The accompanying notes are an integral part of these financial statements.
76
The accompanying notes are an integral part of these financial statements.
77
MUTUAL OF AMERICA INVESTMENT CORPORATION
FINANCIAL HIGHLIGHTS (Continued)
| | | Composite Fund | | Retirement Income Fund | | 2010 Retirement Fund | | 2015 Retirement Fund | |
| | | Years Ended December 31, | | Years Ended December 31, | | Years Ended December 31, | | Years Ended December 31, | |
| | | 2012 | | 2011 | | 2010 | | 2009 | | 2008 | | 2012 | | 2011 | | 2010 | | 2009 | | 2008 | | 2012 | | 2011 | | 2010 | | 2009 | | 2008 | | 2012 | | 2011 | | 2010 | | 2009 | | 2008 | |
Net Asset Value, Beginning of Period | | $ | 1.47 | | | $ | 1.50 | | | $ | 1.39 | | | $ | 1.20 | | | $ | 1.60 | | | $ | 1.05 | | | $ | 1.03 | | | $ | 0.97 | | | $ | 0.83 | | | $ | 0.96 | | | $ | 0.97 | | | $ | 0.96 | | | $ | 0.87 | | | $ | 0.74 | | | $ | 0.94 | | | $ | 0.93 | | | $ | 0.93 | | | $ | 0.83 | | | $ | 0.70 | | | $ | 0.92 | | |
INCOME (LOSS) FROM INVESTMENT OPERATIONS: | |
Net Investment Income (Loss) | | | 0.04 | | | | 0.04 | | | | 0.04 | | | | 0.04 | | | | 0.04 | | | | — | (f) | | | 0.03 | | | | 0.02 | | | | 0.03 | | | | 0.03 | | | | — | (f) | | | 0.02 | | | | 0.02 | | | | 0.02 | | | | 0.03 | | | | — | (f) | | | 0.02 | | | | 0.02 | | | | 0.02 | | | | 0.03 | | |
Net Realized and Unrealized Gains (Losses) on Investments and Futures Contracts | | | 0.13 | | | | — | | | | 0.11 | | | | 0.19 | | | | (0.40 | ) | | | 0.07 | | | | 0.02 | | | | 0.07 | | | | 0.11 | | | | (0.13 | ) | | | 0.09 | | | | 0.01 | | | | 0.07 | | | | 0.13 | | | | (0.20 | ) | | | 0.10 | | | | — | (f) | | | 0.08 | | | | 0.13 | | | | (0.22 | ) | |
Total From Investment Operations | | | 0.17 | | | | 0.04 | | | | 0.15 | | | | 0.23 | | | | (0.36 | ) | | | 0.07 | | | | 0.05 | | | | 0.09 | | | | 0.14 | | | | (0.10 | ) | | | 0.09 | | | | 0.03 | | | | 0.09 | | | | 0.15 | | | | (0.17 | ) | | | 0.10 | | | | 0.02 | | | | 0.10 | | | | 0.15 | | | | (0.19 | ) | |
Less: Dividend Distributions:
From Net Investment Income | | | — | (f) | | | (0.07 | ) | | | (0.04 | ) | | | (0.04 | ) | | | (0.04 | ) | | | (0.03 | ) | | | (0.03 | ) | | | (0.02 | ) | | | — | (f) | | | (0.03 | ) | | | (0.02 | ) | | | (0.02 | ) | | | — | (f) | | | (0.02 | ) | | | (0.03 | ) | | | (0.02 | ) | | | (0.02 | ) | | | — | (f) | | | (0.02 | ) | | | (0.03 | ) | |
| From Capital Gains | | | — | | | | — | | | | — | | | | — | | | | — | | | | (0.02 | ) | | | — | (f) | | | (0.01 | ) | | | — | | | | — | (f) | | | (0.04 | ) | | | — | (f) | | | — | (f) | | | — | (f) | | | — | (f) | | | (0.01 | ) | | | — | (f) | | | — | (f) | | | — | (f) | | | — | | |
From Return of Capital | | | — | | | | — | | | | — | | | | — | | | | — | | | | — | | | | — | | | | — | | | | — | | | | — | | | | — | | | | — | | | | — | | | | — | (f) | | | — | | | | — | | | | — | | | | — | | | | — | (f) | | | — | (f) | |
| Total Distributions | | | — | | | | (0.07 | ) | | | (0.04 | ) | | | (0.04 | ) | | | (0.04 | ) | | | (0.05 | ) | | | (0.03 | ) | | | (0.03 | ) | | | — | | | | (0.03 | ) | | | (0.06 | ) | | | (0.02 | ) | | | — | | | | (0.02 | ) | | | (0.03 | ) | | | (0.03 | ) | | | (0.02 | ) | | | — | | | | (0.02 | ) | | | (0.03 | ) | |
Net Asset Value, End of Period | | $ | 1.64 | | | $ | 1.47 | | | $ | 1.50 | | | $ | 1.39 | | | $ | 1.20 | | | $ | 1.07 | | | $ | 1.05 | | | $ | 1.03 | | | $ | 0.97 | | | $ | 0.83 | | | $ | 1.00 | | | $ | 0.97 | | | $ | 0.96 | | | $ | 0.87 | | | $ | 0.74 | | | $ | 1.00 | | | $ | 0.93 | | | $ | 0.93 | | | $ | 0.83 | | | $ | 0.70 | | |
Total Return (%) | | | 11.65 | | | | 2.84 | | | | 11.02 | | | | 18.45 | | | | (22.51 | ) | | | 7.15 | | | | 4.72 | | | | 9.04 | | | | 16.25 | | | | (9.61 | ) | | | 9.69 | | | | 3.08 | | | | 11.36 | | | | 19.79 | | | | (17.45 | ) | | | 10.59 | | | | 2.09 | | | | 12.27 | | | | 21.27 | | | | (21.01 | ) | |
Net Assets, End of Period ($ millions) | | | 170 | | | | 161 | | | | 167 | | | | 166 | | | | 150 | | | | 31 | | | | 23 | | | | 18 | | | | 9 | | | | 4 | | | | 21 | | | | 21 | | | | 19 | | | | 15 | | | | 8 | | | | 112 | | | | 91 | | | | 78 | | | | 44 | | | | 20 | | |
Ratio of Net Investment Income (Loss) to Average Net Assets (%) | | | 2.17 | | | | 2.22 | | | | 2.26 | | | | 2.74 | | | | 3.01 | | | | (0.03 | ) | | | 3.03 | | | | 3.65 | | | | 4.39 | | | | 5.42 | | | | (0.03 | ) | | | 2.41 | | | | 2.67 | | | | 3.51 | | | | 5.36 | | | | (0.03 | ) | | | 2.53 | | | | 2.79 | | | | 3.45 | | | | 4.65 | | |
Ratio of Expenses to Average Net Assets Before Expense Reimbursement (%)(d) | | | 0.55 | | | | 0.56 | | | | 0.57 | | | | 0.58 | | | | 0.57 | | | | 0.05 | | | | 0.05 | | | | 0.05 | | | | 0.05 | | | | 0.05 | | | | 0.05 | | | | 0.05 | | | | 0.05 | | | | 0.05 | | | | 0.05 | | | | 0.05 | | | | 0.05 | | | | 0.05 | | | | 0.05 | | | | 0.05 | | |
Ratio of Expenses to Average Net Assets After Expense Reimbursement (%)(d) | | | 0.55 | | | | 0.56 | | | | 0.57 | | | | 0.58 | | | | 0.57 | | | | 0.05 | | | | 0.05 | | | | 0.05 | | | | 0.05 | | | | 0.05 | | | | 0.05 | | | | 0.05 | | | | 0.05 | | | | 0.05 | | | | 0.05 | | | | 0.05 | | | | 0.05 | | | | 0.05 | | | | 0.05 | | | | 0.05 | | |
Portfolio Turnover Rate (%)(a) | | | 25.42 | | | | 22.69 | | | | 36.00 | | | | 31.73 | | | | 37.98 | | | | 18.07 | | | | 23.77 | | | | 17.62 | | | | 35.31 | | | | 82.92 | | | | 26.61 | | | | 21.22 | | | | 18.31 | | | | 38.17 | | | | 32.37 | | | | 19.59 | | | | 8.10 | | | | 5.64 | | | | 26.96 | | | | 21.47 | | |
(a) Portfolio turnover rate excludes all short-term securities.
(b) Not annualized.
(c) Annualized.
(d) Allocation and Retirement Funds exclude expenses of the underlying funds.
(e) For the period October 1, 2012 (commencement of operations) through December 31, 2012.
(f) Amount is less than $0.005 per share.
NA = Not Applicable
The accompanying notes are an integral part of these financial statements.
78
The accompanying notes are an integral part of these financial statements.
79
MUTUAL OF AMERICA INVESTMENT CORPORATION
FINANCIAL HIGHLIGHTS (Continued)
| | | 2020 Retirement Fund | | 2025 Retirement Fund | | 2030 Retirement Fund | |
| | | Years Ended December 31, | | Years Ended December 31, | | Years Ended December 31, | |
| | | 2012 | | 2011 | | 2010 | | 2009 | | 2008 | | 2012 | | 2011 | | 2010 | | 2009 | | 2008 | | 2012 | | 2011 | | 2010 | | 2009 | | 2008 | |
Net Asset Value, Beginning of Period | | $ | 0.90 | | | $ | 0.91 | | | $ | 0.80 | | | $ | 0.66 | | | $ | 0.91 | | | $ | 0.89 | | | $ | 0.90 | | | $ | 0.78 | | | $ | 0.64 | | | $ | 0.92 | | | $ | 0.88 | | | $ | 0.90 | | | $ | 0.77 | | | $ | 0.62 | | | $ | 0.92 | | |
INCOME (LOSS) FROM INVESTMENT OPERATIONS: | |
| Net Investment Income (Loss) | | | — | (f) | | | 0.02 | | | | 0.02 | | | | 0.02 | | | | 0.02 | | | | — | (f) | | | 0.02 | | | | 0.02 | | | | 0.02 | | | | 0.02 | | | | — | (f) | | | 0.02 | | | | 0.02 | | | | 0.01 | | | | 0.02 | | |
Net Realized and Unrealized Gains (Losses) on Investments and Futures Contracts | | | 0.11 | | | | (0.01 | ) | | | 0.09 | | | | 0.14 | | | | (0.25 | ) | | | 0.11 | | | | (0.02 | ) | | | 0.10 | | | | 0.14 | | | | (0.28 | ) | | | 0.12 | | | | (0.02 | ) | | | 0.11 | | | | 0.15 | | | | (0.30 | ) | |
Total From Investment Operations | | | 0.11 | | | | 0.01 | | | | 0.11 | | | | 0.16 | | | | (0.23 | ) | | | 0.11 | | | | — | | | | 0.12 | | | | 0.16 | | | | (0.26 | ) | | | 0.12 | | | | — | | | | 0.13 | | | | 0.16 | | | | (0.28 | ) | |
Less: Dividend Distributions: | |
From Net Investment Income | | | (0.02 | ) | | | (0.02 | ) | | | — | (f) | | | (0.02 | ) | | | (0.02 | ) | | | (0.02 | ) | | | (0.01 | ) | | | — | (f) | | | (0.02 | ) | | | (0.02 | ) | | | (0.02 | ) | | | (0.02 | ) | | | — | (f) | | | (0.01 | ) | | | (0.02 | ) | |
| From Capital Gains | | | — | (f) | | | — | (f) | | | — | (f) | | | — | (f) | | | — | | | | — | (f) | | | — | (f) | | | — | (f) | | | — | (f) | | | — | | | | — | (f) | | | — | (f) | | | — | (f) | | | — | (f) | | | — | | |
From Return of Capital | | | — | | | | — | | | | — | | | | — | (f) | | | — | (f) | | | — | | | | — | | | | — | | | | — | (f) | | | — | (f) | | | — | | | | — | | | | — | | | | — | (f) | | | — | (f) | |
Total Distributions | | | (0.02 | ) | | | (0.02 | ) | | | — | | | | (0.02 | ) | | | (0.02 | ) | | | (0.02 | ) | | | (0.01 | ) | | | — | | | | (0.02 | ) | | | (0.02 | ) | | | (0.02 | ) | | | (0.02 | ) | | | — | | | | (0.01 | ) | | | (0.02 | ) | |
Net Asset Value, End of Period | | $ | 0.99 | | | $ | 0.90 | | | $ | 0.91 | | | $ | 0.80 | | | $ | 0.66 | | | $ | 0.98 | | | $ | 0.89 | | | $ | 0.90 | | | $ | 0.78 | | | $ | 0.64 | | | $ | 0.98 | | | $ | 0.88 | | | $ | 0.90 | | | $ | 0.77 | | | $ | 0.62 | | |
Total Return (%) | | | 11.69 | | | | 1.55 | | | | 13.90 | | | | 23.18 | | | | (24.81 | ) | | | 12.90 | | | | 0.83 | | | | 15.49 | | | | 25.10 | | | | (28.32 | ) | | | 13.69 | | | | 0.21 | | | | 16.59 | | | | 26.47 | | | | (29.95 | ) | |
Net Assets, End of Period ($ millions) | | | 169 | | | | 118 | | | | 90 | | | | 50 | | | | 21 | | | | 162 | | | | 109 | | | | 81 | | | | 42 | | | | 15 | | | | 133 | | | | 90 | | | | 67 | | | | 35 | | | | 12 | | |
Ratio of Net Investment Income (Loss) to Average Net Assets (%) | | | (0.03 | ) | | | 2.63 | | | | 2.76 | | | | 3.61 | | | | 4.73 | | | | (0.04 | ) | | | 2.49 | | | | 2.50 | | | | 3.25 | | | | 5.06 | | | | (0.04 | ) | | | 2.37 | | | | 2.37 | | | | 3.07 | | | | 4.61 | | |
Ratio of Expenses to Average Net Assets Before Expense Reimbursement (%)(d) | | | 0.05 | | | | 0.05 | | | | 0.05 | | | | 0.05 | | | | 0.05 | | | | 0.05 | | | | 0.05 | | | | 0.05 | | | | 0.05 | | | | 0.05 | | | | 0.05 | | | | 0.05 | | | | 0.05 | | | | 0.05 | | | | 0.05 | | |
Ratio of Expenses to Average Net Assets After Expense Reimbursement (%)(d) | | | 0.05 | | | | 0.05 | | | | 0.05 | | | | 0.05 | | | | 0.05 | | | | 0.05 | | | | 0.05 | | | | 0.05 | | | | 0.05 | | | | 0.05 | | | | 0.05 | | | | 0.05 | | | | 0.05 | | | | 0.05 | | | | 0.05 | | |
Portfolio Turnover Rate (%)(a) | | | 9.89 | | | | 4.73 | | | | 2.62 | | | | 13.70 | | | | 14.74 | | | | 8.59 | | | | 2.52 | | | | 3.16 | | | | 9.21 | | | | 10.06 | | | | 7.61 | | | | 2.66 | | | | 1.74 | | | | 8.96 | | | | 12.34 | | |
(a) Portfolio turnover rate excludes all short-term securities.
(b) Not annualized.
(c) Annualized.
(d) Allocation and Retirement Funds exclude expenses of the underlying funds.
(e) For the period October 1, 2012 (commencement of operations) through December 31, 2012.
(f) Amount is less than $0.005 per share.
NA = Not Applicable
The accompanying notes are an integral part of these financial statements.
80
The accompanying notes are an integral part of these financial statements.
81
MUTUAL OF AMERICA INVESTMENT CORPORATION
FINANCIAL HIGHLIGHTS (Continued)
| | | 2035 Retirement Fund | | 2040 Retirement Fund | | 2045 Retirement Fund | | 2050 Retirement Fund | |
| | | Years Ended December 31, | | Years Ended December 31, | | Years Ended December 31, | | Period Ended
December 31, | |
| | | 2012 | | 2011 | | 2010 | | 2009 | | 2008 | | 2012 | | 2011 | | 2010 | | 2009 | | 2008 | | 2012 | | 2011 | | 2010 | | 2009 | | 2008 | | 2012(e) | |
Net Asset Value, Beginning of Period | | $ | 0.86 | | | $ | 0.88 | | | $ | 0.75 | | | $ | 0.60 | | | $ | 0.92 | | | $ | 0.85 | | | $ | 0.88 | | | $ | 0.74 | | | $ | 0.59 | | | $ | 0.91 | | | $ | 0.85 | | | $ | 0.88 | | | $ | 0.74 | | | $ | 0.59 | | | $ | 0.91 | | | $ | 1.00 | | |
INCOME (LOSS) FROM INVESTMENT OPERATIONS: | |
| Net Investment Income (Loss) | | | — | (f) | | | 0.01 | | | | 0.01 | | | | 0.01 | | | | 0.02 | | | | — | (f) | | | 0.01 | | | | 0.01 | | | | 0.01 | | | | 0.02 | | | | — | (f) | | | 0.01 | | | | 0.01 | | | | 0.01 | | | | 0.02 | | | | — | (f) | |
Net Realized and Unrealized Gains (Losses) on Investments and Futures Contracts | | | 0.13 | | | | (0.02 | ) | | | 0.12 | | | | 0.15 | | | | (0.32 | ) | | | 0.13 | | | | (0.03 | ) | | | 0.13 | | | | 0.15 | | | | (0.32 | ) | | | 0.13 | | | | (0.03 | ) | | | 0.13 | | | | 0.15 | | | | (0.32 | ) | | | 0.02 | | |
Total From Investment Operations | | | 0.13 | | | | (0.01 | ) | | | 0.13 | | | | 0.16 | | | | (0.30 | ) | | | 0.13 | | | | (0.02 | ) | | | 0.14 | | | | 0.16 | | | | (0.30 | ) | | | 0.13 | | | | (0.02 | ) | | | 0.14 | | | | 0.16 | | | | (0.30 | ) | | | 0.02 | | |
Less: Dividend Distributions:
From Net Investment Income | | | (0.02 | ) | | | (0.01 | ) | | | — | (f) | | | (0.01 | ) | | | (0.02 | ) | | | (0.02 | ) | | | (0.01 | ) | | | — | (f) | | | (0.01 | ) | | | (0.02 | ) | | | (0.02 | ) | | | (0.01 | ) | | | — | (f) | | | (0.01 | ) | | | (0.02 | ) | | | — | | |
| From Capital Gains | | | — | (f) | | | — | (f) | | | — | (f) | | | — | (f) | | | — | | | | — | (f) | | | — | (f) | | | — | (f) | | | — | (f) | | | — | | | | — | (f) | | | — | (f) | | | — | (f) | | | — | (f) | | | — | | | | — | | |
From Return of Capital | | | — | | | | — | | | | — | | | | — | (f) | | | — | (f) | | | — | | | | — | | | | — | | | | — | (f) | | | — | (f) | | | — | | | | — | | | | — | | | | — | (f) | | | — | (f) | | | — | | |
Total Distributions | | | (0.02 | ) | | | (0.01 | ) | | | — | | | | (0.01 | ) | | | (0.02 | ) | | | (0.02 | ) | | | (0.01 | ) | | | — | | | | (0.01 | ) | | | (0.02 | ) | | | (0.02 | ) | | | (0.01 | ) | | | — | | | | (0.01 | ) | | | (0.02 | ) | | | — | | |
Net Asset Value, End of Period | | $ | 0.97 | | | $ | 0.86 | | | $ | 0.88 | | | $ | 0.75 | | | $ | 0.60 | | | $ | 0.96 | | | $ | 0.85 | | | $ | 0.88 | | | $ | 0.74 | | | $ | 0.59 | | | $ | 0.96 | | | $ | 0.85 | | | $ | 0.88 | | | $ | 0.74 | | | $ | 0.59 | | | $ | 1.02 | | |
Total Return (%) | | | 14.39 | | | | (0.63 | ) | | | 17.66 | | | | 27.05 | | | | (32.53 | ) | | | 14.63 | | | | (1.24 | ) | | | 18.38 | | | | 27.84 | | | | (32.75 | ) | | | 14.45 | | | | (1.45 | ) | | | 18.57 | | | | 27.55 | | | | (32.90 | ) | | | 1.83 | (b) | |
Net Assets, End of Period ($ millions) | | | 107 | | | | 69 | | | | 53 | | | | 27 | | | | 9 | | | | 94 | | | | 62 | | | | 47 | | | | 23 | | | | 6 | | | | 118 | | | | 76 | | | | 54 | | | | 25 | | | | 7 | | | | 2 | | |
Ratio of Net Investment Income (Loss) to Average Net Assets (%) | | | (0.04 | ) | | | 2.17 | | | | 2.20 | | | | 2.74 | | | | 4.21 | | | | (0.04 | ) | | | 2.09 | | | | 2.13 | | | | 2.75 | | | | 4.20 | | | | (0.04 | ) | | | 2.09 | | | | 2.14 | | | | 2.61 | | | | 4.49 | | | | (0.01 | )(b) | |
Ratio of Expenses to Average Net Assets Before Expense Reimbursement (%)(d) | | | 0.05 | | | | 0.05 | | | | 0.05 | | | | 0.05 | | | | 0.05 | | | | 0.05 | | | | 0.05 | | | | 0.05 | | | | 0.05 | | | | 0.05 | | | | 0.05 | | | | 0.05 | | | | 0.05 | | | | 0.05 | | | | 0.05 | | | | 0.05 | (c) | |
Ratio of Expenses to Average Net Assets After Expense Reimbursement (%)(d) | | | 0.05 | | | | 0.05 | | | | 0.05 | | | | 0.05 | | | | 0.05 | | | | 0.05 | | | | 0.05 | | | | 0.05 | | | | 0.05 | | | | 0.05 | | | | 0.05 | | | | 0.05 | | | | 0.05 | | | | 0.05 | | | | 0.05 | | | | 0.05 | (c) | |
Portfolio Turnover Rate (%)(a) | | | 6.51 | | | | 2.78 | | | | 1.47 | | | | 6.27 | | | | 7.62 | | | | 4.99 | | | | 2.28 | | | | 1.37 | | | | 5.79 | | | | 7.79 | | | | 4.03 | | | | 1.97 | | | | 1.04 | | | | 7.87 | | | | 6.77 | | | | 0.76 | (b) | |
(a) Portfolio turnover rate excludes all short-term securities.
(b) Not annualized.
(c) Annualized.
(d) Allocation and Retirement Funds exclude expenses of the underlying funds.
(e) For the period October 1, 2012 (commencement of operations) through December 31, 2012.
(f) Amount is less than $0.005 per share.
NA = Not Applicable
The accompanying notes are an integral part of these financial statements.
82
The accompanying notes are an integral part of these financial statements.
83
MUTUAL OF AMERICA INVESTMENT CORPORATION
FINANCIAL HIGHLIGHTS (Continued)
| | | Conservative Allocation Fund | | Moderate Allocation Fund | | Aggressive Allocation Fund | |
| | | Years Ended December 31, | | Years Ended December 31, | | Years Ended December 31, | |
| | | 2012 | | 2011 | | 2010 | | 2009 | | 2008 | | 2012 | | 2011 | | 2010 | | 2009 | | 2008 | | 2012 | | 2011 | | 2010 | | 2009 | | 2008 | |
Net Asset Value, Beginning of Period | | $ | 1.11 | | | $ | 1.08 | | | $ | 0.99 | | | $ | 0.89 | | | $ | 1.03 | | | $ | 1.18 | | | $ | 1.16 | | | $ | 1.03 | | | $ | 0.88 | | | $ | 1.14 | | | $ | 1.24 | | | $ | 1.24 | | | $ | 1.06 | | | $ | 0.86 | | | $ | 1.24 | | |
INCOME (LOSS) FROM INVESTMENT OPERATIONS: | |
| Net Investment Income (Loss) | | | — | (f) | | | 0.03 | | | | 0.03 | | | | 0.03 | | | | 0.04 | | | | — | (f) | | | 0.03 | | | | 0.03 | | | | 0.03 | | | | 0.03 | | | | — | (f) | | | 0.02 | | | | 0.02 | | | | 0.02 | | | | 0.02 | | |
Net Realized and Unrealized Gains (Losses) on Investments and Futures Contracts | | | 0.08 | | | | 0.03 | | | | 0.06 | | | | 0.11 | | | | (0.14 | ) | | | 0.13 | | | | 0.02 | | | | 0.11 | | | | 0.15 | | | | (0.25 | ) | | | 0.17 | | | | — | (f) | | | 0.16 | | | | 0.20 | | | | (0.37 | ) | |
Total From Investment Operations | | | 0.08 | | | | 0.06 | | | | 0.09 | | | | 0.14 | | | | (0.10 | ) | | | 0.13 | | | | 0.05 | | | | 0.14 | | | | 0.18 | | | | (0.22 | ) | | | 0.17 | | | | 0.02 | | | | 0.18 | | | | 0.22 | | | | (0.35 | ) | |
Less: Dividend Distributions: | |
From Net Investment Income | | | (0.03 | ) | | | (0.03 | ) | | | — | (f) | | | (0.03 | ) | | | (0.04 | ) | | | (0.03 | ) | | | (0.03 | ) | | | — | (f) | | | (0.03 | ) | | | (0.03 | ) | | | (0.03 | ) | | | (0.02 | ) | | | — | (f) | | | (0.02 | ) | | | (0.02 | ) | |
From Capital Gains | | | (0.01 | ) | | | — | (f) | | | — | (f) | | | (0.01 | ) | | | — | (f) | | | (0.01 | ) | | | — | (f) | | | (0.01 | ) | | | — | (f) | | | (0.01 | ) | | | — | (f) | | | — | | | | — | | | | — | (f) | | | (0.01 | ) | |
From Return of Capital | | | — | | | | — | | | | — | | | | — | | | | — | | | | — | | | | — | | | | — | | | | — | (f) | | | — | | | | — | | | | — | | | | — | | | | — | | | | — | (f) | |
Total Distributions | | | (0.04 | ) | | | (0.03 | ) | | | — | | | | (0.04 | ) | | | (0.04 | ) | | | (0.04 | ) | | | (0.03 | ) | | | (0.01 | ) | | | (0.03 | ) | | | (0.04 | ) | | | (0.03 | ) | | | (0.02 | ) | | | — | | | | (0.02 | ) | | | (0.03 | ) | |
Net Asset Value, End of Period | | $ | 1.15 | | | $ | 1.11 | | | $ | 1.08 | | | $ | 0.99 | | | $ | 0.89 | | | $ | 1.27 | | | $ | 1.18 | | | $ | 1.16 | | | $ | 1.03 | | | $ | 0.88 | | | $ | 1.38 | | | $ | 1.24 | | | $ | 1.24 | | | $ | 1.06 | | | $ | 0.86 | | |
Total Return (%) | | | 7.44 | | | | 5.79 | | | | 9.34 | | | | 15.94 | | | | (10.19 | ) | | | 10.90 | | | | 4.19 | | | | 13.11 | | | | 21.27 | | | | (19.85 | ) | | | 13.41 | | | | 2.31 | | | | 17.02 | | | | 25.64 | | | | (28.20 | ) | |
Net Assets, End of Period ($ millions) | | | 86 | | | | 66 | | | | 52 | | | | 38 | | | | 24 | | | | 225 | | | | 182 | | | | 163 | | | | 125 | | | | 90 | | | | 187 | | | | 158 | | | | 147 | | | | 117 | | | | 81 | | |
Ratio of Net Investment Income (Loss) to Average Net Assets (%) | | | 0.03 | | | | 3.40 | | | | 3.47 | | | | 4.24 | | | | 4.04 | | | | 0.02 | | | | 2.68 | | | | 2.73 | | | | 3.22 | | | | 3.14 | | | | 0.01 | | | | 2.13 | | | | 2.07 | | | | 2.44 | | | | 2.41 | | |
| Ratio of Expenses to Average Net Assets Before Expense Reimbursement (%)(d) | | | — | | | | — | | | | — | | | | — | | | | — | | | | — | | | | — | | | | — | | | | — | | | | — | | | | — | | | | — | | | | — | | | | — | | | | — | | |
| Ratio of Expenses to Average Net Assets After Expense Reimbursement (%)(d) | | | — | | | | — | | | | — | | | | — | | | | — | | | | — | | | | — | | | | — | | | | — | | | | — | | | | — | | | | — | | | | — | | | | — | | | | — | | |
Portfolio Turnover Rate (%)(a) | | | 10.14 | | | | 12.14 | | | | 20.11 | | | | 14.24 | | | | 38.30 | | | | 8.11 | | | | 11.21 | | | | 15.68 | | | | 15.29 | | | | 25.21 | | | | 7.82 | | | | 7.73 | | | | 12.91 | | | | 11.70 | | | | 20.56 | | |
(a) Portfolio turnover rate excludes all short-term securities.
(b) Not annualized.
(c) Annualized.
(d) Allocation and Retirement Funds exclude expenses of the underlying funds.
(e) For the period October 1, 2012 (commencement of operations) through December 31, 2012.
(f) Amount is less than $0.005 per share.
NA = Not Applicable
The accompanying notes are an integral part of these financial statements.
84
The accompanying notes are an integral part of these financial statements.
85
MUTUAL OF AMERICA INVESTMENT CORPORATION
FINANCIAL HIGHLIGHTS (Continued)
| | | Money Market Fund | | Mid-Term Bond Fund | | Bond Fund | |
| | | Years Ended December 31, | | Years Ended December 31, | | Years Ended December 31, | |
| | | 2012 | | 2011 | | 2010 | | 2009 | | 2008 | | 2012 | | 2011 | | 2010 | | 2009 | | 2008 | | 2012 | | 2011 | | 2010 | | 2009 | | 2008 | |
Net Asset Value, Beginning of Period | | $ | 1.20 | | | $ | 1.20 | | | $ | 1.21 | | | $ | 1.21 | | | $ | 1.21 | | | $ | 1.06 | | | $ | 1.03 | | | $ | 1.00 | | | $ | 0.94 | | | $ | 0.96 | | | $ | 1.39 | | | $ | 1.34 | | | $ | 1.30 | | | $ | 1.18 | | | $ | 1.27 | | |
INCOME (LOSS) FROM INVESTMENT OPERATIONS: | |
| Net Investment Income (Loss) | | | — | (f) | | | — | (f) | | | — | (f) | | | — | (f) | | | 0.03 | | | | 0.03 | | | | 0.03 | | | | 0.04 | | | | 0.04 | | | | 0.04 | | | | 0.05 | | | | 0.05 | | | | 0.05 | | | | 0.05 | | | | 0.07 | | |
| Net Realized and Unrealized Gains (Losses) on Investments and Futures Contracts | | | — | (f) | | | — | (f) | | | (0.01 | ) | | | — | (f) | | | — | (f) | | | — | (f) | | | 0.03 | | | | 0.02 | | | | 0.07 | | | | (0.02 | ) | | | 0.03 | | | | 0.05 | | | | 0.04 | | | | 0.12 | | | | (0.09 | ) | |
| Total From Investment Operations | | | — | | | | — | | | | (0.01 | ) | | | — | | | | 0.03 | | | | 0.03 | | | | 0.06 | | | | 0.06 | | | | 0.11 | | | | 0.02 | | | | 0.08 | | | | 0.10 | | | | 0.09 | | | | 0.17 | | | | (0.02 | ) | |
Less: Dividend Distributions: | |
| From Net Investment Income | | | — | | | | — | | | | — | | | | — | (f) | | | (0.03 | ) | | | — | (f) | | | (0.03 | ) | | | (0.03 | ) | | | (0.04 | ) | | | (0.04 | ) | | | — | (f) | | | (0.05 | ) | | | (0.05 | ) | | | (0.05 | ) | | | (0.07 | ) | |
| From Capital Gains | | | — | | | | — | | | | — | | | | — | (f) | | | — | (f) | | | — | (f) | | | — | | | | — | (f) | | | (0.01 | ) | | | — | | | | — | | | | — | | | | — | | | | — | | | | — | | |
| Total Distributions | | | — | | | | — | | | | — | | | | — | | | | (0.03 | ) | | | — | | | | (0.03 | ) | | | (0.03 | ) | | | (0.05 | ) | | | (0.04 | ) | | | — | | | | (0.05 | ) | | | (0.05 | ) | | | (0.05 | ) | | | (0.07 | ) | |
Net Asset Value, End of Period | | $ | 1.20 | | | $ | 1.20 | | | $ | 1.20 | | | $ | 1.21 | | | $ | 1.21 | | | $ | 1.09 | | | $ | 1.06 | | | $ | 1.03 | | | $ | 1.00 | | | $ | 0.94 | | | $ | 1.47 | | | $ | 1.39 | | | $ | 1.34 | | | $ | 1.30 | | | $ | 1.18 | | |
Total Return (%) | | | (0.17 | ) | | | (0.17 | ) | | | (0.14 | ) | | | (0.08 | ) | | | 2.34 | | | | 3.33 | | | | 6.34 | | | | 6.93 | | | | 11.22 | | | | 1.84 | | | | 5.79 | | | | 7.30 | | | | 7.29 | | | | 14.61 | | | | (1.75 | ) | |
Net Assets, End of Period ($ millions) | | | 90 | | | | 101 | | | | 109 | | | | 119 | | | | 201 | | | | 387 | | | | 338 | | | | 298 | | | | 234 | | | | 183 | | | | 753 | | | | 635 | | | | 597 | | | | 488 | | | | 372 | | |
Ratio of Net Investment Income (Loss) to Average Net Assets (%) | | | (0.18 | ) | | | (0.17 | ) | | | (0.15 | ) | | | (0.04 | ) | | | 2.38 | | | | 2.94 | | | | 3.02 | | | | 3.66 | | | | 4.16 | | | | 4.27 | | | | 3.55 | | | | 3.61 | | | | 3.81 | | | | 4.62 | | | | 5.05 | | |
Ratio of Expenses to Average Net Assets Before Expense Reimbursement (%) | | | 0.30 | | | | 0.31 | | | | 0.32 | | | | 0.33 | | | | 0.32 | | | | 0.55 | | | | 0.55 | | | | 0.57 | | | | 0.58 | | | | 0.55 | | | | 0.55 | | | | 0.55 | | | | 0.57 | | | | 0.58 | | | | 0.56 | | |
Ratio of Expenses to Average Net Assets After Expense Reimbursement (%) | | | 0.30 | | | | 0.31 | | | | 0.32 | | | | 0.33 | | | | 0.32 | | | | 0.55 | | | | 0.55 | | | | 0.57 | | | | 0.58 | | | | 0.55 | | | | 0.55 | | | | 0.55 | | | | 0.57 | | | | 0.58 | | | | 0.56 | | |
Portfolio Turnover Rate (%)(a) | | | N/A | | | | N/A | | | | NA | | | | NA | | | | NA | | | | 14.30 | | | | 23.69 | | | | 16.70 | | | | 30.76 | | | | 34.95 | | | | 28.89 | | | | 30.24 | | | | 40.33 | | | | 46.27 | | | | 23.76 | | |
(a) Portfolio turnover rate excludes all short-term securities.
(b) Not annualized.
(c) Annualized.
(d) Allocation and Retirement Funds exclude expenses of the underlying funds.
(e) For the period October 1, 2012 (commencement of operations) through December 31, 2012.
(f) Amount is less than $0.005 per share.
NA = Not Applicable
The accompanying notes are an integral part of these financial statements.
86
The accompanying notes are an integral part of these financial statements.
87
MUTUAL OF AMERICA INVESTMENT CORPORATION
NOTES TO FINANCIAL STATEMENTS
1. SIGNIFICANT ACCOUNTING POLICIES AND ORGANIZATION
Mutual of America Investment Corporation (the "Investment Company") is a diversified, open-end management investment company — a type of company commonly known as a "mutual fund". It is registered as such under the Investment Company Act of 1940 (the "Investment Company Act"). The Investment Company was formed on February 21, 1986 as a Maryland corporation and principally offers its shares exclusively to separate accounts of Mutual of America Life Insurance Company ("Mutual of America Life") and its affiliates. As a "series" type mutual fund, the Investment Company issues separate classes (or series) of capital stock, each of which represents a separate Fund of investments. At December 31, 2012, there were 24 active Funds (collectively, "the Funds"): Equity Index Fund, All America Fund, Small Cap Value Fund, Small Cap Growth Fund, Mid Cap Value Fund, Mid-Cap Equity Index Fund, International Fund, Composite Fund, Money Market Fund, Mid-Term Bond Fund, Bond Fund; Retirement Income Fund, 2010 Retirement Fund, 2015 Retirement Fund, 2020 Retirement Fund, 2025 Retirement Fund, 2030 Retirement Fund, 2035 Retirement Fund, 2040 Retirement Fund, 2045 Retirement Fund and 2050 Retirement Fund (collectively, "Retirement Funds"); a Conservative Allocation Fund, a Moderate Allocation Fund and an Aggressive Allocation Fund (collectively, "Allocation Funds"). The International Fund and the Retirement Funds (other than the 2050 Retirement Fund) commenced operations on November 5, 2007. The 2050 Retirement Fund commenced operations on October 1, 2012.
Investment Company shares are issued to Mutual of America Life, and on a limited basis, to Wilton Reassurance Life Company of New York (formerly The American Life Insurance Company of New York), for allocation to their Separate Accounts as a funding medium for variable accumulation annuity contracts and variable life insurance policies. In addition, shares of selected equity and fixed income funds of the Investment Company are directly issued to one or more of the Investment Company's Allocation Funds.
The preparation of financial statements in accordance with U.S. generally accepted accounting principles requires management to make estimates and assumptions that affect the reported amounts of assets, liabilities, income, expenses and related disclosures. Actual results, however, may differ from those estimates.
The following is a summary of the significant accounting policies consistently followed by the Investment Company, which are in conformity with U.S. generally accepted accounting principles ("GAAP"):
Fair Value — The Investment Company values its investments at fair value. Fair value is an estimate of the price the Fund would receive upon selling a security in an orderly arms-length transaction. Investments are categorized based on a three-level valuation hierarchy for measurement and disclosure of fair value. The valuation hierarchy is based upon the transparency of inputs used to measure fair value. The three levels are as follows:
• Level 1 — quoted prices in active markets for identical securities.
• Level 2 — other significant observable inputs (including yield, quality, coupon rate, maturity, issue type, quoted prices for similar securities, prepayment speeds, trading characteristics, etc.).
• Level 3 — significant unobservable inputs (including the Fund's own assumptions in determining the fair value of investments).
As of December 31, 2012, management determined that the fair value inputs for all equity securities, including shares of registered investment companies, were considered Level 1, with the exception of non-registered securities under Rule 144A of the Securities Act of 1933 which were considered Level 2. In addition, certain Rule 144A securities not actively traded are considered Level 3; however, there were no such securities as of December 31, 2012. Fair value inputs for all debt securities were considered Level 2. The inputs used for valuing securities are not necessarily an indication of the risk associated with investing in those securities. Transfers between levels are reflected based on the fair value at the beginning of a reporting period.
88
MUTUAL OF AMERICA INVESTMENT CORPORATION
NOTES TO FINANCIAL STATEMENTS (Continued)
1. SIGNIFICANT ACCOUNTING POLICIES AND ORGANIZATION (CONTINUED)
The following is a summary of the inputs used to value the Funds' investments and other financial instruments as of December 31, 2012, by fair value input hierarchy:
Fund | | Level 1 — Quoted
Prices | | Level 2 — Significant
Observable Inputs | | Level 3 — Significant
Unobservable Inputs | | Total | |
Investments at Market Value:
(See Portfolios of Investments for More Details) | |
Equity Index Fund | |
Common Stock | | $ | 1,069,563,554 | | | | — | | | | — | | | $ | 1,069,563,554 | | |
Short-Term Debt Securities | | | — | | | $ | 36,894,226 | | | | — | | | $ | 36,894,226 | | |
Temporary Cash Investments | | | — | | | $ | 32,700 | | | | — | | | $ | 32,700 | | |
| | | $ | 1,069,563,554 | | | $ | 36,926,926 | | | | — | | | $ | 1,106,490,480 | | |
All America Fund | |
Common Stock-Indexed | | $ | 131,737,697 | | | | — | | | | — | | | $ | 131,737,697 | | |
Common Stock-Active | | $ | 114,869,959 | | | | — | | | | — | | | $ | 114,869,959 | | |
Convertible Preferred Stock | | $ | 191,225 | | | | — | | | | — | | | $ | 191,225 | | |
Short-Term Debt Securities | | | — | | | $ | 7,298,250 | | | | — | | | $ | 7,298,250 | | |
Temporary Cash Investments | | | — | | | $ | 1,489,000 | | | | — | | | $ | 1,489,000 | | |
| | | $ | 246,798,881 | | | $ | 8,787,250 | | | | — | | | $ | 255,586,131 | | |
Small Cap Value Fund | |
Common Stock | | $ | 277,220,165 | | | | — | | | | — | | | $ | 277,220,165 | | |
Convertible Preferred Stock | | $ | 1,463,422 | | | | — | | | | — | | | $ | 1,463,422 | | |
Short-Term Debt Securities | | | — | | | $ | 11,497,820 | | | | — | | | $ | 11,497,820 | | |
| | | $ | 278,683,587 | | | $ | 11,497,820 | | | | — | | | $ | 290,181,407 | | |
Small Cap Growth Fund | |
Common Stock | | $ | 260,482,002 | | | | — | | | | — | | | $ | 260,482,002 | | |
Short-Term Debt Securities | | | — | | | $ | 11,598,038 | | | | — | | | $ | 11,598,038 | | |
| | | $ | 260,482,002 | | | $ | 11,598,038 | | | | — | | | $ | 272,080,040 | | |
Mid Cap Value Fund | |
Common Stock | | $ | 50,624,162 | | | | — | | | | — | | | $ | 50,624,162 | | |
Short-Term Debt Securities | | | — | | | $ | 2,499,614 | | | | — | | | $ | 2,499,614 | | |
| | | $ | 50,624,162 | | | $ | 2,499,614 | | | | — | | | $ | 53,123,776 | | |
Mid-Cap Equity Index Fund | |
Common Stock | | $ | 590,192,857 | | | | — | | | | — | | | $ | 590,192,857 | | |
Short-Term Debt Securities | | | — | | | $ | 18,696,990 | | | | — | | | $ | 18,696,990 | | |
Temporary Cash Investments | | | — | | | $ | 301,400 | | | | — | | | $ | 301,400 | | |
| | | $ | 590,192,857 | | | $ | 18,998,390 | | | | — | | | $ | 609,191,247 | | |
International Fund | | | | | | | | | |
Common Stock | | $ | 113,980,101 | | | | — | | | | — | | | $ | 113,980,101 | | |
Composite Fund | |
Common Stock | | $ | 94,323,287 | | | | — | | | | — | | | $ | 94,323,287 | | |
U.S. Government Debt | | | — | | | $ | 11,150,774 | | | | — | | | $ | 11,150,774 | | |
U.S. Government Agency Residential
Mortgage-Backed Obligations | | | — | | | $ | 22,889,607 | | | | — | | | $ | 22,889,607 | | |
Corporate Long-Term Debt | | | — | | | $ | 31,672,350 | | | | — | | | $ | 31,672,350 | | |
Short-Term Debt | | | — | | | $ | 8,048,365 | | | | — | | | $ | 8,048,365 | | |
Temporary Cash Investments | | | — | | | $ | 934,600 | | | | — | | | $ | 934,600 | | |
| | $ | 94,323,287 | | | $ | 74,695,696 | | | | — | | | $ | 169,018,983 | | |
Retirement Income Fund | |
Common Stock | | $ | 31,243,375 | | | | — | | | | — | | | $ | 31,243,375 | | |
| | 2010 | Retirement Fund | |
Common Stock | | $ | 21,452,723 | | | | — | | | | — | | | $ | 21,452,723 | | |
| | 2015 | Retirement Fund | |
Common Stock | | $ | 112,337,705 | | | | — | | | | — | | | $ | 112,337,705 | | |
89
MUTUAL OF AMERICA INVESTMENT CORPORATION
NOTES TO FINANCIAL STATEMENTS (Continued)
1. SIGNIFICANT ACCOUNTING POLICIES AND ORGANIZATION (CONTINUED)
Fund | | Level 1 — Quoted
Prices | | Level 2 — Significant
Observable Inputs | | Level 3 — Significant
Unobservable Inputs | | Total | |
| | 2020 | Retirement Fund | |
Common Stock | | $ | 169,031,294 | | | | — | | | | — | | | $ | 169,031,294 | | |
| | 2025 | Retirement Fund | |
Common Stock | | $ | 161,771,470 | | | | — | | | | — | | | $ | 161,771,470 | | |
| | 2030 | Retirement Fund | |
Common Stock | | $ | 133,273,336 | | | | — | | | | — | | | $ | 133,273,336 | | |
| | 2035 | Retirement Fund | |
Common Stock | | $ | 106,699,288 | | | | — | | | | — | | | $ | 106,699,288 | | |
| | 2040 | Retirement Fund | |
Common Stock | | $ | 93,991,633 | | | | — | | | | — | | | $ | 93,991,633 | | |
| | 2045 | Retirement Fund | |
Common Stock | | $ | 118,318,475 | | | | — | | | | — | | | $ | 118,318,475 | | |
| | 2050 | Retirement Fund | |
Common Stock | | $ | 2,117,191 | | | | — | | | | — | | | $ | 2,117,191 | | |
Conservative Allocation Fund | |
Common Stock | | $ | 86,359,906 | | | | — | | | | — | | | $ | 86,359,906 | | |
Moderate Allocation Fund | |
Common Stock | | $ | 225,205,190 | | | | — | | | | — | | | $ | 225,205,190 | | |
Aggressive Allocation Fund | |
Common Stock | | $ | 186,917,156 | | | | — | | | | — | | | $ | 186,917,156 | | |
Money Market Fund | |
U.S. Government Debt | | | — | | | $ | 7,999,292 | | | | — | | | $ | 7,999,292 | | |
U.S. Government Agency Short-Term Debt | | | — | | | $ | 20,410,885 | | | | — | | | $ | 20,410,885 | | |
Commercial Paper | | | — | | | $ | 60,444,997 | | | | — | | | $ | 60,444,997 | | |
Temporary Cash Investments | | | — | | | $ | 1,078,600 | | | | — | | | $ | 1,078,600 | | |
| | | | — | | | $ | 89,933,774 | | | | — | | | $ | 89,933,774 | | |
Mid-Term Bond Fund | |
U.S. Government Debt | | | — | | | $ | 179,805,893 | | | | — | | | $ | 179,805,893 | | |
U.S. Government Agency Residential
Mortgage-Backed Obligations | | | — | | | $ | 31,803 | | | | — | | | $ | 31,803 | | |
U.S. Government Agency
Non-Mortgage-Backed Obligations | | | — | | | $ | 46,101,248 | | | | — | | | $ | 46,101,248 | | |
Corporate Debt | | | — | | | $ | 157,328,936 | | | | — | | | $ | 157,328,936 | | |
Municipal Obligations | | | — | | | $ | 769,456 | | | | — | | | $ | 769,456 | | |
Temporary Cash Investments | | | — | | | $ | 697,600 | | | | — | | | $ | 697,600 | | |
| | | | — | | | $ | 384,734,936 | | | | — | | | $ | 384,734,936 | | |
Bond Fund | |
U.S. Government Debt | | | — | | | $ | 92,524,579 | | | | — | | | $ | 92,524,579 | | |
U.S. Government Agency Residential
Mortgage-Backed Obligations | | | — | | | $ | 202,094,681 | | | | — | | | $ | 202,094,681 | | |
U.S. Government Agency
Non-Mortgage-Backed Obligations | | | — | | | $ | 17,521,140 | | | | — | | | $ | 17,521,140 | | |
Long-Term Corporate Debt | | | — | | | $ | 428,832,328 | | | | — | | | $ | 428,832,328 | | |
Sovereign Debt | | | — | | | $ | 4,453,291 | | | | — | | | $ | 4,453,291 | | |
Short-Term Debt | | | — | | | $ | 1,999,993 | | | | — | | | $ | 1,999,993 | | |
Temporary Cash Investments | | | — | | | $ | 487,200 | | | | — | | | $ | 487,200 | | |
| | | | — | | | $ | 747,913,212 | | | | — | | | $ | 747,913,212 | | |
Other Financial Instruments:* | |
Equity Index Fund | | $ | (271,225 | ) | | | — | | | | — | | | $ | (271,225 | ) | |
All America Fund | | $ | (19,126 | ) | | | — | | | | — | | | $ | (19,126 | ) | |
Mid-Cap Equity Index Fund | | $ | (111,507 | ) | | | — | | | | — | | | $ | (111,507 | ) | |
* Other financial instruments are derivative instruments not reflected in the Portfolio of Investments, such as futures, which are valued at the unrealized appreciation/depreciation on the instrument.
90
MUTUAL OF AMERICA INVESTMENT CORPORATION
NOTES TO FINANCIAL STATEMENTS (Continued)
1. SIGNIFICANT ACCOUNTING POLICIES AND ORGANIZATION (CONTINUED)
| | | Fair Value Measurement Using Significant Unobservable
Inputs (Level 3) for the Year Ended December 31, 2012 | |
| | | Balance
December 31,
2011 | | Change in
Unrealized
Gains
(Losses) | | Transfers
Into
Level 3(a) | | Transfers
Out of
Level 3(b) | | Balance
December 31,
2012 | | Net Change in
Unrealized Gains/(Losses)
of Level 3 Assets Held as of
December 31, 2012 Included
in Statement of Operations | |
All America Fund —
Active Common Stock | | | — | | | | — | | | $ | 810,576 | | | $ | (810,576 | ) | | | — | | | | — | | |
Small Cap Value Fund —
Common Stock | | | — | | | | — | | | $ | 4,725,984 | | | $ | (4,725,984 | ) | | | — | | | | — | | |
(a) Reflects transfers into Level 3 from Level 2 as a result of a security being carried at a calculated fair value due to the absence of recent trading activity in the security, as described in Security Valuation below.
(b) Reflects transfers into Level 2 as a result of a security no longer being carried at a calculated fair value due to a recent trade, as further described under Security Valuation below. Also reflects the transfer of common stock of NBH Holdings Co. from Level 3 to Level 1 as a result of the security commencing trading on a public exchange. The market value of this security as of December 31, 2011 was $270,192 in the All America Fund and $1,575,328 in the Small Cap Value Fund, respectively.
During the year ended December 31, 2012, there were no transfers of securities between Level 1 and Level 2.
In May 2011, the FASB issued ASU No. 2011-04, "Fair Value Measurements (Topic 820) — Amendments to Achieve Common Fair Value Measurement and Disclosure Requirements in U.S. GAAP and IFRSs" ("ASU No. 2011-04"). ASU No. 2011-04 requires additional disclosures regarding fair value measurements in financial statements of interim and annual periods beginning after December 15, 2011. The discussion under Security Valuation, below, reflects these additional disclosures.
Security Valuation — Investment securities are carried at fair value as follows:
Exchange-traded equity securities are valued at the last sales price on the principal exchange on which the security is traded. If there is no trading volume for a particular valuation day, the last bid price is used. For equity securities traded in the over-the-counter market, the security is valued at the last sale price, or if no sale, at the latest bid price available.
Short-term debt securities with a maturity of 60 days or less are valued at amortized cost, which approximates fair value for such securities.
Debt securities, including short-term debt securities maturing in excess of 60 days, are valued on the basis of prices obtained from an independent pricing source. The pricing source may utilize various pricing methodologies that incorporate both models (which consider factors such as yield, quality, coupon rate, maturity, issue type, quoted prices for similar securities, prepayment speeds and trading characteristics) and dealer-supplied valuations to derive a valuation.
In the rare instance when a price is not available from an independent pricing source or when prices may not reflect fair value, such as when the price provided by the pricing source is not based on a recent trade, a calculated fair value is used, as determined in good faith by the Adviser and reviewed by a Valuation Committee, in accordance with procedures adopted by the Board of Directors of the Investment Company.
The Advisor uses a market approach to calculate fair value for equity securities which are categorized as Level 3. The Adviser's valuation is primarily based on information regarding the specific equity issuer, such as the last trade price, financial statements, the relationship of per-share book value to the last trade price, operating information and any corporate actions, such as dividends or returns of capital, that may have occurred since the last trade. The Adviser also considers industry-specific conditions and overall market conditions, to determine whether the last trade price reflects fair value or needs to be adjusted. Generally, absent any significant contrary indications, the last trade price will be used as the calculated fair value.
91
MUTUAL OF AMERICA INVESTMENT CORPORATION
NOTES TO FINANCIAL STATEMENTS (Continued)
1. SIGNIFICANT ACCOUNTING POLICIES AND ORGANIZATION (CONTINUED)
The Retirement Funds and the Allocation Funds value their investments in the underlying Funds of the Investment Company at their respective net asset values.
Investment Transactions — Investment transactions are accounted for as of the trade date. Realized gains and losses on the sale of short and long-term debt securities are computed on the basis of amortized cost at the time of sale. Realized gains and losses on the sale of equity securities are based on the identified cost basis of the security, determined on the first-in, first-out ("FIFO") basis.
Futures Contracts — The Equity Index Fund, Mid-Cap Equity Index Fund and a portion of the All America Fund each maintain indexed asset portfolios which are subject to equity price risk. In order to remain more fully invested in the equity markets while minimizing transaction costs, the funds purchase stock index futures contracts. An initial cash margin deposit (represented by cash or Treasury bills) is made upon entering into a futures contract and serves as collateral for the contract. This initial margin, maintained in a segregated account, is equal to approximately 5%-6% of the contract amount, and does not involve the borrowing of funds to finance the transaction. During the period the futures contract is outstanding, changes in the value of the contract are recognized as unrealized gains or losses by "marking-to-market" on a daily basis to reflect the market value of the contract at the end of each trading day. The accumulated unrealized gain or loss on the contract is included in Net Unrealized Appreciation (Depreciation) of Investments in the Components of Net Assets section of the Statement of Assets and Liabilities. Futures contracts are valued at the settlement price established each day by the exchange on which traded. Depending upon whether unrealized gains or losses are incurred, variation margin payments are received or made daily. The net change in unrealized appreciation or depreciation of futures contracts is recorded in the Statement of Operations. When the contract is closed, a realized gain or loss from futures transactions is recorded in the Statement of Operations, equal to the net variation margin received or paid over the period the contract was outstanding.
The "Underlying Face Amount at Value" (appearing in the "Notes to the Summary Portfolio of Investments in Securities") representing the aggregate of outstanding contractual amounts under futures contracts reflects the extent of a Fund's exposure to off-balance sheet risk. The use of futures transactions involves the risk of imperfect correlation in the price movements of the contract and the underlying securities. With futures contracts, there is minimal counterparty credit risk to the Fund since futures are exchange traded and the exchange's clearinghouse, as counterparty to all exchange traded futures, guarantees the futures against default.
During the year ended December 31, 2012, the Equity Index Fund, Mid-Cap Equity Index Fund and the All America Fund purchased futures contracts with total principal amounts of $302,066,728, $145,338,079 and $33,294,345, respectively.
Retirement Funds — Each of the Retirement Funds invests in equity (stock) funds and fixed income (bond) funds and targets different percentages to these asset classes. The targets reflect varying emphases on achieving capital appreciation and gains versus preserving capital and producing income, depending on the specific Fund's time horizon.
The Retirement Funds target their investments in the following underlying funds of the Investment Company in accordance with the percentage allocations noted:
| | | Equity
Index
Fund | | Mid-Cap
Equity
Index
Fund | | Small Cap
Growth
Fund | | Small Cap
Value
Fund | | International
Fund | | Bond
Fund | | Mid-Term
Bond
Fund | | Money
Market
Fund | |
| | Retirement Income Fund | | | | 20 | % | | | 5 | % | | | — | | | | — | | | | — | | | | 30 | % | | | 40 | % | | | 5 | % | |
| | 2010 | Retirement Fund | | | 25 | % | | | 11 | % | | | — | | | | — | | | | 3 | % | | | 25 | % | | | 31 | % | | | 5 | % | |
| | 2015 | Retirement Fund | | | 28 | % | | | 11 | % | | | 2 | % | | | 2 | % | | | 6 | % | | | 25 | % | | | 26 | % | | | — | | |
| | 2020 | Retirement Fund | | | 33 | % | | | 11 | % | | | 3 | % | | | 3 | % | | | 9 | % | | | 25 | % | | | 16 | % | | | — | | |
| | 2025 | Retirement Fund | | | 37 | % | | | 15 | % | | | 4 | % | | | 4 | % | | | 9 | % | | | 23 | % | | | 8 | % | | | — | | |
| | 2030 | Retirement Fund | | | 40 | % | | | 17 | % | | | 5 | % | | | 5 | % | | | 10 | % | | | 23 | % | | | — | | | | — | | |
| | 2035 | Retirement Fund | | | 40 | % | | | 20 | % | | | 6 | % | | | 6 | % | | | 12 | % | | | 16 | % | | | — | | | | — | | |
| | 2040 | Retirement Fund | | | 35 | % | | | 23 | % | | | 8 | % | | | 8 | % | | | 14 | % | | | 12 | % | | | — | | | | — | | |
| | 2045 | Retirement Fund | | | 35 | % | | | 21 | % | | | 9 | % | | | 9 | % | | | 16 | % | | | 10 | % | | | — | | | | — | | |
| | 2050 | Retirement Fund | | | 35 | % | | | 20 | % | | | 10 | % | | | 10 | % | | | 17 | % | | | 8 | % | | | — | | | | — | | |
92
MUTUAL OF AMERICA INVESTMENT CORPORATION
NOTES TO FINANCIAL STATEMENTS (Continued)
1. SIGNIFICANT ACCOUNTING POLICIES AND ORGANIZATION (CONTINUED)
Generally, rebalancing of the Retirement Funds' holdings is performed on a quarterly or other periodic basis and the mix of underlying Funds is reviewed annually.
Allocation Funds — The Allocation Funds target their investments in the following underlying Funds of the Investment Company in accordance with the percentage allocations noted:
Conservative Allocation: | | Equity Index (25%), Bond (30%), | |
| | | | | Mid-Term Bond (45%). | |
Moderate Allocation: | | Equity Index (35%), Bond (30%), | |
| | | | | Mid-Term Bond (20%), Mid-Cap Equity Index (15%). | |
Aggressive Allocation: | | Equity Index (45%), Bond (25%), | |
| | | | | Mid-Cap Equity Index (20%), Small Cap Value (5%), Small Cap Growth (5%). | |
Generally, rebalancing of the Allocation Funds' holdings is performed on a monthly basis.
Investment Income — Interest income, accretion of discount and amortization of premium are recorded daily on an accrual basis using the effective interest method. A debt obligation may cease accrual of income and result in a reduction to interest income when the collection of all or a portion of current and past due interest is in doubt. Dividend income is recorded on the ex-dividend date. Foreign source tax withheld from dividends is recorded as a reduction from dividend income. Should reclamation efforts succeed, such amounts are recorded as income upon collection.
Distributions to Shareholders ("Dividends") — Distributions to shareholders are recorded on the ex-dividend date and are made at least annually. It is the Investment Company's policy to make distributions of its net investment income and net realized gains, if any, in accordance with Federal income tax regulations, which may differ from U.S. generally accepted accounting principles. Accordingly, periodic reclassifications (which do not impact the funds' net asset values) are made within the funds' capital accounts to reflect income and gains available for distribution under Federal income tax regulations.
Federal Income Taxes — Each Fund in the Investment Company intends to comply with the requirements of the Internal Revenue Code applicable to regulated investment companies and to distribute substantially all of its taxable income to shareholders. Therefore, no Federal income or excise tax provision is required.
GAAP requires the evaluation of tax positions taken in the course of preparing a fund's tax return to determine whether it is "more-likely-than-not" that tax positions taken in the fund's tax return will be ultimately sustained, and, if not, a tax liability and expense is recorded.
As of December 31, 2012, management has evaluated the tax positions taken on the Funds' tax returns for all open tax years and has concluded that no tax provision is required in any of the Funds' financial statements. Each Fund's federal and state income, franchise and federal excise tax returns for tax years for which the applicable statutes of limitations have not expired are subject to examination by the Internal Revenue Service and state departments of revenue.
At December 31, 2012, the Funds had the following capital loss carry forwards to offset net capital gains, to the extent provided by Federal income tax regulations, which if unused expire on the dates noted.
| Expiring on December 31, | | Equity
Index Fund | | All America
Fund | | Small Cap
Value Fund | | Small Cap
Growth | | Mid Cap
Value Fund | |
| | 2013 | | | $ | 0 | | | $ | 0 | | | $ | 0 | | | $ | 0 | | | $ | 0 | | |
| | 2014 | | | | 0 | | | | 0 | | | | 0 | | | | 0 | | | | 0 | | |
| | 2015 | | | | 0 | | | | 0 | | | | 0 | | | | 0 | | | | 0 | | |
| | 2016 | | | | 0 | | | | 0 | | | | 0 | | | | 0 | | | | 0 | | |
| | 2017 | | | | 0 | | | | 0 | | | | 6,732,589 | | | | 0 | | | | 0 | | |
| | 2018 | | | | 0 | | | | 0 | | | | 0 | | | | 0 | | | | 0 | | |
| | No Expiration** | | | | 0 | | | | 0 | | | | 0 | | | | 0 | | | | 0 | | |
| | Total | | | $ | 0 | | | $ | 0 | | | $ | 6,732,589 | | | $ | 0 | | | $ | 0 | | |
93
MUTUAL OF AMERICA INVESTMENT CORPORATION
NOTES TO FINANCIAL STATEMENTS (Continued)
1. SIGNIFICANT ACCOUNTING POLICIES AND ORGANIZATION (CONTINUED)
Expiring on December 31, | | Mid-Cap
Equity Index
Fund | | International
Fund | | Composite
Fund | | Retirement
Income
Fund | | 2010
Retirement
Fund | |
| | 2013 | | | $ | 0 | | | $ | 0 | | | $ | 0 | | | $ | 0 | | | $ | 0 | | |
| | 2014 | | | | 0 | | | | 0 | | | | 0 | | | | 0 | | | | 0 | | |
| | 2015 | | | | 0 | | | | 0 | | | | 0 | | | | 0 | | | | 0 | | |
| | 2016 | | | | 0 | | | | 0 | | | | 0 | | | | 0 | | | | 0 | | |
| | 2017 | | | | 0 | | | | 0 | | | | 9,842,700 | | | | 0 | | | | 0 | | |
| | 2018 | | | | 0 | | | | 0 | | | | 0 | | | | 0 | | | | 0 | | |
| | No Expiration** | | | | 0 | | | | 10,241 | | | | 0 | | | | 0 | | | | 0 | | |
| | Total | | | $ | 0 | | | $ | 10,241 | | | $ | 9,842,700 | | | $ | 0 | | | $ | 0 | | |
Expiring on December 31, | | 2015
Retirement
Fund | | 2020
Retirement
Fund | | 2025
Retirement
Fund | | 2030
Retirement
Fund | | 2035
Retirement
Fund | |
| | 2013 | | | $ | 0 | | | $ | 0 | | | $ | 0 | | | $ | 0 | | | $ | 0 | | |
| | 2014 | | | | 0 | | | | 0 | | | | 0 | | | | 0 | | | | 0 | | |
| | 2015 | | | | 0 | | | | 0 | | | | 0 | | | | 0 | | | | 0 | | |
| | 2016 | | | | 0 | | | | 0 | | | | 0 | | | | 0 | | | | 0 | | |
| | 2017 | | | | 0 | | | | 0 | | | | 0 | | | | 0 | | | | 0 | | |
| | 2018 | | | | 0 | | | | 0 | | | | 0 | | | | 0 | | | | 0 | | |
| | No Expiration** | | | | 0 | | | | 0 | | | | 0 | | | | 0 | | | | 0 | | |
| | Total | | | $ | 0 | | | $ | 0 | | | $ | 0 | | | $ | 0 | | | $ | 0 | | |
Expiring on December 31, | | 2040
Retirement
Fund | | 2045
Retirement
Fund | | 2050
Retirement
Fund | | Conservative
Allocation
Fund | | Moderate
Allocation
Fund | |
| | 2013 | | | $ | 0 | | | $ | 0 | | | $ | 0 | | | $ | 0 | | | $ | 0 | | |
| | 2014 | | | | 0 | | | | 0 | | | | 0 | | | | 0 | | | | 0 | | |
| | 2015 | | | | 0 | | | | 0 | | | | 0 | | | | 0 | | | | 0 | | |
| | 2016 | | | | 0 | | | | 0 | | | | 0 | | | | 0 | | | | 0 | | |
| | 2017 | | | | 0 | | | | 0 | | | | 0 | | | | 0 | | | | 0 | | |
| | 2018 | | | | 0 | | | | 0 | | | | 0 | | | | 0 | | | | 0 | | |
| | No Expiration** | | | | 0 | | | | 0 | | | | 0 | | | | 0 | | | | 0 | | |
| | Total | | | $ | 0 | | | $ | 0 | | | $ | 0 | | | $ | 0 | | | $ | 0 | | |
Expiring on December 31, | | Aggressive
Allocation
Fund | | Money
Market Fund | | Mid-Term
Bond Fund | | Bond
Fund | |
| | 2013 | | | $ | 0 | | | $ | 0 | | | $ | 0 | | | $ | 0 | | |
| | 2014 | | | | 0 | | | | 0 | | | | 0 | | | | 0 | | |
| | 2015 | | | | 0 | | | | 0 | | | | 0 | | | | 0 | | |
| | 2016 | | | | 0 | | | | 0 | | | | 0 | | | | 0 | | |
| | 2017 | | | | 0 | | | | 0 | | | | 0 | | | | 0 | | |
| | 2018 | | | | 0 | | | | 0 | | | | 0 | | | | 0 | | |
| | No Expiration** | | | | 0 | | | | 0 | | | | 0 | | | | 0 | | |
| | Total | | | $ | 0 | | | $ | 0 | | | $ | 0 | | | $ | 0 | | |
** Under the Regulated Investment Company Modernization Act of 2010, the Funds are permitted to carryforward these capital losses for an unlimited period. However, these losses will be required to be utilized prior to the Funds' other capital losses with the expiration dates listed above. Additionally, these capital losses retain their character as either short-term or long-term capital losses rather than being considered all short-term as under previous law.
94
MUTUAL OF AMERICA INVESTMENT CORPORATION
NOTES TO FINANCIAL STATEMENTS (Continued)
1. SIGNIFICANT ACCOUNTING POLICIES AND ORGANIZATION (CONTINUED)
New Accounting Pronouncement — In December 2011, the Financial Accounting Standards Board ("FASB") issued Accounting Standards Update ("ASU") No. 2011-11 regarding "Disclosures about Offsetting Assets and Liabilities." The amendments, which will be effective for annual reporting periods beginning on or after January 1, 2013 and interim periods within those annual periods, require an entity to disclose information about offsetting and related arrangements for assets and liabilities, financial instruments and derivatives that are either currently offset in accordance with current requirements or are subject to enforceable master netting arrangements or similar agreements. At this time, management is evaluating the implications of ASU No. 2011-11 and its impact on the financial statements has not yet been determined.
2. EXPENSES
The Investment Company has an Investment Advisory Agreement with Mutual of America Capital Management Corporation ("the Adviser"), an indirect wholly-owned subsidiary of Mutual of America Life. For providing investment management services to each of the Funds of the Investment Company, the Adviser receives a fee, calculated as a daily charge of the value of the net assets of each fund, at the following annual rates:
Fund | | Annual Investment
Management Fee | |
Retirement Funds | | | .05 | % | |
Equity Index, Mid Cap Equity Index, International Funds | | | .075 | % | |
Money Market Fund | | | .15 | % | |
All America, Composite, Mid-Term Bond, Bond Funds | | | .40 | % | |
Mid Cap Value Fund | | | .55 | % | |
Small Cap Value, Small Cap Growth Funds | | | .75 | % | |
The Adviser does not assess a fee for investment management to the Allocation Funds. However, shareholders in the Allocation Funds (and the Retirement and International Funds) will indirectly bear their pro-rata share of the investment management fees incurred by the underlying Funds in which they invest.
3. INVESTMENTS
The cost of investment purchases and proceeds from sales of investments, excluding short-term securities and futures contracts, for the year ended December 31, 2012, were as follows:
| | | Equity Index
Fund | | All America
Fund | | Small Cap
Value Fund | | Small Cap
Growth Fund | | Mid Cap
Value Fund | |
Cost of investment purchases | | $ | 112,231,655 | | | $ | 43,279,836 | | | $ | 64,976,572 | | | $ | 179,614,499 | | | $ | 14,332,532 | | |
Proceeds from sales of investments | | $ | 64,409,517 | | | $ | 69,117,485 | | | $ | 67,757,950 | | | $ | 195,494,025 | | | $ | 16,633,459 | | |
| | | Mid-Cap
Equity Index
Fund | | International
Fund | | Composite
Fund | | Retirement
Income
Fund | | 2010
Retirement
Fund | |
Cost of investment purchases | | $ | 85,748,546 | | | $ | 34,081,159 | | | $ | 41,007,084 | | | $ | 11,023,225 | | | $ | 5,600,486 | | |
Proceeds from sales of investments | | $ | 71,368,568 | | | $ | 237,668 | | | $ | 50,218,901 | | | $ | 4,712,130 | | | $ | 6,534,392 | | |
| | | 2015
Retirement
Fund | | 2020
Retirement
Fund | | 2025
Retirement
Fund | | 2030
Retirement
Fund | | 2035
Retirement
Fund | |
Cost of investment purchases | | $ | 31,886,324 | | | $ | 50,707,875 | | | $ | 49,095,078 | | | $ | 38,706,752 | | | $ | 32,908,322 | | |
Proceeds from sales of investments | | $ | 19,979,642 | | | $ | 14,107,047 | | | $ | 11,381,189 | | | $ | 8,295,857 | | | $ | 5,593,602 | | |
| | | 2040
Retirement
Fund | | 2045
Retirement
Fund | | 2050
Retirement
Fund | | Conservative
Allocation
Fund | | Moderate
Allocation
Fund | |
Cost of investment purchases | | $ | 26,484,086 | | | $ | 35,160,418 | | | $ | 2,087,225 | | | $ | 22,837,078 | | | $ | 40,575,873 | | |
Proceeds from sales of investments | | $ | 3,841,561 | | | $ | 3,873,500 | | | $ | 7,586 | | | $ | 7,718,922 | | | $ | 16,613,949 | | |
95
MUTUAL OF AMERICA INVESTMENT CORPORATION
NOTES TO FINANCIAL STATEMENTS (Continued)
3. INVESTMENTS (CONTINUED)
| | | Aggressive
Allocation
Fund | | Money
Market Fund | | Mid-Term
Bond Fund | | Bond
Fund | | | |
Cost of investment purchases | | $ | 22,243,580 | | | | — | | | $ | 98,107,998 | | | $ | 301,489,246 | | | | | | |
Proceeds from sales of investments | | $ | 13,752,257 | | | | — | | | $ | 49,355,073 | | | $ | 191,910,445 | | | | | | |
The cost of short-term security purchases for the Money Market Fund for the year ended December 31, 2012, was $1,065,737,314; net proceeds from sales for the year were $1,076,524,101.
The components of net unrealized appreciation (depreciation) of investments for Federal income tax purposes and the cost of investments for Federal income tax purposes at December 31, 2012 for each of the funds were as follows. Differences with amounts reflected in the Statements of Assets and Liabilities arise principally from wash sales and the treatment of distributions from partnerships and Real Estate Investment Trusts (REITs).
| | | Equity Index
Fund | | All America
Fund | | Small Cap
Value Fund | | Small Cap
Growth | | Mid Cap
Value Fund | |
Unrealized Appreciation | | $ | 305,202,913 | | | $ | 49,848,619 | | | $ | 68,151,790 | | | $ | 45,013,158 | | | $ | 9,007,613 | | |
Unrealized Depreciation | | | (67,963,152 | ) | | | (19,282,304 | ) | | | (9,018,338 | ) | | | (11,892,714 | ) | | | (3,328,101 | ) | |
Net | | $ | 237,239,761 | | | $ | 30,566,315 | | | $ | 59,133,452 | | | $ | 33,120,444 | | | $ | 5,679,512 | | |
Tax Cost of Investments | | $ | 869,250,719 | | | $ | 225,019,816 | | | $ | 231,047,955 | | | $ | 238,959,596 | | | $ | 47,444,264 | | |
| | | Mid-Cap
Equity Index
Fund | | International
Fund | | Composite
Fund | | Retirement
Income
Fund | | 2010
Retirement
Fund | |
Unrealized Appreciation | | $ | 135,724,570 | | | $ | 5,988,070 | | | $ | 24,976,539 | | | $ | 1,518,105 | | | $ | 1,569,552 | | |
Unrealized Depreciation | | | (36,606,606 | ) | | | (1,703,855 | ) | | | (4,272,189 | ) | | | (5,884 | ) | | | (123,861 | ) | |
Net | | $ | 99,117,964 | | | $ | 4,284,215 | | | $ | 20,704,350 | | | $ | 1,512,221 | | | $ | 1,445,691 | | |
Tax Cost of Investments | | $ | 510,073,284 | | | $ | 109,695,886 | | | $ | 148,314,633 | | | $ | 29,731,154 | | | $ | 20,007,032 | | |
| | | 2015
Retirement
Fund | | 2020
Retirement
Fund | | 2025
Retirement
Fund | | 2030
Retirement
Fund | | 2035
Retirement
Fund | |
Unrealized Appreciation | | $ | 11,251,005 | | | $ | 18,573,460 | | | $ | 19,492,887 | | | $ | 17,537,770 | | | $ | 14,606,722 | | |
Unrealized Depreciation | | | (1,529,805 | ) | | | (1,785,234 | ) | | | (1,109,298 | ) | | | (978,990 | ) | | | (679,380 | ) | |
Net | | $ | 9,721,200 | | | $ | 16,788,226 | | | $ | 18,383,589 | | | $ | 16,558,780 | | | $ | 13,927,342 | | |
Tax Cost of Investments | | $ | 102,616,505 | | | $ | 152,243,068 | | | $ | 143,387,881 | | | $ | 116,714,556 | | | $ | 92,771,946 | | |
| | | 2040
Retirement
Fund | | 2045
Retirement
Fund | | 2050
Retirement
Fund | | Conservative
Allocation
Fund | | Moderate
Allocation
Fund | |
Unrealized Appreciation | | $ | 13,277,493 | | | $ | 16,295,953 | | | $ | 37,172 | | | $ | 6,565,588 | | | $ | 32,056,967 | | |
Unrealized Depreciation | | | (458,222 | ) | | | (506,961 | ) | | | 0 | | | | (583,176 | ) | | | (7,520,615 | ) | |
Net | | $ | 12,819,271 | | | $ | 15,788,992 | | | $ | 37,172 | | | $ | 5,982,412 | | | $ | 24,536,352 | | |
Tax Cost of Investments | | $ | 81,172,363 | | | $ | 102,529,483 | | | $ | 2,080,019 | | | $ | 80,377,494 | | | $ | 200,668,838 | | |
| | | Aggressive
Allocation
Fund | | Money
Market Fund | | Mid-Term
Bond Fund | | Bond
Fund | |
Unrealized Appreciation | | $ | 28,931,727 | | | $ | 494 | | | $ | 22,274,497 | | | $ | 41,771,088 | | |
Unrealized Depreciation | | | (4,671,217 | ) | | | (111 | ) | | | (220,196 | ) | | | (1,214,578 | ) | |
Net | | $ | 24,260,510 | | | $ | 383 | | | $ | 22,054,301 | | | $ | 40,556,510 | | |
Tax Cost of Investments | | $ | 162,656,646 | | | $ | 89,933,391 | | | $ | 362,680,635 | | | $ | 707,356,702 | | |
96
MUTUAL OF AMERICA INVESTMENT CORPORATION
NOTES TO FINANCIAL STATEMENTS (Continued)
4. CAPITAL SHARE ACTIVITY
The Investment Company has registered an indefinite number of its capital shares pursuant to Rule 24f-2 under the Investment Company Act of 1940. As of December 31, 2012, shares authorized were allocated into the 24 series of Funds as follows:
| | | Authorized No. of Shares | |
| | Equity Index Fund | | | | 500,000,000 | | |
| | All America Fund | | | | 225,000,000 | | |
| | Small Cap Value Fund | | | | 350,000,000 | | |
| | Small Cap Growth Fund | | | | 350,000,000 | | |
| | Mid Cap Value Fund | | | | 100,000,000 | | |
| | Mid-Cap Equity Index Fund | | | | 450,000,000 | | |
| | International Fund | | | | 200,000,000 | | |
| | Composite Fund | | | | 200,000,000 | | |
| | Retirement Income Fund | | | | 50,000,000 | | |
| | 2010 | Retirement Fund | | | 50,000,000 | | |
| | 2015 | Retirement Fund | | | 150,000,000 | | |
| | 2020 | Retirement Fund | | | 225,000,000 | | |
| | 2025 | Retirement Fund | | | 175,000,000 | | |
| | 2030 | Retirement Fund | | | 150,000,000 | | |
| | 2035 | Retirement Fund | | | 150,000,000 | | |
| | 2040 | Retirement Fund | | | 150,000,000 | | |
| | 2045 | Retirement Fund | | | 150,000,000 | | |
| | 2050 | Retirement Fund | | | 100,000,000 | | |
| | Conservative Allocation Fund | | | | 100,000,000 | | |
| | Moderate Allocation Fund | | | | 200,000,000 | | |
| | Aggressive Allocation Fund | | | | 200,000,000 | | |
| | Money Market Fund | | | | 175,000,000 | | |
| | Mid-Term Bond Fund | | | | 350,000,000 | | |
| | Bond Fund | | | | 600,000,000 | | |
| | Sub-Total | | | | 5,350,000,000 | | |
| | Shares to be allocated at the discretion of the Board of Directors | | | | 650,000,000 | | |
| | Total | | | | 6,000,000,000 | | |
See Footnote 6, "Subsequent Events," for information regarding an addition to the number of authorized shares and changes to the allocation of authorized shares that took place on February 28, 2013.
5. DIVIDENDS
On September 13, 2012 and September 14, 2012, required distributions of net investment income and, as applicable, net realized gains relating to 2011 were declared and paid for the funds (other than the All America, Small Cap Value, Mid Cap Value and Money Market Funds) in accordance with Internal Revenue Section 855(a). The Funds of Mutual of America Investment Corporation intend to declare and pay their respective tax year 2012 investment company taxable income and capital gains in 2013 in accordance with Internal Revenue Section 855(a).
97
MUTUAL OF AMERICA INVESTMENT CORPORATION
NOTES TO FINANCIAL STATEMENTS (Continued)
Pursuant to shareholders' instructions, substantially all dividend distributions throughout 2012 and 2011 were immediately reinvested into their respective funds. The tax character of the distributions paid during 2012 and 2011 was as follows:
| | | Equity Index
Fund | | All America
Fund | | Small Cap
Value Fund | | Small Cap
Growth | | Mid Cap
Value Fund | |
Ordinary Income (a) | | | |
| | 2012 | | | $ | 82,879 | | | $ | 0 | | | $ | 0 | | | $ | 0 | | | $ | 0 | | |
| | 2011 | | | $ | 18,904,206 | | | $ | 6,317,474 | | | $ | 2,548,887 | | | $ | 0 | | | $ | 628,396 | | |
Long-Term Capital Gains | | | |
| | 2012 | | | $ | 0 | | | $ | 0 | | | $ | 0 | | | $ | 2,029,204 | | | $ | 0 | | |
| | 2011 | | | $ | 0 | | | $ | 0 | | | $ | 0 | | | $ | 0 | | | $ | 0 | | |
| | | Mid-Cap
Equity Index
Fund | | International
Fund | | Composite
Fund | | Retirement
Fund | | 2010
Retirement
Fund | |
Ordinary Income (a) | | | |
| | 2012 | | | $ | 0 | | | $ | 21,604 | | | $ | 26,332 | | | $ | 598,298 | | | $ | 501,103 | | |
| | 2011 | | | $ | 6,927,757 | | | $ | 2,142,256 | | | $ | 7,396,780 | | | $ | 478,508 | | | $ | 441,941 | | |
Long-Term Capital Gains | | | |
| | 2012 | | | $ | 21,609,254 | | | $ | 73,236 | | | $ | 0 | | | $ | 555,974 | | | $ | 711,769 | | |
| | 2011 | | | $ | 8,232,316 | | | $ | 211,930 | | | $ | 0 | | | $ | 47,419 | | | $ | 25,781 | | |
| | | 2015
Retirement
Fund | | 2020
Retirement
Fund | | 2025
Retirement
Fund | | 2030
Retirement
Fund | | 2035
Retirement
Fund | |
Ordinary Income (a) | | | |
| | 2012 | | | $ | 2,132,730 | | | $ | 2,712,014 | | | $ | 2,312,037 | | | $ | 1,804,778 | | | $ | 1,281,243 | | |
| | 2011 | | | $ | 1,729,238 | | | $ | 1,955,796 | | | $ | 1,518,829 | | | $ | 1,162,444 | | | $ | 836,651 | | |
Long-Term Capital Gains | | | |
| | 2012 | | | $ | 705,161 | | | $ | 463,425 | | | $ | 386,258 | | | $ | 338,408 | | | $ | 310,979 | | |
| | 2011 | | | $ | 120,136 | | | $ | 139,097 | | | $ | 201,103 | | | $ | 195,986 | | | $ | 173,801 | | |
| | | 2040
Retirement
Fund | | 2045
Retirement
Equity Fund | | 2050
Retirement
Equity Fund | | Conservative
Allocation
Fund | | Moderate
Allocation
Fund | |
Ordinary Income (a) | | | |
| | 2012 | | | $ | 1,115,985 | | | $ | 1,327,885 | | | $ | 0 | | | $ | 1,854,503 | | | $ | 4,454,203 | | |
| | 2011 | | | $ | 707,075 | | | $ | 801,800 | | | | N/A | | | $ | 1,565,125 | | | $ | 4,054,555 | | |
Long-Term Capital Gains | | | |
| | 2012 | | | $ | 321,679 | | | $ | 317,477 | | | $ | 0 | | | $ | 770,637 | | | $ | 1,816,656 | | |
| | 2011 | | | $ | 182,882 | | | $ | 173,340 | | | | N/A | | | $ | 19,438 | | | $ | 304,510 | | |
| | | Aggressive
Allocation
Fund | | Money
Market Fund | | Mid-Term
Bond Fund | | Bond
Fund | | | |
Ordinary Income (a) | | | |
| | 2012 | | | $ | 3,143,042 | | | $ | 0 | | | $ | 269,325 | | | $ | 187,178 | | | | | | |
| | 2011 | | | $ | 3,017,256 | | | $ | 0 | | | $ | 10,100,703 | | | $ | 22,722,570 | | | | | | |
Long-Term Capital Gains | | | |
| | 2012 | | | $ | 511,903 | | | $ | 0 | | | $ | 715,725 | | | $ | 0 | | | | | | |
| | 2011 | | | $ | 0 | | | $ | 0 | | | $ | 0 | | | $ | 0 | | | | | | |
Notes:
(a) Includes distributions from Fund-level net short-term capital gains.
N/A = Not applicable.
98
MUTUAL OF AMERICA INVESTMENT CORPORATION
NOTES TO FINANCIAL STATEMENTS (Continued)
Undistributed net income and gains (losses) — As of December 31, 2012, undistributed net income and undistributed accumulated gain (loss) on a tax basis were as follows:
| | | Equity Index
Fund | | All America
Fund | | Small Cap
Value Fund | | Small Cap
Growth | | Mid Cap
Value Fund | |
Accumulated undistributed net
investment income | | $ | 21,317,195 | | | $ | 3,842,108 | | | $ | 4,127,875 | | | $ | 0 | | | $ | 651,813 | | |
Accumulated undistributed net realized
gain/(loss) on investments
and futures contracts | | $ | 7,754,140 | | | $ | 3,062,592 | | | $ | (6,732,589 | ) | | $ | 24,133,834 | | | $ | 1,077,034 | | |
Net unrealized appreciation (depreciation)
of investments and futures contracts | | $ | 237,239,761 | | | $ | 30,566,315 | | | $ | 59,133,452 | | | $ | 33,120,444 | | | $ | 5,679,512 | | |
| | | Mid-Cap
Equity Index
Fund | | International
Fund | | Composite
Fund | | Retirement
Fund | | 2010
Retirement
Fund | |
Accumulated undistributed net
investment income | | $ | 9,797,334 | | | $ | 2,689,340 | | | $ | 3,658,493 | | | $ | 0 | | | $ | 0 | | |
Accumulated undistributed net realized
gain/(loss) on investments
and futures contracts | | $ | 19,299,423 | | | $ | (10,241 | ) | | $ | (9,842,700 | ) | | $ | 542,068 | | | $ | 1,047,363 | | |
Net unrealized appreciation (depreciation)
of investments and futures contracts | | $ | 99,117,964 | | | $ | 4,284,215 | | | $ | 20,704,350 | | | $ | 1,512,221 | | | $ | 1,445,691 | | |
| | | 2015
Retirement
Fund | | 2020
Retirement
Fund | | 2025
Retirement
Fund | | 2030
Retirement
Fund | | 2035
Retirement
Fund | |
Accumulated undistributed net
investment income | | $ | 0 | | | $ | 0 | | | $ | 0 | | | $ | 0 | | | $ | 0 | | |
Accumulated undistributed net realized
gain/(loss) on investments
and futures contracts | | $ | 4,933,865 | | | $ | 4,150,732 | | | $ | 3,973,935 | | | $ | 2,870,031 | | | $ | 2,178,280 | | |
Net unrealized appreciation (depreciation)
of investments and futures contracts | | $ | 9,721,200 | | | $ | 16,788,226 | | | $ | 18,383,589 | | | $ | 16,558,780 | | | $ | 13,927,342 | | |
| | | 2040
Retirement
Fund | | 2045
Retirement
Fund | | 2050
Retirement
Fund | | Conservative
Allocation
Fund | | Moderate
Allocation
Fund | |
Accumulated undistributed net
investment income | | $ | 0 | | | $ | 0 | | | $ | 292 | | | $ | 34,834 | | | $ | 52,765 | | |
Accumulated undistributed net realized
gain/(loss) on investments
and futures contracts | | $ | 1,713,021 | | | $ | 1,950,857 | | | $ | 0 | | | $ | 1,110,957 | | | $ | 2,609,374 | | |
Net unrealized appreciation (depreciation)
of investments and futures contracts | | $ | 12,819,271 | | | $ | 15,788,992 | | | $ | 37,172 | | | $ | 5,982,412 | | | $ | 24,536,352 | | |
| | | Aggressive
Allocation
Fund | | Money
Market Fund | | Mid-Term
Bond Fund | | Bond
Fund | | | |
Accumulated undistributed net
investment income | | $ | 17,814 | | | $ | 0 | | | $ | 10,246,278 | | | $ | 23,755,259 | | | | | | |
Accumulated undistributed net realized
gain/(loss) on investments
and futures contracts | | $ | 2,247,152 | | | $ | 0 | | | $ | 821,302 | | | $ | 1,270,568 | | | | | | |
Net unrealized appreciation (depreciation)
of investments and futures contracts | | $ | 24,260,510 | | | $ | 383 | | | $ | 22,054,301 | | | $ | 40,556,510 | | | | | | |
99
MUTUAL OF AMERICA INVESTMENT CORPORATION
NOTES TO FINANCIAL STATEMENTS (Continued)
The difference between the components of distributable earnings on a tax basis and the amounts reflected in the statements of assets and liabilities are primarily due to wash sales, and the Federal income tax treatment of futures contracts.
Reclassifications — Periodically, the Funds may reclassify book to tax differences as a result of the differences arising from the accounting for partnerships, REIT securities, non-deductible net operating loss, and Fund distributions for Federal income tax purposes versus financial reporting purposes. Each Fund's net assets are not affected by these reclassifications.
During the year ended December 31, 2012, each Fund reclassified the following book to tax differences [increases (decreases)]:
| | | Equity Index
Fund | | All America
Fund | | Small Cap
Value Fund | | Small Cap
Growth | | Mid Cap
Value Fund | |
Accumulated undistributed net investment income | | $ | (139,456 | ) | | $ | (144,000 | ) | | $ | (1,063,070 | ) | | $ | 33,438 | | | $ | (51,395 | ) | |
Accumulated undistributed net realized gains (loss)
on investments and futures contracts | | $ | 226,759 | | | $ | 195,088 | | | $ | 1,252,772 | | | $ | 385,163 | | | $ | 59,559 | | |
Paid in capital | | $ | (87,303 | ) | | $ | (51,088 | ) | | $ | (189,702 | ) | | $ | (418,601 | ) | | $ | (8,164 | ) | |
| | | Mid-Cap
Equity Index
Fund | | International
Fund | | Composite
Fund | | Retirement
Fund | | 2010
Retirement
Fund | |
Accumulated undistributed net investment income | | $ | (761,720 | ) | | $ | 0 | | | $ | (80 | ) | | $ | 6,543 | | | $ | 6,410 | | |
Accumulated undistributed net realized gains (loss)
on investments and futures contracts | | $ | 761,720 | | | $ | 0 | | | $ | 80 | | | $ | (3,578 | ) | | $ | (1,972 | ) | |
Paid in capital | | $ | 0 | | | $ | 0 | | | $ | 0 | | | $ | (2,965 | ) | | $ | (4,438 | ) | |
| | | 2015
Retirement
Fund | | 2020
Retirement
Fund | | 2025
Retirement
Fund | | 2030
Retirement
Fund | | 2035
Retirement
Fund | |
Accumulated undistributed net investment income | | $ | 32,827 | | | $ | 47,226 | | | $ | 48,419 | | | $ | 42,506 | | | $ | 34,751 | | |
Accumulated undistributed net realized gains (loss)
on investments and futures contracts | | $ | (7,626 | ) | | $ | (7,003 | ) | | $ | (3,103 | ) | | $ | (4 | ) | | $ | (4 | ) | |
Paid in capital | | $ | (25,201 | ) | | $ | (40,223 | ) | | $ | (45,316 | ) | | $ | (42,502 | ) | | $ | (34,747 | ) | |
| | | 2040
Retirement
Fund | | 2045
Retirement
Fund | | 2050
Retirement
Fund | | Conservative
Allocation
Fund | | Moderate
Allocation
Fund | |
Accumulated undistributed net investment income | | $ | 31,587 | | | $ | 39,291 | | | $ | 88 | | | $ | 12,774 | | | $ | 14,445 | | |
Accumulated undistributed net realized gains (loss)
on investments and futures contracts | | $ | (4 | ) | | $ | (5 | ) | | $ | (88 | ) | | $ | (12,774 | ) | | $ | (14,445 | ) | |
Paid in capital | | $ | (31,583 | ) | | $ | (39,286 | ) | | $ | 0 | | | $ | 0 | | | $ | 0 | | |
| | | Aggressive
Allocation
Fund | | Money
Market Fund | | Mid-Term
Bond Fund | | Bond
Fund | |
Accumulated undistributed net investment income | | | | $ | 0 | | | $ | 169,628 | | | $ | 0 | | �� | $ | 0 | | |
Accumulated undistributed net realized gains (loss)
on investments and futures contracts | | | | $ | 0 | | | $ | (139 | ) | | $ | 0 | | | $ | 0 | | |
Paid in capital | | | | $ | 0 | | | $ | (169,489 | ) | | $ | 0 | | | $ | 0 | | |
These reclassifications were made as a result of the differences arising from the disallowance of net operating losses, distributions from partnerships, distributions from REITs, distribution reclassifications and other cumulative adjustments for Federal income tax purposes versus financial reporting purposes.
100
MUTUAL OF AMERICA INVESTMENT CORPORATION
NOTES TO FINANCIAL STATEMENTS (Continued)
On February 28, 2013, the Board of Directors of the Investment Company increased the number of authorized shares from six billion to seven billion. Also on that date, the Board of Directors changed the number of authorized shares of the following Funds. As a result of these actions, there remained 1,075,000,000 unallocated shares on that date.
Fund | | Previous Allocation | | Allocation Increase
(Decrease) | | Total Shares Allocated | |
| | Money Market Fund | | | | 175,000,000 | | | | (50,000,000 | ) | | | 125,000,000 | | |
| | All America Fund | | | | 225,000,000 | | | | (25,000,000 | ) | | | 200,000,000 | | |
| | Composite Fund | | | | 200,000,000 | | | | (50,000,000 | ) | | | 150,000,000 | | |
| | Small Cap Growth Fund | | | | 350,000,000 | | | | (25,000,000 | ) | | | 325,000,000 | | |
| | Small Cap Value Fund | | | | 350,000,000 | | | | (25,000,000 | ) | | | 325,000,000 | | |
| | Bond Fund | | | | 600,000,000 | | | | 50,000,000 | | | | 650,000,000 | | |
| | Mid-Term Bond Fund | | | | 350,000,000 | | | | 100,000,000 | | | | 450,000,000 | | |
| | International Fund | | | | 200,000,000 | | | | 100,000,000 | | | | 300,000,000 | | |
| | 2020 | Retirement Fund | | | 225,000,000 | | | | 100,000,000 | | | | 325,000,000 | | |
| | 2025 | Retirement Fund | | | 175,000,000 | | | | 100,000,000 | | | | 275,000,000 | | |
| | 2030 | Retirement Fund | | | 150,000,000 | | | | 100,000,000 | | | | 250,000,000 | | |
| | 2035 | Retirement Fund | | | 150,000,000 | | | | 75,000,000 | | | | 225,000,000 | | |
| | 2040 | Retirement Fund | | | 150,000,000 | | | | 50,000,000 | | | | 200,000,000 | | |
| | 2045 | Retirement Fund | | | 150,000,000 | | | | 75,000,000 | | | | 225,000,000 | | |
Management, on behalf of the Investment Company, has evaluated the need for disclosures and/or adjustments to the financial statements resulting from subsequent events. As a result of this evaluation, except as noted above, no additional subsequent events require disclosure and/or adjustment to the financial statements.
101
REPORT OF INDEPENDENT REGISTERED PUBLIC ACCOUNTING FIRM
The Shareholders and Board of Directors
of Mutual of America Investment Corporation:
We have audited the accompanying statement of assets and liabilities of Mutual of America Investment Corporation, comprising the Equity Index Fund, All America Fund, Small Cap Value Fund, Small Cap Growth Fund, Mid Cap Value Fund, Mid-Cap Equity Index Fund, International Fund, Composite Fund, Retirement Income Fund, 2010 Retirement Fund, 2015 Retirement Fund, 2020 Retirement Fund, 2025 Retirement Fund, 2030 Retirement Fund, 2035 Retirement Fund, 2040 Retirement Fund, 2045 Retirement Fund, 2050 Retirement Fund, Conservative Allocation Fund, Moderate Allocation Fund, Aggressive Allocation Fund, Money Market Fund, Mid-Term Bond Fund and Bond Fund (collectively, the "Funds"), including the portfolios of investments in securities for the Conservative Allocation Fund, Moderate Allocation Fund, Aggressive Allocation Fund, Money Market Fund, International Fund, Retirement Income Fund, 2010 Retirement Fund, 2015 Retirement Fund, 2020 Retirement Fund, 2025 Retirement Fund, 2030 Retirement Fund, 2035 Retirement Fund, 2040 Retirement Fund, 2045 Retirement Fund and 2050 Retirement Fund, and the summary portfolios of investments in securities for each of the remaining Funds as of December 31, 2012, and the related statements of operations for the year or period then ended, the statements of changes in net assets for each of the years or period in the two-year period then ended, and the financial highlights for each of the years or period in the five-year period then ended. These financial statements and financial highlights are the responsibility of the Funds' management. Our responsibility is to express an opinion on these financial statements and financial highlights based on our audits.
We conducted our audits in accordance with the standards of the Public Company Accounting Oversight Board (United States). Those standards require that we plan and perform the audit to obtain reasonable assurance about whether the financial statements and financial highlights are free of material misstatement. An audit includes examining, on a test basis, evidence supporting the amounts and disclosures in the financial statements. Our procedures included confirmation of securities owned as of December 31, 2012, by correspondence with the custodian and brokers. An audit also includes assessing the accounting principles used and significant estimates made by management, as well as evaluating the overall financial statement presentation. We believe that our audits provide a reasonable basis for our opinion.
In our opinion, the financial statements and financial highlights referred to above present fairly, in all material respects, the financial position of each of the aforementioned Funds of Mutual of America Investment Corporation as of December 31, 2012, the results of their operations for the year or period then ended, the changes in their net assets for each of the years or period in the two-year period then ended, and the financial highlights for each of the years or period in the five-year period then ended, in conformity with U.S. generally accepted accounting principles.

New York, New York
February 28, 2013
102
MUTUAL OF AMERICA INVESTMENT CORPORATION
ADDITIONAL INFORMATION
Directors and Officers — unaudited
The tables below show information about the Directors and officers of the Investment Company. The address of each Director and officer is c/o Mutual of America Investment Corporation, 320 Park Avenue, New York, New York 10022. The Investment Company does not hold regular annual meetings of shareholders, and each Director has been elected by shareholders to serve until a successor is duly elected at a meeting of shareholders called for the purpose of electing directors. Each officer of the Investment Company has been elected by the Board of Directors to serve until a successor is duly elected. The Independent Directors do not serve as directors of any other investment companies advised by or affiliated with the Adviser or Mutual of America with the exception of serving on the Board of Directors of Mutual of America Institutional Funds, Inc., an affiliated registered management investment company, which also receives investment advice from the Adviser. The Interested Directors and officers of the Investment Company do not receive compensation from the Investment Company for their service. Mr. Greed serves as director of one other investment company advised by or affiliated with the Adviser, Mutual of America Institutional Funds, Inc.
The Investment Company's Statement of Additional Information ("SAI"), filed with the Securities and Exchange Commission, contains additional information about the Investment Company's Directors and Officers. A copy of the latest SAI can be obtained, without charge, by writing to Mutual of America Investment Corporation at 320 Park Avenue, New York, NY 10022-6839 or by calling 1-800-468-3785 or through the following websites: http://www.mutualofamerica.com or http://www.sec.gov.
Independent Directors
Name and Age | | Length of
Time Served | | Principal Occupation(s)
in Past Five Years | | Other Directorships
Held by Director | |
Carolyn N. Dolan
age 66 | | since May 2008 | | Founding Principal and Portfolio Manager, Samson Capital Advisors LLC | | Samson Capital; One Beacon Court; Mutual of America Institutional Funds, Inc. | |
Kevin M. Kearney
age 60 | | since April 2011 | | Partner, Wingate, Kearney & Cullen | | Concern Worldwide, USA; College of Mount Saint Vincent; Futures in Education Foundation; Mutual of America Institutional Funds, Inc. | |
LaSalle D. Leffall, III,
age 50 | | since April 2011 | | President and Founder, LDL Financial, Inc., the managing member of LDL Financial, LLC | | Federal Home Loan Bank of Atlanta; Lockhart Companies Incorporated; Mutual of America Institutional Funds, Inc. | |
John W. Sibal,
age 60 | | since April 2011 | | President & Chief Executive Officer, Eustis Commercial Mortgage Corporation | | New Orleans Recreation Development Foundation; Mutual of America Institutional Funds, Inc. | |
Margaret M. Smyth
age 49 | | since April 2011 | | Vice President of Finance, Con Edison; prior thereto Vice President, Chief Financial Officer, Hamilton Sundstrand, a United Technologies Company; prior thereto Vice President, Controller, United Technologies Corporation; prior thereto Vice President and Chief Accounting Officer, 3M Company | | Concern Worldwide (U.S.) Inc.; Trustee Fellow and President's Council, Fordham University; Financial Executives International Committee on Corporate Reporting; International Accounting Standards Board Interpretations Committee; Mutual of America Institutional Funds, Inc. | |
103
Independent Directors
Name and Age | | Length of
Time Served | | Principal Occupation(s)
in Past Five Years | | Other Directorships
Held by Director | |
Patrick J. Waide, Jr.
age 75 | | since August 1996 | | | | John Simon Guggenheim Memorial Foundation; The National Catholic Reporter Publishing Company; Mutual of America Institutional Funds, Inc. | |
William E. Whiston,
age 59 | | since February 2011 | | Chief Financial Officer, the Archdiocese of New York; Adjunct Professor in Finance, Fordham University Graduate School of Business; prior thereto Executive Vice President and member, United States Management Board at Allied Irish Bank | | Trustee and Treasurer, Trustees of St. Patrick's Cathedral in New York City; St. Joseph's Seminary; New York Medical College; Mutual of America Institutional Funds, Inc. | |
Interested Director
Name and Age | | Length of
Time Served | | Principal Occupation(s)
in Past Five Years | | Other Directorships
Held by Director | |
John R. Greed
Chairman, President and
Chief Executive Officer,
age 52 | | Chairman of the Board since September 2003 | | Senior Executive Vice President and Chief Financial Officer, Mutual of America Life Insurance Company and Mutual of America Holding Company, Inc. since December 2007; prior thereto, Senior Executive Vice President and Treasurer; Senior Executive Vice President, Chief Financial Officer and Treasurer, Mutual of America Capital Management Corporation; Chairman of the Board, President and Chief Executive Officer, Mutual of America Investment Corporation and Mutual of America Institutional Funds, Inc. | | Mutual of America Life Insurance Company, Mutual of America Holding Company, Inc. , Mutual of America Foundation; Greater NYC Councils of the Boy Scouts; Mutual of America Institutional Funds, Inc. | |
Mr. Greed is an "interested person" as an officer of the Adviser and of affiliates of the Adviser.
104
Officers
Name, Position and Age | | Length of
Time Served | | Principal Occupation(s)
in Past Five Years | | Other Directorships
Held by Director | |
James J. Roth
Executive Vice President and General Counsel, age 63 | | since April 2009 | | Executive Vice President and General Counsel, Mutual of America Life Insurance Company since April 2009, prior thereto Executive Vice President, Deputy General Counsel, prior thereto Senior Vice President, Chief Compliance Officer, prior thereto Vice President and Associate General Counsel; Executive Vice President and General Counsel, Mutual of America Capital Management Corporation, Mutual of America Securities Corporation, Mutual of America Investment Corporation, and Mutual of America Institutional Funds, Inc; Chairman, President and Chief Executive Officer, Mutual of America Holding Company, Inc. | | Mutual of America Life Insurance Company; Mutual of America Holding Company, Inc.; Mutual of America Foundation; Respect for Law Alliance, Stuyvesant Town Peter Cooper Village Tenants Association | |
George L. Medlin,
Executive Vice President,
Chief Financial Officer
and Treasurer, age 60 | | since February 2008 | | Executive Vice President and Treasurer, Mutual of America Life Insurance Company and Mutual of America Holding Company, Inc. since December 2007; prior thereto, Executive Vice President, Internal Audit, Mutual of America Life Insurance Company; Executive Vice President, Chief Financial Officer and Treasurer, Mutual of America Investment Corporation and Mutual of America Institutional Funds, Inc. | | Director and Board Treasurer, Nassau County Coalition Against Domestic Violence | |
Thomas L. Martin
Executive Vice President,
Deputy General Counsel
and Corporate Secretary,
age 63 | | since August 2003 | | Executive Vice President and Deputy General Counsel, Mutual of America Life Insurance Company since November 2008, prior thereto, Senior Vice President and Associate General Counsel; Executive Vice President Deputy General Counsel and Secretary, Mutual of America Investment Corporation and Mutual of America Institutional Funds, Inc. | | | None | | |
105
Officers
Name, Position and Age | | Length of
Time Served | | Principal Occupation(s)
in Past Five Years | | Other Directorships
Held by Director | |
Kathryn Lu
Executive Vice President and Chief Compliance Officer, age 52 | | since July 2008 | | Executive Vice President and Chief Compliance Officer, Mutual of America Life Insurance Company, prior thereto Senior Vice President and Chief Compliance Officer, prior thereto Senior Vice President and Associate General Counsel, Mutual of America; Executive Vice President and Chief Compliance Officer, Mutual of America Investment Corporation and Mutual of America Institutional Funds, Inc. | | | None | | |
John Corrigan
Executive Vice President and Internal Auditor, age 52 | | since February 2008 | | Executive Vice President and Internal Auditor, Mutual of America Life Insurance Company, prior thereto Senior Vice President and Internal Auditor; Executive Vice President and Internal Auditor, Mutual of America Investment Corporation and Mutual of America Institutional Funds, Inc. | | | None | | |
Myron O. Schlanger,
Senior Vice President and Chief Accounting Officer, age 57 | | since April 2012 | | Senior Vice President and Associate Treasurer | | New York City Chapter of Financial Executives International; Executive Committee and Nominating Committee of the Life Insurance Company Guaranty Corporation of New York; CenterLight Health System | |
106
Quarterly Portfolio Schedules
Included in this Annual Report are summary schedules of Mutual of America Investment Corporation's ("Investment Company") Fund portfolio holdings as of December 31, 2012. The Investment Company files complete schedules of Fund portfolio holdings with the Securities and Exchange Commission ("SEC") for the first and third quarters of each fiscal year on Form N-Q and for the second and fourth quarters of each fiscal year on Form N-CSR. The Forms N-Q and N-CSR are available on the SEC's website at http://www.sec.gov. Additionally, the Forms N-Q and N-CSR may be reviewed and copied at the SEC's Public Reference Room in Washington, DC. Information on the operation of the Public Reference Room may be obtained by calling 1-800-SEC-0330.
Proxy Voting Policies and Procedures
A copy of the Investment Company's proxy voting policies and procedures can be obtained free of charge by calling 1-800-468-3785. It is also available on the SEC's website at http://www.sec.gov.
Information regarding how the Investment Company voted proxies relating to portfolio securities during the 12-month period ended June 30, 2012 is available without charge by calling 1-800-468-3785. It is also available on the SEC website.
Code of Ethics
The Investment Company has adopted a Code of Ethics that complies with Rule 17j-1 of the Investment Company Act of 1940 and with the requirements of the Sarbanes-Oxley Act of 2002. A copy of the Code of Ethics is available free of charge, upon request. To obtain a free copy of the Code of Ethics, please call (212) 224-1568 or write to:
Ms. Kathryn Lu
Chief Compliance Officer
Mutual of America Investment Corporation
320 Park Avenue
New York, NY 10022-6839
Supplemental Dividend Information — Unaudited
Dividends from the International, Mid-Term Bond and Bond Funds do not qualify for the corporate dividends received deduction. All America, Money Market, Mid-Cap Equity Index, Small Cap Value, Small Cap Growth, Mid Cap Value, and 2050 Retirement Funds did not distribute any dividends during 2012. The following are the percentages of the ordinary dividends distributed in 2012 by the other Investment Corporation Funds that qualify for the corporate dividends received deduction:
| | | Equity
Index Fund | | Composite
Fund | | Retirement
Income Fund | | 2010
Retirement
Fund | | 2015
Retirement
Fund | |
Ordinary dividend qualifying
percentage | | | 100 | % | | | 46.96 | % | | | 60.62 | % | | | 60.87 | % | | | 54.95 | % | |
| | | 2020
Retirement
Fund | | 2025
Retirement
Fund | | 2030
Retirement
Fund | | 2035
Retirement
Fund | | 2040
Retirement
Fund | |
Ordinary dividend qualifying
percentage | | | 54.10 | % | | | 55.89 | % | | | 52.88 | % | | | 59.43 | % | | | 59.19 | % | |
| | | 2045
Retirement
Fund | | Conservative
Allocation
Fund | | Moderate
Allocation
Fund | | Aggressive
Allocation
Fund | |
Ordinary dividend qualifying
percentage | | | | | 58.83 | % | | | 63.54 | % | | | 58.52 | % | | | 58.23 | % | |
107
Important tax information: The following amounts of 2012 Investment Corporation Fund long-term capital gains (if any) are considered capital gain dividends.
| | | Equity
Index Fund | | All America
Fund | | Small Cap
Value Fund | | Small Cap
Growth Fund | | Mid-Cap
Equity Index
Fund | |
Dividends qualifying for reduced
long-term capital gains tax rate | | $ | 0 | | | $ | 0 | | | $ | 0 | | | $ | 2,029,204 | | | $ | 21,609,254 | | |
| | | Mid Cap
Value Fund | | International | | Composite
Fund | | Retirement
Income Fund | | 2010
Retirement
Fund | |
Dividends qualifying for reduced
long-term capital gains tax rate | | $ | 0 | | | $ | 73,236 | | | $ | 0 | | | $ | 555,974 | | | $ | 711,769 | | |
| | | 2015
Retirement
Fund | | 2020
Retirement
Fund | | 2025
Retirement
Fund | | 2030
Retirement
Fund | | 2035
Retirement
Fund | |
Dividends qualifying for reduced
long-term capital gains tax rate | | $ | 705,161 | | | $ | 463,425 | | | $ | 386,258 | | | $ | 338,408 | | | $ | 310,979 | | |
| | | 2040
Retirement
Fund | | 2045
Retirement
Fund | | 2050
Retirement
Fund | | Conservative
Allocation
Fund | | Moderate
Allocation
Fund | |
Dividends qualifying for reduced
long-term capital gains tax rate | | $ | 321,679 | | | $ | 317,477 | | | $ | 0 | | | $ | 770,637 | | | $ | 1,816,656 | | |
| | | Aggressive
Allocation
Fund | | Money
Market Fund | | Mid-Term
Bond Fund | | Bond
Fund | | | |
Dividends qualifying for reduced
long-term capital gains tax rate | | $ | 511,903 | | | $ | 0 | | | $ | 715,725 | | | $ | 0 | | | | | | |
108
MUTUAL OF AMERICA
LIFE INSURANCE COMPANY
320 PARK AVENUE
NEW YORK, NY 10022-6839
www.mutualofamerica.com

320 PARK AVENUE
NEW YORK NY 10022-6839
ADDRESS SERVICE REQUESTED

You can receive these and other important documents electronically. Sign up for eDocuments and we'll waive the monthly participant charge.
Find out more at mutualofamerica.com
or call 1-800-468-3785.
ITEM 2. CODE OF ETHICS.
Mutual of America Investment Corporation has adopted a Code of Ethics that applies to its principal executive and financial officers, as well as all Access Persons as defined under Rule 17j-1 of the Investment Company Act of 1940. The Code consists of two sections. The first section, designated as Section A, is the Code of Ethics required under Rule 17j-1. Section A requires those subject to it to submit periodic reports detailing their securities holdings and transactions (subject to several exemptions contained in the rules) and requires pre-approval for certain securities transactions by such persons, including purchases and sales of reportable securities, investments in initial public offerings and private placements.
The second section, designated as Section B, is to assure compliance with the Code of Ethics requirements of Section 406 of the Sarbanes-Oxley Act of 2002. It applies specifically to the Corporation’s principal executive and financial officers.
The two sections are not mutually exclusive and must be observed independently by each person to whom they are intended to apply. Section A applies to all individuals while Section B applies to the individuals designated in Section B. Both Sections explicitly require those individuals subject to the provisions of the Code of Ethics to promptly report violations of the Code of Ethics to the Chief Compliance Officer.
There have been no amendments to Section A or B during the period covered by this report.
The Annual Report to Shareholders includes information on how to obtain a copy of the Code of Ethics at no charge.
ITEM 3. AUDIT COMMITTEE FINANCIAL EXPERT.
(a) (1) Mutual of America Investment Corporation’s Board of Directors has determined that one audit committee financial expert serves on its Audit Committee.
(a) (2) The audit committee financial expert is Patrick J. Waide, Jr. He was Senior Vice-President, Administration at Sullivan & Company until March 1998; Director of the Drucker Foundation from 1996-1999 and President, Drucker Foundation in 1999. Mr. Waide is considered an independent director.
(a) (3) Not applicable.
ITEM 4. PRINCIPAL ACCOUNTANT FEES AND SERVICES.
(a) Aggregate Audit Fees:
2012: $444,357
2011: $392,343
(b), (c), (d) There were no Audit-Related, Tax or Other Fees.
(e) All non-audit fees are pre-approved by the Audit Committee in advance.
(f), (g), (h) Not applicable.
ITEM 5. AUDIT COMMITTEE OF LISTED REGISTRANTS.
Not applicable.
ITEM 6. INVESTMENTS.
(a) Schedule I — Portfolios of Investments in Securities follows:
MUTUAL OF AMERICA INVESTMENT CORPORATION - EQUITY INDEX FUND
PORTFOLIO OF INVESTMENTS IN SECURITIES
December 31, 2012
| | Shares | | Value | |
INDEXED ASSETS: | | | | | |
COMMON STOCKS: | | | | | |
CONSUMER DISCRETIONARY (11.1%) | | | | | |
Abercrombie & Fitch Co. Cl A | | 6,774 | | 324,949 | |
Amazon.com, Inc.* | | 30,413 | | 7,637,921 | |
Apollo Group, Inc.* | | 8,967 | | 187,590 | |
AutoNation, Inc.* | | 3,268 | | 129,740 | |
AutoZone, Inc.* | | 3,123 | | 1,106,885 | |
Bed Bath & Beyond, Inc.* | | 20,564 | | 1,149,733 | |
Best Buy Co., Inc. | | 22,870 | | 271,010 | |
Big Lots, Inc.* | | 4,946 | | 140,763 | |
BorgWarner, Inc.* | | 9,630 | | 689,701 | |
Cablevision Systems Corp. Cl A | | 18,319 | | 273,686 | |
CarMax, Inc.* | | 17,643 | | 662,318 | |
Carnival Corp. | | 38,779 | | 1,425,904 | |
CBS Corp. Cl B | | 48,143 | | 1,831,841 | |
Chipotle Mexican Grill, Inc.* | | 2,702 | | 803,737 | |
Coach, Inc. | | 24,100 | | 1,337,791 | |
Comcast Corp. Cl A | | 224,243 | | 8,382,203 | |
D.R. Horton, Inc. | | 23,583 | | 466,472 | |
Darden Restaurants, Inc. | | 11,252 | | 507,128 | |
Delphi Automotive PLC* | | 23,554 | | 900,941 | |
DIRECTV* | | 51,368 | | 2,576,619 | |
Discovery Communications, Inc. Cl A* | | 20,015 | | 1,270,552 | |
Disney (Walt) Co. | | 146,932 | | 7,315,744 | |
Dollar General Corp.* | | 22,080 | | 973,507 | |
Dollar Tree, Inc.* | | 19,105 | | 774,899 | |
Expedia, Inc.* | | 7,894 | | 485,086 | |
Family Dollar Stores, Inc. | | 8,205 | | 520,279 | |
Ford Motor Co. | | 319,026 | | 4,131,387 | |
Fossil, Inc.* | | 4,627 | | 430,774 | |
GameStop Corp. Cl A* | | 10,799 | | 270,947 | |
Gannett Co., Inc. | | 18,866 | | 339,777 | |
Gap, Inc. | | 25,028 | | 776,869 | |
Garmin Ltd. | | 9,432 | | 385,014 | |
Genuine Parts Co. | | 12,709 | | 808,038 | |
Goodyear Tire & Rubber Co.* | | 21,226 | | 293,131 | |
H&R Block, Inc. | | 22,801 | | 423,415 | |
Harley-Davidson, Inc. | | 19,188 | | 937,142 | |
Harman Int’l. Industries, Inc. | | 5,615 | | 250,654 | |
Hasbro, Inc. | | 9,717 | | 348,840 | |
Home Depot, Inc. | | 127,422 | | 7,881,051 | |
International Game Technology | | 22,629 | | 320,653 | |
Interpublic Group of Cos., Inc. | | 35,850 | | 395,067 | |
Johnson Controls, Inc. | | 55,471 | | 1,702,960 | |
Kohl’s Corp. | | 17,867 | | 767,924 | |
Leggett & Platt, Inc. | | 11,759 | | 320,080 | |
Lennar Corp. Cl A | | 14,101 | | 545,286 | |
Limited Brands, Inc. | | 19,953 | | 938,988 | |
Lowe’s Cos., Inc. | | 95,758 | | 3,401,324 | |
Macy’s, Inc. | | 33,931 | | 1,323,988 | |
Marriott International, Inc. Cl A | | 20,481 | | 763,327 | |
Mattel, Inc. | | 28,776 | | 1,053,777 | |
McDonald’s Corp. | | 84,213 | | 7,428,429 | |
McGraw-Hill Cos., Inc. | | 22,904 | | 1,252,162 | |
Netflix, Inc.* | | 4,766 | | 442,189 | |
Newell Rubbermaid, Inc. | | 24,026 | | 535,059 | |
News Corp. Cl A | | 170,250 | | 4,348,185 | |
NIKE, Inc. Cl B | | 57,794 | | 2,982,170 | |
Nordstrom, Inc. | | 12,709 | | 679,932 | |
O’Reilly Automotive, Inc.* | | 9,605 | | 858,879 | |
Omnicom Group, Inc. | | 22,014 | | 1,099,819 | |
Penney (J.C.) Co., Inc. | | 12,000 | | 236,520 | |
PetSmart, Inc. | | 9,077 | | 620,322 | |
Priceline.com, Inc.* | | 4,207 | | 2,613,388 | |
Pulte Homes, Inc.* | | 28,949 | | 525,714 | |
Ralph Lauren Corp. | | 5,190 | | 778,085 | |
Ross Stores, Inc. | | 18,849 | | 1,020,673 | |
Scripps Networks Interactive, Inc. Cl A | | 7,367 | | 426,697 | |
Staples, Inc. | | 58,780 | | 670,092 | |
Starbucks Corp. | | 62,899 | | 3,372,644 | |
Starwood Hotels & Resorts | | 16,013 | | 918,506 | |
Target Corp. | | 55,952 | | 3,310,680 | |
Tiffany & Co. | | 10,219 | | 585,957 | |
Time Warner Cable, Inc. | | 25,001 | | 2,429,847 | |
Time Warner, Inc. | | 79,086 | | 3,782,683 | |
TJX Cos., Inc. | | 62,600 | | 2,657,370 | |
TripAdvisor, Inc.* | | 9,205 | | 386,242 | |
Urban Outfitters, Inc.* | | 8,997 | | 354,122 | |
V.F. Corp. | | 7,386 | | 1,115,064 | |
Viacom, Inc. Cl B | | 39,030 | | 2,058,442 | |
Washington Post Co. Cl B | | 384 | | 140,241 | |
Whirlpool Corp. | | 6,599 | | 671,448 | |
Wyndham Worldwide Corp. | | 11,556 | | 614,895 | |
Wynn Resorts Ltd. | | 6,639 | | 746,821 | |
Yum! Brands, Inc. | | 40,425 | | 2,684,220 | |
| | | | 123,304,909 | |
CONSUMER STAPLES (10.2%) | | | | | |
Altria Group, Inc. | | 170,216 | | 5,348,187 | |
Archer-Daniels-Midland Co. | | 55,548 | | 1,521,460 | |
Avon Products, Inc. | | 35,985 | | 516,745 | |
Beam, Inc. | | 13,361 | | 816,223 | |
Brown-Forman Corp. Cl B | | 12,745 | | 806,121 | |
Campbell Soup Co. | | 15,146 | | 528,444 | |
Clorox Co. | | 11,038 | | 808,202 | |
Coca-Cola Co. | | 323,336 | | 11,720,930 | |
Coca-Cola Enterprises, Inc. | | 22,699 | | 720,239 | |
Colgate-Palmolive Co. | | 37,252 | | 3,894,324 | |
ConAgra Foods, Inc. | | 34,054 | | 1,004,593 | |
Constellation Brands, Inc. Cl A* | | 12,600 | | 445,914 | |
Costco Wholesale Corp. | | 36,161 | | 3,571,622 | |
CVS Caremark Corp. | | 104,583 | | 5,056,588 | |
Dean Foods Co.* | | 15,293 | | 252,487 | |
Dr. Pepper Snapple Group, Inc. | | 17,276 | | 763,254 | |
Estee Lauder Cos., Inc. Cl A | | 20,400 | | 1,221,144 | |
General Mills, Inc. | | 54,332 | | 2,195,556 | |
Heinz (H.J.) Co. | | 26,779 | | 1,544,613 | |
Hershey Co. | | 12,499 | | 902,678 | |
Hormel Foods Corp. | | 11,269 | | 351,705 | |
J.M. Smucker Co. | | 9,115 | | 786,078 | |
Kellogg Co. | | 20,681 | | 1,155,034 | |
Kimberly-Clark Corp. | | 33,071 | | 2,792,185 | |
Kraft Foods Group, Inc.* | | 49,722 | | 2,260,859 | |
Kroger Co. | | 43,294 | | 1,126,510 | |
Lorillard, Inc. | | 10,548 | | 1,230,635 | |
McCormick & Co., Inc. | | 11,124 | | 706,708 | |
Mead Johnson Nutrition Co. | | 16,912 | | 1,114,332 | |
Molson Coors Brewing Co. Cl B | | 13,039 | | 557,939 | |
Mondelez International, Inc. Cl A* | | 148,083 | | 3,771,674 | |
Monster Beverage Corp.* | | 12,896 | | 681,940 | |
PepsiCo, Inc. | | 129,981 | | 8,894,600 | |
Philip Morris Int’l., Inc. | | 141,302 | | 11,818,499 | |
Proctor & Gamble Co. | | 229,250 | | 15,563,783 | |
Reynolds American, Inc. | | 26,815 | | 1,110,945 | |
Safeway, Inc. | | 20,264 | | 366,576 | |
Sysco Corp. | | 48,935 | | 1,549,282 | |
Tyson Foods, Inc. Cl A | | 24,244 | | 470,334 | |
Wal-Mart Stores, Inc. | | 140,008 | | 9,552,746 | |
Walgreen Co. | | 72,555 | | 2,685,261 | |
Whole Foods Market, Inc. | | 14,493 | | 1,323,646 | |
| | | | 113,510,595 | |
ENERGY (10.6%) | | | | | |
Anadarko Petroleum Corp. | | 41,917 | | 3,114,852 | |
Apache Corp. | | 32,860 | | 2,579,510 | |
Baker Hughes, Inc. | | 37,575 | | 1,534,563 | |
Cabot Oil & Gas Corp. | | 16,729 | | 832,100 | |
Cameron International Corp.* | | 20,879 | | 1,178,828 | |
Chesapeake Energy Corp. | | 42,936 | | 713,596 | |
Chevron Corp. | | 163,568 | | 17,688,244 | |
ConocoPhillips | | 101,747 | | 5,900,309 | |
CONSOL Energy, Inc. | | 19,549 | | 627,523 | |
Denbury Resources, Inc.* | | 32,604 | | 528,185 | |
Devon Energy Corp. | | 31,851 | | 1,657,526 | |
Diamond Offshore Drilling, Inc. | | 5,739 | | 390,022 | |
Ensco PLC Cl A* | | 19,204 | | 1,138,413 | |
EOG Resources, Inc. | | 22,570 | | 2,726,230 | |
EQT Corp. | | 12,333 | | 727,400 | |
Exxon Mobil Corp. | | 385,191 | | 33,338,278 | |
FMC Technologies, Inc.* | | 19,961 | | 854,930 | |
Halliburton Co. | | 76,917 | | 2,668,251 | |
Helmerich & Payne, Inc. | | 8,755 | | 490,368 | |
Hess Corp. | | 25,280 | | 1,338,829 | |
Kinder Morgan, Inc.* | | 52,506 | | 1,855,037 | |
Marathon Oil Corp. | | 59,162 | | 1,813,907 | |
Marathon Petroleum Corp. | | 28,603 | | 1,801,989 | |
Murphy Oil Corp. | | 15,644 | | 931,600 | |
Nabors Industries Ltd.* | | 23,951 | | 346,092 | |
National Oilwell Varco, Inc. | | 35,618 | | 2,434,490 | |
Newfield Exploration Co.* | | 11,378 | | 304,703 | |
Noble Drilling Corp.* | | 20,733 | | 721,923 | |
Noble Energy, Inc. | | 14,868 | | 1,512,670 | |
Occidental Petroleum Corp. | | 67,526 | | 5,173,167 | |
Peabody Energy Corp. | | 23,219 | | 617,858 | |
Phillips 66* | | 52,931 | | 2,810,636 | |
Pioneer Natural Resources Co. | | 10,247 | | 1,092,228 | |
QEP Resources, Inc. | | 15,103 | | 457,168 | |
Range Resources Corp. | | 13,774 | | 865,420 | |
Rowan Companies PLC Cl A* | | 10,303 | | 322,175 | |
Schlumberger Ltd. | | 112,031 | | 7,762,628 | |
Southwestern Energy Co.* | | 28,913 | | 965,983 | |
Spectra Energy Corp. | | 55,079 | | 1,508,063 | |
Tesoro Corp.* | | 11,799 | | 519,746 | |
Valero Energy Corp. | | 46,124 | | 1,573,751 | |
Williams Cos., Inc.* | | 55,511 | | 1,817,430 | |
WPX Energy, Inc.* | | 17,136 | | 254,984 | |
| | | | 117,491,605 | |
FINANCIALS (14.9%) | | | | | |
ACE Ltd. | | 28,294 | | 2,257,861 | |
Aflac, Inc. | | 39,242 | | 2,084,535 | |
Allstate Corp. | | 40,454 | | 1,625,037 | |
American Express Co. | | 81,644 | | 4,692,897 | |
American Int’l. Group, Inc.* | | 124,540 | | 4,396,262 | |
American Tower Corp.* | | 32,933 | | 2,544,733 | |
Ameriprise Financial, Inc. | | 17,221 | | 1,078,551 | |
Aon PLC | | 26,502 | | 1,473,776 | |
Apartment Investment & Management Co. Cl A | | 11,762 | | 318,280 | |
Assurant, Inc. | | 6,627 | | 229,957 | |
AvalonBay Communities, Inc. | | 9,318 | | 1,263,428 | |
Bank of America Corp. | | 902,925 | | 10,473,930 | |
Bank of New York Mellon Corp. | | 97,378 | | 2,502,615 | |
BB&T Corp. | | 58,253 | | 1,695,745 | |
Berkshire Hathaway, Inc. Cl B* | | 151,595 | | 13,598,072 | |
BlackRock, Inc. | | 10,397 | | 2,149,164 | |
Boston Properties, Inc. | | 12,393 | | 1,311,303 | |
Capital One Financial Corp. | | 49,081 | | 2,843,262 | |
CBRE Group, Inc.* | | 25,717 | | 511,768 | |
Charles Schwab Corp. | | 90,556 | | 1,300,384 | |
Chubb Corp. | | 22,169 | | 1,669,769 | |
Cincinnati Financial Corp. | | 12,208 | | 478,065 | |
Citigroup, Inc. | | 244,654 | | 9,678,512 | |
CME Group, Inc. | | 26,091 | | 1,323,075 | |
Comerica, Inc. | | 15,896 | | 482,285 | |
Discover Financial Svcs. | | 44,144 | | 1,701,751 | |
E*Trade Financial Corp.* | | 21,544 | | 192,819 | |
Equity Residential | | 26,460 | | 1,499,488 | |
Federated Investors, Inc. Cl B | | 7,866 | | 159,129 | |
Fifth Third Bancorp | | 74,967 | | 1,138,749 | |
First Horizon National Corp. | | 20,630 | | 204,443 | |
Franklin Resources, Inc. | | 11,511 | | 1,446,933 | |
Genworth Financial, Inc. Cl A* | | 41,875 | | 314,481 | |
Goldman Sachs Group, Inc. | | 36,782 | | 4,691,912 | |
Hartford Financial Svcs. Group, Inc. | | 36,022 | | 808,334 | |
HCP, Inc. | | 37,345 | | 1,687,247 | |
Health Care REIT, Inc. | | 21,315 | | 1,306,396 | |
Host Hotels & Resorts, Inc. | | 59,525 | | 932,757 | |
Hudson City Bancorp, Inc. | | 39,699 | | 322,753 | |
Huntington Bancshares, Inc. | | 72,309 | | 462,055 | |
IntercontinentalExchange, Inc.* | | 5,991 | | 741,746 | |
Invesco Ltd. | | 37,154 | | 969,348 | |
JPMorgan Chase & Co. | | 313,596 | | 13,788,816 | |
KeyCorp | | 78,046 | | 657,147 | |
Kimco Realty Corp. | | 33,670 | | 650,504 | |
Legg Mason, Inc. | | 9,796 | | 251,953 | |
Leucadia National Corp. | | 16,638 | | 395,818 | |
Lincoln National Corp. | | 23,021 | | 596,244 | |
Loews Corp. | | 26,287 | | 1,071,195 | |
M&T Bank Corp. | | 10,189 | | 1,003,311 | |
Marsh & McLennan Cos., Inc. | | 44,504 | | 1,534,053 | |
MetLife, Inc. | | 89,785 | | 2,957,518 | |
Moody’s Corp. | | 16,167 | | 813,523 | |
Morgan Stanley | | 115,783 | | 2,213,771 | |
Nasdaq OMX Group, Inc.* | | 9,584 | | 239,696 | |
Northern Trust Corp. | | 17,941 | | 899,921 | |
NYSE Euronext | | 14,896 | | 469,820 | |
People’s United Financial, Inc. | | 29,190 | | 352,907 | |
Plum Creek Timber Co., Inc. | | 13,388 | | 594,026 | |
PNC Financial Svcs. Grp., Inc. | | 44,790 | | 2,611,705 | |
Principal Financial Grp., Inc. | | 23,311 | | 664,830 | |
Progressive Corp. | | 46,205 | | 974,926 | |
ProLogis, Inc. | | 37,769 | | 1,378,191 | |
Prudential Financial, Inc. | | 37,857 | | 2,018,914 | |
Public Storage | | 11,774 | | 1,706,759 | |
Regions Financial Corp. | | 116,358 | | 828,469 | |
Simon Property Group, Inc. | | 25,547 | | 4,038,725 | |
SLM Corp. | | 39,772 | | 681,294 | |
State Street Corp. | | 39,260 | | 1,845,613 | |
SunTrust Banks, Inc. | | 44,343 | | 1,257,124 | |
T. Rowe Price Group, Inc. | | 21,209 | | 1,381,342 | |
Torchmark Corp. | | 7,776 | | 401,786 | |
Travelers Cos., Inc. | | 32,058 | | 2,302,406 | |
U.S. Bancorp | | 157,609 | | 5,034,031 | |
Unum Group | | 23,121 | | 481,379 | |
Ventas, Inc. | | 24,450 | | 1,582,404 | |
Vornado Realty Trust | | 13,964 | | 1,118,237 | |
Wells Fargo & Co. | | 409,067 | | 13,981,910 | |
Weyerhaeuser Co. | | 44,798 | | 1,246,280 | |
XL Group PLC | | 25,351 | | 635,296 | |
Zions Bancorporation | | 15,314 | | 327,720 | |
| | | | 165,553,171 | |
HEALTH CARE (11.7%) | | | | | |
Abbott Laboratories | | 132,286 | | 8,664,733 | |
Aetna, Inc. | | 27,810 | | 1,287,603 | |
Agilent Technologies, Inc.* | | 29,652 | | 1,213,953 | |
Alexion Pharmaceuticals, Inc.* | | 16,610 | | 1,558,184 | |
Allergan, Inc. | | 25,850 | | 2,371,221 | |
AmerisourceBergen Corp. | | 19,644 | | 848,228 | |
Amgen, Inc. | | 64,988 | | 5,609,764 | |
Bard (C.R.), Inc. | | 6,339 | | 619,574 | |
Baxter International, Inc. | | 45,653 | | 3,043,229 | |
Becton, Dickinson & Co. | | 16,410 | | 1,283,098 | |
Biogen Idec, Inc.* | | 20,040 | | 2,939,267 | |
Boston Scientific Corp.* | | 115,091 | | 659,471 | |
Bristol-Myers Squibb Co. | | 139,014 | | 4,530,466 | |
Cardinal Health, Inc. | | 28,675 | | 1,180,837 | |
CareFusion Corp.* | | 18,185 | | 519,727 | |
Celgene Corp.* | | 35,472 | | 2,792,356 | |
Cerner Corp.* | | 12,392 | | 962,115 | |
CIGNA Corp. | | 24,113 | | 1,289,081 | |
Coventry Health Care, Inc.* | | 11,186 | | 501,468 | |
Covidien PLC | | 39,952 | | 2,306,828 | |
DaVita HealthCare Partners, Inc* | | 6,876 | | 760,004 | |
DENTSPLY International, Inc. | | 12,033 | | 476,627 | |
Edwards Lifesciences Corp.* | | 9,562 | | 862,206 | |
Express Scripts Hldg. Co.* | | 68,766 | | 3,713,364 | |
Forest Laboratories, Inc.* | | 19,737 | | 697,111 | |
Gilead Sciences, Inc.* | | 65,514 | | 4,812,003 | |
Hospira, Inc.* | | 13,829 | | 432,018 | |
Humana, Inc. | | 13,247 | | 909,142 | |
Intuitive Surgical, Inc.* | | 3,730 | | 1,829,080 | |
Johnson & Johnson | | 231,161 | | 16,204,386 | |
Laboratory Corp. of America Hldgs.* | | 7,951 | | 688,716 | |
Life Technologies Corp.* | | 14,810 | | 726,875 | |
Lilly (Eli) & Co. | | 85,729 | | 4,228,154 | |
McKesson Corp. | | 19,958 | | 1,935,128 | |
Medtronic, Inc. | | 85,025 | | 3,487,726 | |
Merck & Co., Inc. | | 264,685 | | 10,836,204 | |
Mylan, Inc.* | | 34,679 | | 952,979 | |
Patterson Cos., Inc. | | 6,990 | | 239,268 | |
PerkinElmer, Inc. | | 9,786 | | 310,608 | |
Perrigo Co. | | 7,418 | | 771,695 | |
Pfizer, Inc. | | 622,595 | | 15,614,683 | |
Quest Diagnostics, Inc. | | 13,406 | | 781,168 | |
St. Jude Medical, Inc. | | 25,541 | | 923,052 | |
Stryker Corp. | | 24,040 | | 1,317,873 | |
Tenet Healthcare Corp.* | | 8,764 | | 284,567 | |
Thermo Fisher Scientific, Inc.* | | 30,461 | | 1,942,803 | |
UnitedHealth Group, Inc. | | 84,903 | | 4,605,139 | |
Varian Medical Systems, Inc.* | | 9,307 | | 653,724 | |
Waters Corp.* | | 7,281 | | 634,321 | |
Watson Pharmaceuticals, Inc.* | | 10,604 | | 911,944 | |
WellPoint, Inc. | | 25,027 | | 1,524,645 | |
Zimmer Hldgs., Inc.* | | 14,586 | | 972,303 | |
| | | | 129,220,719 | |
INDUSTRIALS (9.8%) | | | | | |
3M Co. | | 53,085 | | 4,928,942 | |
Avery Dennison Corp. | | 8,233 | | 287,496 | |
Boeing Co. | | 55,982 | | 4,218,804 | |
Caterpillar, Inc. | | 56,262 | | 5,039,950 | |
Cintas Corp. | | 9,014 | | 368,673 | |
CSX Corp. | | 87,047 | | 1,717,437 | |
Cummins, Inc. | | 14,939 | | 1,618,641 | |
Danaher Corp. | | 48,625 | | 2,718,138 | |
Deere & Co. | | 32,832 | | 2,837,341 | |
Dover Corp. | | 15,072 | | 990,381 | |
Dun & Bradstreet Corp. | | 3,792 | | 298,241 | |
Eaton Corp. PLC* | | 37,874 | | 2,052,013 | |
Emerson Electric Co. | | 60,321 | | 3,194,600 | |
Equifax, Inc. | | 10,153 | | 549,480 | |
Expeditors Int’l. of Wash. | | 17,180 | | 679,469 | |
Fastenal Co. | | 22,297 | | 1,041,047 | |
FedEx Corp. | | 24,105 | | 2,210,911 | |
Flowserve Corp. | | 4,164 | | 611,275 | |
Fluor Corp. | | 13,868 | | 814,606 | |
General Dynamics Corp. | | 27,196 | | 1,883,867 | |
General Electric Co. | | 900,808 | | 18,907,960 | |
Grainger (W.W.), Inc. | | 4,895 | | 990,601 | |
Honeywell International, Inc. | | 64,955 | | 4,122,694 | |
Illinois Tool Works, Inc. | | 35,719 | | 2,172,072 | |
Ingersoll-Rand PLC | | 23,177 | | 1,111,569 | |
Iron Mountain, Inc. | | 14,134 | | 438,861 | |
Jacobs Engineering Group, Inc.* | | 10,746 | | 457,457 | |
Joy Global, Inc. | | 8,873 | | 565,920 | |
L-3 Communications Hldgs., Inc. | | 7,774 | | 595,644 | |
Lockheed Martin Corp. | | 22,449 | | 2,071,818 | |
Masco Corp. | | 30,300 | | 504,798 | |
Norfolk Southern Corp. | | 26,249 | | 1,623,238 | |
Northrop Grumman Corp. | | 20,254 | | 1,368,765 | |
PACCAR, Inc. | | 29,631 | | 1,339,618 | |
Pall Corp. | | 9,370 | | 564,636 | |
Parker Hannifin Corp. | | 12,602 | | 1,071,926 | |
Pentair Ltd.* | | 17,858 | | 877,721 | |
Pitney Bowes, Inc. | | 17,035 | | 181,252 | |
Precision Castparts Corp. | | 12,062 | | 2,284,784 | |
Quanta Services, Inc.* | | 17,887 | | 488,136 | |
Raytheon Co. | | 27,303 | | 1,571,561 | |
Republic Services, Inc. | | 24,801 | | 727,413 | |
Robert Half Int’l., Inc. | | 11,326 | | 360,393 | |
Robinson (C.H.) Worldwide, Inc. | | 13,405 | | 847,464 | |
Rockwell Automation, Inc. | | 11,928 | | 1,001,833 | |
Rockwell Collins, Inc. | | 11,612 | | 675,470 | |
Roper Industries, Inc. | | 8,269 | | 921,828 | |
Ryder System, Inc. | | 4,286 | | 214,000 | |
Snap-on, Inc. | | 4,893 | | 386,498 | |
Southwest Airlines Co. | | 61,059 | | 625,244 | |
Stanley Black & Decker, Inc. | | 14,145 | | 1,046,306 | |
Stericycle, Inc.* | | 7,318 | | 682,550 | |
Textron, Inc. | | 23,646 | | 586,184 | |
The ADT Corp.* | | 19,687 | | 915,249 | |
Tyco International Ltd. | | 38,806 | | 1,135,076 | |
Union Pacific Corp. | | 39,613 | | 4,980,146 | |
United Parcel Service, Inc. Cl B | | 59,596 | | 4,394,013 | |
United Technologies Corp. | | 69,789 | | 5,723,396 | |
Waste Management, Inc. | | 36,231 | | 1,222,434 | |
Xylem, Inc. | | 15,901 | | 430,917 | |
| | | | 108,248,757 | |
INFORMATION TECHNOLOGY (18.5%) | | | | | |
Accenture Ltd. Cl A | | 55,102 | | 3,664,283 | |
Adobe Systems, Inc.* | | 41,031 | | 1,546,048 | |
Advanced Micro Devices, Inc.* | | 54,917 | | 131,801 | |
Akamai Technologies, Inc.* | | 14,520 | | 594,013 | |
Altera Corp. | | 26,480 | | 911,971 | |
Amphenol Corp. Cl A | | 13,302 | | 860,639 | |
Analog Devices, Inc. | | 25,248 | | 1,061,931 | |
Apple, Inc. | | 81,328 | | 43,350,259 | |
Applied Materials, Inc. | | 99,006 | | 1,132,629 | |
Autodesk, Inc.* | | 18,876 | | 667,267 | |
Automatic Data Processing, Inc. | | 40,580 | | 2,313,466 | |
BMC Software, Inc.* | | 12,049 | | 477,863 | |
Broadcom Corp. Cl A* | | 43,875 | | 1,457,089 | |
CA, Inc. | | 27,879 | | 612,780 | |
Cisco Systems, Inc. | | 452,098 | | 8,883,726 | |
Citrix Systems, Inc.* | | 15,941 | | 1,048,121 | |
Cognizant Technology Solutions* | | 25,380 | | 1,879,389 | |
Computer Sciences Corp. | | 13,243 | | 530,382 | |
Corning, Inc. | | 126,175 | | 1,592,329 | |
Dell, Inc.* | | 123,901 | | 1,255,117 | |
eBay, Inc.* | | 98,068 | | 5,003,429 | |
Electronic Arts, Inc.* | | 27,706 | | 402,568 | |
EMC Corp.* | | 177,341 | | 4,486,727 | |
F5 Networks, Inc.* | | 6,594 | | 640,607 | |
Fidelity Nat’l. Information Svcs., Inc. | | 20,721 | | 721,298 | |
First Solar, Inc.* | | 5,084 | | 156,994 | |
Fiserv, Inc.* | | 11,300 | | 893,039 | |
FLIR Systems, Inc. | | 12,378 | | 276,153 | |
Google, Inc. Cl A* | | 22,205 | | 15,751,561 | |
Harris Corp. | | 9,428 | | 461,595 | |
Hewlett-Packard Co. | | 166,845 | | 2,377,541 | |
Int’l. Business Machines Corp. | | 89,033 | | 17,054,271 | |
Intel Corp. | | 417,262 | | 8,608,115 | |
Intuit, Inc. | | 23,245 | | 1,383,078 | |
Jabil Circuit, Inc. | | 14,654 | | 282,676 | |
JDS Uniphase Corp.* | | 19,639 | | 265,912 | |
Juniper Networks, Inc.* | | 43,534 | | 856,314 | |
KLA-Tencor Corp. | | 13,842 | | 661,094 | |
Lam Research Corp.* | | 14,464 | | 522,584 | |
Linear Technology Corp. | | 19,411 | | 665,797 | |
LSI Corp.* | | 48,751 | | 345,157 | |
MasterCard, Inc. Cl A | | 8,842 | | 4,343,898 | |
Microchip Technology, Inc. | | 16,121 | | 525,383 | |
Micron Technology, Inc.* | | 89,468 | | 568,122 | |
Microsoft Corp. | | 637,244 | | 17,033,532 | |
Molex, Inc. | | 11,513 | | 314,650 | |
Motorola Solutions, Inc. | | 23,524 | | 1,309,816 | |
NetApp, Inc.* | | 30,263 | | 1,015,324 | |
NVIDIA Corp.* | | 52,586 | | 646,282 | |
Oracle Corp. | | 304,888 | | 10,158,868 | |
Paychex, Inc. | | 27,691 | | 862,298 | |
QUALCOMM, Inc. | | 144,795 | | 8,980,186 | |
Red Hat, Inc.* | | 15,278 | | 809,123 | |
SAIC, Inc.* | | 23,841 | | 269,880 | |
Salesforce.com, inc.* | | 10,960 | | 1,842,376 | |
SanDisk Corp.* | | 19,942 | | 868,674 | |
Seagate Technology PLC* | | 27,430 | | 836,066 | |
Symantec Corp.* | | 58,938 | | 1,108,624 | |
TE Connectivity Ltd. | | 35,202 | | 1,306,698 | |
Teradata Corp.* | | 13,952 | | 863,489 | |
Teradyne, Inc.* | | 15,801 | | 266,879 | |
Texas Instruments, Inc. | | 94,415 | | 2,921,200 | |
Total System Services, Inc. | | 13,592 | | 291,141 | |
VeriSign, Inc. | | 12,689 | | 492,587 | |
Visa, Inc. Cl A | | 43,152 | | 6,540,980 | |
Western Digital Corp.* | | 17,418 | | 740,091 | |
Western Union Co. | | 48,677 | | 662,494 | |
Xerox Corp. | | 106,144 | | 723,902 | |
Xilinx, Inc. | | 21,753 | | 780,933 | |
Yahoo!, Inc.* | | 87,258 | | 1,736,434 | |
| | | | 204,607,543 | |
MATERIALS (3.5%) | | | | | |
Air Products & Chemicals, Inc. | | 17,647 | | 1,482,701 | |
Airgas, Inc. | | 5,839 | | 533,042 | |
Alcoa, Inc. | | 91,773 | | 796,590 | |
Allegheny Technologies, Inc. | | 8,869 | | 269,263 | |
Ball Corp. | | 12,512 | | 559,912 | |
Bemis Co., Inc. | | 8,475 | | 283,574 | |
CF Industries Hldgs., Inc. | | 5,314 | | 1,079,592 | |
Cliffs Natural Resources, Inc. | | 11,985 | | 462,142 | |
Dow Chemical Co. | | 101,638 | | 3,284,940 | |
Du Pont (E.I.) de Nemours & Co. | | 77,429 | | 3,481,982 | |
Eastman Chemical Co. | | 12,785 | | 870,019 | |
Ecolab, Inc. | | 21,950 | | 1,578,205 | |
FMC Corp. | | 11,426 | | 668,650 | |
Freeport-McMoRan Copper & Gold, Inc. | | 79,816 | | 2,729,707 | |
Int’l. Flavors & Fragrances, Inc. | | 6,780 | | 451,141 | |
International Paper Co. | | 36,238 | | 1,443,722 | |
LyondellBasell Industries N.V. Cl A* | | 31,548 | | 1,801,075 | |
MeadWestvaco Corp. | | 14,417 | | 459,470 | |
Monsanto Co. | | 44,320 | | 4,194,888 | |
Newmont Mining Corp. | | 41,139 | | 1,910,495 | |
Nucor Corp. | | 26,530 | | 1,145,565 | |
Owens-Illinois, Inc.* | | 13,523 | | 287,634 | |
PPG Industries, Inc. | | 12,609 | | 1,706,628 | |
Praxair, Inc. | | 24,833 | | 2,717,972 | |
Sealed Air Corp. | | 15,605 | | 273,244 | |
Sherwin-Williams Co. | | 7,121 | | 1,095,352 | |
Sigma-Aldrich Corp. | | 10,052 | | 739,626 | |
The Mosaic Co. | | 23,215 | | 1,314,665 | |
United States Steel Corp. | | 12,122 | | 289,352 | |
Vulcan Materials Co. | | 10,795 | | 561,880 | |
| | | | 38,473,028 | |
TELECOMMUNICATION SERVICES (2.9%) | | | | | |
AT&T, Inc. | | 477,196 | | 16,086,277 | |
CenturyLink, Inc. | | 52,709 | | 2,061,976 | |
Crown Castle International Corp.* | | 24,243 | | 1,749,375 | |
Frontier Communications Corp. | | 88,199 | | 377,492 | |
MetroPCS Communications, Inc.* | | 26,446 | | 262,873 | |
Sprint Nextel Corp.* | | 253,882 | | 1,439,511 | |
Verizon Communications, Inc. | | 236,398 | | 10,228,941 | |
Windstream Corp. | | 49,475 | | 409,653 | |
| | | | 32,616,098 | |
UTILITIES (3.3%) | | | | | |
AES Corp.* | | 51,606 | | 552,184 | |
AGL Resources, Inc. | | 9,700 | | 387,709 | |
Ameren Corp. | | 19,570 | | 601,190 | |
American Electric Power Co., Inc. | | 40,647 | | 1,734,814 | |
CenterPoint Energy, Inc. | | 36,070 | | 694,348 | |
CMS Energy Corp. | | 21,892 | | 533,727 | |
Consolidated Edison, Inc. | | 24,680 | | 1,370,727 | |
Dominion Resources, Inc. | | 47,833 | | 2,477,749 | |
DTE Energy Co. | | 14,334 | | 860,757 | |
Duke Energy Corp.* | | 58,652 | | 3,741,998 | |
Edison International | | 26,980 | | 1,219,226 | |
Entergy Corp. | | 14,970 | | 954,338 | |
Exelon Corp. | | 72,522 | | 2,156,804 | |
FirstEnergy Corp. | | 34,610 | | 1,445,314 | |
Integrys Energy Group, Inc. | | 6,545 | | 341,780 | |
NextEra Energy, Inc. | | 35,401 | | 2,449,395 | |
NiSource, Inc. | | 25,353 | | 631,036 | |
Northeast Utilities | | 26,231 | | 1,025,107 | |
NRG Energy, Inc.* | | 27,111 | | 623,282 | |
ONEOK, Inc. | | 16,975 | | 725,681 | |
Pepco Hldgs., Inc. | | 19,092 | | 374,394 | |
PG&E Corp. | | 35,311 | | 1,418,796 | |
Pinnacle West Capital Corp. | | 9,077 | | 462,745 | |
PPL Corp. | | 48,905 | | 1,400,150 | |
Public Svc. Enterprise Group, Inc. | | 42,308 | | 1,294,625 | |
SCANA Corp. | | 11,079 | | 505,646 | |
Sempra Energy | | 18,839 | | 1,336,439 | |
Southern Co. | | 73,256 | | 3,136,089 | |
TECO Energy, Inc. | | 16,800 | | 281,568 | |
Wisconsin Energy Corp. | | 19,327 | | 712,200 | |
Xcel Energy, Inc. | | 40,708 | | 1,087,311 | |
| | | | 36,537,129 | |
TOTAL INDEXED ASSETS - COMMON STOCKS | | | | | |
(Cost: $822,824,420) 96.5% | | | | 1,069,563,554 | |
| | Rating** | | Rate(%) | | Maturity | | Face Amount | | Value | |
SHORT-TERM DEBT SECURITIES: | | | | | | | | | | | |
U.S. GOVERNMENT (0.9%) | | | | | | | | | | | |
U.S. Treasury Bill (1) | | A-1 | + | | 0.03 | | 04/04/13 | | 3,100,000 | | 3,099,760 | |
U.S. Treasury Bill (1) | | A-1 | + | | 0.06 | | 03/21/13 | | 5,000,000 | | 4,999,342 | |
U.S. Treasury Bill (1) | | A-1 | + | | 0.10 | | 02/14/13 | | 2,000,000 | | 1,999,756 | |
| | | | | | | | | | | 10,098,858 | |
COMMERCIAL PAPER (2.4%) | | | | | | | | | | | | |
Air Products & Chemicals† | | A-1 | | | 0.13 | | 01/16/13 | | 3,400,000 | | 3,399,816 | |
General Electric Capital Corp. | | A-1 | + | | 0.12 | | 03/18/13 | | 10,000,000 | | 9,997,465 | |
New Jersey Natural Gas | | A-1 | | | 0.11 | | 01/14/13 | | 1,300,000 | | 1,299,948 | |
Toyota Motor Credit Corp. | | A-1 | + | | 0.15 | | 02/22/13 | | 3,000,000 | | 2,999,350 | |
Toyota Motor Credit Corp. | | A-1 | + | | 0.16 | | 02/15/13 | | 6,000,000 | | 5,998,800 | |
Washington Gas Light Co. | | A-1 | | | 0.13 | | 01/02/13 | | 3,100,000 | | 3,099,989 | |
| | | | | | | | | | 26,795,368 | |
TOTAL SHORT-TERM DEBT SECURITIES
(Cost: $36,894,226) 3.3% | | | | | | | | | | 36,894,226 | |
| | | | | | | | | | | |
TEMPORARY CASH INVESTMENTS (2)
(Cost: $32,700) 0.0% (3) | | | | | | | | | | 32,700 | |
| | | | | | | | | | | |
TOTAL INVESTMENTS
(Cost: $859,751,346) 99.8% | | | | | | | | | | 1,106,490,480 | |
| | | | | | | | | | | |
OTHER NET ASSETS 0.2% | | | | | | | | | | 2,096,585 | |
| | | | | | | | | | | |
NET ASSETS 100.0% | | | | | | | | | | 1,108,587,065 | |
The accompanying notes are an integral part of these portfolio schedules.
MUTUAL OF AMERICA INVESTMENT CORPORATION - ALL AMERICA FUND
PORTFOLIO OF INVESTMENTS IN SECURITIES
December 31, 2012
| | Shares | | Value | |
INDEXED ASSETS: | | | | | |
COMMON STOCKS: | | | | | |
CONSUMER DISCRETIONARY (5.9%) | | | | | |
Abercrombie & Fitch Co. Cl A | | 834 | | 40,007 | |
Amazon.com, Inc.* | | 3,743 | | 940,017 | |
Apollo Group, Inc.* | | 1,108 | | 23,179 | |
AutoNation, Inc.* | | 402 | | 15,959 | |
AutoZone, Inc.* | | 385 | | 136,456 | |
Bed Bath & Beyond, Inc.* | | 2,532 | | 141,564 | |
Best Buy Co., Inc. | | 2,798 | | 33,156 | |
Big Lots, Inc.* | | 611 | | 17,389 | |
BorgWarner, Inc.* | | 1,183 | | 84,726 | |
Cablevision Systems Corp. Cl A | | 2,264 | | 33,824 | |
CarMax, Inc.* | | 2,173 | | 81,574 | |
Carnival Corp. | | 4,780 | | 175,761 | |
CBS Corp. Cl B | | 5,905 | | 224,685 | |
Chipotle Mexican Grill, Inc.* | | 334 | | 99,352 | |
Coach, Inc. | | 2,967 | | 164,698 | |
Comcast Corp. Cl A | | 27,683 | | 1,034,791 | |
D.R. Horton, Inc. | | 2,909 | | 57,540 | |
Darden Restaurants, Inc. | | 1,389 | | 62,602 | |
Delphi Automotive PLC* | | 2,900 | | 110,925 | |
DIRECTV* | | 6,337 | | 317,864 | |
Discovery Communications, Inc. Cl A* | | 2,482 | | 157,557 | |
Disney (Walt) Co. | | 18,111 | | 901,747 | |
Dollar General Corp.* | | 2,720 | | 119,925 | |
Dollar Tree, Inc.* | | 2,364 | | 95,884 | |
Expedia, Inc.* | | 975 | | 59,914 | |
Family Dollar Stores, Inc. | | 1,019 | | 64,615 | |
Ford Motor Co. | | 39,164 | | 507,174 | |
Fossil, Inc.* | | 564 | | 52,508 | |
GameStop Corp. Cl A* | | 1,330 | | 33,370 | |
Gannett Co., Inc. | | 2,337 | | 42,089 | |
Gap, Inc. | | 3,093 | | 96,007 | |
Garmin Ltd. | | 1,161 | | 47,392 | |
Genuine Parts Co. | | 1,570 | | 99,821 | |
Goodyear Tire & Rubber Co.* | | 2,712 | | 37,453 | |
H&R Block, Inc. | | 2,802 | | 52,033 | |
Harley-Davidson, Inc. | | 2,364 | | 115,458 | |
Harman Int’l. Industries, Inc. | | 693 | | 30,936 | |
Hasbro, Inc. | | 1,195 | | 42,901 | |
Home Depot, Inc. | | 15,787 | | 976,426 | |
International Game Technology | | 2,783 | | 39,435 | |
Interpublic Group of Cos., Inc. | | 4,428 | | 48,797 | |
Johnson Controls, Inc. | | 6,860 | | 210,602 | |
Kohl’s Corp. | | 2,212 | | 95,072 | |
Leggett & Platt, Inc. | | 1,443 | | 39,278 | |
Lennar Corp. Cl A | | 1,740 | | 67,286 | |
Limited Brands, Inc. | | 2,448 | | 115,203 | |
Lowe’s Cos., Inc. | | 11,762 | | 417,786 | |
Macy’s, Inc. | | 4,204 | | 164,040 | |
Marriott International, Inc. Cl A | | 2,530 | | 94,293 | |
Mattel, Inc. | | 3,546 | | 129,855 | |
McDonald’s Corp. | | 10,389 | | 916,414 | |
McGraw-Hill Cos., Inc. | | 2,830 | | 154,716 | |
Netflix, Inc.* | | 585 | | 54,276 | |
Newell Rubbermaid, Inc. | | 2,958 | | 65,875 | |
News Corp. Cl A | | 21,023 | | 536,927 | |
NIKE, Inc. Cl B | | 7,118 | | 367,289 | |
Nordstrom, Inc. | | 1,570 | | 83,995 | |
O’Reilly Automotive, Inc.* | | 1,181 | | 105,605 | |
Omnicom Group, Inc. | | 2,715 | | 135,641 | |
Penney (J.C.) Co., Inc. | | 1,474 | | 29,053 | |
PetSmart, Inc. | | 1,118 | | 76,404 | |
Priceline.com, Inc.* | | 516 | | 320,539 | |
Pulte Homes, Inc.* | | 3,589 | | 65,176 | |
Ralph Lauren Corp. | | 639 | | 95,799 | |
Ross Stores, Inc. | | 2,325 | | 125,899 | |
Scripps Networks Interactive, Inc. Cl A | | 905 | | 52,418 | |
Staples, Inc. | | 7,234 | | 82,468 | |
Starbucks Corp. | | 7,766 | | 416,413 | |
Starwood Hotels & Resorts | | 1,970 | | 112,999 | |
Target Corp. | | 6,889 | | 407,622 | |
Tiffany & Co. | | 1,255 | | 71,962 | |
Time Warner Cable, Inc. | | 3,077 | | 299,054 | |
Time Warner, Inc. | | 9,742 | | 465,960 | |
TJX Cos., Inc. | | 7,733 | | 328,266 | |
TripAdvisor, Inc.* | | 1,134 | | 47,583 | |
Urban Outfitters, Inc.* | | 1,106 | | 43,532 | |
V.F. Corp. | | 911 | | 137,534 | |
Viacom, Inc. Cl B | | 4,807 | | 253,521 | |
Washington Post Co. Cl B | | 47 | | 17,165 | |
Whirlpool Corp. | | 809 | | 82,316 | |
Wyndham Worldwide Corp. | | 1,425 | | 75,824 | |
Wynn Resorts Ltd. | | 816 | | 91,792 | |
Yum! Brands, Inc. | | 4,925 | | 327,020 | |
| | | | 15,197,983 | |
CONSUMER STAPLES (5.4%) | | | | | |
Altria Group, Inc. | | 20,922 | | 657,369 | |
Archer-Daniels-Midland Co. | | 6,840 | | 187,348 | |
Avon Products, Inc. | | 4,426 | | 63,557 | |
Beam, Inc. | | 1,637 | | 100,004 | |
Brown-Forman Corp. Cl B | | 1,566 | | 99,050 | |
Campbell Soup Co. | | 1,865 | | 65,070 | |
Clorox Co. | | 1,358 | | 99,433 | |
Coca-Cola Co. | | 39,712 | | 1,439,560 | |
Coca-Cola Enterprises, Inc. | | 2,787 | | 88,432 | |
Colgate-Palmolive Co. | | 4,608 | | 481,720 | |
ConAgra Foods, Inc. | | 4,196 | | 123,782 | |
Constellation Brands, Inc. Cl A* | | 1,557 | | 55,102 | |
Costco Wholesale Corp. | | 4,464 | | 440,909 | |
CVS Caremark Corp. | | 12,841 | | 620,862 | |
Dean Foods Co.* | | 1,879 | | 31,022 | |
Dr. Pepper Snapple Group, Inc. | | 2,130 | | 94,103 | |
Estee Lauder Cos., Inc. Cl A | | 2,502 | | 149,770 | |
General Mills, Inc. | | 6,693 | | 270,464 | |
Heinz (H.J.) Co. | | 3,304 | | 190,575 | |
Hershey Co. | | 1,538 | | 111,074 | |
Hormel Foods Corp. | | 1,387 | | 43,288 | |
J.M. Smucker Co. | | 1,112 | | 95,899 | |
Kellogg Co. | | 2,547 | | 142,250 | |
Kimberly-Clark Corp. | | 4,066 | | 343,292 | |
Kraft Foods Group, Inc.* | | 6,093 | | 277,049 | |
Kroger Co. | | 5,317 | | 138,348 | |
Lorillard, Inc. | | 1,297 | | 151,321 | |
McCormick & Co., Inc. | | 1,366 | | 86,782 | |
Mead Johnson Nutrition Co. | | 2,068 | | 136,261 | |
Molson Coors Brewing Co. Cl B | | 1,609 | | 68,849 | |
Mondelez International, Inc. Cl A* | | 18,249 | | 464,802 | |
Monster Beverage Corp.* | | 1,584 | | 83,762 | |
PepsiCo, Inc. | | 15,968 | | 1,092,690 | |
Philip Morris Int’l., Inc. | | 17,357 | | 1,451,739 | |
Proctor & Gamble Co. | | 28,159 | | 1,911,715 | |
Reynolds American, Inc. | | 3,304 | | 136,885 | |
Safeway, Inc. | | 2,479 | | 44,845 | |
Sysco Corp. | | 6,017 | | 190,498 | |
Tyson Foods, Inc. Cl A | | 2,992 | | 58,045 | |
Wal-Mart Stores, Inc. | | 17,212 | | 1,174,375 | |
Walgreen Co. | | 8,981 | | 332,387 | |
Whole Foods Market, Inc. | | 1,786 | | 163,115 | |
| | | | 13,957,403 | |
ENERGY (5.6%) | | | | | |
Anadarko Petroleum Corp. | | 5,158 | | 383,291 | |
Apache Corp. | | 4,062 | | 318,867 | |
Baker Hughes, Inc. | | 4,626 | | 188,926 | |
Cabot Oil & Gas Corp. | | 2,075 | | 103,211 | |
Cameron International Corp.* | | 2,571 | | 145,159 | |
Chesapeake Energy Corp. | | 5,276 | | 87,687 | |
Chevron Corp. | | 20,131 | | 2,176,966 | |
ConocoPhillips | | 12,512 | | 725,571 | |
CONSOL Energy, Inc. | | 2,402 | | 77,104 | |
Denbury Resources, Inc.* | | 4,011 | | 64,978 | |
Devon Energy Corp. | | 3,926 | | 204,309 | |
Diamond Offshore Drilling, Inc. | | 703 | | 47,776 | |
Ensco PLC Cl A* | | 2,362 | | 140,019 | |
EOG Resources, Inc. | | 2,784 | | 336,279 | |
EQT Corp. | | 1,525 | | 89,945 | |
Exxon Mobil Corp. | | 47,262 | | 4,090,521 | |
FMC Technologies, Inc.* | | 2,456 | | 105,190 | |
Halliburton Co. | | 9,518 | | 330,179 | |
Helmerich & Payne, Inc. | | 1,079 | | 60,435 | |
Hess Corp. | | 3,111 | | 164,759 | |
Kinder Morgan, Inc.* | | 6,477 | | 228,832 | |
Marathon Oil Corp. | | 7,269 | | 222,868 | |
Marathon Petroleum Corp. | | 3,548 | | 223,524 | |
Murphy Oil Corp. | | 1,924 | | 114,574 | |
Nabors Industries Ltd.* | | 2,948 | | 42,599 | |
National Oilwell Varco, Inc. | | 4,389 | | 299,988 | |
Newfield Exploration Co.* | | 1,405 | | 37,626 | |
Noble Drilling Corp.* | | 2,554 | | 88,930 | |
Noble Energy, Inc. | | 1,832 | | 186,388 | |
Occidental Petroleum Corp. | | 8,323 | | 637,625 | |
Peabody Energy Corp. | | 2,865 | | 76,238 | |
Phillips 66* | | 6,524 | | 346,424 | |
Pioneer Natural Resources Co. | | 1,259 | | 134,197 | |
QEP Resources, Inc. | | 1,862 | | 56,363 | |
Range Resources Corp. | | 1,698 | | 106,685 | |
Rowan Companies PLC Cl A* | | 1,265 | | 39,557 | |
Schlumberger Ltd. | | 13,828 | | 958,142 | |
Southwestern Energy Co.* | | 3,561 | | 118,973 | |
Spectra Energy Corp. | | 6,780 | | 185,636 | |
Tesoro Corp.* | | 1,458 | | 64,225 | |
Valero Energy Corp. | | 5,705 | | 194,655 | |
Williams Cos., Inc.* | | 6,821 | | 223,320 | |
WPX Energy, Inc.* | | 2,101 | | 31,263 | |
| | | | 14,459,804 | |
FINANCIALS (7.9%) | | | | | |
ACE Ltd. | | 3,487 | | 278,263 | |
Aflac, Inc. | | 4,838 | | 256,995 | |
Allstate Corp. | | 5,000 | | 200,850 | |
American Express Co. | | 10,064 | | 578,479 | |
American Int’l. Group, Inc.* | | 15,372 | | 542,632 | |
American Tower Corp.* | | 4,058 | | 313,562 | |
Ameriprise Financial, Inc. | | 2,125 | | 133,089 | |
Aon PLC | | 3,260 | | 181,289 | |
Apartment Investment & Management Co. Cl A | | 1,451 | | 39,264 | |
Assurant, Inc. | | 815 | | 28,281 | |
AvalonBay Communities, Inc. | | 1,151 | | 156,064 | |
Bank of America Corp. | | 111,031 | | 1,287,960 | |
Bank of New York Mellon Corp. | | 11,958 | | 307,321 | |
BB&T Corp. | | 7,171 | | 208,748 | |
Berkshire Hathaway, Inc. Cl B* | | 18,622 | | 1,670,393 | |
BlackRock, Inc. | | 1,278 | | 264,175 | |
Boston Properties, Inc. | | 1,527 | | 161,572 | |
Capital One Financial Corp. | | 6,055 | | 350,766 | |
CBRE Group, Inc.* | | 3,183 | | 63,342 | |
Charles Schwab Corp. | | 11,155 | | 160,186 | |
Chubb Corp. | | 2,732 | | 205,774 | |
Cincinnati Financial Corp. | | 1,508 | | 59,053 | |
Citigroup, Inc. | | 30,184 | | 1,194,079 | |
CME Group, Inc. | | 3,208 | | 162,678 | |
Comerica, Inc. | | 1,969 | | 59,739 | |
Discover Financial Svcs. | | 5,428 | | 209,249 | |
E*Trade Financial Corp.* | | 2,666 | | 23,861 | |
Equity Residential | | 3,264 | | 184,971 | |
Federated Investors, Inc. Cl B | | 972 | | 19,664 | |
Fifth Third Bancorp | | 9,247 | | 140,462 | |
First Horizon National Corp. | | 2,546 | | 25,231 | |
Franklin Resources, Inc. | | 1,410 | | 177,237 | |
Genworth Financial, Inc. Cl A* | | 5,158 | | 38,737 | |
Goldman Sachs Group, Inc. | | 4,536 | | 578,612 | |
Hartford Financial Svcs. Group, Inc. | | 4,459 | | 100,060 | |
HCP, Inc. | | 4,599 | | 207,783 | |
Health Care REIT, Inc. | | 2,624 | | 160,825 | |
Host Hotels & Resorts, Inc. | | 7,341 | | 115,033 | |
Hudson City Bancorp, Inc. | | 4,914 | | 39,951 | |
Huntington Bancshares, Inc. | | 8,936 | | 57,101 | |
IntercontinentalExchange, Inc.* | | 742 | | 91,867 | |
Invesco Ltd. | | 4,591 | | 119,779 | |
JPMorgan Chase & Co. | | 38,604 | | 1,697,418 | |
KeyCorp | | 9,648 | | 81,236 | |
Kimco Realty Corp. | | 4,147 | | 80,120 | |
Legg Mason, Inc. | | 1,203 | | 30,941 | |
Leucadia National Corp. | | 2,066 | | 49,150 | |
Lincoln National Corp. | | 2,834 | | 73,401 | |
Loews Corp. | | 3,235 | | 131,826 | |
M&T Bank Corp. | | 1,257 | | 123,777 | |
Marsh & McLennan Cos., Inc. | | 5,507 | | 189,826 | |
MetLife, Inc. | | 11,060 | | 364,316 | |
Moody’s Corp. | | 1,988 | | 100,036 | |
Morgan Stanley | | 14,278 | | 272,995 | |
Nasdaq OMX Group, Inc.* | | 1,177 | | 29,437 | |
Northern Trust Corp. | | 2,214 | | 111,054 | |
NYSE Euronext | | 1,848 | | 58,286 | |
People’s United Financial, Inc. | | 3,616 | | 43,717 | |
Plum Creek Timber Co., Inc. | | 1,646 | | 73,033 | |
PNC Financial Svcs. Grp., Inc. | | 5,495 | | 320,413 | |
Principal Financial Grp., Inc. | | 2,875 | | 81,995 | |
Progressive Corp. | | 5,689 | | 120,038 | |
ProLogis, Inc. | | 4,653 | | 169,788 | |
Prudential Financial, Inc. | | 4,658 | | 248,411 | |
Public Storage | | 1,451 | | 210,337 | |
Regions Financial Corp. | | 14,354 | | 102,200 | |
Simon Property Group, Inc. | | 3,138 | | 496,086 | |
SLM Corp. | | 4,905 | | 84,023 | |
State Street Corp. | | 4,838 | | 227,434 | |
SunTrust Banks, Inc. | | 5,479 | | 155,330 | |
T. Rowe Price Group, Inc. | | 2,617 | | 170,445 | |
Torchmark Corp. | | 957 | | 49,448 | |
Travelers Cos., Inc. | | 3,948 | | 283,545 | |
U.S. Bancorp | | 19,445 | | 621,073 | |
Unum Group | | 2,848 | | 59,295 | |
Ventas, Inc. | | 3,005 | | 194,484 | |
Vornado Realty Trust | | 1,719 | | 137,658 | |
Wells Fargo & Co. | | 50,464 | | 1,724,860 | |
Weyerhaeuser Co. | | 5,524 | | 153,678 | |
XL Group PLC | | 3,117 | | 78,112 | |
Zions Bancorporation | | 1,889 | | 40,425 | |
| | | | 20,394,624 | |
HEALTH CARE (6.2%) | | | | | |
Abbott Laboratories | | 16,331 | | 1,069,681 | |
Aetna, Inc. | | 3,425 | | 158,578 | |
Agilent Technologies, Inc.* | | 3,647 | | 149,308 | |
Alexion Pharmaceuticals, Inc.* | | 2,052 | | 192,498 | |
Allergan, Inc. | | 3,179 | | 291,610 | |
AmerisourceBergen Corp. | | 2,430 | | 104,927 | |
Amgen, Inc. | | 7,997 | | 690,301 | |
Bard (C.R.), Inc. | | 778 | | 76,042 | |
Baxter International, Inc. | | 5,597 | | 373,096 | |
Becton, Dickinson & Co. | | 2,020 | | 157,944 | |
Biogen Idec, Inc.* | | 2,478 | | 363,448 | |
Boston Scientific Corp.* | | 14,153 | | 81,097 | |
Bristol-Myers Squibb Co. | | 17,119 | | 557,908 | |
Cardinal Health, Inc. | | 3,524 | | 145,118 | |
CareFusion Corp.* | | 2,229 | | 63,705 | |
Celgene Corp.* | | 4,384 | | 345,108 | |
Cerner Corp.* | | 1,526 | | 118,479 | |
CIGNA Corp. | | 2,969 | | 158,723 | |
Coventry Health Care, Inc.* | | 1,378 | | 61,776 | |
Covidien PLC | | 4,920 | | 284,081 | |
DaVita HealthCare Partners, Inc.* | | 846 | | 93,508 | |
DENTSPLY International, Inc. | | 1,480 | | 58,623 | |
Edwards Lifesciences Corp.* | | 1,180 | | 106,401 | |
Express Scripts Hldg. Co.* | | 8,477 | | 457,758 | |
Forest Laboratories, Inc.* | | 2,434 | | 85,969 | |
Gilead Sciences, Inc.* | | 8,066 | | 592,448 | |
Hospira, Inc.* | | 1,705 | | 53,264 | |
Humana, Inc. | | 1,629 | | 111,798 | |
Intuitive Surgical, Inc.* | | 457 | | 224,099 | |
Johnson & Johnson | | 28,496 | | 1,997,570 | |
Laboratory Corp. of America Hldgs.* | | 980 | | 84,888 | |
Life Technologies Corp.* | | 1,807 | | 88,688 | |
Lilly (Eli) & Co. | | 10,547 | | 520,178 | |
McKesson Corp. | | 2,455 | | 238,037 | |
Medtronic, Inc. | | 10,471 | | 429,520 | |
Merck & Co., Inc. | | 32,567 | | 1,333,293 | |
Mylan, Inc.* | | 4,245 | | 116,653 | |
Patterson Cos., Inc. | | 858 | | 29,369 | |
PerkinElmer, Inc. | | 1,202 | | 38,151 | |
Perrigo Co. | | 914 | | 95,083 | |
Pfizer, Inc. | | 76,543 | | 1,919,698 | |
Quest Diagnostics, Inc. | | 1,652 | | 96,262 | |
St. Jude Medical, Inc. | | 3,144 | | 113,624 | |
Stryker Corp. | | 2,957 | | 162,103 | |
Tenet Healthcare Corp.* | | 1,075 | | 34,905 | |
Thermo Fisher Scientific, Inc.* | | 3,731 | | 237,963 | |
UnitedHealth Group, Inc. | | 10,430 | | 565,723 | |
Varian Medical Systems, Inc.* | | 1,144 | | 80,355 | |
Waters Corp.* | | 897 | | 78,147 | |
Watson Pharmaceuticals, Inc.* | | 1,310 | | 112,660 | |
WellPoint, Inc. | | 3,083 | | 187,816 | |
Zimmer Hldgs., Inc.* | | 1,790 | | 119,321 | |
| | | | 15,907,303 | |
INDUSTRIALS (5.2%) | | | | | |
3M Co. | | 6,561 | | 609,189 | |
Avery Dennison Corp. | | 1,020 | | 35,618 | |
Boeing Co. | | 6,934 | | 522,546 | |
Caterpillar, Inc. | | 6,930 | | 620,789 | |
Cintas Corp. | | 1,128 | | 46,135 | |
CSX Corp. | | 10,706 | | 211,229 | |
Cummins, Inc. | | 1,851 | | 200,556 | |
Danaher Corp. | | 6,013 | | 336,127 | |
Deere & Co. | | 4,053 | | 350,260 | |
Dover Corp. | | 1,863 | | 122,418 | |
Dun & Bradstreet Corp. | | 472 | | 37,123 | |
Eaton Corp. PLC* | | 4,664 | | 252,696 | |
Emerson Electric Co. | | 7,452 | | 394,658 | |
Equifax, Inc. | | 1,247 | | 67,488 | |
Expeditors Int’l. of Wash. | | 2,124 | | 84,004 | |
Fastenal Co. | | 2,761 | | 128,911 | |
FedEx Corp. | | 2,969 | | 272,317 | |
Flowserve Corp. | | 512 | | 75,162 | |
Fluor Corp. | | 1,713 | | 100,622 | |
General Dynamics Corp. | | 3,349 | | 231,985 | |
General Electric Co. | | 111,555 | | 2,341,539 | |
Grainger (W.W.), Inc. | | 607 | | 122,839 | |
Honeywell International, Inc. | | 8,011 | | 508,458 | |
Illinois Tool Works, Inc. | | 4,411 | | 268,233 | |
Ingersoll-Rand PLC | | 2,856 | | 136,974 | |
Iron Mountain, Inc. | | 1,731 | | 53,748 | |
Jacobs Engineering Group, Inc.* | | 1,307 | | 55,639 | |
Joy Global, Inc. | | 1,091 | | 69,584 | |
L-3 Communications Hldgs., Inc. | | 961 | | 73,632 | |
Lockheed Martin Corp. | | 2,779 | | 256,474 | |
Masco Corp. | | 3,721 | | 61,992 | |
Norfolk Southern Corp. | | 3,230 | | 199,743 | |
Northrop Grumman Corp. | | 2,502 | | 169,085 | |
PACCAR, Inc. | | 3,658 | | 165,378 | |
Pall Corp. | | 1,155 | | 69,600 | |
Parker Hannifin Corp. | | 1,555 | | 132,268 | |
Pentair Ltd.* | | 2,196 | | 107,933 | |
Pitney Bowes, Inc. | | 2,102 | | 22,365 | |
Precision Castparts Corp. | | 1,485 | | 281,289 | |
Quanta Services, Inc.* | | 2,196 | | 59,929 | |
Raytheon Co. | | 3,370 | | 193,977 | |
Republic Services, Inc. | | 3,050 | | 89,457 | |
Robert Half Int’l., Inc. | | 1,392 | | 44,293 | |
Robinson (C.H.) Worldwide, Inc. | | 1,655 | | 104,629 | |
Rockwell Automation, Inc. | | 1,465 | | 123,045 | |
Rockwell Collins, Inc. | | 1,438 | | 83,648 | |
Roper Industries, Inc. | | 1,018 | | 113,487 | |
Ryder System, Inc. | | 530 | | 26,463 | |
Snap-on, Inc. | | 603 | | 47,631 | |
Southwest Airlines Co. | | 7,521 | | 77,015 | |
Stanley Black & Decker, Inc. | | 1,746 | | 129,152 | |
Stericycle, Inc.* | | 895 | | 83,477 | |
Textron, Inc. | | 2,914 | | 72,238 | |
The ADT Corp.* | | 2,430 | | 112,971 | |
Tyco International Ltd. | | 4,775 | | 139,669 | |
Union Pacific Corp. | | 4,882 | | 613,765 | |
United Parcel Service, Inc. Cl B | | 7,332 | | 540,588 | |
United Technologies Corp. | | 8,600 | | 705,286 | |
Waste Management, Inc. | | 4,432 | | 149,536 | |
Xylem, Inc. | | 1,966 | | 53,279 | |
| | | | 13,360,141 | |
INFORMATION TECHNOLOGY (9.8%) | | | | | |
Accenture Ltd. Cl A | | 6,770 | | 450,205 | |
Adobe Systems, Inc.* | | 5,065 | | 190,849 | |
Advanced Micro Devices, Inc.* | | 6,824 | | 16,378 | |
Akamai Technologies, Inc.* | | 1,795 | | 73,433 | |
Altera Corp. | | 3,282 | | 113,032 | |
Amphenol Corp. Cl A | | 1,639 | | 106,043 | |
Analog Devices, Inc. | | 3,108 | | 130,722 | |
Apple, Inc. | | 9,998 | | 5,329,229 | |
Applied Materials, Inc. | | 12,250 | | 140,140 | |
Autodesk, Inc.* | | 2,344 | | 82,860 | |
Automatic Data Processing, Inc. | | 4,993 | | 284,651 | |
BMC Software, Inc.* | | 1,480 | | 58,697 | |
Broadcom Corp. Cl A* | | 5,426 | | 180,197 | |
CA, Inc. | | 3,423 | | 75,238 | |
Cisco Systems, Inc. | | 55,721 | | 1,094,918 | |
Citrix Systems, Inc.* | | 1,972 | | 129,659 | |
Cognizant Technology Solutions* | | 3,121 | | 231,110 | |
Computer Sciences Corp. | | 1,629 | | 65,241 | |
Corning, Inc. | | 15,543 | | 196,153 | |
Dell, Inc.* | | 15,233 | | 154,310 | |
eBay, Inc.* | | 12,076 | | 616,118 | |
Electronic Arts, Inc.* | | 3,440 | | 49,983 | |
EMC Corp.* | | 21,880 | | 553,564 | |
F5 Networks, Inc.* | | 822 | | 79,857 | |
Fidelity Nat’l. Information Svcs., Inc. | | 2,554 | | 88,905 | |
First Solar, Inc.* | | 631 | | 19,485 | |
Fiserv, Inc.* | | 1,393 | | 110,089 | |
FLIR Systems, Inc. | | 1,528 | | 34,090 | |
Google, Inc. Cl A* | | 2,737 | | 1,941,546 | |
Harris Corp. | | 1,164 | | 56,989 | |
Hewlett-Packard Co. | | 20,640 | | 294,120 | |
Int’l. Business Machines Corp. | | 10,929 | | 2,093,450 | |
Intel Corp. | | 51,451 | | 1,061,434 | |
Intuit, Inc. | | 2,864 | | 170,408 | |
Jabil Circuit, Inc. | | 1,811 | | 34,934 | |
JDS Uniphase Corp.* | | 2,428 | | 32,875 | |
Juniper Networks, Inc.* | | 5,379 | | 105,805 | |
KLA-Tencor Corp. | | 1,707 | | 81,526 | |
Lam Research Corp.* | | 1,788 | | 64,600 | |
Linear Technology Corp. | | 2,398 | | 82,251 | |
LSI Corp.* | | 6,204 | | 43,924 | |
MasterCard, Inc. Cl A | | 1,091 | | 535,986 | |
Microchip Technology, Inc. | | 1,985 | | 64,691 | |
Micron Technology, Inc.* | | 10,900 | | 69,215 | |
Microsoft Corp. | | 78,356 | | 2,094,456 | |
Molex, Inc. | | 1,420 | | 38,809 | |
Motorola Solutions, Inc. | | 2,894 | | 161,138 | |
NetApp, Inc.* | | 3,750 | | 125,813 | |
NVIDIA Corp.* | | 6,483 | | 79,676 | |
Oracle Corp. | | 37,424 | | 1,246,968 | |
Paychex, Inc. | | 3,424 | | 106,623 | |
QUALCOMM, Inc. | | 17,892 | | 1,109,662 | |
Red Hat, Inc.* | | 1,870 | | 99,035 | |
SAIC, Inc.* | | 2,936 | | 33,236 | |
Salesforce.com, inc.* | | 1,352 | | 227,271 | |
SanDisk Corp.* | | 2,480 | | 108,029 | |
Seagate Technology PLC* | | 3,429 | | 104,516 | |
Symantec Corp.* | | 7,284 | | 137,012 | |
TE Connectivity Ltd. | | 4,320 | | 160,358 | |
Teradata Corp.* | | 1,730 | | 107,070 | |
Teradyne, Inc.* | | 1,953 | | 32,986 | |
Texas Instruments, Inc. | | 11,630 | | 359,832 | |
Total System Services, Inc. | | 1,675 | | 35,879 | |
VeriSign, Inc. | | 1,548 | | 60,093 | |
Visa, Inc. Cl A | | 5,326 | | 807,315 | |
Western Digital Corp.* | | 2,156 | | 91,608 | |
Western Union Co. | | 6,005 | | 81,728 | |
Xerox Corp. | | 13,150 | | 89,683 | |
Xilinx, Inc. | | 2,690 | | 96,571 | |
Yahoo!, Inc.* | | 10,765 | | 214,224 | |
| | | | 25,198,501 | |
MATERIALS (1.9%) | | | | | |
Air Products & Chemicals, Inc. | | 2,169 | | 182,239 | |
Airgas, Inc. | | 721 | | 65,820 | |
Alcoa, Inc. | | 11,318 | | 98,240 | |
Allegheny Technologies, Inc. | | 1,097 | | 33,305 | |
Ball Corp. | | 1,540 | | 68,915 | |
Bemis Co., Inc. | | 1,044 | | 34,932 | |
CF Industries Hldgs., Inc. | | 655 | | 133,070 | |
Cliffs Natural Resources, Inc. | | 1,492 | | 57,532 | |
Dow Chemical Co. | | 12,555 | | 405,778 | |
Du Pont (E.I.) de Nemours & Co. | | 9,551 | | 429,508 | |
Eastman Chemical Co. | | 1,578 | | 107,383 | |
Ecolab, Inc. | | 2,708 | | 194,705 | |
FMC Corp. | | 1,404 | | 82,162 | |
Freeport-McMoRan Copper & Gold, Inc. | | 9,849 | | 336,836 | |
Int’l. Flavors & Fragrances, Inc. | | 831 | | 55,295 | |
International Paper Co. | | 4,481 | | 178,523 | |
LyondellBasell Industries N.V. Cl A* | | 3,890 | | 222,080 | |
MeadWestvaco Corp. | | 1,773 | | 56,506 | |
Monsanto Co. | | 5,459 | | 516,694 | |
Newmont Mining Corp. | | 5,054 | | 234,708 | |
Nucor Corp. | | 3,258 | | 140,680 | |
Owens-Illinois, Inc.* | | 1,662 | | 35,351 | |
PPG Industries, Inc. | | 1,561 | | 211,281 | |
Praxair, Inc. | | 3,050 | | 333,823 | |
Sealed Air Corp. | | 1,929 | | 33,777 | |
Sherwin-Williams Co. | | 879 | | 135,208 | |
Sigma-Aldrich Corp. | | 1,239 | | 91,166 | |
The Mosaic Co. | | 2,860 | | 161,962 | |
United States Steel Corp. | | 1,488 | | 35,519 | |
Vulcan Materials Co. | | 1,331 | | 69,279 | |
| | | | 4,742,277 | |
TELECOMMUNICATION SERVICES (1.6%) | | | | | |
AT&T, Inc. | | 58,732 | | 1,979,856 | |
CenturyLink, Inc. | | 6,466 | | 252,950 | |
Crown Castle International Corp.* | | 2,986 | | 215,470 | |
Frontier Communications Corp. | | 10,790 | | 46,181 | |
MetroPCS Communications, Inc.* | | 3,248 | | 32,285 | |
Sprint Nextel Corp.* | | 31,275 | | 177,329 | |
Verizon Communications, Inc. | | 29,234 | | 1,264,955 | |
Windstream Corp. | | 6,074 | | 50,293 | |
| | | | 4,019,319 | |
UTILITIES (1.8%) | | | | | |
AES Corp.* | | 6,345 | | 67,892 | |
AGL Resources, Inc. | | 1,195 | | 47,764 | |
Ameren Corp. | | 2,409 | | 74,004 | |
American Electric Power Co., Inc. | | 5,006 | | 213,656 | |
CenterPoint Energy, Inc. | | 4,445 | | 85,566 | |
CMS Energy Corp. | | 2,696 | | 65,728 | |
Consolidated Edison, Inc. | | 3,048 | | 169,286 | |
Dominion Resources, Inc. | | 5,888 | | 304,998 | |
DTE Energy Co. | | 1,777 | | 106,709 | |
Duke Energy Corp.* | | 7,232 | | 461,402 | |
Edison International | | 3,321 | | 150,076 | |
Entergy Corp. | | 1,841 | | 117,364 | |
Exelon Corp. | | 8,915 | | 265,132 | |
FirstEnergy Corp. | | 4,264 | | 178,065 | |
Integrys Energy Group, Inc. | | 805 | | 42,037 | |
NextEra Energy, Inc. | | 4,354 | | 301,253 | |
NiSource, Inc. | | 3,125 | | 77,781 | |
Northeast Utilities | | 3,227 | | 126,111 | |
NRG Energy, Inc.* | | 3,326 | | 76,465 | |
ONEOK, Inc. | | 2,095 | | 89,561 | |
Pepco Hldgs., Inc. | | 2,354 | | 46,162 | |
PG&E Corp. | | 4,346 | | 174,622 | |
Pinnacle West Capital Corp. | | 1,118 | | 56,996 | |
PPL Corp. | | 6,034 | | 172,753 | |
Public Svc. Enterprise Group, Inc. | | 5,205 | | 159,273 | |
SCANA Corp. | | 1,364 | | 62,253 | |
Sempra Energy | | 2,323 | | 164,794 | |
Southern Co. | | 9,022 | | 386,232 | |
TECO Energy, Inc. | | 2,069 | | 34,676 | |
Wisconsin Energy Corp. | | 2,385 | | 87,887 | |
Xcel Energy, Inc. | | 5,011 | | 133,844 | |
| | | | 4,500,342 | |
TOTAL INDEXED ASSETS - COMMON STOCKS
(Cost: $112,321,645) 51.3% | | | | 131,737,697 | |
| | | | | | | | | | | |
| | Rating** | | Rate(%) | | Maturity | | Face Amount | | Value | |
INDEXED ASSETS: | | | | | | | | | | | |
SHORT-TERM DEBT SECURITIES: | | | | | | | | | | | |
U.S. GOVERNMENT (0.4%) | | | | | | | | | | | |
U.S. Treasury Bill (1) | | A-1+ | | 0.05 | | 03/21/13 | | 1,000,000 | | 999,867 | |
COMMERCIAL PAPER (0.9%) | | | | | | | | | | | |
General Electric Capital Corp. | | A-1+ | | 0.12 | | 03/13/13 | | 1,500,000 | | 1,499,581 | |
General Electric Capital Corp. | | A-1+ | | 0.12 | | 03/18/13 | | 800,000 | | 799,773 | |
| | | | | | | | | | 2,299,354 | |
TOTAL INDEXED ASSETS - SHORT-TERM DEBT SECURITIES
(Cost: $3,299,333) 1.3% | | | | | | | | | | 3,299,221 | |
| | | | | | | | | | | |
TOTAL INDEXED ASSETS
(Cost: $115,620,978) 52.6% | | | | | | | | | | 135,036,918 | |
| | | | | |
| | Shares | | Value | |
ACTIVE ASSETS: | | | | | |
COMMON STOCKS: | | | | | |
CONSUMER DISCRETIONARY (4.9%) | | | | | |
Abercrombie & Fitch Co. Cl A | | 3,487 | | 167,271 | |
AFC Enterprises, Inc.* | | 18,658 | | 487,534 | |
Amazon.com, Inc.* | | 3,603 | | 904,857 | |
American Axle & Mfg. Hldgs., Inc.* | | 26,371 | | 295,355 | |
ANN, Inc.* | | 7,337 | | 248,284 | |
Bally Technologies, Inc.* | | 4,154 | | 185,725 | |
Bassett Furniture Industries, Inc. | | 27,116 | | 338,137 | |
bebe stores, inc. | | 35,050 | | 139,850 | |
BorgWarner, Inc.* | | 2,075 | | 148,612 | |
Cinemark Hldgs., Inc.* | | 7,277 | | 189,056 | |
Darden Restaurants, Inc. | | 5,336 | | 240,494 | |
Deckers Outdoor Corp.* | | 8,465 | | 340,886 | |
Discovery Communications, Inc. Cl A* | | 4,827 | | 306,418 | |
Disney (Walt) Co. | | 14,336 | | 713,789 | |
Ford Motor Co. | | 57,693 | | 747,124 | |
Haverty Furniture Cos., Inc. | | 10,238 | | 166,982 | |
Hibbett Sports, Inc.* | | 3,079 | | 162,263 | |
HSN, Inc. | | 6,955 | | 383,081 | |
Johnson Controls, Inc. | | 5,238 | | 160,807 | |
Macy’s, Inc. | | 10,028 | | 391,293 | |
Monro Muffler Brake, Inc. | | 7,063 | | 246,993 | |
Pep Boys - Manny, Moe & Jack | | 45,912 | | 451,315 | |
Red Robin Gourmet Burgers, Inc.* | | 5,924 | | 209,058 | |
Rent-A-Center, Inc. | | 15,145 | | 520,382 | |
Ruby Tuesday, Inc.* | | 9,150 | | 71,919 | |
Shutterfly, Inc.* | | 18,515 | | 553,043 | |
Starbucks Corp. | | 21,172 | | 1,135,243 | |
Steiner Leisure Ltd.* | | 3,371 | | 162,448 | |
Steve Madden Ltd.* | | 4,981 | | 210,547 | |
Target Corp. | | 3,975 | | 235,201 | |
Time Warner Cable, Inc. | | 5,357 | | 520,647 | |
Time Warner, Inc. | | 9,015 | | 431,187 | |
Urban Outfitters, Inc.* | | 6,460 | | 254,266 | |
Viacom, Inc. Cl B | | 6,401 | | 337,589 | |
Wolverine World Wide, Inc. | | 11,113 | | 455,411 | |
| | | | 12,513,067 | |
CONSUMER STAPLES (3.4%) | | | | | |
Avon Products, Inc. | | 18,684 | | 268,302 | |
ConAgra Foods, Inc. | | 13,465 | | 397,218 | |
Constellation Brands, Inc. Cl A* | | 10,561 | | 373,754 | |
Darling International, Inc.* | | 10,218 | | 163,897 | |
Dean Foods Co.* | | 26,041 | | 429,937 | |
Elizabeth Arden, Inc.* | | 3,810 | | 171,488 | |
Estee Lauder Cos., Inc. Cl A | | 7,348 | | 439,851 | |
Farmer Brothers Co.* | | 11,990 | | 173,016 | |
Hain Celestial Group, Inc.* | | 3,735 | | 202,512 | |
J.M. Smucker Co. | | 4,032 | | 347,720 | |
PepsiCo, Inc. | | 9,829 | | 672,598 | |
Philip Morris Int’l., Inc. | | 13,570 | | 1,134,995 | |
Post Hldgs., Inc.* | | 4,569 | | 156,488 | |
Prestige Brands Hldgs., Inc.* | | 17,149 | | 343,494 | |
Proctor & Gamble Co. | | 15,488 | | 1,051,480 | |
Susser Hldgs. Corp.* | | 7,012 | | 241,844 | |
The Pantry, Inc.* | | 18,802 | | 228,068 | |
TreeHouse Foods, Inc.* | | 2,367 | | 123,392 | |
Tyson Foods, Inc. Cl A | | 24,583 | | 476,910 | |
Vector Group Ltd. | | 10,746 | | 159,793 | |
Wal-Mart Stores, Inc. | | 17,613 | | 1,201,735 | |
| | | | 8,758,492 | |
ENERGY (4.0%) | | | | | |
Anadarko Petroleum Corp. | | 6,989 | | 519,353 | |
Apache Corp. | | 4,731 | | 371,384 | |
Chevron Corp. | | 6,326 | | 684,094 | |
Endeavour International Corp.* | | 27,272 | | 141,269 | |
Energy XXI (Bermuda) Ltd. | | 27,537 | | 886,416 | |
EOG Resources, Inc. | | 3,423 | | 413,464 | |
Exxon Mobil Corp. | | 25,539 | | 2,210,400 | |
Gasco Energy, Inc.* | | 305,816 | | 21,407 | |
Halliburton Co. | | 15,737 | | 545,917 | |
Hess Corp. | | 4,574 | | 242,239 | |
Lufkin Industries, Inc. | | 2,283 | | 132,711 | |
McMoRan Exploration Co.* | | 70,241 | | 1,127,368 | |
National Oilwell Varco, Inc. | | 7,079 | | 483,850 | |
Noble Energy, Inc. | | 6,057 | | 616,239 | |
Oasis Petroleum, Inc.* | | 7,155 | | 227,529 | |
Occidental Petroleum Corp. | | 7,449 | | 570,668 | |
PBF Energy, Inc.* | | 19,383 | | 563,076 | |
Range Resources Corp. | | 3,971 | | 249,498 | |
Saratoga Resources, Inc.* | | 29,903 | | 105,857 | |
Susser Petroleum Partners LP* | | 5,885 | | 148,067 | |
| | | | 10,260,806 | |
FINANCIALS (8.9%) | | | | | |
American Assets Trust, Inc.* | | 5,711 | | 159,508 | |
American Int’l. Group, Inc.* | | 14,552 | | 513,686 | |
AmREIT, Inc. Cl B* | | 4,935 | | 84,635 | |
Aon PLC | | 4,615 | | 256,640 | |
Ashford Hospitality Trust, Inc. | | 15,502 | | 162,926 | |
Aspen Insurance Hldgs. Ltd. | | 5,669 | | 181,862 | |
Associated Estates Realty Corp. | | 10,024 | | 161,587 | |
BancFirst Corp. | | 3,741 | | 158,469 | |
Bank of America Corp. | | 52,718 | | 611,529 | |
Bank of Marin Bancorp | | 2,448 | | 91,702 | |
Banner Corp. | | 4,269 | | 131,186 | |
BB&T Corp. | | 14,565 | | 423,987 | |
Berkshire Hathaway, Inc. Cl B* | | 5,917 | | 530,755 | |
Brookline Bancorp, Inc. | | 25,922 | | 220,337 | |
Bryn Mawr Bank Corp. | | 7,387 | | 164,508 | |
Capital One Financial Corp. | | 14,184 | | 821,679 | |
Cash America Int’l., Inc. | | 5,631 | | 223,382 | |
Chesapeake Lodging Trust | | 20,106 | | 419,813 | |
Citigroup, Inc. | | 13,874 | | 548,855 | |
Colonial Properties Trust | | 24,347 | | 520,295 | |
Dime Community Bancshares | | 12,281 | | 170,583 | |
EastGroup Properties, Inc. | | 5,045 | | 271,471 | |
Ellington Financial LLC | | 20,630 | | 463,350 | |
Endurance Specialty Hldgs. Ltd.* | | 3,765 | | 149,433 | |
Equity Lifestyle Properties, Inc. | | 5,783 | | 389,138 | |
FelCor Lodging Trust, Inc.* | | 46,512 | | 217,211 | |
First Interstate BancSytem, Inc. | | 11,319 | | 174,652 | |
Flushing Financial Corp. | | 3,420 | | 52,463 | |
Forest City Enterprises, Inc. Cl A* | | 19,052 | | 307,690 | |
Franklin Resources, Inc. | | 1,841 | | 231,414 | |
Glacier Bancorp, Inc. | | 13,777 | | 202,660 | |
Goldman Sachs Group, Inc. | | 4,870 | | 621,217 | |
Highwoods Properties, Inc. | | 8,543 | | 285,763 | |
Host Hotels & Resorts, Inc. | | 29,758 | | 466,308 | |
IBERIABANK Corp. | | 3,130 | | 153,746 | |
Investors Bancorp, Inc. | | 12,881 | | 229,024 | |
iShares Russell 2000 Growth Index Fund | | 1,860 | | 177,277 | |
iShares Russell 2000 Index Fund | | 4,280 | | 360,761 | |
iShares Russell 2000 Value Index Fund | | 5,840 | | 440,978 | |
Janus Capital Group, Inc. | | 23,081 | | 196,650 | |
JPMorgan Chase & Co. | | 31,400 | | 1,380,658 | |
Marlin Business Svcs. Corp. | | 14,497 | | 290,810 | |
MB Financial, Inc. | | 9,110 | | 179,923 | |
Meadowbrook Insurance Group, Inc. | | 38,601 | | 223,114 | |
MetLife, Inc. | | 14,386 | | 473,875 | |
Mid-America Apt. Communities, Inc. | | 1,674 | | 108,392 | |
National Bank Hldgs. Corp. Cl A* | | 16,887 | | 320,684 | |
National Retail Pptys., Inc. | | 7,624 | | 237,869 | |
Northwest Bancshares, Inc. | | 15,390 | | 186,835 | |
Oritani Financial Corp.* | | 7,740 | | 118,577 | |
Pennsylvania REIT | | 11,247 | | 198,397 | |
PHH Corp.* | | 10,401 | | 236,623 | |
PNC Financial Svcs. Grp., Inc. | | 6,213 | | 362,280 | |
ProAssurance Corp. | | 9,716 | | 409,918 | |
Prosperity Bancshares, Inc. | | 4,824 | | 202,608 | |
PS Business Parks, Inc. | | 2,356 | | 153,093 | |
S.Y. Bancorp, Inc. | | 13,693 | | 306,997 | |
Sabra Health Care REIT, Inc. | | 10,150 | | 220,458 | |
SeaBright Hldgs., Inc. | | 42,287 | | 468,117 | |
Select Income REIT | | 10,690 | | 264,791 | |
Signature Bank* | | 7,271 | | 518,713 | |
Simon Property Group, Inc. | | 5,117 | | 808,947 | |
Starwood Property Trust, Inc.* | | 7,655 | | 175,759 | |
Stifel Financial Corp.* | | 5,969 | | 190,829 | |
SVB Financial Group* | | 4,813 | | 269,384 | |
Symetra Financial Corp. | | 26,998 | | 350,434 | |
Terreno Realty Corp.* | | 6,610 | | 102,058 | |
Texas Capital Bancshares. Inc.* | | 3,120 | | 139,838 | |
UMB Financial Corp. | | 4,318 | | 189,301 | |
Urstadt Biddle Pptys., Inc. Cl A | | 6,621 | | 130,301 | |
Wells Fargo & Co. | | 38,762 | | 1,324,885 | |
West Coast Bancorp* | | 7,430 | | 164,575 | |
Westamerica Bancorporation | | 3,566 | | 151,876 | |
| | | | 22,810,049 | |
HEALTH CARE (5.6%) | | | | | |
Abbott Laboratories | | 4,072 | | 266,716 | |
Abiomed, Inc.* | | 10,477 | | 141,020 | |
Acorda Therapeutics, Inc.* | | 2,212 | | 54,990 | |
Alnylam Pharmaceuticals, Inc.* | | 9,145 | | 166,896 | |
AmerisourceBergen Corp. | | 2,217 | | 95,730 | |
athenahealth, Inc.* | | 2,625 | | 192,806 | |
Biogen Idec, Inc.* | | 1,299 | | 190,524 | |
BioScrip, Inc.* | | 23,867 | | 257,048 | |
BioSpecifics Technologies Corp.* | | 5,304 | | 79,295 | |
Bruker Corp.* | | 7,980 | | 121,855 | |
Cantel Medical Corp.* | | 6,113 | | 181,739 | |
Capital Senior Living Corp.* | | 13,952 | | 260,763 | |
Celgene Corp.* | | 6,636 | | 522,386 | |
Celsion Corp.* | | 4,872 | | 39,902 | |
Cepheid, Inc.* | | 5,502 | | 186,023 | |
Computer Programs & Systems, Inc.* | | 4,484 | | 225,725 | |
Conceptus, Inc.* | | 26,630 | | 559,496 | |
Covidien PLC | | 5,466 | | 315,607 | |
Cubist Pharmaceuticals, Inc.* | | 6,635 | | 279,068 | |
Cyberonics, Inc.* | | 4,632 | | 243,319 | |
DexCom, Inc.* | | 12,293 | | 167,308 | |
Emergent Biosolutions, Inc.* | | 7,790 | | 124,952 | |
Endologix, Inc.* | | 6,981 | | 99,409 | |
Exact Sciences Corp.* | | 6,495 | | 68,782 | |
Express Scripts Hldg. Co.* | | 5,054 | | 272,916 | |
Forest Laboratories, Inc.* | | 16,214 | | 572,678 | |
Gilead Sciences, Inc.* | | 7,228 | | 530,897 | |
Halozyme Therapeutics, Inc.* | | 4,827 | | 32,389 | |
Harvard Bioscience, Inc.* | | 26,040 | | 114,055 | |
HeartWare International, Inc.* | | 2,012 | | 168,907 | |
HMS Hldgs. Corp.* | | 9,124 | | 236,494 | |
Humana, Inc. | | 1,418 | | 97,317 | |
Impax Laboratories, Inc.* | | 6,023 | | 123,411 | |
Insulet Corp.* | | 8,453 | | 179,373 | |
IPC The Hospitalist Co.* | | 2,991 | | 118,773 | |
MAP Pharmaceuticals, Inc.* | | 5,052 | | 79,367 | |
McKesson Corp. | | 4,132 | | 400,639 | |
Medicines Co.* | | 1,185 | | 28,404 | |
Merck & Co., Inc. | | 21,999 | | 900,639 | |
MWI Veterinary Supply, Inc.* | | 1,368 | | 150,480 | |
Mylan, Inc.* | | 21,436 | | 589,061 | |
Neogen Corp.* | | 4,684 | | 212,279 | |
NPS Pharmaceuticals Inc* | | 9,851 | | 89,644 | |
Omeros Corp.* | | 9,459 | | 49,092 | |
OraSure Technologies, Inc.* | | 9,693 | | 69,596 | |
Orexigen Therapeutics, Inc.* | | 7,780 | | 41,001 | |
OSI Pharmaceuticals, Inc. - rights* | | 1,570 | | 16 | |
PAREXEL International Corp.* | | 10,380 | | 307,144 | |
Pfizer, Inc. | | 51,541 | | 1,292,648 | |
Pharmacyclics, Inc.* | | 3,162 | | 183,080 | |
QLT, Inc.* | | 64,611 | | 507,842 | |
Quest Diagnostics, Inc. | | 1,455 | | 84,783 | |
Questcor Pharmaceuticals, Inc. | | 8,423 | | 225,063 | |
Salix Pharmaceuticals Ltd.* | | 4,857 | | 196,611 | |
Seattle Genetics, Inc.* | | 7,093 | | 164,558 | |
St. Jude Medical, Inc. | | 5,322 | | 192,337 | |
Stryker Corp. | | 7,002 | | 383,850 | |
Sunesis Pharmaceuticals, Inc.* | | 6,675 | | 28,035 | |
Synageva BioPharma Corp.* | | 1,607 | | 74,388 | |
Threshold Pharmaceuticals, Inc.* | | 7,655 | | 32,228 | |
UnitedHealth Group, Inc. | | 6,351 | | 344,478 | |
Vascular Solutions, Inc.* | | 10,038 | | 158,600 | |
VIVUS, Inc.* | | 3,935 | | 52,808 | |
WellCare Health Plans, Inc.* | | 2,873 | | 139,886 | |
XenoPort, Inc.* | | 5,560 | | 43,201 | |
| | | | 14,310,327 | |
INDUSTRIALS (5.9%) | | | | | |
Actuant Corp. Cl A | | 11,394 | | 318,007 | |
Alaska Air Group, Inc.* | | 7,856 | | 338,515 | |
Allegiant Travel Co.* | | 1,445 | | 106,077 | |
Astronics Corp.* | | 10,547 | | 241,315 | |
Astronics Corp. Cl B* | | 1,582 | | 34,331 | |
AZZ, Inc. | | 21,339 | | 820,058 | |
Beacon Roofing Supply, Inc.* | | 7,176 | | 238,817 | |
Boeing Co. | | 10,566 | | 796,254 | |
Caterpillar, Inc. | | 7,729 | | 692,364 | |
CIRCOR International, Inc. | | 5,690 | | 225,267 | |
Corporate Executive Board Co. | | 4,060 | | 192,688 | |
Cummins, Inc. | | 5,365 | | 581,298 | |
Encore Wire Corp. | | 13,981 | | 423,764 | |
EnPro Industries, Inc.* | | 4,994 | | 204,255 | |
Expeditors Int’l. of Wash. | | 9,856 | | 389,805 | |
FedEx Corp. | | 5,376 | | 493,087 | |
General Electric Co. | | 62,144 | | 1,304,403 | |
Genesee & Wyoming, Inc. Cl A* | | 10,900 | | 829,272 | |
Healthcare Svcs. Group, Inc. | | 13,501 | | 313,628 | |
Hub Group, Inc. Cl A* | | 3,720 | | 124,992 | |
Insperity, Inc. | | 4,520 | | 147,171 | |
Miller Industries, Inc. | | 18,090 | | 275,873 | |
Mueller Industries, Inc. | | 13,393 | | 670,052 | |
Old Dominion Freight Line, Inc.* | | 29,600 | | 1,014,688 | |
On Assignment, Inc.* | | 15,358 | | 311,460 | |
Precision Castparts Corp. | | 4,211 | | 797,648 | |
Raven Industries, Inc. | | 14,000 | | 369,040 | |
Rexnord Corp.* | | 7,367 | | 156,917 | |
Robbins & Myers, Inc. | | 5,262 | | 312,826 | |
Roper Industries, Inc. | | 5,584 | | 622,504 | |
Smith (A.O.) Corp. | | 4,985 | | 314,404 | |
Sun Hydraulics Corp. | | 8,804 | | 229,608 | |
Teledyne Technologies, Inc.* | | 4,513 | | 293,661 | |
The Advisory Board Co.* | | 6,111 | | 285,934 | |
Union Pacific Corp. | | 3,758 | | 472,456 | |
USG Corp.* | | 3,370 | | 94,596 | |
| | | | 15,037,035 | |
INFORMATION TECHNOLOGY (7.4%) | | | | | |
Adtran, Inc. | | 9,159 | | 178,967 | |
Altera Corp. | | 4,087 | | 140,756 | |
Anixter International, Inc.* | | 1,170 | | 74,857 | |
Apple, Inc. | | 5,401 | | 2,878,893 | |
Arris Group, Inc.* | | 4,950 | | 73,953 | |
Aruba Network, Inc.* | | 4,135 | | 85,801 | |
Automatic Data Processing, Inc. | | 6,413 | | 365,605 | |
Brightcove, Inc.* | | 14,576 | | 131,767 | |
Broadcom Corp. Cl A* | | 8,910 | | 295,901 | |
Cavium, Inc.* | | 7,061 | | 220,374 | |
Ciena Corp.* | | 4,620 | | 72,534 | |
Cirrus Logic, Inc.* | | 13,557 | | 392,746 | |
Cisco Systems, Inc. | | 14,262 | | 280,248 | |
Coherent, Inc.* | | 2,757 | | 139,559 | |
CommVault Systems, Inc.* | | 11,934 | | 831,919 | |
comScore, Inc.* | | 10,800 | | 148,824 | |
EMC Corp.* | | 15,865 | | 401,385 | |
Emulex Corp.* | | 19,760 | | 144,248 | |
F5 Networks, Inc.* | | 976 | | 94,818 | |
Finisar Corp.* | | 9,706 | | 158,208 | |
Google, Inc. Cl A* | | 1,426 | | 1,011,562 | |
Harris Corp. | | 2,288 | | 112,020 | |
Heartland Payment Systems, Inc.* | | 5,037 | | 148,592 | |
iGATE Corp.* | | 13,471 | | 212,438 | |
Imperva, Inc.* | | 6,905 | | 217,715 | |
Informatica Corp.* | | 12,920 | | 391,734 | |
Int’l. Business Machines Corp. | | 5,392 | | 1,032,838 | |
Jive Software, Inc.* | | 10,623 | | 154,352 | |
KLA-Tencor Corp. | | 4,135 | | 197,488 | |
Littelfuse, Inc. | | 1,482 | | 91,454 | |
LogMeIn, Inc.* | | 18,383 | | 411,963 | |
MasterCard, Inc. Cl A | | 814 | | 399,902 | |
MAXIMUS, Inc. | | 3,615 | | 228,540 | |
Mercury Computer Systems, Inc.* | | 10,914 | | 100,409 | |
Microsemi Corp.* | | 13,285 | | 279,516 | |
Microsoft Corp. | | 32,624 | | 872,040 | |
MKS Instruments, Inc. | | 5,944 | | 153,236 | |
Monolithic Power Systems, Inc.* | | 5,280 | | 117,638 | |
Nanometrics, Inc.* | | 21,154 | | 305,041 | |
NetApp, Inc.* | | 1,895 | | 63,577 | |
Oracle Corp. | | 20,533 | | 684,160 | |
Parametric Technology Corp.* | | 16,385 | | 368,826 | |
Plantronics, Inc. | | 4,382 | | 161,564 | |
Plexus Corp.* | | 4,226 | | 109,031 | |
QLIK Technologies, Inc.* | | 3,432 | | 74,543 | |
QUALCOMM, Inc. | | 11,609 | | 719,990 | |
Richardson Electronics Ltd. | | 39,047 | | 442,012 | |
Salesforce.com, inc.* | | 4,512 | | 758,467 | |
Semtech Corp.* | | 7,126 | | 206,298 | |
Sourcefire, Inc.* | | 7,698 | | 363,500 | |
Super Micro Computer, Inc.* | | 10,764 | | 109,793 | |
Take-Two Interactive Software, Inc.* | | 7,302 | | 80,395 | |
Teradyne, Inc.* | | 6,461 | | 109,126 | |
Texas Instruments, Inc. | | 9,413 | | 291,238 | |
TIBCO Software, Inc.* | | 17,631 | | 388,058 | |
TTM Technologies, Inc.* | | 16,182 | | 148,874 | |
WEX, Inc.* | | 2,818 | | 212,393 | |
Yahoo!, Inc.* | | 11,157 | | 222,024 | |
| | | | 19,063,710 | |
MATERIALS (2.5%) | | | | | |
Allied Nevada Gold Corp.* | | 4,601 | | 138,628 | |
Ball Corp. | | 8,507 | | 380,688 | |
Boise, Inc. | | 61,890 | | 492,026 | |
Buckeye Technologies, Inc. | | 6,395 | | 183,600 | |
CF Industries Hldgs., Inc. | | 1,561 | | 317,133 | |
Commercial Metals Co. | | 13,109 | | 194,800 | |
Copper Mountain Mining Corp.* | | 26,862 | | 106,239 | |
Crown Hldgs., Inc.* | | 13,106 | | 482,432 | |
CVR Partners LP | | 7,809 | | 197,099 | |
Dow Chemical Co. | | 11,438 | | 369,676 | |
Eagle Materials, Inc. | | 1,190 | | 69,615 | |
Eastman Chemical Co. | | 8,975 | | 610,749 | |
FMC Corp. | | 2,574 | | 150,630 | |
Freeport-McMoRan Copper & Gold, Inc. | | 11,668 | | 399,046 | |
Innophos Hldgs., Inc. | | 14,575 | | 677,738 | |
Kaiser Aluminum Corp. | | 7,910 | | 487,968 | |
McEwen Mining, Inc.* | | 63,971 | | 245,010 | |
Silgan Hldgs., Inc. | | 19,747 | | 821,278 | |
Stepan Co.* | | 3,050 | | 169,397 | |
| | | | 6,493,752 | |
TELECOMMUNICATION SERVICES (0.8%) | | | | | |
AT&T, Inc. | | 32,277 | | 1,088,058 | |
CenturyLink, Inc. | | 7,061 | | 276,226 | |
Consolidated Comms. Hldgs., Inc. | | 19,627 | | 312,462 | |
Frontier Communications Corp. | | 65,538 | | 280,503 | |
| | | | 1,957,249 | |
UTILITIES (1.4%) | | | | | |
Ameren Corp. | | 3,142 | | 96,522 | |
Avista Corp. | | 13,157 | | 317,215 | |
Black Hills Corp. | | 6,288 | | 228,506 | |
Dominion Resources, Inc. | | 9,776 | | 506,397 | |
Edison International | | 5,654 | | 255,504 | |
Idacorp, Inc. | | 6,994 | | 303,190 | |
Northwest Natural Gas Co. | | 9,566 | | 422,817 | |
PNM Resources, Inc. | | 14,581 | | 299,056 | |
PPL Corp. | | 6,269 | | 179,481 | |
Public Svc. Enterprise Group, Inc. | | 11,013 | | 336,998 | |
Sempra Energy | | 5,142 | | 364,773 | |
UNS Energy Corp. | | 8,369 | | 355,013 | |
| | | | 3,665,472 | |
TOTAL ACTIVE ASSETS - COMMON STOCKS | | | | | |
(Cost: $95,259,528) 44.8% | | | | 114,869,959 | |
| | | | | |
ACTIVE ASSETS: | | | | | |
CONVERTIBLE PREFERRED STOCKS: | | | | | |
ENERGY (0.1%) | | | | | |
Energy XXI (Bermuda) Ltd., 7.25% | | 556 | | 191,225 | |
TOTAL ACTIVE ASSETS - CONVERTIBLE PREFERRED STOCKS | | | | | |
(Cost: $55,600) 0.1% | | | | 191,225 | |
| | Rating** | | Rate(%) | | Maturity | | Face Amount | | Value | |
ACTIVE ASSETS: | | | | | | | | | | | |
SHORT-TERM DEBT SECURITIES: | | | | | | | | | | | |
COMMERCIAL PAPER (1.6%) | | | | | | | | | | | |
General Electric Capital Corp. | | | A-1+ | | 0.12 | | 03/13/13 | | 600,000 | | 599,832 | |
General Electric Capital Corp. | | | A-1+ | | 0.12 | | 03/18/13 | | 1,400,000 | | 1,399,604 | |
Toyota Motor Credit Corp. | | | A-1+ | | 0.15 | | 02/22/13 | | 2,000,000 | | 1,999,593 | |
| | | | | | | | | | 3,999,029 | |
TOTAL ACTIVE ASSETS - SHORT-TERM DEBT SECURITIES | | | | | | | | | | | |
(Cost: $3,999,096) 1.6% | | | | | | | | | | 3,999,029 | |
| | | | | | | | | | | |
TOTAL ACTIVE ASSETS | | | | | | | | | | | |
(Cost: $99,314,224) 46.5% | | | | | | | | | | 119,060,213 | |
| | | | | | | | | | | |
TEMPORARY CASH INVESTMENTS (2) | | | | | | | | | | | |
(Cost: $1,489,000) 0.6% | | | | | | | | | | 1,489,000 | |
| | | | | | | | | | | |
TOTAL INVESTMENTS | | | | | | | | | | | |
(Cost: $216,424,202) 99.7% | | | | | | | | | | 255,586,131 | |
| | | | | | | | | | | |
OTHER NET ASSETS 0.3% | | | | | | | | | | 651,959 | |
| | | | | | | | | | | |
NET ASSETS 100.0% | | | | | | | | | | $ | 256,238,090 | |
| | | | | | | | | | | | | |
The accompanying notes are an integral part of these portfolio schedules.
MUTUAL OF AMERICA INVESTMENT CORPORATION - SMALL CAP VALUE FUND
PORTFOLIO OF INVESTMENTS IN SECURITIES
December 31, 2012
| | Shares | | Value | |
COMMON STOCKS: | | | | | |
CONSUMER DISCRETIONARY (6.2%) | | | | | |
Bassett Furniture Industries, Inc. | | 250,937 | | 3,129,184 | |
bebe stores, inc. | | 345,930 | | 1,380,261 | |
Deckers Outdoor Corp.* | | 35,200 | | 1,417,504 | |
Pep Boys - Manny, Moe & Jack | | 274,091 | | 2,694,315 | |
Rent-A-Center, Inc. | | 73,658 | | 2,530,889 | |
Ruby Tuesday, Inc.* | | 91,150 | | 716,439 | |
Shutterfly, Inc.* | | 86,812 | | 2,593,074 | |
Wolverine World Wide, Inc. | | 84,192 | | 3,450,188 | |
| | | | 17,911,854 | |
CONSUMER STAPLES (2.9%) | | | | | |
Farmer Brothers Co.* | | 118,910 | | 1,715,871 | |
Prestige Brands Hldgs., Inc.* | | 170,630 | | 3,417,719 | |
The Pantry, Inc.* | | 186,980 | | 2,268,067 | |
Vector Group Ltd. | | 64,716 | | 962,327 | |
| | | | 8,363,984 | |
ENERGY (6.2%) | | | | | |
Endeavour International Corp.* | | 136,252 | | 705,785 | |
Energy XXI (Bermuda) Ltd. | | 170,518 | | 5,488,974 | |
Gasco Energy, Inc.* | | 2,236,626 | | 156,564 | |
McMoRan Exploration Co.* | | 514,326 | | 8,254,933 | |
PBF Energy, Inc.* | | 93,886 | | 2,727,388 | |
Saratoga Resources, Inc.* | | 189,470 | | 670,724 | |
| | | | 18,004,368 | |
FINANCIALS (35.3%) | | | | | |
Ashford Hospitality Trust, Inc. | | 148,330 | | 1,558,948 | |
Aspen Insurance Hldgs. Ltd. | | 56,483 | | 1,811,975 | |
Associated Estates Realty Corp. | | 102,796 | | 1,657,072 | |
BancFirst Corp. | | 38,241 | | 1,619,889 | |
Bank of Marin Bancorp | | 25,013 | | 936,987 | |
Banner Corp. | | 42,279 | | 1,299,234 | |
Brookline Bancorp, Inc. | | 266,743 | | 2,267,316 | |
Bryn Mawr Bank Corp. | | 75,431 | | 1,679,848 | |
Cash America Int’l., Inc. | | 53,763 | | 2,132,778 | |
Chesapeake Lodging Trust | | 120,188 | | 2,509,525 | |
Colonial Properties Trust | | 140,135 | | 2,994,685 | |
Dime Community Bancshares | | 125,352 | | 1,741,139 | |
EastGroup Properties, Inc. | | 51,570 | | 2,774,982 | |
Ellington Financial LLC | | 201,248 | | 4,520,030 | |
Equity Lifestyle Properties, Inc. | | 55,306 | | 3,721,541 | |
FelCor Lodging Trust, Inc.* | | 462,527 | | 2,160,001 | |
First Interstate BancSytem, Inc. | | 115,823 | | 1,787,149 | |
Flushing Financial Corp. | | 34,959 | | 536,271 | |
Forest City Enterprises, Inc. Cl A* | | 193,991 | | 3,132,955 | |
Glacier Bancorp, Inc. | | 143,562 | | 2,111,797 | |
Highwoods Properties, Inc. | | 86,575 | | 2,895,934 | |
IBERIABANK Corp. | | 31,925 | | 1,568,156 | |
Investors Bancorp, Inc. | | 131,530 | | 2,338,603 | |
Janus Capital Group, Inc. | | 221,130 | | 1,884,028 | |
Marlin Business Svcs. Corp. | | 129,133 | | 2,590,408 | |
MB Financial, Inc. | | 93,200 | | 1,840,700 | |
Meadowbrook Insurance Group, Inc. | | 381,192 | | 2,203,290 | |
Mid-America Apt. Communities, Inc. | | 16,381 | | 1,060,670 | |
National Bank Hldgs. Corp. Cl A* | | 98,458 | | 1,869,717 | |
National Retail Pptys., Inc. | | 76,962 | | 2,401,214 | |
Northwest Bancshares, Inc. | | 157,061 | | 1,906,721 | |
Pennsylvania REIT | | 111,798 | | 1,972,117 | |
PHH Corp.* | | 104,995 | | 2,388,636 | |
ProAssurance Corp. | | 98,452 | | 4,153,690 | |
Prosperity Bancshares, Inc. | | 49,252 | | 2,068,584 | |
S.Y. Bancorp, Inc. | | 88,905 | | 1,993,250 | |
SeaBright Hldgs., Inc. | | 421,334 | | 4,664,167 | |
Select Income REIT | | 105,967 | | 2,624,803 | |
Signature Bank* | | 51,071 | | 3,643,405 | |
SVB Financial Group* | | 47,850 | | 2,678,165 | |
Symetra Financial Corp. | | 257,477 | | 3,342,051 | |
Terreno Realty Corp.* | | 65,800 | | 1,015,952 | |
UMB Financial Corp. | | 44,108 | | 1,933,695 | |
Urstadt Biddle Pptys., Inc. Cl A | | 67,873 | | 1,335,741 | |
West Coast Bancorp* | | 73,700 | | 1,632,455 | |
Westamerica Bancorporation | | 35,464 | | 1,510,412 | |
| | | | 102,470,686 | |
HEALTH CARE (5.3%) | | | | | |
Capital Senior Living Corp.* | | 136,096 | | 2,543,634 | |
Computer Programs & Systems, Inc.* | | 44,581 | | 2,244,208 | |
Conceptus, Inc.* | | 198,804 | | 4,176,872 | |
Harvard Bioscience, Inc.* | | 253,950 | | 1,112,301 | |
NPS Pharmaceuticals Inc* | | 97,477 | | 887,041 | |
PAREXEL International Corp.* | | 26,070 | | 771,411 | |
QLT, Inc.* | | 462,866 | | 3,638,127 | |
| | | | 15,373,594 | |
INDUSTRIALS (12.5%) | | | | | |
Actuant Corp. Cl A | | 116,737 | | 3,258,130 | |
Alaska Air Group, Inc.* | | 80,066 | | 3,450,044 | |
AZZ, Inc. | | 104,766 | | 4,026,157 | |
Encore Wire Corp. | | 139,323 | | 4,222,880 | |
Genesee & Wyoming, Inc. Cl A* | | 57,567 | | 4,379,697 | |
Insperity, Inc. | | 44,946 | | 1,463,442 | |
Miller Industries, Inc. | | 181,808 | | 2,772,572 | |
Mueller Industries, Inc. | | 127,675 | | 6,387,580 | |
Old Dominion Freight Line, Inc.* | | 187,675 | | 6,433,499 | |
| | | | 36,394,001 | |
INFORMATION TECHNOLOGY (10.0%) | | | | | |
Anixter International, Inc.* | | 11,710 | | 749,206 | |
Arris Group, Inc.* | | 49,300 | | 736,542 | |
Cirrus Logic, Inc.* | | 52,504 | | 1,521,041 | |
Coherent, Inc.* | | 27,452 | | 1,389,620 | |
CommVault Systems, Inc.* | | 43,379 | | 3,023,950 | |
Emulex Corp.* | | 196,447 | | 1,434,063 | |
Informatica Corp.* | | 52,600 | | 1,594,832 | |
LogMeIn, Inc.* | | 77,260 | | 1,731,397 | |
Microsemi Corp.* | | 73,611 | | 1,548,775 | |
MKS Instruments, Inc. | | 59,130 | | 1,524,371 | |
Monolithic Power Systems, Inc.* | | 52,530 | | 1,170,368 | |
Nanometrics, Inc.* | | 79,750 | | 1,149,995 | |
Parametric Technology Corp.* | | 59,999 | | 1,350,577 | |
Richardson Electronics Ltd. | | 385,634 | | 4,365,377 | |
Semtech Corp.* | | 73,070 | | 2,115,377 | |
TIBCO Software, Inc.* | | 90,487 | | 1,991,619 | |
TTM Technologies, Inc.* | | 161,227 | | 1,483,288 | |
| | | | 28,880,398 | |
MATERIALS (10.6%) | | | | | |
Boise, Inc. | | 616,526 | | 4,901,382 | |
Buckeye Technologies, Inc. | | 63,546 | | 1,824,406 | |
Commercial Metals Co. | | 133,622 | | 1,985,623 | |
Copper Mountain Mining Corp.* | | 198,900 | | 786,650 | |
Crown Hldgs., Inc.* | | 133,733 | | 4,922,712 | |
Innophos Hldgs., Inc. | | 86,374 | | 4,016,391 | |
Kaiser Aluminum Corp. | | 79,388 | | 4,897,446 | |
McEwen Mining, Inc.* | | 259,815 | | 995,091 | |
Silgan Hldgs., Inc. | | 156,858 | | 6,523,724 | |
| | | | 30,853,425 | |
TELECOMMUNICATION SERVICES (0.6%) | | | | | |
Consolidated Comms. Hldgs., Inc. | | 107,770 | | 1,715,698 | |
| | | | | |
UTILITIES (5.9%) | | | | | |
Avista Corp. | | 133,367 | | 3,215,478 | |
Black Hills Corp. | | 61,209 | | 2,224,335 | |
Idacorp, Inc. | | 70,860 | | 3,071,781 | |
Northwest Natural Gas Co. | | 47,677 | | 2,107,323 | |
PNM Resources, Inc. | | 146,738 | | 3,009,596 | |
UNS Energy Corp. | | 85,423 | | 3,623,644 | |
| | | | 17,252,157 | |
TOTAL COMMON STOCKS
(Cost: $219,265,972) 95.5% | | | | 277,220,165 | |
| | | | | |
| | Shares | | Value | |
CONVERTIBLE PREFERRED STOCKS: | | | | | |
ENERGY (0.5%) | | | | | |
Energy XXI (Bermuda) Ltd., 7.25% | | 4,255 | | 1,463,422 | |
TOTAL CONVERTIBLE PREFERRED STOCKS
(Cost: $425,500) 0.5% | | | | 1,463,422 | |
| | | | | | | | | | | |
| | Rating** | | Rate(%) | | Maturity | | Face Amount | | Value | |
SHORT-TERM DEBT SECURITIES: | | | | | | | | | | | |
U.S. GOVERNMENT (0.3%) | | | | | | | | | | | |
U.S. Treasury Bill | | A-1+ | | 0.03 | | 04/04/13 | | 1,000,000 | | 999,923 | |
COMMERCIAL PAPER (3.6%) | | | | | | | | | | | |
General Electric Capital Corp. | | A-1+ | | 0.12 | | 03/18/13 | | 4,000,000 | | 3,998,987 | |
Toyota Motor Credit Corp. | | A-1+ | | 0.15 | | 02/22/13 | | 5,000,000 | | 4,998,915 | |
Washington Gas Light Co. | | A-1 | | 0.13 | | 01/02/13 | | 1,500,000 | | 1,499,995 | |
| | | | | | | | | | 10,497,897 | |
TOTAL SHORT-TERM DEBT SECURITIES
(Cost: $11,497,820) 3.9% | | | | | | | | | | 11,497,820 | |
| | | | | | | | | | | |
TOTAL INVESTMENTS
(Cost: $231,189,292) 99.9% | | | | | | | | | | 290,181,407 | |
| | | | | | | | | | | |
OTHER NET ASSETS 0.1% | | | | | | | | | | 153,526 | |
| | | | | | | | | | | |
NET ASSETS 100.0% | | | | | | | | | | $ | 290,334,933 | |
| | | | | | | | | | | | |
The accompanying notes are an integral part of these portfolio schedules.
MUTUAL OF AMERICA INVESTMENT CORPORATION - SMALL CAP GROWTH FUND
PORTFOLIO OF INVESTMENTS IN SECURITIES
December 31, 2012
| | Shares | | Value | |
COMMON STOCKS: | | | | | |
CONSUMER DISCRETIONARY (14.2%) | | | | | |
AFC Enterprises, Inc.* | | 176,415 | | 4,609,724 | |
American Axle & Mfg. Hldgs., Inc.* | | 253,328 | | 2,837,274 | |
ANN, Inc.* | | 70,746 | | 2,394,045 | |
Bally Technologies, Inc.* | | 39,628 | | 1,771,768 | |
Cinemark Hldgs., Inc.* | | 69,425 | | 1,803,662 | |
Deckers Outdoor Corp.* | | 46,434 | | 1,869,897 | |
Haverty Furniture Cos., Inc. | | 101,207 | | 1,650,686 | |
Hibbett Sports, Inc.* | | 28,221 | | 1,487,247 | |
HSN, Inc. | | 67,787 | | 3,733,708 | |
Monro Muffler Brake, Inc. | | 69,353 | | 2,425,274 | |
Pep Boys - Manny, Moe & Jack | | 178,037 | | 1,750,104 | |
Red Robin Gourmet Burgers, Inc.* | | 59,023 | | 2,082,922 | |
Rent-A-Center, Inc. | | 76,019 | | 2,612,013 | |
Shutterfly, Inc.* | | 94,884 | | 2,834,185 | |
Steiner Leisure Ltd.* | | 33,213 | | 1,600,534 | |
Steve Madden Ltd.* | | 47,195 | | 1,994,933 | |
Wolverine World Wide, Inc. | | 26,302 | | 1,077,856 | |
| | | | 38,535,832 | |
CONSUMER STAPLES (4.4%) | | | | | |
Darling International, Inc.* | | 101,433 | | 1,626,985 | |
Elizabeth Arden, Inc.* | | 36,821 | | 1,657,313 | |
Hain Celestial Group, Inc.* | | 36,542 | | 1,981,307 | |
Post Hldgs., Inc.* | | 43,079 | | 1,475,456 | |
Susser Hldgs. Corp.* | | 66,765 | | 2,302,725 | |
TreeHouse Foods, Inc.* | | 23,346 | | 1,217,027 | |
Vector Group Ltd. | | 106,279 | | 1,580,369 | |
| | | | 11,841,182 | |
ENERGY (5.6%) | | | | | |
Endeavour International Corp.* | | 131,932 | | 683,408 | |
Energy XXI (Bermuda) Ltd. | | 104,372 | | 3,359,735 | |
Lufkin Industries, Inc. | | 22,589 | | 1,313,099 | |
McMoRan Exploration Co.* | | 184,367 | | 2,959,090 | |
Oasis Petroleum, Inc.* | | 71,032 | | 2,258,818 | |
PBF Energy, Inc.* | | 100,357 | | 2,915,371 | |
Saratoga Resources, Inc.* | | 109,835 | | 388,816 | |
Susser Petroleum Partners LP* | | 56,051 | | 1,410,243 | |
| | | | 15,288,580 | |
FINANCIALS (7.5%) | | | | | |
American Assets Trust, Inc.* | | 55,699 | | 1,555,673 | |
AmREIT, Inc. Cl B* | | 49,785 | | 853,813 | |
Chesapeake Lodging Trust | | 81,686 | | 1,705,604 | |
Colonial Properties Trust | | 104,847 | | 2,240,580 | |
Endurance Specialty Hldgs. Ltd.* | | 36,998 | | 1,468,451 | |
Oritani Financial Corp.* | | 78,158 | | 1,197,381 | |
PS Business Parks, Inc. | | 23,077 | | 1,499,543 | |
S.Y. Bancorp, Inc. | | 49,141 | | 1,101,741 | |
Sabra Health Care REIT, Inc. | | 101,553 | | 2,205,731 | |
Signature Bank* | | 20,532 | | 1,464,753 | |
Starwood Property Trust, Inc.* | | 75,137 | | 1,725,146 | |
Stifel Financial Corp.* | | 59,837 | | 1,912,989 | |
Texas Capital Bancshares, Inc.* | | 30,442 | | 1,364,410 | |
| | | | 20,295,815 | |
HEALTH CARE (20.5%) | | | | | |
Abiomed, Inc.* | | 102,772 | | 1,383,311 | |
Acorda Therapeutics, Inc.* | | 21,543 | | 535,559 | |
Alnylam Pharmaceuticals, Inc.* | | 89,856 | | 1,639,872 | |
athenahealth, Inc.* | | 26,440 | | 1,942,018 | |
BioScrip, Inc.* | | 234,083 | | 2,521,074 | |
BioSpecifics Technologies Corp.* | | 50,982 | | 762,181 | |
Bruker Corp.* | | 84,339 | | 1,287,857 | |
Cantel Medical Corp.* | | 59,531 | | 1,769,857 | |
Celsion Corp.* | | 47,753 | | 391,097 | |
Cepheid, Inc.* | | 53,840 | | 1,820,330 | |
Conceptus, Inc.* | | 64,994 | | 1,365,524 | |
Cubist Pharmaceuticals, Inc.* | | 64,193 | | 2,699,958 | |
Cyberonics, Inc.* | | 43,622 | | 2,291,464 | |
DexCom, Inc.* | | 119,355 | | 1,624,422 | |
Emergent Biosolutions, Inc.* | | 76,467 | | 1,226,531 | |
Endologix, Inc.* | | 67,849 | | 966,170 | |
Exact Sciences Corp.* | | 63,576 | | 673,270 | |
Halozyme Therapeutics, Inc.* | | 47,595 | | 319,362 | |
HeartWare International, Inc.* | | 19,756 | | 1,658,516 | |
HMS Hldgs. Corp.* | | 90,051 | | 2,334,122 | |
Impax Laboratories, Inc.* | | 58,998 | | 1,208,869 | |
Insulet Corp.* | | 82,095 | | 1,742,056 | |
IPC The Hospitalist Co.* | | 29,272 | | 1,162,391 | |
MAP Pharmaceuticals, Inc.* | | 49,502 | | 777,676 | |
Medicines Co.* | | 11,517 | | 276,062 | |
MWI Veterinary Supply, Inc.* | | 13,206 | | 1,452,660 | |
Neogen Corp.* | | 45,734 | | 2,072,665 | |
Omeros Corp.* | | 91,704 | | 475,944 | |
OraSure Technologies, Inc.* | | 94,983 | | 681,978 | |
Orexigen Therapeutics, Inc.* | | 75,915 | | 400,072 | |
PAREXEL International Corp.* | | 76,921 | | 2,276,092 | |
Pharmacyclics, Inc.* | | 30,816 | | 1,784,246 | |
QLT, Inc.* | | 180,882 | | 1,421,733 | |
Questcor Pharmaceuticals, Inc. | | 82,922 | | 2,215,676 | |
Salix Pharmaceuticals Ltd.* | | 47,977 | | 1,942,109 | |
Seattle Genetics, Inc.* | | 70,168 | | 1,627,898 | |
Sunesis Pharmaceuticals, Inc.* | | 65,108 | | 273,454 | |
Synageva BioPharma Corp.* | | 15,520 | | 718,421 | |
Threshold Pharmaceuticals, Inc.* | | 74,573 | | 313,952 | |
Vascular Solutions, Inc.* | | 99,270 | | 1,568,466 | |
VIVUS, Inc.* | | 38,240 | | 513,181 | |
WellCare Health Plans, Inc.* | | 28,011 | | 1,363,856 | |
XenoPort, Inc.* | | 56,060 | | 435,586 | |
| | | | 55,917,538 | |
INDUSTRIALS (18.8%) | | | | | |
Allegiant Travel Co.* | | 14,595 | | 1,071,419 | |
Astronics Corp.* | | 108,361 | | 2,479,300 | |
Astronics Corp. Cl B* | | 15,932 | | 345,724 | |
AZZ, Inc. | | 100,373 | | 3,857,334 | |
Beacon Roofing Supply, Inc.* | | 65,922 | | 2,193,884 | |
CIRCOR International, Inc. | | 53,491 | | 2,117,709 | |
Corporate Executive Board Co. | | 41,040 | | 1,947,758 | |
EnPro Industries, Inc.* | | 49,764 | | 2,035,348 | |
Genesee & Wyoming, Inc. Cl A* | | 47,358 | | 3,602,997 | |
Healthcare Svcs. Group, Inc. | | 132,401 | | 3,075,675 | |
Hub Group, Inc. Cl A* | | 35,626 | | 1,197,034 | |
Old Dominion Freight Line, Inc.* | | 106,602 | | 3,654,317 | |
On Assignment, Inc.* | | 150,089 | | 3,043,805 | |
Raven Industries, Inc. | | 146,113 | | 3,851,539 | |
Rexnord Corp.* | | 72,128 | | 1,536,326 | |
Robbins & Myers, Inc. | | 52,524 | | 3,122,552 | |
Smith (A.O.) Corp. | | 48,990 | | 3,089,799 | |
Sun Hydraulics Corp. | | 86,631 | | 2,259,336 | |
Teledyne Technologies, Inc.* | | 43,901 | | 2,856,638 | |
The Advisory Board Co.* | | 60,592 | | 2,835,100 | |
USG Corp.* | | 33,805 | | 948,906 | |
| | | | 51,122,500 | |
INFORMATION TECHNOLOGY (19.2%) | | | | | |
Adtran, Inc. | | 87,754 | | 1,714,713 | |
Aruba Network, Inc.* | | 40,268 | | 835,561 | |
Brightcove, Inc.* | | 142,032 | | 1,283,969 | |
Cavium, Inc.* | | 69,224 | | 2,160,481 | |
Ciena Corp.* | | 43,412 | | 681,568 | |
Cirrus Logic, Inc.* | | 81,127 | | 2,350,249 | |
CommVault Systems, Inc.* | | 74,275 | | 5,177,706 | |
comScore, Inc.* | | 106,194 | | 1,463,353 | |
Finisar Corp.* | | 91,139 | | 1,485,566 | |
Heartland Payment Systems, Inc.* | | 48,830 | | 1,440,485 | |
iGATE Corp.* | | 134,067 | | 2,114,237 | |
Imperva, Inc.* | | 67,785 | | 2,137,261 | |
Informatica Corp.* | | 75,207 | | 2,280,276 | |
Jive Software, Inc.* | | 103,633 | | 1,505,787 | |
Littelfuse, Inc. | | 14,391 | | 888,069 | |
LogMeIn, Inc.* | | 101,639 | | 2,277,730 | |
MAXIMUS, Inc. | | 36,520 | | 2,308,794 | |
Mercury Computer Systems, Inc.* | | 108,020 | | 993,784 | |
Microsemi Corp.* | | 56,708 | | 1,193,136 | |
Nanometrics, Inc.* | | 128,136 | | 1,847,721 | |
Parametric Technology Corp.* | | 99,208 | | 2,233,172 | |
Plantronics, Inc. | | 43,460 | | 1,602,370 | |
Plexus Corp.* | | 41,508 | | 1,070,906 | |
QLIK Technologies, Inc.* | | 32,732 | | 710,939 | |
Sourcefire, Inc.* | | 75,720 | | 3,575,498 | |
Super Micro Computer, Inc.* | | 104,874 | | 1,069,715 | |
Take-Two Interactive Software, Inc.* | | 72,480 | | 798,005 | |
Teradyne, Inc.* | | 63,569 | | 1,073,680 | |
TIBCO Software, Inc.* | | 84,181 | | 1,852,824 | |
WEX, Inc.* | | 27,594 | | 2,079,760 | |
| | | | 52,207,315 | |
MATERIALS (4.3%) | | | | | |
Allied Nevada Gold Corp.* | | 44,918 | | 1,353,379 | |
CVR Partners LP | | 77,875 | | 1,965,565 | |
Eagle Materials, Inc. | | 12,035 | | 704,048 | |
Innophos Hldgs., Inc. | | 59,487 | | 2,766,146 | |
McEwen Mining, Inc.* | | 381,831 | | 1,462,413 | |
Silgan Hldgs., Inc. | | 44,187 | | 1,837,737 | |
Stepan Co.* | | 30,075 | | 1,670,366 | |
| | | | 11,759,654 | |
TELECOMMUNICATION SERVICES (0.5%) | | | | | |
Consolidated Comms. Hldgs., Inc. | | 87,850 | | 1,398,572 | |
| | | | | |
UTILITIES (0.8%) | | | | | |
Northwest Natural Gas Co. | | 47,851 | | 2,115,014 | |
| | | | | |
TOTAL COMMON STOCKS
(Cost: $225,502,801) 95.8% | | | | 260,482,002 | |
| | | | | | | | | | | |
| | Rating** | | Rate(%) | | Maturity | | Face Amount | | Value | |
SHORT-TERM DEBT SECURITIES: | | | | | | | | | | | |
U.S. GOVERNMENT (0.7%) | | | | | | | | | | | |
U.S. Treasury Bill | | A-1+ | | 0.03 | | 04/04/13 | | 2,000,000 | | 1,999,845 | |
COMMERCIAL PAPER (3.5%) | | | | | | | | | | | |
General Electric Capital Corp. | | A-1+ | | 0.12 | | 03/18/13 | | 3,000,000 | | 2,999,240 | |
Toyota Motor Credit Corp. | | A-1+ | | 0.14 | | 02/14/13 | | 4,000,000 | | 3,999,316 | |
Toyota Motor Credit Corp. | | A-1+ | | 0.16 | | 02/15/13 | | 1,800,000 | | 1,799,640 | |
Washington Gas Light Co. | | A-1 | | 0.13 | | 01/02/13 | | 800,000 | | 799,997 | |
| | | | | | | | | | 9,598,193 | |
TOTAL SHORT-TERM DEBT SECURITIES
(Cost: $11,598,038) 4.2% | | | | | | | | | | 11,598,038 | |
| | | | | | | | | | | |
TOTAL INVESTMENTS
(Cost: $237,100,839) 100.0% | | | | | | | | | | 272,080,040 | |
| | | | | | | | | | | |
OTHER NET ASSETS 0.0% (3) | | | | | | | | | | 99,748 | |
| | | | | | | | | | | |
NET ASSETS 100.0% | | | | | | | | | | $ | 272,179,788 | |
| | | | | | | | | | | | |
The accompanying notes are an integral part of these portfolio schedules.
MUTUAL OF AMERICA INVESTMENT CORPORATION - MID CAP VALUE FUND
PORTFOLIO OF INVESTMENTS IN SECURITIES
December 31, 2012
| | Shares | | Value | |
COMMON STOCKS: | | | | | |
CONSUMER DISCRETIONARY (7.5%) | | | | | |
Deckers Outdoor Corp.* | | 3,890 | | 156,650 | |
Dillard’s, Inc. Cl A | | 1,640 | | 137,383 | |
Discovery Communications, Inc. Cl A* | | 5,799 | | 368,121 | |
Lamar Advertising Co. Cl A* | | 9,387 | | 363,746 | |
Mohawk Industries, Inc.* | | 8,280 | | 749,092 | |
Newell Rubbermaid, Inc. | | 25,777 | | 574,054 | |
Rent-A-Center, Inc. | | 10,250 | | 352,190 | |
Shutterfly, Inc.* | | 15,436 | | 461,073 | |
V.F. Corp. | | 3,493 | | 527,338 | |
Whirlpool Corp. | | 2,680 | | 272,690 | |
| | | | 3,962,337 | |
CONSUMER STAPLES (4.8%) | | | | | |
ConAgra Foods, Inc. | | 31,403 | | 926,389 | |
Dr. Pepper Snapple Group, Inc. | | 17,601 | | 777,612 | |
J.M. Smucker Co. | | 6,775 | | 584,276 | |
Vector Group Ltd. | | 17,220 | | 256,061 | |
| | | | 2,544,338 | |
ENERGY (9.7%) | | | | | |
Atwood Oceanics, Inc.* | | 6,236 | | 285,546 | |
Energy XXI (Bermuda) Ltd. | | 33,997 | | 1,094,363 | |
McMoRan Exploration Co.* | | 83,913 | | 1,346,803 | |
Noble Energy, Inc. | | 11,367 | | 1,156,479 | |
Range Resources Corp. | | 10,221 | | 642,185 | |
Spectra Energy Corp. | | 17,501 | | 479,177 | |
Tesoro Corp.* | | 3,460 | | 152,413 | |
| | | | 5,156,966 | |
FINANCIALS (27.9%) | | | | | |
American Financial Group, Inc. | | 22,519 | | 889,951 | |
Ameriprise Financial, Inc. | | 15,536 | | 973,020 | |
Annaly Capital Mgmt., Inc. | | 17,226 | | 241,853 | |
Aon PLC | | 13,110 | | 729,047 | |
Associated Banc-Corp. | | 35,032 | | 459,620 | |
Assurant, Inc. | | 3,541 | | 122,873 | |
BOK Financial Corp. | | 11,843 | | 644,970 | |
Brandywine Realty Trust | | 42,060 | | 512,711 | |
CBL & Associates Pptys., Inc. | | 31,240 | | 662,600 | |
City National Corp. | | 4,506 | | 223,137 | |
Comerica, Inc. | | 8,210 | | 249,091 | |
DDR Corp. | | 12,272 | | 192,180 | |
Discover Financial Svcs. | | 12,829 | | 494,558 | |
Duke Realty Corp. | | 35,710 | | 495,298 | |
Equity Lifestyle Properties, Inc. | | 7,250 | | 487,853 | |
Everest Re Group Ltd. | | 5,685 | | 625,066 | |
Fifth Third Bancorp | | 18,140 | | 275,547 | |
Fulton Financial Corp. | | 39,809 | | 382,564 | |
HCC Insurance Hldgs., Inc. | | 5,072 | | 188,729 | |
Home Properties, Inc. | | 10,070 | | 617,392 | |
Host Hotels & Resorts, Inc. | | 34,412 | | 539,236 | |
Janus Capital Group, Inc. | | 31,612 | | 269,334 | |
Kilroy Realty Corp. | | 10,800 | | 511,596 | |
Lincoln National Corp. | | 11,260 | | 291,634 | |
M&T Bank Corp. | | 2,741 | | 269,906 | |
Marsh & McLennan Cos., Inc. | | 12,380 | | 426,739 | |
National Retail Pptys., Inc. | | 16,449 | | 513,209 | |
People’s United Financial, Inc. | | 40,439 | | 488,908 | |
Progressive Corp. | | 17,917 | | 378,049 | |
Reinsurance Grp. of America, Inc. | | 8,642 | | 462,520 | |
StanCorp Financial Group, Inc. | | 12,885 | | 472,493 | |
Vornado Realty Trust | | 9,825 | | 786,786 | |
| | | | 14,878,470 | |
HEALTH CARE (6.9%) | | | | | |
AmerisourceBergen Corp. | | 17,615 | | 760,616 | |
CIGNA Corp. | | 11,462 | | 612,759 | |
Forest Laboratories, Inc.* | | 14,473 | | 511,186 | |
HCA Hldgs., Inc.* | | 5,890 | | 177,701 | |
Hospira, Inc.* | | 9,310 | | 290,844 | |
Humana, Inc. | | 8,584 | | 589,120 | |
MEDNAX, Inc.* | | 6,323 | | 502,805 | |
Mylan, Inc.* | | 8,891 | | 244,325 | |
| | | | 3,689,356 | |
INDUSTRIALS (10.5%) | | | | | |
Eaton Corp. PLC* | | 7,510 | | 406,892 | |
Flowserve Corp. | | 2,910 | | 427,188 | |
General Cable Corp.* | | 11,751 | | 357,348 | |
Joy Global, Inc. | | 9,020 | | 575,296 | |
Kirby Corp.* | | 15,712 | | 972,416 | |
L-3 Communications Hldgs., Inc. | | 3,344 | | 256,217 | |
Lincoln Electric Hldgs., Inc. | | 11,981 | | 583,235 | |
Old Dominion Freight Line, Inc.* | | 21,480 | | 736,334 | |
Oshkosh Corp.* | | 15,389 | | 456,284 | |
Timken Co. | | 6,830 | | 326,679 | |
Triumph Group, Inc. | | 8,040 | | 525,012 | |
| | | | 5,622,901 | |
INFORMATION TECHNOLOGY (10.0%) | | | | | |
Altera Corp. | | 8,727 | | 300,558 | |
Avago Technologies Ltd.* | | 8,950 | | 283,357 | |
Avnet, Inc.* | | 8,540 | | 261,409 | |
Coherent, Inc.* | | 9,787 | | 495,418 | |
F5 Networks, Inc.* | | 2,890 | | 280,764 | |
Harris Corp. | | 6,810 | | 333,418 | |
Informatica Corp.* | | 19,387 | | 587,814 | |
KLA-Tencor Corp. | | 5,610 | | 267,934 | |
Microsemi Corp.* | | 13,214 | | 278,023 | |
NCR Corp.* | | 23,781 | | 605,940 | |
NetApp, Inc.* | | 7,690 | | 258,000 | |
Silicon Laboratories, Inc.* | | 6,160 | | 257,550 | |
Tech Data Corp.* | | 7,762 | | 353,404 | |
Teradata Corp.* | | 7,675 | | 475,006 | |
TIBCO Software, Inc.* | | 12,566 | | 276,578 | |
| | | | 5,315,173 | |
MATERIALS (7.5%) | | | | | |
Agnico-Eagle Mines Ltd. | | 10,372 | | 544,115 | |
Crown Hldgs., Inc.* | | 42,242 | | 1,554,923 | |
Cytec Industries, Inc. | | 10,131 | | 697,317 | |
Eastman Chemical Co. | | 10,522 | | 716,022 | |
Walter Energy, Inc. | | 13,666 | | 490,336 | |
| | | | 4,002,713 | |
TELECOMMUNICATION SERVICES (0.6%) | | | | | |
Windstream Corp. | | 35,415 | | 293,236 | |
| | | | | |
UTILITIES (9.7%) | | | | | |
Ameren Corp. | | 21,916 | | 673,260 | |
Atmos Energy Corp. | | 18,147 | | 637,323 | |
Edison International | | 18,465 | | 834,433 | |
Entergy Corp. | | 6,273 | | 399,904 | |
FirstEnergy Corp. | | 13,882 | | 579,712 | |
Great Plains Energy, Inc. | | 27,493 | | 558,383 | |
ITC Hldgs. Corp. | | 9,659 | | 742,874 | |
NV Energy, Inc. | | 40,396 | | 732,783 | |
| | | | 5,158,672 | |
TOTAL COMMON STOCKS
(Cost: $44,839,472) 95.1% | | | | 50,624,162 | |
| | Rating** | | Rate(%) | | Maturity | | Face Amount | | Value | |
SHORT-TERM DEBT SECURITIES: | | | | | | | | | | | |
U.S. GOVERNMENT (1.2%) | | | | | | | | | | | |
U.S. Treasury Bill | | A-1+ | | 0.03 | | 04/04/13 | | 650,000 | | 649,950 | |
COMMERCIAL PAPER (3.5%) | | | | | | | | | | | |
General Electric Capital Corp. | | A-1+ | | 0.12 | | 03/13/13 | | 1,200,000 | | 1,199,716 | |
Toyota Motor Credit Corp. | | A-1+ | | 0.13 | | 01/23/13 | | 650,000 | | 649,948 | |
| | | | | | | | | | 1,849,664 | |
TOTAL SHORT-TERM DEBT SECURITIES
(Cost: $2,499,614) 4.7% | | | | | | | | | | 2,499,614 | |
| | | | | | | | | | | |
TOTAL INVESTMENTS
(Cost: $47,339,086) 99.8% | | | | | | | | | | 53,123,776 | |
| | | | | | | | | | | |
OTHER NET ASSETS 0.2% | | | | | | | | | | 91,394 | |
| | | | | | | | | | | |
NET ASSETS 100.0% | | | | | | | | | | $ | 53,215,170 | |
| | | | | | | | | | | | |
The accompanying notes are an integral part of these portfolio schedules.
MUTUAL OF AMERICA INVESTMENT CORPORATION - MID-CAP EQUITY INDEX FUND
PORTFOLIO OF INVESTMENTS IN SECURITIES
December 31, 2012
| | Shares | | Value | |
INDEXED ASSETS: | | | | | |
COMMON STOCKS: | | | | | |
CONSUMER DISCRETIONARY (12.9%) | | | | | |
Aaron’s, Inc. | | 35,357 | | 999,896 | |
Advance Auto Parts, Inc. | | 37,204 | | 2,691,709 | |
Aeropostale, Inc.* | | 40,115 | | 521,896 | |
AMC Networks, Inc. Cl A* | | 29,098 | | 1,440,351 | |
American Eagle Outfitters, Inc. | | 90,231 | | 1,850,638 | |
ANN, Inc.* | | 24,551 | | 830,806 | |
Ascena Retail Group, Inc.* | | 63,033 | | 1,165,480 | |
Bally Technologies, Inc.* | | 20,328 | | 908,865 | |
Barnes & Noble, Inc. | | 19,890 | | 300,140 | |
Bob Evans Farms, Inc. | | 14,145 | | 568,629 | |
Brinker International, Inc. | | 36,680 | | 1,136,713 | |
Cabela’s, Inc.* | | 21,573 | | 900,673 | |
Carter’s, Inc.* | | 24,715 | | 1,375,390 | |
Cheesecake Factory, Inc.* | | 25,057 | | 819,865 | |
Chico’s FAS, Inc. | | 83,183 | | 1,535,558 | |
Cinemark Hldgs., Inc.* | | 51,310 | | 1,333,034 | |
Deckers Outdoor Corp.* | | 18,846 | | 758,928 | |
DeVry, Inc. | | 29,998 | | 711,853 | |
Dick’s Sporting Goods, Inc.* | | 49,387 | | 2,246,615 | |
DreamWorks Animation SKG Cl A* | | 35,890 | | 594,697 | |
Foot Locker, Inc. | | 75,350 | | 2,420,242 | |
Gentex Corp. | | 70,521 | | 1,327,205 | |
Guess?, Inc. | | 31,254 | | 766,973 | |
Hanesbrands, Inc.* | | 49,479 | | 1,772,338 | |
HSN, Inc. | | 18,061 | | 994,800 | |
International Speedway Corp. Cl A | | 12,572 | | 347,239 | |
ITT Educational Svcs., Inc.* | | 8,828 | | 152,813 | |
Jarden Corp. | | 35,713 | | 1,846,362 | |
KB Home | | 42,183 | | 666,491 | |
Lamar Advertising Co. Cl A* | | 27,569 | | 1,068,299 | |
Life Time Fitness, Inc.* | | 20,142 | | 991,188 | |
LKQ Corp.* | | 144,433 | | 3,047,536 | |
Matthews International Corp. Cl A | | 13,754 | | 441,503 | |
MDC Hldgs., Inc. | | 19,979 | | 734,428 | |
Meredith Corp. | | 17,896 | | 616,517 | |
Mohawk Industries, Inc.* | | 27,120 | | 2,453,546 | |
New York Times Co. Cl A* | | 60,147 | | 513,054 | |
NVR, Inc.* | | 2,321 | | 2,135,320 | |
Office Depot, Inc.* | | 151,316 | | 496,316 | |
Panera Bread Co. Cl A* | | 14,434 | | 2,292,552 | |
Polaris Industries, Inc. | | 31,331 | | 2,636,504 | |
PVH Corp. | | 35,321 | | 3,920,984 | |
Regis Corp. | | 28,985 | | 490,426 | |
Rent-A-Center, Inc. | | 29,836 | | 1,025,165 | |
Saks, Inc.* | | 51,893 | | 545,395 | |
Scholastic Corp. | | 13,214 | | 390,606 | |
Scientific Games Corp. Cl A* | | 26,389 | | 228,793 | |
Service Corp. International | | 106,662 | | 1,473,002 | |
Signet Jewelers Ltd. | | 40,979 | | 2,188,279 | |
Sotheby’s | | 33,650 | | 1,131,313 | |
Strayer Education, Inc. | | 6,041 | | 339,323 | |
Tempur-Pedic Int’l., Inc.* | | 30,904 | | 973,167 | |
The Warnaco Group, Inc.* | | 20,342 | | 1,455,877 | |
The Wendy’s Co. | | 140,718 | | 661,375 | |
Thor Industries, Inc. | | 20,452 | | 765,518 | |
Toll Brothers, Inc.* | | 76,745 | | 2,481,166 | |
Tractor Supply Co. | | 34,354 | | 3,035,519 | |
Tupperware Brands Corp. | | 27,961 | | 1,792,300 | |
Under Armour, Inc. Cl A* | | 39,107 | | 1,897,863 | |
Valassis Communications, Inc.* | | 19,837 | | 511,398 | |
Wiley (John) & Sons, Inc. Cl A | | 23,047 | | 897,220 | |
Williams-Sonoma, Inc. | | 43,734 | | 1,914,237 | |
WMS Industries, Inc.* | | 26,479 | | 463,383 | |
| | | | 78,995,271 | |
CONSUMER STAPLES (3.7%) | | | | | |
Church & Dwight Co., Inc. | | 69,677 | | 3,732,597 | |
Energizer Hldgs., Inc. | | 30,971 | | 2,477,061 | |
Flowers Foods, Inc. | | 57,583 | | 1,339,956 | |
Green Mountain Coffee Roasters, Inc.* | | 60,287 | | 2,493,470 | |
Harris Teeter Supermarkets, Inc.* | | 24,757 | | 954,630 | |
Hillshire Brands Co.* | | 60,693 | | 1,707,901 | |
Ingredion, Inc.* | | 37,668 | | 2,426,949 | |
Lancaster Colony Corp. | | 9,780 | | 676,678 | |
Post Hldgs., Inc.* | | 16,248 | | 556,494 | |
Ralcorp Hldgs., Inc.* | | 27,198 | | 2,438,301 | |
Smithfield Foods, Inc.* | | 62,984 | | 1,358,565 | |
SUPERVALU, Inc. | | 110,946 | | 274,037 | |
Tootsie Roll Industries, Inc. | | 10,424 | | 270,190 | |
United Natural Foods, Inc.* | | 24,468 | | 1,311,240 | |
Universal Corp. | | 11,369 | | 567,427 | |
| | | | 22,585,496 | |
ENERGY (5.9%) | | | | | |
Alpha Natural Resources, Inc.* | | 117,476 | | 1,144,216 | |
Arch Coal, Inc. | | 109,841 | | 804,036 | |
Atwood Oceanics, Inc.* | | 28,379 | | 1,299,474 | |
Bill Barrett Corp.* | | 25,156 | | 447,525 | |
CARBO Ceramics, Inc. | | 9,746 | | 763,502 | |
Cimarex Energy Co. | | 43,045 | | 2,484,988 | |
Dresser-Rand Group, Inc.* | | 37,258 | | 2,091,664 | |
Dril-Quip, Inc.* | | 18,154 | | 1,326,150 | |
Energen Corp. | | 36,044 | | 1,625,224 | |
Forest Oil Corp.* | | 60,997 | | 408,070 | |
Helix Energy Solutions Group* | | 47,140 | | 972,970 | |
HollyFrontier Corp. | | 100,054 | | 4,657,514 | |
Northern Oil and Gas, Inc.* | | 29,526 | | 496,627 | |
Oceaneering Int’l., Inc. | | 53,414 | | 2,873,139 | |
Oil States International, Inc.* | | 26,959 | | 1,928,647 | |
Patterson-UTI Energy, Inc. | | 74,414 | | 1,386,333 | |
Plains Exploration & Production Co.* | | 64,321 | | 3,019,228 | |
Quicksilver Resources, Inc.* | | 60,262 | | 172,349 | |
Rosetta Resources, Inc.* | | 26,028 | | 1,180,630 | |
SM Energy Co. | | 31,272 | | 1,632,711 | |
Superior Energy Services, Inc.* | | 79,328 | | 1,643,676 | |
Tidewater, Inc. | | 24,879 | | 1,111,594 | |
Unit Corp.* | | 21,504 | | 968,755 | |
World Fuel Services Corp. | | 35,710 | | 1,470,181 | |
| | | | 35,909,203 | |
FINANCIALS (21.0%) | | | | | |
Affiliated Managers Group, Inc.* | | 25,842 | | 3,363,336 | |
Alexander & Baldwin, Inc.* | | 21,302 | | 625,640 | |
Alexandria Real Estate Equities, Inc. | | 31,446 | | 2,179,837 | |
Alleghany Corp.* | | 8,458 | | 2,836,982 | |
American Campus Communities, Inc. | | 50,817 | | 2,344,188 | |
American Financial Group, Inc. | | 37,598 | | 1,485,873 | |
Apollo Investment Corp. | | 98,913 | | 826,913 | |
Aspen Insurance Hldgs. Ltd. | | 34,660 | | 1,111,893 | |
Associated Banc-Corp. | | 84,452 | | 1,108,010 | |
Astoria Financial Corp. | | 41,711 | | 390,415 | |
BancorpSouth, Inc. | | 41,298 | | 600,473 | |
Bank of Hawaii Corp. | | 22,319 | | 983,152 | |
Berkley (W.R.) Corp. | | 54,543 | | 2,058,453 | |
BioMed Realty Trust, Inc. | | 74,398 | | 1,438,113 | |
BRE Properties, Inc. | | 36,870 | | 1,874,102 | |
Brown & Brown, Inc. | | 59,520 | | 1,515,379 | |
Camden Property Trust | | 41,136 | | 2,805,887 | |
Cathay General Bancorp | | 35,460 | | 691,470 | |
CBOE Holdings, Inc.* | | 41,987 | | 1,236,937 | |
City National Corp. | | 23,477 | | 1,162,581 | |
Commerce Bancshares, Inc. | | 39,085 | | 1,370,334 | |
Corporate Office Pptys. Trust | | 39,780 | | 993,704 | |
Cullen/Frost Bankers, Inc. | | 30,494 | | 1,654,909 | |
Duke Realty Corp. | | 135,812 | | 1,883,712 | |
East West Bancorp, Inc. | | 69,360 | | 1,490,546 | |
Eaton Vance Corp. | | 56,770 | | 1,808,125 | |
Equity One, Inc. | | 30,129 | | 633,010 | |
Essex Property Trust, Inc. | | 17,757 | | 2,604,064 | |
Everest Re Group Ltd. | | 25,391 | | 2,791,740 | |
Federal Realty Investment Trust | | 32,005 | | 3,329,160 | |
Fidelity Nat’l. Financial, Inc. Cl A | | 103,460 | | 2,436,483 | |
First American Financial Corp. | | 51,164 | | 1,232,541 | |
First Niagara Financial Group, Inc. | | 175,046 | | 1,388,115 | |
FirstMerit Corp. | | 54,303 | | 770,560 | |
Fulton Financial Corp. | | 98,563 | | 947,190 | |
Gallagher (Arthur J.) & Co. | | 61,811 | | 2,141,751 | |
Greenhill & Co., Inc. | | 13,006 | | 676,182 | |
Hancock Hldg. Co. | | 42,722 | | 1,355,996 | |
Hanover Insurance Group, Inc. | | 21,979 | | 851,466 | |
HCC Insurance Hldgs., Inc. | | 50,029 | | 1,861,579 | |
Highwoods Properties, Inc. | | 38,011 | | 1,271,468 | |
Home Properties, Inc. | | 24,859 | | 1,524,105 | |
Hospitality Properties Trust | | 61,143 | | 1,431,969 | |
International Bancshares Corp. | | 27,117 | | 489,462 | |
Janus Capital Group, Inc. | | 93,551 | | 797,055 | |
Jefferies Group, Inc. | | 63,691 | | 1,182,742 | |
Jones Lang LaSalle, Inc. | | 22,418 | | 1,881,767 | |
Kemper Corp. | | 26,963 | | 795,409 | |
Liberty Property Trust | | 57,833 | | 2,068,686 | |
Mack-Cali Realty Corp. | | 40,432 | | 1,055,680 | |
Mercury General Corp. | | 18,192 | | 722,040 | |
MSCI, Inc. Cl A* | | 59,535 | | 1,844,990 | |
National Retail Pptys., Inc. | | 53,720 | | 1,676,064 | |
New York Community Bancorp, Inc. | | 219,802 | | 2,879,406 | |
Old Republic Int’l. Corp. | | 121,127 | | 1,290,003 | |
Omega Healthcare Investors, Inc. | | 53,693 | | 1,280,578 | |
Potlatch Corp. | | 20,130 | | 788,895 | |
Prosperity Bancshares, Inc. | | 21,833 | | 916,986 | |
Protective Life Corp. | | 39,272 | | 1,122,394 | |
Raymond James Financial, Inc. | | 55,739 | | 2,147,624 | |
Rayonier, Inc. | | 60,605 | | 3,141,157 | |
Realty Income Corp. | | 66,028 | | 2,654,986 | |
Regency Centers Corp. | | 44,614 | | 2,102,212 | |
Reinsurance Grp. of America, Inc. | | 36,503 | | 1,953,641 | |
SEI Investments Co. | | 65,373 | | 1,525,806 | |
Senior Housing Pptys. Trust | | 86,494 | | 2,044,718 | |
Signature Bank* | | 22,536 | | 1,607,718 | |
SL Green Realty Corp | | 44,882 | | 3,440,205 | |
StanCorp Financial Group, Inc. | | 21,481 | | 787,708 | |
SVB Financial Group* | | 22,080 | | 1,235,818 | |
Synovus Financial Corp. | | 395,400 | | 968,730 | |
Taubman Centers, Inc. | | 29,955 | | 2,358,058 | |
TCF Financial Corp. | | 80,909 | | 983,044 | |
The Macerich Co. | | 67,386 | | 3,928,604 | |
Trustmark Corp. | | 32,588 | | 731,926 | |
UDR, Inc. | | 120,630 | | 2,868,581 | |
Valley National Bancorp | | 98,764 | | 918,505 | |
Waddell & Reed Financial, Inc. Cl A | | 42,414 | | 1,476,855 | |
Washington Federal, Inc. | | 51,711 | | 872,365 | |
Webster Financial Corp. | | 39,672 | | 815,260 | |
Weingarten Realty Investors | | 55,435 | | 1,483,995 | |
Westamerica Bancorporation | | 13,518 | | 575,732 | |
| | | | 128,503,748 | |
HEALTH CARE (9.2%) | | | | | |
Allscripts Healthcare Solutions, Inc.* | | 99,298 | | 935,387 | |
Bio-Rad Laboratories, Inc. Cl A* | | 10,082 | | 1,059,114 | |
Charles River Laboratories Int’l., Inc.* | | 24,520 | | 918,764 | |
Community Health Systems, Inc.* | | 46,079 | | 1,416,468 | |
Cooper Companies, Inc. | | 24,525 | | 2,268,072 | |
Covance, Inc.* | | 27,315 | | 1,577,988 | |
Endo Health Solutions, Inc.* | | 57,188 | | 1,502,329 | |
Health Management Associates, Inc. Cl A* | | 120,325 | | 1,121,429 | |
Health Net, Inc.* | | 41,106 | | 998,876 | |
Hill-Rom Hldgs., Inc. | | 30,399 | | 866,372 | |
HMS Hldgs. Corp.* | | 42,900 | | 1,111,968 | |
Hologic, Inc.* | | 132,901 | | 2,662,007 | |
IDEXX Laboratories, Inc.* | | 27,014 | | 2,506,899 | |
LifePoint Hospitals, Inc.* | | 24,603 | | 928,763 | |
Masimo Corp. | | 25,794 | | 541,932 | |
MEDNAX, Inc.* | | 24,744 | | 1,967,643 | |
Mettler-Toledo Int’l., Inc.* | | 15,184 | | 2,935,067 | |
Omnicare, Inc. | | 55,043 | | 1,987,052 | |
Owens & Minor, Inc. | | 31,264 | | 891,337 | |
Regeneron Pharmaceuticals, Inc.* | | 38,556 | | 6,595,774 | |
ResMed, Inc. | | 73,935 | | 3,073,478 | |
Schein (Henry), Inc.* | | 43,824 | | 3,526,079 | |
STERIS Corp. | | 28,595 | | 993,104 | |
Techne Corp. | | 17,058 | | 1,165,744 | |
Teleflex, Inc. | | 20,135 | | 1,435,827 | |
Thoratec Corp.* | | 29,605 | | 1,110,780 | |
United Therapeutics Corp.* | | 23,238 | | 1,241,374 | |
Universal Health Svcs., Inc. Cl B | | 43,393 | | 2,098,052 | |
VCA Antech, Inc.* | | 43,393 | | 913,423 | |
Vertex Pharmaceuticals, Inc.* | | 107,251 | | 4,498,107 | |
WellCare Health Plans, Inc.* | | 20,716 | | 1,008,662 | |
| | | | 55,857,871 | |
INDUSTRIALS (16.7%) | | | | | |
Acuity Brands, Inc. | | 20,826 | | 1,410,545 | |
AECOM Technology Corp.* | | 53,965 | | 1,284,367 | |
AGCO Corp.* | | 49,030 | | 2,408,354 | |
Alaska Air Group, Inc.* | | 34,656 | | 1,493,327 | |
Alliant TechSystems, Inc. | | 16,103 | | 997,742 | |
AMETEK, Inc. | | 121,352 | | 4,559,195 | |
B/E Aerospace, Inc.* | | 50,595 | | 2,499,393 | |
Carlisle Cos., Inc. | | 31,100 | | 1,827,436 | |
CLARCOR, Inc. | | 23,959 | | 1,144,761 | |
Clean Harbors, Inc.* | | 26,282 | | 1,445,773 | |
Con-way, Inc. | | 27,088 | | 753,588 | |
Copart, Inc.* | | 53,430 | | 1,576,185 | |
Corporate Executive Board Co. | | 16,937 | | 803,830 | |
Corrections Corp. of America* | | 49,258 | | 1,747,181 | |
Crane Co. | | 22,870 | | 1,058,424 | |
Deluxe Corp. | | 24,653 | | 794,813 | |
Donaldson Co., Inc. | | 68,311 | | 2,243,333 | |
Donnelley (R.R.) & Sons Co. | | 88,970 | | 800,730 | |
Esterline Technologies Corp.* | | 15,404 | | 979,848 | |
Exelis, Inc. | | 94,941 | | 1,069,985 | |
Fortune Brands Home & Security, Inc.* | | 81,758 | | 2,388,969 | |
FTI Consulting, Inc.* | | 20,577 | | 679,041 | |
Gardner Denver, Inc. | | 23,891 | | 1,636,534 | |
GATX Corp. | | 23,160 | | 1,002,828 | |
General Cable Corp.* | | 25,127 | | 764,112 | |
Genesee & Wyoming, Inc. Cl A* | | 21,409 | | 1,628,797 | |
Graco, Inc. | | 29,857 | | 1,537,337 | |
Granite Construction, Inc. | | 17,826 | | 599,310 | |
Harsco Corp. | | 39,991 | | 939,789 | |
HNI Corp. | | 22,457 | | 675,057 | |
Hubbell, Inc. Cl B | | 26,204 | | 2,217,645 | |
Hunt (J.B.) Transport Svcs., Inc. | | 44,855 | | 2,678,292 | |
Huntington Ingalls Industries, Inc.* | | 24,375 | | 1,056,413 | |
IDEX Corp. | | 40,832 | | 1,899,913 | |
ITT Corp. | | 46,384 | | 1,088,169 | |
JetBlue Airways Corp* | | 111,896 | | 638,926 | |
Kansas City Southern | | 53,909 | | 4,500,323 | |
KBR, Inc. | | 75,296 | | 2,252,856 | |
Kennametal, Inc. | | 40,347 | | 1,613,880 | |
Kirby Corp.* | | 27,340 | | 1,692,073 | |
Landstar System, Inc. | | 22,420 | | 1,176,153 | |
Lennox International, Inc. | | 23,049 | | 1,210,533 | |
Lincoln Electric Hldgs., Inc. | | 41,396 | | 2,015,157 | |
Manpower, Inc. | | 39,101 | | 1,659,446 | |
Matson, Inc.* | | 20,935 | | 517,513 | |
Miller (Herman), Inc. | | 29,375 | | 629,213 | |
Mine Safety Appliances Co. | | 15,036 | | 642,188 | |
MSC Industrial Direct Co., Inc. Cl A | | 22,773 | | 1,716,629 | |
Nordson Corp. | | 27,763 | | 1,752,401 | |
Oshkosh Corp.* | | 46,296 | | 1,372,676 | |
Regal-Beloit Corp. | | 22,052 | | 1,554,004 | |
Rollins, Inc. | | 32,994 | | 727,188 | |
Shaw Group, Inc.* | | 32,682 | | 1,523,308 | |
SPX Corp. | | 24,920 | | 1,748,138 | |
Terex Corp.* | | 56,301 | | 1,582,621 | |
The Brink’s Co. | | 23,893 | | 681,667 | |
Timken Co. | | 40,417 | | 1,933,145 | |
Towers Watson & Co. Cl A | | 28,821 | | 1,620,028 | |
Trinity Industries, Inc. | | 39,831 | | 1,426,746 | |
Triumph Group, Inc. | | 24,822 | | 1,620,877 | |
United Rentals, Inc.* | | 46,222 | | 2,104,025 | |
URS Corp.* | | 38,329 | | 1,504,797 | |
UTI Worldwide, Inc. | | 51,122 | | 685,035 | |
Valmont Industries, Inc. | | 11,634 | | 1,588,623 | |
Wabtec Corp. | | 23,935 | | 2,095,270 | |
Waste Connections, Inc. | | 60,281 | | 2,036,895 | |
Watsco, Inc. | | 14,607 | | 1,094,064 | |
Werner Enterprises, Inc. | | 21,895 | | 474,465 | |
Woodward, Inc. | | 29,586 | | 1,128,114 | |
| | | | 102,209,993 | |
INFORMATION TECHNOLOGY (15.0%) | | | | | |
ACI Worldwide, Inc.* | | 19,189 | | 838,367 | |
Acxiom Corp.* | | 37,853 | | 660,913 | |
Adtran, Inc. | | 31,711 | | 619,633 | |
Advent Software, Inc.* | | 15,745 | | 336,628 | |
Alliance Data Systems Corp.* | | 24,609 | | 3,562,399 | |
ANSYS, Inc.* | | 46,145 | | 3,107,404 | |
AOL, Inc.* | | 41,935 | | 1,241,695 | |
Arrow Electronics, Inc.* | | 53,073 | | 2,021,020 | |
Atmel Corp.* | | 212,873 | | 1,394,318 | |
Avnet, Inc.* | | 68,367 | | 2,092,714 | |
Broadridge Financial Solutions, Inc. | | 61,330 | | 1,403,230 | |
Cadence Design Systems, Inc.* | | 138,989 | | 1,877,741 | |
Ciena Corp.* | | 49,937 | | 784,011 | |
Compuware Corp.* | | 105,167 | | 1,143,165 | |
Concur Technologies, Inc.* | | 22,147 | | 1,495,365 | |
Convergys Corp.* | | 54,432 | | 893,229 | |
CoreLogic, Inc.* | | 50,531 | | 1,360,295 | |
Cree, Inc.* | | 58,594 | | 1,991,024 | |
Cypress Semiconductor Corp.* | | 65,803 | | 713,305 | |
Diebold, Inc. | | 31,244 | | 956,379 | |
DST Systems, Inc. | | 15,301 | | 927,241 | |
Equinix, Inc.* | | 24,122 | | 4,973,956 | |
FactSet Research Systems, Inc. | | 20,746 | | 1,826,893 | |
Fair Isaac Corp. | | 17,144 | | 720,562 | |
Fairchild Semiconductor Int’l., Inc.* | | 64,193 | | 924,379 | |
Gartner, Inc.* | | 47,356 | | 2,179,323 | |
Global Payments, Inc. | | 39,406 | | 1,785,092 | |
Henry (Jack) & Associates, Inc. | | 42,672 | | 1,675,303 | |
Informatica Corp.* | | 52,759 | | 1,599,653 | |
Ingram Micro, Inc. Cl A* | | 73,561 | | 1,244,652 | |
Integrated Device Technology, Inc.* | | 69,004 | | 503,729 | |
InterDigital, Inc.* | | 20,941 | | 860,675 | |
International Rectifier Corp.* | | 34,734 | | 615,834 | |
Intersil Corp. Cl A | | 63,705 | | 528,114 | |
Itron, Inc.* | | 19,480 | | 867,834 | |
Lender Processing Svcs., Inc. | | 42,829 | | 1,054,450 | |
Lexmark International, Inc. Cl A | | 33,307 | | 772,389 | |
ManTech International Corp. Cl A | | 11,720 | | 304,017 | |
MEMC Electronic Materials, Inc.* | | 110,492 | | 354,679 | |
Mentor Graphics Corp.* | | 45,698 | | 777,780 | |
MICROS Systems, Inc.* | | 38,073 | | 1,615,818 | |
Monster Worldwide, Inc.* | | 62,194 | | 349,530 | |
National Instruments Corp. | | 47,184 | | 1,217,819 | |
NCR Corp.* | | 78,515 | | 2,000,562 | |
NeuStar, Inc. Cl A* | | 33,996 | | 1,425,452 | |
Parametric Technology Corp.* | | 59,215 | | 1,332,930 | |
Plantronics, Inc. | | 20,991 | | 773,938 | |
Polycom, Inc.* | | 88,319 | | 923,817 | |
QLogic Corp.* | | 44,442 | | 432,421 | |
Rackspace Hosting, Inc.* | | 53,927 | | 4,005,158 | |
RF Micro Devices, Inc.* | | 141,629 | | 634,498 | |
Riverbed Technology, Inc.* | | 77,191 | | 1,522,207 | |
Rovi Corp.* | | 53,499 | | 825,490 | |
Semtech Corp.* | | 32,906 | | 952,629 | |
Silicon Laboratories, Inc.* | | 19,278 | | 806,013 | |
Skyworks Solutions, Inc.* | | 100,627 | | 2,042,728 | |
SolarWinds, Inc.* | | 30,465 | | 1,597,889 | |
Solera Hldgs., Inc. | | 34,383 | | 1,838,459 | |
Synopsys, Inc.* | | 75,069 | | 2,390,197 | |
Tech Data Corp.* | | 18,479 | | 841,349 | |
Tellabs, Inc. | | 168,838 | | 384,951 | |
TIBCO Software, Inc.* | | 75,744 | | 1,667,125 | |
Trimble Navigation Ltd.* | | 61,951 | | 3,703,431 | |
ValueClick, Inc.* | | 35,641 | | 691,792 | |
VeriFone Systems, Inc.* | | 53,537 | | 1,588,978 | |
Vishay Intertechnology, Inc.* | | 65,570 | | 697,009 | |
WEX, Inc.* | | 18,908 | | 1,425,096 | |
Zebra Technologies Corp. Cl A* | | 25,508 | | 1,001,954 | |
| | | | 91,678,630 | |
MATERIALS (7.0%) | | | | | |
Albemarle Corp. | | 44,465 | | 2,762,166 | |
AptarGroup, Inc. | | 32,381 | | 1,545,221 | |
Ashland, Inc. | | 35,862 | | 2,883,663 | |
Cabot Corp. | | 30,112 | | 1,198,156 | |
Carpenter Technology Corp. | | 21,807 | | 1,125,895 | |
Commercial Metals Co. | | 58,280 | | 866,041 | |
Compass Minerals Int’l., Inc. | | 16,301 | | 1,217,848 | |
Cytec Industries, Inc. | | 22,813 | | 1,570,219 | |
Domtar Corp. | | 17,282 | | 1,443,393 | |
Greif, Inc. Cl A | | 14,655 | | 652,148 | |
Intrepid Potash, Inc.* | | 26,830 | | 571,211 | |
Louisiana-Pacific Corp.* | | 67,837 | | 1,310,611 | |
Martin Marietta Materials, Inc. | | 22,746 | | 2,144,493 | |
Minerals Technologies, Inc. | | 17,368 | | 693,331 | |
NewMarket Corp. | | 5,401 | | 1,416,142 | |
Olin Corp. | | 39,468 | | 852,114 | |
Packaging Corp. of America | | 48,343 | | 1,859,755 | |
Reliance Steel & Aluminum Co. | | 37,092 | | 2,303,413 | |
Rock-Tenn Co. Cl A | | 35,127 | | 2,455,729 | |
Royal Gold, Inc. | | 32,792 | | 2,666,318 | |
RPM International, Inc. | | 65,981 | | 1,937,202 | |
Scotts Miracle-Gro Co. Cl A | | 19,045 | | 838,932 | |
Sensient Technologies Corp. | | 24,982 | | 888,360 | |
Silgan Hldgs., Inc. | | 24,573 | | 1,021,991 | |
Sonoco Products Co. | | 49,286 | | 1,465,273 | |
Steel Dynamics, Inc. | | 113,058 | | 1,552,286 | |
Valspar Corp. | | 41,441 | | 2,585,918 | |
Worthington Industries, Inc. | | 25,745 | | 669,113 | |
| | | | 42,496,942 | |
TELECOMMUNICATION SERVICES (0.5%) | | | | | |
Telephone & Data Systems, Inc.* | | 48,590 | | 1,075,783 | |
tw telecom inc* | | 75,443 | | 1,921,533 | |
| | | | 2,997,316 | |
UTILITIES (4.8%) | | | | | |
Alliant Energy Corp. | | 55,539 | | 2,438,717 | |
Aqua America, Inc. | | 69,874 | | 1,776,197 | |
Atmos Energy Corp. | | 44,700 | | 1,569,864 | |
Black Hills Corp. | | 21,824 | | 793,084 | |
Cleco Corp. | | 29,950 | | 1,198,300 | |
Great Plains Energy, Inc. | | 76,757 | | 1,558,935 | |
Hawaiian Electric Industries, Inc. | | 48,501 | | 1,219,315 | |
Idacorp, Inc. | | 25,017 | | 1,084,487 | |
MDU Resources Group | | 93,856 | | 1,993,501 | |
National Fuel Gas Co. | | 41,899 | | 2,123,860 | |
NV Energy, Inc. | | 116,607 | | 2,115,251 | |
OGE Energy Corp. | | 49,054 | | 2,762,231 | |
PNM Resources, Inc. | | 39,035 | | 800,608 | |
Questar Corp. | | 87,203 | | 1,723,131 | |
UGI Corp. | | 55,260 | | 1,807,555 | |
Vectren Corp. | | 40,738 | | 1,197,697 | |
Westar Energy, Inc. | | 62,582 | | 1,791,097 | |
WGL Hldgs., Inc. | | 25,633 | | 1,004,557 | |
| | | | 28,958,387 | |
TOTAL INDEXED ASSETS - COMMON STOCKS
(Cost: $490,418,436) 96.7% | | | | 590,192,857 | |
| | Rating** | | Rate(%) | | Maturity | | Face Amount | | Value | |
SHORT-TERM DEBT SECURITIES: | | | | | | | | | | | |
U.S. GOVERNMENT (0.7%) | | | | | | | | | | | |
U.S. Treasury Bill (1) | | A-1+ | | 0.09 | | 02/21/13 | | 3,000,000 | | 2,999,617 | |
U.S. Treasury Bill (1) | | A-1+ | | 0.10 | | 01/10/13 | | 1,300,000 | | 1,299,968 | |
| | | | | | | | | | 4,299,585 | |
COMMERCIAL PAPER (2.4%) | | | | | | | | | | | |
General Electric Capital Corp. | | A-1+ | | 0.12 | | 03/18/13 | | 4,000,000 | | 3,998,987 | |
Toyota Motor Credit Corp. | | A-1+ | | 0.16 | | 02/15/13 | | 7,000,000 | | 6,998,600 | |
Toyota Motor Credit Corp. | | A-1+ | | 0.15 | | 02/22/13 | | 800,000 | | 799,827 | |
Washington Gas Light Co. | | A-1 | | 0.13 | | 01/02/13 | | 2,600,000 | | 2,599,991 | |
| | | | | | | | | | 14,397,405 | |
TOTAL SHORT-TERM DEBT SECURITIES
(Cost: $18,696,990) 3.1% | | | | | | | | | | 18,696,990 | |
| | | | | | | | | | | |
TEMPORARY CASH INVESTMENTS (2)
(Cost: $301,400) 0.1% | | | | | | | | | | 301,400 | |
| | | | | | | | | | | |
TOTAL INVESTMENTS
(Cost: $509,416,826) 99.9% | | | | | | | | | | 609,191,247 | |
| | | | | | | | | | | |
OTHER NET ASSETS 0.1% | | | | | | | | | | 774,221 | |
| | | | | | | | | | | |
NET ASSETS 100.0% | | | | | | | | | | $ | 609,965,468 | |
| | | | | | | | | | | | |
The accompanying notes are an integral part of these portfolio schedules.
MUTUAL OF AMERICA INVESTMENT CORPORATION - INTERNATIONAL FUND
PORTFOLIO OF INVESTMENTS IN SECURITIES
December 31, 2012
| | Shares | | Value | |
COMMON STOCKS: | | | | | |
FINANCIALS (99.5%) | | | | | |
iShares MSCI EAFE Growth Index Fund | | 162,700 | | 9,768,508 | |
iShares MSCI EAFE Index Fund | | 220,600 | | 12,534,492 | |
iShares MSCI EAFE Value Index Fund | | 200,200 | | 9,739,730 | |
Vanguard MSCI EAFE ETF | | 1,584,800 | | 55,832,504 | |
Vanguard MSCI Europe ETF | | 350,300 | | 17,108,652 | |
Vanguard MSCI Pacific ETF | | 168,500 | | 8,996,215 | |
| | | | 113,980,101 | |
TOTAL COMMON STOCKS
(Cost: $108,021,891) 99.5% | | | | 113,980,101 | |
| | | | | |
TOTAL INVESTMENTS
(Cost: $108,021,891) 99.5% | | | | 113,980,101 | |
| | | | | |
OTHER NET ASSETS 0.5% | | | | 567,858 | |
| | | | | |
NET ASSETS 100.0% | | | | 114,547,959 | |
The accompanying notes are an integral part of these portfolio schedules.
MUTUAL OF AMERICA INVESTMENT CORPORATION - COMPOSITE FUND
PORTFOLIO OF INVESTMENTS IN SECURITIES
December 31, 2012
| | Shares | | Value | |
COMMON STOCKS: | | | | | |
CONSUMER DISCRETIONARY (6.3%) | | | | | |
Abercrombie & Fitch Co. Cl A | | 5,500 | | 263,835 | |
Amazon.com, Inc.* | | 5,756 | | 1,445,562 | |
BorgWarner, Inc.* | | 3,278 | | 234,770 | |
Darden Restaurants, Inc. | | 8,527 | | 384,312 | |
Discovery Communications, Inc. Cl A* | | 7,714 | | 489,685 | |
Disney (Walt) Co. | | 22,904 | | 1,140,390 | |
Ford Motor Co. | | 92,449 | | 1,197,215 | |
Johnson Controls, Inc. | | 8,354 | | 256,468 | |
Macy’s, Inc. | | 15,812 | | 616,984 | |
Starbucks Corp. | | 33,831 | | 1,814,018 | |
Target Corp. | | 6,351 | | 375,789 | |
Time Warner Cable, Inc. | | 8,567 | | 832,627 | |
Time Warner, Inc. | | 14,422 | | 689,804 | |
Urban Outfitters, Inc.* | | 10,324 | | 406,353 | |
Viacom, Inc. Cl B | | 10,296 | | 543,011 | |
| | | | 10,690,823 | |
CONSUMER STAPLES (6.1%) | | | | | |
ConAgra Foods, Inc. | | 21,357 | | 630,032 | |
Constellation Brands, Inc. Cl A* | | 16,750 | | 592,783 | |
Dean Foods Co.* | | 41,298 | | 681,830 | |
Estee Lauder Cos., Inc. Cl A | | 11,559 | | 691,922 | |
J.M. Smucker Co. | | 6,440 | | 555,386 | |
PepsiCo, Inc. | | 15,726 | | 1,076,130 | |
Philip Morris Int’l., Inc. | | 21,598 | | 1,806,457 | |
Proctor & Gamble Co. | | 24,483 | | 1,662,151 | |
Tyson Foods, Inc. Cl A | | 39,178 | | 760,053 | |
Wal-Mart Stores, Inc. | | 28,141 | | 1,920,060 | |
| | | | 10,376,804 | |
ENERGY (6.5%) | | | | | |
Anadarko Petroleum Corp. | | 11,048 | | 820,977 | |
Apache Corp. | | 7,559 | | 593,382 | |
Chevron Corp. | | 10,082 | | 1,090,267 | |
EOG Resources, Inc. | | 5,413 | | 653,836 | |
Exxon Mobil Corp. | | 40,801 | | 3,531,327 | |
Halliburton Co. | | 25,134 | | 871,898 | |
Hess Corp. | | 7,312 | | 387,244 | |
National Oilwell Varco, Inc. | | 11,306 | | 772,765 | |
Noble Energy, Inc. | | 9,679 | | 984,741 | |
Occidental Petroleum Corp. | | 11,903 | | 911,889 | |
Range Resources Corp. | | 6,350 | | 398,971 | |
| | | | 11,017,297 | |
FINANCIALS (8.9%) | | | | | |
American Int’l. Group, Inc.* | | 23,031 | | 812,994 | |
Aon PLC | | 7,362 | | 409,401 | |
Bank of America Corp. | | 84,219 | | 976,940 | |
BB&T Corp. | | 23,270 | | 677,390 | |
Berkshire Hathaway, Inc. Cl B* | | 9,503 | | 852,419 | |
Capital One Financial Corp. | | 22,847 | | 1,323,527 | |
Citigroup, Inc. | | 22,177 | | 877,322 | |
Franklin Resources, Inc. | | 2,936 | | 369,055 | |
Goldman Sachs Group, Inc. | | 7,861 | | 1,002,749 | |
Host Hotels & Resorts, Inc. | | 47,179 | | 739,295 | |
JPMorgan Chase & Co. | | 50,495 | | 2,220,265 | |
MetLife, Inc. | | 22,943 | | 755,742 | |
PNC Financial Svcs. Grp., Inc. | | 10,239 | | 597,036 | |
Simon Property Group, Inc. | | 8,180 | | 1,293,176 | |
Wells Fargo & Co. | | 62,372 | | 2,131,875 | |
| | | | 15,039,186 | |
HEALTH CARE (6.6%) | | | | | |
Abbott Laboratories | | 6,428 | | 421,034 | |
AmerisourceBergen Corp. | | 3,504 | | 151,303 | |
Biogen Idec, Inc.* | | 2,061 | | 302,287 | |
Celgene Corp.* | | 6,476 | | 509,791 | |
Covidien PLC | | 13,986 | | 807,552 | |
Express Scripts Hldg. Co.* | | 8,049 | | 434,646 | |
Forest Laboratories, Inc.* | | 25,575 | | 903,309 | |
Gilead Sciences, Inc.* | | 11,463 | | 841,957 | |
Humana, Inc. | | 2,248 | | 154,280 | |
McKesson Corp. | | 6,507 | | 630,919 | |
Merck & Co., Inc. | | 35,136 | | 1,438,468 | |
Mylan, Inc.* | | 34,259 | | 941,437 | |
Pfizer, Inc. | | 79,547 | | 1,995,039 | |
Quest Diagnostics, Inc. | | 2,300 | | 134,021 | |
St. Jude Medical, Inc. | | 8,634 | | 312,033 | |
Stryker Corp. | | 11,067 | | 606,693 | |
UnitedHealth Group, Inc. | | 10,210 | | 553,790 | |
| | | | 11,138,559 | |
INDUSTRIALS (5.8%) | | | | | |
Boeing Co. | | 16,880 | | 1,272,077 | |
Caterpillar, Inc. | | 12,290 | | 1,100,938 | |
Cummins, Inc. | | 8,572 | | 928,776 | |
Expeditors Int’l. of Wash. | | 15,748 | | 622,833 | |
FedEx Corp. | | 8,586 | | 787,508 | |
General Electric Co. | | 99,279 | | 2,083,866 | |
Precision Castparts Corp. | | 6,731 | | 1,274,986 | |
Roper Industries, Inc. | | 8,877 | | 989,608 | |
Union Pacific Corp. | | 6,006 | | 755,074 | |
| | | | 9,815,666 | |
INFORMATION TECHNOLOGY (10.1%) | | | | | |
Altera Corp. | | 6,448 | | 222,069 | |
Apple, Inc. | | 8,636 | | 4,603,250 | |
Automatic Data Processing, Inc. | | 10,246 | | 584,124 | |
Broadcom Corp. Cl A* | | 14,078 | | 467,530 | |
Cisco Systems, Inc. | | 22,879 | | 449,572 | |
EMC Corp.* | | 25,332 | | 640,900 | |
F5 Networks, Inc.* | | 1,548 | | 150,388 | |
Google, Inc. Cl A* | | 2,290 | | 1,624,457 | |
Harris Corp. | | 3,649 | | 178,655 | |
Int’l. Business Machines Corp. | | 8,626 | | 1,652,310 | |
KLA-Tencor Corp. | | 6,669 | | 318,511 | |
MasterCard, Inc. Cl A | | 1,291 | | 634,242 | |
Microsoft Corp. | | 52,135 | | 1,393,569 | |
NetApp, Inc.* | | 3,029 | | 101,623 | |
Nortel Networks Corp.* | | 5,419 | | 27 | |
Oracle Corp. | | 32,470 | | 1,081,900 | |
QUALCOMM, Inc. | | 18,564 | | 1,151,339 | |
Salesforce.com, inc.* | | 7,209 | | 1,211,833 | |
Texas Instruments, Inc. | | 15,109 | | 467,472 | |
Yahoo!, Inc.* | | 17,836 | | 354,936 | |
| | | | 17,288,707 | |
MATERIALS (2.1%) | | | | | |
Ball Corp. | | 13,586 | | 607,974 | |
CF Industries Hldgs., Inc. | | 2,469 | | 501,602 | |
Dow Chemical Co. | | 18,281 | | 590,842 | |
Eastman Chemical Co. | | 14,395 | | 979,580 | |
FMC Corp. | | 4,225 | | 247,247 | |
Freeport-McMoRan Copper & Gold, Inc. | | 18,647 | | 637,727 | |
| | | | 3,564,972 | |
TELECOMMUNICATION SERVICES (1.5%) | | | | | |
AT&T, Inc. | | 50,988 | | 1,718,805 | |
CenturyLink, Inc. | | 11,293 | | 441,782 | |
Frontier Communications Corp. | | 103,550 | | 443,194 | |
| | | | 2,603,781 | |
UTILITIES (1.6%) | | | | | |
Ameren Corp. | | 5,267 | | 161,802 | |
Dominion Resources, Inc. | | 15,619 | | 809,064 | |
Edison International | | 9,033 | | 408,201 | |
PPL Corp. | | 10,022 | | 286,930 | |
Public Svc. Enterprise Group, Inc. | | 17,603 | | 538,652 | |
Sempra Energy | | 8,216 | | 582,843 | |
| | | | 2,787,492 | |
TOTAL COMMON STOCKS
(Cost: $76,948,298) 55.5% | | | | 94,323,287 | |
| | Rating** | | Rate(%) | | Maturity | | Face Amount | | Value | |
LONG-TERM DEBT SECURITIES: | | | | | | | | | | | |
U.S. GOVERNMENT (6.6%) | | | | | | | | | | | |
U.S. Treasury Note | | AA+ | | 0.25 | | 05/31/14 | | 800,000 | | 800,375 | |
U.S. Treasury Note | | AA+ | | 0.25 | | 07/15/15 | | 500,000 | | 499,180 | |
U.S. Treasury Strip | | AA+ | | 0.00 | | 08/15/21 | | 300,000 | | 261,339 | |
U.S. Treasury Strip | | AA+ | | 0.00 | | 11/15/21 | | 7,050,000 | | 6,086,880 | |
U.S. Treasury Strip | | AA+ | | 0.00 | | 08/15/29 | | 5,500,000 | | 3,503,000 | |
| | | | | | | | | | 11,150,774 | |
U.S. GOVERNMENT AGENCIES (13.5%) | | | | | | | | | | | |
MORTGAGE-BACKED OBLIGATIONS (13.5%) | | | | | | | | | | | |
FHARM | | AA+ | | 4.64 | | 09/01/39 | | 108,958 | | 116,362 | |
FHARM | | AA+ | | 5.22 | | 04/01/37 | | 113,253 | | 121,053 | |
FHARM | | AA+ | | 5.24 | | 02/01/36 | | 90,316 | | 95,655 | |
FHARM | | AA+ | | 5.43 | | 05/01/37 | | 121,933 | | 131,512 | |
FHARM | | AA+ | | 5.77 | | 03/01/37 | | 48,739 | | 52,790 | |
FHLMC | | AA+ | | 2.50 | | 09/01/27 | | 488,360 | | 510,590 | |
FHLMC | | AA+ | | 3.00 | | 06/01/27 | | 243,242 | | 256,706 | |
FHLMC | | AA+ | | 3.00 | | 08/01/27 | | 490,707 | | 517,870 | |
FHLMC | | AA+ | | 4.00 | | 02/01/25 | | 151,623 | | 160,297 | |
FHLMC | | AA+ | | 4.00 | | 03/01/41 | | 429,779 | | 459,485 | |
FHLMC | | AA+ | | 4.00 | | 07/01/41 | | 351,025 | | 375,068 | |
FHLMC | | AA+ | | 4.50 | | 08/01/34 | | 139,901 | | 150,476 | |
FHLMC | | AA+ | | 4.50 | | 08/15/35 | | 177,010 | | 198,266 | |
FHLMC | | AA+ | | 5.00 | | 02/01/26 | | 72,238 | | 78,207 | |
FHLMC | | AA+ | | 5.50 | | 01/15/32 | | 105,264 | | 108,473 | |
FHLMC | | AA+ | | 5.50 | | 07/01/32 | | 155,398 | | 168,553 | |
FHLMC | | AA+ | | 5.50 | | 05/01/33 | | 206,275 | | 224,704 | |
FHLMC | | AA+ | | 5.50 | | 06/01/37 | | 218,000 | | 235,910 | |
FHLMC | | AA+ | | 6.00 | | 03/15/32 | | 122,381 | | 136,980 | |
FNMA | | AA+ | | 3.50 | | 10/01/41 | | 241,347 | | 262,438 | |
FNMA | | AA+ | | 3.50 | | 12/01/41 | | 480,189 | | 522,152 | |
FNMA | | AA+ | | 3.50 | | 04/01/42 | | 574,637 | | 613,135 | |
FNMA | | AA+ | | 3.50 | | 04/01/42 | | 493,155 | | 536,316 | |
FNMA | | AA+ | | 3.50 | | 08/01/42 | | 496,663 | | 531,023 | |
FNMA | | AA+ | | 3.50 | | 10/01/42 | | 398,155 | | 425,701 | |
FNMA | | AA+ | | 4.00 | | 05/01/19 | | 90,749 | | 97,515 | |
FNMA | | AA+ | | 4.00 | | 06/01/39 | | 225,098 | | 241,473 | |
FNMA | | AA+ | | 4.00 | | 11/01/40 | | 380,792 | | 408,612 | |
FNMA | | AA+ | | 4.00 | | 05/01/41 | | 320,082 | | 351,101 | |
FNMA | | AA+ | | 4.50 | | 05/01/18 | | 105,734 | | 114,030 | |
FNMA | | AA+ | | 4.50 | | 05/01/30 | | 228,456 | | 249,003 | |
FNMA | | AA+ | | 4.50 | | 04/01/31 | | 259,997 | | 283,219 | |
FNMA | | AA+ | | 4.50 | | 08/01/33 | | 119,514 | | 129,740 | |
FNMA | | AA+ | | 4.50 | | 09/01/33 | | 239,432 | | 259,919 | |
FNMA | | AA+ | | 4.50 | | 06/01/34 | | 189,300 | | 205,142 | |
FNMA | | AA+ | | 4.50 | | 08/01/35 | | 206,413 | | 223,300 | |
FNMA | | AA+ | | 4.50 | | 12/01/35 | | 168,353 | | 182,127 | |
FNMA | | AA+ | | 4.50 | | 05/01/39 | | 195,903 | | 211,686 | |
FNMA | | AA+ | | 4.50 | | 05/01/39 | | 291,108 | | 314,561 | |
FNMA | | AA+ | | 4.50 | | 05/01/40 | | 270,487 | | 296,117 | |
FNMA | | AA+ | | 5.00 | | 04/01/18 | | 223,899 | | 243,320 | |
FNMA | | AA+ | | 5.00 | | 06/01/33 | | 259,376 | | 282,589 | |
FNMA | | AA+ | | 5.00 | | 10/01/33 | | 227,993 | | 248,398 | |
FNMA | | AA+ | | 5.00 | | 11/01/33 | | 551,100 | | 600,422 | |
FNMA | | AA+ | | 5.00 | | 11/01/33 | | 162,591 | | 177,143 | |
FNMA | | AA+ | | 5.00 | | 03/01/34 | | 77,838 | | 84,804 | |
FNMA | | AA+ | | 5.00 | | 04/01/34 | | 113,714 | | 123,607 | |
FNMA | | AA+ | | 5.00 | | 09/01/35 | | 128,397 | | 139,407 | |
FNMA | | AA+ | | 5.00 | | 11/25/35 | | 300,000 | | 329,495 | |
FNMA | | AA+ | | 5.00 | | 05/01/39 | | 284,834 | | 310,677 | |
FNMA | | AA+ | | 5.00 | | 06/01/40 | | 133,697 | | 145,495 | |
FNMA | | AA+ | | 5.50 | | 04/01/17 | | 13,235 | | 14,256 | |
FNMA | | AA+ | | 5.50 | | 05/01/17 | | 6,440 | | 6,937 | |
FNMA | | AA+ | | 5.50 | | 06/01/17 | | 4,327 | | 4,661 | |
FNMA | | AA+ | | 5.50 | | 03/01/34 | | 76,346 | | 83,906 | |
FNMA | | AA+ | | 5.50 | | 05/01/34 | | 569,986 | | 623,581 | |
FNMA | | AA+ | | 5.50 | | 07/01/34 | | 122,014 | | 133,487 | |
FNMA | | AA+ | | 5.50 | | 09/01/34 | | 108,230 | | 118,406 | |
FNMA | | AA+ | | 5.50 | | 09/01/34 | | 247,085 | | 270,782 | |
FNMA | | AA+ | | 5.50 | | 10/01/34 | | 89,647 | | 98,077 | |
FNMA | | AA+ | | 5.50 | | 02/01/35 | | 177,108 | | 193,761 | |
FNMA | | AA+ | | 5.50 | | 02/01/35 | | 129,881 | | 141,931 | |
FNMA | | AA+ | | 5.50 | | 08/01/35 | | 80,416 | | 87,877 | |
FNMA | | AA+ | | 5.50 | | 08/01/37 | | 58,416 | | 63,480 | |
FNMA | | AA+ | | 5.50 | | 11/01/38 | | 87,688 | | 94,125 | |
FNMA | | AA+ | | 5.50 | | 06/01/48 | | 101,624 | | 109,655 | |
FNMA | | AA+ | | 6.00 | | 03/01/17 | | 6,642 | | 7,144 | |
FNMA | | AA+ | | 6.00 | | 05/01/23 | | 56,560 | | 63,461 | |
FNMA | | AA+ | | 6.00 | | 03/01/32 | | 10,209 | | 11,406 | |
FNMA | | AA+ | | 6.00 | | 04/01/32 | | 30,527 | | 34,098 | |
FNMA | | AA+ | | 6.00 | | 04/01/32 | | 25,529 | | 28,516 | |
FNMA | | AA+ | | 6.00 | | 05/01/32 | | 39,333 | | 43,935 | |
FNMA | | AA+ | | 6.00 | | 04/01/33 | | 193,239 | | 215,848 | |
FNMA | | AA+ | | 6.00 | | 05/01/33 | | 140,401 | | 156,827 | |
FNMA | | AA+ | | 6.00 | | 06/01/34 | | 85,761 | | 95,367 | |
FNMA | | AA+ | | 6.00 | | 09/01/34 | | 50,958 | | 56,666 | |
FNMA | | AA+ | | 6.00 | | 10/01/34 | | 92,636 | | 103,011 | |
FNMA | | AA+ | | 6.00 | | 11/01/34 | | 95,078 | | 105,727 | |
FNMA | | AA+ | | 6.00 | | 12/01/36 | | 149,251 | | 163,402 | |
FNMA | | AA+ | | 6.00 | | 01/01/37 | | 144,791 | | 158,518 | |
FNMA | | AA+ | | 6.00 | | 04/01/37 | | 80,184 | | 86,784 | |
FNMA | | AA+ | | 6.00 | | 05/01/37 | | 49,768 | | 53,865 | |
FNMA | | AA+ | | 6.00 | | 06/01/37 | | 130,344 | | 141,073 | |
FNMA | | AA+ | | 6.00 | | 10/25/44 | | 161,513 | | 180,847 | |
FNMA | | AA+ | | 6.00 | | 02/25/47 | | 147,215 | | 166,810 | |
FNMA | | AA+ | | 6.00 | | 12/25/49 | | 131,415 | | 150,406 | |
FNMA | | AA+ | | 6.50 | | 09/01/16 | | 7,450 | | 7,971 | |
FNMA | | AA+ | | 6.50 | | 03/01/17 | | 17,655 | | 19,141 | |
FNMA | | AA+ | | 6.50 | | 05/01/17 | | 3,277 | | 3,553 | |
FNMA | | AA+ | | 6.50 | | 06/01/17 | | 21,541 | | 23,355 | |
FNMA | | AA+ | | 6.50 | | 04/01/32 | | 14,471 | | 17,122 | |
FNMA | | AA+ | | 6.50 | | 05/01/32 | | 41,153 | | 48,693 | |
FNMA | | AA+ | | 6.50 | | 05/01/32 | | 28,219 | | 33,389 | |
FNMA | | AA+ | | 6.50 | | 07/01/32 | | 9,983 | | 11,812 | |
FNMA | | AA+ | | 6.50 | | 07/01/34 | | 101,843 | | 120,733 | |
FNMA | | AA+ | | 6.50 | | 05/01/37 | | 110,717 | | 131,580 | |
FNMA | | AA+ | | 6.50 | | 09/01/37 | | 96,259 | | 114,398 | |
FNMA | | AA+ | | 7.00 | | 09/01/31 | | 19,377 | | 23,152 | |
FNMA | | AA+ | | 7.00 | | 04/01/32 | | 20,014 | | 23,886 | |
FNMA | | AA+ | | 7.50 | | 06/01/31 | | 13,180 | | 15,560 | |
FNMA | | AA+ | | 7.50 | | 02/01/32 | | 9,690 | | 11,471 | |
FNMA | | AA+ | | 7.50 | | 04/01/32 | | 17,025 | | 20,182 | |
FNMA | | AA+ | | 7.50 | | 06/01/32 | | 12,704 | | 15,060 | |
FNMA | | AA+ | | 8.00 | | 03/01/31 | | 6,228 | | 7,441 | |
FNMA | | AA+ | | 8.00 | | 04/01/32 | | 14,101 | | 16,911 | |
FNMA | | AA+ | | 8.00 | | 04/01/32 | | 2,552 | | 3,052 | |
GNMA (4) | | AA+ | | 3.50 | | 09/20/33 | | 337,400 | | 352,059 | |
GNMA (4) | | AA+ | | 3.50 | | 01/20/37 | | 307,637 | | 316,523 | |
GNMA (4) | | AA+ | | 4.00 | | 08/15/41 | | 377,845 | | 414,765 | |
GNMA (4) | | AA+ | | 4.00 | | 01/15/42 | | 454,260 | | 498,931 | |
GNMA (4) | | AA+ | | 4.00 | | 03/20/42 | | 320,828 | | 350,345 | |
GNMA (4) | | AA+ | | 4.00 | | 08/20/42 | | 374,471 | | 408,923 | |
GNMA (4) | | AA+ | | 4.50 | | 04/20/31 | | 416,246 | | 459,579 | |
GNMA (4) | | AA+ | | 4.50 | | 10/15/40 | | 361,676 | | 399,216 | |
GNMA (4) | | AA+ | | 5.00 | | 10/15/24 | | 376,249 | | 407,306 | |
GNMA (4) | | AA+ | | 5.00 | | 04/15/39 | | 294,426 | | 322,317 | |
GNMA (4) | | AA+ | | 5.00 | | 06/20/39 | | 238,163 | | 275,520 | |
GNMA (4) | | AA+ | | 5.00 | | 11/15/39 | | 243,162 | | 266,196 | |
GNMA (4) | | AA+ | | 6.50 | | 04/15/31 | | 4,360 | | 5,169 | |
GNMA (4) | | AA+ | | 6.50 | | 10/15/31 | | 8,221 | | 9,747 | |
GNMA (4) | | AA+ | | 6.50 | | 12/15/31 | | 6,615 | | 7,842 | |
GNMA (4) | | AA+ | | 6.50 | | 05/15/32 | | 11,711 | | 13,916 | |
GNMA (4) | | AA+ | | 7.00 | | 05/15/31 | | 6,368 | | 7,590 | |
GNMA (4) | | AA+ | | 7.00 | | 09/15/31 | | 6,414 | | 7,646 | |
GNMA (4) | | AA+ | | 7.00 | | 09/15/31 | | 2,366 | | 2,821 | |
GNMA (4) | | AA+ | | 7.00 | | 05/15/32 | | 2,741 | | 3,260 | |
Vendee Mortgage Trust (4) | | AA+ | | 5.25 | | 01/15/32 | | 327,911 | | 380,217 | |
| | | | | | | | | | 22,889,607 | |
CORPORATE DEBT (18.7%) | | | | | | | | | | | |
CONSUMER DISCRETIONARY (2.9%) | | | | | | | | | | | |
Advance Auto Parts, Inc. | | BBB- | | 5.75 | | 05/01/20 | | 250,000 | | 269,371 | |
AutoZone, Inc. | | BBB | | 4.00 | | 11/15/20 | | 250,000 | | 271,117 | |
Ethan Allen Interiors, Inc. | | BB- | | 5.38 | | 10/01/15 | | 500,000 | | 513,750 | |
Expedia, Inc. | | BBB- | | 5.95 | | 08/15/20 | | 250,000 | | 278,151 | |
Home Depot, Inc. | | A- | | 5.40 | | 03/01/16 | | 500,000 | | 571,208 | |
Hyatt Hotels Corp. | | BBB | | 3.88 | | 08/15/16 | | 100,000 | | 106,485 | |
Kohl’s Corp. | | BBB+ | | 4.00 | | 11/01/21 | | 100,000 | | 105,759 | |
Lowe’s Cos., Inc. | | A- | | 3.12 | | 04/15/22 | | 300,000 | | 315,800 | |
Marriott International, Inc. | | BBB | | 5.63 | | 02/15/13 | | 500,000 | | 502,688 | |
NVR, Inc. | | BBB | | 3.95 | | 09/15/22 | | 300,000 | | 310,877 | |
O’Reilly Automotive, Inc. | | BBB | | 3.80 | | 09/01/22 | | 300,000 | | 312,146 | |
Omnicom Group, Inc. | | BBB+ | | 4.45 | | 08/15/20 | | 250,000 | | 278,184 | |
Scholastic Corp. | | BB- | | 5.00 | | 04/15/13 | | 500,000 | | 501,875 | |
Tupperware Brands Corp. | | BBB- | | 4.75 | | 06/01/21 | | 250,000 | | 267,512 | |
Whirlpool Corp. | | BBB- | | 6.50 | | 06/15/16 | | 250,000 | | 286,726 | |
| | | | | | | | | | 4,891,649 | |
CONSUMER STAPLES (1.1%) | | | | | | | | | | | |
Avon Products, Inc. | | BBB- | | 4.20 | | 07/15/18 | | 150,000 | | 152,847 | |
CVS Caremark Corp. | | BBB+ | | 6.13 | | 08/15/16 | | 250,000 | | 297,697 | |
Energizer Hldgs., Inc. | | BBB- | | 4.70 | | 05/19/21 | | 225,000 | | 241,140 | |
Ingredion, Inc. | | BBB | | 4.63 | | 11/01/20 | | 250,000 | | 279,144 | |
Kroger Co. | | BBB | | 4.95 | | 01/15/15 | | 500,000 | | 539,116 | |
Sysco Corp. | | A+ | | 2.60 | | 06/12/22 | | 300,000 | | 306,162 | |
| | | | | | | | | | 1,816,106 | |
ENERGY (3.0%) | | | | | | | | | | | |
Cameron International Corp. | | BBB+ | | 4.50 | | 06/01/21 | | 300,000 | | 335,687 | |
Diamond Offshore Drilling, Inc. | | A- | | 4.88 | | 07/01/15 | | 500,000 | | 551,050 | |
Enbridge, Inc. | | A- | | 5.80 | | 06/15/14 | | 100,000 | | 107,328 | |
Energen Corp. | | BBB | | 4.63 | | 09/01/21 | | 250,000 | | 260,475 | |
EQT Corp. | | BBB | | 4.88 | | 11/15/21 | | 200,000 | | 214,707 | |
Kinder Morgan, Inc. | | BB | | 5.15 | | 03/01/15 | | 500,000 | | 531,484 | |
Murphy Oil Corp. | | BBB | | 2.50 | | 12/01/17 | | 200,000 | | 201,233 | |
National Oilwell Varco, Inc. | | A- | | 6.13 | | 08/15/15 | | 250,000 | | 252,488 | |
Noble Drilling Corp. | | BBB+ | | 7.50 | | 03/15/19 | | 800,000 | | 967,184 | |
Rowan Companies PLC | | BBB- | | 4.88 | | 06/01/22 | | 300,000 | | 325,820 | |
Seacor Hldgs., Inc. | | BB | | 7.38 | | 10/01/19 | | 250,000 | | 265,590 | |
Sunoco, Inc. | | BBB- | | 4.88 | | 10/15/14 | | 500,000 | | 527,748 | |
Weatherford Int’l. Ltd. | | BBB- | | 5.50 | | 02/15/16 | | 500,000 | | 550,761 | |
| | | | | | | | | | 5,091,555 | |
FINANCIALS (5.7%) | | | | | | | | | | | |
Aflac, Inc. | | A- | | 4.00 | | 02/15/22 | | 300,000 | | 323,617 | |
Alleghany Corp. | | BBB | | 5.63 | | 09/15/20 | | 300,000 | | 333,148 | |
Bank of America Corp. | | A- | | 3.70 | | 09/01/15 | | 250,000 | | 264,285 | |
Barrick N.A. Finance LLC | | BBB+ | | 4.40 | | 05/30/21 | | 250,000 | | 274,160 | |
Berkley (W.R.) Corp. | | BBB+ | | 7.38 | | 09/15/19 | | 250,000 | | 305,788 | |
Block Financial LLC | | BBB | | 5.13 | | 10/30/14 | | 250,000 | | 263,229 | |
Bunge Ltd. Finance Corp. | | BBB- | | 5.35 | | 04/15/14 | | 500,000 | | 526,133 | |
CNA Financial Corp. | | BBB- | | 6.50 | | 08/15/16 | | 250,000 | | 288,431 | |
Duke Realty LP | | BBB- | | 4.63 | | 05/15/13 | | 250,000 | | 253,491 | |
Fairfax Financial Hldgs. | | BBB- | | 8.25 | | 10/01/15 | | 500,000 | | 567,195 | |
First Horizon National Corp. | | BB+ | | 4.50 | | 05/15/13 | | 1,500,000 | | 1,517,982 | |
Hartford Financial Svcs. | | BBB | | 5.50 | | 10/15/16 | | 250,000 | | 279,822 | |
HCP, Inc. | | BBB+ | | 5.65 | | 12/15/13 | | 250,000 | | 261,498 | |
Health Care REIT, Inc. | | BBB- | | 6.13 | | 04/15/20 | | 250,000 | | 292,801 | |
Hospitality Properties Trust | | BBB- | | 5.00 | | 08/15/22 | | 250,000 | | 264,503 | |
Markel Corp. | | BBB | | 6.80 | | 02/15/13 | | 250,000 | | 251,580 | |
Moody’s Corp. | | BBB+ | | 4.50 | | 09/01/22 | | 250,000 | | 267,287 | |
Morgan Stanley | | A- | | 4.00 | | 07/24/15 | | 250,000 | | 261,571 | |
National Retail Pptys., Inc. | | BBB | | 3.80 | | 10/15/22 | | 250,000 | | 253,864 | |
Old Republic Int’l. Corp. | | BBB+ | | 3.75 | | 03/15/18 | | 100,000 | | 104,063 | |
Pacific LifeCorp.† | | BBB+ | | 6.00 | | 02/10/20 | | 100,000 | | 111,627 | |
Penske Truck Leasing Co. LP† | | BBB- | | 3.38 | | 03/15/18 | | 300,000 | | 302,690 | |
ProLogis LP | | BBB- | | 6.63 | | 05/15/18 | | 150,000 | | 181,174 | |
Prudential Financial, Inc. | | A | | 4.50 | | 11/16/21 | | 250,000 | | 281,161 | |
Raymond James Financial, Inc. | | BBB | | 4.25 | | 04/15/16 | | 250,000 | | 262,845 | |
Reckson Operating Partnership | | BBB- | | 6.00 | | 03/31/16 | | 100,000 | | 109,643 | |
Regency Centers LP | | BBB | | 4.95 | | 04/15/14 | | 250,000 | | 261,568 | |
Senior Housing Pptys. Trust | | BBB- | | 4.30 | | 01/15/16 | | 250,000 | | 259,192 | |
Ventas Realty LP/Capital Corp. | | BBB | | 4.00 | | 04/30/19 | | 100,000 | | 107,494 | |
Ventas Realty LP/Capital Corp. | | BBB | | 4.75 | | 06/01/21 | | 200,000 | | 218,716 | |
Zions Bancorporation | | BB+ | | 5.65 | | 05/15/14 | | 397,000 | | 408,109 | |
| | | | | | | | | | 9,658,667 | |
HEALTH CARE (1.5%) | | | | | | | | | | | |
Allergan, Inc. | | A+ | | 5.75 | | 04/01/16 | | 250,000 | | 287,674 | |
Bio-Rad Laboratories, Inc. | | BBB | | 4.88 | | 12/15/20 | | 200,000 | | 211,450 | |
CIGNA Corp. | | BBB | | 2.75 | | 11/15/16 | | 250,000 | | 262,986 | |
Laboratory Corp. of America | | BBB+ | | 5.63 | | 12/15/15 | | 500,000 | | 563,920 | |
Medco Health Solutions, Inc. | | BBB+ | | 4.13 | | 09/15/20 | | 250,000 | | 273,228 | |
PerkinElmer, Inc. | | BBB | | 5.00 | | 11/15/21 | | 300,000 | | 332,613 | |
Quest Diagnostics, Inc. | | BBB+ | | 4.75 | | 01/30/20 | | 250,000 | | 276,087 | |
WellPoint, Inc. | | A- | | 4.35 | | 08/15/20 | | 250,000 | | 275,938 | |
| | | | | | | | | | 2,483,896 | |
INDUSTRIALS (1.6%) | | | | | | | | | | | |
CSX Corp. | | BBB | | 6.25 | | 04/01/15 | | 250,000 | | 279,940 | |
Donnelley (R.R.) & Sons Co. | | BB | | 4.95 | | 04/01/14 | | 500,000 | | 511,250 | |
Dun & Bradstreet Corp. | | BBB+ | | 3.25 | | 12/01/17 | | 250,000 | | 252,648 | |
Equifax, Inc. | | BBB+ | | 3.30 | | 12/15/22 | | 300,000 | | 297,583 | |
Harsco Corp. | | BBB | | 5.75 | | 05/15/18 | | 250,000 | | 278,121 | |
L-3 Communications Corp. | | BBB- | | 4.75 | | 07/15/20 | | 250,000 | | 278,659 | |
Pentair Ltd. | | BBB | | 5.00 | | 05/15/21 | | 250,000 | | 282,401 | |
Pitney Bowes, Inc. | | BBB | | 5.25 | | 01/15/37 | | 250,000 | | 255,031 | |
URS Corp.† | | BBB- | | 5.00 | | 04/01/22 | | 300,000 | | 308,840 | |
| | | | | | | | | | 2,744,473 | |
INFORMATION TECHNOLOGY (0.1%) | | | | | | | | | | | |
Ingram Micro, Inc. | | BBB- | | 5.25 | | 09/01/17 | | 100,000 | | 108,599 | |
Tech Data Corp. | | BBB- | | 3.75 | | 09/21/17 | | 100,000 | | 102,581 | |
| | | | | | | | | | 211,180 | |
MATERIALS (1.3%) | | | | | | | | | | | |
Freeport-McMoRan Copper & Gold | | BBB | | 3.55 | | 03/01/22 | | 100,000 | | 99,178 | |
Geon Co. | | BB- | | 7.50 | | 12/15/15 | | 1,000,000 | | 1,030,000 | |
Methanex Corp. | | BBB- | | 3.25 | | 12/15/19 | | 250,000 | | 251,454 | |
Packaging Corp. of America | | BBB | | 3.90 | | 06/15/22 | | 250,000 | | 258,888 | |
Teck Resources Ltd. | | BBB | | 4.75 | | 01/15/22 | | 300,000 | | 330,143 | |
Vulcan Materials Co. | | BB | | 7.00 | | 06/15/18 | | 250,000 | | 276,250 | |
| | | | | | | | | | 2,245,913 | |
TELECOMMUNICATION SERVICES (0.3%) | | | | | | | | | | | |
CenturyLink, Inc. | | BB | | 5.00 | | 02/15/15 | | 500,000 | | 531,451 | |
| | | | | | | | | | | |
UTILITIES (1.2%) | | | | | | | | | | | |
AmerenEnergy Generating Co. | | B | | 6.30 | | 04/01/20 | | 250,000 | | 180,000 | |
Constellation Energy | | BBB- | | 5.15 | | 12/01/20 | | 340,000 | | 388,661 | |
Entergy Corp. | | BBB- | | 5.13 | | 09/15/20 | | 250,000 | | 271,121 | |
National Fuel Gas Co. | | BBB | | 4.90 | | 12/01/21 | | 250,000 | | 276,037 | |
Progress Energy, Inc. | | A | | 5.25 | | 12/15/15 | | 500,000 | | 567,078 | |
SCANA Corp. | | BBB | | 4.13 | | 02/01/22 | | 300,000 | | 314,563 | |
| | | | | | | | | | 1,997,460 | |
| | | | | | | | | | | |
TOTAL LONG-TERM DEBT SECURITIES
(Cost: $61,615,438) 38.8% | | | | | | | | | | 65,712,731 | |
| | Rating** | | Rate(%) | | Maturity | | Face Amount | | Value | |
SHORT-TERM DEBT SECURITIES: | | | | | | | | | | | |
COMMERCIAL PAPER (4.8%) | | | | | | | | | | | |
General Electric Capital Corp. | | A-1+ | | 0.12 | | 03/18/13 | | 2,800,000 | | 2,799,282 | |
Procter & Gamble Co.† | | A-1+ | | 0.15 | | 01/16/13 | | 250,000 | | 249,984 | |
Toyota Motor Credit Corp. | | A-1+ | | 0.14 | | 02/14/13 | | 4,000,000 | | 3,999,316 | |
Toyota Motor Credit Corp. | | A-1+ | | 0.15 | | 02/22/13 | | 1,000,000 | | 999,783 | |
| | | | | | | | | | 8,048,365 | |
TOTAL SHORT-TERM DEBT SECURITIES
(Cost: $8,048,374) 4.8% | | | | | | | | | | 8,048,365 | |
| | | | | | | | | | | |
TEMPORARY CASH INVESTMENTS (2)
(Cost: $934,600) 0.6% | | | | | | | | | | 934,600 | |
| | | | | | | | | | | |
TOTAL INVESTMENTS
(Cost: $147,546,710) 99.7% | | | | | | | | | | 169,018,983 | |
| | | | | | | | | | | |
OTHER NET ASSETS 0.3% | | | | | | | | | | 578,050 | |
| | | | | | | | | | | |
NET ASSETS 100.0% | | | | | | | | | | $ | 169,597,033 | |
| | | | | | | | | | | | |
The accompanying notes are an integral part of these portfolio schedules.
MUTUAL OF AMERICA INVESTMENT CORPORATION - RETIREMENT INCOME FUND
PORTFOLIO OF INVESTMENTS IN SECURITIES
December 31, 2012
| | Shares | | Value | |
COMMON STOCKS: | | | | | |
DIVERSIFIED MUTUAL FUNDS (100.0%) | | | | | |
Mutual of America Investment Corporation | | | | | |
Bond Fund (30.0%) | | 6,393,146 | | 9,390,938 | |
Equity Index Fund (19.9%) | | 2,591,460 | | 6,210,784 | |
Mid-Cap Equity Index Fund (5.0%) | | 955,239 | | 1,557,655 | |
Mid-Term Bond Fund (40.1%) | | 11,467,988 | | 12,522,103 | |
Money Market Fund (5.0%) | | 1,300,960 | | 1,561,895 | |
TOTAL INVESTMENTS
(Cost: $29,728,136) 100.0% | | | | 31,243,375 | |
| | | | | |
OTHER NET ASSETS -0.0% (3) | | | | (128 | ) |
| | | | | |
NET ASSETS 100.0% | | | | $ | 31,243,247 | |
| | | | | | |
The accompanying notes are an integral part of these portfolio schedules.
MUTUAL OF AMERICA INVESTMENT CORPORATION - 2010 RETIREMENT FUND
PORTFOLIO OF INVESTMENTS IN SECURITIES
December 31, 2012
| | Shares | | Value | |
COMMON STOCKS: | | | | | |
DIVERSIFIED MUTUAL FUNDS (100.0%) | | | | | |
Mutual of America Investment Corporation | | | | | |
Bond Fund (25.1%) | | 3,660,382 | | 5,376,761 | |
Equity Index Fund (24.9%) | | 2,225,135 | | 5,332,836 | |
International Fund (3.0%) | | 916,323 | | 648,422 | |
Mid-Cap Equity Index Fund (11.0%) | | 1,443,628 | | 2,354,044 | |
Mid-Term Bond Fund (31.0%) | | 6,106,306 | | 6,667,585 | |
Money Market Fund (5.0%) | | 893,804 | | 1,073,075 | |
TOTAL INVESTMENTS
(Cost: $19,885,714) 100.0% | | | | 21,452,723 | |
| | | | | |
OTHER NET ASSETS -0.0% (3) | | | | (88 | ) |
| | | | | |
NET ASSETS 100.0% | | | | $ | 21,452,635 | |
| | | | | | |
The accompanying notes are an integral part of these portfolio schedules.
MUTUAL OF AMERICA INVESTMENT CORPORATION - 2015 RETIREMENT FUND
PORTFOLIO OF INVESTMENTS IN SECURITIES
December 31, 2012
| | Shares | | Value | |
COMMON STOCKS: | | | | | |
DIVERSIFIED MUTUAL FUNDS (100.0%) | | | | | |
Mutual of America Investment Corporation | | | | | |
Bond Fund (25.1%) | | 19,167,793 | | 28,155,705 | |
Equity Index Fund (27.8%) | | 13,051,120 | | 31,278,771 | |
International Fund (6.1%) | | 9,597,129 | | 6,791,255 | |
Mid-Cap Equity Index Fund (11.0%) | | 7,560,037 | | 12,327,737 | |
Mid-Term Bond Fund (26.0%) | | 26,818,584 | | 29,283,695 | |
Small Cap Growth Fund (2.0%) | | 1,839,521 | | 2,245,115 | |
Small Cap Value Fund (2.0%) | | 1,672,556 | | 2,255,427 | |
TOTAL INVESTMENTS
(Cost: $101,086,700) 100.0% | | | | 112,337,705 | |
| | | | | |
OTHER NET ASSETS -0.0% (3) | | | | (460 | ) |
| | | | | |
NET ASSETS 100.0% | | | | $ | 112,337,245 | |
| | | | | | |
The accompanying notes are an integral part of these portfolio schedules.
MUTUAL OF AMERICA INVESTMENT CORPORATION - 2020 RETIREMENT FUND
PORTFOLIO OF INVESTMENTS IN SECURITIES
December 31, 2012
| | Shares | | Value | |
COMMON STOCKS: | | | | | |
DIVERSIFIED MUTUAL FUNDS (100.0%) | | | | | |
Mutual of America Investment Corporation | | | | | |
Bond Fund (25.0%) | | 28,849,093 | | 42,376,635 | |
Equity Index Fund (32.8%) | | 23,151,096 | | 55,484,727 | |
International Fund (9.1%) | | 21,666,342 | | 15,331,840 | |
Mid-Cap Equity Index Fund (11.0%) | | 11,378,696 | | 18,554,614 | |
Mid-Term Bond Fund (16.1%) | | 24,839,481 | | 27,122,676 | |
Small Cap Growth Fund (3.0%) | | 4,153,114 | | 5,068,830 | |
Small Cap Value Fund (3.0%) | | 3,776,052 | | 5,091,972 | |
TOTAL INVESTMENTS
(Cost: $150,457,834) 100.0% | | | | 169,031,294 | |
| | | | | |
OTHER NET ASSETS -0.0% (3) | | | | (693 | ) |
| | | | | |
NET ASSETS 100.0% | | | | $ | 169,030,601 | |
| | | | | | |
The accompanying notes are an integral part of these portfolio schedules.
MUTUAL OF AMERICA INVESTMENT CORPORATION - 2025 RETIREMENT FUND
PORTFOLIO OF INVESTMENTS IN SECURITIES
December 31, 2012
| | Shares | | Value | |
COMMON STOCKS: | | | | | |
DIVERSIFIED MUTUAL FUNDS (100.0%) | | | | | |
Mutual of America Investment Corporation | | | | | |
Bond Fund (23.1%) | | 25,416,163 | | 37,333,980 | |
Equity Index Fund (36.8%) | | 24,855,316 | | 59,569,121 | |
International Fund (9.1%) | | 20,747,235 | | 14,681,449 | |
Mid-Cap Equity Index Fund (15.0%) | | 14,857,728 | | 24,227,679 | |
Mid-Term Bond Fund (8.0%) | | 11,893,320 | | 12,986,531 | |
Small Cap Growth Fund (4.0%) | | 5,302,420 | | 6,471,546 | |
Small Cap Value Fund (4.0%) | | 4,821,065 | | 6,501,164 | |
TOTAL INVESTMENTS
(Cost: $142,278,583) 100.0% | | | | 161,771,470 | |
| | | | | |
OTHER NET ASSETS -0.0% (3) | | | | (663 | ) |
| | | | | |
NET ASSETS 100.0% | | | | $ | 161,770,807 | |
| | | | | | |
The accompanying notes are an integral part of these portfolio schedules.
MUTUAL OF AMERICA INVESTMENT CORPORATION - 2030 RETIREMENT FUND
PORTFOLIO OF INVESTMENTS IN SECURITIES
December 31, 2012
| | Shares | | Value | |
COMMON STOCKS: | | | | | |
DIVERSIFIED MUTUAL FUNDS (100.0%) | | | | | |
Mutual of America Investment Corporation | | | | | |
Bond Fund (23.1%) | | 20,944,508 | | 30,765,535 | |
Equity Index Fund (39.8%) | | 22,144,736 | | 53,072,850 | |
International Fund (10.1%) | | 18,996,322 | | 13,442,443 | |
Mid-Cap Equity Index Fund (17.0%) | | 13,877,060 | | 22,628,558 | |
Small Cap Growth Fund (5.0%) | | 5,462,548 | | 6,666,980 | |
Small Cap Value Fund (5.0%) | | 4,966,269 | | 6,696,970 | |
TOTAL INVESTMENTS
(Cost: $115,735,566) 100.0% | | | | 133,273,336 | |
| | | | | |
OTHER NET ASSETS -0.0% (3) | | | | (546 | ) |
| | | | | |
NET ASSETS 100.0% | | | | $ | 133,272,790 | |
| | | | | | |
The accompanying notes are an integral part of these portfolio schedules.
MUTUAL OF AMERICA INVESTMENT CORPORATION - 2035 RETIREMENT FUND
PORTFOLIO OF INVESTMENTS IN SECURITIES
December 31, 2012
| | Shares | | Value | |
COMMON STOCKS: | | | | | |
DIVERSIFIED MUTUAL FUNDS (100.0%) | | | | | |
Mutual of America Investment Corporation | | | | | |
Bond Fund (16.1%) | | 11,664,761 | | 17,134,450 | |
Equity Index Fund (39.8%) | | 17,730,782 | | 42,494,213 | |
International Fund (12.1%) | | 18,251,579 | | 12,915,438 | |
Mid-Cap Equity Index Fund (20.0%) | | 13,071,709 | | 21,315,316 | |
Small Cap Growth Fund (6.0%) | | 5,248,311 | | 6,405,505 | |
Small Cap Value Fund (6.0%) | | 4,771,531 | | 6,434,366 | |
TOTAL INVESTMENTS
(Cost: $92,092,566) 100.0% | | | | 106,699,288 | |
| | | | | |
OTHER NET ASSETS -0.0% (3) | | | | (437 | ) |
| | | | | |
NET ASSETS 100.0% | | | | $ | 106,698,851 | |
| | | | | | |
The accompanying notes are an integral part of these portfolio schedules.
MUTUAL OF AMERICA INVESTMENT CORPORATION - 2040 RETIREMENT FUND
PORTFOLIO OF INVESTMENTS IN SECURITIES
December 31, 2012
| | Shares | | Value | |
COMMON STOCKS: | | | | | |
DIVERSIFIED MUTUAL FUNDS (100.0%) | | | | | |
Mutual of America Investment Corporation | | | | | |
Bond Fund (12.0%) | | 7,704,355 | | 11,316,981 | |
Equity Index Fund (34.9%) | | 13,662,133 | | 32,743,147 | |
International Fund (14.1%) | | 18,751,460 | | 13,269,170 | |
Mid-Cap Equity Index Fund (23.0%) | | 13,237,849 | | 21,586,232 | |
Small Cap Growth Fund (8.0%) | | 6,162,354 | | 7,521,085 | |
Small Cap Value Fund (8.0%) | | 5,602,572 | | 7,555,018 | |
TOTAL INVESTMENTS
(Cost: $80,714,140) 100.0% | | | | 93,991,633 | |
| | | | | |
OTHER NET ASSETS -0.0% (3) | | | | (385 | ) |
| | | | | |
NET ASSETS 100.0% | | | | $ | 93,991,248 | |
| | | | | | |
The accompanying notes are an integral part of these portfolio schedules.
MUTUAL OF AMERICA INVESTMENT CORPORATION - 2045 RETIREMENT FUND
PORTFOLIO OF INVESTMENTS IN SECURITIES
December 31, 2012
| | Shares | | Value | |
COMMON STOCKS: | | | | | |
DIVERSIFIED MUTUAL FUNDS (100.0%) | | | | | |
Mutual of America Investment Corporation | | | | | |
Bond Fund (10.0%) | | 8,080,848 | | 11,870,014 | |
Equity Index Fund (34.9%) | | 17,194,929 | | 41,209,968 | |
International Fund (16.1%) | | 26,972,457 | | 19,086,627 | |
Mid-Cap Equity Index Fund (21.0%) | | 15,212,109 | | 24,805,549 | |
Small Cap Growth Fund (9.0%) | | 8,725,252 | | 10,649,075 | |
Small Cap Value Fund (9.0%) | | 7,932,750 | | 10,697,242 | |
TOTAL INVESTMENTS
(Cost: $102,022,522) 100.0% | | | | 118,318,475 | |
| | | | | |
OTHER NET ASSETS -0.0% (3) | | | | (485 | ) |
| | | | | |
NET ASSETS 100.0% | | | | $ | 118,317,990 | |
| | | | | | |
The accompanying notes are an integral part of these portfolio schedules.
MUTUAL OF AMERICA INVESTMENT CORPORATION - 2050 RETIREMENT FUND
PORTFOLIO OF INVESTMENTS IN SECURITIES
December 31, 2012
| | Shares | | Value | |
COMMON STOCKS: | | | | | |
DIVERSIFIED MUTUAL FUNDS (100.0%) | | | | | |
Mutual of America Investment Corporation | | | | | |
Bond Fund (8.0%) | | 115,525 | | 169,695 | |
Equity Index Fund (34.9%) | | 307,810 | | 737,707 | |
International Fund (17.1%) | | 512,298 | | 362,519 | |
Mid-Cap Equity Index Fund (20.0%) | | 259,278 | | 422,790 | |
Small Cap Growth Fund (10.0%) | | 173,600 | | 211,877 | |
Small Cap Value Fund (10.0%) | | 157,660 | | 212,603 | |
TOTAL INVESTMENTS
(Cost: $2,080,019) 100.0% | | | | 2,117,191 | |
| | | | | |
OTHER NET ASSETS -0.0% (3) | | | | (9 | ) |
| | | | | |
NET ASSETS 100.0% | | | | $ | 2,117,182 | |
| | | | | | |
The accompanying notes are an integral part of these portfolio schedules.
MUTUAL OF AMERICA INVESTMENT CORPORATION - CONSERVATIVE ALLOCATION FUND
PORTFOLIO OF INVESTMENTS IN SECURITIES
December 31, 2012
| | Shares | | Value | |
COMMON STOCKS: | | | | | |
DIVERSIFIED MUTUAL FUNDS (100.0%) | | | | | |
Mutual of America Investment Corporation | | | | | |
Bond Fund (30.3%) | | 17,803,214 | | 26,151,266 | |
Equity Index Fund (24.6%) | | 8,851,114 | | 21,212,889 | |
Mid-Term Bond Fund (45.1%) | | 35,713,076 | | 38,995,751 | |
TOTAL INVESTMENTS
(Cost: $79,794,318) 100.0% | | | | 86,359,906 | |
| | | | | |
OTHER NET ASSETS | | | | — | |
| | | | | |
NET ASSETS 100.0% | | | | $ | 86,359,906 | |
| | | | | | |
The accompanying notes are an integral part of these portfolio schedules.
MUTUAL OF AMERICA INVESTMENT CORPORATION - MODERATE ALLOCATION FUND
PORTFOLIO OF INVESTMENTS IN SECURITIES
December 31, 2012
| | Shares | | Value | |
COMMON STOCKS: | | | | | |
DIVERSIFIED MUTUAL FUNDS (100.0%) | | | | | |
Mutual of America Investment Corporation | | | | | |
Bond Fund (30.3%) | | 46,473,212 | | 68,264,826 | |
Equity Index Fund (34.4%) | | 32,325,478 | | 77,472,372 | |
Mid-Cap Equity Index Fund (15.2%) | | 20,993,570 | | 34,233,059 | |
Mid-Term Bond Fund (20.1%) | | 41,427,042 | | 45,234,933 | |
TOTAL INVESTMENTS
(Cost: $193,148,223) 100.0% | | | | 225,205,190 | |
| | | | | |
OTHER NET ASSETS | | | | — | |
| | | | | |
NET ASSETS 100.0% | | | | $ | 225,205,190 | |
| | | | | | |
The accompanying notes are an integral part of these portfolio schedules.
MUTUAL OF AMERICA INVESTMENT CORPORATION - AGGRESSIVE ALLOCATION FUND
PORTFOLIO OF INVESTMENTS IN SECURITIES
December 31, 2012
| | Shares | | Value | |
COMMON STOCKS: | | | | | |
DIVERSIFIED MUTUAL FUNDS (100.0%) | | | | | |
Mutual of America Investment Corporation | | | | | |
Bond Fund (25.4%) | | 32,332,875 | | 47,493,987 | |
Equity Index Fund (44.5%) | | 34,670,024 | | 83,091,393 | |
Mid-Cap Equity Index Fund (20.4%) | | 23,359,792 | | 38,091,527 | |
Small Cap Growth Fund (4.7%) | | 7,256,078 | | 8,855,963 | |
Small Cap Value Fund (5.0%) | | 6,959,101 | | 9,384,286 | |
TOTAL INVESTMENTS
(Cost: $157,985,430) 100.0% | | | | 186,917,156 | |
| | | | | |
OTHER NET ASSETS | | | | — | |
| | | | | |
NET ASSETS 100.0% | | | | $ | 186,917,156 | |
| | | | | | |
The accompanying notes are an integral part of these portfolio schedules.
MUTUAL OF AMERICA INVESTMENT CORPORATION - MONEY MARKET FUND
PORTFOLIO OF INVESTMENTS IN SECURITIES
December 31, 2012
| | Rating** | | Rate(%) | | Maturity | | Face Amount | | Value | |
SHORT-TERM DEBT SECURITIES: | | | | | | | | | | | |
U.S. GOVERNMENT (8.9%) | | | | | | | | | | | |
U.S. Treasury Bill | | A-1+ | | 0.05 | | 03/28/13 | | 8,000,000 | | 7,999,292 | |
| | | | | | | | | | | |
U.S. GOVERNMENT AGENCIES (22.7%) | | | | | | | | | | | |
FHLB | | A-1+ | | 0.08 | | 04/08/13 | | 4,530,000 | | 4,529,024 | |
FHLB | | A-1+ | | 0.09 | | 02/05/13 | | 640,000 | | 639,944 | |
FHLB | | A-1+ | | 0.11 | | 03/15/13 | | 6,500,000 | | 6,498,550 | |
FHLMC | | A-1+ | | 0.09 | | 04/03/13 | | 739,000 | | 738,839 | |
FHLMC | | A-1+ | | 0.11 | | 02/19/13 | | 1,905,000 | | 1,904,715 | |
FHLMC | | A-1+ | | 0.11 | | 03/04/13 | | 1,101,000 | | 1,100,791 | |
FNMA | | A-1+ | | 0.11 | | 03/13/13 | | 5,000,000 | | 4,999,022 | |
| | | | | | | | | | 20,410,885 | |
COMMERCIAL PAPER (67.2%) | | | | | | | | | | | |
Air Products & Chemicals† | | A-1 | | 0.13 | | 01/14/13 | | 500,000 | | 499,977 | |
Air Products & Chemicals† | | A-1 | | 0.13 | | 01/16/13 | | 1,600,000 | | 1,599,913 | |
Air Products & Chemicals† | | A-1 | | 0.15 | | 01/02/13 | | 1,600,000 | | 1,599,993 | |
Baker Hughes, Inc.† | | A-1 | | 0.14 | | 02/19/13 | | 2,950,000 | | 2,949,438 | |
Baker Hughes, Inc.† | | A-1 | | 0.15 | | 01/07/13 | | 750,000 | | 749,981 | |
Coca-Cola Co.† | | A-1+ | | 0.12 | | 02/13/13 | | 950,000 | | 949,864 | |
Danaher Corp.† | | A-1 | | 0.15 | | 01/02/13 | | 1,000,000 | | 999,996 | |
Disney (Walt) Co.† | | A-1 | | 0.12 | | 02/15/13 | | 3,700,000 | | 3,699,445 | |
General Electric Capital Corp. | | A-1+ | | 0.12 | | 03/13/13 | | 3,700,000 | | 3,699,013 | |
Google, Inc.† | | A-1+ | | 0.13 | | 03/06/13 | | 1,100,000 | | 1,099,789 | |
Google, Inc.† | | A-1+ | | 0.14 | | 01/04/13 | | 2,000,000 | | 1,999,977 | |
Kimberly-Clark Worldwide† | | A-1 | | 0.08 | | 01/09/13 | | 2,450,000 | | 2,449,956 | |
Kimberly-Clark Worldwide† | | A-1 | | 0.09 | | 01/14/13 | | 1,250,000 | | 1,249,959 | |
National Rural Utilities | | A-1 | | 0.14 | | 02/07/13 | | 3,700,000 | | 3,699,468 | |
New Jersey Natural Gas | | A-1 | | 0.14 | | 01/07/13 | | 3,800,000 | | 3,799,911 | |
Praxair, Inc. | | A-1 | | 0.10 | | 01/04/13 | | 3,700,000 | | 3,699,969 | |
Precision Castparts Corp.† | | A-1 | | 0.18 | | 01/11/13 | | 3,700,000 | | 3,699,815 | |
Private Export Funding Corp.† | | A-1 | | 0.16 | | 01/15/13 | | 2,000,000 | | 1,999,876 | |
Rockwell Collins, Inc.† | | A-1 | | 0.12 | | 01/11/13 | | 3,700,000 | | 3,699,877 | |
Sysco Corp.† | | A-1 | | 0.09 | | 01/02/13 | | 3,700,000 | | 3,699,991 | |
Toyota Motor Credit Corp. | | A-1+ | | 0.21 | | 01/16/13 | | 3,700,000 | | 3,699,676 | |
Unilever Capital Corp.† | | A-1 | | 0.16 | | 02/04/13 | | 3,700,000 | | 3,699,441 | |
Wal-Mart Stores, Inc.† | | A-1+ | | 0.11 | | 01/24/13 | | 1,400,000 | | 1,399,902 | |
Washington Gas Light Co. | | A-1 | | 0.15 | | 01/10/13 | | 300,000 | | 299,989 | |
Washington Gas Light Co. | | A-1 | | 0.15 | | 01/16/13 | | 3,500,000 | | 3,499,781 | |
| | | | | | | | | | 60,444,997 | |
TOTAL SHORT-TERM DEBT SECURITIES
(Cost: $88,854,791) 98.8% | | | | | | | | | | 88,855,174 | |
| | | | | | | | | | | |
TEMPORARY CASH INVESTMENTS (2)
(Cost: $1,078,600) 1.2% | | | | | | | | | | 1,078,600 | |
| | | | | | | | | | | |
TOTAL INVESTMENTS
(Cost: $89,933,391) 100.0% | | | | | | | | | | 89,933,774 | |
| | | | | | | | | | | |
OTHER NET ASSETS -0.0% (3) | | | | | | | | | | (1,068 | ) |
| | | | | | | | | | | |
NET ASSETS 100.0% | | | | | | | | | | $ | 89,932,706 | |
| | | | | | | | | | | | |
The accompanying notes are an integral part of these portfolio schedules.
MUTUAL OF AMERICA INVESTMENT CORPORATION - MID-TERM BOND FUND
PORTFOLIO OF INVESTMENTS IN SECURITIES
December 31, 2012
| | Rating** | | Rate(%) | | Maturity | | Face Amount | | Value | |
LONG-TERM DEBT SECURITIES: | | | | | | | | | | | |
U.S. GOVERNMENT (46.5%) | | | | | | | | | | | |
U.S. Treasury Note | | AA+ | | 0.13 | | 12/31/14 | | 7,000,000 | | 6,982,500 | |
U.S. Treasury Note | | AA+ | | 0.25 | | 07/15/15 | | 1,000,000 | | 998,359 | |
U.S. Treasury Note | | AA+ | | 0.63 | | 11/30/17 | | 5,000,000 | | 4,983,205 | |
U.S. Treasury Note | | AA+ | | 0.88 | | 07/31/19 | | 7,000,000 | | 6,913,592 | |
U.S. Treasury Note | | AA+ | | 1.00 | | 10/31/16 | | 5,000,000 | | 5,095,310 | |
U.S. Treasury Note | | AA+ | | 1.00 | | 08/31/19 | | 4,500,000 | | 4,473,635 | |
U.S. Treasury Note | | AA+ | | 1.00 | | 11/30/19 | | 5,000,000 | | 4,951,560 | |
U.S. Treasury Note | | AA+ | | 1.13 | | 12/31/19 | | 8,000,000 | | 7,977,504 | |
U.S. Treasury Note | | AA+ | | 1.25 | | 08/31/15 | | 9,000,000 | | 9,218,673 | |
U.S. Treasury Note | | AA+ | | 1.88 | | 06/30/15 | | 3,000,000 | | 3,116,250 | |
U.S. Treasury Note | | AA+ | | 1.88 | | 10/31/17 | | 5,000,000 | | 5,281,640 | |
U.S. Treasury Note | | AA+ | | 2.25 | | 11/30/17 | | 3,500,000 | | 3,763,592 | |
U.S. Treasury Note | | AA+ | | 2.38 | | 03/31/16 | | 3,500,000 | | 3,720,938 | |
U.S. Treasury Note | | AA+ | | 2.50 | | 03/31/15 | | 500,000 | | 524,844 | |
U.S. Treasury Note | | AA+ | | 3.00 | | 02/28/17 | | 16,500,000 | | 18,149,995 | |
U.S. Treasury Note | | AA+ | | 3.13 | | 05/15/19 | | 3,000,000 | | 3,397,500 | |
U.S. Treasury Note | | AA+ | | 3.25 | | 05/31/16 | | 10,000,000 | | 10,950,000 | |
U.S. Treasury Note | | AA+ | | 3.25 | | 07/31/16 | | 7,000,000 | | 7,692,342 | |
U.S. Treasury Strip | | AA+ | | 0.00 | | 08/15/17 | | 15,000,000 | | 14,522,249 | |
U.S. Treasury Strip | | AA+ | | 0.00 | | 11/15/17 | | 5,000,000 | | 4,821,970 | |
U.S. Treasury Strip | | AA+ | | 0.00 | | 08/15/18 | | 55,000,000 | | 52,270,235 | |
| | | | | | | | | | 179,805,893 | |
U.S. GOVERNMENT AGENCIES (11.9%) | | | | | | | | | | | |
MORTGAGE-BACKED OBLIGATIONS (0.0%) (3) | | | | | | | | | | | |
FHLMC | | AA+ | | 6.00 | | 02/01/19 | | 5,243 | | 5,797 | |
FHLMC | | AA+ | | 6.50 | | 04/01/14 | | 9,353 | | 9,498 | |
FHLMC | | AA+ | | 7.00 | | 02/01/14 | | 3,013 | | 3,065 | |
FHLMC | | AA+ | | 7.50 | | 03/15/21 | | 7,771 | | 8,843 | |
FHLMC | | AA+ | | 8.00 | | 09/01/18 | | 1,300 | | 1,318 | |
FHLMC | | AA+ | | 8.50 | | 09/01/17 | | 2,023 | | 2,055 | |
FNMA | | AA+ | | 6.50 | | 08/01/13 | | 1,037 | | 1,049 | |
FNMA | | AA+ | | 8.00 | | 06/01/17 | | 177 | | 178 | |
| | | | | | | | | | 31,803 | |
NON-MORTGAGE-BACKED OBLIGATIONS (11.9%) | | | | | | | | | |
FFCB | | AA+ | | 4.95 | | 10/10/14 | | 12,500,000 | | 13,531,800 | |
FFCB | | AA+ | | 5.10 | | 08/05/13 | | 5,000,000 | | 5,145,400 | |
FHLB | | AA+ | | 1.38 | | 05/28/14 | | 17,000,000 | | 17,290,678 | |
FNMA | | AA+ | | 1.25 | | 02/27/14 | | 10,000,000 | | 10,133,370 | |
| | | | | | | | | | 46,101,248 | |
CORPORATE DEBT (40.5%) | | | | | | | | | | | |
CONSUMER DISCRETIONARY (3.3%) | | | | | | | | | | | |
AutoZone, Inc. | | BBB | | 4.00 | | 11/15/20 | | 700,000 | | 759,128 | |
AutoZone, Inc. | | BBB | | 6.50 | | 01/15/14 | | 1,000,000 | | 1,055,780 | |
Best Buy Co., Inc. | | BB | | 6.75 | | 07/15/13 | | 1,000,000 | | 1,012,500 | |
Brinker International, Inc. | | BBB- | | 5.75 | | 06/01/14 | | 1,000,000 | | 1,057,791 | |
Ethan Allen Interiors, Inc. | | BB- | | 5.38 | | 10/01/15 | | 500,000 | | 513,750 | |
Home Depot, Inc. | | A- | | 5.40 | | 03/01/16 | | 250,000 | | 285,604 | |
Hyatt Hotels Corp. | | BBB | | 3.88 | | 08/15/16 | | 1,525,000 | | 1,623,896 | |
Hyatt Hotels Corp.† | | BBB | | 5.75 | | 08/15/15 | | 200,000 | | 219,555 | |
Johnson Controls, Inc. | | BBB+ | | 4.88 | | 09/15/13 | | 250,000 | | 257,307 | |
Kohl’s Corp. | | BBB+ | | 3.25 | | 02/01/23 | | 700,000 | | 679,673 | |
Kohl’s Corp. | | BBB+ | | 4.00 | | 11/01/21 | | 1,000,000 | | 1,057,590 | |
Leggett & Platt, Inc. | | BBB+ | | 4.70 | | 04/01/13 | | 750,000 | | 756,519 | |
Marriott International, Inc. | | BBB | | 3.00 | | 03/01/19 | | 1,200,000 | | 1,235,046 | |
Marriott International, Inc. | | BBB | | 5.63 | | 02/15/13 | | 750,000 | | 754,031 | |
Scholastic Corp. | | BB- | | 5.00 | | 04/15/13 | | 250,000 | | 250,938 | |
Whirlpool Corp. | | BBB- | | 5.50 | | 03/01/13 | | 850,000 | | 856,827 | |
Whirlpool Corp. | | BBB- | | 6.50 | | 06/15/16 | | 500,000 | | 573,452 | |
| | | | | | | | | | 12,949,387 | |
CONSUMER STAPLES (3.3%) | | | | | | | | | | | |
Anheuser-Busch Cos., Inc. | | A | | 4.38 | | 01/15/13 | | 1,000,000 | | 1,001,107 | |
Avon Products, Inc. | | BBB- | | 6.50 | | 03/01/19 | | 1,800,000 | | 1,941,899 | |
Cargill, Inc.† | | A | | 5.20 | | 01/22/13 | | 1,000,000 | | 1,002,581 | |
Clorox Co. | | BBB+ | | 5.00 | | 03/01/13 | | 500,000 | | 503,648 | |
Clorox Co. | | BBB+ | | 5.00 | | 01/15/15 | | 300,000 | | 323,328 | |
CVS Caremark Corp. | | BBB+ | | 6.13 | | 08/15/16 | | 500,000 | | 595,393 | |
Dr. Pepper Snapple Group, Inc. | | BBB | | 2.60 | | 01/15/19 | | 150,000 | | 154,685 | |
Energizer Hldgs., Inc. | | BBB- | | 4.70 | | 05/19/21 | | 1,700,000 | | 1,821,946 | |
Flowers Foods, Inc. | | BBB- | | 4.38 | | 04/01/22 | | 1,500,000 | | 1,537,665 | |
Hershey Co. | | A | | 4.85 | | 08/15/15 | | 500,000 | | 552,315 | |
Hershey Co. | | A | | 5.00 | | 04/01/13 | | 500,000 | | 505,634 | |
Ingredion, Inc. | | BBB | | 4.63 | | 11/01/20 | | 275,000 | | 307,058 | |
Kroger Co. | | BBB | | 4.95 | | 01/15/15 | | 500,000 | | 539,116 | |
Molson Coors Brewing Co. | | BBB- | | 3.50 | | 05/01/22 | | 400,000 | | 422,296 | |
Mondelez International, Inc. | | BBB- | | 5.25 | | 10/01/13 | | 500,000 | | 515,900 | |
Safeway, Inc. | | BBB | | 3.95 | | 08/15/20 | | 1,000,000 | | 1,000,226 | |
| | | | | | | | | | 12,724,797 | |
ENERGY (3.2%) | | | | | | | | | | | |
Diamond Offshore Drilling, Inc. | | A- | | 4.88 | | 07/01/15 | | 500,000 | | 551,050 | |
Enbridge, Inc. | | A- | | 5.80 | | 06/15/14 | | 1,065,000 | | 1,143,040 | |
Energen Corp. | | BBB | | 4.63 | | 09/01/21 | | 1,500,000 | | 1,562,850 | |
Kinder Morgan, Inc. | | BB | | 5.15 | | 03/01/15 | | 250,000 | | 265,742 | |
Marathon Petroleum Corp. | | BBB | | 3.50 | | 03/01/16 | | 1,500,000 | | 1,596,764 | |
Murphy Oil Corp. | | BBB | | 2.50 | | 12/01/17 | | 1,750,000 | | 1,760,792 | |
National Oilwell Varco, Inc. | | A- | | 6.13 | | 08/15/15 | | 1,000,000 | | 1,009,951 | |
Noble Corp. | | A- | | 5.88 | | 06/01/13 | | 1,000,000 | | 1,020,808 | |
Sunoco, Inc. | | BBB- | | 4.88 | | 10/15/14 | | 500,000 | | 527,748 | |
Sunoco, Inc. | | BBB- | | 5.75 | | 01/15/17 | | 290,000 | | 326,942 | |
Sunoco, Inc. | | BBB- | | 9.63 | | 04/15/15 | | 500,000 | | 584,640 | |
Valero Energy Corp. | | BBB | | 4.75 | | 06/15/13 | | 1,000,000 | | 1,018,843 | |
Weatherford Int’l. Ltd. | | BBB- | | 5.15 | | 03/15/13 | | 500,000 | | 503,962 | |
Weatherford Int’l. Ltd. | | BBB- | | 5.50 | | 02/15/16 | | 500,000 | | 550,761 | |
| | | | | | | | | | 12,423,893 | |
FINANCIALS (13.3%) | | | | | | | | | | | |
Aflac, Inc. | | A- | | 2.65 | | 02/15/17 | | 1,500,000 | | 1,576,832 | |
American Express Credit Corp. | | A- | | 5.88 | | 05/02/13 | | 1,000,000 | | 1,018,056 | |
Bank of America Corp. | | A- | | 3.70 | | 09/01/15 | | 250,000 | | 264,285 | |
Bank of America Corp. | | BBB+ | | 5.75 | | 08/15/16 | | 500,000 | | 546,766 | |
Block Financial LLC | | BBB | | 5.13 | | 10/30/14 | | 750,000 | | 789,686 | |
Boston Properties LP | | A- | | 3.70 | | 11/15/18 | | 470,000 | | 510,555 | |
Bunge Ltd. Finance Corp. | | BBB- | | 5.10 | | 07/15/15 | | 1,000,000 | | 1,082,627 | |
Caterpillar Financial Services | | A | | 6.13 | | 02/17/14 | | 1,000,000 | | 1,066,147 | |
CNA Financial Corp. | | BBB- | | 5.85 | | 12/15/14 | | 200,000 | | 217,136 | |
CNA Financial Corp. | | BBB- | | 6.50 | | 08/15/16 | | 1,000,000 | | 1,153,725 | |
Duke Realty LP | | BBB- | | 4.63 | | 05/15/13 | | 500,000 | | 506,981 | |
Erac USA Finance Co.† | | BBB+ | | 2.75 | | 03/15/17 | | 1,000,000 | | 1,043,782 | |
ERP Operating LP | | BBB+ | | 5.38 | | 08/01/16 | | 500,000 | | 569,190 | |
Fairfax Financial Hldgs. | | BBB- | | 8.25 | | 10/01/15 | | 742,000 | | 841,717 | |
First Horizon National Corp. | | BB+ | | 4.50 | | 05/15/13 | | 125,000 | | 126,499 | |
Fosters Finance Corp.† | | BBB+ | | 4.88 | | 10/01/14 | | 500,000 | | 533,677 | |
General Electric Capital Corp. | | AA+ | | 5.00 | | 01/08/16 | | 500,000 | | 555,509 | |
Goldman Sachs Group, Inc. | | A- | | 3.70 | | 08/01/15 | | 900,000 | | 949,851 | |
Harley-Davidson Financial Svcs.† | | BBB+ | | 3.88 | | 03/15/16 | | 500,000 | | 536,699 | |
Hartford Financial Svcs. | | BBB | | 4.00 | | 10/15/17 | | 850,000 | | 928,542 | |
Hartford Financial Svcs. | | BBB | | 5.50 | | 10/15/16 | | 1,000,000 | | 1,119,286 | |
HCP, Inc. | | BBB+ | | 5.65 | | 12/15/13 | | 500,000 | | 522,995 | |
HCP, Inc. | | BBB+ | | 6.00 | | 01/30/17 | | 1,250,000 | | 1,435,936 | |
Health Care REIT, Inc. | | BBB- | | 3.63 | | 03/15/16 | | 1,750,000 | | 1,847,951 | |
HSBC Finance Corp. | | A | | 4.29 | | 11/10/13 | | 40,000 | | 40,719 | |
HSBC Finance Corp. | | A | | 4.32 | | 11/10/13 | | 43,000 | | 43,597 | |
HSBC Finance Corp. | | A | | 4.50 | | 11/10/13 | | 70,000 | | 70,906 | |
Jefferson-Pilot Corp. | | A- | | 4.75 | | 01/30/14 | | 500,000 | | 518,242 | |
Kemper Corp. | | BBB- | | 6.00 | | 11/30/15 | | 1,500,000 | | 1,617,827 | |
KeyCorp | | BBB+ | | 6.50 | | 05/14/13 | | 1,050,000 | | 1,072,537 | |
Mack-Cali Realty LP | | BBB | | 5.80 | | 01/15/16 | | 1,000,000 | | 1,103,024 | |
Markel Corp. | | BBB | | 6.80 | | 02/15/13 | | 1,000,000 | | 1,006,318 | |
MetLife, Inc. | | A- | | 5.00 | | 11/24/13 | | 250,000 | | 260,163 | |
Morgan Stanley | | A- | | 2.88 | | 01/24/14 | | 500,000 | | 508,402 | |
Morgan Stanley | | A- | | 4.00 | | 07/24/15 | | 1,000,000 | | 1,046,285 | |
Nissan Motor Acceptance Corp.† | | BBB+ | | 4.50 | | 01/30/15 | | 790,000 | | 844,948 | |
Odyssey Re Hldgs. Corp. | | BBB- | | 6.88 | | 05/01/15 | | 250,000 | | 278,276 | |
Old Republic Int’l. Corp. | | BBB+ | | 3.75 | | 03/15/18 | | 750,000 | | 780,469 | |
Penske Truck Leasing Co. LP† | | BBB- | | 3.38 | | 03/15/18 | | 1,300,000 | | 1,311,656 | |
Penske Truck Leasing Co. LP† | | BBB- | | 3.75 | | 05/11/17 | | 490,000 | | 512,722 | |
ProLogis LP | | BBB- | | 6.63 | | 05/15/18 | | 1,500,000 | | 1,811,738 | |
Protective Life Corp. | | A- | | 4.88 | | 11/01/14 | | 1,000,000 | | 1,055,003 | |
Prudential Financial, Inc. | | A | | 4.75 | | 09/17/15 | | 1,000,000 | | 1,096,147 | |
Raymond James Financial, Inc. | | BBB | | 4.25 | | 04/15/16 | | 1,600,000 | | 1,682,206 | |
Reckson Operating Partnership | | BBB- | | 6.00 | | 03/31/16 | | 1,700,000 | | 1,863,936 | |
Regency Centers LP | | BBB | | 4.95 | | 04/15/14 | | 500,000 | | 523,136 | |
Reinsurance Grp. of America, Inc. | | A- | | 5.63 | | 03/15/17 | | 1,500,000 | | 1,694,295 | |
Senior Housing Pptys. Trust | | BBB- | | 4.30 | | 01/15/16 | | 1,650,000 | | 1,710,669 | |
Simon Property Group LP | | A- | | 2.80 | | 01/30/17 | | 1,500,000 | | 1,582,779 | |
SLM Corp. | | BBB- | | 5.00 | | 10/01/13 | | 1,500,000 | | 1,535,625 | |
Southtrust Bank, N.A. | | A+ | | 4.75 | | 03/01/13 | | 250,000 | | 251,650 | |
Textron Financial Corp. | | BBB- | | 5.40 | | 04/28/13 | | 1,000,000 | | 1,013,814 | |
Ventas Realty LP/Capital Corp. | | BBB | | 4.00 | | 04/30/19 | | 1,700,000 | | 1,827,401 | |
Vornado Realty LP | | BBB | | 4.25 | | 04/01/15 | | 1,500,000 | | 1,585,520 | |
Zions Bancorporation | | BBB- | | 4.50 | | 03/27/17 | | 400,000 | | 417,900 | |
Zions Bancorporation | | BB+ | | 5.65 | | 05/15/14 | | 1,000,000 | | 1,027,983 | |
| | | | | | | | | | 51,440,323 | |
HEALTH CARE (3.5%) | | | | | | | | | | | |
Allergan, Inc. | | A+ | | 5.75 | | 04/01/16 | | 500,000 | | 575,347 | |
Baxter International, Inc. | | A | | 4.63 | | 03/15/15 | | 250,000 | | 270,747 | |
Bio-Rad Laboratories, Inc. | | BBB | | 4.88 | | 12/15/20 | | 1,000,000 | | 1,057,250 | |
Biogen Idec, Inc. | | BBB+ | | 6.88 | | 03/01/18 | | 1,250,000 | | 1,548,331 | |
Cardinal Health, Inc. | | A- | | 5.50 | | 06/15/13 | | 1,000,000 | | 1,020,830 | |
CIGNA Corp. | | BBB | | 2.75 | | 11/15/16 | | 1,750,000 | | 1,840,902 | |
Humana, Inc. | | BBB | | 6.45 | | 06/01/16 | | 1,415,000 | | 1,607,256 | |
Laboratory Corp. of America | | BBB+ | | 3.13 | | 05/15/16 | | 500,000 | | 526,809 | |
Laboratory Corp. of America | | BBB+ | | 4.63 | | 11/15/20 | | 400,000 | | 445,352 | |
Laboratory Corp. of America | | BBB+ | | 5.50 | | 02/01/13 | | 285,000 | | 285,964 | |
Laboratory Corp. of America | | BBB+ | | 5.63 | | 12/15/15 | | 500,000 | | 563,920 | |
Lilly (Eli) & Co. | | AA- | | 5.20 | | 03/15/17 | | 500,000 | | 583,549 | |
Medtronic, Inc. | | A+ | | 1.63 | | 04/15/13 | | 1,500,000 | | 1,504,688 | |
PerkinElmer, Inc. | | BBB | | 5.00 | | 11/15/21 | | 1,700,000 | | 1,884,807 | |
| | | | | | | | | | 13,715,752 | |
INDUSTRIALS (5.2%) | | | | | | | | | | | |
Avery Dennison Corp. | | BBB | | 4.88 | | 01/15/13 | | 500,000 | | 500,795 | |
Black & Decker Corp. | | A | | 5.75 | | 11/15/16 | | 500,000 | | 576,962 | |
Burlington Northern Santa Fe | | BBB+ | | 4.30 | | 07/01/13 | | 500,000 | | 509,263 | |
CSX Corp. | | BBB | | 6.25 | | 04/01/15 | | 1,000,000 | | 1,119,759 | |
Dun & Bradstreet Corp. | | BBB+ | | 3.25 | | 12/01/17 | | 1,750,000 | | 1,768,536 | |
Equifax, Inc. | | BBB+ | | 3.30 | | 12/15/22 | | 1,700,000 | | 1,686,301 | |
Flowserve Corp. | | BBB- | | 3.50 | | 09/15/22 | | 1,500,000 | | 1,506,470 | |
Harsco Corp. | | BBB | | 5.75 | | 05/15/18 | | 1,850,000 | | 2,058,092 | |
Masco Corp. | | BBB- | | 4.80 | | 06/15/15 | | 500,000 | | 523,743 | |
Pitney Bowes, Inc. | | BBB | | 5.25 | | 01/15/37 | | 1,500,000 | | 1,530,188 | |
Precision Castparts Corp. | | A- | | 5.60 | | 12/15/13 | | 750,000 | | 782,611 | |
Roper Industries, Inc. | | BBB | | 6.63 | | 08/15/13 | | 1,000,000 | | 1,035,616 | |
Ryder System, Inc. | | BBB | | 6.00 | | 03/01/13 | | 500,000 | | 503,798 | |
Ryder System, Inc. | | BBB | | 7.20 | | 09/01/15 | | 1,000,000 | | 1,145,266 | |
Southwest Airlines Co. | | BBB- | | 5.25 | | 10/01/14 | | 500,000 | | 532,144 | |
Southwest Airlines Co. | | BBB- | | 5.75 | | 12/15/16 | | 735,000 | | 831,224 | |
Textron, Inc. | | BBB- | | 4.63 | | 09/21/16 | | 750,000 | | 816,897 | |
Union Pacific Corp. | | A- | | 4.88 | | 01/15/15 | | 500,000 | | 540,684 | |
URS Corp.† | | BBB- | | 3.85 | | 04/01/17 | | 1,700,000 | | 1,751,236 | |
Waste Management, Inc. | | BBB | | 5.00 | | 03/15/14 | | 500,000 | | 524,832 | |
| | | | | | | | | | 20,244,417 | |
INFORMATION TECHNOLOGY (2.5%) | | | | | | | | | | | |
Arrow Electronics, Inc. | | BBB- | | 6.88 | | 07/01/13 | | 750,000 | | 771,105 | |
Arrow Electronics, Inc. | | BBB- | | 6.88 | | 06/01/18 | | 700,000 | | 820,560 | |
Avnet, Inc. | | BBB- | | 5.88 | | 03/15/14 | | 750,000 | | 783,798 | |
Avnet, Inc. | | BBB- | | 6.00 | | 09/01/15 | | 980,000 | | 1,069,034 | |
Ingram Micro, Inc. | | BBB- | | 5.25 | | 09/01/17 | | 1,500,000 | | 1,628,991 | |
Lexmark International, Inc. | | BBB- | | 6.65 | | 06/01/18 | | 1,500,000 | | 1,640,790 | |
Motorola Solutions, Inc. | | BBB | | 3.75 | | 05/15/22 | | 1,500,000 | | 1,532,571 | |
Tech Data Corp. | | BBB- | | 3.75 | | 09/21/17 | | 1,500,000 | | 1,538,711 | |
| | | | | | | | | | 9,785,560 | |
MATERIALS (3.1%) | | | | | | | | | | | |
Airgas, Inc. | | BBB | | 3.25 | | 10/01/15 | | 1,500,000 | | 1,593,185 | |
Cytec Industries, Inc. | | BBB | | 6.00 | | 10/01/15 | | 1,000,000 | | 1,103,413 | |
Freeport-McMoRan Copper & Gold | | BBB | | 2.15 | | 03/01/17 | | 1,750,000 | | 1,759,294 | |
Kinross Gold Corp. | | NR | | 3.63 | | 09/01/16 | | 2,000,000 | | 2,034,906 | |
Kinross Gold Corp. | | NR | | 5.13 | | 09/01/21 | | 750,000 | | 769,514 | |
Lubrizol Corp. | | AA+ | | 5.50 | | 10/01/14 | | 500,000 | | 541,982 | |
Methanex Corp. | | BBB- | | 3.25 | | 12/15/19 | | 1,750,000 | | 1,760,178 | |
Rock-Tenn Co.† | | BBB- | | 3.50 | | 03/01/20 | | 600,000 | | 615,836 | |
Rohm & Haas Co. | | BBB | | 5.60 | | 03/15/13 | | 750,000 | | 757,106 | |
Vulcan Materials Co. | | BB | | 6.30 | | 06/15/13 | | 1,000,000 | | 1,020,000 | |
| | | | | | | | | | 11,955,414 | |
TELECOMMUNICATION SERVICES (0.3%) | | | | | | | | | | | |
CenturyLink, Inc. | | BB | | 5.00 | | 02/15/15 | | 1,250,000 | | 1,328,626 | |
| | | | | | | | | | | |
UTILITIES (2.8%) | | | | | | | | | | | |
AGL Capital Corp. | | BBB+ | | 6.38 | | 07/15/16 | | 500,000 | | 588,565 | |
Atmos Energy Corp. | | BBB+ | | 4.95 | | 10/15/14 | | 1,000,000 | | 1,071,642 | |
Black Hills Corp. | | BBB- | | 9.00 | | 05/15/14 | | 2,000,000 | | 2,202,070 | |
CenterPoint Energy Resources | | BBB+ | | 7.88 | | 04/01/13 | | 750,000 | | 762,711 | |
Constellation Energy | | BBB- | | 5.15 | | 12/01/20 | | 1,500,000 | | 1,714,680 | |
Entergy Corp. | | BBB- | | 4.70 | | 01/15/17 | | 600,000 | | 649,956 | |
Entergy New Orleans, Inc. | | BBB+ | | 5.25 | | 08/01/13 | | 1,000,000 | | 1,021,316 | |
Exelon Generation Co. LLC | | BBB | | 5.35 | | 01/15/14 | | 1,000,000 | | 1,046,004 | |
PPL Energy Supply LLC | | BBB | | 5.70 | | 10/15/15 | | 600,000 | | 662,350 | |
TransAlta Corp. | | BBB- | | 5.75 | | 12/15/13 | | 1,000,000 | | 1,041,473 | |
| | | | | | | | | | 10,760,767 | |
MUNICIPAL OBLIGATIONS (0.2%) | | | | | | | | | | | |
Tennessee Valley Auth. Strip | | NR | | 0.00 | | 11/01/20 | | 900,000 | | 769,456 | |
| | | | | | | | | | | |
TOTAL LONG-TERM DEBT SECURITIES
(Cost: $361,983,035) 99.1% | | | | | | | | | | 384,037,336 | |
| | | | | | | | | | | |
TEMPORARY CASH INVESTMENTS (2)
(Cost: $697,600) 0.2% | | | | | | | | | | 697,600 | |
| | | | | | | | | | | |
TOTAL INVESTMENTS
(Cost: $362,680,635) 99.3% | | | | | | | | | | 384,734,936 | |
| | | | | | | | | | | |
OTHER NET ASSETS 0.7% | | | | | | | | | | 2,581,298 | |
| | | | | | | | | | | |
NET ASSETS 100.0% | | | | | | | | | | $ | 387,316,234 | |
| | | | | | | | | | | | |
The accompanying notes are an integral part of these portfolio schedules.
MUTUAL OF AMERICA INVESTMENT CORPORATION — BOND FUND
PORTFOLIO OF INVESTMENTS IN SECURITIES
December 31, 2012
| | Rating** | | Rate(%) | | Maturity | | Face Amount | | Value | |
LONG-TERM DEBT SECURITIES: | | | | | | | | | | | |
U.S. GOVERNMENT (12.3%) | | | | | | | | | | | |
U.S. Treasury Note | | AA+ | | 0.13 | | 12/31/14 | | 7,000,000 | | 6,982,500 | |
U.S. Treasury Note | | AA+ | | 0.25 | | 05/31/14 | | 12,500,000 | | 12,505,863 | |
U.S. Treasury Note | | AA+ | | 0.25 | | 11/30/14 | | 16,000,000 | | 16,000,624 | |
U.S. Treasury Note | | AA+ | | 0.25 | | 07/15/15 | | 6,000,000 | | 5,990,154 | |
U.S. Treasury Note | | AA+ | | 0.63 | | 11/30/17 | | 600,000 | | 597,985 | |
U.S. Treasury Note | | AA+ | | 0.88 | | 07/31/19 | | 10,000,000 | | 9,876,560 | |
U.S. Treasury Note | | AA+ | | 1.63 | | 08/15/22 | | 8,000,000 | | 7,947,504 | |
U.S. Treasury Note | | AA+ | | 2.13 | | 08/15/21 | | 5,000,000 | | 5,256,250 | |
U.S. Treasury Strip | | AA+ | | 0.00 | | 08/15/18 | | 4,000,000 | | 3,801,472 | |
U.S. Treasury Strip | | AA+ | | 0.00 | | 08/15/29 | | 37,000,000 | | 23,565,667 | |
| | | | | | | | | | 92,524,579 | |
U.S. GOVERNMENT AGENCIES (29.1%) | | | | | | | | | | | |
MORTGAGE-BACKED OBLIGATIONS (26.8%) | | | | | | | | | | | |
FHARM | | AA+ | | 2.90 | | 04/01/37 | | 726,356 | | 775,738 | |
FHARM | | AA+ | | 3.38 | | 04/01/42 | | 1,078,557 | | 1,109,450 | |
FHARM | | AA+ | | 4.64 | | 09/01/39 | | 878,696 | | 938,404 | |
FHARM | | AA+ | | 5.22 | | 04/01/37 | | 467,169 | | 499,343 | |
FHARM | | AA+ | | 5.24 | | 02/01/36 | | 399,475 | | 423,092 | |
FHARM | | AA+ | | 5.43 | | 05/01/37 | | 447,087 | | 482,211 | |
FHARM | | AA+ | | 5.77 | | 03/01/37 | | 219,325 | | 237,557 | |
FHLMC | | AA+ | | 2.50 | | 09/01/27 | | 2,930,158 | | 3,063,542 | |
FHLMC | | AA+ | | 3.00 | | 06/01/27 | | 1,327,216 | | 1,400,683 | |
FHLMC | | AA+ | | 3.00 | | 08/01/27 | | 1,599,603 | | 1,688,147 | |
FHLMC | | AA+ | | 3.00 | | 07/01/42 | | 1,485,124 | | 1,567,506 | |
FHLMC | | AA+ | | 3.50 | | 08/01/42 | | 2,484,106 | | 2,649,073 | |
FHLMC | | AA+ | | 4.00 | | 05/01/24 | | 452,878 | | 478,786 | |
FHLMC | | AA+ | | 4.00 | | 02/01/25 | | 1,121,594 | | 1,185,758 | |
FHLMC | | AA+ | | 4.00 | | 05/01/26 | | 1,179,110 | | 1,246,564 | |
FHLMC | | AA+ | | 4.00 | | 12/01/34 | | 1,101,676 | | 1,181,954 | |
FHLMC | | AA+ | | 4.00 | | 12/15/38 | | 500,000 | | 539,024 | |
FHLMC | | AA+ | | 4.00 | | 07/01/41 | | 2,193,908 | | 2,344,177 | |
FHLMC | | AA+ | | 4.00 | | 12/01/41 | | 1,183,036 | | 1,264,806 | |
FHLMC | | AA+ | | 4.00 | | 06/01/42 | | 1,436,346 | | 1,534,727 | |
FHLMC | | AA+ | | 4.50 | | 03/01/34 | | 1,328,289 | | 1,429,527 | |
FHLMC | | AA+ | | 4.50 | | 08/01/34 | | 1,049,255 | | 1,128,570 | |
FHLMC | | AA+ | | 4.50 | | 08/15/35 | | 455,934 | | 510,686 | |
FHLMC | | AA+ | | 5.00 | | 02/01/26 | | 270,894 | | 293,276 | |
FHLMC | | AA+ | | 5.00 | | 08/01/35 | | 1,634,607 | | 1,767,109 | |
FHLMC | | AA+ | | 5.50 | | 03/01/21 | | 360,349 | | 391,155 | |
FHLMC | | AA+ | | 5.50 | | 07/01/32 | | 776,990 | | 842,765 | |
FHLMC | | AA+ | | 5.50 | | 01/15/33 | | 693,446 | | 776,099 | |
FHLMC | | AA+ | | 5.50 | | 05/01/33 | | 1,219,197 | | 1,328,123 | |
FHLMC | | AA+ | | 5.50 | | 01/15/35 | | 617,000 | | 656,909 | |
FHLMC | | AA+ | | 5.50 | | 06/01/37 | | 2,180,003 | | 2,359,099 | |
FHLMC | | AA+ | | 6.00 | | 07/15/29 | | 490,013 | | 544,806 | |
FHLMC | | AA+ | | 6.00 | | 03/15/32 | | 538,475 | | 602,711 | |
FNMA | | AA+ | | 3.00 | | 10/01/42 | | 1,393,326 | | 1,463,929 | |
FNMA | | AA+ | | 3.50 | | 03/01/32 | | 1,760,125 | | 1,890,146 | |
FNMA | | AA+ | | 3.50 | | 10/01/41 | | 1,689,426 | | 1,837,063 | |
FNMA | | AA+ | | 3.50 | | 12/01/41 | | 2,304,908 | | 2,506,331 | |
FNMA | | AA+ | | 3.50 | | 04/01/42 | | 2,169,882 | | 2,359,792 | |
FNMA | | AA+ | | 3.50 | | 04/01/42 | | 1,915,457 | | 2,043,783 | |
FNMA | | AA+ | | 3.50 | | 07/01/42 | | 3,417,816 | | 3,654,267 | |
FNMA | | AA+ | | 3.50 | | 08/01/42 | | 2,970,685 | | 3,176,203 | |
FNMA | | AA+ | | 3.50 | | 10/01/42 | | 2,986,166 | | 3,192,755 | |
FNMA | | AA+ | | 4.00 | | 05/01/19 | | 744,143 | | 799,621 | |
FNMA | | AA+ | | 4.00 | | 01/01/31 | | 3,086,062 | | 3,345,278 | |
FNMA | | AA+ | | 4.00 | | 11/01/33 | | 2,384,503 | | 2,571,379 | |
FNMA | | AA+ | | 4.00 | | 03/01/35 | | 876,282 | | 944,957 | |
FNMA | | AA+ | | 4.00 | | 06/01/39 | | 1,260,546 | | 1,352,246 | |
FNMA | | AA+ | | 4.00 | | 11/01/40 | | 2,105,556 | | 2,259,386 | |
FNMA | | AA+ | | 4.00 | | 12/01/40 | | 1,633,806 | | 1,753,170 | |
FNMA | | AA+ | | 4.00 | | 05/01/41 | | 2,032,954 | | 2,229,965 | |
FNMA | | AA+ | | 4.50 | | 05/01/18 | | 502,236 | | 541,640 | |
FNMA | | AA+ | | 4.50 | | 05/01/19 | | 112,930 | | 121,790 | |
FNMA | | AA+ | | 4.50 | | 06/01/19 | | 241,184 | | 260,107 | |
FNMA | | AA+ | | 4.50 | | 05/01/30 | | 1,269,198 | | 1,383,349 | |
FNMA | | AA+ | | 4.50 | | 04/01/31 | | 1,745,694 | | 1,901,610 | |
FNMA | | AA+ | | 4.50 | | 08/01/33 | | 453,328 | | 492,117 | |
FNMA | | AA+ | | 4.50 | | 08/01/33 | | 386,015 | | 419,044 | |
FNMA | | AA+ | | 4.50 | | 09/01/33 | | 1,218,928 | | 1,323,226 | |
FNMA | | AA+ | | 4.50 | | 10/01/33 | | 1,214,475 | | 1,318,392 | |
FNMA | | AA+ | | 4.50 | | 10/01/33 | | 725,453 | | 787,526 | |
FNMA | | AA+ | | 4.50 | | 05/01/34 | | 393,917 | | 426,884 | |
FNMA | | AA+ | | 4.50 | | 06/01/34 | | 770,720 | | 835,221 | |
FNMA | | AA+ | | 4.50 | | 07/01/34 | | 696,971 | | 755,301 | |
FNMA | | AA+ | | 4.50 | | 01/01/35 | | 1,478,279 | | 1,604,768 | |
FNMA | | AA+ | | 4.50 | | 08/01/35 | | 1,032,063 | | 1,116,501 | |
FNMA | | AA+ | | 4.50 | | 09/01/35 | | 514,862 | | 550,550 | |
FNMA | | AA+ | | 4.50 | | 12/01/35 | | 951,056 | | 1,028,867 | |
FNMA | | AA+ | | 4.50 | | 05/01/39 | | 2,073,516 | | 2,240,569 | |
FNMA | | AA+ | | 4.50 | | 05/01/39 | | 2,183,307 | | 2,359,205 | |
FNMA | | AA+ | | 4.50 | | 05/01/40 | | 1,352,435 | | 1,480,587 | |
FNMA | | AA+ | | 4.50 | | 11/01/40 | | 1,954,356 | | 2,117,916 | |
FNMA | | AA+ | | 4.50 | | 06/01/41 | | 1,604,798 | | 1,739,104 | |
FNMA | | AA+ | | 4.50 | | 01/01/42 | | 312,502 | | 339,241 | |
FNMA | | AA+ | | 5.00 | | 04/01/18 | | 119,946 | | 130,350 | |
FNMA | | AA+ | | 5.00 | | 09/01/18 | | 539,354 | | 586,138 | |
FNMA | | AA+ | | 5.00 | | 09/01/20 | | 412,894 | | 448,709 | |
FNMA | | AA+ | | 5.00 | | 10/01/20 | | 769,854 | | 836,631 | |
FNMA | | AA+ | | 5.00 | | 10/01/25 | | 470,282 | | 511,637 | |
FNMA | | AA+ | | 5.00 | | 09/01/33 | | 2,488,692 | | 2,711,425 | |
FNMA | | AA+ | | 5.00 | | 10/01/33 | | 1,475,249 | | 1,607,281 | |
FNMA | | AA+ | | 5.00 | | 11/01/33 | | 1,398,945 | | 1,524,148 | |
FNMA | | AA+ | | 5.00 | | 03/01/34 | | 345,945 | | 376,906 | |
FNMA | | AA+ | | 5.00 | | 04/01/34 | | 214,231 | | 232,868 | |
FNMA | | AA+ | | 5.00 | | 04/01/34 | | 671,454 | | 729,869 | |
FNMA | | AA+ | | 5.00 | | 04/01/35 | | 710,077 | | 770,965 | |
FNMA | | AA+ | | 5.00 | | 06/01/35 | | 483,593 | | 525,060 | |
FNMA | | AA+ | | 5.00 | | 09/01/35 | | 1,540,767 | | 1,672,884 | |
FNMA | | AA+ | | 5.00 | | 11/25/35 | | 2,500,000 | | 2,745,795 | |
FNMA | | AA+ | | 5.00 | | 05/01/39 | | 1,939,293 | | 2,115,249 | |
FNMA | | AA+ | | 5.00 | | 09/25/40 | | 1,651,938 | | 1,844,963 | |
FNMA | | AA+ | | 5.50 | | 04/01/17 | | 48,529 | | 52,272 | |
FNMA | | AA+ | | 5.50 | | 05/01/17 | | 86,298 | | 92,954 | |
FNMA | | AA+ | | 5.50 | | 01/01/24 | | 458,015 | | 501,654 | |
FNMA | | AA+ | | 5.50 | | 03/01/24 | | 1,017,631 | | 1,113,636 | |
FNMA | | AA+ | | 5.50 | | 09/01/25 | | 436,720 | | 477,784 | |
FNMA | | AA+ | | 5.50 | | 11/01/26 | | 356,225 | | 389,052 | |
FNMA | | AA+ | | 5.50 | | 01/01/27 | | 210,859 | | 230,290 | |
FNMA | | AA+ | | 5.50 | | 03/01/33 | | 512,464 | | 561,291 | |
FNMA | | AA+ | | 5.50 | | 09/01/33 | | 629,307 | | 691,627 | |
FNMA | | AA+ | | 5.50 | | 10/01/33 | | 1,099,559 | | 1,208,447 | |
FNMA | | AA+ | | 5.50 | | 03/01/34 | | 636,953 | | 700,029 | |
FNMA | | AA+ | | 5.50 | | 03/01/34 | | 327,197 | | 359,598 | |
FNMA | | AA+ | | 5.50 | | 07/01/34 | | 488,056 | | 533,948 | |
FNMA | | AA+ | | 5.50 | | 09/01/34 | | 422,096 | | 461,785 | |
FNMA | | AA+ | | 5.50 | | 09/01/34 | | 622,288 | | 681,968 | |
FNMA | | AA+ | | 5.50 | | 09/01/34 | | 219,898 | | 240,574 | |
FNMA | | AA+ | | 5.50 | | 10/01/34 | | 1,179,568 | | 1,290,481 | |
FNMA | | AA+ | | 5.50 | | 02/01/35 | | 637,587 | | 697,539 | |
FNMA | | AA+ | | 5.50 | | 02/01/35 | | 467,572 | | 510,953 | |
FNMA | | AA+ | | 5.50 | | 04/01/35 | | 720,941 | | 787,830 | |
FNMA | | AA+ | | 5.50 | | 08/01/35 | | 1,489,310 | | 1,627,487 | |
FNMA | | AA+ | | 5.50 | | 02/25/37 | | 578,805 | | 632,488 | |
FNMA | | AA+ | | 5.50 | | 05/01/38 | | 1,420,155 | | 1,543,040 | |
FNMA | | AA+ | | 5.50 | | 11/01/38 | | 485,656 | | 521,305 | |
FNMA | | AA+ | | 5.50 | | 06/01/48 | | 575,867 | | 621,377 | |
FNMA | | AA+ | | 6.00 | | 03/01/17 | | 84,546 | | 90,937 | |
FNMA | | AA+ | | 6.00 | | 05/01/23 | | 556,617 | | 624,523 | |
FNMA | | AA+ | | 6.00 | | 01/01/25 | | 377,421 | | 419,692 | |
FNMA | | AA+ | | 6.00 | | 03/01/28 | | 539,083 | | 592,046 | |
FNMA | | AA+ | | 6.00 | | 04/01/32 | | 92,897 | | 103,765 | |
FNMA | | AA+ | | 6.00 | | 04/01/32 | | 119,664 | | 133,664 | |
FNMA | | AA+ | | 6.00 | | 05/01/32 | | 527,060 | | 588,725 | |
FNMA | | AA+ | | 6.00 | | 04/01/33 | | 1,103,700 | | 1,232,830 | |
FNMA | | AA+ | | 6.00 | | 11/01/34 | | 469,931 | | 522,562 | |
FNMA | | AA+ | | 6.00 | | 03/01/36 | | 185,528 | | 201,379 | |
FNMA | | AA+ | | 6.00 | | 12/01/36 | | 576,937 | | 631,637 | |
FNMA | | AA+ | | 6.00 | | 01/01/37 | | 703,056 | | 769,713 | |
FNMA | | AA+ | | 6.00 | | 03/01/37 | | 703,048 | | 760,916 | |
FNMA | | AA+ | | 6.00 | | 04/01/37 | | 400,921 | | 433,921 | |
FNMA | | AA+ | | 6.00 | | 05/01/37 | | 223,678 | | 242,089 | |
FNMA | | AA+ | | 6.00 | | 06/01/37 | | 547,444 | | 592,505 | |
FNMA | | AA+ | | 6.00 | | 07/01/37 | | 357,822 | | 391,748 | |
FNMA | | AA+ | | 6.00 | | 08/01/37 | | 576,308 | | 630,948 | |
FNMA | | AA+ | | 6.00 | | 12/01/37 | | 261,698 | | 286,509 | |
FNMA | | AA+ | | 6.00 | | 10/25/44 | | 819,990 | | 918,148 | |
FNMA | | AA+ | | 6.00 | | 02/25/47 | | 1,781,886 | | 2,019,064 | |
FNMA | | AA+ | | 6.00 | | 12/25/49 | | 1,314,148 | | 1,504,057 | |
FNMA | | AA+ | | 6.50 | | 09/01/16 | | 26,415 | | 28,260 | |
FNMA | | AA+ | | 6.50 | | 03/01/17 | | 235,399 | | 255,219 | |
FNMA | | AA+ | | 6.50 | | 05/01/17 | | 13,575 | | 14,718 | |
FNMA | | AA+ | | 6.50 | | 04/01/32 | | 52,622 | | 62,263 | |
FNMA | | AA+ | | 6.50 | | 05/01/32 | | 110,647 | | 130,919 | |
FNMA | | AA+ | | 6.50 | | 05/01/32 | | 559,686 | | 662,228 | |
FNMA | | AA+ | | 6.50 | | 09/01/36 | | 344,927 | | 382,103 | |
FNMA | | AA+ | | 6.50 | | 05/01/37 | | 498,227 | | 592,110 | |
FNMA | | AA+ | | 6.50 | | 07/01/37 | | 126,442 | | 150,268 | |
FNMA | | AA+ | | 6.50 | | 09/01/37 | | 367,211 | | 436,407 | |
FNMA | | AA+ | | 6.50 | | 05/01/38 | | 536,587 | | 638,160 | |
FNMA | | AA+ | | 7.00 | | 09/01/31 | | 69,896 | | 83,512 | |
FNMA | | AA+ | | 7.00 | | 01/25/44 | | 698,579 | | 846,280 | |
FNMA | | AA+ | | 7.50 | | 04/01/32 | | 68,107 | | 80,735 | |
FNMA | | AA+ | | 7.50 | | 06/01/32 | | 180,399 | | 213,847 | |
FNMA | | AA+ | | 8.00 | | 03/01/31 | | 23,668 | | 28,277 | |
FNMA | | AA+ | | 8.00 | | 04/01/32 | | 33,171 | | 39,671 | |
FNMA | | AA+ | | 8.00 | | 04/01/32 | | 32,891 | | 39,445 | |
GNMA (4) | | AA+ | | 2.68 | | 10/16/47 | | 2,000,000 | | 2,078,462 | |
GNMA (4) | | AA+ | | 3.50 | | 09/20/33 | | 2,024,402 | | 2,112,357 | |
GNMA (4) | | AA+ | | 3.50 | | 01/20/37 | | 1,230,550 | | 1,266,094 | |
GNMA (4) | | AA+ | | 3.50 | | 07/15/42 | | 1,983,830 | | 2,157,457 | |
GNMA (4) | | AA+ | | 3.70 | | 05/15/42 | | 1,894,946 | | 2,060,793 | |
GNMA (4) | | AA+ | | 4.00 | | 04/15/24 | | 680,773 | | 734,078 | |
GNMA (4) | | AA+ | | 4.00 | | 08/15/41 | | 2,444,879 | | 2,683,775 | |
GNMA (4) | | AA+ | | 4.00 | | 11/15/41 | | 1,435,826 | | 1,576,124 | |
GNMA (4) | | AA+ | | 4.00 | | 12/15/41 | | 2,157,422 | | 2,368,230 | |
GNMA (4) | | AA+ | | 4.00 | | 01/15/42 | | 883,150 | | 969,998 | |
GNMA (4) | | AA+ | | 4.00 | | 03/20/42 | | 1,480,745 | | 1,616,978 | |
GNMA (4) | | AA+ | | 4.00 | | 08/20/42 | | 2,596,330 | | 2,835,200 | |
GNMA (4) | | AA+ | | 4.25 | | 06/20/36 | | 1,569,469 | | 1,710,922 | |
GNMA (4) | | AA+ | | 4.25 | | 04/20/41 | | 1,382,672 | | 1,506,426 | |
GNMA (4) | | AA+ | | 4.29 | | 04/15/41 | | 1,128,168 | | 1,238,405 | |
GNMA (4) | | AA+ | | 4.50 | | 02/20/20 | | 1,528,493 | | 1,609,697 | |
GNMA (4) | | AA+ | | 4.50 | | 06/20/30 | | 246,676 | | 272,896 | |
GNMA (4) | | AA+ | | 4.50 | | 09/15/30 | | 1,125,695 | | 1,245,348 | |
GNMA (4) | | AA+ | | 4.50 | | 06/20/34 | | 1,176,239 | | 1,293,914 | |
GNMA (4) | | AA+ | | 4.50 | | 10/15/40 | | 2,938,621 | | 3,243,629 | |
GNMA (4) | | AA+ | | 4.50 | | 10/15/40 | | 1,456,316 | | 1,607,472 | |
GNMA (4) | | AA+ | | 5.00 | | 04/15/39 | | 2,078,302 | | 2,275,179 | |
GNMA (4) | | AA+ | | 5.00 | | 06/20/39 | | 2,083,923 | | 2,410,801 | |
GNMA (4) | | AA+ | | 5.00 | | 11/15/39 | | 1,389,494 | | 1,521,121 | |
GNMA (4) | | AA+ | | 5.00 | | 06/20/40 | | 1,347,858 | | 1,489,441 | |
GNMA (4) | | AA+ | | 5.00 | | 06/20/40 | | 1,285,621 | | 1,420,667 | |
GNMA (4) | | AA+ | | 5.50 | | 01/15/36 | | 358,665 | | 393,594 | |
GNMA (4) | | AA+ | | 6.50 | | 04/15/31 | | 16,279 | | 19,299 | |
GNMA (4) | | AA+ | | 6.50 | | 12/15/31 | | 94,261 | | 111,746 | |
GNMA (4) | | AA+ | | 6.50 | | 05/15/32 | | 44,716 | | 53,132 | |
GNMA (4) | | AA+ | | 7.00 | | 09/15/31 | | 32,454 | | 38,683 | |
GNMA (4) | | AA+ | | 7.00 | | 09/15/31 | | 23,190 | | 27,642 | |
GNMA (4) | | AA+ | | 7.00 | | 05/15/32 | | 10,658 | | 12,677 | |
Vendee Mortgage Trust (4) | | AA+ | | 5.25 | | 01/15/32 | | 1,803,511 | | 2,091,194 | |
| | | | | | | | | | 202,094,681 | |
| | | | | | | | | | | |
NON-MORTGAGE-BACKED OBLIGATIONS (2.3%) | | | | | | | | | | | |
FNMA | | AA+ | | 0.00 | | 10/09/19 | | 20,000,000 | | 17,521,140 | |
| | | | | | | | | | | |
CORPORATE DEBT (57.0%) | | | | | | | | | | | |
CONSUMER DISCRETIONARY (7.9%) | | | | | | | | | | | |
Advance Auto Parts, Inc. | | BBB- | | 5.75 | | 05/01/20 | | 3,000,000 | | 3,232,446 | |
AutoZone, Inc. | | BBB | | 4.00 | | 11/15/20 | | 3,000,000 | | 3,253,404 | |
Best Buy Co., Inc. | | BB | | 6.75 | | 07/15/13 | | 500,000 | | 506,250 | |
Brinker International, Inc. | | BBB- | | 5.75 | | 06/01/14 | | 2,000,000 | | 2,115,582 | |
Ethan Allen Interiors, Inc. | | BB- | | 5.38 | | 10/01/15 | | 2,000,000 | | 2,055,000 | |
Expedia, Inc. | | BBB- | | 5.95 | | 08/15/20 | | 3,000,000 | | 3,337,806 | |
Home Depot, Inc. | | A- | | 5.40 | | 03/01/16 | | 2,000,000 | | 2,284,832 | |
Hyatt Hotels Corp. | | BBB | | 3.88 | | 08/15/16 | | 2,800,000 | | 2,981,580 | |
Hyatt Hotels Corp. | | BBB | | 5.38 | | 08/15/21 | | 200,000 | | 224,284 | |
Johnson Controls, Inc. | | BBB+ | | 4.88 | | 09/15/13 | | 2,500,000 | | 2,573,073 | |
Kohl’s Corp. | | BBB+ | | 3.25 | | 02/01/23 | | 880,000 | | 854,446 | |
Kohl’s Corp. | | BBB+ | | 4.00 | | 11/01/21 | | 2,620,000 | | 2,770,886 | |
Leggett & Platt, Inc. | | BBB+ | | 4.70 | | 04/01/13 | | 2,000,000 | | 2,017,384 | |
Lowe’s Cos., Inc. | | A- | | 3.12 | | 04/15/22 | | 2,000,000 | | 2,105,334 | |
Marriott International, Inc. | | BBB | | 3.00 | | 03/01/19 | | 1,000,000 | | 1,029,205 | |
Marriott International, Inc. | | BBB | | 5.63 | | 02/15/13 | | 2,000,000 | | 2,010,750 | |
Mattel, Inc. | | BBB+ | | 4.35 | | 10/01/20 | | 1,000,000 | | 1,078,574 | |
Newell Rubbermaid, Inc. | | BBB- | | 4.70 | | 08/15/20 | | 3,000,000 | | 3,313,473 | |
NVR, Inc. | | BBB | | 3.95 | | 09/15/22 | | 3,000,000 | | 3,108,765 | |
O’Reilly Automotive, Inc. | | BBB | | 3.80 | | 09/01/22 | | 3,250,000 | | 3,381,580 | |
Omnicom Group, Inc. | | BBB+ | | 4.45 | | 08/15/20 | | 3,000,000 | | 3,338,208 | |
Scholastic Corp. | | BB- | | 5.00 | | 04/15/13 | | 2,000,000 | | 2,007,500 | |
Tupperware Brands Corp. | | BBB- | | 4.75 | | 06/01/21 | | 3,000,000 | | 3,210,141 | |
Whirlpool Corp. | | BBB- | | 4.85 | | 06/15/21 | | 1,000,000 | | 1,071,828 | |
Whirlpool Corp. | | BBB- | | 6.50 | | 06/15/16 | | 2,000,000 | | 2,293,806 | |
Wynn Las Vegas LLC | | BBB- | | 5.38 | | 03/15/22 | | 3,000,000 | | 3,187,500 | |
| | | | | | | | | | 59,343,637 | |
CONSUMER STAPLES (3.8%) | | | | | | | | | | | |
Avon Products, Inc. | | BBB- | | 4.20 | | 07/15/18 | | 900,000 | | 917,082 | |
Avon Products, Inc. | | BBB- | | 6.50 | | 03/01/19 | | 2,100,000 | | 2,265,549 | |
Beam, Inc. | | BBB- | | 5.38 | | 01/15/16 | | 344,000 | | 384,295 | |
Cargill, Inc.† | | A | | 5.00 | | 11/15/13 | | 500,000 | | 518,048 | |
Clorox Co. | | BBB+ | | 5.00 | | 03/01/13 | | 2,000,000 | | 2,014,590 | |
CVS Caremark Corp. | | BBB+ | | 6.13 | | 08/15/16 | | 2,000,000 | | 2,381,572 | |
Energizer Hldgs., Inc. | | BBB- | | 4.70 | | 05/19/21 | | 3,000,000 | | 3,215,199 | |
Flowers Foods, Inc. | | BBB- | | 4.38 | | 04/01/22 | | 3,500,000 | | 3,587,885 | |
Ingredion, Inc. | | BBB | | 4.63 | | 11/01/20 | | 3,225,000 | | 3,600,954 | |
Kroger Co. | | BBB | | 4.95 | | 01/15/15 | | 2,000,000 | | 2,156,462 | |
Molson Coors Brewing Co. | | BBB- | | 3.50 | | 05/01/22 | | 3,000,000 | | 3,167,220 | |
Ralcorp Hldgs., Inc. | | BBB- | | 4.95 | | 08/15/20 | | 1,500,000 | | 1,583,027 | |
Safeway, Inc. | | BBB | | 3.95 | | 08/15/20 | | 2,900,000 | | 2,900,655 | |
| | | | | | | | | | 28,692,538 | |
ENERGY (5.1%) | | | | | | | | | | | |
Cameron International Corp. | | BBB+ | | 4.50 | | 06/01/21 | | 3,000,000 | | 3,356,871 | |
Diamond Offshore Drilling, Inc. | | A- | | 4.88 | | 07/01/15 | | 2,000,000 | | 2,204,198 | |
Enbridge, Inc. | | A- | | 5.80 | | 06/15/14 | | 1,000,000 | | 1,073,277 | |
Energen Corp. | | BBB | | 4.63 | | 09/01/21 | | 3,500,000 | | 3,646,650 | |
EQT Corp. | | BBB | | 4.88 | | 11/15/21 | | 3,000,000 | | 3,220,611 | |
Kinder Morgan, Inc. | | BB | | 5.15 | | 03/01/15 | | 2,000,000 | | 2,125,936 | |
Marathon Petroleum Corp. | | BBB | | 5.13 | | 03/01/21 | | 3,000,000 | | 3,530,520 | |
Murphy Oil Corp. | | BBB | | 2.50 | | 12/01/17 | | 1,250,000 | | 1,257,709 | |
Murphy Oil Corp. | | BBB | | 3.70 | | 12/01/22 | | 2,250,000 | | 2,241,437 | |
National Oilwell Varco, Inc. | | A- | | 6.13 | | 08/15/15 | | 2,000,000 | | 2,019,902 | |
Noble Drilling Corp. | | BBB+ | | 7.50 | | 03/15/19 | | 2,000,000 | | 2,417,960 | |
Rowan Companies PLC | | BBB- | | 4.88 | | 06/01/22 | | 3,500,000 | | 3,801,238 | |
Seacor Hldgs., Inc. | | BB | | 7.38 | | 10/01/19 | | 2,775,000 | | 2,948,049 | |
Sunoco, Inc. | | BBB- | | 5.75 | | 01/15/17 | | 2,000,000 | | 2,254,770 | |
Weatherford Int’l. Ltd. | | BBB- | | 5.15 | | 03/15/13 | | 500,000 | | 503,962 | |
Weatherford Int’l. Ltd. | | BBB- | | 5.50 | | 02/15/16 | | 1,500,000 | | 1,652,282 | |
| | | | | | | | | | 38,255,372 | |
FINANCIALS (19.0%) | | | | | | | | | | | |
Aflac, Inc. | | A- | | 4.00 | | 02/15/22 | | 3,000,000 | | 3,236,169 | |
Alleghany Corp. | | BBB | | 5.63 | | 09/15/20 | | 3,000,000 | | 3,331,479 | |
Allstate Corp. | | A- | | 7.45 | | 05/16/19 | | 2,000,000 | | 2,622,740 | |
American Express Credit Corp. | | A- | | 5.88 | | 05/02/13 | | 500,000 | | 509,028 | |
Bank of America Corp. | | A- | | 3.70 | | 09/01/15 | | 2,000,000 | | 2,114,278 | |
Barrick N.A. Finance LLC | | BBB+ | | 4.40 | | 05/30/21 | | 3,000,000 | | 3,289,914 | |
Berkley (W.R.) Corp. | | BBB+ | | 7.38 | | 09/15/19 | | 2,000,000 | | 2,446,304 | |
Block Financial LLC | | BBB | | 5.13 | | 10/30/14 | | 1,750,000 | | 1,842,600 | |
Boston Properties LP | | A- | | 3.85 | | 02/01/23 | | 3,000,000 | | 3,151,452 | |
Bunge Ltd. Finance Corp. | | BBB- | | 5.35 | | 04/15/14 | | 2,000,000 | | 2,104,532 | |
Capital One Financial Corp. | | BBB | | 4.75 | | 07/15/21 | | 3,200,000 | | 3,690,118 | |
CNA Financial Corp. | | BBB- | | 6.50 | | 08/15/16 | | 2,000,000 | | 2,307,450 | |
Duke Realty LP | | BBB- | | 4.63 | | 05/15/13 | | 2,000,000 | | 2,027,924 | |
Fairfax Financial Hldgs. | | BBB- | | 8.25 | | 10/01/15 | | 2,500,000 | | 2,835,975 | |
Fairfax Financial Hldgs.† | | BBB- | | 5.80 | | 05/15/21 | | 500,000 | | 516,819 | |
First Horizon National Corp. | | BB+ | | 4.50 | | 05/15/13 | | 5,000,000 | | 5,059,955 | |
Genworth Financial, Inc. | | BBB- | | 7.20 | | 02/15/21 | | 1,750,000 | | 1,890,000 | |
Genworth Financial, Inc. | | BBB- | | 7.63 | | 09/24/21 | | 1,300,000 | | 1,434,640 | |
Goldman Sachs Group, Inc. | | A- | | 3.70 | | 08/01/15 | | 3,000,000 | | 3,166,170 | |
Harley-Davidson Financial Svcs.† | | BBB+ | | 3.88 | | 03/15/16 | | 2,678,000 | | 2,874,557 | |
Hartford Financial Svcs. | | BBB | | 5.50 | | 10/15/16 | | 2,000,000 | | 2,238,572 | |
Hartford Financial Svcs. | | BBB | | 5.50 | | 03/30/20 | | 1,000,000 | | 1,161,875 | |
HCP, Inc. | | BBB+ | | 5.65 | | 12/15/13 | | 2,000,000 | | 2,091,980 | |
HCP, Inc. | | BBB+ | | 6.00 | | 01/30/17 | | 1,250,000 | | 1,435,936 | |
Health Care REIT, Inc. | | BBB- | | 3.63 | | 03/15/16 | | 750,000 | | 791,979 | |
Health Care REIT, Inc. | | BBB- | | 6.13 | | 04/15/20 | | 2,500,000 | | 2,928,005 | |
Hospitality Properties Trust | | BBB- | | 5.00 | | 08/15/22 | | 3,000,000 | | 3,174,036 | |
HSBC Finance Corp. | | A | | 4.29 | | 11/10/13 | | 100,000 | | 101,797 | |
HSBC Finance Corp. | | A | | 4.46 | | 10/10/13 | | 70,000 | | 70,639 | |
JP Morgan Chase Bank NA | | A | | 6.00 | | 10/01/17 | | 2,000,000 | | 2,367,680 | |
Kemper Corp. | | BBB- | | 6.00 | | 11/30/15 | | 2,500,000 | | 2,696,378 | |
KeyCorp | | BBB+ | | 6.50 | | 05/14/13 | | 2,000,000 | | 2,042,928 | |
Lincoln National Corp. | | A- | | 4.85 | | 06/24/21 | | 1,000,000 | | 1,121,941 | |
Markel Corp. | | BBB | | 5.35 | | 06/01/21 | | 1,000,000 | | 1,092,893 | |
Markel Corp. | | BBB | | 6.80 | | 02/15/13 | | 2,000,000 | | 2,012,636 | |
Marsh & McLennan Cos., Inc. | | BBB | | 4.80 | | 07/15/21 | | 3,000,000 | | 3,375,732 | |
Moody’s Corp. | | BBB+ | | 4.50 | | 09/01/22 | | 2,000,000 | | 2,138,294 | |
Morgan Stanley | | A- | | 2.88 | | 01/24/14 | | 1,000,000 | | 1,016,804 | |
Morgan Stanley | | A- | | 4.00 | | 07/24/15 | | 2,000,000 | | 2,092,570 | |
National Retail Pptys., Inc. | | BBB | | 3.80 | | 10/15/22 | | 3,000,000 | | 3,046,371 | |
Old Republic Int’l. Corp. | | BBB+ | | 3.75 | | 03/15/18 | | 2,000,000 | | 2,081,250 | |
Pacific LifeCorp.† | | BBB+ | | 6.00 | | 02/10/20 | | 3,000,000 | | 3,348,807 | |
Penske Truck Leasing Co. LP† | | BBB- | | 3.38 | | 03/15/18 | | 3,000,000 | | 3,026,898 | |
ProLogis LP | | BBB- | | 6.63 | | 05/15/18 | | 3,000,000 | | 3,623,475 | |
Protective Life Corp. | | A- | | 4.88 | | 11/01/14 | | 1,000,000 | | 1,055,003 | |
Protective Life Secured Trust | | AA- | | 3.82 | | 12/10/14 | | 124,000 | | 126,082 | |
Protective Life Secured Trust | | AA- | | 3.97 | | 10/10/14 | | 53,000 | | 53,950 | |
Protective Life Secured Trust | | AA- | | 4.07 | | 08/10/14 | | 21,000 | | 21,279 | |
Prudential Financial, Inc. | | A | | 4.50 | | 11/16/21 | | 1,000,000 | | 1,124,643 | |
Prudential Financial, Inc. | | A | | 4.75 | | 09/17/15 | | 2,000,000 | | 2,192,294 | |
Raymond James Financial, Inc. | | BBB | | 4.25 | | 04/15/16 | | 3,150,000 | | 3,311,844 | |
Reckson Operating Partnership | | BBB- | | 6.00 | | 03/31/16 | | 3,200,000 | | 3,508,586 | |
Regency Centers LP | | BBB | | 4.95 | | 04/15/14 | | 2,000,000 | | 2,092,542 | |
Reinsurance Grp. of America, Inc. | | A- | | 5.00 | | 06/01/21 | | 3,000,000 | | 3,303,288 | |
Retail Properties, Inc.† | | A- | | 7.88 | | 03/15/16 | | 5,000,000 | | 5,981,510 | |
Senior Housing Pptys. Trust | | BBB- | | 4.30 | | 01/15/16 | | 3,000,000 | | 3,110,307 | |
SLM Corp. | | BBB- | | 5.00 | | 10/01/13 | | 3,150,000 | | 3,224,813 | |
Southtrust Bank, N.A. | | A+ | | 4.75 | | 03/01/13 | | 1,250,000 | | 1,258,250 | |
Travelers Cos., Inc. | | A | | 3.90 | | 11/01/20 | | 2,500,000 | | 2,823,975 | |
Ventas Realty LP/Capital Corp. | | BBB | | 3.25 | | 08/15/22 | | 500,000 | | 490,245 | |
Ventas Realty LP/Capital Corp. | | BBB | | 4.75 | | 06/01/21 | | 3,000,000 | | 3,280,734 | |
Vornado Realty LP | | BBB | | 4.25 | | 04/01/15 | | 3,000,000 | | 3,171,039 | |
Zions Bancorporation | | BBB- | | 4.50 | | 03/27/17 | | 1,000,000 | | 1,044,751 | |
Zions Bancorporation | | BB+ | | 5.65 | | 05/15/14 | | 2,000,000 | | 2,055,966 | |
| | | | | | | | | | 142,762,681 | |
HEALTH CARE (4.8%) | | | | | | | | | | | |
Allergan, Inc. | | A+ | | 5.75 | | 04/01/16 | | 2,000,000 | | 2,301,388 | |
AmerisourceBergen Corp. | | A- | | 4.88 | | 11/15/19 | | 2,500,000 | | 2,898,760 | |
Bio-Rad Laboratories, Inc. | | BBB | | 4.88 | | 12/15/20 | | 3,000,000 | | 3,171,750 | |
Biogen Idec, Inc. | | BBB+ | | 6.88 | | 03/01/18 | | 2,500,000 | | 3,096,663 | |
CIGNA Corp. | | BBB | | 2.75 | | 11/15/16 | | 1,000,000 | | 1,051,944 | |
CIGNA Corp. | | BBB | | 5.38 | | 03/15/17 | | 2,000,000 | | 2,264,864 | |
Humana, Inc. | | BBB | | 7.20 | | 06/15/18 | | 2,000,000 | | 2,466,250 | |
Laboratory Corp. of America | | BBB+ | | 4.63 | | 11/15/20 | | 1,000,000 | | 1,113,381 | |
Laboratory Corp. of America | | BBB+ | | 5.50 | | 02/01/13 | | 1,000,000 | | 1,003,383 | |
Laboratory Corp. of America | | BBB+ | | 5.63 | | 12/15/15 | | 1,000,000 | | 1,127,839 | |
Medco Health Solutions, Inc. | | BBB+ | | 4.13 | | 09/15/20 | | 3,000,000 | | 3,278,733 | |
Medtronic, Inc. | | A+ | | 1.63 | | 04/15/13 | | 3,000,000 | | 3,009,375 | |
PerkinElmer, Inc. | | BBB | | 5.00 | | 11/15/21 | | 3,500,000 | | 3,880,485 | |
Quest Diagnostics, Inc. | | BBB+ | | 4.75 | | 01/30/20 | | 2,850,000 | | 3,147,389 | |
WellPoint, Inc. | | A- | | 4.35 | | 08/15/20 | | 2,000,000 | | 2,207,504 | |
| | | | | | | | | | 36,019,708 | |
INDUSTRIALS (5.2%) | | | | | | | | | | | |
CSX Corp. | | BBB | | 6.25 | | 04/01/15 | | 2,000,000 | | 2,239,518 | |
Donnelley (R.R.) & Sons Co. | | BB | | 4.95 | | 04/01/14 | | 2,000,000 | | 2,045,000 | |
Dun & Bradstreet Corp. | | BBB+ | | 3.25 | | 12/01/17 | | 2,475,000 | | 2,501,215 | |
Dun & Bradstreet Corp. | | BBB+ | | 4.38 | | 12/01/22 | | 1,000,000 | | 1,021,285 | |
Equifax, Inc. | | BBB+ | | 3.30 | | 12/15/22 | | 3,500,000 | | 3,471,797 | |
Flowserve Corp. | | BBB- | | 3.50 | | 09/15/22 | | 3,500,000 | | 3,515,096 | |
Harsco Corp. | | BBB | | 5.75 | | 05/15/18 | | 3,000,000 | | 3,337,446 | |
L-3 Communications Corp. | | BBB- | | 4.75 | | 07/15/20 | | 3,000,000 | | 3,343,908 | |
Pentair Ltd. | | BBB | | 5.00 | | 05/15/21 | | 3,000,000 | | 3,388,815 | |
Pitney Bowes, Inc. | | BBB | | 5.25 | | 01/15/37 | | 3,000,000 | | 3,060,375 | |
Precision Castparts Corp. | | A- | | 5.60 | | 12/15/13 | | 2,000,000 | | 2,086,962 | |
Ryder System, Inc. | | BBB | | 6.00 | | 03/01/13 | | 2,000,000 | | 2,015,190 | |
Textron, Inc. | | BBB- | | 4.63 | | 09/21/16 | | 2,900,000 | | 3,158,668 | |
URS Corp.† | | BBB- | | 5.00 | | 04/01/22 | | 3,600,000 | | 3,706,081 | |
| | | | | | | | | | 38,891,356 | |
INFORMATION TECHNOLOGY (3.0%) | | | | | | | | | | | |
Arrow Electronics, Inc. | | BBB- | | 6.88 | | 06/01/18 | | 2,900,000 | | 3,399,461 | |
Avnet, Inc. | | BBB- | | 5.88 | | 03/15/14 | | 400,000 | | 418,026 | |
Avnet, Inc. | | BBB- | | 5.88 | | 06/15/20 | | 600,000 | | 653,854 | |
Avnet, Inc. | | BBB- | | 6.00 | | 09/01/15 | | 2,000,000 | | 2,181,702 | |
Fiserv, Inc. | | BBB- | | 4.63 | | 10/01/20 | | 2,770,000 | | 3,019,688 | |
Ingram Micro, Inc. | | BBB- | | 5.25 | | 09/01/17 | | 3,000,000 | | 3,257,982 | |
Lexmark International, Inc. | | BBB- | | 6.65 | | 06/01/18 | | 3,000,000 | | 3,281,580 | |
Motorola Solutions, Inc. | | BBB | | 3.75 | | 05/15/22 | | 3,500,000 | | 3,575,999 | |
Tech Data Corp. | | BBB- | | 3.75 | | 09/21/17 | | 3,000,000 | | 3,077,421 | |
| | | | | | | | | | 22,865,713 | |
MATERIALS (4.4%) | | | | | | | | | | | |
Airgas, Inc. | | BBB | | 3.25 | | 10/01/15 | | 2,000,000 | | 2,124,246 | |
Cytec Industries, Inc. | | BBB | | 6.00 | | 10/01/15 | | 2,000,000 | | 2,206,826 | |
Eastman Chemical Co. | | BBB | | 4.50 | | 01/15/21 | | 2,500,000 | | 2,776,090 | |
Freeport-McMoRan Copper & Gold | | BBB | | 3.55 | | 03/01/22 | | 3,000,000 | | 2,975,328 | |
Geon Co. | | BB- | | 7.50 | | 12/15/15 | | 3,750,000 | | 3,862,500 | |
Kinross Gold Corp. | | NR | | 5.13 | | 09/01/21 | | 3,000,000 | | 3,078,054 | |
Lubrizol Corp. | | AA+ | | 5.50 | | 10/01/14 | | 2,000,000 | | 2,167,926 | |
Methanex Corp. | | BBB- | | 3.25 | | 12/15/19 | | 2,900,000 | | 2,916,866 | |
Methanex Corp. | | BBB- | | 5.25 | | 03/01/22 | | 600,000 | | 665,473 | |
Newmont Mining Corp. | | BBB+ | | 3.50 | | 03/15/22 | | 3,000,000 | | 3,094,092 | |
Packaging Corp. of America | | BBB | | 3.90 | | 06/15/22 | | 2,000,000 | | 2,071,102 | |
Teck Resources Ltd. | | BBB | | 4.75 | | 01/15/22 | | 3,000,000 | | 3,301,425 | |
Vulcan Materials Co. | | BB | | 7.00 | | 06/15/18 | | 2,000,000 | | 2,210,000 | |
| | | | | | | | | | 33,449,928 | |
TELECOMMUNICATION SERVICES (0.6%) | | | | | | | | | | | |
Alltel Corp. | | A- | | 7.00 | | 03/15/16 | | 2,000,000 | | 2,372,352 | |
CenturyLink, Inc. | | BB | | 5.00 | | 02/15/15 | | 2,000,000 | | 2,125,802 | |
| | | | | | | | | | 4,498,154 | |
UTILITIES (3.2%) | | | | | | | | | | | |
AGL Capital Corp. | | BBB+ | | 6.38 | | 07/15/16 | | 500,000 | | 588,565 | |
AmerenEnergy Generating Co. | | B | | 6.30 | | 04/01/20 | | 2,500,000 | | 1,800,000 | |
Constellation Energy | | BBB- | | 5.15 | | 12/01/20 | | 3,000,000 | | 3,429,360 | |
Entergy Corp. | | BBB- | | 4.70 | | 01/15/17 | | 1,500,000 | | 1,624,890 | |
Entergy Corp. | | BBB- | | 5.13 | | 09/15/20 | | 500,000 | | 542,243 | |
Entergy New Orleans, Inc. | | BBB+ | | 5.25 | | 08/01/13 | | 1,075,000 | | 1,097,915 | |
National Fuel Gas Co. | | BBB | | 4.90 | | 12/01/21 | | 3,000,000 | | 3,312,447 | |
PPL Energy Supply LLC | | BBB | | 4.60 | | 12/15/21 | | 1,000,000 | | 1,084,200 | |
PPL Energy Supply LLC | | BBB | | 5.40 | | 08/15/14 | | 2,000,000 | | 2,132,364 | |
Progress Energy, Inc. | | A | | 5.25 | | 12/15/15 | | 2,000,000 | | 2,268,312 | |
SCANA Corp. | | BBB | | 4.13 | | 02/01/22 | | 3,100,000 | | 3,250,483 | |
UIL Hldgs. Corp. | | BBB- | | 4.63 | | 10/01/20 | | 2,725,000 | | 2,922,462 | |
| | | | | | | | | | 24,053,241 | |
SOVEREIGN DEBT (0.6%) | | | | | | | | | | | |
Sri Lanka AID | | NR | | 6.59 | | 09/15/28 | | 3,554,103 | | 4,453,291 | |
| | | | | | | | | | | |
TOTAL LONG-TERM DEBT SECURITIES | | | | | | | | | | | |
(Cost: $704,869,509) 99.0% | | | | | | | | | | 745,426,019 | |
| | Rating** | | Rate(%) | | Maturity | | Face Amount | | Value | |
SHORT-TERM DEBT SECURITIES: | | | | | | | | | | | |
COMMERCIAL PAPER (0.3%) | | | | | | | | | | | |
Washington Gas Light Co. | | A-1 | | 0.13 | | 01/02/13 | | 2,000,000 | | 1,999,993 | |
TOTAL SHORT-TERM DEBT SECURITIES | | | | | | | | | | | |
(Cost: $1,999,993) 0.3% | | | | | | | | | | 1,999,993 | |
TEMPORARY CASH INVESTMENTS (2) | | | | | | | | | | | |
(Cost: $487,200) 0.1% | | | | | | | | | | 487,200 | |
| | | | | | | | | | | |
TOTAL INVESTMENTS | �� | | | | | | | | | | |
(Cost: $707,356,702) 99.4% | | | | | | | | | | 747,913,212 | |
| | | | | | | | | | | |
OTHER NET ASSETS 0.6% | | | | | | | | | | 4,833,160 | |
| | | | | | | | | | | |
NET ASSETS 100.0% | | | | | | | | | | $ | 752,746,372 | |
| | | | | | | | | | | | |
The accompanying notes are an integral part of these portfolio schedules.
MUTUAL OF AMERICA INVESTMENT CORPORATION
FOOTNOTES TO PORTFOLIOS OF INVESTMENTS IN SECURITIES
December 31, 2012
Abbreviations: | FFCB = Federal Farm Credit Bank |
| FHARM = Federal Home Adjustable Rate Mortgage |
| FHLB = Federal Home Loan Bank |
| FHLMC = Federal Home Loan Mortgage Corporation |
| FNMA = Federal National Mortgage Association |
| GNMA = Government National Mortgage Association |
| NR = Not Rated |
* Non-income producing security.
** Ratings as per Standard & Poor’s Corporation (unaudited).
† Security is exempt from registration under Rule 144A of the Securities Act of 1933. These securities may be resold in transactions exempt from registration, normally to qualified institutional buyers. At December 31, 2012, the aggregate values of these securities and their percentages of the respective Funds’ net assets were as follows:
| | Aggregate | | Percentage | |
| | Market | | of | |
Fund | | Value | | Net Assets | |
| | | | | |
EQUITY INDEX FUND | | $ | 3,399,816 | | 0.3 | % |
COMPOSITE FUND | | $ | 973,141 | | 0.6 | % |
MONEY MARKET FUND | | $ | 38,047,190 | | 42.3 | % |
MID-TERM BOND FUND | | $ | 8,372,692 | | 2.2 | % |
BOND FUND | | $ | 19,972,720 | | 2.7 | % |
(1) This security, or a portion thereof, has been segregated to cover initial margin requirements on open futures contracts.
Information on futures contracts outstanding in the Funds as of December 31, 2012, were as follows:
Fund | | Number of
Contracts | | Contract Type | | Purchased (P)
or Sold (S) | | Expiration
Date | | Underlying
Face Amount
at Value(a) | | Unrealized
Gain(Loss) | | Face Value
of Futures
as a % of
Total
Investments | |
| | | | | | | | | | | | | | | |
EQUITY INDEX FUND | | 515 | | E-mini S&P 500 Stock Index | | P | | March 2013 | | $ | 36,567,575 | | $ | (271,225 | ) | 3.3 | % |
ALL AMERICA FUND | | 45 | | E-mini S&P 500 Stock Index | | P | | March 2013 | | $ | 3,195,225 | | $ | (19,126 | ) | 1.3 | % |
MID-CAP EQUITY INDEX FUND | | 188 | | E-mini S&P MidCap 400 Stock Index | | P | | March 2013 | | $ | 19,140,280 | | $ | (111,507 | ) | 3.1 | % |
(a) Includes the cumulative appreciation(depreciation) of futures contracts.
(2) The fund has an arrangement with its custodian bank, JP Morgan Chase Bank, whereby uninvested cash, subject to parameters set by the fund, is automatically invested in the fund’s name by the bank in overnight commercial paper issued by J.P. Morgan Chase & Co. On the next business day, these funds (and earned interest) are automatically returned to the fund. The annual rate of interest earned on this temporary cash investment at December 31, 2012 was 0.15%.
(3) Percentage is less than 0.05%.
(4) U.S. Government guaranteed security.
Fair Value—The Investment Company values its investments at fair value. Fair value is an estimate of the price the Fund would receive upon selling a security in an orderly arms-length transaction. Investments are categorized based on a three-level valuation hierarchy for measurement and disclosure of fair value. The valuation hierarchy is based upon the transparency of inputs used to measure fair value. The three levels are as follows:
· Level 1 — quoted prices in active markets for identical securities.
· Level 2 — other significant observable inputs (including yield, quality, coupon rate, maturity, issue type, quoted prices for similar securities, prepayment speeds, trading characteristics, etc.).
· Level 3 — significant unobservable inputs (including the Fund’s own assumptions in determining the fair value of investments).
As of December 31, 2012, management determined that the fair value inputs for all equity securities, including shares of registered investment companies, were considered Level 1, with the exception of non-registered securities under Rule 144A of the Securities Act of 1933 which were considered Level 2. In addition, certain Rule 144A securities not actively traded were considered Level 3; however, there were no such securities as of December 31, 2012. Fair value inputs for all debt securities were considered Level 2. The inputs used for valuing securities are not necessarily an indication of the risk associated with investing in those securities. Transfers between levels are reflected based on the fair value at the beginning of a reporting period.
The following is a summary of the inputs used to value the Funds’ investments and other financial instruments as of December 31, 2012, by fair value input hierarchy:
Fund | | Level 1 – Quoted
Prices | | Level 2 – Significant
Observable Inputs | | Level 3 – Significant
Unobservable Inputs | | Total | |
Investments at Market Value: | | | | | | | | | |
(See Portfolios of Investments for More Details) | | | | | | | | | |
Equity Index Fund | | | | | | | | | |
Common Stock | | $ | 1,069,563,554 | | — | | — | | $ | 1,069,563,554 | |
Short-Term Debt Securities | | — | | $ | 36,894,226 | | — | | $ | 36,894,226 | |
Temporary Cash Investments | | — | | $ | 32,700 | | — | | $ | 32,700 | |
| | $ | 1,069,563,554 | | $ | 36,926,926 | | — | | $ | 1,106,490,480 | |
| | | | | | | | | |
All America Fund | | | | | | | | | |
Common Stock - Indexed | | $ | 131,737,697 | | — | | — | | $ | 131,737,697 | |
Common Stock - Active | | $ | 114,869,959 | | — | | — | | $ | 114,869,959 | |
Convertible Preferred Stock | | $ | 191,225 | | — | | — | | $ | 191,225 | |
Short-Term Debt Securities | | — | | $ | 7,298,250 | | — | | $ | 7,298,250 | |
Temporary Cash Investments | | — | | $ | 1,489,000 | | — | | $ | 1,489,000 | |
| | $ | 246,798,881 | | $ | 8,787,250 | | — | | $ | 255,586,131 | |
| | | | | | | | | |
Small Cap Value Fund | | | | | | | | | |
Common Stock | | $ | 277,220,165 | | — | | — | | $ | 277,220,165 | |
Convertible Preferred Stock | | $ | 1,463,422 | | — | | — | | $ | 1,463,422 | |
Short-Term Debt Securities | | — | | $ | 11,497,820 | | — | | $ | 11,497,820 | |
| | $ | 278,683,587 | | $ | 11,497,820 | | — | | $ | 290,181,407 | |
| | | | | | | | | |
Small Cap Growth Fund | | | | | | | | | |
Common Stock | | $ | 260,482,002 | | — | | — | | $ | 260,482,002 | |
Short-Term Debt Securities | | — | | $ | 11,598,038 | | — | | $ | 11,598,038 | |
| | $ | 260,482,002 | | $ | 11,598,038 | | — | | $ | 272,080,040 | |
| | | | | | | | | |
Mid Cap Value Fund | | | | | | | | | |
Common Stock | | $ | 50,624,162 | | — | | — | | $ | 50,624,162 | |
Short-Term Debt Securities | | — | | $ | 2,499,614 | | — | | $ | 2,499,614 | |
| | $ | 50,624,162 | | $ | 2,499,614 | | — | | $ | 53,123,776 | |
| | | | | | | | | |
Mid-Cap Equity Index Fund | | | | | | | | | |
Common Stock | | $ | 590,192,857 | | — | | — | | $ | 590,192,857 | |
Short-Term Debt Securities | | — | | $ | 18,696,990 | | — | | $ | 18,696,990 | |
Temporary Cash Investments | | — | | $ | 301,400 | | — | | $ | 301,400 | |
| | $ | 590,192,857 | | $ | 18,998,390 | | — | | $ | 609,191,247 | |
| | | | | | | | | |
International Fund | | | | | | | | | |
Common Stock | | $ | 113,980,101 | | — | | — | | $ | 113,980,101 | |
| | | | | | | | | |
Composite Fund | | | | | | | | | |
Common Stock | | $ | 94,323,287 | | — | | — | | $ | 94,323,287 | |
U.S. Government Debt | | — | | $ | 11,150,774 | | — | | $ | 11,150,774 | |
U.S. Government Agency Residential Mortgage-Backed Obligations | | — | | $ | 22,889,607 | | — | | $ | 22,889,607 | |
Corporate Long-Term Debt | | — | | $ | 31,672,350 | | — | | $ | 31,672,350 | |
Short-Term Debt | | — | | $ | 8,048,365 | | — | | $ | 8,048,365 | |
Temporary Cash Investments | | — | | $ | 934,600 | | — | | $ | 934,600 | |
| | $ | 94,323,287 | | $ | 74,695,696 | | — | | $ | 169,018,983 | |
| | | | | | | | | |
Retirement Income Fund | | | | | | | | | |
Common Stock | | $ | 31,243,375 | | — | | — | | $ | 31,243,375 | |
| | | | | | | | | |
2010 Retirement Fund | | | | | | | | | |
Common Stock | | $ | 21,452,723 | | — | | — | | $ | 21,452,723 | |
| | | | | | | | | |
2015 Retirement Fund | | | | | | | | | |
Common Stock | | $ | 112,337,705 | | — | | — | | $ | 112,337,705 | |
| | | | | | | | | |
2020 Retirement Fund | | | | | | | | | |
Common Stock | | $ | 169,031,294 | | — | | — | | $ | 169,031,294 | |
| | | | | | | | | |
2025 Retirement Fund | | | | | | | | | |
Common Stock | | $ | 161,771,470 | | — | | — | | $ | 161,771,470 | |
| | | | | | | | | |
2030 Retirement Fund | | | | | | | | | |
Common Stock | | $ | 133,273,336 | | — | | — | | $ | 133,273,336 | |
2035 Retirement Fund | | | | | | | | | |
Common Stock | | $ | 106,699,288 | | — | | — | | $ | 106,699,288 | |
| | | | | | | | | |
2040 Retirement Fund | | | | | | | | | |
Common Stock | | $ | 93,991,633 | | — | | — | | $ | 93,991,633 | |
| | | | | | | | | |
2045 Retirement Fund | | | | | | | | | |
Common Stock | | $ | 118,318,475 | | — | | — | | $ | 118,318,475 | |
| | | | | | | | | |
2050 Retirement Fund | | | | | | | | | |
Common Stock | | $ | 2,117,191 | | — | | — | | $ | 2,117,191 | |
| | | | | | | | | |
Conservative Allocation Fund | | | | | | | | | |
Common Stock | | $ | 86,359,906 | | — | | — | | $ | 86,359,906 | |
| | | | | | | | | |
Moderate Allocation Fund | | | | | | | | | |
Common Stock | | $ | 225,205,190 | | — | | — | | $ | 225,205,190 | |
| | | | | | | | | |
Aggressive Allocation Fund | | | | | | | | | |
Common Stock | | $ | 186,917,156 | | — | | — | | $ | 186,917,156 | |
| | | | | | | | | |
Money Market Fund | | | | | | | | | |
U.S. Government Debt | | — | | $ | 7,999,292 | | — | | $ | 7,999,292 | |
U.S. Government Agency Short-Term Debt | | — | | $ | 20,410,885 | | — | | $ | 20,410,885 | |
Commercial Paper | | — | | $ | 60,444,997 | | — | | $ | 60,444,997 | |
Temporary Cash Investments | | — | | $ | 1,078,600 | | — | | $ | 1,078,600 | |
| | — | | $ | 89,933,774 | | — | | $ | 89,933,774 | |
| | | | | | | | | |
Mid-Term Bond Fund | | | | | | | | | |
U.S. Government Debt | | — | | $ | 179,805,893 | | — | | $ | 179,805,893 | |
U.S. Government Agency Residential Mortgage-Backed Obligations | | — | | $ | 31,803 | | — | | $ | 31,803 | |
U.S. Government Agency Non-Mortgage-Backed Obligations | | — | | $ | 46,101,248 | | — | | $ | 46,101,248 | |
Corporate Debt | | — | | $ | 157,328,936 | | — | | $ | 157,328,936 | |
Municipal Obligations | | — | | $ | 769,456 | | — | | $ | 769,456 | |
Temporary Cash Investments | | — | | $ | 697,600 | | — | | $ | 697,600 | |
| | — | | $ | 384,734,936 | | — | | $ | 384,734,936 | |
| | | | | | | | | |
Bond Fund | | | | | | | | | |
U.S. Government Debt | | — | | $ | 92,524,579 | | — | | $ | 92,524,579 | |
U.S. Government Agency Residential Mortgage-Backed Obligations | | — | | $ | 202,094,681 | | — | | $ | 202,094,681 | |
U.S. Government Agency Non-Mortgage-Backed Obligations | | — | | $ | 17,521,140 | | — | | $ | 17,521,140 | |
Long-Term Corporate Debt | | — | | $ | 428,832,328 | | — | | $ | 428,832,328 | |
Sovereign Debt | | — | | $ | 4,453,291 | | — | | $ | 4,453,291 | |
Short-Term Debt | | — | | 1,999,993 | | — | | 1,999,993 | |
Temporary Cash Investments | | — | | 487,200 | | — | | 487,200 | |
| | — | | $ | 747,913,212 | | — | | $ | 747,913,212 | |
| | | | | | | | | |
Other Financial Instruments:* | | | | | | | | | |
| | | | | | | | | |
Equity Index Fund | | $ | (271,225 | ) | — | | — | | $ | (271,225 | ) |
All America Fund | | $ | (19,126 | ) | — | | — | | $ | (19,126 | ) |
Mid-Cap Equity Index Fund | | $ | (111,507 | ) | — | | — | | $ | (111,507 | ) |
* Other financial instruments are derivative instruments not reflected in the Portfolio of Investments, such as futures, which are valued at the unrealized appreciation/depreciation on the instrument.
Fair Value Measurement Using Signficant Unobservable Inputs (Level 3)
for the Year Ended December 31, 2012
| | Balance
December 31,
2011 | | Change in
Unrealized
Gains
(Losses) | | Transfers
Into
Level 3 (a) | | Transfers
Out of
Level 3 (b) | | Balance
December 31,
2012 | | Net Change in
Unrealized Gains/(Losses)
of Level 3 Assets Held as of
December 31, 2012 Included
in Statement of Operations | |
All America Fund - Active Common Stock | | — | | — | | $ | 810,576 | | $ | (810,576 | ) | — | | — | |
Small Cap Value Fund - Common Stock | | — | | — | | $ | 4,725,984 | | $ | (4,725,984 | ) | — | | — | |
(a) Reflects transfers into Level 3 from Level 2 as a result of a security being carried at a calculated fair value due to the absence of recent trading activity in the security, as described in Security Valuation below.
(b) Reflects transfers into Level 2 as a result of a security no longer being carried at a calculated fair value due to a recent trade, as further described under Security Valuation below. Also reflects the transfer of common stock of NBH Holdings Co. from Level 3 to Level 1 as a result of the security commencing trading on a public exchange. The market value of this security as of December 31, 2011 was $270,192 in the All America Fund and $1,575,328 in the Small Cap Value Fund, respectively.
During the year ended December 31, 2012, there were no transfers of securities between Level 1 and Level 2.
In May 2011, the FASB issued ASU No. 2011-04, “Fair Value Measurements (Topic 820) — Amendments to Achieve Common Fair Value Measurement and Disclosure Requirements in U.S. GAAP and IFRSs” (“ASU No. 2011-04”). ASU No. 2011-04 requires additional disclosures regarding fair value measurements in financial statements of interim and annual periods beginning after December 15, 2011. The discussion under Security Valuation, below, reflects these additional disclosures.
Security Valuation — Investment securities are carried at fair value as follows:
Exchange-traded equity securities are valued at the last sales price on the principal exchange on which the security is traded. If there is no trading volume for a particular valuation day, the last bid price is used. For equity securities traded in the over-the-counter market, the security is valued at the last sale price, or if no sale, at the latest bid price available.
Short-term debt securities with a maturity of 60 days or less are valued at amortized cost, which approximates fair value for such securities.
Debt securities, including short-term debt securities maturing in excess of 60 days, are valued on the basis of prices obtained from an independent pricing source. The pricing source may utilize various pricing methodologies that incorporate both models (which consider factors such as yield, quality, coupon rate, maturity, issue type, quoted prices for similar securities, prepayment speeds and trading characteristics) and dealer supplied valuations to derive a valuation.
In the rare instance when a price is not available from an independent pricing source or when prices may not reflect fair value, such as when the price porvided by the pricing source is not based on a recent trade, a calculated fair value is used, as determined in good faith by the Adviser and reviewed by a Valuation Committee, in accordance with procedures adopted by the Board of Directors of the Investment Company.
The Advisor uses a market approach to calculate fair value for equity securities which are categorized as Level 3. The Adviser’s valuation is primarily based on information regarding the specific equity issuer, such as the last trade price, financial statements, the relationship of per-share book value to the last trade price, operating information and any corporate actions, such as dividends or returns of capital, that may have occurred since the last trade. The Adviser also considers industry-specific conditions and overall market conditions, to determine whether the last trade price reflects fair value or needs to be adjusted. Generally, absent any significant contrary indications, the last trade price will be used to calculate fair value.
Retirement Funds and the Allocation Funds value their investments in the underlying Funds of the Investment Company at their respective net asset values.
Investment Transactions — Investment transactions are accounted for as of the trade date. Realized gain and loss on the sale of short and long-term debt securities are computed on the basis of amortized cost at the time of sale. Realized gains and losses on the sale of equity securities are based on the identified cost basis of the security, determined on the first-in, first-out (“FIFO”) basis.
Futures Contracts - The Equity Index Fund, Mid-Cap Equity Index Fund and a portion of the All America Fund each maintain indexed asset portfolios which are subject to equity price risk. In order to remain more fully invested in the equity markets while minimizing transaction costs, the funds purchase stock index futures contracts. An initial cash margin deposit (represented by cash or Treasury bills) is made upon entering into a futures contract and serves as collateral for the contract. This initial margin, maintained in a segregated account, is equal to approximately 5%-6% of the contract amount, and does not involve the borrowing of funds to finance the transaction. During the period the futures contract is outstanding, changes in the value of the contract are recognized as unrealized gains or losses by “marking-to-market” on a daily basis to reflect the market value of the contract at the end of each trading day. The accumulated unrealized gain or loss on the contract is included in Net Unrealized Appreciation (Depreciation) of Investments in the Components of Net Assets section of the Statement of Assets and Liabilities.
Futures contracts are valued at the settlement price established each day by the exchange on which traded. Depending upon whether unrealized gains or losses are incurred, variation margin payments are received or made daily. The net change in unrealized appreciation or depreciation of futures contracts is recorded in the Statement of Operations. When the contract is closed, a realized gain or loss from futures transactions is recorded in the Statement of Operations, equal to the net variation margin received or paid over the period the contract was outstanding. The “Underlying Face Amount at Value” (appearing in the “Notes to the Summary Portfolios of Investments in Securities”), representing the aggregate of outstanding contractual amounts under futures contracts, reflects the extent of a Fund’s exposure to off-balance sheet risk. The use of futures transactions involves the risk of imperfect correlation in the price movements of the contract and the underlying securities. With futures contracts, there is minimal counterparty credit risk to the Fund since futures are exchange traded and the exchange’s clearinghouse, as counterparty to all exchange traded futures, guarantees the futures against default.
Tax Information - The components of net unrealized appreciation (depreciation) of investments for Federal income tax purposes and the cost of investments for Federal income tax purposes at December 31, 2012 for each of the funds were as follows.
| | Equity Index
Fund | | All America
Fund | | Small Cap
Value Fund | | Small Cap
Growth | | Mid Cap
Value Fund | |
Unrealized Appreciation | | $ | 305,202,913 | | $ | 49,848,619 | | $ | 68,151,790 | | $ | 45,013,158 | | $ | 9,007,613 | |
Unrealized Depreciation | | (67,963,152 | ) | (19,282,304 | ) | (9,018,338 | ) | (11,892,714 | ) | (3,328,101 | ) |
Net | | $ | 237,239,761 | | $ | 30,566,315 | | $ | 59,133,452 | | $ | 33,120,444 | | $ | 5,679,512 | |
Cost of Investments | | $ | 869,250,719 | | $ | 225,019,816 | | $ | 231,047,955 | | $ | 238,959,596 | | $ | 47,444,264 | |
| | Mid-Cap
Equity Index
Fund | | International
Fund | | Composite
Fund | | Retirement
Income
Fund | | 2010
Retirement
Fund | |
Unrealized Appreciation | | $ | 135,724,570 | | $ | 5,988,070 | | $ | 24,976,539 | | $ | 1,518,105 | | $ | 1,569,552 | |
Unrealized Depreciation | | (36,606,606 | ) | (1,703,855 | ) | (4,272,189 | ) | (5,884 | ) | (123,861 | ) |
Net | | $ | 99,117,964 | | $ | 4,284,215 | | $ | 20,704,350 | | $ | 1,512,221 | | $ | 1,445,691 | |
Cost of Investments | | $ | 510,073,284 | | $ | 109,695,886 | | $ | 148,314,633 | | $ | 29,731,154 | | $ | 20,007,032 | |
| | 2015
Retirement
Fund | | 2020
Retirement
Fund | | 2025
Retirement
Fund | | 2030
Retirement
Fund | | 2035
Retirement
Fund | |
Unrealized Appreciation | | $ | 11,251,005 | | $ | 18,573,460 | | $ | 19,492,887 | | $ | 17,537,770 | | $ | 14,606,722 | |
Unrealized Depreciation | | (1,529,805 | ) | (1,785,234 | ) | (1,109,298 | ) | (978,990 | ) | (679,380 | ) |
Net | | $ | 9,721,200 | | $ | 16,788,226 | | $ | 18,383,589 | | $ | 16,558,780 | | $ | 13,927,342 | |
Cost of Investments | | $ | 102,616,505 | | $ | 152,243,068 | | $ | 143,387,881 | | $ | 116,714,556 | | $ | 92,771,946 | |
| | 2040
Retirement
Fund | | 2045
Retirement
Fund | | 2050
Retirement
Fund | | Conservative
Allocation
Fund | | Moderate
Allocation
Fund | |
Unrealized Appreciation | | $ | 13,277,493 | | $ | 16,295,953 | | $ | 37,172 | | $ | 6,565,588 | | $ | 32,056,967 | |
Unrealized Depreciation | | (458,222 | ) | (506,961 | ) | — | | (583,176 | ) | (7,520,615 | ) |
Net | | $ | 12,819,271 | | $ | 15,788,992 | | $ | 37,172 | | $ | 5,982,412 | | $ | 24,536,352 | |
Cost of Investments | | $ | 81,172,363 | | $ | 102,529,483 | | $ | 2,080,019 | | $ | 80,377,494 | | $ | 200,668,838 | |
| | Aggressive
Allocation
Fund | | Money
Market
Fund | | Mid-Term
Bond Fund | | Bond
Fund | |
Unrealized Appreciation | | $ | 28,931,727 | | $ | 494 | | $ | 22,274,497 | | $ | 41,771,088 | |
Unrealized Depreciation | | (4,671,217 | ) | (111 | ) | (220,196 | ) | (1,214,578 | ) |
Net | | $ | 24,260,510 | | $ | 383 | | $ | 22,054,301 | | $ | 40,556,510 | |
Cost of Investments | | $ | 162,656,646 | | $ | 89,933,391 | | $ | 362,680,635 | | $ | 707,356,702 | |
(b) Not applicable.
ITEM 7. DISCLOSURE OF PROXY VOTING POLICIES AND PROCEDURES FOR CLOSED-END MANAGEMENT INVESTMENT COMPANIES.
Not applicable.
ITEM 8. PORTFOLIO MANAGERS OF CLOSED-END MANAGEMENT INVESTMENT COMPANIES.
Not applicable.
ITEM 9. PURCHASES OF EQUITY SECURITES BY CLOSED-END MANAGEMENT INVESTMENT COMPANY AND AFFILIATED PURCHASERS.
Not applicable.
ITEM 10. SUBMISSION OF MATTERS TO A VOTE OF SECURITY HOLDERS.
Not applicable.
ITEM 11. CONTROLS AND PROCEDURES.
(a) The registrant’s principal executive officer and principal financial officer have evaluated the registrant’s disclosure controls and procedures within 90 days of this filing and have concluded that the registrant’s disclosure controls and procedures were effective, as of that date, in ensuring that information required to be disclosed by the registrant in this Form N-CSR was recorded, processed, summarized, and reported in a timely and accurate manner.
(b) The registrant’s principal executive officer and principal financial officer are aware of no changes in the registrant’s internal control over financial reporting that occurred during the second fiscal quarter of the period covered by this report that has materially affected, or is likely to materially affect, the registrant’s internal control over financial reporting.
ITEM 12. EXHIBITS.
Attached hereto:
(a) | (1) Not applicable. | |
| | |
| (2) Exhibit 99.CERT | Certifications by the registrant’s principal executive officer and principal financial officer, pursuant to Section 302 of |
| | the Sarbanes-Oxley Act of 2002 and required by Rule 30a-2(a) under the Investment Company Act of 1940. |
| (3) Not applicable. | |
| | |
(b) | Exhibit 99.906CERT | Certifications pursuant to Section 906 of the Sarbanes-Oxley Act of 2002 and required by Rule 30a-2(b) under the Investment Company Act of 1940. |
| | |
| Exhibit 99.REPT | Report of Independent Registered Public Accounting Firm |
SIGNATURES
Pursuant to the requirements of the Securities Exchange Act of 1934 and the Investment Company Act of 1940, the registrant has duly caused this report to be signed on its behalf by the undersigned, thereunto duly authorized.
| Mutual of America Investment Corporation | |
| |
By: | /s/ JOHN R. GREED | |
| John R. Greed | |
| Chairman, | |
| President and Chief Executive Officer of | |
| Mutual of America Investment Corporation | |
| |
Date: March 7, 2013 | |
Pursuant to the requirements of the Securities Exchange Act of 1934 and the Investment Company Act of 1940, this report has been signed below by the following persons on behalf of the registrant and in the capacities and on the dates indicated.
By: | /s/ JOHN R. GREED | |
| John R. Greed | |
| Chairman, | |
| President and Chief Executive Officer of | |
| Mutual of America Investment Corporation | |
| | |
Date: March 7, 2013 | |
| | |
By: | /s/ GEORGE L. MEDLIN | |
| George L. Medlin | |
| Executive Vice President, | |
| Chief Financial Officer and Treasurer of | |
| Mutual of America Investment Corporation | |
| |
Date: March 7, 2013 | |