UNITED STATES
SECURITIES AND EXCHANGE COMMISSION
Washington, D.C. 20549
FORM N-CSR
CERTIFIED SHAREHOLDER REPORT OF REGISTERED MANAGEMENT INVESTMENT
COMPANIES
Investment Company Act file number 811-05084
Mutual of America Investment Corporation
(Exact name of registrant as specified in charter)
320 Park Avenue, New York, N.Y. 10022
(Address of principal executive offices) (Zip code)
John R. Greed
Senior Executive Vice President and Chief Financial Officer
Mutual of America Life Insurance Company
320 Park Avenue
New York, NY 10022
(Name and address of agents for service)
Registrant’s telephone number, including area code: (212) 224-1600
Date of fiscal year end: December 31
Date of reporting period: December 31, 2014
ITEM 1. REPORTS TO STOCKHOLDERS.
The Annual Report to Shareholders follows:
DECEMBER 31, 2014
Annual Reports of Investment Options Offered by Mutual of America Life Insurance Company
This report is not to be construed as an offering for sale of any Variable Policy. No offering is made except in conjunction with a prospectus which must precede or accompany this report.


320 PARK AVENUE
NEW YORK NY 10022-6839
February 2015
Dear Contract Owner,
As a valued variable annuity owner, we are pleased to provide you with the annual fund reports for the investment options you have selected. Included in this booklet are the annual reports of the Mutual of America Investment Corporation Funds. If you have also selected other investments options, you will receive annual reports for those funds in a separate booklet or booklets. The reports provide an update on each portfolio’s performance as of December 31, 2014. Please note that portfolio performance does not take into account the fees charged by the contract. If these fees had been included, the fund’s performance would have been lower. As always, past performance cannot predict or guarantee future returns.
Mutual of America has specialized in providing retirement products and related services to organizations and their employees, as well as individuals, for 70 years. As a mutual company, we do not have stockholders and are not publicly traded. We operate solely for the benefit of our customers, managing the Company for their long-term interest, rather than for the short-term demands of stockholders. Today, as in the past, Mutual of America remains financially strong and is rated among the strongest companies in the life insurance industry by the major independent rating agencies.*
Since 1945, Mutual of America has remained committed to offering plan sponsors, plan participants and individuals carefully selected, quality products and services at a competitive price and personal attention they need to help build and preserve assets for a financially secure future. Integrity, prudence, and reliability are the values that have guided us since our inception and that continue to serve us well.
We hope you will find the enclosed information helpful. We appreciate and value your business and look forward to serving you in the future. If you have any questions, please call your local Mutual of America Regional Office or 1-800-468-3785.
Sincerely,
Mutual of America Life Insurance Company
| * | While these ratings do not apply to the safety or investment performance of the Separate Account investment funds available under Mutual of America’s products, they do reflect the Company’s ability to fulfill its General Account obligations, which include its obligations under the Interest Accumulation Account, annuity purchase rate guarantees and annuity benefit payouts, as well as life insurance and disability income payments. Third party ratings are subject to change. |
DECEMBER 31, 2014
Annual Reports of Mutual of America Investment Corporation
This report is not to be construed as an offering for sale of any Variable Policy. No offering is made except in conjunction with a prospectus which must precede or accompany this report.

(This page has been left blank intentionally.)
CONTENTS
(This page has been left blank intentionally.)
MUTUALOF AMERICA INVESTMENT CORPORATION
We are pleased to present the Mutual of America Investment Corporation (the “Investment Company”) Annual Report. This Report includes important information regarding the performance and financial position of the Investment Company’s funds for the year ended December 31, 2014.
The S&P 500® Index (S&P 500) generated a total return of 13.7% for the year, ahead of expectations at the beginning of year of 8-10%. In doing so, the index set 53 new all-time highs, surpassed in only two prior years, 1964 and 1998. Domestically, only the mid-cap indexes beat the S&P 500, and U.S. stocks in general outperformed all major non-domestic equity indexes.
It was also an extremely good year for the performance of U.S. bonds, especially U.S. Treasury securities with maturities over 10 years, which generated a total return of 17.1%. All U.S. Treasury securities posted total returns of 5.1% in aggregate, while investment grade bonds produced returns of 7.5%. Domestic high-yield bonds did not fare as well, returning only 2.5%, and spreads widened during the last several months of the year as a variety of uncertainties, more fully discussed below, were reflected more immediately in these riskier issues. Compared to non-domestic bond markets, U.S. bonds came in at the middle of the pack in aggregate.
The outperformance of U.S. stocks was based on clear improvement in domestic economic fundamentals, especially in comparison to deterioration in most other economies of the world. Europe remained on the verge of recession, China continued to struggle to maintain growth in the mid-7% range after twenty years of double-digit growth and nations dependent on commodity exports struggled with excess supply in the face of falling demand from China.
With regard to the U.S. economy specifically, signs of accelerating growth began to appear following the weather-impacted first quarter, which experienced a decline in GDP growth of -2.1%. However, GDP growth in the second and third quarters was 4.6% and 5.0%, respectively, with current expectations of a 2.8% gain in the fourth quarter. All key components of GDP except net exports, namely, consumption, investment, and government, made positive contributions in the second quarter, and all four contributed positively in the third quarter.
In particular, consumer spending has been running at a year-over-year monthly rate of 4.0% in 2014, up from the mid-3.0% range in 2012 and 2013. Business investment spending has been accelerating for the past seven quarters. Government spending has stopped detracting from overall growth. In fact, because the pace of spending cuts have been diminishing, annual federal budget deficits have more than halved since their peak in 2009, having shrunk from over 10% of GDP to less than 3%.
The most important set of economic statistics for driving future growth are those pertaining to labor. The key headline data point highlighting U.S. economic improvement is the fact that the unemployment rate has declined from a peak of 10.0% in October, 2009 to 5.6% in December, 2014, not far from the average lows of 4.6% in 2006 and 2007. Driving this improvement has been the addition of an average 225,000 new jobs per month during 2014. However, despite the fact that all jobs lost in the financial crisis of 2008 — 2009 have been replaced, there is still little indication that wages have begun to improve. Growth in the labor force is of course good for consumer spending because it adds income to the national aggregate, but wage increases are necessary for consumers to keep up with the rising cost of living and have the confidence to spend rather than save. The recent drop in gasoline prices likely will be a big help, especially for lower wage earners whose gasoline bills constitute a greater portion of their overall income. It is estimated that at the current national average price per gallon of gasoline, the incremental dollars saved across the economy could run as high as between $200-$350 billion dollars on an annual basis, representing 2.0% of current nominal GDP.
The conclusion: the U.S. economy is healing and prospects for further improvement are good. There has been concern expressed that the U.S. will not be able to sustain continued improvement in growth if the rest of the world stagnates. However, the U.S. economy is a closed economy, with exports representing less than 15% of total GDP, the lowest export share of any major or minor economy in the world, while consumption constitutes nearly 70%. In addition, even though our imports as a percent of GDP, at about 17%, is also among the lowest in the world, the size of our economy, which will continue to grow, means that we spend more on imported goods than any other nation. Thus, U.S. growth should positively impact economies around the world. The recent relative appreciation of the dollar should also increase our import expenditures, further assisting export dominated nations with which we trade.
Of course, there are always concerns. One of the most significant is what impact the Federal Reserve’s impending initiation of interest rate increases will have on the world’s economic and financial system. No one knows.
The most recent set of uncertainties to arise is what will be the impact of the rapid and dramatic collapse in oil prices, a global trend toward deflation, and the increase in the relative value of the U.S. dollar. Stir into this mix the seeming explosion of geopolitical risk (Ukraine, ISIS, cyber-attacks, Greece) and it becomes extremely difficult to come up with a most likely scenario.
1
Compounding the problem is that each of these changes sets in motion responses, which in turn spawn counter responses. We have already seen currency devaluations in response to a stronger dollar, the most dramatic of which being the 16% decline in the relative value of the euro in response to interest rate cuts over the past six months and the announcement that the European Central Bank (ECB) will begin a massive quantitative easing program. This coupled with the prospect of rising U.S. policy rates has prompted sales of euro denominated bonds and purchases of U.S. Treasury securities, with the consequence that the 10-year U.S. Treasury Note yields under 2%, near historical lows.
Nevertheless, we have witnessed over the past six years successful negotiation of seemingly intractable problems (European Sovereign Bond Crisis, U.S. Treasury Budget Crisis, the collapse of global commodity prices, interest rate and currency shocks, etc.). We expect the same going forward.
The combination of Japanese and now Eurozone quantitative easing are expected to inject three times the liquidity into the global financial system in 2015 than was added by the Federal Reserve during its nine month tapering phase which just ended. The 50% decline in the price of oil since last June will reduce costs and stimulate spending, especially in the United States, but also in most nations, despite the strength in the relative value of the dollar. China, Europe, and Japan, the three largest economic entities in the world after the United States, are all net importers of oil. And as noted previously, improving consumer and business fundamentals coupled with a stronger dollar should prompt greater import expenditures, serving to drive growth in exporting nations.
This potential for slow but eventual improvement in global economic and financial fundamentals should continue to be supportive of stock price appreciation, not necessarily robust or without setbacks and volatility, but in our estimation, the trajectory should be up at least over the next two years.
The total return performance (net of investment management and other operating expenses) for each of the Investment Company Funds is reflected below:
| | | | |
| Total Returns — Year Ended December 31, 2014 | |
| |
Equity Index Fund | | | +13.49% | |
All America Fund | | | +11.16% | |
Small Cap Value Fund | | | + 5.17% | |
Small Cap Growth Fund | | | + 5.70% | |
Mid Cap Value Fund | | | +13.82% | |
Mid-Cap Equity Index Fund | | | + 9.63% | |
International Fund | | | - 6.03% | |
Composite Fund | | | + 9.10% | |
Retirement Income Fund | | | + 6.50% | |
2010 Retirement Fund | | | + 6.93% | |
2015 Retirement Fund | | | + 7.16% | |
2020 Retirement Fund | | | + 7.36% | |
2025 Retirement Fund | | | + 8.00% | |
2030 Retirement Fund | | | + 8.44% | |
2035 Retirement Fund | | | + 8.26% | |
2040 Retirement Fund | | | + 7.71% | |
2045 Retirement Fund | | | + 7.36% | |
2050 Retirement Fund | | | + 7.15% | |
Conservative Allocation Fund | | | + 6.62% | |
Moderate Allocation Fund | | | + 7.71% | |
Aggressive Allocation Fund | | | + 7.66% | |
Money Market Fund | | | - 0.14% | |
Mid-Term Bond Fund | | | + 3.22% | |
Bond Fund | | | + 6.31% | |
The above performance figures do not reflect the deduction of respective Separate Account fees and expenses imposed by Mutual of America Life Insurance Company. All Fund performances presented throughout this report are historical, reflect the full reinvestment of dividends paid, and should not be considered indicative of future results.
2
The pages that immediately follow include brief discussions of each Fund’s performance for the year ended December 31, 2014, compared with its relevant index. Also presented are graphs and tables for each Fund (except for the Money Market Fund) that illustrates each Fund’s respective:
| | — | | Historical total return achieved over specific periods, expressed as an average annual rate and as a cumulative rate; |
| | — | | Value in dollars of a $10,000 hypothetical investment at the beginning of each specified period; and |
| | — | | Historical performance compared to an appropriate index. |
Following the discussions are the graphical representations of the asset allocations of each Fund and an illustration of each Fund’s operating expenses. The summarized portfolios of each Fund and financial statements are presented in the pages that follow.
Thank you for your continued investment in our Funds.
Sincerely,

John R. Greed
Chairman of the Board, President
and Chief Executive Officer
Mutual of America Investment Corporation
The views expressed in this Annual Report are subject to change at any time based on market and other conditions and should not be construed as a recommendation. This Report contains forward looking statements which speak only as of the date they were made and involve a number of risks and uncertainties that could cause actual results to differ materially from those expressed herein. Readers are cautioned not to place undue reliance on our forward-looking statements, as we assume no obligation to update these forward-looking statements. Readers assume any and all responsibility for any investment decision made as a result of the views expressed herein.
3
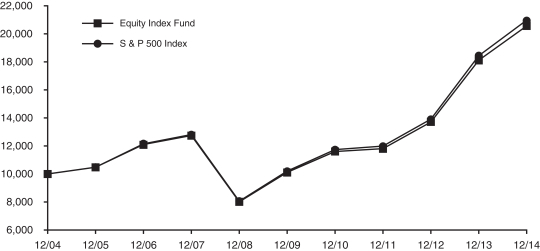
EQUITY INDEX FUND
The Equity Index Fund’s objective is to replicate the performance of the S&P 500® Index (S&P 500), which consists of 500 stocks chosen by Standard & Poor’s for market size, liquidity and industry group representation. The S&P 500 is a market-weighted index of 500 stocks traded on the New York Stock Exchange, American Stock Exchange and NASDAQ, with each stock’s weight in the index proportionate to its market value. The weightings make each company’s influence on the S&P 500’s performance directly proportional to that company’s market value.
The S&P 500 ended the year strong, returning 13.69% including dividends. The S&P 500 closed 2014 at its all-time high level on December 29, 2014. In the second half of the year, most of the positive returns came during the fourth quarter as the index rose 4.9%. For the year, the Energy sector had the worst performance, -7.6% amid a stronger dollar and falling oil, while Health Care and Utilities were the best performing sectors in 2014, returning 28.7% and 25.4%, respectively.
The Equity Index Fund’s performance for the year ended December 31, 2014, was 13.66% before expenses and 13.49% after expenses, in line with the benchmark return of 13.69%. Note that the Equity Index Fund’s performance includes expenses, such as transaction costs and management fees, which are not applicable to the benchmark.
GROWTH OF A $10,000 INVESTMENT
| | | | | | | | | | | | |
Equity Index Fund | |
Period
Ended
12/31/14 | | Growth
of
$10,000 | | | Total Return | |
| | Cumu-
lative | | | Average
Annual | |
1 Year | | | $11,350 | | | | 13.49% | | | | 13.49% | |
5 Years | | | $20,295 | | | | 102.95% | | | | 15.20% | |
10 Years | | | $20,536 | | | | 105.36% | | | | 7.46% | |
| | | | | | | | | | | | |
S & P 500 Index | |
Period
Ended
12/31/14 | | Growth
of
$10,000 | | | Total Return | |
| | Cumu-
lative | | | Average
Annual | |
1 Year | | | $11,369 | | | | 13.69% | | | | 13.69% | |
5 Years | | | $20,512 | | | | 105.12% | | | | 15.45% | |
10 Years | | | $20,942 | | | | 109.42% | | | | 7.67% | |
The line representing the performance return of the Equity Index Fund includes expenses, such as transaction costs and management fees that reduce returns, while the performance return line of the Index does not. Past performance is not indicative of future results.
4
ALL AMERICA FUND
The investment objective of the All America Fund is to outperform the S&P 500® Index (S&P 500). The All America Fund is approximately 60% invested in the 500 stocks that comprise the S&P 500, with the remaining 40% actively managed, using three different investment approaches. The actively managed portion of the All America Fund is close to being equally distributed between large cap stocks and small cap stocks, with the small cap stocks in turn equally distributed between small cap value and small cap growth stocks.
For the year ended December 31, 2014, the S&P 500 of large capitalization stocks increased by 13.69% on a total return basis, while the Russell 2000® Growth Index was up 5.60% and the Russell 2000® Value Index was up 4.22%.
The All America Fund’s return for the year ended December 31, 2014, before expenses was 11.65% and 11.16% after expenses versus the benchmark return of 13.69%. The under-performance of the Fund was the result of under-performance by the Small Cap Growth, Small Cap Value, Active Large Cap and Equity Index components of the Fund, the latter by only 3 basis points.
GROWTH OF A $10,000 INVESTMENT

| | | | | | | | | | | | |
All America Fund | |
Period
Ended
12/31/14 | | Growth
of
$10,000 | | | Total Return | |
| | Cumu-
lative | | | Average
Annual | |
1 Year | | | $11,117 | | | | 11.16% | | | | 11.16% | |
5 Years | | | $19,895 | | | | 98.95% | | | | 14.74% | |
10 Years | | | $20,131 | | | | 101.31% | | | | 7.24% | |
| | | | | | | | | | | | |
S & P 500 INDEX | |
Period
Ended
12/31/14 | | Growth
of
$10,000 | | | Total Return | |
| | Cumu-
lative | | | Average
Annual | |
1 Year | | | $11,369 | | | | 13.69% | | | | 13.69% | |
5 Years | | | $20,512 | | | | 105.12% | | | | 15.45% | |
10 Years | | | $20,942 | | | | 109.42% | | | | 7.67% | |
The line representing the performance return of the All America Fund includes expenses, such as transaction costs and management fees that reduce returns, while the performance return line of the Index does not. Past performance is not indicative of future results.
5
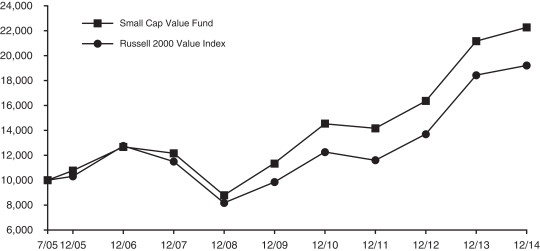
SMALL CAP VALUE FUND
The investment objective of the Small Cap Value Fund is to outperform the Russell 2000® Value Index. The Small Cap Value Fund generally invests in companies that are below $3 billion in market capitalization and have lower price-to-book characteristics than the overall market.
For the year ended December 31, 2014, the Small Cap Value Fund returned 6.01% before expenses and 5.17% after expenses versus a 4.22% return for the Russell 2000 Value Index. Within the benchmark, the best performing sectors were Utilities and Real Estate Investment Trusts (REITs) while the worst performing sectors were Energy and Basic Materials.
Stock selection was the primary driver of positive performance versus the benchmark. Sectors contributing to Fund performance included Industrials and Consumer Cyclicals, while sectors detracting from Fund performance included Energy and Retail.
GROWTH OF A $10,000 INVESTMENT
| | | | | | | | | | | | |
Small Cap Value Fund | |
Period
Ended
12/31/14 | | Growth
of
$10,000 | | | Total Return | |
| | Cumu-
lative | | | Average
Annual | |
1 Year | | | $10,520 | | | | 5.17% | | | | 5.17% | |
5 Years | | | $19,571 | | | | 95.71% | | | | 14.36% | |
Since 7/1/05 (Inception) | | | $22,225 | | | | 122.25% | | | | 8.76% | |
| | | | | | | | | | | | |
Russell 2000 Value Index | |
Period
Ended
12/31/14 | | Growth
of
$10,000 | | | Total Return | |
| | Cumu-
lative | | | Average
Annual | |
1 Year | | | $10,422 | | | | 4.22% | | | | 4.22% | |
5 Years | | | $19,471 | | | | 94.71% | | | | 14.26% | |
Since 7/1/05 (Inception) | | | $19,185 | | | | 91.85% | | | | 7.10% | |
The line representing the performance return of the Small Cap Value Fund includes expenses, such as transaction costs and management fees that reduce returns, while the performance return line of the Index does not. Past performance is not indicative of future results.
6
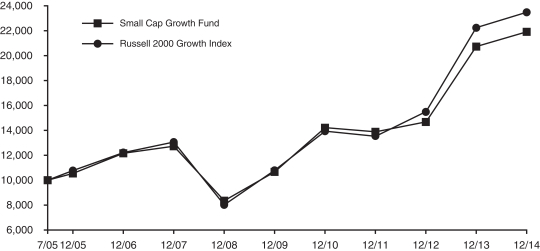
SMALL CAP GROWTH FUND
The investment objective of the Small Cap Growth Fund is capital appreciation. The Small Cap Growth Fund invests in growth stocks within the small capitalization marketplace. The Fund returned 6.54% before expenses and 5.70% after expenses during the year ended December 31, 2014. The Fund’s benchmark, the Russell 2000® Growth Index, returned 5.60% for the period.
The small capitalization market sector produced single digit returns for calendar year 2014. Stock selection was the primary driver of positive out performance during the calendar year for the Fund. Our exposure to REITs, Biotechnology and Pharmaceuticals were all beneficial to the Fund as these industries had some of the strongest performance in the small capitalization sector.
Most of our outperformance came from the stock selection in the Industrial, Energy and Information Technology sectors which proved to be meaningful relative to our benchmark. Financial and Materials were the sectors where we struggled and were a drag on the Fund.
GROWTH OF A $10,000 INVESTMENT
| | | | | | | | | | | | |
Small Cap Growth Fund | |
Period
Ended
12/31/14 | | Growth
of
$10,000 | | | Total Return | |
| | Cumu-
lative | | | Average
Annual | |
1 Year | | | $10,573 | | | | 5.70% | | | | 5.70% | |
5 Years | | | $20,529 | | | | 105.29% | | | | 15.44% | |
Since 7/1/05 (Inception) | | | $21,876 | | | | 118.76% | | | | 8.57% | |
| | | | | | | | | | | | |
Russell 2000 Growth Index | |
Period
Ended
12/31/14 | | Growth
of
$10,000 | | | Total Return | |
| | Cumu-
lative | | | Average
Annual | |
1 Year | | | $10,560 | | | | 5.60% | | | | 5.60% | |
5 Years | | | $21,732 | | | | 117.32% | | | | 16.80% | |
Since 7/1/05 (Inception) | | | $23,443 | | | | 134.43% | | | | 9.38% | |
The line representing the performance return of the Small Cap Growth Fund includes expenses, such as transaction costs and management fees that reduce returns, while the performance return line of the Index does not. Past performance is not indicative of future results.
7
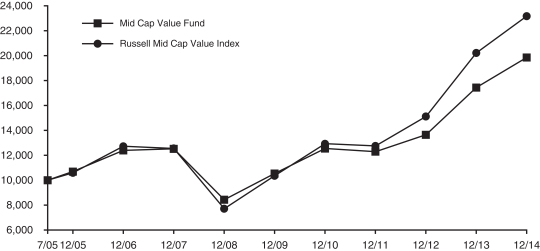
MID CAP VALUE FUND
The investment objective of the Mid Cap Value Fund is to outperform the Russell Midcap® Value Index. The Mid Cap Value Fund generally invests in companies that are between $1 billion and $20 billion in market capitalization and have lower price-to-book characteristics.
For the year ended December 31, 2014, the Mid Cap Value Fund returned 14.46% before expenses and 13.82% after expenses versus a 14.75% return for the Russell Midcap Value Index. Within the benchmark, the best performing sectors were REITs and Utilities while the worst performing sectors were Energy and Basic Materials.
Stock selection was the primary driver of in-line performance versus the benchmark while sector allocation detracted from performance. Sectors contributing to Mid Cap Value Fund performance included Industrials and Consumer Staples while sectors detracting from Fund performance included Technology and Energy.
GROWTH OF A $10,000 INVESTMENT
| | | | | | | | | | | | |
Mid Cap Value Fund | |
Period
Ended
12/31/14 | | Growth
of
$10,000 | | | Total Return | |
| | Cumu-
lative | | | Average
Annual | |
1 Year | | | $11,383 | | | | 13.82% | | | | 13.82% | |
5 Years | | | $18,797 | | | | 87.97% | | | | 13.43% | |
Since 7/1/05 (Inception) | | | $19,824 | | | | 98.24% | | | | 7.45% | |
| | | | | | | | | | | | |
Russell Mid Cap Value Index | |
Period
Ended
12/31/14 | | Growth
of
$10,000 | | | Total Return | |
| | Cumu-
lative | | | Average
Annual | |
1 Year | | | $11,475 | | | | 14.75% | | | | 14.75% | |
5 Years | | | $22,328 | | | | 123.28% | | | | 17.43% | |
Since 7/1/05 (Inception) | | | $23,143 | | | | 131.43% | | | | 9.23% | |
The line representing the performance return of the Mid Cap Value Fund includes expenses, such as transaction costs and management fees that reduce returns, while the performance return line of the Index does not. Past performance is not indicative of future results.
8
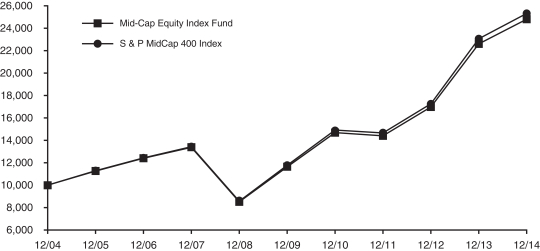
MID-CAP EQUITY INDEX FUND
The Mid-Cap Equity Index Fund invests in the 400 stocks that comprise the S&P MidCap 400® Index (S&P MidCap 400). The S&P MidCap 400 is a market-weighted index of 400 stocks traded on the New York Stock Exchange, American Stock Exchange and NASDAQ. The weightings make each company’s influence on the S&P MidCap 400’s performance directly proportional to that company’s market value. The companies included in the S&P MidCap 400 tend to be typical of this asset class, the medium-capitalized sector of the U.S. securities market.
The S&P MidCap 400 had a strong year ending 2014 up 9.77%. Most of the outperformance in the second half of the year came from the fourth quarter as the index was up 6.4%. Within the S&P MidCap 400, Consumer Staples, Telecommunications and Health Care sectors were up substantially, advancing 35.2%, 24.7%, and 23.7%, respectively. The worst performing sector was Energy as it detracted 25.4% from the index.
The Mid-Cap Equity Index Fund’s performance for the year ended December 31, 2014, was 9.80% before expenses and 9.63% after expenses, in line with the 9.77% return of the S&P MidCap 400. Note that the performance of the Mid-Cap Equity Index Fund includes expenses, such as transaction costs and management fees, which are not applicable to the benchmark.
GROWTH OF A $10,000 INVESTMENT
| | | | | | | | | | | | |
Mid-Cap Equity Index Fund | |
Period
Ended
12/31/14 | | Growth
of
$10,000 | | | Total Return | |
| | Cumu-
lative | | | Average
Annual | |
1 Year | | | $10,964 | | | | 9.63% | | | | 9.63% | |
5 Years | | | $21,295 | | | | 112.95% | | | | 16.31% | |
10 Years | | | $24,741 | | | | 147.41% | | | | 9.47% | |
| | | | | | | | | | | | |
S & P MidCap 400 Index | |
Period
Ended
12/31/14 | | Growth
of
$10,000 | | | Total Return | |
| | Cumu-
lative | | | Average
Annual | |
1 Year | | | $10,977 | | | | 9.77% | | | | 9.77% | |
5 Years | | | $21,497 | | | | 114.97% | | | | 16.54% | |
10 Years | | | $25,253 | | | | 152.53% | | | | 9.71% | |
The line representing the performance return of the Mid-Cap Equity Index Fund includes expenses, such as transaction costs and management fees that reduce returns, while the performance return line of the Index does not. Past performance is not indicative of future results.
9
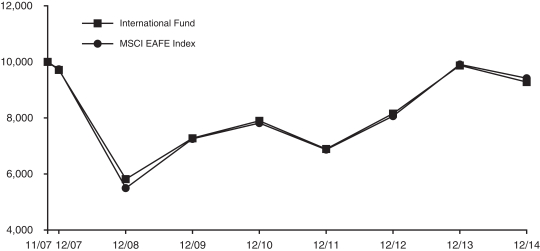
INTERNATIONAL FUND
The International Fund seeks capital appreciation by investing, directly or indirectly, in stocks of companies located outside of the United States that are reflected or contained in the Morgan Stanley Capital International, Inc. Europe, Australasia and Far East® Index (MSCI EAFE® Index). Currently the International Fund is invested mainly in exchange traded funds that reflect the MSCI EAFE Index. The Fund also has invested a small percentage of assets in exchange traded funds that provide exposure to emerging markets and to companies with small market capitalizations in developed market countries.
For the year ended December 31, 2014, the International Fund returned -5.86% before expenses and -6.03% after expenses, underperforming the -4.90% return of the benchmark. The fund’s benchmark closes earlier in the day than the actual market for the fund’s investments. This time lag can result in both positive and negative performance differences. During the fourth quarter the fund added exposure to two new exchange traded funds that invest all of their assets in common stocks of countries that are included in the MSCI EAFE® Index.
GROWTH OF A $10,000 INVESTMENT
| | | | | | | | | | | | |
International Fund | |
Period
Ended
12/31/14 | | Growth
of
$10,000 | | | Total Return | |
| | Cumu-
lative | | | Average
Annual | |
1 Year | | | $9,397 | | | | -6.03% | | | | -6.03% | |
5 Years | | | $12,729 | | | | 27.29% | | | | 4.94% | |
Since 11/5/07 (Inception) | | | $9,275 | | | | -7.25% | | | | -1.05% | |
| | | | | | | | | | | | |
MSCI EAFE Index | |
Period
Ended
12/31/14 | | Growth
of
$10,000 | | | Total Return | |
| | Cumu-
lative | | | Average
Annual | |
1 Year | | | $9,510 | | | | -4.90% | | | | -4.90% | |
5 Years | | | $12,967 | | | | 29.67% | | | | 5.33% | |
Since 11/5/07 (Inception) | | | $9,414 | | | | -5.86% | | | | -0.85% | |
The line representing the performance return of the International Fund includes expenses, such as transaction costs and management fees that reduce returns, while the performance return line of the Index does not. Past performance is not indicative of future results.
10
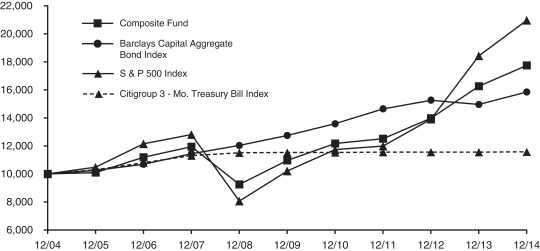
COMPOSITE FUND
For the year ended December 31, 2014, the fixed income portion of the Fund had a total return of 7.22% before expenses, compared to the Barclays Capital Aggregate Bond Index, which returned 5.97% for the period. The fixed income portion of the Fund focused on income and capital preservation.
The Federal Reserve emphasized low short-term rates throughout 2014. Their belief was that this policy would stimulate the economy without causing excessive inflation, re-liquefy the banking system, and support the mortgage market. For example, 30-Day Treasury Bill yields began and ended the year at one basis point. One year Treasury Bill yields did increase somewhat during the year, but not by a meaningful amount. They began the year at 16 basis points and ended at 29 basis points.
The yields of intermediate and longer dated issues declined throughout the year in response to Federal Reserve market intervention and a lack of reasonable alternatives by the international investing community. For example, ten year Treasury Notes ended 2013 at 3.03%, fell to 2.53% by the end of the Second Quarter and ended the year at 2.17%. Thirty-year Treasury Bonds exhibited a similar pattern falling to 2.75% from 3.97% at year-end 2013, and 3.36% at the end of June. As a result, fixed income returns were positive year-over-year.
Yield spreads between corporate and Treasury Bonds narrowed during the first three Quarters of 2014, then began to widen into year-end. As a result, 7-10 year spreads generally widened by 11 basis points year-over-year and longer corporates widened by 33 basis points. This was not enough to off-set the favorable performance impact of lower gross yields, so the net performance result was positive on an annual basis.
The Composite Fund’s fixed income strategy was to maintain a similar maturity profile to the Barclays Capital U.S. Aggregate Bond Index with an overweighting of BBB issuers, who now comprise nearly one-half of the investment grade corporate bond market. Intermediate maturities were also emphasized, as was extreme diversification among issuers. This was done to protect the Fund from unexpected credit events, so very few holdings exceeded one-half of one percent of the Fund’s value. Fortunately, the extreme diversification has proven unnecessary, but it will be maintained going forward as part of our risk control.
For the year ended December 31, 2014, the equity portion of the Fund had a total return of 11.54% (before expenses), underperforming the S&P 500 Index by 215 basis points. The primary reason for the underperformance of this portion of the Fund was adverse stock selection in a market in which only 19% of active large cap managers were able to outperform the S&P 500.
The equity portion of the Composite Fund maintains sector weights within plus or minus 100 basis points of the S&P 500 Index and does not take positions in individual stocks with over-weights of more than 200 basis points. This structural discipline produces a relatively low-risk portfolio that emphasizes stock selection based on strong fundamental analysis. The year 2014 was characterized by wide dispersion in sector performance such that outperformance required over-weights in sectors outperforming the benchmark and underweights in underperforming sectors. Our investment style precludes such an investment posture.
For the year ended December 31, 2014, the Composite Fund returned 9.59% before expenses and 9.10% after expenses compared to the weighted benchmark return of 10.56%, 40% of which is based on the Barclays Capital Aggregate Bond Index and 60% of which is based on the S&P 500. All of the underperformance of the Composite Fund was the result of the underperformance of the equity portion of the fund.
GROWTH OF A $10,000 INVESTMENT
| | | | | | | | | | | | |
Composite Fund | |
Period
Ended
12/31/14 | | Growth
of
$10,000 | | | Total Return | |
| | | Cumu-
lative | | | Average
Annual | |
1 Year | | | $10,913 | | | | 9.10% | | | | 9.10% | |
5 Years | | | $16,184 | | | | 61.84% | | | | 10.10% | |
10 Years | | | $17,729 | | | | 77.29% | | | | 5.89% | |
| | | | | | | | | | | | |
S & P 500 Index | |
Period
Ended
12/31/14 | | Growth
of
$10,000 | | | Total Return | |
| | | Cumu-
lative | | | Average
Annual | |
1 Year | | | $11,369 | | | | 13.69% | | | | 13.69% | |
5 Years | | | $20,512 | | | | 105.12% | | | | 15.45% | |
10 Years | | | $20,942 | | | | 109.42% | | | | 7.67% | |
| | | | | | | | | | | | |
Barclays Capital Aggregate Bond Index | |
Period
Ended
12/31/14 | | Growth
of
$10,000 | | | Total Return | |
| | | Cumu-
lative | | | Average
Annual | |
1 Year | | | $10,597 | | | | 5.97% | | | | 5.97% | |
5 Years | | | $12,430 | | | | 24.30% | | | | 4.45% | |
10 Years | | | $15,840 | | | | 58.40% | | | | 4.71% | |
| | | | | | | | | | | | |
Citigroup 3 - Month T-Bill Index | |
Period
Ended
12/31/14 | | Growth
of
$10,000 | | | Total Return | |
| | | Cumu-
lative | | | Average
Annual | |
1 Year | | | $10,004 | | | | 0.04% | | | | 0.04% | |
5 Years | | | $10,036 | | | | 0.36% | | | | 0.07% | |
10 Years | | | $11,565 | | | | 15.65% | | | | 1.47% | |
The line representing the performance return of the Composite Fund includes expenses, such as transaction costs and management fees that reduce returns, while the performance return lines of the Indices do not. Past performance is not indicative of future results.
11
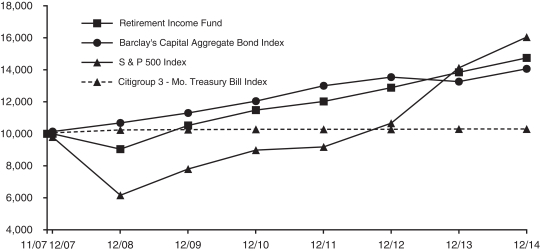
RETIREMENT INCOME FUND
The objective of the Retirement Income Fund is current income consistent with the preservation of capital and, to a lesser extent, capital appreciation. The Retirement Income Fund invests primarily in the fixed-income funds of the Investment Company and also invests in two equity funds of the Investment Company. The Fund’s current target allocation is approximately 75% of net assets in fixed-income funds (approximately 30% in the Bond, 40% in the Mid-Term Bond Funds and 5% in the Money Market Fund) and approximately 25% of net assets in equity funds (20% in the Equity Index Fund and 5% in the Mid-Cap Equity Index Fund).
Performance for the Retirement Income Fund is compared to the Barclays Capital Aggregate Bond Index (70% weighting), the Citigroup 3-Month Treasury Bill Index (5% weighting) and the S&P 500® Index (25% weighting). For the year ended December 31, 2014, the Fund returned 6.55% before expenses and 6.50% after expenses, versus a 7.56% return in the weighted benchmark. The underperformance of the Fund is attributable to the underperformance of the Mid-Term Bond Fund and the Money Market Fund relative to the Barclays Capital Aggregate Bond Index, and the underperformance of smaller capitalization equities versus the S&P 500® Index.
GROWTH OF A $10,000 INVESTMENT
| | | | | | | | | | | | |
Retirement Income Fund | |
Period
Ended
12/31/14 | | Growth
of
$10,000 | | | Total Return | |
| | Cumu-
lative | | | Average
Annual | |
1 Year | | | $10,650 | | | | 6.50% | | | | 6.50% | |
5 Years | | | $14,000 | | | | 40.00% | | | | 6.95% | |
Since 11/5/07 (Inception) | | | $14,724 | | | | 47.24% | | | | 5.55% | |
| | | | | | | | | | | | |
S & P 500 Index | |
Period
Ended
12/31/14 | | Growth
of
$10,000 | | | Total Return | |
| | Cumu-
lative | | | Average
Annual | |
1 Year | | | $11,369 | | | | 13.69% | | | | 13.69% | |
5 Years | | | $20,512 | | | | 105.12% | | | | 15.45% | |
Since 11/5/07 (Inception) | | | $16,034 | | | | 60.34% | | | | 6.82% | |
| | | | | | | | | | | | |
Barclays Capital Aggregate Bond Index | |
Period
Ended
12/31/14 | | Growth
of
$10,000 | | | Total Return | |
| | Cumu-
lative | | | Average
Annual | |
1 Year | | | $10,597 | | | | 5.97% | | | | 5.97% | |
5 Years | | | $12,430 | | | | 24.30% | | | | 4.45% | |
Since 11/5/07 (Inception) | | | $14,055 | | | | 40.55% | | | | 4.87% | |
| | | | | | | | | | | | |
Citigroup 3 - Month T-Bill Index | |
Period
Ended
12/31/14 | | Growth
of
$10,000 | | | Total Return | |
| | Cumu-
lative | | | Average
Annual | |
1 Year | | | $10,004 | | | | 0.04% | | | | 0.04% | |
5 Years | | | $10,036 | | | | 0.36% | | | | 0.07% | |
Since 11/5/07 (Inception) | | | $10,299 | | | | 2.99% | | | | 0.41% | |
Through 2014, the line representing the performance return of the Retirement Income Fund includes expenses, such as direct management fees and expenses of the underlying funds (via the expense charges applied to the underlying funds’ net asset value calculations) in which the Fund invests, that reduce returns while the performance return lines of the Indices do not. Commencing in 2015, certain expenses that in the past were charged to the underlying funds in which the Retirement Income Fund invests will now be directly charged to the Retirement Income Fund. Performance return lines of the indices will continue to exclude expenses. Past performance is not indicative of future results.
12
2010 RETIREMENT FUND
The objective of the 2010 Retirement Fund is current income and capital appreciation appropriate for the asset allocation associated with a target retirement in 2010. The 2010 Retirement Fund invests in funds of the Investment Company. The Fund’s current target allocation is approximately 63% of net assets in fixed-income funds (approximately 25% in the Bond Fund, 33% in the Mid-Term Bond Fund and 5% in the Money Market Fund) and approximately 37% of net assets in equity funds (25% in the Equity Index Fund, 9% in the Mid-Cap Equity Index Fund and 3% in the International Fund) (See Note 1 in the Notes to Financial Statements for additional information on changes to Fund target allocations during 2014).
Performance for the 2010 Retirement Fund is compared to the Barclays Capital Aggregate Bond Index (58% weighting), the Citigroup 3-Month Treasury Bill Index (5% weighting) and the S&P 500® Index (37% weighting). For the year ended December 31, 2014, the Fund returned 6.98% before expenses and 6.93% after expenses, versus an 8.48% return in the weighted benchmark. The underperformance of the Fund is attributable to the underperformance of the Mid-Term Bond Fund and the Money Market Fund relative to the Barclays Capital Aggregate Bond Index, and the underperformance of smaller capitalization and international equities versus the S&P 500® Index.
GROWTH OF A $10,000 INVESTMENT
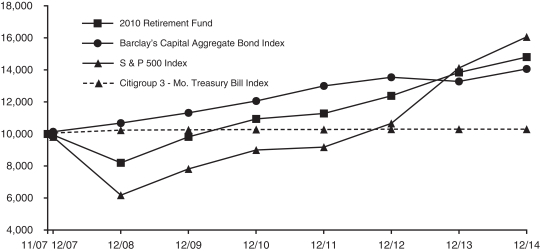
| | | | | | | | | | | | |
2010 Retirement Fund | |
Period
Ended
12/31/14 | | Growth
of
$10,000 | | | Total Return | |
| | Cumu-
lative | | | Average
Annual | |
1 Year | | | $10,695 | | | | 6.93% | | | | 6.93% | |
5 Years | | | $15,054 | | | | 50.54% | | | | 8.52% | |
Since 11/5/07 (Inception) | | | $14,788 | | | | 47.88% | | | | 5.61% | |
| | | | | | | | | | | | |
S & P 500 Index | |
Period
Ended
12/31/14 | | Growth
of
$10,000 | | | Total Return | |
| | Cumu-
lative | | | Average
Annual | |
1 Year | | | $11,369 | | | | 13.69% | | | | 13.69% | |
5 Years | | | $20,512 | | | | 105.12% | | | | 15.45% | |
Since 11/5/07 (Inception) | | | $16,034 | | | | 60.34% | | | | 6.82% | |
| | | | | | | | | | | | |
Barclays Capital Aggregate Bond Index | |
Period
Ended
12/31/14 | | Growth
of
$10,000 | | | Total Return | |
| | Cumu-
lative | | | Average
Annual | |
1 Year | | | $10,597 | | | | 5.97% | | | | 5.97% | |
5 Years | | | $12,430 | | | | 24.30% | | | | 4.45% | |
Since 11/5/07 (Inception) | | | $14,055 | | | | 40.55% | | | | 4.87% | |
| | | | | | | | | | | | |
Citigroup 3 - Month T-Bill Index | |
Period
Ended
12/31/14 | | Growth
of
$10,000 | | | Total Return | |
| | Cumu-
lative | | | Average
Annual | |
1 Year | | | $10,004 | | | | 0.04% | | | | 0.04% | |
5 Years | | | $10,036 | | | | 0.36% | | | | 0.07% | |
Since 11/5/07 (Inception) | | | $10,299 | | | | 2.99% | | | | 0.41% | |
Through 2014, the line representing the performance return of the 2010 Retirement Fund includes expenses, such as direct management fees and expenses of the underlying funds (via the expense charges applied to the underlying funds’ net asset value calculations) in which the Fund invests, that reduce returns while the performance return lines of the Indices do not. Commencing in 2015, certain expenses that in the past were charged to the underlying funds in which the 2010 Retirement Fund invests will now be directly charged to the 2010 Retirement Fund. Performance return lines of the indices will continue to exclude expenses. Past performance is not indicative of future results.
13
2015 RETIREMENT FUND
The objective of the 2015 Retirement Fund is current income and capital appreciation appropriate for the asset allocation associated with a target retirement in 2015. The 2015 Retirement Fund invests in funds of the Investment Company. The Fund’s current target allocation is approximately 47% of net assets in equity funds (approximately 28% in the Equity Index Fund, 11% in the Mid-Cap Equity Index Fund, 6% in the International Fund and 1% each in the Small Cap Growth and Small Cap Value Funds) and approximately 53% of net assets in fixed-income funds (25% in the Bond Fund and 28% in the Mid-Term Bond Fund) (See Note 1 in the Notes to Financial Statements for additional information on changes to Fund target allocations during 2014).
Performance for the 2015 Retirement Fund is compared to the S&P 500® Index (47% weighting) and the Barclays Capital Aggregate Bond Index (53% weighting). For the year ended December 31, 2014, the Fund returned 7.21% before expenses and 7.16% after expenses, versus a 9.55% return in the weighted benchmark. The underperformance of the Fund is attributable to the underperformance of the Mid-Term Bond Fund relative to the Barclays Capital Aggregate Bond Index, and the underperformance of smaller capitalization and international equities versus the S&P 500® Index.
GROWTH OF A $10,000 INVESTMENT
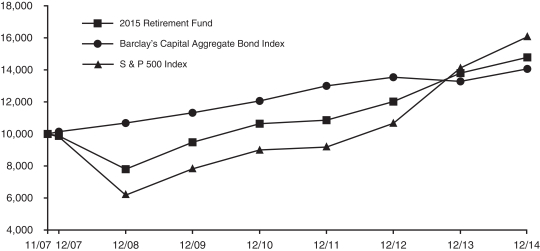
| | | | | | | | | | | | |
2015 Retirement Fund | |
Period
Ended
12/31/14 | | Growth
of
$10,000 | | | Total Return | |
| | Cumu-
lative | | | Average
Annual | |
1 Year | | | $10,716 | | | | 7.16% | | | | 7.16% | |
5 Years | | | $15,595 | | | | 55.95% | | | | 9.29% | |
Since 11/5/07 (Inception) | | | $14,766 | | | | 47.66% | | | | 5.59% | |
| | | | | | | | | | | | |
S & P 500 Index | |
Period
Ended
12/31/14 | | Growth
of
$10,000 | | | Total Return | |
| | Cumu-
lative | | | Average
Annual | |
1 Year | | | $11,369 | | | | 13.69% | | | | 13.69% | |
5 Years | | | $20,512 | | | | 105.12% | | | | 15.45% | |
Since 11/5/07 (Inception) | | | $16,034 | | | | 60.34% | | | | 6.82% | |
| | | | | | | | | | | | |
Barclays Capital Aggregate Bond Index | |
Period
Ended
12/31/14 | | Growth
of
$10,000 | | | Total Return | |
| | Cumu-
lative | | | Average
Annual | |
1 Year | | | $10,597 | | | | 5.97% | | | | 5.97% | |
5 Years | | | $12,430 | | | | 24.30% | | | | 4.45% | |
Since 11/5/07 (Inception) | | | $14,055 | | | | 40.55% | | | | 4.87% | |
Through 2014, the line representing the performance return of the 2015 Retirement Fund includes expenses, such as direct management fees and expenses of the underlying funds (via the expense charges applied to the underlying funds’ net asset value calculations) in which the Fund invests, that reduce returns while the performance return lines of the Indices do not. Commencing in 2015, certain expenses that in the past were charged to the underlying funds in which the 2015 Retirement Fund invests will now be directly charged to the 2015 Retirement Fund. Performance return lines of the indices will continue to exclude expenses. Past performance is not indicative of future results.
14
2020 RETIREMENT FUND
The objective of the 2020 Retirement Fund is current income and capital appreciation appropriate for the asset allocation associated with a target retirement in 2020. The 2020 Retirement Fund invests in funds of the Investment Company. The Fund’s current target allocation is approximately 57% of net assets in equity funds (approximately 33% in the Equity Index Fund, 11% in the Mid-Cap Equity Index Fund, 9% in the International Fund and 2% each in the Small Cap Growth and Small Cap Value Funds) and approximately 43% of net assets in fixed-income funds (25% in the Bond Fund and 18% in the Mid-Term Bond Fund) (See Note 1 in the Notes to Financial Statements for additional information on changes to Fund target allocations during 2014).
Performance for the 2020 Retirement Fund is compared to the S&P 500® Index (57% weighting) and the Barclays Capital Aggregate Bond Index (43% weighting). For the year ended December 31, 2014, the Fund returned 7.41% before expenses and 7.36% after expenses, versus a 10.33% return in the weighted benchmark. The underperformance of the Fund is attributable to the underperformance of the Mid-Term Bond Fund relative to the Barclays Capital Aggregate Bond Index, and the underperformance of smaller capitalization and international equities versus the S&P 500® Index.
GROWTH OF A $10,000 INVESTMENT
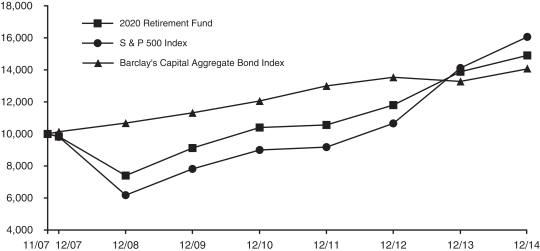
| | | | | | | | | | | | |
2020 Retirement Fund | |
Period
Ended
12/31/14 | | Growth
of
$10,000 | | | Total Return | |
| | Cumu-
lative | | | Average
Annual | |
1 Year | | | $10,737 | | | | 7.36% | | | | 7.36% | |
5 Years | | | $16,333 | | | | 63.33% | | | | 10.30% | |
Since 11/5/07 (Inception) | | | $14,897 | | | | 48.97% | | | | 5.72% | |
| | | | | | | | | | | | |
S & P 500 Index | |
Period
Ended
12/31/14 | | Growth of
$10,000 | | | Total Return | |
| | Cumu-
lative | | | Average
Annual | |
1 Year | | | $11,369 | | | | 13.69% | | | | 13.69% | |
5 Years | | | $20,512 | | | | 105.12% | | | | 15.45% | |
Since 11/5/07 (Inception) | | | $16,034 | | | | 60.34% | | | | 6.82% | |
| | | | | | | | | | | | |
Barclays Capital Aggregate Bond Index | |
Period
Ended
12/31/14 | | Growth of
$10,000 | | | Total Return | |
| | Cumu-
lative | | | Average
Annual | |
1 Year | | | $10,597 | | | | 5.97% | | | | 5.97% | |
5 Years | | | $12,430 | | | | 24.30% | | | | 4.45% | |
Since 11/5/07 (Inception) | | | $14,055 | | | | 40.55% | | | | 4.87% | |
Through 2014, the line representing the performance return of the 2020 Retirement Fund includes expenses, such as direct management fees and expenses of the underlying funds (via the expense charges applied to the underlying funds’ net asset value calculations) in which the Fund invests, that reduce returns while the performance return lines of the Indices do not. Commencing in 2015, certain expenses that in the past were charged to the underlying funds in which the 2020 Retirement Fund invests will now be directly charged to the 2020 Retirement Fund. Performance return lines of the indices will continue to exclude expenses. Past performance is not indicative of future results.
15
2025 RETIREMENT FUND
The objective of the 2025 Retirement Fund is current income and capital appreciation appropriate for the asset allocation associated with a target retirement in 2025. The 2025 Retirement Fund invests in funds of the Investment Company. The Fund’s current target allocation is approximately 69% of net assets in equity funds (approximately 37% in the Equity Index Fund, 16% in the Mid-Cap Equity Index Fund, 10% in the International Fund and 3% each in the Small Cap Growth and Small Cap Value Funds) and approximately 31% of net assets in fixed-income funds (23% in the Bond Fund and 8% in the Mid-Term Bond Fund) (See Note 1 in the Notes to Financial Statements for additional information on changes to Fund target allocations during 2014).
Performance for the 2025 Retirement Fund is compared to the S&P 500® Index (69% weighting) and the Barclays Capital Aggregate Bond Index (31% weighting). For the year ended December 31, 2014, the Fund returned 8.05% before expenses and 8.00% after expenses, versus an 11.26% return in the weighted benchmark. The underperformance of the Fund is attributable to the underperformance of the Mid-Term Bond Fund relative to the Barclays Capital Aggregate Bond Index, and the underperformance of smaller capitalization and international equities versus the S&P 500® Index.
GROWTH OF A $10,000 INVESTMENT
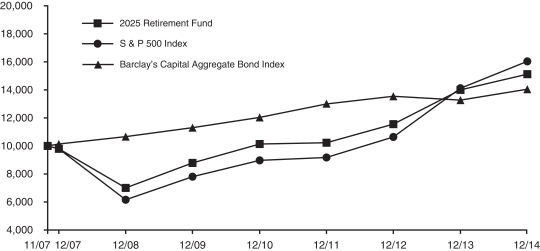
| | | | | | | | | | | | |
2025 Retirement Fund | |
Period
Ended
12/31/14 | | Growth of
$10,000 | | | Total Return | |
| | Cumu-
lative | | | Average
Annual | |
1 Year | | | $10,800 | | | | 8.00% | | | | 8.00% | |
5 Years | | | $17,201 | | | | 72.01% | | | | 11.45% | |
Since 11/5/07 (Inception) | | | $15,126 | | | | 51.26% | | | | 5.94% | |
| | | | | | | | | | | | |
S & P 500 Index | |
Period Ended
12/31/14 | | Growth of
$10,000 | | | Total Return | |
| | Cumu-
lative | | | Average
Annual | |
1 Year | | | $11,369 | | | | 13.69% | | | | 13.69% | |
5 Years | | | $20,512 | | | | 105.12% | | | | 15.45% | |
Since 11/5/07 (Inception) | | | $16,034 | | | | 60.34% | | | | 6.82% | |
| | | | | | | | | | | | |
Barclays Capital Aggregate Bond Index | |
Period Ended
12/31/14 | | Growth of
$10,000 | | | Total Return | |
| | Cumu-
lative | | | Average
Annual | |
1 Year | | | $10,597 | | | | 5.97% | | | | 5.97% | |
5 Years | | | $12,430 | | | | 24.30% | | | | 4.45% | |
Since 11/5/07 (Inception) | | | $14,055 | | | | 40.55% | | | | 4.87% | |
Through 2014, the line representing the performance return of the 2025 Retirement Fund includes expenses, such as direct management fees and expenses of the underlying funds (via the expense charges applied to the underlying funds’ net asset value calculations) in which the Fund invests, that reduce returns while the performance return lines of the Indices do not. Commencing in 2015, certain expenses that in the past were charged to the underlying funds in which the 2025 Retirement Fund invests will now be directly charged to the 2025 Retirement Fund. Performance return lines of the indices will continue to exclude expenses. Past performance is not indicative of future results.
16
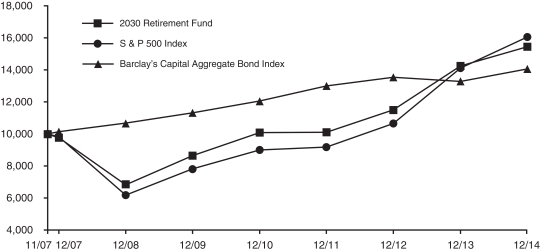
2030 RETIREMENT FUND
The objective of the 2030 Retirement Fund is current income and capital appreciation appropriate for the asset allocation associated with a target retirement in 2030. The 2030 Retirement Fund invests in funds of the Investment Company. The Fund’s current target allocation is approximately 77% of net assets in equity funds (approximately 40% in the Equity Index Fund, 17% in the Mid-Cap Equity Index Fund, 10% in the International Fund and 5% each in the Small Cap Growth and Small Cap Value Funds) and approximately 23% of net assets in the Bond Fund.
Performance for the 2030 Retirement Fund is compared to the S&P 500® Index (77% weighting) and the Barclays Capital Aggregate Bond Index (23% weighting). For the year ended December 31, 2014, the Fund returned 8.49% before expenses and 8.44% after expenses, versus an 11.88% return in the weighted benchmark. The underperformance of the Fund is attributable to the underperformance of smaller capitalization and international equities versus the S&P 500® Index.
GROWTH OF A $10,000 INVESTMENT
| | | | | | | | | | | | |
2030 Retirement Fund | |
Period Ended
12/31/14 | | Growth of
$10,000 | | | Total Return | |
| | Cumu-
lative | | | Average
Annual | |
1 Year | | | $10,845 | | | | 8.44% | | | | 8.44% | |
5 Years | | | $17,826 | | | | 78.26% | | | | 12.25% | |
Since 11/5/07 (Inception) | | | $15,445 | | | | 54.45% | | | | 6.25% | |
| | | | | | | | | | | | |
S & P 500 Index | |
Period Ended
12/31/14 | | Growth of
$10,000 | | | Total Return | |
| | Cumu-
lative | | | Average
Annual | |
1 Year | | | $11,369 | | | | 13.69% | | | | 13.69% | |
5 Years | | | $20,512 | | | | 105.12% | | | | 15.45% | |
Since 11/5/07 (Inception) | | | $16,034 | | | | 60.34% | | | | 6.82% | |
| | | | | | | | | | | | |
Barclays Capital Aggregate Bond Index | |
Period Ended
12/31/14 | | Growth of
$10,000 | | | Total Return | |
| | Cumu-
lative | | | Average
Annual | |
1 Year | | | $10,597 | | | | 5.97% | | | | 5.97% | |
5 Years | | | $12,430 | | | | 24.30% | | | | 4.45% | |
Since 11/5/07 (Inception) | | | $14,055 | | | | 40.55% | | | | 4.87% | |
Through 2014, the line representing the performance return of the 2030 Retirement Fund includes expenses, such as direct management fees and expenses of the underlying funds (via the expense charges applied to the underlying funds’ net asset value calculations) in which the Fund invests, that reduce returns while the performance return lines of the Indices do not. Commencing in 2015, certain expenses that in the past were charged to the underlying funds in which the 2030 Retirement Fund invests will now be directly charged to the 2030 Retirement Fund. Performance return lines of the indices will continue to exclude expenses. Past performance is not indicative of future results.
17
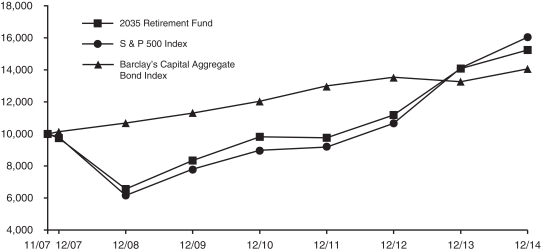
2035 RETIREMENT FUND
The objective of the 2035 Retirement Fund is current income and capital appreciation appropriate for the asset allocation associated with a target retirement in 2035. The 2035 Retirement Fund invests in funds of the Investment Company. The Fund’s current target allocation is approximately 84% of net assets in equity funds (approximately 40% in the Equity Index Fund, 20% in the Mid-Cap Equity Index Fund, 12% in the International Fund and 6% each in the Small Cap Growth and Small Cap Value Funds) and approximately 16% of net assets in the Bond Fund.
Performance for the 2035 Retirement Fund is compared to the S&P 500® Index (84% weighting) and the Barclays Capital Aggregate Bond Index (16% weighting). For the year ended December 31, 2014, the Fund returned 8.31% before expenses and 8.26% after expenses, versus a 12.43% return in the weighted benchmark. The underperformance of the Fund is attributable to the underperformance of smaller capitalization and international equities versus the S&P 500® Index.
GROWTH OF A $10,000 INVESTMENT
| | | | | | | | | | | | |
2035 Retirement Fund | |
Period Ended
12/31/14 | | Growth of
$10,000 | | | Total Return | |
| | Cumu-
lative | | | Average
Annual | |
1 Year | | | $10,827 | | | | 8.26% | | | | 8.26% | |
5 Years | | | $18,235 | | | | 82.35% | | | | 12.76% | |
Since 11/5/07 (Inception) | | | $15,237 | | | | 52.37% | | | | 6.05% | |
| | | | | | | | | | | | |
S & P 500 Index | |
Period Ended
12/31/14 | | Growth of
$10,000 | | | Total Return | |
| | Cumu-
lative | | | Average
Annual | |
1 Year | | | $11,369 | | | | 13.69% | | | | 13.69% | |
5 Years | | | $20,512 | | | | 105.12% | | | | 15.45% | |
Since 11/5/07 (Inception) | | | $16,034 | | | | 60.34% | | | | 6.82% | |
| | | | | | | | | | | | |
Barclays Capital Aggregate Bond Index | |
Period Ended
12/31/14 | | Growth of
$10,000 | | | Total Return | |
| | Cumu-
lative | | | Average
Annual | |
1 Year | | | $10,597 | | | | 5.97% | | | | 5.97% | |
5 Years | | | $12,430 | | | | 24.30% | | | | 4.45% | |
Since 11/5/07 (Inception) | | | $14,055 | | | | 40.55% | | | | 4.87% | |
Through 2014, the line representing the performance return of the 2035 Retirement Fund includes expenses, such as direct management fees and expenses of the underlying funds (via the expense charges applied to the underlying funds’ net asset value calculations) in which the Fund invests, that reduce returns while the performance return lines of the Indices do not. Commencing in 2015, certain expenses that in the past were charged to the underlying funds in which the 2035 Retirement Fund invests will now be directly charged to the 2035 Retirement Fund. Performance return lines of the indices will continue to exclude expenses. Past performance is not indicative of future results.
18
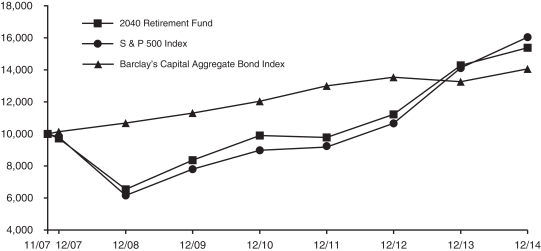
2040 RETIREMENT FUND
The objective of the 2040 Retirement Fund is current income and capital appreciation appropriate for the asset allocation associated with a target retirement in 2040. The 2040 Retirement Fund invests in funds of the Investment Company. The Fund’s current target allocation is approximately 88% of net assets in equity funds (approximately 35% in the Equity Index Fund, 23% in the Mid-Cap Equity Index Fund, 14% in the International Fund and 8% each in the Small Cap Growth and Small Cap Value Funds) and approximately 12% of net assets in the Bond Fund.
Performance for the 2040 Retirement Fund is compared to the S&P 500® Index (88% weighting) and the Barclays Capital Aggregate Bond Index (12% weighting). For the year ended December 31, 2014, the Fund returned 7.76% before expenses and 7.71% after expenses, versus a 12.74% return in the weighted benchmark. The underperformance of the Fund is attributable to the underperformance of smaller capitalization and international equities versus the S&P 500® Index.
GROWTH OF A $10,000 INVESTMENT
| | | | | | | | | | | | |
2040 Retirement Fund | |
Period Ended
12/31/14 | | Growth of
$10,000 | | | Total Return | |
| | Cumu-
lative | | | Average
Annual | |
1 Year | | | $10,772 | | | | 7.71% | | | | 7.71% | |
5 Years | | | $18,367 | | | | 83.67% | | | | 12.92% | |
Since 11/5/07 (Inception) | | | $15,369 | | | | 53.69% | | | | 6.18% | |
| | | | | | | | | | | | |
S & P 500 Index | |
Period Ended
12/31/14 | | Growth of
$10,000 | | | Total Return | |
| | Cumu-
lative | | | Average
Annual | |
1 Year | | | $11,369 | | | | 13.69% | | | | 13.69% | |
5 Years | | | $20,512 | | | | 105.12% | | | | 15.45% | |
Since 11/5/07 (Inception) | | | $16,034 | | | | 60.34% | | | | 6.82% | |
| | | | | | | | | | | | |
Barclays Capital Aggregate Bond Index | |
Period Ended
12/31/14 | | Growth of
$10,000 | | | Total Return | |
| | Cumu-
lative | | | Average
Annual | |
1 Year | | | $10,597 | | | | 5.97% | | | | 5.97% | |
5 Years | | | $12,430 | | | | 24.30% | | | | 4.45% | |
Since 11/5/07 (Inception) | | | $14,055 | | | | 40.55% | | | | 4.87% | |
Through 2014, the line representing the performance return of the 2040 Retirement Fund includes expenses, such as direct management fees and expenses of the underlying funds (via the expense charges applied to the underlying funds’ net asset value calculations) in which the Fund invests, that reduce returns while the performance return lines of the Indices do not. Commencing in 2015, certain expenses that in the past were charged to the underlying funds in which the 2040 Retirement Fund invests will now be directly charged to the 2040 Retirement Fund. Performance return lines of the indices will continue to exclude expenses. Past performance is not indicative of future results.
19
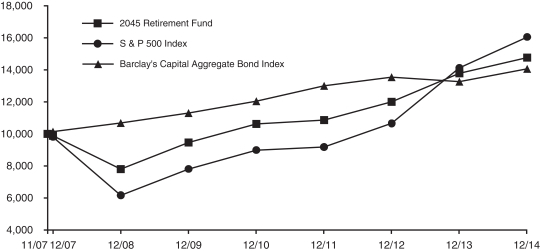
2045 RETIREMENT FUND
The objective of the 2045 Retirement Fund is current income and capital appreciation appropriate for the asset allocation associated with a target retirement in 2045. The 2045 Retirement Fund invests in funds of the Investment Company. The Fund’s current target allocation is approximately 90% of net assets in equity funds (approximately 35% in the Equity Index Fund, 21% in the Mid-Cap Equity Index Fund, 16% in the International Fund and 9% each in the Small Cap Growth and Small Cap Value Funds) and approximately 10% of net assets in the Bond Fund.
Performance for the 2045 Retirement Fund is compared to the S&P 500® Index (90% weighting) and the Barclays Capital Aggregate Bond Index (10% weighting). For the year ended December 31, 2014, the Fund returned 7.41% before expenses and 7.36% after expenses, versus a 12.90% return in the weighted benchmark. The underperformance of the Fund is attributable to the underperformance of smaller capitalization and international equities versus the S&P 500® Index.
GROWTH OF A $10,000 INVESTMENT
| | | | | | | | | | | | |
2045 Retirement Fund | |
Period Ended
12/31/14 | | Growth of
$10,000 | | | Total Return | |
| | Cumu-
lative | | | Average
Annual | |
1 Year | | | $10,738 | | | | 7.36% | | | | 7.36% | |
5 Years | | | $18,342 | | | | 83.42% | | | | 12.89% | |
Since 11/5/07 (Inception) | | | $15,262 | | | | 52.62% | | | | 6.08% | |
| | | | | | | | | | | | |
S & P 500 Index | |
Period Ended
12/31/14 | | Growth of
$10,000 | | | Total Return | |
| | Cumu-
lative | | | Average
Annual | |
1 Year | | | $11,369 | | | | 13.69% | | | | 13.69% | |
5 Years | | | $20,512 | | | | 105.12% | | | | 15.45% | |
Since 11/5/07 (Inception) | | | $16,034 | | | | 60.34% | | | | 6.82% | |
| | | | | | | | | | | | |
Barclays Capital Aggregate Bond Index | |
Period Ended
12/31/14 | | Growth of
$10,000 | | | Total Return | |
| | Cumu-
lative | | | Average
Annual | |
1 Year | | | $10,597 | | | | 5.97% | | | | 5.97% | |
5 Years | | | $12,430 | | | | 24.30% | | | | 4.45% | |
Since 11/5/07 (Inception) | | | $14,055 | | | | 40.55% | | | | 4.87% | |
Through 2014, the line representing the performance return of the 2045 Retirement Fund includes expenses, such as direct management fees and expenses of the underlying funds (via the expense charges applied to the underlying funds’ net asset value calculations) in which the Fund invests, that reduce returns while the performance return lines of the Indices do not. Commencing in 2015, certain expenses that in the past were charged to the underlying funds in which the 2045 Retirement Fund invests will now be directly charged to the 2045 Retirement Fund. Performance return lines of the indices will continue to exclude expenses. Past performance is not indicative of future results.
20
2050 RETIREMENT FUND
The objective of the 2050 Retirement Fund is current income and capital appreciation appropriate for the asset allocation associated with a target retirement in 2050. The 2050 Retirement Fund invests in funds of the Investment Company. The Fund’s current target allocation is approximately 92% of net assets in equity funds (approximately 35% in the Equity Index Fund, 20% in the Mid-Cap Equity Index Fund, 17% in the International Fund and 10% each in the Small Cap Growth and Small Cap Value Funds) and approximately 8% of net assets in the Bond Fund.
Performance for the 2050 Retirement Fund is compared to the S&P 500® Index (92% weighting) and the Barclays Capital Aggregate Bond Index (8% weighting). For the year ended December 31, 2014, the Fund returned 7.20% before expenses and 7.15% after expenses, versus a 13.06% return in the weighted benchmark. The underperformance of the Fund is attributable to the underperformance of smaller capitalization and international equities versus the S&P 500® Index.
GROWTH OF A $10,000 INVESTMENT
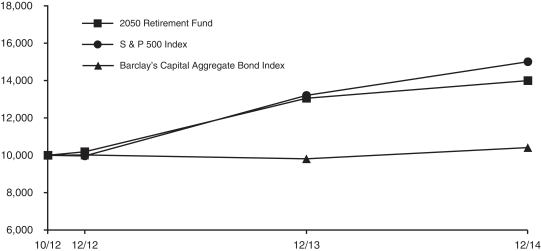
| | | | | | | | | | | | |
2050 Retirement Fund | |
Period Ended
12/31/14 | | Growth of
$10,000 | | | Total Return | |
| | Cumu-
lative | | | Average
Annual | |
1 Year | | | $10,715 | | | | 7.15% | | | | 7.15% | |
Since 10/1/12 (Inception) | | | $13,985 | | | | 39.85% | | | | 16.06% | |
| | | | | | | | | | | | |
S & P 500 Index | |
Period Ended
12/31/14 | | Growth of
$10,000 | | | Total Return | |
| | Cumu-
lative | | | Average
Annual | |
1 Year | | | $11,369 | | | | 13.69% | | | | 13.69% | |
Since 10/1/12 (Inception) | | | $14,994 | | | | 49.94% | | | | 19.74% | |
| | | | | | | | | | | | |
Barclays Capital Aggregate Bond Index | |
Period Ended
12/31/14 | | Growth of
$10,000 | | | Total Return | |
| | Cumu-
lative | | | Average
Annual | |
1 Year | | | $10,597 | | | | 5.97% | | | | 5.97% | |
Since 10/1/12 (Inception) | | | $10,405 | | | | 4.05% | | | | 1.75% | |
Through 2014, the line representing the performance return of the 2050 Retirement Fund includes expenses, such as direct management fees and expenses of the underlying funds (via the expense charges applied to the underlying funds’ net asset value calculations) in which the Fund invests, that reduce returns while the performance return lines of the Indices do not. Commencing in 2015, certain expenses that in the past were charged to the underlying funds in which the 2050 Retirement Fund invests will now be directly charged to the 2050 Retirement Fund. Performance return lines of the indices will continue to exclude expenses. Past performance is not indicative of future results.
21
CONSERVATIVE ALLOCATION FUND
The objective of the Conservative Allocation Fund is current income and, to a lesser extent, capital appreciation. The Conservative Allocation Fund invests primarily in the fixed-income funds of the Investment Company and also invests in the equity funds of the Investment Company. The Conservative Allocation Fund’s target allocation is approximately 65% of net assets in fixed-income funds (approximately 30% in the Bond Fund and 35% in the Mid-Term Bond Fund) and approximately 35% of net assets in equity funds (approximately 25% in the Equity Index Fund, 5% in the Mid-Cap Equity Index Fund and 5% in the International Fund) (See Note 1 in the Notes to Financial Statements for additional information on changes to Fund target allocations during 2014).
Performance for the Conservative Allocation Fund is compared to the Barclays Capital Aggregate Bond Index (65% weighting) and the S&P 500® Index (35% weighting). For the year ended December 31, 2014, the Conservative Allocation Fund returned 6.62% versus an 8.63% return in the weighted benchmark. The underperformance of the Fund is attributable to the underperformance of the Mid-Term Bond Fund relative to the Barclays Capital Aggregate Bond Index, and the underperformance of smaller capitalization and international equities versus the S&P 500® Index.
GROWTH OF A $10,000 INVESTMENT
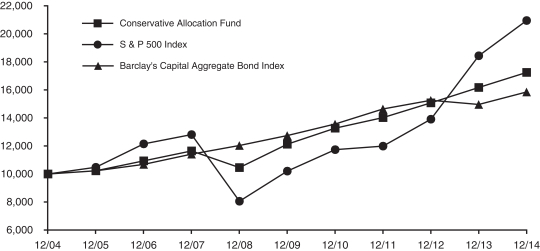
| | | | | | | | | | | | |
Conservative Allocation Fund | |
Period Ended
12/31/14 | | Growth of
$10,000 | | | Total Return | |
| | Cumu-
lative | | | Average
Annual | |
1 Year | | | $10,663 | | | | 6.62% | | | | 6.62% | |
5 Years | | | $14,224 | | | | 42.24% | | | | 7.30% | |
10 Years | | | $17,249 | | | | 72.49% | | | | 5.60% | |
| | | | | | | | | | | | |
S & P 500 Index | |
Period Ended
12/31/14 | | Growth of
$10,000 | | | Total Return | |
| | Cumu-
lative | | | Average
Annual | |
1 Year | | | $11,369 | | | | 13.69% | | | | 13.69% | |
5 Years | | | $20,512 | | | | 105.12% | | | | 15.45% | |
10 Years | | | $20,942 | | | | 109.42% | | | | 7.67% | |
| | | | | | | | | | | | |
Barclays Capital Aggregate Bond Index | |
Period Ended
12/31/14 | | Growth of
$10,000 | | | Total Return | |
| | Cumu-
lative | | | Average
Annual | |
1 Year | | | $10,597 | | | | 5.97% | | | | 5.97% | |
5 Years | | | $12,430 | | | | 24.30% | | | | 4.45% | |
10 Years | | | $15,840 | | | | 58.40% | | | | 4.71% | |
Through 2014, the line representing the performance return of the Conservative Allocation Fund includes expenses, such as transaction costs and management fees in the underlying funds (via the expense charges applied to the underlying funds’ net asset value calculations) that reduce returns, while the performance return lines of the Indicies do not. Commencing in 2015, certain expenses that in the past were charged to the underlying funds in which the Conservative Allocation Fund invests will now be directly charged to the Conservative Allocation Fund. Performance return lines of the indices will continue to exclude expenses. Past performance is not indicative of future results.
22
MODERATE ALLOCATION FUND
The objective of the Moderate Allocation Fund is capital appreciation and current income. The Moderate Allocation Fund invests in the equity and fixed-income funds of the Investment Company. The Moderate Allocation Fund’s target allocation is approximately 60% of net assets in equity funds (approximately 35% of its net assets in the Equity Index Fund, 15% in the Mid-Cap Equity Index Fund and 10% in the International Fund) and approximately 40% of net assets in fixed-income funds (approximately 25% of its net assets in the Bond Fund and approximately 15% of its net assets in the Mid-Term Bond Fund) (See Note 1 in the Notes to Financial Statements for additional information on changes to Fund target allocations during 2014).
Performance for the Moderate Allocation Fund is compared to the S&P 500® Index (60% weighting) and the Barclays Capital Aggregate Bond Index (40% weighting). For the year ended December 31, 2014, the Moderate Allocation Fund returned 7.71% versus a 10.56% return for the weighted benchmark. The underperformance of the Fund is attributable to the underperformance of the Mid-Term Bond Fund relative to the Barclays Capital Aggregate Bond Index, and the underperformance of smaller capitalization and international equities versus the S&P 500® Index.
GROWTH OF A $10,000 INVESTMENT

| | | | | | | | | | | | |
Moderate Allocation Fund | |
Period Ended
12/31/14 | | Growth of
$10,000 | | | Total Return | |
| | Cumu-
lative | | | Average
Annual | |
1 Year | | | $10,770 | | | | 7.71% | | | | 7.71% | |
5 Years | | | $16,277 | | | | 62.77% | | | | 10.24% | |
10 Years | | | $19,178 | | | | 91.78% | | | | 6.73% | |
| | | | | | | | | | | | |
S & P 500 Index | |
Period Ended
12/31/14 | | Growth of
$10,000 | | | Total Return | |
| | Cumu-
lative | | | Average
Annual | |
1 Year | | | $11,369 | | | | 13.69% | | | | 13.69% | |
5 Years | | | $20,512 | | | | 105.12% | | | | 15.45% | |
10 Years | | | $20,942 | | | | 109.42% | | | | 7.67% | |
| | | | | | | | | | | | |
Barclays Capital Aggregate Bond Index | |
Period Ended
12/31/14 | | Growth of
$10,000 | | | Total Return | |
| | Cumu-
lative | | | Average
Annual | |
1 Year | | | $10,597 | | | | 5.97% | | | | 5.97% | |
5 Years | | | $12,430 | | | | 24.30% | | | | 4.45% | |
10 Years | | | $15,840 | | | | 58.40% | | | | 4.71% | |
Through 2014, the line representing the performance return of the Moderate Allocation Fund includes expenses, such as transaction costs and management fees in the underlying funds (via the expense charges applied to the underlying funds’ net asset value calculations) that reduce returns, while the performance return lines of the Indicies do not. Commencing in 2015, certain expenses that in the past were charged to the underlying funds in which the Moderate Allocation Fund invests will now be directly charged to the Moderate Allocation Fund. Performance return lines of the indices will continue to exclude expenses. Past performance is not indicative of future results.
23
AGGRESSIVE ALLOCATION FUND
The objective of the Aggressive Allocation Fund is capital appreciation and, to a lesser extent, current income. The Aggressive Allocation Fund invests in the equity and fixed-income funds of the Investment Company. The Aggressive Allocation Fund’s target allocation is approximately 80% of net assets in equity funds (approximately 35% of its net assets in the Equity Index Fund, 20% in the Mid-Cap Equity Index Fund, 5% in the Small Cap Value Fund, 5% in the Small Cap Growth Fund and 15% in the International Fund) and approximately 20% of net assets in the Bond Fund) (See Note 1 in the Notes to Financial Statements for additional information on changes to Fund target allocations during 2014).
Performance for the Aggressive Allocation Fund is compared to the S&P 500® Index (80% weighting) and the Barclays Capital Aggregate Bond Index (20% weighting). For the year ended December 31, 2014, the Aggressive Allocation Fund returned 7.66% versus a 12.12% return for the weighted benchmark. The underperformance of the Fund is attributable to the underperformance of smaller capitalization and international equities versus the S&P 500® Index.
GROWTH OF A $10,000 INVESTMENT
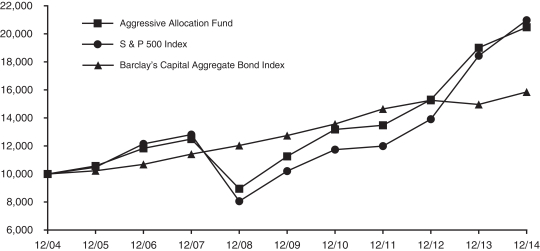
| | | | | | | | | | | | |
Aggressive Allocation Fund | |
Period Ended
12/31/14 | | Growth of
$10,000 | | | Total Return | |
| | Cumu-
lative | | | Average
Annual | |
1 Year | | | $10,769 | | | | 7.66% | | | | 7.66% | |
5 Years | | | $18,156 | | | | 81.56% | | | | 12.66% | |
10 Years | | | $20,453 | | | | 104.53% | | | | 7.42% | |
| | | | | | | | | | | | |
S & P 500 Index | |
Period Ended
12/31/14 | | Growth of
$10,000 | | | Total Return | |
| | Cumu-
lative | | | Average
Annual | |
1 Year | | | $11,369 | | | | 13.69% | | | | 13.69% | |
5 Years | | | $20,512 | | | | 105.12% | | | | 15.45% | |
10 Years | | | $20,942 | | | | 109.42% | | | | 7.67% | |
| | | | | | | | | | | | |
Barclays Capital Aggregate Bond Index | |
Period Ended
12/31/14 | | Growth of
$10,000 | | | Total Return | |
| | Cumu-
lative | | | Average
Annual | |
1 Year | | | $10,597 | | | | 5.97% | | | | 5.97% | |
5 Years | | | $12,430 | | | | 24.30% | | | | 4.45% | |
10 Years | | | $15,840 | | | | 58.40% | | | | 4.71% | |
Through 2014, the line representing the performance return of the Aggressive Allocation Fund includes expenses, such as transaction costs and management fees in the underlying funds (via the expense charges applied to the underlying funds’ net asset value calculations) that reduce returns, while the performance return lines of the Indicies do not. Commencing in 2015, certain expenses that in the past were charged to the underlying funds in which the Aggressive Allocation Fund invests will now be directly charged to the Aggressive Allocation Fund. Performance return lines of the indices will continue to exclude expenses. Past performance is not indicative of future results.
24
MONEY MARKET FUND
The Money Market Fund’s investment objective is to realize current income while maintaining liquidity, investment quality and stability of capital through investing in high-quality commercial paper issued by U.S. corporations and securities issued by the U.S. government and its agencies. For the year ended December 31, 2014, the Money Market Fund returned 0.10% before expenses and -0.14% after expenses, compared to a 0.04% return for the Citigroup 3-Month Treasury Bill Index. Note that the benchmark performance does not reflect any expenses.
Despite the conclusion of its quantitative easing program in October 2014, the Federal Reserve remained committed to a near-zero interest rate policy. The Fed Funds target rate was kept at a range of 0% to 0.25% throughout the year. As a result, money market returns were affected by extremely low yields and a limited supply of eligible investments. The Fund’s strategy continued to focus on quality, liquidity, and maintaining a relatively short weighted average maturity.
The seven-day effective yield as of February 10, 2015, was -0.12%. As with all performance reporting, this yield is not necessarily indicative of future annual yields. Neither the Federal Deposit Insurance Corporation nor any other U.S. government agency insures or guarantees the Separate Account’s investments in shares of the Money Market Fund.
MID-TERM BOND FUND
The Mid-Term Bond Fund seeks a high level of return consistent with the preservation of capital through investment in publicly traded debt securities. The Mid-Term Bond Fund primarily invests in corporate and U.S. government agency securities, which normally yield more than U.S. Treasury issues.
The Mid-Term Bond Fund emphasized corporate issues during 2014 in order to capture incremental income. We will continue to focus on income, rather than market volatility, to achieve superior returns over market cycles. In addition, the Fund’s corporate positions will remain highly diversified in order to shield the portfolio from any credit risk that might arise from a weakening domestic economy.
The average maturity of the Fund was similar to the Barclays Capital Intermediate Government/Credit Bond Index throughout the year. The Fund does not emphasize market volatility, but seeks to achieve superior returns by compounding incremental income over market cycles.
An additional component of the Fund’s low risk profile is to maintain an extremely diversified portfolio in terms of the number of corporate issuers represented in the Fund. At year-end, over 150 companies were represented in the portfolio with an average weighting of less than 0.50% of the Fund’s value.
For the year ended December 31, 2014, the Mid-Term Bond Fund returned 3.71% before expenses and 3.22% after expenses. This compares to a 3.12% return for the Barclays Capital Intermediate Government/Credit Bond Index. The Fund’s continuing emphasis on higher-yielding corporate issues was a major contributor to its outperformance.
GROWTH OF A $10,000 INVESTMENT
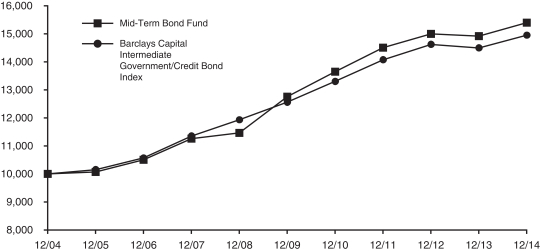
| | | | | | | | | | | | |
Mid-Term Bond Fund | |
Period Ended
12/31/14 | | Growth of
$10,000 | | | Total Return | |
| | Cumu-
lative | | | Average
Annual | |
1 Year | | | $10,325 | | | | 3.22% | | | | 3.22% | |
5 Years | | | $12,062 | | | | 20.62% | | | | 3.82% | |
10 Years | | | $15,384 | | | | 53.84% | | | | 4.40% | |
| | | | | | | | | | | | |
Barclays Capital Intermediate
Government/Credit Bond Index | |
Period Ended
12/31/14 | | Growth of
$10,000 | | | Total Return | |
| | Cumu-
lative | | | Average
Annual | |
1 Year | | | $10,312 | | | | 3.12% | | | | 3.12% | |
5 Years | | | $11,898 | | | | 18.98% | | | | 3.54% | |
10 Years | | | $14,939 | | | | 49.39% | | | | 4.10% | |
The line representing the performance return of the Mid-Term Bond Fund includes expenses, such as transaction costs and management fees that reduce returns, while the performance return line of the Index does not. Past performance is not indicative of future results.
25
BOND FUND
The Bond Fund’s primary investment objective is to provide as high a level of current income over time as is believed to be consistent with prudent investment risk. It does this by investing primarily in investment grade publicly traded debt securities. A secondary objective is preservation of capital. The securities held by the Bond Fund include corporate, U.S. agency and mortgage-backed bonds, all of which normally yield more than U.S. Treasury issues.
The Federal Reserve emphasized low short-term rates throughout 2014. Their belief was that this policy would stimulate the economy without causing excessive inflation, re-liquefy the banking system and support the mortgage market. For example, 30-Day Treasury Bill yields began and ended the year at one basis point. One-year Treasury Bill yields did increase somewhat during the year, but not by a meaningful amount. They began the year at 16 basis points and ended at 29 basis points.
The yields of intermediate and longer dated issues declined throughout the year in response to Federal Reserve market intervention and a lack of reasonable alternatives by the international investing community. For example, ten year Treasury Notes ended 2013 at 3.03%, fell to 2.53% by the end of the Second Quarter and ended the year at 2.17%. Thirty-year Treasury Bonds exhibited a similar pattern falling to 2.75% from 3.97% at year-end 2013, and 3.36% at the end of June. As a result, fixed income returns were positive year-over-year.
Yield spreads between corporate and Treasury Bonds narrowed during the first three Quarters of 2014, then began to widen into year-end. As a result, 7-10 year spreads generally widened by 11 basis points year-over-year and longer corporates widened by 33 basis points. This was not enough to off-set the favorable performance impact of lower gross yields, so the net performance result was positive on an annual basis.
The Bond Fund’s strategy was to maintain a similar maturity profile to the Barclays Capital U.S. Aggregate Bond Index with an overweighting of BBB issuers, who now comprise nearly one-half of the investment grade corporate bond market. Intermediate maturities were also emphasized, as was extreme diversification among issuers. This was done to protect the Fund from unexpected credit events, so very few holdings exceeded one-half of one percent of the Fund’s value. Fortunately, the extreme diversification has proven unnecessary, but it will be maintained going forward as part of our risk control.
For the year ended December 31, 2014, the Bond Fund returned 6.79% before expenses and 6.31% after expenses. This compares favorably to the Barclays Capital U.S. Aggregate Bond Index, which returned 5.97% for the period. As in past years, the Fund’s emphasis on higher-yielding corporate issues was a major contributor to its outperformance.
GROWTH OF A $10,000 INVESTMENT
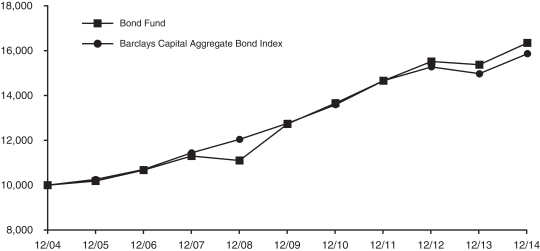
| | | | | | | | | | | | |
Bond Fund | |
Period Ended
12/31/14 | | Growth of
$10,000 | | | Total Return | |
| | Cumu-
lative | | | Average
Annual | |
1 Year | | | $10,634 | | | | 6.31% | | | | 6.31% | |
5 Years | | | $12,830 | | | | 28.30% | | | | 5.13% | |
10 Years | | | $16,371 | | | | 63.71% | | | | 5.03% | |
| | | | | | | | | | | | |
Barclays Capital Aggregate Bond Index | |
Period Ended
12/31/14 | | Growth of
$10,000 | | | Total Return | |
| | Cumu-
lative | | | Average
Annual | |
1 Year | | | $10,597 | | | | 5.97% | | | | 5.97% | |
5 Years | | | $12,430 | | | | 24.30% | | | | 4.45% | |
10 Years | | | $15,840 | | | | 58.40% | | | | 4.71% | |
The line representing the performance return of the Bond Fund includes expenses, such as transaction costs and management fees that reduce returns, while the performance return line of the Index does not. Past performance is not indicative of future results.
26
MUTUAL OF AMERICA INVESTMENT CORPORATION
ASSET ALLOCATIONS AS OF DECEMBER 31, 2014 (Unaudited)
Equity Index Fund
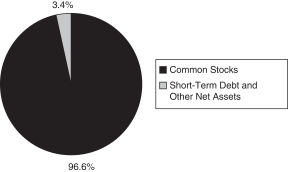
All America Fund
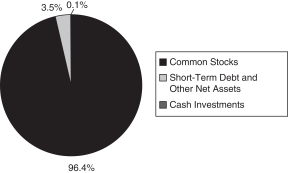
Small Cap Value Fund
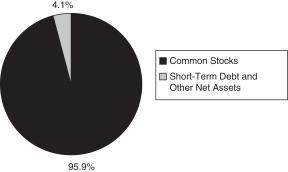
Small Cap Growth Fund

Mid Cap Value Fund
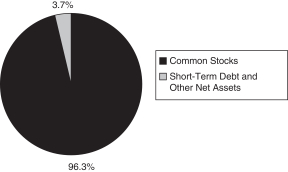
Mid-Cap Equity Index Fund
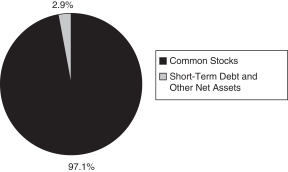
27
MUTUAL OF AMERICA INVESTMENT CORPORATION
ASSET ALLOCATIONS AS OF DECEMBER 31, 2014 (Unaudited) (Continued)
International Fund
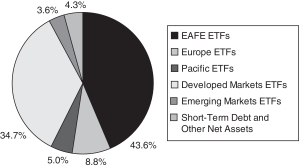
Composite Fund
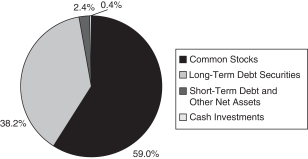
Retirement Income Fund
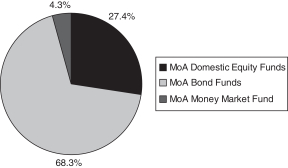
2010 Retirement Fund
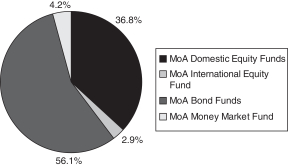
2015 Retirement fund

2020 Retirement fund
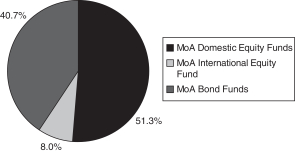
28
MUTUAL OF AMERICA INVESTMENT CORPORATION
ASSET ALLOCATIONS AS OF DECEMBER 31, 2014 (Unaudited) (Continued)
2025 Retirement Fund
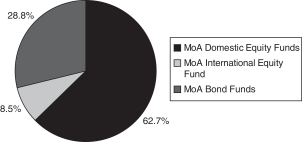
2030 Retirement Fund
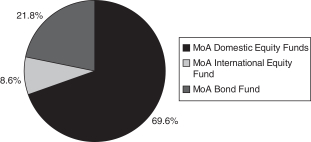
2035 Retirement Fund
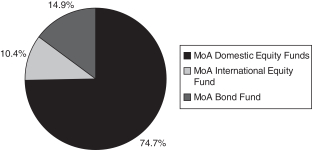
2040 Retirement Fund
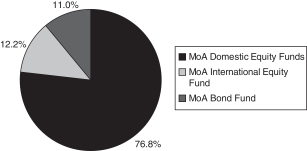
2045 Retirement Fund
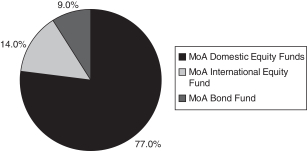
2050 Retirement Fund
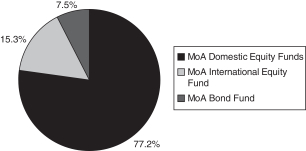
29
MUTUAL OF AMERICA INVESTMENT CORPORATION
ASSET ALLOCATIONS AS OF DECEMBER 31, 2014 (Unaudited) (Continued)
Conservative Allocation Fund
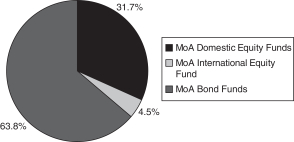
Moderate Allocation Fund
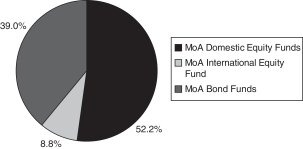
Aggressive Allocation fund
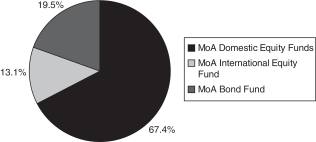
Money Market Fund
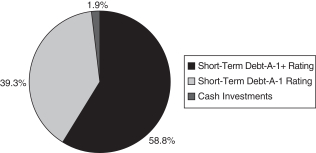
Mid-Term Bond Fund
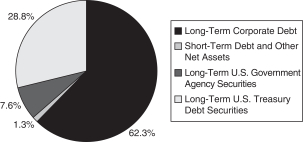
Bond Fund
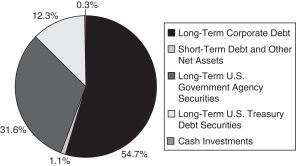
30
MUTUAL OF AMERICA INVESTMENT CORPORATION
EXPENSE EXAMPLE (Unaudited)
EXAMPLE
As a shareholder of one of the Mutual of America Investment Corporation Funds, you incur ongoing costs, including management fees and other Fund expenses. You do not incur transactional costs, such as sales charges (loads), redemption fees or exchange fees.
This Example is intended to help you understand your ongoing costs (in dollars) of investing in a Fund and to compare these costs with the ongoing costs of investing in other mutual funds. The Example is based on an investment of $1,000 invested at July 1, 2014 and held for the entire period ending December 31, 2014.
ACTUAL EXPENSES
The first line of the tables below provides information about actual account values and actual expenses. You may use the information in this line, together with the amount you invested, to estimate the expenses that you paid over the period. Simply divide your account value by $1,000 (for example, an $8,600 account value divided by $1,000=8.6), then multiply the result by the number in the first line under the heading entitled “Expenses Paid During Period” to estimate the expenses you paid on your account during this period.
HYPOTHETICAL EXAMPLE FOR COMPARISON PURPOSES
The second line of the tables below provides information about hypothetical account values and hypothetical expenses based on each Fund’s actual expense ratio and an assumed rate of return of 5% per year before expenses, which is not the Fund’s actual return. The hypothetical account values and expenses may not be used to estimate the actual ending account balance or expenses you paid for the period. You may use this information to compare the ongoing costs of investing in the Fund with other funds. To do so, compare this 5% hypothetical example with the 5% hypothetical examples that appear in the shareholder reports of the other funds.
Please note that the second line of the table is useful in comparing ongoing costs only, and will not help you determine the relative total costs of owning other funds, which may also charge transactional costs, such as sales charges (loads), redemption fees or exchange fees.
| | | | | | | | | | | | | | | | |
| | | Equity Index Fund | | | |
| | | | | Beginning
Account Value
July 1, 2014 | | | Ending
Account Value
December 31, 2014 | | | Expenses Paid
During Period*
July 1 to
December 31, 2014 | | | |
| | | Actual | | | $1,000.00 | | | | $1,060.65 | | | | $0.88 | | | |
| | | Hypothetical
(5% return before expenses) | | | $1,000.00 | | | | $1,024.15 | | | | $0.87 | | | |
| | * | Expenses are equal to the Fund’s annual expense ratio of 0.17%, multiplied by the average account value over the period, multiplied by 184/365 (to reflect the one-half year period). |
| | | | | | | | | | | | | | | | |
| | | All America Fund | | | |
| | | | | Beginning
Account Value
July 1, 2014 | | | Ending
Account Value
December 31, 2014 | | | Expenses Paid
During Period*
July 1 to
December 31, 2014 | | | |
| | | Actual | | | $1,000.00 | | | | $1,049.59 | | | | $2.53 | | | |
| | | Hypothetical
(5% return before expenses) | | | $1,000.00 | | | | $1,022.49 | | | | $2.50 | | | |
| | * | Expenses are equal to the Fund’s annual expense ratio of 0.49%, multiplied by the average account value over the period, multiplied by 184/365 (to reflect the one-half year period). |
31
MUTUAL OF AMERICA INVESTMENT CORPORATION
EXPENSE EXAMPLE (Unaudited) (Continued)
| | | | | | | | | | | | | | | | |
| | | Small Cap Value Fund | | | |
| | | | | Beginning
Account Value
July 1, 2014 | | | Ending
Account Value
December 31, 2014 | | | Expenses Paid
During Period*
July 1 to
December 31, 2014 | | | |
| | | Actual | | | $1,000.00 | | | | $1,011.84 | | | | $4.26 | | | |
| | | Hypothetical
(5% return before expenses) | | | $1,000.00 | | | | $1,020.68 | | | | $4.28 | | | |
| | * | Expenses are equal to the Fund’s annual expense ratio of 0.84%, multiplied by the average account value over the period, multiplied by 184/365 (to reflect the one-half year period). |
| | | | | | | | | | | | | | | | |
| | | Small Cap Growth Fund | | | |
| | | | | Beginning
Account Value
July 1, 2014 | | | Ending
Account Value
December 31, 2014 | | | Expenses Paid
During Period*
July 1 to
December 31, 2014 | | | |
| | | Actual | | | $1,000.00 | | | | $1,045.81 | | | | $4.33 | | | |
| | | Hypothetical
(5% return before expenses) | | | $1,000.00 | | | | $1,020.68 | | | | $4.28 | | | |
| | * | Expenses are equal to the Fund’s annual expense ratio of 0.84%, multiplied by the average account value over the period, multiplied by 184/365 (to reflect the one-half year period). |
| | | | | | | | | | | | | | | | |
| | | Mid Cap Value Fund | | | |
| | | | | Beginning
Account Value
July 1, 2014 | | | Ending
Account Value
December 31, 2014 | | | Expenses Paid
During Period*
July 1 to
December 31, 2014 | | | |
| | | Actual | | | $1,000.00 | | | | $1,043.48 | | | | $3.30 | | | |
| | | Hypothetical
(5% return before expenses) | | | $1,000.00 | | | | $1,021.72 | | | | $3.26 | | | |
| | * | Expenses are equal to the Fund’s annual expense ratio of 0.64%, multiplied by the average account value over the period, multiplied by 184/365 (to reflect the one-half year period). |
| | | | | | | | | | | | | | | | |
| | | Mid-Cap Equity Index Fund | | | |
| | | | | Beginning
Account Value
July 1, 2014 | | | Ending
Account Value
December 31, 2014 | | | Expenses Paid
During Period*
July 1 to
December 31, 2014 | | | |
| | | Actual | | | $1,000.00 | | | | $1,020.48 | | | | $0.87 | | | |
| | | Hypothetical
(5% return before expenses) | | | $1,000.00 | | | | $1,024.15 | | | | $0.87 | | | |
| | * | Expenses are equal to the Fund’s annual expense ratio of 0.17%, multiplied by the average account value over the period, multiplied by 184/365 (to reflect the one-half year period). |
32
MUTUAL OF AMERICA INVESTMENT CORPORATION
EXPENSE EXAMPLE (Unaudited) (Continued)
| | | | | | | | | | | | | | | | |
| | | International Fund | | | |
| | | | | Beginning
Account Value
July 1, 2014 | | | Ending
Account Value
December 31, 2014 | | | Expenses Paid
During Period*
July 1 to
December 31, 2014 | | | |
| | | Actual | | | $1,000.00 | | | | $901.68 | | | | $1.77 | | | |
| | | Hypothetical
(5% return before expenses) | | | $1,000.00 | | | | $1,023.12 | | | | $1.89 | | | |
| | * | Expenses are equal to the Fund’s annual expense ratio of 0.37% (reflecting direct expenses and the proportional expense ratios of the underlying funds in which the Fund invests), multiplied by the average account value over the period, and multiplied by 184/365 (to reflect the one-half year period). |
| | | | | | | | | | | | | | | | |
| | | Composite Fund | | | |
| | | | | Beginning
Account Value
July 1, 2014 | | | Ending Account Value
December 31, 2014 | | | Expenses Paid
During Period*
July 1 to
December 31, 2014 | | | |
| | | Actual | | | $1,000.00 | | | | $1,033.42 | | | | $2.51 | | | |
| | | Hypothetical
(5% return before expenses) | | | $1,000.00 | | | | $1,022.49 | | | | $2.50 | | | |
| | * | Expenses are equal to the Fund’s annual expense ratio of 0.49%, multiplied by the average account value over the period, multiplied by 184/365 (to reflect the one-half year period). |
| | | | | | | | | | | | | | | | |
| | | Retirement Income Fund | | | |
| | | | | Beginning
Account Value
July 1, 2014 | | | Ending
Account Value
December 31, 2014 | | | Expenses Paid
During Period*
July 1 to
December 31, 2014 | | | |
| | | Actual | | | $1,000.00 | | | | $1,019.13 | | | | $2.24 | | | |
| | | Hypothetical
(5% return before expenses) | | | $1,000.00 | | | | $1,022.75 | | | | $2.24 | | | |
| | * | Expenses are equal to the Fund’s annual expense ratio of 0.44% (reflecting direct investment management fees and the proportional expense ratios of the underlying funds in which the Fund invests), multiplied by the average account value over the period, multiplied by 184/365 (to reflect the one-half year period). |
| | | | | | | | | | | | | | | | |
| | | 2010 Retirement Fund | | | |
| | | | | Beginning
Account Value
July 1, 2014 | | | Ending
Account Value
December 31, 2014 | | | Expenses Paid
During Period*
July 1 to
December 31, 2014 | | | |
| | | Actual | | | $1,000.00 | | | | $1,018.88 | | | | $1.98 | | | |
| | | Hypothetical
(5% return before expenses) | | | $1,000.00 | | | | $1,023.01 | | | | $1.99 | | | |
| | * | Expenses are equal to the Fund’s annual expense ratio of 0.39% (reflecting direct investment management fees and the proportional expense ratios of the underlying funds in which the Fund invests), multiplied by the average account value over the period, multiplied by 184/365 (to reflect the one-half year period). |
33
MUTUAL OF AMERICA INVESTMENT CORPORATION
EXPENSE EXAMPLE (Unaudited) (Continued)
| | | | | | | | | | | | | | | | |
| | | 2015 Retirement Fund | | | |
| | | | | Beginning
Account Value
July 1, 2014 | | | Ending
Account Value
December 31, 2014 | | | Expenses Paid
During Period*
July 1 to
December 31, 2014 | | | |
| | | Actual | | | $1,000.00 | | | | $1,018.19 | | | | $2.03 | | | |
| | | Hypothetical
(5% return before expenses) | | | $1,000.00 | | | | $1,022.96 | | | | $2.04 | | | |
| | * | Expenses are equal to the Fund’s annual expense ratio of 0.40% (reflecting direct investment management fees and the proportional expense ratios of the underlying funds in which the Fund invests), multiplied by the average account value over the period, multiplied by 184/365 (to reflect the one-half year period). |
| | | | | | | | | | | | | | | | |
| | | 2020 Retirement Fund | | | |
| | | | | Beginning
Account Value
July 1, 2014 | | | Ending
Account Value
December 31, 2014 | | | Expenses Paid
During Period*
July 1 to
December 31, 2014 | | | |
| | | Actual | | | $1,000.00 | | | | $1,018.63 | | | | $1.93 | | | |
| | | Hypothetical
(5% return before expenses) | | | $1,000.00 | | | | $1,023.07 | | | | $1.94 | | | |
| | * | Expenses are equal to the Fund’s annual expense ratio of 0.38% (reflecting direct investment management fees and the proportional expense ratios of the underlying funds in which the Fund invests), multiplied by the average account value over the period, multiplied by 184/365 (to reflect the one-half year period). |
| | | | | | | | | | | | | | | | |
| | | 2025 Retirement Fund | | | |
| | | | | Beginning
Account Value
July 1, 2014 | | | Ending
Account Value
December 31, 2014 | | | Expenses Paid
During Period*
July 1 to
December 31, 2014 | | | |
| | | Actual | | | $1,000.00 | | | | $1,021.77 | | | | $1.83 | | | |
| | | Hypothetical
(5% return before expenses) | | | $1,000.00 | | | | $1,023.17 | | | | $1.84 | | | |
| | * | Expenses are equal to the Fund’s annual expense ratio of 0.36% (reflecting direct investment management fees and the proportional expense ratios of the underlying funds in which the Fund invests), multiplied by the average account value over the period, multiplied by 184/365 (to reflect the one-half year period). |
| | | | | | | | | | | | | | | | |
| | | 2030 Retirement Fund | | | |
| | | | | Beginning
Account Value
July 1, 2014 | | | Ending
Account Value
December 31, 2014 | | | Expenses Paid
During Period*
July 1 to
December 31, 2014 | | | |
| | | Actual | | | $1,000.00 | | | | $1,024.05 | | | | $1.79 | | | |
| | | Hypothetical
(5% return before expenses) | | | $1,000.00 | | | | $1,023.22 | | | | $1.78 | | | |
| | * | Expenses are equal to the Fund’s annual expense ratio of 0.35% (reflecting direct investment management fees and the proportional expense ratios of the underlying funds in which the Fund invests), multiplied by the average account value over the period, multiplied by 184/365 (to reflect the one-half year period). |
34
MUTUAL OF AMERICA INVESTMENT CORPORATION
EXPENSE EXAMPLE (Unaudited) (Continued)
| | | | | | | | | | | | | | | | |
| | | 2035 Retirement Fund | | | |
| | | | | Beginning
Account Value
July 1, 2014 | | | Ending
Account Value
December 31, 2014 | | | Expenses Paid
During Period*
July 1 to
December 31, 2014 | | | |
| | | Actual | | | $1,000.00 | | | | $1,022.26 | | | | $1.78 | | | |
| | | Hypothetical
(5% return before expenses) | | | $1,000.00 | | | | $1,023.22 | | | | $1.78 | | | |
| | * | Expenses are equal to the Fund’s annual expense ratio of 0.35% (reflecting direct investment management fees and the proportional expense ratios of the underlying funds in which the Fund invests), multiplied by the average account value over the period, multiplied by 184/365 (to reflect the one-half year period). |
| | | | | | | | | | | | | | | | |
| | | 2040 Retirement Fund | | | |
| | | | | Beginning
Account Value
July 1, 2014 | | | Ending
Account Value
December 31, 2014 | | | Expenses Paid
During Period*
July 1 to
December 31, 2014 | | | |
| | | Actual | | | $1,000.00 | | | | $1,018.49 | | | | $1.83 | | | |
| | | Hypothetical
(5% return before expenses) | | | $1,000.00 | | | | $1,023.17 | | | | $1.84 | | | |
| | * | Expenses are equal to the Fund’s annual expense ratio of 0.36% (reflecting direct investment management fees and the proportional expense ratios of the underlying funds in which the Fund invests), multiplied by the average account value over the period, multiplied by 184/365 (to reflect the one-half year period). |
| | | | | | | | | | | | | | | | |
| | | 2045 Retirement Fund | | | |
| | | | | Beginning
Account Value
July 1, 2014 | | | Ending
Account Value
December 31, 2014 | | | Expenses Paid
During Period*
July 1 to
December 31, 2014 | | | |
| | | Actual | | | $1,000.00 | | | | $1,016.49 | | | | $1.88 | | | |
| | | Hypothetical
(5% return before expenses) | | | $1,000.00 | | | | $1,023.12 | | | | $1.89 | | | |
| | * | Expenses are equal to the Fund’s annual expense ratio of 0.37% (reflecting direct investment management fees and the proportional expense ratios of the underlying funds in which the Fund invests), multiplied by the average account value over the period, multiplied by 184/365 (to reflect the one-half year period). |
| | | | | | | | | | | | | | | | |
| | | 2050 Retirement Fund | | | |
| | | | | Beginning
Account Value
July 1, 2014 | | | Ending
Account Value
December 31, 2014 | | | Expenses Paid
During Period*
July 1 to
December 31, 2014 | | | |
| | | Actual | | | $1,000.00 | | | | $1,015.34 | | | | $1.93 | | | |
| | | Hypothetical
(5% return before expenses) | | | $1,000.00 | | | | $1,023.07 | | | | $1.94 | | | |
| | * | Expenses are equal to the Fund’s annual expense ratio of 0.38% (reflecting direct investment management fees and the proportional expense ratios of the underlying funds in which the Fund invests), multiplied by the average account value over the period, multiplied by 184/365 (to reflect the one-half year period). |
35
MUTUAL OF AMERICA INVESTMENT CORPORATION
EXPENSE EXAMPLE (Unaudited) (Continued)
| | | | | | | | | | | | | | | | |
| | | Conservative Allocation Fund | | | |
| | | | | Beginning
Account Value
July 1, 2014 | | | Ending
Account Value
December 31, 2014 | | | Expenses Paid
During Period*
July 1 to
December 31, 2014 | | | |
| | | Actual | | | $1,000.00 | | | | $1,016.69 | | | | $1.93 | | | |
| | | Hypothetical
(5% return before expenses) | | | $1,000.00 | | | | $1,023.07 | | | | $1.94 | | | |
| | * | Expenses are equal to the Fund’s annual expense ratio of 0.38% (reflecting the proportional expense ratios of the underlying funds in which the Fund invests), multiplied by the average account value over the period, and multiplied by 184/365 (to reflect the one-half year period). |
| | | | | | | | | | | | | | | | |
| | | Moderate Allocation Fund | | | |
| | | | | Beginning
Account Value
July 1, 2014 | | | Ending
Account Value
December 31, 2014 | | | Expenses Paid
During Period*
July 1 to
December 31, 2014 | | | |
| | | Actual | | | $1,000.00 | | | | $1,018.54 | | | | $1.48 | | | |
| | | Hypothetical
(5% return before expenses) | | | $1,000.00 | | | | $1,023.53 | | | | $1.48 | | | |
| | * | Expenses are equal to the Fund’s annual expense ratio of 0.29% (reflecting the proportional expense ratios of the underlying funds in which the Fund invests), multiplied by the average account value over the period, and multiplied by 184/365 (to reflect the one-half year period). |
| | | | | | | | | | | | | | | | |
| | | Aggressive Allocation Fund | | | |
| | | | | Beginning
Account Value
July 1, 2014 | | | Ending
Account Value
December 31, 2014 | | | Expenses Paid
During Period*
July 1 to
December 31, 2014 | | | |
| | | Actual | | | $1,000.00 | | | | $1,016.19 | | | | $1.47 | | | |
| | | Hypothetical
(5% return before expenses) | | | $1,000.00 | | | | $1,023.53 | | | | $1.48 | | | |
| | * | Expenses are equal to the Fund’s annual expense ratio of 0.29% (reflecting the proportional expense ratios of the underlying funds in which the Fund invests), multiplied by the average account value over the period, and multiplied by 184/365 (to reflect the one-half year period). |
| | | | | | | | | | | | | | | | |
| | | Money Market Fund | | | |
| | | | | Beginning
Account Value
July 1, 2014 | | | Ending
Account Value
December 31, 2014 | | | Expenses Paid
During Period*
July 1 to
December 31, 2014 | | | |
| | | Actual | | | $1,000.00 | | | | $999.24 | | | | $1.21 | | | |
| | | Hypothetical
(5% return before expenses) | | | $1,000.00 | | | | $1,023.79 | | | | $1.22 | | | |
| | * | Expenses are equal to the Fund’s annual expense ratio of 0.24%, multiplied by the average account value over the period, multiplied by 184/365 (to reflect the one-half year period). |
36
MUTUAL OF AMERICA INVESTMENT CORPORATION
EXPENSE EXAMPLE (Unaudited) (Continued)
| | | | | | | | | | | | | | | | |
| | | Mid-Term Bond Fund | | | |
| | | | | Beginning
Account Value
July 1, 2014 | | | Ending
Account Value
December 31, 2014 | | | Expenses Paid
During Period*
July 1 to
December 31, 2014 | | | |
| | | Actual | | | $1,000.00 | | | | $1,003.54 | | | | $2.47 | | | |
| | | Hypothetical
(5% return before expenses) | | | $1,000.00 | | | | $1,022.49 | | | | $2.50 | | | |
| | * | Expenses are equal to the Fund’s annual expense ratio of 0.49%, multiplied by the average account value over the period, multiplied by 184/365 (to reflect the one-half year period). |
| | | | | | | | | | | | | | | | |
| | | Bond Fund | | | |
| | | | | Beginning
Account Value
July 1, 2014 | | | Ending
Account Value
December 31, 2014 | | | Expenses Paid
During Period*
July 1 to
December 31, 2014 | | | |
| | | Actual | | | $1,000.00 | | | | $1,014.09 | | | | $2.44 | | | |
| | | Hypothetical
(5% return before expenses) | | | $1,000.00 | | | | $1,022.55 | | | | $2.45 | | | |
| | * | Expenses are equal to the Fund’s annual expense ratio of 0.48%, multiplied by the average account value over the period, multiplied by 184/365 (to reflect the one-half year period). |
37
MUTUAL OF AMERICA INVESTMENT CORPORATION — EQUITY INDEX FUND
SUMMARY PORTFOLIO OF INVESTMENTS IN SECURITIES
December 31, 2014
| | | | | | | | |
| | | Shares | | | Value | |
| | | | | | | | |
| INDEXED ASSETS: | | | | | | | | |
COMMON STOCKS: | | | | | | | | |
CONSUMER DISCRETIONARY (11.7%) | | | | | | | | |
Amazon.com, Inc.* | | | 35,947 | | | $ | 11,156,151 | |
Comcast Corp. Cl A | | | 243,926 | | | | 14,150,147 | |
Disney (Walt) Co. | | | 147,708 | | | | 13,912,617 | |
Home Depot, Inc. | | | 124,773 | | | | 13,097,422 | |
McDonald’s Corp. | | | 92,145 | | | | 8,633,987 | |
Other Securities | | | 2,555,158 | | | | 148,764,446 | |
| | | | | | | | |
| | | | | | | 209,714,770 | |
| | | | | | | | |
CONSUMER STAPLES (9.5%) | | | | | | | | |
Altria Group, Inc. | | | 187,135 | | | | 9,220,141 | |
Coca-Cola Co. | | | 373,243 | | | | 15,758,319 | |
CVS Health Corp. | | | 108,374 | | | | 10,437,500 | |
PepsiCo, Inc. | | | 141,716 | | | | 13,400,665 | |
Philip Morris Int’l., Inc. | | | 147,108 | | | | 11,981,947 | |
Proctor & Gamble Co. | | | 255,839 | | | | 23,304,375 | |
Wal-Mart Stores, Inc. | | | 149,536 | | | | 12,842,152 | |
Other Securities | | | 1,156,608 | | | | 72,368,110 | |
| | | | | | | | |
| | | | | | | 169,313,209 | |
| | | | | | | | |
ENERGY (8.1%) | | | | | | | | |
Chevron Corp. | | | 178,987 | | | | 20,078,762 | |
ConocoPhillips | | | 116,308 | | | | 8,032,230 | |
Exxon Mobil Corp. | | | 400,930 | | | | 37,065,974 | |
Schlumberger Ltd. | | | 121,835 | | | | 10,405,927 | |
Other Securities | | | 1,411,462 | | | | 70,127,179 | |
| | | | | | | | |
| | | | | | | 145,710,072 | |
| | | | | | | | |
FINANCIALS (16.1%) | | | | | | | | |
American Express Co. | | | 84,250 | | | | 7,838,620 | |
Bank of America Corp. | | | 995,709 | | | | 17,813,234 | |
Berkshire Hathaway, Inc. Cl B* | | | 172,656 | | | | 25,924,298 | |
Citigroup, Inc. | | | 286,836 | | | | 15,520,696 | |
JPMorgan Chase & Co. | | | 353,936 | | | | 22,149,315 | |
U.S. Bancorp | | | 169,422 | | | | 7,615,519 | |
Wells Fargo & Co. | | | 446,965 | | | | 24,502,621 | |
Other Securities | | | 3,031,029 | | | | 166,297,366 | |
| | | | | | | | |
| | | | | | | 287,661,669 | |
| | | | | | | | |
HEALTH CARE (13.7%) | | | | | | | | |
AbbVie, Inc. | | | 150,853 | | | | 9,871,820 | |
Amgen, Inc. | | | 72,021 | | | | 11,472,225 | |
Bristol-Myers Squibb Co. | | | 156,911 | | | | 9,262,456 | |
Celgene Corp.* | | | 75,622 | | | | 8,459,077 | |
Gilead Sciences, Inc.* | | | 142,842 | | | | 13,464,287 | |
Johnson & Johnson | | | 265,023 | | | | 27,713,455 | |
| | | | | | | | |
| | | Shares | | | Value | |
| | | | | | | | |
| INDEXED ASSETS (CONTINUED): | |
COMMON STOCKS (CONTINUED): | |
HEALTH CARE (CONTINUED) | |
Merck & Co., Inc. | | | 269,923 | | | $ | 15,328,927 | |
Pfizer, Inc. | | | 596,554 | | | | 18,582,657 | |
UnitedHealth Group, Inc. | | | 90,977 | | | | 9,196,865 | |
Other Securities | | | 1,369,804 | | | | 122,216,923 | |
| | | | | | | | |
| | | | | | | 245,568,692 | |
| | | | | | | | |
INDUSTRIALS (10.1%) | | | | | | | | |
3M Co. | | | 60,674 | | | | 9,969,952 | |
Boeing Co. | | | 62,775 | | | | 8,159,495 | |
General Electric Co. | | | 950,806 | | | | 24,026,868 | |
Union Pacific Corp. | | | 84,180 | | | | 10,028,363 | |
United Technologies Corp. | | | 80,275 | | | | 9,231,625 | |
Other Securities | | | 1,519,864 | | | | 118,392,963 | |
| | | | | | | | |
| | | | | | | 179,809,266 | |
| | | | | | | | |
INFORMATION TECHNOLOGY (19.1%) | | | | | | | | |
Apple, Inc. | | | 555,290 | | | | 61,292,905 | |
Cisco Systems, Inc. | | | 484,078 | | | | 13,464,630 | |
Facebook, Inc. Cl A* | | | 197,967 | | | | 15,445,385 | |
Google, Inc. Cl A* | | | 26,989 | | | | 14,321,983 | |
Google, Inc. Cl C* | | | 26,964 | | | | 14,193,850 | |
Int’l. Business Machines Corp. | | | 87,142 | | | | 13,981,062 | |
Intel Corp. | | | 457,784 | | | | 16,612,981 | |
MasterCard, Inc. Cl A | | | 92,888 | | | | 8,003,230 | |
Microsoft Corp. | | | 780,442 | | | | 36,251,531 | |
Oracle Corp. | | | 306,279 | | | | 13,773,367 | |
QUALCOMM, Inc. | | | 157,417 | | | | 11,700,806 | |
Visa, Inc. Cl A | | | 46,245 | | | | 12,125,439 | |
Other Securities | | | 2,344,473 | | | | 109,680,205 | |
| | | | | | | | |
| | | | | | | 340,847,374 | |
| | | | | | | | |
MATERIALS (3.1%) | | | | | | | | |
Other Securities | | | 880,568 | | | | 54,743,903 | |
| | | | | | | | |
TELECOMMUNICATION SERVICES (2.1%) | | | | | | | | |
AT&T, Inc. | | | 491,111 | | | | 16,496,418 | |
Verizon Communications, Inc. | | | 392,901 | | | | 18,379,909 | |
Other Securities | | | 205,180 | | | | 3,236,555 | |
| | | | | | | | |
| | | | | | | 38,112,882 | |
| | | | | | | | |
UTILITIES (3.1%) | | | | | | | | |
Other Securities | | | 1,091,248 | | | | 56,023,796 | |
| | | | | | | | |
TOTAL INDEXED ASSETS-COMMON STOCKS | | | | | | | | |
(Cost: $1,045,622,052) 96.6% | | | | | | | 1,727,505,633 | |
| | | | | | | | |
The accompanying notes are an integral part of these portfolio schedules.
38
MUTUAL OF AMERICA INVESTMENT CORPORATION — EQUITY INDEX FUND
SUMMARY PORTFOLIO OF INVESTMENTS IN SECURITIES (Continued)
December 31, 2014
| | | | | | | | | | | | | | |
| | | Rating** | | Rate(%) | | Maturity | | Face Amount | | | Value | |
| SHORT-TERM DEBT SECURITIES: | | | | | | | | | | | | | | |
U.S. GOVERNMENT (0.8%) | | | | | | | | | | | | | | |
U.S. Treasury Bill (1) | | A-1+ | | 0.01 - 0.10 | | 03/05/15 - 06/18/15 | | $ | 14,250,000 | | | $ | 14,245,746 | |
| | | | | | | | | | | | | | |
U.S. GOVERNMENT AGENCIES (0.1%) | | | | | | | | | | | | | | |
FHLMC | | A-1+ | | 0.10 | | 03/12/15 | | | 2,200,000 | | | | 2,199,572 | |
| | | | | | | | | | | | | | |
COMMERCIAL PAPER (2.5%) | | | | | | | | | | | | | | |
Abbott Laboratories† | | A-1+ | | 0.09 - 0.10 | | 01/20/15 | | | 5,000,000 | | | | 4,999,753 | |
Emerson Electric Co.† | | A-1 | | 0.14 | | 03/30/15 | | | 1,400,000 | | | | 1,399,521 | |
Exxon Mobil Corp. | | A-1+ | | 0.13 | | 02/04/15 | | | 12,200,000 | | | | 12,198,502 | |
General Re Corp. | | A-1+ | | 0.14 | | 03/09/15 | | | 1,200,000 | | | | 1,199,687 | |
Madison Gas & Electric | | A-1+ | | 0.10 | | 01/09/15 | | | 7,000,000 | | | | 6,999,844 | |
San Diego Gas & Electric Co.† | | A-1 | | 0.20 | | 01/09/15 | | | 10,000,000 | | | | 9,999,556 | |
Toyota Motor Credit Corp. | | A-1+ | | 0.14 | | 02/11/15 | | | 4,000,000 | | | | 3,999,362 | |
Wisconsin Gas Co. | | A-1 | | 0.15 | | 01/06/15 | | | 2,850,000 | | | | 2,849,941 | |
| | | | | | | | | | | | | | |
| | | | | | | | | | | | | 43,646,166 | |
| | | | | | | | | | | | | | |
TOTAL SHORT-TERM DEBT SECURITIES
(Cost: $60,091,484) 3.4% | | | | 60,091,484 | |
| | | | | | | | | | | | | | |
TEMPORARY CASH INVESTMENTS (2)
(Cost: $750,000) 0.0% (3) | | | | 750,000 | |
| | | | | | | | | | | | | | |
TOTAL INVESTMENTS
(Cost: $1,106,463,536) 100.0% | | | | 1,788,347,117 | |
| | | | | | | | | | | | | | |
OTHER NET ASSETS 0.0% (3) | | | | 763,247 | |
| | | | | | | | | | | | | | |
NET ASSETS 100.0% | | | $ | 1,789,110,364 | |
| | | | | | | | | | | | | | |
The accompanying notes are an integral part of these portfolio schedules.
39
MUTUAL OF AMERICA INVESTMENT CORPORATION — ALL AMERICA FUND
SUMMARY PORTFOLIO OF INVESTMENTS IN SECURITIES
December 31, 2014
| | | | | | | | |
| | | Shares | | | Value | |
| | | | | | | | |
| INDEXED ASSETS: | | | | | | | | |
COMMON STOCKS: | | | | | | | | |
CONSUMER DISCRETIONARY (6.7%) | | | | | | | | |
Amazon.com, Inc.* | | | 3,741 | | | $ | 1,161,019 | |
Comcast Corp. Cl A | | | 25,387 | | | | 1,472,700 | |
Disney (Walt) Co. | | | 15,374 | | | | 1,448,077 | |
Home Depot, Inc. | | | 12,986 | | | | 1,363,140 | |
McDonald’s Corp. | | | 9,591 | | | | 898,677 | |
Starbucks Corp. | | | 7,374 | | | | 605,037 | |
Time Warner, Inc. | | | 8,270 | | | | 706,423 | |
Other Securities | | | 250,308 | | | | 14,174,278 | |
| | | | | | | | |
| | | | | | | 21,829,351 | |
| | | | | | | | |
CONSUMER STAPLES (5.4%) | | | | | | | | |
Coca-Cola Co. | | | 38,847 | | | | 1,640,120 | |
PepsiCo, Inc. | | | 14,748 | | | | 1,394,571 | |
Philip Morris Int’l., Inc. | | | 15,311 | | | | 1,247,081 | |
Proctor & Gamble Co. | | | 26,627 | | | | 2,425,453 | |
Wal-Mart Stores, Inc. | | | 15,564 | | | | 1,336,636 | |
Other Securities | | | 151,139 | | | | 9,578,325 | |
| | | | | | | | |
| | | | | | | 17,622,186 | |
| | | | | | | | |
ENERGY (4.7%) | | | | | | | | |
Chevron Corp. | | | 18,628 | | | | 2,089,689 | |
Exxon Mobil Corp. | | | 41,727 | | | | 3,857,656 | |
Other Securities | | | 171,684 | | | | 9,217,393 | |
| | | | | | | | |
| | | | | | | 15,164,738 | |
| | | | | | | | |
FINANCIALS (9.2%) | | | | | | | | |
American Int’l. Group, Inc. | | | 13,788 | | | | 772,266 | |
Bank of America Corp. | | | 103,631 | | | | 1,853,959 | |
Berkshire Hathaway, Inc. Cl B* | | | 17,970 | | | | 2,698,196 | |
Capital One Financial Corp. | | | 5,482 | | | | 452,539 | |
Citigroup, Inc. | | | 29,854 | | | | 1,615,400 | |
Goldman Sachs Group, Inc. | | | 3,991 | | | | 773,576 | |
JPMorgan Chase & Co. | | | 36,836 | | | | 2,305,197 | |
MetLife, Inc. | | | 11,195 | | | | 605,538 | |
Simon Property Group, Inc. | | | 3,063 | | | | 557,803 | |
Wells Fargo & Co. | | | 46,520 | | | | 2,550,226 | |
Other Securities | | | 304,354 | | | | 15,755,925 | |
| | | | | | | | |
| | | | | | | 29,940,625 | |
| | | | | | | | |
HEALTH CARE (7.9%) | | | | | | | | |
Abbott Laboratories | | | 14,838 | | | | 668,007 | |
Biogen Idec, Inc.* | | | 2,327 | | | | 789,900 | |
Celgene Corp.* | | | 7,870 | | | | 880,338 | |
Gilead Sciences, Inc.* | | | 14,866 | | | | 1,401,269 | |
| | | | | | | | |
| | | Shares | | | Value | |
| | | | | | | | |
| INDEXED ASSETS (CONTINUED): | |
COMMON STOCKS (CONTINUED): | |
HEALTH CARE (CONTINUED) | |
Johnson & Johnson | | | 27,583 | | | $ | 2,884,354 | |
Merck & Co., Inc. | | | 28,093 | | | | 1,595,401 | |
Pfizer, Inc. | | | 62,088 | | | | 1,934,041 | |
UnitedHealth Group, Inc. | | | 9,468 | | | | 957,120 | |
Other Securities | | | 164,929 | | | | 14,447,730 | |
| | | | | | | | |
| | | | | | | 25,558,160 | |
| | | | | | | | |
INDUSTRIALS (5.8%) | | | | | | | | |
Boeing Co. | | | 6,533 | | | | 849,159 | |
General Electric Co. | | | 98,957 | | | | 2,500,643 | |
Roper Industries, Inc. | | | 985 | | | | 154,005 | |
Union Pacific Corp. | | | 8,761 | | | | 1,043,698 | |
Other Securities | | | 171,875 | | | | 14,167,017 | |
| | | | | | | | |
| | | | | | | 18,714,522 | |
| | | | | | | | |
INFORMATION TECHNOLOGY (11.0%) | | | | | | | | |
Apple, Inc. | | | 57,794 | | | | 6,379,296 | |
Cisco Systems, Inc. | | | 50,377 | | | | 1,401,236 | |
Facebook, Inc. Cl A* | | | 20,604 | | | | 1,607,524 | |
Google, Inc. Cl A* | | | 2,809 | | | | 1,490,624 | |
Google, Inc. Cl C* | | | 2,807 | | | | 1,477,605 | |
Int’l. Business Machines Corp. | | | 9,069 | | | | 1,455,030 | |
Intel Corp. | | | 47,646 | | | | 1,729,073 | |
MasterCard, Inc. Cl A | | | 9,667 | | | | 832,909 | |
Microsoft Corp. | | | 81,226 | | | | 3,772,946 | |
Oracle Corp. | | | 31,876 | | | | 1,433,464 | |
QUALCOMM, Inc. | | | 16,384 | | | | 1,217,823 | |
Visa, Inc. Cl A | | | 4,813 | | | | 1,261,969 | |
Other Securities | | | 244,012 | | | | 11,415,667 | |
| | | | | | | | |
| | | | | | | 35,475,166 | |
| | | | | | | | |
MATERIALS (1.8%) | | | | | | | | |
Other Securities | | | 91,652 | | | | 5,698,331 | |
| | | | | | | | |
TELECOMMUNICATION SERVICES (1.2%) | | | | | | | | |
AT&T, Inc. | | | 51,113 | | | | 1,716,886 | |
Verizon Communications, Inc. | | | 40,893 | | | | 1,912,975 | |
Other Securities | | | 21,353 | | | | 336,814 | |
| | | | | | | | |
| | | | | | | 3,966,675 | |
| | | | | | | | |
UTILITIES (1.8%) | | | | | | | | |
Other Securities | | | 113,578 | | | | 5,831,099 | |
| | | | | | | | |
TOTAL INDEXED ASSETS-COMMON STOCKS | | | | | | | | |
(Cost: $121,658,753) 55.5% | | | | | | | 179,800,853 | |
| | | | | | | | |
| | | | | | | | | | | | | | |
| | | Rating** | | Rate(%) | | Maturity | | Face Amount | | | Value | |
| INDEXED ASSETS: | | | | | | | | | | | | | | |
SHORT-TERM DEBT SECURITIES: | | | | | | | | | | | | | | |
U.S. GOVERNMENT (0.3%) | | | | | | | | | | | | | | |
U.S. Treasury Bill (1) | | A-1+ | | 0.01 - 0.09 | | 03/05/15 - 06/25/15 | | $ | 1,100,000 | | | $ | 1,099,559 | |
| | | | | | | | | | | | | | |
COMMERCIAL PAPER (1.2%) | | | | | | | | | | | | | | |
Exxon Mobil Corp. | | A-1+ | | 0.13 | | 02/04/15 | | | 3,900,000 | | | | 3,899,522 | |
| | | | | | | | | | | | | | |
TOTAL INDEXED ASSETS-SHORT-TERM DEBT SECURITIES
(Cost: $4,999,081) 1.5% | | | | 4,999,081 | |
| | | | | | | | | | | | | | |
TOTAL INDEXED ASSETS
(Cost: $126,657,834) 57.0% | | | $ | 184,799,934 | |
| | | | | | | | | | | | | | |
The accompanying notes are an integral part of these portfolio schedules.
40
MUTUAL OF AMERICA INVESTMENT CORPORATION — ALL AMERICA FUND
SUMMARY PORTFOLIO OF INVESTMENTS IN SECURITIES (Continued)
December 31, 2014
| | | | | | | | |
| | | Shares | | | Value | |
| | | | | | | | |
| ACTIVE ASSETS: | | | | | | | | |
COMMON STOCKS: | | | | | | | | |
CONSUMER DISCRETIONARY (5.3%) | | | | | | | | |
Amazon.com, Inc.* | | | 2,475 | | | $ | 768,116 | |
Diamond Resorts Int’l., Inc.* | | | 44,421 | | | | 1,239,346 | |
Disney (Walt) Co. | | | 11,399 | | | | 1,073,672 | |
Home Depot, Inc. | | | 7,734 | | | | 811,838 | |
McDonald’s Corp. | | | 6,515 | | | | 610,456 | |
Starbucks Corp. | | | 8,369 | | | | 686,676 | |
Time Warner, Inc. | | | 7,168 | | | | 612,291 | |
Other Securities | | | 331,720 | | | | 11,368,656 | |
| | | | | | | | |
| | | | | | | 17,171,051 | |
| | | | | | | | |
CONSUMER STAPLES (2.5%) | | | | | | | | |
Coca-Cola Co. | | | 10,875 | | | | 459,143 | |
PepsiCo, Inc. | | | 7,058 | | | | 667,404 | |
Philip Morris Int’l., Inc. | | | 4,716 | | | | 384,118 | |
Proctor & Gamble Co. | | | 12,315 | | | | 1,121,773 | |
Wal-Mart Stores, Inc. | | | 9,917 | | | | 851,672 | |
Other Securities | | | 127,614 | | | | 4,585,953 | |
| | | | | | | | |
| | | | | | | 8,070,063 | |
| | | | | | | | |
ENERGY (2.4%) | | | | | | | | |
Chevron Corp. | | | 5,030 | | | | 564,265 | |
Exxon Mobil Corp. | | | 20,307 | | | | 1,877,382 | |
Other Securities | | | 215,671 | | | | 5,460,698 | |
| | | | | | | | |
| | | | | | | 7,902,345 | |
| | | | | | | | |
FINANCIALS (7.9%) | | | | | | | | |
American Int’l. Group, Inc. | | | 11,571 | | | | 648,092 | |
Bank of America Corp. | | | 41,917 | | | | 749,895 | |
Berkshire Hathaway, Inc. Cl B* | | | 4,705 | | | | 706,456 | |
Capital One Financial Corp. | | | 11,278 | | | | 930,999 | |
Citigroup, Inc. | | | 11,032 | | | | 596,942 | |
Goldman Sachs Group, Inc. | | | 3,872 | | | | 750,510 | |
JPMorgan Chase & Co. | | | 24,967 | | | | 1,562,435 | |
MetLife, Inc. | | | 11,439 | | | | 618,736 | |
Simon Property Group, Inc. | | | 4,069 | | | | 741,006 | |
Wells Fargo & Co. | | | 24,266 | | | | 1,330,262 | |
Other Securities | | | 682,653 | | | | 17,111,895 | |
| | | | | | | | |
| | | | | | | 25,747,228 | |
| | | | | | | | |
HEALTH CARE (6.4%) | | | | | | | | |
Abbott Laboratories | | | 11,794 | | | | 530,966 | |
Biogen Idec, Inc.* | | | 1,703 | | | | 578,083 | |
Celgene Corp.* | | | 10,554 | | | | 1,180,570 | |
| | | | | | | | |
| | | Shares | | | Value | |
| | | | | | | | |
| ACTIVE ASSETS (CONTINUED): | |
COMMON STOCKS (CONTINUED): | |
HEALTH CARE (CONTINUED) | |
Gilead Sciences, Inc.* | | | 9,551 | | | $ | 900,277 | |
Merck & Co., Inc. | | | 17,492 | | | | 993,371 | |
Pfizer, Inc. | | | 40,982 | | | | 1,276,589 | |
UnitedHealth Group, Inc. | | | 4,884 | | | | 493,724 | |
Other Securities | | | 527,651 | | | | 14,776,966 | |
| | | | | | | | |
| | | | | | | 20,730,546 | |
| | | | | | | | |
INDUSTRIALS (5.3%) | | | | | | | | |
Boeing Co. | | | 8,402 | | | | 1,092,092 | |
General Electric Co. | | | 37,205 | | | | 940,170 | |
Roper Industries, Inc. | | | 8,544 | | | | 1,335,854 | |
Union Pacific Corp. | | | 5,976 | | | | 711,921 | |
Other Securities | | | 340,495 | | | | 13,130,254 | |
| | | | | | | | |
| | | | | | | 17,210,291 | |
| | | | | | | | |
INFORMATION TECHNOLOGY (7.4%) | | | | | | | | |
Apple, Inc. | | | 30,065 | | | | 3,318,575 | |
Cisco Systems, Inc. | | | 22,656 | | | | 630,177 | |
Facebook, Inc. Cl A* | | | 8,137 | | | | 634,849 | |
Google, Inc. Cl A* | | | 1,134 | | | | 601,768 | |
Google, Inc. Cl C* | | | 1,134 | | | | 596,938 | |
Intel Corp. | | | 11,680 | | | | 423,867 | |
MasterCard, Inc. Cl A | | | 6,470 | | | | 557,455 | |
Microsoft Corp. | | | 25,940 | | | | 1,204,913 | |
Oracle Corp. | | | 16,326 | | | | 734,180 | |
QUALCOMM, Inc. | | | 9,230 | | | | 686,066 | |
Other Securities | | | 421,694 | | | | 14,679,507 | |
| | | | | | | | |
| | | | | | | 24,068,295 | |
| | | | | | | | |
MATERIALS (1.7%) | | | | | | | | |
Other Securities | | | 147,377 | | | | 5,411,207 | |
| | | | | | | | |
TELECOMMUNICATION SERVICES (0.7%) | |
AT&T, Inc. | | | 21,988 | | | | 738,577 | |
Verizon Communications, Inc. | | | 9,334 | | | | 436,645 | |
Other Securities | | | 58,038 | | | | 936,845 | |
| | | | | | | | |
| | | | | | | 2,112,067 | |
| | | | | | | | |
UTILITIES (1.3%) | | | | | | | | |
Other Securities | | | 82,869 | | | | 4,246,718 | |
| | | | | | | | |
TOTAL ACTIVE ASSETS-COMMON STOCKS | |
(Cost: $91,911,468) 40.9% | | | | | | | 132,669,811 | |
| | | | | | | | |
The accompanying notes are an integral part of these portfolio schedules.
41
MUTUAL OF AMERICA INVESTMENT CORPORATION — ALL AMERICA FUND
SUMMARY PORTFOLIO OF INVESTMENTS IN SECURITIES (Continued)
December 31, 2014
| | | | | | | | | | | | | | | | |
| | | Rating** | | | Rate(%) | | Maturity | | Face Amount | | | Value | |
| ACTIVE ASSETS: | | | | | | | | | | | | | | | | |
SHORT-TERM DEBT SECURITIES: | | | | | | | | | | | | | | | | |
U.S. GOVERNMENT (1.1%) | | | | | | | | | | | | | | | | |
U.S. Treasury Bill | | | A-1+ | | | 0.09 | | 06/25/15 - 07/23/15 | | $ | 3,600,000 | | | $ | 3,598,243 | |
| | | | | | | | | | | | | | | | |
COMMERCIAL PAPER (0.7%) | | | | | | | | | | | | | | | | |
General Electric Capital Corp. | | | A-1+ | | | 0.12 | | 03/02/15 | | | 1,000,000 | | | | 999,800 | |
Toyota Motor Credit Corp. | | | A-1+ | | | 0.10 - 0.12 | | 01/02/15 - 01/13/15 | | | 1,300,000 | | | | 1,299,974 | |
| | | | | | | | | | | | | | | | |
| | | | | | | | | | | | | | | 2,299,774 | |
| | | | | | | | | | | | | | | | |
TOTAL ACTIVE ASSETS-SHORT-TERM DEBT SECURITIES
(Cost: $5,898,017) 1.8% | | | | 5,898,017 | |
| | | | | | | | | | | | | | | | |
TOTAL ACTIVE ASSETS
(Cost: $97,809,485) 42.7% | | | | 138,567,828 | |
| | | | | | | | | | | | | | | | |
TEMPORARY CASH INVESTMENTS (2)
(Cost: $228,300) 0.1% | | | | 228,300 | |
| | | | | | | | | | | | | | | | |
TOTAL INVESTMENTS
(Cost: $224,695,619) 99.8% | | | | 323,596,062 | |
| | | | | | | | | | | | | | | | |
OTHER NET ASSETS 0.2% | | | | 587,061 | |
| | | | | | | | | | | | | | | | |
NET ASSETS 100.0% | | | $ | 324,183,123 | |
| | | | | | | | | | | | | | | | |
The accompanying notes are an integral part of these portfolio schedules.
42
MUTUAL OF AMERICA INVESTMENT CORPORATION — SMALL CAP VALUE FUND
SUMMARY PORTFOLIO OF INVESTMENTS IN SECURITIES
December 31, 2014
| | | | | | | | |
| | | Shares | | | Value | |
| | | | | | | | |
| COMMON STOCKS: | | | | | | | | |
CONSUMER DISCRETIONARY (10.8%) | |
Bassett Furniture Industries, Inc. | | | 373,980 | | | $ | 7,296,350 | |
CST Brands, Inc. | | | 72,800 | | | | 3,174,808 | |
Diamond Resorts Int’l., Inc.* | | | 354,327 | | | | 9,885,723 | |
Houghton Mifflin Harcourt Co.* | | | 281,471 | | | | 5,829,264 | |
Select Comfort Corp.* | | | 121,889 | | | | 3,294,660 | |
Wolverine World Wide, Inc. | | | 108,615 | | | | 3,200,884 | |
Other Securities | | | 651,602 | | | | 9,778,720 | |
| | | | | | | | |
| | | | | | | 42,460,409 | |
| | | | | | | | |
CONSUMER STAPLES (2.8%) | | | | | | | | |
Crimson Wine Group Ltd.* | | | 415,416 | | | | 3,946,452 | |
Farmer Brothers Co.* | | | 152,535 | | | | 4,492,156 | |
Other Securities | | | 127,476 | | | | 2,716,514 | |
| | | | | | | | |
| | | | | | | 11,155,122 | |
| | | | | | | | |
ENERGY (2.6%) | | | | | | | | |
PBF Energy, Inc. | | | 206,620 | | | | 5,504,357 | |
Other Securities | | | 1,069,104 | | | | 4,578,241 | |
| | | | | | | | |
| | | | | | | 10,082,598 | |
| | | | | | | | |
FINANCIALS (36.8%) | | | | | | | | |
Aspen Insurance Hldgs. Ltd. | | | 70,612 | | | | 3,090,687 | |
BancFirst Corp. | | | 52,011 | | | | 3,296,977 | |
Banner Corp. | | | 84,989 | | | | 3,656,227 | |
Brookline Bancorp, Inc. | | | 333,217 | | | | 3,342,167 | |
Chatham Lodging Trust | | | 121,980 | | | | 3,533,761 | |
Chesapeake Lodging Trust | | | 150,226 | | | | 5,589,909 | |
Ellington Financial LLC | | | 276,849 | | | | 5,525,906 | |
FelCor Lodging Trust, Inc. | | | 512,453 | | | | 5,544,741 | |
Forest City Enterprises, Inc. Cl A* | | | 242,508 | | | | 5,165,420 | |
Glacier Bancorp, Inc. | | | 129,383 | | | | 3,592,966 | |
Highwoods Properties, Inc. | | | 97,279 | | | | 4,307,514 | |
Investors Bancorp, Inc. | | | 326,037 | | | | 3,659,765 | |
Meadowbrook Insurance Group, Inc. | | | 472,531 | | | | 3,997,612 | |
Northfield Bancorp, Inc. | | | 228,383 | | | | 3,380,068 | |
Pennsylvania REIT | | | 139,768 | | | | 3,278,957 | |
PrivateBancorp, Inc. | | | 123,084 | | | | 4,111,006 | |
Select Income REIT | | | 149,817 | | | | 3,657,033 | |
Stock Yards Bancorp, Inc. | | | 121,910 | | | | 4,064,479 | |
SVB Financial Group* | | | 52,339 | | | | 6,074,988 | |
Symetra Financial Corp. | | | 252,010 | | | | 5,808,831 | |
Other Securities | | | 2,354,189 | | | | 60,010,617 | |
| | | | | | | | |
| | | | | | | 144,689,631 | |
| | | | | | | | |
| | | | | | | | |
| | | Shares | | | Value | |
| | | | | | | | |
| COMMON STOCKS (CONTINUED): | | | | | | | | |
HEALTH CARE (5.5%) | | | | | | | | |
Other Securities | | | 2,325,791 | | | $ | 21,587,844 | |
| | | | | | | | |
INDUSTRIALS (15.5%) | | | | | | | | |
Alaska Air Group, Inc. | | | 87,972 | | | | 5,257,207 | |
AZZ, Inc. | | | 110,213 | | | | 5,171,194 | |
Blount International, Inc.* | | | 301,318 | | | | 5,294,157 | |
Deluxe Corp. | | | 57,541 | | | | 3,581,927 | |
Encore Wire Corp. | | | 104,236 | | | | 3,891,130 | |
EnPro Industries, Inc.* | | | 59,042 | | | | 3,705,476 | |
Miller Industries, Inc. | | | 241,043 | | | | 5,011,284 | |
Mueller Industries, Inc. | | | 295,355 | | | | 10,083,417 | |
Old Dominion Freight Line, Inc.* | | | 84,563 | | | | 6,565,471 | |
Orbital Sciences Corp.* | | | 179,044 | | | | 4,814,493 | |
Uti Worldwide, Inc.* | | | 313,353 | | | | 3,782,171 | |
Other Securities | | | 193,415 | | | | 3,663,494 | |
| | | | | | | | |
| | | | | | | 60,821,421 | |
| | | | | | | | |
INFORMATION TECHNOLOGY (8.8%) | |
Anixter International, Inc.* | | | 37,180 | | | | 3,288,943 | |
Proofpoint, Inc.* | | | 63,802 | | | | 3,077,170 | |
Richardson Electronics Ltd. | | | 518,914 | | | | 5,189,140 | |
SYNNEX Corp. | | | 48,207 | | | | 3,767,859 | |
Other Securities | | | 1,072,995 | | | | 19,292,920 | |
| | | | | | | | |
| | | | | | | 34,616,032 | |
| | | | | | | | |
MATERIALS (5.9%) | | | | | | | | |
Kaiser Aluminum Corp. | | | 93,794 | | | | 6,699,705 | |
Silgan Hldgs., Inc. | | | 75,242 | | | | 4,032,971 | |
Other Securities | | | 498,745 | | | | 12,427,254 | |
| | | | | | | | |
| | | | | | | 23,159,930 | |
| | | | | | | | |
TELECOMMUNICATION SERVICES (1.3%) | | | | | | | | |
Other Securities | | | 324,740 | | | | 5,219,268 | |
| | | | | | | | |
UTILITIES (5.9%) | | | | | | | | |
Avista Corp. | | | 112,912 | | | | 3,991,439 | |
Idacorp, Inc. | | | 83,429 | | | | 5,522,166 | |
PNM Resources, Inc. | | | 122,683 | | | | 3,635,097 | |
Portland General Electric Co. | | | 93,213 | | | | 3,526,248 | |
Other Securities | | | 128,795 | | | | 6,838,148 | |
| | | | | | | | |
| | | | | | | 23,513,098 | |
| | | | | | | | |
TOTAL COMMON STOCKS | | | | | | | | |
(Cost: $288,159,357) 95.9% | | | | | | | 377,305,353 | |
| | | | | | | | |
The accompanying notes are an integral part of these portfolio schedules.
43
MUTUAL OF AMERICA INVESTMENT CORPORATION — SMALL CAP VALUE FUND
SUMMARY PORTFOLIO OF INVESTMENTS IN SECURITIES (Continued)
December 31, 2014
| | | | | | | | | | | | | | |
| | | Rating** | | Rate(%) | | Maturity | | Face Amount | | | Value | |
| SHORT-TERM DEBT SECURITIES: | | | | | | | | | | | | | | |
U.S. GOVERNMENT (1.4%) | | | | | | | | | | | | | | |
U.S. Treasury Bill | | A-1+ | | 0.09 | | 07/23/15 | | $ | 5,350,000 | | | $ | 5,347,285 | |
| | | | | | | | | | | | | | |
U.S. GOVERNMENT AGENCIES (0.6%) | | | | | | | | | | | | | | |
FHLB | | A-1+ | | 0.10 | | 03/06/15 | | | 2,500,000 | | | | 2,499,533 | |
| | | | | | | | | | | | | | |
COMMERCIAL PAPER (2.5%) | | | | | | | | | | | | | | |
Dover Corp.† | | A-1 | | 0.10 | | 01/02/15 | | | 3,900,000 | | | | 3,899,989 | |
Piedmont Natural Gas Co.† | | A-1 | | 0.17 | | 01/05/15 | | | 1,050,000 | | | | 1,049,980 | |
Questar Corp.† | | A-1 | | 0.15 - 0.19 | | 01/07/15 - 01/14/15 | | | 2,100,000 | | | | 2,099,922 | |
Toyota Motor Credit Corp. | | A-1+ | | 0.11 | | 01/09/15 | | | 3,000,000 | | | | 2,999,927 | |
| | | | | | | | | | | | | | |
| | | | | | | | | | | | | 10,049,818 | |
| | | | | | | | | | | | | | |
TOTAL SHORT-TERM DEBT SECURITIES
(Cost: $17,896,636) 4.5% | | | | 17,896,636 | |
| | | | | | | | | | | | | | |
TOTAL INVESTMENTS
(Cost: $306,055,993) 100.4% | | | | 395,201,989 | |
| | | | | | | | | | | | | | |
OTHER NET ASSETS -0.4% | | | | (1,745,447 | ) |
| | | | | | | | | | | | | | |
NET ASSETS 100.0% | | | $ | 393,456,542 | |
| | | | | | | | | | | | | | |
The accompanying notes are an integral part of these portfolio schedules.
44
MUTUAL OF AMERICA INVESTMENT CORPORATION — SMALL CAP GROWTH FUND
SUMMARY PORTFOLIO OF INVESTMENTS IN SECURITIES
December 31, 2014
| | | | | | | | |
| | | Shares | | | Value | |
| | | | | | | | |
| COMMON STOCKS: | | | | | | | | |
CONSUMER DISCRETIONARY (14.7%) | | | | | | | | |
Carmike Cinemas, Inc.* | | | 122,947 | | | $ | 3,229,805 | |
Cooper Tire & Rubber Co. | | | 100,731 | | | | 3,490,336 | |
CST Brands, Inc. | | | 91,891 | | | | 4,007,371 | |
Diamond Resorts Int’l., Inc.* | | | 178,932 | | | | 4,992,197 | |
Popeyes Louisiana Kitchen, Inc.* | | | 59,591 | | | | 3,353,157 | |
Red Robin Gourmet Burgers, Inc.* | | | 96,634 | | | | 7,438,384 | |
Select Comfort Corp.* | | | 132,244 | | | | 3,574,542 | |
Steve Madden Ltd.* | | | 106,603 | | | | 3,393,186 | |
Other Securities | | | 899,800 | | | | 27,200,704 | |
| | | | | | | | |
| | | | | | | 60,679,682 | |
| | | | | | | | |
CONSUMER STAPLES (2.7%) | | | | | | | | |
Spectrum Brands Hldgs., Inc. | | | 34,974 | | | | 3,346,293 | |
TreeHouse Foods, Inc.* | | | 39,910 | | | | 3,413,485 | |
Other Securities | | | 206,393 | | | | 4,481,981 | |
| | | | | | | | |
| | | | | | | 11,241,759 | |
| | | | | | | | |
ENERGY (3.4%) | | | | | | | | |
Targa Resources Corp. | | | 34,880 | | | | 3,699,024 | |
Other Securities | | | 506,207 | | | | 10,325,182 | |
| | | | | | | | |
| | | | | | | 14,024,206 | |
| | | | | | | | |
FINANCIALS (7.2%) | | | | | | | | |
Sabra Health Care REIT, Inc. | | | 151,257 | | | | 4,593,692 | |
Other Securities | | | 1,235,847 | | | | 25,070,802 | |
| | | | | | | | |
| | | | | | | 29,664,494 | |
| | | | | | | | |
HEALTH CARE (24.2%) | | | | | | | | |
Abiomed, Inc.* | | | 128,510 | | | | 4,891,107 | |
DexCom, Inc.* | | | 90,890 | | | | 5,003,500 | |
Emergent Biosolutions, Inc.* | | | 149,662 | | | | 4,075,296 | |
Exact Sciences Corp.* | | | 162,009 | | | | 4,445,526 | |
Insulet Corp.* | | | 75,401 | | | | 3,472,947 | |
MWI Veterinary Supply, Inc.* | | | 20,211 | | | | 3,434,000 | |
Omeros Corp.* | | | 137,886 | | | | 3,416,813 | |
Omnicell, Inc.* | | | 97,239 | | | | 3,220,569 | |
PAREXEL International Corp.* | | | 74,569 | | | | 4,143,042 | |
Other Securities | | | 2,413,540 | | | | 63,792,539 | |
| | | | | | | | |
| | | | | | | 99,895,339 | |
| | | | | | | | |
INDUSTRIALS (14.0%) | | | | | | | | |
Allegiant Travel Co. | | | 26,513 | | | | 3,985,654 | |
Astronics Corp.* | | | 97,868 | | | | 5,413,079 | |
AZZ, Inc. | | | 88,201 | | | | 4,138,387 | |
| | | | | | | | |
| | | Shares | | | Value | |
| | | | | | | | |
| COMMON STOCKS (CONTINUED): | | | | | | | | |
INDUSTRIALS (CONTINUED) | | | | | | | | |
Corporate Executive Board Co. | | | 46,639 | | | $ | 3,382,756 | |
EnPro Industries, Inc.* | | | 54,756 | | | | 3,436,480 | |
Healthcare Svcs. Group, Inc. | | | 114,741 | | | | 3,548,933 | |
Mueller Water Product, Inc. Cl A | | | 354,018 | | | | 3,625,143 | |
Raven Industries, Inc. | | | 139,176 | | | | 3,479,390 | |
Saia, Inc.* | | | 100,186 | | | | 5,546,296 | |
Sun Hydraulics Corp. | | | 85,277 | | | | 3,358,189 | |
Teledyne Technologies, Inc.* | | | 39,074 | | | | 4,014,494 | |
Trex Co., Inc.* | | | 111,041 | | | | 4,728,127 | |
Other Securities | | | 387,967 | | | | 9,241,441 | |
| | | | | | | | |
| | | | | | | 57,898,369 | |
| | | | | | | | |
INFORMATION TECHNOLOGY (24.0%) | | | | | | | | |
ARRIS Group, Inc.* | | | 122,933 | | | | 3,711,359 | |
CalAmp Corp.* | | | 211,920 | | | | 3,878,134 | |
Cavium, Inc.* | | | 65,209 | | | | 4,031,233 | |
comScore, Inc.* | | | 113,653 | | | | 5,276,891 | |
Electronics for Imaging, Inc.* | | | 82,057 | | | | 3,514,493 | |
Euronet Worldwide, Inc.* | | | 58,454 | | | | 3,209,125 | |
iGATE Corp.* | | | 127,875 | | | | 5,048,498 | |
Imperva, Inc.* | | | 100,889 | | | | 4,986,968 | |
LogMeIn, Inc.* | | | 83,520 | | | | 4,120,892 | |
Monolithic Power Systems, Inc. | | | 78,156 | | | | 3,887,479 | |
Proofpoint, Inc.* | | | 91,974 | | | | 4,435,892 | |
Qlik Technologies, Inc.* | | | 144,961 | | | | 4,477,856 | |
Rogers Corp.* | | | 69,309 | | | | 5,644,522 | |
Synaptics, Inc.* | | | 58,321 | | | | 4,014,818 | |
Other Securities | | | 1,099,094 | | | | 38,815,336 | |
| | | | | | | | |
| | | | | | | 99,053,496 | |
| | | | | | | | |
MATERIALS (4.1%) | | | | | | | | |
A. Schulman, Inc. | | | 92,097 | | | | 3,732,671 | |
Resolute Forest Products, Inc.* | | | 198,655 | | | | 3,498,315 | |
U.S. Concrete, Inc.* | | | 119,479 | | | | 3,399,175 | |
Other Securities | | | 274,740 | | | | 6,303,556 | |
| | | | | | | | |
| | | | | | | 16,933,717 | |
| | | | | | | | |
TELECOMMUNICATION SERVICES (1.5%) | | | | | | | | |
Other Securities | | | 370,358 | | | | 6,067,335 | |
| | | | | | | | |
UTILITIES (0.8%) | | | | | | | | |
Other Securities | | | 54,480 | | | | 3,082,461 | |
| | | | | | | | |
TOTAL COMMON STOCKS | | | | | | | | |
(Cost: $309,765,383) 96.6% | | | | | | | 398,540,858 | |
| | | | | | | | |
The accompanying notes are an integral part of these portfolio schedules.
45
MUTUAL OF AMERICA INVESTMENT CORPORATION — SMALL CAP GROWTH FUND
SUMMARY PORTFOLIO OF INVESTMENTS IN SECURITIES (Continued)
December 31, 2014
| | | | | | | | | | | | | | |
| | | Rating** | | Rate(%) | | Maturity | | Face Amount | | | Value | |
| SHORT-TERM DEBT SECURITIES: | | | | | | | | | | | | | | |
COMMERCIAL PAPER (3.3%) | | | | | | | | | | | | | | |
Emerson Electric Co.† | | A-1 | | 0.14 | | 03/30/15 | | $ | 4,300,000 | | | $ | 4,298,528 | |
Exxon Mobil Corp. | | A-1+ | | 0.13 | | 02/04/15 | | | 4,700,000 | | | | 4,699,423 | |
Toyota Motor Credit Corp. | | A-1+ | | 0.11 | | 01/09/15 | | | 4,500,000 | | | | 4,499,890 | |
| | | | | | | | | | | | | | |
| | | | | | | | | | | | | 13,497,841 | |
| | | | | | | | | | | | | | |
TOTAL SHORT-TERM DEBT SECURITIES
(Cost: $13,497,841) 3.3% | | | | 13,497,841 | |
| | | | | | | | | | | | | | |
TOTAL INVESTMENTS
(Cost: $323,263,224) 99.9% | | | | 412,038,699 | |
| | | | | | | | | | | | | | |
OTHER NET ASSETS 0.1% | | | | 310,343 | |
| | | | | | | | | | | | | | |
NET ASSETS 100.0% | | | $ | 412,349,042 | |
| | | | | | | | | | | | | | |
The accompanying notes are an integral part of these portfolio schedules.
46
MUTUAL OF AMERICA INVESTMENT CORPORATION — MID CAP VALUE FUND
SUMMARY PORTFOLIO OF INVESTMENTS IN SECURITIES
December 31, 2014
| | | | | | | | |
| | | Shares | | | Value | |
| COMMON STOCKS: | | | | | | | | |
CONSUMER DISCRETIONARY (8.7%) | | | | | | | | |
Diamond Resorts Int’l., Inc.* | | | 49,347 | | | $ | 1,376,781 | |
Dillard’s, Inc. Cl A | | | 7,310 | | | | 915,066 | |
Newell Rubbermaid, Inc. | | | 25,099 | | | | 956,021 | |
TRW Automotive Hldgs. Corp.* | | | 8,175 | | | | 840,799 | |
Other Securities | | | 95,895 | | | | 3,980,884 | |
| | | | | | | | |
| | | | | | | 8,069,551 | |
| | | | | | | | |
CONSUMER STAPLES (3.2%) | | | | | | | | |
Energizer Hldgs., Inc. | | | 6,652 | | | | 855,181 | |
Ingredion, Inc. | | | 10,515 | | | | 892,093 | |
Other Securities | | | 29,860 | | | | 1,171,339 | |
| | | | | | | | |
| | | | | | | 2,918,613 | |
| | | | | | | | |
ENERGY (3.3%) | | | | | | | | |
Noble Energy, Inc. | | | 19,338 | | | | 917,201 | |
Tesoro Corp. | | | 11,599 | | | | 862,386 | |
Other Securities | | | 57,363 | | | | 1,308,998 | |
| | | | | | | | |
| | | | | | | 3,088,585 | |
| | | | | | | | |
FINANCIALS (33.1%) | | | | | | | | |
American Financial Group, Inc. | | | 27,163 | | | | 1,649,337 | |
Ameriprise Financial, Inc. | | | 14,464 | | | | 1,912,859 | |
Aon PLC | | | 9,799 | | | | 929,239 | |
Discover Financial Svcs. | | | 15,475 | | | | 1,013,458 | |
Duke Realty Corp. | | | 43,075 | | | | 870,115 | |
Everest Re Group Ltd. | | | 5,234 | | | | 891,350 | |
Fifth Third Bancorp | | | 39,312 | | | | 800,982 | |
Hartford Financial Svcs. Group, Inc. | | | 24,173 | | | | 1,007,772 | |
Home Properties, Inc. | | | 12,147 | | | | 796,843 | |
Host Hotels & Resorts, Inc. | | | 41,509 | | | | 986,669 | |
iShares Russell Mid-Cap Value ETF | | | 12,170 | | | | 897,781 | |
KeyCorp | | | 66,023 | | | | 917,720 | |
Lincoln National Corp. | | | 17,743 | | | | 1,023,239 | |
Reinsurance Grp. of America, Inc. | | | 10,423 | | | | 913,263 | |
RLJ Lodging Trust | | | 24,389 | | | | 817,763 | |
Vornado Realty Trust | | | 11,850 | | | | 1,394,864 | |
Voya Financial, Inc. | | | 23,104 | | | | 979,148 | |
Other Securities | | | 497,279 | | | | 12,811,045 | |
| | | | | | | | |
| | | | | | | 30,613,447 | |
| | | | | | | | |
HEALTH CARE (9.9%) | | | | | | | | |
Boston Scientific Corp.* | | | 62,696 | | | | 830,722 | |
Cardinal Health, Inc. | | | 10,324 | | | | 833,457 | |
CIGNA Corp. | | | 9,494 | | | | 977,028 | |
| | | | | | | | |
| | | Shares | | | Value | |
| COMMON STOCKS (CONTINUED): | | | | | | | | |
HEALTH CARE (CONTINUED) | | | | | | | | |
HCA Hldgs., Inc.* | | | 17,042 | | | $ | 1,250,712 | |
Humana, Inc. | | | 8,415 | | | | 1,208,646 | |
Other Securities | | | 64,974 | | | | 4,009,904 | |
| | | | | | | | |
| | | | | | | 9,110,469 | |
| | | | | | | | |
INDUSTRIALS (8.1%) | | | | | | | | |
Alaska Air Group, Inc. | | | 15,686 | | | | 937,395 | |
L-3 Communications Hldgs., Inc. | | | 9,004 | | | | 1,136,395 | |
Old Dominion Freight Line, Inc.* | | | 16,601 | | | | 1,288,902 | |
Oshkosh Corp. | | | 20,974 | | | | 1,020,385 | |
Triumph Group, Inc. | | | 16,724 | | | | 1,124,187 | |
Other Securities | | | 37,511 | | | | 1,951,609 | |
| | | | | | | | |
| | | | | | | 7,458,873 | |
| | | | | | | | |
INFORMATION TECHNOLOGY (10.4%) | | | | | | | | |
Avago Technologies Ltd. | | | 9,317 | | | | 937,197 | |
CA, Inc. | | | 32,517 | | | | 990,143 | |
Western Digital Corp. | | | 10,540 | | | | 1,166,778 | |
Other Securities | | | 173,816 | | | | 6,486,967 | |
| | | | | | | | |
| | | | | | | 9,581,085 | |
| | | | | | | | |
MATERIALS (7.7%) | | | | | | | | |
Crown Hldgs., Inc.* | | | 27,790 | | | | 1,414,511 | |
Eastman Chemical Co. | | | 12,692 | | | | 962,815 | |
International Paper Co. | | | 17,896 | | | | 958,868 | |
Packaging Corp. of America | | | 20,673 | | | | 1,613,528 | |
Other Securities | | | 33,778 | | | | 2,116,410 | |
| | | | | | | | |
| | | | | | | 7,066,132 | |
| | | | | | | | |
UTILITIES (11.9%) | | | | | | | | |
Ameren Corp. | | | 21,241 | | | | 979,847 | |
Atmos Energy Corp. | | | 15,423 | | | | 859,678 | |
Consolidated Edison, Inc. | | | 12,187 | | | | 804,464 | |
Edison International | | | 26,048 | | | | 1,705,623 | |
Great Plains Energy, Inc. | | | 33,163 | | | | 942,161 | |
ITC Hldgs. Corp. | | | 20,779 | | | | 840,095 | |
PPL Corp. | | | 24,935 | | | | 905,889 | |
Public Svc. Enterprise Group, Inc. | | | 22,660 | | | | 938,351 | |
Other Securities | | | 51,481 | | | | 2,963,246 | |
| | | | | | | | |
| | | | | | | 10,939,354 | |
| | | | | | | | |
TOTAL COMMON STOCKS | |
(Cost: $69,196,114) 96.3% | | | | | | | 88,846,109 | |
| | | | | | | | |
The accompanying notes are an integral part of these portfolio schedules.
47
MUTUAL OF AMERICA INVESTMENT CORPORATION — MID CAP VALUE FUND
SUMMARY PORTFOLIO OF INVESTMENTS IN SECURITIES (Continued)
December 31, 2014
| | | | | | | | | | | | | | |
| | | Rating** | | Rate(%) | | Maturity | | Face Amount | | | Value | |
| SHORT-TERM DEBT SECURITIES: | | | | | | | | | | | | | | |
U.S. GOVERNMENT (0.5%) | | | | | | | | | | | | | | |
U.S. Treasury Bill | | A-1+ | | 0.09 | | 07/23/15 | | $ | 500,000 | | | $ | 499,746 | |
| | | | | | | | | | | | | | |
U.S. GOVERNMENT AGENCIES (1.0%) | | | | | | | | | | | | | | |
FHLB | | A-1+ | | 0.10 | | 03/04/15 | | | 900,000 | | | | 899,845 | |
| | | | | | | | | | | | | | |
COMMERCIAL PAPER (2.0%) | | | | | | | | | | | | | | |
Toyota Motor Credit Corp. | | A-1+ | | 0.11 - 0.14 | | 01/09/15 - 02/06/15 | | | 1,850,000 | | | | 1,849,857 | |
| | | | | | | | | | | | | | |
TOTAL SHORT-TERM DEBT SECURITIES
(Cost: $3,249,448) 3.5% | | | | 3,249,448 | |
| | | | | | | | | | | | | | |
TOTAL INVESTMENTS
(Cost: $72,445,562) 99.8% | | | | 92,095,557 | |
| | | | | | | | | | | | | | |
OTHER NET ASSETS 0.2% | | | | 232,400 | |
| | | | | | | | | | | | | | |
NET ASSETS 100.0% | | | $ | 92,327,957 | |
| | | | | | | | | | | | | | |
The accompanying notes are an integral part of these portfolio schedules.
48
MUTUAL OF AMERICA INVESTMENT CORPORATION — MID-CAP EQUITY INDEX FUND
SUMMARY PORTFOLIO OF INVESTMENTS IN SECURITIES
December 31, 2014
| | | | | | | | |
| | | Shares | | | Value | |
| | | | | | | | |
| INDEXED ASSETS: | | | | | | | | |
COMMON STOCKS: | | | | | | | | |
CONSUMER DISCRETIONARY (13.2%) | | | | | | | | |
Advance Auto Parts, Inc. | | | 43,468 | | | $ | 6,923,583 | |
Foot Locker, Inc. | | | 84,511 | | | | 4,747,828 | |
Hanesbrands, Inc. | | | 59,415 | | | | 6,631,902 | |
Jarden Corp.* | | | 106,414 | | | | 5,095,102 | |
LKQ Corp.* | | | 180,241 | | | | 5,068,377 | |
Polaris Industries, Inc. | | | 36,333 | | | | 5,495,003 | |
Signet Jewelers Ltd. | | | 47,689 | | | | 6,274,442 | |
Other Securities | | | 2,854,781 | | | | 92,257,038 | |
| | | | | | | | |
| | | | | | | 132,493,275 | |
| | | | | | | | |
CONSUMER STAPLES (3.3%) | | | | | | | | |
Church & Dwight Co., Inc. | | | 79,568 | | | | 6,270,754 | |
Energizer Hldgs., Inc. | | | 36,934 | | | | 4,748,235 | |
Other Securities | | | 599,798 | | | | 22,144,526 | |
| | | | | | | | |
| | | | | | | 33,163,515 | |
| | | | | | | | |
ENERGY (3.9%) | | | | | | | | |
HollyFrontier Corp. | | | 116,421 | | | | 4,363,459 | |
Other Securities | | | 1,296,715 | | | | 34,933,885 | |
| | | | | | | | |
| | | | | | | 39,297,344 | |
| | | | | | | | |
FINANCIALS (22.7%) | | | | | | | | |
Alleghany Corp.* | | | 9,579 | | | | 4,439,867 | |
Duke Realty Corp. | | | 203,247 | | | | 4,105,589 | |
Everest Re Group Ltd. | | | 26,913 | | | | 4,583,284 | |
Federal Realty Investment Trust | | | 40,525 | | | | 5,408,467 | |
Gallagher (Arthur J.) & Co. | | | 95,982 | | | | 4,518,833 | |
Jones Lang LaSalle, Inc. | | | 26,659 | | | | 3,996,984 | |
New York Community Bancorp, Inc. | | | 263,281 | | | | 4,212,496 | |
Raymond James Financial, Inc. | | | 74,932 | | | | 4,292,854 | |
Realty Income Corp. | | | 132,450 | | | | 6,319,190 | |
SL Green Realty Corp | | | 57,407 | | | | 6,832,581 | |
UDR, Inc. | | | 151,564 | | | | 4,671,202 | |
Other Securities | | | 5,025,814 | | | | 173,982,275 | |
| | | | | | | | |
| | | | | | | 227,363,622 | |
| | | | | | | | |
HEALTH CARE (10.0%) | | | | | | | | |
Cooper Companies, Inc. | | | 28,717 | | | | 4,654,739 | |
Cubist Pharmaceuticals, Inc.* | | | 45,379 | | | | 4,567,396 | |
Endo International PLC* | | | 91,426 | | | | 6,593,643 | |
IDEXX Laboratories, Inc.* | | | 28,385 | | | | 4,208,644 | |
MEDNAX, Inc.* | | | 59,726 | | | | 3,948,486 | |
Mettler-Toledo Int’l., Inc.* | | | 16,979 | | | | 5,135,468 | |
Omnicare, Inc. | | | 58,220 | | | | 4,245,985 | |
ResMed, Inc. | | | 83,077 | | | | 4,657,297 | |
| | | | | | | | |
| | | Shares | | | Value | |
| INDEXED ASSETS (CONTINUED): | | | | | | | | |
COMMON STOCKS (CONTINUED): | | | | | | | | |
HEALTH CARE (CONTINUED) | | | | | | | | |
Salix Pharmaceuticals Ltd.* | | | 37,902 | | | $ | 4,356,456 | |
Schein (Henry), Inc.* | | | 50,089 | | | | 6,819,617 | |
Other Securities | | | 942,430 | | | | 50,622,016 | |
| | | | | | | | |
| | | | | | | 99,809,747 | |
| | | | | | | | |
INDUSTRIALS (14.7%) | | | | | | | | |
Alaska Air Group, Inc. | | | 78,252 | | | | 4,676,340 | |
Fortune Brands Home & Security, Inc. | | | 93,830 | | | | 4,247,684 | |
Hunt (J.B.) Transport Svcs., Inc. | | | 55,101 | | | | 4,642,259 | |
Towers Watson & Co. Cl A | | | 41,597 | | | | 4,707,532 | |
Wabtec Corp. | | | 57,332 | | | | 4,981,577 | |
Other Securities | | | 2,522,863 | | | | 123,463,894 | |
| | | | | | | | |
| | | | | | | 146,719,286 | |
| | | | | | | | |
INFORMATION TECHNOLOGY (17.2%) | | | | | | | | |
ANSYS, Inc.* | | | 54,665 | | | | 4,482,530 | |
Equinix, Inc. | | | 32,472 | | | | 7,362,377 | |
Gartner, Inc.* | | | 52,384 | | | | 4,411,257 | |
RF Micro Devices, Inc.* | | | 346,058 | | | | 5,741,102 | |
Skyworks Solutions, Inc. | | | 113,399 | | | | 8,245,236 | |
Synopsys, Inc.* | | | 92,683 | | | | 4,028,930 | |
Trimble Navigation Ltd.* | | | 154,053 | | | | 4,088,567 | |
Other Securities | | | 4,496,552 | | | | 134,115,061 | |
| | | | | | | | |
| | | | | | | 172,475,060 | |
| | | | | | | | |
MATERIALS (7.2%) | | | | | | | | |
Ashland, Inc. | | | 37,959 | | | | 4,545,970 | |
Packaging Corp. of America | | | 58,516 | | | | 4,567,174 | |
Rock-Tenn Co. Cl A | | | 83,300 | | | | 5,079,634 | |
RPM International, Inc. | | | 79,390 | | | | 4,025,867 | |
Valspar Corp. | | | 45,341 | | | | 3,921,090 | |
Other Securities | | | 1,247,338 | | | | 49,627,451 | |
| | | | | | | | |
| | | | | | | 71,767,186 | |
| | | | | | | | |
TELECOMMUNICATION SERVICES (0.2%) | | | | | | | | |
Other Securities | | | 58,404 | | | | 1,474,701 | |
| | | | | | | | |
UTILITIES (4.7%) | | | | | | | | |
Alliant Energy Corp. | | | 65,984 | | | | 4,382,657 | |
OGE Energy Corp. | | | 118,553 | | | | 4,206,260 | |
Other Securities | | | 1,016,688 | | | | 38,615,569 | |
| | | | | | | | |
| | | | | | | 47,204,486 | |
| | | | | | | | |
TOTAL INDEXED ASSETS-COMMON STOCKS | |
(Cost: $690,724,952) 97.1% | | | | | | | 971,768,222 | |
| | | | | | | | |
The accompanying notes are an integral part of these portfolio schedules.
49
MUTUAL OF AMERICA INVESTMENT CORPORATION — MID-CAP EQUITY INDEX FUND
SUMMARY PORTFOLIO OF INVESTMENTS IN SECURITIES (Continued)
December 31, 2014
| | | | | | | | | | | | | | |
| | | Rating** | | Rate(%) | | Maturity | | Face Amount | | | Value | |
| SHORT-TERM DEBT SECURITIES: | | | | | | | | | | | | | | |
U.S. GOVERNMENT (0.7%) | | | | | | | | | | | | | | |
U.S. Treasury Bill (1) | | A-1+ | | 0.01 - 0.10 | | 03/05/15 - 06/18/15 | | $ | 7,400,000 | | | $ | 7,397,545 | |
| | | | | | | | | | | | | | |
COMMERCIAL PAPER (2.4%) | | | | | | | | | | | | | | |
Emerson Electric Co.† | | A-1 | | 0.14 | | 03/30/15 | | | 1,000,000 | | | | 999,658 | |
Exxon Mobil Corp. | | A-1+ | | 0.12 | | 01/21/15 | | | 10,000,000 | | | | 9,999,333 | |
Intercontinental Exchange, Inc.† | | A-1 | | 0.17 | | 01/06/15 | | | 1,300,000 | | | | 1,299,969 | |
Piedmont Natural Gas Co.† | | A-1 | | 0.18 | | 01/06/15 | | | 1,500,000 | | | | 1,499,963 | |
Toyota Motor Credit Corp. | | A-1+ | | 0.13 | | 01/28/15 | | | 10,000,000 | | | | 9,999,025 | |
| | | | | | | | | | | | | | |
| | | | | | | | | | | | | 23,797,948 | |
| | | | | | | | | | | | | | |
TOTAL SHORT-TERM DEBT SECURITIES
(Cost: $31,195,493) 3.1% | | | | 31,195,493 | |
| | | | | | | | | | | | | | |
TEMPORARY CASH INVESTMENTS (2)
(Cost: $100,000) 0.0% (3) | | | | 100,000 | |
| | | | | | | | | | | | | | |
TOTAL INVESTMENTS
(Cost: $722,020,445) 100.2% | | | | 1,003,063,715 | |
| | | | | | | | | | | | | | |
OTHER NET ASSETS -0.2% | | | | (2,435,125 | ) |
| | | | | | | | | | | | | | |
NET ASSETS 100.0% | | | $ | 1,000,628,590 | |
| | | | | | | | | | | | | | |
The accompanying notes are an integral part of these portfolio schedules.
50
MUTUAL OF AMERICA INVESTMENT CORPORATION — INTERNATIONAL FUND
PORTFOLIO OF INVESTMENTS IN SECURITIES
December 31, 2014
| | | | | | | | |
| | | Shares | | | Value | |
| | | | | | | | |
| COMMON STOCKS: | | | | | | | | |
FINANCIALS (95.6%) | | | | | | | | |
iShares Core MSCI Europe ETF | | | 19,229 | | | $ | 841,076 | |
iShares Core MSCI Pacific ETF | | | 10,218 | | | | 483,107 | |
iShares MSCI EAFE ETF | | | 1,136,525 | | | | 69,146,181 | |
iShares MSCI EAFE Growth ETF | | | 287,839 | | | | 18,939,806 | |
iShares MSCI EAFE Small-Cap ETF | | | 177,935 | | | | 8,311,344 | |
iShares MSCI EAFE Value ETF | | | 365,047 | | | | 18,628,348 | |
iShares MSCI Emerging Markets ETF | | | 169,437 | | | | 9,595,217 | |
Vanguard FTSE Developed Markets ETF | | | 2,416,800 | | | | 91,548,386 | |
Vanguard FTSE Europe ETF | | | 424,630 | | | | 22,254,858 | |
Vanguard FTSE Pacific ETF | | | 220,480 | | | | 12,578,384 | |
| | | | | | | | |
| | | | | | | 252,326,707 | |
| | | | | | | | |
TOTAL COMMON STOCKS
(Cost: $249,366,368) 95.7% | | | | 252,326,707 | |
| | | | | | | | |
| | | | | | | | | | | | | | |
| | | Rating** | | Rate(%) | | Maturity | | Face Amount | | | Value | |
| SHORT-TERM DEBT SECURITIES: | | | | | | | | | | | | | | |
U.S. GOVERNMENT (2.0%) | | | | | | | | | | | | | | |
U.S. Treasury Bill | | A-1+ | | 0.09 | | 06/25/15 - 07/23/15 | | $ | 5,400,000 | | | $ | 5,397,469 | |
| | | | | | | | | | | | | | |
COMMERCIAL PAPER (2.3%) | | | | | | | | | | | | | | |
Toyota Motor Credit Corp. | | A-1+ | | 0.11 - 0.14 | | 01/13/15 - 02/20/15 | | | 6,000,000 | | | | 5,998,991 | |
| | | | | | | | | | | | | | |
TOTAL SHORT-TERM DEBT SECURITIES
(Cost: $11,396,460) 4.3% | | | | 11,396,460 | |
| | | | | | | | | | | | | | |
TOTAL INVESTMENTS
(Cost: $260,762,828) 100.0% | | | | 263,723,167 | |
| | | | | | | | | | | | | | |
OTHER NET ASSETS 0.0% (3) | | | | 110,408 | |
| | | | | | | | | | | | | | |
NET ASSETS 100.0% | | | $ | 263,833,575 | |
| | | | | | | | | | | | | | |
The accompanying notes are an integral part of these portfolio schedules.
51
MUTUAL OF AMERICA INVESTMENT CORPORATION — COMPOSITE FUND
SUMMARY PORTFOLIO OF INVESTMENTS IN SECURITIES
December 31, 2014
| | | | | | | | |
| | | Shares | | | Value | |
| | | | | | | | |
| COMMON STOCKS: | | | | | | | | |
CONSUMER DISCRETIONARY (7.6%) | | | | | | | | |
Amazon.com, Inc.* | | | 4,186 | | | $ | 1,299,125 | |
Disney (Walt) Co. | | | 19,331 | | | | 1,820,787 | |
Home Depot, Inc. | | | 13,072 | | | | 1,372,168 | |
McDonald’s Corp. | | | 11,005 | | | | 1,031,169 | |
Starbucks Corp. | | | 14,254 | | | | 1,169,541 | |
Time Warner Cable, Inc. | | | 7,231 | | | | 1,099,546 | |
Time Warner, Inc. | | | 12,173 | | | | 1,039,818 | |
Other Securities | | | 104,219 | | | | 5,767,841 | |
| | | | | | | | |
| | | | | | | 14,599,995 | |
| | | | | | | | |
CONSUMER STAPLES (5.4%) | | | | | | | | |
Constellation Brands, Inc. Cl A* | | | 10,942 | | | | 1,074,176 | |
PepsiCo, Inc. | | | 11,994 | | | | 1,134,153 | |
Proctor & Gamble Co. | | | 20,662 | | | | 1,882,102 | |
Wal-Mart Stores, Inc. | | | 16,847 | | | | 1,446,820 | |
Other Securities | | | 92,721 | | | | 4,922,267 | |
| | | | | | | | |
| | | | | | | 10,459,518 | |
| | | | | | | | |
ENERGY (5.1%) | | | | | | | | |
Exxon Mobil Corp. | | | 34,436 | | | | 3,183,608 | |
Other Securities | | | 106,049 | | | | 6,774,065 | |
| | | | | | | | |
| | | | | | | 9,957,673 | |
| | | | | | | | |
FINANCIALS (9.4%) | | | | | | | | |
American Int’l. Group, Inc. | | | 19,438 | | | | 1,088,722 | |
Bank of America Corp. | | | 71,077 | | | | 1,271,568 | |
Berkshire Hathaway, Inc. Cl B* | | | 8,022 | | | | 1,204,503 | |
Capital One Financial Corp. | | | 19,282 | | | | 1,591,729 | |
Goldman Sachs Group, Inc. | | | 6,635 | | | | 1,286,062 | |
JPMorgan Chase & Co. | | | 42,616 | | | | 2,666,909 | |
MetLife, Inc. | | | 19,364 | | | | 1,047,399 | |
Simon Property Group, Inc. | | | 6,905 | | | | 1,257,470 | |
Wells Fargo & Co. | | | 41,555 | | | | 2,278,045 | |
Other Securities | | | 99,632 | | | | 4,593,924 | |
| | | | | | | | |
| | | | | | | 18,286,331 | |
| | | | | | | | |
HEALTH CARE (9.1%) | | | | | | | | |
Celgene Corp.* | | | 10,935 | | | | 1,223,189 | |
Covidien PLC | | | 11,804 | | | | 1,207,313 | |
Gilead Sciences, Inc.* | | | 16,070 | | | | 1,514,758 | |
Merck & Co., Inc. | | | 29,654 | | | | 1,684,051 | |
Mylan, Inc.* | | | 28,914 | | | | 1,629,882 | |
Pfizer, Inc. | | | 67,135 | | | | 2,091,255 | |
| | | | | | | | |
| | | Shares | | | Value | |
| | | | | | | | |
| COMMON STOCKS (CONTINUED): | | | | | | | | |
HEALTH CARE (CONTINUED) | | | | | | | | |
Other Securities | | | 81,135 | | | $ | 8,296,822 | |
| | | | | | | | |
| | | | | | | 17,647,270 | |
| | | | | | | | |
INDUSTRIALS (6.5%) | | | | | | | | |
Boeing Co. | | | 14,247 | | | | 1,851,825 | |
Cummins, Inc. | | | 7,237 | | | | 1,043,358 | |
FedEx Corp. | | | 7,248 | | | | 1,258,688 | |
General Electric Co. | | | 63,173 | | | | 1,596,382 | |
Precision Castparts Corp. | | | 5,682 | | | | 1,368,680 | |
Roper Industries, Inc. | | | 14,431 | | | | 2,256,287 | |
Union Pacific Corp. | | | 10,139 | | | | 1,207,859 | |
Other Securities | | | 42,393 | | | | 1,956,450 | |
| | | | | | | | |
| | | | | | | 12,539,529 | |
| | | | | | | | |
INFORMATION TECHNOLOGY (11.3%) | | | | | | | | |
Apple, Inc. | | | 51,026 | | | | 5,632,249 | |
Cisco Systems, Inc. | | | 38,347 | | | | 1,066,622 | |
Facebook, Inc. Cl A* | | | 13,726 | | | | 1,070,903 | |
Google, Inc. Cl A* | | | 1,934 | | | | 1,026,296 | |
Google, Inc. Cl C* | | | 1,934 | | | | 1,018,058 | |
Microsoft Corp. | | | 44,000 | | | | 2,043,800 | |
Oracle Corp. | | | 27,405 | | | | 1,232,403 | |
QUALCOMM, Inc. | | | 15,668 | | | | 1,164,602 | |
Salesforce.com, inc.* | | | 24,335 | | | | 1,443,309 | |
Other Securities | | | 113,549 | | | | 6,118,921 | |
| | | | | | | | |
| | | | | | | 21,817,163 | |
| | | | | | | | |
MATERIALS (1.8%) | | | | | | | | |
Other Securities | | | 60,440 | | | | 3,546,861 | |
| | | | | | | | |
TELECOMMUNICATION SERVICES (1.0%) | | | | | | | | |
AT&T, Inc. | | | 36,824 | | | | 1,236,918 | |
Verizon Communications, Inc. | | | 15,780 | | | | 738,188 | |
| | | | | | | | |
| | | | | | | 1,975,106 | |
| | | | | | | | |
UTILITIES (1.8%) | | | | | | | | |
Dominion Resources, Inc. | | | 13,183 | | | | 1,013,773 | |
Other Securities | | | 42,324 | | | | 2,399,361 | |
| | | | | | | | |
| | | | | | | 3,413,134 | |
| | | | | | | | |
TOTAL COMMON STOCKS | |
(Cost: $70,914,200) 59.0% | | | | | | | 114,242,580 | |
| | | | | | | | |
| | | | | | | | | | | | | | |
| | | Rating** | | Rate(%) | | Maturity | | Face Amount | | | Value | |
| LONG-TERM DEBT SECURITIES: | | | | | | | | | | | | | | |
U.S. GOVERNMENT (8.7%) | | | | | | | | | | | | | | |
U.S. Treasury Note | | AA+ | | 0.63 - 2.00 | | 12/31/16 - 11/30/20 | | $ | 1,650,000 | | | $ | 1,645,563 | |
U.S. Treasury Strip | | AA+ | | 0.00 | | 11/15/16 - 08/15/29 | | | 19,850,000 | | | | 15,190,340 | |
| | | | | | | | | | | | | | |
| | | | | | | | | | | | | 16,835,903 | |
| | | | | | | | | | | | | | |
U.S. GOVERNMENT AGENCIES (12.7%) | | | | | | | | | | | | | | |
MORTGAGE-BACKED OBLIGATIONS (12.5%) | | | | | | | | | | | | | | |
FHARM | | AA+ | | 2.38 - 5.77 | | 02/01/36 - 09/01/39 | | | 215,847 | | | | 229,838 | |
FHLMC | | AA+ | | 2.50 - 6.00 | | 02/01/25 - 02/01/44 | | | 5,357,902 | | | | 5,678,892 | |
FHLMC Strip | | AA+ | | 3.00 | | 01/15/43 | | | 449,393 | | | | 448,215 | |
FNMA | | AA+ | | 2.42 - 8.00 | | 09/01/16 - 12/25/49 | | | 12,779,096 | | | | 13,662,789 | |
FNMA Strip | | AA+ | | 3.00 | | 08/25/42 | | | 390,265 | | | | 387,921 | |
GNMA (4) | | AA+ | | 3.50 - 7.00 | | 10/15/24 - 10/20/43 | | | 3,237,001 | | | | 3,535,800 | |
The accompanying notes are an integral part of these portfolio schedules.
52
MUTUAL OF AMERICA INVESTMENT CORPORATION — COMPOSITE FUND
SUMMARY PORTFOLIO OF INVESTMENTS IN SECURITIES (Continued)
December 31, 2014
| | | | | | | | | | | | | | |
| | | Rating** | | Rate(%) | | Maturity | | Face Amount | | | Value | |
| LONG-TERM DEBT SECURITIES (CONTINUED): | | | | | | | | | | | | | | |
U.S. GOVERNMENT AGENCIES (CONTINUED) | | | | | | | | | | | | | | |
MORTGAGE-BACKED OBLIGATIONS (CONTINUED) | | | | | | | | | | | | | | |
Other Securities | | | | | | | | $ | 246,597 | | | $ | 273,251 | |
| | | | | | | | | | | | | | |
| | | | | | | | | | | | | 24,216,706 | |
| | | | | | | | | | | | | | |
NON-MORTGAGE-BACKED OBLIGATIONS (0.2%) | | | | | | | | | | | | | | |
FHLMC | | AA+ | | 0.00 | | 11/29/19 | | | 500,000 | | | | 445,483 | |
| | | | | | | | | | | | | | |
CORPORATE DEBT (16.7%) | | | | | | | | | | | | | | |
CONSUMER DISCRETIONARY (2.9%) | | | | | | | | | | | | | | |
Other Securities | | | | | | | | | 5,470,000 | | | | 5,672,418 | |
| | | | | | | | | | | | | | |
CONSUMER STAPLES (1.1%) | | | | | | | | | | | | | | |
Other Securities | | | | | | | | | 2,125,000 | | | | 2,161,348 | |
| | | | | | | | | | | | | | |
ENERGY (2.3%) | | | | | | | | | | | | | | |
Other Securities | | | | | | | | | 4,310,000 | | | | 4,418,995 | |
| | | | | | | | | | | | | | |
FINANCIALS (3.4%) | | | | | | | | | | | | | | |
Other Securities | | | | | | | | | 6,200,000 | | | | 6,568,811 | |
| | | | | | | | | | | | | | |
HEALTH CARE (2.0%) | | | | | | | | | | | | | | |
Other Securities | | | | | | | | | 3,715,000 | | | | 3,929,923 | |
| | | | | | | | | | | | | | |
INDUSTRIALS (1.2%) | | | | | | | | | | | | | | |
Other Securities | | | | | | | | | 2,133,000 | | | | 2,223,292 | |
| | | | | | | | | | | | | | |
INFORMATION TECHNOLOGY (1.0%) | | | | | | | | | | | | | | |
Other Securities | | | | | | | | | 1,710,000 | | | | 1,814,904 | |
| | | | | | | | | | | | | | |
MATERIALS (1.5%) | | | | | | | | | | | | | | |
Geon Co. | | BBB- | | 7.50 | | 12/15/15 | | | 1,000,000 | | | | 1,060,000 | |
Other Securities | | | | | | | | | 1,850,000 | | | | 1,888,054 | |
| | | | | | | | | | | | | | |
| | | | | | | | | | | | | 2,948,054 | |
| | | | | | | | | | | | | | |
TELECOMMUNICATION SERVICES (0.4%) | | | | | | | | | | | | | | |
Verizon Communications, Inc. | | BBB+ | | 4.50 | | 09/15/20 | | | 325,000 | | | | 352,871 | |
Other Securities | | | | | | | | | 500,000 | | | | 501,875 | |
| | | | | | | | | | | | | | |
| | | | | | | | | | | | | 854,746 | |
| | | | | | | | | | | | | | |
UTILITIES (1.0%) | | | | | | | | | | | | | | |
Other Securities | | | | | | | | | 1,890,000 | | | | 1,960,291 | |
| | | | | | | | | | | | | | |
TOTAL LONG-TERM DEBT SECURITIES | | | | | | | | | | | | | | |
(Cost: $71,340,034) 38.2% | | | | | | | | | | | | | 74,050,874 | |
| | | | | | | | | | | | | | |
| | | | | |
| SHORT-TERM DEBT SECURITIES: | | | | | | | | | | | | | | |
U.S. GOVERNMENT (0.6%) | | | | | | | | | | | | | | |
U.S. Treasury Bill | | A-1+ | | 0.09 | | 07/23/15 | | | 1,200,000 | | | | 1,199,391 | |
| | | | | | | | | | | | | | |
COMMERCIAL PAPER (1.7%) | | | | | | | | | | | | | | |
Piedmont Natural Gas Co.† | | A-1 | | 0.17 - 0.18 | | 01/05/15 - 01/06/15 | | | 1,750,000 | | | | 1,749,963 | |
Toyota Motor Credit Corp. | | A-1+ | | 0.14 | | 02/11/15 | | | 1,500,000 | | | | 1,499,761 | |
| | | | | | | | | | | | | | |
| | | | | | | | | | | | | 3,249,724 | |
| | | | | | | | | | | | | | |
TOTAL SHORT-TERM DEBT SECURITIES
(Cost: $4,449,115) 2.3% | | | | 4,449,115 | |
| | | | | | | | | | | | | | |
TEMPORARY CASH INVESTMENTS (2)
(Cost: $808,900) 0.4% | | | | 808,900 | |
| | | | | | | | | | | | | | |
TOTAL INVESTMENTS
(Cost: $147,512,249) 99.9% | | | | 193,551,469 | |
| | | | | | | | | | | | | | |
OTHER NET ASSETS 0.1% | | | | 273,814 | |
| | | | | | | | | | | | | | |
NET ASSETS 100.0% | | | $ | 193,825,283 | |
| | | | | | | | | | | | | | |
The accompanying notes are an integral part of these portfolio schedules.
53
MUTUAL OF AMERICA INVESTMENT CORPORATION — RETIREMENT INCOME FUND
PORTFOLIO OF INVESTMENTS IN SECURITIES
December 31, 2014
| | | | | | | | |
| | | Shares | | | Value | |
| COMMON STOCKS: | | | | | | | | |
DIVERSIFIED MUTUAL FUNDS (100.0%) | | | | | | | | |
Mutual of America Investment Corporation | | | | | | | | |
Bond Fund (29.8%) | | | 10,992,481 | | | $ | 15,966,282 | |
Equity Index Fund (21.7%) | | | 3,413,853 | | | | 11,634,388 | |
Mid-Cap Equity Index Fund (5.7%) | | | 1,420,871 | | | | 3,072,080 | |
Mid-Term Bond Fund (38.5%) | | | 19,495,437 | | | | 20,582,191 | |
Money Market Fund (4.3%) | | | 1,904,974 | | | | 2,280,374 | |
| | | | | | | | |
TOTAL INVESTMENTS
(Cost: $50,814,567) 100.0% | | | | | | | 53,535,315 | |
| | | | | | | | |
OTHER NET ASSETS -0.0% (3) | | | | | | | (176 | ) |
| | | | | | | | |
NET ASSETS 100.0% | | | | | | $ | 53,535,139 | |
| | | | | | | | |
MUTUAL OF AMERICA INVESTMENT CORPORATION — 2010 RETIREMENT FUND
PORTFOLIO OF INVESTMENTS IN SECURITIES
December 31, 2014
| | | | | | | | |
| | | Shares | | | Value | |
| COMMON STOCKS: | | | | | | | | |
DIVERSIFIED MUTUAL FUNDS (100.0%) | | | | | |
Mutual of America Investment Corporation | | | | | | | | |
Bond Fund (24.4%) | | | 4,464,378 | | | $ | 6,484,388 | |
Equity Index Fund (27.0%) | | | 2,103,917 | | | | 7,170,134 | |
International Fund (2.9%) | | | 985,925 | | | | 761,989 | |
Mid-Cap Equity Index Fund (9.8%) | | | 1,208,870 | | | | 2,613,709 | |
Mid-Term Bond Fund (31.7%) | | | 7,976,351 | | | | 8,420,984 | |
Money Market Fund (4.2%) | | | 924,681 | | | | 1,106,901 | |
| | | | | | | | |
TOTAL INVESTMENTS
(Cost: $23,954,752) 100.0% | | | | | | | 26,558,105 | |
| | | | | | | | |
OTHER NET ASSETS -0.0% (3) | | | | | | | (99 | ) |
| | | | | | | | |
NET ASSETS 100.0% | | | | | | $ | 26,558,006 | |
| | | | | | | | |
MUTUAL OF AMERICA INVESTMENT CORPORATION — 2015 RETIREMENT FUND
PORTFOLIO OF INVESTMENTS IN SECURITIES
December 31, 2014
| | | | | | | | |
| | | Shares | | | Value | |
| COMMON STOCKS: | | | | | | | | |
DIVERSIFIED MUTUAL FUNDS (100.0%) | | | | | |
Mutual of America Investment Corporation | | | | | | | | |
Bond Fund (23.9%) | | | 25,383,078 | | | $ | 36,868,235 | |
Equity Index Fund (29.6%) | | | 13,391,023 | | | | 45,636,514 | |
International Fund (5.3%) | | | 10,603,987 | | | | 8,195,471 | |
Mid-Cap Equity Index Fund (11.6%) | | | 8,283,425 | | | | 17,909,677 | |
Mid-Term Bond Fund (26.6%) | | | 38,747,834 | | | | 40,907,794 | |
Small Cap Growth Fund (1.5%) | | | 1,541,350 | | | | 2,370,037 | |
Small Cap Value Fund (1.5%) | | | 1,415,340 | | | | 2,275,148 | |
| | | | | | | | |
TOTAL INVESTMENTS
(Cost: $134,753,285) 100.0% | | | | | | | 154,162,876 | |
| | | | | | | | |
OTHER NET ASSETS -0.0% (3) | | | | | | | (1,344 | ) |
| | | | | | | | |
NET ASSETS 100.0% | | | | | | $ | 154,161,532 | |
| | | | | | | | |
The accompanying notes are an integral part of these portfolio schedules.
54
MUTUAL OF AMERICA INVESTMENT CORPORATION — 2020 RETIREMENT FUND
PORTFOLIO OF INVESTMENTS IN SECURITIES
December 31, 2014
| | | | | | | | |
| | | Shares | | | Value | |
| COMMON STOCKS: | | | | | | | | |
DIVERSIFIED MUTUAL FUNDS (100.0%) | | | | | |
Mutual of America Investment Corporation | | | | | | | | |
Bond Fund (23.9%) | | | 52,734,566 | | | $ | 76,595,533 | |
Equity Index Fund (34.6%) | | | 32,596,444 | | | | 111,088,452 | |
International Fund (8.0%) | | | 33,134,083 | | | | 25,608,239 | |
Mid-Cap Equity Index Fund (11.6%) | | | 17,148,430 | | | | 37,076,791 | |
Mid-Term Bond Fund (16.8%) | | | 50,833,397 | | | | 53,667,054 | |
Small Cap Growth Fund (2.6%) | | | 5,309,018 | | | | 8,163,343 | |
Small Cap Value Fund (2.5%) | | | 4,878,781 | | | | 7,842,607 | |
| | | | | | | | |
TOTAL INVESTMENTS
(Cost: $276,550,552) 100.0% | | | | | | | 320,042,019 | |
| | | | | | | | |
OTHER NET ASSETS -0.0% (3) | | | | | | | (1,066 | ) |
| | | | | | | | |
NET ASSETS 100.0% | | | | | | $ | 320,040,953 | |
| | | | | | | | |
MUTUAL OF AMERICA INVESTMENT CORPORATION — 2025 RETIREMENT FUND
PORTFOLIO OF INVESTMENTS IN SECURITIES
December 31, 2014
| | | | | | | | |
| | | Shares | | | Value | |
| COMMON STOCKS: | | | | | | | | |
DIVERSIFIED MUTUAL FUNDS (100.0%) | | | | | |
Mutual of America Investment Corporation | | | | | | | | |
Bond Fund (21.9%) | | | 49,823,138 | | | $ | 72,366,762 | |
Equity Index Fund (39.1%) | | | 38,025,175 | | | | 129,589,532 | |
International Fund (8.5%) | | | 36,248,001 | | | | 28,014,884 | |
Mid-Cap Equity Index Fund (16.6%) | | | 25,377,900 | | | | 54,869,811 | |
Mid-Term Bond Fund (6.9%) | | | 21,766,376 | | | | 22,979,721 | |
Small Cap Growth Fund (3.6%) | | | 7,717,654 | | | | 11,866,950 | |
Small Cap Value Fund (3.4%) | | | 7,093,895 | | | | 11,403,387 | |
| | | | | | | | |
TOTAL INVESTMENTS
(Cost: $275,229,535) 100.0% | | | | | | | 331,091,047 | |
| | | | | | | | |
OTHER NET ASSETS -0.0% (3) | | | | | | | (1,121 | ) |
| | | | | | | | |
NET ASSETS 100.0% | | | | | | $ | 331,089,926 | |
| | | | | | | | |
MUTUAL OF AMERICA INVESTMENT CORPORATION — 2030 RETIREMENT FUND
PORTFOLIO OF INVESTMENTS IN SECURITIES
December 31, 2014
| | | | | | | | |
| | | Shares | | | Value | |
| COMMON STOCKS: | | | | | | | | |
DIVERSIFIED MUTUAL FUNDS (100.0%) | | | | | |
Mutual of America Investment Corporation | | | | | | | | |
Bond Fund (21.8%) | | | 41,587,843 | | | $ | 60,405,219 | |
Equity Index Fund (41.9%) | | | 34,038,924 | | | | 116,004,414 | |
International Fund (8.6%) | | | 30,938,645 | | | | 23,911,458 | |
Mid-Cap Equity Index Fund (17.5%) | | | 22,451,867 | | | | 48,543,406 | |
Small Cap Growth Fund (5.2%) | | | 9,349,217 | | | | 14,375,702 | |
Small Cap Value Fund (5.0%) | | | 8,597,220 | | | | 13,819,971 | |
| | | | | | | | |
TOTAL INVESTMENTS
(Cost: $225,551,895) 100.0% | | | | | | | 277,060,170 | |
| | | | | | | | |
OTHER NET ASSETS -0.0% (3) | | | | | | | (908 | ) |
| | | | | | | | |
NET ASSETS 100.0% | | | | | | $ | 277,059,262 | |
| | | | | | | | |
The accompanying notes are an integral part of these portfolio schedules.
55
MUTUAL OF AMERICA INVESTMENT CORPORATION — 2035 RETIREMENT FUND
PORTFOLIO OF INVESTMENTS IN SECURITIES
December 31, 2014
| | | | | | | | |
| | | Shares | | | Value | |
| COMMON STOCKS: | | | | | | | | |
DIVERSIFIED MUTUAL FUNDS (100.0%) | | | | | |
Mutual of America Investment Corporation | | | | | | | | |
Bond Fund (14.9%) | | | 23,606,064 | | | $ | 34,287,171 | |
Equity Index Fund (41.9%) | | | 28,261,233 | | | | 96,314,085 | |
International Fund (10.4%) | | | 30,946,013 | | | | 23,917,152 | |
Mid-Cap Equity Index Fund (20.6%) | | | 21,848,554 | | | | 47,238,976 | |
Small Cap Growth Fund (6.2%) | | | 9,317,651 | | | | 14,327,165 | |
Small Cap Value Fund (6.0%) | | | 8,565,562 | | | | 13,769,081 | |
| | | | | | | | |
TOTAL INVESTMENTS
(Cost: $184,789,316) 100.0% | | | | | | | 229,853,630 | |
| | | | | | | | |
OTHER NET ASSETS -0.0% (3) | | | | | | | (743 | ) |
| | | | | | | | |
NET ASSETS 100.0% | | | | | | $ | 229,852,887 | |
| | | | | | | | |
MUTUAL OF AMERICA INVESTMENT CORPORATION — 2040 RETIREMENT FUND
PORTFOLIO OF INVESTMENTS IN SECURITIES
December 31, 2014
| | | | | | | | |
| | | Shares | | | Value | |
| COMMON STOCKS: | | | | | | | | |
DIVERSIFIED MUTUAL FUNDS (100.0%) | | | | | |
Mutual of America Investment Corporation | | | | | | | | |
Bond Fund (11.0%) | | | 14,267,646 | | | $ | 20,723,371 | |
Equity Index Fund (36.9%) | | | 20,396,002 | | | | 69,509,433 | |
International Fund (12.2%) | | | 29,762,277 | | | | 23,002,281 | |
Mid-Cap Equity Index Fund (23.6%) | | | 20,612,764 | | | | 44,567,064 | |
Small Cap Growth Fund (8.3%) | | | 10,216,620 | | | | 15,709,453 | |
Small Cap Value Fund (8.0%) | | | 9,392,920 | | | | 15,099,054 | |
| | | | | | | | |
TOTAL INVESTMENTS
(Cost: $149,140,140) 100.0% | | | | | | | 188,610,656 | |
| | | | | | | | |
OTHER NET ASSETS -0.0% (3) | | | | | | | (627 | ) |
| | | | | | | | |
NET ASSETS 100.0% | | | | | | $ | 188,610,029 | |
| | | | | | | | |
MUTUAL OF AMERICA INVESTMENT CORPORATION — 2045 RETIREMENT FUND
PORTFOLIO OF INVESTMENTS IN SECURITIES
December 31, 2014
| | | | | | | | |
| | | Shares | | | Value | |
| COMMON STOCKS: | | | | | | | | |
DIVERSIFIED MUTUAL FUNDS (100.0%) | | | | | | | | |
Mutual of America Investment Corporation | | | | | | | | |
Bond Fund (9.0%) | | | 14,391,388 | | | $ | 20,903,102 | |
Equity Index Fund (36.9%) | | | 25,181,198 | | | | 85,817,347 | |
International Fund (14.0%) | | | 41,897,652 | | | | 32,381,312 | |
Mid-Cap Equity Index Fund (21.7%) | | | 23,257,166 | | | | 50,284,552 | |
Small Cap Growth Fund (9.4%) | | | 14,169,900 | | | | 21,788,163 | |
Small Cap Value Fund (9.0%) | | | 13,021,610 | | | | 20,932,146 | |
| | | | | | | | |
TOTAL INVESTMENTS
(Cost: $181,799,043) 100.0% | | | | | | | 232,106,622 | |
| | | | | | | | |
OTHER NET ASSETS -0.0% (3) | | | | | | | (744 | ) |
| | | | | | | | |
NET ASSETS 100.0% | | | | | | $ | 232,105,878 | |
| | | | | | | | |
The accompanying notes are an integral part of these portfolio schedules.
56
MUTUAL OF AMERICA INVESTMENT CORPORATION — 2050 RETIREMENT FUND
PORTFOLIO OF INVESTMENTS IN SECURITIES
December 31, 2014
| | | | | | | | |
| | | Shares | | | Value | |
| COMMON STOCKS: | | | | | | | | |
DIVERSIFIED MUTUAL FUNDS (100.0%) | | | | | | | | |
Mutual of America Investment Corporation | | | | | | | | |
Bond Fund (7.5%) | | | 2,578,720 | | | $ | 3,745,522 | |
Equity Index Fund (36.5%) | | | 5,377,385 | | | | 18,326,092 | |
International Fund (15.3%) | | | 9,958,602 | | | | 7,696,675 | |
Mid-Cap Equity Index Fund (20.2%) | | | 4,693,642 | | | | 10,148,171 | |
Small Cap Growth Fund (10.4%) | | | 3,406,352 | | | | 5,237,733 | |
Small Cap Value Fund (10.1%) | | | 3,145,781 | | | | 5,056,821 | |
| | | | | | | | |
TOTAL INVESTMENTS
(Cost: $47,255,825) 100.0% | | | | | | | 50,211,014 | |
| | | | | | | | |
OTHER NET ASSETS -0.0% (3) | | | | | | | (98 | ) |
| | | | | | | | |
NET ASSETS 100.0% | | | | | | $ | 50,210,916 | |
| | | | | | | | |
MUTUAL OF AMERICA INVESTMENT CORPORATION — CONSERVATIVE ALLOCATION FUND
PORTFOLIO OF INVESTMENTS IN SECURITIES
December 31, 2014
| | | | | | | | |
| | | Shares | | | Value | |
| COMMON STOCKS: | | | | | | | | |
DIVERSIFIED MUTUAL FUNDS (100.0%) | | | | | | | | |
Mutual of America Investment Corporation | | | | | | | | |
Bond Fund (29.7%) | | | 25,053,613 | | | $ | 36,389,697 | |
Equity Index Fund (26.5%) | | | 9,520,605 | | | | 32,446,155 | |
International Fund (4.5%) | | | 7,116,724 | | | | 5,500,281 | |
Mid-Cap Equity Index Fund (5.2%) | | | 2,938,347 | | | | 6,353,030 | |
Mid-Term Bond Fund (34.1%) | | | 39,625,102 | | | | 41,833,962 | |
| | | | | | | | |
TOTAL INVESTMENTS
(Cost: $113,572,753) 100.0% | | | | | | | 122,523,125 | |
| | | | | | | | |
OTHER NET ASSETS | | | | | | | — | |
| | | | | | | | |
NET ASSETS 100.0% | | | | | | $ | 122,523,125 | |
| | | | | | | | |
MUTUAL OF AMERICA INVESTMENT CORPORATION — MODERATE ALLOCATION FUND
PORTFOLIO OF INVESTMENTS IN SECURITIES
December 31, 2014
| | | | | | | | |
| | | Shares | | | Value | |
| COMMON STOCKS: | | | | | | | | |
DIVERSIFIED MUTUAL FUNDS (100.0%) | | | | | | | | |
Mutual of America Investment Corporation | | | | | | | | |
Bond Fund (24.5%) | | | 53,096,550 | | | $ | 77,121,305 | |
Equity Index Fund (36.8%) | | | 34,074,787 | | | | 116,126,635 | |
International Fund (8.8%) | | | 35,970,009 | | | | 27,800,033 | |
Mid-Cap Equity Index Fund (15.4%) | | | 22,484,866 | | | | 48,614,754 | |
Mid-Term Bond Fund (14.5%) | | | 43,140,622 | | | | 45,545,453 | |
| | | | | | | | |
TOTAL INVESTMENTS
(Cost: $257,461,053) 100.0% | | | | | | | 315,208,180 | |
| | | | | | | | |
OTHER NET ASSETS | | | | | | | — | |
| | | | | | | | |
NET ASSETS 100.0% | | | | | | $ | 315,208,180 | |
| | | | | | | | |
The accompanying notes are an integral part of these portfolio schedules.
57
MUTUAL OF AMERICA INVESTMENT CORPORATION — AGGRESSIVE ALLOCATION FUND
PORTFOLIO OF INVESTMENTS IN SECURITIES
December 31, 2014
| | | | | | | | |
| | | Shares | | | Value | |
| COMMON STOCKS: | | | | | | | | |
DIVERSIFIED MUTUAL FUNDS (100.0%) | | | | | | | | |
Mutual of America Investment Corporation | | | | | | | | |
Bond Fund (19.5%) | | | 34,133,160 | | | $ | 49,577,494 | |
Equity Index Fund (36.6%) | | | 27,412,087 | | | | 93,420,201 | |
International Fund (13.1%) | | | 43,289,687 | | | | 33,457,170 | |
Mid-Cap Equity Index Fund (20.5%) | | | 24,103,909 | | | | 52,115,303 | |
Small Cap Growth Fund (5.3%) | | | 8,746,066 | | | | 13,448,275 | |
Small Cap Value Fund (5.0%) | | | 7,951,362 | | | | 12,781,759 | |
| | | | | | | | |
TOTAL INVESTMENTS
(Cost: $191,686,539) 100.0% | | | | | | | 254,800,202 | |
| | | | | | | | |
OTHER NET ASSETS | | | | | | | — | |
| | | | | | | | |
NET ASSETS 100.0% | | | | | | $ | 254,800,202 | |
| | | | | | | | |
The accompanying notes are an integral part of these portfolio schedules.
58
MUTUAL OF AMERICA INVESTMENT CORPORATION — MONEY MARKET FUND
PORTFOLIO OF INVESTMENTS IN SECURITIES
December 31, 2014
| | | | | | | | | | | | | | | | |
| | | Rating** | | Rate(%) | | Maturity | | | Face Amount | | | Value | |
| SHORT-TERM DEBT SECURITIES: | | | | | | | | | | | | | | | | |
U.S. GOVERNMENT (3.9%) | | | | | | | | | | | | | | | | |
U.S. Treasury Bill | | A-1+ | | 0.12 | | | 06/25/15 | | | $ | 3,000,000 | | | $ | 2,999,067 | |
| | | | | | | | | | | | | | | | |
U.S. GOVERNMENT AGENCIES (45.0%) | | | | | | | | | | | | | | | | |
FHLB | | A-1+ | | 0.10 | | | 01/28/15 | | | | 2,500,000 | | | | 2,499,812 | |
FHLB | | A-1+ | | 0.10 | | | 02/13/15 | | | | 5,000,000 | | | | 4,999,403 | |
FHLB | | A-1+ | | 0.10 | | | 02/18/15 | | | | 900,000 | | | | 899,880 | |
FHLB | | A-1+ | | 0.10 | | | 03/06/15 | | | | 3,190,000 | | | | 3,189,712 | |
FHLB | | A-1+ | | 0.10 | | | 03/06/15 | | | | 1,260,000 | | | | 1,259,853 | |
FHLB | | A-1+ | | 0.10 | | | 03/11/15 | | | | 6,600,000 | | | | 6,600,354 | |
FHLB | | A-1+ | | 0.10 | | | 03/13/15 | | | | 700,000 | | | | 700,032 | |
FHLB | | A-1+ | | 0.10 | | | 03/20/15 | | | | 1,200,000 | | | | 1,199,971 | |
FHLMC | | A-1+ | | 0.10 | | | 01/13/15 | | | | 100,000 | | | | 99,997 | |
FHLMC | | A-1+ | | 0.10 | | | 01/14/15 | | | | 107,000 | | | | 106,996 | |
FHLMC | | A-1+ | | 0.10 | | | 03/11/15 | | | | 1,885,000 | | | | 1,884,782 | |
FHLMC | | A-1+ | | 0.11 | | | 02/19/15 | | | | 200,000 | | | | 199,970 | |
FHLMC | | A-1+ | | 0.13 | | | 03/09/15 | | | | 3,800,000 | | | | 3,799,550 | |
FNMA | | A-1+ | | 0.09 | | | 03/04/15 | | | | 1,550,000 | | | | 1,549,915 | |
FNMA | | A-1+ | | 0.10 | | | 01/12/15 | | | | 250,000 | | | | 249,992 | |
FNMA | | A-1+ | | 0.10 | | | 03/02/15 | | | | 2,300,000 | | | | 2,299,894 | |
FNMA | | A-1+ | | 0.18 | | | 01/20/15 | | | | 35,000 | | | | 34,997 | |
Tennessee Valley Authority | | A-1+ | | 0.01 | | | 01/02/15 | | | | 3,300,000 | | | | 3,299,999 | |
| | | | | | | | | | | | | | | | |
| | | | | | | | | | | | | | | 34,875,109 | |
| | | | | | | | | | | | | | | | |
COMMERCIAL PAPER (49.2%) | | | | | | | | | | | | | | | | |
Abbott Laboratories† | | A-1+ | | 0.10 | | | 02/10/15 | | | | 1,400,000 | | | | 1,399,844 | |
Abbott Laboratories† | | A-1+ | | 0.11 | | | 02/19/15 | | | | 1,700,000 | | | | 1,699,745 | |
Dover Corp.† | | A-1 | | 0.11 | | | 01/06/15 | | | | 2,750,000 | | | | 2,749,958 | |
Eli Lilly & Co.† | | A-1+ | | 0.10 | | | 01/30/15 | | | | 900,000 | | | | 899,928 | |
Emerson Electric Co.† | | A-1 | | 0.12 | | | 02/25/15 | | | | 3,200,000 | | | | 3,199,413 | |
Exxon Mobil Corp. | | A-1+ | | 0.12 | | | 02/18/15 | | | | 600,000 | | | | 599,904 | |
Intercontinental Exchange, Inc.† | | A-1 | | 0.17 | | | 01/06/15 | | | | 1,850,000 | | | | 1,849,956 | |
Intercontinental Exchange, Inc.† | | A-1 | | 0.18 | | | 01/30/15 | | | | 1,300,000 | | | | 1,299,811 | |
J.P. Morgan Securities LLC | | A-1 | | 0.20 | | | 02/02/15 | | | | 1,900,000 | | | | 1,899,662 | |
J.P. Morgan Securities LLC† | | A-1 | | 0.21 | | | 03/09/15 | | | | 800,000 | | | | 799,775 | |
J.P. Morgan Securities LLC† | | A-1 | | 0.22 | | | 02/04/15 | | | | 500,000 | | | | 499,896 | |
Microsoft Corp.† | | A-1+ | | 0.10 | | | 02/04/15 | | | | 3,100,000 | | | | 3,099,707 | |
National Rural Utilities | | A-1 | | 0.13 | | | 01/20/15 | | | | 2,000,000 | | | | 1,999,863 | |
National Rural Utilities | | A-1 | | 0.13 | | | 02/05/15 | | | | 1,600,000 | | | | 1,599,798 | |
New Jersey Natural Gas | | A-1 | | 0.12 | | | 01/09/15 | | | | 675,000 | | | | 674,982 | |
New Jersey Natural Gas | | A-1 | | 0.15 | | | 01/15/15 | | | | 1,500,000 | | | | 1,499,912 | |
Piedmont Natural Gas Co.† | | A-1 | | 0.17 | | | 01/05/15 | | | | 1,850,000 | | | | 1,849,965 | |
Piedmont Natural Gas Co.† | | A-1 | | 0.18 | | | 01/06/15 | | | | 1,250,000 | | | | 1,249,969 | |
Questar Corp.† | | A-1 | | 0.19 | | | 01/14/15 | | | | 3,200,000 | | | | 3,199,780 | |
San Diego Gas & Electric Co.† | | A-1 | | 0.21 | | | 01/09/15 | | | | 2,300,000 | | | | 2,299,893 | |
Simon Property Group LP† | | A-1 | | 0.18 | | | 02/11/15 | | | | 3,100,000 | | | | 3,099,364 | |
Wells Fargo & Co. | | A-1 | | 0.13 | | | 02/09/15 | | | | 650,000 | | | | 649,908 | |
| | | | | | | | | | | | | | | | |
| | | | | | | | | | | | | | | 38,121,033 | |
| | | | | | | | | | | | | | | | |
TOTAL SHORT-TERM DEBT SECURITIES
(Cost: $75,990,837) 98.1% | | | | 75,995,209 | |
| | | | | | | | | | | | | | | | |
TEMPORARY CASH INVESTMENTS (2)
(Cost: $1,484,000) 1.9% | | | | 1,484,000 | |
| | | | | | | | | | | | | | | | |
TOTAL INVESTMENTS
(Cost: $77,474,837) 100.0% | | | | 77,479,209 | |
| | | | | | | | | | | | | | | | |
OTHER NET ASSETS -0.0% (3) | | | | (443 | ) |
| | | | | | | | | | | | | | | | |
NET ASSETS 100.0% | | | $ | 77,478,766 | |
| | | | | | | | | | | | | | | | |
The accompanying notes are an integral part of these portfolio schedules.
59
MUTUAL OF AMERICA INVESTMENT CORPORATION — MID-TERM BOND FUND
SUMMARY PORTFOLIO OF INVESTMENTS IN SECURITIES
December 31, 2014
| | | | | | | | | | | | | | |
| | | Rating** | | Rate(%) | | Maturity | | Face Amount | | | Value | |
| LONG-TERM DEBT SECURITIES: | | | | | | | | | | | | | | |
U.S. GOVERNMENT (28.8%) | | | | | | | | | | | | | | |
U.S. Treasury Note | | AA+ | | 0.50 - 2.00 | | 09/30/16 - 11/30/20 | | $ | 53,500,000 | | | $ | 53,358,792 | |
U.S. Treasury Strip | | AA+ | | 0.00 | | 08/15/17 - 08/15/18 | | | 75,000,000 | | | | 71,840,694 | |
| | | | | | | | | | | | | | |
| | | | | | | | | | | | | 125,199,486 | |
| | | | | | | | | | | | | | |
U.S. GOVERNMENT AGENCIES (7.6%) | | | | | | | | | | | | | | |
MORTGAGE-BACKED OBLIGATIONS (0.0%) (3) | | | | | | | | | | | | | | |
FHLMC | | AA+ | | 7.50 - 8.50 | | 09/01/17 - 03/15/21 | | | 5,341 | | | | 5,879 | |
| | | | | | | | | | | | | | |
NON-MORTGAGE-BACKED OBLIGATIONS (7.6%) | | | | | | | | | | | | | | |
FHLMC | | AA+ | | 0.00 | | 11/29/19 | | | 13,500,000 | | | | 12,028,028 | |
FNMA | | AA+ | | 0.00 | | 10/09/19 | | | 22,500,000 | | | | 20,229,047 | |
Other Securities | | | | | | | | | 900,000 | | | | 789,931 | |
| | | | | | | | | | | | | | |
| | | | | | | | | | | | | 33,047,006 | |
| | | | | | | | | | | | | | |
CORPORATE DEBT (62.3%) | | | | | | | | | | | | | | |
CONSUMER DISCRETIONARY (8.1%) | | | | | | | | | | | | | | |
Advance Auto Parts, Inc. | | BBB- | | 4.50 - 5.75 | | 05/01/20 - 01/15/22 | | | 2,000,000 | | | | 2,211,259 | |
Expedia, Inc. | | BBB- | | 5.95 | | 08/15/20 | | | 2,000,000 | | | | 2,234,948 | |
Family Dollar Stores, Inc. | | BBB- | | 5.00 | | 02/01/21 | | | 2,000,000 | | | | 2,109,660 | |
Kohl’s Corp. | | BBB | | 3.25 - 4.00 | | 11/01/21 - 02/01/23 | | | 2,025,000 | | | | 2,057,471 | |
Tupperware Brands Corp. | | BBB- | | 4.75 | | 06/01/21 | | | 2,000,000 | | | | 2,140,890 | |
Wyndham Worldwide Corp. | | BBB- | | 2.95 | | 03/01/17 | | | 2,160,000 | | | | 2,205,865 | |
Other Securities | | | | | | | | | 22,085,000 | | | | 22,339,367 | |
| | | | | | | | | | | | | | |
| | | | | | | | | | | | | 35,299,460 | |
| | | | | | | | | | | | | | |
CONSUMER STAPLES (4.5%) | | | | | | | | | | | | | | |
Energizer Hldgs., Inc. | | BBB- | | 4.70 | | 05/19/21 | | | 2,000,000 | | | | 2,075,230 | |
Mead Johnson Nutrition Co. | | BBB | | 4.90 | | 11/01/19 | | | 3,075,000 | | | | 3,379,410 | |
Other Securities | | | | | | | | | 14,200,000 | | | | 14,163,151 | |
| | | | | | | | | | | | | | |
| | | | | | | | | | | | | 19,617,791 | |
| | | | | | | | | | | | | | |
ENERGY (4.1%) | | | | | | | | | | | | | | |
Pioneer Natural Resources Co. | | BBB- | | 6.65 | | 03/15/17 | | | 2,000,000 | | | | 2,191,096 | |
SESI LLC | | BBB- | | 7.13 | | 12/15/21 | | | 2,150,000 | | | | 2,064,000 | |
Other Securities | | | | | | | | | 13,790,000 | | | | 13,682,243 | |
| | | | | | | | | | | | | | |
| | | | | | | | | | | | | 17,937,339 | |
| | | | | | | | | | | | | | |
FINANCIALS (18.0%) | | | | | | | | | | | | | | |
Alleghany Corp. | | BBB | | 4.95 | | 06/27/22 | | | 2,000,000 | | | | 2,199,786 | |
American Tower Corp. | | BBB- | | 4.50 | | 01/15/18 | | | 2,000,000 | | | | 2,123,974 | |
Berkley (W.R.) Corp. | | BBB+ | | 4.63 | | 03/15/22 | | | 2,000,000 | | | | 2,144,652 | |
Boston Properties LP | | A- | | 3.70 | | 11/15/18 | | | 1,970,000 | | | | 2,077,229 | |
Capital One Financial Corp. | | BBB | | 4.75 | | 07/15/21 | | | 2,000,000 | | | | 2,204,276 | |
Fairfax Financial Hldgs. | | BBB- | | 8.25 | | 10/01/15 | | | 742,000 | | | | 777,163 | |
Fairfax Financial Hldgs.† | | BBB- | | 5.80 | | 05/15/21 | | | 1,274,000 | | | | 1,366,523 | |
Health Care REIT, Inc. | | BBB | | 3.63 | | 03/15/16 | | | 2,000,000 | | | | 2,058,434 | |
Healthcare Realty Trust | | BBB- | | 5.75 | | 01/15/21 | | | 2,000,000 | | | | 2,236,322 | |
Kemper Corp. | | BBB- | | 6.00 | | 11/30/15 - 05/15/17 | | | 2,000,000 | | | | 2,103,832 | |
Moody’s Corp. | | BBB+ | | 5.50 | | 09/01/20 | | | 2,000,000 | | | | 2,270,908 | |
Morgan Stanley | | A- | | 4.00 - 4.75 | | 07/24/15 - 03/22/17 | | | 2,000,000 | | | | 2,084,016 | |
Nasdaq OMX Group, Inc. | | BBB- | | 5.55 | | 01/15/20 | | | 2,150,000 | | | | 2,389,117 | |
Other Securities | | | | | | | | | 50,916,000 | | | | 52,375,937 | |
| | | | | | | | | | | | | | |
| | | | | | | | | | | | | 78,412,169 | |
| | | | | | | | | | | | | | |
HEALTH CARE (7.3%) | | | | | | | | | | | | | | |
Agilent Technologies, Inc. | | BBB+ | | 5.00 | | 07/15/20 | | | 2,000,000 | | | | 2,175,648 | |
Bio-Rad Laboratories, Inc. | | BBB | | 4.88 | | 12/15/20 | | | 2,000,000 | | | | 2,147,854 | |
Hospira, Inc. | | BBB- | | 6.05 | | 03/30/17 | | | 2,000,000 | | | | 2,156,330 | |
Laboratory Corp. of America | | BBB+ | | 3.13 - 5.63 | | 12/15/15 - 08/23/22 | | | 2,000,000 | | | | 2,078,299 | |
PerkinElmer, Inc. | | BBB | | 5.00 | | 11/15/21 | | | 2,000,000 | | | | 2,175,838 | |
The accompanying notes are an integral part of these portfolio schedules.
60
MUTUAL OF AMERICA INVESTMENT CORPORATION — MID-TERM BOND FUND
SUMMARY PORTFOLIO OF INVESTMENTS IN SECURITIES (Continued)
December 31, 2014
| | | | | | | | | | | | | | |
| | | Rating** | | Rate(%) | | Maturity | | Face Amount | | | Value | |
| LONG-TERM DEBT SECURITIES (CONTINUED): | | | | | | | | | | | | | | |
HEALTH CARE (CONTINUED) | | | | | | | | | | | | | | |
Quest Diagnostics, Inc. | | BBB+ | | 4.75 | | 01/30/20 | | $ | 2,000,000 | | | $ | 2,157,038 | |
Thermo Fisher Scientific, Inc. | | BBB | | 3.60 - 4.50 | | 03/01/21 - 08/15/21 | | | 2,000,000 | | | | 2,141,442 | |
Other Securities | | | | | | | | | 16,250,000 | | | | 16,571,304 | |
| | | | | | | | | | | | | | |
| | | | | | | | | | | | | 31,603,753 | |
| | | | | | | | | | | | | | |
INDUSTRIALS (5.7%) | | | | | | | | | | | | | | |
GATX Corp. | | BBB | | 6.00 | | 02/15/18 | | | 2,050,000 | | | | 2,279,586 | |
Harsco Corp. | | BB+ | | 5.75 | | 05/15/18 | | | 2,250,000 | | | | 2,368,125 | |
L-3 Communications Corp. | | BBB- | | 5.20 | | 10/15/19 | | | 2,000,000 | | | | 2,196,632 | |
Valmont Industries, Inc. | | BBB+ | | 6.63 | | 04/20/20 | | | 2,000,000 | | | | 2,347,260 | |
Other Securities | | | | | | | | | 15,318,000 | | | | 15,617,377 | |
| | | | | | | | | | | | | | |
| | | | | | | | | | | | | 24,808,980 | |
| | | | | | | | | | | | | | |
INFORMATION TECHNOLOGY (6.8%) | | | | | | | | | | | | | | |
Adobe Systems, Inc. | | A- | | 4.75 | | 02/01/20 | | | 2,000,000 | | | | 2,195,470 | |
Arrow Electronics, Inc. | | BBB- | | 3.00 - 6.88 | | 03/01/18 - 03/01/23 | | | 2,000,000 | | | | 2,126,387 | |
Avnet, Inc. | | BBB- | | 5.88 - 6.00 | | 09/01/15 - 06/15/20 | | | 1,930,000 | | | | 2,072,091 | |
Fiserv, Inc. | | BBB | | 4.75 | | 06/15/21 | | | 1,900,000 | | | | 2,091,796 | |
FLIR Systems, Inc. | | BBB | | 3.75 | | 09/01/16 | | | 2,000,000 | | | | 2,073,080 | |
Lender Processing Svcs., Inc. | | BBB | | 5.75 | | 04/15/23 | | | 2,000,000 | | | | 2,100,000 | |
Lexmark International, Inc. | | BBB- | | 6.65 | | 06/01/18 | | | 2,000,000 | | | | 2,221,828 | |
Symantec Corp. | | BBB | | 4.20 | | 09/15/20 | | | 2,000,000 | | | | 2,070,962 | |
Tech Data Corp. | | BBB- | | 3.75 | | 09/21/17 | | | 2,000,000 | | | | 2,066,034 | |
Western Union Co. | | BBB | | 5.93 | | 10/01/16 | | | 2,000,000 | | | | 2,147,372 | |
Other Securities | | | | | | | | | 8,226,000 | | | | 8,377,002 | |
| | | | | | | | | | | | | | |
| | | | | | | | | | | | | 29,542,022 | |
| | | | | | | | | | | | | | |
MATERIALS (4.6%) | | | | | | | | | | | | | | |
Alcoa, Inc. | | BBB- | | 6.75 | | 07/15/18 | | | 2,000,000 | | | | 2,246,680 | |
Kinross Gold Corp. | | BBB- | | 3.63 - 5.13 | | 09/01/16 - 09/01/21 | | | 2,750,000 | | | | 2,729,443 | |
Other Securities | | | | | | | | | 15,187,000 | | | | 15,007,735 | |
| | | | | | | | | | | | | | |
| | | | | | | | | | | | | 19,983,858 | |
| | | | | | | | | | | | | | |
TELECOMMUNICATION SERVICES (1.2%) | | | | | | | | | | | | | | |
Verizon Communications, Inc. | | BBB+ | | 4.50 | | 09/15/20 | | | 2,000,000 | | | | 2,171,514 | |
Other Securities | | | | | | | | | 3,250,000 | | | | 3,217,048 | |
| | | | | | | | | | | | | | |
| | | | | | | | | | | | | 5,388,562 | |
| | | | | | | | | | | | | | |
UTILITIES (2.0%) | | | | | | | | | | | | | | |
Entergy Corp. | | BBB- | | 4.70 - 5.13 | | 01/15/17 - 09/15/20 | | | 2,000,000 | | | | 2,156,908 | |
Other Securities | | | | | | | | | 6,165,000 | | | | 6,376,977 | |
| | | | | | | | | | | | | | |
| | | | | | | | | | | | | 8,533,885 | |
| | | | | | | | | | | | | | |
TOTAL LONG-TERM DEBT SECURITIES
(Cost: $421,750,278) 98.7% | | | | | | | | | | | | | 429,380,190 | |
| | | | | | | | | | | | | | |
| | | | | |
| SHORT-TERM DEBT SECURITIES: | | | | | | | | | | | | | | |
COMMERCIAL PAPER (0.7%) | | | | | | | | | | | | | | |
Exxon Mobil Corp. | | A-1+ | | 0.13 | | 02/04/15 | | | 1,500,000 | | | | 1,499,816 | |
National Rural Utilities | | A-1 | | 0.13 | | 01/20/15 | | | 260,000 | | | | 259,982 | |
Toyota Motor Credit Corp. | | A-1+ | | 0.13 - 0.15 | | 02/04/15 - 03/11/15 | | | 1,250,000 | | | | 1,249,764 | |
| | | | | | | | | | | | | | |
| | | | | | | | | | | | | 3,009,562 | |
| | | | | | | | | | | | | | |
TOTAL SHORT-TERM DEBT SECURITIES
(Cost: $3,009,562) 0.7% | | | | 3,009,562 | |
| | | | | |
TEMPORARY CASH INVESTMENTS (2)
(Cost: $11,100) 0.0% (3) | | | | 11,100 | |
| | | | | |
TOTAL INVESTMENTS
(Cost: $424,770,940) 99.4% | | | | 432,400,852 | |
| | | | | |
OTHER NET ASSETS 0.6% | | | | 2,832,646 | |
| | | | | |
NET ASSETS 100.0% | | | $ | 435,233,498 | |
| | | | | | | | | | | | | | |
The accompanying notes are an integral part of these portfolio schedules.
61
MUTUAL OF AMERICA INVESTMENT CORPORATION — BOND FUND
SUMMARY PORTFOLIO OF INVESTMENTS IN SECURITIES
December 31, 2014
| | | | | | | | | | | | | | |
| | | Rating** | | Rate(%) | | Maturity | | Face Amount | | | Value | |
| LONG-TERM DEBT SECURITIES: | | | | | | | | | | | | | | |
U.S. GOVERNMENT (12.3%) | | | | | | | | | | | | | | |
U.S. Treasury Note | | AA+ | | 0.63 - 2.25 | | 12/31/16 - 03/31/21 | | $ | 26,500,000 | | | $ | 26,439,650 | |
U.S. Treasury Strip | | AA+ | | 0.00 | | 08/15/16 - 08/15/29 | | | 123,500,000 | | | | 91,953,259 | |
| | | | | | | | | | | | | | |
| | | | | | | | | | | | | 118,392,909 | |
| | | | | | | | | | | | | | |
U.S. GOVERNMENT AGENCIES (31.6%) | | | | | | | | | | | | | | |
MORTGAGE-BACKED OBLIGATIONS (28.2%) | | | | | | | | | | | | | | |
FHARM | | AA+ | | 2.38 - 5.77 | | 02/01/36 - 04/01/42 | | | 2,232,618 | | | | 2,356,876 | |
FHLMC | | AA+ | | 2.50 - 6.00 | | 03/01/21 - 01/01/44 | | | 69,704,796 | | | | 73,463,414 | |
FHLMC Strip | | AA+ | | 3.00 | | 01/15/43 | | | 2,696,358 | | | | 2,689,291 | |
FNMA | | AA+ | | 2.25 - 8.00 | | 09/01/16 - 12/25/49 | | | 135,104,065 | | | | 143,977,354 | |
FNMA Strip | | AA+ | | 3.00 | | 08/25/42 | | | 2,168,141 | | | | 2,155,117 | |
GNMA (4) | | AA+ | | 2.68 - 7.00 | | 04/15/24 - 10/16/47 | | | 39,632,499 | | | | 42,497,746 | |
GNMA TBA (4) | | AA+ | | 4.50 | | 02/20/20 | | | 1,202,206 | | | | 1,232,380 | |
Other Securities | | | | | | | | | 1,356,281 | | | | 1,502,880 | |
| | | | | | | | | | | | | | |
| | | | | | | | | | | | | 269,875,058 | |
| | | | | | | | | | | | | | |
NON-MORTGAGE-BACKED OBLIGATIONS (3.4%) | | | | | | | | | | | | | | |
FHLMC | | AA+ | | 0.00 | | 11/29/19 | | | 10,872,000 | | | | 9,686,571 | |
FNMA | | AA+ | | 0.00 | | 10/09/19 | | | 25,707,000 | | | | 23,112,362 | |
| | | | | | | | | | | | | | |
| | | | | | | | | | | | | 32,798,933 | |
| | | | | | | | | | | | | | |
CORPORATE DEBT (54.3%) | | | | | | | | | | | | | | |
CONSUMER DISCRETIONARY (8.0%) | | | | | | | | | | | | | | |
Advance Auto Parts, Inc. | | BBB- | | 4.50 - 5.75 | | 05/01/20 - 01/15/22 | | | 4,000,000 | | | | 4,422,518 | |
Expedia, Inc. | | BBB- | | 5.95 | | 08/15/20 | | | 4,000,000 | | | | 4,469,896 | |
Family Dollar Stores, Inc. | | BBB- | | 5.00 | | 02/01/21 | | | 4,000,000 | | | | 4,219,320 | |
NVR, Inc. | | BBB | | 3.95 | | 09/15/22 | | | 4,000,000 | | | | 4,102,792 | |
Omnicom Group, Inc. | | BBB+ | | 3.63 - 4.45 | | 08/15/20 - 05/01/22 | | | 4,000,000 | | | | 4,253,454 | |
Tupperware Brands Corp. | | BBB- | | 4.75 | | 06/01/21 | | | 4,000,000 | | | | 4,281,780 | |
Other Securities | | | | | | | | | 50,150,000 | | | | 51,143,370 | |
| | | | | | | | | | | | | | |
| | | | | | | | | | | | | 76,893,130 | |
| | | | | | | | | | | | | | |
CONSUMER STAPLES (2.9%) | | | | | | | | | | | | | | |
Energizer Hldgs., Inc. | | BBB- | | 4.70 | | 05/19/21 | | | 4,000,000 | | | | 4,150,460 | |
Other Securities | | | | | | | | | 22,869,000 | | | | 23,429,576 | |
| | | | | | | | | | | | | | |
| | | | | | | | | | | | | 27,580,036 | |
| | | | | | | | | | | | | | |
ENERGY (5.0%) | | | | | | | | | | | | | | |
EQT Corp. | | BBB | | 4.88 | | 11/15/21 | | | 4,000,000 | | | | 4,321,228 | |
FMC Technologies, Inc. | | BBB | | 2.00 | | 10/01/17 | | | 4,500,000 | | | | 4,467,776 | |
SESI LLC | | BBB- | | 7.13 | | 12/15/21 | | | 4,500,000 | | | | 4,320,000 | |
Other Securities | | | | | | | | | 34,276,000 | | | | 34,328,000 | |
| | | | | | | | | | | | | | |
| | | | | | | | | | | | | 47,437,004 | |
| | | | | | | | | | | | | | |
FINANCIALS (13.5%) | | | | | | | | | | | | | | |
Alleghany Corp. | | BBB | | 4.95 - 5.63 | | 09/15/20 - 06/27/22 | | | 4,000,000 | | | | 4,468,041 | |
American Tower Corp. | | BBB- | | 4.50 | | 01/15/18 | | | 4,000,000 | | | | 4,247,948 | |
Berkley (W.R.) Corp. | | BBB+ | | 4.63 - 7.38 | | 09/15/19 - 03/15/22 | | | 4,000,000 | | | | 4,511,920 | |
Boston Properties LP | | A- | | 3.70 - 3.85 | | 11/15/18 - 02/01/23 | | | 4,000,000 | | | | 4,168,662 | |
Capital One Financial Corp. | | BBB | | 4.75 | | 07/15/21 | | | 4,000,000 | | | | 4,408,552 | |
Fairfax Financial Hldgs. | | BBB- | | 8.25 | | 10/01/15 | | | 2,500,000 | | | | 2,618,473 | |
Fairfax Financial Hldgs.† | | BBB- | | 5.80 | | 05/15/21 | | | 1,500,000 | | | | 1,608,936 | |
Health Care REIT, Inc. | | BBB | | 3.63 - 6.13 | | 03/15/16 - 03/15/23 | | | 4,000,000 | | | | 4,402,214 | |
Hospitality Properties Trust | | BBB- | | 5.00 | | 08/15/22 | | | 4,550,000 | | | | 4,794,699 | |
Jones Lang LaSalle, Inc. | | BBB | | 4.40 | | 11/15/22 | | | 4,000,000 | | | | 4,151,268 | |
Moody’s Corp. | | BBB+ | | 4.50 | | 09/01/22 | | | 4,000,000 | | | | 4,290,192 | |
Reinsurance Grp. of America, Inc. | | A- | | 4.70 - 5.00 | | 06/01/21 - 09/15/23 | | | 4,000,000 | | | | 4,378,685 | |
Other Securities | | | | | | | | | 77,869,000 | | | | 81,548,418 | |
| | | | | | | | | | | | | | |
| | | | | | | | | | | | | 129,598,008 | |
| | | | | | | | | | | | | | |
The accompanying notes are an integral part of these portfolio schedules.
62
MUTUAL OF AMERICA INVESTMENT CORPORATION — BOND FUND
SUMMARY PORTFOLIO OF INVESTMENTS IN SECURITIES (Continued)
December 31, 2014
| | | | | | | | | | | | | | |
| | | Rating** | | Rate(%) | | Maturity | | Face Amount | | | Value | |
| LONG-TERM DEBT SECURITIES (CONTINUED): | | | | | | | | | | | | | | |
HEALTH CARE (5.8%) | | | | | | | | | | | | | | |
Agilent Technologies, Inc. | | BBB+ | | 5.00 | | 07/15/20 | | $ | 4,000,000 | | | $ | 4,351,296 | |
Bio-Rad Laboratories, Inc. | | BBB | | 4.88 | | 12/15/20 | | | 4,000,000 | | | | 4,295,708 | |
Edwards Lifesciences Corp. | | BBB- | | 2.88 | | 10/15/18 | | | 4,500,000 | | | | 4,561,812 | |
Hospira, Inc. | | BBB- | | 6.05 | | 03/30/17 | | | 4,000,000 | | | | 4,312,660 | |
Laboratory Corp. of America | | BBB+ | | 3.75 - 5.63 | | 12/15/15 - 08/23/22 | | | 4,000,000 | | | | 4,164,396 | |
PerkinElmer, Inc. | | BBB | | 5.00 | | 11/15/21 | | | 4,000,000 | | | | 4,351,676 | |
Quest Diagnostics, Inc. | | BBB+ | | 4.75 | | 01/30/20 | | | 4,000,000 | | | | 4,314,076 | |
Thermo Fisher Scientific, Inc. | | BBB | | 3.60 - 4.50 | | 03/01/21 - 08/15/21 | | | 4,000,000 | | | | 4,273,373 | |
Other Securities | | | | | | | | | 19,200,000 | | | | 20,862,620 | |
| | | | | | | | | | | | | | |
| | | | | | | | | | | | | 55,487,617 | |
| | | | | | | | | | | | | | |
INDUSTRIALS (4.2%) | | | | | | | | | | | | | | |
Dun & Bradstreet Corp. | | BBB- | | 3.25 - 4.38 | | 12/01/17 - 12/01/22 | | | 4,000,000 | | | | 4,107,518 | |
Harsco Corp. | | BB+ | | 5.75 | | 05/15/18 | | | 4,000,000 | | | | 4,210,000 | |
L-3 Communications Corp. | | BBB- | | 4.75 - 5.20 | | 10/15/19 - 07/15/20 | | | 4,000,000 | | | | 4,320,103 | |
Other Securities | | | | | | | | | 26,320,000 | | | | 27,135,470 | |
| | | | | | | | | | | | | | |
| | | | | | | | | | | | | 39,773,091 | |
| | | | | | | | | | | | | | |
INFORMATION TECHNOLOGY (5.4%) | | | | | | | | | | | | | | |
Adobe Systems, Inc. | | A- | | 4.75 | | 02/01/20 | | | 4,000,000 | | | | 4,390,940 | |
Arrow Electronics, Inc. | | BBB- | | 4.50 - 6.88 | | 06/01/18 - 03/01/23 | | | 4,000,000 | | | | 4,421,936 | |
Fiserv, Inc. | | BBB | | 4.63 - 4.75 | | 10/01/20 - 06/15/21 | | | 3,800,000 | | | | 4,142,638 | |
Ingram Micro, Inc. | | BBB- | | 4.95 - 5.25 | | 09/01/17 - 12/15/24 | | | 4,750,000 | | | | 5,057,778 | |
Lender Processing Svcs., Inc. | | BBB | | 5.75 | | 04/15/23 | | | 4,500,000 | | | | 4,725,000 | |
Lexmark International, Inc. | | BBB- | | 6.65 | | 06/01/18 | | | 4,000,000 | | | | 4,443,656 | |
Symantec Corp. | | BBB | | 4.20 | | 09/15/20 | | | 4,000,000 | | | | 4,141,924 | |
Tech Data Corp. | | BBB- | | 3.75 | | 09/21/17 | | | 4,000,000 | | | | 4,132,068 | |
Western Union Co. | | BBB | | 5.93 | | 10/01/16 | | | 4,000,000 | | | | 4,294,744 | |
Other Securities | | | | | | | | | 11,370,000 | | | | 11,555,882 | |
| | | | | | | | | | | | | | |
| | | | | | | | | | | | | 51,306,566 | |
| | | | | | | | | | | | | | |
MATERIALS (5.9%) | | | | | | | | | | | | | | |
Alcoa, Inc. | | BBB- | | 6.75 | | 07/15/18 | | | 4,000,000 | | | | 4,493,360 | |
Domtar Corp. | | BBB- | | 4.40 | | 04/01/22 | | | 4,000,000 | | | | 4,105,504 | |
Packaging Corp. of America | | BBB | | 3.90 - 4.50 | | 06/15/22 - 11/01/23 | | | 4,000,000 | | | | 4,146,318 | |
Other Securities | | | | | | | | | 43,850,000 | | | | 43,641,098 | |
| | | | | | | | | | | | | | |
| | | | | | | | | | | | | 56,386,280 | |
| | | | | | | | | | | | | | |
TELECOMMUNICATION SERVICES (0.9%) | | | | | | | | | | | | | | |
Other Securities | | | | | | | | | 8,000,000 | | | | 8,103,734 | |
| | | | | | | | | | | | | | |
UTILITIES (2.7%) | | | | | | | | | | | | | | |
Entergy Corp. | | BBB- | | 4.70 - 5.13 | | 01/15/17 - 09/15/20 | | | 4,000,000 | | | | 4,302,949 | |
SCANA Corp. | | BBB | | 4.13 | | 02/01/22 | | | 4,000,000 | | | | 4,146,696 | |
Other Securities | | | | | | | | | 16,725,000 | | | | 17,027,581 | |
| | | | | | | | | | | | | | |
| | | | | | | | | | | | | 25,477,226 | |
| | | | | | | | | | | | | | |
SOVEREIGN DEBT (0.4%) | | | | | | | | | | | | | | |
Sri Lanka AID | | NR | | 6.59 | | 09/15/28 | | | 3,283,889 | | | | 4,029,201 | |
| | | | | | | | | | | | | | |
TOTAL LONG-TERM DEBT SECURITIES
(Cost: $917,538,549) 98.6% | | | | | | | | | | | | | 943,138,793 | |
| | | | | | | | | | | | | | |
| | | | | |
| SHORT-TERM DEBT SECURITIES: | | | | | | | | | | | | | | |
U.S. GOVERNMENT (0.2%) | | | | | | | | | | | | | | |
U.S. Treasury Bill | | A-1+ | | 0.09 | | 06/25/15 | | | 2,000,000 | | | | 1,999,076 | |
| | | | | | | | | | | | | | |
The accompanying notes are an integral part of these portfolio schedules.
63
MUTUAL OF AMERICA INVESTMENT CORPORATION — BOND FUND
SUMMARY PORTFOLIO OF INVESTMENTS IN SECURITIES (Continued)
December 31, 2014
| | | | | | | | | | | | | | |
| | | Rating** | | Rate(%) | | Maturity | | Face Amount | | | Value | |
| SHORT-TERM DEBT SECURITIES (CONTINUED): | | | | | | | | | | | | | | |
COMMERCIAL PAPER (0.9%) | | | | | | | | | | | | | | |
Coca-Cola Co.† | | A-1+ | | 0.10 | | 02/12/15 | | $ | 700,000 | | | $ | 699,918 | |
Exxon Mobil Corp. | | A-1+ | | 0.13 | | 02/04/15 | | | 2,700,000 | | | | 2,699,669 | |
New Jersey Natural Gas | | A-1 | | 0.15 | | 01/15/15 | | | 900,000 | | | | 899,948 | |
Toyota Motor Credit Corp. | | A-1+ | | 0.13 | | 01/28/15 | | | 4,000,000 | | | | 3,999,610 | |
| | | | | | | | | | | | | | |
| | | | | | | | | | | | | 8,299,145 | |
| | | | | | | | | | | | | | |
TOTAL SHORT-TERM DEBT SECURITIES
(Cost: $10,298,221) 1.1% | | | | 10,298,221 | |
| | | | | | | | | | | | | | |
TEMPORARY CASH INVESTMENTS (2)
(Cost: $2,798,500) 0.3% | | | | 2,798,500 | |
| | | | | | | | | | | | | | |
TOTAL INVESTMENTS
(Cost: $930,635,270) 100.0% | | | | 956,235,514 | |
| | | | | | | | | | | | | | |
OTHER NET ASSETS -0.0% (3) | | | | (353,715 | ) |
| | | | | | | | | | | | | | |
NET ASSETS 100.0% | | | $ | 955,881,799 | |
| | | | | | | | | | | | | | |
The accompanying notes are an integral part of these portfolio schedules.
64
MUTUAL OF AMERICA INVESTMENT CORPORATION
FOOTNOTES TO SUMMARY PORTFOLIOS OF INVESTMENTS IN SECURITIES
December 31, 2014
| | |
| Abbreviations: | | FHARM = Federal Home Adjustable Rate Mortgage |
| | FHLB = Federal Home Loan Bank |
| | FHLMC = Federal Home Loan Mortgage Corporation |
| | FNMA = Federal National Mortgage Association |
| | GNMA = Government National Mortgage Association |
| | NR = Not Rated |
| | “Other Securities” represent securities in the respective category that individually, or in the aggregate by issuer, do not exceed 1% of net assets. |
| * | Non-income producing security. |
| ** | Ratings as per Standard & Poor’s Corporation (unaudited). |
| † | Security is exempt from registration under Rule 144A of the Securities Act of 1933. These securities may be resold in transactions exempt from registration, normally to qualified institutional buyers. At December 31, 2014, the aggregate values of these securities and their percentages of the respective Funds’ net assets were as follows: |
| | | | | | | | |
Fund | | Aggregate
Market
Value | | | Percentage
of
Net Assets | |
EQUITY INDEX FUND | | $ | 16,398,830 | | | | 0.9 | % |
SMALL CAP VALUE FUND | | $ | 7,049,891 | | | | 1.8 | % |
SMALL CAP GROWTH FUND | | $ | 4,298,528 | | | | 1.0 | % |
MID-CAP EQUITY INDEX FUND | | $ | 3,799,590 | | | | 0.4 | % |
COMPOSITE FUND | | $ | 2,173,351 | | | | 1.1 | % |
MONEY MARKET FUND | | $ | 29,197,004 | | | | 37.7 | % |
MID-TERM BOND FUND | | $ | 6,548,275 | | | | 1.5 | % |
BOND FUND | | $ | 11,579,935 | | | | 1.2 | % |
| (1) | This security, or a portion thereof, has been segregated to cover initial margin requirements on open futures contracts. Information on futures contracts outstanding in the Funds as of December 31, 2014, was as follows: |
| | | | | | | | | | | | | | | | | | | | | | | | | | |
Fund | | Number of
Contracts | | | Contract Type | | Purchased (P)
or Sold (S) | | | Expiration
Date | | | Underlying
Face Amount
at Value(a) | | | Unrealized
Gain(Loss) | | | Face Value
of Futures
as a %
of Total
Investments | |
EQUITY INDEX FUND | | | 603 | | | E-mini S&P 500
Stock Index | | | P | | | | March 2015 | | | $ | 61,879,860 | | | $ | 656,358 | | | | 3.5 | % |
ALL AMERICA FUND | | | 52 | | | E-mini S&P 500
Stock Index | | | P | | | | March 2015 | | | $ | 5,336,240 | | | $ | (32,565 | ) | | | 1.6 | % |
MID-CAP EQUITY INDEX FUND | | | 199 | | | E-mini S&P MidCap
400 Stock Index | | | P | | | | March 2015 | | | $ | 28,827,140 | | | $ | 657,202 | | | | 2.9 | % |
| | (a) | Includes the cumulative appreciation(depreciation) of futures contracts, which is included in Net Unrealized Appreciation (Depreciation) of Investments and Futures Contracts in the Components of Net Assets section of the Statements of Assets and Liabilities. The Receivable or Payable for Daily Variation on Futures Contracts in the Statements of Assets and Liabilities only includes the current day’s variation margin payable or receivable. |
| (2) | The fund has an arrangement with its custodian bank, JP Morgan Chase Bank, whereby uninvested cash, subject to parameters set by the fund, is automatically invested in the fund’s name by the bank in overnight commercial paper issued by J.P. Morgan Chase & Co. On the next business day, these funds (and earned interest) are automatically returned to the fund. The annual rate of interest earned on this temporary cash investment at December 31, 2014 was 0.12%. |
| (3) | Percentage is less than 0.05%. |
| (4) | U.S. Government guaranteed security. |
65
MUTUAL OF AMERICA INVESTMENT CORPORATION
STATEMENTS OF ASSETS AND LIABILITIES
December 31, 2014
| | | | | | | | | | | | | | | | | | | | | | | | |
| | | Equity Index
Fund | | | All America
Fund | | | Small Cap
Value Fund | | | Small Cap
Growth Fund | | | Mid Cap
Value Fund | | | Mid-Cap
Equity Index
Fund | |
ASSETS: | | | | | | | | | | | | | | | | | | | | | | | | |
Investments at fair value | | | | | | | | | | | | | | | | | | | | | | | | |
(Cost: Equity Index Fund — $1,106,463,536 All America Fund — $224,695,619 Small Cap Value Fund — $306,055,993 Small Cap Growth Fund — $323,263,224 Mid Cap Value Fund — $72,445,562 Mid-Cap Equity Index Fund — $722,020,445 International Fund — $260,762,828 Composite Fund — $147,512,249 Retirement Income Fund — $50,814,567 2010 Retirement Fund — $23,954,752 2015 Retirement Fund — $134,753,285 2020 Retirement Fund — $276,550,552 2025 Retirement Fund — $275,229,535) | |
(Notes 1 and 3) | | $ | 1,788,347,117 | | | $ | 323,596,062 | | | $ | 395,201,989 | | | $ | 412,038,699 | | | $ | 92,095,557 | | | $ | 1,003,063,715 | |
Cash | | | 11,572,108 | | | | — | | | | 319,540 | | | | 11,336 | | | | 83,542 | | | | 99 | |
Interest and dividends receivable | | | 2,182,595 | | | | 360,536 | | | | 256,346 | | | | 181,639 | | | | 150,455 | | | | 851,620 | |
Receivable for securities sold | | | — | | | | 1,489,922 | | | | 8,458,543 | | | | 9,101,444 | | | | — | | | | — | |
| | | | | | | | | | | | | | | | | | | | | | | | |
TOTAL ASSETS | | | 1,802,101,820 | | | | 325,446,520 | | | | 404,236,418 | | | | 421,333,118 | | | | 92,329,554 | | | | 1,003,915,434 | |
| | | | | | | | | | | | | | | | | | | | | | | | |
| | | | | | |
LIABILITIES: | | | | | | | | | | | | | | | | | | | | | | | | |
Due to custodian bank | | | — | | | | 6,400 | | | | — | | | | — | | | | — | | | | — | |
Payable for securities purchased | | | 12,198,458 | | | | 1,190,864 | | | | 10,767,464 | | | | 8,974,950 | | | | — | | | | 2,874,091 | |
Payable for daily variation margin on future contracts | | | 785,980 | | | | 61,878 | | | | — | | | | — | | | | — | | | | 408,980 | |
Accrued expenses | | | 7,018 | | | | 4,255 | | | | 12,412 | | | | 9,126 | | | | 1,597 | | | | 3,773 | |
| | | | | | | | | | | | | | | | | | | | | | | | |
TOTAL LIABILITIES: | | | 12,991,456 | | | | 1,263,397 | | | | 10,779,876 | | | | 8,984,076 | | | | 1,597 | | | | 3,286,844 | |
| | | | | | | | | | | | | | | | | | | | | | | | |
NET ASSETS | | $ | 1,789,110,364 | | | $ | 324,183,123 | | | $ | 393,456,542 | | | $ | 412,349,042 | | | $ | 92,327,957 | | | $ | 1,000,628,590 | |
| | | | | | | | | | | | | | | | | | | | | | | | |
NUMBEROF SHARES OUTSTANDING (Note 4) | | | 524,974,834 | | | | 134,209,249 | | | | 244,764,120 | | | | 268,125,197 | | | | 56,753,645 | | | | 462,801,870 | |
| | | | | | | | | | | | | | | | | | | | | | | | |
NET ASSET VALUES, offering and redemption price per share | | | $3.41 | | | | $2.42 | | | | $1.61 | | | | $1.54 | | | | $1.63 | | | | $2.16 | |
| | | | | | | | | | | | | | | | | | | | | | | | |
| | | | | | |
COMPONENTSOF NET ASSETS: | | | | | | | | | | | | | | | | | | | | | | | | |
Paid-in capital | | $ | 1,025,151,435 | | | $ | 208,246,454 | | | $ | 278,128,750 | | | $ | 272,625,715 | | | $ | 66,646,089 | | | $ | 649,830,444 | |
Accumulated undistributed net investment income (loss) | | | 28,715,350 | | | | 3,971,841 | | | | 2,553,337 | | | | — | | | | 969,246 | | | | 11,509,632 | |
Accumulated undistributed net realized gain (loss) on investments and futures contracts | | | 52,703,640 | | | | 13,096,950 | | | | 23,628,459 | | | | 50,947,852 | | | | 5,062,627 | | | | 57,588,042 | |
Net unrealized appreciation (depreciation) of investments and futures contracts | | | 682,539,939 | | | | 98,867,878 | | | | 89,145,996 | | | | 88,775,475 | | | | 19,649,995 | | | | 281,700,472 | |
| | | | | | | | | | | | | | | | | | | | | | | | |
NET ASSETS | | $ | 1,789,110,364 | | | $ | 324,183,123 | | | $ | 393,456,542 | | | $ | 412,349,042 | | | $ | 92,327,957 | | | $ | 1,000,628,590 | |
| | | | | | | | | | | | | | | | | | | | | | | | |
The accompanying notes are an integral part of these financial statements.
66
| | | | | | | | | | | | | | | | | | | | | | | | | | | | |
International
Fund | | | Composite
Fund | | | Retirement
Income
Fund | | | 2010
Retirement
Fund | | | 2015
Retirement
Fund | | | 2020
Retirement
Fund | | | 2025
Retirement
Fund | | | |
| | | | | | | | | | | | | | | | | | | | | | | | | | | | |
| | | | | | | | | | | | | | | | | | | | | | | | | | | | |
| | | | | | | |
| | | | | | | | | | | | | | | | | | | | | | | | | | | | |
| $ | 263,723,167 | | | $ | 193,551,469 | | | $ | 53,535,315 | | | $ | 26,558,105 | | | $ | 154,162,876 | | | $ | 320,042,019 | | | $ | 331,091,047 | | | |
| | 111,634 | | | | 103 | | | | — | | | | — | | | | — | | | | — | | | | — | | | |
| | — | | | | 618,480 | | | | — | | | | — | | | | — | | | | — | | | | — | | | |
| | — | | | | 13,652 | | | | — | | | | — | | | | — | | | | — | | | | — | | | |
| | | | | | | | | | | | | | | | | | | | | | | | | | | | |
| | 263,834,801 | | | | 194,183,704 | | | | 53,535,315 | | | | 26,558,105 | | | | 154,162,876 | | | | 320,042,019 | | | | 331,091,047 | | | |
| | | | | | | | | | | | | | | | | | | | | | | | | | | | |
| | | | | | | |
| | | | | | | | | | | | | | | | | | | | | | | | | | | | |
| | — | | | | — | | | | — | | | | — | | | | — | | | | — | | | | — | | | |
| | — | | | | 355,871 | | | | — | | | | — | | | | — | | | | — | | | | — | | | |
| | — | | | | — | | | | — | | | | — | | | | — | | | | — | | | | — | | | |
| | 1,226 | | | | 2,550 | | | | 176 | | | | 99 | | | | 1,344 | | | | 1,066 | | | | 1,121 | | | |
| | | | | | | | | | | | | | | | | | | | | | | | | | | | |
| | 1,226 | | | | 358,421 | | | | 176 | | | | 99 | | | | 1,344 | | | | 1,066 | | | | 1,121 | | | |
| | | | | | | | | | | | | | | | | | | | | | | | | | | | |
| $ | 263,833,575 | | | $ | 193,825,283 | | | $ | 53,535,139 | | | $ | 26,558,006 | | | $ | 154,161,532 | | | $ | 320,040,953 | | | $ | 331,089,926 | | | |
| | | | | | | | | | | | | | | | | | | | | | | | | | | | |
| | 341,369,894 | | | | 96,812,141 | | | | 46,045,385 | | | | 24,456,165 | | | | 136,513,695 | | | | 270,183,637 | | | | 268,929,635 | | | |
| | | | | | | | | | | | | | | | | | | | | | | | | | | | |
|
$0.77 |
| | | $2.00 | | | | $1.16 | | | | $1.09 | | | | $1.13 | | | | $1.18 | | | | $1.23 | | | |
| | | | | | | | | | | | | | | | | | | | | | | | | | | | |
| | | | | | | |
| | | | | | | | | | | | | | | | | | | | | | | | | | | | |
| $ | 254,378,300 | | | $ | 143,082,954 | | | $ | 48,362,892 | | | $ | 22,073,596 | | | $ | 123,585,119 | | | $ | 257,239,911 | | | $ | 257,669,561 | | | |
| | 8,132,055 | | | | 3,940,898 | | | | 1,043,642 | | | | 553,391 | | | | 3,145,217 | | | | 5,971,939 | | | | 5,804,497 | | | |
| (1,637,119 | ) | | | 762,211 | | | | 1,407,857 | | | | 1,327,666 | | | | 8,021,605 | | | | 13,337,636 | | | | 11,754,356 | | | |
| 2,960,339 | | | | 46,039,220 | | | | 2,720,748 | | | | 2,603,353 | | | | 19,409,591 | | | | 43,491,467 | | | | 55,861,512 | | | |
| | | | | | | | | | | | | | | | | | | | | | | | | | | | |
| $ | 263,833,575 | | | $ | 193,825,283 | | | $ | 53,535,139 | | | $ | 26,558,006 | | | $ | 154,161,532 | | | $ | 320,040,953 | | | $ | 331,089,926 | | | |
| | | | | | | | | | | | | | | | | | | | | | | | | | | | |
The accompanying notes are an integral part of these financial statements.
67
MUTUAL OF AMERICA INVESTMENT CORPORATION
STATEMENTS OF ASSETS AND LIABILITIES (Continued)
December 31, 2014
| | | | | | | | | | | | | | | | | | | | |
| | | 2030
Retirement
Fund | | | 2035
Retirement
Fund | | | 2040
Retirement
Fund | | | 2045
Retirement
Fund | | | 2050
Retirement
Fund | |
ASSETS: | | | | | | | | | | | | | | | | | | | | |
Investments at fair value | | | | | | | | | | | | | | | | | | | | |
(Cost: 2030 Retirement Fund — $225,551,895 2035 Retirement Fund — $184,789,316 2040 Retirement Fund — $149,140,140 2045 Retirement Fund — $181,799,043 2050 Retirement Fund — $47,255,825 Conservative Allocation Fund — $113,572,753 Moderate Allocation Fund — $257,461,053 Aggressive Allocation Fund — $191,686,539 Money Market Fund — $77,474,837 Mid-Term Bond Fund — $424,770,940 Bond Fund — $930,635,270) | | | | | | | | | | | | | | | | | | | | |
(Notes 1 and 3) | | $ | 277,060,170 | | | $ | 229,853,630 | | | $ | 188,610,656 | | | $ | 232,106,622 | | | $ | 50,211,014 | |
Cash | | | — | | | | — | | | | — | | | | — | | | | — | |
Interest and dividends receivable | | | — | | | | — | | | | — | | | | — | | | | — | |
Receivable for securities sold | | | — | | | | — | | | | — | | | | — | | | | — | |
| | | | | | | | | | | | | | | | | | | | |
TOTAL ASSETS | | | 277,060,170 | | | | 229,853,630 | | | | 188,610,656 | | | | 232,106,622 | | | | 50,211,014 | |
| | | | | | | | | | | | | | | | | | | | |
| | | | | |
LIABILITIES: | | | | | | | | | | | | | | | | | | | | |
Due to custodian bank | | | — | | | | — | | | | — | | | | — | | | | — | |
Payable for securities purchased | | | — | | | | — | | | | — | | | | — | | | | — | |
Payable for daily variation margin on future contracts | | | — | | | | — | | | | — | | | | — | | | | — | |
Accrued expenses | | | 908 | | | | 743 | | | | 627 | | | | 744 | | | | 98 | |
| | | | | | | | | | | | | | | | | | | | |
TOTAL LIABILITIES | | | 908 | | | | 743 | | | | 627 | | | | 744 | | | | 98 | |
| | | | | | | | | | | | | | | | | | | | |
NET ASSETS | | $ | 277,059,262 | | | $ | 229,852,887 | | | $ | 188,610,029 | | | $ | 232,105,878 | | | $ | 50,210,916 | |
| | | | | | | | | | | | | | | | | | | | |
NUMBEROF SHARES OUTSTANDING (Note 4) | | | 218,780,055 | | | | 181,398,047 | | | | 149,253,147 | | | | 183,851,790 | | | | 36,041,942 | |
| | | | | | | | | | | | | | | | | | | | |
NET ASSET VALUES, offering and redemption price per share | | | $1.27 | | | | $1.27 | | | | $1.26 | | | | $1.26 | | | | $1.39 | |
| | | | | | | | | | | | | | | | | | | | |
| | | | | |
COMPONENTSOF NET ASSETS: | | | | | | | | | | | | | | | | | | | | |
Paid-in capital | | $ | 210,467,640 | | | $ | 173,052,727 | | | $ | 138,749,965 | | | $ | 169,300,280 | | | $ | 45,513,629 | |
Accumulated undistributed net investment income (loss) | | | 4,662,610 | | | | 3,637,561 | | | | 2,857,782 | | | | 3,540,101 | | | | 592,908 | |
Accumulated undistributed net realized gain (loss)
on investments and futures contracts | | | 10,420,737 | | | | 8,098,285 | | | | 7,531,766 | | | | 8,957,918 | | | | 1,149,190 | |
Net unrealized appreciation (depreciation)
of investments and futures contracts | | | 51,508,275 | | | | 45,064,314 | | | | 39,470,516 | | | | 50,307,579 | | | | 2,955,189 | |
| | | | | | | | | | | | | | | | | | | | |
NET ASSETS | | $ | 277,059,262 | | | $ | 229,852,887 | | | $ | 188,610,029 | | | $ | 232,105,878 | | | $ | 50,210,916 | |
| | | | | | | | | | | | | | | | | | | | |
The accompanying notes are an integral part of these financial statements.
68
| | | | | | | | | | | | | | | | | | | | | | | | |
Conservative
Allocation
Fund | | | Moderate
Allocation
Fund | | | Aggressive
Allocation
Fund | | | Money
Market
Fund | | | Mid-Term
Bond Fund | | | Bond Fund | | | |
| | | | | | | | | | | | | | | | | | | | | | | | |
| | | | | | | | | | | | | | | | | | | | | | | | |
| | | | | | |
| | | | | | | | | | | | | | | | | | | | | | | | |
| $ | 122,523,125 | | | $ | 315,208,180 | | | $ | 254,800,202 | | | $ | 77,479,209 | | | $ | 432,400,852 | | | $ | 956,235,514 | | | |
| | — | | | | — | | | | — | | | | 64 | | | | 24 | | | | 26 | | | |
| | — | | | | — | | | | — | | | | — | | | | 2,843,436 | | | | 6,756,499 | | | |
| | — | | | | — | | | | — | | | | — | | | | — | | | | 56,953 | | | |
| | | | | | | | | | | | | | | | | | | | | | | | |
| | 122,523,125 | | | | 315,208,180 | | | | 254,800,202 | | | | 77,479,273 | | | | 435,244,312 | | | | 963,048,992 | | | |
| | | | | | | | | | | | | | | | | | | | | | | | |
| | | | | | |
| | | | | | | | | | | | | | | | | | | | | | | | |
| | — | | | | — | | | | — | | | | — | | | | — | | | | — | | | |
| | — | | | | — | | | | — | | | | — | | | | — | | | | 7,154,798 | | | |
| | — | | | | — | | | | — | | | | — | | | | — | | | | — | | | |
| | — | | | | — | | | | — | | | | 507 | | | | 10,814 | | | | 12,395 | | | |
| | | | | | | | | | | | | | | | | | | | | | | | |
| | — | | | | — | | | | — | | | | 507 | | | | 10,814 | | | | 7,167,193 | | | |
| | | | | | | | | | | | | | | | | | | | | | | | |
| $ | 122,523,125 | | | $ | 315,208,180 | | | $ | 254,800,202 | | | $ | 77,478,766 | | | $ | 435,233,498 | | | $ | 955,881,799 | | | |
| | | | | | | | | | | | | | | | | | | | | | | | |
| | 97,670,821 | | | | 208,049,805 | | | | 144,356,850 | | | | 64,724,065 | | | | 412,252,911 | | | | 658,106,501 | | | |
| | | | | | | | | | | | | | | | | | | | | | | | |
| | $1.25 | | | | $1.52 | | | | $1.77 | | | | $1.20 | | | | $1.06 | | | | $1.45 | | | |
| | | | | | | | | | | | | | | | | | | | | | | | |
| | | | | | |
| | | | | | | | | | | | | | | | | | | | | | | | |
| $ | 107,218,181 | | | $ | 241,317,023 | | | $ | 174,517,182 | | | $ | 77,474,394 | | | $ | 415,445,233 | | | $ | 897,173,921 | | | |
| | 2,608,920 | | | | 6,514,098 | | | | 4,669,780 | | | | — | | | | 10,593,942 | | | | 31,506,309 | | | |
| | | | | | |
| | 3,745,652 | | | | 9,629,932 | | | | 12,499,577 | | | | — | | | | 1,564,411 | | | | 1,601,325 | | | |
| | | | | | |
| | 8,950,372 | | | | 57,747,127 | | | | 63,113,663 | | | | 4,372 | | | | 7,629,912 | | | | 25,600,244 | | | |
| | | | | | | | | | | | | | | | | | | | | | | | |
| $ | 122,523,125 | | | $ | 315,208,180 | | | $ | 254,800,202 | | | $ | 77,478,766 | | | $ | 435,233,498 | | | $ | 955,881,799 | | | |
| | | | | | | | | | | | | | | | | | | | | | | | |
The accompanying notes are an integral part of these financial statements.
69
MUTUAL OF AMERICA INVESTMENT CORPORATION
STATEMENTS OF OPERATIONS
For the Year Ended December 31, 2014
| | | | | | | | | | | | | | | | | | | | |
| | |
Equity Index
Fund | | | All America
Fund | | | Small Cap
Value Fund | | | Small Cap
Growth Fund | | | Mid Cap
Value Fund | |
INVESTMENT INCOMEAND EXPENSES: | | | | | | | | | | | | | | | | | | | | |
INCOME: | | | | | | | | | | | | | | | | | | | | |
Dividends | | $ | 32,053,415 | | | $ | 5,805,485 | | | $ | 6,954,298 | | | $ | 2,984,121 | | | $ | 1,551,260 | |
Interest | | | 52,393 | | | | 6,927 | | | | 16,081 | | | | 13,689 | | | | 3,779 | |
| | | | | | | | | | | | | | | | | | | | |
Total income | | | 32,105,808 | | | | 5,812,412 | | | | 6,970,379 | | | | 2,997,810 | | | | 1,555,039 | |
| | | | | | | | | | | | | | | | | | | | |
| | | | | |
EXPENSES: | | | | | | | | | | | | | | | | | | | | |
Investment advisory fees (Note 2) | | | 1,204,094 | | | | 1,260,906 | | | | 2,809,338 | | | | 2,980,899 | | | | 449,116 | |
Accounting and recordkeeping expenses | | | 388,255 | | | | 48,659 | | | | 84,576 | | | | 98,994 | | | | 20,626 | |
Shareholders reports | | | 118,736 | | | | 14,881 | | | | 25,865 | | | | 30,274 | | | | 6,307 | |
Custodian expenses | | | 41,956 | | | | 84,872 | | | | 15,933 | | | | 20,248 | | | | 6,702 | |
Independent directors’ fees and expenses | | | 43,051 | | | | 36,085 | | | | 42,775 | | | | 45,356 | | | | 6,376 | |
Audit | | | 131,755 | | | | 16,512 | | | | 28,701 | | | | 33,594 | | | | 6,999 | |
Legal and Compliance | | | 199,055 | | | | 24,948 | | | | 43,361 | | | | 50,754 | | | | 10,575 | |
Administrative | | | 326,196 | | | | 40,881 | | | | 71,057 | | | | 83,171 | | | | 17,329 | |
Licenses | | | 184,843 | | | | 21,186 | | | | — | | | | — | | | | — | |
Other | | | 42,288 | | | | 5,300 | | | | 9,212 | | | | 10,782 | | | | 2,247 | |
| | | | | | | | | | | | | | | | | | | | |
Total expenses | | | 2,680,229 | | | | 1,554,230 | | | | 3,130,818 | | | | 3,354,072 | | | | 526,277 | |
| | | | | | | | | | | | | | | | | | | | |
Net Investment Income (Loss) | | | 29,425,579 | | | | 4,258,182 | | | | 3,839,561 | | | | (356,262 | ) | | | 1,028,762 | |
| | | | | | | | | | | | | | | | | | | | |
NET REALIZEDAND UNREALIZED GAIN (LOSS)ON INVESTMENTSAND
FUTURES CONTRACTS (Note 1): | | | | | | | | | | | | | | | | | | | | |
Net realized gain (loss) on: | | | | | | | | | | | | | | | | | | | | |
Investment securities | | | 52,925,080 | | | | 20,921,415 | | | | 24,556,592 | | | | 50,567,338 | | | | 5,078,377 | |
Futures contracts | | | 11,348,514 | | | | 243,766 | | | | — | | | | — | | | | — | |
| | | | | | | | | | | | | | | | | | | | |
| | | 64,273,594 | | | | 21,165,181 | | | | 24,556,592 | | | | 50,567,338 | | | | 5,078,377 | |
| | | | | | | | | | | | | | | | | | | | |
Change in net unrealized appreciation (depreciation) of: | | | | | | | | | | | | | | | | | | | | |
Investment securities | | | 114,897,084 | | | | 8,237,076 | | | | (9,069,882 | ) | | | (28,964,625 | ) | | | 4,464,671 | |
Futures contracts | | | (1,138,445 | ) | | | (206,474 | ) | | | — | | | | — | | | | — | |
| | | | | | | | | | | | | | | | | | | | |
| | | 113,758,639 | | | | 8,030,602 | | | | (9,069,882 | ) | | | (28,964,625 | ) | | | 4,464,671 | |
| | | | | | | | | | | | | | | | | | | | |
NET REALIZEDAND UNREALIZED GAIN (LOSS)ON INVESTMENTSAND
FUTURES CONTRACTS | | | 178,032,233 | | | | 29,195,783 | | | | 15,486,710 | | | | 21,602,713 | | | | 9,543,048 | |
| | | | | | | | | | | | | | | | | | | | |
NET INCREASE (DECREASE)IN NET ASSETS RESULTINGFROM OPERATIONS | | $ | 207,457,812 | | | $ | 33,453,965 | | | $ | 19,326,271 | | | $ | 21,246,451 | | | $ | 10,571,810 | |
| | | | | | | | | | | | | | | | | | | | |
| (a) | The Retirement and Allocation Funds incur direct investment management expenses of .05% and .00%, respectively. The Retirement and Allocation Funds also bear their pro-rata share of the investment management fees charged to each of the underlying funds in which they invest. For the year ended December 31, 2014, the Retirement Funds and Allocation Funds incurred no operating expenses other than those included in each of the underlying funds in which they invest. Commencing in 2015, the expense allocation methodology will be modified such that certain expenses that can be attributed only to the Retirement and Allocation Funds will now be charged directly to those Funds. The Retirement and Allocation Funds will also bear their pro-rata share of the operating expenses borne by each of the underlying Funds in which they invest. This change in expense allocation methodology is not expected to result in a material change in the expense ratios of the Funds. |
| (b) | Net of foreign taxes of $500,086. |
The accompanying notes are an integral part of these financial statements.
70
| | | | | | | | | | | | | | | | | | | | | | | | | | | | | | |
Mid-Cap
Equity Index
Fund | | | International
Fund | | | Composite
Fund | | | Retirement
Income
Fund | | | 2010
Retirement
Fund | | | 2015
Retirement
Fund | | | 2020
Retirement
Fund | | | 2025
Retirement
Fund | |
| | | | | | | | | | | | | | | | | | | | | | | | | | | | | | |
| | | | | | | | | | | | | | | | | | | | | | | | | | | | | | |
| $ | 13,792,798 | | | $ | 8,515,800 | (b) | | $ | 2,056,961 | | | $ | 1,011,430 | | | $ | 524,347 | | | $ | 2,936,737 | | | $ | 5,489,709 | | | $ | 5,146,458 | |
| | 29,023 | | | | 2,496 | | | | 2,810,824 | | | | — | | | | — | | | | — | | | | — | | | | — | |
| | | | | | | | | | | | | | | | | | | | | | | | | | | | | | |
| | 13,821,821 | | | | 8,518,296 | | | | 4,867,785 | | | | 1,011,430 | | | | 524,347 | | | | 2,936,737 | | | | 5,489,709 | | | | 5,146,458 | |
| | | | | | | | | | | | | | | | | | | | | | | | | | | | | | |
| | | | | | | |
| | | | | | | | | | | | | | | | | | | | | | | | | | | | | | |
| | 695,487 | | | | 175,081 | | | | 751,267 | | | | 22,350 | (a) | | | 12,451 | (a) | | | 71,450 | (a) | | | 139,119 | (a) | | | 143,181 | (a) |
| | 218,723 | | | | 53,605 | | | | 34,850 | | | | — | (a) | | | — | (a) | | | — | (a) | | | — | (a) | | | — | (a) |
| | 66,890 | | | | 16,394 | | | | 10,658 | | | | — | (a) | | | — | (a) | | | — | (a) | | | — | (a) | | | — | (a) |
| | 35,949 | | | | 802 | | | | 24,799 | | | | — | (a) | | | — | (a) | | | — | (a) | | | — | (a) | | | — | (a) |
| | 41,756 | | | | 43,809 | | | | 41,453 | | | | — | (a) | | | — | (a) | | | — | (a) | | | — | (a) | | | — | (a) |
| | 74,224 | | | | 18,191 | | | | 11,826 | | | | — | (a) | | | — | (a) | | | — | (a) | | | — | (a) | | | — | (a) |
| | 112,138 | | | | 27,483 | | | | 17,867 | | | | — | (a) | | | — | (a) | | | — | (a) | | | — | (a) | | | — | (a) |
| | 183,763 | | | | 45,037 | | | | 29,279 | | | | — | (a) | | | — | (a) | | | — | (a) | | | — | (a) | | | — | (a) |
| | 107,314 | | | | — | | | | — | | | | — | (a) | | | — | (a) | | | — | (a) | | | — | (a) | | | — | (a) |
| | 23,823 | | | | 5,839 | | | | 3,796 | | | | — | (a) | | | — | (a) | | | — | (a) | | | — | (a) | | | — | (a) |
| | | | | | | | | | | | | | | | | | | | | | | | | | | | | | |
| | 1,560,067 | | | | 386,241 | | | | 925,795 | | | | 22,350 | | | | 12,451 | | | | 71,450 | | | | 139,119 | | | | 143,181 | |
| | | | | | | | | | | | | | | | | | | | | | | | | | | | | | |
| | 12,261,754 | | | | 8,132,055 | | | | 3,941,990 | | | | 989,080 | | | | 511,896 | | | | 2,865,287 | | | | 5,350,590 | | | | 5,003,277 | |
| | | | | | | | | | | | | | | | | | | | | | | | | | | | | | |
| | | | | | | |
| | | | | | | | | | | | | | | | | | | | | | | | | | | | | | |
| | | | | | | | | | | | | | | | | | | | | | | | | | | | | | |
| | 54,889,982 | | | | 37,335 | | | | 5,241,485 | | | | 1,548,214 | | | | 1,392,302 | | | | 8,985,307 | | | | 15,490,205 | | | | 13,645,476 | |
| | 3,778,465 | | | | — | | | | — | | | | — | | | | — | | | | — | | | | — | | | | — | |
| | | | | | | | | | | | | | | | | | | | | | | | | | | | | | |
| | 58,668,447 | | | | 37,335 | | | | 5,241,485 | | | | 1,548,214 | | | | 1,392,302 | | | | 8,985,307 | | | | 15,490,205 | | | | 13,645,476 | |
| | | | | | | | | | | | | | | | | | | | | | | | | | | | | | |
| | | | | | | | | | | | | | | | | | | | | | | | | | | | | | |
| | 16,851,068 | | | | (25,660,305 | ) | | | 7,249,605 | | | | 297,295 | | | | (245,571 | ) | | | (1,950,195 | ) | | | (701,197 | ) | | | 3,839,197 | |
| | (357,658 | ) | | | — | | | | — | | | | — | | | | — | | | | — | | | | — | | | | — | |
| | | | | | | | | | | | | | | | | | | | | | | | | | | | | | |
| | 16,493,410 | | | | (25,660,305 | ) | | | 7,249,605 | | | | 297,295 | | | | (245,571 | ) | | | (1,950,195 | ) | | | (701,197 | ) | | | 3,839,197 | |
| | | | | | | | | | | | | | | | | | | | | | | | | | | | | | |
| | | | | | | |
| | 75,161,857 | | | | (25,622,970 | ) | | | 12,491,090 | | | | 1,845,509 | | | | 1,146,731 | | | | 7,035,112 | | | | 14,789,008 | | | | 17,484,673 | |
| | | | | | | | | | | | | | | | | | | | | | | | | | | | | | |
| $ | 87,423,611 | | | $ | (17,490,915 | ) | | $ | 16,433,080 | | | $ | 2,834,589 | | | $ | 1,658,627 | | | $ | 9,900,399 | | | $ | 20,139,598 | | | $ | 22,487,950 | |
| | | | | | | | | | | | | | | | | | | | | | | | | | | | | | |
The accompanying notes are an integral part of these financial statements.
71
MUTUAL OF AMERICA INVESTMENT CORPORATION
STATEMENTS OF OPERATIONS (Continued)
For the Year Ended December 31, 2014
| | | | | | | | | | | | | | | | |
| | | 2030
Retirement
Fund | | | 2035
Retirement
Fund | | | 2040
Retirement
Fund | | | 2045
Retirement
Fund | |
INVESTMENT INCOMEAND EXPENSES: | | | | | | | | | | | | | | | | |
INCOME: | | | | | | | | | | | | | | | | |
Dividends | | $ | 4,047,571 | | | $ | 3,072,699 | | | $ | 2,360,814 | | | $ | 2,920,683 | |
Interest | | | — | | | | — | | | | — | | | | — | |
| | | | | | | | | | | | | | | | |
Total income | | | 4,047,571 | | | | 3,072,699 | | | | 2,360,814 | | | | 2,920,683 | |
| | | | | | | | | | | | | | | | |
| | | | |
EXPENSES: | | | | | | | | | | | | | | | | |
Investment advisory fees (Note 2) | | | 118,589 | (a) | | | 98,043 | (a) | | | 81,579 | (a) | | | 103,004 | (a) |
Accounting and recordkeeping expenses | | | — | (a) | | | — | (a) | | | — | (a) | | | — | (a) |
Shareholders reports | | | — | (a) | | | — | (a) | | | — | (a) | | | — | (a) |
Custodian expenses | | | — | (a) | | | — | (a) | | | — | (a) | | | — | (a) |
Independent directors’ fees and expenses | | | — | (a) | | | — | (a) | | | — | (a) | | | — | (a) |
Audit | | | — | (a) | | | — | (a) | | | — | (a) | | | — | (a) |
Legal and Compliance | | | — | (a) | | | — | (a) | | | — | (a) | | | — | (a) |
Administrative | | | — | (a) | | | — | (a) | | | — | (a) | | | — | (a) |
Licenses | | | — | (a) | | | — | (a) | | | — | (a) | | | — | (a) |
Other | | | — | (a) | | | — | (a) | | | — | (a) | | | — | (a) |
| | | | | | | | | | | | | | | | |
Total expenses | | | 118,589 | | | | 98,043 | | | | 81,579 | | | | 103,004 | |
| | | | | | | | | | | | | | | | |
Net Investment Income (Loss) | | | 3,928,982 | | | | 2,974,656 | | | | 2,279,235 | | | | 2,817,679 | |
| | | | | | | | | | | | | | | | |
NET REALIZEDAND UNREALIZED GAIN (LOSS)ON INVESTMENTSAND
FUTURES CONTRACTS (Note 1): | | | | | | | | | | | | | | | | |
Net realized gain (loss) on: | | | | | | | | | | | | | | | | |
Investment securities | | | 12,059,724 | | | | 9,433,453 | | | | 8,540,747 | | | | 10,187,546 | |
Futures contracts | | | — | | | | — | | | | — | | | | — | |
| | | | | | | | | | | | | | | | |
| | | 12,059,724 | | | | 9,433,453 | | | | 8,540,747 | | | | 10,187,546 | |
| | | | | | | | | | | | | | | | |
Change in net unrealized appreciation (depreciation) of: | | | | | | | | | | | | | | | | |
Investment securities | | | 3,675,712 | | | | 3,646,401 | | | | 1,662,706 | | | | 2,026,948 | |
Futures contracts | | | — | | | | — | | | | — | | | | — | |
| | | | | | | | | | | | | | | | |
| | | 3,675,712 | | | | 3,646,401 | | | | 1,662,706 | | | | 2,026,948 | |
| | | | | | | | | | | | | | | | |
NET REALIZEDAND UNREALIZED GAIN (LOSS)ON INVESTMENTSAND
FUTURES CONTRACTS | | | 15,735,436 | | | | 13,079,854 | | | | 10,203,453 | | | | 12,214,494 | |
| | | | | | | | | | | | | | | | |
NET INCREASE (DECREASE)IN NET ASSETS RESULTINGFROM OPERATIONS | | $ | 19,664,418 | | | $ | 16,054,510 | | | $ | 12,482,688 | | | $ | 15,032,173 | |
| | | | | | | | | | | | | | | | |
| (a) | The Retirement and Allocation Funds incur direct investment management expenses of .05% and .00%, respectively. The Retirement and Allocation Funds also bear their pro-rata share of the investment management fees charged to each of the underlying funds in which they invest. For the year ended December 31, 2014, the Retirement Funds and Allocation Funds incurred no operating expenses other than those included in each of the underlying funds in which they invest. Commencing in 2015, the expense allocation methodology will be modified such that certain expenses that can be attributed only to the Retirement and Allocation Funds will now be charged directly to those Funds. The Retirement and Allocation Funds will also bear their pro-rata share of the operating expenses borne by each of the underlying Funds in which they invest. This change in expense allocation methodology is not expected to result in a material change in the expense ratios of the Funds. |
The accompanying notes are an integral part of these financial statements.
72
| | | | | | | | | | | | | | | | | | | | | | | | | | | | |
2050
Retirement
Fund | | | Conservative
Allocation
Fund | | | Moderate
Allocation
Fund | | | Aggressive
Allocation
Fund | | | Money
Market
Fund | | | Mid-Term
Bond Fund | | | Bond Fund | | | |
| | | | | | | | | | | | | | | | | | | | | | | | | | | | |
| | | | | | | | | | | | | | | | | | | | | | | | | | | | |
| $ | 486,607 | | | $ | 2,464,461 | | | $ | 5,816,011 | | | $ | 3,931,404 | | | $ | — | | | $ | — | | | $ | — | | | |
| | — | | | | — | | | | — | | | | — | | | | 82,674 | | | | 12,624,643 | | | | 35,734,372 | | | |
| | | | | | | | | | | | | | | | | | | | | | | | | | | | |
| | 486,607 | | | | 2,464,461 | | | | 5,816,011 | | | | 3,931,404 | | | | 82,674 | | | | 12,624,643 | | | | 35,734,372 | | | |
| | | | | | | | | | | | | | | | | | | | | | | | | | | | |
| | | | | | | |
| | | | | | | | | | | | | | | | | | | | | | | | | | | | |
| | 16,013 | (a) | | | — | (a) | | | — | (a) | | | — | (a) | | | 119,754 | | | | 1,651,249 | | | | 3,424,190 | | | |
| | — | (a) | | | — | (a) | | | — | (a) | | | — | (a) | | | 17,882 | | | | 103,848 | | | | 233,217 | | | |
| | — | (a) | | | — | (a) | | | — | (a) | | | — | (a) | | | 5,469 | | | | 31,759 | | | | 71,323 | | | |
| | — | (a) | | | — | (a) | | | — | (a) | | | — | (a) | | | 13,964 | | | | 10,879 | | | | 28,519 | | | |
| | — | (a) | | | — | (a) | | | — | (a) | | | — | (a) | | | 5,528 | | | | 45,920 | | | | 50,758 | | | |
| | — | (a) | | | — | (a) | | | — | (a) | | | — | (a) | | | 6,068 | | | | 35,241 | | | | 79,143 | | | |
| | — | (a) | | | — | (a) | | | — | (a) | | | — | (a) | | | 9,168 | | | | 53,242 | | | | 119,570 | | | |
| | — | (a) | | | — | (a) | | | — | (a) | | | — | (a) | | | 15,024 | | | | 87,250 | | | | 195,941 | | | |
| | — | (a) | | | — | (a) | | | — | (a) | | | — | (a) | | | — | | | | — | | | | — | | | |
| | — | (a) | | | — | (a) | | | — | (a) | | | — | (a) | | | 1,948 | | | | 11,311 | | | | 25,402 | | | |
| | | | | | | | | | | | | | | | | | | | | | | | | | | | |
| | 16,013 | | | | — | | | | — | | | | — | | | | 194,805 | | | | 2,030,699 | | | | 4,228,063 | | | |
| | | | | | | | | | | | | | | | | | | | | | | | | | | | |
| | 470,594 | | | | 2,464,461 | | | | 5,816,011 | | | | 3,931,404 | | | | (112,131 | ) | | | 10,593,944 | | | | 31,506,309 | | | |
| | | | | | | | | | | | | | | | | | | | | | | | | | | | |
| | | | | | | |
| | | | | | | | | | | | | | | | | | | | | | | | | | | | |
| | | | | | | | | | | | | | | | | | | | | | | | | | | | |
| | 1,271,844 | | | | 4,283,970 | | | | 17,802,197 | | | | 17,884,871 | | | | 113 | | | | 1,564,411 | | | | 1,687,269 | | | |
| | — | | | | — | | | | — | | | | — | | | | — | | | | — | | | | — | | | |
| | | | | | | | | | | | | | | | | | | | | | | | | | | | |
| | 1,271,844 | | | | 4,283,970 | | | | 17,802,197 | | | | 17,884,871 | | | | 113 | | | | 1,564,411 | | | | 1,687,269 | | | |
| | | | | | | | | | | | | | | | | | | | | | | | | | | | |
| | | | | | | | | | | | | | | | | | | | | | | | | | | | |
| | 722,036 | | | | 23,341 | | | | (1,516,814 | ) | | | (3,648,961 | ) | | | 4,165 | | | | 591,865 | | | | 19,079,980 | | | |
| | — | | | | — | | | | — | | | | — | | | | — | | | | — | | | | — | | | |
| | | | | | | | | | | | | | | | | | | | | | | | | | | | |
| | 722,036 | | | | 23,341 | | | | (1,516,814 | ) | | | (3,648,961 | ) | | | 4,165 | | | | 591,865 | | | | 19,079,980 | | | |
| | | | | | | | | | | | | | | | | | | | | | | | | | | | |
| | | | | | | |
| | 1,993,880 | | | | 4,307,311 | | | | 16,285,383 | | | | 14,235,910 | | | | 4,278 | | | | 2,156,276 | | | | 20,767,249 | | | |
| | | | | | | | | | | | | | | | | | | | | | | | | | | | |
| $ | 2,464,474 | | | $ | 6,771,772 | | | $ | 22,101,394 | | | $ | 18,167,314 | | | $ | (107,853 | ) | | $ | 12,750,220 | | | $ | 52,273,558 | | | |
| | | | | | | | | | | | | | | | | | | | | | | | | | | | |
The accompanying notes are an integral part of these financial statements.
73
MUTUAL OF AMERICA INVESTMENT CORPORATION
STATEMENTS OF CHANGES IN NET ASSETS
For the Years Ended December 31,
| | | | | | | | | | | | | | | | |
| | | Equity Index Fund | | | All America Fund | |
| | | 2014 | | | 2013 | | | 2014 | | | 2013 | |
INCREASE (DECREASE)IN NET ASSETS: | | | | | | | | | | | | | | | | |
FROM OPERATIONS: | | | | | | | | | | | | | | | | |
Net investment income (loss) | | $ | 29,425,579 | | | $ | 24,796,411 | | | $ | 4,258,182 | | | $ | 4,127,686 | |
Net realized gain (loss) on investments and futures contracts | | | 64,273,594 | | | | 17,442,494 | | | | 21,165,181 | | | | 23,746,129 | |
Change in net unrealized appreciation (depreciation) of investments and futures contracts | | | 113,758,639 | | | | 322,313,391 | | | | 8,030,602 | | | | 51,694,473 | |
| | | | | | | | | | | | | | | | |
NET INCREASE (DECREASE)IN NET ASSETS RESULTINGFROM OPERATIONS | | | 207,457,812 | | | | 364,552,296 | | | | 33,453,965 | | | | 79,568,288 | |
| | | | | | | | | | | | | | | | |
| | | | |
DISTRIBUTIONS (Note 1 and Note 5) | | | | | | | | | | | | | | | | |
From net investment income | | | (24,529,282 | ) | | | (20,977,297 | ) | | | (3,966,513 | ) | | | (4,003,917 | ) |
From capital gains | | | (20,276,973 | ) | | | (8,578,725 | ) | | | (23,520,331 | ) | | | (3,065,838 | ) |
| | | | | | | | | | | | | | | | |
Total distributions | | | (44,806,255 | ) | | | (29,556,022 | ) | | | (27,486,844 | ) | | | (7,069,755 | ) |
| | | | | | | | | | | | | | | | |
| | | | |
CAPITAL SHARE TRANSACTIONS (Note 4): | | | | | | | | | | | | | | | | |
Net proceeds from sale of shares | | | 200,883,507 | | | | 159,683,235 | | | | 5,473,836 | | | | 5,007,367 | |
Dividends reinvested | | | 44,806,255 | | | | 29,556,022 | | | | 27,486,844 | | | | 7,069,755 | |
Cost of shares redeemed | | | (175,606,931 | ) | | | (76,446,620 | ) | | | (33,028,231 | ) | | | (22,530,192 | ) |
| | | | | | | | | | | | | | | | |
NET INCREASE (DECREASE)IN NET ASSETSFROM CAPITAL SHARE TRANSACTIONS | | | 70,082,831 | | | | 112,792,637 | | | | (67,551 | ) | | | (10,453,070 | ) |
| | | | | | | | | | | | | | | | |
INCREASE (DECREASE)IN NET ASSETS | | | 232,734,388 | | | | 447,788,911 | | | | 5,899,570 | | | | 62,045,463 | |
NET ASSETS, BEGINNINGOF YEAR | | | 1,556,375,976 | | | | 1,108,587,065 | | | | 318,283,553 | | | | 256,238,090 | |
| | | | | | | | | | | | | | | | |
NET ASSETS, ENDOF YEAR | | $ | 1,789,110,364 | | | $ | 1,556,375,976 | | | $ | 324,183,123 | | | $ | 318,283,553 | |
| | | | | | | | | | | | | | | | |
ACCUMULATED UNDISTRIBUTED NET INVESTMENT INCOME (LOSS) | | $ | 28,715,350 | | | $ | 23,910,635 | | | $ | 3,971,841 | | | $ | 4,033,324 | |
| | | | | | | | | | | | | | | | |
| | | | |
OTHER INFORMATION: | | | | | | | | | | | | | | | | |
Shares outstanding at the beginning of year | | | 504,328,472 | | | | 462,559,004 | | | | 133,925,766 | | | | 138,745,627 | |
| | | | | | | | | | | | | | | | |
Shares sold | | | 61,976,101 | | | | 58,203,198 | | | | 2,274,534 | | | | 2,344,108 | |
Shares issued as reinvestment of dividends | | | 13,626,112 | | | | 11,796,332 | | | | 11,766,990 | | | | 3,671,799 | |
Shares redeemed | | | (54,955,851 | ) | | | (28,230,062 | ) | | | (13,758,041 | ) | | | (10,835,768 | ) |
| | | | | | | | | | | | | | | | |
Net increase (decrease) | | | 20,646,362 | | | | 41,769,468 | | | | 283,483 | | | | (4,819,861 | ) |
| | | | | | | | | | | | | | | | |
Shares outstanding at the end of year | | | 524,974,834 | | | | 504,328,472 | | | | 134,209,249 | | | | 133,925,766 | |
| | | | | | | | | | | | | | | | |
The accompanying notes are an integral part of these financial statements.
74
| | | | | | | | | | | | | | | | | | | | | | | | | | | | | | | | |
| Small Cap Value Fund | | | Small Cap Growth Fund | | | Mid Cap Value Fund | | | Mid-Cap Equity Index Fund | | | |
| 2014 | | | 2013 | | | 2014 | | | 2013 | | | 2014 | | | 2013 | | | 2014 | | | 2013 | | | |
| | | | | | | | | | | | | | | | | | | | | | | | | | | | | | | | |
| | | | | | | | | | | | | | | | | | | | | | | | | | | | | | | | |
| $ | 3,839,561 | | | $ | 5,694,956 | | | $ | (356,262 | ) | | $ | 653,526 | | | $ | 1,028,762 | | | $ | 704,947 | | | $ | 12,261,754 | | | $ | 9,634,049 | | | |
| | 24,556,592 | | | | 40,992,938 | | | | 50,567,338 | | | | 32,714,069 | | | | 5,078,377 | | | | 5,394,597 | | | | 58,668,447 | | | | 39,677,548 | | | |
| | | | | | | | |
| | (9,069,882 | ) | | | 39,223,763 | | | | (28,964,625 | ) | | | 82,760,899 | | | | 4,464,671 | | | | 9,400,634 | | | | 16,493,410 | | | | 165,544,148 | | | |
| | | | | | | | | | | | | | | | | | | | | | | | | | | | | | | | |
| | 19,326,271 | | | | 85,911,657 | | | | 21,246,451 | | | | 116,128,494 | | | | 10,571,810 | | | | 15,500,178 | | | | 87,423,611 | | | | 214,855,745 | | | |
| | | | | | | | | | | | | | | | | | | | | | | | | | | | | | | | |
| | | | | | | | |
| | | | | | | | | | | | | | | | | | | | | | | | | | | | | | | | |
| | (4,756,094 | ) | | | (5,227,376 | ) | | | (211,378 | ) | | | — | | | | (645,431 | ) | | | (653,251 | ) | | | (9,181,477 | ) | | | (7,797,143 | ) | | |
| | (36,455,404 | ) | | | — | | | | (31,305,992 | ) | | | (24,171,500 | ) | | | (5,410,001 | ) | | | (1,089,797 | ) | | | (41,218,855 | ) | | | (21,498,456 | ) | | |
| | | | | | | | | | | | | | | | | | | | | | | | | | | | | | | | |
| | (41,211,498 | ) | | | (5,227,376 | ) | | | (31,517,370 | ) | | | (24,171,500 | ) | | | (6,055,432 | ) | | | (1,743,048 | ) | | | (50,400,332 | ) | | | (29,295,599 | ) | | |
| | | | | | | | | | | | | | | | | | | | | | | | | | | | | | | | |
| | | | | | | | |
| | | | | | | | | | | | | | | | | | | | | | | | | | | | | | | | |
| | 29,123,428 | | | | 24,720,788 | | | | 29,941,719 | | | | 51,084,056 | | | | 17,268,133 | | | | 9,704,615 | | | | 93,894,132 | | | | 121,145,845 | | | |
| | 41,211,498 | | | | 5,227,376 | | | | 31,517,370 | | | | 24,171,500 | | �� | | 6,055,432 | | | | 1,743,048 | | | | 50,400,332 | | | | 29,295,599 | | | |
| | (36,715,125 | ) | | | (19,245,410 | ) | | | (62,340,748 | ) | | | (15,890,718 | ) | | | (7,843,296 | ) | | | (6,088,653 | ) | | | (82,369,583 | ) | | | (44,286,628 | ) | | |
| | | | | | | | | | | | | | | | | | | | | | | | | | | | | | | | |
| | 33,619,801 | | | | 10,702,754 | | | | (881,659 | ) | | | 59,364,838 | | | | 15,480,269 | | | | 5,359,010 | | | | 61,924,881 | | | | 106,154,816 | | | |
| | | | | | | | | | | | | | | | | | | | | | | | | | | | | | | | |
| | 11,734,574 | | | | 91,387,035 | | | | (11,152,578 | ) | | | 151,321,832 | | | | 19,996,647 | | | | 19,116,140 | | | | 98,948,160 | | | | 291,714,962 | | | |
| | 381,721,968 | | | | 290,334,933 | | | | 423,501,620 | | | | 272,179,788 | | | | 72,331,310 | | | | 53,215,170 | | | | 901,680,430 | | | | 609,965,468 | | | |
| | | | | | | | | | | | | | | | | | | | | | | | | | | | | | | | |
| $ | 393,456,542 | | | $ | 381,721,968 | | | $ | 412,349,042 | | | $ | 423,501,620 | | | $ | 92,327,957 | | | $ | 72,331,310 | | | $ | 1,000,628,590 | | | $ | 901,680,430 | | | |
| | | | | | | | | | | | | | | | | | | | | | | | | | | | | | | | |
| $ | 2,553,337 | | | $ | 5,737,708 | | | $ | — | | | $ | 848,884 | | | $ | 969,246 | | | $ | 625,249 | | | $ | 11,509,632 | | | $ | 9,014,126 | | | |
| | | | | | | | | | | | | | | | | | | | | | | | | | | | | | | | |
| | | | | | | | |
| | | | | | | | | | | | | | | | | | | | | | | | | | | | | | | | |
| | 222,484,724 | | | | 215,294,961 | | | | 267,803,649 | | | | 223,008,469 | | | | 47,238,273 | | | | 43,126,278 | | | | 433,467,620 | | | | 374,064,073 | | | |
| | | | | | | | | | | | | | | | | | | | | | | | | | | | | | | | |
| | 17,919,560 | | | | 16,224,700 | | | | 19,668,152 | | | | 36,539,168 | | | | 10,715,300 | | | | 7,158,032 | | | | 44,498,982 | | | | 66,122,333 | | | |
| | 26,338,022 | | | | 3,607,089 | | | | 21,594,428 | | | | 19,984,726 | | | | 3,871,430 | | | | 1,324,905 | | | | 23,681,584 | | | | 17,123,163 | | | |
| | (21,978,186 | ) | | | (12,642,026 | ) | | | (40,941,032 | ) | | | (11,728,714 | ) | | | (5,071,358 | ) | | | (4,370,942 | ) | | | (38,846,316 | ) | | | (23,841,949 | ) | | |
| | | | | | | | | | | | | | | | | | | | | | | | | | | | | | | | |
| | 22,279,396 | | | | 7,189,763 | | | | 321,548 | | | | 44,795,180 | | | | 9,515,372 | | | | 4,111,995 | | | | 29,334,250 | | | | 59,403,547 | | | |
| | | | | | | | | | | | | | | | | | | | | | | | | | | | | | | | |
| | 244,764,120 | | | | 222,484,724 | | | | 268,125,197 | | | | 267,803,649 | | | | 56,753,645 | | | | 47,238,273 | | | | 462,801,870 | | | | 433,467,620 | | | |
| | | | | | | | | | | | | | | | | | | | | | | | | | | | | | | | |
The accompanying notes are an integral part of these financial statements.
75
MUTUAL OF AMERICA INVESTMENT CORPORATION
STATEMENTS OF CHANGES IN NET ASSETS (Continued)
For the Years Ended December 31,
| | | | | | | | | | | | | | | | |
| | | International Fund | | | Composite Fund | |
| | | 2014 | | | 2013 | | | 2014 | | | 2013 | |
INCREASE (DECREASE)IN NET ASSETS: | | | | | | | | | | | | | | | | |
FROM OPERATIONS: | | | | | | | | | | | | | | | | |
Net investment income (loss) | | $ | 8,132,055 | | | $ | 3,863,157 | | | $ | 3,941,990 | | | $ | 3,642,650 | |
Net realized gain (loss) on investments and futures contracts | | | 37,335 | | | | 873,160 | | | | 5,241,485 | | | | 6,129,582 | |
Change in net unrealized appreciation (depreciation) of investments and futures contracts | | | (25,660,305 | ) | | | 22,662,434 | | | | 7,249,605 | | | | 17,317,342 | |
| | | | | | | | | | | | | | | | |
NET INCREASE (DECREASE)IN NET ASSETS RESULTINGFROM OPERATIONS | | | (17,490,915 | ) | | | 27,398,751 | | | | 16,433,080 | | | | 27,089,574 | |
| | | | | | | | | | | | | | | | |
| | | | |
DISTRIBUTIONS (Note 1 and Note 5) | | | | | | | | | | | | | | | | |
From net investment income | | | (3,863,157 | ) | | | (2,689,340 | ) | | | (3,641,558 | ) | | | (3,658,911 | ) |
From capital gains | | | (863,378 | ) | | | — | | | | — | | | | — | |
| | | | | | | | | | | | | | | | |
Total distributions | | | (4,726,535 | ) | | | (2,689,340 | ) | | | (3,641,558 | ) | | | (3,658,911 | ) |
| | | | | | | | | | | | | | | | |
| | | | |
CAPITAL SHARE TRANSACTIONS (Note 4): | | | | | | | | | | | | | | | | |
Net proceeds from sale of shares | | | 119,004,856 | | | | 37,567,300 | | | | 5,774,213 | | | | 7,301,802 | |
Dividends reinvested | | | 4,726,535 | | | | 2,689,340 | | | | 3,641,558 | | | | 3,658,911 | |
Cost of shares redeemed | | | (11,845,104 | ) | | | (5,349,272 | ) | | | (14,873,202 | ) | | | (17,497,217 | ) |
| | | | | | | | | | | | | | | | |
NET INCREASE (DECREASE)IN NET ASSETSFROM CAPITAL SHARE TRANSACTIONS | | | 111,886,287 | | | | 34,907,368 | | | | (5,457,431 | ) | | | (6,536,504 | ) |
| | | | | | | | | | | | | | | | |
INCREASE (DECREASE)IN NET ASSETS | | | 89,668,837 | | | | 59,616,779 | | | | 7,334,091 | | | | 16,894,159 | |
NET ASSETS, BEGINNINGOF YEAR | | | 174,164,738 | | | | 114,547,959 | | | | 186,491,192 | | | | 169,597,033 | |
| | | | | | | | | | | | | | | | |
NET ASSETS, ENDOF YEAR | | $ | 263,833,575 | | | $ | 174,164,738 | | | $ | 193,825,283 | | | $ | 186,491,192 | |
| | | | | | | | | | | | | | | | |
ACCUMULATED UNDISTRIBUTED NET INVESTMENT INCOME (LOSS) | | $ | 8,132,055 | | | $ | 3,863,157 | | | $ | 3,940,898 | | | $ | 3,642,450 | |
| | | | | | | | | | | | | | | | |
| | | | |
OTHER INFORMATION: | | | | | | | | | | | | | | | | |
Shares outstanding at the beginning of year | | | 207,998,511 | | | | 161,874,441 | | | | 99,694,061 | | | | 103,273,971 | |
| | | | | | | | | | | | | | | | |
Shares sold | | | 141,996,939 | | | | 49,384,258 | | | | 2,950,873 | | | | 4,235,956 | |
Shares issued as reinvestment of dividends | | | 5,692,817 | | | | 3,779,424 | | | | 1,857,200 | | | | 2,210,581 | |
Shares redeemed | | | (14,318,373 | ) | | | (7,039,612 | ) | | | (7,689,993 | ) | | | (10,026,447 | ) |
| | | | | | | | | | | | | | | | |
Net increase (decrease) | | | 133,371,383 | | | | 46,124,070 | | | | (2,881,920 | ) | | | (3,579,910 | ) |
| | | | | | | | | | | | | | | | |
Shares outstanding at the end of year | | | 341,369,894 | | | | 207,998,511 | | | | 96,812,141 | | | | 99,694,061 | |
| | | | | | | | | | | | | | | | |
The accompanying notes are an integral part of these financial statements.
76
| | | | | | | | | | | | | | | | | | | | | | | | | | | | | | | | |
| Retirement Income Fund | | | 2010 Retirement Fund | | | 2015 Retirement Fund | | | 2020 Retirement Fund | | | |
| 2014 | | | 2013 | | | 2014 | | | 2013 | | | 2014 | | | 2013 | | | 2014 | | | 2013 | | | |
| | | | | | | | | | | | | | | | | | | | | | | | | | | | | | | | |
| | | | | | | | | | | | | | | | | | | | | | | | | | | | | | | | |
| $ | 989,080 | | | $ | 739,216 | | | $ | 511,896 | | | $ | 469,648 | | | $ | 2,865,287 | | | $ | 2,574,890 | | | $ | 5,350,590 | | | $ | 3,796,910 | | | |
| | 1,548,214 | | | | 783,514 | | | | 1,392,302 | | | | 765,458 | | | | 8,985,307 | | | | 4,401,927 | | | | 15,490,205 | | | | 3,957,641 | | | |
| | | | | | | | |
| | 297,295 | | | | 908,214 | | | | (245,571 | ) | | | 1,281,915 | | | | (1,950,195 | ) | | | 10,108,781 | | | | (701,197 | ) | | | 25,619,204 | | | |
| | | | | | | | | | | | | | | | | | | | | | | | | | | | | | | | |
| | 2,834,589 | | | | 2,430,944 | | | | 1,658,627 | | | | 2,517,021 | | | | 9,900,399 | | | | 17,085,598 | | | | 20,139,598 | | | | 33,373,755 | | | |
| | | | | | | | | | | | | | | | | | | | | | | | | | | | | | | | |
| | | | | | | | |
| | | | | | | | | | | | | | | | | | | | | | | | | | | | | | | | |
| | (746,239 | ) | | | (254 | ) | | | (478,710 | ) | | | (204 | ) | | | (2,616,090 | ) | | | (9,916 | ) | | | (3,853,531 | ) | | | (24,228 | ) | | |
| | (853,955 | ) | | | (547,127 | ) | | | (653,628 | ) | | | (1,051,750 | ) | | | (3,478,425 | ) | | | (4,960,216 | ) | | | (3,571,569 | ) | | | (4,201,941 | ) | | |
| | | | | | | | | | | | | | | | | | | | | | | | | | | | | | | | |
| | (1,600,194 | ) | | | (547,381 | ) | | | (1,132,338 | ) | | | (1,051,954 | ) | | | (6,094,515 | ) | | | (4,970,132 | ) | | | (7,425,100 | ) | | | (4,226,169 | ) | | |
| | | | | | | | | | | | | | | | | | | | | | | | | | | | | | | | |
| | | | | | | | |
| | | | | | | | | | | | | | | | | | | | | | | | | | | | | | | | |
| | 19,027,717 | | | | 15,273,014 | | | | 4,531,697 | | | | 5,072,886 | | | | 23,686,143 | | | | 26,771,976 | | | | 63,885,795 | | | | 59,532,752 | | | |
| | 1,600,194 | | | | 547,381 | | | | 1,132,338 | | | | 1,051,954 | | | | 6,094,515 | | | | 4,970,132 | | | | 7,425,100 | | | | 4,226,169 | | | |
| | (7,899,016 | ) | | | (9,375,356 | ) | | | (3,674,978 | ) | | | (4,999,882 | ) | | | (17,349,841 | ) | | | (18,269,988 | ) | | | (15,276,500 | ) | | | (10,645,048 | ) | | |
| | | | | | | | | | | | | | | | | | | | | | | | | | | | | | | | |
| | 12,728,895 | | | | 6,445,039 | | | | 1,989,057 | | | | 1,124,958 | | | | 12,430,817 | | | | 13,472,120 | | | | 56,034,395 | | | | 53,113,873 | | | |
| | | | | | | | | | | | | | | | | | | | | | | | | | | | | | | | |
| | 13,963,290 | | | | 8,328,602 | | | | 2,515,346 | | | | 2,590,025 | | | | 16,236,701 | | | | 25,587,586 | | | | 68,748,893 | | | | 82,261,459 | | | |
| | 39,571,849 | | | | 31,243,247 | | | | 24,042,660 | | | | 21,452,635 | | | | 137,924,831 | | | | 112,337,245 | | | | 251,292,060 | | | | 169,030,601 | | | |
| | | | | | | | | | | | | | | | | | | | | | | | | | | | | | | | |
| $ | 53,535,139 | | | $ | 39,571,849 | | | $ | 26,558,006 | | | $ | 24,042,660 | | | $ | 154,161,532 | | | $ | 137,924,831 | | | $ | 320,040,953 | | | $ | 251,292,060 | | | |
| | | | | | | | | | | | | | | | | | | | | | | | | | | | | | | | |
| $ | 1,043,642 | | | $ | 746,239 | | | $ | 553,391 | | | $ | 478,710 | | | $ | 3,145,217 | | | $ | 2,616,087 | | | $ | 5,971,939 | | | $ | 3,853,531 | | | |
| | | | | | | | | | | | | | | | | | | | | | | | | | | | | | | | |
| | | | | | | | |
| | | | | | | | | | | | | | | | | | | | | | | | | | | | | | | | |
| | 34,961,828 | | | | 29,130,938 | | | | 22,616,328 | | | | 21,461,692 | | | | 125,288,707 | | | | 112,209,986 | | | | 221,831,608 | | | | 171,582,429 | | | |
| | | | | | | | | | | | | | | | | | | | | | | | | | | | | | | | |
| | 16,491,999 | | | | 13,899,924 | | | | 4,176,979 | | | | 5,006,116 | | | | 21,121,082 | | | | 25,717,519 | | | | 54,995,344 | | | | 56,112,570 | | | |
| | 1,404,057 | | | | 510,728 | | | | 1,062,168 | | | | 1,076,851 | | | | 5,552,659 | | | | 5,015,085 | | | | 6,459,934 | | | | 4,222,059 | | | |
| | (6,812,499 | ) | | | (8,579,762 | ) | | | (3,399,310 | ) | | | (4,928,331 | ) | | | (15,448,753 | ) | | | (17,653,883 | ) | | | (13,103,249 | ) | | | (10,085,450 | ) | | |
| | | | | | | | | | | | | | | | | | | | | | | | | | | | | | | | |
| | 11,083,557 | | | | 5,830,890 | | | | 1,839,837 | | | | 1,154,636 | | | | 11,224,988 | | | | 13,078,721 | | | | 48,352,029 | | | | 50,249,179 | | | |
| | | | | | | | | | | | | | | | | | | | | | | | | | | | | | | | |
| | 46,045,385 | | | | 34,961,828 | | | | 24,456,165 | | | | 22,616,328 | | | | 136,513,695 | | | | 125,288,707 | | | | 270,183,637 | | | | 221,831,608 | | | |
| | | | | | | | | | | | | | | | | | | | | | | | | | | | | | | | |
The accompanying notes are an integral part of these financial statements.
77
MUTUAL OF AMERICA INVESTMENT CORPORATION
STATEMENTS OF CHANGES IN NET ASSETS (Continued)
For the Years Ended December 31,
| | | | | | | | | | | | | | | | |
| | | 2025 Retirement Fund | | | 2030 Retirement Fund | |
| | | 2014 | | | 2013 | | | 2014 | | | 2013 | |
INCREASE (DECREASE)IN NET ASSETS: | | | | | | | | | | | | | | | | |
FROM OPERATIONS: | | | | | | | | | | | | | | | | |
Net investment income (loss) | | $ | 5,003,277 | | | $ | 3,390,507 | | | $ | 3,928,982 | | | $ | 2,701,397 | |
Net realized gain (loss) on investments and futures contracts | | | 13,645,476 | | | | 2,996,791 | | | | 12,059,724 | | | | 2,768,638 | |
Change in net unrealized appreciation (depreciation) of investments and futures contracts | | | 3,839,197 | | | | 32,529,428 | | | | 3,675,712 | | | | 30,294,793 | |
| | | | | | | | | | | | | | | | |
NET INCREASE (DECREASE)IN NET ASSETS RESULTINGFROM OPERATIONS | | | 22,487,950 | | | | 38,916,726 | | | | 19,664,418 | | | | 35,764,828 | |
| | | | | | | | | | | | | | | | |
| | | | |
DISTRIBUTIONS (Note 1 and Note 5) | | | | | | | | | | | | | | | | |
From net investment income | | | (3,459,110 | ) | | | (31,347 | ) | | | (2,762,712 | ) | | | (31,859 | ) |
From capital gains | | | (2,819,455 | ) | | | (4,031,923 | ) | | | (2,549,750 | ) | | | (2,922,114 | ) |
| | | | | | | | | | | | | | | | |
Total distributions | | | (6,278,565 | ) | | | (4,063,270 | ) | | | (5,312,462 | ) | | | (2,953,973 | ) |
| | | | | | | | | | | | | | | | |
| | | | |
CAPITAL SHARE TRANSACTIONS (Note 4): | | | | | | | | | | | | | | | | |
Net proceeds from sale of shares | | | 63,610,725 | | | | 61,903,930 | | | | 55,246,165 | | | | 47,399,486 | |
Dividends reinvested | | | 6,278,565 | | | | 4,063,270 | | | | 5,312,462 | | | | 2,953,973 | |
Cost of shares redeemed | | | (11,753,478 | ) | | | (5,846,734 | ) | | | (9,611,179 | ) | | | (4,677,246 | ) |
| | | | | | | | | | | | | | | | |
NET INCREASE (DECREASE)IN NET ASSETSFROM CAPITAL SHARE TRANSACTIONS | | | 58,135,812 | | | | 60,120,466 | | | | 50,947,448 | | | | 45,676,213 | |
| | | | | | | | | | | | | | | | |
INCREASE (DECREASE)IN NET ASSETS | | | 74,345,197 | | | | 94,973,922 | | | | 65,299,404 | | | | 78,487,068 | |
NET ASSETS, BEGINNINGOF YEAR | | | 256,744,729 | | | | 161,770,807 | | | | 211,759,858 | | | | 133,272,790 | |
| | | | | | | | | | | | | | | | |
NET ASSETS, ENDOF YEAR | | $ | 331,089,926 | | | $ | 256,744,729 | | | $ | 277,059,262 | | | $ | 211,759,858 | |
| | | | | | | | | | | | | | | | |
ACCUMULATED UNDISTRIBUTED NET INVESTMENT INCOME (LOSS) | | $ | 5,804,497 | | | $ | 3,459,110 | | | $ | 4,662,610 | | | $ | 2,762,712 | |
| | | | | | | | | | | | | | | | |
| | | | |
OTHER INFORMATION: | | | | | | | | | | | | | | | | |
Shares outstanding at the beginning of year | | | 220,409,889 | | | | 164,296,317 | | | | 177,408,455 | | | | 135,356,937 | |
| | | | | | | | | | | | | | | | |
Shares sold | | | 53,077,272 | | | | 57,548,135 | | | | 44,925,560 | | | | 43,450,256 | |
Shares issued as reinvestment of dividends | | | 5,284,854 | | | | 4,027,315 | | | | 4,370,328 | | | | 2,900,142 | |
Shares redeemed | | | (9,842,380 | ) | | | (5,461,878 | ) | | | (7,924,288 | ) | | | (4,298,880 | ) |
| | | | | | | | | | | | | | | | |
Net increase (decrease) | | | 48,519,746 | | | | 56,113,572 | | | | 41,371,600 | | | | 42,051,518 | |
| | | | | | | | | | | | | | | | |
Shares outstanding at the end of year | | | 268,929,635 | | | | 220,409,889 | | | | 218,780,055 | | | | 177,408,455 | |
| | | | | | | | | | | | | | | | |
The accompanying notes are an integral part of these financial statements.
78
| | | | | | | | | | | | | | | | | | | | | | | | | | | | | | | | |
| 2035 Retirement Fund | | | 2040 Retirement Fund | | | 2045 Retirement Fund | | | 2050 Retirement Fund | | | |
| 2014 | | | 2013 | | | 2014 | | | 2013 | | | 2014 | | | 2013 | | | 2014 | | | 2013 | | | |
| | | | | | | | | | | | | | | | | | | | | | | | | | | | | | | | |
| | | | | | | | | | | | | | | | | | | | | | | | | | | | | | | | |
| $ | 2,974,656 | | | $ | 2,007,101 | | | $ | 2,279,235 | | | $ | 1,662,062 | | | $ | 2,817,679 | | | $ | 2,071,835 | | | $ | 470,594 | | | $ | 50,301 | | | |
| | 9,433,453 | | | | 2,389,225 | | | | 8,540,747 | | | | 2,259,283 | | | | 10,187,546 | | | | 2,648,744 | | | | 1,271,844 | | | | 72,749 | | | |
| | | | | | | | |
| | 3,646,401 | | | | 26,811,191 | | | | 1,662,706 | | | | 24,530,317 | | | | 2,026,948 | | | | 31,984,678 | | | | 722,036 | | | | 2,195,981 | | | |
| | | | | | | | | | | | | | | | | | | | | | | | | | | | | | | | |
| | 16,054,510 | | | | 31,207,517 | | | | 12,482,688 | | | | 28,451,662 | | | | 15,032,173 | | | | 36,705,257 | | | | 2,464,474 | | | | 2,319,031 | | | |
| | | | | | | | | | | | | | | | | | | | | | | | | | | | | | | | |
| | | | | | | | |
| | | | | | | | | | | | | | | | | | | | | | | | | | | | | | | | |
| | (2,061,376 | ) | | | (30,023 | ) | | | (1,709,321 | ) | | | (34,163 | ) | | | (2,118,365 | ) | | | (48,673 | ) | | | (48,352 | ) | | | (4,198 | ) | | |
| | (2,255,109 | ) | | | (2,220,980 | ) | | | (2,115,297 | ) | | | (1,747,797 | ) | | | (2,510,179 | ) | | | (1,994,464 | ) | | | (67,482 | ) | | | (3,650 | ) | | |
| | | | | | | | | | | | | | | | | | | | | | | | | | | | | | | | |
| | (4,316,485 | ) | | | (2,251,003 | ) | | | (3,824,618 | ) | | | (1,781,960 | ) | | | (4,628,544 | ) | | | (2,043,137 | ) | | | (115,834 | ) | | | (7,848 | ) | | |
| | | | | | | | | | | | | | | | | | | | | | | | | | | | | | | | |
| | | | | | | | |
| | | | | | | | | | | | | | | | | | | | | | | | | | | | | | | | |
| | 48,788,674 | | | | 38,583,673 | | | | 34,207,916 | | | | 28,828,922 | | | | 37,208,271 | | | | 33,663,673 | | | | 28,066,598 | | | | 16,278,216 | | | |
| | 4,316,485 | | | | 2,251,003 | | | | 3,824,618 | | | | 1,781,960 | | | | 4,628,544 | | | | 2,043,137 | | | | 115,834 | | | | 7,848 | | | |
| | (7,555,845 | ) | | | (3,924,493 | ) | | | (6,126,354 | ) | | | (3,226,053 | ) | | | (6,273,383 | ) | | | (2,548,103 | ) | | | (610,481 | ) | | | (424,104 | ) | | |
| | | | | | | | | | | | | | | | | | | | | | | | | | | | | | | | |
| | 45,549,314 | | | | 36,910,183 | | | | 31,906,180 | | | | 27,384,829 | | | | 35,563,432 | | | | 33,158,707 | | | | 27,571,951 | | | | 15,861,960 | | | |
| | | | | | | | | | | | | | | | | | | | | | | | | | | | | | | | |
| | 57,287,339 | | | | 65,866,697 | | | | 40,564,250 | | | | 54,054,531 | | | | 45,967,061 | | | | 67,820,827 | | | | 29,920,591 | | | | 18,173,143 | | | |
| | 172,565,548 | | | | 106,698,851 | | | | 148,045,779 | | | | 93,991,248 | | | | 186,138,817 | | | | 118,317,990 | | | | 20,290,325 | | | | 2,117,182 | | | |
| | | | | | | | | | | | | | | | | | | | | | | | | | | | | | | | |
| $ | 229,852,887 | | | $ | 172,565,548 | | | $ | 188,610,029 | | | $ | 148,045,779 | | | $ | 232,105,878 | | | $ | 186,138,817 | | | $ | 50,210,916 | | | $ | 20,290,325 | | | |
| | | | | | | | | | | | | | | | | | | | | | | | | | | | | | | | |
| $ | 3,637,561 | | | $ | 2,061,376 | | | $ | 2,857,782 | | | $ | 1,709,321 | | | $ | 3,540,101 | | | $ | 2,118,365 | | | $ | 592,908 | | | $ | 48,352 | | | |
| | | | | | | | | | | | | | | | | | | | | | | | | | | | | | | | |
| | | | | | | | |
| | | | | | | | | | | | | | | | | | | | | | | | | | | | | | | | |
| | 144,301,756 | | | | 110,190,376 | | | | 123,313,696 | | | | 97,860,427 | | | | 154,880,979 | | | | 123,735,275 | | | | 15,556,794 | | | | 2,079,203 | | | |
| | | | | | | | | | | | | | | | | | | | | | | | | | | | | | | | |
| | 39,748,793 | | | | 35,487,449 | | | | 27,836,625 | | | | 26,618,511 | | | | 30,334,894 | | | | 31,405,135 | | | | 20,860,316 | | | | 13,822,593 | | | |
| | 3,542,685 | | | | 2,232,830 | | | | 3,144,107 | | | | 1,771,801 | | | | 3,802,172 | | | | 2,035,082 | | | | 86,165 | | | | 6,540 | | | |
| | (6,195,187 | ) | | | (3,608,899 | ) | | | (5,041,281 | ) | | | (2,937,043 | ) | | | (5,166,255 | ) | | | (2,294,513 | ) | | | (461,333 | ) | | | (351,542 | ) | | |
| | | | | | | | | | | | | | | | | | | | | | | | | | | | | | | | |
| | 37,096,291 | | | | 34,111,380 | | | | 25,939,451 | | | | 25,453,269 | | | | 28,970,811 | | | | 31,145,704 | | | | 20,485,148 | | | | 13,477,591 | | | |
| | | | | | | | | | | | | | | | | | | | | | | | | | | | | | | | |
| | 181,398,047 | | | | 144,301,756 | | | | 149,253,147 | | | | 123,313,696 | | | | 183,851,790 | | | | 154,880,979 | | | | 36,041,942 | | | | 15,556,794 | | | |
| | | | | | | | | | | | | | | | | | | | | | | | | | | | | | | | |
The accompanying notes are an integral part of these financial statements.
79
MUTUAL OF AMERICA INVESTMENT CORPORATION
STATEMENTS OF CHANGES IN NET ASSETS (Continued)
For the Years Ended December 31,
| | | | | | | | | | | | | | | | |
| | | Conservative Allocation Fund | | | Moderate Allocation Fund | |
| | | 2014 | | | 2013 | | | 2014 | | | 2013 | |
INCREASE (DECREASE)IN NET ASSETS: | | | | | | | | | | | | | | | | |
FROM OPERATIONS: | | | | | | | | | | | | | | | | |
Net investment income (loss) | | $ | 2,464,461 | | | $ | 2,266,292 | | | $ | 5,816,011 | | | $ | 5,317,790 | |
Net realized gain (loss) on investments and futures contracts | | | 4,283,970 | | | | 1,877,526 | | | | 17,802,197 | | | | 4,245,263 | |
Change in net unrealized appreciation (depreciation) of investments and futures contracts | | | 23,341 | | | | 2,361,443 | | | | (1,516,814 | ) | | | 27,206,974 | |
| | | | | | | | | | | | | | | | |
NET INCREASE (DECREASE)IN NET ASSETS RESULTINGFROM OPERATIONS | | | 6,771,772 | | | | 6,505,261 | | | | 22,101,394 | | | | 36,770,027 | |
| | | | | | | | | | | | | | | | |
| | | | |
DISTRIBUTIONS (Note 1 and Note 5) | | | | | | | | | | | | | | | | |
From net investment income | | | (2,273,586 | ) | | | (35,676 | ) | | | (5,452,659 | ) | | | (55,911 | ) |
From capital gains | | | (1,664,925 | ) | | | (1,126,105 | ) | | | (3,993,394 | ) | | | (2,676,791 | ) |
| | | | | | | | | | | | | | | | |
Total distributions | | | (3,938,511 | ) | | | (1,161,781 | ) | | | (9,446,053 | ) | | | (2,732,702 | ) |
| | | | | | | | | | | | | | | | |
| | | | |
CAPITAL SHARE TRANSACTIONS (Note 4): | | | | | | | | | | | | | | | | |
Net proceeds from sale of shares | | | 27,512,215 | | | | 16,631,463 | | | | 28,072,903 | | | | 34,473,634 | |
Dividends reinvested | | | 3,938,511 | | | | 1,161,781 | | | | 9,446,053 | | | | 2,732,702 | |
Cost of shares redeemed | | | (9,352,979 | ) | | | (11,904,513 | ) | | | (16,363,290 | ) | | | (15,051,678 | ) |
| | | | | | | | | | | | | | | | |
NET INCREASE (DECREASE)IN NET ASSETSFROM CAPITAL SHARE TRANSACTIONS | | | 22,097,747 | | | | 5,888,731 | | | | 21,155,666 | | | | 22,154,658 | |
| | | | | | | | | | | | | | | | |
INCREASE (DECREASE)IN NET ASSETS | | | 24,931,008 | | | | 11,232,211 | | | | 33,811,007 | | | | 56,191,983 | |
NET ASSETS, BEGINNINGOF YEAR | | | 97,592,117 | | | | 86,359,906 | | | | 281,397,173 | | | | 225,205,190 | |
| | | | | | | | | | | | | | | | |
NET ASSETS, ENDOF YEAR | | $ | 122,523,125 | | | $ | 97,592,117 | | | $ | 315,208,180 | | | $ | 281,397,173 | |
| | | | | | | | | | | | | | | | |
ACCUMULATED UNDISTRIBUTED NET INVESTMENT INCOME (LOSS) | | $ | 2,608,920 | | | $ | 2,273,588 | | | $ | 6,514,098 | | | $ | 5,452,659 | |
| | | | | | | | | | | | | | | | |
| | | | |
OTHER INFORMATION: | | | | | | | | | | | | | | | | |
Shares outstanding at the beginning of year | | | 79,934,785 | | | | 74,926,086 | | | | 193,762,078 | | | | 177,299,750 | |
| | | | | | | | | | | | | | | | |
Shares sold | | | 22,009,867 | | | | 14,084,437 | | | | 18,843,986 | | | | 25,407,537 | |
Shares issued as reinvestment of dividends | | | 3,216,965 | | | | 1,005,801 | | | | 6,402,498 | | | | 2,096,356 | |
Shares redeemed | | | (7,490,796 | ) | | | (10,081,539 | ) | | | (10,958,757 | ) | | | (11,041,565 | ) |
| | | | | | | | | | | | | | | | |
Net increase (decrease) | | | 17,736,036 | | | | 5,008,699 | | | | 14,287,727 | | | | 16,462,328 | |
| | | | | | | | | | | | | | | | |
Shares outstanding at the end of year | | | 97,670,821 | | | | 79,934,785 | | | | 208,049,805 | | | | 193,762,078 | |
| | | | | | | | | | | | | | | | |
The accompanying notes are an integral part of these financial statements.
80
| | | | | | | | | | | | | | | | | | | | | | | | | | | | | | | | |
| Aggressive Allocation Fund | | | Money Market Fund | | | Mid-Term Bond Fund | | | Bond Fund | | | |
| 2014 | | | 2013 | | | 2014 | | | 2013 | | | 2014 | | | 2013 | | | 2014 | | | 2013 | | | |
| | | | | | | | | | | | | | | | | | | | | | | | | | | | | | | | |
| | | | | | | | | | | | | | | | | | | | | | | | | | | | | | | | |
| $ | 3,931,404 | | | $ | 3,709,761 | | | $ | (112,131 | ) | | $ | (137,712 | ) | | $ | 10,593,944 | | | $ | 10,740,646 | | | $ | 31,506,309 | | | $ | 26,340,172 | | | |
| | 17,884,871 | | | | 4,145,765 | | | | 113 | | | | 852 | | | | 1,564,411 | | | | 2,091,825 | | | | 1,687,269 | | | | (85,944 | ) | | |
| | | | | | | | |
| | (3,648,961 | ) | | | 37,830,898 | | | | 4,165 | | | | (176 | ) | | | 591,865 | | | | (15,016,254 | ) | | | 19,079,980 | | | | (34,036,246 | ) | | |
| | | | | | | | | | | | | | | | | | | | | | | | | | | | | | | | |
| | 18,167,314 | | | | 45,686,424 | | | | (107,853 | ) | | | (137,036 | ) | | | 12,750,220 | | | | (2,183,783 | ) | | | 52,273,558 | | | | (7,782,018 | ) | | |
| | | | | | | | | | | | | | | | | | | | | | | | | | | | | | | | |
| | | | | | | | |
| | | | | | | | | | | | | | | | | | | | | | | | | | | | | | | | |
| | (3,819,966 | ) | | | (56,754 | ) | | | — | | | | — | | | | (10,740,646 | ) | | | (10,236,774 | ) | | | (26,340,172 | ) | | | (23,755,259 | ) | | |
| | (3,901,158 | ) | | | (2,318,315 | ) | | | — | | | | — | | | | (2,091,825 | ) | | | (830,806 | ) | | | — | | | | (1,270,568 | ) | | |
| | | | | | | | | | | | | | | | | | | | | | | | | | | | | | | | |
| | (7,721,124 | ) | | | (2,375,069 | ) | | | — | | | | — | | | | (12,832,471 | ) | | | (11,067,580 | ) | | | (26,340,172 | ) | | | (25,025,827 | ) | | |
| | | | | | | | | | | | | | | | | | | | | | | | | | | | | | | | |
| | | | | | | | |
| | | | | | | | | | | | | | | | | | | | | | | | | | | | | | | | |
| | 14,917,233 | | | | 16,579,124 | | | | 7,274,917 | | | | 12,509,651 | | | | 75,795,501 | | | | 50,891,428 | | | | 149,352,882 | | | | 145,960,331 | | | |
| | 7,721,124 | | | | 2,375,069 | | | | — | | | | — | | | | 12,832,471 | | | | 11,067,580 | | | | 26,340,172 | | | | 25,025,827 | | | |
| | (14,708,504 | ) | | | (12,758,545 | ) | | | (13,675,231 | ) | | | (18,318,388 | ) | | | (45,450,673 | ) | | | (43,885,429 | ) | | | (49,629,189 | ) | | | (87,040,137 | ) | | |
| | | | | | | | | | | | | | | | | | | | | | | | | | | | | | | | |
| | 7,929,853 | | | | 6,195,648 | | | | (6,400,314 | ) | | | (5,808,737 | ) | | | 43,177,299 | | | | 18,073,579 | | | | 126,063,865 | | | | 83,946,021 | | | |
| | | | | | | | | | | | | | | | | | | | | | | | | | | | | | | | |
| | 18,376,043 | | | | 49,507,003 | | | | (6,508,167 | ) | | | (5,945,773 | ) | | | 43,095,048 | | | | 4,822,216 | | | | 151,997,251 | | | | 51,138,176 | | | |
| | 236,424,159 | | | | 186,917,156 | | | | 83,986,933 | | | | 89,932,706 | | | | 392,138,450 | | | | 387,316,234 | | | | 803,884,548 | | | | 752,746,372 | | | |
| | | | | | | | | | | | | | | | | | | | | | | | | | | | | | | | |
| $ | 254,800,202 | | | $ | 236,424,159 | | | $ | 77,478,766 | | | $ | 83,986,933 | | | $ | 435,233,498 | | | $ | 392,138,450 | | | $ | 955,881,799 | | | $ | 803,884,548 | | | |
| | | | | | | | | | | | | | | | | | | | | | | | | | | | | | | | |
| $ | 4,669,780 | | | $ | 3,819,966 | | | $ | — | | | $ | — | | | $ | 10,593,942 | | | $ | 10,740,644 | | | $ | 31,506,309 | | | $ | 26,340,172 | | | |
| | | | | | | | | | | | | | | | | | | | | | | | | | | | | | | | |
| | | | | | | | |
| | | | | | | | | | | | | | | | | | | | | | | | | | | | | | | | |
| | 139,705,582 | | | | 135,535,587 | | | | 70,066,197 | | | | 74,907,971 | | | | 371,707,177 | | | | 354,712,016 | | | | 571,329,146 | | | | 512,445,634 | | | |
| | | | | | | | | | | | | | | | | | | | | | | | | | | | | | | | |
| | 8,631,107 | | | | 10,765,976 | | | | 6,073,454 | | | | 10,427,772 | | | | 70,789,793 | | | | 48,005,664 | | | | 102,660,413 | | | | 102,834,458 | | | |
| | 4,516,418 | | | | 1,643,346 | | | | — | | | | — | | | | 12,210,237 | | | | 10,449,216 | | | | 18,362,750 | | | | 17,680,249 | | | |
| | (8,496,257 | ) | | | (8,239,327 | ) | | | (11,415,586 | ) | | | (15,269,546 | ) | | | (42,454,296 | ) | | | (41,459,719 | ) | | | (34,245,808 | ) | | | (61,631,195 | ) | | |
| | | | | | | | | | | | | | | | | | | | | | | | | | | | | | | | |
| | 4,651,268 | | | | 4,169,995 | | | | (5,342,132 | ) | | | (4,841,774 | ) | | | 40,545,734 | | | | 16,995,161 | | | | 86,777,355 | | | | 58,883,512 | | | |
| | | | | | | | | | | | | | | | | | | | | | | | | | | | | | | | |
| | 144,356,850 | | | | 139,705,582 | | | | 64,724,065 | | | | 70,066,197 | | | | 412,252,911 | | | | 371,707,177 | | | | 658,106,501 | | | | 571,329,146 | | | |
| | | | | | | | | | | | | | | | | | | | | | | | | | | | | | | | |
The accompanying notes are an integral part of these financial statements.
81
MUTUAL OF AMERICA INVESTMENT CORPORATION
FINANCIAL HIGHLIGHTS
Income from investment operations and distributions per share for a Fund share outstanding throughout the five years ended December 31, 2014 (or since the Fund’s inception date if in existence less than five years) and other supplementary data with respect to each Fund are presented below and in the pages following:
| | | | | | | | | | | | | | | | | | | | |
| | | Equity Index Fund | |
| | | Years Ended December 31, | |
| | | 2014 | | | 2013 | | | 2012 | | | 2011 | | | 2010 | |
Net Asset Value, Beginning of Period | | $ | 3.09 | | | $ | 2.40 | | | $ | 2.07 | | | $ | 2.07 | | | $ | 1.84 | |
| | | | | | | | | | | | | | | | | | | | |
| | | | | |
INCOME (LOSS)FROM INVESTMENT OPERATIONS: | | | | | | | | | | | | | | | | | | | | |
Net Investment Income (Loss) | | | 0.06 | | | | 0.05 | | | | 0.05 | | | | 0.04 | | | | 0.03 | |
Net Realized and Unrealized Gains (Losses) on Investments and Futures Contracts | | | 0.35 | | | | 0.70 | | | | 0.28 | | | | — | (f) | | | 0.23 | |
| | | | | | | | | | | | | | | | | | | | |
Total From Investment Operations | | | 0.41 | | | | 0.75 | | | | 0.33 | | | | 0.04 | | | | 0.26 | |
| | | | | | | | | | | | | | | | | | | | |
| | | | | |
Less: Dividend Distributions: | | | | | | | | | | | | | | | | | | | | |
From Net Investment Income | | | (0.05 | ) | | | (0.04 | ) | | | — | (f) | | | (0.04 | ) | | | (0.03 | ) |
From Capital Gains | | | (0.04 | ) | | | (0.02 | ) | | | — | | | | — | | | | — | |
| | | | | | | | | | | | | | | | | | | | |
Total Distributions | | | (0.09 | ) | | | (0.06 | ) | | | — | | | | (0.04 | ) | | | (0.03 | ) |
| | | | | | | | | | | | | | | | | | | | |
Net Asset Value, End of Period | | $ | 3.41 | | | $ | 3.09 | | | $ | 2.40 | | | $ | 2.07 | | | $ | 2.07 | |
| | | | | | | | | | | | | | | | | | | | |
Total Return (%) | | | 13.49 | | | | 32.02 | | | | 15.94 | | | | 1.88 | | | | 14.68 | |
Net Assets, End of Period ($ millions) | | | 1,789 | | | | 1,556 | | | | 1,109 | | | | 929 | | | | 905 | |
Ratio of Net Investment Income (Loss) to Average Net Assets (%) | | | 1.82 | | | | 1.87 | | | | 2.03 | | | | 1.81 | | | | 1.76 | |
Ratio of Expenses to Average Net Assets Before Expense Reimbursement (%) | | | 0.17 | | | | 0.19 | | | | 0.22 | | | | 0.23 | | | | 0.25 | |
Ratio of Expenses to Average Net Assets After Expense Reimbursement (%) | | | 0.17 | | | | 0.19 | | | | 0.22 | | | | 0.23 | | | | 0.25 | |
Portfolio Turnover Rate (%)(a) | | | 8.07 | | | | 3.90 | | | | 6.45 | | | | 5.26 | | | | 4.50 | |
| (a) | Portfolio turnover rate excludes all short-term securities. |
| (d) | Allocation and Retirement Funds exclude expenses of the underlying funds. |
| (e) | For the period October 1, 2012 (commencement of operations) through December 31, 2012. |
| (f) | Amount is less than $0.005 per share. |
NA = Not Applicable
The accompanying notes are an integral part of these financial statements.
82
| | | | | | | | | | | | | | | | | | | | | | | | | | | | | | | | | | | | | | | | |
| All America Fund | | | Small Cap Value Fund | | | |
| Years Ended December 31, | | | Years Ended December 31, | | | |
| 2014 | | | 2013 | | | 2012 | | | 2011 | | | 2010 | | | 2014 | | | 2013 | | | 2012 | | | 2011 | | | 2010 | | | |
| $ | 2.38 | | | $ | 1.85 | | | $ | 1.61 | | | $ | 1.65 | | | $ | 1.42 | | | $ | 1.72 | | | $ | 1.35 | | | $ | 1.17 | | | $ | 1.21 | | | $ | 0.96 | | | |
| | | | | | | | | | | | | | | | | | | | | | | | | | | | | | | | | | | | | | | | |
| | | | | | | | | | |
| | | | | | | | | | | | | | | | | | | | | | | | | | | | | | | | | | | | | | | | |
| | 0.03 | | | | 0.03 | | | | 0.03 | | | | 0.02 | | | | 0.02 | | | | 0.02 | | | | 0.03 | | | | 0.02 | | | | 0.01 | | | | 0.01 | | | |
| | 0.23 | | | | 0.55 | | | | 0.21 | | | | (0.02 | ) | | | 0.23 | | | | 0.06 | | | | 0.36 | | | | 0.16 | | | | (0.04 | ) | | | 0.25 | | | |
| | | | | | | | | | | | | | | | | | | | | | | | | | | | | | | | | | | | | | | | |
| | 0.26 | | | | 0.58 | | | | 0.24 | | | | — | | | | 0.25 | | | | 0.08 | | | | 0.39 | | | | 0.18 | | | | (0.03 | ) | | | 0.26 | | | |
| | | | | | | | | | | | | | | | | | | | | | | | | | | | | | | | | | | | | | | | |
| | | | | | | | | | |
| | | | | | | | | | | | | | | | | | | | | | | | | | | | | | | | | | | | | | | | |
| | (0.03 | ) | | | (0.03 | ) | | | — | | | | (0.04 | ) | | | (0.02 | ) | | | (0.02 | ) | | | (0.02 | ) | | | — | | | | (0.01 | ) | | | (0.01 | ) | | |
| | (0.19 | ) | | | (0.02 | ) | | | — | | | | — | | | | — | | | | (0.17 | ) | | | — | | | | — | | | | — | | | | — | | | |
| | | | | | | | | | | | | | | | | | | | | | | | | | | | | | | | | | | | | | | | |
| | (0.22 | ) | | | (0.05 | ) | | | — | | | | (0.04 | ) | | | (0.02 | ) | | | (0.19 | ) | | | (0.02 | ) | | | — | | | | (0.01 | ) | | | (0.01 | ) | | |
| | | | | | | | | | | | | | | | | | | | | | | | | | | | | | | | | | | | | | | | |
| $ | 2.42 | | | $ | 2.38 | | | $ | 1.85 | | | $ | 1.61 | | | $ | 1.65 | | | $ | 1.61 | | | $ | 1.72 | | | $ | 1.35 | | | $ | 1.17 | | | $ | 1.21 | | | |
| | | | | | | | | | | | | | | | | | | | | | | | | | | | | | | | | | | | | | | | |
| | 11.16 | | | | 32.13 | | | | 14.73 | | | | 0.24 | | | | 17.78 | | | | 5.17 | | | | 29.35 | | | | 15.46 | | | | (2.46 | ) | | | 27.72 | | | |
| | 324 | | | | 318 | | | | 256 | | | | 250 | | | | 271 | | | | 393 | | | | 382 | | | | 290 | | | | 260 | | | | 277 | | | |
| | 1.35 | | | | 1.44 | | | | 1.52 | | | | 1.24 | | | | 1.21 | | | | 1.02 | | | | 1.70 | | | | 1.67 | | | | 0.92 | | | | 0.99 | | | |
| | 0.49 | | | | 0.51 | | | | 0.55 | | | | 0.56 | | | | 0.57 | | | | 0.84 | | | | 0.87 | | | | 0.90 | | | | 0.90 | | | | 0.92 | | | |
| | 0.49 | | | | 0.51 | | | | 0.55 | | | | 0.56 | | | | 0.57 | | | | 0.84 | | | | 0.87 | | | | 0.90 | | | | 0.90 | | | | 0.92 | | | |
| | 15.38 | | | | 28.48 | | | | 17.37 | | | | 24.67 | | | | 22.71 | | | | 38.09 | | | | 41.36 | | | | 24.71 | | | | 23.34 | | | | 35.34 | | | |
The accompanying notes are an integral part of these financial statements.
83
MUTUAL OF AMERICA INVESTMENT CORPORATION
FINANCIAL HIGHLIGHTS (Continued)
| | | | | | | | | | | | | | | | | | | | |
| | | Small Cap Growth Fund | |
| | | Years Ended December 31, | |
| | | 2014 | | | 2013 | | | 2012 | | | 2011 | | | 2010 | |
Net Asset Value, Beginning of Period | | $ | 1.58 | | | $ | 1.22 | | | $ | 1.16 | | | $ | 1.19 | | | $ | 0.89 | |
| | | | | | | | | | | | | | | | | | | | |
| | | | | |
INCOME (LOSS)FROM INVESTMENT OPERATIONS: | | | | | | | | | | | | | | | | | | | | |
Net Investment Income (Loss) | | | — | (f) | | | — | (f) | | | — | (f) | | | — | (f) | | | — | (f) |
Net Realized and Unrealized Gains (Losses) on Investments and Futures Contracts | | | 0.09 | | | | 0.47 | | | | 0.07 | | | | (0.03 | ) | | | 0.30 | |
| | | | | | | | | | | | | | | | | | | | |
Total From Investment Operations | | | 0.09 | | | | 0.47 | | | | 0.07 | | | | (0.03 | ) | | | 0.30 | |
| | | | | | | | | | | | | | | | | | | | |
| | | | | |
Less: Dividend Distributions: | | | | | | | | | | | | | | | | | | | | |
From Net Investment Income | | | — | (f) | | | — | | | | — | | | | — | | | | — | |
From Capital Gains | | | (0.13 | ) | | | (0.11 | ) | | | (0.01 | ) | | | — | | | | — | |
| | | | | | | | | | | | | | | | | | | | |
Total Distributions | | | (0.13 | ) | | | (0.11 | ) | | | (0.01 | ) | | | — | | | | — | |
| | | | | | | | | | | | | | | | | | | | |
Net Asset Value, End of Period | | $ | 1.54 | | | $ | 1.58 | | | $ | 1.22 | | | $ | 1.16 | | | $ | 1.19 | |
| | | | | | | | | | | | | | | | | | | | |
Total Return (%) | | | 5.70 | | | | 41.19 | | | | 5.62 | | | | (2.28 | ) | | | 33.27 | |
Net Assets, End of Period ($ millions) | | | 412 | | | | 424 | | | | 272 | | | | 271 | | | | 281 | |
Ratio of Net Investment Income (Loss) to Average Net Assets (%) | | | (0.09 | ) | | | 0.19 | | | | (0.08 | ) | | | (0.31 | ) | | | (0.26 | ) |
Ratio of Expenses to Average Net Assets Before Expense Reimbursement (%) | | | 0.84 | | | | 0.86 | | | | 0.90 | | | | 0.90 | | | | 0.92 | |
Ratio of Expenses to Average Net Assets After Expense Reimbursement (%) | | | 0.84 | | | | 0.86 | | | | 0.90 | | | | 0.90 | | | | 0.92 | |
Portfolio Turnover Rate (%)(a) | | | 67.58 | | | | 53.36 | | | | 66.69 | | | | 59.53 | | | | 50.73 | |
| (a) | Portfolio turnover rate excludes all short-term securities. |
| (d) | Allocation and Retirement Funds exclude expenses of the underlying funds. |
| (e) | For the period October 1, 2012 (commencement of operations) through December 31, 2012. |
| (f) | Amount is less than $0.005 per share. |
NA = Not Applicable
The accompanying notes are an integral part of these financial statements.
84
| | | | | | | | | | | | | | | | | | | | | | | | | | | | | | | | | | | | | | | | |
| Mid Cap Value Fund | | | Mid-Cap Equity Index Fund | | | |
| Years Ended December 31, | | | Years Ended December 31, | | | |
| 2014 | | | 2013 | | | 2012 | | | 2011 | | | 2010 | | | 2014 | | | 2013 | | | 2012 | | | 2011 | | | 2010 | | | |
| $ | 1.53 | | | $ | 1.23 | | | $ | 1.11 | | | $ | 1.15 | | | $ | 0.98 | | | $ | 2.08 | | | $ | 1.63 | | | $ | 1.43 | | | $ | 1.51 | | | $ | 1.24 | | | |
| | | | | | | | | | | | | | | | | | | | | | | | | | | | | | | | | | | | | | | | |
| | | | | | | | | | |
| | | | | | | | | | | | | | | | | | | | | | | | | | | | | | | | | | | | | | | | |
| | 0.02 | | | | 0.01 | | | | 0.02 | | | | 0.01 | | | | 0.01 | | | | 0.03 | | | | 0.02 | | | | 0.02 | | | | 0.02 | | | | 0.01 | | | |
| | 0.19 | | | | 0.33 | | | | 0.10 | | | | (0.04 | ) | | | 0.17 | | | | 0.17 | | | | 0.51 | | | | 0.24 | | | | (0.05 | ) | | | 0.31 | | | |
| | | | | | | | | | | | | | | | | | | | | | | | | | | | | | | | | | | | | | | | |
| | 0.21 | | | | 0.34 | | | | 0.12 | | | | (0.03 | ) | | | 0.18 | | | | 0.20 | | | | 0.53 | | | | 0.26 | | | | (0.03 | ) | | | 0.32 | | | |
| | | | | | | | | | | | | | | | | | | | | | | | | | | | | | | | | | | | | | | | |
| | | | | | | | | | |
| | | | | | | | | | | | | | | | | | | | | | | | | | | | | | | | | | | | | | | | |
| | (0.01 | ) | | | (0.01 | ) | | | — | | | | (0.01 | ) | | | (0.01 | ) | | | (0.02 | ) | | | (0.02 | ) | | | — | | | | (0.02 | ) | | | (0.01 | ) | | |
| | (0.10 | ) | | | (0.03 | ) | | | — | | | | — | | | | — | | | | (0.10 | ) | | | (0.06 | ) | | | (0.06 | ) | | | (0.03 | ) | | | (0.04 | ) | | |
| | | | | | | | | | | | | | | | | | | | | | | | | | | | | | | | | | | | | | | | |
| | (0.11 | ) | | | (0.04 | ) | | | — | | | | (0.01 | ) | | | (0.01 | ) | | | (0.12 | ) | | | (0.08 | ) | | | (0.06 | ) | | | (0.05 | ) | | | (0.05 | ) | | |
| | | | | | | | | | | | | | | | | | | | | | | | | | | | | | | | | | | | | | | | |
| $ | 1.63 | | | $ | 1.53 | | | $ | 1.23 | | | $ | 1.11 | | | $ | 1.15 | | | $ | 2.16 | | | $ | 2.08 | | | $ | 1.63 | | | $ | 1.43 | | | $ | 1.51 | | | |
| | | | | | | | | | | | | | | | | | | | | | | | | | | | | | | | | | | | | | | | |
| | 13.82 | | | | 27.78 | | | | 11.01 | | | | (2.12 | ) | | | 18.94 | | | | 9.63 | | | | 33.21 | | | | 17.80 | | | | (1.99 | ) | | | 26.28 | | | |
| | 92 | | | | 72 | | | | 53 | | | | 51 | | | | 55 | | | | 1,001 | | | | 902 | | | | 610 | | | | 505 | | | | 494 | | | |
| | 1.25 | | | | 1.08 | | | | 1.36 | | | | 1.19 | | | | 1.25 | | | | 1.31 | | | | 1.25 | | | | 1.50 | | | | 1.14 | | | | 1.16 | | | |
| | 0.64 | | | | 0.66 | | | | 0.70 | | | | 0.70 | | | | 0.72 | | | | 0.17 | | | | 0.19 | | | | 0.22 | | | | 0.23 | | | | 0.25 | | | |
| | 0.64 | | | | 0.66 | | | | 0.70 | | | | 0.70 | | | | 0.72 | | | | 0.17 | | | | 0.19 | | | | 0.22 | | | | 0.23 | | | | 0.25 | | | |
| | 40.91 | | | | 36.42 | | | | 29.05 | | | | 12.99 | | | | 29.88 | | | | 16.29 | | | | 13.30 | | | | 12.98 | | | | 15.98 | | | | 13.29 | | | |
The accompanying notes are an integral part of these financial statements.
85
MUTUAL OF AMERICA INVESTMENT CORPORATION
FINANCIAL HIGHLIGHTS (Continued)
| | | | | | | | | | | | | | | | | | | | |
| | | International Fund | |
| | | Years Ended December 31, | |
| | | 2014 | | | 2013 | | | 2012 | | | 2011 | | | 2010 | |
Net Asset Value, Beginning of Period | | $ | 0.84 | | | $ | 0.71 | | | $ | 0.60 | | | $ | 0.71 | | | $ | 0.67 | |
| | | | | | | | | | | | | | | | | | | | |
| | | | | |
INCOME (LOSS)FROM INVESTMENT OPERATIONS: | | | | | | | | | | | | | | | | | | | | |
Net Investment Income (Loss) | | | 0.02 | | | | 0.02 | | | | 0.02 | | | | 0.02 | | | | 0.02 | |
Net Realized and Unrealized Gains (Losses) on Investments and Futures Contracts | | | (0.08 | ) | | | 0.13 | | | | 0.09 | | | | (0.11 | ) | | | 0.04 | |
| | | | | | | | | | | | | | | | | | | | |
Total From Investment Operations | | | (0.06 | ) | | | 0.15 | | | | 0.11 | | | | (0.09 | ) | | | 0.06 | |
| | | | | | | | | | | | | | | | | | | | |
| | | | | |
Less: Dividend Distributions: | | | | | | | | | | | | | | | | | | | | |
From Net Investment Income | | | (0.01 | ) | | | (0.02 | ) | | | — | (f) | | | (0.02 | ) | | | (0.02 | ) |
From Capital Gains | | | — | (f) | | | — | | | | — | (f) | | | — | (f) | | | — | |
| | | | | | | | | | | | | | | | | | | | |
Total Distributions | | | (0.01 | ) | | | (0.02 | ) | | | — | | | | (0.02 | ) | | | (0.02 | ) |
| | | | | | | | | | | | | | | | | | | | |
Net Asset Value, End of Period | | $ | 0.77 | | | $ | 0.84 | | | $ | 0.71 | | | $ | 0.60 | | | $ | 0.71 | |
| | | | | | | | | | | | | | | | | | | | |
Total Return (%) | | | (6.03 | ) | | | 21.00 | | | | 18.24 | | | | (12.60 | ) | | | 8.32 | |
Net Assets, End of Period ($ millions) | | | 264 | | | | 174 | | | | 115 | | | | 69 | | | | 61 | |
Ratio of Net Investment Income (Loss) to Average Net Assets (%) | | | 3.48 | | | | 2.76 | | | | 3.20 | | | | 3.24 | | | | 3.48 | |
Ratio of Expenses to Average Net Assets Before Expense Reimbursement (%)(d) | | | 0.17 | | | | 0.18 | | | | 0.21 | | | | 0.23 | | | | 0.24 | |
Ratio of Expenses to Average Net Assets After Expense Reimbursement (%)(d) | | | 0.17 | | | | 0.18 | | | | 0.21 | | | | 0.23 | | | | 0.24 | |
Portfolio Turnover Rate (%)(a) | | | 0.61 | | | | 10.22 | | | | 0.28 | | | | 1.44 | | | | 9.17 | |
| (a) | Portfolio turnover rate excludes all short-term securities. |
| (d) | Allocation and Retirement Funds exclude expenses of the underlying funds. |
| (e) | For the period October 1, 2012 (commencement of operations) through December 31, 2012. |
| (f) | Amount is less than $0.005 per share. |
NA = Not Applicable
The accompanying notes are an integral part of these financial statements.
86
| | | | | | | | | | | | | | | | | | | | | | | | | | | | | | | | | | | | | | | | |
| Composite Fund | | | Retirement Income Fund | | | |
| Years Ended December 31, | | | Years Ended December 31, | | | |
| 2014 | | | 2013 | | | 2012 | | | 2011 | | | 2010 | | | 2014 | | | 2013 | | | 2012 | | | 2011 | | | 2010 | | | |
| $ | 1.87 | | | $ | 1.64 | | | $ | 1.47 | | | $ | 1.50 | | | $ | 1.39 | | | $ | 1.13 | | | $ | 1.07 | | | $ | 1.05 | | | $ | 1.03 | | | $ | 0.97 | | | |
| | | | | | | | | | | | | | | | | | | | | | | | | | | | | | | | | | | | | | | | |
| | | | | | | | | | |
| | | | | | | | | | | | | | | | | | | | | | | | | | | | | | | | | | | | | | | | |
| | 0.04 | | | | 0.04 | | | | 0.04 | | | | 0.04 | | | | 0.04 | | | | 0.02 | | | | 0.02 | | | | — | (f) | | | 0.03 | | | | 0.02 | | | |
| | 0.13 | | | | 0.23 | | | | 0.13 | | | | — | | | | 0.11 | | | | 0.05 | | | | 0.06 | | | | 0.07 | | | | 0.02 | | | | 0.07 | | | |
| | | | | | | | | | | | | | | | | | | | | | | | | | | | | | | | | | | | | | | | |
| | 0.17 | | | | 0.27 | | | | 0.17 | | | | 0.04 | | | | 0.15 | | | | 0.07 | | | | 0.08 | | | | 0.07 | | | | 0.05 | | | | 0.09 | | | |
| | | | | | | | | | | | | | | | | | | | | | | | | | | | | | | | | | | | | | | | |
| | | | | | | | | | |
| | | | | | | | | | | | | | | | | | | | | | | | | | | | | | | | | | | | | | | | |
| | (0.04 | ) | | | (0.04 | ) | | | — | (f) | | | (0.07 | ) | | | (0.04 | ) | | | (0.02 | ) | | | — | (f) | | | (0.03 | ) | | | (0.03 | ) | | | (0.02 | ) | | |
| | — | | | | — | | | | — | | | | — | | | | — | | | | (0.02 | ) | | | (0.02 | ) | | | (0.02 | ) | | | — | (f) | | | (0.01 | ) | | |
| | | | | | | | | | | | | | | | | | | | | | | | | | | | | | | | | | | | | | | | |
| | (0.04 | ) | | | (0.04 | ) | | | — | | | | (0.07 | ) | | | (0.04 | ) | | | (0.04 | ) | | | (0.02 | ) | | | (0.05 | ) | | | (0.03 | ) | | | (0.03 | ) | | |
| | | | | | | | | | | | | | | | | | | | | | | | | | | | | | | | | | | | | | | | |
| $ | 2.00 | | | $ | 1.87 | | | $ | 1.64 | | | $ | 1.47 | | | $ | 1.50 | | | $ | 1.16 | | | $ | 1.13 | | | $ | 1.07 | | | $ | 1.05 | | | $ | 1.03 | | | |
| | | | | | | | | | | | | | | | | | | | | | | | | | | | | | | | | | | | | | | | |
| | 9.10 | | | | 16.37 | | | | 11.65 | | | | 2.84 | | | | 11.02 | | | | 6.50 | | | | 7.40 | | | | 7.15 | | | | 4.72 | | | | 9.04 | | | |
| | 194 | | | | 186 | | | | 170 | | | | 161 | | | | 167 | | | | 54 | | | | 40 | | | | 31 | | | | 23 | | | | 18 | | | |
| | 2.09 | | | | 2.04 | | | | 2.17 | | | | 2.22 | | | | 2.26 | | | | 2.21 | | | | 2.18 | | | | (0.03 | ) | | | 3.03 | | | | 3.65 | | | |
| | 0.49 | | | | 0.51 | | | | 0.55 | | | | 0.56 | | | | 0.57 | | | | 0.05 | | | | 0.05 | | | | 0.05 | | | | 0.05 | | | | 0.05 | | | |
| | 0.49 | | | | 0.51 | | | | 0.55 | | | | 0.56 | | | | 0.57 | | | | 0.05 | | | | 0.05 | | | | 0.05 | | | | 0.05 | | | | 0.05 | | | |
| | 12.31 | | | | 20.98 | | | | 25.42 | | | | 22.69 | | | | 36.00 | | | | 17.63 | | | | 24.01 | | | | 18.07 | | | | 23.77 | | | | 17.62 | | | |
The accompanying notes are an integral part of these financial statements.
87
MUTUAL OF AMERICA INVESTMENT CORPORATION
FINANCIAL HIGHLIGHTS (Continued)
| | | | | | | | | | | | | | | | | | | | |
| | | 2010 Retirement Fund | |
| | | Years Ended December 31, | |
| | | 2014 | | | 2013 | | | 2012 | | | 2011 | | | 2010 | |
Net Asset Value, Beginning of Period | | $ | 1.06 | | | $ | 1.00 | | | $ | 0.97 | | | $ | 0.96 | | | $ | 0.87 | |
| | | | | | | | | | | | | | | | | | | | |
| | | | | |
INCOME (LOSS)FROM INVESTMENT OPERATIONS: | | | | | | | | | | | | | | | | | | | | |
Net Investment Income (Loss) | | | 0.02 | | | | 0.02 | | | | — | (f) | | | 0.02 | | | | 0.02 | |
Net Realized and Unrealized Gains (Losses) on Investments and Futures Contracts | | | 0.06 | | | | 0.09 | | | | 0.09 | | | | 0.01 | | | | 0.07 | |
| | | | | | | | | | | | | | | | | | | | |
Total From Investment Operations | | | 0.08 | | | | 0.11 | | | | 0.09 | | | | 0.03 | | | | 0.09 | |
| | | | | | | | | | | | | | | | | | | | |
| | | | | |
Less: Dividend Distributions: | | | | | | | | | | | | | | | | | | | | |
From Net Investment Income | | | (0.02 | ) | | | — | (f) | | | (0.02 | ) | | | (0.02 | ) | | | — | (f) |
From Capital Gains | | | (0.03 | ) | | | (0.05 | ) | | | (0.04 | ) | | | — | (f) | | | — | (f) |
| | | | | | | | | | | | | | | | | | | | |
Total Distributions | | | (0.05 | ) | | | (0.05 | ) | | | (0.06 | ) | | | (0.02 | ) | | | — | |
| | | | | | | | | | | | | | | | | | | | |
Net Asset Value, End of Period | | $ | 1.09 | | | $ | 1.06 | | | $ | 1.00 | | | $ | 0.97 | | | $ | 0.96 | |
| | | | | | | | | | | | | | | | | | | | |
Total Return (%) | | | 6.93 | | | | 11.78 | | | | 9.69 | | | | 3.08 | | | | 11.36 | |
Net Assets, End of Period ($ millions) | | | 27 | | | | 24 | | | | 21 | | | | 21 | | | | 19 | |
Ratio of Net Investment Income (Loss) to Average Net Assets (%) | | | 2.06 | | | | 2.09 | | | | (0.03 | ) | | | 2.41 | | | | 2.67 | |
Ratio of Expenses to Average Net Assets Before Expense Reimbursement (%)(d) | | | 0.05 | | | | 0.05 | | | | 0.05 | | | | 0.05 | | | | 0.05 | |
Ratio of Expenses to Average Net Assets After Expense Reimbursement (%)(d) | | | 0.05 | | | | 0.05 | | | | 0.05 | | | | 0.05 | | | | 0.05 | |
Portfolio Turnover Rate (%)(a) | | | 20.45 | | | | 19.60 | | | | 26.61 | | | | 21.22 | | | | 18.31 | |
| (a) | Portfolio turnover rate excludes all short-term securities. |
| (d) | Allocation and Retirement Funds exclude expenses of the underlying funds. |
| (e) | For the period October 1, 2012 (commencement of operations) through December 31, 2012. |
| (f) | Amount is less than $0.005 per share. |
NA = Not Applicable
The accompanying notes are an integral part of these financial statements.
88
| | | | | | | | | | | | | | | | | | | | | | | | | | | | | | | | | | | | | | | | |
| 2015 Retirement Fund | | | 2020 Retirement Fund | | | |
| Years Ended December 31, | | | Years Ended December 31, | | | |
| 2014 | | | 2013 | | | 2012 | | | 2011 | | | 2010 | | | 2014 | | | 2013 | | | 2012 | | | 2011 | | | 2010 | | | |
| $ | 1.10 | | | $ | 1.00 | | | $ | 0.93 | | | $ | 0.93 | | | $ | 0.83 | | | $ | 1.13 | | | $ | 0.99 | | | $ | 0.90 | | | $ | 0.91 | | | $ | 0.80 | | | |
| | | | | | | | | | | | | | | | | | | | | | | | | | | | | | | | | | | | | | | | |
| | | | | | | | | | |
| | | | | | | | | | | | | | | | | | | | | | | | | | | | | | | | | | | | | | | | |
| | 0.02 | | | | 0.02 | | | | — | (f) | | | 0.02 | | | | 0.02 | | | | 0.02 | | | | 0.02 | | | | — | (f) | | | 0.02 | | | | 0.02 | | | |
| | 0.06 | | | | 0.12 | | | | 0.10 | | | | — | (f) | | | 0.08 | | | | 0.06 | | | | 0.14 | | | | 0.11 | | | | (0.01 | ) | | | 0.09 | | | |
| | | | | | | | | | | | | | | | | | | | | | | | | | | | | | | | | | | | | | | | |
| | 0.08 | | | | 0.14 | | | | 0.10 | | | | 0.02 | | | | 0.10 | | | | 0.08 | | | | 0.16 | | | | 0.11 | | | | 0.01 | | | | 0.11 | | | |
| | | | | | | | | | | | | | | | | | | | | | | | | | | | | | | | | | | | | | | | |
| | | | | | | | | | |
| | | | | | | | | | | | | | | | | | | | | | | | | | | | | | | | | | | | | | | | |
| | (0.02 | ) | | | — | (f) | | | (0.02 | ) | | | (0.02 | ) | | | — | (f) | | | (0.02 | ) | | | — | (f) | | | (0.02 | ) | | | (0.02 | ) | | | — | (f) | | |
| | (0.03 | ) | | | (0.04 | ) | | | (0.01 | ) | | | — | (f) | | | — | (f) | | | (0.01 | ) | | | (0.02 | ) | | | — | (f) | | | — | (f) | | | — | (f) | | |
| | | | | | | | | | | | | | | | | | | | | | | | | | | | | | | | | | | | | | | | |
| | (0.05 | ) | | | (0.04 | ) | | | (0.03 | ) | | | (0.02 | ) | | | — | | | | (0.03 | ) | | | (0.02 | ) | | | (0.02 | ) | | | (0.02 | ) | | | — | | | |
| | | | | | | | | | | | | | | | | | | | | | | | | | | | | | | | | | | | | | | | |
| $ | 1.13 | | | $ | 1.10 | | | $ | 1.00 | | | $ | 0.93 | | | $ | 0.93 | | | $ | 1.18 | | | $ | 1.13 | | | $ | 0.99 | | | $ | 0.90 | | | $ | 0.91 | | | |
| | | | | | | | | | | | | | | | | | | | | | | | | | | | | | | | | | | | | | | | |
| | 7.16 | | | | 14.80 | | | | 10.59 | | | | 2.09 | | | | 12.27 | | | | 7.36 | | | | 17.72 | | | | 11.69 | | | | 1.55 | | | | 13.90 | | | |
| | 154 | | | | 138 | | | | 112 | | | | 91 | | | | 78 | | | | 320 | | | | 251 | | | | 169 | | | | 118 | | | | 90 | | | |
| | 2.00 | | | | 2.07 | | | | (0.03 | ) | | | 2.53 | | | | 2.79 | | | | 1.92 | | | | 1.85 | | | | (0.03 | ) | | | 2.63 | | | | 2.76 | | | |
| | 0.05 | | | | 0.05 | | | | 0.05 | | | | 0.05 | | | | 0.05 | | | | 0.05 | | | | 0.05 | | | | 0.05 | | | | 0.05 | | | | 0.05 | | | |
| | 0.05 | | | | 0.05 | | | | 0.05 | | | | 0.05 | | | | 0.05 | | | | 0.05 | | | | 0.05 | | | | 0.05 | | | | 0.05 | | | | 0.05 | | | |
| | 16.41 | | | | 11.83 | | | | 19.59 | | | | 8.10 | | | | 5.64 | | | | 9.54 | | | | 3.56 | | | | 9.89 | | | | 4.73 | | | | 2.62 | | | |
The accompanying notes are an integral part of these financial statements.
89
MUTUAL OF AMERICA INVESTMENT CORPORATION
FINANCIAL HIGHLIGHTS (Continued)
| | | | | | | | | | | | | | | | | | | | |
| | | 2025 Retirement Fund | |
| | | Years Ended December 31, | |
| | | 2014 | | | 2013 | | | 2012 | | | 2011 | | | 2010 | |
Net Asset Value, Beginning of Period | | $ | 1.16 | | | $ | 0.98 | | | $ | 0.89 | | | $ | 0.90 | | | $ | 0.78 | |
| | | | | | | | | | | | | | | | | | | | |
| | | | | |
INCOME (LOSS)FROM INVESTMENT OPERATIONS: | | | | | | | | | | | | | | | | | | | | |
Net Investment Income (Loss) | | | 0.02 | | | | 0.02 | | | | — | (f) | | | 0.02 | | | | 0.02 | |
Net Realized and Unrealized Gains (Losses) on Investments and Futures Contracts | | | 0.08 | | | | 0.18 | | | | 0.11 | | | | (0.02 | ) | | | 0.10 | |
| | | | | | | | | | | | | | | | | | | | |
Total From Investment Operations | | | 0.10 | | | | 0.20 | | | | 0.11 | | | | — | | | | 0.12 | |
| | | | | | | | | | | | | | | | | | | | |
| | | | | |
Less: Dividend Distributions: | | | | | | | | | | | | | | | | | | | | |
From Net Investment Income | | | (0.02 | ) | | | — | (f) | | | (0.02 | ) | | | (0.01 | ) | | | — | (f) |
From Capital Gains | | | (0.01 | ) | | | (0.02 | ) | | | — | (f) | | | — | (f) | | | — | (f) |
| | | | | | | | | | | | | | | | | | | | |
Total Distributions | | | (0.03 | ) | | | (0.02 | ) | | | (0.02 | ) | | | (0.01 | ) | | | — | |
| | | | | | | | | | | | | | | | | | | | |
Net Asset Value, End of Period | | $ | 1.23 | | | $ | 1.16 | | | $ | 0.98 | | | $ | 0.89 | | | $ | 0.90 | |
| | | | | | | | | | | | | | | | | | | | |
Total Return (%) | | | 8.00 | | | | 21.11 | | | | 12.90 | | | | 0.83 | | | | 15.49 | |
Net Assets, End of Period ($ millions) | | | 331 | | | | 257 | | | | 162 | | | | 109 | | | | 81 | |
Ratio of Net Investment Income (Loss) to Average Net Assets (%) | | | 1.75 | | | | 1.67 | | | | (0.04 | ) | | | 2.49 | | | | 2.50 | |
Ratio of Expenses to Average Net Assets Before Expense Reimbursement (%)(d) | | | 0.05 | | | | 0.05 | | | | 0.05 | | | | 0.05 | | | | 0.05 | |
Ratio of Expenses to Average Net Assets After Expense Reimbursement (%)(d) | | | 0.05 | | | | 0.05 | | | | 0.05 | | | | 0.05 | | | | 0.05 | |
Portfolio Turnover Rate (%)(a) | | | 6.00 | | | | 1.49 | | | | 8.59 | | | | 2.52 | | | | 3.16 | |
| (a) | Portfolio turnover rate excludes all short-term securities. |
| (d) | Allocation and Retirement Funds exclude expenses of the underlying funds. |
| (e) | For the period October 1, 2012 (commencement of operations) through December 31, 2012. |
| (f) | Amount is less than $0.005 per share. |
NA = Not Applicable
The accompanying notes are an integral part of these financial statements.
90
| | | | | | | | | | | | | | | | | | | | | | | | | | | | | | | | | | | | | | | | |
| 2030 Retirement Fund | | | 2035 Retirement Fund | | | |
| Years Ended December 31, | | | Years Ended December 31, | | | |
| 2014 | | | 2013 | | | 2012 | | | 2011 | | | 2010 | | | 2014 | | | 2013 | | | 2012 | | | 2011 | | | 2010 | | | |
| $ | 1.19 | | | $ | 0.98 | | | $ | 0.88 | | | $ | 0.90 | | | $ | 0.77 | | | $ | 1.20 | | | $ | 0.97 | | | $ | 0.86 | | | $ | 0.88 | | | $ | 0.75 | | | |
| | | | | | | | | | | | | | | | | | | | | | | | | | | | | | | | | | | | | | | | |
| | | | | | | | | | |
| | | | | | | | | | | | | | | | | | | | | | | | | | | | | | | | | | | | | | | | |
| | 0.02 | | | | 0.02 | | | | — | (f) | | | 0.02 | | | | 0.02 | | | | 0.01 | | | | 0.01 | | | | — | (f) | | | 0.01 | | | | 0.01 | | | |
| | 0.09 | | | | 0.21 | | | | 0.12 | | | | (0.02 | ) | | | 0.11 | | | | 0.08 | | | | 0.24 | | | | 0.13 | | | | (0.02 | ) | | | 0.12 | | | |
| | | | | | | | | | | | | | | | | | | | | | | | | | | | | | | | | | | | | | | | |
| | 0.11 | | | | 0.23 | | | | 0.12 | | | | — | | | | 0.13 | | | | 0.09 | | | | 0.25 | | | | 0.13 | | | | (0.01 | ) | | | 0.13 | | | |
| | | | | | | | | | | | | | | | | | | | | | | | | | | | | | | | | | | | | | | | |
| | | | | | | | | | |
| | | | | | | | | | | | | | | | | | | | | | | | | | | | | | | | | | | | | | | | |
| | (0.02 | ) | | | — | (f) | | | (0.02 | ) | | | (0.02 | ) | | | — | (f) | | | (0.01 | ) | | | — | (f) | | | (0.02 | ) | | | (0.01 | ) | | | — | (f) | | |
| | (0.01 | ) | | | (0.02 | ) | | | — | (f) | | | — | (f) | | | — | (f) | | | (0.01 | ) | | | (0.02 | ) | | | — | (f) | | | — | (f) | | | — | (f) | | |
| | | | | | | | | | | | | | | | | | | | | | | | | | | | | | | | | | | | | | | | |
| | (0.03 | ) | | | (0.02 | ) | | | (0.02 | ) | | | (0.02 | ) | | | — | | | | (0.02 | ) | | | (0.02 | ) | | | (0.02 | ) | | | (0.01 | ) | | | — | | | |
| | | | | | | | | | | | | | | | | | | | | | | | | | | | | | | | | | | | | | | | |
| $ | 1.27 | | | $ | 1.19 | | | $ | 0.98 | | | $ | 0.88 | | | $ | 0.90 | | | $ | 1.27 | | | $ | 1.20 | | | $ | 0.97 | | | $ | 0.86 | | | $ | 0.88 | | | |
| | | | | | | | | | | | | | | | | | | | | | | | | | | | | | | | | | | | | | | | |
| | 8.44 | | | | 23.72 | | | | 13.69 | | | | 0.21 | | | | 16.59 | | | | 8.26 | | | | 25.92 | | | | 14.39 | | | | (0.63 | ) | | | 17.66 | | | |
| | 277 | | | | 212 | | | | 133 | | | | 90 | | | | 67 | | | | 230 | | | | 173 | | | | 107 | | | | 69 | | | | 53 | | | |
| | 1.66 | | | | 1.60 | | | | (0.04 | ) | | | 2.37 | | | | 2.37 | | | | 1.52 | | | | 1.47 | | | | (0.04 | ) | | | 2.17 | | | | 2.20 | | | |
| | 0.05 | | | | 0.05 | | | | 0.05 | | | | 0.05 | | | | 0.05 | | | | 0.05 | | | | 0.05 | | | | 0.05 | | | | 0.05 | | | | 0.05 | | | |
| | 0.05 | | | | 0.05 | | | | 0.05 | | | | 0.05 | | | | 0.05 | | | | 0.05 | | | | 0.05 | | | | 0.05 | | | | 0.05 | | | | 0.05 | | | |
| | 5.52 | | | | 1.58 | | | | 7.61 | | | | 2.66 | | | | 1.74 | | | | 4.29 | | | | 1.76 | | | | 6.51 | | | | 2.78 | | | | 1.47 | | | |
The accompanying notes are an integral part of these financial statements.
91
MUTUAL OF AMERICA INVESTMENT CORPORATION
FINANCIAL HIGHLIGHTS (Continued)
| | | | | | | | | | | | | | | | | | | | |
| | | 2040 Retirement Fund | |
| |
| | | Years Ended December 31, | |
| | | 2014 | | | 2013 | | | 2012 | | | 2011 | | | 2010 | |
Net Asset Value, Beginning of Period | | $ | 1.20 | | | $ | 0.96 | | | $ | 0.85 | | | $ | 0.88 | | | $ | 0.74 | |
| | | | | | | | | | | | | | | | | | | | |
| | | | | |
INCOME (LOSS)FROM INVESTMENT OPERATIONS: | | | | | | | | | | | | | | | | | | | | |
Net Investment Income (Loss) | | | 0.01 | | | | 0.01 | | | | — | (f) | | | 0.01 | | | | 0.01 | |
Net Realized and Unrealized Gains (Losses) on Investments and Futures Contracts | | | 0.08 | | | | 0.25 | | | | 0.13 | | | | (0.03 | ) | | | 0.13 | |
| | | | | | | | | | | | | | | | | | | | |
Total From Investment Operations | | | 0.09 | | | | 0.26 | | | | 0.13 | | | | (0.02 | ) | | | 0.14 | |
| | | | | | | | | | | | | | | | | | | | |
| | | | | |
Less: Dividend Distributions: | | | | | | | | | | | | | | | | | | | | |
From Net Investment Income | | | (0.01 | ) | | | — | (f) | | | (0.02 | ) | | | (0.01 | ) | | | — | (f) |
From Capital Gains | | | (0.02 | ) | | | (0.02 | ) | | | — | (f) | | | — | (f) | | | — | (f) |
| | | | | | | | | | | | | | | | | | | | |
Total Distributions | | | (0.03 | ) | | | (0.02 | ) | | | (0.02 | ) | | | (0.01 | ) | | | — | |
| | | | | | | | | | | | | | | | | | | | |
Net Asset Value, End of Period | | $ | 1.26 | | | $ | 1.20 | | | $ | 0.96 | | | $ | 0.85 | | | $ | 0.88 | |
| | | | | | | | | | | | | | | | | | | | |
Total Return (%) | | | 7.71 | | | | 27.20 | | | | 14.63 | | | | (1.24 | ) | | | 18.38 | |
Net Assets, End of Period ($ millions) | | | 189 | | | | 148 | | | | 94 | | | | 62 | | | | 47 | |
Ratio of Net Investment Income (Loss) to Average Net Assets (%) | | | 1.40 | | | | 1.39 | | | | (0.04 | ) | | | 2.09 | | | | 2.13 | |
Ratio of Expenses to Average Net Assets Before Expense Reimbursement (%)(d) | | | 0.05 | | | | 0.05 | | | | 0.05 | | | | 0.05 | | | | 0.05 | |
Ratio of Expenses to Average Net Assets After Expense Reimbursement (%)(d) | | | 0.05 | | | | 0.05 | | | | 0.05 | | | | 0.05 | | | | 0.05 | |
Portfolio Turnover Rate (%)(a) | | | 4.31 | | | | 1.37 | | | | 4.99 | | | | 2.28 | | | | 1.37 | |
| (a) | Portfolio turnover rate excludes all short-term securities. |
| (d) | Allocation and Retirement Funds exclude expenses of the underlying funds. |
| (e) | For the period October 1, 2012 (commencement of operations) through December 31, 2012. |
| (f) | Amount is less than $0.005 per share. |
NA = Not Applicable
The accompanying notes are an integral part of these financial statements.
92
| | | | | | | | | | | | | | | | | | | | | | | | | | | | | | | | |
| 2045 Retirement Fund | | | 2050 Retirement Fund | | | |
| Years Ended December 31, | | | Years Ended December 31, | | | Period Ended
December 31, 2012(e) | | | |
| 2014 | | | 2013 | | | 2012 | | | 2011 | | | 2010 | | | 2014 | | | 2013 | | | |
| $ | 1.20 | | | $ | 0.96 | | | $ | 0.85 | | | $ | 0.88 | | | $ | 0.74 | | | $ | 1.30 | | | $ | 1.02 | | | $ | 1.00 | | | |
| | | | | | | | | | | | | | | | | | | | | | | | | | | | | | | | |
| | | | | | | | |
| | | | | | | | | | | | | | | | | | | | | | | | | | | | | | | | |
| | 0.01 | | | | 0.01 | | | | — | (f) | | | 0.01 | | | | 0.01 | | | | 0.01 | | | | — | (f) | | | — | (f) | | |
| | 0.07 | | | | 0.25 | | | | 0.13 | | | | (0.03 | ) | | | 0.13 | | | | 0.08 | | | | 0.28 | | | | 0.02 | | | |
| | | | | | | | | | | | | | | | | | | | | | | | | | | | | | | | |
| | 0.08 | | | | 0.26 | | | | 0.13 | | | | (0.02 | ) | | | 0.14 | | | | 0.09 | | | | 0.28 | | | | 0.02 | | | |
| | | | | | | | | | | | | | | | | | | | | | | | | | | | | | | | |
| | | | | | | | |
| | | | | | | | | | | | | | | | | | | | | | | | | | | | | | | | |
| | (0.01 | ) | | | — | (f) | | | (0.02 | ) | | | (0.01 | ) | | | — | (f) | | | — | (f) | | | — | (f) | | | — | | | |
| | (0.01 | ) | | | (0.02 | ) | | | — | (f) | | | — | (f) | | | — | (f) | | | — | (f) | | | — | (f) | | | — | | | |
| | | | | | | | | | | | | | | | | | | | | | | | | | | | | | | | |
| | (0.02 | ) | | | (0.02 | ) | | | (0.02 | ) | | | (0.01 | ) | | | — | | | | — | | | | — | | | | — | | | |
| | | | | | | | | | | | | | | | | | | | | | | | | | | | | | | | |
| $ | 1.26 | | | $ | 1.20 | | | $ | 0.96 | | | $ | 0.85 | | | $ | 0.88 | | | $ | 1.39 | | | $ | 1.30 | | | $ | 1.02 | | | |
| | | | | | | | | | | | | | | | | | | | | | | | | | | | | | | | |
| | 7.36 | | | | 27.68 | | | | 14.45 | | | | (1.45 | ) | | | 18.57 | | | | 7.15 | | | | 28.17 | | | | 1.83 | (b) | | |
| | 232 | | | | 186 | | | | 118 | | | | 76 | | | | 54 | | | | 50 | | | | 20 | | | | 2 | | | |
| | 1.37 | | | | 1.37 | | | | (0.04 | ) | | | 2.09 | | | | 2.14 | | | | 1.47 | | | | 0.54 | | | | (0.01 | )(b) | | |
| | 0.05 | | | | 0.05 | | | | 0.05 | | | | 0.05 | | | | 0.05 | | | | 0.05 | | | | 0.05 | | | | 0.05 | (c) | | |
| | 0.05 | | | | 0.05 | | | | 0.05 | | | | 0.05 | | | | 0.05 | | | | 0.05 | | | | 0.05 | | | | 0.05 | (c) | | |
| | 3.48 | | | | 0.93 | | | | 4.03 | | | | 1.97 | | | | 1.04 | | | | 1.53 | | | | 1.22 | | | | 0.76 | (b) | | |
The accompanying notes are an integral part of these financial statements.
93
MUTUAL OF AMERICA INVESTMENT CORPORATION
FINANCIAL HIGHLIGHTS (Continued)
| | | | | | | | | | | | | | | | | | | | |
| | | Conservative Allocation Fund | |
| | | Years Ended December 31, | |
| | | 2014 | | | 2013 | | | 2012 | | | 2011 | | | 2010 | |
Net Asset Value, Beginning of Period | | $ | 1.22 | | | $ | 1.15 | | | $ | 1.11 | | | $ | 1.08 | | | $ | 0.99 | |
| | | | | | | | | | | | | | | | | | | | |
| | | | | |
INCOME (LOSS)FROM INVESTMENT OPERATIONS: | | | | | | | | | | | | | | | | | | | | |
Net Investment Income (Loss) | | | 0.03 | | | | 0.03 | | | | — | (f) | | | 0.03 | | | | 0.03 | |
Net Realized and Unrealized Gains (Losses) on Investments and Futures Contracts | | | 0.05 | | | | 0.05 | | | | 0.08 | | | | 0.03 | | | | 0.06 | |
| | | | | | | | | | | | | | | | | | | | |
Total From Investment Operations | | | 0.08 | | | | 0.08 | | | | 0.08 | | | | 0.06 | | | | 0.09 | |
| | | | | | | | | | | | | | | | | | | | |
| | | | | |
Less: Dividend Distributions: | | | | | | | | | | | | | | | | | | | | |
From Net Investment Income | | | (0.03 | ) | | | — | (f) | | | (0.03 | ) | | | (0.03 | ) | | | — | (f) |
From Capital Gains | | | (0.02 | ) | | | (0.01 | ) | | | (0.01 | ) | | | — | (f) | | | — | (f) |
| | | | | | | | | | | | | | | | | | | | |
Total Distributions | | | (0.05 | ) | | | (0.01 | ) | | | (0.04 | ) | | | (0.03 | ) | | | — | |
| | | | | | | | | | | | | | | | | | | | |
Net Asset Value, End of Period | | $ | 1.25 | | | $ | 1.22 | | | $ | 1.15 | | | $ | 1.11 | | | $ | 1.08 | |
| | | | | | | | | | | | | | | | | | | | |
Total Return (%) | | | 6.62 | | | | 7.34 | | | | 7.44 | | | | 5.79 | | | | 9.34 | |
Net Assets, End of Period ($ millions) | | | 123 | | | | 98 | | | | 86 | | | | 66 | | | | 52 | |
Ratio of Net Investment Income (Loss) to Average Net Assets (%) | | | 2.31 | | | | 2.45 | | | | 0.03 | | | | 3.40 | | | | 3.47 | |
Ratio of Expenses to Average Net Assets Before Expense Reimbursement (%)(d) | | | — | | | | — | | | | — | | | | — | | | | — | |
Ratio of Expenses to Average Net Assets After Expense Reimbursement (%)(d) | | | — | | | | — | | | | — | | | | — | | | | — | |
Portfolio Turnover Rate (%)(a) | | | 17.24 | | | | 10.16 | | | | 10.14 | | | | 12.14 | | | | 20.11 | |
| (a) | Portfolio turnover rate excludes all short-term securities. |
| (d) | Allocation and Retirement Funds exclude expenses of the underlying funds. |
| (e) | For the period October 1, 2012 (commencement of operations) through December 31, 2012. |
| (f) | Amount is less than $0.005 per share. |
NA = Not Applicable
The accompanying notes are an integral part of these financial statements.
94
| | | | | | | | | | | | | | | | | | | | | | | | | | | | | | | | | | | | | | | | |
| Moderate Allocation Fund | | | Aggressive Allocation Fund | | | |
| Years Ended December 31, | | | Years Ended December 31, | | | |
| 2014 | | | 2013 | | | 2012 | | | 2011 | | | 2010 | | | 2014 | | | 2013 | | | 2012 | | | 2011 | | | 2010 | | | |
| $ | 1.45 | | | $ | 1.27 | | | $ | 1.18 | | | $ | 1.16 | | | $ | 1.03 | | | $ | 1.69 | | | $ | 1.38 | | | $ | 1.24 | | | $ | 1.24 | | | $ | 1.06 | | | |
| | | | | | | | | | | | | | | | | | | | | | | | | | | | | | | | | | | | | | | | |
| | | | | | | | | | |
| | | | | | | | | | | | | | | | | | | | | | | | | | | | | | | | | | | | | | | | |
| | 0.03 | | | | 0.03 | | | | — | (f) | | | 0.03 | | | | 0.03 | | | | 0.03 | | | | 0.03 | | | | — | (f) | | | 0.02 | | | | 0.02 | | | |
| | 0.09 | | | | 0.16 | | | | 0.13 | | | | 0.02 | | | | 0.11 | | | | 0.11 | | | | 0.30 | | | | 0.17 | | | | — | (f) | | | 0.16 | | | |
| | | | | | | | | | | | | | | | | | | | | | | | | | | | | | | | | | | | | | | | |
| | 0.12 | | | | 0.19 | | | | 0.13 | | | | 0.05 | | | | 0.14 | | | | 0.14 | | | | 0.33 | | | | 0.17 | | | | 0.02 | | | | 0.18 | | | |
| | | | | | | | | | | | | | | | | | | | | | | | | | | | | | | | | | | | | | | | |
| | | | | | | | | | |
| | | | | | | | | | | | | | | | | | | | | | | | | | | | | | | | | | | | | | | | |
| | (0.03 | ) | | | — | (f) | | | (0.03 | ) | | | (0.03 | ) | | | — | (f) | | | (0.03 | ) | | | — | (f) | | | (0.03 | ) | | | (0.02 | ) | | | — | (f) | | |
| | (0.02 | ) | | | (0.01 | ) | | | (0.01 | ) | | | — | (f) | | | (0.01 | ) | | | (0.03 | ) | | | (0.02 | ) | | | — | (f) | | | — | | | | — | | | |
| | | | | | | | | | | | | | | | | | | | | | | | | | | | | | | | | | | | | | | | |
| | (0.05 | ) | | | (0.01 | ) | | | (0.04 | ) | | | (0.03 | ) | | | (0.01 | ) | | | (0.06 | ) | | | (0.02 | ) | | | (0.03 | ) | | | (0.02 | ) | | | — | | | |
| | | | | | | | | | | | | | | | | | | | | | | | | | | | | | | | | | | | | | | | |
| $ | 1.52 | | | $ | 1.45 | | | $ | 1.27 | | | $ | 1.18 | | | $ | 1.16 | | | $ | 1.77 | | | $ | 1.69 | | | $ | 1.38 | | | $ | 1.24 | | | $ | 1.24 | | | |
| | | | | | | | | | | | | | | | | | | | | | | | | | | | | | | | | | | | | | | | |
| | 7.71 | | | | 15.66 | | | | 10.90 | | | | 4.19 | | | | 13.11 | | | | 7.66 | | | | 24.19 | | | | 13.41 | | | | 2.31 | | | | 17.02 | | | |
| | 315 | | | | 281 | | | | 225 | | | | 182 | | | | 163 | | | | 255 | | | | 236 | | | | 187 | | | | 158 | | | | 147 | | | |
| | 1.95 | | | | 2.09 | | | | 0.02 | | | | 2.68 | | | | 2.73 | | | | 1.60 | | | | 1.75 | | | | 0.01 | | | | 2.13 | | | | 2.07 | | | |
| | — | | | | — | | | | — | | | | — | | | | — | | | | — | | | | — | | | | — | | | | — | | | | — | | | |
| | — | | | | — | | | | — | | | | — | | | | — | | | | — | | | | — | | | | — | | | | — | | | | — | | | |
| | 13.87 | | | | 4.71 | | | | 8.11 | | | | 11.21 | | | | 15.68 | | | | 19.61 | | | | 4.93 | | | | 7.82 | | | | 7.73 | | | | 12.91 | | | |
The accompanying notes are an integral part of these financial statements.
95
MUTUAL OF AMERICA INVESTMENT CORPORATION
FINANCIAL HIGHLIGHTS (Continued)
| | | | | | | | | | | | | | | | | | | | |
| | | Money Market Fund | |
| | | Years Ended December 31, | |
| | | 2014 | | | 2013 | | | 2012 | | | 2011 | | | 2010 | |
Net Asset Value, Beginning of Period | | $ | 1.20 | | | $ | 1.20 | | | $ | 1.20 | | | $ | 1.20 | | | $ | 1.21 | |
| | | | | | | | | | | | | | | | | | | | |
| | | | | |
INCOME (LOSS)FROM INVESTMENT OPERATIONS: | | | | | | | | | | | | | | | | | | | | |
Net Investment Income (Loss) | | | — | (f) | | | — | (f) | | | — | (f) | | | — | (f) | | | — | (f) |
Net Realized and Unrealized Gains (Losses) on Investments and Futures Contracts | | | — | (f) | | | — | (f) | | | — | (f) | | | — | (f) | | | (0.01 | ) |
| | | | | | | | | | | | | | | | | | | | |
Total From Investment Operations | | | — | | | | — | | | | — | | | | — | | | | (0.01 | ) |
| | | | | | | | | | | | | | | | | | | | |
| | | | | |
Less: Dividend Distributions: | | | | | | | | | | | | | | | | | | | | |
From Net Investment Income | | | — | | | | — | | | | — | | | | — | | | | — | |
From Capital Gains | | | — | | | | — | | | | — | | | | — | | | | — | |
| | | | | | | | | | | | | | | | | | | | |
Total Distributions | | | — | | | | — | | | | — | | | | — | | | | — | |
| | | | | | | | | | | | | | | | | | | | |
Net Asset Value, End of Period | | $ | 1.20 | | | $ | 1.20 | | | $ | 1.20 | | | $ | 1.20 | | | $ | 1.20 | |
| | | | | | | | | | | | | | | | | | | | |
Total Return (%) | | | (0.14 | ) | | | (0.16 | ) | | | (0.17 | ) | | | (0.17 | ) | | | (0.14 | ) |
Net Assets, End of Period ($ millions) | | | 77 | | | | 84 | | | | 90 | | | | 101 | | | | 109 | |
Ratio of Net Investment Income (Loss) to Average Net Assets (%) | | | (0.14 | ) | | | (0.16 | ) | | | (0.18 | ) | | | (0.17 | ) | | | (0.15 | ) |
Ratio of Expenses to Average Net Assets Before Expense Reimbursement (%) | | | 0.24 | | | | 0.27 | | | | 0.30 | | | | 0.31 | | | | 0.32 | |
Ratio of Expenses to Average Net Assets After Expense Reimbursement (%) | | | 0.24 | | | | 0.27 | | | | 0.30 | | | | 0.31 | | | | 0.32 | |
Portfolio Turnover Rate (%)(a) | | | NA | | | | NA | | | | NA | | | | NA | | | | NA | |
| (a) | Portfolio turnover rate excludes all short-term securities. |
| (d) | Allocation and Retirement Funds exclude expenses of the underlying funds. |
| (e) | For the period October 1, 2012 (commencement of operations) through December 31, 2012. |
| (f) | Amount is less than $0.005 per share. |
NA = Not Applicable
The accompanying notes are an integral part of these financial statements.
96
| | | | | | | | | | | | | | | | | | | | | | | | | | | | | | | | | | | | | | | | |
| Mid-Term Bond Fund | | | Bond Fund | | | |
| Years Ended December 31, | | | Years Ended December 31, | | | |
| 2014 | | | 2013 | | | 2012 | | | 2011 | | | 2010 | | | 2014 | | | 2013 | | | 2012 | | | 2011 | | | 2010 | | | |
| $ | 1.05 | | | $ | 1.09 | | | $ | 1.06 | | | $ | 1.03 | | | $ | 1.00 | | | $ | 1.41 | | | $ | 1.47 | | | $ | 1.39 | | | $ | 1.34 | | | $ | 1.30 | | | |
| | | | | | | | | | | | | | | | | | | | | | | | | | | | | | | | | | | | | | | | |
| | | | | | | | | | |
| | | | | | | | | | | | | | | | | | | | | | | | | | | | | | | | | | | | | | | | |
| | 0.03 | | | | 0.03 | | | | 0.03 | | | | 0.03 | | | | 0.04 | | | | 0.04 | | | | 0.05 | | | | 0.05 | | | | 0.05 | | | | 0.05 | | | |
| | 0.02 | | | | (0.04 | ) | | | — | (f) | | | 0.03 | | | | 0.02 | | | | 0.04 | | | | (0.06 | ) | | | 0.03 | | | | 0.05 | | | | 0.04 | | | |
| | | | | | | | | | | | | | | | | | | | | | | | | | | | | | | | | | | | | | | | |
| | 0.05 | | | | (0.01 | ) | | | 0.03 | | | | 0.06 | | | | 0.06 | | | | 0.08 | | | | (0.01 | ) | | | 0.08 | | | | 0.10 | | | | 0.09 | | | |
| | | | | | | | | | | | | | | | | | | | | | | | | | | | | | | | | | | | | | | | |
| | | | | | | | | | |
| | | | | | | | | | | | | | | | | | | | | | | | | | | | | | | | | | | | | | | | |
| | (0.03 | ) | | | (0.03 | ) | | | — | (f) | | | (0.03 | ) | | | (0.03 | ) | | | (0.04 | ) | | | (0.05 | ) | | | — | (f) | | | (0.05 | ) | | | (0.05 | ) | | |
| | (0.01 | ) | | | — | (f) | | | — | (f) | | | — | | | | — | (f) | | | — | | | | — | (f) | | | — | | | | — | | | | — | | | |
| | | | | | | | | | | | | | | | | | | | | | | | | | | | | | | | | | | | | | | | |
| | (0.04 | ) | | | (0.03 | ) | | | — | | | | (0.03 | ) | �� | | (0.03 | ) | | | (0.04 | ) | | | (0.05 | ) | | | — | | | | (0.05 | ) | | | (0.05 | ) | | |
| | | | | | | | | | | | | | | | | | | | | | | | | | | | | | | | | | | | | | | | |
| $ | 1.06 | | | $ | 1.05 | | | $ | 1.09 | | | $ | 1.06 | | | $ | 1.03 | | | $ | 1.45 | | | $ | 1.41 | | | $ | 1.47 | | | $ | 1.39 | | | $ | 1.34 | | | |
| | | | | | | | | | | | | | | | | | | | | | | | | | | | | | | | | | | | | | | | |
| | 3.22 | | | | (0.55 | ) | | | 3.33 | | | | 6.34 | | | | 6.93 | | | | 6.31 | | | | (0.91 | ) | | | 5.79 | | | | 7.30 | | | | 7.29 | | | |
| | 435 | | | | 392 | | | | 387 | | | | 338 | | | | 298 | | | | 956 | | | | 804 | | | | 753 | | | | 635 | | | | 597 | | | |
| | 2.57 | | | | 2.77 | | | | 2.94 | | | | 3.02 | | | | 3.66 | | | | 3.59 | | | | 3.35 | | | | 3.55 | | | | 3.61 | | | | 3.81 | | | |
| | 0.49 | | | | 0.51 | | | | 0.55 | | | | 0.55 | | | | 0.57 | | | | 0.48 | | | | 0.51 | | | | 0.55 | | | | 0.55 | | | | 0.57 | | | |
| | 0.49 | | | | 0.51 | | | | 0.55 | | | | 0.55 | | | | 0.57 | | | | 0.48 | | | | 0.51 | | | | 0.55 | | | | 0.55 | | | | 0.57 | | | |
| | 36.56 | | | | 23.94 | | | | 14.30 | | | | 23.69 | | | | 16.70 | | | | 15.00 | | | | 27.41 | | | | 28.89 | | | | 30.24 | | | | 40.33 | | | |
The accompanying notes are an integral part of these financial statements.
97
MUTUAL OF AMERICA INVESTMENT CORPORATION
NOTES TO FINANCIAL STATEMENTS
December 31, 2014
| 1. | SIGNIFICANT ACCOUNTING POLICIESAND ORGANIZATION |
Mutual of America Investment Corporation (the “Investment Company”) is a diversified, open-end management investment company — a type of company commonly known as a “mutual fund”. It is registered as such under the Investment Company Act of 1940 (the “Investment Company Act”). The Investment Company was formed on February 21, 1986 as a Maryland corporation and principally offers its shares exclusively to separate accounts of Mutual of America Life Insurance Company (“Mutual of America Life”) and its affiliates. As a “series” type mutual fund, the Investment Company issues separate classes (or series) of capital stock, each of which represents a separate Fund of investments. At December 31, 2014, there were 24 active Funds (collectively, “the Funds”): Equity Index Fund, All America Fund, Small Cap Value Fund, Small Cap Growth Fund, Mid Cap Value Fund, Mid-Cap Equity Index Fund, International Fund, Composite Fund, Money Market Fund, Mid-Term Bond Fund, Bond Fund; Retirement Income Fund, 2010 Retirement Fund, 2015 Retirement Fund, 2020 Retirement Fund, 2025 Retirement Fund, 2030 Retirement Fund, 2035 Retirement Fund, 2040 Retirement Fund, 2045 Retirement Fund and 2050 Retirement Fund (collectively, “Retirement Funds”); a Conservative Allocation Fund, a Moderate Allocation Fund and an Aggressive Allocation Fund (collectively, “Allocation Funds”). The International Fund and the Retirement Funds (other than the 2050 Retirement Fund) commenced operations on November 5, 2007. The 2050 Retirement Fund commenced operations on October 1, 2012.
Investment Company shares are issued to Mutual of America Life and, on a limited basis, to Wilton Reassurance Life Company of New York (formerly The American Life Insurance Company of New York), for allocation to their Separate Accounts as a funding medium for variable accumulation annuity contracts and variable life insurance policies. In addition, shares of selected equity and fixed income funds of the Investment Company are directly issued to one or more of the Investment Company’s Retirement Funds and Allocation Funds.
The preparation of financial statements in accordance with U.S. generally accepted accounting principles (“GAAP”) requires management to make estimates and assumptions that affect the reported amounts of assets, liabilities, income, expenses and related disclosures. Changes in the economic environment, financial markets and any other parameters used in determining these estimates could cause actual results to differ.
The following is a summary of the significant accounting policies consistently followed by the Investment Company, which are in conformity with GAAP:
Fair Value — The Investment Company values its investments at fair value. Fair value is an estimate of the price the Fund would receive upon selling a security in an orderly arms-length transaction. Investments are categorized based on a three-level valuation hierarchy for measurement and disclosure of fair value. The valuation hierarchy is based upon the transparency of inputs used to measure fair value. These inputs are summarized in the three broad levels listed below:
| | • | | Level 1 — quoted prices in active markets for identical securities. |
| | • | | Level 2 — other significant observable inputs (including yield, quality, coupon rate, maturity, issue type, quoted prices for similar securities, prepayment speeds, trading characteristics, etc.). |
| | • | | Level 3 — significant unobservable inputs (including the Fund’s own assumptions in determining the fair value of investments). |
As of December 31, 2014 management determined that the fair value inputs for all equity securities, including shares of registered investment companies, were considered Level 1, with the exception of non-registered securities under Rule 144A of the Securities Act of 1933 which were considered Level 2. In addition, certain Rule 144A securities not actively traded are considered Level 3; however, there were no such securities as of December 31, 2014. Fair value inputs for all debt securities were considered Level 2. The inputs or methodologies used for valuing securities are not necessarily an indication of the risk associated with investing in those securities. Transfers between levels are reflected based on the fair value at the beginning of a reporting period.
98
MUTUAL OF AMERICA INVESTMENT CORPORATION
NOTES TO FINANCIAL STATEMENTS (Continued)
December 31, 2014
| 1. | SIGNIFICANT ACCOUNTING POLICIESAND ORGANIZATION (CONTINUED) |
The following is a summary of the inputs used to value the Funds’ investments and other financial instruments as of December 31, 2014:
| | | | | | | | | | | | | | | | |
Fund | | Level 1 — Quoted
Prices | | | Level 2 — Significant
Observable Inputs | | | Level 3 — Significant
Unobservable Inputs | | | Total | |
Investments at Fair Value: | | | | | | | | | | | | | | | | |
(See Summary Portfolios or Portfolios of Investments for More Details) | | | | | | | | | | | | | |
Equity Index Fund | | | | | | | | | | | | | | | | |
Common Stock | | $ | 1,727,505,633 | | | | — | | | | — | | | $ | 1,727,505,633 | |
Short-Term Debt Securities | | | — | | | $ | 60,091,484 | | | | — | | | $ | 60,091,484 | |
Temporary Cash Investments | | | — | | | $ | 750,000 | | | | — | | | $ | 750,000 | |
| | | | | | | | | | | | | | | | |
| | $ | 1,727,505,633 | | | $ | 60,841,484 | | | | — | | | $ | 1,788,347,117 | |
All America Fund | | | | | | | | | | | | | | | | |
Common Stock-Indexed | | $ | 179,800,853 | | | | — | | | | — | | | $ | 179,800,853 | |
Common Stock-Active | | $ | 132,669,811 | | | | — | | | | — | | | $ | 132,669,811 | |
Short-Term Debt Securities-Indexed | | | — | | | $ | 4,999,081 | | | | — | | | $ | 4,999,081 | |
Short-Term Debt Securities-Active | | | — | | | $ | 5,898,017 | | | | — | | | $ | 5,898,017 | |
Temporary Cash Investments | | | — | | | $ | 228,300 | | | | — | | | $ | 228,300 | |
| | | | | | | | | | | | | | | | |
| | $ | 312,470,664 | | | $ | 11,125,398 | | | | — | | | $ | 323,596,062 | |
Small Cap Value Fund | | | | | | | | | | | | | | | | |
Common Stock | | $ | 377,305,353 | | | | — | | | | — | | | $ | 377,305,353 | |
Short-Term Debt Securities | | | — | | | $ | 17,896,636 | | | | — | | | $ | 17,896,636 | |
| | | | | | | | | | | | | | | | |
| | $ | 377,305,353 | | | $ | 17,896,636 | | | | — | | | $ | 395,201,989 | |
Small Cap Growth Fund | | | | | | | | | | | | | | | | |
Common Stock | | $ | 398,540,858 | | | | — | | | | — | | | $ | 398,540,858 | |
Short-Term Debt Securities | | | — | | | $ | 13,497,841 | | | | — | | | $ | 13,497,841 | |
| | | | | | | | | | | | | | | | |
| | $ | 398,540,858 | | | $ | 13,497,841 | | | | — | | | $ | 412,038,699 | |
Mid Cap Value Fund | | | | | | | | | | | | | | | | |
Common Stock | | $ | 88,846,109 | | | | — | | | | — | | | $ | 88,846,109 | |
Short-Term Debt Securities | | | — | | | $ | 3,249,448 | | | | — | | | $ | 3,249,448 | |
| | | | | | | | | | | | | | | | |
| | $ | 88,846,109 | | | $ | 3,249,448 | | | | — | | | $ | 92,095,557 | |
Mid-Cap Equity Index Fund | | | | | | | | | | | | | | | | |
Common Stock | | $ | 971,768,222 | | | | — | | | | — | | | $ | 971,768,222 | |
Short-Term Debt Securities | | | — | | | $ | 31,195,493 | | | | — | | | $ | 31,195,493 | |
Temporary Cash Investments | | | — | | | $ | 100,000 | | | | — | | | $ | 100,000 | |
| | | | | | | | | | | | | | | | |
| | $ | 971,768,222 | | | $ | 31,295,493 | | | | — | | | $ | 1,003,063,715 | |
International Fund | | | | | | | | | | | | | | | | |
Common Stock | | $ | 252,326,707 | | | | — | | | | — | | | $ | 252,326,707 | |
Short-Term Debt Securities | | | — | | | $ | 11,396,460 | | | | — | | | $ | 11,396,460 | |
| | | | | | | | | | | | | | | | |
| | $ | 252,326,707 | | | $ | 11,396,460 | | | | — | | | $ | 263,723,167 | |
Composite Fund | | | | | | | | | | | | | | | | |
Common Stock | | $ | 114,242,580 | | | | — | | | | — | | | $ | 114,242,580 | |
U.S. Government Debt | | | — | | | $ | 16,835,903 | | | | — | | | $ | 16,835,903 | |
U.S. Government Agency Residential
Mortgage-Backed Obligations | | | — | | | $ | 24,216,706 | | | | — | | | $ | 24,216,706 | |
U.S. Government Agency
Non-Mortgage-Backed Obligations | | | — | | | $ | 445,483 | | | | — | | | $ | 445,483 | |
Long-Term Corporate Debt | | | — | | | $ | 32,552,782 | | | | — | | | $ | 32,552,782 | |
Short-Term Debt Securities | | | — | | | $ | 4,449,115 | | | | — | | | $ | 4,449,115 | |
Temporary Cash Investments | | | — | | | $ | 808,900 | | | | — | | | $ | 808,900 | |
| | | | | | | | | | | | | | | | |
| | $ | 114,242,580 | | | $ | 79,308,889 | | | | — | | | $ | 193,551,469 | |
99
MUTUAL OF AMERICA INVESTMENT CORPORATION
NOTES TO FINANCIAL STATEMENTS (Continued)
December 31, 2014
| 1. | SIGNIFICANT ACCOUNTING POLICIESAND ORGANIZATION (CONTINUED) |
| | | | | | | | | | | | | | | | |
Fund | | Level 1 — Quoted
Prices | | | Level 2 — Significant
Observable Inputs | | | Level 3 — Significant
Unobservable Inputs | | | Total | |
Retirement Income Fund | | | | | | | | | | | | | | | | |
Common Stock | | $ | 53,535,315 | | | | — | | | | — | | | $ | 53,535,315 | |
2010 Retirement Fund | | | | | | | | | | | | | | | | |
Common Stock | | $ | 26,558,105 | | | | — | | | | — | | | $ | 26,558,105 | |
2015 Retirement Fund | | | | | | | | | | | | | | | | |
Common Stock | | $ | 154,162,876 | | | | — | | | | — | | | $ | 154,162,876 | |
2020 Retirement Fund | | | | | | | | | | | | | | | | |
Common Stock | | $ | 320,042,019 | | | | — | | | | — | | | $ | 320,042,019 | |
2025 Retirement Fund | | | | | | | | | | | | | | | | |
Common Stock | | $ | 331,091,047 | | | | — | | | | — | | | $ | 331,091,047 | |
2030 Retirement Fund | | | | | | | | | | | | | | | | |
Common Stock | | $ | 277,060,170 | | | | — | | | | — | | | $ | 277,060,170 | |
2035 Retirement Fund | | | | | | | | | | | | | | | | |
Common Stock | | $ | 229,853,630 | | | | — | | | | — | | | $ | 229,853,630 | |
2040 Retirement Fund | | | | | | | | | | | | | | | | |
Common Stock | | $ | 188,610,656 | | | | — | | | | — | | | $ | 188,610,656 | |
2045 Retirement Fund | | | | | | | | | | | | | | | | |
Common Stock | | $ | 232,106,622 | | | | — | | | | — | | | $ | 232,106,622 | |
2050 Retirement Fund | | | | | | | | | | | | | | | | |
Common Stock | | $ | 50,211,014 | | | | — | | | | — | | | $ | 50,211,014 | |
Conservative Allocation Fund | | | | | | | | | | | | | | | | |
Common Stock | | $ | 122,523,125 | | | | — | | | | — | | | $ | 122,523,125 | |
Moderate Allocation Fund | | | | | | | | | | | | | | | | |
Common Stock | | $ | 315,208,180 | | | | — | | | | — | | | $ | 315,208,180 | |
Aggressive Allocation Fund | | | | | | | | | | | | | | | | |
Common Stock | | $ | 254,800,202 | | | | — | | | | — | | | $ | 254,800,202 | |
Money Market Fund | | | | | | | | | | | | | | | | |
U.S. Government Debt | | | — | | | $ | 2,999,067 | | | | — | | | $ | 2,999,067 | |
U.S. Government Agency Short-Term Debt | | | — | | | $ | 34,875,109 | | | | — | | | $ | 34,875,109 | |
Commercial Paper | | | — | | | $ | 38,121,033 | | | | — | | | $ | 38,121,033 | |
Temporary Cash Investments | | | — | | | $ | 1,484,000 | | | | — | | | $ | 1,484,000 | |
| | | | | | | | | | | | | | | | |
| | | — | | | $ | 77,479,209 | | | | — | | | $ | 77,479,209 | |
Mid-Term Bond Fund | | | | | | | | | | | | | | | | |
U.S. Government Debt | | | — | | | $ | 125,199,486 | | | | — | | | $ | 125,199,486 | |
U.S. Government Agency Residential
Mortgage-Backed Obligations | | | — | | | $ | 5,879 | | | | — | | | $ | 5,879 | |
U.S. Government Agency
Non-Mortgage-Backed Obligations | | | — | | | $ | 33,047,006 | | | | — | | | $ | 33,047,006 | |
Long-Term Corporate Debt | | | — | | | $ | 271,127,819 | | | | — | | | $ | 271,127,819 | |
Short-Term Debt Securities | | | — | | | $ | 3,009,562 | | | | — | | | $ | 3,009,562 | |
Temporary Cash Investments | | | — | | | $ | 11,100 | | | | — | | | $ | 11,100 | |
| | | | | | | | | | | | | | | | |
| | | — | | | $ | 432,400,852 | | | | — | | | $ | 432,400,852 | |
Bond Fund | | | | | | | | | | | | | | | | |
U.S. Government Debt | | | — | | | $ | 118,392,909 | | | | — | | | $ | 118,392,909 | |
U.S. Government Agency Residential
Mortgage-Backed Obligations | | | — | | | $ | 269,875,058 | | | | — | | | $ | 269,875,058 | |
U.S. Government Agency
Non-Mortgage-Backed Obligations | | | — | | | $ | 32,798,933 | | | | — | | | $ | 32,798,933 | |
Long-Term Corporate Debt | | | — | | | $ | 518,042,692 | | | | — | | | $ | 518,042,692 | |
Sovereign Debt | | | — | | | $ | 4,029,201 | | | | — | | | $ | 4,029,201 | |
Short-Term Debt Securities | | | — | | | $ | 10,298,221 | | | | — | | | $ | 10,298,221 | |
Temporary Cash Investments | | | — | | | $ | 2,798,500 | | | | — | | | $ | 2,798,500 | |
| | | | | | | | | | | | | | | | |
| | | — | | | $ | 956,235,514 | | | | — | | | $ | 956,235,514 | |
100
MUTUAL OF AMERICA INVESTMENT CORPORATION
NOTES TO FINANCIAL STATEMENTS (Continued)
December 31, 2014
| 1. | SIGNIFICANT ACCOUNTING POLICIESAND ORGANIZATION (CONTINUED) |
| | | | | | | | | | | | | | | | |
Fund | | Level 1 — Quoted
Prices | | | Level 2 — Significant
Observable Inputs | | | Level 3 — Significant
Unobservable Inputs | | | Total | |
Other Financial Instruments:* | | | | | | | | | | | | | | | | |
| | | | |
Equity Index Fund | | $ | 656,358 | | | | — | | | | — | | | $ | 656,358 | |
All America Fund | | $ | (32,565 | ) | | | — | | | | — | | | $ | (32,565 | ) |
Mid-Cap Equity Index Fund | | $ | 657,202 | | | | — | | | | — | | | $ | 657,202 | |
| * | Other financial instruments are derivative instruments not reflected in the Portfolio of Investments, such as futures, which are valued at the unrealized appreciation/depreciation on the instrument. |
During the year ended December 31, 2014, there were no transfers of securities between Level 1, Level 2, or Level 3.
Security Valuation — Investment securities are carried at fair value as follows:
Exchange-traded equity securities are valued at the last reported sales price on the principal exchange on which the security is traded. If there is no trading volume for a particular valuation day, the last bid price is used. For equity securities traded in the over-the-counter market, the security is valued at the last sale price, or if no sale, at the latest bid price available.
Short-term debt securities with a maturity of 60 days or less are valued at amortized cost, which approximates fair value for such securities.
Debt securities, including short-term debt securities maturing in excess of 60 days, are valued on the basis of prices obtained from an independent pricing source. The pricing source may utilize various pricing methodologies that incorporate both models (which consider factors such as yield, quality, coupon rate, maturity, issue type, quoted prices for similar securities, prepayment speeds and trading characteristics) and dealer-supplied valuations to derive a valuation.
In the rare instance when a price is not available from an independent pricing source or when prices may not reflect fair value, such as when the price provided by the pricing source is not based on a recent trade, a calculated fair value is used, as determined in good faith by the Adviser and reviewed by a Valuation Committee, in accordance with procedures adopted by the Board of Directors of the Investment Company.
The Advisor uses a market approach to calculate fair value for equity securities which are categorized as Level 3. The Adviser’s valuation is primarily based on information regarding the specific equity issuer, such as the last trade price, financial statements, the relationship of per-share book value to the last trade price, operating information and any corporate actions, such as dividends or returns of capital, that may have occurred since the last trade. The Adviser also considers industry-specific conditions and overall market conditions, to determine whether the last trade price reflects fair value or needs to be adjusted. Generally, absent any significant contrary indications, the last trade price will be used as the calculated fair value.
The Retirement Funds and the Allocation Funds value their investments in the underlying Funds of the Investment Company at their respective net asset values.
Investment Transactions — Investment transactions are accounted for as of the trade date. Realized gains and losses on the sale of short and long-term debt securities are computed on the basis of amortized cost at the time of sale. Realized gains and losses on the sale of equity securities are based on the identified cost basis of the security, determined on the first-in, first-out (“FIFO”) basis.
Futures Contracts — The Equity Index Fund, Mid-Cap Equity Index Fund and a portion of the All America Fund each maintain indexed asset portfolios which are subject to equity price risk. In order to remain more fully invested in the equity markets while minimizing transaction costs, the funds purchase stock index futures contracts. An initial cash margin deposit (represented by cash or Treasury bills) is made upon entering into a futures contract and serves as
101
MUTUAL OF AMERICA INVESTMENT CORPORATION
NOTES TO FINANCIAL STATEMENTS (Continued)
December 31, 2014
| 1. | SIGNIFICANT ACCOUNTING POLICIESAND ORGANIZATION (CONTINUED) |
collateral for the contract. This initial margin, maintained in a segregated account, is equal to approximately 5%-6% of the contract amount, and does not involve the borrowing of funds to finance the transaction. During the period the futures contract is outstanding, changes in the value of the contract are recognized as unrealized appreciation or depreciation by “marking-to-market” on a daily basis to reflect the market value of the contract at the end of each trading day. The accumulated unrealized appreciation or depreciation on the contract is included in Net Unrealized Appreciation (Depreciation) of Investments and Futures Contracts in the Components of Net Assets section of the Statements of Assets and Liabilities. Futures contracts are valued at the settlement price established each day by the exchange on which traded. Depending upon whether unrealized appreciation or depreciation are incurred, variation margin payments are received or made daily. The net change in unrealized appreciation or depreciation of futures contracts is recorded in the Statements of Operations. When the contract is closed, a realized gain or loss from futures transactions is recorded in the Statements of Operations, equal to the net variation margin received or paid over the period the contract was outstanding.
The “Underlying Face Amount at Value” (appearing in the “Footnotes to the Summary Portfolio of Investments in Securities”) representing the aggregate of outstanding contractual amounts under futures contracts reflects the extent of a Fund’s exposure to off-balance sheet risk. The use of futures transactions involves the risk of imperfect correlation in the price movements of the contract and the underlying securities. With futures contracts, there is minimal counterparty credit risk to the Fund since futures are exchange traded and the exchange’s clearinghouse, as counterparty to all exchange traded futures, guarantees the futures against default.
During the year ended December 31, 2014, the Equity Index Fund, Mid-Cap Equity Index Fund and the All America Fund purchased futures contracts with total principal amounts of $488,097,486, $236,522,358 and $42,995,370, respectively.
Retirement Funds — Each of the Retirement Funds invests in equity (stock) funds and fixed income (bond) funds and targets different percentages to these asset classes. The targets reflect varying emphases on achieving capital appreciation and gains versus preserving capital and producing income, depending on the specific Fund’s time horizon.
The Retirement Funds target their investments in the following underlying funds of the Investment Company in accordance with the percentage allocations noted:
| | | | | | | | | | | | | | | | | | | | | | | | | | | | | | | | |
| | | Equity
Index
Fund | | | Mid-Cap
Equity
Index
Fund | | | Small Cap
Growth
Fund | | | Small Cap
Value
Fund | | | International
Fund | | | Bond
Fund | | | Mid-Term
Bond
Fund | | | Money
Market
Fund | |
Retirement Income Fund | | | 20% | | | | 5% | | | | — | | | | — | | | | — | | | | 30% | | | | 40% | | | | 5% | |
2010 Retirement Fund | | | 25% | | | | 9% | | | | — | | | | — | | | | 3% | | | | 25% | | | | 33% | | | | 5% | |
2015 Retirement Fund | | | 28% | | | | 11% | | | | 1% | | | | 1% | | | | 6% | | | | 25% | | | | 28% | | | | — | |
2020 Retirement Fund | | | 33% | | | | 11% | | | | 2% | | | | 2% | | | | 9% | | | | 25% | | | | 18% | | | | — | |
2025 Retirement Fund | | | 37% | | | | 16% | | | | 3% | | | | 3% | | | | 10% | | | | 23% | | | | 8% | | | | — | |
2030 Retirement Fund | | | 40% | | | | 17% | | | | 5% | | | | 5% | | | | 10% | | | | 23% | | | | — | | | | — | |
2035 Retirement Fund | | | 40% | | | | 20% | | | | 6% | | | | 6% | | | | 12% | | | | 16% | | | | — | | | | — | |
2040 Retirement Fund | | | 35% | | | | 23% | | | | 8% | | | | 8% | | | | 14% | | | | 12% | | | | — | | | | — | |
2045 Retirement Fund | | | 35% | | | | 21% | | | | 9% | | | | 9% | | | | 16% | | | | 10% | | | | — | | | | — | |
2050 Retirement Fund | | | 35% | | | | 20% | | | | 10% | | | | 10% | | | | 17% | | | | 8% | | | | — | | | | — | |
Generally, rebalancing of the Retirement Funds’ holdings is performed on a quarterly or other periodic basis and the mix of underlying Funds is reviewed annually.
102
MUTUAL OF AMERICA INVESTMENT CORPORATION
NOTES TO FINANCIAL STATEMENTS (Continued)
December 31, 2014
| 1. | SIGNIFICANT ACCOUNTING POLICIESAND ORGANIZATION (CONTINUED) |
Allocation Funds — The Allocation Funds target their investments in the following underlying Funds of the Investment Company in accordance with the percentage allocations noted:
| | | | | | | | | | | | | | | | | | | | | | | | | | | | |
| | | Equity
Index
Fund | | | Mid-Cap
Equity
Index
Fund | | | Small Cap
Growth
Fund | | | Small Cap
Value
Fund | | | International
Fund | | | Bond
Fund | | | Mid-Term
Bond
Fund | |
Conservative Allocation | | | 25% | | | | 5% | | | | — | | | | — | | | | 5% | | | | 30% | | | | 35% | |
Moderate Allocation | | | 35% | | | | 15% | | | | — | | | | — | | | | 10% | | | | 25% | | | | 15% | |
Aggressive Allocation | | | 35% | | | | 20% | | | | 5% | | | | 5% | | | | 15% | | | | 20% | | | | — | |
Generally, rebalancing of the Allocation Funds’ holdings is performed on a periodic basis.
Change in Target Investments — During the year, the Retirement Funds listed below had changes to their target investments. Additionally, each of the Allocation Funds had added the International Fund as an equity fund investment during the period. The Conservative Allocation Fund had also added the Mid-Cap Equity Index Fund as an equity fund investment during the period. Overall increases (decreases) to the target percentages were as follows:
| | | | | | | | | | | | | | | | | | | | | | | | | | | | | | | | |
| | | Equity
Index
Fund | | | Mid-Cap
Equity
Index
Fund | | | Small Cap
Growth
Fund | | | Small Cap
Value
Fund | | | International
Fund | | | Bond
Fund | | | Mid-Term
Bond
Fund | | | Money
Market
Fund | |
2010 Retirement Fund | | | — | | | | (2% | ) | | | — | | | | — | | | | — | | | | — | | | | 2% | | | | — | |
2015 Retirement Fund | | | — | | | | — | | | | (1% | ) | | | (1% | ) | | | — | | | | — | | | | 2% | | | | — | |
2020 Retirement Fund | | | — | | | | — | | | | (1% | ) | | | (1% | ) | | | — | | | | — | | | | 2% | | | | — | |
2025 Retirement Fund | | | — | | | | 1% | | | | (1% | ) | | | (1% | ) | | | 1% | | | | — | | | | — | | | | — | |
Conservative Allocation | | | — | | | | 5% | | | | — | | | | — | | | | 5% | | | | — | | | | (10% | ) | | | — | |
Moderate Allocation | | | — | | | | — | | | | — | | | | — | | | | 10% | | | | (5% | ) | | | (5% | ) | | | — | |
Aggressive Allocation | | | (10% | ) | | | — | | | | — | | | | — | | | | 15% | | | | (5% | ) | | | — | | | | — | |
Investment Income — Interest income, accretion of discount and amortization of premium are recorded daily on an accrual basis using the effective interest method. A debt obligation may cease accrual of income and result in a reduction to interest income when the collection of all or a portion of current and past due interest is in doubt. Dividend income is recorded on the ex-dividend date. Foreign source tax withheld from dividends is recorded as a reduction from dividend income. Should reclamation efforts succeed, such amounts are recorded as income upon collection.
Distributions to Shareholders (“Dividends”) — Distributions to shareholders are recorded on the ex-dividend date and are made at least annually. It is the Investment Company’s policy to make distributions of its net investment income and net realized gains, if any, in accordance with Federal income tax regulations, which may differ from U.S. generally accepted accounting principles. Accordingly, periodic reclassifications (which do not impact the funds’ net asset values) are made within the funds’ capital accounts to reflect income and gains available for distribution under Federal income tax regulations.
Federal Income Taxes — Each Fund in the Investment Company intends to comply with the requirements of the Internal Revenue Code applicable to regulated investment companies and to distribute substantially all of its taxable income to shareholders. Therefore, no Federal income or excise tax provision is required.
GAAP requires the evaluation of tax positions taken in the course of preparing a fund’s tax return to determine whether it is “more-likely-than-not” that tax positions taken in the fund’s tax return will be ultimately sustained, and, if not, a tax liability and expense is recorded.
As of December 31, 2014, management has evaluated the tax positions taken on the Funds’ tax returns for all open tax years and has concluded that no tax provision is required in any of the Funds’ financial statements. Each Fund’s federal and state income, franchise and federal excise tax returns for tax years for which the applicable statutes of limitations have not expired are subject to examination by the Internal Revenue Service and state departments of revenue.
103
MUTUAL OF AMERICA INVESTMENT CORPORATION
NOTES TO FINANCIAL STATEMENTS (Continued)
December 31, 2014
| 1. | SIGNIFICANT ACCOUNTING POLICIESAND ORGANIZATION (CONTINUED) |
At December 31, 2014, no Fund had a capital loss carry forward to offset any future net realized capital gains generated after December 31, 2014.
The Investment Company has an Investment Advisory Agreement with Mutual of America Capital Management LLC (“the Adviser”), an indirect wholly-owned subsidiary of Mutual of America Life. For providing investment management services to each of the Funds of the Investment Company, the Adviser receives a fee, calculated as a daily charge of the value of the net assets of each fund, at the following annual rates:
| | | | |
Fund | | Annual Investment
Management Fee | |
Retirement Funds | | | .05 | % |
Equity Index, Mid-Cap Equity Index, International Funds | | | .075 | % |
Money Market Fund | | | .15 | % |
Bond Fund | | | .39 | % |
All America, Composite, Mid-Term Bond Funds | | | .40 | % |
Mid Cap Value Fund | | | .55 | % |
Small Cap Value, Small Cap Growth Funds | | | .75 | % |
The Adviser does not assess a fee for investment management to the Allocation Funds. However, shareholders in the Allocation Funds (and the Retirement and International Funds) will indirectly bear their pro-rata share of the investment management fees incurred by the underlying Funds in which they invest.
The cost of investment purchases and proceeds from sales of investments, excluding short-term securities and futures contracts, for the year ended December 31, 2014, were as follows:
| | | | | | | | | | | | | | | | | | | | |
| | | Equity Index
Fund | | | All America
Fund | | | Small Cap
Value Fund | | | Small Cap
Growth Fund | | | Mid Cap
Value Fund | |
Cost of investment purchases | | $ | 183,954,286 | | | $ | 47,572,701 | | | $ | 136,971,827 | | | $ | 261,577,511 | | | $ | 41,148,670 | |
| | | | | | | | | | | | | | | | | | | | |
Proceeds from sales of investments | | $ | 125,970,838 | | | $ | 74,270,176 | | | $ | 147,383,052 | | | $ | 301,127,182 | | | $ | 32,168,562 | |
| | | | | | | | | | | | | | | | | | | | |
| | | | | |
| | | Mid-Cap Equity
Index Fund | | | International
Fund | | | Composite
Fund | | | Retirement
Income Fund | | | 2010
Retirement
Fund | |
Cost of investment purchases | | $ | 180,669,554 | | | $ | 106,869,869 | | | $ | 22,529,098 | | | $ | 20,345,720 | | | $ | 6,704,159 | |
| | | | | | | | | | | | | | | | | | | | |
Proceeds from sales of investments | | $ | 147,535,238 | | | $ | 1,382,797 | | | $ | 26,599,231 | | | $ | 7,910,397 | | | $ | 5,103,479 | |
| | | | | | | | | | | | | | | | | | | | |
| | | | | |
| | | 2015
Retirement
Fund | | | 2020
Retirement
Fund | | | 2025
Retirement
Fund | | | 2030
Retirement
Fund | | | 2035
Retirement
Fund | |
Cost of investment purchases | | $ | 34,565,292 | | | $ | 84,823,741 | | | $ | 79,664,576 | | | $ | 68,117,844 | | | $ | 57,771,375 | |
| | | | | | | | | | | | | | | | | | | | |
Proceeds from sales of investments | | $ | 23,531,489 | | | $ | 26,653,946 | | | $ | 17,262,898 | | | $ | 13,142,484 | | | $ | 8,446,126 | |
| | | | | | | | | | | | | | | | | | | | |
| | | | | |
| | | 2040
Retirement
Fund | | | 2045
Retirement
Fund | | | 2050
Retirement
Fund | | | Conservative
Allocation
Fund | | | Moderate
Allocation
Fund | |
Cost of investment purchases | | $ | 42,403,990 | | | $ | 47,477,387 | | | $ | 29,579,677 | | | $ | 39,858,785 | | | $ | 62,576,779 | |
| | | | | | | | | | | | | | | | | | | | |
Proceeds from sales of investments | | $ | 7,073,370 | | | $ | 7,201,711 | | | $ | 495,604 | | | $ | 18,440,215 | | | $ | 41,390,420 | |
| | | | | | | | | | | | | | | | | | | | |
104
MUTUAL OF AMERICA INVESTMENT CORPORATION
NOTES TO FINANCIAL STATEMENTS (Continued)
December 31, 2014
| 3. | INVESTMENTS (CONTINUED) |
| | | | | | | | | | | | | | | | | | |
| | | Aggressive
Allocation
Fund | | | Money
Market
Fund | | | Mid-Term
Bond Fund | | | Bond Fund | | | |
Cost of investment purchases | | $ | 57,953,284 | | | | — | | | $ | 187,398,731 | | | $ | 255,545,458 | | | |
| | | | | | | | | | | | | | | | | | |
Proceeds from sales of investments | | $ | 48,194,660 | | | | — | | | $ | 148,456,466 | | | $ | 129,974,953 | | | |
| | | | | | | | | | | | | | | | | | |
The cost of short-term security purchases for the Money Market Fund for the year ended December 31, 2014, was $1,908,166,366; net proceeds from sales for the year were $1,914,760,778.
The components of net unrealized appreciation (depreciation) of investments for Federal income tax purposes and the cost of investments for Federal income tax purposes at December 31, 2014 for each of the funds were as follows:
| | | | | | | | | | | | | | | | | | | | |
| | | Equity Index
Fund | | | All America
Fund | | | Small Cap
Value Fund | | | Small Cap
Growth Fund | | | Mid Cap
Value Fund | |
Unrealized Appreciation | | $ | 694,181,719 | | | $ | 102,491,477 | | | $ | 100,911,535 | | | $ | 98,068,512 | | | $ | 20,817,308 | |
Unrealized Depreciation | | | (24,404,414 | ) | | | (10,292,888 | ) | | | (12,365,336 | ) | | | (9,460,093 | ) | | �� | (1,249,445 | ) |
| | | | | | | | | | | | | | | | | | | | |
Net | | $ | 669,777,305 | | | $ | 92,198,589 | | | $ | 88,546,199 | | | $ | 88,608,419 | | | $ | 19,567,863 | |
| | | | | | | | | | | | | | | | | | | | |
Tax Cost of Investments | | $ | 1,118,569,813 | | | $ | 231,397,473 | | | $ | 306,655,790 | | | $ | 323,430,280 | | | $ | 72,527,694 | |
| | | | | | | | | | | | | | | | | | | | |
| | | | | |
| | | Mid-Cap Equity
Index Fund | | | International
Fund | | | Composite
Fund | | | Retirement
Income Fund | | | 2010
Retirement
Fund | |
Unrealized Appreciation | | $ | 307,034,807 | | | $ | 8,738,298 | | | $ | 47,530,328 | | | $ | 2,995,971 | | | $ | 2,706,059 | |
Unrealized Depreciation | | | (30,050,327 | ) | | | (7,516,135 | ) | | | (2,099,079 | ) | | | (412,854 | ) | | | (138,321 | ) |
| | | | | | | | | | | | | | | | | | | | |
Net | | $ | 276,984,480 | | | $ | 1,222,163 | | | $ | 45,431,249 | | | $ | 2,583,117 | | | $ | 2,567,738 | |
| | | | | | | | | | | | | | | | | | | | |
Tax Cost of Investments | | $ | 726,079,235 | | | $ | 262,501,004 | | | $ | 148,120,220 | | | $ | 50,952,198 | | | $ | 23,990,367 | |
| | | | | | | | | | | | | | | | | | | | |
| | | | | |
| | | 2015
Retirement
Fund | | | 2020
Retirement
Fund | | | 2025
Retirement
Fund | | | 2030
Retirement
Fund | | | 2035
Retirement
Fund | |
Unrealized Appreciation | | $ | 20,074,607 | | | $ | 44,098,847 | | | $ | 56,061,460 | | | $ | 51,508,275 | | | $ | 45,064,314 | |
Unrealized Depreciation | | | (973,657 | ) | | | (1,412,554 | ) | | | (1,017,636 | ) | | | (588,721 | ) | | | (449,304 | ) |
| | | | | | | | | | | | | | | | | | | | |
Net | | $ | 19,100,950 | | | $ | 42,686,293 | | | $ | 55,043,824 | | | $ | 50,919,554 | | | $ | 44,615,010 | |
| | | | | | | | | | | | | | | | | | | | |
Tax Cost of Investments | | $ | 135,061,926 | | | $ | 277,355,726 | | | $ | 276,047,223 | | | $ | 226,140,616 | | | $ | 185,238,620 | |
| | | | | | | | | | | | | | | | | | | | |
| | | | | |
| | | 2040
Retirement
Fund | | | 2045
Retirement
Fund | | | 2050
Retirement
Fund | | | Conservative
Allocation
Fund | | | Moderate
Allocation
Fund | |
Unrealized Appreciation | | $ | 39,470,516 | | | $ | 50,307,579 | | | $ | 3,168,000 | | | $ | 9,972,163 | | | $ | 60,502,882 | |
Unrealized Depreciation | | | (283,390 | ) | | | (413,206 | ) | | | (244,623 | ) | | | (1,078,001 | ) | | | (8,651,355 | ) |
| | | | | | | | | | | | | | | | | | | | |
Net | | $ | 39,187,126 | | | $ | 49,894,373 | | | $ | 2,923,377 | | | $ | 8,894,162 | | | $ | 51,851,527 | |
| | | | | | | | | | | | | | | | | | | | |
Tax Cost of Investments | | $ | 149,423,530 | | | $ | 182,212,249 | | | $ | 47,287,637 | | | $ | 113,628,963 | | | $ | 263,356,653 | |
| | | | | | | | | | | | | | | | | | | | |
| | | | | |
| | | Aggressive
Allocation
Fund | | | Money Market
Fund | | | Mid-Term Bond
Fund | | | Bond Fund | | | | |
Unrealized Appreciation | | $ | 66,414,032 | | | $ | 4,372 | | | $ | 9,863,728 | | | $ | 31,826,773 | | | | | |
Unrealized Depreciation | | | (7,774,377 | ) | | | 0 | | | | (2,233,818 | ) | | | (6,226,529 | ) | | | | |
| | | | | | | | | | | | | | | | | | | | |
Net | | $ | 58,639,655 | | | $ | 4,372 | | | $ | 7,629,910 | | | $ | 25,600,244 | | | | | |
| | | | | | | | | | | | | | | | | | | | |
Tax Cost of Investments | | $ | 196,160,547 | | | $ | 77,474,837 | | | $ | 424,770,942 | | | $ | 930,635,270 | | | | | |
| | | | | | | | | | | | | | | | | | | | |
105
MUTUAL OF AMERICA INVESTMENT CORPORATION
NOTES TO FINANCIAL STATEMENTS (Continued)
December 31, 2014
| 3. | INVESTMENTS (CONTINUED) |
Differences between amounts reflected in the Statements of Assets and Liabilities and those computed for Federal income tax purposes arise primarily from federal income tax treatment of wash sales, REITs, partnerships, corporate actions and futures contracts.
Investments in affiliated investment companies during the year ended December 31, 2014 were as follows:
| | | | | | | | | | | | | | | | | | | | | | | | | | | | | | | | |
Affiliated Investment Company | | Value as of
December 31,
2013 | | | Purchases | | | Realized
Gain
(Loss) on
Investment
Securities | | | Change in
Unrealized
Appreciation
(Depreciation)
of Investment
Securities | | | Sales | | | Value as of
December 31,
2014 | | | Dividends | | | Realized
Gain,
Distributions | |
Retirement Income Fund | |
Bond Fund | | $ | 11,060,123 | | | $ | 6,422,565 | | | $ | 100,873 | | | $ | 249,594 | | | $ | (1,866,873 | ) | | $ | 15,966,282 | | | $ | 394,506 | | | $ | — | |
Equity Index Fund | | | 9,472,682 | | | | 3,727,671 | | | | 965,507 | | | | 132,293 | | | | (2,663,765 | ) | | | 11,634,388 | | | | 143,331 | | | | 118,483 | |
Mid-Cap Equity Index Fund | | | 2,391,954 | | | | 1,002,981 | | | | 123,022 | | | | 8,089 | | | | (453,966 | ) | | | 3,072,080 | | | | 24,869 | | | | 111,647 | |
Mid-Term Bond Fund | | | 14,794,071 | | | | 8,326,041 | | | | 43,334 | | | | (92,091 | ) | | | (2,489,164 | ) | | | 20,582,191 | | | | 448,724 | | | | 87,392 | |
Money Market Fund | | | 1,853,175 | | | | 866,464 | | | | (2,044 | ) | | | (590 | ) | | | (436,631 | ) | | | 2,280,374 | | | | — | | | | — | |
| | | | | | | | | | | | | | | | | | | | | | | | | | | | | | | | |
Total | | $ | 39,572,005 | | | $ | 20,345,722 | | | $ | 1,230,692 | | | $ | 297,295 | | | $ | (7,910,399 | ) | | $ | 53,535,315 | | | $ | 1,011,430 | | | $ | 317,522 | |
| | | | | | | | | | | | | | | | | | | | | | | | | | | | | | | | |
2010 Retirement Fund | |
Bond Fund | | $ | 5,345,699 | | | $ | 1,785,435 | | | $ | 51,887 | | | $ | 118,304 | | | $ | (816,937 | ) | | $ | 6,484,388 | | | $ | 181,007 | | | $ | — | |
Equity Index Fund | | | 7,044,683 | | | | 1,210,106 | | | | 723,585 | | | | (27,500 | ) | | | (1,780,740 | ) | | | 7,170,134 | | | | 99,692 | | | | 82,410 | |
International Fund | | | 786,432 | | | | 137,509 | | | | 13,015 | | | | (75,526 | ) | | | (99,441 | ) | | | 761,989 | | | | 11,564 | | | | 2,584 | |
Mid-Cap Equity Index Fund | | | 3,138,716 | | | | 523,472 | | | | 373,076 | | | | (237,721 | ) | | | (1,183,834 | ) | | | 2,613,709 | | | | 23,720 | | | | 106,488 | |
Mid-Term Bond Fund | | | 6,652,736 | | | | 2,842,036 | | | | (315 | ) | | | (22,697 | ) | | | (1,050,776 | ) | | | 8,420,984 | | | | 208,364 | | | | 40,580 | |
Money Market Fund | | | 1,074,490 | | | | 205,600 | | | | (1,008 | ) | | | (431 | ) | | | (171,750 | ) | | | 1,106,901 | | | | — | | | | — | |
| | | | | | | | | | | | | | | | | | | | | | | | | | | | | | | | |
Total | | $ | 24,042,756 | | | $ | 6,704,158 | | | $ | 1,160,240 | | | $ | (245,571 | ) | | $ | (5,103,478 | ) | | $ | 26,558,105 | | | $ | 524,347 | | | $ | 232,062 | |
| | | | | | | | | | | | | | | | | | | | | | | | | | | | | | | | |
2015 Retirement Fund | |
Bond Fund | | $ | 29,996,556 | | | $ | 9,282,729 | | | $ | 253,019 | | | $ | 699,304 | | | $ | (3,363,373 | ) | | $ | 36,868,235 | | | $ | 1,010,550 | | | $ | — | |
Equity Index Fund | | | 43,931,916 | | | | 6,658,670 | | | | 4,024,738 | | | | 409,458 | | | | (9,388,268 | ) | | | 45,636,514 | | | | 622,742 | | | | 514,785 | |
International Fund | | | 8,773,231 | | | | 1,332,039 | | | | 243,852 | | | | (890,011 | ) | | | (1,263,640 | ) | | | 8,195,471 | | | | 121,731 | | | | 27,206 | |
Mid-Cap Equity Index Fund | | | 17,449,211 | | | | 3,044,198 | | | | 1,382,709 | | | | (626,204 | ) | | | (3,340,237 | ) | | | 17,909,677 | | | | 159,432 | | | | 715,746 | |
Mid-Term Bond Fund | | | 31,308,702 | | | | 13,368,587 | | | | 169,385 | | | | (296,026 | ) | | | (3,642,854 | ) | | | 40,907,794 | | | | 994,083 | | | | 193,605 | |
Small Cap Growth Fund | | | 3,363,187 | | | | 409,875 | | | | 562,344 | | | | (626,448 | ) | | | (1,338,921 | ) | | | 2,370,037 | | | | 1,173 | | | | 173,691 | |
Small Cap Value Fund | | | 3,103,348 | | | | 469,195 | | | | 517,070 | | | | (620,268 | ) | | | (1,194,197 | ) | | | 2,275,148 | | | | 27,026 | | | | 207,157 | |
| | | | | | | | | | | | | | | | | | | | | | | | | | | | | | | | |
Total | | $ | 137,926,151 | | | $ | 34,565,293 | | | $ | 7,153,117 | | | $ | (1,950,195 | ) | | $ | (23,531,490 | ) | | $ | 154,162,876 | | | $ | 2,936,737 | | | $ | 1,832,190 | |
| | | | | | | | | | | | | | | | | | | | | | | | | | | | | | | | |
2020 Retirement Fund | |
Bond Fund | | $ | 54,151,265 | | | $ | 23,461,312 | | | $ | 440,284 | | | $ | 1,267,110 | | | $ | (2,724,438 | ) | | $ | 76,595,533 | | | $ | 2,012,576 | | | $ | — | |
Equity Index Fund | | | 91,264,914 | | | | 22,250,782 | | | | 6,583,586 | | | | 3,565,174 | | | | (12,576,004 | ) | | | 111,088,452 | | | | 1,455,857 | | | | 1,203,475 | |
International Fund | | | 23,361,744 | | | | 5,787,815 | | | | 635,412 | | | | (2,598,323 | ) | | | (1,578,409 | ) | | | 25,608,239 | | | | 363,462 | | | | 81,231 | |
Mid-Cap Equity Index Fund | | | 30,696,081 | | | | 8,270,058 | | | | 1,760,729 | | | | (310,936 | ) | | | (3,339,141 | ) | | | 37,076,791 | | | | 316,900 | | | | 1,422,675 | |
Mid-Term Bond Fund | | | 34,761,499 | | | | 21,071,370 | | | | 149,336 | | | | (414,076 | ) | | | (1,901,075 | ) | | | 53,667,054 | | | | 1,247,656 | | | | 242,991 | |
Small Cap Growth Fund | | | 8,839,789 | | | | 1,893,072 | | | | 890,750 | | | | (1,041,217 | ) | | | (2,419,051 | ) | | | 8,163,343 | | | | 3,878 | | | | 574,341 | |
Small Cap Value Fund | | | 8,217,735 | | | | 2,089,331 | | | | 820,297 | | | | (1,168,929 | ) | | | (2,115,827 | ) | | | 7,842,607 | | | | 89,380 | | | | 685,098 | |
| | | | | | | | | | | | | | | | | | | | | | | | | | | | | | | | |
Total | | $ | 251,293,027 | | | $ | 84,823,740 | | | $ | 11,280,394 | | | $ | (701,197 | ) | | $ | (26,653,945 | ) | | $ | 320,042,019 | | | $ | 5,489,709 | | | $ | 4,209,811 | |
| | | | | | | | | | | | | | | | | | | | | | | | | | | | | | | | |
2025 Retirement Fund | |
Bond Fund | | $ | 49,846,172 | | | $ | 22,620,853 | | | $ | 279,279 | | | $ | 1,298,778 | | | $ | (1,678,320 | ) | | $ | 72,366,762 | | | $ | 1,905,908 | | | $ | — | |
Equity Index Fund | | | 101,899,038 | | | | 24,949,961 | | | | 4,978,423 | | | | 6,509,757 | | | | (8,747,647 | ) | | | 129,589,532 | | | | 1,705,756 | | | | 1,410,052 | |
International Fund | | | 23,311,469 | | | | 7,634,024 | | | | 235,977 | | | | (2,467,471 | ) | | | (699,115 | ) | | | 28,014,884 | | | | 397,148 | | | | 88,759 | |
Mid-Cap Equity Index Fund | | | 41,667,327 | | | | 12,442,497 | | | | 682,199 | | | | 1,214,726 | | | | (1,136,938 | ) | | | 54,869,811 | | | | 470,139 | | | | 2,110,618 | |
Mid-Term Bond Fund | | | 17,388,092 | | | | 6,222,752 | | | | 59,236 | | | | (106,595 | ) | | | (583,764 | ) | | | 22,979,721 | | | | 532,151 | | | | 103,641 | |
Small Cap Growth Fund | | | 11,720,380 | | | | 2,754,830 | | | | 1,002,796 | | | | (1,214,517 | ) | | | (2,396,539 | ) | | | 11,866,950 | | | | 5,629 | | | | 833,622 | |
Small Cap Value Fund | | | 10,913,264 | | | | 3,039,660 | | | | 866,520 | | | | (1,395,481 | ) | | | (2,020,576 | ) | | | 11,403,387 | | | | 129,727 | | | | 994,354 | |
| | | | | | | | | | | | | | | | | | | | | | | | | | | | | | | | |
Total | | $ | 256,745,742 | | | $ | 79,664,577 | | | $ | 8,104,430 | | | $ | 3,839,197 | | | $ | (17,262,899 | ) | | $ | 331,091,047 | | | $ | 5,146,458 | | | $ | 5,541,046 | |
| | | | | | | | | | | | | | | | | | | | | | | | | | | | | | | | |
106
MUTUAL OF AMERICA INVESTMENT CORPORATION
NOTES TO FINANCIAL STATEMENTS (Continued)
December 31, 2014
| 3. | INVESTMENTS (CONTINUED) |
| | | | | | | | | | | | | | | | | | | | | | | | | | | | | | | | |
Affiliated Investment Company | | Value as of
December 31,
2013 | | | Purchases | | | Realized
Gain
(Loss) on
Investment
Securities | | | Change in
Unrealized
Appreciation
(Depreciation)
of Investment
Securities | | | Sales | | | Value as of
December 31,
2014 | | | Dividends | | | Realized
Gain,
Distributions | |
2030 Retirement Fund | |
Bond Fund | | $ | 40,287,392 | | | $ | 20,325,713 | | | $ | 237,960 | | | $ | 1,012,233 | | | $ | (1,458,079 | ) | | $ | 60,405,219 | | | $ | 1,595,832 | | | $ | — | |
Equity Index Fund | | | 89,289,145 | | | | 23,538,822 | | | | 3,961,401 | | | | 6,142,502 | | | | (6,927,456 | ) | | | 116,004,414 | | | | 1,530,915 | | | | 1,265,520 | |
International Fund | | | 20,965,955 | | | | 5,602,748 | | | | 276,194 | | | | (2,156,099 | ) | | | (777,340 | ) | | | 23,911,458 | | | | 340,952 | | | | 76,199 | |
Mid-Cap Equity Index Fund | | | 38,280,701 | | | | 11,105,782 | | | | 1,498,161 | | | | 233,718 | | | | (2,574,956 | ) | | | 48,543,406 | | | | 417,220 | | | | 1,873,047 | |
Small Cap Growth Fund | | | 11,882,350 | | | | 3,601,206 | | | | 443,166 | | | | (650,741 | ) | | | (900,279 | ) | | | 14,375,702 | | | | 6,763 | | | | 1,001,645 | |
Small Cap Value Fund | | | 11,055,127 | | | | 3,943,572 | | | | 231,546 | | | | (905,901 | ) | | | (504,373 | ) | | | 13,819,971 | | | | 155,889 | | | | 1,194,885 | |
| | | | | | | | | | | | | | | | | | | | | | | | | | | | | | | | |
Total | | $ | 211,760,670 | | | $ | 68,117,843 | | | $ | 6,648,428 | | | $ | 3,675,712 | | | $ | (13,142,483 | ) | | $ | 277,060,170 | | | $ | 4,047,571 | | | $ | 5,411,296 | |
| | | | | | | | | | | | | | | | | | | | | | | | | | | | | | | | |
2035 Retirement Fund | | | | | | | | | | | | | | | | | | | | | | | | | | | | | | | | |
Bond Fund | | $ | 22,499,794 | | | $ | 11,810,827 | | | $ | 122,960 | | | $ | 588,310 | | | $ | (734,720 | ) | | $ | 34,287,171 | | | $ | 900,935 | | | $ | — | |
Equity Index Fund | | | 71,648,314 | | | | 20,603,823 | | | | 2,332,274 | | | | 5,997,888 | | | | (4,268,214 | ) | | | 96,314,085 | | | | 1,266,298 | | | | 1,046,777 | |
International Fund | | | 20,190,530 | | | | 6,163,431 | | | | 185,447 | | | | (2,071,216 | ) | | | (551,040 | ) | | | 23,917,152 | | | | 339,743 | | | | 75,929 | |
Mid-Cap Equity Index Fund | | | 36,139,476 | | | | 11,364,722 | | | | 1,162,603 | | | | 507,910 | | | | (1,935,735 | ) | | | 47,238,976 | | | | 404,301 | | | | 1,815,048 | |
Small Cap Growth Fund | | | 11,442,269 | | | | 3,744,401 | | | | 363,642 | | | | (559,601 | ) | | | (663,546 | ) | | | 14,327,165 | | | | 6,712 | | | | 994,077 | |
Small Cap Value Fund | | | 10,645,824 | | | | 4,084,171 | | | | 148,847 | | | | (816,890 | ) | | | (292,871 | ) | | | 13,769,081 | | | | 154,710 | | | | 1,185,849 | |
| | | | | | | | | | | | | | | | | | | | | | | | | | | | | | | | |
Total | | $ | 172,566,207 | | | $ | 57,771,375 | | | $ | 4,315,773 | | | $ | 3,646,401 | | | $ | (8,446,126 | ) | | $ | 229,853,630 | | | $ | 3,072,699 | | | $ | 5,117,680 | |
| | | | | | | | | | | | | | | | | | | | | | | | | | | | | | | | |
2040 Retirement Fund | | | | | | | | | | | | | | | | | | | | | | | | | | | | | | | | |
Bond Fund | | $ | 14,272,871 | | | $ | 6,531,896 | | | $ | 87,602 | | | $ | 362,463 | | | $ | (531,461 | ) | | $ | 20,723,371 | | | $ | 547,695 | | | $ | — | |
Equity Index Fund | | | 53,326,774 | | | | 13,032,307 | | | | 1,614,651 | | | | 4,404,476 | | | | (2,868,775 | ) | | | 69,509,433 | | | | 920,924 | | | | 761,276 | |
International Fund | | | 20,010,528 | | | | 5,438,530 | | | | 210,519 | | | | (2,037,259 | ) | | | (620,037 | ) | | | 23,002,281 | | | | 329,454 | | | | 73,630 | |
Mid-Cap Equity Index Fund | | | 35,365,556 | | | | 9,568,315 | | | | 1,087,233 | | | | 488,843 | | | | (1,942,883 | ) | | | 44,567,064 | | | | 384,321 | | | | 1,725,352 | |
Small Cap Growth Fund | | | 12,999,229 | | | | 3,700,515 | | | | 376,041 | | | | (610,425 | ) | | | (755,907 | ) | | | 15,709,453 | | | | 7,419 | | | | 1,098,786 | |
Small Cap Value Fund | | | 12,071,390 | | | | 4,132,427 | | | | 194,936 | | | | (945,392 | ) | | | (354,307 | ) | | | 15,099,054 | | | | 171,001 | | | | 1,310,721 | |
| | | | | | | | | | | | | | | | | | | | | | | | | | | | | | | | |
Total | | $ | 148,046,348 | | | $ | 42,403,990 | | | $ | 3,570,982 | | | $ | 1,662,706 | | | $ | (7,073,370 | ) | | $ | 188,610,656 | | | $ | 2,360,814 | | | $ | 4,969,765 | |
| | | | | | | | | | | | | | | | | | | | | | | | | | | | | | | | |
2045 Retirement Fund | | | | | | | | | | | | | | | | | | | | | | | | | | | | | | | | |
Bond Fund | | $ | 14,859,036 | | | $ | 6,002,419 | | | $ | 68,945 | | | $ | 402,935 | | | $ | (430,233 | ) | | $ | 20,903,102 | | | $ | 569,713 | | | $ | — | |
Equity Index Fund | | | 66,824,740 | | | | 14,434,110 | | | | 1,688,621 | | | | 5,880,697 | | | | (3,010,821 | ) | | | 85,817,347 | | | | 1,169,966 | | | | 967,145 | |
International Fund | | | 28,641,578 | | | | 7,062,078 | | | | 221,615 | | | | (2,855,586 | ) | | | (688,373 | ) | | | 32,381,312 | | | | 479,356 | | | | 107,131 | |
Mid-Cap Equity Index Fund | | | 40,465,694 | | | | 9,830,049 | | | | 959,636 | | | | 805,027 | | | | (1,775,854 | ) | | | 50,284,552 | | | | 446,656 | | | | 2,005,194 | |
Small Cap Growth Fund | | | 18,336,839 | | | | 4,743,025 | | | | 528,050 | | | | (910,531 | ) | | | (909,220 | ) | | | 21,788,163 | | | | 10,603 | | | | 1,570,336 | |
Small Cap Value Fund | | | 17,011,607 | | | | 5,405,706 | | | | 197,637 | | | | (1,295,594 | ) | | | (387,210 | ) | | | 20,932,146 | | | | 244,389 | | | | 1,873,236 | |
| | | | | | | | | | | | | | | | | | | | | | | | | | | | | | | | |
Total | | $ | 186,139,494 | | | $ | 47,477,387 | | | $ | 3,664,504 | | | $ | 2,026,948 | | | $ | (7,201,711 | ) | | $ | 232,106,622 | | | $ | 2,920,683 | | | $ | 6,523,042 | |
| | | | | | | | | | | | | | | | | | | | | | | | | | | | | | | | |
2050 Retirement Fund | | | | | | | | | | | | | | | | | | | | | | | | | | | | | | | | |
Bond Fund | | $ | 1,435,319 | | | $ | 2,301,762 | | | $ | (562 | ) | | $ | 45,995 | | | $ | (36,992 | ) | | $ | 3,745,522 | | | $ | 79,530 | | | $ | — | |
Equity Index Fund | | | 7,188,888 | | | | 10,085,858 | | | | 42,338 | | | | 1,173,483 | | | | (164,475 | ) | | | 18,326,092 | | | | 199,050 | | | | 164,542 | |
International Fund | | | 3,403,713 | | | | 4,897,548 | | | | 11,262 | | | | (558,429 | ) | | | (57,419 | ) | | | 7,696,675 | | | | 88,543 | | | | 19,788 | |
Mid-Cap Equity Index Fund | | | 4,099,458 | | | | 5,945,519 | | | | 46,524 | | | | 225,835 | | | | (169,165 | ) | | | 10,148,171 | | | | 71,035 | | | | 318,902 | |
Small Cap Growth Fund | | | 2,118,222 | | | | 3,135,051 | | | | 7,626 | | | | 10,610 | | | | (33,776 | ) | | | 5,237,733 | | | | 2,013 | | | | 298,154 | |
Small Cap Value Fund | | | 2,044,781 | | | | 3,213,938 | | | | 7,336 | | | | (175,458 | ) | | | (33,776 | ) | | | 5,056,821 | | | | 46,436 | | | | 355,934 | |
| | | | | | | | | | | | | | | | | | | | | | | | | | | | | | | | |
Total | | $ | 20,290,381 | | | $ | 29,579,676 | | | $ | 114,524 | | | $ | 722,036 | | | $ | (495,603 | ) | | $ | 50,211,014 | | | $ | 486,607 | | | $ | 1,157,320 | |
| | | | | | | | | | | | | | | | | | | | | | | | | | | | | | | | |
Conservative Allocation Fund | | | | | | | | | | | | | | | | | | | | | | | | | | | | | | | | |
Bond Fund | | $ | 27,314,101 | | | $ | 10,087,015 | | | $ | 198,546 | | | $ | 697,156 | | | $ | (1,907,121 | ) | | $ | 36,389,697 | | | $ | 947,266 | | | $ | — | |
Equity Index Fund | | | 29,386,718 | | | | 6,899,286 | | | | 2,855,475 | | | | 9,594 | | | | (6,704,918 | ) | | | 32,446,155 | | | | 421,653 | | | | 348,556 | |
International Fund | | | — | | | | 6,220,310 | | | | (6,323 | ) | | | (501,361 | ) | | | (212,345 | ) | | | 5,500,281 | | | | 77,219 | | | | 17,258 | |
Mid-Cap Equity Index Fund | | | — | | | | 6,420,756 | | | | 1,313 | | | | 143,306 | | | | (212,345 | ) | | | 6,353,030 | | | | 53,726 | | | | 241,196 | |
Mid-Term Bond Fund | | | 40,891,298 | | | | 10,231,418 | | | | 440,086 | | | | (325,354 | ) | | | (9,403,486 | ) | | | 41,833,962 | | | | 964,597 | | | | 187,863 | |
| | | | | | | | | | | | | | | | | | | | | | | | | | | | | | | | |
Total | | $ | 97,592,117 | | | $ | 39,858,785 | | | $ | 3,489,097 | | | $ | 23,341 | | | $ | (18,440,215 | ) | | $ | 122,523,125 | | | $ | 2,464,461 | | | $ | 794,873 | |
| | | | | | | | | | | | | | | | | | | | | | | | | | | | | | | | |
107
MUTUAL OF AMERICA INVESTMENT CORPORATION
NOTES TO FINANCIAL STATEMENTS (Continued)
December 31, 2014
| 3. | INVESTMENTS (CONTINUED) |
| | | | | | | | | | | | | | | | | | | | | | | | | | | | | | | | |
Affiliated Investment Company | | Value as of
December 31,
2013 | | | Purchases | | | Realized
Gain
(Loss) on
Investment
Securities | | | Change in
Unrealized
Appreciation
(Depreciation)
of Investment
Securities | | | Sales | | | Value as of
December 31,
2014 | | | Dividends | | | Realized
Gain,
Distributions | |
Moderate Allocation Fund | | | | | | | | | | | | | | | | | | | | | | | | | | | | | | | | |
Bond Fund | | $ | 73,457,620 | | | $ | 8,532,915 | | | $ | 934,540 | | | $ | 1,482,356 | | | $ | (7,286,126 | ) | | $ | 77,121,305 | | | $ | 2,176,570 | | | $ | — | |
Equity Index Fund | | | 110,115,462 | | | | 11,292,108 | | | | 7,602,485 | | | | 3,316,873 | | | | (16,200,293 | ) | | | 116,126,635 | | | | 1,629,225 | | | | 1,346,788 | |
International Fund | | | — | | | | 31,404,191 | | | | (30,772 | ) | | | (2,698,075 | ) | | | (875,311 | ) | | | 27,800,033 | | | | 425,796 | | | | 95,161 | |
Mid-Cap Equity Index Fund | | | 48,956,526 | | | | 6,005,670 | | | | 4,765,944 | | | | (2,901,569 | ) | | | (8,211,817 | ) | | | 48,614,754 | | | | 444,794 | | | | 1,996,835 | |
Mid-Term Bond Fund | | | 48,867,565 | | | | 5,341,895 | | | | 869,265 | | | | (716,399 | ) | | | (8,816,873 | ) | | | 45,545,453 | | | | 1,139,626 | | | | 221,951 | |
| | | | | | | | | | | | | | | | | | | | | | | | | | | | | | | | |
Total | | $ | 281,397,173 | | | $ | 62,576,779 | | | $ | 14,141,462 | | | $ | (1,516,814 | ) | | $ | (41,390,420 | ) | | $ | 315,208,180 | | | $ | 5,816,011 | | | $ | 3,660,735 | |
| | | | | | | | | | | | | | | | | | | | | | | | | | | | | | | | |
Aggressive Allocation Fund | | | | | | | | | | | | | | | | | | | | | | | | | | | | | | | | |
Bond Fund | | $ | 48,009,963 | | | $ | 4,086,094 | | | $ | 633,162 | | | $ | 941,591 | | | $ | (4,093,316 | ) | | $ | 49,577,494 | | | $ | 1,425,471 | | | $ | — | |
Equity Index Fund | | | 111,681,822 | | | | 7,150,016 | | | | 9,185,272 | | | | 233,054 | | | | (34,829,963 | ) | | | 93,420,201 | | | | 1,333,881 | | | | 1,102,644 | |
International Fund | | | — | | | | 38,022,428 | | | | (32,608 | ) | | | (3,300,368 | ) | | | (1,232,282 | ) | | | 33,457,170 | | | | 522,828 | | | | 116,847 | |
Mid-Cap Equity Index Fund | | | 51,632,826 | | | | 5,096,393 | | | | 2,039,575 | | | | (59,185 | ) | | | (6,594,306 | ) | | | 52,115,303 | | | | 485,555 | | | | 2,179,824 | |
Small Cap Growth Fund | | | 12,738,539 | | | | 1,631,924 | | | | 194,160 | | | | (489,062 | ) | | | (627,286 | ) | | | 13,448,275 | | | | 6,869 | | | | 1,017,302 | |
Small Cap Value Fund | | | 12,361,009 | | | | 1,966,428 | | | | 246,819 | | | | (974,991 | ) | | | (817,506 | ) | | | 12,781,759 | | | | 156,800 | | | | 1,201,874 | |
| | | | | | | | | | | | | | | | | | | | | | | | | | | | | | | | |
Total | | $ | 236,424,159 | | | $ | 57,953,283 | | | $ | 12,266,380 | | | $ | (3,648,961 | ) | | $ | (48,194,659 | ) | | $ | 254,800,202 | | | $ | 3,931,404 | | | $ | 5,618,491 | |
| | | | | | | | | | | | | | | | | | | | | | | | | | | | | | | | |
The Investment Company has registered an indefinite number of its capital shares pursuant to Rule 24f-2 under the Investment Company Act of 1940. On February 25, 2014, the Board of Directors of the Investment Company increased the number of authorized shares from seven billion to seven and a half billion. Also on February 25, 2014, September 11, 2014 and November 13, 2014, the Board of Directors changed the number of authorized shares for the Funds as indicated by the following table. As a result of these actions, there remained 525,000,000 unallocated shares as of December 31, 2014.
| | | | | | | | | | | | |
| | | Authorized No. of Shares | |
| | | Previous
Allocation | | | Allocation
Increase/
(Decrease) | | | Total Shares
Allocated | |
Equity Index Fund | | | 700,000,000 | | | | — | | | | 700,000,000 | |
All America Fund | | | 200,000,000 | | | | — | | | | 200,000,000 | |
Small Cap Value Fund | | | 325,000,000 | | | | — | | | | 325,000,000 | |
Small Cap Growth Fund | | | 325,000,000 | | | | 70,000,000 | | | | 395,000,000 | |
Mid Cap Value Fund | | | 100,000,000 | | | | — | | | | 100,000,000 | |
Mid-Cap Equity Index Fund | | | 550,000,000 | | | | 50,000,000 | | | | 600,000,000 | |
International Fund | | | 300,000,000 | | | | 125,000,000 | | | | 425,000,000 | |
Composite Fund | | | 150,000,000 | | | | — | | | | 150,000,000 | |
Retirement Income Fund | | | 50,000,000 | | | | 20,000,000 | | | | 70,000,000 | |
2010 Retirement Fund | | | 50,000,000 | | | | — | | | | 50,000,000 | |
2015 Retirement Fund | | | 200,000,000 | | | | — | | | | 200,000,000 | |
2020 Retirement Fund | | | 325,000,000 | | | | 25,000,000 | | | | 350,000,000 | |
2025 Retirement Fund | | | 275,000,000 | | | | 100,000,000 | | | | 375,000,000 | |
2030 Retirement Fund | | | 250,000,000 | | | | 40,000,000 | | | | 290,000,000 | |
2035 Retirement Fund | | | 225,000,000 | | | | 20,000,000 | | | | 245,000,000 | |
2040 Retirement Fund | | | 200,000,000 | | | | — | | | | 200,000,000 | |
2045 Retirement Fund | | | 225,000,000 | | | | 25,000,000 | | | | 250,000,000 | |
2050 Retirement Fund | | | 100,000,000 | | | | — | | | | 100,000,000 | |
Conservative Allocation Fund | | | 100,000,000 | | | | 25,000,000 | | | | 125,000,000 | |
Moderate Allocation Fund | | | 250,000,000 | | | | — | | | | 250,000,000 | |
Aggressive Allocation Fund | | | 200,000,000 | | | | — | | | | 200,000,000 | |
108
MUTUAL OF AMERICA INVESTMENT CORPORATION
NOTES TO FINANCIAL STATEMENTS (Continued)
December 31, 2014
| 4. | CAPITAL SHARE ACTIVITY (CONTINUED) |
| | | | | | | | | | | | |
| | | Authorized No. of Shares | |
| | | Previous
Allocation | | | Allocation
Increase/
(Decrease) | | | Total Shares
Allocated | |
Money Market Fund | | | 125,000,000 | | | | — | | | | 125,000,000 | |
Mid-Term Bond Fund | | | 450,000,000 | | | | 50,000,000 | | | | 500,000,000 | |
Bond Fund | | | 750,000,000 | | | | — | | | | 750,000,000 | |
| | | | | | | | | | | | |
Sub-Total | | | 6,425,000,000 | | | | 550,000,000 | | | | 6,975,000,000 | |
Shares to be allocated at the discretion of the Board of Directors | | | 575,000,000 | | | | (50,000,000 | ) | | | 525,000,000 | |
| | | | | | | | | | | | |
Total | | | 7,000,000,000 | | | | 500,000,000 | | | | 7,500,000,000 | |
| | | | | | | | | | | | |
| 5. | DISTRIBUTIONSTO SHAREHOLDERSAND INCOME TAX INFORMATION |
Distributions — On September 11, 2014, required distributions of net investment income and, as applicable, net realized gains relating to 2013 were declared and paid for all applicable funds in accordance with Internal Revenue Section 855(a).
The Funds of Mutual of America Investment Corporation intend to declare and pay their respective tax year 2014 investment company taxable income and capital gains in 2015 in accordance with Internal Revenue Section 855(a).
Pursuant to shareholders’ instructions, substantially all dividend distributions throughout 2014 and 2013 were immediately reinvested into their respective funds. The tax character of the distributions paid during 2014 and 2013 was as follows:
| | | | | | | | | | | | | | | | | | | | |
| | | Equity Index
Fund | | | All America
Fund | | | Small Cap
Value Fund | | | Small Cap
Growth | | | Mid Cap
Value Fund | |
Ordinary Income (a) | | | | | | | | | | | | | | | | | | | | |
2014 | | $ | 30,196,225 | | | $ | 6,490,290 | | | $ | 4,756,094 | | | $ | 2,993,761 | | | $ | 1,405,694 | |
2013 | | $ | 21,417,456 | | | $ | 4,003,917 | | | $ | 5,227,376 | | | $ | 102,671 | | | $ | 653,251 | |
Long-Term Capital Gains | | | | | | | | | | | | | | | | | | | | |
2014 | | $ | 14,610,030 | | | $ | 20,996,554 | | | $ | 36,455,404 | | | $ | 28,523,609 | | | $ | 4,649,738 | |
2013 | | $ | 8,138,566 | | | $ | 3,065,838 | | | $ | 0 | | | $ | 24,068,829 | | | $ | 1,089,797 | |
| | | | | |
| | | Mid-Cap
Equity Index
Fund | | | International
Fund | | | Composite
Fund | | | Retirement
Fund | | | 2010
Retirement
Fund | |
Ordinary Income (a) | | | | | | | | | | | | | | | | | | | | |
2014 | | $ | 15,510,466 | | | $ | 3,900,803 | | | $ | 3,641,558 | | | $ | 746,239 | | | $ | 478,710 | |
2013 | | $ | 9,796,628 | | | $ | 2,689,340 | | | $ | 3,658,911 | | | $ | 627 | | | $ | 505 | |
Long-Term Capital Gains | | | | | | | | | | | | | | | | | | | | |
2014 | | $ | 34,889,866 | | | $ | 825,732 | | | $ | 0 | | | $ | 853,955 | | | $ | 653,628 | |
2013 | | $ | 19,498,971 | | | $ | 0 | | | $ | 0 | | | $ | 546,754 | | | $ | 1,051,449 | |
| | | | | |
| | | 2015
Retirement
Fund | | | 2020
Retirement
Fund | | | 2025
Retirement
Fund | | | 2030
Retirement
Fund | | | 2035
Retirement
Fund | |
Ordinary Income (a) | | | | | | | | | | | | | | | | | | | | |
2014 | | $ | 2,616,090 | | | $ | 3,853,531 | | | $ | 3,459,110 | | | $ | 2,762,712 | | | $ | 2,061,376 | |
2013 | | $ | 12,035 | | | $ | 28,565 | | | $ | 36,299 | | | $ | 36,402 | | | $ | 33,799 | |
Long-Term Capital Gains | | | | | | | | | | | | | | | | | | | | |
2014 | | $ | 3,478,425 | | | $ | 3,571,569 | | | $ | 2,819,455 | | | $ | 2,549,750 | | | $ | 2,255,109 | |
2013 | | $ | 4,958,097 | | | $ | 4,197,604 | | | $ | 4,026,971 | | | $ | 2,917,571 | | | $ | 2,217,204 | |
109
MUTUAL OF AMERICA INVESTMENT CORPORATION
NOTES TO FINANCIAL STATEMENTS (Continued)
December 31, 2014
| 5. | DISTRIBUTIONSTO SHAREHOLDERSAND INCOME TAX INFORMATION (CONTINUED) |
| | | | | | | | | | | | | | | | | | | | |
| | | 2040
Retirement
Fund | | | 2045
Retirement
Fund | | | 2050
Retirement
Fund | | | Conservative
Allocation
Fund | | | Moderate
Allocation
Fund | |
Ordinary Income (a) | | | | | | | | | | | | | | | | | | | | |
2014 | | $ | 1,709,321 | | | $ | 2,118,365 | | | $ | 55,752 | | | $ | 2,273,586 | | | $ | 5,452,659 | |
2013 | | $ | 37,437 | | | $ | 53,020 | | | $ | 4,839 | | | $ | 36,913 | | | $ | 60,531 | |
Long-Term Capital Gains | | | | | | | | | | | | | | | | | | | | |
2014 | | $ | 2,115,297 | | | $ | 2,510,179 | | | $ | 60,082 | | | $ | 1,664,925 | | | $ | 3,993,394 | |
2013 | | $ | 1,744,523 | | | $ | 1,990,117 | | | $ | 3,009 | | | $ | 1,124,868 | | | $ | 2,672,171 | |
| | | | | |
| | | Aggressive
Allocation
Fund | | | Money
Market Fund | | | Mid-Term
Bond Fund | | | Bond Fund | | | | |
Ordinary Income (a) | | | | | | | | | | | | | | | | | | | | |
2014 | | $ | 3,819,966 | | | $ | 0 | | | $ | 10,843,710 | | | $ | 26,340,172 | | | | | |
2013 | | $ | 62,703 | | | $ | 0 | | | $ | 10,246,278 | | | $ | 23,755,259 | | | | | |
Long-Term Capital Gains | | | | | | | | | | | | | | | | | | | | |
2014 | | $ | 3,901,158 | | | $ | 0 | | | $ | 1,988,761 | | | $ | 0 | | | | | |
2013 | | $ | 2,312,366 | | | $ | 0 | | | $ | 821,302 | | | $ | 1,270,568 | | | | | |
Notes:
| (a) | Includes distributions from Fund-level net short-term capital gains. |
Undistributed net income and gains (losses) — As of December 31, 2014, undistributed net income and undistributed accumulated gain (loss) for Federal income tax purposes were as follows:
| | | | | | | | | | | | | | | | | | | | |
| | | Equity Index
Fund | | | All America
Fund | | | Small Cap
Value Fund | | | Small Cap
Growth Fund | | | Mid Cap
Value Fund | |
Accumulated undistributed net investment income | | $ | 31,636,022 | | | $ | 4,034,588 | | | $ | 2,561,526 | | | $ | 0 | | | $ | 1,128,441 | |
Accumulated undistributed net realized gain/(loss) on investments and futures contracts | | $ | 62,545,602 | | | $ | 19,703,492 | | | $ | 24,220,067 | | | $ | 51,114,908 | | | $ | 4,985,564 | |
Net unrealized appreciation (depreciation) of investments and futures contracts | | $ | 669,777,305 | | | $ | 92,198,589 | | | $ | 88,546,199 | | | $ | 88,608,419 | | | $ | 19,567,863 | |
| | | | | |
| | | Mid-Cap
Equity Index
Fund | | | International
Fund | | | Composite
Fund | | | Retirement
Income
Fund | | | 2010
Retirement
Fund | |
Accumulated undistributed net investment income | | $ | 16,535,839 | | | $ | 8,147,328 | | | $ | 3,940,898 | | | $ | 1,043,642 | | | $ | 553,391 | |
Accumulated undistributed net realized gain/(loss) on investments and futures contracts | | $ | 57,277,827 | | | $ | 85,784 | | | $ | 1,370,182 | | | $ | 1,545,488 | | | $ | 1,363,281 | |
Net unrealized appreciation (depreciation) of investments and futures contracts | | $ | 276,984,480 | | | $ | 1,222,163 | | | $ | 45,431,249 | | | $ | 2,583,117 | | | $ | 2,567,738 | |
| | | | | |
| | | 2015
Retirement
Fund | | | 2020
Retirement
Fund | | | 2025
Retirement
Fund | | | 2030
Retirement
Fund | | | 2035
Retirement
Fund | |
Accumulated undistributed net investment income | | $ | 3,145,220 | | | $ | 5,971,939 | | | $ | 5,804,497 | | | $ | 4,662,610 | | | $ | 3,637,561 | |
Accumulated undistributed net realized gain/(loss) on investments and futures contracts | | $ | 8,330,243 | | | $ | 14,142,810 | | | $ | 12,572,044 | | | $ | 11,009,458 | | | $ | 8,547,589 | |
Net unrealized appreciation (depreciation) of investments and futures contracts | | $ | 19,100,950 | | | $ | 42,686,293 | | | $ | 55,043,824 | | | $ | 50,919,554 | | | $ | 44,615,010 | |
110
MUTUAL OF AMERICA INVESTMENT CORPORATION
NOTES TO FINANCIAL STATEMENTS (Continued)
December 31, 2014
| 5. | DISTRIBUTIONSTO SHAREHOLDERSAND INCOME TAX INFORMATION (CONTINUED) |
| | | | | | | | | | | | | | | | | | | | |
| | | 2040
Retirement
Fund | | | 2045
Retirement
Fund | | | 2050
Retirement
Fund | | | Conservative
Allocation
Fund | | | Moderate
Allocation
Fund | |
Accumulated undistributed net investment income | | $ | 2,857,782 | | | $ | 3,540,101 | | | $ | 592,908 | | | $ | 2,610,734 | | | $ | 6,514,098 | |
Accumulated undistributed net realized gain/(loss) on investments and futures contracts | | $ | 7,815,156 | | | $ | 9,371,124 | | | $ | 1,181,002 | | | $ | 3,800,048 | | | $ | 15,525,532 | |
Net unrealized appreciation (depreciation) of investments and futures contracts | | $ | 39,187,126 | | | $ | 49,894,373 | | | $ | 2,923,377 | | | $ | 8,894,162 | | | $ | 51,851,527 | |
| | | | | |
| | | Aggressive
Allocation
Fund | | | Money Market
Fund | | | Mid-Term
Bond Fund | | | Bond Fund | | | | |
Accumulated undistributed net investment income | | $ | 4,669,780 | | | $ | 0 | | | $ | 10,648,630 | | | $ | 31,972,350 | | | | | |
Accumulated undistributed net realized gain/(loss) on investments and futures contracts | | $ | 16,973,585 | | | $ | 0 | | | $ | 1,509,725 | | | $ | 1,135,284 | | | | | |
Net unrealized appreciation (depreciation) of investments and futures contracts | | $ | 58,639,655 | | | $ | 4,372 | | | $ | 7,629,910 | | | $ | 25,600,244 | | | | | |
The difference between the components of distributable earnings for income tax purposes and the amounts reflected in the statements of assets and liabilities arise primarily from federal income tax treatment of wash sales, REITs, partnerships, corporate actions and futures contracts.
Reclassifications — The Funds make adjustments to the components of net assets for book to tax differences that are considered permanent in nature. For the year ended December 31, 2014, the Funds reclassified amounts primarily relating to differences in the book to tax treatment of partnership investments, REITs, net operating losses and the character of distributions. Each Fund’s net assets are not affected by these reclassifications.
During the year ended December 31, 2014, each Fund reclassified the following book to tax differences [increases (decreases)]:
| | | | | | | | | | | | | | | | | | | | |
| | | Equity Index
Fund | | | All America
Fund | | | Small Cap
Value Fund | | | Small Cap
Growth Fund | | | Mid Cap
Value Fund | |
Accumulated undistributed net investment income | | $ | (91,582 | ) | | $ | (353,152 | ) | | $ | (2,267,838 | ) | | $ | (281,244 | ) | | $ | (39,334 | ) |
Accumulated undistributed net realized gains (loss) on investments and futures contracts | | $ | 91,582 | | | $ | 353,152 | | | $ | 2,267,838 | | | $ | 1,375,160 | | | $ | 39,334 | |
| | | | | | | | | | | | | | | | | | | | |
Paid in capital | | $ | 0 | | | $ | 0 | | | $ | 0 | | | $ | (1,093,916 | ) | | $ | 0 | |
| | | | | | | | | | | | | | | | | | | | |
| | | | | |
| | | Mid-Cap
Equity Index
Fund | | | International
Fund | | | Composite
Fund | | | Retirement
Income
Fund | | | 2010
Retirement
Fund | |
Accumulated undistributed net investment income | | $ | (584,771 | ) | | $ | 0 | | | $ | (1,984 | ) | | $ | 54,562 | | | $ | 41,495 | |
Accumulated undistributed net realized gains (loss) on investments and futures contracts | | $ | 584,771 | | | $ | 0 | | | $ | 1,984 | | | $ | (54,562 | ) | | $ | (41,495 | ) |
| | | | | | | | | | | | | | | | | | | | |
Paid in capital | | $ | 0 | | | $ | 0 | | | $ | 0 | | | $ | 0 | | | $ | 0 | |
| | | | | | | | | | | | | | | | | | | | |
| | | | | |
| | | 2015
Retirement
Fund | | | 2020
Retirement
Fund | | | 2025
Retirement
Fund | | | 2030
Retirement
Fund | | | 2035
Retirement
Fund | |
Accumulated undistributed net investment income | | $ | 279,933 | | | $ | 621,349 | | | $ | 801,220 | | | $ | 733,628 | | | $ | 662,905 | |
Accumulated undistributed net realized gains (loss) on investments and futures contracts | | $ | (279,933 | ) | | $ | (621,349 | ) | | $ | (801,220 | ) | | $ | (733,628 | ) | | $ | (662,905 | ) |
| | | | | | | | | | | | | | | | | | | | |
Paid in capital | | $ | 0 | | | $ | 0 | | | $ | 0 | | | $ | 0 | | | $ | 0 | |
| | | | | | | | | | | | | | | | | | | | |
111
MUTUAL OF AMERICA INVESTMENT CORPORATION
NOTES TO FINANCIAL STATEMENTS (Continued)
December 31, 2014
| 5. | DISTRIBUTIONSTO SHAREHOLDERSAND INCOME TAX INFORMATION (CONTINUED) |
| | | | | | | | | | | | | | | | | | | | |
| | | 2040
Retirement
Fund | | | 2045
Retirement
Fund | | | 2050
Retirement
Fund | | | Conservative
Allocation
Fund | | | Moderate
Allocation
Fund | |
Accumulated undistributed net investment income | | $ | 578,547 | | | $ | 722,422 | | | $ | 122,314 | | | $ | 144,457 | | | $ | 698,087 | |
Accumulated undistributed net realized gains (loss) on investments and futures contracts | | $ | (578,547 | ) | | $ | (722,422 | ) | | $ | (122,314 | ) | | $ | (144,457 | ) | | $ | (698,087 | ) |
| | | | | | | | | | | | | | | | | | | | |
Paid in capital | | $ | 0 | | | $ | 0 | | | $ | 0 | | | $ | 0 | | | $ | 0 | |
| | | | | | | | | | | | | | | | | | | | |
| | | | | |
| | | Aggressive
Allocation
Fund | | | Money
Market Fund | | | Mid-Term
Bond Fund | | | Bond
Fund | | | | |
Accumulated undistributed net investment income | | $ | 738,376 | | | $ | 112,131 | | | $ | 0 | | | $ | 0 | | | | | |
Accumulated undistributed net realized gains (loss) on investments and futures contracts | | $ | (738,376 | ) | | $ | (113 | ) | | $ | 0 | | | $ | 0 | | | | | |
| | | | | | | | | | | | | | | | | | | | |
Paid in capital | | $ | 0 | | | $ | (112,018 | ) | | $ | 0 | | | $ | 0 | | | | | |
| | | | | | | | | | | | | | | | | | | | |
On February 26, 2015, the Board of Directors of the Investment Company increased the number of authorized shares from seven and a half billion to eight and a quarter billion. Also on that date, the Board of Directors changed the number of authorized shares of the following Funds. As a result of these actions, there remained 610,000,000 unallocated shares on that date.
| | | | | | | | | | | | |
Fund | | Previous
Allocation | | | Allocation
Increase | | | Total Shares
Allocated | |
International Fund | | | 425,000,000 | | | | 100,000,000 | | | | 525,000,000 | |
Retirement Income Fund | | | 70,000,000 | | | | 10,000,000 | | | | 80,000,000 | |
2020 Retirement Fund | | | 350,000,000 | | | | 75,000,000 | | | | 425,000,000 | |
2025 Retirement Fund | | | 375,000,000 | | | | 50,000,000 | | | | 425,000,000 | |
2030 Retirement Fund | | | 290,000,000 | | | | 75,000,000 | | | | 365,000,000 | |
2035 Retirement Fund | | | 245,000,000 | | | | 50,000,000 | | | | 295,000,000 | |
2040 Retirement Fund | | | 200,000,000 | | | | 25,000,000 | | | | 225,000,000 | |
2045 Retirement Fund | | | 250,000,000 | | | | 25,000,000 | | | | 275,000,000 | |
2050 Retirement Fund | | | 100,000,000 | | | | 10,000,000 | | | | 110,000,000 | |
Conservative Allocation Fund | | | 125,000,000 | | | | 25,000,000 | | | | 150,000,000 | |
Moderate Allocation Fund | | | 250,000,000 | | | | 5,000,000 | | | | 255,000,000 | |
Mid-Term Bond Fund | | | 500,000,000 | | | | 40,000,000 | | | | 540,000,000 | |
Bond Fund | | | 750,000,000 | | | | 175,000,000 | | | | 925,000,000 | |
Management, on behalf of the Investment Company, has evaluated the need for disclosures and/or adjustments to the financial statements from subsequent events. As a result of this evaluation, except as noted above, no additional subsequent events require disclosure and/or adjustment to the financial statements.
112
REPORT OF INDEPENDENT REGISTERED PUBLIC ACCOUNTING FIRM
The Shareholders and Board of Directors
of Mutual of America Investment Corporation:
We have audited the accompanying statement of assets and liabilities of Mutual of America Investment Corporation, comprised of Equity Index Fund, All America Fund, Small Cap Value Fund, Small Cap Growth Fund, Mid Cap Value Fund, Mid-Cap Equity Index Fund, International Fund, Composite Fund, Retirement Income Fund, 2010 Retirement Fund, 2015 Retirement Fund, 2020 Retirement Fund, 2025 Retirement Fund, 2030 Retirement Fund, 2035 Retirement Fund, 2040 Retirement Fund, 2045 Retirement Fund, 2050 Retirement Fund, Conservative Allocation Fund, Moderate Allocation Fund, Aggressive Allocation Fund, Money Market Fund, Mid-Term Bond Fund and Bond Fund (collectively, the “Funds”), including the portfolios of investments in securities for the Conservative Allocation Fund, Moderate Allocation Fund, Aggressive Allocation Fund, Money Market Fund, International Fund, Retirement Income Fund, 2010 Retirement Fund, 2015 Retirement Fund, 2020 Retirement Fund, 2025 Retirement Fund, 2030 Retirement Fund, 2035 Retirement Fund, 2040 Retirement Fund, 2045 Retirement Fund and 2050 Retirement Fund, and the summary portfolios of investments in securities for each of the remaining Funds as of December 31, 2014, and the related statements of operations for the year then ended, the statements of changes in net assets for each of the years in the two-year period then ended, and the financial highlights for each of the years or period in the five-year period then ended. These financial statements and financial highlights are the responsibility of the Funds’ management. Our responsibility is to express an opinion on these financial statements and financial highlights based on our audits.
We conducted our audits in accordance with the standards of the Public Company Accounting Oversight Board (United States). Those standards require that we plan and perform the audit to obtain reasonable assurance about whether the financial statements and financial highlights are free of material misstatement. An audit includes examining, on a test basis, evidence supporting the amounts and disclosures in the financial statements. Our procedures included confirmation of securities owned as of December 31, 2014, by correspondence with the custodian and brokers. An audit also includes assessing the accounting principles used and significant estimates made by management, as well as evaluating the overall financial statement presentation. We believe that our audits provide a reasonable basis for our opinion.
In our opinion, the financial statements and financial highlights referred to above present fairly, in all material respects, the financial position of each of the aforementioned Funds of Mutual of America Investment Corporation as of December 31, 2014, the results of their operations for the year then ended, the changes in their net assets for each of the years in the two-year period then ended, and the financial highlights for each of the years or period in the five-year period then ended, in conformity with U.S. generally accepted accounting principles.

New York, New York
February 27, 2015
113
MUTUAL OF AMERICA INVESTMENT CORPORATION
ADDITIONAL INFORMATION
Directors and Officers — Unaudited
The tables below show information about the Directors and officers of the Investment Company. The address of each Director and officer is c/o Mutual of America Investment Corporation, 320 Park Avenue, New York, New York 10022. The Investment Company does not hold regular annual meetings of shareholders, and each Director has been elected by shareholders to serve until a successor is duly elected at a meeting of shareholders called for the purpose of electing directors. Each officer of the Investment Company has been elected by the Board of Directors to serve until a successor is duly elected. The Independent Directors do not serve as directors of any other investment companies advised by or affiliated with the Adviser or Mutual of America with the exception of serving on the Board of Directors of Mutual of America Institutional Funds, Inc., an affiliated registered management investment company, which also receives investment advice from the Adviser. The Interested Directors and officers of the Investment Company do not receive compensation from the Investment Company for their service. Mr. Greed serves as director of one other investment company advised by or affiliated with the Adviser, Mutual of America Institutional Funds, Inc.
The Investment Company’s Statement of Additional Information (“SAI”), filed with the Securities and Exchange Commission, contains additional information about the Investment Company’s Directors and Officers. A copy of the latest SAI can be obtained, without charge, by writing to Mutual of America Investment Corporation at 320 Park Avenue, New York, NY 10022-6839 or by calling 1-800-468-3785 or through the following websites: http://www.mutualofamerica.com or http://www.sec.gov.
| | | | | | |
| Independent Directors |
| Name and Age | | Length of
Time Served | | Principal Occupation(s)
in Past Five Years | | Other Directorships
Held by Director |
| | | | | | |
| | | |
Carolyn N. Dolan, age 67 | | Since
April 2011 | | Founding Principal and Portfolio Manager, Samson Capital Advisors LLC | | Trustee, Fordham University; Mutual of America Institutional Funds, Inc. |
| | | | | | |
Kevin M. Kearney, age 62 | | Since
May 2008 | | Partner, Wingate, Kearney & Cullen | | Director, Concern Worldwide, USA; Trustee, College of Mount Saint Vincent; Mutual of America Institutional Funds, Inc. |
| | | | | | |
LaSalle D. Leffall, III, age 51 | | Since
April 2011 | | President and Founder, LDL Financial, LLC | | Director, Federal Home Loan Bank of Atlanta; Mutual of America Institutional Funds, Inc. |
| | | | | | |
John W. Sibal, age 62 | | Since
April 2011 | | President & Chief Executive Officer, Eustis Commercial Mortgage Corporation | | Director, Eustis Commercial Mortgage Corporation; Chairman and Director, New Orleans Recreation Development Foundation; Commissioner, New Orleans Recreation Development Commission; Treasurer and Director, Friends of NORD, Inc.; Mutual of America Institutional Funds, Inc. |
114
| | | | | | |
| Independent Directors |
| Name and Age | | Length of
Time Served | | Principal Occupation(s)
in Past Five Years | | Other Directorships
Held by Director |
| | | | | | |
| | | |
Margaret M. Smyth, age 51 | | Since
February 2007 | | U.S. Chief Financial Officer, National Grid; prior thereto Vice President of Finance, Con Edison; prior thereto Vice President, Chief Financial Officer, Hamilton Sundstrand, a United Technologies Company; prior thereto Vice President, Controller, United Technologies Company; prior thereto Vice President and Chief Accounting Officer, 3M Company | | Director, Martha Stewart Living Omnimedia, Inc.; Director, Vonage Holdings; Director, Concern Worldwide, USA; President’s Council and Trustee Fellow, Fordham University; Director, National Grid USA; Member, Aspen Institute Global Leadership Network; Member, Women Corporate Directors; Mutual of America Institutional Funds, Inc. |
| | | | | | |
Patrick J. Waide, Jr., age 77 | | Since
December 2003 | | Certified Public Accountant | | Trustee, John Simon Guggenheim Memorial Foundation; Emeritus Director, National Catholic Reporter; Mutual of America Institutional Funds, Inc. |
| | | | | | |
William E. Whiston, age 60 | | Since
February 2011 | | Chief Financial Officer, the Archdiocese of New York; Adjunct Professor in Finance, Fordham University Graduate School of Business; prior thereto Executive Vice President and member, United States Management Board at Allied Irish Bank | | Director, Hudson Valley Bank; Trustee and Treasurer, Trustees of St. Patrick’s Cathedral in New York City; Trustee, St. Joseph’s Seminary; Mutual of America Institutional Funds, Inc. |
| | | |
| Interested Director | | | | | | |
| Name and Age | | Length of
Time Served | | Principal Occupation(s)
in Past Five Years | | Other Directorships
Held by Director |
| | | | | | |
| | | |
John R. Greed, Chairman, President and Chief Executive Officer, age 54 | | Director since
September 2003;
Chairman of the
Board since
July 2010 | | Senior Executive Vice President and Chief Financial Officer, Mutual of America Life Insurance Company and Mutual of America Holding Company LLC since December 2007; Chairman of the Board, President and Chief Executive Officer, Mutual of America Investment Corporation and Mutual of America Institutional Funds, Inc. | | Mutual of America Life Insurance Company, Mutual of America Holding Company LLC, Mutual of America Foundation; Mutual of America Institutional Funds, Inc. |
Mr. Greed is an “interested person” as an officer of the Adviser and of affiliates of the Adviser.
115
| | | | | | |
| Officers | | | | | | |
| Name, Position and Age | | Length of
Time Served | | Principal Occupation(s)
in Past Five Years | | Other Directorships
Held by Officer |
| | | | | | |
| | | |
James J. Roth, Senior Executive Vice President and General Counsel, age 65 | | Since
April 2009 | | Senior Executive Vice President and General Counsel, Mutual of America Life Insurance Company since March 2013; prior thereto Executive Vice President and General Counsel, Mutual of America Life Insurance Company since April 2009; Senior Executive Vice President and General Counsel, Mutual of America Capital Management LLC, Mutual of America Securities LLC, Mutual of America Investment Corporation, and Mutual of America Institutional Funds, Inc.; Chairman, President and Chief Executive Officer, Mutual of America Holding Company LLC | | Mutual of America Holding Company LLC; Mutual of America Foundation; Respect for Law Alliance |
| | | | | | |
George L. Medlin, Executive Vice President, Chief Financial Officer and Treasurer, age 62 | | Since
July 2010 | | Executive Vice President and Treasurer, Mutual of America Life Insurance Company; prior thereto Executive Vice President, Internal Audit, Mutual of America Life Insurance Company; Executive Vice President, Chief Financial Officer and Treasurer, Mutual of America Investment Corporation and Mutual of America Institutional Funds, Inc. | | Director, Mutual of America Holding Company LLC; Director, Safe Center of Long Island; Director, Msgr. McClancy Memorial High School |
| | | | | | |
Scott H. Rothstein, Executive Vice President, Deputy General Counsel and Secretary, age 49 | | Since
April 2013 | | Executive Vice President and Deputy General Counsel, Mutual of America Life Insurance Company, since January 2009; Executive Vice President, Deputy General Counsel and Corporate Secretary, Mutual of America Investment Corporation and Mutual of America Institutional Funds, Inc., since April 2013 | | None |
116
| | | | | | |
| Officers | | | | | | |
| Name, Position and Age | | Length of
Time Served | | Principal Occupation(s)
in Past Five Years | | Other Directorships
Held by Officer |
| | | | | | |
| | | |
Kathryn Lu, Executive Vice President and Chief Compliance Officer, age 54 | | Since
July 2008 | | Executive Vice President and Chief Compliance Officer, Mutual of America Life Insurance Company, prior thereto Senior Vice President and Chief Compliance Officer, Mutual of America Life Insurance; Executive Vice President and Chief Compliance Officer, Mutual of America Investment Corporation and Mutual of America Institutional Funds, Inc. | | None |
| | | | | | |
John Corrigan, Executive Vice President and Internal Auditor, age 55 | | Since
February 2008 | | Executive Vice President and Internal Auditor, Mutual of America Life Insurance Company, prior thereto Senior Vice President and Internal Auditor, Mutual of America; Executive Vice President and Internal Auditor, Mutual of America Investment Corporation and Mutual of America Institutional Funds, Inc. | | None |
| | | | | | |
Chris W. Festog, Senior Vice President and Deputy Treasurer, age 53 | | Since
April 2013 | | Executive Vice President and Deputy Treasurer, Mutual of America Life Insurance Company; prior thereto, Senior Vice President and Deputy Treasurer, Mutual of America Life Insurance Company | | None |
| | | | | | |
Christopher M. Miseo, Senior Vice President and Chief Accounting Officer, age 58 | | Since
March 2013 | | Senior Vice President and Director of Accounting and Financial Reporting, Mutual of America Life Insurance Company | | None |
117
Quarterly Portfolio Schedules
Included in this Annual Report are summary schedules of Mutual of America Investment Corporation’s (“Investment Company”) Fund portfolio holdings as of December 31, 2014. The Investment Company files complete schedules of Fund portfolio holdings with the Securities and Exchange Commission (“SEC”) for the first and third quarters of each fiscal year on Form N-Q and for the second and fourth quarters of each fiscal year on Form N-CSR. The Forms N-Q and N-CSR are available on the SEC’s website at http://www.sec.gov. Additionally, the Forms N-Q and N-CSR may be reviewed and copied at the SEC’s Public Reference Room in Washington, DC. Information on the operation of the Public Reference Room may be obtained by calling 1-800-SEC-0330.
Proxy Voting Policies and Procedures
A copy of the Investment Company’s proxy voting policies and procedures can be obtained free of charge by calling 1-800-468-3785. It is also available on the SEC’s website at http://www.sec.gov.
Information regarding how the Investment Company voted proxies relating to portfolio securities during the 12-month period ended June 30, 2014 is available without charge by calling 1-800-468-3785. It is also available on the SEC website.
Code of Ethics
The Investment Company has adopted a Code of Ethics that complies with Rule 17j-1 of the Investment Company Act of 1940 and with the requirements of the Sarbanes-Oxley Act of 2002. A copy of the Code of Ethics is available free of charge, upon request. To obtain a free copy of the Code of Ethics, please call (212) 224-1568 or write to:
Ms. Kathryn Lu
Chief Compliance Officer
Mutual of America Investment Corporation
320 Park Avenue
New York, NY 10022-6839
Supplemental Dividend Information — Unaudited
Dividends from the International, Mid-Term Bond and Bond Funds do not qualify for the corporate dividends received deduction. The Money Market Fund did not distribute any dividends during 2014. The following are the percentages of the ordinary dividends distributed in 2014 by the other Investment Corporation Funds that qualify for the corporate dividends received deduction:
| | | | | | | | | | | | | | | | | | | | |
| | | Equity
Index Fund | | | All America
Fund | | | Small Cap
Value Fund | | | Small Cap
Growth Fund | | | Mid Cap
Value
Fund | |
Ordinary dividend
qualifying percentage | | | 87.23% | | | | 79.75% | | | | 100% | | | | 92.10% | | | | 63.41% | |
| | | | | |
| | | Mid-Cap
Equity Index
Fund | | | Composite
Fund | | | Retirement
Income Fund | | | 2010
Retirement
Fund | | | 2015
Retirement
Fund | |
Ordinary dividend
qualifying percentage | | | 50.75% | | | | 52.53% | | | | 18.44% | | | | 27.08% | | | | 30.77% | |
| | | | | |
| | | 2020
Retirement
Fund | | | 2025
Retirement
Fund | | | 2030
Retirement
Fund | | | 2035
Retirement
Fund | | | 2040
Retirement
Fund | |
Ordinary dividend
qualifying percentage | | | 37.11% | | | | 46.19% | | | | 53.06% | | | | 59.16% | | | | 61.05% | |
| | | | | |
| | | 2045
Retirement
Fund | | | 2050
Retirement
Fund | | | Conservative
Allocation
Fund | | | Moderate
Allocation
Fund | | | Aggressive
Allocation
Fund | |
Ordinary dividend
qualifying percentage | | | 61.72% | | | | 60.22% | | | | 17.99% | | | | 35.74% | | | | 58.22% | |
118
Important tax information: The following amounts of 2014 Investment Corporation Fund long-term capital gains (if any) have been designated as capital gains dividends.
| | | | | | | | | | | | | | | | | | | | |
| | | Equity
Index Fund | | | All America
Fund | | | Small Cap
Value Fund | | | Small Cap
Growth Fund | | | Mid Cap
Value
Fund | |
Dividends qualifying for reduced
long-term capital gains tax rate | | $ | 14,610,030 | | | $ | 20,996,554 | | | $ | 36,455,404 | | | $ | 28,523,609 | | | $ | 4,649,738 | |
| | | | | |
| | | Mid-Cap
Equity Index
Fund | | | International
Fund | | | Composite
Fund | | | Retirement
Income Fund | | | 2010
Retirement
Fund | |
Dividends qualifying for reduced
long-term capital gains tax rate | | $ | 34,889,866 | | | $ | 825,732 | | | $ | 0 | | | $ | 853,955 | | | $ | 653,628 | |
| | | | | |
| | | 2015
Retirement
Fund | | | 2020
Retirement
Fund | | | 2025
Retirement
Fund | | | 2030
Retirement
Fund | | | 2035
Retirement
Fund | |
Dividends qualifying for reduced
long-term capital gains tax rate | | $ | 3,478,425 | | | $ | 3,571,569 | | | $ | 2,819,455 | | | $ | 2,549,750 | | | $ | 2,255,109 | |
| | | | | |
| | | 2040
Retirement
Fund | | | 2045
Retirement
Fund | | | 2050
Retirement
Fund | | | Conservative
Allocation
Fund | | | Moderate
Allocation
Fund | |
Dividends qualifying for reduced
long-term capital gains tax rate | | $ | 2,115,297 | | | $ | 2,510,179 | | | $ | 60,082 | | | $ | 1,664,925 | | | $ | 3,993,394 | |
| | | | | |
| | | Aggressive
Allocation
Fund | | | Money
Market Fund | | | Mid-Term
Bond Fund | | | Bond Fund | | | | |
Dividends qualifying for reduced
long-term capital gains tax rate | | $ | 3,901,158 | | | $ | 0 | | | $ | 1,988,761 | | | $ | 0 | | | | | |
119
MUTUALOF AMERICA
LIFE INSURANCE COMPANY
320 PARK AVENUE
NEW YORK, NY 10022-6839
www.mutualofamerica.com
320 PARK AVENUE
NEW YORK NY 10022-6839
ADDRESS SERVICE REQUESTED
| | |
 | | You can receive these and other important documents electronically. Sign up for eDocuments and we’ll waive the monthly participant charge. Find out more at mutualofamerica.com or call 1-800-468-3785. |
ITEM 2. CODE OF ETHICS.
Mutual of America Investment Corporation has adopted a Code of Ethics that applies to its principal executive and financial officers, as well as all Access Persons as defined under Rule 17j-1 of the Investment Company Act of 1940. The Code consists of two sections. The first section, designated as Section A, is the Code of Ethics required under Rule 17j-1. Section A requires those subject to it to submit periodic reports detailing their securities holdings and transactions (subject to several exemptions contained in the rules) and requires pre-approval for certain securities transactions by such persons, including purchases and sales of reportable securities, investments in initial public offerings and private placements.
The second section, designated as Section B, is to assure compliance with the Code of Ethics requirements of Section 406 of the Sarbanes-Oxley Act of 2002. It applies specifically to the Corporation’s principal executive and financial officers.
The two sections are not mutually exclusive and must be observed independently by each person to whom they are intended to apply. Section A applies to all individuals while Section B applies to the individuals designated in Section B. Both Sections explicitly require those individuals subject to the provisions of the Code of Ethics to promptly report violations of the Code of Ethics to the Chief Compliance Officer.
There have been no amendments to Section A or B during the period covered by this report.
The Annual Report to Shareholders includes information on how to obtain a copy of the Code of Ethics at no charge.
ITEM 3. AUDIT COMMITTEE FINANCIAL EXPERT.
(a) (1) Mutual of America Investment Corporation’s Board of Directors has determined that one audit committee financial expert serves on its Audit Committee.
(a) (2) The audit committee financial expert is Patrick J. Waide, Jr. He was Senior Vice-President, Administration at Sullivan & Company until March 1998; Director of the Drucker Foundation from 1996-1999 and President, Drucker Foundation in 1999. Mr. Waide is considered an independent director.
(a) (3) Not applicable.
ITEM 4. PRINCIPAL ACCOUNTANT FEES AND SERVICES.
(a) Aggregate Audit Fees:
2014: $442,254
2013: $427,597
(b), (c), (d) There were no Audit-Related, Tax or Other Fees.
(e) All non-audit fees are pre-approved by the Audit Committee in advance.
(f), (g), (h) Not applicable.
ITEM 5. AUDIT COMMITTEE OF LISTED REGISTRANTS.
Not applicable.
ITEM 6. INVESTMENTS.
(a) Schedule I – Portfolios of Investments in Securities follows for those Funds for which a summary portfolio is presented in the Annual Report to Shareholders:
MUTUAL OF AMERICA INVESTMENT CORPORATION - EQUITY INDEX FUND
PORTFOLIO OF INVESTMENTS IN SECURITIES
December 31, 2014
| | | | | | | | |
| | | Shares | | | Value | |
INDEXED ASSETS: | | | | | | | | |
COMMON STOCKS: | | | | | | | | |
CONSUMER DISCRETIONARY (11.7%) | | | | | | | | |
Amazon.com, Inc.* | | | 35,947 | | | | 11,156,151 | |
AutoNation, Inc.* | | | 7,055 | | | | 426,193 | |
AutoZone, Inc.* | | | 3,058 | | | | 1,893,238 | |
Bed Bath & Beyond, Inc.* | | | 17,705 | | | | 1,348,590 | |
Best Buy Co., Inc. | | | 27,459 | | | | 1,070,352 | |
BorgWarner, Inc. | | | 21,239 | | | | 1,167,083 | |
Cablevision Systems Corp. Cl A | | | 20,828 | | | | 429,890 | |
CarMax, Inc.* | | | 20,393 | | | | 1,357,766 | |
Carnival Corp. | | | 42,461 | | | | 1,924,757 | |
CBS Corp. Cl B | | | 45,355 | | | | 2,509,946 | |
Chipotle Mexican Grill, Inc.* | | | 2,959 | | | | 2,025,465 | |
Coach, Inc. | | | 26,250 | | | | 985,950 | |
Comcast Corp. Cl A | | | 243,926 | | | | 14,150,147 | |
D.R. Horton, Inc. | | | 31,014 | | | | 784,344 | |
Darden Restaurants, Inc. | | | 12,663 | | | | 742,432 | |
Delphi Automotive PLC | | | 27,826 | | | | 2,023,507 | |
DIRECTV* | | | 47,562 | | | | 4,123,625 | |
Discovery Communications, Inc. Cl A* | | | 14,310 | | | | 492,980 | |
Discovery Communications, Inc. Cl C* | | | 26,272 | | | | 885,892 | |
Disney (Walt) Co. | | | 147,708 | | | | 13,912,617 | |
Dollar General Corp.* | | | 28,729 | | | | 2,031,140 | |
Dollar Tree, Inc.* | | | 19,472 | | | | 1,370,439 | |
Expedia, Inc. | | | 9,295 | | | | 793,421 | |
Family Dollar Stores, Inc. | | | 9,195 | | | | 728,336 | |
Ford Motor Co. | | | 363,823 | | | | 5,639,257 | |
Fossil Group, Inc.* | | | 4,388 | | | | 485,927 | |
GameStop Corp. Cl A | | | 10,396 | | | | 351,385 | |
Gannett Co., Inc. | | | 21,381 | | | | 682,695 | |
Gap, Inc. | | | 25,600 | | | | 1,078,016 | |
Garmin Ltd. | | | 11,407 | | | | 602,632 | |
General Motors Co. | | | 127,784 | | | | 4,460,939 | |
Genuine Parts Co. | | | 14,364 | | | | 1,530,771 | |
Goodyear Tire & Rubber Co. | | | 26,065 | | | | 744,677 | |
H&R Block, Inc. | | | 26,053 | | | | 877,465 | |
Harley-Davidson, Inc. | | | 20,469 | | | | 1,349,112 | |
Harman Int’l. Industries, Inc. | | | 6,488 | | | | 692,334 | |
Hasbro, Inc. | | | 10,710 | | | | 588,943 | |
Home Depot, Inc. | | | 124,773 | | | | 13,097,422 | |
Interpublic Group of Cos., Inc. | | | 39,722 | | | | 825,026 | |
Johnson Controls, Inc. | | | 63,075 | | | | 3,049,046 | |
Kohl’s Corp. | | | 19,344 | | | | 1,180,758 | |
L Brands, Inc. | | | 23,278 | | | | 2,014,711 | |
Leggett & Platt, Inc. | | | 13,183 | | | | 561,728 | |
Lennar Corp. Cl A | | | 17,097 | | | | 766,117 | |
Lowe’s Cos., Inc. | | | 92,117 | | | | 6,337,650 | |
Macy’s, Inc. | | | 32,693 | | | | 2,149,565 | |
Marriott International, Inc. Cl A | | | 20,160 | | | | 1,573,085 | |
Mattel, Inc. | | | 32,081 | | | | 992,747 | |
McDonald’s Corp. | | | 92,145 | | | | 8,633,987 | |
Michael Kors Hldgs. Ltd.* | | | 19,496 | | | | 1,464,150 | |
Mohawk Industries, Inc.* | | | 5,804 | | | | 901,709 | |
Netflix, Inc.* | | | 5,663 | | | | 1,934,537 | |
Newell Rubbermaid, Inc. | | | 25,547 | | | | 973,085 | |
News Corp. Cl A* | | | 46,634 | | | | 731,687 | |
NIKE, Inc. Cl B | | | 66,071 | | | | 6,352,727 | |
Nordstrom, Inc. | | | 13,330 | | | | 1,058,269 | |
| | | | | | | | |
O’Reilly Automotive, Inc.* | | | 9,605 | | | | 1,850,115 | |
Omnicom Group, Inc. | | | 23,498 | | | | 1,820,390 | |
PetSmart, Inc. | | | 9,364 | | | | 761,246 | |
Priceline Group Inc.* | | | 4,954 | | | | 5,648,600 | |
Pulte Homes, Inc. | | | 31,496 | | | | 675,904 | |
PVH Corp. | | | 7,907 | | | | 1,013,440 | |
Ralph Lauren Corp. | | | 5,730 | | | | 1,060,967 | |
Ross Stores, Inc. | | | 19,868 | | | | 1,872,758 | |
Royal Caribbean Cruises Ltd.* | | | 15,794 | | | | 1,301,899 | |
Scripps Networks Interactive, Inc. Cl A | | | 9,747 | | | | 733,657 | |
Staples, Inc. | | | 61,397 | | | | 1,112,514 | |
Starbucks Corp. | | | 70,850 | | | | 5,813,243 | |
Starwood Hotels & Resorts | | | 16,830 | | | | 1,364,408 | |
Target Corp. | | | 60,309 | | | | 4,578,056 | |
Tiffany & Co. | | | 10,715 | | | | 1,145,005 | |
Time Warner Cable, Inc. | | | 26,557 | | | | 4,038,257 | |
Time Warner, Inc. | | | 79,461 | | | | 6,787,559 | |
TJX Cos., Inc. | | | 65,226 | | | | 4,473,199 | |
Tractor Supply Co. | | | 13,015 | | | | 1,025,842 | |
TripAdvisor, Inc.* | | | 10,567 | | | | 788,932 | |
Twenty-First Century Fox, Inc. Cl A | | | 175,564 | | | | 6,742,536 | |
Under Armour, Inc. Cl A* | | | 15,782 | | | | 1,071,598 | |
Urban Outfitters, Inc.* | | | 9,758 | | | | 342,799 | |
V.F. Corp. | | | 32,713 | | | | 2,450,204 | |
Viacom, Inc. Cl B | | | 34,940 | | | | 2,629,235 | |
Whirlpool Corp. | | | 7,407 | | | | 1,435,032 | |
Wyndham Worldwide Corp. | | | 11,689 | | | | 1,002,449 | |
Wynn Resorts Ltd. | | | 7,669 | | | | 1,140,840 | |
Yum! Brands, Inc. | | | 41,423 | | | | 3,017,666 | |
| | | | | | | | |
| | | | | | | 209,714,770 | |
| | | | | | | | |
CONSUMER STAPLES (9.5%) | | | | | | | | |
Altria Group, Inc. | | | 187,135 | | | | 9,220,141 | |
Archer-Daniels-Midland Co. | | | 60,954 | | | | 3,169,608 | |
Avon Products, Inc. | | | 42,292 | | | | 397,122 | |
Brown-Forman Corp. Cl B | | | 14,963 | | | | 1,314,350 | |
Campbell Soup Co. | | | 16,834 | | | | 740,696 | |
Clorox Co. | | | 12,321 | | | | 1,283,971 | |
Coca-Cola Co. | | | 373,243 | | | | 15,758,319 | |
Coca-Cola Enterprises, Inc. | | | 20,844 | | | | 921,722 | |
Colgate-Palmolive Co. | | | 81,114 | | | | 5,612,278 | |
ConAgra Foods, Inc. | | | 39,867 | | | | 1,446,375 | |
Constellation Brands, Inc. Cl A* | | | 16,038 | | | | 1,574,450 | |
Costco Wholesale Corp. | | | 41,447 | | | | 5,875,112 | |
CVS Health Corp. | | | 108,374 | | | | 10,437,500 | |
Dr. Pepper Snapple Group, Inc. | | | 18,611 | | | | 1,334,036 | |
Estee Lauder Cos., Inc. Cl A | | | 21,148 | | | | 1,611,478 | |
General Mills, Inc. | | | 57,260 | | | | 3,053,676 | |
Hershey Co. | | | 13,885 | | | | 1,443,068 | |
Hormel Foods Corp. | | | 12,613 | | | | 657,137 | |
J.M. Smucker Co. | | | 9,649 | | | | 974,356 | |
Kellogg Co. | | | 23,710 | | | | 1,551,582 | |
Keurig Green Mountain, Inc. | | | 11,557 | | | | 1,530,089 | |
Kimberly-Clark Corp. | | | 35,353 | | | | 4,084,686 | |
Kraft Foods Group, Inc. | | | 55,776 | | | | 3,494,924 | |
Kroger Co. | | | 46,308 | | | | 2,973,437 | |
Lorillard, Inc. | | | 34,201 | | | | 2,152,611 | |
McCormick & Co., Inc. | | | 12,258 | | | | 910,769 | |
Mead Johnson Nutrition Co. | | | 19,090 | | | | 1,919,309 | |
Molson Coors Brewing Co. Cl B | | | 15,280 | | | | 1,138,666 | |
Mondelez International, Inc. Cl A | | | 159,057 | | | | 5,777,746 | |
Monster Beverage Corp.* | | | 13,698 | | | | 1,484,178 | |
PepsiCo, Inc. | | | 141,716 | | | | 13,400,665 | |
Philip Morris Int’l., Inc. | | | 147,108 | | | | 11,981,947 | |
Proctor & Gamble Co. | | | 255,839 | | | | 23,304,375 | |
Reynolds American, Inc. | | | 29,176 | | | | 1,875,142 | |
| | | | | | | | |
Safeway, Inc. | | | 21,811 | | | | 766,002 | |
Sysco Corp. | | | 55,647 | | | | 2,208,629 | |
Tyson Foods, Inc. Cl A | | | 27,592 | | | | 1,106,163 | |
Wal-Mart Stores, Inc. | | | 149,536 | | | | 12,842,152 | |
Walgreens Boots Alliance, Inc. | | | 82,359 | | | | 6,275,756 | |
Whole Foods Market, Inc. | | | 33,895 | | | | 1,708,986 | |
| | | | | | | | |
| | | | | | | 169,313,209 | |
| | | | | | | | |
ENERGY (8.1%) | | | | | | | | |
Anadarko Petroleum Corp. | | | 47,841 | | | | 3,946,883 | |
Apache Corp. | | | 35,645 | | | | 2,233,872 | |
Baker Hughes, Inc. | | | 40,966 | | | | 2,296,964 | |
Cabot Oil & Gas Corp. | | | 39,106 | | | | 1,157,929 | |
Cameron International Corp.* | | | 18,523 | | | | 925,224 | |
Chesapeake Energy Corp. | | | 49,152 | | | | 961,905 | |
Chevron Corp. | | | 178,987 | | | | 20,078,762 | |
Cimarex Energy Co. | | | 8,197 | | | | 868,882 | |
ConocoPhillips | | | 116,308 | | | | 8,032,230 | |
CONSOL Energy, Inc. | | | 21,794 | | | | 736,855 | |
Denbury Resources, Inc. | | | 31,985 | | | | 260,038 | |
Devon Energy Corp. | | | 36,550 | | | | 2,237,226 | |
Diamond Offshore Drilling, Inc. | | | 6,224 | | | | 228,483 | |
Ensco PLC Cl A | | | 22,184 | | | | 664,411 | |
EOG Resources, Inc. | | | 51,724 | | | | 4,762,229 | |
EQT Corp. | | | 14,345 | | | | 1,085,917 | |
Exxon Mobil Corp. | | | 400,930 | | | | 37,065,974 | |
FMC Technologies, Inc.* | | | 22,140 | | | | 1,037,038 | |
Halliburton Co. | | | 80,238 | | | | 3,155,761 | |
Helmerich & Payne, Inc. | | | 10,249 | | | | 690,988 | |
Hess Corp. | | | 24,060 | | | | 1,776,109 | |
Kinder Morgan, Inc. | | | 160,875 | | | | 6,806,621 | |
Marathon Oil Corp. | | | 63,901 | | | | 1,807,759 | |
Marathon Petroleum Corp. | | | 26,528 | | | | 2,394,417 | |
Murphy Oil Corp. | | | 15,538 | | | | 784,980 | |
Nabors Industries Ltd. | | | 26,388 | | | | 342,516 | |
National Oilwell Varco, Inc. | | | 40,762 | | | | 2,671,134 | |
Newfield Exploration Co.* | | | 12,768 | | | | 346,268 | |
Noble Corp. PLC | | | 23,856 | | | | 395,294 | |
Noble Energy, Inc. | | | 34,120 | | | | 1,618,312 | |
Occidental Petroleum Corp. | | | 73,257 | | | | 5,905,247 | |
ONEOK, Inc. | | | 19,713 | | | | 981,510 | |
Phillips 66 | | | 52,407 | | | | 3,757,582 | |
Pioneer Natural Resources Co. | | | 14,168 | | | | 2,108,907 | |
QEP Resources, Inc. | | | 15,771 | | | | 318,890 | |
Range Resources Corp. | | | 15,973 | | | | 853,757 | |
Schlumberger Ltd. | | | 121,835 | | | | 10,405,927 | |
Southwestern Energy Co.* | | | 33,819 | | | | 922,921 | |
Spectra Energy Corp. | | | 63,566 | | | | 2,307,446 | |
Tesoro Corp. | | | 11,845 | | | | 880,676 | |
Transocean Ltd. | | | 32,239 | | | | 590,941 | |
Valero Energy Corp. | | | 49,352 | | | | 2,442,924 | |
Williams Cos., Inc. | | | 63,693 | | | | 2,862,363 | |
| | | | | | | | |
| | | | | | | 145,710,072 | |
| | | | | | | | |
FINANCIALS (16.1%) | | | | | | | | |
ACE Ltd. | | | 31,414 | | | | 3,608,840 | |
Affiliated Managers Group, Inc.* | | | 5,262 | | | | 1,116,807 | |
Aflac, Inc. | | | 42,620 | | | | 2,603,656 | |
Allstate Corp. | | | 39,713 | | | | 2,789,838 | |
American Express Co. | | | 84,250 | | | | 7,838,620 | |
American Int’l. Group, Inc. | | | 132,490 | | | | 7,420,765 | |
American Tower Corp. | | | 37,527 | | | | 3,709,544 | |
Ameriprise Financial, Inc. | | | 17,592 | | | | 2,326,542 | |
Aon PLC | | | 27,004 | | | | 2,560,789 | |
Apartment Investment & Management Co. Cl A | | | 13,554 | | | | 503,531 | |
Assurant, Inc. | | | 6,593 | | | | 451,159 | |
AvalonBay Communities, Inc. | | | 12,560 | | | | 2,052,178 | |
| | | | | | | | |
Bank of America Corp. | | | 995,709 | | | | 17,813,234 | |
Bank of New York Mellon Corp. | | | 106,765 | | | | 4,331,456 | |
BB&T Corp. | | | 68,470 | | | | 2,662,798 | |
Berkshire Hathaway, Inc. Cl B* | | | 172,656 | | | | 25,924,298 | |
BlackRock, Inc. | | | 12,038 | | | | 4,304,307 | |
Boston Properties, Inc. | | | 14,589 | | | | 1,877,458 | |
Capital One Financial Corp. | | | 52,672 | | | | 4,348,074 | |
CBRE Group, Inc.* | | | 26,507 | | | | 907,865 | |
Charles Schwab Corp. | | | 109,241 | | | | 3,297,986 | |
Chubb Corp. | | | 22,239 | | | | 2,301,069 | |
Cincinnati Financial Corp. | | | 13,791 | | | | 714,788 | |
Citigroup, Inc. | | | 286,836 | | | | 15,520,696 | |
CME Group, Inc. | | | 30,107 | | | | 2,668,986 | |
Comerica, Inc. | | | 17,120 | | | | 801,901 | |
Crown Castle Int’l. Corp. | | | 31,445 | | | | 2,474,722 | |
Discover Financial Svcs. | | | 42,837 | | | | 2,805,395 | |
E*Trade Financial Corp.* | | | 27,500 | | | | 667,013 | |
Equity Residential | | | 34,263 | | | | 2,461,454 | |
Essex Property Trust, Inc. | | | 6,073 | | | | 1,254,682 | |
Fifth Third Bancorp | | | 78,212 | | | | 1,593,570 | |
Franklin Resources, Inc. | | | 36,873 | | | | 2,041,658 | |
General Growth Pptys., Inc. | | | 59,665 | | | | 1,678,376 | |
Genworth Financial, Inc.* | | | 46,635 | | | | 396,398 | |
Goldman Sachs Group, Inc. | | | 38,351 | | | | 7,433,574 | |
Hartford Financial Svcs. Group, Inc. | | | 40,854 | | | | 1,703,203 | |
HCP, Inc. | | | 43,340 | | | | 1,908,260 | |
Health Care REIT, Inc. | | | 31,220 | | | | 2,362,417 | |
Host Hotels & Resorts, Inc. | | | 71,886 | | | | 1,708,730 | |
Hudson City Bancorp, Inc. | | | 45,083 | | | | 456,240 | |
Huntington Bancshares, Inc. | | | 77,839 | | | | 818,866 | |
Intercontinental Exchange, Inc. | | | 10,672 | | | | 2,340,263 | |
Invesco Ltd. | | | 41,018 | | | | 1,621,031 | |
Iron Mountain, Inc. | | | 17,916 | | | | 692,633 | |
JPMorgan Chase & Co. | | | 353,936 | | | | 22,149,315 | |
KeyCorp | | | 81,378 | | | | 1,131,154 | |
Kimco Realty Corp. | | | 38,790 | | | | 975,181 | |
Legg Mason, Inc. | | | 9,591 | | | | 511,872 | |
Leucadia National Corp. | | | 29,508 | | | | 661,569 | |
Lincoln National Corp. | | | 24,557 | | | | 1,416,202 | |
Loews Corp. | | | 28,068 | | | | 1,179,417 | |
M&T Bank Corp. | | | 12,488 | | | | 1,568,743 | |
Marsh & McLennan Cos., Inc. | | | 51,052 | | | | 2,922,216 | |
McGraw-Hill Financial, Inc. | | | 25,706 | | | | 2,287,320 | |
MetLife, Inc. | | | 107,562 | | | | 5,818,029 | |
Moody’s Corp. | | | 17,381 | | | | 1,665,274 | |
Morgan Stanley | | | 144,556 | | | | 5,608,773 | |
Nasdaq OMX Group, Inc. | | | 11,103 | | | | 532,500 | |
Navient Corp. | | | 38,840 | | | | 839,332 | |
Northern Trust Corp. | | | 20,965 | | | | 1,413,041 | |
People’s United Financial, Inc. | | | 28,948 | | | | 439,431 | |
Plum Creek Timber Co., Inc. | | | 16,593 | | | | 710,014 | |
PNC Financial Svcs. Grp., Inc. | | | 49,823 | | | | 4,545,352 | |
Principal Financial Grp., Inc. | | | 25,860 | | | | 1,343,168 | |
Progressive Corp. | | | 50,542 | | | | 1,364,129 | |
ProLogis, Inc. | | | 47,340 | | | | 2,037,040 | |
Prudential Financial, Inc. | | | 43,359 | | | | 3,922,255 | |
Public Storage | | | 13,782 | | | | 2,547,603 | |
Regions Financial Corp. | | | 130,462 | | | | 1,377,679 | |
Simon Property Group, Inc. | | | 29,426 | | | | 5,358,769 | |
State Street Corp. | | | 39,601 | | | | 3,108,679 | |
SunTrust Banks, Inc. | | | 49,258 | | | | 2,063,910 | |
T. Rowe Price Group, Inc. | | | 24,633 | | | | 2,114,989 | |
The Macerich Co. | | | 13,472 | | | | 1,123,700 | |
Torchmark Corp. | | | 12,134 | | | | 657,299 | |
Travelers Cos., Inc. | | | 31,452 | | | | 3,329,194 | |
| | | | | | | | |
U.S. Bancorp | | | 169,422 | | | | 7,615,519 | |
Unum Group | | | 23,527 | | | | 820,622 | |
Ventas, Inc. | | | 28,014 | | | | 2,008,604 | |
Vornado Realty Trust | | | 16,578 | | | | 1,951,396 | |
Wells Fargo & Co. | | | 446,965 | | | | 24,502,621 | |
Weyerhaeuser Co. | | | 49,647 | | | | 1,781,831 | |
XL Group PLC | | | 24,327 | | | | 836,119 | |
Zions Bancorporation | | | 19,156 | | | | 546,138 | |
| | | | | | | | |
| | | | | | | 287,661,669 | |
| | | | | | | | |
HEALTH CARE (13.7%) | | | | | | | | |
Abbott Laboratories | | | 142,570 | | | | 6,418,501 | |
AbbVie, Inc. | | | 150,853 | | | | 9,871,820 | |
Actavis PLC* | | | 25,096 | | | | 6,459,961 | |
Aetna, Inc. | | | 33,299 | | | | 2,957,950 | |
Agilent Technologies, Inc. | | | 31,577 | | | | 1,292,762 | |
Alexion Pharmaceuticals, Inc.* | | | 18,774 | | | | 3,473,753 | |
Allergan, Inc. | | | 28,205 | | | | 5,996,101 | |
AmerisourceBergen Corp. | | | 19,717 | | | | 1,777,685 | |
Amgen, Inc. | | | 72,021 | | | | 11,472,225 | |
Anthem, Inc. | | | 25,589 | | | | 3,215,770 | |
Bard (C.R.), Inc. | | | 7,139 | | | | 1,189,500 | |
Baxter International, Inc. | | | 51,253 | | | | 3,756,332 | |
Becton, Dickinson & Co. | | | 18,277 | | | | 2,543,427 | |
Biogen Idec, Inc.* | | | 22,359 | | | | 7,589,763 | |
Boston Scientific Corp.* | | | 125,632 | | | | 1,664,624 | |
Bristol-Myers Squibb Co. | | | 156,911 | | | | 9,262,456 | |
Cardinal Health, Inc. | | | 31,162 | | | | 2,515,708 | |
CareFusion Corp.* | | | 19,318 | | | | 1,146,330 | |
Celgene Corp.* | | | 75,622 | | | | 8,459,077 | |
Cerner Corp.* | | | 28,719 | | | | 1,856,971 | |
CIGNA Corp. | | | 24,783 | | | | 2,550,419 | |
Covidien PLC | | | 42,871 | | | | 4,384,846 | |
DaVita HealthCare Partners, Inc.* | | | 16,315 | | | | 1,235,698 | |
DENTSPLY International, Inc. | | | 13,464 | | | | 717,227 | |
Edwards Lifesciences Corp.* | | | 10,069 | | | | 1,282,589 | |
Express Scripts Hldg. Co.* | | | 69,487 | | | | 5,883,464 | |
Gilead Sciences, Inc.* | | | 142,842 | | | | 13,464,287 | |
Hospira, Inc.* | | | 16,063 | | | | 983,859 | |
Humana, Inc. | | | 14,560 | | | | 2,091,253 | |
Intuitive Surgical, Inc.* | | | 3,412 | | | | 1,804,743 | |
Johnson & Johnson | | | 265,023 | | | | 27,713,455 | |
Laboratory Corp. of America Hldgs.* | | | 8,042 | | | | 867,732 | |
Lilly (Eli) & Co. | | | 92,771 | | | | 6,400,271 | |
Mallinckrodt PLC* | | | 11,009 | | | | 1,090,221 | |
McKesson Corp. | | | 21,997 | | | | 4,566,137 | |
Medtronic, Inc. | | | 93,197 | | | | 6,728,823 | |
Merck & Co., Inc. | | | 269,923 | | | | 15,328,927 | |
Mylan, Inc.* | | | 35,158 | | | | 1,981,856 | |
Patterson Cos., Inc. | | | 8,134 | | | | 391,245 | |
PerkinElmer, Inc. | | | 10,642 | | | | 465,375 | |
Perrigo Co. PLC | | | 13,327 | | | | 2,227,741 | |
Pfizer, Inc. | | | 596,554 | | | | 18,582,657 | |
Quest Diagnostics, Inc. | | | 13,694 | | | | 918,320 | |
Regeneron Pharmaceuticals, Inc.* | | | 7,026 | | | | 2,882,417 | |
St. Jude Medical, Inc. | | | 27,077 | | | | 1,760,817 | |
Stryker Corp. | | | 28,298 | | | | 2,669,350 | |
Tenet Healthcare Corp.* | | | 9,347 | | | | 473,613 | |
Thermo Fisher Scientific, Inc. | | | 37,874 | | | | 4,745,233 | |
UnitedHealth Group, Inc. | | | 90,977 | | | | 9,196,865 | |
Universal Health Svcs., Inc. Cl B | | | 8,675 | | | | 965,181 | |
Varian Medical Systems, Inc.* | | | 9,529 | | | | 824,354 | |
Vertex Pharmaceuticals, Inc.* | | | 22,772 | | | | 2,705,314 | |
Waters Corp.* | | | 7,866 | | | | 886,656 | |
Zimmer Hldgs., Inc. | | | 16,164 | | | | 1,833,321 | |
Zoetis, Inc. | | | 47,495 | | | | 2,043,710 | |
| | | | | | | | |
| | | | | | | 245,568,692 | |
| | | | | | | | |
| | | | | | | | |
INDUSTRIALS (10.1%) | | | | | | | | |
3M Co. | | | 60,674 | | | | 9,969,952 | |
Allegion PLC | | | 9,152 | | | | 507,570 | |
AMETEK, Inc. | | | 23,036 | | | | 1,212,385 | |
Boeing Co. | | | 62,775 | | | | 8,159,495 | |
Caterpillar, Inc. | | | 57,320 | | | | 5,246,500 | |
Cintas Corp. | | | 9,192 | | | | 721,020 | |
CSX Corp. | | | 94,246 | | | | 3,414,533 | |
Cummins, Inc. | | | 16,139 | | | | 2,326,760 | |
Danaher Corp. | | | 57,883 | | | | 4,961,152 | |
Deere & Co. | | | 33,800 | | | | 2,990,286 | |
Delta Air Lines, Inc. | | | 78,951 | | | | 3,883,600 | |
Dover Corp. | | | 15,656 | | | | 1,122,848 | |
Dun & Bradstreet Corp. | | | 3,449 | | | | 417,191 | |
Eaton Corp. PLC | | | 44,935 | | | | 3,053,783 | |
Emerson Electric Co. | | | 65,674 | | | | 4,054,056 | |
Equifax, Inc. | | | 11,315 | | | | 915,044 | |
Expeditors Int’l. of Wash. | | | 18,091 | | | | 807,040 | |
Fastenal Co. | | | 25,558 | | | | 1,215,538 | |
FedEx Corp. | | | 24,993 | | | | 4,340,284 | |
Flowserve Corp. | | | 12,798 | | | | 765,704 | |
Fluor Corp. | | | 14,808 | | | | 897,809 | |
General Dynamics Corp. | | | 29,823 | | | | 4,104,241 | |
General Electric Co. | | | 950,806 | | | | 24,026,868 | |
Grainger (W.W.), Inc. | | | 5,745 | | | | 1,464,343 | |
Honeywell International, Inc. | | | 74,117 | | | | 7,405,771 | |
Illinois Tool Works, Inc. | | | 34,014 | | | | 3,221,126 | |
Ingersoll-Rand PLC | | | 24,980 | | | | 1,583,482 | |
Jacobs Engineering Group, Inc.* | | | 12,271 | | | | 548,391 | |
Joy Global, Inc. | | | 9,197 | | | | 427,844 | |
Kansas City Southern | | | 10,320 | | | | 1,259,350 | |
L-3 Communications Hldgs., Inc. | | | 8,118 | | | | 1,024,573 | |
Lockheed Martin Corp. | | | 25,425 | | | | 4,896,092 | |
Masco Corp. | | | 33,972 | | | | 856,094 | |
Nielsen Holdings | | | 30,769 | | | | 1,376,297 | |
Norfolk Southern Corp. | | | 29,299 | | | | 3,211,463 | |
Northrop Grumman Corp. | | | 19,125 | | | | 2,818,834 | |
PACCAR, Inc. | | | 33,676 | | | | 2,290,305 | |
Pall Corp. | | | 10,086 | | | | 1,020,804 | |
Parker Hannifin Corp. | | | 13,987 | | | | 1,803,624 | |
Pentair PLC | | | 17,555 | | | | 1,166,003 | |
Pitney Bowes, Inc. | | | 19,016 | | | | 463,420 | |
Precision Castparts Corp. | | | 13,540 | | | | 3,261,515 | |
Quanta Services, Inc.* | | | 20,250 | | | | 574,898 | |
Raytheon Co. | | | 29,196 | | | | 3,158,131 | |
Republic Services, Inc. | | | 24,275 | | | | 977,069 | |
Robert Half Int’l., Inc. | | | 13,006 | | | | 759,290 | |
Robinson (C.H.) Worldwide, Inc. | | | 13,644 | | | | 1,021,799 | |
Rockwell Automation, Inc. | | | 12,813 | | | | 1,424,806 | |
Rockwell Collins, Inc. | | | 12,658 | | | | 1,069,348 | |
Roper Industries, Inc. | | | 9,462 | | | | 1,479,384 | |
Ryder System, Inc. | | | 4,916 | | | | 456,451 | |
Snap-on, Inc. | | | 5,545 | | | | 758,223 | |
Southwest Airlines Co. | | | 64,265 | | | | 2,719,695 | |
Stanley Black & Decker, Inc. | | | 14,867 | | | | 1,428,421 | |
Stericycle, Inc.* | | | 8,129 | | | | 1,065,549 | |
Textron, Inc. | | | 25,770 | | | | 1,085,175 | |
The ADT Corp. | | | 16,524 | | | | 598,665 | |
Tyco International PLC | | | 39,609 | | | | 1,737,251 | |
Union Pacific Corp. | | | 84,180 | | | | 10,028,363 | |
United Parcel Service, Inc. Cl B | | | 65,995 | | | | 7,336,664 | |
United Rentals, Inc.* | | | 9,446 | | | | 963,586 | |
United Technologies Corp. | | | 80,275 | | | | 9,231,625 | |
Waste Management, Inc. | | | 40,322 | | | | 2,069,325 | |
Xylem, Inc. | | | 17,141 | | | | 652,558 | |
| | | | | | | | |
| | | | | | | 179,809,266 | |
| | | | | | | | |
| | | | | | | | |
INFORMATION TECHNOLOGY (19.1%) | | | | | | | | |
Accenture Ltd. Cl A | | | 59,412 | | | | 5,306,086 | |
Adobe Systems, Inc.* | | | 45,080 | | | | 3,277,316 | |
Akamai Technologies, Inc.* | | | 16,744 | | | | 1,054,202 | |
Alliance Data Systems Corp.* | | | 6,053 | | | | 1,731,461 | |
Altera Corp. | | | 28,861 | | | | 1,066,125 | |
Amphenol Corp. Cl A | | | 29,228 | | | | 1,572,759 | |
Analog Devices, Inc. | | | 29,664 | | | | 1,646,945 | |
Apple, Inc. | | | 555,290 | | | | 61,292,905 | |
Applied Materials, Inc. | | | 115,359 | | | | 2,874,746 | |
Autodesk, Inc.* | | | 21,389 | | | | 1,284,623 | |
Automatic Data Processing, Inc. | | | 45,642 | | | | 3,805,174 | |
Avago Technologies Ltd. | | | 23,945 | | | | 2,408,628 | |
Broadcom Corp. Cl A | | | 50,703 | | | | 2,196,961 | |
CA, Inc. | | | 30,204 | | | | 919,712 | |
Cisco Systems, Inc. | | | 484,078 | | | | 13,464,630 | |
Citrix Systems, Inc.* | | | 15,179 | | | | 968,420 | |
Cognizant Technology Solutions* | | | 57,653 | | | | 3,036,007 | |
Computer Sciences Corp. | | | 13,297 | | | | 838,376 | |
Corning, Inc. | | | 121,366 | | | | 2,782,922 | |
eBay, Inc.* | | | 107,043 | | | | 6,007,253 | |
Electronic Arts, Inc.* | | | 29,191 | | | | 1,372,415 | |
EMC Corp. | | | 192,667 | | | | 5,729,917 | |
F5 Networks, Inc.* | | | 6,987 | | | | 911,559 | |
Facebook, Inc. Cl A* | | | 197,967 | | | | 15,445,385 | |
Fidelity Nat’l. Information Svcs., Inc. | | | 26,944 | | | | 1,675,917 | |
First Solar, Inc.* | | | 7,313 | | | | 326,123 | |
Fiserv, Inc.* | | | 23,099 | | | | 1,639,336 | |
FLIR Systems, Inc. | | | 13,542 | | | | 437,542 | |
Google, Inc. Cl A* | | | 26,989 | | | | 14,321,983 | |
Google, Inc. Cl C* | | | 26,964 | | | | 14,193,850 | |
Harris Corp. | | | 9,768 | | | | 701,538 | |
Hewlett-Packard Co. | | | 176,701 | | | | 7,091,011 | |
Int’l. Business Machines Corp. | | | 87,142 | | | | 13,981,062 | |
Intel Corp. | | | 457,784 | | | | 16,612,981 | |
Intuit, Inc. | | | 26,931 | | | | 2,482,769 | |
Juniper Networks, Inc. | | | 35,785 | | | | 798,721 | |
KLA-Tencor Corp. | | | 15,729 | | | | 1,106,063 | |
Lam Research Corp. | | | 15,080 | | | | 1,196,447 | |
Level 3 Communications, Inc.* | | | 26,457 | | | | 1,306,447 | |
Linear Technology Corp. | | | 22,686 | | | | 1,034,482 | |
MasterCard, Inc. Cl A | | | 92,888 | | | | 8,003,230 | |
Microchip Technology, Inc. | | | 19,219 | | | | 866,969 | |
Micron Technology, Inc.* | | | 101,635 | | | | 3,558,241 | |
Microsoft Corp. | | | 780,442 | | | | 36,251,531 | |
Motorola Solutions, Inc. | | | 20,181 | | | | 1,353,741 | |
NetApp, Inc. | | | 29,314 | | | | 1,215,065 | |
NVIDIA Corp. | | | 48,568 | | | | 973,788 | |
Oracle Corp. | | | 306,279 | | | | 13,773,367 | |
Paychex, Inc. | | | 30,918 | | | | 1,427,484 | |
QUALCOMM, Inc. | | | 157,417 | | | | 11,700,806 | |
Red Hat, Inc.* | | | 17,783 | | | | 1,229,517 | |
Salesforce.com, inc.* | | | 55,392 | | | | 3,285,300 | |
SanDisk Corp. | | | 20,891 | | | | 2,046,900 | |
Seagate Technology PLC | | | 30,983 | | | | 2,060,370 | |
Symantec Corp. | | | 65,343 | | | | 1,676,375 | |
TE Connectivity Ltd. | | | 38,666 | | | | 2,445,625 | |
Teradata Corp.* | | | 14,114 | | | | 616,500 | |
Texas Instruments, Inc. | | | 100,012 | | | | 5,347,142 | |
Total System Services, Inc. | | | 15,621 | | | | 530,489 | |
VeriSign, Inc.* | | | 10,189 | | | | 580,773 | |
Visa, Inc. Cl A | | | 46,245 | | | | 12,125,439 | |
Western Digital Corp. | | | 20,668 | | | | 2,287,948 | |
| | | | | | | | |
Western Union Co. | | | 49,129 | | | | 879,900 | |
Xerox Corp. | | | 101,598 | | | | 1,408,148 | |
Xilinx, Inc. | | | 25,039 | | | | 1,083,938 | |
Yahoo!, Inc.* | | | 83,508 | | | | 4,217,989 | |
| | | | | | | | |
| | | | | | | 340,847,374 | |
| | | | | | | | |
MATERIALS (3.1%) | | | | | | | | |
Air Products & Chemicals, Inc. | | | 18,210 | | | | 2,626,428 | |
Airgas, Inc. | | | 6,303 | | | | 725,980 | |
Alcoa, Inc. | | | 110,611 | | | | 1,746,548 | |
Allegheny Technologies, Inc. | | | 9,989 | | | | 347,318 | |
Avery Dennison Corp. | | | 8,413 | | | | 436,466 | |
Ball Corp. | | | 12,887 | | | | 878,507 | |
CF Industries Hldgs., Inc. | | | 4,708 | | | | 1,283,118 | |
Dow Chemical Co. | | | 105,067 | | | | 4,792,106 | |
Du Pont (E.I.) de Nemours & Co. | | | 85,776 | | | | 6,342,277 | |
Eastman Chemical Co. | | | 14,099 | | | | 1,069,550 | |
Ecolab, Inc. | | | 25,573 | | | | 2,672,890 | |
FMC Corp. | | | 12,512 | | | | 713,559 | |
Freeport-McMoRan Copper & Gold, Inc. | | | 98,003 | | | | 2,289,350 | |
Int’l. Flavors & Fragrances, Inc. | | | 7,597 | | | | 770,032 | |
International Paper Co. | | | 40,109 | | | | 2,149,040 | |
LyondellBasell Inds. N.V. Cl A | | | 39,345 | | | | 3,123,600 | |
Martin Marietta Materials, Inc. | | | 5,775 | | | | 637,098 | |
MeadWestvaco Corp. | | | 15,805 | | | | 701,584 | |
Monsanto Co. | | | 45,832 | | | | 5,475,549 | |
Newmont Mining Corp. | | | 46,461 | | | | 878,113 | |
Nucor Corp. | | | 30,254 | | | | 1,483,959 | |
Owens-Illinois, Inc.* | | | 15,715 | | | | 424,148 | |
PPG Industries, Inc. | | | 13,052 | | | | 3,016,970 | |
Praxair, Inc. | | | 27,588 | | | | 3,574,301 | |
Sealed Air Corp. | | | 19,963 | | | | 847,030 | |
Sherwin-Williams Co. | | | 7,697 | | | | 2,024,619 | |
Sigma-Aldrich Corp. | | | 11,308 | | | | 1,552,249 | |
The Mosaic Co. | | | 29,563 | | | | 1,349,551 | |
Vulcan Materials Co. | | | 12,353 | | | | 811,963 | |
| | | | | | | | |
| | | | | | | 54,743,903 | |
| | | | | | | | |
TELECOMMUNICATION SERVICES (2.1%) | | | | | | | | |
AT&T, Inc. | | | 491,111 | | | | 16,496,418 | |
CenturyLink, Inc. | | | 54,035 | | | | 2,138,705 | |
Frontier Communications Corp. | | | 94,003 | | | | 627,000 | |
Verizon Communications, Inc. | | | 392,901 | | | | 18,379,909 | |
Windstream Hldgs., Inc. | | | 57,142 | | | | 470,850 | |
| | | | | | | | |
| | | | | | | 38,112,882 | |
| | | | | | | | |
UTILITIES (3.1%) | | | | | | | | |
AES Corp. | | | 62,111 | | | | 855,268 | |
AGL Resources, Inc. | | | 11,283 | | | | 615,036 | |
Ameren Corp. | | | 23,017 | | | | 1,061,774 | |
American Electric Power Co., Inc. | | | 46,322 | | | | 2,812,672 | |
CenterPoint Energy, Inc. | | | 40,605 | | | | 951,375 | |
CMS Energy Corp. | | | 26,150 | | | | 908,713 | |
Consolidated Edison, Inc. | | | 27,801 | | | | 1,835,144 | |
Dominion Resources, Inc. | | | 55,386 | | | | 4,259,183 | |
DTE Energy Co. | | | 16,772 | | | | 1,448,598 | |
Duke Energy Corp. | | | 67,021 | | | | 5,598,934 | |
Edison International | | | 30,935 | | | | 2,025,624 | |
Entergy Corp. | | | 17,164 | | | | 1,501,507 | |
Exelon Corp. | | | 81,376 | | | | 3,017,422 | |
FirstEnergy Corp. | | | 39,887 | | | | 1,555,194 | |
Integrys Energy Group, Inc. | | | 7,666 | | | | 596,798 | |
NextEra Energy, Inc. | | | 41,469 | | | | 4,407,740 | |
NiSource, Inc. | | | 30,025 | | | | 1,273,661 | |
Northeast Utilities | | | 30,202 | | | | 1,616,411 | |
NRG Energy, Inc. | | | 32,476 | | | | 875,228 | |
Pepco Hldgs., Inc. | | | 24,260 | | | | 653,322 | |
PG&E Corp. | | | 44,982 | | | | 2,394,842 | |
| | | | | | | | |
Pinnacle West Capital Corp. | | | 10,544 | | | | 720,261 | |
PPL Corp. | | | 63,150 | | | | 2,294,240 | |
Public Svc. Enterprise Group, Inc. | | | 48,120 | | | | 1,992,649 | |
SCANA Corp. | | | 13,651 | | | | 824,520 | |
Sempra Energy | | | 21,925 | | | | 2,441,568 | |
Southern Co. | | | 85,058 | | | | 4,177,198 | |
TECO Energy, Inc. | | | 22,677 | | | | 464,652 | |
Wisconsin Energy Corp. | | | 21,292 | | | | 1,122,940 | |
Xcel Energy, Inc. | | | 47,921 | | | | 1,721,322 | |
| | | | | | | | |
| | | | | | | 56,023,796 | |
| | | | | | | | |
TOTAL INDEXED ASSETS - COMMON STOCKS
(Cost: $1,045,622,052) 96.6% | | | | | | | 1,727,505,633 | |
| | | | | | | | |
| | | | | | | | | | | | | | | | | | |
| | | Rating** | | Rate(%) | | | Maturity | | | | Face Amount | | | Value | |
SHORT-TERM DEBT SECURITIES: | | | | | | | | | | | | | | | | |
U.S. GOVERNMENT (0.8%) | | | | | | | | | | | | | | | | | | |
U.S. Treasury Bill (1) | | A-1+ | | | 0.01 | | | 03/05/15 | | | | | 3,700,000 | | | | 3,699,903 | |
U.S. Treasury Bill (1) | | A-1+ | | | 0.05 | | | 05/07/15 | | | | | 550,000 | | | | 549,904 | |
U.S. Treasury Bill (1) | | A-1+ | | | 0.06 | | | 05/28/15 | | | | | 1,000,000 | | | | 999,735 | |
U.S. Treasury Bill (1) | | A-1+ | | | 0.09 | | | 06/11/15 | | | | | 4,000,000 | | | | 3,998,479 | |
U.S. Treasury Bill (1) | | A-1+ | | | 0.10 | | | 06/18/15 | | | | | 5,000,000 | | | | 4,997,725 | |
| | | | | | | | | | | | | | | | | | |
| | | | | | | | | | | | | | | | | 14,245,746 | |
| | | | | | | | | | | | | | | | | | |
U.S. GOVERNMENT AGENCIES (0.1%) | | | | | | | | | | | | | | | | | | |
FHLMC | | A-1+ | | | 0.10 | | | 03/12/15 | | | | | 2,200,000 | | | | 2,199,572 | |
| | | | | | | | | | | | | | | | | | |
COMMERCIAL PAPER (2.5%) | | | | | | | | | | | | | | | | | | |
Abbott Laboratories† | | A-1+ | | | 0.09 | | | 01/20/15 | | | | | 3,200,000 | | | | 3,199,848 | |
Abbott Laboratories† | | A-1+ | | | 0.10 | | | 01/20/15 | | | | | 1,800,000 | | | | 1,799,905 | |
Emerson Electric Co.† | | A-1 | | | 0.14 | | | 03/30/15 | | | | | 1,400,000 | | | | 1,399,521 | |
Exxon Mobil Corp. | | A-1+ | | | 0.13 | | | 02/04/15 | | | | | 12,200,000 | | | | 12,198,502 | |
General Re Corp. | | A-1+ | | | 0.14 | | | 03/09/15 | | | | | 1,200,000 | | | | 1,199,687 | |
Madison Gas & Electric | | A-1+ | | | 0.10 | | | 01/09/15 | | | | | 7,000,000 | | | | 6,999,844 | |
San Diego Gas & Electric Co.† | | A-1 | | | 0.20 | | | 01/09/15 | | | | | 10,000,000 | | | | 9,999,556 | |
Toyota Motor Credit Corp. | | A-1+ | | | 0.14 | | | 02/11/15 | | | | | 4,000,000 | | | | 3,999,362 | |
Wisconsin Gas Co. | | A-1 | | | 0.15 | | | 01/06/15 | | | | | 2,850,000 | | | | 2,849,941 | |
| | | | | | | | | | | | | | | | | | |
| | | | | | | | | | | | | | | | | 43,646,166 | |
| | | | | | | | | | | | | | | | | | |
TOTAL SHORT-TERM DEBT SECURITIES
(Cost: $60,091,484) 3.4% | | | | | | | | | | | | | | | | | 60,091,484 | |
| | | | | | | | | | | | | | | | | | |
| | | | | | |
TEMPORARY CASH INVESTMENTS (2)
(Cost: $750,000) 0.0% (3) | | | | | | | | | | | | | | | | | 750,000 | |
| | | | | | | | | | | | | | | | | | |
| | | | | | |
TOTAL INVESTMENTS
(Cost: $1,106,463,536) 100.0% | | | | | | | | | | | | | | | | | 1,788,347,117 | |
| | | | | | | | | | | | | | | | | | |
| | | | | | |
OTHER NET ASSETS 0.0% (3) | | | | | | | | | | | | | | | | | 763,247 | |
| | | | | | | | | | | | | | | | | | |
| | | | | | |
NET ASSETS 100.0% | | | | | | | | | | | | | | | | | $1,789,110,364 | |
| | | | | | | | | | | | | | | | | | |
The accompanying notes are an integral part of these portfolio schedules.
MUTUAL OF AMERICA INVESTMENT CORPORATION - ALL AMERICA FUND
PORTFOLIO OF INVESTMENTS IN SECURITIES
December 31, 2014
| | | | | | | | |
| | | Shares | | | Value | |
INDEXED ASSETS: | | | | | | | | |
COMMON STOCKS: | | | | | | | | |
CONSUMER DISCRETIONARY (6.7%) | | | | | | | | |
Amazon.com, Inc.* | | | 3,741 | | | | 1,161,019 | |
AutoNation, Inc.* | | | 735 | | | | 44,401 | |
AutoZone, Inc.* | | | 319 | | | | 197,496 | |
Bed Bath & Beyond, Inc.* | | | 1,843 | | | | 140,381 | |
Best Buy Co., Inc. | | | 2,858 | | | | 111,405 | |
BorgWarner, Inc. | | | 2,211 | | | | 121,494 | |
Cablevision Systems Corp. Cl A | | | 2,168 | | | | 44,748 | |
CarMax, Inc.* | | | 2,122 | | | | 141,283 | |
Carnival Corp. | | | 4,419 | | | | 200,313 | |
CBS Corp. Cl B | | | 4,721 | | | | 261,260 | |
Chipotle Mexican Grill, Inc.* | | | 308 | | | | 210,829 | |
Coach, Inc. | | | 2,732 | | | | 102,614 | |
Comcast Corp. Cl A | | | 25,387 | | | | 1,472,700 | |
D.R. Horton, Inc. | | | 3,228 | | | | 81,636 | |
Darden Restaurants, Inc. | | | 1,318 | | | | 77,274 | |
Delphi Automotive PLC | | | 2,896 | | | | 210,597 | |
DIRECTV* | | | 4,950 | | | | 429,165 | |
Discovery Communications, Inc. Cl A* | | | 1,489 | | | | 51,296 | |
Discovery Communications, Inc. Cl C* | | | 2,735 | | | | 92,224 | |
Disney (Walt) Co. | | | 15,374 | | | | 1,448,077 | |
Dollar General Corp.* | | | 2,991 | | | | 211,464 | |
Dollar Tree, Inc.* | | | 2,027 | | | | 142,660 | |
Expedia, Inc. | | | 968 | | | | 82,628 | |
Family Dollar Stores, Inc. | | | 957 | | | | 75,804 | |
Ford Motor Co. | | | 37,862 | | | | 586,861 | |
Fossil Group, Inc.* | | | 457 | | | | 50,608 | |
GameStop Corp. Cl A | | | 1,082 | | | | 36,572 | |
Gannett Co., Inc. | | | 2,225 | | | | 71,044 | |
Gap, Inc. | | | 2,665 | | | | 112,223 | |
Garmin Ltd. | | | 1,188 | | | | 62,762 | |
General Motors Co. | | | 13,299 | | | | 464,268 | |
Genuine Parts Co. | | | 1,495 | | | | 159,322 | |
Goodyear Tire & Rubber Co. | | | 2,713 | | | | 77,510 | |
H&R Block, Inc. | | | 2,711 | | | | 91,306 | |
Harley-Davidson, Inc. | | | 2,131 | | | | 140,454 | |
Harman Int’l. Industries, Inc. | | | 676 | | | | 72,136 | |
Hasbro, Inc. | | | 1,115 | | | | 61,314 | |
Home Depot, Inc. | | | 12,986 | | | | 1,363,140 | |
Interpublic Group of Cos., Inc. | | | 4,134 | | | | 85,863 | |
Johnson Controls, Inc. | | | 6,564 | | | | 317,304 | |
Kohl’s Corp. | | | 2,014 | | | | 122,935 | |
L Brands, Inc. | | | 2,423 | | | | 209,711 | |
Leggett & Platt, Inc. | | | 1,372 | | | | 58,461 | |
Lennar Corp. Cl A | | | 1,780 | | | | 79,762 | |
Lowe’s Cos., Inc. | | | 9,588 | | | | 659,654 | |
Macy’s, Inc. | | | 3,403 | | | | 223,747 | |
Marriott International, Inc. Cl A | | | 2,098 | | | | 163,707 | |
Mattel, Inc. | | | 3,339 | | | | 103,325 | |
McDonald’s Corp. | | | 9,591 | | | | 898,677 | |
Michael Kors Hldgs. Ltd.* | | | 2,030 | | | | 152,453 | |
Mohawk Industries, Inc.* | | | 605 | | | | 93,993 | |
Netflix, Inc.* | | | 590 | | | | 201,550 | |
Newell Rubbermaid, Inc. | | | 2,659 | | | | 101,281 | |
News Corp. Cl A* | | | 4,854 | | | | 76,159 | |
NIKE, Inc. Cl B | | | 6,877 | | | | 661,224 | |
Nordstrom, Inc. | | | 1,388 | | | | 110,193 | |
MUTUAL OF AMERICA INVESTMENT CORPORATION - ALL AMERICA FUND
PORTFOLIO OF INVESTMENTS IN SECURITIES
December 31, 2014
| | | | | | | | |
O’Reilly Automotive, Inc.* | | | 1,000 | | | | 192,620 | |
Omnicom Group, Inc. | | | 2,446 | | | | 189,492 | |
PetSmart, Inc. | | | 975 | | | | 79,263 | |
Priceline Group Inc.* | | | 516 | | | | 588,348 | |
Pulte Homes, Inc. | | | 3,278 | | | | 70,346 | |
PVH Corp. | | | 823 | | | | 105,484 | |
Ralph Lauren Corp. | | | 597 | | | | 110,541 | |
Ross Stores, Inc. | | | 2,068 | | | | 194,930 | |
Royal Caribbean Cruises Ltd.* | | | 1,644 | | | | 135,515 | |
Scripps Networks Interactive, Inc. Cl A | | | 1,015 | | | | 76,399 | |
Staples, Inc. | | | 6,390 | | | | 115,787 | |
Starbucks Corp. | | | 7,374 | | | | 605,037 | |
Starwood Hotels & Resorts | | | 1,752 | | | | 142,035 | |
Target Corp. | | | 6,277 | | | | 476,487 | |
Tiffany & Co. | | | 1,116 | | | | 119,256 | |
Time Warner Cable, Inc. | | | 2,764 | | | | 420,294 | |
Time Warner, Inc. | | | 8,270 | | | | 706,423 | |
TJX Cos., Inc. | | | 6,789 | | | | 465,590 | |
Tractor Supply Co. | | | 1,355 | | | | 106,801 | |
TripAdvisor, Inc.* | | | 1,100 | | | | 82,126 | |
Twenty-First Century Fox, Inc. Cl A | | | 18,272 | | | | 701,736 | |
Under Armour, Inc. Cl A* | | | 1,643 | | | | 111,560 | |
Urban Outfitters, Inc.* | | | 1,016 | | | | 35,692 | |
V.F. Corp. | | | 3,405 | | | | 255,035 | |
Viacom, Inc. Cl B | | | 3,637 | | | | 273,684 | |
Whirlpool Corp. | | | 771 | | | | 149,374 | |
Wyndham Worldwide Corp. | | | 1,217 | | | | 104,370 | |
Wynn Resorts Ltd. | | | 798 | | | | 118,710 | |
Yum! Brands, Inc. | | | 4,312 | | | | 314,129 | |
| | | | | | | | |
| | | | | | | 21,829,351 | |
| | | | | | | | |
CONSUMER STAPLES (5.4%) | | | | | | | | |
Altria Group, Inc. | | | 19,477 | | | | 959,632 | |
Archer-Daniels-Midland Co. | | | 6,344 | | | | 329,888 | |
Avon Products, Inc. | | | 4,401 | | | | 41,325 | |
Brown-Forman Corp. Cl B | | | 1,558 | | | | 136,855 | |
Campbell Soup Co. | | | 1,752 | | | | 77,088 | |
Clorox Co. | | | 1,283 | | | | 133,701 | |
Coca-Cola Co. | | | 38,847 | | | | 1,640,120 | |
Coca-Cola Enterprises, Inc. | | | 2,170 | | | | 95,957 | |
Colgate-Palmolive Co. | | | 8,442 | | | | 584,102 | |
ConAgra Foods, Inc. | | | 4,149 | | | | 150,526 | |
Constellation Brands, Inc. Cl A* | | | 1,670 | | | | 163,944 | |
Costco Wholesale Corp. | | | 4,313 | | | | 611,368 | |
CVS Health Corp. | | | 11,279 | | | | 1,086,280 | |
Dr. Pepper Snapple Group, Inc. | | | 1,937 | | | | 138,844 | |
Estee Lauder Cos., Inc. Cl A | | | 2,201 | | | | 167,716 | |
General Mills, Inc. | | | 5,959 | | | | 317,793 | |
Hershey Co. | | | 1,445 | | | | 150,179 | |
Hormel Foods Corp. | | | 1,313 | | | | 68,407 | |
J.M. Smucker Co. | | | 1,005 | | | | 101,485 | |
Kellogg Co. | | | 2,468 | | | | 161,506 | |
Keurig Green Mountain, Inc. | | | 1,203 | | | | 159,271 | |
Kimberly-Clark Corp. | | | 3,680 | | | | 425,187 | |
Kraft Foods Group, Inc. | | | 5,805 | | | | 363,741 | |
Kroger Co. | | | 4,820 | | | | 309,492 | |
Lorillard, Inc. | | | 3,560 | | | | 224,066 | |
McCormick & Co., Inc. | | | 1,276 | | | | 94,807 | |
Mead Johnson Nutrition Co. | | | 1,987 | | | | 199,773 | |
Molson Coors Brewing Co. Cl B | | | 1,591 | | | | 118,561 | |
Mondelez International, Inc. Cl A | | | 16,554 | | | | 601,324 | |
Monster Beverage Corp.* | | | 1,426 | | | | 154,507 | |
MUTUAL OF AMERICA INVESTMENT CORPORATION - ALL AMERICA FUND
PORTFOLIO OF INVESTMENTS IN SECURITIES
December 31, 2014
| | | | | | | | |
PepsiCo, Inc. | | | 14,748 | | | | 1,394,571 | |
Philip Morris Int’l., Inc. | | | 15,311 | | | | 1,247,081 | |
Proctor & Gamble Co. | | | 26,627 | | | | 2,425,453 | |
Reynolds American, Inc. | | | 3,037 | | | | 195,188 | |
Safeway, Inc. | | | 2,270 | | | | 79,722 | |
Sysco Corp. | | | 5,792 | | | | 229,884 | |
Tyson Foods, Inc. Cl A | | | 2,872 | | | | 115,138 | |
Wal-Mart Stores, Inc. | | | 15,564 | | | | 1,336,636 | |
Walgreens Boots Alliance, Inc. | | | 8,572 | | | | 653,186 | |
Whole Foods Market, Inc. | | | 3,528 | | | | 177,882 | |
| | | | | | | | |
| | | | | | | 17,622,186 | |
| | | | | | | | |
ENERGY (4.7%) | | | | | | | | |
Anadarko Petroleum Corp. | | | 4,979 | | | | 410,768 | |
Apache Corp. | | | 3,709 | | | | 232,443 | |
Baker Hughes, Inc. | | | 4,263 | | | | 239,026 | |
Cabot Oil & Gas Corp. | | | 4,070 | | | | 120,513 | |
Cameron International Corp.* | | | 1,928 | | | | 96,304 | |
Chesapeake Energy Corp. | | | 5,116 | | | | 100,120 | |
Chevron Corp. | | | 18,628 | | | | 2,089,689 | |
Cimarex Energy Co. | | | 854 | | | | 90,524 | |
ConocoPhillips | | | 12,104 | | | | 835,902 | |
CONSOL Energy, Inc. | | | 2,269 | | | | 76,715 | |
Denbury Resources, Inc. | | | 3,329 | | | | 27,065 | |
Devon Energy Corp. | | | 3,804 | | | | 232,843 | |
Diamond Offshore Drilling, Inc. | | | 648 | | | | 23,788 | |
Ensco PLC Cl A | | | 2,308 | | | | 69,125 | |
EOG Resources, Inc. | | | 5,383 | | | | 495,613 | |
EQT Corp. | | | 1,493 | | | | 113,020 | |
Exxon Mobil Corp. | | | 41,727 | | | | 3,857,656 | |
FMC Technologies, Inc.* | | | 2,304 | | | | 107,919 | |
Halliburton Co. | | | 8,351 | | | | 328,445 | |
Helmerich & Payne, Inc. | | | 1,066 | | | | 71,870 | |
Hess Corp. | | | 2,504 | | | | 184,845 | |
Kinder Morgan, Inc. | | | 16,743 | | | | 708,396 | |
Marathon Oil Corp. | | | 6,651 | | | | 188,157 | |
Marathon Petroleum Corp. | | | 2,761 | | | | 249,208 | |
Murphy Oil Corp. | | | 1,618 | | | | 81,741 | |
Nabors Industries Ltd. | | | 2,747 | | | | 35,656 | |
National Oilwell Varco, Inc. | | | 4,242 | | | | 277,978 | |
Newfield Exploration Co.* | | | 1,329 | | | | 36,042 | |
Noble Corp. PLC | | | 2,482 | | | | 41,127 | |
Noble Energy, Inc. | | | 3,551 | | | | 168,424 | |
Occidental Petroleum Corp. | | | 7,624 | | | | 614,571 | |
ONEOK, Inc. | | | 2,052 | | | | 102,169 | |
Phillips 66 | | | 5,454 | | | | 391,052 | |
Pioneer Natural Resources Co. | | | 1,474 | | | | 219,405 | |
QEP Resources, Inc. | | | 1,642 | | | | 33,201 | |
Range Resources Corp. | | | 1,663 | | | | 88,887 | |
Schlumberger Ltd. | | | 12,680 | | | | 1,082,999 | |
Southwestern Energy Co.* | | | 3,520 | | | | 96,061 | |
Spectra Energy Corp. | | | 6,616 | | | | 240,161 | |
Tesoro Corp. | | | 1,233 | | | | 91,674 | |
Transocean Ltd. | | | 3,355 | | | | 61,497 | |
Valero Energy Corp. | | | 5,136 | | | | 254,232 | |
Williams Cos., Inc. | | | 6,629 | | | | 297,907 | |
| | | | | | | | |
| | | | | | | 15,164,738 | |
| | | | | | | | |
FINANCIALS (9.2%) | | | | | | | | |
ACE Ltd. | | | 3,270 | | | | 375,658 | |
Affiliated Managers Group, Inc.* | | | 548 | | | | 116,308 | |
Aflac, Inc. | | | 4,436 | | | | 270,995 | |
Allstate Corp. | | | 4,133 | | | | 290,343 | |
MUTUAL OF AMERICA INVESTMENT CORPORATION - ALL AMERICA FUND
PORTFOLIO OF INVESTMENTS IN SECURITIES
December 31, 2014
| | | | | | | | |
American Express Co. | | | 8,769 | | | | 815,868 | |
American Int’l. Group, Inc. | | | 13,788 | | | | 772,266 | |
American Tower Corp. | | | 3,906 | | | | 386,108 | |
Ameriprise Financial, Inc. | | | 1,831 | | | | 242,150 | |
Aon PLC | | | 2,811 | | | | 266,567 | |
Apartment Investment & Management Co. Cl A | | | 1,411 | | | | 52,419 | |
Assurant, Inc. | | | 687 | | | | 47,011 | |
AvalonBay Communities, Inc. | | | 1,308 | | | | 213,714 | |
Bank of America Corp. | | | 103,631 | | | | 1,853,959 | |
Bank of New York Mellon Corp. | | | 11,111 | | | | 450,773 | |
BB&T Corp. | | | 7,126 | | | | 277,130 | |
Berkshire Hathaway, Inc. Cl B* | | | 17,970 | | | | 2,698,196 | |
BlackRock, Inc. | | | 1,253 | | | | 448,023 | |
Boston Properties, Inc. | | | 1,519 | | | | 195,480 | |
Capital One Financial Corp. | | | 5,482 | | | | 452,539 | |
CBRE Group, Inc.* | | | 2,759 | | | | 94,496 | |
Charles Schwab Corp. | | | 11,369 | | | | 343,230 | |
Chubb Corp. | | | 2,315 | | | | 239,533 | |
Cincinnati Financial Corp. | | | 1,436 | | | | 74,428 | |
Citigroup, Inc. | | | 29,854 | | | | 1,615,400 | |
CME Group, Inc. | | | 3,134 | | | | 277,829 | |
Comerica, Inc. | | | 1,782 | | | | 83,469 | |
Crown Castle Int’l. Corp. | | | 3,273 | | | | 257,585 | |
Discover Financial Svcs. | | | 4,458 | | | | 291,954 | |
E*Trade Financial Corp.* | | | 2,862 | | | | 69,418 | |
Equity Residential | | | 3,566 | | | | 256,181 | |
Essex Property Trust, Inc. | | | 633 | | | | 130,778 | |
Fifth Third Bancorp | | | 8,140 | | | | 165,853 | |
Franklin Resources, Inc. | | | 3,838 | | | | 212,510 | |
General Growth Pptys., Inc. | | | 6,210 | | | | 174,687 | |
Genworth Financial, Inc.* | | | 4,854 | | | | 41,259 | |
Goldman Sachs Group, Inc. | | | 3,991 | | | | 773,576 | |
Hartford Financial Svcs. Group, Inc. | | | 4,252 | | | | 177,266 | |
HCP, Inc. | | | 4,511 | | | | 198,619 | |
Health Care REIT, Inc. | | | 3,248 | | | | 245,776 | |
Host Hotels & Resorts, Inc. | | | 7,481 | | | | 177,823 | |
Hudson City Bancorp, Inc. | | | 4,692 | | | | 47,483 | |
Huntington Bancshares, Inc. | | | 8,101 | | | | 85,223 | |
Intercontinental Exchange, Inc. | | | 1,111 | | | | 243,631 | |
Invesco Ltd. | | | 4,269 | | | | 168,711 | |
Iron Mountain, Inc. | | | 1,864 | | | | 72,062 | |
JPMorgan Chase & Co. | | | 36,836 | | | | 2,305,197 | |
KeyCorp | | | 8,469 | | | | 117,719 | |
Kimco Realty Corp. | | | 4,037 | | | | 101,490 | |
Legg Mason, Inc. | | | 999 | | | | 53,317 | |
Leucadia National Corp. | | | 3,071 | | | | 68,852 | |
Lincoln National Corp. | | | 2,556 | | | | 147,405 | |
Loews Corp. | | | 2,922 | | | | 122,782 | |
M&T Bank Corp. | | | 1,300 | | | | 163,306 | |
Marsh & McLennan Cos., Inc. | | | 5,313 | | | | 304,116 | |
McGraw-Hill Financial, Inc. | | | 2,676 | | | | 238,110 | |
MetLife, Inc. | | | 11,195 | | | | 605,538 | |
Moody’s Corp. | | | 1,809 | | | | 173,320 | |
Morgan Stanley | | | 15,045 | | | | 583,746 | |
Nasdaq OMX Group, Inc. | | | 1,156 | | | | 55,442 | |
Navient Corp. | | | 4,042 | | | | 87,348 | |
Northern Trust Corp. | | | 2,182 | | | | 147,067 | |
People’s United Financial, Inc. | | | 3,013 | | | | 45,737 | |
Plum Creek Timber Co., Inc. | | | 1,727 | | | | 73,898 | |
PNC Financial Svcs. Grp., Inc. | | | 5,186 | | | | 473,119 | |
Principal Financial Grp., Inc. | | | 2,692 | | | | 139,822 | |
MUTUAL OF AMERICA INVESTMENT CORPORATION - ALL AMERICA FUND
PORTFOLIO OF INVESTMENTS IN SECURITIES
December 31, 2014
| | | | | | | | |
Progressive Corp. | | | 5,260 | | | | 141,967 | |
ProLogis, Inc. | | | 4,927 | | | | 212,009 | |
Prudential Financial, Inc. | | | 4,513 | | | | 408,246 | |
Public Storage | | | 1,435 | | | | 265,260 | |
Regions Financial Corp. | | | 13,577 | | | | 143,373 | |
Simon Property Group, Inc. | | | 3,063 | | | | 557,803 | |
State Street Corp. | | | 4,122 | | | | 323,577 | |
SunTrust Banks, Inc. | | | 5,127 | | | | 214,821 | |
T. Rowe Price Group, Inc. | | | 2,564 | | | | 220,145 | |
The Macerich Co. | | | 1,403 | | | | 117,024 | |
Torchmark Corp. | | | 1,263 | | | | 68,417 | |
Travelers Cos., Inc. | | | 3,274 | | | | 346,553 | |
U.S. Bancorp | | | 17,633 | | | | 792,603 | |
Unum Group | | | 2,449 | | | | 85,421 | |
Ventas, Inc. | | | 2,916 | | | | 209,077 | |
Vornado Realty Trust | | | 1,726 | | | | 203,167 | |
Wells Fargo & Co. | | | 46,520 | | | | 2,550,226 | |
Weyerhaeuser Co. | | | 5,167 | | | | 185,444 | |
XL Group PLC | | | 2,532 | | | | 87,025 | |
Zions Bancorporation | | | 1,994 | | | | 56,849 | |
| | | | | | | | |
| | | | | | | 29,940,625 | |
| | | | | | | | |
HEALTH CARE (7.9%) | | | | | | | | |
Abbott Laboratories | | | 14,838 | | | | 668,007 | |
AbbVie, Inc. | | | 15,701 | | | | 1,027,473 | |
Actavis PLC* | | | 2,611 | | | | 672,098 | |
Aetna, Inc. | | | 3,465 | | | | 307,796 | |
Agilent Technologies, Inc. | | | 3,286 | | | | 134,529 | |
Alexion Pharmaceuticals, Inc.* | | | 1,953 | | | | 361,364 | |
Allergan, Inc. | | | 2,935 | | | | 623,952 | |
AmerisourceBergen Corp. | | | 2,052 | | | | 185,008 | |
Amgen, Inc. | | | 7,495 | | | | 1,193,879 | |
Anthem, Inc. | | | 2,663 | | | | 334,659 | |
Bard (C.R.), Inc. | | | 743 | | | | 123,799 | |
Baxter International, Inc. | | | 5,334 | | | | 390,929 | |
Becton, Dickinson & Co. | | | 1,903 | | | | 264,821 | |
Biogen Idec, Inc.* | | | 2,327 | | | | 789,900 | |
Boston Scientific Corp.* | | | 13,075 | | | | 173,244 | |
Bristol-Myers Squibb Co. | | | 16,330 | | | | 963,960 | |
Cardinal Health, Inc. | | | 3,243 | | | | 261,807 | |
CareFusion Corp.* | | | 2,011 | | | | 119,333 | |
Celgene Corp.* | | | 7,870 | | | | 880,338 | |
Cerner Corp.* | | | 2,989 | | | | 193,269 | |
CIGNA Corp. | | | 2,580 | | | | 265,508 | |
Covidien PLC | | | 4,462 | | | | 456,373 | |
DaVita HealthCare Partners, Inc.* | | | 1,698 | | | | 128,607 | |
DENTSPLY International, Inc. | | | 1,402 | | | | 74,685 | |
Edwards Lifesciences Corp.* | | | 1,048 | | | | 133,494 | |
Express Scripts Hldg. Co.* | | | 7,232 | | | | 612,333 | |
Gilead Sciences, Inc.* | | | 14,866 | | | | 1,401,269 | |
Hospira, Inc.* | | | 1,672 | | | | 102,410 | |
Humana, Inc. | | | 1,516 | | | | 217,743 | |
Intuitive Surgical, Inc.* | | | 356 | | | | 188,303 | |
Johnson & Johnson | | | 27,583 | | | | 2,884,354 | |
Laboratory Corp. of America Hldgs.* | | | 837 | | | | 90,312 | |
Lilly (Eli) & Co. | | | 9,656 | | | | 666,167 | |
Mallinckrodt PLC* | | | 1,145 | | | | 113,389 | |
McKesson Corp. | | | 2,290 | | | | 475,358 | |
Medtronic, Inc. | | | 9,700 | | | | 700,340 | |
Merck & Co., Inc. | | | 28,093 | | | | 1,595,401 | |
Mylan, Inc.* | | | 3,659 | | | | 206,258 | |
Patterson Cos., Inc. | | | 847 | | | | 40,741 | |
MUTUAL OF AMERICA INVESTMENT CORPORATION - ALL AMERICA FUND
PORTFOLIO OF INVESTMENTS IN SECURITIES
December 31, 2014
| | | | | | | | |
PerkinElmer, Inc. | | | 1,108 | | | | 48,453 | |
Perrigo Co. PLC | | | 1,387 | | | | 231,851 | |
Pfizer, Inc. | | | 62,088 | | | | 1,934,041 | |
Quest Diagnostics, Inc. | | | 1,426 | | | | 95,628 | |
Regeneron Pharmaceuticals, Inc.* | | | 731 | | | | 299,893 | |
St. Jude Medical, Inc. | | | 2,818 | | | | 183,255 | |
Stryker Corp. | | | 2,946 | | | | 277,896 | |
Tenet Healthcare Corp.* | | | 973 | | | | 49,302 | |
Thermo Fisher Scientific, Inc. | | | 3,941 | | | | 493,768 | |
UnitedHealth Group, Inc. | | | 9,468 | | | | 957,120 | |
Universal Health Svcs., Inc. Cl B | | | 903 | | | | 100,468 | |
Varian Medical Systems, Inc.* | | | 992 | | | | 85,818 | |
Vertex Pharmaceuticals, Inc.* | | | 2,370 | | | | 281,556 | |
Waters Corp.* | | | 819 | | | | 92,318 | |
Zimmer Hldgs., Inc. | | | 1,683 | | | | 190,886 | |
Zoetis, Inc. | | | 4,943 | | | | 212,697 | |
| | | | | | | | |
| | | | | | | 25,558,160 | |
| | | | | | | | |
INDUSTRIALS (5.8%) | | | | | | | | |
3M Co. | | | 6,315 | | | | 1,037,681 | |
Allegion PLC | | | 953 | | | | 52,853 | |
AMETEK, Inc. | | | 2,398 | | | | 126,207 | |
Boeing Co. | | | 6,533 | | | | 849,159 | |
Caterpillar, Inc. | | | 5,966 | | | | 546,068 | |
Cintas Corp. | | | 956 | | | | 74,989 | |
CSX Corp. | | | 9,809 | | | | 355,380 | |
Cummins, Inc. | | | 1,680 | | | | 242,206 | |
Danaher Corp. | | | 6,025 | | | | 516,403 | |
Deere & Co. | | | 3,518 | | | | 311,237 | |
Delta Air Lines, Inc. | | | 8,217 | | | | 404,194 | |
Dover Corp. | | | 1,629 | | | | 116,832 | |
Dun & Bradstreet Corp. | | | 359 | | | | 43,425 | |
Eaton Corp. PLC | | | 4,676 | | | | 317,781 | |
Emerson Electric Co. | | | 6,835 | | | | 421,925 | |
Equifax, Inc. | | | 1,178 | | | | 95,265 | |
Expeditors Int’l. of Wash. | | | 1,883 | | | | 84,001 | |
Fastenal Co. | | | 2,660 | | | | 126,510 | |
FedEx Corp. | | | 2,601 | | | | 451,690 | |
Flowserve Corp. | | | 1,332 | | | | 79,694 | |
Fluor Corp. | | | 1,542 | | | | 93,491 | |
General Dynamics Corp. | | | 3,104 | | | | 427,172 | |
General Electric Co. | | | 98,957 | | | | 2,500,643 | |
Grainger (W.W.), Inc. | | | 597 | | | | 152,169 | |
Honeywell International, Inc. | | | 7,713 | | | | 770,683 | |
Illinois Tool Works, Inc. | | | 3,540 | | | | 335,238 | |
Ingersoll-Rand PLC | | | 2,600 | | | | 164,814 | |
Jacobs Engineering Group, Inc.* | | | 1,278 | | | | 57,114 | |
Joy Global, Inc. | | | 958 | | | | 44,566 | |
Kansas City Southern | | | 1,075 | | | | 131,182 | |
L-3 Communications Hldgs., Inc. | | | 845 | | | | 106,647 | |
Lockheed Martin Corp. | | | 2,646 | | | | 509,540 | |
Masco Corp. | | | 3,536 | | | | 89,107 | |
Nielsen Holdings | | | 3,202 | | | | 143,225 | |
Norfolk Southern Corp. | | | 3,050 | | | | 334,311 | |
Northrop Grumman Corp. | | | 1,990 | | | | 293,306 | |
PACCAR, Inc. | | | 3,505 | | | | 238,375 | |
Pall Corp. | | | 1,049 | | | | 106,169 | |
Parker Hannifin Corp. | | | 1,456 | | | | 187,751 | |
Pentair PLC | | | 1,827 | | | | 121,349 | |
Pitney Bowes, Inc. | | | 1,979 | | | | 48,228 | |
Precision Castparts Corp. | | | 1,410 | | | | 339,641 | |
Quanta Services, Inc.* | | | 2,108 | | | | 59,846 | |
MUTUAL OF AMERICA INVESTMENT CORPORATION - ALL AMERICA FUND
PORTFOLIO OF INVESTMENTS IN SECURITIES
December 31, 2014
| | | | | | | | |
Raytheon Co. | | | 3,038 | | | | 328,620 | |
Republic Services, Inc. | | | 2,527 | | | | 101,712 | |
Robert Half Int’l., Inc. | | | 1,354 | | | | 79,047 | |
Robinson (C.H.) Worldwide, Inc. | | | 1,420 | | | | 106,344 | |
Rockwell Automation, Inc. | | | 1,334 | | | | 148,341 | |
Rockwell Collins, Inc. | | | 1,318 | | | | 111,345 | |
Roper Industries, Inc. | | | 985 | | | | 154,005 | |
Ryder System, Inc. | | | 512 | | | | 47,539 | |
Snap-on, Inc. | | | 578 | | | | 79,036 | |
Southwest Airlines Co. | | | 6,689 | | | | 283,078 | |
Stanley Black & Decker, Inc. | | | 1,548 | | | | 148,732 | |
Stericycle, Inc.* | | | 847 | | | | 111,025 | |
Textron, Inc. | | | 2,682 | | | | 112,939 | |
The ADT Corp. | | | 1,719 | | | | 62,279 | |
Tyco International PLC | | | 4,122 | | | | 180,791 | |
Union Pacific Corp. | | | 8,761 | | | | 1,043,698 | |
United Parcel Service, Inc. Cl B | | | 6,868 | | | | 763,516 | |
United Rentals, Inc.* | | | 983 | | | | 100,276 | |
United Technologies Corp. | | | 8,355 | | | | 960,825 | |
Waste Management, Inc. | | | 4,197 | | | | 215,390 | |
Xylem, Inc. | | | 1,784 | | | | 67,917 | |
| | | | | | | | |
| | | | | | | 18,714,522 | |
| | | | | | | | |
INFORMATION TECHNOLOGY (11.0%) | | | | | | | | |
Accenture Ltd. Cl A | | | 6,183 | | | | 552,204 | |
Adobe Systems, Inc.* | | | 4,692 | | | | 341,108 | |
Akamai Technologies, Inc.* | | | 1,743 | | | | 109,739 | |
Alliance Data Systems Corp.* | | | 630 | | | | 180,212 | |
Altera Corp. | | | 3,004 | | | | 110,968 | |
Amphenol Corp. Cl A | | | 3,042 | | | | 163,690 | |
Analog Devices, Inc. | | | 3,088 | | | | 171,446 | |
Apple, Inc. | | | 57,794 | | | | 6,379,296 | |
Applied Materials, Inc. | | | 12,007 | | | | 299,214 | |
Autodesk, Inc.* | | | 2,226 | | | | 133,694 | |
Automatic Data Processing, Inc. | | | 4,751 | | | | 396,091 | |
Avago Technologies Ltd. | | | 2,493 | | | | 250,771 | |
Broadcom Corp. Cl A | | | 5,277 | | | | 228,652 | |
CA, Inc. | | | 3,144 | | | | 95,735 | |
Cisco Systems, Inc. | | | 50,377 | | | | 1,401,236 | |
Citrix Systems, Inc.* | | | 1,580 | | | | 100,804 | |
Cognizant Technology Solutions* | | | 6,000 | | | | 315,960 | |
Computer Sciences Corp. | | | 1,384 | | | | 87,261 | |
Corning, Inc. | | | 12,631 | | | | 289,629 | |
eBay, Inc.* | | | 11,141 | | | | 625,233 | |
Electronic Arts, Inc.* | | | 3,038 | | | | 142,832 | |
EMC Corp. | | | 20,052 | | | | 596,346 | |
F5 Networks, Inc.* | | | 728 | | | | 94,979 | |
Facebook, Inc. Cl A* | | | 20,604 | | | | 1,607,524 | |
Fidelity Nat’l. Information Svcs., Inc. | | | 2,805 | | | | 174,471 | |
First Solar, Inc.* | | | 761 | | | | 33,937 | |
Fiserv, Inc.* | | | 2,405 | | | | 170,683 | |
FLIR Systems, Inc. | | | 1,410 | | | | 45,557 | |
Google, Inc. Cl A* | | | 2,809 | | | | 1,490,624 | |
Google, Inc. Cl C* | | | 2,807 | | | | 1,477,605 | |
Harris Corp. | | | 1,017 | | | | 73,041 | |
Hewlett-Packard Co. | | | 18,390 | | | | 737,991 | |
Int’l. Business Machines Corp. | | | 9,069 | | | | 1,455,030 | |
Intel Corp. | | | 47,646 | | | | 1,729,073 | |
Intuit, Inc. | | | 2,803 | | | | 258,409 | |
Juniper Networks, Inc. | | | 3,724 | | | | 83,120 | |
KLA-Tencor Corp. | | | 1,637 | | | | 115,114 | |
Lam Research Corp. | | | 1,570 | | | | 124,564 | |
MUTUAL OF AMERICA INVESTMENT CORPORATION - ALL AMERICA FUND
PORTFOLIO OF INVESTMENTS IN SECURITIES
December 31, 2014
| | | | | | | | |
Level 3 Communications, Inc.* | | | 2,754 | | | | 135,993 | |
Linear Technology Corp. | | | 2,361 | | | | 107,662 | |
MasterCard, Inc. Cl A | | | 9,667 | | | | 832,909 | |
Microchip Technology, Inc. | | | 2,001 | | | | 90,265 | |
Micron Technology, Inc.* | | | 10,578 | | | | 370,336 | |
Microsoft Corp. | | | 81,226 | | | | 3,772,946 | |
Motorola Solutions, Inc. | | | 2,101 | | | | 140,935 | |
NetApp, Inc. | | | 3,051 | | | | 126,464 | |
NVIDIA Corp. | | | 5,055 | | | | 101,353 | |
Oracle Corp. | | | 31,876 | | | | 1,433,464 | |
Paychex, Inc. | | | 3,218 | | | | 148,575 | |
QUALCOMM, Inc. | | | 16,384 | | | | 1,217,823 | |
Red Hat, Inc.* | | | 1,850 | | | | 127,909 | |
Salesforce.com, inc.* | | | 5,765 | | | | 341,922 | |
SanDisk Corp. | | | 2,174 | | | | 213,009 | |
Seagate Technology PLC | | | 3,224 | | | | 214,396 | |
Symantec Corp. | | | 6,800 | | | | 174,454 | |
TE Connectivity Ltd. | | | 4,024 | | | | 254,518 | |
Teradata Corp.* | | | 1,469 | | | | 64,166 | |
Texas Instruments, Inc. | | | 10,409 | | | | 556,517 | |
Total System Services, Inc. | | | 1,626 | | | | 55,219 | |
VeriSign, Inc.* | | | 1,061 | | | | 60,477 | |
Visa, Inc. Cl A | | | 4,813 | | | | 1,261,969 | |
Western Digital Corp. | | | 2,151 | | | | 238,116 | |
Western Union Co. | | | 5,113 | | | | 91,574 | |
Xerox Corp. | | | 10,574 | | | | 146,556 | |
Xilinx, Inc. | | | 2,606 | | | | 112,814 | |
Yahoo!, Inc.* | | | 8,691 | | | | 438,982 | |
| | | | | | | | |
| | | | | | | 35,475,166 | |
| | | | | | | | |
MATERIALS (1.8%) | | | | | | | | |
Air Products & Chemicals, Inc. | | | 1,895 | | | | 273,316 | |
Airgas, Inc. | | | 657 | | | | 75,673 | |
Alcoa, Inc. | | | 11,511 | | | | 181,759 | |
Allegheny Technologies, Inc. | | | 1,040 | | | | 36,161 | |
Avery Dennison Corp. | | | 876 | | | | 45,447 | |
Ball Corp. | | | 1,342 | | | | 91,484 | |
CF Industries Hldgs., Inc. | | | 490 | | | | 133,545 | |
Dow Chemical Co. | | | 10,934 | | | | 498,700 | |
Du Pont (E.I.) de Nemours & Co. | | | 8,927 | | | | 660,062 | |
Eastman Chemical Co. | | | 1,468 | | | | 111,362 | |
Ecolab, Inc. | | | 2,661 | | | | 278,128 | |
FMC Corp. | | | 1,303 | | | | 74,310 | |
Freeport-McMoRan Copper & Gold, Inc. | | | 10,199 | | | | 238,249 | |
Int’l. Flavors & Fragrances, Inc. | | | 791 | | | | 80,176 | |
International Paper Co. | | | 4,175 | | | | 223,697 | |
LyondellBasell Inds. N.V. Cl A | | | 4,094 | | | | 325,023 | |
Martin Marietta Materials, Inc. | | | 602 | | | | 66,413 | |
MeadWestvaco Corp. | | | 1,645 | | | | 73,022 | |
Monsanto Co. | | | 4,770 | | | | 569,872 | |
Newmont Mining Corp. | | | 4,836 | | | | 91,400 | |
Nucor Corp. | | | 3,149 | | | | 154,458 | |
Owens-Illinois, Inc.* | | | 1,636 | | | | 44,156 | |
PPG Industries, Inc. | | | 1,359 | | | | 314,133 | |
Praxair, Inc. | | | 2,872 | | | | 372,096 | |
Sealed Air Corp. | | | 2,078 | | | | 88,170 | |
Sherwin-Williams Co. | | | 802 | | | | 210,958 | |
Sigma-Aldrich Corp. | | | 1,177 | | | | 161,567 | |
The Mosaic Co. | | | 3,077 | | | | 140,465 | |
Vulcan Materials Co. | | | 1,286 | | | | 84,529 | |
| | | | | | | | |
| | | | | | | 5,698,331 | |
| | | | | | | | |
MUTUAL OF AMERICA INVESTMENT CORPORATION - ALL AMERICA FUND
PORTFOLIO OF INVESTMENTS IN SECURITIES
December 31, 2014
| | | | | | | | |
TELECOMMUNICATION SERVICES (1.2%) | | | | | | | | |
AT&T, Inc. | | | 51,113 | | | | 1,716,886 | |
CenturyLink, Inc. | | | 5,623 | | | | 222,558 | |
Frontier Communications Corp. | | | 9,783 | | | | 65,253 | |
Verizon Communications, Inc. | | | 40,893 | | | | 1,912,975 | |
Windstream Hldgs., Inc. | | | 5,947 | | | | 49,003 | |
| | | | | | | | |
| | | | | | | 3,966,675 | |
| | | | | | | | |
UTILITIES (1.8%) | | | | | | | | |
AES Corp. | | | 6,464 | | | | 89,009 | |
AGL Resources, Inc. | | | 1,175 | | | | 64,049 | |
Ameren Corp. | | | 2,396 | | | | 110,527 | |
American Electric Power Co., Inc. | | | 4,822 | | | | 292,792 | |
CenterPoint Energy, Inc. | | | 4,226 | | | | 99,015 | |
CMS Energy Corp. | | | 2,722 | | | | 94,590 | |
Consolidated Edison, Inc. | | | 2,894 | | | | 191,033 | |
Dominion Resources, Inc. | | | 5,764 | | | | 443,252 | |
DTE Energy Co. | | | 1,746 | | | | 150,802 | |
Duke Energy Corp. | | | 6,975 | | | | 582,691 | |
Edison International | | | 3,220 | | | | 210,846 | |
Entergy Corp. | | | 1,787 | | | | 156,327 | |
Exelon Corp. | | | 8,470 | | | | 314,068 | |
FirstEnergy Corp. | | | 4,151 | | | | 161,847 | |
Integrys Energy Group, Inc. | | | 798 | | | | 62,124 | |
NextEra Energy, Inc. | | | 4,316 | | | | 458,748 | |
NiSource, Inc. | | | 3,125 | | | | 132,563 | |
Northeast Utilities | | | 3,144 | | | | 168,267 | |
NRG Energy, Inc. | | | 3,380 | | | | 91,091 | |
Pepco Hldgs., Inc. | | | 2,524 | | | | 67,971 | |
PG&E Corp. | | | 4,682 | | | | 249,270 | |
Pinnacle West Capital Corp. | | | 1,098 | | | | 75,004 | |
PPL Corp. | | | 6,572 | | | | 238,761 | |
Public Svc. Enterprise Group, Inc. | | | 5,008 | | | | 207,381 | |
SCANA Corp. | | | 1,421 | | | | 85,828 | |
Sempra Energy | | | 2,282 | | | | 254,124 | |
Southern Co. | | | 8,852 | | | | 434,722 | |
TECO Energy, Inc. | | | 2,360 | | | | 48,356 | |
Wisconsin Energy Corp. | | | 2,216 | | | | 116,872 | |
Xcel Energy, Inc. | | | 4,988 | | | | 179,169 | |
| | | | | | | | |
| | | | | | | 5,831,099 | |
| | | | | | | | |
TOTAL INDEXED ASSETS - COMMON STOCKS
(Cost: $121,658,753) 55.5% | | | | | | | 179,800,853 | |
| | | | | | | | |
| | | | | | | | | | | | | | | | |
| | | Rating** | | Rate(%) | | | Maturity | | Face Amount | | | Value | |
INDEXED ASSETS: | | | | | | | | | | | | | | | | |
SHORT-TERM DEBT SECURITIES: | | | | | | | | | | | | | | | | |
U.S. GOVERNMENT (0.3%) | | | | | | | | | | | | | | | | |
U.S. Treasury Bill (1) | | A-1+ | | | 0.01 | | | 03/05/15 | | | 100,000 | | | | 99,997 | |
U.S. Treasury Bill (1) | | A-1+ | | | 0.09 | | | 06/25/15 | | | 1,000,000 | | | | 999,562 | |
| | | | | | | | | | | | | | | | |
| | | | | | | | | | | | | | | 1,099,559 | |
| | | | | | | | | | | | | | | | |
COMMERCIAL PAPER (1.2%) | | | | | | | | | | | | | | | | |
Exxon Mobil Corp. | | A-1+ | | | 0.13 | | | 02/04/15 | | | 3,900,000 | | | | 3,899,522 | |
| | | | | | | | | | | | | | | | |
TOTAL INDEXED ASSETS - SHORT-TERM DEBT SECURITIES
(Cost: $4,999,081) 1.5% | | | | 4,999,081 | |
| | | | | | | | | | | | | | | | |
| | | | | |
TOTAL INDEXED ASSETS
(Cost: $126,657,834) 57.0% | | | | | | | | | | | | | | | 184,799,934 | |
| | | | | | | | | | | | | | | | |
MUTUAL OF AMERICA INVESTMENT CORPORATION - ALL AMERICA FUND
PORTFOLIO OF INVESTMENTS IN SECURITIES
December 31, 2014
| | | | | | | | |
| | | Shares | | | Value | |
ACTIVE ASSETS: | | | | | | | | |
COMMON STOCKS: | | | | | | | | |
CONSUMER DISCRETIONARY (5.3%) | | | | | | | | |
Amazon.com, Inc.* | | | 2,475 | | | | 768,116 | |
American Axle & Mfg. Hldgs., Inc.* | | | 8,497 | | | | 191,947 | |
AutoZone, Inc.* | | | 659 | | | | 407,993 | |
Bassett Furniture Industries, Inc. | | | 30,303 | | | | 591,212 | |
Carmike Cinemas, Inc.* | | | 13,636 | | | | 358,218 | |
Cooper Tire & Rubber Co. | | | 8,211 | | | | 284,511 | |
CST Brands, Inc. | | | 13,703 | | | | 597,588 | |
Diamond Resorts Int’l., Inc.* | | | 44,421 | | | | 1,239,346 | |
Discovery Communications, Inc. Cl A* | | | 3,838 | | | | 132,219 | |
Discovery Communications, Inc. Cl C* | | | 3,838 | | | | 129,417 | |
Disney (Walt) Co. | | | 11,399 | | | | 1,073,672 | |
Dollar Tree, Inc.* | | | 2,799 | | | | 196,994 | |
Drew Industries, Inc.* | | | 4,172 | | | | 213,064 | |
Eros International PLC* | | | 8,519 | | | | 180,262 | |
Five Below, Inc.* | | | 4,998 | | | | 204,068 | |
Ford Motor Co. | | | 16,682 | | | | 258,571 | |
FTD Companies, Inc.* | | | 4,296 | | | | 149,587 | |
General Motors Co. | | | 8,119 | | | | 283,434 | |
Haverty Furniture Cos., Inc. | | | 11,757 | | | | 258,772 | |
Home Depot, Inc. | | | 7,734 | | | | 811,838 | |
Houghton Mifflin Harcourt Co.* | | | 36,168 | | | | 749,039 | |
HSN, Inc. | | | 3,189 | | | | 242,364 | |
Intrawest Resorts Hldgs., Inc.* | | | 21,771 | | | | 259,946 | |
Johnson Controls, Inc. | | | 4,165 | | | | 201,336 | |
Macy’s, Inc. | | | 7,974 | | | | 524,291 | |
McDonald’s Corp. | | | 6,515 | | | | 610,456 | |
Panera Bread Co. Cl A* | | | 1,236 | | | | 216,053 | |
Popeyes Louisiana Kitchen, Inc.* | | | 5,002 | | | | 281,463 | |
Priceline Group Inc.* | | | 256 | | | | 291,894 | |
Red Robin Gourmet Burgers, Inc.* | | | 8,107 | | | | 624,036 | |
Ruby Tuesday, Inc.* | | | 30,179 | | | | 206,424 | |
Select Comfort Corp.* | | | 20,941 | | | | 566,035 | |
Sotheby’s | | | 3,256 | | | | 140,594 | |
Starbucks Corp. | | | 8,369 | | | | 686,676 | |
Steve Madden Ltd.* | | | 8,639 | | | | 274,979 | |
Target Corp. | | | 7,835 | | | | 594,755 | |
The Men’s Wearhouse, Inc. | | | 10,115 | | | | 446,578 | |
Time Warner Cable, Inc. | | | 4,260 | | | | 647,776 | |
Time Warner, Inc. | | | 7,168 | | | | 612,291 | |
Viacom, Inc. Cl B | | | 5,089 | | | | 382,947 | |
Wolverine World Wide, Inc. | | | 9,511 | | | | 280,289 | |
| | | | | | | | |
| | | | 17,171,051 | |
| | | | | | | | |
CONSUMER STAPLES (2.5%) | | | | | | | | |
Coca-Cola Co. | | | 10,875 | | | | 459,143 | |
Colgate-Palmolive Co. | | | 6,058 | | | | 419,153 | |
Constellation Brands, Inc. Cl A* | | | 6,487 | | | | 636,829 | |
Crimson Wine Group Ltd.* | | | 35,282 | | | | 335,179 | |
Darling Ingredients Inc.* | | | 10,348 | | | | 187,920 | |
Estee Lauder Cos., Inc. Cl A | | | 5,842 | | | | 445,160 | |
Farmer Brothers Co.* | | | 13,341 | | | | 392,892 | |
Mead Johnson Nutrition Co. | | | 2,439 | | | | 245,217 | |
Mondelez International, Inc. Cl A | | | 8,942 | | | | 324,818 | |
PepsiCo, Inc. | | | 7,058 | | | | 667,404 | |
Philip Morris Int’l., Inc. | | | 4,716 | | | | 384,118 | |
Proctor & Gamble Co. | | | 12,315 | | | | 1,121,773 | |
Spectrum Brands Hldgs., Inc. | | | 2,949 | | | | 282,160 | |
Sysco Corp. | | | 8,709 | | | | 345,660 | |
TreeHouse Foods, Inc.* | | | 3,340 | | | | 285,670 | |
Tyson Foods, Inc. Cl A | | | 7,359 | | | | 295,022 | |
Vector Group Ltd. | | | 10,202 | | | | 217,404 | |
MUTUAL OF AMERICA INVESTMENT CORPORATION - ALL AMERICA FUND
PORTFOLIO OF INVESTMENTS IN SECURITIES
December 31, 2014
| | | | | | | | |
Village Super Market, Inc. Cl A | | | 6,316 | | | | 172,869 | |
Wal-Mart Stores, Inc. | | | 9,917 | | | | 851,672 | |
| | | | | | | | |
| | | | | | | 8,070,063 | |
| | | | | | | | |
ENERGY (2.4%) | | | | | | | | |
Anadarko Petroleum Corp. | | | 5,557 | | | | 458,453 | |
Apache Corp. | | | 3,762 | | | | 235,765 | |
Bonanza Creek Energy, Inc.* | | | 8,749 | | | | 209,976 | |
California Resources Corp.* | | | 2,369 | | | | 13,053 | |
Carrizo Oil and Gas, Inc.* | | | 7,756 | | | | 322,650 | |
Chevron Corp. | | | 5,030 | | | | 564,265 | |
Emerald Oil, Inc.* | | | 15,088 | | | | 18,106 | |
EOG Resources, Inc. | | | 5,444 | | | | 501,229 | |
Exxon Mobil Corp. | | | 20,307 | | | | 1,877,382 | |
Gulf Coast Ultra Deep Royalty Trust* | | | 70,148 | | | | 89,088 | |
Halliburton Co. | | | 12,513 | | | | 492,136 | |
Helix Energy Solutions Group* | | | 7,938 | | | | 172,255 | |
Hess Corp. | | | 3,637 | | | | 268,483 | |
National Oilwell Varco, Inc. | | | 5,629 | | | | 368,868 | |
Noble Energy, Inc. | | | 9,632 | | | | 456,846 | |
Occidental Petroleum Corp. | | | 5,923 | | | | 477,453 | |
PBF Energy, Inc. | | | 17,300 | | | | 460,872 | |
Range Resources Corp. | | | 3,158 | | | | 168,795 | |
Sanchez Energy Corp.* | | | 10,250 | | | | 95,223 | |
Synergy Resources Corp.* | | | 13,308 | | | | 166,882 | |
Targa Resources Corp. | | | 2,942 | | | | 311,999 | |
Western Refining, Inc. | | | 4,567 | | | | 172,541 | |
Whiting Petroleum Corp.* | | | 1 | | | | 25 | |
| | | | | | | | |
| | | | | | | 7,902,345 | |
| | | | | | | | |
FINANCIALS (7.9%) | | | | | | | | |
Agree Realty Corp. | | | 2,200 | | | | 68,398 | |
Alexander’s, Inc. | | | 313 | | | | 136,837 | |
American Int’l. Group, Inc. | | | 11,571 | | | | 648,092 | |
Aon PLC | | | 3,670 | | | | 348,026 | |
Ashford Hospitality Prime, Inc | | | 6,363 | | | | 109,189 | |
Ashford Hospitality Trust, Inc. | | | 11,738 | | | | 123,014 | |
Aspen Insurance Hldgs. Ltd. | | | 5,687 | | | | 248,920 | |
BancFirst Corp. | | | 4,194 | | | | 265,858 | |
Bank of America Corp. | | | 41,917 | | | | 749,895 | |
Bank of Marin Bancorp | | | 3,446 | | | | 181,225 | |
Banner Corp. | | | 6,885 | | | | 296,193 | |
Berkshire Hathaway, Inc. Cl B* | | | 4,705 | | | | 706,456 | |
Brookline Bancorp, Inc. | | | 26,003 | | | | 260,810 | |
Bryn Mawr Bank Corp. | | | 7,410 | | | | 231,933 | |
Capital One Financial Corp. | | | 11,278 | | | | 930,999 | |
Charter Financial Corp. | | | 12,686 | | | | 145,255 | |
Chatham Lodging Trust | | | 9,760 | | | | 282,747 | |
Chesapeake Lodging Trust | | | 14,296 | | | | 531,954 | |
Citigroup, Inc. | | | 11,032 | | | | 596,942 | |
Columbia Banking System, Inc. | | | 2,957 | | | | 81,643 | |
Comerica, Inc. | | | 7,965 | | | | 373,081 | |
Cousins Properties, Inc. | | | 14,766 | | | | 168,628 | |
Customers Bancorp, Inc.* | | | 9,513 | | | | 182,840 | |
Dime Community Bancshares | | | 12,188 | | | | 198,421 | |
Eagle Bancorp, Inc.* | | | 4,351 | | | | 154,548 | |
EastGroup Properties, Inc. | | | 1,724 | | | | 109,164 | |
Ellington Financial LLC | | | 22,810 | | | | 455,288 | |
Enterprise Financial Svcs. Corp. | | | 7,982 | | | | 157,485 | |
Equity Lifestyle Properties, Inc. | | | 4,468 | | | | 230,325 | |
FBR & Co.* | | | 3,650 | | | | 89,754 | |
FelCor Lodging Trust, Inc. | | | 40,972 | | | | 443,317 | |
First Connecticut Bancorp, Inc. | | | 3,346 | | | | 54,607 | |
MUTUAL OF AMERICA INVESTMENT CORPORATION - ALL AMERICA FUND
PORTFOLIO OF INVESTMENTS IN SECURITIES
December 31, 2014
| | | | | | | | |
First Interstate BancSytem, Inc. | | | 8,401 | | | | 233,716 | |
Flushing Financial Corp. | | | 7,664 | | | | 155,349 | |
Forest City Enterprises, Inc. Cl A* | | | 19,112 | | | | 407,086 | |
Franklin Resources, Inc. | | | 4,390 | | | | 243,074 | |
Glacier Bancorp, Inc. | | | 11,323 | | | | 314,440 | |
Goldman Sachs Group, Inc. | | | 3,872 | | | | 750,510 | |
Hanmi Financial Corp. | | | 5,543 | | | | 120,893 | |
Health Insurance Innovations, Inc. Cl A* | | | 20,534 | | | | 147,023 | |
Highwoods Properties, Inc. | | | 8,019 | | | | 355,081 | |
Host Hotels & Resorts, Inc. | | | 15,817 | | | | 375,970 | |
Investors Bancorp, Inc. | | | 45,871 | | | | 514,902 | |
iShares Micro-Cap ETF | | | 2,793 | | | | 215,005 | |
iShares Russell 2000 ETF | | | 2,860 | | | | 342,113 | |
iShares Russell 2000 Value ETF | | | 3,340 | | | | 339,611 | |
Janus Capital Group, Inc. | | | 11,111 | | | | 179,220 | |
JPMorgan Chase & Co. | | | 24,967 | | | | 1,562,435 | |
Marlin Business Svcs. Corp. | | | 12,346 | | | | 253,463 | |
MB Financial, Inc. | | | 5,311 | | | | 174,519 | |
Meadowbrook Insurance Group, Inc. | | | 37,666 | | | | 318,654 | |
MetLife, Inc. | | | 11,439 | | | | 618,736 | |
Northfield Bancorp, Inc. | | | 19,123 | | | | 283,020 | |
Parkway Properties, Inc. | | | 9,510 | | | | 174,889 | |
Pennsylvania REIT | | | 11,281 | | | | 264,652 | |
PNC Financial Svcs. Grp., Inc. | | | 4,940 | | | | 450,676 | |
Primerica, Inc. | | | 4,796 | | | | 260,231 | |
PrivateBancorp, Inc. | | | 9,974 | | | | 333,132 | |
ProAssurance Corp. | | | 2,513 | | | | 113,462 | |
Prosperity Bancshares, Inc. | | | 4,299 | | | | 237,993 | |
PS Business Parks, Inc. | | | 2,228 | | | | 177,215 | |
Sabra Health Care REIT, Inc. | | | 12,680 | | | | 385,092 | |
Select Income REIT | | | 12,710 | | | | 310,251 | |
Selective Insurance Group, Inc. | | | 6,567 | | | | 178,425 | |
Silvercrest Asset Mgmt. Group, Inc. Cl A | | | 12,069 | | | | 188,880 | |
Simon Property Group, Inc. | | | 4,069 | | | | 741,006 | |
Southside Bancshares, Inc. | | | 944 | | | | 27,290 | |
Southwest Bancorp, Inc. | | | 10,943 | | | | 189,970 | |
Sovran Self Storage, Inc. | | | 1,545 | | | | 134,755 | |
Starwood Property Trust, Inc. | | | 7,818 | | | | 181,690 | |
Stifel Financial Corp.* | | | 4,963 | | | | 253,212 | |
Stock Yards Bancorp, Inc. | | | 9,795 | | | | 326,565 | |
SVB Financial Group* | | | 4,326 | | | | 502,119 | |
Symetra Financial Corp. | | | 20,183 | | | | 465,218 | |
Terreno Realty Corp. | | | 7,711 | | | | 159,078 | |
The GEO Group, Inc. | | | 5,670 | | | | 228,841 | |
UMB Financial Corp. | | | 2,650 | | | | 150,759 | |
Urstadt Biddle Pptys., Inc. Cl A | | | 6,220 | | | | 136,094 | |
ViewPoint Financial Group, Inc.* | | | 2,840 | | | | 67,734 | |
Wells Fargo & Co. | | | 24,266 | | | | 1,330,262 | |
Zions Bancorporation | | | 10,911 | | | | 311,073 | |
| | | | | | | | |
| | | | | | | 25,747,228 | |
| | | | | | | | |
HEALTH CARE (6.4%) | | | | | | | | |
Abbott Laboratories | | | 11,794 | | | | 530,966 | |
Abiomed, Inc.* | | | 10,651 | | | | 405,377 | |
ACADIA Pharmaceuticals, Inc.* | | | 3,037 | | | | 96,425 | |
Acorda Therapeutics, Inc.* | | | 3,790 | | | | 154,897 | |
Actavis PLC* | | | 1,787 | | | | 459,992 | |
Albany Molecular Research, Inc* | | | 14,937 | | | | 243,174 | |
Allergan, Inc. | | | 1,625 | | | | 345,459 | |
Alnylam Pharmaceuticals, Inc.* | | | 1,826 | | | | 177,122 | |
Ani Pharmaceuticals, Inc.* | | | 6,859 | | | | 386,779 | |
Anika Therapeutics, Inc.* | | | 5,587 | | | | 227,614 | |
MUTUAL OF AMERICA INVESTMENT CORPORATION - ALL AMERICA FUND
PORTFOLIO OF INVESTMENTS IN SECURITIES
December 31, 2014
| | | | | | | | |
Biogen Idec, Inc.* | | | 1,703 | | | | 578,083 | |
BioScrip, Inc.* | | | 35,378 | | | | 247,292 | |
BioSpecifics Technologies Corp.* | | | 4,410 | | | | 170,314 | |
Celgene Corp.* | | | 10,554 | | | | 1,180,570 | |
Cepheid, Inc.* | | | 3,644 | | | | 197,286 | |
Cerner Corp.* | | | 3,154 | | | | 203,938 | |
Computer Programs & Systems, Inc. | | | 4,227 | | | | 256,790 | |
Covidien PLC | | | 4,346 | | | | 444,509 | |
Cubist Pharmaceuticals, Inc.* | | | 1,504 | | | | 151,378 | |
DexCom, Inc.* | | | 7,622 | | | | 419,591 | |
Emergent Biosolutions, Inc.* | | | 12,179 | | | | 331,634 | |
Ensign Group, Inc. | | | 5,925 | | | | 263,011 | |
Exact Sciences Corp.* | | | 12,999 | | | | 356,693 | |
Express Scripts Hldg. Co.* | | | 4,906 | | | | 415,391 | |
Gilead Sciences, Inc.* | | | 9,551 | | | | 900,277 | |
GW Pharmaceuticals PLC ADR* | | | 1,614 | | | | 109,236 | |
Harvard Bioscience, Inc.* | | | 37,224 | | | | 211,060 | |
Humana, Inc. | | | 1,730 | | | | 248,480 | |
Insulet Corp.* | | | 6,113 | | | | 281,565 | |
Isis Pharmaceuticals, Inc.* | | | 4,117 | | | | 254,184 | |
Karyopharm Therapeutics, Inc.* | | | 3,011 | | | | 112,702 | |
Kindred Healthcare, Inc. | | | 5,323 | | | | 96,772 | |
Lannett Co., Inc.* | | | 4,442 | | | | 190,473 | |
McKesson Corp. | | | 2,122 | | | | 440,485 | |
Medicines Co.* | | | 5,629 | | | | 155,754 | |
Medidata Solutions, Inc.* | | | 4,573 | | | | 218,361 | |
Medtronic, Inc. | | | 4,750 | | | | 342,950 | |
Merck & Co., Inc. | | | 17,492 | | | | 993,371 | |
MWI Veterinary Supply, Inc.* | | | 1,603 | | | | 272,366 | |
Mylan, Inc.* | | | 17,044 | | | | 960,770 | |
Neogen Corp.* | | | 3,586 | | | | 177,830 | |
Omeros Corp.* | | | 11,265 | | | | 279,147 | |
Omnicell, Inc.* | | | 7,911 | | | | 262,012 | |
OSI Pharmaceuticals, Inc. - rights* | | | 1,570 | | | | 16 | |
Pacific Biosciences of CA, Inc.* | | | 30,234 | | | | 237,035 | |
Pacira Pharmaceuticals, Inc.* | | | 1,893 | | | | 167,833 | |
PAREXEL International Corp.* | | | 6,291 | | | | 349,528 | |
Pfizer, Inc. | | | 40,982 | | | | 1,276,589 | |
Pharmacyclics, Inc.* | | | 1,609 | | | | 196,716 | |
Puma Biotechnology, Inc.* | | | 1,200 | | | | 227,124 | |
QLT, Inc.* | | | 46,330 | | | | 185,783 | |
Rigel Pharmaceuticals, Inc.* | | | 15,254 | | | | 34,627 | |
Sarepta Therapeutics, Inc.* | | | 4,677 | | | | 67,676 | |
Sorrento Therapeutics, Inc.* | | | 10,467 | | | | 105,403 | |
St. Jude Medical, Inc. | | | 3,142 | | | | 204,324 | |
STAAR Surgical Co.* | | | 16,975 | | | | 154,642 | |
Stryker Corp. | | | 4,335 | | | | 408,921 | |
Supernus Pharmaceuticals, Inc.* | | | 53,747 | | | | 446,100 | |
Synageva BioPharma Corp.* | | | 1,849 | | | | 171,569 | |
Team Health Hldgs., Inc.* | | | 3,663 | | | | 210,732 | |
TearLab Corp.* | | | 20,467 | | | | 54,238 | |
UnitedHealth Group, Inc. | | | 4,884 | | | | 493,724 | |
Universal American Corp.* | | | 12,085 | | | | 112,149 | |
Vertex Pharmaceuticals, Inc.* | | | 2,106 | | | | 250,193 | |
WellCare Health Plans, Inc.* | | | 2,872 | | | | 235,676 | |
Wright Medical Group, Inc.* | | | 14,435 | | | | 387,868 | |
| | | | | | | | |
| | | | | | | 20,730,546 | |
| | | | | | | | |
INDUSTRIALS (5.3%) | | | | | | | | |
Alaska Air Group, Inc. | | | 7,286 | | | | 435,411 | |
Allegiant Travel Co. | | | 2,067 | | | | 310,732 | |
Applied Industrial Technologies, Inc. | | | 4,134 | | | | 188,469 | |
MUTUAL OF AMERICA INVESTMENT CORPORATION - ALL AMERICA FUND
PORTFOLIO OF INVESTMENTS IN SECURITIES
December 31, 2014
| | | | | | | | |
Astronics Corp.* | | | 8,244 | | | | 455,976 | |
AZZ, Inc. | | | 16,143 | | | | 757,430 | |
Blount International, Inc.* | | | 25,239 | | | | 443,449 | |
Boeing Co. | | | 8,402 | | | | 1,092,092 | |
Corporate Executive Board Co. | | | 3,894 | | | | 282,432 | |
Cummins, Inc. | | | 4,266 | | | | 615,029 | |
Delta Air Lines, Inc. | | | 9,680 | | | | 476,159 | |
Deluxe Corp. | | | 4,821 | | | | 300,107 | |
Encore Wire Corp. | | | 8,635 | | | | 322,345 | |
EnPro Industries, Inc.* | | | 9,453 | | | | 593,271 | |
Expeditors Int’l. of Wash. | | | 7,837 | | | | 349,609 | |
FedEx Corp. | | | 4,275 | | | | 742,397 | |
General Electric Co. | | | 37,205 | | | | 940,170 | |
Healthcare Svcs. Group, Inc. | | | 9,642 | | | | 298,227 | |
Matrix Service Co.* | | | 3,630 | | | | 81,022 | |
Miller (Herman), Inc. | | | 5,536 | | | | 162,924 | |
Miller Industries, Inc. | | | 19,981 | | | | 415,405 | |
Mueller Industries, Inc. | | | 24,391 | | | | 832,709 | |
Mueller Water Product, Inc. Cl A | | | 28,230 | | | | 289,075 | |
Old Dominion Freight Line, Inc.* | | | 7,013 | | | | 544,489 | |
Orbital Sciences Corp.* | | | 14,968 | | | | 402,490 | |
Precision Castparts Corp. | | | 3,349 | | | | 806,707 | |
Raven Industries, Inc. | | | 11,594 | | | | 289,850 | |
Roper Industries, Inc. | | | 8,544 | | | | 1,335,854 | |
Saia, Inc.* | | | 8,342 | | | | 461,813 | |
Steelcase, Inc. | | | 12,530 | | | | 224,914 | |
Sun Hydraulics Corp. | | | 6,962 | | | | 274,164 | |
Teledyne Technologies, Inc.* | | | 3,141 | | | | 322,706 | |
The Advisory Board Co.* | | | 3,833 | | | | 187,740 | |
Trex Co., Inc.* | | | 9,251 | | | | 393,908 | |
Tyco International PLC | | | 7,553 | | | | 331,275 | |
Union Pacific Corp. | | | 5,976 | | | | 711,921 | |
Uti Worldwide, Inc.* | | | 44,575 | | | | 538,020 | |
| | | | | | | | |
| | | | | | | 17,210,291 | |
| | | | | | | | |
INFORMATION TECHNOLOGY (7.4%) | | | | | | | | |
Analog Devices, Inc. | | | 4,795 | | | | 266,218 | |
Anixter International, Inc.* | | | 5,779 | | | | 511,211 | |
Apple, Inc. | | | 30,065 | | | | 3,318,575 | |
Arista Networks, Inc.* | | | 1,277 | | | | 77,591 | |
ARRIS Group, Inc.* | | | 13,725 | | | | 414,358 | |
Aspen Technology, Inc.* | | | 3,331 | | | | 116,652 | |
Automatic Data Processing, Inc. | | | 5,099 | | | | 425,104 | |
Blackhawk Network Hldgs., Inc.* | | | 4,475 | | | | 173,630 | |
Broadcom Corp. Cl A | | | 5,992 | | | | 259,633 | |
CalAmp Corp.* | | | 28,090 | | | | 514,047 | |
Cavium, Inc.* | | | 5,568 | | | | 344,214 | |
Cisco Systems, Inc. | | | 22,656 | | | | 630,177 | |
CommVault Systems, Inc.* | | | 4,228 | | | | 218,545 | |
comScore, Inc.* | | | 9,579 | | | | 444,753 | |
Electronics for Imaging, Inc.* | | | 7,186 | | | | 307,776 | |
Emulex Corp.* | | | 10,570 | | | | 59,932 | |
Envestnet, Inc.* | | | 1,376 | | | | 67,617 | |
Euronet Worldwide, Inc.* | | | 4,941 | | | | 271,261 | |
F5 Networks, Inc.* | | | 1,456 | | | | 189,957 | |
Facebook, Inc. Cl A* | | | 8,137 | | | | 634,849 | |
FEI Company | | | 2,757 | | | | 249,095 | |
Google, Inc. Cl A* | | | 1,134 | | | | 601,768 | |
Google, Inc. Cl C* | | | 1,134 | | | | 596,938 | |
Guidewire Software, Inc.* | | | 2,597 | | | | 131,486 | |
iGATE Corp.* | | | 13,413 | | | | 529,545 | |
Imation Corp.* | | | 24,758 | | | | 93,833 | |
MUTUAL OF AMERICA INVESTMENT CORPORATION - ALL AMERICA FUND
PORTFOLIO OF INVESTMENTS IN SECURITIES
December 31, 2014
| | | | | | | | |
Imperva, Inc.* | | | 8,518 | | | | 421,045 | |
Informatica Corp.* | | | 4,141 | | | | 157,917 | |
Intel Corp. | | | 11,680 | | | | 423,867 | |
j2 Global, Inc. | | | 1,955 | | | | 121,210 | |
KLA-Tencor Corp. | | | 2,557 | | | | 179,808 | |
LogMeIn, Inc.* | | | 11,684 | | | | 576,489 | |
Manhattan Associates, Inc.* | | | 3,606 | | | | 146,836 | |
MasterCard, Inc. Cl A | | | 6,470 | | | | 557,455 | |
MAXIMUS, Inc. | | | 4,811 | | | | 263,835 | |
MaxLinear, Inc. Cl A* | | | 27,358 | | | | 202,723 | |
Micron Technology, Inc.* | | | 8,419 | | | | 294,749 | |
Microsemi Corp.* | | | 5,162 | | | | 146,498 | |
Microsoft Corp. | | | 25,940 | | | | 1,204,913 | |
MKS Instruments, Inc. | | | 5,204 | | | | 190,466 | |
Monolithic Power Systems, Inc. | | | 6,116 | | | | 304,210 | |
Nanometrics, Inc.* | | | 6,258 | | | | 105,260 | |
NetApp, Inc. | | | 1,578 | | | | 65,408 | |
Nova Measuring Instruments Ltd.* | | | 10,616 | | | | 110,300 | |
Oracle Corp. | | | 16,326 | | | | 734,180 | |
Plexus Corp.* | | | 2,614 | | | | 107,723 | |
Proofpoint, Inc.* | | | 12,697 | | | | 612,377 | |
PTC, Inc.* | | | 5,796 | | | | 212,423 | |
Qlik Technologies, Inc.* | | | 12,151 | | | | 375,344 | |
QUALCOMM, Inc. | | | 9,230 | | | | 686,066 | |
Richardson Electronics Ltd. | | | 45,433 | | | | 454,330 | |
Rogers Corp.* | | | 6,796 | | | | 553,466 | |
Ruckus Wireless, Inc.* | | | 7,476 | | | | 89,862 | |
Salesforce.com, inc.* | | | 14,350 | | | | 851,099 | |
Semtech Corp.* | | | 11,257 | | | | 310,356 | |
Synaptics, Inc.* | | | 4,895 | | | | 336,972 | |
SYNNEX Corp. | | | 4,029 | | | | 314,907 | |
Teradata Corp.* | | | 4,773 | | | | 208,485 | |
Texas Instruments, Inc. | | | 5,633 | | | | 301,168 | |
Ultimate Software Group, Inc.* | | | 1,494 | | | | 219,342 | |
Verint Systems, Inc.* | | | 2,711 | | | | 157,997 | |
WEX, Inc.* | | | 1,742 | | | | 172,319 | |
Yahoo!, Inc.* | | | 8,872 | | | | 448,125 | |
| | | | | | | | |
| | | | | | | 24,068,295 | |
| | | | | | | | |
MATERIALS (1.7%) | | | | | | | | |
A. Schulman, Inc. | | | 7,729 | | | | 313,256 | |
Ball Corp. | | | 6,764 | | | | 461,102 | |
Boise Cascade Co.* | | | 5,737 | | | | 213,130 | |
Calgon Carbon Corp.* | | | 8,441 | | | | 175,404 | |
CF Industries Hldgs., Inc. | | | 1,241 | | | | 338,222 | |
Crown Hldgs., Inc.* | | | 2,768 | | | | 140,891 | |
Dow Chemical Co. | | | 9,095 | | | | 414,823 | |
Eastman Chemical Co. | | | 7,136 | | | | 541,337 | |
FMC Corp. | | | 2,046 | | | | 116,683 | |
Freeport-McMoRan Copper & Gold, Inc. | | | 9,277 | | | | 216,711 | |
Horsehead Hldg. Corp.* | | | 20,402 | | | | 322,964 | |
Kaiser Aluminum Corp. | | | 7,747 | | | | 553,368 | |
Kraton Performance Polymers, Inc.* | | | 10,415 | | | | 216,528 | |
PolyOne Corp. | | | 5,406 | | | | 204,941 | |
Resolute Forest Products, Inc.* | | | 16,392 | | | | 288,663 | |
Schnitzer Steel Industries, Inc. Cl A | | | 7,930 | | | | 178,901 | |
Silgan Hldgs., Inc. | | | 6,201 | | | | 332,374 | |
TimkenSteel Corp. | | | 2,566 | | | | 95,019 | |
U.S. Concrete, Inc.* | | | 10,084 | | | | 286,890 | |
| | | | | | | | |
| | | | | | | 5,411,207 | |
| | | | | | | | |
MUTUAL OF AMERICA INVESTMENT CORPORATION - ALL AMERICA FUND
PORTFOLIO OF INVESTMENTS IN SECURITIES
December 31, 2014
| | | | | | | | |
TELECOMMUNICATION SERVICES (0.7%) | | | | | | | | |
AT&T, Inc. | | | 21,988 | | | | 738,577 | |
Consolidated Comms. Hldgs., Inc. | | | 14,500 | | | | 403,535 | |
IDT Corp. Cl B | | | 7,606 | | | | 154,478 | |
ORBCOMM, Inc.* | | | 30,111 | | | | 196,926 | |
Shenandoah Telecommunications Co. | | | 5,821 | | | | 181,906 | |
Verizon Communications, Inc. | | | 9,334 | | | | 436,645 | |
| | | | | | | | |
| | | | | | | 2,112,067 | |
| | | | | | | | |
UTILITIES (1.3%) | | | | | | | | |
Ameren Corp. | | | 2,498 | | | | 115,233 | |
Avista Corp. | | | 9,876 | | | | 349,117 | |
Black Hills Corp. | | | 3,108 | | | | 164,848 | |
Dominion Resources, Inc. | | | 7,773 | | | | 597,744 | |
Edison International | | | 4,496 | | | | 294,398 | |
Idacorp, Inc. | | | 7,006 | | | | 463,727 | |
Northwest Natural Gas Co. | | | 3,947 | | | | 196,955 | |
NorthWestern Corp. | | | 8,208 | | | | 464,408 | |
PNM Resources, Inc. | | | 10,305 | | | | 305,337 | |
Portland General Electric Co. | | | 7,821 | | | | 295,868 | |
PPL Corp. | | | 4,985 | | | | 181,105 | |
Public Svc. Enterprise Group, Inc. | | | 8,757 | | | | 362,627 | |
Sempra Energy | | | 4,089 | | | | 455,351 | |
| | | | | | | | |
| | | | | | | 4,246,718 | |
| | | | | | | | |
TOTAL ACTIVE ASSETS - COMMON STOCKS
(Cost: $91,911,468) 40.9% | | | | | | | 132,669,811 | |
| | | | | | | | |
| | | | | | | | | | | | | | | | |
| | | Rating** | | Rate(%) | | | Maturity | | Face Amount | | | Value | |
ACTIVE ASSETS: | | | | | | | | | | | | | | | | |
SHORT-TERM DEBT SECURITIES: | | | | | | | | | | | | | | | | |
U.S. GOVERNMENT (1.1%) | | | | | | | | | | | | | | | | |
U.S. Treasury Bill | | A-1+ | | | 0.09 | | | 06/25/15 | | | 1,000,000 | | | | 999,562 | |
U.S. Treasury Bill | | A-1+ | | | 0.09 | | | 07/23/15 | | | 900,000 | | | | 899,543 | |
U.S. Treasury Bill | | A-1+ | | | 0.09 | | | 07/23/15 | | | 600,000 | | | | 599,696 | |
U.S. Treasury Bill | | A-1+ | | | 0.09 | | | 07/23/15 | | | 1,100,000 | | | | 1,099,442 | |
| | | | | | | | | | | | | | | | |
| | | | | | | | | | | | | | | 3,598,243 | |
| | | | | | | | | | | | | | | | |
COMMERCIAL PAPER (0.7%) | | | | | | | | | | | | | | | | |
General Electric Capital Corp. | | A-1+ | | | 0.12 | | | 03/02/15 | | | 1,000,000 | | | | 999,800 | |
Toyota Motor Credit Corp. | | A-1+ | | | 0.10 | | | 01/02/15 | | | 700,000 | | | | 699,998 | |
Toyota Motor Credit Corp. | | A-1+ | | | 0.12 | | | 01/13/15 | | | 600,000 | | | | 599,976 | |
| | | | | | | | | | | | | | | | |
| | | | | | | | | | | | | | | 2,299,774 | |
| | | | | | | | | | | | | | | | |
TOTAL ACTIVE ASSETS - SHORT-TERM DEBT SECURITIES
(Cost: $5,898,017) 1.8% | | | | 5,898,017 | |
| | | | | | | | | | | | | | | | |
| |
TOTAL ACTIVE ASSETS
(Cost: $97,809,485) 42.7% | | | | 138,567,828 | |
| | | | | | | | | | | | | | | | |
| |
TEMPORARY CASH INVESTMENTS (2)
(Cost: $228,300) 0.1% | | | | 228,300 | |
| | | | | | | | | | | | | | | | |
| |
TOTAL INVESTMENTS
(Cost: $224,695,619) 99.8% | | | | 323,596,062 | |
| | | | | | | | | | | | | | | | |
| |
OTHER NET ASSETS 0.2% | | | | 587,061 | |
| | | | | | | | | | | | | | | | |
| |
NET ASSETS 100.0% | | | | $324,183,123 | |
| | | | | | | | | | | | | | | | |
The accompanying notes are an integral part of these portfolio schedules.
MUTUAL OF AMERICA INVESTMENT CORPORATION - SMALL CAP VALUE FUND
PORTFOLIO OF INVESTMENTS IN SECURITIES
December 31, 2014
| | | | | | | | |
| | | Shares | | | Value | |
COMMON STOCKS: | | | | | | | | |
CONSUMER DISCRETIONARY (10.8%) | | | | | | | | |
Bassett Furniture Industries, Inc. | | | 373,980 | | | | 7,296,350 | |
Carmike Cinemas, Inc.* | | | 37,272 | | | | 979,135 | |
CST Brands, Inc. | | | 72,800 | | | | 3,174,808 | |
Diamond Resorts Int’l., Inc.* | | | 354,327 | | | | 9,885,723 | |
FTD Companies, Inc.* | | | 51,827 | | | | 1,804,616 | |
Houghton Mifflin Harcourt Co.* | | | 281,471 | | | | 5,829,264 | |
Intrawest Resorts Hldgs., Inc.* | | | 118,078 | | | | 1,409,851 | |
Ruby Tuesday, Inc.* | | | 376,206 | | | | 2,573,249 | |
Select Comfort Corp.* | | | 121,889 | | | | 3,294,660 | |
The Men’s Wearhouse, Inc. | | | 68,219 | | | | 3,011,869 | |
Wolverine World Wide, Inc. | | | 108,615 | | | | 3,200,884 | |
| | | | | | | | |
| | | | | | | 42,460,409 | |
| | | | | | | | |
CONSUMER STAPLES (2.8%) | | | | | | | | |
Crimson Wine Group Ltd.* | | | 415,416 | | | | 3,946,452 | |
Farmer Brothers Co.* | | | 152,535 | | | | 4,492,156 | |
Vector Group Ltd. | | | 127,476 | | | | 2,716,514 | |
| | | | | | | | |
| | | | | | | 11,155,122 | |
| | | | | | | | |
ENERGY (2.6%) | | | | | | | | |
Carrizo Oil and Gas, Inc.* | | | 29,610 | | | | 1,231,776 | |
Emerald Oil, Inc.* | | | 172,513 | | | | 207,016 | |
Gulf Coast Ultra Deep Royalty Trust* | | | 767,207 | | | | 974,353 | |
Helix Energy Solutions Group* | | | 99,774 | | | | 2,165,096 | |
PBF Energy, Inc. | | | 206,620 | | | | 5,504,357 | |
| | | | | | | | |
| | | | | | | 10,082,598 | |
| | | | | | | | |
FINANCIALS (36.8%) | | | | | | | | |
Agree Realty Corp. | | | 27,580 | | | | 857,462 | |
Alexander’s, Inc. | | | 3,892 | | | | 1,701,505 | |
Ashford Hospitality Prime, Inc | | | 75,938 | | | | 1,303,096 | |
Ashford Hospitality Trust, Inc. | | | 141,647 | | | | 1,484,461 | |
Ashford, Inc.* | | | 0 | | | | 4 | |
Aspen Insurance Hldgs. Ltd. | | | 70,612 | | | | 3,090,687 | |
BancFirst Corp. | | | 52,011 | | | | 3,296,977 | |
Bank of Marin Bancorp | | | 41,894 | | | | 2,203,205 | |
Banner Corp. | | | 84,989 | | | | 3,656,227 | |
Brookline Bancorp, Inc. | | | 333,217 | | | | 3,342,167 | |
Bryn Mawr Bank Corp. | | | 93,720 | | | | 2,933,436 | |
Charter Financial Corp. | | | 153,212 | | | | 1,754,277 | |
Chatham Lodging Trust | | | 121,980 | | | | 3,533,761 | |
Chesapeake Lodging Trust | | | 150,226 | | | | 5,589,909 | |
Columbia Banking System, Inc. | | | 33,849 | | | | 934,571 | |
Customers Bancorp, Inc.* | | | 119,034 | | | | 2,287,833 | |
Dime Community Bancshares | | | 150,242 | | | | 2,445,940 | |
Eagle Bancorp, Inc.* | | | 53,576 | | | | 1,903,020 | |
EastGroup Properties, Inc. | | | 20,899 | | | | 1,323,325 | |
Ellington Financial LLC | | | 276,849 | | | | 5,525,906 | |
Enterprise Financial Svcs. Corp. | | | 96,550 | | | | 1,904,932 | |
Equity Lifestyle Properties, Inc. | | | 54,036 | | | | 2,785,556 | |
FBR & Co.* | | | 44,529 | | | | 1,094,968 | |
FelCor Lodging Trust, Inc. | | | 512,453 | | | | 5,544,741 | |
First Connecticut Bancorp, Inc. | | | 40,634 | | | | 663,147 | |
First Interstate BancSytem, Inc. | | | 96,363 | | | | 2,680,819 | |
Flushing Financial Corp. | | | 92,833 | | | | 1,881,725 | |
Forest City Enterprises, Inc. Cl A* | | | 242,508 | | | | 5,165,420 | |
Glacier Bancorp, Inc. | | | 129,383 | | | | 3,592,966 | |
Hanmi Financial Corp. | | | 66,948 | | | | 1,460,136 | |
Highwoods Properties, Inc. | | | 97,279 | | | | 4,307,514 | |
Investors Bancorp, Inc. | | | 326,037 | | | | 3,659,765 | |
MUTUAL OF AMERICA INVESTMENT CORPORATION - SMALL CAP VALUE FUND
PORTFOLIO OF INVESTMENTS IN SECURITIES
December 31, 2014
| | | | | | | | |
Janus Capital Group, Inc. | | | 133,961 | | | | 2,160,791 | |
Marlin Business Svcs. Corp. | | | 149,468 | | | | 3,068,578 | |
MB Financial, Inc. | | | 60,621 | | | | 1,992,006 | |
Meadowbrook Insurance Group, Inc. | | | 472,531 | | | | 3,997,612 | |
Northfield Bancorp, Inc. | | | 228,383 | | | | 3,380,068 | |
Parkway Properties, Inc. | | | 113,417 | | | | 2,085,739 | |
Pennsylvania REIT | | | 139,768 | | | | 3,278,957 | |
PrivateBancorp, Inc. | | | 123,084 | | | | 4,111,006 | |
ProAssurance Corp. | | | 28,626 | | | | 1,292,464 | |
Prosperity Bancshares, Inc. | | | 51,121 | | | | 2,830,059 | |
Select Income REIT | | | 149,817 | | | | 3,657,033 | |
Selective Insurance Group, Inc. | | | 78,484 | | | | 2,132,410 | |
Southside Bancshares, Inc. | | | 11,298 | | | | 326,616 | |
Sovran Self Storage, Inc. | | | 19,337 | | | | 1,686,573 | |
Stock Yards Bancorp, Inc. | | | 121,910 | | | | 4,064,479 | |
SVB Financial Group* | | | 52,339 | | | | 6,074,988 | |
Symetra Financial Corp. | | | 252,010 | | | | 5,808,831 | |
Terreno Realty Corp. | | | 93,911 | | | | 1,937,384 | |
The GEO Group, Inc. | | | 67,661 | | | | 2,730,798 | |
UMB Financial Corp. | | | 30,180 | | | | 1,716,940 | |
Urstadt Biddle Pptys., Inc. Cl A | | | 74,275 | | | | 1,625,137 | |
ViewPoint Financial Group, Inc.* | | | 34,453 | | | | 821,704 | |
| | | | | | | | |
| | | | | | | 144,689,631 | |
| | | | | | | | |
HEALTH CARE (5.5%) | | | | | | | | |
Albany Molecular Research, Inc* | | | 69,989 | | | | 1,139,421 | |
Ani Pharmaceuticals, Inc.* | | | 41,935 | | | | 2,364,715 | |
Computer Programs & Systems, Inc. | | | 50,446 | | | | 3,064,595 | |
Ensign Group, Inc. | | | 25,119 | | | | 1,115,032 | |
Harvard Bioscience, Inc.* | | | 391,855 | | | | 2,221,818 | |
Kindred Healthcare, Inc. | | | 66,534 | | | | 1,209,588 | |
Pacific Biosciences of CA, Inc.* | | | 193,197 | | | | 1,514,664 | |
QLT, Inc.* | | | 555,375 | | | | 2,227,054 | |
Rigel Pharmaceuticals, Inc.* | | | 175,041 | | | | 397,343 | |
Supernus Pharmaceuticals, Inc.* | | | 292,180 | | | | 2,425,094 | |
TearLab Corp.* | | | 244,219 | | | | 647,180 | |
Universal American Corp.* | | | 150,506 | | | | 1,396,696 | |
Wright Medical Group, Inc.* | | | 69,395 | | | | 1,864,644 | |
| | | | | | | | |
| | | | | | | 21,587,844 | |
| | | | | | | | |
INDUSTRIALS (15.5%) | | | | | | | | |
Alaska Air Group, Inc. | | | 87,972 | | | | 5,257,207 | |
AZZ, Inc. | | | 110,213 | | | | 5,171,194 | |
Blount International, Inc.* | | | 301,318 | | | | 5,294,157 | |
Deluxe Corp. | | | 57,541 | | | | 3,581,927 | |
Encore Wire Corp. | | | 104,236 | | | | 3,891,130 | |
EnPro Industries, Inc.* | | | 59,042 | | | | 3,705,476 | |
Matrix Service Co.* | | | 43,866 | | | | 979,089 | |
Miller Industries, Inc. | | | 241,043 | | | | 5,011,284 | |
Mueller Industries, Inc. | | | 295,355 | | | | 10,083,417 | |
Old Dominion Freight Line, Inc.* | | | 84,563 | | | | 6,565,471 | |
Orbital Sciences Corp.* | | | 179,044 | | | | 4,814,493 | |
Steelcase, Inc. | | | 149,549 | | | | 2,684,405 | |
Uti Worldwide, Inc.* | | | 313,353 | | | | 3,782,171 | |
| | | | | | | | |
| | | | | | | 60,821,421 | |
| | | | | | | | |
INFORMATION TECHNOLOGY (8.8%) | | | | | | | | |
Anixter International, Inc.* | | | 37,180 | | | | 3,288,943 | |
ARRIS Group, Inc.* | | | 38,831 | | | | 1,172,308 | |
CalAmp Corp.* | | | 124,343 | | | | 2,275,477 | |
Emulex Corp.* | | | 127,473 | | | | 722,772 | |
iGATE Corp.* | | | 33,415 | | | | 1,319,224 | |
Imation Corp.* | | | 283,072 | | | | 1,072,843 | |
LogMeIn, Inc.* | | | 53,143 | | | | 2,622,076 | |
MUTUAL OF AMERICA INVESTMENT CORPORATION - SMALL CAP VALUE FUND
PORTFOLIO OF INVESTMENTS IN SECURITIES
December 31, 2014
| | | | | | | | |
Microsemi Corp.* | | | 62,287 | | | | 1,767,705 | |
MKS Instruments, Inc. | | | 62,949 | | | | 2,303,933 | |
Nanometrics, Inc.* | | | 71,289 | | | | 1,199,081 | |
Nova Measuring Instruments Ltd.* | | | 128,953 | | | | 1,339,822 | |
Plexus Corp.* | | | 31,160 | | | | 1,284,104 | |
Proofpoint, Inc.* | | | 63,802 | | | | 3,077,170 | |
Richardson Electronics Ltd. | | | 518,914 | | | | 5,189,140 | |
Rogers Corp.* | | | 12,390 | | | | 1,009,042 | |
Semtech Corp.* | | | 43,690 | | | | 1,204,533 | |
SYNNEX Corp. | | | 48,207 | | | | 3,767,859 | |
| | | | | | | | |
| | | | | | | 34,616,032 | |
| | | | | | | | |
MATERIALS (5.9%) | | | | | | | | |
Boise Cascade Co.* | | | 70,074 | | | | 2,603,249 | |
Crown Hldgs., Inc.* | | | 31,622 | | | | 1,609,560 | |
Horsehead Hldg. Corp.* | | | 142,062 | | | | 2,248,841 | |
Kaiser Aluminum Corp. | | | 93,794 | | | | 6,699,705 | |
Kraton Performance Polymers, Inc.* | | | 133,485 | | | | 2,775,153 | |
Schnitzer Steel Industries, Inc. Cl A | | | 90,447 | | | | 2,040,484 | |
Silgan Hldgs., Inc. | | | 75,242 | | | | 4,032,971 | |
TimkenSteel Corp. | | | 31,055 | | | | 1,149,967 | |
| | | | | | | | |
| | | | | | | 23,159,930 | |
| | | | | | | | |
TELECOMMUNICATION SERVICES (1.3%) | | | | | | | | |
Consolidated Comms. Hldgs., Inc. | | | 85,993 | | | | 2,393,185 | |
IDT Corp. Cl B | | | 91,843 | | | | 1,865,331 | |
ORBCOMM, Inc.* | | | 146,904 | | | | 960,752 | |
| | | | | | | | |
| | | | | | | 5,219,268 | |
| | | | | | | | |
UTILITIES (5.9%) | | | | | | | | |
Avista Corp. | | | 112,912 | | | | 3,991,439 | |
Black Hills Corp. | | | 37,143 | | | | 1,970,065 | |
Idacorp, Inc. | | | 83,429 | | | | 5,522,166 | |
Northwest Natural Gas Co. | | | 47,543 | | | | 2,372,396 | |
NorthWestern Corp. | | | 44,109 | | | | 2,495,687 | |
PNM Resources, Inc. | | | 122,683 | | | | 3,635,097 | |
Portland General Electric Co. | | | 93,213 | | | | 3,526,248 | |
| | | | | | | | |
| | | | | | | 23,513,098 | |
| | | | | | | | |
TOTAL COMMON STOCKS
(Cost: $288,159,357) 95.9% | | | | | | | 377,305,353 | |
| | | | | | | | |
| | | | | | | | | | | | | | | | | | |
| | | Rating** | | Rate(%) | | | Maturity | | | Face Amount | | | Value | |
SHORT-TERM DEBT SECURITIES: | | | | | | | | | | | | | | | | | | |
U.S. GOVERNMENT (1.4%) | | | | | | | | | | | | | | | | | | |
U.S. Treasury Bill | | A-1+ | | | 0.09 | | | | 07/23/15 | | | | 5,350,000 | | | | 5,347,285 | |
| | | | | | | | | | | | | | | | | | |
U.S. GOVERNMENT AGENCIES (0.6%) | | | | | | | | | | | | | | | | | | |
FHLB | | A-1+ | | | 0.10 | | | | 03/06/15 | | | | 2,500,000 | | | | 2,499,533 | |
| | | | | | | | | | | | | | | | | | |
COMMERCIAL PAPER (2.5%) | | | | | | | | | | | | | | | | | | |
Dover Corp.† | | A-1 | | | 0.10 | | | | 01/02/15 | | | | 3,900,000 | | | | 3,899,989 | |
Piedmont Natural Gas Co.† | | A-1 | | | 0.17 | | | | 01/05/15 | | | | 1,050,000 | | | | 1,049,980 | |
Questar Corp.† | | A-1 | | | 0.15 | | | | 01/07/15 | | | | 1,500,000 | | | | 1,499,963 | |
Questar Corp.† | | A-1 | | | 0.19 | | | | 01/14/15 | | | | 600,000 | | | | 599,959 | |
Toyota Motor Credit Corp. | | A-1+ | | | 0.11 | | | | 01/09/15 | | | | 3,000,000 | | | | 2,999,927 | |
| | | | | | | | | | | | | | | | | | |
| | | | | | | | | | | | | | | | | 10,049,818 | |
| | | | | | | | | | | | | | | | | | |
TOTAL SHORT-TERM DEBT SECURITIES
(Cost: $17,896,636) 4.5% | | | | | | | | | | | | 17,896,636 | |
| | | | | | | | | | | | | | | | | | |
| | | |
TOTAL INVESTMENTS
(Cost: $306,055,993) 100.4% | | | | | | | | | | | | 395,201,989 | |
| | | | | | | | | | | | | | | | | | |
| | | | | |
OTHER NET ASSETS -0.4% | | | | | | | | | | | | | | | | | (1,745,447) | |
| | | | | | | | | | | | | | | | | | |
| | | | | |
NET ASSETS 100.0% | | | | | | | | | | | | | | | | | $393,456,542 | |
| | | | | | | | | | | | | | | | | | |
The accompanying notes are an integral part of these portfolio schedules.
MUTUAL OF AMERICA INVESTMENT CORPORATION - SMALL CAP GROWTH FUND
PORTFOLIO OF INVESTMENTS IN SECURITIES
December 31, 2014
| | | | | | | | |
| | | Shares | | | Value | |
COMMON STOCKS: | | | | | |
CONSUMER DISCRETIONARY (14.7%) | | | | | | | | |
American Axle & Mfg. Hldgs., Inc.* | | | 103,515 | | | | 2,338,411 | |
Carmike Cinemas, Inc.* | | | 122,947 | | | | 3,229,805 | |
Cooper Tire & Rubber Co. | | | 100,731 | | | | 3,490,336 | |
CST Brands, Inc. | | | 91,891 | | | | 4,007,371 | |
Diamond Resorts Int’l., Inc.* | | | 178,932 | | | | 4,992,197 | |
Drew Industries, Inc.* | | | 52,259 | | | | 2,668,882 | |
Eros International PLC* | | | 99,902 | | | | 2,113,918 | |
Five Below, Inc.* | | | 59,335 | | | | 2,422,656 | |
Haverty Furniture Cos., Inc. | | | 143,308 | | | | 3,154,209 | |
Houghton Mifflin Harcourt Co.* | | | 151,667 | | | | 3,141,019 | |
HSN, Inc. | | | 39,619 | | | | 3,011,036 | |
Intrawest Resorts Hldgs., Inc.* | | | 142,022 | | | | 1,695,738 | |
Panera Bread Co. Cl A* | | | 14,687 | | | | 2,567,288 | |
Popeyes Louisiana Kitchen, Inc.* | | | 59,591 | | | | 3,353,157 | |
Red Robin Gourmet Burgers, Inc.* | | | 96,634 | | | | 7,438,384 | |
Select Comfort Corp.* | | | 132,244 | | | | 3,574,542 | |
Sotheby’s | | | 41,097 | | | | 1,774,577 | |
Steve Madden Ltd.* | | | 106,603 | | | | 3,393,186 | |
The Men’s Wearhouse, Inc. | | | 52,389 | | | | 2,312,970 | |
| | | | | | | | |
| | | | | | | 60,679,682 | |
| | | | | | | | |
CONSUMER STAPLES (2.7%) | | | | | | | | |
Darling Ingredients Inc.* | | | 126,710 | | | | 2,301,046 | |
Spectrum Brands Hldgs., Inc. | | | 34,974 | | | | 3,346,293 | |
TreeHouse Foods, Inc.* | | | 39,910 | | | | 3,413,485 | |
Village Super Market, Inc. Cl A | | | 79,683 | | | | 2,180,935 | |
| | | | | | | | |
| | | | | | | 11,241,759 | |
| | | | | | | | |
ENERGY (3.4%) | | | | | | | | |
Bonanza Creek Energy, Inc.* | | | 103,703 | | | | 2,488,872 | |
Carrizo Oil and Gas, Inc.* | | | 62,770 | | | | 2,611,232 | |
Sanchez Energy Corp.* | | | 122,286 | | | | 1,136,041 | |
Synergy Resources Corp.* | | | 163,476 | | | | 2,049,990 | |
Targa Resources Corp. | | | 34,880 | | | | 3,699,024 | |
Western Refining, Inc. | | | 53,972 | | | | 2,039,043 | |
Whiting Petroleum Corp.* | | | 0 | | | | 4 | |
| | | | | | | | |
| | | | | | | 14,024,206 | |
| | | | | | | | |
FINANCIALS (7.2%) | | | | | | | | |
Chesapeake Lodging Trust | | | 29,210 | | | | 1,086,904 | |
Cousins Properties, Inc. | | | 181,209 | | | | 2,069,408 | |
Health Insurance Innovations, Inc. Cl A* | | | 243,417 | | | | 1,742,865 | |
Investors Bancorp, Inc. | | | 221,483 | | | | 2,486,148 | |
iShares Micro-Cap ETF | | | 30,584 | | | | 2,354,379 | |
Primerica, Inc. | | | 57,629 | | | | 3,126,939 | |
PS Business Parks, Inc. | | | 25,994 | | | | 2,067,539 | |
Sabra Health Care REIT, Inc. | | | 151,257 | | | | 4,593,692 | |
Silvercrest Asset Mgmt. Group, Inc. Cl A | | | 146,182 | | | | 2,287,740 | |
Southwest Bancorp, Inc. | | | 142,896 | | | | 2,480,676 | |
Starwood Property Trust, Inc. | | | 95,549 | | | | 2,220,556 | |
Stifel Financial Corp.* | | | 61,694 | | | | 3,147,648 | |
| | | | | | | | |
| | | | | | | 29,664,494 | |
| | | | | | | | |
HEALTH CARE (24.2%) | | | | | | | | |
Abiomed, Inc.* | | | 128,510 | | | | 4,891,107 | |
ACADIA Pharmaceuticals, Inc.* | | | 36,033 | | | | 1,144,048 | |
Acorda Therapeutics, Inc.* | | | 46,469 | | | | 1,899,168 | |
Albany Molecular Research, Inc* | | | 108,390 | | | | 1,764,584 | |
Alnylam Pharmaceuticals, Inc.* | | | 21,613 | | | | 2,096,461 | |
Ani Pharmaceuticals, Inc.* | | | 40,421 | | | | 2,279,318 | |
Anika Therapeutics, Inc.* | | | 66,228 | | | | 2,698,116 | |
BioScrip, Inc.* | | | 419,856 | | | | 2,934,794 | |
MUTUAL OF AMERICA INVESTMENT CORPORATION - SMALL CAP GROWTH FUND
PORTFOLIO OF INVESTMENTS IN SECURITIES
December 31, 2014
| | | | | | | | |
BioSpecifics Technologies Corp.* | | | 52,591 | | | | 2,031,053 | |
Cepheid, Inc.* | | | 45,189 | | | | 2,446,522 | |
Cubist Pharmaceuticals, Inc.* | | | 17,788 | | | | 1,790,362 | |
DexCom, Inc.* | | | 90,890 | | | | 5,003,500 | |
Emergent Biosolutions, Inc.* | | | 149,662 | | | | 4,075,296 | |
Ensign Group, Inc. | | | 49,577 | | | | 2,200,732 | |
Exact Sciences Corp.* | | | 162,009 | | | | 4,445,526 | |
GW Pharmaceuticals PLC ADR* | | | 19,328 | | | | 1,308,139 | |
Insulet Corp.* | | | 75,401 | | | | 3,472,947 | |
Isis Pharmaceuticals, Inc.* | | | 50,586 | | | | 3,123,173 | |
Karyopharm Therapeutics, Inc.* | | | 36,984 | | | | 1,384,319 | |
Lannett Co., Inc.* | | | 52,640 | | | | 2,257,203 | |
Medicines Co.* | | | 66,811 | | | | 1,848,663 | |
Medidata Solutions, Inc.* | | | 53,705 | | | | 2,564,409 | |
MWI Veterinary Supply, Inc.* | | | 20,211 | | | | 3,434,000 | |
Neogen Corp.* | | | 44,941 | | | | 2,228,624 | |
Omeros Corp.* | | | 137,886 | | | | 3,416,813 | |
Omnicell, Inc.* | | | 97,239 | | | | 3,220,569 | |
Pacific Biosciences of CA, Inc.* | | | 173,689 | | | | 1,361,725 | |
Pacira Pharmaceuticals, Inc.* | | | 22,450 | | | | 1,990,435 | |
PAREXEL International Corp.* | | | 74,569 | | | | 4,143,042 | |
Pharmacyclics, Inc.* | | | 19,574 | | | | 2,393,117 | |
Puma Biotechnology, Inc.* | | | 14,272 | | | | 2,701,261 | |
Sarepta Therapeutics, Inc.* | | | 55,817 | | | | 807,673 | |
Sorrento Therapeutics, Inc.* | | | 123,468 | | | | 1,243,323 | |
STAAR Surgical Co.* | | | 201,020 | | | | 1,831,292 | |
Supernus Pharmaceuticals, Inc.* | | | 366,671 | | | | 3,043,368 | |
Synageva BioPharma Corp.* | | | 22,772 | | | | 2,113,005 | |
Team Health Hldgs., Inc.* | | | 45,087 | | | | 2,593,849 | |
WellCare Health Plans, Inc.* | | | 35,578 | | | | 2,919,514 | |
Wright Medical Group, Inc.* | | | 103,993 | | | | 2,794,289 | |
| | | | | | | | |
| | | | | | | 99,895,339 | |
| | | | | | | | |
INDUSTRIALS (14.0%) | | | | | | | | |
Allegiant Travel Co. | | | 26,513 | | | | 3,985,654 | |
Applied Industrial Technologies, Inc. | | | 50,788 | | | | 2,315,407 | |
Astronics Corp.* | | | 97,868 | | | | 5,413,079 | |
AZZ, Inc. | | | 88,201 | | | | 4,138,387 | |
Corporate Executive Board Co. | | | 46,639 | | | | 3,382,756 | |
EnPro Industries, Inc.* | | | 54,756 | | | | 3,436,480 | |
Healthcare Svcs. Group, Inc. | | | 114,741 | | | | 3,548,933 | |
Miller (Herman), Inc. | | | 67,777 | | | | 1,994,677 | |
Mueller Water Product, Inc. Cl A | | | 354,018 | | | | 3,625,143 | |
Raven Industries, Inc. | | | 139,176 | | | | 3,479,390 | |
Saia, Inc.* | | | 100,186 | | | | 5,546,296 | |
Sun Hydraulics Corp. | | | 85,277 | | | | 3,358,189 | |
Teledyne Technologies, Inc.* | | | 39,074 | | | | 4,014,494 | |
The Advisory Board Co.* | | | 45,507 | | | | 2,228,933 | |
Trex Co., Inc.* | | | 111,041 | | | | 4,728,127 | |
Uti Worldwide, Inc.* | | | 223,896 | | | | 2,702,424 | |
| | | | | | | | |
| | | | | | | 57,898,369 | |
| | | | | | | | |
INFORMATION TECHNOLOGY (24.0%) | | | | | | | | |
Anixter International, Inc.* | | | 32,954 | | | | 2,915,067 | |
Arista Networks, Inc.* | | | 15,330 | | | | 931,433 | |
ARRIS Group, Inc.* | | | 122,933 | | | | 3,711,359 | |
Aspen Technology, Inc.* | | | 41,442 | | | | 1,451,302 | |
Blackhawk Network Hldgs., Inc.* | | | 51,944 | | | | 2,015,408 | |
CalAmp Corp.* | | | 211,920 | | | | 3,878,134 | |
Cavium, Inc.* | | | 65,209 | | | | 4,031,233 | |
CommVault Systems, Inc.* | | | 51,768 | | | | 2,675,893 | |
comScore, Inc.* | | | 113,653 | | | | 5,276,891 | |
Electronics for Imaging, Inc.* | | | 82,057 | | | | 3,514,493 | |
MUTUAL OF AMERICA INVESTMENT CORPORATION - SMALL CAP GROWTH FUND
PORTFOLIO OF INVESTMENTS IN SECURITIES
December 31, 2014
| | | | | | | | |
Envestnet, Inc.* | | | 16,358 | | | | 803,832 | |
Euronet Worldwide, Inc.* | | | 58,454 | | | | 3,209,125 | |
FEI Company | | | 32,573 | | | | 2,942,989 | |
Guidewire Software, Inc.* | | | 31,610 | | | | 1,600,389 | |
iGATE Corp.* | | | 127,875 | | | | 5,048,498 | |
Imperva, Inc.* | | | 100,889 | | | | 4,986,968 | |
Informatica Corp.* | | | 49,833 | | | | 1,900,366 | |
j2 Global, Inc. | | | 23,231 | | | | 1,440,322 | |
LogMeIn, Inc.* | | | 83,520 | | | | 4,120,892 | |
Manhattan Associates, Inc.* | | | 42,774 | | | | 1,741,745 | |
MAXIMUS, Inc. | | | 58,175 | | | | 3,190,312 | |
MaxLinear, Inc. Cl A* | | | 329,690 | | | | 2,443,000 | |
Monolithic Power Systems, Inc. | | | 78,156 | | | | 3,887,479 | |
Proofpoint, Inc.* | | | 91,974 | | | | 4,435,892 | |
PTC, Inc.* | | | 69,339 | | | | 2,541,271 | |
Qlik Technologies, Inc.* | | | 144,961 | | | | 4,477,856 | |
Rogers Corp.* | | | 69,309 | | | | 5,644,522 | |
Ruckus Wireless, Inc.* | | | 88,664 | | | | 1,065,741 | |
Semtech Corp.* | | | 91,850 | | | | 2,532,299 | |
Synaptics, Inc.* | | | 58,321 | | | | 4,014,818 | |
Ultimate Software Group, Inc.* | | | 18,060 | | | | 2,651,450 | |
Verint Systems, Inc.* | | | 32,479 | | | | 1,892,882 | |
WEX, Inc.* | | | 21,023 | | | | 2,079,635 | |
| | | | | | | | |
| | | | | | | 99,053,496 | |
| | | | | | | | |
MATERIALS (4.1%) | | | | | | | | |
A. Schulman, Inc. | | | 92,097 | | | | 3,732,671 | |
Calgon Carbon Corp.* | | | 102,209 | | | | 2,123,903 | |
Horsehead Hldg. Corp.* | | | 106,928 | | | | 1,692,677 | |
PolyOne Corp. | | | 65,602 | | | | 2,486,976 | |
Resolute Forest Products, Inc.* | | | 198,655 | | | | 3,498,315 | |
U.S. Concrete, Inc.* | | | 119,479 | | | | 3,399,175 | |
| | | | | | | | |
| | | | | | | 16,933,717 | |
| | | | | | | | |
TELECOMMUNICATION SERVICES (1.5%) | | | | | | | | |
Consolidated Comms. Hldgs., Inc. | | | 90,595 | | | | 2,521,251 | |
ORBCOMM, Inc.* | | | 210,300 | | | | 1,375,362 | |
Shenandoah Telecommunications Co. | | | 69,463 | | | | 2,170,722 | |
| | | | | | | | |
| | | | | | | 6,067,335 | |
| | | | | | | | |
UTILITIES (0.8%) | | | | | | | | |
NorthWestern Corp. | | | 54,480 | | | | 3,082,461 | |
| | | | | | | | |
| | |
TOTAL COMMON STOCKS
(Cost: $309,765,383) 96.6% | | | | | | | 398,540,858 | |
| | | | | | | | |
| | | | | | | | | | | | | | | | |
| | | Rating** | | Rate(%) | | | Maturity | | Face Amount | | | Value | |
SHORT-TERM DEBT SECURITIES: | | | | | | | | | | | | | | | | |
COMMERCIAL PAPER (3.3%) | | | | | | | | | | | | | | | | |
Emerson Electric Co.† | | A-1 | | | 0.14 | | | 03/30/15 | | | 4,300,000 | | | | 4,298,528 | |
Exxon Mobil Corp. | | A-1+ | | | 0.13 | | | 02/04/15 | | | 4,700,000 | | | | 4,699,423 | |
Toyota Motor Credit Corp. | | A-1+ | | | 0.11 | | | 01/09/15 | | | 4,500,000 | | | | 4,499,890 | |
| | | | | | | | | | | | | | | | |
| | | | | | | | | | | | | | | 13,497,841 | |
| | | | | | | | | | | | | | | | |
TOTAL SHORT-TERM DEBT SECURITIES
(Cost: $13,497,841) 3.3% | | | | 13,497,841 | |
| | | | | | | | | | | | | | | | |
| | | | | |
TOTAL INVESTMENTS
(Cost: $323,263,224) 99.9% | | | | | | | | | | | | | | | 412,038,699 | |
| | | | | | | | | | | | | | | | |
| | | | | |
OTHER NET ASSETS 0.1% | | | | | | | | | | | | | | | 310,343 | |
| | | | | | | | | | | | | | | | |
| | | | | |
NET ASSETS 100.0% | | | | | | | | | | | | | | | $412,349,042 | |
| | | | | | | | | | | | | | | | |
The accompanying notes are an integral part of these portfolio schedules.
MUTUAL OF AMERICA INVESTMENT CORPORATION - MID CAP VALUE FUND
PORTFOLIO OF INVESTMENTS IN SECURITIES
December 31, 2014
| | | | | | | | |
| | | Shares | | | Value | |
COMMON STOCKS: | | | | | |
CONSUMER DISCRETIONARY (8.7%) | | | | | | | | |
Abercrombie & Fitch Co. Cl A | | | 6,959 | | | | 199,306 | |
CST Brands, Inc. | | | 16,624 | | | | 724,973 | |
Diamond Resorts Int’l., Inc.* | | | 49,347 | | | | 1,376,781 | |
Dillard’s, Inc. Cl A | | | 7,310 | | | | 915,066 | |
Discovery Communications, Inc. Cl A* | | | 4,530 | | | | 156,059 | |
Discovery Communications, Inc. Cl C* | | | 4,530 | | | | 152,752 | |
Jarden Corp.* | | | 11,940 | | | | 571,687 | |
Liberty Ventures Cl A* | | | 16,676 | | | | 507,092 | |
Macy’s, Inc. | | | 11,451 | | | | 752,903 | |
Newell Rubbermaid, Inc. | | | 25,099 | | | | 956,021 | |
Taylor Morrison Home Corp. Cl A* | | | 11,335 | | | | 214,118 | |
TRW Automotive Hldgs. Corp.* | | | 8,175 | | | | 840,799 | |
Wiley (John) & Sons, Inc. Cl A | | | 11,850 | | | | 701,994 | |
| | | | | | | | |
| | | | | | | 8,069,551 | |
| | | | | | | | |
CONSUMER STAPLES (3.2%) | | | | | | | | |
Constellation Brands, Inc. Cl A* | | | 6,961 | | | | 683,361 | |
Energizer Hldgs., Inc. | | | 6,652 | | | | 855,181 | |
Ingredion, Inc. | | | 10,515 | | | | 892,093 | |
Vector Group Ltd. | | | 22,899 | | | | 487,978 | |
| | | | | | | | |
| | | | | | | 2,918,613 | |
| | | | | | | | |
ENERGY (3.3%) | | | | | | | | |
Atwood Oceanics, Inc. | | | 7,521 | | | | 213,371 | |
Cameron International Corp.* | | | 7,151 | | | | 357,192 | |
Denbury Resources, Inc. | | | 21,548 | | | | 175,185 | |
Noble Energy, Inc. | | | 19,338 | | | | 917,201 | |
PBF Energy, Inc. | | | 21,143 | | | | 563,250 | |
Tesoro Corp. | | | 11,599 | | | | 862,386 | |
| | | | | | | | |
| | | | | | | 3,088,585 | |
| | | | | | | | |
FINANCIALS (33.1%) | | | | | | | | |
Alexander’s, Inc. | | | 1,034 | | | | 452,044 | |
American Financial Group, Inc. | | | 27,163 | | | | 1,649,337 | |
Ameriprise Financial, Inc. | | | 14,464 | | | | 1,912,859 | |
Annaly Capital Mgmt., Inc. | | | 53,712 | | | | 580,627 | |
Aon PLC | | | 9,799 | | | | 929,239 | |
Apartment Investment & Management Co. Cl A | | | 13,848 | | | | 514,453 | |
Associated Banc-Corp. | | | 42,258 | | | | 778,392 | |
Assurant, Inc. | | | 4,270 | | | | 292,196 | |
BOK Financial Corp. | | | 9,453 | | | | 567,558 | |
Brandywine Realty Trust | | | 39,059 | | | | 624,163 | |
CBL & Associates Pptys., Inc. | | | 37,684 | | | | 731,823 | |
CIT Group, Inc. | | | 9,642 | | | | 461,177 | |
Comerica, Inc. | | | 14,024 | | | | 656,884 | |
DDR Corp. | | | 23,580 | | | | 432,929 | |
Discover Financial Svcs. | | | 15,475 | | | | 1,013,458 | |
Duke Realty Corp. | | | 43,075 | | | | 870,115 | |
E*Trade Financial Corp.* | | | 12,060 | | | | 292,515 | |
Equity Lifestyle Properties, Inc. | | | 11,542 | | | | 594,990 | |
Everest Re Group Ltd. | | | 5,234 | | | | 891,350 | |
Fifth Third Bancorp | | | 39,312 | | | | 800,982 | |
First Niagara Financial Group, Inc. | | | 64,348 | | | | 542,454 | |
General Growth Pptys., Inc. | | | 25,394 | | | | 714,333 | |
Hartford Financial Svcs. Group, Inc. | | | 24,173 | | | | 1,007,772 | |
Health Care REIT, Inc. | | | 7,781 | | | | 588,788 | |
Highwoods Properties, Inc. | | | 5,646 | | | | 250,005 | |
Home Properties, Inc. | | | 12,147 | | | | 796,843 | |
Host Hotels & Resorts, Inc. | | | 41,509 | | | | 986,669 | |
Huntington Bancshares, Inc. | | | 34,269 | | | | 360,510 | |
iShares Russell Mid-Cap Value ETF | | | 12,170 | | | | 897,781 | |
MUTUAL OF AMERICA INVESTMENT CORPORATION - MID CAP VALUE FUND
PORTFOLIO OF INVESTMENTS IN SECURITIES
December 31, 2014
| | | | | | | | |
KeyCorp | | | 66,023 | | | | 917,720 | |
Kilroy Realty Corp. | | | 7,353 | | | | 507,872 | |
Lincoln National Corp. | | | 17,743 | | | | 1,023,239 | |
Progressive Corp. | | | 19,987 | | | | 539,449 | |
ProLogis, Inc. | | | 16,555 | | | | 712,362 | |
Reinsurance Grp. of America, Inc. | | | 10,423 | | | | 913,263 | |
RLJ Lodging Trust | | | 24,389 | | | | 817,763 | |
Starwood Property Trust, Inc. | | | 19,552 | | | | 454,388 | |
SVB Financial Group* | | | 4,252 | | | | 493,530 | |
Vornado Realty Trust | | | 11,850 | | | | 1,394,864 | |
Voya Financial, Inc. | | | 23,104 | | | | 979,148 | |
Weyerhaeuser Co. | | | 13,291 | | | | 477,014 | |
Zions Bancorporation | | | 6,685 | | | | 190,589 | |
| | | | | | | | |
| | | | | | | 30,613,447 | |
| | | | | | | | |
HEALTH CARE (9.9%) | | | | | | | | |
Agilent Technologies, Inc. | | | 13,553 | | | | 554,860 | |
Boston Scientific Corp.* | | | 62,696 | | | | 830,722 | |
Cardinal Health, Inc. | | | 10,324 | | | | 833,457 | |
CareFusion Corp.* | | | 12,553 | | | | 744,895 | |
CIGNA Corp. | | | 9,494 | | | | 977,028 | |
HCA Hldgs., Inc.* | | | 17,042 | | | | 1,250,712 | |
Hospira, Inc.* | | | 11,230 | | | | 687,838 | |
Humana, Inc. | | | 8,415 | | | | 1,208,646 | |
MEDNAX, Inc.* | | | 10,581 | | | | 699,510 | |
Mylan, Inc.* | | | 10,724 | | | | 604,512 | |
Zimmer Hldgs., Inc. | | | 6,333 | | | | 718,289 | |
| | | | | | | | |
| | | | | | | 9,110,469 | |
| | | | | | | | |
INDUSTRIALS (8.1%) | | | | | | | | |
Alaska Air Group, Inc. | | | 15,686 | | | | 937,395 | |
AZZ, Inc. | | | 5,247 | | | | 246,189 | |
L-3 Communications Hldgs., Inc. | | | 9,004 | | | | 1,136,395 | |
Old Dominion Freight Line, Inc.* | | | 16,601 | | | | 1,288,902 | |
Orbital Sciences Corp.* | | | 22,861 | | | | 614,732 | |
Oshkosh Corp. | | | 20,974 | | | | 1,020,385 | |
Snap-on, Inc. | | | 3,786 | | | | 517,698 | |
Triumph Group, Inc. | | | 16,724 | | | | 1,124,187 | |
United Rentals, Inc.* | | | 5,617 | | | | 572,990 | |
| | | | | | | | |
| | | | | | | 7,458,873 | |
| | | | | | | | |
INFORMATION TECHNOLOGY (10.4%) | | | | | | | | |
Analog Devices, Inc. | | | 8,656 | | | | 480,581 | |
Avago Technologies Ltd. | | | 9,317 | | | | 937,197 | |
Avnet, Inc. | | | 15,350 | | | | 660,357 | |
Broadcom Corp. Cl A | | | 14,910 | | | | 646,050 | |
Brocade Communications Systems, Inc. | | | 19,928 | | | | 235,948 | |
CA, Inc. | | | 32,517 | | | | 990,143 | |
Computer Sciences Corp. | | | 10,916 | | | | 688,254 | |
F5 Networks, Inc.* | | | 3,485 | | | | 454,671 | |
Fidelity Nat’l. Information Svcs., Inc. | | | 8,412 | | | | 523,226 | |
Harris Corp. | | | 8,034 | | | | 577,002 | |
Keysight Technologies, Inc.* | | | 6,776 | | | | 228,826 | |
KLA-Tencor Corp. | | | 3,281 | | | | 230,720 | |
Lam Research Corp. | | | 7,219 | | | | 572,755 | |
Symantec Corp. | | | 22,217 | | | | 569,977 | |
Western Digital Corp. | | | 10,540 | | | | 1,166,778 | |
Xerox Corp. | | | 44,632 | | | | 618,600 | |
| | | | | | | | |
| | | | | | | 9,581,085 | |
| | | | | | | | |
MATERIALS (7.7%) | | | | | | | | |
CF Industries Hldgs., Inc. | | | 2,466 | | | | 672,084 | |
Crown Hldgs., Inc.* | | | 27,790 | | | | 1,414,511 | |
Eastman Chemical Co. | | | 12,692 | | | | 962,815 | |
International Paper Co. | | | 17,896 | | | | 958,868 | |
Packaging Corp. of America | | | 20,673 | | | | 1,613,528 | |
MUTUAL OF AMERICA INVESTMENT CORPORATION - MID CAP VALUE FUND
PORTFOLIO OF INVESTMENTS IN SECURITIES
December 31, 2014
| | | | | | | | |
RPM International, Inc. | | | 10,723 | | | | 543,763 | |
TimkenSteel Corp. | | | 14,847 | | | | 549,784 | |
Westlake Chemical Corp. | | | 5,742 | | | | 350,779 | |
| | | | | | | | |
| | | | | | | 7,066,132 | |
| | | | | | | | |
UTILITIES (11.9%) | | | | | | | | |
Ameren Corp. | | | 21,241 | | | | 979,847 | |
Atmos Energy Corp. | | | 15,423 | | | | 859,678 | |
Consolidated Edison, Inc. | | | 12,187 | | | | 804,464 | |
Edison International | | | 26,048 | | | | 1,705,623 | |
Entergy Corp. | | | 7,566 | | | | 661,874 | |
FirstEnergy Corp. | | | 16,744 | | | | 652,849 | |
Great Plains Energy, Inc. | | | 33,163 | | | | 942,161 | |
ITC Hldgs. Corp. | | | 20,779 | | | | 840,095 | |
Northeast Utilities | | | 9,255 | | | | 495,328 | |
PPL Corp. | | | 24,935 | | | | 905,889 | |
Public Svc. Enterprise Group, Inc. | | | 22,660 | | | | 938,351 | |
Sempra Energy | | | 5,909 | | | | 658,026 | |
Westar Energy, Inc. | | | 12,007 | | | | 495,169 | |
| | | | | | | | |
| | | | | | | 10,939,354 | |
| | | | | | | | |
TOTAL COMMON STOCKS
(Cost: $69,196,114) 96.3% | | | | | | | 88,846,109 | |
| | | | | | | | |
| | | | | | | | | | | | | | | | | | | | |
| | | Rating** | | Rate(%) | | | Maturity | | | | | Face Amount | | | Value | |
SHORT-TERM DEBT SECURITIES: | | | | | | | | | | | |
U.S. GOVERNMENT (0.5%) | | | | | | | | | | | | | | | | | | | | |
U.S. Treasury Bill | | A-1+ | | | 0.09 | | | | 07/23/15 | | | | | | 500,000 | | | | 499,746 | |
| | | | | | | | | | | | | | | | | | | | |
U.S. GOVERNMENT AGENCIES (1.0%) | | | | | | | | | | | |
FHLB | | A-1+ | | | 0.10 | | | | 03/04/15 | | | | | | 900,000 | | | | 899,845 | |
| | | | | | | | | | | | | | | | | | | | |
COMMERCIAL PAPER (2.0%) | | | | | | | | | | | | | | | | | | | | |
Toyota Motor Credit Corp. | | A-1+ | | | 0.11 | | | | 01/09/15 | | | | | | 1,000,000 | | | | 999,976 | |
Toyota Motor Credit Corp. | | A-1+ | | | 0.14 | | | | 02/06/15 | | | | | | 850,000 | | | | 849,881 | |
| | | | | | | | | | | | | | | | | | | | |
| | | | | | | | | | | | | | | | | | | 1,849,857 | |
| | | | | | | | | | | | | | | | | | | | |
TOTAL SHORT-TERM DEBT SECURITIES
(Cost: $3,249,448) 3.5% | | | | | | | | | | 3,249,448 | |
| | | | | | | | | | | | | | | | | | | | |
| | | | | | |
TOTAL INVESTMENTS
(Cost: $72,445,562) 99.8% | | | | | | | | | | | | | | | | | | | 92,095,557 | |
| | | | | | | | | | | | | | | | | | | | |
| | | | | | |
OTHER NET ASSETS 0.2% | | | | | | | | | | | | | | | | | | | 232,400 | |
| | | | | | | | | | | | | | | | | | | | |
| | | | | | |
NET ASSETS 100.0% | | | | | | | | | | | | | | | | | | | $92,327,957 | |
| | | | | | | | | | | | | | | | | | | | |
The accompanying notes are an integral part of these portfolio schedules.
MUTUAL OF AMERICA INVESTMENT CORPORATION - MID-CAP EQUITY INDEX FUND
PORTFOLIO OF INVESTMENTS IN SECURITIES
December 31, 2014
| | | | | | | | |
| | | Shares | | | Value | |
INDEXED ASSETS: | | | | | | | | |
COMMON STOCKS: | | | | | | | | |
CONSUMER DISCRETIONARY (13.2%) | | | | | | | | |
Aaron’s, Inc. | | | 38,364 | | | | 1,172,787 | |
Abercrombie & Fitch Co. Cl A | | | 42,549 | | | | 1,218,603 | |
Advance Auto Parts, Inc. | | | 43,468 | | | | 6,923,583 | |
AMC Networks, Inc. Cl A* | | | 35,169 | | | | 2,242,727 | |
American Eagle Outfitters, Inc. | | | 104,113 | | | | 1,445,088 | |
ANN, Inc.* | | | 27,192 | | | | 991,964 | |
Apollo Education Group, Inc.* | | | 57,450 | | | | 1,959,620 | |
Ascena Retail Group, Inc.* | | | 78,338 | | | | 983,925 | |
Big Lots, Inc. | | | 31,793 | | | | 1,272,356 | |
Brinker International, Inc. | | | 37,803 | | | | 2,218,658 | |
Brunswick Corp. | | | 55,287 | | | | 2,834,012 | |
Cabela’s, Inc.* | | | 28,328 | | | | 1,493,169 | |
Carter’s, Inc. | | | 31,563 | | | | 2,755,766 | |
Cheesecake Factory, Inc. | | | 27,378 | | | | 1,377,387 | |
Chico’s FAS, Inc. | | | 90,964 | | | | 1,474,526 | |
Cinemark Hldgs., Inc. | | | 61,938 | | | | 2,203,754 | |
CST Brands, Inc. | | | 46,132 | | | | 2,011,817 | |
Deckers Outdoor Corp.* | | | 20,602 | | | | 1,875,606 | |
Devry Education Group Inc. | | | 34,190 | | | | 1,622,999 | |
Dick’s Sporting Goods, Inc. | | | 58,353 | | | | 2,897,226 | |
Domino’s Pizza, Inc. | | | 32,716 | | | | 3,080,866 | |
DreamWorks Animation SKG Cl A* | | | 43,085 | | | | 962,088 | |
Foot Locker, Inc. | | | 84,511 | | | | 4,747,828 | |
Gentex Corp. | | | 86,949 | | | | 3,141,467 | |
Graham Hldgs. Co. Cl B | | | 2,619 | | | | 2,262,056 | |
Guess?, Inc. | | | 38,287 | | | | 807,090 | |
Hanesbrands, Inc. | | | 59,415 | | | | 6,631,902 | |
HSN, Inc. | | | 19,267 | | | | 1,464,292 | |
International Game Technology | | | 147,038 | | | | 2,536,406 | |
International Speedway Corp. Cl A | | | 16,628 | | | | 526,276 | |
Jarden Corp.* | | | 106,414 | | | | 5,095,102 | |
Kate Spade & Co.* | | | 75,604 | | | | 2,420,084 | |
KB Home | | | 54,144 | | | | 896,083 | |
Life Time Fitness, Inc.* | | | 21,408 | | | | 1,212,121 | |
Live Nation Entertainment, Inc.* | | | 85,931 | | | | 2,243,658 | |
LKQ Corp.* | | | 180,241 | | | | 5,068,377 | |
MDC Hldgs., Inc. | | | 23,228 | | | | 614,845 | |
Meredith Corp. | | | 21,680 | | | | 1,177,658 | |
Murphy USA, Inc.* | | | 25,567 | | | | 1,760,544 | |
New York Times Co. Cl A | | | 77,779 | | | | 1,028,238 | |
NVR, Inc.* | | | 2,309 | | | | 2,944,737 | |
Office Depot, Inc.* | | | 288,328 | | | | 2,472,413 | |
Panera Bread Co. Cl A* | | | 15,239 | | | | 2,663,777 | |
Penney (J.C.) Co., Inc.* | | | 181,322 | | | | 1,174,967 | |
Polaris Industries, Inc. | | | 36,333 | | | | 5,495,003 | |
Rent-A-Center, Inc. | | | 31,465 | | | | 1,142,809 | |
Service Corp. International | | | 123,504 | | | | 2,803,541 | |
Signet Jewelers Ltd. | | | 47,689 | | | | 6,274,442 | |
Sotheby’s | | | 36,429 | | | | 1,573,004 | |
Tempur Sealy Int’l., Inc.* | | | 36,230 | | | | 1,989,389 | |
The Wendy’s Co. | | | 162,942 | | | | 1,471,366 | |
Thor Industries, Inc. | | | 27,627 | | | | 1,543,520 | |
Time, Inc. | | | 64,847 | | | | 1,595,885 | |
Toll Brothers, Inc.* | | | 96,297 | | | | 3,300,098 | |
Tupperware Brands Corp. | | | 29,960 | | | | 1,887,480 | |
Wiley (John) & Sons, Inc. Cl A | | | 27,906 | | | | 1,653,151 | |
Williams-Sonoma, Inc. | | | 50,940 | | | | 3,855,139 | |
| | | | | | | | |
| | | | | | | 132,493,275 | |
| | | | | | | | |
MUTUAL OF AMERICA INVESTMENT CORPORATION - MID-CAP EQUITY INDEX FUND
PORTFOLIO OF INVESTMENTS IN SECURITIES
December 31, 2014
| | | | | | | | |
CONSUMER STAPLES (3.3%) | | | | | | | | |
Church & Dwight Co., Inc. | | | 79,568 | | | | 6,270,754 | |
Dean Foods Co. | | | 55,805 | | | | 1,081,501 | |
Energizer Hldgs., Inc. | | | 36,934 | | | | 4,748,235 | |
Flowers Foods, Inc. | | | 109,879 | | | | 2,108,578 | |
Hain Celestial Group, Inc.* | | | 60,026 | | | | 3,498,916 | |
Ingredion, Inc. | | | 42,743 | | | | 3,626,316 | |
Lancaster Colony Corp. | | | 11,546 | | | | 1,081,167 | |
Post Hldgs., Inc.* | | | 26,683 | | | | 1,117,751 | |
SUPERVALU, Inc.* | | | 122,694 | | | | 1,190,132 | |
Tootsie Roll Industries, Inc. | | | 11,867 | | | | 363,724 | |
TreeHouse Foods, Inc.* | | | 25,176 | | | | 2,153,303 | |
United Natural Foods, Inc.* | | | 29,673 | | | | 2,294,465 | |
WhiteWave Foods Co. Cl A* | | | 103,706 | | | | 3,628,673 | |
| | | | | | | | |
| | | | | | | 33,163,515 | |
| | | | | | | | |
ENERGY (3.9%) | | | | | | | | |
Atwood Oceanics, Inc. | | | 35,599 | | | | 1,009,944 | |
California Resources Corp.* | | | 180,576 | | | | 994,974 | |
CARBO Ceramics, Inc. | | | 11,676 | | | | 467,624 | |
Dresser-Rand Group, Inc.* | | | 45,590 | | | | 3,729,262 | |
Dril-Quip, Inc.* | | | 23,477 | | | | 1,801,390 | |
Energen Corp. | | | 43,540 | | | | 2,776,110 | |
Gulfport Energy Corp.* | | | 50,873 | | | | 2,123,439 | |
Helix Energy Solutions Group* | | | 58,410 | | | | 1,267,497 | |
HollyFrontier Corp. | | | 116,421 | | | | 4,363,459 | |
Oceaneering Int’l., Inc. | | | 62,460 | | | | 3,673,273 | |
Oil States International, Inc.* | | | 31,626 | | | | 1,546,511 | |
Patterson-UTI Energy, Inc. | | | 87,084 | | | | 1,444,724 | |
Peabody Energy Corp. | | | 160,519 | | | | 1,242,417 | |
Rosetta Resources, Inc.* | | | 36,573 | | | | 815,944 | |
Rowan Companies PLC Cl A | | | 74,074 | | | | 1,727,406 | |
SM Energy Co. | | | 40,091 | | | | 1,546,711 | |
Superior Energy Services, Inc. | | | 90,510 | | | | 1,823,777 | |
Tidewater, Inc. | | | 29,577 | | | | 958,591 | |
Unit Corp.* | | | 27,421 | | | | 935,056 | |
Western Refining, Inc. | | | 43,404 | | | | 1,639,803 | |
World Fuel Services Corp. | | | 42,673 | | | | 2,002,644 | |
WPX Energy, Inc.* | | | 120,962 | | | | 1,406,788 | |
| | | | | | | | |
| | | | | | | 39,297,344 | |
| | | | | | | | |
FINANCIALS (22.7%) | | | | | | | | |
Alexander & Baldwin, Inc. | | | 26,969 | | | | 1,058,803 | |
Alexandria Real Estate Equities, Inc. | | | 42,829 | | | | 3,800,645 | |
Alleghany Corp.* | | | 9,579 | | | | 4,439,867 | |
American Campus Communities, Inc. | | | 62,522 | | | | 2,585,910 | |
American Financial Group, Inc. | | | 43,902 | | | | 2,665,729 | |
Aspen Insurance Hldgs. Ltd. | | | 37,016 | | | | 1,620,190 | |
Associated Banc-Corp. | | | 89,559 | | | | 1,649,677 | |
Astoria Financial Corp. | | | 52,232 | | | | 697,820 | |
BancorpSouth, Inc. | | | 50,868 | | | | 1,145,039 | |
Bank of Hawaii Corp. | | | 26,097 | | | | 1,547,813 | |
Berkley (W.R.) Corp. | | | 60,394 | | | | 3,095,796 | |
BioMed Realty Trust, Inc. | | | 117,423 | | | | 2,529,291 | |
Brown & Brown, Inc. | | | 70,118 | | | | 2,307,583 | |
Camden Property Trust | | | 51,366 | | | | 3,792,865 | |
Cathay General Bancorp | | | 44,089 | | | | 1,128,238 | |
CBOE Holdings, Inc. | | | 50,200 | | | | 3,183,684 | |
City National Corp. | | | 28,521 | | | | 2,304,782 | |
Commerce Bancshares, Inc. | | | 49,255 | | | | 2,142,085 | |
Corporate Office Pptys. Trust | | | 55,030 | | | | 1,561,201 | |
Corrections Corp. of America | | | 69,279 | | | | 2,517,599 | |
Cullen/Frost Bankers, Inc. | | | 32,631 | | | | 2,305,054 | |
Duke Realty Corp. | | | 203,247 | | | | 4,105,589 | |
East West Bancorp, Inc. | | | 85,384 | | | | 3,305,215 | |
Eaton Vance Corp. | | | 70,339 | | | | 2,878,975 | |
Equity One, Inc. | | | 45,664 | | | | 1,158,039 | |
Everest Re Group Ltd. | | | 26,913 | | | | 4,583,284 | |
MUTUAL OF AMERICA INVESTMENT CORPORATION - MID-CAP EQUITY INDEX FUND
PORTFOLIO OF INVESTMENTS IN SECURITIES
December 31, 2014
| | | | | | | | |
Extra Space Storage, Inc. | | | 65,607 | | | | 3,847,194 | |
Federal Realty Investment Trust | | | 40,525 | | | | 5,408,467 | |
Federated Investors, Inc. Cl B | | | 56,656 | | | | 1,865,682 | |
First American Financial Corp. | | | 64,073 | | | | 2,172,075 | |
First Horizon National Corp. | | | 139,922 | | | | 1,900,141 | |
First Niagara Financial Group, Inc. | | | 210,519 | | | | 1,774,675 | |
FirstMerit Corp. | | | 98,213 | | | | 1,855,244 | |
Fulton Financial Corp. | | | 110,029 | | | | 1,359,958 | |
Gallagher (Arthur J.) & Co. | | | 95,982 | | | | 4,518,833 | |
Hancock Hldg. Co. | | | 48,516 | | | | 1,489,441 | |
Hanover Insurance Group, Inc. | | | 26,272 | | | | 1,873,719 | |
HCC Insurance Hldgs., Inc. | | | 57,576 | | | | 3,081,468 | |
Highwoods Properties, Inc. | | | 54,459 | | | | 2,411,445 | |
Home Properties, Inc. | | | 34,121 | | | | 2,238,338 | |
Hospitality Properties Trust | | | 89,157 | | | | 2,763,867 | |
International Bancshares Corp. | | | 34,714 | | | | 921,310 | |
Janus Capital Group, Inc. | | | 87,395 | | | | 1,409,681 | |
Jones Lang LaSalle, Inc. | | | 26,659 | | | | 3,996,984 | |
Kemper Corp. | | | 29,759 | | | | 1,074,597 | |
Kilroy Realty Corp. | | | 49,907 | | | | 3,447,076 | |
Lamar Advertising Co. Cl A | | | 47,680 | | | | 2,557,555 | |
LaSalle Hotel Propertie | | | 66,474 | | | | 2,690,203 | |
Liberty Property Trust | | | 88,354 | | | | 3,324,761 | |
Mack-Cali Realty Corp. | | | 49,778 | | | | 948,769 | |
Mercury General Corp. | | | 21,604 | | | | 1,224,299 | |
Mid-America Apt. Communities, Inc. | | | 44,761 | | | | 3,342,751 | |
MSCI, Inc. Cl A | | | 66,790 | | | | 3,168,518 | |
National Retail Pptys., Inc. | | | 78,445 | | | | 3,088,380 | |
New York Community Bancorp, Inc. | | | 263,281 | | | | 4,212,496 | |
Old Republic Int’l. Corp. | | | 144,310 | | | | 2,111,255 | |
Omega Healthcare Investors, Inc. | | | 75,791 | | | | 2,961,154 | |
PacWest Bancorp | | | 57,586 | | | | 2,617,860 | |
Potlatch Corp. | | | 24,146 | | | | 1,010,993 | |
Primerica, Inc. | | | 31,607 | | | | 1,714,996 | |
Prosperity Bancshares, Inc. | | | 35,688 | | | | 1,975,688 | |
Protective Life Corp. | | | 46,999 | | | | 3,273,480 | |
Raymond James Financial, Inc. | | | 74,932 | | | | 4,292,854 | |
Rayonier, Inc. | | | 75,374 | | | | 2,105,950 | |
Realty Income Corp. | | | 132,450 | | | | 6,319,190 | |
Regency Centers Corp. | | | 55,461 | | | | 3,537,303 | |
Reinsurance Grp. of America, Inc. | | | 40,860 | | | | 3,580,153 | |
RenaissanceRe Hldgs. Ltd. | | | 22,971 | | | | 2,233,930 | |
SEI Investments Co. | | | 77,617 | | | | 3,107,785 | |
Senior Housing Pptys. Trust | | | 121,267 | | | | 2,681,213 | |
Signature Bank* | | | 29,926 | | | | 3,769,479 | |
SL Green Realty Corp | | | 57,407 | | | | 6,832,581 | |
SLM Corp. | | | 251,693 | | | | 2,564,752 | |
StanCorp Financial Group, Inc. | | | 25,005 | | | | 1,746,849 | |
SVB Financial Group* | | | 30,192 | | | | 3,504,385 | |
Synovus Financial Corp. | | | 81,230 | | | | 2,200,521 | |
Tanger Factory Outlet Centers, Inc. | | | 57,039 | | | | 2,108,161 | |
Taubman Centers, Inc. | | | 37,663 | | | | 2,878,206 | |
TCF Financial Corp. | | | 99,880 | | | | 1,587,093 | |
Trustmark Corp. | | | 40,149 | | | | 985,256 | |
UDR, Inc. | | | 151,564 | | | | 4,671,202 | |
Umpqua Hldgs. Corp. | | | 128,860 | | | | 2,191,909 | |
Valley National Bancorp | | | 130,803 | | | | 1,270,097 | |
Waddell & Reed Financial, Inc. Cl A | | | 49,732 | | | | 2,477,648 | |
Washington Federal, Inc. | | | 58,396 | | | | 1,293,471 | |
Washington Prime Group, Inc. | | | 92,288 | | | | 1,589,199 | |
Webster Financial Corp. | | | 53,758 | | | | 1,748,748 | |
Weingarten Realty Investors | | | 67,055 | | | | 2,341,561 | |
| | | | | | | | |
| | | | | | | 227,363,622 | |
| | | | | | | | |
MUTUAL OF AMERICA INVESTMENT CORPORATION - MID-CAP EQUITY INDEX FUND
PORTFOLIO OF INVESTMENTS IN SECURITIES
December 31, 2014
| | | | | | | | |
HEALTH CARE (10.0%) | | | | | | | | |
Align Technology, Inc.* | | | 42,979 | | | | 2,402,956 | |
Allscripts Healthcare Solutions, Inc.* | | | 100,784 | | | | 1,287,012 | |
Bio-Rad Laboratories, Inc. Cl A* | | | 12,229 | | | | 1,474,328 | |
Bio-Techne Corp. | | | 22,052 | | | | 2,037,605 | |
Centene Corporation* | | | 34,896 | | | | 3,623,950 | |
Charles River Laboratories Int’l., Inc.* | | | 27,908 | | | | 1,776,065 | |
Community Health Systems, Inc.* | | | 69,066 | | | | 3,724,039 | |
Cooper Companies, Inc. | | | 28,717 | | | | 4,654,739 | |
Covance, Inc.* | | | 33,655 | | | | 3,494,735 | |
Cubist Pharmaceuticals, Inc.* | | | 45,379 | | | | 4,567,396 | |
Endo International PLC* | | | 91,426 | | | | 6,593,643 | |
Halyard Health, Inc.* | | | 27,678 | | | | 1,258,519 | |
Health Net, Inc.* | | | 46,181 | | | | 2,472,069 | |
Hill-Rom Hldgs., Inc. | | | 34,211 | | | | 1,560,706 | |
HMS Hldgs. Corp.* | | | 52,229 | | | | 1,104,121 | |
Hologic, Inc.* | | | 144,198 | | | | 3,855,855 | |
IDEXX Laboratories, Inc.* | | | 28,385 | | | | 4,208,644 | |
LifePoint Hospitals, Inc.* | | | 26,900 | | | | 1,934,379 | |
MEDNAX, Inc.* | | | 59,726 | | | | 3,948,486 | |
Mettler-Toledo Int’l., Inc.* | | | 16,979 | | | | 5,135,468 | |
Omnicare, Inc. | | | 58,220 | | | | 4,245,985 | |
Owens & Minor, Inc. | | | 37,519 | | | | 1,317,292 | |
ResMed, Inc. | | | 83,077 | | | | 4,657,297 | |
Salix Pharmaceuticals Ltd.* | | | 37,902 | | | | 4,356,456 | |
Schein (Henry), Inc.* | | | 50,089 | | | | 6,819,617 | |
Sirona Dental Systems, Inc.* | | | 32,917 | | | | 2,875,958 | |
STERIS Corp. | | | 35,226 | | | | 2,284,406 | |
Teleflex, Inc. | | | 24,682 | | | | 2,833,987 | |
Thoratec Corp.* | | | 32,713 | | | | 1,061,864 | |
United Therapeutics Corp.* | | | 28,257 | | | | 3,658,999 | |
VCA Inc.* | | | 50,036 | | | | 2,440,256 | |
WellCare Health Plans, Inc.* | | | 26,114 | | | | 2,142,915 | |
| | | | | | | | |
| | | | | | | 99,809,747 | |
| | | | | | | | |
INDUSTRIALS (14.7%) | | | | | | | | |
Acuity Brands, Inc. | | | 25,796 | | | | 3,613,246 | |
AECOM Technology Corp.* | | | 91,585 | | | | 2,781,436 | |
AGCO Corp. | | | 49,783 | | | | 2,250,192 | |
Alaska Air Group, Inc. | | | 78,252 | | | | 4,676,340 | |
Alliant TechSystems, Inc. | | | 18,993 | | | | 2,207,936 | |
B/E Aerospace, Inc.* | | | 62,634 | | | | 3,634,025 | |
Carlisle Cos., Inc. | | | 38,166 | | | | 3,444,100 | |
CLARCOR, Inc. | | | 29,817 | | | | 1,987,005 | |
Clean Harbors, Inc.* | | | 32,448 | | | | 1,559,126 | |
Con-way, Inc. | | | 34,406 | | | | 1,692,087 | |
Copart, Inc.* | | | 67,629 | | | | 2,467,782 | |
Corporate Executive Board Co. | | | 20,009 | | | | 1,451,253 | |
Crane Co. | | | 29,469 | | | | 1,729,830 | |
Deluxe Corp. | | | 29,545 | | | | 1,839,176 | |
Donaldson Co., Inc. | | | 75,953 | | | | 2,934,064 | |
Donnelley (R.R.) & Sons Co. | | | 118,838 | | | | 1,997,073 | |
Esterline Technologies Corp.* | | | 18,997 | | | | 2,083,591 | |
Exelis, Inc. | | | 111,075 | | | | 1,947,145 | |
Fortune Brands Home & Security, Inc. | | | 93,830 | | | | 4,247,684 | |
FTI Consulting, Inc.* | | | 24,527 | | | | 947,478 | |
GATX Corp. | | | 26,289 | | | | 1,512,669 | |
Genesee & Wyoming, Inc. Cl A* | | | 30,445 | | | | 2,737,614 | |
Graco, Inc. | | | 35,371 | | | | 2,836,047 | |
Granite Construction, Inc. | | | 21,424 | | | | 814,540 | |
Harsco Corp. | | | 47,806 | | | | 903,055 | |
HNI Corp. | | | 26,406 | | | | 1,348,290 | |
Hubbell, Inc. Cl B | | | 32,309 | | | | 3,451,570 | |
Hunt (J.B.) Transport Svcs., Inc. | | | 55,101 | | | | 4,642,259 | |
Huntington Ingalls Industries, Inc. | | | 28,679 | | | | 3,225,240 | |
IDEX Corp. | | | 47,224 | | | | 3,675,916 | |
MUTUAL OF AMERICA INVESTMENT CORPORATION - MID-CAP EQUITY INDEX FUND
PORTFOLIO OF INVESTMENTS IN SECURITIES
December 31, 2014
| | | | | | | | |
ITT Corp. | | | 54,483 | | | | 2,204,382 | |
JetBlue Airways Corp* | | | 145,795 | | | | 2,312,309 | |
KBR, Inc. | | | 86,291 | | | | 1,462,632 | |
Kennametal, Inc. | | | 47,051 | | | | 1,683,955 | |
Kirby Corp.* | | | 33,937 | | | | 2,740,073 | |
KLX, Inc.* | | | 31,319 | | | | 1,291,888 | |
Landstar System, Inc. | | | 26,608 | | | | 1,929,878 | |
Lennox International, Inc. | | | 26,287 | | | | 2,499,105 | |
Lincoln Electric Hldgs., Inc. | | | 46,215 | | | | 3,192,994 | |
Manpowergroup, Inc. | | | 47,008 | | | | 3,204,535 | |
Miller (Herman), Inc. | | | 35,664 | | | | 1,049,592 | |
MSA Safety, Inc. | | | 18,639 | | | | 989,545 | |
MSC Industrial Direct Co., Inc. Cl A | | | 30,046 | | | | 2,441,238 | |
Nordson Corp. | | | 34,902 | | | | 2,720,960 | |
NOW, Inc.* | | | 63,681 | | | | 1,638,512 | |
Old Dominion Freight Line, Inc.* | | | 40,488 | | | | 3,143,488 | |
Oshkosh Corp. | | | 47,465 | | | | 2,309,172 | |
Regal-Beloit Corp. | | | 26,580 | | | | 1,998,816 | |
Rollins, Inc. | | | 38,085 | | | | 1,260,614 | |
Smith (A.O.) Corp. | | | 44,739 | | | | 2,523,727 | |
SPX Corp. | | | 24,429 | | | | 2,098,940 | |
Terex Corp. | | | 64,474 | | | | 1,797,535 | |
Timken Co. | | | 44,310 | | | | 1,891,151 | |
Towers Watson & Co. Cl A | | | 41,597 | | | | 4,707,532 | |
Trinity Industries, Inc. | | | 92,571 | | | | 2,592,914 | |
Triumph Group, Inc. | | | 30,208 | | | | 2,030,582 | |
Valmont Industries, Inc. | | | 14,664 | | | | 1,862,328 | |
Wabtec Corp. | | | 57,332 | | | | 4,981,577 | |
Waste Connections, Inc. | | | 73,825 | | | | 3,247,562 | |
Watsco, Inc. | | | 16,254 | | | | 1,739,178 | |
Werner Enterprises, Inc. | | | 26,502 | | | | 825,537 | |
Woodward, Inc. | | | 34,720 | | | | 1,709,266 | |
| | | | | | | | |
| | | | | | | 146,719,286 | |
| | | | | | | | |
INFORMATION TECHNOLOGY (17.2%) | | | | | | | | |
3D Systems Corp.* | | | 62,182 | | | | 2,043,922 | |
ACI Worldwide, Inc.* | | | 68,362 | | | | 1,378,862 | |
Acxiom Corp.* | | | 45,806 | | | | 928,488 | |
Advanced Micro Devices, Inc.* | | | 376,505 | | | | 1,005,268 | |
Advent Software, Inc. | | | 26,445 | | | | 810,275 | |
ANSYS, Inc.* | | | 54,665 | | | | 4,482,530 | |
AOL, Inc.* | | | 46,325 | | | | 2,138,825 | |
ARRIS Group, Inc.* | | | 78,362 | | | | 2,365,749 | |
Arrow Electronics, Inc.* | | | 57,639 | | | | 3,336,722 | |
Atmel Corp.* | | | 248,479 | | | | 2,085,981 | |
Avnet, Inc. | | | 81,515 | | | | 3,506,775 | |
Belden, Inc. | | | 25,467 | | | | 2,007,054 | |
Broadridge Financial Solutions, Inc. | | | 71,384 | | | | 3,296,513 | |
Cadence Design Systems, Inc.* | | | 174,106 | | | | 3,302,791 | |
CDK Global, Inc. | | | 95,542 | | | | 3,894,292 | |
Ciena Corp.* | | | 63,384 | | | | 1,230,283 | |
Cognex Corp* | | | 51,774 | | | | 2,139,819 | |
CommVault Systems, Inc.* | | | 25,587 | | | | 1,322,592 | |
Convergys Corp. | | | 59,684 | | | | 1,215,763 | |
CoreLogic, Inc.* | | | 53,377 | | | | 1,686,179 | |
Cree, Inc.* | | | 71,045 | | | | 2,289,070 | |
Cypress Semiconductor Corp. | | | 88,230 | | | | 1,259,924 | |
Diebold, Inc. | | | 38,440 | | | | 1,331,562 | |
DST Systems, Inc. | | | 17,430 | | | | 1,641,035 | |
Equinix, Inc. | | | 32,472 | | | | 7,362,377 | |
FactSet Research Systems, Inc. | | | 23,059 | | | | 3,245,554 | |
Fair Isaac Corp. | | | 19,096 | | | | 1,380,641 | |
Fairchild Semiconductor Int’l., Inc.* | | | 70,643 | | | | 1,192,454 | |
FEI Company | | | 24,714 | | | | 2,232,910 | |
Fortinet, Inc.* | | | 82,365 | | | | 2,525,311 | |
MUTUAL OF AMERICA INVESTMENT CORPORATION - MID-CAP EQUITY INDEX FUND
PORTFOLIO OF INVESTMENTS IN SECURITIES
December 31, 2014
| | | | | | | | |
Gartner, Inc.* | | | 52,384 | | | | 4,411,257 | |
Global Payments, Inc. | | | 40,230 | | | | 3,247,768 | |
Henry (Jack) & Associates, Inc. | | | 48,640 | | | | 3,022,490 | |
Informatica Corp.* | | | 64,637 | | | | 2,464,932 | |
Ingram Micro, Inc. Cl A* | | | 92,748 | | | | 2,563,555 | |
Integrated Device Technology, Inc.* | | | 88,415 | | | | 1,732,934 | |
InterDigital, Inc. | | | 22,104 | | | | 1,169,302 | |
International Rectifier Corp.* | | | 42,548 | | | | 1,697,665 | |
Intersil Corp. Cl A | | | 77,033 | | | | 1,114,668 | |
IPG Photonics Corp.* | | | 21,105 | | | | 1,581,187 | |
Itron, Inc.* | | | 23,196 | | | | 980,959 | |
Jabil Circuit, Inc. | | | 115,028 | | | | 2,511,061 | |
JDS Uniphase Corp.* | | | 137,621 | | | | 1,888,160 | |
Keysight Technologies, Inc.* | | | 99,626 | | | | 3,364,370 | |
Knowles Corp.* | | | 50,581 | | | | 1,191,183 | |
Leidos Hldgs., Inc. | | | 37,006 | | | | 1,610,501 | |
Lexmark International, Inc. Cl A | | | 36,754 | | | | 1,516,838 | |
Mentor Graphics Corp. | | | 58,191 | | | | 1,275,547 | |
National Instruments Corp. | | | 59,951 | | | | 1,863,877 | |
NCR Corp.* | | | 100,161 | | | | 2,918,692 | |
NeuStar, Inc. Cl A* | | | 32,585 | | | | 905,863 | |
Plantronics, Inc. | | | 25,531 | | | | 1,353,654 | |
Polycom, Inc.* | | | 81,178 | | | | 1,095,903 | |
PTC, Inc.* | | | 68,992 | | | | 2,528,557 | |
Rackspace Hosting, Inc.* | | | 70,869 | | | | 3,317,378 | |
RF Micro Devices, Inc.* | | | 346,058 | | | | 5,741,102 | |
Riverbed Technology, Inc.* | | | 92,257 | | | | 1,882,965 | |
Rovi Corp.* | | | 56,344 | | | | 1,272,811 | |
Science Applications Int’l. Corp. | | | 24,052 | | | | 1,191,296 | |
Semtech Corp.* | | | 39,703 | | | | 1,094,612 | |
Silicon Laboratories, Inc.* | | | 23,443 | | | | 1,116,356 | |
Skyworks Solutions, Inc. | | | 113,399 | | | | 8,245,236 | |
SolarWinds, Inc.* | | | 39,140 | | | | 1,950,346 | |
Solera Hldgs., Inc. | | | 40,580 | | | | 2,076,884 | |
SunEdison, Inc.* | | | 149,885 | | | | 2,924,256 | |
Synopsys, Inc.* | | | 92,683 | | | | 4,028,930 | |
Tech Data Corp.* | | | 22,754 | | | | 1,438,735 | |
Teradyne, Inc. | | | 128,768 | | | | 2,548,319 | |
Trimble Navigation Ltd.* | | | 154,053 | | | | 4,088,567 | |
Tyler Technologies TYL* | | | 19,717 | | | | 2,157,828 | |
Ultimate Software Group, Inc.* | | | 16,874 | | | | 2,477,356 | |
VeriFone Systems, Inc.* | | | 67,325 | | | | 2,504,490 | |
Vishay Intertechnology, Inc. | | | 80,688 | | | | 1,141,735 | |
WEX, Inc.* | | | 23,058 | | | | 2,280,897 | |
Zebra Technologies Corp. Cl A* | | | 30,287 | | | | 2,344,517 | |
| | | | | | | | |
| | | | | | | 172,475,060 | |
| | | | | | | | |
MATERIALS (7.2%) | | | | | | | | |
Albemarle Corp. | | | 46,541 | | | | 2,798,510 | |
AptarGroup, Inc. | | | 38,500 | | | | 2,573,340 | |
Ashland, Inc. | | | 37,959 | | | | 4,545,970 | |
Bemis Co., Inc. | | | 59,408 | | | | 2,685,836 | |
Cabot Corp. | | | 38,164 | | | | 1,673,873 | |
Carpenter Technology Corp. | | | 31,666 | | | | 1,559,551 | |
Cliffs Natural Resources, Inc. | | | 90,185 | | | | 643,921 | |
Commercial Metals Co. | | | 70,279 | | | | 1,144,845 | |
Compass Minerals Int’l., Inc. | | | 20,052 | | | | 1,741,115 | |
Cytec Industries, Inc. | | | 42,869 | | | | 1,979,262 | |
Domtar Corp. | | | 38,345 | | | | 1,542,236 | |
Eagle Materials, Inc. | | | 29,895 | | | | 2,272,917 | |
Greif, Inc. Cl A | | | 20,160 | | | | 952,157 | |
Louisiana-Pacific Corp.* | | | 84,585 | | | | 1,400,728 | |
Minerals Technologies, Inc. | | | 20,524 | | | | 1,425,392 | |
NewMarket Corp. | | | 6,335 | | | | 2,556,363 | |
Olin Corp. | | | 46,509 | | | | 1,059,010 | |
MUTUAL OF AMERICA INVESTMENT CORPORATION - MID-CAP EQUITY INDEX FUND
PORTFOLIO OF INVESTMENTS IN SECURITIES
December 31, 2014
| | | | | | | | |
Packaging Corp. of America | | | 58,516 | | | | 4,567,174 | |
PolyOne Corp. | | | 54,073 | | | | 2,049,907 | |
Reliance Steel & Aluminum Co. | | | 46,438 | | | | 2,845,256 | |
Rock-Tenn Co. Cl A | | | 83,300 | | | | 5,079,634 | |
Royal Gold, Inc. | | | 38,778 | | | | 2,431,381 | |
RPM International, Inc. | | | 79,390 | | | | 4,025,867 | |
Scotts Miracle-Gro Co. Cl A | | | 26,321 | | | | 1,640,325 | |
Sensient Technologies Corp. | | | 28,643 | | | | 1,728,319 | |
Silgan Hldgs., Inc. | | | 25,938 | | | | 1,390,277 | |
Sonoco Products Co. | | | 60,228 | | | | 2,631,964 | |
Steel Dynamics, Inc. | | | 142,996 | | | | 2,822,741 | |
TimkenSteel Corp. | | | 22,951 | | | | 849,876 | |
United States Steel Corp. | | | 86,814 | | | | 2,321,406 | |
Valspar Corp. | | | 45,341 | | | | 3,921,090 | |
Worthington Industries, Inc. | | | 30,141 | | | | 906,943 | |
| | | | | | | | |
| | | | | | | 71,767,186 | |
| | | | | | | | |
TELECOMMUNICATION SERVICES (0.2%) | | | | | | | | |
Telephone & Data Systems, Inc. | | | 58,404 | | | | 1,474,701 | |
| | | | | | | | |
| | |
UTILITIES (4.7%) | | | | | | | | |
Alliant Energy Corp. | | | 65,984 | | | | 4,382,657 | |
Aqua America, Inc. | | | 105,060 | | | | 2,805,102 | |
Atmos Energy Corp. | | | 59,713 | | | | 3,328,403 | |
Black Hills Corp. | | | 26,560 | | | | 1,408,742 | |
Cleco Corp. | | | 35,911 | | | | 1,958,586 | |
Great Plains Energy, Inc. | | | 91,514 | | | | 2,599,913 | |
Hawaiian Electric Industries, Inc. | | | 61,003 | | | | 2,042,380 | |
Idacorp, Inc. | | | 29,899 | | | | 1,979,015 | |
MDU Resources Group | | | 115,453 | | | | 2,713,146 | |
National Fuel Gas Co. | | | 50,075 | | | | 3,481,715 | |
OGE Energy Corp. | | | 118,553 | | | | 4,206,260 | |
ONE Gas, Inc. | | | 30,961 | | | | 1,276,212 | |
PNM Resources, Inc. | | | 47,378 | | | | 1,403,810 | |
Questar Corp. | | | 104,241 | | | | 2,635,212 | |
UGI Corp. | | | 102,556 | | | | 3,895,077 | |
Vectren Corp. | | | 49,093 | | | | 2,269,569 | |
Westar Energy, Inc. | | | 77,762 | | | | 3,206,905 | |
WGL Hldgs., Inc. | | | 29,509 | | | | 1,611,782 | |
| | | | | | | | |
| | | | | | | 47,204,486 | |
| | | | | | | | |
TOTAL INDEXED ASSETS - COMMON STOCKS
(Cost: $690,724,952) 97.1% | | | | | | | 971,768,222 | |
| | | | | | | | |
| | | | | | | | | | | | | | | | |
| | | Rating** | | Rate(%) | | | Maturity | | Face Amount | | | Value | |
SHORT-TERM DEBT SECURITIES: | | | | | | | | | | | | | | | | |
U.S. GOVERNMENT (0.7%) | | | | | | | | | | | | | | | | |
U.S. Treasury Bill (1) | | A-1+ | | | 0.01 | | | 03/05/15 | | | 2,400,000 | | | | 2,399,937 | |
U.S. Treasury Bill (1) | | A-1+ | | | 0.10 | | | 06/18/15 | | | 5,000,000 | | | | 4,997,608 | |
| | | | | | | | | | | | | | | | |
| | | | | | | | | | | | | | | 7,397,545 | |
| | | | | | | | | | | | | | | | |
COMMERCIAL PAPER (2.4%) | | | | | | | | | | | | | | | | |
Emerson Electric Co.† | | A-1 | | | 0.14 | | | 03/30/15 | | | 1,000,000 | | | | 999,658 | |
Exxon Mobil Corp. | | A-1+ | | | 0.12 | | | 01/21/15 | | | 10,000,000 | | | | 9,999,333 | |
Intercontinental Exchange, Inc.† | | A-1 | | | 0.17 | | | 01/06/15 | | | 1,300,000 | | | | 1,299,969 | |
Piedmont Natural Gas Co.† | | A-1 | | | 0.18 | | | 01/06/15 | | | 1,500,000 | | | | 1,499,963 | |
Toyota Motor Credit Corp. | | A-1+ | | | 0.13 | | | 01/28/15 | | | 10,000,000 | | | | 9,999,025 | |
| | | | | | | | | | | | | | | | |
| | | | | | | | | | | | | | | 23,797,948 | |
| | | | | | | | | | | | | | | | |
| | | |
TOTAL SHORT-TERM DEBT SECURITIES
(Cost: $31,195,493) 3.1% | | | | | | | | | | 31,195,493 | |
| | | | | | | | | | | | | | | | |
| | | |
TEMPORARY CASH INVESTMENTS (2)
(Cost: $100,000) 0.0% (3) | | | | | | | | | | 100,000 | |
| | | | | | | | | | | | | | | | |
| | | |
TOTAL INVESTMENTS
(Cost: $722,020,445) 100.2% | | | | | | | | | | 1,003,063,715 | |
| | | | | | | | | | | | | | | | |
| | | | | |
OTHER NET ASSETS -0.2% | | | | | | | | | | | | | | | (2,435,125) | |
| | | | | | | | | | | | | | | | |
| | | | | |
NET ASSETS 100.0% | | | | | | | | | | | | | | | $1,000,628,590 | |
| | | | | | | | | | | | | | | | |
The accompanying notes are an integral part of these portfolio schedules.
MUTUAL OF AMERICA INVESTMENT CORPORATION - INTERNATIONAL FUND
PORTFOLIO OF INVESTMENTS IN SECURITIES
December 31, 2014
| | | | | | | | |
| | | Shares | | | Value | |
COMMON STOCKS: | | | | | | | | |
FINANCIALS (95.6%) | | | | | | | | |
iShares Core MSCI Europe ETF | | | 19,229 | | | | 841,076 | |
iShares Core MSCI Pacific ETF | | | 10,218 | | | | 483,107 | |
iShares MSCI EAFE ETF | | | 1,136,525 | | | | 69,146,181 | |
iShares MSCI EAFE Growth ETF | | | 287,839 | | | | 18,939,806 | |
iShares MSCI EAFE Small-Cap ETF | | | 177,935 | | | | 8,311,344 | |
iShares MSCI EAFE Value ETF | | | 365,047 | | | | 18,628,348 | |
iShares MSCI Emerging Markets ETF | | | 169,437 | | | | 9,595,217 | |
Vanguard FTSE Developed Markets ETF | | | 2,416,800 | | | | 91,548,386 | |
Vanguard FTSE Europe ETF | | | 424,630 | | | | 22,254,858 | |
Vanguard FTSE Pacific ETF | | | 220,480 | | | | 12,578,384 | |
| | | | | | | | |
| | | | | | | 252,326,707 | |
| | | | | | | | |
TOTAL COMMON STOCKS
(Cost: $249,366,368) 95.7% | | | | | | | 252,326,707 | |
| | | | | | | | |
| | | | | | | | | | | | | | | | | | |
| | | Rating** | | Rate(%) | | | Maturity | | | Face Amount | | | Value | |
SHORT-TERM DEBT SECURITIES: | | | | | | | | | | | | | |
U.S. GOVERNMENT (2.0%) | | | | | | | | | | | | | | | | | | |
U.S. Treasury Bill | | A-1+ | | | 0.09 | | | | 06/25/15 | | | | 3,000,000 | | | | 2,998,687 | |
U.S. Treasury Bill | | A-1+ | | | 0.09 | | | | 07/23/15 | | | | 2,400,000 | | | | 2,398,782 | |
| | | | | | | | | | | | | | | | | | |
| | | | | | | | | | | | | | | | | 5,397,469 | |
| | | | | | | | | | | | | | | | | | |
COMMERCIAL PAPER (2.3%) | | | | | | | | | | | | | | | | | | |
Toyota Motor Credit Corp. | | A-1+ | | | 0.11 | | | | 01/13/15 | | | | 1,000,000 | | | | 999,963 | |
Toyota Motor Credit Corp. | | A-1+ | | | 0.14 | | | | 02/20/15 | | | | 5,000,000 | | | | 4,999,028 | |
| | | | | | | | | | | | | | | | | | |
| | | | | | | | | | | | | | | | | 5,998,991 | |
| | | | | | | | | | | | | | | | | | |
TOTAL SHORT-TERM DEBT SECURITIES
(Cost: $11,396,460) 4.3% | | | | | | | | 11,396,460 | |
| | | | | | | | | | | | | | | | | | |
| | | | | |
TOTAL INVESTMENTS
(Cost: $260,762,828) 100.0% | | | | | | | | | | | | | | | | | 263,723,167 | |
| | | | | | | | | | | | | | | | | | |
| | | |
OTHER NET ASSETS 0.0% (3) | | | | | | | | | | | | 110,408 | |
| | | | | | | | | | | | | | | | | | |
| | | |
NET ASSETS 100.0% | | | | | | | | | | | | $263,833,575 | |
| | | | | | | | | | | | | | | | | | |
The accompanying notes are an integral part of these portfolio schedules.
MUTUAL OF AMERICA INVESTMENT CORPORATION - COMPOSITE FUND
PORTFOLIO OF INVESTMENTS IN SECURITIES
December 31, 2014
| | | | | | | | |
| | | Shares | | | Value | |
COMMON STOCKS: | | | | | |
CONSUMER DISCRETIONARY (7.6%) | | | | | | | | |
Amazon.com, Inc.* | | | 4,186 | | | | 1,299,125 | |
AutoZone, Inc.* | | | 1,117 | | | | 691,546 | |
Discovery Communications, Inc. Cl A* | | | 6,512 | | | | 224,338 | |
Discovery Communications, Inc. Cl C* | | | 6,512 | | | | 219,585 | |
Disney (Walt) Co. | | | 19,331 | | | | 1,820,787 | |
Dollar Tree, Inc.* | | | 4,736 | | | | 333,320 | |
Ford Motor Co. | | | 28,832 | | | | 446,896 | |
General Motors Co. | | | 13,723 | | | | 479,070 | |
Home Depot, Inc. | | | 13,072 | | | | 1,372,168 | |
Johnson Controls, Inc. | | | 7,051 | | | | 340,845 | |
Macy’s, Inc. | | | 13,345 | | | | 877,434 | |
McDonald’s Corp. | | | 11,005 | | | | 1,031,169 | |
Priceline Group Inc.* | | | 433 | | | | 493,711 | |
Starbucks Corp. | | | 14,254 | | | | 1,169,541 | |
Target Corp. | | | 13,267 | | | | 1,007,098 | |
Time Warner Cable, Inc. | | | 7,231 | | | | 1,099,546 | |
Time Warner, Inc. | | | 12,173 | | | | 1,039,818 | |
Viacom, Inc. Cl B | | | 8,691 | | | | 653,998 | |
| | | | | | | | |
| | | | | | | 14,599,995 | |
| | | | | | | | |
CONSUMER STAPLES (5.4%) | | | | | | | | |
Coca-Cola Co. | | | 18,383 | | | | 776,130 | |
Colgate-Palmolive Co. | | | 10,234 | | | | 708,090 | |
Constellation Brands, Inc. Cl A* | | | 10,942 | | | | 1,074,176 | |
Estee Lauder Cos., Inc. Cl A | | | 9,757 | | | | 743,483 | |
Mead Johnson Nutrition Co. | | | 4,122 | | | | 414,426 | |
Mondelez International, Inc. Cl A | | | 15,121 | | | | 549,270 | |
PepsiCo, Inc. | | | 11,994 | | | | 1,134,153 | |
Philip Morris Int’l., Inc. | | | 7,965 | | | | 648,749 | |
Proctor & Gamble Co. | | | 20,662 | | | | 1,882,102 | |
Sysco Corp. | | | 14,710 | | | | 583,840 | |
Tyson Foods, Inc. Cl A | | | 12,429 | | | | 498,279 | |
Wal-Mart Stores, Inc. | | | 16,847 | | | | 1,446,820 | |
| | | | | | | | |
| | | | | | | 10,459,518 | |
| | | | | | | | |
ENERGY (5.1%) | | | | | | | | |
Anadarko Petroleum Corp. | | | 9,324 | | | | 769,230 | |
Apache Corp. | | | 6,381 | | | | 399,897 | |
California Resources Corp.* | | | 4,019 | | | | 22,145 | |
Chevron Corp. | | | 8,510 | | | | 954,652 | |
EOG Resources, Inc. | | | 9,137 | | | | 841,244 | |
Exxon Mobil Corp. | | | 34,436 | | | | 3,183,608 | |
Halliburton Co. | | | 21,212 | | | | 834,268 | |
Hess Corp. | | | 6,173 | | | | 455,691 | |
National Oilwell Varco, Inc. | | | 9,544 | | | | 625,418 | |
Noble Energy, Inc. | | | 16,340 | | | | 775,006 | |
Occidental Petroleum Corp. | | | 10,048 | | | | 809,969 | |
Range Resources Corp. | | | 5,361 | | | | 286,545 | |
| | | | | | | | |
| | | | | | | 9,957,673 | |
| | | | | | | | |
FINANCIALS (9.4%) | | | | | | | | |
American Int’l. Group, Inc. | | | 19,438 | | | | 1,088,722 | |
Aon PLC | | | 6,214 | | | | 589,274 | |
Bank of America Corp. | | | 71,077 | | | | 1,271,568 | |
Berkshire Hathaway, Inc. Cl B* | | | 8,022 | | | | 1,204,503 | |
Capital One Financial Corp. | | | 19,282 | | | | 1,591,729 | |
Citigroup, Inc. | | | 18,717 | | | | 1,012,777 | |
Comerica, Inc. | | | 13,471 | | | | 630,982 | |
Franklin Resources, Inc. | | | 7,434 | | | | 411,621 | |
Goldman Sachs Group, Inc. | | | 6,635 | | | | 1,286,062 | |
Host Hotels & Resorts, Inc. | | | 26,697 | | | | 634,588 | |
MUTUAL OF AMERICA INVESTMENT CORPORATION - COMPOSITE FUND
PORTFOLIO OF INVESTMENTS IN SECURITIES
December 31, 2014
| | | | | | | | |
JPMorgan Chase & Co. | | | 42,616 | | | | 2,666,909 | |
MetLife, Inc. | | | 19,364 | | | | 1,047,399 | |
PNC Financial Svcs. Grp., Inc. | | | 8,643 | | | | 788,501 | |
Simon Property Group, Inc. | | | 6,905 | | | | 1,257,470 | |
Wells Fargo & Co. | | | 41,555 | | | | 2,278,045 | |
Zions Bancorporation | | | 18,456 | | | | 526,181 | |
| | | | | | | | |
| | | | | | | 18,286,331 | |
| | | | | | | | |
HEALTH CARE (9.1%) | | | | | | | | |
Abbott Laboratories | | | 19,877 | | | | 894,863 | |
Actavis PLC* | | | 2,956 | | | | 760,904 | |
Allergan, Inc. | | | 2,744 | | | | 583,347 | |
Biogen Idec, Inc.* | | | 2,876 | | | | 976,258 | |
Celgene Corp.* | | | 10,935 | | | | 1,223,189 | |
Cerner Corp.* | | | 5,307 | | | | 343,151 | |
Covidien PLC | | | 11,804 | | | | 1,207,313 | |
Express Scripts Hldg. Co.* | | | 8,293 | | | | 702,168 | |
Gilead Sciences, Inc.* | | | 16,070 | | | | 1,514,758 | |
Humana, Inc. | | | 2,915 | | | | 418,681 | |
McKesson Corp. | | | 3,527 | | | | 732,135 | |
Medtronic, Inc. | | | 8,024 | | | | 579,333 | |
Merck & Co., Inc. | | | 29,654 | | | | 1,684,051 | |
Mylan, Inc.* | | | 28,914 | | | | 1,629,882 | |
Pfizer, Inc. | | | 67,135 | | | | 2,091,255 | |
St. Jude Medical, Inc. | | | 5,447 | | | | 354,218 | |
Stryker Corp. | | | 7,260 | | | | 684,836 | |
UnitedHealth Group, Inc. | | | 8,349 | | | | 844,000 | |
Vertex Pharmaceuticals, Inc.* | | | 3,560 | | | | 422,928 | |
| | | | | | | | |
| | | | | | | 17,647,270 | |
| | | | | | | | |
INDUSTRIALS (6.5%) | | | | | | | | |
Boeing Co. | | | 14,247 | | | | 1,851,825 | |
Cummins, Inc. | | | 7,237 | | | | 1,043,358 | |
Delta Air Lines, Inc. | | | 16,346 | | | | 804,060 | |
Expeditors Int’l. of Wash. | | | 13,292 | | | | 592,956 | |
FedEx Corp. | | | 7,248 | | | | 1,258,688 | |
General Electric Co. | | | 63,173 | | | | 1,596,382 | |
Precision Castparts Corp. | | | 5,682 | | | | 1,368,680 | |
Roper Industries, Inc. | | | 14,431 | | | | 2,256,287 | |
Tyco International PLC | | | 12,755 | | | | 559,434 | |
Union Pacific Corp. | | | 10,139 | | | | 1,207,859 | |
| | | | | | | | |
| | | | | | | 12,539,529 | |
| | | | | | | | |
| | | | | | | | |
INFORMATION TECHNOLOGY (11.3%) | | | | | | | | |
Analog Devices, Inc. | | | 8,090 | | | | 449,157 | |
Apple, Inc. | | | 51,026 | | | | 5,632,249 | |
Automatic Data Processing, Inc. | | | 8,649 | | | | 721,067 | |
Broadcom Corp. Cl A | | | 10,110 | | | | 438,066 | |
Cisco Systems, Inc. | | | 38,347 | | | | 1,066,622 | |
F5 Networks, Inc.* | | | 2,580 | | | | 336,600 | |
Facebook, Inc. Cl A* | | | 13,726 | | | | 1,070,903 | |
Google, Inc. Cl A* | | | 1,934 | | | | 1,026,296 | |
Google, Inc. Cl C* | | | 1,934 | | | | 1,018,058 | |
Intel Corp. | | | 19,711 | | | | 715,312 | |
KLA-Tencor Corp. | | | 4,314 | | | | 303,360 | |
MasterCard, Inc. Cl A | | | 10,899 | | | | 939,058 | |
Micron Technology, Inc.* | | | 14,207 | | | | 497,387 | |
Microsoft Corp. | | | 44,000 | | | | 2,043,800 | |
NetApp, Inc. | | | 2,353 | | | | 97,532 | |
Oracle Corp. | | | 27,405 | | | | 1,232,403 | |
QUALCOMM, Inc. | | | 15,668 | | | | 1,164,602 | |
Salesforce.com, inc.* | | | 24,335 | | | | 1,443,309 | |
Teradata Corp.* | | | 8,075 | | | | 352,716 | |
Texas Instruments, Inc. | | | 9,506 | | | | 508,238 | |
Yahoo!, Inc.* | | | 15,055 | | | | 760,428 | |
| | | | | | | | |
| | | | | | | 21,817,163 | |
| | | | | | | | |
MUTUAL OF AMERICA INVESTMENT CORPORATION - COMPOSITE FUND
PORTFOLIO OF INVESTMENTS IN SECURITIES
December 31, 2014
| | | | | | | | |
MATERIALS (1.8%) | | | | | | | | |
Ball Corp. | | | 11,467 | | | | 781,705 | |
CF Industries Hldgs., Inc. | | | 2,086 | | | | 568,518 | |
Dow Chemical Co. | | | 15,429 | | | | 703,717 | |
Eastman Chemical Co. | | | 12,151 | | | | 921,775 | |
FMC Corp. | | | 3,568 | | | | 203,483 | |
Freeport-McMoRan Copper & Gold, Inc. | | | 15,739 | | | | 367,663 | |
| | | | | | | | |
| | | | | | | 3,546,861 | |
| | | | | | | | |
TELECOMMUNICATION SERVICES (1.0%) | | | | | | | | |
AT&T, Inc. | | | 36,824 | | | | 1,236,918 | |
Verizon Communications, Inc. | | | 15,780 | | | | 738,188 | |
| | | | | | | | |
| | | | | | | 1,975,106 | |
| | | | | | | | |
UTILITIES (1.8%) | | | | | | | | |
Ameren Corp. | | | 4,447 | | | | 205,140 | |
Dominion Resources, Inc. | | | 13,183 | | | | 1,013,773 | |
Edison International | | | 7,625 | | | | 499,285 | |
PPL Corp. | | | 8,459 | | | | 307,315 | |
Public Svc. Enterprise Group, Inc. | | | 14,857 | | | | 615,228 | |
Sempra Energy | | | 6,936 | �� | | | 772,393 | |
| | | | | | | | |
| | | | | | | 3,413,134 | |
| | | | | | | | |
TOTAL COMMON STOCKS
(Cost: $70,914,200) 59.0% | | | | | | | 114,242,580 | |
| | | | | | | | |
| | | | | | | | | | | | | | | | | | |
| | | Rating** | | | | Rate(%) | | | | Maturity | | | | Face Amount | | | | Value |
LONG-TERM DEBT SECURITIES: | | | | |
U.S. GOVERNMENT (8.7%) | | | | | | | | | | | | | | | | | | |
U.S. Treasury Note | | AA+ | | | | 0.63 | | | | 12/31/16 | | | | 400,000 | | | | 399,469 |
U.S. Treasury Note | | AA+ | | | | 1.50 | | | | 10/31/19 | | | | 1,000,000 | | | | 993,906 |
U.S. Treasury Note | | AA+ | | | | 2.00 | | | | 11/30/20 | | | | 250,000 | | | | 252,188 |
U.S. Treasury Strip | | AA+ | | | | 0.00 | | | | 11/15/16 | | | | 1,000,000 | | | | 830,329 |
U.S. Treasury Strip | | AA+ | | | | 0.00 | | | | 08/15/21 | | | | 300,000 | | | | 262,361 |
U.S. Treasury Strip | | AA+ | | | | 0.00 | | | | 11/15/21 | | | | 7,050,000 | | | | 6,118,168 |
U.S. Treasury Strip | | AA+ | | | | 0.00 | | | | 08/15/28 | | | | 6,000,000 | | | | 4,223,818 |
U.S. Treasury Strip | | AA+ | | | | 0.00 | | | | 08/15/29 | | | | 5,500,000 | | | | 3,755,664 |
| | | | | | | | | | | | | | | | | | |
| | | | | | | | | | | | | | | | | | 16,835,903 |
| | | | | | | | | | | | | | | | | | |
U.S. GOVERNMENT AGENCIES (12.7%) | | | | |
MORTGAGE-BACKED OBLIGATIONS (12.5%) | | | | |
FHARM | | AA+ | | | | 2.38 | | | | 04/01/37 | | | | 67,930 | | | | 72,755 |
FHARM | | AA+ | | | | 2.38 | | | | 09/01/39 | | | | 50,783 | | | | 54,236 |
FHARM | | AA+ | | | | 5.24 | | | | 02/01/36 | | | | 47,582 | | | | 50,651 |
FHARM | | AA+ | | | | 5.43 | | | | 05/01/37 | | | | 33,100 | | | | 34,722 |
FHARM | | AA+ | | | | 5.77 | | | | 03/01/37 | | | | 16,452 | | | | 17,474 |
FHLMC | | AA+ | | | | 2.50 | | | | 09/01/27 | | | | 394,058 | | | | 401,870 |
FHLMC | | AA+ | | | | 3.00 | | | | 06/01/27 | | | | 215,785 | | | | 224,556 |
FHLMC | | AA+ | | | | 3.00 | | | | 08/01/27 | | | | 321,624 | | | | 334,228 |
FHLMC | | AA+ | | | | 3.00 | | | | 10/15/37 | | | | 322,351 | | | | 328,259 |
FHLMC | | AA+ | | | | 3.00 | | | | 11/01/42 | | | | 294,943 | | | | 298,383 |
FHLMC | | AA+ | | | | 3.00 | | | | 04/01/43 | | | | 383,022 | | | | 387,959 |
FHLMC | | AA+ | | | | 3.50 | | | | 01/01/43 | | | | 435,480 | | | | 453,501 |
FHLMC | | AA+ | | | | 4.00 | | | | 02/01/25 | | | | 73,746 | | | | 78,516 |
FHLMC | | AA+ | | | | 4.00 | | | | 03/01/41 | | | | 287,993 | | | | 307,357 |
FHLMC | | AA+ | | | | 4.00 | | | | 07/01/41 | | | | 274,004 | | | | 294,918 |
FHLMC | | AA+ | | | | 4.00 | | | | 11/01/42 | | | | 216,173 | | | | 231,334 |
FHLMC | | AA+ | | | | 4.00 | | | | 01/01/43 | | | | 363,569 | | | | 389,719 |
FHLMC | | AA+ | | | | 4.00 | | | | 01/01/44 | | | | 332,141 | | | | 355,594 |
FHLMC | | AA+ | | | | 4.50 | | | | 08/01/34 | | | | 68,093 | | | | 74,240 |
FHLMC | | AA+ | | | | 4.50 | | | | 08/15/35 | | | | 82,365 | | | | 89,081 |
FHLMC | | AA+ | | | | 4.50 | | | | 02/01/44 | | | | 327,565 | | | | 356,676 |
MUTUAL OF AMERICA INVESTMENT CORPORATION - COMPOSITE FUND
PORTFOLIO OF INVESTMENTS IN SECURITIES
December 31, 2014
| | | | | | | | | | | | | | | | | | | | | | | | | | |
FHLMC | | AA+ | | | | | 5.00 | | | | | | 02/01/26 | | | | | | 37,262 | | | | | | 41,080 | |
FHLMC | | AA+ | | | | | 5.00 | | | | | | 10/01/40 | | | | | | 514,838 | | | | | | 570,265 | |
FHLMC | | AA+ | | | | | 5.50 | | | | | | 07/01/32 | | | | | | 74,386 | | | | | | 83,452 | |
FHLMC | | AA+ | | | | | 5.50 | | | | | | 05/01/33 | | | | | | 128,058 | | | | | | 143,936 | |
FHLMC | | AA+ | | | | | 5.50 | | | | | | 06/01/37 | | | | | | 145,447 | | | | | | 163,029 | |
FHLMC | | AA+ | | | | | 6.00 | | | | | | 03/15/32 | | | | | | 64,999 | | | | | | 70,939 | |
FHLMC Strip | | AA+ | | | | | 3.00 | | | | | | 01/15/43 | | | | | | 449,393 | | | | | | 448,215 | |
FNMA | | AA+ | | | | | 2.42 | | | | | | 05/01/43 | | | | | | 446,440 | | | | | | 446,935 | |
FNMA | | AA+ | | | | | 3.00 | | | | | | 06/01/33 | | | | | | 444,308 | | | | | | 459,444 | |
FNMA | | AA+ | | | | | 3.00 | | | | | | 09/01/33 | | | | | | 366,959 | | | | | | 379,023 | |
FNMA | | AA+ | | | | | 3.00 | | | | | | 12/01/42 | | | | | | 426,693 | | | | | | 427,752 | |
FNMA | | AA+ | | | | | 3.00 | | | | | | 02/01/43 | | | | | | 240,971 | | | | | | 244,009 | |
FNMA | | AA+ | | | | | 3.00 | | | | | | 03/01/43 | | | | | | 460,690 | | | | | | 467,250 | |
FNMA | | AA+ | | | | | 3.50 | | | | | | 03/25/28 | | | | | | 321,743 | | | | | | 335,773 | |
FNMA | | AA+ | | | | | 3.50 | | | | | | 08/01/38 | | | | | | 334,487 | | | | | | 350,283 | |
FNMA | | AA+ | | | | | 3.50 | | | | | | 10/01/41 | | | | | | 219,259 | | | | | | 229,294 | |
FNMA | | AA+ | | | | | 3.50 | | | | | | 11/01/41 | | | | | | 368,798 | | | | | | 385,226 | |
FNMA | | AA+ | | | | | 3.50 | | | | | | 12/01/41 | | | | | | 367,079 | | | | | | 383,879 | |
FNMA | | AA+ | | | | | 3.50 | | | | | | 04/01/42 | | | | | | 418,259 | | | | | | 437,976 | |
FNMA | | AA+ | | | | | 3.50 | | | | | | 04/01/42 | | | | | | 521,418 | | | | | | 544,422 | |
FNMA | | AA+ | | | | | 3.50 | | | | | | 08/01/42 | | | | | | 475,125 | | | | | | 495,973 | |
FNMA | | AA+ | | | | | 3.50 | | | | | | 10/01/42 | | | | | | 360,351 | | | | | | 376,061 | |
FNMA | | AA+ | | | | | 3.50 | | | | | | 01/01/44 | | | | | | 209,530 | | | | | | 215,079 | |
FNMA | | AA+ | | | | | 4.00 | | | | | | 05/01/19 | | | | | | 45,527 | | | | | | 48,246 | |
FNMA | | AA+ | | | | | 4.00 | | | | | | 07/25/26 | | | | | | 456,556 | | | | | | 486,291 | |
FNMA | | AA+ | | | | | 4.00 | | | | | | 01/01/31 | | | | | | 319,374 | | | | | | 344,322 | |
FNMA | | AA+ | | | | | 4.00 | | | | | | 11/01/40 | | | | | | 286,439 | | | | | | 306,201 | |
FNMA | | AA+ | | | | | 4.00 | | | | | | 05/01/41 | | | | | | 250,549 | | | | | | 267,451 | |
FNMA | | AA+ | | | | | 4.00 | | | | | | 08/01/42 | | | | | | 373,368 | | | | | | 398,950 | |
FNMA | | AA+ | | | | | 4.50 | | | | | | 05/01/18 | | | | | | 40,624 | | | | | | 42,675 | |
FNMA | | AA+ | | | | | 4.50 | | | | | | 05/01/30 | | | | | | 117,837 | | | | | | 128,605 | |
FNMA | | AA+ | | | | | 4.50 | | | | | | 04/01/31 | | | | | | 148,520 | | | | | | 162,149 | |
FNMA | | AA+ | | | | | 4.50 | | | | | | 08/01/33 | | | | | | 62,583 | | | | | | 68,205 | |
FNMA | | AA+ | | | | | 4.50 | | | | | | 09/01/33 | | | | | | 119,724 | | | | | | 130,446 | |
FNMA | | AA+ | | | | | 4.50 | | | | | | 06/01/34 | | | | | | 89,502 | | | | | | 97,661 | |
FNMA | | AA+ | | | | | 4.50 | | | | | | 08/01/35 | | | | | | 73,578 | | | | | | 79,847 | |
FNMA | | AA+ | | | | | 4.50 | | | | | | 12/01/35 | | | | | | 80,846 | | | | | | 88,197 | |
FNMA | | AA+ | | | | | 4.50 | | | | | | 05/01/39 | | | | | | 104,736 | | | | | | 114,520 | |
FNMA | | AA+ | | | | | 4.50 | | | | | | 05/01/39 | | | | | | 177,059 | | | | | | 194,294 | |
FNMA | | AA+ | | | | | 4.50 | | | | | | 05/01/40 | | | | | | 133,716 | | | | | | 145,363 | |
FNMA | | AA+ | | | | | 5.00 | | | | | | 04/01/18 | | | | | | 91,853 | | | | | | 96,781 | |
FNMA | | AA+ | | | | | 5.00 | | | | | | 06/01/33 | | | | | | 126,098 | | | | | | 139,699 | |
FNMA | | AA+ | | | | | 5.00 | | | | | | 10/01/33 | | | | | | 116,325 | | | | | | 129,665 | |
FNMA | | AA+ | | | | | 5.00 | | | | | | 11/01/33 | | | | | | 338,673 | | | | | | 375,137 | |
FNMA | | AA+ | | | | | 5.00 | | | | | | 11/01/33 | | | | | | 82,234 | | | | | | 91,113 | |
FNMA | | AA+ | | | | | 5.00 | | | | | | 03/01/34 | | | | | | 45,326 | | | | | | 50,200 | |
FNMA | | AA+ | | | | | 5.00 | | | | | | 04/01/34 | | | | | | 66,627 | | | | | | 74,257 | |
FNMA | | AA+ | | | | | 5.00 | | | | | | 09/01/35 | | | | | | 51,303 | | | | | | 56,865 | |
FNMA | | AA+ | | | | | 5.00 | | | | | | 11/25/35 | | | | | | 170,450 | | | | | | 181,958 | |
FNMA | | AA+ | | | | | 5.00 | | | | | | 08/01/37 | | | | | | 389,296 | | | | | | 430,269 | |
FNMA | | AA+ | | | | | 5.00 | | | | | | 05/01/39 | | | | | | 157,188 | | | | | | 174,230 | |
FNMA | | AA+ | | | | | 5.00 | | | | | | 06/01/40 | | | | | | 80,476 | | | | | | 89,140 | |
FNMA | | AA+ | | | | | 5.50 | | | | | | 04/01/17 | | | | | | 4,904 | | | | | | 5,178 | |
FNMA | | AA+ | | | | | 5.50 | | | | | | 05/01/17 | | | | | | 1,575 | | | | | | 1,662 | |
FNMA | | AA+ | | | | | 5.50 | | | | | | 06/01/17 | | | | | | 2,547 | | | | | | 2,691 | |
FNMA | | AA+ | | | | | 5.50 | | | | | | 03/01/34 | | | | | | 25,978 | | | | | | 29,029 | |
FNMA | | AA+ | | | | | 5.50 | | | | | | 05/01/34 | | | | | | 290,181 | | | | | | 327,451 | |
FNMA | | AA+ | | | | | 5.50 | | | | | | 07/01/34 | | | | | | 75,044 | | | | | | 84,418 | |
FNMA | | AA+ | | | | | 5.50 | | | | | | 09/01/34 | | | | | | 45,106 | | | | | | 50,877 | |
FNMA | | AA+ | | | | | 5.50 | | | | | | 09/01/34 | | | | | | 141,412 | | | | | | 159,376 | |
FNMA | | AA+ | | | | | 5.50 | | | | | | 10/01/34 | | | | | | 53,200 | | | | | | 60,054 | |
MUTUAL OF AMERICA INVESTMENT CORPORATION - COMPOSITE FUND
PORTFOLIO OF INVESTMENTS IN SECURITIES
December 31, 2014
| | | | | | | | | | | | | | | | |
FNMA | | AA+ | | | | 5.50 | | | | 02/01/35 | | | | 60,504 | | 67,914 |
FNMA | | AA+ | | | | 5.50 | | | | 02/01/35 | | | | 111,784 | | 126,769 |
FNMA | | AA+ | | | | 5.50 | | | | 08/01/35 | | | | 41,302 | | 46,608 |
FNMA | | AA+ | | | | 5.50 | | | | 08/01/37 | | | | 19,895 | | 22,231 |
FNMA | | AA+ | | | | 5.50 | | | | 11/01/38 | | | | 37,141 | | 40,383 |
FNMA | | AA+ | | | | 5.50 | | | | 06/01/48 | | | | 45,320 | | 49,209 |
FNMA | | AA+ | | | | 6.00 | | | | 03/01/17 | | | | 2,252 | | 2,338 |
FNMA | | AA+ | | | | 6.00 | | | | 05/01/23 | | | | 34,144 | | 38,876 |
FNMA | | AA+ | | | | 6.00 | | | | 04/01/32 | | | | 24,145 | | 27,366 |
FNMA | | AA+ | | | | 6.00 | | | | 04/01/32 | | | | 17,808 | | 20,297 |
FNMA | | AA+ | | | | 6.00 | | | | 05/01/32 | | | | 22,874 | | 26,189 |
FNMA | | AA+ | | | | 6.00 | | | | 04/01/33 | | | | 124,925 | | 143,011 |
FNMA | | AA+ | | | | 6.00 | | | | 05/01/33 | | | | 70,670 | | 80,625 |
FNMA | | AA+ | | | | 6.00 | | | | 06/01/34 | | | | 43,763 | | 49,575 |
FNMA | | AA+ | | | | 6.00 | | | | 09/01/34 | | | | 24,290 | | 27,744 |
FNMA | | AA+ | | | | 6.00 | | | | 10/01/34 | | | | 50,346 | | 57,389 |
FNMA | | AA+ | | | | 6.00 | | | | 11/01/34 | | | | 14,129 | | 16,010 |
FNMA | | AA+ | | | | 6.00 | | | | 12/01/36 | | | | 74,418 | | 85,533 |
FNMA | | AA+ | | | | 6.00 | | | | 01/01/37 | | | | 67,867 | | 77,969 |
FNMA | | AA+ | | | | 6.00 | | | | 04/01/37 | | | | 27,765 | | 30,482 |
FNMA | | AA+ | | | | 6.00 | | | | 05/01/37 | | | | 17,517 | | 19,231 |
FNMA | | AA+ | | | | 6.00 | | | | 06/01/37 | | | | 33,490 | | 36,749 |
FNMA | | AA+ | | | | 6.00 | | | | 10/25/44 | | | | 121,747 | | 141,797 |
FNMA | | AA+ | | | | 6.00 | | | | 02/25/47 | | | | 119,808 | | 134,686 |
FNMA | | AA+ | | | | 6.00 | | | | 12/25/49 | | | | 83,691 | | 92,924 |
FNMA | | AA+ | | | | 6.50 | | | | 09/01/16 | | | | 1,699 | | 1,739 |
FNMA | | AA+ | | | | 6.50 | | | | 03/01/17 | | | | 6,178 | | 6,396 |
FNMA | | AA+ | | | | 6.50 | | | | 05/01/17 | | | | 1,716 | | 1,736 |
FNMA | | AA+ | | | | 6.50 | | | | 06/01/17 | | | | 9,784 | | 10,173 |
FNMA | | AA+ | | | | 6.50 | | | | 05/01/32 | | | | 15,363 | | 17,495 |
FNMA | | AA+ | | | | 6.50 | | | | 05/01/32 | | | | 26,464 | | 30,138 |
FNMA | | AA+ | | | | 6.50 | | | | 07/01/32 | | | | 4,315 | | 4,914 |
FNMA | | AA+ | | | | 6.50 | | | | 07/01/34 | | | | 42,700 | | 48,697 |
FNMA | | AA+ | | | | 6.50 | | | | 05/01/37 | | | | 74,290 | | 85,983 |
FNMA | | AA+ | | | | 6.50 | | | | 09/01/37 | | | | 30,894 | | 37,064 |
FNMA | | AA+ | | | | 7.00 | | | | 09/01/31 | | | | 17,917 | | 20,362 |
FNMA | | AA+ | | | | 7.00 | | | | 04/01/32 | | | | 12,307 | | 14,735 |
FNMA | | AA+ | | | | 7.50 | | | | 06/01/31 | | | | 9,795 | | 11,824 |
FNMA | | AA+ | | | | 7.50 | | | | 02/01/32 | | | | 6,706 | | 7,842 |
FNMA | | AA+ | | | | 7.50 | | | | 06/01/32 | | | | 7,277 | | 8,158 |
FNMA | | AA+ | | | | 8.00 | | | | 04/01/32 | | | | 1,652 | | 1,776 |
FNMA Strip | | AA+ | | | | 3.00 | | | | 08/25/42 | | | | 390,265 | | 387,921 |
GNMA (4) | | AA+ | | | | 3.50 | | | | 09/20/33 | | | | 136,429 | | 139,906 |
GNMA (4) | | AA+ | | | | 3.50 | | | | 01/20/37 | | | | 71,188 | | 72,137 |
GNMA (4) | | AA+ | | | | 4.00 | | | | 08/15/41 | | | | 278,582 | | 301,180 |
GNMA (4) | | AA+ | | | | 4.00 | | | | 01/15/42 | | | | 391,822 | | 420,736 |
GNMA (4) | | AA+ | | | | 4.00 | | | | 03/20/42 | | | | 275,125 | | 295,394 |
GNMA (4) | | AA+ | | | | 4.00 | | | | 08/20/42 | | | | 236,131 | | 253,412 |
GNMA (4) | | AA+ | | | | 4.50 | | | | 04/20/31 | | | | 206,533 | | 227,991 |
GNMA (4) | | AA+ | | | | 4.50 | | | | 10/15/40 | | | | 254,335 | | 283,296 |
GNMA (4) | | AA+ | | | | 4.50 | | | | 10/20/43 | | | | 449,854 | | 501,241 |
GNMA (4) | | AA+ | | | | 5.00 | | | | 10/15/24 | | | | 279,458 | | 312,677 |
GNMA (4) | | AA+ | | | | 5.00 | | | | 04/15/39 | | | | 207,036 | | 230,531 |
GNMA (4) | | AA+ | | | | 5.00 | | | | 06/20/39 | | | | 263,156 | | 288,941 |
GNMA (4) | | AA+ | | | | 5.00 | | | | 11/15/39 | | | | 159,945 | | 176,919 |
GNMA (4) | | AA+ | | | | 6.50 | | | | 04/15/31 | | | | 4,106 | | 4,686 |
GNMA (4) | | AA+ | | | | 6.50 | | | | 10/15/31 | | | | 5,159 | | 6,025 |
GNMA (4) | | AA+ | | | | 6.50 | | | | 12/15/31 | | | | 4,067 | | 4,642 |
GNMA (4) | | AA+ | | | | 6.50 | | | | 05/15/32 | | | | 8,129 | | 9,276 |
GNMA (4) | | AA+ | | | | 7.00 | | | | 05/15/31 | | | | 4,257 | | 4,978 |
GNMA (4) | | AA+ | | | | 7.00 | | | | 05/15/32 | | | | 1,689 | | 1,832 |
Vendee Mortgage Trust (4) | | AA+ | | | | 5.25 | | | | 01/15/32 | | | | 246,597 | | 273,251 |
| | | | | | | | | | | | | | | | |
| | | | | | | | | | | | | | | | 24,216,706 |
| | | | | | | | | | | | | | | | |
MUTUAL OF AMERICA INVESTMENT CORPORATION - COMPOSITE FUND
PORTFOLIO OF INVESTMENTS IN SECURITIES
December 31, 2014
| | | | | | | | | | | | | | | | |
NON-MORTGAGE-BACKED OBLIGATIONS (0.2%) | | | | |
FHLMC | | AA+ | | | | 0.00 | | | | 11/29/19 | | | | 500,000 | | 445,483 |
| | | | | | | | | | | | | | | | |
| | | | | | | | |
CORPORATE DEBT (16.7%) | | | | | | | | | | | | | | | | |
CONSUMER DISCRETIONARY (2.9%) | | | | | | | | | | | | | | | | |
Advance Auto Parts, Inc. | | BBB- | | | | 5.75 | | | | 05/01/20 | | | | 270,000 | | 302,491 |
AutoZone, Inc. | | BBB | | | | 4.00 | | | | 11/15/20 | | | | 250,000 | | 265,256 |
Dollar General Corp. | | BBB- | | | | 3.25 | | | | 04/15/23 | | | | 300,000 | | 273,074 |
Ethan Allen Global, Inc. | | BB- | | | | 5.38 | | | | 10/01/15 | | | | 500,000 | | 506,250 |
Expedia, Inc. | | BBB- | | | | 5.95 | | | | 08/15/20 | | | | 250,000 | | 279,369 |
Family Dollar Stores, Inc. | | BBB- | | | | 5.00 | | | | 02/01/21 | | | | 300,000 | | 316,449 |
Home Depot, Inc. | | A | | | | 5.40 | | | | 03/01/16 | | | | 500,000 | | 527,658 |
Hyatt Hotels Corp. | | BBB | | | | 3.88 | | | | 08/15/16 | | | | 100,000 | | 103,745 |
Kohl’s Corp. | | BBB | | | | 3.25 | | | | 02/01/23 | | | | 100,000 | | 97,369 |
Kohl’s Corp. | | BBB | | | | 4.00 | | | | 11/01/21 | | | | 100,000 | | 103,841 |
Lowe’s Cos., Inc. | | A- | | | | 3.12 | | | | 04/15/22 | | | | 300,000 | | 306,971 |
Marriott International, Inc. | | BBB | | | | 3.13 | | | | 10/15/21 | | | | 25,000 | | 25,143 |
Marriott International, Inc. | | BBB | | | | 3.25 | | | | 09/15/22 | | | | 350,000 | | 351,406 |
NVR, Inc. | | BBB | | | | 3.95 | | | | 09/15/22 | | | | 300,000 | | 307,709 |
O’Reilly Automotive, Inc. | | BBB | | | | 3.80 | | | | 09/01/22 | | | | 300,000 | | 309,903 |
Omnicom Group, Inc. | | BBB+ | | | | 3.63 | | | | 05/01/22 | | | | 100,000 | | 102,659 |
Omnicom Group, Inc. | | BBB+ | | | | 4.45 | | | | 08/15/20 | | | | 250,000 | | 268,905 |
Staples, Inc. | | BBB- | | | | 4.38 | | | | 01/12/23 | | | | 275,000 | | 275,750 |
Tupperware Brands Corp. | | BBB- | | | | 4.75 | | | | 06/01/21 | | | | 350,000 | | 374,656 |
Whirlpool Corp. | | BBB | | | | 6.50 | | | | 06/15/16 | | | | 250,000 | | 269,314 |
Wynn Las Vegas LLC | | BBB- | | | | 5.38 | | | | 03/15/22 | | | | 300,000 | | 304,500 |
| | | | | | | | | | | | | | | | |
| | | | | | | | | | | | | | | | 5,672,418 |
| | | | | | | | | | | | | | | | |
CONSUMER STAPLES (1.1%) | | | | | | | | | | | | | | | | |
Avon Products, Inc. | | BB+ | | | | 4.20 | | | | 07/15/18 | | | | 150,000 | | 137,250 |
CVS Health Corp. | | BBB+ | | | | 6.13 | | | | 08/15/16 | | | | 250,000 | | 269,714 |
Energizer Hldgs., Inc. | | BBB- | | | | 4.70 | | | | 05/19/21 | | | | 275,000 | | 285,344 |
Ingredion, Inc. | | BBB | | | | 4.63 | | | | 11/01/20 | | | | 250,000 | | 269,313 |
Kroger Co. | | BBB | | | | 4.95 | | | | 01/15/15 | | | | 500,000 | | 500,588 |
Molson Coors Brewing Co. | | BBB+ | | | | 3.50 | | | | 05/01/22 | | | | 400,000 | | 404,012 |
Sysco Corp. | | A | | | | 2.60 | | | | 06/12/22 | | | | 300,000 | | 295,127 |
| | | | | | | | | | | | | | | | |
| | | | | | | | | | | | | | | | 2,161,348 |
| | | | | | | | | | | | | | | | |
ENERGY (2.3%) | | | | | | | | | | | | | | | | |
Cameron International Corp. | | BBB+ | | | | 4.50 | | | | 06/01/21 | | | | 300,000 | | 317,496 |
Diamond Offshore Drilling, Inc. | | A- | | | | 4.88 | | | | 07/01/15 | | | | 500,000 | | 510,009 |
Energen Corp. | | BB | | | | 4.63 | | | | 09/01/21 | | | | 250,000 | | 221,553 |
EQT Corp. | | BBB | | | | 4.88 | | | | 11/15/21 | | | | 210,000 | | 226,864 |
FMC Technologies, Inc. | | BBB | | | | 2.00 | | | | 10/01/17 | | | | 250,000 | | 248,210 |
Kinder Morgan, Inc. | | BBB- | | | | 5.15 | | | | 03/01/15 | | | | 500,000 | | 502,580 |
Murphy Oil Corp. | | BBB | | | | 2.50 | | | | 12/01/17 | | | | 200,000 | | 198,800 |
National Oilwell Varco, Inc. | | A | | | | 6.13 | | | | 08/15/15 | | | | 250,000 | | 250,119 |
Noble Corp. | | BBB | | | | 7.50 | | | | 03/15/19 | | | | 800,000 | | 873,767 |
Rowan Companies PLC | | BBB- | | | | 4.88 | | | | 06/01/22 | | | | 300,000 | | 291,924 |
Seacor Hldgs., Inc. | | BB- | | | | 7.38 | | | | 10/01/19 | | | | 250,000 | | 261,875 |
Weatherford Int’l. Ltd. | | BBB- | | | | 5.50 | | | | 02/15/16 | | | | 500,000 | | 515,798 |
| | | | | | | | | | | | | | | | |
| | | | | | | | | | | | | | | | 4,418,995 |
| | | | | | | | | | | | | | | | |
FINANCIALS (3.4%) | | | | | | | | | | | | | | | | |
Aflac, Inc. | | A | | | | 4.00 | | | | 02/15/22 | | | | 300,000 | | 318,401 |
Alleghany Corp. | | BBB | | | | 5.63 | | | | 09/15/20 | | | | 300,000 | | 336,815 |
American Tower Corp. | | BBB- | | | | 4.50 | | | | 01/15/18 | | | | 250,000 | | 265,497 |
Bank of America Corp. | | A- | | | | 3.70 | | | | 09/01/15 | | | | 250,000 | | 254,363 |
Barrick N.A. Finance LLC | | BBB | | | | 4.40 | | | | 05/30/21 | | | | 250,000 | | 252,438 |
Berkley (W.R.) Corp. | | BBB+ | | | | 7.38 | | | | 09/15/19 | | | | 250,000 | | 295,909 |
Capital One Financial Corp. | | BBB | | | | 4.75 | | | | 07/15/21 | | | | 300,000 | | 330,641 |
CNA Financial Corp. | | BBB | | | | 6.50 | | | | 08/15/16 | | | | 250,000 | | 270,409 |
MUTUAL OF AMERICA INVESTMENT CORPORATION - COMPOSITE FUND
PORTFOLIO OF INVESTMENTS IN SECURITIES
December 31, 2014
| | | | | | | | | | | | | | | | |
Fairfax Financial Hldgs. | | BBB- | | | | 8.25 | | | | 10/01/15 | | | | 500,000 | | 523,695 |
First Republic Bank | | A- | | | | 2.38 | | | | 06/17/19 | | | | 150,000 | | 150,707 |
Government Pptys. Income Trust | | BBB- | | | | 3.75 | | | | 08/15/19 | | | | 350,000 | | 355,302 |
Health Care REIT, Inc. | | BBB | | | | 6.13 | | | | 04/15/20 | | | | 250,000 | | 287,383 |
Healthcare Realty Trust | | BBB- | | | | 3.75 | | | | 04/15/23 | | | | 250,000 | | 245,383 |
Hospitality Properties Trust | | BBB- | | | | 5.00 | | | | 08/15/22 | | | | 250,000 | | 263,445 |
Moody’s Corp. | | BBB+ | | | | 4.50 | | | | 09/01/22 | | | | 250,000 | | 268,137 |
Morgan Stanley | | A- | | | | 4.00 | | | | 07/24/15 | | | | 250,000 | | 254,706 |
National Retail Pptys., Inc. | | BBB+ | | | | 3.80 | | | | 10/15/22 | | | | 250,000 | | 256,608 |
Pacific LifeCorp.† | | BBB+ | | | | 6.00 | | | | 02/10/20 | | | | 100,000 | | 113,668 |
Penske Truck Leasing Co. LP† | | BBB- | | | | 3.38 | | | | 03/15/18 | | | | 300,000 | | 309,720 |
Prudential Financial, Inc. | | A | | | | 4.50 | | | | 11/16/21 | | | | 250,000 | | 272,543 |
Raymond James Financial, Inc. | | BBB | | | | 4.25 | | | | 04/15/16 | | | | 250,000 | | 259,202 |
Reckson Operating Partnership | | BBB- | | | | 6.00 | | | | 03/31/16 | | | | 100,000 | | 105,413 |
Senior Housing Pptys. Trust | | BBB- | | | | 4.30 | | | | 01/15/16 | | | | 250,000 | | 255,219 |
Ventas Realty LP/Capital Corp. | | BBB+ | | | | 4.00 | | | | 04/30/19 | | | | 100,000 | | 105,828 |
Ventas Realty LP/Capital Corp. | | BBB+ | | | | 4.75 | | | | 06/01/21 | | | | 200,000 | | 217,379 |
| | | | | | | | | | | | | | | | |
| | | | | | | | | | | | | | | | 6,568,811 |
| | | | | | | | | | | | | | | | |
HEALTH CARE (2.0%) | | | | | | | | | | | | | | | | |
Agilent Technologies, Inc. | | BBB+ | | | | 5.00 | | | | 07/15/20 | | | | 290,000 | | 315,469 |
Allergan, Inc. | | A+ | | | | 5.75 | | | | 04/01/16 | | | | 250,000 | | 264,493 |
Anthem, Inc. | | A- | | | | 4.35 | | | | 08/15/20 | | | | 250,000 | | 270,849 |
Bio-Rad Laboratories, Inc. | | BBB | | | | 4.88 | | | | 12/15/20 | | | | 200,000 | | 214,785 |
CIGNA Corp. | | A | | | | 2.75 | | | | 11/15/16 | | | | 250,000 | | 256,717 |
Hospira, Inc. | | BBB- | | | | 6.05 | | | | 03/30/17 | | | | 300,000 | | 323,450 |
Laboratory Corp. of America | | BBB+ | | | | 5.63 | | | | 12/15/15 | | | | 500,000 | | 520,134 |
Medco Health Solutions, Inc. | | BBB+ | | | | 4.13 | | | | 09/15/20 | | | | 250,000 | | 265,466 |
Owens & Minor, Inc. | | BBB | | | | 3.88 | | | | 09/15/21 | | | | 400,000 | | 404,524 |
PerkinElmer, Inc. | | BBB | | | | 5.00 | | | | 11/15/21 | | | | 300,000 | | 326,376 |
Quest Diagnostics, Inc. | | BBB+ | | | | 4.70 | | | | 04/01/21 | | | | 150,000 | | 162,412 |
Quest Diagnostics, Inc. | | BBB+ | | | | 4.75 | | | | 01/30/20 | | | | 250,000 | | 269,630 |
Thermo Fisher Scientific, Inc. | | BBB | | | | 3.60 | | | | 08/15/21 | | | | 325,000 | | 335,618 |
| | | | | | | | | | | | | | | | |
| | | | | | | | | | | | | | | | 3,929,923 |
| | | | | | | | | | | | | | | | |
INDUSTRIALS (1.2%) | | | | | | | | | | | | | | | | |
Crane Co. | | BBB | | | | 2.75 | | | | 12/15/18 | | | | 350,000 | | 353,775 |
CSX Corp. | | BBB+ | | | | 6.25 | | | | 04/01/15 | | | | 83,000 | | 84,119 |
Dun & Bradstreet Corp. | | BBB- | | | | 3.25 | | | | 12/01/17 | | | | 400,000 | | 411,277 |
Equifax, Inc. | | BBB+ | | | | 3.30 | | | | 12/15/22 | | | | 300,000 | | 296,608 |
Harsco Corp. | | BB+ | | | | 5.75 | | | | 05/15/18 | | | | 250,000 | | 263,125 |
L-3 Communications Corp. | | BBB- | | | | 4.75 | | | | 07/15/20 | | | | 250,000 | | 268,482 |
Pentair PLC | | BBB | | | | 5.00 | | | | 05/15/21 | | | | 250,000 | | 278,087 |
Pitney Bowes, Inc. | | BBB | | | | 5.25 | | | | 01/15/37 | | | | 250,000 | | 267,819 |
| | | | | | | | | | | | | | | | |
| | | | | | | | | | | | | | | | 2,223,292 |
| | | | | | | | | | | | | | | | |
INFORMATION TECHNOLOGY (1.0%) | | | | | | | | | | | | | | | | |
Arrow Electronics, Inc. | | BBB- | | | | 4.50 | | | | 03/01/23 | | | | 300,000 | | 310,100 |
Fiserv, Inc. | | BBB | | | | 4.75 | | | | 06/15/21 | | | | 360,000 | | 396,340 |
Ingram Micro, Inc. | | BBB- | | | | 5.00 | | | | 08/10/22 | | | | 200,000 | | 212,445 |
Ingram Micro, Inc. | | BBB- | | | | 5.25 | | | | 09/01/17 | | | | 100,000 | | 108,193 |
Symantec Corp. | | BBB | | | | 4.20 | | | | 09/15/20 | | | | 350,000 | | 362,418 |
Tech Data Corp. | | BBB- | | | | 3.75 | | | | 09/21/17 | | | | 100,000 | | 103,302 |
Western Union Co. | | BBB | | | | 5.93 | | | | 10/01/16 | | | | 300,000 | | 322,106 |
| | | | | | | | | | | | | | | | |
| | | | | | | | | | | | | | | | 1,814,904 |
| | | | | | | | | | | | | | | | |
MATERIALS (1.5%) | | | | | | | | | | | | | | | | |
Alcoa, Inc. | | BBB- | | | | 6.75 | | | | 07/15/18 | | | | 250,000 | | 280,835 |
Freeport-McMoRan Copper & Gold | | BBB | | | | 3.55 | | | | 03/01/22 | | | | 300,000 | | 283,533 |
Geon Co. | | BBB- | | | | 7.50 | | | | 12/15/15 | | | | 1,000,000 | | 1,060,000 |
Methanex Corp. | | BBB- | | | | 3.25 | | | | 12/15/19 | | | | 250,000 | | 247,897 |
Packaging Corp. of America | | BBB | | | | 3.90 | | | | 06/15/22 | | | | 250,000 | | 256,412 |
Packaging Corp. of America | | BBB | | | | 4.50 | | | | 11/01/23 | | | | 150,000 | | 157,127 |
Southern Copper Corp. | | BBB | | | | 3.50 | | | | 11/08/22 | | | | 100,000 | | 94,837 |
Teck Resources Ltd. | | BBB | | | | 4.75 | | | | 01/15/22 | | | | 300,000 | | 292,413 |
Vulcan Materials Co. | | BB+ | | | | 7.00 | | | | 06/15/18 | | | | 250,000 | | 275,000 |
| | | | | | | | | | | | | | | | |
| | | | | | | | | | | | | | | | 2,948,054 |
| | | | | | | | | | | | | | | | |
MUTUAL OF AMERICA INVESTMENT CORPORATION - COMPOSITE FUND
PORTFOLIO OF INVESTMENTS IN SECURITIES
December 31, 2014
| | | | | | | | | | | | | | | | |
TELECOMMUNICATION SERVICES (0.4%) |
CenturyLink, Inc. | | BB | | | | 5.00 | | | | 02/15/15 | | | | 500,000 | | 501,875 |
Verizon Communications, Inc. | | BBB+ | | | | 4.50 | | | | 09/15/20 | | | | 325,000 | | 352,871 |
| | | | | | | | | | | | | | | | |
| | | | | | | | | | | | | | | | 854,746 |
| | | | | | | | | | | | | | | | |
UTILITIES (1.0%) | | | | | | | | | | | | | | | | |
Constellation Energy | | BBB- | | | | 5.15 | | | | 12/01/20 | | | | 340,000 | | 376,448 |
Duke Energy Progress, Inc. | | A | | | | 5.25 | | | | 12/15/15 | | | | 500,000 | | 521,898 |
Entergy Corp. | | BBB- | | | | 5.13 | | | | 09/15/20 | | | | 250,000 | | 272,331 |
Illinois Power Generating Co. | | CCC+ | | | | 6.30 | | | | 04/01/20 | | | | 250,000 | | 207,500 |
National Fuel Gas Co. | | BBB | | | | 4.90 | | | | 12/01/21 | | | | 250,000 | | 271,112 |
SCANA Corp. | | BBB | | | | 4.13 | | | | 02/01/22 | | | | 300,000 | | 311,002 |
| | | | | | | | | | | | | | | | |
| | | | | | | | | | | | | | | | 1,960,291 |
| | | | | | | | | | | | | | | | |
TOTAL LONG-TERM DEBT SECURITIES
(Cost: $71,340,034) 38.2% | | | | | | 74,050,874 |
| | | | | | | | | | | | | | | | |
| | | | | | | | |
| | | Rating** | | | | Rate(%) | | | | Maturity | | | | Face Amount | | Value |
SHORT-TERM DEBT SECURITIES: | | | | | | | | | | | | | | | | |
U.S. GOVERNMENT (0.6%) | | | | | | | | | | | | | | | | |
U.S. Treasury Bill | | A-1+ | | | | 0.09 | | | | 07/23/15 | | | | 800,000 | | 799,594 |
U.S. Treasury Bill | | A-1+ | | | | 0.09 | | | | 07/23/15 | | | | 400,000 | | 399,797 |
| | | | | | | | | | | | | | | | |
| | | | | | | | | | | | | | | | 1,199,391 |
| | | | | | | | | | | | | | | | |
COMMERCIAL PAPER (1.7%) | | | | | | | | | | | | | | | | |
Piedmont Natural Gas Co.† | | A-1 | | | | 0.17 | | | | 01/05/15 | | | | 1,050,000 | | 1,049,980 |
Piedmont Natural Gas Co.† | | A-1 | | | | 0.18 | | | | 01/06/15 | | | | 700,000 | | 699,983 |
Toyota Motor Credit Corp. | | A-1+ | | | | 0.14 | | | | 02/11/15 | | | | 1,500,000 | | 1,499,761 |
| | | | | | | | | | | | | | | | |
| | | | | | | | | | | | | | | | 3,249,724 |
| | | | | | | | | | | | | | | | |
TOTAL SHORT-TERM DEBT SECURITIES
(Cost: $4,449,115) 2.3% | | | | | | | | | | 4,449,115 |
| | | | | | | | | | | | | | | | |
| | | | |
TEMPORARY CASH INVESTMENTS (2)
(Cost: $808,900) 0.4% | | | | | | | | 808,900 |
| | | | | | | | | | | | | | | | |
| | | | |
TOTAL INVESTMENTS
(Cost: $147,512,249) 99.9% | | | | | | | | 193,551,469 |
| | | | | | | | | | | | | | | | |
| | | |
OTHER NET ASSETS 0.1% | | | | | | 273,814 |
| | | | | | | | | | | | | | | | |
| | | |
NET ASSETS 100.0% | | | | | | $193,825,283 |
| | | | | | | | | | | | | | | | |
The accompanying notes are an integral part of these portfolio schedules.
MUTUAL OF AMERICA INVESTMENT CORPORATION - RETIREMENT INCOME FUND
PORTFOLIO OF INVESTMENTS IN SECURITIES
December 31, 2014
| | | | | | | | |
| | | Shares | | | Value | |
COMMON STOCKS: | | | | | | | | |
DIVERSIFIED MUTUAL FUNDS (100.0%) | | | | | | | | |
Mutual of America Investment Corporation | | | | | | | | |
Bond Fund (29.8%) | | | 10,992,481 | | | | 15,966,282 | |
Equity Index Fund (21.7%) | | | 3,413,853 | | | | 11,634,388 | |
Mid-Cap Equity Index Fund (5.7%) | | | 1,420,871 | | | | 3,072,080 | |
Mid-Term Bond Fund (38.5%) | | | 19,495,437 | | | | 20,582,191 | |
Money Market Fund (4.3%) | | | 1,904,974 | | | | 2,280,374 | |
| | | | | | | | |
TOTAL INVESTMENTS
(Cost: $50,814,567) 100.0% | | | | | | | 53,535,315 | |
| | | | | | | | |
| |
OTHER NET ASSETS -0.0% (3) | | | | (176) | |
| | | | | | | | |
| |
NET ASSETS 100.0% | | | | $53,535,139 | |
| | | | | | | | |
The accompanying notes are an integral part of these portfolio schedules.
MUTUAL OF AMERICA INVESTMENT CORPORATION - 2010 RETIREMENT FUND
PORTFOLIO OF INVESTMENTS IN SECURITIES
December 31, 2014
| | | | | | | | |
| | | Shares | | | Value | |
COMMON STOCKS: | | | | | | | | |
DIVERSIFIED MUTUAL FUNDS (100.0%) | | | | | | | | |
Mutual of America Investment Corporation | | | | | | | | |
Bond Fund (24.4%) | | | 4,464,378 | | | | 6,484,388 | |
Equity Index Fund (27.0%) | | | 2,103,917 | | | | 7,170,134 | |
International Fund (2.9%) | | | 985,925 | | | | 761,989 | |
Mid-Cap Equity Index Fund (9.8%) | | | 1,208,870 | | | | 2,613,709 | |
Mid-Term Bond Fund (31.7%) | | | 7,976,351 | | | | 8,420,984 | |
Money Market Fund (4.2%) | | | 924,681 | | | | 1,106,901 | |
| | | | | | | | |
TOTAL INVESTMENTS
(Cost: $23,954,752) 100.0% | | | | | | | 26,558,105 | |
| | | | | | | | |
| | |
OTHER NET ASSETS -0.0% (3) | | | | | | | (99) | |
| | | | | | | | |
| | |
NET ASSETS 100.0% | | | | | | | $26,558,006 | |
| | | | | | | | |
The accompanying notes are an integral part of these portfolio schedules.
MUTUAL OF AMERICA INVESTMENT CORPORATION - 2015 RETIREMENT FUND
PORTFOLIO OF INVESTMENTS IN SECURITIES
December 31, 2014
| | | | | | | | |
| | | Shares | | | Value | |
COMMON STOCKS: | | | | | |
DIVERSIFIED MUTUAL FUNDS (100.0%) | | | | | | | | |
Mutual of America Investment Corporation | | | | | | | | |
Bond Fund (23.9%) | | | 25,383,078 | | | | 36,868,235 | |
Equity Index Fund (29.6%) | | | 13,391,023 | | | | 45,636,514 | |
International Fund (5.3%) | | | 10,603,987 | | | | 8,195,471 | |
Mid-Cap Equity Index Fund (11.6%) | | | 8,283,425 | | | | 17,909,677 | |
Mid-Term Bond Fund (26.6%) | | | 38,747,834 | | | | 40,907,794 | |
Small Cap Growth Fund (1.5%) | | | 1,541,350 | | | | 2,370,037 | |
Small Cap Value Fund (1.5%) | | | 1,415,340 | | | | 2,275,148 | |
| | | | | | | | |
TOTAL INVESTMENTS
(Cost: $134,753,285) 100.0% | | | | | | | 154,162,876 | |
| | | | | | | | |
| |
OTHER NET ASSETS -0.0% (3) | | | | (1,344) | |
| | | | | | | | |
| |
NET ASSETS 100.0% | | | | $154,161,532 | |
| | | | | | | | |
The accompanying notes are an integral part of these portfolio schedules.
MUTUAL OF AMERICA INVESTMENT CORPORATION - 2020 RETIREMENT FUND
PORTFOLIO OF INVESTMENTS IN SECURITIES
December 31, 2014
| | | | | | | | |
| | | Shares | | | Value | |
COMMON STOCKS: | | | | | | | | |
DIVERSIFIED MUTUAL FUNDS (100.0%) | | | | | | | | |
Mutual of America Investment Corporation | | | | | | | | |
Bond Fund (23.9%) | | | 52,734,566 | | | | 76,595,533 | |
Equity Index Fund (34.6%) | | | 32,596,444 | | | | 111,088,452 | |
International Fund (8.0%) | | | 33,134,083 | | | | 25,608,239 | |
Mid-Cap Equity Index Fund (11.6%) | | | 17,148,430 | | | | 37,076,791 | |
Mid-Term Bond Fund (16.8%) | | | 50,833,397 | | | | 53,667,054 | |
Small Cap Growth Fund (2.6%) | | | 5,309,018 | | | | 8,163,343 | |
Small Cap Value Fund (2.5%) | | | 4,878,781 | | | | 7,842,607 | |
| | | | | | | | |
TOTAL INVESTMENTS
(Cost: $276,550,552) 100.0% | | | | | | | 320,042,019 | |
| | | | | | | | |
| | |
OTHER NET ASSETS -0.0% (3) | | | | | | | (1,066) | |
| | | | | | | | |
| | |
NET ASSETS 100.0% | | | | | | | $320,040,953 | |
| | | | | | | | |
The accompanying notes are an integral part of these portfolio schedules.
MUTUAL OF AMERICA INVESTMENT CORPORATION - 2025 RETIREMENT FUND
PORTFOLIO OF INVESTMENTS IN SECURITIES
December 31, 2014
| | | | | | | | |
| | | Shares | | | Value | |
COMMON STOCKS: | | | | | | | | |
DIVERSIFIED MUTUAL FUNDS (100.0%) | | | | | | | | |
Mutual of America Investment Corporation | | | | | | | | |
Bond Fund (21.9%) | | | 49,823,138 | | | | 72,366,762 | |
Equity Index Fund (39.1%) | | | 38,025,175 | | | | 129,589,532 | |
International Fund (8.5%) | | | 36,248,001 | | | | 28,014,884 | |
Mid-Cap Equity Index Fund (16.6%) | | | 25,377,900 | | | | 54,869,811 | |
Mid-Term Bond Fund (6.9%) | | | 21,766,376 | | | | 22,979,721 | |
Small Cap Growth Fund (3.6%) | | | 7,717,654 | | | | 11,866,950 | |
Small Cap Value Fund (3.4%) | | | 7,093,895 | | | | 11,403,387 | |
| | | | | | | | |
TOTAL INVESTMENTS
Cost: $275,229,535) 100.0% | | | | | | | 331,091,047 | |
| | | | | | | | |
| |
OTHER NET ASSETS -0.0% (3) | | | | (1,121) | |
| | | | | | | | |
| |
NET ASSETS 100.0% | | | | $331,089,926 | |
| | | | | | | | |
The accompanying notes are an integral part of these portfolio schedules.
MUTUAL OF AMERICA INVESTMENT CORPORATION - 2030 RETIREMENT FUND
PORTFOLIO OF INVESTMENTS IN SECURITIES
December 31, 2014
| | | | | | | | |
| | | Shares | | | Value | |
COMMON STOCKS: | | | | | | | | |
DIVERSIFIED MUTUAL FUNDS (100.0%) | | | | | | | | |
Mutual of America Investment Corporation | | | | | | | | |
Bond Fund (21.8%) | | | 41,587,843 | | | | 60,405,219 | |
Equity Index Fund (41.9%) | | | 34,038,924 | | | | 116,004,414 | |
International Fund (8.6%) | | | 30,938,645 | | | | 23,911,458 | |
Mid-Cap Equity Index Fund (17.5%) | | | 22,451,867 | | | | 48,543,406 | |
Small Cap Growth Fund (5.2%) | | | 9,349,217 | | | | 14,375,702 | |
Small Cap Value Fund (5.0%) | | | 8,597,220 | | | | 13,819,971 | |
| | | | | | | | |
TOTAL INVESTMENTS
(Cost: $225,551,895) 100.0% | | | | | | | 277,060,170 | |
| | | | | | | | |
| | |
OTHER NET ASSETS -0.0% (3) | | | | | | | (908) | |
| | | | | | | | |
| | |
NET ASSETS 100.0% | | | | | | | $277,059,262 | |
| | | | | | | | |
The accompanying notes are an integral part of these portfolio schedules.
MUTUAL OF AMERICA INVESTMENT CORPORATION - 2035 RETIREMENT FUND
PORTFOLIO OF INVESTMENTS IN SECURITIES
December 31, 2014
| | | | | | | | |
| | | Shares | | | Value | |
COMMON STOCKS: | | | | | | | | |
DIVERSIFIED MUTUAL FUNDS (100.0%) | | | | | | | | |
Mutual of America Investment Corporation | | | | | | | | |
Bond Fund (14.9%) | | | 23,606,064 | | | | 34,287,171 | |
Equity Index Fund (41.9%) | | | 28,261,233 | | | | 96,314,085 | |
International Fund (10.4%) | | | 30,946,013 | | | | 23,917,152 | |
Mid-Cap Equity Index Fund (20.6%) | | | 21,848,554 | | | | 47,238,976 | |
Small Cap Growth Fund (6.2%) | | | 9,317,651 | | | | 14,327,165 | |
Small Cap Value Fund (6.0%) | | | 8,565,562 | | | | 13,769,081 | |
| | | | | | | | |
TOTAL INVESTMENTS
(Cost: $184,789,316) 100.0% | | | | | | | 229,853,630 | |
| | | | | | | | |
| |
OTHER NET ASSETS -0.0% (3) | | | | (743) | |
| | | | | | | | |
| |
NET ASSETS 100.0% | | | | $229,852,887 | |
| | | | | | | | |
The accompanying notes are an integral part of these portfolio schedules.
MUTUAL OF AMERICA INVESTMENT CORPORATION - 2040 RETIREMENT FUND
PORTFOLIO OF INVESTMENTS IN SECURITIES
December 31, 2014
| | | | | | | | |
| | | Shares | | | Value | |
COMMON STOCKS: | | | | | | | | |
DIVERSIFIED MUTUAL FUNDS (100.0%) | | | | | | | | |
Mutual of America Investment Corporation | | | | | | | | |
Bond Fund (11.0%) | | | 14,267,646 | | | | 20,723,371 | |
Equity Index Fund (36.9%) | | | 20,396,002 | | | | 69,509,433 | |
International Fund (12.2%) | | | 29,762,277 | | | | 23,002,281 | |
Mid-Cap Equity Index Fund (23.6%) | | | 20,612,764 | | | | 44,567,064 | |
Small Cap Growth Fund (8.3%) | | | 10,216,620 | | | | 15,709,453 | |
Small Cap Value Fund (8.0%) | | | 9,392,920 | | | | 15,099,054 | |
| | | | | | | | |
TOTAL INVESTMENTS
(Cost: $149,140,140) 100.0% | | | | | | | 188,610,656 | |
| | | | | | | | |
| |
OTHER NET ASSETS -0.0% (3) | | | | (627) | |
| | | | | | | | |
| |
NET ASSETS 100.0% | | | | $188,610,029 | |
| | | | | | | | |
The accompanying notes are an integral part of these portfolio schedules.
MUTUAL OF AMERICA INVESTMENT CORPORATION - 2045 RETIREMENT FUND
PORTFOLIO OF INVESTMENTS IN SECURITIES
December 31, 2014
| | | | | | | | |
| | | Shares | | | Value | |
COMMON STOCKS: | | | | | | | | |
DIVERSIFIED MUTUAL FUNDS (100.0%) | | | | | | | | |
Mutual of America Investment Corporation | | | | | | | | |
Bond Fund (9.0%) | | | 14,391,388 | | | | 20,903,102 | |
Equity Index Fund (36.9%) | | | 25,181,198 | | | | 85,817,347 | |
International Fund (14.0%) | | | 41,897,652 | | | | 32,381,312 | |
Mid-Cap Equity Index Fund (21.7%) | | | 23,257,166 | | | | 50,284,552 | |
Small Cap Growth Fund (9.4%) | | | 14,169,900 | | | | 21,788,163 | |
Small Cap Value Fund (9.0%) | | | 13,021,610 | | | | 20,932,146 | |
| | | | | | | | |
TOTAL INVESTMENTS
(Cost: $181,799,043) 100.0% | | | | | | | 232,106,622 | |
| | | | | | | | |
| | |
OTHER NET ASSETS -0.0% (3) | | | | | | | (744) | |
| | | | | | | | |
| | |
NET ASSETS 100.0% | | | | | | | $232,105,878 | |
| | | | | | | | |
The accompanying notes are an integral part of these portfolio schedules.
MUTUAL OF AMERICA INVESTMENT CORPORATION - 2050 RETIREMENT FUND
PORTFOLIO OF INVESTMENTS IN SECURITIES
December 31, 2014
| | | | | | | | |
| | | Shares | | | Value | |
COMMON STOCKS: | | | | | |
DIVERSIFIED MUTUAL FUNDS (100.0%) | | | | | | | | |
Mutual of America Investment Corporation | | | | | | | | |
Bond Fund (7.5%) | | | 2,578,720 | | | | 3,745,522 | |
Equity Index Fund (36.5%) | | | 5,377,385 | | | | 18,326,092 | |
International Fund (15.3%) | | | 9,958,602 | | | | 7,696,675 | |
Mid-Cap Equity Index Fund (20.2%) | | | 4,693,642 | | | | 10,148,171 | |
Small Cap Growth Fund (10.4%) | | | 3,406,352 | | | | 5,237,733 | |
Small Cap Value Fund (10.1%) | | | 3,145,781 | | | | 5,056,821 | |
| | | | | | | | |
TOTAL INVESTMENTS
(Cost: $47,255,825) 100.0% | | | | | | | 50,211,014 | |
| | | | | | | | |
| |
OTHER NET ASSETS -0.0% (3) | | | | (98) | |
| | | | | | | | |
| |
NET ASSETS 100.0% | | | | $50,210,916 | |
| | | | | | | | |
The accompanying notes are an integral part of these portfolio schedules.
MUTUAL OF AMERICA INVESTMENT CORPORATION - CONSERVATIVE ALLOCATION FUND
PORTFOLIO OF INVESTMENTS IN SECURITIES
December 31, 2014
| | | | | | | | |
| | | Shares | | | Value | |
COMMON STOCKS: | | | | | |
DIVERSIFIED MUTUAL FUNDS (100.0%) | | | | | | | | |
Mutual of America Investment Corporation | | | | | | | | |
Bond Fund (29.7%) | | | 25,053,613 | | | | 36,389,697 | |
Equity Index Fund (26.5%) | | | 9,520,605 | | | | 32,446,155 | |
International Fund (4.5%) | | | 7,116,724 | | | | 5,500,281 | |
Mid-Cap Equity Index Fund (5.2%) | | | 2,938,347 | | | | 6,353,030 | |
Mid-Term Bond Fund (34.1%) | | | 39,625,102 | | | | 41,833,962 | |
| | | | | | | | |
TOTAL INVESTMENTS
(Cost: $113,572,753) 100.0% | | | | | | | 122,523,125 | |
| | | | | | | | |
OTHER NET ASSETS | | | | - | |
| | | | | | | | |
| |
NET ASSETS 100.0% | | | | $122,523,125 | |
| | | | | | | | |
The accompanying notes are an integral part of these portfolio schedules.
MUTUAL OF AMERICA INVESTMENT CORPORATION - MODERATE ALLOCATION FUND
PORTFOLIO OF INVESTMENTS IN SECURITIES
December 31, 2014
| | | | | | | | | | |
| | | Shares | | | | | Value | |
COMMON STOCKS: | | | | | | | | | | |
DIVERSIFIED MUTUAL FUNDS (100.0%) | | | | | | | | | | |
Mutual of America Investment Corporation | | | | | | | | | | |
Bond Fund (24.5%) | | | 53,096,550 | | | | | | 77,121,305 | |
Equity Index Fund (36.8%) | | | 34,074,787 | | | | | | 116,126,635 | |
International Fund (8.8%) | | | 35,970,009 | | | | | | 27,800,033 | |
Mid-Cap Equity Index Fund (15.4%) | | | 22,484,866 | | | | | | 48,614,754 | |
Mid-Term Bond Fund (14.5%) | | | 43,140,622 | | | | | | 45,545,453 | |
| | | | | | | | | | |
TOTAL INVESTMENTS (Cost: $257,461,053) 100.0% | | | | | | | | | 315,208,180 | |
| | | | | | | | | | |
OTHER NET ASSETS | | | | | | | | | - | |
| | | | | | | | | | |
| | | |
NET ASSETS 100.0% | | | | | | | | | $315,208,180 | |
| | | | | | | | | | |
The accompanying notes are an integral part of these portfolio schedules.
MUTUAL OF AMERICA INVESTMENT CORPORATION - AGGRESSIVE ALLOCATION FUND
PORTFOLIO OF INVESTMENTS IN SECURITIES
December 31, 2014
| | | | | | | | | | |
| | | Shares | | | | | Value | |
COMMON STOCKS: | | | | | | | | | | |
DIVERSIFIED MUTUAL FUNDS (100.0%) | | | | | | | | | | |
Mutual of America Investment Corporation | | | | | | | | | | |
Bond Fund (19.5%) | | | 34,133,160 | | | | | | 49,577,494 | |
Equity Index Fund (36.6%) | | | 27,412,087 | | | | | | 93,420,201 | |
International Fund (13.1%) | | | 43,289,687 | | | | | | 33,457,170 | |
Mid-Cap Equity Index Fund (20.5%) | | | 24,103,909 | | | | | | 52,115,303 | |
Small Cap Growth Fund (5.3%) | | | 8,746,066 | | | | | | 13,448,275 | |
Small Cap Value Fund (5.0%) | | | 7,951,362 | | | | | | 12,781,759 | |
| | | | | | | | | | |
| | | |
TOTAL INVESTMENTS (Cost: $191,686,539) 100.0% | | | | | | | | | 254,800,202 | |
| | | | | | | | | | |
OTHER NET ASSETS | | | | | | | | | - | |
| | | | | | | | | | |
| | | |
NET ASSETS 100.0% | | | | | | | | | $254,800,202 | |
| | | | | | | | | | |
The accompanying notes are an integral part of these portfolio schedules.
MUTUAL OF AMERICA INVESTMENT CORPORATION - MONEY MARKET FUND
PORTFOLIO OF INVESTMENTS IN SECURITIES
December 31, 2014
| | | | | | | | | | | | | | |
| | | Rating** | | Rate(%) | | | Maturity | | Face Amount | | | Value |
SHORT-TERM DEBT SECURITIES: | | | | | | | | | | | | | | |
U.S. GOVERNMENT (3.9%) | | | | | | | | | | | | | | |
U.S. Treasury Bill | | A-1+ | | | 0.12 | | | 06/25/15 | | | 3,000,000 | | | 2,999,067 |
| | | | | | | | | | | | | | |
| | | | | |
U.S. GOVERNMENT AGENCIES (45.0%) | | | | | | | | | | | | | | |
FHLB | | A-1+ | | | 0.10 | | | 01/28/15 | | | 2,500,000 | | | 2,499,812 |
FHLB | | A-1+ | | | 0.10 | | | 02/13/15 | | | 5,000,000 | | | 4,999,403 |
FHLB | | A-1+ | | | 0.10 | | | 02/18/15 | | | 900,000 | | | 899,880 |
FHLB | | A-1+ | | | 0.10 | | | 03/06/15 | | | 3,190,000 | | | 3,189,712 |
FHLB | | A-1+ | | | 0.10 | | | 03/06/15 | | | 1,260,000 | | | 1,259,853 |
FHLB | | A-1+ | | | 0.10 | | | 03/11/15 | | | 6,600,000 | | | 6,600,354 |
FHLB | | A-1+ | | | 0.10 | | | 03/13/15 | | | 700,000 | | | 700,032 |
FHLB | | A-1+ | | | 0.10 | | | 03/20/15 | | | 1,200,000 | | | 1,199,971 |
FHLMC | | A-1+ | | | 0.10 | | | 01/13/15 | | | 100,000 | | | 99,997 |
FHLMC | | A-1+ | | | 0.10 | | | 01/14/15 | | | 107,000 | | | 106,996 |
FHLMC | | A-1+ | | | 0.10 | | | 03/11/15 | | | 1,885,000 | | | 1,884,782 |
FHLMC | | A-1+ | | | 0.11 | | | 02/19/15 | | | 200,000 | | | 199,970 |
FHLMC | | A-1+ | | | 0.13 | | | 03/09/15 | | | 3,800,000 | | | 3,799,550 |
FNMA | | A-1+ | | | 0.09 | | | 03/04/15 | | | 1,550,000 | | | 1,549,915 |
FNMA | | A-1+ | | | 0.10 | | | 01/12/15 | | | 250,000 | | | 249,992 |
FNMA | | A-1+ | | | 0.10 | | | 03/02/15 | | | 2,300,000 | | | 2,299,894 |
FNMA | | A-1+ | | | 0.18 | | | 01/20/15 | | | 35,000 | | | 34,997 |
Tennessee Valley Authority | | A-1+ | | | 0.01 | | | 01/02/15 | | | 3,300,000 | | | 3,299,999 |
| | | | | | | | | | | | | | |
| | | | | | | | | | | | | | 34,875,109 |
| | | | | | | | | | | | | | |
COMMERCIAL PAPER (49.2%) | | | | | | | | | | | | | | |
Abbott Laboratories† | | A-1+ | | | 0.10 | | | 02/10/15 | | | 1,400,000 | | | 1,399,844 |
Abbott Laboratories† | | A-1+ | | | 0.11 | | | 02/19/15 | | | 1,700,000 | | | 1,699,745 |
Dover Corp.† | | A-1 | | | 0.11 | | | 01/06/15 | | | 2,750,000 | | | 2,749,958 |
Eli Lilly & Co.† | | A-1+ | | | 0.10 | | | 01/30/15 | | | 900,000 | | | 899,928 |
Emerson Electric Co.† | | A-1 | | | 0.12 | | | 02/25/15 | | | 3,200,000 | | | 3,199,413 |
Exxon Mobil Corp. | | A-1+ | | | 0.12 | | | 02/18/15 | | | 600,000 | | | 599,904 |
Intercontinental Exchange, Inc.† | | A-1 | | | 0.17 | | | 01/06/15 | | | 1,850,000 | | | 1,849,956 |
Intercontinental Exchange, Inc.† | | A-1 | | | 0.18 | | | 01/30/15 | | | 1,300,000 | | | 1,299,811 |
J.P. Morgan Securities LLC | | A-1 | | | 0.20 | | | 02/02/15 | | | 1,900,000 | | | 1,899,662 |
J.P. Morgan Securities LLC† | | A-1 | | | 0.21 | | | 03/09/15 | | | 800,000 | | | 799,775 |
J.P. Morgan Securities LLC† | | A-1 | | | 0.22 | | | 02/04/15 | | | 500,000 | | | 499,896 |
Microsoft Corp.† | | A-1+ | | | 0.10 | | | 02/04/15 | | | 3,100,000 | | | 3,099,707 |
National Rural Utilities | | A-1 | | | 0.13 | | | 01/20/15 | | | 2,000,000 | | | 1,999,863 |
National Rural Utilities | | A-1 | | | 0.13 | | | 02/05/15 | | | 1,600,000 | | | 1,599,798 |
New Jersey Natural Gas | | A-1 | | | 0.12 | | | 01/09/15 | | | 675,000 | | | 674,982 |
New Jersey Natural Gas | | A-1 | | | 0.15 | | | 01/15/15 | | | 1,500,000 | | | 1,499,912 |
Piedmont Natural Gas Co.† | | A-1 | | | 0.17 | | | 01/05/15 | | | 1,850,000 | | | 1,849,965 |
Piedmont Natural Gas Co.† | | A-1 | | | 0.18 | | | 01/06/15 | | | 1,250,000 | | | 1,249,969 |
Questar Corp.† | | A-1 | | | 0.19 | | | 01/14/15 | | | 3,200,000 | | | 3,199,780 |
San Diego Gas & Electric Co.† | | A-1 | | | 0.21 | | | 01/09/15 | | | 2,300,000 | | | 2,299,893 |
Simon Property Group LP† | | A-1 | | | 0.18 | | | 02/11/15 | | | 3,100,000 | | | 3,099,364 |
Wells Fargo & Co. | | A-1 | | | 0.13 | | | 02/09/15 | | | 650,000 | | | 649,908 |
| | | | | | | | | | | | | | |
| | | | | | | | | | | | | | 38,121,033 |
| | | | | | | | | | | | | | |
TOTAL SHORT-TERM DEBT SECURITIES
(Cost: $75,990,837) 98.1% | | | | | | 75,995,209 |
| | | | | | | | | | | | | | |
| | | | | |
TEMPORARY CASH INVESTMENTS (2)
(Cost: $1,484,000) 1.9% | | | | | | | | | | | | | | 1,484,000 |
| | | | | | | | | | | | | | |
| | | | | |
TOTAL INVESTMENTS
(Cost: $77,474,837) 100.0% | | | | | | | | | | | | | | 77,479,209 |
| | | | | | | | | | | | | | |
| | | | | |
OTHER NET ASSETS -0.0% (3) | | | | | | | | | | | | | | (443) |
| | | | | | | | | | | | | | |
| | | | | |
NET ASSETS 100.0% | | | | | | | | | | | | | | $77,478,766 |
| | | | | | | | | | | | | | |
The accompanying notes are an integral part of these portfolio schedules.
MUTUAL OF AMERICA INVESTMENT CORPORATION - MID-TERM BOND FUND
PORTFOLIO OF INVESTMENTS IN SECURITIES
December 31, 2014
| | | | | | | | | | | | | | |
| | | Rating** | | Rate(%) | | | Maturity | | Face Amount | | | Value |
LONG-TERM DEBT SECURITIES: | | | | | | | | | | | | | | |
U.S. GOVERNMENT (28.8%) | | | | | | | | | | | | | | |
U.S. Treasury Note | | AA+ | | | 0.50 | | | 09/30/16 | | | 5,000,000 | | | 4,994,140 |
U.S. Treasury Note | | AA+ | | | 0.63 | | | 12/31/16 | | | 5,000,000 | | | 4,993,360 |
U.S. Treasury Note | | AA+ | | | 0.63 | | | 11/30/17 | | | 3,000,000 | | | 2,961,564 |
U.S. Treasury Note | | AA+ | | | 1.00 | | | 08/31/19 | | | 2,500,000 | | | 2,431,835 |
U.S. Treasury Note | | AA+ | | | 1.25 | | | 11/30/18 | | | 8,500,000 | | | 8,440,237 |
U.S. Treasury Note | | AA+ | | | 1.38 | | | 12/31/18 | | | 11,000,000 | | | 10,957,034 |
U.S. Treasury Note | | AA+ | | | 1.50 | | | 10/31/19 | | | 4,500,000 | | | 4,472,577 |
U.S. Treasury Note | | AA+ | | | 1.75 | | | 09/30/19 | | | 5,000,000 | | | 5,029,295 |
U.S. Treasury Note | | AA+ | | | 2.00 | | | 11/30/20 | | | 9,000,000 | | | 9,078,750 |
U.S. Treasury Strip | | AA+ | | | 0.00 | | | 08/15/17 | | | 15,000,000 | | | 14,615,984 |
U.S. Treasury Strip | | AA+ | | | 0.00 | | | 11/15/17 | | | 5,000,000 | | | 4,842,825 |
U.S. Treasury Strip | | AA+ | | | 0.00 | | | 08/15/18 | | | 55,000,000 | | | 52,381,885 |
| | | | | | | | | | | | | | |
| | | | | | | | | | | | | | 125,199,486 |
| | | | | | | | | | | | | | |
U.S. GOVERNMENT AGENCIES (7.6%) | | | | | | | | | | | | | | |
MORTGAGE-BACKED OBLIGATIONS (0.0%) (3) | | | | | | | | | | | | |
FHLMC | | AA+ | | | 7.50 | | | 03/15/21 | | | 4,915 | | | 5,450 |
FHLMC | | AA+ | | | 8.00 | | | 09/01/18 | | | 422 | | | 425 |
FHLMC | | AA+ | | | 8.50 | | | 09/01/17 | | | 4 | | | 4 |
| | | | | | | | | | | | | | |
| | | | | | | | | | | | | | 5,879 |
| | | | | | | | | | | | | | |
NON-MORTGAGE-BACKED OBLIGATIONS (7.6%) | | | | | | | | | |
FHLMC | | AA+ | | | 0.00 | | | 11/29/19 | | | 13,500,000 | | | 12,028,028 |
FNMA | | AA+ | | | 0.00 | | | 10/09/19 | | | 22,500,000 | | | 20,229,047 |
Tennessee Valley Auth. Strip | | AA+ | | | 0.00 | | | 11/01/20 | | | 900,000 | | | 789,931 |
| | | | | | | | | | | | | | |
| | | | | | | | | | | | | | 33,047,006 |
| | | | | | | | | | | | | | |
CORPORATE DEBT (62.3%) | | | | | | | | | | | | | | |
CONSUMER DISCRETIONARY (8.1%) | | | | | | | | | | | | | | |
Advance Auto Parts, Inc. | | BBB- | | | 4.50 | | | 01/15/22 | | | 500,000 | | | 530,752 |
Advance Auto Parts, Inc. | | BBB- | | | 5.75 | | | 05/01/20 | | | 1,500,000 | | | 1,680,507 |
AutoZone, Inc. | | BBB | | | 3.70 | | | 04/15/22 | | | 300,000 | | | 308,533 |
AutoZone, Inc. | | BBB | | | 4.00 | | | 11/15/20 | | | 700,000 | | | 742,718 |
Brinker International, Inc. | | BBB- | | | 2.60 | | | 05/15/18 | | | 2,000,000 | | | 1,996,174 |
Carnival Corp. | | BBB+ | | | 1.88 | | | 12/15/17 | | | 2,000,000 | | | 1,985,040 |
Dollar General Corp. | | BBB- | | | 3.25 | | | 04/15/23 | | | 1,047,000 | | | 953,027 |
Dollar General Corp. | | BBB- | | | 4.13 | | | 07/15/17 | | | 962,000 | | | 992,126 |
Ethan Allen Global, Inc. | | BB- | | | 5.38 | | | 10/01/15 | | | 500,000 | | | 506,250 |
Expedia, Inc. | | BBB- | | | 5.95 | | | 08/15/20 | | | 2,000,000 | | | 2,234,948 |
Family Dollar Stores, Inc. | | BBB- | | | 5.00 | | | 02/01/21 | | | 2,000,000 | | | 2,109,660 |
Home Depot, Inc. | | A | | | 5.40 | | | 03/01/16 | | | 250,000 | | | 263,829 |
Hyatt Hotels Corp. | | BBB | | | 3.88 | | | 08/15/16 | | | 1,525,000 | | | 1,582,113 |
Hyatt Hotels Corp. | | BBB | | | 5.38 | | | 08/15/21 | | | 50,000 | | | 56,852 |
Kohl’s Corp. | | BBB | | | 3.25 | | | 02/01/23 | | | 700,000 | | | 681,580 |
Kohl’s Corp. | | BBB | | | 4.00 | | | 11/01/21 | | | 1,325,000 | | | 1,375,891 |
Marriott International, Inc. | | BBB | | | 3.00 | | | 03/01/19 | | | 1,200,000 | | | 1,231,834 |
Marriott International, Inc. | | BBB | | | 3.38 | | | 10/15/20 | | | 800,000 | | | 819,024 |
Mattel, Inc. | | BBB+ | | | 1.70 | | | 03/15/18 | | | 2,000,000 | | | 1,974,886 |
Newell Rubbermaid, Inc. | | BBB- | | | 4.70 | | | 08/15/20 | | | 525,000 | | | 564,712 |
O’Reilly Automotive, Inc. | | BBB | | | 4.63 | | | 09/15/21 | | | 281,000 | | | 306,386 |
Omnicom Group, Inc. | | BBB+ | | | 3.63 | | | 05/01/22 | | | 2,000,000 | | | 2,053,188 |
Staples, Inc. | | BBB- | | | 2.75 | | | 01/12/18 | | | 2,000,000 | | | 1,997,912 |
Tupperware Brands Corp. | | BBB- | | | 4.75 | | | 06/01/21 | | | 2,000,000 | | | 2,140,890 |
Whirlpool Corp. | | BBB | | | 2.40 | | | 03/01/19 | | | 1,445,000 | | | 1,436,135 |
Whirlpool Corp. | | BBB | | | 6.50 | | | 06/15/16 | | | 500,000 | | | 538,628 |
Wyndham Worldwide Corp. | | BBB- | | | 2.95 | | | 03/01/17 | | | 2,160,000 | | | 2,205,865 |
Wynn Las Vegas LLC | | BBB- | | | 5.38 | | | 03/15/22 | | | 2,000,000 | | | 2,030,000 |
| | | | | | | | | | | | | | |
| | | | | | | | | | | | | | 35,299,460 |
| | | | | | | | | | | | | | |
CONSUMER STAPLES (4.5%) | | | | | | | | | | | | | | |
Avon Products, Inc. | | BB+ | | | 4.60 | | | 03/15/20 | | | 1,800,000 | | | 1,633,500 |
MUTUAL OF AMERICA INVESTMENT CORPORATION - MID-TERM BOND FUND
PORTFOLIO OF INVESTMENTS IN SECURITIES
December 31, 2014
| | | | | | | | | | |
Beam, Inc. | | BBB | | 1.75 | | 06/15/18 | | 2,000,000 | | 1,979,034 |
Clorox Co. | | BBB+ | | 5.00 | | 01/15/15 | | 300,000 | | 300,359 |
ConAgra Foods, Inc. | | BBB- | | 1.90 | | 01/25/18 | | 2,000,000 | | 1,986,676 |
CVS Health Corp. | | BBB+ | | 6.13 | | 08/15/16 | | 500,000 | | 539,429 |
Dr. Pepper Snapple Group, Inc. | | BBB+ | | 2.60 | | 01/15/19 | | 150,000 | | 151,224 |
Energizer Hldgs., Inc. | | BBB- | | 4.70 | | 05/19/21 | | 2,000,000 | | 2,075,230 |
Flowers Foods, Inc. | | BBB- | | 4.38 | | 04/01/22 | | 1,500,000 | | 1,580,340 |
General Mills, Inc. | | BBB+ | | 2.20 | | 10/21/19 | | 775,000 | | 768,489 |
Hershey Co. | | A | | 4.85 | | 08/15/15 | | 500,000 | | 513,650 |
Ingredion, Inc. | | BBB | | 4.63 | | 11/01/20 | | 275,000 | | 296,244 |
Kroger Co. | | BBB | | 2.95 | | 11/01/21 | | 1,500,000 | | 1,487,696 |
Kroger Co. | | BBB | | 4.95 | | 01/15/15 | | 500,000 | | 500,588 |
Mead Johnson Nutrition Co. | | BBB | | 4.90 | | 11/01/19 | | 3,075,000 | | 3,379,410 |
Molson Coors Brewing Co. | | BBB+ | | 3.50 | | 05/01/22 | | 400,000 | | 404,012 |
Safeway, Inc. | | BBB | | 3.95 | | 08/15/20 | | 2,000,000 | | 2,021,910 |
| | | | | | | | | | |
| | | | | | | | | | 19,617,791 |
| | | | | | | | | | |
ENERGY (4.1%) | | | | | | | | | | |
Diamond Offshore Drilling, Inc. | | A- | | 4.88 | | 07/01/15 | | 500,000 | | 510,009 |
Energen Corp. | | BB | | 4.63 | | 09/01/21 | | 2,000,000 | | 1,772,420 |
EQT Corp. | | BBB | | 4.88 | | 11/15/21 | | 1,250,000 | | 1,350,384 |
FMC Technologies, Inc. | | BBB | | 2.00 | | 10/01/17 | | 2,000,000 | | 1,985,678 |
Kinder Morgan, Inc. | | BBB- | | 5.15 | | 03/01/15 | | 250,000 | | 251,290 |
Marathon Petroleum Corp. | | BBB | | 3.50 | | 03/01/16 | | 1,500,000 | | 1,537,116 |
Murphy Oil Corp. | | BBB | | 2.50 | | 12/01/17 | | 2,000,000 | | 1,988,000 |
National Oilwell Varco, Inc. | | A | | 6.13 | | 08/15/15 | | 1,000,000 | | 1,000,476 |
Pioneer Natural Resources Co. | | BBB- | | 6.65 | | 03/15/17 | | 2,000,000 | | 2,191,096 |
Rowan Companies PLC | | BBB- | | 4.88 | | 06/01/22 | | 2,000,000 | | 1,946,162 |
SESI LLC | | BBB- | | 7.13 | | 12/15/21 | | 2,150,000 | | 2,064,000 |
Sunoco, Inc. | | BBB- | | 5.75 | | 01/15/17 | | 290,000 | | 313,531 |
Sunoco, Inc. | | BBB- | | 9.63 | | 04/15/15 | | 500,000 | | 511,379 |
Weatherford Int’l. Ltd. | | BBB- | | 5.50 | | 02/15/16 | | 500,000 | | 515,798 |
| | | | | | | | | | |
| | | | | | | | | | 17,937,339 |
| | | | | | | | | | |
FINANCIALS (18.0%) | | | | | | | | | | |
Aflac, Inc. | | A | | 2.65 | | 02/15/17 | | 1,500,000 | | 1,543,365 |
Aflac, Inc. | | A | | 3.63 | | 06/15/23 | | 500,000 | | 512,109 |
Alleghany Corp. | | BBB | | 4.95 | | 06/27/22 | | 2,000,000 | | 2,199,786 |
American Express Credit Corp. | | A- | | 2.25 | | 08/15/19 | | 2,000,000 | | 2,000,320 |
American Tower Corp. | | BBB- | | 4.50 | | 01/15/18 | | 2,000,000 | | 2,123,974 |
Bank of America Corp. | | A- | | 2.65 | | 04/01/19 | | 1,250,000 | | 1,259,169 |
Bank of America Corp. | | A- | | 3.70 | | 09/01/15 | | 250,000 | | 254,363 |
Bank of America Corp. | | BBB+ | | 5.75 | | 08/15/16 | | 500,000 | | 532,295 |
Barrick N.A. Finance LLC | | BBB | | 4.40 | | 05/30/21 | | 2,000,000 | | 2,019,504 |
Berkley (W.R.) Corp. | | BBB+ | | 4.63 | | 03/15/22 | | 2,000,000 | | 2,144,652 |
Block Financial LLC | | BBB | | 5.50 | | 11/01/22 | | 1,265,000 | | 1,389,867 |
Boston Properties LP | | A- | | 3.70 | | 11/15/18 | | 1,970,000 | | 2,077,229 |
Bunge Ltd. Finance Corp. | | BBB- | | 5.10 | | 07/15/15 | | 1,000,000 | | 1,021,716 |
Capital One Financial Corp. | | BBB | | 4.75 | | 07/15/21 | | 2,000,000 | | 2,204,276 |
Citigroup, Inc. | | A- | | 2.55 | | 04/08/19 | | 1,850,000 | | 1,862,167 |
CNA Financial Corp. | | BBB | | 6.50 | | 08/15/16 | | 1,000,000 | | 1,081,635 |
Erac USA Finance Co.† | | BBB+ | | 2.75 | | 03/15/17 | | 1,000,000 | | 1,026,653 |
Erac USA Finance LLC† | | BBB+ | | 2.35 | | 10/15/19 | | 1,000,000 | | 992,547 |
ERP Operating LP | | BBB+ | | 5.38 | | 08/01/16 | | 500,000 | | 532,866 |
Fairfax Financial Hldgs. | | BBB- | | 8.25 | | 10/01/15 | | 742,000 | | 777,163 |
Fairfax Financial Hldgs.† | | BBB- | | 5.80 | | 05/15/21 | | 1,274,000 | | 1,366,523 |
First Republic Bank | | A- | | 2.38 | | 06/17/19 | | 2,000,000 | | 2,009,422 |
Ford Motor Credit Co. LLC | | BBB- | | 3.00 | | 06/12/17 | | 2,000,000 | | 2,052,014 |
General Electric Capital Corp. | | AA+ | | 5.00 | | 01/08/16 | | 500,000 | | 520,939 |
Goldman Sachs Group, Inc. | | A- | | 3.70 | | 08/01/15 | | 900,000 | | 914,525 |
Government Pptys. Income Trust | | BBB- | | 3.75 | | 08/15/19 | | 2,000,000 | | 2,030,296 |
Harley-Davidson Financial Svcs.† | | A- | | 3.88 | | 03/15/16 | | 500,000 | | 516,026 |
HCP, Inc. | | BBB+ | | 6.00 | | 01/30/17 | | 1,250,000 | | 1,363,915 |
MUTUAL OF AMERICA INVESTMENT CORPORATION - MID-TERM BOND FUND
PORTFOLIO OF INVESTMENTS IN SECURITIES
December 31, 2014
| | | | | | | | | | |
Health Care REIT, Inc. | | BBB | | 3.63 | | 03/15/16 | | 2,000,000 | | 2,058,434 |
Healthcare Realty Trust | | BBB- | | 5.75 | | 01/15/21 | | 2,000,000 | | 2,236,322 |
Hospitality Properties Trust | | BBB- | | 5.00 | | 08/15/22 | | 1,300,000 | | 1,369,914 |
Hospitality Properties Trust | | BBB- | | 5.63 | | 03/15/17 | | 566,000 | | 606,219 |
Huntington National Bank | | BBB+ | | 1.35 | | 08/02/16 | | 1,995,000 | | 1,996,061 |
Jones Lang LaSalle, Inc. | | BBB | | 4.40 | | 11/15/22 | | 1,410,000 | | 1,463,322 |
JPMorgan Chase & Co. | | A | | 2.00 | | 08/15/17 | | 2,000,000 | | 2,019,020 |
Kemper Corp. | | BBB- | | 6.00 | | 11/30/15 | | 1,500,000 | | 1,563,666 |
Kemper Corp. | | BBB- | | 6.00 | | 05/15/17 | | 500,000 | | 540,166 |
Mack-Cali Realty LP | | BBB- | | 5.80 | | 01/15/16 | | 1,000,000 | | 1,042,806 |
Moody’s Corp. | | BBB+ | | 5.50 | | 09/01/20 | | 2,000,000 | | 2,270,908 |
Morgan Stanley | | A- | | 4.00 | | 07/24/15 | | 1,000,000 | | 1,018,823 |
Morgan Stanley | | A- | | 4.75 | | 03/22/17 | | 1,000,000 | | 1,065,193 |
Nasdaq OMX Group, Inc. | | BBB- | | 5.55 | | 01/15/20 | | 2,150,000 | | 2,389,117 |
Nissan Motor Acceptance Corp.† | | A- | | 4.50 | | 01/30/15 | | 790,000 | | 792,304 |
Odyssey Re Hldgs. Corp. | | BBB- | | 6.88 | | 05/01/15 | | 250,000 | | 253,731 |
Penske Truck Leasing Co. LP† | | BBB- | | 3.38 | | 03/15/18 | | 1,300,000 | | 1,342,119 |
Penske Truck Leasing Co. LP† | | BBB- | | 3.75 | | 05/11/17 | | 490,000 | | 512,103 |
Prudential Financial, Inc. | | A | | 4.75 | | 09/17/15 | | 1,000,000 | | 1,026,120 |
Raymond James Financial, Inc. | | BBB | | 4.25 | | 04/15/16 | | 1,600,000 | | 1,658,890 |
Reckson Operating Partnership | | BBB- | | 6.00 | | 03/31/16 | | 1,700,000 | | 1,792,024 |
Reinsurance Grp. of America, Inc. | | A- | | 5.63 | | 03/15/17 | | 1,500,000 | | 1,622,088 |
Senior Housing Pptys. Trust | | BBB- | | 4.30 | | 01/15/16 | | 1,650,000 | | 1,684,442 |
Simon Property Group LP | | A | | 2.80 | | 01/30/17 | | 1,500,000 | | 1,544,628 |
Ventas Realty LP/Capital Corp. | | BBB+ | | 4.00 | | 04/30/19 | | 1,700,000 | | 1,799,081 |
Vornado Realty LP | | BBB | | 2.50 | | 06/30/19 | | 500,000 | | 495,669 |
Vornado Realty LP | | BBB | | 4.25 | | 04/01/15 | | 1,500,000 | | 1,500,000 |
Wells Fargo & Co. | | A+ | | 2.13 | | 04/22/19 | | 2,000,000 | | 1,999,476 |
Zions Bancorporation | | BBB- | | 4.50 | | 03/27/17 | | 400,000 | | 420,207 |
| | | | | | | | | | |
| | | | | | | | | | 78,412,169 |
| | | | | | | | | | |
HEALTH CARE (7.3%) | | | | | | | | | | |
AbbVie, Inc. | | A | | 1.75 | | 11/06/17 | | 2,000,000 | | 2,004,346 |
Agilent Technologies, Inc. | | BBB+ | | 5.00 | | 07/15/20 | | 2,000,000 | | 2,175,648 |
Allergan, Inc. | | A+ | | 5.75 | | 04/01/16 | | 500,000 | | 528,986 |
Baxter International, Inc. | | A- | | 4.63 | | 03/15/15 | | 250,000 | | 252,043 |
Bio-Rad Laboratories, Inc. | | BBB | | 4.88 | | 12/15/20 | | 2,000,000 | | 2,147,854 |
Biogen Idec, Inc. | | A- | | 6.88 | | 03/01/18 | | 1,250,000 | | 1,440,544 |
CareFusion Corp. | | BBB | | 1.45 | | 05/15/17 | | 2,000,000 | | 1,985,846 |
CIGNA Corp. | | A | | 2.75 | | 11/15/16 | | 1,750,000 | | 1,797,021 |
Edwards Lifesciences Corp. | | BBB- | | 2.88 | | 10/15/18 | | 2,000,000 | | 2,027,472 |
Express Scripts Hldg. Co. | | BBB+ | | 2.25 | | 06/15/19 | | 2,000,000 | | 1,978,584 |
Hospira, Inc. | | BBB- | | 6.05 | | 03/30/17 | | 2,000,000 | | 2,156,330 |
Laboratory Corp. of America | | BBB+ | | 3.13 | | 05/15/16 | | 500,000 | | 513,130 |
Laboratory Corp. of America | | BBB+ | | 3.75 | | 08/23/22 | | 600,000 | | 613,849 |
Laboratory Corp. of America | | BBB+ | | 4.63 | | 11/15/20 | | 400,000 | | 431,186 |
Laboratory Corp. of America | | BBB+ | | 5.63 | | 12/15/15 | | 500,000 | | 520,134 |
Lilly (Eli) & Co. | | AA- | | 5.20 | | 03/15/17 | | 500,000 | | 543,684 |
Mylan, Inc. | | BBB- | | 1.35 | | 11/29/16 | | 2,000,000 | | 1,990,156 |
Owens & Minor, Inc. | | BBB | | 3.88 | | 09/15/21 | | 2,000,000 | | 2,022,622 |
PerkinElmer, Inc. | | BBB | | 5.00 | | 11/15/21 | | 2,000,000 | | 2,175,838 |
Quest Diagnostics, Inc. | | BBB+ | | 4.75 | | 01/30/20 | | 2,000,000 | | 2,157,038 |
Thermo Fisher Scientific, Inc. | | BBB | | 3.60 | | 08/15/21 | | 400,000 | | 413,068 |
Thermo Fisher Scientific, Inc. | | BBB | | 4.50 | | 03/01/21 | | 1,600,000 | | 1,728,374 |
| | | | | | | | | | |
| | | | | | | | | | 31,603,753 |
| | | | | | | | | | |
INDUSTRIALS (5.7%) | | | | | | | | | | |
Crane Co. | | BBB | | 2.75 | | 12/15/18 | | 2,000,000 | | 2,021,574 |
CSX Corp. | | BBB+ | | 6.25 | | 04/01/15 | | 333,000 | | 337,488 |
Dun & Bradstreet Corp. | | BBB- | | 3.25 | | 12/01/17 | | 2,000,000 | | 2,056,386 |
Equifax, Inc. | | BBB+ | | 3.30 | | 12/15/22 | | 2,000,000 | | 1,977,388 |
Flowserve Corp. | | BBB- | | 3.50 | | 09/15/22 | | 2,000,000 | | 2,000,752 |
GATX Corp. | | BBB | | 6.00 | | 02/15/18 | | 2,050,000 | | 2,279,586 |
MUTUAL OF AMERICA INVESTMENT CORPORATION - MID-TERM BOND FUND
PORTFOLIO OF INVESTMENTS IN SECURITIES
December 31, 2014
| | | | | | | | | | |
Harsco Corp. | | BB+ | | 5.75 | | 05/15/18 | | 2,250,000 | | 2,368,125 |
Kennametal, Inc. | | BBB | | | | 11/01/19 | | 2,000,000 | | 1,978,838 |
L-3 Communications Corp. | | BBB- | | 5.20 | | 10/15/19 | | 2,000,000 | | 2,196,632 |
Masco Corp. | | BBB | | 4.80 | | 06/15/15 | | 500,000 | | 507,704 |
Pitney Bowes, Inc. | | BBB | | 5.25 | | 01/15/37 | | 1,500,000 | | 1,606,913 |
Ryder System, Inc. | | BBB | | 7.20 | | 09/01/15 | | 1,000,000 | | 1,042,100 |
Southwest Airlines Co. | | BBB | | 5.75 | | 12/15/16 | | 735,000 | | 794,134 |
Textron, Inc. | | BBB- | | 4.63 | | 09/21/16 | | 750,000 | | 793,511 |
Union Pacific Corp. | | A | | 4.88 | | 01/15/15 | | 500,000 | | 500,589 |
Valmont Industries, Inc. | | BBB+ | | 6.63 | | 04/20/20 | | 2,000,000 | | 2,347,260 |
| | | | | | | | | | |
| | | | | | | | | | 24,808,980 |
| | | | | | | | | | |
INFORMATION TECHNOLOGY (6.8%) | | | | | | | | | | |
Adobe Systems, Inc. | | A- | | 4.75 | | 02/01/20 | | 2,000,000 | | 2,195,470 |
Amphenol Corp. | | BBB+ | | 2.55 | | 01/30/19 | | 2,000,000 | | 2,013,906 |
Arrow Electronics, Inc. | | BBB- | | 3.00 | | 03/01/18 | | 1,250,000 | | 1,281,796 |
Arrow Electronics, Inc. | | BBB- | | 4.50 | | 03/01/23 | | 50,000 | | 51,683 |
Arrow Electronics, Inc. | | BBB- | | 6.88 | | 06/01/18 | | 700,000 | | 792,908 |
Avnet, Inc. | | BBB- | | 5.88 | | 06/15/20 | | 950,000 | | 1,061,382 |
Avnet, Inc. | | BBB- | | 6.00 | | 09/01/15 | | 980,000 | | 1,010,709 |
Fidelity Nat’l. Information | | BBB | | 1.45 | | 06/05/17 | | 2,000,000 | | 1,988,798 |
Fiserv, Inc. | | BBB | | 4.75 | | 06/15/21 | | 1,900,000 | | 2,091,796 |
FLIR Systems, Inc. | | BBB | | 3.75 | | 09/01/16 | | 2,000,000 | | 2,073,080 |
Ingram Micro, Inc. | | BBB- | | 5.25 | | 09/01/17 | | 1,500,000 | | 1,622,900 |
Jabil Circuit, Inc. | | BBB- | | 4.70 | | 09/15/22 | | 726,000 | | 722,370 |
Lender Processing Svcs., Inc. | | BBB | | 5.75 | | 04/15/23 | | 2,000,000 | | 2,100,000 |
Lexmark International, Inc. | | BBB- | | 6.65 | | 06/01/18 | | 2,000,000 | | 2,221,828 |
Motorola Solutions, Inc. | | BBB | | 3.75 | | 05/15/22 | | 2,000,000 | | 2,029,028 |
Symantec Corp. | | BBB | | 4.20 | | 09/15/20 | | 2,000,000 | | 2,070,962 |
Tech Data Corp. | | BBB- | | 3.75 | | 09/21/17 | | 2,000,000 | | 2,066,034 |
Western Union Co. | | BBB | | 5.93 | | 10/01/16 | | 2,000,000 | | 2,147,372 |
| | | | | | | | | | |
| | | | | | | | | | 29,542,022 |
| | | | | | | | | | |
MATERIALS (4.6%) | | | | | | | | | | |
Airgas, Inc. | | BBB | | 3.25 | | 10/01/15 | | 1,500,000 | | 1,523,901 |
Albemarle Corp. | | BBB- | | 4.50 | | 12/15/20 | | 1,065,000 | | 1,146,727 |
Alcoa, Inc. | | BBB- | | 6.75 | | 07/15/18 | | 2,000,000 | | 2,246,680 |
Eastman Chemical Co. | | BBB | | 2.40 | | 06/01/17 | | 2,000,000 | | 2,031,222 |
Freeport-McMoRan Copper & Gold | | BBB | | 3.10 | | 03/15/20 | | 1,750,000 | | 1,702,283 |
Freeport-McMoRan Copper & Gold | | BBB | | 3.55 | | 03/01/22 | | 250,000 | | 236,278 |
Goldcorp, Inc. | | BBB+ | | 2.13 | | 03/15/18 | | 2,000,000 | | 1,976,728 |
Kinross Gold Corp. | | BBB- | | 3.63 | | 09/01/16 | | 2,000,000 | | 2,012,450 |
Kinross Gold Corp. | | BBB- | | 5.13 | | 09/01/21 | | 750,000 | | 716,993 |
Methanex Corp. | | BBB- | | 3.25 | | 12/15/19 | | 2,000,000 | | 1,983,176 |
Newmont Mining Corp. | | BBB | | 3.50 | | 03/15/22 | | 2,000,000 | | 1,879,494 |
Rock-Tenn Co. | | BBB | | 3.50 | | 03/01/20 | | 622,000 | | 631,196 |
Southern Copper Corp. | | BBB | | 3.50 | | 11/08/22 | | 2,000,000 | | 1,896,730 |
| | | | | | | | | | |
| | | | | | | | | | 19,983,858 |
| | | | | | | | | | |
TELECOMMUNICATION SERVICES (1.2%) | | | | | | | | | | |
AT&T, Inc. | | A- | | 3.00 | | 02/15/22 | | 2,000,000 | | 1,962,360 |
CenturyLink, Inc. | | BB | | 5.00 | | 02/15/15 | | 1,250,000 | | 1,254,688 |
Verizon Communications, Inc. | | BBB+ | | 4.50 | | 09/15/20 | | 2,000,000 | | 2,171,514 |
| | | | | | | | | | |
| | | | | | | | | | 5,388,562 |
| | | | | | | | | | |
UTILITIES (2.0%) | | | | | | | | | | |
AGL Capital Corp. | | BBB+ | | 6.38 | | 07/15/16 | | 500,000 | | 537,882 |
Constellation Energy | | BBB- | | 5.15 | | 12/01/20 | | 1,500,000 | | 1,660,802 |
Entergy Corp. | | BBB- | | 4.70 | | 01/15/17 | | 600,000 | | 631,856 |
Entergy Corp. | | BBB- | | 5.13 | | 09/15/20 | | 1,400,000 | | 1,525,052 |
Exelon Generation Co. LLC | | BBB | | 4.25 | | 06/15/22 | | 1,000,000 | | 1,039,180 |
PPL Energy Supply LLC | | BB | | 4.60 | | 12/15/21 | | 1,400,000 | | 1,270,381 |
PPL Energy Supply LLC | | BB | | 5.70 | | 10/15/15 | | 600,000 | | 613,066 |
SCANA Corp. | | BBB | | 4.75 | | 05/15/21 | | 1,165,000 | | 1,255,666 |
| | | | | | | | | | |
| | | | | | | | | | 8,533,885 |
| | | | | | | | | | |
TOTAL LONG-TERM DEBT SECURITIES
(Cost: $421,750,278) 98.7% | | | | | | | | | | 429,380,190 |
| | | | | | | | | | |
MUTUAL OF AMERICA INVESTMENT CORPORATION - MID-TERM BOND FUND
PORTFOLIO OF INVESTMENTS IN SECURITIES
December 31, 2014
| | | | | | | | | | |
| | | Rating** | | Rate(%) | | Maturity | | Face Amount | | Value |
SHORT-TERM DEBT SECURITIES: | | | | | | | | | | |
COMMERCIAL PAPER (0.7%) | | | | | | | | | | |
Exxon Mobil Corp. | | A-1+ | | 0.13 | | 02/04/15 | | 1,500,000 | | 1,499,816 |
National Rural Utilities | | A-1 | | 0.13 | | 01/20/15 | | 260,000 | | 259,982 |
Toyota Motor Credit Corp. | | A-1+ | | 0.13 | | 02/04/15 | | 750,000 | | 749,908 |
Toyota Motor Credit Corp. | | A-1+ | | 0.15 | | 03/11/15 | | 500,000 | | 499,856 |
| | | | | | | | | | |
| | | | | | | | | | 3,009,562 |
| | | | | | | | | | |
| | | | | |
TOTAL SHORT-TERM DEBT SECURITIES
(Cost: $3,009,562) 0.7% | | | | | | | | | | 3,009,562 |
| | | | | | | | | | |
| | | | | |
TEMPORARY CASH INVESTMENTS (2)
(Cost: $11,100) 0.0% (3) | | | | | | | | | | 11,100 |
| | | | | | | | | | |
| | | | | |
TOTAL INVESTMENTS
(Cost: $424,770,940) 99.4% | | | | | | | | | | 432,400,852 |
| | | | | | | | | | |
| | | | | |
OTHER NET ASSETS 0.6% | | | | | | | | | | 2,832,646 |
| | | | | | | | | | |
| | | | | |
NET ASSETS 100.0% | | | | | | | | | | $435,233,498 |
| | | | | | | | | | |
The accompanying notes are an integral part of these portfolio schedules.
MUTUAL OF AMERICA INVESTMENT CORPORATION - BOND FUND
PORTFOLIO OF INVESTMENTS IN SECURITIES
December 31, 2014
| | | | | | | | | | |
| | | Rating** | | Rate(%) | | Maturity | | Face Amount | | Value |
LONG-TERM DEBT SECURITIES: | | | | | | | | | | |
U.S. GOVERNMENT (12.3%) | | | | | | | | | | |
U.S. Treasury Note | | AA+ | | 0.63 | | 12/31/16 | | 9,500,000 | | 9,487,384 |
U.S. Treasury Note | | AA+ | | 1.38 | | 12/31/18 | | 7,000,000 | | 6,972,658 |
U.S. Treasury Note | | AA+ | | 1.50 | | 10/31/19 | | 8,500,000 | | 8,448,201 |
U.S. Treasury Note | | AA+ | | 2.25 | | 03/31/21 | | 1,500,000 | | 1,531,407 |
U.S. Treasury Strip | | AA+ | | 0.00 | | 08/15/16 | | 20,000,000 | | 14,988,360 |
U.S. Treasury Strip | | AA+ | | 0.00 | | 11/15/16 | | 13,500,000 | | 11,209,442 |
U.S. Treasury Strip | | AA+ | | 0.00 | | 08/15/24 | | 10,000,000 | | 7,993,680 |
U.S. Treasury Strip | | AA+ | | 0.00 | | 08/15/25 | | 20,000,000 | | 15,503,537 |
U.S. Treasury Strip | | AA+ | | 0.00 | | 08/15/27 | | 20,000,000 | | 14,521,880 |
U.S. Treasury Strip | | AA+ | | 0.00 | | 08/15/28 | | 20,000,000 | | 14,079,400 |
U.S. Treasury Strip | | AA+ | | 0.00 | | 08/15/29 | | 20,000,000 | | 13,656,960 |
| | | | | | | | | | |
| | | | | | | | | | 118,392,909 |
| | | | | | | | | | |
U.S. GOVERNMENT AGENCIES (31.6%) | | | | | | | | | | |
MORTGAGE-BACKED OBLIGATIONS (28.2%) | | | | | | | | | | |
FHARM | | AA+ | | 2.38 | | 04/01/37 | | 280,210 | | 300,116 |
FHARM | | AA+ | | 2.38 | | 09/01/39 | | 409,539 | | 437,383 |
FHARM | | AA+ | | 2.90 | | 04/01/37 | | 437,977 | | 461,889 |
FHARM | | AA+ | | 3.33 | | 04/01/42 | | 699,088 | | 727,570 |
FHARM | | AA+ | | 5.24 | | 02/01/36 | | 210,460 | | 224,035 |
FHARM | | AA+ | | 5.43 | | 05/01/37 | | 121,333 | | 127,276 |
FHARM | | AA+ | | 5.77 | | 03/01/37 | | 74,011 | | 78,607 |
FHLMC | | AA+ | | 2.50 | | 09/01/27 | | 2,364,349 | | 2,411,219 |
FHLMC | | AA+ | | 2.50 | | 12/01/27 | | 2,382,769 | | 2,430,019 |
FHLMC | | AA+ | | 2.50 | | 04/01/28 | | 1,237,615 | | 1,261,400 |
FHLMC | | AA+ | | 3.00 | | 06/01/27 | | 1,177,401 | | 1,225,263 |
FHLMC | | AA+ | | 3.00 | | 08/01/27 | | 1,048,428 | | 1,089,512 |
FHLMC | | AA+ | | 3.00 | | 10/15/37 | | 2,210,409 | | 2,250,917 |
FHLMC | | AA+ | | 3.00 | | 12/15/40 | | 2,561,871 | | 2,579,471 |
FHLMC | | AA+ | | 3.00 | | 07/01/42 | | 1,185,506 | | 1,226,328 |
FHLMC | | AA+ | | 3.00 | | 11/01/42 | | 1,320,322 | | 1,335,239 |
FHLMC | | AA+ | | 3.00 | | 11/01/42 | | 1,384,524 | | 1,402,344 |
FHLMC | | AA+ | | 3.00 | | 11/01/42 | | 3,279,446 | | 3,319,655 |
FHLMC | | AA+ | | 3.00 | | 04/01/43 | | 2,105,769 | | 2,132,911 |
FHLMC | | AA+ | | 3.00 | | 04/01/43 | | 1,436,710 | | 1,453,588 |
FHLMC | | AA+ | | 3.50 | | 07/01/42 | | 2,966,541 | | 3,100,136 |
FHLMC | | AA+ | | 3.50 | | 01/01/43 | | 2,351,593 | | 2,448,904 |
FHLMC | | AA+ | | 3.50 | | 01/01/43 | | 1,866,704 | | 1,943,229 |
FHLMC | | AA+ | | 3.50 | | 02/01/43 | | 2,685,874 | | 2,801,686 |
FHLMC | | AA+ | | 4.00 | | 05/01/24 | | 212,054 | | 226,351 |
FHLMC | | AA+ | | 4.00 | | 02/01/25 | | 545,515 | | 580,803 |
FHLMC | | AA+ | | 4.00 | | 05/01/26 | | 642,657 | | 688,258 |
FHLMC | | NR | | 4.00 | | 12/01/33 | | 1,789,950 | | 1,917,555 |
FHLMC | | NR | | 4.00 | | 12/01/34 | | 695,485 | | 743,294 |
FHLMC | | AA+ | | 4.00 | | 12/15/38 | | 500,000 | | 519,351 |
FHLMC | | AA+ | | 4.00 | | 07/01/41 | | 1,712,525 | | 1,843,240 |
FHLMC | | AA+ | | 4.00 | | 12/01/41 | | 1,051,453 | | 1,122,681 |
FHLMC | | AA+ | | 4.00 | | 06/01/42 | | 926,068 | | 988,338 |
FHLMC | | AA+ | | 4.00 | | 07/01/42 | | 3,494,546 | | 3,762,553 |
FHLMC | | AA+ | | 4.00 | | 08/01/42 | | 2,647,101 | | 2,831,607 |
FHLMC | | AA+ | | 4.00 | | 09/01/42 | | 1,603,201 | | 1,714,750 |
FHLMC | | AA+ | | 4.00 | | 11/01/42 | | 2,507,607 | | 2,683,478 |
FHLMC | | AA+ | | 4.00 | | 12/01/42 | | 1,960,790 | | 2,117,376 |
FHLMC | | AA+ | | 4.00 | | 01/01/43 | | 2,817,663 | | 3,020,324 |
FHLMC | | AA+ | | 4.00 | | 01/01/44 | | 2,562,233 | | 2,743,155 |
FHLMC | | AA+ | | 4.50 | | 03/01/34 | | 753,667 | | 821,063 |
FHLMC | | AA+ | | 4.50 | | 08/01/34 | | 510,698 | | 556,797 |
MUTUAL OF AMERICA INVESTMENT CORPORATION - BOND FUND
PORTFOLIO OF INVESTMENTS IN SECURITIES
December 31, 2014
| | | | | | | | | | |
FHLMC | | AA+ | | 4.50 | | 08/15/35 | | 212,153 | | 229,450 |
FHLMC | | AA+ | | 4.50 | | 12/01/39 | | 1,265,798 | | 1,371,204 |
FHLMC | | AA+ | | 5.00 | | 02/01/26 | | 139,733 | | 154,050 |
FHLMC | | AA+ | | 5.00 | | 08/01/35 | | 1,355,512 | | 1,503,047 |
FHLMC | | AA+ | | 5.00 | | 10/01/40 | | 2,316,769 | | 2,566,192 |
FHLMC | | AA+ | | 5.50 | | 03/01/21 | | 191,601 | | 207,616 |
FHLMC | | AA+ | | 5.50 | | 07/01/32 | | 371,928 | | 417,260 |
FHLMC | | AA+ | | 5.50 | | 01/15/33 | | 385,787 | | 420,519 |
FHLMC | | AA+ | | 5.50 | | 05/01/33 | | 756,892 | | 850,741 |
FHLMC | | AA+ | | 5.50 | | 01/15/35 | | 207,243 | | 217,309 |
FHLMC | | AA+ | | 5.50 | | 06/01/37 | | 1,454,468 | | 1,630,290 |
FHLMC | | AA+ | | 6.00 | | 07/15/29 | | 261,871 | | 290,807 |
FHLMC | | AA+ | | 6.00 | | 03/15/32 | | 285,997 | | 312,134 |
FHLMC Strip | | AA+ | | 3.00 | | 01/15/43 | | 2,696,358 | | 2,689,291 |
FNMA | | AA+ | | 2.25 | | 01/01/28 | | 1,798,173 | | 1,766,163 |
FNMA | | AA+ | | 2.42 | | 05/01/43 | | 2,303,632 | | 2,306,187 |
FNMA | | AA+ | | 3.00 | | 09/01/29 | | 2,466,547 | | 2,572,870 |
FNMA | | AA+ | | 3.00 | | 06/01/33 | | 2,043,819 | | 2,113,441 |
FNMA | | AA+ | | 3.00 | | 07/01/33 | | 3,229,645 | | 3,335,768 |
FNMA | | AA+ | | 3.00 | | 09/01/33 | | 3,807,195 | | 3,932,368 |
FNMA | | AA+ | | 3.00 | | 10/01/42 | | 1,187,908 | | 1,202,881 |
FNMA | | AA+ | | 3.00 | | 12/01/42 | | 1,460,154 | | 1,480,084 |
FNMA | | AA+ | | 3.00 | | 12/01/42 | | 2,133,465 | | 2,138,762 |
FNMA | | AA+ | | 3.00 | | 01/01/43 | | 2,924,986 | | 2,964,874 |
FNMA | | AA+ | | 3.00 | | 02/01/43 | | 2,409,715 | | 2,440,089 |
FNMA | | AA+ | | 3.00 | | 03/01/43 | | 2,994,486 | | 3,037,127 |
FNMA | | AA+ | | 3.50 | | 03/01/32 | | 1,716,356 | | 1,810,918 |
FNMA | | AA+ | | 3.50 | | 08/01/38 | | 2,867,027 | | 3,002,428 |
FNMA | | AA+ | | 3.50 | | 03/01/41 | | 2,463,475 | | 2,580,312 |
FNMA | | AA+ | | 3.50 | | 10/01/41 | | 1,534,816 | | 1,605,059 |
FNMA | | AA+ | | 3.50 | | 11/01/41 | | 3,429,817 | | 3,582,598 |
FNMA | | AA+ | | 3.50 | | 12/01/41 | | 1,761,981 | | 1,842,620 |
FNMA | | AA+ | | 3.50 | | 04/01/42 | | 1,738,061 | | 1,814,739 |
FNMA | | AA+ | | 3.50 | | 04/01/42 | | 1,840,339 | | 1,927,094 |
FNMA | | AA+ | | 3.50 | | 07/01/42 | | 3,121,402 | | 3,257,851 |
FNMA | | AA+ | | 3.50 | | 08/01/42 | | 2,841,860 | | 2,966,558 |
FNMA | | AA+ | | 3.50 | | 10/01/42 | | 2,702,636 | | 2,820,455 |
FNMA | | AA+ | | 3.50 | | 12/01/42 | | 3,008,038 | | 3,170,887 |
FNMA | | AA+ | | 3.50 | | 03/01/43 | | 2,719,326 | | 2,838,625 |
FNMA | | AA+ | | 3.50 | | 10/01/43 | | 2,264,722 | | 2,387,244 |
FNMA | | AA+ | | 3.50 | | 01/01/44 | | 2,328,113 | | 2,389,766 |
FNMA | | AA+ | | 4.00 | | 05/01/19 | | 373,324 | | 395,619 |
FNMA | | AA+ | | 4.00 | | 07/25/26 | | 2,282,781 | | 2,431,456 |
FNMA | | AA+ | | 4.00 | | 01/01/31 | | 226,652 | | 244,358 |
FNMA | | AA+ | | 4.00 | | 12/01/33 | | 2,167,169 | | 2,316,795 |
FNMA | | AA+ | | 4.00 | | 03/01/35 | | 660,692 | | 707,537 |
FNMA | | AA+ | | 4.00 | | 11/01/38 | | 2,727,825 | | 2,919,564 |
FNMA | | AA+ | | 4.00 | | 11/01/40 | | 1,583,839 | | 1,693,113 |
FNMA | | AA+ | | 4.00 | | 05/01/41 | | 1,591,325 | | 1,698,677 |
FNMA | | AA+ | | 4.00 | | 08/01/42 | | 3,146,478 | | 3,370,215 |
FNMA | | AA+ | | 4.00 | | 05/01/43 | | 2,534,832 | | 2,715,819 |
FNMA | | AA+ | | 4.50 | | 05/01/18 | | 192,963 | | 202,704 |
FNMA | | AA+ | | 4.50 | | 05/01/19 | | 49,381 | | 51,983 |
FNMA | | AA+ | | 4.50 | | 06/01/19 | | 151,636 | | 161,028 |
FNMA | | AA+ | | 4.50 | | 05/01/30 | | 654,648 | | 714,474 |
FNMA | | AA+ | | 4.50 | | 04/01/31 | | 997,203 | | 1,088,712 |
FNMA | | AA+ | | 4.50 | | 08/01/33 | | 193,136 | | 210,417 |
FNMA | | AA+ | | 4.50 | | 08/01/33 | | 237,385 | | 258,709 |
FNMA | | AA+ | | 4.50 | | 09/01/33 | | 609,506 | | 664,089 |
FNMA | | AA+ | | 4.50 | | 10/01/33 | | 618,325 | | 676,175 |
FNMA | | AA+ | | 4.50 | | 10/01/33 | | 274,993 | | 298,423 |
FNMA | | AA+ | | 4.50 | | 05/01/34 | | 223,871 | | 244,126 |
MUTUAL OF AMERICA INVESTMENT CORPORATION - BOND FUND
PORTFOLIO OF INVESTMENTS IN SECURITIES
December 31, 2014
| | | | | | | | | | |
FNMA | | AA+ | | 4.50 | | 06/01/34 | | 364,399 | | 397,618 |
FNMA | | AA+ | | 4.50 | | 07/01/34 | | 346,927 | | 378,448 |
FNMA | | AA+ | | 4.50 | | 01/01/35 | | 992,278 | | 1,082,011 |
FNMA | | AA+ | | 4.50 | | 08/01/35 | | 367,889 | | 399,235 |
FNMA | | AA+ | | 4.50 | | 09/01/35 | | 177,103 | | 190,196 |
FNMA | | AA+ | | 4.50 | | 12/01/35 | | 456,714 | | 498,239 |
FNMA | | AA+ | | 4.50 | | 05/01/39 | | 1,327,940 | | 1,457,202 |
FNMA | | AA+ | | 4.50 | | 05/01/39 | | 1,108,573 | | 1,212,131 |
FNMA | | AA+ | | 4.50 | | 05/01/40 | | 668,581 | | 726,817 |
FNMA | | AA+ | | 4.50 | | 11/01/40 | | 1,049,464 | | 1,140,286 |
FNMA | | AA+ | | 4.50 | | 06/01/41 | | 974,048 | | 1,058,400 |
FNMA | | AA+ | | 4.50 | | 10/01/41 | | 1,781,549 | | 1,935,258 |
FNMA | | AA+ | | 4.50 | | 11/01/41 | | 1,469,750 | | 1,603,049 |
FNMA | | AA+ | | 4.50 | | 01/01/42 | | 212,708 | | 231,074 |
FNMA | | AA+ | | 4.50 | | 07/01/42 | | 3,295,820 | | 3,618,596 |
FNMA | | AA+ | | 4.50 | | 03/01/44 | | 2,666,079 | | 2,908,681 |
FNMA | | AA+ | | 4.50 | | 05/01/44 | | 2,481,170 | | 2,701,171 |
FNMA | | AA+ | | 5.00 | | 04/01/18 | | 49,207 | | 51,847 |
FNMA | | AA+ | | 5.00 | | 09/01/18 | | 275,213 | | 290,833 |
FNMA | | AA+ | | 5.00 | | 09/01/20 | | 160,958 | | 172,961 |
FNMA | | AA+ | | 5.00 | | 10/01/20 | | 306,442 | | 325,834 |
FNMA | | AA+ | | 5.00 | | 10/01/25 | | 226,311 | | 249,855 |
FNMA | | AA+ | | 5.00 | | 09/01/33 | | 1,211,829 | | 1,342,705 |
FNMA | | AA+ | | 5.00 | | 10/01/33 | | 752,688 | | 839,010 |
FNMA | | AA+ | | 5.00 | | 11/01/33 | | 859,709 | | 952,272 |
FNMA | | AA+ | | 5.00 | | 03/01/34 | | 201,449 | | 223,110 |
FNMA | | AA+ | | 5.00 | | 04/01/34 | | 393,419 | | 438,468 |
FNMA | | AA+ | | 5.00 | | 04/01/34 | | 103,480 | | 114,562 |
FNMA | | AA+ | | 5.00 | | 04/01/35 | | 349,397 | | 389,547 |
FNMA | | AA+ | | 5.00 | | 06/01/35 | | 244,557 | | 271,152 |
FNMA | | AA+ | | 5.00 | | 09/01/35 | | 279,940 | | 309,242 |
FNMA | | AA+ | | 5.00 | | 09/01/35 | | 615,638 | | 682,379 |
FNMA | | AA+ | | 5.00 | | 11/25/35 | | 1,420,414 | | 1,516,319 |
FNMA | | AA+ | | 5.00 | | 08/01/37 | | 1,698,744 | | 1,877,537 |
FNMA | | AA+ | | 5.00 | | 05/01/39 | | 1,070,213 | | 1,186,244 |
FNMA | | AA+ | | 5.00 | | 09/25/40 | | 1,539,105 | | 1,649,306 |
FNMA | | AA+ | | 5.50 | | 04/01/17 | | 17,982 | | 18,987 |
FNMA | | AA+ | | 5.50 | | 05/01/17 | | 21,099 | | 22,271 |
FNMA | | AA+ | | 5.50 | | 01/01/24 | | 265,267 | | 296,436 |
FNMA | | AA+ | | 5.50 | | 03/01/24 | | 542,200 | | 605,980 |
FNMA | | AA+ | | 5.50 | | 09/01/25 | | 231,047 | | 259,579 |
FNMA | | AA+ | | 5.50 | | 11/01/26 | | 168,513 | | 188,368 |
FNMA | | AA+ | | 5.50 | | 01/01/27 | | 98,871 | | 110,498 |
FNMA | | AA+ | | 5.50 | | 03/01/33 | | 402,656 | | 453,549 |
FNMA | | AA+ | | 5.50 | | 09/01/33 | | 396,867 | | 450,387 |
FNMA | | AA+ | | 5.50 | | 10/01/33 | | 758,270 | | 860,286 |
FNMA | | AA+ | | 5.50 | | 03/01/34 | | 409,875 | | 465,002 |
FNMA | | AA+ | | 5.50 | | 03/01/34 | | 111,335 | | 124,412 |
FNMA | | AA+ | | 5.50 | | 07/01/34 | | 300,175 | | 337,673 |
FNMA | | AA+ | | 5.50 | | 09/01/34 | | 175,913 | | 198,421 |
FNMA | | AA+ | | 5.50 | | 09/01/34 | | 356,149 | | 401,390 |
FNMA | | AA+ | | 5.50 | | 09/01/34 | | 101,794 | | 115,133 |
FNMA | | AA+ | | 5.50 | | 10/01/34 | | 700,000 | | 790,185 |
FNMA | | AA+ | | 5.50 | | 02/01/35 | | 402,421 | | 456,370 |
FNMA | | AA+ | | 5.50 | | 02/01/35 | | 217,815 | | 244,489 |
FNMA | | AA+ | | 5.50 | | 04/01/35 | | 368,251 | | 415,532 |
FNMA | | AA+ | | 5.50 | | 08/01/35 | | 764,912 | | 863,174 |
FNMA | | AA+ | | 5.50 | | 02/25/37 | | 200,064 | | 217,115 |
FNMA | | AA+ | | 5.50 | | 05/01/38 | | 864,682 | | 973,289 |
FNMA | | AA+ | | 5.50 | | 11/01/38 | | 205,705 | | 223,660 |
FNMA | | AA+ | | 5.50 | | 06/01/48 | | 256,815 | | 278,851 |
FNMA | | AA+ | | 6.00 | | 03/01/17 | | 28,668 | | 29,760 |
MUTUAL OF AMERICA INVESTMENT CORPORATION - BOND FUND
PORTFOLIO OF INVESTMENTS IN SECURITIES
December 31, 2014
| | | | | | | | | | |
FNMA | | AA+ | | 6.00 | | 05/01/23 | | 336,018 | | 382,581 |
FNMA | | AA+ | | 6.00 | | 01/01/25 | | 212,747 | | 240,910 |
FNMA | | AA+ | | 6.00 | | 03/01/28 | | 272,472 | | 309,713 |
FNMA | | AA+ | | 6.00 | | 04/01/32 | | 87,861 | | 99,584 |
FNMA | | AA+ | | 6.00 | | 04/01/32 | | 69,806 | | 79,565 |
FNMA | | AA+ | | 6.00 | | 05/01/32 | | 306,508 | | 350,935 |
FNMA | | AA+ | | 6.00 | | 04/01/33 | | 713,516 | | 816,819 |
FNMA | | AA+ | | 6.00 | | 11/01/34 | | 69,836 | | 79,129 |
FNMA | | AA+ | | 6.00 | | 03/01/36 | | 76,971 | | 86,753 |
FNMA | | AA+ | | 6.00 | | 12/01/36 | | 287,667 | | 330,631 |
FNMA | | AA+ | | 6.00 | | 01/01/37 | | 329,540 | | 378,593 |
FNMA | | AA+ | | 6.00 | | 03/01/37 | | 247,729 | | 272,212 |
FNMA | | AA+ | | 6.00 | | 04/01/37 | | 138,825 | | 152,409 |
FNMA | | AA+ | | 6.00 | | 05/01/37 | | 78,730 | | 86,430 |
FNMA | | AA+ | | 6.00 | | 06/01/37 | | 140,656 | | 154,346 |
FNMA | | AA+ | | 6.00 | | 07/01/37 | | 159,088 | | 180,439 |
FNMA | | AA+ | | 6.00 | | 08/01/37 | | 201,294 | | 228,393 |
FNMA | | AA+ | | 6.00 | | 12/01/37 | | 97,935 | | 111,081 |
FNMA | | AA+ | | 6.00 | | 10/25/44 | | 618,102 | | 719,894 |
FNMA | | AA+ | | 6.00 | | 02/25/47 | | 1,450,159 | | 1,630,237 |
FNMA | | AA+ | | 6.00 | | 12/25/49 | | 836,910 | | 929,238 |
FNMA | | AA+ | | 6.50 | | 09/01/16 | | 6,023 | | 6,164 |
FNMA | | AA+ | | 6.50 | | 03/01/17 | | 82,377 | | 85,285 |
FNMA | | AA+ | | 6.50 | | 05/01/17 | | 7,108 | | 7,190 |
FNMA | | AA+ | | 6.50 | | 05/01/32 | | 208,930 | | 237,935 |
FNMA | | AA+ | | 6.50 | | 05/01/32 | | 103,767 | | 118,173 |
FNMA | | AA+ | | 6.50 | | 09/01/36 | | 88,497 | | 104,300 |
FNMA | | AA+ | | 6.50 | | 05/01/37 | | 334,306 | | 386,922 |
FNMA | | AA+ | | 6.50 | | 07/01/37 | | 44,193 | | 50,328 |
FNMA | | AA+ | | 6.50 | | 09/01/37 | | 117,855 | | 141,392 |
FNMA | | AA+ | | 6.50 | | 05/01/38 | | 204,690 | | 245,892 |
FNMA | | AA+ | | 7.00 | | 09/01/31 | | 64,629 | | 73,449 |
FNMA | | AA+ | | 7.00 | | 01/25/44 | | 521,805 | | 587,354 |
FNMA | | AA+ | | 7.50 | | 06/01/32 | | 103,335 | | 115,842 |
FNMA | | AA+ | | 8.00 | | 04/01/32 | | 21,471 | | 23,083 |
FNMA Strip | | AA+ | | 3.00 | | 08/25/42 | | 2,168,141 | | 2,155,117 |
GNMA (4) | | AA+ | | 2.68 | | 10/16/47 | | 2,000,000 | | 1,950,190 |
GNMA (4) | | AA+ | | 3.00 | | 07/16/36 | | 1,982,318 | | 2,026,730 |
GNMA (4) | | AA+ | | 3.50 | | 11/20/32 | | 2,554,530 | | 2,685,143 |
GNMA (4) | | AA+ | | 3.50 | | 09/20/33 | | 818,572 | | 839,435 |
GNMA (4) | | AA+ | | 3.50 | | 01/20/37 | | 284,750 | | 288,550 |
GNMA (4) | | AA+ | | 3.50 | | 07/15/42 | | 1,825,849 | | 1,923,039 |
GNMA (4) | | AA+ | | 3.50 | | 11/15/42 | | 1,608,074 | | 1,693,720 |
GNMA (4) | | AA+ | | 3.70 | | 05/15/42 | | 1,174,557 | | 1,247,853 |
GNMA (4) | | AA+ | | 4.00 | | 04/15/24 | | 381,429 | | 405,390 |
GNMA (4) | | AA+ | | 4.00 | | 01/20/41 | | 2,510,343 | | 2,694,270 |
GNMA (4) | | AA+ | | 4.00 | | 08/15/41 | | 1,802,587 | | 1,948,815 |
GNMA (4) | | AA+ | | 4.00 | | 11/15/41 | | 1,189,187 | | 1,294,753 |
GNMA (4) | | AA+ | | 4.00 | | 12/15/41 | | 1,977,033 | | 2,122,926 |
GNMA (4) | | AA+ | | 4.00 | | 01/15/42 | | 699,685 | | 751,666 |
GNMA (4) | | AA+ | | 4.00 | | 03/20/42 | | 1,269,805 | | 1,363,358 |
GNMA (4) | | AA+ | | 4.00 | | 08/20/42 | | 1,637,172 | | 1,756,993 |
GNMA (4) | | AA+ | | 4.25 | | 06/20/36 | | 1,048,114 | | 1,141,135 |
GNMA (4) | | AA+ | | 4.25 | | 04/20/41 | | 1,129,054 | | 1,224,589 |
GNMA (4) | | AA+ | | 4.29 | | 04/15/41 | | 852,144 | | 924,312 |
GNMA (4) | | AA+ | | 4.50 | | 06/20/30 | | 167,820 | | 186,882 |
GNMA (4) | | AA+ | | 4.50 | | 09/15/30 | | 795,601 | | 877,424 |
GNMA (4) | | AA+ | | 4.50 | | 06/20/34 | | 797,016 | | 878,968 |
GNMA (4) | | AA+ | | 4.50 | | 09/15/40 | | 1,562,033 | | 1,707,757 |
GNMA (4) | | AA+ | | 4.50 | | 10/15/40 | | 2,066,474 | | 2,301,777 |
GNMA (4) | | AA+ | | 4.50 | | 10/15/40 | | 672,760 | | 735,522 |
GNMA (4) | | AA+ | | 5.00 | | 04/15/39 | | 1,461,432 | | 1,627,281 |
MUTUAL OF AMERICA INVESTMENT CORPORATION - BOND FUND
PORTFOLIO OF INVESTMENTS IN SECURITIES
December 31, 2014
| | | | | | | | | | |
GNMA (4) | | AA+ | | 5.00 | | 06/20/39 | | 2,302,613 | | 2,528,232 |
GNMA (4) | | AA+ | | 5.00 | | 11/15/39 | | 913,973 | | 1,010,963 |
GNMA (4) | | AA+ | | 5.00 | | 05/15/40 | | 392,063 | | 436,056 |
GNMA (4) | | AA+ | | 5.00 | | 06/20/40 | | 751,106 | | 818,567 |
GNMA (4) | | AA+ | | 5.00 | | 06/20/40 | | 717,375 | | 782,157 |
GNMA (4) | | AA+ | | 5.50 | | 01/15/36 | | 176,138 | | 197,102 |
GNMA (4) | | AA+ | | 6.50 | | 04/15/31 | | 15,331 | | 17,494 |
GNMA (4) | | AA+ | | 6.50 | | 12/15/31 | | 57,952 | | 66,154 |
GNMA (4) | | AA+ | | 6.50 | | 05/15/32 | | 31,039 | | 35,419 |
GNMA (4) | | AA+ | | 7.00 | | 05/15/32 | | 6,570 | | 7,124 |
GNMA TBA (4) | | AA+ | | 4.50 | | 02/20/20 | | 1,202,206 | | 1,232,380 |
Vendee Mortgage Trust (4) | | AA+ | | 5.25 | | 01/15/32 | | 1,356,281 | | 1,502,880 |
| | | | | | | | | | |
| | | | | | | | | | 269,875,058 |
| | | | | | | | | | |
NON-MORTGAGE-BACKED OBLIGATIONS (3.4%) | | | | | | | | | | |
FHLMC | | AA+ | | 0.00 | | 11/29/19 | | 10,872,000 | | 9,686,571 |
FNMA | | AA+ | | 0.00 | | 10/09/19 | | 25,707,000 | | 23,112,362 |
| | | | | | | | | | |
| | | | | | | | | | 32,798,933 |
| | | | | | | | | | |
CORPORATE DEBT (54.3%) | | | | | | | | | | |
CONSUMER DISCRETIONARY (8.0%) | | | | | | | | | | |
Advance Auto Parts, Inc. | | BBB- | | 4.50 | | 01/15/22 | | 1,000,000 | | 1,061,504 |
Advance Auto Parts, Inc. | | BBB- | | 5.75 | | 05/01/20 | | 3,000,000 | | 3,361,014 |
AutoZone, Inc. | | BBB | | 3.70 | | 04/15/22 | | 700,000 | | 719,911 |
AutoZone, Inc. | | BBB | | 4.00 | | 11/15/20 | | 3,000,000 | | 3,183,075 |
Brinker International, Inc. | | BBB- | | 3.88 | | 05/15/23 | | 4,000,000 | | 3,988,860 |
Dollar General Corp. | | BBB- | | 3.25 | | 04/15/23 | | 4,000,000 | | 3,640,980 |
Ethan Allen Global, Inc. | | BB- | | 5.38 | | 10/01/15 | | 2,000,000 | | 2,025,000 |
Expedia, Inc. | | BBB- | | 5.95 | | 08/15/20 | | 4,000,000 | | 4,469,896 |
Family Dollar Stores, Inc. | | BBB- | | 5.00 | | 02/01/21 | | 4,000,000 | | 4,219,320 |
Home Depot, Inc. | | A | | 5.40 | | 03/01/16 | | 2,000,000 | | 2,110,630 |
Hyatt Hotels Corp. | | BBB | | 3.88 | | 08/15/16 | | 2,800,000 | | 2,904,863 |
Hyatt Hotels Corp. | | BBB | | 5.38 | | 08/15/21 | | 200,000 | | 227,406 |
Kohl’s Corp. | | BBB | | 3.25 | | 02/01/23 | | 880,000 | | 856,844 |
Kohl’s Corp. | | BBB | | 4.00 | | 11/01/21 | | 2,620,000 | | 2,720,629 |
Lowe’s Cos., Inc. | | A- | | 3.12 | | 04/15/22 | | 2,000,000 | | 2,046,476 |
Marriott International, Inc. | | BBB | | 3.00 | | 03/01/19 | | 1,000,000 | | 1,026,528 |
Marriott International, Inc. | | BBB | | 3.38 | | 10/15/20 | | 3,000,000 | | 3,071,340 |
Mattel, Inc. | | BBB+ | | 4.35 | | 10/01/20 | | 1,000,000 | | 1,068,086 |
Newell Rubbermaid, Inc. | | BBB- | | 4.70 | | 08/15/20 | | 3,000,000 | | 3,226,926 |
NVR, Inc. | | BBB | | 3.95 | | 09/15/22 | | 4,000,000 | | 4,102,792 |
O’Reilly Automotive, Inc. | | BBB | | 3.80 | | 09/01/22 | | 3,250,000 | | 3,357,279 |
Omnicom Group, Inc. | | BBB+ | | 3.63 | | 05/01/22 | | 1,000,000 | | 1,026,594 |
Omnicom Group, Inc. | | BBB+ | | 4.45 | | 08/15/20 | | 3,000,000 | | 3,226,860 |
Staples, Inc. | | BBB- | | 4.38 | | 01/12/23 | | 3,700,000 | | 3,710,086 |
Tupperware Brands Corp. | | BBB- | | 4.75 | | 06/01/21 | | 4,000,000 | | 4,281,780 |
Whirlpool Corp. | | BBB | | 4.85 | | 06/15/21 | | 1,000,000 | | 1,097,397 |
Whirlpool Corp. | | BBB | | 6.50 | | 06/15/16 | | 2,000,000 | | 2,154,510 |
Wyndham Worldwide Corp. | | BBB- | | 3.90 | | 03/01/23 | | 4,000,000 | | 3,946,544 |
Wynn Las Vegas LLC | | BBB- | | 5.38 | | 03/15/22 | | 4,000,000 | | 4,060,000 |
| | | | | | | | | | |
| | | | | | | | | | 76,893,130 |
| | | | | | | | | | |
CONSUMER STAPLES (2.9%) | | | | | | | | | | |
Avon Products, Inc. | | BB+ | | 4.20 | | 07/15/18 | | 900,000 | | 823,500 |
Avon Products, Inc. | | BB+ | | 4.60 | | 03/15/20 | | 2,100,000 | | 1,905,750 |
Beam, Inc. | | BBB | | 5.38 | | 01/15/16 | | 344,000 | | 359,661 |
ConAgra Foods, Inc. | | BBB- | | 4.95 | | 08/15/20 | | 1,500,000 | | 1,647,558 |
CVS Health Corp. | | BBB+ | | 6.13 | | 08/15/16 | | 2,000,000 | | 2,157,714 |
Energizer Hldgs., Inc. | | BBB- | | 4.70 | | 05/19/21 | | 4,000,000 | | 4,150,460 |
Flowers Foods, Inc. | | BBB- | | 4.38 | | 04/01/22 | | 3,500,000 | | 3,687,460 |
Ingredion, Inc. | | BBB | | 4.63 | | 11/01/20 | | 3,225,000 | | 3,474,131 |
Kroger Co. | | BBB | | 2.95 | | 11/01/21 | | 300,000 | | 297,539 |
Kroger Co. | | BBB | | 4.95 | | 01/15/15 | | 2,000,000 | | 2,002,350 |
Molson Coors Brewing Co. | | BBB+ | | 3.50 | | 05/01/22 | | 3,000,000 | | 3,030,093 |
Safeway, Inc. | | BBB | | 3.95 | | 08/15/20 | | 4,000,000 | | 4,043,820 |
| | | | | | | | | | |
| | | | | | | | | | 27,580,036 |
| | | | | | | | | | |
MUTUAL OF AMERICA INVESTMENT CORPORATION - BOND FUND
PORTFOLIO OF INVESTMENTS IN SECURITIES
December 31, 2014
| | | | | | | | | | |
ENERGY (5.0%) | | | | |
Cameron International Corp. | | BBB+ | | 4.50 | | 06/01/21 | | 3,000,000 | | 3,174,960 |
Diamond Offshore Drilling, Inc. | | A- | | 4.88 | | 07/01/15 | | 2,000,000 | | 2,040,034 |
Energen Corp. | | BB | | 4.63 | | 09/01/21 | | 4,000,000 | | 3,544,840 |
EQT Corp. | | BBB | | 4.88 | | 11/15/21 | | 4,000,000 | | 4,321,228 |
FMC Technologies, Inc. | | BBB | | 2.00 | | 10/01/17 | | 4,500,000 | | 4,467,776 |
Kinder Morgan, Inc. | | BBB- | | 5.15 | | 03/01/15 | | 2,000,000 | | 2,010,320 |
Marathon Oil Corp. | | BBB | | 2.80 | | 11/01/22 | | 2,000,000 | | 1,872,996 |
Marathon Petroleum Corp. | | BBB | | 5.13 | | 03/01/21 | | 3,000,000 | | 3,279,111 |
Murphy Oil Corp. | | BBB | | 2.50 | | 12/01/17 | | 1,250,000 | | 1,242,500 |
Murphy Oil Corp. | | BBB | | 3.70 | | 12/01/22 | | 2,751,000 | | 2,469,058 |
National Oilwell Varco, Inc. | | A | | 6.13 | | 08/15/15 | | 2,000,000 | | 2,000,952 |
Noble Corp. | | BBB | | 7.50 | | 03/15/19 | | 2,000,000 | | 2,184,418 |
Rowan Companies PLC | | BBB- | | 4.88 | | 06/01/22 | | 4,000,000 | | 3,892,324 |
Seacor Hldgs., Inc. | | BB- | | 7.38 | | 10/01/19 | | 2,775,000 | | 2,906,813 |
SESI LLC | | BBB- | | 7.13 | | 12/15/21 | | 4,500,000 | | 4,320,000 |
Sunoco, Inc. | | BBB- | | 5.75 | | 01/15/17 | | 2,000,000 | | 2,162,280 |
Weatherford Int’l. Ltd. | | BBB- | | 5.50 | | 02/15/16 | | 1,500,000 | | 1,547,394 |
| | | | | | | | | | |
| | | | | | | | | | 47,437,004 |
| | | | | | | | | | |
FINANCIALS (13.5%) | | | | | | | | | | |
Aflac, Inc. | | A | | 4.00 | | 02/15/22 | | 3,000,000 | | 3,184,005 |
Alleghany Corp. | | BBB | | 4.95 | | 06/27/22 | | 1,000,000 | | 1,099,893 |
Alleghany Corp. | | BBB | | 5.63 | | 09/15/20 | | 3,000,000 | | 3,368,148 |
American Tower Corp. | | BBB- | | 4.50 | | 01/15/18 | | 4,000,000 | | 4,247,948 |
Barrick N.A. Finance LLC | | BBB | | 4.40 | | 05/30/21 | | 4,000,000 | | 4,039,008 |
Berkley (W.R.) Corp. | | BBB+ | | 4.63 | | 03/15/22 | | 2,000,000 | | 2,144,652 |
Berkley (W.R.) Corp. | | BBB+ | | 7.38 | | 09/15/19 | | 2,000,000 | | 2,367,268 |
Block Financial LLC | | BBB | | 5.50 | | 11/01/22 | | 2,250,000 | | 2,472,095 |
Boston Properties LP | | A- | | 3.70 | | 11/15/18 | | 1,000,000 | | 1,054,431 |
Boston Properties LP | | A- | | 3.85 | | 02/01/23 | | 3,000,000 | | 3,114,231 |
Capital One Financial Corp. | | BBB | | 4.75 | | 07/15/21 | | 4,000,000 | | 4,408,552 |
CNA Financial Corp. | | BBB | | 6.50 | | 08/15/16 | | 2,000,000 | | 2,163,270 |
Fairfax Financial Hldgs. | | BBB- | | 8.25 | | 10/01/15 | | 2,500,000 | | 2,618,473 |
Fairfax Financial Hldgs.† | | BBB- | | 5.80 | | 05/15/21 | | 1,500,000 | | 1,608,936 |
First Republic Bank | | A- | | 2.38 | | 06/17/19 | | 2,000,000 | | 2,009,422 |
Genworth Financial, Inc. | | BB+ | | 7.20 | | 02/15/21 | | 1,750,000 | | 1,704,164 |
Genworth Financial, Inc. | | BB+ | | 7.63 | | 09/24/21 | | 1,300,000 | | 1,271,130 |
Government Pptys. Income Trust | | BBB- | | 3.75 | | 08/15/19 | | 4,000,000 | | 4,060,592 |
Harley-Davidson Financial Svcs.† | | A- | | 3.88 | | 03/15/16 | | 2,678,000 | | 2,763,835 |
Hartford Financial Svcs. | | BBB | | 5.50 | | 03/30/20 | | 1,000,000 | | 1,130,088 |
HCP, Inc. | | BBB+ | | 6.00 | | 01/30/17 | | 1,250,000 | | 1,363,915 |
Health Care REIT, Inc. | | BBB | | 3.63 | | 03/15/16 | | 750,000 | | 771,913 |
Health Care REIT, Inc. | | BBB | | 3.75 | | 03/15/23 | | 750,000 | | 756,473 |
Health Care REIT, Inc. | | BBB | | 6.13 | | 04/15/20 | | 2,500,000 | | 2,873,828 |
Healthcare Realty Trust | | BBB- | | 3.75 | | 04/15/23 | | 4,000,000 | | 3,926,124 |
Hospitality Properties Trust | | BBB- | | 5.00 | | 08/15/22 | | 4,550,000 | | 4,794,699 |
Jones Lang LaSalle, Inc. | | BBB | | 4.40 | | 11/15/22 | | 4,000,000 | | 4,151,268 |
JPMorgan Chase Bank NA | | A | | 6.00 | | 10/01/17 | | 2,000,000 | | 2,219,768 |
Kemper Corp. | | BBB- | | 6.00 | | 11/30/15 | | 2,500,000 | | 2,606,110 |
Kemper Corp. | | BBB- | | 6.00 | | 05/15/17 | | 1,091,000 | | 1,178,641 |
Lincoln National Corp. | | A- | | 4.85 | | 06/24/21 | | 1,000,000 | | 1,101,586 |
Markel Corp. | | BBB | | 5.35 | | 06/01/21 | | 1,200,000 | | 1,346,502 |
Marsh & McLennan Cos., Inc. | | A- | | 4.80 | | 07/15/21 | | 3,000,000 | | 3,334,260 |
Moody’s Corp. | | BBB+ | | 4.50 | | 09/01/22 | | 4,000,000 | | 4,290,192 |
Nasdaq OMX Group, Inc. | | BBB- | | 5.55 | | 01/15/20 | | 2,500,000 | | 2,778,043 |
National Retail Pptys., Inc. | | BBB+ | | 3.30 | | 04/15/23 | | 1,000,000 | | 981,903 |
National Retail Pptys., Inc. | | BBB+ | | 3.80 | | 10/15/22 | | 3,000,000 | | 3,079,293 |
Pacific LifeCorp.† | | BBB+ | | 6.00 | | 02/10/20 | | 3,000,000 | | 3,410,049 |
Penske Truck Leasing Co. LP† | | BBB- | | 3.38 | | 03/15/18 | | 3,000,000 | | 3,097,197 |
Prudential Financial, Inc. | | A | | 4.50 | | 11/16/21 | | 1,000,000 | | 1,090,172 |
Raymond James Financial, Inc. | | BBB | | 4.25 | | 04/15/16 | | 3,150,000 | | 3,265,939 |
MUTUAL OF AMERICA INVESTMENT CORPORATION - BOND FUND
PORTFOLIO OF INVESTMENTS IN SECURITIES
December 31, 2014
| | | | | | | | | | |
Reckson Operating Partnership | | BBB- | | 6.00 | | 03/31/16 | | 3,200,000 | | 3,373,222 |
Reinsurance Grp. of America, Inc. | | A- | | 4.70 | | 09/15/23 | | 1,000,000 | | 1,074,557 |
Reinsurance Grp. of America, Inc. | | A- | | 5.00 | | 06/01/21 | | 3,000,000 | | 3,304,128 |
Senior Housing Pptys. Trust | | BBB- | | 4.30 | | 01/15/16 | | 3,000,000 | | 3,062,622 |
Travelers Cos., Inc. | | A | | 3.90 | | 11/01/20 | | 2,500,000 | | 2,685,515 |
Ventas Realty LP/Capital Corp. | | BBB+ | | 3.25 | | 08/15/22 | | 500,000 | | 493,429 |
Ventas Realty LP/Capital Corp. | | BBB+ | | 4.75 | | 06/01/21 | | 3,000,000 | | 3,260,688�� |
Vornado Realty LP | | BBB | | 2.50 | | 06/30/19 | | 1,000,000 | | 991,337 |
Vornado Realty LP | | BBB | | 4.25 | | 04/01/15 | | 3,000,000 | | 3,000,000 |
Wells Fargo & Co. | | A | | 3.45 | | 02/13/23 | | 4,000,000 | | 4,053,976 |
Zions Bancorporation | | BBB- | | 4.50 | | 03/27/17 | | 1,000,000 | | 1,050,518 |
| | | | | | | | | | |
| | | | | | | | | | 129,598,008 |
| | | | | | | | | | |
HEALTH CARE (5.8%) | | | | | | | | | | |
Agilent Technologies, Inc. | | BBB+ | | 5.00 | | 07/15/20 | | 4,000,000 | | 4,351,296 |
Allergan, Inc. | | A+ | | 5.75 | | 04/01/16 | | 2,000,000 | | 2,115,944 |
AmerisourceBergen Corp. | | A- | | 4.88 | | 11/15/19 | | 2,500,000 | | 2,764,550 |
Anthem, Inc. | | A- | | 4.35 | | 08/15/20 | | 2,000,000 | | 2,166,790 |
Bio-Rad Laboratories, Inc. | | BBB | | 4.88 | | 12/15/20 | | 4,000,000 | | 4,295,708 |
Biogen Idec, Inc. | | A- | | 6.88 | | 03/01/18 | | 2,500,000 | | 2,881,088 |
CIGNA Corp. | | A | | 2.75 | | 11/15/16 | | 1,000,000 | | 1,026,869 |
CIGNA Corp. | | A | | 5.38 | | 03/15/17 | | 2,000,000 | | 2,160,524 |
Edwards Lifesciences Corp. | | BBB- | | 2.88 | | 10/15/18 | | 4,500,000 | | 4,561,812 |
Hospira, Inc. | | BBB- | | 6.05 | | 03/30/17 | | 4,000,000 | | 4,312,660 |
Humana, Inc. | | BBB+ | | 7.20 | | 06/15/18 | | 2,000,000 | | 2,336,376 |
Laboratory Corp. of America | | BBB+ | | 3.75 | | 08/23/22 | | 2,000,000 | | 2,046,162 |
Laboratory Corp. of America | | BBB+ | | 4.63 | | 11/15/20 | | 1,000,000 | | 1,077,966 |
Laboratory Corp. of America | | BBB+ | | 5.63 | | 12/15/15 | | 1,000,000 | | 1,040,268 |
Medco Health Solutions, Inc. | | BBB+ | | 4.13 | | 09/15/20 | | 3,000,000 | | 3,185,595 |
Owens & Minor, Inc. | | BBB | | 3.88 | | 09/15/21 | | 2,200,000 | | 2,224,884 |
PerkinElmer, Inc. | | BBB | | 5.00 | | 11/15/21 | | 4,000,000 | | 4,351,676 |
Quest Diagnostics, Inc. | | BBB+ | | 4.75 | | 01/30/20 | | 4,000,000 | | 4,314,076 |
Thermo Fisher Scientific, Inc. | | BBB | | 3.60 | | 08/15/21 | | 1,000,000 | | 1,032,671 |
Thermo Fisher Scientific, Inc. | | BBB | | 4.50 | | 03/01/21 | | 3,000,000 | | 3,240,702 |
| | | | | | | | | | |
| | | | | | | | | | 55,487,617 |
| | | | | | | | | | |
INDUSTRIALS (4.2%) | | | | | | | | | | |
Crane Co. | | BBB | | 2.75 | | 12/15/18 | | 4,000,000 | | 4,043,148 |
CSX Corp. | | BBB+ | | 6.25 | | 04/01/15 | | 670,000 | | 679,030 |
Dun & Bradstreet Corp. | | BBB- | | 3.25 | | 12/01/17 | | 3,000,000 | | 3,084,579 |
Dun & Bradstreet Corp. | | BBB- | | 4.38 | | 12/01/22 | | 1,000,000 | | 1,022,939 |
Equifax, Inc. | | BBB+ | | 3.30 | | 12/15/22 | | 4,000,000 | | 3,954,776 |
Flowserve Corp. | | BBB- | | 3.50 | | 09/15/22 | | 4,000,000 | | 4,001,504 |
Harsco Corp. | | BB+ | | 5.75 | | 05/15/18 | | 4,000,000 | | 4,210,000 |
Kennametal, Inc. | | BBB | | 2.65 | | 11/01/19 | | 4,000,000 | | 3,957,676 |
L-3 Communications Corp. | | BBB- | | 4.75 | | 07/15/20 | | 3,000,000 | | 3,221,787 |
L-3 Communications Corp. | | BBB- | | 5.20 | | 10/15/19 | | 1,000,000 | | 1,098,316 |
Pentair PLC | | BBB | | 5.00 | | 05/15/21 | | 3,000,000 | | 3,337,047 |
Pitney Bowes, Inc. | | BBB | | 5.25 | | 01/15/37 | | 3,000,000 | | 3,213,825 |
Textron, Inc. | | BBB- | | 4.63 | | 09/21/16 | | 2,900,000 | | 3,068,241 |
Valmont Industries, Inc. | | BBB+ | | 6.63 | | 04/20/20 | | 750,000 | | 880,223 |
| | | | | | | | | | |
| | | | | | | | | | 39,773,091 |
| | | | | | | | | | |
INFORMATION TECHNOLOGY (5.4%) | | | | | | | | | | |
Adobe Systems, Inc. | | A- | | 4.75 | | 02/01/20 | | 4,000,000 | | 4,390,940 |
Arrow Electronics, Inc. | | BBB- | | 4.50 | | 03/01/23 | | 1,100,000 | | 1,137,033 |
Arrow Electronics, Inc. | | BBB- | | 6.88 | | 06/01/18 | | 2,900,000 | | 3,284,903 |
Avnet, Inc. | | BBB- | | 4.88 | | 12/01/22 | | 270,000 | | 286,542 |
Avnet, Inc. | | BBB- | | 5.88 | | 06/15/20 | | 1,100,000 | | 1,228,968 |
Avnet, Inc. | | BBB- | | 6.00 | | 09/01/15 | | 2,000,000 | | 2,062,672 |
Fiserv, Inc. | | BBB | | 4.63 | | 10/01/20 | | 2,800,000 | | 3,041,693 |
Fiserv, Inc. | | BBB | | 4.75 | | 06/15/21 | | 1,000,000 | | 1,100,945 |
Ingram Micro, Inc. | | BBB- | | 4.95 | | 12/15/24 | | 750,000 | | 749,753 |
Ingram Micro, Inc. | | BBB- | | 5.00 | | 08/10/22 | | 1,000,000 | | 1,062,226 |
Ingram Micro, Inc. | | BBB- | | 5.25 | | 09/01/17 | | 3,000,000 | | 3,245,799 |
MUTUAL OF AMERICA INVESTMENT CORPORATION - BOND FUND
PORTFOLIO OF INVESTMENTS IN SECURITIES
December 31, 2014
| | | | | | | | | | |
Lender Processing Svcs., Inc. | | BBB | | 5.75 | | 04/15/23 | | 4,500,000 | | 4,725,000 |
Lexmark International, Inc. | | BBB- | | 6.65 | | 06/01/18 | | 4,000,000 | | 4,443,656 |
Motorola Solutions, Inc. | | BBB | | 3.75 | | 05/15/22 | | 4,000,000 | | 4,058,056 |
Symantec Corp. | | BBB | | 4.20 | | 09/15/20 | | 4,000,000 | | 4,141,924 |
Tech Data Corp. | | BBB- | | 3.75 | | 09/21/17 | | 4,000,000 | | 4,132,068 |
Total System Services, Inc. | | BBB+ | | 3.75 | | 06/01/23 | | 4,000,000 | | 3,919,644 |
Western Union Co. | | BBB | | 5.93 | | 10/01/16 | | 4,000,000 | | 4,294,744 |
| | | | | | | | | | |
| | | | | | | | | | 51,306,566 |
| | | | | | | | | | |
MATERIALS (5.9%) | | | | | | | | | | |
Airgas, Inc. | | BBB | | 3.25 | | 10/01/15 | | 2,000,000 | | 2,031,868 |
Albemarle Corp. | | BBB- | | 4.50 | | 12/15/20 | | 2,000,000 | | 2,153,478 |
Alcoa, Inc. | | BBB- | | 6.75 | | 07/15/18 | | 4,000,000 | | 4,493,360 |
Carpenter Technology Corp. | | BBB | | 4.45 | | 03/01/23 | | 3,600,000 | | 3,666,316 |
Domtar Corp. | | BBB- | | 4.40 | | 04/01/22 | | 4,000,000 | | 4,105,504 |
Eastman Chemical Co. | | BBB | | 4.50 | | 01/15/21 | | 2,500,000 | | 2,667,775 |
Freeport-McMoRan Copper & Gold | | BBB | | 3.55 | | 03/01/22 | | 4,000,000 | | 3,780,444 |
Geon Co. | | BBB- | | 7.50 | | 12/15/15 | | 3,750,000 | | 3,975,000 |
Goldcorp, Inc. | | BBB+ | | 2.13 | | 03/15/18 | | 4,000,000 | | 3,953,456 |
Kinross Gold Corp. | | BBB- | | 5.13 | | 09/01/21 | | 4,000,000 | | 3,823,960 |
Methanex Corp. | | BBB- | | 3.25 | | 12/15/19 | | 3,400,000 | | 3,371,399 |
Methanex Corp. | | BBB- | | 5.25 | | 03/01/22 | | 600,000 | | 644,530 |
Newmont Mining Corp. | | BBB | | 3.50 | | 03/15/22 | | 4,000,000 | | 3,758,988 |
Packaging Corp. of America | | BBB | | 3.90 | | 06/15/22 | | 2,000,000 | | 2,051,296 |
Packaging Corp. of America | | BBB | | 4.50 | | 11/01/23 | | 2,000,000 | | 2,095,022 |
Southern Copper Corp. | | BBB | | 3.50 | | 11/08/22 | | 4,000,000 | | 3,793,460 |
Teck Resources Ltd. | | BBB | | 3.75 | | 02/01/23 | | 1,000,000 | | 896,291 |
Teck Resources Ltd. | | BBB | | 4.75 | | 01/15/22 | | 3,000,000 | | 2,924,133 |
Vulcan Materials Co. | | BB+ | | 7.00 | | 06/15/18 | | 2,000,000 | | 2,200,000 |
| | | | | | | | | | |
| | | | | | | | | | 56,386,280 |
| | | | | | | | | | |
TELECOMMUNICATION SERVICES (0.9%) | | | | | | | | | | |
AT&T, Inc. | | A- | | 3.00 | | 02/15/22 | | 4,000,000 | | 3,924,720 |
CenturyLink, Inc. | | BB | | 5.00 | | 02/15/15 | | 2,000,000 | | 2,007,500 |
Verizon Communications, Inc. | | BBB+ | | 4.50 | | 09/15/20 | | 2,000,000 | | 2,171,514 |
| | | | | | | | | | |
| | | | | | | | | | 8,103,734 |
| | | | | | | | | | |
UTILITIES (2.7%) | | | | | | | | | | |
AGL Capital Corp. | | BBB+ | | 6.38 | | 07/15/16 | | 500,000 | | 537,882 |
Constellation Energy | | BBB- | | 5.15 | | 12/01/20 | | 3,000,000 | | 3,321,603 |
Duke Energy Progress, Inc. | | A | | 5.25 | | 12/15/15 | | 2,000,000 | | 2,087,592 |
Entergy Corp. | | BBB- | | 4.70 | | 01/15/17 | | 1,500,000 | | 1,579,641 |
Entergy Corp. | | BBB- | | 5.13 | | 09/15/20 | | 2,500,000 | | 2,723,308 |
Exelon Generation Co. LLC | | BBB | | 4.25 | | 06/15/22 | | 1,000,000 | | 1,039,180 |
Illinois Power Generating Co. | | CCC+ | | 6.30 | | 04/01/20 | | 2,500,000 | | 2,075,000 |
National Fuel Gas Co. | | BBB | | 4.90 | | 12/01/21 | | 3,000,000 | | 3,253,347 |
PPL Energy Supply LLC | | BB | | 4.60 | | 12/15/21 | | 2,000,000 | | 1,814,830 |
SCANA Corp. | | BBB | | 4.13 | | 02/01/22 | | 4,000,000 | | 4,146,696 |
UIL Hldgs. Corp. | | BBB- | | 4.63 | | 10/01/20 | | 2,725,000 | | 2,898,147 |
| | | | | | | | | | |
| | | | | | | | | | 25,477,226 |
| | | | | | | | | | |
SOVEREIGN DEBT (0.4%) | | | | | | | | | | |
Sri Lanka AID | | NR | | 6.59 | | 09/15/28 | | 3,283,889 | | 4,029,201 |
| | | | | | | | | | |
| | | | | |
TOTAL LONG-TERM DEBT SECURITIES
(Cost: $917,538,549) 98.6% | | | | | | | | | | 943,138,793 |
| | | | | | | | | | |
| | | | | |
| | | Rating** | | Rate(%) | | Maturity | | Face Amount. | | Value |
SHORT-TERM DEBT SECURITIES: | | | | | | | | | | |
U.S. GOVERNMENT (0.2%) | | | | | | | | | | |
U.S. Treasury Bill | | A-1+ | | 0.09 | | 06/25/15 | | 2,000,000 | | 1,999,076 |
| | | | | | | | | | |
COMMERCIAL PAPER (0.9%) | | | | | | | | | | |
Coca-Cola Co.† | | A-1+ | | 0.10 | | 02/12/15 | | 700,000 | | 699,918 |
Exxon Mobil Corp. | | A-1+ | | 0.13 | | 02/04/15 | | 2,700,000 | | 2,699,669 |
New Jersey Natural Gas | | A-1 | | 0.15 | | 01/15/15 | | 900,000 | | 899,948 |
Toyota Motor Credit Corp. | | A-1+ | | 0.13 | | 01/28/15 | | 4,000,000 | | 3,999,610 |
| | | | | | | | | | |
| | | | | | | | | | 8,299,145 |
| | | | | | | | | | |
MUTUAL OF AMERICA INVESTMENT CORPORATION - BOND FUND
PORTFOLIO OF INVESTMENTS IN SECURITIES
December 31, 2014
| | | | | | | | | | |
TOTAL SHORT-TERM DEBT SECURITIES
(Cost: $10,298,221) 1.1% | | | | | | | | | | 10,298,221 |
| | | | | | | | | | |
| | | | | |
TEMPORARY CASH INVESTMENTS (2)
(Cost: $2,798,500) 0.3% | | | | | | | | | | 2,798,500 |
| | | | | | | | | | |
| | | | | |
TOTAL INVESTMENTS
(Cost: $930,635,270) 100.0% | | | | | | | | | | 956,235,514 |
| | | | | | | | | | |
| | | | | |
OTHER NET ASSETS -0.0% (3) | | | | | | | | | | (353,715) |
| | | | | | | | | | |
| | | | | |
NET ASSETS 100.0% | | | | | | | | | | $955,881,799 |
| | | | | | | | | | |
The accompanying notes are an integral part of these portfolio schedules.
MUTUAL OF AMERICA INVESTMENT CORPORATION
FOOTNOTES TO PORTFOLIOS OF INVESTMENTS IN SECURITIES
December 31, 2014
| | |
Abbreviations: | | FHARM = Federal Home Adjustable Rate Mortgage |
| | FHLB = Federal Home Loan Bank |
| | FHLMC = Federal Home Loan Mortgage Corporation |
| | FNMA = Federal National Mortgage Association |
| | GNMA = Government National Mortgage Association |
| | NR = Not Rated |
* Non-income producing security.
** Ratings as per Standard & Poor’s Corporation (unaudited).
† Security is exempt from registration under Rule 144A of the Securities Act of 1933. These securities may be resold in transactions exempt from registration, normally to qualified institutional buyers. At December 31, 2014, the aggregate values of these securities and their percentages of the respective Funds’ net assets were as follows:
| | | | | | | | | | | | | | |
Fund | | | | | | Aggregate Market Value | | | | | | Percentage of Net Assets | | |
| | | | | | | | | | | | | | |
EQUITY INDEX FUND | | | | | | $16,398,830 | | | | | | 0.9% | |
SMALL CAP VALUE FUND | | | | | | $7,049,891 | | | | | | 1.8% | |
SMALL CAP GROWTH FUND | | | | | | $4,298,528 | | | | | | 1.0% | |
MID-CAP EQUITY INDEX FUND | | | | | | $3,799,590 | | | | | | 0.4% | |
COMPOSITE FUND | | | | | | $2,173,351 | | | | | | 1.1% | |
MONEY MARKET FUND | | | | | | $29,197,004 | | | | | | 37.7% | |
MID-TERM BOND FUND | | | | | | $6,548,275 | | | | | | 1.5% | |
BOND FUND | | | | | | $11,579,935 | | | | | | 1.2% | |
| (1) | This security, or a portion thereof, has been segregated to cover initial margin requirements on open futures contracts. |
Information on futures contracts outstanding in the Funds as of December 31, 2014, was as follows:
| | | | | | | | | | | | | | | | | | |
| Fund | | Number of
Contracts | | Contract Type | | Purchased (P)
or Sold (S) | | Expiration
Date | | Underlying
Face Amount
at Value(a) | | Unrealized
Gain(Loss) | | | Face Value
of Futures
as a % of
Total
Investments | |
| | | | | | | |
| EQUITY INDEX FUND | | 603 | | E-mini S&P 500 Stock Index | | P | | March 2015 | | $61,879,860 | | | $656,358 | | | | 3.5% | |
| ALL AMERICA FUND | | 52 | | E-mini S&P 500 Stock Index | | P | | March 2015 | | $5,336,240 | | | ($32,565 | ) | | | 1.6% | |
| MID-CAP EQUITY INDEX FUND | | 199 | | E-mini S&P MidCap 400 Stock Index | | P | | March 2015 | | $28,827,140 | | | $657,202 | | | | 2.9% | |
| (a) | Includes the cumulative appreciation(depreciation) of futures contracts. |
| (2) | The fund has an arrangement with its custodian bank, JP Morgan Chase Bank, whereby uninvested cash, subject to parameters set by the fund, is automatically invested in the fund’s name by the bank in overnight commercial paper issued by J.P. Morgan Chase & Co. On the next business day, these funds (and earned interest) are automatically returned to the fund. The annual rate of interest earned on this temporary cash investment at December 31, 2014 was 0.12%. | |
| (3) | Percentage is less than 0.05%. |
| (4) | U.S. Government guaranteed security. |
Fair Value—The Investment Company values its investments at fair value. Fair value is an estimate of the price the Fund would receive upon selling a security in an orderly arms-length transaction. Investments are categorized based on a three-level valuation hierarchy for measurement and disclosure of fair value. The valuation hierarchy is based upon the transparency of inputs used to measure fair value. These inputs are summarized in the three broad levels listed below:
MUTUAL OF AMERICA INVESTMENT CORPORATION
FOOTNOTES TO PORTFOLIOS OF INVESTMENTS IN SECURITIES
December 31, 2014
| • | | Level 1 – quoted prices in active markets for identical securities. | |
| • | | Level 2 – other significant observable inputs (including yield, quality, coupon rate, maturity, issue type, quoted prices for similar securities, prepayment speeds, trading characteristics, etc.). | |
| • | | Level 3 – significant unobservable inputs (including the Fund’s own assumptions in determining the fair value of investments). | |
As of December 31, 2014, management determined that the fair value inputs for all equity securities, including shares of registered investment companies, were considered Level 1, with the exception of non-registered securities under Rule 144A of the Securities Act of 1933 which were considered Level 2. In addition, certain Rule 144A securities not actively traded were considered Level 3; however, there were no such securities as of December 31, 2014. Fair value inputs for all debt securities were considered Level 2. The inputs used for valuing securities are not necessarily an indication of the risk associated with investing in those securities. Transfers between levels are reflected based on the fair value at the beginning of a reporting period.
The following is a summary of the inputs used to value the Funds’ investments and other financial instruments as of December 31, 2014:
| | | | | | | | | | | | | | |
| Fund | | Level 1 – Quoted Prices | | Level 2 – Significant
Observable Inputs | | | Level 3 – Significant
Unobservable Inputs | | | Total | |
Investments at Fair Value: | | | | | | | | | | | | | | |
| (See Portfolios of Investments for More Details) | | | | | | | | | | | | | | |
Equity Index Fund | | | | | | | | | | | | | | |
Common Stock | | $1,727,505,633 | | | - | | | | - | | | | $1,727,505,633 | |
Short-Term Debt Securities | | - | | | $60,091,484 | | | | - | | | | $60,091,484 | |
Temporary Cash Investments | | - | | | $750,000 | | | | - | | | | $750,000 | |
| | | |
| | $1,727,505,633 | | | $60,841,484 | | | | - | | | | $1,788,347,117 | |
| | | | |
All America Fund | | | | | | | | | | | | | | |
Common Stock - Indexed | | $179,800,853 | | | - | | | | - | | | | $179,800,853 | |
Common Stock - Active | | $132,669,811 | | | - | | | | - | | | | $132,669,811 | |
Short-Term Debt Securities - Indexed | | - | | | $4,999,081 | | | | - | | | | $4,999,081 | |
Short-Term Debt Securities - Active | | - | | | $5,898,017 | | | | - | | | | $5,898,017 | |
Temporary Cash Investments | | - | | | $228,300 | | | | - | | | | $228,300 | |
| | | |
| | $312,470,664 | | | $11,125,398 | | | | - | | | | $323,596,062 | |
| | | | |
Small Cap Value Fund | | | | | | | | | | | | | | |
Common Stock | | $377,305,353 | | | - | | | | - | | | | $377,305,353 | |
Short-Term Debt Securities | | - | | | $17,896,636 | | | | - | | | | $17,896,636 | |
| | | |
| | $377,305,353 | | | $17,896,636 | | | | - | | | | $395,201,989 | |
| | | | |
Small Cap Growth Fund | | | | | | | | | | | | | | |
Common Stock | | $398,540,858 | | | - | | | | - | | | | $398,540,858 | |
Short-Term Debt Securities | | - | | | $13,497,841 | | | | - | | | | $13,497,841 | |
| | | |
| | $398,540,858 | | | $13,497,841 | | | | - | | | | $412,038,699 | |
| | | | |
Mid Cap Value Fund | | | | | | | | | | | | | | |
Common Stock | | $88,846,109 | | | - | | | | - | | | | $88,846,109 | |
Short-Term Debt Securities | | - | | | $3,249,448 | | | | - | | | | $3,249,448 | |
| | | |
| | $88,846,109 | | | $3,249,448 | | | | - | | | | $92,095,557 | |
| | | | |
Mid-Cap Equity Index Fund | | | | | | | | | | | | | | |
Common Stock | | $971,768,222 | | | - | | | | - | | | | $971,768,222 | |
Short-Term Debt Securities | | - | | | $31,195,493 | | | | - | | | | $31,195,493 | |
Temporary Cash Investments | | - | | | $100,000 | | | | - | | | | $100,000 | |
| | | |
| | $971,768,222 | | | $31,295,493 | | | | - | | | | $1,003,063,715 | |
| | | | |
International Fund | | | | | | | | | | | | | | |
Common Stock | | $252,326,707 | | | - | | | | - | | | | $252,326,707 | |
Short-Term Debt Securities | | - | | | $11,396,460 | | | | - | | | | $11,396,460 | |
| | | |
| | $252,326,707 | | | $11,396,460 | | | | - | | | | $263,723,167 | |
| | | | |
Composite Fund | | | | | | | | | | | | | | |
Common Stock | | $114,242,580 | | | - | | | | - | | | | $114,242,580 | |
U.S. Government Debt | | - | | | $16,835,903 | | | | - | | | | $16,835,903 | |
U.S. Government Agency Residential Mortgage-Backed Obligations | | - | | | $24,216,706 | | | | - | | | | $24,216,706 | |
U.S. Government Agency Non-Mortgage-Backed Obligations | | - | | | $445,483 | | | | - | | | | $445,483 | |
Long-Term Corporate Debt | | - | | | $32,552,782 | | | | - | | | | $32,552,782 | |
Short-Term Debt Securities | | - | | | $4,449,115 | | | | - | | | | $4,449,115 | |
Temporary Cash Investments | | - | | | $808,900 | | | | - | | | | $808,900 | |
| | | |
| | $114,242,580 | | | $79,308,889 | | | | - | | | | $193,551,469 | |
MUTUAL OF AMERICA INVESTMENT CORPORATION
FOOTNOTES TO PORTFOLIOS OF INVESTMENTS IN SECURITIES
December 31, 2014
| | | | | | | | | | | | |
Retirement Income Fund | | | | | | | | | | | | |
Common Stock | | $53,535,315 | | | - | | | | - | | | $53,535,315 |
| | | | |
2010 Retirement Fund | | | | | | | | | | | | |
Common Stock | | $26,558,105 | | | - | | | | - | | | $26,558,105 |
| | | | |
2015 Retirement Fund | | | | | | | | | | | | |
Common Stock | | $154,162,876 | | | - | | | | - | | | $154,162,876 |
| | | | |
2020 Retirement Fund | | | | | | | | | | | | |
Common Stock | | $320,042,019 | | | - | | | | - | | | $320,042,019 |
| | | | |
2025 Retirement Fund | | | | | | | | | | | | |
Common Stock | | $331,091,047 | | | - | | | | - | | | $331,091,047 |
| | | | |
2030 Retirement Fund | | | | | | | | | | | | |
Common Stock | | $277,060,170 | | | - | | | | - | | | $277,060,170 |
| | | | |
2035 Retirement Fund | | | | | | | | | | | | |
Common Stock | | $229,853,630 | | | - | | | | - | | | $229,853,630 |
| | | | |
2040 Retirement Fund | | | | | | | | | | | | |
Common Stock | | $188,610,656 | | | - | | | | - | | | $188,610,656 |
| | | | |
2045 Retirement Fund | | | | | | | | | | | | |
Common Stock | | $232,106,622 | | | - | | | | - | | | $232,106,622 |
| | | | |
2050 Retirement Fund | | | | | | | | | | | | |
Common Stock | | $50,211,014 | | | - | | | | - | | | $50,211,014 |
| | | | |
Conservative Allocation Fund | | | | | | | | | | | | |
Common Stock | | $122,523,125 | | | - | | | | - | | | $122,523,125 |
| | | | |
Moderate Allocation Fund | | | | | | | | | | | | |
Common Stock | | $315,208,180 | | | - | | | | - | | | $315,208,180 |
| | | | |
Aggressive Allocation Fund | | | | | | | | | | | | |
Common Stock | | $254,800,202 | | | - | | | | - | | | $254,800,202 |
| | | | |
Money Market Fund | | | | | | | | | | | | |
U.S. Government Debt | | - | | | $2,999,067 | | | | - | | | $2,999,067 |
U.S. Government Agency Short-Term Debt | | - | | | $34,875,109 | | | | - | | | $34,875,109 |
Commercial Paper | | - | | | $38,121,033 | | | | - | | | $38,121,033 |
Temporary Cash Investments | | - | | | $1,484,000 | | | | - | | | $1,484,000 |
| | |
| | - | | | $77,479,209 | | | | - | | | $77,479,209 |
| | | | |
Mid-Term Bond Fund | | | | | | | | | | | | |
U.S. Government Debt | | - | | | $125,199,486 | | | | - | | | $125,199,486 |
U.S. Government Agency Residential Mortgage-Backed Obligations | | - | | | $5,879 | | | | - | | | $5,879 |
U.S. Government Agency Non-Mortgage-Backed Obligations | | - | | | $33,047,006 | | | | - | | | $33,047,006 |
Long-Term Corporate Debt | | - | | | $271,127,819 | | | | - | | | $271,127,819 |
Short-Term Debt Securities | | - | | | $3,009,562 | | | | - | | | $3,009,562 |
Temporary Cash Investments | | - | | | $11,100 | | | | - | | | $11,100 |
| | |
| | - | | | $432,400,852 | | | | - | | | $432,400,852 |
| | | | |
Bond Fund | | | | | | | | | | | | |
U.S. Government Debt | | - | | | $118,392,909 | | | | - | | | $118,392,909 |
U.S. Government Agency Residential Mortgage-Backed Obligations | | - | | | $269,875,058 | | | | - | | | $269,875,058 |
MUTUAL OF AMERICA INVESTMENT CORPORATION
FOOTNOTES TO PORTFOLIOS OF INVESTMENTS IN SECURITIES
December 31, 2014
| | | | | | | | | | |
U.S. Government Agency Non-Mortgage-Backed Obligations | | - | | $32,798,933 | | | - | | | $32,798,933 |
Long-Term Corporate Debt | | - | | $518,042,692 | | | - | | | $518,042,692 |
Sovereign Debt | | - | | $4,029,201 | | | - | | | $4,029,201 |
Short-Term Debt Securities | | - | | $10,298,221 | | | - | | | $10,298,221 |
Temporary Cash Investments | | - | | $2,798,500 | | | - | | | $2,798,500 |
| | |
| | - | | $956,235,514 | | | - | | | $956,235,514 |
| | | | |
Other Financial Instruments:* | | | | | | | | | | |
Equity Index Fund | | $656,358 | | — | | | — | | | $656,358 |
All America Fund | | ($32,565) | | — | | | — | | | ($32,565) |
Mid-Cap Equity Index Fund | | $657,202 | | — | | | — | | | $657,202 |
* Other financial instruments are derivative instruments not reflected in the Portfolio of Investments, such as futures, which are valued at the unrealized appreciation/depreciation on the instrument.
During the year ended December 31, 2014, there were no transfers of securities between Level 1, Level 2 or Level 3.
Security Valuation — Investment securities are carried at fair value as follows:
Exchange-traded equity securities are valued at the last reported sales price on the principal exchange on which the security is traded. If there is no trading volume for a particular valuation day, the last bid price is used. For equity securities traded in the over-the-counter market, the security is valued at the last sale price, or if no sale, at the latest bid price available.
Short-term debt securities with a maturity of 60 days or less are valued at amortized cost, which approximates fair value for such securities.
Debt securities, including short-term debt securities maturing in excess of 60 days, are valued on the basis of prices obtained from an independent pricing source. The pricing source may utilize various pricing methodologies that incorporate both models (which consider factors such as yield, quality, coupon rate, maturity, issue type, quoted prices for similar securities, prepayment speeds and trading characteristics) and dealer supplied valuations to derive a valuation.
In the rare instance when a price is not available from an independent pricing source or when prices may not reflect fair value, such as when the price provided by the pricing source is not based on a recent trade, a calculated fair value is used, as determined in good faith by the Adviser and reviewed by a Valuation Committee, in accordance with procedures adopted by the Board of Directors of the Investment Company.
The Advisor uses a market approach to calculate fair value for equity securities which are categorized as Level 3. The Adviser’s valuation is primarily based on information regarding the specific equity issuer, such as the last trade price, financial statements, the relationship of per-share book value to the last trade price, operating information and any corporate actions, such as dividends or returns of capital, that may have occurred since the last trade. The Adviser also considers industry-specific conditions and overall market conditions, to determine whether the last trade price reflects fair value or needs to be adjusted. Generally, absent any significant contrary indications, the last trade price will be used to calculate fair value.
Retirement Funds and the Allocation Funds value their investments in the underlying Funds of the Investment Company at their respective net asset values.
Investment Transactions — Investment transactions are accounted for as of the trade date. Realized gain and loss on the sale of short and long-term debt securities are computed on the basis of amortized cost at the time of sale. Realized gains and losses on the sale of equity securities are based on the identified cost basis of the security, determined on the first-in, first-out (“FIFO”) basis.
Futures Contracts - The Equity Index Fund, Mid-Cap Equity Index Fund and a portion of the All America Fund each maintain indexed asset portfolios which are subject to equity price risk. In order to remain more fully invested in the equity markets while minimizing transaction costs, the funds purchase stock index futures contracts. An initial cash margin deposit (represented by cash or Treasury bills) is made upon entering into a futures contract and serves as collateral for the contract. This initial margin, maintained in a segregated account, is equal to approximately 5%-6% of the contract amount, and does not involve the borrowing of funds to finance the transaction. During the period the futures contract is outstanding, changes in the value of the contract are recognized as unrealized appreciation or depreciation by “marking-to-market” on a daily basis to reflect the market value of the contract at the end of each trading day. The accumulated unrealized appreciation or depreciation on the contract is included in Net Unrealized Appreciation (Depreciation) of Investments and Futures Contracts in the Components of Net Assets section of the Statements of Assets and Liabilities.
MUTUAL OF AMERICA INVESTMENT CORPORATION
FOOTNOTES TO PORTFOLIOS OF INVESTMENTS IN SECURITIES
December 31, 2014
Futures contracts are valued at the settlement price established each day by the exchange on which traded. Depending upon whether unrealized appreciation or depreciation are incurred, variation margin payments are received or made daily. The net change in unrealized appreciation or depreciation of futures contracts is recorded in the Statements of Operations. When the contract is closed, a realized gain or loss from futures transactions is recorded in the Statements of Operations, equal to the net variation margin received or paid over the period the contract was outstanding. The “Underlying Face Amount at Value” (appearing in the “Notes to the Portfolios of Investments in Securities”), representing the aggregate of outstanding contractual amounts under futures contracts, reflects the extent of a Fund’s exposure to off-balance sheet risk. The use of futures transactions involves the risk of imperfect correlation in the price movements of the contract and the underlying securities. With futures contracts, there is minimal counterparty credit risk to the Fund since futures are exchange traded and the exchange’s clearinghouse, as counterparty to all exchange traded futures, guarantees the futures against default.
Tax Information - The components of net unrealized appreciation (depreciation) of investments for Federal income tax purposes and the cost of investments for Federal income tax purposes at December 31, 2014 for each of the funds were as follows.
| | | | | | | | | | | | | | | | | | | | |
| | | Equity Index Fund | | | All America Fund | | | Small Cap Value Fund | | | Small Cap Growth Fund | | | Mid Cap Value Fund | |
Unrealized Appreciation | | $ | 694,181,719 | | | $ | 102,491,477 | | | $ | 100,911,535 | | | $ | 98,068,512 | | | $ | 20,817,308 | |
Unrealized Depreciation | | | (24,404,414) | | | | (10,292,888) | | | | (12,365,336) | | | | (9,460,093) | | | | (1,249,445) | |
| | | | | | | | | | | | | | | | | | | | |
Net | | $ | 669,777,305 | | | $ | 92,198,589 | | | $ | 88,546,199 | | | $ | 88,608,419 | | | | 19,567,863 | |
| | | | | | | | | | | | | | | | | | | | |
Cost of Investments | | $ | 1,118,569,813 | | | $ | 231,397,473 | | | $ | 306,655,790 | | | $ | 323,430,280 | | | $ | 72,527,694 | |
| | | | | | | | | | | | | | | | | | | | |
| | | | | |
| | | Mid-Cap
Equity Index Fund | | | International
Fund | | | Composite Fund | | | Retirement
Income Fund | | | 2010 Retirement Fund | |
Unrealized Appreciation | | $ | 307,034,807 | | | $ | 8,738,298 | | | $ | 47,530,328 | | | $ | 2,995,971 | | | $ | 2,706,059 | |
Unrealized Depreciation | | | (30,050,327) | | | | (7,516,135) | | | | (2,099,079) | | | | (412,854) | | | | (138,321) | |
| | | | | | | | | | | | | | | | | | | | |
Net | | $ | 276,984,480 | | | $ | 1,222,163 | | | $ | 45,431,249 | | | $ | 2,583,117 | | | | 2,567,738 | |
| | | | | | | | | | | | | | | | | | | | |
Cost of Investments | | $ | 726,079,235 | | | $ | 262,501,004 | | | $ | 148,120,220 | | | $ | 50,952,198 | | | $ | 23,990,367 | |
| | | | | | | | | | | | | | | | | | | | |
| | | | | |
| | | 2015 Retirement Fund | | | 2020 Retirement Fund | | | 2025 Retirement Fund | | | 2030 Retirement Fund | | | 2035 Retirement Fund | |
Unrealized Appreciation | | $ | 20,074,607 | | | $ | 44,098,847 | | | $ | 56,061,460 | | | $ | 51,508,275 | | | $ | 45,064,314 | |
Unrealized Depreciation | | | (973,657) | | | | (1,412,554) | | | | (1,017,636) | | | | (588,721) | | | | (449,304) | |
| | | | | | | | | | | | | | | | | | | | |
Net | | $ | 19,100,950 | | | $ | 42,686,293 | | | $ | 55,043,824 | | | $ | 50,919,554 | | | $ | 44,615,010 | |
| | | | | | | | | | | | | | | | | | | | |
Cost of Investments | | $ | 135,061,926 | | | $ | 277,355,726 | | | $ | 276,047,223 | | | $ | 226,140,616 | | | $ | 185,238,620 | |
| | | | | | | | | | | | | | | | | | | | |
| | | | | |
| | | 2040 Retirement Fund | | | 2045 Retirement Fund | | | 2050 Retirement Fund | | | Conservative
Allocation Fund | | | Moderate
Allocation Fund | |
Unrealized Appreciation | | $ | 39,470,516 | | | $ | 50,307,579 | | | $ | 3,168,000 | | | $ | 9,972,163 | | | $ | 60,502,882 | |
Unrealized Depreciation | | | (283,390) | | | | (413,206) | | | | (244,623) | | | | (1,078,001) | | | | (8,651,355) | |
| | | | | | | | | | | | | | | | | | | | |
Net | | $ | 39,187,126 | | | $ | 49,894,373 | | | $ | 2,923,377 | | | $ | 8,894,162 | | | $ | 51,851,527 | |
| | | | | | | | | | | | | | | | | | | | |
Cost of Investments | | $ | 149,423,530 | | | $ | 182,212,249 | | | $ | 47,287,637 | | | $ | 113,628,963 | | | $ | 263,356,653 | |
| | | | | | | | | | | | | | | | | | | | |
| | | | | |
| | | Aggressive Allocation Fund | | | Money Market Fund | | | Mid-Term Bond Fund | | | Bond Fund | | | | |
Unrealized Appreciation | | $ | 66,414,032 | | | $ | 4,372 | | | $ | 9,863,728 | | | $ | 31,826,773 | | |
Unrealized Depreciation | | | (7,774,377) | | | | - | | | | (2,233,818) | | | | (6,226,529) | | |
| | | | | | | | | | | | | | | | | |
Net | | $ | 58,639,655 | | | $ | 4,372 | | | $ | 7,629,910 | | | $ | 25,600,244 | | |
| | | | | | | | | | | | | | | | | |
Cost of Investments | | $ | 196,160,547 | | | $ | 77,474,837 | | | $ | 424,770,942 | | | $ | 930,635,270 | | |
| | | | | | | | | | | | | | | | | |
Differences in basis between amounts reflected in the Schedules of Investments and those computed for Federal income tax purposes arise from the Federal income tax treatment of wash sales, Real Estate Investment Trusts, partnerships, corporate actions and futures contracts.
(b) Not applicable.
ITEM 7. DISCLOSURE OF PROXY VOTING POLICIES AND PROCEDURES FOR CLOSED-END MANAGEMENT INVESTMENT COMPANIES.
Not applicable.
ITEM 8. PORTFOLIO MANAGERS OF CLOSED-END MANAGEMENT INVESTMENT COMPANIES.
Not applicable.
ITEM 9. PURCHASES OF EQUITY SECURITES BY CLOSED-END MANAGEMENT INVESTMENT COMPANY AND AFFILIATED PURCHASERS.
Not applicable.
ITEM 10. SUBMISSION OF MATTERS TO A VOTE OF SECURITY HOLDERS.
Not applicable.
ITEM 11. CONTROLS AND PROCEDURES.
| | |
| (a) | | The registrant’s principal executive officer and principal financial officer have evaluated the registrant’s disclosure controls and procedures within 90 days of this filing and have concluded that the registrant’s disclosure controls and procedures were effective, as of that date, in ensuring that information required to be disclosed by the registrant in this Form N-CSR was recorded, processed, summarized, and reported in a timely and accurate manner. |
| |
| (b) | | The registrant’s principal executive officer and principal financial officer are aware of no changes in the registrant’s internal control over financial reporting that occurred during the second fiscal quarter of the period covered by this report that has materially affected, or is likely to materially affect, the registrant’s internal control over financial reporting. |
ITEM 12. EXHIBITS.
Attached hereto:
| | | | | | |
| (a) | | (1) | | Not applicable. |
| | | |
| | (2) | | Exhibit 99.CERT | | Certifications by the registrant’s principal executive officer and principal financial officer, pursuant to Section 302 of the Sarbanes-Oxley Act of 2002 and required by Rule 30a-2(a) under the Investment Company Act of 1940. |
| | (3) | | Not applicable. |
| | | | | | |
| | | |
| (b) | | | | Exhibit 99.906CERT | | Certifications pursuant to Section 906 of the Sarbanes-Oxley Act of 2002 and required by Rule 30a-2(b) under the Investment Company Act of 1940. |
| | | |
| | | | Exhibit 99.REPT | | Report of Independent Registered Public Accounting Firm |
SIGNATURES
Pursuant to the requirements of the Securities Exchange Act of 1934 and the Investment Company Act of 1940, the registrant has duly caused this report to be signed on its behalf by the undersigned, thereunto duly authorized.
| | | | |
| | Mutual of America Investment Corporation | | |
| | |
| By: | | /s/ JOHN R. GREED | | |
| | John R. Greed | | |
| | Chairman of the Board, | | |
| | President and Chief Executive Officer of | | |
| | Mutual of America Investment Corporation | | |
Date: March 5, 2015
Pursuant to the requirements of the Securities Exchange Act of 1934 and the Investment Company Act of 1940, this report has been signed below by the following persons on behalf of the registrant and in the capacities and on the dates indicated.
| | | | |
| By: | | /s/ JOHN R. GREED | | |
| | John R. Greed | | |
| | Chairman of the Board, | | |
| | President and Chief Executive Officer of | | |
| | Mutual of America Investment Corporation | | |
Date: March 5, 2015
| | | | |
| By: | | /s/ GEORGE L. MEDLIN | | |
| | George L. Medlin | | |
| | Executive Vice President, | | |
| | Chief Financial Officer and Treasurer of | | |
| | Mutual of America Investment Corporation | | |
Date: March 5, 2015